UNITED STATES
SECURITIES AND EXCHANGE COMMISSION
Washington, D.C. 20549
FORM N-CSR
Certified Shareholder Report of
Registered Management Investment Companies
Investment Company Act File Number: 811-03735
The New Economy Fund
(Exact Name of Registrant as Specified in Charter)
333 South Hope Street
Los Angeles, California 90071
(Address of Principal Executive Offices)
Registrant's telephone number, including area code: (213) 486-9200
Date of fiscal year end: November 30
Date of reporting period: November 30, 2013
Michael W. Stockton
The New Economy Fund
333 South Hope Street
Los Angeles, California 90071
(Name and Address of Agent for Service)
Copies to:
Kathryn A. Sanders
O’Melveny & Myers LLP
400 South Hope Street, 10th Floor
Los Angeles, California 90071
(Counsel for the Registrant)
ITEM 1 – Reports to Stockholders

We continue to invest
in the companies
that benefit from the
ever-evolving new
economy.
Special feature page 6
| | | |
 | | The New Economy Fund®
Annual report
for the year ended
November 30, 2013 |
The New Economy Fund seeks long-term growth of capital by investing in securities of companies that can benefit from innovation, exploit new technologies or provide products and services that meet the demands of an evolving global economy.
This fund is one of more than 40 offered by one of the nation’s largest mutual fund families, American Funds, from Capital Group. For more than 80 years, Capital has invested with a long-term focus based on thorough research and attention to risk.
Fund results shown in this report, unless otherwise indicated, are for Class A shares at net asset value. If a sales charge (maximum 5.75%) had been deducted, the results would have been lower. Results are for past periods and are not predictive of results for future periods. Current and future results may be lower or higher than those shown. Share prices and returns will vary, so investors may lose money. Investing for short periods makes losses more likely. Investments are not FDIC-insured, nor are they deposits of or guaranteed by a bank or any other entity, so they may lose value. For current information and month-end results, visit americanfunds.com.
Here are the average annual total returns on a $1,000 investment with all distributions reinvested for periods ended December 31, 2013 (the most recent calendar quarter-end):
| Class A shares | | 1 year | | 5 years | | 10 years |
| | | | | | | |
| Reflecting 5.75% maximum sales charge | | 35.13% | | 21.08% | | 9.32% |
For other share class results, visit americanfunds.com and americanfundsretirement.com.
The total annual fund operating expense ratio is 0.83% for Class A shares as of the prospectus dated February 1, 2014 (unaudited).
Investment results assume all distributions are reinvested and reflect applicable fees and expenses. When applicable, investment results reflect fee waivers, without which results would have been lower. Visit americanfunds.com for more information.
Investing outside the United States may be subject to risks, such as currency fluctuations, periods of illiquidity and price volatility. These risks may be heightened in connection with investments in developing countries. Global diversification can help reduce these risks. Refer to the fund prospectus and the Risk Factors section of this report for more information on these and other risks associated with investing in the fund.

Special feature
Fellow investors:
The New Economy Fund advanced 42.5% for the 12 months ended November 30, 2013. Its return exceeded the 30.3% return of the unmanaged Standard & Poor’s 500 Composite Index, a broad measure of the U.S. stock market, and the 29.1% return of the Global Service and Information Index, an unmanaged index that tracks companies in the services and information sectors around the world. The fund’s return also compares favorably with the 33.4% return of the Lipper Growth Funds Index, which measures a number of U.S. growth funds, and the 23.4% return of the Lipper International Funds Index, which measures funds invested in securities whose primary trading markets are outside the U.S.
For the 10-year period ending November 30, 2013, The New Economy Fund had an average annual total return of 10.1%, compared with 7.7% for the S&P 500 and 6.8% for the Global Service and Information Index. The fund’s return also compares favorably with the 7.0% return of the Lipper Growth Funds Index and the 8.1% return for the Lipper International Funds Index.
The fiscal year in review
Global economies continued to improve as they bounce back from the recession of 2007–2009. Monetary policy in most major economies continues to be accommodative, thus adding to the reflation of financial assets and stocks.
The fund’s fiscal year began on a positive note as steady progress was made regarding Europe’s debt concerns, Chinese economic recovery and policy shifts in Japan, all of which contributed to rising global stock markets.
Results at a glance
For periods ended November 30, 2013, with all distributions reinvested
| | | Cumulative | | Average annual total returns |
| | | total returns | | | | | | | | Lifetime |
| | | 1 year | | 5 years | | 10 years | | (since 12/1/83) |
| | | | | | | | | |
| The New Economy Fund (Class A shares) | | | 42.52 | % | | | 22.75 | % | | | 10.06 | % | | | 11.54 | % |
| Standard & Poor’s 500 Composite Index* | | | 30.28 | | | | 17.59 | | | | 7.68 | | | | 10.97 | |
| Global Service and Information Index*† | | | 29.11 | | | | 16.81 | | | | 6.79 | | | | N/A | |
| Lipper Growth Funds Index | | | 33.43 | | | | 19.47 | | | | 7.00 | | | | 9.25 | |
| Lipper International Funds Index | | | 23.45 | | | | 14.38 | | | | 8.08 | | | | N/A | |
| * | This market index is unmanaged and, therefore, has no expenses. |
| † | The index is compiled by Capital Research and Management Company, the investment adviser to the fund. |
As the year progressed, many corporations reported improved earnings sending global stocks higher. Markets were also supported by firmer data in many developing economies and further evidence of economic stabilization in China. U.S. stocks hit a succession of all-time highs.
The fund’s portfolio in review
Many of The New Economy Fund’s top-10 holdings yielded positive absolute results, and had favorable returns compared to the broader stock market. The holding that had the greatest impact to the portfolio’s results was the fund’s third-largest holding, Netflix, an American provider of on-demand internet streaming media, which gained 347.7%. This was due to the growth of its global subscriber base, and the contribution per subscriber for its online streaming business. Galaxy Entertainment Group, a Hong Kong-based company that owns and operates hotels and casinos in Macau, and the fund’s second-largest holding, increased 105.4%.
Many of our holdings in the health care sector also did well. The fund’s largest holding by percent of total assets, Gilead Sciences, rose 99.5%. Alexion Pharmaceuticals, an American biopharmaceutical company, was up 29.7%. Thermo Fisher Scientific, a U.S.-based precision laboratory equipment company, increased 58.7%.
Google, the fund’s fourth-largest holding, was up 51.7%. SoftBank, a Japan-based telecommunications and internet corporation, rose 115.9%. Nielsen Holdings, a global information measurement company that enables companies to understand consumer behavior, rose 52.4%.
Two of the fund’s top-10 holdings increased on an absolute basis, but they lagged the broader markets. Hologic, a developer, manufacturer and supplier of diagnostic and medical imaging systems related to women’s health, was up 17.4%. Samsung Electronics gained 8.7% for the period as its Galaxy smartphones continued to show robust sales, and profits were at record levels in the third quarter.
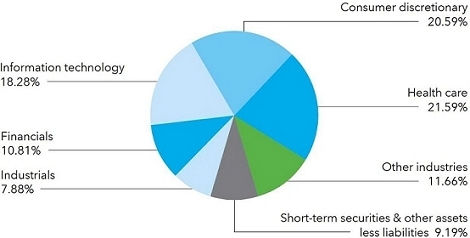
The 9.2% of the fund’s assets held in cash and short-term securities clearly hurt results, but it provided the fund with liquidity to take advantage of buying opportunities.
Looking ahead
The U.S. economy continues to recover and improve. Europe is showing modest signs of improvement, although it still struggles with muted growth and lingering high unemployment. However, fundamental improvements in tax and spending policy, while painful in the short-term, should help the region’s economies in the long run.
Many countries have begun to wean themselves from the unusually strong dependence on fiscal policy to maintain economic stability. In the U.S., the Fed has begun unwinding its quantitative easing program, trimming its monthly bond purchases from $85 billion to $75 billion.
Where the fund’s assets are invested

| | As of November 30, 2013 | | Percent of net assets |
| ■ | United States | | | 56.3 | % |
| ■ | Asia & Pacific Basin | | | 19.1 | |
| ■ | Europe | | | 14.8 | |
| ■ | Other (including Latin America) | | | 0.6 | |
| ■ | Short-term securities & other assets less liabilities | | | 9.2 | |

| | As of November 30, 2012 | | Percent of net assets |
| ■ | United States | | | 58.6 | % |
| ■ | Asia & Pacific Basin | | | 20.6 | |
| ■ | Europe | | | 12.5 | |
| ■ | Other (including Latin America) | | | 0.4 | |
| ■ | Short-term securities & other assets less liabilities | | | 7.9 | |

The great amount of liquidity that’s been injected into the system by the Fed has kept interest rates lower than where they would otherwise have been. U.S. interest rates are likely to move up as the Fed slows its quantitative easing program. While this may be a headwind in the short run, reliance on market forces to determine the level of interest rates should prove healthier.
History suggests that rising rates are not necessarily a negative for equity markets; indeed, a strong economy typically results in rising interest rates. Generally, the risk isn’t rising rates per say, it’s the absolute level of rates. We believe interest rates have room to increase before hampering growth in the U.S. economy.
Globally, easy money policies have continued to fuel stock markets in the U.S., Europe and Japan, which is reflected in price-to-earnings (PE) multiple expansion. As valuations rise, it is important to make sure that the fundamentals are keeping pace with expectations. We continue to pursue an active, research-driven approach to finding attractive companies that we believe are reasonably priced compared to their growth expectations.
The close of the fiscal year marked The New Economy Fund’s 30th anniversary. Over its lifetime, global economies have seen dramatic shifts, but as a number of the fund’s investment professionals note in this year’s feature article beginning on page 6, the new economy continues to evolve.
We thank you for your long-term commitment and investment in The New Economy Fund.
Cordially,

Timothy D. Armour
Vice Chairman of the Board

Claudia P. Huntington
President
January 10, 2014
For current information about the fund, visit americanfunds.com.
The value of a long-term perspective
Fund results shown are for Class A shares and reflect deduction of the maximum sales charge of 5.75% on the $10,000 investment.1 Thus, the net amount invested was $9,425.2 Results are for past periods and are not predictive of results for future periods. Current and future results may be lower or higher than those shown. Share prices and returns will vary, so investors may lose money. For current information and month-end results, visit americanfunds.com.
The results shown are before taxes on fund distributions and sale of fund shares.
| 1 | As outlined in the prospectus, the sales charge is reduced for accounts (and aggregated investments) of $25,000 or more and is eliminated for purchases of $1 million or more. There is no sales charge on dividends or capital gain distributions that are reinvested in additional shares. |
| 2 | The maximum initial sales charge was 8.5% prior to July 1, 1988. |
| 3 | All results are calculated with dividends and capital gains reinvested. |
| 4 | Standard & Poor’s 500 Composite Index is unmanaged and, therefore, has no expenses. |
| 5 | This index tracks 30 growth funds, as defined by each fund’s related prospectus. |
| 6 | Computed from data supplied by the U.S. Department of Labor, Bureau of Labor Statistics. |
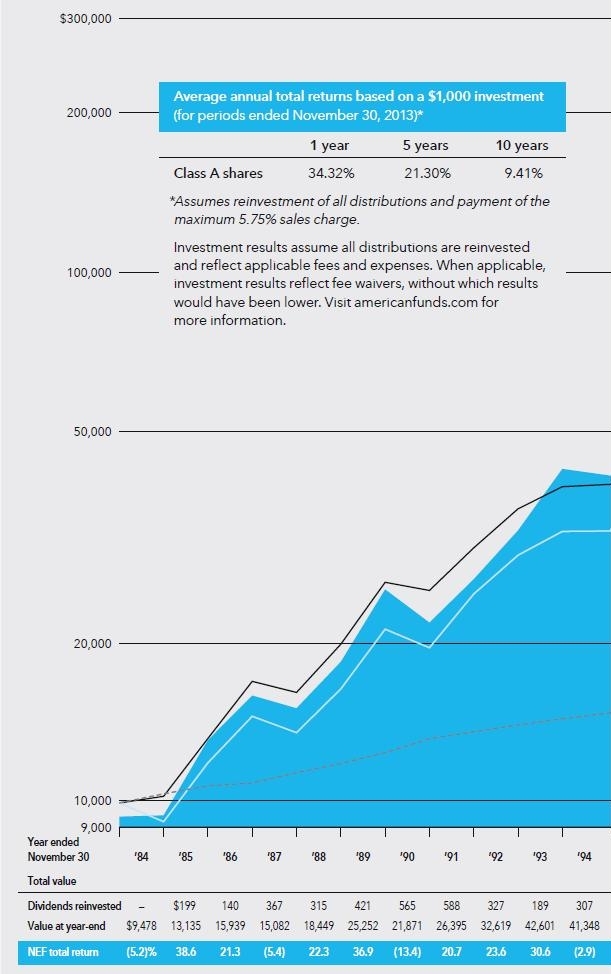
Here’s how a $10,000 investment in The New Economy Fund’s Class A shares grew between December 1, 1983 — when the fund began operations — and November 30, 2013, the end of its latest fiscal year. As you can see, the $10,000 would have increased to $249,747 after deducting the maximum 5.75% sales charge and reinvesting all distributions, an average annual increase of 11.3%. The fund’s year-by-year results appear under the chart.


We continue to invest in the
companies that benefit from the
ever-evolving new economy.
As the name suggests, The New Economy Fund invests in companies that benefit from the world’s ever-changing economies. As developing countries expand and grow and much of their population experiences upward mobility, the world’s middle class is becoming a larger force for the global economy and stock markets. Millions more people around the world will have more money in their pockets to buy new products and services, and companies that understand these trends will benefit.
“The term ‘new economy’ means a lot of things,” says fund portfolio manager Claudia Huntington. “It certainly means the growth and expansion of the middle class in developing markets. It continues to mean the expansion of services around the world. It means innovations that can expand market opportunities for companies and for consumers and, in some cases, can give rise to entirely new industries.”
The size of the opportunity is immense: According to the McKinsey Global Institute, the global consumer class will swell from about 2.4 billion today to 4.2 billion by 2025, when the world’s population is expected to be near 8 billion.1 That’s 410,000 people — the population of Miami, Florida2 — entering the middle class every day. The rapidly growing ranks of people improving their socioeconomic status are not just in the “BRIC countries” — Brazil, Russia, India and China — but span a dozen nations including Indonesia, Malaysia and some in Africa. The growing middle class is projected to spend $20 trillion annually during the next decade — double the current consumption in the United States.
This broad expansion of a middle class with the discretionary income for purchasing more goods and services represents a significant opportunity for companies that effectively position themselves to benefit from these trends. The developing world’s consumers have similarities to those in developed nations: Many are aware of, and have a fondness for, brands and want access to a variety of products including those they aspire to but can’t currently afford.3 This emerging and globally minded generation is confident and independent, and determined to display those traits through their consumption.
410,000 people — the population of Miami, Florida2 — are entering the consumer class every day.

In a lot of the industries in which the fund invests, disruptive events occur because change happens fairly rapidly. It can be disruptive in an abrupt sense, or it just can be solving a problem better than before, so it doesn’t necessarily have to be really dramatic. But it can, on the margin, change things.
Claudia Huntington, portfolio manager
In Indonesia, for example, the cell phone is an ubiquitous technology; there are over 220 million active mobile phone subscriptions in the country, making the mobile penetration rate over 90%.4
This new breed of consumer is more willing to try a new product such as a “wearable” (a miniature electronic device that is worn by the user) or a tablet, and stream movies or television shows. Younger consumers tend to be tech savvy and more willing to spend on luxury goods, gaming, restaurants, hotels, travel and vacations. Many already own a smartphone and are now seeking data and apps to go with it. In Indonesia, for example, the cell phone is an ubiquitous technology; there are over 220 million active mobile phone subscriptions in the country, making the mobile penetration rate over 90%.4 Millions have leapfrogged traditional cable, and are purely on-demand consumers. Many never owned a personal computer; they usurped them with smartphones and tablets.
For The New Economy Fund and its investors, this means locating the companies that benefit from this growing middle class and investing in those companies that create products and services that the growing consumer population desires. That might mean faster growth, it might mean the need for a superior set of products or services, or it could be a shift geographically in how companies go about doing their business.
The companies that are innovators or market leaders or able to otherwise take advantage of the new economy are likely able to increase their opportunities for growth and success.
The New Economy Fund’s focus is not only to find opportunities in well-established industries, but also to watch for industries that are less obvious. Revealingly, six of the fund’s top-10 holdings as of November 30, 2013, did not even exist when the fund was founded in 1983.
The New Economy Fund has also found success by investing in many companies that have changed how an industry works, such as Netflix, Amazon and Gilead Sciences. “In a lot of the industries in which the fund invests, disruptive events occur because change happens fairly rapidly. It can be disruptive in an abrupt sense, or it just can be solving a problem better than before, so it doesn’t necessarily have to be really dramatic. But it can, on the margin, change things,” says Claudia. “We look for companies led by CEOs who think strategically and who are operating and executing better than their competition.”

Our goal is to invest sensibly with a long-term perspective. Our mission isn’t to chase the hot area. It’s to apply our well-rounded principles of investing and bottom-up fundamental analysis to try and understand where the world is heading — uncover what areas are emerging, anticipate areas that are going to be important and see if we can identify attractively valued investments to capitalize on these trends.
Tim Armour, portfolio manager
One problem with emerging sectors or industries is often there can be a lot of hype as these areas begin to grow very rapidly. “Our goal is to invest sensibly with a long-term perspective,” says fund portfolio manager Tim Armour. “Our mission isn’t to chase the hot area. It’s to apply our well-rounded principles of investing and bottom-up fundamental analysis to try and understand where the world is heading — uncover what areas are emerging, anticipate areas that are going to be important and see if we can identify attractively valued investments to capitalize on these trends.”
Sometimes an interesting area to invest is where industries converge. For instance, companies like Netflix are using technology to expand media’s reach and allow consumers to watch media wherever and whenever they want. This phenomenon is seemingly gaining momentum. “Consumers want access to content on any device they choose, on-demand, anywhere they happen to be. This is a long-term trend, and companies that help consumers do this are doing very well,” says Brad Barrett, an investment analyst who covers media and the Internet.


Consumers want access to content on any device they choose, on-demand, anywhere they happen to be. This is a long-term trend, and companies that help consumers do this are doing very well.
Brad Barrett, investment analyst

Another big theme: mobile devices that allow for different sorts of experiences. Presently, many mobile phone experiences simply have been adapted from traditional desktop computing. While interesting, the real advantage of mobile phones will be doing unique things that only mobile phones can do. For example, a mobile phone can now use an app to locate and call a taxi to arrive for pickup right where you stand.
Another important sector that is clearly benefitting from innovation and evolution is the biotech industry. Lifesaving and life-enhancing drugs are available and under development. These breakthroughs are likely to have a significant, positive impact on the world’s populations. “We are on the cusp of really applying technology to health care to more effectively treat diseases,” says Tim. “I think the world will develop better treatments and possibly cures for diseases that take people’s lives today. The time needed to do gene sequencing has shortened dramatically. The pace and knowledge of drug discovery, efficacy and application is having huge, profound impacts. Ultimately this means over the next 20 years, health care should become more affordable, and it should be easier to treat diseases.”

Drug companies that are combating diseases are having bigger impacts. The idea of leveraging research with human patients who have rare genetic defects in order to develop a therapy is a major deal. Using these patients’ disease history and their genetic conditions to validate the pursuit of a certain drug is new and impactful.
Craig Gordon, M.D., investment analyst
The evolution of drug development technologies is having a considerable effect on the diseases that are being targeted. There is a substantial amount of new technology being developed to battle diseases such as some cancers, some rare bone diseases, rare neurological diseases and rare blood diseases.
“Drug companies that are combating diseases are having bigger impacts,” says Craig Gordon, M.D., a biotechnology investment analyst who is a rheumatologist and internist. “The idea of leveraging research with human patients who have rare genetic defects in order to develop a therapy is a major deal. Using these patients’ disease history and their genetic conditions to validate the pursuit of a certain drug is new and impactful. This will help lower the financial risk in developing a drug. We’re in the early days of understanding how to treat simple genetic diseases — often caused by one or two genetic mutations — with oral drugs, antibodies or complex biologics, or through RNA or gene therapies.”
The economic opportunities in today’s marketplace are substantial: The global consumer class is growing in size, along with its buying power, and the companies that can effectively provide goods and services to that population will benefit in the long term. Whether it’s a company that has advanced the latest medical or technological innovation, or a company that has gained market share by simply making better strategic decisions, the investment professionals of The New Economy Fund continue to do the fundamental research needed to invest in these opportunities at fair valuations. ¢
Ultimately this means over the next 20 years, health care should become more affordable, and it should be easier to treat diseases.
| 1 | “Consuming class” is defined as having daily disposable income of greater than the equivalent of $10 US. “Winning the $30 trillion decathlon: Going for gold in emerging markets,” McKinsey Quarterly, McKinsey & Co., August 2012, by Yuval Atsmon, Peter Child, Richard Dobbs and Laxman Narasimhan. |
| 2 | U.S. Census Bureau, July 2012. |
| 3 | “Capturing the world’s emerging class,” McKinsey Quarterly, McKinsey & Co., July 2010, by David Court and Laxman Narasimhan. |
| 4 | “The growing Indonesian middle class,” www.jana.com, Jana Mobile Inc., July 2013. |
Summary investment portfolio November 30, 2013
| Industry sector diversification | Percent of net assets |
| Country diversification | | Percent of net assets |
| United States | | 56.3 | % |
| Hong Kong | | 7.9 | |
| Euro zone* | | 7.6 | |
| United Kingdom | | 5.0 | |
| China | | 3.5 | |
| Japan | | 2.3 | |
| Korea | | 1.9 | |
| Russian Federation | | 1.0 | |
| India | | 0.7 | |
| Denmark | | 0.7 | |
| Other countries | | 3.9 | |
| Short-term securities & other assets less liabilities | | 9.2 | |
| * | Countries using the euro as a common currency; those represented in the fund’s portfolio are Finland, France, Germany, Greece, Ireland, the Netherlands, Portugal and Spain. |
| Common stocks 90.81% | | Shares | | | Value
(000) | | | Percent of
net assets | |
| Health care 21.59% | | | | | | | | | | | | |
| Gilead Sciences, Inc.1 | | | 5,248,473 | | | $ | 392,638 | | | | 3.16 | % |
| Develops drugs to treat infectious diseases and cancer. | | | | | | �� | | | | | | |
| | | | | | | | | | | | | |
| Alexion Pharmaceuticals, Inc.1 | | | 1,539,600 | | | | 191,680 | | | | 1.54 | |
| Biopharmaceutical company focused on treating severe and ultra-rare disorders. | | | | | | | | | | | | |
| | | | | | | | | | | | | |
| Thermo Fisher Scientific Inc. | | | 1,628,000 | | | | 164,184 | | | | 1.32 | |
| A leading worldwide provider of analytical instruments, including lab and industrial equipment. | | | | | | | | | | | | |
| | | | | | | | | | | | | |
| Hologic, Inc.1 | | | 7,108,850 | | | | 159,167 | | | | 1.28 | |
| Manufacturer of various medical technologies relating to women’s health care. | | | | | | | | | | | | |
| | | | | | | | | | | | | |
| Grifols, SA, Class A | | | 1,601,000 | | | | 73,198 | | | | | |
| Grifols, SA, Class B | | | 1,051,557 | | | | 35,878 | | | | 1.13 | |
| Grifols, SA, Class B (ADR) | | | 929,726 | | | | 31,922 | | | | | |
| Global manufacturer of health care products, specializing in hemoderivatives. | | | | | | | | | | | | |
| | | | | | | | | | | | | |
| BioMarin Pharmaceutical Inc.1 | | | 1,529,630 | | | | 107,655 | | | | .86 | |
| Biotechnology company engaged in the treatment of serious diseases and medical conditions. | | | | | | | | | | | | |
| | | | | | | | | | | | | |
| Biogen Idec Inc.1 | | | 367,600 | | | | 106,961 | | | | .86 | |
| A leader in developing therapies to treat multiple sclerosis and cancer. | | | | | | | | | | | | |
| | | | | | | | | | | | | |
| McKesson Corp. | | | 600,000 | | | | 99,534 | | | | .80 | |
| A leading distributor of pharmaceuticals in the U.S. | | | | | | | | | | | | |
| | | | | | | | | | | | | |
| Stryker Corp. | | | 1,296,500 | | | | 96,485 | | | | .78 | |
| A global leader in the medical technology industry, particularly in the orthopaedic market. | | | | | | | | | | | | |
| | | | | | | | | | | | | |
| NuVasive, Inc.1,2 | | | 2,896,186 | | | | 96,298 | | | | .77 | |
| Medical device company that develops products for the minimally invasive surgical treatment of spine disorders. | | | | | | | | | | | | |
| | | | | | | | | | | | | |
| Illumina, Inc.1 | | | 874,476 | | | | 85,699 | | | | .69 | |
| Biotechnology company engaged in the manufacture of integrated systems for the analysis of genetic variation and biological function. | | | | | | | | | | | | |
| | | | | | | | | | | | | |
| William Demant Holding A/S1 | | | 873,000 | | | | 81,560 | | | | .66 | |
| Denmark-based hearing health care company. | | | | | | | | | | | | |
| | | | | | | | | | | | | |
| Myriad Genetics, Inc.1 | | | 2,688,885 | | | | 79,994 | | | | .64 | |
| Biopharmaceutical company focused on diagnostic and therapeutic products to prevent and treat cancer and viral diseases. | | | | | | | | | | | | |
| | | | | | | | | | | | | |
| Mesoblast Ltd.1 | | | 14,210,000 | | | | 79,489 | | | | .64 | |
| Biotechnology company focused on the development of adult stem cell technologies. | | | | | | | | | | | | |
| | | Shares | | | Value
(000) | | | Percent of
net assets | |
| UnitedHealth Group Inc. | | | 962,100 | | | $ | 71,657 | | | | .58 | % |
| Provides managed health care services across the U.S. | | | | | | | | | | | | |
| | | | | | | | | | | | | |
| Exelixis, Inc.1,2 | | | 11,930,900 | | | | 69,557 | | | | .56 | |
| Develops technologies to compare genetic data. Its findings and methods are used by pharmaceutical and agrochemical companies. | | | | | | | | | | | | |
| | | | | | | | | | | | | |
| Amgen Inc. | | | 608,000 | | | | 69,361 | | | | .56 | |
| The world’s largest biotechnology company. | | | | | | | | | | | | |
| Other securities | | | | | | | 592,418 | | | | 4.76 | |
| | | | | | | | 2,685,335 | | | | 21.59 | |
| | | | | | | | | | | | | |
| Consumer discretionary 20.59% | | | | | | | | | | | | |
| Galaxy Entertainment Group Ltd.1 | | | 49,722,000 | | | | 389,302 | | | | 3.13 | |
| Operator of gaming and entertainment facilities in Macau and a manufacturer of construction materials. | | | | | | | | | | | | |
| | | | | | | | | | | | | |
| Netflix, Inc.1 | | | 924,400 | | | | 338,145 | | | | 2.72 | |
| Internet subscription service for watching TV shows and movies. | | | | | | | | | | | | |
| | | | | | | | | | | | | |
| Daily Mail and General Trust PLC, Class A, nonvoting | | | 10,236,701 | | | | 153,396 | | | | 1.23 | |
| Operates in the digital information, media and events businesses. | | | | | | | | | | | | |
| | | | | | | | | | | | | |
| Amazon.com, Inc.1 | | | 336,800 | | | | 132,571 | | | | 1.07 | |
| Major online retailer of books, CDs, DVDs, toys, apparel, home furnishings and other products. | | | | | | | | | | | | |
| | | | | | | | | | | | | |
| MGM China Holdings Ltd. | | | 36,772,000 | | | | 130,911 | | | | 1.05 | |
| Owns and operates a casino in Macau. | | | | | | | | | | | | |
| | | | | | | | | | | | | |
| lululemon athletica inc.1 | | | 1,642,100 | | | | 114,487 | | | | .92 | |
| Manufacturer and retailer of yoga-inspired athletic apparel. | | | | | | | | | | | | |
| | | | | | | | | | | | | |
| Sands China Ltd. | | | 14,792,800 | | | | 111,910 | | | | .90 | |
| Owns and operates integrated resorts and casinos in Macau. | | | | | | | | | | | | |
| | | | | | | | | | | | | |
| Melco Crown Entertainment Ltd. (ADR)1 | | | 2,881,000 | | | | 102,535 | | | | .82 | |
| Casino gaming and resort operator based in Macau. | | | | | | | | | | | | |
| | | | | | | | | | | | | |
| ProSiebenSat.1 Media AG | | | 2,071,000 | | | | 93,167 | | | | .75 | |
| Germany-based media company with stations also in Austria and Switzerland. | | | | | | | | | | | | |
| | | | | | | | | | | | | |
| Comcast Corp., Class A | | | 1,476,400 | | | | 73,628 | | | | .59 | |
| Provides media and television broadcasting services worldwide. | | | | | | | | | | | | |
| Other securities | | | | | | | 921,011 | | | | 7.41 | |
| | | | | | | | 2,561,063 | | | | 20.59 | |
| | | | | | | | | | | | | |
| Information technology 18.28% | | | | | | | | | | | | |
| Google Inc., Class A1 | | | 262,225 | | | | 277,851 | | | | 2.23 | |
| One of the most frequently used website search engines in the world. | | | | | | | | | | | | |
| | | | | | | | | | | | | |
| Samsung Electronics Co. Ltd. | | | 163,047 | | | | 230,173 | | | | 1.85 | |
| Korea’s top electronics manufacturer and a global leader in semiconductor production. | | | | | | | | | | | | |
| | | | | | | | | | | | | |
| Intuit Inc. | | | 1,717,200 | | | | 127,468 | | | | 1.02 | |
| Produces user-friendly financial software, including Quicken and TurboTax, and offers services to home and small-business users. | | | | | | | | | | | | |
| | | | | | | | | | | | | |
| Baidu, Inc., Class A (ADR)1 | | | 749,000 | | | | 124,761 | | | | 1.01 | |
| Internet search engine in China that also operates a Japanese language service. | | | | | | | | | | | | |
| | | | | | | | | | | | | |
| Accenture PLC, Class A | | | 1,451,700 | | | | 112,463 | | | | .91 | |
| Management consulting, technology services and outsourcing company. | | | | | | | | | | | | |
| | | | | | | | | | | | | |
| Texas Instruments Inc. | | | 2,555,000 | | | | 109,865 | | | | .89 | |
| Global maker of semiconductors and a leading producer of digital signal processors. | | | | | | | | | | | | |
| | | | | | | | | | | | | |
| Youku Tudou Inc., Class A (ADR)1 | | | 3,240,000 | | | | 91,303 | | | | .73 | |
| Chinese Internet television company. | | | | | | | | | | | | |
| | | | | | | | | | | | | |
| Gemalto NV | | | 666,300 | | | | 75,238 | | | | .60 | |
| Provider of digital security products and services. | | | | | | | | | | | | |
| Common stocks (continued) | | Shares | | | Value
(000) | | | Percent of
net assets | |
| Information technology (continued) | | | | | | | | | | | | |
| Oracle Corp. | | | 1,977,000 | | | $ | 69,768 | | | | .56 | % |
| Major supplier of database management software. Also develops business applications and provides consulting and support. | | | | | | | | | | | | |
| | | | | | | | | | | | | |
| Motorola Solutions, Inc. | | | 1,051,225 | | | | 69,255 | | | | .56 | |
| A leader in wireless telecommunications equipment. | | | | | | | | | | | | |
| Other securities | | | | | | | 984,841 | | | | 7.92 | |
| | | | | | | | 2,272,986 | | | | 18.28 | |
| | | | | | | | | | | | | |
| Financials 10.81% | | | | | | | | | | | | |
| AIA Group Ltd. | | | 27,722,200 | | | | 140,531 | | | | 1.13 | |
| Life insurance and financial services provider in the Asia-Pacific region. | | | | | | | | | | | | |
| | | | | | | | | | | | | |
| Endurance Specialty Holdings Ltd. | | | 1,509,395 | | | | 85,884 | | | | .69 | |
| Provides property and casualty insurance and reinsurance. | | | | | | | | | | | | |
| | | | | | | | | | | | | |
| SVB Financial Group1 | | | 835,000 | | | | 84,535 | | | | .68 | |
| Financial services provider for companies in the technology, life science, venture capital, private equity and premium wine markets. | | | | | | | | | | | | |
| Other securities | | | | | | | 1,033,765 | | | | 8.31 | |
| | | | | | | | 1,344,715 | | | | 10.81 | |
| | | | | | | | | | | | | |
| Industrials 7.88% | | | | | | | | | | | | |
| Nielsen Holdings NV | | | 3,762,000 | | | | 162,368 | | | | 1.31 | |
| Marketing and advertisement measurement company. | | | | | | | | | | | | |
| | | | | | | �� | | | | | | |
| Ryanair Holdings PLC (ADR)1 | | | 2,274,700 | | | | 109,242 | | | | .88 | |
| European discount airline serving Continental Europe, Ireland and the United Kingdom. | | | | | | | | | | | | |
| | | | | | | | | | | | | |
| Verisk Analytics, Inc., Class A1 | | | 1,226,000 | | | | 79,825 | | | | .64 | |
| Risk assessment services provider operating mainly in the property/casualty insurance industry. | | | | | | | | | | | | |
| | | | | | | | | | | | | |
| CSX Corp. | | | 2,654,722 | | | | 72,394 | | | | .58 | |
| Operates a major rail system and provides freight transportation across the U.S. | | | | | | | | | | | | |
| | | | | | | | | | | | | |
| Union Pacific Corp. | | | 437,977 | | | | 70,970 | | | | .57 | |
| Operates the largest railroad in the U.S.; also delivers freight to Canada and Mexico. | | | | | | | | | | | | |
| Other securities | | | | | | | 485,318 | | | | 3.90 | |
| | | | | | | | 980,117 | | | | 7.88 | |
| | | | | | | | | | | | | |
| Telecommunication services 4.14% | | | | | | | | | | | | |
| SoftBank Corp. | | | 2,185,100 | | | | 176,856 | | | | 1.42 | |
| Internet and telecommunications conglomerate and distributor of digital media and software. | | | | | | | | | | | | |
| Crown Castle International Corp.1 | | | 1,361,500 | | | | 101,064 | | | | .81 | |
| A leading provider of wireless communications and transmission sites. | | | | | | | | | | | | |
| Other securities | | | | | | | 237,544 | | | | 1.91 | |
| | | | | | | | 515,464 | | | | 4.14 | |
| | | | | | | | | | | | | |
| Energy 1.28% | | | | | | | | | | | | |
| Schlumberger Ltd. | | | 1,122,400 | | | | 99,243 | | | | .80 | |
| A leading provider of services and technology to the petroleum industry. | | | | | | | | | | | | |
| Other securities | | | | | | | 59,697 | | | | .48 | |
| | | | | | | | 158,940 | | | | 1.28 | |
| | | | | | | | | | | | | |
| Consumer staples 0.99% | | | | | | | | | | | | |
| Costco Wholesale Corp. | | | 650,000 | | | | 81,528 | | | | .66 | |
| Operates membership warehouse clubs that serve both small businesses and consumers. | | | | | | | | | | | | |
| Other securities | | | | | | | 41,441 | | | | .33 | |
| | | | | | | | 122,969 | | | | .99 | |
| | | Value
(000) | | | Percent of
net assets | |
| Utilities 0.27% | | | | | | | | |
| Other securities | | $ | 33,101 | | | | .27 | % |
| | | | | | | | | |
| Miscellaneous 4.98% | | | | | | | | |
| Other common stocks in initial period of acquisition | | | 619,822 | | | | 4.98 | |
| | | | | | | | | |
| Total common stocks (cost: $7,034,463,000) | | | 11,294,512 | | | | 90.81 | |
| Short-term securities 9.03% | | Principal amount
(000) | | | | | | | |
| Freddie Mac 0.10%–0.16% due 12/19/2013–8/8/2014 | | $ | 386,980 | | | | 386,797 | | | | 3.11 | |
| Federal Home Loan Bank 0.05%–0.15% due 12/27/2013–4/4/2014 | | | 351,200 | | | | 351,147 | | | | 2.83 | |
| Coca-Cola Co. 0.10%–0.18% due 12/5/2013–2/18/20143 | | | 96,000 | | | | 95,993 | | | | .77 | |
| Other securities | | | | | | | 288,556 | | | | 2.32 | |
| | | | | | | | | | | | | |
| Total short-term securities (cost: $1,122,467,000) | | | | | | | 1,122,493 | | | | 9.03 | |
| Total investment securities (cost: $8,156,930,000) | | | | | | | 12,417,005 | | | | 99.84 | |
| Other assets less liabilities | | | | | | | 20,300 | | | | .16 | |
| | | | | | | | | | | | | |
| Net assets | | | | | | $ | 12,437,305 | | | | 100.00 | % |
This summary investment portfolio is designed to streamline the report and help investors better focus on the fund’s principal holdings. See the inside back cover for details on how to obtain a complete schedule of portfolio holdings.
The descriptions of the companies shown in the summary investment portfolio, which were obtained from published reports and other sources believed to be reliable, are supplemental and are not covered by the Report of Independent Registered Public Accounting Firm.
As permitted by U.S. Securities and Exchange Commission regulations, “Miscellaneous” securities include holdings in their first year of acquisition that have not previously been publicly disclosed.
“Other securities” includes all issues that are not disclosed separately in the summary investment portfolio, including one security which was valued under fair value procedures adopted by authority of the board of trustees. The value of this security was $6,608,000, with a cost of $31,574,000, and represented .05% of the net assets of the fund; it was acquired from 9/6/2000 to 4/18/2002 through private placement transactions exempt from registration under the Securities Act of 1933 which may subject it to legal or contractual restrictions on resale.
Investments in affiliates
A company is considered to be an affiliate of the fund under the Investment Company Act of 1940 if the fund’s holdings in that company represent 5% or more of the outstanding voting shares. The value of the fund’s affiliated-company holdings is either shown in the summary investment portfolio or included in the value of “Other securities” under the respective industry sector. Further details on such holdings and related transactions during the year ended November 30, 2013, appear below.
| | | Beginning
shares | | | Additions | | | Reductions | | | Ending
shares | | | Dividend
income
(000) | | | Value of
affiliates at
11/30/2013
(000) | |
| NuVasive, Inc.1 | | | 2,205,286 | | | | 690,900 | | | — | | | | 2,896,186 | | | $ | — | | | $ | 96,298 | |
| Exelixis, Inc.1 | | | 10,950,900 | | | | 980,000 | | | — | | | | 11,930,900 | | | | — | | | | 69,557 | |
| Avanti Communications Group PLC1 | | | 6,933,372 | | | | — | | | — | | | | 6,933,372 | | | | — | | | | 26,300 | |
| | | | | | | | | | | | | | | | | | $ | — | | | $ | 192,155 | |
The following footnotes apply to either the individual securities noted or one or more of the securities aggregated and listed as a single line item.
| 1 | Security did not produce income during the last 12 months. |
| 2 | Represents an affiliated company as defined under the Investment Company Act of 1940. |
| 3 | Acquired in a transaction exempt from registration under section 4(2) of the Securities Act of 1933. May be resold in the U.S. in transactions exempt from registration, normally to qualified institutional buyers. The total value of all such securities, including those in “Other securities,” was $256,284,000, which represented 2.06% of the net assets of the fund. |
Key to abbreviation
ADR = American Depositary Receipts
See Notes to Financial Statements
Financial statements
Statement of assets and liabilities
at November 30, 2013 | | (dollars in thousands) |
| | | | |
| Assets: | | | | | | | | |
| Investment securities, at value: | | | | | | | | |
| Unaffiliated issuers (cost: $7,988,119) | | $ | 12,224,850 | | | | | |
| Affiliated issuers (cost: $168,811) | | | 192,155 | | | $ | 12,417,005 | |
| Cash | | | | | | | 74 | |
| Receivables for: | | | | | | | | |
| Sales of investments | | | 14,156 | | | | | |
| Sales of fund’s shares | | | 21,920 | | | | | |
| Dividends and interest | | | 10,889 | | | | 46,965 | |
| | | | | | | | 12,464,044 | |
| Liabilities: | | | | | | | | |
| Payables for: | | | | | | | | |
| Purchases of investments | | | 8,167 | | | | | |
| Repurchases of fund’s shares | | | 6,481 | | | | | |
| Investment advisory services | | | 3,896 | | | | | |
| Services provided by related parties | | | 5,945 | | | | | |
| Trustees’ deferred compensation | | | 2,114 | | | | | |
| Other | | | 136 | | | | 26,739 | |
| Net assets at November 30, 2013 | | | | | | $ | 12,437,305 | |
| | | | | | | | | |
| Net assets consist of: | | | | | | | | |
| Capital paid in on shares of beneficial interest | | | | | | $ | 7,377,785 | |
| Undistributed net investment income | | | | | | | 40,560 | |
| Undistributed net realized gain | | | | | | | 758,851 | |
| Net unrealized appreciation | | | | | | | 4,260,109 | |
| Net assets at November 30, 2013 | | | | | | $ | 12,437,305 | |
(dollars and shares in thousands, except per-share amounts)
Shares of beneficial interest issued and outstanding (no stated par value) —
unlimited shares authorized (315,071 total shares outstanding)
| | | Net assets | | | Shares
outstanding | | | Net asset value
per share |
| Class A | | $ | 8,919,932 | | | | 225,183 | | | $ | 39.61 | |
| Class B | | | 54,577 | | | | 1,452 | | | | 37.59 | |
| Class C | | | 350,195 | | | | 9,425 | | | | 37.16 | |
| Class F-1 | | | 417,775 | | | | 10,530 | | | | 39.67 | |
| Class F-2 | | | 329,712 | | | | 8,315 | | | | 39.65 | |
| Class 529-A | | | 325,066 | | | | 8,264 | | | | 39.33 | |
| Class 529-B | | | 8,126 | | | | 216 | | | | 37.68 | |
| Class 529-C | | | 93,854 | | | | 2,495 | | | | 37.62 | |
| Class 529-E | | | 16,632 | | | | 427 | | | | 38.91 | |
| Class 529-F-1 | | | 22,084 | | | | 561 | | | | 39.33 | |
| Class R-1 | | | 33,246 | | | | 875 | | | | 37.99 | |
| Class R-2 | | | 173,243 | | | | 4,540 | | | | 38.16 | |
| Class R-3 | | | 262,369 | | | | 6,731 | | | | 38.98 | |
| Class R-4 | | | 252,390 | | | | 6,413 | | | | 39.36 | |
| Class R-5 | | | 232,703 | | | | 5,847 | | | | 39.80 | |
| Class R-6 | | | 945,401 | | | | 23,797 | | | | 39.73 | |
See Notes to Financial Statements
Statement of operations
for the year ended November 30, 2013 | | (dollars in thousands) |
| | | | |
| Investment income: | | | | | | | | |
| Income: | | | | | | | | |
| Dividends (net of non-U.S. taxes of $4,520) | | $ | 128,413 | | | | | |
| Interest (net of non-U.S. taxes of $17) | | | 1,280 | | | $ | 129,693 | |
| Fees and expenses*: | | | | | | | | |
| Investment advisory services | | | 38,972 | | | | | |
| Distribution services | | | 24,842 | | | | | |
| Transfer agent services | | | 13,984 | | | | | |
| Administrative services | | | 1,970 | | | | | |
| Reports to shareholders | | | 600 | | | | | |
| Registration statement and prospectus | | | 314 | | | | | |
| Trustees’ compensation | | | 956 | | | | | |
| Auditing and legal | | | 175 | | | | | |
| Custodian | | | 860 | | | | | |
| State and local taxes | | | 32 | | | | | |
| Other | | | 467 | | | | 83,172 | |
| Net investment income | | | | | | | 46,521 | |
| | | | | | | | | |
| Net realized gain and unrealized appreciation on investments and currency: | | | | | | | | |
| Net realized gain on: | | | | | | | | |
| Investments | | | 829,182 | | | | | |
| Currency transactions | | | 28 | | | | 829,210 | |
| Net unrealized appreciation on: | | | | | | | | |
| Investments | | | 2,609,008 | | | | | |
| Currency translations | | | 204 | | | | 2,609,212 | |
| Net realized gain and unrealized appreciation on investments and currency | | | | | | | 3,438,422 | |
| | | | | | | | | |
| Net increase in net assets resulting from operations | | | | | | $ | 3,484,943 | |
*Additional information related to class-specific fees and expenses is included in the Notes to Financial Statements.
See Notes to Financial Statements
| Statements of changes in net assets | | |
| | | (dollars in thousands) |
| | | |
| | | Year ended November 30 | |
| | | 2013 | | | 2012 | |
| Operations: | | | | | | | | |
| Net investment income | | $ | 46,521 | | | $ | 41,858 | |
| Net realized gain on investments and currency transactions | | | 829,210 | | | | 302,895 | |
| Net unrealized appreciation on investments and currency translations | | | 2,609,212 | | | | 987,990 | |
| Net increase in net assets resulting from operations | | | 3,484,943 | | | | 1,332,743 | |
| | | | | | | | | |
| Dividends and distributions paid to shareholders: | | | | | | | | |
| Dividends from net investment income | | | (46,579 | ) | | | (32,433 | ) |
| Distributions from net realized gain on investments | | | (236,050 | ) | | | — | |
| Total dividends and distributions paid to shareholders | | | (282,629 | ) | | | (32,433 | ) |
| | | | | | | | | |
| Net capital share transactions | | | 1,434,691 | | | | (348,396 | ) |
| | | | | | | | | |
| Total increase in net assets | | | 4,637,005 | | | | 951,914 | |
| | | | | | | | | |
| Net assets: | | | | | | | | |
| Beginning of year | | | 7,800,300 | | | | 6,848,386 | |
End of year (including undistributed net investment income:
$40,560 and $40,637, respectively) | | $ | 12,437,305 | | | $ | 7,800,300 | |
See Notes to Financial Statements
Notes to financial statements
1. Organization
The New Economy Fund (the “fund”) is registered under the Investment Company Act of 1940 as an open-end, diversified management investment company. The fund seeks long-term growth of capital by investing in securities of companies that can benefit from innovation, exploit new technologies or provide products and services that meet the demands of an evolving global economy. Shareholders approved a proposal to reorganize the fund from a Massachusetts business trust to a Delaware statutory trust. The reorganization may be completed in 2014; however, the fund reserves the right to delay the implementation.
The fund has 16 share classes consisting of five retail share classes (Classes A, B and C, as well as two F share classes, F-1 and F-2), five 529 college savings plan share classes (Classes 529-A, 529-B, 529-C, 529-E and 529-F-1) and six retirement plan share classes (Classes R-1, R-2, R-3, R-4, R-5 and R-6). The 529 college savings plan share classes can be used to save for college education. The retirement plan share classes are generally offered only through eligible employer-sponsored retirement plans. The fund’s share classes are further described:
| Share class | | Initial sales charge | | Contingent deferred sales
charge upon redemption | | Conversion feature |
| Classes A and 529-A | | Up to 5.75% | | None (except 1% for certain redemptions within one year of purchase without an initial sales charge) | | None |
| Classes B and 529-B* | | None | | Declines from 5% to 0% for redemptions within six years of purchase | | Classes B and 529-B convert to Classes A and 529-A, respectively, after eight years |
| Class C | | None | | 1% for redemptions within one year of purchase | | Class C converts to Class F-1 after 10 years |
| Class 529-C | | None | | 1% for redemptions within one year of purchase | | None |
| Class 529-E | | None | | None | | None |
| Classes F-1, F-2 and 529-F-1 | | None | | None | | None |
| Classes R-1, R-2, R-3, R-4, R-5 and R-6 | | None | | None | | None |
*Class B and 529-B shares of the fund are not available for purchase.
Holders of all share classes have equal pro rata rights to assets, dividends and liquidation proceeds. Each share class has identical voting rights, except for the exclusive right to vote on matters affecting only its class. Share classes have different fees and expenses (“class-specific fees and expenses”), primarily due to different arrangements for distribution, administrative and shareholder services. Differences in class-specific fees and expenses will result in differences in net investment income and, therefore, the payment of different per-share dividends by each share class.
2. Significant accounting policies
The financial statements have been prepared to comply with accounting principles generally accepted in the United States of America. These principles require management to make estimates and assumptions that affect reported amounts and disclosures. Actual results could differ from those estimates. The fund follows the significant accounting policies described below, as well as the valuation policies described in the next section on valuation.
Security transactions and related investment income — Security transactions are recorded by the fund as of the date the trades are executed with brokers. Realized gains and losses from security transactions are determined based on the specific identified cost of the securities. In the event a security is purchased with a delayed payment date, the fund will segregate liquid assets sufficient to meet its payment obligations. Dividend income is recognized on the ex-dividend date and interest income is recognized on an accrual basis. Market discounts, premiums and original issue discounts on fixed-income securities are amortized daily over the expected life of the security.
Class allocations — Income, fees and expenses (other than class-specific fees and expenses) and realized and unrealized gains and losses are allocated daily among the various share classes based on their relative net assets. Class-specific fees and expenses, such as distribution, administrative and shareholder services, are charged directly to the respective share class.
Dividends and distributions to shareholders — Dividends and distributions to shareholders are recorded on the ex-dividend date.
Currency translation — Assets and liabilities, including investment securities, denominated in currencies other than U.S. dollars are translated into U.S. dollars at the exchange rates supplied by one or more pricing vendors on the valuation date. Purchases and sales of investment securities and income and expenses are translated into U.S. dollars at the exchange rates on the dates of such transactions. The effects of changes in exchange rates on investment securities are included with the net realized gain or loss and net unrealized appreciation or depreciation on investments in the fund’s statement of operations. The realized gain or loss and unrealized appreciation or depreciation resulting from all other transactions denominated in currencies other than U.S. dollars are disclosed separately.
3. Valuation
Capital Research and Management Company (“CRMC”), the fund’s investment adviser, values the fund’s investments at fair value as defined by accounting principles generally accepted in the United States of America. The net asset value of each share class of the fund is generally determined as of approximately 4:00 p.m. New York time each day the New York Stock Exchange is open.
Methods and inputs — The fund’s investment adviser uses the following methods and inputs to establish the fair value of the fund’s assets and liabilities. Use of particular methods and inputs may vary over time based on availability and relevance as market and economic conditions evolve.
Equity securities are generally valued at the official closing price of, or the last reported sale price on, the exchange or market on which such securities are traded, as of the close of business on the day the securities are being valued or, lacking any sales, at the last available bid price. Prices for each security are taken from the principal exchange or market on which the security trades.
Fixed-income securities, including short-term securities purchased with more than 60 days left to maturity, are generally valued at prices obtained from one or more pricing vendors. Vendors value such securities based on one or more of the inputs described in the following table. The table provides examples of inputs that are commonly relevant for valuing particular classes of fixed-income securities in which the fund is authorized to invest. However, these classifications are not exclusive, and any of the inputs may be used to value any other class of fixed-income security.
| Fixed-income class | Examples of standard inputs |
| All | Benchmark yields, transactions, bids, offers, quotations from dealers and trading systems, new issues, spreads and other relationships observed in the markets among comparable securities; and proprietary pricing models such as yield measures calculated using factors such as cash flows, financial or collateral performance and other reference data (collectively referred to as “standard inputs”) |
| Corporate bonds & notes; convertible securities | Standard inputs and underlying equity of the issuer |
| Bonds & notes of governments & government agencies | Standard inputs and interest rate volatilities |
When the fund’s investment adviser deems it appropriate to do so (such as when vendor prices are unavailable or not deemed to be representative), fixed-income securities will be valued in good faith at the mean quoted bid and ask prices that are reasonably and timely available (or bid prices, if ask prices are not available) or at prices for securities of comparable maturity, quality and type.
Securities with both fixed-income and equity characteristics, or equity securities traded principally among fixed-income dealers, are generally valued in the manner described for either equity or fixed-income securities, depending on which method is deemed most appropriate by the fund’s investment adviser. Short-term securities purchased within 60 days to maturity are valued at amortized cost, which approximates fair value. The value of short-term securities originally purchased with maturities greater than 60 days is determined based on an amortized value to par when they reach 60 days.
Securities and other assets for which representative market quotations are not readily available or are considered unreliable by the fund’s investment adviser are fair valued as determined in good faith under fair valuation guidelines adopted by authority of the fund’s board of trustees as further described. The investment adviser follows fair valuation guidelines, consistent with U.S. Securities and Exchange Commission rules and guidance, to consider relevant principles and factors when making fair value determinations.
The investment adviser considers relevant indications of value that are reasonably and timely available to it in determining the fair value to be assigned to a particular security, such as the type and cost of the security; contractual or legal restrictions on resale of the security; relevant financial or business developments of the issuer; actively traded similar or related securities; conversion or exchange rights on the security; related corporate actions; significant events occurring after the close of trading in the security; and changes in overall market conditions. In addition, the closing prices of equity securities that trade in markets outside U.S. time zones may be adjusted to reflect significant events that occur after the close of local trading but before the net asset value of each share class of the fund is determined. Fair valuations and valuations of investments that are not actively trading involve judgment and may differ materially from valuations that would have been used had greater market activity occurred.
Processes and structure — The fund’s board of trustees has delegated authority to the fund’s investment adviser to make fair value determinations, subject to board oversight. The investment adviser has established a Joint Fair Valuation Committee (the “Fair Valuation Committee”) to administer, implement and oversee the fair valuation process, and to make fair value decisions. The Fair Valuation Committee regularly reviews its own fair value decisions, as well as decisions made under its standing instructions to the investment adviser’s valuation teams. The Fair Valuation Committee reviews changes in fair value measurements from period to period and may, as deemed appropriate, update the fair valuation guidelines to better reflect the results of back testing and address new or evolving issues. The Fair Valuation Committee reports any changes to the fair valuation guidelines to the board of trustees with supplemental information to support the changes. The fund’s board and audit committee also regularly review reports that describe fair value determinations and methods.
The fund’s investment adviser has also established a Fixed-Income Pricing Review Group to administer and oversee the fixed-income valuation process, including the use of fixed-income pricing vendors. This group regularly reviews pricing vendor information and market data. Pricing decisions, processes and controls over security valuation are also subject to additional internal reviews, including an annual control self-evaluation program facilitated by the investment adviser’s compliance group.
Classifications — The fund’s investment adviser classifies the fund’s assets and liabilities into three levels based on the inputs used to value the assets or liabilities. Level 1 values are based on quoted prices in active markets for identical securities. Level 2 values are based on significant observable market inputs, such as quoted prices for similar securities and quoted prices in inactive markets. Certain securities trading outside the U.S. may transfer between Level 1 and Level 2 due to valuation adjustments resulting from significant market movements following the close of local trading. Level 3 values are based on significant unobservable inputs that reflect the investment adviser’s determination of assumptions that market participants might reasonably use in valuing the securities. The valuation levels are not necessarily an indication of the risk or liquidity associated with the underlying investment. For example, U.S. government securities are reflected as Level 2 because the inputs used to determine fair value may not always be quoted prices in an active market. The following table presents the fund’s valuation levels as of November 30, 2013 (dollars in thousands):
| | | Investment securities | |
| | | Level 1 | | | Level 2 | | | Level 3 | | | Total | |
| Assets: | | | | | | | | | | | | | | | | |
| Common stocks: | | | | | | | | | | | | | | | | |
| Health care | | $ | 2,685,335 | | | $ | — | | | $ | — | | | $ | 2,685,335 | |
| Consumer discretionary | | | 2,554,455 | | | | — | | | | 6,608 | | | | 2,561,063 | |
| Information technology | | | 2,272,986 | | | | — | | | | — | | | | 2,272,986 | |
| Financials | | | 1,344,715 | | | | — | | | | — | | | | 1,344,715 | |
| Industrials | | | 980,117 | | | | — | | | | — | | | | 980,117 | |
| Telecommunication services | | | 515,464 | | | | — | | | | — | | | | 515,464 | |
| Energy | | | 158,940 | | | | — | | | | — | | | | 158,940 | |
| Consumer staples | | | 122,969 | | | | — | | | | — | | | | 122,969 | |
| Utilities | | | 33,101 | | | | — | | | | — | | | | 33,101 | |
| Miscellaneous | | | 619,822 | | | | — | | | | — | | | | 619,822 | |
| Short-term securities | | | — | | | | 1,122,493 | | | | — | | | | 1,122,493 | |
| Total | | $ | 11,287,904 | | | $ | 1,122,493 | | | $ | 6,608 | | | $ | 12,417,005 | |
4. Risk factors
Investing in the fund may involve certain risks including, but not limited to, those described below.
Market conditions — The prices of, and the income generated by, the common stocks and other securities held by the fund may decline due to market conditions and other factors, including those directly involving the issuers of securities held by the fund. The fund may be subject to additional risks because it invests in a more limited group of sectors and industries than the broad market.
Investing in growth-oriented stocks — Growth-oriented stocks may involve larger price swings and greater potential for loss than other types of investments.
Investing in small companies — Investing in smaller companies may pose additional risks. For example, it is often more difficult to value or dispose of small company stocks and more difficult to obtain information about smaller companies than about larger companies. In addition, the prices of these stocks may be more volatile than stocks of larger, more established companies.
Investing outside the U.S. — Securities of issuers domiciled outside the U.S., or with significant operations outside the U.S., may lose value because of adverse political, social, economic or market developments in the countries or regions in which the issuers operate. These securities may also lose value due to changes in foreign currency exchange rates against the U.S. dollar and/or currencies of other countries. Securities markets in certain countries may be more volatile and/or less liquid than those in the U.S. Investments outside the U.S. may also be subject to different settlement and accounting practices and different regulatory, legal and reporting standards, and may be more difficult to value, than those in the U.S. The risks of investing outside the U.S. may be heightened in connection with investments in emerging markets.
Investing in emerging markets — Investing in emerging markets may involve risks in addition to and greater than those generally associated with investing in the securities markets of developed countries. For instance, developing countries may have less developed legal and accounting systems than those in developed countries. The governments of these countries may be less stable and more likely to impose capital controls, nationalize a company or industry, place restrictions on foreign ownership and on withdrawing sale proceeds of securities from the country, and/or impose punitive taxes that could adversely affect the prices of securities. In addition, the economies of these countries may be dependent on relatively few industries that are more susceptible to local and global changes. Securities markets in these countries can also be relatively small and have substantially lower trading volumes. As a result, securities issued in these countries may be more volatile and less liquid, and may be more difficult to value, than securities issued in countries with more developed economies and/or markets. Additionally, there may be increased settlement risks for transactions in local securities.
Management — The investment adviser to the fund actively manages the fund’s investments. Consequently, the fund is subject to the risk that the methods and analyses employed by the investment adviser in this process may not produce the desired results. This could cause the fund to lose value or its investment results to lag relevant benchmarks or other funds with similar objectives.
5. Taxation and distributions
Federal income taxation — The fund complies with the requirements under Subchapter M of the Internal Revenue Code applicable to mutual funds and intends to distribute substantially all of its net taxable income and net capital gains each year. The fund is not subject to income taxes to the extent such distributions are made. Therefore, no federal income tax provision is required.
As of and during the period ended November 30, 2013, the fund did not have a liability for any unrecognized tax benefits. The fund recognizes interest and penalties, if any, related to unrecognized tax benefits as income tax expense in the statement of operations. During the period, the fund did not incur any interest or penalties.
The fund is not subject to examination by U.S. federal tax authorities for tax years before 2009, by state tax authorities for tax years before 2008 and by tax authorities outside the U.S. for tax years before 2006.
Non-U.S. taxation — Dividend and interest income are recorded net of non-U.S. taxes paid. Gains realized by the fund on the sale of securities in certain countries are subject to non-U.S. taxes. The fund records a liability based on unrealized gains to provide for potential non-U.S. taxes payable upon the sale of these securities.
Distributions — Distributions paid to shareholders are based on net investment income and net realized gains determined on a tax basis, which may differ from net investment income and net realized gains for financial reporting purposes. These differences are due primarily to different treatment for items such as currency gains and losses; short-term capital gains and losses; unrealized appreciation of certain investments in securities outside the U.S.; and deferred expenses. The fiscal year in which amounts are distributed may differ from the year in which the net investment income and net realized gains are recorded by the fund for financial reporting purposes. The fund may also designate a portion of the amount paid to redeeming shareholders as a distribution for tax purposes.
During the year ended November 30, 2013, the fund reclassified $28,000 from undistributed net realized gain to undistributed net investment income, $47,000 from undistributed net investment income to capital paid in on shares of beneficial interest and $46,184,000 from undistributed net realized gain to capital paid in on shares of beneficial interest to align financial reporting with tax reporting.
As of November 30, 2013, the tax basis components of distributable earnings, unrealized appreciation (depreciation) and cost of investment securities were as follows (dollars in thousands):
| Undistributed ordinary income | $ | 84,896 | |
| Undistributed long-term capital gains | | 717,857 | |
| Gross unrealized appreciation on investment securities | | 4,352,595 | |
| Gross unrealized depreciation on investment securities | | (93,747 | ) |
| Net unrealized appreciation on investment securities | | 4,258,848 | |
| Cost of investment securities | | 8,158,157 | |
The tax character of distributions paid to shareholders was as follows (dollars in thousands):
| | | Year ended November 30, 2013 | | | Year ended November 30, 2012 | |
| Share class | | Ordinary
income | | | Long-term
capital
gains | | | Total
distributions
paid | | | Ordinary
income | | | Long-term
capital
gains | | | Total
distributions
paid | |
| Class A | | $ | 35,632 | | | $ | 178,162 | | | $ | 213,794 | | | $ | 25,493 | | | $ | — | | | $ | 25,493 | |
| Class B | | | — | | | | 1,543 | | | | 1,543 | | | | — | | | | — | | | | — | |
| Class C | | | — | | | | 5,991 | | | | 5,991 | | | | — | * | | | — | | | | — | |
| Class F-1 | | | 786 | | | | 4,288 | | | | 5,074 | | | | 624 | | | | — | | | | 624 | |
| Class F-2 | | | 998 | | | | 3,248 | | | | 4,246 | | | | 552 | | | | — | | | | 552 | |
| Class 529-A | | | 1,139 | | | | 6,060 | | | | 7,199 | | | | 767 | | | | — | | | | 767 | |
| Class 529-B | | | — | | | | 234 | | | | 234 | | | | — | | | | — | | | | — | |
| Class 529-C | | | — | | | | 1,911 | | | | 1,911 | | | | — | * | | | — | | | | — | |
| Class 529-E | | | 33 | | | | 309 | | | | 342 | | | | 15 | | | | — | | | | 15 | |
| Class 529-F-1 | | | 101 | | | | 391 | | | | 492 | | | | 66 | | | | — | | | | 66 | |
| Class R-1 | | | — | | | | 701 | | | | 701 | | | | — | | | | — | | | | — | |
| Class R-2 | | | — | | | | 3,844 | | | | 3,844 | | | | — | | | | — | | | | — | |
| Class R-3 | | | 491 | | | | 5,174 | | | | 5,665 | | | | 274 | | | | — | | | | 274 | |
| Class R-4 | | | 1,047 | | | | 4,799 | | | | 5,846 | | | | 712 | | | | — | | | | 712 | |
| Class R-5 | | | 1,192 | | | | 3,825 | | | | 5,017 | | | | 892 | | | | — | | | | 892 | |
| Class R-6 | | | 5,160 | | | | 15,570 | | | | 20,730 | | | | 3,038 | | | | — | | | | 3,038 | |
| Total | | $ | 46,579 | | | $ | 236,050 | | | $ | 282,629 | | | $ | 32,433 | | | $ | — | | | $ | 32,433 | |
| | |
| * | Amount less than one thousand. |
6. Fees and transactions with related parties
CRMC, the fund’s investment adviser, is the parent company of American Funds Distributors,® Inc. (“AFD”), the principal underwriter of the fund’s shares, and American Funds Service Company® (“AFS”), the fund’s transfer agent. CRMC, AFD and AFS are considered related parties to the fund.
Investment advisory services — The fund has an investment advisory and service agreement with CRMC that provides for monthly fees accrued daily. These fees are based on a series of decreasing annual rates beginning with 0.580% on the first $500 million of daily net assets and decreasing to 0.345% on such assets in excess of $27 billion. For the year ended November 30, 2013, the investment advisory services fee was $38,972,000, which was equivalent to an annualized rate of 0.400% of average daily net assets.
Class-specific fees and expenses — Expenses that are specific to individual share classes are accrued directly to the respective share class. The principal class-specific fees and expenses are described below:
Distribution services — The fund has plans of distribution for all share classes, except Class F-2, R-5 and R-6 shares. Under the plans, the board of trustees approves certain categories of expenses that are used to finance activities primarily intended to sell fund shares and service existing accounts. The plans provide for payments, based on an annualized percentage of average daily net assets, ranging from 0.25% to 1.00% as noted in this section. In some cases, the board of trustees has limited the amounts that may be paid to less than the maximum allowed by the plans. All share classes with a plan may use up to 0.25% of average daily net assets to pay service fees, or to compensate AFD for paying service fees, to firms that have entered into agreements with AFD to provide certain shareholder services. The remaining amounts available to be paid under each plan are paid to dealers to compensate them for their sales activities.
For Class A and 529-A shares, distribution-related expenses include the reimbursement of dealer and wholesaler commissions paid by AFD for certain shares sold without a sales charge. These share classes reimburse AFD for amounts billed within the prior 15 months but only to the extent that the overall annual expense limit of 0.25% is not exceeded. As of November 30, 2013, there were no unreimbursed expenses subject to reimbursement for Class A or 529-A shares.
| Share class | | Currently approved limits | | Plan limits |
| Class A | | | 0.25 | % | | | 0.25 | % |
| Class 529-A | | | 0.25 | | | | 0.50 | |
| Classes B and 529-B | | | 1.00 | | | | 1.00 | |
| Classes C, 529-C and R-1 | | | 1.00 | | | | 1.00 | |
| Class R-2 | | | 0.75 | | | | 1.00 | |
| Classes 529-E and R-3 | | | 0.50 | | | | 0.75 | |
| Classes F-1, 529-F-1 and R-4 | | | 0.25 | | | | 0.50 | |
Transfer agent services — The fund has a shareholder services agreement with AFS under which the fund compensates AFS for providing transfer agent services to each of the fund’s share classes. These services include recordkeeping, shareholder communications and transaction processing. In addition, the fund reimburses AFS for amounts paid to third parties for performing transfer agent services on behalf of fund shareholders.
Administrative services — The fund has an administrative services agreement with CRMC under which the fund compensates CRMC for providing administrative services to Class A, C, F, 529 and R shares. These services include, but are not limited to, coordinating, monitoring, assisting and overseeing third parties that provide services to fund shareholders. Under the agreement, Class A shares pay an annual fee of 0.01% and Class C, F, 529 and R shares pay an annual fee of 0.05% of their respective average daily net assets.
529 plan services — Each 529 share class is subject to service fees to compensate the Commonwealth of Virginia for the maintenance of the 529 college savings plan. The quarterly fee is based on a series of decreasing annual rates beginning with 0.10% on the first $30 billion of the net assets invested in Class 529 shares of the American Funds and decreasing to 0.06% on such assets between $120 billion and $150 billion. The fee for any given calendar quarter is accrued and calculated on the basis of the average net assets of Class 529 shares of the American Funds for the last month of the prior calendar quarter. The fee is included in other expenses in the fund’s statement of operations. The Commonwealth of Virginia is not considered a related party.
For the year ended November 30, 2013, class-specific expenses under the agreements were as follows (dollars in thousands):
| Share class | | Distribution
services | | Transfer agent
services | | Administrative
services | | 529 Plan
services |
| Class A | | | $16,973 | | | | $11,393 | | | | $720 | | | | Not applicable |
| Class B | | | 508 | | | | 87 | | | | Not applicable | | | | Not applicable |
| Class C | | | 2,494 | | | | 394 | | | | 125 | | | | Not applicable |
| Class F-1 | | | 615 | | | | 311 | | | | 123 | | | | Not applicable |
| Class F-2 | | | Not applicable | | | | 166 | | | | 91 | | | | Not applicable |
| Class 529-A | | | 514 | | | | 324 | | | | 127 | | | | $250 |
| Class 529-B | | | 76 | | | | 11 | | | | 4 | | | | 7 |
| Class 529-C | | | 746 | | | | 103 | | | | 38 | | | | 74 |
| Class 529-E | | | 65 | | | | 11 | | | | 7 | | | | 13 |
| Class 529-F-1 | | | — | | | | 21 | | | | 8 | | | | 16 |
| Class R-1 | | | 262 | | | | 30 | | | | 13 | | | | Not applicable |
| Class R-2 | | | 1,073 | | | | 499 | | | | 72 | | | | Not applicable |
| Class R-3 | | | 1,029 | | | | 348 | | | | 103 | | | | Not applicable |
| Class R-4 | | | 487 | | | | 198 | | | | 98 | | | | Not applicable |
| Class R-5 | | | Not applicable | | | | 85 | | | | 87 | | | | Not applicable |
| Class R-6 | | | Not applicable | | | | 3 | | | | 354 | | | | Not applicable |
| Total class-specific expenses | | | $24,842 | | | | $13,984 | | | | $1,970 | | | | $360 |
Trustees’ deferred compensation — Trustees who are unaffiliated with CRMC may elect to defer the cash payment of part or all of their compensation. These deferred amounts, which remain as liabilities of the fund, are treated as if invested in shares of the fund or other American Funds. These amounts represent general, unsecured liabilities of the fund and vary according to the total returns of the selected funds. Trustees’ compensation of $956,000 in the fund’s statement of operations includes $452,000 in current fees (either paid in cash or deferred) and a net increase of $504,000 in the value of the deferred amounts.
Affiliated officers and trustees — Officers and certain trustees of the fund are or may be considered to be affiliated with CRMC, AFD and AFS. No affiliated officers or trustees received any compensation directly from the fund.
7. Capital share transactions
Capital share transactions in the fund were as follows (dollars and shares in thousands):
| | | Sales* | | | Reinvestments of dividends
and distributions | | | Repurchases* | | | Net increase (decrease) | |
| Share class | | Amount | | | Shares | | | Amount | | | Shares | | | Amount | | | Shares | | | Amount | | | Shares | |
| | | | | | | | | | | | | | | | | | | | | | | | | |
| Year ended November 30, 2013 | | | | | | | | | | | | | | | | | | | | |
| | | | | | | | | | | | | | | | | | | | | | | | | | | | | | | | | |
| Class A | | $ | 1,346,842 | | | | 40,376 | | | $ | 208,058 | | | | 7,397 | | | $ | (911,557 | ) | | | (27,868 | ) | | $ | 643,343 | | | | 19,905 | |
| Class B | | | 7,162 | | | | 225 | | | | 1,531 | | | | 57 | | | | (20,042 | ) | | | (643 | ) | | | (11,349 | ) | | | (361 | ) |
| Class C | | | 128,010 | | | | 4,007 | | | | 5,896 | | | | 222 | | | | (51,508 | ) | | | (1,651 | ) | | | 82,398 | | | | 2,578 | |
| Class F-1 | | | 247,530 | | | | 7,245 | | | | 4,991 | | | | 177 | | | | (61,931 | ) | | | (1,848 | ) | | | 190,590 | | | | 5,574 | |
| Class F-2 | | | 198,082 | | | | 5,745 | | | | 3,851 | | | | 137 | | | | (41,092 | ) | | | (1,248 | ) | | | 160,841 | | | | 4,634 | |
| Class 529-A | | | 63,174 | | | | 1,926 | | | | 7,189 | | | | 257 | | | | (26,566 | ) | | | (814 | ) | | | 43,797 | | | | 1,369 | |
| Class 529-B | | | 747 | | | | 24 | | | | 234 | | | | 9 | | | | (2,947 | ) | | | (95 | ) | | | (1,966 | ) | | | (62 | ) |
| Class 529-C | | | 17,070 | | | | 541 | | | | 1,909 | | | | 71 | | | | (9,543 | ) | | | (305 | ) | | | 9,436 | | | | 307 | |
| Class 529-E | | | 3,101 | | | | 96 | | | | 342 | | | | 12 | | | | (1,074 | ) | | | (33 | ) | | | 2,369 | | | | 75 | |
| Class 529-F-1 | | | 5,417 | | | | 164 | | | | 492 | | | | 17 | | | | (1,932 | ) | | | (59 | ) | | | 3,977 | | | | 122 | |
| Class R-1 | | | 10,373 | | | | 321 | | | | 701 | | | | 26 | | | | (9,112 | ) | | | (291 | ) | | | 1,962 | | | | 56 | |
| Class R-2 | | | 47,774 | | | | 1,496 | | | | 3,839 | | | | 141 | | | | (48,917 | ) | | | (1,546 | ) | | | 2,696 | | | | 91 | |
| Class R-3 | | | 91,757 | | | | 2,787 | | | | 5,659 | | | | 204 | | | | (70,623 | ) | | | (2,184 | ) | | | 26,793 | | | | 807 | |
| Class R-4 | | | 82,091 | | | | 2,480 | | | | 5,845 | | | | 209 | | | | (50,222 | ) | | | (1,525 | ) | | | 37,714 | | | | 1,164 | |
| Class R-5 | | | 76,557 | | | | 2,279 | | | | 5,009 | | | | 178 | | | | (37,629 | ) | | | (1,129 | ) | | | 43,937 | | | | 1,328 | |
| Class R-6 | | | 249,660 | | | | 7,537 | | | | 20,730 | | | | 737 | | | | (72,237 | ) | | | (2,178 | ) | | | 198,153 | | | | 6,096 | |
| Total net increase (decrease) | | $ | 2,575,347 | | | | 77,249 | | | $ | 276,276 | | | | 9,851 | | | $ | (1,416,932 | ) | | | (43,417 | ) | | $ | 1,434,691 | | | | 43,683 | |
See page 26 for footnotes.
| | | Sales* | | | Reinvestments of dividends | | | Repurchases* | | | Net (decrease) increase | |
| Share class | | Amount | | | Shares | | | Amount | | | Shares | | | Amount | | | Shares | | | Amount | | | Shares | |
| | | | | | | | | | | | | | | | | | | | | | | | | | | | | | | | | |
| Year ended November 30, 2012 | | | | | | | | | | | | | | | | | | | | | | | | |
| | | | | | | | | | | | | | | | | | | | | | | | | | | | | | | | | |
| Class A | | $ | 520,447 | | | | 19,362 | | | $ | 24,629 | | | | 1,044 | | | $ | (921,314 | ) | | | (34,589 | ) | | $ | (376,238 | ) | | | (14,183 | ) |
| Class B | | | 3,885 | | | | 151 | | | | — | | | | — | | | | (26,445 | ) | | | (1,046 | ) | | | (22,560 | ) | | | (895 | ) |
| Class C | | | 31,070 | | | | 1,223 | | | | — | | | | — | | | | (48,106 | ) | | | (1,914 | ) | | | (17,036 | ) | | | (691 | ) |
| Class F-1 | | | 56,584 | | | | 2,092 | | | | 611 | | | | 26 | | | | (82,817 | ) | | | (3,076 | ) | | | (25,622 | ) | | | (958 | ) |
| Class F-2 | | | 47,810 | | | | 1,740 | | | | 440 | | | | 19 | | | | (27,751 | ) | | | (1,031 | ) | | | 20,499 | | | | 728 | |
| Class 529-A | | | 34,535 | | | | 1,305 | | | | 766 | | | | 33 | | | | (25,062 | ) | | | (945 | ) | | | 10,239 | | | | 393 | |
| Class 529-B | | | 350 | | | | 14 | | | | — | | | | — | | | | (4,094 | ) | | | (163 | ) | | | (3,744 | ) | | | (149 | ) |
| Class 529-C | | | 10,843 | | | | 426 | | | | — | | | | — | | | | (9,543 | ) | | | (374 | ) | | | 1,300 | | | | 52 | |
| Class 529-E | | | 1,704 | | | | 65 | | | | 15 | | | | — | † | | | (1,465 | ) | | | (57 | ) | | | 254 | | | | 8 | |
| Class 529-F-1 | | | 3,231 | | | | 120 | | | | 66 | | | | 3 | | | | (2,377 | ) | | | (91 | ) | | | 920 | | | | 32 | |
| Class R-1 | | | 6,015 | | | | 232 | | | | — | | | | — | | | | (9,901 | ) | | | (380 | ) | | | (3,886 | ) | | | (148 | ) |
| Class R-2 | | | 35,868 | | | | 1,386 | | | | — | | | | — | | | | (45,105 | ) | | | (1,751 | ) | | | (9,237 | ) | | | (365 | ) |
| Class R-3 | | | 49,626 | | | | 1,885 | | | | 274 | | | | 12 | | | | (60,409 | ) | | | (2,299 | ) | | | (10,509 | ) | | | (402 | ) |
| Class R-4 | | | 52,920 | | | | 1,994 | | | | 711 | | | | 30 | | | | (60,124 | ) | | | (2,279 | ) | | | (6,493 | ) | | | (255 | ) |
| Class R-5 | | | 25,996 | | | | 956 | | | | 890 | | | | 38 | | | | (28,021 | ) | | | (1,033 | ) | | | (1,135 | ) | | | (39 | ) |
| Class R-6 | | | 135,693 | | | | 5,159 | | | | 3,038 | | | | 128 | | | | (43,879 | ) | | | (1,623 | ) | | | 94,852 | | | | 3,664 | |
| Total net increase (decrease) | | $ | 1,016,577 | | | | 38,110 | | | $ | 31,440 | | | | 1,333 | | | $ | (1,396,413 | ) | | | (52,651 | ) | | $ | (348,396 | ) | | | (13,208 | ) |
| * | Includes exchanges between share classes of the fund. |
| † | Amount less than one thousand. |
8. Investment transactions
The fund made purchases and sales of investment securities, excluding short-term securities and U.S. government obligations, if any, of $3,269,545,000 and $2,593,801,000, respectively, during the year ended November 30, 2013.
Financial highlights
| | | | | Income (loss) from investment operations1 | | | Dividends and distributions | | | | | | | | | | | | | | | | | |
| | | Net asset
value,
beginning
of period |
|
Net
investment
income
(loss) |
|
| Net gains
(losses) on
securities
(both
realized and
unrealized) |
|
|
Total from
investment
operations |
|
|
Dividends
(from net
investment
income) |
|
|
Distributions
(from
capital
gains) |
|
|
Total
dividends
and
distributions |
|
|
Net asset
value, end
of period |
|
Total
return2,3 |
|
|
Net assets,
end of period
(in millions) |
| Ratio of
expenses to
average net
assets before
waivers |
|
| Ratio of
expenses to
average net
assets after
waivers3 |
|
| Ratio of
net income
(loss) to
average
net assets3 |
|
| Class A: | | | | | | | | | | | | | | | | | | | | | | | | | | | | | | | | | | | | | | | | | | | | | | | | | |
| Year ended 11/30/2013 | | $ | 28.83 | | $ | .17 | | | $ | 11.67 | | | $ | 11.84 | | | $ | (.18 | ) | | $ | (.88 | ) | | $ | (1.06 | ) | | $ | 39.61 | | | 42.52 | % | | $ | 8,920 | | | .83 | % | | | .83 | % | | | .50 | % |
| Year ended 11/30/2012 | | | 24.14 | | | .16 | | | | 4.65 | | | | 4.81 | | | | (.12 | ) | | | — | | | | (.12 | ) | | | 28.83 | | | 20.02 | | | | 5,919 | | | .87 | | | | .87 | | | | .59 | |
| Year ended 11/30/2011 | | | 24.22 | | | .11 | | | | (.02 | ) | | | .09 | | | | (.17 | ) | | | — | | | | (.17 | ) | | | 24.14 | | | .31 | | | | 5,298 | | | .85 | | | | .85 | | | | .45 | |
| Year ended 11/30/2010 | | | 21.87 | | | .18 | | | | 2.28 | | | | 2.46 | | | | (.11 | ) | | | — | | | | (.11 | ) | | | 24.22 | | | 11.34 | | | | 5,760 | | | .86 | | | | .86 | | | | .78 | |
| Year ended 11/30/2009 | | | 15.22 | | | .12 | | | | 6.76 | | | | 6.88 | | | | (.23 | ) | | | — | | | | (.23 | ) | | | 21.87 | | | 45.88 | | | | 5,733 | | | .95 | | | | .94 | | | | .67 | |
| Class B: | | | | | | | | | | | | | | | | | | | | | | | | | | | | | | | | | | | | | | | | | | | | | | | | | |
| Year ended 11/30/2013 | | | 27.45 | | | (.08 | ) | | | 11.10 | | | | 11.02 | | | | — | | | | (.88 | ) | | | (.88 | ) | | | 37.59 | | | 41.39 | | | | 55 | | | 1.60 | | | | 1.60 | | | | (.24 | ) |
| Year ended 11/30/2012 | | | 23.04 | | | (.05 | ) | | | 4.46 | | | | 4.41 | | | | — | | | | — | | | | — | | | | 27.45 | | | 19.09 | | | | 50 | | | 1.63 | | | | 1.63 | | | | (.19 | ) |
| Year ended 11/30/2011 | | | 23.14 | | | (.08 | ) | | | (.02 | ) | | | (.10 | ) | | | — | | | | — | | | | — | | | | 23.04 | | | (.39 | ) | | | 62 | | | 1.62 | | | | 1.62 | | | | (.34 | ) |
| Year ended 11/30/2010 | | | 20.95 | | | — | 4 | | | 2.19 | | | | 2.19 | | | | — | | | | — | | | | — | | | | 23.14 | | | 10.45 | | | | 90 | | | 1.64 | | | | 1.64 | | | | — | 5 |
| Year ended 11/30/2009 | | | 14.50 | | | (.02 | ) | | | 6.50 | | | | 6.48 | | | | (.03 | ) | | | — | | | | (.03 | ) | | | 20.95 | | | 44.73 | | | | 117 | | | 1.72 | | | | 1.71 | | | | (.09 | ) |
| Class C: | | | | | | | | | | | | | | | | | | | | | | | | | | | | | | | | | | | | | | | | | | | | | | | | | |
| Year ended 11/30/2013 | | | 27.15 | | | (.10 | ) | | | 10.99 | | | | 10.89 | | | | — | | | | (.88 | ) | | | (.88 | ) | | | 37.16 | | | 41.37 | | | | 350 | | | 1.63 | | | | 1.63 | | | | (.32 | ) |
| Year ended 11/30/2012 | | | 22.80 | | | (.05 | ) | | | 4.40 | | | | 4.35 | | | | — | | | | — | | | | — | | | | 27.15 | | | 19.08 | | | | 186 | | | 1.67 | | | | 1.67 | | | | (.22 | ) |
| Year ended 11/30/2011 | | | 22.90 | | | (.08 | ) | | | (.02 | ) | | | (.10 | ) | | | — | | | | — | | | | — | | | | 22.80 | | | (.47 | ) | | | 172 | | | 1.63 | | | | 1.63 | | | | (.33 | ) |
| Year ended 11/30/2010 | | | 20.75 | | | — | 4 | | | 2.16 | | | | 2.16 | | | | (.01 | ) | | | — | | | | (.01 | ) | | | 22.90 | | | 10.45 | | | | 188 | | | 1.64 | | | | 1.64 | | | | .01 | |
| Year ended 11/30/2009 | | | 14.39 | | | (.02 | ) | | | 6.44 | | | | 6.42 | | | | (.06 | ) | | | — | | | | (.06 | ) | | | 20.75 | | | 44.81 | | | | 182 | | | 1.69 | | | | 1.68 | | | | (.09 | ) |
| Class F-1: | | | | | | | | | | | | | | | | | | | | | | | | | | | | | | | | | | | | | | | | | | | | | | | | | |
| Year ended 11/30/2013 | | | 28.87 | | | .14 | | | | 11.70 | | | | 11.84 | | | | (.16 | ) | | | (.88 | ) | | | (1.04 | ) | | | 39.67 | | | 42.46 | | | | 418 | | | .86 | | | | .86 | | | | .43 | |
| Year ended 11/30/2012 | | | 24.16 | | | .16 | | | | 4.66 | | | | 4.82 | | | | (.11 | ) | | | — | | | | (.11 | ) | | | 28.87 | | | 20.03 | | | | 143 | | | .86 | | | | .86 | | | | .61 | |
| Year ended 11/30/2011 | | | 24.23 | | | .11 | | | | (.01 | ) | | | .10 | | | | (.17 | ) | | | — | | | | (.17 | ) | | | 24.16 | | | .33 | | | | 143 | | | .85 | | | | .85 | | | | .44 | |
| Year ended 11/30/2010 | | | 21.90 | | | .18 | | | | 2.28 | | | | 2.46 | | | | (.13 | ) | | | — | | | | (.13 | ) | | | 24.23 | | | 11.32 | | | | 167 | | | .86 | | | | .86 | | | | .77 | |
| Year ended 11/30/2009 | | | 15.11 | | | .12 | | | | 6.77 | | | | 6.89 | | | | (.10 | ) | | | — | | | | (.10 | ) | | | 21.90 | | | 45.93 | | | | 187 | | | .91 | | | | .91 | | | | .66 | |
| Class F-2: | | | | | �� | | | | | | | | | | | | | | | | | | | | | | | | | | | | | | | | | | | | | | | | | | | | |
| Year ended 11/30/2013 | | | 28.88 | | | .24 | | | | 11.68 | | | | 11.92 | | | | (.27 | ) | | | (.88 | ) | | | (1.15 | ) | | | 39.65 | | | 42.88 | | | | 330 | | | .57 | | | | .57 | | | | .70 | |
| Year ended 11/30/2012 | | | 24.19 | | | .23 | | | | 4.65 | | | | 4.88 | | | | (.19 | ) | | | — | | | | (.19 | ) | | | 28.88 | | | 20.35 | | | | 106 | | | .59 | | | | .59 | | | | .87 | |
| Year ended 11/30/2011 | | | 24.27 | | | .18 | | | | (.02 | ) | | | .16 | | | | (.24 | ) | | | — | | | | (.24 | ) | | | 24.19 | | | .58 | | | | 72 | | | .59 | | | | .59 | | | | .72 | |
| Year ended 11/30/2010 | | | 21.93 | | | .24 | | | | 2.29 | | | | 2.53 | | | | (.19 | ) | | | — | | | | (.19 | ) | | | 24.27 | | | 11.63 | | | | 63 | | | .59 | | | | .59 | | | | 1.06 | |
| Year ended 11/30/2009 | | | 15.24 | | | .14 | | | | 6.81 | | | | 6.95 | | | | (.26 | ) | | | — | | | | (.26 | ) | | | 21.93 | | | 46.33 | | | | 54 | | | .62 | | | | .61 | | | | .69 | |
| Class 529-A: | | | | | | | | | | | | | | | | | | | | | | | | | | | | | | | | | | | | | | | | | | | | | | | | | |
| Year ended 11/30/2013 | | | 28.65 | | | .14 | | | | 11.58 | | | | 11.72 | | | | (.16 | ) | | | (.88 | ) | | | (1.04 | ) | | | 39.33 | | | 42.38 | | | | 325 | | | .91 | | | | .91 | | | | .42 | |
| Year ended 11/30/2012 | | | 24.00 | | | .14 | | | | 4.63 | | | | 4.77 | | | | (.12 | ) | | | — | | | | (.12 | ) | | | 28.65 | | | 19.92 | | | | 197 | | | .93 | | | | .93 | | | | .53 | |
| Year ended 11/30/2011 | | | 24.10 | | | .10 | | | | (.02 | ) | | | .08 | | | | (.18 | ) | | | — | | | | (.18 | ) | | | 24.00 | | | .32 | | | | 156 | | | .90 | | | | .90 | | | | .40 | |
| Year ended 11/30/2010 | | | 21.77 | | | .17 | | | | 2.27 | | | | 2.44 | | | | (.11 | ) | | | — | | | | (.11 | ) | | | 24.10 | | | 11.27 | | | | 135 | | | .91 | | | | .91 | | | | .75 | |
| Year ended 11/30/2009 | | | 15.16 | | | .12 | | | | 6.72 | | | | 6.84 | | | | (.23 | ) | | | — | | | | (.23 | ) | | | 21.77 | | | 45.84 | | | | 110 | | | .97 | | | | .97 | | | | .64 | |
| Class 529-B: | | | | | | | | | | | | | | | | | | | | | | | | | | | | | | | | | | | | | | | | | | | | | | | | | |
| Year ended 11/30/2013 | | | 27.54 | | | (.11 | ) | | | 11.13 | | | | 11.02 | | | | — | | | | (.88 | ) | | | (.88 | ) | | | 37.68 | | | 41.26 | | | | 8 | | | 1.72 | | | | 1.72 | | | | (.36 | ) |
| Year ended 11/30/2012 | | | 23.15 | | | (.08 | ) | | | 4.47 | | | | 4.39 | | | | — | | | | — | | | | — | | | | 27.54 | | | 18.96 | | | | 8 | | | 1.75 | | | | 1.75 | | | | (.31 | ) |
| Year ended 11/30/2011 | | | 23.27 | | | (.11 | ) | | | (.01 | ) | | | (.12 | ) | | | — | | | | — | | | | — | | | | 23.15 | | | (.52 | ) | | | 10 | | | 1.72 | | | | 1.72 | | | | (.43 | ) |
| Year ended 11/30/2010 | | | 21.09 | | | (.02 | ) | | | 2.20 | | | | 2.18 | | | | — | | | | — | | | | — | | | | 23.27 | | | 10.34 | | | | 13 | | | 1.74 | | | | 1.74 | | | | (.10 | ) |
| Year ended 11/30/2009 | | | 14.63 | | | (.03 | ) | | | 6.54 | | | | 6.51 | | | | (.05 | ) | | | — | | | | (.05 | ) | | | 21.09 | | | 44.65 | | | | 14 | | | 1.80 | | | | 1.80 | | | | (.18 | ) |
| Class 529-C: | | | | | | | | | | | | | | | | | | | | | | | | | | | | | | | | | | | | | | | | | | | | | | | | | |
| Year ended 11/30/2013 | | | 27.49 | | | (.12 | ) | | | 11.13 | | | | 11.01 | | | | — | | | | (.88 | ) | | | (.88 | ) | | | 37.62 | | | 41.30 | | | | 94 | | | 1.71 | | | | 1.71 | | | | (.38 | ) |
| Year ended 11/30/2012 | | | 23.11 | | | (.07 | ) | | | 4.45 | | | | 4.38 | | | | — | | | | — | | | | — | | | | 27.49 | | | 18.95 | | | | 60 | | | 1.74 | | | | 1.74 | | | | (.28 | ) |
| Year ended 11/30/2011 | | | 23.24 | | | (.10 | ) | | | (.02 | ) | | | (.12 | ) | | | (.01 | ) | | | — | | | | (.01 | ) | | | 23.11 | | | (.53 | ) | | | 49 | | | 1.71 | | | | 1.71 | | | | (.41 | ) |
| Year ended 11/30/2010 | | | 21.06 | | | (.01 | ) | | | 2.19 | | | | 2.18 | | | | — | | | | — | | | | — | | | | 23.24 | | | 10.35 | | | | 44 | | | 1.72 | | | | 1.72 | | | | (.07 | ) |
| Year ended 11/30/2009 | | | 14.62 | | | (.03 | ) | | | 6.53 | | | | 6.50 | | | | (.06 | ) | | | — | | | | (.06 | ) | | | 21.06 | | | 44.71 | | | | 36 | | | 1.79 | | | | 1.79 | | | | (.18 | ) |
| Class 529-E: | | | | | | | | | | | | | | | | | | | | | | | | | | | | | | | | | | | | | | | | | | | | | | | | | |
| Year ended 11/30/2013 | | | 28.35 | | | .05 | | | | 11.48 | | | | 11.53 | | | | (.09 | ) | | | (.88 | ) | | | (.97 | ) | | | 38.91 | | | 42.04 | | | | 17 | | | 1.16 | | | | 1.16 | | | | .16 | |
| Year ended 11/30/2012 | | | 23.75 | | | .07 | | | | 4.57 | | | | 4.64 | | | | (.04 | ) | | | — | | | | (.04 | ) | | | 28.35 | | | 19.59 | | | | 10 | | | 1.20 | | | | 1.20 | | | | .26 | |
| Year ended 11/30/2011 | | | 23.85 | | | .03 | | | | (.01 | ) | | | .02 | | | | (.12 | ) | | | — | | | | (.12 | ) | | | 23.75 | | | — | 5 | | | 8 | | | 1.19 | | | | 1.19 | | | | .11 | |
| Year ended 11/30/2010 | | | 21.57 | | | .10 | | | | 2.24 | | | | 2.34 | | | | (.06 | ) | | | — | | | | (.06 | ) | | | 23.85 | | | 10.93 | | | | 7 | | | 1.21 | | | | 1.21 | | | | .44 | |
| Year ended 11/30/2009 | | | 15.01 | | | .06 | | | | 6.67 | | | | 6.73 | | | | (.17 | ) | | | — | | | | (.17 | ) | | | 21.57 | | | 45.45 | | | | 6 | | | 1.28 | | | | 1.27 | | | | .34 | |
See footnotes on page 28.
Financial highlights (continued)
| | | | | Income (loss) from investment operations1 | | | Dividends and distributions | | | | | | | | | | | | | | | | | | |
| | Net asset
value,
beginning
of period | | Net
investment
income
(loss) | | | Net gains
(losses) on
securities
(both
realized and
unrealized) | | | Total from
investment
operations | | | Dividends
(from net
investment
income) | | | Distributions
(from
capital
gains) | | | Total
dividends
and
distributions | | | Net asset
value, end
of period | | Total
return2,3 | | | Net assets,
end of period
(in millions) | | | Ratio of
expenses to
average net
assets before
waivers | | | Ratio of
expenses to
average net
assets after
waivers3 | | | Ratio of
net income
(loss) to
average
net assets3 | |
| Class 529-F-1: | | | | | | | | | | | | | | | | | | | | | | | | | | | | | | | | | | | | | | | | | | | | | | | | | | |
| Year ended 11/30/2013 | | $ | 28.65 | | $ | .21 | | | $ | 11.58 | | | $ | 11.79 | | | $ | (.23 | ) | | $ | (.88 | ) | | $ | (1.11 | ) | | $ | 39.33 | | | 42.69 | % | | $ | 22 | | | | .71 | % | | | .71 | % | | | .62 | % |
| Year ended 11/30/2012 | | | 24.01 | | | .19 | | | | 4.62 | | | | 4.81 | | | | (.17 | ) | | | — | | | | (.17 | ) | | | 28.65 | | | 20.17 | | | | 13 | | | | .74 | | | | .74 | | | | .73 | |
| Year ended 11/30/2011 | | | 24.09 | | | .16 | | | | (.03 | ) | | | .13 | | | | (.21 | ) | | | — | | | | (.21 | ) | | | 24.01 | | | .47 | | | | 10 | | | | .70 | | | | .70 | | | | .62 | |
| Year ended 11/30/2010 | | | 21.77 | | | .21 | | | | 2.27 | | | | 2.48 | | | | (.16 | ) | | | — | | | | (.16 | ) | | | 24.09 | | | 11.47 | | | | 7 | | | | .71 | | | | .71 | | | | .94 | |
| Year ended 11/30/2009 | | | 15.17 | | | .15 | | | | 6.73 | | | | 6.88 | | | | (.28 | ) | | | — | | | | (.28 | ) | | | 21.77 | | | 46.18 | | | | 6 | | | | .78 | | | | .77 | | | | .79 | |
| Class R-1: | | | | | | | | | | | | | | | | | | | | | | | | | | | | | | | | | | | | | | | | | | | | | | | | | | |
| Year ended 11/30/2013 | | | 27.72 | | | (.08 | ) | | | 11.23 | | | | 11.15 | | | | — | | | | (.88 | ) | | | (.88 | ) | | | 37.99 | | | 41.46 | | | | 33 | | | | 1.59 | | | | 1.59 | | | | (.25 | ) |
| Year ended 11/30/2012 | | | 23.27 | | | (.04 | ) | | | 4.49 | | | | 4.45 | | | | — | | | | — | | | | — | | | | 27.72 | | | 19.12 | | | | 23 | | | | 1.61 | | | | 1.61 | | | | (.15 | ) |
| Year ended 11/30/2011 | | | 23.39 | | | (.08 | ) | | | (.01 | ) | | | (.09 | ) | | | (.03 | ) | | | — | | | | (.03 | ) | | | 23.27 | | | (.41 | ) | | | 23 | | | | 1.61 | | | | 1.61 | | | | (.32 | ) |
| Year ended 11/30/2010 | | | 21.20 | | | .01 | | | | 2.21 | | | | 2.22 | | | | (.03 | ) | | | — | | | | (.03 | ) | | | 23.39 | | | 10.46 | | | | 22 | | | | 1.62 | | | | 1.62 | | | | .03 | |
| Year ended 11/30/2009 | | | 14.71 | | | (.01 | ) | | | 6.57 | | | | 6.56 | | | | (.07 | ) | | | — | | | | (.07 | ) | | | 21.20 | | | 44.78 | | | | 16 | | | | 1.68 | | | | 1.68 | | | | (.08 | ) |
| Class R-2: | | | | | | | | | | | | | | | | | | | | | | | | | | | | | | | | | | | | | | | | | | | | | | | | | | |
| Year ended 11/30/2013 | | | 27.84 | | | (.07 | ) | | | 11.27 | | | | 11.20 | | | | — | | | | (.88 | ) | | | (.88 | ) | | | 38.16 | | | 41.47 | | | | 173 | | | | 1.57 | | | | 1.57 | | | | (.23 | ) |
| Year ended 11/30/2012 | | | 23.37 | | | (.05 | ) | | | 4.52 | | | | 4.47 | | | | — | | | | — | | | | — | | | | 27.84 | | | 19.13 | | | | 124 | | | | 1.63 | | | | 1.63 | | | | (.17 | ) |
| Year ended 11/30/2011 | | | 23.47 | | | (.08 | ) | | | (.02 | ) | | | (.10 | ) | | | — | | | | — | | | | — | | | | 23.37 | | | (.43 | ) | | | 112 | | | | 1.63 | | | | 1.63 | | | | (.33 | ) |
| Year ended 11/30/2010 | | | 21.26 | | | — | 4 | | | 2.21 | | | | 2.21 | | | | — | | | | — | | | | — | | | | 23.47 | | | 10.40 | | | | 118 | | | | 1.67 | | | | 1.67 | | | | (.01 | ) |
| Year ended 11/30/2009 | | | 14.76 | | | (.03 | ) | | | 6.59 | | | | 6.56 | | | | (.06 | ) | | | — | | | | (.06 | ) | | | 21.26 | | | 44.58 | | | | 108 | | | | 1.81 | | | | 1.80 | | | | (.19 | ) |
| Class R-3: | | | | | | | | | | | | | | | | | | | | | | | | | | | | | | | | | | | | | | | | | | | | | | | | | | |
| Year ended 11/30/2013 | | | 28.38 | | | .06 | | | | 11.50 | | | | 11.56 | | | | (.08 | ) | | | (.88 | ) | | | (.96 | ) | | | 38.98 | | | 42.09 | | | | 262 | | | | 1.15 | | | | 1.15 | | | | .19 | |
| Year ended 11/30/2012 | | | 23.77 | | | .07 | | | | 4.58 | | | | 4.65 | | | | (.04 | ) | | | — | | | | (.04 | ) | | | 28.38 | | | 19.62 | | | | 168 | | | | 1.18 | | | | 1.18 | | | | .28 | |
| Year ended 11/30/2011 | | | 23.87 | | | .03 | | | | (.02 | ) | | | .01 | | | | (.11 | ) | | | — | | | | (.11 | ) | | | 23.77 | | | .04 | | | | 150 | | | | 1.17 | | | | 1.17 | | | | .13 | |
| Year ended 11/30/2010 | | | 21.58 | | | .11 | | | | 2.25 | | | | 2.36 | | | | (.07 | ) | | | — | | | | (.07 | ) | | | 23.87 | | | 10.98 | | | | 150 | | | | 1.18 | | | | 1.18 | | | | .47 | |
| Year ended 11/30/2009 | | | 15.01 | | | .07 | | | | 6.67 | | | | 6.74 | | | | (.17 | ) | | | — | | | | (.17 | ) | | | 21.58 | | | 45.39 | | | | 127 | | | | 1.25 | | | | 1.24 | | | | .36 | |
| Class R-4: | | | | | | | | | | | | | | | | | | | | | | | | | | | | | | | | | | | | | | | | | | | | | | | | | | |
| Year ended 11/30/2013 | | | 28.67 | | | .16 | | | | 11.60 | | | | 11.76 | | | | (.19 | ) | | | (.88 | ) | | | (1.07 | ) | | | 39.36 | | | 42.52 | | | | 252 | | | | .83 | | | | .83 | | | | .49 | |
| Year ended 11/30/2012 | | | 24.01 | | | .16 | | | | 4.63 | | | | 4.79 | | | | (.13 | ) | | | — | | | | (.13 | ) | | | 28.67 | | | 20.06 | | | | 150 | | | | .85 | | | | .85 | | | | .61 | |
| Year ended 11/30/2011 | | | 24.11 | | | .12 | | | | (.03 | ) | | | .09 | | | | (.19 | ) | | | — | | | | (.19 | ) | | | 24.01 | | | .35 | | | | 132 | | | | .85 | | | | .85 | | | | .45 | |
| Year ended 11/30/2010 | | | 21.79 | | | .18 | | | | 2.27 | | | | 2.45 | | | | (.13 | ) | | | — | | | | (.13 | ) | | | 24.11 | | | 11.28 | | | | 111 | | | | .86 | | | | .86 | | | | .79 | |
| Year ended 11/30/2009 | | | 15.17 | | | .13 | | | | 6.73 | | | | 6.86 | | | | (.24 | ) | | | — | | | | (.24 | ) | | | 21.79 | | | 45.97 | | | | 85 | | | | .90 | | | | .90 | | | | .71 | |
| Class R-5: | | | | | | | | | | | | | | | | | | | | | | | | | | | | | | | | | | | | | | | | | | | | | | | | | | |
| Year ended 11/30/2013 | | | 28.98 | | | .26 | | | | 11.71 | | | | 11.97 | | | | (.27 | ) | | | (.88 | ) | | | (1.15 | ) | | | 39.80 | | | 42.93 | | | | 233 | | | | .53 | | | | .53 | | | | .79 | |
| Year ended 11/30/2012 | | | 24.26 | | | .25 | | | | 4.67 | | | | 4.92 | | | | (.20 | ) | | | — | | | | (.20 | ) | | | 28.98 | | | 20.45 | | | | 131 | | | | .54 | | | | .54 | | | | .92 | |
| Year ended 11/30/2011 | | | 24.34 | | | .19 | | | | (.03 | ) | | | .16 | | | | (.24 | ) | | | — | | | | (.24 | ) | | | 24.26 | | | .64 | | | | 111 | | | | .54 | | | | .54 | | | | .76 | |
| Year ended 11/30/2010 | | | 21.97 | | | .24 | | | | 2.31 | | | | 2.55 | | | | (.18 | ) | | | — | | | | (.18 | ) | | | 24.34 | | | 11.65 | | | | 133 | | | | .56 | | | | .56 | | | | 1.08 | |
| Year ended 11/30/2009 | | | 15.31 | | | .17 | | | | 6.80 | | | | 6.97 | | | | (.31 | ) | | | — | | | | (.31 | ) | | | 21.97 | | | 46.45 | | | | 165 | | | | .59 | | | | .59 | | | | .99 | |
| Class R-6: | | | | | | | | | | | | | | | | | | | | | | | | | | | | | | | | | | | | | | | | | | | | | | | | | | |
| Year ended 11/30/2013 | | | 28.93 | | | .28 | | | | 11.69 | | | | 11.97 | | | | (.29 | ) | | | (.88 | ) | | | (1.17 | ) | | | 39.73 | | | 43.02 | | | | 945 | | | | .48 | | | | .48 | | | | .84 | |
| Year ended 11/30/2012 | | | 24.23 | | | .26 | | | | 4.66 | | | | 4.92 | | | | (.22 | ) | | | — | | | | (.22 | ) | | | 28.93 | | | 20.48 | | | | 512 | | | | .49 | | | | .49 | | | | .97 | |
| Year ended 11/30/2011 | | | 24.31 | | | .21 | | | | (.03 | ) | | | .18 | | | | (.26 | ) | | | — | | | | (.26 | ) | | | 24.23 | | | .70 | | | | 340 | | | | .49 | | | | .49 | | | | .81 | |
| Year ended 11/30/2010 | | | 21.92 | | | .27 | | | | 2.28 | | | | 2.55 | | | | (.16 | ) | | | — | | | | (.16 | ) | | | 24.31 | | | 11.68 | | | | 270 | | | | .51 | | | | .51 | | | | 1.17 | |
Period from 5/1/2009
to 11/30/20096 | | | 17.22 | | | .13 | | | | 4.57 | | | | 4.70 | | | | — | | | | — | | | | — | | | | 21.92 | | | 27.29 | | | | 154 | | | | .54 | 7 | | | .54 | 7 | | | 1.06 | 7 |
| | | Year ended November 30 | |
| | | 2013 | | 2012 | | 2011 | | 2010 | | 2009 |
| Portfolio turnover rate for all share classes | | | 29 | % | | | 37 | % | | | 45 | % | | | 47 | % | | | 51 | % |
| 1 | Based on average shares outstanding. |
| 2 | Total returns exclude any applicable sales charges, including contingent deferred sales charges. |
| 3 | This column reflects the impact, if any, of certain waivers from CRMC. During one of the periods shown, CRMC reduced fees for investment advisory services. |
| 4 | Amount less than $.01. |
| 5 | Amount less than .01%. |
| 6 | Based on operations for the period shown and, accordingly, is not representative of a full year. |
| 7 | Annualized. |
See Notes to Financial Statements
Report of Independent Registered Public Accounting Firm
To the Board of Trustees and Shareholders of The New Economy Fund
In our opinion, the accompanying statement of assets and liabilities, including the summary investment portfolio, and the related statements of operations and of changes in net assets and the financial highlights present fairly, in all material respects, the financial position of The New Economy Fund (the “Fund”) at November 30, 2013, the results of its operations for the year then ended, the changes in its net assets for each of the two years in the period then ended and the financial highlights for each of the periods presented, in conformity with accounting principles generally accepted in the United States of America. These financial statements and financial highlights (hereafter referred to as “financial statements”) are the responsibility of the Fund’s management. Our responsibility is to express an opinion on these financial statements based on our audits. We conducted our audits of these financial statements in accordance with the standards of the Public Company Accounting Oversight Board (United States). Those standards require that we plan and perform the audit to obtain reasonable assurance about whether the financial statements are free of material misstatement. An audit includes examining, on a test basis, evidence supporting the amounts and disclosures in the financial statements, assessing the accounting principles used and significant estimates made by management, and evaluating the overall financial statement presentation. We believe that our audits, which included confirmation of securities at November 30, 2013 by correspondence with the custodian and brokers, provide a reasonable basis for our opinion.
PricewaterhouseCoopers LLP
Los Angeles, California
January 10, 2014
As a fund shareholder, you incur two types of costs: (1) transaction costs, such as initial sales charges on purchase payments and contingent deferred sales charges on redemptions (loads), and (2) ongoing costs, including management fees, distribution and service (12b-1) fees, and other expenses. This example is intended to help you understand your ongoing costs (in dollars) of investing in the fund so you can compare these costs with the ongoing costs of investing in other mutual funds. The example is based on an investment of $1,000 invested at the beginning of the period and held for the entire six-month period (June 1, 2013, through November 30, 2013).
Actual expenses:
The first line of each share class in the table on the following page provides information about actual account values and actual expenses. You may use the information in this line, together with the amount you invested, to estimate the expenses that you paid over the period. Simply divide your account value by $1,000 (for example, an $8,600 account value divided by $1,000 = 8.6), then multiply the result by the number in the first line under the heading entitled “Expenses paid during period” to estimate the expenses you paid on your account during this period.
Hypothetical example for comparison purposes:
The second line of each share class in the table on the following page provides information about hypothetical account values and hypothetical expenses based on the actual expense ratio for the share class and an assumed rate of return of 5.00% per year before expenses, which is not the actual return of the share class. The hypothetical account values and expenses may not be used to estimate the actual ending account balance or expenses you paid for the period. You may use this information to compare the ongoing costs of investing in the fund and other funds. To do so, compare this 5.00% hypothetical example with the 5.00% hypothetical examples that appear in the shareholder reports of the other funds.
Notes:
There are some account fees that are charged to certain types of accounts, such as individual retirement accounts and 529 college savings plan accounts (generally, a $10 fee is charged to set up the account and an additional $10 fee is charged to the account annually), that would increase the amount of expenses paid on your account. In addition, retirement plan participants may be subject to certain fees charged by the plan sponsor, and Class F-1, F-2 and 529-F-1 shareholders may be subject to fees charged by financial intermediaries, typically ranging from 0.75% to 1.50% of assets annually depending on services offered. You can estimate the impact of these fees by adding the amount of the fees to the total estimated expenses you paid on your account during the period as calculated above. In addition, your ending account value would be lower by the amount of these fees.
Note that the expenses shown in the table on the following page are meant to highlight your ongoing costs only and do not reflect any transactional costs, such as sales charges (loads). Therefore, the second line of each share class in the table is useful in comparing ongoing costs only and will not help you determine the relative total costs of owning different funds. In addition, if these transactional costs were included, your costs would have been higher.
| | | Beginning
account value
6/1/2013 | | Ending
account value
11/30/2013 | | Expenses paid
during period* | | Annualized
expense ratio | |
| Class A — actual return | | $ | 1,000.00 | | $ | 1,191.63 | | $ | 4.45 | | | .81 | % |
| Class A — assumed 5% return | | | 1,000.00 | | | 1,021.01 | | | 4.10 | | | .81 | |
| Class B — actual return | | | 1,000.00 | | | 1,187.32 | | | 8.66 | | | 1.58 | |
| Class B — assumed 5% return | | | 1,000.00 | | | 1,017.15 | | | 7.99 | | | 1.58 | |
| Class C — actual return | | | 1,000.00 | | | 1,187.22 | | | 8.88 | | | 1.62 | |
| Class C — assumed 5% return | | | 1,000.00 | | | 1,016.95 | | | 8.19 | | | 1.62 | |
| Class F-1 — actual return | | | 1,000.00 | | | 1,191.65 | | | 4.67 | | | .85 | |
| Class F-1 — assumed 5% return | | | 1,000.00 | | | 1,020.81 | | | 4.31 | | | .85 | |
| Class F-2 — actual return | | | 1,000.00 | | | 1,193.19 | | | 3.13 | | | .57 | |
| Class F-2 — assumed 5% return | | | 1,000.00 | | | 1,022.21 | | | 2.89 | | | .57 | |
| Class 529-A — actual return | | | 1,000.00 | | | 1,191.11 | | | 4.89 | | | .89 | |
| Class 529-A — assumed 5% return | | | 1,000.00 | | | 1,020.61 | | | 4.51 | | | .89 | |
| Class 529-B — actual return | | | 1,000.00 | | | 1,186.77 | | | 9.26 | | | 1.69 | |
| Class 529-B — assumed 5% return | | | 1,000.00 | | | 1,016.60 | | | 8.54 | | | 1.69 | |
| Class 529-C — actual return | | | 1,000.00 | | | 1,186.76 | | | 9.26 | | | 1.69 | |
| Class 529-C — assumed 5% return | | | 1,000.00 | | | 1,016.60 | | | 8.54 | | | 1.69 | |
| Class 529-E — actual return | | | 1,000.00 | | | 1,189.56 | | | 6.31 | | | 1.15 | |
| Class 529-E — assumed 5% return | | | 1,000.00 | | | 1,019.30 | | | 5.82 | | | 1.15 | |
| Class 529-F-1 — actual return | | | 1,000.00 | | | 1,192.52 | | | 3.79 | | | .69 | |
| Class 529-F-1 — assumed 5% return | | | 1,000.00 | | | 1,021.61 | | | 3.50 | | | .69 | |
| Class R-1 — actual return | | | 1,000.00 | | | 1,187.19 | | | 8.66 | | | 1.58 | |
| Class R-1 — assumed 5% return | | | 1,000.00 | | | 1,017.15 | | | 7.99 | | | 1.58 | |
| Class R-2 — actual return | | | 1,000.00 | | | 1,187.31 | | | 8.50 | | | 1.55 | |
| Class R-2 — assumed 5% return | | | 1,000.00 | | | 1,017.30 | | | 7.84 | | | 1.55 | |
| Class R-3 — actual return | | | 1,000.00 | | | 1,189.86 | | | 6.26 | | | 1.14 | |
| Class R-3 — assumed 5% return | | | 1,000.00 | | | 1,019.35 | | | 5.77 | | | 1.14 | |
| Class R-4 — actual return | | | 1,000.00 | | | 1,192.02 | | | 4.51 | | | .82 | |
| Class R-4 — assumed 5% return | | | 1,000.00 | | | 1,020.96 | | | 4.15 | | | .82 | |
| Class R-5 — actual return | | | 1,000.00 | | | 1,193.76 | | | 2.86 | | | .52 | |
| Class R-5 — assumed 5% return | | | 1,000.00 | | | 1,022.46 | | | 2.64 | | | .52 | |
| Class R-6 — actual return | | | 1,000.00 | | | 1,193.81 | | | 2.58 | | | .47 | |
| Class R-6 — assumed 5% return | | | 1,000.00 | | | 1,022.71 | | | 2.38 | | | .47 | |
| * | The “expenses paid during period” are equal to the “annualized expense ratio,” multiplied by the average account value over the period, multiplied by the number of days in the period, and divided by 365 (to reflect the one-half year period). |
We are required to advise you of the federal tax status of certain distributions received by shareholders during the fiscal year. The fund hereby designates the following amounts for the fund’s fiscal year ended November 30, 2013:
| Long-term capital gains | | | $236,050,000 |
| Qualified dividend income | | | 100% |
| Corporate dividends received deduction | | | 100% |
| U.S. government income that may be exempt from state taxation | | | $99,000 |
Individual shareholders should refer to their Form 1099 or other tax information, which will be mailed in January 2014, to determine the calendar year amounts to be included on their 2013 tax returns. Shareholders should consult their tax advisors.
Approval of Investment Advisory and Service Agreement
The fund’s board has approved the fund’s Investment Advisory and Service Agreement (the “agreement”) with Capital Research and Management Company (“CRMC”) for an additional one-year term through October 31, 2014. The board approved the agreement following the recommendation of the fund’s Contracts Committee (the “committee”), which is composed of all of the fund’s independent board members. The board and the committee determined that the fund’s advisory fee structure was fair and reasonable in relation to the services provided and that approving the agreement was in the best interests of the fund and its shareholders.
In reaching this decision, the board and the committee took into account information furnished to them throughout the year and as otherwise provided to them, as well as information prepared specifically in connection with their review of the agreement, and were advised by their independent counsel. They considered the factors discussed below, among others, but did not identify any single issue or particular piece of information that, in isolation, was the controlling factor, and each board and committee member did not necessarily attribute the same weight to each factor.
1. Nature, extent and quality of services
The board and the committee considered the depth and quality of CRMC’s investment management process, including its global research capabilities; the experience, capability and integrity of its senior management and other personnel; the low turnover rates of its key personnel; the overall financial strength and stability of its organization; and the ongoing evolution of CRMC’s organizational structure designed to maintain and strengthen these qualities. The board and the committee also considered the nature, extent and quality of administrative, compliance and shareholder services provided by CRMC to the fund under the agreement and other agreements, as well as the benefits to fund shareholders from investing in a fund that is part of a large family of funds. The board and the committee concluded that the nature, extent and quality of the services provided by CRMC have benefited and should continue to benefit the fund and its shareholders.
2. Investment results
The board and the committee considered the investment results of the fund in light of its objective of providing long-term growth of capital. They compared the fund’s investment results with those of other relevant funds (including the other funds that are the basis of the Lipper index for the category in which the fund is included) and market data such as relevant market indices over various periods through March 31, 2013. This report, including the letter to shareholders and related disclosures, contains certain information about the fund’s investment results. The board and the committee reviewed the fund’s investment results measured against the S&P 500 index, the Global Service and Information Index, the Lipper Growth Funds Index and the Lipper International Funds Index. It was the consensus of the board and committee that the fund’s continuing investment results are sound, both on an absolute basis and relative to the presented peer groups and relevant Lipper indexes as well as relevant broad-based securities market indexes. Overall, the board and committee concluded that the results have been satisfactory and that the quality of the services CRMC provides combined with CRMC’s long-term record in managing the fund indicates that its continued management should benefit the fund and its shareholders.
3. Advisory fees and total expenses
The board and the committee compared the advisory fees and total expense levels of the fund to those of other relevant funds. They observed that the fund’s advisory fees and expenses generally compared favorably with other similar funds included in the Lipper Growth Funds Index category. The board and the committee also considered the breakpoint discounts in the fund’s advisory fee structure that reduce the level of fees charged by CRMC to the fund as fund assets increase. In addition, they reviewed information regarding the effective advisory fees charged to non-mutual fund accounts by CRMC and affiliates of CRMC. They noted that, to the extent there were differences between the advisory fees paid by the fund and the advisory fees paid by those clients, the differences appropriately reflected the investment, operational and regulatory differences between advising the fund and the other clients. The board and the committee concluded that the fund’s cost structure was fair and reasonable in relation to the services provided, and that the shareholders receive reasonable value in return for the advisory fees and other amounts paid to CRMC by the fund.
4. Ancillary benefits
The board and the committee considered a variety of other benefits received by CRMC and its affiliates as a result of CRMC’s relationship with the fund and the other American Funds, including fees for administrative services provided to certain share classes; fees paid to CRMC’s affiliated transfer agent; sales charges and distribution fees received and retained by the fund’s principal underwriter, an affiliate of CRMC; and possible ancillary benefits to CRMC and its institutional management affiliates in managing other investment vehicles. The board and the committee reviewed CRMC’s portfolio trading practices, noting that while CRMC receives the benefit of research provided by broker-dealers executing portfolio transactions on behalf of the fund, it does not obtain third-party research or other services in return for allocating brokerage to such broker-dealers. The board and the committee took these ancillary benefits into account in evaluating the reasonableness of the advisory fees and other amounts paid to CRMC by the fund.
5. Adviser financial information
The board and the committee reviewed information regarding CRMC’s costs of providing services to the American Funds, including personnel, systems and resources of investment, compliance, trading, accounting and other administrative operations. They considered CRMC’s costs and willingness to invest in technology, infrastructure and staff to maintain and expand services and capabilities, respond to industry and regulatory developments, and attract and retain qualified personnel. They noted information regarding the compensation structure for CRMC’s investment professionals. The board and the committee also compared CRMC’s profitability and compensation data to the reported results and data of several large, publicly-held investment management companies. The board and the committee noted the competitiveness and cyclicality of both the mutual fund industry and the capital markets, and the importance in that environment of CRMC’s long-term profitability for maintaining its independence, company culture and management continuity. They further considered the breakpoint discounts in the fund’s advisory fee structure. The board and the committee concluded that the fund’s advisory fee structure reflected a reasonable sharing of benefits between CRMC and the fund’s shareholders.
Board of trustees and other officers
“Independent” trustees1
| Name and age | | Year first
elected
a trustee
of the fund2 | | Principal occupation(s) during past five years | | Number of
portfolios in fund
complex overseen
by trustee | | Other directorships3
held by trustee |
| Joseph C. Berenato, 67 | | 2000 | | Former Chairman and CEO, Ducommun Incorporated (aerospace components manufacturer) | | 6 | | Ducommun Incorporated |
| Robert J. Denison, 72 | | 2010 | | Chair, First Security Management (private investment) | | 6 | | None |
| Mary Anne Dolan, 66 | | 2008 | | Founder and President, MAD Ink (communications company) | | 10 | | None |
| R. Clark Hooper, 67 | | 2006 | | Private investor | | 71 | | JPMorgan Value
Opportunities Fund, Inc.;
The Swiss Helvetia Fund, Inc. |
| Koichi Itoh, 73 | | 2010 | | Chairman of the Board, Itoh Building Co., Ltd. (building management) | | 6 | | None |
Merit E. Janow, 55
Chairman of the Board
(Independent and Non-Executive) | | 2010 | | Dean and Professor, Columbia University, School of International and Public Affairs | | 68 | | The NASDAQ Stock
Market LLC;
Trimble Navigation Limited |
| Leonade D. Jones, 66 | | 1995 | | Retired; former Treasurer, The Washington Post Company (1987–1996) | | 10 | | None |
| Stefanie Powers, 71 | | 2010 | | Actor, producer, author, entrepreneur; Co-founder and President of The William Holden Wildlife Foundation; conservation consultant to Land Rover and Jaguar North America; founder of The Jaguar Conservation Trust | | 3 | | None |
| Christopher E. Stone, 57 | | 2007 | | President, Open Society Foundations; former Professor of the Practice of Criminal Justice, John F. Kennedy School of Government, Harvard University | | 6 | | None |
| Steadman Upham, Ph.D., 64 | | 2010 | | President and University Professor, The University of Tulsa | | 68 | | None |
Robert J. O’Neill, Ph.D., a trustee of the fund since 2010, retired from the board on December 31, 2013. The trustees thank Dr. O’Neill for his dedication and service to the fund.
“Interested” trustees4,5
Name, age and
position with fund | | Year first
elected
a trustee
or officer
of the fund2 | | Principal occupation(s) during past five years
and positions held with affiliated entities or
the principal underwriter of the fund | | Number of
portfolios in fund
complex overseen
by trustee | | Other directorships3
held by trustee |
Timothy D. Armour, 53
Vice Chairman of the Board | | 1991 | | Chairman of the Board, Capital Research and Management Company; Senior Vice President — Capital Research Global Investors, Capital Research and Management Company; Director, The Capital Group Companies, Inc.6 | | 2 | | None |
Claudia P. Huntington, 61
President | | 1996 | | Senior Vice President — Capital Research Global Investors, Capital Research and Management Company; Director, Capital Research and Management Company | | 2 | | None |
The fund’s statement of additional information includes further details about fund trustees and is available without charge upon request by calling American Funds Service Company at (800) 421-4225 or by visiting the American Funds website at americanfunds.com. The address for all trustees and officers of the fund is 333 South Hope Street, Los Angeles, CA 90071, Attention: Secretary.
See page 36 for footnotes.
Other officers5
Name, age and
position with fund | | Year first
elected
an officer
of the fund2 | | Principal occupation(s) during past five years and positions held with affiliated entities
or the principal underwriter of the fund |
Paul F. Roye, 60
Executive Vice President | | 2007 | | Senior Vice President — Fund Business Management Group, Capital Research and Management Company; Chief Legal Officer, Capital Research and Management Company; Director, American Funds Service Company6 |
Mark E. Denning, 56
Senior Vice President | | 2006 | | Senior Vice President — Capital Research Global Investors, Capital Research Company;6 Director, Capital Research and Management Company |
Harold H. La, 43
Vice President | | 2006 | | Senior Vice President — Capital Research Global Investors, Capital Research Company6 |
Donald H. Rolfe, 41
Vice President | | 2010 | | Chief Compliance Officer, Capital Research Company;6 Chief Compliance Officer, Capital Research and Management Company; Vice President and Senior Counsel — Fund Business Management Group, Capital Research and Management Company |
Lawrence R. Solomon, 51
Vice President | | 2010 | | Senior Vice President — Capital Research Global Investors, Capital Research Company;6 President and Chairman of the Board, Capital Management Services, Inc.6 |
Michael W. Stockton, 46
Secretary | | 2013 | | Vice President — Fund Business Management Group, Capital Research and Management Company |
Neal F. Wellons, 42
Treasurer | | 2008 | | Vice President — Fund Business Management Group, Capital Research and Management Company |
Jennifer L. Butler, 47
Assistant Secretary | | 2013 | | Assistant Vice President — Fund Business Management Group, Capital Research and Management Company |
Dori Laskin, 62
Assistant Treasurer | | 2010 | | Vice President — Fund Business Management Group, Capital Research and Management Company |
Jeffrey P. Regal, 42
Assistant Treasurer | | 2010 | | Vice President — Fund Business Management Group, Capital Research and Management Company |
| 1 | The term “independent” trustee refers to a trustee who is not an “interested person” of the fund within the meaning of the Investment Company Act of 1940. |
| 2 | Trustees and officers of the fund serve until their resignation, removal or retirement. |
| 3 | This includes all directorships (other than those in the American Funds or other funds managed by Capital Research and Management Company) that are held by each trustee as a trustee or director of a public company or a registered investment company. |
| 4 | “Interested persons” within the meaning of the Investment Company Act of 1940, on the basis of their affiliation with the fund’s investment adviser, Capital Research and Management Company, or affiliated entities (including the fund’s principal underwriter). |
| 5 | All of the officers listed are officers and/or directors/trustees of one or more of the other funds for which Capital Research and Management Company serves as investment adviser. |
| 6 | Company affiliated with Capital Research and Management Company. |
Offices of the fund and of the investment adviser
Capital Research and Management Company
333 South Hope Street
Los Angeles, CA 90071-1406
6455 Irvine Center Drive
Irvine, CA 92618-4518
Transfer agent for shareholder accounts
American Funds Service Company
(Write to the address near you.)
P.O. Box 6007
Indianapolis, IN 46206-6007
P.O. Box 2280
Norfolk, VA 23501-2280
Custodian of assets
State Street Bank and Trust Company
One Lincoln Street
Boston, MA 02111
Counsel
O’Melveny & Myers LLP
400 South Hope Street
Los Angeles, CA 90071-2899
Independent registered public accounting firm
PricewaterhouseCoopers LLP
601 South Figueroa Street
Los Angeles, CA 90017-3874
Principal underwriter
American Funds Distributors, Inc.
333 South Hope Street
Los Angeles, CA 90071-1406
Investors should carefully consider investment objectives, risks, charges and expenses. This and other important information is contained in the fund prospectus and summary prospectus, which can be obtained from your financial professional and should be read carefully before investing. You may also call American Funds Service Company (AFS) at (800) 421-4225 or visit the American Funds website at americanfunds.com.
“American Funds Proxy Voting Procedures and Principles” — which describes how we vote proxies relating to portfolio securities — is available on the American Funds website or upon request by calling AFS. The fund files its proxy voting record with the U.S. Securities and Exchange Commission (SEC) for the 12 months ended June 30 by August 31. The proxy voting record is available free of charge on the SEC website at sec.gov and on the American Funds website.
A complete November 30, 2013, portfolio of The New Economy Fund’s investments is available free of charge by calling AFS or visiting the SEC website (where it is part of Form N-CSR).
The New Economy Fund files a complete list of its portfolio holdings with the SEC for the first and third quarters of each fiscal year on Form N-Q. This filing is available free of charge on the SEC website. You may also review or, for a fee, copy this filing at the SEC’s Public Reference Room in Washington, D.C. Additional information regarding the operation of the Public Reference Room may be obtained by calling the SEC’s Office of Investor Education and Advocacy at (800) SEC-0330. Additionally, the list of portfolio holdings is available by calling AFS.
This report is for the information of shareholders of The New Economy Fund, but it also may be used as sales literature when preceded or accompanied by the current prospectus or summary prospectus, which gives details about charges, expenses, investment objectives and operating policies of the fund. If used as sales material after March 31, 2014, this report must be accompanied by an American Funds statistical update for the most recently completed calendar quarter.
The American Funds Advantage
Since 1931, American Funds, part of Capital Group, has helped investors pursue long-term investment success. Our consistent approach — in combination with The Capital SystemSM — has resulted in a superior long-term track record.
Aligned with investor success
We base our decisions on a long-term perspective, which we believe aligns our goals with the interests of our clients. Our portfolio managers average 25 years of investment experience, including 20 years at our company, reflecting a career commitment to our long-term approach.1
The Capital SystemSM
Our investment process, The Capital System, combines individual accountability with teamwork. Each fund is divided into portions that are managed independently by investment professionals with diverse backgrounds, ages and investment approaches. An extensive global research effort is the backbone of our system.
Superior long-term track record
Our equity funds have beaten their Lipper peer indexes in 90% of 10-year periods and 96% of 20-year periods. Our fixed-income funds have beaten their Lipper indexes in 58% of 10-year periods and 63% of 20-year periods.2 Our fund management fees have been among the lowest in the industry.3
| | 1 | Portfolio manager experience as of December 31, 2012. |
| | 2 | Based on Class A share results for rolling periods through December 31, 2012. Periods covered are the shorter of the fund’s lifetime or since the comparable Lipper index inception date. |
| | 3 | Based on management fees for the 20-year period ended December 31, 2012, versus comparable Lipper categories, excluding funds of funds. |

ITEM 2 – Code of Ethics
The Registrant has adopted a Code of Ethics that applies to its Principal Executive Officer and Principal Financial Officer. The Registrant undertakes to provide to any person without charge, upon request, a copy of the Code of Ethics. Such request can be made to American Funds Service Company at 800/421-9225 or to the Secretary of the Registrant, 333 South Hope Street, Los Angeles, California 90071.
ITEM 3 – Audit Committee Financial Expert
The Registrant’s board has determined that Leonade D. Jones, a member of the Registrant’s audit committee, is an “audit committee financial expert” and "independent," as such terms are defined in this Item. This designation will not increase the designee’s duties, obligations or liability as compared to his or her duties, obligations and liability as a member of the audit committee and of the board, nor will it reduce the responsibility of the other audit committee members. There may be other individuals who, through education or experience, would qualify as "audit committee financial experts" if the board had designated them as such. Most importantly, the board believes each member of the audit committee contributes significantly to the effective oversight of the Registrant’s financial statements and condition.
ITEM 4 – Principal Accountant Fees and Services
| | Registrant: |
| | | a) Audit Fees: |
| | | | 2012 | $98,000 |
| | | | 2013 | $101,000 |
| | | | |
| | | b) Audit-Related Fees: |
| | | | 2012 | None |
| | | | 2013 | None |
| | | | |
| | | c) Tax Fees: |
| | | | 2012 | None |
| | | | 2013 | $8,000 |
| | | | The tax fees consist of professional services relating to the preparation of the Registrant’s tax returns. |
| | | | |
| | | d) All Other Fees: |
| | | | 2012 | None |
| | | | 2013 | None |
| | | | |
| | Adviser and affiliates (includes only fees for non-audit services billed to the adviser and affiliates for engagements that relate directly to the operations and financial reporting of the Registrant and were subject to the pre-approval policies described below): |
| | | a) Audit Fees: |
| | | | Not Applicable |
| | | | |
| | | b) Audit-Related Fees: |
| | | | 2012 | None |
| | | | 2013 | None |
| | | | |
| | | c) Tax Fees: |
| | | | 2012 | $1,000 |
| | | | 2013 | $32,000 |
| | | | The tax fees consist of consulting services relating to the Registrant’s investments. |
| | | | |
| | | d) All Other Fees: |
| | | | 2012 | $2,000 |
| | | | 2013 | $4,000 |
| | | | The other fees consist of subscription services related to an accounting research tool. |
All audit and permissible non-audit services that the Registrant’s audit committee considers compatible with maintaining the independent registered public accounting firm’s independence are required to be pre-approved by the committee. The pre-approval requirement will extend to all non-audit services provided to the Registrant, the investment adviser, and any entity controlling, controlled by, or under common control with the investment adviser that provides ongoing services to the Registrant, if the engagement relates directly to the operations and financial reporting of the Registrant. The committee will not delegate its responsibility to pre-approve these services to the investment adviser. The committee may delegate to one or more committee members the authority to review and pre-approve audit and permissible non-audit services. Actions taken under any such delegation will be reported to the full committee at its next meeting. The pre-approval requirement is waived with respect to non-audit services if certain conditions are met. The pre-approval requirement was not waived for any of the non-audit services listed above provided to the Registrant, adviser and affiliates.
Aggregate non-audit fees paid to the Registrant’s auditors, including fees for all services billed to the Registrant, adviser and affiliates that provide ongoing services to the Registrant, were $2,000 for fiscal year 2012 and $43,000 for fiscal year 2013. The non-audit services represented by these amounts were brought to the attention of the committee and considered to be compatible with maintaining the auditors’ independence.
ITEM 5 – Audit Committee of Listed Registrants
Not applicable to this Registrant, insofar as the Registrant is not a listed issuer as defined in Rule 10A-3 under the Securities Exchange Act of 1934.
ITEM 6 – Schedule of Investments
 | The New Economy Fund® Investment portfolio November 30, 2013 |
| Common stocks 90.81% | | |
| | | Value |
| Health care 21.59% | Shares | (000) |
| | | |
| Gilead Sciences, Inc.1 | 5,248,473 | $ 392,638 |
| Alexion Pharmaceuticals, Inc.1 | 1,539,600 | 191,680 |
| Thermo Fisher Scientific Inc. | 1,628,000 | 164,184 |
| Hologic, Inc.1 | 7,108,850 | 159,167 |
| Grifols, SA, Class A | 1,601,000 | 73,198 |
| Grifols, SA, Class B | 1,051,557 | 35,878 |
| Grifols, SA, Class B (ADR) | 929,726 | 31,922 |
| BioMarin Pharmaceutical Inc.1 | 1,529,630 | 107,655 |
| Biogen Idec Inc.1 | 367,600 | 106,961 |
| McKesson Corp. | 600,000 | 99,534 |
| Stryker Corp. | 1,296,500 | 96,485 |
| NuVasive, Inc.1,2 | 2,896,186 | 96,298 |
| Illumina, Inc.1 | 874,476 | 85,699 |
| William Demant Holding A/S1 | 873,000 | 81,560 |
| Myriad Genetics, Inc.1 | 2,688,885 | 79,994 |
| Mesoblast Ltd.1 | 14,210,000 | 79,489 |
| UnitedHealth Group Inc. | 962,100 | 71,657 |
| Exelixis, Inc.1,2 | 11,930,900 | 69,557 |
| Amgen Inc. | 608,000 | 69,361 |
| St. Jude Medical, Inc. | 1,139,700 | 66,581 |
| Allergan, Inc. | 624,000 | 60,559 |
| Insulet Corp.1 | 1,445,836 | 53,525 |
| Bayer AG | 360,000 | 48,026 |
| QIAGEN NV1 | 2,052,814 | 47,897 |
| Synageva BioPharma Corp.1 | 719,188 | 43,446 |
| Endo Health Solutions Inc.1 | 645,500 | 43,371 |
| Aetna Inc. | 577,000 | 39,773 |
| Merck KGaA | 226,278 | 39,255 |
| Envision Healthcare Holdings, Inc. | 1,000,000 | 29,620 |
| Boston Scientific Corp.1 | 2,551,292 | 29,544 |
| Humana Inc. | 253,811 | 26,394 |
| Centene Corp.1 | 374,000 | 22,339 |
| Edwards Lifesciences Corp.1 | 273,100 | 17,896 |
| ArthroCare Corp.1 | 338,200 | 12,757 |
| Zimmer Holdings, Inc. | 125,100 | 11,435 |
| | | 2,685,335 |
| Consumer discretionary 20.59% | | |
| | | |
| Galaxy Entertainment Group Ltd.1 | 49,722,000 | 389,302 |
| Netflix, Inc.1 | 924,400 | 338,145 |
| Daily Mail and General Trust PLC, Class A, nonvoting | 10,236,701 | 153,396 |
| Amazon.com, Inc.1 | 336,800 | 132,571 |
| MGM China Holdings Ltd. | 36,772,000 | 130,911 |
| lululemon athletica inc.1 | 1,642,100 | 114,487 |
| Common stocks | | |
| | | Value |
| Consumer discretionary (continued) | Shares | (000) |
| | | |
| Sands China Ltd. | 14,792,800 | $ 111,910 |
| Melco Crown Entertainment Ltd. (ADR)1 | 2,881,000 | 102,535 |
| ProSiebenSat.1 Media AG | 2,071,000 | 93,167 |
| Comcast Corp., Class A | 1,476,400 | 73,628 |
| DIRECTV1 | 1,012,100 | 66,910 |
| Lions Gate Entertainment Corp.1 | 2,105,000 | 66,602 |
| Sky Deutschland AG1 | 6,303,088 | 64,649 |
| Twenty-First Century Fox, Inc., Class A | 1,845,497 | 61,806 |
| JCDecaux SA | 1,400,000 | 55,089 |
| Garmin Ltd. | 1,100,000 | 53,416 |
| Time Warner Inc. | 800,000 | 52,568 |
| SJM Holdings Ltd. | 16,340,000 | 52,375 |
| Reed Elsevier PLC | 3,430,000 | 49,630 |
| William Hill PLC | 7,102,700 | 44,829 |
| Nordstrom, Inc. | 700,000 | 43,547 |
| Kingfisher PLC | 6,500,000 | 39,993 |
| Liberty Global PLC, Class C1 | 428,700 | 34,918 |
| Liberty Global PLC, Class A1 | 21,000 | 1,802 |
| WPP PLC | 1,650,000 | 36,487 |
| Home Depot, Inc. | 443,500 | 35,777 |
| John Wiley & Sons, Inc., Class A | 700,000 | 35,672 |
| NIKE, Inc., Class B | 364,800 | 28,870 |
| Penske Automotive Group, Inc. | 637,000 | 28,296 |
| Time Warner Cable Inc. | 183,014 | 25,296 |
| Zhongsheng Group Holdings Ltd. | 14,264,500 | 19,209 |
| YUM! Brands, Inc. | 214,500 | 16,662 |
| Multi Screen Media Private Ltd.1,3,4 | 79,866 | 6,608 |
| | | 2,561,063 |
| Information technology 18.28% | | |
| | | |
| Google Inc., Class A1 | 262,225 | 277,851 |
| Samsung Electronics Co. Ltd. | 163,047 | 230,173 |
| Intuit Inc. | 1,717,200 | 127,468 |
| Baidu, Inc., Class A (ADR)1 | 749,000 | 124,761 |
| Accenture PLC, Class A | 1,451,700 | 112,463 |
| Texas Instruments Inc. | 2,555,000 | 109,865 |
| Youku Inc., Class A (ADR)1 | 3,240,000 | 91,303 |
| Gemalto NV | 666,300 | 75,238 |
| Oracle Corp. | 1,977,000 | 69,768 |
| Motorola Solutions, Inc. | 1,051,225 | 69,255 |
| Adobe Systems Inc.1 | 1,175,000 | 66,717 |
| Yandex NV, Class A1 | 1,675,000 | 66,581 |
| Seagate Technology | 1,309,397 | 64,213 |
| Yahoo! Inc.1 | 1,735,000 | 64,160 |
| Trimble Navigation Ltd.1 | 1,910,300 | 60,939 |
| Western Union Co. | 3,435,000 | 57,261 |
| SAP AG | 650,000 | 53,820 |
| Mail.Ru Group Ltd. (GDR) | 1,300,000 | 53,755 |
| Murata Manufacturing Co., Ltd. | 620,000 | 53,329 |
| AAC Technologies Holdings Inc. | 11,753,000 | 53,060 |
| Delta Electronics, Inc. | 9,598,000 | 51,243 |
| Autodesk, Inc.1 | 1,000,000 | 45,250 |
| Apple Inc. | 79,100 | 43,985 |
| Hexagon AB, Class B | 1,426,838 | 43,876 |
| Common stocks | | |
| | | Value |
| Information technology (continued) | Shares | (000) |
| | | |
| NetEase, Inc. (ADR) | 430,800 | $ 30,936 |
| Avago Technologies Ltd. | 606,000 | 27,106 |
| FactSet Research Systems, Inc. | 213,200 | 24,092 |
| Tencent Holdings Ltd. | 340,000 | 19,665 |
| CoStar Group, Inc.1 | 105,000 | 19,555 |
| EMC Corp. | 750,000 | 17,888 |
| ASML Holding NV | 186,340 | 17,439 |
| Rackspace Hosting, Inc.1 | 394,700 | 15,081 |
| Hittite Microwave Corp.1 | 215,000 | 13,594 |
| Nokia Corp.1 | 1,580,000 | 12,793 |
| Microsoft Corp. | 223,000 | 8,503 |
| | | 2,272,986 |
| Financials 10.81% | | |
| | | |
| AIA Group Ltd. | 27,722,200 | 140,531 |
| Endurance Specialty Holdings Ltd. | 1,509,395 | 85,884 |
| SVB Financial Group1 | 835,000 | 84,535 |
| Principal Financial Group, Inc. | 1,200,000 | 60,756 |
| Wells Fargo & Co. | 1,362,300 | 59,968 |
| Aberdeen Asset Management PLC | 7,370,000 | 59,387 |
| Banco Espírito Santo, SA1 | 42,000,000 | 58,769 |
| Assured Guaranty Ltd. | 2,400,000 | 56,352 |
| Ocwen Financial Corp.1 | 950,000 | 53,827 |
| Chongqing Rural Commercial Bank Co., Ltd., Class H | 97,595,000 | 51,110 |
| State Street Corp. | 700,000 | 50,827 |
| Agricultural Bank of China, Class H | 97,780,000 | 50,198 |
| Marsh & McLennan Companies, Inc. | 1,000,000 | 47,450 |
| JPMorgan Chase & Co. | 800,000 | 45,776 |
| Banco Santander, SA1 | 5,008,382 | 44,518 |
| Mizuho Financial Group, Inc. | 20,400,000 | 42,822 |
| HSBC Holdings PLC | 3,770,215 | 42,115 |
| Fairfax Financial Holdings Ltd., subordinate voting shares | 100,000 | 38,867 |
| Fifth Third Bancorp | 1,800,000 | 36,576 |
| Industrial and Commercial Bank of China Ltd., Class H | 48,736,000 | 35,015 |
| HDFC Bank Ltd. | 2,550,000 | 26,985 |
| Bank of China Ltd., Class H | 55,556,000 | 26,873 |
| Altisource Portfolio Solutions SA1 | 157,500 | 25,354 |
| Home Loan Servicing Solutions, Ltd. | 1,061,800 | 24,708 |
| China Construction Bank Corp., Class H | 27,994,050 | 22,677 |
| UBS AG1 | 1,134,312 | 21,624 |
| Longfor Properties Co. Ltd. | 13,800,000 | 20,470 |
| Leucadia National Corp. | 439,262 | 12,589 |
| Kotak Mahindra Bank Ltd. | 894,917 | 10,838 |
| Primerica, Inc. | 169,984 | 7,314 |
| | | 1,344,715 |
| Industrials 7.88% | | |
| | | |
| Nielsen Holdings NV | 3,762,000 | 162,368 |
| Ryanair Holdings PLC (ADR)1 | 2,274,700 | 109,242 |
| Verisk Analytics, Inc., Class A1 | 1,226,000 | 79,825 |
| CSX Corp. | 2,654,722 | 72,394 |
| Union Pacific Corp. | 437,977 | 70,970 |
| PT AKR Corporindo Tbk | 173,899,680 | 67,961 |
| Sensata Technologies Holding NV1 | 1,530,800 | 59,671 |
| Common stocks | | |
| | | Value |
| Industrials (continued) | Shares | (000) |
| | | |
| Intertek Group PLC | 900,000 | $ 44,739 |
| AirAsia Bhd. | 55,681,000 | 41,290 |
| JG Summit Holdings, Inc. | 39,268,800 | 35,748 |
| MSC Industrial Direct Co., Inc., Class A | 450,000 | 34,582 |
| Alliance Global Group, Inc. | 58,300,000 | 33,828 |
| Babcock International Group PLC | 1,500,000 | 32,163 |
| United Continental Holdings, Inc.1 | 787,500 | 30,909 |
| Waste Management, Inc. | 643,300 | 29,386 |
| Danaher Corp. | 347,000 | 25,956 |
| United Parcel Service, Inc., Class B | 210,000 | 21,500 |
| KBR, Inc. | 350,000 | 11,840 |
| FedEx Corp. | 71,700 | 9,945 |
| Beacon Roofing Supply, Inc.1 | 156,000 | 5,800 |
| | | 980,117 |
| Telecommunication services 4.14% | | |
| | | |
| SoftBank Corp. | 2,185,100 | 176,856 |
| Crown Castle International Corp.1 | 1,361,500 | 101,064 |
| Vodafone Group PLC | 17,838,000 | 66,219 |
| T-Mobile US, Inc. | 1,545,000 | 40,186 |
| MTN Group Ltd. | 1,800,000 | 34,987 |
| Verizon Communications Inc. | 650,000 | 32,253 |
| Avanti Communications Group PLC1,2 | 6,933,372 | 26,300 |
| CenturyLink, Inc. | 727,700 | 22,340 |
| Telephone and Data Systems, Inc. | 326,100 | 9,069 |
| United States Cellular Corp. | 139,500 | 6,190 |
| | | 515,464 |
| Energy 1.28% | | |
| | | |
| Schlumberger Ltd. | 1,122,400 | 99,243 |
| FMC Technologies, Inc.1 | 715,400 | 34,411 |
| Halliburton Co. | 480,000 | 25,286 |
| | | 158,940 |
| Consumer staples 0.99% | | |
| | | |
| Costco Wholesale Corp. | 650,000 | 81,529 |
| Walgreen Co. | 700,000 | 41,440 |
| | | 122,969 |
| Utilities 0.27% | | |
| | | |
| ENN Energy Holdings Ltd. | 4,700,000 | 33,101 |
| Miscellaneous 4.98% | | |
| | | |
| Other common stocks in initial period of acquisition | | 619,822 |
| Total common stocks (cost: $7,034,463,000) | | 11,294,512 |
| | Principal amount | |
| Short-term securities 9.03% | (000) | |
| | | |
| Freddie Mac 0.10%–0.16% due 12/19/2013–8/8/2014 | $386,980 | 386,797 |
| Federal Home Loan Bank 0.05%–0.15% due 12/27/2013–4/4/2014 | 351,200 | 351,147 |
| Coca-Cola Co. 0.10%–0.18% due 12/5/2013–2/18/20145 | 96,000 | 95,993 |
| Wal-Mart Stores, Inc. 0.05%–0.07% due 12/2–12/23/20135 | 62,700 | 62,699 |
| | Principal amount | Value |
| Short-term securities | (000) | (000) |
| | | |
| Fannie Mae 0.055%–0.08% due 1/2–3/19/2014 | $50,500 | $ 50,488 |
| General Electric Capital Corp. 0.07% due 12/18/2013 | 42,800 | 42,798 |
| Federal Farm Credit Banks 0.16% due 5/28/2014 | 35,000 | 34,979 |
| Jupiter Securitization Co., LLC 0.24% due 12/17/2013–1/24/20145 | 28,100 | 28,095 |
| Private Export Funding Corp. 0.21% due 12/16/20135 | 25,000 | 24,999 |
| Colgate-Palmolive Co. 0.06% due 12/2/20135 | 21,000 | 21,000 |
| Bank of New York Mellon Corp. 0.05% due 12/4/20135 | 13,500 | 13,500 |
| Army and Air Force Exchange Service 0.10% due 1/27/20145 | 10,000 | 9,998 |
| Total short-term securities (cost: $1,122,467,000) | | 1,122,493 |
| Total investment securities (cost: $8,156,930,000) | | 12,417,005 |
| Other assets less liabilities | | 20,300 |
| Net assets | | $12,437,305 |
As permitted by U.S. Securities and Exchange Commission regulations, “Miscellaneous” securities include holdings in their first year of acquisition that have not previously been publicly disclosed.
| 1 | Security did not produce income during the last 12 months. |
| 2 | Represents an affiliated company as defined under the Investment Company Act of 1940. |
| 3 | Valued under fair value procedures adopted by authority of the board of trustees. The total value of all such securities was $6,608,000, which represented .05% of the net assets of the fund. |
| 4 | Acquired through a private placement transaction exempt from registration under the Securities Act of 1933. This security (acquired from 9/6/2000 to 4/18/2002 at a cost of $31,574,000) may be subject to legal or contractual restrictions on resale. |
| 5 | Acquired in a transaction exempt from registration under section 4(2) of the Securities Act of 1933. May be resold in the U.S. in transactions exempt from registration, normally to qualified institutional buyers. The total value of all such securities, was $256,284,000, which represented 2.06% of the net assets of the fund. |
Key to abbreviations
ADR = American Depositary Receipts
GDR = Global Depositary Receipts
Investments are not FDIC-insured, nor are they deposits of or guaranteed by a bank or any other entity, so they may lose value.
Investors should carefully consider investment objectives, risks, charges and expenses. This and other important information is contained in the fund prospectus and summary prospectus, which can be obtained from your financial professional and should be read carefully before investing. You may also call American Funds Service Company (AFS) at (800) 421-4225 or visit the American Funds website at americanfunds.com.
MFGEFPX-014-0114O-S37685
Report of Independent Registered Public Accounting Firm
To the Board of Trustees and Shareholders of The New Economy Fund
We have audited, in accordance with standards of the Public Company Accounting Oversight Board (United States), the financial statements of The New Economy Fund (the “Fund”) as of November 30, 2013, and for the year then ended and have issued our unqualified report thereon dated January 10, 2014 (which report and financial statements are included in Item 1 of this Certified Shareholder Report on Form N-CSR). Our audit included an audit of the Fund’s investment portfolio (the “Portfolio”) as of November 30, 2013 appearing in Item 6 of this Form N-CSR. The Portfolio is the responsibility of the Fund’s management. Our responsibility is to express an opinion on the Portfolio based on our audit.
In our opinion, the Portfolio referred to above, when read in conjunction with the financial statements of the Fund referred to above, presents fairly, in all material respects, the information set forth therein.
PricewaterhouseCoopers LLP
Los Angeles, California
January 10, 2014
ITEM 7 – Disclosure of Proxy Voting Policies and Procedures for Closed-End Management Investment Companies
Not applicable to this Registrant, insofar as the Registrant is not a closed-end management investment company.
ITEM 8 – Portfolio Managers of Closed-End Management Investment Companies
Not applicable to this Registrant, insofar as the Registrant is not a closed-end management investment company.
ITEM 9 – Purchases of Equity Securities by Closed-End Management Investment Company and Affiliated Purchasers
Not applicable to this Registrant, insofar as the Registrant is not a closed-end management investment company.
ITEM 10 – Submission of Matters to a Vote of Security Holders
There have been no material changes to the procedures by which shareholders may recommend nominees to the Registrant’s board of trustees since the Registrant last submitted a proxy statement to its shareholders. The procedures are as follows. The Registrant has a nominating and governance committee comprised solely of persons who are not considered ‘‘interested persons’’ of the Registrant within the meaning of the Investment Company Act of 1940, as amended. The committee periodically reviews such issues as the board’s composition, responsibilities, committees, compensation and other relevant issues, and recommends any appropriate changes to the full board of trustees. While the committee normally is able to identify from its own resources an ample number of qualified candidates, it will consider shareholder suggestions of persons to be considered as nominees to fill future vacancies on the board. Such suggestions must be sent in writing to the nominating and governance committee of the Registrant, c/o the Registrant’s Secretary, and must be accompanied by complete biographical and occupational data on the prospective nominee, along with a written consent of the prospective nominee for consideration of his or her name by the nominating and governance committee.
ITEM 11 – Controls and Procedures
| (a) | The Registrant’s Principal Executive Officer and Principal Financial Officer have concluded, based on their evaluation of the Registrant’s disclosure controls and procedures (as such term is defined in Rule 30a-3 under the Investment Company Act of 1940), that such controls and procedures are adequate and reasonably designed to achieve the purposes described in paragraph (c) of such rule. |
| | |
| (b) | There were no changes in the Registrant’s internal controls over financial reporting (as defined in Rule 30a-3(d) under the Investment Company Act of 1940) that occurred during the Registrant’s second fiscal quarter of the period covered by this report that has materially affected, or is reasonably likely to materially affect, the Registrant’s internal control over financial reporting. |
ITEM 12 – Exhibits
| (a)(1) | The Code of Ethics that is the subject of the disclosure required by Item 2 is attached as an exhibit hereto. |
| | |
| (a)(2) | The certifications required by Rule 30a-2 of the Investment Company Act of 1940 and Sections 302 and 906 of the Sarbanes-Oxley Act of 2002 are attached as exhibits hereto. |
SIGNATURES
Pursuant to the requirements of the Securities Exchange Act of 1934 and the Investment Company Act of 1940, the Registrant has duly caused this report to be signed on its behalf by the undersigned, thereunto duly authorized.
| | THE NEW ECONOMY FUND |
| | |
| | By /s/ Paul F. Roye |
| | Paul F. Roye, Executive Vice President and Principal Executive Officer |
| | |
| | Date: January 31, 2014 |
Pursuant to the requirements of the Securities Exchange Act of 1934 and the Investment Company Act of 1940, this report has been signed below by the following persons on behalf of the Registrant and in the capacities and on the dates indicated.
| By /s/ Paul F. Roye |
Paul F. Roye, Executive Vice President and Principal Executive Officer |
| |
| Date: January 31, 2014 |
| By /s/ Neal F. Wellons |
Neal F. Wellons, Treasurer and Principal Financial Officer |
| |
| Date: January 31, 2014 |