UNITED STATES
SECURITIES AND EXCHANGE COMMISSION
Washington, D.C. 20549
FORM N-CSR
Certified Shareholder Report of
Registered Management Investment Companies
Investment Company Act File Number: 811-03735
The New Economy Fund
(Exact Name of Registrant as Specified in Charter)
333 South Hope Street
Los Angeles, California 90071
(Address of Principal Executive Offices)
Registrant's telephone number, including area code: (213) 486-9200
Date of fiscal year end: November 30
Date of reporting period: November 30, 2012
Vincent P. Corti
The New Economy Fund
333 South Hope Street
Los Angeles, California 90071
(Name and Address of Agent for Service)
Copies to:
Kathryn A. Sanders
O’Melveny & Myers LLP
400 South Hope Street, 10th Floor
Los Angeles, California 90071
(Counsel for the Registrant)
ITEM 1 – Reports to Stockholders

The right choice for the long term®
The New
Economy Fund®
Special feature
Finding growth where
it may not yet be visible
See page 6
Annual report for the year ended November 30, 2012
The New Economy Fund seeks long-term growth of capital by investing in securities of companies that can benefit from innovation, exploit new technologies or provide products and services that meet the demands of an evolving global economy.
This fund is one of more than 40 offered by American Funds, which is one of the nation’s largest mutual fund families. For more than 80 years, Capital Research and Management Company,SM the American Funds adviser, has invested with a long-term focus based on thorough research and attention to risk.
Fund results shown in this report, unless otherwise indicated, are for Class A shares at net asset value. If a sales charge (maximum 5.75%) had been deducted, the results would have been lower. Results are for past periods and are not predictive of results for future periods. Current and future results may be lower or higher than those shown. Share prices and returns will vary, so investors may lose money. Investing for short periods makes losses more likely. Investments are not FDIC-insured, nor are they deposits of or guaranteed by a bank or any other entity, so they may lose value. For current information and month-end results, visit americanfunds.com.
Here are the average annual total returns on a $1,000 investment with all distributions reinvested for periods ended December 31, 2012 (the most recent calendar quarter-end):
| | | | |
| Class A shares | 1 year | 5 years | 10 years |
| | | | |
| Reflecting 5.75% maximum sales charge | 16.89% | 1.08% | 8.96% |
| | | | |
The total annual fund operating expense ratio is 0.87% for Class A shares as of the prospectus dated February 1, 2013 (unaudited).
Investment results assume all distributions are reinvested and reflect applicable fees and expenses. When applicable, investment results reflect fee waivers, without which results would have been lower. Visit americanfunds.com for more information.
Results for other share classes can be found on page 34.
Investing outside the United States may be subject to risks, such as currency fluctuations, periods of illiquidity and price volatility. These risks may be heightened in connection with investments in developing countries. Global diversification can help reduce these risks. Refer to the fund prospectus and the Risk Factors section of this report for more information on these and other risks associated with investing in the fund.
Fellow investors:
The New Economy Fund’s fiscal year was marked by significant swings in market sentiment because of challenging situations such as the European sovereign debt crisis, decelerating growth in China and U.S. fiscal problems. However, quantitative easing and other supportive actions from both the Federal Reserve and the European Central Bank, and slow but continuing and broad economic recovery in the U.S., buoyed equity markets.
The New Economy Fund returned 20.0% for the 12 months ended November 30, 2012. This exceeded the 16.1% return for the unmanaged Standard & Poor’s 500 Composite Index, and outpaced the 17.8% return of the unmanaged Global Service and Information Index, which tracks companies in the services and information sectors around the world; its results do not include expenses. That figure compares with the 14.8% return of the Lipper Growth Funds Index, which measures a number of growth funds, and the 12.5% return of the Lipper International Funds Index, which measures funds invested in securities whose primary trading markets are outside the U.S.

| | |
| In this report |
| | |
| | Special feature |
| | |
| 6 | Finding growth where it may not yet be visible |
| | |
| | Contents |
| | |
| 1 | Letter to investors |
| | |
| 4 | The value of a long-term perspective |
| | |
| 12 | Summary investment portfolio |
| | |
| 16 | Financial statements |
| | |
| 35 | Board of trustees and other officers |
Results at a glance (for periods ended November 30, 2012, with all distributions reinvested)
| | | | | | | | | | | | | | |
| | | Total returns | | Average annual total returns | |
| | | | | |
| | | 1 year | | 5 years | | 10 years | | Lifetime (since 12/1/83) | |
| The New Economy Fund (Class A shares) | | 20.02 | % | | 1.59 | % | | 8.29 | % | | 10.60 | % | |
| | | | | | | | | | | | | | |
| Lipper Growth Funds Index | | 14.81 | | | 0.23 | | | 5.48 | | | 8.50 | | |
| | | | | | | | | | | | | | |
| Lipper International Funds Index | | 12.55 | | | -3.82 | | | 8.07 | | | N/A | | |
| | | | | | | | | | | | | | |
| Global Service and Information Index*† | | 17.84 | | | -0.76 | | | 6.07 | | | N/A | | |
| | | | | | | | | | | | | | |
| Standard & Poor’s 500 Composite Index† | | 16.11 | | | 1.34 | | | 6.35 | | | 10.36 | | |
| | | | | | | | | | | | | | |
| | |
| * | The index is compiled by Capital Research and Management Company, the investment adviser to the fund. |
| † | This market index is unmanaged and, therefore, has no expenses. |
Macroeconomic difficulties meant buying opportunities
In the euro zone, the high debt load and austerity efforts of its southern members — Greece, Portugal, Spain and Italy — threatened the region’s economy. Several rounds of summits and negotiations have failed to find a quick solution but, on balance, the situation seems to have stabilized. The New Economy Fund’s portfolio counselors continue to monitor this situation closely.
In China, the government’s policies have helped engineer a “soft landing,” enabling the country to avoid a recession. China is now projected to have 7% gross domestic product (GDP) growth near term, down from double-digit growth rates that have occurred in a number of years in the prior decade but, nonetheless, good growth by global standards.
In the U.S., concerns over tax hikes and federal spending cuts added to market volatility in the second half of the year, which raised concern over the risk of another recession. In spite of all of this, global equity markets showed strength throughout the year as economic growth improved and corporate earnings continued to rise.
For The New Economy Fund, many of the companies we invested in this year have seen their stock prices appreciate.
Portfolio review
Health care became one of the fund’s largest sectors and Gilead Sciences, the fund’s largest holding at 2.4% of total assets, rose 88.2%. Hologic, a U.S.-based developer, manufacturer and supplier of medical equipment related to womens’ health and the fund’s fifth-largest holding, increased 8.4%.
Strong contributors also included holdings of consumer discretionary companies, especially those that generate revenue from gaming in Macau, China. Galaxy Entertainment Group (the fund’s second-largest holding), an operator of gaming and entertainment facilities in Macau, gained 92.0%. Within the consumer discretionary sector, media companies also did generally well. Comcast, the fund’s sixth-largest holding, rose 63.2%.
Within information technology, some of our major holdings did very well. Apple, the fund’s largest holding at the beginning of the year and now the seventh-largest, increased 53.1% for the 12 months. Samsung Electronics, another large holding, was up 43.0%. Offsetting information technology gains was Baidu — an internet search engine company based in China that also operates a Japanese language service — which lost 26.5% and Texas Instruments, which slid 2.1%.
Crown Castle International, a provider of wireless communication and towers in North America and Australia, represented the fund’s third-largest holding and rose 59.6%. AIA Group, a life insurance and financial services provider based in Hong Kong and the fund’s 10th-largest holding, increased 23.7%.
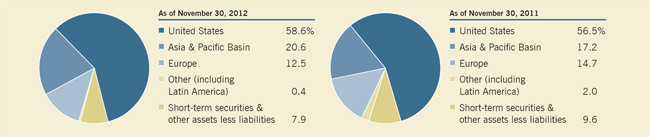
Where the fund’s assets are invested (percent of net assets)

Looking ahead
We expect the global economic environment to remain challenging for the foreseeable future. With that said, there are opportunities to invest in attractively valued companies throughout the world. Significant fundamental growth opportunities still exist in many developing countries within sectors related to infrastructure and the consumer. This creates a growing consumer class. In turn, there are innovative companies that will help devise ways to make us more productive, healthier, safer, efficient and hopefully happier — or at least more entertained.
One of Capital’s guiding principles always has been to invest for the long term, and we will continue to do so.
Thank you for your continued confidence in our long-term investment philosophy.
Sincerely,
| | |
 |  |
| | |
| Timothy D. Armour | Claudia P. Huntington |
| Vice Chairman of the Board | President |
January 11, 2013
For current information about the fund, visit americanfunds.com.
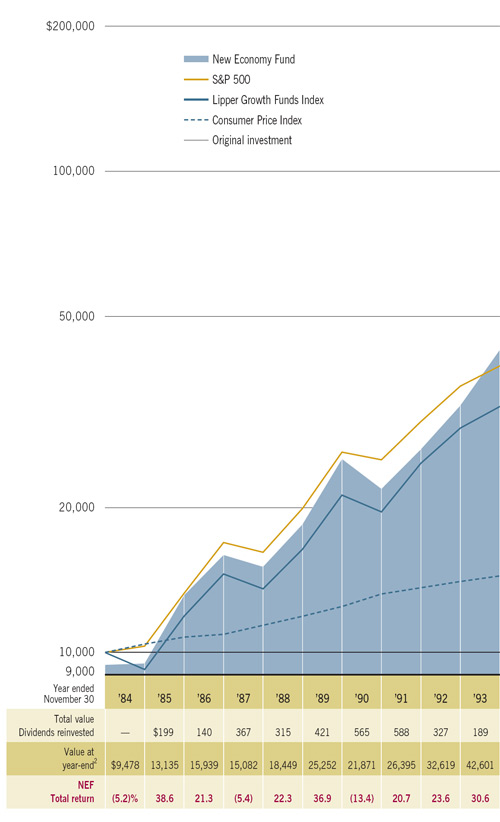
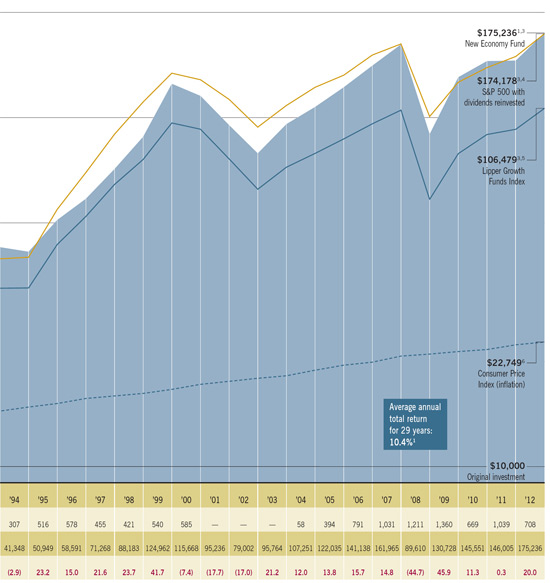
The value of a long-term perspective
Fund results shown are for Class A shares and reflect deduction of the maximum sales charge of 5.75% on the $10,000 investment.1 Thus, the net amount invested was $9,425.2 Results are for past periods and are not predictive of results for future periods. Current and future results may be lower or higher than those shown. Share prices and returns will vary, so investors may lose money. For current information and month-end results, visit americanfunds.com.
Here’s how a $10,000 investment in The New Economy Fund’s Class A shares grew between December 1, 1983 — when the fund began operations — and November 30, 2012, the end of its latest fiscal year. As you can see, the $10,000 would have increased to $175,236 after deducting the maximum 5.75% sales charge and reinvesting all distributions, an average annual increase of 10.4%. The fund’s year-by-year results appear under the chart.
Average annual total returns based on a $1,000 investment (for periods ended November 30, 2012)*
| | | |
| Class A shares: |
| 1 year | 5 years | 10 years |
| 13.13% | 0.39% | 7.65% |
| | | |
* Assumes reinvestment of all distributions and payment of the maximum 5.75% sales charge.
Investment results assume all distributions are reinvested and reflect applicable fees and expenses. When applicable, investment results reflect fee waivers, without which results would have been lower. Visit americanfunds.com for more information.
| | |
| The results shown are before taxes on fund distributions and sale of fund shares. |
| 1 | As outlined in the prospectus, the sales charge is reduced for accounts (and aggregated investments) of $25,000 or more and is eliminated for purchases of $1 million or more. There is no sales charge on dividends or capital gain distributions that are reinvested in additional shares. |
| 2 | The maximum initial sales charge was 8.5% prior to July 1, 1988. |
| |
| 3 All results are calculated with dividends and capital gains reinvested. |
| 4 Standard & Poor’s 500 Composite Index is unmanaged and, therefore, has no expenses. |
| 5 This index tracks 30 growth funds, as defined by each fund’s related prospectus. |
| 6 Computed from data supplied by the U.S. Department of Labor, Bureau of Labor Statistics. |

Finding growth
where it may not
yet be visible
As The New Economy Fund enters its 30th year, we look back on a fiscal year that had a number of macroeconomic and political crosscurrents, but nevertheless delivered a solid fund return. Despite near-term problems in many mature economies globally, we consistently focus on the fund’s objective, which we believe can continue to benefit shareholders in the long run.
6 The New Economy Fund
The New Economy Fund invests in stocks of companies that can benefit from innovation, exploit new technologies or provide products and services that meet the demands of an evolving global economy.
All companies to some extent are in a constant state of evolution. Sometimes that evolution is apparent to all, sometimes it is more difficult to determine. Frequently, the portfolio counselors in The New Economy Fund look for investment opportunities in the less obvious places. For instance, portfolio counselor Claudia Huntington describes her approach as a principle of thirds. “Ideally my investment would fall into three groups: one-third where the company’s evolution and strengths are visible, one-third where it’s starting to show and one-third where it hasn’t shown yet. But we’ve done our homework and are hopeful that the company’s growth and evolution soon will be perceived positively.” Some of the fund’s investments in 2012 were good examples of this mix.
By applying fundamental research, The New Economy Fund locates companies that can grow their customer bases and expand in innovative ways. The fund’s investment analysts dig deeply into a company, evaluate products and services in the

“Ideally my investment would fall into three groups: one-third where the company’s evolution and strengths are visible, one-third where it’s starting to show and one-third where it hasn’t shown yet. But we’ve done our homework and are hopeful that the company’s growth and evolution soon will be perceived positively.”
Claudia Huntington


Craig Gordon, an investment analyst whose background is as a rheumatologist and internist, spends a great deal of time tracking down the status of new drug discoveries and their progress in the pipeline between discovery and approval.

pipeline, discern the market’s appetite for such products and services, and finally, evaluate if the company’s prospects are reflected in the stock price.
Examples of two industries that have made strong contributions to investment results in the current fiscal year are health care and gaming. Craig Gordon, an investment analyst whose background is as a rheumatologist and internist, spends a great deal of time tracking down the status of new drug discoveries and their progress in the pipeline between discovery and approval. One example is Gilead Sciences, a biotech company whose Hepatitis C treatment was in the late stages of development and was about to be released to market. Craig’s analysis concluded that the opportunity in the product was greater than the market view and that the company’s stock price did not reflect the inherent value of the company. Companies such as Grifols, BioMarin Pharmaceutical and Alexion Pharmaceuticals are other examples of how fundamental research resulted in investments that have benefited the fund.
In the gaming industry, there was a great deal of fundamental work done by our investment professionals Harold La and Greg Wendt around the growing strength of the consumer in Asia and

how that could benefit hotel, leisure, tourism and casino companies doing business in Macau, China. The fund invested in Las Vegas Sands, which is the only company with casinos both in Macau and Singapore, and continues to have investments now. An example of another gaming company whose stock we own is Galaxy Entertainment Group, which rose 92% this year and is the fund’s second-largest holding. It is interesting to note that today, the quantity of money passing through Macau exceeds that of Las Vegas by a product of five.*
Tim Armour, portfolio counselor of The New Economy Fund, sums up our approach to finding profitable investments for the fund by noting that our holdings are evaluated on an individual, company-by-company basis and not by sector or country classification. He explains, “We think the best way to invest is to focus on a company’s fundamentals using a long-term orientation. We are bottom-up fundamental investors and, ultimately, we have to determine what we think a company is worth and what we’re willing to pay for its stock.”
Long-term investing vs. short-term headline risk
This has been a year of unsettling headlines: the European debt crisis, concerns about the staying power of the European Union, slowing growth in China, implications of changing political landscapes in multiple countries and the fiscal cliff threatening the recovery of the U.S. economy. Despite the spate of bleak news, however, none of the doomsday scenarios have come to pass as of yet.
There is no doubt that the mature economies that are growing, including the U.S., are still in a fragile state. Those in decline (some in Europe) could face several years of difficulty before they can be proclaimed healthy. Developing and less mature economies can have volatile stock markets if growth just slows rather than declines. As this era of instantly available information — some of it accurate, some of it incomplete at best — evolves, often headlines can focus on shorter term issues and add to the volatility of global stock markets.
We are committed to focusing on long-term investment decisions despite the short-term focus of the media and many who operate in financial markets. Much of our time is spent identifying and investing in companies that fit the fund’s objectives and have a long-term strategy and opportunity that can allow for multiple years of growth. In fact, there are times when negative short-term headlines give us an opportunity to invest in companies at very favorable valuations.
* The New Yorker, April 9, 2012.

“There are some good companies that got very cheap during the financial crisis and we tried to take advantage of some of those opportunities. Many of the investments we made have worked out well.”
Tim Armour

Looking forward
“We’re still dealing with the impact of the global financial crisis, which caused global stock markets to decline precipitously in 2008. There are some good companies that got very cheap during the financial crisis and we tried to take advantage of some of those opportunities. Many of the investments we made have worked out well,” explains Tim. As we look forward, The New Economy Fund’s portfolio counselors continue to find and invest in attractively valued companies that have good growth prospects.
Claudia notes that the entire world doesn’t stand idle and world economies are not all the same. People still need goods and services. “There are hundreds of millions of people below the poverty line, by Western standards, and there is nothing long-term that will derail the opportunity to service them as their purchasing power grows,” she says. We see this in China’s gradual shift from dependency on its exporting economy providing cheap labor, to a consumer-driven economy driven by its more than 1 billion residents. And by many measures, the U.S. economy and the equity markets are on the mend. There has been pent-up demand

for housing and autos, and consumer and business balance sheets have been strengthened to allow for continued demand if confidence is maintained.
There are always elements of the world in which we invest that can be cause for concern — and cause for hope. So while debt concerns persist in Europe and the U.S., and questions remain unanswered about the growth rates of some developing markets such as China, Brazil and India, opportunity remains. We will continue to focus on the same investment approach that we always have had in The New Economy Fund: to search for innovative companies and expanding sectors of the economy that can be invested in at reasonable prices. ■
The New Economy Fund’s portfolio counselors
The New Economy Fund currently has four portfolio counselors, who bring together a combined 110 years of investment experience. Here are the specific years* of experience with American Funds for these primary decision-makers:
| | |
| Timothy D. Armour | 29 years |
| | |
| Claudia P. Huntington | 39 years |
| | |
| Mark E. Denning | 29 years |
| | |
| Harold H. La | 13 years |
*As of November 30, 2012.
Summary investment portfolio November 30, 2012
The following summary investment portfolio is designed to streamline the report and help investors better focus on the fund’s principal holdings. See the inside back cover for details on how to obtain a complete schedule of portfolio holdings.
| |
| Industry sector diversification (percent of net assets) |
| |

| | | | | |
| Country diversification (percent of net assets) | | | | |
| | | | | |
| United States | | | 58.6 | % |
| | | | | |
| Hong Kong | | | 8.0 | |
| | | | | |
| Euro zone* | | | 6.1 | |
| | | | | |
| China | | | 5.4 | |
| | | | | |
| United Kingdom | | | 3.7 | |
| | | | | |
| South Korea | | | 1.5 | |
| | | | | |
| Japan | | | 1.3 | |
| | | | | |
| Indonesia | | | 1.1 | |
| | | | | |
| Sweden | | | 1.0 | |
| | | | | |
| India | | | .9 | |
| | | | | |
| Other countries | | | 4.5 | |
| | | | | |
| Short-term securities & other assets less liabilities | | | 7.9 | |
| | | | | |
| | |
| * | Countries using the euro as a common currency; those represented in the fund’s portfolio are Finland, France, Germany, Ireland, the Netherlands and Spain. |
| | | | | | | | | | | |
| Common stocks — 91.96% | | Shares | | Value
(000) | | Percent of
net assets | |
| | | | | | | | |
| Consumer discretionary — 20.43% | | | | | | | | | | |
| Galaxy Entertainment Group Ltd.1 | | | 48,784,000 | | $ | 186,004 | | | 2.38 | % |
| Operator of gaming and entertainment facilities in Macau and a manufacturer of construction materials. | | | | | | | | | | |
| | | | | | | | | | | |
| Comcast Corp., Class A | | | 2,532,400 | | | 94,155 | | | 1.72 | |
| Comcast Corp., Class A, special nonvoting shares | | | 1,100,000 | | | 39,644 | | | |
| The largest cable TV provider in the U.S. | | | | | | | | | | |
| | | | | | | | | | | |
| Netflix, Inc.1 | | | 1,503,400 | | | 122,843 | | | 1.58 | |
| Internet subscription service for watching TV shows and movies. | | | | | | | | | | |
| | | | | | | | | | | |
| Amazon.com, Inc.1 | | | 410,000 | | | 103,340 | | | 1.33 | |
| Major online retailer of books, CDs, DVDs, toys, apparel, home furnishings and other products. | | | | | | | | | | |
| | | | | | | | | | | |
| Sky Deutschland AG1 | | | 15,923,947 | | | 79,070 | | | 1.01 | |
| A leading pay TV provider in Austria and Germany. | | | | | | | | | | |
| | | | | | | | | | | |
| Sands China Ltd. | | | 16,812,800 | | | 71,697 | | | .92 | |
| Owns and operates integrated resorts and casinos in Macau. | | | | | | | | | | |
| | | | | | | | | | | |
| Lions Gate Entertainment Corp.1 | | | 4,325,000 | | | 70,843 | | | .91 | |
| Independent motion picture and television producer and distributor. | | | | | | | | | | |
| | | | | | | | | | | |
| MGM China Holdings Ltd. | | | 36,772,000 | | | 68,797 | | | .88 | |
| Owns and operates a casino in Macau. | | | | | | | | | | |
| | | | | | | | | | | |
| News Corp., Class A | | | 2,602,815 | | | 64,133 | | | .82 | |
| A leading global media conglomerate with businesses ranging from movies and television to operation of satellite TV platforms. | | | | | | | | | | |
| | | | | | | | | | | |
| Daily Mail and General Trust PLC, Class A, nonvoting | | | 7,082,251 | | | 59,798 | | | .77 | |
| Operates in the digital information, media and events businesses. | | | | | | | | | | |
| | | | | | | | | | | |
| DIRECTV1 | | | 1,200,000 | | | 59,640 | | | .76 | |
| Digital television services provider in the United States, Latin America and the Caribbean. | | | | | | | | | | |
| | | | | | | | | | | |
| Other securities | | | | | | 573,366 | | | 7.35 | |
| | | | | | | | | | | |
| | | | | | | 1,593,330 | | | 20.43 | |
| | | | | | | | | | | |
| | | | | | | | | | | |
| Health care — 19.78% | | | | | | | | | | |
| Gilead Sciences, Inc.1 | | | 2,521,500 | | | 189,112 | | | 2.42 | |
| Develops drugs to treat infectious diseases and cancer. | | | | | | | | | | |
| | | | | | | | | | | |
| Hologic, Inc.1 | | | 7,054,550 | | | 134,601 | | | 1.73 | |
| Manufacturer of various medical technologies relating to women’s health care. | | | | | | | | | | |
| | | | | | | | | | | |
| | | | | | | | | | | |
| | | | | | | | | | | |
| Common stocks | | Shares | | Value
(000 | ) | Percent of
net assets | |
| | | | | | | | |
| Alexion Pharmaceuticals, Inc.1 | | | 1,012,600 | | $ | 97,230 | | | 1.25 | % |
| Develops drug treatments for cardiovascular, autoimmune and neurologic diseases. | | | | | | | | | | |
| | | | | | | | | | | |
| Thermo Fisher Scientific Inc. | | | 1,428,000 | | | 90,749 | | | 1.16 | |
| A leading worldwide provider of analytical instruments, including lab and industrial equipment. | | | | | | | | | | |
| | | | | | | | | | | |
| Grifols, SA, Class A1 | | | 2,135,000 | | | 68,292 | | | 1.15 | |
| Grifols, SA, Class B1 | | | 878,500 | | | 21,422 | | | |
| Global manufacturer of health care products, specializing in hemoderivatives. | | | | | | | | | | |
| | | | | | | | | | | |
| Forest Laboratories, Inc.1 | | | 2,400,000 | | | 85,104 | | | 1.09 | |
| Licenses and markets drugs to treat psychiatric disorders, neurologic diseases and heart disease. | | | | | | | | | | |
| | | | | | | | | | | |
| William Demant Holding A/S1 | | | 873,000 | | | 70,920 | | | .91 | |
| Health care company focused on hearing devices, diagnostic instruments and personal communication. | | | | | | | | | | |
| | | | | | | | | | | |
| Edwards Lifesciences Corp.1 | | | 761,600 | | | 66,084 | | | .85 | |
| Manufacturer of tissue heart valves and related repair products for the treatment of advanced cardiovascular disease. | | | | | | | | | | |
| | | | | | | | | | | |
| Illumina, Inc.1 | | | 1,164,876 | | | 62,565 | | | .80 | |
| Biotechnology company engaged in the manufacture of integrated systems for the analysis of genetic variation and biological function. | | | | | | | | | | |
| | | | | | | | | | | |
| McKesson Corp. | | | 600,000 | | | 56,682 | | | .73 | |
| A leading distributor of pharmaceuticals in the U.S. | | | | | | | | | | |
| | | | | | | | | | | |
| Celesio AG | | | 3,167,000 | | | 53,792 | | | .69 | |
| Pharmaceutical distribution holding company based in Germany. | | | | | | | | | | |
| | | | | | | | | | | |
| Exelixis, Inc.1,2 | | | 10,950,900 | | | 53,550 | | | .69 | |
| Develops technologies to compare genetic data. Its findings and methods are used by pharmaceutical and agrochemical companies. | | | | | | | | | | |
| | | | | | | | | | | |
| Stryker Corp. | | | 984,000 | | | 53,293 | | | .68 | |
| A global leader in the medical technology industry, particularly in the orthopaedic market. | | | | | | | | | | |
| | | | | | | | | | | |
| BioMarin Pharmaceutical Inc.1 | | | 1,045,100 | | | 50,792 | | | .65 | |
| Biotechnology company engaged in the treatment of serious diseases and medical conditions. | | | | | | | | | | |
| | | | | | | | | | | |
| Amgen Inc. | | | 564,000 | | | 50,083 | | | .64 | |
| The world’s largest biotechnology company. | | | | | | | | | | |
| | | | | | | | | | | |
| Biogen Idec Inc.1 | | | 335,600 | | | 50,035 | | | .64 | |
| A leader in developing therapies to treat multiple sclerosis and cancer. | | | | | | | | | | |
| | | | | | | | | | | |
| Other securities | | | | | | 288,935 | | | 3.70 | |
| | | | | | | | | | | |
| | | | | | | 1,543,241 | | | 19.78 | |
| | | | | | | | | | | |
| | | | | | | | | | | |
| Information technology — 19.66% | | | | | | | | | | |
| Google Inc., Class A1 | | | 209,300 | | | 146,169 | | | 1.87 | |
| One of the most frequently used website search engines in the world. | | | | | | | | | | |
| | | | | | | | | | | |
| Apple Inc. | | | 221,140 | | | 129,429 | | | 1.66 | |
| Manufacturer of personal computers and various software products, as well as tablets, laptops, media players, browsers and smartphones. | | | | | | | | | | |
| | | | | | | | | | | |
| Samsung Electronics Co. Ltd. | | | 90,437 | | | 117,426 | | | 1.51 | |
| Korea’s top electronics manufacturer and a global leader in semiconductor production. | | | | | | | | | | |
| | | | | | | | | | | |
| Baidu, Inc., Class A (ADR)1 | | | 1,042,400 | | | 100,394 | | | 1.29 | |
| Internet search engine in China that also operates a Japanese language service. | | | | | | | | | | |
| | | | | | | | | | | |
| Texas Instruments Inc. | | | 2,555,000 | | | 75,296 | | | .96 | |
| Global maker of semiconductors and a leading producer of digital signal processors. | | | | | | | | | | |
| | | | | | | | | | | |
| Facebook, Inc., Class A1 | | | 2,500,000 | | | 70,000 | | | .90 | |
| World’s largest social networking service. | | | | | | | | | | |
| | | | | | | | | | | |
| NetEase, Inc. (ADR)1 | | | 1,398,000 | | | 61,316 | | | .79 | |
| Operates an online community in China. | | | | | | | | | | |
| | | | | | | | | | | |
| Adobe Systems Inc.1 | | | 1,675,000 | | | 57,972 | | | .74 | |
| Computer software manufacturer of multimedia and creativity products. | | | | | | | | | | |
| | | | | | | | | | | |
| Microsoft Corp. | | | 1,995,000 | | | 53,107 | | | .68 | |
| A world leader in software and Internet technologies. Its products include the Windows operating system and Office software. | | | | | | | | | | |
| | | | | | | | | | | |
| Oracle Corp. | | | 1,591,000 | | | 51,071 | | | .65 | |
| Major supplier of database management software. Also develops business applications and provides consulting and support. | | | | | | | | | | |
| | | | | | | | | | | |
| Other securities | | | | | | 671,514 | | | 8.61 | |
| | | | | | | | | | | |
| | | | | | | 1,533,694 | | | 19.66 | |
| | | | | | | | | | | |
| | | | | | | | | | | |
| Common stocks | | Shares | | Value
(000) | | Percent of
net assets | |
| | | | | | | | |
| Financials — 10.50% | | | | | | | | | | |
| AIA Group Ltd. | | | 28,336,000 | | $ | 110,233 | | | 1.41 | % |
| Life insurance and financial services provider in the Asia-Pacific region. | | | | | | | | | | |
| | | | | | | | | | | |
| Other securities | | | | | | 708,966 | | | 9.09 | |
| | | | | | | | | | | |
| | | | | | | 819,199 | | | 10.50 | |
| | | | | | | | | | | |
| | | | | | | | | | | |
| Industrials — 7.64% | | | | | | | | | | |
| Ryanair Holdings PLC (ADR) | | | 2,274,700 | | | 78,318 | | | 1.00 | |
| European discount airline serving Continental Europe, Ireland and the United Kingdom. | | | | | | | | | | |
| | | | | | | | | | | |
| PT AKR Corporindo Tbk | | | 173,899,680 | | | 77,945 | | | 1.00 | |
| Indonesia-based distributor of energy products, including refined petroleum products. | | | | | | | | | | |
| | | | | | | | | | | |
| AirAsia Bhd. | | | 62,860,000 | | | 58,936 | | | .76 | |
| Low-fare airline based in Malaysia. | | | | | | | | | | |
| | | | | | | | | | | |
| Nielsen Holdings NV1 | | | 1,915,000 | | | 54,233 | | | .69 | |
| Marketing and advertisement measurement company. | | | | | | | | | | |
| | | | | | | | | | | |
| Union Pacific Corp. | | | 437,977 | | | 53,775 | | | .69 | |
| Operates the largest railroad in the U.S.; also delivers freight to Canada and Mexico. | | | | | | | | | | |
| | | | | | | | | | | |
| Verisk Analytics, Inc., Class A1 | | | 1,074,900 | | | 53,573 | | | .69 | |
| Risk assessment services provider operating mainly in the property/casualty insurance industry. | | | | | | | | | | |
| | | | | | | | | | | |
| CSX Corp. | | | 2,654,722 | | | 52,457 | | | .67 | |
| Operates a major rail system and provides freight transportation across the U.S. | | | | | | | | | | |
| | | | | | | | | | | |
| Other securities | | | | | | 167,054 | | | 2.14 | |
| | | | | | | | | | | |
| | | | | | | 596,291 | | | 7.64 | |
| | | | | | | | | | | |
| | | | | | | | | | | |
| Telecommunication services — 5.66% | | | | | | | | | | |
| Crown Castle International Corp.1 | | | 2,208,122 | | | 149,092 | | | 1.91 | |
| A leading provider of wireless communications and transmission sites. | | | | | | | | | | |
| | | | | | | | | | | |
| SOFTBANK CORP. | | | 2,443,000 | | | 91,574 | | | 1.17 | |
| Internet and telecommunications conglomerate and distributor of digital media and software. | | | | | | | | | | |
| | | | | | | | | | | |
| Other securities | | | | | | 200,986 | | | 2.58 | |
| | | | | | | | | | | |
| | | | | | | 441,652 | | | 5.66 | |
| | | | | | | | | | | |
| | | | | | | | | | | |
| Energy — 1.59% | | | | | | | | | | |
| Schlumberger Ltd. | | | 1,052,400 | | | 75,373 | | | .97 | |
| A leading provider of services and technology to the petroleum industry. | | | | | | | | | | |
| | | | | | | | | | | |
| Other securities | | | | | | 48,248 | | | .62 | |
| | | | | | | | | | | |
| | | | | | | 123,621 | | | 1.59 | |
| | | | | | | | | | | |
| | | | | | | | | | | |
| Consumer staples — 0.87% | | | | | | | | | | |
| Costco Wholesale Corp. | | | 650,000 | | | 67,593 | | | .87 | |
| | | | | | | | | | | |
| Operates membership warehouse clubs that serve both small businesses and consumers in North America, Asia, the U.K. and Australia. | | | | | | | | | | |
| | | | | | | | | | | |
| | | | | | | | | | | |
| Other — 1.03% | | | | | | | | | | |
| Other securities | | | | | | 80,051 | | | 1.03 | |
| | | | | | | | | | | |
| | | | | | | | | | | |
| Miscellaneous — 4.80% | | | | | | | | | | |
| Other common stocks in initial period of acquisition | | | | | | 374,398 | | | 4.80 | |
| | | | | | | | | | | |
| | | | | | | | | | | |
| Total common stocks (cost: $5,523,515,000) | | | | | | 7,173,070 | | | 91.96 | |
| | | | | | | | | | | |
| | | | | | | | | | | |
| Preferred stocks — 0.16% | | | | | | Value
(000) | | | Percent of
net assets | |
| | | | | | | | | | | |
| Financials — 0.05% | | | | | | | | | | |
| Other securities | | | | | $ | 4,168 | | | .05 | % |
| | | | | | | | | | | |
| | | | | | | | | | | |
| Miscellaneous — 0.11% | | | | | | | | | | |
| Other preferred stocks in initial period of acquisition | | | | | | 8,304 | | | .11 | |
| | | | | | | | | | | |
| |
| Total preferred stocks (cost: $11,000,000) | | | | | | 12,472 | | | .16 | |
| | | | | | | | | | | |
| | | | | | | | | | | |
| Short-term securities — 7.40% | | Principal amount
(000) | | | | | | | |
| | | | | | | | | | |
| Fannie Mae 0.135%–0.18% due 12/17/2012–7/1/2013 | | $ | 205,300 | | | 205,227 | | | 2.63 | |
| | | | | | | | | | | |
| Freddie Mac 0.14%–0.17% due 1/9/2013–5/29/2013 | | | 100,700 | | | 100,660 | | | 1.29 | |
| | | | | | | | | | | |
| Federal Home Loan Bank 0.12%–0.165% due 2/15/2013–4/17/2013 | | | 98,000 | | | 97,970 | | | 1.26 | |
| | | | | | | | | | | |
| Other securities | | | | | | 173,515 | | | 2.22 | |
| | | | | | | | | | | |
| |
| Total short-term securities (cost: $577,332,000) | | | | | | 577,372 | | | 7.40 | |
| | | | | | | | | | | |
| |
| Total investment securities (cost: $6,111,847,000) | | | | | | 7,762,914 | | | 99.52 | |
| Other assets less liabilities | | | | | | 37,386 | | | .48 | |
| | | | | | | | | | | |
| | | | | | | | | | | |
| Net assets | | | | | $ | 7,800,300 | | | 100.00 | % |
| | | | | | | | | | | |
As permitted by U.S. Securities and Exchange Commission regulations, “Miscellaneous” securities include holdings in their first year of acquisition that have not previously been publicly disclosed.
“Other securities” includes all issues that are not disclosed separately in the summary investment portfolio, including one security which was valued under fair value procedures adopted by authority of the board of trustees. The value of this security was $6,608,000, with a cost of $31,574,000, and represented .08% of the net assets of the fund; it was acquired from 9/6/2000 to 4/18/2002 through private placement transactions exempt from registration under the Securities Act of 1933 which may subject it to legal or contractual restrictions on resale. Some of these securities (with an aggregate value of $95,678,000, which represented 1.23% of the net assets of the fund) were acquired in transactions exempt from registration under section 4(2) of the Securities Act of 1933 and may be resold in the U.S. in transactions exempt from registration, normally to qualified institutional buyers.
The descriptions of the companies shown in the summary investment portfolio, which were obtained from published reports and other sources believed to be reliable, are supplemental and are not covered by the Report of Independent Registered Public Accounting Firm.
Investments in affiliates
A company is considered to be an affiliate of the fund under the Investment Company Act of 1940 if the fund’s holdings in that company represent 5% or more of the outstanding voting shares. The value of the fund’s affiliated-company holdings is either shown in the summary investment portfolio or included in the value of “Other securities” under the respective industry sectors. Further details on such holdings and related transactions during the year ended November 30, 2012, appear below.
| | | | | | | | | | | | | | | | | | | | |
| | | Beginning shares | | Additions | | Reductions | | Ending shares | | Dividend income
(000) | | Value of affiliates
at 11/30/2012
(000) | |
| Exelixis, Inc.1 | | | — | | | 10,950,900 | | | — | | | 10,950,900 | | $ | — | | $ | 53,550 | |
| | | | | | | | | | | | | | | | | | | | |
| NuVasive, Inc.1 | | | 1,972,286 | | | 233,000 | | | — | | | 2,205,286 | | | — | | | 32,021 | |
| | | | | | | | | | | | | | | | | | | | |
| Avanti Communications Group PLC1 | | | 3,488,372 | | | 3,445,000 | | | — | | | 6,933,372 | | | — | | | 26,715 | |
| | | | | | | | | | | | | | | | | | | | |
| | | | | | | | | | | | | | | $ | — | | $ | 112,286 | |
| | | | | | | | | | | | | | | | | | | | |
The following footnotes apply to either the individual securities noted or one or more of the securities aggregated and listed as a single line item.
1 Security did not produce income during the last 12 months.
2 Represents an affiliated company as defined under the Investment Company Act of 1940.
Key to abbreviation
ADR = American Depositary Receipts
See Notes to Financial Statements
Financial statements
| | | | | | | | |
| Statement of assets and liabilities at November 30, 2012 | | | (dollars in thousands) | |
| | | | | | | | |
| Assets: | | | | | | | |
| Investment securities, at value: | | | | | | | |
| Unaffiliated issuers (cost: $5,963,956) | | $ | 7,650,628 | | | | |
| Affiliated issuers (cost: $147,891) | | | 112,286 | | $ | 7,762,914 | |
| | | | | | | | |
| Cash | | | | | | 121 | |
| Receivables for: | | | | | | | |
| Sales of investments | | | 55,885 | | | | |
| Sales of fund’s shares | | | 8,604 | | | | |
| Dividends and interest | | | 13,066 | | | 77,555 | |
| | | | | | | | |
| | | | | | | 7,840,590 | |
| Liabilities: | | | | | | | |
| Payables for: | | | | | | | |
| Purchases of investments | | | 14,405 | | | | |
| Repurchases of fund’s shares | | | 17,100 | | | | |
| Investment advisory services | | | 2,563 | | | | |
| Services provided by related parties | | | 4,474 | | | | |
| Trustees’ deferred compensation | | | 1,656 | | | | |
| Other | | | 92 | | | 40,290 | |
| | | | | | | | |
| Net assets at November 30, 2012 | | | | | $ | 7,800,300 | |
| | | | | | | | |
| | | | | | | | |
| Net assets consist of: | | | | | | | |
| Capital paid in on shares of beneficial interest | | | | | $ | 5,896,863 | |
| Undistributed net investment income | | | | | | 40,637 | |
| Undistributed net realized gain | | | | | | 211,903 | |
| Net unrealized appreciation | | | | | | 1,650,897 | |
| | | | | | | | |
| Net assets at November 30, 2012 | | | | | $ | 7,800,300 | |
| | | | | | | | |
| | | | | | | | | | | |
| (dollars and shares in thousands, except per-share amounts) | |
| Shares of beneficial interest issued and outstanding (no stated par value) — unlimited shares authorized (271,388 total shares outstanding) | | |
| | | |
| | | Net assets | | Shares
outstanding | | Net asset value
per share | |
| Class A | | $ | 5,919,121 | | | 205,278 | | $ | 28.83 | |
| | | | | | | | | | | |
| Class B | | | 49,761 | | | 1,813 | | | 27.45 | |
| | | | | | | | | | | |
| Class C | | | 185,890 | | | 6,847 | | | 27.15 | |
| | | | | | | | | | | |
| Class F-1 | | | 143,087 | | | 4,956 | | | 28.87 | |
| | | | | | | | | | | |
| Class F-2 | | | 106,306 | | | 3,681 | | | 28.88 | |
| | | | | | | | | | | |
| Class 529-A | | | 197,530 | | | 6,895 | | | 28.65 | |
| | | | | | | | | | | |
| Class 529-B | | | 7,663 | | | 278 | | | 27.54 | |
| | | | | | | | | | | |
| Class 529-C | | | 60,159 | | | 2,188 | | | 27.49 | |
| | | | | | | | | | | |
| Class 529-E | | | 9,980 | | | 352 | | | 28.35 | |
| | | | | | | | | | | |
| Class 529-F-1 | | | 12,573 | | | 439 | | | 28.65 | |
| | | | | | | | | | | |
| Class R-1 | | | 22,713 | | | 819 | | | 27.72 | |
| | | | | | | | | | | |
| Class R-2 | | | 123,852 | | | 4,449 | | | 27.84 | |
| | | | | | | | | | | |
| Class R-3 | | | 168,152 | | | 5,924 | | | 28.38 | |
| | | | | | | | | | | |
| Class R-4 | | | 150,480 | | | 5,249 | | | 28.67 | |
| | | | | | | | | | | |
| Class R-5 | | | 130,934 | | | 4,519 | | | 28.98 | |
| | | | | | | | | | | |
| Class R-6 | | | 512,099 | | | 17,701 | | | 28.93 | |
| | | | | | | | | | | |
See Notes to Financial Statements
| | | | | | | | |
| Statement of operations for the year ended November 30, 2012 | | (dollars in thousands) | |
| | | | |
| Investment income: | | | | | | | |
| Income: | | | | | | | |
| Dividends (net of non-U.S. taxes of $2,654) | | $ | 105,176 | | | | |
| Interest | | | 2,979 | | $ | 108,155 | |
| | | | | | | | |
| | | | | | | | |
| Fees and expenses*: | | | | | | | |
| Investment advisory services | | | 30,352 | | | | |
| Distribution services | | | 19,095 | | | | |
| Transfer agent services | | | 12,640 | | | | |
| Administrative services | | | 1,361 | | | | |
| Reports to shareholders | | | 585 | | | | |
| Registration statement and prospectus | | | 251 | | | | |
| Trustees’ compensation | | | 662 | | | | |
| Auditing and legal | | | 151 | | | | |
| Custodian | | | 737 | | | | |
| State and local taxes | | | 63 | | | | |
| Other | | | 400 | | | 66,297 | |
| | | | | | | | |
| Net investment income | | | | | | 41,858 | |
| | | | | | | | |
| | | | | | | | |
| Net realized gain and unrealized appreciation on investments and currency: | | | | | | | |
| Net realized gain on: | | | | | | | |
| Investments (net of non-U.S. taxes of $231) | | | 302,378 | | | | |
| Currency transactions | | | 517 | | | 302,895 | |
| | | | | | | | |
| Net unrealized appreciation (depreciation) on: | | | | | | | |
| Investments | | | 988,325 | | | | |
| Currency translations | | | (335 | ) | | 987,990 | |
| | | | | | | | |
| Net realized gains and unrealized appreciation on investments and currency | | | | | | 1,290,885 | |
| | | | | | | | |
| Net increase in net assets resulting from operations | | | | | $ | 1,332,743 | |
| | | | | | | | |
| | | | | | | | |
| *Additional information related to class-specific fees and expenses is included in the Notes to Financial Statements. | |
| | | | | | | | |
| Statements of changes in net assets | | (dollars in thousands) | |
| | | | |
| | | Year ended November 30 | |
| | | 2012 | | 2011 | |
| | | | | | |
| Operations: | | | | | | | |
| Net investment income | | $ | 41,858 | | $ | 31,441 | |
| Net realized gain on investments and currency transactions | | | 302,895 | | | 457,860 | |
| Net unrealized appreciation (depreciation) on investments and currency translations | | | 987,990 | | | (450,860 | ) |
| | | | | | | | |
| Net increase in net assets resulting from operations | | | 1,332,743 | | | 38,441 | |
| | | | | | | | |
| | | | | | | | |
| Dividends paid to shareholders from net investment income | | | (32,433 | ) | | (49,998 | ) |
| | | | | | | | |
| Net capital share transactions | | | (348,396 | ) | | (417,678 | ) |
| | | | | | | | |
| | | | | | | | |
| Total increase (decrease) in net assets | | | 951,914 | | | (429,235 | ) |
| | | | | | | | |
| Net assets: | | | | | | | |
| Beginning of year | | | 6,848,386 | | | 7,277,621 | |
| | | | | | | | |
| End of year (including undistributed net investment income: $40,637 and $30,851, respectively) | | $ | 7,800,300 | | $ | 6,848,386 | |
| | | | | | | | |
See Notes to Financial Statements
Notes to financial statements
The New Economy Fund (the “fund”) is registered under the Investment Company Act of 1940 as an open-end, diversified management investment company. The fund seeks long-term growth of capital by investing in securities of companies that can benefit from innovation, exploit new technologies or provide products and services that meet the demands of an evolving global economy. Shareholders approved a proposal to reorganize the fund from a Massachusetts business trust to a Delaware statutory trust. The reorganization may be completed in 2013; however, the fund reserves the right to delay the implementation.
The fund has 16 share classes consisting of five retail share classes (Classes A, B and C, as well as two F share classes, F-1 and F-2), five 529 college savings plan share classes (Classes 529-A, 529-B, 529-C, 529-E and 529-F-1) and six retirement plan share classes (Classes R-1, R-2, R-3, R-4, R-5 and R-6). The 529 college savings plan share classes can be used to save for college education. The retirement plan share classes are generally offered only through eligible employer-sponsored retirement plans. The fund’s share classes are further described below:
| | | | | | | |
| Share class | | Initial sales charge | | Contingent deferred sales charge upon redemption | | Conversion feature |
| Classes A and 529-A | | Up to 5.75% | | None (except 1% for certain redemptions within one year of purchase without an initial sales charge) | | None |
| | | | | | | |
| Classes B and 529-B* | | None | | Declines from 5% to 0% for redemptions within six years of purchase | | Classes B and 529-B convert to Classes A and 529-A, respectively, after eight years |
| | | | | | | |
| Class C | | None | | 1% for redemptions within one year of purchase | | Class C converts to Class F-1 after 10 years |
| | | | | | | |
| Class 529-C | | None | | 1% for redemptions within one year of purchase | | None |
| | | | | | | |
| Class 529-E | | None | | None | | None |
| | | | | | | |
| Classes F-1, F-2 and 529-F-1 | | None | | None | | None |
| | | | | | | |
| Classes R-1, R-2, R-3, R-4, R-5 and R-6 | | None | | None | | None |
| | | | | | | |
| *Class B and 529-B shares of the fund are not available for purchase. |
Holders of all share classes have equal pro rata rights to assets, dividends and liquidation proceeds. Each share class has identical voting rights, except for the exclusive right to vote on matters affecting only its class. Share classes have different fees and expenses (“class-specific fees and expenses”), primarily due to different arrangements for distribution, administrative and shareholder services. Differences in class-specific fees and expenses will result in differences in net investment income and, therefore, the payment of different per-share dividends by each class.
| |
| 2. Significant accounting policies |
| |
The financial statements have been prepared to comply with accounting principles generally accepted in the United States of America. These principles require management to make estimates and assumptions that affect reported amounts and disclosures. Actual results could differ from those estimates. The fund follows the significant accounting policies described below, as well as the valuation policies described in the next section on valuation.
Security transactions and related investment income — Security transactions are recorded by the fund as of the date the trades are executed with brokers. Realized gains and losses from security transactions are determined based on the specific identified cost of the securities. In the event a security is purchased with a delayed payment date, the fund will segregate liquid assets sufficient to meet its payment obligations. Dividend income is recognized on the ex-dividend date and interest income is recognized on an accrual basis. Market discounts, premiums and original issue discounts on fixed-income securities are amortized daily over the expected life of the security.
Class allocations — Income, fees and expenses (other than class-specific fees and expenses) and realized and unrealized gains and losses are allocated daily among the various share classes based on their relative net assets. Class-specific fees and expenses, such as distribution, administrative and shareholder services, are charged directly to the respective share class.
Dividends and distributions to shareholders — Dividends and distributions paid to shareholders are recorded on the ex-dividend date.
Currency translation — Assets and liabilities, including investment securities, denominated in currencies other than U.S. dollars are translated into U.S. dollars at the exchange rates supplied by one or more pricing vendors on the valuation date. Purchases and sales
of investment securities and income and expenses are translated into U.S. dollars at the exchange rates on the dates of such transactions. On the accompanying financial statements, the effects of changes in exchange rates on investment securities are included with the net realized gain or loss and net unrealized appreciation or depreciation on investments. The realized gain or loss and unrealized appreciation or depreciation resulting from all other transactions denominated in currencies other than U.S. dollars are disclosed separately.
Capital Research and Management Company (“CRMC”), the fund’s investment adviser, values the fund’s investments at fair value as defined by accounting principles generally accepted in the United States of America. The net asset value of each share class of the fund is generally determined as of approximately 4:00 p.m. New York time each day the New York Stock Exchange is open.
Methods and inputs — The fund’s investment adviser uses the following methods and inputs to establish the fair value of the fund’s assets and liabilities. Use of particular methods and inputs may vary over time based on availability and relevance as market and economic conditions evolve.
Equity securities are generally valued at the official closing price of, or the last reported sale price on, the exchange or market on which such securities are traded, as of the close of business on the day the securities are being valued or, lacking any sales, at the last available bid price. Prices for each security are taken from the principal exchange or market on which the security trades.
Fixed-income securities, including short-term securities purchased with more than 60 days left to maturity, are generally valued at prices obtained from one or more pricing vendors. Vendors value such securities based on one or more of the inputs described in the following table. The table provides examples of inputs that are commonly relevant for valuing particular classes of fixed-income securities in which the fund is authorized to invest. However, these classifications are not exclusive, and any of the inputs may be used to value any other class of fixed-income security.
| | | |
| Fixed-income class | | Examples of standard inputs |
| All | | Benchmark yields, transactions, bids, offers, quotations from dealers and trading systems, new issues, spreads and other relationships observed in the markets among comparable securities; and proprietary pricing models such as yield measures calculated using factors such as cash flows, financial or collateral performance and other reference data (collectively referred to as “standard inputs”) |
| | | |
| Corporate bonds & notes; convertible securities | | Standard inputs and underlying equity of the issuer |
| | | |
| Bonds & notes of governments & government agencies | | Standard inputs and interest rate volatilities |
| | | |
When the fund’s investment adviser deems it appropriate to do so (such as when vendor prices are unavailable or not deemed to be representative), fixed-income securities will be valued in good faith at the mean quoted bid and ask prices that are reasonably and timely available (or bid prices, if ask prices are not available) or at prices for securities of comparable maturity, quality and type.
Securities with both fixed-income and equity characteristics, or equity securities traded principally among fixed-income dealers, are generally valued in the manner described above for either equity or fixed-income securities, depending on which method is deemed most appropriate by the fund’s investment adviser. Short-term securities purchased within 60 days to maturity are valued at amortized cost, which approximates fair value. The value of short-term securities originally purchased with maturities greater than 60 days is determined based on an amortized value to par when they reach 60 days.
Securities and other assets for which representative market quotations are not readily available or are considered unreliable by the fund’s investment adviser are fair valued as determined in good faith under fair value guidelines adopted by authority of the fund’s board of trustees as further described below. The investment adviser follows fair valuation guidelines, consistent with U.S. Securities and Exchange Commission rules and guidance, to consider relevant principles and factors when making fair value determinations. The investment adviser considers relevant indications of value that are reasonably and timely available to it in determining the fair value to be assigned to a particular security, such as the type and cost of the security; contractual or legal restrictions on resale of the security; relevant financial or business developments of the issuer; actively traded similar or related securities; conversion or exchange rights on the security; related corporate actions; significant events occurring after the close of trading in the security; and changes in overall market conditions. In addition, the closing prices of equity securities that trade in markets outside U.S. time zones may be adjusted to reflect significant events that occur after the close of local trading but before the net asset value of each share class of the fund is determined. Fair valuations and valuations of investments that are not actively trading involve judgment and may differ materially from valuations that would have been used had greater market activity occurred.
Processes and structure — The fund’s board of trustees has delegated authority to the fund’s investment adviser to make fair value determinations, subject to board oversight. The investment adviser has established a Joint Fair Valuation Committee (the “Fair Valuation Committee”) to administer, implement and oversee the fair valuation process, and to make fair value decisions. The Fair Valuation Committee regularly reviews its own fair value decisions, as well as decisions made under its standing instructions to the investment adviser’s valuation teams. The Fair Valuation Committee reviews changes in fair value measurements from period to period and may, as deemed appropriate, update the fair valuation guidelines to better reflect the results of back testing and address new or evolving issues. The Fair Valuation Committee reports any changes to the fair valuation guidelines to the board of trustees with supplemental information to support the changes. The fund’s board and audit committee also regularly review reports that describe fair value determinations and methods.
The fund’s investment adviser has also established a Fixed-Income Pricing Review Group to administer and oversee the fixed-income valuation process, including the use of fixed-income pricing vendors. This group regularly reviews pricing vendor information and market data. Pricing decisions, processes and controls over security valuation are also subject to additional internal reviews, including an annual control self-evaluation program facilitated by the investment adviser’s compliance group.
Classifications — The fund’s investment adviser classifies the fund’s assets and liabilities into three levels based on the inputs used to value the assets or liabilities. Level 1 values are based on quoted prices in active markets for identical securities. Level 2 values are based on significant observable market inputs, such as quoted prices for similar securities and quoted prices in inactive markets. Certain securities trading outside the U.S. may transfer between Level 1 and Level 2 due to valuation adjustments resulting from significant market movements following the close of local trading. Level 3 values are based on significant unobservable inputs that reflect the investment adviser’s determination of assumptions that market participants might reasonably use in valuing the securities. The valuation levels are not necessarily an indication of the risk or liquidity associated with the underlying investment. For example, U.S. government securities are reflected as Level 2 because the inputs used to determine fair value may not always be quoted prices in an active market. The following table presents the fund’s valuation levels as of November 30, 2012 (dollars in thousands):
| | | | | | | | | | | | | | |
| | | Investment securities | |
| | | | |
| | | Level 1* | | Level 2 | | Level 3 | | Total | |
| Assets: | | | | | | | | | | | | | |
| Common stocks: | | | | | | | | | | | | | |
| Consumer discretionary | | $ | 1,586,722 | | $ | — | | $ | 6,608 | | $ | 1,593,330 | |
| Health care | | | 1,543,241 | | | — | | | — | | | 1,543,241 | |
| Information technology | | | 1,533,694 | | | — | | | — | | | 1,533,694 | |
| Financials | | | 819,199 | | | — | | | — | | | 819,199 | |
| Industrials | | | 596,291 | | | — | | | — | | | 596,291 | |
| Telecommunication services | | | 441,652 | | | — | | | — | | | 441,652 | |
| Energy | | | 123,621 | | | — | | | — | | | 123,621 | |
| Consumer staples | | | 67,593 | | | — | | | — | | | 67,593 | |
| Other | | | 80,051 | | | — | | | — | | | 80,051 | |
| Miscellaneous | | | 374,398 | | | — | | | — | | | 374,398 | |
| Preferred stocks | | | | | | | | | | | | | |
| Financials | | | — | | | 4,168 | | | — | | | 4,168 | |
| Miscellaneous | | | — | | | 8,304 | | | — | | | 8,304 | |
| Short-term securities | | | — | | | 577,372 | | | — | | | 577,372 | |
| | | | | | | | | | | | | | |
| Total | | $ | 7,166,462 | | $ | 589,844 | | $ | 6,608 | | $ | 7,762,914 | |
| | | | | | | | | | | | | | |
| | |
| * | Securities with a market value of $1,746,373,000, which represented 22.39% of the net assets of the fund, transferred from Level 2 to Level 1 since the prior fiscal year-end, primarily due to a lack of significant market movements following the close of local trading. |
Investing in the fund may involve certain risks including, but not limited to, those described below.
Market conditions — The prices of, and the income generated by, the common stocks and other securities held by the fund may decline due to market conditions and other factors, including those directly involving the issuers of securities held by the fund. The fund may be subject to additional risks because it invests in a more limited group of sectors and industries than the broad market.
Investing in growth-oriented stocks — Growth-oriented stocks may involve larger price swings and greater potential for loss than other types of investments.
Investing in small companies — Investing in smaller companies may pose additional risks. For example, it is often more difficult to value or dispose of small company stocks and more difficult to obtain information about smaller companies than about larger companies. In addition, the prices of these stocks may be more volatile than stocks of larger, more established companies.
Investing outside the U.S. — Securities of issuers domiciled outside the U.S., or with significant operations outside the U.S., may lose value because of adverse political, social, economic or market developments in the countries or regions in which the issuer operates. These securities may also lose value due to changes in foreign currency exchange rates against the U.S. dollar and/or currencies of other countries. Securities markets in certain countries may be more volatile and/or less liquid than those in the U.S. Investments outside the U.S. may also be subject to different settlement and accounting practices and different regulatory, legal and reporting standards, and may be more difficult to value, than those in the U.S. The risks of investing outside the U.S. may be heightened in connection with investments in emerging markets.
Investing in emerging markets — Investing in emerging markets may involve risks in addition to and greater than those generally associated with investing in developed countries. For instance, developing countries may have less developed legal and accounting systems than those in developed countries. The governments of these countries may be less stable and more likely to impose capital controls, nationalize a company or industry, place restrictions on foreign ownership and on withdrawing sale proceeds of securities from the country, and/or impose punitive taxes that could adversely affect the prices of securities. In addition, the economies of these countries may be dependent on relatively few industries that are more susceptible to local and global changes. Securities markets in these countries can also be relatively small and have substantially lower trading volumes. As a result, securities issued in these countries may be more volatile and less liquid, and may be more difficult to value, than securities issued in countries with more developed economies and/or markets. Additionally, there may be increased settlement risks for transactions in local securities.
Management — The investment adviser to the fund actively manages the fund’s investments. Consequently, the fund is subject to the risk that the methods and analyses employed by the investment adviser in this process may not produce the desired results. This could cause the fund to lose value or its investment results to lag relevant benchmarks or other funds with similar objectives.
| |
| 5. Taxation and distributions |
| |
Federal income taxation — The fund complies with the requirements under Subchapter M of the Internal Revenue Code applicable to mutual funds and intends to distribute substantially all of its net taxable income and net capital gains each year. The fund is not subject to income taxes to the extent such distributions are made. Therefore, no federal income tax provision is required.
As of and during the period ended November 30, 2012, the fund did not have a liability for any unrecognized tax benefits. The fund recognizes interest and penalties, if any, related to unrecognized tax benefits as income tax expense in the statement of operations. During the period, the fund did not incur any interest or penalties.
The fund is not subject to examination by U.S. federal tax authorities for tax years before 2008, by state tax authorities for tax years before 2007 and by tax authorities outside the U.S. for tax years before 2005.
Non-U.S. taxation — Dividend and interest income are recorded net of non-U.S. taxes paid. Gains realized by the fund on the sale of securities in certain countries are subject to non-U.S. taxes. The fund records a liability based on unrealized gains to provide for potential non-U.S. taxes payable upon the sale of these securities.
Distributions — Distributions paid to shareholders are based on net investment income and net realized gains determined on a tax basis, which may differ from net investment income and net realized gains for financial reporting purposes. These differences are due primarily to different treatment for items such as currency gains and losses; short-term capital gains and losses; and net capital losses. The fiscal year in which amounts are distributed may differ from the year in which the net investment income and net realized gains are recorded by the fund for financial reporting purposes. The fund may also designate a portion of the amount paid to redeeming shareholders as a distribution for tax purposes.
During the year ended November 30, 2012, the fund reclassified $370,000 from undistributed net realized gain to undistributed net investment income, $8,000 from undistributed net investment income to capital paid in on shares of beneficial interest and $17,169,000 from undistributed net realized gain to capital paid in on shares of beneficial interest to align financial reporting with tax reporting. The fund also utilized capital loss carryforward of $73,421,000.
As of November 30, 2012, the tax basis components of distributable earnings, unrealized appreciation (depreciation) and cost of investment securities were as follows:
| | | | | |
| | | (dollars in thousands) | |
| Undistributed ordinary income | | $ | 42,294 | |
| Undistributed long-term capital gain | | | 235,263 | |
| Post-October capital loss deferral* | | | (23,361 | ) |
| | | | | |
| Gross unrealized appreciation on investment securities | | | 1,922,800 | |
| Gross unrealized depreciation on investment securities | | | (271,733 | ) |
| Net unrealized appreciation on investment securities | | | 1,651,067 | |
| | | | | |
| Cost of investment securities | | | 6,111,847 | |
| | | | | |
| *This deferral is considered incurred in the subsequent year. | | | | |
Tax-basis distributions paid to shareholders from ordinary income were as follows (dollars in thousands):
| | | | | | | | |
| | | Year ended November 30 | |
| | | | |
| Share class | | 2012 | | 2011 | |
| Class A | | $ | 25,493 | | $ | 41,005 | |
| Class B | | | — | | | — | |
| Class C | | | — | * | | 29 | |
| Class F-1 | | | 624 | | | 1,167 | |
| Class F-2 | | | 552 | | | 627 | |
| Class 529-A | | | 767 | | | 997 | |
| Class 529-B | | | — | | | — | |
| Class 529-C | | | — | * | | 15 | |
| Class 529-E | | | 15 | | | 36 | |
| Class 529-F-1 | | | 66 | | | 63 | |
| Class R-1 | | | — | | | 24 | |
| Class R-2 | | | — | | | — | |
| Class R-3 | | | 274 | | | 719 | |
| Class R-4 | | | 712 | | | 993 | |
| Class R-5 | | | 892 | | | 1,337 | |
| Class R-6 | | | 3,038 | | | 2,986 | |
| | | | | | | | |
| Total | | $ | 32,433 | | $ | 49,998 | |
| | | | | | | | |
| *Amount less than one thousand. | | | | | | | |
| |
| 6. Fees and transactions with related parties |
| |
CRMC, the fund’s investment adviser, is the parent company of American Funds Distributors,® Inc. (“AFD”), the principal underwriter of the fund’s shares, and American Funds Service Company® (“AFS”), the fund’s transfer agent.
Investment advisory services — The fund has an investment advisory and service agreement with CRMC that provides for monthly fees accrued daily. These fees are based on a series of decreasing annual rates beginning with 0.580% on the first $500 million of daily net assets and decreasing to 0.345% on such assets in excess of $27 billion. For the year ended November 30, 2012, the investment advisory services fee was $30,352,000, which was equivalent to an annualized rate of 0.409% of average daily net assets.
Class-specific fees and expenses — Expenses that are specific to individual share classes are accrued directly to the respective share class. The principal class-specific fees and expenses are described below:
| | |
| | Distribution services — The fund has plans of distribution for all share classes, except Class F-2, R-5 and R-6 shares. Under the plans, the board of trustees approves certain categories of expenses that are used to finance activities primarily intended to sell fund shares and service existing accounts. The plans provide for payments, based on an annualized percentage of average daily net assets, ranging from 0.25% to 1.00% as noted on the following page. In some cases, the board of trustees has limited the amounts that may be paid to less than the maximum allowed by the plans. All share classes with a plan may use up to 0.25% of average daily net assets to pay service fees, or to compensate AFD for paying service fees, to firms that have entered into agreements with AFD to provide certain shareholder services. The remaining amounts available to be paid under each plan are paid to dealers to compensate them for their sales activities. |
For Class A and 529-A shares, distribution-related expenses include the reimbursement of dealer and wholesaler commissions paid by AFD for certain shares sold without a sales charge. These share classes reimburse AFD for amounts billed within the prior 15 months but only to the extent that the overall annual expense limit of 0.25% is not exceeded. As of November 30, 2012, there were no unreimbursed expenses subject to reimbursement for Class A or 529-A shares.
| | | | | | | | |
| Share class | | Currently approved limits | | Plan limits | |
| Class A | | 0.25 | % | | 0.25 | % | |
| | | | | | | | |
| Class 529-A | | 0.25 | | | 0.50 | | |
| | | | | | | | |
| Classes B and 529-B | | 1.00 | | | 1.00 | | |
| | | | | | | | |
| Classes C, 529-C and R-1 | | 1.00 | | | 1.00 | | |
| | | | | | | | |
| Class R-2 | | 0.75 | | | 1.00 | | |
| | | | | | | | |
| Classes 529-E and R-3 | | 0.50 | | | 0.75 | | |
| | | | | | | | |
| Classes F-1, 529-F-1 and R-4 | | 0.25 | | | 0.50 | | |
| | | | | | | | |
Transfer agent services — The fund has a shareholder services agreement with AFS under which the fund compensates AFS for providing transfer agent services to each of the fund’s share classes. These services include recordkeeping, shareholder communications and transaction processing. In addition, the fund reimburses AFS for amounts paid to third parties for performing transfer agent services on behalf of fund shareholders.
During the period December 1, 2011, through December 31, 2011, only Class A and B shares were subject to the shareholder services agreement with AFS. During this period, AFS and other third parties were compensated for providing transfer agent services to Class C, F, 529 and R shares through the fees paid by the fund to CRMC under the fund’s administrative services agreement with CRMC as described in the administrative services section below; CRMC paid for any transfer agent services expenses in excess of 0.10% of the respective average daily net assets of each of such share classes.
Effective January 1, 2012, the shareholder services agreement with AFS was modified to include Class C, F, 529 and R shares and payment for transfer agent services for such classes under the administrative services agreement terminated. Under this structure, transfer agent services expenses for some classes may exceed 0.10% of average daily net assets, resulting in an increase in expenses paid by some share classes.
For the year ended November 30, 2012, the total transfer agent services fee paid under these agreements was $12,640,000, of which $12,546,000 was paid by the fund to AFS and $94,000 was paid by the fund to CRMC through its administrative services agreement with the fund. Amounts paid to CRMC by the fund were then paid by CRMC to AFS and other third parties.
Administrative services — The fund has an administrative services agreement with CRMC under which the fund compensates CRMC for providing administrative services to Class A, C, F, 529 and R shares. These services include, but are not limited to, coordinating, monitoring, assisting and overseeing third parties that provide services to fund shareholders.
During the period December 1, 2011, through December 31, 2011, the agreement applied only to Class C, F, 529 and R shares. The agreement also required CRMC to arrange for the provision of transfer agent services for such share classes, which paid CRMC annual fees up to 0.15% (0.10% for Class R-5 and 0.05% for Class R-6) of their respective average daily net assets. During this period, up to 0.05% of these fees were used to compensate CRMC for performing administrative services; all other amounts paid under this agreement were used to compensate AFS and other third parties for transfer agent services.
Effective January 1, 2012, the administrative services agreement with CRMC was modified to include Class A shares. Under the revised agreement, Class A shares pay an annual fee of 0.01% and Class C, F, 529 and R shares pay an annual fee of 0.05% of their respective average daily net assets to CRMC for administrative services. Fees for transfer agent services are no longer included as part of the administrative services fee paid by the fund to CRMC.
For the year ended November 30, 2012, total fees paid to CRMC for performing administrative services were $1,361,000.
529 plan services — Each 529 share class is subject to service fees to compensate the Commonwealth of Virginia for the maintenance of the 529 college savings plan. The quarterly fee is based on a series of decreasing annual rates beginning with 0.10% on the first $30 billion of the net assets invested in Class 529 shares of the American Funds and decreasing to 0.06% on such assets between $120 billion and $150 billion. The fee for any given calendar quarter is accrued and calculated on the basis of the average net assets of Class 529 shares of the American Funds for the last month of the prior calendar quarter. The fee is included in other expenses on the accompanying financial statements. The Commonwealth of Virginia is not considered a related party.
| | |
| | Class-specific expenses under the agreements described on the previous page for the year ended November 30, 2012, were as follows (dollars in thousands): |
| | | | | | | | | | | | | | |
| Share class | | Distribution
services | | Transfer agent
services | | Administrative
services | | 529 plan
services | |
| Class A | | $ | 13,028 | | $ | 10,543 | | $ | 523 | | | Not applicable | |
| Class B | | | 558 | | | 107 | | | Not applicable | | | Not applicable | |
| Class C | | | 1,797 | | | 333 | | | 84 | | | Not applicable | |
| Class F-1 | | | 391 | | | 183 | | | 76 | | | Not applicable | |
| Class F-2 | | | Not applicable | | | 78 | | | 39 | | | Not applicable | |
| Class 529-A | | | 352 | | | 262 | | | 88 | | $ | 179 | |
| Class 529-B | | | 86 | | | 15 | | | 4 | | | 9 | |
| Class 529-C | | | 555 | | | 89 | | | 27 | | | 55 | |
| Class 529-E | | | 45 | | | 10 | | | 5 | | | 9 | |
| Class 529-F-1 | | | — | | | 16 | | | 5 | | | 11 | |
| Class R-1 | | | 237 | | | 28 | | | 12 | | | Not applicable | |
| Class R-2 | | | 884 | | | 468 | | | 61 | | | Not applicable | |
| Class R-3 | | | 813 | | | 301 | | | 84 | | | Not applicable | |
| Class R-4 | | | 349 | | | 143 | | | 73 | | | Not applicable | |
| Class R-5 | | | Not applicable | | | 62 | | | 62 | | | Not applicable | |
| Class R-6 | | | Not applicable | | | 2 | | | 218 | | | Not applicable | |
| | | | | | | | | | | | | | |
| Total class-specific expenses | | $ | 19,095 | | $ | 12,640 | | $ | 1,361 | | $ | 263 | |
| | | | | | | | | | | | | | |
Trustees’ deferred compensation — Trustees who are unaffiliated with CRMC may elect to defer the cash payment of part or all of their compensation. These deferred amounts, which remain as liabilities of the fund, are treated as if invested in shares of the fund or other American Funds. These amounts represent general, unsecured liabilities of the fund and vary according to the total returns of the selected funds. Trustees’ compensation of $662,000, shown on the accompanying financial statements, includes $464,000 in current fees (either paid in cash or deferred) and a net increase of $198,000 in the value of the deferred amounts.
Affiliated officers and trustees — Officers and certain trustees of the fund are or may be considered to be affiliated with CRMC, AFS and AFD. No affiliated officers or trustees received any compensation directly from the fund.
| |
| 7. Capital share transactions |
| |
Capital share transactions in the fund were as follows (dollars and shares in thousands):
| | | | | | | | | | | | | | | | | | | | | | | | | | |
| | | Sales* | | Reinvestments
of dividends | | Repurchases* | | Net (decrease)
increase | |
| | | | | | | | | | |
| Share class | | Amount | | Shares | | Amount | | Shares | | Amount | | Shares | | Amount | | Shares | |
| Year ended November 30, 2012 | | | | | | | | | | | | | | | | | | | | | | | | | |
| Class A | | $ | 520,447 | | | 19,362 | | $ | 24,629 | | | 1,044 | | $ | (921,314 | ) | | (34,589 | ) | $ | (376,238 | ) | | (14,183 | ) |
| Class B | | | 3,885 | | | 151 | | | — | | | — | | | (26,445 | ) | | (1,046 | ) | | (22,560 | ) | | (895 | ) |
| Class C | | | 31,070 | | | 1,223 | | | — | | | — | | | (48,106 | ) | | (1,914 | ) | | (17,036 | ) | | (691 | ) |
| Class F-1 | | | 56,584 | | | 2,092 | | | 611 | | | 26 | | | (82,817 | ) | | (3,076 | ) | | (25,622 | ) | | (958 | ) |
| Class F-2 | | | 47,810 | | | 1,740 | | | 440 | | | 19 | | | (27,751 | ) | | (1,031 | ) | | 20,499 | | | 728 | |
| Class 529-A | | | 34,535 | | | 1,305 | | | 766 | | | 33 | | | (25,062 | ) | | (945 | ) | | 10,239 | | | 393 | |
| Class 529-B | | | 350 | | | 14 | | | — | | | — | | | (4,094 | ) | | (163 | ) | | (3,744 | ) | | (149 | ) |
| Class 529-C | | | 10,843 | | | 426 | | | — | | | — | | | (9,543 | ) | | (374 | ) | | 1,300 | | | 52 | |
| Class 529-E | | | 1,704 | | | 65 | | | 15 | | | — | † | | (1,465 | ) | | (57 | ) | | 254 | | | 8 | |
| Class 529-F-1 | | | 3,231 | | | 120 | | | 66 | | | 3 | | | (2,377 | ) | | (91 | ) | | 920 | | | 32 | |
| Class R-1 | | | 6,015 | | | 232 | | | — | | | — | | | (9,901 | ) | | (380 | ) | | (3,886 | ) | | (148 | ) |
| Class R-2 | | | 35,868 | | | 1,386 | | | — | | | — | | | (45,105 | ) | | (1,751 | ) | | (9,237 | ) | | (365 | ) |
| Class R-3 | | | 49,626 | | | 1,885 | | | 274 | | | 12 | | | (60,409 | ) | | (2,299 | ) | | (10,509 | ) | | (402 | ) |
| Class R-4 | | | 52,920 | | | 1,994 | | | 711 | | | 30 | | | (60,124 | ) | | (2,279 | ) | | (6,493 | ) | | (255 | ) |
| Class R-5 | | | 25,996 | | | 956 | | | 890 | | | 38 | | | (28,021 | ) | | (1,033 | ) | | (1,135 | ) | | (39 | ) |
| Class R-6 | | | 135,693 | | | 5,159 | | | 3,038 | | | 128 | | | (43,879 | ) | | (1,623 | ) | | 94,852 | | | 3,664 | |
| | | | | | | | | | | | | | | | | | | | | | | | | | |
| Total net increase (decrease) | | $ | 1,016,577 | | | 38,110 | | $ | 31,440 | | | 1,333 | | $ | (1,396,413 | ) | | (52,651 | ) | $ | (348,396 | ) | | (13,208 | ) |
| | | | | | | | | | | | | | | | | | | | | | | | | | |
| | | | | | | | | | | | | | | | | | | | | | | | | | |
| | | Sales* | | Reinvestments
of dividends | | Repurchases* | | Net (decrease)
increase | |
| | | | | | | | | | |
| Share class | | Amount | | Shares | | Amount | | Shares | | Amount | | Shares | | Amount | | Shares | |
| Year ended November 30, 2011 | | | | | | | | | | | | | | | | | | | | | | | | | |
| Class A | | $ | 637,497 | | | 24,843 | | $ | 39,334 | | | 1,560 | | $ | (1,140,627 | ) | | (44,743 | ) | $ | (463,796 | ) | | (18,340 | ) |
| Class B | | | 7,986 | | | 322 | | | — | | | — | | | (36,864 | ) | | (1,516 | ) | | (28,878 | ) | | (1,194 | ) |
| Class C | | | 41,831 | | | 1,713 | | | 28 | | | 1 | | | (57,097 | ) | | (2,382 | ) | | (15,238 | ) | | (668 | ) |
| Class F-1 | | | 81,175 | | | 3,147 | | | 1,107 | | | 44 | | | (104,962 | ) | | (4,153 | ) | | (22,680 | ) | | (962 | ) |
| Class F-2 | | | 26,067 | | | 1,017 | | | 489 | | | 19 | | | (17,278 | ) | | (693 | ) | | 9,278 | | | 343 | |
| Class 529-A | | | 39,340 | | | 1,548 | | | 996 | | | 39 | | | (17,543 | ) | | (694 | ) | | 22,793 | | | 893 | |
| Class 529-B | | | 873 | | | 36 | | | — | | | — | | | (3,937 | ) | | (162 | ) | | (3,064 | ) | | (126 | ) |
| Class 529-C | | | 13,329 | | | 540 | | | 15 | | | 1 | | | (7,193 | ) | | (295 | ) | | 6,151 | | | 246 | |
| Class 529-E | | | 1,901 | | | 75 | | | 36 | | | 1 | | | (865 | ) | | (34 | ) | | 1,072 | | | 42 | |
| Class 529-F-1 | | | 4,909 | | | 190 | | | 63 | | | 3 | | | (2,008 | ) | | (78 | ) | | 2,964 | | | 115 | |
| Class R-1 | | | 7,074 | | | 286 | | | 24 | | | 1 | | | (6,282 | ) | | (253 | ) | | 816 | | | 34 | |
| Class R-2 | | | 38,696 | | | 1,554 | | | — | | | — | | | (43,220 | ) | | (1,742 | ) | | (4,524 | ) | | (188 | ) |
| Class R-3 | | | 61,020 | | | 2,426 | | | 719 | | | 29 | | | (60,222 | ) | | (2,394 | ) | | 1,517 | | | 61 | |
| Class R-4 | | | 61,089 | | | 2,423 | | | 992 | | | 40 | | | (39,283 | ) | | (1,556 | ) | | 22,798 | | | 907 | |
| Class R-5 | | | 34,199 | | | 1,330 | | | 1,336 | | | 53 | | | (56,867 | ) | | (2,305 | ) | | (21,332 | ) | | (922 | ) |
| Class R-6 | | | 98,041 | | | 3,862 | | | 2,986 | | | 118 | | | (26,582 | ) | | (1,045 | ) | | 74,445 | | | 2,935 | |
| | | | | | | | | | | | | | | | | | | | | | | | | | |
| Total net increase (decrease) | | $ | 1,155,027 | | | 45,312 | | $ | 48,125 | | | 1,909 | | $ | (1,620,830 | ) | | (64,045 | ) | $ | (417,678 | ) | | (16,824 | ) |
| | | | | | | | | | | | | | | | | | | | | | | | | | |
* Includes exchanges between share classes of the fund.
† Amount less than one thousand.
| |
| 8. Investment transactions |
| |
The fund made purchases and sales of investment securities, excluding short-term securities and U.S. government obligations, if any, of $2,459,033,000 and $2,546,065,000, respectively, during the year ended November 30, 2012.
Financial highlights
| | | | | | | | | | | | | | | | | | | | | | | | | | | | | | | | | | | | | | | | | |
| | | | | | Income (loss) from
investment operations1 | | Dividends and distributions | | | | | | | | | | | | | | | | |
| | | | | | | | | | | | | | | | | | | | | | | | |
| | | Net asset
value,
beginning
of period | | Net
investment
income
(loss) | | Net gains
(losses)
on
securities
(both
realized
and
unrealized) | | Total from
investment
operations | | Dividends
(from net
investment
income) | | Distributions
(from
capital
gains) | | Total
dividends
and
distributions | | Net
asset
value,
end of
period | | Total
return2,3 | | Net assets,
end of
period
(in millions) | | Ratio of
expenses
to average
net assets
before
waivers | | Ratio of
expenses to
average net
assets after
waivers3 | | Ratio of
net
income
(loss) to
average
net assets3 | |
| Class A: | | | | | | | | | | | | | | | | | | | | | | | | | | | | | | | | | | | | | |
| Year ended 11/30/2012 | | $ | 24.14 | | $ | .16 | | $ | 4.65 | | $ | 4.81 | | $ | (.12 | ) | $ | — | | $ | (.12 | ) | $ | 28.83 | | | 20.02 | % | $ | 5,919 | | .87 | % | | .87 | % | | .59 | % | |
| Year ended 11/30/2011 | | | 24.22 | | | .11 | | | (.02 | ) | | .09 | | | (.17 | ) | | — | | | (.17 | ) | | 24.14 | | | .31 | | | 5,298 | | .85 | | | .85 | | | .45 | | |
| Year ended 11/30/2010 | | | 21.87 | | | .18 | | | 2.28 | | | 2.46 | | | (.11 | ) | | — | | | (.11 | ) | | 24.22 | | | 11.34 | | | 5,760 | | .86 | | | .86 | | | .78 | | |
| Year ended 11/30/2009 | | | 15.22 | | | .12 | | | 6.76 | | | 6.88 | | | (.23 | ) | | — | | | (.23 | ) | | 21.87 | | | 45.88 | | | 5,733 | | .95 | | | .94 | | | .67 | | |
| Year ended 11/30/2008 | | | 30.09 | | | .29 | | | (12.57 | ) | | (12.28 | ) | | (.23 | ) | | (2.36 | ) | | (2.59 | ) | | 15.22 | | | (44.67 | ) | | 4,237 | | .83 | | | .79 | | | 1.24 | | |
| | | | | | | | | | | | | | | | | | | | | | | | | | | | | | | | | | | | | | | | | |
| Class B: | | | | | | | | | | | | | | | | | | | | | | | | | | | | | | | | | | | | | | | | |
| Year ended 11/30/2012 | | | 23.04 | | | (.05 | ) | | 4.46 | | | 4.41 | | | — | | | — | | | — | | | 27.45 | | | 19.09 | | | 50 | | 1.63 | | | 1.63 | | | (.19 | ) | |
| Year ended 11/30/2011 | | | 23.14 | | | (.08 | ) | | (.02 | ) | | (.10 | ) | | — | | | — | | | — | | | 23.04 | | | (.39 | ) | | 62 | | 1.62 | | | 1.62 | | | (.34 | ) | |
| Year ended 11/30/2010 | | | 20.95 | | | — | 4 | | 2.19 | | | 2.19 | | | — | | | — | | | — | | | 23.14 | | | 10.45 | | | 90 | | 1.64 | | | 1.64 | | | —5 | | |
| Year ended 11/30/2009 | | | 14.50 | | | (.02 | ) | | 6.50 | | | 6.48 | | | (.03 | ) | | — | | | (.03 | ) | | 20.95 | | | 44.73 | | | 117 | | 1.72 | | | 1.71 | | | (.09 | ) | |
| Year ended 11/30/2008 | | | 28.80 | | | .10 | | | (12.00 | ) | | (11.90 | ) | | (.04 | ) | | (2.36 | ) | | (2.40 | ) | | 14.50 | | | (45.08 | ) | | 100 | | 1.60 | | | 1.56 | | | .47 | | |
| | | | | | | | | | | | | | | | | | | | | | | | | | | | | | | | | | | | | | | | | |
| Class C: | | | | | | | | | | | | | | | | | | | | | | | | | | | | | | | | | | | | | | | | |
| Year ended 11/30/2012 | | | 22.80 | | | (.05 | ) | | 4.40 | | | 4.35 | | | — | | | — | | | — | | | 27.15 | | | 19.08 | | | 186 | | 1.67 | | | 1.67 | | | (.22 | ) | |
| Year ended 11/30/2011 | | | 22.90 | | | (.08 | ) | | (.02 | ) | | (.10 | ) | | — | | | — | | | — | | | 22.80 | | | (.47 | ) | | 172 | | 1.63 | | | 1.63 | | | (.33 | ) | |
| Year ended 11/30/2010 | | | 20.75 | | | — | 4 | | 2.16 | | | 2.16 | | | (.01 | ) | | — | | | (.01 | ) | | 22.90 | | | 10.45 | | | 188 | | 1.64 | | | 1.64 | | | .01 | | |
| Year ended 11/30/2009 | | | 14.39 | | | (.02 | ) | | 6.44 | | | 6.42 | | | (.06 | ) | | — | | | (.06 | ) | | 20.75 | | | 44.81 | | | 182 | | 1.69 | | | 1.68 | | | (.09 | ) | |
| Year ended 11/30/2008 | | | 28.63 | | | .10 | | | (11.91 | ) | | (11.81 | ) | | (.07 | ) | | (2.36 | ) | | (2.43 | ) | | 14.39 | | | (45.09 | ) | | 113 | | 1.62 | | | 1.58 | | | .46 | | |
| | | | | | | | | | | | | | | | | | | | | | | | | | | | | | | | | | | | | | | | | |
| Class F-1: | | | | | | | | | | | | | | | | | | | | | | | | | | | | | | | | | | | | | | | | |
| Year ended 11/30/2012 | | | 24.16 | | | .16 | | | 4.66 | | | 4.82 | | | (.11 | ) | | — | | | (.11 | ) | | 28.87 | | | 20.03 | | | 143 | | .86 | | | .86 | | | .61 | | |
| Year ended 11/30/2011 | | | 24.23 | | | .11 | | | (.01 | ) | | .10 | | | (.17 | ) | | — | | | (.17 | ) | | 24.16 | | | .33 | | | 143 | | .85 | | | .85 | | | .44 | | |
| Year ended 11/30/2010 | | | 21.90 | | | .18 | | | 2.28 | | | 2.46 | | | (.13 | ) | | — | | | (.13 | ) | | 24.23 | | | 11.32 | | | 167 | | .86 | | | .86 | | | .77 | | |
| Year ended 11/30/2009 | | | 15.11 | | | .12 | | | 6.77 | | | 6.89 | | | (.10 | ) | | — | | | (.10 | ) | | 21.90 | | | 45.93 | | | 187 | | .91 | | | .91 | | | .66 | | |
| Year ended 11/30/2008 | | | 29.91 | | | .28 | | | (12.48 | ) | | (12.20 | ) | | (.24 | ) | | (2.36 | ) | | (2.60 | ) | | 15.11 | | | (44.68 | ) | | 188 | | .85 | | | .81 | | | 1.22 | | |
| | | | | | | | | | | | | | | | | | | | | | | | | | | | | | | | | | | | | | | | | |
| Class F-2: | | | | | | | | | | | | | | | | | | | | | | | | | | | | | | | | | | | | | | | | |
| Year ended 11/30/2012 | | | 24.19 | | | .23 | | | 4.65 | | | 4.88 | | | (.19 | ) | | — | | | (.19 | ) | | 28.88 | | | 20.35 | | | 106 | | .59 | | | .59 | | | .87 | | |
| Year ended 11/30/2011 | | | 24.27 | | | .18 | | | (.02 | ) | | .16 | | | (.24 | ) | | — | | | (.24 | ) | | 24.19 | | | .58 | | | 72 | | .59 | | | .59 | | | .72 | | |
| Year ended 11/30/2010 | | | 21.93 | | | .24 | | | 2.29 | | | 2.53 | | | (.19 | ) | | — | | | (.19 | ) | | 24.27 | | | 11.63 | | | 63 | | .59 | | | .59 | | | 1.06 | | |
| Year ended 11/30/2009 | | | 15.24 | | | .14 | | | 6.81 | | | 6.95 | | | (.26 | ) | | — | | | (.26 | ) | | 21.93 | | | 46.33 | | | 54 | | .62 | | | .61 | | | .69 | | |
| Period from 8/1/2008 to 11/30/20086 | | | 22.62 | | | .07 | | | (7.45 | ) | | (7.38 | ) | | — | | | — | | | — | | | 15.24 | | | (32.63 | ) | | 2 | | .21 | | | .19 | | | .37 | | |
| | | | | | | | | | | | | | | | | | | | | | | | | | | | | | | | | | | | | | | | | |
| Class 529-A: | | | | | | | | | | | | | | | | | | | | | | | | | | | | | | | | | | | | | | | | |
| Year ended 11/30/2012 | | | 24.00 | | | .14 | | | 4.63 | | | 4.77 | | | (.12 | ) | | — | | | (.12 | ) | | 28.65 | | | 19.92 | | | 197 | | .93 | | | .93 | | | .53 | | |
| Year ended 11/30/2011 | | | 24.10 | | | .10 | | | (.02 | ) | | .08 | | | (.18 | ) | | — | | | (.18 | ) | | 24.00 | | | .32 | | | 156 | | .90 | | | .90 | | | .40 | | |
| Year ended 11/30/2010 | | | 21.77 | | | .17 | | | 2.27 | | | 2.44 | | | (.11 | ) | | — | | | (.11 | ) | | 24.10 | | | 11.27 | | | 135 | | .91 | | | .91 | | | .75 | | |
| Year ended 11/30/2009 | | | 15.16 | | | .12 | | | 6.72 | | | 6.84 | | | (.23 | ) | | — | | | (.23 | ) | | 21.77 | | | 45.84 | | | 110 | | .97 | | | .97 | | | .64 | | |
| Year ended 11/30/2008 | | | 29.98 | | | .28 | | | (12.52 | ) | | (12.24 | ) | | (.22 | ) | | (2.36 | ) | | (2.58 | ) | | 15.16 | | | (44.68 | ) | | 69 | | .87 | | | .83 | | | 1.22 | | |
| | | | | | | | | | | | | | | | | | | | | | | | | | | | | | | | | | | | | | | | | |
| Class 529-B: | | | | | | | | | | | | | | | | | | | | | | | | | | | | | | | | | | | | | | | | |
| Year ended 11/30/2012 | | | 23.15 | | | (.08 | ) | | 4.47 | | | 4.39 | | | — | | | — | | | — | | | 27.54 | | | 18.96 | | | 8 | | 1.75 | | | 1.75 | | | (.31 | ) | |
| Year ended 11/30/2011 | | | 23.27 | | | (.11 | ) | | (.01 | ) | | (.12 | ) | | — | | | — | | | — | | | 23.15 | | | (.52 | ) | | 10 | | 1.72 | | | 1.72 | | | (.43 | ) | |
| Year ended 11/30/2010 | | | 21.09 | | | (.02 | ) | | 2.20 | | | 2.18 | | | — | | | — | | | — | | | 23.27 | | | 10.34 | | | 13 | | 1.74 | | | 1.74 | | | (.10 | ) | |
| Year ended 11/30/2009 | | | 14.63 | | | (.03 | ) | | 6.54 | | | 6.51 | | | (.05 | ) | | — | | | (.05 | ) | | 21.09 | | | 44.65 | | | 14 | | 1.80 | | | 1.80 | | | (.18 | ) | |
| Year ended 11/30/2008 | | | 29.05 | | | .08 | | | (12.12 | ) | | (12.04 | ) | | (.02 | ) | | (2.36 | ) | | (2.38 | ) | | 14.63 | | | (45.14 | ) | | 10 | | 1.71 | | | 1.66 | | | .38 | | |
| | | | | | | | | | | | | | | | | | | | | | | | | | | | | | | | | | | | | | | | | |
| Class 529-C: | | | | | | | | | | | | | | | | | | | | | | | | | | | | | | | | | | | | | | | | |
| Year ended 11/30/2012 | | | 23.11 | | | (.07 | ) | | 4.45 | | | 4.38 | | | — | | | — | | | — | | | 27.49 | | | 18.95 | | | 60 | | 1.74 | | | 1.74 | | | (.28 | ) | |
| Year ended 11/30/2011 | | | 23.24 | | | (.10 | ) | | (.02 | ) | | (.12 | ) | | (.01 | ) | | — | | | (.01 | ) | | 23.11 | | | (.53 | ) | | 49 | | 1.71 | | | 1.71 | | | (.41 | ) | |
| Year ended 11/30/2010 | | | 21.06 | | | (.01 | ) | | 2.19 | | | 2.18 | | | — | | | — | | | — | | | 23.24 | | | 10.35 | | | 44 | | 1.72 | | | 1.72 | | | (.07 | ) | |
| Year ended 11/30/2009 | | | 14.62 | | | (.03 | ) | | 6.53 | | | 6.50 | | | (.06 | ) | | — | | | (.06 | ) | | 21.06 | | | 44.71 | | | 36 | | 1.79 | | | 1.79 | | | (.18 | ) | |
| Year ended 11/30/2008 | | | 29.04 | | | .09 | | | (12.10 | ) | | (12.01 | ) | | (.05 | ) | | (2.36 | ) | | (2.41 | ) | | 14.62 | | | (45.15 | ) | | 23 | | 1.70 | | | 1.66 | | | .39 | | |
| | | | | | | | | | | | | | | | | | | | | | | | | | | | | | | | | | | | | | | | | |
| Class 529-E: | | | | | | | | | | | | | | | | | | | | | | | | | | | | | | | | | | | | | | | | |
| Year ended 11/30/2012 | | | 23.75 | | | .07 | | | 4.57 | | | 4.64 | | | (.04 | ) | | — | | | (.04 | ) | | 28.35 | | | 19.59 | | | 10 | | 1.20 | | | 1.20 | | | .26 | | |
| Year ended 11/30/2011 | | | 23.85 | | | .03 | | | (.01 | ) | | .02 | | | (.12 | ) | | — | | | (.12 | ) | | 23.75 | | | — | 5 | | 8 | | 1.19 | | | 1.19 | | | .11 | | |
| Year ended 11/30/2010 | | | 21.57 | | | .10 | | | 2.24 | | | 2.34 | | | (.06 | ) | | — | | | (.06 | ) | | 23.85 | | | 10.93 | | | 7 | | 1.21 | | | 1.21 | | | .44 | | |
| Year ended 11/30/2009 | | | 15.01 | | | .06 | | | 6.67 | | | 6.73 | | | (.17 | ) | | — | | | (.17 | ) | | 21.57 | | | 45.45 | | | 6 | | 1.28 | | | 1.27 | | | .34 | | |
| Year ended 11/30/2008 | | | 29.71 | | | .20 | | | (12.39 | ) | | (12.19 | ) | | (.15 | ) | | (2.36 | ) | | (2.51 | ) | | 15.01 | | | (44.86 | ) | | 4 | | 1.19 | | | 1.15 | | | .90 | | |
| | | | | | | | | | | | | | | | | | | | | | | | | | | | | | | | | | | | | | | | | |
| | | | | | | | | | | | | | | | | | | | | | | | | | | | | | | | | | | | | | | | | |
| | | | | | Income (loss) from
investment operations1 | | Dividends and distributions | | | | | | | | | | | | | | | | | | | |
| | | | | | | | | | | | | | | | | | | | | | | | | | | |
| | | Net asset
value,
beginning
of period | | Net
investment
income
(loss) | | Net gains
(losses)
on
securities
(both
realized
and
unrealized) | | Total from
investment
operations | | Dividends
(from net
investment
income) | | Distributions
(from
capital
gains) | | Total
dividends
and
distributions | | Net
asset
value,
end
of period | | Total
return3 | | Net assets,
end of
period
(in millions) | | Ratio of
expenses
to
average
net
assets
before
waivers | | Ratio of
expenses to
average
net
assets
after
waivers3 | | Ratio of
net
income
(loss) to
average
net
assets3 | |
| Class 529-F-1: | | | | | | | | | | | | | | | | | | | | | | | | | | | | | | | | | | | | | | | | |
| Year ended 11/30/2012 | | $ | 24.01 | | $ | .19 | | $ | 4.62 | | $ | 4.81 | | $ | (.17 | ) | $ | — | | $ | (.17 | ) | $ | 28.65 | | | 20.17 | % | $ | 13 | | .74 | % | | .74 | % | | .73 | % | |
| Year ended 11/30/2011 | | | 24.09 | | | .16 | | | (.03 | ) | | .13 | | | (.21 | ) | | — | | | (.21 | ) | | 24.01 | | | .47 | | | 10 | | .70 | | | .70 | | | .62 | | |
| Year ended 11/30/2010 | | | 21.77 | | | .21 | | | 2.27 | | | 2.48 | | | (.16 | ) | | — | | | (.16 | ) | | 24.09 | | | 11.47 | | | 7 | | .71 | | | .71 | | | .94 | | |
| Year ended 11/30/2009 | | | 15.17 | | | .15 | | | 6.73 | | | 6.88 | | | (.28 | ) | | — | | | (.28 | ) | | 21.77 | | | 46.18 | | | 6 | | .78 | | | .77 | | | .79 | | |
| Year ended 11/30/2008 | | | 30.00 | | | .32 | | | (12.52 | ) | | (12.20 | ) | | (.27 | ) | | (2.36 | ) | | (2.63 | ) | | 15.17 | | | (44.58 | ) | | 3 | | .69 | | | .65 | | | 1.41 | | |
| | | | | | | | | | | | | | | | | | | | | | | | | | | | | | | | | | | | | | | | | |
| Class R-1: | | | | | | | | | | | | | | | | | | | | | | | | | | | | | | | | | | | | | | | | |
| Year ended 11/30/2012 | | | 23.27 | | | (.04 | ) | | 4.49 | | | 4.45 | | | — | | | — | | | — | | | 27.72 | | | 19.12 | | | 23 | | 1.61 | | | 1.61 | | | (.15 | ) | |
| Year ended 11/30/2011 | | | 23.39 | | | (.08 | ) | | (.01 | ) | | (.09 | ) | | (.03 | ) | | — | | | (.03 | ) | | 23.27 | | | (.41 | ) | | 23 | | 1.61 | | | 1.61 | | | (.32 | ) | |
| Year ended 11/30/2010 | | | 21.20 | | | .01 | | | 2.21 | | | 2.22 | | | (.03 | ) | | — | | | (.03 | ) | | 23.39 | | | 10.46 | | | 22 | | 1.62 | | | 1.62 | | | .03 | | |
| Year ended 11/30/2009 | | | 14.71 | | | (.01 | ) | | 6.57 | | | 6.56 | | | (.07 | ) | | — | | | (.07 | ) | | 21.20 | | | 44.78 | | | 16 | | 1.68 | | | 1.68 | | | (.08 | ) | |
| Year ended 11/30/2008 | | | 29.22 | | | .11 | | | (12.18 | ) | | (12.07 | ) | | (.08 | ) | | (2.36 | ) | | (2.44 | ) | | 14.71 | | | (45.08 | ) | | 10 | | 1.61 | | | 1.57 | | | .50 | | |
| | | | | | | | | | | | | | | | | | | | | | | | | | | | | | | | | | | | | | | | | |
| Class R-2: | | | | | | | | | | | | | | | | | | | | | | | | | | | | | | | | | | | | | | | | |
| Year ended 11/30/2012 | | | 23.37 | | | (.05 | ) | | 4.52 | | | 4.47 | | | — | | | — | | | — | | | 27.84 | | | 19.13 | | | 124 | | 1.63 | | | 1.63 | | | (.17 | ) | |
| Year ended 11/30/2011 | | | 23.47 | | | (.08 | ) | | (.02 | ) | | (.10 | ) | | — | | | — | | | — | | | 23.37 | | | (.43 | ) | | 112 | | 1.63 | | | 1.63 | | | (.33 | ) | |
| Year ended 11/30/2010 | | | 21.26 | | | — | 4 | | 2.21 | | | 2.21 | | | — | | | — | | | — | | | 23.47 | | | 10.40 | | | 118 | | 1.67 | | | 1.67 | | | (.01 | ) | |
| Year ended 11/30/2009 | | | 14.76 | | | (.03 | ) | | 6.59 | | | 6.56 | | | (.06 | ) | | — | | | (.06 | ) | | 21.26 | | | 44.58 | | | 108 | | 1.81 | | | 1.80 | | | (.19 | ) | |
| Year ended 11/30/2008 | | | 29.30 | | | .08 | | | (12.22 | ) | | (12.14 | ) | | (.04 | ) | | (2.36 | ) | | (2.40 | ) | | 14.76 | | | (45.13 | ) | | 68 | | 1.72 | | | 1.68 | | | .37 | | |
| | | | | | | | | | | | | | | | | | | | | | | | | | | | | | | | | | | | | | | | | |
| Class R-3: | | | | | | | | | | | | | | | | | | | | | | | | | | | | | | | | | | | | | | | | |
| Year ended 11/30/2012 | | | 23.77 | | | .07 | | | 4.58 | | | 4.65 | | | (.04 | ) | | — | | | (.04 | ) | | 28.38 | | | 19.62 | | | 168 | | 1.18 | | | 1.18 | | | .28 | | |
| Year ended 11/30/2011 | | | 23.87 | | | .03 | | | (.02 | ) | | .01 | | | (.11 | ) | | — | | | (.11 | ) | | 23.77 | | | .04 | | | 150 | | 1.17 | | | 1.17 | | | .13 | | |
| Year ended 11/30/2010 | | | 21.58 | | | .11 | | | 2.25 | | | 2.36 | | | (.07 | ) | | — | | | (.07 | ) | | 23.87 | | | 10.98 | | | 150 | | 1.18 | | | 1.18 | | | .47 | | |
| Year ended 11/30/2009 | | | 15.01 | | | .07 | | | 6.67 | | | 6.74 | | | (.17 | ) | | — | | | (.17 | ) | | 21.58 | | | 45.39 | | | 127 | | 1.25 | | | 1.24 | | | .36 | | |
| Year ended 11/30/2008 | | | 29.72 | | | .21 | | | (12.40 | ) | | (12.19 | ) | | (.16 | ) | | (2.36 | ) | | (2.52 | ) | | 15.01 | | | (44.83 | ) | | 78 | | 1.17 | | | 1.13 | | | .93 | | |
| | | | | | | | | | | | | | | | | | | | | | | | | | | | | | | | | | | | | | | | | |
| Class R-4: | | | | | | | | | | | | | | | | | | | | | | | | | | | | | | | | | | | | | | | | |
| Year ended 11/30/2012 | | | 24.01 | | | .16 | | | 4.63 | | | 4.79 | | | (.13 | ) | | — | | | (.13 | ) | | 28.67 | | | 20.06 | | | 150 | | .85 | | | .85 | | | .61 | | |
| Year ended 11/30/2011 | | | 24.11 | | | .12 | | | (.03 | ) | | .09 | | | (.19 | ) | | — | | | (.19 | ) | | 24.01 | | | .35 | | | 132 | | .85 | | | .85 | | | .45 | | |
| Year ended 11/30/2010 | | | 21.79 | | | .18 | | | 2.27 | | | 2.45 | | | (.13 | ) | | — | | | (.13 | ) | | 24.11 | | | 11.28 | | | 111 | | .86 | | | .86 | | | .79 | | |
| Year ended 11/30/2009 | | | 15.17 | | | .13 | | | 6.73 | | | 6.86 | | | (.24 | ) | | — | | | (.24 | ) | | 21.79 | | | 45.97 | | | 85 | | .90 | | | .90 | | | .71 | | |
| Year ended 11/30/2008 | | | 30.01 | | | .28 | | | (12.52 | ) | | (12.24 | ) | | (.24 | ) | | (2.36 | ) | | (2.60 | ) | | 15.17 | | | (44.67 | ) | | 49 | | .84 | | | .80 | | | 1.25 | | |
| | | | | | | | | | | | | | | | | | | | | | | | | | | | | | | | | | | | | | | | | |
| Class R-5: | | | | | | | | | | | | | | | | | | | | | | | | | | | | | | | | | | | | | | | | |
| Year ended 11/30/2012 | | | 24.26 | | | .25 | | | 4.67 | | | 4.92 | | | (.20 | ) | | — | | | (.20 | ) | | 28.98 | | | 20.45 | | | 131 | | .54 | | | .54 | | | .92 | | |
| Year ended 11/30/2011 | | | 24.34 | | | .19 | | | (.03 | ) | | .16 | | | (.24 | ) | | — | | | (.24 | ) | | 24.26 | | | .64 | | | 111 | | .54 | | | .54 | | | .76 | | |
| Year ended 11/30/2010 | | | 21.97 | | | .24 | | | 2.31 | | | 2.55 | | | (.18 | ) | | — | | | (.18 | ) | | 24.34 | | | 11.65 | | | 133 | | .56 | | | .56 | | | 1.08 | | |
| Year ended 11/30/2009 | | | 15.31 | | | .17 | | | 6.80 | | | 6.97 | | | (.31 | ) | | — | | | (.31 | ) | | 21.97 | | | 46.45 | | | 165 | | .59 | | | .59 | | | .99 | | |
| Year ended 11/30/2008 | | | 30.24 | | | .36 | | | (12.63 | ) | | (12.27 | ) | | (.30 | ) | | (2.36 | ) | | (2.66 | ) | | 15.31 | | | (44.50 | ) | | 157 | | .53 | | | .49 | | | 1.58 | | |
| | | | | | | | | | | | | | | | | | | | | | | | | | | | | | | | | | | | | | | | | |
| Class R-6: | | | | | | | | | | | | | | | | | | | | | | | | | | | | | | | | | | | | | | | | |
| Year ended 11/30/2012 | | | 24.23 | | | .26 | | | 4.66 | | | 4.92 | | | (.22 | ) | | — | | | (.22 | ) | | 28.93 | | | 20.48 | | | 512 | | .49 | | | .49 | | | .97 | | |
| Year ended 11/30/2011 | | | 24.31 | | | .21 | | | (.03 | ) | | .18 | | | (.26 | ) | | — | | | (.26 | ) | | 24.23 | | | .70 | | | 340 | | .49 | | | .49 | | | .81 | | |
| Year ended 11/30/2010 | | | 21.92 | | | .27 | | | 2.28 | | | 2.55 | | | (.16 | ) | | — | | | (.16 | ) | | 24.31 | | | 11.68 | | | 270 | | .51 | | | .51 | | | 1.17 | | |
| Period from 5/1/2009 to 11/30/20096 | | | 17.22 | | | .13 | | | 4.57 | | | 4.70 | | | — | | | — | | | — | | | 21.92 | | | 27.29 | | | 154 | | .54 | 7 | | .54 | 7 | | 1.06 | 7 | |
| | | | | | | | | | | | | | | | | | | | | | | | | | | | | | | | | | | | | | | | | |
| | | | | | | | | | | | | | | | | |
| | | Year ended November 30 | |
| | | | |
| | | | 2012 | | | 2011 | | | 2010 | | | 2009 | | | 2008 | |
| Portfolio turnover rate for all share classes | | | 37% | | | 45% | | | 47% | | | 51% | | | 52% | |
| | | | | | | | | | | | | | | | | |
| | |
| 1 | Based on average shares outstanding. |
| 2 | Total returns exclude any applicable sales charges, including contingent deferred sales charges. |
| 3 | This column reflects the impact, if any, of certain waivers from CRMC. During some of the periods shown, CRMC reduced fees for investment advisory services. |
| 4 | Amount less than $.01. |
| 5 | Amount less than .01%. |
| 6 | Based on operations for the period shown and, accordingly, is not representative of a full year. |
| 7 | Annualized. |
See Notes to Financial Statements
Report of Independent Registered Public Accounting Firm
| |
| To the Board of Trustees and Shareholders of The New Economy Fund |
| |
In our opinion, the accompanying statement of assets and liabilities, including the summary investment portfolio, and the related statements of operations and of changes in net assets and the financial highlights present fairly, in all material respects, the financial position of The New Economy Fund (the “Fund”) at November 30, 2012, the results of its operations for the year then ended, the changes in its net assets for each of the two years in the period then ended and the financial highlights for each of the periods presented, in conformity with accounting principles generally accepted in the United States of America. These financial statements and financial highlights (hereafter referred to as “financial statements”) are the responsibility of the Fund’s management. Our responsibility is to express an opinion on these financial statements based on our audits. We conducted our audits of these financial statements in accordance with the standards of the Public Company Accounting Oversight Board (United States). Those standards require that we plan and perform the audit to obtain reasonable assurance about whether the financial statements are free of material misstatement. An audit includes examining, on a test basis, evidence supporting the amounts and disclosures in the financial statements, assessing the accounting principles used and significant estimates made by management, and evaluating the overall financial statement presentation. We believe that our audits, which included confirmation of securities at November 30, 2012 by correspondence with the custodian and brokers, provide a reasonable basis for our opinion.
PricewaterhouseCoopers LLP
Los Angeles, California
January 11, 2013
We are required to advise you of the federal tax status of certain distributions received by shareholders during the fiscal year. The fund hereby designates the following amounts for the fund’s fiscal year ended November 30, 2012:
| | | | | |
| | | | | |
| Long-term capital gains | | $ | 252,433,000 | |
| | | | | |
| Qualified dividend income | | | 100 | % |
| | | | | |
| Corporate dividends received deduction | | | 100 | % |
| | | | | |
| U.S. government income that may be exempt from state taxation | | $ | 895,000 | |
| | | | | |
Individual shareholders should refer to their Form 1099 or other tax information, which will be mailed in January 2013, to determine the calendar year amounts to be included on their 2012 tax returns. Shareholders should consult their tax advisers.
As a shareholder of the fund, you incur two types of costs: (1) transaction costs, such as initial sales charges on purchase payments and contingent deferred sales charges on redemptions (loads), and (2) ongoing costs, including management fees, distribution and service (12b-1) fees, and other expenses. This example is intended to help you understand your ongoing costs (in dollars) of investing in the fund so you can compare these costs with the ongoing costs of investing in other mutual funds. The example is based on an investment of $1,000 invested at the beginning of the period and held for the entire six-month period (June 1, 2012, through November 30, 2012).
Actual expenses:
The first line of each share class in the table on the next page provides information about actual account values and actual expenses. You may use the information in this line, together with the amount you invested, to estimate the expenses that you paid over the period. Simply divide your account value by $1,000 (for example, an $8,600 account value divided by $1,000 = 8.6), then multiply the result by the number in the first line under the heading entitled “Expenses paid during period” to estimate the expenses you paid on your account during this period.
Hypothetical example for comparison purposes:
The second line of each share class in the table on the next page provides information about hypothetical account values and hypothetical expenses based on the actual expense ratio for the share class and an assumed rate of return of 5.00% per year before expenses, which is not the actual return of the share class. The hypothetical account values and expenses may not be used to estimate the actual ending account balance or expenses you paid for the period. You may use this information to compare the ongoing costs of investing in the fund and other funds. To do so, compare this 5.00% hypothetical example with the 5.00% hypothetical examples that appear in the shareholder reports of the other funds.
Notes:
There are some account fees that are charged to certain types of accounts, such as individual retirement accounts and 529 college savings plan accounts (generally, a $10 fee is charged to set up the account and an additional $10 fee is charged to the account annually), that would increase the amount of expenses paid on your account. In addition, retirement plan participants may be subject to certain fees charged by the plan sponsor, and Class F-1, F-2 and 529-F-1 shareholders may be subject to fees charged by financial intermediaries, typically ranging from 0.75% to 1.50% of assets annually depending on services offered. You can estimate the impact of these fees by adding the amount of the fees to the total estimated expenses you paid on your account during the period as calculated above. In addition, your ending account value would be lower by the amount of these fees.
Note that the expenses shown in the table are meant to highlight your ongoing costs only and do not reflect any transactional costs, such as sales charges (loads). Therefore, the second line of each share class in the table is useful in comparing ongoing costs only and will not help you determine the relative total costs of owning different funds. In addition, if these transactional costs were included, your costs would have been higher.
| | | | | | | | | | | | | | |
| | | Beginning account value
6/1/2012 | | Ending account value
11/30/2012 | | Expenses paid
during period* | | Annualized
expense ratio | |
| Class A — actual return | | $ | 1,000.00 | | $ | 1,117.88 | | $ | 4.55 | | .86 | % | |
| Class A — assumed 5% return | | | 1,000.00 | | | 1,020.70 | | | 4.34 | | .86 | | |
| | | | | | | | | | | | | | |
| Class B — actual return | | | 1,000.00 | | | 1,113.59 | | | 8.56 | | 1.62 | | |
| Class B — assumed 5% return | | | 1,000.00 | | | 1,016.90 | | | 8.17 | | 1.62 | | |
| | | | | | | | | | | | | | |
| Class C — actual return | | | 1,000.00 | | | 1,113.15 | | | 8.82 | | 1.67 | | |
| Class C — assumed 5% return | | | 1,000.00 | | | 1,016.65 | | | 8.42 | | 1.67 | | |
| | | | | | | | | | | | | | |
| Class F-1 — actual return | | | 1,000.00 | | | 1,117.70 | | | 4.55 | | .86 | | |
| Class F-1 — assumed 5% return | | | 1,000.00 | | | 1,020.70 | | | 4.34 | | .86 | | |
| | | | | | | | | | | | | | |
| Class F-2 — actual return | | | 1,000.00 | | | 1,119.39 | | | 3.13 | | .59 | | |
| Class F-2 — assumed 5% return | | | 1,000.00 | | | 1,022.05 | | | 2.98 | | .59 | | |
| | | | | | | | | | | | | | |
| Class 529-A — actual return | | | 1,000.00 | | | 1,117.41 | | | 4.92 | | .93 | | |
| Class 529-A — assumed 5% return | | | 1,000.00 | | | 1,020.35 | | | 4.70 | | .93 | | |
| | | | | | | | | | | | | | |
| Class 529-B — actual return | | | 1,000.00 | | | 1,113.17 | | | 9.19 | | 1.74 | | |
| Class 529-B — assumed 5% return | | | 1,000.00 | | | 1,016.30 | | | 8.77 | | 1.74 | | |
| | | | | | | | | | | | | | |
| Class 529-C — actual return | | | 1,000.00 | | | 1,112.96 | | | 9.19 | | 1.74 | | |
| Class 529-C — assumed 5% return | | | 1,000.00 | | | 1,016.30 | | | 8.77 | | 1.74 | | |
| | | | | | | | | | | | | | |
| Class 529-E — actual return | | | 1,000.00 | | | 1,115.71 | | | 6.29 | | 1.19 | | |
| Class 529-E — assumed 5% return | | | 1,000.00 | | | 1,019.05 | | | 6.01 | | 1.19 | | |
| | | | | | | | | | | | | | |
| Class 529-F-1 — actual return | | | 1,000.00 | | | 1,118.70 | | | 3.87 | | .73 | | |
| Class 529-F-1 — assumed 5% return | | | 1,000.00 | | | 1,021.35 | | | 3.69 | | .73 | | |
| | | | | | | | | | | | | | |
| Class R-1 — actual return | | | 1,000.00 | | | 1,113.71 | | | 8.51 | | 1.61 | | |
| Class R-1 — assumed 5% return | | | 1,000.00 | | | 1,016.95 | | | 8.12 | | 1.61 | | |
| | | | | | | | | | | | | | |
| Class R-2 — actual return | | | 1,000.00 | | | 1,113.60 | | | 8.56 | | 1.62 | | |
| Class R-2 — assumed 5% return | | | 1,000.00 | | | 1,016.90 | | | 8.17 | | 1.62 | | |
| | | | | | | | | | | | | | |
| Class R-3 — actual return | | | 1,000.00 | | | 1,116.02 | | | 6.19 | | 1.17 | | |
| Class R-3 — assumed 5% return | | | 1,000.00 | | | 1,019.15 | | | 5.91 | | 1.17 | | |
| | | | | | | | | | | | | | |
| Class R-4 — actual return | | | 1,000.00 | | | 1,118.19 | | | 4.45 | | .84 | | |
| Class R-4 — assumed 5% return | | | 1,000.00 | | | 1,020.80 | | | 4.24 | | .84 | | |
| | | | | | | | | | | | | | |
| Class R-5 — actual return | | | 1,000.00 | | | 1,119.79 | | | 2.86 | | .54 | | |
| Class R-5 — assumed 5% return | | | 1,000.00 | | | 1,022.30 | | | 2.73 | | .54 | | |
| | | | | | | | | | | | | | |
| Class R-6 — actual return | | | 1,000.00 | | | 1,120.02 | | | 2.60 | | .49 | | |
| Class R-6 — assumed 5% return | | | 1,000.00 | | | 1,022.55 | | | 2.48 | | .49 | | |
| | | | | | | | | | | | | | |
| | |
| * | The “expenses paid during period” are equal to the “annualized expense ratio,” multiplied by the average account value over the period, multiplied by the number of days in the period, and divided by 366 (to reflect the one-half year period). |
The New Economy Fund 31
Approval of Investment Advisory and Service Agreement
The fund’s board has approved the fund’s Investment Advisory and Service Agreement (the “agreement”) with Capital Research and Management Company (“CRMC”) for an additional one-year term through October 31, 2013. The board approved the agreement following the recommendation of the fund’s Contracts Committee (the “committee”), which is composed of all of the fund’s independent board members. The board and the committee determined that the fund’s advisory fee structure was fair and reasonable in relation to the services provided and that approving the agreement was in the best interests of the fund and its shareholders.
In reaching this decision, the board and the committee took into account information furnished to them throughout the year, as well as information prepared specifically in connection with their review of the agreement, and were advised by their independent counsel. They considered the factors discussed below, among others, but did not identify any single issue or particular piece of information that, in isolation, was the controlling factor.
| |
| 1. Nature, extent and quality of services |
| |
| The board and the committee considered the depth and quality of CRMC’s investment management process, including its global research capabilities; the experience, capability and integrity of its senior management and other personnel; the low turnover rates of its key personnel; the overall financial strength and stability of its organization; and the ongoing evolution of CRMC’s organizational structure designed to maintain and strengthen these qualities. The board and the committee also considered the nature, extent and quality of administrative, compliance and shareholder services provided by CRMC to the fund under the agreement and other agreements, as well as the benefits to fund shareholders from investing in a fund that is part of a large family of funds. The board and the committee concluded that the nature, extent and quality of the services provided by CRMC have benefited and should continue to benefit the fund and its shareholders. |
| |
| 2. Investment results |
| |
| The board and the committee considered the investment results of the fund in light of its objective of providing long-term growth of capital. They compared the fund’s total returns with those of other relevant funds (including the other funds that are the basis of the Lipper index for the category in which the fund is included) and market data such as relevant market indices, in each case as available at the time of the related board and committee meetings. This report, including the letter to shareholders and related disclosures, contains certain information about the fund’s investment results. The board and the committee concluded that the fund’s long-term results have been satisfactory and that CRMC’s record in managing the fund indicated that its continued management should benefit the fund and its shareholders. |
| |
| 3. Advisory fees and total expenses |
| |
| The board and the committee compared the advisory fees and total expense levels of the fund to those of other relevant funds. They observed that the fund’s advisory fees and expenses remain significantly below those of most other relevant funds. The board and the committee also noted the breakpoint discounts in the fund’s advisory fee structure that reduce the level of fees charged by CRMC to the fund as fund assets increase. In addition, they reviewed information regarding the advisory fees paid by clients of an affiliate of CRMC. They noted that, to the extent there were differences between the advisory fees paid by the fund and the advisory fees paid by those clients, the differences appropriately reflected the investment, operational and regulatory differences between advising the fund and the other clients. The board and the committee concluded that the fund’s cost structure was fair and reasonable in relation to the services provided, and that the shareholders receive reasonable value in return for the advisory fees and other amounts paid to CRMC by the fund. |
32 The New Economy Fund
| |
| 4. Ancillary benefits |
| |
| The board and the committee considered a variety of other benefits received by CRMC and its affiliates as a result of CRMC’s relationship with the fund and the other American Funds, including fees for administrative services provided to certain share classes; fees paid to CRMC’s affiliated transfer agent; sales charges and distribution fees received and retained by the fund’s principal underwriter, an affiliate of CRMC; and possible ancillary benefits to CRMC’s institutional management affiliates. The board and the committee reviewed CRMC’s portfolio trading practices, noting that while CRMC receives the benefit of research provided by broker-dealers executing portfolio transactions on behalf of the fund, it does not obtain third-party research or other services in return for allocating brokerage to such broker-dealers. The board and the committee took these ancillary benefits into account in evaluating the reasonableness of the advisory fees and other amounts paid to CRMC by the fund. |
| |
| 5. Adviser financial information |
| |
| The board and the committee reviewed information regarding CRMC’s costs of providing services to the American Funds, including personnel, systems and resources of investment, compliance, trading, accounting and other administrative operations. They considered CRMC’s costs and willingness to invest in technology, infrastructure and staff to maintain and expand services and capabilities, respond to industry and regulatory developments, and attract and retain qualified personnel. They noted information regarding the compensation structure for CRMC’s investment professionals. The board and the committee also compared CRMC’s profitability to the reported results of several large, publicly held investment management companies. The board and the committee noted the competitiveness and cyclicality of both the mutual fund industry and the capital markets, and the importance in that environment of CRMC’s long-term profitability for maintaining its independence, company culture and management continuity. They further considered the breakpoint discounts in the fund’s advisory fee structure. The board and the committee concluded that the fund’s advisory fee structure reflected a reasonable sharing of benefits between CRMC and the fund’s shareholders. |
The New Economy Fund 33
| | |
| Other share class results | unaudited |
| | |
| Classes B, C, F and 529 | |
| | |
Fund results shown are for past periods and are not predictive of results for future periods. Current and future results may be lower or higher than those shown. Share prices and returns will vary, so investors may lose money. For current information and month-end results, visit americanfunds.com.
Average annual total returns for periods ended December 31, 2012 (the most recent calendar quarter-end):
| | | | | | | | | | | | | | |
| | | 1 year | | 5 years | | 10 years/
Life of class1 | |
| Class B shares2 | | | | | | | | | | | | | |
| Reflecting applicable contingent deferred sales charge (CDSC), maximum of 5%, payable only if shares are sold within six years of purchase | | | 18.04 | % | | | 1.13 | % | | | 8.94 | % | |
| Not reflecting CDSC | | | 23.04 | | | | 1.51 | | | | 8.94 | | |
| | | | | | | | | | | | | | |
| Class C shares | | | | | | | | | | | | | |
| Reflecting CDSC, maximum of 1%, payable only if shares are sold within one year of purchase | | | 21.98 | | | | 1.50 | | | | 8.74 | | |
| Not reflecting CDSC | | | 22.98 | | | | 1.50 | | | | 8.74 | | |
| | | | | | | | | | | | | | |
| Class F-1 shares3 | | | | | | | | | | | | | |
| Not reflecting annual asset-based fee charged by sponsoring firm | | | 24.01 | | | | 2.29 | | | | 9.60 | | |
| | | | | | | | | | | | | | |
| Class F-2 shares3 — first sold 8/1/08 | | | | | | | | | | | | | |
| Not reflecting annual asset-based fee charged by sponsoring firm | | | 24.35 | | | | — | | | | 7.26 | | |
| | | | | | | | | | | | | | |
| Class 529-A shares4 | | | | | | | | | | | | | |
| Reflecting 5.75% maximum sales charge | | | 16.83 | | | | 1.04 | | | | 8.93 | | |
| Not reflecting maximum sales charge | | | 23.94 | | | | 2.24 | | | | 9.58 | | |
| | | | | | | | | | | | | | |
| Class 529-B shares2,4 | | | | | | | | | | | | | |
| Reflecting applicable CDSC, maximum of 5%, payable only if shares are sold within six years of purchase | | | 17.95 | | | | 1.02 | | | | 8.82 | | |
| Not reflecting CDSC | | | 22.95 | | | | 1.40 | | | | 8.82 | | |
| | | | | | | | | | | | | | |
| Class 529-C shares4 | | | | | | | | | | | | | |
| Reflecting CDSC, maximum of 1%, payable only if shares are sold within one year of purchase | | | 21.94 | | | | 1.41 | | | | 8.65 | | |
| Not reflecting CDSC | | | 22.94 | | | | 1.41 | | | | 8.65 | | |
| | | | | | | | | | | | | | |
| Class 529-E shares3,4 | | | 23.62 | | | | 1.94 | | | | 9.22 | | |
| | | | | | | | | | | | | | |
| Class 529-F-1 shares3,4 | | | | | | | | | | | | | |
| Not reflecting annual asset-based fee charged by sponsoring firm | | | 24.21 | | | | 2.45 | | | | 9.70 | | |
| | | | | | | | | | | | | | |
| |
| 1 Applicable to Class F-2 shares only. All other share classes reflect 10-year results. |
| 2 These shares are not available for purchase. |
| 3 These shares are sold without any initial or contingent deferred sales charge. |
| 4 Results shown do not reflect the $10 account setup fee and an annual $10 account maintenance fee. |
Investment results assume all distributions are reinvested and reflect applicable fees and expenses. When applicable, investment results reflect fee waivers, without which results would have been lower. Visit americanfunds.com for more information.
For information regarding the differences among the various share classes, refer to the fund prospectus.
Board of trustees and other officers
| | | | | | | | |
| “Independent” trustees1 |
| Name and age | | Year first elected
a trustee
of the fund2 | Principal occupation(s) during past five years | | Number of portfolios
in fund complex 3
overseen by trustee | | Other directorships4
held by trustee |
| | | | | | | | |
| Joseph C. Berenato, 66 | | 2000 | Former Chairman and CEO, Ducommun Incorporated (aerospace components manufacturer) | | 6 | | Ducommun Incorporated |
| | | | | | | | |
| Robert J. Denison, 71 | | 2010 | Chair, First Security Management (private investment) | | 6 | | None |
| | | | | | | | |
| Mary Anne Dolan, 65 | | 2008 | Founder and President, MAD Ink (communications company) | | 10 | | None |
| | | | | | | | |
| R. Clark Hooper, 66 | | 2006 | Private investor | | 67 | | JPMorgan Value Opportunities Fund, Inc.;
The Swiss Helvetia Fund, Inc. |
| | | | | | | | |
| Koichi Itoh, 72 | | 2010 | Chairman of the Board, Itoh Building Co., Ltd. (building management) | | 6 | | None |
| | | | | | | | |
Merit E. Janow, 54
Chairman of the Board
(Independent and Non-Executive) | | 2010 | Professor, Columbia University, School of International and Public Affairs; former Member, World Trade Organization Appellate Body | | 64 | | The NASDAQ Stock Market LLC; Trimble Navigation Limited |
| | | | | | | | |
| Leonade D. Jones, 65 | | 1995 | Retired; former Treasurer, The Washington Post Company | | 9 | | None |
| | | | | | | | |
| Robert J. O’Neill, Ph.D., 76 | | 2010 | Member of the Board of Directors, The Lowy Institute for International Policy Studies, Sydney, Australia; Fellow of the Australian Institute of International Affairs; former Chairman of Directors, Forty Seven Friends Pty Ltd (a not-for-profit supporting a local art and craft center in Australia); former Chairman, Academic Advisory Committee, United States Studies Centre, University of Sydney; former Planning Director and acting CEO, United States Studies Centre, University of Sydney; former Deputy Chairman of the Council and Chairman of the International Advisory Panel, Graduate School of Government, University of Sydney | | 3 | | None |
| | | | | | | | |
| Stefanie Powers, 70 | | 2010 | Actor, producer, author, entrepreneur; Co-founder and President of The William Holden Wildlife Foundation; conservation consultant to Land Rover and Jaguar North America; founder of The Jaguar Conservation Trust | | 3 | | None |
| | | | | | | | |
| Christopher E. Stone, 56 | | 2007 | President, Open Society Foundations; former Professor of the Practice of Criminal Justice, John F. Kennedy School of Government, Harvard University | | 6 | | None |
| | | | | | | | |
| Steadman Upham, Ph.D., 63 | | 2010 | President and University Professor, The University of Tulsa | | 64 | | None |
| | | | | | | | |
Gail L. Neale, a trustee of the fund since 2010, has retired from the board. The trustees thank Ms. Neale for her dedication and service to the fund.
| | | | | | | | |
| “Interested” trustees5,6 |
Name, age and
position with fund | | Year first elected
a trustee
or officer
of the fund2 | Principal occupation(s) during past five years
and positions held with affiliated entities or
the principal underwriter of the fund | | Number of portfolios
in fund complex3
overseen by trustee | | Other directorships4
held by trustee |
| | | | | | | | |
Timothy D. Armour, 52
Vice Chairman of the Board | | 1991 | President and Director, Capital Research and Management Company; Senior Vice President — Capital Research Global Investors, Capital Research and Management Company; Director, The Capital Group Companies, Inc.7 | | 2 | | None |
| | | | | | | | |
Claudia P. Huntington, 60
President | | 1996 | Senior Vice President — Capital Research Global Investors, Capital Research and Management Company; Director, Capital Research and Management Company | | 2 | | None |
| | | | | | | | |
The fund’s statement of additional information includes further details about fund trustees and is available without charge upon request by calling American Funds Service Company at 800/421-4225 or by visiting the American Funds website at americanfunds.com. The address for all trustees and officers of the fund is 333 South Hope Street, Los Angeles, CA 90071, Attention: Secretary.
See page 36 for footnotes.
| | | | | |
| Other officers6 | | | | |
| |
Name, age and
position with fund | | Year first elected an
officer of the fund2 | | Principal occupation(s) during past five years and positions held
with affiliated entities or the principal underwriter of the fund |
| | | | | |
Paul F. Roye, 59
Executive Vice President | | 2007 | | Senior Vice President — Fund Business Management Group, Capital Research and Management Company; Director, American Funds Service Company;7 former Director, Division of Investment Management, United States Securities and Exchange Commission |
| | | | | |
Mark E. Denning, 55
Senior Vice President | | 2006 | | Senior Vice President — Capital Research Global Investors, Capital Research Company;7 Director, Capital Research and Management Company |
| | | | | |
Harold H. La, 42
Vice President | | 2006 | | Senior Vice President — Capital Research Global Investors, Capital Research Company7 |
| | | | | |
Donald H. Rolfe, 40
Vice President | | 2010 | | Chief Compliance Officer, Capital Research Company;7 Chief Compliance Officer, Capital Research and Management Company; Vice President and Senior Counsel — Fund Business Management Group, Capital Research and Management Company |
| | | | | |
Lawrence R. Solomon, 50
Vice President | | 2010 | | Senior Vice President — Capital Research Global Investors, Capital Research Company;7 President and Chairman of the Board, Capital Management Services, Inc.7 |
| | | | | |
Vincent P. Corti, 56
Secretary | | 1984 | | Vice President — Fund Business Management Group, Capital Research and Management Company |
| | | | | |
Neal F. Wellons, 41
Treasurer | | 2008 | | Vice President — Fund Business Management Group, Capital Research and Management Company |
| | | | | |
Dori Laskin, 61
Assistant Treasurer | | 2010 | | Vice President — Fund Business Management Group, Capital Research and Management Company |
| | | | | |
Jeffrey P. Regal, 41
Assistant Treasurer | | 2010 | | Vice President — Fund Business Management Group, Capital Research and Management Company |
| | | | | |
| | |
| 1 | The term “independent” trustee refers to a trustee who is not an “interested person” of the fund within the meaning of the Investment Company Act of 1940. |
| 2 | Trustees and officers of the fund serve until their resignation, removal or retirement. |
| 3 | Capital Research and Management Company manages the American Funds. Capital Research and Management Company also manages American Funds Insurance Series,® which is composed of 19 funds and serves as the underlying investment vehicle for certain variable insurance contracts; American Funds Target Date Retirement Series,® which is composed of 10 funds and is available through tax-deferred retirement plans and IRAs; American Funds Portfolio Series,SM which is composed of eight funds; and American Funds College Target Date Series,SM which is composed of seven funds. |
| 4 | This includes all directorships (other than those in the American Funds or other funds managed by Capital Research and Management Company) that are held by each trustee as a trustee or director of a public company or a registered investment company. |
| 5 | ”Interested persons” within the meaning of the Investment Company Act of 1940, on the basis of their affiliation with the fund’s investment adviser, Capital Research and Management Company, or affiliated entities (including the fund’s principal underwriter). |
| 6 | All of the officers listed are officers and/or directors/trustees of one or more of the other funds for which Capital Research and Management Company serves as investment adviser. |
| 7 | Company affiliated with Capital Research and Management Company. |
Offices
Offices of the fund and of the investment adviser
Capital Research and Management Company
333 South Hope Street
Los Angeles, CA 90071-1406
6455 Irvine Center Drive
Irvine, CA 92618
Transfer agent for shareholder accounts
American Funds Service Company
(Write to the address near you.)
P.O. Box 6007
Indianapolis, IN 46206-6007
P.O. Box 2280
Norfolk, VA 23501-2280
Custodian of assets
State Street Bank and Trust Company
One Lincoln Street
Boston, MA 02111
Counsel
O’Melveny & Myers LLP
400 South Hope Street
Los Angeles, CA 90071-2899
Independent registered public accounting firm
PricewaterhouseCoopers LLP
350 South Grand Avenue
Los Angeles, CA 90071-2889
Principal underwriter
American Funds Distributors, Inc.
333 South Hope Street
Los Angeles, CA 90071-1406
Investors should carefully consider investment objectives, risks, charges and expenses. This and other important information is contained in the fund prospectus and summary prospectus, which can be obtained from your financial professional and should be read carefully before investing. You may also call American Funds Service Company (AFS) at 800/421-4225 or visit the American Funds website at americanfunds.com.
“American Funds Proxy Voting Procedures and Principles” — which describes how we vote proxies relating to portfolio securities — is available on the American Funds website or upon request by calling AFS. The fund files its proxy voting record with the U.S. Securities and Exchange Commission (SEC) for the 12 months ended June 30 by August 31. The proxy voting record is available free of charge on the SEC website at sec.gov and on the American Funds website.
A complete November 30, 2012, portfolio of The New Economy Fund’s investments is available free of charge by calling AFS or visiting the SEC website (where it is part of Form N-CSR).
The New Economy Fund files a complete list of its portfolio holdings with the SEC for the first and third quarters of each fiscal year on Form N-Q. This filing is available free of charge on the SEC website. You may also review or, for a fee, copy this filing at the SEC’s Public Reference Room in Washington, D.C. Additional information regarding the operation of the Public Reference Room may be obtained by calling the SEC’s Office of Investor Education and Advocacy at 800/SEC-0330. Additionally, the list of portfolio holdings is available by calling AFS.
This report is for the information of shareholders of The New Economy Fund, but it also may be used as sales literature when preceded or accompanied by the current prospectus or summary prospectus, which gives details about charges, expenses, investment objectives and operating policies of the fund. If used as sales material after March 31, 2013, this report must be accompanied by an American Funds statistical update for the most recently completed calendar quarter.
| | |
 | The right choice for the long term® |
The American Funds difference
Since 1931, American Funds has helped investors pursue long-term investment success. Our consistent approach — in combination with a proven system — has resulted in a superior long-term track record.
| | | |
 | | Consistent approach |
| | We base our decisions on a long-term perspective because we believe it is the best way to achieve superior long-term investment results. Our portfolio counselors average 25 years of investment experience, including 21 years at our company, reflecting a career commitment to our long-term approach.1 |
| | | |
 | | Proven system |
| | Our system combines individual accountability with teamwork. Each fund is divided into portions that are managed by investment professionals with varied backgrounds, ages and investment styles. An extensive global research effort is the backbone of our system. |
| | | |
 | | Superior long-term track record |
| | Our equity funds have beaten their Lipper peer indexes in 91% of 10-year periods and 96% of 20-year periods. Our fixed-income funds have beaten their Lipper indexes in 60% of 10-year periods and 67% of 20-year periods.2 Our fund management fees have been among the lowest in the industry.3 |
| | | |
| | 1 | As of 12/31/11. |
| | | |
| | 2 | Based on Class A share results for periods through 12/31/11. Periods covered are the shorter of the fund’s lifetime or since the comparable Lipper index inception date. |
| | | |
| | 3 | Based on management fees for the 20-year period ended 12/31/11 versus comparable Lipper categories, excluding funds of funds. |
| | |
| | American Funds span a range of investment objectives |
| |
| n | Growth funds |
| | AMCAP Fund® |
| | EuroPacific Growth Fund® |
| | The Growth Fund of America® |
| | The New Economy Fund® |
| | New Perspective Fund® |
| | New World Fund® |
| | SMALLCAP World Fund® |
| | |
| n | Growth-and-income funds |
| | American Mutual Fund® |
| | Capital World Growth and Income Fund® |
| | Fundamental InvestorsSM |
| | International Growth and Income FundSM |
| | The Investment Company of America® |
| | Washington Mutual Investors FundSM |
| | |
| n | Equity-income funds |
| | Capital Income Builder® |
| | The Income Fund of America® |
| | |
| n | Balanced funds |
| | American Balanced Fund® |
| | American Funds Global Balanced FundSM |
| | �� |
| n | Bond funds |
| | American Funds Mortgage Fund® |
| | American High-Income Trust® |
| | The Bond Fund of America® |
| | Capital World Bond Fund® |
| | Intermediate Bond Fund of America® |
| | Short-Term Bond Fund of America® |
| | U.S. Government Securities Fund® |
| | |
| n | Tax-exempt bond funds |
| | American Funds Short-Term Tax-Exempt Bond Fund® |
| | American High-Income Municipal Bond Fund® |
| | Limited Term Tax-Exempt Bond Fund of America® |
| | The Tax-Exempt Bond Fund of America® |
| | State-specific tax-exempt funds |
| | American Funds Tax-Exempt Fund of New York® |
| | The Tax-Exempt Fund of California® |
| | The Tax-Exempt Fund of Maryland® |
| | The Tax-Exempt Fund of Virginia® |
| | |
| n | Money market fund |
| | American Funds Money Market Fund® |
| | |
| n | American Funds Portfolio SeriesSM |
| | American Funds Global Growth PortfolioSM |
| | American Funds Growth PortfolioSM |
| | American Funds Growth and Income PortfolioSM |
| | American Funds Balanced PortfolioSM |
| | American Funds Income PortfolioSM |
| | American Funds Tax-Advantaged Income PortfolioSM |
| | American Funds Preservation PortfolioSM |
| | American Funds Tax-Exempt Preservation PortfolioSM |
| | |
| n | American Funds Target Date Retirement Series® |
| | |
| n | American Funds College Target Date SeriesSM |
| | | | | |
| |
| The Capital Group Companies |
| American Funds | Capital Research and Management | Capital International | Capital Guardian | Capital Bank and Trust |

ITEM 2 – Code of Ethics
The Registrant has adopted a Code of Ethics that applies to its Principal Executive Officer and Principal Financial Officer. The Registrant undertakes to provide to any person without charge, upon request, a copy of the Code of Ethics. Such request can be made to American Funds Service Company at 800/421-0180 or to the Secretary of the Registrant, 333 South Hope Street, Los Angeles, California 90071.
ITEM 3 – Audit Committee Financial Expert
The Registrant’s board has determined that Joseph C. Berenato, a member of the Registrant’s audit committee, is an “audit committee financial expert” and "independent," as such terms are defined in this Item. This designation will not increase the designee’s duties, obligations or liability as compared to his or her duties, obligations and liability as a member of the audit committee and of the board, nor will it reduce the responsibility of the other audit committee members. There may be other individuals who, through education or experience, would qualify as "audit committee financial experts" if the board had designated them as such. Most importantly, the board believes each member of the audit committee contributes significantly to the effective oversight of the Registrant’s financial statements and condition.
ITEM 4 – Principal Accountant Fees and Services
| | Registrant: |
| | | a) Audit Fees: |
| | | | 2011 | $99,000 |
| | | | 2012 | $98,000 |
| | | | |
| | | b) Audit-Related Fees: |
| | | | 2011 | None |
| | | | 2012 | None |
| | | | |
| | | c) Tax Fees: |
| | | | 2011 | $8,000 |
| | | | 2012 | None |
| | | | The tax fees consist of professional services relating to the preparation of the Registrant’s tax returns. |
| | | | |
| | | d) All Other Fees: |
| | | | 2011 | None |
| | | | 2012 | None |
| | | | |
| | Adviser and affiliates (includes only fees for non-audit services billed to the adviser and affiliates for engagements that relate directly to the operations and financial reporting of the Registrant and were subject to the pre-approval policies described below): |
| | | a) Audit Fees: |
| | | | Not Applicable |
| | | | |
| | | b) Audit-Related Fees: |
| | | | 2011 | None |
| | | | 2012 | None |
| | | | |
| | | c) Tax Fees: |
| | | | 2011 | $19,000 |
| | | | 2012 | $1,000 |
| | | | The tax fees consist of consulting services relating to the Registrant’s investments. |
| | | | |
| | | d) All Other Fees: |
| | | | 2011 | $2,000 |
| | | | 2012 | $2,000 |
| | | | The other fees consist of subscription services related to an accounting research tool. |
All audit and permissible non-audit services that the Registrant’s audit committee considers compatible with maintaining the independent registered public accounting firm’s independence are required to be pre-approved by the committee. The pre-approval requirement will extend to all non-audit services provided to the Registrant, the investment adviser, and any entity controlling, controlled by, or under common control with the investment adviser that provides ongoing services to the Registrant, if the engagement relates directly to the operations and financial reporting of the Registrant. The committee will not delegate its responsibility to pre-approve these services to the investment adviser. The committee may delegate to one or more committee members the authority to review and pre-approve audit and permissible non-audit services. Actions taken under any such delegation will be reported to the full committee at its next meeting. The pre-approval requirement is waived with respect to non-audit services if certain conditions are met. The pre-approval requirement was not waived for any of the non-audit services listed above provided to the Registrant, adviser and affiliates.
Aggregate non-audit fees paid to the Registrant’s auditors, including fees for all services billed to the Registrant, adviser and affiliates that provide ongoing services to the Registrant, were $29,000 for fiscal year 2011 and $2,000 for fiscal year 2012. The non-audit services represented by these amounts were brought to the attention of the committee and considered to be compatible with maintaining the auditors’ independence.
ITEM 5 – Audit Committee of Listed Registrants
Not applicable to this Registrant, insofar as the Registrant is not a listed issuer as defined in Rule 10A-3 under the Securities Exchange Act of 1934.
ITEM 6 – Schedule of Investments

The New Economy Fund®
Investment portfolio
November 30, 2012
| Common stocks — 91.96% | Shares | Value (000) |
| | | |
| CONSUMER DISCRETIONARY — 20.43% | | |
| Galaxy Entertainment Group Ltd.1 | 48,784,000 | $ 186,004 |
| Comcast Corp., Class A | 2,532,400 | 94,155 |
| Comcast Corp., Class A, special nonvoting shares | 1,100,000 | 39,644 |
| Netflix, Inc.1 | 1,503,400 | 122,843 |
| Amazon.com, Inc.1 | 410,000 | 103,340 |
| Sky Deutschland AG1 | 15,923,947 | 79,070 |
| Sands China Ltd. | 16,812,800 | 71,697 |
| Lions Gate Entertainment Corp.1 | 4,325,000 | 70,843 |
| MGM China Holdings Ltd. | 36,772,000 | 68,797 |
| News Corp., Class A | 2,602,815 | 64,133 |
| Daily Mail and General Trust PLC, Class A, nonvoting | 7,082,251 | 59,798 |
| DIRECTV1 | 1,200,000 | 59,640 |
| Time Warner Inc. | 1,000,000 | 47,300 |
| Melco Crown Entertainment Ltd. (ADR)1 | 2,881,000 | 43,964 |
| SJM Holdings Ltd. | 17,342,000 | 40,904 |
| Garmin Ltd. | 951,200 | 36,992 |
| Li & Fung Ltd. | 22,000,000 | 36,221 |
| Reed Elsevier PLC | 3,430,000 | 35,308 |
| Time Warner Cable Inc. | 365,014 | 34,636 |
| Tractor Supply Co. | 350,000 | 31,367 |
| John Wiley & Sons, Inc., Class A | 700,000 | 29,890 |
| Paddy Power PLC | 357,000 | 26,934 |
| Home Depot, Inc. | 396,000 | 25,768 |
| Kingfisher PLC | 5,500,000 | 24,497 |
| JCDecaux SA | 1,050,000 | 23,754 |
| WPP PLC | 1,650,000 | 22,629 |
| Liberty Media Corp., Class A1 | 200,000 | 21,998 |
| Zhongsheng Group Holdings Ltd. | 14,264,500 | 17,577 |
| Churchill Downs Inc. | 250,000 | 15,802 |
| CTC Media, Inc. | 1,800,000 | 15,210 |
| YUM! Brands, Inc. | 214,500 | 14,389 |
| NIKE, Inc., Class B | 136,600 | 13,316 |
| Darden Restaurants, Inc. | 157,000 | 8,302 |
| Multi Screen Media Private Ltd.1,2,3 | 79,866 | 6,608 |
| | | 1,593,330 |
| | | |
| | | |
| HEALTH CARE — 19.78% | | |
| Gilead Sciences, Inc.1 | 2,521,500 | 189,112 |
| Hologic, Inc.1 | 7,054,550 | 134,601 |
| Alexion Pharmaceuticals, Inc.1 | 1,012,600 | 97,230 |
| Thermo Fisher Scientific Inc. | 1,428,000 | 90,749 |
| Grifols, SA, Class A1 | 2,135,000 | 68,292 |
| Grifols, SA, Class B1 | 878,500 | 21,422 |
| Forest Laboratories, Inc.1 | 2,400,000 | 85,104 |
| William Demant Holding A/S1 | 873,000 | 70,920 |
| Edwards Lifesciences Corp.1 | 761,600 | 66,084 |
| Illumina, Inc.1 | 1,164,876 | 62,565 |
| McKesson Corp. | 600,000 | 56,682 |
| Celesio AG | 3,167,000 | 53,792 |
| Exelixis, Inc.1,4 | 10,950,900 | 53,550 |
| Stryker Corp. | 984,000 | 53,293 |
| BioMarin Pharmaceutical Inc.1 | 1,045,100 | 50,792 |
| Amgen Inc. | 564,000 | 50,083 |
| Biogen Idec Inc.1 | 335,600 | 50,035 |
| Allergan, Inc. | 500,000 | 46,375 |
| UnitedHealth Group Inc. | 780,000 | 42,424 |
| St. Jude Medical, Inc. | 1,120,000 | 38,394 |
| NuVasive, Inc.1,4 | 2,205,286 | 32,021 |
| Medtronic, Inc. | 700,000 | 29,477 |
| Orthofix International NV1 | 700,000 | 26,075 |
| Mesoblast Ltd.1 | 3,325,000 | 20,820 |
| Hill-Rom Holdings, Inc. | 518,000 | 14,483 |
| Teva Pharmaceutical Industries Ltd. (ADR) | 319,000 | 12,872 |
| Zimmer Holdings, Inc. | 116,000 | 7,653 |
| ArthroCare Corp.1 | 213,700 | 7,157 |
| Volcano Corp.1 | 218,920 | 5,968 |
| Endo Health Solutions Inc.1 | 182,000 | 5,216 |
| | | 1,543,241 |
| | | |
| | | |
| INFORMATION TECHNOLOGY — 19.66% | | |
| Google Inc., Class A1 | 209,300 | 146,169 |
| Apple Inc. | 221,140 | 129,429 |
| Samsung Electronics Co. Ltd. | 90,437 | 117,426 |
| Baidu, Inc., Class A (ADR)1 | 1,042,400 | 100,394 |
| Texas Instruments Inc. | 2,555,000 | 75,296 |
| Facebook, Inc., Class A1 | 2,500,000 | 70,000 |
| NetEase, Inc. (ADR)1 | 1,398,000 | 61,316 |
| Adobe Systems Inc.1 | 1,675,000 | 57,972 |
| Microsoft Corp. | 1,995,000 | 53,107 |
| Oracle Corp. | 1,591,000 | 51,071 |
| Accenture PLC, Class A | 730,000 | 49,582 |
| Yahoo! Inc.1 | 2,335,000 | 43,828 |
| Mail.ru Group Ltd. (GDR) | 1,300,000 | 42,900 |
| SINA Corp.1 | 900,000 | 40,968 |
| Intuit Inc. | 670,000 | 40,140 |
| Hexagon AB, Class B | 1,560,000 | 38,593 |
| Computer Sciences Corp. | 1,000,000 | 38,060 |
| AAC Technologies Holdings Inc. | 10,096,000 | 37,908 |
| Trimble Navigation Ltd.1 | 650,000 | 36,166 |
| AOL Inc.1 | 916,503 | 34,387 |
| Delta Electronics, Inc. | 9,598,000 | 34,356 |
| Autodesk, Inc.1 | 1,000,000 | 33,130 |
| eBay Inc.1 | 600,000 | 31,692 |
| Logitech International SA | 3,500,000 | 24,850 |
| Motorola Solutions, Inc. | 380,000 | 20,691 |
| EMC Corp.1 | 750,000 | 18,615 |
| FactSet Research Systems, Inc. | 172,000 | 15,891 |
| Avago Technologies Ltd. | 425,000 | 14,917 |
| Gemalto NV | 153,000 | 14,068 |
| Avid Technology, Inc.1 | 1,800,000 | 11,754 |
| ASML Holding NV | 186,340 | 11,642 |
| Maxim Integrated Products, Inc. | 350,000 | 10,216 |
| Electronic Arts Inc.1 | 665,000 | 9,849 |
| Rovi Corp.1 | 502,000 | 7,701 |
| KLA-Tencor Corp. | 153,000 | 6,957 |
| Nokia Corp. | 800,000 | 2,653 |
| | | 1,533,694 |
| | | |
| | | |
| FINANCIALS — 10.50% | | |
| AIA Group Ltd. | 28,336,000 | 110,233 |
| Wells Fargo & Co. | 1,362,300 | 44,970 |
| Chongqing Rural Commercial Bank Co., Ltd., Class H | 97,595,000 | 44,830 |
| Agricultural Bank of China, Class H | 97,780,000 | 42,896 |
| State Street Corp. | 932,700 | 41,449 |
| Aberdeen Asset Management PLC | 7,370,000 | 39,911 |
| Aon PLC, Class A | 661,000 | 37,545 |
| Marsh & McLennan Companies, Inc. | 1,000,000 | 35,220 |
| Assured Guaranty Ltd. | 2,400,000 | 33,480 |
| HDFC Bank Ltd. | 2,550,000 | 33,001 |
| Industrial and Commercial Bank of China Ltd., Class H | 48,736,000 | 32,888 |
| JPMorgan Chase & Co. | 800,000 | 32,864 |
| Zions Bancorporation | 1,600,000 | 32,112 |
| Banco Santander, SA | 4,079,202 | 31,375 |
| First American Financial Corp. | 1,170,900 | 27,867 |
| Longfor Properties Co. Ltd. | 13,800,000 | 26,460 |
| Fifth Third Bancorp | 1,800,000 | 26,352 |
| Citigroup Inc. | 704,000 | 24,337 |
| Bank of China Ltd., Class H | 55,556,000 | 23,440 |
| China Construction Bank Corp., Class H | 27,994,050 | 21,456 |
| IndusInd Bank Ltd. | 2,700,000 | 20,686 |
| Stewart Information Services Corp. | 550,000�� | 15,015 |
| Ping An Insurance (Group) Co. of China, Ltd., Class H | 1,805,000 | 13,659 |
| Primerica, Inc. | 425,000 | 12,168 |
| Kotak Mahindra Bank Ltd. | 894,917 | 11,030 |
| Banco Santander (Brasil) SA, units | 303,085 | 2,057 |
| Banco Santander (Brasil) SA, units (ADR) | 104,800 | 701 |
| Genworth Financial, Inc., Class A1 | 172,100 | 1,024 |
| Jefferies Group, Inc. | 10,200 | 173 |
| | | 819,199 |
| | | |
| | | |
| INDUSTRIALS — 7.64% | | |
| Ryanair Holdings PLC (ADR) | 2,274,700 | 78,318 |
| PT AKR Corporindo Tbk | 173,899,680 | 77,945 |
| AirAsia Bhd. | 62,860,000 | 58,936 |
| Nielsen Holdings NV1 | 1,915,000 | 54,233 |
| Union Pacific Corp. | 437,977 | 53,775 |
| Verisk Analytics, Inc., Class A1 | 1,074,900 | 53,573 |
| CSX Corp. | 2,654,722 | 52,457 |
| JG Summit Holdings, Inc. | 48,426,000 | 42,517 |
| United Parcel Service, Inc., Class B | 460,000 | 33,631 |
| MSC Industrial Direct Co., Inc., Class A | 450,000 | 32,697 |
| Exponent, Inc.1 | 350,300 | 18,720 |
| United Continental Holdings, Inc.1 | 787,500 | 15,923 |
| FedEx Corp. | 71,700 | 6,419 |
| Iron Mountain Inc. | 192,719 | 6,090 |
| Beacon Roofing Supply, Inc.1 | 195,000 | 6,014 |
| United Stationers Inc. | 164,320 | 5,043 |
| | | 596,291 |
| | | |
| | | |
| TELECOMMUNICATION SERVICES — 5.66% | | |
| Crown Castle International Corp.1 | 2,208,122 | 149,092 |
| SOFTBANK CORP. | 2,443,000 | 91,574 |
| Sprint Nextel Corp., Series 11 | 6,685,000 | 38,305 |
| Millicom International Cellular SA (SDR) | 443,269 | 38,042 |
| Vodafone Group PLC | 14,000,000 | 36,146 |
| Avanti Communications Group PLC1,4 | 6,933,372 | 26,715 |
| MTN Group Ltd. | 1,040,000 | 19,141 |
| tw telecom inc.1 | 480,000 | 12,331 |
| MetroPCS Communications, Inc.1 | 1,085,000 | 11,555 |
| Telephone and Data Systems, Inc. | 326,100 | 7,504 |
| Leap Wireless International, Inc.1 | 982,252 | 6,385 |
| United States Cellular Corp.1 | 139,500 | 4,862 |
| | | 441,652 |
| | | |
| | | |
| ENERGY — 1.59% | | |
| Schlumberger Ltd. | 1,052,400 | 75,373 |
| FMC Technologies, Inc.1 | 600,000 | 24,516 |
| Baker Hughes Inc. | 550,000 | 23,732 |
| | | 123,621 |
| | | |
| | | |
| CONSUMER STAPLES — 0.87% | | |
| Costco Wholesale Corp. | 650,000 | 67,593 |
| | | |
| | | |
| UTILITIES — 0.58% | | |
| SSE PLC | 1,055,000 | 24,086 |
| ENN Energy Holdings Ltd. | 4,700,000 | 21,165 |
| | | 45,251 |
| | | |
| | | |
| MATERIALS — 0.45% | | |
| Monsanto Co. | 379,950 | 34,800 |
| | | |
| | | |
| MISCELLANEOUS — 4.80% | | |
| Other common stocks in initial period of acquisition | | 374,398 |
| | | |
| | | |
| Total common stocks (cost: $5,523,515,000) | | 7,173,070 |
| | | |
| | | |
| | | |
| Preferred stocks — 0.16% | | |
| | | |
| FINANCIALS — 0.05% | | |
| Zions Bancorporation, Series C, 9.50% noncumulative depositary shares | 160,000 | 4,168 |
| | | |
| | | |
| MISCELLANEOUS — 0.11% | | |
| Other preferred stocks in initial period of acquisition | | 8,304 |
| | | |
| | | |
| Total preferred stocks (cost: $11,000,000) | | 12,472 |
| | | |
| | | |
| | Principal amount | |
| Short-term securities — 7.40% | (000) | |
| | | |
| Fannie Mae 0.135%–0.18% due 12/17/2012–7/1/2013 | $205,300 | 205,227 |
| Freddie Mac 0.14%–0.17% due 1/9–5/29/2013 | 100,700 | 100,660 |
| Federal Home Loan Bank 0.12%–0.165% due 2/15–4/17/2013 | 98,000 | 97,970 |
| U.S. Treasury Bills 0.143%–0.193% due 12/20/2012–8/22/2013 | 43,500 | 43,468 |
| Variable Funding Capital Company LLC 0.16%–0.18% due 12/17/2012–1/14/20135 | 29,800 | 29,796 |
| Federal Farm Credit Banks 0.19% due 8/13/2013 | 25,000 | 24,969 |
| Wal-Mart Stores, Inc. 0.15% due 12/10/20125 | 18,400 | 18,399 |
| Medtronic Inc. 0.17% due 2/14/20135 | 17,200 | 17,192 |
| Coca-Cola Co. 0.18% due 1/28/20135 | 15,400 | 15,397 |
| Private Export Funding Corp. 0.28% due 2/8/20135 | 14,900 | 14,894 |
| Paccar Financial Corp. 0.13% due 12/11/2012 | 9,400 | 9,400 |
| | | |
| Total short-term securities (cost: $577,332,000) | | 577,372 |
| | | |
| | | |
| Total investment securities (cost: $6,111,847,000) | | $7,762,914 |
| Other assets less liabilities | | 37,386 |
| | | |
| Net assets | | $7,800,300 |
As permitted by U.S. Securities and Exchange Commission regulations, “Miscellaneous” securities include holdings in their first year of acquisition that have not previously been publicly disclosed.
1Security did not produce income during the last 12 months.
2Valued under fair value procedures adopted by authority of the board of trustees. The total value of all such securities was $6,608,000, which represented .08% of the net assets of the fund.
3Acquired through a private placement transaction exempt from registration under the Securities Act of 1933. This security (acquired from 9/6/2000 to 4/18/2002 at a cost of $31,574,000) may be subject to legal or contractual restrictions on resale.
4Represents an affiliated company as defined under the Investment Company Act of 1940.
5Acquired in a transaction exempt from registration under section 4(2) of the Securities Act of 1933. May be resold in the U.S. in transactions exempt from registration, normally to qualified institutional buyers. The total value of all such securities was $95,678,000, which represented 1.23% of the net assets
of the fund.
Key to abbreviations
ADR = American Depositary Receipts
GDR = Global Depositary Receipts
SDR = Swedish Depositary Receipts
Investments are not FDIC-insured, nor are they deposits of or guaranteed by a bank or any other entity, so they may lose value.
Investors should carefully consider investment objectives, risks, charges and expenses. This and other important information is contained in the fund prospectus and summary prospectus, which can be obtained from your financial professional and should be read carefully before investing. You may also call American Funds Service Company (AFS) at 800/421-4225 or visit the American Funds website at americanfunds.com.
MFGEFPX-014-0113O-S32835
Report of Independent Registered Public Accounting Firm
To the Board of Trustees and Shareholders of The New Economy Fund
We have audited, in accordance with standards of the Public Company Accounting Oversight Board (United States), the financial statements of The New Economy Fund (the “Fund”) as of November 30, 2012, and for the year then ended and have issued our unqualified report thereon dated January 11, 2013 (which report and financial statements are included in Item 1 of this Certified Shareholder Report on Form N-CSR). Our audit included an audit of the Fund’s investment portfolio (the “Portfolio”) as of November 30, 2012 appearing in Item 6 of this Form N-CSR. The Portfolio is the responsibility of the Fund’s management. Our responsibility is to express an opinion on the Portfolio based on our audit.
In our opinion, the Portfolio referred to above, when read in conjunction with the financial statements of the Fund referred to above, presents fairly, in all material respects, the information set forth therein.
PricewaterhouseCoopers LLP
January 11, 2013
ITEM 7 – Disclosure of Proxy Voting Policies and Procedures for Closed-End Management Investment Companies
Not applicable to this Registrant, insofar as the Registrant is not a closed-end management investment company.
ITEM 8 – Portfolio Managers of Closed-End Management Investment Companies
Not applicable to this Registrant, insofar as the Registrant is not a closed-end management investment company.
ITEM 9 – Purchases of Equity Securities by Closed-End Management Investment Company and Affiliated Purchasers
Not applicable to this Registrant, insofar as the Registrant is not a closed-end management investment company.
ITEM 10 – Submission of Matters to a Vote of Security Holders
There have been no material changes to the procedures by which shareholders may recommend nominees to the Registrant’s board of trustees since the Registrant last submitted a proxy statement to its shareholders. The procedures are as follows. The Registrant has a nominating and governance committee comprised solely of persons who are not considered ‘‘interested persons’’ of the Registrant within the meaning of the Investment Company Act of 1940, as amended. The committee periodically reviews such issues as the board’s composition, responsibilities, committees, compensation and other relevant issues, and recommends any appropriate changes to the full board of trustees. While the committee normally is able to identify from its own resources an ample number of qualified candidates, it will consider shareholder suggestions of persons to be considered as nominees to fill future vacancies on the board. Such suggestions must be sent in writing to the nominating and governance committee of the Registrant, c/o the Registrant’s Secretary, and must be accompanied by complete biographical and occupational data on the prospective nominee, along with a written consent of the prospective nominee for consideration of his or her name by the nominating and governance committee.
ITEM 11 – Controls and Procedures
| (a) | The Registrant’s Principal Executive Officer and Principal Financial Officer have concluded, based on their evaluation of the Registrant’s disclosure controls and procedures (as such term is defined in Rule 30a-3 under the Investment Company Act of 1940), that such controls and procedures are adequate and reasonably designed to achieve the purposes described in paragraph (c) of such rule. |
| | |
| (b) | There were no changes in the Registrant’s internal controls over financial reporting (as defined in Rule 30a-3(d) under the Investment Company Act of 1940) that occurred during the Registrant’s second fiscal quarter of the period covered by this report that has materially affected, or is reasonably likely to materially affect, the Registrant’s internal control over financial reporting. |
ITEM 12 – Exhibits
| (a)(1) | The Code of Ethics that is the subject of the disclosure required by Item 2 is attached as an exhibit hereto. |
| | |
| (a)(2) | The certifications required by Rule 30a-2 of the Investment Company Act of 1940 and Sections 302 and 906 of the Sarbanes-Oxley Act of 2002 are attached as exhibits hereto. |
SIGNATURES
Pursuant to the requirements of the Securities Exchange Act of 1934 and the Investment Company Act of 1940, the Registrant has duly caused this report to be signed on its behalf by the undersigned, thereunto duly authorized.
| | THE NEW ECONOMY FUND |
| | |
| | By /s/ Paul F. Roye |
| | Paul F. Roye, Executive Vice President and Principal Executive Officer |
| | |
| | Date: January 31, 2013 |
Pursuant to the requirements of the Securities Exchange Act of 1934 and the Investment Company Act of 1940, this report has been signed below by the following persons on behalf of the Registrant and in the capacities and on the dates indicated.
| By /s/ Paul F. Roye |
Paul F. Roye, Executive Vice President and Principal Executive Officer |
| |
| Date: January 31, 2013 |
| By /s/ Neal F. Wellons |
Neal F. Wellons, Treasurer and Principal Financial Officer |
| |
| Date: January 31, 2013 |