SECURITIES AND EXCHANGE COMMISSION
WASHINGTON, D. C. 20549
FORM 10‑K
Annual Report Pursuant to Section 13 or 15(d) of the
Securities Exchange Act of 1934
For the fiscal year ended December 31, 2016
Commission file number 0‑12422
MAINSOURCE FINANCIAL GROUP, INC.
(Exact name of registrant as specified in its charter)
| |
Indiana
(State or other jurisdiction
of incorporation or organization) | 35‑1562245
(I.R.S. Employer
Identification No.) |
2105 North State Road 3 Bypass
Greensburg, Indiana 47240
(Address of principal executive offices) (Zip code) |
Registrant’s telephone number, including area code: (812) 663‑6734 |
Securities registered pursuant to Section 12(b) of the Act: |
Title of each class
Common shares, no par value | Name of each exchange on which registered
The NASDAQ Stock Market LLC |
Securities registered pursuant to Section 12(g) of the Act:
None |
Indicate by check mark if the registrant is a well‑known seasoned issuer, as defined in Rule 405 of the Securities Act. Yes ☒ No ☐
Indicate by check mark if the registrant is not required to file reports pursuant to Section 13 or Section 15(d) of the Act. Yes ☐ No ☒
Indicate by check mark whether the registrant (1) has filed all reports required to be filed by Section 13 or 15(d) of the Securities Exchange Act of 1934 during the preceding 12 months (or for such shorter period that the registrant was required to file such reports), and (2) has been subject to such filing requirements for the past 90 days. Yes ☒ No ☐
Indicate by check mark whether the registrant has submitted electronically and posted on its corporate Website, if any, every Interactive Data File required to be submitted and posted pursuant to Rule 405 of Regulation S‑T during the previous 12 months (or for such shorter period that the registrant was required to submit and post such files). Yes ☒ No ☐
Indicate by check mark if disclosure of delinquent filers pursuant to Item 405 of Regulation S‑K is not contained herein, and will not be contained, to the best of registrant’s knowledge, in definitive proxy or information statements incorporated by reference in Part III of this Form 10‑K or any amendment to this Form 10‑K. ☐
Indicate by check mark whether the registrant is a large accelerated filer, an accelerated filer, a non‑accelerated filer, or a smaller reporting company. See definitions of “large accelerated filer”, “accelerated filer”, and “smaller reporting company” in Rule 12b‑2 of the Exchange Act.
| | | |
Large accelerated filer ☐ | Accelerated filer ☒ | Non-accelerated filer ☐
(Do not check if a smaller
reporting company) | Smaller reporting company ☐ |
Indicate by check mark whether the registrant is a shell company (as defined in Rule 12b‑2 of the Act). Yes ☐ No ☒
The aggregate market value (not necessarily a reliable indication of the price at which more than a limited number of shares would trade) of the voting stock held by non‑affiliates of the registrant was $529,339,599 as of June 30, 2016.
As of March 10, 2017, there were outstanding 24,135,544 common shares, without par value, of the registrant.
DOCUMENTS INCORPORATED BY REFERENCE
Documents | | Part of Form 10-K
Into Which Incorporated |
Definitive Proxy Statement for Annual
Meeting of Shareholders to be held
May 3, 2017 | | Part III (Items 10 through 14) |
FORM 10‑K
TABLE OF CONTENTS
Pursuant to General Instruction G, the information called for by Items 10‑14 is omitted by MainSource Financial Group, Inc. since MainSource Financial Group, Inc. will file with the Commission a definitive proxy statement for its 2017 Annual Meeting of Shareholders pursuant to Regulation 14A not later than 120 days after the close of the fiscal year containing the information required by Items 10‑14.
PART I.
(Dollar amounts in thousands except per share data)
Cautionary Note Regarding Forward‑Looking Statements
Except for historical information contained herein, the discussion in this Annual Report includes certain forward looking statements within the meaning of Section 27A of the Securities Act of 1933, as amended, and Section 21E of the Securities Exchange Act of 1934, as amended. Any statement that does not describe historical or current facts is a forward looking statement. These statements often include the words “believes,” “expects,” “anticipates,” “estimates,” “intends,” “plans,” “goals,” “targets,” “initiatives,” “potentially,” “probably,” “projects,” “outlook” or similar expressions or future conditional verbs such as “may,” “will,” “should,” “would,” and “could.” Actual results and experience could differ materially from the anticipated results or other expectations expressed in the Company’s forward looking statements. The Company disclaims any intent or obligation to update such forward looking statements. Factors which could cause future results to differ from these expectations include the following: general economic conditions; legislative and regulatory initiatives; monetary and fiscal policies of the federal government; deposit flows; the cost of funds; general market rates of interest; interest rates on competing investments; demand for loan products; demand for financial services; changes in accounting policies or guidelines; changes in the quality or composition of the Company’s loan and investment portfolios; the Company’s ability to integrate acquisitions, and other factors, including the risk factors set forth in Item 1A of this Annual Report on Form 10 K and in other reports we file from time to time with the Securities and Exchange Commission. The Company intends the forward looking statements set forth herein to be covered by the safe harbor provisions for forward looking statements contained in the Private Securities Litigation Reform Act of 1995.
ITEM 1. BUSINESS
General
MainSource Financial Group, Inc. (“MainSource” or the “Company”) is an Indiana corporation and bank holding company, within the meaning of the Bank Holding Company Act of 1956, as amended (the “BHC Act”), that has elected to become a financial holding company (“FHC”). The Company is based in Greensburg, Indiana. As of December 31, 2016, the Company operated one banking subsidiary: MainSource Bank (“the Bank”), an Indiana state chartered bank. Through its non‑bank affiliates, the Company provides services incidental to the business of banking. Since its formation in 1982, the Company has acquired and established various institutions and financial services companies and may acquire additional financial institutions and financial services companies in the future. For further discussion of the business of the Company see Management’s Discussion and Analysis in Part II, Item 7.
As of December 31, 2016, the Company operated 90 branch banking offices in Indiana, Illinois, Ohio and Kentucky. As of December 31, 2016, the Company had consolidated assets of $4,080,257, consolidated deposits of $3,110,871 and shareholders’ equity of $449,494.
Through the Bank, the Company offers a broad range of financial services, including: accepting time and transaction deposits; making consumer, commercial, agribusiness and real estate mortgage loans; renting safe deposit facilities; providing personal and corporate trust services; and providing other corporate services such as letters of credit and repurchase agreements.
The lending activities of the Bank are separated into primarily the categories of commercial, commercial real estate, residential, and consumer. Loans are originated by the lending officers of the Bank subject to limitations set forth in lending policies. The Board of Directors of the Bank monitors concentrations of credit, problem and past due loans and charge‑offs of uncollectible loans and approves loan policy. The Bank maintains conservative loan policies and underwriting practices in order to address and manage loan risks. These policies and practices include granting loans on a sound and collectible basis, serving the legitimate needs of the community and the general market area while obtaining a balance between maximum yield and minimum risk, ensuring that primary and secondary sources of repayment are adequate in relation to the amount of the loan, developing and maintaining adequate diversification of the loan portfolio as a whole and of the loans within each category and developing and applying adequate collection policies.
Commercial loans include secured and unsecured loans, including real estate loans, to individuals and companies and to governmental units predominantly within the market area of the Bank for a myriad of business purposes.
Agricultural loans are generated in the Bank’s markets. Most of the loans are real estate loans on farm properties. Loans are also made for agricultural production and such loans are generally reviewed annually.
Residential real estate lending has been the largest component of the loan portfolio for many years. The Bank generates residential mortgages for its own portfolio. However, the Company elects to sell the majority of its fixed rate mortgages into the secondary market while maintaining the servicing of such loans. At December 31, 2016, the Company was servicing a $1.115 billion residential real estate loan portfolio. By originating loans for sale in the secondary market, the Company can more fully satisfy customer demand for fixed rate residential mortgages and increase fee income, while reducing the risk of loss caused by rising interest rates.
The principal source of revenues for the Company is interest and fees on loans, which accounted for 56.1% of total revenues in 2016, 53.9% in 2015 and 53.9% in 2014. While the Company’s chief decision makers monitor the revenue streams of the various Company products and services, the identifiable segments are not material and operations are managed and financial performance is evaluated on a Company‑wide basis. Accordingly, all of the Company’s financial service operations are considered by management to be aggregated in one reportable operating segment.
The Company’s investment securities portfolio is primarily comprised of state and municipal bonds; U.S. government sponsored entities’ mortgage‑backed securities and collateralized mortgage obligations; and corporate securities. The Company has classified its entire investment portfolio as available for sale, with fair value changes reported separately in shareholders’ equity. Funds invested in the investment portfolio generally represent funds not immediately required to meet loan demand. Income related to the Company’s investment portfolio accounted for 14.7% of total revenues in 2016, 14.9% in 2015 and 16.6% in 2014. As of December 31, 2016, the Company had not identified any securities as being “high risk” as defined by the FFIEC Supervisory Policy Statement on Securities Activities.
The primary source of funds for the Bank is deposits generated in local market areas. To attract and retain stable depositors, the Bank markets various programs for demand, savings and time deposit accounts. These programs include interest and non‑interest bearing demand and individual retirement accounts.
Currently, national retailing and manufacturing subsidiaries, brokerage and insurance firms and credit unions are fierce competitors within the financial services industry. Mergers between financial institutions within Indiana and neighboring states, which became permissible under the Riegle-Neal Interstate Banking and Branching Efficiency Act of 1994 (the “Riegle-Neal Act”), have also added competitive pressure.
Historically, the branches of the Bank were located in non-metropolitan areas. For the past several years, the Company has prioritized growth in metropolitan areas, primarily Louisville, Cincinnati and Indianapolis, and within its existing market. Since 2009, the Company has entered or expanded its presence in Columbus, Seymour, Bloomington and Indianapolis, Indiana, Cincinnati, Ohio and Louisville, Kentucky. In these markets, in addition to competing vigorously with other banks, thrift institutions, credit unions and finance companies, the Company competes, directly and indirectly, with all providers of financial services.
Employees
As of December 31, 2016, the Company and the Bank had 888 full‑time equivalent employees to whom they provide a variety of benefits and with whom they enjoy excellent relations. None of our employees are subject to collective bargaining agreements.
Available Information
We make available free of charge on or through our Internet web site, www.mainsourcebank.com, our Annual Report on Form 10‑K, Quarterly Reports on Form 10‑Q and Current Reports on Form 8‑K and all amendments to those reports filed or furnished pursuant to Section 13(a) or Section 15(d) of the Securities Exchange Act of 1934, as amended
(the “Exchange Act”) as soon as reasonably practicable after we electronically file such material with, or furnish it to, the Securities and Exchange Commission (“SEC”). Such materials are also available free of charge on the SEC website, www.sec.gov. We have included our and the SEC’s Internet website addresses throughout this Annual Report on Form 10‑K as textual references only. The information contained on these websites is not incorporated into this Annual Report on Form 10‑K.
Regulation and Supervision
The Company is a financial holding company within the meaning of the Bank Holding Company Act of 1956, as amended. As a FHC, the Company is subject to regulation by the Federal Reserve Board (“FRB”). The Bank is an Indiana state chartered bank subject to supervision and regulation by the Federal Deposit Insurance Corporation (“FDIC”) and the Indiana Department of Financial Institutions. The following is a discussion of material statutes and regulations affecting the Company and the Bank. The discussion is qualified in its entirety by reference to such statutes and regulations.
Bank Holding Company Act of 1956
Generally, the BHC Act governs the acquisition and control of banks and nonbanking companies by bank holding companies. A bank holding company is subject to regulation by and is required to register with the FRB under the BHC Act. The BHC Act requires a bank holding company to file an annual report of its operations and such additional information as the FRB may require. The FRB has issued regulations under the BHC Act requiring a bank holding company to serve as a source of financial and managerial strength to its subsidiary banks. It is the policy of the FRB that, pursuant to this requirement, a bank holding company should stand ready to use its resources to provide adequate capital funds to its subsidiary banks during periods of financial stress or adversity.
The acquisition of 5% or more of the voting shares of any bank or bank holding company generally requires the prior approval of the FRB and is subject to applicable federal and state law, including the Riegle‑Neal Act for interstate transactions. The FRB evaluates acquisition applications based on, among other things, competitive factors, supervisory factors, adequacy of financial and managerial resources, and banking and community needs considerations.
The BHC Act also prohibits, with certain exceptions, a bank holding company from acquiring direct or indirect ownership or control of more than 5% of the voting shares of any “nonbanking” company unless the nonbanking activities are found by the FRB to be “so closely related to banking ... as to be a proper incident thereto.” Under current regulations of the FRB, a bank holding company and its nonbank subsidiaries are permitted, among other activities, to engage in such banking‑related business ventures as consumer finance, equipment leasing, data processing, mortgage banking, financial and investment advice, and securities brokerage services. The BHC Act does not place territorial restrictions on the activities of a bank holding company or its nonbank subsidiaries.
Federal law prohibits acquisition of “control” of a bank or bank holding company without prior notice to certain federal bank regulators. “Control” is defined in certain cases as the acquisition of as little as 10% of the outstanding shares of any class of voting stock. Furthermore, under certain circumstances, a bank holding company may not be able to purchase its own stock, where the gross consideration will equal 10% or more of the company’s net worth, without obtaining approval of the FRB. Under the Federal Reserve Act, banks and their affiliates are subject to certain requirements and restrictions when dealing with each other (affiliate transactions include transactions between a bank and its bank holding company).
Gramm‑Leach‑Bliley Financial Modernization Act of 1999
The Gramm‑Leach‑Bliley Financial Modernization Act of 1999 (the “Modernization Act”) was enacted on November 12, 1999. The Modernization Act, which amended the BHC Act,
| · | | allows bank holding companies that qualify as “financial holding companies” to engage in a broad range of financial and related activities; |
| · | | allows insurers and other financial services companies to acquire banks; |
| · | | removes various restrictions that applied to bank holding company ownership of securities firms and mutual fund advisory companies; and |
| · | | establishes the overall regulatory structure applicable to bank holding companies that also engage in insurance and securities operations. |
The Company initially qualified as a financial holding company in December, 2004. Thus the Company is authorized to operate as a financial holding company and is eligible to engage in, or acquire companies engaged in, the broader range of activities that are permitted by the Modernization Act. These activities include those that are determined to be “financial in nature,” including insurance underwriting, securities underwriting and dealing, and making merchant banking investments in commercial and financial companies. If a banking subsidiary ceases to be “well capitalized” or “well managed” under applicable regulatory standards, the FRB may, among other things, place limitations on our ability to conduct these broader financial activities or, if the deficiencies persist, require us to divest the banking subsidiary. In addition, if a banking subsidiary receives a rating of less than satisfactory under the Community Reinvestment Act of 1977 (“CRA”), we would be prohibited from engaging in any additional activities other than those permissible for bank holding companies that are not financial holding companies.
Bank Secrecy Act and USA Patriot Act
In 1970, Congress enacted the Currency and Foreign Transactions Reporting Act, commonly known as the Bank Secrecy Act (the “BSA”). The BSA requires financial institutions to maintain records of certain customers and currency transactions and to report certain domestic and foreign currency transactions, which may have a high degree of usefulness in criminal, tax, or regulatory investigations or proceedings. Under this law, financial institutions are required to develop a BSA compliance program.
In 2001, the President signed into law comprehensive anti‑terrorism legislation known as the USA Patriot Act. Title III of the USA Patriot Act requires financial institutions, including the Company and the Bank, to help prevent and detect international money laundering and the financing of terrorism and prosecute those involved in such activities. The Department of the Treasury has adopted additional requirements to further implement Title III.
Under these regulations, a mechanism has been established for law enforcement officials to communicate names of suspected terrorists and money launderers to financial institutions to enable financial institutions to promptly locate accounts and transactions involving those suspects. Financial institutions receiving names of suspects must search their account and transaction records for potential matches and report positive results to the U.S. Department of the Treasury Financial Crimes Enforcement Network (“FinCEN”). Each financial institution must designate a point of contact to receive information requests. These regulations outline how financial institutions can share information concerning suspected terrorist and money laundering activity with other financial institutions under the protection of a statutory safe harbor if each financial institution notifies FinCEN of its intent to share information. The Department of the Treasury has also adopted regulations intended to prevent money laundering and terrorist financing through correspondent accounts maintained by U.S. financial institutions on behalf of foreign banks. Financial institutions are required to take reasonable steps to ensure that they are not providing banking services directly or indirectly to foreign shell banks. In addition, banks must have procedures in place to verify the identity of the persons with whom they deal.
FDIC Improvement Act of 1991
The Federal Deposit Insurance Act, as amended (“FDIA”), requires among other things, the federal banking agencies to take “prompt corrective action” in respect of depository institutions that do not meet minimum capital requirements. The FDIA includes the following five capital tiers: “well capitalized,” “adequately capitalized,” “undercapitalized,” “significantly undercapitalized” and “critically undercapitalized.” A depository institution’s capital tier will depend upon how its capital levels compare with various relevant capital measures and certain other factors, as established by regulation. The relevant capital measures are the total risk‑based capital ratio, the Tier 1 risk‑based capital ratio, the common equity Tier 1 risk‑based capital ratio, and the leverage ratio.
A bank will be (i) “well capitalized” if the institution has a total risk‑based capital ratio of 10.0% or greater, a Tier 1 risk‑based capital ratio of 8.0% or greater, a common equity Tier 1 risk‑based capital ratio of 6.5% or greater, and
a leverage ratio of 5.0% or greater, and is not subject to any order or written directive by any such regulatory authority to meet and maintain a specific capital level for any capital measure; (ii) “adequately capitalized” if the institution has a total risk‑based capital ratio of 8.0% or greater, a Tier 1 risk‑based capital ratio of 6.0% or greater, a common equity Tier 1 risk‑based capital ratio of 4.5% or greater, and a leverage ratio of 4.0% or greater and is not “well capitalized”; (iii) “undercapitalized” if the institution has a total risk‑based capital ratio that is less than 8.0%, a Tier 1 risk‑based capital ratio of less than 6.0%, a common equity Tier 1 risk‑based capital ratio of less than 4.5%, or a leverage ratio of less than 4.0%; (iv) “significantly undercapitalized” if the institution has a total risk‑based capital ratio of less than 6.0%, a Tier 1 risk‑based capital ratio of less than 4.0%, a common equity Tier 1 risk‑based capital ratio of less than 3.0%, or a leverage ratio of less than 3.0%; and (v) “critically undercapitalized” if the institution’s tangible equity is equal to or less than 2.0% of average quarterly tangible assets. An institution may be downgraded to, or deemed to be in, a capital category that is lower than indicated by its capital ratios if it is determined to be in an unsafe or unsound condition or if it receives an unsatisfactory examination rating with respect to certain matters. A bank’s capital category is determined solely for the purpose of applying prompt corrective action regulations, and the capital category may not constitute an accurate representation of the bank’s overall financial condition or prospects for other purposes.
The FDIA generally prohibits a depository institution from making any capital distributions (including payment of a dividend) or paying any management fee to its parent holding company if the depository institution would thereafter be “undercapitalized.” “Undercapitalized” institutions are subject to growth limitations and are required to submit a capital restoration plan. The agencies may not accept such a plan without determining, among other things, that the plan is based on realistic assumptions and is likely to succeed in restoring the depository institution’s capital. In addition, for a capital restoration plan to be acceptable, the depository institution’s parent holding company must guarantee that the institution will comply with such capital restoration plan. The bank holding company must also provide appropriate assurances of performance. The aggregate liability of the parent holding company is limited to the lesser of (i) an amount equal to 5.0% of the depository institution’s total assets at the time it became undercapitalized and (ii) the amount which is necessary (or would have been necessary) to bring the institution into compliance with all capital standards applicable with respect to such institution as of the time it fails to comply with the plan. If a depository institution fails to submit an acceptable plan, it is treated as if it is “significantly undercapitalized.” “Significantly undercapitalized” depository institutions may be subject to a number of requirements and restrictions, including orders to sell sufficient voting stock to become “adequately capitalized,” requirements to reduce total assets, and cessation of receipt of deposits from correspondent banks. “Critically undercapitalized” institutions are subject to the appointment of a receiver or conservator.
The appropriate federal banking agency may, under certain circumstances, reclassify a well‑capitalized insured depository institution as adequately capitalized. The FDIA provides that an institution may be reclassified if the appropriate federal banking agency determines (after notice and opportunity for hearing) that the institution is in an unsafe or unsound condition or deems the institution to be engaging in an unsafe or unsound practice. The appropriate agency is also permitted to require an adequately capitalized or undercapitalized institution to comply with the supervisory provisions as if the institution were in the next lower category (but not treat a significantly undercapitalized institution as critically undercapitalized) based on supervisory information other than the capital levels of the institution.
The Company believes that, as of December 31, 2016, the Company and the Bank were each “well capitalized” based on the aforementioned ratios.
Deposit Insurance Fund
The deposits of the Bank are insured to the maximum extent permitted by law by the Deposit Insurance Fund (“DIF”) of the FDIC, which was created in 2006 as the result of the merger of the Bank Insurance Fund and the Savings Association Insurance Fund in accordance with the Federal Deposit Insurance Reform Act of 2005 (the “FDI Act”). The FDIC maintains the DIF by assessing depository institutions an insurance premium. Pursuant to the Dodd‑Frank Wall Street Reform and Consumer Protection Act (the “Dodd-Frank Act”), the FDIC is required to set a DIF reserve ratio of 1.35% of estimated insured deposits and is required to achieve this ratio by September 30, 2020.
Under the FDIC’s risk‑based assessment system, insured institutions are required to pay deposit insurance premiums based on the risk that each institution poses to the DIF. An institution’s risk to the DIF is measured by its regulatory capital levels, supervisory evaluations, and certain other factors. An institution’s assessment rate depends upon
the risk category to which it is assigned. Pursuant to the Dodd‑Frank Act, the FDIC will calculate an institution’s assessment level based on its total average consolidated assets during the assessment period less average tangible equity (i.e., Tier 1 capital) as opposed to an institution’s deposit level which was the previous basis for calculating insurance assessments. Pursuant to the Dodd‑Frank Act, institutions will be placed into one of four risk categories for purposes of determining the institution’s actual assessment rate. The FDIC will determine the risk category based on the institution’s capital position (well capitalized, adequately capitalized, or undercapitalized) and supervisory condition (based on exam reports and related information provided by the institution’s primary federal regulator).
Dividends
The Company is a legal entity separate and distinct from the Bank. There are various legal limitations on the extent to which the Bank can supply funds to the Company. The principal source of the Company’s funds consists of dividends from the Bank. State and Federal law restricts the amount of dividends that may be paid by banks. The specific limits depend on a number of factors, including the bank’s type of charter, recent earnings, recent dividends, level of capital and regulatory status. The regulators are authorized, and under certain circumstances are required, to determine that the payment of dividends or other distributions by a bank would be an unsafe or unsound practice and to prohibit that payment. For example, the FDI Act generally prohibits a depository institution from making any capital distribution (including payment of a dividend) or paying any management fee to its parent holding company if the depository institution would thereafter be undercapitalized.
The Dodd‑Frank Act and its accompanying regulations also limit a depository institution’s ability to make capital distributions if it does not hold a 2.5% capital buffer above the required minimum risk‑based capital ratios. Regulators also review and limit proposed dividend payments as part of the supervisory process and review of an institution’s capital planning. In addition to dividend limitations, the Bank is subject to certain restrictions on extensions of credit to the Company, on investments in the stock or other securities of the Company and in taking such stock or securities as collateral for loans.
Community Reinvestment Act
The Community Reinvestment Act requires that the federal banking regulators evaluate the records of a financial institution in meeting the credit needs of its local community, including low and moderate income neighborhoods. These factors are also considered in evaluating mergers, acquisitions, and applications to open a branch or facility. Failure to adequately meet these criteria could result in the imposition of additional requirements and limitations on the Bank.
The Dodd‑Frank Wall Street Reform and Consumer Protection Act
The Dodd-Frank Act was enacted in July, 2010. Under this law, various federal agencies are given significant discretion in drafting and implementing a broad range of rules and regulations. While many new rules and regulation have been adopted, many more remain to be adopted.
Certain provisions of the Dodd‑Frank Act are now effective and have been fully implemented, including the revisions in the deposit insurance assessment base for FDIC insurance and the permanent increase in coverage to $250,000; the permissibility of paying interest on business checking accounts; the removal of barriers to interstate branching and required disclosure and shareholder advisory votes on executive compensation. Recent action to implement the final Dodd‑Frank Act provisions included (i) final new capital rules, (ii) a final rule to implement the so called “Volcker rule” restrictions on certain proprietary trading and investment activities and (iii) final rules and increased enforcement action by the Consumer Finance Protection Bureau (“CFPB”).
On February 3, 2017, President Donald J. Trump signed an executive order calling for his administration to review existing U.S. financial laws and regulations, including the Dodd-Frank Act, in order to determine their consistency with a set of “core principles” of financial policy. The core financial principles identified in the executive order include the following: empowering Americans to make independent financial decisions and informed choices in the marketplace, save for retirement, and build individual wealth; preventing taxpayer-funded bailouts; fostering economic growth and vibrant financial markets through more rigorous regulatory impact analysis that addresses systemic risk and market failures, such
as moral hazard and information asymmetry; enabling American companies to be competitive with foreign firms in domestic and foreign markets; advancing American interests in international financial regulatory negotiations and meetings; and restoring public accountability within Federal financial regulatory agencies and “rationalizing” the Federal financial regulatory framework. It is too early at this point to predict the likelihood, scope, or timing of any changes or their impact on the existing or proposed regulations implementing the Dodd-Frank Act.
S.A.F.E. Act Requirements
Regulations issued under the Secure and Fair Enforcement for Mortgage Licensing Act of 2008 (the “S.A.F.E. Act”) require residential mortgage loan originators who are employees of institutions regulated by the foregoing agencies, including national banks, to meet the registration requirements of the S.A.F.E. Act. The S.A.F.E. Act requires residential mortgage loan originators who are employees of regulated financial institutions to be registered with the Nationwide Mortgage Licensing System and Registry, a database created by the Conference of State Bank Supervisors and the American Association of Residential Mortgage Regulators to support the licensing of mortgage loan originators by the states. Employees of regulated financial institutions are generally prohibited from originating residential mortgage loans unless they are registered.
Regulatory Capital Requirements
In July 2013, the federal banking agencies published the Basel III Capital Rules establishing a new comprehensive capital framework for U.S. banking organizations. The rules implement the Basel Committee’s December 2010 framework known as “Basel III” for strengthening international capital standards as well as certain provisions of the Dodd-Frank Act.
The Basel III Capital Rules became effective on January 1, 2015 (subject to a phase-in period) and, among other things, introduced a new capital measure known as “Common Equity Tier 1” (“CET1”), which generally consists of common equity Tier 1 capital instruments and related surplus, retained earnings, and common equity Tier 1 minority interests (minus certain adjustments and deductions, as discussed below).
The Basel III Capital Rules provide for a number of deductions from and adjustments to CET1. These include, for example, the requirement that mortgage servicing rights, deferred tax assets arising from temporary differences that could not be realized through net operating loss carrybacks and significant investments in non-consolidated financial entities be deducted from CET1 to the extent that any one such category exceeds 10% of CET1 or all such categories in the aggregate exceed 15% of CET1. Under the former capital standards, the effects of accumulated other comprehensive income items included in capital were excluded for the purposes of determining regulatory capital ratios. Under the Basel III Capital Rules, the effects of certain accumulated other comprehensive items are not excluded; however, non-advanced approaches banking organizations, including the Company, may make a one-time permanent election to continue to exclude these items. The Company and the Bank both made this election in order to avoid significant variations in the level of capital depending upon the impact of interest rate fluctuations on the fair value of the Company’s available-for-sale securities portfolio. The Basel III Capital Rules also preclude certain hybrid securities, such as trust preferred securities, as Tier 1 capital of bank holding companies, subject to phase-out. The Company has some trust preferred securities. Implementation of the deductions and other adjustments to CET1 began on January 1, 2015 and will be phased-in over a four-year period (beginning at 40% on January 1, 2015 and an additional 20% per year thereafter).
The Basel III Capital Rules prescribe a standardized approach for risk weightings depending on the nature of the assets, generally ranging from 0% for U.S. government and agency securities, to 600% for certain equity exposures. Specifics risk-weights impacting the Company’s determination of risk-weighted assets include, among other things:
| · | | Applying a 150% risk weight for certain high volatility commercial real estate acquisition, development and construction loans; |
| · | | Assigning a 150% risk weight to exposures (other than residential mortgage exposures) that are 90 days past due; |
| · | | Providing for a 20% credit conversion factor for the unused portion of a commitment with an original maturity of one year or less that is not unconditionally cancellable; and |
| · | | Providing for a risk weight, generally not less than 20% with certain exceptions, for securities lending transactions based on the risk weight category of the underlying collateral securing the transaction. |
When fully phased in on January 1, 2019, the Basel III Capital Rules will require the Company and its banking subsidiaries to maintain:
| · | | a minimum ratio of CET1 to risk-weighted assets of at least 4.5%, plus a 2.5% “capital conservation buffer” (which is added to the 4.5% CET1 ratio as that buffer is phased in, effectively resulting in a minimum ratio of CET1 to risk-weighted assets of at least 7% upon full implementation); |
| · | | a minimum ratio of Tier 1 capital to risk-weighted assets of at least 6.0%, plus the capital conservation buffer (which is added to the 6.0% Tier 1 capital ratio as that buffer is phased in, effectively resulting in a minimum Tier 1 capital ratio of 8.5% upon full implementation); |
| · | | a minimum ratio of Total capital (that is, Tier 1 plus Tier 2) to risk-weighted assets of at least 8.0%, plus the capital conservation buffer (which is added to the 8.0% total capital ratio as that buffer is phased in, effectively resulting in a minimum total capital ratio of 10.5% upon full implementation), and |
| · | | a minimum leverage ratio of 4%, calculated as the ratio of Tier 1 capital to average assets. |
The implementation of the capital conservation buffer began on January 1, 2016 at the 0.625% level and will be phased in over a four-year period (increasing by that amount on each subsequent January 1, until it reaches 2.5% on January 1, 2019). The capital conservation buffer is designed to absorb losses during periods of economic stress. Banking institutions with a ratio of CET1 to risk-weighted assets above the minimum but below the conservation buffer (or below the combined capital conservation buffer and countercyclical capital buffer, when the latter is applied) will face constraints on dividends, equity repurchases and compensation based on the amount of the shortfall.
Under the Basel III Capital Rules, the minimum capital ratios, with the capital conversation buffer, as of January 1, 2017 are as follows:
| · | | 5.75% CET1 to risk-weighted assets; |
| · | | 7.25% Tier 1 capital to risk-weighted assets; and |
| · | | 9.25% Total capital to risk-weighted assets. |
Certain regulatory capital ratios for the Company as of December 31, 2016, are shown below:
| · | | 12.4% CET1 to risk-weighted assets; |
| · | | 13.9% Tier 1 capital to risk-weighted assets; |
| · | | 14.7% Total capital to risk-weighted assets; and |
Certain regulatory capital ratios for the Bank as of December 31, 2016, are shown below:
| · | | 13.9% CET1 to risk-weighted assets; |
| · | | 13.9% Tier 1 capital to risk-weighted assets; |
| · | | 14.7% Total capital to risk-weighted assets; and |
Volcker Rule
On December 10, 2013, the Federal Reserve, the Office of the Comptroller of the Currency, the FDIC, the CFTC and the SEC issued final rules to implement the Volcker Rule contained in section 619 of the Dodd‑Frank Act. On July 7, 2016, the FRB granted a one‑year extension to July 21, 2017 and confirm investments in and relationships with covered funds that were in place prior to December 31, 2013 (“Legacy Covered Funds”). This was the last of the three one-year extendsions that the FRB was authorized to issue. With respect to all other investments in and relationships with convered funds other than Legacy Covered Funds, the Volcker Rule became effective July 21, 2015.
The Volcker Rule prohibits an insured depository institution and its affiliates from: (i) engaging in “proprietary trading” and (ii) investing in or sponsoring certain types of funds (“covered funds”) subject to certain limited exceptions. The rule also effectively prohibits short‑term trading strategies by any U.S. banking entity if those strategies involve instruments other than those specifically permitted for trading and prohibits the use of some hedging strategies.
Under these rules and subject to certain exceptions, banking entities, including the Company and the Bank, will be restricted from engaging in activities that are considered proprietary trading and from sponsoring or investing in certain entities, including hedge or private equity funds that are considered “covered funds.” Certain collateralized debt obligations (“CDO”) securities backed by trust preferred securities were initially defined as covered funds subject to the investment prohibitions of the final rule. Action taken by the Federal Reserve in January 2014 exempted many such securities to address the concern that community banks holding such CDO securities may have been required to recognize losses on those securities. Banks with less than $10 billion in total consolidated assets, such as the Bank, that do not engage in any covered activities, other than trading in certain government agency, state or municipal obligations, do not have any significant compliance obligations under the rules implementing the Volcker Rule.
Office of Foreign Assets Control Regulation
The United States has imposed economic sanctions that affect transactions with designated foreign countries, nationals and others which are administered by the U.S. Treasury Department Office of Foreign Assets Control. Failure to comply with these sanctions could have serious legal and reputational consequences, including causing applicable bank regulatory authorities not to approve merger or acquisition transactions when regulatory approval is required or to prohibit such transactions even if approval is not required.
Incentive Compensation
The Dodd‑Frank Act requires the federal bank regulatory agencies and the SEC to establish joint regulations or guidelines prohibiting incentive‑based payment arrangements at specified regulated entities having at least $1 billion in total assets. The regulations must prohibit compensation that encourages inappropriate risks by providing an executive officer, employee, director or principal stockholder with excessive compensation, fees, or benefits that could lead to material financial loss to the entity. In addition, these regulations or guidelines must require enhanced disclosure of incentive‑based compensation arrangements to regulators. The agencies proposed the regulations in April 2011, but the regulations were not finalized. In 2016 the federal agencies re-proposed these rules with some modifications.
In June 2010, the FRB and the FDIC issued comprehensive final guidance on incentive compensation policies intended to ensure that the incentive compensation policies of banking organizations do not undermine the safety and soundness of such organizations by encouraging excessive risk‑taking. The guidance, which covers all employees that have the ability to materially affect the risk profile of an organization, either individually or as part of a group, is based upon the key principles that a banking organization’s incentive compensation arrangements should (i) provide incentives
that do not encourage risk‑taking beyond the organization’s ability to effectively identify and manage risks, (ii) be compatible with effective internal controls and risk management, and (iii) be supported by strong corporate governance, including active and effective oversight by the organization’s board of directors. These three principles are incorporated into the proposed joint compensation regulations under the Dodd‑Frank Act, discussed above. The FRB will review, as part of its regular, risk‑focused examination process, the incentive compensation arrangements of banking organizations, such as the Company, that are not “large, complex banking organizations.” These reviews will be tailored to each organization based on the scope and complexity of the organization’s activities and the prevalence of incentive compensation arrangements. The findings of the supervisory initiatives will be included in reports of examination. Deficiencies will be incorporated into the organization’s supervisory ratings, which can affect the organization’s ability to make acquisitions and take other actions. Enforcement actions may be taken against a banking organization if its incentive compensation arrangements, or related risk‑management control or governance processes, pose a risk to the organization’s safety and soundness and the organization is not taking prompt and effective measures to correct the deficiency.
Future Legislation
Since the U.S. federal elections in November 2016, there has been significant discussion regarding financial regulatory reform. For example, in February 2017, President Trump issued an executive order calling for his administration to review existing U.S. financial laws and regulations in order to determine their consistency with a set of “core principles” of financial policy. Additionally, the Financial CHOICE Act, which was introduced in the House Financial Services Committee, would make changes to the Dodd-Frank Act such as providing a Dodd-Frank Act off-ramp for highly-rated banking organizations that satisfy a heightened leverage ratio requirement, repealing the Volcker Rule and Durbin Amendment, revamping the CFPB and eliminating or substantially modifying the federal banking agencies’ authority to exercise extraordinary powers during a financial crises.
In addition to the specific legislation described above, various additional legislation is currently being considered by Congress. This legislation may change banking statutes and the Company’s operating environment in substantial and unpredictable ways and may increase reporting requirements and governance. If enacted, such legislation could increase or decrease the cost of doing business, limit or expand permissible activities, or affect the competitive balance among banks, savings associations, credit unions, and other financial institutions. The Company cannot predict whether any potential legislation will be enacted and, if enacted, the effect that it, or any implementing regulations, would have on its business, results of operations, or financial condition.
ITEM 1A. RISK FACTORS
In addition to the other information contained in this report, the following risks may affect us. If any of these risks actually occur, our business, financial condition or results of operations may suffer. As a result, the price of our common shares could decline.
Risks Related to Our Business.
A significant portion of our assets consists of loans, which if not repaid could result in losses to the Company.
As a lender, we are exposed to the risk that our customers will be unable to repay their loans according to their terms and that the collateral securing the payment of their loans (if any) may not be sufficient to assure repayment. Credit losses could have a material adverse effect on our operating results.
As of December 31, 2016, our total loan portfolio was approximately $2,652 million or 65% of our total assets. Three major components of the loan portfolio are loans principally secured by real estate, approximately $2,055 million or 78% of total loans; other commercial loans, approximately $535 million or 20% of total loans; and consumer loans, approximately $62 million or 2% of total loans. Our credit risk with respect to our consumer installment loan portfolio and commercial loan portfolio relates principally to the general creditworthiness of individuals and businesses within our local market area. Our credit risk with respect to our residential and commercial real estate mortgage and construction loan portfolio relates principally to the general creditworthiness of individuals and businesses and the value of real estate serving as security for the repayment of the loans. A related risk in connection with loans secured by commercial real estate is the effect of unknown or unexpected environmental contamination, which could make the real estate effectively unmarketable or otherwise significantly reduce its value as security. Continued or worsening declines in the economy could cause additional credit issues, particularly within our residential and commercial real estate mortgage and construction loan portfolio.
Our allowance for loan losses may not be sufficient to cover actual loan losses, which could adversely affect our earnings.
We maintain an allowance for loan losses at a level estimated by management to be sufficient to cover probable incurred loan losses in our loan portfolio. Loan losses will likely occur in the future and may occur at a rate greater than we have experienced to date. In determining the size of the allowance, our management makes various assumptions and judgments about the collectability of our loan portfolio, including the diversification by industry of our commercial loan portfolio, the effect of changes in the local real estate markets on collateral values, the results of recent regulatory examinations, the effects on the loan portfolio of current economic indicators and their probable impact on borrowers, the amount of charge‑offs for the period, the amount of nonperforming loans and related collateral security, and the evaluation of our loan portfolio by an external loan review. If our assumptions and judgments prove to be incorrect, our current allowance may not be sufficient and adjustments may be necessary to allow for different economic conditions or adverse developments in our loan portfolio. Additionally, continuing deterioration in economic conditions affecting borrowers, new information regarding existing loans, identification of additional problem loans and other factors, both within and outside the Company’s control, may require an increase in the allowance for loan losses. Federal and state regulators also periodically review our allowance for loan losses and may require us to increase our provision for loan losses or recognize further loan charge‑offs, based on judgments different than those of our management. Any increase in our allowance for loan losses or loan charge‑offs could have an adverse effect on our operating results and financial condition. There can be no assurance that our monitoring procedures and policies will reduce certain lending risks or that our allowance for loan losses will be adequate to cover actual losses.
If we foreclose on collateral property, we may be subject to the increased costs associated with ownership of real property, resulting in reduced revenues and earnings.
We may have to foreclose on collateral property to protect our investment and may thereafter own and operate such property, in which case we will be exposed to the risks inherent in the ownership of real estate. The amount that we, as a mortgagee, may realize after a default is dependent upon factors outside of our control, including, but not limited to: (i) general or local economic conditions; (ii) neighborhood values; (iii) interest rates; (iv) real estate tax rates; (v) operating expenses of the mortgaged properties; (vi) environmental remediation liabilities; (vii) ability to obtain and maintain
adequate occupancy of the properties; (viii) zoning laws; (ix) governmental rules, regulations and fiscal policies; and (x) acts of God. Certain expenditures associated with the ownership of real estate, principally real estate taxes, insurance, and maintenance costs, may adversely affect the income from the real estate. Therefore, the cost of operating real property may exceed the income earned from such property, and we may have to advance funds in order to protect our investment, or we may be required to dispose of the real property at a loss. The foregoing expenditures and costs could adversely affect our ability to generate revenues, resulting in reduced levels of profitability.
Fluctuating interest rates could adversely affect our profitability.
Our profitability is dependent to a large extent upon our net interest income, which is the difference between the interest earned on loans, securities and other interest-earning assets and interest paid on deposits, borrowings, and other interest-bearing liabilities. Because of the differences in maturities and re-pricing characteristics of our interest-earning assets and interest-bearing liabilities, changes in interest rates do not produce equivalent changes in interest income earned on interest-earning assets and interest paid on interest-bearing liabilities. Accordingly, fluctuations in interest rates could adversely affect our net interest margin, and, in turn, our profitability. We manage our interest rate risk within established guidelines and generally seek an asset and liability structure that insulates net interest income from large deviations attributable to changes in market rates. However, our interest rate risk management practices may not be effective in a highly volatile rate environment.
Revisions to the mortgage regulations may adversely impact our business.
Revisions made pursuant to the Dodd‑Frank Act to Regulation Z, which implements the Truth in Lending Act (the “TILA”), were effective in January 2014, and apply to all consumer mortgages (except home equity lines of credit, timeshare plans, reverse mortgages, or temporary loans). The revisions mandate specific underwriting criteria and “ability to repay” requirements for home loans. This may impact our offering and underwriting of single family residential loans in our residential mortgage lending operation and could have a resulting unknown effect on potential delinquencies. In addition, the relatively uniform requirements may make it difficult for regional and community banks to compete against the larger national banks for single family residential loan originations.
The impact of new capital rules will impose enhanced capital adequacy requirements on us and may materially impact our operations.
Pursuant to the Dodd‑Frank Act and the “Basel III” standards, the federal banking agencies have adopted a new set of rules on minimum leverage and risk-based capital that will apply to both insured banks and their holding companies. These regulations were issued in July 2013. The full implementation of the new capital rules may adversely affect our ability to pay dividends, or require us to reduce business levels or raise capital, including in ways that may adversely affect our business, liquidity, financial condition and results of operations.
We may be required to pay significantly higher Federal Deposit Insurance Corporation (FDIC) premiums in the future.
Insured institution failures during the past several years have significantly increased FDIC loss provisions, resulting in a decline in the designated reserve ratio to historical lows. In addition the Dodd‑Frank Act permanently implemented FDIC insurance coverage for all deposit accounts up to $250,000 and revised the insurance premium assessment base from all domestic deposits to the average of total assets less tangible equity. The minimum reserve ratio of the deposit insurance fund has been increased from 1.15% to 1.35%, with the increase to be covered by assessments on insured institutions with assets over $10 billion until the new reserve ratio is reached.
We are generally unable to control the amount of premiums that we are required to pay for FDIC insurance. If there are additional bank or financial institution failures, we may be required to pay even higher FDIC premiums than the recently increased levels. Additionally, the FDIC may make material changes to the calculation of the prepaid assessment from the current proposal. Any future changes in the calculation or assessment of FDIC insurance premiums may have a material adverse effect on our results of operations, financial condition and our ability to continue to pay dividends on our common shares at the current rate or at all.
Future growth or operating results may require the Company to raise additional capital but that capital may not be available or it may be dilutive.
We are required by federal and state regulatory authorities to maintain adequate levels of capital to support our operations. To the extent our future operating results erode capital or we elect to expand through loan growth or acquisition we may be required to raise capital. Our ability to raise capital will depend on conditions in the capital markets, which are outside of our control, and on our financial performance. Accordingly, we cannot be assured of our ability to raise capital if needed or on favorable terms. If we cannot raise additional capital when needed, we will be subject to increased regulatory supervision and the imposition of restrictions on our growth and business. These could negatively impact our ability to operate or further expand our operations through acquisitions or the establishment of additional branches and may result in increases in operating expenses and reductions in revenues that could have a material adverse effect on our financial condition and results of operations.
We rely heavily on our management and other key personnel, and the loss of any of them may adversely affect our operations.
We are and will continue to be dependent upon the services of our management team. The loss of any of our senior managers could have an adverse effect on our growth and performance because of their skills, knowledge of the markets in which we operate and years of industry experience and the difficulty of promptly finding qualified replacement personnel. The loss of key personnel in a particular market could have an adverse effect on our performance in that market because it may be difficult to find qualified replacement personnel who are already located in or would be willing to relocate to a non‑metropolitan market. Additionally, recent regulations issued by banking regulators regarding executive compensation may impact our ability to compensate executives and, as a result, to attract and retain qualified personnel.
The geographic concentration of our markets makes our business highly susceptible to local economic conditions.
Unlike larger banking organizations that are more geographically diversified, our operations are currently concentrated in Indiana, Illinois, Ohio, and Kentucky. As a result of this geographic concentration in four fairly contiguous markets, our financial results depend largely upon economic conditions in these market areas. A deterioration in economic conditions in one or all of these markets could result in one or more of the following:
| · | | an increase in loan delinquencies; |
| · | | an increase in problem assets and foreclosures; |
| · | | a decrease in the demand for our products and services; or |
| · | | a decrease in the value of collateral for loans, especially real estate, in turn reducing customers’ borrowing power, the value of assets associated with problem loans and collateral coverage. |
If we do not adjust to rapid changes in the financial services industry, our financial performance may suffer.
We face substantial competition for deposit, credit and trust relationships, as well as other sources of funding in the communities we serve. Competing providers include other banks, thrifts and trust companies, insurance companies, mortgage banking operations, credit unions, finance companies, money market funds, financial technology companies and other financial and nonfinancial companies which may offer products functionally equivalent to those offered by the Bank. Competing providers may have greater financial resources than we do and offer services within and outside the market areas we serve. In addition to this challenge of attracting and retaining customers for traditional banking services, our competitors now include securities dealers, brokers, mortgage bankers, investment advisors and finance and insurance companies who seek to offer one‑stop financial services to their customers that may include services that banks have not been able or allowed to offer to their customers in the past. The increasingly competitive environment is primarily a result of changes in regulation, changes in technology and product delivery systems and the accelerating pace of consolidation among financial service providers. If we are unable to adjust both to increased competition for traditional banking services
and changing customer needs and preferences, it could adversely affect our financial performance and your investment in our common stock.
The operations of our business, including our interaction with customers, are increasingly done via electronic means, and this has increased our risks related to cybersecurity and data security.
The Company relies heavily on internal and outsourced digital technologies, communications, and information systems to conduct its business. As the Company's reliance on technology systems increases, the potential risks of technology-related operation interruptions in the Company's customer relationship management, general ledger, deposit, loan, or other systems or the occurrence of cyber and data security incidents also increases. Cyber and data security incidents can result from deliberate attacks or unintentional events including, among other things, (i) gaining unauthorized access to digital systems for purposes of misappropriating assets or sensitive information, corrupting data, or causing potentially debilitating operational disruptions; (ii) causing denial-of-service attacks on websites; or (iii) intelligence gathering and social engineering aimed at obtaining information. The occurrence of an operational interruption, cyber incident, data security breach or other deficiency in the security of the Company's technology systems (internal or outsourced) could negatively impact the Company's financial condition or results of operations.
The Company has policies and procedures expressly designed to prevent or limit the effect of a failure, interruption, or security breach of its systems and maintains cyber security insurance. Significant interruptions to the Company's business from technology issues could result in expensive remediation efforts and distraction of management. The Company invests in security and controls to prevent and mitigate incidents. Although the Company has not experienced any material losses related to a technology-related operational interruption, cyber-attack, or data security breach, there can be no assurance that such failures, interruptions, or security breaches will not occur in the future or, if they do occur, that the impact will not be substantial.
The occurrence of any failures, interruptions, or security breaches of the Company's technology systems could damage the Company's reputation, result in a loss of customer business, result in the unauthorized release, gathering, monitoring, misuse, loss, or destruction of proprietary information, subject the Company to additional regulatory scrutiny, or expose the Company to civil litigation and possible financial liability, any of which could have a material adverse effect on the Company's business, financial condition, and results of operations, as well as its reputation or stock price. As cyber and data security threats continue to evolve, the Company expects it will be required to spend significant resources on an ongoing basis to continue to modify and enhance its protective measures and to investigate and remediate any information security vulnerabilities.
Negative perception of the Company through social media may adversely affect the Company’s reputation and business.
The Company’s reputation is critical to the success of its business. The Company believes that its brand image has been well received by customers, reflecting the fact that the brand image, like the Company’s business, is based in part on trust and confidence. The Company’s reputation and brand image could be negatively affected by rapid and widespread distribution of publicity through social media channels. The Company’s reputation could also be affected by the Company’s association with clients affected negatively through social media distribution, or other third parties, or by circumstances outside of the Company’s control. Negative publicity, whether true or untrue, could affect the Company’s ability to attract or retain customers, or cause the Company to incur additional liabilities or costs, or result in additional regulatory scrutiny.
Acquisitions entail risks which could negatively affect our operations.
Acquisitions involve numerous risks, including:
| · | | exposure to asset quality problems of the acquired institution; |
| · | | maintaining adequate regulatory capital; |
| · | | diversion of management’s attention from other business concerns; |
| · | | risks and expenses of entering new geographic markets; |
| · | | potential significant loss of depositors or loan customers from the acquired institution; or |
| · | | exposure to undisclosed or unknown liabilities of an acquired institution. |
Any of these acquisition risks could result in unexpected losses or expenses and thereby reduce the expected benefits of the acquisition.
Unanticipated costs related to our acquisitions could reduce our future earnings per share.
We believe we have reasonably estimated the likely costs of integrating the operations of the banks we acquire into the Company and the incremental costs of operating such banks as a part of the MainSource family. However, it is possible that unexpected transaction costs such as taxes, fees or professional expenses or unexpected future operating expenses, such as increased personnel costs or increased taxes, as well as other types of unanticipated adverse developments, could have a material adverse effect on the results of operations and financial condition of MainSource. If unexpected costs are incurred, acquisitions could have a dilutive effect on our earnings per share. Current accounting guidance requires expensing of acquisition costs. In prior years, these costs could be capitalized. In other words, if we incur such unexpected costs and expenses as a result of our acquisitions, we believe that the earnings per share of our common stock could be less than they would have been if those acquisitions had not been completed.
We may be unable to successfully integrate the operations of the banks we have acquired and may acquire in the future and retain employees of such banks.
Our acquisition strategy involves the integration of the banks we have acquired and may acquire in the future into MainSource Bank. The difficulties of integrating the operations of such banks with MainSource Bank include:
| · | | coordinating geographically separated organizations; |
| · | | integrating personnel with diverse business backgrounds; |
| · | | combining different corporate cultures; or |
| · | | retaining key employees. |
The process of integrating operations could cause an interruption of, or loss of momentum in, the activities of one or more of the Company, our subsidiary banks and the banks we have acquired and may acquire in the future and the loss of key personnel. The integration of such banks as MainSource subsidiary banks requires the experience and expertise of certain key employees of such banks who we expect to retain. We cannot be sure, however, that we will be successful in retaining these employees for the time period necessary to successfully integrate such banks’ operations as subsidiary banks of MainSource. The diversion of management’s attention and any delays or difficulties encountered in connection with the mergers, along with the integration of the banks as MainSource subsidiary banks, could have an adverse effect on our business and results of operation.
The Company’s success depends on our ability to respond to the threats and opportunities of financial technology innovation.
Financial technology (“FinTech”), a broad category referring to technological innovation in the design and delivery of financial services and products, has the potential to disrupt the financial industry and change the way banks do business. Investment in new technology to stay competitive may result in significant costs and increased risks of cyber security attacks. Our success depends on our ability to adapt to the pace of the rapidly changing technological environment, which is crucial to retention and acquisition of customers. On December 2, 2016 the Office of the Comptroller of the Currency announced that it will consider applications from FinTech companies to become special purpose national banks.
The federal charter would largely allow FinTech companies to operate nationwide under a single set of national standards, without needing to seek state-by-state licenses or joining with brick-and-mortar banks, and may therefore allow FinTech companies to more easily compete with us for customers of financial products and services in the communities we serve.
Risks Relating to the Banking Industry
Changes in governmental regulation and legislation could limit our future performance and growth.
We are subject to extensive state and federal regulation, supervision and legislation that governs almost all aspects of our operations, as well as any acquisitions we may propose to make. Any change in applicable federal or state laws or regulations could have a substantial impact on us, our subsidiary banks and our operations. While we cannot predict what effect any presently contemplated or future changes in the laws or regulations or their interpretations would have on us, these changes could reduce the value of your investment.
The implementation of final rules under the many provisions of the Dodd‑Frank Act could adversely affect us.
Regulation of the financial services industry is undergoing major changes from the enactment and ongoing implementation of Dodd‑Frank. Certain provisions of Dodd‑Frank are effective and have been fully implemented, including the revisions in the deposit insurance assessment base for FDIC insurance and the permanent increase in FDIC coverage to $250,000; the permissibility of paying interest on business checking accounts; the removal of remaining barriers to interstate branching and required disclosure and shareholder advisory votes on executive compensation. Other actions to implement the final Dodd‑Frank Act provisions include (i) final capital rules; (ii) a final rule to implement the “Volcker Rule” restrictions on certain proprietary trading and investment activities; and (iii) the promulgation of final rules and increased enforcement action by the CFPB. The full implementation of certain final rules is delayed or phased in over several years; therefore, as yet we cannot definitively assess what may be the short or longer term specific or aggregate effect of the full implementation of the Dodd‑Frank Act on us.
Changes in regulation or oversight may have a material adverse impact on our operations.
We are subject to extensive regulation, supervision and examination by the Indiana Department of Financial Institutions, the Federal Deposit Insurance Corporation, the Board of Governors of the Federal Reserve System, the Securities and Exchange Commission and other regulatory bodies. Such regulation and supervision governs the activities in which we may engage. Regulatory authorities have extensive discretion in their supervisory and enforcement activities, including the imposition of restrictions on our operations, investigations and limitations related to our securities, the classification of our assets and determination of the level of our allowance for loan losses. In light of the recent conditions in the U.S. financial markets and economy, Congress and regulators have increased their focus on the regulation of the financial services industry. Any change in such regulation and oversight, whether in the form of regulatory policy, regulations, legislation or supervisory action, may have a material adverse impact on our business, financial condition or results of operations.
Changes in economic or political conditions could adversely affect the Company’s business and results of operations, as the ability of the Company’s borrowers to repay loans, and the value of the collateral securing such loans, decline.
The Company’s success depends, to a certain extent, upon economic or political conditions, local and national, as well as governmental monetary policies. Conditions such as recession, unemployment, changes in interest rates, inflation, money supply and other factors beyond our control may adversely affect our asset quality, deposit levels and loan demand and, therefore, our earnings. Adverse changes in the economy may also have a negative effect on the ability of our borrowers to make timely repayments of their loans, which would have an adverse impact on our earnings. In addition, substantially all of the Company’s loans are to individuals and businesses in our market area. Consequently, any economic decline in the Company’s primary market areas, which include Indiana, Illinois, Ohio and Kentucky, could have an adverse impact on the Company’s earnings.
Weakness in the U.S. economy, including within the Company’s geographic footprint, has adversely affected the
Company in the past and may adversely affect the Company in the future.
If the strength of the U.S. economy in general or the strength of the local economies in the Company’s markets declines, this could result in, among other things, a decreased demand for our products and services, a deterioration in credit quality or a reduced demand for credit. These factors could result in higher delinquencies, greater charge-offs and increased losses in future periods, which could materially adversely affect our financial condition and results of operations.
Changes in consumer use of banks and changes in consumer spending and savings habits could adversely affect our financial results.
Technology and other changes now allow many customers to complete financial transactions without using banks. For example, consumers can pay bills and transfer funds directly without going through a bank. This process of eliminating banks as intermediaries could result in the loss of fee income, as well as the loss of customer deposits and income generated from those deposits. In addition, changes in consumer spending and savings habits could adversely affect our operations, and we may be unable to timely develop competitive new products and services in response to these changes that are accepted by new and existing customers.
Our earnings could be adversely impacted by incidences of fraud and compliance failure.
Financial institutions are inherently exposed to fraud risk and compliance risk. A fraud can be perpetrated by a customer of MainSource, an employee, a vendor, or members of the general public. We are most subject to fraud and compliance risk in connection with the origination of loans, ACH transactions, ATM transactions and checking transactions. Our largest fraud risk, associated with the origination of loans, includes the intentional misstatement of information in property appraisals or other underwriting documentation provided to us by third parties. Compliance risk is the risk to earnings or capital from noncompliance with laws, rules, and regulations. We face risk of noncompliance and enforcement actions under the BSA and other anti-money laundering statutes and regulations. The BSA requires banks and other financial institutions to, among other things, develop and maintain an effective anti-money laundering program and file suspicious activity and currency transaction reports as appropriate. If our policies, procedures and internal controls are deemed deficient, we could face money penalties as well as serious reputational consequences. There can be no assurance that we can prevent or detect acts of fraud or violation of law or our compliance standards by our employees or the other parties with whom we conduct business. Repeated incidences of fraud or compliance failures would adversely impact our reputation, the performance of our loan portfolio, and our earnings.
Risks Related to the Company’s Stock
We may not be able to pay dividends in the future in accordance with past practice.
The Company has traditionally paid a quarterly dividend to common stockholders. The Company is a separate legal entity from the Bank and receives substantially all of its revenue and cash flow from dividends paid by the Bank to the Company. Indiana state law and agreements between the Bank and its federal and state regulators may limit the amount of dividends that the Bank may pay to the Company. In the event that the Bank is unable to pay dividends to the Company for an extended period of time, the Company may not be able to service its debt obligations or pay dividends on its common stock. Additionally, any payment of dividends in the future will depend, in large part, on the Bank’s earnings, capital requirements, financial condition and other factors considered relevant by the Company’s Board of Directors. Starting in the second quarter of 2009 and continuing to the second quarter of 2012, the Company reduced the amount of cash dividends paid. This reduction was made to preserve capital levels at the Company. Beginning in the third quarter of 2012, the Company has steadily raised the dividend, including an increase to $0.11 per common share in the third quarter of 2014, $0.13 per common share in the first quarter of 2015, $0.14 per common share in the third quarter of 2015, $0.15 per common share in the first quarter of 2016, and $0.16 per common share in the fourth quarter of 2016. There can be no assurance that the Company will continue to raise the amount of the dividend or that it will not decrease or eliminate the dividend in the future.
The price of the Company’s common stock may be volatile, which may result in losses for investors.
General market price declines or market volatility in the future could adversely affect the price of the Company’s common stock. In addition, the following factors may cause the market price for shares of the Company’s common stock to fluctuate:
| · | | announcements of developments related to the Company’s business; |
| · | | fluctuations in the Company’s results of operations; |
| · | | sales or purchases of substantial amounts of the Company’s securities in the marketplace; |
| · | | general conditions in the banking industry, the US economy or the global economy; |
| · | | a shortfall or excess in revenues or earnings compared to securities analysts’ expectations; |
| · | | changes in analysts’ recommendations or projections; and |
| · | | the Company’s announcement of new acquisitions or other projects. |
The Company’s charter documents and federal regulations may inhibit a takeover, or prevent a transaction that may favor or otherwise limit the Company’s growth opportunities, which could cause the market price of the Company’s common stock to decline.
Certain provisions of the Company’s charter documents and federal regulations could have the effect of making it more difficult for a third party to acquire, or of discouraging a third party from attempting to acquire, control of the Company. In addition, the Company must obtain approval from regulatory authorities before acquiring control of any other company.
ITEM 1B. UNRESOLVED STAFF COMMENTS.
None.
ITEM 2. PROPERTIES
As of December 31, 2016, the Company leased an office building located in Greensburg, Indiana, from one of its subsidiaries for use as its corporate headquarters. The Company’s subsidiaries own, or lease, all of the facilities from which they conduct business. All leases are comparable to other leases in the respective market areas and do not contain provisions materially detrimental to the Company or its subsidiaries. As of December 31, 2016 the Company had 90 banking locations and approximately $76,426 invested in premises and equipment.
ITEM 3. LEGAL PROCEEDINGS
From time to time the Company and its subsidiaries may be parties (both plaintiff and defendant) to ordinary litigation incidental to the conduct of business.
ITEM 4. MINE SAFETY DISCLOSURES
Not applicable.
PART II
ITEM 5. MARKET FOR THE REGISTRANT’S COMMON EQUITY, RELATED STOCKHOLDER MATTERS AND ISSUER’S PURCHASES OF EQUITY SECURITIES
Market Information
The Company’s Common Stock is traded on the NASDAQ Global Select Market under the symbol MSFG. The Common Stock was held by approximately 9,700 shareholders at March 10, 2017. The quarterly high and low closing prices for the Company’s common stock as reported by NASDAQ and quarterly cash dividends declared and paid are set forth in the tables below. All per share data is retroactively restated for all stock dividends and splits.
The range of known per share prices by calendar quarter, based on actual transactions, excluding commissions, is shown below.
| | | | | | | | | | | | | |
| | Market Prices | |
2016 | | Q1 | | Q2 | | Q3 | | Q4 | |
High | | $ | 22.18 | | $ | 23.25 | | $ | 24.95 | | $ | 34.57 | |
Low | | $ | 19.95 | | $ | 20.30 | | $ | 21.39 | | $ | 23.94 | |
| | | | | | | | | | | | | |
2015 | | | Q1 | | | Q2 | | | Q3 | | | Q4 | |
High | | $ | 20.62 | | $ | 22.40 | | $ | 22.15 | | $ | 23.79 | |
Low | | $ | 18.71 | | $ | 19.04 | | $ | 20.21 | | $ | 20.15 | |
| | | | | | | | | | | | | |
| | Cash Dividends | |
2016 | | | Q1 | | | Q2 | | | Q3 | | | Q4 | |
| | $ | 0.15 | | $ | 0.15 | | $ | 0.15 | | $ | 0.16 | |
| | | | | | | | | | | | | |
2015 | | | Q1 | | | Q2 | | | Q3 | | | Q4 | |
| | $ | 0.13 | | $ | 0.13 | | $ | 0.14 | | $ | 0.14 | |
It is expected that the Company will continue to consider the Company’s results of operations, capital levels and other external factors beyond management’s control in making the decision to maintain or further raise the dividend.
Issuer Purchases of Equity Securities
The Company purchased the following equity securities of the Company during the quarter ended December 31, 2016:
| | | | | | | | | |
| | | | | | Total Number of Shares | | Maximum Number (or | |
| | | | | | (or Units) Purchased as | | Approximate Dollar Value) | |
| | Total Number | | | | Part of Publicly | | of Shares (or Units) That | |
| | of Shares (or | | Average Price Paid Per | | Announced Plans or | | May Yet Be Purchased | |
Period | | Units) Purchased (1) | | Share (or Unit) | | Programs | | Under the Plans or Programs | |
October 1‑31, 2016 | | — | $ | — | | — | | — | |
November 1‑30, 2016 | | 18,487 | | 29.30 | | — | | — | |
December 1-31, 2016 | | 5,280 | | 31.98 | | — | | — | |
Total: | | 23,767 | $ | 29.90 | | — | | — | |
| (1) | | Represents shares purchased by the Company from employees upon the vesting of restricted stock grants for purposes of satisfying the employees’ tax withholding obligations. |
Stock Performance Graph
The following performance graph compares the performance of our common shares to the performance of the NASDAQ Market Index (U.S.) and the NASDAQ Bank Stocks Index for the 60 months ended December 31, 2016. The graph assumes an investment of $100 in each of the Company’s common shares, the NASDAQ Market Index (U.S.) and the NASDAQ Bank Stocks Index on December 31, 2011.
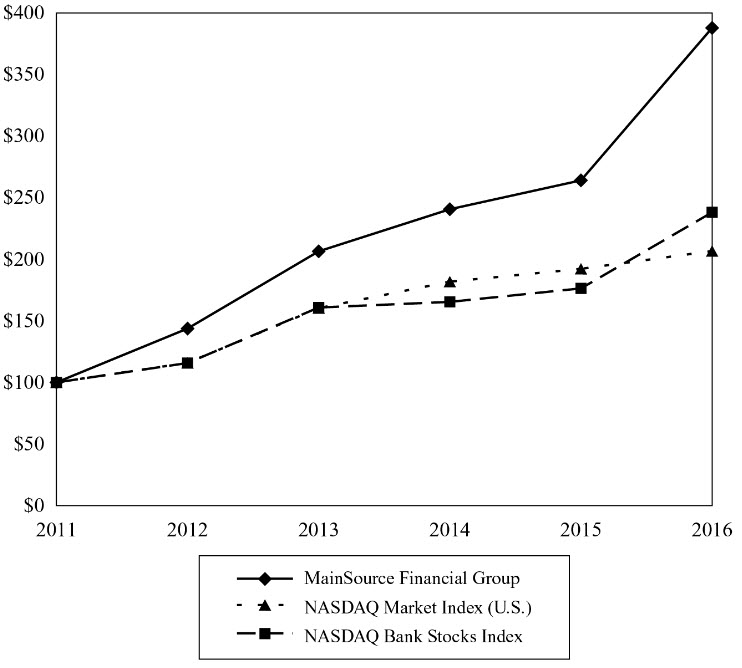
| | | | | | | | | | | | | |
| | 12/31/11 | | 12/31/12 | | 12/31/13 | | 12/31/14 | | 12/31/15 | | 12/31/16 | |
MainSource Financial Group | | 100.00 | | 143.74 | | 206.43 | | 240.59 | | 264.04 | | 387.82 | |
NASDAQ MARKET INDEX (U.S.) | | 100.00 | | 115.91 | | 160.31 | | 181.80 | | 192.22 | | 206.65 | |
NASDAQ Bank Stocks Index | | 100.00 | | 115.77 | | 160.82 | | 165.39 | | 176.34 | | 238.10 | |
ITEM 6. SELECTED FINANCIAL DATA
Selected Financial Data
(Dollar amounts in thousands except per share data)
| | | | | | | | | | | | | | | | |
| | 2016 | | 2015 | | 2014 | | 2013 | | 2012 | |
Results of Operations | | | | | | | | | | | | | | | | |
Net interest income | | $ | 117,601 | | $ | 102,725 | | $ | 94,488 | | $ | 91,300 | | $ | 94,082 | |
Provision for loan losses | | | 1,705 | | | 1,625 | | | 1,500 | | | 4,534 | | | 9,850 | |
Noninterest income | | | 52,612 | | | 50,272 | | | 43,007 | | | 43,129 | | | 43,891 | |
Noninterest expense | | | 118,048 | | | 105,597 | | | 99,220 | | | 98,231 | | | 94,838 | |
Income before income tax | | �� | 50,460 | | | 45,775 | | | 36,775 | | | 31,664 | | | 33,285 | |
Income tax | | | 12,137 | | | 10,233 | | | 7,779 | | | 5,319 | | | 6,027 | |
Net income | | | 38,323 | | | 35,542 | | | 28,996 | | | 26,345 | | | 27,258 | |
Preferred dividends and accretion | | | — | | | — | | | — | | | 504 | | | 2,110 | |
Net income available to common shareholders | | | 38,323 | | | 35,542 | | | 28,996 | | | 25,693 | | | 26,505 | |
Dividends paid on common stock | | | 14,296 | | | 11,680 | | | 8,726 | | | 5,709 | | | 1,623 | |
Per Common Share* | | | | | | | | | | | | | | | | |
Earnings per share (basic) | | $ | 1.66 | | $ | 1.64 | | $ | 1.40 | | $ | 1.26 | | $ | 1.31 | |
Earnings per share (diluted) | | | 1.64 | | | 1.62 | | | 1.39 | | | 1.26 | | | 1.30 | |
Dividends paid | | | 0.61 | | | 0.54 | | | 0.42 | | | 0.28 | | | 0.08 | |
Book value — end of period | | | 18.68 | | | 17.67 | | | 16.63 | | | 14.96 | | | 15.21 | |
Tangible book value — end of period | | | 14.16 | | | 13.94 | | | 13.01 | | | 11.53 | | | 11.72 | |
Market price — end of period | | | 34.40 | | | 22.88 | | | 20.92 | | | 18.03 | | | 12.67 | |
At Year End | | | | | | | | | | | | | | | | |
Total assets | | $ | 4,080,257 | | $ | 3,385,408 | | $ | 3,122,516 | | $ | 2,847,209 | | $ | 2,769,288 | |
Securities | | | 1,007,540 | | | 925,279 | | | 867,760 | | | 891,106 | | | 902,341 | |
Loans, excluding held for sale | | | 2,651,673 | | | 2,155,392 | | | 1,957,765 | | | 1,671,926 | | | 1,553,383 | |
Allowance for loan losses | | | 22,499 | | | 22,020 | | | 23,250 | | | 27,609 | | | 32,227 | |
Total deposits | | | 3,110,871 | | | 2,650,775 | | | 2,468,321 | | | 2,200,628 | | | 2,185,054 | |
Federal Home Loan Bank advances | | | 249,658 | | | 269,488 | | | 214,413 | | | 247,858 | | | 141,052 | |
Subordinated debentures | | | 41,239 | | | 41,239 | | | 41,239 | | | 46,394 | | | 50,418 | |
Shareholders’ equity | | | 449,494 | | | 381,360 | | | 360,662 | | | 305,526 | | | 323,751 | |
Financial Ratios | | | | | | | | | | | | | | | | |
Return on average assets | | | 1.01 | % | | 1.10 | % | | 0.99 | % | | 0.95 | % | | 0.99 | % |
Return on average common shareholders’ equity | | | 8.93 | | | 9.56 | | | 8.81 | | | 8.35 | | | 8.15 | |
Allowance for loan losses to total loans (year end, excluding held for sale) | | | 0.85 | | | 1.02 | | | 1.19 | | | 1.65 | | | 2.07 | |
Allowance for loan losses to total non‑performing loans (year end) | | | 106.06 | | | 137.29 | | | 80.62 | | | 104.02 | | | 63.04 | |
Shareholders’ equity to total assets (year end) | | | 11.02 | | | 11.26 | | | 11.55 | | | 10.73 | | | 11.69 | |
Average equity to average total assets | | | 11.36 | | | 11.46 | | | 11.27 | | | 11.32 | | | 12.12 | |
Dividend payout ratio | | | 37.30 | | | 32.86 | | | 30.09 | | | 22.22 | | | 6.12 | |
* Adjusted for stock split and dividends
Tangible book value per share is a non-GAAP financial measure calculated using GAAP amounts. Tangible book value per share is calculated by dividing tangible common equity by the number of shares outstanding. Tangible common equity is calculated by excluding the balance of preferred stock, goodwill, and other intangible assets from the calculation of stockholders' equity. The Company believes that this non-GAAP financial measure provides information to investors that is useful in understanding its financial condition. Because not all companies use the same calculation of tangible common equity, this presentation may not be comparable to other similarly titled measures calculated by other companies.
A reconciliation of this non-GAAP financial measure to the most comparable GAAP financial measure is provided below.
| | | | | | | | | | | | | | | | |
| | | 2016 | | 2015 | | 2014 | | 2013 | | 2012 |
Shareholders' Equity | | $ | 449,494 | | $ | 381,360 | | $ | 360,662 | | $ | 305,526 | | $ | 323,751 | |
Less: Preferred Stock | | | — | | | — | | | — | | | — | | | 14,918 | |
Intangible Assets | | | 108,734 | | | 80,615 | | | 78,546 | | | 70,025 | | | 70,940 | |
Tangible Common Equity | | $ | 340,760 | | $ | 300,745 | | $ | 282,116 | | $ | 235,501 | | $ | 237,893 | |
| | | | | | | | | | | | | | | | |
Ending Shares Outstanding | | | 24,067,364 | | | 21,579,575 | | | 21,687,525 | | | 20,417,224 | | | 20,304,525 | |
| | | | | | | | | | | | | | | | |
Tangible Book Value Per Common Share | | $ | 14.16 | | $ | 13.94 | | $ | 13.01 | | $ | 11.53 | | $ | 11.72 | |
The allowance for loan losses to total loans ratio at December 31, 2016 includes The Merchant’s Bank and Trust Company, Old National Bank, and Cheviot Savings Bank acquired loans brought over at fair value with no associated allowance. The allowance for loan losses to total loans ratio at December 31, 2015 includes The Merchant’s Bank and Trust Company and Old National Bank acquired loans brought over at fair value with no associated allowance. See Note 26 to the Consolidated Financial Statements for additional information concerning acquisitions by the Company.
ITEM 7. MANAGEMENT’S DISCUSSION AND ANALYSIS OF FINANCIAL CONDITION AND RESULTS OF OPERATIONS
Management’s Discussion and Analysis
(Dollar amounts in thousands except per share data)
Overview
MainSource Financial Group, Inc. is a financial holding company whose principal activity is the ownership and management of its wholly owned subsidiary bank: MainSource Bank headquartered in Greensburg, Indiana. The Bank operates under an Indiana state charter and is subject to regulation by the Indiana Department of Financial Institutions and the Federal Deposit Insurance Corporation. Non-banking subsidiaries of the Company include MainSource Insurance, LLC, Insurance Services Marketing, LLC, MainSource Title, LLC, and MainSource Risk Management, Inc. Non banking subsidiaries of the Bank are New American Real Estate, LLC. The first three subsidiaries are subject to regulation by the Indiana Department of Insurance.
Business Strategy
The Company operates under the broad tenets of a long‑term strategic plan (“Plan”) designed to improve the Company’s financial performance, expand its competitive position and enhance long‑term shareholder value. The Plan is premised on the belief of the Company’s Board of Directors that it can best promote long‑term shareholder interests by pursuing strategies which will continue to preserve its community‑focused philosophy. The dynamics of the Plan assure continually evolving goals, with the enhancement of shareholder value being the constant, overriding objective. The extent
of the Company’s success will depend upon how well it anticipates and responds to competitive changes within its markets, the interest rate environment and other external forces.
Results of Operations
Net income attributable to common shareholders was $38,323 in 2016, $35,542 in 2015, and $28,996 in 2014. Earnings per common share on a fully diluted basis were $1.64 in 2016, $1.62 in 2015, and $1.39 in 2014. The primary drivers that led to the increase in net income in 2016 versus 2015 were an increase in net interest income of $14,876, increases in mortgage banking of $1,689, interchange income of $1,877, as well as a prepayment penalty on a FHLB advance taken in 2015 and a reduction in consultant expenses of $557. An increase in earning assets primarily from the 2015 acquisition of the five Old National branches and the partial year effect of the Cheviot acquisition as well as organic loan growth resulted in higher net interest income. Continued emphasis on new deposit generation, the effect of the aforementioned acquisitions, and a switch of debit card providers from VISA to Mastercard in 2016 led to increased interchange income. The continued low interest rate environment spurred new home sales as well as refinancing activity. The decrease in the consultant expense is due to the end of the amortization period of these payments made in prior years for revenue enhancements/cost savings opportunities. Offsetting these increases were a decrease in service charges of $1,033, increases in salaries and employee benefits of $6,586, net occupancy expenses of $972, equipment expenses of $1,336, interchange expenses of $757, and acquisition related expenses of $6,399. The full year effect of the Old National branch acquisition and the partial year effect of the Cheviot acquisition led to increases in salaries and employee benefits, net occupancy, and equipment expenses. The increase in interchange expense is a direct result of higher interchange income in 2016.
The primary drivers that led to the increase in net income in 2015 versus 2014 were an increase in net interest income of $8,237, increases in mortgage banking of $1,601, interchange income of $1,649, service charge income of $1,341, swap fee income of $674, and securities gains of $362 as well as reductions in acquisition related expenses of $2,388 and consultant expenses of $294. An increase in earning assets (primarily loans) and a continued slight reduction in interest costs resulted in higher net interest income. Continued emphasis on new deposit generation as well as a full year effect of the MBT Bancorp acquisition and partial year effect of the Old National Branch branch acquisitions led to increased service charge and interchange income. The low interest rate environment spurred new home sales as well as refinancing activity. Favorable pricing in 2015 allowed the Company to realize higher securities gain. The Company started offering derivative products to some of its commercial customers in 2015 that generated fee income. The costs incurred in acquiring the five Old National branches in 2015 were siginificantly less than the costs incurred for the MBT Bancorp acquisition in 2014. Offsetting these increases were increases in salaries and employee benefits of $3,609, net occupancy expenses of $698, equipment expenses of $1,023, FHLB advance prepayment penalty of $2,364, and interchange expenses of $332. The full year effect of the MBT Bancorp acquisition and the partial year effect of the Old National branch acquisition led to increases in salaries and employee benefits, net occupancy, and equipment expenses. The increase in interchange expense is a direct result of higher interchange income in 2015.
Net Interest Income
Net interest income and net interest margin are influenced by the volume and yield or cost of earning assets and interest‑bearing liabilities. Tax equivalent net interest income of $125,011 in 2016 increased from $109,939 in 2015. Net interest margin, on a fully‑taxable equivalent basis, was 3.65% for 2016 compared to 3.74% for the same period a year ago. The Company was unable to match reductions in its yield on earning assets with a corresponding reduction in its cost of funds, as the cost of funds has essentially floored. The Company experienced loan growth in 2016 which partially offset the reduction in its yield.
The following table summarizes net interest income (on a tax‑equivalent basis) for each of the past three years.
Average Balance Sheet and Net Interest Analysis (Taxable Equivalent Basis)*
| | | | | | | | | | | | | | | | | | | | | | | | | |
| | 2016 | | 2015 | | 2014 | |
| | Average | | | | | Average | | Average | | | | | Average | | Average | | | | | Average | |
| | Balance | | Interest | Rate*** | | Balance | | Interest | Rate*** | | Balance | | Interest | Rate | |
Assets | | | | | | | | | | | | | | | | | | | | | | | | | |
Short‑term investments | | $ | 17,062 | | $ | 86 | | 0.50 | % | $ | 28,223 | | $ | 73 | | 0.26 | % | $ | 19,389 | | $ | 51 | | 0.26 | % |
Federal funds sold and money market accounts | | | 19,676 | | | 131 | | 0.67 | | | 19,343 | | | 61 | | 0.32 | | | 14,582 | | | 46 | | 0.32 | |
Securities | | | | | | | | | | | | | | | | | | | | | | | | | |
Taxable | | | 645,712 | | | 14,550 | | 2.25 | | | 554,269 | | | 12,004 | | 2.17 | | | 558,848 | | | 12,366 | | 2.21 | |
Non‑taxable* | | | 333,814 | | | 18,462 | | 5.53 | | | 323,205 | | | 18,366 | | 5.68 | | | 308,953 | | | 18,249 | | 5.91 | |
Total securities | | | 979,526 | | | 33,012 | | 3.37 | | | 877,474 | | | 30,370 | | 3.46 | | | 867,801 | | | 30,615 | | 3.53 | |
Loans** | | | | | | | | | | | | | | | | | | | | | | | | | |
Commercial* | | | 1,510,103 | | | 65,425 | | 4.33 | | | 1,247,639 | | | 55,544 | | 4.45 | | | 1,035,645 | | | 47,820 | | 4.62 | |
Residential real estate | | | 530,107 | | | 22,061 | | 4.16 | | | 437,751 | | | 18,204 | | 4.16 | | | 415,390 | | | 17,852 | | 4.30 | |
Consumer | | | 365,860 | | | 15,022 | | 4.11 | | | 329,661 | | | 14,072 | | 4.27 | | | 299,940 | | | 13,447 | | 4.48 | |
Total loans | | | 2,406,070 | | | 102,508 | | 4.26 | | | 2,015,051 | | | 87,820 | | 4.36 | | | 1,750,975 | | | 79,119 | | 4.52 | |
Total earning assets | | | 3,422,334 | | | 135,737 | | 3.97 | | | 2,940,091 | | | 118,324 | | 4.03 | | | 2,652,747 | | | 109,831 | | 4.14 | |
Cash and due from banks | | | 56,796 | | | | | | | | 49,146 | | | | | | | | 43,143 | | | | | | |
Unrealized gains (losses) on securities | | | 28,158 | | | | | | | | 22,121 | | | | | | | | 16,271 | | | | | | |
Allowance for loan losses | | | (21,676) | | | | | | | | (23,096) | | | | | | | | (25,816) | | | | | | |
Premises and equipment, net | | | 72,509 | | | | | | | | 61,497 | | | | | | | | 56,103 | | | | | | |
Intangible assets | | | 95,998 | | | | | | | | 78,639 | | | | | | | | 70,914 | | | | | | |
Accrued interest receivable and other assets | | | 122,026 | | | | | | | | 116,581 | | | | | | | | 109,267 | | | | | | |
Total assets | | $ | 3,776,145 | | | | | | | $ | 3,244,979 | | | | | | | $ | 2,922,629 | | | | | | |
Liabilities | | | | | | | | | | | | | | | | | | | | | | | | | |
Interest‑bearing deposits DDA, savings, and money market accounts | | $ | 1,853,401 | | $ | 2,130 | | 0.11 | | $ | 1,666,268 | | $ | 1,985 | | 0.12 | | $ | 1,489,938 | | $ | 1,647 | | 0.11 | |
Certificates of deposit | | | 418,297 | | | 2,039 | | 0.49 | | | 334,810 | | | 1,693 | | 0.51 | | | 341,343 | | | 2,031 | | 0.60 | |
Total interest‑bearing deposits | | | 2,271,698 | | | 4,169 | | 0.18 | | | 2,001,078 | | | 3,678 | | 0.18 | | | 1,831,281 | | | 3,678 | | 0.20 | |
Short‑term borrowings | | | 73,736 | | | 714 | | 0.97 | | | 30,512 | | | 56 | | 0.18 | | | 30,320 | | | 71 | | 0.23 | |
Subordinated debentures | | | 41,239 | | | 1,425 | | 3.46 | | | 41,239 | | | 1,264 | | 3.07 | | | 41,042 | | | 1,286 | | 3.13 | |
Notes payable and FHLB borrowings | | | 261,490 | | | 4,418 | | 1.69 | | | 190,356 | | | 3,387 | | 1.78 | | | 200,598 | | | 3,572 | | 1.75 | |
Total interest‑bearing liabilities | | | 2,648,163 | | | 10,726 | | 0.41 | | | 2,263,185 | | | 8,385 | | 0.37 | | | 2,103,241 | | | 8,607 | | 0.41 | |
Demand deposits | | | 679,879 | | | | | | | | 576,341 | | | | | | | | 463,197 | | | | | | |
Other liabilities | | | 19,124 | | | | | | | | 33,535 | | | | | | | | 26,951 | | | | | | |
Total liabilities | | | 3,347,166 | | | | | | | | 2,873,061 | | | | | | | | 2,593,389 | | | | | | |
Shareholders’ equity | | | 428,979 | | | | | | | | 371,918 | | | | | | | | 329,240 | | | | | | |
Total liabilities and shareholders’ equity | | $ | 3,776,145 | | | 10,726 | | 0.32*** | | $ | 3,244,979 | | | 8,385 | | 0.29*** | | $ | 2,922,629 | | | 8,607 | | 0.32*** | |
Net interest income | | | | | $ | 125,011 | | 3.65**** | | | | | $ | 109,939 | | 3.74**** | | | | | $ | 101,224 | | 3.82**** | |
Conversion of tax exempt income to a fully taxable equivalent basis using a marginal rate of 35% | | | | | $ | 7,410 | | | | | | | $ | 7,214 | | | | | | | $ | 6,736 | | | |
Security yields are calculated based on amortized cost.
*Adjusted to reflect income related to securities and loans exempt from Federal income taxes.
** Non-accruing loans have been included in the average balances.
*** Total interest expense divided by total earning assets.
**** Net interest income divided by total earning assets.
The following table sets forth for the periods indicated a summary of the changes in interest income and interest expense resulting from changes in volume and changes in rates.
Volume/Rate Analysis of Changes in Net Interest Income
(Tax Equivalent Basis)
| | | | | | | | | | | | | | | | | | | |
| | 2016 OVER 2015 | | 2015 OVER 2014 | |
| | Volume | | Rate | | Total | | Volume | | Rate | | Total | |
Interest income | | | | | | | | | | | | | | | | | | | |
Loans | | $ | 16,699 | | $ | (2,011) | | $ | 14,688 | | $ | 11,590 | | $ | (2,889) | | $ | 8,701 | |
Securities | | | 3,456 | | | (814) | | | 2,642 | | | 339 | | | (584) | | | (245) | |
Federal funds sold and money market funds | | | 1 | | | 69 | | | 70 | | | 15 | | | — | | | 15 | |
Short‑term investments | | | (37) | | | 50 | | | 13 | | | 23 | | | (1) | | | 22 | |
Total interest income | | | 20,119 | | | (2,706) | | | 17,413 | | | 11,967 | | | (3,474) | | | 8,493 | |
Interest expense | | | | | | | | | | | | | | | | | | | |
Interest‑bearing DDA, savings, and money market accounts | | $ | 217 | | $ | (72) | | $ | 145 | | $ | 204 | | $ | 134 | | $ | 338 | |
Certificates of deposit | | | 409 | | | (63) | | | 346 | | | (38) | | | (300) | | | (338) | |
Borrowings | | | 1,752 | | | (63) | | | 1,689 | | | (156) | | | (44) | | | (200) | |
Subordinated debentures | | | — | | | 161 | | | 161 | | | 6 | | | (28) | | | (22) | |
Total interest expense | | | 2,378 | | | (37) | | | 2,341 | | | 16 | | | (238) | | | (222) | |
Change in net interest income | | | 17,741 | | | (2,669) | | | 15,072 | | | 11,951 | | | (3,236) | | | 8,715 | |
Change in tax equivalent adjustment | | | | | | | | | 196 | | | | | | | | | 478 | |
Change in net interest income before tax equivalent adjustment | | | | | | | | $ | 14,876 | | | | | | | | $ | 8,237 | |
Variances not attributed to rate or volume are allocated between rate and volume in proportion to the relationship of the absolute dollar amount of the change in each.
Provision for Loan Losses
The Company expensed $1,705, $1,625, and $1,500 in provision for loan losses in 2016, 2015, and 2014 respectively. This level of provision allowed the Company to maintain an adequate allowance for loan losses. This topic is discussed in detail under the heading “Loans, Credit Risk and the Allowance and Provision for Loan Losses”.
Non‑interest Income and Expense
| | | | | | | | | | | |
| | | | | | | | | | Percent Change |
| | 2016 | | 2015 | | 2014 | 16/15 | 15/14 |
Non-interest income | | | | | | | | | | | |
Mortgage banking | | $ | 10,044 | | $ | 8,355 | | $ | 6,754 | 20.2% | 23.7% |
Trust and investment product fees | | | 4,866 | | | 4,947 | | | 4,712 | -1.6% | 5.0% |
Service charges on deposit accounts | | | 21,006 | | | 22,039 | | | 20,698 | -4.7% | 6.5% |
Net realized gains on securities sales | | | 170 | | | 386 | | | 24 | -56.0% | 1,508.3% |
Increase in cash surrender value of life insurance | | | 1,513 | | | 1,236 | | | 1,298 | 22.4% | -4.8% |
Interchange income | | | 11,116 | | | 9,239 | | | 7,590 | 20.3% | 21.7% |
Gain/(loss) on sale of OREO | | | 268 | | | 68 | | | (153) | 294.1% | 44.4% |
Other | | | 3,629 | | | 4,002 | | | 2,084 | -9.3% | 92.0% |
Total non-interest income | | $ | 52,612 | | $ | 50,272 | | $ | 43,007 | 4.7% | 16.9% |
Non-interest expense | | | | | | | | | | | |
Salaries and employee benefits | | $ | 64,327 | | $ | 57,741 | | $ | 54,132 | 11.4% | 6.7% |
Net occupancy | | | 9,298 | | | 8,326 | | | 7,628 | 11.7% | 9.2% |
Equipment | | | 12,696 | | | 11,360 | | | 10,337 | 11.8% | 9.9% |
Intangibles amortization | | | 1,342 | | | 1,640 | | | 1,690 | -18.2% | -3.0% |
Telecommunications | | | 1,647 | | | 1,775 | | | 1,747 | -7.2% | 1.6% |
Stationery, printing, and supplies | | | 1,052 | | | 1,162 | | | 1,174 | -9.5% | -1.0% |
FDIC assessment | | | 1,560 | | | 1,655 | | | 1,620 | -5.7% | 2.2% |
Marketing | | | 3,390 | | | 3,193 | | | 3,187 | 6.2% | 0.2% |
Collection expenses | | | 910 | | | 1,173 | | | 1,330 | -22.4% | -11.8% |
Consultant expense | | | 549 | | | 1,106 | | | 1,400 | -50.4% | -21.0% |
Prepayment penalty on FHLB advance | | | — | | | 2,364 | | | — | -100.0% | NA |
Interchange expense | | | 3,376 | | | 2,619 | | | 2,287 | 28.9% | 14.5% |
Bank acquisition expense | | | 7,130 | | | 731 | | | 3,119 | 875.4% | -76.6% |
Other | | | 10,771 | | | 10,752 | | | 9,569 | 0.2% | 12.4% |
Total non-interest expense | | $ | 118,048 | | $ | 105,597 | | $ | 99,220 | 11.8% | 6.4% |
Non‑interest Income
Non‑interest income was $52,612 for 2016 compared to $50,272 for the same period in 2015, an increase of $2,340 or 4.7%. Increases in interchange income, mortgage banking, and increase in cash surrender value on life insurance contracts were the reasons for the increase. The full year effect of the Old National Bank branch acquisitions in 2015 and the partial year effect of the Cheviot acquisition in 2016 as well as a switch in debit card providers from VISA to Mastercard generated additional interchange income as well as other ancillary fee increases. The continued low interest rate environment led to increased mortgage banking activity. Offsetting these increases were decreases in service charges and other income (primarily title company revenue). The Company elected to exit the title company business in mid 2016 and expect to be fully dissolved in 2017.
Non‑interest income was $50,272 for 2015 compared to $43,007 for the same period in 2014, an increase of $7,265 or 16.9%. Increases in service charges, interchange income, mortgage banking, and securities gains were the reasons for the increase. The full year effect of the MBT Bancorp acquisition and the partial year effect of the Old National branch acquisitions generated additional service charges and interchange income as well as other ancillary fee increases. The continued low interest rate environment led to increased mortgage banking activity. Favorable pricing led the Company to realize higher securities gains in 2015.
Non‑interest Expense
Total non‑interest expense was $118,048 in 2016 compared to $105,597 in 2015, an increase of $12,451 or 11.8%. The increase was primarily attributable to increases in salaries and employee benefits, occupancy and equipment costs, acquisition related expenses, and interchange expenses. The Company’s entry into new markets, resulting from the
Cheviot acquisition and Old National Bank branch acquisitions, resulted in increases of the above mentioned expenses with the exception of interchange expenses which increased as a result of higher interchange income. Offsetting these increases was a decrease in a prepayment penalty on a FHLB advance in 2015 and consultant expense. The decrease in the consultant expense is due to the end of the amortization period for revenue enhancements/cost savings opportunities paid up front in a prior year.
Total non‑interest expense was $105,597 in 2015 compared to $99,220 in 2014, an increase of $6,377 or 6.4%. The increase was primarily attributable to increases in salaries and employee benefits, occupancy and equipment costs, an FHLB advance prepayment penalty, and interchange expenses. The Company’s entry into new markets, resulting from the MBT Bancorp acquisition and Old National Bank branch acquisitions, resulted in increases of the above mentioned expenses with the exception of interchange expenses which increased as a result of higher interchange income. The prepayment penalty should result in lower interest expense in future periods. Offsetting these increases was a decrease in acquisition related expenses. The expenses related to the acquisition of the Old National branches in 2015 were significantly lower than the expenses related to the acquisition of MBT Bancorp in 2014.
Income Taxes
The effective tax rate was 24.1% in 2016, 22.4% in 2015, and 21.2% in 2014. The increase in the Company’s effective rate from 2015 to 2016 was due primarily to an increase in taxable income with the tax exempt income and tax credits remaining the same from year to year. The increase in the Company’s effective rate from 2014 to 2015 was due primarily to an increase in taxable income with the tax exempt income and tax credits remaining the same from year to year.
Balance Sheet
At December 31, 2016, total assets were $4,080,257 compared to $3,385,408 at December 31, 2015, an increase of $694,849. Increases in loans of $496,281 and investment securities of $82,261 made up the majority of the increase.
Loans, Credit Risk and the Allowance and Provision for Loan Losses
Loans remain the Company’s largest concentration of assets and continue to represent the greatest potential risk. The loan underwriting standards observed by the Bank are viewed by management as a means of controlling problem loans and the resulting charge‑offs. The Company also believes credit risks may be elevated if undue concentrations of loans in specific industry segments and to out‑of‑area borrowers are incurred. Accordingly, the Company’s Board of Directors regularly monitors such concentrations to determine compliance with its loan concentration policy. The Company believes it has no undue concentrations of loans.
Total loans (excluding those held for sale) increased by $496,281 in 2016 with $355,343 of the increase coming from the acquisition of Cheviot in the second quarter of 2016. All categories of loans experienced loan growth in 2016. The Company has also invested in additional lending personnel and opened branches in new markets which has contributed to the growth. Commercial real estate loans continue to represent the largest portion of the total loan portfolio and were 44% of total loans at December 31, 2016 compared to 43% of total loans at the end of 2015.
The following table details the Company’s loan portfolio by type of loan.
Loan Portfolio
| | | | | | | | | | | | | | | | |
| �� | 2016 | | 2015 | | 2014 | | 2013 | | 2012 | |
Types of loans | | | | | | | | | | | | | | | | |
Commercial and industrial | | $ | 461,092 | | $ | 380,960 | | $ | 275,646 | | $ | 180,378 | | $ | 134,156 | |
Agricultural production financing | | | 73,467 | | | 64,704 | | | 46,784 | | | 30,323 | | | 22,355 | |
Farm real estate | | | 111,807 | | | 97,916 | | | 76,849 | | | 76,082 | | | 66,119 | |
Commercial real estate mortgage | | | 948,291 | | | 750,574 | | | 741,379 | | | 655,196 | | | 638,726 | |
Construction and development | | | 102,598 | | | 77,394 | | | 61,640 | | | 35,731 | | | 25,208 | |
Residential real estate mortgage | | | 892,513 | | | 727,073 | | | 709,495 | | | 648,010 | | | 618,524 | |
Consumer | | | 61,905 | | | 56,771 | | | 45,972 | | | 46,206 | | | 48,295 | |
Total loans | | $ | 2,651,673 | | $ | 2,155,392 | | $ | 1,957,765 | | $ | 1,671,926 | | $ | 1,553,383 | |
The following table indicates the amounts of loans (excluding residential and commercial mortgages and consumer loans) outstanding as of December 31, 2016 which, based on remaining scheduled repayments of principal, are due in the periods indicated.
Maturities and Sensitivity to Changes in Interest Rates of Commercial and Construction Loans
| | | | | | | | | | | | | | | |
| | | | Within | | | | | Over | | | | |
| | Due: | | 1 Year | | 1‑5 Years | | 5 years | | Total | |
Loan Type | | | | | | | | | | | | | | | |
Commercial and industrial | | | | $ | 133,092 | | $ | 181,239 | | $ | 146,761 | | $ | 461,092 | |
Agricultural production financing | | | | | 53,605 | | | 15,253 | | | 4,609 | | | 73,467 | |
Construction and development | | | | | 15,626 | | | 45,188 | | | 41,784 | | | 102,598 | |
Totals | | | | $ | 202,323 | | $ | 241,680 | | $ | 193,154 | | $ | 637,157 | |
Percent | | | | | 32 | % | | 38 | % | | 30 | % | | 100 | % |
Rate Sensitivity | | | | | | | | | | | | | | | |
Fixed Rate | | | | $ | 23,254 | | $ | 171,697 | | $ | 91,588 | | $ | 286,539 | |
Variable Rate | | | | | 268,595 | | | 54,454 | | | 27,569 | | | 350,618 | |
Totals | | | | $ | 291,849 | | $ | 226,151 | | $ | 119,157 | | $ | 637,157 | |
Loans are placed on “non‑accrual” status when, in management’s judgment, the collateral value and/or the borrower’s financial condition does not justify accruing interest. As a general rule, commercial, commercial real estate, residential, and consumer loans are reclassified to non‑accrual status at or before becoming 90 days past due. Interest previously recorded is reversed and charged against current income. Subsequent interest payments collected on non‑accrual loans are thereafter applied as a reduction of the loan’s principal balance. Non‑performing loans were $21,213 as of December 31, 2016 compared to $16,039 as of December 31, 2015 and represented 0.80% of total loans at December 31, 2016 versus 0.74% one year ago. The increase in 2016 is the result the acquisition of Cheviot in 2016 and the non-accrual loans that were part of the acquisition
The following table details the Company’s non‑performing loans as of December 31 for the years indicated.
Non‑performing Loans
| | | | | | | | | | | | | | | | |
| | 2016 | | 2015 | | 2014 | | 2013 | | 2012 | |
Non‑accruing loans | | $ | 15,808 | | $ | 12,843 | | $ | 13,596 | | $ | 22,341 | | $ | 35,451 | |
Troubled debt restructurings (accruing) | | | 3,270 | | | 3,196 | | | 15,243 | | | 4,188 | | | 15,102 | |
Accruing loans contractually past due 90 days or more | | | 2,135 | | | — | | | — | | | 14 | | | 565 | |
Total | | $ | 21,213 | | $ | 16,039 | | $ | 28,839 | | $ | 26,543 | | $ | 51,118 | |
% of total loans | | | 0.80 | % | | 0.74 | % | | 1.47 | % | | 1.59 | % | | 3.29 | % |
A reconciliation of non‑performing assets (“NPA”) for 2016 and 2015 is as follows:
| | | | | | | |
| | 2016 | | 2015 | |
Beginning Balance — NPA — January 1 | | $ | 17,998 | | $ | 31,527 | |
Non‑accrual | | | | | | | |
Add: New non‑accruals | | | 11,784 | | | 12,551 | |
Add: Acquisition | | | 4,052 | | | — | |
Less: To accrual/payoff/restructured | | | (9,680) | | | (8,974) | |
Less: To OREO | | | (1,965) | | | (1,475) | |
Less: Net charge offs | | | (1,226) | | | (2,855) | |
Increase/(Decrease): Non‑accrual loans | | | 2,965 | | | (753) | |
Other Real Estate Owned (OREO) | | | | | | | |
Add: New OREO properties | | | 1,965 | | | 1,475 | |
Add: New OREO from acquisition | | | 1,668 | | | — | |
Less: OREO sold | | | (3,607) | | | (2,166) | |
Less: OREO losses (write‑downs) | | | (110) | | | (38) | |
Increase/(Decrease): OREO | | | (84) | | | (729) | |
Increase/(Decrease): 90 Days Delinquent | | | 2,135 | | | — | |
Increase/(Decrease): TDR’s | | | 74 | | | (12,047) | |
Total NPA change | | | 5,090 | | | (13,529) | |
Ending Balance — NPA — December 31 | | $ | 23,088 | | $ | 17,998 | |
At December 31, 2016, the Company had only five relationships $250 and over on non-accrual with one of the five a loan from the Cheviot acquisition. The Company is working with these borrowers in an attempt to minimize its losses. In the course of resolving problem loans, the Company may choose to restructure the contractual terms of certain loans. The Company attempts to work out an alternative payment schedule with the borrower in order to avoid foreclosure actions. Any loans that are modified are reviewed by the Company to identify if a troubled debt restructuring has occurred, which is when for economic or legal reasons related to a borrower’s financial difficulties, the Company grants a concession to the borrower that it would not otherwise consider. Terms may be modified to fit the ability of the borrower to repay in line with its current financial status and could include reduction of the stated interest rate, other than normal market rate adjustments, extension of maturity dates, or reduction of principal balance or accrued interest. The decision to restructure a loan, versus aggressively enforcing the collection of the loan, may benefit us by increasing the ultimate probability of collection. The Company reviews each relationship before it grants the concession to insure the creditor can comply with the new terms. To date, most of the concessions have been extensions of maturity dates. The provision for loan losses was $1,705 in 2016, $1,625 in 2015, and $1,500 in 2014. The Company’s provision for loan losses remained flat in 2016 due to the stabilization of problem credits. New non‑accrual loans were flat compared to 2015. While the provision for loan losses remained relatively flat in 2016 from 2015, the Company experienced a large increase in the commericlal loan portfolio allowance due to the large increase in the Company’s commercial loan portfolio in 2016. Also, the Company showed a negative provision expense for the commercial real estate segment due to a reduction in the historical loss reserve factor. This decrease was caused by a reduction in the historical loss factor for these loans due to several factors. One, the Company uses a three year historical charge off factor for its homogenous pools. A large number of charge-offs occurred on these loans in 2012 and fell out of the calculation in 2016 and were replaced by a smaller number of charge-offs. Two, the Company also received several large recoveries on these type of loans in 2016 that became part of the homogenous pool charge-off percentage. Net charge‑offs were $1,226 in 2016 compared to $2,855 in 2015 and $5,859 in
2014. As a percentage of average loans, net charge‑offs equaled 0.05%, 0.14%, and 0.33% in 2016, 2015, and 2014, respectively.
Potential problem loans are identified on the Company’s watch list and consist of loans that require close monitoring by management and are not necessarily considered classified credits by regulators. Credits may be considered as a potential problem loan for reasons that are temporary or correctable, such as for a deficiency in loan documentation or absence of current financial statements of the borrower. Potential problem loans may also include credits where adverse circumstances are identified that may affect the borrower’s ability to comply with the contractual terms of the loan. Other factors which might indicate the existence of a potential problem loan include the delinquency of a scheduled loan payment, deterioration in a borrower’s financial condition identified in a review of periodic financial statements, a decrease in the value of the collateral securing the loan, or a change in the economic environment in which the borrower operates. Substandard commercial loans that were not classified as non‑accrual were $18,626 at December 31, 2016 and $7,157 at December 31, 2015, an increase of $11,469 with $6,129 coming from the Cheviot acquisition. These loans which are $250 or greater are reviewed at least quarterly by senior management. This review includes monitoring how the borrower is performing versus their workout plan, obtaining and reviewing the borrower’s financial information, and monitoring collateral values. Management believes these loans were well secured and had adequate allowance allocations at December 31, 2016.
Summary of the Allowance for Loan Losses
| | | | | | | | | | | | | | | | |
| | 2016 | | 2015 | | 2014 | | 2013 | | 2012 | |
Balance at January 1 | | $ | 22,020 | | $ | 23,250 | | $ | 27,609 | | $ | 32,227 | | $ | 39,889 | |
Chargeoffs | | | | | | | | | | | | | | | | |
Commercial | | | 682 | | | 978 | | | 241 | | | 1,152 | | | 1,946 | |
Commercial real estate mortgage | | | 663 | | | 727 | | | 5,583 | | | 6,353 | | | 13,553 | |
Residential real estate mortgage | | | 1,345 | | | 2,094 | | | 2,295 | | | 2,349 | | | 3,547 | |
Consumer | | | 3,725 | | | 3,593 | | | 2,899 | | | 2,648 | | | 3,286 | |
Total Chargeoffs | | | 6,415 | | | 7,392 | | | 11,018 | | | 12,502 | | | 22,332 | |
Recoveries | | | | | | | | | | | | | | | | |
Commercial | | | 659 | | | 502 | | | 1,131 | | | 341 | | | 543 | |
Commercial real estate mortgage | | | 1,207 | | | 1,942 | | | 2,262 | | | 1,087 | | | 2,432 | |
Residential real estate mortgage | | | 415 | | | 337 | | | 410 | | | 650 | | | 265 | |
Consumer | | | 2,908 | | | 1,756 | | | 1,356 | | | 1,272 | | | 1,580 | �� |
Total Recoveries | | | 5,189 | | | 4,537 | | | 5,159 | | | 3,350 | | | 4,820 | |
Net Chargeoffs | | | 1,226 | | | 2,855 | | | 5,859 | | | 9,152 | | | 17,512 | |
Provision for loan losses | | | 1,705 | | | 1,625 | | | 1,500 | | | 4,534 | | | 9,850 | |
Balance at December 31 | | $ | 22,499 | | $ | 22,020 | | $ | 23,250 | | $ | 27,609 | | $ | 32,227 | |
Net Chargeoffs to average loans | | | 0.05 | % | | 0.14 | % | | 0.33 | % | | 0.57 | % | | 1.13 | % |
Provision for loan losses to average loans | | | 0.07 | % | | 0.08 | % | | 0.09 | % | | 0.28 | % | | 0.63 | % |
Allowance to total loans at year end | | | 0.85 | % | | 1.02 | % | | 1.19 | % | | 1.65 | % | | 2.07 | % |
Although the allowance for loan losses is available for any loan that, in management’s judgment, should be charged off, the following table details the allowance for loan losses by loan category and the percent of loans in each category compared to total loans at December 31.
Allocation of the Allowance for Loan Losses
| | | | | | | | | | | | | | | | | | | | | | | | | | |
| | 2016 | | 2015 | | 2014 | | 2013 | | 2012 | |
| | | | | Percent | | | | | Percent | | | | | Percent | | | | | Percent | | | | | Percent | |
| | | | | of loans | | | | | of loans | | | | | of loans | | | | | of loans | | | | | of loans | |
| | | | | to total | | | | | to total | | | | | to total | | | | | to total | | | | | to total | |
December 31 | | Amount | | loans | | Amount | | loans | | Amount | | loans | | Amount | | loans | | Amount | | loans | |
Real estate | | | | | | | | | | | | | | | | | | | | | | | | | | |
Residential | | $ | 4,247 | | 34 | % | $ | 3,860 | | 34 | % | $ | 3,501 | | 36 | % | $ | 3,409 | | 39 | % | $ | 3,180 | | 40 | % |
Farm real estate | | | 819 | | 4 | | | 354 | | 4 | | | 576 | | 4 | | | 194 | | 5 | | | 722 | | 4 | |
Commercial | | | 6,166 | | 36 | | | 9,363 | | 35 | | | 13,536 | | 38 | | | 17,679 | | 39 | | | 20,465 | | 41 | |
Construction and development | | | 721 | | 4 | | | 984 | | 3 | | | 1,493 | | 3 | | | 2,337 | | 2 | | | 2,970 | | 2 | |
Total real estate | | | 11,953 | | 78 | | | 14,561 | | 76 | | | 19,106 | | 81 | | | 23,619 | | 85 | | | 27,337 | | 87 | |
Commercial | | | | | | | | | | | | | | | | | | | | | | | | | | |
Agribusiness | | | 272 | | 3 | | | 118 | | 3 | | | 192 | | 3 | | | 64 | | 2 | | | 166 | | 2 | |
Other commercial | | | 9,382 | | 17 | | | 6,393 | | 18 | | | 2,785 | | 14 | | | 3,227 | | 10 | | | 3,728 | | 8 | |
Total Commercial | | | 9,654 | | 20 | | | 6,511 | | 21 | | | 2,977 | | 17 | | | 3,291 | | 12 | | | 3,894 | | 10 | |
Consumer | | | 892 | | 2 | | | 948 | | 3 | | | 1,167 | | 2 | | | 699 | | 3 | | | 996 | | 3 | |
Total | | $ | 22,499 | | 100 | % | $ | 22,020 | | 100 | % | $ | 23,250 | | 100 | % | $ | 27,609 | | 100 | % | $ | 32,227 | | 100 | % |
Management maintains a list of loans warranting either the assignment of a specific reserve amount or other special administrative attention. This watch list, together with a listing of all classified loans, non‑accrual loans and delinquent loans, is reviewed monthly by management. Additionally, the Company evaluates its consumer and residential real estate loan pools for probable losses incurred based on historical trends, adjusted by current delinquency and non‑performing loan levels.
The Company has both internal and external loan review personnel who annually review approximately 50% of all loans. External loan review personnel examine the top 75 commercial credit relationships annually. This equates to all relationships above approximately $4,650.
The ability to absorb loan losses promptly when problems are identified is invaluable to a banking organization. Most often, losses incurred as a result of prompt, aggressive collection actions are much lower than losses incurred after prolonged legal proceedings. Accordingly, the Company observes the practice of quickly initiating stringent collection efforts in the early stages of loan delinquency.
The adequacy of the allowance for loan losses is reviewed at least quarterly. The determination of the provision amount in any period is based upon management’s continuing review and evaluation of loan loss experience, changes in the composition of the loan portfolio, classified loans including non‑accrual and impaired loans, current economic conditions, the amount of loans presently outstanding, and the amount and composition of loan growth. The Company’s allowance for loan losses was $22,499, or 0.85% of total loans, at December 31, 2016 compared to $22,020, or 1.02% of total loans, at the end of 2015. The Company’s decrease in the allowance percentage to total loans was due primarily to the acquisition of Cheviot Financial Corp. in 2016 and the continued improvement in its credit metrics. The acquired loans were brought over at fair value with no allowance for loan losses. See Note 26 to the Consolidated Financial Statements for additional information concerning acquisitions by the Company.
Securities, at Fair Value
| | | | | | | | | | |
| | December 31, | |
| | 2016 | | 2015 | | 2014 | |
Available for Sale | | | | | | | | | | |
U.S. Government‑sponsored entities | | $ | 955 | | $ | 504 | | $ | 661 | |
State and municipal | | | 369,286 | | | 350,733 | | | 334,298 | |
Mortgage‑backed | | | 626,031 | | | 562,829 | | | 525,609 | |
Equity and other | | | 11,268 | | | 11,213 | | | 7,192 | |
Total securities | | $ | 1,007,540 | | $ | 925,279 | | $ | 867,760 | |
Securities offer flexibility in the Company’s management of interest rate risk, and are the primary means by which the Company provides liquidity and responds to changing maturity characteristics of assets and liabilities. The Company’s investment policy prohibits trading activities and does not allow investment in high‑risk derivative products or junk bonds.
As of December 31, 2016, all of the Company’s securities were classified as available for sale (“AFS”) and were carried at fair value with unrealized gains and losses, net of taxes, excluded from earnings and reported as a separate component of shareholders’ equity. A net unrealized gain of $4,737 was recorded to adjust the AFS portfolio to current market value at December 31, 2016 compared to a net unrealized gain of $19,422 at December 31, 2015.
Securities
(Carrying Values at December 31)
| | | | | | | | | | | | | | | | |
| | Within | | | | | | | | Beyond | | | | |
| | 1 Year | | 2‑5 Yrs | | 6‑10 Yrs | | 10 Years | | Total 2016 | |
Available for sale | | | | | | | | | | | | | | | | |
US government agency | | $ | 545 | | $ | — | | $ | 410 | | $ | — | | $ | 955 | |
State and municipal | | | 11,670 | | | 80,412 | | | 107,302 | | | 169,902 | | | 369,286 | |
Mortgage‑backed securities & CMOs | | | — | | | 2,591 | | | 46,166 | | | 577,274 | | | 626,031 | |
Other securities | | | 500 | | | 2,028 | | | 4,070 | | | — | | | 6,598 | |
Total available for sale | | $ | 12,715 | | $ | 85,031 | | $ | 157,948 | | $ | 747,176 | | $ | 1,002,870 | |
Weighted average yield* | | | 5.28 | % | | 5.58 | % | | 4.80 | % | | 2.78 | % | | 3.37 | % |
*Adjusted to reflect income related to securities exempt from federal income taxes.
Amounts in the table above are based on scheduled maturity dates. Variable interest rates are subject to change not less than annually based upon certain interest rate indexes. Expected maturities will differ from contractual maturities because issuers may have the right to call or prepay obligations with or without call or prepayment penalties. Equity securities of $4,670 do not have contractual maturities and are excluded from the table above.
As of December 31, 2016, there were no corporate bonds and other securities which represented more than 10% of shareholders’ equity.
For 2016 the tax equivalent yield of the investment securities portfolio was 3.37%, compared to 3.46% and 3.53% for 2015 and 2014, respectively. The average life of the Company’s investment securities portfolio was 14.88 years at December 31, 2016. During 2016 the portfolio balances increased moderately as excess funds from the Cheviot acquisition in the second quarter were invested in the securities portfolio. Reinvestments were targeted at maintaining the portfolio’s current average life balancing the need for future cash flow with current earnings performance.
The Company and its investment advisor monitor the securities portfolio on at least a quarterly basis for other‑than‑temporary impairment (“OTTI”). The amount of the OTTI recognized in earnings depends on whether the Company intends to sell the security or it is more likely than not it will be required to sell the security before recovery of its amortized cost basis, less any current‑period credit loss. If an entity intends to sell or it is more likely than not it will be required to sell the security before recovery of its amortized cost basis, less any current‑period credit loss, the OTTI shall be recognized in earnings equal to the entire difference between the investment’s amortized cost basis and its fair value at the balance sheet date. If an entity does not intend to sell the security and it is not more likely than not that the entity will be required to sell the security before recovery of its amortized cost basis less any current‑period loss, the OTTI shall be separated into the amount representing the credit loss and the amount related to all other factors. The amount of the total OTTI related to the credit loss is determined based on the present value of cash flows expected to be collected and is recognized in earnings. The amount of the total OTTI related to other factors is recognized in other comprehensive income, net of applicable taxes. In 2014, the Company had a recovery of a $500 impairment loss on one of its equity securities.
In December, 2013, banking regulators published the final rules under Section 619 of the Dodd‑Frank Act (commonly referred to as the “Volcker Rule”). Under the Volcker Rule, collateralized debt obligations, including pooled trust preferred securities, are no longer a permissible investment and would have to be divested prior to July 15, 2015. On January 14, 2014, banking regulators released their interim final rule regarding the Volcker Rule and its impact on collateralized debt obligations. Under the interim final rule, regulators clarified the final rule and said that collateralized debt obligations primarily backed by trust preferred securities issued by depository institutions could continue to be held by banks. The Company was informed from an outside third party that it may be holding one security that would need to be divested by the conformance date. The conformance date for the Volcker Rule has been extended to July 21, 2017.
Sources of Funds
The Company relies primarily on customer deposits and securities sold under agreement to repurchase (“repurchase agreements”) along with shareholders’ equity to fund earning assets. Federal Home Loan Bank (“FHLB”) advances are used to provide additional funding. The Company also attempts to obtain deposits through branch and whole bank acquisitions.
Deposits generated within local markets provide the major source of funding for earning assets. Average total deposits were 86.2% and 87.7% of total average earning assets for 2016 and 2015, respectively. Total interest‑bearing deposits averaged 77.0% and 77.6% of average total deposits during 2016 and 2015. Management strives to increase the percentage of transaction‑related deposits to total deposits due to the positive effect on earnings.
Repurchase agreements are high denomination investments utilized by public entities and commercial customers as an element of their cash management responsibilities. During 2016, repurchase agreements averaged $27,816, with an average cost of 0.14%.
The Company had FHLB advances of $249,658 outstanding at December 31, 2016. These advances have interest rates ranging from 0.97% to 2.67% (see Note 12 to the consolidated financial statements for the maturity schedule of these advances). The Company averaged $261,490 in FHLB advances during 2016 compared to $190,356 during 2015. Other sources of funding are fed funds purchased, short term FHLB advances, and a short term note. The Company had $15,000 of federal funds purchased as of December 31, 2016 and $0 at December 31, 2015. Short term FHLB advances had a balance of $138,000 at December 31, 2016 and $0 at December 31, 2015. The interest rate on these advances was 0.90% at December 31, 2016. The term debt had a balance of $18,333 at December 31, 2016 and $0 at December 31, 2015. The term debt had an interest rate of 2.8125% at December 31, 2016.
Average Deposits
| | | | | | | | | | | | | | | | |
| | 2016 | | 2015 | | 2014 | |
| | Amount | | Rate | | Amount | | Rate | | Amount | | Rate | |
Demand | | $ | 679,879 | | | | $ | 576,341 | | | | $ | 463,197 | | | |
Interest Bearing Demand | | | 1,153,640 | | 0.14 | % | | 1,077,308 | | 0.14 | % | | 959,186 | | 0.12 | % |
Savings/Money Markets | | | 699,761 | | 0.07 | | | 588,960 | | 0.09 | | | 530,752 | | 0.09 | |
Certificates of Deposit | | | 418,297 | | 0.49 | | | 334,810 | | 0.51 | | | 341,343 | | 0.60 | |
Totals | | $ | 2,951,577 | | 0.14 | % | $ | 2,577,419 | | 0.14 | % | $ | 2,294,478 | | 0.16 | % |
As of December 31, 2016, certificates of deposit and other time deposits of $100 or more mature as follows:
| | | | | | | | | | | | | | | | |
| | 3 months or less | | 4‑6 months | | 6‑12 months | | over 12 months | | Total | |
Amount | | $ | 30,340 | | $ | 57,867 | | $ | 23,733 | | $ | 70,437 | | $ | 182,377 | |
Percent | | | 17 | % | | 32 | % | | 13 | % | | 38 | % | | | |
Capital Resources
The Federal Reserve Board and other regulatory agencies have adopted risk‑based capital guidelines that assign risk weightings to assets and off‑balance sheet items. The Company’s core capital (“Tier 1”) consists of common shareholders’ equity adjusted for unrealized gains or losses on available for sale (AFS) securities plus limited amounts of Trust Preferred Securities less goodwill and intangible assets. Total capital consists of core capital, certain debt instruments and a portion of the allowance for loan losses. At December 31, 2016, Tier 1 capital to average assets was 9.8%. Total capital to risk‑weighted assets was 14.7%. Both ratios exceed all required ratios established for bank holding companies. Risk‑adjusted capital levels of the Bank also exceed regulatory definitions of well‑capitalized institutions. On January 1, 2015 the Basel III Capital Rules became effective and introduced a new capital measure known as “Common Equity Tier 1” (“CET1”), which generally consists of common equity Tier 1capital instruments and related surplus, retained earnings, and common equity Tier 1 minority interests. To be adequately capitalized in 2016, the CET1 to risk weighted assets ratio must be 4.5%. At December 31, 2016, this ratio was 12.4%. The new capital rules also require a common equity Tier 1
capital conservation buffer to be phased in between 0.0% in 2015 to 2.5% in 2019. The capital conservation buffer for 2016 is 0.625%.
The Trust Preferred Securities (which are classified as subordinated debentures) currently qualify as Tier 1 capital or core capital with respect to the Company under the risk‑based capital guidelines established by the Federal Reserve. Under such guidelines, capital received from the proceeds of the sale of these securities cannot constitute more than 25% of the total Tier 1 capital of the Company. Consequently, the amount of Trust Preferred Securities in excess of the 25% limitation constitutes Tier 2 capital, or supplementary capital, of the Company. As of December 31, 2016, all of the Company’s Trust Preferred Securities qualify as Tier 1 capital. The Company redeemed $5,155 of these securities in March, 2014.
Common shareholders’ equity is impacted by the Company’s decision to categorize its securities portfolio as available for sale (AFS). Securities in this category are carried at fair value, and common shareholders’ equity is adjusted to reflect unrealized gains and losses, net of taxes.
The Company declared and paid common dividends of $0.61 per share in 2016 compared to $0.54 in 2015 and $0.42 in 2014. Book value per common share increased to $18.68 at December 31, 2016 compared to $17.67 at the end of 2015. The increase is primarily the result of the net income for the year. The net adjustment for AFS securities increased book value per share by $0.13 at December 31, 2016 and increased book value per share by $0.58 at December 31, 2015. Depending on market conditions, the adjustment for AFS securities can cause significant fluctuations in shareholders’ equity.
Liquidity
Liquidity management involves maintaining sufficient cash levels to fund operations and to meet the requirements of borrowers, depositors and creditors. Higher levels of liquidity bear higher corresponding costs, measured in terms of lower yields on short‑term, more liquid earning assets and higher interest expense involved in extending liability maturities. Liquid assets include cash and cash equivalents, loans and securities maturing within one year and money market instruments. In addition, the Company holds approximately $994,825 of AFS securities maturing after one year, which can be sold to meet liquidity needs.
Maintaining a relatively stable funding base, which is achieved by diversifying funding sources, supports liquidity, extends the contractual maturity of liabilities, and limits reliance on volatile short‑term purchased funds. Short‑term funding needs may arise from declines in deposits or other funding sources, funding of loan commitments and requests for new loans. The Company’s strategy is to fund assets to the maximum extent possible with core deposits, which provide a sizable source of relatively stable low‑cost funds. The Company defines core deposits as all deposits except certificates of deposits greater than $100. Average core deposits funded approximately 81.4% of total earning assets during 2016 and approximately 83.3% in 2015.
Management believes the Company has sufficient liquidity to meet all reasonable borrower, depositor and creditor needs in the present economic environment. Management also plans to meet the funding requirements of the FCB Bancorp, Inc. acquisition (See Note 26) with internally generated funds. The Company has not received any directives from regulatory authorities that would materially affect liquidity, capital resources or operations.
Contractual Obligations as of December 31, 2016
| | | | | | | | | | | | | | | | |
| | | | | Less than | | | | | | | | More than | |
| | Total | | 1 Year | | 1‑3 Years | | 3‑5 Years | | 5 Years | |
Time Deposits | | $ | 431,311 | | $ | 242,669 | | $ | 116,538 | | $ | 63,735 | | $ | 8,369 | |
FHLB Advances | | | 250,000 | | | 20,000 | | | 105,000 | | | 75,000 | | | 50,000 | |
Subordinated Debentures | | | 41,239 | | | — | | | — | | | — | | | 41,239 | |
Other Borrowings | | | 209,672 | | | 198,003 | | | 11,669 | | | — | | | — | |
Low Income Housing Unfunded Commitments | | | 5,796 | | | 2,782 | | | 2,649 | | | 225 | | | 140 | |
Capital Lease Payment | | | 2,047 | | | 96 | | | 192 | | | 192 | | | 1,567 | |
Operating Lease Commitments | | | 12,937 | | | 1,965 | | | 3,675 | | | 2,649 | | | 4,648 | |
Total | | $ | 953,002 | | $ | 465,515 | | $ | 239,723 | | $ | 141,801 | | $ | 105,963 | |
Off‑balance Sheet Arrangements
The Bank incurs off‑balance sheet risks in the normal course of business in order to meet the financing needs of its customers. These risks derive from commitments to extend credit and standby letters of credit. Off‑balance sheet risk to credit loss exists up to the face amount of these instruments, although material losses are not anticipated. See Note 16 to the Consolidated Financial Statements for additional details on the Company’s off‑balance sheet arrangements.
Interest Rate Risk Management
Interest rate risk is the exposure of the Company’s financial condition to adverse changes in market interest rates. In an effort to estimate the impact of sustained interest rate movements to the Company’s earnings, the Company monitors interest rate risk through computer‑assisted simulation modeling of its net interest income. The Company’s simulation modeling monitors the potential impact to net interest income under various interest rate scenarios. The Company’s objective is to actively manage its asset/liability position within a one‑year interval and to limit the risk in any of the interest rate scenarios to a reasonable level of tax‑equivalent net interest income within that interval. The Company monitors compliance within established guidelines of the Funds Management Policy. See Item 7A. Quantitative and Qualitative Disclosures About Market Risk section for further discussion regarding interest rate risk.
Critical Accounting Policies
The accounting and reporting policies of the Company comply with accounting principles generally accepted in the United States and conform to general practices within the banking industry. These policies require estimates and assumptions. Changes in underlying factors, assumptions, or estimates in any of these areas could have a material impact on the Company’s future financial condition and results of operations. In management’s opinion, some of these areas have a more significant impact than others on the Company’s financial reporting. These areas currently include accounting for securities, the allowance for loan losses, goodwill, income taxes, and mortgage servicing rights.
Business Combinations – Business combinations require management to use certain assumptions and estimates pertaining to the fair value of the assets acquired and liabilities assumed for initial purchase accounting. Information received subsequent to initial measurement must be analyzed for its impact on the original accounting through the end of the measurement period.
Securities Valuation and Other Than Temporary Impairment of Securities — Securities available‑for‑sale are carried at fair value, with unrealized holding gains and losses reported separately in accumulated other comprehensive income (loss), net of tax. In estimating the fair value for the majority of securities, fair values are based on observable market prices of the same or similar investments. The majority of securities are priced by an independent third party pricing service. Equity securities that do not have readily determinable fair values are carried at cost. When the fair value of securities is less than its amortized cost for an extended period, the Company will decide if the security is other than temporarily impaired. If the security is deemed to be other than temporarily impaired, an impairment charge will be recorded through earnings. In determining whether a market value decline is other than temporary, management considers the reason for the decline, the extent of the decline, the duration of the decline and whether the Company intends to sell or believes it will be required to sell the securities prior to recovery.
Allowance for Loan Losses — The level of the allowance for loan losses is based upon management’s evaluation of the loan and lease portfolios, past loan loss experience, known and inherent risks in the portfolio, adverse situations that may affect the borrower’s ability to repay (including the timing of future payments), the estimated value of any underlying collateral, composition of the loan portfolio, economic conditions, and other pertinent factors. This evaluation is inherently subjective as it requires material estimates including the amounts and timing of future cash flows expected to be received on impaired loans that may be susceptible to significant change. The level of allowance maintained is believed by management to be adequate to cover losses inherent in the portfolio. The allowance is increased by provisions charged to expense and decreased by charge‑offs, net of recoveries of amounts previously charged‑off.
Goodwill — Goodwill and intangible assets deemed to have indefinite lives are subject to annual impairment tests. The Company has selected June 30 as its date for annual impairment testing, but will test more frequently if circumstances warrant. No goodwill impairment was identified during testing performed in 2016 or 2015.
Income taxes — The Company is subject to the income tax laws of the U.S., its states and the municipalities in which it operates. These tax laws are complex and subject to different interpretations by the taxpayer and the relevant government taxing authorities. The Company reviews income tax expense and the carrying value of deferred tax assets; and as new information becomes available, the balances are adjusted as appropriate. In establishing a provision for income tax expense, the Company makes judgments and interpretations about the application of these inherently complex tax laws and also makes estimates about when in the future certain items will affect taxable income in the various tax jurisdictions.
Mortgage servicing rights — The Company originally records mortgage servicing rights at fair value and amortizes them over the period of the estimated future net servicing income of the underlying loans. The servicing rights are evaluated for impairment based upon the fair value of the rights as compared to the carrying amount. Impairment is determined by stratifying rights into groupings based on predominant risk characteristics, such as interest rate, loan type and investor type. Impairment is recognized through a valuation allowance for an individual grouping, to the extent that fair value is less than the carrying amount.
New Accounting Matters
See Note 1 to the Consolidated Financial Statements regarding the adoption of new accounting standards in 2016.
ITEM 7A. QUANTITATIVE AND QUALITATIVE DISCLOSURES ABOUT MARKET RISK
The Company’s exposure to market risk is reviewed on a regular basis by the Credit and Risk Committee of the Board of Directors and by the Boards of Directors of the Company and the Bank. Primary market risks, which impact the Company’s operations, are liquidity risk and interest rate risk, as discussed above.
As discussed previously, the Company monitors interest rate risk by the use of computer simulation modeling to estimate the potential impact on its net interest income under various interest rate scenarios. Another method by which the Company’s interest rate risk position can be estimated is by computing estimated changes in its net portfolio value (“NPV”). This method estimates interest rate risk exposure from movements in interest rates by using interest rate sensitivity analysis to determine the change in the NPV of discounted cash flows from assets and liabilities. Computations are based on a number of assumptions, including the relative levels of market interest rates and prepayments in mortgage loans and certain types of investments. These computations do not contemplate any actions management may undertake in response to changes in interest rates, and should not be relied upon as indicative of actual results. In addition, certain shortcomings are inherent in the method of computing NPV. Should interest rates remain or decrease below current levels, the proportion of adjustable rate loans could decrease in future periods due to refinancing activity. In the event of an interest rate change, prepayment levels would likely be different from those assumed in the table. Lastly, the ability of many borrowers to repay their adjustable rate debt may decline during a rising interest rate environment.
The following tables provide an assessment of the risk to NPV in the event of sudden and sustained 1% and 2% increases and decreases in prevailing interest rates. The table indicates that as of December 31, 2016 the Company’s estimated NPV might be expected to increase in the event of a decrease in prevailing interest rates, and might be expected to generally decrease in the event of an increase in prevailing interest rates (dollars in thousands). As of December 31,
2015 the Company’s estimated NPV would generally increase in the event of a decrease in prevailing rates and generally decrease in the event of an increase in prevailing interest rates.
December 31, 2016
| | | | | | | | | |
| | $ Amount | | $ Change | | NPV Ratio | | Change | |
+2% | | 893,702 | | (82,041) | | 22.18 | % | (72) | |
+1% | | 936,342 | | (39,401) | | 22.58 | % | (32) | |
Base | | 975,743 | | — | | 22.90 | % | — | |
−1% | | 985,526 | | 9,783 | | 22.52 | % | (38) | |
−2% | | 982,901 | | 7,158 | | 21.91 | % | (99) | |
December 31, 2015
| | | | | | | | | |
| | $ Amount | | $ Change | | NPV Ratio | | Change | |
+2% | | 778,743 | | (67,189) | | 23.16 | % | (52) | |
+1% | | 814,888 | | (31,044) | | 23.51 | % | (17) | |
Base | | 845,932 | | — | | 23.68 | % | — | |
−1% | | 846,048 | | 116 | | 23.04 | % | (64) | |
−2% | | 846,939 | | 1,007 | | 22.45 | % | (123) | |
The above discussion, and the portions of “Management’s Discussion and Analysis” in Item 7 of this Report that are referenced in the above discussion, contain statements relating to future results of the Company that are considered “forward‑looking‑statements” within the meaning of the Private Securities Litigation Reform Act of 1995. These statements relate to, among other things, simulation of the impact on net interest income from changes in interest rates. Actual results may differ materially from those expressed or implied therein as a result of certain risks and uncertainties, including those risks and uncertainties expressed above, those that are described in “Management’s Discussion and Analysis” in Item 7 of this Report, those that are described in Item 1 of this Report, “Business,” under the caption “Forward‑Looking‑Statements,” and those that are described in Item 1A of this Report, “Risk Factors”, all of which discussions are incorporated herein by reference.
ITEM 8. FINANCIAL STATEMENTS AND SUPPLEMENTARY DATA

REPORT OF INDEPENDENT REGISTERED PUBLIC ACCOUNTING FIRM
Board of Directors and Shareholders
MainSource Financial Group, Inc.
Greensburg, Indiana
We have audited the accompanying consolidated balance sheets of MainSource Financial Group, Inc. as of December 31, 2016 and 2015 and the related consolidated statements of income, comprehensive income, shareholders’ equity, and cash flows for each of the three years in the period ended December 31, 2016. We also have audited MainSource Financial Group, Inc.’s internal control over financial reporting as of December 31, 2016, based on criteria established in the 2013 Internal Control — Integrated Framework issued by the Committee of Sponsoring Organizations of the Treadway Commission (COSO). MainSource Financial Group, Inc.’s management is responsible for these consolidated financial statements, for maintaining effective internal control over financial reporting, and for its assessment of the effectiveness of internal control over financial reporting, included in the accompanying Management’s Report on Internal Control over Financial Reporting. Our responsibility is to express an opinion on these consolidated financial statements and an opinion on the company’s internal control over financial reporting based on our audits.
We conducted our audits in accordance with the standards of the Public Company Accounting Oversight Board (United States). Those standards require that we plan and perform the audits to obtain reasonable assurance about whether the financial statements are free of material misstatement and whether effective internal control over financial reporting was maintained in all material respects. Our audits of the financial statements included examining, on a test basis, evidence supporting the amounts and disclosures in the financial statements, assessing the accounting principles used and significant estimates made by management, and evaluating the overall financial statement presentation. Our audit of internal control over financial reporting included obtaining an understanding of internal control over financial reporting, assessing the risk that a material weakness exists, and testing and evaluating the design and operating effectiveness of internal control based on the assessed risk. Our audits also included performing such other procedures as we considered necessary in the circumstances. We believe that our audits provide a reasonable basis for our opinions.
A company’s internal control over financial reporting is a process designed to provide reasonable assurance regarding the reliability of financial reporting and the preparation of financial statements for external purposes in accordance with generally accepted accounting principles. A company’s internal control over financial reporting includes those policies and procedures that (1) pertain to the maintenance of records that, in reasonable detail, accurately and fairly reflect the transactions and dispositions of the assets of the company; (2) provide reasonable assurance that transactions are recorded as necessary to permit preparation of financial statements in accordance with generally accepted accounting principles, and that receipts and expenditures of the company are being made only in accordance with authorizations of management and directors of the company; and (3) provide reasonable assurance regarding prevention or timely detection of unauthorized acquisition, use, or disposition of the company’s assets that could have a material effect on the financial statements.
Because of its inherent limitations, internal control over financial reporting may not prevent or detect misstatements. Also, projections of any evaluation of effectiveness to future periods are subject to the risk that controls may become inadequate because of changes in conditions, or that the degree of compliance with the policies or procedures may deteriorate.
In our opinion, the consolidated financial statements referred to above present fairly, in all material respects, the financial position of MainSource Financial Group, Inc. as of December 31, 2016 and 2015, and the results of its operations and its cash flows for each of the three years in the period ended December 31, 2016, in conformity with accounting principles generally accepted in the United States of America. Also in our opinion, MainSource Financial Group, Inc. maintained, in all material respects, effective internal control over financial reporting as of December 31, 2016, based on criteria established in the 2013 Internal Control — Integrated Framework issued by the COSO.
| |
| /s/ Crowe Horwath LLP |
Indianapolis, Indiana | |
March 10, 2017 | |
MAINSOURCE FINANCIAL GROUP, INC.
CONSOLIDATED BALANCE SHEETS
(Dollar amounts in thousands except share and per share data)
| | | | | | | |
| | December 31, | | December 31, | |
| | 2016 | | 2015 | |
Assets | | | | | | | |
Cash and due from banks | | $ | 75,778 | | $ | 56,104 | |
Money market funds and federal funds sold | | | 10,774 | | | 11,474 | |
Cash and cash equivalents | | | 86,552 | | | 67,578 | |
Interest bearing time deposits | | | 1,960 | | | 1,960 | |
Securities available for sale | | | 1,007,540 | | | 925,279 | |
Loans held for sale | | | 12,479 | | | 7,533 | |
Loans, net of allowance for loan losses of $22,499 and $22,020 | | | 2,629,174 | | | 2,133,372 | |
FHLB and other stock, at cost | | | 21,693 | | | 11,300 | |
Premises and equipment, net | | | 76,426 | | | 62,973 | |
Goodwill | | | 101,315 | | | 75,953 | |
Purchased intangible assets | | | 7,419 | | | 4,662 | |
Cash surrender value of life insurance | | | 80,539 | | | 62,451 | |
Interest receivable and other assets | | | 55,160 | | | 32,347 | |
Total assets | | $ | 4,080,257 | | $ | 3,385,408 | |
Liabilities | | | | | | | |
Deposits | | | | | | | |
Noninterest bearing | | $ | 767,159 | | $ | 641,439 | |
Interest bearing | | | 2,343,712 | | | 2,009,336 | |
Total deposits | | | 3,110,871 | | | 2,650,775 | |
Other borrowings | | | 209,672 | | | 28,363 | |
Long term Federal Home Loan Bank (FHLB) advances | | | 249,658 | | | 269,488 | |
Subordinated debentures | | | 41,239 | | | 41,239 | |
Other liabilities | | | 19,323 | | | 14,183 | |
Total liabilities | | | 3,630,763 | | | 3,004,048 | |
Commitments and contingent liabilities | | | | | | | |
Shareholders’ equity | | | | | | | |
Preferred stock, no par value | | | | | | | |
Authorized shares — 400,000 | | | | | | | |
Issued shares — 0 | | | | | | | |
Outstanding shares — 0 | | | | | | | |
Aggregate liquidation preference $0 | | | — | | | — | |
Common stock $.50 stated value: | | | | | | | |
Authorized shares — 100,000,000 | | | | | | | |
Issued shares — 24,682,189 and 22,266,107 | | | | | | | |
Outstanding shares — 24,067,364 and 21,579,575 | | | 12,463 | | | 11,201 | |
Treasury stock — 614,825 and 686,532 shares, at cost | | | (10,909) | | | (11,812) | |
Additional paid-in capital | | | 299,116 | | | 247,629 | |
Retained earnings | | | 145,745 | | | 121,718 | |
Accumulated other comprehensive income | | | 3,079 | | | 12,624 | |
Total shareholders’ equity | | | 449,494 | | | 381,360 | |
Total liabilities and shareholders’ equity | | $ | 4,080,257 | | $ | 3,385,408 | |
The accompanying notes are an integral part of these consolidated financial statements.
MAINSOURCE FINANCIAL GROUP, INC.
CONSOLIDATED STATEMENTS OF INCOME
YEARS ENDED DECEMBER 31, 2016, 2015, AND 2014
(Dollar amounts in thousands except per share data)
| | | | | | | | | | |
| | 2016 | | 2015 | | 2014 | |
| | | | | | | | | | |
| | | | | | | | | | |
| | | | | | | | | | |
Interest income | | | | | | | | | | |
Loans, including fees | | $ | 101,560 | | $ | 87,002 | | $ | 78,770 | |
Securities | | | | | | | | | | |
Taxable | | | 14,550 | | | 12,004 | | | 12,366 | |
Tax exempt | | | 12,000 | | | 11,970 | | | 11,862 | |
Other interest income | | | 217 | | | 134 | | | 97 | |
Total interest income | | | 128,327 | | | 111,110 | | | 103,095 | |
Interest expense | | | | | | | | | | |
Deposits | | | 4,169 | | | 3,678 | | | 3,678 | |
Federal Home Loan Bank advances | | | 4,418 | | | 3,387 | | | 3,572 | |
Subordinated debentures | | | 1,425 | | | 1,264 | | | 1,286 | |
Other borrowings | | | 714 | | | 56 | | | 71 | |
Total interest expense | | | 10,726 | | | 8,385 | | | 8,607 | |
Net interest income | | | 117,601 | | | 102,725 | | | 94,488 | |
Provision for loan losses | | | 1,705 | | | 1,625 | | | 1,500 | |
Net interest income after provision for loan losses | | | 115,896 | | | 101,100 | | | 92,988 | |
Non-interest income | | | | | | | | | | |
Service charges on deposit accounts | | | 21,006 | | | 22,039 | | | 20,698 | |
Interchange income | | | 11,116 | | | 9,239 | | | 7,590 | |
Mortgage banking | | | 10,044 | | | 8,355 | | | 6,754 | |
Trust and investment product fees | | | 4,866 | | | 4,947 | | | 4,712 | |
Increase in cash surrender value of life insurance | | | 1,513 | | | 1,236 | | | 1,298 | |
Net realized gains on securities (includes $170, $386, $24 accumulated other comprehensive income (AOCI) reclassifications for realized net gains on available for sale securities | | | 170 | | | 386 | | | 24 | |
Gain/(Loss) on sale and write-down of OREO | | | 268 | | | 68 | | | (153) | |
Other income | | | 3,629 | | | 4,002 | | | 2,084 | |
Total non-interest income | | | 52,612 | | | 50,272 | | | 43,007 | |
Non-interest expense | | | | | | | | | | |
Salaries and employee benefits | | | 64,327 | | | 57,741 | | | 54,132 | |
Net occupancy | | | 9,298 | | | 8,326 | | | 7,628 | |
Equipment | | | 12,696 | | | 11,360 | | | 10,337 | |
Intangibles amortization | | | 1,342 | | | 1,640 | | | 1,690 | |
Telecommunications | | | 1,647 | | | 1,775 | | | 1,747 | |
Stationery printing and supplies | | | 1,052 | | | 1,162 | | | 1,174 | |
FDIC assessment | | | 1,560 | | | 1,655 | | | 1,620 | |
Marketing | | | 3,390 | | | 3,193 | | | 3,187 | |
Collection expense | | | 910 | | | 1,173 | | | 1,330 | |
Prepayment penalty on FHLB advance | | | — | | | 2,364 | | | — | |
Acquisition related expenses | | | 7,130 | | | 731 | | | 3,119 | |
Consultant expense | | | 549 | | | 1,106 | | | 1,400 | |
Interchange expense | | | 3,376 | | | 2,619 | | | 2,287 | |
Other expenses | | | 10,771 | | | 10,752 | | | 9,569 | |
Total non-interest expense | | | 118,048 | | | 105,597 | | | 99,220 | |
Income before income tax | | | 50,460 | | | 45,775 | | | 36,775 | |
Income tax expense (includes $60, $135, and $8 income tax expense from AOCI reclassification items) | | | 12,137 | | | 10,233 | | | 7,779 | |
Net income attributable to common shareholders | | $ | 38,323 | | $ | 35,542 | | $ | 28,996 | |
Net income per common share: | | | | | | | | | | |
Basic | | $ | 1.66 | | $ | 1.64 | | $ | 1.40 | |
Diluted | | $ | 1.64 | | $ | 1.62 | | $ | 1.39 | |
Dividend per share | | $ | 0.61 | | $ | 0.54 | | $ | 0.42 | |
The accompanying notes are an integral part of these consolidated financial statements.
MAINSOURCE FINANCIAL GROUP, INC.
CONSOLIDATED STATEMENTS OF COMPREHENSIVE INCOME
YEARS ENDED DECEMBER 31, 2016, 2015, AND 2014
(Dollar amounts in thousands)
| | | | | | | | | | |
| | 2016 | | 2015 | | 2014 | |
| | | | | | | | | | |
| | | | | | | | | | |
| | | | | | | | | | |
Net income | | $ | 38,323 | | $ | 35,542 | | $ | 28,996 | |
Other comprehensive income: | | | | | | | | | | |
Unrealized holding gains/(losses) on securities available for sale | | | (14,515) | | | (970) | | | 19,056 | |
Reclassification adjustment for (gains) included in net income | | | (170) | | | (386) | | | (24) | |
Tax effect | | | 5,140 | | | 267 | | | (6,453) | |
Other comprehensive income | | | (9,545) | | | (1,089) | | | 12,579 | |
Comprehensive income | | $ | 28,778 | | $ | 34,453 | | $ | 41,575 | |
The accompanying notes are an integral part of these consolidated financial statements.
MAINSOURCE FINANCIAL GROUP, INC.
CONSOLIDATED STATEMENTS OF SHAREHOLDERS’ EQUITY
YEARS ENDED DECEMBER 31, 2016, 2015, AND 2014
(Dollar amounts in thousands except per share data)
| | | | | | | | | | | | | | | | | | | | | | |
| | | | | | | | | | | | | | | | | | Accumulated | | | |
| | | | Common Stock | | | | | Additional | | | | | Other | | | |
| Preferred | | Shares | | | | | Treasury | | Paid-in | | Retained | | Comprehensive | | | |
| Stock | | Outstanding | | Amount | | Stock | | Capital | | Earnings | | Income/(Loss) | | Total |
Balance, January 1, 2014 | $ | — | | 20,417,224 | | $ | 10,508 | | $ | (8,495) | | $ | 224,793 | | $ | 77,586 | | $ | 1,134 | | $ | 305,526 |
Net income | | | | | | | | | | | | | | | | 28,996 | | | | | | 28,996 |
Other comprehensive loss | | | | | | | | | | | | | | | | | | | 12,579 | | | 12,579 |
Purchase of treasury stock | | | | (19,078) | | | | | | (319) | | | | | | | | | | | | (319) |
Stock option exercise | | | | 6,950 | | | 4 | | | 113 | | | (51) | | | | | | | | | 66 |
Stock option expense | | | | | | | | | | | | | 160 | | | | | | | | | 160 |
Dividends — common stock ( $.42 per share) | | | | | | | | | | | | | | | | (8,726) | | | | | | (8,726) |
Restricted stock award | | | | 34,337 | | | 23 | | | | | | 464 | | | | | | | | | 487 |
Director retainer award | | | | 21,780 | | | 11 | | | | | | 348 | | | | | | | | | 359 |
Issuance of common stock in acquisition | | | | 1,226,312 | | | 613 | | | | | | 20,921 | | | — | | | | | | 21,534 |
Balance, December 31, 2014 | | — | | 21,687,525 | | | 11,159 | | | (8,701) | | | 246,635 | | | 97,856 | | | 13,713 | | | 360,662 |
Net income | | | | | | | | | | | | | | | | 35,542 | | | | | | 35,542 |
Other comprehensive income | | | | | | | | | | | | | | | | | | | (1,089) | | | (1,089) |
Purchase of treasury stock | | | | (176,405) | | | | | | (3,527) | | | | | | | | | | | | (3,527) |
Stock option exercise | | | | 25,075 | | | 13 | | | 416 | | | (135) | | | | | | | | | 294 |
Stock option expense | | | | | | | | | | | | | 180 | | | | | | | | | 180 |
Dividends — common stock ( $.54 per share) | | | | | | | | | | | | | | | | (11,680) | | | | | | (11,680) |
Restricted stock award | | | | 27,955 | | | 21 | | | | | | 642 | | | | | | | | | 663 |
Director retainer award | | | | 15,425 | | | 8 | | | | | | 307 | | | | | | | | | 315 |
Issuance of common stock in acquisition | | — | | — | | | — | | | | | | — | | | — | | | | | | — |
Balance, December 31, 2015 | | — | | 21,579,575 | | | 11,201 | | | (11,812) | | | 247,629 | | | 121,718 | | | 12,624 | | | 381,360 |
Net income | | | | | | | | | | | | | | | | 38,323 | | | | | | 38,323 |
Other comprehensive loss | | | | | | | | | | | | | | | | | | | (9,545) | | | (9,545) |
Stock option exercise, including tax benefit | | | | 111,595 | | | 55 | | | 1,948 | | | (220) | | | | | | | | | 1,783 |
Stock option expense | | | | | | | | | | | | | 91 | | | | | | | | | 91 |
Dividends — common stock ( $.61 per share) | | | | | | | | | | | | | — | | | (14,296) | | | | | | (14,296) |
Restricted stock award, including tax benefit | | | | 45,932 | | | 22 | | | | | | 1,032 | | | | | | | | | 1,054 |
Director retainer award | | | | 18,334 | | | 9 | | | | | | 373 | | | | | | | | | 382 |
Purchase of treasury stock | | | | (39,888) | | | | | | (1,045) | | | | | | | | | | | | (1,045) |
Issuance of common stock in acquisition | | — | | 2,351,816 | | | 1,176 | | | | | | 50,211 | | | — | | | | | | 51,387 |
Balance, December 31, 2016 | $ | — | | 24,067,364 | | $ | 12,463 | | $ | (10,909) | | $ | 299,116 | | $ | 145,745 | | $ | 3,079 | | $ | 449,494 |
The accompanying notes are an integral part of these consolidated financial statements.
MAINSOURCE FINANCIAL GROUP, INC.
CONSOLIDATED STATEMENTS OF CASH FLOWS
YEARS ENDED DECEMBER 31, 2016, 2015, AND 2014
(Dollars in thousands)
| | | | | | | | | | |
| | 2016 | | 2015 | | 2014 | |
Operating Activities | | | | | | | | | | |
Net income | | $ | 38,323 | | $ | 35,542 | | $ | 28,996 | |
Adjustments to reconcile net income to net cash provided by operating activities: | | | | | | | | | | |
Provision for loan losses | | | 1,705 | | | 1,625 | | | 1,500 | |
Depreciation expense | | | 7,289 | | | 6,410 | | | 5,886 | |
Amortization of mortgage servicing rights | | | 1,510 | | | 1,313 | | | 1,004 | |
(Recovery)/additional impairment of valuation allowance on mortgage servicing rights | | | — | | | (200) | | | 25 | |
Securities amortization, net | | | 4,901 | | | 3,386 | | | 1,973 | |
Amortization of purchased intangible assets | | | 1,342 | | | 1,640 | | | 1,690 | |
Earnings on cash surrender value of life insurance policies | | | (1,513) | | | (1,236) | | | (1,298) | |
Gain on life insurance benefit | | | — | | | (307) | | | — | |
Securities gains, net | | | (170) | | | (386) | | | (24) | |
Gain on loans sold | | | (7,311) | | | (5,553) | | | (4,730) | |
Loans originated for sale | | | (254,581) | | | (236,928) | | | (165,827) | |
Proceeds from loan sales | | | 256,946 | | | 243,230 | | | 168,832 | |
Stock based compensation expense | | | 1,001 | | | 843 | | | 647 | |
Stock portion of director retainer fee expense | | | 382 | | | 315 | | | 359 | |
(Gain)/Loss on sale and write-down of OREO | | | (268) | | | (68) | | | 153 | |
Prepayment penalty on FHLB advance | | | — | | | 2,364 | | | — | |
Change in other assets and liabilities | | | (2,294) | | | 1,402 | | | 4,172 | |
Net cash provided by operating activities | | | 47,262 | | | 53,392 | | | 43,358 | |
Investing Activities | | | | | | | | | | |
Net change in short term investments | | | — | | | (45) | | | (1,915) | |
Purchases of securities available for sale | | | (242,730) | | | (345,783) | | | (61,756) | |
Proceeds from calls, maturities, and payments on securities available for sale | | | 142,543 | | | 136,799 | | | 106,268 | |
Proceeds from sales of securities available for sale | | | 88,203 | | | 147,109 | | | 27,131 | |
Loan originations and payments, net | | | (144,129) | | | (176,184) | | | (110,124) | |
Purchases of premises and equipment | | | (14,068) | | | (7,794) | | | (5,593) | |
Proceeds from sale of OREO | | | 3,985 | | | 2,272 | | | 3,864 | |
Proceeds from redemption of restricted stock | | | 3,789 | | | 2,785 | | | 3,251 | |
Purchase of restricted stock | | | (5,531) | | | (231) | | | — | |
Proceeds from sale of portfolio loans | | | — | | | 11,356 | | | — | |
Proceeds from life insurance benefit | | | — | | | 1,094 | | | 588 | |
Cash received/(paid) from bank/branch acquisitions, net | | | (11,289) | | | 57,083 | | | (10,686) | |
Net cash used by investing activities | | | (179,227) | | | (171,539) | | | (48,972) | |
Financing Activities | | | | | | | | | | |
Net change in deposits | | | 15,401 | | | 83,428 | | | 83,796 | |
Net change in other borrowings | | | 162,976 | | | 2,014 | | | (13,293) | |
Proceeds from FHLB advances | | | 420,000 | | | 700,000 | | | 825,000 | |
Repayment of FHLB advances | | | (451,986) | | | (647,289) | | | (874,745) | |
Proceeds from term debt | | | 30,000 | | | — | | | — | |
Cash dividends on common stock | | | (14,296) | | | (11,680) | | | (8,726) | |
Purchase of treasury shares | | | (1,045) | | | (3,527) | | | (319) | |
Repayment on term debt | | | (11,667) | | | — | | | — | |
Repayment of subordinated debentures, net | | | — | | | — | | | (5,000) | |
Proceeds from exercise of stock options, including tax benefit | | | 1,556 | | | 294 | | | 66 | |
Net cash provided by financing activities | | | 150,939 | | | 123,240 | | | 6,779 | |
Net change in cash and cash equivalents | | | 18,974 | | | 5,093 | | | 1,165 | |
Cash and cash equivalents, beginning of period | | | 67,578 | | | 62,485 | | | 61,320 | |
Cash and cash equivalents, end of period | | $ | 86,552 | | $ | 67,578 | | $ | 62,485 | |
Supplemental cash flow information | | | | | | | | | | |
Interest paid | | $ | 10,420 | | $ | 8,424 | | $ | 8,807 | |
Income taxes paid | | | 5,365 | | | 4,985 | | | 4,725 | |
Supplemental non cash disclosure | | | | | | | | | | |
Loan balances transferred to foreclosed real estate | | | 1,965 | | | 1,475 | | | 2,585 | |
Loan balances transferred to loans held for sale | | | — | | | 11,356 | | | — | |
See NOTE 26 regarding non‑cash transactions included in acquisitions.
The accompanying notes are an integral part of these consolidated financial statements.
NOTES TO THE CONSOLIDATED FINANCIAL STATEMENTS
(Dollar amounts in thousands except per share data)
NOTE 1 — SUMMARY OF SIGNIFICANT ACCOUNTING POLICIES
Nature of Operations and Principles of Consolidation: The consolidated financial statements include MainSource Financial Group, Inc. and its wholly owned subsidiaries, together referred to as “the Company”. Intercompany transactions and balances are eliminated in consolidation.
The Company’s wholly owned subsidiaries include MainSource Bank (“the Bank”), MainSource Title, LLC, MainSource Insurance, LLC, Insurance Services Marketing, LLC, and MainSource Risk Management. In the second quarter of 2016, the Company acquired 100% of the outstanding common shares of Cheviot Financial Corp, (“Cheviot”) and its subsidiary Cheviot Savings Bank. At the date of acquisition, Cheviot Savings Bank was merged into MainSource Bank. In the fourth quarter of 2014, the Company acquired 100% of the outstanding common shares of MBT Bancorp (“MBT”) and its subsidiary The Merchant’s Bank and Trust Company. At the date of acquisition, The Merchant’s Bank and Trust Company was merged into MainSource Bank. (See NOTE 26).
The Company provides financial services through its offices in Indiana, Illinois, Ohio, and Kentucky. Its primary deposit products are checking, savings, and term certificate accounts, and its primary lending products are residential mortgage, commercial, and installment loans. Substantially all loans are secured by specific items of collateral including business assets, consumer assets and real estate. Other financial instruments which potentially represent concentrations of credit risk include deposit accounts in other financial institutions and federal funds sold. See the Loan Policy section for further discussion on loan information.
Use of Estimates: To prepare financial statements in conformity with U.S. generally accepted accounting principles, management makes estimates and assumptions based on available information. These estimates and assumptions affect the amounts reported in the financial statements and the disclosures provided and actual results could differ.
Cash Flows: Cash and cash equivalents include cash and due from banks, interest bearing deposits with other financial institutions with maturities under 90 days, money market funds and federal funds sold. Net cash flows are reported for loan and deposit transactions, federal funds purchased and repurchase agreements.
Interest-Bearing Time Deposits: Interest-bearing deposits in other financial institutions mature within one year and are carried at cost.
Securities: Securities are classified as available for sale when they might be sold before maturity. Securities available for sale are carried at fair value, with unrealized holding gains and losses reported in other comprehensive income/(loss), net of tax.
Interest income includes amortization of purchase premium or discount. Premiums and discounts on securities are amortized on the level‑yield method, which considers prepayments only on mortgage‑backed securities. Gains and losses on sales are recorded on the trade date and are based on the amortized cost of the security sold. The Company evaluates securities for other‑than‑temporary impairment (“OTTI”) at least on a quarterly basis, and more frequently when economic or market conditions warrant such an evaluation. For securities in an unrealized loss position, management considers the extent and duration of the unrealized loss, and the financial condition and near‑term prospects of the issuer. Management also assesses whether it intends to sell, or it is more likely than not that it will be required to sell, a security in an unrealized loss position before recovery of its amortized cost basis. If either of the criteria regarding intent or requirement to sell is met, the entire difference between amortized cost and fair value is recognized as impairment through earnings. For debt securities that do not meet the aforementioned criteria, the amount of impairment is split into two components as follows: 1) OTTI related to credit loss, which must be recognized in the income statement and 2) OTTI related to other factors, which is recognized in other comprehensive income. The credit loss is defined as the difference between the present value of the cash flows expected to be collected and the amortized cost basis. For equity securities, the entire amount of impairment is recognized through earnings.
Loans Held for Sale: Loans originated and intended for sale in the secondary market are carried at the lower of cost or fair value in the aggregate, as determined by outstanding commitments from investors. Net unrealized losses, if any, are recorded as a valuation allowance and charged to earnings.
Mortgage loans held for sale are generally sold with servicing rights retained. The carrying value of mortgage loans sold is reduced by the amount allocated to the servicing right. Gains and losses on sales of mortgage loans are based on the difference between the selling price and the carrying value of the related loan sold.
Loans: Loans that management has the intent and ability to hold for the foreseeable future or until maturity or payoff are reported at the principal balance outstanding, net of purchase premiums or discounts, unearned interest, deferred loan fees and costs, and an allowance for loan losses. Interest income is accrued on the unpaid principal balance. Loan origination fees, net of certain direct origination costs, are deferred and recognized in interest income using the level‑yield method without anticipating prepayments.
For all classes of financing receivables, interest income is not reported when full loan repayment is in doubt, typically when the loan is impaired or payments are past due over 90 days. Past due status is based on the contractual terms of the loan. Loans are placed on non‑accrual or charged‑off at an earlier date if collection of principal or interest is considered doubtful.
For all classes of financing receivables, interest accrued but not received for loans placed on non‑accrual is reversed against interest income. Payments received on such loans subsequent to being placed on non‑accrual are applied to the principal balance of the loans. Loans are returned to accrual status when all the principal and interest amounts contractually due are brought current and future payments are reasonably assured. Non‑accrual loans and loans past due 90 days still on accrual include both smaller balance homogeneous loans that are collectively evaluated for impairment and individually classified impaired loans. Troubled Debt Restructurings, (“TDRs”) normally follow the same guidelines as regular loans in placing on non‑accrual status.
Loans acquired in a business combination are designated as purchased loans. These loans are recorded at their fair value at acquisition date, factoring in credit losses expected to be incurred over the life of the loan. An allowance for loan losses is not carried over as of the acquisition date. Loans purchased with evidence of credit deterioration since origination for which it is probable that all contractually required payments will not be collected are accounted for under Financial Accounting Standards Board Accounting Standards Codification 310-30, Loans and Debt Securities Acquired with Deteriorated Credit Quality. Expected cash flows at the acquisition date in excess of the fair value of loans are considered to be accretable yield, which is recognized as interest income over the life of the loan using a level yield method.
Allowance for Loan Losses: The allowance for loan losses is a valuation allowance for probable incurred credit losses. Loan losses are charged against the allowance when management believes the uncollectibility of a loan balance is confirmed. Subsequent recoveries, if any, are credited to the allowance. Management estimates the allowance balance required using past loan loss experience, the nature and volume of the portfolio, information about specific borrower situations and estimated collateral values, economic conditions, and other factors. Allocations of the allowance may be made for specific loans, but the entire allowance is available for any loan that, in management’s judgment, should be charged‑off.
The allowance consists of specific and general components. The specific component relates to loans that are individually classified as impaired. The general component covers non-impaired loans and is based on historical loss experience adjusted for current factors. The historical loss experience is determined by portfolio segment and is based on the actual loss history experienced by the Company over the most recent 3 years. However, a floor of 15 basis points of historical losses is used to reflect a minimum level of risk in a portfolio segment. This actual loss experience is supplemented with other economic factors based on the risks present. These economic factors include consideration of the following: levels of and trends in delinquencies and impaired loans; levels of and trends in charge-offs and recoveries; trends in volume and terms of loans; effects of any changes in risk selection and underwriting standards; other changes in lending policies, procedures, and practices; experience, ability, and depth of lending management and other relevant staff; national and local economic trends and conditions; industry conditions; and effects of changes in credit concentrations. The allowance for loans collectively evaluated for impairment also consists of reserves on certain loans that are classified
but determined not to be impaired based on an analysis which incorporates probability of default with a loss given default scenario.
For allowance purposes, the following portfolio segments have been identified: Commercial, Commercial Real Estate (“CRE”), Residential and Consumer. The classes within the Commercial portfolio are commercial and industrial and agricultural. The classes within the Commercial Real Estate portfolio are farm, hotel, construction and development, and other. The classes within the Residential portfolio are 1‑4 family and home equity. Finally, the classes within the Consumer portfolio are direct and indirect.
The risk characteristics of each loan portfolio segment are as follows:
Commercial
The commercial portfolio contains commercial and industrial and agricultural loans. Commercial loans are made to commercial customers for use in normal business operations to finance working capital needs, equipment purchases, agricultural financing, or other projects and are repaid from operations of the business. The majority of these borrowers are customers doing business within the Company’s geographic regions. Commercial loans are generally underwritten individually and secured with the assets of the company and/or the personal guarantee of the business owners. In the case of loans secured by accounts receivable, the availability of funds for the repayment of these loans may be substantially dependent on the ability of the borrower to collect amounts due from its customers.
Commercial real estate
Commercial real estate loans consist of loans for income‑producing real estate properties and real estate developers. The Company mitigates its risk on these loans by requiring collateral values that exceed the loan amount and underwriting the loan with projected cash flow in excess of the debt service requirement. These loans are made to finance properties such as apartment buildings, office and industrial buildings, hotels, farm real estate, and retail shopping centers; and are repaid through cash flows related to the operation, sale, or refinance of the property.
Residential
The residential portfolio contains residential mortgage and home equity loans. Residential mortgage loans represent loans to consumers for the purchase or refinance of a residence. These loans are generally financed over a 15 to 30 year term, and in most cases, are extended to borrowers to finance their primary residence. Residential loans are secured by the residence being financed. For residential loans that are secured by 1‑4 family residences and are generally owner occupied, the Company generally establishes a maximum loan‑to‑value ratio and requires private mortgage insurance if that ratio is exceeded. Home equity lending includes both home equity loans and lines‑of‑credit. This type of lending, which is secured by a first‑ or second‑ lien on the borrower’s residence, allows customers to borrow against the equity in their home. Repayment of these loans is primarily dependent on the personal income of the borrowers, which can be impacted by economic conditions in their market areas such as unemployment levels. Repayment can also be impacted by changes in property values on residential properties. Risk is mitigated by the fact that the loans are of smaller individual amounts and spread over a large number of borrowers.
Consumer
The consumer portfolio consists of direct and indirect installment loans. The largest percentage of the direct consumer loans are automobile loans and the automobile or other vehicle is normally used as collateral for the loan. The Company no longer writes any indirect loans. These loans are generally financed over a short (3‑7 year) time horizon. Similar to the residential loans above, repayment of these loans is primarily dependent on the personal income of the borrowers, which can be impacted by economic conditions in their market areas such as unemployment levels. Risk is mitigated by the fact that the loans are of smaller individual amounts and spread over a large number of borrowers.
All loans are charged off when the Company has determined that future collectability of the entire loan balance is doubtful. For commercial and commercial real estate loans, collateral dependent loans are written down to fair value less cost to sell.
A loan is considered impaired when, based on current information and events, it is probable that the Company will be unable to collect the scheduled payments of principal or interest when due according to the contractual terms of the loan agreement. Loans that experience insignificant payment delays and payment shortfalls generally are not classified as impaired. Management determines the significance of payment delays and payment shortfalls on a case‑by‑case basis, taking into consideration all of the circumstances surrounding the loan and the borrower, including the length of the delay, the reasons for the delay, the borrower’s prior payment record, and the amount of the shortfall in relation to the principal and interest owed. Loans, for which the terms have been modified, and for which the borrower is experiencing financial difficulties, are considered troubled debt restructurings and classified as impaired. Impairment is measured on a loan by loan basis for commercial and commercial real estate loans by either the present value of expected future cash flows discounted at the loan’s effective interest rate, the loan’s obtainable market price, or the fair value of the collateral if the loan is collateral dependent. Large groups of smaller balance homogeneous loans are collectively evaluated for impairment. Accordingly, the Company does not separately identify individual consumer and residential real estate loans for impairment disclosures. A specific reserve is established as a component of the allowance when a loan has been determined to be impaired for all commercial and commercial real estate relationships greater than $250.
Federal Home Loan Bank (FHLB) Stock: The Bank is a member of the Federal Home Loan Bank (“FHLB”) system. Members are required to own a certain amount of stock based on the level of borrowings and other factors, and may invest in additional amounts. FHLB stock is carried at cost, classified as a restricted security, and periodically evaluated for impairment based on ultimate recovery of par value. Both cash and stock dividends are reported as income.
Premises and Equipment: Land is carried at cost. Premises and equipment are stated at cost less accumulated depreciation. Buildings and related components are depreciated using the straight‑line method with useful lives ranging from 30 to 39 years for buildings and 5 to 15 years for related components. Leasehold improvements are depreciated over the shorter of its useful life or lease term. Furniture, fixtures and equipment are depreciated using the straight‑line method with useful lives ranging from 3 to 10 years.
Foreclosed Assets: Assets acquired through or instead of loan foreclosure are initially recorded at fair value net of estimated selling costs when acquired, establishing a new cost basis. Physical possession of residential real estate property collateralizing a consumer mortgage loan occurs when legal title is obtained upon completion of foreclosure or when the borrower conveys all interest in property to satisfy the loan through completion of a deed in lieu of foreclosure or through a similar legal agreement. These assets are subsequently accounted for at lower of cost or fair value less estimated cost to sell. If fair value declines after acquisition, a valuation allowance is recorded through expense. Costs after acquisition are expensed.
Company Owned Life Insurance: The Company has purchased life insurance policies on certain employees. Company owned life insurance is recorded at the amount that can be realized under the insurance contract at the balance sheet date, which is the cash surrender value adjusted for other charges or other amounts due that are probable at settlement.
Servicing Assets: Servicing rights are recognized separately when they are acquired through sales of loans. When mortgage loans are sold, servicing rights are initially recorded at fair value with the income statement effect recorded in mortgage banking in non‑interest income. Fair value is based on a valuation model that calculates the present value of estimated future net servicing income. All classes of servicing assets are subsequently measured using the amortization method which requires servicing rights to be amortized into non‑interest income in proportion to, and over the period of, the estimated future net servicing income of the underlying loans.
Servicing assets are evaluated for impairment based upon the fair value of the rights as compared to carrying amount. Impairment is determined by stratifying rights into groupings based on predominant risk characteristics, such as interest rate, loan type and investor type. Impairment is recognized through a valuation allowance for an individual grouping, to the extent that fair value is less than the carrying amount. If the Company later determines that all or a portion of the impairment no longer exists for a particular grouping, a reduction of the allowance may be recorded as an increase
to income. Changes in valuation allowances are reported with mortgage banking on the income statement. The fair values of servicing rights are subject to significant fluctuations as a result of changes in estimated and actual prepayment speeds and default rates and losses.
Servicing fee income, which is reported on the income statement as mortgage banking in non‑interest income, is recorded for fees earned for servicing loans. The fees are based on a contractual percentage of the outstanding principal, or a fixed amount per loan and are recorded as income when earned. The amortization of mortgage servicing rights is netted against loan servicing fee income. Servicing fees totaled $2,653, $2,415 and $2,065 for the years ended December 31, 2016, 2015 and 2014. Late fees and ancillary fees related to loan servicing are not material.
Mortgage Banking Derivatives: Commitments to fund mortgage loans (interest rate locks) to be sold into the secondary market and forward commitments for the future delivery of these mortgage loans are accounted for as free standing derivatives. Fair values of interest rate locks are recorded at the time of commitment, adjusted for expected fall out before the loan is funded. The Company enters into forward commitments for the future delivery of mortgage loans when interest rate locks are entered into, in order to hedge the change in interest rates resulting from its commitments to fund the loans. The fair value of these forward commitments is estimated based on the change in mortgage interest rates from the date the commitment is entered into. Any changes are recorded in mortgage banking on the income statement. The amount of income/(expense) related to these derivatives was $(52), $(275), and $450 in 2016, 2015, and 2014 and is included in the “Gain from sale of mortgage loans and interest rate locks” in Note 14. See Note 14 for additional information on mortgage banking activities.
Transfers of Financial Assets: Transfers of financial assets are accounted for as sales when control over the assets has been surrendered. Control over transferred assets is deemed to be surrendered when the assets have been isolated from the Company, the transferee obtains the right (free of conditions that constrain it from taking advantage of that right) to pledge or exchange the transferred assets, and the Company does not maintain effective control over the transferred assets through an agreement or option to repurchase them before their maturity.
Goodwill and Other Intangible Assets: Goodwill resulting from business combinations prior to January 1, 2009 represents the excess of the purchase price over the fair value of acquired tangible assets and liabilities and identifiable intangible assets. Goodwill resulting from business combinations after January 1, 2009, is generally determined as the excess of the fair value of the consideration transferred, plus the fair value of any noncontrolling interests in the acquiree, over the fair value of the net assets acquired and liabilities assumed as of the acquisition date. Goodwill and intangible assets acquired in a purchase business combination and determined to have an indefinite useful life are not amortized, but tested for impairment at least annually and more frequently if events and circumstances exist that indicate that a goodwill impairment test should be performed. The Company has selected June 30 of each year as the date to perform its impairment review. Intangible assets with definite useful lives are amortized over their estimated useful lives to their estimated residual values. Goodwill is the only intangible asset with an indefinite life on the Company’s balance sheet.
Other intangible assets consist largely of core deposit and acquired customer relationship intangibles arising from whole bank and branch acquisitions. They are initially measured at fair value and then are amortized on an accelerated method over their estimated useful lives, generally ten years.
Loan Commitments and Related Financial Instruments: Financial instruments include off‑balance sheet credit instruments, such as commitments to make loans and commercial letters of credit, issued to meet customer financing needs. The face amount for these items represents the exposure to loss, before considering customer collateral or ability to repay. Such financial instruments are recorded when they are funded.
Long‑term Assets: Premises and equipment and other long‑term assets are reviewed for impairment when events indicate their carrying amount may not be recoverable from future undiscounted cash flows. If impaired, the assets are recorded at fair value.
Income Taxes: Income tax expense is the total of the current year income tax due or refundable and the change in deferred tax assets and liabilities. Deferred tax assets and liabilities are the expected future tax amounts for the temporary
differences between carrying amounts and tax bases of assets and liabilities, computed using enacted tax rates. A valuation allowance, if needed, reduces deferred tax assets to the amount expected to be realized.
A tax position is recognized as a benefit only if it is “more likely than not” that the tax position would be sustained in a tax examination, with a tax examination being presumed to occur. The amount recognized is the largest amount of tax benefit that is greater than 50% likely of being realized on examination. For tax positions not meeting the “more likely than not” test, no tax benefit is recorded.
The Company recognizes interest and/or penalties related to income tax matters in income tax expense.
Stock‑Based Compensation: Compensation cost is recognized for stock options and restricted stock awards issued to employees, based on the fair value of these awards at the date of grant. A Black‑Scholes model is utilized to estimate the fair value of stock options. Compensation cost is recognized over the required service period, generally defined as the vesting period. For awards with graded vesting, compensation cost is recognized on a straight‑line basis over the requisite service period for the entire award.
Retirement Plans: Employee 401(k) and profit sharing plan expense is the amount of matching contributions and discretionary contributions, respectively.
Earnings Per Common Share: Basic earnings per common share is net income available to common shareholders divided by the weighted average number of common shares outstanding during the period. Diluted earnings per common share include the dilutive effect of additional potential common shares issuable under stock options as well as stock warrants issued as part of the Treasury Department’s Capital Purchase Program. Earnings and dividends per share are restated for all stock splits and dividends through the date of issuance of the financial statements.
Comprehensive Income: Comprehensive income consists of net income and other comprehensive income. Other comprehensive income includes unrealized gains and losses on securities available for sale which are also recognized as a separate component of equity.
Loss Contingencies: Loss contingencies, including claims and legal actions arising in the ordinary course of business, are recorded as liabilities when the likelihood of loss is probable and an amount or range of loss can be reasonably estimated. Management does not believe there are now any such matters that will have a material effect on the financial statements.
Restrictions on Cash: Cash on hand or on deposit with the Federal Reserve Bank is required to meet regulatory reserve and clearing requirements.
Equity: Stock dividends in excess of 20% are reported by transferring the par value of the stock issued from retained earnings to common stock. Stock dividends for 20% or less are reported by transferring the fair value, as of the ex‑dividend date, of the stock issued from retained earnings to common stock and additional paid‑in capital. Fractional share amounts are paid in cash with a reduction in retained earnings. Treasury stock is carried at cost and valued on an average cost basis.
Dividend Restriction: Banking regulations require banks to maintain certain capital levels and may limit the dividends paid to the holding companies or by holding companies to shareholders.
Fair Value of Financial Instruments: Fair values of financial instruments are estimated using relevant market information and other assumptions, as more fully disclosed in Note 7. Fair value estimates involve uncertainties and matters of significant judgment regarding interest rates, credit risk, prepayments, and other factors, especially in the absence of broad markets for particular items. Changes in assumptions or in market conditions could significantly affect the estimates.
Operating Segments: While the Company monitors the revenue streams of its various products and services, the identifiable segments are not material and operations are managed and financial performance is evaluated on a
Company‑ wide basis. Accordingly, all of the Company’s financial service operations are considered by management to be aggregated in one reportable operating segment.
Reclassifications: Some items in the prior year financial statements were reclassified to conform to the current presentation. Reclassifications had no effect on prior year net income or shareholders’ equity.
Adoption of New Accounting Standards and Newly Issued Not Yet Effective Accounting Standards:
In May 2014, the FASB issued ASU No. 2014-09 “Revenue from Contracts with Customers (Topic 606 )” ASU 2014-09 says that an entity should recognize revenue to depict the transfer of promised goods or services to customers in an amount that reflects the consideration to which the entity expects to be entitled in exchange for those goods and services. On July 9, 2015, the FASB approved amendments deferring the effective date by one year. ASU 2014-09 is now effective for annual reporting periods beginning after December 15, 2017, including interim periods within that reporting period. The amendments can be applied retrospectively to each prior reporting period or retrospectively with the cumulative effect of initially applying this Update recognized at the date of initial application. Early application is permitted but not before the original public entity effective date, i.e ., annual periods beginning after December 15, 2016. The Company has determined that ASU No 2014-09 will not have a significant impact on its financial statements as a significant portion of the Company’s revenue is scoped out of the standard.
In September 2015, the FASB issued ASU 2015-16, “Business Combinations (Topic 805) – Simplifying the Accounting for Measurement-Period Adjustments.” ASU 2015-16 requires that an acquirer recognize adjustments to provisional amounts that are identified during the measurement period in the reporting period in which the adjustment amounts are determined. It also requires that the acquirer record, in the same period’s financial statements, the effect on earnings of changes in depreciation, amortization, or other income effects, if any, as a result of the change to the provisional amounts, calculated as if the accounting had been completed at the acquisition date. This ASU requires an entity to present separately on the face of the income statement or disclose in the notes the portion of the amount recorded in current-period earnings by line item that would have been recorded in previous reporting periods if the adjustment to the provisional amounts had been recognized as of the acquisition date. ASU 2016-16 is effective for fiscal years beginning after December 15, 2015, including interim periods within those fiscal years. This ASU should be applied prospectively to adjustments to provisional amounts that occur after the effective date of this ASU with earlier application permitted for financial statements that have not been issued. The Company implemented this ASU with the acquisition of Cheviot Financial Corp in the second quarter of 2016.
In January 2016, the FASB issued ASU No. 2016-01 “Financial Instruments - Overall (Subtopic 825-10) - Recognition and Measurement of Financial Assets and Financial Liabilities.” ASU 2016-01 is intended to improve the recognition and measurement of financial instruments by requiring equity investments to be measured at fair value with changes in fair value recognized in net income; requiring public business entities to use the exit price notion when measuring the fair value of financial instruments for disclosure purposes; requiring separate presentation of financial assets and financial liabilities by measurement category and form of financial asset on the balance sheet or the accompanying notes to the financial statements; eliminating the requirement for public business entities to disclose the method(s) and significant assumptions used to estimate the fair value that is required to be disclosed for financial instruments measured and amortized at cost on the balance sheet; and requiring a reporting organization to present separately in other comprehensive income the portion of the total change in the fair value of a liability resulting from a change in the instrument-specific credit risk when the organization has elected to measure the liability at fair value in accordance with the fair value option for financial instruments. ASU 2016-01 is effective for annual periods and interim periods within those annual periods, beginning after December 15, 2017. The amendments should be applied by means of a cumulative-effect adjustment to the balance sheet as of the beginning of the fiscal year of adoption. The amendments related to equity securities without readily determinable fair values (including disclosure requirements) should be applied prospectively to equity investments that exist as of the date of adoption. The Company will be assessing the impact of ASU 2016-01 during 2017.
In February 2016, the FASB issued ASU No. 2016-02 “Leases (Topic 842).” ASU 2016-02 requires lessees and lessors to classify leases as either capital leases or operating leases. ASU 2016-02 also requires lessees to recognize assets and liabilities for all leases with the exception of short term leases. There are new disclosure requirements for these leases
which will provide users of financial statements with information to understand the amount, timing, and uncertainty of cash flows arising from leases. ASU 2016-02 will become effective for fiscal years beginning after December 15, 2018. The Company currently has prepared a worksheet of all of its leases and will reviewing them during the next two years to determine the impact on the Company’s financial statements.
In March 2016, the FASB issued (ASU) No. 2016-09 “Compensation - Stock Compensation (Topic 718) - Improvements to Employee Share-Based Payment Accounting.” ASU 2016-09 requires all income tax effects of awards to be recognized in the income statement when the awards vest or are settled. It also allows an employer to repurchase more of an employee’s shares than it can today for tax withholding purposes without triggering liability accounting and to make a policy election for forfeitures as they occur. ASU 2016-09 is effective for public business entities for fiscal years beginning after December 15, 2016, and interim periods within those years. Early adoption is permitted. The Company elected to implement this ASU in 2017. If it had adopted this ASU in 2016, the impact would have been an approximate $325 reduction in its income tax expense - $140 from restricted stock activity and $185 from stock option activity.
In June 2016, the FASB issued ASU 2016-13 “Financial Instruments (Topic 326) Measurement of Credit Losses on Financial Instrurment” “CECL”). ASU 2016-13 requires an allowance for expected credit losses on financial assets be recognized as early as day one of the instrument. This ASU departs from the incurred loss model which means the probab ility threshold is removed. It considers more forward-looking information and requires the entity to estimate its credit losses as far as it can reasonably estimate. This ASU is effective for fiscal years beginning after December 15, 2019, including interim periods within those fiscal years. Early adoption is permitted. The Company has captured loan level loss data since 2011. The Company will be starting its segregation of loans during 2017. The Company anticipates that its allowance for loan losses will increase with the adoption of this standard.
In August 2016, the FASB issued ASU 2016-15 "Statement of Cash Flows (Topic 320): Classification of Certain Cash Receipts and Cash Payments". ASU 2016-15 addresses the diversity in how certain cash receipts and cash payments are presented and classified in the statement of cash flows, including the following:.
| · | | Debt Prepayment or Debt Extinguishment Costs |
| · | | Settlement of Zero-Coupon Bonds or Debt with Coupon Interest Rates That Are Insignificant in Relation to the Effective Interest Rate |
| · | | Contingent Consideration Payments Made Soon After a Business Combination |
| · | | Proceeds From the Settlement of Insurance Claims |
| · | | Proceeds From the Settlement of BOLI and COLI Policies |
| · | | Distributions Received From Equity Method Investees |
| · | | Beneficial Interests in Securitization Transactions |
This ASU is effective for fiscal years beginning after December 31, 2017 on a retrospective basis. The Company does not anticipate the adoption of this standard to have a material impact on the Company’s operating results.
In January 2017, the FASB issued ASU 2017-01 “Clarifying the Definition of a Business”. ASU 2017-01 clarifies the definition of a business with the objective of adding guidance to assist entities with evaluating whether transactions should be accounted for as acquistions or disposals of assets or businesses. It provides a framework to assist entities in evaluating whether assets acquired or sold represent a business. This ASU is effective for periods beginning after December 15, 2017 on a prospective basis. The Company has determined that this ASU will not impact them.
In January 2017, the FASB issued ASU 2017-04 “Simplifying the Test for Goodwill Impairment”. ASU 2017-04 removes step 2 from the goodwill impairment test. This ASU requires an entity to perform its annual or interim goodwill impairment test by comparing the fair value of a reporting unit with its carrying amount and recognize an impairment charge for the amount by which the carrying amount exceeds the reporting unit’s fair value. However, the loss recognized should not exceed the total amount of goodwill allocated to that reporting unit. This ASU is effective for periods beginning after December 15, 2019 on a prospective basis. The Company will be evaluating the impact this ASU has on its financial statements over the next several years.
NOTE 2 — STOCK WARRANTS
In January, 2009, the Company entered into an agreement with the United States Department of Treasury (the “Treasury Department”) as part of the Treasury Department’s Capital Purchase Program. As part of this agreement, the Treasury Department received a warrant to purchase 571,906 shares of the Company’s common stock at an initial per-share exercise price of $14.95. The warrant provides for the adjustment of the exercise price and the number of shares of the Company’s common stock issuable upon exercise pursuant to customary anti-dilution provisions, such as upon stock splits or distributions of securities or other assets to holders of Company common stock, upon certain issuances of the Company common stock at or below a specified price relative to the initial exercise price and in the event the Company’s quarterly dividend exceeds $0.145/share. The warrant has a term of ten years and is currently exercisable. Like stock options, the warrant issued through the Capital Purchase Program is potentially dilutive. On June 6, 2013, the Treasury Department announced it had completed an auction to sell the warrant in a private transaction. The average stock price for the Company for 2016, 2015, and 2014 was $23.64, $20.91, and $17.27 per share, respectively, and the warrant issued in 2009 has an exercise price of $14.95 per share. This resulted in additional dilutive shares in calculating earnings per share of 210,638, 163,011 and 76,828 in 2016, 2015 and 2014, respectively.
NOTE 3 — RESTRICTION ON CASH AND DUE FROM BANKS
The Bank is required to maintain reserve funds in cash or on deposit with the Federal Reserve Bank. The reserves required at December 31, 2016 and 2015 were $33,844 and $23,957. The Company had no compensating balance requirements at December 31, 2016 and 2015.
NOTE 4 — SECURITIES
The fair value of securities available for sale and related gross unrealized gains and losses recognized in accumulated other comprehensive income was as follows:
| | | | | | | | | | | | | |
| | | | | Gross | | Gross | | | | |
| | Amortized | | Unrealized | | Unrealized | | | | |
| | Cost | | Gains | | Losses | | Fair Value | |
As of December 31, 2016 | | | | | | | | | | | | | |
Available for Sale | | | | | | | | | | | | | |
U. S. government agency | | $ | 951 | | $ | 4 | | $ | — | | $ | 955 | |
State and municipal | | | 361,335 | | | 10,799 | | | (2,848) | | | 369,286 | |
Mortgage-backed securities-residential (Government Sponsored Entity) | | | 450,006 | | | 1,253 | | | (4,629) | | | 446,630 | |
Collateralized mortgage obligations (Government Sponsored Entity) | | | 179,314 | | | 1,514 | | | (1,427) | | | 179,401 | |
Equity securities | | | 4,670 | | | — | | | — | | | 4,670 | |
Other securities | | | 6,527 | | | 71 | | | — | | | 6,598 | |
Total available for sale | | $ | 1,002,803 | | $ | 13,641 | | $ | (8,904) | | $ | 1,007,540 | |
| | | | | | | | | | | | | |
| | | | | Gross | | Gross | | | | |
| | Amortized | | Unrealized | | Unrealized | | | | |
| | Cost | | Gains | | Losses | | Fair Value | |
As of December 31, 2015 | | | | | | | | | | | | | |
Available for Sale | | | | | | | | | | | | | |
U. S. government agency | | $ | 499 | | $ | 5 | | $ | — | | $ | 504 | |
State and municipal | | | 332,999 | | | 17,802 | | | (68) | | | 350,733 | |
Mortgage-backed securities-residential (Government Sponsored Entity) | | | 332,525 | | | 2,199 | | | (644) | | | 334,080 | |
Collateralized mortgage obligations (Government Sponsored Entity) | | | 228,621 | | | 1,966 | | | (1,838) | | | 228,749 | |
Equity securities | | | 4,689 | | | — | | | — | | | 4,689 | |
Other securities | | | 6,524 | | | — | | | — | | | 6,524 | |
Total available for sale | | $ | 905,857 | | $ | 21,972 | | $ | (2,550) | | $ | 925,279 | |
Contractual maturities of securities available for sale at December 31, 2016 were as follows. Securities not due at a single maturity or with no maturity at year end are shown separately.
| | | | | | | |
| | Available for Sale | |
| | Amortized Cost | | Fair Value | |
Within one year | | $ | 12,583 | | $ | 12,715 | |
One through five years | | | 79,099 | | | 82,440 | |
Six through ten years | | | 107,719 | | | 111,782 | |
After ten years | | | 169,412 | | | 169,902 | |
Mortgage-backed securities-residential (Government Sponsored Entity) | | | 450,006 | | | 446,630 | |
Collateralized mortgage obligations (Government Sponsored Entity) | | | 179,314 | | | 179,401 | |
Equity securities | | | 4,670 | | | 4,670 | |
Total available for sale securities | | $ | 1,002,803 | | $ | 1,007,540 | |
Gross proceeds from sales of securities available for sale during 2016, 2015 and 2014 were $88,203, $147,109, and $27,131. Gross gains of $174, $1,689, and $570 and gross losses of $4, $1,303, and $546 were realized on those sales in 2016, 2015 and 2014, respectively. The tax provision related to these net realized gains was $60, $135, and $8 respectively.
Securities with a carrying value of $294,806 and $282,897 were pledged at December 31, 2016 and 2015 to secure certain deposits and repurchase agreements, secure future funding needs, and for other purposes as permitted or required by law.
At year end 2016 and 2015, there were no holdings of securities of any one issuer, other than the U.S. Government and its sponsored entities, in an amount greater than 10% of shareholders’ equity.
Below is a summary of securities with unrealized losses as of year‑end 2016 and 2015 presented by length of time the securities have been in a continuous unrealized loss position.
| | | | | | | | | | | | | | | | | | | |
| | Less than 12 months | | 12 months or longer | | Total | |
December 31, 2016 | | | | | Unrealized | | | | | Unrealized | | | | | Unrealized | |
Description of securities | | Fair Value | | Losses | | Fair Value | | Losses | | Fair Value | | Losses | |
U. S. government agency | | $ | — | | $ | — | | $ | — | | $ | — | | $ | — | | $ | — | |
State and municipal | | | 95,822 | | | (2,848) | | | — | | | — | | | 95,822 | | | (2,848) | |
Mortgage-backed securities-residential (Government Sponsored Entity) | | | 335,668 | | | (4,629) | | | — | | | — | | | 335,668 | | | (4,629) | |
Collateralized mortgage obligations (Government Sponsored Entity) | | | 77,694 | | | (1,202) | | | 8,518 | | | (225) | | | 86,212 | | | (1,427) | |
Other securities | | | — | | | — | | | — | | | — | | | — | | | — | |
Total temporarily impaired | | $ | 509,184 | | $ | (8,679) | | $ | 8,518 | | $ | (225) | | $ | 517,702 | | $ | (8,904) | |
| | | | | | | | | | | | | | | | | | | |
| | Less than 12 months | | 12 months or longer | | Total | |
December 31, 2015 | | | | | Unrealized | | | | | Unrealized | | | | | Unrealized | |
Description of securities | | Fair Value | | Losses | | Fair Value | | Losses | | Fair Value | | Losses | |
U. S. government agency | | $ | — | | $ | — | | $ | — | | $ | — | | $ | — | | $ | — | |
State and municipal | | | 4,802 | | | (33) | | | 1,367 | | | (35) | | | 6,169 | | | (68) | |
Mortgage-backed securities-residential (Government Sponsored Entity) | | | 168,950 | | | (644) | | | — | | | — | | | 168,950 | | | (644) | |
Collateralized mortgage obligations (Government Sponsored Entity) | | | 53,324 | | | (591) | | | 52,061 | | | (1,247) | | | 105,385 | | | (1,838) | |
Other securities | | | — | | | — | | | — | | | — | | | — | | | — | |
Total temporarily impaired | | $ | 227,076 | | $ | (1,268) | | $ | 53,428 | | $ | (1,282) | | $ | 280,504 | | $ | (2,550) | |
Other‑Than‑Temporary‑Impairment
Management evaluates securities for OTTI at least on a quarterly basis, and more frequently when economic or market conditions warrant such an evaluation. The investment securities portfolio is evaluated for OTTI by segregating the portfolio into two general segments and applying the appropriate OTTI model. Investment securities are generally evaluated for OTTI under ASC 320.
In determining OTTI under ASC 320, management considers many factors, including: (1) the length of time and the extent to which the fair value has been less than cost, (2) the financial condition and near‑term prospects of the issuer, (3) whether the market decline was affected by macroeconomic conditions, and (4) whether the entity has the intent to sell the debt security or more likely than not will be required to sell the debt security before its anticipated recovery. The
assessment of whether an other‑than‑temporary decline exists involves a high degree of subjectivity and judgment and is based on the information available to management at a point in time.
When OTTI occurs, the amount of the OTTI recognized in earnings depends on whether the Company intends to sell the security or it is more likely than not it will be required to sell the security before recovery of its amortized cost basis, less any current period credit loss. If an entity intends to sell or it is more likely than not it will be required to sell the security before recovery of its amortized cost basis, less any current period credit loss, the OTTI shall be recognized in earnings equal to the entire difference between the investment’s amortized cost basis and its fair value at the balance sheet date. If an entity does not intend to sell the security and it is not more likely than not that the entity will be required to sell the security before recovery of its amortized cost basis less any current period loss, the OTTI shall be separated into the amount representing the credit loss and the amount related to all other factors. The amount of the total OTTI related to the credit loss is determined based on the present value of cash flows expected to be collected and is recognized in earnings. The amount of the total OTTI related to other factors is recognized in other comprehensive income, net of applicable taxes. The previous amortized cost basis less the OTTI recognized in earnings becomes the new amortized cost basis of the investment.
As of December 31, 2016, the Company’s security portfolio consisted of 969 securities, 247 of which were in an unrealized loss position. Unrealized losses on state and municipal securities of $2,848 have not been recognized into income because management has the ability to hold for a period of time sufficient to allow for any anticipated recovery in fair value and it is unlikely that management will be required to sell the securities before their anticipated recovery. The decline in value is primarily attributable to changes in interest rates. The fair value of these debt securities is expected to recover as the securities approach their maturity date.
At December 31, 2016, all of the mortgage‑backed securities held by the Company were issued by U.S. government‑sponsored entities and agencies, primarily Fannie Mae and Freddie Mac, institutions which the government has affirmed its commitment to support. Because the decline in fair value of approximately $4,629 is attributable to changes in interest rates and illiquidity, and not credit quality, and because the Company does not have the intent to sell these mortgage‑backed securities and it is unlikely that it will be required to sell the securities before their anticipated recovery, the Company does not consider these securities to be other‑than‑temporarily impaired at December 31, 2016.
The Company’s collateralized mortgage obligation securities portfolio includes agency collateralized mortgage obligations which were issued by U.S. government-sponsored entities and agencies. The government has affirmed its commitment to support. These securities with an unrealized loss had a market value of $86,212 and unrealized losses of approximately $1,427 at December 31, 2016. The Company monitors to ensure it has adequate credit support and as of December 31, 2016, the Company believes there is no OTTI and does not have the intent to sell these securities and it is unlikely that it will be required to sell the securities before their anticipated recovery. All securities are investment grade.
NOTE 5 — LOANS AND ALLOWANCE FOR LOAN LOSSES
Loans were as follows:
| | | | | | | |
| | December 31, | | December 31, | |
| | 2016 | | 2015 | |
Commercial | | | | | | | |
Commercial and industrial | | $ | 461,092 | | $ | 380,960 | |
Agricultural | | | 73,467 | | | 64,704 | |
Commercial Real Estate | | | | | | | |
Farm | | | 111,807 | | | 97,916 | |
Hotel | | | 91,213 | | | 72,193 | |
Construction and development | | | 102,598 | | | 77,394 | |
Other | | | 857,078 | | | 678,381 | |
Residential | | | | | | | |
1-4 family | | | 608,366 | | | 438,808 | |
Home equity | | | 284,147 | | | 288,265 | |
Consumer | | | | | | | |
Direct | | | 61,574 | | | 56,312 | |
Indirect | | | 331 | | | 459 | |
Total loans | | | 2,651,673 | | | 2,155,392 | |
Allowance for loan losses | | | (22,499) | | | (22,020) | |
Net loans | | $ | 2,629,174 | | $ | 2,133,372 | |
Financing receivables purchased during the years ended December 31, 2016 and 2015 by portfolio class are as follows. These loans are included in the above table and all other tables below in the recorded investment amount. No allowance for loan losses is provided for these loans at December 31, 2016 and 2015.
| | | | | | |
| | As of December 31, | | As of December 31, |
| | 2016 | | 2015 |
Commercial and industrial | | $ | 13,875 | | $ | 9,406 |
Agricultural | | | 872 | | | — |
Construction and development | | | 16,634 | | | 3,666 |
Farm real estate | | | 389 | | | — |
Hotel | | | 2,983 | | | — |
Other real estate | | | 164,505 | | | 81,831 |
1-4 family | | | 206,044 | | | 46,967 |
Home equity | | | 14,342 | | | 19,076 |
Direct | | | 2,517 | | | 2,818 |
| | $ | 422,161 | | $ | 163,764 |
The remaining discount on the above loans was $7,313 and $2,198 at December 31, 2016 and 2015 respectively.
The Company purchased some credit impaired (PCI) loans in 2014 related to the MBT acquisition. These loans had a net balance of under $1,000 so additional disclosures were not made due to their immateriality. There were no loans classified as purchased credit impaired from 2015 purchases. The Company purchased some PCI loans in 2016 related to the Cheviot acquisition. These loans had a contractual balance of $16,175 with a fair value of $11,560.
The following tables present the activity in the allowance for loan losses by portfolio segment for the years ending December 31, 2016, 2015, and 2014:
| | | | | | | | | | | | | | | | |
| | | | | Commercial | | | | | | | | | | |
2016 | | Commercial | | Real Estate | | Residential | | Consumer | | Total | |
Allowance for loan losses | | | | | | | | | | | | | | | | |
Balance, January 1 | | $ | 6,511 | | $ | 10,702 | | $ | 3,859 | | $ | 948 | | $ | 22,020 | |
Provision charged to expense | | | 3,166 | | | (3,540) | | | 1,318 | | | 761 | | | 1,705 | |
Losses charged off | | | (682) | | | (663) | | | (1,345) | | | (3,725) | | | (6,415) | |
Recoveries | | | 659 | | | 1,207 | | | 415 | | | 2,908 | | | 5,189 | |
Balance, December 31 | | $ | 9,654 | | $ | 7,706 | | $ | 4,247 | | $ | 892 | | $ | 22,499 | |
| | | | | | | | | | | | | | | | |
| | | | | Commercial | | | | | | | | | | |
2015 | | Commercial | | Real Estate | | Residential | | Consumer | | Total | |
Allowance for loan losses | | | | | | | | | | | | | | | | |
Balance, January 1 | | $ | 2,977 | | $ | 15,605 | | $ | 3,501 | | $ | 1,167 | | $ | 23,250 | |
Provision charged to expense | | | 4,010 | | | (6,118) | | | 2,115 | | | 1,618 | | | 1,625 | |
Losses charged off | | | (978) | | | (727) | | | (2,094) | | | (3,593) | | | (7,392) | |
Recoveries | | | 502 | | | 1,942 | | | 337 | | | 1,756 | | | 4,537 | |
Balance, December 31 | | $ | 6,511 | | $ | 10,702 | | $ | 3,859 | | $ | 948 | | $ | 22,020 | |
| | | | | | | | | | | | | | | | |
| | | | | Commercial | | | | | | | | | | |
2014 | | Commercial | | Real Estate | | Residential | | Consumer | | Total | |
Allowance for loan losses | | | | | | | | | | | | | | | | |
Balance, January 1 | | $ | 3,291 | | $ | 20,210 | | $ | 3,409 | | $ | 699 | | $ | 27,609 | |
Provision charged to expense | | | (1,204) | | | (1,284) | | | 1,977 | | | 2,011 | | | 1,500 | |
Losses charged off | | | (241) | | | (5,583) | | | (2,295) | | | (2,899) | | | (11,018) | |
Recoveries | | | 1,131 | | | 2,262 | | | 410 | | | 1,356 | | | 5,159 | |
Balance, December 31 | | $ | 2,977 | | $ | 15,605 | | $ | 3,501 | | $ | 1,167 | | $ | 23,250 | |
The following table presents the balance in the allowance for loan losses and the recorded investment by portfolio segment and based on impairment method as of December 31, 2016 and 2015:
| | | | | | | | | | | | | | | | |
| | | | | Commercial | | | | | | | | | | |
December 31, 2016 | | Commercial | | Real Estate | | Residential | | Consumer | | Total | |
Allowance for loan losses | | | | | | | | | | | | | | | | |
Ending Balance individually evaluated for impairment | | $ | 898 | | $ | 755 | | $ | 147 | | $ | — | | $ | 1,800 | |
Ending Balance collectively evaluated for impairment | | | 8,756 | | | 6,951 | | | 4,100 | | | 892 | | | 20,699 | |
Ending Balance acquired with deteriorated credit quality | | | — | | | — | | | — | | | — | | | — | |
Total ending allowance balance | | $ | 9,654 | | $ | 7,706 | | $ | 4,247 | | $ | 892 | | $ | 22,499 | |
Loans | | | | | | | | | | | | | | | | |
Ending Balance individually evaluated for impairment | | $ | 2,705 | | $ | 7,904 | | $ | 10,458 | | $ | 130 | | $ | 21,197 | |
Ending Balance collectively evaluated for impairment | | | 531,854 | | | 1,147,536 | | | 880,357 | | | 61,775 | | | 2,621,522 | |
Ending Balance acquired with deteriorated credit quality | | | — | | | 7,256 | | | 1,698 | | | — | | | 8,954 | |
Total ending loan balance excludes $7,342 of accrued interest | | $ | 534,559 | | $ | 1,162,696 | | $ | 892,513 | | $ | 61,905 | | $ | 2,651,673 | |
| | | | | | | | | | | | | | | | |
| | | | | Commercial | | | | | | | | | | |
December 31, 2015 | | Commercial | | Real Estate | | Residential | | Consumer | | Total | |
Allowance for loan losses | | | | | | | | | | | | | | | | |
Ending Balance individually evaluated for impairment | | $ | 92 | | $ | 1,166 | | $ | 171 | | $ | — | | $ | 1,429 | |
Ending Balance collectively evaluated for impairment | | | 6,419 | | | 9,536 | | | 3,688 | | | 948 | | | 20,591 | |
Total ending allowance balance | | $ | 6,511 | | $ | 10,702 | | $ | 3,859 | | $ | 948 | | $ | 22,020 | |
Loans | | | | | | | | | | | | | | | | |
Ending Balance individually evaluated for impairment | | $ | 812 | | $ | 8,909 | | $ | 9,155 | | $ | 113 | | $ | 18,989 | |
Ending Balance collectively evaluated for impairment | | | 444,852 | | | 916,975 | | | 717,918 | | | 56,658 | | | 2,136,403 | |
Total ending loan balance excludes $5,878 of accrued interest | | $ | 445,664 | | $ | 925,884 | | $ | 727,073 | | $ | 56,771 | | $ | 2,155,392 | |
The allowance for loans collectively evaluated for impairment consists of reserves on groups of similar loans based on historical loss experience adjusted for other factors, as well as reserves on certain loans that are classified but determined not to be impaired based on an analysis which incorporates probability of default with a loss given default scenario. The reserves on these loans totaled $2,697 at December 31, 2016 and $1,583 at December 31, 2015.
Nonperforming loans were as follows:
| | | | | | | |
December 31 | | 2016 | | 2015 | |
Loans past due 90 days or more still on accrual | | $ | 2,135 | | $ | — | |
Troubled debt restructurings (accruing) | | | 3,270 | | | 3,196 | |
Non-accrual loans | | | 15,808 | | | 12,843 | |
Total | | $ | 21,213 | | $ | 16,039 | |
Nonperforming loans include both smaller balance homogeneous loans that are collectively evaluated for impairment and individually classified impaired loans.
The following tables present loans individually evaluated for impairment by class of loans as of December 31, 2016, 2015, and 2014. Performing troubled debt restructurings at December 31, 2016, 2015, and 2014, totaling $1,925, $2,760 and $7,499 were excluded as allowed by ASC 310‑40.
| | | | | | | | | | | | | | | | |
| | | | | | | | Allowance | | | | | | | |
| | Unpaid | | | | | for Loan | | Interest | | Cash Basis | |
| | Principal | | Recorded | | Losses | | Income | | Interest | |
December 31, 2016 | | Balance | | Investment | | Allocated | | Recognized | | Recognized | |
With an allowance recorded | | | | | | | | | | | | | | | | |
Commercial | | | | | | | | | | | | | | | | |
Commercial and industrial | | $ | 719 | | $ | 689 | | $ | 429 | | $ | — | | $ | — | |
Agricultural | | | 1,441 | | | 1,441 | | | 469 | | | — | | | — | |
Commercial Real Estate | | | | | | | | | | | | | | | | |
Farm | | | 1,106 | | | 1,105 | | | 360 | | | — | | | — | |
Hotel | | | — | | | — | | | — | | | — | | | — | |
Construction and development | | | — | | | — | | | — | | | — | | | — | |
Other | | | 1,900 | | | 1,755 | | | 395 | | | — | | | — | |
Residential | | | | | | | | | | | | | | | | |
1-4 Family | | | 1,091 | | | 1,046 | | | 146 | | | — | | | — | |
Home Equity | | | 15 | | | 105 | | | 1 | | | — | | | — | |
Consumer | | | | | | | | | | | | | | | | |
Direct | | | — | | | — | | | — | | | — | | | — | |
Indirect | | | — | | | — | | | — | | | — | | | — | |
Subtotal — impaired with allowance recorded | | | 6,272 | | | 6,141 | | | 1,800 | | | — | | | — | |
With no related allowance recorded | | | | | | | | | | | | | | | | |
Commercial | | | | | | | | | | | | | | | | |
Commercial and industrial | | $ | 1,028 | | $ | 322 | | $ | — | | $ | 53 | | $ | 53 | |
Agricultural | | | 254 | | | 253 | | | — | | | — | | | — | |
Commercial Real Estate | | | | | | | | | | | | | | | | |
Farm | | | 506 | | | 241 | | | — | | | — | | | — | |
Hotel | | | 64 | | | 64 | | | — | | | — | | | — | |
Construction and development | | | 239 | | | 162 | | | — | | | — | | | — | |
Other | | | 3,558 | | | 2,652 | | | — | | | 200 | | | 200 | |
Residential | | | | | | | | | | | | | | | | |
1-4 Family | | | 9,215 | | | 7,432 | | | — | | | 53 | | | 53 | |
Home Equity | | | 2,233 | | | 1,875 | | | — | | | 47 | | | 47 | |
Consumer | | | | | | | | | | | | | | | | |
Direct | | | 139 | | | 130 | | | — | | | 12 | | | 12 | |
Indirect | | | — | | | — | | | — | | | — | | | — | |
Subtotal — impaired with no allowance recorded | | | 17,236 | | | 13,131 | | | — | | | 365 | | | 365 | |
Total impaired loans | | $ | 23,508 | | $ | 19,272 | | $ | 1,800 | | $ | 365 | | $ | 365 | |
| | | | | | | | | | | | | | | | |
| | | | | | | | Allowance | | | | | | | |
| | Unpaid | | | | | for Loan | | Interest | | Cash Basis | |
| | Principal | | Recorded | | Losses | | Income | | Interest | |
December 31, 2015 | | Balance | | Investment | | Allocated | | Recognized | | Recognized | |
With an allowance recorded | | | | | | | | | | | | | | | | |
Commercial | | | | | | | | | | | | | | | | |
Commercial and industrial | | $ | 150 | | $ | 150 | | $ | 92 | | $ | — | | $ | — | |
Agricultural | | | — | | | — | | | — | | | — | | | — | |
Commercial Real Estate | | | | | | | | | | | | | | | | |
Farm | | | — | | | — | | | — | | | — | | | — | |
Hotel | | | — | | | — | | | — | | | — | | | — | |
Construction and development | | | — | | | — | | | — | | | — | | | — | |
Other | | | 2,480 | | | 2,363 | | | 1,166 | | | — | | | — | |
Residential | | | | | | | | | | | | | | | | |
1-4 Family | | | 1,357 | | | 1,309 | | | 167 | | | — | | | — | |
Home Equity | | | 159 | | | 159 | | | 4 | | | — | | | — | |
Consumer | | | | | | | | | | | | | | | | |
Direct | | | — | | | — | | | — | | | — | | | — | |
Indirect | | | — | | | — | | | — | | | — | | | — | |
Subtotal — impaired with allowance recorded | | | 4,146 | | | 3,981 | | | 1,429 | | | — | | | — | |
With no related allowance recorded | | | | | | | | | | | | | | | | |
Commercial | | | | | | | | | | | | | | | | |
Commercial and industrial | | $ | 676 | | $ | 655 | | $ | — | | $ | 34 | | $ | 34 | |
Agricultural | | | 7 | | | 7 | | | — | | | — | | | — | |
Commercial Real Estate | | | | | | | | | | | | | | | | |
Farm | | | 496 | | | 309 | | | — | | | 12 | | | 12 | |
Hotel | | | — | | | — | | | — | | | — | | | — | |
Construction and development | | | 189 | | | 186 | | | — | | | 47 | | | 47 | |
Other | | | 4,429 | | | 3,291 | | | — | | | 160 | | | 160 | |
Residential | | | | | | | | | | | | | | | | |
1-4 Family | | | 6,718 | | | 5,391 | | | — | | | 49 | | | 49 | |
Home Equity | | | 2,589 | | | 2,296 | | | — | | | 17 | | | 17 | |
Consumer | | | | | | | | | | | | | | | | |
Direct | | | 126 | | | 113 | | | — | | | 18 | | | 18 | |
Indirect | | | — | | | — | | | — | | | 5 | | | 5 | |
Subtotal — impaired with no allowance recorded | | | 15,230 | | | 12,248 | | | — | | | 342 | | | 342 | |
Total impaired loans | | $ | 19,376 | | $ | 16,229 | | $ | 1,429 | | $ | 342 | | $ | 342 | |
| | | | | | | | | | | | | | | | |
| | | | | | | | Allowance | | | | | | | |
| | Unpaid | | | | | for Loan | | Interest | | Cash Basis | |
| | Principal | | Recorded | | Losses | | Income | | Interest | |
December 31, 2014 | | Balance | | Investment | | Allocated | | Recognized | | Recognized | |
With an allowance recorded | | | | | | | | | | | | | | | | |
Commercial | | | | | | | | | | | | | | | | |
Commercial and industrial | | $ | 82 | | $ | 64 | | $ | 12 | | $ | — | | $ | — | |
Agricultural | | | 397 | | | 150 | | | 150 | | | — | | | — | |
Commercial Real Estate | | | | | | | | | | | | | | | | |
Farm | | | 76 | | | 76 | | | 21 | | | — | | | — | |
Hotel | | | — | | | — | | | — | | | — | | | — | |
Construction and development | | | — | | | — | | | — | | | — | | | — | |
Other | | | 979 | | | 889 | | | 684 | | | — | | | — | |
Residential | | | | | | | | | | | | | | | | |
1-4 Family | | | 1,543 | | | 1,478 | | | 178 | | | — | | | — | |
Home Equity | | | 167 | | | 167 | | | 5 | | | — | | | — | |
Consumer | | | | | | | | | | | | | | | | |
Direct | | | — | | | — | | | — | | | — | | | — | |
Indirect | | | — | | | — | | | — | | | — | | | — | |
Subtotal — impaired with allowance recorded | | | 3,244 | | | 2,824 | | | 1,050 | | | — | | | — | |
With no related allowance recorded | | | | | | | | | | | | | | | | |
Commercial | | | | | | | | | | | | | | | | |
Commercial and industrial | | $ | 761 | | $ | 491 | | $ | — | | $ | 10 | | $ | 10 | |
Agricultural | �� | | — | | | — | | | — | | | — | | | — | |
Commercial Real Estate | | | | | | | | | | | | | | | | |
Farm | | | 864 | | | 616 | | | — | | | — | | | — | |
Hotel | | | 11,423 | | | 11,377 | | | — | | | — | | | — | |
Construction and development | | | 84 | | | 78 | | | — | | | — | | | — | |
Other | | | 5,848 | | | 4,186 | | | — | | | 94 | | | 94 | |
Residential | | | | | | | | | | | | | | | | |
1-4 Family | | | 7,325 | | | 6,400 | | | — | | | 28 | | | 28 | |
Home Equity | | | 2,847 | | | 2,618 | | | — | | | 15 | | | 15 | |
Consumer | | | | | | | | | | | | | | | | |
Direct | | | 238 | | | 213 | | | — | | | 17 | | | 17 | |
Indirect | | | 7 | | | 7 | | | — | | | — | | | — | |
Subtotal — impaired with no allowance recorded | | | 29,397 | | | 25,986 | | | — | | | 164 | | | 164 | |
Total impaired loans | | $ | 32,641 | | $ | 28,810 | | $ | 1,050 | | $ | 164 | | $ | 164 | |
The following table presents the average recorded investment of impaired loans in 2016, 2015, and 2014.
| | | | | | | | | | |
| | | | | | | | | | |
| | | | | | | |
| | | | | | | |
| | 2016 | | 2015 | | 2014 | |
Commercial | | | | | | | | | | |
Commercial and industrial | | $ | 805 | | $ | 1,165 | | $ | 308 | |
Agricultural | | | 998 | | | 31 | | | 195 | |
Commercial Real Estate | | | | | | | | | | |
Farm | | | 933 | | | 401 | | | 875 | |
Hotel | | | 26 | | | 2,851 | | | 7,255 | |
Construction and development | | | 156 | | | 53 | | | 270 | |
Other | | | 4,800 | | | 5,734 | | | 9,259 | |
Residential | | | | | | | | | | |
1-4 family | | | 7,642 | | | 7,362 | | | 8,062 | |
Home equity | | | 2,212 | | | 2,268 | | | 2,535 | |
Consumer | | | | | | | | | | |
Direct | | | 123 | | | 130 | | | 264 | |
Indirect | | | — | | | 1 | | | 6 | |
Total loans | | $ | 17,695 | | $ | 19,996 | | $ | 29,029 | |
The following table presents the recorded investment in non‑accrual and loans past due over 90 days still on accrual by class of loans as of December 31, 2016 and 2015.
| | | | | | | | | | | | | |
| | | | | | | | Past due over | |
| | | | | | | | 90 days and | |
| | Non-accrual | still accruing | |
| | December 31, 2016 | | December 31, 2015 | | December 31, 2016 | | December 31, 2015 | |
| | | | | | | | | |
Commercial | | | | | | | | | | | | | |
Commercial and industrial | | $ | 882 | | $ | 654 | | $ | — | | $ | — | |
Agricultural | | | 1,631 | | | 7 | | | — | | | — | |
Commercial Real Estate | | | | | | | | | | | | | |
Farm | | | 1,347 | | | 308 | | | — | | | — | |
Hotel | | | 64 | | | — | | | — | | | — | |
Construction and development | | | 122 | | | 144 | | | 2,135 | | | — | |
Other | | | 3,219 | | | 4,791 | | | — | | | — | |
Residential | | | | | | | | | | | | | |
1-4 Family | | | 7,163 | | | 5,211 | | | — | | | — | |
Home Equity | | | 1,273 | | | 1,639 | | | — | | | — | |
Consumer | | | | | | | | | | | | | |
Direct | | | 107 | | | 89 | | | — | | | — | |
Indirect | | | — | | | — | | | — | | | — | |
Total | | $ | 15,808 | | $ | 12,843 | | $ | 2,135 | | $ | — | |
The following table presents the aging of the recorded investment in past due loans as of December 31, 2016 and 2015 by class of loans:
| | | | | | | | | | | | | | | | | | | |
| | | | | | | | | | | Greater than | | | | | | | |
| | Total | | 30-59 Days | | 60-89 Days | | 90 Days | | Total | | Loans Not | |
December 31, 2016 | | Loans | | Past Due | | Past Due | | Past Due | | Past Due | | Past Due | |
Commercial | | | | | | | | | | | | | | | | | | | |
Commercial and industrial | | $ | 461,092 | | $ | — | | $ | — | | $ | 176 | | $ | 176 | | $ | 460,916 | |
Agricultural | | | 73,467 | | | 215 | | | — | | | 1,606 | | | 1,821 | | | 71,646 | |
Commercial Real Estate | | | | | | | | | | | | | | | | | | | |
Farm | | | 111,807 | | | 81 | | | — | | | 1,243 | | | 1,324 | | | 110,483 | |
Hotel | | | 91,213 | | | — | | | — | | | 63 | | | 63 | | | 91,150 | |
Construction and development | | | 102,598 | | | 1,416 | | | — | | | 2,223 | | | 3,639 | | | 98,959 | |
Other | | | 857,078 | | | 1,268 | | | 90 | | | 1,812 | | | 3,170 | | | 853,908 | |
Residential | | | | | | | | | | | | | | | | | | | |
1-4 Family | | | 608,366 | | | 4,884 | | | 2,002 | | | 3,262 | | | 10,148 | | | 598,218 | |
Home Equity | | | 284,147 | | | 830 | | | 137 | | | 914 | | | 1,881 | | | 282,266 | |
Consumer | | | | | | | | | | | | | | | | | | | |
Direct | | | 61,574 | | | 936 | | | — | | | 66 | | | 1,002 | | | 60,572 | |
Indirect | | | 331 | | | 10 | | | — | | | — | | | 10 | | | 321 | |
Total — excludes $7,342 of accrued interest | | $ | 2,651,673 | | $ | 9,640 | | $ | 2,229 | | $ | 11,365 | | $ | 23,234 | | $ | 2,628,439 | |
| | | | | | | | | | | | | | | | | | | |
| | | | | | | | | | | Greater than | | | | | | | |
| | Total | | 30-59 Days | | 60-89 Days | | 90 Days | | Total | | Loans Not | |
December 31, 2015 | | Loans | | Past Due | | Past Due | | Past Due | | Past Due | | Past Due | |
Commercial | | | | | | | | | | | | | | | | | | | |
Commercial and industrial | | $ | 380,960 | | $ | 93 | | $ | — | | $ | 249 | | $ | 342 | | $ | 380,618 | |
Agricultural | | | 64,704 | | | 20 | | | — | | | 7 | | | 27 | | | 64,677 | |
Commercial Real Estate | | | | | | | | | | | | | | | | | | | |
Farm | | | 97,916 | | | — | | | — | | | 119 | | | 119 | | | 97,797 | |
Hotel | | | 72,193 | | | — | | | 13 | | | — | | | 13 | | | 72,180 | |
Construction and development | | | 77,394 | | | — | | | 67 | | | 144 | | | 211 | | | 77,183 | |
Other | | | 678,381 | | | 873 | | | 102 | | | 2,601 | | | 3,576 | | | 674,805 | |
Residential | | | | | | | | | | | | | | | | | | | |
1-4 Family | | | 438,808 | | | 3,726 | | | 1,904 | | | 2,771 | | | 8,401 | | | 430,407 | |
Home Equity | | | 288,265 | | | 410 | | | 446 | | | 1,133 | | | 1,989 | | | 286,276 | |
Consumer | | | | | | | | | | | | | | | | | | | |
Direct | | | 56,312 | | | 40 | | | 65 | | | 68 | | | 173 | | | 56,139 | |
Indirect | | | 459 | | | 2 | | | — | | | — | | | 2 | | | 457 | |
Total — excludes $5,878 of accrued interest | | $ | 2,155,392 | | $ | 5,164 | | $ | 2,597 | | $ | 7,092 | | $ | 14,853 | | $ | 2,140,539 | |
Troubled Debt Restructurings
During the years ending December 31, 2016 and 2015, the terms of certain loans were modified as troubled debt restructurings. The modification of the terms of such loans included one or a combination of the following: a reduction of the stated interest rate of the loan, an extension of the maturity date at a stated rate of interest lower than the current market rate for new debt with similar risk, or a partial forgiveness of the principle balance.
Modifications involving a reduction of the stated interest rate of the loan were for periods ranging from 60 months to 30 years. Modifications involving an extension of the maturity date were for periods ranging from 6 months to 40 years.
The total of troubled debt restructurings at December 31, 2016 and 2015 was $6,474 and $8,389 respectively. The Company has allocated $508 and $863 of specific reserves to customers whose loan terms have been modified in troubled
debt restructurings as of December 31, 2016 and 2015. The Company has committed to lend additional amounts totaling $0 to customers with outstanding loans that are classified as troubled debt restructuring at December 31, 2016 and 2015.
The following tables present loans by class modified as troubled debt restructurings that occurred during the year ending December 31, 2016, 2015 and 2014:
| | | | | | | | | |
| | | | Pre-Modification | | Post-Modification | |
| | | | Outstanding Recorded | | Outstanding Recorded | |
For the year ended December 31, 2016 | | Number of Loans | | Investment | | Investment | |
Commercial | | | | | | | | | |
Agricultural | | 1 | | $ | 89 | | $ | 89 | |
Commercial Real Estate | | | | | | | | | |
Other | | 2 | | | 298 | | | 298 | |
Residential | | | | | | | | | |
1-4 Family | | 1 | | | 124 | | | 124 | |
Home Equity | | 4 | | | 76 | | | 76 | |
Total | | 8 | | $ | 587 | | $ | 587 | |
| | | | | | | | | |
| | | | Pre-Modification | | Post-Modification | |
| | | | Outstanding Recorded | | Outstanding Recorded | |
For the year ended December 31, 2015 | | Number of Loans | | Investment | | Investment | |
Commercial | | | | | | | | | |
Commercial and industrial | | 3 | | $ | 216 | | $ | 216 | |
Commercial real estate | | | | | | | | | |
Other | | 9 | | | 1,664 | | | 1,403 | |
Residential | | | | | | | | | |
1-4 Family | | 3 | | | 215 | | | 215 | |
Home Equity | | 2 | | | 44 | | | 44 | |
Total | | 17 | | $ | 2,139 | | $ | 1,878 | |
| | | | | | | | | |
| | | | Pre-Modification | | Post-Modification | |
| | | | Outstanding Recorded | | Outstanding Recorded | |
For the year ended December 31, 2014 | | Number of Loans | | Investment | | Investment | |
Commercial real estate | | | | | | | | | |
Hotel | | 2 | | $ | 15,362 | | $ | 11,550 | |
Other | | 2 | | | 1,015 | | | 1,015 | |
Residential | | | | | | | | | |
1-4 Family | | 5 | | | 628 | | | 628 | |
Home Equity | | 1 | | | 34 | | | 34 | |
Consumer | | | | | | | | | |
Direct | | 1 | | | 26 | | | 26 | |
Total | | 11 | | $ | 17,065 | | $ | 13,253 | |
The troubled debt restructurings described above increased the allowance for loan losses by $0, $50 and $130 and resulted in charge offs of $0, $261 and $3,849 during the years ending December 31, 2016, 2015 and 2014 respectively.
The following tables present loans by class modified as troubled debt restructurings for which there was a payment default within twelve months following the modification during the years ending December 31, 2016, 2015 and 2014:
| | | | | | |
For the year ended December 31, 2016 | | Number of Loans | | Recorded Investment | |
Commercial real estate | | | | | | |
Other | | 2 | | $ | 149 | |
Residential | | | | | | |
1-4 Family | | 2 | | | 250 | |
Home equity | | 1 | | | 10 | |
Total | | 5 | | $ | 409 | |
| | | | | | |
For the year ended December 31, 2015 | | Number of Loans | | Recorded Investment | |
Commercial real estate | | | | | | |
Other | | 3 | | $ | 863 | |
Residential | | | | | | |
1-4 Family | | 2 | | | 232 | |
Home Equity | | 2 | | | 88 | |
Total | | 7 | | $ | 1,183 | |
| | | | | | |
For the year ended December 31, 2014 | | Number of Loans | | Recorded Investment | |
Commercial real estate | | | | | | |
Other | | 1 | | $ | 1,431 | |
Residential | | | | | | |
1-4 Family | | 2 | | | 102 | |
Home Equity | | 1 | | | 14 | |
Total | | 4 | | $ | 1,547 | |
A loan is considered to be in payment default once it is 90 days contractually past due under the modified terms. The troubled debt restructurings that subsequently defaulted described above did not result in any increase in the allowance for loan losses or charge offs during the during the years ending December 31, 2016, 2015, and 2014 respectively.
In order to determine whether a borrower is experiencing financial difficulty, an evaluation is performed of the probability that the borrower will be in payment default on any of its debt in the foreseeable future without the modification. This evaluation is performed under the company’s internal underwriting policy.
The terms of certain other loans were modified during years ending December 31, 2016 and 2015 that did not meet the definition of a troubled debt restructuring. These loans have a total recorded investment as of December 31, 2016 and 2015 of $12,484 and $5,973. The modification of these loans involved either a modification of the terms of a loan to borrowers who were not experiencing financial difficulties or a delay in a payment that was considered to be insignificant.
Credit Quality Indicators:
The Company categorizes loans into risk categories based on relevant information about the ability of the borrower to service their debt such as: current financial information, historical payment experience, credit documentation, public information, and current economic trends, among other factors. The Company analyzes commercial and commercial real estate loans individually by classifying the loans as to credit risk. This analysis includes the top 75 credit relationships on an annual basis. The Company uses the following definitions for risk ratings:
Special Mention — Loans classified as special mention have above average risk that requires management’s ongoing attention. The borrower may have demonstrated inability to generate profits or to maintain net worth, chronic delinquency and /or a demonstrated lack of willingness or capacity to meet obligations.
Substandard — Loans classified as substandard are inadequately protected by the current net worth and paying capacity of the obligor or of the collateral pledged, if any. Loans so classified have a well‑defined weakness or weaknesses that jeopardize the liquidation of the debt. They are classified by the distinct possibility that the institution will sustain some loss if the deficiencies are not corrected.
Non‑accrual — Loans classified as non‑accrual are loans where the further accrual of interest is stopped because payment in full of principal and interest is not expected. In most cases, the principal and interest has been in default for a period of 90 days or more.
As of December 31, 2016 and 2015, and based on the most recent analysis performed, the risk category of loans by class of loans is as follows:
| | | | | | | | | | | | | |
| | | | | Special | | | | | | | |
December 31, 2016 | | Pass | | Mention | | Substandard | | Non-accrual | |
Commercial | | | | | | | | | | | | | |
Commercial and industrial | | $ | 415,064 | | $ | 3,347 | | $ | 5,297 | | $ | 827 | |
Agricultural | | | 61,637 | | | 2,283 | | | — | | | 1,441 | |
Commercial Real Estate | | | | | | | | | | | | | |
Farm | | | 89,297 | | | 2,209 | | | 694 | | | 1,340 | |
Hotel | | | 88,166 | | | — | | | 2,983 | | | 64 | |
Construction and development | | | 74,811 | | | 3,600 | | | 2,287 | | | 31 | |
Other | | | 752,063 | | | 9,087 | | | 7,365 | | | 2,141 | |
Total | | $ | 1,481,038 | | $ | 20,526 | | $ | 18,626 | | $ | 5,844 | |
| | | | | | | | | | | | | |
| | | | | Special | | | | | | | |
December 31, 2015 | | Pass | | Mention | | Substandard | | Non-accrual | |
Commercial | | | | | | | | | | | | | |
Commercial and industrial | | $ | 338,436 | | $ | 8,324 | | $ | 636 | | $ | 555 | |
Agricultural | | | 58,253 | | | — | | | — | | | — | |
Commercial Real Estate | | | | | | | | | | | | | |
Farm | | | 75,924 | | | 328 | | | 713 | | | 308 | |
Hotel | | | 72,193 | | | — | | | — | | | — | |
Construction and development | | | 60,246 | | | — | | | 2,499 | | | 113 | |
Other | | | 576,619 | | | 10,367 | | | 3,309 | | | 3,811 | |
Total | | $ | 1,181,671 | | $ | 19,019 | | $ | 7,157 | | $ | 4,787 | |
Loans not analyzed individually as part of the above described process are classified by delinquency. These loans are primarily smaller commercial (<$250), smaller commercial real estate (<$250), residential mortgage and consumer loans. All commercial, commercial real estate, or consumer loans fully or partially secured by 1-4 family residential real estate that are 60‑89 days past due will be classified as Watch. If loans are greater than 90 days past due or commercial or commercial real estate loans on non-accrual, they will be classified as Substandard. Consumer loans not secured by 1-4 family residential real estate that are 60‑119 days past due will be classified Substandard while loans greater than 119 days will be classified as Loss and charged off. As of December 31, 2016 and December 31, 2015, the grading of loans by category was as follows:
| | | | | | | | | | |
December 31, 2016 | | Performing | | Watch | | Substandard | |
Commercial | | | | | | | | | | |
Commercial and industrial | | $ | 36,502 | | $ | — | | $ | 55 | |
Agricultural | | | 7,916 | | | — | | | 190 | |
Commercial Real Estate | | | | | | | | | | |
Farm | | | 18,260 | | | — | | | 7 | |
Construction and development | | | 21,778 | | | — | | | 91 | |
Other | | | 85,254 | | | 90 | | | 1,078 | |
Total | | $ | 169,710 | | $ | 90 | | $ | 1,421 | |
| | | | | | | | | | |
December 31, 2015 | | Performing | | Watch | | Substandard | |
Commercial | | | | | | | | | | |
Commercial and industrial | | $ | 32,910 | | $ | — | | $ | 99 | |
Agricultural | | | 6,444 | | | — | | | 7 | |
Commercial Real Estate | | | | | | | | | | |
Construction and development | | | 14,438 | | | 67 | | | 31 | |
Farm | | | 20,643 | | | — | | | — | |
Other | | | 83,193 | | | 102 | | | 980 | |
Total | | $ | 157,628 | | $ | 169 | | $ | 1,117 | |
| | | | | | | | | | |
December 31, 2016 | | Performing | | Watch | | Substandard | |
Residential | | | | | | | | | | |
1-4 family | | $ | 603,102 | | $ | 2,002 | | $ | 3,262 | |
Home equity | | | 283,096 | | | 137 | | | 914 | |
Total | | $ | 886,198 | | $ | 2,139 | | $ | 4,176 | |
| | | | | | | | | | |
December 31, 2015 | | Performing | | Watch | | Substandard | |
Residential | | | | | | | | | | |
1-4 family | | $ | 434,133 | | $ | 1,904 | | $ | 2,771 | |
Home equity | | | 286,686 | | | 446 | | | 1,133 | |
Total | | $ | 720,819 | | $ | 2,350 | | $ | 3,904 | |
| | | | | | | | | | |
December 31, 2016 | | Performing | | Substandard | | Loss | |
Consumer | | | | | | | | | | |
Direct | | $ | 61,508 | | $ | 4 | | $ | 62 | |
Indirect | | | 331 | | | — | | | — | |
Total | | $ | 61,839 | | $ | 4 | | $ | 62 | |
| | | | | | | | | | |
December 31, 2015 | | Performing | | Substandard | | Loss | |
Consumer | | | | | | | | | | |
Direct | | $ | 56,179 | | $ | 101 | | $ | 32 | |
Indirect | | | 459 | | | — | | | — | |
Total | | $ | 56,638 | | $ | 101 | | $ | 32 | |
The following table presents financing receivables purchased and/or sold during the year by portfolio segment:
| | | | | | | | | | | | | | | |
| | | | | Commercial | | | | | | | | | |
2016 | | Commercial | | Real Estate | | Residential | | Consumer | | Total |
Purchases | | $ | 14,241 | | $ | 138,896 | | $ | 201,397 | | $ | 809 | | $ | 355,343 |
Sales | | | | | | | | | 256,946 | | | | | | 256,946 |
| | | | | | | | | | | | | | | |
| | | | | | | | | | | | | | | |
| | | | | Commercial | | | | | | | | | |
2015 | | Commercial | | Real Estate | | Residential | | Consumer | | Total |
Purchases | | $ | 2,761 | | $ | 4,484 | | $ | 28,090 | | $ | 1,785 | | $ | 37,120 |
Sales | | | | | | | | | 243,230 | | | | | | 243,230 |
Purchased Credit Impaired Loans
The Company has purchased loans, for which there was, at acquisition, evidence of credit deterioration of credit quality since origination and it was probable, at acquisition, that all contractually required payments would not be collected. The carrying amount of these loans is as follows:
| | | | | |
| | 2016 | | | 2015 |
Commercial | $ | 10,817 | | $ | 240 |
1-4 Family | | 2,399 | | | 31 |
Outstanding Balance | $ | 13,216 | | $ | 271 |
| | | | | |
Carrying amount, net of allowance of $0 and $0 | $ | 8,954 | | $ | 212 |
For those purchased credit impaired loans (PCI) disclosed above, the Company did not increase the allowance for loan losses during 2016, 2015, and 2014. No allowances for loan losses were reversed in 2016, 2015, or 2014.
Purchased credit impaired loans purchased during the years ending December 31, 2016, 2015, and 2014 for which it was probable at acquisition that all contractually required payments would not be collected are as follows:
| | | | | | | |
| | 2016 | | | 2015 | | 2014 |
Contractually required payments receivable of | | | | | | | |
loans purchased during the year: | | | | | | | |
Commercial | $ | 12,907 | | $ | — | $ | 1,005 |
1-4 Family | | 3,268 | | | — | | 33 |
| $ | 16,175 | | $ | — | $ | 1,038 |
| | | | | | | |
Fair value of acquired loans at acquisition | $ | 11,560 | | $ | — | $ | 604 |
There were no PCI transfers from non-accretable to accretable yields during 2016, 2015, and 2014.
NOTE 6 — OTHER REAL ESTATE OWNED
Activity in the real estate owned assets, which are included in interest receivable and other assets in the consolidated balance sheets, was as follows:
| | | | | | | | | | |
| | 2016 | | 2015 | | 2014 | |
| | | | | | | | | | |
Beginning Balance | | $ | 1,959 | | $ | 2,688 | | $ | 4,120 | |
Transfer to other real estate owned | | | 1,965 | | | 1,475 | | | 2,585 | |
Sale — Out of other real estate owned | | | (3,607) | | | (2,166) | | | (3,597) | |
Acquisition | | | 1,668 | | | — | | | — | |
Write-down | | | (110) | | | (38) | | | (420) | |
Ending Balance | | $ | 1,875 | | $ | 1,959 | | $ | 2,688 | |
The value of the sale amount above is the carrying value of the property when it was sold.
Activity in the valuation account for other real estate was as follows:
| | | | | | | | | | |
| | 2016 | | 2015 | | 2014 | |
| | | | | | | | | | |
Beginning Balance — | | $ | (217) | | $ | (448) | | $ | (1,328) | |
Impairments during year | | | (110) | | | (38) | | | (420) | |
Recovery on impairments | | | — | | | — | | | — | |
Reductions | | | 91 | | | 269 | | | 1,300 | |
Ending Balance — | | $ | (236) | | $ | (217) | | $ | (448) | |
Net (gain)/ loss on OREO activity which is included in non‑interest income and expenses related to foreclosed assets included in other expenses in the consolidated statements of income, were as follows:
| | | | | | | | | | |
| | 2016 | | 2015 | | 2014 | |
Write-downs | | $ | 110 | | $ | 38 | | $ | 420 | |
Losses/(gains)on sales | | | (378) | | | (106) | | | (267) | |
Net loss/(gain) | | $ | (268) | | $ | (68) | | $ | 153 | |
Operating expenses | | $ | 154 | | $ | 203 | | $ | 150 | |
Foreclosed residential real estate properties included in Interest receivable and other assets on the Consolidated Balance Sheets totaled $1,443 and $915 at December 31, 2016 and December 31, 2015, respectively. Retail mortgage loans secured by residential real estate properties for which formal foreclosure proceedings are in process according to local requirements totaled $3,266 and $2,407 at December 31, 2016 and December 31, 2015, respectively.
NOTE 7 — FAIR VALUE
ASC 820 establishes a fair value hierarchy which requires an entity to maximize the use of observable inputs and minimize the use of unobservable inputs when measuring fair value. The standard describes three levels of inputs that may be used to measure fair value:
Level 1: Quoted prices (unadjusted) for identical assets or liabilities in active markets that the entity has the ability to access as of the measurement date.
Level 2: Significant other observable inputs other than Level 1 prices such as quoted prices for similar assets or liabilities; quoted prices in markets that are not active; or other inputs that are observable or can be corroborated by observable market data.
Level 3: Significant unobservable inputs that reflect a reporting entity’s own assumptions about the assumptions that market participants would use in pricing an asset or liability.
The fair values of securities available for sale are determined by obtaining quoted prices on nationally recognized securities exchanges (Level 1 inputs) or using market data utilizing pricing models, primarily Interactive Data Corporation (“IDC”), that vary based upon asset class and include available trade, bid, and other market information. Matrix pricing is used for most municipals, which is a mathematical technique widely used in the industry to value debt securities without relying exclusively on quoted prices for the specific securities but rather by relying on the securities’ relationship to other benchmark quoted securities. The grouping of securities is done according to insurer, credit support, state of issuance, and rating to incorporate additional spreads and municipal curves. For the general market municipals, the Thomson Municipal Market Data curve is used to determine the initial curve for determining the price, movement, and yield relationships with the municipal market (Level 2 inputs). Level 3 securities are largely comprised of small, local municipality issuances. Fair values are derived through consideration of funding type, maturity and other features of the issuance, and include reviewing financial statements, earnings forecasts, industry trends and the valuation of comparative issuers. In most cases, the book value of the security is used as the fair value as meaningful pricing data is not readily available. Twice a year, a sample of prices supplied by the pricing agent is validated by comparison to prices obtained from other third party sources.
The fair value of impaired loans with specific allocations of the allowance for loan losses is generally based on recent real estate appraisals or industry accepted valuation methods and excludes loans evaluated under the present value of cash flows. In a limited number of situations, the Company’s appraisal department is determining the value of appraisal. These appraisals may utilize a single valuation approach or a combination of approaches including comparable sales and the income approach. Adjustments are routinely made in the appraisal process by the loan officers to adjust for differences between the comparable sales and income data available. Such adjustments are typically significant and result in a Level 3 classification of the inputs for determining fair value. These adjustments typically range from 0% ‑ 50%. Impaired loans are evaluated quarterly for additional impairment and take into account changing market conditions, specific information in the market the property is located, and the overall economic climate as well as overall changes in the credit. The Company’s Appraisal Manager has the overall responsibility for all appraisals. The Company’s loan officer responsible for the loan, the special assets officer, as well as the senior officers of the Company review the adjustments made to the appraisal for market and disposal costs on the loan.
The fair value of servicing rights is based on a valuation model from a third party that calculates the present value of estimated net servicing income. The valuation model incorporates assumptions that market participants would use in estimating future net servicing income. The inputs used include estimates of prepayment speeds, discount rate, cost to service, contractual servicing fee income, late fees, and float income. The most significant assumption used to value mortgage servicing rights is prepayment rate. Prepayment rates are estimated based on published industry consensus prepayment rates. The most significant unobservable assumption is the discount rate. At December 31, 2016 the constant prepayment speed (PSA) used was 135 and the discount rate was 14.0%. At December 31, 2015 the constant prepayment speed (PSA) used was 155 and the discount rate was 10.0%. The Company is able to compare the valuation model inputs and results to widely available published industry data for reasonableness (Level 3 inputs). On a quarterly basis, loan servicing rights are evaluated for impairment based upon the fair value of the rights as compared to carrying amount. If the carrying amount of an individual tranche exceeds fair value, impairment is recorded on that tranche so that the servicing asset is carried at fair value. Fair value is determined at a tranche level, based on market prices for comparable mortgage servicing contracts, when available, or alternatively based on a valuation model that calculates the present value of estimated future net servicing income. The valuation model utilizes assumptions that market participants would use in estimating future net servicing income and that can be validated against available market data.
The fair value of other real estate owned is measured based on the value of the collateral securing those assets and is determined using several methods. The fair value of real estate is generally determined based on appraisals by qualified licensed (third party) appraisers. The appraisers typically determine the value of the real estate by utilizing an income or market valuation approach. If an appraisal is not available, the fair value may be determined by using a cash flow analysis. Appraisals for both collateral‑dependent impaired loans and other real estate owned are performed by certified general appraisers whose qualifications and licenses have been reviewed and verified by the Company. Once received, a member of the Appraisal Department reviews the assumptions and approaches utilized in the appraisal as well as the overall resulting fair value in comparison with independent data sources such as recent market data or industry‑wide
statistics. Fair values are reviewed on at least an annual basis. The Company normally applies an internal discount to the value of appraisals used in the fair value evaluation of OREO. The deductions take into account changing business factors and market conditions. These deductions typically range from 0% to 50%. As noted in the impaired loans discussion above, the Company’s Appraisal Manager has the overall responsibility for all appraisals. The Appraisal Manager reports to the Vice President of Credit Administration who reports to the Chief Credit Officer of the Company.
The fair value of mortgage banking derivatives are based on derivative valuation models using market data inputs as of the valuation date (Level 2). The mortgage banking derivative is classified as Interest receivable and other assets on the balance sheet.
The fair value of interest rate swaps are based on valuation models using observable market data as of the measurement date (Level 2). The fair value derivatives are classified as Interest receivable and other assets and Other liabilities on the balance sheet.
Assets and Liabilities Measured on a Recurring Basis
Assets and liabilities measured at fair value under ASC 820 on a recurring basis, including financial assets and liabilities for which the Company has elected the fair value option, are summarized below:
| | | | | | | | | | | | | |
| | | | | Fair Value Measurements at December 31, 2016 Using: | |
| | | | | Quoted Prices in | | Significant | | Significant | |
| | | | | Active Markets for | | Other Observable | | Unobservable | |
| | Carrying | | Identical Assets | | Inputs | | Inputs | |
(Dollars in thousands) | | Value | | (Level 1) | | (Level 2) | | (Level 3) | |
Financial Assets | | | | | | | | | | | | | |
Investment securities available-for-sale | | | | | | | | | | | | | |
U. S. government agency | | $ | 955 | | $ | — | | $ | 955 | | $ | — | |
States and municipal | | | 369,286 | | | — | | | 359,166 | | | 10,120 | |
Mortgage-backed securities — residential — Government Sponsored Entity | | | 446,630 | | | — | | | 446,630 | | | — | |
Collateralized mortgage obligations — Government Sponsored Entity | | | 179,401 | | | — | | | 179,401 | | | — | |
Equity securities | | | 4,670 | | | 4,670 | | | — | | | — | |
Other securities | | | 6,598 | | | — | | | — | | | 6,598 | |
Total investment securities available-for-sale | | $ | 1,007,540 | | $ | 4,670 | | $ | 986,152 | | $ | 16,718 | |
| | | | | | | | | | | | | |
Mortgage banking derivatives | | $ | 648 | | | — | | $ | 648 | | | — | |
| | | | | | | | | | | | | |
Interest rate swap asset | | $ | 3,003 | | | — | | $ | 3,003 | | | — | |
Interest rate swap liability | | $ | (3,003) | | | — | | $ | (3,003) | | | — | |
| | | | | | | | | | | | | |
| | | | | Fair Value Measurements at December 31, 2015 Using: | |
| | | | | Quoted Prices in | | Significant | | Significant | |
| | | | | Active Markets for | | Other Observable | | Unobservable | |
| | Carrying | | Identical Assets | | Inputs | | Inputs | |
(Dollars in thousands) | | Value | | (Level 1) | | (Level 2) | | (Level 3) | |
Financial Assets | | | | | | | | | | | | | |
Investment securities available-for-sale | | | | | | | | | | | | | |
U. S. government agency | | $ | 504 | | $ | — | | $ | 504 | | $ | — | |
States and municipal | | | 350,733 | | | — | | | 339,875 | | | 10,858 | |
Mortgage-backed securities — residential — Government Sponsored Entity | | | 334,080 | | | — | | | 334,080 | | | — | |
Collateralized mortgage obligations — Government Sponsored Entity | | | 228,749 | | | — | | | 228,749 | | | — | |
Equity securities | | | 4,689 | | | 4,689 | | | — | | | — | |
Other securities | | | 6,524 | | | — | | | — | | | 6,524 | |
Total investment securities available-for-sale | | $ | 925,279 | | $ | 4,689 | | $ | 903,208 | | $ | 17,382 | |
| | | | | | | | | | | | | |
Mortgage banking derivative | | $ | 700 | | | — | | $ | 700 | | | — | |
| | | | | | | | | | | | | |
Interest rate swap asset | | $ | 1,508 | | | — | | $ | 1,508 | | | — | |
Interest rate swap liability | | $ | (1,508) | | | — | | $ | (1,508) | | | — | |
There have been no transfers between Level 1 and 2 during the two years ending December 31, 2016 and 2015.
The tables below present a reconciliation and income statement classification of gains and losses for all assets measured at fair value on a recurring basis using significant unobservable inputs (Level 3) for the years ended December 31, 2016 and 2015:
| | | | | | | |
States and municipal | | 2016 | | 2015 | |
Beginning balance, January 1 | | $ | 10,858 | | $ | 12,810 | |
Total gains or losses (realized / unrealized) | | | | | | | |
Included in other comprehensive income | | | (1) | | | (36) | |
Settlements | | | (737) | | | (1,916) | |
Ending balance, December 31 | | $ | 10,120 | | $ | 10,858 | |
| | | | | | | |
Other securities | | 2016 | | 2015 | |
Beginning balance, January 1 | | $ | 6,524 | | $ | 2,503 | |
Total gains or losses (realized / unrealized) | | | | | | | |
Purchases | | | — | | | 4,000 | |
Included in other comprehensive income | | | 74 | | | 21 | |
Ending balance, December 31 | | $ | 6,598 | | $ | 6,524 | |
The Company’s state and municipal security valuations were supported by analysis prepared by an independent third party. Fair values are derived through consideration of funding type, maturity and other features of the issuance, and include reviewing financial statements, earnings forecasts, industry trends and the valuation of comparative issuers.
The Company’s other security valuation was supported by analysis prepared by an independent third party. Fair values are derived through consideration of funding type, maturity and other features of the issuance, and include reviewing financial statements, earnings forecasts, industry trends and the valuation of comparative issuers.
Assets and Liabilities Measured on a Non‑Recurring Basis
Assets and liabilities measured at fair value on a non‑recurring basis are summarized below:
| | | | | | | | | | | |
| | | | | Fair Value Measurements at December 31, 2016 Using: | |
| | | | | Quoted Prices in | | Significant | | Significant | |
| | | | | Active Markets for | | Other Observable | | Unobservable | |
| | December 31, | | Identical Assets | | Inputs | | Inputs | |
| | 2016 | | (Level 1) | | (Level 2) | | (Level 3) | |
Assets: | | | | | | | | | | | |
Impaired loans | | | | | | | | | | | |
Commercial and industrial | | $ | 260 | | | | | | $ | 260 | |
Agricultural | | | 972 | | | | | | | 972 | |
Farm real estate | | | 745 | | | | | | | 745 | |
Other real estate | | | 560 | | | | | | | 560 | |
Total impaired loans | | $ | 2,537 | | | | | | $ | 2,537 | |
| | | | | | | | | | | |
Impaired servicing rights | | $ | 1,083 | | | | | | $ | 1,083 | |
| | | | | | | | | | | |
| | | | | Fair Value Measurements at December 31, 2015 Using: | |
| | | | | Quoted Prices in | | Significant | | Significant | |
| | | | | Active Markets for | | Other Observable | | Unobservable | |
| | December 31, | | Identical Assets | | Inputs | | Inputs | |
| | 2015 | | (Level 1) | | (Level 2) | | (Level 3) | |
Assets: | | | | | | | | | | | |
Impaired loans | | | | | | | | | | | |
Commercial and industrial | | $ | 58 | | | | | | $ | 58 | |
Other real estate | | | 1,082 | | | | | | | 1,082 | |
Total impaired loans | | $ | 1,140 | | | | | | $ | 1,140 | |
| | | | | | | | | | | |
Impaired servicing rights | | $ | 531 | | | | | | $ | 531 | |
The following represents impairment charges recognized during the period:
Impaired loans, which are measured for impairment using the fair value of the collateral for collateral dependent loans, had a recorded investment of $4,008, with a valuation allowance of $1,471, resulting in an additional provision for loan losses of $1,158 in 2016. A breakdown of these loans by portfolio class is as follows:
| | | | | | | | | | |
| | Recorded | | Valuation | | | | |
| | Investment | | Allowance | | Net | |
Commercial and industrial | | $ | 689 | | $ | 429 | | $ | 260 | |
Agricultural | | | 1,441 | | | 469 | | | 972 | |
Farm real estate | | | 1,105 | | | 360 | | | 745 | |
Other real estate | | | 773 | | | 213 | | | 560 | |
Ending Balance | | $ | 4,008 | | $ | 1,471 | | $ | 2,537 | |
At December 31, 2015, impaired loans had a recorded investment of $2,393, with a valuation allowance of $1,253, resulting in an additional provision for loan losses of $769 for the year ending December 31, 2015.
Impaired tranches of servicing rights were carried at a fair value of $1,083 which is made up of the gross outstanding balance of $1,283, net of a valuation allowance of $200. There was no change in the valuation allowance in 2016. In 2015, impaired servicing rights were written down to a fair value of $531, which was made up of the gross outstanding balance of $731, net of a valuation allowance of $200. A recovery of $200 was included in 2015 earnings.
The following table presents quantitative information about level 3 fair value measurements for financial instruments measured at fair value on a non‑recurring basis at December 31, 2016 and 2015. Impaired commercial, commercial real estate loans, and other real estate owned that are deemed collateral dependent are valued based on the fair value of the underlying collateral. These estimates are based on the most recently available appraisals with certain adjustments made based on the type of property, age of appraisal, current status of the property and other related factors to estimate the current value of the collateral.
| | | | | | | | | | | | | |
| | Fair Value | | Valuation | | Unobservable | | Range/ | |
December 31, 2016 | | (in thousands) | | Technique(s) | | Input(s) | | Average | |
Impaired Loans: | | | | | | | | | | | | | |
Commercial and industrial | | $ | 260 | | Sales comparison approach | | Adjustment for differences between comparable sales | | | 10% - 30% | | | |
| | | | | | | | | | 18% Avg | | | |
Agricultural | | | 972 | | Sales comparison approach | | Adjustment for differences between comparable sales | | | 10% | | | |
| | | | | | | | | | 10% Avg | | | |
Farm real estate | | | 745 | | Sales comparison approach | | Adjustment for differences between comparable sales | | | 10% | | | |
| | | | | | | | | | 10% Avg | | | |
Other real estate | | | 560 | | Sales comparison approach | | Adjustment for differences between comparable sales, type of property, current status of property | | | 16% - 31% | | | |
| | | | | | | | | | 27% Avg | | | |
| | $ | 2,537 | | | | | | | | | | |
| | | | | | | | | | | | | |
Mortgage servicing rights | | $ | 1,083 | | Cash flow analysis | | Discount rate | | | 10% | | | |
| | | | | | | | | | | | | |
| | Fair Value | | Valuation | | Unobservable | | Range/ | |
December 31, 2015 | | (in thousands) | | Technique(s) | | Input(s) | | Average | |
Impaired Loans: | | | | | | | | | | | | | |
Farm real estate | | $ | 58 | | Sales comparison approach | | Adjustment for differences between comparable sales | | | 10% | | | |
| | | | | | | | | | 10% Avg | | | |
Other | | | 1,082 | | Sales comparison approach | | Adjustment for differences between comparable sales, type of property, current status of property | | | 0% - 20% | | | |
| | $ | 1,140 | | | | | | | 10% Avg | | | |
| | | | | | | | | | | | | |
Mortgage servicing rights | | $ | 531 | | Cash flow analysis | | Discount rate | | | 10% | | | |
Carrying amount and estimated fair values of financial instruments, not previously presented, at year end were as follows:
| | | | | | | | | | | | | | | | |
| | Carrying | | | | | | | | | | | | | |
December 31, 2016 | | Amount | | Level 1 | | Level 2 | | Level 3 | | Total | |
Assets | | | | | | | | | | | | | | | | |
Cash and cash equivalents | | $ | 86,552 | | $ | 75,778 | | $ | 10,774 | | $ | | | $ | 86,552 | |
Interest bearing time deposits | | | 1,960 | | | | | | 1,960 | | | | | | 1,960 | |
Loans including loans held for sale, net | | | 2,639,046 | | | | | | 12,598 | | | 2,662,431 | | | 2,675,029 | |
FHLB and other stock | | | 21,693 | | | | | | | | | | | | N/A | |
Interest receivable | | | 12,576 | | | | | | 5,234 | | | 7,342 | | | 12,576 | |
Liabilities | | | | | | | | | | | | | | | | |
Deposits | | | (3,110,871) | | | (767,159) | | | (2,340,824) | | | | | | (3,107,983) | |
Other borrowings | | | (209,672) | | | | | | (209,686) | | | | | | (209,686) | |
FHLB advances | | | (249,658) | | | | | | (248,944) | | | | | | (248,944) | |
Interest payable | | | (642) | | | | | | (642) | | | | | | (642) | |
Subordinated debentures | | | (41,239) | | | | | | (34,084) | | | | | | (34,084) | |
| | | | | | | | | | | | | | | | |
| | Carrying | | | | | | | | | | | | | |
December 31, 2015 | | Amount | | Level 1 | | Level 2 | | Level 3 | | Total | |
Assets | | | | | | | | | | | | | | | | |
Cash and cash equivalents | | $ | 67,578 | | $ | 56,104 | | $ | 11,474 | | $ | | | $ | 67,578 | |
Interest bearing time deposits | | | 1,960 | | | | | | 1,960 | | | | | | 1,960 | |
Loans including loans held for sale, net | | | 2,139,765 | | | | | | 7,726 | | | 2,187,366 | | | 2,195,092 | |
FHLB and other stock | | | 11,300 | | | | | | | | | | | | N/A | |
Interest receivable | | | 10,779 | | | | | | 4,901 | | | 5,878 | | | 10,779 | |
Liabilities | | | | | | | | | | | | | | | | |
Deposits | | | (2,650,775) | | | (641,439) | | | (2,007,405) | | | | | | (2,648,844) | |
Other borrowings | | | (28,363) | | | | | | (28,363) | | | | | | (28,363) | |
FHLB advances | | | (269,488) | | | | | | (270,977) | | | | | | (270,977) | |
Interest payable | | | (560) | | | | | | (560) | | | | | | (560) | |
Subordinated debentures | | | (41,239) | | | | | | (24,212) | | | | | | (24,212) | |
The difference between the loan balance included above and the amounts shown in Note 5 are the impaired loans discussed above.
The methods and assumptions, not previously presented, used to estimate fair values are described as follows:
(a) Cash and Cash Equivalents
The carrying amounts of cash, short term instruments, and interest bearing time deposits approximate fair values and are classified as either Level 1 or Level 2. Noninterest bearing deposits are Level 1 whereas interest bearing due from bank accounts and fed funds sold are Level 2.
(b) FHLB and other stock
It is not practical to determine the fair value of FHLB stock due to restrictions placed on its transferability.
(c) Loans, Net
Fair values of loans are estimated as follows: For variable rate loans that reprice frequently and with no significant change in credit risk, fair values are based on carrying values resulting in a Level 3 classification. Fair values for other loans are estimated using discounted cash flow analyses, using interest rates currently being offered for loans with similar terms to borrowers of similar credit quality resulting in a Level 3 classification. Loans held for sale is estimated based upon binding contracts and quotes from third party investors resulting in a Level 2 classification. Impaired loans are valued at the lower of cost or fair value as described previously. The methods utilized to estimate the fair value of loans do not necessarily represent an exit price.
(d) Deposits
The fair values disclosed for non‑interest bearing deposits are equal to the amount payable on demand at the reporting date resulting in a Level 1 classification. The carrying amounts of variable rate interest bearing deposits approximate their fair values at the reporting date resulting in a Level 2 classification. Fair values for fixed rate interest bearing deposits are estimated using a discounted cash flows calculation that applies interest rates currently being offered on certificates to a schedule of aggregated expected monthly maturities on time deposits resulting in a Level 2 classification.
(e) Other Borrowings
The fair values of the Company’s FHLB advances are estimated using discounted cash flow analyses based on the current borrowing rates resulting in a Level 2 classification.
The fair values of the Company’s subordinated debentures are estimated using discounted cash flow analyses based on the current borrowing rates for similar types of borrowing arrangements resulting in a Level 2 classification.
The fair values of the Company’s Other borrowings are estimated using discounted cash flow analyses based on current borrowing rates resulting in a Level 2 classification.
(f) Accrued Interest Receivable/Payable
The carrying amounts of accrued interest approximate fair value resulting in a Level 2 or Level 3 classification based on the level of the asset or liability with which the accrual is associated.
NOTE 8 — PREMISES AND EQUIPMENT
| | | | | | | |
December 31 | | 2016 | | 2015 | |
Land | | $ | 18,662 | | $ | 15,491 | |
Buildings | | | 68,584 | | | 58,175 | |
Furniture and equipment | | | 49,834 | | | 43,838 | |
Total cost | | | 137,080 | | | 117,504 | |
Accumulated depreciation | | | (60,654) | | | (54,531) | |
Net | | $ | 76,426 | | $ | 62,973 | |
Depreciation expense was $7,289, $6,410, and $5,886 in 2016, 2015 and 2014.
Operating Leases: The Company leases certain branch properties under operating leases. Rent expense less rental income was $2,014, $1,712, and $1,376 for 2016, 2015, and 2014. Rent commitments, before considering renewal options that generally are present, were as follows:
| | | | |
2017 | | $ | 1,965 | |
2018 | | | 1,905 | |
2019 | | | 1,770 | |
2020 | | | 1,452 | |
2021 | | | 1,197 | |
Thereafter | | | 4,648 | |
Total | | $ | 12,937 | |
Capital Leases: The Company leases certain land and buildings under capital leases. The lease arrangement requires monthly payments through 2037.
The Company has included these leases in premises and equipment as follows:
| | | | | | | |
December 31, | | 2016 | | 2015 | |
Land and buildings | | $ | 1,342 | | $ | 1,342 | |
Accumulated depreciation | | | (126) | | | (68) | |
Net | | $ | 1,216 | | $ | 1,274 | |
The following is a schedule by year of future minimum lease payments under the capitalized lease, together with the present value of net minimum lease payments at year end 2016:
| | | | |
2017 | | $ | 96 | |
2018 | | | 96 | |
2019 | | | 96 | |
2020 | | | 96 | |
2021 | | | 96 | |
Thereafter | | | 1,567 | |
Total minimum lease payments | | $ | 2,047 | |
Less amount representing interest | | | (728) | |
Present value of net minimum lease payments | | $ | 1,319 | |
NOTE 9 — GOODWILL AND INTANGIBLE ASSETS
Goodwill
The change in carrying amount of goodwill is as follows.
| | | | | | | |
| | 2016 | | 2015 | |
Balance, January 1 | | $ | 75,953 | | $ | 73,450 | |
Acquired goodwill | | | 25,362 | | | 2,503 | |
Balance, December 31 | | $ | 101,315 | | $ | 75,953 | |
The Company tests goodwill for impairment on an annual basis, or more often if events or circumstances indicate there may be impairment. Impairment exists when a reporting unit’s carrying value of goodwill exceeds its fair value. At June 30, 2016, the Company elected to perform a quantitative assessment to determine if the fair value of the reporting unit exceeded its carrying value, including goodwill. The quantitative assessment indicated that the fair value of the reporting unit exceeded its carrying value, resulting in no impairment. There have been no issues identified since then indicating goodwill impairment.
A discussion of goodwill acquired in 2016, 2015 and 2014 can be found at NOTE 26.
Acquired Intangible Assets
| | | | | | | |
| | 2016 | | 2015 | |
Core deposit intangibles | | $ | 34,135 | | $ | 30,036 | |
Other customer relationship intangibles | | | 2,194 | | | 2,194 | |
Accumulated amortization | | | (28,910) | | | (27,568) | |
Purchased intangibles, net | | $ | 7,419 | | $ | 4,662 | |
Aggregate amortization expense was $1,342, $1,640, and $1,690 for 2016, 2015, and 2014.
Estimated amortization expense for each of the next five years follows:
| | | | |
2017 | | $ | 1,244 | |
2018 | | | 1,170 | |
2019 | | | 991 | |
2020 | | | 896 | |
2021 | | | 789 | |
Thereafter | | | 2,329 | |
NOTE 10 — DEPOSITS
| | | | | | | |
| | December 31, | | December 31, | |
| | 2016 | | 2015 | |
Non-interest-bearing demand | | $ | 767,159 | | $ | 641,439 | |
Interest-bearing demand | | | 1,163,010 | | | 1,084,786 | |
Savings | | | 749,391 | | | 599,729 | |
Certificates of deposit of $250 or more | | | 65,815 | | | 73,493 | |
Other certificates and time deposits | | | 365,496 | | | 251,328 | |
Total deposits | | $ | 3,110,871 | | $ | 2,650,775 | |
Certificates and other time deposits mature as follows:
| | | | |
2017 | | $ | 242,669 | |
2018 | | | 86,936 | |
2019 | | | 29,602 | |
2020 | | | 47,438 | |
2021 | | | 16,297 | |
Thereafter | | | 8,369 | |
Total | | $ | 431,311 | |
NOTE 11 — OTHER BORROWINGS
| | | | | | | |
December 31 | | 2016 | | 2015 | |
Other borrowings consisted of the following at year-end: | | | | | | | |
Securities sold under repurchase agreements | | $ | 38,339 | | $ | 28,363 | |
Short term FHLB advances | | | 138,000 | | | — | |
Term debt | | | 18,333 | | | — | |
Federal funds purchased | | | 15,000 | | | — | |
Total other borrowings | | $ | 209,672 | | $ | 28,363 | |
Securities sold under repurchase agreements (“agreements”) consist of obligations secured by securities issued by government‑sponsored entities, and a safekeeping agent holds such collateral. The majority of the agreements at December 31, 2016 mature within 30 days. At December 31, 2016, these agreements were secured by a pledged amount of $58,001 of mortgage backed securities. Management monitors the fair value of the securities on a regular basis. If the fair value of the securities declined to an amount approximating these agreements, more securities would be pledged.
Short term FHLB advances were obtained to help the Company with its short term funding needs. The advances all mature in six months or less and have a current interest rate of 0.90%. These advances are secured by real estate backed loans.
The term debt was obtained by the Company to help fund the Cheviot acquisition. $30,000 was originally obtained and $11,667 was repaid in 2016. The debt matures in 2019 and is secured by a negative pledge agreement on the Bank’s stock. The current interest rate on this loan is 2.8125%
Information concerning securities sold under agreements to repurchase is summarized as follows:
| | | | | | | | | | |
| | 2016 | | 2015 | | 2014 | |
Average daily balance during the year | | $ | 27,816 | | $ | 26,723 | | $ | 25,006 | |
Average interest rate during the year | | | 0.14 | % | | 0.15 | % | | 0.18 | % |
Maximum month-end balance during the year | | $ | 40,778 | | $ | 34,439 | | $ | 32,203 | |
Weighted average interest rate at year-end | | | 0.18 | % | | 0.15 | % | | 0.14 | % |
NOTE 12 — FEDERAL HOME LOAN BANK ADVANCES
FHLB advances at year end were as follows:
| | | | | | | |
| | 2016 | | 2015 | |
Maturities from March 2017 through September 2025, primarily fixed rates from 0.97% to 2.67%, averaging 1.75% | | $ | 249,658 | | | — | |
Maturities from June 2016 through September 2025, primarily fixed rates from 0.58% to 4.80%, averaging 1.53% | | | — | | $ | 269,488 | |
| | $ | 249,658 | | $ | 269,488 | |
The majority of the FHLB advances are secured by real estate backed loans totaling approximately 182% of the advance under a blanket security agreement. The advances are subject to restrictions or penalties in the event of prepayment. Of the $249,658 in advances at December 31, 2016, $25,000 of the advances contained options whereby the FHLB may convert the fixed rate advance to an adjustable rate advance, at which time the Company may prepay the advance without a penalty. Of the $269,488 in advances at December 31, 2015, $25,000 of the advances contained such options.
In 2013, the Company prepaid a $25,000 fixed rate FHLB advance with a contractual interest rate of 4.55% and a remaining maturity of 18 months. The prepaid FHLB advance was replaced with a $25,000 fixed rate FHLB advance. In accordance with the restructure, the Company was required to pay a prepayment penalty of $1,609 in 2013 to the FHLB. The present value of the cash flows under the terms of the new FHLB advance (including the prepayment penalties) was not more than 10% different from the present value of the cash flows under the terms of the prepaid FHLB advance and therefore the new advance was not considered to be substantially different from the original advance in accordance with ASC 470-50, Debt – Modifications and Exchanges. As a result, the prepayment penalty has been treated as a discount on the new debt and is being amortized over the life of the new advances as an adjustment to yield. The prepayment penalty effectively increases the interest rate on the new advance over the life of the new advance at the time of the transaction. The benefit of prepaying this advance was an immediate decrease in interest expense.
Required payments over the next five years are:
| | | | |
2017 | | $ | 20,000 | |
2018 | | | 45,000 | |
2019 | | | 60,000 | |
2020 | | | 55,000 | |
2021 | | | 20,000 | |
Thereafter | | | 50,000 | |
| | $ | 250,000 | |
Restructuring prepayment penalty | | | (342) | |
| | $ | 249,658 | |
NOTE 13 — SUBORDINATED DEBENTURES
The Company formed four separate trusts in 2002, 2003, and 2006 that issued floating rate trust preferred securities as part of pooled offerings. The Company issued subordinated debentures to the trusts in exchange for the proceeds of the offerings, which debentures represent the sole asset of the trusts. In the first quarter of 2014, the Company redeemed one trust it had acquired in a prior acquisition — Harrodsburg Statutory Trust I. In accordance with accounting guidelines, the trusts are not consolidated with the Company’s financial statements, but rather the subordinated debentures are shown as a liability, because the Company is not considered the primary beneficiary of the trusts. The Company’s investment in the common stock of the trusts was $1,239 at December 31, 2016 and 2015 and is included in interest receivable and other assets on the consolidated balance sheets. Interest payments are payable quarterly in arrears and the Company has the option to defer interest payments from time to time for a period not to exceed 20 consecutive quarters. The subordinated debentures mature in 30 years from issuance and can be called anytime after five years at par. The subordinated debentures may be included in Tier 1 capital (with certain limitations) under current regulatory guidelines and interpretations. The following table summarizes the other terms of each issuance.
| | | | | | | | | | | | | | | | | | |
| | | | Amount | | Amount | | | | | | | | | | |
| | | | December 31, | | December 31, | | Variable | | Rate as of | | | |
Trust Name | | Issuance | | 2016 | | 2015 | | Rate | | 12/31/2016 | | Maturity | |
Trust 1 | | 2002 | | $ | 8,248 | | $ | 8,248 | | LIBOR | + | 3.25 | | % | 4.25 | % | 2032 | |
Trust 2 | | 2003 | | | 14,433 | | | 14,433 | | LIBOR | + | 3.25 | | % | 4.25 | % | 2033 | |
Trust 3 | | 2003 | | | 7,217 | | | 7,217 | | LIBOR | + | 3.15 | | % | 4.11 | % | 2033 | |
Trust 4 | | 2006 | | | 11,341 | | | 11,341 | | LIBOR | + | 1.63 | | % | 2.59 | % | 2036 | |
| | | | $ | 41,239 | | $ | 41,239 | | | | | | | | | | |
NOTE 14 — MORTGAGE BANKING AND LOAN SERVICING
Net revenues from mortgage banking activity consisted of the following:
| | | | | | | | | | |
| | Years Ended December 31 | |
| | 2016 | | 2015 | | 2014 | |
Gain from sale of mortgage loans and interest rate locks | | $ | 7,264 | | $ | 5,528 | | $ | 4,730 | |
Mortgage loan servicing revenue (expense): | | | | | | | | | | |
Mortgage loan servicing revenue | | | 4,290 | | | 3,940 | | | 3,053 | |
Amortization of mortgage servicing rights | | | (1,510) | | | (1,313) | | | (1,004) | |
Mortgage servicing rights valuation adjustments | | | — | | | 200 | | | (25) | |
Net servicing revenue | | | 2,780 | | | 2,827 | | | 2,024 | |
Net revenue from mortgage banking activity | | $ | 10,044 | | $ | 8,355 | | $ | 6,754 | |
Loans serviced for others are not included in the accompanying consolidated balance sheets. Loan servicing fee income was $2,653, $2,415, and $2,065 for 2016, 2015, and 2014. The unpaid principal balances of loans serviced for others totaled $1,115,246 and $924,836 at December 31, 2016 and 2015. Custodial escrow balances maintained in connection with serviced loans were $16,609 and $12,766 at year end 2016 and 2015. Mortgage servicing rights are included in other assets on the consolidated balance sheets. The weighted average amortization period is 7.14 years. The fair value of capitalized mortgage servicing assets is based on comparable market values and expected cash flows, with impairment assessed based on portfolio characteristics including product type and interest rates. The carrying value of capitalized mortgage servicing rights was $7,410 and $6,120 at year end 2016 and 2015. Fair value at year‑end 2016 was determined using a discount rate of 14%, and prepayment speeds ranging from 104% to 272%, depending on the stratification of the specific right. Fair value at year‑end 2015 was determined using a discount rate of 10%, and prepayment speeds ranging from 105% to 369%, depending on the stratification of the specific right. The notional amount of interest rate lock commitments to make 1‑4 family residential mortgage loans intended to be sold on the secondary market totaled $38.7 million and $30.0 million at December 31, 2016 and 2015, respectively. The estimated fair value of these
commitments totaled $648 and $700 at December 31, 2016 and 2015, respectively, and is included in other assets on the consolidated balance sheet.
| | | | | | | | | | |
| | 2016 | | 2015 | | 2014 | |
Mortgage servicing assets | | | | | | | | | | |
Balances, January 1 | | $ | 6,120 | | $ | 5,708 | | $ | 5,155 | |
Servicing assets capitalized | | | 1,636 | | | 1,525 | | | 988 | |
Servicing rights acquired | | | 1,164 | | | — | | | 594 | |
Amortization of servicing assets | | | (1,510) | | | (1,313) | | | (1,004) | |
Change in valuation allowance | | | — | | | 200 | | | (25) | |
Balance, December 31 | | $ | 7,410 | | $ | 6,120 | | $ | 5,708 | |
Valuation allowance: | | | | | | | | | | |
Balances, January 1 | | $ | 200 | | $ | 400 | | $ | 375 | |
Additions expensed | | | 175 | | | 25 | | | 75 | |
Reductions credited to operations | | | (175) | | | (225) | | | (50) | |
Balance, December 31 | | $ | 200 | | $ | 200 | | $ | 400 | |
NOTE 15 — INCOME TAX
Income tax expense was as follows:;
| | | | | | | | | | |
Year Ended December 31 | | 2016 | | 2015 | | 2014 | |
Income tax expense | | | | | | | | | | |
Currently payable | | $ | 8,455 | | $ | 4,726 | | $ | 4,578 | |
Deferred | | | 4,135 | | | 5,697 | | | 5,950 | |
Change in valuation allowance | | | (453) | | | (190) | | | (2,749) | |
Total income tax expense | | $ | 12,137 | | $ | 10,233 | | $ | 7,779 | |
Effective tax rates differ from the federal statutory rate of 35% applied to income before income taxes due to the following:
| | | | | | | | | | |
| | | 2016 | | | 2015 | | | 2014 | |
Federal statutory income tax rate | | | 35 | % | | 35 | % | | 35 | % |
Federal statutory income tax | | $ | 17,661 | | $ | 16,021 | | $ | 12,871 | |
Tax exempt interest | | | (4,799) | | | (4,676) | | | (4,425) | |
Effect of state income taxes | | | 75 | | | 169 | | | 3,199 | |
Non-deductible expenses | | | 436 | | | 193 | | | 338 | |
Tax exempt income on life insurance | | | (530) | | | (537) | | | (454) | |
Tax credits | | | (397) | | | (501) | | | (369) | |
Change in valuation allowance | | | (453) | | | (190) | | | (2,749) | |
Captive insurance premiums | | | (335) | | | (361) | | | (371) | |
Low income housing proportional amortization | | | 419 | | | 363 | | | — | |
Other | | | 60 | | | (248) | | | (261) | |
Income tax expense | | $ | 12,137 | | $ | 10,233 | | $ | 7,779 | |
The components of the net deferred tax asset (liability) are as follows:
| | | | | | | |
December 31 | | 2016 | | 2015 | |
Assets | | | | | | | |
Allowance for loan losses | | $ | 8,590 | | $ | 8,474 | |
Net operating loss carryforward | | | 3,876 | | | 3,543 | |
Credit carryforwards | | | 6,439 | | | 8,401 | |
OREO write-downs | | | 583 | | | 514 | |
Other | | | 3,456 | | | 3,019 | |
Total assets | | | 22,944 | | | 23,951 | |
Liabilities | | | | | | | |
Depreciation | | | (6,041) | | | (6,864) | |
Mortgage servicing rights | | | (2,717) | | | (2,209) | |
Unrealized gain on securities AFS | | | (1,658) | | | (6,798) | |
Intangibles | | | (434) | | | (2,981) | |
Deferred loan fees/costs | | | (2,058) | | | (1,901) | |
Other | | | (3,725) | | | (2,336) | |
Total liabilities | | | (16,633) | | | (23,089) | |
Less: Valuation allowance | | | (2,934) | | | (3,091) | |
Net deferred tax asset/(liability) | | $ | 3,377 | | $ | (2,229) | |
As of December 31, 2016, the Company had $3,288 of alternative minimum tax credit carryforwards, which under current tax law have no expiration period. The Company had general business credit carryforwards of $3,152 that begin to expire in 2031.
The Company has an Indiana state operating loss carryforward of $102,365, which begins to expire in 2021. The Company maintains a valuation allowance to reduce these carryforward items and other Indiana deferred tax assets to the amount expected to be realized.
A valuation allowance for deferred tax assets is recorded when it is more likely than not that some portion or all of the deferred tax assets will not be realized. The ultimate realization of the deferred tax assets depends on the ability of the Company to generate sufficient taxable income of the appropriate character in the future and in the appropriate taxing jurisdictions. At December 31, 2016, the largest component of deferred tax assets is associated with the allowance for loan losses. The Company considers the scheduled reversal of deferred tax liabilities, projected future taxable income, and tax planning strategies in making this assessment. With the exception of the deferred tax asset associated with the Company’s Indiana state operating loss carryforward and all Indiana deferred tax activity since 2004, no valuation allowance for deferred tax assets was considered necessary at December 31, 2016 or 2015.
Retained earnings of the Bank include approximately $16,112 for which no deferred income tax liability has been recognized. This amount represents an allocation of previously acquired institutions to bad debt deductions as of December 31, 1987 for tax purposes only. Reduction of amounts so allocated for purposes other than tax bad debt losses including redemption of bank stock or excess dividends, or loss of “bank” status would create income for tax purposes only, which would be subject to the then‑current corporate income tax rate. The unrecorded deferred income tax liability on the above amount for the Company was approximately $5,639 at December 31, 2016 and $4,589 at December 31, 2015.
Unrecognized Tax Benefits
The Company does not have any unrecognized tax benefits during any periods presented and does not expect this to significantly change in the next twelve months.
There were no interest and penalties recorded in the income statement during any period and no amounts accrued for interest and penalties at December 31, 2016, or 2015.
The Company and its subsidiaries are subject to U.S. federal income tax as well as income tax of the states of
Indiana and Illinois. The Company is no longer subject to examination by taxing authorities for years before 2013.
NOTE 16 — COMMITMENTS
Some financial instruments, such as loan commitments, credit lines, letters of credit, and overdraft protection, are issued to meet customer financing needs. These are agreements to provide credit or to support the credit of others, as long as conditions established in the contract are met, and usually have expiration dates. Commitments may expire without being used. Off‑balance sheet risk to credit loss exists up to the face amount of these instruments, although material losses are not anticipated. The same credit policies are used to make such commitments as are used for loans, including obtaining collateral at exercise of the commitment.
Financial instruments whose contract amount represents credit risk as of December 31 were as follows:
| | | | | | | | | | | | | |
| | 2016 | | 2015 | |
| | Fixed | | Variable | | Fixed | | Variable | |
| | Rate | | Rate | | Rate | | Rate | |
Commitments to extend credit and unused lines of credit | | $ | 91,076 | | $ | 809,004 | | $ | 42,754 | | $ | 658,291 | |
Commercial letters of credit | | | — | | | 6,575 | | | — | | | 5,739 | |
Commitments to make loans are generally made for periods of 60 days or less. Interest rates on fixed rate commitments range from 1.50% to 19.80% with maturities ranging from 1 month to 33 years.
NOTE 17 — DIVIDENDS
The Company’s principal source of funds for dividend payments is dividends received from the Bank. Banking regulations limit the amount of dividends that may be paid without prior approval of regulatory agencies. Under these regulations, the amount of dividends that may be paid in any calendar year is limited to the current year’s net profits, combined with the retained net profits of the preceding two years, subject to the capital requirements described in Note 19. As of December 31, 2016, the Bank could pay out approximately $25,000 in dividends before the Bank would need 2017 income to pay additional dividends without regulatory approval.
NOTE 18 — DIVIDEND REINVESTMENT PLAN
The Company maintains an Automatic Dividend Reinvestment Plan. The plan enables shareholders to elect to have their cash dividends on all or a portion of shares held automatically reinvested in additional shares of the Company’s common stock. The stock is purchased by the Company’s transfer agent on the open market and credited to participant accounts at fair market value. Dividends are reinvested on a quarterly basis.
NOTE 19 — REGULATORY MATTERS
Banks and bank holding companies are subject to various regulatory capital requirements administered by the federal banking agencies and are assigned to a capital category. The assigned capital category is largely determined by four ratios that are calculated according to the regulations. The ratios are intended to measure capital relative to assets and credit risk associated with those assets and off-balance sheet exposures. The capital category assigned to an entity can also be affected by qualitative judgments made by regulatory agencies about the risk inherent in the entity’s activities that are not part of the calculated ratios.
On July 2, 2013, the Federal Reserve approved a final rule that establishes an integrated regulatory capital framework. The rule implements the Basel III regulatory capital reforms from the Basel Committee on Banking Supervision and certain changes required by the Dodd-Frank Act. In general, under the new rules, minimum requirements have increased for both the quantity and quality of capital held by banking organizations. Consistent with the international Basel framework, the new rules include a new minimum ratio of common equity Tier 1 capital to risk-weighted assets of 4.5% and a common equity Tier 1 capital conservation buffer to be phased in between 0.0% in 2015 to 2.5% by 2019.
The capital conservation buffer for 2016 is 0.625% The rule also raises the minimum ratio of Tier 1 capital to risk-weighted assets from 4% to 6% and includes a minimum leverage ratio of 4% for all banking organizations. The new rules also change the methodology for calculating risk-weighted assets to enhance risk sensitivity and became effective on January 1, 2015. The net unrealized gain or loss on available for sale securities is not included in computing regulatory capital. Actual and required capital amounts and ratios are presented below. Management believes as of December 31, 2016, the Company and Bank met all capital adequacy requirements to which they were subject.
Prompt corrective action regulations provide five classifications: well capitalized, adequately capitalized, undercapitalized, significantly undercapitalized, and critically undercapitalized, although these terms are not used to represent overall financial condition. If adequately capitalized, regulatory approval is required to accept brokered deposits. If undercapitalized, capital distributions are limited, as is asset growth and expansion, and capital restoration plans are required. At year-end 2016 and 2015, the most recent regulatory notifications categorized the Bank as well capitalized under the regulatory framework for prompt corrective action. There are no conditions or events since that notification that management believes have changed the Bank’s category.
| | | | | | | | | | | | | | | | |
| | | | | | | Required for | | To Be | |
| | Actual | | Adequate Capital | | Well Capitalized | |
December 31, 2016 | | Amount | | Ratio | | Amount | | Ratio | | Amount | | Ratio | |
MainSource Financial Group | | | | | | | | | | | | | | | | |
Total capital (to risk-weighted assets) | | $ | 407,802 | | 14.7 | % | $ | 222,095 | | 8.0 | % | | N/A | | N/A | |
Tier 1 capital (to risk-weighted assets) | | | 385,303 | | 13.9 | | | 166,571 | | 6.0 | | | N/A | | N/A | |
Common equity Tier 1 capital (to risk-weighted assets) | | | 344,212 | | 12.4 | | | 124,928 | | 4.5 | | | N/A | | N/A | |
Tier 1 capital (to average assets) | | | 385,303 | | 9.8 | | | 157,671 | | 4.0 | | | N/A | | N/A | |
MainSource Bank | | | | | | | | | | | | | | | | |
Total capital (to risk-weighted assets) | | $ | 407,939 | | 14.7 | % | $ | 222,152 | | 8.0 | % | $ | 277,690 | | 10.0 | % |
Tier 1 capital (to risk-weighted assets) | | | 385,440 | | 13.9 | | | 166,614 | | 6.0 | | | 222,152 | | 8.0 | |
Common equity Tier 1 capital (to risk-weighted assets) | | | 385,440 | | 13.9 | | | 124,960 | | 4.5 | | | 180,498 | | 6.5 | |
Tier 1 capital (to average assets) | | | 385,440 | | 9.8 | | | 157,390 | | 4.0 | | | 196,737 | | 5.0 | |
| | | | | | | | | | | | | | | | |
| | | | | | | Required for | | To Be | |
| | Actual | | Adequate Capital | | Well Capitalized | |
December 31, 2015 | | Amount | | Ratio | | Amount | | Ratio | | Amount | | Ratio | |
MainSource Financial Group | | | | | | | | | | | | | | | | |
Total capital (to risk-weighted assets) | | $ | 356,210 | | 15.5 | % | $ | 184,170 | | 8.0 | % | | N/A | | N/A | |
Tier 1 capital (to risk-weighted assets) | | | 334,190 | | 14.5 | | | 138,127 | | 6.0 | | | N/A | | N/A | |
Common equity Tier 1 capital (to risk-weighted assets) | | | 293,316 | | 12.7 | | | 103,595 | | 4.5 | | | N/A | | N/A | |
Tier 1 capital (to average assets) | | | 334,190 | | 10.2 | | | 130,845 | | 4.0 | | | N/A | | N/A | |
MainSource Bank | | | | | | | | | | | | | | | | |
Total capital (to risk-weighted assets) | | $ | 334,266 | | 14.5 | % | $ | 184,168 | | 8.0 | % | $ | 230,211 | | 10.0 | % |
Tier 1 capital (to risk-weighted assets) | | | 312,246 | | 13.6 | | | 138,126 | | 6.0 | | | 184,168 | | 8.0 | |
Common equity Tier 1 capital (to risk-weighted assets) | | | 312,246 | | 13.6 | | | 103,595 | | 4.5 | | | 149,637 | | 6.5 | |
Tier 1 capital (to average assets) | | | 312,246 | | 9.6 | | | 130,555 | | 4.0 | | | 163,194 | | 5.0 | |
NOTE 20 — EMPLOYEE BENEFIT PLANS
The Company has a defined‑contribution retirement plan in which substantially all employees may participate. The Company matches 80% of the first 8% of eligible employees’ contributions and makes additional contributions based on employee compensation and the overall profitability of the Company. Expense was $2,535 in 2016, $2,895 in 2015, and $2,751 in 2014 which included an additional contribution in 2016, 2015 and 2014 based on the overall profitability of the Company.
NOTE 21 — RELATED PARTY TRANSACTIONS
The Company has entered into transactions with certain directors, executive officers, significant shareholders and their affiliates or associates (related parties).
The aggregate amount of loans, as defined, to such related parties was as follows:
| | | | |
Balances, January 1, 2016 | | $ | 2,129 | |
Changes in composition of related parties | | | 562 | |
New loans, including renewals and advances | | | 342 | |
Payments, including renewals | | | (810) | |
Balances, December 31, 2016 | | $ | 2,223 | |
Deposits from related parties held by the Company at December 31, 2016 and 2015 totaled $1,530 and $1,138.
NOTE 22 — STOCK‑BASED COMPENSATION
On January 19, 2015, the Board of Directors adopted and approved the MainSource Financial Group, Inc. 2015 Stock Incentive Plan (the “2015 Plan”) which was effective following the approval of the 2015 Plan by the Company’s shareholders at the 2015 Annual Meeting of Shareholders held on April 29, 2015. The 2015 Plan provides for the grant of incentive stock options, non-qualified stock options, stock appreciation rights, share awards of restricted stock, performance share units and other equity based awards. Incentive stock options may be granted only to employees. An aggregate of 1,000,000 shares of common stock are reserved for issuance under the 2015 Plan. Shares issuable under the 2015 Plan may be authorized and unissued shares of common stock or treasury shares. The 2015 Plan is in addition to, and not in replacement of, a similar plan adopted in 2007. The 2007 Stock Incentive Plan (the “2007 Plan”) provided for the grant of incentive stock options, nonstatutory stock options, stock bonuses and restricted stock awards. An aggregate of 650,000 shares of common stock were reserved for issuance under the 2007 Stock Incentive Plan. The 2007 Plan was in replacement of a similar plan adopted in 2003, the 2003 Stock Option Plan (the “2003 Plan”). Any stock or option awards that were previously issued under the 2007 Plan or 2003 Plan have not been terminated as a result of the adoption of the 2015 Plan, but will continue in accordance with the applicable plan terms and the agreements pursuant to which such stock or option awards were issued. However, no further awards of stock or options will be made under the 2007 Plan.
The fair value of each option award is estimated on the date of grant using a closed form option valuation (Black‑Scholes) model that uses the assumptions noted in the table below. Expected volatilities are based on historical volatilities of the Company’s common stock. The Company uses historical data to estimate option exercise and post‑vesting termination behavior. Employee and director options are tracked separately. The expected term of options granted is based on historical data and represents the period of time that options granted are expected to be outstanding, which takes into account that the options are not transferable. The risk‑free interest rate for the expected term of the option is based on the U.S. Treasury yield curve in effect at the time of the grant.
All share-based payments to employees, including grants of employee stock options, are recognized as compensation expense over the service period (generally the vesting period) in the consolidated financial statements based on their fair values. For options with graded vesting, the Company values the stock option grants and recognizes compensation expense as if each vesting portion of the award was a single award.
The fair value of options granted was determined using the following weighted average assumptions as of grant date.
| | | | | | | |
| | 2016 | | 2015 | | 2014 | |
Risk-free interest rate | | NA | | NA | | 2.08 | % |
Expected term (years) | | NA | | NA | | 7.00 | |
Expected stock price volatility | | NA | | NA | | 28.04 | % |
Dividend yield | | NA | | NA | | 2.49 | % |
A summary of the activity in the Company’s stock incentive plans for 2016 follows:
| | | | | | | | | | | |
| | | | | | | Weighted | | | | |
| | | | | | | Average | | | | |
| | | | Weighted | | Remaining | | | | |
| | | | Average | | Contractual | | Aggregate | |
| | | | Exercise | | Term | | Intrinsic | |
Options | | Shares | | Price | | (years) | | Value | |
Outstanding, beginning of year | | 310,665 | | $ | 12.83 | | | | | | |
Granted | | — | | | — | | | | | | |
Exercised | | (111,595) | | | 13.94 | | | | | | |
Forfeited or expired | | (5,956) | | | 16.07 | | | | | | |
Outstanding at end of period | | 193,114 | | $ | 12.09 | | 4.0 | | $ | 4,309 | |
Exercisable at end of period | | 181,710 | | $ | 11.83 | | 3.8 | | $ | 4,101 | |
Fully vested and expected to vest | | 192,542 | | $ | 12.07 | | 4.0 | | $ | 4,299 | |
Information related to the Company’s stock incentive plans during each year follows:
| | | | | | | | | | |
| | 2016 | | 2015 | | 2014 | |
Intrinsic value of options exercised | | $ | 1,306 | | $ | 244 | | $ | 55 | |
Cash received from option exercises | | | 1,556 | | | 294 | | | 66 | |
Tax benefit realized from option exercises | | | 164 | | | 31 | | | — | |
Weighted average (per share) fair value of options granted | | | NA | | | NA | | | 3.78 | |
The intrinsic value for stock options is calculated based on the exercise price of the underlying awards and the market price of the Company’s common stock as of the reporting date for those options where the exercise price is less than the market price.
The Company recorded $91, $180, and $160 in stock option compensation expense during 2016, 2015, and 2014 to salaries and employee benefits. As of December 31, 2016, there was $30 of total unrecognized compensation cost related to nonvested stock options granted under the Plan. The cost is expected to be recognized over a weighted‑average period of 1.0 years.
In the second quarter of each of 2016, 2015 and 2014, the Executive Compensation Committee of the Board of Directors of the Company granted restricted stock awards to certain executive officers and other employees pursuant to the Company’s LTIP. Compensation expense is recognized over the vesting period of the awards based on the fair value of the stock at the issue date. The value of the awards was determined by multiplying the award amount by the closing price of a share of Company common stock on the grant date. The restricted stock awards vest as follows — 100% on the third anniversary of the date of grant. A total of 50,152, 28,955, and 33,836 shares of common stock of the Company were granted in 2016, 2015 and 2014 respectively.
A summary of changes in the Company’s nonvested shares for 2016 follows:
| | | | | | |
| | | | Weighted Average | |
| | Restricted | | Grant Date | |
| | Shares | | Fair Value | |
Nonvested at January 1, 2016 | | 101,631 | | $ | 16.57 | |
Granted | | 50,152 | | | 22.48 | |
Vested | | (43,244) | | | 14.75 | |
Forfeited | | (4,220) | | | 20.00 | |
Nonvested at December 31, 2016 | | 104,319 | | $ | 20.03 | |
As of December 31, 2016, there was $1,101 of total unrecognized compensation costs related to nonvested restricted stock awards granted under the 2015 and 2007 Plans that will be recognized over the remaining vesting period of approximately 2.32 years. The recognized compensation costs related to the 2007 Plan were $670, $584, and $487 for 2016, 2015, and 2014 respectively.
Additionally, in the first quarter of 2016 and 2015, the Committee voted to grant performance share units to certain executive officers pursuant to the Company’s LTIP, subject to and effective upon the approval of the 2015 Plan by the Company’s shareholders at the 2015 Annual Meeting of Shareholders held on April 29, 2015. The Committee established performance measures, goals and payout calibration for the Performance Share Units. At the end of each three-year performance period, the Committee will certify the results of the performance measures and goals and will pay the earned awards out in cash or shares of Company common stock. Each executive’s target payout is achieved once the performance equals the target level, and the maximum payout is achieved once the performance equals the superior level (with interpolation between discrete points).
The value of the awards was determined by multiplying the award amount by the closing price of a share of Company common stock on the grant date. The performance share units are earned over the three year period of the award. A total of 16,152 performance share units were granted in the first quarter of 2016 at a weighted average cost of $21.41 per share. A total of 16,205 performance share units were granted in the first quarter of 2015 at a weighted average cost of $19.57 per share. Compensation expense is recognized over the three year performance period of the awards based on the fair value of the stock at the issue date and the anticipated achievement level of the target performance. Quarterly, the performance measures will be reevaluated and adjustments made to the expense recorded in the financial statements, if needed, to reflect the new revised achievement levels. A total of $240 and $79 of expense was recognized on these awards in 2016 and 2015 respectively. A total of $344 will be expensed in future periods if the Target level is achieved.
In the second quarters of 2014, 2015, and 2016, members of the Board of Directors received their entire annual retainer in restricted Company stock for the following year. The awards vest quarterly for all directors who remain on the Board of Directors on the vesting date, with 25% of the award vesting on each of May 1, August 1, and November 1, and February 1, of the following year. The value of the retainer awards was determined by multiplying the award amount by the closing price of the stock on the issuance date.
For all awards, other expense is recognized over the three month period of the awards based on the fair value of the stock at the issue dates. Shares awarded by quarter were as follows:
| | | | | | | | |
Quarter | | | | Shares | | Price per Share | |
2014 | | 2Q | | 21,780 | | $ | 16.53 | |
2015 | | 2Q | | 14,084 | | | 19.89 | |
2015 | | 4Q | | 1,341 | | | 19.89 | |
2016 | | 1Q | | 358 | | | 19.89 | |
2016 | | 2Q | | 17,976 | | | 21.89 | |
A total of $382, $315, and $359 was recognized as expense in 2016, 2015, and 2014 for these grants.
In late 2014, the Company announced a stock repurchase program pursuant to which the Company could repurchase up to 5.0% of its outstanding shares of common stock, or approximately 1,085,000 shares prior to December
31, 2015. During 2015, the Company repurchased 169,110 shares at a total cost of $3,381. The program expired on December 31, 2015.
NOTE 23 — EARNINGS PER COMMON SHARE
Earnings per common share were computed as follows:
| | | | | | | | | |
| | | | | Weighted | | Per | |
| | Net | | Average | | Share | |
Year Ended December 31, 2016 | | Income | | Shares | | Amount | |
Basic Earnings Per Common Share | | | | | | | | | |
Net income | | $ | 38,323 | | 23,105,317 | | $ | 1.66 | |
Effect of dilutive warrants | | | | | 210,638 | | | | |
Effect of dilutive stock options | | | | | 115,400 | | | | |
Diluted Earnings Per Common Share | | | | | | | | | |
Net income attributable to common shareholders and assumed conversions | | $ | 38,323 | | 23,431,355 | | $ | 1.64 | |
| | | | | | | | | |
| | | | | Weighted | | Per | |
| | Net | | Average | | Share | |
Year Ended December 31, 2015 | | Income | | Shares | | Amount | |
Basic Earnings Per Common Share | | | | | | | | | |
Net income | | $ | 35,542 | | 21,637,775 | | $ | 1.64 | |
Effect of dilutive warrants | | | | | 163,011 | | | | |
Effect of dilutive stock options | | | | | 108,584 | | | | |
Diluted Earnings Per Common Share | | | | | | | | | |
Net income attributable to common shareholders and assumed conversions | | $ | 35,542 | | 21,909,370 | | $ | 1.62 | |
| | | | | | | | | |
| | | | | Weighted | | Per | |
| | Net | | Average | | Share | |
Year Ended December 31, 2014 | | Income | | Shares | | Amount | |
Basic Earnings Per Common Share | | | | | | | | | |
Net income | | $ | 28,996 | | 20,706,688 | | $ | 1.40 | |
Effect of dilutive warrants | | | | | 76,828 | | | | |
Effect of dilutive stock options | | | | | 70,552 | | | | |
Diluted Earnings Per Common Share | | | | | | | | | |
Net income attributable to common shareholders and assumed conversions | | $ | 28,996 | | 20,854,068 | | $ | 1.39 | |
All stock options were dilutive in 2016 based on the Company’s stock price. Stock options for 452, and 125,530 shares of common stock were not considered in computing diluted earnings per common share for 2015 and 2014 because they were antidilutive.
NOTE 24 — QUARTERLY FINANCIAL DATA (UNAUDITED)
| | | | | | | | | | | | | | | | |
| | | | | | | | | | | Earnings per | |
| | | | | | | | | | | Common Share | |
| | Interest | | Net Interest | | | | | | | | | |
| | Income | | Income | | Net Income | | Basic | | Diluted | |
2016 | | | | | | | | | | | | | | | | |
First quarter | | $ | 28,746 | | $ | 26,372 | | $ | 8,766 | | $ | 0.41 | | $ | 0.40 | |
Second quarter | | | 30,870 | | | 28,198 | | | 6,117 | | | 0.27 | | | 0.27 | |
Third quarter | | | 33,857 | | | 30,990 | | | 11,696 | | | 0.49 | | | 0.48 | |
Fourth quarter | | | 34,854 | | | 32,041 | | | 11,744 | | | 0.49 | | | 0.48 | |
2015 | | | | | | | | | | | | | | | | |
First quarter | | $ | 27,267 | | $ | 25,054 | | $ | 7,663 | | $ | 0.35 | | $ | 0.35 | |
Second quarter | | | 27,293 | | | 25,344 | | | 9,660 | | | 0.45 | | | 0.44 | |
Third quarter | | | 28,113 | | | 26,088 | | | 9,111 | | | 0.42 | | | 0.42 | |
Fourth quarter | | | 28,437 | | | 26,239 | | | 9,108 | | | 0.42 | | | 0.42 | |
NOTE 25 — PARENT ONLY CONDENSED FINANCIAL STATEMENTS
Parent Only Condensed Balance Sheets
| | | | | | | |
December 31 | | 2016 | | 2015 | |
Assets | | | | | | | |
Cash and cash equivalents | | $ | 10,366 | | $ | 14,846 | |
Securities available for sale | | | 130 | | | 149 | |
Investment in subsidiaries | | | 494,158 | | | 403,981 | |
Other assets | | | 8,396 | | | 9,586 | |
Total assets | | $ | 513,050 | | $ | 428,562 | |
Liabilities | | | | | | | |
Subordinated debentures | | $ | 41,239 | | $ | 41,239 | |
Borrowings | | | 18,333 | | | — | |
Other liabilities | | | 3,984 | | | 5,963 | |
Total liabilities | | | 63,556 | | | 47,202 | |
Shareholders’ equity | | | 449,494 | | | 381,360 | |
Total liabilities and shareholders’ equity | | $ | 513,050 | | $ | 428,562 | |
Parent Only Condensed Statement of Income and Comprehensive Income
| | | | | | | | | | |
Year Ended December 31 | | 2016 | | 2015 | | 2014 | |
Income | | | | | | | | | | |
Dividends from subsidiaries | | $ | 43,100 | | $ | 28,900 | | $ | 24,275 | |
Fees from subsidiaries | | | 13,674 | | | 13,232 | | | 13,518 | |
Other income | | | 13 | | | 19 | | | 526 | |
Total income | | | 56,787 | | | 42,151 | | | 38,319 | |
Expenses | | | | | | | | | | |
Interest expense | | | 1,876 | | | 1,264 | | | 1,286 | |
Salaries and benefits | | | 13,101 | | | 9,873 | | | 11,038 | |
Professional fees | | | 1,364 | | | 1,238 | | | 1,372 | |
Other expenses | | | 9,685 | | | 9,233 | | | 9,381 | |
Total expenses | | | 26,026 | | | 21,608 | | | 23,077 | |
Income before income taxes and equity in undistributed income of subsidiaries | | | 30,761 | | | 20,543 | | | 15,242 | |
Income tax (benefit) | | | (4,415) | | | (2,989) | | | (3,118) | |
Income before equity in undistributed income of subsidiaries | | | 35,176 | | | 23,532 | | | 18,360 | |
Equity in undistributed income of subsidiaries | | | 3,147 | | | 12,010 | | | 10,636 | |
Net income | | $ | 38,323 | | $ | 35,542 | | $ | 28,996 | |
Comprehensive Income | | $ | 28,778 | | $ | 34,453 | | $ | 41,575 | |
Parent Only Condensed Statements of Cash Flows
| | | | | | | | | | |
Year Ended December 31 | | 2016 | | 2015 | | 2014 | |
Operating Activities | | | | | | | | | | |
Net income | | $ | 38,323 | | $ | 35,542 | | $ | 28,996 | |
Undistributed (income)/loss of subsidiaries | | | (3,147) | | | (12,010) | | | (10,636) | |
Changes in other assets and liabilities | | | 1,953 | | | 1,896 | | | 3,862 | |
Net cash provided by operating activities | | | 37,129 | | | 25,428 | | | 22,222 | |
Investing Activities | | | | | | | | | | |
Proceeds from sales of securities | | | 19 | | | 0 | | | 750 | |
Cash paid for bank acquisition, net | | | (45,188) | | | 0 | | | (13,935) | |
Purchases of equipment | | | (1,215) | | | (1,991) | | | (403) | |
Net cash used by investing activities | | | (46,384) | | | (1,991) | | | (13,588) | |
Financing Activities | | | | | | | | | | |
Proceeds from exercise of stock options | | | 1,783 | | | 294 | | | 66 | |
Proceeds from term debt | | | 30,000 | | | — | | | — | |
Purchase of treasury shares | | | (1,045) | | | (3,527) | | | (319) | |
Repayment of subordinated debentures, net | | | — | | | 0 | | | (5,000) | |
Repayment on term debt | | | (11,667) | | | — | | | — | |
Cash dividends on common stock | | | (14,296) | | | (11,680) | | | (8,726) | |
Net cash used by financing activities | | | 4,775 | | | (14,913) | | | (13,979) | |
Net change in cash and cash equivalents | | | (4,480) | | | 8,524 | | | (5,345) | |
Cash and cash equivalents, beginning of year | | | 14,846 | | | 6,322 | | | 11,667 | |
Cash and cash equivalents, end of year | | $ | 10,366 | | $ | 14,846 | | $ | 6,322 | |
NOTE 26 — ACQUISITIONS
On February 17, 2017, MainSource Bank entered into an agreement with First Service Capital Management, Inc. (“First Service”), located in Elizabethtown, Kentucky, to acquire the assets under management. In connection with the acquisition, the Bank also agreed to hire all of First Service employees, including its four brokers. The purchase price of approximately $1,750 will result in intangible assets including goodwill and a customer relationship intangible. These amounts are currently being calculated and the amounts will be included in the first half on 2017 results.
On December 19, 2016, the Company entered into an Agreement and Plan of Merger (the “Merger Agreement”) with FCB Bancorp, Inc., a Kentucky corporation (“FCB”), pursuant to which FCB will merge with and into the Company, whereupon the separate corporate existence of FCB will cease and MainSource will survive (the “Merger”). After the Merger, The First Capital Bank of Kentucky, a Kentucky-chartered bank and a wholly-owned subsidiary of FCB (“FCB Bank”), will be a wholly-owned subsidiary of MainSource. The Company anticipates that within a few months following the Merger, FCB Bank will merge with and into MainSource Bank, with MainSource Bank as the surviving bank.
Subject to the approval of FCB’s stockholders of the merger, regulatory approvals and other customary closing conditions, the parties anticipate completing the Merger in the second quarter of 2017.
At the effective time of the Merger, stockholders of FCB shall be entitled to receive (i) 0.9 shares of MainSource common stock (the “Exchange Ratio”) and (ii) $7.00 in cash for each share of FCB common stock owned. Additionally, all outstanding and unexercised options to purchase FCB stock will vest in full and be converted automatically into the right to receive an amount of cash equal to the product of (i) the difference (if positive) between (A) $7.00 plus the product of (y) 0.9 and (z) the average of the daily closing sales prices of a share of MainSource common stock as reported on the NASDAQ for the 10 consecutive trading days ending on the third business day preceding the Closing Date minus (B) the exercise price of such FCB stock option, multiplied by (ii) the number of shares of FCB common stock subject to such FCB stock option. Based upon the December 16, 2016 closing price of $32.65 per share of MainSource common stock, the transaction is valued at approximately $56.9 million.
FCB is the holding company of FCB Bank. FCB Bank was founded in 1911 as a Kentucky-chartered savings and loan association. FCB Bank now operates 7 full service branches in Jefferson County, Kentucky. As of December 31, 2016, FCB had $518,380 of total assets, $427,047 of loans, $387,862 of deposits and total equity of $30,798 .
On May 20, 2016, the Company acquired 100% of the outstanding common shares of Cheviot Financial Corp. (“Cheviot”) and its subsidiary Cheviot Savings Bank in exchange for stock and cash. Shareholders of Cheviot were entitled to merger consideration in accordance with the terms of the merger agreement. At the time of the merger, stockholders of Cheviot received either 0.6916 shares of the Company’s common stock or $15.00 in cash for each share of Cheviot common stock owned, subject to proration provisions specified in the Merger Agreement that provide for a targeted aggregate split of total consideration of 50% common stock and 50% cash. In total, the Company issued 2,351,816 shares of common stock and paid $49.7 million in cash to the former shareholders of Cheviot.
With the acquisition, the Company expanded its presence in the greater Cincinnati area. The acquisition offers the Company the opportunity to increase profitability by introducing new products and services to the acquired customer base and adding new customers in the expanded region. Cheviot’s results of operations were included in the Company’s results beginning May 21, 2016. Acquisition-related costs of $7,130 were included in the Company’s income statement for 2016. The fair value of the common shares issued as part of the consideration paid for Cheviot was determined on the basis of the closing price of the Company’s common shares on the acquisition date.
Goodwill of $25,362 arising from the acquisition consisted largely of synergies and the cost savings resulting from the combining of the operations of the companies. Goodwill will not be deductible for income tax purposes. The following table summarizes the consideration paid for Cheviot and the amounts of the assets acquired and liabilities assumed recognized at the acquisition date:The Core Deposit Intangible of $4,099 is being amortized for book purposes over 10 years.
Consideration | | | |
Cash | | $ | 49,715 |
Equity Instruments | | | 51,387 |
Fair Value of Total Consideration | | $ | 101,102 |
| | | |
Recognized Amounts of Identifiable Assets Acquired and Liabilities Assumed | | | |
Cash and cash equivalents | | $ | 38,426 |
Securities | | | 89,693 |
Federal Home Loan Bank stock | | | 8,651 |
Loans | | | 355,343 |
Premises and equipment | | | 6,674 |
Core deposit intangibles | | | 4,099 |
Bank owned life insurance | | | 16,575 |
Other assets | | | 15,972 |
Total assets acquired | | | 535,433 |
| | | |
Deposits | | | 444,695 |
Federal Home Loan Bank advances | | | 12,156 |
Other liabilities | | | 2,842 |
Total liabilities assumed | | | 459,693 |
| | | |
Total identifiable net assets | | $ | 75,740 |
| | | |
Goodwill | | $ | 25,362 |
The fair value of net assets acquired includes fair value adjustments to certain receivables that were not considered impaired as of the acquisition date. The fair value adjustments were determined using discounted contractual cash flows. However, the Company believes that all contractual cash flows related to these financial instruments will be collected. As such, these receivables were not considered impaired at the acquisition date and were not subject to the guidance relating to purchased credit impaired loans, which have shown evidence of credit deterioration since origination. Receivables acquired that were not subject to these requirements include non-impaired loans and customer receivables with a fair value and gross contractual amounts receivable of $343,783 and $350,869 on the date of acquisition. The Company also purchased some PCI loans related to the Cheviot acquisition. These loans had a contractual balance of $16,175 with a fair value of $11,560.
The following table presents pro forma information as if the acquisition had occurred at the beginning of 2015. The pro forma information includes adjustments for interest income on loans and securities acquired, amortization of intangibles arising from the transaction, depreciation expense on property acquired, interest expense on deposits acquired, and the related income tax effects. The pro forma financial information is not necessarily indicative of the results of operations that would have occurred had the transaction been effected on the assumed dates.
| | | | | | |
| | | | | | |
| | | 2016 | 2015 |
Net interest income | | | $ | 124,727 | $ | 120,960 |
Net income | | | | 44,013 | | 39,073 |
Basic earnings per share | | | | 1.83 | | 1.63 |
Diluted earnings per share | | | | 1.81 | | 1.61 |
On August 14, 2015, the Company completed its purchase of five Old National Bank branches located in Batesville, Brownstown, Richmond, and Portland, Indiana and Union City, Ohio. As of the date of acquisition, the Company acquired $37 million in loans, $99 million in deposits, and $1 million in property. Goodwill of $2.5 million and a core deposit intangible of $1.2 million were also recorded resulting in purchase premium of $3.7 million. $57 million of cash was received at purchase. The Company incurred $731 of expenses related to the acquisition of these branches. The core deposit intangible asset is being amortized over 10 years. Goodwill and the core deposit intangible will be deducted for tax purposes over 15 years.
On October 17, 2014, the Company acquired 100% of the outstanding common shares of MBT Bancorp (“MBT”) in exchange for $35.16 in cash or 2.055 shares of common stock of the Company for each share of MBT common stock outstanding. The merger agreement required that 60% of the outstanding shares of MBT common stock be converted into MainSource common stock and 40% of the outstanding shares of MBT common stock be converted into cash. A shareholder election was conducted and completed prior to the closing wherein MBT shareholders were provided the opportunity to select their preferred form of consideration, subject to the allocation and proration procedures contained in the merger agreement. MBT shareholder stock elections were not sufficient to reach the 60% stock requirement established in the merger agreement. Consequently, MBT shareholders who did not make an election received a portion of their merger consideration in MainSource common stock and a portion in cash. In total, the Company issued 1,226,312 shares of common stock and paid $13.9 million in cash to the former shareholders of MBT.
At the time of the acquisition, MBT’s wholly-owned bank subsidiary, The Merchant’s Bank and Trust Company, was merged into the Bank. With the acquisition, the Company expanded its presence in the southeastern Indiana and greater Cincinnati market areas. The acquisition of MBT offered the Company the opportunity to increase profitability by introducing existing products and services to the acquired customer base and to add new customers in the expanded region. MBT’s results of operations were included in the Company’s results beginning October 18, 2014. Acquisition-related costs of $3,119 were included in the Company’s income statement for the year ended December 31, 2014. The fair value of the common shares issued as part of the consideration paid for MBT was determined on the basis of the closing price of the Company’s common shares on the acquisition date.
Goodwill of $8,550 arising from the acquisition consisted largely of synergies and the cost savings resulting from the combining of the operations of the companies. Goodwill will not be deductible for income tax purposes. The following
table summarizes the consideration paid for MBT and the value of the assets acquired and liabilities assumed recognized at the acquisition date:
| | | | |
Consideration | | | | |
Cash | | $ | 13,992 | |
Equity Instruments | | | 21,534 | |
Fair Value of Total Consideration | | $ | 35,526 | |
Recognized Amounts of Identifiable Assets Acquired and Liabilities Assumed | | | | |
Cash and cash equivalents | | $ | 3,306 | |
Securities | | | 31,214 | |
Federal Home Loan Bank stock | | | 1,476 | |
Loans | | | 184,716 | |
Premises and equipment | | | 4,863 | |
Core deposit intangibles | | | 1,661 | |
Other assets | | | 3,468 | |
Total assets acquired | | | 230,704 | |
| | | | |
Deposits | | | 183,897 | |
Federal Home Loan Bank advances | | | 16,300 | |
Other liabilities | | | 3,531 | |
Total liabilities assumed | | | 203,728 | |
| | | | |
Total identifiable net assets | | $ | 26,976 | |
| | | | |
Goodwill | | $ | 8,550 | |
The fair value of net assets acquired includes fair value adjustments to certain receivables that were not considered impaired as of the acquisition date. The fair value adjustments were determined using discounted contractual cash flows. However, the Company believes that all contractual cash flows related to these financial instruments will be collected. As such, these receivables were not considered impaired at the acquisition date and were not subject to the guidance relating to purchased credit impaired loans, which have shown evidence of credit deterioration since origination. Receivables acquired that were not subject to these requirements include non-impaired loans and customer receivables with a fair value and gross contractual amounts receivable of $183,485 and $185,400 on the date of acquisition. The Company did acquire a small number of credit impaired loans. These loans had a net carrying amount of less than $1,000. Accordingly, no additional disclosures were made due to their immateriality.
The pro forma financial information is not included as it was considered immaterial to the Company’s results.
The above transactions were considered business combinations. Their results of operations are included in the financial statements after acquisition. Proforma data was not considered material and is not presented.
NOTE 27 — BRANCH CLOSURES
In the fourth quarter of 2016, the Company announced that it would be closing the following branches in the first quarter of 2017: Bloomfield and Jasonville, Indiana and Piqua, Ohio. As of December 31, 2016, the three branches had approximately $53 million in total deposits. Included in the operating results of 2016 are $389 of impairment costs for the affected properties, $75 of severance costs, and $20 of other costs related to the closing of the branches.
In the fourth quarter of 2015, the Company announced that it would be closing the following branches in the second quarter of 2016: one of two branches in the following cities in Indiana – Rushville, New Castle, and Crawfordsville, Indiana and its branch in Bourbonnais, Illinois. Included in the operating results of 2015 are $175 of impairment costs for the affected properties and $75 of severance costs.
In the second quarter of 2014, the Company closed three branches in the following locations: Griffith, Indiana and the downtown branch located in Linton, Indiana, and one of its branches located in Frankfort, Kentucky. As of December 31, 2013, the three branches had approximately $22 million in total deposits. Included in the operating results of 2014 are $550 of impairment costs for the affected properties, $25 of severance costs, and $25 of other costs related to the closing of the branches.
NOTE 28 – DERIVATIVES
The Bank executes interest rate swaps with commercial banking customers to facilitate their risk management strategies. These derivative positions relate to transactions in which the Bank enters into an interest rate swap with a customer while at the same time entering into an offsetting interest rate swap with another financial institution. The Bank agrees to pay interest to the customer on a notional amount at a variable interest rate and receive interest from the customer on the same notional amount at a fixed interest rate. At the same time, the Bank agrees to pay another financial institution the same fixed interest rate on the same notional amount and receive the same variable interest rate on the same notional amount. The transaction allows the customer to effectively convert a variable rate loan to a fixed rate. Because the terms of the swaps with the customers and the other financial institutions offset each other, with the only difference being counterparty credit risk, changes in the fair value of the underlying derivative contracts are not materially different and do not significantly impact the Bank’s results of operations. The notional amounts of these interest rate swaps and the offsetting counterparty derivative instruments were $143.3 million at December 31, 2016 and $53.7 million at December 31, 2015.
Credit risk arises from the possible inability of counterparties to meet the terms of their contracts. The Bank’s exposure is limited to the replacement value of the contracts rather than the notional, principal or contract amounts. There are provisions in the agreements with the counterparties that allow for certain unsecured credit exposure up to an agreed threshold. Exposures in excess of the agreed thresholds are collateralized. In addition, the Bank minimizes credit risk through credit approvals, limits, and monitoring procedures.
The fair value hedges are summarized below:
| | | | | | | | | | | | | |
| | | December 31, 2016 | | December 31, 2015 | |
| | Notional | | | | | Notional | | | | |
| | Amount | | Fair Value | | Amount | | Fair Value | |
Included in Other Assets: | | | | | | | | | | | | | |
Interest Rate Swaps at Fair Value | | $ | 143,300 | | $ | 3,003 | | $ | 53,741 | | $ | 1,508 | |
| | | | | | | | | | | | | |
Included in Other Liabilities: | | | | | | | | | | | | | |
Interest Rate Swaps at Fair Value | | $ | 143,300 | | $ | 3,003 | | $ | 53,741 | | $ | 1,508 | |
The effect of derivative instruments on the Consolidated Statement of Income is presented below:
| | | | | | | |
| | Year Ended | |
| | December 31, | |
| | 2016 | | 2015 | |
Interest Rate Swaps – Fee Income | | | | | | | |
Included in Other Income / (Expense) | | $ | 1,071 | | $ | 694 | |
ITEM 9. CHANGES IN AND DISAGREEMENTS WITH ACCOUNTANTS ON ACCOUNTING AND FINANCIAL DISCLOSURE
In connection with its audits for the three most recent fiscal years ended December 31, 2016, there have been no disagreements with the Company’s independent registered public accounting firm on any matter of accounting principles or practices, financial statement disclosure or auditing scope or procedure.
ITEM 9A. CONTROLS & PROCEDURES
Disclosure Controls and Procedures
As of the end of the period covered by this report, an evaluation was carried out under the supervision and with the participation of the Company’s management, including our Chief Executive Officer and Chief Financial Officer, of the effectiveness of our disclosure controls and procedures (as defined in Exchange Act Rules 13a‑15(e) and 15d‑15(e) under the Securities Exchange Act of 1934). Based on their evaluation, our Chief Executive Officer and Chief Financial Officer have concluded that the Company’s disclosure controls and procedures are effective to ensure that information required to be disclosed by the Company in reports that it files or submits under the Exchange Act is recorded, processed, summarized and reported within the time periods specified in Securities and Exchange Commission rules and forms as of such date.
Our management has evaluated our internal control over financial reporting and there were no changes in our internal control over financial reporting that occurred during the most recent fiscal quarter that have materially affected, or are reasonably likely to materially affect, the Company’s internal control over financial reporting.
Management’s Report on Internal Control Over Financial Reporting
MainSource Financial Group, Inc. (the “Company”) is responsible for the preparation, integrity, and fair presentation of the consolidated financial statements included in this annual report. The consolidated financial statements and notes included in this annual report have been prepared in conformity with United States generally accepted accounting principles and necessarily include some amounts that are based on management’s best estimates and judgments.
We, as management of the Company, are responsible for establishing and maintaining effective internal control over financial reporting that is designed to produce reliable financial statements in conformity with United States generally accepted accounting principles. The system of internal control over financial reporting as it relates to the financial statements is evaluated for effectiveness by management and tested for reliability through a program of internal audits and other management testing. Because of its inherent limitations, internal control over financial reporting may not prevent or detect misstatements. Also, projections of any evaluation of effectiveness to future periods are subject to the risk that controls may become inadequate because of changes in conditions, or that the degree of compliance with the policies or procedures may deteriorate.
Management assessed the Company’s system of internal control over financial reporting as of December 31, 2016, in relation to criteria for effective internal control over financial reporting as described in “2013 Internal Control — Integrated Framework” issued by the Committee of Sponsoring Organizations of the Treadway Commission. Based on this assessment, management concluded that as of December 31, 2016, its system of internal controls over financial reporting is effective and meets the criteria of the “2013 Internal Control — Integrated Framework”. Crowe Horwath LLP, independent registered public accounting firm, has issued an attestation report dated March 10, 2017 on the Company’s internal control over financial reporting. This report is incorporated by reference in Item 8 above, under the heading “Report of Independent Registered Public Accounting Firm”.
Archie M. Brown, Jr.
President and Chief Executive Officer
James M. Anderson
Executive Vice President and Chief Financial Officer
ITEM 9B. OTHER INFORMATION
None
PART IV
ITEM 15. EXHIBITS, FINANCIAL STATEMENT SCHEDULES
(a)(1) Financial Statements.
Financial Statements filed as part of this Form 10‑K are included under Part II, Item 8, above.
(a)(2) Financial statement schedules
All schedules are omitted because they are not applicable or not required, or because the required information is included in the consolidated financial statements or related notes in Part II, Item 8 above.
(a)(3) Exhibits:
2.1Agreement and Plan of Merger, dated April 7, 2014, by and between MainSource Financial Group, Inc. and MBT Bancorp (incorporated by reference to Exhibit 2.1 to the Report on Form 8‑K of the registrant filed on April 7, 2014 with the Commission (Commission File No. 0‑12422)).
2.2Agreement and Plan of Merger, dated November 23, 2015, by and between MainSource Financial Group, Inc. and Cheviot Financial Corp. (incorporated by reference to Exhibit 2.1 to the Report on Form 8‑K of the registrant filed on November 24, 2015 with the Commission (Commission File No. 0‑12422)).
2.3Agreement and Plan of Merger, dated December 19, 2016, by and between MainSource Financial Group, Inc. and FCB Bancorp, Inc. (incorporated by reference to Exhibit 2.1 to the report on Form 8-K of the registrant filed on December 19, 2016 with the Commission (Commision File No. 0-12422)).
3.1Amended and Restated Articles of Incorporation (incorporated by reference to Exhibit 3.1 to the Report on Form 8‑K of the registrant filed December 13, 2013 with the Commission (Commission File No. 0‑12422)).
3.2Amended and Restated Bylaws of MainSource Financial Group, Inc. dated July 19, 2010 (incorporated by reference to Exhibit 3.1 to the Report on Form 8‑K of the registrant filed July 22, 2010 with the Commission (Commission File No. 0‑12422)).
4.1Indenture dated as of December 19, 2002 between the Registrant, as issuer, and State Street Bank and Trust Company of Connecticut, N.A., as trustee, re: floating rate junior subordinated deferrable interest debentures due 2032 (incorporated by reference to Exhibit 4.6 to the Annual Report on Form 10‑K of the registrant for the fiscal year ended December 31, 2002 filed March 28, 2003 with the Commission (Commission File No. 0‑12422)).
4.2Amended and Restated Declaration of Trust dated as of December 19, 2002 among State Street Bank and Trust Company of Connecticut, N.A., as institutional trustee, the Registrant, as sponsor, and James L. Saner Sr., Donald A. Benziger and James M. Anderson, as administrators (incorporated by reference to Exhibit 4.7 to the Annual Report on Form 10‑K of the registrant for the fiscal year ended December 31, 2002 filed March 28, 2003 with the Commission (Commission File No. 0‑12422)).
4.3Guarantee Agreement dated as of December 19, 2002 between the Registrant, and State Street Bank and Trust Company of Connecticut, N.A (incorporated by reference to Exhibit 4.8 to the Annual Report on Form 10‑K of the registrant for the fiscal year ended December 31, 2002 filed March 28, 2003 with the Commission (Commission File No. 0‑12422)).
4.4Indenture dated as of April 1, 2003 between the Registrant, as issuer, and U.S. Bank, N.A., as trustee, re: floating rate junior subordinated deferrable interest debentures due 2033 (incorporated by reference to Exhibit 4.1 to the Quarterly Report on Form 10‑Q of the registrant for the quarter ended June 30, 2003 filed August 14, 2003 with the Commission (Commission File No. 0‑12422)).
4.5Amended and Restated Declaration of Trust dated as of April 1, 2003 among U.S. Bank, N.A., as institutional trustee, the Registrant, as sponsor, and James L. Saner Sr., Donald A. Benziger and James M. Anderson, as administrators (incorporated by reference to Exhibit 4.2 to the Quarterly Report on Form 10‑Q of the registrant for the quarter ended June 30, 2003 filed August 14, 2003 with the Commission (Commission File No. 0‑12422)).
4.6Guarantee Agreement dated as of April 1, 2003 between the Registrant, and U.S. Bank, N.A (incorporated by reference to Exhibit 4.3 to the Quarterly Report on Form 10‑Q of the registrant for the quarter ended June 30, 2003 filed August 14, 2003 with the Commission (Commission File No. 0‑12422)).
4.7Indenture dated as of June 12, 2003 between the Registrant, as issuer, and The Bank of New York, as trustee, re: rate junior subordinated deferrable interest debentures due (incorporated by reference to Exhibit 4.4 to the Quarterly Report on Form 10‑Q of the registrant for the quarter ended June 30, 2003 filed August 14, 2003 with the Commission (Commission File No. 0‑12422)).
4.8Amended and Restated Declaration of Trust dated as of June 12, 2003 among The Bank of New York, as institutional trustee, the Registrant, as sponsor, and James L. Saner Sr., Donald A. Benziger and James M. Anderson, as administrators (incorporated by reference to Exhibit 4.5 to the Quarterly Report on Form 10‑Q of the registrant for the quarter ended June 30, 2003 filed August 14, 2003 with the Commission (Commission File No. 0‑12422)).
4.9Guarantee Agreement dated as of June 12, 2003 between the Registrant, and The Bank of New York (incorporated by reference to Exhibit 4.6 to the Quarterly Report on Form 10‑Q of the registrant for the quarter ended June 30, 2003 filed August 14, 2003 with the Commission (Commission File No. 0‑12422)).
4.10Form of Amended and Restated Declaration of Trust dated as of October 13, 2006, of MainSource Statutory Trust IV, among MainSource Financial Group, Inc. as sponsor, Wells Fargo Delaware Trust Company as Delaware trustee and Wells Fargo Bank, National Association, as institutional trustee (incorporated by reference to Exhibit 10.1 to the periodic report on Form 8‑K of the registrant filed October 17, 2006 with the Commission (Commission File No. 0‑12422)).
4.11Form of Indenture dated as of October 13, 2006, between MainSource Financial Group, Inc. and Wells Fargo Bank, National Association, as trustee (incorporated by reference to Exhibit 10.2 to the periodic report on Form 8‑K of the registrant filed October 17, 2006 with the Commission (Commission File No. 0‑12422)).
4.12Form of Guarantee Agreement dated as of October 13, 2006, between MainSource Financial Group, Inc., as guarantor, and Wells Fargo Bank, National Association, as guarantee trustee (incorporated by reference to Exhibit 10.3 to the periodic report on Form 8‑K of the registrant filed October 17, 2006 with the Commission (Commission File No. 0‑12422)).
4.13Warrant for the Purchase of Shares of MainSource Financial Group, Inc. Common Stock (incorporated by reference to Exhibit 4.2 to the Report on Form 8‑K of the registrant filed January 20, 2009 with the Commission (Commission File No. 0‑12422)).
10.1Registrant’s 2003 Stock Option Plan (incorporated by reference to Exhibit 10.1 to the Annual Report on Form 10‑K of the registrant for the fiscal year ended December 31, 2003 filed March 12, 2004 with the Commission (Commission File No. 0‑12422)).*
10.2Form of Stock Option Agreement Under 2003 Stock Option Plan for Directors of Registrant dated May 19, 2003 (incorporated by reference to Exhibit 10.2 to the Annual Report on Form 10‑K of the registrant for the fiscal year ended December 31, 2003 filed March 12, 2004 with the Commission (Commission File No. 0‑12422)).*
10.3Form of Stock Option Agreement Under 2003 Stock Option Plan for Officers of Registrant (incorporated by reference to Exhibit 10.1 to the Report on Form 8‑K of the registrant filed February 24, 2005 with the Commission (Commission File No. 0‑12422)).*
10.4Form of Indemnification Agreement for Directors and Certain Officers of Registrant (incorporated by reference to Exhibit 10.1 to the Report on Form 8‑K of the registrant filed February 24, 2005 with the Commission (Commission File No. 0‑12422)).
10.5Registrant’s 2007 Stock Incentive Plan (incorporated by reference to Exhibit 10.9 to the Report on Form 10‑K of the registrant for the year ending December 31, 2007, filed March 17, 2008 with the Commission (Commission File No. 0‑12422)).*
10.6Form of Award Agreement for Archie M. Brown, Jr. under the MainSource Financial Group, Inc. 2007 Stock Incentive Plan (incorporated by reference to Exhibit 10.2 to the Report on Form 8‑K of the registrant filed July 24, 2008 with the Commission (Commission File No. 0‑12422)).*
10.7Form of Stock Award Agreement under the MainSource Financial Group, Inc. 2007 Stock Incentive Plan (for Executives) (incorporated by reference to Exhibit 10.1 to the Report on Form 8‑K of the registrant filed February 27, 2009 with the Commission (Commission File No. 0‑12422)).*
10.8Form of Restricted Stock Award Agreement (for Executives) under the MainSource Financial Group, Inc. 2007 Stock Incentive Plan (incorporated by reference to Exhibit 10.1 to the Quarterly Report on Form 10‑Q of the registrant filed on August 8, 2011, for the quarter ending June 30, 2011, with the Commission (Commission File No. 0‑12422)).*
10.9Change in Control Agreement with Archie M. Brown, Jr. dated November 14, 2011 (incorporated by reference to Exhibit 99.1 to the Report on Form 8‑K of the registrant filed on November 17, 2011 with the Commission (Commission File No. 0‑12422)).*
10.10Change in Control Agreement with James M. Anderson dated November 14, 2011 (incorporated by reference to Exhibit 99.2 to the Report on Form 8‑K of the registrant filed on November 17, 2011 with the Commission (Commission File No. 0‑12422)).*
10.11Change in Control Agreement with Daryl R. Tressler dated November 14, 2011 (incorporated by reference to Exhibit 99.3 to the Report on Form 8‑K of the registrant filed on November 17, 2011 with the Commission (Commission File No. 0‑12422)).*
10.12Change in Control Agreement with William J. Goodwin dated November 14, 2011 (incorporated by reference to Exhibit 99.4 to the Report on Form 8‑K of the registrant filed on November 17, 2011 with the Commission (Commission File No. 0‑12422)).*
10.13Change in Control Agreement with Chris Harrison dated May 4, 2012 (incorporated by reference to Exhibit 10.1 to the Report on Form 8‑K of the registrant filed on May 10, 2012 with the Commission (Commission File No. 0‑12422)).*
10.14Short‑Term Incentive Plan, Effective January 1, 2014 (incorporated by reference to Exhibit 10.1 to the Report on Form 8‑K of the registrant filed on December 23, 2014 with the Commission (Commission File No. 0‑12422)).*
10.15MainSource Finanacial Group, Inc. 2015 Stock Incentive Plan, effective January 1, 2015 (incorporated by reference to Exhibit 10.1 to the Report on Form 10-Q of the registrant filed on May 8, 2015 with the Commission (Commission File No. 0-12422)).*
10.16Form of Performance Share Unit Award Agreement under the MainSource Financial Group, Inc. 2015 Stock Incentive Plan (incorporated by reference to Exhibit 10.2 to the Report on Form 10-Q of the registrant filed on May 8, 2015 with the Commission (Commission File No. 0-12422)).*
10.17Form of Restricted Stock Award Agreement under the MainSource Financial Group, Inc. 2015 Stock Incentive Plan (incorporated by reference to Exhibit 10.3 to the Report on Form 10-Q of the registrant filed on August 6, 2015 with the Commission (Commission File No. 0-12422)).*
10.18Form of Voting Agreement dated November 23, 2015 (incorporated by reference to Exhibit 10.1 to the Report on Form 8-K of the registrant filed on November 24, 2015 with the Commission (Commission File No. 0-12422)).
10.19Loan Agreement between U.S. Bank National Association and MainSource Financial Group, Inc. dated April 28, 2016 (incorporated by reference to Exhibit 10.1 to the Report on Form 10-Q of the registrant filed on August 8, 2016 with the Commission (Commission File No. 0-12422)).
10.20Amendment to Change in Control Agreement between MainSource Financial Group, Inc. and Chris Harrison dated April 20, 2016 (incorporated by reference to Exhibit 10.2 to the Report on Form 10-Q of the registrant filed on August 8, 2016 with the Commission (Commission File No. 0-12422)).*
10.21Form of Voting Agreement dated December 19, 2016 (incorporated by reference to Exhibit 10.1 to the Report on Form 8-K of the registrant filed on December 19, 2016 with the Commission (Commission File No. 0-12422)).
10.22Retirement Agreement and General Release between Daryl R. Tressler and MainSource Financial Group, Inc. dated December 21, 2016 (incorporated by reference to Exhibit 10.1 to the Report on Form 8-K of the registrant filed on December 28, 2016 with the Commission (Commission File No. 0-12422)).*
21List of subsidiaries of the Registrant.
23.1Consent of Crowe Horwath LLP.
31.1Certification pursuant to Section 302 of Sarbanes‑Oxley Act of 2002 by Chief Executive Officer
31.2Certification pursuant to Section 302 of Sarbanes‑Oxley Act of 2002 by Chief Financial Officer
32.1Certification pursuant to Section 906 of the Sarbanes‑Oxley Act of 2002, by Chief Executive Officer
32.2Certification pursuant to Section 906 of the Sarbanes‑Oxley Act of 2002, by Chief Financial Officer
101The following financial statements and notes from the MainSource Financial Group Annual Report on Form 10‑K for the year ended December 31, 2016, formatted in XBRL pursuant to Rule 405 of Regulation S‑T: (i) Condensed Consolidated Balance Sheets; (ii) Condensed Consolidated Statements of Income; (iii) Condensed Consolidated Statements of Comprehensive Income; (iv) Condensed Consolidated Statements of Shareholders’ Equity; (v) Condensed Consolidated Statements of Cash Flow; and (vi) the Notes to the condensed consolidated financial statements.
*A management contract or compensatory plan or agreement.
(b)Exhibits
Reference is made to Item 15(a)(3) above.
(c)Schedules
None required.
Pursuant to the requirements of Section 13 or 15(d) of the Securities Exchange Act of 1934, the registrant has duly caused this report to be signed on its behalf by the undersigned, thereunto duly authorized, on the 10th day of March, 2017.
| |
| MAINSOURCE FINANCIAL GROUP, INC. |
| |
| /s/ Archie M. Brown, Jr. |
| President and Chief Executive Officer |
Pursuant to the requirements of the Securities Exchange Act of 1934, this report on Form 10‑K has been signed by the following persons on behalf of the registrant and in the capacities with the Company and on the dates indicated.
| | | |
Signature | Capacity | Date |
| | |
/s/ | Kathleen L. Bardwell | | |
| Kathleen L. Bardwell | Lead Director | March 10, 2017 |
| | | |
/s/ | William G. Barron | | |
| William G. Barron | Director | March 10, 2017 |
| | | |
/s/ | Vince A. Berta | | |
| Vince A. Berta | Director | March 10, 2017 |
| | | |
/s/ | D.J. Hines | | |
| D.J. Hines | Director | March 10, 2017 |
| | | |
/s/ | Erin Hoeflinger | | |
| Erin Hoeflinger | Director | March 10, 2017 |
| | | |
/s/ | Thomas M. O’Brien | | |
| Thomas M. O’Brien | Director | March 10, 2017 |
| | | |
/s/ | Lawrence R. Rueff DVM | | |
| Lawrence R. Rueff DVM | Director | March 10, 2017 |
| | | |
/s/ | John G. Seale | | |
| John G. Seale | Director | March 10, 2017 |
| | | |
/s/ | John T. Smith | | |
| John T. Smith | Director | March 10, 2017 |
| | | |
/s/ | Charles J. Thayer | | |
| Charles J. Thayer | Director | March 10, 2017 |
| | | |
/s/ | James M. Anderson | | |
| James M. Anderson | Executive Vice President and Chief | March 10, 2017 |
| | Financial Officer | |
| | (Principal Financial Officer) | |
| | | |
/s/ | Patrick A. Weigel | | |
| Patrick A. Weigel | Vice President, Controller | March 10, 2017 |
| | (Principal Accounting Officer) | |
| | | |
/s/ | Archie M. Brown, Jr. | | |
| Archie M. Brown, Jr. | President, Chief Executive Officer and | March 10, 2017 |
| | Chairman of the Board | |
| | (Principal Executive Officer) | |