| | | UNITED STATES |
| | | SECURITIES AND EXCHANGE COMMISSION |
| | | Washington, D.C. 20549 |
| |
| |
| | | FORM N-CSR/A |
| |
| CERTIFIED SHAREHOLDER REPORT OF REGISTERED MANAGEMENT |
| | | INVESTMENT COMPANIES |
| |
| Investment Company Act file number 811-3757 |
| |
| Dreyfus Premier California Tax Exempt Bond Fund, Inc. |
| | | (Exact name of Registrant as specified in charter) |
| |
| |
| | | c/o The Dreyfus Corporation |
| | | 200 Park Avenue |
| | | New York, New York 10166 |
| | | (Address of principal executive offices) (Zip code) |
| |
| | | Mark N. Jacobs, Esq. |
| | | 200 Park Avenue |
| | | New York, New York 10166 |
| | | (Name and address of agent for service) |
| |
| Registrant's telephone number, including area code: (212) 922-6000 |
| |
| Date of fiscal year end: | | 5/31 |
| |
| Date of reporting period: | | 5/31/06 |
| | | | | FORM N-CSR |
| Item 1. | | Reports to Stockholders. | | |

Save time. Save paper. View your next shareholder report online as soon as it’s available. Log into www.dreyfus.com and sign up for Dreyfus eCommunications. It’s simple and only takes a few minutes.
The views expressed in this report reflect those of the portfolio manager only through the end of the period covered and do not necessarily represent the views of Dreyfus or any other person in the Dreyfus organization. Any such views are subject to change at any time based upon market or other conditions and Dreyfus disclaims any responsibility to update such views.These views may not be relied on as investment advice and, because investment decisions for a Dreyfus fund are based on numerous factors, may not be relied on as an indication of trading intent on behalf of any Dreyfus fund.
Not FDIC-Insured • Not Bank-Guaranteed • May Lose Value
| | | Contents |
| |
| | | THE FUND |
| |
|
| 2 | | Letter from the Chairman |
| 3 | | Discussion of Fund Performance |
| 6 | | Fund Performance |
| 8 | | Understanding Your Fund’s Expenses |
| 8 | | Comparing Your Fund’s Expenses |
| | | With Those of Other Funds |
| 9 | | Statement of Investments |
| 23 | | Statement of Assets and Liabilities |
| 24 | | Statement of Operations |
| 25 | | Statement of Changes in Net Assets |
| 28 | | Financial Highlights |
| 32 | | Notes to Financial Statements |
| 43 | | Report of Independent Registered |
| | | Public Accounting Firm |
| 45 | | Important Tax Information |
| 46 | | Information About the Review and Approval |
| | | of the Fund’s Management Agreement |
| 50 | | Board Members Information |
| 52 | | Officers of the Fund |
| |
| | | FOR MORE INFORMATION |
| |
|
| | | Back Cover |
| Dreyfus Premier California |
| Tax Exempt Bond Fund, Inc. |
The Fund

LETTER FROM THE CHAIRMAN
We are pleased to present this annual report for Dreyfus Premier California Tax Exempt Bond Fund, Inc., covering the 12-month period from June 1, 2005, through May 31, 2006.
Since June 2004, the Federal Reserve Board (the “Fed”) has attempted to manage U.S. economic growth and forestall potential inflation by gradually raising short-term interest rates. In our view, the Fed’s shift from a stimulative monetary policy to a neutral one has so far been successful: the economy has grown at a moderate pace, the unemployment rate has dropped, corporate profits have risen, and inflation has generally remained in check despite recent cost pressures stemming from higher energy and import prices.
As we near the second half of the year, the financial markets appear more likely to be influenced not by what the Fed already has accomplished, but by investors’ expectations of what is to come, including the Fed’s decision to increase rates further, maintain them at current levels or reduce them to stimulate future growth.We believe that this decision will depend largely on the outlook for core inflation in 2007.The Fed probably can stand pat as long as it expects inflation to remain subdued. But if inflationary pressures continue to build, the Fed may choose to tighten monetary policy further. As always, we urge you to discuss with your financial advisor the potential implications of these possibilities on your investments.
For information about how the fund performed during the reporting period, as well as market perspectives, we have provided a Discussion of Fund Performance given by the fund’s portfolio manager.
Thank you for your continued confidence and support.

Stephen E. Canter
Chairman and Chief Executive Officer
The Dreyfus Corporation
June 15, 2006
|

DISCUSSION OF FUND PERFORMANCE
Joseph P. Darcy, Senior Portfolio Manager
How did Dreyfus Premier California Tax Exempt Bond Fund perform relative to its benchmark?
For the 12-month period ended May 31, 2006, the fund’s Class A, Class B, Class C and Class Z shares produced total returns of 1.44%, 0.93%, 0.67% and 1.57%, respectively.1 In comparison, the Lehman Brothers Municipal Bond Index, the fund’s benchmark, achieved a total return of 1.89% for the same period.2
Although municipal bond prices held up relatively well during most of the reporting period, and despite rising interest rates and other market factors, prices began to fall more steeply when inflation concerns intensified in the spring of 2006. The fund’s returns lagged its benchmark, primarily because the benchmark contains bonds from many states, not just California, and does not reflect fund fees and expenses.
What is the fund’s investment approach?
The fund seeks as high a level of current income exempt from federal and California state income taxes as is consistent with the preservation of cap-ital.To pursue this goal, the fund normally invests substantially all of its assets in municipal bonds that provide income exempt from federal and California state personal income taxes.The fund will invest at least 80% of its assets in investment-grade municipal bonds or the unrated equivalent as determined by Dreyfus.The fund may invest up to 20% of its assets in municipal bonds rated below investment grade (“high yield”or “junk” bonds) or the unrated equivalent as determined by Dreyfus.The dollar-weighted average maturity of the fund’s portfolio normally exceeds 10 years, but the fund’s average portfolio maturity is not restricted.
We may buy and sell bonds based on credit quality, market outlook and yield potential. In selecting municipal bonds for investment, we may assess the current interest-rate environment and the municipal bond’s potential volatility in different rate environments.We focus on
The Fund 3
DISCUSSION OF FUND PERFORMANCE (continued)
|
bonds with the potential to offer attractive current income, typically looking for bonds that can provide consistently attractive current yields or that are trading at competitive market prices.A portion of the fund’s assets may be allocated to “discount” bonds, which are bonds that sell at a price below their face value, or to “premium” bonds, which are bonds that sell at a price above their face value.The fund’s allocation either to discount bonds or to premium bonds will change along with our changing views of the current interest-rate and market environment.We also may look to select bonds that are most likely to obtain attractive prices when sold.
What other factors influenced the fund’s performance?
During the reporting period, the Federal Reserve Board (the “Fed”) implemented eight more increases in the overnight federal funds rate, driving it to 5% by the reporting period’s end. While longer-term bond yields also rose, they climbed less steeply than short-term rates, contributing to a further narrowing of yield differences between the short and long ends of the market. A more pronounced rise in long-term yields in the spring of 2006 occurred in response to mounting inflation concerns, but was not enough to erase the fund’s positive absolute performance for the reporting period overall.
The fund’s results also were influenced by supply-and-demand factors. The steadily growing U.S. economy benefited California and most other states, helping to reduce unemployment and boost corporate and personal incomes. Consequently, California enjoyed higher tax revenues, which helped reduce longstanding budget pressures. At the same time, demand for California securities remained robust from individual and institutional investors, putting downward pressure on yields and supporting prices.
In this environment, we set the fund’s average duration — a measure of sensitivity to changing interest rates — in a range we considered slightly longer than industry averages.This enabled the fund to participate more fully in relative strength at the longer end of the market’s
maturity spectrum for much of the reporting period. However, relative returns were constrained when we placed more emphasis on higher-quality bonds than the benchmark at a time when higher-yielding, lower-rated municipal securities produced higher returns.
As market volatility intensified in March 2006, we began to focus more intently on bonds with intermediate-term maturities, and we modestly increased the fund’s exposure to higher-yielding, investment-grade credits, including bonds backed by California health care facilities.As a result, the fund avoided the full brunt of renewed turbulence among longer-term securities.
What is the fund’s current strategy?
Although additional rate hikes are probable, we believe that the Fed’s credit tightening campaign may end soon should the U.S. economy begin to slow. Accordingly, we have maintained a neutral average duration given the recent market volatility. Further changes in the fund’s investment posture are likely to be determined as the strength and direction of economic growth, inflation and interest rates become clearer.
| 1 | | Total return includes reinvestment of dividends and any capital gains paid. Past performance is no |
| | | guarantee of future results. Share price, yield and investment return fluctuate such that upon |
| | | redemption, fund shares may be worth more or less than their original cost. Income may be subject |
| | | to state and local taxes for non-California residents, and some income may be subject to the federal |
| | | alternative minimum tax (AMT) for certain investors. Capital gains, if any, are taxable. Return |
| | | figures provided for the fund’s Class A, B and C shares reflect the absorption of certain expenses |
| | | by The Dreyfus Corporation pursuant to an agreement which was terminated on May 31, 2006. |
| | | Had these expenses not been absorbed, the fund’s returns would have been lower. |
| 2 | | SOURCE: LIPPER INC. — Reflects reinvestment of dividends and, where applicable, capital |
| | | gain distributions.The Lehman Brothers Municipal Bond Index is a widely accepted, unmanaged |
| | | total return performance benchmark for the long-term, investment-grade, tax-exempt bond market. |
| | | Index returns do not reflect fees and expenses associated with operating a mutual fund. |
The Fund 5
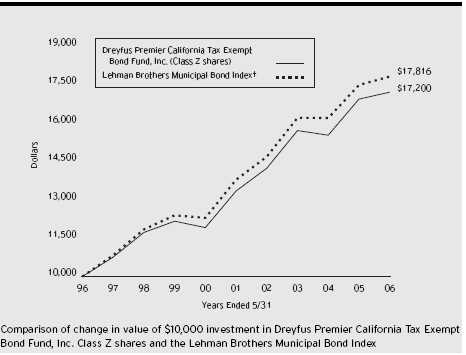
| † Source: Lipper Inc. |
| Past performance is not predictive of future performance. |
| The above graph compares a $10,000 investment made in Class Z shares of Dreyfus Premier California Tax Exempt |
| Bond Fund, Inc. on 5/31/96 to a $10,000 investment made in the Lehman Brothers Municipal Bond Index (the |
| “Index”) on that date. All dividends and capital gain distributions are reinvested. Performance for Class A, Class B and |
| Class C shares will vary from the performance of Class Z shares shown above due to differences in charges and expenses. |
| The fund invests primarily in California municipal securities and its performance shown in the line graph takes into |
| account all applicable fees and expenses for Class Z shares.The Index is not limited to investments principally in |
| California municipal obligations and does not take into account charges, fees and other expenses.The Index, unlike the |
| fund, is an unmanaged total return performance benchmark for the long-term, investment-grade, geographically unrestricted |
| tax-exempt bond market, calculated by using municipal bonds selected to be representative of the municipal market |
| overall.These factors can contribute to the Index potentially outperforming or underperforming the fund. Further |
| information relating to fund performance, including expense reimbursements, if applicable, is contained in the Financial |
| Highlights section of the prospectus and elsewhere in this report. |
| Actual Aggregate Total Returns as of | | 5/31/06 | | | | | | |
| |
| | | Inception | | | | | | | | From |
| | | Date | | 1 Year | | 5 Years | | 10 Years | | Inception |
| |
| |
| |
| |
| |
|
| Class Z shares | | | | 1.57% | | 5.21% | | 5.57% | | |
| Class A shares | | | | | | | | | | |
| with maximum sales charge (4.50%) | | 10/21/04 | | (3.15)% | | — | | — | | (0.08)% |
| without sales charge | | 10/21/04 | | 1.44% | | — | | — | | 2.83% |
| Class B shares | | | | | | | | | | |
| with applicable redemption charge † | | 10/21/04 | | (2.97)% | | — | | — | | (0.08)% |
| without redemption | | 10/21/04 | | 0.93% | | — | | — | | 2.33% |
| Class C shares | | | | | | | | | | |
| with applicable redemption charge †† | | 10/21/04 | | (0.31)% | | — | | — | | 2.06% |
| without redemption | | 10/21/04 | | 0.67% | | — | | — | | 2.06% |
Past performance is not predictive of future performance.The fund’s performance shown in the graph and table does not reflect the deduction of taxes that a shareholder would pay on fund distributions or the redemption of fund shares.
| † | | The maximum contingent deferred sales charge for Class B shares is 4%. After six years Class B shares convert to |
| | | Class A shares. |
| †† | | The maximum contingent deferred sales charge for Class C shares is 1% for shares redeemed within one year of the |
| | | date of purchase. |
The Fund 7
U N D E R S TA N D I N G YO U R F U N D ’ S E X P E N S E S ( U n a u d i t e d )
As a mutual fund investor, you pay ongoing expenses, such as management fees and other expenses. Using the information below, you can estimate how these expenses affect your investment and compare them with the expenses of other funds.You also may pay one-time transaction expenses, including sales charges (loads) and redemption fees, which are not shown in this section and would have resulted in higher total expenses. For more information, see your fund’s prospectus or talk to your financial adviser.
Review your fund’s expenses
|
The table below shows the expenses you would have paid on a $1,000 investment in Dreyfus Premier California Tax Exempt Bond Fund, Inc. from December 1, 2005 to May 31, 2006. It also shows how much a $1,000 investment would be worth at the close of the period, assuming actual returns and expenses.
| Expenses and Value of a $1,000 Investment | | | | | | |
| assuming actual returns for the six months ended May 31, 2006 | | | | |
| | | Class A | | Class B | | Class C | | Class Z |
| |
| |
| |
| |
|
| Expenses paid per $1,000 † | | $ 5.07 | | $ 7.58 | | $ 8.87 | | $ 4.07 |
| Ending value (after expenses) | | $1,014.70 | | $1,012.20 | | $1,010.10 | | $1,015.00 |
| COMPARING YOUR FUND’S EXPENSES |
| WITH THOSE OF OTHER FUNDS (Unaudited) |
Using the SEC’s method to compare expenses
The Securities and Exchange Commission (SEC) has established guidelines to help investors assess fund expenses. Per these guidelines, the table below shows your fund’s expenses based on a $1,000 investment, assuming a hypothetical 5% annualized return. You can use this information to compare the ongoing expenses (but not transaction expenses or total cost) of investing in the fund with those of other funds.All mutual fund shareholder reports will provide this information to help you make this comparison. Please note that you cannot use this information to estimate your actual ending account balance and expenses paid during the period.
| Expenses and Value of a $1,000 Investment |
| assuming a hypothetical 5% annualized return for the six months ended May 31, 2006 |
| | | Class A | | Class B | | Class C | | Class Z |
| |
| |
| |
| |
|
| Expenses paid per $1,000 † | | $ 5.09 | | $ 7.59 | | $ 8.90 | | $ 4.08 |
| Ending value (after expenses) | | $1,019.90 | | $1,017.40 | | $1,016.11 | | $1,020.89 |
| † Expenses are equal to the fund’s annualized expense ratio of .90% for Class A, 1.39% for Class B, 1.66% for |
| Class C and .71% for Class Z; multiplied by the average account value over the period, multiplied by 182/365 |
| (to reflect the one-half year period). |
STATEMENT OF INVESTMENTS
May 31, 2006
|
| Long-Term Municipal | | Coupon | | Maturity | | Principal | | |
| Investments—102.6% | | Rate (%) | | Date | | Amount ($) | | Value ($) |
| |
| |
| |
| |
|
| ABAG Finance Authority for | | | | | | | | |
| Nonprofit Corps., MFHR | | | | | | | | |
| (Central Park Apartments) | | 5.50 | | 7/1/19 | | 1,010,000 | | 1,036,452 |
| ABAG Finance Authority for | | | | | | | | |
| Nonprofit Corps., MFHR | | | | | | | | |
| (Central Park Apartments) | | 5.60 | | 7/1/38 | | 5,815,000 | | 5,918,740 |
| ABAG Finance Authority for | | | | | | | | |
| Nonprofit Corps., MFHR | | | | | | | | |
| (Sansum-Santa Barbara Medical) | | 5.50 | | 4/1/21 | | 3,500,000 | | 3,680,320 |
| Alameda County, | | | | | | | | |
| COP (Insured; MBIA) | | 7.06 | | 12/1/13 | | 10,000,000 a,b | | 10,867,800 |
| Alameda County, | | | | | | | | |
| COP (Financing Project) | | | | | | | | |
| (Insured; MBIA) | | 6.00 | | 9/1/06 | | 2,560,000 c | | 2,626,048 |
| Anaheim Public Finance Authority, | | | | | | | | |
| Tax Allocation Revenue | | | | | | | | |
| (Insured; MBIA) | | 6.45 | | 12/28/18 | | 26,000,000 | | 27,575,340 |
| Bay Area Toll Authority, | | | | | | | | |
| San Francisco Bay Area Toll | | | | | | | | |
| Bridge Revenue | | 5.00 | | 4/1/25 | | 17,675,000 | | 18,419,824 |
| Bay Area Toll Authority, | | | | | | | | |
| San Francisco Bay Area Toll | | | | | | | | |
| Bridge Revenue | | 5.00 | | 4/1/26 | | 14,500,000 | | 15,075,940 |
| Bay Area Toll Authority, | | | | | | | | |
| San Francisco Bay Area Toll | | | | | | | | |
| Bridge Revenue | | 5.00 | | 4/1/31 | | 19,000,000 | | 19,647,710 |
| California, | | | | | | | | |
| Economic Recovery Bonds | | 5.00 | | 7/1/16 | | 13,000,000 | | 13,726,830 |
| California, | | | | | | | | |
| GO | | 5.00 | | 2/1/20 | | 10,000,000 | | 10,284,800 |
| California, | | | | | | | | |
| GO | | 5.00 | | 2/1/20 | | 11,385,000 | | 11,806,017 |
| California, | | | | | | | | |
| GO | | 5.00 | | 3/1/20 | | 10,395,000 | | 10,863,503 |
| California, | | | | | | | | |
| GO | | 5.25 | | 4/1/27 | | 6,475,000 | | 6,798,750 |
| California, | | | | | | | | |
| GO | | 5.50 | | 4/1/28 | | 900,000 | | 977,355 |
| California, | | | | | | | | |
| GO | | 5.25 | | 2/1/30 | | 25,700,000 | | 26,594,617 |
The Fund 9
STATEMENT OF INVESTMENTS (continued)
|
| Long-Term Municipal | | Coupon | | Maturity | | Principal | | |
| Investments (continued) | | Rate (%) | | Date | | Amount ($) | | Value ($) |
| |
| |
| |
| |
|
| California, | | | | | | | | |
| GO | | 5.25 | | 4/1/34 | | 17,000,000 | | 17,722,160 |
| California, | | | | | | | | |
| GO (Veterans) | | 5.05 | | 12/1/36 | | 14,500,000 | | 14,544,805 |
| California, | | | | | | | | |
| Various Purpose | | 6.13 | | 10/1/11 | | 2,875,000 | | 3,206,516 |
| California, | | | | | | | | |
| Various Purpose | | 5.25 | | 11/1/28 | | 14,650,000 | | 15,312,326 |
| California Department of Veteran | | | | | | | | |
| Affairs, Home Purchase Revenue | | 5.50 | | 12/1/19 | | 11,380,000 | | 11,866,154 |
| California Department of Veteran | | | | | | | | |
| Affairs, Home Purchase Revenue | | 5.20 | | 12/1/28 | | 10,000,000 | | 10,004,000 |
| California Department of Water | | | | | | | | |
| Resources, Power Supply Revenue | | 5.88 | | 5/1/12 | | 10,000,000 c | | 11,207,700 |
| California Department of Water | | | | | | | | |
| Resources, Power Supply | | | | | | | | |
| Revenue (Insured; AMBAC) | | 5.38 | | 5/1/12 | | 20,585,000 c | | 22,535,017 |
| California Educational Facilities | | | | | | | | |
| Authority, Revenue (Pooled | | | | | | | | |
| College and University | | | | | | | | |
| Projects) | | 5.63 | | 7/1/23 | | 1,275,000 | | 1,275,395 |
| California Health Facilities | | | | | | | | |
| Financing Authority, Revenue | | | | | | | | |
| (Cedars-Sinai Medical Center) | | 6.13 | | 12/1/09 | | 30,695,000 c | | 33,403,527 |
| California Health Facilities | | | | | | | | |
| Financing Authority, Revenue | | | | | | | | |
| (Cedars-Sinai Medical Center) | | 6.25 | | 12/1/09 | | 9,460,000 c | | 10,333,253 |
| California Health Facilities | | | | | | | | |
| Financing Authority, Revenue | | | | | | | | |
| (Sutter Health) | | 6.25 | | 8/15/35 | | 7,965,000 | | 8,753,376 |
| California Health Facilities | | | | | | | | |
| Financing Authority, Revenue | | | | | | | | |
| (Sutter Health) (Insured; MBIA) | | 5.35 | | 8/15/28 | | 3,780,000 | | 3,949,155 |
| California Housing Finance Agency, | | | | | | | | |
| MFHR (Insured; AMBAC) | | 6.15 | | 8/1/22 | | 1,845,000 | | 1,885,405 |
| California Housing Finance | | | | | | | | |
| Agency, SFMR | | 6.30 | | 8/1/24 | | 700,000 | | 702,667 |
| California Housing Finance | | | | | | | | |
| Agency, SFMR | | 6.45 | | 8/1/25 | | 370,000 | | 371,458 |
| Long-Term Municipal | | Coupon | | Maturity | | Principal | | |
| Investments (continued) | | Rate (%) | | Date | | Amount ($) | | Value ($) |
| |
| |
| |
| |
|
| California Housing Finance | | | | | | | | |
| Agency, SFMR | | | | | | | | |
| (Insured; AMBAC) | | 6.25 | | 8/1/14 | | 250,000 | | 250,935 |
| California Infrastructure and | | | | | | | | |
| Economic Development Bank, | | | | | | | | |
| Revenue (Kaiser Hospital | | | | | | | | |
| Assistance I-LLC) | | 5.55 | | 8/1/31 | | 21,900,000 | | 22,933,242 |
| California Pollution Control | | | | | | | | |
| Financing Authority, PCR | | 7.46 | | 6/1/14 | | 11,000,000 a,b | | 12,410,860 |
| California Pollution Control | | | | | | | | |
| Financing Authority, PCR | | | | | | | | |
| (Insured; MBIA) | | 7.46 | | 6/1/14 | | 48,330,000 a,b | | 54,528,806 |
| California Pollution Control | | | | | | | | |
| Financing Authority, SWDR | | | | | | | | |
| (Browning Ferris Industries) | | 5.80 | | 12/1/16 | | 2,000,000 | | 1,972,840 |
| California Pollution Control | | | | | | | | |
| Financing Authority, SWDR | | | | | | | | |
| (Browning Ferris Industries) | | 6.75 | | 9/1/19 | | 600,000 | | 604,020 |
| California Pollution Control | | | | | | | | |
| Financing Authority, SWDR | | | | | | | | |
| (Keller Canyon Landfill Co. | | | | | | | | |
| Project) | | 6.88 | | 11/1/27 | | 1,000,000 | | 1,004,350 |
| California Public Works Board, | | | | | | | | |
| LR (Department of Corrections, | | | | | | | | |
| Calipatria State Prison, | | | | | | | | |
| Imperial County) (Insured; MBIA) | | 6.50 | | 9/1/17 | | 13,000,000 | | 15,172,950 |
| California Public Works Board, | | | | | | | | |
| LR (Department of Health | | | | | | | | |
| Services, Richmond Laboratory | | | | | | | | |
| Project) (Insured; AMBAC) | | 5.00 | | 11/1/21 | | 10,910,000 | | 11,439,899 |
| California Public Works Board, | | | | | | | | |
| LR (University of California | | | | | | | | |
| Research Projects) (Insured; MBIA) | | 5.25 | | 11/1/28 | | 10,005,000 | | 10,650,523 |
| California Public Works Board, | | | | | | | | |
| LR (Various University of | | | | | | | | |
| California Projects) | | 5.50 | | 6/1/14�� | | 5,000,000 | | 5,422,950 |
| California State University, | | | | | | | | |
| Fresno Association Inc., | | | | | | | | |
| Auxiliary Organization Event | | | | | | | | |
| Center Revenue | | 6.00 | | 7/1/12 | | 3,500,000 c | | 3,935,330 |
The Fund 11
STATEMENT OF INVESTMENTS (continued)
|
| Long-Term Municipal | | Coupon | | Maturity | | Principal | | |
| Investments (continued) | | Rate (%) | | Date | | Amount ($) | | Value ($) |
| |
| |
| |
| |
|
| California (continued) | | | | | | | | |
| California State University, | | | | | | | | |
| Fresno Association Inc., | | | | | | | | |
| Auxiliary Organization Event | | | | | | | | |
| Center Revenue | | 6.00 | | 7/1/12 | | 2,500,000 c | | 2,810,950 |
| California State University, | | | | | | | | |
| Fresno Association Inc., | | | | | | | | |
| Auxiliary Organization Event | | | | | | | | |
| Center Revenue | | 6.00 | | 7/1/12 | | 5,250,000 c | | 5,902,995 |
| California Statewide Communities | | | | | | | | |
| Development Authority, COP | | | | | | | | |
| (Catholic Healthcare West) | | 6.50 | | 7/1/10 | | 2,780,000 c | | 3,094,640 |
| California Statewide Communities | | | | | | | | |
| Development Authority, COP | | | | | | | | |
| (Catholic Healthcare West) | | 6.50 | | 7/1/20 | | 1,220,000 | | 1,329,251 |
| California Statewide Communities | | | | | | | | |
| Development Authority, COP | | | | | | | | |
| (The Internext Group) | | 5.38 | | 4/1/30 | | 20,000,000 | | 20,015,200 |
| California Statewide Communities | | | | | | | | |
| Development Authority, Health | | | | | | | | |
| Facility Revenue (Adventist | | | | | | | | |
| Health System/West) | | 5.00 | | 3/1/35 | | 11,880,000 | | 11,948,548 |
| California Statewide Communities | | | | | | | | |
| Development Authority, Revenue | | | | | | |
| (Daughters of Charity Health | | | | | | | | |
| System) | | 5.25 | | 7/1/24 | | 8,205,000 | | 8,425,222 |
| California Statewide Communities | | | | | | | | |
| Development Authority, Revenue | | | | | | |
| (Daughters of Charity Health | | | | | | | | |
| System) | | 5.25 | | 7/1/35 | | 18,625,000 | | 19,015,380 |
| California Statewide Communities | | | | | | | | |
| Development Authority, Revenue | | | | | | |
| (Kaiser Permanente) | | 5.50 | | 11/1/32 | | 13,500,000 | | 13,979,115 |
| California Statewide Communities | | | | | | | | |
| Development Authority, Revenue | | | | | | |
| (Kaiser Permanente) | | 5.25 | | 3/1/45 | | 15,000,000 d | | 15,407,850 |
| California Statewide Communities | | | | | | | | |
| Development Authority, Revenue | | | | | | |
| (Sutter Health) | | 5.50 | | 8/15/28 | | 14,000,000 | | 14,610,260 |
| California Statewide Communities | | | | | | | | |
| Development Authority, Revenue | | | | | | |
| (The California Endowment) | | 5.00 | | 7/1/28 | | 15,360,000 | | 15,844,301 |
| |
| |
| |
| 12 | | | | | | | | |
| Long-Term Municipal | | Coupon | | Maturity | | Principal | | |
| Investments (continued) | | Rate (%) | | Date | | Amount ($) | | Value ($) |
| |
| |
| |
| |
|
| California Statewide Communities | | | | | | | | |
| Development Authority, Revenue | | | | | | | | |
| (The California Endowment) | | 5.00 | | 7/1/33 | | 16,710,000 | | 17,206,287 |
| Capistrano Unified School District, | | | | | | | | |
| Community Facilities District Special | | | | | | |
| Tax Number 98 (Ladera) | | 5.75 | | 9/1/09 | | 5,500,000 c | | 5,944,510 |
| Capistrano Unified School | | | | | | | | |
| District, School Facilities | | | | | | | | |
| Improvement District Number 1 | | | | | | | | |
| (Insured; FGIC) | | 6.00 | | 8/1/24 | | 2,075,000 | | 2,260,961 |
| Castaic Lake Water Agency, | | | | | | | | |
| COP, Revenue (Water System | | | | | | | | |
| Improvement Project) (Insured; | | | | | | | | |
| AMBAC) | | 0.00 | | 8/1/27 | | 10,000,000 | | 3,552,300 |
| Central California Joint Powers | | | | | | | | |
| Health Financing Authority, | | | | | | | | |
| COP (Community Hospitals of | | | | | | | | |
| Central California Obligated Group) | | 6.00 | | 2/1/30 | | 5,000,000 | | 5,189,050 |
| Central California Joint Powers | | | | | | | | |
| Health Financing Authority, | | | | | | | | |
| COP (Community Hospitals of | | | | | | | | |
| Central California Obligated Group) | | 5.75 | | 2/1/31 | | 18,500,000 | | 19,033,540 |
| Chino Valley Unified School | | | | | | | | |
| District, GO (Insured; MBIA) | | 5.25 | | 8/1/30 | | 10,000,000 | | 10,646,500 |
| Chula Vista, | | | | | | | | |
| IDR (San Diego Gas and | | | | | | | | |
| Electric Co.) | | 5.00 | | 12/1/27 | | 3,000,000 | | 3,030,360 |
| Contra Costa County Public | | | | | | | | |
| Finance Authority, Tax | | | | | | | | |
| Allocation Revenue | | | | | | | | |
| (Pleasant Hill) | | 5.45 | | 8/1/28 | | 2,780,000 | | 2,845,664 |
| Cucamonga County Water District, | | | | | | | | |
| COP (Insured; FGIC) | | 5.25 | | 9/1/25 | | 5,555,000 | | 5,873,690 |
| Del Mar Race Track Authority, | | | | | | | | |
| Revenue | | 6.20 | | 8/15/06 | | 2,000,000 c | | 2,050,100 |
| Delano, | | | | | | | | |
| COP (Delano Regional Medical | | | | | | | | |
| Center) | | 5.25 | | 1/1/18 | | 13,500,000 | | 13,298,175 |
| Elsinore Valley Municipal Water | | | | | | | | |
| District, COP (Insured; FGIC) | | 5.38 | | 7/1/18 | | 2,000,000 | | 2,207,840 |
The Fund 13
STATEMENT OF INVESTMENTS (continued)
|
| Long-Term Municipal | | Coupon | | Maturity | | Principal | | |
| Investments (continued) | | Rate (%) | | Date | | Amount ($) | | Value ($) |
| |
| |
| |
| |
|
| Elsinore Valley Municipal Water | | | | | | | | |
| District, COP (Insured; FGIC) | | 5.38 | | 7/1/19 | | 3,855,000 | | 4,268,256 |
| Escondido Reassessment District | | | | | | | | |
| Number 98-1 (Rancho San Pasqual) | | 5.70 | | 9/2/26 | | 1,335,000 | | 1,376,265 |
| Fontana, | | | | | | | | |
| Special Tax (Insured; MBIA) | | 5.25 | | 9/1/17 | | 10,000,000 | | 10,490,400 |
| Fontana Public Financing | | | | | | | | |
| Authority, Tax Allocation | | | | | | | | |
| Revenue (North Fontana | | | | | | | | |
| Redevelopment Project) | | | | | | | | |
| (Insured; AMBAC) | | 5.00 | | 10/1/21 | | 5,000,000 | | 5,233,150 |
| Fontana Public Financing | | | | | | | | |
| Authority, Tax Allocation | | | | | | | | |
| Revenue (North Fontana | | | | | | | | |
| Redevelopment Project) | | | | | | | | |
| (Insured; AMBAC) | | 5.50 | | 9/1/32 | | 13,800,000 | | 14,795,256 |
| Foothill/Eastern Transportation | | | | | | | | |
| Corridor Agency, Toll Road | | | | | | | | |
| Revenue | | 5.75 | | 1/15/40 | | 500,000 | | 518,200 |
| Fremont Union High School District | | | | | | | | |
| (Insured; FGIC) | | 5.25 | | 9/1/10 | | 3,400,000 c | | 3,609,134 |
| Fremont Union High School District | | | | | | | | |
| (Insured; FGIC) | | 5.25 | | 9/1/10 | | 4,000,000 c | | 4,246,040 |
| Fremont Union High School District | | | | | | | | |
| (Insured; FGIC) | | 5.25 | | 9/1/10 | | 11,295,000 c | | 11,989,755 |
| Fullerton Community Facilities | | | | | | | | |
| District Number 1, Special Tax | | | | | | | | |
| (Amerige Heights) | | 6.10 | | 9/1/22 | | 1,000,000 | | 1,059,820 |
| Fullerton Community Facilities | | | | | | | | |
| District Number 1, Special Tax | | | | | | | | |
| (Amerige Heights) | | 6.20 | | 9/1/32 | | 2,500,000 | | 2,646,600 |
| Golden State Tobacco | | | | | | | | |
| Securitization Corp., Enhanced | | | | | | | | |
| Tobacco Settlement | | | | | | | | |
| Asset-Backed Bonds | | 5.50 | | 6/1/13 | | 5,000,000 c | | 5,498,150 |
| Golden State Tobacco | | | | | | | | |
| Securitization Corp., Tobacco | | | | | | | | |
| Settlement Asset-Backed Bonds | | 6.75 | | 6/1/39 | | 14,770,000 | | 16,525,710 |
| High Desert Memorial Health Care | | | | | | | | |
| District, Revenue | | 5.40 | | 10/1/11 | | 2,500,000 | | 2,536,525 |
| Long-Term Municipal | | Coupon | | Maturity | | Principal | | |
| Investments (continued) | | Rate (%) | | Date | | Amount ($) | | Value ($) |
| |
| |
| |
| |
|
| Kaweah Delta Health Care District, | | | | | | | | |
| Revenue | | 6.00 | | 8/1/34 | | 9,000,000 | | 9,655,740 |
| La Quinta Financing Authority, | | | | | | | | |
| Local Agency Revenue (Insured; | | | | | | | | |
| AMBAC) | | 5.00 | | 9/1/29 | | 12,400,000 | | 12,766,544 |
| Long Beach Special Tax | | | | | | | | |
| Community Facilities | | | | | | | | |
| District Number 5 | | | | | | | | |
| (Towne Center) | | 6.88 | | 10/1/25 | | 500,000 | | 514,140 |
| Los Angeles Harbor Department, | | | | | | | | |
| Revenue | | 6.00 | | 8/1/12 | | 8,900,000 | | 9,019,527 |
| Los Angeles Unified School | | | | | | | | |
| District (Insured; MBIA) | | 5.75 | | 7/1/17 | | 10,135,000 | | 11,553,900 |
| Madera County, | | | | | | | | |
| COP (Valley Children’s | | | | | | | | |
| Hospital) (Insured; MBIA) | | 6.50 | | 3/15/09 | | 3,370,000 | | 3,621,065 |
| Metropolitan Water District of | | | | | | | | |
| Southern California, | | | | | | | | |
| Waterworks, GO | | 5.00 | | 3/1/17 | | 5,500,000 | | 5,841,000 |
| Metropolitan Water District of | | | | | | | | |
| Southern California, | | | | | | | | |
| Waterworks, GO | | 5.00 | | 3/1/18 | | 5,510,000 | | 5,831,729 |
| Murrieta Unified School District | | | | | | | | |
| (Insured; FGIC) | | 0.00 | | 9/1/21 | | 4,950,000 | | 2,397,780 |
| Natomas Unified School District | | | | | | | | |
| (Insured; MBIA) | | 5.95 | | 9/1/21 | | 2,500,000 | | 2,892,775 |
| New Haven Unified School District | | | | | | | | |
| (Insured; FSA) | | 5.75 | | 8/1/19 | | 2,000,000 | | 2,204,980 |
| Northern California Power Agency, | | | | | | | | |
| Revenue (Hydroelectric Project | | | | | | | | |
| Number 1) (Insured; AMBAC) | | 7.00 | | 1/1/16 | | 670,000 c | | 819,986 |
| Northern California Power Agency, | | | | | | | | |
| Revenue (Hydroelectric Project | | | | | | | | |
| Number 1) (Insured; AMBAC) | | 7.50 | | 7/1/21 | | 375,000 c | | 495,495 |
| Northern California Power Agency, | | | | | | | | |
| Revenue (Hydroelectric Project | | | | | | | | |
| Number 1) (Insured; MBIA) | | 6.30 | | 7/1/18 | | 26,400,000 | | 31,358,976 |
| Oakland Unified School District | | | | | | | | |
| (Insured; FGIC) | | 5.25 | | 8/1/24 | | 17,275,000 | | 18,337,240 |
The Fund 15
STATEMENT OF INVESTMENTS (continued)
|
| Long-Term Municipal | | Coupon | | Maturity | | Principal | | |
| Investments (continued) | | Rate (%) | | Date | | Amount ($) | | Value ($) |
| |
| |
| |
| |
|
| Orange County Community Facilities | | | | | | |
| District (Landera Ranch) | | | | | | | | |
| Special Tax Number 1 | | 6.25 | | 8/15/08 | | 1,600,000 c | | 1,688,848 |
| Orange County Community Facilities | | | | | | |
| District (Landera Ranch) | | | | | | | | |
| Special Tax Number 1 | | 6.00 | | 8/15/10 | | 3,000,000 c | | 3,294,450 |
| Orange County Community Facilities | | | | | | |
| District (Landera Ranch) | | | | | | | | |
| Special Tax Number 3 | | 5.60 | | 8/15/28 | | 3,250,000 | | 3,413,215 |
| Orange County Community Facilities | | | | | | |
| District (Landera Ranch) | | | | | | | | |
| Special Tax Number 3 | | 5.63 | | 8/15/34 | | 6,000,000 | | 6,318,600 |
| Orange County Public Financing | | | | | | | | |
| Authority, LR (Juvenile | | | | | | | | |
| Justice Center Facility) | | | | | | | | |
| (Insured; AMBAC) | | 5.38 | | 6/1/19 | | 6,150,000 | | 6,654,853 |
| Pomona, | | | | | | | | |
| COP (General Fund Lease | | | | | | | | |
| Financing) (Insured; AMBAC) | | 5.50 | | 6/1/28 | | 1,000,000 | | 1,092,240 |
| Pomona Redevelopment Agency, Tax | | | | | | |
| Allocation (West Holt Avenue) | | 5.50 | | 5/1/32 | | 3,000,000 | | 3,111,930 |
| Rancho Cucamonga Redevelopment | | | | | | |
| Agency (Tax Allocation Rancho | | | | | | |
| Development) (Insured; MBIA) | | 5.38 | | 9/1/25 | | 7,485,000 | | 7,951,839 |
| Rancho Mirage Joint Powers | | | | | | | | |
| Financing Authority, Revenue | | | | | | | | |
| (Eisenhower Medical Center) | | 5.63 | | 7/1/29 | | 10,430,000 | | 11,057,782 |
| Redwood Empire Financing | | | | | | | | |
| Authority, COP | | 6.40 | | 12/1/23 | | 2,750,000 | | 2,770,487 |
| Riverside County, | | | | | | | | |
| SFMR (Collateralized; GNMA) | | 7.80 | | 5/1/21 | | 1,250,000 | | 1,675,812 |
| Sacramento City Financing | | | | | | | | |
| Authority, Revenue (Insured; | | | | | | | | |
| AMBAC) | | 6.70 | | 12/1/13 | | 4,670,000 a,b | | 5,058,941 |
| Sacramento City Financing | | | | | | | | |
| Authority, Revenue (Insured; | | | | | | | | |
| AMBAC) | | 6.70 | | 12/1/14 | | 5,140,000 a,b | | 5,568,085 |
| Sacramento County, | | | | | | | | |
| Airport System Revenue | | | | | | | | |
| (Insured; MBIA) | | 6.00 | | 7/1/06 | | 5,850,000 c | | 5,976,301 |
| Long-Term Municipal | | Coupon | | Maturity | | Principal | | |
| Investments (continued) | | Rate (%) | | Date | | Amount ($) | | Value ($) |
| |
| |
| |
| |
|
| Sacramento County, | | | | | | | | |
| Laguna Creek Ranch/Elliott | | | | | | | | |
| Ranch Community Facilities | | | | | | | | |
| District Number 1, Improvement | | | | | | |
| Area Number 1, Special Tax | | | | | | | | |
| (Laguna Creek Ranch) | | 5.70 | | 12/1/20 | | 2,970,000 | | 3,004,749 |
| Sacramento County Housing | | | | | | | | |
| Authority, MFHR (Cottage | | | | | | | | |
| Estate Apartments) | | | | | | | | |
| (Collateralized; FNMA) | | 6.00 | | 2/1/33 | | 1,000,000 | | 1,045,150 |
| Sacramento Municipal Utility | | | | | | | | |
| District, Electric Revenue | | | | | | | | |
| (Insured; MBIA) | | 6.50 | | 9/1/13 | | 6,930,000 | | 7,804,705 |
| Sacramento Municipal Utility | | | | | | | | |
| District, Electric Revenue | | | | | | | | |
| (Insured; MBIA) | | 5.20 | | 7/1/17 | | 300,000 | | 310,425 |
| San Bernardino County, COP | | | | | | | | |
| (Capital Facilities Project) | | 6.88 | | 8/1/24 | | 5,000,000 | | 6,392,200 |
| San Diego County, | | | | | | | | |
| COP (Burnham Institute for | | | | | | | | |
| Medical Research) | | 6.25 | | 9/1/09 | | 3,800,000 c | | 4,123,722 |
| San Diego County, | | | | | | | | |
| COP (Burnham Institute for | | | | | | | | |
| Medical Research) | | 5.00 | | 9/1/24 | | 2,265,000 | | 2,284,819 |
| San Diego County, | | | | | | | | |
| COP (Burnham Institute for | | | | | | | | |
| Medical Research) | | 5.00 | | 9/1/34 | | 5,190,000 | | 5,184,135 |
| San Diego Unified School District | | | | | | |
| (Insured; FGIC) | | 0.00 | | 7/1/17 | | 2,325,000 | | 1,407,509 |
| San Francisco City and County, | | | | | | | | |
| COP (San Bruno Jail Number 3) | | | | | | |
| (Insured; AMBAC) | | 5.25 | | 10/1/21 | | 2,985,000 | | 3,127,056 |
| San Francisco City and County | | | | | | | | |
| Public Utilities Commission, | | | | | | | | |
| San Francisco Water Revenue | | | | | | |
| (Insured; FSA) | | 5.00 | | 11/1/18 | | 5,855,000 | | 6,219,298 |
| San Francisco City and County | | | | | | | | |
| Public Utilities Commission, | | | | | | | | |
| San Francisco Water Revenue | | | | | | |
| (Insured; FSA) | | 5.00 | | 11/1/24 | | 10,000,000 | | 10,465,300 |
The Fund 17
STATEMENT OF INVESTMENTS (continued)
|
| Long-Term Municipal | | Coupon | | Maturity | | Principal | | |
| Investments (continued) | | Rate (%) | | Date | | Amount ($) | | Value ($) |
| |
| |
| |
| |
|
| San Joaquin Hills Transportation | | | | | | | | |
| Corridor Agency, | | | | | | | | |
| Toll Road Revenue | | | | | | | | |
| (Insured; MBIA) | | 0.00 | | 1/15/32 | | 48,295,000 | | 13,694,047 |
| San Jose Redevelopment Agency, Tax | | | | | | |
| Allocation (Merged Area | | | | | | | | |
| Redevelopment Project) | | 5.25 | | 8/1/29 | | 1,000,000 | | 1,020,910 |
| South Placer Authority, | | | | | | | | |
| Wastewater Revenue (Insured; | | | | | | | | |
| FGIC) | | 5.25 | | 11/1/10 | | 1,000,000 c | | 1,073,720 |
| Southeast Resource Recovery | | | | | | | | |
| Facility Authority, LR | | | | | | | | |
| (Insured; AMBAC) | | 5.25 | | 12/1/16 | | 11,715,000 | | 12,603,934 |
| Southeast Resource Recovery | | | | | | | | |
| Facility Authority, LR | | | | | | | | |
| (Insured; AMBAC) | | 5.25 | | 12/1/17 | | 6,475,000 | | 6,902,544 |
| Southeast Resource Recovery | | | | | | | | |
| Facility Authority, LR | | | | | | | | |
| (Insured; AMBAC) | | 5.25 | | 12/1/18 | | 8,085,000 | | 8,612,951 |
| Stockton, | | | | | | | | |
| Health Facilities Revenue | | | | | | | | |
| (Dameron Hospital Association) | | 5.70 | | 12/1/14 | | 1,000,000 | | 1,035,770 |
| Tobacco Securitization Authority | | | | | | | | |
| Northern California, Tobacco | | | | | | | | |
| Settlement Asset-Backed Bonds | | | | | | | | |
| (Sacramento County Tobacco | | | | | | | | |
| Securitization Corp.) | | 5.38 | | 6/1/38 | | 20,000,000 | | 20,141,800 |
| Torrance Redevelopment Agency, | | | | | | | | |
| Tax Allocation Revenue | | 5.63 | | 9/1/28 | | 500,000 | | 509,585 |
| University of California, | | | | | | | | |
| General Revenue | | | | | | | | |
| (Insured; MBIA) | | 5.00 | | 5/15/23 | | 9,165,000 | | 9,552,405 |
| University of California, | | | | | | | | |
| Multi Purpose Revenue | | | | | | | | |
| (Insured; MBIA) | | 5.25 | | 9/1/27 | | 31,475,000 | | 32,606,212 |
| University of California, | | | | | | | | |
| Revenue (Limited Project) | | | | | | | | |
| (Insured; FSA) | | 5.00 | | 5/15/22 | | 14,655,000 | | 15,304,510 |
| Ventura County Community College | | | | | | |
| District (Insured; MBIA) | | 5.50 | | 8/1/23 | | 4,250,000 | | 4,609,933 |
| Long-Term Municipal | | Coupon | | Maturity | | Principal | | |
| Investments (continued) | | Rate (%) | | Date | | Amount ($) | | Value ($) |
| |
| |
| |
| |
|
| West Covina Redevelopment Agency, | | | | | | |
| Community Facilities District | | | | | | | | |
| Special Tax (Fashion Plaza) | | 6.00 | | 9/1/17 | | 6,000,000 | | 6,647,280 |
| West Covina Redevelopment Agency, | | | | | | |
| Community Facilities District | | | | | | | | |
| Special Tax (Fashion Plaza) | | 6.00 | | 9/1/22 | | 11,325,000 | | 12,810,953 |
| Whittier Health Facility, | | | | | | | | |
| Revenue (Presbyterian | | | | | | | | |
| Intercommunity Hospital) | | 5.75 | | 6/1/31 | | 10,090,000 | | 10,614,781 |
| U.S. Related—6.7% | | | | | | | | |
| Puerto Rico Highway and | | | | | | | | |
| Transportation Authority, | | | | | | | | |
| Highway Revenue (Insured; MBIA) | | 5.50 | | 7/1/13 | | 4,750,000 | | 5,152,325 |
| Puerto Rico Highway and | | | | | | | | |
| Transportation Authority, | | | | | | | | |
| Transportation Revenue | | 6.00 | | 7/1/10 | | 2,000,000 c | | 2,186,420 |
| Puerto Rico Highway and | | | | | | | | |
| Transportation Authority, | | | | | | | | |
| Transportation Revenue | | | | | | | | |
| (Insured; MBIA) | | 6.37 | | 7/1/38 | | 2,000,000 a,b | | 2,030,650 |
| Puerto Rico Infrastructure | | | | | | | | |
| Financing Authority, Special | | | | | | | | |
| Obligation | | 5.50 | | 10/1/32 | | 10,000,000 | | 10,668,800 |
| Puerto Rico Infrastructure | | | | | | | | |
| Financing Authority, Special | | | | | | | | |
| Tax Revenue | | 5.50 | | 10/1/40 | | 40,000,000 | | 42,658,800 |
| Puerto Rico Infrastructure | | | | | | | | |
| Financing Authority, Special | | | | | | | | |
| Tax Revenue (Insured; AMBAC) | | 6.23 | | 7/1/15 | | 2,000,000 a,b | | 2,061,710 |
| Puerto Rico Public Buildings | | | | | | | | |
| Authority, Government | | | | | | | | |
| Facilities Revenue | | 5.25 | | 7/1/15 | | 11,600,000 | | 12,625,672 |
| Virgin Islands Public Finance | | | | | | | | |
| Authority, Revenue | | 7.30 | | 10/1/18 | | 3,100,000 | | 3,814,147 |
| Virgin Islands Public Finance | | | | | | | | |
| Authority, Revenue, Virgin | | | | | | | | |
| Islands Matching Fund Loan Notes | | 6.00 | | 10/1/22 | | 2,000,000 | | 2,087,920 |
| Total Long-Term Municipal Investments | | | | | | |
| (cost $1,226,240,347) | | | | | | | | 1,278,956,722 |
The Fund 19
STATEMENT OF INVESTMENTS (continued)
|
| Short-Term Municipal | | Coupon | | Maturity | | Principal | | |
| Investment—.6% | | Rate (%) | | Date | | Amount ($) | | Value ($) |
| |
| |
| |
| |
|
| California Department of Water | | | | |
| Resources, Power Supply | | | | |
| Revenue (LOC; BNP Paribas) | | | | |
| (cost $7,500,000) 3.56 | | 6/1/06 7,500,000 e | | 7,500,000 |
| |
| |
|
| |
| Total Investments (cost $1,233,740,347) | | 103.2% | | 1,286,456,722 |
| |
| Liabilities, Less Cash and Receivables | | (3.2%) | | (40,159,117) |
| |
| Net Assets | | 100.0% | | 1,246,297,605 |
| |
| a Collateral for floating rate borrowings. | | | | |
| b Securities exempt from registration under Rule 144A of the Securities Act of 1933.These securities may be resold in |
| transactions exempt from registration, normally to qualified institutional buyers. At May 31, 2006, these securities |
| amounted to $92,526,852 or 7.42% of net assets. | | | | |
| c These securities are prerefunded; the date shown represents the prerefunded date. Bonds which are prerefunded are |
| collateralized by U.S. Government securities which are held in escrow and are used to pay principal and interest on |
| the municipal issue and to retire the bonds in full at the earliest refunding date. | | |
| d Purchased on a delayed delivery basis. | | | | |
| e Securities payable on demand.Variable interest rate—subject to periodic change. | | |
| Summary of Abbreviations | | | | |
| |
| ACA | | American Capital Access | | AGC | | ACE Guaranty Corporation |
| AGIC | | Asset Guaranty Insurance | | AMBAC | | American Municipal Bond |
| | | Company | | | | Assurance Corporation |
| ARRN | | Adjustable Rate Receipt Notes | | BAN | | Bond Anticipation Notes |
| BIGI | | Bond Investors Guaranty Insurance | | BPA | | Bond Purchase Agreement |
| CGIC | | Capital Guaranty Insurance | | CIC | | Continental Insurance |
| | | Company | | | | Company |
| CIFG | | CDC Ixis Financial Guaranty | | CMAC | | Capital Market Assurance |
| | | | | | | Corporation |
| COP | | Certificate of Participation | | CP | | Commercial Paper |
| EDR | | Economic Development Revenue | | EIR | | Environmental Improvement |
| | | | | | | Revenue |
| FGIC | | Financial Guaranty Insurance | | | | |
| | | Company | | FHA | | Federal Housing Administration |
| FHLB | | Federal Home Loan Bank | | FHLMC | | Federal Home Loan Mortgage |
| | | | | | | Corporation |
| FNMA | | Federal National | | | | |
| | | Mortgage Association | | FSA | | Financial Security Assurance |
| GAN | | Grant Anticipation Notes | | GIC | | Guaranteed Investment Contract |
| GNMA | | Government National | | | | |
| | | Mortgage Association | | GO | | General Obligation |
| HR | | Hospital Revenue | | IDB | | Industrial Development Board |
| IDC | | Industrial Development Corporation | | IDR | | Industrial Development Revenue |
| LOC | | Letter of Credit | | LOR | | Limited Obligation Revenue |
| LR | | Lease Revenue | | MBIA | | Municipal Bond Investors |
| | | | | | | Assurance Insurance |
| | | | | | | Corporation |
| MFHR | | Multi-Family Housing Revenue | | MFMR | | Multi-Family Mortgage Revenue |
| PCR | | Pollution Control Revenue | | RAC | | Revenue Anticipation |
| | | | | | | Certificates |
| RAN | | Revenue Anticipation Notes | | RAW | | Revenue Anticipation Warrants |
| RRR | | Resources Recovery Revenue | | SAAN | | State Aid Anticipation Notes |
| SBPA | | Standby Bond Purchase Agreement | | SFHR | | Single Family Housing Revenue |
| SFMR | | Single Family Mortgage Revenue | | SONYMA | | State of New York Mortgage |
| | | | | | | Agency |
| SWDR | | Solid Waste Disposal Revenue | | TAN | | Tax Anticipation Notes |
| TAW | | Tax Anticipation Warrants | | TRAN | | Tax and Revenue |
| | | | | | | Anticipation Notes |
| XLCA | | XL Capital Assurance | | | | |
The Fund 21
STATEMENT OF INVESTMENTS (continued)
|
| Summary of Combined Ratings (Unaudited) | | |
| |
| Fitch | | or Moody’s | | or | | Standard & Poor’s | | Value (%)† |
| |
| |
| |
| |
|
| AAA | | Aaa | | | | AAA | | 49.7 |
| AA | | Aa | | | | AA | | 15.0 |
| A | | | | A | | | | A | | 20.2 |
| BBB | | Baa | | | | BBB | | 11.2 |
| BB | | Ba | | | | BB | | .4 |
| F1 | | MIG1/P1 | | | | SP1/A1 | | .6 |
| Not Rated f | | Not Rated f | | | | Not Rated f | | 2.9 |
| | | | | | | | | | | 100.0 |
| † | | Based on total investments. | | | | | | |
| f | | Securities which, while not rated by Fitch, Moody’s and Standard & Poor’s, have been determined by the Manager to |
| | | be of comparable quality to those rated securities in which the fund may invest. | | |
| See notes to financial statements. | | | | | | |
STATEMENT OF ASSETS AND LIABILITIES
May 31, 2006
| | | | | | | Cost | | Value |
| |
| |
| |
| |
|
| Assets ($): | | | | | | | | |
| Investments in securities—See Statement of Investments | | 1,233,740,347 | | 1,286,456,722 |
| Interest receivable | | | | | | | | 20,090,601 |
| Receivable for shares of Common Stock subscribed | | | | 153,545 |
| Prepaid expenses | | | | | | | | 34,212 |
| | | | | | | | | 1,306,735,080 |
| |
| |
| |
| |
|
| Liabilities ($): | | | | | | | | |
| Due to The Dreyfus Corporation and affiliates—Note 3(c) | | | | 689,755 |
| Payable for floating rate notes issued | | | | | | 41,570,000 |
| Payable for investment securities purchased | | | | | | 15,412,950 |
| Cash overdraft due to Custodian | | | | | | | | 1,045,038 |
| Payable for shares of Common Stock redeemed | | | | | | 876,635 |
| Interest and related expenses payable | | | | | | 718,380 |
| Accrued expenses | | | | | | | | 124,717 |
| | | | | | | | | 60,437,475 |
| |
| |
| |
| |
|
| Net Assets ($) | | | | | | | | 1,246,297,605 |
| |
| |
| |
| |
|
| Composition of Net Assets ($): | | | | | | | | |
| Paid-in capital | | | | | | | | 1,203,956,763 |
| Accumulated net realized gain (loss) on investments | | | | (10,375,533) |
| Accumulated net unrealized appreciation | | | | | | |
| (depreciation) on investments | | | | | | | | 52,716,375 |
| |
| |
| |
| |
|
| Net Assets ($) | | | | | | | | 1,246,297,605 |
| |
| |
| |
| |
|
| |
| |
| Net Asset Value Per Share | | | | | | | | |
| | | Class A | | Class B | | Class C | | Class Z |
| |
| |
| |
| |
|
| Net Assets ($) | | 81,578,821 | | 6,626,172 | | 3,054,299 | | 1,155,038,313 |
| Shares Outstanding | | 5,581,152 | | 453,326 | | 208,919 | | 79,034,816 |
| |
| |
| |
| |
|
| Net Asset Value Per Share ($) | | 14.62 | | 14.62 | | 14.62 | | 14.61 |
See notes to financial statements.
|
The Fund 23
STATEMENT OF OPERATIONS
Year Ended May 31, 2006
|
| Investment Income ($): | | |
| Interest Income | | 63,665,998 |
| Expenses: | | |
| Management fee—Note 3(a) | | 7,779,457 |
| Interest and related expenses | | 1,332,619 |
| Shareholder servicing costs—Note 3(c) | | 1,314,710 |
| Custodian fees | | 88,238 |
| Professional fees | | 74,965 |
| Directors’ fees and expenses—Note 3(c) | | 69,398 |
| Registration fees | | 69,166 |
| Distribution fees—Note 3(b) | | 60,739 |
| Prospectus and shareholders’ reports | | 20,547 |
| Loan commitment fees—Note 2 | | 2,389 |
| Miscellaneous | | 60,498 |
| Total Expenses | | 10,872,726 |
| Less—reduction in expenses due to undertaking—Note 3(a) | | (29,620) |
| Less—reduction in custody fees due to earnings credits—Note 1(b) | | (24,329) |
| Net Expenses | | 10,818,777 |
| Investment Income–Net | | 52,847,221 |
| |
|
| Realized and Unrealized Gain (Loss) on Investments—Note 4 ($): |
| Net realized gain (loss) on investments | | 5,148,435 |
| Net unrealized appreciation (depreciation) on investments | | (37,661,072) |
| Net Realized and Unrealized Gain (Loss) on Investments | | (32,512,637) |
| Net Increase In Net Assets Resulting from Operations | | 20,334,584 |
See notes to financial statements.
|
STATEMENT OF CHANGES IN NET ASSETS
| | | | | Year Ended May 31, |
| |
| |
|
| | | 2006 | | 2005 a |
| |
| |
|
| Operations ($): | | | | |
| Investment income—net | | 52,847,221 | | 47,183,272 |
| Net realized gain (loss) on investments | | 5,148,435 | | 5,425,934 |
| Net unrealized appreciation | | | | |
| (depreciation) on investments | | (37,661,072) | | 44,387,228 |
| Net Increase (Decrease) in Net Assets | | |
| Resulting from Operations | | 20,334,584 | | 96,996,434 |
| |
| |
|
| Dividends to Shareholders from ($): | | | | |
| Investment income—net: | | | | |
| Class A shares | | (3,311,668) | | (2,009,238) |
| Class B shares | | (268,502) | | (201,274) |
| Class C shares | | (87,936) | | (59,186) |
| Class Z shares | | (49,135,562) | | (45,060,543) |
| Net realized gain on investments: | | | | |
| Class A shares | | (83,762) | | (526,333) |
| Class B shares | | (7,538) | | (63,364) |
| Class C shares | | (2,716) | | (20,828) |
| Class Z shares | | (1,192,823) | | (7,226,618) |
| Total Dividends | | (54,090,507) | | (55,167,384) |
| |
| |
|
| Capital Stock Transactions ($): | | | | |
| Net proceeds from shares sold: | | | | |
| Class A shares | | 6,568,651 | | 4,073,951 |
| Class B shares | | 351,072 | | 411,375 |
| Class C shares | | 1,052,655 | | 947,904 |
| Class Z shares | | 41,757,321 | | 77,690,992 |
| Net assets received in connection with | | | | |
| reorganization—Note 1 | | — | | 352,241,502 |
The Fund 25
STATEMENT OF CHANGES IN NET ASSETS (continued)
|
| | | | | Year Ended May 31, |
| |
| |
|
| | | 2006 | | 2005a |
| |
| |
|
| Capital Stock Transactions ($) (continued): | | |
| Dividends reinvested: | | | | |
| Class A shares | | 2,223,662 | | 1,609,900 |
| Class B shares | | 192,856 | | 188,321 |
| Class C shares | | 58,074 | | 54,596 |
| Class Z shares | | 34,073,188 | | 35,584,032 |
| Cost of shares redeemed: | | | | |
| Class A shares | | (12,964,954) | | (8,457,781) |
| Class B shares | | (3,245,768) | | (2,152,575) |
| Class C shares | | (848,560) | | (1,566,296) |
| Class Z shares | | (127,164,572) | | (168,708,354) |
| Increase (Decrease) in Net Assets from | | | | |
| Capital Stock Transactions | | (57,946,375) | | 291,917,567 |
| Total Increase (Decrease) in Net Assets | | (91,702,298) | | 333,746,617 |
| |
| |
|
| Net Assets ($): | | | | |
| Beginning of Period | | 1,337,999,903 | | 1,004,253,286 |
| End of Period | | 1,246,297,605 | | 1,337,999,903 |
| | | | | Year Ended May 31, |
| |
| |
|
| | | 2006 | | 2005a |
| |
| |
|
| Capital Share Transactions: | | | | |
| Class A b | | | | |
| Shares sold | | 444,418 | | 272,224 |
| Shares issued in connection with reorganization—Note 1 | | — | | 6,053,943 |
| Shares issued for dividends reinvested | | 150,247 | | 108,488 |
| Shares redeemed | | (877,760) | | (570,408) |
| Net Increase (Decrease) in Shares Outstanding | | (283,095) | | 5,864,247 |
| |
| |
|
| Class B b | | | | |
| Shares sold | | 23,819 | | 27,558 |
| Shares issued in connection with reorganization—Note 1 | | — | | 740,391 |
| Shares issued for dividends reinvested | | 13,022 | | 12,694 |
| Shares redeemed | | (219,069) | | (145,089) |
| Net Increase (Decrease) in Shares Outstanding | | (182,228) | | 635,554 |
| |
| |
|
| Class C | | | | |
| Shares sold | | 71,071 | | 63,829 |
| Shares issued in connection with reorganization—Note 1 | | — | | 229,827 |
| Shares issued for dividends reinvested | | 3,926 | | 3,679 |
| Shares redeemed | | (57,154) | | (106,259) |
| Net Increase (Decrease) in Shares Outstanding | | 17,843 | | 191,076 |
| |
| |
|
| Class Z | | | | |
| Shares sold | | 2,821,639 | | 5,244,078 |
| Shares issued in connection with reorganization—Note 1 | | — | | 16,492,966 |
| Shares issued for dividends reinvested | | 2,303,054 | | 2,405,394 |
| Shares redeemed | | (8,602,582) | | (11,416,084) |
| Net Increase (Decrease) in Shares Outstanding | | (3,477,889) | | 12,726,354 |
| a | | The fund commenced offering four classes of shares on October 21, 2004.The existing shares were redesignated |
| | | Class Z shares and the fund added Class A, Class B and Class C shares. |
| b | | During the period ended May 31, 2006, 99,222 Class B shares representing $1,469,616 were automatically |
| | | converted to 99,222 Class A shares and during the period ended May 31, 2005, 25,517 Class B shares |
| | | representing $377,455 were automatically converted to 25,517 Class A shares. |
| See notes to financial statements. |
The Fund 27
The following tables describe the performance for each share class for the fiscal periods indicated. All information (except portfolio turnover rate) reflects financial results for a single fund share.Total return shows how much your investment in the fund would have increased (or decreased) during each period, assuming you had reinvested all dividends and distributions.These figures have been derived from the fund’s financial statements.
| | | | | Year Ended May 31, |
| | | |
|
| Class A Shares | | 2006 | | 2005a |
| |
| |
|
| Per Share Data ($): | | | | |
| Net asset value, beginning of period | | 15.00 | | 14.97 |
| Investment Operations: | | | | |
| Investment income—net b | | .58 | | .34 |
| Net realized and unrealized gain | | | | |
| (loss) on investments | | (.37) | | .12 |
| Total from Investment Operations | | .21 | | .46 |
| Distributions: | | | | |
| Dividends from investment income—net | | (.58) | | (.34) |
| Dividends from net realized gain on investments | | (.01) | | (.09) |
| Total Distributions | | (.59) | | (.43) |
| Net asset value, end of period | | 14.62 | | 15.00 |
| |
| |
|
| Total Return (%) c | | 1.44 | | 3.12 |
| |
| |
|
| Ratios/Supplemental Data (%): | | | | |
| Ratio of total expenses to average net assets d | | 1.04 | | 1.03e |
| Ratio of net expenses to average net assets d | | 1.01 | | 1.02e |
| Ratio of net investment income | | | | |
| to average net assets | | 3.90 | | 3.77e |
| Portfolio Turnover Rate | | 35.92 | | 38.73 |
| |
| |
|
| Net Assets, end of period ($ x 1,000) | | 81,579 | | 87,976 |
| a | | From October 21, 2004 (commencement of initial offering) to May 31, 2005. | | |
| b | | Based on average shares outstanding at each month end. | | | | |
| c | | Exclusive of sales charge. | | | | |
| d | | Ratio of total expenses to average net assets and ratio of net expenses to average net assets for all periods have been |
| | | restated.This restatement has no impact on the fund’s previously reported net assets, net investment income, net asset |
| | | value or total return. See Note 6. | | | | |
| e | | Annualized. | | | | |
| See notes to financial statements. | | | | |
| | | | | Year Ended May 31, |
| | | |
|
| Class B Shares | | 2006 | | 2005a |
| |
| |
|
| Per Share Data ($): | | | | |
| Net asset value, beginning of period | | 15.00 | | 14.97 |
| Investment Operations: | | | | |
| Investment income—net b | | .50 | | .30 |
| Net realized and unrealized gain | | | | |
| (loss) on investments | | (.37) | | .12 |
| Total from Investment Operations | | .13 | | .42 |
| Distributions: | | | | |
| Dividends from investment income—net | | (.50) | | (.30) |
| Dividends from net realized gain on investments | | (.01) | | (.09) |
| Total Distributions | | (.51) | | (.39) |
| Net asset value, end of period | | 14.62 | | 15.00 |
| |
| |
|
| Total Return (%) c | | .93 | | 2.82 |
| |
| |
|
| Ratios/Supplemental Data (%): | | | | |
| Ratio of total expenses to average net assets d | | 1.56 | | 1.54e |
| Ratio of net expenses to average net assets d | | 1.51 | | 1.51e |
| Ratio of net investment income | | | | |
| to average net assets | | 3.39 | | 3.29e |
| Portfolio Turnover Rate | | 35.92 | | 38.73 |
| |
| |
|
| Net Assets, end of period ($ x 1,000) | | 6,626 | | 9,534 |
| a | | From October 21, 2004 (commencement of initial offering) to May 31, 2005. | | |
| b | | Based on average shares outstanding at each month end. | | | | |
| c | | Exclusive of sales charge. | | | | |
| d | | Ratio of total expenses to average net assets and ratio of net expenses to average net assets for all periods have been |
| | | restated.This restatement has no impact on the fund’s previously reported net assets, net investment income, net asset |
| | | value or total return. See Note 6. | | | | |
| e | | Annualized. | | | | |
| See notes to financial statements. | | | | |
The Fund 29
FINANCIAL HIGHLIGHTS (continued)
|
| | | | | Year Ended May 31, |
| | | |
|
| Class C Shares | | 2006 | | 2005a |
| |
| |
|
| Per Share Data ($): | | | | |
| Net asset value, beginning of period | | 15.00 | | 14.97 |
| Investment Operations: | | | | |
| Investment income—net b | | .46 | | .27 |
| Net realized and unrealized gain | | | | |
| (loss) on investments | | (.37) | | .12 |
| Total from Investment Operations | | .09 | | .39 |
| Distributions: | | | | |
| Dividends from investment income—net | | (.46) | | (.27) |
| Dividends from net realized gain on investments | | (.01) | | (.09) |
| Total Distributions | | (.47) | | (.36) |
| Net asset value, end of period | | 14.62 | | 15.00 |
| |
| |
|
| Total Return (%) c | | .67 | | 2.67 |
| |
| |
|
| Ratios/Supplemental Data (%): | | | | |
| Ratio of total expenses to average net assets d | | 1.80 | | 1.77e |
| Ratio of net expenses to average net assets d | | 1.87 | | 1.76e |
| Ratio of net investment income | | | | |
| to average net assets | | 3.13 | | 3.01e |
| Portfolio Turnover Rate | | 35.92 | | 38.73 |
| |
| |
|
| Net Assets, end of period ($ x 1,000) | | 3,054 | | 2,867 |
| a | | From October 21, 2004 (commencement of initial offering) to May 31, 2005. | | |
| b | | Based on average shares outstanding at each month end. | | | | |
| c | | Exclusive of sales charge. | | | | |
| d | | Ratio of total expenses to average net assets and ratio of net expenses to average net assets for all periods have been |
| | | restated.This restatement has no impact on the fund’s previously reported net assets, net investment income, net asset |
| | | value or total return. See Note 6. | | | | |
| e | | Annualized. | | | | |
| See notes to financial statements. | | | | |
| | | | | | | | | Year Ended May 31, | | |
| | | |
| |
| |
| |
|
| Class Z Shares | | 2006 | | 2005 | | 2004 | | 2003 | | 2002 |
| |
| |
| |
| |
| |
|
| Per Share Data ($): | | | | | | | | | | |
| Net asset value, | | | | | | | | | | |
| beginning of period | | 15.00 | | 14.39 | | 15.28 | | 14.60 | | 14.56 |
| Investment Operations: | | | | | | | | | | |
| Investment income—net a | | .61 | | .58 | | .58 | | .63 | | .67 |
| Net realized and unrealized | | | | | | | | | | |
| gain (loss) on investments | | (.38) | | .71 | | (.76) | | .83 | | .29 |
| Total from Investment Operations | | .23 | | 1.29 | | (.18) | | 1.46 | | .96 |
| Distributions: | | | | | | | | | | |
| Dividends from investment | | | | | | | | | | |
| income—net | | (.61) | | (.59) | | (.57) | | (.63) | | (.67) |
| Dividends from net realized | | | | | | | | | | |
| gain on investments | | (.01) | | (.09) | | (.14) | | (.15) | | (.25) |
| Total Distributions | | (.62) | | (.68) | | (.71) | | (.78) | | (.92) |
| Net asset value, end of period | | 14.61 | | 15.00 | | 14.39 | | 15.28 | | 14.60 |
| |
| |
| |
| |
| |
|
| Total Return (%) | | 1.57 | | 9.10 | | (1.16) | | 10.30 | | 6.69 |
| |
| |
| |
| |
| |
|
| Ratios/Supplemental Data (%): | | | | | | | | | | |
| Ratio of total expenses | | | | | | | | | | |
| to average net assets b | | .81 | | .78 | | .73 | | .75 | | .78 |
| Ratio of net expenses | | | | | | | | | | |
| to average net assets b | | .81 | | .78 | | .73 | | .75 | | .78 |
| Ratio of net investment income | | | | | | | | | | |
| to average net assets | | 4.10 | | 3.96 | | 3.93 | | 4.27 | | 4.54 |
| Portfolio Turnover Rate | | 35.92 | | 38.73 | | 56.87 | | 47.21 | | 51.69 |
| |
| |
| |
| |
| |
|
| Net Assets, end of period | | | | | | | | | | |
| ($ x 1,000) | | 1,155,038 | | 1,237,623 | | 1,004,253 | | 1,140,398 | | 1,099,751 |
| a | | Based on average shares outstanding at each month end. | | | | | | |
| b | | Ratio of total expenses to average net assets and ratio of net expenses to average net assets for all periods have been |
| | | restated.This restatement has no impact on the fund’s previously reported net assets, net investment income, net asset |
| | | value or total return. See Note 6. | | | | | | | | | | |
| See notes to financial statements. | | | | | | | | | | |
The Fund 31
NOTES TO FINANCIAL STATEMENTS
NOTE 1—Significant Accounting Policies:
Dreyfus Premier California Tax Exempt Bond Fund, Inc. (the “fund”) is registered under the Investment Company Act of 1940, as amended (the “Act”), as a non-diversified open-end management investment company.The fund’s investment objective is to provide investors with a high level of current income exempt from federal and California state income taxes, as is consistent with the preservation of capital.The Dreyfus Corporation (the “Manager”or “Dreyfus”) serves as the fund’s investment adviser. The Manager is a wholly-owned subsidiary of Mellon Financial Corporation (“Mellon Financial”).
As of the close of business on February 24, 2005, pursuant to an Agreement and Plan of Reorganization previously approved by the fund’s Board of Directors, all of the assets, subject to the liabilities, of Dreyfus California Municipal Income, Inc. (“California Municipal Income”) were transferred to the fund in exchange for shares of Common Stock of the fund of equal value. Shareholders of California Municipal Income received Class Z shares of the fund, in an amount equal to the aggregate net asset value of their investment in California Municipal Income at the time of the exchange. The fund’s net asset value on the close of business on February 24, 2005 was $14.89 per share for Class Z shares, and a total of 2,769,887 Class Z shares representing net assets of $41,243,622 (including $2,753,782 accumulated net realized loss in investments and $1,967,026 net unrealized appreciation on investments) were issued to the shareholders of California Municipal Income in the exchange.The exchange was a tax-free event to California Municipal Income shareholders.
As of the close of business on October 26, 2004, pursuant to an Agreement and Plan of Reorganization previously approved by the fund’s Board of Directors, all of the assets, subject to the liabilities, of General California Municipal Bond Fund (“General California”) were transferred to the fund in exchange for shares of Common Stock of the fund of equal value. Shareholders of General California received Class Z shares of the fund, in an amount equal to the aggregate net
asset value of their investment in General California at the time of the exchange. The fund’s net asset value on the close of business on October 26, 2004 was $15.00 per share for Class Z shares, and a total of 13,723,079 Class Z shares representing net assets of $205,846,182 (including $9,031,565 accumulated net realized loss on investments and $18,179,239 net unrealized appreciation on investments) were issued to the shareholders of General California in the exchange.The exchange was a tax-free event to General California shareholders.
As of the close of business on October 21, 2004, pursuant to an Agreement and Plan of Reorganization previously approved by the fund’s Board of Directors, all of the assets, subject to the liabilities, of Dreyfus Premier California Municipal Bond Fund (“Premier California”) were transferred to the fund in exchange for the corresponding class of shares of Common Stock of the fund, in equal value, on the close of business on October 21, 2004. Holders of Class A, Class B, and Class C shares of Premier California received Class A, Class B and Class C shares of the fund, respectively, in each case in an amount equal to the aggregate net asset value of their investment in Premier California at the time of the exchange.The net asset value of the fund’s shares on the close of business October 21, 2004, after the reorganization, was $14.97 per share for each of Class A, Class B, and Class C shares, and a total of 6,053,943 Class A shares, 740,391 Class B shares and 229,827 Class C shares, representing net assets of $105,151,698 (including $4,814,089 accumulated net realized loss on investments and $9,508,057 net unrealized appreciation on investments) were issued to Premier California’s shareholders in the exchange.The exchange was a tax-free event to Premier California shareholders.
Dreyfus Service Corporation (the “Distributor”), a wholly-owned subsidiary of the Manager, is the distributor of the fund’s shares.The fund is authorized to issue 500 million shares of $.001 par value Common Stock.The fund currently offers four classes of shares: Class A (100 million shares authorized). Class B (100 million shares authorized), Class C (100 million shares authorized) and Class Z (200 million shares autho-
The Fund 33
NOTES TO FINANCIAL STATEMENTS (continued)
|
rized). Class A shares are subject to a sales charge imposed at the time of purchase. Class B shares are subject to a contingent deferred sales charge (“CDSC”) imposed on Class B share redemptions made within six years of purchase and automatically convert to Class A shares after six years. Class C shares are subject to a CDSC imposed on Class C shares redeemed within one year of purchase. Class Z shares are sold at net asset value per share generally only to shareholders who received Class Z shares in exchange for their shares of General California and California Municipal Income, as a result of the reorganization of such funds. Class Z shares generally are not available for new accounts. Other differences between the classes include the services offered to and the expenses borne by each class and certain voting rights. Income, expenses (other than expenses attributable to a specific class), and realized and unrealized gains or losses on investments are allocated to each class of shares based on its relative net assets.
Effective March 1, 2006, Class A shares of the fund may be purchased at net asset value (“NAV”) without payment of a sales charge:
- By qualified investors who (i) purchase Class A shares directly through the Distributor, and (ii) have, or whose spouse or minor children have, beneficially owned shares and continuously maintained an open account directly through the Distributor in a Dreyfus-managed fund, including the fund, or a Founders Asset Management LLC
(“Founders”) managed fund since on or before February 28, 2006. - With the cash proceeds from an investor’s exercise of employment- related stock options, whether invested in the fund directly or indi- rectly through an exchange from a Dreyfus-managed money mar- ket fund, provided that the proceeds are processed through an entity that has entered into an agreement with the Distributor specifically relating to processing stock options. Upon establishing the account in the fund or the Dreyfus-managed money market fund, the investor and the investor’s spouse and minor children become eligi- ble to purchase Class A shares of the fund at NAV, whether or not using the proceeds of the employment-related stock options.
- By members of qualified affinity groups who purchase Class A shares directly through the Distributor, provided that the qualified affinity group has entered into an affinity agreement with the Distributor.
The fund’s financial statements are prepared in accordance with U.S. generally accepted accounting principles, which may require the use of management estimates and assumptions. Actual results could differ from those estimates.
The fund enters into contracts that contain a variety of indemnifications. The fund’s maximum exposure under these arrangements is unknown.The fund does not anticipate recognizing any loss related to these arrangements.
(a) Portfolio valuation: Investments in securities are valued each business day by an independent pricing service (the “Service”) approved by the Board of Directors. Investments for which quoted bid prices are readily available and are representative of the bid side of the market in the judgment of the Service are valued at the mean between the quoted bid prices (as obtained by the Service from dealers in such securities) and asked prices (as calculated by the Service based upon its evaluation of the market for such securities). Other investments (which constitute a majority of the portfolio securities) are carried at fair value as determined by the Service, based on methods which include consideration of: yields or prices of municipal securities of comparable quality, coupon, maturity and type; indications as to values from dealers; and general market conditions. Options and financial futures on municipal and U.S.Treasury securities are valued at the last sales price on the securities exchange on which such securities are primarily traded or at the last sales price on the national securities market on each business day.
(b) Securities transactions and investment income: Securities transactions are recorded on a trade date basis. Realized gain and loss from securities transactions are recorded on the identified cost basis. Interest income, adjusted for accretion of discount and amortization of premium on investments, is earned from settlement date and recognized on the
The Fund 35
NOTES TO FINANCIAL STATEMENTS (continued)
|
accrual basis. Securities purchased or sold on a when-issued or delayed-delivery basis may be settled a month or more after the trade date.
The fund has an arrangement with the custodian bank whereby the fund receives earnings credits from the custodian when positive cash balances are maintained, which are used to offset custody fees. For financial reporting purposes, the fund includes net earnings credits as an expense offset in the Statement of Operations.
The fund follows an investment policy of investing primarily in municipal obligations of one state. Economic changes affecting the state and certain of its public bodies and municipalities may affect the ability of issuers within the state to pay interest on, or repay principal of, municipal obligations held by the fund.
(c) Dividends to shareholders: It is the policy of the fund to declare dividends daily from investment income-net. Such dividends are paid monthly. Dividends from net realized capital gain, if any, are normally declared and paid annually, but the fund may make distributions on a more frequent basis to comply with the distribution requirements of the Internal Revenue Code of 1986, as amended (the “Code”).To the extent that net realized capital gain can be offset by capital loss carryovers, if any, it is the policy of the fund not to distribute such gain. Income and capital gain distributions are determined in accordance with income tax regulations, which may differ from U.S. generally accepted accounting principles.
(d) Federal income taxes: It is the policy of the fund to continue to qualify as a regulated investment company, which can distribute tax exempt dividends, by complying with the applicable provisions of the Code, and to make distributions of income and net realized capital gain sufficient to relieve it from substantially all federal income and excise taxes.
At May 31, 2006, the components of accumulated earnings on a tax basis were as follows: undistributed tax exempt income $276,078, undistributed ordinary income $49,620, undistributed capital gains $1,084,613 and unrealized appreciation $52,283,594.As a result of the
fund’s mergers with Dreyfus Premier California Municipal Bond Fund, General California and California Municipal Income, capital losses of $11,076,983 are available to offset future gains. Based on certain provisions in the Code, the amount of losses which can be utilized in subsequent years is subject to an annual limitation.These acquired capital losses are expected to expire between fiscal 2008-2011.
The tax character of distributions paid to shareholders during the fiscal year ended May 31, 2006 and May 31, 2005, were as follows: tax exempt income $52,803,668 and $47,330,241, ordinary income $1,286,839 and $2,058,818 and long term capital gains $0 and $5,778,325, respectively.
During the period ended May 31, 2006, as a result of permanent book to tax differences, primarily due to the tax treatment for amortization adjustments, the fund decreased accumulated undistributed investment income-net by $43,553, increased accumulated net realized gain (loss) on investments by $264,824 and decreased paid-in capital by $221,271. Net assets were not affected by this reclassification.
NOTE 2—Bank Line of Credit:
|
The fund participates with other Dreyfus-managed funds in a $350 million redemption credit facility (the “Facility”) to be utilized for temporary or emergency purposes, including the financing of redemptions. In connection therewith, the fund has agreed to pay commitment fees on its pro rata portion of the Facility. Interest is charged to the fund based on prevailing market rates in effect at the time of borrowing. During the period ended May 31, 2006, the fund did not borrow under the Facility.
NOTE 3—Management Fee and Other Transactions with Affiliates:
(a) Pursuant to a management agreement (“Agreement”) with the Manager, the management fee is computed at the annual rate of .60% of the value of the fund’s average daily net assets and is payable monthly.
The Fund 37
NOTES TO FINANCIAL STATEMENTS (continued)
|
The Agreement provides that if in any fiscal year the aggregate expenses allocable to Class Z, exclusive of taxes, brokerage fees, interest on borrowings, commitment fees and extraordinary expenses, exceed 1 1 / 2% of the value of the average net assets of Class Z, the fund may deduct from the fees paid to the Manager, or the Manager will bear such excess expense. During the period ended May 31, 2006, there was no expense reimbursement pursuant to the Agreement.The Manager had contractually agreed to waive receipt of its fee and/or assume the expenses,from June 1, 2005 through September 30, 2005, so that the total annual operating expenses, excluding certain expenses as described above, do not exceed .96% for Class A, 1.45% for Class B and 1.71% for Class C.The Manager has contractually agreed, from October 1, 2005 through May 31, 2006, to waive receipt of its fee and/or assume the expenses, so that the total annual operating expenses, excluding certain expenses as described above, do not exceed .90% for Class A, 1.39% for Class B and 1.66% for Class C.The reduction in expenses, pursuant to the undertaking, amounted to $29,620 during the period ended May 31, 2006.
During the period ended May 31, 2006, the Distributor retained $12,079 and $8,774 from commissions earned on sales of the fund’s Class A and Class Z shares and $10,168 and $245 from CDSC on redemptions of the fund’s Class B and Class C shares, respectively.
(b) Under the Distribution Plan (the “Plan”) adopted pursuant to Rule 12b-1 under the Act, Class B and Class C shares pay the Distributor for distributing their shares at an annual rate of .50% of the value of the average daily net assets of Class B shares and .75% of the value of the average daily net assets of Class C shares. During the period ended May 31, 2006, Class B and Class C shares were charged $39,671 and $21,068, respectively, pursuant to the Plan.
(c) Under the Shareholder Services Plan, Class A, Class B and Class C shares pay the Distributor at an annual rate of .25% of the value of the average daily net assets of their shares, for the provision of certain ser-vices.The services provided may include personal services relating to
shareholder accounts, such as answering shareholder inquiries regarding the fund and providing reports and other information, and services related to the maintenance of shareholder accounts. The Distributor may make payments to Service Agents (a securities dealer, financial institution or other industry professional) in respect of these services. The Distributor determines the amounts to be paid to Service Agents. During the period ended May 31, 2006, Class A, Class B and Class C shares were charged $212,602, $19,836 and $7,023, respectively, pursuant to the Shareholder Services Plan.
Under the Shareholder Services Plan, Class Z shares reimburse the Distributor an amount not to exceed an annual rate of .25% of the value of Class Z shares’ average daily net assets for certain allocated expenses of providing personal services and/or maintaining shareholder accounts.The services provided may include personal services relating to shareholder accounts, such as answering shareholder inquiries regarding Class Z shares and providing reports and other information, and services related to the maintenance of shareholder accounts. During the period ended May 31, 2006, Class Z shares were charged $571,602 pursuant to the Shareholder Services Plan.
The fund compensates Dreyfus Transfer, Inc., a wholly-owned subsidiary of the Manager, under a transfer agency agreement for providing personnel and facilities to perform transfer agency services for the fund. During the period ended May 31, 2006, the fund was charged $327,224 pursuant to the transfer agency agreement.
During the period ended May 31, 2006, the fund was charged $3,829 for services performed by the Chief Compliance Officer.
The components of Due to The Dreyfus Corporation and affiliates in the Statement of Assets and Liabilities consist of: management fees $634,542, Rule 12b-1 distribution plan fees $4,329, transfer agency per account fees $51,694, chief compliance officer fees $1,605, which
The Fund 39
NOTES TO FINANCIAL STATEMENTS (continued)
|
are offset against an expense reimbursement currently in effect in the amount of $2,415.
(d) Each Board member also serves as a Board member of other funds within the Dreyfus complex. Annual retainer fees and attendance fees are allocated to each fund based on net assets.
NOTE 4—Securities Transactions:
|
The aggregate amount of purchases and sales of investment securities, excluding short-term securities, during the period ended May 31, 2006, amounted to $456,338,970 and $501,509,011, respectively.
At May 31, 2006, the cost of investments for federal income tax purposes was $1,192,603,128; accordingly, accumulated net unrealized appreciation on investments was $52,283,594, consisting of $55,128,730 gross unrealized appreciation and $2,845,136 gross unrealized depreciation.
NOTE 5—Subsequent Event:
Effective June 1, 2006, the fund will no longer offer Class B shares, except in connection with dividend reinvestment and permitted exchanges of Class B shares.
Subsequent to the issuance of the May 31, 2006 financial statements, the fund determined that the transfers of certain tax-exempt municipal bond securities by the fund to special purpose bond trusts in connection with participation in inverse floater structures do not qualify for sale treatment under Statement of Financial Accounting Standard No. 140, Accounting for Transfers and Servicing of Financial Assets and Extinguishment of Liabilities, and should have been accounted for as a secured borrowing.
The correction of the above item resulted in the restatement of the ratio of net expenses of the financial highlights table as shown below:
| Ratio of Total Expenses | | 2006 | | 2005 | | 2004 | | 2003 | | 2002 |
| |
| |
| |
| |
| |
|
| Class A shares: | | | | | | | | | | |
| As previously reported | | .94% | | .97% | | | | | | |
| As restated | | 1.04% | | 1.03% | | | | | | |
| Class B shares: | | | | | | | | | | |
| As previously reported | | 1.46% | | 1.48% | | | | | | |
| As restated | | 1.56% | | 1.54% | | | | | | |
| Class C shares: | | | | | | | | | | |
| As previously reported | | 1.70% | | 1.71% | | | | | | |
| As restated | | 1.80% | | 1.77% | | | | | | |
| Class Z shares: | | | | | | | | | | |
| As previously reported | | .71% | | .72% | | .70% | | .70% | | .71% |
| As restated | | .81% | | .78% | | .73% | | .75% | | .78% |
| |
| Ratio of Net Expenses | | 2006 | | 2005 | | 2004 | | 2003 | | 2002 |
| |
| |
| |
| |
| |
|
| Class A shares: | | | | | | | | | | |
| As previously reported | | .91% | | .96% | | | | | | |
| As restated | | 1.01% | | 1.02% | | | | | | |
| Class B shares: | | | | | | | | | | |
| As previously reported | | 1.41% | | 1.45% | | | | | | |
| As restated | | 1.51% | | 1.51% | | | | | | |
| Class C shares: | | | | | | | | | | |
| As previously reported | | 1.67% | | 1.70% | | | | | | |
| As restated | | 1.77% | | 1.76% | | | | | | |
| Class Z shares: | | | | | | | | | | |
| As previously reported | | .71% | | .72% | | .70% | | .70% | | .71% |
| As restated | | .81% | | .78% | | .73% | | .75% | | .78% |
This restatement has no impact on the fund’s previously reported net assets, net investment income, net asset value per share or total return.
The Fund 41
NOTES TO FINANCIAL STATEMENTS (continued)
|
In addition, the statement of investments, the statement of assets and liabilities, the statement of operations and the statement of changes in net assets were also restated as follows:
| | | 2006 | | 2006 |
| | | Original Reported | | As Restated |
| |
| |
|
| Portfolio of Investments ($): | | | | |
| Total investments | | 1,244,866,722 | | 1,286,456,722 |
| Identified cost | | 1,192,818,332 | | 1,233,740,347 |
| Other assets and liabilities | | 1,410,883 | | (40,159,117) |
| Statement of Assets and Liabilities ($): | | |
| Total investments in securities, at value | | 1,244,866,722 | | 1,286,456,722 |
| Identified cost | | 1,192,818,332 | | 1,233,740,347 |
| Total assets | | 1,264,446,700 | | 1,306,735,080 |
| Payable for floating rate notes issued | | — | | 41,570,000 |
| Total liabilities | | 18,149,095 | | 60,437,475 |
| Net unrealized appreciation | | | | |
| of investments | | 52,068,390 | | 52,716,375 |
| Accumulated net realized | | | | |
| loss on investments | | (9,727,548) | | (10,375,533) |
| Statement of Operations ($): | | | | |
| Investment income—Interest | | 62,333,379 | | 63,665,998 |
| Expense—Interest | | — | | 1,332,619 |
| Total expenses | | 9,540,107 | | 10,872,726 |
| Net expenses | | 9,486,158 | | 10,818,777 |
REPORT OF INDEPENDENT REGISTERED PUBLIC ACCOUNTING FIRM
Shareholders and Board of Directors
Dreyfus Premier California Tax Exempt Bond Fund, Inc.
We have audited the accompanying statement of assets and liabilities of Dreyfus Premier California Tax Exempt Bond Fund, Inc., including the statement of investments, as of May 31, 2006, and the related statement of operations for the year then ended, the statement of changes in net assets for each of the two years in the period then ended, and financial highlights for each of the periods indicated therein. These financial statements and financial highlights are the responsibility of the Fund’s management. Our responsibility is to express an opinion on these financial statements and financial highlights based on our audits.
We conducted our audits in accordance with the standards of the Public Company Accounting Oversight Board (United States).Those standards require that we plan and perform the audit to obtain reasonable assurance about whether the financial statements and financial highlights are free of material misstatement.We were not engaged to perform an audit of the Fund’s internal control over financial reporting. Our audits included consideration of internal control over financial reporting as a basis for designing audit procedures that are appropriate in the circumstances, but not for the purposes of expressing an opinion on the effectiveness of the Fund’s internal control over financial reporting. Accordingly, we express no such opinion.An audit also includes examining, on a test basis, evidence supporting the amounts and disclosures in the financial statements and financial highlights, assessing the accounting principles used and significant estimates made by management, and evaluating the overall financial statement presentation. Our procedures included confirmation of securities owned as of May 31, 2006 by correspondence with the custodian and others or by other appropriate auditing procedures where replies from others were not received. We believe that our audits provide a reasonable basis for our opinion.
In our opinion, the financial statements and financial highlights referred to above present fairly, in all material respects, the financial position of Dreyfus Premier California Tax Exempt Bond Fund, Inc.
The Fund 43
REPORT OF INDEPENDENT REGISTERED PUBLIC ACCOUNTING FIRM (continued)
at May 31, 2006, the results of its operations for the year then ended, the changes in its net assets for each of the two years in the period then ended, and the financial highlights for each of the indicated periods, in conformity with U.S. generally accepted accounting principles.
As discussed in Note 6,the statement of assets and liabilities,including the statement of investments, as of May 31, 2006, and the related statements of operations for the year then ended, the statements of changes in net assets for each of the two years in the period then ended, and financial highlights for each of the periods indicated therein have been restated.
IMPORTANT TAX INFORMATION (Unaudited)
In accordance with federal tax law, the fund hereby designates all the dividends paid from investment income-net during its fiscal year ended May 31, 2006 as “exempt-interest dividends” (not subject to regular federal income tax, and for individuals who are California residents, California personal income taxes).As required by federal tax law rules, shareholders will receive notification of their portion of the fund’s taxable ordinary dividends (if any) and capital gains distributions (if any) paid for the 2006 calendar year on Form 1099-DIV which will be mailed by January 31, 2007.
The Fund 45
INFORMATION ABOUT THE REVIEW AND APPROVAL OF THE FUND’S MANAGEMENT AGREEMENT (Unaudited)
At a meeting of the fund’s Board of Directors held on April 18, 2006, the Board considered the re-approval for an annual period of the fund’s Management Agreement, pursuant to which the Manager provides the fund with investment advisory and administrative services. The Board members, none of whom are “interested persons” (as defined in the Investment Company Act of 1940, as amended) of the fund, were assisted in their review by independent legal counsel and met with counsel in executive session separate from representatives of the Manager.
Analysis of Nature, Extent, and Quality of Services Provided to the Fund. The Board members received a presentation from representatives of the Manager regarding services provided to the fund and other funds in the Dreyfus fund complex, and discussed the nature, extent, and quality of the services provided to the fund pursuant to its Management Agreement.The Manager’s representatives reviewed the fund’s distribution of accounts and the relationships the Manager has with various intermediaries and the different needs of each. The Manager’s representatives noted the diversity of distribution of the fund as well as among the funds in the Dreyfus fund complex, and the Manager’s corresponding need for broad, deep, and diverse resources to be able to provide ongoing shareholder services to each of the fund’s distribution channels. The Board also reviewed the number of shareholder accounts in the fund, as well as the fund’s asset size.
The Board members also considered the Manager’s research and portfolio management capabilities.The Board members also considered that the Manager also provides oversight of day-to-day fund operations, including fund accounting and administration and assistance in meeting legal and regulatory requirements, and the Manager’s extensive administrative, accounting and compliance infrastructure.
Comparative Analysis of the Fund’s Management Fee, Expense Ratio, and Performance. The Board members reviewed reports prepared by Lipper, Inc., an independent provider of investment company data, which included information comparing the fund’s management fee and expense ratio with a group of comparable funds (the “Expense Group”)
and with a broader group of funds (the “Expense Universe”) that were selected by Lipper. Included in these reports were comparisons of contractual and actual management fee rates, total operating expenses, and yield and total return performance. The Manager furnished these reports to the Board along with a description of the methodology Lipper used to select the Expense Group and Expense Universe.
The Board reviewed the results of the Expense Group and Expense Universe comparisons for various periods ended February 28, 2006. The Board reviewed the range of management fees and expense ratios of the funds in the Expense Group and Expense Universe, and noted that the fund’s contractual and actual management fees and total expense ratio (for Class A shares) were higher than medians of the Expense Group and Expense Universe.
The Board members also reviewed the reports prepared by Lipper that presented the fund’s performance for various periods ended February 28, 2006, and placed significant emphasis on comparisons of yield and total return performance among the same group of funds as the Expense Group (the “Performance Group”) and to a group of funds that was broader than the Expense Universe (the “Performance Universe”) that also was selected by Lipper. Because the fund’s Class A shares have only one year of performance history, the Board also reviewed performance results for the fund’s Class Z shares, which is the fund’s oldest share class. The Board noted that the fund achieved total returns that were at or above the Performance Group medians for each reported time period up to 5 years. On a yield performance basis, the Board noted that the fund’s one-year yield performance for the past 10 annual periods was below the Performance Group medians and variously above and below the Performance Universe medians for each reported time period.
The Board discussed the fund’s total expense ratio relative to the Expense Group with management. In that regard, the Board noted that the fund has the same contractual management fee rate as the substantial majority of Dreyfus municipal bond funds and that the fund’s total expense ratio is only eight basis points higher than the Expense Group
The Fund 47
I N FO R M AT I O N A B O U T T H E R E V I E W A N D A P P R OVA L O F T H E F U N D ’S M A N A G E M E N T A G R E E M E N T ( U n a u d i t e d ) ( c o n t i n u e d )
median.The Board also noted the portfolio manager’s experience and long-term track record, including his competitive total return performance results.
Representatives of the Manager noted that there were no similarly managed mutual funds, institutional separate accounts, or wrap fee accounts managed by the Manager or its affiliates with similar investment objectives, policies, and strategies and, as to mutual funds only, reported in the same Lipper category, as the fund.
Analysis of Profitability and Economies of Scale. The Manager’s representatives reviewed the dollar amount of expenses allocated and profit received by the Manager and the method used to determine such expenses and profit.The Board considered information, previously provided and discussed, prepared by an independent consulting firm regarding the Manager’s approach to allocating costs to, and determining the profitability of, individual funds and the entire Dreyfus mutual fund complex.The Board members also considered that the methodology had also been reviewed by an independent registered public accounting firm which, like the consultant, found the methodology to be reasonable.The consulting firm also analyzed where any economies of scale might emerge in connection with the management of the fund. The Board members evaluated the profitability analysis in light of the relevant circumstances for the fund, including the decline in fund assets from the prior year, and the extent to which economies of scale would be realized if the fund grows and whether fee levels reflect these economies of scale for the benefit of fund shareholders. The Board members also considered potential benefits to the Manager from acting as investment adviser to the fund and noted that there were no soft dollar arrangements in effect with respect to trading the fund’s portfolio.
It was noted that the Board members should consider the Manager’s profitability with respect to the fund as part of their evaluation of whether the fees under the Management Agreement bear a reasonable relationship to the mix of services provided by the Manager, including the nature, extent, and quality of such services and that a discussion of
economies of scale is predicated on increasing assets and that, if a fund’s assets had been decreasing, the possibility that the Manager may have realized any economies of scale would be less. It was noted that the profitability percentage for managing the fund was within ranges determined by appropriate court cases to be reasonable given the services rendered and that the profitability percentage for managing the fund was reasonable given the fund’s overall performance and generally superior service levels provided.
At the conclusion of these discussions, the Board agreed that it had been furnished with sufficient information to make an informed business decision with respect to continuation of the fund’s Management Agreement. Based on the discussions and considerations as described above, the Board made the following conclusions and determinations.
- The Board concluded that the nature, extent, and quality of the services provided by the Manager are adequate and appropriate.
- The Board was satisfied with the fund’s performance.
- The Board concluded that the fee paid to the Manager by the fund was reasonable in light of the services provided, comparative performance and expense and advi- sory fee information, costs of the services provided, and profits to be realized and benefits derived or to be derived by the Manager from its relationship with the fund.
- The Board determined that the economies of scale which may accrue to the Manager and its affiliates in connection with the management of the fund had been adequately considered by the Manager in connection with the management fee rate charged to the fund, and that, to the extent in the future it were to be determined that material economies of scale had not been shared with the fund, the Board would seek to have those economies of scale shared with the fund.
The Board members considered these conclusions and determinations, along with the information received on a routine and regular basis throughout the year, and, without any one factor being dispositive, the Board determined that re-approval of the fund’s Management Agreement was in the best interests of the fund and its shareholders.
The Fund 49
BOARD MEMBERS INFORMATION (Unaudited)
| Joseph S. DiMartino (62) |
| Chairman of the Board (1995) |
| Principal Occupation During Past 5 Years: |
| • Corporate Director and Trustee |
| Other Board Memberships and Affiliations: |
| • The Muscular Dystrophy Association, Director |
| • Levcor International, Inc., an apparel fabric processor, Director |
| • Century Business Services, Inc., a provider of outsourcing functions for small and medium size |
| companies, Director |
| • The Newark Group, a provider of a national market of paper recovery facilities, paperboard |
| mills and paperboard converting plants, Director |
| • Sunair Services Corporation, engaging in the design, manufacture and sale of high frequency |
| systems for long-range voice and data communications, as well as providing certain outdoor- |
| related services to homes and businesses, Director |
| No. of Portfolios for which Board Member Serves: 186 |
| ——————— |
| David W. Burke (70) |
| Board Member (1994) |
| Principal Occupation During Past 5 Years: |
| • Corporate Director and Trustee |
| Other Board Memberships and Affiliations: |
| • John F. Kennedy Library Foundation, Director |
| • U.S.S. Constitution Museum, Director |
| No. of Portfolios for which Board Member Serves: 79 |
| ——————— |
| Gordon J. Davis (64) |
| Board Member (1995) |
| Principal Occupation During Past 5 Years: |
| • Partner in the law firm of LeBoeuf, Lamb, Greene & MacRae, LLP |
| • President, Lincoln Center for the Performing Arts, Inc. (2001) |
| Other Board Memberships and Affiliations: |
| • Consolidated Edison, Inc., a utility company, Director |
| • Phoenix Companies, Inc., a life insurance company, Director |
| • Board Member/Trustee for several not-for-profit groups |
| No. of Portfolios for which Board Member Serves: 24 |
| Joni Evans (64) |
| Board Member (1987) |
| Principal Occupation During Past 5 Years: |
| • Principal, Joni Evans Ltd. |
| • Senior Vice President of the William Morris Agency (2005) |
| No. of Portfolios for which Board Member Serves: 15 |
| ——————— |
| Arnold S. Hiatt (79) |
| Board Member (1987) |
| Principal Occupation During Past 5 Years: |
| • Chairman of The Stride Rite Charitable Foundation |
| Other Board Memberships and Affiliations: |
| • Isabella Stewart Gardner Museum,Trustee |
| • John Merck Fund, a charitable trust,Trustee |
| • Business for Social Responsibility, Director |
| • The A.M. Fund,Trustee |
| No. of Portfolios for which Board Member Serves: 15 |
| ——��———— |
| Burton N. Wallack (55) |
| Board Member (1991) |
| Principal Occupation During Past 5 Years: |
| • President and co-owner of Wallack Management Company, a real estate management company |
| No. of Portfolios for which Board Member Serves: 15 |
| ——————— |
| Once elected all Board Members serve for an indefinite term.The address of the Board Members and Officers is in c/o |
| The Dreyfus Corporation, 200 Park Avenue, New York, New York 10166. Additional information about the Board |
| Members is available in the fund’s Statement of Additional Information which can be obtained from Dreyfus free of |
| charge by calling this toll free number: 1-800-554-4611. |
| Samuel Chase, Emeritus Board Member |
The Fund 51
OFFICERS OF THE FUND (Unaudited)
| STEPHEN E. CANTER, President since |
| March 2000. |
Chairman of the Board and Chief Executive Officer of the Manager, and an officer of 90 investment companies (comprised of 186 portfolios) managed by the Manager. Mr. Canter also is a Board member and, where applicable, an Executive Committee Member of the other investment management subsidiaries of Mellon Financial Corporation, each of which is an affiliate of the Manager. He is 60 years old and has been an employee of the Manager since May 1995.
| STEPHEN R. BYERS, Executive Vice |
| President since November 2002. |
Chief Investment Officer,Vice Chairman and a director of the Manager, and an officer of 90 investment companies (comprised of 186 portfolios) managed by the Manager. Mr. Byers also is an officer, director or an Executive Committee Member of certain other investment management subsidiaries of Mellon Financial Corporation, each of which is an affiliate of the Manager. He is 52 years old and has been an employee of the Manager since January 2000.
| MARK N. JACOBS, Vice President since |
| March 2000. |
Executive Vice President, Secretary and General Counsel of the Manager, and an officer of 91 investment companies (comprised of 202 portfolios) managed by the Manager. He is 60 years old and has been an employee of the Manager since June 1977.
| MICHAEL A. ROSENBERG, Vice President |
| and Secretary since August 2005. |
Associate General Counsel of the Manager, and an officer of 91 investment companies (comprised of 202 portfolios) managed by the Manager. He is 46 years old and has been an employee of the Manager since October 1991.
| JAMES BITETTO, Vice President and |
| Assistant Secretary since August 2005. |
Assistant General Counsel and Assistant Secretary of the Manager, and an officer of 91 investment companies (comprised of 202
portfolios) managed by the Manager. He is 39 years old and has been an employee of the Manager since December 1996.
| JONI LACKS CHARATAN, Vice President |
| and Assistant Secretary since |
| August 2005. |
Associate General Counsel of the Manager, and an officer of 91 investment companies (comprised of 202 portfolios) managed by the Manager. She is 50 years old and has been an employee of the Manager since October 1988.
| JOSEPH M. CHIOFFI, Vice President and |
| Assistant Secretary since August 2005. |
Assistant General Counsel of the Manager, and an officer of 91 investment companies (comprised of 202 portfolios) managed by the Manager. He is 44 years old and has been an employee of the Manager since June 2000.
| JANETTE E. FARRAGHER, Vice President |
| and Assistant Secretary since |
| August 2005. |
Associate General Counsel of the Manager, and an officer of 91 investment companies (comprised of 202 portfolios) managed by the Manager. She is 43 years old and has been an employee of the Manager since February 1984.
| JOHN B. HAMMALIAN, Vice President and |
| Assistant Secretary since August 2005. |
Associate General Counsel of the Manager, and an officer of 91 investment companies (comprised of 202 portfolios) managed by the Manager. He is 42 years old and has been an employee of the Manager since February 1991.
52
| ROBERT R. MULLERY, Vice President and |
| Assistant Secretary since August 2005. |
Associate General Counsel of the Manager, and an officer of 91 investment companies (comprised of 202 portfolios) managed by the Manager. He is 54 years old and has been an employee of the Manager since May 1986.
| JEFF PRUSNOFSKY, Vice President and |
| Assistant Secretary since August 2005. |
Associate General Counsel of the Manager, and an officer of 91 investment companies (comprised of 202 portfolios) managed by the Manager. He is 41 years old and has been an employee of the Manager since October 1990.
| JAMES WINDELS, Treasurer since |
| November 2001. |
Director – Mutual Fund Accounting of the Manager, and an officer of 91 investment companies (comprised of 202 portfolios) managed by the Manager. He is 47 years old and has been an employee of the Manager since April 1985.
| ERIK D. NAVILOFF, Assistant Treasurer |
| since August 2005. |
Senior Accounting Manager – Taxable Fixed Income Funds of the Manager, and an officer of 91 investment companies (comprised of 202 portfolios) managed by the Manager. He is 37 years old and has been an employee of the Manager since November 1992.
| ROBERT ROBOL, Assistant Treasurer |
| since August 2003. |
Senior Accounting Manager – Money Market and Municipal Bond Funds of the Manager, and an officer of 91 investment companies (comprised of 202 portfolios) managed by the Manager. He is 42 years old and has been an employee of the Manager since October 1988.
| ROBERT SVAGNA, Assistant Treasurer |
| since August 2005. |
Senior Accounting Manager – Equity Funds of the Manager, and an officer of 91 investment companies (comprised of 201 portfolios) managed by the Manager. He is 39 years old and has been an employee of the Manager since November 1990.
| GAVIN C. REILLY, Assistant Treasurer |
| since December 2005. |
Tax Manager of the Investment Accounting and Support Department of the Manager, and an officer of 91 investment companies (comprised of 202 portfolios) managed by the Manager. He is 37 years old and has been an employee of the Manager since April 1991.
| JOSEPH W. CONNOLLY, Chief Compliance |
| Officer since October 2004. |
Chief Compliance Officer of the Manager and The Dreyfus Family of Funds (91 investment companies, comprised of 202 portfolios). From November 2001 through March 2004, Mr. Connolly was first Vice-President, Mutual Fund Servicing for Mellon Global Securities Services. In that capacity, Mr. Connolly was responsible for managing Mellon’s Custody, Fund Accounting and Fund Administration services to third-party mutual fund clients. He is 49 years old and has served in various capacities with the Manager since 1980, including manager of the firm’s Fund Accounting Department from 1997 through October 2001.
| WILLIAM GERMENIS, Anti-Money |
| Laundering Compliance Officer since |
| October 2002. |
Vice President and Anti-Money Laundering Compliance Officer of the Distributor, and the Anti-Money Laundering Compliance Officer of 87 investment companies (comprised of 198 portfolios) managed by the Manager. He is 35 years old and has been an employee of the Distributor since October 1998.
| Dreyfus Premier |
| California Tax Exempt |
| Bond Fund, Inc. |
| 200 Park Avenue |
| New York, NY 10166 |
| |
| Manager |
| The Dreyfus Corporation |
| 200 Park Avenue |
| New York, NY 10166 |
| |
| Custodian |
| The Bank of New York |
| One Wall Street |
| New York, NY 10286 |
| Transfer Agent & |
| Dividend Disbursing Agent |
| Dreyfus Transfer, Inc. |
| 200 Park Avenue |
| New York, NY 10166 |
| |
| Distributor |
| Dreyfus Service Corporation |
| 200 Park Avenue |
| New York, NY 10166 |
Telephone Call your financial representative or 1-800-554-4611
| Mail | | The Dreyfus Premier Family of Funds |
| | | 144 Glenn Curtiss Boulevard, Uniondale, NY 11556-0144 |
The fund files its complete schedule of portfolio holdings with the Securities and Exchange Commission (“SEC”) for the first and third quarters of each fiscal year on Form N-Q. The fund's Forms N-Q are available on the SEC’s website at http://www.sec.gov and may be reviewed and copied at the SEC’s Public Reference Room in Washington, DC. Information on the operation of the Public Reference Room may be obtained by calling 1-800-SEC-0330.
Information regarding how the fund voted proxies relating to portfolio securities for the 12-month period ended June 30, 2005, is available on the SEC’s website at http://www.sec.gov and without charge, upon request, by calling 1-800-645-6561.
© 2006 Dreyfus Service Corporation

The Registrant has adopted a code of ethics that applies to the Registrant's principal executive officer, principal financial officer, principal accounting officer or controller, or persons performing similar functions. There have been no amendments to, or waivers in connection with, the Code of Ethics during the period covered by this Report.
| Item 3. | | Audit Committee Financial Expert. |
The Registrant's Board has determined that Joseph S. DiMartino, a member of the Audit Committee of the Board, is an audit committee financial expert as defined by the Securities and Exchange Commission (the "SEC"). Joseph S. DiMartino is "independent" as defined by the SEC for purposes of audit committee financial expert determinations.
| Item 4. | | Principal Accountant Fees and Services |
(a) Audit Fees. The aggregate fees billed for each of the last two fiscal years (the "Reporting Periods") for professional services rendered by the Registrant's principal accountant (the "Auditor") for the audit of the Registrant's annual financial statements, or services that are normally provided by the Auditor in connection with the statutory and regulatory filings or engagements for the Reporting Periods, were $40,634 in 2005 and $42,565 in 2006.
(b) Audit-Related Fees. The aggregate fees billed in the Reporting Periods for assurance and related services by the Auditor that are reasonably related to the performance of the audit of the Registrant's financial statements and are not reported under paragraph (a) of this Item 4 were $0 in 2005 and $0 in 2006.
The aggregate fees billed in the Reporting Periods for non-audit assurance and related services by the Auditor to the Registrant's investment adviser (not including any sub-investment adviser whose role is primarily portfolio management and is subcontracted with or overseen by another investment adviser), and any entity controlling, controlled by or under common control with the investment adviser that provides ongoing services to the Registrant ("Service Affiliates"), that were reasonably related to the performance of the annual audit of the Service Affiliate, which required pre-approval by the Audit Committee were $0 in 2005 and $0 in 2006.
Note: For the second paragraph in each of (b) through (d) of this Item 4, certain of such services were not pre-approved prior to May 6, 2003, when such services were required to be pre-approved. On and after May 6, 2003, 100% of all services provided by the Auditor were pre-approved as required. For comparative purposes, the fees shown assume that all such services were pre-approved, including services that were not pre-approved prior to the compliance date of the pre-approval requirement.
(c) Tax Fees. The aggregate fees billed in the Reporting Periods for professional services rendered by the Auditor for tax compliance, tax advice and tax planning ("Tax Services") were $3,873 in 2005 and $3,148 in 2006. These services consisted of (i) review or preparation of U.S. federal, state, local and excise tax returns; (ii) U.S. federal, state and local tax planning, advice and assistance regarding statutory, regulatory or administrative developments, and (iii) tax advice regarding tax qualification matters and/or treatment of various financial instruments held or proposed to be acquired or held.
The aggregate fees billed in the Reporting Periods for Tax Services by the Auditor to Service Affiliates which required pre-approval by the Audit Committee were $0 in 2005 and $0 in 2006.
(d) All Other Fees. The aggregate fees billed in the Reporting Periods for products and services provided by the Auditor, other than the services reported in paragraphs (a) through (c) of this Item, were $700 in 2005 and $736 in 2006. These services consisted of a review of the Registrant's anti-money laundering program.
The aggregate fees billed in the Reporting Periods for Non-Audit Services by the Auditor to Service Affiliates, other than the services reported in paragraphs (b) through (c) of this Item, which required pre-approval by the Audit Committee were $0 in 2005 and $0 in 2006.
Audit Committee Pre-Approval Policies and Procedures. The Registrant's Audit Committee has established policies and procedures (the "Policy") for pre-approval (within specified fee limits) of the Auditor's engagements for non-audit services to the Registrant and Service Affiliates without specific case-by-case consideration. Pre-approval considerations include whether the proposed services are compatible with maintaining the Auditor's independence. Pre-approvals pursuant to the Policy are considered annually.
Non-Audit Fees. The aggregate non-audit fees billed by the Auditor for services rendered to the Registrant, and rendered to Service Affiliates, for the Reporting Periods were $811,636 in 2005 and $586,749 in 2006.
Auditor Independence. The Registrant's Audit Committee has considered whether the provision of non-audit services that were rendered to Service Affiliates which were not pre-approved (not requiring pre-approval) is compatible with maintaining the Auditor's independence.
| Item 5. | | Audit Committee of Listed Registrants. |
| | | Not applicable. |
| Item 6. | | Schedule of Investments. |
| | | Not applicable. |
| Item 7. | | Disclosure of Proxy Voting Policies and Procedures for Closed-End Management |
| | | Investment Companies. |
| | | Not applicable. |
| Item 8. | | Portfolio Managers of Closed-End Management Investment Companies. |
| | | Not applicable. |
| Item 9. | | Purchases of Equity Securities by Closed-End Management Investment Companies and |
| | | Affiliated Purchasers. |
| | | Not applicable. |
| Item 10. | | Submission of Matters to a Vote of Security Holders. |
The Registrant has a Nominating Committee (the "Committee"), which is responsible for selecting and nominating persons for election or appointment by the Registrant's Board as Board members. The Committee has adopted a Nominating Committee Charter (the "Charter"). Pursuant to the Charter, the
Committee will consider recommendations for nominees from shareholders submitted to the Secretary of the Registrant, c/o The Dreyfus Corporation Legal Department, 200 Park Avenue, 8th Floor East, New York, New York 10166. A nomination submission must include information regarding the recommended nominee as specified in the Charter. This information includes all information relating to a recommended nominee that is required to be disclosed in solicitations or proxy statements for the election of Board members, as well as information sufficient to evaluate the factors to be considered by the Committee, including character and integrity, business and professional experience, and whether the person has the ability to apply sound and independent business judgment and would act in the interests of the Registrant and its shareholders.
Nomination submissions are required to be accompanied by a written consent of the individual to stand for election if nominated by the Board and to serve if elected by the shareholders, and such additional information must be provided regarding the recommended nominee as reasonably requested by the Committee.
| Item 11. | | Controls and Procedures. |
(a) The Registrant's principal executive and principal financial officers have concluded, based on their evaluation of the Registrant's disclosure controls and procedures as of a date within 90 days of the filing date of this report, that the Registrant's disclosure controls and procedures are reasonably designed to ensure that information required to be disclosed by the Registrant on Form N-CSR is recorded, processed, summarized and reported within the required time periods and that information required to be disclosed by the Registrant in the reports that it files or submits on Form N-CSR is accumulated and communicated to the Registrant's management, including its principal executive and principal financial officers, as appropriate to allow timely decisions regarding required disclosure.
(b) The Registrant has revised its internal control over financial reporting with respect to a change in accounting for investments in certain inverse floater structures. As a consequence of this change, Dreyfus Premier California Tax Exempt Bond Fund, Inc. has restated one or more sections of certain of its historical financial statements to account for these investments as secured borrowings and to report the related income and expense.
| (a)(1) | | Code of ethics referred to in Item 2. |
| (a)(2) | | Certifications of principal executive and principal financial officers as required by Rule 30a-2(a) |
| under the Investment Company Act of 1940. |
| (a)(3) | | Not applicable. |
| (b) | | Certification of principal executive and principal financial officers as required by Rule 30a-2(b) |
| under the Investment Company Act of 1940. |
Pursuant to the requirements of the Securities Exchange Act of 1934 and the Investment Company Act of 1940, the Registrant has duly caused this Report to be signed on its behalf by the undersigned, thereunto duly authorized.
Dreyfus Premier California Tax Exempt Bond Fund, Inc.
Pursuant to the requirements of the Securities Exchange Act of 1934 and the Investment Company Act of 1940, this Report has been signed below by the following persons on behalf of the Registrant and in the capacities and on the dates indicated.
| | | EXHIBIT INDEX |
| (a)(1) | | Code of ethics referred to in Item 2. |
| (a)(2) | | Certifications of principal executive and principal financial officers as required by Rule 30a- |
| 2(a) under the Investment Company Act of 1940. (EX-99.CERT) |
| (b) | | Certification of principal executive and principal financial officers as required by Rule 30a- |
| 2(b) under the Investment Company Act of 1940. (EX-99.906CERT) |