| UNITED STATES |
| SECURITIES AND EXCHANGE COMMISSION |
| Washington, D.C. 20549 |
| |
| |
| FORM N-CSR |
| |
| CERTIFIED SHAREHOLDER REPORT OF REGISTERED MANAGEMENT |
| INVESTMENT COMPANIES |
| |
| Investment Company Act file number 811-3757 |
| |
| DREYFUS PREMIER CALIFORNIA TAX EXEMPT BOND FUND, INC. |
| (Exact name of Registrant as specified in charter) |
| |
| |
| c/o The Dreyfus Corporation |
| 200 Park Avenue |
| New York, New York 10166 |
| (Address of principal executive offices) (Zip code) |
| |
| Michael A. Rosenberg, Esq. |
| 200 Park Avenue |
| New York, New York 10166 |
| (Name and address of agent for service) |
| |
| Registrant's telephone number, including area code: (212) 922-6000 |
| Date of fiscal year end: | | 05/31 |
| Date of reporting period: | | 05/31/07 |
| | | | | FORM N-CSR |
| Item 1. | | Reports to Stockholders. | | |
Save time. Save paper. View your next shareholder report online as soon as it’s available. Log into www.dreyfus.com and sign up for Dreyfus eCommunications. It’s simple and only takes a few minutes.
The views expressed in this report reflect those of the portfolio manager only through the end of the period covered and do not necessarily represent the views of Dreyfus or any other person in the Dreyfus organization. Any such views are subject to change at any time based upon market or other conditions and Dreyfus disclaims any responsibility to update such views.These views may not be relied on as investment advice and, because investment decisions for a Dreyfus fund are based on numerous factors, may not be relied on as an indication of trading intent on behalf of any Dreyfus fund.
Not FDIC-Insured • Not Bank-Guaranteed • May Lose Value
| | | Contents |
| |
| | | T H E F U N D |
| |
|
| 2 | | A Letter from the CEO |
| 3 | | Discussion of Fund Performance |
| 6 | | Fund Performance |
| 8 | | Understanding Your Fund’s Expenses |
| 8 | | Comparing Your Fund’s Expenses |
| | | With Those of Other Funds |
| 9 | | Statement of Investments |
| 24 | | Statement of Assets and Liabilities |
| 25 | | Statement of Operations |
| 26 | | Statement of Changes in Net Assets |
| 28 | | Financial Highlights |
| 32 | | Notes to Financial Statements |
| 41 | | Report of Independent Registered |
| | | Public Accounting Firm |
| 42 | | Important Tax Information |
| 43 | | Information About the Review and Approval |
| | | of the Fund’s Management Agreement |
| 48 | | Board Members Information |
| 51 | | Officers of the Fund |
| |
| | | F O R M O R E I N F O R M AT I O N |
| |
|
| | | Back Cover |
The Fund
| Dreyfus Premier California |
| Tax Exempt Bond Fund, Inc. |

A L E T T E R F R O M T H E C E O
Dear Shareholder:
We are pleased to present this annual report for Dreyfus Premier California Tax Exempt Bond Fund, Inc., covering the 12-month period from June 1, 2006, through May 31, 2007.
The U.S. economy continued to moderate during the reporting period as cooling housing markets took their toll on consumer and business spending. Labor markets, however, remained quite strong, and key measures of inflation have stayed stubbornly above the Federal Reserve’s stated “comfort zone.” Our economists believe that the anemic rate of U.S. economic growth recorded in the first quarter of 2007 should be the weakest reading of the current midcycle slowdown, and economic growth is likely to recover eventually to a near-trend pace.
The likely implications of our economic outlook include a long pause in Fed policy, a modest drop in 10-year Treasury bond yields (and consequent rise in price) and, in the absence of an as-yet unforeseen event, persistently tight yield spreads throughout the municipal bond market sectors.We expect these developments to produce both challenges and opportunities for fixed-income investors. As always, your financial advisor can help you position your investments for these trends.
For information about how the fund performed during the reporting period, as well as market perspectives, we have provided a Discussion of Fund Performance given by the fund’s Portfolio Manager.
Thank you for your continued confidence and support.
2

D I S C U S S I O N O F F U N D P E R F O R M A N C E
For the period of June 1, 2006, through May 31, 2007, as provided by Joseph Darcy, Portfolio Manager
Market and Fund Performance Overview
Despite heightened market volatility, municipal bond prices generally ended the reporting period close to where they began. Class A and Z shares of the fund produced higher returns than the fund’s Lipper category average return, primarily due to the fund’s emphasis on income-oriented securities. However, the fund’s returns lagged its benchmark, which contains bonds from many states, not just California, whose results do not reflect fund fees and expenses.
For the 12-month period ended May 31, 2007, the fund produced total returns of 4.75% for Class A shares, 4.20% for Class B shares, 3.95% for Class C shares and 4.97% for Class Z shares.1 In comparison, the Lehman Brothers Municipal Bond Index, the fund’s benchmark index, achieved a total return of 4.84% for the same period.2 In addition, the average total return for all funds reported in the Lipper California Municipal Debt Funds category was 4.55% .3
The Fund’s Investment Approach
The fund seeks as high a level of current income exempt from federal and California state income taxes as is consistent with the preservation of cap-ital.To pursue this goal, the fund normally invests substantially all of its assets in municipal bonds that provide income exempt from federal and California state personal income taxes.The fund will invest at least 80% of its assets in investment-grade municipal bonds or the unrated equivalent as determined by Dreyfus.The fund may invest up to 20% of its assets in municipal bonds rated below investment grade (“junk” bonds) or the unrated equivalent as determined by Dreyfus.The dollar-weighted average maturity of the fund’s portfolio normally exceeds 10 years, but the fund’s average portfolio maturity is not restricted.
We may buy and sell bonds based on credit quality, market outlook and yield potential. In selecting municipal bonds for investment, we may
T h e F u n d 3
D I S C U S S I O N O F F U N D P E R F O R M A N C E (continued)
assess the current interest-rate environment and the municipal bond’s potential volatility in different rate environments. We focus on bonds with the potential to offer attractive current income, typically looking for bonds that can provide consistently attractive current yields or that are trading at competitive market prices. A portion of the fund’s assets may be allocated to “discount”bonds,which are bonds that sell at a price below their face value, or to “premium” bonds, which are bonds that sell at a price above their face value.The fund’s allocation either to discount bonds or to premium bonds will change along with our changing views of the current interest-rate and market environment.We also may look to select bonds that are most likely to obtain attractive prices when sold.
Income Drove Returns in the Municipal Bond Market
Bouts of market volatility mostly offset a generally rallying market over much of the reporting period. Although robust economic growth sparked inflation fears in the spring of 2006, those concerns subsequently waned amid reports of softening housing markets and falling energy prices. The Federal Reserve Board (the “Fed”) apparently agreed with a more benign inflation outlook, as it held short-term interest rates steady between July 2006 and the reporting period’s end.
Near the end of February 2007, turmoil in overseas equity markets and rising delinquencies among U.S. sub-prime mortgage holders sparked fears of a more severe economic slowdown. In fact, the U.S. economy posted a relatively anemic 0.6% annualized growth rate over the first quarter of the year.Yet, by the end of the reporting period, investor sentiment had shifted dramatically due to robust labor markets, rising energy prices and comments from the Fed that inflation represented a greater concern than recession. With municipal bonds ending the reporting period with only slightly higher prices than where they began, the market’s total return performance was driven primarily by income.
Despite the economic slowdown, rising tax revenues have continued to fill state coffers and strengthen its fiscal position. However, California has embarked on an aggressive debt management program aimed at reducing its funding costs by replacing older, high interest
4
loans with newly issued bonds at lower rates. In addition, several ballot initiatives championed by the governor have authorized new borrowing for the purpose of updating and improving the state’s aging infrastructure. As a result, the supply of newly issued securities from California and its agencies is expected to increase sharply.
Core Holdings Supported the Fund’s Results
The fund continued to benefit from its core holdings of seasoned bonds, which carry higher yields than currently are available from newly issued securities. In addition, some of the fund’s general obligation holdings were advanced refunded, causing their prices to rise. With yield differences along the market’s credit rating spectrum near historically narrow levels, we sacrificed little income by emphasizing higher-quality securities.
Fund Remains Positioned for Stable Interest Rates
Although the supply of California bonds has been ample, new issuance has consisted primarily of the state’s general obligation bonds.We have attempted to diversify the fund’s holdings with bonds from local issuers, revenue-producing agencies and private universities. In addition, mixed economic and inflation data suggest that the Fed is unlikely either to raise or lower short-term interest rates over the foreseeable future. Therefore, we currently intend to maintain the fund’s emphasis on high-quality, income-oriented bonds.
| 1 | | Total return includes reinvestment of dividends and any capital gains paid. Past performance is no |
| | | guarantee of future results. Share price, yield and investment return fluctuate such that upon |
| | | redemption, fund shares may be worth more or less than their original cost. Income may be subject |
| | | to state and local taxes for non-California residents, and some income may be subject to the federal |
| | | alternative minimum tax (AMT) for certain investors. Capital gains, if any, are fully taxable. |
| 2 | | SOURCE: LIPPER INC. — Reflects reinvestment of dividends and, where applicable, capital |
| | | gain distributions.The Lehman Brothers Municipal Bond Index is a widely accepted, unmanaged |
| | | total return performance benchmark for the long-term, investment-grade, tax-exempt bond market. |
| | | Index returns do not reflect fees and expenses associated with operating a mutual fund. |
| 3 | | Source: Lipper Inc. |
T h e F u n d 5
F U N D P E R F O R M A N C E
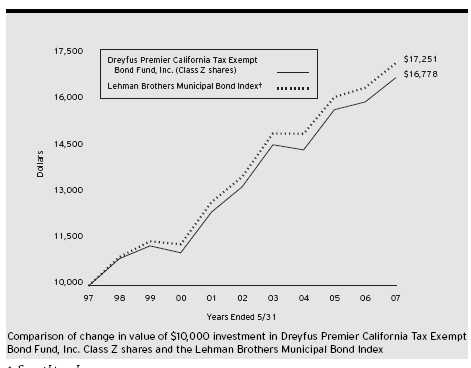
† Source: Lipper Inc.
Past performance is not predictive of future performance.
The above graph compares a $10,000 investment made in Class Z shares of Dreyfus Premier California Tax Exempt Bond Fund, Inc. on 5/31/97 to a $10,000 investment made in the Lehman Brothers Municipal Bond Index (the “Index”) on that date. All dividends and capital gain distributions are reinvested. Performance for Class A, Class B and Class C shares will vary from the performance of Class Z shares shown above due to differences in charges and expenses. The fund invests primarily in California municipal securities and its performance shown in the line graph takes into account all applicable fees and expenses for Class Z shares.The Index is not limited to investments principally in California municipal obligations and does not take into account charges, fees and other expenses.The Index, unlike the fund, is an unmanaged total return performance benchmark for the long-term, investment-grade, geographically unrestricted tax-exempt bond market, calculated by using municipal bonds selected to be representative of the municipal market overall.These factors can contribute to the Index potentially outperforming or underperforming the fund. Further information relating to fund performance, including expense reimbursements, if applicable, is contained in the Financial Highlights section of the prospectus and elsewhere in this report.
6
| Average Annual Total Returns as of 5/31/07 | | | | |
| |
| | | Inception | | | | | | |
| | | Date | | 1 Year | | 5 Years | | 10 Years |
| |
| |
| |
| |
|
| Class Z shares | | | | 4.97% | | 4.87% | | 5.31% |
| Class A shares | | | | | | | | |
| with maximum sales charge (4.50%) | | 10/21/04 | | 0.03% | | 3.80%††† | | 4.78%††† |
| without sales charge | | 10/21/04 | | 4.75% | | 4.76%††† | | 5.26%††† |
| Class B shares | | | | | | | | |
| with applicable redemption charge † | | 10/21/04 | | 0.20% | | 4.15%††† | | 5.26%†††, †††† |
| without redemption | | 10/21/04 | | 4.20% | | 4.49%††† | | 5.26%†††, †††† |
| Class C shares | | | | | | | | |
| with applicable redemption charge †† | | 10/21/04 | | 2.95% | | 4.35%††† | | 5.05%††† |
| without redemption | | 10/21/04 | | 3.95% | | 4.35%††† | | 5.05%††† |
Past performance is not predictive of future performance.The fund’s performance shown in the graph and table does not reflect the deduction of taxes that a shareholder would pay on fund distributions or the redemption of fund shares.
† The maximum contingent deferred sales charge for Class B shares is 4%. After six years Class B shares convert to Class A shares.
The maximum contingent deferred sales charge for Class C shares is 1% for shares redeemed within one year of the date of purchase.
The total return performance figures presented for Class A, B, and C shares of the fund represent the performance of the fund’s Class Z shares for periods prior to October 21, 2004 (the inception date for Class A, B, and C shares), adjusted to reflect the applicable sales load for that class and the applicable distribution/servicing fees thereafter. Assumes the conversion of Class B shares to Class A shares at the end of the sixth year following the date of purchase.
T h e F u n d 7
U N D E R S TA N D I N G YO U R F U N D ’ S E X P E N S E S ( U n a u d i t e d )
As a mutual fund investor, you pay ongoing expenses, such as management fees and other expenses. Using the information below, you can estimate how these expenses affect your investment and compare them with the expenses of other funds.You also may pay one-time transaction expenses, including sales charges (loads) and redemption fees, which are not shown in this section and would have resulted in higher total expenses. For more information, see your fund’s prospectus or talk to your financial adviser.
Review your fund’s expenses
The table below shows the expenses you would have paid on a $1,000 investment in Dreyfus Premier California Tax Exempt Bond Fund, Inc. from December 1, 2006 to May 31, 2007. It also shows how much a $1,000 investment would be worth at the close of the period, assuming actual returns and expenses.
| Expenses and Value of a $1,000 Investment | | | | | | |
| assuming actual returns for the six months ended May 31, 2007 | | | | |
| | | Class A | | Class B | | Class C | | Class Z |
| |
| |
| |
| |
|
| Expenses paid per $1,000 † | | $ 5.23 | | $ 7.82 | | $ 9.00 | | $ 4.14 |
| Ending value (after expenses) | | $999.40 | | $996.70 | | $994.90 | | $999.80 |
C O M P A R I N G Y O U R F U N D ’ S E X P E N S E S W I T H T H O S E O F O T H E R F U N D S ( U n a u d i t e d )
Using the SEC’s method to compare expenses
The Securities and Exchange Commission (SEC) has established guidelines to help investors assess fund expenses. Per these guidelines, the table below shows your fund’s expenses based on a $1,000 investment, assuming a hypothetical 5% annualized return. You can use this information to compare the ongoing expenses (but not transaction expenses or total cost) of investing in the fund with those of other funds.All mutual fund shareholder reports will provide this information to help you make this comparison. Please note that you cannot use this information to estimate your actual ending account balance and expenses paid during the period.
| Expenses and Value of a $1,000 Investment | | | | | | |
| assuming a hypothetical 5% annualized return for the six months ended May 31, 2007 |
| | | Class A | | Class B | | Class C | | Class Z |
| |
| |
| |
| |
|
| Expenses paid per $1,000 † | | $ 5.29 | | $ 7.90 | | $ 9.10 | | $ 4.18 |
| Ending value (after expenses) | | $1,019.70 | | $1,017.10 | | $1,015.91 | | $1,020.79 |
† Expenses are equal to the fund’s annualized expense ratio of 1.05% for Class A, 1.57% for Class B, 1.81% for Class C and .83% for Class Z; multiplied by the average account value over the period, multiplied by 182/365 (to reflect the one-half year period).
8
S TAT E M E N T O F I N V E S T M E N T S
M a y 3 1 , 2 0 0 7
| Long-Term Municipal | | Coupon | | Maturity | | Principal | | |
| Investments—101.5% | | Rate (%) | | Date | | Amount ($) | | Value ($) |
| |
| |
| |
| |
|
| California—95.8% | | | | | | | | |
| ABAG Finance Authority for | | | | | | | | |
| Nonprofit Corporations, | | | | | | | | |
| Insured Revenue (Sansum-Santa | | | | | | |
| Barbara Medical | | | | | | | | |
| Foundation Clinic) | | 5.50 | | 4/1/21 | | 3,500,000 | | 3,677,415 |
| ABAG Finance Authority for | | | | | | | | |
| Nonprofit Corporations, MFHR | | | | | | |
| (Central Park Apartments) | | 5.50 | | 7/1/19 | | 1,010,000 | | 1,033,331 |
| ABAG Finance Authority for | | | | | | | | |
| Nonprofit Corporations, MFHR | | | | | | |
| (Central Park Apartments) | | 5.60 | | 7/1/38 | | 5,815,000 | | 5,907,807 |
| Alameda County, | | | | | | | | |
| COP (Insured; MBIA) | | 5.38 | | 12/1/13 | | 10,000,000 a,b | | 10,734,600 |
| Anaheim Public Finance Authority, | | | | | | |
| Tax Allocation Revenue | | | | | | | | |
| (Insured; MBIA) | | 6.45 | | 12/28/18 | | 26,000,000 | | 26,875,420 |
| Bay Area Toll Authority, | | | | | | | | |
| San Francisco Bay Area Toll | | | | | | |
| Bridge Revenue | | 5.00 | | 4/1/25 | | 17,675,000 | | 18,648,539 |
| California, | | | | | | | | |
| Economic Recovery Bonds | | 5.00 | | 7/1/16 | | 13,000,000 | | 13,584,480 |
| California, | | | | | | | | |
| GO | | 5.25 | | 2/1/12 | | 90,000 c | | 95,627 |
| California, | | | | | | | | |
| GO | | 5.00 | | 3/1/25 | | 10,000,000 | | 10,434,900 |
| California, | | | | | | | | |
| GO | | 5.25 | | 2/1/30 | | 25,610,000 | | 26,925,586 |
| California, | | | | | | | | |
| GO (Insured; FSA) | | 5.25 | | 8/1/32 | | 10,000,000 | | 11,426,200 |
| California, | | | | | | | | |
| GO (Various Purpose) | | 6.13 | | 10/1/11 | | 2,875,000 | | 3,142,576 |
| California, | | | | | | | | |
| GO (Various Purpose) | | 5.50 | | 4/1/14 | | 555,000 c | | 609,357 |
| California, | | | | | | | | |
| GO (Various Purpose) | | 5.00 | | 12/1/21 | | 10,000,000 | | 10,545,200 |
| California, | | | | | | | | |
| GO (Various Purpose) | | 5.50 | | 4/1/28 | | 20,000 | | 21,733 |
| California, | | | | | | | | |
| GO (Veterans) | | 5.05 | | 12/1/36 | | 14,500,000 | | 14,812,910 |
T h e F u n d 9
S TAT E M E N T O F I N V E S T M E N T S (continued)
| Long-Term Municipal | | Coupon | | Maturity | | Principal | | |
| Investments (continued) | | Rate (%) | | Date | | Amount ($) | | Value ($) |
| |
| |
| |
| |
|
| California (continued) | | | | | | | | |
| California Department of Veteran | | | | | | | | |
| Affairs, Home Purchase Revenue | | 5.50 | | 12/1/19 | | 5,945,000 | | 6,198,435 |
| California Department of Veteran | | | | | | | | |
| Affairs, Home Purchase Revenue | | 4.50 | | 12/1/23 | | 10,000,000 | | 9,913,800 |
| California Department of Veteran | | | | | | | | |
| Affairs, Home Purchase Revenue | | 5.20 | | 12/1/28 | | 5,680,000 | | 5,683,238 |
| California Department of Water | | | | | | | | |
| Resources, Power Supply Revenue | | 5.88 | | 5/1/12 | | 10,000,000 c | | 11,017,200 |
| California Department of Water | | | | | | | | |
| Resources, Water System | | | | | | | | |
| Revenue (Central Valley | | | | | | | | |
| Project) (Insured; MBIA) | | 5.00 | | 12/1/23 | | 10,000,000 | | 10,519,300 |
| California Educational Facilities | | | | | | | | |
| Authority, Revenue (Claremont | | | | | | | | |
| Graduate University) | | 5.00 | | 3/1/37 | | 3,000,000 | | 3,081,360 |
| California Educational Facilities | | | | | | | | |
| Authority, Revenue (Pooled | | | | | | | | |
| College and University | | | | | | | | |
| Projects) | | 5.63 | | 7/1/23 | | 1,275,000 | | 1,288,566 |
| California Educational Facilities | | | | | | | | |
| Authority, Revenue | | | | | | | | |
| (Stanford University) | | 5.00 | | 3/15/39 | | 10,000,000 d | | 11,230,700 |
| California Educational Facilities | | | | | | | | |
| Authority, Revenue (University | | | | | | | | |
| of Southern California) | | 4.50 | | 10/1/33 | | 5,000,000 | | 4,927,600 |
| California Health Facilities | | | | | | | | |
| Financing Authority, Revenue | | | | | | | | |
| (Cedars-Sinai Medical Center) | | 6.13 | | 12/1/09 | | 30,695,000 c | | 32,809,272 |
| California Health Facilities | | | | | | | | |
| Financing Authority, Revenue | | | | | | | | |
| (Cedars-Sinai Medical Center) | | 6.25 | | 12/1/09 | | 9,460,000 c | | 10,139,606 |
| California Health Facilities | | | | | | | | |
| Financing Authority, Revenue | | | | | | | | |
| (Sutter Health) | | 6.25 | | 8/15/35 | | 7,965,000 | | 8,602,439 |
| California Health Facilities | | | | | | | | |
| Financing Authority, Revenue | | | | | | | | |
| (Sutter Health) | | 5.25 | | 11/15/46 | | 31,300,000 | | 32,725,402 |
| California Health Facilities | | | | | | | | |
| Financing Authority, Revenue | | | | | | | | |
| (Sutter Health) (Insured; MBIA) | | 5.35 | | 7/15/09 | | 240,000 c | | 250,546 |
10
| Long-Term Municipal | | Coupon | | Maturity | | Principal | | |
| Investments (continued) | | Rate (%) | | Date | | Amount ($) | | Value ($) |
| |
| |
| |
| |
|
| California (continued) | | | | | | | | |
| California Health Facilities | | | | | | | | |
| Financing Authority, Revenue | | | | | | | | |
| (Sutter Health) (Insured; MBIA) | | 5.35 | | 8/15/28 | | 3,540,000 | | 3,662,555 |
| California Housing Finance Agency, | | | | | | |
| Home Mortgage Revenue | | 4.80 | | 8/1/36 | | 7,500,000 | | 7,332,525 |
| California Housing Finance Agency, | | | | | | |
| MFHR (Insured; AMBAC) | | 6.15 | | 8/1/22 | | 1,845,000 | | 1,872,601 |
| California Housing Finance Agency, | | | | | | |
| SFMR | | 6.30 | | 8/1/24 | | 520,000 | | 524,930 |
| California Housing Finance Agency, | | | | | | |
| SFMR | | 6.45 | | 8/1/25 | | 160,000 | | 161,621 |
| California Housing Finance Agency, | | | | | | |
| SFMR (Collateralized; FHA and | | | | | | | | |
| Insured; AMBAC) | | 6.25 | | 8/1/14 | | 195,000 | | 196,802 |
| California Infrastructure and | | | | | | | | |
| Economic Development Bank, | | | | | | | | |
| Revenue (Kaiser Hospital | | | | | | | | |
| Assistance I-LLC) | | 5.55 | | 8/1/31 | | 21,900,000 | | 23,052,597 |
| California Infrastructure and | | | | | | | | |
| Economic Development Bank, | | | | | | | | |
| Revenue (Performing Arts | | | | | | | | |
| Center of Los Angeles County) | | 5.00 | | 12/1/27 | | 1,000,000 | | 1,039,350 |
| California Municipal Finance | | | | | | | | |
| Authority, COP (Community | | | | | | | | |
| Hospitals of Central | | | | | | | | |
| California Obligated Group) | | 5.25 | | 2/1/37 | | 11,710,000 | | 12,017,270 |
| California Pollution Control | | | | | | | | |
| Financing Authority, PCR | | 5.90 | | 6/1/14 | | 11,000,000 a,b | | 12,342,110 |
| California Pollution Control | | | | | | | | |
| Financing Authority, PCR | | | | | | | | |
| (Insured; MBIA) | | 5.90 | | 6/1/14 | | 48,330,000 a,b | | 54,226,743 |
| California Pollution Control | | | | | | | | |
| Financing Authority, SWDR | | | | | | | | |
| (Browning-Ferris Industries of | | | | | | | | |
| California, Inc. Project) | | 5.80 | | 12/1/16 | | 2,000,000 | | 2,025,500 |
| California Pollution Control | | | | | | | | |
| Financing Authority, SWDR | | | | | | | | |
| (Browning-Ferris Industries of | | | | | | | | |
| California, Inc. Project) | | 6.75 | | 9/1/19 | | 600,000 | | 601,854 |
T h e F u n d 11
S TAT E M E N T O F I N V E S T M E N T S (continued)
| Long-Term Municipal | | Coupon | | Maturity | | Principal | | |
| Investments (continued) | | Rate (%) | | Date | | Amount ($) | | Value ($) |
| |
| |
| |
| |
|
| California (continued) | | | | | | | | |
| California Public Works Board, | | | | | | | | |
| LR (Department of Corrections, | | | | | | |
| Calipatria State Prison, | | | | | | | | |
| Imperial County) | | | | | | | | |
| (Insured; MBIA) | | 6.50 | | 9/1/17 | | 13,000,000 | | 15,118,610 |
| California Public Works Board, | | | | | | | | |
| LR (Department of Health | | | | | | | | |
| Services, Richmond Laboratory | | | | | | |
| Project) (Insured; AMBAC) | | 5.00 | | 11/1/21 | | 10,910,000 | | 11,527,070 |
| California Public Works Board, | | | | | | | | |
| LR (University of California | | | | | | | | |
| Research Projects) | | | | | | | | |
| (Insured; MBIA) | | 5.25 | | 11/1/28 | | 10,005,000 | | 10,746,671 |
| California Public Works Board, | | | | | | | | |
| LR (Various University of | | | | | | | | |
| California Projects) | | 5.50 | | 6/1/14 | | 5,000,000 | | 5,360,650 |
| California State University, | | | | | | | | |
| Fresno Association Inc., | | | | | | | | |
| Auxiliary Organization Event | | | | | | | | |
| Center Revenue | | 6.00 | | 7/1/12 | | 3,500,000 c | | 3,873,975 |
| California State University, | | | | | | | | |
| Fresno Association Inc., | | | | | | | | |
| Auxiliary Organization Event | | | | | | | | |
| Center Revenue | | 6.00 | | 7/1/12 | | 2,500,000 c | | 2,767,125 |
| California State University, | | | | | | | | |
| Fresno Association Inc., | | | | | | | | |
| Auxiliary Organization Event | | | | | | | | |
| Center Revenue | | 6.00 | | 7/1/12 | | 5,250,000 c | | 5,810,962 |
| California Statewide Communities | | | | | | |
| Development Authority, COP | | | | | | | | |
| (Catholic Healthcare West) | | 6.50 | | 7/1/10 | | 2,780,000 c | | 3,022,360 |
| California Statewide Communities | | | | | | |
| Development Authority, COP | | | | | | | | |
| (Catholic Healthcare West) | | 6.50 | | 7/1/20 | | 1,220,000 | | 1,323,017 |
| California Statewide Communities | | | | | | |
| Development Authority, COP | | | | | | | | |
| (The Internext Group) | | 5.38 | | 4/1/30 | | 20,000,000 | | 20,219,000 |
| California Statewide Communities | | | | | | |
| Development Authority, Health | | | | | | |
| Facility Revenue (Adventist | | | | | | | | |
| Health System/West) | | 5.00 | | 3/1/35 | | 11,880,000 | | 12,039,073 |
| Long-Term Municipal | | Coupon | | Maturity | | Principal | | |
| Investments (continued) | | Rate (%) | | Date | | Amount ($) | | Value ($) |
| |
| |
| |
| |
|
| California (continued) | | | | | | | | |
| California Statewide Communities | | | | | | | | |
| Development Authority, Revenue | | | | | | |
| (Daughters of Charity | | | | | | | | |
| Health System) | | 5.25 | | 7/1/24 | | 8,205,000 | | 8,463,457 |
| California Statewide Communities | | | | | | | | |
| Development Authority, Revenue | | | | | | |
| (Kaiser Permanente) | | 5.50 | | 11/1/32 | | 13,500,000 | | 14,105,745 |
| California Statewide Communities | | | | | | | | |
| Development Authority, Revenue | | | | | | |
| (Kaiser Permanente) | | 5.25 | | 3/1/45 | | 15,000,000 | | 15,465,750 |
| California Statewide Communities | | | | | | | | |
| Development Authority, Revenue | | | | | | |
| (Sutter Health) | | 5.50 | | 8/15/28 | | 14,000,000 | | 14,889,840 |
| California Statewide Communities | | | | | | | | |
| Development Authority, Revenue | | | | | | |
| (The California Endowment) | | 5.00 | | 7/1/28 | | 15,360,000 | | 15,992,218 |
| California Statewide Communities | | | | | | | | |
| Development Authority, Revenue | | | | | | |
| (The California Endowment) | | 5.00 | | 7/1/33 | | 16,710,000 | | 17,379,570 |
| Capistrano Unified School | | | | | | | | |
| District, Community Facilities | | | | | | | | |
| District Special Tax | | | | | | | | |
| Number 98 (Ladera) | | 5.75 | | 9/1/09 | | 5,500,000 c | | 5,846,500 |
| Capistrano Unified School | | | | | | | | |
| District, School Facilities | | | | | | | | |
| Improvement District Number 1 | | | | | | |
| (Insured; FGIC) | | 6.00 | | 8/1/24 | | 2,075,000 | | 2,223,777 |
| Castaic Lake Water Agency, | | | | | | | | |
| COP, Revenue (Water System | | | | | | | | |
| Improvement Project) | | | | | | | | |
| (Insured; AMBAC) | | 0.00 | | 8/1/27 | | 10,000,000 | | 4,012,300 |
| Central California Joint Powers | | | | | | | | |
| Health Financing Authority, | | | | | | | | |
| COP (Community Hospitals | | | | | | | | |
| of Central California | | | | | | | | |
| Obligated Group) | | 6.00 | | 2/1/10 | | 5,000,000 c | | 5,311,550 |
| Central California Joint Powers | | | | | | | | |
| Health Financing Authority, | | | | | | | | |
| COP (Community Hospitals | | | | | | | | |
| of Central California | | | | | | | | |
| Obligated Group) | | 5.75 | | 2/1/11 | | 18,500,000 c | | 19,814,980 |
T h e F u n d 13
S TAT E M E N T O F I N V E S T M E N T S (continued)
| Long-Term Municipal | | Coupon | | Maturity | | Principal | | |
| Investments (continued) | | Rate (%) | | Date | | Amount ($) | | Value ($) |
| |
| |
| |
| |
|
| California (continued) | | | | | | | | |
| Chabot-Las Positas Community | | | | | | | | |
| College District, GO | | | | | | | | |
| (Insured; AMBAC) | | 0.00 | | 8/1/32 | | 10,000,000 | | 2,899,800 |
| Chino Valley Unified School | | | | | | | | |
| District, GO (Insured; MBIA) | | 5.25 | | 8/1/30 | | 10,000,000 | | 10,736,900 |
| Coast Community College District, | | | | | | |
| GO (Insured; FSA) | | 0.00 | | 8/1/29 | | 15,565,000 | | 12,016,336 |
| Contra Costa County Public Finance | | | | | | |
| Authority, Tax Allocation | | | | | | | | |
| Revenue (Pleasant Hill BART, | | | | | | | | |
| North Richmond, Bay Point, | | | | | | | | |
| Oakley and Rodeo Redevlopment | | | | | | |
| Projects Areas) | | 5.45 | | 8/1/28 | | 2,720,000 | | 2,818,872 |
| Cucamonga County Water District, | | | | | | |
| COP (Insured; FGIC) | | 5.25 | | 9/1/25 | | 5,555,000 | | 5,847,360 |
| Delano, | | | | | | | | |
| COP (Delano Regional | | | | | | | | |
| Medical Center) | | 5.25 | | 1/1/18 | | 13,500,000 | | 13,748,265 |
| Elsinore Valley Municipal Water | | | | | | | | |
| District, COP (Insured; FGIC) | | 5.38 | | 7/1/19 | | 3,855,000 | | 4,298,094 |
| Escondido Reassessment District | | | | | | |
| Number 98-1 (Rancho | | | | | | | | |
| San Pasqual) | | 5.70 | | 9/2/26 | | 1,335,000 | | 1,376,892 |
| Fontana, | | | | | | | | |
| Special Tax (Insured; MBIA) | | 5.25 | | 9/1/17 | | 10,000,000 | | 10,388,100 |
| Fontana Public Financing | | | | | | | | |
| Authority, Tax Allocation | | | | | | | | |
| Revenue (North Fontana | | | | | | | | |
| Redevelopment Project) | | | | | | | | |
| (Insured; AMBAC) | | 5.50 | | 9/1/32 | | 13,800,000 | | 14,684,028 |
| Foothill/Eastern Transportation | | | | | | | | |
| Corridor Agency, Toll Road | | | | | | | | |
| Revenue | | 5.75 | | 1/15/40 | | 1,745,000 | | 1,816,580 |
| Fremont Union High School District, | | | | | | |
| GO (Insured; FGIC) | | 5.25 | | 9/1/10 | | 3,400,000 c | | 3,552,898 |
| Fremont Union High School District, | | | | | | |
| GO (Insured; FGIC) | | 5.25 | | 9/1/10 | | 4,000,000 c | | 4,179,880 |
| Fremont Union High School District, | | | | | | |
| GO (Insured; FGIC) | | 5.25 | | 9/1/10 | | 11,295,000 c | | 11,802,936 |
14
| Long-Term Municipal | | Coupon | | Maturity | | Principal | | |
| Investments (continued) | | Rate (%) | | Date | | Amount ($) | | Value ($) |
| |
| |
| |
| |
|
| California (continued) | | | | | | | | |
| Fullerton Community Facilities | | | | | | | | |
| District Number 1, Special Tax | | | | | | |
| Revenue (Amerige Heights) | | 6.10 | | 9/1/22 | | 1,000,000 | | 1,058,040 |
| Fullerton Community Facilities | | | | | | | | |
| District Number 1, Special Tax | | | | | | |
| Revenue (Amerige Heights) | | 6.20 | | 9/1/32 | | 2,500,000 | | 2,648,500 |
| Golden State Tobacco | | | | | | | | |
| Securitization Corporation, | | | | | | | | |
| Enhanced Tobacco Settlement | | | | | | |
| Asset-Backed Bonds | | 5.50 | | 6/1/13 | | 5,000,000 c | | 5,434,050 |
| Golden State Tobacco | | | | | | | | |
| Securitization Corporation, | | | | | | | | |
| Tobacco Settlement | | | | | | | | |
| Asset-Backed Bonds | | 6.75 | | 6/1/13 | | 14,770,000 c | | 17,006,916 |
| Golden State Tobacco | | | | | | | | |
| Securitization Corporation, | | | | | | | | |
| Tobacco Settlement | | | | | | | | |
| Asset-Backed Bonds | | 5.75 | | 6/1/47 | | 5,000,000 | | 5,296,350 |
| Kaweah Delta Health Care District, | | | | | | |
| Revenue | | 6.00 | | 8/1/12 | | 9,000,000 c | | 10,048,320 |
| La Quinta Financing Authority, | | | | | | | | |
| Local Agency Revenue | | | | | | | | |
| (Insured; AMBAC) | | 5.00 | | 9/1/29 | | 12,400,000 | | 12,923,156 |
| Long Beach Special Tax Community | | | | | | |
| Facilities District Number 5 | | | | | | | | |
| (Towne Center) | | 6.88 | | 10/1/25 | | 500,000 | | 508,500 |
| Los Angeles Unified School | | | | | | | | |
| District, GO (Insured; FGIC) | | 5.00 | | 7/1/20 | | 20,000,000 | | 21,329,600 |
| Los Angeles Unified School | | | | | | | | |
| District, GO (Insured; MBIA) | | 5.75 | | 7/1/17 | | 8,385,000 | | 9,599,986 |
| Madera County, | | | | | | | | |
| COP (Valley Children’s | | | | | | | | |
| Hospital) (Insured; MBIA) | | 6.50 | | 3/15/09 | | 3,370,000 | | 3,528,356 |
| Metropolitan Water District of | | | | | | | | |
| Southern California, | | | | | | | | |
| Waterworks GO | | 5.00 | | 3/1/17 | | 5,500,000 | | 5,890,335 |
| Metropolitan Water District of | | | | | | | | |
| Southern California, | | | | | | | | |
| Waterworks GO | | 5.00 | | 3/1/18 | | 5,510,000 | | 5,882,421 |
T h e F u n d 15
S TAT E M E N T O F I N V E S T M E N T S (continued)
|
| Long-Term Municipal | | Coupon | | Maturity | | Principal | | |
| Investments (continued) | | Rate (%) | | Date | | Amount ($) | | Value ($) |
| |
| |
| |
| |
|
| California (continued) | | | | | | | | |
| Murrieta Valley Unified School District, | | | | | | |
| GO (Insured; FGIC) | | 0.00 | | 9/1/21 | | 4,950,000 | | 2,647,458 |
| Natomas Unified School District, | | | | | | | | |
| GO (Insured; MBIA) | | 5.95 | | 9/1/21 | | 2,500,000 | | 2,911,725 |
| Northern California Power Agency, | | | | | | |
| Revenue (Hydroelectric Project | | | | | | | | |
| Number 1) (Insured; AMBAC) | | 7.00 | | 1/1/16 | | 670,000 c | | 818,325 |
| Northern California Power Agency, | | | | | | |
| Revenue (Hydroelectric Project | | | | | | | | |
| Number 1) (Insured; AMBAC) | | 7.50 | | 7/1/21 | | 375,000 c | | 496,005 |
| Northern California Power Agency, | | | | | | |
| Revenue (Hydroelectric Project | | | | | | | | |
| Number 1) (Insured; MBIA) | | 6.30 | | 7/1/18 | | 26,400,000 | | 31,429,200 |
| Oakland Unified School District, | | | | | | | | |
| GO (Insured; FGIC) | | 5.25 | | 8/1/24 | | 17,275,000 | | 18,264,685 |
| Orange County Community Facilities | | | | | | |
| District (Landera Ranch) | | | | | | | | |
| Special Tax Number 1 | | 6.25 | | 8/15/08 | | 1,600,000 c | | 1,650,336 |
| Orange County Community Facilities | | | | | | |
| District (Landera Ranch) | | | | | | | | |
| Special Tax Number 1 | | 6.00 | | 8/15/10 | | 3,000,000 c | | 3,231,840 |
| Orange County Community Facilities | | | | | | |
| District (Landera Ranch) | | | | | | | | |
| Special Tax Number 3 | | 5.60 | | 8/15/28 | | 3,250,000 | | 3,444,935 |
| Orange County Community Facilities | | | | | | |
| District (Landera Ranch) | | | | | | | | |
| Special Tax Number 3 | | 5.63 | | 8/15/34 | | 6,000,000 | | 6,355,860 |
| Orange County Public Financing | | | | | | | | |
| Authority, LR (Juvenile | | | | | | | | |
| Justice Center Facility) | | | | | | | | |
| (Insured; AMBAC) | | 5.38 | | 6/1/19 | | 6,150,000 | | 6,597,597 |
| Pomona, | | | | | | | | |
| COP (General Fund Lease | | | | | | | | |
| Financing) (Insured; AMBAC) | | 5.50 | | 6/1/28 | | 1,000,000 | | 1,097,890 |
| Pomona Redevelopment Agency, | | | | | | | | |
| Tax Allocation Revenue (West | | | | | | | | |
| Holt Avenue Redevelopment | | | | | | | | |
| Project) | | 5.50 | | 5/1/32 | | 3,000,000 | | 3,201,090 |
| Long-Term Municipal | | Coupon | | Maturity | | Principal | | |
| Investments (continued) | | Rate (%) | | Date | | Amount ($) | | Value ($) |
| |
| |
| |
| |
|
| California (continued) | | | | | | | | |
| Port of Oakland, | | | | | | | | |
| Revenue (Insured; FGIC) | | 5.38 | | 11/1/27 | | 18,920,000 | | 19,972,330 |
| Rancho Cucamonga Redevelopment | | | | | | |
| Agency, Tax Allocation Revenue | | | | | | |
| (Rancho Development Project) | | | | | | |
| (Insured; MBIA) | | 5.38 | | 9/1/25 | | 7,485,000 | | 7,877,139 |
| Rancho Mirage Joint Powers | | | | | | | | |
| Financing Authority, Revenue | | | | | | |
| (Eisenhower Medical Center) | | 5.63 | | 7/1/29 | | 10,430,000 | | 11,076,034 |
| Redwood Empire Financing | | | | | | | | |
| Authority, COP | | 6.40 | | 12/1/23 | | 2,215,000 | | 2,215,000 |
| Riverside County, | | | | | | | | |
| SFMR (Collateralized; GNMA) | | 7.80 | | 5/1/21 | | 1,250,000 | | 1,686,387 |
| Sacramento City Financing | | | | | | | | |
| Authority, Revenue (Insured; | | | | | | | | |
| AMBAC) | | 5.50 | | 12/1/13 | | 4,670,000 a,b | | 4,971,845 |
| Sacramento City Financing | | | | | | | | |
| Authority, Revenue (Insured; | | | | | | | | |
| AMBAC) | | 5.50 | | 12/1/14 | | 5,140,000 a,b | | 5,472,224 |
| Sacramento County, | | | | | | | | |
| Laguna Creek Ranch/Elliott | | | | | | | | |
| Ranch Community Facilities | | | | | | | | |
| District Number 1, Improvement | | | | | | |
| Area Number 1, Special Tax | | | | | | | | |
| (Laguna Creek Ranch) | | 5.70 | | 12/1/20 | | 2,970,000 | | 3,039,350 |
| Sacramento County Housing | | | | | | | | |
| Authority, MFHR (Cottage | | | | | | | | |
| Estate Apartments) | | | | | | | | |
| (Collateralized; FNMA) | | 6.00 | | 2/1/33 | | 1,000,000 | | 1,041,500 |
| Sacramento Municipal Utility | | | | | | | | |
| District, Electric Revenue | | | | | | | | |
| (Insured; MBIA) | | 6.50 | | 9/1/13 | | 6,930,000 | | 7,673,243 |
| San Bernardino County, | | | | | | | | |
| COP (Capital Facilities | | | | | | | | |
| Project) | | 6.88 | | 8/1/24 | | 5,000,000 | | 6,446,450 |
| San Diego County, | | | | | | | | |
| COP (Burnham Institute for | | | | | | | | |
| Medical Research) | | 6.25 | | 9/1/09 | | 3,800,000 c�� | | 4,041,642 |
T h e F u n d 17
S TAT E M E N T O F I N V E S T M E N T S (continued)
| Long-Term Municipal | | Coupon | | Maturity | | Principal | | |
| Investments (continued) | | Rate (%) | | Date | | Amount ($) | | Value ($) |
| |
| |
| |
| |
|
| California (continued) | | | | | | | | |
| San Diego County, | | | | | | | | |
| COP (Burnham Institute for | | | | | | | | |
| Medical Research) | | 5.00 | | 9/1/24 | | 2,265,000 | | 2,330,753 |
| San Diego County, | | | | | | | | |
| COP (Burnham Institute for | | | | | | | | |
| Medical Research) | | 5.00 | | 9/1/34 | | 5,190,000 | | 5,336,410 |
| San Francisco City and County, | | | | | | | | |
| COP (San Bruno Jail Number 3) | | | | | | | | |
| (Insured; AMBAC) | | 5.25 | | 10/1/21 | | 2,985,000 | | 3,092,012 |
| San Francisco City and County | | | | | | | | |
| Public Utilities Commission, | | | | | | | | |
| San Francisco Water Revenue | | | | | | | | |
| (Insured; FSA) | | 5.00 | | 11/1/24 | | 10,000,000 | | 10,585,700 |
| San Joaquin Hills Transportation | | | | | | | | |
| Corridor Agency, Toll Road | | | | | | | | |
| Revenue (Insured; MBIA) | | 0.00 | | 1/15/32 | | 48,295,000 | | 15,647,580 |
| San Jose Redevelopment Agency, | | | | | | | | |
| Tax Allocation Revenue (Merged | | | | | | |
| Area Redevelopment Project) | | 5.25 | | 8/1/08 | | 1,000,000 c | | 1,038,700 |
| San Jose Unified School District, | | | | | | | | |
| GO (Insured; FGIC) | | 5.00 | | 8/1/24 | | 12,580,000 | | 13,333,542 |
| Sequoia Union High School | | | | | | | | |
| District, GO (Insured; FSA) | | 5.00 | | 7/1/24 | | 2,695,000 | | 2,855,272 |
| South Placer Authority, | | | | | | | | |
| Wastewater Revenue | | | | | | | | |
| (Insured; FGIC) | | 5.25 | | 11/1/10 | | 1,000,000 c | | 1,057,610 |
| Southeast Resource Recovery | | | | | | | | |
| Facility Authority, LR | | | | | | | | |
| (Insured; AMBAC) | | 5.25 | | 12/1/18 | | 8,085,000 | | 8,627,504 |
| Stockton, | | | | | | | | |
| Health Facilities Revenue | | | | | | | | |
| (Dameron Hospital Association) | | 5.70 | | 12/1/14 | | 1,000,000 | | 1,026,440 |
| Tobacco Securitization Authority | | | | | | | | |
| of Northern California, | | | | | | | | |
| Tobacco Settlement | | | | | | | | |
| Asset-Backed Bonds (Sacramento | | | | | | |
| County Tobacco Securitization | | | | | | | | |
| Corporation) | | 5.38 | | 6/1/38 | | 20,000,000 | | 20,390,600 |
| Torrance Redevelopment Agency, | | | | | | | | |
| Tax Allocation Revenue | | 5.63 | | 9/1/28 | | 500,000 | | 508,250 |
18
| Long-Term Municipal | | Coupon | | Maturity | | Principal | | |
| Investments (continued) | | Rate (%) | | Date | | Amount ($) | | Value ($) |
| |
| |
| |
| |
|
| California (continued) | | | | | | | | |
| Trustees of the California State | | | | | | | | |
| University, Systemwide Revenue | | | | | | | | |
| (Insured; AMBAC) | | 5.00 | | 11/1/19 | | 10,000,000 | | 10,632,100 |
| University of California, | | | | | | | | |
| Multi Purpose Revenue | | | | | | | | |
| (Insured; MBIA) | | 5.25 | | 9/1/08 | | 31,475,000 c | | 32,432,784 |
| University of California, | | | | | | | | |
| Revenue (Limited Project) | | | | | | | | |
| (Insured; FSA) | | 5.00 | | 5/15/22 | | 14,655,000 | | 15,447,689 |
| Ventura County Community College | | | | | | | | |
| District, GO (Insured; MBIA) | | 5.50 | | 8/1/23 | | 4,250,000 | | 4,583,412 |
| West Covina Redevelopment Agency, | | | | | | |
| Community Facilities District, | | | | | | | | |
| Special Tax Revenue | | | | | | | | |
| (Fashion Plaza) | | 6.00 | | 9/1/17 | | 6,000,000 | | 6,646,260 |
| West Covina Redevelopment Agency, | | | | | | |
| Community Facilities District, | | | | | | | | |
| Special Tax Revenue | | | | | | | | |
| (Fashion Plaza) | | 6.00 | | 9/1/22 | | 11,325,000 | | 12,934,056 |
| Whittier Health Facility, | | | | | | | | |
| Revenue (Presbyterian | | | | | | | | |
| Intercommunity Hospital) | | 5.75 | | 6/1/12 | | 10,090,000 c | | 11,054,705 |
| U.S. Related—5.7% | | | | | | | | |
| Puerto Rico Highways and | | | | | | | | |
| Transportation Authority, | | | | | | | | |
| Highway Revenue (Insured; MBIA) | | 5.50 | | 7/1/13 | | 4,750,000 | | 5,066,493 |
| Puerto Rico Highways and | | | | | | | | |
| Transportation Authority, | | | | | | | | |
| Transportation Revenue | | 6.00 | | 7/1/10 | | 2,000,000 c | | 2,146,120 |
| Puerto Rico Highways and | | | | | | | | |
| Transportation Authority, | | | | | | | | |
| Transportation Revenue | | | | | | | | |
| (Insured; MBIA) | | 5.00 | | 7/1/38 | | 2,000,000 a,b | | 2,047,370 |
| Puerto Rico Infrastructure | | | | | | | | |
| Financing Authority, Special | | | | | | | | |
| Obligation | | 5.50 | | 10/1/32 | | 10,000,000 | | 10,642,700 |
| Puerto Rico Infrastructure | | | | | | | | |
| Financing Authority, Special | | | | | | | | |
| Tax Revenue | | 5.50 | | 10/1/40 | | 40,000,000 | | 42,544,800 |
T h e F u n d 19
S TAT E M E N T O F I N V E S T M E N T S (continued)
| Long-Term Municipal | | Coupon | | Maturity | | Principal | | |
| Investments (continued) | | Rate (%) | | Date | | Amount ($) | | Value ($) |
| |
| |
| |
| |
|
| U.S. Related (continued) | | | | | | | | |
| Puerto Rico Infrastructure | | | | | | | | |
| Financing Authority, Special | | | | | | | | |
| Tax Revenue (Insured; AMBAC) | | 5.00 | | 7/1/15 | | 2,000,000 a,b | | 2,035,840 |
| Virgin Islands Public Finance | | | | | | | | |
| Authority, Revenue | | 7.30 | | 10/1/18 | | 3,100,000 | | 3,779,024 |
| Virgin Islands Public Finance | | | | | | | | |
| Authority, Revenue, Virgin | | | | | | | | |
| Islands Matching Fund | | | | | | | | |
| Loan Notes | | 6.00 | | 10/1/22 | | 2,000,000 | | 2,065,660 |
| Total Long-Term | | | | | | | | |
| Municipal Investments | | | | | | | | |
| (cost $1,192,208,088) | | | | | | | | 1,250,104,750 |
| |
| |
| |
| |
|
| |
| |
| Short-Term Municipal Investments—1.4% | | | | | | |
| |
| |
| |
|
| California; | | | | | | | | |
| California Department of Water | | | | | | | | |
| Resources, Power Supply | | | | | | | | |
| Revenue (LOC: California | | | | | | | | |
| Public Employees’ Retirement | | | | | | | | |
| System and The Bank of | | | | | | | | |
| New York) | | 3.78 | | 6/1/07 | | 2,000,000 e | | 2,000,000 |
| California Pollution Control | | | | | | | | |
| Financing Authority, PCR, | | | | | | | | |
| Refunding (Pacific Gas and | | | | | | | | |
| Electric Company) | | | | | | | | |
| (LOC; Bank One) | | 3.80 | | 6/1/07 | | 2,100,000 e | | 2,100,000 |
| California Pollution Control | | | | | | | | |
| Financing Authority, PCR, | | | | | | | | |
| Refunding (Pacific Gas and | | | | | | | | |
| Electric Company) | | | | | | | | |
| (LOC; Bank One) | | 3.80 | | 6/1/07 | | 5,000,000 e | | 5,000,000 |
| California Statewide Communities | | | | | | | | |
| Development Authority, | | | | | | | | |
| Revenue, Refunding (University | | | | | | | | |
| Retirement Community at Davis | | | | | | |
| Project) (Insured; Radian Bank | | | | | | | | |
| and Liquidity Facility; Bank | | | | | | | | |
| of America) | | 3.80 | | 6/1/07 | | 3,450,000 e | | 3,450,000 |
20
| Short-Term Municipal | | Coupon | | Maturity | | Principal | | |
| Investments (continued) | | Rate (%) | | Date | | Amount ($) | | Value ($) |
| |
| |
| |
| |
|
| California (continued) | | | | | | | | |
| Los Angeles Department of Water | | | | | | | | |
| and Power, Power System | | | | | | | | |
| Revenue (Liquidity Facility: | | | | | | | | |
| Bank of America, Bayerische | | | | | | | | |
| Landesbank, Dexia Credit | | | | | | | | |
| Locale, Landesbank | | | | | | | | |
| Baden-Wurttemberg, JPMorgan | | | | | | | | |
| Chase Bank, State Street Bank | | | | | | | | |
| and Trust Co. and Westdeutsche | | | | | | |
| Landesbank) | | 3.78 | | 6/1/07 | | 2,100,000 e | | 2,100,000 |
| Ontario Industrial Development | | | | | | | | |
| Authority, IDR (L.D. Brinkman | | | | | | | | |
| and Company—West Coast | | | | | | | | |
| Project) (LOC; Bank of America) | | 3.79 | | 6/1/07 | | 2,000,000 e | | 2,000,000 |
| Total Short-Term | | | | | | | | |
| Municipal Investments | | | | | | | | |
| (cost $16,650,000) | | | | | | | | 16,650,000 |
| |
| |
| |
| |
|
| |
| Total Investments (cost $1,208,858,088) | | | | 102.9% | | 1,266,754,750 |
| |
| Liabilities, Less Cash and Receivables | | | | (2.9%) | | (36,187,890) |
| |
| Net Assets | | | | | | 100.0% | | 1,230,566,860 |
| |
| a Securities exempt from registration under Rule 144A of the Securities Act of 1933.These securities may be resold in |
| transactions exempt from registration, normally to qualified institutional buyers. At May 31, 2007, these securities |
| amounted to $91,830,732 or 7.5% of net assets. | | | | | | |
| b Collateral for floating rate borrowings. | | | | | | | | |
| c These securities are prerefunded; the date shown represents the prerefunded date. Bonds which are prerefunded are |
| collateralized by U.S. Government securities which are held in escrow and are used to pay principal and interest on |
| the municipal issue and to retire the bonds in full at the earliest refunding date. | | |
| d Purchased on a delayed delivery basis. | | | | | | | | |
| e Securities payable on demand.Variable interest rate—subject to periodic change. | | |
T h e F u n d 21
S TAT E M E N T O F I N V E S T M E N T S (continued)
| Summary of Abbreviations | | | | |
| |
| ACA | | American Capital Access | | AGC | | ACE Guaranty Corporation |
| AGIC | | Asset Guaranty Insurance | | AMBAC | | American Municipal Bond |
| | | Company | | | | Assurance Corporation |
| ARRN | | Adjustable Rate Receipt Notes | | BAN | | Bond Anticipation Notes |
| BIGI | | Bond Investors Guaranty Insurance | | BPA | | Bond Purchase Agreement |
| CGIC | | Capital Guaranty Insurance | | CIC | | Continental Insurance |
| | | Company | | | | Company |
| CIFG | | CDC Ixis Financial Guaranty | | CMAC | | Capital Market Assurance |
| | | | | | | Corporation |
| COP | | Certificate of Participation | | CP | | Commercial Paper |
| EDR | | Economic Development Revenue | | EIR | | Environmental Improvement |
| | | | | | | Revenue |
| FGIC | | Financial Guaranty Insurance | | | | |
| | | Company | | FHA | | Federal Housing Administration |
| FHLB | | Federal Home Loan Bank | | FHLMC | | Federal Home Loan Mortgage |
| | | | | | | Corporation |
| FNMA | | Federal National | | | | |
| | | Mortgage Association | | FSA | | Financial Security Assurance |
| GAN | | Grant Anticipation Notes | | GIC | | Guaranteed Investment Contract |
| GNMA | | Government National | | | | |
| | | Mortgage Association | | GO | | General Obligation |
| HR | | Hospital Revenue | | IDB | | Industrial Development Board |
| IDC | | Industrial Development Corporation | | IDR | | Industrial Development Revenue |
| LOC | | Letter of Credit | | LOR | | Limited Obligation Revenue |
| LR | | Lease Revenue | | MBIA | | Municipal Bond Investors Assurance |
| | | | | | | Insurance Corporation |
| MFHR | | Multi-Family Housing Revenue | | MFMR | | Multi-Family Mortgage Revenue |
| PCR | | Pollution Control Revenue | | PILOT | | Payment in Lieu of Taxes |
| RAC | | Revenue Anticipation Certificates | | RAN | | Revenue Anticipation Notes |
| RAW | | Revenue Anticipation Warrants | | RRR | | Resources Recovery Revenue |
| SAAN | | State Aid Anticipation Notes | | SBPA | | Standby Bond Purchase Agreement |
| SFHR | | Single Family Housing Revenue | | SFMR | | Single Family Mortgage Revenue |
| SONYMA | | State of New York Mortgage Agency | | SWDR | | Solid Waste Disposal Revenue |
| TAN | | Tax Anticipation Notes | | TAW | | Tax Anticipation Warrants |
| TRAN | | Tax and Revenue Anticipation Notes | | XLCA | | XL Capital Assurance |
22
| Summary of Combined Ratings (Unaudited) | | |
| |
| Fitch | | or Moody’s | | or | | Standard & Poor’s | | Value (%) † |
| |
| |
| |
| |
|
| AAA | | Aaa | | | | AAA | | 53.9 |
| AA | | Aa | | | | AA | | 15.7 |
| A | | | | A | | | | A | | 11.2 |
| BBB | | Baa | | | | BBB | | 11.4 |
| BB | | Ba | | | | BB | | .3 |
| F1 | | MIG1/P1 | | | | SP1/A1 | | 1.4 |
| Not Rated f | | Not Rated f | | | | Not Rated f | | 6.1 |
| | | | | | | | | | | 100.0 |
| |
| † | | Based on total investments. | | | | | | |
| f | | Securities which, while not rated by Fitch, Moody’s and Standard & Poor’s, have been determined by the Manager to |
| | | be of comparable quality to those rated securities in which the fund may invest. | | |
| See notes to financial statements. | | | | | | |
T h e F u n d 23
S TAT E M E N T O F A S S E T S A N D L I A B I L I T I E S
M a y 3 1 , 2 0 0 7
| | | | | | | Cost | | Value |
| |
| |
| |
| |
|
| Assets ($): | | | | | | | | |
| Investments in securities—See Statement of Investments | | 1,208,858,088 | | 1,266,754,750 |
| Interest receivable | | | | | | | | 19,230,380 |
| Receivable for shares of Common Stock subscribed | | | | | | 48,643 |
| Prepaid expenses | | | | | | | | 57,712 |
| | | | | | | | | 1,286,091,485 |
| |
| |
| |
| |
|
| Liabilities ($): | | | | | | | | |
| Due to The Dreyfus Corporation and affiliates—Note 3(c) | | | | | | 718,076 |
| Cash overdraft due to Custodian | | | | | | | | 553,859 |
| Payable for floating rate notes issued | | | | | | 41,570,000 |
| Payable for investment securities purchased | | | | | | 11,242,800 |
| Interest and related expenses payable | | | | | | 806,587 |
| Payable for shares of Common Stock redeemed | | | | | | 537,921 |
| Accrued expenses | | | | | | | | 95,382 |
| | | | | | | | | 55,524,625 |
| |
| |
| |
| |
|
| Net Assets ($) | | | | | | | | 1,230,566,860 |
| |
| |
| |
| |
|
| Composition of Net Assets ($): | | | | | | | | |
| Paid-in capital | | | | | | | | 1,179,843,602 |
| Accumulated net realized gain (loss) on investments | | | | | | (7,173,404) |
| Accumulated net unrealized appreciation | | | | | | |
| (depreciation) on investments | | | | | | | | 57,896,662 |
| |
| |
| |
| |
|
| Net Assets ($) | | | | | | | | 1,230,566,860 |
| |
| |
| |
| |
|
| |
| |
| Net Asset Value Per Share | | | | | | | | |
| | | Class A | | Class B | | Class C | | Class Z |
| |
| |
| |
| |
|
| Net Assets ($) | | 95,697,635 | | 5,411,150 | | 4,450,527 | | 1,125,007,548 |
| Shares Outstanding | | 6,503,311 | | 367,721 | | 302,396 | | 76,466,646 |
| |
| |
| |
| |
|
| Net Asset Value Per Share ($) | | 14.72 | | 14.72 | | 14.72 | | 14.71 |
See notes to financial statements.
24
| S TAT E M E N T | | O F O P E R AT I O N S |
| Ye a r E n d e d M a y 3 1 , | | 2 0 0 7 |
| Investment Income ($): | | |
| Interest Income | | 61,196,175 |
| Expenses: | | |
| Management fee—Note 3(a) | | 7,458,292 |
| Interest and related expenses | | 1,621,639 |
| Shareholder servicing costs—Note 3(c) | | 1,151,869 |
| Custodian fees | | 85,135 |
| Directors’ fees and expenses—Note 3(c) | | 78,877 |
| Professional fees | | 71,316 |
| Distribution fees—Note 3(b) | | 58,669 |
| Registration fees | | 52,032 |
| Prospectus and shareholders’ reports | | 29,864 |
| Loan commitment fees—Note 2 | | 2,410 |
| Miscellaneous | | 57,413 |
| Total Expenses | | 10,667,516 |
| Less—reduction in custody fees due to | | |
| earnings credits—Note 1(b) | | (50,353) |
| Net Expenses | | 10,617,163 |
| Investment Income-Net | | 50,579,012 |
| |
|
| Realized and Unrealized Gain (Loss) on Investments—Note 4 ($): |
| Net realized gain (loss) on investments | | 4,338,589 |
| Net unrealized appreciation (depreciation) on investments | | 5,180,287 |
| Net Realized and Unrealized Gain (Loss) on Investments | | 9,518,876 |
| Net Increase In Net Assets Resulting from Operations | | 60,097,888 |
See notes to financial statements.
T h e F u n d 25
S TAT E M E N T O F C H A N G E S I N N E T A S S E T S
| | | | | Year Ended May 31, |
| |
| |
|
| | | 2007 | | 2006 |
| |
| |
|
| Operations ($): | | | | |
| Investment income—net | | 50,579,012 | | 52,847,221 |
| Net realized gain (loss) on investments | | 4,338,589 | | 5,148,435 |
| Net unrealized appreciation | | | | |
| (depreciation) on investments | | 5,180,287 | | (37,661,072) |
| Net Increase (Decrease) in Net Assets | | | | |
| Resulting from Operations | | 60,097,888 | | 20,334,584 |
| |
| |
|
| Dividends to Shareholders from ($): | | | | |
| Investment income—net: | | | | |
| Class A shares | | (3,318,862) | | (3,311,668) |
| Class B shares | | (198,996) | | (268,502) |
| Class C shares | | (119,586) | | (87,936) |
| Class Z shares | | (46,902,863) | | (49,135,562) |
| Net realized gain on investments: | | | | |
| Class A shares | | (78,215) | | (83,762) |
| Class B shares | | (5,391) | | (7,538) |
| Class C shares | | (3,803) | | (2,716) |
| Class Z shares | | (1,050,468) | | (1,192,823) |
| Total Dividends | | (51,678,184) | | (54,090,507) |
| |
| |
|
| Capital Stock Transactions ($): | | | | |
| Net proceeds from shares sold: | | | | |
| Class A shares | | 29,185,773 | | 6,568,651 |
| Class B shares | | 401,174 | | 351,072 |
| Class C shares | | 2,064,929 | | 1,052,655 |
| Class Z shares | | 47,193,908 | | 41,757,321 |
| Dividends reinvested: | | | | |
| Class A shares | | 2,400,697 | | 2,223,662 |
| Class B shares | | 142,766 | | 192,856 |
| Class C shares | | 74,489 | | 58,074 |
| Class Z shares | | 32,875,249 | | 34,073,188 |
| Cost of shares redeemed: | | | | |
| Class A shares | | (17,878,688) | | (12,964,954) |
| Class B shares | | (1,813,270) | | (3,245,768) |
| Class C shares | | (750,800) | | (848,560) |
| Class Z shares | | (118,046,676) | | (127,164,572) |
| Increase (Decrease) in Net Assets from | | | | |
| Capital Stock Transactions | | (24,150,449) | | (57,946,375) |
| Total Increase (Decrease) in Net Assets | | (15,730,745) | | (91,702,298) |
| |
| |
|
| Net Assets ($): | | | | |
| Beginning of Period | | 1,246,297,605 | | 1,337,999,903 |
| End of Period | | 1,230,566,860 | | 1,246,297,605 |
| |
| |
| 26 | | | | |
| | | | | Year Ended May 31, |
| |
| |
|
| | | 2007 | | 2006 |
| |
| |
|
| Capital Share Transactions: | | | | |
| Class Aa | | | | |
| Shares sold | | 1,970,644 | | 444,418 |
| Shares issued for dividends reinvested | | 162,042 | | 150,247 |
| Shares redeemed | | (1,210,527) | | (877,760) |
| Net Increase (Decrease) in Shares Outstanding | | 922,159 | | (283,095) |
| |
| |
|
| Class B a | | | | |
| Shares sold | | 27,088 | | 23,819 |
| Shares issued for dividends reinvested | | 9,647 | | 13,022 |
| Shares redeemed | | (122,340) | | (219,069) |
| Net Increase (Decrease) in Shares Outstanding | | (85,605) | | (182,228) |
| |
| |
|
| Class C | | | | |
| Shares sold | | 139,260 | | 71,071 |
| Shares issued for dividends reinvested | | 5,024 | | 3,926 |
| Shares redeemed | | (50,807) | | (57,154) |
| Net Increase (Decrease) in Shares Outstanding | | 93,477 | | 17,843 |
| |
| |
|
| Class Z | | | | |
| Shares sold | | 3,186,354 | | 2,821,639 |
| Shares issued for dividends reinvested | | 2,219,726 | | 2,303,054 |
| Shares redeemed | | (7,974,250) | | (8,602,582) |
| Net Increase (Decrease) in Shares Outstanding | | (2,568,170) | | (3,477,889) |
a During the period ended May 31, 2007, 60,703 Class B shares representing $904,102 were automatically converted to 60,703 Class A shares and during the period ended May 31, 2006, 99,222 Class B shares representing $1,469,616 were automatically converted to 99,222 Class A shares.
See notes to financial statements.
T h e F u n d 27
F I N A N C I A L H I G H L I G H T S
The following tables describe the performance for each share class for the fiscal periods indicated. All information (except portfolio turnover rate) reflects financial results for a single fund share.Total return shows how much your investment in the fund would have increased (or decreased) during each period, assuming you had reinvested all dividends and distributions.These figures have been derived from the fund’s financial statements.
| | | | | | | Year Ended May 31, |
| | | |
| |
|
| Class A Shares | | 2007 | | 2006 | | 2005 a |
| |
| |
| |
|
| Per Share Data ($): | | | | | | |
| Net asset value, beginning of period | | 14.62 | | 15.00 | | 14.97 |
| Investment Operations: | | | | | | |
| Investment income—net b | | .57 | | .58 | | .34 |
| Net realized and unrealized | | | | | | |
| gain (loss) on investments | | .11 | | (.37) | | .12 |
| Total from Investment Operations | | .68 | | .21 | | .46 |
| Distributions: | | | | | | |
| Dividends from investment income—net | | (.57) | | (.58) | | (.34) |
| Dividends from net realized gain on investments | | (.01) | | (.01) | | (.09) |
| Total Distributions | | (.58) | | (.59) | | (.43) |
| Net asset value, end of period | | 14.72 | | 14.62 | | 15.00 |
| |
| |
| |
|
| Total Return (%) c | | 4.75 | | 1.44 | | 3.12 |
| |
| |
| |
|
| Ratios/Supplemental Data (%): | | | | | | |
| Ratio of total expenses to average net assets | | 1.06 | | 1.04d | | 1.03d,e |
| Ratio of net expenses to average net assets | | 1.05 | | 1.01d | | 1.02d,e |
| Ratio of net investment income | | | | | | |
| to average net assets | | 3.87 | | 3.90 | | 3.77d |
| Portfolio Turnover Rate | | 43.68 | | 35.92 | | 38.73 |
| |
| |
| |
|
| Net Assets, end of period ($ x 1,000) | | 95,698 | | 81,579 | | 87,976 |
| |
| a | | From October 21, 2004 (commencement of initial offering) to May 31, 2005. | | | | |
| b | | Based on average shares outstanding at each month end. | | | | |
| c | | Exclusive of sales charge. | | | | | | |
| d | | Ratio of total expenses to average net assets and ratio of net expenses to average net assets for all periods have been |
| | | restated.This restatement has no impact on the fund’s previously reported net assets, net investment, net asset value or |
| | | total return. See Note 6. | | | | | | |
| e | | Annualized. | | | | | | |
| See notes to financial statements. | | | | | | |
28
| | | | | | | Year Ended May 31, | | |
| | | |
| |
| |
|
| Class B Shares | | 2007 | | 2006 | | 2005 a |
| |
| |
| |
|
| Per Share Data ($): | | | | | | |
| Net asset value, beginning of period | | 14.62 | | 15.00 | | 14.97 |
| Investment Operations: | | | | | | |
| Investment income—net b | | .49 | | .50 | | .30 |
| Net realized and unrealized | | | | | | |
| gain (loss) on investments | | .12 | | (.37) | | .12 |
| Total from Investment Operations | | .61 | | .13 | | .42 |
| Distributions: | | | | | | |
| Dividends from investment income—net | | (.50) | | (.50) | | (.30) |
| Dividends from net realized gain on investments | | (.01) | | (.01) | | (.09) |
| Total Distributions | | (.51) | | (.51) | | (.39) |
| Net asset value, end of period | | 14.72 | | 14.62 | | 15.00 |
| |
| |
| |
|
| Total Return (%) c | | 4.20 | | .93 | | 2.82 |
| |
| |
| |
|
| Ratios/Supplemental Data (%): | | | | | | |
| Ratio of total expenses to average net assets | | 1.58 | | 1.56d | | 1.54d,e |
| Ratio of net expenses to average net assets | | 1.58 | | 1.51d | | 1.51d,e |
| Ratio of net investment income | | | | | | |
| to average net assets | | 3.35 | | 3.39 | | 3.29e |
| Portfolio Turnover Rate | | 43.68 | | 35.92 | | 38.73 |
| |
| |
| |
|
| Net Assets, end of period ($ x 1,000) | | 5,411 | | 6,626 | | 9,534 |
| |
| a | | From October 21, 2004 (commencement of initial offering) to May 31, 2005. | | | | |
| b | | Based on average shares outstanding at each month end. | | | | |
| c | | Exclusive of sales charge. | | | | | | |
| d | | Ratio of total expenses to average net assets and ratio of net expenses to average net assets for all periods have been |
| | | restated.This restatement has no impact on the fund’s previously reported net assets, net investment, net asset value or |
| | | total return. See Note 6. | | | | | | |
| e | | Annualized. | | | | | | |
| See notes to financial statements. | | | | | | |
T h e F u n d 29
F I N A N C I A L H I G H L I G H T S (continued)
| | | | | | | Year Ended May 31, | | |
| | | |
| |
| |
|
| Class C Shares | | 2007 | | 2006 | | 2005 a |
| |
| |
| |
|
| Per Share Data ($): | | | | | | |
| Net asset value, beginning of period | | 14.62 | | 15.00 | | 14.97 |
| Investment Operations: | | | | | | |
| Investment income—net b | | .46 | | .46 | | .27 |
| Net realized and unrealized | | | | | | |
| gain (loss) on investments | | .11 | | (.37) | | .12 |
| Total from Investment Operations | | .57 | | .09 | | .39 |
| Distributions: | | | | | | |
| Dividends from investment income—net | | (.46) | | (.46) | | (.27) |
| Dividends from net realized gain on investments | | (.01) | | (.01) | | (.09) |
| Total Distributions | | (.47) | | (.47) | | (.36) |
| Net asset value, end of period | | 14.72 | | 14.62 | | 15.00 |
| |
| |
| |
|
| Total Return (%) c | | 3.95 | | .67 | | 2.67 |
| |
| |
| |
|
| Ratios/Supplemental Data (%): | | | | | | |
| Ratio of total expenses to average net assets | | 1.82 | | 1.80d | | 1.77d,e |
| Ratio of net expenses to average net assets | | 1.81 | | 1.77d | | 1.76d,e |
| Ratio of net investment income | | | | | | |
| to average net assets | | 3.10 | | 3.13 | | 3.01e |
| Portfolio Turnover Rate | | 43.68 | | 35.92 | | 38.73 |
| |
| |
| |
|
| Net Assets, end of period ($ x 1,000) | | 4,451 | | 3,054 | | 2,867 |
| |
| a | | From October 21, 2004 (commencement of initial offering) to May 31, 2005. | | | | |
| b | | Based on average shares outstanding at each month end. | | | | |
| c | | Exclusive of sales charge. | | | | | | |
| d | | Ratio of total expenses to average net assets and ratio of net expenses to average net assets for all periods have been |
| | | restated.This restatement has no impact on the fund’s previously reported net assets, net investment, net asset value or |
| | | total return. See Note 6. | | | | | | |
| e | | Annualized. | | | | | | |
| See notes to financial statements. | | | | | | |
30
| | | | | | | | | Year Ended May 31, | | |
| | | |
| |
| |
| |
|
| Class Z Shares | | 2007 | | 2006 | | 2005 | | 2004 | | 2003 |
| |
| |
| |
| |
| |
|
| Per Share Data ($): | | | | | | | | | | |
| Net asset value, | | | | | | | | | | |
| beginning of period | | 14.61 | | 15.00 | | 14.39 | | 15.28 | | 14.60 |
| Investment Operations: | | | | | | | | | | |
| Investment income—net a | | .61 | | .61 | | .58 | | .58 | | .63 |
| Net realized and unrealized | | | | | | | | | | |
| gain (loss) on investments | | .11 | | (.38) | | .71 | | (.76) | | .83 |
| Total from Investment Operations | | .72 | | .23 | | 1.29 | | (.18) | | 1.46 |
| Distributions: | | | | | | | | | | |
| Dividends from investment | | | | | | | | | | |
| income—net | | (.61) | | (.61) | | (.59) | | (.57) | | (.63) |
| Dividends from net realized | | | | | | | | | | |
| gain on investments | | (.01) | | (.01) | | (.09) | | (.14) | | (.15) |
| Total Distributions | | (.62) | | (.62) | | (.68) | | (.71) | | (.78) |
| Net asset value, end of period | | 14.71 | | 14.61 | | 15.00 | | 14.39 | | 15.28 |
| |
| |
| |
| |
| |
|
| Total Return (%) | | 4.97 | | 1.57 | | 9.10 | | (1.16) | | 10.30 |
| |
| |
| |
| |
| |
|
| Ratios/Supplemental Data (%): | | | | | | | | | | |
| Ratio of total expenses | | | | | | | | | | |
| to average net assets | | .84 | | .81b | | .78b | | .73b | | .75b |
| Ratio of net expenses | | | | | | | | | | |
| to average net assets | | .83 | | .81b | | .78b | | .73b | | .75b |
| Ratio of net investment income | | | | | | | | | | |
| to average net assets | | 4.09 | | 4.10 | | 3.96 | | 3.93 | | 4.27 |
| Portfolio Turnover Rate | | 43.68 | | 35.92 | | 38.73 | | 56.87 | | 47.21 |
| |
| |
| |
| |
| |
|
| Net Assets, end of period | | | | | | | | | | |
| ($ x 1,000) | | 1,125,008 | | 1,155,038 | | 1,237,623 | | 1,004,253 | | 1,140,398 |
| |
| a | | Based on average shares outstanding at each month end. | | | | | | |
| b | | Ratio of total expenses to average net assets and ratio of net expenses to average net assets for all periods have been |
| | | restated.This restatement has no impact on the fund’s previously reported net assets, net investment, net asset value or |
| | | total return. See Note 6. | | | | | | | | | | |
| See notes to financial statements. | | | | | | | | | | |
T h e F u n d 31
N O T E S T O F I N A N C I A L S TAT E M E N T S
NOTE 1—Significant Accounting Policies:
Dreyfus Premier California Tax Exempt Bond Fund, Inc. (the “fund”) is registered under the Investment Company Act of 1940, as amended (the “Act”), as a non-diversified open-end management investment company. The fund’s investment objective is to provide investors with a high level of current income exempt from federal and California state income taxes, as is consistent with the preservation of capital.The Dreyfus Corporation (the “Manager” or “Dreyfus”) serves as the fund’s investment adviser. During the reporting period, the Manager was a wholly-owned subsidiary of Mellon Financial Corporation (“Mellon Financial”).
On July 1, 2007, Mellon Financial and The Bank of New York Company, Inc. merged, forming The Bank of New York Mellon Corporation. As part of this transaction, Dreyfus became a wholly-owned subsidiary of The Bank of New York Mellon Corporation.
Dreyfus Service Corporation (the “Distributor”), a wholly-owned subsidiary of the Manager, is the distributor of the fund’s shares. Effective June 30, 2007, the Distributor will be known as MBSC Securities Corporation. The fund is authorized to issue 500 million shares of $.001 par value Common Stock. The fund currently offers four classes of shares: Class A (100 million shares authorized). Class B (100 million shares authorized), Class C (100 million shares authorized) and Class Z (200 million shares authorized). Class A shares are subject to a sales charge imposed at the time of purchase. Class B shares are subject to a contingent deferred sales charge (“CDSC”) imposed on Class B share redemptions made within six years of purchase and automatically convert to Class A shares after six years. The fund no longer offers Class B shares, except in connection with dividend reinvestment and permitted exchanges of Class B shares. Class C shares are subject to a CDSC imposed on Class C shares redeemed within one year of purchase. Class Z shares are sold at net asset value per share generally only to shareholders who received Class Z shares in exchange for their shares of General California and California Municipal Income, as a result of the reorganization of such funds. Class
32
Z shares generally are not available for new accounts. Other differences between the classes include the services offered to and the expenses borne by each class and certain voting rights. Income, expenses (other than expenses attributable to a specific class), and realized and unrealized gains or losses on investments are allocated to each class of shares based on its relative net assets.
The fund’s financial statements are prepared in accordance with U.S. generally accepted accounting principles, which may require the use of management estimates and assumptions. Actual results could differ from those estimates.
The fund enters into contracts that contain a variety of indemnifications. The fund’s maximum exposure under these arrangements is unknown.The fund does not anticipate recognizing any loss related to these arrangements.
(a) Portfolio valuation: Investments in securities are valued each business day by an independent pricing service (the “Service”) approved by the Board of Directors. Investments for which quoted bid prices are readily available and are representative of the bid side of the market in the judgment of the Service are valued at the mean between the quoted bid prices (as obtained by the Service from dealers in such securities) and asked prices (as calculated by the Service based upon its evaluation of the market for such securities). Other investments (which constitute a majority of the portfolio securities) are carried at fair value as determined by the Service, based on methods which include consideration of: yields or prices of municipal securities of comparable quality, coupon, maturity and type; indications as to values from dealers; and general market conditions. Options and financial futures on municipal and U.S.Treasury securities are valued at the last sales price on the securities exchange on which such securities are primarily traded or at the last sales price on the national securities market on each business day.
T h e F u n d 33
N O T E S T O F I N A N C I A L S TAT E M E N T S (continued)
On September 20, 2006, the Financial Accounting Standards Board (FASB) released Statement of Financial Accounting Standards No. 157 “Fair Value Measurements” (“FAS 157”). FAS 157 establishes an authoritative definition of fair value, sets out a framework for measuring fair value, and requires additional disclosures about fair-value mea-surements.The application of FAS 157 is required for fiscal years beginning after November 15, 2007 and interim periods within those fiscal years. Management does not believe that the application of this standard will have a material impact on the financial statements of the fund.
(b) Securities transactions and investment income: Securities transactions are recorded on a trade date basis. Realized gain and loss from securities transactions are recorded on the identified cost basis. Interest income, adjusted for accretion of discount and amortization of premium on investments, is earned from settlement date and recognized on the accrual basis. Securities purchased or sold on a when-issued or delayed-delivery basis may be settled a month or more after the trade date.
The fund has an arrangement with the custodian bank whereby the fund receives earnings credits from the custodian when positive cash balances are maintained, which are used to offset custody fees. For financial reporting purposes, the fund includes net earnings credits as an expense offset in the Statement of Operations.
The fund follows an investment policy of investing primarily in municipal obligations of one state. Economic changes affecting the state and certain of its public bodies and municipalities may affect the ability of issuers within the state to pay interest on, or repay principal of, municipal obligations held by the fund.
(c) Dividends to shareholders: It is the policy of the fund to declare dividends daily from investment income-net. Such dividends are paid monthly. Dividends from net realized capital gain, if any, are normally declared and paid annually, but the fund may make distributions on a more frequent basis to comply with the distribution requirements of the Internal Revenue Code of 1986, as amended (the “Code”).To the extent that net realized capital gain can be offset by capital loss carry-
34
overs, if any, it is the policy of the fund not to distribute such gain. Income and capital gain distributions are determined in accordance with income tax regulations, which may differ from U.S. generally accepted accounting principles.
(d) Federal income taxes: It is the policy of the fund to continue to qualify as a regulated investment company, which can distribute tax exempt dividends, by complying with the applicable provisions of the Code, and to make distributions of income and net realized capital gain sufficient to relieve it from substantially all federal income and excise taxes.
On July 13, 2006, the FASB released FASB Interpretation No. 48 “Accounting for Uncertainty in Income Taxes” (FIN 48). FIN 48 provides guidance for how uncertain tax positions should be recognized, measured, presented and disclosed in the financial statements. FIN 48 requires the evaluation of tax positions taken or expected to be taken in the course of preparing the fund’s tax returns to determine whether the tax positions are “more-likely-than-not” of being sustained by the applicable tax authority.Tax positions not deemed to meet the more-likely-than-not threshold would be recorded as a tax benefit or expense in the current year. Adoption of FIN 48 is required for fiscal years beginning after December 15, 2006 and is to be applied to all open tax years as of the effective date. Management does not believe that the application of this standard will have a material impact on the financial statements of the fund.
At May 31, 2007, the components of accumulated earnings on a tax basis were as follows: undistributed tax exempt income $313,364, and unrealized appreciation $57,462,039. As a result of the fund’s mergers with Dreyfus Premier California Municipal Bond Fund, General California Municipal Bond and Dreyfus California Municipal Income, Inc., capital losses of $6,738,775 are available to offset future gains. Based on certain provisions in the code, the amount of losses which can be utilized in subsequent years is subject to an annual limitation.These acquired capital losses are expected to expire fiscal 2011.
T h e F u n d 35
N O T E S T O F I N A N C I A L S TAT E M E N T S (continued)
The tax character of distributions paid to shareholders during the fiscal periods ended May 31, 2007 and May 31, 2006, were as follows: tax exempt income $50,540,307 and $52,803,668, ordinary income $50,224 and $1,286,839 and long term capital gains $1,087,653 and $0, respectively.
During the period ended May 31, 2007, as a result of permanent book to tax differences, primarily due to the tax treatment for amortization adjustments, the fund decreased accumulated undistributed investment income-net by $38,705, increased accumulated net realized gain (loss) on investments by $1,417 and increased paid-in capital by $37,288. Net assets were not affected by this reclassification.
NOTE 2—Bank Line of Credit:
The fund participates with other Dreyfus-managed funds in a $350 million redemption credit facility (the “Facility”) to be utilized for temporary or emergency purposes, including the financing of redemptions. In connection therewith, the fund has agreed to pay commitment fees on its pro rata portion of the Facility. Interest is charged to the fund based on prevailing market rates in effect at the time of borrowing. During the period ended May 31, 2007, the fund did not borrow under the Facility.
NOTE 3—Management Fee and Other Transactions with Affiliates:
(a) Pursuant to a management agreement (“Agreement”) with the Manager, the management fee is computed at the annual rate of .60% of the value of the fund’s average daily net assets and is payable monthly.The Agreement provides that if in any fiscal year the aggregate expenses allocable to Class Z, exclusive of taxes, brokerage fees, interest on borrowings, commitment fees and extraordinary expenses, exceed 1 1 / 2% of the value of the average net assets of Class Z, the fund may deduct from the fees paid to the Manager, or the Manager will bear such excess expense. During the period ended May 31, 2007, there was no expense reimbursement pursuant to the Agreement.
36
During the period ended May 31, 2007, the Distributor retained $43,937 from commissions earned on sales of the fund’s Class A shares and $8,906 and $2,962 from CDSC on redemptions of the fund’s Class B and Class C shares, respectively.
(b) Under the Distribution Plan (the “Plan”) adopted pursuant to Rule 12b-1 under the Act, Class B and Class C shares pay the Distributor for distributing their shares at an annual rate of .50% of the value of the average daily net assets of Class B shares and .75% of the value of the average daily net assets of Class C shares. During the period ended May 31, 2007, Class B and Class C shares were charged $29,685 and $28,984, respectively, pursuant to the Plan.
(c) Under the Shareholder Services Plan, Class A, Class B and Class C shares pay the Distributor at an annual rate of .25% of the value of the average daily net assets of their shares, for the provision of certain ser-vices.The services provided may include personal services relating to shareholder accounts, such as answering shareholder inquiries regarding the fund and providing reports and other information, and services related to the maintenance of shareholder accounts. The Distributor may make payments to Service Agents (a securities dealer, financial institution or other industry professional) in respect of these services. The Distributor determines the amounts to be paid to Service Agents. During the period ended May 31, 2007, Class A, Class B and Class C shares were charged $214,736, $14,843 and $9,661, respectively, pursuant to the Shareholder Services Plan.
Under the Shareholder Services Plan, Class Z shares reimburse the Distributor an amount not to exceed an annual rate of .25% of the value of Class Z shares’ average daily net assets for certain allocated expenses of providing personal services and/or maintaining shareholder accounts.The services provided may include personal services relating to shareholder accounts, such as answering shareholder inquiries regarding Class Z shares and providing reports and other information,
T h e F u n d 37
N O T E S T O F I N A N C I A L S TAT E M E N T S (continued)
and services related to the maintenance of shareholder accounts. During the period ended May 31, 2007, Class Z shares were charged $464,000 pursuant to the Shareholder Services Plan.
The fund compensates Dreyfus Transfer, Inc., a wholly-owned subsidiary of the Manager, under a transfer agency agreement for providing personnel and facilities to perform transfer agency services for the fund. During the period ended May 31, 2007, the fund was charged $298,355 pursuant to the transfer agency agreement.
During the period ended May 31, 2007, the fund was charged $4,089 for services performed by the Chief Compliance Officer.
The components of “Due to The Dreyfus Corporation and affiliates” in the Statement of Assets and Liabilities consist of: management fees $629,069, Rule 12b-1 distribution plan fees $5,029, shareholder services plan fees $25,962, chief compliance officer fees $3,748 and transfer agency per account fees $54,268.
(d) Each Board member also serves as a Board member of other funds within the Dreyfus complex. Annual retainer fees and attendance fees are allocated to each fund based on net assets.
NOTE 4—Securities Transactions:
The aggregate amount of purchases and sales of investment securities, excluding short-term securities, during the period ended May 31, 2007, amounted to $550,418,914 and $587,043,049, respectively.
The fund may purchase floating rate notes. A floating rate note is a Municipal Bond or other debt obligation (generally held pursuant to a custodial arrangement) having a relatively long maturity and bearing interest at a fixed rate substantially higher than prevailing short-term tax exempt rates, that has been coupled with the agreement of a third party, such as a bank, broker-dealer or other financial institution, pursuant to which such institution grants the security holders the option, at periodic intervals, to tender their securities to the institution and receive the face value thereof. As consideration for providing the
38
option, the financial institution receives periodic fees equal to the difference between the obligation’s fixed coupon rate and the rate, as determined by a remarketing or similar agent at or near the commencement of such period, that would cause the securities, coupled with the tender option, to trade at par on the date of such determination. Thus, after payment of this fee, the security holder effectively holds a demand obligation that bears interest at the prevailing short-term tax exempt rate.
At May 31,2007,the cost of investments for federal income tax purposes was $1,167,722,711; accordingly, accumulated net unrealized appreciation on investments was $57,462,039, consisting of $59,271,419 gross unrealized appreciation and $1,809,380 gross unrealized depreciation.
NOTE 5—Plan of Reorganization:
On November 8, 2006, the fund’s Board of Directors approved, subject to shareholder approval on March 1, 2007 of Dreyfus California Intermediate Municipal Bond Fund, an Agreement and Plan of Reorganization to merge Dreyfus California Intermediate Bond Fund into the fund as part of a tax-free reorganization.The merger occurred as of the close of business on June 5, 2007. On the date of the merger, Dreyfus California Intermediate Municipal Bond Fund exchanged all of its assets at net asset value, subject to liabilities, for Class Z shares of the fund. Those shares were distributed pro rata to shareholders of Dreyfus California Intermediate Municipal Bond Fund so that each shareholder received a number of Class Z shares of the fund equal to the aggregate net asset value of the shareholder’s Dreyfus California Intermediate Municipal Bond Fund shares.
NOTE 6—Restatement:
Subsequent to the issuance of the November 30, 2006 financial statements, the fund determined that the transfers of certain tax-exempt municipal bond securities by the fund to special purpose bond trusts in connection with participation in inverse floater structures do not
T h e F u n d 39
N O T E S T O F I N A N C I A L S TAT E M E N T S (continued)
qualify for sale treatment under Statement of Financial Accounting Standard No. 140,Accounting for Transfers and Servicing of Financial Assets and Extinguishment of Liabilities, and should have been accounted for as a secured borrowing.
The correction of the above item resulted in the restatement of the ratio of total and net expenses of the financial highlights table as shown below:
| Ratio of Total Expenses | | 2006 | | 2005 | | 2004 | | 2003 |
| |
| |
| |
| |
|
| Class A shares: | | | | | | | | |
| As previously reported | | .94% | | .97% | | | | |
| As restated | | 1.04% | | 1.03% | | | | |
| Class B shares: | | | | | | | | |
| As previously reported | | 1.46% | | 1.48% | | | | |
| As restated | | 1.56% | | 1.54% | | | | |
| Class C shares: | | | | | | | | |
| As previously reported | | 1.70% | | 1.71% | | | | |
| As restated | | 1.80% | | 1.77% | | | | |
| Class Z shares: | | | | | | | | |
| As previously reported | | .71% | | .72% | | .70% | | .70% |
| As restated | | .81% | | .78% | | .73% | | .75% |
| |
| Ratio of Net Expenses | | 2006 | | 2005 | | 2004 | | 2003 |
| |
| |
| |
| |
|
| Class A shares: | | | | | | | | |
| As previously reported | | .91% | | .96% | | | | |
| As restated | | 1.01% | | 1.02% | | | | |
| Class B shares: | | | | | | | | |
| As previously reported | | 1.41% | | 1.45% | | | | |
| As restated | | 1.51% | | 1.51% | | | | |
| Class C shares: | | | | | | | | |
| As previously reported | | 1.67% | | 1.70% | | | | |
| As restated | | 1.77% | | 1.76% | | | | |
| Class Z shares: | | | | | | | | |
| As previously reported | | .71% | | .72% | | .70% | | .70% |
| As restated | | .81% | | .78% | | .73% | | .75% |
This restatement has no impact on the fund’s previously reported net assets, net investment income, net asset value per share or total return.
40
R E P O R T O F I N D E P E N D E N T R E G I S T E R E D P U B L I C A C C O U N T I N G F I R M
Shareholders and Board of Directors
Dreyfus Premier California Tax Exempt Bond Fund, Inc.
We have audited the accompanying statement of assets and liabilities of Dreyfus Premier California Tax Exempt Bond Fund, Inc., including the statement of investments, as of May 31, 2007, and the related statement of operations for the year then ended, the statement of changes in net assets for each of the two years in the period then ended, and financial highlights for each of the periods indicated therein. These financial statements and financial highlights are the responsibility of the Fund’s management. Our responsibility is to express an opinion on these financial statements and financial highlights based on our audits.
We conducted our audits in accordance with the standards of the Public Company Accounting Oversight Board (United States).Those standards require that we plan and perform the audit to obtain reasonable assurance about whether the financial statements and financial highlights are free of material misstatement.We were not engaged to perform an audit of the Fund’s internal control over financial reporting. Our audits included consideration of internal control over financial reporting as a basis for designing audit procedures that are appropriate in the circumstances, but not for the purposes of expressing an opinion on the effectiveness of the Fund’s internal control over financial reporting. Accordingly, we express no such opinion.An audit also includes examining, on a test basis, evidence supporting the amounts and disclosures in the financial statements and financial highlights, assessing the accounting principles used and significant estimates made by management, and evaluating the overall financial statement presentation. Our procedures included confirmation of securities owned as of May 31, 2007 by correspondence with the custodian or by other appropriate auditing procedures where replies from others were not received.We believe that our audits provide a reasonable basis for our opinion.
In our opinion, the financial statements and financial highlights referred to above present fairly, in all material respects, the financial position of Dreyfus Premier California Tax Exempt Bond Fund, Inc. at May 31, 2007, the results of its operations for the year then ended, the changes in its net assets for each of the two years in the period then ended, and the financial highlights for each of the indicated periods, in conformity with U.S. generally accepted accounting principles.

| New York, New York |
| July 16, 2007 |
T h e F u n d 41
I M P O R TA N T TA X I N F O R M AT I O N (Unaudited)
In accordance with federal tax law, the fund hereby makes the following designations regarding its fiscal year ended May 31, 2007:
- all the dividends paid from investment income-net are “exempt-interest dividends” (not generally subject to regular federal and, for individuals who are California residents, California personal income taxes), and
- the fund hereby designates $.0130 per share as a long-term capital gain distributions and $.0006 per share as a short-term capital gain distribution paid on December 15, 2006.
As required by federal tax law rules, shareholders will receive notification of their portion of the fund’s taxable ordinary dividends (if any) and capital gains distributions (if any) paid for the 2007 calendar year on Form 1099-DIV and their portion of the fund’s exempt-interest dividends paid for 2007 calendar year on Form 1099-INT, both which will be mailed by January 31, 2008.
42
INFORMATION ABOUT THE REVIEW AND APPROVAL OF THE FUND’S MANAGEMENT AGREEMENT (Unaudited)
At a meeting of the fund’s Board of Directors held on May 8, 2007, the Board considered the re-approval of the fund’s Management Agreement through November 30, 2007, pursuant to which the Manager provides the fund with investment advisory and administrative services. The Board members, none of whom are “interested persons” (as defined in the Investment Company Act of 1940, as amended) of the fund, were assisted in their review by independent legal counsel and met with counsel in executive session separate from representatives of the Manager.
Analysis of Nature, Extent, and Quality of Services Provided to the Fund. The Board members received a presentation from representatives of the Manager regarding services provided to the fund and other funds in the Dreyfus fund complex, and discussed the nature, extent, and quality of the services provided to the fund pursuant to its Management Agreement.The Manager’s representatives reviewed the fund’s distribution of accounts and the relationships the Manager has with various intermediaries and the different needs of each.The Manager’s representatives noted the diversity of distribution of the fund as well as among the funds in the Dreyfus fund complex, and the Manager’s corresponding need for broad, deep, and diverse resources to be able to provide ongoing shareholder services in each distribution channel, including those of the fund.The Board also reviewed the number of shareholder accounts in the fund, as well as the fund’s asset size.
The Board members also considered the Manager’s research and portfolio management capabilities, as well as the Manager’s oversight of day-to-day fund operations, including fund accounting and administration and assistance in meeting legal and regulatory requirements, and the Manager’s extensive administrative, accounting and compliance infrastructure.
Comparative Analysis of the Fund’s Management Fee and Expense Ratio and Performance. The Board members reviewed reports prepared by Lipper, Inc., an independent provider of investment company data, which included information comparing the fund’s management
T h e F u n d 43
I N FO R M AT I O N A B O U T T H E R E V I E W A N D A P P R OVA L O F T H E F U N D ’S M A N A G E M E N T A G R E E M E N T ( U n a u d i t e d ) ( c o n t i n u e d )
fee and expense ratio with a group of comparable funds (the “Expense Group”) and with a broader group of funds (the “Expense Universe”) that were selected by Lipper. Included in these reports were comparisons of contractual and actual management fee rates and total operating expenses. The Manager also provided a comparison of the fund’s total returns to the fund’s Lipper category average returns for the past 10 calendar years.
The Board reviewed the results of the Expense Group and Expense Universe comparisons that were prepared based on financial statements currently available to Lipper as of February 28, 2007.The Board reviewed the range of management fees and expense ratios of the funds in the Expense Group and Expense Universe, and noted that the fund’s contractual and actual management fees and total expense ratio (for Class A shares) were higher than the respective Expense Group and Expense Universe medians.
The Board members also reviewed the reports prepared by Lipper that presented the fund’s performance for various periods ended February 28, 2007, and placed significant emphasis on comparisons of yield and total return performance among the same group of funds as the Expense Group (the “Performance Group”) and to a group of funds that was broader than the Expense Universe (the “Performance Universe”) that also was selected by Lipper. Because the fund’s Class A shares have only two years of performance history, the Board also reviewed performance results for the fund’s Class Z shares, which is the fund’s oldest share class.The Board noted that Class Z shares of the fund achieved total returns higher or within several basis points lower than the Performance Group and Performance Universe medians for each reported time period up to 10 years. The Board noted that Class A shares performance was somewhat lower than the Class Z performance and was lower than the medians. The Board also noted that Class Z shares outperformed the fund’s Lipper category average on a total return basis in each of the past 5 calendar years. On a yield performance basis, the Board noted that the fund’s 1-year yield performance for the
44
past 10 annual periods was at or lower than the Performance Group median, and variously at, higher, and lower than the Performance Universe median, for each reported time period.
Representatives of the Manager noted that there were no similarly managed mutual funds, institutional separate accounts, or wrap fee accounts managed by the Manager or its affiliates with similar investment objectives, policies, and strategies and, as to mutual funds only, reported in the same Lipper category, as the fund.
Analysis of Profitability and Economies of Scale. The Manager’s representatives reviewed the dollar amount of expenses allocated and profit received by the Manager and the method used to determine such expenses and profit. The Board considered information, previously provided and discussed, prepared by an independent consulting firm regarding the Manager’s approach to allocating costs to, and determining the profitability of, individual funds and the entire Dreyfus mutual fund complex. The Board members also considered that the methodology had also been reviewed by an independent registered public accounting firm which, like the consultant, found the methodology to be reasonable. The consulting firm also analyzed where any economies of scale might emerge in connection with the management of the fund.The Board members evaluated the profitability analysis in light of the relevant circumstances for the fund, including the extent to which economies of scale would be realized if the fund grows and whether fee levels reflect these economies of scale for the benefit of fund shareholders.The Board members also considered potential benefits to the Manager from acting as investment adviser to the fund and noted that there were no soft dollar arrangements in effect with respect to trading the fund’s portfolio.
It was noted that the Board members should consider the Manager’s profitability with respect to the fund as part of their evaluation of whether the fees under the Management Agreement bear a reasonable relationship to the mix of services provided by the Manager, including
T h e F u n d 45
I N FO R M AT I O N A B O U T T H E R E V I E W A N D A P P R OVA L O F T H E F U N D ’S M A N A G E M E N T A G R E E M E N T ( U n a u d i t e d ) ( c o n t i n u e d )
the nature, extent, and quality of such services and that a discussion of economies of scale is predicated on increasing assets and that, if a fund’s assets had been decreasing, the possibility that the Manager may have realized any economies of scale would be less. It was noted that the profitability percentage for managing the fund was within the range determined by appropriate court cases to be reasonable given the services rendered and that the profitability percentage for managing the fund was reasonable given the generally superior service levels provided.
At the conclusion of these discussions, the Board agreed that it had been furnished with sufficient information to make an informed business decision with respect to continuation of the fund’s Management Agreement. Based on the discussions and considerations as described above, the Board made the following conclusions and determinations.
- The Board concluded that the nature, extent, and quality of the ser- vices provided by the Manager are adequate and appropriate.
- The Board was satisfied with the fund’s overall performance.
- The Board concluded that the fee paid to the Manager by the fund was reasonable in light of the services provided, comparative perfor- mance and expense and management fee information, costs of the services provided, and profits to be realized and benefits derived or to be derived by the Manager from its relationship with the fund.
- The Board determined that the economies of scale which may accrue to the Manager and its affiliates in connection with the management of the fund had been adequately considered by the Manager in con- nection with the management fee rate charged to the fund, and that, to the extent in the future it were to be determined that material economies of scale had not been shared with the fund, the Board would seek to have those economies of scale shared with the fund.
46
The Board members considered these conclusions and determinations, along with the information received on a routine and regular basis throughout the year, and, without any one factor being dispositive, the Board determined that re-approval of the fund’s Management Agreement was in the best interests of the fund and its shareholders.
The Board members considered these conclusions and determinations, along with the information received on a routine and regular basis throughout the year, and, without any one factor being dispositive, the Board determined that re-approval of the fund’s Management Agreement was in the best interests of the fund and its shareholders.
T h e F u n d 47
B O A R D M E M B E R S I N F O R M AT I O N ( U n a u d i t e d )
| Joseph S. DiMartino (63) |
| Chairman of the Board (1995) |
| Principal Occupation During Past 5 Years: |
| • Corporate Director and Trustee |
| Other Board Memberships and Affiliations: |
| • The Muscular Dystrophy Association, Director |
| • Century Business Services, Inc., a provider of outsourcing functions for small and medium size |
| companies, Director |
| • The Newark Group, a provider of a national market of paper recovery facilities, paperboard |
| mills and paperboard converting plants, Director |
| • Sunair Services Corporation, a provider of certain outdoor-related services to homes and |
| businesses, Director |
| No. of Portfolios for which Board Member Serves: 168 |
| David W. Burke (71) |
| Board Member (1994) |
| Principal Occupation During Past 5 Years: |
| • Corporate Director and Trustee. |
| Other Board Memberships and Affiliations: |
| • John F. Kennedy Library Foundation, Director |
| No. of Portfolios for which Board Member Serves: 92 |
| William Hodding Carter III (72) |
| Board Member (2007) |
| Principal Occupation During Past 5 Years: |
| • Professor of Leadership & Public Policy, University of North Carolina, Chapel Hill |
| (January 1, 2006-present) |
| • President and Chief Executive Officer of the John S. and James L. Knight Foundation |
| (February 1, 1998-February 1, 2006) |
| Other Board Memberships and Affiliations: |
| • The Century Foundation, Emeritus Director |
| • The Enterprise Corporation of the Delta, Director |
| No. of Portfolios for which Board Member Serves: 28 |
| Gordon J. Davis (65) |
| Board Member (1995) |
| Principal Occupation During Past 5 Years: |
| • Partner in the law firm of LeBoeuf, Lamb, Greene & MacRae, LLP |
| • President, Lincoln Center for the Performing Arts, Inc. (2001) |
| Other Board Memberships and Affiliations: |
| • Consolidated Edison, Inc., a utility company, Director |
| • Phoenix Companies, Inc., a life insurance company, Director |
| • Board Member/Trustee for several not-for-profit groups |
| No. of Portfolios for which Board Member Serves: 37 |
48
| Joni Evans (65) |
| Board Member (1987) |
| Principal Occupation During Past 5 Years: |
| • Principal, Joni Evans Ltd. |
| • Senior Vice President of the William Morris Agency (2005) |
| No. of Portfolios for which Board Member Serves: 28 |
| Ehud Houminer (66) |
| Board Member (2006) |
| Principal Occupation During Past 5 Years: |
| • Executive-in-Residence at the Columbia Business School, Columbia University |
| |
| Other Board Memberships and Affiliations: |
| • Avnet Inc., an electronics distributor, Director |
| • International Advisory Board to the MBA Program School of Management, Ben Gurion |
| University, Chairman |
| |
| No. of Portfolios for which Board Member Serves: 69 |
| Richard C. Leone (67) |
| Board Member (2006) |
| Principal Occupation During Past 5 Years: |
| • President of The Century Foundation (formerly,The Twentieth Century Fund, Inc.), a tax |
| exempt research foundation engaged in the study of economic, foreign policy and domestic issues |
| |
| Other Board Memberships and Affiliations: |
| • The American Prospect, Director |
| • Center for American Progress, Director |
| |
| No. of Portfolios for which Board Member Serves: 28 |
| Hans C. Mautner (69) |
| Board Member (2006) |
| Principal Occupation During Past 5 Years: |
| • President—International Division and an Advisory Director of Simon Property Group, a real |
| estate investment company (1998-present) |
| • Director and Vice Chairman of Simon Property Group (1998-2003) |
| • Chairman and Chief Executive Officer of Simon Global Limited (1999-present) |
| |
| Other Board Memberships and Affiliations: |
| • Capital and Regional PLC, a British co-investing real estate asset manager, Director |
| • Member - Board of Managers of: |
| Mezzacappa Long/Short Fund LLC |
| Mezzacappa Partners LLC |
| |
| No. of Portfolios for which Board Member Serves: 28 |
T h e F u n d 49
B O A R D M E M B E R S I N F O R M AT I O N ( U n a u d i t e d ) (continued)
| Robin A. Melvin (43) |
| Board Member (2006) |
| Principal Occupation During Past 5 Years: |
| • Director, Boisi Family Foundation, a private family foundation that supports youth-serving |
| organizations that promote the self sufficiency of youth from disadvantaged circumstances |
| No. of Portfolios for which Board Member Serves: 28 |
| Burton N. Wallack (56) |
| Board Member (1991) |
| Principal Occupation During Past 5 Years: |
| • President and co-owner of Wallack Management Company, a real estate management company |
| No. of Portfolios for which Board Member Serves: 28 |
| John E. Zuccotti (69) |
| Board Member (2006) |
| Principal Occupation During Past 5 Years: |
| • Chairman of Brookfield Financial Properties, Inc. |
| • Senior Counsel of Weil, Gotshal & Manges, LLP |
| • Chairman of the Real Estate Board of New York |
| Other Board Memberships and Affiliations: |
| • Emigrant Savings Bank, Director |
| • Wellpoint, Inc., Director |
| • Visiting Nurse Service of New York, Director |
| • Columbia University,Trustee |
| • Doris Duke Charitable Foundation,Trustee |
| No. of Portfolios for which Board Member Serves: 28 |
Once elected all Board Members serve for an indefinite term, but achieve Emeritus status upon reaching age 80.The address of the Board Members and Officers is in c/o The Dreyfus Corporation, 200 Park Avenue, New York, New York 10166. Additional information about the Board Members is available in the fund’s Statement of Additional Information which can be obtained from Dreyfus free of charge by calling this toll free number: 1-800-554-4611.
Arnold S. Hiatt, Emeritus Board Member
50
O F F I C E R S O F T H E F U N D ( U n a u d i t e d )
| J. DAVID OFFICER, President since |
| December 2006. |
Chief Operating Officer,Vice Chairman and a Director of the Manager, and an officer of 86 investment companies (comprised of 168 portfolios) managed by the Manager. He is 58 years old and has been an employee of the Manager since April 1998.
| MARK N. JACOBS, Vice President since |
| March 2000. |
Executive Vice President, Secretary and General Counsel of the Manager, and an officer of 87 investment companies (comprised of 184 portfolios) managed by the Manager. He is 61 years old and has been an employee of the Manager since June 1977.
| MICHAEL A. ROSENBERG, Vice President |
| and Secretary since August 2005. |
Associate General Counsel of the Manager, and an officer of 87 investment companies (comprised of 184 portfolios) managed by the Manager. He is 47 years old and has been an employee of the Manager since October 1991.
| JAMES BITETTO, Vice President and |
| Assistant Secretary since August 2005. |
Associate General Counsel and Assistant Secretary of the Manager, and an officer of 87 investment companies (comprised of 184 portfolios) managed by the Manager. He is 40 years old and has been an employee of the Manager since December 1996.
| JONI LACKS CHARATAN, Vice President |
| and Assistant Secretary since |
| August 2005. |
Associate General Counsel of the Manager, and an officer of 87 investment companies (comprised of 184 portfolios) managed by the Manager. She is 51 years old and has been an employee of the Manager since October 1988.
| JOSEPH M. CHIOFFI, Vice President and |
| Assistant Secretary since August 2005. |
Associate General Counsel of the Manager, and an officer of 87 investment companies (comprised of 184 portfolios) managed by the Manager. He is 45 years old and has been an employee of the Manager since June 2000.
| JANETTE E. FARRAGHER, Vice President |
| and Assistant Secretary since |
| August 2005. |
Associate General Counsel of the Manager, and an officer of 87 investment companies (comprised of 184 portfolios) managed by the Manager. She is 44 years old and has been an employee of the Manager since February 1984.
| JOHN B. HAMMALIAN, Vice President and |
| Assistant Secretary since August 2005. |
Associate General Counsel of the Manager, and an officer of 87 investment companies (comprised of 184 portfolios) managed by the Manager. He is 43 years old and has been an employee of the Manager since February 1991.
| ROBERT R. MULLERY, Vice President and |
| Assistant Secretary since August 2005. |
Associate General Counsel of the Manager, and an officer of 87 investment companies (comprised of 184 portfolios) managed by the Manager. He is 55 years old and has been an employee of the Manager since May 1986.
| JEFF PRUSNOFSKY, Vice President and |
| Assistant Secretary since August 2005. |
Associate General Counsel of the Manager, and an officer of 87 investment companies (comprised of 184 portfolios) managed by the Manager. He is 42 years old and has been an employee of the Manager since October 1990.
T h e F u n d 51
O F F I C E R S O F T H E F U N D ( U n a u d i t e d ) (continued)
| JAMES WINDELS, Treasurer since |
| November 2001. |
Director – Mutual Fund Accounting of the Manager, and an officer of 87 investment companies (comprised of 184 portfolios) managed by the Manager. He is 48 years old and has been an employee of the Manager since April 1985.
| ROBERT ROBOL, Assistant Treasurer |
| since August 2003. |
Senior Accounting Manager – Money Market and Municipal Bond Funds of the Manager, and an officer of 87 investment companies (comprised of 184 portfolios) managed by the Manager. He is 43 years old and has been an employee of the Manager since October 1988.
| ROBERT SVAGNA, Assistant Treasurer |
| since August 2005. |
Senior Accounting Manager – Equity Funds of the Manager, and an officer of 87 investment companies (comprised of 184 portfolios) managed by the Manager. He is 40 years old and has been an employee of the Manager since November 1990.
| GAVIN C. REILLY, Assistant Treasurer |
| since December 2005. |
Tax Manager of the Investment Accounting and Support Department of the Manager, and an officer of 87 investment companies (comprised of 184 portfolios) managed by the Manager. He is 38 years old and has been an employee of the Manager since April 1991.
| JOSEPH W. CONNOLLY, Chief Compliance |
| Officer since October 2004. |
Chief Compliance Officer of the Manager and The Dreyfus Family of Funds (87 investment companies, comprised of 184 portfolios). From November 2001 through March 2004, Mr. Connolly was first Vice-President, Mutual Fund Servicing for Mellon Global Securities Services. In that capacity, Mr. Connolly was responsible for managing Mellon’s Custody, Fund Accounting and Fund Administration services to third-party mutual fund clients. He is 50 years old and has served in various capacities with the Manager since 1980, including manager of the firm’s Fund Accounting Department from 1997 through October 2001.
| WILLIAM GERMENIS, Anti-Money |
| Laundering Compliance Officer since |
| October 2002. |
Vice President and Anti-Money Laundering Compliance Officer of the Distributor, and the Anti-Money Laundering Compliance Officer of 83 investment companies (comprised of 180 portfolios) managed by the Manager. He is 36 years old and has been an employee of the Distributor since October 1998.
52

Item 2. Code of Ethics.
The Registrant has adopted a code of ethics that applies to the Registrant's principal executive officer, principal financial officer, principal accounting officer or controller, or persons performing similar functions. There have been no amendments to, or waivers in connection with, the Code of Ethics during the period covered by this Report.
Item 3. Audit Committee Financial Expert.
The Registrant's Board has determined that Joseph S. DiMartino, a member of the Audit Committee of the Board, is an audit committee financial expert as defined by the Securities and Exchange Commission (the "SEC"). Joseph S. DiMartino is "independent" as defined by the SEC for purposes of audit committee financial expert determinations.
Item 4. Principal Accountant Fees and Services
(a) Audit Fees. The aggregate fees billed for each of the last two fiscal years (the "Reporting Periods") for professional services rendered by the Registrant's principal accountant (the "Auditor") for the audit of the Registrant's annual financial statements, or services that are normally provided by the Auditor in connection with the statutory and regulatory filings or engagements for the Reporting Periods, were $42,565 in 2006 and $42,565 in 2007.
(b) Audit-Related Fees. The aggregate fees billed in the Reporting Periods for assurance and related services by the Auditor that are reasonably related to the performance of the audit of the Registrant's financial statements and are not reported under paragraph (a) of this Item 4 were $0 in 2006 and $0 in 2007.
The aggregate fees billed in the Reporting Periods for non-audit assurance and related services by the Auditor to the Registrant's investment adviser (not including any sub-investment adviser whose role is primarily portfolio management and is subcontracted with or overseen by another investment adviser), and any entity controlling, controlled by or under common control with the investment adviser that provides ongoing services to the Registrant ("Service Affiliates"), that were reasonably related to the performance of the annual audit of the Service Affiliate, which required pre-approval by the Audit Committee were $0 in 2006 and $0 in 2007.
Note: For the second paragraph in each of (b) through (d) of this Item 4, certain of such services were not pre-approved prior to May 6, 2003, when such services were required to be pre-approved. On and after May 6, 2003, 100% of all services provided by the Auditor were pre-approved as required. For comparative purposes, the fees shown assume that all such services were pre-approved, including services that were not pre-approved prior to the compliance date of the pre-approval requirement.
(c) Tax Fees. The aggregate fees billed in the Reporting Periods for professional services rendered by the Auditor for tax compliance, tax advice and tax planning ("Tax Services") were $3,148 in 2006 and $3,262 in 2007. These services consisted of (i) review or preparation of U.S. federal, state, local and excise tax returns; (ii) U.S. federal, state and local tax planning, advice and assistance regarding statutory, regulatory or administrative developments, and (iii) tax advice regarding tax qualification matters and/or treatment of various financial instruments held or proposed to be acquired or held.
The aggregate fees billed in the Reporting Periods for Tax Services by the Auditor to Service Affiliates which required pre-approval by the Audit Committee were $0 in 2006 and $0 in 2007.
(d) All Other Fees. The aggregate fees billed in the Reporting Periods for products and services provided by the Auditor, other than the services reported in paragraphs (a) through (c) of this Item, were $736 in 2006 and $810 in 2007. These services consisted of a review of the Registrant's anti-money laundering program.
The aggregate fees billed in the Reporting Periods for Non-Audit Services by the Auditor to Service Affiliates, other than the services reported in paragraphs (b) through (c) of this Item, which required pre-approval by the Audit Committee were $0 in 2006 and $0 in 2007.
Audit Committee Pre-Approval Policies and Procedures. The Registrant's Audit Committee has established policies and procedures (the "Policy") for pre-approval (within specified fee limits) of the Auditor's engagements for non-audit services to the Registrant and Service Affiliates without specific case-by-case consideration. Pre-approval considerations include whether the proposed services are compatible with maintaining the Auditor's independence. Pre-approvals pursuant to the Policy are considered annually.
Non-Audit Fees. The aggregate non-audit fees billed by the Auditor for services rendered to the Registrant, and rendered to Service Affiliates, for the Reporting Periods were $586,749 in 2006 and $1,302,603 in 2007.
Auditor Independence. The Registrant's Audit Committee has considered whether the provision of non-audit services that were rendered to Service Affiliates which were not pre-approved (not requiring pre-approval) is compatible with maintaining the Auditor's independence.
| Item 5. | | Audit Committee of Listed Registrants. |
| | | Not applicable. |
| Item 6. | | Schedule of Investments. |
| | | Not applicable. |
| Item 7. | | Disclosure of Proxy Voting Policies and Procedures for Closed-End Management |
| | | Investment Companies. |
| | | Not applicable. |
| Item 8. | | Portfolio Managers of Closed-End Management Investment Companies. |
| | | Not applicable. |
| Item 9. | | Purchases of Equity Securities by Closed-End Management Investment Companies and |
| | | Affiliated Purchasers. |
| | | Not applicable. |
| Item 10. | | Submission of Matters to a Vote of Security Holders. |
The Registrant has a Nominating Committee (the "Committee"), which is responsible for selecting and nominating persons for election or appointment by the Registrant's Board as Board members. The Committee has adopted a Nominating Committee Charter (the "Charter"). Pursuant to the Charter, the
Committee will consider recommendations for nominees from shareholders submitted to the Secretary of the Registrant, c/o The Dreyfus Corporation Legal Department, 200 Park Avenue, 8th Floor East, New York, New York 10166. A nomination submission must include information regarding the recommended nominee as specified in the Charter. This information includes all information relating to a recommended nominee that is required to be disclosed in solicitations or proxy statements for the election of Board members, as well as information sufficient to evaluate the factors to be considered by the Committee, including character and integrity, business and professional experience, and whether the person has the ability to apply sound and independent business judgment and would act in the interests of the Registrant and its shareholders.
Nomination submissions are required to be accompanied by a written consent of the individual to stand for election if nominated by the Board and to serve if elected by the shareholders, and such additional information must be provided regarding the recommended nominee as reasonably requested by the Committee.
Item 11. Controls and Procedures.
(a) The Registrant's principal executive and principal financial officers have concluded, based on their evaluation of the Registrant's disclosure controls and procedures as of a date within 90 days of the filing date of this report, that the Registrant's disclosure controls and procedures are reasonably designed to ensure that information required to be disclosed by the Registrant on Form N-CSR is recorded, processed, summarized and reported within the required time periods and that information required to be disclosed by the Registrant in the reports that it files or submits on Form N-CSR is accumulated and communicated to the Registrant's management, including its principal executive and principal financial officers, as appropriate to allow timely decisions regarding required disclosure.
(b) There were no changes to the Registrant's internal control over financial reporting that occurred during the second fiscal quarter of the period covered by this report that have materially affected, or are reasonably likely to materially affect, the Registrant's internal control over financial reporting.
Item 12. Exhibits.
| (a)(1) | | Code of ethics referred to in Item 2. |
| (a)(2) | | Certifications of principal executive and principal financial officers as required by Rule 30a-2(a) |
| under the Investment Company Act of 1940. |
| (a)(3) | | Not applicable. |
| (b) | | Certification of principal executive and principal financial officers as required by Rule 30a-2(b) |
| under the Investment Company Act of 1940. |
SIGNATURES
Pursuant to the requirements of the Securities Exchange Act of 1934 and the Investment Company Act of 1940, the Registrant has duly caused this Report to be signed on its behalf by the undersigned, thereunto duly authorized.
DREYFUS PREMIER CALIFORNIA TAX EXEMPT BOND FUND, INC.
| By: | | /s/ J. David Officer |
| | | J. David Officer |
| | | President |
| |
| Date: | | July 23, 2007 |
Pursuant to the requirements of the Securities Exchange Act of 1934 and the Investment Company Act of 1940, this Report has been signed below by the following persons on behalf of the Registrant and in the capacities and on the dates indicated.
| By: | | /s/J. David Officer |
| | | J. David Officer |
| | | President |
| |
| Date: | | July 23, 2007 |
| |
| By: | | /s/ James Windels |
| | | James Windels |
| | | Treasurer |
| |
| Date: | | July 23, 2007 |
EXHIBIT INDEX
| (a)(1) | | Code of ethics referred to in Item 2. |
| |
| (a)(2) | | Certifications of principal executive and principal financial officers as required by Rule 30a- |
| 2(a) under the Investment Company Act of 1940. (EX-99.CERT) |
| |
| (b) | | Certification of principal executive and principal financial officers as required by Rule 30a- |
| 2(b) under the Investment Company Act of 1940. (EX-99.906CERT) |