UNITED STATES
SECURITIES AND EXCHANGE COMMISSION
Washington, D.C. 20549
FORM N-CSR
CERTIFIED SHAREHOLDER REPORT OF REGISTERED MANAGEMENT
INVESTMENT COMPANIES
Investment Company Act file number: 811-3752
THE MANAGERS FUNDS
(Exact name of registrant as specified in charter)
| | |
| 800 Connecticut Avenue, Norwalk, Connecticut | | 06854 |
| (Address of principal executive offices) | | (Zip code) |
Managers Investment Group LLC
800 Connecticut Avenue, Norwalk, Connecticut 06854
(Name and address of agent for service)
Registrant’s telephone number, including area code: (203) 299-3500
| | |
| Date of fiscal year end: | | DECEMBER 31 |
| |
| Date of reporting period: | | JANUARY 1, 2004 – DECEMBER 31, 2004 (Annual Shareholder Report) |
| Item 1. | REPORTS TO STOCK HOLDERS. |
ANNUAL REPORT
Managers Funds
| • | | Capital Appreciation Fund |
| • | | International Equity Fund |
| • | | Emerging Markets Equity Fund |
December 31, 2004

Table of Contents
Nothing contained herein is to be considered an offer, sale, or solicitation of an offer to buy shares of The Managers Funds. Such offering is made only by Prospectus, which includes details as to offering price and other material information.
Letter to Shareholders
Dear Fellow Shareholder:
The U.S. economy grew steadily this past year, providing a generally healthy backdrop for the financial markets. In addition, inflation remained moderately positive despite a sharp rise in energy prices that could have put pressure on all prices or stalled growth completely. The latest evidence is that the economy was growing at an annualized rate of 4% through the third quarter. Importantly, consumer spending did not show the deterioration that many had predicted. Rather, the consumer showed impressive resilience in the face of higher costs for energy and select other necessities. Also, nonresidential fixed investment continued to rebound. Capital spending had declined between 10% and 15% annually during the heart of the 2001 recession, but increased at a comparable pace in recent quarters. This spending also translated into improving balance sheets and earnings for a good number of companies. Meanwhile, energy and other raw material prices eased in late 2004. While long-term interest rates moderated over the course of the year, short-term rates rose, due primarily to the five one-quarter-point (0.25%) interest rate hikes instituted by the Federal Open Market Committee (FOMC) during the period.
Despite the generally positive economic backdrop, the equity markets were mired in somewhat of a trading range throughout most of 2004, but jumped out of it immediately following the November presidential election. Small capitalization stocks again outpaced large cap stocks and value style benchmarks performed significantly better than growth benchmarks. This was driven by strong gains in the energy and materials sectors while traditional growth sectors such as technology and healthcare struggled for most of the year. Developed and emerging foreign markets also posted healthy gains, enhanced for U.S. investors by a weakening U.S. dollar. The surprise for many investors was the strength of longer term bonds. Despite the steady rise of short-term rates as a result of the FOMC tightening program, long-term rates were steady to lower for the year.
We are pleased to report that the Funds within the Managers Funds family performed well within expectations for the year. It was also a very active year from an organizational perspective. Notably, the Managers family of funds celebrated its 20th anniversary in June as Managers Capital Appreciation, Managers Special Equity and Managers Bond Funds each eclipsed their 20th year since inception.
In addition to taking over the management and administration of several Funds formerly managed by Conseco Funds Group, we were, at year end, in the process of seeking shareholder approval to integrate the Fremont family of mutual funds within our group. Shareholder approval was received in mid-January. These Funds also utilize a subadvisor structure. We believe that a key advantage to shareholders of both Fund families will be a broader array of asset classes, investment styles and “intelligence diversification” available within one group of Funds.
Beginning in May we instituted expense caps on several of our Funds which effectively lowered their respective costs to shareholders. These include Managers Value, now capped at 1.19% per year, Managers Capital Appreciation, now capped at 1.29% per year, Managers International Equity, now capped at 1.55% per year, Managers Emerging Markets Equity, now capped at 1.79% per year, and Managers Global Bond, now capped at 1.19% per year. In a similar effort to reduce costs, we commenced operation of a new share class of Managers Special Equity (I Class) which, by virtue of a high minimum investment ($250,000), will be of lower cost than the original share class.
Finally, throughout the latter half of the year, Managers made preparations to partner with several of our AMG Affiliates to create Managers Investment Group, which we formed on January 1, 2005. The new organization has expanded resources and a broad variety of investment management and distribution services.
As always, we post any news or other pertinent information about the Funds as soon as applicable on our new Web site at www.managersinvest.com. Should you have any questions about any of our Funds or this report, please feel free to contact us at 1-800-835-3879, or visit the Web site. We thank you for your investment in The Managers Funds.
| | | | |
Sincerely, | | | | |
| | |
 | | | |  |
Peter M. Lebovitz | | | | Thomas G. Hoffman, CFA |
President | | | | Executive Vice President |
The Managers Funds | | | | Chief Investment Officer |
| | | | | Managers Investment Group LLC |
1
About Your Fund’s Expenses
We believe it is important for you to understand the impact of costs on your investment. All mutual funds have operating expenses. As a shareholder of the Fund, you incur ongoing costs, which include costs for portfolio management, administrative services, and shareholder reports (like this one), among others. Operating expenses, which are deducted from the Fund’s gross income, directly reduce the investment return of the Fund.
A fund’s expenses are expressed as a percentage of its average net assets. This figure is known as the expense ratio. The following examples are intended to help you understand the ongoing costs (in dollars) of investing in the Fund, so you can compare these costs with those of other mutual funds. The examples are based on an investment in the Fund of $1,000 made at the beginning of the most recent fiscal period and held for the entire period.
The table below illustrates your Fund’s costs in two ways:
Actual Fund return: This helps you to estimate the actual expenses that you paid over the period. The “Ending Account Value” shown is derived from the Fund’s actual return, and the fourth column shows the dollar amount that would have been paid by an investor who started with $1,000 in the Fund. You may use the information here, together with the amount you invested, to estimate the expenses that you paid over the period.
To do so, simply divide your account value by $1,000 (for example, an $8,600 account value divided by $1,000 = 8.6), then multiply the result by the number given for the Fund under the heading “Expenses Paid During Period.”
Hypothetical 5% annual return: This helps you compare the Fund’s costs with those of other mutual funds because the Securities and Exchange Commission requires all mutual funds to calculate expenses based on a 5% annual return less expenses. It assumes that the Fund had a return of 5% per year and that the expense ratio is unchanged. You can assess the Fund’s costs by comparing this hypothetical example with the hypothetical examples that appear in shareholder reports of other funds.
| | | | | | | | | | | | |
Six Months Ended December 31, 2004
| | Expense Ratio
| | | Beginning Account
Value 6/30/2004
| | Ending Account
Value
12/31/2004
| | Expenses Paid
During the
Period*
|
Managers Value Fund | | | | | | | | | | | | |
Based on Actual Fund Return | | 1.19 | % | | $ | 1,000 | | $ | 1,087 | | $ | 6.26 |
Based on Hypothetical 5% Annual Return | | 1.19 | % | | $ | 1,000 | | $ | 1,019 | | $ | 6.06 |
Managers Capital Appreciation Fund | | | | | | | | | | | | |
Based on Actual Fund Return | | 1.29 | % | | $ | 1,000 | | $ | 1,047 | | $ | 6.66 |
Based on Hypothetical 5% Annual Return | | 1.29 | % | | $ | 1,000 | | $ | 1,019 | | $ | 6.56 |
Managers Small Company Fund | | | | | | | | | | | | |
Based on Actual Fund Return | | 1.45 | % | | $ | 1,000 | | $ | 1,063 | | $ | 7.52 |
Based on Hypothetical 5% Annual Return | | 1.45 | % | | $ | 1,000 | | $ | 1,018 | | $ | 7.35 |
Managers Special Equity Fund | | | | | | | | | | | | |
Based on Actual Fund Return | | 1.39 | % | | $ | 1,000 | | $ | 1,098 | | $ | 7.34 |
Based on Hypothetical 5% Annual Return | | 1.39 | % | | $ | 1,000 | | $ | 1,018 | | $ | 7.06 |
Managers Special Equity Fund - I Shares | | | | | | | | | | | | |
Based on Actual Fund Return | | 1.17 | % | | $ | 1,000 | | $ | 1,099 | | $ | 6.19 |
Based on Hypothetical 5% Annual Return | | 1.17 | % | | $ | 1,000 | | $ | 1,019 | | $ | 5.96 |
Managers International Equity Fund | | | | | | | | | | | | |
Based on Actual Fund Return | | 1.55 | % | | $ | 1,000 | | $ | 1,135 | | $ | 8.34 |
Based on Hypothetical 5% Annual Return | | 1.55 | % | | $ | 1,000 | | $ | 1,017 | | $ | 7.88 |
Managers Emerging Markets | | | | | | | | | | | | |
Based on Actual Fund Return | | 1.79 | % | | $ | 1,000 | | $ | 1,275 | | $ | 10.26 |
Based on Hypothetical 5% Annual Return | | 1.79 | % | | $ | 1,000 | | $ | 1,016 | | $ | 9.10 |
Managers Bond Fund | | | | | | | | | | | | |
Based on Actual Fund Return | | 0.99 | % | | $ | 1,000 | | $ | 1,059 | | $ | 5.12 |
Based on Hypothetical 5% Annual Return | | 0.99 | % | | $ | 1,000 | | $ | 1,020 | | $ | 5.03 |
Managers Global Bond Fund | | | | | | | | | | | | |
Based on Actual Fund Return | | 1.19 | % | | $ | 1,000 | | $ | 1,110 | | $ | 6.33 |
Based on Hypothetical 5% Annual Return | | 1.19 | % | | $ | 1,000 | | $ | 1,019 | | $ | 6.06 |
| * | Expenses are equal to the Fund’s annualized expense ratio multiplied by the average account value over the period, multiplied by the number of days in the most recent fiscal half-year, then divided by 365. |
You can find more information about each Fund’s expenses, including annual expense ratios for the past fiscal periods, in the Financial Statements section of this report. For additional information on operating expenses and other shareholder costs, please refer to the Fund’s prospectus.
2
| | |
| Managers Value Fund | | Value |
Managers Value Fund (“Value”) is a value oriented stock Fund seeking long-term capital appreciation through a diversified portfolio of medium and large capitalization companies. In line with our belief in “intelligence diversification,” Managers currently utilizes two independent subadvisors who each manage approximately half of the total portfolio: a team led by Jeffrey Shaw of Armstrong Shaw Associates Inc. (“Armstrong Shaw”), hired in March 2000, and a team led by John Liang of Osprey Partners Investment Management (“Osprey”), hired in September 2001.
The Portfolio Managers
Armstrong Shaw Associates Inc.
Jeff and the investment management team at Armstrong Shaw take a disciplined absolute value approach to investing in the equity market. Their goal is to purchase companies that are selling at a substantial discount to intrinsic value. Shaw defines intrinsic value as an estimate of what a company would be worth if it were sold as a continuing operation to a knowledgeable buyer. This approach permits price appreciation, if the stock grows into its intrinsic value, while limiting the risk of significant price depreciation.
Shaw begins by screening the universe of domestic stocks for those with market caps more than $2.5 billion, P/E ratios below the market average, EPS growth better than 10% and return on equity better than 15%. Shaw might also search for certain events or special situations such as restructurings, industry events, or legislative changes. After narrowing the universe to about 200 mid- and large-cap names, the investment team analyzes the companies by speaking with management, suppliers and customers and examining financial statements. Qualitatively, Shaw prefers companies with discernable business franchises and a management team with a successful track record. The importance of a strong business model and management team in Shaw’s approach cannot be overemphasized. Unlike a deep value manager where price is the main concern, Shaw is willing to pay a bit more for a company with a strong business plan as long as the price is still below what he estimates as the intrinsic value. Quantitatively, the team compares the stock prices to cash flows, EPS, sales, etc. Shaw will estimate the stock’s intrinsic value and purchase stocks only when they are selling for less than 70% of the estimated intrinsic value.
This results in a portfolio of 30-40 of the team’s best ideas. Another 100 stocks or so remain on a watch list for future consideration. Shaw sets target prices on these stocks that reflect his expectation of 30-50% price appreciation over the next 2-3 years. Thus, turnover tends to be low. The portfolio’s performance is driven by each stock’s appreciation toward its intrinsic value along with rising intrinsic value in response to improved business or industry outlooks. Armstrong Shaw will sell a position when a price target is reached, the company’s fundamentals deteriorate, or if it reports below-expectation financial results. Additionally, a drop in price of 25% from average cost triggers an automatic review process for potential sale.
Osprey Partners Investment Management, LLC
As traditional value investors, John Liang and the investment team at Osprey Partners Investment Management seek to identify undervalued stocks with low price to earnings (P/E) and price to cash flow (P/CF) ratios. At the same time, Osprey’s investment team focuses its in-depth bottom-up analysis to identify fundamentally strong, well-managed companies.
The initial step is to screen the investment universe for companies with a market cap above $1.5 billion and a P/E ratio at least 20% less than the P/E ratio of the S&P 500. The analysts will also review other metrics to determine which companies warrant further investigation, favoring companies with low debt to capital, low price to cash flow, and low price to book ratios. The next step of the process is to determine the strength and risks of each company’s business. Each idea is presented to the Research Committee, which determines which securities warrant further analysis and which should be considered for inclusion in the portfolio. The analysts focus on each company’s balance sheet and income statement, earnings quality and sustainability, and profit margin trends. An in-depth assessment of management’s capability and reputation is crucial because many of the companies that Osprey considers have either fallen in price or have not risen as much as some of their peers. Thus, Osprey analysts meet management to review the company’s business models, use of cash, competitiveness, and any acquisition strategies. John and the analysts also monitor the macroeconomic backdrop to determine how industry-level factors could affect a company’s competitiveness or business plan. All of this is intended to identify well-managed companies that are strong competitors. After all research is completed, purchase ideas are considered by the firm’s Investment Committee. This group is responsible for all portfolio management decisions, most importantly what stocks to buy or sell and when to add to or trim a position. In order to purchase a stock, the group must reach a consensus, and an initial position is typically 2%. Industry exposure is monitored to ensure diversification; no industry can comprise more than 15% of the portfolio.
The portfolio will typically consist of 35-45 stocks spread among 15-20 industry groups. A position is sold when the P/E ratio exceeds the P/E ratio of the market, when it appreciates to a predetermined price target, if fundamentals change, or if a better idea should present itself. Additionally, a 20% drop relative to the market prompts a review and positions exceeding 6% of the portfolio are scaled back. The investment team tends to have an investment time horizon of 2 years or more; and the portfolio turnover has been 25% to 40% annually.
The Year in Review
For the year 2004, the Managers Value Fund gained 13.87% compared with a gain of 10.88% for the S&P 500. In the U.S., the broad market (using, for example, the Russell 3000, Wilshire 5000, and S&P 500 indices) rose about 12% for the year and, by most measures, it was the first consecutive positive year since 1998-1999.
3
The equity markets opened the year continuing the rally of 2003 before falling in March amid security concerns following the terrorist attacks in Madrid. The economy took center stage in the middle of the year as the Federal Open Market Committee began to raise the Federal funds rate 0.25%, the first of many such increases. While corporate earnings were strong, the market was soft as a result of concerns about a slowing economy and constrained consumer spending due to rising energy costs. The market began to rally in September only to be slowed down by Merck, which announced the recall of its successful arthritis drug Vioxx.
Throughout most of 2004 the market had been locked into a trading zone, but jumped out immediately after the presidential election. A decisive election boosted markets to their best performance since the fourth quarter of 2003. This strong performance was led by the IT and consumer sectors. Both sectors had been negative all year and posted strong returns of about 13% in the fourth quarter. As corporate profits continued to grow, capital spending increased, helping the IT sector. The consumer was helped by a decrease in energy and materials prices. While price indices rose over all, the fourth quarter saw a decrease in oil prices from a high of over $55 per barrel to about $43 per barrel. This decrease did not stop the energy sector from posting strong returns for the year. Global demand for oil and other materials helped the energy (+31%) and materials (+13%) sectors throughout the year. Industrials (18%) had a strong year despite the poor performance of the airline industry which continues to struggle.
From a style standpoint, the S&P Barra/Value Index outperformed its growth counterpart by over 900 basis points (bps). Low price-to-sales and price-to earnings stocks were the leaders early in the year. The resurgence of the information technology and consumer discretionary sectors in the fourth quarter evened out the distribution as all price-to-earnings quintiles performed well.
The Fund started the year again with a large overweight in the financials sector. However, the results were not as beneficial as in 2003 as an investigation into illegal sales practices within the insurance industry hurt returns and Fannie Mae (-5%) was involved in its own accounting scandal. An overweight in energy was additive to the Fund due to strong performance amid rising energy costs and increased demand. Examples include ConocoPhillips (+32%), Transocean (+77%) and Devon Energy (+36%).
Despite strong performance from the consumer discretionary sector the Fund did not fair as well. Retail in particular lagged due to the performance of Dollar Tree Stores (-4%), Gap (-9%) and Rent-A-Center (-12%). The healthcare sector did not subtract from the Fund as much as it might have thanks to some good stock selection. The poor performance of Merck (-30%) and Pfizer (-24%) was offset by positions in WellPoint (+53%) and Lab Corp. of America (35%). While Merck was liquidated from the Fund, Pfizer remains a significant holding.
Looking Forward
Looking forward, the portfolio managers continue to find value in financials, healthcare and consumer sectors.
The Fund’s subadvisors had the following comments as we progress into 2005:
Armstrong Shaw - With signs that the profit cycle is decelerating, the “quality trade” seems poised to work in 2005. During past periods of decelerating earnings growth, higher quality, large cap stocks have outperformed. Large cap valuations are attractive vs. small cap stocks and have higher dividend support. The weaker dollar should also favor EPS growth for large cap stocks. More than half of all large cap stocks have a cash flow yield greater than the 10 Year Treasury, twice the norm. The last time we were at these levels was in the late 70’s.
Finally, we feel 2005 will be marked by the aggressive use of corporate capital, or put another way, corporations will find more productive uses for all the cash that is sitting on their balance sheets. Corporate cash as a percentage of total assets is at 40 year highs, and totals over $1 trillion dollars. Our portfolio companies have more than their fair share of cash to reinvest and we expect our management teams to make astute capital allocation decisions to deploy this excess cash in ways that increase shareholder value.
Our portfolio is valued at a very reasonable 14.2x 2005 expected earnings which compares favorably to the Russell 1000 Value at 14.5x, the S&P 500 at 17.4x. We are optimistic that the inexpensive valuation level of our portfolio will produce attractive returns going forward.
Osprey - Corporate earnings have been nothing short of spectacular growing in the neighborhood of 20% for all of 2004 - the highest rate in over a decade - after an 18% gain in 2003. Unfortunately, all good things must come to an end, as earnings growth for the S&P 500 Index is projected to slow to 10.5% in 2005. The reason? Corporate after-tax profit margins are the highest on record due to the enormous gains in productivity that U.S. corporations have achieved over the past several years without a corresponding increase in wages and benefits. With productivity gains slowing, raw material and labor costs rising, and little or no pricing power, U.S. companies will have a hard time growing their bottom line much in excess of the projected 3.5% economic growth rate. This dramatic slowing of profits in the U.S. supports our thesis that investors will begin to prize companies with certain and stable earnings more and more as the year progresses.
In conclusion, we see the market as pretty fairly valued at today’s P/E of 17X consensus earnings estimates for 2005. With short-term interest rates rising we don’t expect to see multiple expansion. Therefore, market appreciation in 2005 will most likely be less than 10% with individual companies in the aforementioned defensive and stable earnings growth categories doing much better.
4
With our portfolio deeply undervalued and in excellent position to capitalize on the changing market environment described above, we look forward to what the coming year holds in store.
Cumulative Total Return Performance
Value Fund’s cumulative total return is based on the daily change in net asset value (NAV), and assumes that all dividends and distributions were reinvested. The S&P 500 Index is an unmanaged capitalization weighted index of 500 commonly traded stocks designed to measure performance of the broad domestic economy through changes in the aggregate market value of those stocks. The Index assumes reinvestment of dividends. This chart compares a hypothetical $10,000 investment made in Value Fund on December 31,1994, to a $10,000 investment made in the S&P 500 for the same time period. The chart is not intended to imply any future performance of the Fund. The graph and chart do not reflect the deduction of taxes that a shareholder would pay on a Fund distribution or redemption of shares. Total Returns would have been lower had certain expenses not been reduced.
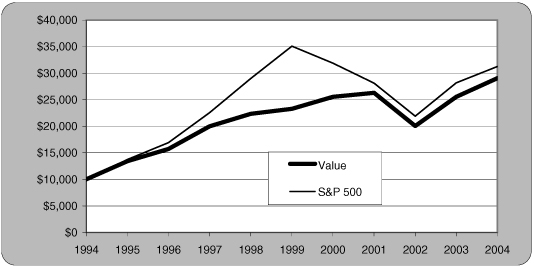
The table below shows the average annual total returns for the Value Fund and the S&P 500 Index since December 31,1994 through December 31, 2004.
| | | | | | | | | |
Average Annual Total Returns:
| | 1 Year
| | | 5 Years
| | | 10 Years
| |
Value Fund | | 13.87 | % | | 4.55 | % | | 11.27 | % |
S&P 500 Index | | 10.88 | % | | (2.30 | )% | | 12.07 | % |
The table below displays a full breakdown of the sector allocation of the Fund as well as the top ten positions as of December 31, 2004.
| | | |
Top Ten Holdings (out of 71 securities)
| | % Fund
| |
Citigroup, Inc.* | | 3.8 | % |
WellPoint Health Networks, Inc.* | | 3.8 | |
Fannie Mae Co. | | 3.6 | |
Bank of America Corp. | | 2.7 | |
ChevronTexaco Corp.* | | 2.6 | |
Comcast Corp., Special Class A | | 2.4 | |
Merrill Lynch & Co., Inc. | | 2.4 | |
Cendant Corp. | | 2.0 | |
Pfizer, Inc. | | 1.9 | |
GlaxoSmithKline PLC, Sponsored ADR | | 1.9 | |
| | |
|
|
Top Ten as a Group | | 27.1 | % |
| | |
|
|
| * | Top Ten Holding at December 31, 2003 |
| | | |
| |
Industry Weightings
| | | |
| Financials | | 31.6 | % |
| Consumer Discretionary | | 20.5 | |
| Health Care | | 14.0 | |
| Industrials | | 9.4 | |
| Energy | | 8.6 | |
| Consumer Staples | | 3.6 | |
| Telecommunication Services | | 2.8 | |
| Information Technology | | 2.7 | |
| Utilities | | 2.6 | |
| Materials | | 1.5 | |
5
Managers Value Fund
December 31, 2004
| | |
| Schedule of Portfolio Investments | | Value |
| | | | | | | |
Security Description
| | Shares
| | | Value
| |
Common Stocks - 97.3% | | | | | | | |
Consumer Discretionary - 20.5% | | | | | | | |
Brinker International, Inc.* | | 26,200 | 2 | | $ | 918,834 | |
Claire’s Stores, Inc. | | 29,600 | | | | 629,000 | |
Clear Channel Communications, Inc. | | 36,600 | | | | 1,225,734 | |
Comcast Corp., Special Class A* | | 87,000 | 2 | | | 2,857,080 | |
Darden Restaurants, Inc. | | 32,000 | | | | 887,680 | |
Dollar Tree Stores, Inc.* | | 56,100 | | | | 1,608,948 | |
Gannett Co., Inc. | | 18,050 | | | | 1,474,685 | |
Gap, Inc., The | | 43,200 | | | | 912,384 | |
Jones Apparel Group, Inc. | | 41,300 | | | | 1,510,341 | |
Lear Corp. | | 10,300 | | | | 628,403 | |
Liberty Media Corp. | | 145,400 | | | | 1,596,492 | |
Mattel, Inc. | | 79,700 | | | | 1,553,353 | |
Office Depot, Inc.* | | 96,000 | | | | 1,666,560 | |
Pulte Homes, Inc. | | 20,950 | | | | 1,336,610 | |
Rent-A-Center, Inc.* | | 40,000 | | | | 1,060,000 | |
Ruby Tuesday, Inc. | | 35,700 | 2 | | | 931,056 | |
Time Warner Co., Inc.* | | 92,000 | | | | 1,788,480 | |
Yum! Brands, Inc. | | 40,500 | | | | 1,910,790 | |
Total Consumer Discretionary | | | | | | 24,496,430 | |
Consumer Staples - 3.6% | | | | | | | |
CVS Corp. | | 36,700 | | | | 1,654,069 | |
SUPERVALU, Inc. | | 38,500 | | | | 1,329,020 | |
Unilever NV | | 20,400 | | | | 1,360,884 | |
Total Consumer Staples | | | | | | 4,343,973 | |
Energy - 8.6% | | | | | | | |
BP, PLC., Sponsored ADR, | | 18,400 | | | | 1,074,560 | |
ChevronTexaco Corp. | | 60,300 | | | | 3,166,353 | |
ConocoPhillips Co. | | 24,698 | | | | 2,144,527 | |
Devon Energy Corp. | | 37,800 | | | | 1,471,176 | |
Kerr-McGee Corp. | | 19,700 | 2 | | | 1,138,463 | |
Transocean, Inc.* | | 29,000 | | | | 1,229,310 | |
Total Energy | | | | | | 10,224,389 | |
Financials - 31.6% | | | | | | | |
ACE, Ltd. | | 36,400 | | | | 1,556,100 | |
Allstate Corp., The | | 34,200 | | | | 1,768,824 | |
American Express Co. | | 19,150 | | | | 1,079,486 | |
American International Group, Inc. | | 28,900 | | | | 1,897,863 | |
Bank of America Corp. | | 68,900 | | | | 3,237,611 | |
Chubb Corp. | | 23,200 | | | | 1,784,080 | |
Citigroup, Inc. | | 95,241 | 2 | | | 4,588,712 | |
Fannie Mae Co. | | 60,900 | | | | 4,336,689 | |
Goldman Sachs Group, Inc. | | 14,400 | | | | 1,498,176 | |
Hartford Financial Services Group, Inc. | | 26,800 | 2 | | | 1,857,508 | |
Jefferson-Pilot Corp. | | 11,700 | | | | 607,932 | |
MBIA, Inc. | | 29,800 | | | | 1,885,744 | |
MBNA Corp. | | 64,407 | | | | 1,815,633 | |
Merrill Lynch & Co., Inc. | | 47,600 | | | | 2,845,052 | |
Morgan Stanley Co. | | 26,500 | | | | 1,471,280 | |
Regions Financial Corp. | | 22,726 | 2 | | | 808,818 | |
St. Paul Travelers Companies, Inc., The | | 32,930 | | | | 1,220,715 | |
Washington Mutual, Inc. | | 33,800 | | | $ | 1,429,064 | |
Wells Fargo & Co. | | 23,949 | | | | 1,488,430 | |
XL Capital, Ltd. | | 7,600 | | | | 590,140 | |
Total Financials | | | | | | 37,767,857 | |
Health Care - 14.0% | | | | | | | |
Abbott Laboratories Co. | | 40,300 | | | | 1,879,995 | |
AmerisourceBergen Corp. | | 9,900 | 2 | | | 580,932 | |
Cardinal Health, Inc. | | 26,100 | 2 | | | 1,517,715 | |
GlaxoSmithKline PLC, ADR | | 47,100 | 2 | | | 2,232,069 | |
HCA, Inc. | | 33,300 | 2 | | | 1,330,668 | |
Health Management Associates, Inc. | | 54,600 | 2 | | | 1,240,512 | |
McKesson Corp. | | 39,400 | | | | 1,239,524 | |
Pfizer, Inc. | | 84,800 | | | | 2,280,272 | |
WellPoint, Inc.* | | 39,000 | | | | 4,485,000 | |
Total Health Care | | | | | | 16,786,687 | |
Industrials - 9.4% | | | | | | | |
Cendant Corp. | | 101,490 | | | | 2,372,836 | |
Emerson Electric Co. | | 24,900 | | | | 1,745,490 | |
General Dynamics Corp. | | 12,200 | 2 | | | 1,276,120 | |
General Electric Co. | | 47,000 | | | | 1,715,500 | |
Honeywell International, Inc. | | 27,800 | | | | 984,397 | |
Pitney Bowes, Inc. | | 37,200 | | | | 1,721,616 | |
United Technologies Corp. | | 13,900 | | | | 1,436,565 | |
Total Industrials | | | | | | 11,252,524 | |
Information Technology - 2.7% | | | | | | | |
Hewlett-Packard Co. | | 96,526 | | | | 2,024,150 | |
Xerox Corp.* | | 73,100 | | | | 1,243,431 | |
Total Information Technology | | | | | | 3,267,581 | |
Materials - 1.5% | | | | | | | |
E.I. du Pont de Nemours & Co., Inc. | | 36,150 | | | | 1,773,158 | |
Telecommunication Services - 2.8% | | | | | | | |
Centurytel, Inc. | | 10,500 | | | | 372,435 | |
Nextel Communications, Inc.* | | 61,000 | | | | 1,830,000 | |
Verizon Communications, Inc. | | 27,245 | | | | 1,103,695 | |
Total Telecommunication Services | | | | | | 3,306,130 | |
Utilities - 2.6% | | | | | | | |
Exelon Corp. | | 44,100 | | | | 1,943,487 | |
FirstEnergy Corp. | | 29,760 | | | | 1,175,818 | |
Total Utilities | | | | | | 3,119,305 | |
Total Common Stocks
(cost $92,295,763) | | | | | | 116,338,034 | |
Other Investment Companies - 12.6%1 | | | | | | | |
Bank of New York Institutional Cash Reserves Fund, 2.35%3 | | 11,038,721 | | | | 11,038,721 | |
JPMorgan Prime Money Market Fund, Institutional Class Shares, 2.12% | | 4,052,302 | | | | 4,052,302 | |
Total Other Investment Companies
(cost $15,091,023) | | | | | | 15,091,023 | |
Total Investments -109.9%
(cost $107,386,786) | | | | | | 131,429,057 | |
Other Assets, less Liabilities – (9.9)% | | | | | | (11,881,851 | ) |
Net Assets - 100.0% | | | | | $ | 119,547,206 | |
The accompanying notes are an integral part of these financial statements.
6
| | |
| Managers Capital Appreciation Fund | | Capital Appreciation |
Managers Capital Appreciation Fund (“Capital Appreciation”) is a growth oriented stock Fund seeking long-term capital appreciation through a diversified portfolio of equity securities. In line with our belief in “Intelligence Diversification,” Managers currently utilizes two independent subadvisors who each manage approximately half of the total portfolio: Elizabeth Bramwell at Bramwell Capital Management, Inc., hired in June 2003, and Steve Cutler and Malcolm MacColl at Essex Investment Management Company, LLC, hired in March 1997.
The Portfolio Managers
Bramwell Capital Management, Inc.
Bramwell Capital Management, Inc. (“BramCap”), led by Chief Investment Officer Elizabeth R. Bramwell, CFA, seeks long-term capital growth through investment in companies that are positioned to realize above-average long-term unit and earnings growth. Bramwell’s focus is on companies that have new products and services and that are positioned to benefit from the long-term payoff on research, as well as plant and market development and expansion.
Bramwell is an active equity manager who builds portfolios stock by stock. She makes investment decisions based on fundamental research, bottom-up earnings forecasts within a macroeconomic and political framework, and company valuations relative to their respective industries, projected future growth rates and the overall equity market.
Among the variables considered are the leadership position of the company, new products and markets, sensitivity to macroeconomic factors, e.g., inflation, interest, currency and tax rates, potential for accelerating earnings growth and improving returns on sales and equity. Within this context, BramCap looks for companies where valuations are attractive relative to projected future growth rates, multiples paid for the S&P 500 and other companies in the industry, and historical valuations.
Stock selection is based on internal research. BramCap’s three securities analysts are dedicated to the research process and with the direction of Ms. Bramwell, monitor current portfolio positions, as well as identify and evaluate potential additions or deletions to the portfolio.
Investment ideas are generated from awareness and synthesis of varying news events and trends, historical experience, industry conferences, company meetings and conference calls. Additionally, information from primary materials such as annual and quarterly reports, and the brokerage community are utilized. The portfolio typically holds 30-60 securities.
BramCap sell stocks when company fundamentals deteriorate, for example, when profitability declines or sales and earnings growth decelerates. Changes in the macroeconomic outlook, such as changes in interest and inflation rates, may also result in reducing or eliminating positions. Additionally, positions may be sold when market valuations are believed to be excessive relative to projected future growth or to make room for better opportunities. Finally, BramCap will typically trim positions that grow to more than 5% of the portfolio. Portfolio turnover is expected to be in the 50-75% range.
Essex Investment Management Company, LLC.
The investment managers at Essex Investment Management Company, LLC (“Essex”) focus on the principle that a company’s earnings growth and profitability will drive its future price performance. Essex attempts to identify companies that have accelerating, sustainable earnings growth and the potential for superior revenue growth and margin expansion. Ideally, Essex searches for companies that have a dominant product or service and a strong management team. Essex seeks investments that are under-owned or attractively priced relative to Essex’s growth projections. Companies that meet all these criteria are defined as “franchise opportunities.”
The research and portfolio management teams at Essex generate ideas by visiting companies and attending conferences and trade shows, as well as through database screening. They then develop earnings models and projections, evaluate balance sheet strengths and weaknesses, and speak with company managements.
Upon initiating a position, Essex applies risk controls to limit negative effects. These consist of price targets, individual position limits of 5% of the portfolio, and a maximum industry exposure limit of 20% of the portfolio. Companies are sold for several reasons: a perceived loss of dominant position, an earnings disappointment, excess value versus forecasted growth, or if there is a better opportunity elsewhere.
The result is that Essex’s portfolio is comprised of a blend of large multinationals with dynamic medium to large industry leaders. The portfolio’s market cap ranges from $1 billion to $100 billion with 50 to 60 companies that display sustainable, high quality earnings growth at reasonable valuations.
The Year in Review
For the twelve months ended December 31, 2004, the Fund posted a total return (including distributions) of 5.14% compared to a total return of 10.88% for the S&P 500. On the heels of a very profitable 2003, U.S. stock prices struggled for most of 2004. There were concerns about terrorism, continued war and political turmoil in the Middle East, rising interest rates, rising raw material costs, and the sustainability of the economic recovery. Thus, the broad equity indices traded in a fairly narrow range during the first ten months of the year. An orderly conclusion to the U.S. presidential election and an easing of energy prices later in the year, however, seemed to release the market from its doldrums. Stock prices shot up during the fourth quarter, and the broad markets concluded 2004 with a second consecutive double-digit calendar year gain. Within the market, there
7
was a slight bias favoring smaller companies over larger ones. For instance, the Russell 2000 (a commonly used small cap index) returned over 18% during 2004 compared with a return of a bit over 10% for the S&P 500. Also, within the S&P 500, those companies with the largest market capitalizations (a common measure of company size) underperformed those companies with the smallest market capitalizations by 12 percentage points.
There was also a strong bias favoring value-style stocks over growth-style stocks during 2004. As an example, S&P and BARRA split the S&P 500 into two categories, the S&P 500/BARRA Growth Index and its Value counterpart. For 2004, the Value Index rose 15.7% while the Growth Index rose 6.1%. A comparable trend can be found in a variety of reports that distinguish between growth and value investing. Consistent with this style bias, energy (+31%) and utilities (+24%) were the best performing sectors of the market, while health care (+2%) and information technology (+3%) were the worst.
All of these broad market trends worked against the Fund during 2004, which nevertheless did post a moderate gain. The Fund’s primary focus is on large-cap growth stocks, which, as noted above, lagged other segments of the stock market during 2004. Also, both of the subadvisors to the Fund have historically held relatively large allocations to the IT and health care sectors. For the year, the Fund’s IT allocation averaged over 23% compared with an average weight of less than 17% for the IT stocks in the S&P 500. Similarly, the Fund’s health care weight averaged almost 18% compared to just over 13% for the health care stocks in the S&P 500 Index. The “allocation effect” of these exposures was a tough hill to climb during the year. In fact, the Fund’s performance for the year was in line with large-cap growth-specific benchmarks, such as the S&P 500\BARRA Growth Index.
One of the areas that worked well for the Fund was energy. The investment team at Essex, in particular, had increased their portfolio’s energy exposure to over 10% early in the first quarter. Portfolio manager Steve Cutler noted in the 2003 Annual Report that his team was having success identifying dynamic growth companies among the oil service and producers. Additionally, the Fund’s industrial holdings rose almost 23% compared with a gain of 18% for the industrial stocks in the S&P 500 Index. Portfolio manager Elizabeth Bramwell bought aggressively into the industrial sector during 2004, particularly in the industrial conglomerate and machinery industries. Her expectation was that capital spending trends looked strong, and would only be enhanced by the continued economic emergence of China.
Looking Forward
Heading into 2005, Bramwell remains constructive about her outlook for the U.S. economy. BramCap’s portfolio continues to emphasize some of the more economically sensitive areas of the market, including infrastructure development and global manufacturers. In addition, Bramwell anticipates continued demand for and innovation within the IT segment. In that regard, she has looked for investments in VoIP, medical technology, and digitalized consumer products.
The IT and consumer sectors remain Essex’s largest sector weights. In IT, they have focused mostly on the hardware and wireless industries. Meanwhile, the Essex consumer analysts continue to see good consumer sentiment and spending trends, which gives them confidence on their outlook for certain retailers. Also, they selectively added some investments in the leisure and travel industry.
The Fund as a whole remains focused on the more traditional growth sectors within the stock market. Almost 25% of the Fund’s assets are invested in IT stocks, followed by 18% in consumer discretionary, 17% in industrials, and 14% in health care. The Fund continues to be positioned, in aggregate, for a continuation of the global economic recovery that we saw in 2003 and 2004.
8
Cumulative Total Return Performance
Capital Appreciation’s cumulative total return is based on the daily change in net asset value (NAV), and assumes that all distributions were reinvested. The S&P 500 Index is an unmanaged capitalization weighted index of 500 commonly traded stocks designed to measure performance of the broad domestic economy through changes in the aggregate market value of those stocks. The Index assumes reinvestment of dividends. This chart compares a hypothetical $10,000 investment made in Capital Appreciation on December 31,1994, to a $10,000 investment made in the S&P 500 for the same time period. The chart is not intended to imply any future performance of the Fund. The graph and chart do not reflect the deduction of taxes that a shareholder would pay on a Fund distribution or redemption of shares. Total Returns would have been lower had certain expenses not been reduced.
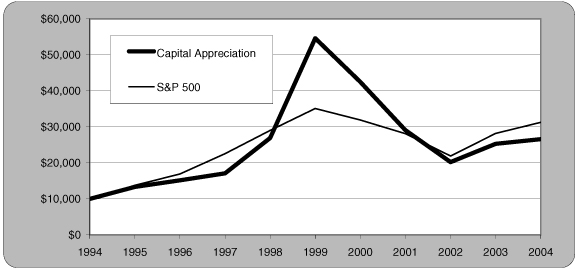
The table below shows the average annual total returns for the Capital Appreciation and the S&P 500 Index since December 31, 1994 through December 31, 2004.
| | | | | | | | | |
Average Annual Total Returns:
| | 1 Year
| | | 5 Years
| | | 10 Years
| |
Capital Appreciation Fund | | 5.14 | % | | (13.41 | )% | | 10.27 | % |
S&P 500 Index | | 10.88 | % | | (2.30 | )% | | 12.07 | % |
The table below displays a full breakdown of the sector allocation of the Fund as well as the top ten positions as of December 31, 2004.
| | | |
Top Ten Holdings (out of 95 securities)
| | % Fund
| |
Dell, Inc.* | | 3.1 | % |
Shlumberger, Ltd.* | | 2.6 | |
3M Co.* | | 2.6 | |
United Parcel Service, Inc., Class B | | 2.5 | |
Best Buy Co., Inc. | | 2.4 | |
Gilead Sciences, Inc. | | 2.3 | |
Microsoft Corp.* | | 2.3 | |
EMC Corp.* | | 2.1 | |
Cisco Systems, Inc. | | 2.1 | |
Norvartis AG | | 1.9 | |
| | |
|
|
Top Ten as a Group | | 23.9 | % |
| | |
|
|
| * | Top Ten Holding at December 31, 2003 |
| | | |
Industry Weightings
| | | |
Information Technology | | 24.8 | % |
Consumer Discretionary | | 17.7 | |
Industrials | | 17.0 | |
Health Care | | 14.5 | |
Energy | | 9.6 | |
Consumer Staples | | 8.0 | |
Financials | | 7.1 | |
Materials | | 1.4 | |
9
Managers Capital Appreciation Fund
December 31, 2004
| | |
| Schedule of Portfolio Investments | | Capital Appreciation |
| | | | | | |
Security Description
| | Shares
| | | Value
|
Common Stocks - 100.1% | | | | | | |
Consumer Discretionary - 17.7% | | | | | | |
Bed Bath & Beyond, Inc.* | | 26,500 | | | $ | 1,055,495 |
Best Buy Co., Inc. | | 39,000 | | | | 2,317,380 |
Brunswick Corp. | | 19,800 | | | | 980,100 |
Carnival Corp. | | 14,700 | | | | 847,161 |
Cheesecake Factory, Inc., The* | | 13,500 | 2 | | | 438,345 |
Coach, Inc.* | | 22,000 | | | | 1,240,800 |
D.R. Horton, Inc. | | 18,700 | | | | 753,797 |
eBay, Inc.* | | 10,800 | | | | 1,255,824 |
Home Depot, Inc. | | 14,500 | | | | 619,730 |
J.C. Penney Co., Inc., Holding Co. | | 30,000 | 2 | | | 1,242,000 |
Las Vegas Sands Corp.* | | 8,790 | 2 | | | 421,920 |
McDonald’s Corp. | | 17,000 | | | | 545,020 |
Nike, Inc., Class B | | 7,900 | | | | 716,451 |
PETsMART, Inc. | | 14,500 | 2 | | | 515,185 |
Pulte Homes, Inc. | | 11,900 | | | | 759,220 |
Royal Caribbean Cruises, Ltd. | | 11,100 | 2 | | | 604,284 |
Staples, Inc. | | 20,000 | | | | 674,200 |
Walt Disney Co., The | | 51,900 | | | | 1,442,820 |
Yum! Brands, Inc. | | 20,000 | | | | 943,600 |
Total Consumer Discretionary | | | | | | 17,373,332 |
Consumer Staples - 8.0% | | | | | | |
Archer-Daniels-Midland Co. | | 33,000 | | | | 736,230 |
Bunge, Ltd. | | 15,000 | 2 | | | 855,150 |
Estee Lauder Co., Class A | | 12,000 | | | | 549,240 |
Hershey Foods Corp. | | 10,000 | | | | 555,400 |
Kellogg Co. | | 12,000 | | | | 535,920 |
Procter & Gamble Co. | | 20,000 | | | | 1,101,600 |
Walgreen Co. | | 20,000 | | | | 767,400 |
Wal-Mart Stores, Inc. | | 34,700 | | | | 1,832,854 |
Wm. Wrigley Jr. Co. | | 13,600 | | | | 940,984 |
Total Consumer Staples | | | | | | 7,874,778 |
Energy - 9.6% | | | | | | |
Apache Corp. | | 20,190 | | | | 1,021,008 |
BJ Services Co. | | 21,900 | 2 | | | 1,019,226 |
Devon Energy Corp. | | 14,000 | | | | 544,880 |
EOG Resources, Inc. | | 19,400 | 2 | | | 1,384,384 |
Nabors Industries, Ltd.* | | 26,400 | | | | 1,354,056 |
Noble Corp* | | 17,000 | | | | 845,580 |
Patterson-UTI Energy, Inc. | | 35,000 | | | | 680,750 |
Schlumberger, Ltd. | | 38,200 | 2 | | | 2,557,490 |
Total Energy | | | | | | 9,407,374 |
Financials - 7.1% | | | | | | |
American Express Co. | | 14,000 | | | | 789,180 |
American International Group, Inc. | | 22,700 | | | | 1,490,709 |
Citigroup, Inc. | | 21,500 | 2 | | | 1,035,870 |
Goldman Sachs Group, Inc. | | 9,600 | | | | 998,784 |
HSBC Holdings, PLC | | 6,000 | 2 | | | 510,840 |
Merrill Lynch & Co., Inc. | | 16,700 | | | | 998,159 |
Wells Fargo & Co. | | 19,400 | | | $ | 1,205,710 |
Total Financials | | | | | | 7,029,252 |
Health Care - 14.5% | | | | | | |
Amgen, Inc.* | | 9,000 | | | | 577,350 |
Beckman Coulter, Inc. | | 7,300 | | | | 489,027 |
Biogen Idec, Inc.* | | 7,300 | | | | 486,253 |
Boston Scientific Corp.* | | 20,400 | | | | 725,220 |
Caremark Rx, Inc.* | | 15,800 | | | | 622,994 |
Genentech, Inc.* | | 24,800 | | | | 1,350,112 |
Gilead Sciences, Inc.* | | 65,200 | | | | 2,281,348 |
Kyphon, Inc.* | | 25,000 | 2 | | | 644,000 |
Medtronic, Inc. | | 25,700 | | | | 1,276,519 |
Novartis AG | | 37,900 | | | | 1,915,466 |
Pfizer, Inc. | | 10,000 | 2 | | | 268,900 |
Stryker Corp. | | 17,000 | | | | 820,250 |
Teva Pharmaceutical Industries, Ltd., Sponsored ADR | | 44,500 | | | | 1,328,770 |
UnitedHealth Group, Inc. | | 10,000 | | | | 880,300 |
Zimmer Holdings, Inc.* | | 7,000 | | | | 560,840 |
Total Health Care | | | | | | 14,227,349 |
Industrials - 17.0% | | | | | | |
3M Co. | | 30,900 | | | | 2,535,963 |
Caterpillar, Inc. | | 8,000 | | | | 780,080 |
Cummins, Inc. | | 17,900 | 2 | | | 1,499,841 |
Emerson Electric Co. | | 17,000 | | | | 1,191,700 |
FedEx Corp. | | 17,700 | | | | 1,743,273 |
General Electric Co. | | 45,000 | | | | 1,642,500 |
Illinois Tool Works | | 13,200 | | | | 1,223,376 |
Ingersoll-Rand Co., Class A | | 8,000 | | | | 642,400 |
J.B. Hunt Transport Services, Inc. | | 19,000 | | | | 852,150 |
PACCAR, Inc. | | 10,000 | | | | 804,800 |
Parker Hannifin Corp. | | 10,000 | 2 | | | 757,400 |
Robert Half International, Inc. | | 18,000 | | | | 529,740 |
United Parcel Service, Inc., Class B | | 29,300 | | | | 2,503,978 |
Total Industrials | | | | | | 16,707,201 |
Information Technology - 24.8% | | | | | | |
Applied Materials, Inc.* | | 26,900 | | | | 459,990 |
Avaya, Inc.* | | 40,000 | | | | 688,000 |
Cisco Systems, Inc.* | | 108,700 | | | | 2,097,910 |
Computer Sciences Corp.* | | 28,000 | | | | 1,578,360 |
Dell, Inc.* | | 73,100 | | | | 3,080,434 |
Diebold, Inc. | | 15,000 | 2 | | | 835,950 |
Electronic Arts, Inc.* | | 9,800 | | | | 604,464 |
EMC Corp.* | | 142,100 | | | | 2,113,027 |
Intel Corp. | | 34,900 | | | | 816,311 |
International Business Machines Corp. | | 10,600 | 2 | | | 1,044,948 |
Linear Technology Corp. | | 15,000 | | | | 581,400 |
Marvell Technology Group Ltd.* | | 25,600 | | | | 908,032 |
Microsoft Corp. | | 83,100 | | | | 2,219,601 |
Molex, Inc. | | 28,000 | | | | 746,200 |
The accompanying notes are an integral part of these financial statements.
10
Managers Capital Appreciation Fund
December 31, 2004
| | |
| Schedule of Portfolio Investments (continued) | | Capital Appreciation |
| | | | | | | |
Security Description
| | Shares
| | | Value
| |
Information Technology (continued) | | | | | | | |
Nokia Corp., Sponsored ADR | | 83,900 | | | $ | 1,314,713 | |
Novell, Inc.* | | 142,300 | | | | 960,525 | |
Oracle Corp.* | | 42,000 | | | | 576,240 | |
Qualcomm, Inc. | | 11,000 | | | | 466,400 | |
SAP Aktiengesellschaft Systems, Sponsored ADR | | 25,000 | | | | 1,105,250 | |
Texas Instruments, Inc. | | 9,000 | | | | 221,580 | |
Veritas Software Corp.* | | 29,600 | | | | 845,080 | |
Yahoo!, Inc.* | | 30,700 | | | | 1,156,776 | |
Total Information Technology | | | | | | 24,421,191 | |
Materials - 1.4% | | | | | | | |
Freeport McMoran Copper & Gold, Inc., Class B | | 8,000 | 2 | | | 305,840 | |
Praxair, Inc. | | 25,000 | | | | 1,103,750 | |
Total Materials | | | | | | 1,409,590 | |
Total Common Stocks
(cost $83,784,129) | | | | | | 98,450,067 | |
Other Investment Company - 8.2%1 | | | | | | | |
Bank of New York Institutional Cash Reserves Fund, 2.35%3
(cost $8,061,527) | | 8,061,527 | | | | 8,061,527 | |
Total Investments - 108.3%
(cost $91,845,656) | | | | | | 106,511,594 | |
Other Assets, less Liabilities - (8.3)% | | | | | | (8,164,224 | ) |
Net Assets - 100.0% | | | | | $ | 98,347,370 | |
The accompanying notes are an integral part of these financial statements.
11
| | |
| Managers Small Company Fund | | Small Company |
Managers Small Company Equity Fund (“Small Company”) is an equity Fund that primarily invests in the stocks of small capitalization companies. Managers currently utilizes a single independent subadvisor, Kalmar Investment Advisers, Inc. (“Kalmar”), which has been managing a portion of the Fund since its inception in June 2000. The Fund utilized a dual investment manager structure prior to May 2002.
The Portfolio Manager
Kalmar, located in Wilmington, Delaware, uses a team of portfolio managers led by Ford Draper, Jr., who founded the firm in 1982. Kalmar practices a “Growth with Value” approach to small company investing whereby it seeks to identify high quality growing businesses before they are widely discovered by institutional investors. Kalmar’s team believes there is a low risk/high reward anomaly offered by the equity market in stocks of well managed, rapidly growing smaller companies that for a variety of reasons have not made the radar screen of most typical growth investors. Because these companies are relatively “invisible” institutionally, they can be inefficiently valued and offer strong growth potential. This is the crux of their “Growth with Value” investment style.
The investment team at Kalmar generates investment ideas from several sources: industry reports, discussions with company management teams, quantitative screens, and trade organizations. Thus, there are elements of both “top-down” and “bottom-up” analysis in the initial identification process. Top down thinking is used to identify strategic themes and growth areas to prospect for “Growth with Value” candidates. The most intensive research, however, is dedicated to bottom-up fundamental analysis. The members of the investment management team all come from strong research backgrounds and are committed to disciplined, in-depth fundamental analysis. Fundamentally, Kalmar looks for such criteria as proven and sustainable double-digit growth in revenue and EPS as well as a stock that is reasonably or cheaply priced relative to EPS, book value, and/or cash flow. Additionally, Kalmar looks for dynamic businesses that they can understand, are run by equity owners they can count on, and are buyable at valuations that should rise. Kalmar expects that an idea included in the portfolio will generate a return of 50% inside of two years. This appreciation would come from two sources: compounding growth in business value plus upward revaluation.
The portfolio typically consists of 75-85 securities selected on an individual basis, specifically keyed to the observations and conclusions of their research. Kalmar will tend to avoid concentrated sector bets and will diversify by the size of company, ranging from as small as $50 million up to $2.0 billion at time of purchase. Kalmar also attempts to diversify the portfolio by the “growth character” of its holdings, including both proven “Steady Eddies,” emerging growth opportunities, and growth companies experiencing significant positive transformation. Kalmar is a long-term investor, with annual turnover averaging 48% in recent years. Kalmar’s sell discipline is judgmental, not mechanical. It is based on the team’s assessment of the changing risk/reward fundamentals of a company, the qualifications of a more rewarding replacement, or whether price/fundamental expectations have been met.
The Year in Review
During 2004, the Fund returned 12.73% compared to a gain of 18.33% for the Russell 2000 Index and 14.31% for the Russell 2000 Growth Index. Broad markets continued to rise with small capitalization stocks outperforming large capitalization stocks for the sixth consecutive year. From a stylistic standpoint, small cap value stocks outperformed small cap growth stocks by over 800 basis points. With the exception of technology and telecom, all sectors of the Russell 2000 Index recorded double digit returns. In fact, technology was the lone decliner for the year falling a little over 1% despite a strong rally late in the fourth quarter. The “quality issue” of 2003 that saw some of the more speculative issues post the best returns for the year was largely reversed in 2004. A return to value-oriented companies demonstrating clear revenues and earnings growth largely dominated returns within the small cap universe.
The year opened in rather volatile fashion as a deterioration in the Middle East, rising oil prices, and the pending presidential election all weighed heavily on investor’s minds. Energy sector gains were broad based as both oil & gas companies and energy equipment manufactures benefited from rising oil prices. Conversely, technology shares struggled to regain the growth exhibited in the fourth quarter of 2003. The Fund’s underperformance during the first half of the year came from a combination of factors. Consumer discretionary holdings within the portfolio began the year trailing those of the benchmark which were up over 10% through March. However, the consumer sector cooled off considerably in the second quarter whereby the Fund’s excess exposure hindered returns. An overweight to the struggling technology sector also contributed to underperformance.
After wallowing into negative territory for the first seven months of the year, small cap companies began to rally in mid-August. Much of the rally however was driven by deeper value stocks, a segment of the market that Kalmar’s philosophy and process hasn’t traditionally targeted. Nevertheless, one of the notable bright spots in the portfolio continued to be the active overweight to the energy sector, consisting mainly of oil & gas holdings. Ultra Petroleum, for example, gained on discoveries in offshore China and increased reserves from deeper drilling programs in the U.S. Despite easing somewhat in the fourth quarter, the oil & gas concern was up nearly 29% in the second half of 2004 and 95% for the year. Bucking the positive trend of the small cap universe, Pep Boys managed to do little right for the portfolio from about May onward. The automotive parts and services chain is a transformation play for Kalmar whose recovery has stalled and the company is struggling to regain its past formula for success. Ford and his team continue to monitor the position closely and remain confident that the proper management
12
is in place to correct the turnaround efforts. They are also attracted to the deep discount to book value the company is currently trading at.
All told, contributing influences for the year were attributable to security selection and exposure in both the energy and industrial sectors as Kalmar was able to find value through their strong bottom-up fundamental analysis. Conversely, over exposure to the lagging tech sector and an underweight to the outperforming financial sector was compounded by the Fund’s consumer holdings which trailed those of the Russell 2000 Index.
Looking Forward
Heading into 2005, the Fund’s emphasis remains on the IT, consumer discretionary and industrial sectors, and continues to reflect Kalmar’s strategy of pursuing more aggressive ideas by initiating smaller positions in companies with predictable businesses. Kalmar’s considerable underweight to financials is, and has been, most directly a function of simply not finding as many exciting “Growth with Value” ideas in this sector relative to better risk/reward opportunities found elsewhere. Kalmar’s comments as we progress into the New Year:
In 2005 it seems logical to expect: Several percent early year sustainable economic growth, that likely moderates during the year. Gradually rising interest rates and more slowly increasing inflation, with the Fed continuing to squeeze until real rates clearly go positive and cause a deceleration in inexpensive lending. Better corporate investment and hiring, combined with only modest consumer spending growth. Maintenance of high, volatile energy prices and on-going trended dollar weakness with volatile interludes. Ongoing violence and frustration in Iraq and continuation of over-optimistic, over-simplistic policy initiatives at home and abroad from the Bush administration. Continuation of relatively uninteresting returns for large cap stocks, and if the year is up, another year of better small cap returns – despite near universal prediction of the opposite by market pundits. Likely fairly modest returns for both classes, but better than bonds.
Cumulative Total Return Performance
Small Company’s cumulative total return is based on the daily change in net asset value (NAV), and assumes that all distributions were reinvested. The Russell 2000 Index is comprised of the smallest 2000 companies in the Russell 3000 Index. The Russell 3000 Index is composed of 3000 of the largest U.S. companies, as determined by market capitalization which represents approximately 98% of the investable U.S. equity market. This chart compares a hypothetical $10,000 investment made in Small Company on June 19, 2000, to a $10,000 investment made in the Russell 2000 for the same time period. The chart is not intended to imply any future performance of the Fund. The graph and chart do not reflect the deduction of taxes that a shareholder would pay on a Fund distribution or redemption of shares. Total Returns would have been lower had certain expenses not been reduced.
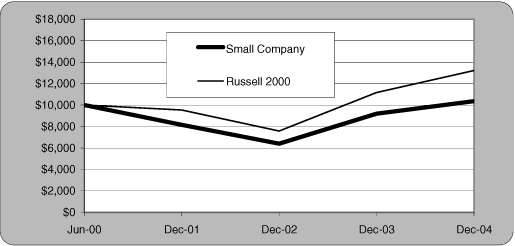
The table below shows the average annual total returns for Small Company and the Russell 2000 Index since inception through December 31, 2004.
| | | | | | |
Average Annual Total Returns:
| | 1 Year
| | | Since Inception *
| |
Small Company Fund | | 12.73 | % | | 0.78 | % |
Russell 2000 Index | | 18.33 | % | | 7.23 | % |
| * | Commencement of operations was June 19, 2000. |
13
The table below displays a full breakdown of the sector allocation of the Fund as well as the top ten positions as of December 31, 2004.
| | | |
Top Ten Holdings (out of 84 securities)
| | % Fund
| |
Pentair, Inc.* | | 3.4 | % |
Acxiom Corp. | | 2.4 | |
Insight Enterprises, Inc.* | | 2.3 | |
Avocent Corp.* | | 2.2 | |
Barr Laboratories, Inc. | | 2.1 | |
Laureate Education, Inc. | | 2.0 | |
PETsMART, Inc.* | | 2.0 | |
Covance, Inc. | | 1.9 | |
Ultra Petroleum Corp. | | 1.9 | |
MSC Industrial Direct Co., Class A* | | 1.8 | |
| | |
|
|
Top Ten as a Group | | 22.0 | % |
| | |
|
|
| * | Top Ten Holding at December 31, 2003 |
| | | |
Industry Weightings
| | | |
Industrials | | 26.1 | % |
Information Technology | | 23.2 | |
Consumer Discretionary | | 22.4 | |
Health Care | | 13.2 | |
Energy | | 6.7 | |
Materials | | 1.6 | |
Consumer Staples | | 1.5 | |
Financials | | 0.4 | |
Other | | 4.9 | |
14
Managers Small Company Fund
December 31, 2004
| | |
| Schedule of Portfolio Investments | | Small Company |
| | | | | | |
Security Description
| | Shares
| | | Value
|
Common Stocks - 95.1% | | | | | | |
| | |
Consumer Discretionary - 22.4% | | | | | | |
Coldwater Creek, Inc.* | | 12,725 | | | $ | 392,821 |
Cost Plus, Inc.* | | 8,175 | 2 | | | 262,663 |
Fred’s, Inc. | | 10,645 | 2 | | | 185,223 |
GameStop Corp.* | | 21,700 | 2 | | | 485,212 |
Gentex Corp. | | 10,000 | | | | 370,200 |
Getty Images, Inc.* | | 3,050 | | | | 209,993 |
Harman International Industries, Inc. | | 2,525 | | | | 320,675 |
Insight Enterprises, Inc.* | | 31,575 | 2 | | | 647,918 |
McCormick & Schmick’s Seafood | | | | | | |
Restaurants, Inc.* | | 5,300 | | | | 89,305 |
Michaels Stores, Inc. | | 9,900 | | | | 296,703 |
O’Reilly Automotive, Inc.* | | 3,700 | 2 | | | 166,685 |
Penn National Gaming, Inc.* | | 5,575 | | | | 337,566 |
PEP Boys-Manny Moe & Jack, Inc. | | 19,650 | | | | 335,426 |
PETsMART, Inc. | | 15,800 | 2 | | | 561,373 |
Red Robin Gourmet Burgers, Inc.* | | 8,150 | | | | 435,781 |
Ruby Tuesday, Inc. | | 13,025 | | | | 339,692 |
TBC Corp.* | | 13,825 | | | | 384,335 |
Tractor Supply Co.* | | 9,650 | | | | 359,077 |
Total Consumer Discretionary | | | | | | 6,180,648 |
| | |
Consumer Staples - 1.5% | | | | | | |
Performance Food Group Co.* | | 15,575 | | | | 419,123 |
| | |
Energy - 6.7% | | | | | | |
Core Laboratories N.V.* | | 6,775 | | | | 158,196 |
Delta Petroleum Corp.* | | 13,250 | 2 | | | 207,760 |
Niko Resources, Ltd.* | | 6,350 | | | | 267,462 |
Tidewater, Inc. | | 8,025 | | | | 285,770 |
Ultra Petroleum Corp.* | | 10,850 | | | | 522,211 |
Whiting Petroleum Corp.* | | 9,100 | | | | 275,275 |
XTO Energy, Inc. | | 3,470 | | | | 122,769 |
Total Energy | | | | | | 1,839,443 |
| | |
Financials - 0.4% | | | | | | |
Boston Private Financial | | | | | | |
Holdings, Inc. | | 4,475 | 2 | | | 126,061 |
| | |
Health Care - 13.2% | | | | | | |
America Service Group, Inc.* | | 5,925 | | | | 158,612 |
Barr Laboratories, Inc.* | | 12,487 | | | | 568,657 |
Covance, Inc.* | | 13,550 | | | | 525,063 |
Luminex Corp.* | | 11,450 | 2 | | | 101,676 |
PSS World Medical, Inc.* | | 28,975 | 2 | | | 362,622 |
Resmed, Inc.* | | 6,825 | 2 | | | 348,758 |
Respironics, Inc.* | | 8,875 | | | | 482,445 |
Salix Pharmaceuticals, Ltd.* | | 12,625 | | | | 222,074 |
Select Medical Corp. | | 11,700 | | | | 205,920 |
Sonosite, Inc.* | | 8,550 | | | | 290,273 |
United Surgical Partners | | | | | | |
International, Inc.* | | 9,300 | | | | 387,810 |
Total Health Care | | | | | | 3,653,910 |
| | |
Industrials - 26.1% | | | | | | |
Actuant Corp., Class A* | | 8,160 | | | $ | 425,544 |
Aeroflex, Inc.* | | 34,100 | | | | 413,292 |
Carlisle Co., Inc. | | 6,100 | | | | 396,012 |
Chicago Bridge & Iron Co. N.V. | | 8,325 | | | | 333,000 |
ChoicePoint, Inc. 6,* | | 10,050 | | | | 462,200 |
DeVry, Inc.* | | 15,075 | | | | 261,702 |
Donaldson Co., Inc. | | 7,150 | | | | 232,947 |
ElkCorp. | | 11,975 | | | | 409,785 |
Hewitt Associates, Inc., Class A* | | 11,900 | | | | 380,919 |
Intermagnetics General Corp.* | | 8,300 | | | | 210,903 |
Laureate Education, Inc.* | | 12,825 | | | | 565,454 |
Mobile Mini, Inc.* | | 10,750 | 2 | | | 355,180 |
MSC Industrial Direct Co., Class A | | 13,750 | | | | 494,725 |
Navigant Consulting, Inc.* | | 16,150 | 2 | | | 429,590 |
NCI Building Systems, Inc.* | | 9,700 | | | | 363,750 |
Pentair, Inc. | | 21,325 | | | | 928,916 |
Providence Service Corp.* | | 3,775 | | | | 79,162 |
Si International, Inc.* | | 6,825 | | | | 209,937 |
UTI Worldwide, Inc. | | 3,625 | 2 | | | 246,573 |
Total Industrials | | | | | | 7,199,591 |
| | |
Information Technology - 23.2% | | | | | | |
Acxiom Corp. | | 24,900 | 2 | | | 654,869 |
Alliance Data Systems Corp.* | | 8,350 | | | | 396,458 |
ATMI, Inc.* | | 9,200 | | | | 207,276 |
Avocent Corp.* | | 14,725 | | | | 596,656 |
Benchmark Electronics, Inc.* | | 14,025 | | | | 478,252 |
Ceridian Corp.* | | 18,650 | | | | 340,922 |
Digitas, Inc.* | | 20,425 | | | | 195,059 |
Emulex Corp.* | | 10,600 | | | | 178,504 |
Excel Technology, Inc.* | | 5,400 | | | | 140,400 |
Fair Isaac Corp. | | 6,293 | 2 | | | 230,827 |
FARO Technologies, Inc.* | | 2,200 | 2 | | | 68,596 |
FEI Co.* | | 11,050 | | | | 232,050 |
International Rectifier Corp.* | | 7,425 | | | | 330,932 |
Lionbridge Technologies, Inc.* | | 15,150 | | | | 101,808 |
MAXIMUS, Inc.* | | 5,150 | | | | 160,268 |
MPS Group, Inc.* | | 20,475 | | | | 251,024 |
OPNET Technologies, Inc.* | | 9,050 | | | | 76,201 |
Polycom, Inc.* | | 8,150 | | | | 190,058 |
Progress Software Corp.* | | 11,500 | | | | 268,525 |
Radisys Corp.* | | 5,350 | | | | 104,593 |
Richardson Electronics, Ltd. | | 10,475 | | | | 111,140 |
Rogers Corp.* | | 8,625 | | | | 371,738 |
StarTek, Inc. | | 3,450 | | | | 98,153 |
Technitrol, Inc.* | | 8,250 | | | | 150,150 |
Tekelec* | | 17,200 | | | | 351,568 |
Tollgrade Communications, Inc.* | | 10,300 | | | | 126,072 |
Total Information Technology | | | | | | 6,412,099 |
| | |
Materials - 1.6% | | | | | | |
MacDermid, Inc. | | 12,100 | | | | 436,809 |
| | |
Total Common Stocks
(cost $18,974,792) | | | | | | 26,267,684 |
The accompanying notes are an integral part of these financial statements.
15
Managers Small Company Fund
December 31, 2004
| | |
| Schedule of Portfolio Investments (continued) | | Small Company |
| | | | | | |
Security Description
| | Shares
| | Value
| |
Other Investment Companies - 19.4%1 | | | | | | |
Bank of New York Institutional Cash Reserves Fund, 2.35%3 | | 3,972,260 | | $ | 3,972,260 | |
JPMorgan Prime Money Market Fund, Institutional Class Shares, 2.12% | | 1,391,714 | | | 1,391,714 | |
| | |
Total Other Investment Companies
(cost $5,363,974) | | | | | 5,363,974 | |
| | |
Total Investments - 114.5%
(cost $24,338,766) | | | | | 31,631,658 | |
| | |
Other Assets, less Liabilities - (14.5%) | | | | | (4,002,858 | ) |
| | |
Net Assets -100.0% | | | | $ | 27,628,800 | |
The accompanying notes are an integral part of these financial statements.
16
| | |
| Managers Special Equity Fund | | Special Equity |
Managers Special Equity Fund (“Special Equity”) is a domestic equity Fund that primarily invests in the stocks of small capitalization companies. In line with our belief in “Intelligence Diversification,” Managers currently utilizes five independent subadvisors who each manage separate portions of the portfolio. For the calendar year 2004 the subadvisors were Donald Smith, of Donald Smith & Co., Inc (“Smith”), who has been managing a portion of the Fund since September 2002, Mike Maloney, of Skyline Asset Management, L.P. (“Skyline”), who has been managing a portion of the Fund since December 2000; Andrew Knuth of Westport Asset Management, Inc. (“Westport”), who has been managing a portion of the Fund since December 1985; Bob Kern, of Kern Capital Management LLC (“Kern Capital”), who has been managing a portion of the Fund since September 1997; and Craig Lewis of Essex Investment Management Company, LLC (“Essex”), who had been managing a portion of the Fund since December 2003.
The Portfolio Managers
Donald Smith & Co., Inc.
Donald Smith is a value manager that invests in out-of-favor small capitalization companies. Smith’s philosophy seeks to identify companies in the bottom decile of price-to-tangible book ratios, with a strong balance sheet, and a positive outlook for earnings potential over the next 2-4 years. Smith believes that extremely low P/B ratio companies often trade below replacement value, are inherently less risky, and are more likely to be acquired. Furthermore, because only a few investment managers focus on companies in the lowest P/B ratio decile, their stocks may be inefficiently priced and can offer tremendous value. Smith limits purchases to companies in the lowest 10% of price-to-tangible book ratios. Smith also assesses price-to-earnings, price-to-sales, and debt-to-capital ratios to form a “watch list” of about 300 securities.
After valuations are addressed, Smith performs fundamental research, including company visits, to assess the quality of the company’s balance sheet and book value. Smith is looking for a catalyst for an improvement in earnings that is not already reflected in the stock price. A concentrated portfolio of 40-50 stocks is the result of his investment process. Stocks are sold when a target price has been achieved, usually set at less than 2x book value. Positions may also be sold if the stock appreciates rapidly, if a better idea is found, or if fundamentals deteriorate. Portfolio turnover is low at 20-40% annually.
Skyline Asset Management, L.P.
Mike Maloney and the investment team at Skyline look for small capitalization stocks that have below average valuations with strong growth prospects. Through their intensive in-house research, they find good companies that are overlooked or not widely followed. Typically, they invest in firms with market capitalizations of less than $2 billion. Skyline believes that this value focus combined with identifying attractive growth prospects and a defined sell discipline can capture inefficiencies in the market.
The investment team’s selection process involves quantitatively and qualitatively screening the universe of small-capitalization stocks for factors such as low price/earnings (P/E) ratio or price/book, attractive earnings prospects, applicable market caps (typically below $2 billion), and lack of institutional coverage. Outside research services, computer screens, and internally maintained lists of potential companies/stocks are the primary sources used to identify new ideas. These ideas are then evaluated to determine whether they meet Skyline’s four basic criteria: relative valuation, capitalization, financial strength, and opportunities for continued growth. In addition, the investment team led by Mike Maloney determines whether the stock provides needed diversification to the portfolio. This multi-step screening process reduces the list from 2000 to 150-200 stocks. Then, one or more of the portfolio manager/analysts perform a rigorous fundamental analysis in an attempt to answer the question, “Why will earnings increase at an above-average rate?” All company documents are analyzed, any available industry or research reports are reviewed and, most importantly, questions are addressed directly with company senior management. In addition, the analysts will review other companies in the same industry to determine competitive threats and the relative valuation of the company being investigated. In so doing, they develop an internal research report that is distributed to the entire investment team and discussed at regular meetings. Input is received from the investment team, and if additional information is required, research is done. The final portfolio will contain approximately 65-85 stocks and is generally fully invested (less than 5% cash) at all times. The portfolio will tend to be well diversified with a price/earnings ratio consistently below the Russell 2000 P/E. Skyline sells stocks when they rise to a sell target, which is usually a price/earnings ratio equal to the overall stock market. In the case of a stock that declines, Skyline will only sell the stock if fundamentals have changed so that the original investment thesis is no longer valid.
Westport Asset Management, Inc.
Andy Knuth’s investment philosophy entails investing in small capitalization companies which he perceives as having significant upside potential in earnings and return on equity over the next 12-18 months. Although he is investing for growth, Andy will purchase stocks only if they are selling at or below the market’s price/earnings multiple, or below valuations of other companies in the same industry. Thus, he must discover and invest in companies very early in their growth cycle.
Implicit in the strategy is that Andy and his investment team focus on a small number of issues, and tend to hold them for a long time. The concentration and low turnover enable Andy to heavily research and monitor each position. He is focused on future profits only, and, in fact, prefers to find businesses which are inherently good but which have gone through a difficult period. Factors that may improve earnings and investor perceptions include acquisitions or divestitures, management shake-ups, changes
17
in the business cycle, or the development of a proprietary product in a strong industry. He searches, in particular, for companies with good managers who are finding ways to substantially improve the company.
The result is that Andy will typically have a concentrated portfolio, and any significant industry concentrations are merely an outcome of bottom-up stock selection. Because some of the companies in which he invests may not yet have earnings, the price to trailing earnings ratio may be high, although the price to forward earnings will be well below average. Andy is a patient investor, usually turning over less than 20% of his portfolio per year.
Kern Capital Management LLC
Bob Kern is one of the pioneers of small-cap and micro-cap investing. While focusing his attention on small companies, Bob directs his efforts toward finding companies that are succeeding through innovation of new products or services. Thus, Bob’s portfolio tends to be concentrated in technology, healthcare, consumer goods and service sectors. Bob seeks to earn returns from the appreciation of stocks as the companies’ products develop and penetrate new markets.
In most cases, the analysis of the product and judgments as to its potential are the most important aspects of the decision to own stock. In all cases, however, the operational and financial health of the company must be verified. Bob and the investment team at Kern Capital like to find companies in which margins will increase with revenue growth, and which can finance much of their growth from operating cash flow. Although valuation is clearly important, Bob is often willing to pay relatively high multiples where he sees enough growth potential. Bob will typically hold a portfolio of 70 to 80 stocks with a median market capitalization of around $500 million.
Essex Investment Management Company, LLC
The investment philosophy at Essex is that a company’s revenue growth, future profitability and cash flow drive share price performance. In particular, the investment professionals at Essex look for dynamic growth opportunities characterized by new or emerging technologies or services, superior and accelerating growth, and improving margins and returns. The focus, therefore, is on fundamental research and the study of macroeconomic/industry trends in order to identify potential growth opportunities.
The investment process at Essex combines bottom-up stock selection with top-down secular trend analysis. The firm’s research analysts are charged with identifying companies with high quality, sustainable growth. Each analyst focuses on understanding the sources of long-term growth within his or her respective industries, and the specific outlook of each stock within those industries in terms of sustainable revenue growth, margin trends, and return trends. In addition, analysts are responsible for considering any potential investment’s attractiveness relative to its stock price (valuation).
The analysts conduct extensive research including contacting company management, evaluating competitors, customers, suppliers and industry experts to formulate their outlooks. In addition, analysts are responsible for company visits. They meet with the sales, manufacturing, and procurement staff to fully understand the market dynamics and specific trends within a particular company and/or industry. Essex’s analysts compare and confirm their findings with the company’s respective competitors, suppliers, and distributors. Analysts then perform financial and strategic analysis and utilize a variety of valuation disciplines to arrive at a target price. The Small Cap Growth portfolio is expected to have between 90 and 100 positions and turnover is expected to be around 100% per year.
The Year in Review
During 2004, the Fund returned 15.18% compared to a gain of 18.33% for the Russell 2000 Index, 14.31% for the Russell 2000 Growth Index and 22.25% for the Russell 2000 Value Index. Broad markets continued to rise with small capitalization stocks outperforming large capitalization stocks for the sixth consecutive year. From a stylistic standpoint, small cap value outperformed small cap growth by over 800 basis points. With the exception of technology and telecom, all sectors of the Russell 2000 Index recorded double digit returns. In fact, technology was the lone decliner for the year falling a little over 1% despite a strong rally late in the fourth quarter. The “quality issue” of 2003 that saw some of the more speculative issues put up the best returns for the year was largely reversed in 2004. A return to value oriented companies demonstrating clear revenues and earnings growth largely dominated returns within the small cap universe.
Throughout the first half of 2004, the U.S. stock markets transitioned from a strong rally which had begun in mid-2003 into a trading range. Although the economy continued to strengthen and corporate profits improved, the stock market paused as investors weighed the various risks associated with continued turmoil in Iraq, increased terrorist activity around the globe, rising short-term interest rates and sharply higher energy prices. The Fund lagged the broad small cap benchmarks modestly during this period due in part to poor performance within its information technology and healthcare holdings. Meanwhile, the Fund’s energy, utilities and materials holdings contributed significantly, which proved to be a prevailing theme for most of the year. The Fund acquired these stocks by virtue of Donald Smith’s deep value approach which identified these shares as offering solid tangible book values. While together they made up only about 13% of the entire portfolio throughout the year, the energy, utilities and materials positions appreciated in excess of 40%, 50% and 60%, respectively, for the year.
Midway through the third quarter and into the fourth, small caps staged an impressive rally and momentum was furthered by an orderly outcome to the U.S. presidential election and continued signs of growth in the economy. Although it fell slightly behind during the early portion of this rally due to weakness in a few individual holdings, which, by and large, the portfolio
18
managers believe is temporary, the Fund participated in the late year rally. Despite being the only sector to decline for the year, technology surged late in the fourth quarter and contributed positively to returns for the Fund. Specifically, those managers with a growth bias such as Essex and Kern were able to capitalize on the upswing with the likes of Ixia, Tesserea Technologies, and Trident Microsystems, all top ten performers for the final quarter.
Looking Forward
Heading into 2005, the Fund’s sector weights have not changed significantly as consumer discretionary, information technology, and industrials remain the three largest allocations. However, as a result of organizational changes within Essex Investment Management, the Fund’s Trustees approved a change to Veredus Investment Management, in place of Essex, in mid-January 2005. Veredus has an investment philosophy that seeks out companies demonstrating positive earnings acceleration and is quite complementary to the investment philosophies of the other managers within the Fund. In addition to the philosophical and intelligence diversification that we always seek when structuring a multi-managed portfolio, we are pleased with the quantitative aspects of the fit. For example, the distribution across portfolio characteristics has widened, and the diversification across sectors has broadened slightly. However we do not expect this change to radically alter these allocations.
Cumulative Total Return Performance
Special Equity’s cumulative total return is based on the daily change in net asset value (NAV), and assumes that all distributions were reinvested. The Russell 2000 Index is comprised of the smallest 2000 companies in the Russell 3000 Index. The Russell 3000 Index is composed of 3000 of the largest U.S. companies, as determined by market capitalization, which represents approximately 98% of the investable U.S. equity market. This chart compares a hypothetical $10,000 investment made in Special Equity on December 31, 1994, to a $10,000 investment made in the Russell 2000 for the same time period. The chart is not intended to imply any future performance of the Fund. The graph and chart do not reflect the deduction of taxes that a shareholder would pay on a Fund distribution or redemption of shares. Total Returns would have been lower had certain expenses not been reduced.
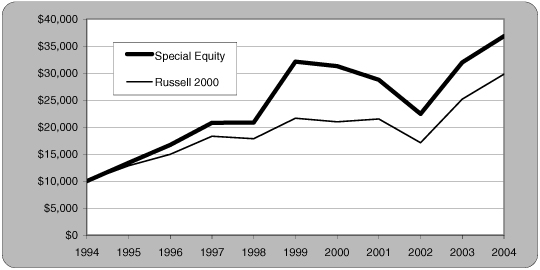
The table below shows the average annual total returns for Special Equity and the Russell 2000 Index since December 31, 1994 through December 31, 2004.
| | | | | | | | | |
Average Annual Total Returns:
| | 1 Year
| | | 5 Years
| | | 10 Years
| |
Special Equity Fund | | 15.18 | % | | 2.78 | % | | 13.93 | % |
Russell 2000 Index | | 18.33 | % | | 6.61 | % | | 11.54 | % |
19
The table below displays a full breakdown of the sector allocation of the Fund as well as the top ten positions as of December 31, 2004.
| | | |
Top Ten Holdings (out of 377 securities)
| | % Fund
| |
AK Steel Holding Corp. | | 2.4 | % |
Reliant Resources, Inc.* | | 2.2 | |
Toys “R” Us, Inc.* | | 1.7 | |
MI Developments, Inc., Class A | | 1.7 | |
Dillard’s, Inc., Class A* | | 1.5 | |
ITT Educational Services, Inc.* | | 1.5 | |
Visteon Corp.* | | 1.2 | |
FelCor Lodging Trust, Inc.* | | 1.2 | |
Meristar Hospitality Corp.* | | 1.1 | |
Corinthian Colleges, Inc. | | 0.9 | |
| | |
|
|
Top Ten as a Group | | 15.4 | % |
| | |
|
|
| * | Top Ten Holding at December 31, 2003 |
| | | |
Industry Weightings
| | | |
Consumer Discretionary | | 19.3 | % |
Information Technology | | 17.3 | |
Industrials | | 16.5 | |
Financials | | 15.0 | |
Health Care | | 9.4 | |
Materials | | 6.6 | |
Utilities | | 3.5 | |
Energy | | 3.3 | |
Telecommunication Services | | 0.3 | |
Other | | 8.8 | |
20
Managers Special Equity Fund
December 31, 2004
| | |
| Schedule of Portfolio Investments | | Special Equity |
| | | | | | |
Security Description
| | Shares
| | | Value
|
Common Stocks - 91.2% | | | | | | |
Consumer Discretionary - 19.3% | | | | | | |
Alliance Gaming Corp.* | | 488,000 | 2 | | $ | 6,739,280 |
AnnTaylor Stores Corp.* | | 833,100 | | | | 17,936,643 |
Applebee’s International, Inc. | | 388,125 | 2 | | | 10,265,906 |
Audible, Inc.* | | 247,700 | | | | 6,452,585 |
Beasley Broadcasting Group, Inc.* | | 237,000 | | | | 4,154,610 |
Big Lots, Inc.* | | 757,152 | 2 | | | 9,184,254 |
Borders Group, Inc. | | 496,900 | 2 | | | 12,621,260 |
CBRL Group, Inc. | | 461,130 | 2 | | | 19,298,291 |
Central European Media Enterprises Ltd., Class A* | | 185,100 | | | | 7,215,568 |
Coldwater Creek, Inc.* | | 228,600 | 2 | | | 7,056,882 |
COX Radio, Inc., Class A* | | 368,600 | | | | 6,074,528 |
CSK Auto Corp.* | | 316,500 | | | | 5,298,210 |
Dillard’s, Inc., Class A | | 2,059,300 | 2 | | | 55,333,391 |
Drew Industries, Inc.* | | 6,600 | | | | 238,722 |
Duckwall-ALCO Stores, Inc.5,* | | 247,800 | | | | 4,372,927 |
Electronics Boutique Holdings Corp.* | | 318,800 | | | | 13,689,272 |
Emmis Communications Corp., Class A* | | 1,203,600 | 2 | | | 23,097,084 |
GameStop Corp.* | | 615,200 | 2 | | | 13,755,872 |
Gaylord Entertainment Co., Class A* | | 161,233 | 2 | | | 6,696,006 |
Getty Images, Inc.* | | 192,500 | 2 | | | 13,253,625 |
Gildan Activewear, Inc. Class A* | | 245,700 | 2 | | | 8,351,343 |
Goody’s Family Clothing, Inc. | | 473,400 | | | | 4,326,876 |
Gymboree Corp.* | | 1,322,600 | | | | 16,955,732 |
Hot Topic, Inc.* | | 399,600 | 2 | | | 6,869,124 |
IMPCO Technologies, Inc.* | | 100,800 | 2 | | | 761,040 |
Insight Communications Co., Inc., Class A* | | 698,400 | 2 | | | 6,474,168 |
Journal Communications, Inc. | | 370,000 | | | | 6,685,900 |
Kerzner International, Ltd.* | | 401,200 | 2 | | | 24,092,060 |
La Quinta Corp.* | | 845,000 | | | | 7,681,050 |
Linens ‘N Things, Inc.* | | 515,100 | 2 | | | 12,774,480 |
M. D. C. Holdings, Inc. | | 146,800 | | | | 12,689,392 |
P.F. Chang’s China Bistro, Inc.* | | 73,800 | 2 | | | 4,158,630 |
Pacific Sunwear of California, Inc.* | | 455,800 | | | | 10,146,108 |
Pier 1 Imports, Inc. | | 790,400 | | | | 15,570,880 |
Priceline.com, Inc.* | | 300,100 | 2 | | | 7,079,359 |
Proquest Co.* | | 356,200 | 2 | | | 10,579,140 |
Quiksilver, Inc.* | | 306,700 | | | | 9,136,593 |
Rare Hospitality International, Inc.* | | 250,600 | | | | 7,984,116 |
Ross Stores, Inc. | | 930,000 | 2 | | | 26,849,100 |
Ruby Tuesday, Inc. | | 510,900 | | | | 13,324,272 |
Saks, Inc. | | 1,023,000 | 2 | | | 14,843,730 |
Salem Communications Corp., Class A* | | 482,900 | | | | 12,048,355 |
School Specialty, Inc.* | | 330,394 | 2 | | | 12,739,993 |
Source Interlink Companies, Inc.* | | 433,700 | 2 | | $ | 5,759,536 |
Sports Authority, Inc.* | | 374,400 | 2 | | | 9,640,800 |
Standard-Pacific Corp. | | 178,000 | | | | 11,416,920 |
Steiner Leisure, Ltd.* | | 130,000 | | | | 3,884,400 |
Talbots, Inc. | | 656,700 | | | | 17,881,941 |
Texas Roadhouse, Inc., Class A* | | 371,080 | 2 | | | 10,965,414 |
TJX Cos., Inc. | | 160,000 | | | | 4,020,800 |
Too, Inc.* | | 94,500 | 2 | | | 2,311,470 |
Toro Co. | | 146,700 | 2 | | | 11,934,045 |
Toys “R” Us, Inc.* | | 3,100,000 | 2 | | | 63,457,000 |
Tweeter Home Entertainment Group, Inc.* | | 783,900 | | | | 5,369,715 |
United Rentals, Inc.* | | 485,600 | 2 | | | 9,177,840 |
Visteon Corp. | | 4,395,300 | 2 | | | 42,942,081 |
WMS Industries, Inc.* | | 357,300 | 2 | | | 11,983,842 |
Wolverine World Wide, Inc. | | 200,500 | | | | 6,299,710 |
Total Consumer Discretionary | | | | | | 711,901,871 |
Energy - 3.3% | | | | | | |
Core Laboratories N.V.* | | 164,800 | | | | 3,848,080 |
Global Industries, Ltd.* | | 1,320,400 | | | | 10,946,116 |
Grant Prideco, Inc.* | | 326,900 | | | | 6,554,345 |
Houston Exploration Co.* | | 217,700 | | | | 12,258,687 |
Key Energy Services, Inc.* | | 648,300 | 2 | | | 7,649,940 |
Mission Resources Corp.* | | 556,600 | | | | 3,250,544 |
Newfield Exploration Co.* | | 193,300 | | | | 11,414,365 |
OMI Corp. | | 64,000 | | | | 1,078,400 |
Overseas Shipholding Group, Inc. | | 152,000 | | | | 8,390,400 |
Pogo Producing Co. | | 484,200 | | | | 23,478,858 |
Quicksilver Resources, Inc.* | | 186,000 | 2 | | | 6,841,080 |
Stone Energy Corp.* | | 184,800 | | | | 8,332,632 |
Veritas DGC, Inc.* | | 567,300 | 2 | | | 12,713,193 |
W-H Energy Services, Inc.* | | 211,100 | | | | 4,720,196 |
Total Energy | | | | | | 121,476,836 |
Financials - 15.0% | | | | | | |
Alabama National Bancorp | | 64,400 | 2 | | | 4,153,800 |
American Financial Group, Inc. | | 155,300 | | | | 4,862,443 |
American National Insurance Co. | | 68,950 | | | | 7,181,832 |
AmerUs Group, Co. | | 256,900 | 2 | | | 11,637,570 |
Archipelago Holdings, Inc.* | | 544,350 | | | | 11,420,463 |
Banknorth Group, Inc. | | 355,482 | 2 | | | 13,010,641 |
Banner Corp. | | 217,740 | | | | 6,791,311 |
Brown & Brown, Inc. | | 265,100 | 2 | | | 11,545,105 |
Chittenden Corp. | | 495,625 | 2 | | | 14,239,306 |
Clark, Inc.* | | 367,800 | | | | 5,708,256 |
Commerce Bancshares, Inc. | | 268,815 | 2 | | | 13,494,513 |
Conseco, Inc.* | | 443,100 | 2 | | | 8,839,845 |
Delphi Financial Group, Inc., Class A | | 277,600 | 2 | | | 12,811,240 |
Direct General Corp. | | 237,500 | 2 | | | 7,623,750 |
Downey Financial Corp. | | 393,380 | 2 | | | 22,422,660 |
The accompanying notes are an integral part of these financial statements.
21
Managers Special Equity Fund
December 31, 2004
| | |
| Schedule of Portfolio Investments (continued) | | Special Equity |
| | | | | | |
Security Description
| | Shares
| | | Value
|
Financials (continued) | | | | | | |
East West Bancorp, Inc. | | 150,700 | | | $ | 6,323,372 |
F.N.B. Corp. | | 116,000 | 2 | | | 2,361,760 |
FelCor Lodging Trust, Inc.* | | 2,900,000 | 2 | | | 42,485,000 |
First National Bankshares of Florida | | 647,870 | 2 | | | 15,484,093 |
Harbor Florida Bancshares, Inc. | | 224,900 | | | | 7,783,789 |
Harris & Harris Group, Inc.* | | 370,800 | | | | 6,073,704 |
Hibernia Corp., Class A | | 816,500 | 2 | | | 24,094,914 |
Hilb, Rogal & Hamilton Co. | | 305,500 | 2 | | | 11,071,320 |
Investment Technology Group, Inc.* | | 439,500 | 2 | | | 8,790,000 |
Investors Financial Services Corp. | | 136,800 | 2 | | | 6,837,264 |
iStar Financial, Inc. | | 312,000 | 2 | | | 14,121,120 |
MCG Capital Corp. | | 557,178 | | | | 9,544,459 |
Meristar Hospitality Corp.5,* | | 5,024,600 | | | | 41,955,410 |
MI Developments, Inc., Class A | | 2,100,000 | 2 | | | 63,357,000 |
National Western Life Insurance Co., Class A* | | 12,000 | | | | 1,999,320 |
Prime Group Realty Trust* | | 786,800 | | | | 5,059,124 |
Provident Bankshares Corp. | | 76,400 | | | | 2,778,668 |
Reinsurance Group of America, Inc. | | 225,800 | | | | 10,940,010 |
Scottish Annuity & Life Holdings, Ltd. | | 455,600 | 2 | | | 11,800,040 |
Selective Insurance Group, Inc. | | 182,396 | | | | 8,069,199 |
Sovereign Bancorp, Inc. | | 522,034 | 2 | | | 11,771,867 |
St. Joe Co., The | | 111,500 | 2 | | | 7,158,300 |
Sterling Financial Corp.* | | 508,837 | 2 | | | 19,976,941 |
Triad Guaranty, Inc.* | | 92,882 | 2 | | | 5,617,503 |
U.S.I. Holdings Corp.* | | 711,001 | 2 | | | 8,226,282 |
Webster Financial Corp. | | 279,800 | | | | 14,169,072 |
Westcorp Inc. | | 312,300 | | | | 14,343,939 |
Wintrust Financial Corp. | | 222,100 | 2 | | | 12,650,816 |
Wrigley (Wm) Jr. Co. | | 128,300 | | | | 3,234,443 |
Total Financials | | | | | | 553,821,464 |
Health Care - 9.4% | | | | | | |
American Healthways, Inc.* | | 365,300 | 2 | | | 12,069,512 |
American Medical Systems Holdings, Inc.* | | 234,600 | 2 | | | 9,808,626 |
Apria Healthcare Group, Inc.* | | 354,200 | | | | 11,670,890 |
Arthrocare Corp.* | | 627,200 | 2 | | | 20,108,032 |
Atherogenics, Inc.* | | 153,900 | 2 | | | 3,625,884 |
Charles River Laboratories International, Inc.* | | 398,516 | 2 | | | 18,335,721 |
CTI Molecular Imaging Inc.* | | 463,000 | | | | 6,569,970 |
Cubist Pharmaceuticals, Inc.* | | 142,800 | | | | 1,689,324 |
Cytyc Corp.* | | 242,200 | | | | 6,677,454 |
DaVita, Inc.* | | 400,900 | | | | 15,847,577 |
Discovery Laboratories, Inc.* | | 94,300 | | | | 747,799 |
Dyax Corp.* | | 226,500 | | | | 1,635,330 |
Eclipsys Corp.* | | 1,074,000 | 2 | | | 21,941,820 |
Encysive Pharmaceuticals, Inc.* | | 431,100 | | | $ | 4,280,823 |
EPIX Pharmaceuticals, Inc.* | | 353,500 | | | | 6,331,185 |
Exelixis, Inc.* | | 407,400 | | | | 3,870,300 |
Fisher Scientific International, Inc.* | | 60,000 | 2 | | | 3,742,800 |
Genesis HealthCare Corp.* | | 357,200 | | | | 12,512,716 |
Gen-Probe, Inc.* | | 295,000 | | | | 13,336,950 |
Harvard Bioscience, Inc.* | | 915,200 | | | | 4,237,376 |
IMS Health, Inc. | | 820,081 | | | | 19,034,080 |
Intuitive Surgical, Inc.* | | 170,800 | | | | 6,835,416 |
Lifecore Biomedical, Inc.* | | 291,300 | | | | 3,280,038 |
Lincare Holdings, Inc.* | | 212,100 | 2 | | | 9,046,065 |
Martek Biosciences Corp.* | | 277,400 | 2 | | | 14,202,880 |
Medicines Co.* | | 327,660 | 2 | | | 9,436,608 |
NeoPharm, Inc.* | | 379,000 | 2 | | | 4,741,290 |
Nuvelo, Inc.* | | 482,196 | | | | 4,749,631 |
Owens & Minor, Inc. | | 213,300 | | | | 6,008,661 |
Par Pharmaceutical Co., Inc.* | | 152,700 | 2 | | | 6,318,726 |
Penwest Pharmaceuticals Co.* | | 361,400 | 2 | | | 4,322,344 |
Pharmion Corp. * | | 151,500 | 2 | | | 6,394,815 |
Priority Healthcare Corp., Class B* | | 229,122 | 2 | | | 4,987,986 |
Protein Design Labs, Inc.* | | 656,200 | 2 | | | 13,557,092 |
PSS World Medical, Inc.* | | 250,900 | 2 | | | 3,140,014 |
Rigel Pharmaceuticals, Inc.* | | 45,650 | 2 | | | 1,114,773 |
Symbion, Inc.* | | 324,120 | | | | 7,156,570 |
Telik, Inc.* | | 182,000 | 2 | | | 3,483,480 |
Triad Hospitals, Inc.* | | 765,764 | | | | 28,494,077 |
Universal Health Services, Inc., Class B | | 170,000 | 2 | | | 7,565,000 |
Zoll Medical Corp.* | | 124,700 | | | | 4,289,680 |
Total Health Care | | | | | | 347,199,315 |
Industrials - 16.5% | | | | | | |
51job, Inc.* | | 123,200 | 2 | | | 6,402,704 |
AAR Corp.* | | 259,200 | | | | 3,530,304 |
Acuity Brands, Inc. | | 389,853 | | | | 12,397,325 |
Air France | | 948,178 | 2 | | | 18,205,018 |
Airtran Holdings, Inc.* | | 479,100 | 2 | | | 5,126,370 |
Alaska Airgroup, Inc.* | | 615,000 | 2 | | | 20,596,350 |
Albany International Corp. | | 281,600 | | | | 9,901,056 |
Ametek, Inc. | | 327,300 | | | | 11,674,791 |
Asset Acceptance Capital Corp.* | | 450,000 | | | | 9,585,000 |
Axsys Technologies, Inc.5,* | | 567,450 | | | | 9,975,771 |
Brink’s Co., The | | 420,241 | | | | 16,607,924 |
Carlisle Co., Inc. | | 119,800 | | | | 7,777,416 |
CNF, Inc. | | 105,600 | | | | 5,290,560 |
Corinthian Colleges, Inc.* | | 1,748,100 | 2 | | | 32,942,945 |
Corporate Executive Board Co. | | 198,985 | | | | 13,320,056 |
CoStar Group, Inc.* | | 412,530 | 2 | | | 19,050,635 |
Crane Co. | | 417,600 | | | | 12,043,584 |
Cuno Inc.* | | 94,100 | | | | 5,589,540 |
Curtiss-Wright Corp. | | 156,800 | 2 | | | 9,001,888 |
The accompanying notes are an integral part of these financial statements.
22
Managers Special Equity Fund
December 31, 2004
| | |
| Schedule of Portfolio Investments (continued) | | Special Equity |
| | | | | | |
Security Description
| | Shares
| | | Value
|
Industrials (continued) | | | | | | |
DeVry, Inc.* | | 658,200 | 2 | | $ | 11,426,352 |
EGL, Inc.* | | 163,500 | 2 | | | 4,887,015 |
EnerSys* | | 417,700 | | | | 6,369,925 |
Flowserve Corp.* | | 465,700 | | | | 12,825,378 |
Global Power Equipment Group, Inc.* | | 839,700 | 2 | | | 8,262,648 |
Hub Group, Inc.* | | 232,775 | | | | 12,155,511 |
IDEX Corp. | | 56,250 | | | | 2,278,125 |
Innovative Solutions & Support, Inc.* | | 109,700 | | | | 3,659,592 |
Insituform Technologies, Inc.* | | 171,800 | 2 | | | 3,894,706 |
Interpool, Inc. | | 340,600 | 2 | | | 8,004,100 |
ITT Educational Services, Inc.* | | 1,139,700 | | | | 54,192,734 |
J.B. Hunt Transport Services, Inc. | | 330,800 | 2 | | | 14,836,380 |
Jacuzzi Brands, Inc.* | | 770,400 | | | | 6,702,480 |
JLG Industries, Inc. | | 388,600 | 2 | | | 7,628,218 |
Kennametal, Inc. | | 176,700 | | | | 8,794,359 |
Laidlaw International, Inc.* | | 652,400 | | | | 13,961,360 |
Lydall, Inc.* | | 234,000 | | | | 2,775,240 |
Mercury Computer Systems, Inc.* | | 396,100 | 2 | | | 11,756,248 |
MSC Industrial Direct Co., Class A | | 222,900 | 2 | | | 8,019,942 |
Old Dominion Freight Line, Inc.* | | 193,100 | | | | 6,719,880 |
Overnite Corp. | | 216,850 | 2 | | | 8,075,494 |
Pacer International, Inc.* | | 329,100 | 2 | | | 6,996,666 |
Pentair, Inc. | | 257,100 | | | | 11,199,276 |
Precision Castparts Corp. | | 80,100 | 2 | | | 5,260,968 |
Raven Industries, Inc. | | 234,800 | | | | 5,003,588 |
Ryder System, Inc. | | 212,600 | | | | 10,155,902 |
Sea Containers, Ltd., Class A | | 795,900 | 2 | | | 15,671,271 |
Sea Containers, Ltd., Class B | | 13,890 | | | | 269,466 |
Sequa Corp., Class A* | | 99,600 | | | | 6,090,540 |
Sequa Corp., Class B* | | 38,300 | | | | 2,336,300 |
Shaw Group Inc., The* | | 804,200 | 2 | | | 14,354,970 |
Stewart & Stevenson Services, Inc. | | 537,400 | | | | 10,871,602 |
Swift Transportation Co Inc.* | | 472,200 | 2 | | | 10,142,856 |
Tecumseh Products Co., Class B | | 101,000 | | | | 4,570,250 |
Thomas & Betts Corp.* | | 653,500 | | | | 20,095,125 |
United Stationers, Inc.* | | 212,600 | | | | 9,822,120 |
Volt Information Sciences, Inc.* | | 69,350 | | | | 2,038,197 |
Waste Connections, Inc.* | | 323,350 | 2 | | | 11,074,738 |
Watson Wyatt & Co. | | 314,700 | | | | 8,481,165 |
York International Corp. | | 212,400 | | | | 7,336,296 |
Total Industrials | | | | | | 608,016,220 |
Information Technology - 17.3% | | | | | | |
Actel Corp.* | | 277,200 | | | | 4,862,088 |
Alliance Data Systems Corp.* | | 265,800 | 2 | | | 12,620,184 |
Altiris, Inc.* | | 276,300 | 2 | | | 9,789,309 |
Alvarion, Ltd.* | | 502,500 | | | | 6,673,200 |
Anaren Microwave, Inc.5,* | | 1,057,900 | 2 | | | 13,710,384 |
| | |
Applied Films Corp.* | | 286,200 | 2 | | $ | 6,170,472 |
ASM International NV* | | 215,500 | 2 | | | 3,536,355 |
ATMI, Inc.* | | 866,200 | 2 | | | 19,515,486 |
AudioCodes, Ltd.* | | 1,150,100 | 2 | | | 19,103,161 |
Audiovox Corp., Class A* | | 213,600 | | | | 3,370,608 |
Avid Technology, Inc .* | | 349,500 | 2 | | | 21,581,625 |
BearingPoint, Inc.* | | 1,143,100 | 2 | | | 9,179,093 |
Benchmark Electronics, Inc.* | | 367,300 | 2 | | | 12,524,930 |
Captiva Software5, * Corp . | | 741,085 | 2 | | | 7,559,067 |
Centra Software, Inc .* | | 321,400 | | | | 752,076 |
Ceridian Corp.* | | 276,200 | | | | 5,048,936 |
CheckFree Corp.* | | 80,700 | 2 | | | 3,073,056 |
Checkpoint Systems, Inc.* | | 401,200 | | | | 7,241,660 |
Cirrus Logic, Inc.* | | 1,118,900 | | | | 6,165,139 |
Citadel Security Software, Inc.* | | 959,500 | 2 | | | 2,494,700 |
Cognizant Technology Solutions Corp.* | | 406,986 | | | | 17,227,717 |
CSG Systems International, Inc.* | | 353,6002 | | | | 6,612,320 |
CTS Corp. | | 929,800 | | | | 12,357,042 |
Dot Hill Systems Corp.* | | 338,200 | | | | 2,651,488 . |
Dupont Photomasks, Inc.* | | 270,794 | 2 | | | 7,151,670 |
eFunds Corp.* | | 435,826 | | | | 10,464,182 |
Electronics for Imaging, Inc.* | | 398,681 | 2 | | | 6,941,036 |
Equinix, Inc.* | | 303,100 | 2 | | | 12,954,494 |
Exfo Electro-Optical Engineering Inc.* | | 1,893,100 | 2 | | | 9,067,949 |
Fairchild Semiconductor International, Inc. * | | 1,150,700 | | | | 18,710,382 |
Formfactor, Inc.* | | 348,400 | | | | 9,455,576 |
Hi/Fn, Inc.* | | 570,300 | 2 | | | 5,258,166 |
Hyperion Solutions Corp.* | | 373,300 | 2 | | | 17,403,246 |
Identix, Inc.* | | 1,592,200 | 2 | | | 11,750,436 |
Infocrossing, Inc.* | | 170,400 | 2 | | | 2,884,872 |
infoUSA, Inc.* | | 517,400 | | | | 5,789,706 |
Intevac, Inc.5, * | | 921,500 | 2 | | | 6,966,540 |
Ixia, Inc.* | | 739,000 | | | | 12,422,590 |
Jupitermedia Corp.* | | 336,600 | | | | 8,004,348 |
Kanbay International, Inc. * | | 224,500 | | | | 7,026,850 |
Keithley Instruments, Inc. | | 500,000 | 2 | | | 9,850,000 |
Lionbridge Technologies, Inc.* | | 741,400 | 2 | | | 4,982,208 |
LoJack Corp.* | | 141,744 | | | | 1,719,355 |
Magma Design Automation, Inc.* | | 144,300 | 2 | | | 1,812,408 |
Marchex, Inc.* | | 338,397 | 2 | | | 7,106,337 |
Measurement Specialties, Inc.* | | 233,400 | | | | 5,942,364 |
MICROS Systems, Inc. * | | 174,800 | | | | 13,644,888 |
Mindspeed Technologies, Inc.* | | 304,150 | 2 | | | 845,537 |
Nanometrics, Inc.* | | 196,000 | 2 | | | 3,159,324 |
NetEase.com, Inc. - ADR* | | 257,100 | 2 | | | 13,582,593 |
Netscout Systems Inc* | | 1,006,200 | | | | 7,023,276 |
Nvidia Corp* | | 349,500 | | | | 8,234,220 |
The accompanying notes are an integral part of these financial statements.
23
Managers Special Equity Fund
December 31, 2004
| | |
Schedule of Portfolio Investments (continued) | | Special Equity |
| | | | | | | |
Security Description
| | Shares
| | | Value
| |
Information Technology (continued) | | | | | | | |
Open Solutions, Inc.* | | 312,400 | | | $ | 8,109,904 | |
Orbotech Ltd.* | | 169,500 | | | | 3,588,315 | |
Parametric Technology Corp.* | | 1,100,200 | | | | 6,480,178 | |
Park Electrochemical Corp. | | 264,300 | | | | 5,730,024 | |
Pemstar, Inc.* | | 332,800 | 2 | | | 602,368 | |
Plantronics, Inc. | | 100,000 | | | | 4,147,000 | |
Quest Software, Inc.* | | 515,200 | 2 | | | 8,217,440 | |
Reynolds & Reynolds Co., The, Class A | | 115,000 | | | | 3,048,650 | |
Rogers Corp.* | | 153,400 | 2 | | | 6,611,540 | |
Roper Industries, Inc. | | 220,300 | 2 | | | 13,387,631 | |
SERENA Software, Inc.* | | 310,600 | 2 | | | 6,721,384 | |
Shanda Interactive Entertainment, Ltd.* | | 326,300 | 2 | | | 13,867,750 | |
Shopping.com, Ltd.* | | 375,230 | 2 | | | 10,600,248 | |
Silicon Laboratories, Inc.* | | 104,800 | 2 | | | 3,700,488 | |
SINA Corp.* | | 205,300 | | | | 6,581,918 | |
SS&C Technologies, Inc. | | 446,200 | | | | 9,214,030 | |
SupportSoft, Inc.* | | 498,100 | | | | 3,317,346 | |
SYNNEX Corp.* | | 290,900 | | | | 6,999,054 | |
Synopsys, Inc.* | | 170,000 | | | | 3,335,400 | |
Take-Two Interactive | | | | | | | |
Software, Inc.* | | 324,800 | | | | 11,299,792 | |
Tech Data Corp.* | | 262,300 | | | | 11,908,420 | |
Tessera Technologies, Inc.* | | 239,300 | 2 | | | 8,904,353 | |
Tier Technologies, Inc.* | | 394,200 | | | | 3,646,350 | |
Trident Microsystems, Inc.* | | 773,300 | 2 | | | 12,929,576 | |
Vishay Intertechnology, Inc.* | | 713,900 | 2 | | | 10,722,778 | |
Woodhead Industries, Inc. | | 386,100 | | | | 6,189,183 | |
X-Rite, Inc. | | 259,700 | | | | 4,157,797 | |
Total Information Technology | | | | | | 637,993,566 | |
Materials - 6.6% | | | | | | | |
Airgas, Inc. | | 793,300 | | | | 21,030,383 | |
AK Steel Holding Corp.5,* | | 6,085,200 | 2 | | | 88,052,844 | |
Crompton Corp. | | 831,600 | | | | 9,812,880 | |
Cytec Industries, Inc. | | 278,700 | 2 | | | 14,330,754 | |
Greif, Inc. | | 4,700 | | | | 263,200 | |
Landec Corp.* | | 490,530 | | | | 3,355,225 | |
Longview Fibre Co. | | 761,700 | 2 | | | 12,910,238 | |
Lubrizol Corp. | | 439,000 | | | | 16,181,540 | |
Minerals Technologies, Inc. | | 176,600 | | | | 11,779,220 | |
RTI International Metals, Inc.* | | 409,030 | | | | 8,401,476 | |
Scotts Co., The, Class A* | | 135,300 | 2 | | | 9,947,256 | |
Spartech Corp. | | 549,500 | 2 | | | 14,885,955 | |
Stillwater Mining Co.* | | 376,000 | 2 | | | 4,233,760 | |
Symyx Technologies, Inc.* | | 355,400 | | | | 10,690,432 | |
USEC, Inc. | | 1,915,600 | | | | 18,562,164 | |
Total Materials | | | | | | 244,437,327 | |
| | |
Telecommunication Services - 0.3% | | | | | | | |
General Communication, Inc., Class A* | | 878,100 | | | $ | 9,694,224 | |
Utilities - 3.5% | | | | | | | |
Avista Corp. | | 1,202,200 | | | | 21,242,874 | |
Reliant Resources, Inc.* | | 5,991,000 | 2 | | | 81,777,150 | |
Sierra Pacific Resources Corp.* | | 2,346,800 | 2 | | | 24,641,400 | |
Total Utilities | | | | | | 127,661,424 | |
Total Common Stocks (cost $2,425,923,021) | | | | | | 3,362,202,247 | |
Warrant - 0.0% | | | | | | | |
Air France, ADR* (cost $1,361,928) | | 861,980 | | | | 982,657 | |
Other Investment Companies – 25.7% | | | | | | | |
AIM Liquid Assets Portfolio Institutional Class Shares, 2.14%1 | | 20,178,099 | | | | 20,178,099 | |
Bank of New York Institutional Cash Reserves Fund, 2.35%1,3 | | 634,905,494 | | | | 634,905,494 | |
iShares Russell 2000 Index Fund | | 174,000 | | | | 22,533,000 | |
iShares Russell 2000 Growth Index Fund | | 335,000 | | | | 22,542,150 | |
iShares S&P SmallCap 600/ BARRA Growth Index Fund | | 210,000 | 2 | | | 22,577,100 | |
Vanguard Small-Cap Growth VIPERs* | | 415,000 | | | | 22,401,700 | |
JPMorgan Prime Money Market Fund, Institutional Class Shares, 2.12%1 | | 202,615,281 | | | | 202,615,231 | |
Total Other Investment Companies
(cost $947,542,231) | | | | | | 947,752,774 | |
Total Investments - 116.9% (cost $3,374,827,180) | | | | | | 4,310,937,678 | |
Other Assets, less Liabilities – (16.9)% | | | | | | (621,924,970 | ) |
Net Assets - 100.0% | | | | | $ | 3,689,012,708 | |
The accompanying notes are an integral part of these financial statements.
24
| | |
| Managers International Equity Fund | | International Equity |
Managers International Equity Fund (“International Equity”) seeks long-term capital appreciation through investment in non-U.S. equity securities. Managers currently utilizes three independent subadvisors who each manage approximately one third of the total portfolio: Bernstein Investment Management and Research, led by Kevin Simms and hired in March of 2002, Lazard Asset Management, led by William Holzer and hired in September 2003, and Wellington Management Company, LLP led by Jean-Marc Berteaux and Andrew S. Offit and hired in September 2004.
The Portfolio Managers
Bernstein Investment Research and Management
Bernstein’s approach to investing is value-based and research driven. Their thesis is that human nature leads investors to buy and sell financial assets based on an overreaction to near-term events as they confuse temporary or cyclical characteristics with structural change. Thus, short-term problems, which cause profits and stocks to decline, can create buying opportunities, as investors underestimate the potential for corrective strategies to restore long-term earnings power. The investment team, led by Kevin Simms, attempts to exploit this by using research to separate fact from emotion. Bernstein’s International Strategic Value discipline is designed to create a focused portfolio of companies with strong fundamentals and sound business prospects not yet reflected in their share price.
They begin with all companies in the MSCI EAFE with a market capitalization greater than $4 billion. This universe of some 600 stocks covers approximately 90% of the capitalization of the EAFE Index. The investment team screens this list with a proprietary return model to identify the companies with the most attractive value attributes. The model derives an expected return for each company by assessing it both from a global industry-based perspective and from a country-based standpoint, including such factors as price to cash earnings, price to book, return on equity, and price momentum. Over 100 analysts perform extensive research, focusing on the most attractively valued stocks. They dissect corporate financial statements and visit company management and also meet frequently with customers, suppliers, or other industry experts. They build spreadsheets of historical and projected balance-sheet and income-statement information in order to estimate normalized earnings power, cash flow and asset values for each company for the next five years, performing simulations to see the potential impact of changes in various components. Analysts then present their estimates and ratings for each security to the Research Review Committee of the Investment Policy Group (IPG). The Committee challenges the analyst’s assumptions and conclusions to ensure they are sound. The IPG uses this research to build a portfolio of 35 - 50 of the best ideas building on the combined convictions of Bernstein industry analysts and regional portfolio management teams. A stock is sold when it has achieved forecasted fair value target, or if a change in the earnings forecast reduces the price target to current levels.
Lazard Asset Management
In September 2003, Managers announced the appointment of Lazard Asset Management as a subadvisor of the Fund, replacing Deutsche Asset Management. The appointment resulted in Willy Holzer and his investment team, who had departed Deutsche Asset Management, continuing to be in charge of the same portion of Managers International Equity Fund that he has managed since 1989. Despite the change in organizations, the Fund’s allocation to and the investment philosophies of the managers did not change. Willy and his investment team will continue to utilize the global thematic strategy that he developed in 1986, which targets the fastest growing or most profitable segments of the global economy.
Willy Holzer can be described as a “top-down” thematic investor, whose themes are based on “bottom-up” observations and company analysis. He views the world as a single global economic unit as opposed to a collection of separate country economies. Willy focuses his efforts by first analyzing the connections within the global economy, and from this analysis develops global investment themes. These themes target the segments of the global economy that he believes are most likely to provide attractive long-term investment returns, and which also represent an asymmetric investment opportunity in the investor’s favor. Themes are typically long lived—three or more years—and are developed through the course of business including discussions with company managements or government officials, fundamental and economic analysis, and the tracking of economic, financial and demographic trends. Willy works with the securities analysts at Lazard to identify the companies which will potentially benefit from the effects of the themes. These companies will necessarily have attractive fundamentals and reasonable valuations, along with strong company management.
Willy believes that it is important to distinguish between three types of companies: Domestic companies are those which produce, sell and raise capital all in their home country; International companies are those which produce at home, but sell their products and raise capital anywhere in the world; Global companies are those which produce, sell and raise capital anywhere. Willy will invest in any of these in order to capitalize on a theme; however, he prefers global companies which generally have the flexibility and resources to exploit global trends. Thus, his portfolio tends to be heavily weighted in large capitalization, multi-national companies. In addition, his portfolio will tend to be concentrated in the developed markets, with only a portion invested in companies domiciled in less developed or “emerging” markets. However, companies in the portfolio, while domiciled in developed markets, may have operations or distribution in the emerging markets. Given the long-term nature of the themes, his rate of turnover is relatively low (30% to 40% annually).
25
Wellington Management Company, LLP
Wellington Management’s portfolio is managed by their International Growth Team (“IGT”), comprised of portfolio managers Jean-Marc Berteaux and Andrew S. Offit. Jean-Marc and Andy are supported by Wellington Management’s global industry analysts and regional analysts, along with specialized fundamental, quantitative, and technical analysts, and traders. The IGT’s investment philosophy is built on the beliefs that industry is the dominant competitive factor for companies, that companies can dominate industries on a global basis, and that expectations about companies, specifically earnings, drive stock prices. Wellington’s focus is to identify industry leaders where their earnings forecasts are ahead of market expectations, and where they’ve identified the key drivers for the earnings.
The initial investable universe is comprised of companies in the MSCI EAFE Index with market capitalizations greater than US$1 billion. These companies are researched by Wellington Management’s specialist group of industry analysts who perform intensive ongoing fundamental analysis. Analysts provide assessments, financial models and fundamental research to the IGT. The focus of this research is to update an ongoing assessment of management, current business challenges and aggregate industry trends. Thorough analysis is done in preparation for and following company contacts to ensure that “the numbers support the story” – that the strategy and challenges outlined by management are coming through in financial results. The companies ultimately purchased for the portfolio will exhibit the following characteristics: industry leadership, identified earnings drivers, and above consensus earnings growth expectations. Companies in the portfolio are continually monitored to ensure their fundamental attractiveness based on the identified earnings drivers. Market expectations catching-up to their earnings forecast and/or deterioration in earnings drivers will factor into the sell decision. The portfolio will generally hold 50 to 80 securities, with less than 5% of assets (at market) committed to any single holding. Portfolio turnover is expected to be high, exceeding 150% on average per annum. While the portfolio’s holdings-based turnover is expected to be in the 100% range, the IGT will actively trade these positions as a result of significant near-term price movements and other factors.
Some thoughts about currencies
One of the risks of investing in foreign companies is the risk that foreign currency devaluations will decrease the value of your investment when translated back to U.S. dollars. This risk can also work in reverse and increase the value of your investment. Currency movements are no less difficult to predict than the direction of interest rates; in fact they are related. One of the benefits of international investing is the diversification benefit gained from the difference in return patterns (lower correlation of returns) that foreign stock markets have with U.S. stocks. Much of this differentiation comes from currency movements. This is a long way of saying that much of the diversification benefit of international investing is a result of currency fluctuations.
For this reason, the portfolio managers of the Fund do not, as a policy, hedge all foreign currency exposure in the portfolio back to U.S. dollars. In fact, all three managers use currency hedges sparingly for two key reasons. First, as previously mentioned, it is difficult to predict currency movements, and none of the managers believe they can consistently add value by timing currencies. Secondly, the currency exposure of the portfolio is not necessarily reflected in the country allocation. Many of the companies in the portfolio are global companies that may have assets in, and certainly derive revenues from a variety of countries in a variety of currencies. Hence, determining the appropriate hedge ratio would be extremely difficult. We and the portfolio managers together believe that the portfolio is naturally well diversified in currencies, and would not benefit from a policy of active hedging or currency management. That being said, there are periods when, if the managers believe there is particular risk of volatility in a certain currency, they will use forward foreign exchange contracts to hedge all or a portion of the currency exposure.
The Year in Review
Despite some deterrents, the U.S. economy continued to grow during 2004. Similarly, U.S. equity markets, after having stalled in anticipation of the U.S. presidential election, rallied strongly following an orderly outcome for the election. Thus, investors were treated to positive calendar year returns from all major equity indices and most foreign markets as well. Outside of the U.S., annual returns were mostly positive regardless of region, country, currency, or style. Also, the weak U.S. dollar (USD) resulted in even better returns for U.S. investors in foreign stocks as the euro gained 7.5%, the yen +4.3% and the British pound +7.4% during 2004. The MSCI EAFE Index (EAFE) rose 20.3% in USD and every region outside of North America rose at least 17%. Every developed country except Finland rose at least 10% in USD. Austria (+72%) was the best performing developed country, and a number of other European countries rose in excess of 25% in USD during the year. Finland was the worst performing developed market and the only one to lose value in local currencies during 2004. This was primarily led down by Nokia, which continued to lose market share in the more competitive wireless equipment industry.
The Fund returned 15.17% for 2004, compared with a return of 20.25% for EAFE. Nearly two-thirds of the Fund’s holdings gained during this period. A majority of the portfolio’s top performing shares were from the materials and financials sectors. Some long-term holdings in the materials sector like Syngenta, POSCO, HeidelbergCement and Arcelor gained over 35% during the year as commodity prices rallied due to increased demand. Similarly in financials, long-term holdings like Promise, UFJ Holdings, Sumitomo Realty & Development and Shinhan Financial Group gained over 45%. In other industries, Ericsson, Vinci, Continental AG and Schering AG gained over 45%, and thus significantly helped performance.
26
On a relative basis, the Fund fell short of the performance of the MSCI EAFE Index. The majority of this underperformance was caused by two factors: the Fund’s exposure to Japan during the first half of 2004, and the Fund’s lack of exposure to the telecom sector towards the end of the year. All three subadvisors had significant allocations in Japan during the second quarter when that market declined amid concerns about China’s slowdown and the resulting effect on Japan’s export-based industries. Since then the Japanese market recovered and ended the year up 16% in USD. The second cause for underperformance was the Fund’s underweight in the telecom sector which rose sharply late in the year. At 3.4%, the Fund’s allocation to the sector was half that of the Index at the start of the fourth quarter. Further, two of the holdings, Singapore Telecommunications (+5%) and Russian based Mobile Telesystems ADR (-5%) trailed the sector rally during the quarter due to country specific reasons.
In September, the Trustees of the Fund voted to hire Wellington Management Company to replace Mastholm as subadvisor for a portion of the Fund. As discussed earlier, Wellington Management Company’s International Growth Team is led by Jean-Marc Bearteaux and Andrew Offit. In transitioning its portion of the portfolio, the Wellington team made a number of structural changes, increasing exposure to financials while eliminating all securities in the materials sector. The allocation to Japan in Wellington’s portion of the Fund was cut from 25% to less than 15% and redeployed into France, UK, and select emerging markets such as Russia and India.
Looking Forward
Heading into 2005, UK, France and Japan comprised nearly 50% of the Fund. Our subadvisors favor financials and consumer holdings in these countries. The Fund has a significant underweight in UK compared to the EAFE Index and overweight in markets like Canada, Hong Kong and South Korea. At 26.3%, financials is the major sector focus where the Fund’s allocation is in line with that of the Index. Consumer discretionary, materials and technology are the other major sectors in the Fund.
Cumulative Total Return Performance
International Equity’s cumulative total return is based on the daily change in net asset value (NAV), and assumes that all distributions were reinvested. The MSCI EAFE Index (“EAFE”) is compiled by Morgan Stanley Capital International. It consists of over 1,000 large, publicly traded stocks from 20 countries of Europe, Asia, Australia and the Far East. The Index assumes reinvestment of dividends. This chart compares a hypothetical $10,000 investment made in International Equity on December 31,1994, to a $10,000 investment made in the EAFE for the same time period. The chart is not intended to imply any future performance of the Fund. The graph and chart do not reflect the deduction of taxes that a shareholder would pay on a Fund distribution or redemption of shares. Total Returns would have been lower had certain expenses not been reduced.
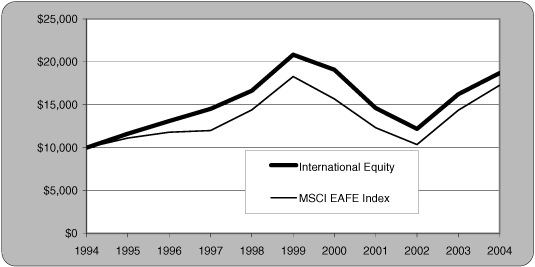
The table below shows the average annual total returns for International Equity and the EAFE since December 31,1994 through December 31, 2004.
| | | | | | | | | |
Average Annual Total Returns:
| | 1 Year
| | | 5 Years
| | | 10 Years
| |
International Equity Fund | | 15.17 | % | | (2.16 | )% | | 6.45 | % |
MSCI EAFE Index | | 20.25 | % | | (1.13 | )% | | 5.62 | % |
27
The table below displays a full breakdown of the sector allocation of the Fund as well as the top ten positions as of December 31, 2004.
| | | |
Top Ten Holdings (out of 184 securities)
| | % Fund
| |
BP PLC | | 2.2 | % |
Canon, Inc.* | | 2.0 | |
Vodafone Group PLC * | | 2.0 | |
Assurances Generales de France* | | 1.5 | |
Elan Corp., PLC -Sponsored ADR | | 1.4 | |
Total SA | | 1.3 | |
Alcan, Inc. | | 1.3 | |
Arcelor* | | 1.3 | |
Continental AG | | 1.3 | |
GlaxoSmithKline PLC* | | 1.2 | |
| | |
|
|
Top Ten as a Group | | 15.5 | % |
| | |
|
|
| * | Top Ten Holding at December 31, 2003 |
| | | |
Industry Weightings
| | | |
Financials | | 26.3 | % |
Consumer Discretionary | | 15.7 | |
Materials | | 11.8 | |
Information Technology | | 9.4 | |
Energy | | 9.2 | |
Industrials | | 8.5 | |
Consumer Staples | | 6.4 | |
Health Care | | 5.4 | |
Telecommunication Services | | 3.6 | |
Utilities | | 2.7 | |
Other | | 1.0 | |
Summary of Investments by Country
| | | | | | |
Country
| | Managers
International
Equity Fund*
| | | MSCI
EAFE
Index
| |
Japan | | 20.6 | % | | 21.9 | % |
United Kingdom | | 18.7 | | | 25.0 | |
France | | 11.1 | | | 9.4 | |
Germany | | 6.9 | | | 7.0 | |
Canada | | 6.8 | | | 0.0 | |
Hong Kong | | 4.9 | | | 1.7 | |
South Korea | | 3.9 | | | 0.0 | |
Netherlands | | 3.8 | | | 4.8 | |
Switzerland | | 2.5 | | | 6.8 | |
Italy | | 2.5 | | | 4.3 | |
Sweden | | 2.3 | | | 2.5 | |
Spain | | 2.1 | | | 4.1 | |
Ireland | | 1.9 | | | 0.9 | |
Luxembourg | | 1.8 | | | 0.0 | |
Singapore | | 1.6 | | | 0.8 | |
Taiwan | | 1.4 | | | 0.0 | |
South Africa | | 1.2 | | | 0.0 | |
Brazil | | 1.0 | | | 0.0 | |
Belgium | | 0.9 | | | 1.3 | |
United States | | 0.8 | | | 0.0 | |
| | |
Country
| | Managers
International
Equity Fund*
| | | MSCI
EAFE
Index
| |
Greece | | 0.6 | % | | 0.6 | % |
Mexico | | 0.4 | | | 0.0 | |
Australia | | 0.4 | | | 5.1 | |
India | | 0.4 | | | 0.0 | |
Russia | | 0.3 | | | 0.0 | |
Norway | | 0.3 | | | 0.6 | |
Hungary | | 0.3 | | | 0.0 | |
Peru | | 0.2 | | | 0.0 | |
Finland | | 0.2 | | | 1.4 | |
Indonesia | | 0.1 | | | 0.0 | |
Cash | | 0.1 | | | 0.0 | |
Portugal | | 0.0 | | | 0.4 | |
Denmark | | 0.0 | | | 0.8 | |
Austria | | 0.0 | | | 0.4 | |
New Zealand | | 0.0 | | | 0.2 | |
| * | As a percent of total market value of common stocks on December 31, 2004. |
28
Managers International Equity Fund
December 31, 2004
| | |
| Schedule of Portfolio Investments | | International Equity |
| | | | | | |
Security Description
| | Shares
| | | Value
|
Common Stocks – 99.0% | | | | | | |
Consumer Discretionary – 15.7% | | | | | | |
Adidas - Salomon AG (Germany) | | 6,700 | | | $ | 1,087,305 |
British Sky Broadcasting PLC (United Kingdom) | | 72,665 | | | | 783,991 |
Carnival PLC (United Kingdom) | | 16,190 | | | | 987,769 |
Carphone Warehouse Group (The) (United Kingdom) | | 476,662 | | | | 1,568,735 |
Club Med (France)* | | 7,900 | 2 | | | 373,047 |
Continental AG (Germany) | | 46,500 | | | | 2,957,316 |
EMI Group PLC (United Kingdom) | | 268 500 | | | | 1 365 274 |
Esprit Holdings Limited (Hong Kong) | | 231,000 | 2 | | | 1,396,169 |
Galeries Lafayette SA (France) | | 3,300 | 2 | | | 848,369 |
George Wimpey PLC (United Kingdom) | | 136,300 | | | | 1,058,506 |
Grupo Televisa S. A. (Mexico) | | 16,700 | | | | 1,010,350 |
GUS PLC (United Kingdom) | | 58,695 | | | | 1,055,670 |
Honda Motor Co., Ltd. (Japan) | | 53,300 | | | | 2,786,621 |
Hyundai Motor Co., Ltd. (South Korea) | | 32,140 | | | | 1,717,267 |
InterContinental Hotels Group PLC (United Kingdom)* | | 197,298 | | | | 2,452,682 |
JC Decaux International (France)* | | 23,771 | | | | 694,416 |
Kia Motors Corp. (South Korea) | | 49,680 | | | | 522,112 |
Nissan Motor Co., Ltd. (Japan) | | 155,100 | | | | 1,707,300 |
Pearson PLC (United Kingdom) | | 82,653 | | | | 995,405 |
Persimmon PLC (United Kingdom) | | 77,100 | | | | 1,021,924 |
Pioneer Corp. (Japan) | | 34,000 | | | | 668,035 |
Renault SA (France) | | 21,100 | | | | 1,767,259 |
Sekisui House, Ltd. (Japan) | | 50,000 | | | | 583,673 |
SES Global (Luxembourg) | | 95,577 | | | | 1,232,435 |
Shanghai Forte Land Company Ltd. (Hong Kong)* | | 224,000 | | | | 78,659 |
SUZUKI MOTOR Corp. (Japan) | | 34,000 | | | | 621,882 |
Swatch Group AG (The)(Switzerland) | | 37,450 | | | | 1,111,359 |
Toyota Motor Corp. (Japan) | | 12,000 | | | | 492,474 |
Vivendi Universal SA (France) | | 36,900 | | | | 1,179,195 |
Whitbread PLC (United Kingdom) | | 114,500 | | | | 1,857,961 |
Wolters Kluwer NV (Netherlands) | | 40,200 | | | | 805,365 |
Total Consumer Discretionary | | | | | | 36,788,525 |
Consumer Staples - 6.4% | | | | | | |
British American Tobacco PLC (United Kingdom) | | 53,400 | | | | 922,692 |
Delhaize Le Lion (Belgium) | | 29,100 | | | | 2,214,017 |
Diageo PLC (United Kingdom) | | 83,646 | | | | 1,194,715 |
Foster’s Group, Ltd. (Australia) | | 200,700 | | | | 912,507 |
Imperial Tobacco Group PLC (United Kingdom) | | 41,200 | | | | 1,128,159 |
Japan Tobacco, Inc. (Japan) | | 140 | | | | 1,597,758 |
Koninklijke Ahold N.V. (Netherlands)* | | 200,800 | | | $ | 1,556,014 |
Nippon Meat Packers, Inc. (Japan) | | 67,000 | | | | 907,946 |
Pernod-Ricard (France) | | 5,400 | 2 | | | 827,928 |
Royal Numico NV (Netherlands)* | | 39,700 | | | | 1,429,044 |
Seven-Eleven Japan Co., Ltd. (Japan) | | 39,000 | | | | 1,230,938 |
Tesco PLC (United Kingdom) | | 95,400 | | | | 588,630 |
Yamazaki Baking Co., Ltd. (Japan) | | 47,000 | | | | 438,121 |
Total Consumer Staples | | | | | | 14,948,469 |
Energy - 9.2% | | | | | | |
BP PLC (United Kingdom) | | 534,100 | | | | 5,197,045 |
China Petroleum and Chemical Corp., Class H (Hong Kong) | | 924,000 | | | | 378,127 |
CNOOC, Ltd. (Hong Kong) | | 18,500 | | | | 1,002,515 |
EnCana Corp. (Canada)* | | 34,234 | | | | 1,954,351 |
Eni S.p.A. (Italy) | | 89,100 | | | | 2,233,410 |
MOL Magyar Olaj-es Gazipari Rt. (Hungary) | | 8,400 | 2 | | | 589,493 |
Oao Gazprom-Sponsored ADR (Russia)* | | 19,500 | 2 | | | 692,250 |
Petro-Canada (Canada)* | | 12,500 | | | | 638,171 |
Petroleo Brasileiro SA, Sponsored ADR (Brazil)* | | 39,000 | | | | 1,412,190 |
Repsol YPF, S.A. (Spain) | | 81,900 | 2 | | | 2,130,395 |
Royal Dutch Petroleum Co. (Netherlands) | | 22,600 | | | | 1,297,114 |
Saipem SpA (Italy) | | 62,800 | | | | 753,940 |
Total SA (France) | | 14,288 | 2 | | | 3,129,253 |
YUKOS, ADR (Russia)* | | 9,500 | 2 | | | 24,700 |
Total Energy | | | | | | 21,432,954 |
Financials - 26.3% | | | | | | |
Aiful Corp. (Japan) | | 16,900 | | | | 1,868,342 |
Allianz AG (Germany) | | 11,500 | | | | 1,520,888 |
Assurances Generales de France (France) | | 47,300 | 2 | | | 3,531,019 |
Aviva PLC (United Kingdom) | | 172,000 | | | | 2,068,140 |
Banca Intesa S.p.A. (Italy) | | 115,200 | | | | 553,548 |
Banco Bilbao Vizcaya Argentaria SA (Spain) | | 67,700 | 2 | | | 1,200,709 |
Bank of East Asia, Ltd. (Hong Kong) | | 302,000 | | | | 938,293 |
Bank of Nova Scotia (Canada)* | | 69,128 | 2 | | | 2,348,211 |
Bank of Yokohama, Ltd. (The) (Japan) | | 94,000 | | | | 592,344 |
Bayerische Vereinsbank AG (Germany)* | | 67,300 | | | | 1,528,096 |
BNP Paribas SA (France) | | 16,100 | 2 | | | 1,166,921 |
China Overseas Land & Investment Ltd. (Hong Kong) | | 952,000 | | | | 235,254 |
Credit Agricole SA (France) | | 5,800 | 2 | | | 175,079 |
The accompanying notes are an integral part of these financial statements.
29
Managers International Equity Fund
December 31, 2004
| | |
| Schedule of Portfolio Investments (continued) | | International Equity |
| | | | | | |
Security Description
| | Shares
| | | Value
|
Financials (continued) | | | | | | |
Credit Suisse Group (Switzerland) | | 49,700 | | | $ | 2,089,289 |
Daiwa Securities Group, Inc. (Japan) | | 104,000 | | | | 752,064 |
DBS Group Holdings, Ltd. (Singapore) | | 122,000 | | | | 1,202,695 |
Depfa Bank PLC (Ireland) | | 58,000 | | | | 976,968 |
Deutsche Boerse AG (Germany) | | 21,636 | 2 | | | 1,303,132 |
Efg Eurobank Ergasias(Greece) | | 41,100 | | | | 1,411,777 |
Hang Seng Bank, Ltd. (Hong Kong) | | 75,800 | | | | 1,052,656 |
HBOS PLC (United Kingdom) | | 20,000 | | | | 325,071 |
Henderson Land Development Co., Ltd. (Hong Kong) | | 166,000 | | | | 863,054 |
Hong Kong Exchanges & Clearing, Ltd. (Hong Kong) | | 180,000 | | | | 481,836 |
ING Groep NV (Netherlands) | | 69,117 | | | | 2,090,213 |
Japan Retail Fund Investment Corp. (Japan)* | | 76 | | | | 641,554 |
Kennedy-Wilson Japan (Japan) | | 19 | | | | 34,798 |
Kennedy-Wilson Japan (Japan) 6,* | | 38 | 2 | | | 66,751 |
KK DaVinci Advisors (Japan)* | | 78 | | | | 90,013 |
Kookmin Bank (South Korea)* | | 55,874 | | | | 2,186,221 |
Man Group PLC (United Kingdom) | | 25,994 | | | | 733,548 |
Manulife Financial Corp. (Canada)* | | 42,000 | | | | 1,941,994 |
Mitsubishi Estate Co., Ltd. (Japan) | | 156,000 | | | | 1,832,726 |
Mitsubishi Securities Co., Ltd. (Japan) | | 13,000 | | | | 142,456 |
Mitsubishi Tokyo Financial Group, Inc. (Japan) | | 50 | | | | 512,090 |
Mitsui Fudosan Co., Ltd. (Japan) | | 135,000 | | | | 1,644,134 |
Nikko Cordial Corp. (Japan) | | 185,000 | | | | 981,664 |
Nomura Holdings, Inc. (Japan) | | 104,000 | | | | 1,521,101 |
NTT Urban Development Corp. (Japan)* | | 22 | | | | 96,399 |
ORIX Corp. (Japan) | | 9,000 | | | | 1,231,754 |
Promise Co., Ltd. (Japan) | | 31,500 | | | | 2,255,584 |
Royal Bank of Scotland Group PLC (United Kingdom) | | 8,000 | | | | 268,678 |
Shinhan Financial Group Co., Ltd. (South Korea) | | 65,790 | | | | 1,476,653 |
Shinsei Bank, Ltd. (Japan) | | 81,000 | | | | 552,405 |
Societe Generale (France) | | 17,900 | 2 | | | 1,812,013 |
Standard Chartered, PLC. (United Kingdom) | | 125,000 | | | | 2,320,371 |
Sumitomo Mitsui Financial Group, Inc. (Japan) | | 314 | 2 | | | 2,294,967 |
Sumitomo Realty & Development Co., Ltd. (Japan) | | 127,000 | | | | 1,656,752 |
Sun Hung Kai Properties, Ltd. (Hong Kong) | | 117,000 | | | | 1,170,978 |
UFJ Holdings, Inc. (Japan)* | | 453 | | | | 2,773,966 |
Unibail (France) | | 7,200 | 2 | | $ | 1,134,250 |
Total Financials | | | | | | 61,649,419 |
Health Care - 5.4% | | | | | | |
Elan Corp., PLC - Sponsored ADR (Ireland)* | | 123,900 | 2 | | | 3,376,275 |
Essilor International SA (France) | | 15,000 | | | | 1,177,482 |
GlaxoSmithKline PLC (United Kingdom) | | 124,600 | | | | 2,925,418 |
Sanofi-Synthelabo SA (France) | | 30,625 | | | | 2,448,512 |
Schering AG (Germany) | | 26,847 | | | | 1,998,346 |
Taisho Pharmaceutical Co., Ltd. (Japan) | | 36,000 | | | | 784,848 |
Total Health Care | | | | | | 12,710,881 |
Industrials - 8.5% | | | | | | |
ABB, Ltd. (Switzerland)* | | 154,500 | | | | 864,152 |
ACS, Actividades de Construccion y Servicios, SA (Spain) | | 66,810 | 2 | | | 1,521,800 |
Assa Abloy AB (Sweden) | | 33,050 | | | | 563,362 |
Autoroutes du sud de la France (France) | | 23,968 | | | | 1,205,683 |
Autostrade S.p.A. (Italy) | | 40,400 | | | | 1,079,630 |
Canadian National Railway Co. (Canada)* | | 15,700 | | | | 957,475 |
Capita Group PLC (United Kingdom) | | 188,400 | | | | 1,319,205 |
Dai Nippon Printing Co., Ltd. (Japan) | | 42,000 | | | | 676,176 |
European Aeronautic Defense and Space Co. (Netherlands) | | 53,534 | | | | 1,553,294 |
FANUC, Ltd. (Japan) | | 7,300 | | | | 480,173 |
Hutchison Whampoa, Ltd. (Hong Kong) | | 142,000 | | | | 1,330,342 |
Kuehne & Nagel International AG (Switzerland) | | 3,420 | | | | 733,681 |
MAN AG (Germany) | | 27,600 | | | | 1,059,193 |
MINEBEA Co., Ltd. (Japan) | | 131,000 | | | | 572,017 |
Mitsubishi Corp. (Japan) | | 102,000 | | | | 1,319,293 |
Rolls Royce Group PLC (United Kingdom) | | 291,482 | | | | 1,377,748 |
Rolls-Royce Group PLC, Class B (United Kingdom)* | | 7,189,216 | | | | 13,112 |
RT Group PLC (United Kingdom)* | | 360,539 | | | | 27,688 |
SNC-Lavalin Group, Inc. (Canada)* | | 7,400 | | | | 358,219 |
Tostem Inax Holding Corp. (Japan) | | 32,000 | | | | 581,754 |
Vinci SA (France) | | 8,791 | | | | 1,181,822 |
Yamato Transport Co., Ltd. (Japan ) | | 75,000 | | | | 1,115,733 |
Total Industrials | | | | | | 19,891,552 |
Information Technology - 9.4% | | | | | | |
Alcatel SA (France)* | | 136,100 | | | | 2,120,646 |
ASML Holding N.V. (Netherlands)* | | 15,097 | | | | 240,193 |
The accompanying notes are an integral part of these financial statements.
30
Managers International Equity Fund
December 31, 2004
| | |
| Schedule of Portfolio Investments (continued) | | International Equity |
| | | | | | | |
Security Description
| | Shares
| | | Value
| |
Information Technology (continued) | | | | | | | |
Canon, Inc. (Japan) | | 86 500 | | | $ | 4,697,257 | |
Compal Electronics, Inc. (Taiwan)* | | 298,054 | 2 | | | 1,490,747 | |
Ericsson (LM) Tel Co., Sponsored ADR (Sweden)* | | 34,900 | 2 | | | 1,099,001 | |
Ericsson (LM), Class B (Sweden)* | | 440,000 | | | | 1,385,833 | |
Flextronics International, Ltd. (Singapore)* | | 64,500 | 2 | | | 891,390 | |
Fujitsu Ltd. (Japan) | | 115,000 | | | | 751,162 | |
Infosys Technologies Limited, Sponsored ADR | | 14,300 | 2 | | | 991,133 | |
Keyence Corp. (Japan) | | 4,100 | | | | 920,868 | |
Nokia Corp., Sponsored ADR (Finland) | | 32,700 | | | | 512,409 | |
Research In Motion, Ltd. (Canada)* | | 14,400 | | | | 1,186,848 | |
Samsung Electronics Co., Ltd. (South Korea) | | 1,500 | | | | 651,751 | |
Taiwan Semiconductor | | | | | | | |
Manufacturing Co., Ltd. (Taiwan) | | 197,872 | | | | 1,679,933 | |
Tandberg ASA (Norway) | | 61,530 | | | | 765,022 | |
Toshiba Corp. (Japan) | | 179,000 | | | | 770,792 | |
Trend Micro, Inc. (Japan) | | 34,500 | | | | 1,875,459 | |
Total Information Technology | | | | | | 22,030,444 | |
Materials -11.8% | | | | | | | |
Alcan, Inc. (Canada)* | | 62,204 | 2 | | | 3,052,703 | |
Aracruz Celulose SA (Brazil)* | | 25,500 | | | | 961,350 | |
Arcelor (Luxembourg) | | 131,900 | 2 | | | 3,041,505 | |
Bayer AG (Germany) | | 29,596 | | | | 1,002,453 | |
BOC Group PLC (United Kingdom) | | 46,378 | | | | 883,849 | |
Cia de Minas Buenaventura SA (Peru) | | 25,200 | | | | 577,080 | |
Gold Fields, Ltd. (South Africa) | | 81,200 | 2 | | | 1,007,042 | |
Goldcorp, Inc. (Canada)* | | 56,000 | 2 | | | 844,101 | |
Harmony Gold Mining Co., Ltd. (South Africa) | | 97,800 | 2 | | | 905,097 | |
HeidelbergCement AG (Germany) | | 25,312 | | | | 1,524,156 | |
Impala Platinum Holdings, Ltd. (South Africa)* | | 47,800 | 2 | | | 1,016,027 | |
JFE Holdings, Inc. (Japan) | | 49,100 | | | | 1,402,897 | |
Meridian Gold, Inc. (Canada)* | | 48,900 | | | | 928,086 | |
Placer Dome, Inc. (Canada)* | | 86,900 | | | | 1,637,693 | |
POSCO (South Korea) | | 9,800 | | | | 1,763,615 | |
Rio Tinto PLC (United Kingdom) | | 33,733 | | | | 994,978 | |
RMC Group, PLC (United Kingdom) | | 40,600 | | | | 661,779 | |
Svenska Cellulosa AB (Sweden) | | 55,900 | | | | 2,385,481 | |
Syngenta AG (Switzerland) | | 10,940 | | | | 1,160,686 | |
Xstrata PLC (United Kingdom) | | 103,090 | | | | 1,840,931 | |
Total Materials | | | | | | 27,591,509 | |
Telecommunication Services - 3.6% | | | | | | | |
France Telecom SA (France) | | 32,500 | | | | 1,073,788 | |
Singapore Telecommunications, Inc. (Singapore) 5,* | | 1,171,857 | | | $ | 1,707,945 | |
Sk Telecom Co., Ltd. (South Korea) | | 3,700 | | | | 705,247 | |
Telekomunikasi Indonesia Tbk PT (Indonesia) | | 16,700 | | | | 351,034 | |
Vodafone Group PLC (United Kingdom) | | 1,710,200 | | | | 4,653,037 | |
Total Telecommunication Services | | | | | | 8,491,051 | |
Utilities - 2.7% | | | | | | | |
CLP Holdings, Ltd. (Hong Kong) | | 232,000 | | | | 1,335,016 | |
E.ON AG (Germany) | | 11,900 | | | | 1,083,619 | |
Enel SpA (Italy) | | 127,100 | | | | 1,249,414 | |
Hong Kong & China Gas Co., Ltd. (Hong Kong) | | 625,000 | | | | 1,291,972 | |
National Grid Transco PLC (United Kingdom) | | 126,900 | | | | 1,208,399 | |
Total Utilities | | | | | | 6,168,420 | |
| | |
Total Common Stocks
(cost $180,300,349) | | | | | | 231,703,224 | |
Other Investment Companies - 13.2%1 | | | | | | | |
Bank of New York Institutional Cash Reserves Fund, 2.35%3 | | 30,268,978 | | | | 30,268,978 | |
JPMorgan Prime Money Market Fund, Institutional Class Shares, 2.12% | | 598,388 | | | | 598,388 | |
Total Other Investment Companies
(cost $30,867,366) | | | | | | 30,867,366 | |
Total Investments - 112.2%
(cost $211,167,715) | | | | | | 262,570,590 | |
Other Assets, less Liabilities - (12.2)% | | | | | | (28,510,022 | ) |
Net Assets - 100.0% | | | | | $ | 234,060,568 | |
The accompanying notes are an integral part of these financial statements.
31
| | |
| Managers Emerging Markets Equity Fund | | Emerging Markets |
Managers Emerging Markets Equity Fund (“Emerging Markets Equity”) seeks long-term capital appreciation through investments in companies within countries considered to be emerging or developing by the World Bank or the United Nations. Managers utilizes an independent subadvisor to manage the assets of the portfolio. Ken King leads the investment team of Rexiter Capital Management Limited (“Rexiter”) in managing this Fund.
The Portfolio Manager
Ken King and the investment management team at Rexiter seek to earn investment return and manage investment risk by analyzing and actively managing country and industry exposure in the portfolio, and investing in companies within the targeted country and industry ranges which demonstrate strong but, most importantly, profitable earnings growth.
Country Allocation
Through years of experience analyzing and investing in emerging markets, Ken King has come to believe that the political, economic and financial health of countries within the emerging markets is essential to the success of the companies domiciled within them. In addition, King believes that emerging markets are inefficient in the technical sense that past behavior contains information about future behavior. Individually, emerging markets’ companies are highly volatile. They regularly and predictably overshoot fair value and then, in relatively short periods, revert towards the mean. Market capitalization weighted indices fail to recognize this; the markets that have risen most take on a larger index weight just as it becomes increasingly likely that they will underperform. Poorly performing markets will have a reduced index weight just as the chance of relative outperformance increases. Market capitalization weighted indices thus encourage managers to chase markets and expose portfolios to the risk of being “whipsawed.” This reduces returns and increases volatility.
Because of this, Rexiter uses a fixed-weight index to define its neutral position. Rexiter splits the markets into two groups: 1) top tier- the twelve most liquid markets (countries) and 2) bottom tier-all other eligible markets. Within each tier, all markets are given an equal weight: top tier markets have a weight of 5.6% so that the neutral allocation is 67% of the portfolio. Bottom tier markets have a weight of 2.6% and make up 33% of the portfolio.
The investment team at Rexiter analyzes political, economic and market factors for each country and ranks them into favorable unfavorable, and neutral rankings that determine the target allocations within the portfolio. A “favorable” rating means exposure to a country in the portfolio should match the neutral weight at a minimum. “Unfavorable” should match the neutral weight only at a maximum. A “neutral” ranking implies a band, which ranges by 1%-2% on either side of the fixed weight depending on the market’s tier. Among the market factors that Rexiter analyzes are the recent performance of each country along with an assessment of the availability of attractively valued stocks.
Stock Selection
The investment management team at Rexiter is a great believer in stock selection. They believe that the quality of company research in the emerging markets is poor. Many companies in the emerging markets have been very successful at destroying shareholder wealth. Rexiter’s research centers on avoiding companies that generate “profitless growth.”
After screening the emerging markets universe for minimum capitalization and liquidity parameters, the Rexiter investment team analyzes roughly 300 companies in detail.
In order to identify companies which can and will undergo profitable growth, Rexiter’s research entails: studying published accounts and accounting policies for the underlying development of earnings; performing a “duPont Analysis” of return on equity; analyzing the return on invested capital and the economic value added; and analyzing the cash flow, capital spending and capital requirements of each company.
The portfolio is thus constructed from both a top-down and a bottom-up perspective. It will typically have 40 to 60 stocks of companies exhibiting profitable growth, and will typically be very diversified across emerging market countries. Because of the fixed-weight benchmark allocation method described above, the Fund will typically be underweighted relative to the weightings of the largest three or four emerging countries in the capitalization-weighted index. The benchmark for the Fund is the Morgan Stanley Capital International – Emerging Markets Free Index (“EMF”).
The Year in Review
Outside of the U.S., annual returns were mostly positive regardless of region, country, currency, or style. Also, the weak U.S. dollar (USD) resulted in even better returns for U.S. investors in foreign stocks as the euro gained 7.5%, yen +4.3% and the British pound +7.4% during 2004. The emerging markets were among the top performing asset classes in 2004. While much of the emerging market gains in 2003 were driven by encouraging U.S. economic data and market performance, the 2004 gains came from improving country and company fundamentals from various EMF economies. Several countries cut their interest rates to keep local currencies competitive in the face of a depreciating USD. The low interest rate environment in turn favored local businesses and domestic spending. All these factors increased investors’ confidence and their appetite for emerging market investments.
Managers Emerging Markets Equity Fund returned 28.85%, including distributions, in 2004. The MSCI Emerging Markets Free Index (EMF) returned 25.95% during 2004. It was the fourth time that the Fund has outperformed the Index over
32
the calendar year since its inception in 1998. A vast majority of the Fund’s holdings gained during the year. Turkcell Iletisim Hizmetleri, which the Fund held for all of 2004, gained over 100% as the leading Turkish GSM operator saw a 23% gain in the customer base during 2004 amid increased demand and a low churn rate. Other long-term holdings from different countries and sectors that gained over 45% include Sanlam, Alfa and Hyundai Motor. A few other holdings added during the year like Daelim Industrial¸ Barloworld, Grupo Financiero Banorte and Hylsamex saw significant gains during the holding period and contributed positively toward Fund performance.
From a sector standpoint, financials, telecom and industrials led the rally while healthcare and technology trailed the market. Regionally, Latin America (+40%) and Eastern Europe (+35%) were the best performing regions while Asia (+14%) lagged other regions. In Latin America, Columbia and Venezuela led the returns as these regions benefited from their materials, telecom and financial holdings. Asia was hurt by China and Thailand as the Chinese market suffered from fear of slowdown and Thailand faced a set-back with the fear of terrorism.
The Fund also benefited from its relatively low exposure to technology. In addition, an overweight in telecom proved beneficial during 2004. Rexiter’s philosophy and process led them to increase the Fund’s telecom exposure during most of the year and this benefited the Fund as that sector saw a comeback late in the year. In the fourth quarter, the Fund’s 10 telecom holdings gained 17% on average.
From a country standpoint, Rexiter’s fixed weight approach had mixed results. Overweights to smaller markets like Turkey, Venezuela and Indonesia helped performance as these markets were among the top performers in the EMF Index. On the other hand, Fund’s underweight in South Africa hurt performance. South Africa is the second largest country allocation in the EMF Index and averaged about 14% of the Index during 2004 while the Fund had less than 5% exposure. Rexiter’s underweight in South Africa was because the investment team believed domestic growth would come at the cost of higher inflation. As it turned out, South Africa’s economy grew at a much higher pace during the final quarter of 2004 without igniting inflation and thus leading to a market rally. That being said, the Fund’s two South African holdings, Sanlam (held throughout 2004) and Barloworld (purchased in September), gained 75% and 57%, respectively, and contributed significantly toward the Fund’s performance.
Looking Ahead
Heading into 2005, the portfolio manager is focusing on companies from India and Brazil. Rexiter added Gail India, ICICI Bank, and Reliance Industries during the fourth quarter of 2004 as concerns about the new Indian government stalling the reform process have subsided. In Brazil, Rexiter added Companhia Brasileira de Distribuicao, a food and drug retailer as it saw more conviction of strong domestic consumption and a strengthening economy. The Fund currently has five Brazilian holdings with a 9% weighting at year end. Korea, Taiwan and Brazil are the top three country allocations while financials, telecom and industrials are the top three sector focus. Rexiter’s fixed weight philosophy leads them to underweight the major markets like Korea, Taiwan and South Africa and overweight markets like India, Malaysia and Turkey.
Cumulative Total Return Performance
Emerging Markets Equity’s cumulative total return is based on the daily change in net asset value (NAV), and assumes that all distributions were reinvested. The MSCI EMF Index (“EMF”) is compiled by Morgan Stanley Capital International (“MSCI”). It is a market capitalization-weighted Index covering over 1,000 stocks in 25 emerging nations in the Asia/Far East, South American, Eastern European and African regions. MSCI designates nations based upon several factors, the most important being per capita GDP. In cases where restrictions on foreign investment exist, the EMF Index limits its coverage to the opportunity set generally available to foreign investors. This chart compares a hypothetical $10,000 investment made in Emerging Markets Equity on February 9,1998, to a $10,000 investment made in the EMF for the same time period. The chart is not intended to imply any future performance of the Fund. The graph and chart do not reflect the deduction of taxes that a shareholder would pay on a Fund distribution or redemption of shares. Total Returns would have been lower had certain expenses not been reduced.
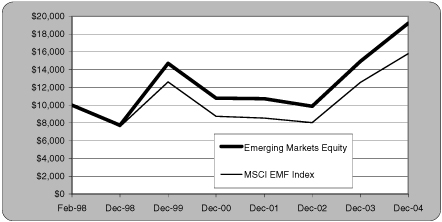
33
The table below shows the average annual total returns for Emerging Markets Equity and the EMF since inception through December 31, 2004.
| | | | | | | | | |
Average Annual Total Returns:
| | 1 Year
| | | 5 Years
| | | Since Inception*
| |
Emerging Markets Equity Fund | | 28.85 | % | | 5.50 | % | | 9.95 | % |
MSCI EMF Index | | 25.95 | % | | 4.62 | % | | 6.76 | % |
| * | Commencement of operations was February 9, 1998. |
The table below displays a full breakdown of the sector allocation of the Fund as well as the top ten positions as of December 31, 2004.
| | | |
Top Ten Holdings (out of 65 securities)
| | % Fund
| |
Sanlam, Ltd.* | | 3.0 | % |
Terkcell Iletisim Hizmetleri A.S. | | 2.8 | |
Turkiye Is Bankasi (Isbank) | | 2.5 | |
Hyundai Motor Co., Ltd.* | | 2.4 | |
Barloworld Ltd. | | 2.4 | |
Samsung Electronics, Ltd., GDR representing 1/2 voting shares * | | 2.3 | |
Telekomunikacja Polska S.A., Sponsored GDR | | 2.2 | |
Grupo Financiero Banorte S.A. de C.V. | | 2.0 | |
Hankook Tire Co., Ltd. | | 2.0 | |
Petroleo Brasileiro S.A., Sponsored ADR | | 2.0 | |
| | |
|
|
Top Ten as a Group | | 23.6 | % |
| | |
|
|
| * | Top Ten Holding at December 31, 2003 |
| | | |
| |
Industry Weightings
| | | |
Financials | | 18.1 | % |
Telecommunication Services | | 17.8 | |
Industrials | | 11.8 | |
Energy | | 9.7 | |
Materials | | 9.5 | |
Information Technology | | 9.3 | |
Consumer Discretionary | | 8.5 | |
Consumer Staples | | 6.2 | |
Health Care | | 5.2 | |
Utilities | | 2.8 | |
Other | | 1.1 | |
34
Managers Emerging Markets Equity Fund
December 31, 2004
| | |
| Schedule of Portfolio Investments | | Emerging Markets |
| | | | | | |
Security Description
| | Shares
| | | Value
|
Common Stocks – 98.9% | | | | | | |
Consumer Discretionary – 8.5% | | | | | | |
Consorcio ARA, S.A. de C.V. (Mexico)* | | 330,000 | | | $ | 991,747 |
Genting Berhad (Malaysia) | | 189,600 | | | | 947,028 |
Hankook Tire Co., Ltd. (South Korea) | | 130,000 | | | | 1,275,805 |
Hyundai Motor Co., Ltd. (South Korea)* | | 55,000 | | | | 1,529,675 |
Land and Houses PCL (Thailand) | | 2,500,000 | | | | 650,593 |
Total Consumer Discretionary | | | | | | 5,394,848 |
Consumer Staples - 6.2% | | | | | | |
Cia Brasileira de Distribuicao Grupo Pao de Acucar (Brazil) | | 31,000 | 2 | | | 793,600 |
IOI Corp., Berhad (Malaysia) 5 | | 416,000 | | | | 1,038,281 |
IOI Oleochemical Industries Berhad (Malaysia) | | 416 | | | | 1,051 |
PT Hanjaya Mandala Sampoerna Tbk (Indonesia) | | 1,600,000 | | | | 1,146,023 |
Shinsegae Co., Ltd. (South Korea) | | 3,500 | | | | 959,934 |
Total Consumer Staples | | | | | | 3,938,889 |
Energy – 9.7% | | | | | | |
China Oilfield Services, Ltd. (China) | | 3,083,000 | | | | 942,197 |
China Petroleum and Chemical Corp., Class H (Hong Kong) | | 2,265,000 | | | | 926,902 |
Companhia Energetica de Minas Gerais (Brazil) | | 46,000,000 | | | | 1,124,021 |
LUKOIL Holdings, ADR (Russia) | | 7,700 | | | | 934,780 |
Petroleo Brasileiro S.A., Sponsored ADR (Brazil) | | 31,600 | 2 | | | 1,257,048 |
Surgutneftegaz Sponsored ADR (Russia)* | | 26,000 | 2 | | | 975,000 |
Total Energy | | | | | | 6,159,948 |
Financials - 18.1% | | | | | | |
Bank Hapoalim, Ltd. (Israel) | | 320,000 | | | | 1,080,067 |
Fubon Financial Holding Co., Ltd. (Taiwan) | | 939,000 | | | | 959,856 |
Grupo Financiero Banorte S.A. de C.V. (Mexico) | | 206,000 | | | | 1,297,317 |
ICICI Bank Ltd., ADR (India) | | 38,000 | 2 | | | 765,700 |
ICICI Banking Corp. (India) | | 22,204 | | | | 189,456 |
Kookmin Bank, Sponsored ADR (South Korea)* | | 31,257 | 2 | | | 1,221,524 |
Sanlam, Ltd. (South Africa) | | 820,000 | | | | 1,892,168 |
Savings Bank of The Russian Federation (Russia)* | | 10,562 | 2 | | | 518,594 |
SM Prime Holdings, Inc. (Philippines) | | 800 | | | | 110 |
Turkiye Is Bankasi (Isbank) (Turkey) | | 287,500,000 | | | $ | 1,588,339 |
Uniao de Bancos Brasileiros SA (Brazil) | | 38,000 | 2 | | | 1,205,360 |
Yuanta Core Pacific Securities Co. (Taiwan) | | 1,071,380 | | | | 814,911 |
Total Financials | | | | | | 11,533,402 |
Health Care - 5.2% | | | | | | |
Ranbaxy Laboratories, Ltd., GDR (India)* | | 38,560 | | | | 1,110,054 |
Richter Gedeon Rt (Hungary) | | 9,565 | | | | 1,201,416 |
Teva Pharmaceutical Industries, Ltd., Sponsored ADR (Israel) | | 33,000 | | | | 985,380 |
Total Health Care | | | | | | 3,296,850 |
Industrials - 11.8% | | | | | | |
Alfa, S.A. (Mexico) | | 233,000 | | | | 1,191,442 |
Barloworld Ltd (South Africa) | | 80,000 | | | | 1,509,474 |
Daelim Industrial Co., Ltd. (South Korea) | | 21,200 | | | | 1,098,170 |
EVA Airways Corp. (Taiwan)* | | 1,881,000 | | | | 928,132 |
Malaysia International Shipping Corporation Berhad (Malaysia) | | 225,000 | | | | 905,288 |
Reliance Industries Ltd., Sponsored GDR (India) (a)* | | 37,000 | | | | 953,120 |
Sime Darby Berhad (Malaysia) | | 600,000 | | | | 947,368 |
Total Industrials | | | | | | 7,532,994 |
Information Technology - 9.3% | | | | | | |
Advanced Semiconductor Engineering, Inc. (Taiwan)* | | 876,584 | | | | 666,481 |
Compal Electronics Inc. (Taiwan) | | 720,000 | | | | 720,055 |
Hon Hai Precision Industry Co., Ltd. (Taiwan) | | 251,849 | | | | 1,169,741 |
Mediatek, Inc. (Taiwan)* | | 147,365 | | | | 1,006,666 |
Samsung Electronics Co., Ltd., GDR, (South Korea) (a)* | | 6,670 | | | | 1,451,331 |
Taiwan Semiconductor Manufacturing Co., Ltd. (Taiwan) | | 912 | | | | 1,453 |
United Microelectronics Corp. (Taiwan)* | | 1,438,000 | | | | 931,333 |
Total Information Technology | | | | | | 5,947,060 |
Materials - 9.5% | | | | | | |
Anglo American PLC (United Kingdom) | | 50,000 | | | | 1,179,798 |
Compania Vale do Rio Doce – ADR (Brazil) | | 42,000 | | | | 1,218,420 |
Formosa Chemicals & Fibre Corp. (Taiwan) | | 600 | | | | 1,145 |
GMK Norilsk Nickel, Sponsored ADR (Russia)* | | 16,000 | 2 | | | 888,000 |
The accompanying notes are an integral part of these financial statements.
35
Managers Emerging Markets Equity Fund
December 31, 2004
| | |
| Schedule of Portfolio Investments (continued) | | Emerging Markets |
| | | | | | | |
Security Description
| | Shares
| | | Value
| |
Materials (continued) | | | | | | | |
Hindalco Ind., Ltd., Sponsored GDR, (India) (a)* | | 31,500 | 2 | | $ | 1,033,912 | |
Sappi Ltd. (South Africa) | | 50,143 | | | | 733,418 | |
Siam Cement Public Co., Ltd., The (Thailand)* | | 135,000 | | | | 959,950 | |
Total Materials | | | | | | 6,014,643 | |
Telecommunication Services - 17.8% | | | | | | | |
Advanced Information Services PCL (Thailand) | | 350,000 | | | | 965,547 | |
Cesky Telecom a.s. (Czech Republic) | | 63,300 | | | | 1,047,884 | |
China Mobile Ltd. (Hong Kong) | | 326,000 | | | | 1,112,475 | |
China Telecom Corp., Ltd., Class H (China) | | 3,204,000 | | | | 1,174,709 | |
Compania Anonima Nacional | | | | | | | |
Telefonos de Venezuela, ADR | | 43,200 | | | | 967,248 | |
Maxis Communications Berhad (Malaysia) | | 370,000 | | | | 910,806 | |
Telecom Argentina Stet France Telecom S.A., Sponsored ADR | | 84,000 | | | | 920,640 | |
Telekomunikacja Polska S.A., Sponsored GDR (Poland) (a)* | | 208,000 | | | | 1,374,900 | |
Telekomunikasi Indonesia Tbk P (Indonesia) | | 2,000,000 | | | | 1,039,127 | |
Turkcell Iletisim Hizmetleri A.S. (Turkey) | | 250,688,690 | | | | 1,778,133 | |
Total Telecommunication Services | | | | | | 11,291,469 | |
Utilities - 2.8% | | | | | | | |
Empresa Nacional de Electricidad SA/Chile, ADR (Chile) | | 45,000 | 2 | | | 820,801 | |
Gail India Ltd. (India) | | 115,000 | | | | 611,559 | |
Gail India, Ltd., Regulated S GDR (India)* | | 10,608 | 2 | | | 337,787 | |
Total Utilities | | | | | | 1,770,147 | |
Total Common Stocks (cost $47,322,966) | | | | | | 62,880,250 | |
Other Investment Companies – 10.9%1 | | | | | | | |
Bank of New York Institutional Cash Reserves Fund, 2.35%3 | | 6,418,419 | | | | 6,418,419 | |
JPMorgan Prime Money Market Fund, Institutional Class Shares, 2.12% | | 487,232 | | | | 487,232 | |
Total Other Investment Companies
(cost $6,905,651) | | | | | | 6,905,651 | |
Total Investments – 109.8%
(cost $54,228,617) | | | | | | 69,785,901 | |
Other Assets, less Liabilities – (9.8)% | | | | | | (6,219,236 | ) |
Net Assets - 100.0% | | | | | $ | 63,566,665 | |
|
| Summary of Investments by Country | |
| | |
Country
| | Managers
Emerging
Markets Equity
Fund*
| | | MSCI EMF Index
| |
South Korea | | 11.8 | % | | | 17.7 | % |
Taiwan | | 11.3 | | | | 14.0 | |
Brazil | | 8.8 | | | | 9.7 | |
India | | 7.8 | | | | 5.7 | |
Malaysia | | 7.5 | | | | 4.0 | |
South Africa | | 6.5 | | | | 12.5 | |
Mexico | | 5.5 | | | | 6.5 | |
Russia | | 5.2 | | | | 3.6 | |
Turkey | | 5.2 | | | | 1.8 | |
Thailand | | 4.1 | | | | 2.5 | |
Indonesia | | 3.4 | | | | 1.9 | |
China | | 3.3 | | | | 7.8 | |
Hong Kong | | 3.2 | | | | 0.0 | |
Israel | | 3.2 | | | | 2.9 | |
Poland | | 2.2 | | | | 2.0 | |
United Kingdom | | 1.9 | | | | 0.0 | |
Hungary | | 1.9 | | | | 1.6 | |
Czech Republic | | 1.6 | | | | 0.8 | |
Venezuela | | 1.5 | | | | 0.2 | |
United States | | 1.4 | | | | 0.0 | |
Argentina | | 1.4 | | | | 0.5 | |
Chile | | 1.3 | | | | 2.0 | |
Colombia | | 0.0 | | | | 0.2 | |
Egypt | | 0.0 | | | | 0.4 | |
Jordan | | 0.0 | | | | 0.2 | |
Morocco | | 0.0 | | | | 0.3 | |
Pakistan | | 0.0 | | | | 0.2 | |
Peru | | 0.0 | | | | 0.5 | |
Philippines | | 0.0 | | | | 0.5 | |
| * | As a percent of total market value of common stocks on December 31, 2004. |
The accompanying notes are an integral part of these financial statements.
36
Managers Bond Fund (“Bond”) seeks current income by investing in fixed-income securities. Daniel Fuss of Loomis, Sayles & Co. L.P. (“Loomis”), who has been managing a portion of the Fund since its inception in 1984, is the subadvisor for this Fund. Prior to April 1993, the Fund utilized a dual investment manager structure.
The Portfolio Manager
Dan Fuss is a contrarian bond investor who focuses on individual issues that will provide the highest return over long periods of time. Dan and his team of credit analysts at Loomis research debt offerings in the same way equity analysts research stocks – looking for undervalued bonds where they see a yield premium, the potential for price appreciation, or both. They analyze the company’s financial condition in detail, as well as the terms of specific bond offerings. Price appreciation can come from a variety of catalysts, including improving company fundamentals, which would lead to credit upgrades, changing market supply and demand forces, and improving sector or economic trends.
Given the typical shape of the yield curve, longer-term bonds generally yield more than shorter-term bonds, and Dan is willing to take the added interest rate risk in order to gain higher yields. In addition, price improvements as a result of credit upgrades are more meaningful for longer-term bonds, thus Dan’s portfolios tend to be relatively long in duration*. In order to mitigate some of the interest rate risk, Dan structures his portfolio with counter-cyclical elements. In doing so, Dan will utilize convertible bonds, municipal bonds, preferred stocks, foreign corporate and government bonds, in addition to the domestic corporate bonds which make up the majority of the portfolio. In addition, Dan seeks bonds with call protection, either through the terms of the bond structure or through deep price discounts relative to the call price.
The Year in Review
Interest rates fluctuated in 2004 due to improving economic fundamentals, despite some mixed data, and a diminishing risk aversion on behalf of investors. U.S. interest rates displayed some volatility in the first and second quarters, with yields falling sharply in the first quarter and then rising quickly in the second, causing the second quarter performance of the bond market to be lackluster. Starting in the second half of the year, yields began to fall again, and leveled out somewhat in the last few months of the fourth quarter. Long rates (10+ years) began the year near 5%, moved up to almost 5.3% by mid-year, and then fell down toward 4.7% by year-end. Overall, the yield curve flattened as short rates were raised in 25 basis point (bp) increments to 2.25 % from 1 % at each FOMC meeting beginning in June, and longer rates declined by a much smaller amount. For the year, Treasury bonds returned some of the lowest returns, while corporate bonds and other non-government (or “spread”) sectors performed better. U.S. investment grade corporate bonds posted a 5.39% return for the year as credit quality, and the economic backdrop as a whole, continued to improve. Such perceived improvements, combined with investors’ increased risk appetite and a low interest rate environment, pushed high yield bonds over 11% higher in 2004 — certainly not as robust as levels seen last year, but impressive nonetheless. Mortgages and other asset-backed securities performed similarly to Treasuries. With increased Fed Funds rates and the Treasury facing huge budget deficits which flooded the market with new issuance, bond yields should have been higher in 2004. However, although short maturity bond yields did rise, longer maturity bonds remained roughly flat, partly due to strong foreign buying, geopolitical risk and economic worries.
The Fund performed well in 2004, posting a total return of 5.14%, compared with a return of 4.19% for the benchmark Lehman Brothers Government/Credit Index (LB G/C). 2004 was the Fund’s 10th consecutive year of positive total returns and it has now outperformed the LB G/C in 12 of the last 16 quarters.
The Fund’s conservative posture that portfolio manager Dan Fuss implemented in late 2002, helped the Fund weather the volatility of interest rates in 2003 and 2004. The strong performance of high yield, longer-duration corporates again complemented Loomis’ investment philosophy in 2004. Thus, the Fund has continued to offer reasonable returns vis-à-vis the tightening of credit spreads, but at the same time has been more protected against a sudden rise in rates. Looking at the first quarter bond market rally, the Fund’s overweight in corporates helped its relative performance. In the second quarter, the Lehman Aggregate Bond Index had its worst quarter since 1Q94. Fewer than 10% of the Fund’s positions offered positive returns during the second quarter, however, Dan’s strategy proved somewhat additive as the shorter governments offered some ballast in an extremely challenging period. The bond market rallied back again in the third quarter behind increasing evidence of an economic slowdown and the rather conservative language and policy responses of the Federal Open Market Committee (FOMC.) The Fund’s third quarter return more than erased the losses of the previous quarter. The Lehman Brothers Aggregate Index rallied for its best quarterly return since the third quarter of 2002. At the same time, the FOMC began increasing short-term rates, beginning 6/30/04 when it hiked from 1% to 1.25% and at every meeting thereafter until winding up the year at 2.25%. The so-called “spread” sectors (credits, mortgage-backed securities (MBS), asset-backed securities (ABS), and commercial mortgage-backed securities (CMBS) outperformed similar duration Treasuries in the quarter, helping the Fund return 3.86% in the third quarter. The Fund’s allocation to U.S. Governments and Agencies was over 30%, remarkably high for Fuss. In an aggregate sense, all of these moves should have limited performance in a period such as the third quarter, when longer-duration, lower-quality strategies worked the best. And yet, through good bond selection, the Fund managed to slightly outperform the LB G/C and fall into the top quartile of its peer group. As the final quarter of 2004 approached, Fuss remained concerned about some of the fundamentals underlying the market, such as continued conflicts in places like Iraq and Afghanistan suggesting more pressure on
37
the federal deficit, which could then grow to strain the capital markets. Secondly, the narrower yield spreads between Treasuries and corporates made corporate bonds less attractive in the near term. Finally, Fuss had noted that some of the recent performance in the market was liquidity driven, which can be an extremely dangerous wild card in fixed income investing. As a result, he maintained the Fund’s conservative posture. Specifically during the fourth quarter, the Fund’s best performing positions were a combination of non-U.S. dollar bonds and (again) below investment grade bonds. The Fund has held around 10% allocation in each of those sectors, and the positions have, for the most part, been positive contributors during this past year. In addition to the improvement in fundamentals and the extra return through currency exposure, some of the Fund’s holdings also benefited from an increase in demand relative to supply. The addition of shorter-maturity Agencies and Treasuries pulled the Fund’s overall duration down to 4.06 vs. 5.22 for the LB G/C by year-end. Looking back, Dan has reduced the Fund’s modified duration from a high of over 11 years in late 1999 and early 2000 to just under 6 years heading into 2004. It’s important to note, however, that this duration management is not a deviation from Fuss’s normal investment philosophy. Indeed, the core of the portfolio has remained invested in those corporate bonds that the Loomis credit analysts find attractive in an improving credit quality environment with allocations to Government/Agencies, high yield and non-dollar bonds. It has been those credits that have helped continue to drive performance, balancing the portfolio’s move into somewhat shorter government securities. Over the past several years, the Loomis research effort has done an excellent job at avoiding, or at least minimizing the cost of, credit blowups and the Fund has benefited from the relatively higher yielding bonds in the portfolio without having to sacrifice capital losses on poorly performing credits.
Looking Ahead
Portfolio manager Dan Fuss has been very vocal about his firm’s expectations for tighter monetary policy and higher interest rates and heading into 2005, the Fund has maintained its cautious duration positioning. As we’ve written in previous quarterly comments, portfolio manager Dan Fuss has repositioned the portfolio to be much less sensitive to the overall change in interest rates than normal. As such, the Fund is positioned to perform well if rates rise sharply but the trend in corporate credit quality continues to improve, as Fuss expects. Approximately 40% of the Fund was invested in Agency and Government debt, the bulk of which were in short Treasuries. Still, the balance of the Fund remains invested in classic “Loomis-like” corporate bonds. Indeed, despite the Fund’s shorter duration, it still maintained a slight yield-to-maturity advantage compared to the LB G/C at year end. Also, despite the shorter duration positioning, Dan has commented that a rise in rates could actually be a good thing for the Fund. He believes that as rates rise, he will have more of an opportunity to reinvest those maturing shorter Treasuries into potentially higher yielding corporate bonds. Thus, reinvestment risk, normally something that Dan wants to minimize, could possibly prove to be an opportunity in the period ahead
Going forward, Dan and the investment team at Loomis remain concerned about a few items, particularly their outlook for the Federal budget deficit which will spur the government to borrow more thereby pushing interest rates higher, but also terrorism and the Iraq situation. While braced for a continued rise in rates, the Fund could also perform well if corporate bond spreads continue to benefit from the improvement in economic activity and credit outlooks. Also, Fuss has maintained a modest allocation to non-dollar and high yield bonds so as to introduce some non-market related potential into the Fund. Loomis uses its research driven investment process to take advantage of different opportunities in the bond market.
Loomis’ 2005 outlook adds, “Moderate economic growth, inflation and yield increases are seen for 2005. Structured finance and corporate bonds should earn higher returns than Treasuries given their yield advantage, even if it is less generous than before.
The Fed appears determined to raise rates in a deliberate fashion this year. We forecast the funds rate to end 2005 roughly 100 basis points (bps) higher, with a similar move in bond yields as the economy is still growing strong… Rising rates could mean lackluster returns for Treasuries. Global governments on both a hedged basis and unhedged basis remain an attractive alternative. Corporate spreads are tight, raising the risk of potentially underperforming… In a low yield environment, income is critical to performance and we anticipate the better returns may come from BBB and below holdings. The narrowness of high yield and emerging markets spreads argues against expecting outsized gains from these sectors for a third year in a row. However, we see the yield advantage as being sufficient to allow the sectors to at least be some of the better performers in 2005.”
Cumulative Total Return Performance
Bond’s cumulative total return is based on the daily change in net asset value (NAV), and assumes that all distributions were reinvested. The Lehman Brothers Government/Credit Index is comprised of 4,864 government securities and investment grade corporate securities. The index assumes reinvestment of all income. This chart compares a hypothetical $10,000 investment made in the Bond Fund on December 31, 1994, to a $10,000 investment made in the Lehman Brothers Government/Credit Index for the same time period. The chart is not intended to imply any future performance of the Fund. The graph and chart do not reflect the deduction of taxes that a shareholder would pay on a Fund distribution or redemption of shares. Total Returns would have been lower had certain expenses not been reduced.
38
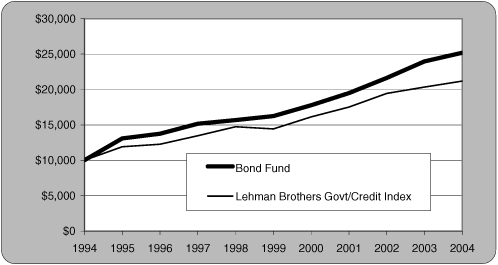
The table below shows the average annual total returns for Bond Fund and the Lehman Brothers Government/Credit Index from December 31, 1994 through December 31, 2004.
| | | | | | | | | |
Average Annual Total Returns:
| | 1 Year
| | | 5 Years
| | | 10 Years
| |
Bond Fund | | 5.14 | % | | 9.17 | % | | 9.68 | % |
Lehman Brothers Government/Credit Index | | 4.19 | % | | 8.00 | % | | 7.80 | % |
| * | Duration is the weighted average time (typically quoted in years) to the receipt of cash flows (principal + interest) of a bond or portfolio. It is used to evaluate the interest rate sensitivity of a bond or portfolio. The longer the duration, the more sensitive the price of the bond is to movement in interest rates. |
39
Managers Bond Fund
December 31, 2004
| | |
| Schedule of Portfolio Investments | | Bond |
| | | | | | | | | |
Security Description
| | | | Principal
Amount
| | | Value
|
Corporate Bonds – 43.2% | | | | | | | | | |
Asset-Backed Security - 1.8% | | | | | | | | | |
Bank of America-First Union National Bank Commercial Mortgage, Series 2001-3, Class A2, 5.464%, 04/11 /37 | | | | $ | 1,500,000 | | | $ | 1,586,394 |
Community Program Loan Trust, Series 87-A, Class A4, 4.500%, 10/01/18 | | | | | 232,259 | | | | 232,318 |
Community Program Loan Trust, Series 87-A, Class A5, 4.500%, 04/01/29 | | | | | 3,225,000 | | | | 2,991,911 |
Total Asset-Backed Security | | | | | | | | | 4,810,623 |
Convertible Bonds – 2.0% | | | | | | | | | |
Loews Corp., 3.125%, 09/15/07 | | | | | 1,920,000 | 2 | | | 1,886,400 |
Devon Energy Corp., 4.900%, 08/15/08 | | | | | 1,250,000 | | | | 1,373,438 |
Devon Energy Corp., 4.950%, 08/15/08 | | | | | 1,692,000 | | | | 1,859,085 |
Total Convertible Bonds | | | | | | | | | 5,118,923 |
Finance - 11.3% | | | | | | | | | |
ASIF Global Financial, 2.380%, 02/26/09 (a) | | SGD | | | 5,800,000 | | | | 3,557,086 |
Cerro Negro Finance Ltd., 7.900%, 12/01/20 (a) | | | | | 500,000 | | | | 499,375 |
Citigroup, Inc., 3.500%, 02/01/08 | | | | | 2,020,000 | | | | 2,010,993 |
EOP Operating LP, 6.750%, 02/15/12 | | | | | 500,000 | | | | 556,597 |
First Industrial L.P., 7.600%, 07/15/28 | | | | | 1,750,000 | | | | 1,969,776 |
First Industrial L.P., Medium Term, 7.500%, 12/01/17 | | | | | 1,145,000 | | | | 1,302,172 |
Ford Motor Credit Co., 7.250%, 02/22/05 | | GBP | | | 650,000 | | | | 1,249,933 |
General Motors Acceptance Corp., 5.625%, 05/15/09 | | | | | 500,000 | 2 | | | 500,018 |
GMAC International Finance BV, 8.000%, 03/14/07 | | NZD | | | 950,000 | | | | 687,695 |
GMAC, 6.125%, 01/22/08 | | | | | 2,000,000 | | | | 2,058,656 |
GMAC, 6.875%, 09/15/11 | | | | | 250,000 | | | | 256,198 |
GMAC, 7.000%, 12/07/05 | | GBP | | | 250,000 | | | | 485,879 |
GMAC, 7.500%, 12/01/06 | | NZD | | | 1,000,000 | | | | 716,630 |
Highwoods Properties, Inc., 7.500%, 04/15/18 | | | | | 2,250,000 | | | | 2,413,033 |
Inter-American Development Bank, 0.000%, 05/11/094 | | BRL | | | 6,500,000 | | | | 1,289,966 |
International Bank for Reconstruction & Development, 0.000%, 08/20/074 | | NZD | | | 4,800,000 | | | | 2,936,031 |
JPMorgan Chase & Co., 4.000%, 02/01/08 | | | | | 1,000,000 | | | | 1,006,627 |
KeyCorp Capital II, 6.875%, 03/17/29 | | | | | 500,000 | | | | 543,675 |
Loews Corp., 7.000%, 10/15/23 | | | | | 150,000 | | | | 151,948 |
Morgan Stanley & Co., Inc., 3.625%, 04/01/08 | | | | | 2,100,000 | | | | 2,088,511 |
New Plan Excel Realty Trust, 5.875%, 06/15/07 | | | | | 1,250,000 | | | | 1,301,359 |
NiSource Finance Corp., 6.150%, 03/01/13 | | | | | 1,250,000 | 2 | | | 1,355,060 |
Spieker Properties, Inc., 7.350%,12/01/17 | | | | | 250,000 | | | | 286,438 |
Total Finance | | | | | | | | | 29,223,656 |
Industrials - 23.1% | | | | | | | | | |
Abitibi-Consolidated, Inc., 7.500%, 04/01/28 | | | | | 500,000 | | | | 444,375 |
Altria Group, Inc., 7.000%, 11 /04/13 | | | | | 1,500,000 | 2 | | | 1,625,324 |
America Movil, S.A. de C.V., 4.125%, 03/01/09 | | | | | 3,000,000 | 2 | | | 2,955,410 |
American Airlines, Inc., 8.608%, 04/01/11 | | | | | 125,000 | 2 | | | 115,019 |
American Airlines, Inc., Series 01-2, 6.978%, 04/01/11 | | | | | 1,822,984 | | | | 1,822,109 |
American President, Ltd., 8.000%, 01/15/24 | | | | | 250,000 | | | | 268,125 |
Arrow Electronics, Inc., 6.875%, 07/01/13 | | | | | 500,000 | 2 | | | 548,960 |
Bausch & Lomb, Inc., 7.125%, 08/01/28 | | | | | 500,000 | | | | 532,749 |
Bowater, Inc., 6.500%, 06/15/13 | | | | | 500,000 | 2 | | | 500,071 |
Cia Brasileira de Bebida, 8.750%, 09/15/13 | | | | | 3,795,000 | | | | 4,421,174 |
Clear Channel Communications, 4.250%, 05/15/09 | | | | | 1,500,000 | | | | 1,484,820 |
Clear Channel Communications, 5.750%, 01/15/13 | | | | | 500,000 | | | | 516,627 |
Continental Airlines Inc., Series 991 A, 6.545%, 02/02/19 | | | | | 4,384,574 | | | | 4,355,991 |
The accompanying notes are an integral part of these financial statements.
40
Managers Bond Fund
December 31, 2004
| | |
| Schedule of Portfolio Investments (continued) | | Bond |
| | | | | | | |
Security Description
| | Principal
Amount
| | | Value
|
Industrials (continued) | | | | | | | |
Continental Airlines, Inc., 6.648%, 09/15/17 | | $ | 1,649,351 | | | $ | 1,602,021 |
Continental Airlines, Inc., 6.795%, 08/02/20 | | | 83,824 | | | | 73,252 |
Continental Airlines, Inc., Series 01-1, 6.703%, 06/15/21 | | | 403,287 | | | | 392,042 |
Continental Airlines, Inc., Series 99-2, 7.256%, 03/15/20 | | | 379,029 | | | | 387,861 |
Delphi Corp., 7.125%, 05/01/29 | | | 1,950,000 | | | | 1,833,357 |
Dillards, Inc., 7.000%, 12/01/28 | | | 225,000 | | | | 217,125 |
Foot Locker, Inc., 8.500%, 01/15/22 | | | 570,000 | | | | 627,000 |
Ford Motor Co., 6.375%, 02/01/29 | | | 2,500,000 | | | | 2,249,840 |
General Motors Corp., 6.750%, 05/01/28 | | | 500,000 | 2 | | | 474,147 |
Georgia-Pacific Corp., 7.250%, 06/01/28 | | | 500,000 | | | | 535,000 |
Georgia-Pacific Corp., 7.750%, 11/15/29 | | | 925,000 | | | | 1,036,000 |
HCA, Inc., 5.750, 03/15/14 | | | 2,500,000 | 2 | | | 2,421,807 |
HCA, Inc., 6.250%, 02/15/13 | | | 1,940,000 | | | | 1,957,010 |
HCA, Inc., 7.050%, 12/01/27 | | | 1,600,000 | | | | 1,516,608 |
HCA, Inc., 7.580%, 09/15/25 | | | 125,000 | | | | 125,630 |
Health Care Property, Inc., 6.000%, 03/01/15 | | | 1,500,000 | | | | 1,591,634 |
Hutchison Whampoa International, Ltd, 5.450%, 11/24/10 (a) | | | 2,225,000 | | | | 2,304,386 |
International Paper Co., 4.000%, 04/01/10 | | | 1,000,000 | | | | 980,398 |
International Paper Co., 4.250%, 01/15/09 | | | 1,000,000 | | | | 1,003,662 |
Kellwood Co., 7.625%, 10/15/17 | | | 250,000 | | | | 274,948 |
Lowe’s Co., Inc., 6.875%, 02/15/28 | | | 500,000 | | | | 589,743 |
MacMillan Bloedel Ltd., 7.700%, 02/15/26 | | | 1,350,000 | | | | 1,591,105 |
Motorola, Inc., 5.800%, 10/15/08 | | | 250,000 | 2 | | | 264,923 |
Motorola, Inc., 7.625%, 11/15/10 | | | 375,000 | | | | 434,986 |
Motorola, Inc., 8.000%, 11/01/11 | | | 1,075,000 | 2 | | | 1,285,656 |
Penney (JC), Co., 7.125%, 11/15/23 | | | 33,000 | | | | 35,145 |
PF Export Rec Master Trust, 6.436%, 06/01/15 (a) | | | 847,273 | | | | 842,113 |
Pulte Homes, Inc., 7.625%, 10/15/17 | | | 500,000 | | | | 580,176 |
Raytheon Co., 6.400%, 12/15/18 | | | 400,000 | | | | 441,375 |
Raytheon Co., 7.000%, 11/01/28 | | | 1,500,000 | | | | 1,743,335 |
Raytheon Co., 7.200%, 08/15/27 | | | 800,000 | 2 | | | 946,807 |
Samsung Electronics Co., Ltd., 7.700%, 10/01/27 (a) | | | 1,800,000 | | | | 2,032,574 |
Schering-Plough Corp., 5.300%, 12/01/13 | | | 1,500,000 | | | | 1,567,737 |
Sprint Capital Corp., 6.875%, 11/15/28 | | | 2,300,000 | | | | 2,518,009 |
Sprint Capital Corp., 6.900%, 05/01/19 | | | 500,000 | | | | 559,345 |
Teck Cominco Ltd., 7.000%, 09/15/12 | | | 1,000,000 | | | | 1,108,371 |
Telekom Malaysia Berhad, 7.875%, 08/01/25 (a) | | | 250,000 | | | | 305,836 |
US West Communications, Inc., 7.250%, 09/15/25 | | | 500,000 | | | | 486,250 |
Weyerhaeuser Co., 6.950%, 10/01/27 | | | 250,000 | | | | 279,313 |
Williams Co., Inc., Series A, 7.500%, 01/15/31 | | | 1,000,000 | | | | 1,035,000 |
Total Industrials | | | | | | | 59,842,281 |
Utility - 5.0% | | | | | | | |
Coastal Corp., 6.950%, 06/01/28 | | | 300,000 | | | | 263,250 |
Constellation Energy Group Inc., 4.550%, 06/15/15 | | | 1,675,000 | | | | 1,598,846 |
El Paso Corp., 6.750%, 05/15/09 | | | 250,000 | 2 | | | 253,750 |
El Paso Corp., 7.000%, 05/15/11 | | | 500,000 | 2 | | | 505,625 |
Empresa Nacional de Electricidad SA, 8.625%, 08/01/15 | | | 300,000 | | | | 359,224 |
Empresa Nacional de Electricidad, Yankee, 7.875%, 02/01/27 | | | 2,900,000 | | | | 3,073,324 |
Enersis SA, Yankee, 7.400%, 12/01/16 | | | 225,000 | | | | 246,146 |
Global Marine, Inc., 7.000%, 06/01/28 | | | 250,000 | | | | 287,430 |
KN Capital Trust III, 7.630%, 04/15/28 | | | 250,000 | | | | 279,600 |
The accompanying notes are an integral part of these financial statements.
41
Managers Bond Fund
December 31, 2004
| | |
| Schedule of Portfolio Investments (continued) | | Bond |
| | | | | | | | | |
Security Description
| | | | Principal
Amount
| | | Value
|
Utility (continued) | | | | | | | | | |
MidAmerican Energy Holdings, 5.875%, 10/01/12 | | | | $ | 750,000 | | | $ | 794,731 |
Petroleos Mexicanos, 8.625%, 12/01/23 (a) | | | | | 950,000 | | | | 1,100,575 |
Southern Natural Gas Co., 7.350%, 02/15/31 | | | | | 1,000,000 | | | | 1,037,500 |
Tenaga Nasional Berhad, 7.500%, 11/01/25 (a) | | | | | 2,000,000 | | | | 2,347,380 |
Tennessee Gas Pipeline Co., 7.500%, 04/01/17 | | | | | 250,000 | 2 | | | 275,625 |
Transocean, Inc., 7.375%, 04/15/18 | | | | | 500,000 | | | | 591,538 |
Total Utility | | | | | | | | | 13,014,544 |
Total Corporate Bonds
(cost $101,999,731) | | | | | | | | | 112,010,027 |
Foreign Government and Agency Obligations - 4.9% | | | | | | | | | |
British Columbia, Province of, 6.000, 06/09/08 | | CAD | | | 560,000 | | | | 505,204 |
Kommunekredit, 5.000%, 06/07/06 | | NOK | | | 1,600,000 | | | | 273,762 |
Manitoba, Province of, 5.750%, 06/02/08 | | CAD | | | 3,800,000 | | | | 3,401,526 |
Mexican Government, 9.000%, 12/20/12 | | MXN | | | 520,000 | | | | 4,494,662 |
Mexico Government, 7.500%, 01/14/12 | | | | | 1,250,000 | | | | 1,417,500 |
New Zealand Government, 6.000%, 11 /15/11 | | NZD | | | 500,000 | | | | 361,622 |
Ontario Province, 5.900%, 03/08/06 | | CAD | | | 585,000 | | | | 505,664 |
Province of Alberta, Series CS, Sinking Fund, 5.930%, 09/16/16 | | CAD | | | 207,423 | | | | 188,404 |
Republic of South Africa, Yankee, 8.500%, 06/23/17 | | | | | 1,175,000 | | | | 1,474,625 |
Total Foreign Government and Agency Obligations
(cost $11,215,647) | | | | | | | | | 12,622,969 |
U.S. Government and Agency Obligations – 46.9% | | | | | | | | | |
U.S. Government Agency Obligations – 17.0% | | | | | | | | | |
FHLMC, 2.875%, 09/01/05 | | | | | 3,500,000 | | | | 3,501,145 |
FHLMC, 3.220%, 06/20/07 | | SGD | | | 500,000 | | | | 316,302 |
FHLMC, Gold, 5.000%, 12/01/31 | | | | | 289,288 | 2 | | | 288,134 |
FHLMC, 5.500%, 09/15/11 | | | | | 5,090,000 | | | | 5,468,533 |
FHLMC, 5.250%, 01/01/06 | | | | | 3,300,000 | | | | 3,370,689 |
FNMA, 2.290%, 02/19/09 | | SGD | | | 3,800,000 | | | | 2,330,801 |
FNMA, 2.375%, 02/15/07 | | | | | 7,000,000 | 2 | | | 6,870,479 |
FNMA, 3.250%, 01/15/08 | | | | | 3,000,000 | 2 | | | 2,976,939 |
FNMA, 4.000%, 10/01/18 | | | | | 5,988,542 | | | | 5,857,133 |
FNMA, 4.000%, 10/01/18 | | | | | 6,497,953 | | | | 6,355,365 |
FNMA, 5.000%, 01/15/07 | | | | | 3,200,000 | | | | 3,307,952 |
FNMA, 5.250%, 04/15/07 | | | | | 3,200,000 | | | | 3,334,195 |
FNMA, 6.000%, 07/01/29 | | | | | 37,746 | | | | 39,164 |
Total U.S. Government Agency Obligations | | | | | | | | | 44,016,831 |
U.S. Treasury Notes - 29.9% | | | | | | | | | |
USTN, 1.625%, 02/28/06 | | | | | 12,000,000 | 2 | | | 11,837,340 |
USTN, 1.625%, 09/30/05 | | | | | 3,500,000 | 2 | | | 3,474,160 |
USTN, 1.625%, 10/31/05 | | | | | 7,000,000 | 2 | | | 6,940,115 |
USTN, 1.875%, 12/31/05 | | | | | 11,000,000 | 2 | | | 10,904,608 |
USTN, 2.375%, 08/15/06 | | | | | 985,000 | 2 | | | 975,650 |
USTN, 2.750%, 06/30/06 | | | | | 40,000,000 | 2 | | | 39,892,200 |
USTN, 3.500%, 11/15/06 | | | | | 3,400,000 | 2 | | | 3,428,689 |
Total U.S. Treasury | | | | | | | | | 77,452,762 |
Total U.S. Government and Agency Obligations (cost $121,850,439) | | | | | | | | | 121,469,593 |
| | | |
| | | | | Shares
| | | |
Preferred Stock - 0.7% | | | | | | | | | |
Entergy Louisiana, Inc., 4.440% | | | | | 226 | | | | 16,632 |
Entergy New Orleans, Inc., 4.750% | | | | | 482 | | | | 37,521 |
Entergy New Orleans, Inc., 5.560% | | | | | 100 | | | | 9,113 |
Newell Financial Trust I, 5.250% | | | | | 32,000 | 2 | | | 1,500,000 |
The accompanying notes are an integral part of these financial statements.
42
Managers Bond Fund
December 31, 2004
| | |
| Schedule of Portfolio Investments (continued) | | Bond |
| | | | | | |
Security Description
| | Shares
| | Value
| |
Preferred Stock (continued) | | | | | | |
Union Electric Co., 3.500% | | 350 | | $ | 23,538 | |
Wisconsin Electric Power Co., 3.600% | | 3,946 | | | 248,598 | |
Total Preferred Stock (cost $1,649,983) | | | | | 1,835,402 | |
Other Investment Companies - 20.3%1 | | | | | | |
Bank of New York Institutional Cash Reserves Fund, 2.35%3 | | 44,978,940 | | | 44,978,940 | |
JPMorgan Prime Money Market Fund, Institutional Class Shares, 2.12% | | 7,769,917 | | | 7,769,917 | |
Total Other Investment Companies (cost $52,748,857) | | | | | 52,748,857 | |
Total Investments - 116.0% (cost $289,464,657) | | | | | 300,686,848 | |
Other Assets, less Liabilities - (16.0)% | | | | | (41,476,823 | ) |
Net Assets - 100.0% | | | | $ | 259,210,025 | |
The accompanying notes are an integral part of these financial statements.
43
| | |
| Managers Global Bond Fund | | Global Bond |
Managers Global Bond Fund (the “Fund”) seeks both income and capital appreciation by investing in domestic and foreign fixed-income securities. Managers has utilized a single independent subadvisor, Loomis, Sayles & Company L.P. (“Loomis”), to manage the portfolio since March 2002. Kenneth M. Buntrock, CFA and David W. Rolley, CFA lead the investment team managing the Fund.
The Portfolio Manager
Ken Buntrock and Dave Rolley at Loomis believe that the greatest inefficiencies in bond markets, hence the greatest opportunities to add value, reside in the pricing of credit risk. They seek to identify attractively valued issues through fundamental research. The investment team and analysts at Loomis generally seek fixed-income securities of issuers whose credit profiles they believe are improving. They also analyze political, economic, and other fundamental factors and combine this analysis with a comparison of the yield spreads of various fixed-income securities in an effort to find securities that the team believes may produce attractive returns in comparison to their risk. Finally, if a security that is believed to be attractive is denominated in a foreign currency, the investment team analyzes whether to accept or to hedge the currency risk.
In deciding which securities to buy and sell, Ken and Dave will consider, among other things, the stability and volatility of a country’s bond markets, the financial strength of the issuer, current interest rates, and their expectations regarding general trends in interest rates. They typically maintain over one half of the global portfolio in non-U.S. dollar denominated securities. Average portfolio quality is AA or higher. Ken and Dave employ currency hedges defensively, for capital preservation. Portfolio construction is bottom-up, not top-down. The team follows a broad global universe of securities ranging from AAA governments to emerging markets, which they believe allows the portfolio to take advantage of timely opportunities if they should arise.
The Year in Review
Managers Global Bond Fund had a total return of 9.62% in 2004 compared with gains of 9.27% for the Lehman Brothers Global Aggregate Index (“Global Agg”) and 10.35% for the Citigroup World Government Bond Index (“WGBI”). For the most part, global interest rates remained in a fairly narrow range for much of 2004. With a few exceptions, most countries experienced slight declines in longer-maturity rates and either little change or, in the case of the U.S., increases in the short-term portion of the yield curve. Japan was again an exception, as rates barely moved across their yield curve for the whole year. Thus, bond returns to local investors were muted for most global markets. Meanwhile the U.S. dollar fell sharply against most developed currencies during the year – the dollar dropped about 7% versus the British pound, the euro, and the Canadian dollar, and it fell over 4% versus the Japanese yen. As a result U.S. investors in bonds priced in these securities benefited from the dollar’s decline. In other words, currency, as opposed to bond market performance, explained the vast majority of the performance of global bonds.
Although a good portion of the Fund’s return could also be attributed to currency, the portfolio managers also did a good job at structuring the portfolio’s country allocations. Additionally, the Loomis analysts had a reasonably good year in their credit decisions. From an allocation perspective, Ken and Dave have been consistently underweight Japanese bonds since taking over the portfolio in 2002 and the Fund had zero yen exposure until late 2003. While Ken and Dave did add some yen exposure during 2004, they did so by buying non-Japanese bonds priced in yen as opposed to buying Japanese bonds. Thus, they were able to build some yen exposure without actually creating any exposure to the lagging Japanese bond market. On the other hand, they had built some above-market exposure to smaller markets such as Canada, New Zealand, and Australia, given their attractive yields and the investment team’s constructive outlook on their currencies. These allocations proved rewarding as each of those markets returned between 10% and 15% during 2004.
Credit bonds also performed well during 2004, outperforming global Governments of comparable duration by more than 1 percentage point. More importantly, the credit analysts at Loomis avoided significant negative credit events during the year. It was generally a positive year for credit quality, given the improvement in the overall economy. But still, there are always credit specific pitfalls that can prove to be extremely costly to portfolios.
Looking Ahead
After repositioning the portfolio in the third and fourth quarters, heading into 2005, the Fund maintains its overweight to the U.S. market. The Fund has a slightly lower USD exposure and shorter duration than the benchmark. The portfolio managers continue to avoid Japanese bonds and keep a significant underweight (compared to WGBI) in Japanese yen. The Fund is also underweight in Italy with only 2.4% allocation versus the WGBI’s 9% weight. Also, the Fund’s allocation between corporates and governments is more conservative, with over 60% invested in U.S. and foreign government bonds.
Loomis’ 2005 outlook states: “Moderate economic growth, inflation and yield increases are seen for 2005. Structured finance and corporate bonds should earn higher returns than Treasuries given their yield advantage, even if it is less generous than before.
Globally, pockets of strength exist in emerging Asia and Latin America and resource rich Canada, Australia and New Zealand. Perennial laggards, Japan and Euroland, should again have the slowest growth.
The Fed appears determined to raise rates in a deliberate fashion this year. We forecast the Fed funds rate to end 2005 roughly 100 basis points (bps) higher, with a similar move in bond yields as the economy is still growing strong. Rising rates
44
could mean lackluster returns for Treasuries. Global governments on both a hedged basis and unhedged basis remain an attractive alternative. Corporate spreads are tight, raising the risk of potentially underperforming. In a low yield environment, income is critical to performance and we anticipate the better returns may come from BBB and below holdings. The narrowness of high yield and emerging markets spreads argues against expecting outsized gains from these sectors for a third year in a row. However, we see the yield advantage as being sufficient to allow the sectors to at least be some of the better performers in 2005. Valuations are especially dear for higher rated sectors like Agencies, though selected commercial mortgage-backed securities and asset-backed security issues are attractive alternatives to richly priced high-grade corporates.”
Cumulative Total Return Performance
Global Bond’s cumulative total return is based on the daily change in net asset value (NAV), and assumes that all distributions were reinvested. The Lehman Brothers Global Aggregate is a broad-based index comprised of 9,661 global investment-grade fixed income securities covering the U.S., Europe and Asia. This chart compares a hypothetical $10,000 investment made in Global Bond on December 31,1994, to a $10,000 investment made in the Lehman Brothers Global Aggregate Index for the same time period. The chart is not intended to imply any future performance of the Fund. The graph and chart do not reflect the deduction of taxes that a shareholder would pay on a Fund distribution or redemption of shares. Total Returns would have been lower had certain expenses not been reduced.
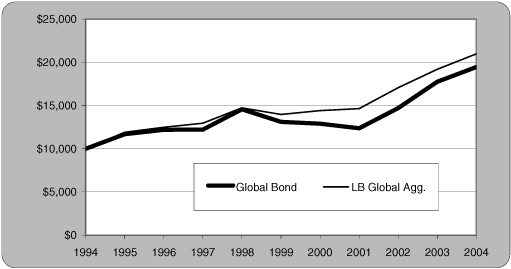
The table below shows the average annual total returns for Global Bond and the Lehman Brothers Global Aggregate Index from December 31, 1994 through December 31, 2004.
| | | | | | | | | |
Average Annual Total Returns:
| | 1 Year
| | | 5 Years
| | | 10 Years
| |
Global Bond Fund | | 9.62 | % | | 8.21 | % | | 7.08 | % |
Lehman Brothers Global Aggregate Index | | 9.27 | % | | 8.47 | % | | 7.75 | % |
45
Managers Global Bond Fund
December 31, 2004
| | |
| Schedule of Portfolio Investments | | Global Bond |
| | | | | | | | |
Security Description
| | | | Principal
Amount
| | | Value
|
Foreign Government and Agency Obligations - 47.6% | | | | | | | | |
Foreign Government - 47.6% | | | | | | | | |
Belgium Government Bond, 3.750%, 03/28/09 | | EUR | | 645,000 | | | $ | 904,262 |
Brazil, Republic of, 8.000%, 04/15/14 | | USD | | 83,560 | | | | 85,490 |
Brazil, Republic of, 8.250, 01/20/34 | | USD | | 180,000 | 2 | | | 175,230 |
Bundes Immobil, 4.625%, 09/27/12 | | EUR | | 525,000 | | | | 761,636 |
Bundes Obligation, 3.250%, 04/17/09 (a) | | EUR | | 825,000 | | | | 1,134,704 |
Bundes Obligation, Series 139, 4.000%, 02/16/07 | | EUR | | 1,035,000 | | | | 1,448,587 |
Canada Government, 0.700%, 03/20/06 | | JPY | | 19,000,000 | | | | 186,698 |
Colombia, Republic of, 8.125, 05/21/24 | | USD | | 140,000 | 2 | | | 135,800 |
Finnish Government Bond, 5.000%, 07/04/07 | | EUR | | 80,000 | | | | 114,928 |
Irish Government, 4.600%, 04/18/16 | | EUR | | 540,000 | | | | 791,268 |
Kingdom of Denmark, 4.000%, 08/15/08 | | DKK | | 1,465,000 | | | | 277,578 |
Kingdom of Norway, 5.500%, 05/15/09 | | NOK | | 1,245,000 | | | | 224,832 |
Kingdom of Spain, 4.750%, 03/14/05 | | JPY | | 40,000,000 | | | | 393,891 |
Mexican Government, 9.000%, 12/20/12 | | MXN | | 20,000 | | | | 172,872 |
Netherlands Government SA, 5.500%, 01/15/28 | | EUR | | 465,000 | | | | 750,650 |
New Zealand Government, 6.000%, 11/15/11 | | NZD | | 85,000 | | | | 61,476 |
Ontario Province, 5.700%, 12/01/08 | | CAD | | 405,000 | | | | 363,467 |
Queensland Treasury Corp., 8.000%, 09/14/07 | | AUD | | 1,105,000 | | | | 925,100 |
Republic of Austria, 4.500%, 09/28/05 | | JPY | | 20,000,000 | | | | 201,487 |
Republic of Austria, 5.500%, 03/03/05 | | CHF | | 215,000 | | | | 190,550 |
Republic of Italy, .375%, 10/10/06 | | JPY | | 89,000,000 | | | | 871,336 |
Republic of Poland, 1.020%, 06/09/09 | | JPY | | 100,000,000 | | | | 973,553 |
Republic of South Africa, 5.250%, 05/16/13 | | EUR | | 350,000 | | | | 505,376 |
Singapore Government, 3.625%, 07/01/11 | | SGD | | 660,000 | | | | 438,285 |
Singapore Government, 4.625%, 07/01/10 | | SGD | | 800,000 | | | | 552,814 |
Spain, Government of, 3.600%, 01/31/09 | | EUR | | 900,000 | | | | 1,255,044 |
Swedish Government, 5.250%, 03/15/11 | | SEK | | 4,450,000 | | | | 732,046 |
Swedish Government, 6.500%, 05/05/08 | | SEK | | 2,195,000 | | | | 366,769 |
U.K. Treasury, 5.000%, 03/07/12 | | GBP | | 350,000 | | | | 691,587 |
U.K. Treasury, 5.000%, 03/07/25 | | GBP | | 240,000 | | | | 490,587 |
U.K. Treasury, 6.250%, 11/25/10 | | GBP | | 295,000 | | | | 617,446 |
United Mexican States, 5.375%, 06/10/13 | | EUR | | 250,000 | | | | 359,759 |
United Mexican States, Series 6Rg, 6.75%, 06/06/06 | | JPY | | 18,000,000 | | | | 191,471 |
Total Foreign Government and Agency Obligations
(cost $15,414,825) | | | | | | | | 17,346,579 |
Corporate Bonds - 29.1% | | | | | | | | |
Finance - 13.9% | | | | | | | | |
Arcel Finance Ltd., 7.048%, 09/01/11 (a) | | USD | | 105,000 | | | | 107,306 |
Asian Development Bank, 3.125%, 06/29/05 | | JPY | | 34,000,000 | | | | 336,585 |
Bangkok Bank Public Co., Hong Kong, 9.025%, 03/15/29 (a) | | USD | | 70,000 | | | | 84,488 |
Cerro Negro Finance Ltd., 7.900%, 12/01/20 (a) | | USD | | 65,000 | 2 | | | 64,919 |
CIT Group Inc., 5.500%, 12/01/14 | | GBP | | 80,000 | | | | 153,687 |
Couche-Tard US/Finance, 7.500%, 12/15/13 | | USD | | 160,000 | | | | 171,600 |
Dexia Municipal Agency, 5.500%, 04/25/06 | | EUR | | 140,000 | | | | 197,971 |
Eksportfinans ASA, 2.500%, 12/28/05 | | CHF | | 145,000 | | | | 129,379 |
Federal Farm Credit Bank, 3.250%, 06/15/07 | | USD | | 600,000 | 2 | | | 598,459 |
First Citizens St Lucia, 5.125%, 02/14/11 (a) | | USD | | 175,000 | | | | 175,847 |
GMAC International Finance BV, 8.000%, 03/14/07 | | NZD | | 160,000 | | | | 115,822 |
The accompanying notes are an integral part of these financial statements.
46
Managers Global Bond Fund
December 31, 2004
| | |
| Schedule of Portfolio Investments (continued) | | Global Bond |
| | | | | | | | |
Security Description
| | | | Principal
Amount
| | | Value
|
Finance (continued) | | | | | | | | |
Hypothekenbank In Essen AG, 5.250%, 01/22/08 | | EUR | | 810,000 | | | $ | 1,178,282 |
International Bank For Reconstruction & Development, 2.000%, 02/18/08 | | JPY | | 26,000,000 | 2 | | | 267,313 |
MBNA Europe Funding, PLC, 6.500%, 03/27/07 | | EUR | | 50,000 | | | | 73,142 |
Morgan Stanley Co., Series EMTN, 5.375%, 11/14/13 | | GBP | | 120,000 | | | | 232,129 |
Muenchener Hypothekenbank eG, 5.000%, 01/16/12 | | EUR | | 30,000 | | | | 44,755 |
NGG Finance, PLC, 6.125%, 08/23/11 | | EUR | | 55,000 | | | | 84,954 |
Nordic Investment Bank, 5.250%, 04/20/06 | | SEK | | 2,000,000 | | | | 311,577 |
Olivetti Finance, 6.875%, 01/24/13 | | EUR | | 105,000 | | | | 168,511 |
Qwest Capital Funding, Inc., 7.250%, 02/15/11 | | USD | | 75,000 | 2 | | | 73,500 |
Russell Corp., 9.250%, 05/01/10 | | USD | | 55,000 | 2 | | | 58,988 |
RWE Finance B.V., 6.125%, 10/26/12 | | EUR | | 55,000 | | | | 86,500 |
Volkswagen International Finance, 4.875%, 05/22/13 | | EUR | | 250,000 | | | | 350,915 |
Total Finance | | | | | | | | 5,066,629 |
Industrials - 13.9% | | | | | | | | |
AGCO Corp., 6.875%, 04/15/14 | | EUR | | 120,000 | | | | 172,897 |
America Movil, S.A. de C.V., 4.125%, 03/01/09 | | USD | | 135,000 | | | | 132,994 |
American Standard, Inc., 7.125%, 06/01/06 | | EUR | | 75,000 | | | | 107,678 |
American Standard, Inc., 8.250%, 06/01/09 | | GBP | | 50,000 | | | | 106,555 |
ASIF Global, 2.380%, 02/26/09 (a) | | SGD | | 500,000 | | | | 306,644 |
Avenor Inc., 10.850%, 11/30/14 | | CAD | | 165,000 | | | | 164,957 |
Bavaria S.A., 8.875%, 11/01/10 (a) | | USD | | 60,000 | | | | 64,800 |
Canadian Pacific Railway, Ltd., 4.900%, 06/15/10 (a) | | CAD | | 50,000 | | | | 42,682 |
Corning Inc., 6.750%, 09/15/13 | | USD | | 125,000 | | | | 132,786 |
Deutsche Telekom, 5.250, 05/20/08 | | EUR | | 60,000 | | | | 85,804 |
Diageo Capital Beverages, 3.875%, 01/06/09 | | EUR | | 65,000 | | | | 90,318 |
EOP Operating LP, 4.650%, 10/01/10 | | USD | | 320,000 | | | | 321,462 |
General Electric Capital Corp., 0.100%, 12/20/05 | | JPY | | 50,000,000 | | | | 487,874 |
HCA, Inc., 5.250%, 11/06/08 | | USD | | 150,000 | 2 | | | 150,874 |
Hutchison Whampoa International, Ltd., 7.450%, 11/24/33 (a) | | USD | | 80,000 | 2 | | | 88,671 |
IMC Global, Inc., 10.875%, 06/01/08 | | USD | | 40,000 | | | | 48,000 |
Lubrizol Corp. (The), 4.625%, 10/01/09 | | USD | | 160,000 | | | | 159,753 |
McDonald’s Corp., 3.628%, 10/10/10 | | SGD | | 250,000 | | | | 159,973 |
News America Holdings, 8.625%, 02/07/14 | | AUD | | 350,000 | | | | 278,499 |
Pearson PLC, 6.125%, 02/01/07 | | EUR | | 35,000 | | | | 50,632 |
Pemex Project Funding Master Trust, 7.875%, 02/01/09 | | USD | | 325,000 | | | | 365,138 |
Phillips-Van Heusen Corp., 7.250%, 02/15/11 | | USD | | 70,000 | | | | 73,500 |
Qwest Corp., 7.875%, 09/01/11 (a) | | USD | | 75,000 | | | | 81,375 |
Rogers Wireless Communications, Inc. 6.375%, 03/01/14 | | USD | | 70,000 | 2 | | | 69,300 |
Rogers Wireless Communications Inc., 7.625%, 12/15/11 (a) | | CAD | | 115,000 | | | | 99,773 |
Samsung Electronics Co., Ltd., 7.700%, 10/01/27 (a) | | USD | | 25,000 | | | | 28,230 |
Shaw Communications, Inc., 7.500%, 11/20/13 | | CAD | | 175,000 | | | | 158,139 |
Sing Telecommunications, 6.000%, 11/21/11 | | EUR | | 50,000 | | | | 77,012 |
Smithfield Foods, Inc., 7.000%, 08/01/11 | | USD | | 145,000 | 2 | | | 154,788 |
Stena AB, 7.000%, 12/01/16 (a) | | USD | | 85,000 | | | | 84,150 |
Stena AB, 7.500%, 11/01/13 | | USD | | 75,000 | | | | 78,563 |
Teck Cominco Ltd., 7.000%, 09/15/12 | | USD | | 100,000 | | | | 110,837 |
Telekom Malaysia Berhad, 7.875%, 08/01/25 (a) | | USD | | 70,000 | | | | 85,634 |
The Premcor Refining Group Inc., 6.750%, 02/01/11 | | USD | | 75,000 | | | | 80,813 |
The accompanying notes are an integral part of these financial statements.
47
Managers Global Bond Fund
December 31, 2004
| | |
| Schedule of Portfolio Investments (continued) | | Global Bond |
| | | | | | | | | |
Security Description
| | | | Principal
Amount
| | | Value
| |
Industrial (continued) | | | | | | | | | |
Union Oil Co. of California, 5.050%, 10/01/12 | | USD | | 85,000 | | | $ | 87,000 | |
Vale Overseas Limited, 8.250, 01/17/34 | | USD | | 50,000 | | | | 52,625 | |
Volvo Treasury AB, 6.000, 02/09/07 | | EUR | | 35,000 | | | | 50,586 | |
Williams Co., Inc., 7.875%, 09/01/21 | | USD | | 90,000 | | | | 100,350 | |
WPP Group, PLC. 6.000%, 06/18/08 | | EUR | | 50,000 | | | | 73,813 | |
Total Industrials | | | | | | | | 5,065,479 | |
Utility - 1.3% | | | | | | | | | |
E. On International Finance BV, Series EMTN, 5.750%, 05/29/09 | | EUR | | 60,000 | | | | 89,962 | |
Empresa Nacional de Electricidad, Yankee, 7.875%, 02/01/27 | | USD | | 100,000 | | | | 105,977 | |
Enersis SA, Yankee, 7.400%, 12/01/16 | | USD | | 80,000 | | | | 87,519 | |
Scottish Power, 6.625%, 01/14/10 | | GBP | | 90,000 | | | | 184,186 | |
Total Utility | | | | | | | | 467,644 | |
Total Corporate Bonds (cost $9,755,505) | | | | | | | | 10,599,752 | |
U.S. Government and Agency Obligations - 18.6% | | | | | | | | | |
U.S. Government Agency Obligations - 4.7% | | | | | | | | | |
Federal Farm Credit Banks Funding Corp., 3.375%, 07/15/08 | | USD | | 650,000 | | | | 644,565 | |
FNMA, 1.750%, 03/26/08 | | JPY | | 80,000,000 | | | | 816,981 | |
FNMA, 2.290%, 02/19/09 | | SGD | | 400,000 | | | | 245,347 | |
Total U.S. Agency | | | | | | | | 1,706,893 | |
U.S. Treasury - 12.8% | | | | | | | | | |
USTN, 1.500%, 02/28/05 | | USD | | 680,000 | 2 | | | 679,522 | |
USTN, 1.875%, 12/31/05 | | USD | | 1,000,000 | 2 | | | 991,328 | |
USTN, 2.500%, 10/31/06 | | USD | | 710,000 | 2 | | | 703,371 | |
USTN, 2.875%, 11/30/06 | | USD | | 80,000 | 2 | | | 79,750 | |
USTN, 3.250%, 08/15/08 | | USD | | 1,000,000 | 2 | | | 995,352 | |
USTN, 5.750%, 08/15/10 | | USD | | 500,000 | 2 | | | 550,489 | |
USTN, 5.750%, 11/15/05 | | USD | | 650,000 | 2 | | | 666,656 | |
Total U.S. Treasury | | | | | | | | 4,666,468 | |
Other MBS - 1.1% | | | | | | | | | |
Permanent Financing PLC, 5.100%, 06/11/07 | | EUR | | 275,000 | | | | 393,605 | |
Total U.S. Government and Agency Obligations (cost $6,582,508) | | | | | | | | 6,766,966 | |
| | | | |
|
| | | | |
Other Investment Companies - 21.6%1 | | | | Shares | | | | | |
| | | | |
|
| | | | |
Bank of New York Institutional Cash Reserves Fund, 2.35%3 | | | | 6,626,433 | | | | 6,626,433 | |
JPMorgan Prime Money Market, Institutional Class Shares, 2.12% | | | | 1,270,084 | | | | 1,270,084 | |
Total Other Investment Companies (cost $7,896,517) | | | | | | | | 7,896,517 | |
Total Investments - 116.9% (cost $39,649,355) | | | | | | | | 42,609,814 | |
Other Assets, less Liabilities - (16.9)% | | | | | | | | (6,156,177 | ) |
Net Assets - 100.0% | | | | | | | $ | 36,453,637 | |
The accompanying notes are an integral part of these financial statements.
48
| | |
| Notes to Schedules of Portfolio Investments | | |
The following footnotes and abbreviations should be read in conjunction with each of the Schedules of Portfolio Investments previously presented in this report.
At December 31, 2004, the cost of securities for Federal income tax purposes and the gross aggregate unrealized appreciation and/or depreciation based on tax cost were approximately:
| | | | | | | | | | | | | |
Fund
| | Cost
| | Appreciation
| | Depreciation
| | | Net
|
Value | | $ | 108,204,528 | | $ | 24,589,755 | | $ | (1,365,226 | ) | | $ | 23,224,529 |
Capital Appreciation | | | 92,098,867 | | | 15,803,314 | | | (1,390,587 | ) | | | 14,412,727 |
Small Company | | | 24,412,809 | | | 7,850,386 | | | (631,537 | ) | | | 7,218,849 |
Special Equity | | | 3,395,888,126 | | | 1,011,900,485 | | | (96,850,933 | ) | | | 915,049,552 |
International Equity | | | 212,335,156 | | | 54,481,224 | | | (4,245,790 | ) | | | 50,235,434 |
Emerging Markets | | | 54,500,420 | | | 15,879,336 | | | (593,855 | ) | | | 15,285,481 |
Bond | | | 289,741,185 | | | 12,110,514 | | | (1,164,851 | ) | | | 10,945,663 |
Global Bond | | | 39,652,002 | | | 2,986,236 | | | (28,424 | ) | | | 2,957,812 |
| * | Non-income-producing security |
| (a) | Security exempt from registration under Rule 144A of the Securities Act of 1933. This security may be resold in transactions exempt from registration, normally to qualified buyers. At December 31, 2004, the value of these securities amounted to the following: |
| | | | | | |
Fund
| | Market Value
| | % of Net Assets
| |
Emerging Markets | | $ | 3,438,363 | | 5.4 | % |
Bond | | | 12,989,325 | | 5.0 | % |
Global Bond | | | 1,314,519 | | 3.6 | % |
| 1 | Yield shown for each investment company represents its December 31, 2004, seven-day average yield, which refers to the sum of the previous seven days’ dividends paid, expressed as an annual percentage. |
| 2 | Some or all of these shares were out on loan to various brokers as of December 31, 2004, amounting to: |
| | | | | | |
Fund
| | Market Value
| | % of Net Assets
| |
Value | | $ | 12,542,166 | | 10.5 | % |
Capital Appreciation | | | 9,922,100 | | 10.1 | % |
Small Company | | | 3,866,422 | | 14.0 | % |
Special Equity | | | 653,865,177 | | 17.7 | % |
International Equity | | | 28,938,106 | | 12.4 | % |
Emerging Markets | | | 6,309,682 | | 9.9 | % |
Bond | | | 59,880,386 | | 23.1 | % |
Global Bond | | | 7,293,216 | | 20.0 | % |
| 3 | Collateral received from brokers for securities lending was invested in these short-term investments. |
| 5 | Affiliated Company – See Note 10 in the Notes to Financial Statements. |
Investments Definitions and Abbreviations:
| | |
ADR/GDR: | | ADR after the name of a holding stands for American Depositary Receipt, representing ownership of foreign securities on deposit with a domestic custodian bank; a GDR (Global Depositary Receipt) is comparable, but foreign securities are held on deposit in a non-U.S. bank. The value of the ADR/GDR securities is determined or significantly influenced by trading on exchanges not located in the United States or Canada. Sponsored ADR/GDRs are initiated by the underlying foreign company |
| | |
FHLMC: Federal Home Loan Mortgage Corp. | | USTB: United States Treasury Bond |
FNMA: Federal National Mortgage Association | | USTN: United States Treasury Note |
GNMA: Government National Mortgage Association | | GMAC: General Motors Acceptance Corp. |
Registered shares: A security whose owner has been recorded with its issuer or issuer’s registrar.
Abbreviations have been used throughout the portfolios to indicate amounts shown in currencies other than the U.S. dollar (USD):
| | | | | | | | | | | | | | |
| AUD: | | Australian Dollar | | GBP: | | British Pound | | SEK: | | Swedish Krone | | CHF: | | Swiss Franc |
| CAD: | | Canadian Dollar | | MXN: | | Mexican Peso | | SGD: | | Singapore Dollar | | | | |
| DKK: | | Danish Krone | | BRL: | | Brazilian Real | | NZD: | | New Zealand Dollar | | | | |
| EUR: | | euro | | NOK: | | Norwegian Krone | | JPY: | | Japanese Yen | | | | |
49
Statements of Assets and Liabilities
December 31, 2004
| | | | | | | | | | | | |
| | | Managers
Value Fund
| | | Managers
Capital
Appreciation
Fund
| | | Managers
Small
Company
Fund
| |
Assets: | | | | | | | | | | | | |
Investments at value (including securities on loan valued at $12,542,166, $9,922,100, $3,866,422, $653,865,177, $28,938,106, $6,309,682, $59,880,386, $7,293,216, respectively) * | | $ | 131,429,057 | | | $ | 106,511,594 | | | $ | 31,631,658 | |
Cash | | | — | | | | — | | | | — | |
Foreign currency** | | | — | | | | — | | | | — | |
Receivable for investments sold | | | — | | | | 873,826 | | | | — | |
Receivable for Fund shares sold | | | 99,558 | | | | 134,638 | | | | 20,331 | |
Receivable for open forward foreign currency contracts | | | — | | | | — | | | | — | |
Dividends, interest and other receivables | | | 113,021 | | | | 85,720 | | | | 4,679 | |
Prepaid expenses | | | 16,028 | | | | 10,823 | | | | 5,513 | |
| | |
|
|
| |
|
|
| |
|
|
|
Total assets | | | 131,657,664 | | | | 107,616,601 | | | | 31,662,181 | |
| | |
|
|
| |
|
|
| |
|
|
|
Liabilities: | | | | | | | | | | | | |
Payable to Custodian | | | — | | | | 98,592 | | | | — | |
Payable for Fund shares repurchased | | | — | | | | 4,200 | | | | — | |
Payable upon return of securities loaned | | | 11,038,721 | | | | 8,061,527 | | | | 3,972,260 | |
Payable for investments purchased | | | 900,890 | | | | 906,435 | | | | — | |
Payable for open forward foreign currency contracts | | | — | | | | — | | | | — | |
Accrued expenses: | | | | | | | | | | | | |
Investment advisory and management fees | | | 54,764 | | | | 60,119 | | | | 20,459 | |
Administrative fees | | | 24,759 | | | | 20,929 | | | | 5,683 | |
Other | | | 91,324 | | | | 117,429 | | | | 34,979 | |
| | |
|
|
| |
|
|
| |
|
|
|
Total liabilities | | | 12,110,458 | | | | 9,269,231 | | | | 4,033,381 | |
| | |
|
|
| |
|
|
| |
|
|
|
Net Assets | | $ | 119,547,206 | | | $ | 98,347,370 | | | $ | 27,628,800 | |
| | |
|
|
| |
|
|
| |
|
|
|
Net Assets | | $ | 119,547,206 | | | $ | 98,347,370 | | | $ | 27,628,800 | |
| | |
|
|
| |
|
|
| |
|
|
|
Shares outstanding | | | 4,021,624 | | | | 3,673,159 | | | | 2,665,748 | |
| | |
|
|
| |
|
|
| |
|
|
|
Net asset value, offering and redemption price per share | | $ | 29.73 | | | $ | 26.77 | | | $ | 10.36 | |
| | |
|
|
| |
|
|
| |
|
|
|
I Class Shares: | | | | | | | | | | | | |
Net Assets | | | | | | | | | | | | |
Shares outstanding | | | | | | | | | | | | |
Net asset value, offering and redemption price per share | | | | | | | | | | | | |
Net Assets Represent: | | | | | | | | | | | | |
Paid-in capital | | $ | 96,197,729 | | | $ | 245,513,349 | | | $ | 28,354,896 | |
Undistributed net investment income | | | 84,317 | | | | — | | | | — | |
Accumulated net realized gain (loss) from investments, futures and foreign currency transactions | | | (777,111 | ) | | | (161,831,917 | ) | | | (8,018,988 | ) |
Net unrealized appreciation of investments, futures and foreign currency contracts and translations | | | 24,042,271 | | | | 14,665,938 | | | | 7,292,892 | |
| | |
|
|
| |
|
|
| |
|
|
|
Net Assets | | $ | 119,547,206 | | | $ | 98,347,370 | | | $ | 27,628,800 | |
| | |
|
|
| |
|
|
| |
|
|
|
| | | $ | 107,386,786 | | | $ | 91,845,656 | | | $ | 24,338,766 | |
| ** | Foreign currency at cost |
50
| | | | | | | | | | | | | | | |
Managers Special
Equity Fund
| | | Managers International
Equity Fund
| | | Emerging Markets
Equity Fund
| | Managers
Bond Fund
| | Managers Global
Bond Fund
|
| $ | 4,310,937,678 | | | $ | 262,570,590 | | | $ | 69,785,901 | | $ | 300,686,848 | | $ | 42,609,814 |
| | 5,120,905 | | | | — | | | | 3,244 | | | — | | | 52,471 |
| | — | | | | 1,004,765 | | | | 144,979 | | | — | | | 3,240 |
| | 35,565,901 | | | | 1,489,779 | | | | — | | | — | | | 162,934 |
| | 4,097,881 | | | | 70,309 | | | | 64,715 | | | 439,824 | | | 91,390 |
| | — | | | | 636,580 | | | | — | | | — | | | 1,698,210 |
| | 1,272,888 | | | | 444,766 | | | | 133,954 | | | 3,323,515 | | | 687,596 |
| | 154,977 | | | | 17,051 | | | | 13,010 | | | 24,968 | | | 9,169 |
|
|
| |
|
|
| |
|
| |
|
| |
|
|
| | 4,357,150,230 | | | | 266,233,840 | | | | 70,145,803 | | | 304,475,155 | | | 45,314,824 |
|
|
| |
|
|
| |
|
| |
|
| |
|
|
| | — | | | | — | | | | — | | | — | | | — |
| | 484,662 | | | | 5,696 | | | | 2,208 | | | 5,359 | | | — |
| | 634,905,494 | | | | 30,268,978 | | | | 6,418,419 | | | 44,978,940 | | | 6,626,433 |
| | 27,482,460 | | | | 558,604 | | | | — | | | — | | | 397,494 |
| | — | | | | 637,472 | | | | — | | | — | | | 1,741,452 |
| | 2,711,248 | | | | 176,661 | | | | 57,881 | | | 111,009 | | | 14,168 |
| | 766,280 | | | | 49,073 | | | | 12,966 | | | 53,091 | | | 5,984 |
| | 1,787,378 | | | | 476,788 | | | | 87,664 | | | 116,731 | | | 75,656 |
|
|
| |
|
|
| |
|
| |
|
| |
|
|
| | 668,137,522 | | | | 32,173,272 | | | | 6,579,138 | | | 45,265,130 | | | 8,861,187 |
|
|
| |
|
|
| |
|
| |
|
| |
|
|
| $ | 3,689,012,708 | | | $ | 234,060,568 | | | $ | 63,566,665 | | $ | 259,210,025 | | $ | 36,453,637 |
|
|
| |
|
|
| |
|
| |
|
| |
|
|
| $ | 3,415,002,907 | | | $ | 234,060,568 | | | $ | 63,566,665 | | $ | 259,210,025 | | $ | 36,453,637 |
|
|
| |
|
|
| |
|
| |
|
| |
|
|
| | 37,767,093 | | | | 4,974,638 | | | | 3,852,639 | | | 10,543,511 | | | 1,628,745 |
|
|
| |
|
|
| |
|
| |
|
| |
|
|
| | $90.42 | | | $ | 47.05 | | | $ | 16.50 | | $ | 24.58 | | $ | 22.38 |
|
|
| |
|
|
| |
|
| |
|
| |
|
|
| $ | 274,009,801 | | | | | | | | | | | | | | |
|
|
| | | | | | | | | | | | | |
| | 3,025,842 | | | | | | | | | | | | | | |
|
|
| | | | | | | | | | | | | |
| $ | 90.56 | | | | | | | | | | | | | | |
|
|
| | | | | | | | | | | | | |
| $ | 2,808,690,751 | | | $ | 311,091,162 | | | $ | 47,289,004 | | $ | 247,646,602 | | $ | 32,919,876 |
| | 658,568 | | | | 22,485 | | | | 101,804 | | | 35,800 | | | 338,255 |
| | (56,447,109 | ) | | | (128,538,358 | ) | | | 611,255 | | | 291,758 | | | 245,889 |
| | 936,110,498 | | | | 51,485,279 | | | | 15,564,602 | | | 11,235,865 | | | 2,949,617 |
|
|
| |
|
|
| |
|
| |
|
| |
|
|
| $ | 3,689,012,708 | | | $ | 234,060,568 | | | $ | 63,566,665 | | $ | 259,210,025 | | $ | 36,453,637 |
|
|
| |
|
|
| |
|
| |
|
| |
|
|
| $ | 3,374,827,180 | | | $ | 211,167,715 | | | $ | 54,228,617 | | $ | 289,464,657 | | $ | 39,649,355 |
| | | | | | 977,280 | | | | 138,687 | | | | | | 4,960 |
The accompanying notes are an integral part of these financial statements.
51
Statements of Operations
For the year ended December 31, 2004
| | | | | | | | |
| | | Managers
Value Fund
| | | Managers
Capital
Appreciation
Fund
| |
Investment Income: | | | | | | | | |
Dividend income | | $ | 1,912,222 | | | $ | 1,045,427 | |
Interest income | | | 92,615 | | | | 41,291 | |
Foreign withholding tax | | | (9,983 | ) | | | (6,821 | ) |
Securities lending fees | | | 14,292 | | | | 17,624 | |
| | |
|
|
| |
|
|
|
Total investment income | | | 2,009,146 | | | | 1,097,521 | |
| | |
|
|
| |
|
|
|
Expenses: | | | | | | | | |
Investment management fees | | | 817,992 | | | | 815,678 | |
Administrative fees | | | 272,664 | | | | 254,899 | |
Transfer agent | | | 263,070 | | | | 280,472 | |
Custodian | | | 48,353 | | | | 49,121 | |
Registration fees | | | 32,649 | | | | 19,273 | |
Professional fees | | | 32,595 | | | | 43,407 | |
Trustees fees and expenses | | | 8,932 | | | | 8,129 | |
Miscellaneous | | | 24,914 | | | | 27,010 | |
| | |
|
|
| |
|
|
|
Total expenses before offsets | | | 1,501,169 | | | | 1,497,989 | |
| | |
|
|
| |
|
|
|
Expense (reimbursement)/recoupment | | | (150,183 | ) | | | (113,864 | ) |
Expense reductions | | | (18,152 | ) | | | (18,632 | ) |
| | |
|
|
| |
|
|
|
Net expenses | | | 1,332,834 | | | | 1,365,493 | |
| | |
|
|
| |
|
|
|
Net investment income (loss) | | | 676,312 | | | | (267,972 | ) |
| | |
|
|
| |
|
|
|
Net Realized and Unrealized Gain (Loss): | | | | | | | | |
Net realized gain on investment transactions | | | 5,860,848 | | | | 5,023,588 | |
Net realized gain on futures contracts | | | — | | | | — | |
Net realized gain (loss) on foreign currency contracts and transactions | | | — | | | | — | |
Net unrealized appreciation (depreciation) of investments | | | 7,766,982 | | | | 145,527 | |
Net unrealized appreciation of futures contracts | | | — | | | | — | |
Net unrealized appreciation (depreciation) of foreign currency contracts and translations | | | — | | | | — | |
| | |
|
|
| |
|
|
|
Net realized and unrealized gain | | | 13,627,830 | | | | 5,169,115 | |
| | |
|
|
| |
|
|
|
Net Increase in Net Assets Resulting from Operations | | $ | 14,304,142 | | | $ | 4,901,143 | |
| | |
|
|
| |
|
|
|
52
| | | | | | | | | | | | | | | | | | | | | | |
Managers
Small
Company
Fund
| | | Managers
Special
Equity
Fund
| | | Managers
International
Equity
Fund
| | | Managers
Emerging
Markets
Equity
Fund
| | | Managers
Bond
Fund
| | | Managers
Global
Bond
Fund
| |
| $ | 67,294 | | | $ | 19,848,743 | | | $ | 5,606,380 | | | $ | 1,251,985 | | | $ | 153,427 | | | $ | — | |
| | 15,134 | | | | 3,156,549 | | | | 43,605 | | | | 43,796 | | | | 9,782,945 | | | | 1,304,684 | |
| | (230 | ) | | | (42,957 | ) | | | (571,540 | ) | | | (156,011 | ) | | | — | | | | — | |
| | 3,333 | | | | 1,122,583 | | | | 194,887 | | | | 19,031 | | | | 69,480 | | | | 4,347 | |
|
|
| |
|
|
| |
|
|
| |
|
|
| |
|
|
| |
|
|
|
| | 85,531 | | | | 24,084,918 | | | | 5,273,332 | | | | 1,158,801 | | | | 10,005,852 | | | | 1,309,031 | |
|
|
| |
|
|
| |
|
|
| |
|
|
| |
|
|
| |
|
|
|
| | 193,548 | | | | 30,337,021 | | | | 2,167,049 | | | | 528,521 | | | | 1,348,661 | | | | 228,343 | |
| | 53,763 | | | | 8,426,950 | | | | 601,958 | | | | 114,896 | | | | 539,465 | | | | 65,241 | |
| | 9,863 | | | | 7,689,767 | | | | 643,792 | | | | 31,562 | | | | 146,394 | | | | 79,063 | |
| | 11,724 | | | | 769,397 | | | | 434,014 | | | | 94,392 | | | | 73,750 | | | | 49,405 | |
| | 15,622 | | | | 147,620 | | | | 37,294 | | | | 22,913 | | | | 57,257 | | | | 20,756 | |
| | 18,413 | | | | 432,392 | | | | 88,281 | | | | 28,886 | | | | 59,207 | | | | 35,870 | |
| | 1,736 | | | | 282,556 | | | | 19,970 | | | | 3,807 | | | | 17,204 | | | | 2,611 | |
| | 3,373 | | | | 566,775 | | | | 79,225 | | | | 28,403 | | | | 57,193 | | | | 6,043 | |
|
|
| |
|
|
| |
|
|
| |
|
|
| |
|
|
| |
|
|
|
| | 308,042 | | | | 48,652,478 | | | | 4,071,583 | | | | 853,380 | | | | 2,299,131 | | | | 487,332 | |
|
|
| |
|
|
| |
|
|
| |
|
|
| |
|
|
| |
|
|
|
| | 3,782 | | | | (530,350 | ) | | | (141,842 | ) | | | (1,588 | ) | | | (162,851 | ) | | | (68,099 | ) |
| | — | | | | (1,056,804 | ) | | | (30,637 | ) | | | — | | | | — | | | | — | |
|
|
| |
|
|
| |
|
|
| |
|
|
| |
|
|
| |
|
|
|
| | 311,824 | | | | 47,065,324 | | | | 3,899,104 | | | | 851,792 | | | | 2,136,280 | | | | 419,233 | |
|
|
| |
|
|
| |
|
|
| |
|
|
| |
|
|
| |
|
|
|
| | (226,293 | ) | | | (22,980,406 | ) | | | 1,374,228 | | | | 307,009 | | | | 7,869,572 | | | | 889,798 | |
|
|
| |
|
|
| |
|
|
| |
|
|
| |
|
|
| |
|
|
|
| | 1,060,845 | | | | 347,977,454 | | | | 34,033,196 | | | | 5,398,139 | | | | 2,867,003 | | | | 2,552,013 | |
| | — | | | | — | | | | 57,427 | | | | — | | | | — | | | | — | |
| | — | | | | — | | | | (122,857 | ) | | | 19,958 | | | | 38,768 | | | | (42,608 | ) |
| | 2,135,788 | | | | 156,903,987 | | | | (2,283,537 | ) | | | 6,506,669 | | | | 3,019,088 | | | | (340,629 | ) |
| | — | | | | — | | | | 8,496 | | | | — | | | | — | | | | — | |
| | — | | | | — | | | | (60,479 | ) | | | 4,277 | | | | (2,902,149 | ) | | | (53,500 | ) |
|
|
| |
|
|
| |
|
|
| |
|
|
| |
|
|
| |
|
|
|
| | 3,196,633 | | | | 504,881,441 | | | | 31,632,246 | | | | 11,929,043 | | | | 3,022,710 | | | | 2,115,276 | |
|
|
| |
|
|
| |
|
|
| |
|
|
| |
|
|
| |
|
|
|
| $ | 2,970,340 | | | $ | 481,901,035 | | | $ | 33,006,474 | | | $ | 12,236,052 | | | $ | 10,892,282 | | | $ | 3,005,074 | |
|
|
| |
|
|
| |
|
|
| |
|
|
| |
|
|
| |
|
|
|
The accompanying notes are an integral part of these financial statements.
53
Statements of Changes in Net Assets
For the year ended December 31, 2004
| | | | | | | | | | | | | | | | |
| | | Managers Value Fund
| | | Managers Capital Appreciation
Fund
| |
| | | 2004
| | | 2003
| | | 2004
| | | 2003
| |
Increase (Decrease) in Net Assets | | | | | | | | | | | | | | | | |
From Operations: | | | | | | | | | | | | | | | | |
Net investment income (loss) | | $ | 676,312 | | | $ | 428,958 | | | $ | (267,972 | ) | | $ | (709,729 | ) |
Net realized gain (loss) on investments, futures and foreign currency transactions | | | 5,860,848 | | | | 326,249 | | | | 5,023,588 | | | | (12,737,985 | ) |
Net unrealized appreciation (depreciation) of investments and foreign currency translations | | | 7,766,982 | | | | 19,154,237 | | | | 145,527 | | | | 37,420,403 | |
| | |
|
|
| |
|
|
| |
|
|
| |
|
|
|
Net increase in net assets resulting from operations | | | 14,304,142 | | | | 19,909,444 | | | | 4,901,143 | | | | 23,972,689 | |
| | |
|
|
| |
|
|
| |
|
|
| |
|
|
|
Distributions to Shareholders: | | | | | | | | | | | | | | | | |
From net investment income | | | (600,552 | ) | | | (438,692 | ) | | | — | | | | — | |
From net realized gain on investments | | | — | | | | — | | | | — | | | | — | |
| | |
|
|
| |
|
|
| |
|
|
| |
|
|
|
Total distributions to shareholders | | | (600,552 | ) | | | (438,692 | ) | | | — | | | | — | |
| | |
|
|
| |
|
|
| |
|
|
| |
|
|
|
From Capital Share Transactions: | | | | | | | | | | | | | | | | |
Proceeds from sale of shares | | | 44,358,223 | | | | 47,708,843 | | | | 24,179,731 | | | | 22,460,907 | |
Reinvestment of dividends and distributions | | | 583,933 | | | | 425,823 | | | | — | | | | — | |
Cost of shares repurchased | | | (39,818,512 | ) | | | (14,886,224 | ) | | | (41,636,068 | ) | | | (43,075,991 | ) |
| | |
|
|
| |
|
|
| |
|
|
| |
|
|
|
Net increase (decrease) from capital share transactions | | | 5,123,644 | | | | 33,248,442 | | | | (17,456,337 | ) | | | (20,615,084 | ) |
| | |
|
|
| |
|
|
| |
|
|
| |
|
|
|
Total increase (decrease) in net assets | | | 18,827,234 | | | | 52,719,194 | | | | (12,555,194 | ) | | | 3,357,605 | |
| | |
|
|
| |
|
|
| |
|
|
| |
|
|
|
Net Assets: | | | | | | | | | | | | | | | | |
Beginning of year | | | 100,719,972 | | | | 48,000,778 | | | | 110,902,564 | | | | 107,544,959 | |
| | |
|
|
| |
|
|
| |
|
|
| |
|
|
|
End of year | | $ | 119,547,206 | | | $ | 100,719,972 | | | $ | 98,347,370 | | | $ | 110,902,564 | |
| | |
|
|
| |
|
|
| |
|
|
| |
|
|
|
End of year undistributed net investment income (loss) | | $ | 84,317 | | | $ | 8,557 | | | $ | — | | | $ | — | |
| | |
|
|
| |
|
|
| |
|
|
| |
|
|
|
Share Transactions: | | | | | | | | | | | | | | | | |
Managers Shares: | | | | | | | | | | | | | | | | |
Sale of shares | | | 1,627,365 | | | | 2,171,992 | | | | 956,706 | | | | 1,000,544 | |
Reinvested shares | | | 19,674 | | | | 16,473 | | | | — | | | | — | |
Shares repurchased | | | (1,463,608 | ) | | | (670,271 | ) | | | (1,638,915 | ) | | | (1,927,145 | ) |
| | |
|
|
| |
|
|
| |
|
|
| |
|
|
|
Net increase (decrease) in shares | | | 183,431 | | | | 1,518,194 | | | | (682,209 | ) | | | (926,601 | ) |
| | |
|
|
| |
|
|
| |
|
|
| |
|
|
|
I Class Shares: | | | | | | | | | | | | | | | | |
Sale of shares | | | | | | | | | | | | | | | | |
Reinvested shares | | | | | | | | | | | | | | | | |
Shares repurchased | | | | | | | | | | | | | | | | |
Net increase in shares | | | | | | | | | | | | | | | | |
54
| | | | | | | | | | | | | | | | | | | | | | |
Managers Small Company Fund
| | | Managers Special Equity Fund
| | | Managers International Equity Fund
| |
2004
| | | 2003
| | | 2004
| | | 2003
| | | 2004
| | | 2003
| |
| $ | (226,293 | ) | | $ | (178,647 | ) | | $ | (22,980,406 | ) | | $ | (17,687,106 | ) | | $ | 1,374,228 | | | $ | 2,019,127 | |
| | 1,060,845 | | | | 652,393 | | | | 347,977,454 | | | | 112,083,619 | | | | 33,967,766 | | | | (7,506,334 | ) |
| | 2,135,788 | | | | 5,031,669 | | | | 156,903,987 | | | | 822,956,114 | | | | (2,335,520 | ) | | | 84,411,352 | |
|
|
| |
|
|
| |
|
|
| |
|
|
| |
|
|
| |
|
|
|
| | 2,970,340 | | | | 5,505,415 | | | | 481,901,035 | | | | 917,352,627 | | | | 33,006,474 | | | | 78,924,145 | |
|
|
| |
|
|
| |
|
|
| |
|
|
| |
|
|
| |
|
|
|
| | — | | | | — | | | | — | | | | — | | | | (1,540,373 | ) | | | (3,048,493 | ) |
| | — | | | | — | | | | — | | | | — | | | | — | | | | — | |
|
|
| |
|
|
| |
|
|
| |
|
|
| |
|
|
| |
|
|
|
| | — | | | | — | | | | — | | | | — | | | | (1,540,373 | ) | | | (3,048,493 | ) |
|
|
| |
|
|
| |
|
|
| |
|
|
| |
|
|
| |
|
|
|
| | 10,890,027 | | | | 5,332,694 | | | | 1,274,582,285 | | | | 1,063,154,651 | | | | 45,879,177 | | | | 806,194,386 | |
| | — | | | | — | | | | — | | | | — | | | | 1,244,967 | | | | 2,327,700 | |
| | (4,981,576 | ) | | | (4,697,715 | ) | | | (1,346,788,882 | ) | | | (722,009,661 | ) | | | (111,140,448 | ) | | | (980,348,314 | ) |
|
|
| |
|
|
| |
|
|
| |
|
|
| |
|
|
| |
|
|
|
| | 5,908,451 | | | | 634,979 | | | | (72,206,597 | ) | | | 341,144,990 | | | | (64,016,304 | ) | | | (171,826,228 | ) |
|
|
| |
|
|
| |
|
|
| |
|
|
| |
|
|
| |
|
|
|
| | 8,878,791 | | | | 6,140,394 | | | | 409,694,438 | | | | 1,258,497,617 | | | | (32,550,203 | ) | | | (95,950,576 | ) |
|
|
| |
|
|
| |
|
|
| |
|
|
| |
|
|
| |
|
|
|
| | 18,750,009 | | | | 12,609,615 | | | | 3,279,318,270 | | | | 2,020,820,653 | | | | 266,610,771 | | | | 362,561,347 | |
|
|
| |
|
|
| |
|
|
| |
|
|
| |
|
|
| |
|
|
|
| $ | 27,628,800 | | | $ | 18,750,009 | | | $ | 3,689,012,708 | | | $ | 3,279,318,270 | | | $ | 234,060,568 | | | $ | 266,610,771 | |
|
|
| |
|
|
| |
|
|
| |
|
|
| |
|
|
| |
|
|
|
| $ | — | | | $ | — | | | $ | 658,568 | | | $ | 782,667 | | | $ | 22,485 | | | $ | (137,750 | ) |
|
|
| |
|
|
| |
|
|
| |
|
|
| |
|
|
| |
|
|
|
| | 1,155,515 | | | | 691,683 | | | | 12,009,151 | | | | 16,496,840 | | | | 1,093,874 | | | | 25,132,128 | |
| | — | | | | — | | | | — | | | | — | | | | 26,483 | | | | 58,033 | |
| | (530,122 | ) | | | (622,350 | ) | | | (16,026,228 | ) | | | (11,400,533 | ) | | | (2,628,151 | ) | | | (30,322,340 | ) |
|
|
| |
|
|
| |
|
|
| |
|
|
| |
|
|
| |
|
|
|
| | 625,393 | | | | 69,333 | | | | (4,017,077 | ) | | | 5,096,307 | | | | (1,507,794 | ) | | | (5,132,179 | ) |
|
|
| |
|
|
| |
|
|
| |
|
|
| |
|
|
| |
|
|
|
| | | | | | | | | | 3,770,486 | | | | | | | | | | | | | |
| | | | | | | | | | — | | | | | | | | | | | | | |
| | | | | | | | | | (744,644 | ) | | | | | | | | | | | | |
| | | | | | | | |
|
|
| | | | | | | | | | | | |
| | | | | | | | | | 3,025,842 | | | | | | | | | | | | | |
| | | | | | | | |
|
|
| | | | | | | | | | | | |
The accompanying notes are an integral part of these financial statements.
55
| | |
Statements of Changes in Net Assets (continued) For the year ended December 31, 2004 | | |
| | | | | | | | | | | | | | | | | | | | | | | | |
| | | Managers Emerging Markets
Equity Fund
| | | Managers Bond Fund
| | | Managers Global Bond Fund
| |
| | | 2004
| | | 2003
| | | 2004
| | | 2003
| | | 2004
| | | 2003
| |
Increase (Decrease) in Net Assets | | | | | | | | | | | | | | | | | | | | | | | | |
From Operations: | | | | | | | | | | | | | | | | | | | | | | | | |
Net investment income | | $ | 307,009 | | | $ | 22,265 | | | $ | 7,869,572 | | | $ | 7,051,680 | | | $ | 889,798 | | | $ | 887,761 | |
Net realized gain on investments, futures and foreign currency transactions | | | 5,418,097 | | | | 2,839,220 | | | | 2,905,771 | | | | 2,620,799 | | | | 2,509,405 | | | | 2,092,353 | |
Net unrealized appreciation (depreciation) of investments and foreign currency translations | | | 6,510,946 | | | | 9,096,605 | | | | 116,939 | | | | 6,488,956 | | | | (394,129 | ) | | | 1,888,674 | |
| | |
|
|
| |
|
|
| |
|
|
| |
|
|
| |
|
|
| |
|
|
|
Net increase in net assets resulting from operations | | | 12,236,052 | | | | 11,958,090 | | | | 10,892,282 | | | | 16,161,435 | | | | 3,005,074 | | | | 4,868,788 | |
| | |
|
|
| |
|
|
| |
|
|
| |
|
|
| |
|
|
| |
|
|
|
Distributions to Shareholders: | | | | | | | | | | | | | | | | | | | | | | | | |
From net investment income | | | (225,163 | ) | | | (122,962 | ) | | | (9,201,004 | ) | | | (7,242,910 | ) | | | (2,005,510 | ) | | | (2,551,417 | ) |
From net realized gain on investments | | | (1,936,391 | ) | | | — | | | | (1,786,138 | ) | | | (1,652,619 | ) | | | (917,446 | ) | | | (644,990 | ) |
| | |
|
|
| |
|
|
| |
|
|
| |
|
|
| |
|
|
| |
|
|
|
Total distributions to shareholders | | | (2,161,554 | ) | | | (122,962 | ) | | | (10,987,142 | ) | | | (8,895,529 | ) | | | (2,922,956 | ) | | | (3,196,407 | ) |
| | |
|
|
| |
|
|
| |
|
|
| |
|
|
| |
|
|
| |
|
|
|
From Capital Share Transactions: | | | | | | | | | | | | | | | | | | | | | | | | |
Proceeds from sale of shares | | | 41,188,851 | | | | 115,364,722 | | | | 148,437,567 | | | | 138,938,793 | | | | 17,122,093 | | | | 54,118,889 | |
Reinvestment of dividends and distributions | | | 2,118,388 | | | | 119,204 | | | | 10,270,433 | | | | 8,197,878 | | | | 2,901,332 | | | | 3,177,019 | |
Cost of shares repurchased | | | (26,542,734 | ) | | | (112,802,639 | ) | | | (79,044,208 | ) | | | (103,102,078 | ) | | | (15,959,002 | ) | | | (46,407,165 | ) |
| | |
|
|
| |
|
|
| |
|
|
| |
|
|
| |
|
|
| |
|
|
|
Net increase from capital share transactions | | | 16,764,505 | | | | 2,681,287 | | | | 79,663,792 | | | | 44,034,593 | | | | 4,064,423 | | | | 10,888,743 | |
| | |
|
|
| |
|
|
| |
|
|
| |
|
|
| |
|
|
| |
|
|
|
Total increase in net assets | | | 26,839,003 | | | | 14,516,415 | | | | 79,568,932 | | | | 51,300,499 | | | | 4,146,541 | | | | 12,561,124 | |
| | |
|
|
| |
|
|
| |
|
|
| |
|
|
| |
|
|
| |
|
|
|
Net Assets: | | | | | | | | | | | | | | | | | | | | | | | | |
Beginning of year | | | 36,727,662 | | | | 22,211,247 | | | | 179,641,093 | | | | 128,340,594 | | | | 32,307,096 | | | | 19,745,972 | |
| | |
|
|
| |
|
|
| |
|
|
| |
|
|
| |
|
|
| |
|
|
|
End of year | | $ | 63,566,665 | | | $ | 36,727,662 | | | $ | 259,210,025 | | | $ | 179,641,093 | | | $ | 36,453,637 | | | $ | 32,307,096 | |
| | |
|
|
| |
|
|
| |
|
|
| |
|
|
| |
|
|
| |
|
|
|
End of year undistributed net investment income | | $ | 101,804 | | | $ | — | | | $ | 35,800 | | | $ | 37,682 | | | $ | 338,255 | | | $ | 115,438 | |
| | |
|
|
| |
|
|
| |
|
|
| |
|
|
| |
|
|
| |
|
|
|
Share Transactions: | | | | | | | | | | | | | | | | | | | | | | | | |
Sale of shares | | | 2,854,814 | | | | 11,585,328 | | | | 6,055,078 | | | | 5,752,592 | | | | 759,922 | | | | 2,429,610 | |
Reinvested shares | | | 130,443 | | | | 9,141 | | | | 421,611 | | | | 338,265 | | | | 129 755 | | | | 144 148 | |
Shares repurchased | | | (1,902,280 | ) | | | (11,349,104 | ) | | | (3,242,568 | ) | | | (4,256,109 | ) | | | (716,810 | ) | | | (2,077,261 | ) |
| | |
|
|
| |
|
|
| |
|
|
| |
|
|
| |
|
|
| |
|
|
|
Net increase in shares | | | 1,082,977 | | | | 245,365 | | | | 3,234,121 | | | | 1,834,748 | | | | 172,867 | | | | 496,497 | |
| | |
|
|
| |
|
|
| |
|
|
| |
|
|
| |
|
|
| |
|
|
|
The accompanying notes are an integral part of these financial statements.
56
Financial Highlights
For a share outstanding throughout the each fiscal year ended December 31,
| | | | | | | | | | | | | | | | | | | | |
| | | Managers Value Fund
| |
| | | 2004
| | | 2003
| | | 2002
| | | 2001
| | | 2000
| |
Net Asset Value, Beginning of Year | | $ | 26.24 | | | $ | 20.69 | | | $ | 27.45 | | | $ | 27.73 | | | $ | 27.50 | |
| | |
|
|
| |
|
|
| |
|
|
| |
|
|
| |
|
|
|
Income from Investment Operations: | | | | | | | | | | | | | | | | | | | | |
Net investment income | | | 0.17 | | | | 0.11 | | | | 0.15 | | | | 0.09 | | | | 0.17 | |
Net realized and unrealized gain (loss) on investments | | | 3.47 | | | | 5.56 | | | | (6.65 | ) | | | 0.70 | | | | 2.45 | |
| | |
|
|
| |
|
|
| |
|
|
| |
|
|
| |
|
|
|
Total from investment operations | | | 3.64 | | | | 5.67 | | | | (6.50 | ) | | | 0.79 | | | | 2.62 | |
| | |
|
|
| |
|
|
| |
|
|
| |
|
|
| |
|
|
|
Less Distributions to Shareholders from: | | | | | | | | | | | | | | | | | | | | |
Net investment income | | | (0.15 | ) | | | (0.12 | ) | | | (0.16 | ) | | | (0.08 | ) | | | (0.17 | ) |
Net realized gain on investments | | | | | | | | | | | (0.10 | ) | | | (0.99 | ) | | | (2.22 | ) |
| | |
|
|
| |
|
|
| |
|
|
| |
|
|
| |
|
|
|
Total distributions to shareholders | | | (0.15 | ) | | | (0.12 | ) | | | (0.26 | ) | | | (1.07 | ) | | | (2.39 | ) |
| | |
|
|
| |
|
|
| |
|
|
| |
|
|
| |
|
|
|
Net Asset Value, End of Year | | $ | 29.73 | | | $ | 26.24 | | | $ | 20.69 | | | $ | 27.45 | | | $ | 27.73 | |
| | |
|
|
| |
|
|
| |
|
|
| |
|
|
| |
|
|
|
Total Return 1 | | | 13.87 | % | | | 27.39 | % | | | (23.79 | )% | | | 2.92 | % | | | 9.80 | % |
| | |
|
|
| |
|
|
| |
|
|
| |
|
|
| |
|
|
|
Ratio of net expenses to average net assets 1 | | | 1.22 | % | | | 1.27 | % | | | 1.28 | % | | | 1.25 | % | | | 1.30 | % |
Ratio of total expenses to average net assets 1 | | | 1.38 | %5 | | | 1.42 | %5 | | | 1.35 | % | | | 1.35 | % | | | 1.38 | % |
Ratio of net investment income to average net assets | | | 0.62 | % | | | 0.59 | % | | | 0.60 | % | | | 0.43 | % | | | 0.61 | % |
Portfolio turnover | | | 39 | % | | | 40 | % | | | 53 | % | | | 147 | % | | | 153 | % |
Net assets at end of year (000’s omitted) | | $ | 119,547 | | | $ | 100,720 | | | $ | 48,001 | | | $ | 63,628 | | | $ | 57,300 | |
| |
| | | Managers Capital Appreciation Fund
| |
| | | 2004
| | | 2003
| | | 2002
| | | 2001
| | | 2000
| |
Net Asset Value, Beginning of Year | | $ | 25.46 | | | $ | 20.36 | | | $ | 29.29 | | | $ | 42.79 | | | $ | 61.12 | |
| | |
|
|
| |
|
|
| |
|
|
| |
|
|
| |
|
|
|
Income from Investment Operations: | | | | | | | | | | | | | | | | | | | | |
Net investment loss | | | (0.07 | ) | | | (0.16 | ) | | | (0.28 | ) | | | (0.25 | ) | | | (0.42 | ) |
Net realized and unrealized gain (loss) on investments | | | 1.38 | | | | 5.26 | | | | (8.65 | ) | | | (13.25 | ) | | | (13.25 | ) |
| | |
|
|
| |
|
|
| |
|
|
| |
|
|
| |
|
|
|
Total from investment operations | | | 1.31 | | | | 5.10 | | | | (8.93 | ) | | | (13.50 | ) | | | (13.67 | ) |
| | |
|
|
| |
|
|
| |
|
|
| |
|
|
| |
|
|
|
Less Distributions to Shareholders from: | | | | | | | | | | | | | | | | | | | | |
Net realized gain on investments | | | — | | | | — | | | | — | | | | — | | | | (4.66 | ) |
| | |
|
|
| |
|
|
| |
|
|
| |
|
|
| |
|
|
|
Net Asset Value, End of Year | | $ | 26.77 | | | $ | 25.46 | | | $ | 20.36 | | | $ | 29.29 | | | $ | 42.79 | |
| | |
|
|
| |
|
|
| |
|
|
| |
|
|
| |
|
|
|
Total Return 1 | | | 5.14 | % | | | 25.05 | % | | | (30.49 | )% | | | (31.55 | )% | | | (22.20 | )% |
| | |
|
|
| |
|
|
| |
|
|
| |
|
|
| |
|
|
|
Ratio of net expenses to average net assets 1 | | | 1.34 | % | | | 1.33 | % | | | 1.39 | % | | | 1.34 | % | | | 1.23 | % |
Ratio of total expenses to average net assets 1 | | | 1.47 | %5 | | | 1.52 | %5 | | | 1.43 | % | | | 1.40 | % | | | 1.26 | % |
Ratio of net investment loss to average net assets | | | (0.26 | )% | | | (0.67 | )% | | | (1.07 | )% | | | (0.75 | )% | | | (0.82 | )% |
Portfolio turnover | | | 79 | % | | | 109 | % | | | 141 | % | | | 265 | % | | | 306 | % |
Net assets at end of year (000’s omitted) | | $ | 98,347 | | | $ | 110,903 | | | $ | 107,545 | | | $ | 186,876 | | | $ | 286,515 | |
57
Financial Highlights
For a share outstanding throughout each fiscal period ended December 31,
| | | | | | | | | | | | | | | | | | | | |
| | | Managers Small Company Fund
| |
| | | 2004
| | | 2003
| | | 2002
| | | 2001
| | | 2000*
| |
Net Asset Value, Beginning of Period | | $ | 9.19 | | | $ | 6.40 | | | $ | 8.16 | | | $ | 9.29 | | | $ | 10.00 | |
| | |
|
|
| |
|
|
| |
|
|
| |
|
|
| |
|
|
|
Income from Investment Operations: | | | | | | | | | | | | | | | | | | | | |
Net investment loss | | | (0.08 | ) | | | (0.09 | ) | | | (0.13 | ) | | | (0.07 | ) | | | (0.01 | ) |
Net realized and unrealized gain (loss) on investments | | | 1.25 | | | | 2.88 | | | | (1.63 | ) | | | (1.06 | ) | | | (0.70 | ) |
| | |
|
|
| |
|
|
| |
|
|
| |
|
|
| |
|
|
|
Total from investment operations | | | 1.17 | | | | 2.79 | | | | (1.76 | ) | | | (1.13 | ) | | | (0.71 | ) |
| | |
|
|
| |
|
|
| |
|
|
| |
|
|
| |
|
|
|
Net Asset Value, End of Period | | $ | 10.36 | | | $ | 9.19 | | | $ | 6.40 | | | $ | 8.16 | | | $ | 9.29 | |
Total Return1 | | | 12.73 | % | | | 43.59 | % | | | (21.57 | )% | | | (12.16 | )% | | | (7.10 | )%2 |
| | |
|
|
| |
|
|
| |
|
|
| |
|
|
| |
|
|
|
Ratio of net expenses to average net assets1 | | | 1.45 | % | | | 1.45 | % | | | 1.40 | % | | | 1.30 | % | | | 1.30 | %3 |
Ratio of total expenses to average net assets1 | | | 1.43 | %5 | | | 1.50 | %5 | | | 1.70 | % | | | 1.71 | % | | | 1.72 | %3 |
Ratio of net investment loss to average net assets | | | (1.05 | )% | | | (1.20 | )% | | | (1.17 | )% | | | (0.92 | )% | | | (0.45 | )%3 |
Portfolio turnover | | | 18 | % | | | 48 | % | | | 134 | % | | | 95 | % | | | 55 | %2 |
Net assets at end of period (000’s omitted) | | $ | 27,629 | | | $ | 18,750 | | | $ | 12,610 | | | $ | 26,764 | | | $ | 25,705 | |
| * | Commencement of operations was June 19, 2000. |
| | | | |
| | | Managers Special Equity
Fund - I Class
| |
| | | For the period* ended December 31, 2004
| |
Net Asset Value, Beginning of Period | | $ | 78.91 | |
| | |
|
|
|
Income from Investment Operations: | | | | |
Net investment loss | | | (0.21 | ) |
Net realized and unrealized gain on investments | | | 11.86 | |
| | |
|
|
|
Total from investment operations | | | 11.65 | |
| | |
|
|
|
Net Asset Value, End of Period | | $ | 90.56 | |
| | |
|
|
|
Total Return 1 | | | 14.75 | %2 |
| | |
|
|
|
Ratio of net expenses to average net assets 1 | | | 1.20 | %3 |
Ratio of total expenses to average net assets 1 | | | 1.26 | %3,5 |
Ratio of net investment loss to average net assets | | | (0.49 | )%3 |
Portfolio turnover | | | 68 | %2 |
Net assets at end of period (000’s omitted) | | $ | 274,010 | |
| * | Commencement of operations was May 3, 2004. |
58
Financial Highlights
For a share outstanding throughout each fiscal year ended December 31,
| | | | | | | | | | | | | | | | | | | | |
| | | Managers Special Equity Fund - Managers Class
| |
| | | 2004
| | | 2003
| | | 2002
| | | 2001
| | | 2000
| |
Net Asset Value, Beginning of Year | | $ | 78.48 | | | $ | 55.08 | | | $ | 70.59 | | | $ | 76.82 | | | $ | 91.42 | |
| | |
|
|
| |
|
|
| |
|
|
| |
|
|
| |
|
|
|
Income from Investment Operations: | | | | | | | | | | | | | | | | | | | | |
Net investment loss | | | (0.56 | ) | | | (0.43 | ) | | | (0.34 | ) | | | (0.18 | ) | | | (0.12 | ) |
Net realized and unrealized gain (loss) on investments | | | 12.50 | | | | 23.83 | | | | (15.17 | ) | | | (6.05 | ) | | | (2.71 | ) |
| | |
|
|
| |
|
|
| |
|
|
| |
|
|
| |
|
|
|
Total from investment operations | | | 11.94 | | | | 23.40 | | | | (15.51 | ) | | | (6.23 | ) | | | (2.83 | ) |
| | |
|
|
| |
|
|
| |
|
|
| |
|
|
| |
|
|
|
Less Distributions to Shareholders from: | | | | | | | | | | | | | | | | | | | | |
Net realized gain on investments | | | — | | | | — | | | | — | | | | — | | | | (11.77 | ) |
| | |
|
|
| |
|
|
| |
|
|
| |
|
|
| |
|
|
|
Net Asset Value, End of Year | | $ | 90.42 | | | $ | 78.48 | | | $ | 55.08 | | | $ | 70.59 | | | $ | 76.82 | |
| | |
|
|
| |
|
|
| |
|
|
| |
|
|
| |
|
|
|
Total Return 1 | | | 15.18 | % | | | 42.50 | % | | | (21.98 | )% | | | (8.07 | )% | | | (2.56 | )% |
| | |
|
|
| |
|
|
| |
|
|
| |
|
|
| |
|
|
|
Ratio of net expenses to average net assets1 | | | 1.40 | % | | | 1.43 | % | | | 1.31 | % | | | 1.29 | % | | | 1.26 | % |
Ratio of total expenses to average net assets1 | | | 1.45 | %5 | | | 1.46 | %5 | | | 1.32 | % | | | 1.30 | % | | | 1.26 | % |
Ratio of net investment loss to average net assets | | | (0.69 | )% | | | (0.72 | )% | | | (0.56 | )% | | | (0.27 | )% | | | (0.16 | )% |
Portfolio turnover | | | 68 | % | | | 64 | % | | | 67 | % | | | 62 | % | | | 69 | % |
Net assets at end of year (000’s omitted) | | $ | 3,415,003 | | | $ | 3,279,318 | | | $ | 2,020,821 | | | $ | 2,295,234 | | | $ | 2,132,376 | |
| | | | | | | | | | | | | | | | | | | | |
| | | Managers International Equity Fund
| |
| | | 2004
| | | 2003
| | | 2002
| | | 2001
| | | 2000
| |
Net Asset Value, Beginning of Year | | $ | 41.13 | | | $ | 31.22 | | | $ | 37.61 | | | $ | 49.38 | | | $ | 58.71 | |
| | |
|
|
| |
|
|
| |
|
|
| |
|
|
| |
|
|
|
Income from Investment Operations: | | | | | | | | | | | | | | | | | | | | |
Net investment income | | | 0.27 | | | | 0.34 | | | | 0.19 | | | | 0.20 | 4 | | | 0.27 | |
Net realized and unrealized gain (loss) on investments | | | 5.96 | | | | 10.04 | | | | (6.48 | ) | | | (11.72 | )4 | | | (5.38 | ) |
| | |
|
|
| |
|
|
| |
|
|
| |
|
|
| |
|
|
|
Total from investment operations | | | 6.23 | | | | 10.38 | | | | (6.29 | ) | | | (11.52 | ) | | | (5.11 | ) |
| | |
|
|
| |
|
|
| |
|
|
| |
|
|
| |
|
|
|
Less Distributions to Shareholders from: | | | | | | | | | | | | | | | | | | | | |
Net investment income | | | (0.31 | ) | | | (0.47 | ) | | | (0.10 | ) | | | (0.25 | ) | | | (0.24 | ) |
Net realized gain on investments | | | — | | | | — | | | | — | | | | — | | | | (3.98 | ) |
| | |
|
|
| |
|
|
| |
|
|
| |
|
|
| |
|
|
|
Total distributions to shareholders | | | (0.31 | ) | | | (0.47 | ) | | | (0.10 | ) | | | (0.25 | ) | | | (4.22 | ) |
| | |
|
|
| |
|
|
| |
|
|
| |
|
|
| |
|
|
|
Net Asset Value, End of Year | | $ | 47.05 | | | $ | 41.13 | | | $ | 31.22 | | | $ | 37.61 | | | $ | 49.38 | |
| | |
|
|
| |
|
|
| |
|
|
| |
|
|
| |
|
|
|
Total Return 1 | | | 15.17 | % | | | 33.21 | % | | | (16.71 | )% | | | (23.35 | )% | | | (8.46 | )% |
| | |
|
|
| |
|
|
| |
|
|
| |
|
|
| |
|
|
|
Ratio of net expenses to average net assets 1 | | | 1.62 | % | | | 1.72 | % | | | 1.54 | % | | | 1.45 | % | | | 1.41 | % |
Ratio of total expenses to average net assets 1 | | | 1.70 | %5 | | | 1.73 | % | | | 1.56 | % | | | 1.46 | % | | | 1.42 | % |
Ratio of net investment income to average net assets | | | 0.57 | % | | | 0.70 | % | | | 0.54 | % | | | 0.46 | %4 | | | 0.42 | % |
Portfolio turnover | | | 93 | % | | | 80 | % | | | 132 | % | | | 108 | % | | | 99 | % |
Net assets at end of year (000’s omitted) | | $ | 234,061 | | | $ | 266,611 | | | $ | 362,561 | | | $ | 560,602 | | | $ | 656,630 | |
59
Financial Highlights
For a share outstanding throughout each fiscal year ended December 31,
| | | | | | | | | | | | | | | | | | | | |
| | | Managers Emerging Markets Equity Fund
| |
| | | 2004
| | | 2003
| | | 2002
| | | 2001
| | | 2000
| |
Net Asset Value, Beginning of Year | | $ | 13.26 | | | $ | 8.80 | | | $ | 9.56 | | | $ | 9.63 | | | $ | 14.67 | |
| | |
|
|
| |
|
|
| |
|
|
| |
|
|
| |
|
|
|
Income from Investment Operations: | | | | | | | | | | | | | | | | | | | | |
Net investment income (loss) | | | 0.08 | | | | 0.01 | | | | 0.03 | | | | (0.01 | ) | | | (0.04 | ) |
Net realized and unrealized gain (loss) on investments | | | 3.74 | | | | 4.50 | | | | (0.79 | ) | | | (0.04 | ) | | | (3.90 | ) |
| | |
|
|
| |
|
|
| |
|
|
| |
|
|
| |
|
|
|
Total from investment operations | | | 3.82 | | | | 4.51 | | | | (0.76 | ) | | | (0.05 | ) | | | (3.94 | ) |
| | |
|
|
| |
|
|
| |
|
|
| |
|
|
| |
|
|
|
Less Distributions to Shareholders from: | | | | | | | | | | | | | | | | | | | | |
Net investment income | | | (0.06 | ) | | | (0.05 | ) | | | — | | | | — | | | | — | |
Net realized gain on investments | | | (0.52 | ) | | | — | | | | — | | | | (0.02 | ) | | | (1.10 | ) |
| | |
|
|
| |
|
|
| |
|
|
| |
|
|
| |
|
|
|
Total distributions to shareholders | | | (0.58 | ) | | | (0.05 | ) | | | — | | | | (0.02 | ) | | | (1.10 | ) |
| | |
|
|
| |
|
|
| |
|
|
| |
|
|
| |
|
|
|
Net Asset Value, End of Year | | $ | 16.50 | | | $ | 13.26 | | | $ | 8.80 | | | $ | 9.56 | | | $ | 9.63 | |
| | |
|
|
| |
|
|
| |
|
|
| |
|
|
| |
|
|
|
Total Return 1 | | | 28.85 | % | | | 51.20 | % | | | (7.95 | )% | | | (0.57 | )% | | | (26.69 | )% |
| | |
|
|
| |
|
|
| |
|
|
| |
|
|
| |
|
|
|
Ratio of net expenses to average net assets 1 | | | 1.85 | % | | | 1.99 | % | | | 1.97 | % | | | 1.94 | % | | | 1.98 | % |
Ratio of total expenses to average net assets 1 | | | 1.87 | %5 | | | 1.97 | %5 | | | 2.18 | % | | | 2.36 | % | | | 2.48 | % |
Ratio of net investment income (loss) to average net assets | | | 0.67 | % | | | 0.08 | % | | | 0.32 | % | | | (0.09 | )% | | | (0.34 | )% |
Portfolio turnover | | | 58 | % | | | 79 | % | | | 68 | % | | | 69 | % | | | 40 | % |
Net assets at end of year (000’s omitted) | | $ | 63,567 | | | $ | 36,728 | | | $ | 22,211 | | | $ | 15,202 | | | $ | 12,390 | |
| |
| | | Managers Bond Fund
| |
| | | 2004
| | | 2003
| | | 2002
| | | 2001
| | | 2000
| |
Net Asset Value, Beginning of Year | | $ | 24.58 | | | $ | 23.44 | | | $ | 22.32 | | | $ | 21.75 | | | $ | 21.45 | |
| | |
|
|
| |
|
|
| |
|
|
| |
|
|
| |
|
|
|
Income from Investment Operations: | | | | | | | | | | | | | | | | | | | | |
Net investment income | | | 0.80 | | | | 1.08 | | | | 1.24 | | | | 1.44 | | | | 1.49 | |
Net realized and unrealized gain on investments | | | 0.30 | | | | 1.40 | | | | 1.12 | | | | 0.60 | | | | 0.48 | |
| | |
|
|
| |
|
|
| |
|
|
| |
|
|
| |
|
|
|
Total from investment operations | | | 1.10 | | | | 2.48 | | | | 2.36 | | | | 2.04 | | | | 1.97 | |
| | |
|
|
| |
|
|
| |
|
|
| |
|
|
| |
|
|
|
Less Distributions to Shareholders from: | | | | | | | | | | | | | | | | | | | | |
Net investment income | | | (0.93 | ) | | | (1.11 | ) | | | (1.24 | ) | | | (1.45 | ) | | | (1.50 | ) |
Net realized gain on investments | | | (0.17 | ) | | | (0.23 | ) | | | — | | | | (0.02 | ) | | | (0.17 | ) |
| | |
|
|
| |
|
|
| |
|
|
| |
|
|
| |
|
|
|
Total distributions to shareholders | | | (1.10 | ) | | | (1.34 | ) | | | (1.24 | ) | | | (1.47 | ) | | | (1.67 | ) |
| | |
|
|
| |
|
|
| |
|
|
| |
|
|
| |
|
|
|
Net Asset Value, End of Year | | $ | 24.58 | | | $ | 24.58 | | | $ | 23.44 | | | $ | 22.32 | | | $ | 21.75 | |
| | |
|
|
| |
|
|
| |
|
|
| |
|
|
| |
|
|
|
Total Return1 | | | 5.14 | % | | | 10.77 | % | | | 10.98 | % | | | 9.64 | % | | | 9.44 | % |
| | |
|
|
| |
|
|
| |
|
|
| |
|
|
| |
|
|
|
Ratio of net expenses to average net assets 1 | | | 0.99 | % | | | 0.99 | % | | | 1.00 | % | | | 1.18 | % | | | 1.19 | % |
Ratio of total expenses to average net assets 1 | | | 1.06 | %5 | | | 1.09 | %5 | | | 1.17 | % | | | 1.18 | % | | | 1.20 | % |
Ratio of net investment income to average net assets | | | 3.65 | % | | | 4.50 | % | | | 5.55 | % | | | 6.45 | % | | | 6.91 | % |
Portfolio turnover | | | 16 | % | | | 73 | % | | | 24 | % | | | 16 | % | | | 10 | % |
Net assets at end of year (000’s omitted) | | $ | 259,210 | | | $ | 179,641 | | | $ | 128,341 | | | $ | 66,817 | | | $ | 51,383 | |
60
Financial Highlights
For a share outstanding throughout each fiscal year ended December 31,
| | | | | | | | | | | | | | | | | | | | |
| | | Managers Global Bond Fund
| |
| | | 2004
| | | 2003
| | | 2002
| | | 2001
| | | 2000
| |
Net Asset Value, Beginning of Year | | $ | 22.19 | | | $ | 20.58 | | | $ | 17.97 | | | $ | 18.98 | | | $ | 19.44 | |
| | |
|
|
| |
|
|
| |
|
|
| |
|
|
| |
|
|
|
Income from Investment Operations: | | | | | | | | | | | | | | | | | | | | |
Net investment income | | | 0.65 | | | | 0.80 | | | | 0.81 | | | | 0.57 | 4 | | | 0.72 | |
Net realized and unrealized gain (loss) on investments | | | 1.49 | | | | 3.43 | | | | 2.57 | | | | (1.33 | )4 | | | (1.06 | ) |
| | |
|
|
| |
|
|
| |
|
|
| |
|
|
| |
|
|
|
Total from investment operations | | | 2.14 | | | | 4.23 | | | | 3.38 | | | | (0.76 | ) | | | (0.34 | ) |
| | |
|
|
| |
|
|
| |
|
|
| |
|
|
| |
|
|
|
Less Distributions to Shareholders from: | | | | | | | | | | | | | | | | | | | | |
Net investment income | | | (1.34 | ) | | | (2.09 | ) | | | (0.55 | ) | | | — | | | | (0.12 | ) |
Net realized gain on investments | | | (0.61 | ) | | | (0.53 | ) | | | (0.22 | ) | | | (0.25 | ) | | | — | |
| | |
|
|
| |
|
|
| |
|
|
| |
|
|
| |
|
|
|
Total distributions to shareholders | | | (1.95 | ) | | | (2.62 | ) | | | (0.77 | ) | | | (0.25 | ) | | | (0.12 | ) |
| | |
|
|
| |
|
|
| |
|
|
| |
|
|
| |
|
|
|
Net Asset Value, End of Year | | $ | 22.38 | | | $ | 22.19 | | | $ | 20.58 | | | $ | 17.97 | | | $ | 18.98 | |
| | |
|
|
| |
|
|
| |
|
|
| |
|
|
| |
|
|
|
Total Return 1 | | | 9.62 | % | | | 20.69 | % | | | 18.85 | % | | | (4.10 | )% | | | (1.62 | )% |
| | |
|
|
| |
|
|
| |
|
|
| |
|
|
| |
|
|
|
Ratio of net expenses to average net assets 1 | | | 1.29 | % | | | 1.68 | % | | | 1.55 | % | | | 1.45 | % | | | 1.47 | % |
Ratio of total expenses to average net assets 1 | | | 1.49 | %5 | | | 1.68 | % | | | 1.56 | % | | | 1.46 | % | | | 1.50 | % |
Ratio of net investment income to average net assets | | | 2.73 | % | | | 3.48 | % | | | 4.01 | % | | | 2.87 | %4 | | | 4.07 | % |
Portfolio turnover | | | 130 | % | | | 152 | % | | | 220 | % | | | 244 | % | | | 176 | % |
Net assets at end of year (000’s omitted) | | $ | 36,454 | | | $ | 32,307 | | | $ | 19,746 | | | $ | 19,879 | | | $ | 22,723 | |
The following notes should be read in conjunction with the Financial Highlights of the Funds presented on the preceding pages.
| 1 | See Note 1(c) of “Notes to Financial Statements.” |
| 4 | Effective January 1, 2001, the Trust adopted the provisions of the AICPA Audit and Accounting Guide for Investment Companies and began amortizing premium and discount on all debt securities, as required. The effect of this change during the year ended December 31, 2001 on International Equity, Intermediate Bond and Global Bond was to decrease net investment income and increase net realized and unrealized gain (loss) per share by $0.01, $0.04 and $0.04, respectively. The effect of this change on the remaining Funds was not significant. Without this change the ratio of net investment income to average net assets for the year ended December 31, 2001 for International Equity and Global Bond would have been 0.46% and 3.08%, respectively. Per share data, ratios and supplemental data for prior periods have not been restated to reflect this change. |
| 5 | Excludes the impact of expense (reimbursement)/recoupment and expense offsets such as brokerage credits, but includes non-reimbursable expenses such as interest and taxes. (See Note 1c to the Notes to Financial Statements.) |
61
Notes to Financial Statements
December 31, 2004
(1) Summary of Significant Accounting Policies
The Managers Funds (the “Trust”) is an open-end management investment company organized as a Massachusetts business trust and registered under the Investment Company Act of 1940, as amended (the “1940 Act”). Currently, the Trust is comprised of a number of investment series. Included in this report are the Managers Value Fund (“Value”), Managers Capital Appreciation Fund (“Capital Appreciation”), Managers Small Company Fund (“Small Company”), Managers Special Equity Fund (“Special Equity”), Managers International Equity Fund (“International Equity”), Managers Emerging Markets Equity Fund (“Emerging Markets Equity”), Managers Bond Fund (“Bond”) and Managers Global Bond Fund (“Global Bond”), collectively the “Funds.”
The Special Equity offers both Managers Class shares and I Class shares. The I Class shares, which are designed primarily for institutional investors that meet certain administrative and servicing criteria, have a minimum investment of $250,000. Managers Class shares are offered to all other investors. Each class represents an interest in the same assets of Special Equity and the classes are identical except for class specific expenses related to shareholder activity. Investment income, realized and unrealized capital gains and losses, the common expenses of Special Equity, and certain Fund level expense reductions, if any, are allocated on a pro rata basis to each class based on the relative net assets of each class to the total net assets of Special Equity. Both classes have equal voting privileges except that each class has exclusive voting rights with respect to its services and/or distribution plan.
The Funds’ financial statements are prepared in accordance with accounting principles generally accepted in the United States of America, which require management to make estimates and assumptions that affect the reported amount of assets and liabilities and disclosure of contingent assets and liabilities at the date of the financial statements and the reported amounts of income and expenses during the reporting periods. Actual results could differ from those estimates. The following is a summary of significant accounting policies followed by the Funds in the preparation of their financial statements:
(a) Valuation of Investments
Equity securities traded on a domestic or international securities exchange are generally valued at the last quoted sale price, or, lacking any sales, at the last quoted bid price. Over-the-counter securities are valued at the Nasdaq Official Closing Price, if one is available. Lacking any sales, over-the-counter securities, are valued at the last quoted bid price. Under certain circumstances, the value of a Fund investment may be based on an evaluation of its fair value, pursuant to procedures established by and under the general supervision of the Board of Trustees of the Fund. A Fund may use the fair value of a portfolio security to calculate its NAV when, for example, (1) market quotations are not readily available because a portfolio security is not traded in a public market or the principal market in which the security trades is closed, (2) trading in a portfolio security is suspended and not resumed prior to the time as of which the Fund calculates its NAV, (3) the Investment Manager determines that a market quotation is inaccurate, or (4) where a significant event affecting the value of a portfolio security is determined to have occurred between the time of the market quotation provided for a portfolio security and the time as of which the Fund calculates its NAV. The Manager monitors intervening events that may affect the value of securities held in each Fund’s portfolio and, in accordance with procedures adopted by the Funds’ Trustees, will adjust the prices of securities traded in foreign markets, as appropriate, to reflect the impact of events occurring subsequent to the close of such markets but prior to the time each Fund’s NAV is calculated. Fixed-income securities are valued based on valuations furnished by independent pricing services that utilize matrix systems, which reflect such factors as security prices, yields, maturities and ratings, and are supplemented by dealer and exchange quotations. Short-term investments having a remaining maturity of 60 days or less are valued at amortized cost, which approximates market value. Investments in other regulated investment companies are valued at their end of day net asset value per share except iShares or other ETF’s, which are valued the same as equity securities. Securities (including derivatives) for which market quotations are not readily available are valued at fair value, as determined in good faith, and pursuant to procedures adopted by the Board of Trustees of the Trust.
Investments in certain mortgage-backed, stripped mortgage-backed, preferred stocks, convertible securities and other debt securities not traded on an organized market, are valued on the basis of valuations provided by dealers or by a pricing service which uses information with respect to transactions in such securities, various relationships between securities and yield to maturity in determining value.
(b) Security Transactions
Security transactions are accounted for as of the trade date. Realized gains and losses on securities sold are determined on the basis of identified cost.
(c) Investment Income and Expenses
Dividend income is recorded on the ex-dividend date except certain dividends from foreign securities where the ex-dividend date may have passed. These dividends are recorded as soon as the Trust is informed of the ex-dividend date. Dividend income on foreign securities is recorded net of any withholding tax. Interest income, which includes amortization of premium and accretion of discount on debt securities, is accrued as earned. Non-cash dividends included in dividend income, if any, are reported at
62
Notes to Financial Statements (continued)
the fair market value of the securities received. Other income and expenses are recorded on an accrual basis. Expenses that cannot be directly attributed to a fund are apportioned among the Funds in the Trust and in some cases other affiliated funds based upon their relative average net assets or number of shareholders.
The following Funds had certain portfolio trades directed to various brokers who paid a portion of such Fund’s expenses. For the year ended December 31, 2004, under these arrangements the amount by which the Funds’ expenses were reduced and the impact on the expense ratios were as follows: Value -$18,152 or 0.02%; Capital Appreciation – $18,632 or 0.02%; Special Equity - $1,056,804 or 0.03% and International Equity - $30,637 or 0.01%.
In addition, each of the Funds has a “balance credit” arrangement with The Bank of New York (“BNY”), the Funds’ custodian, whereby each Fund is credited with an interest factor equal to 1% below the effective 90-day T-Bill rate for account balances left uninvested overnight. These credits serve to reduce custody expenses that would otherwise be charged to each Fund. For the year ended December 31, 2004, the custodian expense was not reduced for any of the Funds.
Effective May 1, 2004, Managers Investment Group LLC (formerly The Managers Funds LLC) (the “Investment Manager”), a subsidiary of Affiliated Managers Group, Inc. (“AMG”) and the Investment Manager for the Funds, has contractually agreed, through at least May 1, 2005, to waive fees and pay or reimburse expenses of Small Company, Bond and Global Bond to the extent that the total annual operating expenses (exclusive of brokerage, interest, taxes and extraordinary expenses) of the Fund exceed 1.45%, 0.99% and 1.19%, respectively, of each Fund’s average daily net assets. The Investment Manager has also contractually agreed to waive fees on Value, Capital Appreciation, International Equity and Emerging Markets Equity to the extent that the total annual operating expenses (exclusive of brokerage, interest, taxes and extraordinary expenses) of the Fund exceed 1.19%, 1.29%, 1.55% and 1.79%, respectively, of each Fund’s average daily net assets, provided that the amount of fees waived, paid or reimbursed does not exceed 0.25% per annum of each Fund’s average daily net assets.
Each Fund may be obligated to repay the Investment Manager such amounts waived, paid or reimbursed in future years provided that the repayment occurs within three (3) years after the waiver or reimbursement and that such repayment would not cause the Fund’s expenses in any such year to exceed the previously stated percentages of that Fund’s average daily net assets. For the year ended December 31, 2004, Small Company and Emerging Markets Equity made such repayments to the Investment Manager in the amounts of $3,782 and $22,187, respectively. At December 31, 2004, the cumulative amount of reimbursement by the Manager subject to repayment for Value, Capital Appreciation, Small Company, International Equity, Emerging Markets Equity, Bond and Global Bond equaled $150,183, $113,864, $65,986, $141,842, $23,775, $485,266 and $68,099, respectively.
The Investment Manager has agreed to waive a portion of its fee or reimburse expenses of Special Equity commensurate with the reduction in the fee paid to Essex Investment Management Company LLC (“Essex”) (subadvisor to Special Equity since December 19, 2003), which is 0.10% of the average daily net assets of the portion of the Fund managed by Essex in excess of $100 million. For the year ended December 31, 2004, the amount reimbursed equaled $530,350.
Total returns and net investment income for the Funds would have been lower had certain expenses not been offset.
(d) Dividends and Distributions
Dividends resulting from net investment income, if any, normally will be declared and paid annually for Global Bond and the Equity Funds. Dividends resulting from net investment income, if any, normally will be declared and paid monthly for Bond. Distributions of capital gains, if any, will be made on an annual basis and when required for Federal excise tax purposes. Income and capital gain distributions are determined in accordance with Federal income tax regulations, which may differ from generally accepted accounting principles. These differences are primarily due to differing treatments for losses deferred due to wash sales, equalization accounting for tax purposes, foreign currency and market discount transactions. Permanent book and tax basis differences, if any, relating to shareholder distributions will result in reclassifications to paid-in capital. The tax character of distributions paid during 2004 was as follows:
| | | | | | | | | | | | | | | | | | | | | | | | | | |
| | | Value
| | | Capital
Appreciation
| | Small Company
| | Special Equity
|
| | | 2004
| | | 2003
| | | 2004
| | 2003
| | 2004
| | 2003
| | 2004
| | 2003
|
Distributions paid from: | | | | | | | | | | | | | | | | | | | | | | | | | | |
Ordinary income | | $ | 600,552 | | | $ | 438,692 | | | $ | — | | $ | — | | $ | — | | $ | — | | $ | — | | $ | — |
Short-term capital gains | | | — | | | | — | | | | — | | | — | | | — | | | — | | | — | | | — |
Long-term capital gains | | | — | | | | — | | | | — | | | — | | | — | | | — | | | — | | | — |
| | |
|
|
| |
|
|
| |
|
| |
|
| |
|
| |
|
| |
|
| |
|
|
| | | $ | 600,552 | | | $ | 438,692 | | | $ | — | | $ | — | | $ | — | | $ | — | | $ | — | | $ | — |
| | |
|
|
| |
|
|
| |
|
| |
|
| |
|
| |
|
| |
|
| |
|
|
As a % of distributions paid: | | | | | | | | | | | | | | | | | | | | | | | | | | |
Qualified ordinary income | | | 100.00 | % | | | 100.00 | % | | | — | | | — | | | — | | | — | | | — | | | — |
Ordinary income - dividends received deduction | | | 100.00 | % | | | 100.00 | % | | | — | | | — | | | — | | | — | | | — | | | — |
63
| | |
| Notes to Financial Statements (continued) | | |
| | | | | | | | | | | | | | | | | | | | | | | | | | | | |
| | | International Equity
| | | Emerging Markets
| | | Bond
| | Global Bond
|
| | | 2004
| | | 2003
| | | 2004
| | | 2003
| | | 2004
| | 2003
| | 2004
| | 2003
|
Distributions paid from: | | | | | | | | | | | | | | | | | | | | | | | | | | | | |
Ordinary income | | $ | 1,540,373 | | | $ | 3,048,493 | | | $ | 225,163 | | | $ | 122,962 | | | $ | 9,201,004 | | $ | 7,242,910 | | $ | 2,005,510 | | $ | 2,551,416 |
Short-term capital gains | | | — | | | | — | | | | — | | | | — | | | | 335,401 | | | 1,005,942 | | | 133,202 | | | 436,611 |
Long-term capital gains | | | — | | | | — | | | | 1,936,391 | | | | — | | | | 1,450,737 | | | 646,677 | | | 784,244 | | | 208,379 |
| | |
|
|
| |
|
|
| |
|
|
| |
|
|
| |
|
| |
|
| |
|
| |
|
|
| | | $ | 1,540,373 | | | $ | 3,048,493 | | | $ | 2,161,554 | | | $ | 122,962 | | | $ | 10,987,142 | | $ | 8,895,529 | | $ | 2,922,956 | | $ | 3,196,406 |
| | |
|
|
| |
|
|
| |
|
|
| |
|
|
| |
|
| |
|
| |
|
| |
|
|
As a % of distributions paid: | | | | | | | | | | | | | | | | | | | | | | | | | | | | |
Qualified ordinary income | | | 100.00 | % | | | 87.46 | % | | | 100.00 | % | | | 70.46 | % | | | — | | | — | | | — | | | — |
Ordinary income - dividends received deduction | | | — | | | | — | | | | — | | | | — | | | | — | | | — | | | — | | | — |
As of December 31, 2004, the components of distributable earnings (excluding unrealized appreciation/depreciation) on a tax basis consisted of:
| | | | | | | | | | | | | | | | | | | | | | | | | | | | |
| | | Value
| | Capital
Appreciation
| | | Special Equity
| | | Small
Company
| | | International
Equity
| | | Emerging
Markets
| | Bond
| | Global
Bond
|
Capital loss carryforward | | $ | — | | $ | (161,578,706 | ) | | $ | (34,727,595 | ) | | $ | (7,944,945 | ) | | $ | (128,192,732 | ) | | $ | — | | $ | — | | $ | — |
Undistributed ordinary income | | | 84,317 | | | — | | | | — | | | | — | | | | 851,904 | | | | 101,804 | | | 307,806 | | | 295,015 |
Undistributed short-term capital gains | | | — | | | — | | | | — | | | | — | | | | — | | | | 263,580 | | | — | | | 93,936 |
Undistributed long-term capital gains | | | 40,631 | | | — | | | | — | | | | — | | | | — | | | | 619,477 | | | 296,280 | | | 154,600 |
| | |
|
| |
|
|
| |
|
|
| |
|
|
| |
|
|
| |
|
| |
|
| |
|
|
| | | $ | 124,948 | | $ | (161,578,706 | ) | | $ | (34,727,595 | ) | | $ | (7,944,945 | ) | | $ | (127,340,828 | ) | | $ | 984,861 | | $ | 604,086 | | $ | 543,551 |
| | |
|
| |
|
|
| |
|
|
| |
|
|
| |
|
|
| |
|
| |
|
| |
|
|
Pursuant to section 852 of the Internal Revenue Code, Value, Emerging Markets Equity, Bond and Global Bond designate $40,631, $2,555,868, $1,512,630 and $938,844, respectively, as long-term capital gain for the taxable year ended December 31, 2004.
(e) Federal Taxes
Each Fund intends to comply with the requirements under Subchapter M of the Internal Revenue Code of 1986, as amended, to distribute substantially all of its taxable income and gains to its shareholders and to meet certain diversification and income requirements with respect to investment companies. Therefore, no provision for Federal income or excise tax is included in the accompanying financial statements.
Additionally, based on the Fund’s understanding of the tax rules and rates related to income, gains and transactions for the foreign jurisdictions in which it invests, the Fund will provide for foreign taxes, and where appropriate, deferred foreign taxes.
(f) Capital Loss Carryovers
As of December 31, 2004, the following Funds had accumulated net realized capital loss carryovers from securities transactions for Federal income tax purposes as shown in the following chart. These amounts may be used to offset realized capital gains, if any, through the expiration dates listed.
| | | | | |
| | | Capital Loss | | |
Fund
| | Carryover Amount
| | Expires December 31,
|
Capital Appreciation | | $ | 117,690,624 | | 2009 |
| | | | 30,988,593 | | 2010 |
| | | | 12,899,489 | | 2011 |
| | |
Small Company | | | 6,244,667 | | 2009 |
| | | | 1,700,278 | | 2010 |
| | |
Special Equity | | | 34,727,595 | | 2010 |
| | |
International Equity | | | 19,754,298 | | 2009 |
| | | | 92,266,533 | | 2010 |
| | | | 16,171,901 | | 2011 |
(g) Capital Stock
The Trust’s Declaration of Trust authorizes for each series the issuance of an unlimited number of shares of beneficial interest, without par value. Each Fund records sales and repurchases of its capital stock on the trade date. Dividends and distributions to shareholders are recorded on the ex-dividend date.
64
| | |
| Notes to Financial Statements (continued) | | |
At December 31, 2004, certain unaffiliated shareholders, specifically omnibus accounts, individually held greater than 10% of the outstanding shares of the following Funds: Value - one owns 35%; Capital Appreciation - one owns 16%; Special Equity - one owns 23%; International Equity - three own 50%; Emerging Markets Equity - two own 61%; Bond - two own 42%; Special Equity I class shares - two unaffiliated shareholders collectively own 34%.
(h) Repurchase Agreements
Each Fund may enter into repurchase agreements provided that the value of the underlying collateral, including accrued interest, will be equal to or exceed the value of the repurchase agreement during the term of the agreement. The underlying collateral for all repurchase agreements is held in safekeeping by the Fund’s custodian or at the Federal Reserve Bank.
If the seller defaults and the value of the collateral declines, or if bankruptcy proceedings commence with respect to the seller of the security, realization of the collateral by the Fund may be delayed or limited.
(i) Foreign Currency Translation
The books and records of the Funds are maintained in U.S. dollars. The value of investments, assets and liabilities denominated in currencies other than U.S. dollars are translated into U.S. dollars based upon current foreign exchange rates. Purchases and sales of foreign investments, income and expenses are converted into U.S. dollars based on currency exchange rates prevailing on the respective dates of such transactions. Net realized and unrealized gain (loss) on foreign currency transactions represent: (1) foreign exchange gains and losses from the sale and holdings of foreign currencies; (2) gains and losses between trade date and settlement date on investment securities transactions and forward foreign currency exchange contracts; and (3) gains and losses from the difference between amounts of interest and dividends recorded and the amounts actually received.
In addition, the Funds do not isolate the net realized and unrealized gain or loss resulting from changes in exchange rates from the fluctuations resulting from changes in market prices of securities held. Such fluctuations are included with the net realized and unrealized gain or loss on investments.
(2) Agreements and Transactions with Affiliates
The Trust has entered into an Investment Management Agreement under which the Investment Manager provides or oversees investment management services to the Funds. The Investment Manager selects subadvisors for each Fund (subject to Trustee approval), allocates assets among subadvisors and monitors the subadvisors’ investment programs and results. Each Fund’s investment portfolio is managed by portfolio managers who serve pursuant to Subadvisory Agreements with the Investment Manager.
Investment management fees are paid directly by each Fund to the Investment Manager based on average daily net assets. The annual investment management fee rates, as a percentage of average daily net assets for the year ended December 31, 2004, were as follows:
| | | |
Fund
| | Investment Management Fee
| |
Value | | 0.75 | % |
Capital Appreciation | | 0.80 | % |
Small Company | | 0.90 | % |
Special Equity | | 0.90 | % |
International Equity | | 0.90 | % |
Emerging Markets Equity | | 1.15 | % |
Bond | | 0.625 | % |
Global Bond | | 0.70 | % |
The Trust has entered into an Administration and Shareholder Servicing Agreement under which Managers Investment Group LLC serves as each Fund’s administrator (the “Administrator”) and is responsible for all aspects of managing the Funds’ operations, including administration and shareholder services to each Fund, its shareholders, and certain institutions, such as bank trust departments, broker-dealers and registered investment advisers, that advise or act as an intermediary with the Funds’ shareholders. During the year ended December 31, 2004, each of the Funds, except Global Bond, paid a fee to the Administrator at the rate of 0.25% per annum of the Fund’s average daily net assets. Global Bond paid a fee to the Administrator at the rate of 0.20% per annum of the Fund’s average daily net assets.
The aggregate annual fee paid to each independent Trustee for serving as a Trustee of the Trust was $20,000. In addition, the Trustees received in-person and telephonic per meeting fees of $1,000 and $500, respectively. Effective April 1, 2004 the aggregate annual retainer paid to each Independent Trustee became $52,000, plus $2,000 for each meeting attended. The Trustees’ fees and expenses are allocated amongst all of the Funds for which Managers Investment Group LLC serves as the Advisor based on the relative net assets of such Funds. The Independent Chairman of the Trust receives an additional payment of $5,000 per
65
| | |
| Notes to Financial Statements (continued) | | |
year. The “Trustee fees and expenses” shown in the financial statements represents the Fund’s allocated portion of the total fees and expenses paid by the Fund and other affiliated funds in the Trust and in the complex.
The Funds are distributed by Managers Distributors, Inc. (the “Distributor”), a wholly-owned subsidiary of Managers Investment Group LLC. Certain Trustees and Officers of the Funds are Officers and/or Directors of the Investment Manager, AMG and/or the Distributor. The Distributor serves as the principal underwriter for each Fund. The Distributor is a registered broker-dealer and member of the National Association of Securities Dealers, Inc. (“NASD”). Shares of each Fund will be continuously offered and will be sold by brokers, dealers or other financial intermediaries who have executed selling agreements with the Distributor. The Distributor bears all the expenses of providing services pursuant to an Underwriting Agreement, including the payment of the expenses relating to the distribution of Prospectuses for sales purposes and any advertising or sales literature.
(3) Purchases and Sales of Securities
Purchases and sales of securities, excluding short-term securities, for the year ended December 31, 2004, were as follows:
| | | | | | | | | | | | |
| | | Long-Term Securities
| | U.S. Government Securities
|
Fund
| | Purchases
| | Sales
| | Purchases
| | Sales
|
Value | | $ | 29,758,422 | | $ | 27,457,648 | | | N/A | | | N/A |
Capital Appreciation | | | 77,379,629 | | | 89,640,434 | | | N/A | | | N/A |
Small Company | | | 9,124,246 | | | 3,658,474 | | | N/A | | | N/A |
Special Equity | | | 2,120,795,680 | | | 2,168,707,772 | | | N/A | | | N/A |
International Equity | | | 220,489,279 | | | 282,910,634 | | | N/A | | | N/A |
Emerging Markets Equity | | | 41,412,181 | | | 25,682,996 | | | N/A | | | N/A |
Bond | | | 43,303,936 | | | 27,975,360 | | $ | 59,499,432 | | $ | 3,179,870 |
Global Bond | | | 30,242,548 | | | 26,374,792 | | | 13,147,316 | | | 10,828,275 |
(4) Portfolio Securities Loaned
The Funds may participate in a securities lending program offered by BNY providing for the lending of equities, corporate bonds and government securities to qualified brokers. Collateral on all securities loaned is accepted in cash and/or government securities. Collateral is maintained at a minimum level of 102% of the market value, plus interest, if applicable, of investments on loan. Collateral received in the form of cash is invested temporarily in institutional money market funds or other short-term investments by BNY. Earnings of such temporary cash investments are divided between BNY, as a fee for its services under the program, and the Fund loaning the security, according to agreed-upon rates.
(5) Commitments and Contingencies
In the normal course of business, the Funds may enter into contracts and agreements that contain a variety of representations and warranties, which provide general indemnifications. The maximum exposure to the Funds under these arrangements is unknown, as this would involve future claims that may be against the Funds that have not yet occurred. However, based on experience, the Funds expect the risks of loss to be remote.
(6) Risks Associated with Collateralized Mortgage Obligations (“CMOs”)
The net asset value of Funds may be sensitive to interest rate fluctuations because the Funds may hold several instruments, including CMOs and other derivatives, whose values can be significantly impacted by interest rate movements. CMOs are obligations collateralized by a portfolio of mortgages or mortgage-related securities. Payments of principal and interest on the mortgage are passed through to the holder of the CMOs on the same schedule as they are received, although certain classes of CMOs have priority over others with respect to the receipt of prepayments on the mortgages.
Therefore, the investment in CMOs may be subject to a greater or lesser risk of prepayment than other types of mortgage-related securities. CMOs may have a fixed or variable rate of interest.
(7) Forward Commitments
Certain transactions, such as futures and forward transactions, dollar roll agreements, or purchases of when-issued or delayed delivery securities may have a similar effect on a Fund’s net asset value as if the Fund had created a degree of leverage in its portfolio. However, if a Fund enters into such a transaction, the Fund will establish a segregated account with its custodian in which it will maintain cash, U.S. government securities or other liquid securities equal in value to its obligations in respect to such transaction. Securities and other assets held in the segregated account may not be sold while the transaction is outstanding, unless other suitable assets are substituted.
(8) Forward Foreign Currency Contracts
During the year ended December 31, 2004, International Equity, Emerging Markets Equity, Bond and Global Bond invested in forward foreign currency exchange contracts to manage currency exposure. These investments may involve greater market risk than the amounts disclosed in the Funds’ financial statements.
66
Notes to Financial Statements (continued)
A forward foreign currency exchange contract is an agreement between a Fund and another party to buy or sell a currency at a set price at a future date. The market value of the contract will fluctuate with changes in currency exchange rates. The contract is marked-to-market daily, and the change in market value is recorded as an unrealized gain or loss. Gain or loss on the purchase or sale of contracts having the same settlement date, amount and counter party is realized on the date of offset, otherwise gain or loss is realized on settlement date.
The Funds, except Value, Capital Appreciation, Small Company and Special Equity, may invest in non-U.S. dollar denominated instruments subject to limitations, and enter into forward foreign currency exchange contracts to facilitate transactions in foreign securities and to protect against a possible loss resulting from an adverse change in the relationship between the U.S. dollar and such foreign currency. Risks may arise upon entering into these contracts from the potential inability of counterparties to meet the terms of their contracts and from unanticipated movements in the value of a foreign currency relative to the U.S. dollar.
Open forward foreign currency exchange contracts (in U.S. Dollars) at December 31, 2004 were as follows:
| | | | | | | | | | | | | | | | |
Foreign Currency
| | | | Settlement
Date
| | Current Value
(Receivable Amount)
| | | Contract Value
(Payable Amount)
| | | Unrealized
Gain/Loss
| |
International Equity | | | | | | | | | | | | | | | | |
Canadian Dollar | | Short | | 01/04/05 | | $ | (70,684 | ) | | $ | (71,482 | ) | | $ | (798 | ) |
Swiss Franc | | Short | | 01/03/05 | | | (61,853 | ) | | | (61,681 | ) | | | 172 | |
euro-dollar Contracts | | Short | | 01/03/05 | | | (106,101 | ) | | | (105,940 | ) | | | 161 | |
euro-dollar Contracts | | Long | | 01/04/05 | | | 18,639 | | | | 18,543 | | | | (96 | ) |
Pound Sterling | | Short | | 01/04/05 | | | (504,523 | ) | | | (505,605 | ) | | | (1,082 | ) |
Hong Kong Dollar | | Short | | 01/03/05 | | | (51,575 | ) | | | (51,627 | ) | | | (52 | ) |
Japanese Yen | | Short | | 01/05/05 | | | (76,275 | ) | | | (77,354 | ) | | | (1,079 | ) |
Japanese Yen | | Long | | 01/06/05 | | | 263,209 | | | | 265,135 | | | | 1,926 | |
Norwegian Krone | | Short | | 01/04/05 | | | (27,546 | ) | | | (27,758 | ) | | | (212 | ) |
Swedish Krona | | Short | | 01/03/05 | | | (19,871 | ) | | | (19,703 | ) | | | 168 | |
| | | | | | |
|
|
| |
|
|
| |
|
|
|
Total | | | | | | $ | (636,580 | ) | | $ | (637,472 | ) | | $ | (892 | ) |
| | | | | | |
|
|
| |
|
|
| |
|
|
|
Global Bond | | | | | | | | | | | | | | | | |
euro-dollar Contracts | | Short | | 03/10/05 | | $ | (1,771,484 | ) | | $ | (1,815,872 | ) | | $ | (44,388 | ) |
Australian Dollar | | Short | | 03/10/05 | | | (323,376 | ) | | | (323,766 | ) | | | (390 | ) |
Pound Sterling | | Long | | 01/05/05 | | | 105,322 | | | | 105,141 | | | | (181 | ) |
Japanese Yen | | Long | | 01/06/05 | | | 291,328 | | | | 293,045 | | | | 1,717 | |
| | | | | | |
|
|
| |
|
|
| |
|
|
|
Total | | | | | | $ | (1,698,210 | ) | | $ | (1,741,452 | ) | | $ | (43,242 | ) |
| | | | | | |
|
|
| |
|
|
| |
|
|
|
(9) Futures Contracts Held or Issued for Purposes other than Trading
International Equity uses Equity Index futures contracts to a limited extent, with the objective of maintaining exposure to equity stock markets while maintaining liquidity. The Fund may purchase or sell futures contracts to achieve a desired level of investment, whether to accommodate portfolio turnover or cash flows from capital shares transactions. There are certain risks associated with futures contracts. Prices may not move as expected or a Fund may not be able to close out the contract when it desires to do so, resulting in losses.
Futures are valued at their quoted daily settlement prices. The aggregate principal amounts of the contracts are not recorded in the financial statements. Fluctuations in the value of the contracts are recorded in the Statement of Assets as an asset (liability) and in the Statement of Operations as unrealized appreciation (depreciation) until the contracts are closed, when they are recorded as realized gains (losses) on futures or forward currency contracts. The Fund had the following open futures contracts as of December 31, 2004: Long - -3-month Eurodollar, 25 contracts, expiring March 2005 with an unrealized gain of $8,496.
67
Notes to Financial Statements (continued)
(10) Transactions with Affiliated Companies
An affiliated company is a company that is directly or indirectly controlled by a related party or a company in which a fund has ownership of at least 5% of the voting securities. Transactions during the year ended December 31, 2004, with companies which are or were affiliates are as follows:
Summary of Transactions with Affiliated Companies - Special Equity
| | | | | | | | | | | | |
Affiliate
| | Purchase Cost
| | Sales Cost
| | Dividend
Income
| | Market Value
|
AK Steel Holding Corp. | | $ | — | | $ | — | | $ | — | | $ | 88,052,844 |
Anaren Microwave, Inc. | | | — | | | — | | | — | | | 13,710,384 |
Axsys Technologies, Inc. | | | 3,125,925 | | | 4,699,544 | | | — | | | 9,975,771 |
Brandywine Realty Trust | | | 224,743 | | | 5,951,031 | | | 195,976 | | | — |
Captiva Software Corp. | | | 7,668,891 | | | — | | | — | | | 7,559,067 |
Duckwall-ALCO Stores, Inc. | | | — | | | — | | | — | | | 4,372,927 |
Intevac, Inc. | | | 11,038,790 | | | — | | | — | | | 6,966,540 |
Meristar Hospitality Corp. | | | 1,162,649 | | | — | | | — | | | 41,955,410 |
| | |
|
| |
|
| |
|
| |
|
|
Totals | | $ | 23,220,998 | | $ | 10,650,575 | | $ | 195,976 | | $ | 172,592,943 |
| | |
|
| |
|
| |
|
| |
|
|
Summary of Transactions with Affiliated Companies - International Equity
| | | | | | | | | | | | |
Affiliate
| | Purchase Cost
| | Sales Cost
| | Dividend
Income
| | Market
Value
|
Singapore Telecommunications, Inc. | | $ | 2,865,551 | | $ | — | | $ | — | | $ | 1,707,945 |
| | |
|
| |
|
| |
|
| |
|
|
Summary of Transactions with Affiliated Companies - Emerging Markets
| | | | | | | | | | | | |
Affiliate
| | Purchase Cost
| | Sales Cost
| | Dividend
Income
| | Market
Value
|
IOI Corp., Berhad | | $ | 206,510 | | $ | — | | $ | — | | $ | 1,038,281 |
| | |
|
| |
|
| |
|
| |
|
|
(11) Subsequent Events
Effective January 1, 2005 The Managers Funds LLC changed its name to Managers Investment Group LLC.
Effective January 18, 2005, Essex Investment Management Co., LLC was replaced with Veredus Asset Management LLC (“Veredus”), as a subadvisor of the Special Equity Fund (the “Fund”). Veredus, located in Louisville, Kentucky was founded in 1998. As of December 31, 2004, Veredus had assets under management of approximately $1.9 billion. The portion of the assets of the Fund managed by Veredus will be managed by a ten-person investment team consisting of three Portfolio Managers with an average of 18 years experience managing small-cap growth stocks which includes B. Anthony Weber, President/Chief Investment Officer who joined Veredus in 1998, Charles P. McCurdy Jr., CFA Executive Vice President and Portfolio Manager, who joined Veredus in 1998, and Charles F. Mercer Jr., CFA Vice President and Portfolio Manager who also joined Veredus in 1998 and seven Research Analysts. The Investment Manager will pay Veredus 0.50% of the average daily net assets of the portion of the Fund managed by Veredus. This fee is higher than the previous subadvisor and as such, the Investment Manager is no longer waving a portion of its management fee.
68
Report of Independent Registered Public Accounting Firm
To the Trustees of The Managers Funds and the Shareholders of Managers Value Fund, Managers Capital Appreciation Fund, Managers Small Company Fund, Managers Special Equity Fund, Managers International Equity Fund, Managers Emerging Markets Equity Fund, Managers Bond Fund and Managers Global Bond Fund:
In our opinion, the accompanying statements of assets and liabilities, including the schedules of portfolio investments, and the related statements of operations and of changes in net assets and the financial highlights present fairly, in all material respects, the financial positions of Managers Value Fund, Managers Capital Appreciation Fund, Managers Small Company Fund, Managers Special Equity Fund, Managers International Equity Fund, Managers Emerging Markets Equity Fund, Managers Bond Fund and Managers Global Bond Fund (eight of the series constituting The Managers Funds, hereafter referred to as the “Funds”), at December 31, 2004, and the results of each of their operations, the changes in each of their net assets and the financial highlights for the periods indicated, in conformity with accounting principles generally accepted in the United States of America. These financial statements and financial highlights (hereafter referred to as “financial statements”) are the responsibility of the Funds’ management; our responsibility is to express an opinion on these financial statements based on our audits. We conducted our audits of these financial statements in accordance with the standards of the Public Company Accounting Oversight Board (United States). Those standards require that we plan and perform the audit to obtain reasonable assurance about whether the financial statements are free of material misstatement. An audit includes examining, on a test basis, evidence supporting the amounts and disclosures in the financial statements, assessing the accounting principles used and significant estimates made by management, and evaluating the overall financial statement presentation. We believe that our audits, which included confirmation of securities at December 31, 2004 by correspondence with the custodian and brokers, provide a reasonable basis for our opinion.
PricewaterhouseCoopers LLP
Boston, Massachusetts
February 15, 2005
69
Trustees and Officers (unaudited)
The Trustees and Officers of the Trust, their business addresses, principal occupations for the past five years and dates of birth are listed below. The Trustees provide broad supervision over the affairs of the Trust and the Fund. The Trustees are experienced executives who meet periodically throughout the year to oversee the Fund’s activities, review contractual arrangements with companies that provide services to the Fund, and review the Fund’s performance. Unless otherwise noted, the address of each Trustee or Officer is the address of the Trust: 800 Connecticut Avenue, Norwalk, Connecticut 06854.
The Trustees hold office without limit in time except that (a) any Trustee may resign or retire; (b) any Trustee may be removed with or without cause by two-thirds of the remaining Trustees and; (c) any Trustee may be removed by action of two-thirds of the outstanding shares of the Trust.
Independent Trustees
The following Trustees are not “interested persons” of the Trust within the meaning of the 1940 Act:
| | |
Name, Date of Birth, Number of Funds Overseen in Fund Complex*
| | Principal Occupation(s) During Past 5 Years and Other Directorships Held by Trustee
|
Jack W. Aber, 9/9/37 • Trustee since 1999 • Oversees 27 Funds in Fund Complex | | Professor of Finance, Boston University School of Management (1972-Present); Trustee of Appleton Growth Fund (1 portfolio); Trustee of Third Avenue Trust (4 portfolios); Trustee of Third Avenue Variable Trust (1 portfolio) |
| |
William E. Chapman, II, 9/23/41 • Independent Chairman • Trustee since 1999 • Oversees 27 Funds in Fund Complex | | President and Owner, Longboat Retirement Planning Solutions (1998-Present); Hewitt Associates, LLC (part time) (provider of Retirement and Investment Education Seminars); Interim Executive Vice President, QuadraMed Corporation (2001); President Retirement Plans Group, Kemper Funds (1990-1998); Trustee of Bowdoin College (2002-Present); Trustee of Third Avenue Trust (4 portfolios); Trustee of Third Avenue Variable Trust (1 portfolio) |
| |
Edward J. Kaier, 9/23/45 • Trustee since 1999 • Oversees 27 Funds in Fund Complex | | Partner, Hepburn Willcox Hamilton & Putnam, LLP (1977-Present); Trustee of Third Avenue Trust (4 portfolios); Trustee of Third Avenue Variable Trust (1 portfolio) |
| |
Steven J. Paggioli, 4/3/50 • Trustee since 1993 • Oversees 27 Funds in Fund Complex | | Consultant (2001-Present); Formerly Executive Vice President and Director, The Wad-sworth Group (1986-2001); Executive Vice President, Secretary and Director, Investment Company Administration, LLC (1990-2001); Vice President, Secretary and Director, First Fund Distributors, Inc. (1991-2001); Trustee, Professionally Managed Portfolios (19 portfolios); Advisory Board Member, Sustainable Growth Advisors, LP. |
| |
Eric Rakowski, 6/5/58 • Trustee since 1999 • Oversees 27 Funds in Fund Complex | | Professor, University of California at Berkeley School of Law (1990-Present); Visiting Professor, Harvard Law School (1998-1999); Trustee of Third Avenue Trust (4 portfolios); Trustee of Third Avenue Variable Trust (1 portfolio) |
| |
Thomas R. Schneeweis, 5/10/47 • Trustee since 1987 • Oversees 27 Funds in Fund Complex | | Professor of Finance, University of Massachusetts (1985-Present); Managing Director, CISDM at the University of Massachusetts, (1994-Present); President and Chief Executive Officer, Schneeweis Partners, LLC (2001-Present); No other directorships held by Trustee. |
| * | The Fund Complex consists of Managers AMG Funds, The Managers Funds, Managers Trust I and Managers Trust II. |
Interested Trustees
The following Trustees are “interested persons” of the Trust within the meaning of the 1940 Act. Mr. Kingston is an interested person of the Trust within the meaning of the 1940 Act by virtue of his positions with, and interest in securities of, Affiliated Managers Group, Inc. Mr. Lebovitz is an interested person of the Trust within the meaning of the 1940 Act by virtue of his positions with Managers Investment Group LLC and Managers Distributors, Inc.
70
| | |
| Trustees and Officers (continued) (unaudited) | | |
| | |
Name, Date of Birth, Number of Funds Overseen in Fund Complex*
| | Principal Occupation(s) During Past 5 Years and Other Directorships Held by Trustee
|
John Kingston, III, 10/23/65 • Trustee since 2004 • Oversees 27 Funds in Fund Complex | | Senior Vice President and General Counsel, (2002-Present), Affiliated Managers Group, Inc.; Vice President and Associate General Counsel, Affiliated Managers Group, Inc. (1999-2002); Director and Secretary, Managers Distributors, Inc. (2000-Present); Secretary, Managers AMG Funds (1999-2004); Served in a general counseling capacity, Morgan Stanley Dean Witter Investment Management, Inc. (1998-1999); Associate, Ropes and Gray (1994-1998); No other directorships held by trustee. |
| |
Peter M. Lebovitz, 1/18/55 • Trustee since 2002 • President since 1999 • Oversees 27 Funds in Fund Complex | | Managing Partner, Managers Investment Group LLC (2005-Present); President and Chief Executive Officer, The Managers Funds LLC (1999-2004); President, Managers Distributors, Inc. (2000-Present); Director of Marketing, The Managers Funds, LP (1994-1999); Director of Marketing, Hyperion Capital Management, Inc. (1993-1994); Senior Vice President, Greenwich Asset Management, Inc. (1989-1993); President, Managers AMG Funds (1999-Present); President, Managers Trust I and Managers Trust II (2000-Present); No other directorships held by trustee. |
| * | The Fund Complex consists of Managers AMG Funds, The Managers Funds, Managers Trust I and Managers Trust II. |
Officers
| | |
Name, Date of Birth, Position(s) Held With Fund & Length of Time Served
| | Principal Occupation(s) During Past 5 Years
|
Galan G. Daukas, 10/24/63 • Chief Financial Officer since 2002 | | Senior Vice-President, Managers Investment Group LLC (2005-Present); Chief Operating Officer, The Managers Funds LLC, (2002-2004); Chief Financial Officer, Managers AMG Funds, Managers Trust I and Managers Trust II (2002-Present); Chief Operating Officer and Chairman of the Management Committee, Harbor Capital Management Co., Inc. (2000-2002); Chief Operating Officer, Fleet Investment Advisors (1992-2000). |
| |
Donald S. Rumery, 5/29/58 • Treasurer since 1999 | | Senior Vice-President, Managers Investment Group LLC (2005-Present); Director, Finance and Planning, The Managers Funds LLC, (1994-2004); Treasurer and Chief Financial Officer, Managers Distributors, Inc. (2000-Present); Treasurer, Managers AMG Funds (1999-Present); Treasurer, Managers Trust I and Managers Trust II (2000-Present); Secretary, Managers Trust I and Managers Trust II (2000-2004); and Secretary, The Managers Funds (1997-2004). |
| |
Christine C. Carsman, 4/2/52 • Secretary since 2004 | | Vice President and Chief Regulatory Counsel, Affiliated Managers Group, Inc. (2004-Present); Secretary, Managers AMG Funds, Managers Trust I and Managers Trust II (2004-Present); Senior Counsel, Vice President and Director of Operational Risk Management and Compliance, Wellington Management Company, LLP (1995-2004) |
71
Investment Manager and Administrator
Managers Investment Group LLC
800 Connecticut Avenue
Norwalk, Connecticut 06854-2325
(203) 299-3500 or (800) 835-3879
Distributor
Managers Distributors, Inc.
800 Connecticut Avenue
Norwalk, Connecticut 06854-2325
(203) 299-3500 or (800) 835-3879
Custodian
The Bank of New York
2 Hanson Place, 7th Floor
Brooklyn, New York 11217
Legal Counsel
Goodwin Procter LLP
Exchange Place
Boston, Massachusetts 02109
Transfer Agent
PFPC, Inc.
Attn: Managers Funds Investor Services
P.O. Box 9769
Providence, Rhode Island 02940-9769
(800) 548-4539
For ManagersChoice Only
The Managers Funds
PFPC Brokerage Service, Inc.
P.O. Box 61487
King of Prussia, Pennslyvania 19406
(800) 358-7668
THE MANAGERS FUNDS
EQUITY FUNDS:
VALUE FUND
Armstrong Shaw Associates Inc.
Osprey Partners Investment Mgmt., LLC
CAPITAL APPRECIATION FUND
Essex Investment Management Co., LLC
Bramwell Capital Management, Inc.
SMALL COMPANY FUND
Kalmar Investment Advisers, Inc.
SPECIAL EQUITY FUND
Donald Smith & Co., Inc.
Veredus Asset Management LLC
Westport Asset Management, Inc.
Kern Capital Management LLC
Skyline Asset Management, L.P.
INTERNATIONAL EQUITY FUND
Lazard Asset Management, LLC
Bernstein Investment Research and Management
Wellington Management Company LLP
EMERGING MARKETS EQUITY FUND
Rexiter Capital Management Limited
FIRST QUADRANT TAX-MANAGED EQUITY FUND
First Quadrant, L.P.
SCIENCE & TECHNOLOGY FUND
20 FUND
Oak Associates, ltd.
MID-CAP FUND
LARGE-CAP FUND
Chicago Equity Partners, LLC
BALANCED FUND
Chicago Equity Partners, LLC
Loomis, Sayles & Co. L.P.
THE MANAGERS FUNDS
INCOME FUNDS:
MONEY MARKET FUND
HIGH YIELD FUND
J.P. Morgan Investment Management, Inc.
GLOBAL BOND FUND
Loomis, Sayles & Co. L.P.
SHORT DURATION GOVERNMENT FUND
INTERMEDIATE DURATION GOVERNMENT FUND
Smith Breeden Associates, Inc.
TOTAL RETURN BOND FUND
Merganser Capital Management LP
BOND FUND
GLOBAL BOND FUND
FIXED INCOME FUND
Loomis, Sayles & Company L.P.
CONVERTIBLE SECURITIES FUND
40\86 Advisors, Inc.
MANAGERS AMG FUNDS
EQUITY FUNDS:
ESSEX AGGRESSIVE GROWTH FUND
ESSEX SMALL CAP GROWTH FUND
ESSEX LARGE CAP GROWTH FUND
Essex Investment Management Company, LLC
RORER LARGE-CAP FUND
RORER MID-CAP FUND
Rorer Asset Management, LLC
SYSTEMATIC VALUE FUND
Systematic Financial Management, L.P.
THE MANAGERS FUNDS
FREMONT FUNDS
MANAGERS FREMONT GLOBAL FUND
333 Global Advisors LLC*
Armstrong Shaw Associates Inc.
First Quadrant, L.P.
Jarislowsky, Fraser Ltd.
Kern Capital Management LLC
Northstar Capital Management
MANAGERS INTERNATIONAL GROWTH FUND
Jarislowsky, Fraser Ltd.
MANAGERS STRUCTURED CORE FUND
First Quadrant, L.P.
MANAGERS SMALL CAP FUND
Times Square Capital Management, LLC
MANAGERS FREMONT MICRO-CAP FUND
MANAGERS FREMONT INSTITUTIONAL
MICRO-CAP FUND
Kern Capital Management LLC
MANAGERS REAL ESTATE FUND
SECURITIES FUND
Urdang Securities Management
MANAGERS FREMONT BOND FUND
Pacific Investment Management Co.
MANAGERS CALIFORNIA INTERMEDIATE TAX- FREE FUND
Evergreen Investments
FREMONT MONEY MARKET
333 Global Advisors LLC*
| * | A division of Managers Investment Group LLC |
This report is prepared for the Funds’ shareholders. It is authorized for distribution to prospective investors only when preceded or accompanied by an effective prospectus. To receive a free copy of the prospectus or Statement of Additional Information, please contact us by calling 1-800-835-3879. Distributed by Managers Distributors, Inc., member NASD.
A description of the policies and procedures each Fund uses to vote its proxies is available: (i) without charge, upon request, by calling 1-800-835-3879, or (ii) on the SEC’s website at www.sec.gov.
www.managersinvest.com
Registrant has adopted a Code of Ethics. See attached Exhibit 10(a).
| Item 3. | AUDIT COMMITTEE FINANCIAL EXPERT. |
Registrant’s Board of Trustees has determined that independent Trustees Mr. Jack W. Aber and Steven J. Paggioli each qualify as the Audit Committee Financial Expert. Mr. Aber and Mr. Paggioli are “independent” as such term is defined in Form N-CSR.
| Item 4. | PRINCIPAL ACCOUNTANT FEES AND SERVICES. |
For the fiscal years ended December 31, 2004 and December 31, 2003, the aggregate Audit Fees billed by PricewaterhouseCoopers LLP (“PwC”) for professional services rendered for the audits of the financial statements, or services that are normally provided in connection with statutory and regulatory filings or engagements for those fiscal years, for Managers Value Fund, Managers Capital Appreciation Fund, Managers Small Company Fund, Managers Special Equity Fund, Managers International Equity Fund, Managers Emerging Markets Equity Fund, Managers Bond Fund and Managers Global Bond Fund (each a “Fund” and collectively the “Funds”) and for all funds in The Managers Funds Family of Funds Complex are shown in the table below.
| | | | | | |
Fund
| | 2003
| | 2004
|
Managers Value Fund | | $ | 19,645 | | $ | 21,659 |
Managers Capital Appreciation Fund | | | 21,481 | | | 23,279 |
Managers Small Company Fund | | | 11,133 | | | 13,019 |
Managers Special Equity Fund | | | 55,328 | | | 38,319 |
Managers International Equity Fund | | | 34,733 | | | 32,459 |
Managers Emerging Markets Equity Fund | | | 14,233 | | | 19,499 |
Managers Bond Fund | | | 26,003 | | | 27,599 |
Managers Global Bond Fund | | | 23,235 | | | 25,979 |
All funds in The Managers Funds Family of Funds Complex audited by PwC | | $ | 318,166 | | $ | 495,640 |
Audit-Related Fees
There were no fees billed by PwC to any Fund in its two recent fiscal years for services rendered for assurance and related services that are reasonably related to the performance of the audit or review of the Fund’s financial statements, but are not reported as Audit Fees (“Audit-Related Fees”).
For the Funds’ two most recent fiscal years, there were no Audit-Related Fees billed by PwC for engagements related directly to the operations and financial reporting of one or more Funds by a Fund Service Provider. A Fund Service Provider is (a) any investment adviser to the Fund (not including any Subadvisor whose role is primarily portfolio management and is subcontracted with or overseen by another investment adviser) or (b) any entity that provides ongoing services to the Fund and is controlling, controlled by or under common control with a Fund investment adviser described in (a).
Tax Fees
In each of the fiscal years ended December 31, 2003 and December 31, 2004, the aggregate Tax Fees billed by PwC for professional services rendered for tax compliance, tax advice, and tax planning for the Funds is shown in the table below.
| | | | | | |
Fund
| | 2003A,B
| | 2004A,B
|
Managers Value Fund | | $ | 2,269 | | $ | 5,940 |
Managers Capital Appreciation Fund | | | 2,527 | | | 6,210 |
Managers Small Company Fund | | | 2,004 | | | 5,670 |
Managers Special Equity Fund | | | 4,124 | | | 8,640 |
Managers International Equity Fund | | | 3,574 | | | 8,640 |
Managers Emerging Markets Equity Fund | | | 2,757 | | | 7,560 |
Managers Bond Fund | | | 3,040 | | | 7,560 |
Managers Global Bond Fund | | | 3,006 | | | 8,100 |
| A | Aggregate amounts may reflect rounding. |
| B | Amounts related to non-audit services prior to May 6, 2003 that would have been subject to pre-approval if the SEC rules relating to the pre-approval of non-audit services had been in effect at that time. |
For the Funds’ two most recent fiscal years, Tax Fees billed by PwC for engagements by Fund Service Providers that related directly to the operations and financial reporting of the Funds were $0 for fiscal 2004 and $0 for fiscal 2003, respectively.
The services for which Tax Fees were charged comprise all services performed by professional staff in PwC’s tax division except those services related to the audit. Typically, this category would include fees for tax compliance, tax planning, and tax advice. Tax compliance, tax advice, and tax planning services include preparation of original and amended tax returns, claims for refund and tax payment-planning services, assistance with tax audits and appeals, tax advice related to mergers and acquisitions and requests for rulings or technical advice from taxing authorities.
All Other Fees
There were no other fees billed by PwC to the Funds for all other non-audit services (“Other Fees”) during the Funds’ two most recent fiscal years. During the same period, there were no Other Fees billed by PwC for engagements by Fund Service Providers that related directly to the operations and financial reporting of the Funds.
According to policies adopted by the Audit Committee, services provided by PwC to the Funds must be pre-approved by the Audit Committee. On an annual basis, the Audit Committee reviews and pre-approves various types of services that PwC may perform for the Funds without specific approval of each engagement, subject to specified budget limitations. As contemplated by the Sarbanes-Oxley Act of 2002 and related SEC rules, the Audit Committee also pre-approves non-audit services provided by PwC to any Fund Service Provider for any engagement that relates directly to the operations and financial reporting of the Funds. Any engagement that is not already pre-approved or that will exceed a pre-approved budget must be submitted to the Audit Committee for pre-approval. The Chairman of the Audit Committee is authorized on
behalf of the Board of Trustees and the Audit Committee to approve the engagement of PwC to perform non-audit services subject to certain conditions, including notification to the Audit Committee of such pre-approval not later than the next meeting of the Audit Committee following the date of such pre-approval.
There were no other fees billed by PwC for non-audit services rendered to the Funds and to Fund Service Providers for the Fund’s two most recent fiscal years.
The Audit Committee has considered whether the provision of non-audit services by PwC to Fund Service Providers that were not required to be pre-approved by the Audit Committee is compatible with maintaining PwC’s independence in its audit of the Funds, taking into account representations from PwC, in accordance with Independence Standards Board Standard No. 1, regarding its independence from the Funds and its related entities.
The following table sets forth the non-audit services provided by PwC to the Funds and its service affiliates defined as the Funds’ investment advisor and any entity controlling, controlled by or under common control with Managers Investment Group LLC that provides ongoing services to the Funds (“Control Affiliates”) for the last two fiscal years.
| | | | | | | | | | | | | | | | | | |
| | | Audit-related fees A
| | Tax fees A
| | All other fees A
|
| | | 2004
| | 2003
| | 2004
| | 2003
| | 2004
| | 2003
|
Control Affiliates | | $ | 155,040 | | $ | | | $ | 260,600 | | $ | 16,350 | | $ | 0 | | $ | 0 |
| A | Aggregate amounts may reflect rounding. |
| Item 5. | AUDIT COMMITTEE OF LISTED REGISTRANTS. |
Not applicable.
| Item 7. | DISCLOSURE OF PROXY VOTING POLICIES AND PROCEDURES FOR CLOSED-END MANAGEMENT INVESTMENT COMPANIES. |
Not applicable.
| Item 11. | CONTROLS AND PROCEDURES. |
(a) The registrant’s principal executive officer and principal financial officer have evaluated the registrant’s disclosure controls and procedures within 90 days of this filing and have concluded that the registrant’s disclosure controls and procedures were effective, as of that date, in ensuring that information required to be disclosed by the registrant in this Form N-CSR was recorded, processed, summarized, and reported timely.
(b) The registrant’s principal executive officer and principal financial officer are aware of no changes in the registrant’s internal control over financial reporting that occurred during the registrant’s most recent fiscal half-year that has materially affected, or is reasonably likely to materially affect, the registrant’s internal control over financial reporting.
| | (a) | Any code of ethics or amendments hereto. Filed herewith. |
| | (b) | Certifications pursuant to Section 302 of the Sarbanes-Oxley Act of 2002. Filed herewith. |
| | (c) | Certifications pursuant to Section 906 of the Sarbanes-Oxley Act of 2002. Filed herewith. |
SIGNATURES
Pursuant to the requirements of the Securities Exchange Act of 1934 and the Investment Company Act of 1940, the registrant has duly caused this report to be signed on its behalf by the undersigned, thereunto duly authorized.
THE MANAGERS FUNDS
| | |
| |
| By: | | /s/ Peter M. Lebovitz |
| | | Peter M. Lebovitz, President |
| |
Date: | | March 11, 2005 |
Pursuant to the requirements of the Securities Exchange Act of 1934 and the Investment Company Act of 1940, this report has been signed below by the following persons on behalf of the registrant and in the capacities and on the dates indicated.
| | |
| |
| |
| By: | | /s/ Peter M. Lebovitz |
| | | Peter M. Lebovitz, President |
| |
Date: | | March 11, 2005 |
| |
| |
| By: | | /s/ Galan G. Daukas |
| | | Galan G. Daukas, Chief Financial Officer |
| |
Date: | | March 11, 2005 |