UNITED STATES
SECURITIES AND EXCHANGE COMMISSION
Washington, D.C. 20549
FORM N-CSR
CERTIFIED SHAREHOLDER REPORT OF REGISTERED
MANAGEMENT INVESTMENT COMPANIES
Investment Company Act file number: 811-03752
THE MANAGERS FUNDS
(Exact name of registrant as specified in charter)
| | |
| 800 Connecticut Avenue, Norwalk, Connecticut | | 06854 |
| |
| (Address of principal executive offices) | | (Zip code) |
Managers Investment Group LLC
800 Connecticut Avenue, Norwalk, Connecticut 06854
(Name and address of agent for service)
Registrant’s telephone number, including area code: (203) 299-3500
Date of fiscal year end: DECEMBER 31
Date of reporting period: JANUARY 1, 2005 - DECEMBER 31, 2005
(Annual Shareholder Report)
Item 1. Reports to Shareholders
ANNUAL REPORT
Managers Funds
December 31, 2005

Table of Contents
Nothing contained herein is to be considered an offer, sale, or solicitation of an offer to buy shares of The Managers Funds. Such offering is made only by Prospectus, which includes details as to offering price and other material information.
Letter to Shareholders
Dear Fellow Shareholder:
Over the past 12 months the markets have been beset with a number of difficult and unpredictable challenges, including recovery from a massive tsunami in Southeast Asia; continuing strife in the Middle East; numerous terrorist incidents; multiple hurricanes in the Gulf of Mexico; and a significant rise in energy prices. We are fortunate that the financial markets have continued to perform so well under these circumstances.
These events serve to remind us that no one can predict the events that are going to shape the markets in coming months. This reinforces our belief that to invest successfully in an uncertain world you have to diversify your investments and be patient.
Most people think of diversification as holding different types of stocks and bonds, but we believe that there is another type of diversification that receives too little notice, and that is diversification by investment manager and holdings. Simply put, no single approach is going to succeed in every kind of market—some growth stock managers will be successful in a rising market, and some will be more successful in a stagnant market. This can be an issue with some investment firms that adhere to only one method of looking at the markets.
That is a major benefit that we bring you at Managers Funds —since we hire subadvisors (affiliates and non-affiliates) to run our portfolios, we offer you a wide selection of very different investment styles to choose from, sometimes within the same asset class. Invest in multiple Managers Funds, and you can get managers with very different approaches and holdings, helping you reduce the risks created by changing economic conditions and natural and man-made events, such as those of the past 12 months.
We also believe that once you have made your manager selection, you must be patient. On the home page of our Web site at www.managersinvest.com, you will find a short article entitled “Stay Invested for the Long Term” that highlights how important it is to consistently stay in the market rather than trying to time the market. We think the implication is clear: to be successful in the market over the long term, select a wide variety of investments giving you good diversification, invest regularly, and stick with your investment plan no matter what events dominate the news.
We invite you to visit our Web site on an ongoing basis to stay in tune with your Managers Funds holdings. The Web site provides detailed profiles of our subadvisors and their investment styles, as well as quarterly commentary on each Fund. If you have any questions, please do call us at 800.835.3879. Thank you for investing with Managers Funds.
| | | | |
Sincerely, | | | | |
| | |
 | | | |  |
Peter M. Lebovitz | | | | Thomas G. Hoffman, CFA |
President | | | | Executive Vice President |
The Managers Funds | | | | Chief Investment Officer |
| | | | Managers Investment Group LLC |
1
About Your Fund’s Expenses
As a shareholder of the Fund, you may incur two types of costs: (1) transaction costs, which may include sales charges (loads) on purchase payments; redemption fees; and exchange fees; and (2) ongoing costs, including management fees; distribution (12b-l) fees; and other Fund expenses. This Fund incurs only ongoing costs. This example is intended to help you understand your ongoing costs (in dollars) of investing in the Fund and to compare these costs with the ongoing costs of investing in other mutual funds. The example is based on an investment of $1,000 invested at the beginning of the period and held for the entire period as indicated below.
Actual Expenses
The first line of the table below provides information about the actual account values and actual expenses. You may use the information in this line, together with the amount you invested, to estimate the expenses that you paid over the period. Simply divide your account value by $1,000 (for example, an $8,600 account value divided by $1,000 = 8.6), then multiply the result by the number in the first line under the heading entitled “Expenses Paid During Period” to estimate the expenses you paid on your account during this period.
Hypothetical Example for Comparison Purposes
The second line of the table below provides information about hypothetical account values and hypothetical expenses based on the Fund’s actual expense ratio and an assumed annual rate of return of 5% before expenses, which is not the Fund’s actual return. The hypothetical account values and expenses may not be used to estimate the actual ending account balance or expenses you paid for the period. You may use this information to compare the ongoing costs of investing in the Fund and other funds by comparing this 5% hypothetical example with the 5% hypothetical examples that appear in the shareholder reports of other funds.
Please note that the expenses shown in the table are meant to highlight your ongoing costs only and do not reflect any transactional costs, such as sales charges (loads), redemption fees, or exchange fees. Therefore, the second line of the table is useful in comparing ongoing costs only, and will not help you determine the relative total costs of owning different funds.
| | | | | | | | | |
Six Months Ended December 31, 2005 | | Beginning Account
Value 7/1/2005 | | Ending Account Value 12/31/2005 | | Expenses Paid
During the
Period* |
Managers Special Equity Fund | | | | | | | | | |
Based on Actual Fund Return | | $ | 1,000 | | $ | 1,061 | | $ | 7.16 |
Based on Hypothetical 5% Annual Return | | $ | 1,000 | | $ | 1,018 | | $ | 7.01 |
Managers Special Equity Fund - Institutional Shares | | | | | | | | | |
Based on Actual Fund Return | | $ | 1,000 | | $ | 1,062 | | $ | 6.27 |
Based on Hypothetical 5% Annual Return | | $ | 1,000 | | $ | 1,019 | | $ | 6.14 |
| * | Expenses are equal to the Fund’s annualized expense ratio multiplied by the average account value over the period, multiplied by the number of days in the most recent fiscal half-year (184), then divided by the fiscal year (365 days). |
You can find more information about your Fund’s expenses, including annual expense ratios for the past fiscal periods, in the Financial Statements section of this report. For additional information on operating expenses and other shareholder costs, please refer to the Fund’s prospectus.
2
Managers Special Equity Fund
Portfolio Manager Comments
The Managers Special Equity Fund’s (the “Fund”) objective is to achieve long-term capital appreciation through a diversified portfolio of equity securities of small- and medium-sized companies.
Managers Special Equity Fund invests at least 80% of its assets in equity securities, i.e., common and preferred stocks of U.S. companies. Although the Fund is permitted to purchase securities of both small- and medium-capitalization companies, the Fund has historically invested substantially all of its assets in the securities of small-capitalization companies, that is, companies with capitalizations that at the time of purchase are less than $2.5 billion. The Fund’s benchmark is the Russell 2000 Index.
The Portfolio Managers
The Fund employs multiple portfolio managers who specialize in distinct investment approaches. This “intelligence diversification” not only serves to manage risk, but also helps us tap the markets’ full potential by focusing different analytical insights on each class of investment. Fund management strives to achieve this performance and diversification while ensuring that the Fund operates within the framework of its investment objective and principal investment strategies.
Donald Smith & Co., Inc.
Donald Smith & Co., Inc. (“Donald Smith”) is a value manager that invests in out-of-favor small-capitalization companies. Donald Smith’s philosophy seeks to identify companies in the bottom decile of price-to-tangible book value ratios, with a strong balance sheet, and a positive outlook for earnings potential over the next 2-4 years. Donald Smith believes that extremely low P/B ratio companies often trade below replacement value, are inherently less risky, and are more likely to be acquired. Furthermore, because only a few investment managers focus on companies in the lowest P/B ratio decile, their stocks may be inefficiently priced and can offer tremendous value.
Donald Smith’s process begins by looking for companies in the lowest 10% of price-to-tangible book value ratios with a strong balance sheet, and a positive outlook for earnings potential over the next 2-4 years. Smith also assesses price-to-earnings, price-to-sales, and debt-to-capital ratios to form a “watch list” of about 300 securities. After valuations are addressed, Smith performs fundamental research, including company visits, to assess the quality of the company’s balance sheet and book value. Smith is looking for a catalyst for an improvement in earnings potential that is not already reflected in the stock price. A concentrated portfolio of 40-50 stocks is the result. Stocks are sold when a target price has been achieved, usually set at less than 2x book value. Positions may also be sold if the stock appreciates rapidly, if a better idea is found, or if fundamentals deteriorate. Portfolio turnover is low at 20-40% annually.
The ideal company exhibits many of the following traits:
| | • | | Low price-to-book value |
| | • | | Positive earnings potential over the next 2-4 years |
Portfolio management:
| | • | | Focuses on lowest decile of price-to-tangible book value stocks |
| | • | | Price-to-earnings, price-to-sales, and debt-to-capital also assessed from valuation standpoint |
| | • | | Concentrates the portfolio in 40-50 stocks |
The Portfolio:
| | • | | Value oriented holdings |
| | • | | Initial stock weightings are generally 3% - 3.5% |
| | • | | Typically holds 40-50 stocks |
| | • | | Average turnover between 20-40% annually |
The following factors influence the sell decision when:
| | • | | Target price is reached, usually less than 2x book value |
| | • | | Stock appreciates rapidly |
| | • | | Fundamentals deteriorate |
3
Managers Special Equity Fund
Portfolio Manager Comments (continuted)
Kern Capital Management LLC
Kern Capital Management LLC (“KCM”) believes the U.S. smaller company stock universe provides the opportunity to invest in innovative companies with exceptional growth prospects. With minimal research coverage by brokerage firms and low institutional ownership, KCM believes small and micro-cap stocks represent the least efficient sector of the market.
KCM’s fundamental research is dedicated to uncovering innovative small companies early in their growth cycle while they are still relatively undiscovered. With a huge universe of investment opportunity, KCM’s investment process focuses on what they believe are the most innovative sectors in the U.S. economy (technology, healthcare, services and consumer sectors). Research specialization by economic sector provides the depth of knowledge necessary to make high quality investment decisions and minimize fundamental investment mistakes.
Kern Capital Management LLC believes that the real attraction of small and micro-cap investing is not the asset class, but the stock selection opportunities within the asset class. KCM defines the small-cap investment universe as the smallest 15% of companies, based on market capitalization, on the U.S. stock markets. KCM’s investment process is designed to capitalize on the inefficiencies in the smaller company market.
KCM builds portfolios one company at a time with investment research focused on the most innovative sectors of the economy (technology, health care, services, and consumer). The team’s hands-on approach to fundamental investment research and financial analysis seeks to answer three basic questions to determine an investment’s attractiveness.
| | • | | How attractive is the business? Companies that are pioneering new markets or revolutionizing existing ones can often sustain rapid growth as they establish leading positions in their targeted markets. |
| | • | | How strong is the management? Successful companies require management capable of capitalizing on attractive growth opportunities. Management’s vision and ability to execute the business plan represent key elements in determining how successful a company will be. |
| | • | | How much is the company worth? The team’s process is valuation sensitive. Depending on the economic sector, different criteria are used to determine a company’s enterprise value, which determines if KCM would buy the entire company at the current market value of its equity. |
Given that KCM is focused on investing in innovative growth companies, the first two questions are answered before determining if the valuation is attractive. In fact, the answers to the first two questions will help determine the appropriate valuation for the company.
The ideal company exhibits many of the following traits:
| | • | | Leading market position in a rapidly growing market with high barriers to entry |
| | • | | Entrepreneurial management team with experience managing a growth business |
| | • | | Focused business plan with tight internal controls |
Portfolio management:
| | • | | Invests in between 70 and 90 companies which have market capitalizations that, at the time of initial purchase, place them among the smallest 15% of companies listed in the U.S. stock markets |
| | • | | Builds portfolios from the bottom up and seeks to identify companies early in their growth cycle |
| | • | | Utilizes a team approach to cover approximately 600 stocks through an extensive network of contact and other information sources: |
| | • | | Brokerage firm and industry analysts |
| | • | | Corporate management contacts |
| | • | | Trade shows and trade journals |
| | • | | Focuses on economic sectors where KCM believes the level of innovation is greatest, such as technology, health care, consumer and services |
| | • | | Uses fundamental analysis to identify small, relatively unknown companies that exhibit the potential to become much larger and more successful |
| | • | | Meets with corporate management to discuss business plans and strategies |
4
Managers Special Equity Fund
Portfolio Manager Comments (continuted)
The investment team will make a sell decision when:
| | • | | An investment’s growth prospects deteriorate |
| | • | | Investments achieve excessive valuation relative to the growth opportunities and/or addressable markets |
| | • | | There is a negative change in fundamental confidence and/or investment time horizon |
Skyline Asset Management, L.P.
The investment team from Skyline Asset Management, L.P. (“Skyline”) looks for small-capitalization stocks that have below average valuations with above average growth prospects. Through their intensive in-house research, they find good companies that are overlooked or not widely followed.
Skyline’s research effort focuses on finding good companies that are not widely followed. Typically they invest in firms with market caps of less than $2 billion. The selection process involves using outside research services, computer screens, and internally maintained lists of potential companies/stocks to identify new ideas. These ideas are then screened to determine whether they meet certain basic criteria: relative valuation, capitalization, financial strength, and opportunities for continued growth. This screening process reduces the list from 2000 names to 150-200. This list is then more rigorously analyzed to answer the question, “Why will earnings increase at an above-average rate?” All company documents are analyzed, any available industry or research reports are reviewed and, most importantly, questions are addressed directly to senior company management.
In addition, other companies in the same industry are reviewed to determine relative valuation of the company being investigated. The final portfolio will contain 65-85 stocks and is generally fully invested. The portfolio will tend to be well diversified and the portfolio’s P/E ratio will consistently be below that of the Russell 2000. Skyline sells stocks when they rise to a sell target, which is usually a P/E equal to the overall stock market, or if the company’s fundamentals have changed so that the original investment thesis is no longer valid.
The ideal company exhibits many of the following traits:
| | • | | Market capitalization less than $2 billion |
| | • | | Discounted price/earnings ratio relative to the market |
| | • | | Above average growth prospects |
| | • | | Neglected, under followed, and often out of favor |
Portfolio management:
| | • | | Broad diversification among economic sectors |
| | • | | Keep attentive to earnings |
| | • | | Maintain favorable risk/reward |
The portfolio:
| | • | | Stocks have a maximum weighting of 5% for each holding |
| | • | | Typically holds 65-85 stocks |
| | • | | Cash equivalents averaging less than 5% |
The following factors influence the sell decision when:
| | • | | P/E equals the market/industry P/E |
| | • | | Holding reaches 5.0% of the portfolio |
Westport Asset Management, Inc.
The investment team at Westport Asset Management, Inc., led by Andy Knuth, focuses on small-capitalization companies that are determined to have significant upside potential in earnings and ROE over the next few years. Although investing for growth, Andy will purchase stocks only if they are selling at or below the market’s P/E multiple, or below valuations of other companies in the same industry. Implicit in the strategy is that Andy and his partner Ed Nicklin focus on a small number of issues, and hold them for a long time. The concentration and low turnover enable them to heavily research and monitor each position.
5
Managers Special Equity Fund
Portfolio Manager Comments (continuted)
The portfolio manager at Westport Asset Management, Inc. is focused on future profits only, and, in fact, prefers to find businesses which are inherently good but which have gone through a troubling period. Acquisitions or divestitures, management shake-ups, changes in the business cycle, or the development of a proprietary product in a strong industry are all factors that might improve earnings and investor perceptions. The portfolio manager will typically have a concentrated portfolio, and any industry concentrations are merely an outcome of stock selection. Because some of the companies in which he invests may not have earnings, the price to trailing earnings ratio may be high, although the price to forward earnings will be well below average. The management style is patient, usually turning over less than 20% per year.
The ideal company exhibits many of the following traits:
| | • | | Upside potential in earnings and ROE (Return On Equity) |
| | • | | Low P/E and improving earnings/cash flow |
| | • | | Company driven by entrepreneurial impact |
| | • | | Preference for turnaround story |
Portfolio management:
| | • | | Has a 2-3 year time horizon on initial investments |
| | • | | Concentrates the portfolio and has low turnover |
| | • | | Views any significant industry concentrations are merely an outcome of bottom-up fundamental analysis |
| | • | | May invest in companies that do not have earnings |
The portfolio:
| | • | | Initial stock weightings will vary depending on liquidity |
| | • | | May have trailing P/E ratios that are higher than the market, but generally forward P/E ratios will be well below the average, because some of the companies Westport invests in may not have earnings |
| | • | | Has an average turnover of less than 20% per year |
The portfolio management team will make a sell decision when:
| | • | | A stock reaches pre-determined price objective |
| | • | | There are negative changes in a company’s fundamentals |
Veredus Asset Management, LLC
The investment philosophy at Veredus Asset Management, LLC (“Veredus”) is based on their belief that positive earnings surprise and positive estimate revision are the key drivers of stock price change. In particular, the Veredus investment team, led by founder Tony Weber, is concerned about the sustainability of this earnings momentum. To that end, the team tends to focus more on the economic performance of a particular company as opposed to more traditional accounting measures. Specifically, the analysts and portfolio managers at Veredus look for companies with strong asset growth and accelerating rates of economic return in excess of their cost of capital. This is what they view as the true definition of wealth creation, or cash flow return on investment (CFROI). Finally, the Veredus team also believes that some technical measures, such as relative strength, flows, and trading volume, can be useful indicators of future stock performance.
The investment team at Veredus Asset Management, LLC starts the research process by screening the entire universe of over 8,000 small companies for upward earnings revisions. Companies are also ranked on the basis of recent estimate changes, considering both absolute and percent change in estimates. This model provides not only a shopping list of potential targets, but the qualification work that Veredus feels is essential to market acceptance. The core of the research effort is placed on calculating the true cash flow return on investment (CFROI) potential of companies on the target list and how Veredus’ internally developed work compares with current street expectations. The primary focus is assessing CFROI on a sequential basis as opposed to year over year. This gives the investment team a more detailed picture for possibilities of margin expansion, sales growth, and other sources of CFROI leverage. Contact with company management is also essential in researching companies in the small-cap arena.
6
Managers Special Equity Fund
Portfolio Manager Comments (continuted)
The ideal investment exhibits many of the following traits:
| | • | | Positive earnings surprise and subsequent upward estimate revisions |
| | • | | Attacking large markets with high barriers to entry |
| | • | | Balance sheet commensurate with income statement |
Portfolio management:
| | • | | Screens for companies which rank in the top 20% of all companies based on earnings estimate revisions and quarterly earning surprise |
| | • | | Employs extensive fundamental research |
| | • | | Seeks sustainability of company’s fundamental performance |
The investment team will make a sell decision when:
| | • | | There is an anticipated/ actual earnings disappointment |
| | • | | They see deteriorating market mechanics |
| | • | | There is a change in strategic market outlook or better idea develops |
The Year in Review
Over the 12 months ended December 31, 2005, the Special Equity Managers Class of shares returned 4.00% and the Institutional class of shares returned 4.21% compared to a gain of 4.55% for the Russell 2000 Index and 4.15% for the Russell 2000 Growth Index. Broad markets continued to appreciate with large capitalization stocks outperforming small capitalization stocks for the first time since 1998. From a style perspective, small cap value stocks narrowly outperformed small growth marking five of the past six years in which value has outperformed growth in the small cap universe. Sector analysis reveals that seven out of ten sectors finished in positive territory during 2005 with only consumer discretionary, information technology, and utilities giving up ground. One of the macro themes across the board for the year was the continued strength of energy. The sector finished the year up 48% with points midway through the third quarter whereby the sector was testing 60% gains. Exposure to, or lack thereof in some cases, weighed heavily on the relative performance of fund managers throughout the year.
The year opened in somewhat volatile fashion as the Russell 2000 ultimately ended the first quarter with a 5.3% decline. The Fund, however, managed to outperform on a relative basis during this period behind underexposure to health care and financial stocks along with a strong aggregate total return within these sectors. The consumer sectors also proved to be a fruitful space as several of the value managers within the Fund were able to capitalize on the increased merger & acquisition activity during the year. Specifically, Toys ‘R Us, a Donald Smith holding, was up 26% on news that it had agreed to be acquired by an investment firm.
The second and third quarters in the small capitalization universe are best noted for a sixteen week period spanning from the beginning of May through the end of July in which the Fund was up 15%. All sectors of the Index appreciated 10% or more during this run headlined by a 30% gain in energy related stocks. While the Fund lost ground to the Russell 2000 in mid to late July, it was still buoyed by considerable strength in its consumer discretionary stocks which also happened to be the Fund’s largest overweight. Veredus’ sizable bet on homebuilders such as Meritage Homes (+47%), Beazer Homes (+43%), and Toll Brothers (+48%) paid off nicely. In fact, the performance gap would have been much closer had it not been for a 3.7% underweight to the outperforming energy sector.
The final quarter of 2005 proved to be a good one on a relative basis for the Fund which outperformed the benchmark by over 130 basis points. While returns weren’t spectacular for either the Fund or the benchmark, it was encouraging to see the growth bias of the portfolio able to capitalize in a market where small cap growth outperformed small cap value. Outperformance was spread across a wide variety of areas as six of the Fund’s nine sectors contributed positively to relative performance. Of particular note, all three value style managers in addition to Veredus took the opportunity to establish and/or add to oil and gas dependent companies such as airlines, shipping, or transportation stocks. Veredus in particular was able to capture a 44% gain from its airline exposure through the likes of Continental (121%), AirTran (27%), and JetBlue (31%). Retailing stocks also posted solid numbers coming off strong year-over-year same store sales and capitalizing on the resiliency of the American consumer around the holiday season.
7
Managers Special Equity Fund
Portfolio Manager Comments (continuted)
Looking Forward
Heading into 2006, the Fund’s sector weights have not changed significantly as consumer discretionary, information technology, and industrials remain the three largest allocations. Fund management on the whole is optimistic about prospects for the coming year. Veredus foresees a stoppage in rate hikes by the Fed as a positive for the homebuilders while capital spending related stocks also look attractive given the cash rich balance sheets of so many companies. With the potential for continued pricing pressures on the traditional consumer, such as higher energy costs and rising interest rates, Skyline has mildly shifted some if its retail holdings in favor of the services industry. Donald Smith continues to reallocate away from the oil suppliers to the oil users, such as airlines and transportation stocks, in an effort to try and take advantage of attractive valuations and what he perceives to be overvalued energy prices. Finally, similar to last year, merger and acquisition activity is expected to remain high with perhaps more deals coming to the table in the smaller market cap ranges this year as opposed to the bigger deals of 2005.
Cumulative Total Return Performance
Special Equity’s cumulative total return is based on the daily change in net asset value (NAV), and assumes that all distributions were reinvested. The Russell 2000 Index is comprised of the smallest 2000 companies in the Russell 3000 Index and is widely regarded in the industry as the premier measure of small cap stock performance. The Russell 3000 Index is composed of 3000 of the largest U.S. companies, as determined by market capitalization which represents approximately 98% of the investable U.S. equity market. Unlike the Fund, the Russell 2000 Index is unmanaged, is not available for investment, and does not incur expenses. The first chart compares a hypothetical $10,000 investment made in Special Equity- Managers Class on December 31, 1995, to a $10,000 investment made in the Russell 2000 for the same time period. The second chart compares a hypothetical $10,000 investment made in Special Equity- Institutional Class on May 3, 2004, to a $10,000 investment made in the Russell 2000 for the same time period. The graphs and tables do not reflect the deduction of taxes that a shareholder would pay on a Fund distribution or redemption of shares. Past performance is not indicative of future results.
The table below shows the average annual total returns for Special Equity – Managers Class and the Russell 2000 Index since December 31, 1995 through December 31, 2005.
| | | | | | | | | |
Average Annual Total Returns: | | 1 Year | | | 5 Years | | | 10 Years | |
Special Equity – Managers Class | | 4.00 | % | | 4.13 | % | | 11.08 | % |
Russell 2000 Index | | 4.55 | % | | 8.22 | % | | 9.26 | % |
8
Managers Special Equity Fund
Portfolio Manager Comments (continuted)
The table below shows the average annual total returns for Special Equity – Institutional Class and the Russell 2000 Index since May 3, 2004 through December 31, 2005.

| | | | | | |
Average Annual Total Returns: | | 1 Year | | | Since Inception | |
Special Equity – Institutional Class | | 4.21 | % | | 11.35 | % |
Russell 2000 Index | | 4.55 | % | | 12.39 | % |
The performance data shown represents past performance. Past performance is not a guarantee of future results. Current performance may be lower or higher than the performance data quoted. The investment return and the principal value of an investment will fluctuate so that an investor’s shares, when redeemed, may be worth more or less than their original cost. For performance information through the most recent month end please call (800) 835-3879 or visit our Web site at www.managersinvest.com.
The Fund is subject to risks associated with investments in small capitalization companies, such as erratic earnings patterns, competitive conditions, limited earnings history, and a reliance on one or a limited number of products.
9
Managers Special Equity Fund
Portfolio Manager Comments (continuted)
The table below displays a full breakdown of the sector allocation of the Fund as well as the top ten positions as of December 31, 2005.
| | | |
Top Ten Holdings (out of 290 securities) | | | |
ITT Educational Services, Inc.* | | 2.0 | % |
MI Developments, Inc., Class A* | | 1.9 | |
Dillard’s, Inc., Class A* | | 1.7 | |
Reliant Resources, Inc.* | | 1.5 | |
FelCor Lodging Trust, Inc.* | | 1.5 | |
Meristar Hospitality Corp. * | | 1.4 | |
AK Steel Holding Corp. * | | 1.2 | |
ATMI, Inc.* | | 0.8 | |
VistCon Corp. | | 0.8 | |
Dana Corp. | | 0.8 | |
| | | |
Top Ten as a Group | | 13.6 | % |
| | | |
| | | | | | |
Portfolio Breakdown | | % of
Net Assets | | | Russell
2000 | |
Information Technology | | 21.9 | % | | 21.7 | % |
Industrials | | 20.4 | | | 17.3 | |
Consumer Discretionary | | 18.7 | | | 20.2 | |
Financials | | 15.3 | | | 14.7 | |
Health Care | | 10.4 | | | 9.9 | |
Materials | | 4.3 | | | 4.1 | |
Energy | | 2.6 | | | 2.5 | |
Utilities | | 2.3 | | | 2.3 | |
Telecommunication Services | | 0.6 | | | 0.6 | |
Other Assets & Liabilities | | 3.5 | | | 6.7 | |
| | | | | | |
| | 100 | % | | 100 | % |
| | | | | | |
| * | Top Ten Holding at June 30, 2005 |
Any sectors, industries, or securities discussed should not be perceived as investment recommendations. Any securities discussed may no longer be held in the account’s portfolio. It should not be assumed that any of the securities transactions discussed were or will prove to be profitable, or that the investment recommendations we make in the future will be profitable.
10
Managers Special Equity Fund
Schedule of Portfolio Investments
December 31, 2005
| | | | | |
Security Description | | Shares | | Value |
Common Stocks - 96.5% | | | | | |
Consumer Discretionary - 18.7% | | | | | |
ADVO, Inc. | | 327,8332 | | $ | 9,238,334 |
Aftermarket Technology Corp.* | | 473,400 | | | 9,202,896 |
AnnTaylor Stores Corp.* | | 639,4502 | | | 22,073,814 |
Applebee’s International, Inc. | | 388,1252 | | | 8,767,744 |
Beasley Broadcasting Group, Inc.* | | 356,7122 | | | 4,819,179 |
Beazer Homes USA, Inc. | | 336,9002 | | | 24,539,796 |
Big 5 Sporting Goods Corp. | | 388,7002 | | | 8,508,643 |
Big Lots, Inc.* | | 907,1522 | | | 10,894,896 |
Borders Group, Inc. | | 345,400 | | | 7,484,818 |
Building Material Holding Corp. | | 82,0002 | | | 5,593,220 |
California Pizza Kitchen, Inc.* | | 214,3752 | | | 6,853,569 |
Carter’s, Inc.* | | 117,450 | | | 6,911,933 |
CBRL Group, Inc. | | 351,0302 | | | 12,338,705 |
Charming Shoppes, Inc.* | | 485,7502 | | | 6,411,900 |
Coldwater Creek, Inc.* | | 383,1502 | | | 11,697,570 |
Comstock Homebuilding Companies, Inc.* | | 207,2502 | | | 2,924,298 |
Cosi, Inc.* | | 714,275 | | | 5,928,483 |
COX Radio, Inc., Class A* | | 368,6002 | | | 5,189,888 |
Dana Corp. | | 3,825,0002 | | | 27,463,499 |
dELiA*s Corp.* | | 256,5002 | | | 2,128,950 |
Dillard’s, Inc., Class A | | 2,296,2002 | | | 56,991,683 |
Drew Industries, Inc.* | | 256,9002 | | | 7,242,011 |
Duckwall-ALCO Stores, Inc.* | | 182,400 | | | 4,166,016 |
Emmis Communications Corp., Class A* | | 703,0682 | | | 13,998,084 |
Gaylord Entertainment Co., Class A* | | 161,2332 | | | 7,028,146 |
Genesco, Inc.* | | 441,6752 | | | 17,132,573 |
Guess?, Inc.* | | 159,8002 | | | 5,688,880 |
Gymboree Corp.* | | 966,100 | | | 22,606,740 |
Hot Topic, Inc.* | | 208,700 | | | 2,973,975 |
Kerzner International, Ltd.* | | 261,0002 | | | 17,943,750 |
La Quinta Corp.* | | 845,0002 | | | 9,413,300 |
Meritage Homes Corp.* | | 331,5002 | | | 20,857,980 |
Mikohn Gaming Corp* | | 1,154,100 | | | 11,390,967 |
Orient-Express Hotels Ltd. | | 341,9002 | | | 10,776,688 |
Pacific Sunwear of California, Inc.* | | 287,900 | | | 7,174,468 |
Proquest Co.* | | 408,7002 | | | 11,406,817 |
Rare Hospitality International, Inc.* | | 256,9002 | | | 7,807,191 |
Ross Stores, Inc. | | 930,0002 | | | 26,876,999 |
Ruby Tuesday, Inc. | | 510,9002 | | | 13,227,201 |
Ryland Group, Inc., The | | 294,2002 | | | 21,220,646 |
Saks, Inc.* | | 1,023,0002 | | | 17,247,780 |
Salem Communications Corp., Class A* | | 448,4222 | | | 7,842,901 |
Scopus Video Neworks, Ltd.* | | 563,3002 | | | 3,379,800 |
Source Interlink Companies, Inc.* | | 235,0002 | | | 2,613,200 |
Sports Authority, Inc.* | | 433,8002 | | | 13,504,194 |
Standard-Pacific Corp. | | 224,5502 | | $ | 8,263,440 |
Steak n Shake Co., The* | | 579,4002 | | | 9,820,830 |
Talbots, Inc. | | 180,400 | | | 5,018,728 |
Texas Roadhouse, Inc., Class A* | | 437,4102 | | | 6,801,726 |
The Wet Seal, Inc., Class A* | | l,721,1002 | | | 7,641,684 |
TJX Companies, Inc. | | 160,000 | | | 3,716,800 |
Toro Co. | | 285,4002 | | | 12,491,958 |
United Rentals, Inc.* | | 231,2002 | | | 5,407,768 |
Visteon Corp. | | 4,395,3002 | | | 27,514,577 |
Total Consumer Discretionary | | | | | 626,161,636 |
Energy - 2.6% | | | | | |
Comstock Resources, Inc.* | | 317,0002 | | | 9,671,670 |
Dresser-Rand Group, Inc.* | | 222,300 | | | 5,375,214 |
Houston Exploration Co.* | | 320,500 | | | 16,922,400 |
Key Energy Services, Inc.* | | 648,300 | | | 8,732,601 |
Newfield Exploration Co.* | | 131,300 | | | 6,574,191 |
OMI Corp. | | 64,0002 | | | 1,161,600 |
Overseas Shipholding Group, Inc. | | 102,0002 | | | 5,139,780 |
Pogo Producing Co. | | 484, 2002 | | | 24,118,002 |
Stone Energy Corp.* | | 184,8002 | | | 8,413,944 |
Total Energy | | | | | 86,109,402 |
Financials - 15.3% | | | | | |
Alabama National Bancorp | | 64,4002 | | | 4,170,544 |
American Financial Group, Inc. | | 155,300 | | | 5,949,543 |
American National Insurance Co. | | 68,950 | | | 8,066,461 |
AmerUs Group | | 204,8002 | | | 11,606,016 |
Aspen Insurance Holdings, Ltd. | | 399,600 | | | 9,458,532 |
BankUnited Financial Corp. | | 601,0882 | | | 15,970,908 |
Banner Corp. | | 217,7402 | | | 6,793,488 |
Brown & Brown, Inc. | | 530,2002 | | | 16,192,308 |
Chicago Mercantile Exchange Holdings, Inc. | | 57,4502 | | | 21,112,301 |
Chittenden Corp. | | 495,6252 | | | 13,783,331 |
Clark, Inc. | | 425,9002 | | | 5,643,175 |
Commercial Capital Bancorp, Inc. | | 497,400 | | | 8,515,488 |
Conseco, Inc.* | | 662,2002 | | | 15,343,174 |
Delphi Financial Group, Inc., Class A | | 298,2002 | | | 13,720,182 |
Downey Financial Corp. | | 393,3802 | | | 26,903,258 |
FelCor Lodging Trust, Inc.* | | 2,900,0002 | | | 49,909,000 |
Harbor Florida Bancshares, Inc. | | 224,9002 | | | 8,332,545 |
Hilb, Rogal & Hamilton Co. | | 305,5002 | | | 11,764,805 |
iStar Financial, Inc. | | 375,6002 | | | 13,390,140 |
Jefferies Group, Inc. | | 290,3502 | | | 13,059,943 |
MCG Capital Corp. | | 693,578 | | | 10,119,303 |
Meristar Hospitality Corp.*4 | | 5,024,600 | | | 47,231,240 |
MI Developments, Inc., Class A | | 1,804,7002 | | | 62,045,586 |
National Western Life Insurance Co., Class A* | | 12,000 | | | 2,482,920 |
Prosperity Bancshares, Inc. | | 330,3002 | | | 9,492,822 |
Provident Bankshares Corp. | | 235,5652 | | | 7,955,030 |
The accompanying notes are an integral part of these financial statements.
11
Managers Special Equity Fund
Schedule of Portfolio Investments (continued)
| | | | | |
Security Description | | Shares | | Value |
Financials (continued) | | | | | |
Reinsurance Group of America, Inc. | | 338,9002 | | $ | 16,185,864 |
Scottish Annuity & Life Holdings, Ltd. | | 516,6002 | | | 12,682,530 |
South Financial Group, Inc. | | 22,011 | | | 606,183 |
St. Joe Co., The | | 111,5002 | | | 7,495,030 |
Sterling Financial Corp. | | 803,1052 | | | 20,061,563 |
Triad Guaranty, Inc.* | | 104,6822 | | | 4,604,961 |
U.S.I. Holdings Corp.* | | 808,4012 | | | 11,131,682 |
United PanAm Financial Corp.* | | 228,200 | | | 5,903,534 |
Webster Financial Corp. | | 279,800 | | | 13,122,620 |
Total Financials | | | | | 510,806,010 |
Health Care - 10.4% | | | | | |
Adams Respiratory Therapeutics, Inc.* | | 276,850 | | | 11,256,721 |
Affymetrix, Inc.* | | 83,300 | | | 3,977,575 |
Amsurg Corp.* | | 258,400 | | | 5,907,024 |
Aspect Medical Systems, Inc.* | | 174,9752 | | | 6,010,391 |
Atherogenics, Inc.* | | 270,1002 | | | 5,404,701 |
Centene Corp.* | | 604,0002 | | | 15,879,160 |
Cepheid, Inc.* | | 464,700 | | | 4,080,066 |
Charles River Laboratories International, Inc.* | | 398,5162 | | | 16,885,122 |
Cyberonics, Inc.* | | 338,4002 | | | 10,930,320 |
DaVita, Inc.* | | 138,4002 | | | 7,008,576 |
DexCom, Inc.* | | 385,000 | | | 5,744,200 |
Eclipsys Corp.* | | 304,200 | | | 5,758,506 |
Fisher Scientific International, Inc.* | | 60,0002 | | | 3,711,600 |
Foxhollow Technologies, Inc.* | | 318,9002 | | | 9,500,031 |
Gen-Probe, Inc.* | | 258,800 | | | 12,626,852 |
Harvard Bioscience, Inc.* | | 595,900 | | | 2,651,755 |
IMS Health, Inc. | | 820,081 | | | 20,436,418 |
Intuitive Surgical, Inc.* | | 195,4002 | | | 22,914,557 |
Kyphon, Inc.* | | 278,1502 | | | 11,356,865 |
LCA-Vision, Inc. | | 192,0502 | | | 9,124,296 |
LifeCell Corp.* | | 253,8252 | | | 4,840,443 |
Lincare Holdings, Inc.* | | 212,1002 | | | 8,889,111 |
Momenta Pharmaceutical, Inc.* | | 220,0002 | | | 4,848,800 |
NeoPharm, Inc.* | | 358,1002 | | | 3,863,899 |
Neurometrix, Inc.* | | 215,6002 | | | 5,881,568 |
NitroMed, Inc.* | | 824,4002 | | | 11,500,380 |
NuVasive, Inc.* | | 396,8752 | | | 7,183,438 |
NxStage Medical, Inc.* | | 239,8002 | | | 2,868,008 |
Omnicell, Inc.* | | 200,500 | | | 2,395,975 |
Owens & Minor, Inc. | | 213,3002 | | | 5,872,149 |
Par Pharmaceutical Co., Inc.* | | 136,900 | | | 4,290,446 |
Resmed, Inc.* | | 148,7252 | | | 5,697,655 |
Sonosite, Inc.* | | 94,300 | | | 3,301,443 |
Syneron Medical Ltd.* | | 416,0502 | | | 13,209,588 |
Telik, Inc.* | | 238,200 | | | 4,047,018 |
Thoratec Corp.* | | 246,200 | | | 5,093,878 |
Triad Hospitals, Inc.* | | 613,264 | | | 24,058,347 |
United Therapeutics Corp.* | | 305,2752 | | | 21,100,608 |
Universal Health Services, Inc., Class B | | 170,0002 | | | 7,945,800 |
VCA Antech, Inc.* | | 284,4502 | | | 8,021,490 |
Total Health Care | | | | | 346,074,780 |
Industrials - 20.4% | | | | | |
AAR Corp.* | | 259,2002 | | | 6,207,840 |
Acuity Brands, Inc. | | 448,9532 | | | 14,276,705 |
Adesa, Inc. | | 546,900 | | | 13,355,298 |
Air France | | 948,178 | | | 20,499,608 |
Airtran Holdings, Inc.* | | 1,542,5502 | | | 24,727,077 |
Alaska Airgroup, Inc.* | | 615,0002 | | | 21,967,800 |
Albany International Corp. | | 312,600 | | | 11,303,616 |
American Commercial Lines, Inc.* | | 147,000 | | | 4,452,630 |
Astec Industries, Inc.* | | 72,775 | | | 2,376,832 |
Axsys Technologies, Inc.*4 | | 680,850 | | | 12,221,258 |
BE Aerospace, Inc.* | | 748,250 | | | 16,461,500 |
Brink’s Co., The | | 420,241 | | | 20,133,746 |
Builders FirstSource, Inc.* | | 427,925 | | | 9,144,757 |
Carlisle Co., Inc. | | 142,700 | | | 9,867,705 |
CNF, Inc. | | 105,600 | | | 5,901,984 |
Continental Airlines, Inc.* | | 529,6002 | | | 11,280,480 |
CoStar Group, Inc.* | | 149,830 | | | 6,468,161 |
Crane Co. | | 502,7002 | | | 17,730,229 |
Curtiss-Wright Corp. | | 131,3002 | | | 7,168,980 |
DeVry, Inc.* | | 658,2002 | | | 13,164,000 |
DRS Technologies, Inc. | | 106,2002 | | | 5,460,804 |
Dycom Industries, Inc.* | | 484,400 | | | 10,656,800 |
Education Management Corp.* | | 112,400 | | | 3,766,524 |
EGL, Inc.* | | 263,500 | | | 9,899,695 |
EnerSys* | | 179,9002 | | | 2,345,896 |
First Advantage Corp.* | | 395,6002 | | | 10,566,476 |
Flowserve Corp.* | | 245,5002 | | | 9,711,980 |
General Cable Corp.* | | 161,775 | | | 3,186,968 |
Global Power Equipment Group, Inc.* | | 746,1002 | | | 3,372,372 |
Granite Construction, Inc. | | 261,7002 | | | 9,397,647 |
Heidrick & Struggles International, Inc.* | | 241,2002 | | | 7,730,460 |
Hudson Highland Group, Inc.* | | 476,400 | | | 8,270,304 |
Insituform Technologies, Inc.* | | 594,800 | | | 11,521,276 |
Interpool, Inc. | | 424,300 | | | 8,010,784 |
ITT Educational Services, Inc.* | | l,131,6002 | | | 66,888,875 |
Jackson Hewitt Tax Service, Inc. | | 214,200 | | | 5,935,482 |
JLG Industries, Inc. | | 366,2002 | | | 16,720,692 |
Laidlaw International, Inc. | | 529,100 | | | 12,290,993 |
Lydall, Inc.* | | 231,500 | | | 1,886,725 |
Mercury Computer Systems, Inc.* | | 494,800 | | | 10,207,724 |
The accompanying notes are an integral part of these financial statements.
12
Managers Special Equity Fund
Schedule of Portfolio Investments (continued)
| | | | | |
Security Description | | Shares | | Value |
Industrials (continued) | | | | | |
NCI Building Systems, Inc.* | | 350,8002 | | $ | 14,901,984 |
Nuco2, Inc.* | | 48,900 | | | 1,363,332 |
Pacer International, Inc.* | | 228,3002 | | | 5,949,498 |
Perini Corp. * | | 195,000 | | | 4,709,250 |
Power-One, Inc.* | | 976,900 | | | 5,880,938 |
Precision Castparts Corp. | | 60,200 | | | 8,299,962 |
Royal Group Technologies Ltd. * | | 1,511,100 | | | 13,599,900 |
Ryder System, Inc. | | 192,8002 | | | 7,908,656 |
Schawk, Inc. | | 73,3002 | | | 1,520,975 |
Sea Containers, Ltd., Class A | | 658,900 | | | 8,262,606 |
Sea Containers, Ltd., Class B | | 13,090 | | | 160,614 |
Sequa Corp., Class A* | | 99,6002 | | | 6,877,380 |
Sequa Corp., Class B* | | 38,300 | | | 2,661,850 |
Shaw Group, Inc., The* | | 779,0502 | | | 22,662,565 |
Steelcase, Inc. | | 826,9002 | | | 13,089,827 |
Swift Transportation Co., Inc.* | | 411,0002 | | | 8,343,300 |
Tecumseh Products Co., Class B | | 175,9932 | | | 3,511,060 |
Thomas & Betts Corp.* | | 653,500 | | | 27,420,860 |
United Stationers, Inc.* | | 232,5002 | | | 11,276,250 |
URS Corp.* | | 511,850 | | | 19,250,679 |
Volt Information Sciences, Inc.* | | 69,350 | | | 1,319,037 |
Walter Industries, Inc. | | 142,5002 | | | 7,085,100 |
Washington Group International, Inc.* | | 197,1002 | | | 10,440,387 |
Watson Wyatt & Co. | | 363,000 | | | 10,127,700 |
Total Industrials | | | | | 683,162,393 |
Information Technology - 21.9% | | | | | |
3Com Corp.* | | 4,638,600 | | | 16,698,960 |
Actel Corp. * | | 669,600 | | | 8,524,008 |
Akamai Technologies, Inc.* | | 846,4002 | | | 16,868,752 |
Aladdin Knowledge Systems, Ltd. * | | 284,400 | | | 4,897,368 |
Anaren Microwave, Inc. *4 | | 1,057,900 | | | 16,534,977 |
Andrew Corp. * | | 632,000 | | | 6,781,360 |
Applied Films Corp.* | | 295,3002 | | | 6,133,381 |
aQuantive, Inc. * | | 991,9002 | | | 25,035,556 |
Artesyn Technologies, Inc. * | | 522,3002 | | | 5,379,690 |
ASM International NV* | | 424,3002 | | | 7,136,726 |
ATMI, Inc.* | | 986,900 | | | 27,603,592 |
AudioCodes, Ltd.* | | 1,268,8002 | | | 14,083,680 |
Avid Technology, Inc.* | | 416,300 | | | 22,796,588 |
Belden CDT, Inc. | | 375,2002 | | | 9,166,136 |
Benchmark Electronics, Inc.* | | 452,7002 | | | 15,224,301 |
Blue Coat Systems, Inc. * | | 315,1502 | | | 14,408,658 |
Centra Software, Inc.* | | 321,400 | | | 642,800 |
CheckFree Corp. * | | 80,700 | | | 3,704,130 |
Checkpoint Systems, Inc. * | | 418,3002 | | | 10,311,095 |
Cognizant Technology Solutions Corp.* | | 188,8802 | | | 9,510,108 |
CommScope, Inc.* | | 662,2002 | | | 13,330,086 |
Comtech Group, Inc.* | | 159,100 | | | 988,011 |
Digitas, Inc.* | | 630,500 | | | 7,893,860 |
ECI Telecommunications, Ltd. * | | 999,400 | | | 7,485,506 |
eFunds Corp.* | | 767,6262 | | | 17,993,153 |
Electronics for Imaging, Inc.* | | 464,7812 | | | 12,367,822 |
Equinix, Inc.* | | 549,600 | | | 22,401,695 |
Exfo Electro-Optical Engineering, Inc.* | | 1,893,1002 | | | 8,526,522 |
F5 Networks, Inc.* | | 225,4502 | | | 12,893,486 |
Fairchild Semiconductor International, Inc.* | | 1,165,6002 | | | 19,710,296 |
Fargo Electronics, Inc.* | | 217,200 | | | 4,181,100 |
FEI Co.* | | 312,300 | | | 5,986,791 |
Foundry Networks, Inc. * | | 850,150 | | | 11,740,572 |
Genesis Microchip, Inc.* | | 377,3002 | | | 6,825,357 |
Global Payments, Inc. | | 175,7002 | | | 8,189,377 |
Identix, Inc. * | | 3,805,6002 | | | 19,066,056 |
Integral Systems, Inc. | | 200,000 | | | 3,772,000 |
Intevac, Inc.* | | 388,200 | | | 5,124,240 |
Keithley Instruments, Inc. | | 570,600 | | | 7,976,988 |
MEMC Electronic Materials, Inc. * | | 331,100 | | | 7,340,487 |
Mentor Graphics Corp.* | | 1,120,600 | | | 11,587,004 |
MRO Software, Inc.* | | 301,400 | | | 4,231,656 |
Multi-Fineline Electronix, Inc.* | | 90,250 | | | 4,347,343 |
NDS Group, PLC* | | 105,700 | | | 4,349,555 |
Netgear, Inc.* | | 265,4002 | | | 5,108,950 |
Netlogic Microsystems, Inc.* | | 196,1752 | | | 5,343,807 |
Parametric Technology Corp.* | | 2,316,100 | | | 14,128,210 |
Park Electrochemical Corp. | | 257,400 | | | 6,687,252 |
Perot Systems Corp.* | | 267,100 | | | 3,776,794 |
Power Integrations, Inc. * | | 585,900 | | | 13,950,279 |
Reynolds & Reynolds Co., The, Class A | | 115,000 | | | 3,228,050 |
RF Micro Devices, Inc.* | | 2,349,550 | | | 12,711,066 |
RightNow Technologies, Inc. * | | 486,3002 | | | 8,977,098 |
Rogers Corp. * | | 370,5002 | | | 14,516,190 |
S1 Corp.* | | 867,700 | | | 3,774,495 |
Salesforce.com, Inc.* | | 599,6002 | | | 19,217,180 |
ScanSource, Inc. * | | 94,3002 | | | 5,156,324 |
SERENA Software, Inc.* | | 269,600 | | | 6,319,424 |
Sierra Wireless, Inc. * | | 557,1002 | | | 6,183,810 |
Symmetricom, Inc.* | | 379,100 | | | 3,210,977 |
SYNNEX Corp.* | | 459,0002 | | | 6,935,490 |
Synopsys, Inc.* | | 356,400 | | | 7,149,384 |
TALX Corp. | | 244,300 | | | 11,166,953 |
Terayon Communication Systems, Inc.* | | 4,565,700 | | | 10,546,767 |
Trident Microsystems, Inc. * | | 1,158,2002 | | | 20,847,600 |
Utstarcom, Inc.* | | 2,080,0002 | | | 16,764,800 |
Vishay Intertechnology, Inc.* | | 713,9002 | | | 9,823,264 |
The accompanying notes are an integral part of these financial statements.
13
Managers Special Equity Fund
Schedule of Portfolio Investments (continued)
| | | | | | | |
Security Description | | Shares | | Value | |
Information Technology (continued) | | | | | | | |
WebEx Communications, Inc.* | | | 728,800 | | $ | 15,763,944 | |
WebSideStory, Inc. * | | | 304,300 | | | 5,516,959 | |
Witness Systems, Inc.* | | | 562,2502 | | | 11,059,458 | |
Woodhead Industries, Inc. 4 | | | 629,200 | | | 8,727,004 | |
Wright Express Corp. * | | | 319,600 | | | 7,031,200 | |
Total Information Technology | | | | | | 733,373,558 | |
Materials - 4.3% | | | | | | | |
AK Steel Holding Corp.* 4 | | | 4,929,4002 | | | 39,188,730 | |
Albemarle Corp. | | | 308,3002 | | | 11,823,305 | |
Aleris International, Inc.* | | | 267,400 | | | 8,620,976 | |
Cytec Industries, Inc. | | | 336,8002 | | | 16,041,784 | |
Longview Fibre Co. | | | 659,9002 | | | 13,732,519 | |
Lubrizol Corp. | | | 439,000 | | | 19,065,770 | |
Scotts Co., The, Class A | | | 160,8002 | | | 7,274,592 | |
Stillwater Mining Co.* | | | 1,168,9002 | | | 13,524,173 | |
Symyx Technologies, Inc.* | | | 509,600 | | | 13,906,984 | |
Total Materials | | | | | | 143,178,833 | |
Telecommunication Services - 0.6% | | | | | | | |
General Communication, Inc., Class A* | | | 878,100 | | | 9,070,773 | |
Syniverse Holdings, Inc.* | | | 559,5002 | | | 11,693,550 | |
Total Telecommunication Services | | | | | | 20,764,323 | |
Utilities - 2.3% | | | | | | | |
Avista Corp. | | | 1,202,200 | | | 21,290,962 | |
Reliant Resources, Inc. * | | | 4,851,5002 | | | 50,067,480 | |
Sierra Pacific Resources Corp.* | | | 530,800 | | | 6,921,632 | |
Total Utilities | | | | | | 78,280,074 | |
Total Common Stocks
(cost $2,508,166,959) | | | | | | 3,227,911,009 | |
| | |
| | | Principal
Amount | | | |
U.S. Government Obligations - 0.6%5 | | | | | | | |
United States Treasury Bonds - 0.4% | | | | | | | |
U.S. Treasury Bonds, 7.125%, 02/15/23 | | $ | 2,567,549 | | | 3,413,960 | |
U.S. Treasury Bonds, 7.250%, 05/15/16 | | | 614,765 | | | 765,338 | |
U.S. Treasury Bonds, 8.750%, 08/15/20 | | | 1,263,170 | | | 1,871,349 | |
U.S. Treasury Inflation Indexed Bonds, 1.875%, 07/15/13 | | | 6,631,644 | | | 7,142,551 | |
Total United States Treasury Bonds | | | | | | 13,193,198 | |
United States Treasury Notes - 0.2% | | | | | | | |
U.S. Inflation Indexed Notes, 0.875%, 04/15/10 | | | 2,034,149 | | | 2,045,352 | |
U.S. Treasury Notes, 4.000%, 06/15/09 | | | 3,912,636 | | | 3,890,877 | |
Total United States Treasury Notes | | | | | | 5,936,229 | |
Total U.S. Government Obligations
(cost $19,129,427) | | | Shares | | | 19,129,427 | |
Rights - 0.0%# | | | | | | | |
dELiA*s Corp. Rights, Exp. 04/30/06 (cost $0) | | | 25,626 | | $ | 25,626 | |
Warrants - 0.0%# | | | | | | | |
Air France, ADR
(cost $1,361,928) | | | 861,980 | | | 1,336,069 | |
Short-Term Investments - 30.1%1 | | | | | | | |
Other Investment Companies - 26.7% | | | | | | | |
AIM Liquid Assets Portfolio, Institutional Class Shares, 4.21% | | | 65,966,719 | | | 65,966,719 | |
Bank of New York Institutional Cash Reserves Fund, 4.30%3 | | | 682,264,546 | | | 682,264,546 | |
JPMorgan Prime Money Market Fund, Institutional Class Shares, 4.14% | | | 91,287,934 | | | 91,287,934 | |
Vanguard Prime Money Market Fund, 4.01% | | | 52,356,926 | | | 52,356,926 | |
Total Other Investment Companies | | | | | | 891,876,125 | |
Other Short-Term Investments - 3.4%3 | | | | | | | |
| | |
| | | Principal
Amount | | | |
Goldman Sachs Promissory Notes, 4.33% | | $ | 45,049,088 | | | 45,049,088 | |
Greenwich Capital Holdings, Inc., 4.33% | | | 30,036,083 | | | 30,036,083 | |
Liquid Funding Ltd., 4.35% | | | 40,090,515 | | | 40,090,515 | |
Total Other Short-Term Investments | | | | | | 115,175,686 | |
Total Short-Term Investments
(cost $1,007,051,811) | | | | | | 1,007,051,811 | |
Total Investments -127.2%
(cost $3,535,710,125) | | | | | | 4,255,453,942 | |
Other Assets, less Liabilities - (27.2)% | | | | | | (910,599,131 | ) |
Net Assets - 100.0% | | | | | $ | 3,344,854,811 | |
Based on the approximate cost of investments of $3,551,635,646 for Federal income tax purposes at December 31, 2005, the aggregate gross unrealized appreciation and depreciation were $819,584,598 and $115,766,302, respectively, resulting in net unrealized appreciation of investments of $703,818,296.
| * | Non-income-producing securities. |
| 1 | Yield shown for an investment company represents the December 31, 2005, seven day yield, which refers to the sum of the previous seven days’ dividends paid, expressed as an annual percentage. |
| 2 | Some or all of these shares were out on loan to various brokers as of December 31, 2005, amounting to a market value of $786,568,322, or approximately 23.5% of net assets. |
| 3 | Collateral received from brokers for securities lending was invested in these short-term investments. |
| 4 | Affiliated Company- See Note 6 in the Notes to Financial Statements. |
| 5 | Non-cash collateral received for securities loaned. |
| # | Rounds to less then 0.1%. |
The accompanying notes are an integral part of these financial statements.
14
Statement of Assets and Liabilities
December 31, 2005
| | | |
Assets: | | | |
Investments at value (including securities on loan valued at $786,568,322) | | $ | 4,255,453,942 |
Receivable for investments sold | | | 26,405,034 |
Receivable for Fund shares sold | | | 1,000,821 |
Dividends, interest and other receivables | | | 2,472,078 |
Prepaid expenses | | | 163,830 |
| | | |
Total assets | | | 4,285,495,705 |
| | | |
Liabilities: | | | |
Payable to Custodian | | | 104,340,476 |
Payable for Fund shares repurchased | | | 4,446,811 |
Payable upon return of securities loaned | | | 816,569,658 |
Payable for investments purchased | | | 9,772,829 |
Accrued expenses: | | | |
Investment advisory and management fees | | | 2,709,448 |
Administrative fees | | | 752,625 |
Other | | | 2,049,047 |
| | | |
Total liabilities | | | 940,640,894 |
| | | |
Net Assets | | $ | 3,344,854,811 |
| | | |
Managers Shares: | | | |
| | | |
Net Assets | | $ | 2,834,313,609 |
| | | |
Shares outstanding | | | 32,661,672 |
| | | |
Net asset value, offering and redemption price per share | | $ | 86.78 |
| | | |
Institutional Class Shares: | | | |
| | | |
Net Assets | | $ | 510,540,761 |
| | | |
Shares outstanding | | | 5,862,288 |
| | | |
Net asset value, offering and redemption price per share | | $ | 87.09 |
| | | |
Net Assets Represent: | | | |
Paid-in capital | | $ | 2,580,850,289 |
Undistributed net investment income | | | 1,227,593 |
Accumulated net realized gain from investments | | | 43,033,112 |
Net unrealized appreciation of investments | | | 719,743,817 |
| | | |
Net Assets | | $ | 3,344,854,811 |
| | | |
* Investments at cost | | $ | 3,535,710,125 |
The accompanying notes are an integral part of these financial statements.
15
Statement of Operations
For the year ended December 31, 2005
| | | | |
Investment Income: | | | | |
Dividend income | | $ | 26,605,557 | |
Foreign withholding tax | | | (218,232 | ) |
Securities lending fees | | | 1,719,042 | |
| | | | |
Total investment income | | | 28,106,367 | |
| | | | |
Expenses: | | | | |
Investment management fees | | | 31,662,152 | |
Administrative fees | | | 8,795,043 | |
Transfer agent | | | 7,953,424 | |
Custodian | | | 643,542 | |
Professional fees | | | 452,668 | |
Reports to shareholders | | | 346,006 | |
Trustees fees and expenses | | | 149,864 | |
Registration fees | | | 116,437 | |
Miscellaneous | | | 182,489 | |
| | | | |
Total expenses before offsets | | | 50,301,625 | |
| | | | |
Fee waiver | | | (28,665 | ) |
Expense reductions | | | (1,834,712 | ) |
| | | | |
Net expenses | | | 48,438,248 | |
| | | | |
Net investment loss | | | (20,331,881 | ) |
| | | | |
Net Realized and Unrealized Gain (Loss): | | | | |
Net realized gain on investment transactions | | | 370,099,739 | |
Net unrealized depreciation of investments | | | (216,366,681 | ) |
| | | | |
Net realized and unrealized gain | | | 153,733,058 | |
| | | | |
Net Increase in Net Assets Resulting from Operations | | $ | 133,401,177 | |
| | | | |
The accompanying notes are an integral part of these financial statements.
16
Statement of Changes in Net Assets
For the year ended December 31,
| | | | | | | | |
| | | Managers Special Equity Fund | |
| | | 2005 | | | 2004 | |
Increase (Decrease) in Net Assets From Operations: | | | | | | | | |
Net investment loss | | $ | (20,331,881 | ) | | $ | (22,980,406 | ) |
Net realized gain on investments | | | 370,099,739 | | | | 347,977,454 | |
Net unrealized appreciation (depreciation) of investments | | | (216,366,681 | ) | | | 156,903,987 | |
| | | | | | | | |
Net increase in net assets resulting from operations | | | 133,401,177 | | | | 481,901,035 | |
| | | | | | | | |
Distributions to Shareholders: | | | | | | | | |
From net realized gain on investments: | | | | | | | | |
Managers Class | | | (230,875,965 | ) | | | — | |
Institutional Class | | | (39,895,773 | ) | | | — | |
| | | | | | | | |
Total distributions to shareholders | | | (270,771,738 | ) | | | — | |
| | | | | | | | |
From Capital Share Transactions: Managers Class: | | | | | | | | |
Proceeds from sale of shares | | | 698,310,169 | | | | 303,268,419 | |
Reinvestment of distributions | | | 210,983,200 | | | | — | |
Cost of shares repurchased | | | (1,368,795,175 | ) | | | (1,287,267,301 | ) |
| | | | | | | | |
Net decrease from capital share transactions | | | (459,501,806 | ) | | | (983,998,882 | ) |
| | | | | | | | |
Institutional Class: | | | | | | | | |
Proceeds from sale of shares | | | 318,303,171 | | | | 971,313,866 | |
Reinvestment of distributions | | | 34,758,890 | | | | — | |
Cost of shares repurchased | | | (100,347,591 | ) | | | (59,521,580 | ) |
| | | | | | | | |
Net increase from capital share transactions | | | 252,714,470 | | | | 911,792,286 | |
| | | | | | | | |
Net decrease from capital share transactions | | | (206,787,336 | ) | | | (72,206,596 | ) |
| | | | | | | | |
Total increase (decrease) in net assets | | | (344,157,897 | ) | | | 409,694,439 | |
| | | | | | | | |
Net Assets: | | | | | | | | |
Beginning of year | | | 3,689,012,708 | | | | 3,279,318,270 | |
| | | | | | | | |
End of year | | $ | 3,344,854,811 | | | $ | 3,689,012,708 | |
| | | | | | | | |
End of year undistributed net investment income | | $ | 1,227,593 | | | $ | 658,568 | |
| | | | | | | | |
Share Transactions: | | | | | | | | |
Managers Class: | | | | | | | | |
Sale of shares | | | 7,901,047 | | | | 12,009,151 | |
Reinvested shares | | | 2,423,708 | | | | — | |
Shares repurchased | | | (15,430,176 | ) | | | (16,026,228 | ) |
| | | | | | | | |
Net decrease in shares | | | (5,105,421 | ) | | | (4,017,077 | ) |
| | | | | | | | |
Institutional Class: | | | | | | | | |
Sale of shares | | | 3,552,228 | | | | 3,770,486 | |
Reinvested shares | | | 397,790 | | | | — | |
Shares repurchased | | | (1,113,572 | ) | | | (744,644 | ) |
| | | | | | | | |
Net increase in shares | | | 2,836,446 | | | | 3,025,842 | |
| | | | | | | | |
The accompanying notes are an integral part of these financial statements.
17
Financial Highlights
For a share outstanding throughout each year ended December 31,
| | | | | | | | | | | | | | | | | | | | |
| | | Managers Class | |
| | | 2005 | | | 2004 | | | 2003 | | | 2002 | | | 2001 | |
Net Asset Value, Beginning of Year | | $ | 90.42 | | | $ | 78.48 | | | $ | 55.08 | | | $ | 70.59 | | | $ | 76.82 | |
| | | | | | | | | | | | | | | | | | | | |
Income from Investment Operations: | | | | | | | | | | | | | | | | | | | | |
Net investment loss | | | (0.54 | ) 5 | | | (0.56 | ) | | | (0.43 | ) | | | (0.34 | ) | | | (0.18 | ) |
Net realized and unrealized gain (loss) on investments | | | 4.18 | | | | 12.50 | | | | 23.83 | | | | (15.17 | ) | | | (6.05 | ) |
| | | | | | | | | | | | | | | | | | | | |
Total from investment operations | | | 3.64 | | | | 11.94 | | | | 23.40 | | | | (15.51 | ) | | | (6.23 | ) |
| | | | | | | | | | | | | | | | | | | | |
Less Distributions to Shareholders from: | | | | | | | | | | | | | | | | | | | | |
| | | | | | | | | | | | | | | | | | | | |
Net realized gain on investments | | | (7.28 | ) | | | — | | | | — | | | | — | | | | — | |
| | | | | | | | | | | | | | | | | | | | |
Net Asset Value, End of Year | | $ | 86.78 | | | $ | 90.42 | | | $ | 78.48 | | | $ | 55.08 | | | $ | 70.59 | |
| | | | | | | | | | | | | | | | | | | | |
Total Return 1 | | | 4.00 | % | | | 15.18 | % | | | 42.50 | % | | | (21.98 | )% | | | (8.07 | )% |
Ratio of net expenses to average net assets 1 | | | 1.40 | % | | | 1.40 | % | | | 1.43 | % | | | 1.31 | % | | | 1.29 | % |
Ratio of total expenses to average net assets 1 | | | 1.45 | % 4 | | | 1.45 | % 4 | | | 1.46 | % 4 | | | 1.32 | % | | | 1.30 | % |
Ratio of net investment loss to average net assets | | | (0.60 | )% | | | (0.69 | )% | | | (0.72 | )% | | | (0.56 | )% | | | (0.27 | )% |
Portfolio turnover | | | 80 | % | | | 68 | % | | | 64 | % | | | 67 | % | | | 62 | % |
Net assets at end of year (000’s omitted) | | $ | 2,834,314 | | | $ | 3,415,003 | | | $ | 3,279,318 | | | $ | 2,020,821 | | | $ | 2,295,234 | |
| | | | | | | | |
| | | Institutional Class | |
| | | For the year
ended December 31,
2005 | | | For the period*
ended December 31,
2004 | |
Net Asset Value, Beginning of Period | | $ | 90.56 | | | $ | 78.91 | |
Income from Investment Operations: | | | | | | | | |
Net investment loss | | | (0.33 | ) 5 | | | (0.21 | ) |
Net realized and unrealized gain on investments | | | 4.14 | | | | 11.86 | |
| | | | | | | | |
Total from investment operations | | | 3.81 | | | | 11.65 | |
| | | | | | | | |
Less Distributions to Shareholders from: | | | | | | | | |
| | | | | | | | |
Net realized gain on investments | | | (7.28 | ) | | | — | |
| | | | | | | | |
Net Asset Value, End of Period | | $ | 87.09 | | | $ | 90.56 | |
| | | | | | | | |
Total Return1 | | | 4.21 | % | | | 14.75 | % 2 |
Ratio of net expenses to average net assets1 | | | 1.20 | % | | | 1.20 | % 3 |
Ratio of total expenses to average net assets1 | | | 1.25 | % 4 | | | 1.26 | % 3,4 |
Ratio of net investment loss to average net assets | | | (0.56 | )% | | | (0.49 | )% 3 |
Portfolio turnover | | | 80 | % | | | 68 | % 2 |
Net assets at end of period (000’s omitted) | | $ | 510,541 | | | $ | 274,010 | |
| * | Commencement of operations was May 3, 2004. |
| 1 | See Note 1(c) of “Notes to Financial Statements.” |
| 4 | Excludes the impact of fee waivers and expense offsets such as brokerage credits, but includes nonreimbursable expenses such as interest and taxes. (See Note 1c to the Notes to Financial Statements.) |
| 5 | Per share numbers have been calculated using average shares. |
18
Notes to Financial Statements
December 31, 2005
(1) Summary of Significant Accounting Policies
The Managers Funds (the “Trust”) is an open-end management investment company organized as a Massachusetts business trust and registered under the Investment Company Act of 1940, as amended (the “1940 Act”). Currently, the Trust is comprised of a number of investment series. Included in this report is the Managers Special Equity Fund (“Special Equity”or the “Fund”).
Special Equity offers both Managers Class shares and Institutional Class shares. The Institutional Class shares, which are designed primarily for institutional investors that meet certain administrative and servicing criteria, have a minimum investment of $2,500,000. Managers Class shares are offered to all other investors. Each class represents an interest in the same assets of Special Equity and the classes are identical except for class specific expenses related to shareholder costs. Investment income, realized and unrealized capital gains and losses, the common expenses of Special Equity, and certain Fund level expense reductions, if any, are allocated on a pro rata basis to each class based on the relative net assets of each class to the total net assets of Special Equity. Both classes have equal voting privileges except that each class has exclusive voting rights with respect to its services and/or distribution plan.
The Fund’s financial statements are prepared in accordance with accounting principles generally accepted in the United States of America, which require management to make estimates and assumptions that affect the reported amount of assets and liabilities and disclosure of contingent assets and liabilities at the date of the financial statements and the reported amounts of income and expenses during the reporting periods. Actual results could differ from those estimates. The following is a summary of significant accounting policies followed by the Fund in the preparation of its financial statements:
(a) Valuation of Investments
Equity securities traded on a domestic or international securities exchange are generally valued at the last quoted sale price, or, lacking any sales, at the last quoted bid price. Over-the-counter securities are valued at the Nasdaq Official Closing Price, if one is available. Lacking any sales, over-the-counter securities, are valued at the last quoted bid price. Under certain circumstances, the value of a Fund investment may be based on an evaluation of its fair value, pursuant to procedures established by and under the general supervision of the Board of Trustees of the Fund. A Fund may use the fair value of a portfolio security to calculate its NAV when, for example, (1) market quotations are not readily available because a portfolio security is not traded in a public market or the principal market in which the security trades is closed, (2) trading in a portfolio security is suspended and not resumed prior to the time as of which the Fund calculates its NAV, (3) where a significant event affecting the value of a portfolio security is determined to have occurred between the time of the market quotation provided for a portfolio security and the time as of which the Fund calculates its NAV, (4) a security’s price has remained unchanged over an extended period of time (often referred to as a “stale price”), or (5) the Investment Manager determines that a market quotation is inaccurate. The Investment Manager monitors intervening events that may affect the value of securities held in each Fund’s portfolio and, in accordance with procedures adopted by the Funds’ Trustees, will adjust the prices of securities traded in foreign markets, as appropriate, to reflect the impact of events occurring subsequent to the close of such markets but prior to the time each Fund’s NAV is calculated. Fixed-income securities are valued based on valuations furnished by independent pricing services that utilize matrix systems, which reflect such factors as security prices, yields, maturities and ratings, and are supplemented by dealer and exchange quotations. Short-term investments having a remaining maturity of 60 days or less are valued at amortized cost, which approximates market value. Investments in other regulated investment companies are valued at their end of day net asset value per share except iShares or other ETF’s, which are valued the same as equity securities. Securities (including derivatives) for which market quotations are not readily available are valued at fair value, as determined in good faith, and pursuant to procedures adopted by the Board of Trustees of the Trust.
Investments in certain securities such as preferred stocks are valued on the basis of valuations provided by dealers or by a pricing service which uses information with respect to transactions in such securities, various relationships between securities in determining value.
(b) Security Transactions
Security transactions are accounted for as of the trade date. Realized gains and losses on securities sold are determined on the basis of identified cost.
The Fund had certain portfolio trades directed to a broker under a brokerage recapture program. For the year ended December 31, 2005, under this arrangement the total amount by which the cost of the Fund’s securities were reduced or proceeds on sales increased was $246,255.
(c) Investment Income and Expenses
Dividend income is recorded on the ex-dividend date except certain dividends from foreign securities where the ex-dividend
19
Notes to Financial Statements (continued)
date may have passed. These dividends are recorded as soon as the Trust is informed of the ex-dividend date. Dividend income on foreign securities is recorded net of any withholding tax. Interest income, which includes amortization of premium and accretion of discount on debt securities, is accrued as earned. Non-cash dividends included in dividend income, if any, are reported at the fair value of the securities received. Other income and expenses are recorded on an accrual basis. Expenses that cannot be directly attributed to a fund are apportioned among the Funds in the Trust and in some cases other affiliated funds based upon their relative average net assets or number of shareholders.
The Fund had certain portfolio trades directed to various brokers who paid a portion of the Fund’s expenses. For the year ended December 31, 2005, under this arrangement the Fund’s expenses were reduced and the impact on the expense ratio was $1,828,210 or 0.05%.
The Fund has a “balance credit” arrangement with The Bank of New York (“BNY”), the Fund’s custodian, whereby the Fund is credited with an interest factor equal to 1% below the effective 90-day T-Bill rate for account balances left uninvested overnight. This credit serves to reduce the custody expense that would otherwise be charged to the Fund. For the year ended December 31, 2005, the custodian expense was reduced $6,502 under this arrangement.
Managers Investment Group LLC (formerly The Managers Funds LLC) (the “Investment Manager”) had agreed to waive a portion of its fee or reimburse expenses of Special Equity commensurate with the reduction in the fee paid to Essex Investment Management Company LLC (“Essex”) (subadvisor to Special Equity from December 19, 2003 to January 17, 2005), which was 0.10% of the average daily net assets of the portion of the Fund managed by Essex in excess of $100 million. From January 1, 2005 to January 17, 2005 the amount waived equaled $28,665. On January 18, 2005, Essex was replaced with Veredus Asset Management, and the Investment Manager discontinued waiving a portion of its fee.
Total returns and net investment income for the Fund would have been lower had certain expenses not been offset.
(d) Dividends and Distributions
Dividends resulting from net investment income, if any, normally will be declared and paid annually. Distributions of capital gains, if any, will be made on an annual basis and when required for Federal excise tax purposes. Income and capital gain distributions are determined in accordance with Federal income tax regulations, which may differ from generally accepted accounting principles. These differences are primarily due to differing treatments for losses deferred due to wash sales, equalization accounting for tax purposes, foreign currency and market discount transactions. Permanent book and tax basis differences, if any, relating to shareholder distributions will result in reclassifications to paid-in capital. The tax character of distributions paid during the past two years were as follows:
| | | | | | |
| | | 2005 | | 2004 |
Distributions paid from: | | | | | | |
Ordinary income | | $ | — | | $ | — |
Short-term capital gains | | | — | | | — |
Long-term capital gains | | | 270,771,738 | | | — |
| | | | | | |
| | $ | 270,771,738 | | $ | |
| | | | | | |
As a % of distributions paid: | | | | | | |
Qualified ordinary income | | | — | | | — |
Ordinary income - dividends received deduction | | | — | | | — |
As of December 31, 2005, the components of distributable earnings (excluding unrealized appreciation/depreciation) on a tax basis consisted of:
| | | |
| | | 2005 |
Capital loss carryforward | | $ | — |
Undistributed ordinary income | | | — |
Undistributed short-term capital gains | | | — |
Undistributed long-term capital gains | | $ | 60,186,226 |
| | | |
| | $ | 60,186,226 |
| | | |
(e) Federal Taxes
The Fund intends to comply with the requirements under Subchapter M of the Internal Revenue Code of 1986, as amended, to distribute substantially all of its taxable income and gains to its shareholders and to meet certain diversification and income requirements with respect to investment companies. Therefore, no provision for Federal income or excise tax is included in the accompanying financial statements.
20
Notes to Financial Statements (continued)
(f) Capital Loss Carryovers
As of December 31, 2005, the Fund had no accumulated net realized capital loss carryover from securities transactions for Federal income tax purposes.
(g) Capital Stock
The Trust’s Declaration of Trust authorizes for each series the issuance of an unlimited number of shares of beneficial interest, without par value. The Fund records sales and repurchases of its capital stock on the trade date. Dividends and distributions to shareholders are recorded on the ex-dividend date.
At December 31, 2005, certain unaffiliated shareholders, specifically omnibus accounts, individually held greater than 10% of the outstanding shares of the Fund: Special Equity Managers Class shares-two own collectively 34%; Special Equity Institutional Class shares – three own collectively 35%.
(2) Agreements and Transactions with Affiliates
The Trust has entered into an Investment Management Agreement under which the Investment Manager provides or oversees investment management services to the Fund. The Investment Manager selects subadvisors for the Fund (subject to Trustee approval), allocates assets among subadvisors and monitors the subadvisor’s investment programs and results. The Fund’s investment portfolio is managed by portfolio managers who serve pursuant to Subadvisory Agreements with the Investment Manager. Investment management fees are paid directly by the Fund to the Investment Manager based on average daily net assets. The annual investment management fee rate, as a percentage of average daily net assets for the year ended December 31, 2005 was 0.90%.
The Trust has entered into an Administration and Shareholder Servicing Agreement under which Managers Investment Group LLC serves as the Fund’s administrator (the “Administrator”) and is responsible for all aspects of managing the Fund’s operations, including administration and shareholder services to the Fund, its shareholders, and certain institutions, such as bank trust departments, broker-dealers and registered investment advisers, that advise or act as an intermediary with the Fund’s shareholders. During the year ended December 31, 2005, the Fund paid a fee to the Administrator at the rate of 0.25% per annum of the Fund’s average daily net assets.
Prior to July 1, 2005, the aggregate annual retainer paid to each Independent Trustee was $52,000, plus $2,000 for each meeting attended. Effective July 1, 2005, the aggregate annual retainer paid to each Independent Trustee is $55,000, plus $4,000 or $2,000 for each regular or special meeting attended, respectively. The Trustees’ fees and expenses are allocated amongst all of the Funds for which Managers Investment Group LLC serves as the Investment Manager (the “Managers Funds”) based on the relative net assets of such Funds. The Independent Chairman of the Trust receives an additional payment of $10,000 per year. (Prior to July 1, 2005, the Independent Chairman was paid an additional $5,000 per year). Effective July 1, 2005, the Chairman of the Audit Committee receives an additional $2,000 per year. The “Trustee fees and expenses” shown in the financial statements represents the Fund’s allocated portion of the total fees and expenses paid by the Managers Funds.
The Fund is distributed by Managers Distributors, Inc. (“MDI”), a wholly-owned subsidiary of Managers Investment Group LLC. Certain Trustees and Officers of the Fund are Officers and/or Directors of the Investment Manager, AMG and/or MDI. MDI serves as the principal underwriter for the Fund. MDI is a registered broker-dealer and member of the National Association of Securities Dealers, Inc. (“NASD”). Shares of the Fund will be continuously offered and will be sold by brokers, dealers or other financial intermediaries who have executed selling agreements with MDI. MDI bears all the expenses of providing services pursuant to an Underwriting Agreement, including the payment of the expenses relating to the distribution of Prospectuses for sales purposes and any advertising or sales literature.
(3) Purchases and Sales of Securities
Purchases and sales of securities, excluding short-term securities, for the year ended December 31, 2005, were $2,605,457,387 and $2,961,439,367, respectively. There were no purchases or sales of U.S. Government securities.
(4) Portfolio Securities Loaned
The Fund may participate in a securities lending program offered by BNY providing for the lending of equities, corporate bonds and government securities to qualified brokers. Collateral on all securities loaned is accepted in cash and/or government securities. Collateral is maintained at a minimum level of 102% of the market value, plus interest, if applicable, of investments on loan. Collateral received in the form of cash is invested temporarily in institutional money market funds or other short-term investments by BNY. Earnings (after any rebate) of such temporary cash investments are divided between BNY, as a fee for its services under the program, and the Fund loaning the security, according to agreed-upon rates.
21
Notes to Financial Statements (continued)
(5) Commitments and Contingencies
In the normal course of business, the Fund may enter into contracts and agreements that contain a variety of representations and warranties, which provide general indemnifications. The maximum exposure to the Fund under these arrangements is unknown, as this would involve future claims that may be against the Fund that have not yet occurred. However, based on experience, the Fund expects the risks of loss to be remote.
(6) Transactions with Affiliated Companies
An affiliated company is a company that is directly or indirectly controlled by a related party or a company in which a fund has ownership of at least 5% of the voting securities. Transactions during the year ended December 31, 2005, with companies which are or were affiliates are as follows:
| | | | | | | | | | | | |
Affiliate | | Purchase Cost | | Sales Cost | | Dividend
Income | | Market Value |
AK Steel Holding Corp. | | $ | 18,203,786 | | $ | 28,775,398 | | $ | — | | $ | 39,188,730 |
Anaren Microwave, Inc. | | | — | | | — | | | — | | | 16,534,977 |
Axsys Technologies, Inc. | | | 7,135,320 | | | 5,648,233 | | | — | | | 12,221,258 |
Meristar Hospitality Corp. | | | — | | | — | | | | | | 47,231,240 |
Woodhead Industries, Inc. | | | 6,745,132 | | | 4,050,727 | | | 147,190 | | | 8,727,004 |
| | | | | | | | | | | | |
Totals | | $ | 32,084,238 | | $ | 38,474,358 | | $ | 147,190 | | $ | 123,903,209 |
| | | | | | | | | | | | |
Tax Information (unaudited)
The Fund hereby designate the maximum amounts allowable of their net taxable income as qualified dividends as provided in the Jobs and Growth Tax Relief Reconciliation Act of 2003. The 2005 Form 1099-DIV you receive for the Fund will show the tax status of all distributions paid to you during the year.
Pursuant to section 852 of the Internal Revenue Code, the Fund designated $330,957,964 as long-term capital gains for the taxable year ended December 31, 2005.
22
Report of Independent Registered Public Accounting Firm
To the Trustees of The Managers Funds and the
Shareholders of Managers Special Equity Fund:
In our opinion, the accompanying statement of assets and liabilities, including the schedule of portfolio investments, and the related statement of operations and of changes in net assets and the financial highlights present fairly, in all material respects, the financial position of Managers Special Equity Fund (hereafter referred to as the “Fund”), at December 31, 2005, and the results of its operations, the changes in its net assets and the financial highlights for the periods indicated, in conformity with accounting principles generally accepted in the United States of America. These financial statements and financial highlights (hereafter referred to as “financial statements”) are the responsibility of the Fund’s management; our responsibility is to express an opinion on these financial statements based on our audits. We conducted our audits of these financial statements in accordance with the standards of the Public Company Accounting Oversight Board (United States). Those standards require that we plan and perform the audit to obtain reasonable assurance about whether the financial statements are free of material misstatement. An audit includes examining, on a test basis, evidence supporting the amounts and disclosures in the financial statements, assessing the accounting principles used and significant estimates made by management, and evaluating the overall financial statement presentation. We believe that our audits, which included confirmation of securities at December 31, 2005 by correspondence with the custodian and brokers, provide a reasonable basis for our opinion.
PricewaterhouseCoopers LLP
Boston, Massachusetts
February 22, 2006
23
Trustees and Officers
The Trustees and Officers of the Trust, their business addresses, principal occupations for the past five years and dates of birth are listed below. The Trustees provide broad supervision over the affairs of the Trust and the Fund. The Trustees are experienced executives who meet periodically throughout the year to oversee the Fund’s activities, review contractual arrangements with companies that provide services to the Fund, and review the Fund’s performance. Unless otherwise noted, the address of each Trustee or Officer is the address of the Trust: 800 Connecticut Avenue, Norwalk, Connecticut 06854.
There is no stated term of office for Trustees. Trustees serve until their resignation, retirement or removal in accordance with the Trust’s organizational documents and policies adopted by the Board from time to time. The President, Treasurer and Secretary hold office until a successor has been duly elected and qualified. Other officers serve at the pleasure of the Trustees.
Independent Trustees
The following Trustees are not “interested persons” of the Trust within the meaning of the 1940 Act:
| | |
Name, Date of Birth, Number of Funds Overseen in Fund Complex* | | Principal Occupation(s) During Past 5 Years and Other Directorships Held
by Trustee |
| |
Jack W. Aber, 9/9/37 • Trustee since 1999 • Oversees 36 Funds in Fund Complex | | Professor of Finance, Boston University School of Management (1972-Present); Trustee of Appleton Growth Fund (1 portfolio); Trustee of Third Avenue Trust (4 portfolios); Trustee of Third Avenue Variable Trust (1 portfolio) |
| |
William E. Chapman, II, 9/23/41 • Independent Chairman • Trustee since 1999 • Oversees 36 Funds in Fund Complex | | President and Owner, Longboat Retirement Planning Solutions (1998-Present); Hewitt Associates, LLC (part time) (provider of Retirement and Investment Education Seminars); Interim Executive Vice President, QuadraMed Corporation (2001); President, Retirement Plans Group, Kemper Funds (1990-1998); Trustee of Bowdoin College (2002-Present); Trustee of Third Avenue Trust (4 portfolios); Trustee of Third Avenue Variable Trust (1 portfolio) |
| |
Edward J. Kaier, 9/23/45 • Trustee since 1999 • Oversees 36 Funds in Fund Complex | | Attorney at Law and Partner, Hepburn Willcox Hamilton & Putnam, LLP (1977-Present); Trustee of Third Avenue Trust (4 portfolios); Trustee of Third Avenue Variable Trust (1 portfolio) |
| |
Steven J. Paggioli, 4/3/50 • Trustee since 1993 • Oversees 36 Funds in Fund Complex | | Consultant (2001-Present); Formerly Executive Vice President and Director, The Wadsworth Group (1986-2001); Executive Vice President, Secretary and Director, Investment Company Administration, LLC (1990-2001); Vice President, Secretary and Director, First Fund Distributors, Inc. (1991-2001); Trustee, Professionally Managed Portfolios (21 portfolios); Advisory Board Member, Sustainable Growth Advisors, LP; Trustee, Guardian Mutual Funds (28 portfolios) |
| |
Eric Rakowski, 6/5/58 • Trustee since 1999 • Oversees 36 Funds in Fund Complex | | Professor, University of California at Berkeley School of Law (1990-Present); Visiting Professor, Harvard Law School (1998-1999); Trustee of Third Avenue Trust (4 portfolios); Trustee of Third Avenue Variable Trust (1 portfolio) |
| |
Thomas R. Schneeweis, 5/10/47 • Trustee since 1987 • Oversees 36 Funds in Fund Complex | | Professor of Finance, University of Massachusetts (1985-Present); Director, CISDM at the University of Massachusetts, (1996-Present); President, Alternative Investment Analytics, LLC, (formerly Schneeweis Partners, LLC) (2001- Present); Director of Research, Lyra/Starview Capital LLC, (2004-Present); Partner, Northampton Capital, LLC; Partner, Schneeweis Advisors and Massachusetts Finance Institute (both wholly owned subsidiaries of Alternative Investment Analytics). No other directorships held by Trustee. |
| * | The Fund Complex consists of Managers AMG Funds, The Managers Funds, Managers Trust I and Managers Trust II. |
24
Trustees and Officers (continued)
Interested Trustees
The following Trustees are “interested persons” of the Trust within the meaning of the 1940 Act. Mr. Lebovitz is an interested person of the Trust within the meaning of the 1940 Act by virtue of his positions with Managers Investment Group LLC and Managers Distributors, Inc. Mr. Nutt is an interested person of the Trust within the meaning of the 1940 Act by virtue of his positions with, and interest in securities of, Affiliated Managers Group, Inc.
| | |
Name, Date of Birth, Number of Funds Overseen in Fund Complex* | | Principal Occupation(s) During Past 5 Years and Other Directorships Held
by Trustee |
| |
Peter M. Lebovitz, 1/18/55 • Trustee since 2002 • President since 1999 • Oversees 36 Funds in Fund Complex | | Managing Partner, Managers Investment Group LLC (2005-Present); President and Chief Executive Officer, The Managers Funds LLC (1999-2004); President, Managers Distributors, Inc. (2000-Present); President, Managers AMG Funds (1999-Present); President, Managers Trust I (2000-Present); President, Managers Trust II (2000-Present); Director of Marketing, The Managers Funds, LP (1994-1999); Director of Marketing, Hyperion Capital Management, Inc. (1993- 1994); Senior Vice President, Greenwich Asset Management, Inc. (1989-1993); No other directorships held by trustee. |
| |
William J. Nutt, 3/30/45 • Trustee since 2005 • Oversees 36 Funds in Fund Complex | | Chairman and Founder of Affiliated Managers Group, Inc., (1993-Present); Chief Executive Officer of Affiliated Managers Group, Inc. (1993-2004); Director, Affiliated Managers Group, Inc. (1993-Present); President of Affiliated Managers Group, Inc. (1993-1999); President and Chief Operating Officer, The Boston Company (1989-1993); Senior Executive Vice President, The Boston Company (1982-1989) |
| * | The Fund Complex consists of Managers AMG Funds, The Managers Funds, Managers Trust I and Managers Trust II. |
Officers
| | |
Name, Date of Birth, Position(s) Held with Fund and Length of Time Served | | Principal Occupation(s) During Past 5 Years |
| |
Bruce M. Aronow, 5/31/65 • Chief Financial Officer since 2005 | | Managing Partner, Managers Investment Group LLC (2005-Present); Chief Financial Officer, Managers AMG Funds, Managers Trust I and Managers Trust II (2005-Present); Executive Vice President and Chief Financial Officer and Principal, Rorer Asset Management (1999-2004); Chief Operating Officer, Rorer Asset Management (2001-2004); Staff Accountant, Manager and Partner, Price- waterhouseCoopers LLP (1987-1998) |
| |
Christine C. Carsman, 4/2/52 • Secretary since 2004 | | Vice President and Chief Regulatory Counsel, Affiliated Managers Group, Inc. (2004-Present); Secretary, Managers AMG Funds, Managers Trust I and Managers Trust II (2004-Present); Senior Counsel, Vice President and Director of Operational Risk Management and Compliance, Wellington Management Company, LLP (1995-2004); Deputy General Counsel, The Boston Company, Inc. (1993-1995); Associate General Counsel, The Boston Company Advisors, Inc. (1991-1993); Associate, Sullivan & Worcester LLP (1987-1991) |
| |
Donald S. Rumery, 5/29/58 • Treasurer since 1995 | | Senior Vice-President, Managers Investment Group LLC (2005-Present); Director, Finance and Planning, The Managers Funds LLC, (1994-2004); Treasurer and Chief Financial Officer, Managers Distributors, Inc. (2000-Present); Treasurer, Managers AMG Funds (1999-Present); Treasurer, Managers Trust I and Managers Trust II (2000-Present); Secretary; Managers Trust I and Managers Trust II (2000-2004) and Secretary; The Managers Funds (1997-2004) |
25
THIS PAGE INTENTIONALLY LEFT BLANK
THIS PAGE INTENTIONALLY LEFT BLANK
Investment Manager and Administrator
Managers Investment Group LLC
800 Connecticut Avenue
Norwalk, Connecticut 06854-2325
(203) 299-3500 or (800) 835-3879
Distributor
Managers Distributors, Inc.
800 Connecticut Avenue
Norwalk, Connecticut 06854-2325
(203) 299-3500 or (800) 835-3879
Custodian
The Bank of New York
2 Hanson Place, 7th Floor
Brooklyn, New York 11217
Legal Counsel
Ropes & Gray LLP
One International Place
Boston, Massachusetts 02110-2624
Transfer Agent
PFPC, Inc.
Attn: Managers
P.O. Box 9769
Providence, Rhode Island 02940
(800) 548-4539
For ManagersChoice Only
The Managers Funds
PFPC, Inc. c/o Wrap Services
P.O. Box 9847
Providence, Rhode Island 02940
(800) 358-7668

MANAGERSAND MANAGERS AMG EQUITY FUNDS
CAPITAL APPRECIATION
Bramwell Capital Management, Inc.
Essex Investment Management Co., LLC
EMERGING MARKETS EQUITY
Rexiter Capital Management Limited
ESSEX AGGRESSIVE GROWTH
ESSEX LARGE CAP GROWTH
ESSEX SMALL/MICRO CAP GROWTH
Essex Investment Management Co., LLC
FIRST QUADRANT TAX-MANAGED EQUITY
First Quadrant, L.P.
INSTITUTIONAL MICRO-CAP
Kern Capital Management LLC
INTERNATIONAL EQUITY
Bernstein Investment Research and Management
Lazard Asset Management, LLC
Wellington Management Company, LLP
INTERNATIONAL GROWTH
Wellington Management Company, LLP
MICRO-CAP
Kern Capital Management LLC
MID-CAP
Chicago Equity Partners, LLC
REAL ESTATE SECURITIES
Urdang Securities Management, Inc.
RORER LARGE-CAP
Rorer Asset Management, LLC
SMALL CAP
TimesSquare Capital Management, LLC
SMALL COMPANY
Kalmar Investment Advisers, Inc.
SPECIAL EQUITY
Donald Smith & Co., Inc.
Kern Capital Management LLC
Skyline Asset Management, L.P.
Veredus Asset Management LLC
Westport Asset Management, Inc.
STRUCTURED CORE
First Quadrant, L.P.
SYSTEMATIC VALUE
Systematic Financial Management, L.P.
TIMESSQUARE MID CAP GROWTH
TIMESSQUARE SMALL CAP GROWTH
TimesSquare Capital Management, LLC
VALUE
Armstrong Shaw Associates Inc.
Osprey Partners Investment Mgmt., LLC
20
Oak Associates, Ltd.
MANAGERS BALANCED FUNDS
BALANCED
Chicago Equity Partners, LLC
Loomis, Sayles & Company L.P.
GLOBAL
333 Global Advisers*
Armstrong Shaw Associates Inc.
Bernstein Investment Research and Management
First Quadrant, L.P.
Kern Capital Management LLC
Northstar Capital Management, Inc.
Wellington Management Company, LLP
MANAGERS
FIXED INCOME FUNDS
BOND (MANAGERS)
Loomis, Sayles & Company L.P.
BOND (MANAGERS FREMONT)
Pacific Investment Management Co. LLC
CALIFORNIA INTERMEDIATE TAX-FREE
Evergreen Investment Management Co., LLC
FIXED INCOME
Loomis, Sayles & Company L.P.
GLOBAL BOND
Loomis, Sayles & Company L.P.
HIGH YIELD
J.P. Morgan Investment Management Inc.
INTERMEDIATE DURATION GOVERNMENT
Smith Breeden Associates, Inc.
MONEY MARKET (MANAGERS)
JPMorgan Investment Advisors Inc.
MONEY MARKET (FREMONT)
333 Global Advisers*
SHORT DURATION GOVERNMENT
Smith Breeden Associates, Inc.
| * | A division of Managers Investment Group LLC |
This report is prepared for the Fund’s shareholders. It is authorized for distribution to prospective investors only when preceded or accompanied by an effective prospectus. To receive a free copy of the prospectus or Statement of Additional Information, which includes additional information about Fund Trustees, please contact us by calling 800.835.3879. Distributed by Managers Distributors, Inc., member NASD.
A description of the policies and procedures the Fund uses to vote its proxies is available: (i) without charge, upon request, by calling 800.835.3879, or (ii) on the Securities and Exchange Commission’s (SEC) Web site at www.sec.gov. For information regarding the Fund’s proxy voting record for the 12-month period ended June 30, call 800.835.3879 or visit the SEC Web site at www.sec.gov.
The Fund files its complete schedule of portfolio holdings with the SEC for the first and third quarters of each fiscal year on Form N-Q. The Fund’s Forms N-Q are available on the SEC’s website at www.sec.gov. A Fund’s Forms N-Q may be reviewed and copied at the SEC’s Public Reference Room in Washington, DC. Information on the operation of the Public Reference Room may be obtained by calling 800.SEC.0330. To review a complete list of the Fund’s portfolio holdings, or to view the most recent quarterly holdings report, semiannual report, or annual report, please visit www.managersinvest.com.
| | |
| www.managersinvest.com | |  |
ANNUAL REPORT
Managers Funds
December 31, 2005
| • | | Managers Capital Appreciation Fund |
| • | | Managers Small Company Fund |
| • | | Managers International Equity Fund |
| • | | Managers Emerging Markets Fund |
| • | | Managers Global Bond Fund |

Table of Contents
Nothing contained herein is to be considered an offer, sale, or solicitation of an offer to buy shares of The Managers Funds. Such offering is made only by Prospectus, which includes details as to offering price and other material information.
Letter to Shareholders
Dear Fellow Shareholder:
Over the past 12 months the markets have been beset with a number of difficult and unpredictable challenges, including recovery from a massive tsunami in Southeast Asia; continuing strife in the Middle East; numerous terrorist incidents; multiple hurricanes in the Gulf of Mexico; and a significant rise in energy prices. We are fortunate that the financial markets have continued to perform so well under these circumstances.
These events serve to remind us that no one can predict the events that are going to shape the markets in coming months. This reinforces our belief that to invest successfully in an uncertain world you have to diversify your investments and be patient.
Most people think of diversification as holding different types of stocks and bonds, but we believe that there is another type of diversification that receives too little notice, and that is diversification by investment manager and holdings. Simply put, no single approach is going to succeed in every kind of market—some growth stock managers will be successful in a rising market, and some will be more successful in a stagnant market. This can be an issue with some investment firms that adhere to only one method of looking at the markets.
That is a major benefit that we bring you at Managers Funds —since we hire subadvisors (affiliates and non-affiliates) to run our portfolios, we offer you a wide selection of very different investment styles to choose from, sometimes within the same asset class. Invest in multiple Managers Funds, and you can get managers with very different approaches and holdings, helping you reduce the risks created by changing economic conditions and natural and man-made events, such as those of the past 12 months.
We also believe that once you have made your manager selection, you must be patient. On the home page of our Web site at www.managersinvest.com, you will find a short article entitled “Stay Invested for the Long Term” that highlights how important it is to consistently stay in the market rather than trying to time the market. We think the implication is clear: to be successful in the market over the long term, select a wide variety of investments giving you good diversification, invest regularly, and stick with your investment plan no matter what events dominate the news.
We invite you to visit our Web site on an ongoing basis to stay in tune with your Managers Funds holdings. The Web site provides detailed profiles of our subadvisors and their investment styles, as well as quarterly commentary on each Fund. If you have any questions, please do call us at 800.835.3879. Thank you for investing with Managers Funds.
Sincerely,
| | | | |
| | |
 | | | |  |
Peter M. Lebovitz | | | | Thomas G. Hoffman |
President | | | | Executive Vice President |
Managers Funds | | | | Chief Investment Officer |
| | | | Managers Investment Group LLC |
1
About Your Fund’s Expenses
As a shareholder of the Fund, you may incur two types of costs: (1) transaction costs, which may include sales charges (loads) on purchase payments; redemption fees; and exchange fees; and (2) ongoing costs, including management fees; distribution (12b-1) fees; and other Fund expenses. These Funds incur only ongoing costs. This example is intended to help you understand your ongoing costs (in dollars) of investing in the Fund and to compare these costs with the ongoing costs of investing in other mutual funds. The example is based on an investment of $1,000 invested at the beginning of the period and held for the entire period as indicated below.
Actual Expenses
The first line of the table below provides information about the actual account values and actual expenses. You may use the information in this line, together with the amount you invested, to estimate the expenses that you paid over the period. Simply divide your account value by $1,000 (for example, an $8,600 account value divided by $1,000 = 8.6), then multiply the result by the number in the first line under the heading entitled “Expenses Paid During Period” to estimate the expenses you paid on your account during this period.
Hypothetical Example for Comparison Purposes
The second line of the table below provides information about hypothetical account values and hypothetical expenses based on the Fund’s actual expense ratio and an assumed annual rate of return of 5 % before expenses, which is not the Fund’s actual return. The hypothetical account values and expenses may not be used to estimate the actual ending account balance or expenses you paid for the period. You may use this information to compare the ongoing costs of investing in the Fund and other funds by comparing this 5 % hypothetical example with the 5 % hypothetical examples that appear in the shareholder reports of other funds.
Please note that the expenses shown in the table are meant to highlight your ongoing costs only and do not reflect any transactional costs, such as sales charges (loads), redemption fees, or exchange fees. Therefore, the second line of the table is useful in comparing ongoing costs only, and will not help you determine the relative total costs of owning different funds.
| | | | | | | | | |
Six Months Ended December 31, 2005 | | Beginning Account
Value
7/1/2005 | | Ending Account
Value
12/31/2005 | | Expenses Paid
During
Period* |
Managers Value Fund | | | | | | | | | |
Based on Actual Fund Return | | $ | 1,000 | | $ | 1,031 | | $ | 6.09 |
Based on Hypothetical 5% Annual Return | | $ | 1,000 | | $ | 1,019 | | $ | 6.06 |
Managers Capital Appreciation Fund | | | | | | | | | |
Based on Actual Fund Return | | $ | 1,000 | | $ | 1,072 | | $ | 6.74 |
Based on Hypothetical 5% Annual Return | | $ | 1,000 | | $ | 1,019 | | $ | 6.56 |
Managers Small Company Fund | | | | | | | | | |
Based on Actual Fund Return | | $ | 1,000 | | $ | 1,059 | | $ | 7.53 |
Based on Hypothetical 5% Annual Return | | $ | 1,000 | | $ | 1,018 | | $ | 7.38 |
Managers International Equity Fund | | | | | | | | | |
Based on Actual Fund Return | | $ | 1,000 | | $ | 1,187 | | $ | 8.05 |
Based on Hypothetical 5% Annual Return | | $ | 1,000 | | $ | 1,018 | | $ | 7.43 |
Managers Emerging Markets Equity Fund | | | | | | | | | |
Based on Actual Fund Return | | $ | 1,000 | | $ | 1,272 | | $ | 12.08 |
Based on Hypothetical 5% Annual Return | | $ | 1,000 | | $ | 1,017 | | $ | 10.73 |
Managers Bond Fund | | | | | | | | | |
Based on Actual Fund Return | | $ | 1,000 | | $ | 1,010 | | $ | 5.02 |
Based on Hypothetical 5% Annual Return | | $ | 1,000 | | $ | 1,020 | | $ | 5.04 |
Managers Global Bond Fund | | | | | | | | | |
Based on Actual Fund Return | | $ | 1,000 | | $ | 983 | | $ | 5.95 |
Based on Hypothetical 5% Annual Return | | $ | 1,000 | | $ | 1,019 | | $ | 6.06 |
| * | Expenses are equal to the Fund’s annualized expense ratio multiplied by the average account value over the period, multiplied the number of days in the most recent fiscal half-year (184 days), then divided by the number of days in the full fiscal year (365 days). |
You can find more information about your Fund’s expenses, including annual expense ratios for the past fiscal periods, in the Financial Statements section of this report. For additional information on operating expenses and other shareholder costs, please refer to the Fund’s prospectus.
2
Managers Value Fund
Portfolio Manager Comments
The Managers Value Fund’s (the “Fund”) objective is to achieve long-term capital appreciation through a diversified portfolio of equity securities. Income is the Fund’s secondary objective.
The Managers Value Fund invests primarily in common and preferred stocks of U.S. companies. The Fund generally invests in medium and large companies, that is, companies with capitalizations that are within the range of capitalizations of companies represented in the S&P 500 Index, the Fund’s benchmark.
The Portfolio Managers
The Fund employs multiple portfolio managers who specialize in distinct investment approaches. This “intelligence diversification” not only serves to manage risk, but also helps us tap the markets’ full potential by focusing different analytical insights on each class of investment. Fund management strives to achieve this performance and diversification while ensuring that the Fund operates within the framework of its investment objective and principal investment strategies.
Armstrong Shaw Associates
Armstrong Shaw Associates, Inc. (Armstrong Shaw) has a disciplined, absolute value approach to the equity market. Valuations are determined using a private purchase test to determine the price that a company could bring in a sale to a sophisticated buyer, discounted cash flow analysis, and market comparables.
Armstrong Shaw invests in securities where a rigid cash flow or asset value analysis determines that a company’s stock is selling at a substantial discount to its intrinsic value. While the level of the overall stock market or trends in economic factors may affect the timing in which value is recognized, they are not the basis for investment. Rather, Armstrong Shaw has a classic bottom up, company-by-company view of investing.
Armstrong Shaw’s decision making process includes market screening for potential new ideas, fundamental research including financial modeling and management interviews, an in depth investment committee review, and a strict sell discipline. Idea generation begins with screening the universe for businesses that are growing earnings and generating good returns on capital, but have fallen out of favor in the market. Armstrong Shaw’s fundamental research focuses on forward and backward looking financial modeling, including an analysis of the income statement, the balance sheet and cash flow statement. The investment team compares each company to its peers, the broader market, and any transactions that may have taken place in its industry. Finally, Armstrong Shaw interviews the management team. During the investment committee review, the investment team challenges the analysis and ultimately decides if the company meets the criteria to be considered for the portfolio.
The ideal investment exhibits many of the following traits:
| | • | | Defensible business franchise |
| | • | | Ability to generate above average returns |
| | • | | Low risk to technical obsolescence |
| | • | | Low cost provider or niche player |
| | • | | Track record of success |
| | • | | Long term incentive program aligned with the interest of shareholders |
| | • | | History of being good allocators of capital |
| | • | | Low price to asset value |
| | • | | Favorable price versus comparables in the market place |
| | • | | Favorable price versus recent transactions |
| | • | | Valuation check: what have buyers paid per hotel room, per subscriber, per a dollar of sales or earnings or cash flow |
Armstrong Shaw’s goal is to buy good businesses, run by proven, capable managers at prices equal to or less than 70% of intrinsic value. They believe that investing in superior businesses at attractive prices will provide superior returns over time.
3
Managers Value Fund
Portfolio Manager Comments (continued)
Portfolio management:
| | • | | Screens the universe of 5600 NYSE and AMEX issues and the largest NASDAQ stocks for: |
| | • | | Market caps more than $2.5 billion |
| | • | | EPS growth greater than 10% |
| | • | | Relative Price Earning multiple less than the market |
| | • | | Return on equity of 15% or greater |
| | • | | Conducts quantitative analysis by: |
| | • | | Analyzing income statement, balance sheet, and cash flow statement |
| | • | | Comparing the stock prices to cash flows, EPS, sales, etc. |
| | • | | Interviewing management team to get a better sense of strategic and financial plans for the company |
| | • | | Estimating the stock’s intrinsic value and purchase stocks only when they are selling for less than 70% of the estimated intrinsic value |
The investment team will make a sell decision when:
| | • | | A price target is reached |
| | • | | Company’s fundamentals deteriorate |
| | • | | A better opportunity emerges |
Additionally, a drop in price of 25% from average cost triggers an automatic review process for potential sale.
Osprey Partners Investment Management
As traditional value investors, John Liang and the investment team at Osprey Partners Investment Management, LLC (Osprey) seek to identify undervalued stocks with low price to earnings and price to cash flow ratios. At the same time, Osprey’s investment team focuses its in-depth bottom-up analysis to identify fundamentally strong, well-managed companies.
Osprey invests in stocks with low price-to-earnings and price-to-cash flow ratios while using in-depth bottom-up analysis to identify financially strong, well-managed companies. Osprey expects to generate returns from dividend income as well as capital appreciation as a result of improvements to the valuations of the stocks such as, among other things, increases in the price to earnings ratio.
The ideal company exhibits many of the following traits:
| | • | | Low debt to capital ratios |
Portfolio management:
| | • | | Screens the investment universe for companies with a market cap above $1.5 billion and a P/E ratio at least 20% less than the P/E ratio of the S&P 500: |
| | • | | Determines the strength and risks of each company’s business with: |
| | • | | Balance sheet and income statement |
| | • | | Earnings quality and sustainability |
The investment team will make a sell decision when:
| | • | | Stock appreciates to a predetermined price target |
| | • | | A better opportunity emerges |
Additionally, a 20% drop relative to the market prompts an in-depth review and positions exceeding 6% of the portfolio are scaled back. The investment team tends to have an investment time horizon of 2 years or more.
The Year in Review
For the year 2005, the Managers Value Fund gained 5.53% compared with a gain of 4.91% for the S&P 500. In the U.S., the broad market (using for example, the Russell 3000, Wilshire 5000, and S&P 500 indices) rose about 6% for the year.
Mid-cap and small-cap stocks rose more than large-caps for the year as measured by the S&P indices. From a style standpoint, the S&P 500/Citigroup Value Index outperformed its counterpart for the sixth consecutive year. Low price-to-earnings stocks were leaders throughout the year, but much of this also coincides with the strong energy sector that has a lower P/E.
4
Managers Value Fund
Portfolio Manager Comments
Despite strong corporate earnings, 2005 got off to a rocky start. The markets were down about 4% after the first four months of the year, but one sector continued to rise. The energy sector was the story of 2005, up over 30%. As oil and gas prices continued to rise throughout the summer, oil rose to over $69 per barrel during the summer, finishing at $61, while gold ended the year at $517/oz. The higher fuel and commodity prices combined with devastating hurricanes to the Gulf Coast region, and continued increases in short-term interest rates could not slow down the economy. GDP continued to grow and core CPI inflation was kept to low levels. Markets rallied in the fourth quarter as the industrials and materials sectors climbed and energy stocks declined. While the holiday shopping season was far from a boom, neither was it the bust that some analysts had anticipated due to higher energy prices.
The Fund benefited from its energy holdings, keeping pace with the market. Only six names were among the energy holdings and only half ended the year in the portfolio; ConocoPhillips (+37%), Devon Energy (+62%) and Chevron (+12%). Financials, particularly insurers, were great contributors to the Fund. ACE and Chubb had gains over 27%, while a large position in AIG was beneficial after the company hit a twelve month low in late-April. Technology was another additive sector. While being significantly underweight the index, the Fund held some winners in Nokia and Hewlett-Packard.
The consumer discretionary sector was the largest drag for the Fund. Lear (-52%), an automotive supplier, was hurt by the challenging environment within the automotive industry. Media holdings Time Warner, Comcast and Gannett were also big decliners for 2005. The good news from this sector came from some of the retailers. Office Depot, Claire’s Stores and Pacific Sunwear of California were some of the winners.
Looking Forward
The Fund’s subadvisors had the following comments as we progress into 2006:
Armstrong Shaw: For 2006 we have an optimistic outlook for the markets as a whole and more specifically our portfolio. Here are some of our thoughts:
The economic backdrop for 2006 looks quite favorable as corporate profit expansion is expected to continue. Consensus calls for 8% revenue growth and 11% operating profit growth for the S&P 500. The Fed is expected to stop raising interest rates some time in the first half of 2006. The consensus is that the federal funds rate will be at 4.75% by the end of June, up from the current 4.25%, and stay there through the year. Current forecasts of moderating inflation is good news. Last year’s surge in energy prices worried the markets and policy makers, but those worries have given way to an outlook of better price stability. Valuation is attractive, with the S&P 500 trading at the lowest multiple in nine years on a bottom up basis.
Given this backdrop, let’s look at how we have positioned our portfolio. Three major themes in the portfolio are worth noting.
First, we feel 2006 will be the year that financial stocks break out of their two year slump. Financials account for almost one-third of our portfolio, and while performing well operationally, have been a lagging group as worries of a flat yield curve and increased inflation have weighted on valuations. The end of the Fed’s tightening campaign should pave the way to meaningful multiple expansion. Our particular focus is on diversified financials, insurance and the brokers.
Second, our overweight in media stocks, with significant focus on cable, should reward investors in 2006 after a long wait. The sector has been out of favor as the new media stars such as Google and Yahoo have taken center stage. Traditional media however is far from dead.
Third, and finally, we are playing the decomglomertization of corporate America. Mergers and acquisition activity was at a five year high in 2005 and should continue. Vast pools of institutional capital have been amassed to take companies private. It makes sense to be in the way of this trend. As a larger cap value investor there are many examples of companies trying to unlock imbedded intrinsic value by selling off pieces of their business. With many willing buyers, the timing seems ideal.
Osprey: For 2006, bottom-up estimates by stock analysts put earnings growth for the S&P 500 index at 13% while market strategists are pegging growth to be just 7% on a macro basis. While these predications typically do not coincide at the beginning of each year, the uncharacteristically wide spread may be due to the treatment of mandated options expensing scheduled to go into effect in 2006. If we use a simplistic formula of expected real GDP growth (3.4%) + expected inflation (2.6%) + an estimated margin benefit of productivity gains (1-2%) + the benefit of producing goods offshore (not measured in GDP but contributing to profits and margins) to arrive at a base earnings growth rate, we get a number that is likely toward the low end of the 7-13% range, approximately 8%. Using this 8% estimated level of earnings growth, the S&P 500 index is trading at 15.8 times expected earnings. We view this as slightly undervalued given the prospects for the better than expected economic growth and productivity gains, continued low inflation, and the probable end to tightening cycle later in 2006.
Looking ahead to 2006, we believe that energy and housing prices will be the two main wildcards for the markets with both being a tough call as to the direction and the extent of the moves. More important to us, however, is that we believe merger and acquisition (M&A) activity will be rampant as the large pools of private equity monies raised in 2005 must be put to work and the public companies look to acquisitions to maintain earnings growth. While our research process does not specifically seek out acquisition candidates, it does lead us to companies with the financial profile most sought after by would-be acquirers; low leverage, strong cash flow and leading products or services.
5
Managers Value Fund
Portfolio Manager Comments (continued)
Cumulative Total Return Performance
Value Fund’s cumulative total return is based on the daily change in net asset value (NAV), and assumes that all dividends and distributions were reinvested. The S&P 500 Index is a capitalization weighted index of 500 stocks designed to measure performance of the broad domestic economy through changes in the aggregate market value of those 500 stocks representing all major industries. Unlike the Fund, the S&P 500 Index is unmanaged, is not available for investment, and does not incur expenses. The Index assumes reinvestment of dividends. This chart compares a hypothetical $10,000 investment made in Value Fund on December 31, 1995, to a $10,000 investment made in the S&P 500 for the same time period. The chart is not intended to imply any future performance of the Fund. The graph and chart do not reflect the deduction of taxes that a shareholder would pay on a Fund distribution or redemption of shares. Total Returns would have lower had certain expenses not been reduced.
The table below shows the average annual total returns for the Value Fund and the S&P 500 Index since December 31,1995 through December 31, 2005.
| | | | | | | | | |
Average Annual Total Returns: | | 1 Year | | | 5 Years | | | 10 Years | |
Value Fund | | 5.53 | % | | 3.73 | % | | 8.61 | % |
S&P 500 Index | | 4.91 | % | | 0.54 | % | | 9.07 | % |
The performance data shown represents past performance. Past performance is not a guarantee of future results. Current performance may be lower or higher than the performance data quoted. The investment return and the principal value of an investment will fluctuate so that an investor’s shares, when redeemed, may be worth more or less than their original cost. For performance information through the most recent month end please call (800) 835-3879 or visit our Web site at www.managersinvest.com.
The table below displays a full breakdown of the sector allocation of the Fund as well as the top ten positions as of December 31, 2005.
| | | |
Top Ten Holdings (out of 57 securities) | | % Fund | |
Citigroup, Inc. * | | 4.5 | % |
American International Group, Inc. | | 4.4 | |
E.I. du Pont de Nemours & Co., Inc. | | 3.5 | |
Pfizer, Inc.* | | 3.5 | |
ChevronTexaco Corp. | | 3.0 | |
Gannett Co., Inc. | | 2.7 | |
MBNA Corp.* | | 2.6 | |
Merrill Lynch & Co., Inc. | | 2.6 | |
Verizon Communications, Inc. | | 2.5 | |
Nokia Corp., Sponsored ADR | | 2.4 | |
| | | |
Top Ten as a Group | | 31.7 | % |
| | | |
| * | Top Ten Holding at June 30, 2005 |
| | | | | | |
Portfolio Breakdown | | % Fund | | | S&P 500 | |
Financials | | 31.7 | % | | 31.6 | % |
Consumer Discretionary | | 23.4 | | | 22.4 | |
Industrials | | 10.3 | | | 11.2 | |
Materials | | 7.7 | | | 7.5 | |
Energy | | 7.0 | | | 7.0 | |
Health Care | | 6.9 | | | 6.9 | |
Information Technology | | 4.7 | | | 4.6 | |
Telecommunication Services | | 3.9 | | | 3.9 | |
Utilities | | 1.5 | | | 1.5 | |
Consumer Staples | | 1.3 | | | 1.3 | |
Other Assets and Liabilities | | 1.6 | | | 2.1 | |
| | | | | | |
| | 100 | % | | 100 | % |
| | | | | | |
Any sectors, industries, or securities discussed should not be perceived as investment recommendations. Any securities discussed may no longer be held in the account’s portfolio. It should not be assumed that any of the securities transactions discussed were or will prove to be profitable, or that the investment recommendations we make in the future will be profitable.
6
Managers Value Fund
Schedule of Portfolio Investments
December 31, 2005
| | | | | | | |
Security Description | | Shares | | | Value | |
Common Stocks - 98.4% | | | | | | | |
Consumer Discretionary - 23.4% | | | | | | | |
Claire’s Stores, Inc. | | 52,400 | 2 | | $ | 1,531,128 | |
Comcast Corp., Special Class A* | | 97,100 | | | | 2,494,499 | |
Dollar Tree Stores, Inc.* | | 86,800 | 2 | | | 2,077,992 | |
Gannett Co., Inc. | | 56,050 | 2 | | | 3,394,949 | |
Gap, Inc., The | | 94,000 | | | | 1,658,160 | |
Hughes Supply, Inc. | | 67,000 | 2 | | | 2,401,950 | |
Jones Apparel Group, Inc. | | 54,000 | 2 | | | 1,658,880 | |
Lear Corp. | | 72,000 | 2 | | | 2,049,120 | |
Mattel, Inc. | | 99,700 | 2 | | | 1,577,254 | |
Office Depot, Inc.* | | 41,570 | | | | 1,305,298 | |
Pacific Sunwear of California, Inc.* | | 76,800 | 2 | | | 1,913,856 | |
Pulte Homes, Inc. | | 32,020 | 2 | | | 1,260,307 | |
Rent-A-Center, Inc.* | | 60,000 | | | | 1,131,600 | |
Ruby Tuesday, Inc. | | 59,500 | 2 | | | 1,540,455 | |
Time Warner Co., Inc. | | 138,400 | | | | 2,413,696 | |
Yum! Brands, Inc. | | 16,880 | | | | 791,334 | |
Total Consumer Discretionary | | | | | | 29,200,478 | |
Consumer Staples - 1.3% | | | | | | | |
CVS Corp. | | 63,400 | | | | 1,675,028 | |
Energy - 7.0% | | | | | | | |
ChevronTexaco Corp. | | 64,900 | | | | 3,684,373 | |
ConocoPhillips Co. | | 49,930 | | | | 2,904,927 | |
Devon Energy Corp. | | 33,900 | | | | 2,120,106 | |
Total Energy | | | | | | 8,709,406 | |
Financials - 31.7% | | | | | | | |
ACE, Ltd. | | 33,050 | | | | 1,766,192 | |
Allstate Corp., The | | 24,000 | | | | 1,297,680 | |
AMBAC Financial Group, Inc. | | 17,500 | 2 | | | 1,348,550 | |
American International Group, Inc. | | 80,620 | | | | 5,500,703 | |
Bank of America Corp. | | 52,900 | | | | 2,441,335 | |
Chubb Corp. | | 14,830 | 2 | | | 1,448,150 | |
Citigroup, Inc. | | 116,041 | | | | 5,631,469 | |
Fannie Mae Co. | | 56,400 | | | | 2,752,884 | |
Goldman Sachs Group, Inc. | | 15,600 | | | | 1,992,276 | |
MBIA, Inc. | | 43,100 | 2 | | | 2,592,896 | |
MBNA Corp. | | 119,600 | | | | 3,247,140 | |
Merrill Lynch & Co., Inc. | | 47,600 | | | | 3,223,948 | |
Morgan Stanley Co. | | 34,020 | | | | 1,930,295 | |
North Fork Bancorporation, Inc. | | 44,800 | 2 | | | 1,225,728 | |
Washington Mutual, Inc. | | 49,800 | | | | 2,166,300 | |
XL Capital, Ltd. | | 13,300 | | | | 896,154 | |
Total Financials | | | | | | 39,461,700 | |
Health Care - 6.9% | | | | | | | |
Abbott Laboratories Co. | | 40,700 | | | | 1,604,801 | |
HCA, Inc. | | 29,340 | 2 | | | 1,481,670 | |
Pfizer, Inc. | | 184,400 | | | | 4,300,208 | |
WellPoint, Inc.* | | 15,590 | | | | 1,243,926 | |
Total Health Care | | | | | | 8,630,605 | |
Industrials - 10.3% | | | | | | | |
Career Education Corp.* | | 36,200 | 2 | | | 1,220,664 | |
Cendant Corp. | | 131,570 | | | | 2,269,582 | |
Emerson Electric Co. | | 22,700 | | | | 1,695,690 | |
General Electric Co. | | 47,775 | | | | 1,674,514 | |
Honeywell International, Inc. | | 32,400 | | | | 1,206,900 | |
Pitney Bowes, Inc. | | 38,100 | | | | 1,609,725 | |
Tyco International, Ltd. | | 52,3002 | | | | 1,509,378 | |
United Technologies Corp. | | 29,200 | | | | 1,632,572 | |
Total Industrials | | | | | | 12,819,025 | |
Information Technology - 4.7% | | | | | | | |
First Data Corp. | | 28,690 | | | | 1,233,957 | |
Nokia Corp., Sponsored ADR* | | 162,000 | | | | 2,964,600 | |
Xerox Corp.* | | 108,3102 | | | | 1,586,742 | |
Total Information Technology | | | | | | 5,785,299 | |
Materials-7.7% | | | | | | | |
E.I. du Pont de Nemours & Co., Inc. | | 103,0002 | | | | 4,377,500 | |
Pactiv Corp.* | | 125,400 | | | | 2,758,800 | |
PPG Industries, Inc. | | 43,000 | | | | 2,489,700 | |
Total Materials | | | | | | 9,626,000 | |
Telecommunication Services - 3.9% | | | | | | | |
Sprint Nextel | | 77,3172 | | | | 1,806,125 | |
Verizon Communications, Inc. | | 103,000 | | | | 3,102,360 | |
Total Telecommunication Services | | | | | | 4,908,485 | |
Utility - 1.5% | | | | | | | |
Exelon Corp. | | 34,9002 | | | | 1,854,586 | |
Total Common Stocks
(cost $106,358,289) | | | | | | 122,670,612 | |
Short-Term Investments - 26.0%1 | | | | | | | |
Other Investment Companies - 25.0% | | | | | | | |
Bank of New York Institutional Cash Reserves Fund, 4.30%3 | | 28,546,823 | | | | 28,546,823 | |
JPMorgan Prime Money Market Fund, Institutional Class Shares, 4.14% | | 2,656,648 | | | | 2,656,648 | |
Total Other Investment Companies | | | | | | 31,203,471 | |
Other Short-Term Investments - 1.0%3 | | | | | | | |
Goldman Sachs Promissory Notes, 4.33% | | 1,251,514 | | | | 1,251,514 | |
Total Short-Term Investments
(cost $32,454,985) | | | | | | 32,454,985 | |
Total Investments - 124.4%
(cost $138,813,274) | | | | | | 155,125,597 | |
Other Assets, less Liabilities - (24.4)% | | | | | | (30,482,466 | ) |
Net Assets - 100.0% | | | | | $ | 124,643,131 | |
The accompanying notes are an integral part of these financial statements.
7
Managers Capital Appreciation Fund
Portfolio Manager Comments
The Managers Capital Appreciation Fund’s (the “Fund”) objective is to achieve long-term capital appreciation through a diversified portfolio of equity securities. Income is the Fund’s secondary objective.
The Managers Capital Appreciation Fund invests primarily in common and preferred stocks of U.S. companies. The Fund generally invests in medium and large companies with capitalizations that are within the range of capitalizations of companies represented in the S&P 500 Index, the Fund’s benchmark.
The Portfolio Managers
The Fund employs multiple portfolio managers who specialize in distinct investment approaches. This “intelligence diversification” not only serves to manage risk, but also helps us tap the markets’ full potential by focusing different analytical insights on each class of investment. Managers strives to achieve this performance and diversification while ensuring that the Fund operates within the framework of its stated mission and restrictions.
Bramwell Capital Management, Inc.
Bramwell Capital Management, Inc. (“Bramwell”), led by Elizabeth R. Bramwell, CFA, seeks long-term capital growth through investment in companies that are positioned to realize above-average long-term unit and earnings growth. Bramwell’s focus is on companies that have new products and services and that are positioned to benefit from the long-term payoff on research as well as plant and market development and expansion.
Bramwell is an active equity manager that builds portfolios stock by stock. Bramwell makes investment decisions based on fundamental research, bottom-up earnings forecasts within a macroeconomic and political framework, and company valuations relative to their respective industries, projected future growth rates and the overall equity market. Among the variables considered are the leadership position of the company, new products and markets, sensitivity to macroeconomic factors, e.g., inflation, interest, currency and tax rates, potential for accelerating earnings growth and improving returns on sales and equity.
The ideal investment exhibits many of the following traits:
| | • | | Valuations are attractive relative to projected future growth rates |
| | • | | Above average long-term earnings growth |
| | • | | New products and services |
| | • | | Market development and expansion |
Portfolio management:
| | • | | Employs a fundamental, bottom-up strategy by investing in companies that are positioned to realize above-average long-term unit and earnings growth |
| | • | | Focuses on companies that have new products and services and are positioned to benefit from the long-term pay off on capital investments and expanding product markets |
Portfolio management will make a sell decision when:
| | • | | Company fundamentals deteriorate |
| | • | | Company profitability declines or sales and earnings growth decelerate |
| | • | | There are changes in the macroeconomic outlook, i.e., changes in interest and inflation rates |
| | • | | Company market valuations are believed to be excessive relative to projected future growth |
| | • | | A better opportunity emerges |
Essex Investment Management, Inc.
Essex Investment Management, Inc.’s (“Essex”) investment philosophy is based on the principle that revenue growth, future profitability, and cash flow drive a company’s price performance. The firm has maintained this philosophy since its inception in 1976. Through an understanding of the factors that determine a company’s growth and profitability, Essex is better able to anticipate inflection points in a company’s performance before they are fully reflected in the stock price.
The portfolio management process at Essex combines bottom-up stock selection with top-down secular trend analysis. The bottom-up process begins with Essex’s team of industry-expert research analysts. The team is charged with identifying companies with high quality, sustainable growth at attractive valuations. Each analyst focuses on understanding the long-term growth of his or her respective industry, and the specific outlook of each stock within that industry in terms of sustainable revenue growth, margin trends, and return trends.
The ideal investment exhibits many of the following traits:
| | • | | Dynamic Growth Companies |
| | • | | New/emerging products or services |
| | • | | Powerful agent of change |
| | • | | Rapid and/or accelerating growth |
| | • | | Improving financial returns |
8
Managers Capital Appreciation Fund
Portfolio Manager Comments
| | • | | Sustainable Growth Companies |
| | • | | Sustainable competitive advantage |
| | • | | Consistent financial performance |
| | • | | Attractive financial returns |
| | • | | Portfolio managers make all buy and sell decisions |
| | • | | Maintain the highest conviction portfolio of 40-55 stocks |
| | • | | Portfolio sector weights may vary significantly from the benchmark (up to 15 percentage points overweight) |
| | • | | Maximum stock weighting of 5% |
Manage risk by understanding portfolio level exposures to external variables and monitoring individual company-specific fundamentals.
Essex portfolio managers execute all buy and sell decisions. A stock will be sold when:
| | • | | Investment thesis has played out and stock is no longer undervalued |
| | • | | Anticipation of investment thesis failure |
| | • | | Better relative investment opportunity |
| | • | | Loss of confidence in management |
The Year in Review
For the twelve months ended December 31, 2005, the Managers Capital Appreciation Fund gained 3.85% compared with a gain of 4.91% for the S&P 500. In the U.S., the broad market (using for example, the Russell 3000, Wilshire 5000, and S&P 500 indices) rose about 6% for the year.
Mid-cap and small-cap stocks rose more than large-caps for the year as measured by the S&P indices. From a style standpoint, the S&P 500/Citigroup Value Index outperformed its counterpart for the sixth consecutive year. Low price-to-earnings stocks were leaders throughout the year, but much of this also coincides with the strong energy sector that has a lower P/E.
Despite strong corporate earnings, 2005 got off to a rocky start. The markets were down about 4% after the first four months of the year, but one sector continued to rise. The energy sector was the story of 2005, up over 30%. As oil and gas prices continued to rise throughout the summer, oil rose to over $69 per barrel during the summer, finishing at $61, while gold ended the year at $517/oz. The higher fuel and commodity prices combined with devastating hurricanes to the Gulf Coast region, and continued increases in short-term interest rates could not slow down the economy. GDP continued to grow and core CPI inflation was kept to low levels. Markets rallied in the fourth quarter as the industrials and materials sectors climbed and energy stocks declined. While the holiday shopping season was far from a boom, neither was it the bust that some analysts had anticipated due to higher energy prices.
Energy was the story for 2005, and was no different for this Fund. While holding some oil producers at the low end of the P/E spectrum, the Fund saw large gains from the growthier oilfield service companies like Schlumberger (+47%) and Haliburton (+59%). Coal was another benefit of rising commodity prices and companies like Peabody Energy (+105%) and Arch Coal (+125%) saw record profits throughout the year.
Solid stock selection in the healthcare industry, which was the largest sector in the Fund, was additive during the year. Biotech companies were among the winners with Gilead Sciences, Genentech and Celgene all returning over 50% for the year. Pharmaceuticals also showed strength behind Teva Pharmaceuticals and Roche Holdings, while avoiding Pfizer which was liquidated during the first quarter.
Technology is another large sector within the Fund. This sector was among the bottom performers all year, and the large weight hurt the Fund. Big technology names like EMC, Dell, IBM and Cisco were among the losers for 2005. The strength in this area has been the semiconductor industry, which is seeing great demand for wireless applications. The consumer discretionary sector was another drag on the Fund. Media holdings such as News Corporation, CBS (formerly Viacom), and Walt Disney were all decliners.
Looking Forward
Heading into 2006, Bramwell remains optimistic about the economy. With an outlook that the economy will grow in the 2.5-3% range for the year, Bramwell also expects the employment number to improve and inflation to remain in check due to increased supply. As the standard of living continues to improve in emerging markets, Bramwell likes companies that benefit from this trend, including those with global brands and internationally sourced sales and earnings.
While Essex expects consumer spending to slow down this year, the team anticipates strong investment spending from the corporate sector. While Essex believes there may be a modest slowdown in the pace of economic growth, it also looks for the Fed to end the tightening cycle that began in mid-2004. Essex anticipates this pause in rising rates should allow valuations to expand and has positioned its portfolio to take advantage of expanding price-earnings ratios.
9
Managers Capital Appreciation Fund
Portfolio Manager Comments (continued)
Cumulative Total Return Performance
Capital Appreciation’s cumulative total return is based on the daily change in net asset value (NAV), and assumes that all dividends and distributions were reinvested. The S&P 500 Index is a capitalization weighted index of 500 stocks designed to measure performance of the broad domestic economy through changes in the aggregate market value of those 500 stocks representing all major industries. Unlike the Fund, the S&P 500 Index is unmanaged, is not available for investment, and does not incur expenses. The Index assumes reinvestment of dividends. This chart compares a hypothetical $10,000 investment made in Capital Appreciation Fund on December 31, 1995, to a $10,000 investment made in the S&P 500 for the same time period. The chart is not intended to imply any future performance of the Fund. The graph and chart do not reflect the deduction of taxes that a shareholder would pay on a Fund distribution or redemption of shares. Total Returns would have lower had certain expenses not been reduced.
The table below shows the average annual total returns for Capital Appreciation and the S&P 500 Index since December 31, 1995 through December 31, 2005.
| | | | | | | | | |
Average Annual Total Returns: | | 1 Year | | | 5 Years | | | 10 Years | |
Capital Appreciation Fund | | 3.85 | % | | (8.26 | )% | | 7.54 | % |
S&P 500 Index | | 4.91 | % | | 0.54 | % | | 9.07 | % |
The performance data shown represents past performance. Past performance is not a guarantee of future results. Current performance may be lower or higher than the performance data quoted. The investment return and the principal value of an investment will fluctuate so that an investor’s shares, when redeemed, may be worth more or less than their original cost. For performance information through the most recent month end please call (800) 835-3879 or visit our Web site at www.managersinvest.com.
The table below displays a full breakdown of the sector allocation of the Fund as well as the top ten positions as of December 31, 2005.
| | | |
Top Ten Holdings (out of 117 securities) | | % Fund | |
General Electric Co.* | | 4.1 | % |
Autodesk, Inc. | | 2.8 | |
Genentech, Inc.* | | 2.7 | |
Medtronic, Inc. | | 2.6 | |
Microsoft Corp.* | | 2.4 | |
QUALCOMM, Inc. | | 2.3 | |
Schlumberger, Ltd.* | | 2.3 | |
UnitedHealth Group, Inc. | | 2.3 | |
Gilead Sciences, Inc. | | 2.0 | |
Novartis AG, Sponsored ADR | | 1.9 | |
| | | |
Top Ten as a Group | | 25.4 | % |
| | | |
| * | Top Ten Holding at June 30, 2005 |
| | | | | | |
Portfolio Breakdown | | % Fund | | | S&P 500 | |
Health Care | | 27.2 | % | | 27.1 | % |
Information Technology | | 19.4 | | | 19.0 | |
Industrials | | 12.3 | | | 12.2 | |
Consumer Discretionary | | 10.9 | | | 10.9 | |
Energy | | 10.1 | | | 11.3 | |
Financials | | 9.4 | | | 9.4 | |
Consumer Staples | | 4.4 | | | 4.4 | |
Materials | | 4.1 | | | 2.9 | |
Other Assets and Liabilities | | 2.2 | | | 2.4 | |
Bonds and Other Assets | | 0.0 | | | 0.4 | |
| | | | | | |
| | 100 | % | | 100 | % |
| | | | | | |
Any sectors, industries, or securities discussed should not be perceived as investment recommendations. Any securities discussed may no longer be held in the account’s portfolio. It should not be assumed that any of the securities transactions discussed were or will prove to be profitable, or that the investment recommendations we make in the future will be profitable.
10
Managers Capital Appreciation Fund
Schedule of Portfolio Investments
December 31, 2005
| | | | | | |
Security Description | | Shares | | | Value |
Common Stocks - 97.8% | | | | | | |
Consumer Discretionary - 10.9% | | | | | | |
Bed Bath & Beyond, Inc.* | | 17,700 | | | $ | 639,855 |
Carnival Corp. | | 22,600 | 2 | | | 1,208,422 |
Cheesecake Factory, Inc., The* | | 18,000 | 2 | | | 673,020 |
Getty Images, Inc.* | | 8,242 | 2 | | | 735,763 |
Harrah’s Entertainment, Inc. | | 11,300 | | | | 805,577 |
J.C. Penney Co., Inc., Holding Co. | | 20,000 | | | | 1,112,000 |
Lowe’s Co., Inc. | | 13,000 | 2 | | | 866,580 |
McDonald’s Corp. | | 20,000 | | | | 674,400 |
News Corp., Inc., Class A | | 44,200 | | | | 687,310 |
Ross Stores, Inc. | | 17,856 | | | | 516,038 |
Staples, Inc. | | 34,350 | | | | 780,089 |
Target Corp. | | 10,000 | | | | 549,700 |
Tiffany & Co. | | 15,000 | 2 | | | 574,350 |
Walt Disney Co., The* | | 28,500 | | | | 683,145 |
XM Satellite Radio Holdings, Inc.* | | 33,800 | 2 | | | 922,064 |
Total Consumer Discretionary | | | | | | 11,428,313 |
Consumer Staples - 4.4% | | | | | | |
Colgate-Palmolive Co. | | 10,000 | | | | 548,500 |
Hershey Foods Corp. | | 10,000 | 2 | | | 552,500 |
Kellogg Co. | | 12,000 | | | | 518,640 |
PepsiCo, Inc. | | 10,000 | | | | 590,800 |
Procter & Gamble Co. | | 26,768 | 2 | | | 1,549,332 |
Walgreen Co. | | 20,000 | 2 | | | 885,200 |
Total Consumer Staples | | | | | | 4,644,972 |
Energy - 10.1% | | | | | | |
Chesapeake Energy Corp. | | 15,300 | 2 | | | 485,469 |
ConocoPhillips Co. | | 10,000 | | | | 581,800 |
Devon Energy Corp. | | 10,000 | | | | 625,400 |
ENSCO International, Inc. | | 21,700 | 2 | | | 962,395 |
EOG Resources, Inc. | | 16,000 | 2 | | | 1,173,920 |
Exxon Mobil Corp. | | 10,000 | | | | 561,700 |
Halliburton Co. | | 15,000 | 2 | | | 929,400 |
Noble Corp. | | 11,500 | 2 | | | 811,210 |
Patterson-UTI Energy, Inc. | | 10,000 | | | | 329,500 |
Petroleo Brasileiro S.A., Sponsored ADR | | 5,000 | | | | 356,350 |
Schlumberger, Ltd. | | 24,900 | 2 | | | 2,419,035 |
Weatherford International, Ltd.* | | 38,000 | | | | 1,375,600 |
Total Energy | | | | | | 10,611,779 |
Financials - 9.4% | | | | | | |
American Express Co. | | 16,500 | | | | 849,090 |
American International Group, Inc. | | 21,300 | | | | 1,453,299 |
Blackrock, Inc. | | 9,300 | 2 | | | 1,008,864 |
CB Richard Ellis Group, Inc.* | | 13,741 | 2 | | | 808,658 |
Chicago Mercantile Exchange Holdings, Inc. | | 1,800 | | | | 661,482 |
CIT Group, Inc. | | 17,000 | | | | 880,260 |
Citigroup, Inc. | | 18,000 | | | | 873,540 |
Goldman Sachs Group, Inc. | | 3,700 | | | | 472,527 |
Merrill Lynch & Co., Inc. | | 19,900 | | | | 1,347,827 |
SLM Corp. | | 17,000 | 2 | | | 936,530 |
Wells Fargo & Co. | | 10,000 | | | | 628,300 |
Total Financials | | | | | | 9,920,377 |
Health Care - 27.2% | | | | | | |
Amgen, Inc.* | | 19,629 | | | | 1,547,943 |
Cardinal Health, Inc. | | 18,897 | | | | 1,299,169 |
Caremark Rx, Inc.* | | 28,064 | | | | 1,453,435 |
Celgene Corp.* | | 10,100 | 2 | | | 654,480 |
Cephalon, Inc.* | | 9,052 | 2 | | | 586,026 |
Genentech, Inc.* | | 30,600 | 2 | | | 2,830,499 |
Genzyme Corp.* | | 13,400 | | | | 948,452 |
Gilead Sciences, Inc.* | | 40,500 | | | | 2,131,515 |
Kyphon, Inc.* | | 10,000 | 2 | | | 408,300 |
McKesson Corp. | | 24,271 | | | | 1,252,141 |
Medtronic, Inc. | | 47,107 | | | | 2,711,950 |
MGI Pharmaceuticals, Inc.* | | 39,200 | 2 | | | 672,672 |
Novartis AG, Sponsored ADR | | 38,490 | 2 | | | 2,019,955 |
Roche Holdings, Ltd., Sponsored ADR | | 15,000 | | | | 1,122,767 |
Shire Pharmaceuticals PLC | | 27,259 | 2 | | | 1,057,377 |
St. Jude Medical, Inc.* | | 16,000 | | | | 803,200 |
Stryker Corp. | | 30,000 | 2 | | | 1,332,900 |
Teva Pharmaceutical Industries, Ltd., Sponsored ADR | | 38,200 | 2 | | | 1,642,982 |
UnitedHealth Group, Inc. | | 38,300 | | | | 2,379,962 |
WellPoint, Inc.* | | 10,000 | | | | 797,900 |
Zimmer Holdings, Inc.* | | 13,000 | 2 | | | 876,720 |
Total Health Care | | | | | | 28,530,345 |
Industrials - 12.3% | | | | | | |
3M Co. | | 7,000 | | | | 542,500 |
Canadian Pacific Railway Ltd. | | 18,000 | 2 | | | 755,100 |
Caterpillar, Inc. | | 19,000 | 2 | | | 1,097,630 |
Emerson Electric Co. | | 19,000 | | | | 1,419,300 |
General Electric Co. | | 123,800 | | | | 4,339,190 |
Illinois Tool Works, Inc. | | 9,500 | | | | 835,905 |
Jacobs Engineering Group, Inc.* | | 10,000 | 2 | | | 678,700 |
PACCAR, Inc. | | 8,000 | | | | 553,840 |
Robert Half International, Inc. | | 30,000 | 2 | | | 1,136,700 |
United Parcel Service, Inc., Class B | | 7,500 | | | | 563,625 |
UTI Worldwide, Inc. | | 10,100 | 2 | | | 937,684 |
Total Industrials | | | | | | 12,860,174 |
Information Technology - 19.4% | | | | | | |
Applied Materials, Inc. | | 26,900 | 2 | | | 482,586 |
Autodesk, Inc. | | 67,293 | 2 | | | 2,890,234 |
Automatic Data Processing, Inc. | | 19,000 | | | | 871,910 |
Cisco Systems, Inc.* | | 45,000 | | | | 770,400 |
Corning, Inc.* | | 42,500 | | | | 835,550 |
Electronic Arts, Inc.* | | 9,800 | 2 | | | 512,638 |
EMC Corp.* | | 45,000 | | | | 612,900 |
Google, Inc.* | | 2,465 | | | | 1,022,630 |
Intel Corp. | | 35,000 | | | | 873,600 |
Linear Technology Corp. | | 15,000 | 2 | | | 541,050 |
The accompanying notes are an integral part of these financial statements.
11
Managers Capital Appreciation Fund
Schedule of Portfolio Investments (continued)
| | | | | | | | |
Security Description | | Shares | | | Value | |
Information Technology (continued) | | | | | | | | |
Marvell Technology Group Ltd.* | | | 21,600 | | | $ | 1,211,544 | |
Maxim Integrated Products, Inc. | | | 22,600 | 2 | | | 819,024 | |
Microsoft Corp. | | | 95,900 | | | | 2,507,785 | |
Molex, Inc. | | | 17,500 | 2 | | | 430,325 | |
Nokia Corp., Sponsored ADR* | | | 35,000 | | | | 640,500 | |
Paychex, Inc. | | | 20,000 | 2 | | | 762,400 | |
QUALCOMM, Inc. | | | 56,500 | | | | 2,434,020 | |
SAP Aktiengesellschaft Systems, Sponsored ADR* | | | 25,000 | | | | 1,126,750 | |
Yahoo!, Inc.* | | | 25,600 | 2 | | | 1,003,008 | |
Total Information Technology | | | | | | | 20,348,854 | |
Materials - 4.1% | | | | | | | | |
Arch Coal, Inc. | | | 8,000 | 2 | | | 636,000 | |
BHP Billiton Ltd. | | | 17,000 | | | | 568,140 | |
Commercial Metals Co. | | | 12,000 | 2 | | | 450,480 | |
Inco, Ltd. | | | 10,000 | 2 | | | 435,700 | |
Peabody Energy Corp. | | | 7,000 | | | | 576,940 | |
Phelps Dodge Corp. | | | 2,000 | | | | 287,740 | |
Praxair, Inc. | | | 25,000 | | | | 1,324,000 | |
Total Materials | | | | | | | 4,279,000 | |
Total Common Stocks
(cost $88,688,715) | | | | | | | 102,623,814 | |
| | |
| | | Principal
Amount | | | | |
U.S. Government Obligations - 2.0%8 | | | | | | | | |
United States Treasury Bonds - 1.3% | | | | | | | | |
U.S. Treasury Bonds, 7.125%, 02/15/23 | | $ | 550,706 | | | | 550,706 | |
U.S. Treasury Bonds, 8.500%, 02/15/20 | | | 17,661 | | | | 25,313 | |
U.S. Treasury Bonds, 8.750%, 08/15/20 | | | 104,216 | | | | 153,174 | |
U.S. Treasury Inflation Indexed Bonds, 1.875%, 07/15/13 | | | 547,135 | | | | 592,173 | |
Total United States Treasury Bonds | | | | | | | 1,321,366 | |
United States Treasury Notes - 0.7% | | | | | | | | |
U.S. Treasury Inflation Indexed Notes, 0.875%, 04/15/10 | | | 306,113 | | | | 307,266 | |
U.S. Treasury Notes, 4.000%, 06/15/09 | | | 322,758 | | | | 320,169 | |
U.S. Treasury Notes, 7.250%, 05/15/06 | | | 100,076 | | | | 123,806 | |
Total United States Treasury Notes | | | | | | | 751,241 | |
Total U.S. Government Obligations
(cost $2,072,607) | | | | | | | 2,072,607 | |
| | |
| | | Shares | | | | |
Short-Term Investments - 27.9%1 | | | | | | | | |
Other Investment Companies - 26.7% | | | | | | | | |
Bank of New York Institutional Cash Reserves Fund, 4.30%3 | | | 25,439,041 | | | | 25,439,041 | |
JPMorgan Prime Money Market Fund, Institutional Class Shares, 4.14% | | | 2,632,686 | | | | 2,632,686 | |
Total Other Investment Companies | | | | | | | 28,071,727 | |
Other Short-Term Investments - 1.2%3 | | | | | | | | |
Goldman Sachs | | | | | | | | |
Promissory Notes, 4.33% | | | 1,251,364 | | | | 1,251,364 | |
Total Short-Term Investments
(cost $29,323,091) | | | | | | | 29,323,091 | |
Total Investments - 127.7%
(cost $120,084,413) | | | | | | | 134,019,512 | |
Other Assets, less Liabilities - (27.7)% | | | | | | | (29,024,726 | ) |
Net Assets - 100.0% | | | | | | $ | 104,877,713 | |
The accompanying notes are an integral part of these financial statements.
12
Managers Small Company Fund
Portfolio Manager Comments
The Managers Small Company Fund’s (the “Fund”) objective is to achieve long-term capital appreciation by investing in equity securities of small companies.
The Managers Small Company Fund invests at least 80% of its assets in small companies, and at least 65% of its total assets in common and preferred stocks of small companies with the potential for long-term capital appreciation. The term “small companies” refers to companies with capitalizations that at the time of purchase are less than $2.5 billion. The Fund may retain securities that it already has purchased even if the specific company outgrows the Fund’s capitalization limits. The Russell 2000 Index is the Fund’s benchmark.
The Fund currently employs a subadvisor, Kalmar Investment Advisers (“Kalmar”), to manage the assets of the Fund. Kalmar practices a “Growth-with-Value” approach to small company investing whereby it seeks to identify high quality growing businesses before they are widely discovered by other institutional investors. Kalmar’s team believes there is a low risk/high reward anomaly offered by the equity market in stocks of such top-notch smaller companies that, for a variety of reasons, have not made the radar screen of most typical growth investors. Because these companies are relatively “invisible” institutionally, they can be purchased at prices which are inefficiently valued to undervalued and yet offer strong growth potential as well. This is the crux of their “Growth-with-Value” investment style.
The investment team at Kalmar generates investment ideas through different screening methodologies and several sources, thus employing elements of both “top-down” and “bottom-up” analysis in the initial identification process. The members of the investment management team all have strong research backgrounds and are committed to disciplined in-depth, hands-on fundamental analysis. Top-down thinking is used to identify strategic themes and growth areas to prospect for individual “Growth-with-Value” candidates.
The most intensive research, however, is dedicated to bottom-up fundamental analysis. Kalmar looks for such criteria as proven and sustainable double-digit growth in revenue and EPS together with a stock that is reasonably to cheaply priced relative to EPS, cash flow, revenues, and enterprise value. Kalmar looks for dynamic businesses that are easily understood, run by equity owners they can count on, and buyable at valuations that they expect to rise. The team’s decision threshold for new holdings is a potential return of 50% in approximately two years. This appreciation is expected to come from two sources: compounding business value plus upward revaluation as greater investor discovery unfolds.
The ideal company exhibits many of the following traits:
| | • | | Market capitalization of $50 million up to $2.5 billion at the time of purchase |
| | • | | Dynamic growth business that Kalmar understands better |
| | • | | Run by committed managements that deliver |
| | • | | Buyable at inefficient valuations that should rise |
| | • | | Strong improving financials with conservative accounting |
| | • | | Reasonable / cheap valuations, with special positive attributes |
Portfolio Management:
| | • | | Diversified portfolio in terms of sector, security and market capitalization |
| | • | | Conscious mix of “growth character” companies, from higher growth “Steady Eddies” bought inefficiently valued through to Positive Surprise / Emerging Growth situations |
The investment team will make a sell decision when:
| | • | | They see a change in the fundamentals of a company |
| | • | | A better opportunity emerges |
| | • | | Price or fundamental expectations have been met |
| | • | | “Peel the Onion” to capture re-valuation upward |
The Year in Review
Over the 12 months ended December 31, 2005, the Fund returned 4.63% compared to a gain of 4.55% for the Russell 2000 Index and 4.15% for the Russell 2000 Growth Index. Broad markets continued to appreciate with large capitalization stocks outperforming small capitalization stocks (as measure by the Russell Indexes) for the first time since 1998. From a style perspective, small cap value stocks narrowly outperformed small growth marking five of the past six years in which value has outperformed growth in the small cap universe. Sector analysis reveals that seven out of ten sectors finished in positive territory during 2005 with only consumer discretionary, information technology, and utilities giving up ground. One of the macro themes across the board for the year was the continued strength of energy. The sector finished the year up 48% with points mid-way through the third quarter whereby the sector was testing 60% gains. Exposure to, or lack thereof in some cases, weighed heavily on the relative performance of fund managers throughout the year.
The year got off to a slow start with the Russell 2000 declining 5.3% following a strong finish to the 2004 year. Technology was the biggest mover to the downside, giving back over 11%. Given the growth tilt of the Fund and its sizable overweight to the tech sector, this was clearly a detriment to returns. Fortunately, Kalmar’s “all weather” approach buffered
13
Managers Small Company Fund
Portfolio Manager Comments (continued)
the Fund from the challenges of the small cap market and allowed it to outperform on a relative basis mainly through stock selection in healthcare and industrials. Martek Biosciences, in particular, contributed 42 basis points to relative return on 14% price appreciation during the opening quarter of the year. Also of note, Kalmar took the opportunity to “re-green” its oil and gas exposure. This turned out to be an opportunistic move as Kalmar was able to “peel the onion” or in some cases liquidate already profitable positions while adding smaller companies earlier on in their development cycle and capable of faster reserve growth.
The second and third quarters are best noted for a sixteen-week period spanning from the beginning of May through the end of July in which the Fund was up over 14%. All sectors of the Index were up double digits headlined by a 30% gain in energy related companies. While the Fund wasn’t quite able to keep pace with the explosive growth in aggregate, it wasn’t far behind. Consumer discretionary, technology, and energy were the key drivers of the Fund contributing a combined 307 basis points to relative return. A notable driver of returns during this stretch was Ultra Petroleum. The oil & gas concern contributed 95 basis points to relative return and was up 45% on a 2.4% position. Also contributing to the Fund’s appreciation during the period was its tactical overweight to the tech sector. Despite trailing returns by 80 basis points, the 7% overweight more than made up for it. The only factor to really challenge returns was a lack of exposure to the strong financial sector.
The final quarter of 2005 started off strong before tapering into a range bound December with no real indication for the New Year. Returns within the benchmark Russell 2000 were lead by uninspiring 3% gains in materials, technology, and industrials. While the Fund outpaced materials and industrial related companies, it trailed the technology sector returns by roughly 340 basis points. On the positive side, consumer discretionary holdings contributed 190 basis points to relative return on an 8 percentage point overweight. Specifically, strength within the services and retail industries added exceptional value. Coldwater Creek and Tractor Supply topped off strong years with gains of 21% and 16%, respectively, for the quarter. As Coldwater Creek has continued to experience growth, it has also received more interest in the analyst community. This story ties in nicely with Kalmar’s belief that if it can seek out “under the radar” companies with strong growth potential, they will ultimately benefit from increased coverage as the companies begin to flourish. Last, the Fund’s energy exposure held up quite well, gaining 1.2% while those of the Index gave up 6.8% during the fourth quarter. This has been a bright spot for Kalmar all year, which subsequently took profits by trimming several positions over the course of the final three months.
Looking Forward
Heading into 2006, the Fund’s emphasis remains on the IT, consumer discretionary and industrial sectors, and continues to reflect Kalmar’s strategy of pursuing more aggressive ideas by initiating smaller positions in companies with predictable businesses. Kalmar’s considerable underweight to financials is, and has been, most directly a function of simply not finding as many exciting “Growth with Value” ideas in this sector relative to better risk/reward opportunities found elsewhere. Kalmar’s comments as we progress into the New Year:
We expect a number of the drags that retarded the equity market in 2005 to fade in 2006. This should allow strong profitability and decent earnings growth, attractive valuations, conducive investor sentiment, on-going low inflation, and favorable liquidity to combine with an end to Fed interest rate hikes, moderately improving valuation multiples, shareholder-friendly corporate cash deployment and rising merger and acquisition activity to produce a rewarding year for US stocks. But after the low market volatility of the last two years, it will probably rise, and no doubt there will be other surprises, keeping the perennial investment challenge demanding.
As always, Kalmar’s strategy will not be to invest against a particular “Big Picture” scenario, but against a range of more probable economic outcomes — such as the one outlined above. We will seek with creative research to own companies that actually deliver strong growth under the forthcoming circumstances, not simply ostensibly “growthy” stocks. We will maintain our focus on better growth businesses because these add superior intrinsic value to themselves and, wherever possible, also buy them with unrecognized business positives as well. This combination of growth and inefficient valuation can lead to “All Weather” results — both better returns and lower risk — which is Kalmar’s “Growth-with- Value” wealth building objective.
Cumulative Total Return Performance
Small Company’s cumulative total return is based on the daily change in net asset value (NAV), and assumes that all distributions were reinvested. The Russell 2000 Index is comprised of the smallest 2000 companies in the Russell 3000 Index and is widely regarded in the industry as the premier measure of small cap stock performance. The Russell 3000 Index is composed of 3000 of the largest U.S. companies, as determined by market capitalization which represents approximately 98% of the investable U.S. equity market. Unlike the Fund, the Russell 2000 Index is unmanaged, is not available for investment, and does not incur expenses. This chart compares a hypothetical $10,000 investment made in Small Company on June 19, 2000, to a $10,000 investment made in the Russell 2000 Index for the same time period. The graph and chart do not reflect the deduction of taxes that a shareholder would pay on a Fund distribution or redemption of shares. Past performance is not indicative of future results. Total returns would have been lower had certain expenses not been reduced.
14
Managers Small Company Fund
Portfolio Manager Comments (continued)
The table below shows the average annual total returns for Small Company and the Russell 2000 Index since inception through December 31, 2005.
| | | | | | |
Average Annual Total Returns: | | 1 Year | | | Since Inception * | |
Small Company | | 4.63 | % | | 1.47 | % |
Russell 2000 Index | | 4.55 | % | | 6.02 | % |
| * | Commencement of operations was June 19, 2000. |
The performance data shown represents past performance. Past performance is not a guarantee of future results. Current performance may be lower or higher than the performance data quoted. The investment return and the principal value of an investment will fluctuate so that an investor’s shares, when redeemed, may be worth more or less than their original cost. For performance information through the most recent month end please call (800) 835-3879 or visit our Web site at www.managersinvest.com.
The Fund is subject to risks associated with investments in small capitalization companies, such as erratic earnings patterns, competitive conditions, limited earnings history, and a reliance on one or a limited number of products.
The tables following the performance chart display a full breakdown of the sector allocation of the Fund as well as the top ten positions as of December 31, 2005.
| | | |
Top Ten Holdings (out of 93 securities) | | % Fund | |
Ultra Petroleum Corp.* | | 2.5 | % |
Coldwater Creek, Inc.* | | 2.3 | |
Tractor Supply Co. | | 1.7 | |
Covance, Inc.* | | 1.7 | |
Insight Enterprises, Inc.* | | 1.7 | |
Respironics, Inc.* | | 1.7 | |
UTI Worldwide, Inc. | | 1.7 | |
Avid Technology, Inc. | | 1.6 | |
Red Robin Gourmet Burgers, Inc.* | | 1.6 | |
Avocent Corp. | | 1.6 | |
| | | |
Top Ten as a Group | | 18.1 | % |
| | | |
| * | Top Ten Holding at June 30, 2005 |
| | | | | | |
Portfolio Breakdown | | % Fund | | | Russell 2000 | |
Information Technology | | 27.2 | % | | 29.0 | % |
Consumer Discretionary | | 20.6 | | | 23.1 | |
Industrials | | 20.0 | | | 13.3 | |
Health Care | | 11.8 | | | 13.2 | |
Energy | | 8.9 | | | 8.9 | |
Consumer Staples | | 2.8 | | | 2.8 | |
Materials | | 1.0 | | | 1.0 | |
Financials | | 0.4 | | | 0.4 | |
Other Assets and Liabilities | | 7.3 | | | 8.3 | |
| | | | | | |
| | 100 | % | | 100 | % |
| | | | | | |
Any sectors, industries, or securities discussed should not be perceived as investment recommendations. Any securities discussed may no longer be held in the account’s portfolio. It should not be assumed that any of the securities transactions discussed were or will prove to be profitable, or that the investment recommendations we make in the future will be profitable.
15
Managers Small Company Fund
Schedule of Portfolio Investments
December 31, 2005
| | | | | | |
Security Description | | Shares | | | Value |
Common Stocks - 92.7% | | | | | | |
Consumer Discretionary - 20.6% | | | | | | |
1-800-FLOWERS.COM, Inc.* | | 13,100 | | | $ | 84,102 |
BJ’s Restaurants, Inc.* | | 8,350 | 2 | | | 190,881 |
Carter’s, Inc.* | | 6,025 | | | | 354,571 |
Coldwater Creek, Inc.* | | 27,437 | 2 | | | 837,651 |
Cost Plus, Inc.* | | 8,175 | 2 | | | 140,201 |
Fred’s, Inc. | | 16,275 | | | | 264,794 |
GameStop Corp.* | | 13,075 | 2 | | | 416,047 |
Gentex Corp. | | 13,950 | | | | 272,025 |
Getty Images, Inc.* | | 3,050 | 2 | | | 272,274 |
Harman International Industries, Inc. | | 1,775 | | | | 173,684 |
Insight Enterprises, Inc.* | | 31,575 | | | | 619,186 |
MarineMax, Inc.* | | 12,600 | 2 | | | 397,782 |
Michaels Stores, Inc. | | 9,200 | | | | 325,404 |
O’Reilly Automotive, Inc.* | | 7,400 | 2 | | | 236,874 |
Penn National Gaming, Inc.* | | 11,150 | | | | 367,393 |
Rare Hospitality International, Inc.* | | 12,800 | | | | 388,992 |
Red Robin Gourmet Burgers, Inc.* | | 11,600 | 2 | | | 591,136 |
Ruby Tuesday, Inc. | | 22,150 | 2 | | | 573,464 |
Service Corp. International | | 59,250 | | | | 484,665 |
Tractor Supply Co.* | | 11,750 | 2 | | | 622,044 |
Total Consumer Discretionary | | | | | | 7,613,170 |
Consumer Staples - 2.8% | | | | | | |
Central European Distribution Corp.* | | 7,351 | 2 | | | 295,069 |
Elizabeth Arden, Inc.* | | 15,525 | 2 | | | 311,432 |
Performance Food Group Co.* | | 15,575 | | | | 441,862 |
Total Consumer Staples | | | | | | 1,048,363 |
Energy - 8.9% | | | | | | |
Core Laboratories N.V.* | | 7,650 | 2 | | | 285,804 |
Delta Petroleum Corp.* | | 13,250 | 2 | | | 288,453 |
Duvernay Oil Corp. | | 5,325 | | | | 202,616 |
Niko Resources, Ltd. | | 9,325 | | | | 442,938 |
Parallel Petroleum Corp.* | | 21,725 | 2 | | | 369,542 |
Tidewater, Inc. | | 8,025 | 2 | | | 356,792 |
Ultra Petroleum Corp.* | | 16,775 | | | | 936,044 |
Union Drilling, Inc.* | | 7,775 | | | | 112,971 |
Whiting Petroleum Corp.* | | 7,750 | | | | 310,000 |
Total Energy | | | | | | 3,305,160 |
Financials - 0.4% | | | | | | |
Boston Private Financial | | | | | | |
Holdings, Inc. | | 4,475 | 2 | | | 136,130 |
Health Care - 11.8% | | | | | | |
Connetics Corp.* | | 20,750 | 2 | | | 299,838 |
Covance, Inc.* | | 12,800 | | | | 621,439 |
Martek Biosciences Corp.* | | 4,550 | 2 | | | 111,976 |
PSS World Medical, Inc.* | | 29,8752 | | | | 443,345 |
Resmed, Inc.* | | 13,650 | | | | 522,932 |
Respironics, Inc.* | | 16,625 | | | | 616,288 |
Salix Pharmaceuticals, Ltd.* | | 23,750 | 2 | | | 417,525 |
Sonosite, Inc.* | | 15,300 | | | | 535,653 |
The Cooper Companies, Inc. | | 5,300 | | | | 271,890 |
United Surgical Partners International, Inc.* | | 15,825 | 2 | | | 508,774 |
Total Health Care | | | | | | 4,349,660 |
Industrials - 20.0% | | | | | | |
Actuant Corp., Class A | | 6,635 | 2 | | | 370,233 |
Aeroflex, Inc. * | | 37,300 | | | | 400,975 |
Carlisle Co., Inc. | | 3,700 | | | | 255,855 |
Chicago Bridge & Iron Co. N.V. | | 16,650 | | | | 419,747 |
ChoicePoint, Inc.* | | 10,050 | | | | 447,326 |
CoStar Group, Inc.* | | 7,025 | 2 | | | 303,269 |
DeVry, Inc.* | | 24,075 | 2 | | | 481,500 |
ElkCorp. | | 9,925 | | | | 334,076 |
Hewitt Associates, Inc., Class A* | | 11,900 | 2 | | | 333,319 |
Intermagnetics General Corp.* | | 12,075 | 2 | | | 385,193 |
Laureate Education, Inc. * | | 10,950 | | | | 574,984 |
Mobile Mini, Inc.* | | 10,750 | | | | 509,550 |
MSC Industrial Direct Co., Class A | | 13,750 | 2 | | | 553,025 |
Navigant Consulting, Inc.* | | 13,800 | | | | 303,324 |
NCI Building Systems, Inc.* | | 9,050 | 2 | | | 384,444 |
Pentair, Inc. | | 10,300 | 2 | | | 355,556 |
Providence Service Corp.* | | 5,625 | | | | 161,944 |
Si International, Inc. * | | 7,500 | | | | 229,275 |
UTI Worldwide, Inc. | | 6,575 | | | | 610,422 |
Total Industrials | | | | | | 7,414,017 |
Information Technology - 27.2% | | | | | | |
Acxiom Corp. | | 12,750 | 2 | | | 293,250 |
Alliance Data Systems Corp.* | | 8,350 | 2 | | | 297,260 |
ATMI, Inc.* | | 19,350 | 2 | | | 541,219 |
Avid Technology, Inc.* | | 10,825 | 2 | | | 592,776 |
Avocent Corp.* | | 21,600 | | | | 587,303 |
Benchmark Electronics, Inc.* | | 14,025 | 2 | | | 471,661 |
Ceridian Corp.* | | 18,650 | | | | 463,453 |
Digitas, Inc.* | | 26,025 | | | | 325,833 |
Diodes, Inc.* | | 10,125 | | | | 314,381 |
Fair Isaac Corp. | | 6,293 | | | | 277,962 |
FARO Technologies, Inc.* | | 4,650 | 2 | | | 93,000 |
FEI Co.* | | 11,050 | 2 | | | 211,829 |
International Rectifier Corp.* | | 7,425 | 2 | | | 236,858 |
MAXIMUS, Inc. | | 13,700 | | | | 502,652 |
MPS Group, Inc.* | | 23,575 | | | | 322,270 |
NCI, Inc., Class A* | | 11,750 | | | | 161,328 |
NICE Systems, Ltd. * | | 5,600 | | | | 269,696 |
OPNET Technologies, Inc.* | | 19,750 | | | | 181,503 |
Photon Dynamics, Inc.* | | 10,250 | 2 | | | 187,370 |
Polycom, Inc.* | | 19,450 | | | | 297,585 |
Progress Software Corp.* | | 13,850 | | | | 393,063 |
Radisys Corp.* | | 18,375 | 2 | | | 318,623 |
RightNow Technologies, Inc.* | | 10,050 | | | | 185,523 |
Rogers Corp.* | | 8,625 | 2 | | | 337,928 |
SRA International, Inc.* | | 11,925 | | | | 364,190 |
Symmetricom, Inc.* | | 21,125 | 2 | | | 178,929 |
Tekelec* | | 36,275 | 2 | | | 504,222 |
The accompanying notes are an integral part of these financial statements.
16
Managers Small Company Fund
Schedule of Portfolio Investments (continued)
| | | | | | | |
Security Description | | Shares | | | Value | |
Information Technology (continued) | | | | | | | |
Tessera Technologies, Inc.* | | 9,150 | | | $ | 236,528 | |
UNOVA, Inc.* | | 14,950 | 2 | | | 505,309 | |
Valueclick, Inc.* | | 22,750 | 2 | | | 412,003 | |
Total Information Technology | | | | | | 10,065,507 | |
Materials - 1.0% | | | | | | | |
Albemarle Corp. | | 9,275 | | | | 355,696 | |
Total Common Stocks
(cost $26,363,684) | | | | | | 34,287,703 | |
Other Investment Companies - 35. 9%1 | | | | | | | |
Bank of New York Institutional Cash Reserves Fund, 4.30%3 | | 9,249,211 | | | | 9,249,211 | |
JPMorgan Prime Money Market Fund Institutional Class Shares, 4.14% | | 4,011,129 | | | | 4,011,129 | |
Total Other Investment Companies
(cost $13,260,340) | | | | | | 13,260,340 | |
Total Investments -128.6%
(cost $39,624,024) | | | | | | 47,548,043 | |
Other Assets, less Liabilities - (28.6)% | | | | | | (10,554,682 | ) |
Net Assets -100.0% | | | | | $ | 36,993,361 | |
The accompanying notes are an integral part of these financial statements.
17
Managers International Equity Fund
Portfolio Manager Comments
The Managers International Equity Fund’s (the “Fund”) objective is to achieve long-term capital appreciation. Income is the Fund’s secondary objective.
The Managers International Equity Fund ordinarily invests at least 80% of assets in equity securities, and 65% of the assets in common and preferred stocks of companies domiciled outside the United States. The Fund intends to diversify investments among countries and normally to hold securities of non-U.S. companies in not less than three countries. Investments may be made in companies in developed as well as developing countries. The Fund may invest in fixed-income securities denominated in both foreign and domestic currencies and may engage in currency hedging strategies. The Fund may invest in companies of any size. The MSCI EAFE Index is the benchmark for the Fund.
The Portfolio Managers
The Fund employs multiple portfolio managers who specialize in distinct investment approaches. This “intelligence diversification” not only serves to manage risk, but also helps us tap the markets’ full potential by focusing different analytical insights on each class of investment. Fund management strives to achieve this performance and diversification while ensuring that the Fund operates within the framework of its investment objective and principal investment strategies.
Bernstein Investment Research and Management
Bernstein’s approach to investing is value-based and research driven. The thesis of Bernstein is that human nature leads investors to buy and sell financial assets based on an overreaction to near-term events as they confuse temporary or cyclical characteristics with structural change. Thus, short-term problems, which cause profits and stocks to decline, can create buying opportunities, as investors underestimate the potential for corrective strategies to restore long-term earnings power. The investment team, led by Kevin Simms, attempts to exploit this by using research to separate fact from emotion.
The primary driver of Bernstein’s performance is research-driven security selection. They begin with a broad universe of all companies within the countries of the MSCI All Country World Index ex-U.S. universe with a market capitalization greater than $750 million. The investment team screens this universe with a proprietary return model in order to identify the companies with the most attractive value attributes. The model derives an expected return for each company within the universe by assessing companies both from a global industry-based perspective and from a country-based standpoint, based on such factors as price to cash earnings, price to book, return on equity, and price momentum.
The ideal company exhibits many of the following traits:
| | • | | Sound future business prospects |
Portfolio Construction
| | • | | Initial investable universe is comprised of all companies within the countries of the MSCI All Country World Index ex-U.S. universe with a market capitalization greater than $750 million. |
| | • | | Investment team screens this universe with a proprietary return model in order to identify the companies with the most attractive value attribute |
| | • | | The model derives an expected return for each company within the universe by assessing companies both from a global industry-based perspective and from a country-based standpoint |
| | • | | Factors include price to cash earnings, price to book, return on equity, and price momentum |
| | • | | Analysts perform extensive research, focusing on the most attractively valued stocks |
| | • | | They then build detailed spreadsheets of historical and projected balance sheet and income statement information in order to estimate: |
| | • | | Normalized earnings power |
| | • | | Cash flow and asset values for each company for the next five years |
| | • | | Perform simulations to see the potential impact of changes in various financial statement components |
| | • | | Analysts present their estimates and ratings for each security to the Research Review Committee of the Investment Policy Group (IPG) |
| | • | | The Committee challenges the analyst’s assumptions and conclusions to ensure they are sound. |
The Portfolio
| | • | | Typically holds 35-70 stocks |
| | • | | Initial stock weightings are 0.5 - 3.5% |
The following factors influence the sell decision when:
| | • | | A stock has achieved Bernstein’s forecasted target of fair value |
| | • | | A change in the long-term earnings forecast reduces the price target to current market levels |
Lazard Investment Management, LLC
Portfolio manager, William (Willy) Holzer believes that there is a single global economy and marketplace within
18
Managers International Equity Fund
Portfolio Manager Comments (continued)
which everything is connected. Within this single market it is important to distinguish between three types of companies: Domestic companies are those which produce, sell and raise capital all in their home country; International companies are those which produce at home, but sell their products and raise capital anywhere in the world; Global companies are those which produce, sell and raise capital anywhere. Willy will invest in any of these types in order to capitalize on a theme; however, he prefers global companies which generally have the flexibility and resources to exploit global trends.
Willy Holzer can be described as a “top-down” thematic investor, whose themes are based on “bottom-up” observations and company analysis. He views the world as a single global economic unit as opposed to a collection of separate country economies. Willy focuses his efforts by first analyzing the connections within the global economy, and from this analysis develops global investment themes. These themes target the segments of the global economy that he believes are most likely to provide attractive long term investment returns, and which also represent an asymmetric investment opportunity in the investor’s favor.
The ideal company exhibits many of the following traits:
| | • | | Attractive fundamentals |
| | • | | Strong company management |
Portfolio Construction
| | • | | Portfolio manager leverages stock ideas and research from top-down “themes” based on “bottom-up” observations and company analysis. |
| | • | | Constructs portfolio around about 10 investment themes to diversify opportunity sets and provide risk benefits. |
| | • | | Portfolio heavily weights large capitalization, multi-managed companies |
| | • | | Concentrated in the developed markets |
| | • | | May have operations or distribution in the emerging markets. |
The Portfolio
| | • | | Portfolio typically holds 70-90 stocks |
| | • | | Initial stock weightings are 1.0 - 1.5% |
| | • | | Relatively low turnover in the 30% to 40% annual range |
The following factors influence the sell decision when:
| | • | | Exceeds price expectations |
| | • | | Underperforms global universe |
Wellington Management Company, LLP
Jean-Marc Berteaux and Andrew S. Offit’s investment philosophy is built on the beliefs that industry is the dominant competitive factor for companies, that companies can dominate industries on a global basis, and that expectations about companies, specifically earnings, drive stock prices. The focus is to identify industry leaders where their earnings forecasts are ahead of market expectations, and where they’ve identified the key drivers for the earnings.
The initial investable universe for the investment team at Wellington Management Company LLP (“Wellington Management”) is comprised of companies in the MSCI EAFE Index with market capitalizations greater than US$1 billion. These companies are researched by Wellington Management’s global industry analysts who perform intensive ongoing fundamental research. Fundamental research consists of comprehensive company meetings, earnings modeling, and valuation analysis. The focus of this research is to update an ongoing assessment of management, current business challenges and aggregate industry trends. Thorough analysis is done in preparation for and following company contacts to ensure that “the numbers support the story”: that the strategy and challenges outlined by management are coming through in financial results.
The ideal company exhibits many of the following traits:
| | • | | Identified earnings drivers |
| | • | | Above consensus earnings growth expectations |
| | • | | Multiple expansion potential |
| | • | | Reasonable valuation levels |
Portfolio Construction
| | • | | The portfolio typically holds 50-80 stocks |
| | • | | Cash levels are maintained at less than 10% of assets |
| | • | | Maximum of 10% is committed to any single holding |
| | • | | Active sector allocations are entirely built from stock selection |
19
Managers International Equity Fund
Portfolio Manager Comments (continued)
| | • | | Country allocation is an implicit result of stock selection |
| | • | | Some consideration is given to ensuring country diversification |
| | • | | Emerging market exposure maximum of 15% |
The portfolio management team may sell an investment when:
| | • | | They see deteriorating earnings drivers or company fundamentals |
| | • | | Trend of earnings growth decelerates |
| | • | | They see limited upside potential left in the stock price |
The Year in Review
For the year 2005, the Managers International Equity Fund returned 15.30% vs. 13.54% for the MSCI EAFE Index (EAFE).
It was a stellar year for foreign developed equity markets, but 2005 proved to be an even better year for emerging markets. While EAFE was up 13.54%, the MSCI Emerging Markets Index returned an astounding 34.54%. The subadvisors to the Fund recognized the compelling opportunities with the emerging markets space throughout the year, and exposure to stocks in countries such as South Korea, Brazil, South Africa, and Mexico contributed positively to the Fund’s overall performance.
From a sector standpoint, the materials sector within EAFE performed extremely well, advancing 28% during the year. On the other hand, the telecommunications sector lagged all other sectors, falling by 12% during 2005. From a relative performance standpoint, the Fund’s overweight to materials throughout the year was therefore additive to performance, and an underweight to telecommunications was also beneficial. The main driver behind the Fund’s performance, however, was strong stock selection, particularly in the financials sector. Strong stock selection within energy and consumer discretionary also proved beneficial. Within financials, Japanese firm Orix turned in very strong returns of 87% for the year, buoyed by strong earnings. Korean-based Kookmin bank, up 93% in 2005, was also a top contributor to Fund performance. Additionally, Lazard’s Japanese real estate theme paid off handsomely; Mitsubishi Estate Company (+77%), Mitsui Fudosan Company (+67%), and Sumitomo Realty & Development Company (+67%) were all among the top contributors to absolute Fund performance.
2005 was a very strong year for energy stocks. The Fund’s subadvisors were able to take advantage of this strength, maintaining an overweight in this sector for much of the year while energy stocks soared, then trimming back on exposure to the sector as energy stocks started to fall off during the fourth quarter. Canadian energy stocks EnCana and Petro-Canada were strong contributors to absolute and relative performance, as both were up over 50% during the year. Petroleo Brasileiro also performed quite well, up 78% for the year. Heading into 2006, the Fund is slightly underweight the energy sector, as the subadvisors trimmed exposure to energy stocks in the fourth quarter based on a combination of factors including high valuations and concerns regarding fundamentals.
Within consumer discretionary, Continental AG performed well, up 39% for the year 2005 as the international automotive supplier continued to boost its sales and earnings. Additionally, while Hyundai Motor Company and Kia Motors both represented small portions of the portfolio, their respective 80% and 149% returns for the year were certainly beneficial to Fund performance.
While stock selection overall was a positive for the Fund, one stock in particular took a substantial hit to performance during the first quarter and wound up costing the Fund over 100 basis points in relative and absolute performance. That stock was Elan. Growth-oriented subadvisor Wellington held a large position in Elan in the first quarter of 2005. Wellington bought the stock based on its belief that Elan’s multiple sclerosis drug Tysabri would lead to strong revenue growth. The drug had successfully completed years of clinical trials and had been approved for use by the FDA. In February of 2005, Elan voluntarily pulled Tysabri from the market after a patient taking the drug died and another developed a serious disease of the central nervous system, causing the stock to fall over 70% in one day. Wellington subsequently sold its entire position in Elan. On a positive note, however, health care company Teva Pharmaceutical Industries contributed positively to Fund performance; the stock rose 45% during 2005 and 29% during the fourth quarter alone as it posted strong earnings and received final FDA approval for Azithromycin, its generic version of Pfizer’s antibiotic Zithromax.
Looking Forward
Heading into 2006, the Fund’s subadvisors are still finding compelling opportunities in Canadian and emerging markets stocks. Conversely, the Fund’s largest relative country underweights are to the United Kingdom and Australia. From a sector perspective, the Fund’s largest absolute weighting is in financials. The Fund’s allocation to financials has increased slightly over the past several months, driven in part by subadvisor Wellington finding compelling growth opportunities within that sector, particularly among non-U.S. investment banks.
Cumulative Total Return Performance
International Equity’s cumulative total return is based on the daily change in net asset value (NAV), and assumes that all distributions were reinvested. The Morgan Stanley Capital International Europe, Australia, Far East (MSCI EAFE)
20
Managers International Equity Fund
Portfolio Manager Comments (continued)
Index (“EAFE”) is composed of over 1,000 large, publicly traded stocks in 22 developed non-U.S. markets. Among the countries included are Australia, France, Germany, Italy, Japan, Singapore, Spain and the United Kingdom. Unlike the Fund, the EAFE is unmanaged, is not available for investment, and does not incur expenses. The Index assumes reinvestment of dividends. This chart compares a hypothetical $10,000 investment made in International Equity on December 31,1995, to a $10,000 investment made in the EAFE for the same time period. The chart is not intended to imply any future performance of the Fund. The graph and chart do not reflect the deduction of taxes that a shareholder would pay on a Fund distribution or redemption of shares. Total returns would have been lower had certain expenses not been reduced.
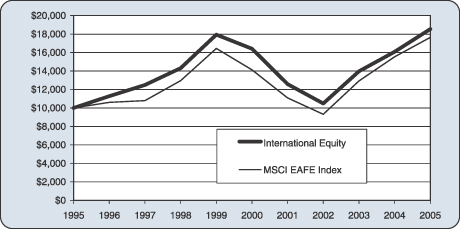
The table below shows the average annual total returns for International Equity and the EAFE since December 31,1995 through December 31, 2005.
| | | | | | | | | |
Average Annual Total Returns: | | 1 Year | | | 5 Years | | | 10 Years | |
International Equity Fund | | 15.30 | % | | 2.46 | % | | 6.37 | % |
MSCI EAFE Index | | 13.54 | % | | 4.55 | % | | 5.84 | % |
The performance data shown represents past performance. Past performance is not a guarantee of future results. Current performance may be lower or higher than the performance data quoted. The investment return and the principal value of an investment will fluctuate so that an investor’s shares, when redeemed, may be worth more or less than their original cost. For performance information through the most recent month end please call (800) 835-3879 or visit our Web site at www.managersinvest.com.
Investments in foreign securities are subject to additional risks such as changing market conditions, economic and political instability, and currency exchange rate fluctuations.
The table below displays a full breakdown of the sector allocation of the Fund as well as the top ten positions as of December 31, 2005.
| | | |
Top Ten Holdings (out of 196 securities) | | % Fund | |
ORIX Corp. | | 1.7 | % |
Credit Suisse Group | | 1.7 | |
Muenchener Rueckversicherungs AG | | 1.6 | |
ING Groep NV * | | 1.5 | |
BP PLC * | | 1.5 | |
Ericsson (LM), Class B | | 1.3 | |
Standard Chartered, PLC. | | 1.3 | |
Mitsubishi Estate Co., Ltd. | | 1.3 | |
Seven & I Holdings Co., Ltd. | | 1.2 | |
Mitsui Fudosan Co., Ltd. | | 1.2 | |
| | | |
Top Ten as a Group | | 14.3 | % |
| | | |
| * | Top Ten Holding at June 30, 2005 |
| | | | | | |
Portfolio Breakdown | | % Fund | | | MSCI
EAFE | |
Financials | | 32.6 | % | | 30.9 | % |
Consumer Discretionary | | 13.4 | | | 12.4 | |
Materials | | 11.5 | | | 10.5 | |
Information Technology | | 9.9 | | | 9.2 | |
Industrials | | 9.2 | | | 7.8 | |
Consumer Staples | | 8.7 | | | 8.1 | |
Energy | | 7.5 | | | 7.2 | |
Health Care | | 6.4 | | | 5.9 | |
Telecommunication Services | | 2.9 | | | 2.7 | |
Utilities | | 2.9 | | | 2.7 | |
Other Assets and Liabilities | | (5.0 | ) | | 2.2 | |
Bonds and Other Assets | | 0.0 | | | 0.3 | |
Other Equities | | 0.0 | | | 0.1 | |
| | | | | | |
| | 100 | % | | 100 | % |
| | | | | | |
Any sectors, industries, or securities discussed should not be perceived as investment recommendations. Any securities discussed may no longer be held in the account’s portfolio. It should not be assumed that any of the securities transactions discussed were or will prove to be profitable, or that the investment recommendations we make in the future will be profitable.
21
Managers International Equity Fund
Portfolio Manager Comments (continued)
| | | | | | |
Country | | Managers
International
Equity Fund* | | | MSCI
EAFE
Index | |
Argentina | | 0.00 | % | | 0.00 | % |
Brazil | | 1.3 | | | 0.0 | |
Chile | | 0.0 | | | 0.0 | |
China | | 0.2 | | | 0.0 | |
Colombia | | 0.0 | | | 0.0 | |
Czech Republic | | 0.0 | | | 0.0 | |
Egypt | | 0.0 | | | 0.0 | |
Hungary | | 0.3 | | | 0.0 | |
India | | 0.3 | | | 0.0 | |
Indonesia | | 0.0 | | | 0.0 | |
Israel | | 0.5 | | | 0.0 | |
Jordan | | 0.0 | | | 0.0 | |
South Korea | | 3.8 | | | 0.0 | |
Malaysia | | 0.0 | | | 0.0 | |
Mexico | | 1.2 | | | 0.0 | |
Morocco | | 0.0 | | | 0.0 | |
Pakistan | | 0.0 | | | 0.0 | |
Peru | | 0.2 | | | 0.0 | |
Philippines | | 0.0 | | | 0.0 | |
Poland | | 0.0 | | | 0.0 | |
Russia | | 0.0 | | | 0.0 | |
South Africa | | 1.0 | | | 0.0 | |
Taiwan | | 1.3 | | | 0.0 | |
Thailand | | 0.0 | | | 0.0 | |
Turkey | | 0.0 | | | 0.0 | |
Venezuela | | 0.0 | | | 0.0 | |
| | |
Country | | Managers
International
Equity Fund* | | | MSCI
EAFE
Index | |
Australia | | 0.7 | % | | 5.2 | % |
Austria | | 0.0 | | | 0.4 | |
Belgium | | 1.4 | | | 1.2 | |
Denmark | | 0.0 | | | 0.8 | |
Finland | | 0.6 | | | 1.4 | |
France | | 10.3 | | | 9.3 | |
Germany | | 8.4 | | | 6.8 | |
Greece | | 0.0 | | | 0.6 | |
Hong Kong | | 3.1 | | | 1.7 | |
Ireland | | 0.6 | | | 0.8 | |
Italy | | 1.6 | | | 3.8 | |
Japan | | 23.5 | | | 25.6 | |
Netherlands | | 4.0 | | | 3.4 | |
New Zealand | | 0.0 | | | 0.2 | |
Norway | | 0.0 | | | 0.7 | |
Portugal | | 0.0 | | | 0.3 | |
Singapore | | 1.8 | | | 0.8 | |
Spain | | 1.9 | | | 3.7 | |
Sweden | | 1.7 | | | 2.4 | |
Switzerland | | 6.4 | | | 6.9 | |
United Kingdom | | 15.2 | | | 24.0 | |
Canada | | 5.4 | | | 0.0 | |
United States | | 2.3 | | | 0.0 | |
Luxembourg | | 1.0 | | | 0.0 | |
| | | | | | |
| | 100 | % | | 100 | % |
| | | | | | |
| * | As a percent of total market value of common stocks on December 31, 2005. |
22
Managers International Equity Fund
Schedule of Portfolio Investments
December 31, 2005
| | | | | | |
Security Description | | Shares | | | Value |
Common Stocks - 105.0% | | | | | | |
Consumer Discretionary - 13.4% | | | | | | |
Adidas - Salomon AG (Germany) | | 5,721 | | | $ | 1,081,961 |
Carphone Warehouse Group, The (United Kingdom) | | 374,753 | | | | 1,786,275 |
Continental AG (Germany)* | | 25,800 | | | | 2,287,530 |
Daiwa House Industry Co., Ltd. (Japan) | | 92,000 | | | | 1,438,182 |
Dentsu, Inc. (Japan) | | 124 | | | | 404,786 |
EMI Group PLC (United Kingdom) | | 352,397 | | | | 1,468,847 |
George Wimpey PLC (United Kingdom) | | 89,700 | | | | 742,752 |
Grupo Televisa S. A. (Mexico) | | 18,000 | | | | 1,449,000 |
Honda Motor Co., Ltd. (Japan) | | 38,800 | | | | 2,239,284 |
Hyundai Motor Co., Ltd. (South Korea) | | 4,100 | | | | 390,042 |
Kingfisher PLC (United Kingdom) | | 175,576 | | | | 716,000 |
Koninklijke (Royal) Phillips Electronics N.V. (Netherlands)* | | 25,008 | | | | 776,692 |
LG Electronics, Inc. (South Korea) | | 4,160 | | | | 363,086 |
LVMH Moet Hennessy Louis Vuitton SA (France) | | 14,411 | | | | 1,279,335 |
Matsushita Electric Industrial Co Ltd (Japan) | | 34,000 | | | | 655,300 |
Pearson PLC (United Kingdom) | | 61,953 | | | | 732,645 |
Pinault-Printemps-Redoute SA (France)* | | 5,910 | | | | 665,738 |
Publicis Groupe (France) | | 31,038 | | | | 1,080,620 |
Renault SA (France) | | 23,200 | | | | 1,889,011 |
SES GLOBAL (France) | | 88,145 | | | | 1,544,305 |
Shanghai Forte Land Company Ltd. (Hong Kong) | | 224,000 | | | | 76,548 |
Sharp Corp. (Japan) | | 64,000 | | | | 973,785 |
Swatch Group AG, The (Switzerland) | | 14,471 | | | | 437,904 |
Toyota Motor Corp. (Japan) | | 27,800 | | | | 1,452,386 |
Whitbread PLC (United Kingdom) | | 53,742 | | | | 876,659 |
Wolters Kluwer NV (Netherlands) | | 40,200 | | | | 813,431 |
Total Consumer Discretionary | | | | | | 27,622,104 |
Consumer Staples - 8.7% | | | | | | |
British American Tobacco PLC (United Kingdom) | | 80,900 | | | | 1,807,810 |
Delhaize Le Lion (Belgium) | | 23,300 | | | | 1,525,391 |
Diageo PLC (United Kingdom) | | 74,846 | | | | 1,081,631 |
Foster’s Group, Ltd. (Australia) | | 176,000 | | | | 718,413 |
Heineken N.V. (Netherlands) | | 22,146 | | | | 702,237 |
Interbrew (Belgium) | | 18,155 | | | | 789,482 |
J Sainsbury PLC (United Kingdom) | | 207,300 | | | | 1,124,019 |
Japan Tobacco, Inc. (Japan) | | 103 | | | | 1,505,982 |
Koninklijke Ahold N.V. (Netherlands)* | | 119,359 | | | | 895,847 |
L’Oreal SA (France)* | | 9,000 | | | | 668,538 |
Metro AG (Germany) | | 8,600 | | | | 414,364 |
Nestle SA, Registered (Switzerland) | | 3,672 | | | | 1,096,601 |
Reckitt Benckiser PLC (United Kingdom) | | 38,167 | | | | 1,258,669 |
Royal Numico NV (Netherlands)* | | 14,345 | | | | 594,938 |
Seven & I Holdings Co., Ltd. (Japan)* | | 58,540 | | | | 2,506,694 |
Tate & Lyle PLC (United Kingdom) | | 76,200 | | | | 737,509 |
Tesco PLC (United Kingdom) | | 65,900 | | | | 375,628 |
Yamazaki Baking Co., Ltd. (Japan) | | 29,000 | | | | 236,253 |
Total Consumer Staples | | | | | | 18,040,006 |
Energy - 7.5% | | | | | | |
BP PLC (United Kingdom) | | 283,500 | | | | 3,035,522 |
Canadian Natural Resources, Ltd. (Canada) | | 36,700 | | | | 1,819,451 |
China Petroleum and Chemical Corp., Class H (Hong Kong) | | 924,000 | 2 | | | 460,439 |
EnCana Corp. (Canada) | | 22,968 | 2 | | | 1,038,495 |
Eni S.p.A. (Italy) | | 83,298 | | | | 2,327,542 |
MOL Magyar Olaj-es Gazipari Rt. (Hungary)* | | 6,100 | | | | 572,462 |
Petroleo Brasileiro SA, Sponsored ADR (Brazil) | | 22,400 | | | | 1,441,888 |
Repsol YPF, S.A. (Spain) | | 59,300 | 2 | | | 1,735,862 |
Suncor Energy Inc (Canada) | | 16,300 | | | | 1,028,101 |
Total SA (France) | | 7,888 | 2 | | | 1,989,148 |
Total Energy | | | | | | 15,448,910 |
Financials - 32.6% | | | | | | |
Allianz AG (Germany) | | 13,190 | | | | 1,995,162 |
Assurances Generales de France (France) | | 18,300 | | | | 1,812,840 |
Aviva PLC (United Kingdom) | | 126,100 | | | | 1,528,747 |
Banco Bilbao Vizcaya Argentaria SA (Spain) | | 39,348 | 2 | | | 702,511 |
Bank of East Asia, Ltd. (Hong Kong) | | 183,800 | | | | 555,250 |
BNP Paribas SA (France) | | 13,400 | 2 | | | 1,082,483 |
CapitaLand Ltd. (Singapore) | | 230,000 | | | | 475,188 |
China Overseas Land & Investment Ltd. (Hong Kong) | | 952,000 | | | | 407,086 |
Commerzbank AG (Germany) | | 35,593 | | | | 1,093,198 |
Credit Agricole SA (France) | | 5,800 | 2 | | | 182,348 |
Credit Suisse Group (Switzerland) | | 70,122 | | | | 3,571,939 |
Daiwa Securities Group, Inc. (Japan) | | 104,000 | | | | 1,178,551 |
DBS Group Holdings, Ltd. (Singapore) | | 122,000 | | | | 1,208,729 |
Depfa Bank PLC (Ireland)* | | 56,860 | | | | 836,754 |
Deutsche Boerse AG (Germany)* | | 9,536 | | | | 975,332 |
Deutsche Postbank AG (Germany) | | 7,900 | | | | 458,098 |
Friends Provident PLC (United Kingdom) | | 53,100 | | | | 173,013 |
Hana Financial Group, Inc. (South Korea)* | | 16,130 | | | | 737,194 |
Hang Seng Bank, Ltd. (Hong Kong) | | 56,300 | | | | 733,866 |
HBOS PLC (United Kingdom) | | 109,200 | | | | 1,863,071 |
The accompanying notes are an integral part of these financial statements.
23
Managers International Equity Fund
Schedule of Portfolio Investments (continued)
| | | | | | |
Security Description | | Shares | | | Value |
Financials (continued) | | | | | | |
HDFC Bank Ltd. (India) | | 15,700 | | | $ | 246,287 |
Henderson Land Development Co., Ltd. (Hong Kong) | | 155,000 | 2 | | | 727,739 |
Hong Kong Exchanges & Clearing, Ltd. (Hong Kong) | | 216,000 | | | | 895,608 |
ING Groep NV (Netherlands) | | 89,117 | | | | 3,091,464 |
Japan Retail Fund Investment Corp. (Japan) | | 76 | | | | 589,462 |
KBC Bank & Insurance Group, Inc. (Belgium) | | 7,798 | | | | 725,958 |
Kennedy-Wilson Japan (Japan) | | 57 | | | | 359,164 |
KK DaVinci Advisors (Japan)* | | 78 | | | | 586,348 |
Kookmin Bank (South Korea) | | 27,474 | | | | 2,070,625 |
Millea Holdings, Inc. (Japan) | | 76 | | | | 1,310,741 |
Mitsubishi Estate Co., Ltd. (Japan) | | 125,000 | | | | 2,588,377 |
Mitsubishi Tokyo Financial Group, Inc. (Japan) | | 73 | | | | 994,096 |
Mitsui Fudosan Co., Ltd. (Japan) | | 120,000 | | | | 2,429,482 |
Muenchener Rueckversicherungs AG (Germany) | | 24,599 | | | | 3,334,435 |
Nikko Cordial Corp. (Japan) | | 43,500 | | | | 692,101 |
Nomura Holdings, Inc. (Japan) | | 104,000 | | | | 2,001,973 |
NTT Urban Development Corp. (Japan) | | 22 | 2 | | | 145,723 |
ORIX Corp. (Japan) | | 14,100 | | | | 3,588,867 |
Royal Bank of Scotland Group PLC (United Kingdom) | | 66,100 | | | | 1,994,712 |
Shinhan Financial Group Co., Ltd. (South Korea) | | 24,090 | | | | 968,894 |
Shinsei Bank, Ltd. (Japan) | | 220,000 | | | | 1,275,461 |
Shun TAK Holdings, Ltd. (Hong Kong) | | 300,000 | | | | 275,644 |
Societe Generale (France)* | | 13,900 | 2 | | | 1,708,209 |
Standard Chartered, PLC. (United Kingdom) | | 119,023 | | | | 2,648,457 |
Sumitomo Mitsui Financial Group, Inc. (Japan) | | 202 | | | | 2,134,000 |
Sumitomo Realty & Development Co., Ltd. (Japan) | | 107,000 | | | | 2,323,975 |
Sun Hung Kai Properties, Ltd. (Hong Kong) | | 74,000 | 2 | | | 718,710 |
Swiss Reinsurance (Switzerland) | | 15,810 | | | | 1,155,295 |
UBS AG (Switzerland) | | 14,250 | | | | 1,354,473 |
Unibail (France) | | 6,571 | 2 | | | 874,043 |
UniCredito Italiano SpA (Italy) | | 172,231 | | | | 1,187,332 |
Zurich Financial Services AG (Switzerland) | | 3,100 | | | | 659,723 |
Total Financials | | | | | | 67,228,738 |
Health Care - 6.4% | | | | | | |
Eisai Co., Ltd. (Japan) | | 23,900 | | | | 1,006,673 |
Essilor International SA (France) | | 15,371 | | | | 1,240,126 |
GlaxoSmithKline PLC (United Kingdom) | | 77,000 | | | | 1,943,821 |
Merck KGaA (Germany) | | 17,750 | | | | 1,469,938 |
Roche Holding AG(Switzerland)* | | 9,130 | | | | 1,368,954 |
Sanofi-Synthelabo SA (France) | | 24,525 | | | | 2,147,097 |
Schering AG (Germany) | | 11,579 | | | | 775,325 |
Serono SA (Switzerland) | | 1,834 | | | | 1,456,388 |
Shionogi & Co., Ltd. (Japan) | | 10,000 | | | | 140,589 |
Taisho Pharmaceutical Co., Ltd. (Japan) | | 34,000 | | | | 637,034 |
Teva Pharmaceutical Industries, Ltd., Sponsored ADR (Israel) | | 23,600 | 2 | | | 1,015,036 |
Total Health Care | | | | | | 13,200,981 |
Industrials - 9.2% | | | | | | |
ABB, Ltd. (Switzerland)* | | 154,500 | | | | 1,503,429 |
ALSTOM (France)* | | 12,843 | | | | 737,598 |
Atlas Copco AB (Sweden) | | 16,800 | | | | 374,225 |
BAE Systems PLC (United Kingdom) | | 117,500 | | | | 772,370 |
Canadian Pacific Railway Ltd (Canada) | | 3,600 | 2 | | | 150,850 |
Dai Nippon Printing Co., Ltd. (Japan) | | 42,000 | | | | 747,216 |
East Japan Railway Co. (Japan) | | 54 | | | | 370,685 |
European Aeronautic Defense and Space Co.(Netherlands) | | 31,820 | 2 | | | 1,199,984 |
FANUC, Ltd. (Japan) | | 20,000 | 2 | | | 1,698,812 |
Hutchison Whampoa, Ltd. (Hong Kong) | | 108,000 | | | | 1,025,919 |
Komatsu Ltd. (Japan) | | 46,000 | | | | 760,403 |
Koyo Seiko Co., Ltd. (Japan) | | 34,000 | | | | 633,613 |
Kuehne & Nagel International AG (Switzerland) | | 3,163 | | | | 892,196 |
Macquarie Infrastructure Group (Australia) | | 145,572 | | | | 378,092 |
MAN AG (Germany)* | | 18,400 | | | | 981,210 |
Mitsubishi Corp. (Japan) | | 37,000 | | | | 816,913 |
Mitsui O.S.K. Lines, Ltd. (Japan) | | 27,000 | | | | 236,140 |
RT Group PLC (United Kingdom) | | 360,539 | | | | 24,812 |
Ryanair Holdings PLC (Ireland)* | | 10,000 | 2 | | | 559,900 |
Siemens AG (Germany) | | 15,356 | | | | 1,314,409 |
SNC-Lavalin Group, Inc. (Canada) | | 10,000 | | | | 656,372 |
Toll Holdings, Ltd. (Australia) | | 35,878 | | | | 390,366 |
Tostem Inax Holding Corp. (Japan) | | 32,000 | | | | 639,310 |
Yamato Transport Co., Ltd. (Japan) | | 121,000 | | | | 2,011,827 |
Total Industrials | | | | | | 18,876,651 |
Information Technology - 9.9% | | | | | | |
Altran Technologies SA (France)* | | 45,386 | | | | 510,403 |
ASML Holding N.V. (Netherlands) | | 36,143 | | | | 724,404 |
Au Optronics Corp., Sponsored ADR (Taiwan) | | 26,800 | | | | 402,268 |
Canon, Inc. (Japan) | | 37,900 | 2 | | | 2,224,734 |
Chi Mei Optoelectronics Corp., GDR (Taiwan) | | 1,819 | | | | 26,917 |
The accompanying notes are an integral part of these financial statements.
24
Managers International Equity Fund
Schedule of Portfolio Investments (continued)
| | | | | | | |
Security Description | | Shares | | | Value | |
Information Technology (continued) | | | | | | | |
Compal Electronics, Inc. (Taiwan) | | 155,395 | 2 | | $ | 700,256 | |
Dassault Systemes SA (France) | | 25,915 | | | | 1,461,872 | |
Ericsson (LM), Class B (Sweden) | | 781,000 | | | | 2,690,921 | |
Flextronics International, Ltd. (Singapore)* | | 64,500 | 2 | | | 673,380 | |
Keyence Corp. (Japan) | | 3,800 | | | | 1,080,662 | |
Logitech International S.A. (Switzerland)* | | 16,724 | | | | 786,961 | |
Nippon Electric Glass Co., Ltd. (Japan) | | 70,000 | | | | 1,535,442 | |
Nokia Oyj (Finland) | | 77,350 | | | | 1,418,530 | |
Research In Motion, Ltd. (Canada)* | | 9,900 | 2 | | | 653,499 | |
Samsung Electronics Co., Ltd. (South Korea) | | 3,536 | | | | 2,274,916 | |
Softbank Corp. (Japan) | | 21,900 | 2 | | | 924,933 | |
Taiwan Semiconductor Manufacturing Co., Ltd., Sponsored ADR | | 187,814 | | | | 1,861,237 | |
Yokogawa Electric Corp. (Japan) | | 26,500 | | | | 452,382 | |
Total Information Technology | | | | | | 20,403,717 | |
Materials - 11.5% | | | | | | | |
Air Liquide Sante International (France) | | 4,001 | | | | 769,338 | |
Alcan, Inc. (Canada) | | 22,504 | | | | 924,591 | |
Anglo American PLC (United Kingdom) | | 20,817 | | | | 710,205 | |
Aracruz Celulose SA (Brazil) | | 19,500 | 2 | | | 780,195 | |
Arcelor (Luxembourg) | | 93,200 | | | | 2,308,086 | |
Bayer AG (Germany)* | | 29,596 | | | | 1,238,021 | |
BOC Group PLC (United Kingdom) | | 46,378 | | | | 956,687 | |
Cameco Corp. (Canada) | | 12,200 | | | | 773,358 | |
China Shenhua Energy Co., Ltd. (China)* | | 359,000 | | | | 395,415 | |
Cia de Minas Buenaventura SA (Peru) | | 17,200 | | | | 486,760 | |
Compania Vale do Rio Doce – ADR (Brazil) | | 14,900 | 2 | | | 612,986 | |
Gold Fields, Ltd. (South Africa) | | 65,500 | 2 | | | 1,162,226 | |
Goldcorp, Inc. (Canada) | | 56,000 | | | | 1,247,710 | |
Impala Platinum Holdings, Ltd. (South Africa) | | 27,300 | | | | 1,002,901 | |
Inco, Ltd. (Canada) | | 15,500 | 2 | | | 675,335 | |
JFE Holdings, Inc. (Japan) | | 49,100 | | | | 1,643,074 | |
JSR Corp. (Japan) | | 43,400 | | | | 1,140,854 | |
Meridian Gold, Inc. (Canada)* | | 37,700 | | | | 826,355 | |
Placer Dome, Inc. (Canada) | | 79,400 | | | | 1,818,253 | |
POSCO (South Korea) | | 6,900 | | | | 1,372,838 | |
Rio Tinto PLC (United Kingdom) | | 14,414 | | | | 658,730 | |
Svenska Cellulosa AB (Sweden)* | | 21,000 | 2 | | | 784,999 | |
Xstrata PLC (United Kingdom) | | 60,716 | | | | 1,420,371 | |
Total Materials | | | | | | 23,709,288 | |
Telecommunication Services - 2.9% | | | | | | | |
America Movil, S.A. de C.V. (Mexico) | | 42,800 | | | | 1,252,328 | |
Bharti Tele-Ventures Ltd. (India)* | | 59,200 | | | | 454,924 | |
Eutelsat Communications (France)* | | 12,518 | | | | 179,322 | |
Singapore Telecommunications, Inc. (Singapore) | | 1,071,857 | | | | 1,678,471 | |
Sk Telecom Co., Ltd. (South Korea) | | 1,800 | | | | 322,087 | |
Vodafone Group PLC (United Kingdom) | | 1,024,000 | | | | 2,203,581 | |
Total Telecommunication Services | | | | | | 6,090,713 | |
Utilities - 2.9% | | | | | | | |
E.ON AG (Germany)* | | 10,017 | | | | 1,035,024 | |
Endesa, S.A. (Spain) | | 65,900 | 2 | | | 1,727,029 | |
Hong Kong & China Gas Co., Ltd. (Hong Kong) | | 527,000 | | | | 1,124,066 | |
National Grid PLC (United Kingdom) | | 111,361 | | | | 1,088,760 | |
Vivendi Environment (France) | | 22,160 | | | | 1,002,276 | |
Total Utilities | | | | | | 5,977,155 | |
Total Common Stocks
(cost $164,242,483) | | | | | | 216,598,263 | |
Mutual Fund - 0.1% | | | | | | | |
streetTracks Gold Trust
(cost $220,634) | | 4,500 | 2 | | | 232,110 | |
Short-Term Investments - 12.4%1 | | | | | | | |
Other Investment Companies - 11.9% | | | | | | | |
Bank of New York Institutional Cash Reserve Fund, 4.36%3 | | 19,785,365 | | | | 19,785,365 | |
JPMorgan Prime Money Market Fund, Institutional Class Shares, 4.14% | | 4,821,320 | | | | 4,821,320 | |
Total Other Investment Companies | | | | | | 24,606,685 | |
Other Short Term Investments - 0.5%3 | | | | | | | |
Goldman Sachs Promissory Notes, 4.33% | | 1,001,091 | | | | 1,001,091 | |
Total Short-Term Investments
(cost $25,607,776) | | | | | | 25,607,776 | |
Total Investments-117.5%
(cost $190,070,893) | | | | | | 242,438,149 | |
Other Assets, less Liabilities - (17.5)% | | | | | | (36,045,022 | ) |
Net Assets -100.0% | | | | | $ | 206,393,127 | |
The accompanying notes are an integral part of these financial statements.
25
Managers Emerging Markets Equity Fund
Portfolio Manager Comments
The Managers Emerging Markets Equity Fund’s (the “Fund”) objective is to achieve long-term capital appreciation. The Fund invests at least 80% of its assets in equity securities, i.e., common and preferred stocks of companies located in countries designated by the World Bank or the United Nations to be a developing country or an emerging market, such as most countries in Africa, Asia, Latin America and the Middle East. The Fund may invest in companies of any size. The MSCI EMF Index is the benchmark for the Fund.
The Fund currently employs a subadvisor, Rexiter Capital Management Limited (“Rexiter”), to manage the assets of the Fund. The investment team at Rexiter believes emerging markets are less efficient than developed markets, and an actively managed portfolio, with respect to both country weightings and stock selection, can add value over a market capitalization-weighted index without materially affecting risk. Rexiter’s approach is active on both asset allocation and stock selection. Investment decisions are based on fundamental analysis of countries and stocks. Portfolio management is controlled by a disciplined process that seeks to add to returns through the exploitation of market inefficiency, while at the same time constraining risk.
Rexiter’s investment strategy is to earn investment return and manage investment risk by analyzing and actively managing country and industry exposure, and investing in companies within targeted country and industry ranges that demonstrate strong and most importantly, profitable earnings growth.
The ideal investment exhibits many of the following traits:
| | • | | Ability to generate and maintain strong earnings growth |
| | • | | Established market positions across a diversity of companies and industries |
Portfolio Construction
| | • | | Use a liquidity-tiered fixed weight benchmark to determine a neutral position for country allocation |
| | • | | Employ active country allocations away from this neutral position based upon fundamental analysis of macro- economic variables and equity market valuations |
| | • | | Screen companies based on capitalizations and liquidity parameters to analyze roughly 300 companies in detail by: |
| | • | | Studying published accounts and accounting policies for the underlying development of earnings |
| | • | | Performing a “DuPont Analysis” of return on equity |
| | • | | Analyzing the return of invested capital and the economic value added |
| | • | | Analyzing the cash flow and capital spending and capital requirements of each company |
The investment team will make a sell decision when:
| | • | | The current stock price is not supported by its expectations regarding the company’s future growth potential |
| | • | | The political, economic or financial health of the country changes |
The Year in Review
Managers Emerging Markets Equity Fund rose 32.53% in 2005, compared with a gain of 34.54% for its benchmark, the MSCI Emerging Markets (MSCI EM) Index. Note that unless otherwise stated, all performance cited in this commentary is in U.S. dollars.
The emerging markets did very well in 2005. Indeed, it has been a tremendous three-year run for emerging markets stocks. Since the end of 2002, the MSCI EM Index has risen 158.2% cumulatively, or 37.2% annualized. There have been several reasons for this performance. First, emerging market stocks (in retrospect) were very attractively valued coming out of the U.S. recession in 2001. Second, the recovery and vigor of the global economy has been very conducive for these markets during this period. Third, and related to the second point, the significant increase in commodities prices has resulted in strong profits within many of the emerging markets, as many EM countries are net suppliers of raw materials. Fourth, emerging market companies have made significant strides to improve both corporate transparency and fundamental productivity. For instance, the weighted average return on equity (ROE) for the companies in the MSCI EM Index rose from just over 15 at the beginning of 2003 to 19.5 at the end of 2005.
For 2005, stocks rose very broadly within the emerging markets. Every region rose by at least 25%, and only one country (Venezuela) declined in dollar terms. Latin America and Europe were the best performing emerging regions during 2005, as they rose in excess of 50% behind the surge in energy prices. By sector, emerging energy stocks rose more than 60%. The worst performing broad sector was industrials, which rose “only” 25.5%.
The Fund generally participated in the continued rally in the emerging markets. The Fund’s Russian holdings and an underweight in Taiwan were two of the more important contributors in the Fund’s performance. The investment team at Rexiter’s fixed-weights approach to portfolio construction often results in an emphasis on the smaller markets. They recently
26
Managers Emerging Markets Equity Fund
Portfolio Manager Comments (continued)
have had a favorable view on Russia, in particular Russia’s energy companies. During 2005, these holdings appreciated an impressive 85%. The offset to an overweight of smaller markets is that Rexiter typically will underweight the largest markets. Such was the case with Taiwan, which made up an average of 14% of the entire MSCI EM Index during the year. The Fund’s underweight proved beneficial as the Taiwan stock market was up a modest 7% (far less than most EM countries) during 2005.
On the other hand, the Fund did slightly lag the MSCI EM Index during the year. In particular, the Fund’s underweight in South Korea, again, due to Rexiter’s investment discipline, (Korea made up more than 17% of the MSCI EM Index) was costly due to the country’s near-60% total return during 2005. Similarly, the Fund’s Malaysian positions (which made up less than 4% of the MSCI EM Index) did not add much value during the quarter.
Looking Forward
Portfolio manager Murray Davey of Rexiter notes that while the emerging market indexes are coming off of impressive gains in 2005 (and, indeed, over the last three years), the improvement in economic fundamentals seems to have justified the performance. Thus, in his view, emerging markets are not necessarily overvalued at this point. Having said that, he cautions that there is a very real potential for abnormal cash flows to continue into these markets. The nature of these flows (i.e., speculative or not) is difficult, if not impossible, to ascertain. However, the magnitude of investor interest in the asset class does introduce some additional risks into an already fairly risky segment of the market. Thus, there is the potential for some additional liquidity-driven gains in the near-term. Once these flows are absorbed, the key question will be how the fundamentals hold up. If the global economy remains strong, then the emerging markets should continue to offer reasonable gains. However, those gains would likely be far more benign than the performance experienced from 2002 to 2005. If the global economic backdrop sours, then the outlook for emerging markets equities would be far less promising.
Cumulative Total Return Performance
Emerging Markets Equity’s cumulative total return is based on the daily change in net asset value (NAV), and assumes that all distributions were reinvested. The Morgan Stanley Capital International Emerging Markets Free (MSCI EMF) Index (“EMF”) is composed of all publicly traded stocks issued by 27 emerging countries including Argentina, Brazil, Chile, Greece, India, Israel, Malaysia, Mexico, the Philippines, Poland and Thailand. MSCI designates nations based upon several factors, the most important being per capita GDP. In cases where restrictions on foreign investment exist, the EMF Index limits its coverage to the opportunity set generally available to foreign investors. Unlike the Fund, EMF is unmanaged, is not available for investment, and does not incur expenses. This chart compares a hypothetical $10,000 investment made in Emerging Markets Equity on February 9, 1998, to a $10,000 investment made in the EMF for the same time period. The chart is not intended to imply any future performance of the Fund. The graph and chart do not reflect the deduction of taxes that a shareholder would pay on a Fund distribution or redemption of shares. Total returns would have been lower had certain expenses not been reduced.
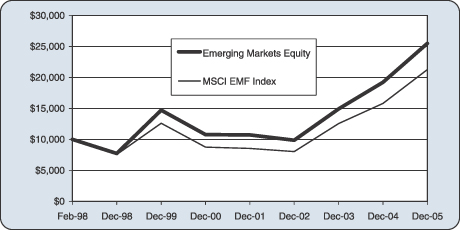
The table below shows the average annual total returns for Emerging Markets Equity and the EMF since inception through December 31, 2005.
| | | | | | | | | |
Average Annual Total Returns: | | 1 Year | | | 5 Years | | | Since Inception* | |
Emerging Markets Equity Fund | | 32.53 | % | | 18.77 | % | | 12.59 | % |
MSCI EMF Index | | 34.54 | % | | 19.44 | % | | 10.03 | % |
| * | Commencement of operations was February 9, 1998. |
27
Managers Emerging Markets Equity Fund
Portfolio Manager Comments (continued)
The performance data shown represents past performance. Past performance is not a guarantee of future results. Current performance may be lower or higher than the performance data quoted. The investment return and the principal value of an investment will fluctuate so that an investor’s shares, when redeemed, may be worth more or less than their original cost. For performance information through the most recent month end please call (800) 835-3879 or visit our Web site at www.managersinvest.com.
The Fund is subject to the risks associated with investments in emerging markets, such as erratic earnings patterns, economic and political instability, changing exchange controls, limitations on repatriation of foreign capital, and changes in local governmental attitudes toward private investment, possibly leading to nationalization or confiscation of investor assets.
The table below displays a full breakdown of the sector allocation of the Fund as well as the top ten positions as of December 31, 2005.
| | | |
Top Ten Holdings (out of 79 securities) | | % Fund | |
Companhia Energetica de Minas Gerais * | | 2.0 | % |
Hon Hai Precision Industry Co., Ltd. | | 1.9 | |
LUKOIL Holdings, ADR | | 1.9 | |
Samsung Electronics Co., Ltd., GDR | | 1.9 | |
TAM S.A. | | 1.8 | |
Shihan Financial Group Co., Ltd. | | 1.8 | |
Angelo American PLC | | 1.8 | |
Sanlam, Ltd.* | | 1.7 | |
Richter Gedeon Rt * | | 1.7 | |
Advanced Semiconductor Engineering, Inc. | | 1.7 | |
| | | |
Top Ten as a Group | | 18.2 | % |
| | | |
| * | Top Ten Holding at June 30, 2005 |
| | | | | | |
Portfolio Breakdown | | % Fund | | | MSCI EAFE | |
Financials | | 21.2 | % | | 20.7 | % |
Information Technology | | 12.5 | | | 12.4 | |
Telecommunication Services | | 12.1 | | | 12.1 | |
Industrials | | 12.1 | | | 14.4 | |
Materials | | 9.0 | | | 10.0 | |
Consumer Discretionary | | 8.4 | | | 9.7 | |
Energy | | 8.2 | | | 8.1 | |
Consumer Staples | | 5.1 | | | 5.1 | |
Utilities | | 2.7 | | | 4.7 | |
Health Care | | 1.7 | | | 1.7 | |
Other Assets and Liabilities | | 7.0 | | | 1.2 | |
| | | | | | |
| | 100 | % | | 100 | % |
| | | | | | |
Any sectors, industries, or securities discussed should not be perceived as investment recommendations. Any securities discussed may no longer be held in the account’s portfolio. It should not be assumed that any of the securities transactions discussed were or will prove to be profitable, or that the investment recommendations we make in the future will be profitable.
| | | | | | |
Country | | Managers
Emerging Markets
Equity Fund* | | | MSCI
EMF
Index | |
Argentina | | 0.00 | % | | 0.00 | % |
Brazil | | 12.5 | | | 10.2 | |
Chile | | 1.7 | | | 1.7 | |
China | | 3.1 | | | 7.7 | |
Colombia | | 0.7 | | | 0.4 | |
Czech Republic | | 1.7 | | | 0.9 | |
Egypt | | 0.0 | | | 0.8 | |
Hungary | | 1.7 | | | 1.2 | |
India | | 7.5 | | | 6.0 | |
Indonesia | | 4.3 | | | 1.4 | |
Israel | | 2.1 | | | 2.9 | |
Jordan | | 0.0 | | | 0.3 | |
South Korea | | 14.4 | | | 18.7 | |
Malaysia | | 6.5 | | | 2.9 | |
Mexico | | 4.1 | | | 6.3 | |
Morocco | | 0.0 | | | 0.2 | |
Pakistan | | 0.0 | | | 0.3 | |
Peru | | 0.0 | | | 0.5 | |
Philippines | | 0.4 | | | 0.5 | |
Poland | | 0.0 | | | 1.7 | |
Russia | | 8.2 | | | 5.3 | |
South Africa | | 6.2 | | | 10.6 | |
Taiwan | | 11.4 | | | 14.5 | |
Thailand | | 3.8 | | | 1.8 | |
Turkey | | 4.8 | | | 2.2 | |
Venezuela | | 0.0 | | | 0.1 | |
Hong Kong | | 1.6 | | | 0.0 | |
United Kingdom | | 1.8 | | | 0.0 | |
Canada | | 0.0 | | | 0.0 | |
United States | | 1.0 | | | 0.0 | |
Bermuda | | 0.5 | | | 0.0 | |
| | | | | | |
| | 100 | % | | 100 | % |
| | | | | | |
| * | As a percent of total market value of common stocks on December 31, 2005. |
28
Managers Emerging Markets Equity Fund
Schedule of Portfolio Investments
December 31, 2005
| | | | | | |
Security Description | | Shares | | | Value |
Common Stocks - 93.0% | | | | | | |
Consumer Discretionary - 8.4% | | | | | | |
Astra International Tbk PT (Indonesia) | | 1,854,000 | | | $ | 1,912,207 |
Consorcio ARA, S.A. de C.V. (Mexico) | | 330,000 | | | | 1,443,217 |
Cosco Pacific, Ltd. (Bermuda) | | 464,000 | | | | 847,916 |
Genting Berhad (Malaysia) | | 292,300 | | | | 1,655,779 |
Hankook Tire Co., Ltd. (South Korea) | | 91,810 | | | | 1,281,450 |
Hyundai Motor Co., Ltd. (South Korea) | | 3,430 | | | | 326,303 |
Land and Houses PCL (Thailand) | | 5,000,000 | 2 | | | 1,019,206 |
Maruti Udyog Ltd. (India) | | 95,533 | | | | 1,351,411 |
Total Consumer Discretionary | | | | | | 9,837,489 |
Consumer Staples - 5.1% | | | | | | |
Cia Brasileira de Distribuicao Grupo Pao de Acucar (Brazil) | | 56,000 | 2 | | | 1,842,400 |
IOI Corp., Berhad (Malaysia) | | 476,000 | | | | 1,561,688 |
IOI Oleochemical Industries Berhad (Malaysia) | | 416 | | | | 1,288 |
ITC, Ltd. (India) | | 350,000 | | | | 1,104,215 |
Shinsegae Co., Ltd. (South Korea) | | 3,500 | | | | 1,525,344 |
Total Consumer Staples | | | | | | 6,034,935 |
Energy - 8.2% | | | | | | |
China Petroleum and Chemical Corp., Class H (Hong Kong) | | 3,731,000 | | | | 1,859,198 |
LUKOIL Holdings, ADR (Russia) | | 37,006 | | | | 2,201,857 |
Oil & Natural Gas Corp., Ltd. (India) | | 59,702 | | | | 1,558,992 |
Petroleo Brasileiro S.A., Sponsored ADR (Brazil) | | 20,500 | 2 | | | 1,461,035 |
PTT Public Co., Ltd. (Thailand) | | 172,600 | | | | 942,411 |
Surgutneftegaz Sponsored ADR (Russia) | | 28,180 | 2 | | | 1,535,810 |
Total Energy | | | | | | 9,559,303 |
Financials - 21.2% | | | | | | |
ABSA Group Ltd. (South Africa) | | 119,267 | | | | 1,901,740 |
Banco Nossa Caixa SA (Brazil)* | | 64,547 | | | | 963,388 |
Bancolombia S.A. (Colombia) | | 28,600 | | | | 824,538 |
Bank Hapoalim, Ltd. (Israel) | | 345,470 | | | | 1,593,416 |
Fubon Financial Holding Co., Ltd. (Taiwan) | | 1,705,000 | | | | 1,466,228 |
Grupo Financiero Banorte S.A. de C.V. (Mexico) | | 807,476 | | | | 1,672,290 |
Haci Omer Sabanci Holding AS (Turkey) | | 329,828 | | | | 1,858,988 |
Kookmin Bank, Sponsored ADR (South Korea) | | 25,248 | 2 | | | 1,886,278 |
PT Bank Central Asia, Tbk (Indonesia) | | 1,750,000 | | | | 602,260 |
PT Bank Rakyat Indonesia (Indonesia) | | 2,211,000 | | | | 677,072 |
Samsung Fire & Marine Insurance Co., Ltd. (South Korea) | | 10,900 | | | | 1,369,827 |
Sanlam, Ltd. (South Africa) | | 850,883 | | | | 2,044,443 |
Savings Bank of The Russian Federation (Russia) | | 13,400 | 2 | | | 1,755,400 |
Shinhan Financial Group Co., Ltd. (South Korea) | | 51,890 | | | | 2,087,004 |
SM Investments Corp. (Philippines) | | 106,080 | | | | 479,331 |
SM Prime Holdings, Inc. (Philippines) | | 800 | | | | 119 |
Turkiye Is Bankasi (Isbank) (Turkey) | | 218,155 | | | | 1,877,357 |
Uniao de Bancos Brasileiros SA (Brazil) | | 28,620 | 2 | | | 1,819,373 |
Total Financials | | | | | | 24,879,052 |
Health Care - 1.7% | | | | | | |
Richter Gedeon Rt (Hungary) | | 11,280 | | | | 2,027,740 |
Industrials - 12.1% | | | | | | |
Alfa, S.A. (Mexico) | | 312,318 | | | | 1,733,060 |
Barloworld Ltd. (South Africa) | | 98,202 | | | | 1,717,950 |
China Shipping Development Co., Ltd. (China) | | 2,558,000 | | | | 1,876,151 |
Daelim Industrial Co., Ltd. (South Korea) | | 19,870 | | | | 1,405,035 |
Daewoo Shipbuilding & Marine Engineering Co., Ltd. (South Korea) | | 70,740 | | | | 1,907,163 |
EVA Airways Corp. (Taiwan) | | 2,679,448 | | | | 1,257,568 |
Hyundai Development Co. (South Korea) | | 24,160 | | | | 1,086,031 |
Malaysia International Shipping Corporation Berhad (Malaysia) | | 720,400 | | | | 1,896,542 |
Sime Darby Berhad (Malaysia) | | 802,000 | | | | 1,305,014 |
Total Industrials | | | | | | 14,184,514 |
Information Technology - 12.5% | | | | | | |
Acer, Inc. (Taiwan) | | 738,000 | | | | 1,856,513 |
Advanced Semiconductor Engineering, Inc. (Taiwan) | | 2,185,728 | | | | 1,996,821 |
Compal Electronics Inc. (Taiwan) | | 1,412,532 | | | | 1,272,118 |
Hon Hai Precision Industry Co., Ltd. (Taiwan) | | 409,154 | | | | 2,248,190 |
Samsung Electronics Co., Ltd., GDR, (a) (South Korea) | | 6,670 | | | | 2,174,175 |
Satyam Computer Services Ltd., ADR (India) | | 47,000 | | | | 1,719,730 |
Taiwan Semiconductor Manufacturing Co., Ltd. (Taiwan) | | 957 | | | | 1,823 |
Taiwan Semiconductor Manufacturing Co., Ltd., Sponsored ADR | | 201,033 | | | | 1,992,237 |
United Microelectronics Corp. (Taiwan) | | 2,395,007 | | | | 1,347,919 |
Total Information Technology | | | | | | 14,609,526 |
The accompanying notes are an integral part of these financial statements.
29
Managers Emerging Markets Equity Fund
Schedule of Portfolio Investments (continued)
| | | | | | | |
Security Description | | Shares | | | Value | |
Materials - 9.0% | | | | | | | |
Anglo American PLC (United Kingdom) | | 61,123 | | | $ | 2,085,308 | |
Compania Vale do Rio Doce - ADR (Brazil) | | 37,000 | | | | 1,522,180 | |
Formosa Chemicals & Fibre Corp. (Taiwan) | | 660 | | | | 1,066 | |
GMK Norilsk Nickel, Sponsored ADR (Russia) | | 18,500 | 2 | | | 1,739,244 | |
Hindalco Ind., Ltd., Sponsored GDR, (a) (India) | | 390,000 | 2 | | | 1,242,540 | |
Novolipetsk Steel, Corp. (Russia)* | | 77,585 | | | | 1,109,466 | |
Sappi Ltd. (South Africa) | | 146,235 | 2 | | | 1,675,780 | |
Siam Cement Public Co., Ltd., The (Thailand) | | 184,600 | | | | 1,190,726 | |
Total Materials | | | | | | 10,566,310 | |
Telecommunication Services - 12.1% | | | | | | | |
Advanced Information Services PCL (Thailand) | | 510,000 | 2 | | | 1,343,119 | |
Bezeq Israeli Telecommunication Corp., Ltd. (Israel)* | | 647,420 | | | | 822,981 | |
Bharti Tele-Ventures Ltd. (India)* | | 240,457 | | | | 1,847,800 | |
Cesky Telecom a.s. (Czech Republic) | | 91,953 | | | | 1,964,032 | |
China Telecom Corp., Ltd., Class H (China) | | 4,842,000 | | | | 1,775,293 | |
Mobile Telesystems, Sponsored ADR (Russia) | | 35,827 | | | | 1,253,945 | |
Tele Norte Leste Participacoes S.A. (Brazil) | | 76,600 | 2 | | | 1,372,672 | |
Telekomunikasi Indonesia Tbk P (Indonesia) | | 3,219,000 | | | | 1,920,256 | |
Turkcell Iletisim Hizmet AS (Turkey) | | 315,331 | | | | 1,902,329 | |
Total Telecommunication Services | | | | | | 14,202,427 | |
Utilities - 2.7% | | | | | | | |
Empresa Nacional de Electricidad SA/Chile, ADR (Chile) | | 64,079 | 2 | | | 1,962,099 | |
Tenaga Nasional Berhad (Malaysia) | | 463,800 | | | | 1,214,876 | |
Total Utilities | | | | | | 3,176,975 | |
Total Common Stocks
(cost $79,339,812) | | | | | | 109,078,271 | |
Preferred Stocks - 6.5% | | | | | | | |
Braskem SA , Preferred A (Brazil) | | 142,400 | | | | 1,157,080 | |
Companhia Energetica de Minas Gerais, 1.58% (Brazil) | | 58,304,967 | | | | 2,368,803 | |
Hyundai Motor Co., Ltd., 3.92% (South Korea) | | 30,560 | 2 | | | 1,950,680 | |
Tam S.A. (Brazil) | | 113,000 | | | | 2,145,661 | |
Total Preferred Stocks
(cost $4,312,624) | | | | | | 7,622,224 | |
Other Investment Companies - 14.3%1 | | | | | | | |
Bank of New York Institutional Cash Reserves Fund, 4.30%3 | | 15,933,904 | | | | 15,933,904 | |
JPMorgan Prime Money Market Fund, Institutional Class Shares, 4.14% | | 758,040 | | | | 758,040 | |
Total Other Investment Companies
(cost $16,691,944) | | | | | | 16,691,944 | |
Total Investments -113.8%
(cost $100,344,380) | | | | | | 133,392,439 | |
Other Assets, less Liabilities - (13.8)% | | | | | | (16,163,646 | ) |
Net Assets - 100.0% | | | | | $ | 117,228,793 | |
The accompanying notes are an integral part of these financial statements.
30
Managers Bond Fund
Portfolio Manager Comments
The Managers Bond Fund’s (the “Fund”) objective is to achieve a high level of current income from a diversified portfolio of fixed-income securities.
The Managers Bond Fund invests at least 80% of its assets in a diversified portfolio of bonds. Normally, the Fund invests at least 65% of its total assets in investment grade corporate bonds and mortgage-related and other asset-backed securities and in securities issued by or guaranteed by the U.S. Government, its agencies or instrumentalities. The Fund may invest up to 10% of its assets in non-U.S. dollar denominated investments. The Fund’s benchmark is the Lehman Brothers Government Credit Index.
The Fund currently employs a subadvisor, Loomis Sayles & Company, L.P. (“Loomis”), to manage the assets of the Fund. The investment team at Loomis believes that there are inherent inefficiencies in bond markets, hence the greatest opportunities to add value, reside in the pricing of credit risk. Their philosophy is to identify attractively valued issues through fundamental research. Portfolio manager Dan Fuss and his investment team and analysts at Loomis are focused on issue selection rather than interest rate timing. They employ a “bond picker’s” approach, capitalizing on the firm’s commitment to credit research.
Portfolio manager Dan Fuss and his team of credit analysts at Loomis research debt offerings in the same way equity analysts research stocks, looking for undervalued bonds where they see a yield premium, the potential for price appreciation, or both. They analyze the company’s financial condition in detail, as well as the terms of specific bond offerings. They believe price appreciation can come from a variety of catalysts including improving company fundamentals which would lead to credit upgrades, changing market supply and demand forces, improving sector or economic trends.
The ideal investment typically exhibits some of the following traits:
| | • | | An attractive yield, both absolute and relative to Loomis’ credit research expectations |
| | • | | Good call protection, particularly when prevailing rates are low |
| | • | | Stable or improving fundamentals (for corporate bonds) |
| | • | | Non-market relatedness to counter the impact of systematic risk |
The portfolio:
| | • | | Primarily holds securities rated BBB/Baa or better, but may hold a small portion in below investment grade and in unrated bonds |
| | • | | Can be invested up to 10% in non-U.S. dollar denominated bonds |
In order to mitigate some of the interest rate risk, the portfolio may be structured with counter cyclical elements. In doing so, Dan Fuss may utilize convertible bonds, municipal bonds, preferred stocks and foreign corporate and government bonds in addition to the domestic corporate bonds, which are used for alpha generation. In addition, Dan seeks bonds with call protection, either through the terms of the bond structure or through deep price discounts relative to the call price.
In deciding which securities to buy, the investment team will consider:
| | • | | The financial strength of the issuer of the security |
| | • | | Current interest rates, the asset manager’s expectations regarding general trends in interest rates |
| | • | | Comparisons of the level of risk associated with particular investments with the asset manager’s expectations concerning the potential return of those investments |
The investment team may make a sell decision when:
| | • | | There is a change in sovereign, industry, or company fundamentals |
| | • | | The issuer is downgraded by Loomis research |
| | • | | Relative valuation is not consistent with its expected rating category |
| | • | | Other securities or sectors offer greater total return potential |
The Year in Review
The Managers Bond Fund returned 2.29% for the year ended 2005, compared to its benchmark, the Lehman Government/Credit Index (LB G/C), which returned 2.37%.
Longer-term interest rates changed little during 2005. Although a strong economy and aggressive rate hikes by the Federal Open Market Committee (FOMC) will typically cause long-term rates to rise, there was enough demand for dollar based assets by foreign investors and a lack of more broadly measurable inflation to keep these rates in check. Thus, the yield on the 10-year Treasury rose by only 18 basis points to a still low 4.4%. As longer-term interest rates inched higher, the return for bonds (as measured by the Lehman Brothers Aggregate Bond Index) was more modest than in recent years. This was the third-lowest annual return for the index over the past 20 years and the lowest since 1999. Within the broad bond market, corporate bonds lagged Treasuries during 2005. Again, this came in the face of good corporate profits and credit-worthiness. However, corporate bonds (especially high-yield bonds) had performed extremely well over the prior few years and thus offered less compelling valuations (typically measured by yield spreads over Treasury yields) heading into the year. Additionally, the high-profile downgrades of GM and Ford (deserved as they were) startled many investors.
31
Managers Bond Fund
Portfolio Manager Comments (continued)
For non-U.S. bond markets, the changes in longer-term yields were comparable. For U.S. investors, though, these bond’s returns were hurt by the aforementioned rise in the U.S. dollar. Thus, the non-U.S. bonds declined more than 8% in U.S. dollar terms during 2005.
Despite its conservative duration posture and its exposure to the poor performing corporate bond and non-U.S. dollar segments to the market, the Fund performed in line with the broad bond market. Security selection within US investment grade corporates, foreign denominated, and convertibles was a positive contributor during the year. For example, returns in the Fund’s industrial and utility corporate sector outperformed the same segments of the LB G/C, while the non-benchmark allocations to foreign bonds and convertibles were generally positive. In the investment-grade corporate sector, the Fund’s best ideas came from BBB and A quality names. Meanwhile, the Fund’s modest high yield (HY) allocation did not detract much from performance. Holdings in HY ended the year at slightly below 5% of the Fund.
Over the course of the year, the best returns from yield curve positioning came from those bonds with durations between 3 and 7 years, where performance exceeded 5%. However total yield curve and duration strategies were not a significant contributor to returns during the year.
As noted above, foreign bonds were a plus for the year, despite the fact that this segment was a negative for the market in general. Specifically, the Fund’s Brazilian Real and Mexican Peso bonds had positive performance in bond returns that was complemented by excellent currency returns. Other non-U.S. dollar holdings, notably Asian currencies, disappointed for the year.
Looking Forward
Portfolio manager Dan Fuss at Loomis expects solid economic growth to continue throughout 2006. Thus, modest returns are possible for most fixed income sectors, given the potential for higher yields and a flat curve. Though corporate balance sheets remain healthy and the consumer is in good shape, historically tight yield spreads (the extra yield offered by corporate bonds) and rising interest rates could limit the upside.
Loomis’ HY team believes HY spreads will remain range bound for the next quarter or two, as the market seems fairly valued relative to its forecasts for economic growth, corporate profits, and credit quality trends. Defaults are expected to rise modestly, though remain below long term averages. Also, the team is less enthusiastic about returns for later in the year.
Whether the Fed stops or continues tightening will become more data dependent in coming months, requiring increased vigilance on the part of bondholders. If the Fed stops at 4.75%, the interest rate differential that had been favoring the US over global bonds could begin to fade. The eventual end to Fed rate increases will most likely give Loomis the ability to extend duration in this Fund where liquidity has been building and as longer corporate names become more attractive. Opportunities in both hedged and unhedged global positions are likely to increase in relative attractiveness in coming months.
Cumulative Total Return Performance
Bond’s cumulative total return is based on the daily change in net asset value (NAV), and assumes that all distributions were reinvested. The Lehman Brothers Government/Credit Index is comprised of 3,778 government securities and investment grade corporate securities with a maturity between 1 and 10 years. Unlike the Fund, the Lehman Brothers Government/Credit Index is unmanaged, is not available for investment, and does not incur expenses. The index assumes reinvestment of all income. This chart compares a hypothetical $10,000 investment made in the Bond Fund on December 31, 1995, to a $10,000 investment made in the Lehman Brothers Government/Credit Index for the same time period. The chart is not intended to imply any future performance of the Fund. The graph and chart do not reflect the deduction of taxes that a shareholder would pay on a Fund distribution or redemption of shares. Total returns would have been lower had certain expenses not been reduced.
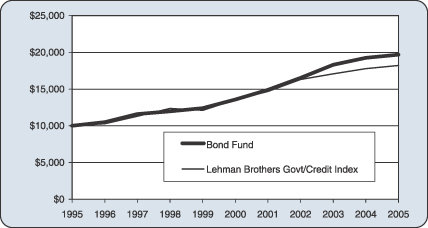
32
Managers Bond Fund
Portfolio Manager Comments (continued)
The table below shows the average annual total returns for Bond Fund and the Lehman Brothers Government/ Credit Index from December 31, 1995 through December 31, 2005.
| | | | | | | | | |
Average Annual Total Returns: | | 1 Year | | | 5 Years | | | 10 Years | |
Bond Fund | | 2.29 | % | | 7.71 | % | | 7.01 | % |
Lehman Brothers Government/Credit Index | | 2.37 | % | | 6.11 | % | | 6.17 | % |
The performance data shown represents past performance. Past performance is not a guarantee of future results. Current performance may be lower or higher than the performance data quoted. The investment return and the principal value of an investment will fluctuate so that an investor’s shares, when redeemed, may be worth more or less than their original cost. For performance information through the most recent month end please call (800) 835-3879 or visit our Web site at www.managersinvest.com.
Fixed income funds are subject to the risks associated with investments in debt securities, such as default risk and fluctuations in the perception of the debtor’s ability to pay its creditors. Changing interest rates may adversely affect the value of a fixed income investment. An increase in interest rates typically causes the value of bonds and other fixed-income securities to fall.
The table below displays a full breakdown of the portfolio allocation of the Fund as well as the top ten positions as of December 31, 2005.
| | | |
Top Ten Holdings (out of 133 securities) | | % Fund | |
USTN. 3.625%, 04/30/07 | | 10.4 | % |
USTN. 4.250%, 10/31/07 | | 9.6 | |
USTN. 2.750%, 06/30/06 | | 9.3 | |
USTN. 4.375%, 05/15/07 | | 5.2 | |
USTN. 3.000%, 02/15/08 | | 4.6 | |
USTN. 2.750%, 07/31/06 | | 3.4 | |
USTN. 1.625%, 02/28/06 | | 2.8 | |
USTN. 4.250%, 11/30/07 | | 2.6 | |
USTN. 2.500%, 09/30/06 | | 2.3 | |
Corning, Inc., 6.850%, 03/01/29 | | 2.1 | |
| | | |
Top Ten as a Group | | 52.3 | % |
| | | |
| | | | | | |
Portfolio Breakdown | | % Fund | | | Lehman Bros
Gov’t/Credit
Index | |
U.S. Treasury Notes | | 58.3 | % | | 60.8 | % |
Industrials | | 18.4 | | | 15.6 | |
Finance | | 8.1 | | | 13.9 | |
Utility | | 4.1 | | | 3.2 | |
Foreign Government | | 4.0 | | | 6.5 | |
Federal National Mortgage Association | | 3.0 | | | 0.0 | |
Government National Mortgage Association | | 2.9 | | | 0.0 | |
Asset-Backed Securities | | 1.5 | | | 0.0 | |
Federal Home Loan Mortgage Corporation | | 1.4 | | | 0.0 | |
U.S. Treasury Bonds/Bills | | 1.3 | | | 0.0 | |
Preferred Stocks | | 1.1 | | | 0.0 | |
Other Assets and Liabilities | | (4.1 | ) | | 0.0 | |
| | | | | | |
| | 100 | % | | 100 | % |
| | | | | | |
Any sectors, industries, or securities discussed should not be perceived as investment recommendations. Any securities discussed may no longer be held in the account’s portfolio. It should not be assumed that any of the securities transactions discussed were or will prove to be profitable, or that the investment recommendations we make in the future will be profitable.
33
Managers Bond Fund
Schedule of Portfolio Investments
December 31, 2005
| | | | | | | | | |
Security Description | | | | Principal Amount | | | Value |
Corporate Bonds - 32.1% | | | | | | | | | |
Asset-Backed Security - 1.5% | | | | | | | | | |
Bank of America-First Union National Bank Commercial Mortgage, Series 2001-3, Class A2, 5.464%, 04/11/37 | | | | $ | 1,500,000 | | | $ | 1,525,660 |
Community Program Loan Trust, Series 87-A, Class A4, 4.500%, 10/01/18 | | | | | 190,331 | | | | 187,430 |
Community Program Loan Trust, Series 87-A, Class A5, 4.500%, 04/01/29 | | | | | 3,225,000 | | | | 2,973,379 |
Continental Airlines, Inc., 6.648%, 09/15/17 | | | | | 1,601,418 | 2 | | | 1,564,902 |
Total Asset-Backed Security | | | | | | | | | 6,251,371 |
Finance - 8.1% | | | | | | | | | |
ASIF Global Financial, 2.380%, 02/26/09 (a) | | SGD | | | 5,800,000 | | | | 3,393,753 |
Barclays Capital Corp., 4.100%, 02/22/10 (a) | | THB | | | 109,000,000 | | | | 2,480,232 |
Barclays Capital Corp., 4.160%, 02/22/10 (a) | | THB | | | 25,000,000 | | | | 570,993 |
Cerro Negro Finance Ltd., 7.900%, 12/01/20 (a) | | | | | 500,000 | | | | 472,500 |
Citibank N.A., 15.000%, 07/02/10 (a) | | BRL | | | 2,000,000 | | | | 900,449 |
Citigroup, Inc., 3.500%, 02/01/08 | | | | | 2,020,000 | | | | 1,966,589 |
Colonial Realty LP, 4.800%, 04/01/11 | | | | | 3,485,000 | | | | 3,363,823 |
Colonial Realty LP, 5.500%, 10/01/15 | | | | | 1,255,000 | | | | 1,223,272 |
EOP Operating LP, 6.750%, 02/15/12 | | | | | 500,000 | | | | 530,617 |
General Electric Capital Corp., 6.625%, 02/04/10 | | NZD | | | 3,500,000 | | | | 2,374,240 |
GMAC, 5.220%, 03/20/07 | | | | | 1,500,000 | | | | 1,416,831 |
GMAC, 5.625%, 05/15/09 | | | | | 500,000 | 2 | | | 444,846 |
GMAC, 6.125%, 01/22/08 | | | | | 2,000,000 | | | | 1,831,459 |
GMAC, 6.875%, 09/15/11 | | | | | 250,000 | | | | 227,986 |
GMAC, 7.500%, 12/01/06 | | NZD | | | 1,000,000 | | | | 657,179 |
GMAC, International Finance BV, 8.000%, 03/14/07 | | NZD | | | 950,000 | | | | 609,316 |
Inter-American Development Bank, 0.000%, 05/11/09 | | BRL | | | 6,500,000 | 4 | | | 1,695,120 |
Inter-American Development Bank, 6.000%, 12/15/17 | | NZD | | | 4,215,000 | | | | 2,811,261 |
JPMorgan Chase & Co., 4.000%, 02/01/08 | | | | | 1,000,000 | 2 | | | 983,244 |
JPMorgan Chase of London, 0.000%, 10/21/10 (a) | | IDR | | | 16,627,462,500 | 4 | | | 940,568 |
JPMorgan Chase Bank, NA, 0.000%, 05/17/10 (a) | | BRL | | | 3,600,000 | 4 | | | 850,770 |
Morgan Stanley & Co., Inc., 3.625%, 04/01/08 | | | | | 2,100,000 | | | | 2,045,845 |
NiSource Finance Corp., 6.150%, 03/01/13 | | | | | 1,250,000 | 2 | | | 1,309,075 |
SLM Corp., 6.500%, 06/15/10 | | NZD | | | 500,000 | | | | 337,864 |
Spieker Properties, Inc., 7.350%,12/01/17 | | | | | 250,000 | | | | 287,034 |
Toll Brothers, Inc., 5.150%, 05/15/15 (a) | | | | | 1,065,000 | | | | 987,107 |
Total Finance | | | | | | | | | 34,711,973 |
Industrials - 18.4% | | | | | | | | | |
Abitibi-Consolidated, Inc., 7.500%, 04/01/28 | | | | | 500,000 | | | | 407,500 |
Altria Group, Inc., 7.000%, 11/04/13 | | | | | 1,500,000 | | | | 1,641,365 |
America Movil, S.A. de C.V., 4.125%, 03/01/09 | | | | | 3,000,000 | | | | 2,916,000 |
American Airlines, Inc., 8.608%, 04/01/11 | | | | | 125,000 | 2 | | | 124,201 |
American Airlines, Inc., Series 01-2, 6.978%, 04/01/11 | | | | | 1,517,057 | | | | 1,564,015 |
American President, Ltd., 8.000%, 01/15/24 | | | | | 250,000 | | | | 252,813 |
Arrow Electronics, Inc., 6.875%, 07/01/13 | | | | | 500,000 | | | | 533,991 |
Avnet Inc., 6.000%, 09/01/15 | | | | | 2,470,000 | | | | 2,402,809 |
Bausch & Lomb, Inc., 7.125%, 08/01/28 | | | | | 500,000 | | | | 541,056 |
Bowater, Inc., 6.500%, 06/15/13 | | | | | 500,000 | 2 | | | 447,500 |
Bristol-Myers Squibb, 3.991%, 09/15/23 | | | | | 3,645,000 | 2 | | | 3,590,507 |
Chiron Corp., 1.625%, 08/01/33 | | | | | 6,625,000 | | | | 6,509,063 |
Cia Brasileira de Bebida, 8.750%, 09/15/13 | | | | | 3,795,000 | | | | 4,435,406 |
Clear Channel Communications, 4.250%, 05/15/09 | | | | | 1,500,000 | | | | 1,441,884 |
Clear Channel Communications, 5.750%, 01/15/13 | | | | | 500,000 | | | | 490,218 |
The accompanying notes are an integral part of these financial statements.
34
Managers Bond Fund
Schedule of Portfolio Investments (continued)
| | | | | | | |
Security Description | | Principal
Amount | | | Value |
Industrials (continued) | | | | | | | |
Continental Airlines, Inc., Series 991A, 6.545%, 02/02/19 | | $ | 4,279,911 | | | $ | 4,273,416 |
Continental Airlines, Inc., 6.795%, 08/02/20 | | | 57,078 | | | | 49,600 |
Continental Airlines, Inc., Series 01-1, 6.703%, 06/15/21 | | | 371,953 | | | | 362,569 |
Continental Airlines, Inc., Series 99-2, 7.256%, 03/15/20 | | | 354,513 | | | | 360,377 |
Corning, Inc., 6.850%, 03/01/29 | | | 8,642,000 | | | | 9,107,336 |
Delphi Corp., 7.125%, 05/01/29 | | | 1,295,000 | 2 | | | 657,213 |
Devon Energy Corp., 4.900%, 08/15/08 | | | 1,250,000 | | | | 1,439,063 |
Devon Energy Corp., 4.950%, 08/15/08 | | | 1,692,000 | 2 | | | 1,947,915 |
Dillards, Inc., 7.000%, 12/01/28 | | | 225,000 | 2 | | | 208,688 |
Foot Locker, Inc., 8.500%, 01/15/22 | | | 570,000 | | | | 602,775 |
Ford Motor Co., 6.375%, 02/01/29 | | | 2,090,000 | | | | 1,316,700 |
Georgia-Pacific Corp., 7.250%, 06/01/28 | | | 500,000 | | | | 443,125 |
Georgia-Pacific Corp., 7.750%, 11/15/29 | | | 925,000 | | | | 844,063 |
HCA, Inc., 6.250%, 02/15/13 | | | 1,940,000 | 2 | | | 1,941,379 |
HCA, Inc., 5.750, 03/15/14 | | | 2,500,000 | | | | 2,424,255 |
HCA, Inc., 7.050%, 12/01/27 | �� | | 1,600,000 | | | | 1,531,906 |
HCA, Inc., 7.580%, 09/15/25 | | | 125,000 | | | | 127,345 |
Hutchison Whampoa International, Ltd., 5.450%, 11/24/10 (a) | | | 2,225,000 | 2 | | | 2,243,156 |
International Paper Co., 4.000%, 04/01/10 | | | 1,000,000 | | | | 944,259 |
International Paper Co., 4.250%, 01/15/09 | | | 1,000,000 | | | | 970,526 |
Kellwood Co., 7.625%, 10/15/17 | | | 250,000 | 2 | | | 226,202 |
Lennar Corp., 5.600%, 05/31/15 | | | 1,205,000 | | | | 1,163,456 |
Lowe’s Co., Inc., 6.875%, 02/15/28 | | | 500,000 | | | | 588,103 |
MacMillan Bloedel Ltd., 7.700%, 02/15/26 | | | 1,350,000 | | | | 1,547,501 |
Motorola, Inc., 7.625%, 11/15/10 | | | 60,000 | 2 | | | 66,698 |
Motorola, Inc., 8.000%, 11/01/11 | | | 1,075,000 | | | | 1,232,726 |
Pemex Project Funding Master Trust, 8.625%, 12/01/23 (a) | | | 950,000 | | | | 1,167,550 |
Penney (JC), Co., 7.125%, 11/15/23 | | | 33,000 | | | | 36,738 |
PF Export Rec Master Trust, 6.436%, 06/01/15 (a) | | | 766,582 | | | | 765,401 |
Pulte Home, Inc., 6.000%, 02/15/35 | | | 245,000 | | | | 217,457 |
Raytheon Co., 7.000%, 11/01/28 | | | 1,500,000 | | | | 1,742,829 |
Raytheon Co., 7.200%, 08/15/27 | | | 800,000 | | | | 945,465 |
Samsung Electronics Co., Ltd., 7.700%, 10/01/27 (a) | | | 4,695,000 | | | | 5,130,836 |
Schering-Plough Corp., 5.300%, 12/01/13 | | | 1,500,000 | | | | 1,528,148 |
Teck Cominco Ltd., 7.000%, 09/15/12 | | | 1,000,000 | | | | 1,083,184 |
Telekom Malaysia Berhad, 7.875%, 08/01/25 (a) | | | 250,000 | | | | 315,142 |
US West Communications, Inc., 7.250%, 09/15/25 | | | 500,000 | | | | 497,500 |
Williams Co., Inc., Series A, 7.500%, 01/15/31 | | | 1,000,000 | 2 | | | 1,035,000 |
Total Industrials | | | | | | | 78,383,930 |
Utilities - 4.1% | | | | | | | |
Coastal Corp., 6.950%, 06/01/28 | | | 300,000 | | | | 272,250 |
Commonwealth Edison, 4.700%, 04/15/15 | | | 1,465,000 | | | | 1,401,535 |
Commonwealth Edison, 5.875%, 02/01/33 | | | 5,000,000 | | | | 5,012,560 |
Constellation Energy Group, Inc., 4.550%, 06/15/15 | | | 1,675,000 | | | | 1,571,165 |
El Paso Corp., 6.750%, 05/15/09 (a) | | | 250,000 | 2 | | | 248,125 |
El Paso Corp., 7.000%, 05/15/11 | | | 500,000 | 2 | | | 496,250 |
Empresa Nacional de Electricidad SA, 8.625%, 08/01/15 | | | 300,000 | | | | 351,293 |
Empresa Nacional de Electricidad, Yankee, 7.875%, 02/01/27 | | | 2,900,000 | | | | 3,205,915 |
Enersis SA, Yankee, 7.400%, 12/01/16 | | | 225,000 | 2 | | | 244,552 |
MidAmerican Energy Holdings, 5.875%, 10/01/12 | | | 750,000 | | | | 774,272 |
Southern Natural Gas Co., 7.350%, 02/15/31 | | | 1,000,000 | | | | 1,025,905 |
The accompanying notes are an integral part of these financial statements.
35
Managers Bond Fund
Schedule of Portfolio Investments (continued)
| | | | | | | | | |
Security Description | | | | Principal
Amount | | | Value |
Utilities (continued) | | | | | | | | | |
Tenaga Nasional Berhad, 7.500%, 11/01/25 (a) | | | | $ | 2,000,000 | | | $ | 2,351,048 |
Transocean, Inc., 7.375%, 04/15/18 | | | | | 500,000 | | | | 587,808 |
Total Utilities | | | | | | | | | 17,542,678 |
Total Corporate Bonds
(cost $132,587,621) | | | | | | | | | 136,889,952 |
Foreign Government and Agency Obligations - 4.0% | | | | | | | | | |
British Columbia, Province of, 6.000%, 06/09/08 | | CAD | | | 560,000 | | | | 504,017 |
European Investment Bank, 0.000%, 09/12/08 (a) | | BRL | | | 13,323,060 | 4 | | | 3,898,598 |
Kommunekredit, 5.000%, 06/07/06 | | NOK | | | 1,600,000 | | | | 239,144 |
Manitoba, Province of, 5.750%, 06/02/08 | | CAD | | | 3,800,000 | | | | 3,398,997 |
Mexican Fixed Rate Bonds, 8.000%, 12/07/23 | | MXN | | | 16,500,000 | | | | 1,460,132 |
Mexican Government, 9.000%, 12/20/12 | | MXN | | | 54,500,000 | | | | 5,347,740 |
Mexican Government, 7.500%, 01/14/12 | | | | | 1,250,000 | | | | 1,393,750 |
Ontario Province, 5.900%, 03/08/06 | | CAD | | | 585,000 | | | | 505,396 |
Province of Alberta, Series CS, Sinking Fund, 5.930%, 09/16/16 | | CAD | | | 195,089 | | | | 181,977 |
Total Foreign Government and Agency
(cost $15,059,887) | | | | | | | | | 16,929,751 |
U.S. Government and Agency Obligations - 66.9% | | | | | | | | | |
Federal Home Loan Mortgage Corporation - 1.4% | | | | | | | | | |
FHLMC, 3.220%, 06/20/07 | | SGD | | | 500,000 | | | | 300,982 |
FHLMC, 5.500%, 09/15/11 | | | | | 5,090,000 | 2 | | | 5,268,445 |
FHLMC, Gold, 5.000%, 12/01/31 | | | | | 234,318 | | | | 227,345 |
FHLMC, 7.75% to 9.50%, 07/25/17 to 09/17/26 8 | | | | | 86,845 | | | | 10,550 |
Total Federal Home Loan Mortgage Corporation | | | | | | | | | 5,807,322 |
Federal National Mortgage Association - 3.0% | | | | | | | | | |
FNMA, 2.290%, 02/19/09 | | SGD | | | 3,800,000 | | | | 2,225,877 |
FNMA, 4.000%, 10/01/18 | | | | | 10,952,042 | | | | 10,477,815 |
FNMA, 6.000%, 07/01/29 | | | | | 27,057 | | | | 27,401 |
Total Federal National Mortgage Association | | | | | | | | | 12,731,093 |
Government National Mortgage Association - 2.9% 8 | | | | | | | | | |
GNMA, 5.00% to 5.50%, 02/15/33 to 06/20/35 | | | | | 2,828,089 | | | | 2,456,664 |
GNMA, 3.00% to 11.00%, 07/15/06 to 08/15/44 | | | | | 87,757,051 | | | | 10,125,508 |
Total Government National Mortgage Association | | | | | | | | | 12,582,172 |
U.S. Treasury Bills - 0.4% 8 | | | | | | | | | |
U.S. Treasury Bills, 0.00%, 02/09/06 to 06/22/06 | | | | | 1,828,112 | 4 | | | 1,803,095 |
U. S. Treasury Bonds - 0.9% 8 | | | | | | | | | |
U.S. Treasury Bonds, 0.00% to 6.25%, 05/15/19 to 05/15/30 | | | | | 2,202,249 | | | | 1,263,003 |
U.S. Treasury Bonds, 5.375% to 9.125%, 05/15/18 to 02/15/31 | | | | | 2,051,506 | | | | 2,731,073 |
Total U.S. Treasury Bonds | | | | | | | | | 3,994,076 |
U.S. Treasury Notes - 58.3% | | | | | | | | | |
USTN, 1.625%, 02/28/06 | | | | | 12,000,000 | 2 | | | 11,955,000 |
USTN, 2.375%, 08/15/06 | | | | | 985,000 | | | | 972,880 |
USTN, 2.500%, 09/30/06 | | | | | 10,000,000 | 2 | | | 9,858,980 |
USTN, 2.750%, 06/30/06 | | | | | 40,000,000 | 2 | | | 39,689,080 |
USTN, 2.750%, 07/31/06 | | | | | 14,785,000 | 2 | | | 14,645,814 |
USTN, 3.000%, 02/15/08 | | | | | 20,000,000 | 2 | | | 19,436,720 |
USTN, 3.250%, 08/15/08 | | | | | 5,000,000 | 2 | | | 4,861,525 |
USTN, 3.375%, 02/28/07 | | | | | 7,080,000 | 2 | | | 6,993,709 |
USTN, 3.500%, 11/15/06 | | | | | 3,400,000 | 2 | | | 3,373,303 |
USTN, 3.625%, 04/30/07 | | | | | 45,000,000 | 2 | | | 44,528,895 |
USTN, 4.250%, 10/31/07 | | | | | 41,000,000 | 2 | | | 40,879,870 |
USTN, 4.250%, 11/30/07 | | | | | 11,000,000 | 2 | | | 10,967,770 |
The accompanying notes are an integral part of these financial statements.
36
Managers Bond Fund
Schedule of Portfolio Investments (continued)
| | | | | | | |
Security Description | | Principal
Amount | | Value | |
U.S. Treasury Notes (continued) | | | | | | | |
USTN, 4.375%,05/15/07 | | $ | 22,000,0002 | | $ | 21,981,960 | |
USTN, 1.500% to 14.00%, 12/31/05 to 11/15/16 8 | | | 10,699,339 | | | 11,121,400 | |
USTN, 0.00% to 9.25%, 05/15/08 to 02/15/16 8 | | | 7,466,450 | | | 7,292,540 | |
Total U.S. Treasury Notes | | | | | | 248,559,446 | |
Total U.S. Government and Agency Obligations
(cost $287,253,358) | | | | | | 285,477,204 | |
| | |
| | | Shares | | | |
Preferred Stocks -1.1% | | | | | | | |
Entergy Louisiana, Inc., 4.440% | | | 226 | | | 17,098 | |
Entergy New Orleans, Inc., 4.750% | | | 482 | | | 21,841 | |
Entergy New Orleans, Inc., 5.560% | | | 100 | | | 5,069 | |
Newell Financial Trust I, 5.250% | | | 42,375 | | | 1,758,562 | |
Travelers Property Casualty Corp., 4.500% | | | 109,275 | | | 2,705,649 | |
Union Electric Co., 3.500% | | | 350 | | | 24,500 | |
Wisconsin Electric Power Co., 3.600% | | | 3,946 | | | 280,659 | |
Total Preferred Stocks
(cost $4,547,122) | | | | | | 4,813,378 | |
Short-Term Investments - 21.0%1 | | | | | | | |
Other Investment Companies - 19.9% | | | | | | | |
Bank of New York Institutional Cash | | | | | | | |
Reserves Fund, 4.30%3 | | | 70,470,423 | | | 70,470,423 | |
JPMorgan Prime Money Market Fund, | | | | | | | |
Institutional Class Shares, 4.14% | | | 13,812,855 | | | 13,812,855 | |
Total Other Investment Companies | | | | | | 84,283,278 | |
| | |
| | | Principal
Amount | | | |
Other Short-Term Investments - 0.6% | | | | | | | |
Goldman Sachs Promissory Notes, 4.33%3 | | $ | 2,502,727 | | $ | 2,502,727 | |
Repurchase Agreement - 0.5% | | | | | | | |
UBS Securities, LLC, dated 12/30/05, due 01/04/06, 4.20%, total to be received $2,157,703 (secured by $2,158,282 U.S. Treasury Notes), at cost3 | | | 2,157,703 | | | 2,157,703 | |
Total Short-Term Investments
(cost $88,943,708) | | | | | | 88,943,708 | |
Total Investments - 125.1%
(cost $528,391,696) | | | | | | 533,053,993 | |
Other Assets, less Liabilities - (25.1)% | | | | | | (106,605,897 | ) |
Net Assets -100.0% | | | | | $ | 426,448,096 | |
The accompanying notes are an integral part of these financial statements.
37
Managers Global Bond Fund
Portfolio Manager Comments
The Managers Global Bond Fund’s (the “Fund”) objective is to achieve income and capital appreciation by investing in high quality foreign and domestic fixed-income securities.
The Managers Global Bond Fund seeks both income and capital appreciation by investing in high quality domestic and foreign fixed-income securities. The Fund ordinarily invests at least 80% of its assets in bonds and invests principally in investment grade U.S. and foreign bonds and in securities issued or guaranteed by the U.S. and foreign governments, their agencies and instrumentalities, and supranational organizations such as the World Bank and the United Nations.
The Fund may also invest in both U.S. dollar and non-U.S. dollar denominated securities. Average maturity is generally expected to be ten years or less. The Fund may engage in currency hedging strategies through the use of forward currency exchange contracts, options and futures contracts. The Fund’s benchmark is the Citigroup World Government Bond Index.
The Fund currently employs a subadvisor, Loomis Sayles & Company, L.P. (“Loomis”), to manage the assets of the Fund. The investment team at Loomis believes that there are inefficiencies inherent in bond markets, hence the greatest opportunities to add value, reside in the pricing of credit risk. Their philosophy is to identify attractively valued issues through fundamental research. The investment team and analysts at Loomis generally seek fixed income securities of issuers whose credit profiles it believes are improving. The investment team also analyzes political, economic, and other fundamental factors and combines this analysis with a comparison of the yield spreads of various fixed income securities throughout the world in an effort to find securities that they believe may produce attractive returns in comparison to their risk. Finally, if a security that is believed to be attractive is denominated in a foreign currency, Loomis analyzes whether to accept or to hedge the currency risk.
Portfolio managers Kenneth Buntrock and David Rolley and their team of credit analysts at Loomis research debt offerings in the same way equity analysts research stocks, looking for undervalued bonds where they see a yield premium, the potential for price appreciation, or both. They analyze in detail the financial condition of individual countries and companies, as well as the terms of specific bond offerings. They believe price appreciation can come from a variety of catalysts including improving country or company fundamentals which would lead to credit upgrades, changing market supply and demand forces, improving sector or economic trends.
The ideal investment typically exhibits some of the following traits:
| | • | | An attractive yield, both absolute and relative to Loomis’ credit research expectations |
| | • | | Good call protection (particularly when prevailing rates are low) |
| | • | | Stable or improving fundamentals (for corporate bonds) |
Portfolio management:
| | • | | Seeks to identify attractively valued issues through fundamental research |
| | • | | Believes the greatest opportunity to add value is through accurately pricing credit risk |
| | • | | Analyzes stability and volatility of a country’s bond markets, the financial strength of the issuer, current interest rates, and Loomis’ expectations regarding general trends in interest rates |
| | • | | Employs bottom-up security selection approach |
| | • | | Ensures the average portfolio quality is Aa or higher |
The investment team may make a sell decision when:
| | • | | There is a change in sovereign, industry, or company fundamentals |
| | • | | The issuer is downgraded by Loomis research |
| | • | | Relative valuation is not consistent with its expected rating category |
| | • | | Other securities or sectors offer greater total return potential |
The Year in Review
Managers Global Bond Fund returned -4.94% during 2005, compared to a return of -4.49% for the Lehman Brothers Global Aggregate Bond Index (“Global Agg”).
The stickiness of longer-term rates and a flattening of yield curves was pretty much a global phenomenon during 2005. As was the case in the U.S., longer-term rates were flat to down slightly during the year while most short-term rates rose. Even Japan experienced a small increase in short-term rates. Thus, most foreign bond markets offered only modest gains in local currencies during the year. For U.S. investors, though, these returns were hurt by the sharp rise in the U.S. Dollar. The U.S. Dollar rose more than 15% versus the Euro and the Japanese Yen, and it rose more than 10% versus the British Pound. Thus, the local currency returns for foreign bonds were reduced by comparable amounts.
The Fund’s performance during 2005 was largely dictated by its currency allocations. As noted above, the limited changes in global yields resulted in only slight changes in bond values. These changes, in turn, were largely overwhelmed by currency changes. On the positive side, the Fund’s Brazilian Real holdings appreciated more than 19% while its South American Rand positions also helped overall performance. An underweight to Euro bonds (compared to the currency’s
38
Managers Global Bond Fund
Portfolio Manager Comments (continued)
weight in the Global Agg) was a positive as that currency fell 15% versus the U.S. Dollar. On the other hand, an overweight to Danish and Swedish Krona Hurt returns in absolute and relative terms. In addition, the strategy to overweight minor Asian currencies such as the Korean Won, the Singapore Dollar and Thai Baht produced negative results during 2005. Finally, although the Japanese Yen fell against the US Dollar, it did not affect performance (in a relative sense) as the Fund’s Yen weight was similar to the Yen’s weight in the Global Agg.
Within local markets portfolio managers Ken Buntrock and David Rolley pursued a modestly defensive duration strategy with an overall short to benchmark position. Thus, their slight underweight on the long end of the maturity spectrum hurt relative performance marginally. Within their corporate bond holdings, an emphasis on the utility, mining and wireless sectors was beneficial.
Looking Forward
Heading into 2006, the Fund’s managers have maintained their cautious duration position. Buntrock and Rolley are looking for world economic growth to remain strong, key policy rates to level in the U.S. (although rising in Europe and possibly Japan), and another official revaluation of the Chinese Yuan. China has seen its external trade surplus nearly triple in a year and reserves have soared further. Therefore, further upward adjustment of the Yuan seems more likely than not. Global inflation looks reasonably well contained despite strong real growth, so bonds in general may be broadly range-bound. U.S. yield curve inversion seems temporary, and not an indicator of imminent slowdown in their view. In this environment they will be maintaining their non-Japan Asian currency positions. Duration is slightly defensive in dollar and Euro markets and very defensive in Yen. They continue to hold tactical positions in emerging market debt for additional yield and to gain exposure to specific positive stories.
Cumulative Total Return Performance
Global Bond’s cumulative total return is based on the daily change in net asset value (NAV), and assumes that all distributions were reinvested. The Lehman Brothers Global Aggregate Index is a broad-based index comprised of 10,232 global investment-grade fixed income securities covering the U.S., Europe and Asia. Unlike the Fund, the Lehman Brothers Global Aggregate Index is unmanaged, is not available for investment, and does not incur expenses This chart compares a hypothetical $10,000 investment made in Global Bond on December 31,1995, to a $10,000 investment made in the Lehman Brothers Global Aggregate Index for the same time period. The chart is not intended to imply any future performance of the Fund. The graph and chart do not reflect the deduction of taxes that a shareholder would pay on a Fund distribution or redemption of shares. Total returns would have been lower had certain expenses not been reduced.
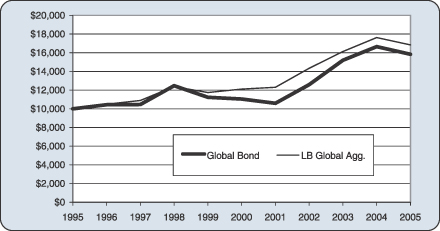
The table below shows the average annual total returns for Global Bond and the Lehman Brothers Global Aggregate Index from December 31,1995 through December 31, 2005.
| | | | | | | | | |
Average Annual Total Returns: | | 1 Year | | | 5 Years | | | 10 Years | |
Global Bond Fund | | (4.94 | )% | | 7.47 | % | | 4.70 | % |
Lehman Brothers Global Aggregate Index | | (4.49 | )% | | 6.81 | % | | 5.35 | % |
The performance data shown represents past performance. Past performance is not a guarantee of future results. Current performance may be lower or higher than the performance data quoted. The investment return and the principal value of an investment will fluctuate so that an investor’s shares, when redeemed, may be worth more or less than their original cost. For performance information through the most recent month end please call (800) 835-3879 or visit our Web site at www.managersinvest.com.
39
Managers Global Bond Fund
Portfolio Manager Comments (continued)
Investments in foreign securities are subject to additional risks such as changing market conditions, economic and political instability, and currency exchange rate fluctuations.
Fixed income funds are subject to the risks associated with investments in debt securities, such as default risk and fluctuations in the perception of the debtor’s ability to pay its creditors. Changing interest rates may adversely affect the value of a fixed income investment. An increase in interest rates typically causes the value of bonds and other fixed-income securities to fall.
The table below displays a full breakdown of the portfolio allocation of the Fund as well as the top ten positions as of December 31, 2005.
| | | |
Top Ten Holdings (out of 150 securities) | | % Fund | |
Swedish Government, 5.250%, 03/13/11 | | 3.2 | % |
KfW International Finance, Inc., 2.050%, 09/21/09 | | 3.1 | |
Spain, Government of, 3.600%, 01/31/09 | | 3.0 | |
Oesterreichische Kontrollbank AG, 1.800%, 03/22/10 | | 2.9 | |
Canada Government, 0.700%, 03/20/06 | | 2.9 | |
FNMA, 1.750%, 03/26/08 | | 2.8 | |
Belgium Government Bond, 3.750%, 03/28/09 | | 2.5 | |
Hypothekenbank in Essen AG, 5.250%, 01/22/08 | | 2.3 | |
Tennessee Valley Authority, 5.375%, 11/13/08 | | 2.3 | |
Irish Government, 4.600%, 04/18/16 | | 2.1 | |
| | | |
Top Ten as a Group | | 27.1 | % |
| | | |
| | | | | | |
Portfolio Breakdown | | % Fund | | | Lehman Bros
Global Aggr.
Index | |
Foreign Government | | 40.4 | % | | 50.1 | % |
Finance | | 21.2 | | | 8.3 | |
Industrials | | 12.6 | | | 6.5 | |
U.S. Government Agency Obligations | | 11.7 | | | 4.2 | |
U.S. Treasury | | 2.6 | | | 9.8 | |
Utilities | | 3.4 | | | 1.7 | |
Asset-Backed Securities | | 3.7 | | | 0.7 | |
Other MBS | | 0.8 | | | 4.5 | |
Agency Fixed Rate MBS/CMO | | 0.0 | | | 14.2 | |
Other Assets and Liabilities | | 3.6 | | | 0.0 | |
| | | | | | |
| | 100 | % | | 100 | % |
| | | | | | |
Any sectors, industries, or securities discussed should not be perceived as investment recommendations. Any securities discussed may no longer be held in the account’s portfolio. It should not be assumed that any of the securities transactions discussed were or will prove to be profitable, or that the investment recommendations we make in the future will be profitable.
40
Managers Global Bond Fund
Schedule of Portfolio Investments
December 31, 2005
| | | | | | | | |
Security Description | | | | Principal
Amount | | | Value |
Foreign Government and Agency Obligations - 40.4% | | | | | | | | |
Foreign Government - 40.4% | | | | | | | | |
Argentina, Republic of, 2.000%, 09/30/14 | | ARS | | 640,000 | | | $ | 211,117 |
Belgium Government Bond, 3.750%, 03/28/09 | | EUR | | 900,000 | | | | 1,089,400 |
Bundes Immobil, 4.625%, 09/27/12 | | EUR | | 525,000 | | | | 668,216 |
Bundes Obligation, 3.250%, 04/17/09 | | EUR | | 465,000 | | | | 555,198 |
Bundes Obligation, Series 139, 4.000%, 02/16/07 | | EUR | | 305,000 | | | | 366,016 |
Canada Government, 0.700%, 03/20/06 | | JPY | | 146,000,000 | | | | 1,239,688 |
Canadian Government, 5.250%, 06/01/13 | | CAD | | 215,000 | | | | 200,353 |
Denmark, Kingdom of, 6.000%, 11/15/09 | | DKK | | 3,050,000 | | | | 536,473 |
Development Bank of Japan, 2.875%, 12/20/06 | | JPY | | 30,000,000 | | | | 261,324 |
Deutscheland Republic, 4.000%, 01/04/37 | | EUR | | 330,000 | | | | 422,252 |
Federal Republic of Brazil, 8.750%, 02/04/25 | | USD | | 105,000 | | | | 116,025 |
Irish Government, 4.600%, 04/18/16 | | EUR | | 700,000 | | | | 919,076 |
Kingdom of Denmark, 5.000%, 11/15/13 | | DKK | | 1,165,000 | | | | 207,861 |
Kingdom of Norway, 5.500%, 05/15/09 | | NOK | | 2,625,000 | | | | 415,227 |
Kingdom Of Spain, 3.100%, 09/20/06 | | JPY | | 30,000,000 | | | | 259,885 |
Mexican Fixed Rate Bonds, 8.000%, 12/07/23 | | MXN | | 500,000 | | | | 44,246 |
Mexican Government, 9.000%, 12/20/12 | | MXN | | 500,000 | | | | 49,062 |
Netherlands Government SA, 5.500%, 01/15/28 | | EUR | | 445,000 | | | | 679,180 |
Ontario Province, 5.700%, 12/01/08 | | CAD | | 130,000 | | | | 116,910 |
Province of Saskatchewan, 5.750%, 03/05/29 | | CAD | | 90,000 | | | | 91,375 |
Queensland Treasury Corp., 8.000%, 09/14/07 | | AUD | | 870,000 | | | | 664,614 |
Republic of Poland, 1.020%, 06/09/09 | | JPY | | 100,000,000 | | | | 849,621 |
Republic of South Africa, 5.250%, 05/16/13 | | EUR | | 350,000 | | | | 449,066 |
Singapore Government, 4.625%, 07/01/10 | | SGD | | 1,120,000 | | | | 718,989 |
Spain, Government of, 3.600%, 01/31/09 | | EUR | | 1,080,000 | | | | 1,302,513 |
Swedish Government, 5.250%, 03/15/11 | | SEK | | 10,075,000 | | | | 1,394,229 |
Swedish Government, 6.500%, 05/05/08 | | SEK | | 3,145,000 | | | | 428,412 |
U.K. Gilts, 4.750%, 03/04/20 | | GBP | | 455,000 | | | | 836,419 |
U.K. Treasury, 5.000%, 03/07/12 | | GBP | | 365,000 | | | | 657,180 |
U.K. Treasury, 6.250%, 11/25/10 | | GBP | | 265,000 | | | | 497,908 |
United Mexican States, 4.250%, 06/16/15 | | EUR | | 250,000 | | | | 297,009 |
United Mexican States, Series 6Rg, 6.750%, 06/06/06 | | JPY | | 18,000,000 | | | | 156,778 |
USTB, 5.000%, 03/07/25 | | GBP | | 380,000 | | | | 735,182 |
Total Foreign Government and Agency Obligations
(cost $17,703,741) | | | | | | | | 17,436,804 |
Corporate Bonds - 40.9% | | | | | | | | |
Asset-Backed Securities - 3.7% | | | | | | | | |
DaimlerChrysler Auto Trust, Series 2004-B, Class A4, 3.710%, 10/08/09 | | USD | | 35,000 | | | | 34,321 |
DaimlerChrysler Auto Trust, Class A4, Series 2005-A, 3.740%, 02/08/10 | | USD | | 340,000 | 2 | | | 332,959 |
Greenwich Capital Commercial Funding Corp., Series 2005-GG5, Class A2, 5.117%, 11/10/37 | | USD | | 385,000 | 2 | | | 385,935 |
Honda Auto Receivables Owner Trust, Class A4, Series 2005-1, 3.820%, 05/21/10 | | USD | | 330,000 | | | | 322,329 |
Honda Auto Receivables Owner Trust, 4.930%, 03/18/11 | | USD | | 100,000 | | | | 100,316 |
MBNA Credit Card Master Note Trust, 4.300%, 02/15/11 | | USD | | 410,000 | | | | 405,005 |
Total Asset-Backed Security | | | | | | | | 1,580,865 |
Finance - 21.2% | | | | | | | | |
Arcel Finance Ltd., 7.048%, 09/01/11 (a) | | USD | | 141,795 | | | | 142,334 |
Barclays Capital Corp., 4.100%, 02/22/10 (a)7 | | THB | | 8,000,000 | | | | 182,035 |
Barclays Capital Corp., 4.160%, 02/22/10 (a)7 | | THB | | 7,000,000 | | | | 159,878 |
The accompanying notes are an integral part of these financial statements.
41
Managers Global Bond Fund
Schedule of Portfolio Investments (continued)
| | | | | | | | |
Security Description | | | | Principal
Amount | | | Value |
Finance (continued) | | | | | | | | |
Barclays Financial LLC., 4.060%, 09/16/10 (a) | | KRW | | 220,000,000 | | | $ | 208,367 |
Barclays Financial LLC., 4.460%, 09/23/10 (a) | | KRW | | 110,000,000 | | | | 105,979 |
Barclays Financial LLC, 5.500%, 11/01/10 (a) | | THB | | 9,000,000 | | | | 215,166 |
BSkyB Finance PLC, 5.750%, 10/20/17 | | GBP | | 160,000 | | | | 282,487 |
BSkyB Finance UK PLC, 5.750%, 10/20/17 (a) | | GBP | | 50,000 | | | | 88,216 |
Cerro Negro Finance Ltd., 7.900%, 12/01/20 (a) | | USD | | 65,000 | | | | 61,425 |
CIT Group, Inc., 5.500%, 12/01/14 | | GBP | | 80,000 | | | | 141,767 |
Citibank N.A., 15.000%, 07/02/10 (a) | | BRL | | 900,000 | | | | 405,202 |
Couche-Tard US/Finance, 7.500%, 12/15/13 | | USD | | 160,000 | | | | 164,800 |
Depfa ACS Bank, 0.750%, 09/22/08 | | JPY | | 40,000,000 | | | | 342,526 |
European Investment Bank, 3.000%, 09/20/06 | | JPY | | 11,000,000 | | | | 95,170 |
Federal Farm Credit Bank, 3.250%, 06/15/07 | | USD | | 600,000 | | | | 2587,500 |
Ford Motor Credit Co., 5.700%, 01/15/10 | | USD | | 55,000 | | | | 46,753 |
Hypothekenbank in Essen AG, 5.250%, 01/22/08 | | EUR | | 810,000 | | | | 1,001,632 |
Inter-American Development Bank, 1.900%, 07/08/09 | | JPY | | 60,000,000 | | | | 2532,374 |
Japan Bank for International Cooperation, 0.350%, 03/19/08 | | JPY | | 18,000,000 | | | | 152,905 |
JPMorgan Chase of London, 0.000%, 10/21/10 (a) | | IDR | | 2,680,548,500 | 4 | | | 151,631 |
KfW International Finance, Inc., 1.750%, 03/23/10 | | JPY | | 20,000,000 | | | | 177,047 |
KfW International Finance, Inc., 2.050%, 09/21/09 | | JPY | | 148,000,000 | | | | 1,320,408 |
MBNA Europe Funding, PLC, 6.500%, 03/27/07 | | EUR | | 50,000 | | | | 61,706 |
Morgan Stanley Co., Series EMTN, 5.375%, 11/14/13 | | GBP | | 120,000 | | | | 213,220 |
Muenchener Hypothekenbank eG, 5.000%, 01/16/12 | | EUR | | 30,000 | | | | 38,965 |
NGG Finance, PLC., 6.125%, 08/23/11 | | EUR | | 55,000 | | | | 73,781 |
Nordic Investment Bank, 5.250%, 04/20/06 | | SEK | | 2,000,000 | | | | 253,963 |
Oesterreichische Kontrollbank AG, 1.800%, 03/22/10 | | JPY | | 140,000,000 | | | | 1,241,779 |
Qwest Capital Funding, Inc., 7.250%, 02/15/11 | | USD | | 75,000 | | | | 75,938 |
RWE Finance B.V., 6.125%, 10/26/12 | | EUR | | 55,000 | | | | 75,276 |
Simon Property Group, L.P., 4.825%, 03/18/10 | | USD | | 180,000 | | | | 177,667 |
SLM Corp., 6.500%, 06/15/10 | | NZD | | 245,000 | | | | 165,553 |
Wells Fargo & Co., 5.750%, 07/12/10 | | AUD | | 260,000 | | | | 189,815 |
Total Finance | | | | | | | | 9,133,265 |
Industrials - 12.6% | | | | | | | | |
AGCO Corp., 6.875%, 04/15/14 | | EUR | | 120,000 | | | | 146,329 |
Albertson’s, Inc., 6.625%, 06/01/28 | | USD | | 10,000 | | | | 8,531 |
Albertson’s, Inc., 8.000%, 05/01/31 | | USD | | 35,000 | 2 | | | 34,435 |
Albertson’s, Inc., 8.700%, 05/01/30 | | USD | | 5,000 | | | | 4,974 |
Albertson’s, Inc., 7.450%, 08/01/29 | | USD | | 55,000 | | | | 50,990 |
America Movil SA, 9.000%, 01/15/16 | | MXN | | 1,400,000 | | | | 134,095 |
America Movil, S.A. de C.V., 4.125%, 03/01/09 | | USD | | 135,000 | | | | 131,220 |
American Standard, Inc., 7.125%, 06/01/06 | | EUR | | 75,000 | | | | 89,680 |
American Standard, Inc., 8.250%, 06/01/09 | | GBP | | 50,000 | | | | 94,197 |
American Stores Co., 8.000%, 06/01/26 | | USD | | 25,000 | | | | 26,159 |
ASIF Global, 2.380%, 02/26/09 (a) | | SGD | | 500,000 | | | | 292,565 |
Avenor, Inc., 10.850%, 11/30/14 | | CAD | | 165,000 | | | | 157,224 |
Bavaria S.A., 8.875%, 11/01/10 (a) | | USD | | 60,000 | | | | 65,175 |
Canadian Pacific Railway, Ltd., 4.900%, 06/15/10 (a) | | CAD | | 195,000 | | | | 171,364 |
Casino Guichard-Perrach S.A., 4.750%, 07/21/11 | | EUR | | 170,000 | | | | 205,529 |
Cia Brasileira de Bebida, 8.750%, 09/15/13 | | USD | | 70,000 | | | | 81,813 |
Clear Channel Communications, Inc., 4.500%, 01/15/10 | | USD | | 190,000 | 2 | | | 181,716 |
Corning, Inc., 6.750%, 09/15/13 | | USD | | 125,000 | | | | 132,819 |
DaimlerChrysler N.A. Holdings Corp., 4.875%, 06/15/10 | | USD | | 95,000 | | | | 92,757 |
The accompanying notes are an integral part of these financial statements.
42
Managers Global Bond Fund
Schedule of Portfolio Investments (continued)
| | | | | | | | |
Security Description | | | | Principal
Amount | | | Value |
Industrials (continued) | | | | | | | | |
Desarrolladora Homex SA, 7.500%, 09/28/15 (a) | | USD | | 230,000 | | | $ | 225,975 |
Deutsche Telekom, 5.250%, 05/20/08 | | EUR | | 60,000 | | | | 74,233 |
Diageo Capital Beverages, 3.875%, 01/06/09 | | EUR | | 65,000 | | | | 78,263 |
Georgia-Pacific Corp., 7.250%, 06/01/28 | | USD | | 160,000 | | | | 141,800 |
Hanarotelecom, Inc., 7.000%, 02/01/12 (a) | | USD | | 50,000 | 2 | | | 49,256 |
HCA, Inc., 5.500%, 12/01/09 | | USD | | 150,000 | | | | 148,145 |
Kroger Co., The, 5.500%, 02/01/13 | | USD | | 90,000 | | | | 88,843 |
LPG International, Inc., 7.250%, 12/20/15 (a) | | USD | | 120,000 | | | | 118,500 |
Lucent Technologies, Inc., 6.450%, 03/15/29 | | USD | | 115,000 | | | | 98,613 |
MGM MIRAGE, 6.000%, 10/01/09 | | USD | | 180,000 | 2 | | | 178,875 |
Molson Coors Capital Finance ULC, 5.000%, 09/22/15 | | CAD | | 225,000 | | | | 192,839 |
News America Holdings, 8.625%, 02/07/14 | | AUD | | 350,000 | | | | 274,793 |
Pearson PLC, 6.125%, 02/01/07 | | EUR | | 35,000 | | | | 42,787 |
Pemex Project Funding Master Trust, 7.875%, 02/01/09 | | USD | | 325,000 | | | | 347,588 |
Phillips-Van Heusen Corp., 7.250%, 02/15/11 | | USD | | 70,000 | | | | 71,050 |
Quest Corp., 7.875%, 09/01/11 | | USD | | 75,000 | | | | 80,813 |
Rogers Cable, Inc., 5.500%, 03/15/14 | | USD | | 110,000 | | | | 102,987 |
Rogers Wireless, Inc., 7.625%, 12/15/11 | | CAD | | 115,000 | | | | 105,853 |
Shaw Communications, Inc., 6.100%, 11/16/12 | | CAD | | 230,000 | | | | 197,566 |
Sing Telecommunications, 6.000%, 11/21/11 | | EUR | | 50,000 | | | | 66,801 |
Smithfield Foods, Inc., 7.000%, 08/01/11 | | USD | | 145,000 | | | | 147,900 |
Stena AB, 7.000%, 12/01/16 | | USD | | 85,000 | | | | 77,775 |
Stena AB, 7.500%, 11/01/13 | | USD | | 75,000 | | | | 72,000 |
Vale Overseas Limited., 8.250, 01/17/34 | | USD | | 185,000 | | | | 212,981 |
Williams Co., Inc., 7.875%, 09/01/21 | | USD | | 90,000 | | | | 97,425 |
WPP Group, PLC. 6.000%, 06/18/08 | | EUR | | 50,000 | | | | 62,828 |
Total Industrials | | | | | | | | 5,458,061 |
Utilities - 3.4% | | | | | | | | |
Empresa Nacional de Electricidad, Yankee, 7.875%, 02/01/27 | | USD | | 100,000 | | | | 110,549 |
Enersis SA, Yankee, 7.400%, 12/01/16 | | USD | | 80,000 | 2 | | | 86,952 |
Pioneer Natural Resources Co., 6.500%, 01/15/08 | | USD | | 110,000 | | | | 112,400 |
Scottish Power, 6.625%, 01/14/10 | | GBP | | 90,000 | | | | 165,841 |
Tennessee Valley Authority, 5.375%, 11/13/08 | | USD | | 960,000 | | | | 977,145 |
Total Utilities | | | | | | | | 1,452,887 |
Total Corporate Bonds
(cost $18,032,800) | | | | | | | | 17,625,078 |
U.S. Government and Agency Obligations - 15.1% | | | | | | | | |
U.S. Government Agency Obligations - 11.7% | | | | | | | | |
Federal Farm Credit Bank, 4.125%, 04/15/09 | | USD | | 695,000 | | | | 682,242 |
Federal Farm Credit Banks Funding Corp., 3.375%, 07/15/08 | | USD | | 650,000 | | | | 629,358 |
FHLMC Gold Pool, 4.000%, 02/01/20 | | USD | | 67,936 | | | | 64,824 |
FHLMC Gold Pool, 6.000%, 05/01/18 to 10/01/20 | | USD | | 89,228 | | | | 91,065 |
FHLMC Gold Pool, 6.500%, 08/01/35 to 10/01/35 | | USD | | 92,555 | | | | 94,859 |
FNMA, 1.750%, 03/26/08 | | JPY | | 140,000,000 | | | | 1,225,171 |
FNMA, 2.290%, 02/19/09 | | SGD | | 400,000 | | | | 234,304 |
FNMA, 4.500%, 05/01/20 to 09/01/35 | | USD | | 314,573 | | | | 303,405 |
FNMA, 5.000%, 06/01/20 to 10/01/19 | | USD | | 772,568 | | | | 751,349 |
FNMA, 5.500%, 06/01/35 to 11/01/34 | | USD | | 639,357 | | | | 633,750 |
FNMA, 6.000%, 05/01/35 to 06/01/17 | | USD | | 251,090 | | | | 254,506 |
FNMA, 6.500%, 07/01/35 | | USD | | 42,630 | | | | 43,735 |
GNMA, 6.000%, 10/20/35 | | USD | | 44,508 | | | | 45,483 |
Total U.S. Agency | | | | | | | | 5,054,051 |
The accompanying notes are an integral part of these financial statements.
43
Managers Global Bond Fund
Schedule of Portfolio Investments (continued)
| | | | | | | | |
Security Description | | | | Principal
Amount | | Value | |
U.S. Treasury - 2.6% | | | | | | | | |
USTB, 5.375%, 02/15/31 | | USD | | 665,000 2 | | $ | 746,982 | |
USTN, 5.750%, 08/15/10 | | USD | | 370,000 2 | | | 391,434 | |
Total U.S. Treasury | | | | | | | 1,138,416 | |
Other MBS - 0.8% | | | | | | | | |
Permanent Financing PLC, 5.100%, 06/11/07 | | EUR | | 275,000 | | | 334,925 | |
Total U.S. Government and Agency Obligations
(cost $6,604,012) | | | | | | | 6,527,392 | |
| | | | | Shares | | | |
Other Investment Companies - 9.0%1 | | | | | | | | |
Bank of New York Institutional Cash Reserves Fund, 4.30%3 | | | | 3,452,413 | | | 3,452,413 | |
JPMorgan Prime Money Market Fund, Institutional Class Shares, 4.14% | | | | 439,269 | | | 439,269 | |
Total Other Investment Companies
(cost $3,891,682) | | | | | | | 3,891,682 | |
Total Investments - 105.4%
(cost $46,232,235) | | | | | | | 45,480,956 | |
Other Assets, less Liabilities - (5.4)% | | | | | | | (2,349,684 | ) |
Net Assets - 100.0% | | | | | | $ | 43,131,272 | |
The accompanying notes are an integral part of these financial statements.
44
Notes to Schedules of Portfolio Investments
The following footnotes and abbreviations should be read in conjunction with each of the Schedules of Portfolio Investments previously presented in this report.
At December 31, 2005, the cost of securities for Federal income tax purposes and the gross aggregate unrealized appreciation and/ or depreciation based on tax cost were approximately:
| | | | | | | | | | | | | | |
Fund | | Cost | | Appreciation | | Depreciation | | | Net | |
Value | | $ | 140,028,705 | | $ | 20,861,565 | | $ | (5,764,673 | ) | | $ | 15,096,892 | |
Capital Appreciation | | | 120,204,033 | | | 15,239,386 | | | (1,423,907 | ) | | | 13,815,479 | |
Small Company | | | 39,698,158 | | | 9,059,159 | | | (1,209,274 | ) | | | 7,849,885 | |
International Equity | | | 192,973,980 | | | 55,208,351 | | | (5,744,182 | ) | | | 49,464,169 | |
Emerging Markets | | | 100,616,182 | | | 34,651,047 | | | (1,874,790 | ) | | | 32,776,257 | |
Bond | | | 528,898,338 | | | 9,183,204 | | | (5,027,549 | ) | | | 4,155,655 | |
Global Bond | | | 46,232,235 | | | 726,194 | | | (1,477,473 | ) | | | (751,279 | ) |
| * | Non-income-producing security. |
| (a) | Security exempt from registration under Rule 144A of the Securities Act of 1933. This security may be resold in transactions exempt from registration, normally to qualified buyers. At December 31, 2005, the value of these securities amounted to the following: |
| | | | | | |
Fund | | Market Value | | % of Net Assets | |
Emerging Markets | | $ | 3,416,715 | | 2.9 | % |
Bond | | | 26,716,627 | | 6.3 | % |
Global Bond | | | 2,643,068 | | 6.1 | % |
| 1 | Yield shown for an investment company represents its December 31, 2005, seven-day average yield, which refers to the sum of the previous seven days’ dividends paid, expressed as an annual percentage. |
| 2 | Some or all of these shares were out on loan to various brokers as of December 31, 2005, amounting to: |
| | | | | | |
Fund | | Market Value | | % of Net Assets | |
Value | | $ | 28,813,154 | | 23.1 | % |
Capital Appreciation | | | 26,935,136 | | 25.7 | % |
Small Company | | | 8,956,184 | | 24.2 | % |
International Equity | | | 19,609,149 | | 9.5 | % |
Emerging Markets | | | 14,886,663 | | 12.7 | % |
Bond | | | 109,730,104 | | 25.7 | % |
Global Bond | | | 3,357,475 | | 7.8 | % |
| 3 | Collateral received from brokers for securities lending was invested in these short-term investments. |
| ‘ | Affiliated Company – See Note 10 in the Notes to Financial Statements. |
| 8 | Non-cash collateral received for securities loaned. |
Investments Definitions and Abbreviations:
| ADR/GDR: | ADR after the name of a holding stands for American Depositary Receipt, representing ownership of foreign securities on deposit with a domestic custodian bank; a GDR (Global Depositary Receipt) is comparable, but foreign securities are held on deposit in a non-U.S. bank. The value of the ADR/GDR securities is determined or significantly influenced by trading on exchanges not located in the United States or Canada. Sponsored ADR/GDRs are initiated by the underlying foreign company. |
|
|
| FHLMC: Federal Home Loan Mortgage Corp. |
|
| FNMA: Federal National Mortgage Association |
|
| GNMA: Government National Mortgage Association |
|
| GMAC: General Motors Acceptance Corp. |
|
| USTB: United States Treasury Bond |
|
| USTN: United States Treasury Note |
|
MBA: Mortgage Backed Security |
Registered shares: A security whose owner has been recorded with its issuer or issuer’s registrar.
Abbreviations have been used throughout the portfolios to indicate amounts shown in currencies other than the U.S. dollar (USD):
| | |
AUD: | | Australian Dollar |
| |
CAD: | | Canadian Dollar |
| |
DKK: | | Danish Krone |
| |
EUR: | | euro |
| |
| GBP: | | British Pound |
| |
MXN: | | Mexican Peso |
| |
BRL: | | Brazilian Real |
| |
NOK: | | Norwegian Krone |
| |
| SEK: | | Swedish Krone |
| |
SGD: | | Singapore Dollar |
| |
NZD: | | New Zealand Dollar |
| |
JPY: | | Japanese Yen |
| |
| ARS: | | Argentine Peso |
| |
THB: | | Thailand Baht |
| |
IDR: | | Indonesian Rupiah |
| |
KRW: | | South Korean Won |
45
Statements of Assets and Liabilities
December 31, 2005
| | | | | | | | | | | |
| | | Managers
Value Fund | | Managers
Capital
Appreciation
Fund | | | Managers
Small
Company
Fund | |
Assets: | | | | | | | | | | | |
Investments at value (including securities on loan valued at $28,813,154, $26,935,136, $8,956,184, $19,609,149, $14,886,663, $109,730,104, $3,357,475, respectively)* | | $ | 155,125,597 | | $ | 134,019,512 | | | $ | 47,548,043 | |
Cash | | | — | | | — | | | | 13,228 | |
Foreign currency** | | | — | | | — | | | | — | |
Receivable for investments sold | | | — | | | — | | | | — | |
Receivable for Fund shares sold | | | 98,045 | | | 121,129 | | | | 29,509 | |
Receivable for open forward foreign currency contracts | | | — | | | — | | | | — | |
Dividends, interest and other receivables | | | 86,567 | | | 98,735 | | | | 16,504 | |
Prepaid expenses | | | 12,603 | | | 8,357 | | | | 7,474 | |
| | | | | | | | | | | |
Total assets | | | 155,322,812 | | | 134,247,733 | | | | 47,614,758 | |
| | | | | | | | | | | |
Liabilities: | | | | | | | | | | | |
Payable to affiliate | | | 17,338 | | | 27,053 | | | | 3,680 | |
Payable to Custodian | | | 69,194 | | | 108,073 | | | | — | |
Payable for Fund shares repurchased | | | 388,801 | | | 295,638 | | | | 181,495 | |
Payable upon return of securities loaned | | | 29,798,337 | | | 28,763,012 | | | | 9,249,211 | |
Payable for investments purchased | | | 231,417 | | | — | | | | 1,115,657 | |
Payable for open forward foreign currency contracts | | | — | | | — | | | | — | |
Accrued expenses: | | | | | | | | | | | |
Investment advisory and management fees | | | 79,710 | | | 72,571 | | | | 28,431 | |
Administrative fees | | | 26,570 | | | 22,679 | | | | 7,898 | |
Other | | | 68,314 | | | 80,994 | | | | 35,025 | |
| | | | | | | | | | | |
Total liabilities | | | 30,679,681 | | | 29,370,020 | | | | 10,621,397 | |
| | | | | | | | | | | |
Net Assets | | $ | 124,643,131 | | $ | 104,877,713 | | | $ | 36,993,361 | |
| | | | | | | | | | | |
Shares outstanding | | | 4,454,633 | | | 3,773,365 | | | | 3,412,682 | |
| | | | | | | | | | | |
Net asset value, offering and redemption price per share | | $ | 27.98 | | $ | 27.79 | | | $ | 10.84 | |
| | | | | | | | | | | |
Net Assets Represent: | | | | | | | | | | | |
Paid-in capital | | $ | 107,570,320 | | $ | 246,717,829 | | | $ | 35,772,112 | |
Undistributed (overdistributed) net investment income | | | — | | | — | | | | — | |
Accumulated net realized gain (loss) from investments, futures and foreign currency transactions | | | 760,488 | | | (155,775,215 | ) | | | (6,702,770 | ) |
Net unrealized appreciation (depreciation) of investments, futures and foreign currency contracts and translations | | | 16,312,323 | | | 13,935,099 | | | | 7,924,019 | |
| | | | | | | | | | | |
Net Assets | | $ | 124,643,131 | | $ | 104,877,713 | | | $ | 36,993,361 | |
| | | | | | | | | | | |
* Investments at cost | | $ | 138,813,274 | | $ | 120,084,413 | | | $ | 39,624,024 | |
** Foreign currency at cost | | | — | | | — | | | | — | |
The accompanying notes are an integral part of these financial statements.
46
| | | | | | | | | | | | |
| Managers International Equity Fund | | Managers Emerging Markets
Equity Fund | | | Managers Bond Fund | | | Managers Global Bond Fund | |
| | | | | | | | | | | | |
| $242,438,149 | | $ | 133,392,439 | | | $ | 533,053,993 | | | $ | 45,480,956 | |
| — | | | 120,623 | | | | 435,964 | | | | 598 | |
| 1,613,572 | | | 500,882 | | | | 68,811 | | | | 7,353 | |
| 737,796 | | | — | | | | — | | | | — | |
| 86,961 | | | 71,095 | | | | 823,505 | | | | 464,563 | |
| 1,306,669 | | | — | | | | — | | | | 2,783,658 | |
| 369,802 | | | 279,056 | | | | 4,786,404 | | | | 711,043 | |
| 16,370 | | | 9,786 | | | | 35,239 | | | | 8,032 | |
| | | | | | | | | | | | | |
| 246,569,319 | | | 134,373,881 | | | | 539,203,916 | | | | 49,456,203 | |
| | | | | | | | | | | | | |
| | | | | | | | | | | | |
| — | | | — | | | | — | | | | — | |
| 15,834,405 | | | — | | | | — | | | | — | |
| 721,043 | | | 432,362 | | | | 400,740 | | | | 22,569 | |
| 20,786,456 | | | 15,933,904 | | | | 111,934,686 | | | | 3,452,413 | |
| 1,033,465 | | | | | | | — | | | | — | |
| 1,304,214 | | | — | | | | — | | | | 2,742,257 | |
| 168,500 | | | 113,423 | | | | 194,546 | | | | 24,147 | |
| 46,806 | | | 24,657 | | | | 87,883 | | | | 7,167 | |
| 281,303 | | | 297,198 | | | | 137,965 | | | | 76,378 | |
| | | | | | | | | | | | | |
| 40,176,192 | | | 17,145,088 | | | | 112,755,820 | | | | 6,324,931 | |
| | | | | | | | | | | | | |
| $206,393,127 | | $ | 117,228,793 | | | $ | 426,448,096 | | | $ | 43,131,272 | |
| | | | | | | | | | | | | |
| 3,839,346 | | | 5,831,242 | | | | 17,686,975 | | | | 2,135,858 | |
| | | | | | | | | | | | | |
| $53.76 | | $ | 20.10 | | | $ | 24.11 | | | $ | 20.19 | |
| | | | | | | | | | | | | |
| | | | | | | | | | | | |
| $255,478,223 | | $ | 84,454,831 | | | $ | 421,841,603 | | | $ | 43,711,059 | |
| (409,088) | | | (15,426 | ) | | | 133,777 | | | | 143,886 | |
| (101,073,547) | | | (271,802 | ) | | | (188,504 | ) | | | — | |
| 52,397,539 | | | 33,061,190 | | | | 4,661,220 | | | | (723,673 | ) |
| | | | | | | | | | | | | |
| $206,393,127 | | $ | 117,228,793 | | | $ | 426,448,096 | | | $ | 43,131,272 | |
| | | | | | | | | | | | | |
| $190,070,893 | | $ | 100,344,380 | | | $ | 528,391,696 | | | $ | 46,232,235 | |
| 1,613,158 | | | 490,310 | | | | 68,792 | | | | 7,393 | |
The accompanying notes are an integral part of these financial statements.
47
Statements of Operations
For the year ended December 31, 2005
| | | | | | | | | | | |
| | | Managers
Value Fund | | | Managers
Capital
Appreciation
Fund | | | Managers
Small
Company
Fund |
Investment Income: | | | | | | | | | | | |
Dividend income | | $ | 2,304,060 | | | $ | 1,003,587 | | | $ | 179,041 |
Interest income | | | — | | | | — | | | | — |
Foreign withholding tax | | | (10,337 | ) | | | (10,596 | ) | | | (559 |
Securities lending fees | | | 23,105 | | | | 19,611 | | | | 15,330 |
| | | | | | | | | | | |
Total investment income | | | 2,316,828 | | | | 1,012,602 | | | | 193,812 |
| | | | | | | | | | | |
Expenses: | | | | | | | | | | | |
Investment management fees | | | 912,310 | | | | 803,038 | | | | 277,859 |
Administrative fees | | | 304,103 | | | | 250,949 | | | | 77,183 |
Transfer agent | | | 45,300 | | | | 57,420 | | | | 11,941 |
Professional fees | | | 50,077 | | | | 40,315 | | | | 25,979 |
Custodian | | | 45,457 | | | | 38,456 | | | | 20,687 |
Registration fees | | | 17,816 | | | | 12,893 | | | | 13,802 |
Reports to shareholders | | | 9,596 | | | | 12,876 | | | | 3,002 |
Trustees fees and expenses | | | 3,338 | | | | 2,752 | | | | 1,672 |
Miscellaneous | | | 6,800 | | | | 4,750 | | | | 1,801 |
| | | | | | | | | | | |
Total expenses before offsets | | | 1,394,797 | | | | 1,223,449 | | | | 433,926 |
| | | | | | | | | | | |
Expense (reimbursement)/recoupment | | | 55,588 | | | | 73,015 | | | | 13,677 |
Expense reductions | | | (7,330 | ) | | | (13,935 | ) | | | — |
| | | | | | | | | | | |
Net expenses | | | 1,443,055 | | | | 1,282,529 | | | | 447,603 |
| | | | | | | | | | | |
Net investment income (loss) | | | 873,773 | | | | (269,927 | ) | | | (253,791 |
| | | | | | | | | | | |
Net Realized and Unrealized Gain (Loss): | | | | | | | | | | | |
Net realized gain on investment transactions | | | 14,156,521 | | | | 6,056,702 | | | | 1,316,218 |
Net realized gain on futures contracts | | | — | | | | — | | | | — |
Net realized gain (loss) on foreign currency contracts and transactions | | | — | | | | — | | | | — |
Net unrealized appreciation (depreciation) of investments | | | (7,729,948 | ) | | | (730,839 | ) | | | 631,127 |
Net unrealized appreciation of futures contracts | | | — | | | | — | | | | — |
Net unrealized appreciation (depreciation) of foreign currency contracts and translations | | | — | | | | — | | | | — |
| | | | | | | | | | | |
Net realized and unrealized gain (loss) | | | 6,426,573 | | | | 5,325,863 | | | | 1,947,345 |
| | | | | | | | | | | |
Net Increase (Decrease) in Net Assets Resulting from Operations | | $ | 7,300,346 | | | $ | 5,055,936 | | | $ | 1,693,554 |
| | | | | | | | | | | |
The accompanying notes are an integral part of these financial statements.
48
| | | | | | | | | | | | | | |
Managers International Equity
Fund | | | Managers Emerging Markets Equity
Fund | | | Managers Bond
Fund | | | Managers Global Bond
Fund | |
| | | | | | | | | | | | | | |
| $ | 5,100,441 | | | $ | 2,071,037 | | | $ | 186,847 | | | $ | — | |
| | — | | | | — | | | | 14,432,007 | | | | 1,377,608 | |
| | (483,328 | ) | | | (215,499 | ) | | | — | | | | — | |
| | 154,129 | | | | 61,584 | | | | 115,354 | | | | 10,560 | |
| | | | | | | | | | | | | | | |
| | 4,771,242 | | | | 1,917,122 | | | | 14,734,208 | | | | 1,388,168 | |
| | | | | | | | | | | | | | | |
| | | | | | | | | | | | | | |
| | 1,938,776 | | | | 943,175 | | | | 2,118,516 | | | | 272,510 | |
| | 538,549 | | | | 205,038 | | | | 847,406 | | | | 77,860 | |
| | 116,960 | | | | 36,576 | | | | 200,492 | | | | 25,737 | |
| | 42,356 | | | | 43,405 | | | | 73,786 | | | | 46,663 | |
| | 322,651 | | | | 137,476 | | | | 92,142 | | | | 43,705 | |
| | 21,579 | | | | 16,822 | | | | 35,367 | | | | 14,277 | |
| | 29,949 | | | | 13,247 | | | | 50,667 | | | | 4,283 | |
| | 9,849 | | | | 4,502 | | | | 18,507 | | | | 1,833 | |
| | 38,418 | | | | 9,543 | | | | 16,493 | | | | 2,362 | |
| | | | | | | | | | | | | | | |
| | 3,059,087 | | | | 1,409,784 | | | | 3,453,376 | | | | 489,230 | |
| | | | | | | | | | | | | | | |
| | 141,842 | | | | 23,774 | | | | (98,243 | ) | | | (25,956 | ) |
| | (36,356 | ) | | | — | | | | (46 | ) | | | (41 | ) |
| | | | | | | | | | | | | | | |
| | 3,164,573 | | | | 1,433,558 | | | | 3,355,087 | | | | 463,233 | |
| | | | | | | | | | | | | | | |
| | 1,606,669 | | | | 483,564 | | | | 11,379,121 | | | | 924,935 | |
| | | | | | | | | | | | | | | |
| | | | | | | | | | | | | | |
| | 27,495,920 | | | | 8,368,321 | | | | 2,119,827 | | | | 351,225 | |
| | 16,834 | | | | — | | | | — | | | | — | |
| | (57,357 | ) | | | (173,420 | ) | | | 1,190,541 | | | | 432,514 | |
| | 936,938 | | | | 17,289,040 | | | | (6,518,999 | ) | | | (3,731,449 | ) |
| | 734 | | | | — | | | | — | | | | — | |
| | (52,855 | ) | | | 5,813 | | | | (55,646 | ) | | | 58,159 | |
| | | | | | | | | | | | | | | |
| | 28,340,214 | | | | 25,489,754 | | | | (3,264,277 | ) | | | (2,889,551 | ) |
| | | | | | | | | | | | | | | |
| $ | 29,946,883 | | | $ | 25,973,318 | | | $ | 8,114,844 | | | $ | (1,964,616 | ) |
| | | | | | | | | | | | | | | |
The accompanying notes are an integral part of these financial statements.
49
Statements of Changes in Net Assets
For the year ended December 31,
| | | | | | | | | | | | | | | | |
| | | Managers Value Fund | | | Managers Capital Appreciation Fund | |
| | | 2005 | | | 2004 | | | 2005 | | | 2004 | |
Increase (Decrease) in Net Assets From Operations: | | | | | | | | | | | | | | | | |
Net investment income (loss) | | $ | 873,773 | | | $ | 676,312 | | | $ | (269,927 | ) | | $ | (267,972 | ) |
Net realized gain on investments, futures and foreign currency transactions | | | 14,156,521 | | | | 5,860,848 | | | | 6,056,702 | | | | 5,023,588 | |
Net unrealized appreciation (depreciation) of investments and foreign currency translations | | | (7,729,948 | ) | | | 7,766,982 | | | | (730,839 | ) | | | 145,527 | |
| | | | | | | | | | | | | | | | |
Net increase (decrease) in net assets resulting from operations | | | 7,300,346 | | | | 14,304,142 | | | | 5,055,936 | | | | 4,901,143 | |
| | | | | | | | | | | | | | | | |
Distributions to Shareholders: | | | | | | | | | | | | | | | | |
From net investment income | | | (974,970 | ) | | | (600,552 | ) | | | — | | | | — | |
From net realized gain on investments | | | (12,602,042 | ) | | | — | | | | — | | | | — | |
| | | | | | | | | | | | | | | | |
Total distributions to shareholders | | | (13,577,012 | ) | | | (600,552 | ) | | | — | | | | — | |
| | | | | | | | | | | | | | | | |
From Capital Share Transactions: | | | | | | | | | | | | | | | | |
Proceeds from sale of shares | | | 41,625,309 | | | | 44,358,223 | | | | 32,049,419 | | | | 24,179,731 | |
Reinvestment of dividends and distributions | | | 13,449,285 | | | | 583,933 | | | | — | | | | — | |
Cost of shares repurchased | | | (43,702,003 | ) | | | (39,818,512 | ) | | | (30,575,012 | ) | | | (41,636,068 | ) |
| | | | | | | | | | | | | | | | |
Net increase (decrease) from capital share transactions | | | 11,372,591 | | | | 5,123,644 | | | | 1,474,407 | | | | (17,456,337 | ) |
| | | | | | | | | | | | | | | | |
Total increase (decrease) in net assets | | | 5,095,925 | | | | 18,827,234 | | | | 6,530,343 | | | | (12,555,194 | ) |
| | | | | | | | | | | | | | | | |
Net Assets: | | | | | | | | | | | | | | | | |
Beginning of year | | | 119,547,206 | | | | 100,719,972 | | | | 98,347,370 | | | | 110,902,564 | |
| | | | | | | | | | | | | | | | |
End of year | | $ | 124,643,131 | | | $ | 119,547,206 | | | $ | 104,877,713 | | | $ | 98,347,370 | |
| | | | | | | | | | | | | | | | |
End of year undistributed net investment income (loss) | | $ | — | | | $ | 84,317 | | | $ | — | | | $ | — | |
| | | | | | | | | | | | | | | | |
Share Transactions: | | | | | | | | | | | | | | | | |
Sale of shares | | | 1,419,446 | | | | 1,627,365 | | | | 1,250,037 | | | | 956,706 | |
Reinvested shares | | | 479,168 | | | | 19,674 | | | | — | | | | — | |
Shares repurchased | | | (1,465,605 | ) | | | (1,463,608 | ) | | | (1,149,831 | ) | | | (1,638,915 | ) |
| | | | | | | | | | | | | | | | |
Net increase (decrease) in shares | | | 433,009 | | | | 183,431 | | | | 100,206 | | | | (682,209 | ) |
| | | | | | | | | | | | | | | | |
The accompanying notes are an integral part of these financial statements.
50
| | | | | | | | | | | | | | |
| Managers Small Company Fund | | | Managers International Equity Fund | |
| 2005 | | | 2004 | | | 2005 | | | 2004 | |
| | | | | | | | | | | | | | |
| $ | (253,791 | ) | | $ | (226,293 | ) | | $ | 1,606,669 | | | $ | 1,374,228 | |
| | 1,316,218 | | | | 1,060,845 | | | | 27,455,397 | | | | 33,967,766 | |
| | 631,127 | | | | 2,135,788 | | | | 884,817 | | | | (2,335,520 | ) |
| | | | | | | | | | | | | | | |
| | 1,693,554 | | | | 2,970,340 | | | | 29,946,883 | | | | 33,006,474 | |
| | | | | | | | | | | | | | | |
| | | | | | | | | | | | | | |
| | — | | | | — | | | | (2,001,385 | ) | | | (1,540,373 | ) |
| | — | | | | — | | | | — | | | | — | |
| | | | | | | | | | | | | | | |
| | — | | | | — | | | | (2,001,385 | ) | | | (1,540,373 | ) |
| | | | | | | | | | | | | | | |
| | | | | | | | | | | | | | |
| | 13,834,182 | | | | 10,890,027 | | | | 36,147,458 | | | | 45,879,177 | |
| | — | | | | — | | | | 1,625,660 | | | | 1,244,967 | |
| | (6,163,175 | ) | | | (4,981,576 | ) | | | (93,386,057 | ) | | | (111,140,448 | ) |
| | | | | | | | | | | | | | | |
| | 7,671,007 | | | | 5,908,451 | | | | (55,612,939 | ) | | | (64,016,304 | ) |
| | | | | | | | | | | | | | | |
| | 9,364,561 | | | | 8,878,791 | | | | (27,667,441 | ) | | | (32,550,203 | ) |
| | | | | | | | | | | | | | | |
| | 27,628,800 | | | | 18,750,009 | | | | 234,060,568 | | | | 266,610,771 | |
| | | | | | | | | | | | | | | |
| $ | 36,993,361 | | | $ | 27,628,800 | | | $ | 206,393,127 | | | $ | 234,060,568 | |
| | | | | | | | | | | | | | | |
| $ | — | | | $ | — | | | $ | (409,088 | ) | | $ | 22,485 | |
| | | | | | | | | | | | | | | |
| | | | | | | | | | | | | | |
| | 1,346,911 | | | | 1,155,515 | | | | 754,899 | | | | 1,093,874 | |
| | — | | | | — | | | | 30,335 | | | | 26,483 | |
| | (599,977 | ) | | | (530,122 | ) | | | (1,920,526 | ) | | | (2,628,151 | ) |
| | | | | | | | | | | | | | | |
| | 746,934 | | | | 625,393 | | | | (1,135,292 | ) | | | (1,507,794 | ) |
| | | | | | | | | | | | | | | |
The accompanying notes are an integral part of these financial statements.
51
Statements of Changes in Net Assets (continued)
For the year ended December 31,
| | | | | | | | | | | | | | | | | | | | | | | | |
| | | Managers Emerging Markets Equity Fund | | | Managers Bond Fund | | | Managers Global Bond Fund | |
| | | 2005 | | | 2004 | | | 2005 | | | 2004 | | | 2005 | | | 2004 | |
Increase (Decrease) in Net Assets From Operations: | | | | | | | | | | | | | | | | | | | | | | | | |
Net investment income (loss) | | $ | 483,564 | | | $ | 307,009 | | | $ | 11,379,121 | | | $ | 7,869,572 | | | $ | 924,935 | | | $ | 889,798 | |
Net realized gain on investments, futures and foreign currency transactions | | | 8,194,901 | | | | 5,418,097 | | | | 3,310,368 | | | | 2,905,771 | | | | 783,739 | | | | 2,509,405 | |
Net unrealized appreciation (depreciation) of investments and foreign currency translations | | | 17,294,853 | | | | 6,510,946 | | | | (6,574,645 | ) | | | 116,939 | | | | (3,673,290 | ) | | | (394,129 | ) |
| | | | | | | | | | | | | | | | | | | | | | | | |
Net increase (decrease) in net assets resulting from operations | | | 25,973,318 | | | | 12,236,052 | | | | 8,114,844 | | | | 10,892,282 | | | | (1,964,616 | ) | | | 3,005,074 | |
| | | | | | | | | | | | | | | | | | | | | | | | |
Distributions to Shareholders: | | | | | | | | | | | | | | | | | | | | | | | | |
From net investment income | | | (299,119 | ) | | | (225,163 | ) | | | (12,451,131 | ) | | | (9,201,004 | ) | | | (1,549,265 | ) | | | (2,005,510 | ) |
From net realized gain on investments | | | (9,253,162 | ) | | | (1,936,391 | ) | | | (2,620,643 | ) | | | (1,786,138 | ) | | | (599,669 | ) | | | (917,446 | ) |
| | | | | | | | | | | | | | | | | | | | | | | | |
Total distributions to shareholders | | | (9,552,281 | ) | | | (2,161,554 | ) | | | (15,071,774 | ) | | | (10,987,142 | ) | | | (2,148,934 | ) | | | (2,922,956 | ) |
| | | | | | | | | | | | | | | | | | | | | | | | |
From Capital Share Transactions: | | | | | | | | | | | | | | | | | | | | | | | | |
Proceeds from sale of shares | | | 51,433,377 | | | | 41,188,851 | | | | 255,440,152 | | | | 148,437,567 | | | | 17,762,867 | | | | 17,122,093 | |
Reinvestment of dividends and distributions | | | 8,975,928 | | | | 2,118,388 | | | | 14,138,984 | | | | 10,270,433 | | | | 2,136,679 | | | | 2,901,332 | |
Cost of shares repurchased | | | (23,168,214 | ) | | | (26,542,734 | ) | | | (95,384,135 | ) | | | (79,044,208 | ) | | | (9,108,361 | ) | | | (15,959,002 | ) |
| | | | | | | | | | | | | | | | | | | | | | | | |
Net increase (decrease) from capital share transactions | | | 37,241,091 | | | | 16,764,505 | | | | 174,195,001 | | | | 79,663,792 | | | | 10,791,185 | | | | 4,064,423 | |
| | | | | | | | | | | | | | | | | | | | | | | | |
Total increase (decrease) in net assets | | | 53,662,128 | | | | 26,839,003 | | | | 167,238,071 | | | | 79,568,932 | | | | 6,677,635 | | | | 4,146,541 | |
| | | | | | | | | | | | | | | | | | | | | | | | |
Net Assets: | | | | | | | | | | | | | | | | | | | | | | | | |
Beginning of year | | | 63,566,665 | | | | 36,727,662 | | | | 259,210,025 | | | | 179,641,093 | | | | 36,453,637 | | | | 32,307,096 | |
| | | | | | | | | | | | | | | | | | | | | | | | |
End of year | | $ | 117,228,793 | | | $ | 63,566,665 | | | $ | 426,448,096 | | | $ | 259,210,025 | | | $ | 43,131,272 | | | $ | 36,453,637 | |
| | | | | | | | | | | | | | | | | | | | | | | | |
End of year undistributed net investment income (loss) | | $ | (15,426 | ) | | $ | 101,804 | | | $ | 133,777 | | | $ | 35,800 | | | $ | 143,886 | | | $ | 338,255 | |
| | | | | | | | | | | | | | | | | | | | | | | | |
Share Transactions: | | | | | | | | | | | | | | | | | | | | | | | | |
Sale of shares | | | 2,819,768 | | | | 2,854,814 | | | | 10,471,518 | | | | 6,055,078 | | | | 820,950 | | | | 759,922 | |
Reinvested shares | | | 450,177 | | | | 130,443 | | | | 581,998 | | | | 421,611 | | | | 105,882 | | | | 129,755 | |
Shares repurchased | | | (1,291,342 | ) | | | (1,902,280 | ) | | | (3,910,052 | ) | | | (3,242,568 | ) | | | (419,719 | ) | | | (716,810 | ) |
| | | | | | | | | | | | | | | | | | | | | | | | |
Net increase (decrease) in shares | | | 1,978,603 | | | | 1,082,977 | | | | 7,143,464 | | | | 3,234,121 | | | | 507,113 | | | | 172,867 | |
| | | | | | | | | | | | | | | | | | | | | | | | |
The accompanying notes are an integral part of these financial statements.
52
Financial Highlights
For a share outstanding throughout each year ended December 31,
| | | | | | | | | | | | | | | | | | | | |
| | | Managers Value Fund | |
| | | 2005 | | | 2004 | | | 2003 | | | 2002 | | | 2001 | |
Net Asset Value, Beginning of Year | | $ | 29.73 | | | $ | 26.24 | | | $ | 20.69 | | | $ | 27.45 | | | $ | 27.73 | |
| | | | | | | | | | | | | | | | | | | | |
Income from Investment Operations: | | | | | | | | | | | | | | | | | | | | |
Net investment income | | | 0.23 | | | | 0.17 | | | | 0.11 | | | | 0.15 | | | | 0.09 | |
Net realized and unrealized gain (loss) on investments | | | 1.43 | | | | 3.47 | | | | 5.56 | | | | (6.65 | ) | | | 0.70 | |
| | | | | | | | | | | | | | | | | | | | |
Total from investment operations | | | 1.66 | | | | 3.64 | | | | 5.67 | | | | (6.50 | ) | | | 0.79 | |
| | | | | | | | | | | | | | | | | | | | |
Less Distributions to Shareholders from: | | | | | | | | | | | | | | | | | | | | |
Net investment income | | | (0.25 | ) | | | (0.15 | ) | | | (0.12 | ) | | | (0.16 | ) | | | (0.08 | ) |
Net realized gain on investments | | | (3.16 | ) | | | — | | | | — | | | | (0.10 | ) | | | (0.99 | ) |
| | | | | | | | | | | | | | | | | | | | |
Total distributions to shareholders | | | (3.41 | ) | | | (0.15 | ) | | | (0.12 | ) | | | (0.26 | ) | | | (1.07 | ) |
| | | | | | | | | | | | | | | | | | | | |
Net Asset Value, End of Year | | $ | 27.98 | | | $ | 29.73 | | | $ | 26.24 | | | $ | 20.69 | | | $ | 27.45 | |
| | | | | | | | | | | | | | | | | | | | |
Total Return1 | | | 5.53 | % | | | 13.87 | % | | | 27.39 | % | | | (23.79 | )% | | | 2.92 | % |
| | | | | | | | | | | | | | | | | | | | |
Ratio of net expenses to average net assets1 | | | 1.18 | % | | | 1.22 | % | | | 1.27 | % | | | 1.28 | % | | | 1.25 | % |
Ratio of total expenses to average net assets1 | | | 1.15 | % 3 | | | 1.38 | % 3 | | | 1.42 | % 3 | | | 1.35 | % | | | 1.35 | % |
Ratio of net investment income to average net assets | | | 0.72 | % | | | 0.62 | % | | | 0.59 | % | | | 0.60 | % | | | 0.43 | % |
Portfolio turnover | | | 54 | % | | | 39 | % | | | 40 | % | | | 53 | % | | | 147 | % |
Net assets at end of year (000’s omitted) | | $ | 124,643 | | | $ | 119,547 | | | $ | 100,720 | | | $ | 48,001 | | | $ | 63,628 | |
| |
| | | Managers Capital Appreciation Fund | |
| | | 2005 | | | 2004 | | | 2003 | | | 2002 | | | 2001 | |
Net Asset Value, Beginning of Year | | $ | 26.77 | | | $ | 25.46 | | | $ | 20.36 | | | $ | 29.29 | | | $ | 42.79 | |
| | | | | | | | | | | | | | | | | | | | |
Income from Investment Operations: | | | | | | | | | | | | | | | | | | | | |
Net investment loss | | | (0.07 | ) 4 | | | (0.07 | ) | | | (0.16 | ) | | | (0.28 | ) | | | (0.25 | ) |
Net realized and unrealized gain (loss) on investments | | | 1.09 | | | | 1.38 | | | | 5.26 | | | | (8.65 | ) | | | (13.25 | ) |
| | | | | | | | | | | | | | | | | | | | |
Total from investment operations | | | 1.02 | | | | 1.31 | | | | 5.10 | | | | (8.93 | ) | | | (13.50 | ) |
| | | | | | | | | | | | | | | | | | | | |
Net Asset Value, End of Year | | $ | 27.79 | | | $ | 26.77 | | | $ | 25.46 | | | $ | 20.36 | | | $ | 29.29 | |
| | | | | | | | | | | | | | | | | | | | |
Total Return1 | | | 3.85 | % | | | 5.14 | % | | | 25.05 | % | | | (30.49 | )% | | | (31.55 | )% |
| | | | | | | | | | | | | | | | | | | | |
Ratio of net expenses to average net assets1 | | | 1.28 | % | | | 1.34 | % | | | 1.33 | % | | | 1.39 | % | | | 1.34 | % |
Ratio of total expenses to average net assets1 | | | 1.22 | %3 | | | 1.47 | %3 | | | 1.52 | %3 | | | 1.43 | % | | | 1.40 | % |
Ratio of net investment loss to average net assets | | | (0.27 | )% | | | (0.26 | )% | | | (0.67 | )% | | | (1.07 | )% | | | (0.75 | )% |
Portfolio turnover | | | 97 | % | | | 79 | % | | | 109 | % | | | 141 | % | | | 265 | % |
Net assets at end of year (000’s omitted) | | $ | 104,878 | | | $ | 98,347 | | | $ | 110,903 | | | $ | 107,545 | | | $ | 186,876 | |
53
Financial Highlights
For a share outstanding throughout each year ended December 31,
| | | | | | | | | | | | | | | | | | | | |
| | | Managers Small Company Fund | |
| | | 2005 | | | 2004 | | | 2003 | | | 2002 | | | 2001 | |
Net Asset Value, Beginning of Year | | $ | 10.36 | | | $ | 9.19 | | | $ | 6.40 | | | $ | 8.16 | | | $ | 9.29 | |
| | | | | | | | | | | | | | | | | | | | |
Income from Investment Operations: | | | | | | | | | | | | | | | | | | | | |
Net investment loss | | | (0.08 | ) 4 | | | (0.08 | ) | | | (0.09 | ) | | | (0.13 | ) | | | (0.07 | ) |
Net realized and unrealized gain (loss) on investments | | | 0.56 | | | | 1.25 | | | | 2.88 | | | | (1.63 | ) | | | (1.06 | ) |
| | | | | | | | | | | | | | | | | | | | |
Total from investment operations | | | 0.48 | | | | 1.17 | | | | 2.79 | | | | (1.76 | ) | | | (1.13 | ) |
| | | | | | | | | | | | | | | | | | | | |
Net Asset Value, End of Year | | $ | 10.84 | | | $ | 10.36 | | | $ | 9.19 | | | $ | 6.40 | | | $ | 8.16 | |
| | | | | | | | | | | | | | | | | | | | |
Total Return1 | | | 4.63 | % | | | 12.73 | % | | | 43.59 | % | | | (21.57 | )% | | | (12.16 | )% |
| | | | | | | | | | | | | | | | | | | | |
Ratio of net expenses to average net assets1 | | | 1.45 | % | | | 1.45 | % | | | 1.45 | % | | | 1.40 | % | | | 1.30 | % |
Ratio of total expenses to average net assets1 | | | 1.41 | % 3 | | | 1.43 | % 3 | | | 1.50 | % | | | 1.70 | % | | | 1.71 | % |
Ratio of net investment loss to average net assets | | | (0.82 | )% | | | (1.05 | )% | | | (1.20 | )% | | | (1.17 | )% | | | (0.92 | )% |
Portfolio turnover | | | 26 | % | | | 18 | % | | | 48 | % | | | 134 | % | | | 95 | % |
Net assets at end of year (000’s omitted) | | $ | 36,993 | | | $ | 27,629 | | | $ | 18,750 | | | $ | 12,610 | | | $ | 26,764 | |
| |
| | | Managers International Equity Fund | |
| | | 2005 | | | 2004 | | | 2003 | | | 2002 | | | 2001 | |
Net Asset Value, Beginning of Year | | $ | 47.05 | | | $ | 41.13 | | | $ | 31.22 | | | $ | 37.61 | | | $ | 49.38 | |
| | | | | | | | | | | | | | | | | | | | |
Income from Investment Operations: | | | | | | | | | | | | | | | | | | | | |
Net investment income | | | 0.37 | | | | 0.27 | | | | 0.34 | | | | 0.19 | | | | 0.20 2 | |
Net realized and unrealized gain (loss) on investments | | | 6.83 | | | | 5.96 | | | | 10.04 | | | | (6.48 | ) | | | (11.72 | ) 2 |
| | | | | | | | | | | | | | | | | | | | |
Total from investment operations | | | 7.20 | | | | 6.23 | | | | 10.38 | | | | (6.29 | ) | | | (11.52 | ) |
| | | | | | | | | | | | | | | | | | | | |
Less Distributions to Shareholders from: | | | | | | | | | | | | | | | | | | | | |
Net investment income | | | (0.49 | ) | | | (0.31 | ) | | | (0.47 | ) | | | (0.10 | ) | | | (0.25 | ) |
Net Asset Value, End of Year | | $ | 53.76 | | | $ | 47.05 | | | $ | 41.13 | | | $ | 31.22 | | | $ | 37.61 | |
| | | | | | | | | | | | | | | | | | | | |
Total Return1 | | | 15.30 | % | | | 15.17 | % | | | 33.21 | % | | | (16.71 | )% | | | (23.35 | )% |
| | | | | | | | | | | | | | | | | | | | |
Ratio of net expenses to average net assets1 | | | 1.45 | % | | | 1.62 | % | | | 1.72 | % | | | 1.54 | % | | | 1.45 | % |
Ratio of total expenses to average net assets1 | | | 1.42 | % 3 | | | 1.70 | % 3 | | | 1.73 | % | | | 1.56 | % | | | 1.46 | % |
Ratio of net investment income to average net assets | | | 0.75 | % | | | 0.57 | % | | | 0.70 | % | | | 0.54 | % | | | 0.46 | % 2 |
Portfolio turnover | | | 79 | % | | | 93 | % | | | 80 | % | | | 132 | % | | | 108 | % |
Net assets at end of year (000’s omitted) | | $ | 206,393 | | | $ | 234,061 | | | $ | 266,611 | | | $ | 362,561 | | | $ | 560,602 | |
54
Financial Highlights
For a share outstanding throughout each year ended December 31,
| | | | | | | | | | | | | | | | | | | | |
| | | Managers Emerging Markets Equity Fund | |
| | | 2005 | | | 2004 | | | 2003 | | | 2002 | | | 2001 | |
Net Asset Value, Beginning of Year | | $ | 16.50 | | | $ | 13.26 | | | $ | 8.80 | | | $ | 9.56 | | | $ | 9.63 | |
| | | | | | | | | | | | | | | | | | | | |
Income from Investment Operations: | | | | | | | | | | | | | | | | | | | | |
Net investment income (loss) | | | 0.52 | | | | 0.08 | | | | 0.01 | | | | 0.03 | | | | (0.01 | ) |
Net realized and unrealized gain (loss) on investments | | | 4.84 | | | | 3.74 | | | | 4.50 | | | | (0.79 | ) | | | (0.04 | ) |
| | | | | | | | | | | | | | | | | | | | |
Total from investment operations | | | 5.36 | | | | 3.82 | | | | 4.51 | | | | (0.76 | ) | | | (0.05 | ) |
| | | | | | | | | | | | | | | | | | | | |
Less Distributions to Shareholders from: | | | | | | | | | | | | | | | | | | | | |
Net investment income | | | (0.55 | ) | | | (0.06 | ) | | | (0.05 | ) | | | — | | | | — | |
Net realized gain on investments | | | (1.21 | ) | | | (0.52 | ) | | | — | | | | — | | | | (0.02 | ) |
| | | | | | | | | | | | | | | | | | | | |
Total distributions to shareholders | | | (1.76 | ) | | | (0.58 | ) | | | (0.05 | ) | | | — | | | | (0.02 | ) |
| | | | | | | | | | | | | | | | | | | | |
Net Asset Value, End of Year | | $ | 20.10 | | | $ | 16.50 | | | $ | 13.26 | | | $ | 8.80 | | | $ | 9.56 | |
| | | | | | | | | | | | | | | | | | | | |
Total Return1 | | | 32.53 | % | | | 28.85 | % | | | 51.20 | % | | | (7.95 | )% | | | (0.57 | )% |
| | | | | | | | | | | | | | | | | | | | |
Ratio of net expenses to average net assets1 | | | 1.50 | % | | | 1.85 | % | | | 1.99 | % | | | 1.97 | % | | | 1.94 | % |
Ratio of total expenses to average net assets1 | | | 1.72 | % 3 | | | 1.87 | % 3 | | | 1.97 | % 3 | | | 2.18 | % | | | 2.36 | % |
Ratio of net investment income (loss) to average net assets | | | 0.59 | % | | | 0.67 | % | | | 0.08 | % | | | 0.32 | % | | | (0.09 | )% |
Portfolio turnover | | | 35 | % | | | 58 | % | | | 79 | % | | | 68 | % | | | 69 | % |
Net assets at end of year (000’s omitted) | | $ | 117,229 | | | $ | 63,567 | | | $ | 36,728 | | | $ | 22,211 | | | $ | 15,202 | |
55
Financial Highlights
For a share outstanding throughout each year ended December 31,
| | | | | | | | | | | | | | | | | | | | |
| | | Managers Bond Fund | |
| | | 2005 | | | 2004 | | | 2003 | | | 2002 | | | 2001 | |
Net Asset Value, Beginning of Year | | $ | 24.58 | | | $ | 24.58 | | | $ | 23.44 | | | $ | 22.32 | | | $ | 21.75 | |
| | | | | | | | | | | | | | | | | | | | |
Income from Investment Operations: | | | | | | | | | | | | | | | | | | | | |
Net investment income | | | 0.88 | | | | 0.80 | | | | 1.08 | | | | 1.24 | | | | 1.44 | |
Net realized and unrealized gain (loss) on investments | | | (0.32 | ) | | | 0.30 | | | | 1.40 | | | | 1.12 | | | | 0.60 | |
| | | | | | | | | | | | | | | | | | | | |
Total from investment operations | | | 0.56 | | | | 1.10 | | | | 2.48 | | | | 2.36 | | | | 2.04 | |
| | | | | | | | | | | | | | | | | | | | |
Less Distributions to Shareholders from: | | | | | | | | | | | | | | | | | | | | |
Net investment income | | | (0.88 | ) | | | (0.93 | ) | | | (1.11 | ) | | | (1.24 | ) | | | (1.45 | ) |
Net realized gain on investments | | | (0.15 | ) | | | (0.17 | ) | | | (0.23 | ) | | | — | | | | (0.02 | ) |
| | | | | | | | | | | | | | | | | | | | |
Total distributions to shareholders | | | (1.03 | ) | | | (1.10 | ) | | | (1.34 | ) | | | (1.24 | ) | | | (1.47 | ) |
| | | | | | | | | | | | | | | | | | | | |
Net Asset Value, End of Year | | $ | 24.11 | | | $ | 24.58 | | | $ | 24.58 | | | $ | 23.44 | | | $ | 22.32 | |
| | | | | | | | | | | | | | | | | | | | |
Total Return1 | | | 2.29 | % | | | 5.14 | % | | | 10.77 | % | | | 10.98 | % | | | 9.64 | % |
| | | | | | | | | | | | | | | | | | | | |
Ratio of net expenses to average net assets1 | | | 0.99 | % | | | 0.99 | % | | | 0.99 | % | | | 1.00 | % | | | 1.18 | % |
Ratio of total expenses to average net assets1 | | | 1.02 | % 3 | | | 1.06 | % 3 | | | 1.09 | %3 | | | 1.17 | % | | | 1.18 | % |
Ratio of net investment income to average net assets | | | 3.36 | % | | | 3.65 | % | | | 4.50 | % | | | 5.55 | % | | | 6.45 | % |
Portfolio turnover | | | 26 | % | | | 16 | % | | | 73 | % | | | 24 | % | | | 16 | % |
Net assets at end of year (000’s omitted) | | $ | 426,448 | | | $ | 259,210 | | | $ | 179,641 | | | $ | 128,341 | | | $ | 66,817 | |
56
Financial Highlights
For a share outstanding throughout each year ended December 31,
| | | | | | | | | | | | | | | | | | | | |
| | | Managers Global Bond Fund | |
| | | 2005 | | | 2004 | | | 2003 | | | 2002 | | | 2001 | |
Net Asset Value, Beginning of Year | | $ | 22.38 | | | $ | 22.19 | | | $ | 20.58 | | | $ | 17.97 | | | $ | 18.98 | |
Income from Investment Operations: | | | | | | | | | | | | | | | | | | | | |
Net investment income | | | 0.63 | | | | 0.65 | | | | 0.80 | | | | 0.81 | | | | 0.57 | 2 |
Net realized and unrealized gain (loss) on investments | | | (1.75 | ) | | | 1.49 | | | | 3.43 | | | | 2.57 | | | | (1.33 | )2 |
| | | | | | | | | | | | | | | | | | | | |
Total from investment operations | | | (1.12 | ) | | | 2.14 | | | | 4.23 | | | | 3.38 | | | | (0.76 | ) |
| | | | | | | | | | | | | | | | | | | | |
Less Distributions to Shareholders from: | | | | | | | | | | | | | | | | | | | | |
Net investment income | | | (0.77 | ) | | | (1.34 | ) | | | (2.09 | ) | | | (0.55 | ) | | | — | |
Net realized gain on investments | | | (0.30 | ) | | | (0.61 | ) | | | (0.53 | ) | | | (0.22 | ) | | | (0.25 | ) |
| | | | | | | | | | | | | | | | | | | | |
Total distributions to shareholders | | | (1.07 | ) | | | (1.95 | ) | | | (2.62 | ) | | | (0.77 | ) | | | (0.25 | ) |
| | | | | | | | | | | | | | | | | | | | |
Net Asset Value, End of Year | | $ | 20.19 | | | $ | 22.38 | | | $ | 22.19 | | | $ | 20.58 | | | $ | 17.97 | |
| | | | | | | | | | | | | | | | | | | | |
Total Return1 | | | (4.94 | )% | | | 9.62 | % | | | 20.69 | % | | | 18.85 | % | | | (4.10 | )% |
| | | | | | | | | | | | | | | | | | | | |
Ratio of net expenses to average net assets1 | | | 1.19 | % | | | 1.29 | % | | | 1.68 | % | | | 1.55 | % | | | 1.45 | % |
Ratio of total expenses to average net assets1 | | | 1.26 | %3 | | | 1.49 | %3 | | | 1.68 | % | | | 1.56 | % | | | 1.46 | % |
Ratio of net investment income to average net assets | | | 2.38 | % | | | 2.73 | % | | | 3.48 | % | | | 4.01 | % | | | 2.87 | %2 |
Portfolio turnover | | | 64 | % | | | 130 | % | | | 152 | % | | | 220 | % | | | 244 | % |
Net assets at end of year (000’s omitted) | | $ | 43,131 | | | $ | 36,454 | | | $ | 32,307 | | | $ | 19,746 | | | $ | 19,879 | |
The following notes should be read in conjunction with the Financial Highlights of the Funds presented on the preceding pages.
| 1 | See Note 1(c) of “Notes to Financial Statements.” |
| 2 | Effective January 1, 2001, the Trust adopted the provisions of the AICPA Audit and Accounting Guide for Investment Companies and began amortizing premium and discount on all debt securities, as required. The effect of this change during the year ended December 31, 2001 on International Equity, Intermediate Bond and Global Bond was to decrease net investment income and increase net realized and unrealized gain (loss) per share by $ 0.01, $0.04 and $ 0.04, respectively. The effect of this change on the remaining Funds was not significant. Without this change the ratio of net investment income to average net assets for the year ended December 31, 2001 for International Equity and Global Bond would have been 0.46% and 3.08%, respectively. Per share data, ratios and supplemental data for prior periods have not been restated to reflect this change. |
| 3 | Excludes the impact of expense (reimbursement)/recoupment and expense offsets such as brokerage credits, but includes non-reimbursable expenses such as interest and taxes. (See Note 1c to the Notes to Financial Statements.) |
| 4 | Per share numbers have been calculated using average shares. |
57
Notes to Financial Statements
December 31, 2005
(1) Summary of Significant Accounting Policies
The Managers Funds (the “Trust”) is an open-end management investment company organized as a Massachusetts business trust and registered under the Investment Company Act of 1940, as amended (the “1940 Act”). Currently, the Trust is comprised of a number of investment series. Included in this report are the Managers Value Fund (“Value”), Managers Capital Appreciation Fund (“Capital Appreciation”), Managers Small Company Fund (“Small Company”), Managers International Equity Fund (“International Equity”), Managers Emerging Markets Equity Fund (“Emerging Markets Equity”), Managers Bond Fund (“Bond”) and Managers Global Bond Fund (“Global Bond”), collectively the “Funds.”
The Funds’ financial statements are prepared in accordance with accounting principles generally accepted in the United States of America, which require management to make estimates and assumptions that affect the reported amount of assets and liabilities and disclosure of contingent assets and liabilities at the date of the financial statements and the reported amounts of income and expenses during the reporting periods. Actual results could differ from those estimates. The following is a summary of significant accounting policies followed by the Funds in the preparation of their financial statements:
(a) Valuation of Investments
Equity securities traded on a domestic or international securities exchange are generally valued at the last quoted sale price, or, lacking any sales, at the last quoted bid price. Over-the-counter securities are valued at the Nasdaq Official Closing Price, if one is available. Lacking any sales, over-the-counter securities, are valued at the last quoted bid price. Under certain circumstances, the value of a Fund investment may be based on an evaluation of its fair value, pursuant to procedures established by and under the general supervision of the Board of Trustees of the Fund. A Fund may use the fair value of a portfolio security to calculate its NAV when, for example, (1) market quotations are not readily available because a portfolio security is not traded in a public market or the principal market in which the security trades is closed, (2) trading in a portfolio security is suspended and not resumed prior to the time as of which the Fund calculates its NAV, (3) where a significant event affecting the value of a portfolio security is determined to have occurred between the time of the market quotation provided for a portfolio security and the time as of which the Fund calculates its NAV, (4) a security’s price has remained unchanged over an extended period of time (often referred to as a “stale price”), or (5) the Investment Manager determines that a market quotation is inaccurate. The Manager monitors intervening events that may affect the value of securities held in each Fund’s portfolio and, in accordance with procedures adopted by the Funds’ Trustees, will adjust the prices of securities traded in foreign markets, as appropriate, to reflect the impact of events occurring subsequent to the close of such markets but prior to the time each Fund’s NAV is calculated. Fixed-income securities are valued based on valuations furnished by independent pricing services that utilize matrix systems, which reflect such factors as security prices, yields, maturities and ratings, and are supplemented by dealer and exchange quotations. Short-term investments having a remaining maturity of 60 days or less are valued at amortized cost, which approximates market value. Investments in other regulated investment companies are valued at their end of day net asset value per share except iShares or other ETF’s, which are valued the same as equity securities. Securities (including derivatives) for which market quotations are not readily available are valued at fair value, as determined in good faith, and pursuant to procedures adopted by the Board of Trustees of the Trust.
Investments in certain mortgage-backed, stripped mortgage-backed, preferred stocks, convertible securities and other debt securities not traded on an organized market, are valued on the basis of valuations provided by dealers or by a pricing service which uses information with respect to transactions in such securities, various relationships between securities and yield to maturity in determining value.
(b) Security Transactions
Security transactions are accounted for as of the trade date. Realized gains and losses on securities sold are determined on the basis of identified cost. The Funds had certain portfolio trades directed to a broker under a brokerage recapture program. For the year ended December 31, 2005, under these arrangements the total amount by which the cost of the Funds’ securities were reduced or proceeds on sales increased were as follows: Value - $11,431; Capital Appreciation - $52,088; and International Equity - $23,134.
(c) Investment Income and Expenses
Dividend income is recorded on the ex-dividend date except certain dividends from foreign securities where the ex-dividend date may have passed. These dividends are recorded as soon as the Trust is informed of the ex-dividend date. Dividend income on foreign securities is recorded net of any withholding tax. Interest income, which includes amortization of premium and accretion of discount on debt securities, is accrued as earned. Non-cash dividends included in dividend income, if any, are reported at the fair market value of the securities received. Other income and expenses are recorded on an accrual basis. Expenses that cannot be directly attributed to a fund are apportioned among the Funds in the Trust and in some cases other affiliated funds based upon their relative average net assets or number of shareholders.
The following Funds had certain portfolio trades directed to various brokers who paid a portion of such Fund’s expenses.
58
Notes to Financial Statements (continued)
For the year ended December 31, 2005, under these arrangements the amount by which certain Fund’s expenses were reduced and the impact on the expense ratios were as follows: Value -$7,330 or 0.01%; Capital Appreciation – $13,837 or 0.01%; and International Equity - $36,214 or 0.02%.
In addition, each of the Funds has a “balance credit” arrangement with The Bank of New York (“BNY”), the Funds’ custodian, whereby each Fund is credited with an interest factor equal to 1 % below the effective 90-day T-Bill rate for account balances left uninvested overnight. These credits serve to reduce custody expenses that would otherwise be charged to each Fund. For the year ended December 31, 2005, the custodian expense was reduced as follows: Capital Appreciation – $98; International Equity - $142; Bond - $46 and Global Bond - $41.
Effective May 1, 2005, Managers Investment Group LLC (formerly The Managers Funds LLC) (the “Investment Manager”), a subsidiary of Affiliated Managers Group, Inc. (“AMG”) and the Investment Manager for the Funds, has contractually agreed, through at least May 1, 2006, to waive fees and pay or reimburse expenses of Small Company, Bond and Global Bond to the extent that the total annual operating expenses (exclusive of brokerage, interest, taxes and extraordinary expenses) of the Fund exceed 1.45%, 0.99% and 1.19%, respectively, of each Fund’s average daily net assets. The Investment Manager has also contractually agreed to waive fees or reimburse expenses on Value, Capital Appreciation, International Equity and Emerging Markets Equity to the extent that the total annual operating expenses (exclusive of brokerage, interest, taxes and extraordinary expenses) of the Fund exceed 1.19%, 1.29%, 1.55% and 1.79%, respectively, of each Fund’s average daily net assets, provided that the amount of fees waived, paid or reimbursed does not exceed 0.25% per annum of each Fund’s average daily net assets.
Each Fund may be obligated to repay the Investment Manager such amounts waived, paid or reimbursed in future years provided that the repayment occurs within three (3) years after the waiver or reimbursement and that such repayment would not cause the Fund’s expenses in any such year to exceed the previously stated percentages of that Fund’s average daily net assets. For the year ended December 31, 2005, the following Funds made such repayments to the Investment Manager in the following amounts: Value - $55,588; Capital Appreciation - $73,015; Small Company - $13,677; International Equity - $141,842; and Emerging Markets Equity - $23,774. At December 31, 2005, the cumulative amount of reimbursement by the Manager subject to repayment for Value, Capital Appreciation, Small Company, Bond and Global Bond equaled $94,595, $40,849, $10,549, $423,221 and $94,056, respectively.
Total returns and net investment income for the Funds would have been lower had certain expenses not been offset.
(d) Dividends and Distributions
Dividends resulting from net investment income, if any, normally will be declared and paid annually for Global Bond and the Equity Funds. Dividends resulting from net investment income, if any, normally will be declared and paid monthly for Bond. Distributions of capital gains, if any, will be made on an annual basis and when required for Federal excise tax purposes. Income and capital gain distributions are determined in accordance with Federal income tax regulations, which may differ from generally accepted accounting principles. These differences are primarily due to differing treatments for losses deferred due to wash sales, equalization accounting for tax purposes, foreign currency and market discount transactions. Permanent book and tax basis differences, if any, relating to shareholder distributions will result in reclassifications to paid-in capital. The tax character of distributions paid during the past two years were as follows:
| | | | | | | | | | | | | | | | | | | | |
| | | Value | | | Capital Appreciation | | Small Company |
| | | 2005 | | | 2004 | | | 2005 | | 2004 | | 2005 | | 2004 |
Distributions paid from: | | | | | | | | | | | | | | | | | | | | |
Ordinary income | | $ | 974,970 | | | $ | 600,552 | | | $ | — | | $ | — | | $ | — | | $ | — |
Short-term capital gains | | | 912,960 | | | | — | | | | — | | | — | | | — | | | — |
Long-term capital gains | | | 11,689,082 | | | | — | | | | — | | | — | | | — | | | — |
| | | | | | | | | | | | | | | | | | | | |
| | $ | 13,577,012 | | | $ | 600,552 | | | $ | — | | $ | — | | $ | — | | $ | — |
| | | | | | | | | | | | | | | | | | | | |
As a % of distributions paid: | | | | | | | | | | | | | | | | | | | | |
Qualified ordinary income | | | 100.00 | % | | | 100.00 | % | | | — | | | — | | | — | | | — |
Ordinary income - dividends received deduction | | | 100.00 | % | | | 100.00 | % | | | — | | | — | | | — | | | — |
59
Notes to Financial Statements (continued)
| | | | | | | | | | | | | | | | | | | | | | | | | | | | |
| | | International Equity | | | Emerging Markets | | | Bond | | Global Bond |
| | | 2005 | | | 2004 | | | 2005 | | | 2004 | | | 2005 | | 2004 | | 2005 | | 2004 |
Distributions paid from: | | | | | | | | | | | | | | | | | | | | | | | | | | | | |
Ordinary income | | $ | 2,001,385 | | | $ | 1,540,373 | | | $ | 299,119 | | | $ | 225,163 | | | $ | 12,451,131 | | $ | 9,201,004 | | $ | 1,549,265 | | $ | 2,005,510 |
Short-term capital gains | | | — | | | | — | | | | 2,392,307 | | | | — | | | | 129,375 | | | 335,401 | | | 104,290 | | | 133,202 |
Long-term capital gains | | | — | | | | — | | | | 6,860,855 | | | | 1,936,391 | | | | 2,491,268 | | | 1,450,737 | | | 495,379 | | | 784,244 |
| | | | | | | | | | | | | | | | | | | | | | | | | | | | |
| | $ | 2,001,385 | | | $ | 1,540,373 | | | $ | 9,552,281 | | | $ | 2,161,554 | | | $ | 15,071,774 | | $ | 10,987,142 | | $ | 2,148,934 | | $ | 2,922,956 |
| | | | | | | | | | | | | | | | | | | | | | | | | | | | |
As a % of distributions paid: | | | | | | | | | | | | | | | | | | | | | | | | | | | | |
Qualified ordinary income | | | 100.00 | % | | | 87.46 | % | | | 100.00 | % | | | 70.46 | % | | | — | | | — | | | — | | | — |
Ordinary income - dividends received deduction | | | — | | | | — | | | | — | | | | — | | | | — | | | — | | | — | | | — |
As of December 31, 2005, the components of distributable earnings (excluding unrealized appreciation/depreciation) on a tax basis consisted of:
| | | | | | | | | | | | | | | | | | | | | | | | |
| | | Value | | Capital
Appreciation | | | Small
Company | | | International
Equity | | | Emerging
Markets | | Bond | | Global
Bond |
Capital loss carryforward | | $ | — | | $ | (155,655,595 | ) | | $ | (6,628,636 | ) | | $ | (100,810,178 | ) | | $ | — | | $ | — | | $ | — |
Undistributed ordinary income | | | — | | | — | | | | — | | | | 2,261,724 | | | | — | | | 512,076 | | | 185,288 |
Undistributed short-term capital gains | | | 10,911 | | | — | | | | — | | | | — | | | | — | | | — | | | — |
Undistributed long-term capital gains | | | 1,965,008 | | | — | | | | — | | | | — | | | | — | | | — | | | — |
| | | | | | | | | | | | | | | | | | | | | | | | |
| | $ | 1,975,919 | | $ | (155,655,595 | ) | | $ | (6,628,636 | ) | | $ | (98,548,454 | ) | | $ | — | | $ | 512,076 | | $ | 185,288 |
| | | | | | | | | | | | | | | | | | | | | | | | |
(e) Taxes
Each Fund intends to comply with the requirements under Subchapter M of the Internal Revenue Code of 1986, as amended, to distribute substantially all of its taxable income and gains to its shareholders and to meet certain diversification and income requirements with respect to investment companies. Therefore, no provision for Federal income or excise tax is included in the accompanying financial statements.
Additionally, based on the Fund’s understanding of the tax rules and rates related to income, gains and transactions for the foreign jurisdictions in which it invests, each Fund will provide for foreign taxes, and where appropriate, deferred foreign taxes. For the year ended December 31, 2005, the amount of deferred foreign taxes on capital gains is: International Equity – India $27,443; and Emerging Markets Equity – India $129,337 and Thailand $72,336.
(f) Capital Loss Carryovers
As of December 31, 2005, the following Funds had accumulated net realized capital loss carryovers from securities transactions for Federal income tax purposes as shown in the following chart. These amounts may be used to offset realized capital gains, if any, through the expiration dates listed.
| | | | | |
Fund | | Capital Loss
Carryover Amount | | Expires December 31, |
Capital Appreciation | | $ | 111,767,513 | | 2009 |
| | | 30,988,593 | | 2010 |
| | | 12,899,489 | | 2011 |
Small Company | | | 4,928,358 | | 2009 |
| | | 1,700,278 | | 2010 |
International Equity | | | 84,638,277 | | 2010 |
| | | 16,171,901 | | 2011 |
(g) Capital Stock
The Trust’s Declaration of Trust authorizes for each series the issuance of an unlimited number of shares of beneficial interest, without par value. Each Fund records sales and repurchases of its capital stock on the trade date. Dividends and distributions to shareholders are recorded on the ex-dividend date.
At December 31, 2005, certain unaffiliated shareholders, specifically omnibus accounts, individually held greater than 10% of the outstanding shares of the following Funds: Value – one owns 16%; Capital Appreciation - one owns 11%; International Equity - two collectively own 39%; Emerging Markets Equity – two collectively own 55%; Bond - two collectively own 31%.
60
Notes to Financial Statements (continued)
(h) Repurchase Agreements
Each Fund may enter into repurchase agreements provided that the value of the underlying collateral, including accrued interest, will be equal to or exceed the value of the repurchase agreement during the term of the agreement. The underlying collateral for all repurchase agreements is held in safekeeping by the Fund’s custodian or at the Federal Reserve Bank.
If the seller defaults and the value of the collateral declines, or if bankruptcy proceedings commence with respect to the seller of the security, realization of the collateral by the Fund may be delayed or limited.
(i) Foreign Currency Translation
The books and records of the Funds are maintained in U.S. dollars. The value of investments, assets and liabilities denominated in currencies other than U.S. dollars are translated into U.S. dollars based upon current foreign exchange rates. Purchases and sales of foreign investments, income and expenses are converted into U.S. dollars based on currency exchange rates prevailing on the respective dates of such transactions. Net realized and unrealized gain (loss) on foreign currency transactions represent: (1) foreign exchange gains and losses from the sale and holdings of foreign currencies; (2) gains and losses between trade date and settlement date on investment securities transactions and forward foreign currency exchange contracts; and (3) gains and losses from the difference between amounts of interest and dividends recorded and the amounts actually received.
In addition, the Funds do not isolate the net realized and unrealized gain or loss resulting from changes in exchange rates from the fluctuations resulting from changes in market prices of securities held. Such fluctuations are included with the net realized and unrealized gain or loss on investments.
(2) Agreements and Transactions with Affiliates
The Trust has entered into an Investment Management Agreement under which the Investment Manager provides or oversees investment management services to the Funds. The Investment Manager selects subadvisors for each Fund (subject to Trustee approval), allocates assets among subadvisors and monitors the subadvisors’ investment programs and results. Each Fund’s investment portfolio is managed by portfolio managers who serve pursuant to Subadvisory Agreements with the Investment Manager.
Investment management fees are paid directly by each Fund to the Investment Manager based on average daily net assets. The annual investment management fee rates, as a percentage of average daily net assets for the year ended December 31, 2005, were as follows:
| | | |
Fund | | Investment
Management Fee | |
Value | | 0.75 | % |
Capital Appreciation | | 0.80 | % |
Small Company | | 0.90 | % |
International Equity | | 0.90 | % |
Emerging Markets Equity | | 1.15 | % |
Bond | | 0.625 | % |
Global Bond | | 0.70 | % |
The Trust has entered into an Administration and Shareholder Servicing Agreement (“Administration Agreement”) under which Managers Investment Group LLC serves as each Fund’s administrator (the “Administrator”) and is responsible for all aspects of managing the Funds’ operations, including administration and shareholder services to each Fund, its shareholders, and certain institutions, such as bank trust departments, broker-dealers and registered investment advisers, that advise or act as an intermediary with the Funds’ shareholders. Under the terms of the Administration Agreement, each of the Funds, except Global Bond, pay a fee to the Administrator at the rate of 0.25% per annum of the Fund’s average daily net assets. Global Bond pays a fee to the Administrator at the rate of 0.20% per annum of the Fund’s average daily net assets.
Prior to July 1, 2005, the aggregate annual retainer paid to each Independent Trustee was $52,000, plus $2,000 for each meeting attended. Effective July 1, 2005, the aggregate annual retainer paid to each Independent Trustee is $55,000, plus $4,000 or $2,000 for each regular or special meeting attended, respectively. The Trustees’ fees and expenses are allocated amongst all of the Funds for which Managers Investment Group LLC serves as the Investment Manager (the “Managers Funds”) based on the relative net assets of such Funds. The Independent Chairman of the Trust receives an additional payment of $10,000 per year. (Prior to July 1, 2005, the Independent Chairman was paid an additional $5,000 per year). Effective July 1, 2005, the Chairman of the Audit Committee receives an additional $2,000 per year. The “Trustee fees and expenses” shown in the financial statements represent each Fund’s allocated portion of the total fees and expenses paid by the Managers Funds.
61
Notes to Financial Statements (continued)
The Funds are distributed by Managers Distributors, Inc. (the “Distributor”), a wholly-owned subsidiary of Managers Investment Group LLC. Certain Trustees and Officers of the Funds are Officers and/or Directors of the Investment Manager, AMG and/or the Distributor. The Distributor serves as the principal underwriter for each Fund. The Distributor is a registered broker-dealer and member of the National Association of Securities Dealers, Inc. (“NASD”). Shares of each Fund will be continuously offered and will be sold by brokers, dealers or other financial intermediaries who have executed selling agreements with the Distributor. The Distributor bears all the expenses of providing services pursuant to an Underwriting Agreement, including the payment of the expenses relating to the distribution of Prospectuses for sales purposes and any advertising or sales literature.
(3) Purchases and Sales of Securities
Purchases and sales of securities, excluding short-term securities, for the year ended December 31, 2005, were as follows:
| | | | | | | | | | | | |
| | | Long-Term Securities | | U.S. Government Securities |
Fund | | Purchases | | Sales | | Purchases | | Sales |
Value | | $ | 63,147,192 | | $ | 63,229,768 | | | N/A | | | N/A |
Capital Appreciation | | | 94,140,410 | | | 95,240,438 | | | N/A | | | N/A |
Small Company | | | 13,327,071 | | | 7,254,398 | | | N/A | | | N/A |
International Equity | | | 168,124,780 | | | 211,434,799 | | | N/A | | | N/A |
Emerging Markets Equity | | | 58,040,971 | | | 28,079,822 | | | N/A | | | N/A |
Bond | | | 67,531,327 | | | 34,670,723 | | $ | 174,978,736 | | $ | 46,085,370 |
Global Bond | | | 28,077,000 | | | 17,677,069 | | | 6,148,153 | | | 6,300,937 |
(4) Portfolio Securities Loaned
The Funds may participate in a securities lending program offered by BNY providing for the lending of equities, corporate bonds and government securities to qualified brokers. Collateral on all securities loaned is accepted in cash and/or government securities. Collateral is maintained at a minimum level of 102% of the market value, plus interest, if applicable, of investments on loan. Collateral received in the form of cash is invested temporarily in institutional money market funds or other short-term investments by BNY. Earnings of such temporary cash investments are divided between BNY, as a fee for its services under the program, and the Fund loaning the security, according to agreed-upon rates.
(5) Commitments and Contingencies
In the normal course of business, the Funds may enter into contracts and agreements that contain a variety of representations and warranties, which provide general indemnifications. The maximum exposure to the Funds under these arrangements is unknown, as this would involve future claims that may be against the Funds that have not yet occurred. However, based on experience, the Funds expect the risks of loss to be remote.
(6) Risks Associated with Collateralized Mortgage Obligations (“CMOs”)
The net asset value of Funds may be sensitive to interest rate fluctuations because the Funds may hold several instruments, including CMOs and other derivatives, whose values can be significantly impacted by interest rate movements. CMOs are obligations collateralized by a portfolio of mortgages or mortgage-related securities. Payments of principal and interest on the mortgage are passed through to the holder of the CMOs on the same schedule as they are received, although certain classes of CMOs have priority over others with respect to the receipt of prepayments on the mortgages.
Therefore, the investment in CMOs may be subject to a greater or lesser risk of prepayment than other types of mortgage-related securities. CMOs may have a fixed or variable rate of interest.
(7) Forward Commitments
Certain transactions, such as futures and forward transactions, dollar roll agreements, or purchases of when-issued or delayed delivery securities may have a similar effect on a Fund’s net asset value as if the Fund had created a degree of leverage in its portfolio. However, if a Fund enters into such a transaction, the Fund will establish a segregated account with its custodian in which it will maintain cash, U.S. government securities or other liquid securities equal in value to its obligations in respect to such transaction. Securities and other assets held in the segregated account may not be sold while the transaction is outstanding, unless other suitable assets are substituted.
(8) Forward Foreign Currency Contracts
International Equity, Emerging Markets Equity, Bond and Global Bond invest in forward foreign currency exchange contracts to manage currency exposure. These investments may involve greater market risk than the amounts disclosed in the Funds’ financial statements.
A forward foreign currency exchange contract is an agreement between a Fund and another party to buy or sell a currency at a set price at a future date. The market value of the contract will fluctuate with changes in currency exchange rates. The
62
Notes to Financial Statements (continued)
contract is marked-to-market daily, and the change in market value is recorded as an unrealized gain or loss. Gain or loss on the purchase or sale of contracts having the same settlement date, amount and counter party is realized on the date of offset, otherwise gain or loss is realized on settlement date.
The Funds, except Value, Capital Appreciation, and Small Company, may invest in non-U.S. dollar denominated instruments subject to limitations, and enter into forward foreign currency exchange contracts to facilitate transactions in foreign securities and to protect against a possible loss resulting from an adverse change in the relationship between the U.S. dollar and such foreign currency. Risks may arise upon entering into these contracts from the potential inability of counterparties to meet the terms of their contracts and from unanticipated movements in the value of a foreign currency relative to the U.S. dollar.
Open forward foreign currency exchange contracts (in U.S. Dollars) at December 31, 2005 were as follows:
| | | | | | | | | | | | | | | | |
Foreign Currency | | | | Settlement
Date | | Current Value
(Receivable Amount) | | | Contract Value (Payable
Amount) | | | Unrealized
Gain/Loss | |
International Equity | | | | | | | | | | | | | | | | |
Canadian Dollar | | Short | | 01/03 - 01/05/06 | | $ | (97,149 | ) | | $ | (97,304 | ) | | $ | (155 | ) |
Swiss Franc | | Short | | 01/03/06 | | | (225,088 | ) | | | (225,622 | ) | | | (534 | ) |
Pound Sterling | | Short | | 01/03 - 01/05/06 | | | (86,430 | ) | | | (86,353 | ) | | | 77 | |
Hong Kong Dollar | | Long | | 01/03 - 01/04/06 | | | 21,950 | | | | 21,949 | | | | (1 | ) |
Japanese Yen | | Long | | 01/04/06 | | | 19,564 | | | | 19,570 | | | | 6 | |
Swedish Krona | | Short | | 03/15/06 | | | (856,482 | ) | | | (853,420 | ) | | | 3,062 | |
| | | | | | | | | | | | | | | | |
Total | | | | | | $ | (1,223,635 | ) | | $ | (1,221,180 | ) | | $ | 2,455 | |
| | | | | | | | | | | | | | | | |
Global Bond | | | | | | | | | | | | | | | | |
Australian Dollar | | Short | | 02/14 - 02/27/06 | | $ | (1,136,185 | ) | | $ | (1,134,564 | ) | | $ | 1,621 | |
Pound Sterling | | Short | | 01/30/06 | | | (1,258,929 | ) | | | (1,221,385 | ) | | | 37,544 | |
Mexican Nuevo Pesa | | Short | | 03/07/06 | | | (115,062 | ) | | | (113,893 | ) | | | 1,169 | |
Mexican Nuevo Pesa | | Long | | 03/07/06 | | | 112,590 | | | | 113,893 | | | | 1,303 | |
New Zealand Dollar | | Short | | 02/15/06 | | | (159,588 | ) | | | (159,824 | ) | | | (236 | ) |
| | | | | | | | | | | | | | | | |
Total | | | | | | $ | (2,557,174 | ) | | $ | (2,515,773 | ) | | $ | 41,401 | |
| | | | | | | | | | | | | | | | |
(9) Futures Contracts Held or Issued for Purposes other than Trading
International Equity uses Equity Index futures contracts to a limited extent, with the objective of maintaining exposure to equity stock markets while maintaining liquidity. The Fund may purchase or sell futures contracts to achieve a desired level of investment, whether to accommodate portfolio turnover or cash flows from capital shares transactions. There are certain risks associated with futures contracts. Prices may not move as expected or a Fund may not be able to close out the contract when it desires to do so, resulting in losses.
Futures are valued at their quoted daily settlement prices. The aggregate principal amounts of the contracts are not recorded in the financial statements. Fluctuations in the value of the contracts are recorded in the Statement of Assets as an asset (liability) and in the Statement of Operations as unrealized appreciation (depreciation) until the contracts are closed, when they are recorded as realized gains (losses) on futures or forward currency contracts. Cash pledged to cover margin requirements for the open futures positions at December 31, 2005 is $129,257. International Equity had the following open futures contracts as of December 31, 2005:
| | | | | | | | | |
Type | | Number of
Contracts | | Position | | Expiration
Month | | Unrealized
Gain/(Loss) |
The Dow Jones Euro STOXX 50 | | 7 | | Long | | March 2006 | | | 4,345 |
The S&P/Toronto Stock Exchange 60 Index | | 4 | | Long | | March 2006 | | | 4,886 |
| | | | | | | | | |
| | | | | | | | $ | 9,230 |
| | | | | | | | | |
65
Notes to Financial Statements (continued)
Tax Information (unaudited)
The Fund hereby designate the maximum amounts allowable of their net taxable income as qualified dividends as provided in the Jobs and Growth Tax Relief Reconciliation Act of 2003. The 2005 Form 1099-DIV you receive for the Fund will show the tax status of all distributions paid to you during the year.
Pursuant to section 852 of the Internal Revenue Code, the Value Fund designated $13,613,459 as long-term capital gains for the taxable year ended December 31, 2005. Pursuant to section 852 of the Internal Revenue Code, the Capital Appreciation, Small Company, International Equity, Emerging Markets Equity, Bond and Global Bond each designated $0 as long-term capital gains for the taxable year ended December 31, 2005.
64
Report of Independent Registered Public Accounting Firm
To the Trustees of The Managers Funds and the Shareholders of
Managers Value Fund, Managers Capital Appreciation Fund, Managers Small Company Fund, Managers International Equity Fund, Managers Emerging Markets Equity Fund, Managers Bond Fund and Managers Global Bond Fund:
In our opinion, the accompanying statements of assets and liabilities, including the schedules of portfolio investments, and the related statements of operations and of changes in net assets and the financial highlights present fairly, in all material respects, the financial positions of Managers Value Fund, Managers Capital Appreciation Fund, Managers Small Company Fund, Managers International Equity Fund, Managers Emerging Markets Equity Fund, Managers Bond Fund and Managers Global Bond Fund (seven of the series constituting The Managers Funds, hereafter referred to as the “Funds”), at December 31, 2005, and the results of each of their operations, the changes in each of their net assets and the financial highlights for the periods indicated, in conformity with accounting principles generally accepted in the United States of America. These financial statements and financial highlights (hereafter referred to as “financial statements”) are the responsibility of the Funds’ management; our responsibility is to express an opinion on these financial statements based on our audits. We conducted our audits of these financial statements in accordance with the standards of the Public Company Accounting Oversight Board (United States). Those standards require that we plan and perform the audit to obtain reasonable assurance about whether the financial statements are free of material misstatement. An audit includes examining, on a test basis, evidence supporting the amounts and disclosures in the financial statements, assessing the accounting principles used and significant estimates made by management, and evaluating the overall financial statement presentation. We believe that our audits, which included confirmation of securities at December 31, 2005 by correspondence with the custodian and brokers, provide a reasonable basis for our opinion.
PricewaterhouseCoopers LLP
Boston, Massachusetts
February 22, 2006
65
Trustees and Officers
The Trustees and Officers of the Trust, their business addresses, principal occupations for the past five years and dates of birth are listed below. The Trustees provide broad supervision over the affairs of the Trust and the Fund. The Trustees are experienced executives who meet periodically throughout the year to oversee the Fund’s activities, review contractual arrangements with companies that provide services to the Fund, and review the Fund’s performance. Unless otherwise noted, the address of each Trustee or Officer is the address of the Trust: 800 Connecticut Avenue, Norwalk, Connecticut 06854.
There is no stated term of office for Trustees. Trustees serve until their resignation, retirement or removal in accordance with the Trust’s organizational documents and policies adopted by the Board from time to time. The President, Treasurer and Secretary hold office until a successor has been duly elected and qualified. Other officers serve at the pleasure of the Trustees.
Independent Trustees
The following Trustees are not “interested persons” of the Trust within the meaning of the 1940 Act:
| | |
Name, Date of Birth, Number of Funds Overseen in Fund Complex* | | Principal Occupation(s) During Past 5 Years and Other Directorships Held
by Trustee |
Jack W. Aber, 9/9/37 • Trustee since 1999 • Oversees 36 Funds in Fund Complex | | Professor of Finance, Boston University School of Management (1972-Present); Trustee of Appleton Growth Fund (1 portfolio); Trustee of Third Avenue Trust (4 portfolios); Trustee of Third Avenue Variable Trust (1 portfolio) |
| |
William E. Chapman, II, 9/23/41 • Independent Chairman • Trustee since 1999 • Oversees 36 Funds in Fund Complex | | President and Owner, Longboat Retirement Planning Solutions (1998-Present); Hewitt Associates, LLC (part time) (provider of Retirement and Investment Education Seminars); Interim Executive Vice President, QuadraMed Corporation (2001); President, Retirement Plans Group, Kemper Funds (1990-1998); Trustee of Bowdoin College (2002-Present); Trustee of Third Avenue Trust (4 portfolios); Trustee of Third Avenue Variable Trust (1 portfolio) |
| |
Edward J.Kaier, 9/23/45 • Trustee since 1999 • Oversees 36 Funds in Fund Complex | | Attorney at Law and Partner, Hepburn Willcox Hamilton & Putnam, LLP (1977-Present); Trustee of Third Avenue Trust (4 portfolios); Trustee of Third Avenue Variable Trust (1 portfolio) |
| |
Steven J. Paggioli, 4/3/50 • Trustee since 1993 • Oversees 36 Funds in Fund Complex | | Consultant (2001-Present); Formerly Executive Vice President and Director, The Wadsworth Group (1986-2001); Executive Vice President, Secretary and Director, Investment Company Administration, LLC (1990-2001); Vice President, Secretary and Director, First Fund Distributors, Inc. (1991-2001); Trustee, Professionally Managed Portfolios (21 portfolios); Advisory Board Member, Sustainable Growth Advisors, LP; Trustee, Guardian Mutual Funds (28 portfolios) |
| |
Eric Rakowski, 6/5/58 • Trustee since 1999 • Oversees 36 Funds in Fund Complex | | Professor, University of California at Berkeley School of Law (1990-Present); Visiting Professor, Harvard Law School (1998-1999); Trustee of Third Avenue Trust (4 portfolios); Trustee of Third Avenue Variable Trust (1 portfolio) |
| |
Thomas R. Schneeweis, 5/10/47 • Trustee since 1987 • Oversees 36 Funds in Fund Complex | | Professor of Finance, University of Massachusetts (1985-Present); Director, CISDM at the University of Massachusetts, (1996-Present); President, Alternative Investment Analytics, LLC, (formerly Schneeweis Partners, LLC) (2001- Present); Director of Research, Lyra/Starview Capital LLC, (2004-Present); Partner, Northampton Capital, LLC; Partner, Schneeweis Advisors and Mas-sachusetts Finance Institute (both wholly owned subsidiaries of Alternative Investment Analytics). No other directorships held by Trustee. |
| * | The Fund Complex consists of Managers AMG Funds, The Managers Funds, Managers Trust I and Managers Trust II. |
66
Trustees and Officers (continued)
Interested Trustees
The following Trustees are “interested persons” of the Trust within the meaning of the 1940 Act. Mr. Lebovitz is an interested person of the Trust within the meaning of the 1940 Act by virtue of his positions with Managers Investment Group LLC and Managers Distributors, Inc. Mr. Nutt is an interested person of the Trust within the meaning of the 1940 Act by virtue of his positions with, and interest in securities of, Affiliated Managers Group, Inc.
| | |
Name, Date of Birth, Number of Funds Overseen in Fund Complex* | | Principal Occupation(s) During Past 5 Years and Other Directorships Held
by Trustee |
Peter M. Lebovitz, 1/18/55 • Trustee since 2002 • President since 1999 • Oversees 36 Funds in Fund Complex | | Managing Partner, Managers Investment Group LLC (2005-Present); President and Chief Executive Officer, The Managers Funds LLC (1999-2004); President, Managers Distributors, Inc. (2000-Present); President, Managers AMG Funds (1999-Present); President, Managers Trust I (2000-Present); President, Managers Trust II (2000-Present); Director of Marketing, The Managers Funds, LP (1994-1999); Director of Marketing, Hyperion Capital Management, Inc. (1993- 1994); Senior Vice President, Greenwich Asset Management, Inc. (1989-1993); No other directorships held by trustee. |
| |
William J.Nutt, 3/30/45 • Trustee since 2005 • Oversees 36 Funds in Fund Complex | | Chairman and Founder of Affiliated Managers Group, Inc., (1993-Present); Chief Executive Officer of Affiliated Managers Group, Inc. (1993-2004); Director, Affiliated Managers Group, Inc. (1993-Present); President of Affiliated Managers Group, Inc. (1993-1999); President and Chief Operating Officer, The Boston Company (1989-1993); Senior Executive Vice President, The Boston Company (1982-1989) |
| * | The Fund Complex consists of Managers AMG Funds, The Managers Funds, Managers Trust I and Managers Trust II. |
Officers
| | |
Name, Date of Birth, Position(s) Held with Fund and Length of Time Served | | Principal Occupation(s) During Past 5 Years |
Bruce M. Aronow, 5/31/65 • Chief Financial Officer since 2005 | | Managing Partner, Managers Investment Group LLC (2005-Present); Chief Financial Officer, Managers AMG Funds, Managers Trust I and Managers Trust II (2005-Present); Executive Vice President and Chief Financial Officer and Principal, Rorer Asset Management (1999-2004); Chief Operating Officer, Rorer Asset Management (2001-2004); Staff Accountant, Manager and Partner, PricewaterhouseCoopers LLP (1987-1998) |
| |
Christine C. Carsman, 4/2/52 • Secretary since 2004 | | Vice President and Chief Regulatory Counsel, Affiliated Managers Group, Inc. (2004-Present); Secretary, Managers AMG Funds, Managers Trust I and Managers Trust II (2004-Present); Senior Counsel, Vice President and Director of Operational Risk Management and Compliance, Wellington Management Company, LLP (1995-2004); Deputy General Counsel, The Boston Company, Inc. (1993-1995); Associate General Counsel, The Boston Company Advisors, Inc. (1991-1993); Associate, Sullivan & Worcester LLP (1987-1991) |
| |
Donald S. Rumery, 5/29/58 • Treasurer since 1995 | | Senior Vice-President, Managers Investment Group LLC (2005-Present); Director, Finance and Planning, The Managers Funds LLC, (1994-2004); Treasurer and Chief Financial Officer, Managers Distributors, Inc. (2000-Present); Treasurer, Managers AMG Funds (1999-Present); Treasurer, Managers Trust I and Managers Trust II (2000-Present); Secretary; Managers Trust I and Managers Trust II (2000-2004) and Secretary; The Managers Funds (1997-2004) |
67
Investment Manager and Administrator
Managers Investment Group LLC
800 Connecticut Avenue
Norwalk, Connecticut 06854
(203) 299-3500 or (800) 835-3879
Distributor
Managers Distributors, Inc.
800 Connecticut Avenue
Norwalk, Connecticut 06854
(203) 299-3500 or (800) 835-3879
Custodian
The Bank of New York
2 Hanson Place, 7th Floor
Brooklyn, New York 11217
Legal Counsel
Ropes & Gray LLP
One International Place
Boston, Massachusetts 02110-2624
Transfer Agent
PFPC, Inc.
Attn: Managers
P.O. Box 9769
Providence, Rhode Island 02940
(800) 358-7668
For ManagersChoice Only
The Managers Funds
PFPC, Inc. c/o Wrap Services
P.O. Box 9847
Providence, Rhode Island 02940
(800) 358-7668

MANAGERSAND MANAGERS AMG EQUITY FUNDS
CAPITAL APPRECIATION
Bramwell Capital Management, Inc.
Essex Investment Management Co., LLC
EMERGING MARKETS EQUITY
Rexiter Capital Management Limited
ESSEX AGGRESSIVE GROWTH
ESSEX LARGE CAP GROWTH
ESSEX SMALL/MICRO CAP GROWTH
Essex Investment Management Co., LLC
FIRST QUADRANT TAX-MANAGED EQUITY
First Quadrant, L.P.
INSTITUTIONAL MICRO-CAP
Kern Capital Management LLC
INTERNATIONAL EQUITY
Bernstein Investment Research and Management
Lazard Asset Management, LLC Wellington Management Company, LLP
INTERNATIONAL GROWTH
Wellington Management Company, LLP
MICRO-CAP
Kern Capital Management LLC
MID-CAP
Chicago Equity Partners, LLC
REAL ESTATE SECURITIES
Urdang Securities Management, Inc.
RORER LARGE-CAP
Rorer Asset Management, LLC
SMALL CAP
TimesSquare Capital Management, LLC
SMALL COMPANY
Kalmar Investment Advisers, Inc.
SPECIAL EQUITY
Donald Smith & Co., Inc.
Kern Capital Management LLC
Skyline Asset Management, L.P.
Veredus Asset Management LLC
Westport Asset Management, Inc.
STRUCTURED CORE
First Quadrant, L.P.
SYSTEMATIC VALUE
Systematic Financial Management, L.P.
TIMESSQUARE MID CAP GROWTH
TIMESSQUARE SMALL CAP GROWTH
TimesSquare Capital Management, LLC
VALUE
Armstrong Shaw Associates Inc.
Osprey Partners Investment Mgmt., LLC
20
Oak Associates, Ltd.
MANAGERS BALANCED FUNDS
BALANCED
Chicago Equity Partners, LLC
Loomis, Sayles & Company L.P.
GLOBAL
333 Global Advisers*
Armstrong Shaw Associates Inc.
Bernstein Investment Research and Management
First Quadrant, L.P.
Kern Capital Management LLC
Northstar Capital Management, Inc.
Wellington Management Company, LLP
MANAGERS FIXED INCOME FUNDS
BOND (MANAGERS)
Loomis, Sayles & Company L.P.
BOND (MANAGERS FREMONT)
Pacific Investment Management Co. LLC
CALIFORNIA INTERMEDIATE TAX-FREE
Evergreen Investment Management Co., LLC
FIXED INCOME
Loomis, Sayles & Company L.P.
GLOBAL BOND
Loomis, Sayles & Company L.P.
HIGH YIELD
J.P. Morgan Investment Management Inc.
INTERMEDIATE DURATION GOVERNMENT
Smith Breeden Associates, Inc.
MONEY MARKET (MANAGERS)
JPMorgan Investment Advisors Inc.
MONEY MARKET (FREMONT)
333 Global Advisers*
SHORT DURATION GOVERNMENT
Smith Breeden Associates, Inc.
| * | A division of Managers Investment Group LLC |
This report is prepared for the Funds’ shareholders. It is authorized for distribution to prospective investors only when preceded or accompanied by an effective prospectus. To receive a free copy of the prospectus or Statement of Additional Information, which includes additional information about Fund Trustees, please contact us by calling 800.835.3879. Distributed by Managers Distributors, Inc., member NASD.
A description of the policies and procedures each Fund uses to vote its proxies is available: (i) without charge, upon request, by calling 800.835.3879, or (ii) on the Securities and Exchange Commission’s (SEC) Web site at www.sec.gov. For information regarding each Fund’s proxy voting record for the 12-month period ended June 30, call 800.835.3879 or visit the SEC Web site at www.sec.gov.
The Funds file their complete schedule of portfolio holdings with the SEC for the first and third quarters of each fiscal year on Form N-Q. The Funds’ Forms N-Q are available on the SEC’s website at www.sec.gov. A Funds’ Forms N-Q may be reviewed and copied at the SEC’s Public Reference Room in Washington, DC. Information on the operation of the Public Reference Room may be obtained by calling 800.SEC.0330. To review a complete list of the Funds’ portfolio holdings, or to view the most recent quarterly holdings report, semiannual report, or annual report, please visit www.managersinvest.com.
AR001-1205
| | |
| www.managersinvest.com | |  |
Registrant has adopted a Code of Ethics. See attached Exhibit (a)(1).
| Item 3. | AUDIT COMMITTEE FINANCIAL EXPERT |
Registrant’s Board of Trustees has determined that independent Trustees Mr. Jack W. Aber and Mr. Steven J. Paggioli each qualify as the Audit Committee Financial Expert. Mr. Aber and Mr. Paggioli are “independent” as such term is defined in Form N-CSR.
| Item 4. | PRINCIPAL ACCOUNTANT FEES AND SERVICES |
The aggregate fees billed by PwC to the Fund for the Funds’ two most recent fiscal years for professional services rendered for audits of annual financial statements, or services that are normally provided in connection with statutory and regulatory filings or engagements (“Audit Fees”) were as follows:
| | | | | | |
| | | 2005 | | 2004 |
Value Fund | | $ | 21,660 | | $ | 21,659 |
Capital Appreciation Fund | | $ | 23,280 | | $ | 23,279 |
Small Company Fund | | $ | 13,000 | | $ | 13,019 |
Special Equity Fund | | $ | 38,340 | | $ | 38,319 |
International Equity Fund | | $ | 32,460 | | $ | 32,459 |
Emerging Markets Equity Fund | | $ | 19,500 | | $ | 19,499 |
Bond Fund | | $ | 27,600 | | $ | 27,599 |
Global Bond Fund | | $ | 25,975 | | $ | 25,979 |
All Funds in The Managers Funds Complex Audited by PwC | | $ | 709,350 | | $ | 535,060 |
Audit-Related Fees
There were no fees billed by PwC to the Fund in its two recent fiscal years for services rendered for assurance and related services that are reasonably related to the performance of the audit or review of the Fund’s financial statements, but are not reported as Audit Fees (“Audit-Related Fees”).
For the Funds’ two most recent fiscal years, there were no Audit-Related Fees billed by PwC for engagements related directly to the operations and financial reporting of one or more Funds by a Fund Service Provider. A Fund Service Provider is (a) any investment adviser to the Fund (not including any Subadvisor whose role is primarily portfolio management and is subcontracted with or overseen by another investment adviser) or (b) any entity that provides ongoing services to the Fund and is controlling, controlled by or under common control with a Fund investment adviser described in (a).
Tax Fees
The aggregate fees billed by PwC to the Funds for the two most recent fiscal years for professional services rendered for tax compliance, tax advice, and tax planning (“Tax Fees”) were as follows:
| | | | | | |
| | | 2005 | | 2004 |
Value Fund | | $ | 3,500 | | $ | 5,940 |
Capital Appreciation Fund | | $ | 3,500 | | $ | 6,210 |
Small Company Fund | | $ | 3,500 | | $ | 5,670 |
Special Equity Fund | | $ | 4,500 | | $ | 8,640 |
International Equity Fund | | $ | 4,500 | | $ | 8,640 |
Emerging Markets Equity Fund | | $ | 4,250 | | $ | 7,560 |
Bond Fund | | $ | 4,250 | | $ | 7,560 |
Global Bond Fund | | $ | 4,500 | | $ | 8,100 |
For the Funds’ two most recent fiscal years, Tax Fees billed by PwC for engagements by Fund Service Providers that related directly to the operations and financial reporting of the Funds were $0 for fiscal 2005 and $0 for fiscal 2004, respectively.
The services for which Tax Fees were charged comprise all services performed by professional staff in PwC’s tax division except those services related to the audit. Typically, this category would include fees for tax compliance, tax planning, and tax advice. Tax compliance, tax advice, and tax planning services include preparation of original and amended tax returns, claims for refund and tax payment-planning services, assistance with tax audits and appeals, tax advice related to mergers and acquisitions and requests for rulings or technical advice from taxing authorities.
All Other Fees
There were no other fees billed by PwC to the Funds for all other non-audit services (“Other Fees”) during the Funds’ two most recent fiscal years. During the same period, there were no Other Fees billed by PwC for engagements by Fund Service Providers that related directly to the operations and financial reporting of the Funds.
According to policies adopted by the Audit Committee, services provided by PwC to the Funds must be pre-approved by the Audit Committee. On an annual basis, the Audit Committee reviews and pre-approves various types of services that PwC may perform for the Funds without specific approval of each engagement, subject to specified budget limitations. As contemplated by the Sarbanes-Oxley Act of 2002 and related SEC rules, the Audit Committee also pre-approves non-audit services provided by PwC to any Fund Service Provider for any engagement that relates directly to the operations and financial reporting of the Funds. Any engagement that is not already pre-approved or that will exceed a pre-approved budget must be submitted to the Audit Committee for pre-approval. The Chairman of the Audit Committee is authorized on behalf of the Board of Trustees and the Audit Committee to approve the engagement of PwC to perform non-audit services subject to certain conditions, including notification to the Audit Committee of such pre-approval not later than the next meeting of the Audit Committee following the date of such pre-approval.
There were no other fees billed by PwC for non-audit services rendered to the Funds and to Fund Service Providers for the Funds’ two most recent fiscal years.
The Audit Committee has considered whether the provision of non-audit services by PwC to Fund Service Providers that were not required to be pre-approved by the Audit Committee is compatible with maintaining PwC’s independence in its audit of the Funds, taking into account representations from PwC, in accordance with Independence Standards Board Standard No. 1, regarding its independence from the Funds and its related entities.
The following table sets forth the non-audit services provided by PwC to the Funds and its service affiliates defined as the Funds’ investment advisor and any entity controlling, controlled by or under common control with Managers Investment Group LLC that provides ongoing services to the Funds (“Control Affiliates”) for the last two fiscal years (as of September 30, 2005).
| | | | | | | | | | | | | | | | | | |
| | | Audit-related fees A | | Tax fees A | | All other fees A |
| | | 2005 | | 2004 | | 2005 | | 2004 | | 2005 | | 2004 |
Control Affiliates | | $ | 476,755 | | $ | 155,040 | | $ | 172,139 | | $ | 260,600 | | $ | 75,729 | | $ | 0 |
| A | Aggregate amounts may reflect rounding. |
| Item 5. | AUDIT COMMITTEE OF LISTED REGISTRANTS |
Not applicable.
| Item 6. | SCHEDULE OF INVESTMENTS |
Not applicable.
| Item 7. | DISCLOSURE OF PROXY VOTING POLICIES AND PROCEDURES FOR CLOSED-END MANAGEMENT INVESTMENT COMPANIES |
Not applicable.
| Item 8. | PORTFOLIO MANAGERS OF CLOSED-END MANAGEMENT INVESTMENT COMPANIES |
Not applicable.
| Item 9. | PURCHASES OF EQUITY SECURITIES BY CLOSED-END MANAGEMENT INVESTMENT COMPANIES AND AFFILIATED PURCHASERS |
Not applicable.
| Item 10. | SUBMISSION OF MATTERS TO A VOTE OF SECURITY HOLDERS |
Not applicable.
| Item 11. | CONTROLS AND PROCEDURES |
(a) The Registrant’s principal executive and principal financial officers have concluded, based on their evaluation of the registrant’s disclosure controls and procedures as of a date within 90 days of the filing of this report, that the Registrant’s disclosure controls and procedures are reasonably designed to ensure that information required to be disclosed by the Registrant on Form N-CSR is recorded, processed, summarized and reported within the required time periods and that information required to be disclosed by the registrant
in the reports that it files or submits on Form N-CSR is accumulated and communicated to the Registrant’s management, including its principal executive and principal financial officers, as appropriate to allow timely decisions regarding required disclosure.
(b) There were no changes in the Registrant’s internal control over financial reporting during the Registrant’s fourth fiscal quarter of the period covered by this report that have materially affected, or are reasonably likely to affect, the internal control over financial reporting.
| | | |
| (a | )(1) | | Any Code of Ethics or amendments hereto. Filed herewith. |
| |
| (a | )(2) | | Certifications pursuant to Rule 30a-2(a) under the Investment Company Act of 1940 - Filed herewith. |
| |
| (a | )(3) | | Not applicable. |
| |
| (b | ) | | Certifications pursuant to Rule 30a-2(b) under the Investment Company Act of 1940 - Filed herewith. |
SIGNATURES
Pursuant to the requirements of the Securities Exchange Act of 1934 and the Investment Company Act of 1940, the registrant has duly caused this report to be signed on its behalf by the undersigned, thereunto duly authorized.
| | |
| THE MANAGERS FUNDS |
| |
By: | | /s/ Peter M. Lebovitz |
| | Peter M. Lebovitz, President |
Date: March 7, 2006
Pursuant to the requirements of the Securities Exchange Act of 1934 and the Investment Company Act of 1940, this report has been signed below by the following persons on behalf of the registrant and in the capacities and on the dates indicated.
| | |
| |
By: | | /s/ Peter M. Lebovitz |
| | Peter M. Lebovitz, President |
Date: March 7, 2006
| | |
| |
By: | | /s/ Bruce M. Aronow |
| | Bruce M. Aronow, Chief Financial Officer |
Date: March 7, 2006