UNITED STATES
SECURITIES AND EXCHANGE COMMISSION
Washington, D.C. 20549
FORM N-CSR
CERTIFIED SHAREHOLDER REPORT OF
REGISTERED MANAGEMENT INVESTMENT COMPANIES
Investment Company Act file number: 811-03752
THE MANAGERS FUNDS
(Exact name of registrant as specified in charter)
| | |
| 800 Connecticut Avenue, Norwalk, Connecticut | | 06854 |
| (Address of principal executive offices) | | (Zip code) |
Managers Investment Group LLC
800 Connecticut Avenue, Norwalk, Connecticut 06854
(Name and address of agent for service)
Registrant’s telephone number, including area code: (203) 299-3500
Date of fiscal year end: DECEMBER 31
Date of reporting period: JANUARY 1, 2006 - DECEMBER 31, 2006
(Annual Shareholder Report)
| Item 1. | Reports to Shareholders |
ANNUAL REPORT
Managers Funds
December 31, 2006
| | • | | Managers AMG Essex Large Cap Growth Fund |
| | • | | Managers Small Company Fund |
| | • | | Managers International Equity Fund |
| | • | | Managers Emerging Markets Equity Fund |
| | • | | Managers Global Bond Fund |

The Managers Funds
Annual Report – December 31, 2006
TABLE OF CONTENTS
Nothing contained herein is to be considered an offer, sale or solicitation of an offer to buy shares of The Managers Funds or Managers AMG Funds. Such offering is made only by Prospectus, which includes details as to offering price and other material information.
Letter to Shareholders
Dear Shareholders and Clients,
We would like to thank you for the opportunity to manage your assets in 2006, and for taking time with us to take a quick glance back at last year’s investment climate.
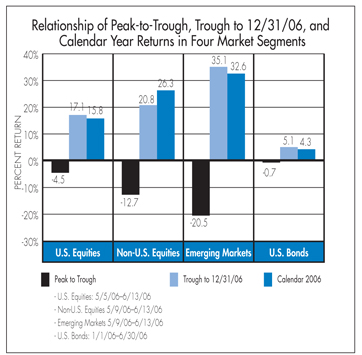
If all we did was focus on the strong, above-average returns generated by most of the asset classes worldwide during 2006—U.S. stocks up 15.8%, non-U.S. stocks up 26.3%, real estate up 36.1%, global bonds up 6.6% (high quality U.S. bonds offered moderately below average returns of 4.3%)—we would be missing one of the most important lessons that 2006 teaches us about investing; for 2006 was a year in which investors needed to endure a period of negative returns in order to reap the benefits the full year had to offer.
Investors with classically diversified portfolios who stuck to their long-term investment plan during the past year should have been pleased with their results. Other investors who were enticed into making asset allocation and investment changes in response to short-term market movements, however, may have experienced below average portfolio results, and certainly took undue risk.
It can be tempting for investors without a solid plan to alter their asset allocations and investment approach. Coming off of three previous years of positive stock market returns, we entered 2006 with the widely reported expectation that the economy was running out of steam. Given the news media’s penchant for pessimism, we were repeatedly told to watch out for: slower economic growth, softer corporate profits, significantly higher oil prices, prospects for higher inflation, expectations for further Federal Reserve interest rate hikes, a collapse in the housing market, the negative impact of a decline in the dollar’s value and of course, a long list of geopolitical concerns. As if that wasn’t enough, the yield curve was borderline inverted, very often a signal of economic weakness.
Investors tried to shrug off this pessimism and through the early part of May the equity markets actually produced positive results. However, the headline risks finally became too much for investors to withstand and the market ran out of steam. From May 5 through June 13, the U.S. equity market declined by 4.5%, while from May 9 through June 13, non-U.S. equities fell by 12.7%, with emerging markets leading the slide down 20.5%. Meanwhile, U.S. bonds had been steadily declining with the Lehman Brothers Aggregate Index down 0.7% through the end of June. Near mid-year, it seemed that the bears were developing a stranglehold on the market. More than a few commentators were wondering what then-new Fed Chairman Dr. Bernanke was trying to accomplish. Cash seemed to be king, commodities were headed higher, and hedge funds were constantly in the news—all very enticing options for investors.
But the whole story was yet to be told. Despite the mixed macro economic news, corporate results were coming through better than many analysts had expected and companies were actually producing positive earnings surprises. In fact, 68% and 76% of S&P 500 companies produced positive earnings surprises in the first and second quarters of 2006, respectively. As the year developed,
1
Letter to Shareholders (continued)
even though economic factors did not dramatically improve, they did not worsen either. The Fed stopped raising rates, oil prices stopped going up (and ultimately finished the year below where they started), inflation concerns tempered, the housing market did not experience the hard landing many had feared, and the mighty consumer did not waver. In retrospect, perhaps it was going to be the soft landing that many had sought.
As more and more positive earnings results came through during the year, even against the backdrop of mixed economic news, the markets staged a broad rally. From the June 13 bottom, the S&P 500 advanced by 17.1%, while the MSCI EAFE increased 20.8%. Meanwhile, the Lehman Aggregate Bond Index advanced 5.1% during the second half of the year.
So what was the lesson to be learned from 2006? Investors who started the year with a reasonably diversified portfolio and simply maintained their long-term perspective had an above-average year and made real progress towards their financial goals. Going into 2006, and for the first part of the year, economic conditions and expectations could easily have compelled an investor to over-think and do something other than stay on plan. The market would have whipsawed these investors, resulting in poor relative returns. Having a well founded long-term plan and sticking with it can improve investors’ odds of reaching their investment goals, and it certainly helped in terms of getting the most out of 2006.
One of our foremost goals at Managers Investment Group (“Managers”) is to structure and manage mutual funds that will help our shareholders and clients become more successful at reaching their investment goals and objectives. Each of our Funds is geared to provide you with exposure to a specific asset class or portion of the market. Investors tend to use our Funds as part of their overall asset allocation in order to structure a well-diversifi ed portfolio intended to meet individual needs. Most of our Funds, therefore, are designed to be building blocks.
Managers International Equity Fund is a great example of how we structure and manage funds for our clients’ benefit. We designed the overall Fund to provide broad exposure to the world’s non-U.S. equity markets, predominately in developed markets. Considering the broad mandate, we believe the best method of accomplishing that goal is by employing a number of investment managers, each with a different focus and approach to investing in the international equity market. As a result, we have built a virtual team of three complimentary institutional investment managers. Each of these three organizations has an experienced team of accomplished professionals and deep resources. Each of them has demonstrated great success in generating attractive investment returns. Yet each has a significantly different outlook and approach to investing. Specifically, the Fund is subadvised by AllianceBernstein, Lazard Asset Management, and Wellington Management Company, whose investment approaches are “bottom-up” value-based, “top-down” thematic, and growth-oriented, respectively. By blending managers with different styles, the portfolio is not held hostage to growth, for example, being out-of-favor. The result is a Fund with expected risk that should be lower than average and that exhibits more stable performance on a relative basis. Though this Fund won’t typically attract performance chasers, it will help investors reach their fi nancial goals without having to zigzag their way through investment styles or fads and give them peace of mind that they have an elegantly diversified portfolio.
At Managers we appreciate the privilege of being part of your investment plan. You can rest assured that under all market conditions our team is focused on delivering excellent investment management services for your benefit. Thank you again for the opportunity to be of service.
| | | | |
| Respectfully, | | | | |
| | |
 | | | |  |
| John Streur | | | | Thomas G. Hoffman, CFA |
| Senior Managing Partner | | | | Executive Vice President |
| Managers Investment Group LLC | | | | Chief Investment Officer |
| | | | Managers Investment Group LLC |
Note: Source for all data referenced in the letter is FactSet and Russell.
2
About Your Fund’s Expenses
As a shareholder of the Fund, you may incur two types of costs: (1) transaction costs, which may include sales charges (loads) on purchase payments; redemption fees; and exchange fees; and (2) ongoing costs, including management fees; distribution (12b-1) fees; and other Fund expenses. This example is intended to help you understand your ongoing costs (in dollars) of investing in the Fund and to compare these costs with the ongoing costs of investing in other mutual funds. The example is based on an investment of $1,000 invested at the beginning of the period and held for the entire period as indicated below.
Actual Expenses
The first line of the table below provides information about the actual account values and actual expenses. You may use the information in this line, together with the amount you invested, to estimate the expenses that you paid over the period. Simply divide your account value by $1,000 (for example, an $8,600 account value divided by $1,000 = 8.6), then multiply the result by the number in the first line under the heading entitled “Expenses Paid During Period” to estimate the expenses you paid on your account during this period.
Hypothetical Example for Comparison Purposes
The second line of the table below provides information about hypothetical account values and hypothetical expenses based on the Fund’s actual expense ratio and an assumed annual rate of return of 5% before expenses, which is not the Fund’s actual return. The hypothetical account values and expenses may not be used to estimate the actual ending account balance or expenses you paid for the period. You may use this information to compare the ongoing costs of investing in the Fund and other funds by comparing this 5% hypothetical example with the 5% hypothetical examples that appear in the shareholder reports of other funds.
Please note that the expenses shown in the table are meant to highlight your ongoing costs only and do not reflect any transactional costs, such as sales charges (loads), redemption fees, or exchange fees. Therefore, the second line of the table is useful in comparing ongoing costs only, and will not help you determine the relative total costs of owning different funds.
| | | | | | | | | |
Six Months Ended December 31, 2006 | | Beginning
Account
Value
7/1/2006 | | Ending
Account
Value
12/31/2006 | | Expenses
Paid
During
the
Period* |
Managers Value Fund | | | | | | | | | |
Based on Actual Fund Return | | $ | 1,000 | | $ | 1,150 | | $ | 6.40 |
Based on Hypothetical 5% Annual Return | | $ | 1,000 | | $ | 1,019 | | $ | 6.01 |
AMG Essex Large Cap Growth Fund | | | | | | | | | |
Based on Actual Fund Return | | $ | 1,000 | | $ | 1,083 | | $ | 6.56 |
Based on Hypothetical 5% Annual Return | | $ | 1,000 | | $ | 1,019 | | $ | 6.36 |
Managers Small Company Fund | | | | | | | | | |
Based on Actual Fund Return | | $ | 1,000 | | $ | 1,073 | | $ | 7.10 |
Based on Hypothetical 5% Annual Return | | $ | 1,000 | | $ | 1,018 | | $ | 6.92 |
Managers International Equity Fund | | | | | | | | | |
Based on Actual Fund Return | | $ | 1,000 | | $ | 1,151 | | $ | 7.92 |
Based on Hypothetical 5% Annual Return | | $ | 1,000 | | $ | 1,018 | | $ | 7.43 |
Managers Emerging Markets Equity Fund | | | | | | | | | |
Based on Actual Fund Return | | $ | 1,000 | | $ | 1,274 | | $ | 10.20 |
Based on Hypothetical 5% Annual Return | | $ | 1,000 | | $ | 1,016 | | $ | 9.05 |
Managers Bond Fund | | | | | | | | | |
Based on Actual Fund Return | | $ | 1,000 | | $ | 1,077 | | $ | 5.18 |
Based on Hypothetical 5% Annual Return | | $ | 1,000 | | $ | 1,020 | | $ | 5.04 |
Managers Global Bond Fund | | | | | | | | | |
Based on Actual Fund Return | | $ | 1,000 | | $ | 1,046 | | $ | 6.14 |
Based on Hypothetical 5% Annual Return | | $ | 1,000 | | $ | 1,019 | | $ | 6.06 |
| * | Expenses are equal to the Fund’s annualized expense ratio multiplied by the average account value over the period, multiplied by the number of days in the most recent fiscal half-year (184), then divided by 365. |
3
Managers Value Fund
Portfolio Managers’ Comments
The Managers Value Fund’s (the “Fund”) objective is to achieve long-term capital appreciation through a diversified portfolio of equity securities. Income is the Fund’s secondary objective.
The Fund invests primarily in common and preferred stocks of U.S. companies. The Fund generally invests in medium and large companies, that is, companies with capitalizations that are within the range of capitalizations of companies represented in the S&P 500 Index, the Fund’s benchmark.
THE PORTFOLIO MANAGERS
The Fund employs multiple portfolio managers who specialize in distinct investment approaches. This “intelligence diversifi cation” not only serves to manage risk, but also helps us tap the markets’ full potential by focusing different analytical insights on each class of investment. Fund management strives to achieve this performance and diversifi cation while ensuring that the Fund operates within the framework of its investment objective and principal investment strategies.
Armstrong Shaw Associates
Armstrong Shaw Associates, Inc. (“Armstrong Shaw”) has a disciplined, absolute value approach to the equity market. Valuations are determined using a private purchase test to determine the price that a company could bring in a sale to a sophisticated buyer, discounted cash flow analysis, and market comparables.
Armstrong Shaw invests in securities where a rigid cash fl ow or asset value analysis determines that a company’s stock is selling at a substantial discount to its intrinsic value. While the level of the overall stock market or trends in economic factors may affect the timing in which value is recognized, they are not the basis for investment. Rather, Armstrong Shaw has a classic bottom up, company-by-company view of investing.
Armstrong Shaw’s decision making process includes market screening for potential new ideas, fundamental research including financial modeling and management interviews, an in depth investment committee review, and a strict sell discipline. Idea generation begins with screening the universe for businesses that are growing earnings and generating good returns on capital, but have fallen out of favor in the market. Armstrong Shaw’s fundamental research focuses on forward and backward looking fi nancial modeling, including an analysis of the income statement, the balance sheet, and the cash fl ow statement. The investment team compares each company to its peers, the broader market, and any transactions that may have taken place in its industry. Finally, Armstrong Shaw interviews the management team. During the investment committee review, the investment team challenges the analysis and ultimately decides if the company meets the criteria to be considered for the Portfolio.
The ideal investment exhibits many of the following traits:
| | • | | Defensible business franchise |
| | • | | Ability to generate above average returns |
| | • | | Low risk to technical obsolescence |
| | • | | Low cost provider or niche player |
| | • | | Track record of success |
| | • | | Long-term incentive program aligned with the interest of shareholders |
| | • | | History of being good allocators of capital |
| | • | | Low price to cash fl ow |
| | • | | Low price to asset value |
| | • | | Favorable price versus comparables in the marketplace |
| | • | | Favorable price versus recent transactions |
| | • | | Valuation check: what have buyers paid per hotel room, per subscriber, per a dollar of sales or earnings or cash flow |
Armstrong Shaw’s goal is to buy good businesses, run by proven, capable managers at prices equal to or less than 70% of intrinsic value. They believe that investing in superior businesses at attractive prices will provide superior returns over time.
Portfolio Management:
| | • | | Screens the universe of approximately 5,600 NYSE and AMEX issues and the largest NASDAQ stocks for: |
| | • | | Market caps more than $2.5 billion |
| | • | | EPS growth greater than 10% |
| | • | | Relative Price Earning multiple less than the market |
| | • | | Return on equity of 15% or greater |
| | • | | Conducts quantitative analysis by: |
| | • | | Analyzing income statement, balance sheet, and cash flow statement |
| | • | | Comparing the stock prices to cash flows, EPS, sales, etc. |
| | • | | Interviewing management team to get a better sense of strategic and fi nancial plans for the company |
| | • | | Estimating the stock’s intrinsic value and purchase stocks only when they are selling for less than 70% of the estimated intrinsic value |
The investment team will make a sell decision when:
| | • | | A price target is reached |
| | • | | Company’s fundamentals deteriorate |
| | • | | A better opportunity emerges |
Additionally, a drop in price of 25% from average cost triggers an automatic review process for potential sale.
Osprey Partners Investment Management
As traditional value investors, John Liang and the investment team at Osprey Partners Investment Management, LLC (“Osprey”) seek to identify undervalued stocks with low price-to-earnings and price-to-cash fl ow ratios. At the same time, Osprey’s investment team focuses its in-depth bottom-up analysis to identify fundamentally strong, well-managed companies.
Osprey expects to generate returns from dividend income as well as capital appreciation as a result of improvements to the valuations of the stocks such as, among other things, increases in the price-to-earnings ratio.
The ideal company exhibits many of the following traits:
| | • | | Low debt-to-capital ratios |
4
Managers Value Fund
Portfolio Managers’ Comments
Portfolio Management:
| | • | | Screens the investment universe for companies with a market cap above $1.5 billion and a P/E ratio at least 20% less than the P/E ratio of the S&P 500: |
| | • | | Determines the strength and risks of each company’s business with: |
| | • | | Balance sheet and income statement |
| | • | | Earnings quality and sustainability |
The investment team will make a sell decision when:
| | • | | Stock appreciates to a predetermined price target |
| | • | | A better opportunity emerges |
Additionally, a 20% drop relative to the market prompts an in-depth review and positions exceeding 6% of the portfolio are scaled back. The investment team tends to have an investment time horizon of 2 years or more.
THE YEAR IN REVIEW
For the year 2006, the Managers Value Fund gained 18.08% compared with a gain of 15.79% for the S&P 500.
Except for a brief panic attack in mid-2006, caused partly by fears that the new Federal Reserve Chairman, Ben Bernanke, would tighten the U.S. economy into a recession, the U.S. stock market marched steadily ahead during 2006, finishing higher than all but the most bullish of pundits expected. It wasn’t an expectations expansion, however. Rather, it was the result of a surprisingly resilient economy, continued increases in corporate profitability and a celebration of the eventual end to the Fed’s long campaign of interest rate hikes.
Contrary to most professionals’ expectations at the beginning of the year, including our own, value indexes continued to significantly outpace their growth counterparts, and small-capitalization stock indexes rose more than their large-cap counterparts. The Fund’s value orientation was beneficial throughout the year as a broad range of companies produced solid fundamental growth, but lower expectation, lower valuation stocks appreciated more.
During the generally rising first four months of the year, the Portfolio outperformed with strong contributions from Nokia, and several retailers including Dollar Tree Stores and Rent-a-Center. In addition, the Portfolio’s large financials allocation with signifi cant positions in best of breed banking and capital markets firms such as Goldman Sachs, Merrill Lynch, and Bank of America continued to advance on strong earnings that they extended throughout all of 2006. During a brief but sharp market sell-off in May through mid-July, the Portfolio generally moved with the market. However, as the market rallied off its July trough, the Fund outperformed with its core fi nancials companies again leading along with strong growth from the surprisingly resilient consumer discretionary sector. Media giant, Time Warner, finally broke out of a two and a half year holding pattern with strong results and a 36% price gain. Meanwhile, there were very few negative surprises and no signifi cant price breaks in portfolio holdings during the second half of the year.
LOOKING FORWARD
Even after the strong second half stock rally, the Fund’s subadvisors remain sanguine about their portfolios and had the following comments as we progress into 2007:
Armstrong Shaw
The economic backdrop for 2007 looks favorable as corporate profi t expansion, while moderating, is expected to continue. Real interest rates are low, employment is high and falling energy prices are offsetting a weaker housing market. Valuations are reasonable, and stocks are more attractive than bonds with the S&P 500 trading at a 6.1% earnings yield vs. a 4.7% yield for bonds. We believe that large-cap equities should do better during a decelerating economy and that the trend of large-cap outperformance is likely to persist for a few years. Interestingly, since 1945, the third year of a Presidential term has always been positive, by 18% on average. We feel that 2007 is likely to be a year of P/E expansion and that our Portfolio of high quality, large-capitalization companies with steady earnings power should be a prime beneficiary. Typically, P/E expansion coincides with slow downs in the growth of profits and the economy. Our industrial holdings are weighted toward late cycle businesses such as GE, United Technologies, and Honeywell, which should benefi t from this stage in the economic cycle. Health care and information technology offer above average opportunities and we have added to our exposure in these sectors. We have stayed true to our discipline of buying good companies, run by strong management teams at discounts to their intrinsic value. Many of the companies that we own delivered strong fundamental results but were not rewarded in the market for much of 2006. We have begun to see a change in market leadership which has resulted in better absolute and relative returns in both the fourth quarter and the beginning of 2007. We believe that we are at the beginning of a multi-year trend and that our Portfolio is poised to benefit from this change.
Osprey Partners
The third and fourth quarter rally in stocks that brought the Dow Jones and S&P 500 Indexes to record heights has resulted in stock valuations that are almost squarely in line with historical averages. Corporate profi ts, however, are fi nally beginning to slow after an unprecedented run of above average growth. For 2007, most strategists are looking for growth somewhere in the 7% - 9% range, which would be in line with the long run average of earnings growth. Assuming little or no multiple expansion it is reasonable to expect a similar 7% - 9% increase in stock prices for the year. We only wish that things were so simple.
Clouding the near term picture is the fact that the stock market appears overbought on many short-term indicators. Also, the market has not had a 10% correction in over four years representing one of the longest stretches in U.S. history. Finally, complacency seems to be ruling the day. Volatility, as measured by the VIX Index recently hit the lowest level in over a decade and market economists are nearly in universal agreement about the prospects for a soft landing in 2007. In eerie similarity, not one of the 30 leading economists polled in early 2000 forecasted a slowdown that occurred later that year. The favorite argument of market and economic bulls is that employment is historically low at 4.4% but it was even lower at 3.9% on the eve of the 2001 recession suggesting that this is a lagging
5
Managers Value Fund
Portfolio Managers’ Comments (continued)
rather than leading indicator at best. Finally, the best argument in favor of a bull market in 2007 is the fact that there has never been a down market in the third year of a presidential term in the last fifty years.
While all of these warning signs point to a choppy market in 2007, we nevertheless find ourselves reluctantly siding with the consensus. We continue to believe that the U.S. consumer will remain resilient given the tight labor market and falling energy prices and the current inventory problem in the housing market will ease as the year progresses. We look for a possible near term correction in equity market that will relieve overbought conditions but set the stage for a more sustained advance as the year progresses.
CUMULATIVE TOTAL RETURN PERFORMANCE
Managers Value Fund’s cumulative total return is based on the daily change in net asset value (NAV), and assumes that all dividends and distributions were reinvested. The S&P 500 Index is an unmanaged capitalization weighted index of 500 commonly traded stocks designed to measure performance of the broad domestic economy through changes in the aggregate market value of those stocks. Unlike the Fund, the S&P 500 Index is unmanaged, is not available for investment, and does not incur expenses. The Index assumes reinvestment of dividends. This graph compares a hypothetical $10,000 investment made in Managers Value Fund on December 31, 1996 to a $10,000 investment made in the S&P 500 Index for the same time period. Performance for periods longer than one year is annualized. The graph and table do not reflect the deduction of taxes that a shareholder would pay on a Fund distribution or redemption of shares. The listed returns for the Fund are net of expenses and the returns for the index exclude expenses. Past performance is not indicative of future results. Total returns would have been lower had certain expenses not been reduced.
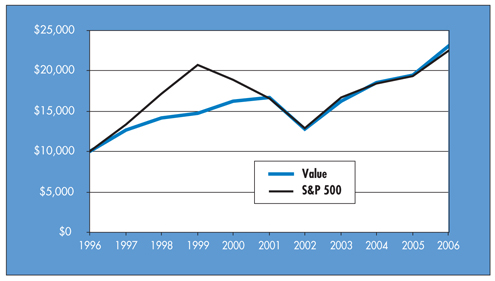
The table below shows the average annual total returns for the Value Fund and the S&P 500 Index since December 31, 1996 through December 31, 2006.
| | | | | | | | | | | |
Average Annualized Total Returns | | One Year | | | Five Years | | | Ten Years | | | Inception Date |
Value | | 18.08 | % | | 6.62 | % | | 8.71 | % | | 10/31/84 |
S&P 500 Index | | 15.79 | % | | 6.19 | % | | 8.42 | % | | |
6
Managers Value Fund
Fund Snapshots
December 31, 2006
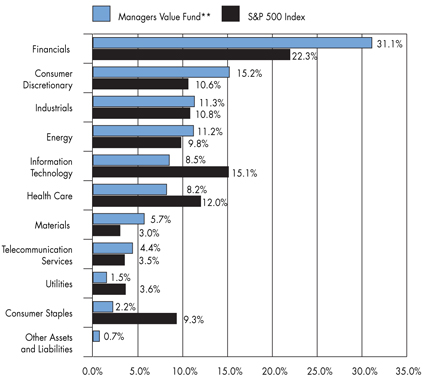
Portfolio Breakdown
| ** | As a percentage of net assets |
| | | | | | |
Industry | | Managers Value Fund** | | | S&P 500 Index | |
Financials | | 31.1 | % | | 22.3 | % |
Consumer Discretionary | | 15.2 | % | | 10.6 | % |
Industrials | | 11.3 | % | | 10.8 | % |
Energy | | 11.2 | % | | 9.8 | % |
Information Technology | | 8.5 | % | | 15.1 | % |
Health Care | | 8.2 | % | | 12.0 | % |
Materials | | 5.7 | % | | 3.0 | % |
Telecommunication Services | | 4.4 | % | | 3.5 | % |
Utilities | | 1.5 | % | | 3.6 | % |
Consumer Staples | | 2.2 | % | | 9.3 | % |
Other Assets and Liabilities | | 0.7 | % | | 0.0 | % |
Top Ten Holdings
| | | |
Security Name | | Percentage of Net Assets | |
American International Group, Inc.* | | 4.7 | % |
Citigroup, Inc.* | | 4.5 | |
Bank of America Corp.* | | 4.4 | |
ChevronTexaco Corp.* | | 4.0 | |
ConocoPhillips Co.* | | 3.3 | |
Capital One Financial Corp. | | 3.2 | |
Merrill Lynch & Co., Inc.* | | 3.1 | |
Verizon Communications, Inc.* | | 2.4 | |
MBIA, Inc. | | 2.3 | |
Nokia Corp., Sponsored ADR* | | 2.2 | |
Top Ten as a Group | | 34.1 | % |
| | | |
| * | Top Ten Holding at June 30, 2006 |
Any sectors, industries, or securities discussed should not be perceived as investment recommendations. Mention of a specific security should not be considered a recommendation to buy or solicitation to sell that security.
7
Managers Value Fund
Schedule of Portfolio Investments
December 31, 2006
| | | | | | | |
| | | Shares | | | Value | |
Common Stocks - 99.3% | | | | | | | |
Consumer Discretionary - 15.2% | | | | | | | |
Abercrombie & Fitch Co. | | 21,000 | 2 | | $ | 1,462,230 | |
Comcast Corp., Special Class A* | | 41,360 | 2 | | | 1,732,157 | |
Gannett Co., Inc. | | 25,200 | 2 | | | 1,523,592 | |
Jarden Corp.* | | 44,900 | 2 | | | 1,562,071 | |
Lowe’s Co., Inc. | | 34,040 | | | | 1,060,346 | |
Mattel, Inc. | | 63,400 | | | | 1,436,644 | |
Rent-A-Center, Inc.* | | 38,900 | 2 | | | 1,147,939 | |
Time Warner Co., Inc. | | 78,700 | | | | 1,714,086 | |
Wyndham Worldwide Corp.* | | 21,602 | | | | 691,696 | |
Total Consumer Discretionary | | | | | | 12,330,761 | |
Consumer Staples - 2.2% | | | | | | | |
CVS Corp. | | 56,440 | 2 | | | 1,744,560 | |
Energy - 11.2% | | | | | | | |
Baker Hughes, Inc. | | 7,910 | 2 | | | 590,561 | |
ChevronTexaco Corp. | | 43,600 | 2 | | | 3,205,908 | |
ConocoPhillips Co. | | 37,130 | | | | 2,671,504 | |
Devon Energy Corp. | | 19,000 | 2 | | | 1,274,520 | |
Transocean, Inc.* | | 16,300 | 2 | | | 1,318,507 | |
Total Energy | | | | | | 9,061,000 | |
Financials - 31.1% | | | | | | | |
ACE, Ltd. | | 28,800 | | | | 1,744,416 | |
Allstate Corp., The | | 10,510 | | | | 684,306 | |
American International Group, Inc. | | 53,620 | | | | 3,842,409 | |
Bank of America Corp. | | 67,000 | | | | 3,577,130 | |
Capital One Financial Corp. | | 33,903 | | | | 2,604,428 | |
Citigroup, Inc. | | 65,541 | | | | 3,650,634 | |
Fannie Mae Co. | | 30,100 | | | | 1,787,639 | |
MBIA, Inc. | | 26,000 | 2 | | | 1,899,560 | |
Merrill Lynch & Co., Inc. | | 27,000 | | | | 2,513,700 | |
Morgan Stanley Co. | | 16,720 | | | | 1,361,510 | |
Washington Mutual, Inc. | | 32,400 | 2 | | | 1,473,876 | |
Total Financials | | | | | | 25,139,608 | |
Health Care - 8.2% | | | | | | | |
Abbott Laboratories Co. | | 24,100 | | | | 1,173,911 | |
Boston Scientific Corp.* | | 44,450 | 2 | | | 763,651 | |
GlaxoSmithKline PLC, Sponsored ADR | | 31,000 | 2 | | | 1,635,560 | |
McKesson Corp. | | 12,250 | 2 | | | 621,075 | |
Pfizer, Inc. | | 68,300 | | | | 1,768,970 | |
UnitedHealth Group, Inc. | | 12,840 | | | | 689,893 | |
Total Health Care | | | | | | 6,653,060 | |
Industrials - 11.3% | | | | | | | |
Emerson Electric Co. | | 13,600 | | | | 599,624 | |
Empresa Brasileira de Aeronautica, S.A. | | 36,600 | | | | 1,516,338 | |
General Electric Co. | | 41,175 | | | | 1,532,122 | |
Honeywell International, Inc. | | 21,100 | 2 | | | 954,564 | |
Ingersoll-Rand Co., Class A | | 31,600 | 2 | | | 1,236,508 | |
Pitney Bowes, Inc. | | 26,700 | 2 | | | 1,233,273 | |
Tyco International, Ltd. | | 37,100 | | | | 1,127,840 | |
United Technologies Corp. | | 15,500 | | | | 969,060 | |
Total Industrials | | | | | | 9,169,329 | |
Information Technology - 8.5% | | | | | | | |
First Data Corp. | | 31,420 | | | | 801,838 | |
Ingram Micro, Inc., Class A* | | 63,700 | | | | 1,300,117 | |
International Business Machines Corp. | | 9,080 | | | | 882,122 | |
Nokia Corp., Sponsored ADR | | 88,000 | | | | 1,788,160 | |
Symantec Corp.* | | 51,900 | 2 | | | 1,082,115 | |
Xerox Corp.* | | 61,010 | | | | 1,034,120 | |
Total Information Technology | | | | | | 6,888,472 | |
Materials - 5.7% | | | | | | | |
Cemex SA de CV* | | 31,190 | | | | 1,056,717 | |
Dow Chemical Co. | | 20,000 | | | | 798,800 | |
E.I. du Pont de Nemours & Co., Inc. | | 31,000 | 2 | | | 1,510,010 | |
PPG Industries, Inc. | | 19,500 | | | | 1,252,095 | |
Total Materials | | | | | | 4,617,622 | |
Telecommunication Services - 4.4% | | | | | | | |
Sprint Corp. | | 82,637 | | | | 1,561,013 | |
Verizon Communications, Inc. | | 53,000 | | | | 1,973,720 | |
Total Telecommunication Services | | | | | | 3,534,733 | |
Utilities - 1.5% | | | | | | | |
Exelon Corp. | | 19,100 | | | | 1,182,099 | |
Total Common Stocks
(cost $ 61,454,223) | | | | | | 80,321,244 | |
Other Investment Companies - 23.2%1 | | | | | | | |
Bank of New York Institutional Cash Reserves Fund, 5.32%3 | | 18,027,521 | | | | 18,027,521 | |
JPMorgan Prime Money Market Fund, Institutional Class Shares, 5.18% | | 758,054 | | | | 758,054 | |
Total Other Investment Companies
(cost $18,785,575) | | | | | | 18,785,575 | |
Total Investments - 122.5%
(cost $80,239,798) | | | | | | 99,106,819 | |
Other Assets, less Liabilities - (22.5)% | | | | | | (18,190,510 | ) |
Net Assets - 100% | | | | | $ | 80,916,309 | |
The accompanying notes are an integral part of these financial statements.
8
Managers AMG Essex Large Cap Fund
Portfolio Manager’s Comments
For the year ended December 31, 2006, the Managers AMG Essex Large Cap Growth Fund (formerly Managers Capital Appreciation Fund) (the “Fund”) gained 4.96%, underperforming the S&P 500 Index, which returned 15.79%.
Falling oil prices, an explosion in merger activity, and easing bond yields created supportive conditions for most equity types in 2006. Growth stocks of all sizes enjoyed a healthy rebound in the fourth quarter, yet trailed their value counterparts for the year. Overall, 2006 proved to be a difficult year for the Fund. Energy and financial services stocks were the top contributors to Fund performance over the course of the year. However, our most heavily weighted sectors, consumer, health care, and technology, were detractors to performance in the Fund.
Consumer related stocks, including consumer electronics and gaming companies were overall detractors to performance for the year. We maintained a cautious view on the consumer sector throughout the year, as we have maintained for some time the thesis that earnings for companies in this area are vulnerable to a housing slowdown. We reduced our exposure to hotel and gaming companies at the end of the year as we believe earnings are set to slow in 2007. Yahoo! was the primary underperformer in the sector, largely suffering as a result of a deferral of the rollout of its key new search monetization platform. There were a few standout performers in the consumer discretionary sector for the year including Google, DreamWorks Animation, and Staples.
The health care sector experienced a difficult start to 2006 with most segments lagging the broader market. A disappointing fourth quarter contributed to the negative relative performance for the year. However, we continue to look to this industry to offer substantial appreciation potential in the year ahead and further increased our generally overweighted positions. Our primary focus remains on companies in the biotechnology and specialty pharmaceutical areas. The Portfolio had positive contributions by stocks in a variety of areas, notably Gilead Sciences and Shire PLC in drug and pharmaceuticals, and Celgene in biotechnology research and production. Notable underperformers for the year were Teva Pharmaceuticals, UnitedHealth Group, and Omnicare.
The Portfolio maintained a relative underweight to technology throughout the year. However, in the fourth quarter, we increased our overall weighting within technology, believing that capital spending in general should expand further in 2007 with IT spending budgets in particular to benefit. Given the disappointing performance in the middle of the year, the technology sector was a detractor to performance for 2006. Semiconductor companies such as Marvell Technology Group significantly underperformed for the year. In contrast, several of our software and communication equipment investments experienced strong relative returns, including BEA Systems and Brocade Communications. The Fund’s storage related holdings, Network Appliance and Seagate Technology, both performed very well for the year.
Despite a rather volatile start to the year for energy stocks, the sector was a positive contributor to performance for the year. We significantly reduced our energy weight due to our belief that high oil and natural gas prices were vulnerable to a correction. Currently, we retain slightly overweighted positions in energy with an emphasis on the services and equipment companies. We believe these companies will help solve the supply issue through new processes and technologies. While the short- to intermediate-term outlook is uncertain, longer term, we see no let up in the worldwide demand for oil and gas, which coupled with supply constraints, should keep energy prices elevated for several years. ENSCO International, an exploration and production company, and Schlumberger, a services and equipment company were the strongest performers for the year.
Outlook:
The year 2006 was noted for its pronounced sector rotation with few consistent trends or themes. The U.S. economy is entering a phase of slower yet sustainable growth, setting the stage for a further easing of inflation expectations and potentially Federal Reserve policy. We remain confident in our thesis that moderating economic activity will provide a more suitable environment for growth stocks of all sizes. As overall earnings slow to a sustainable pace, we believe investors will become increasingly selective and gravitate towards companies with consistently superior earnings growth. We have not wavered from our philosophy of early identification of growth wherever growth exists and believe that it will be rewarded in the year ahead.
Cumulative Total Return Performance
Managers AMG Essex Large Cap Growth’s cumulative total return is based on the daily change in net asset value (NAV), and assumes that all dividends and distributions were reinvested. The S&P 500 Index is a capitalization weighted index of 500 stocks designed to measure performance of the broad domestic economy through changes in the aggregate market value of those 500 stocks representing all major industries. Unlike the Fund, the S&P 500 Index is unmanaged, is not available for investment, and does not incur expenses. The Index assumes reinvestment of dividends. This graph compares a hypothetical $10,000 investment made in Managers AMG Essex Large Cap Growth Fund on December 31, 1996, to a $10,000 investment made in the S&P 500 for the same time period. Performance for periods longer than one year is annualized. The graph and table do not reflect the deduction of taxes that a shareholder would pay on a Fund distribution or redemption of
9
Managers AMG Essex Large Cap Fund
Portfolio Manager’s Comments (continued)
shares. The listed returns for the Fund are net of expenses and the returns for the index exclude expenses. Past performance is not indicative of future results. Total returns would have been lower had certain expenses not been reduced.
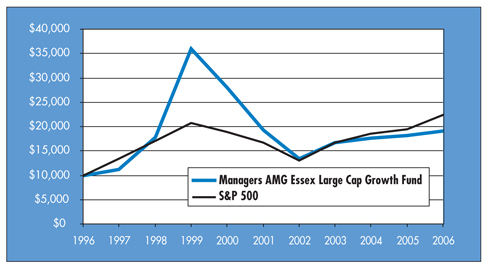
The table below shows the average annual total returns for Managers AMG Essex Large Cap Growth Fund and the S&P 500 Index since December 31, 1996 through December 31, 2006.
| | | | | | | | | | | |
Average Annualized Total Returns | | One Year | | | Five Years | | | Ten Years | | | Inception Date |
Managers AMG Essex Large Cap Growth Fund | | 4.96 | % | | -0.08 | % | | 6.69 | % | | 6/1/84 |
S&P 500 Index | | 15.79 | % | | 6.19 | % | | 8.42 | % | | |
10
Managers AMG Essex Large Cap Growth Fund
Fund Snapshots
December 31, 2006
Portfolio Breakdown
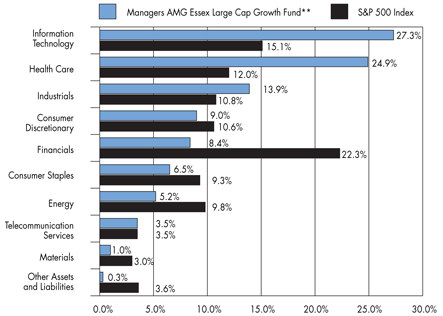
| ** | As a percentage of net assets |
| | | | | | |
Industry | | Managers AMG
Essex Large Cap
Growth Fund** | | | S&P 500 Index | |
Information Technology | | 27.3 | % | | 15.1 | % |
Health Care | | 24.9 | % | | 12.0 | % |
Industrials | | 13.9 | % | | 10.8 | % |
Consumer Discretionary | | 9.0 | % | | 10.6 | % |
Financials | | 8.4 | % | | 22.3 | % |
Consumer Staples | | 6.5 | % | | 9.3 | % |
Energy | | 5.2 | % | | 9.8 | % |
Telecommunication Services | | 3.5 | % | | 3.5 | % |
Materials | | 1.0 | % | | 3.0 | % |
Other Assets and Liabilities | | 0.3 | % | | 3.6 | % |
Top Ten Holdings
| | | |
Security Name | | Percentage of Net Assets | |
General Electric Co.* | | 4.3 | % |
Gilead Sciences, Inc.* | | 3.6 | |
Yahoo!, Inc.* | | 3.5 | |
Google, Inc.* | | 3.3 | |
Merrill Lynch & Co., Inc. | | 3.1 | |
Brocade Communication Systems, Inc. | | 3.0 | |
Network Appliance, Inc. | | 2.9 | |
Genentech, Inc.* | | 2.9 | |
Procter & Gamble Co.* | | 2.8 | |
Seagate Technology, Inc. | | 2.8 | |
Top Ten as a Group | | 32.2 | % |
| | | |
| * | Top Ten Holding at June 30, 2006 |
Any sectors, industries, or securities discussed should not be perceived as investment recommendations. Mention of a specific security should not be considered a recommendation to buy or solicitation to sell that security.
11
Managers AMG Essex Large Cap Growth Fund
Schedule of Portfolio Investments
December 31, 2006
| | | | | | | |
| | | Shares | | | Value | |
Common Stocks - 99.7% | | | | | | | |
Consumer Discretionary - 9.0% | | | | | | | |
Comcast Corp., Class A* | | 32,046 | 2 | | $ | 1,356,507 | |
DreamWorks Animation SKG, Inc.* | | 51,911 | 2 | | | 1,530,855 | |
Laureate Education, Inc.* | | 18,996 | 2 | | | 923,775 | |
McGraw-Hill Companies, Inc., The | | 10,999 | 2 | | | 748,152 | |
Staples, Inc. | | 52,588 | | | | 1,404,100 | |
Total Consumer Discretionary | | | | | | 5,963,389 | |
Consumer Staples - 6.5% | | | | | | | |
PepsiCo, Inc. | | 25,132 | | | | 1,572,007 | |
Procter & Gamble Co. | | 28,575 | | | | 1,836,515 | |
Wal-Mart Stores, Inc. | | 18,162 | | | | 838,721 | |
Total Consumer Staples | | | | | | 4,247,243 | |
Energy - 5.2% | | | | | | | |
Schlumberger, Ltd. | | 19,901 | | | | 1,256,947 | |
Southwestern Energy* | | 27,249 | 2 | | | 955,078 | |
Weatherford International, Ltd.* | | 29,221 | 2 | | | 1,221,147 | |
Total Energy | | | | | | 3,433,172 | |
Financials - 8.4% | | | | | | | |
American International Group, Inc. | | 20,546 | | | | 1,472,326 | |
CB Richard Ellis Group, Inc.* | | 38,012 | | | | 1,261,998 | |
Goldman Sachs Group, Inc. | | 3,662 | | | | 730,020 | |
Merrill Lynch & Co., Inc. | | 22,275 | | | | 2,073,802 | |
Total Financials | | | | | | 5,538,146 | |
Health Care - 24.9% | | | | | | | |
Alcon, Inc. | | 13,755 | 2 | | | 1,537,396 | |
Amgen, Inc.* | | 20,534 | | | | 1,402,678 | |
Baxter International, Inc. | | 22,077 | | | | 1,024,152 | |
Celgene Corp.* | | 17,987 | 2 | | | 1,034,792 | |
Genentech, Inc.* | | 23,720 | | | | 1,924,404 | |
Genzyme Corp-Genl Division* | | 23,710 | | | | 1,460,063 | |
Gilead Sciences, Inc.* | | 36,465 | | | | 2,367,672 | |
McKesson Corp. | | 29,522 | | | | 1,496,765 | |
Novartis AG, Sponsored ADR | | 27,545 | | | | 1,582,185 | |
Sepracor, Inc.* | | 12,806 | 2 | | | 788,593 | |
Shire Pharmaceuticals PLC | | 12,177 | 2 | | | 752,052 | |
Vertex Pharmaceuticals, Inc.* | | 28,924 | 2 | | | 1,082,336 | |
Total Health Care | | | | | | 16,453,088 | |
Industrials - 13.9% | | | | | | | |
AMR Corp* | | 60,142 | 2 | | | 1,818,093 | |
Boeing Co., The | | 19,833 | | | | 1,761,964 | |
General Electric Co. | | 76,269 | | | | 2,837,969 | |
Joy Global, Inc. | | 31,266 | 2 | | | 1,511,398 | |
UTI Worldwide, Inc. | | 41,170 | 2 | | | 1,230,983 | |
Total Industrials | | | | | | 9,160,407 | |
Information Technology - 27.3% | | | | | | | |
BEA Systems, Inc.* | | 101,465 | | | | 1,276,430 | |
Broadcom Corp., Class A* | | 38,560 | 2 | | | 1,245,875 | |
Brocade Communications Systems, Inc.* | | 240,526 | 2 | | | 1,974,718 | |
Cisco Systems, Inc.* | | 37,370 | | | | 1,021,322 | |
Ericsson (LM) Tel Co., Sponsored ADR | | 16,493 | | | | 663,513 | |
Google, Inc.* | | 4,705 | | | | 2,166,558 | |
Marvell Technology Group Ltd.* | | 66,688 | 2 | | | 1,279,743 | |
Network Appliance, Inc.* | | 49,245 | 2 | | | 1,934,344 | |
QUALCOMM, Inc. | | 34,096 | | | | 1,288,488 | |
Seagate Technology, Inc. | | 69,205 | 2 | | | 1,833,932 | |
THQ, Inc.* | | 31,868 | 2 | | | 1,036,347 | |
Yahoo!, Inc.* | | 91,062 | 2 | | | 2,325,723 | |
Total Information Technology | | | | | | 18,046,993 | |
Materials - 1.0% | | | | | | | |
E.I. du Pont de Nemours & Co., Inc. | | 13,530 | | | | 659,046 | |
Telecommunication Services - 3.5% | | | | | | | |
American Tower Corp* | | 25,844 | 2 | | | 963,464 | |
NII Holdings, Inc., Class B* | | 20,410 | 2 | | | 1,315,220 | |
Total Telecommunication Services | | | | | | 2,278,684 | |
Total Common Stocks (cost $57,006,316) | | | | | | 65,780,168 | |
Other Investment Companies - 26.9%1 | | | | | | | |
Bank of New York Institutional Cash Reserves Fund, 5.32%3 | | 17,458,431 | | | | 17,458,431 | |
JPMorgan Prime Money Market Fund, Institutional Class Shares, 5.18% | | 315,760 | | | | 315,760 | |
Total Other Investment Companies
(cost $17,774,191) | | | | | | 17,774,191 | |
Total Investments - 126.6%
(cost $74,780,507) | | | | | | 83,554,359 | |
Other Assets, less Liabilities - (26.6)% | | | | | | (17,555,154 | ) |
Net Assets - 100% | | | | | $ | 65,999,205 | |
The accompanying notes are an integral part of these financial statements.
12
Managers Small Company Fund
Portfolio Managers’ Comments
The Managers Small Company Fund’s (the “Fund”) objective is to achieve long-term capital appreciation by investing in equity securities of small companies.
THE PORTFOLIO MANAGERS
The Fund employs two portfolio managers who specialize in distinct investment approaches. This “intelligence diversification” not only serves to manage risk, but also helps us tap the markets’ full potential by focusing different analytical insights on each class of investment. Fund management strives to achieve this performance and diversification while ensuring that the Fund operates within the framework of its investment objective and principal investment strategies.
Kalmar Investment Advisers
Kalmar Investment Advisers (“Kalmar”), practices a “Growth-with-Value” approach to small- company investing whereby it seeks to identify high quality growing businesses before they are widely discovered by other institutional investors. Kalmar’s team believes there is a low risk/high reward anomaly offered by the equity market in stocks of such top-notch smaller companies that, for a variety of reasons, have not made the radar screen of most typical growth investors. Because these companies are relatively “invisible” institutionally, they can be purchased at prices which are inefficiently valued to undervalued and yet offer strong growth potential as well. This is the crux of their “Growth-with-Value” investment style.
The investment team at Kalmar generates investment ideas through different screening methodologies and several sources, thus employing elements of both “top-down” and “bottom-up” analysis in the initial identification process. The members of the investment management team all have strong research backgrounds and are committed to disciplined in-depth, hands-on fundamental analysis. Top-down thinking is used to identify strategic themes and growth areas to prospect for individual “Growth-with-Value” candidates.
The most intensive research, however, is dedicated to bottom-up fundamental analysis. Kalmar looks for such criteria as proven and sustainable double-digit growth in revenue and EPS together with a stock that is reasonably to cheaply priced relative to EPS, cash flow, revenues, and enterprise value. Kalmar looks for dynamic businesses that are easily understood, run by equity owners they can count on, and buyable at valuations that they expect to rise. The team’s decision threshold for new holdings is a potential return of 50% in approximately two years. This appreciation is expected to come from two sources: compounding business value plus upward revaluation as greater investor discovery unfolds.
The ideal company exhibits many of the following traits:
| | • | | Market capitalization of $50 million up to $2.5 billion at the time of purchase |
| | • | | Dynamic growth business that Kalmar understands better |
| | • | | Run by committed managements that deliver: |
| | • | | Buyable at inefficient valuations that should rise |
| | • | | Strong improving financials with conservative accounting |
| | • | | Reasonable / cheap valuations, with special positive attributes |
Portfolio Management:
| | • | | Diversified portfolio in terms of sector, security, and market capitalization |
| | • | | Conscious mix of “growth character” companies, from higher growth “Steady Eddies” bought inefficiently valued through to Positive Surprise / Emerging Growth situations |
The investment team will make a sell decision when:
| | • | | They see a change in the fundamentals of a company |
| | • | | A better opportunity emerges |
| | • | | Price or fundamental expectations have been met |
| | • | | A position appreciates beyond an optimal allocation |
Epoch Investment Partners
Epoch Investment Partners (“Epoch Parners”) seeks to create excess return without assuming a high degree of capital risk by creating portfolios of businesses with superior risk/reward profiles. They analyze a business in the same manner a private investor would in looking to purchase the entire company and only invest in those businesses they understand and where they have confidence in their financial statements. They seek businesses that generate “free cash flow” and securities that have unrecognized potential yet possess a combination of above average yield, above average free cash flow growth, and/or below average valuation.
Ideal Investment
The ideal company exhibits many of the following traits:
| | • | | Top quality management that has entrepreneurial drive and experience, a history of success, a strong strategic vision, and that has a reward structure determined by shareholder value creation |
| | • | | Strong financial position as determined by cash flow use, financial transparency, hidden or undervalued assets, and low leverage |
| | • | | Competitive positioning in its marketplace, strong demand characteristics, and sustainable free cash flow |
Portfolio Construction
Portfolio management:
| | • | | Screens the Russell 3000® universe using both quantitative and qualitative criteria |
| | • | | Analyzes each business as if they were to buy the entire company including sustainability of the business, earnings drivers, barriers to entry, and competitive advantages |
| | • | | Evaluates potential companies on basis of management quality, financial strength, nature of the business, and external factors |
| | • | | Develops an investment thesis outlining potential value creating and growth in cash flow |
| | • | | Diversifies the Portfolio across important sectors utilizing inverse risk weighting, a 5% position maximum, and recognizing liquidity considerations |
Sell Discipline
The investment team will make a sell decision when:
| | • | | The security’s price target is reached |
| | • | | There is a change in the investment thesis |
| | • | | Downside risk becomes too great |
THE YEAR IN REVIEW
Over the year ended December 31, 2006, the Fund returned 10.42% compared to a gain of 18.37% for the Russell 2000® Index and 13.35% for the Russell 2000® Growth Index. Ultimately, it was a good year to be invested in the equity markets and an even
13
Managers Small Company Fund
Portfolio Managers’ Comments
better year to be invested in small-capitalization stocks. Broad markets posted strong gains with small-cap stocks outperforming large (as measured by the Russell Indexes) and value outperforming growth. For small-cap value stocks, this marked the sixth year out of the past seven they have outperformed their growth counterparts. Sector performance was positive across the board, with materials and telecom services posting 40% gains. Health care was the only sector that failed to reach double digit returns for the year as the pharmaceutical industry turned in lackluster gains. As is generally consistent with a value driven market, those stocks with the lowest quintile of price-to-earnings and price-to-book ratios recorded the strongest returns. It’s also worth noting that investors were hesitant to reward future growth prospects as those stocks in the highest quintile of projected EPS growth performed the worst. This was particularly troublesome for strategies that attempt to take advantage of earnings growth on the basis that it will drive future price appreciation.
Small-cap stocks sprinted out of the blocks in the opening quarter of 2006 with the materials sector providing leadership. The Fund’s near-equal weight to health care related stocks was additive during the quarter as was a sizable allocation to the retail companies. Consumer stocks Coldwater Creek, GameStop, and Tractor Supply all contributed significantly to relative returns in the first quarter. Despite carrying an active overweight position in the technology sector, the Fund wasn’t able to keep pace with the high growth of the Index’s tech holdings. Avid Technology was a particular disappointment, declining 21% over the course of the period. The first quarter also marked the addition of Epoch Investment Partners (“Epoch Partners”) as a second subadvisor to the Fund, which returns the Fund to its original dual subadvised structure and adds both stock and intelligence diversification to the offering.
The U.S. stock market moved sharply lower and showed increased volatility throughout the second quarter and into the third as investors tried to decipher whether the economy was reaching an inflection point. This broad market correction was particularly painful for small-cap stocks which had risen the most leading up to the May 9th peak and struggled to recover as quickly as large-cap stocks which offered greater protection to the downside during the initial sell-off. Given the environment, it was not surprising that the Fund’s large allocation to information technology holdings made for a volatile return stream during the second and third quarters. Ultimately, the Fund’s IT positions performed slightly better than the broad technology sector and proved to be additive to relative returns. Relative returns were buoyed during the two quarter stretch by health care stocks that declined on average approximately 450 basis points (4.5%) less than those of the benchmark. The newly added subadvisor Epoch Partners was particularly instrumental in adding value in this space. The Portfolio’s significantly low weighting within the financials sector was undermining, as these stocks, and particularly those within the Portfolio, held up reasonably well during the decline and consequently had less of a hole to dig out of. The Fund’s industrial holding were disappointing in that they underperformed the Index by over 600 basis points (6.0%). While there were no true “blow-ups,” a duplicate holding in Actuant Corp detracted materially.
Small caps closed out the quarter in strong fashion fully recovering from the mid-year correction and extending gains in a value driven environment. Dissecting the Index further illustrates that the smallest quintile of market capitalization, or micro caps, performed the best, while those stocks with market caps above $1 billion dollars, which make up the majority of the Index, lagged the average return. Also interesting to note—and continuing upon a trend that emerged in the third quarter—the market was still unwilling to reward growth, as the highest quintile of historical and projected EPS growth performed the worst while companies with no historical earnings outpaced the average return. While the Fund lagged on a relative sense, the fundamental performance of the Portfolio holdings continued to be strong, with approximately 70% of the positions reporting earnings in excess of published analysts’ expectations, compared with approximately 60% for the Russell 2000 Index. Given the framework of the investable universe, that did not translate into excess performance during the quarter. Other market-wide trends held true in the Fund as well. The lowest market-cap quintile posted the strongest returns for the Fund, with the same holding true for the lowest quintile of price-to-earnings stocks. Performance leadership by sector was driven by materials stocks.
LOOKING FORWARD
Heading into 2007, the Fund is positioned with a familiar overweight to technology, a somewhat lower underweight in financials, and considerably less exposure to consumer discretionary than this time one year ago. Ford Draper and the Kalmar investment team continue to search for under-the-radar ideas with growth potential that are positioned to perform well or hold up better than most in the face of uncertain economic scenarios. In comparison, David Pearl and the team at Epoch Partners will remain focused on companies that are wisely putting their free cash flow to use or creating high levels of shareholder value.
CUMULATIVE TOTAL RETURN PERFORMANCE
Managers Small Company Fund’s cumulative total return is based on the daily change in net asset value (NAV), and assumes that all distributions were reinvested. The Russell 2000 Index is comprised of the smallest 2000 companies in the Russell 3000® Index and is widely regarded in the industry as the premier measure of small cap stock performance. The Russell 3000 Index is composed of 3000 of the largest U.S. companies, as determined by market capitalization which represents approximately 98% of the investable U.S. equity market. Unlike the Fund, the Russell 2000 Index is unmanaged, is not available for investment, and does not incur expenses. This graph compares a hypothetical $10,000 investment made in the Managers Small Company Fund on June 19, 2000, to a $10,000 investment made in the Russell 2000 Index for the same time period. Performance for periods longer than one year is annualized. The graph and table do not reflect the deduction of taxes
14
Managers Small Company Fund
Portfolio Managers’ Comments (continued)
that a shareholder would pay on a Fund distribution or redemption of shares. The listed returns for the Fund are net of expenses and the returns for the index exclude expenses. Past performance is not indicative of future results. Total returns would have been lower had certain expenses not been reduced.
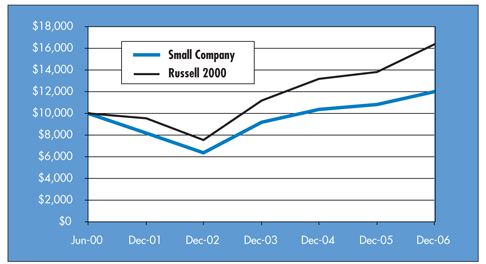
The table below shows the average annual total returns for Managers Small Company Fund and the Russell 2000 Index since inception through December 31, 2006.
| | | | | | | | | | | |
Average Annualized Total Returns | | One Year | | | Five Year | | | Since Inception* | | | Inception Date |
Small Company | | 10.42 | % | | 7.96 | % | | 2.79 | % | | 6/19/00 |
Russell 2000 | | 18.37 | % | | 11.39 | % | | 7.83 | % | | |
| * | Commencement of operations was June 19, 2000. |
15
Managers Small Company Fund
Fund Snapshots
December 31, 2006
Portfolio Breakdown
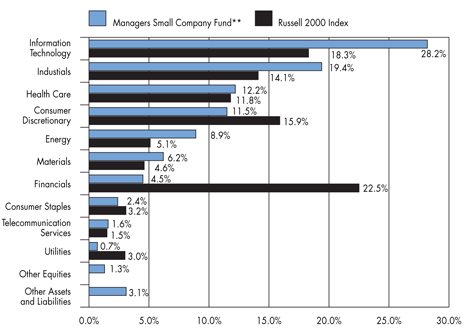
| | | | | | |
Industry | | Managers Small
Company Fund** | | | Russell
2000 Index | |
Information Technology | | 28.2 | % | | 18.3 | % |
Industrials | | 19.4 | % | | 14.1 | % |
Health Care | | 12.2 | % | | 11.8 | % |
Consumer Discretionary | | 11.5 | % | | 15.9 | % |
Energy | | 8.9 | % | | 5.1 | % |
Materials | | 6.2 | % | | 4.6 | % |
Financials | | 4.5 | % | | 22.5 | % |
Consumer Staples | | 2.4 | % | | 3.2 | % |
Telecommunication Services | | 1.6 | % | | 1.5 | % |
Utilities | | 0.7 | % | | 3.0 | % |
Other Equities | | 1.3 | % | | 0.0 | % |
Other Assets and Liabilities | | 3.1 | % | | 0.0 | % |
| ** | As a percentage of net assets |
Top Ten Holdings
| | | |
Security Name | | Percentage of
Net Assets | |
Infocrossing, Inc.* | | 1.8 | % |
Sonosite, Inc. | | 1.5 | |
THQ, Inc. | | 1.5 | |
Service Corp. International* | | 1.4 | |
iShares Russell 2000 Index Fund* | | 1.4 | |
Albemarle, Corp. | | 1.3 | |
Fair Issac Corp. | | 1.2 | |
Cincinnati Bell, Inc. | | 1.2 | |
Florida East Coast Industries, Inc. | | 1.2 | |
Avocent Corp. | | 1.2 | |
Top Ten as a Group | | 13.7 | % |
| | | |
| * | Top Ten Holding at June 30, 2006 |
Any sectors, industries, or securities discussed should not be perceived as investment recommendations. Mention of a specific security should not be considered a recommendation to buy or solicitation to sell that security.
16
Managers Small Company Fund
Schedule of Portfolio Investments
December 31, 2006
| | | | | | |
| | | Shares | | | Value |
Common Stocks - 96.9% | | | | | | |
Consumer Discretionary - 11.5% | | | | | | |
1-800-FLOWERS.COM, Inc.* | | 6,575 | | | $ | 40,502 |
Aaron Rents, Inc. | | 5,035 | | | | 144,907 |
Arbitron, Inc. | | 3,250 | | | | 141,180 |
BJ’s Restaurants, Inc.* | | 4,200 | | | | 84,882 |
Carter’s, Inc.* | | 6,550 | | | | 167,025 |
Coldwater Creek, Inc.* | | 12,430 | 2 | | | 304,784 |
Denny’s Corp.* | | 23,150 | | | | 109,037 |
Fred’s, Inc. | | 8,040 | | | | 96,802 |
GameStop Corp.* | | 4,485 | 2 | | | 247,168 |
Guitar Center, Inc.* | | 4,350 | 2 | | | 197,751 |
Insight Enterprises, Inc.* | | 14,805 | | | | 279,370 |
Life Time Fitness, Inc.* | | 6,255 | 2 | | | 303,430 |
Luby’s, Inc.* | | 9,390 | | | | 102,257 |
Multimedia Games, Inc.* | | 12,950 | | | | 124,320 |
O’Reilly Automotive, Inc.* | | 3,725 | 2 | | | 119,423 |
Penn National Gaming, Inc.* | | 3,400 | | | | 141,508 |
Red Robin Gourmet Burgers, Inc.* | | 5,020 | | | | 179,967 |
Ruby Tuesday, Inc. | | 6,300 | | | | 172,872 |
Service Corp. International | | 52,250 | | | | 535,563 |
Shuffle Master, Inc.* | | 9,300 | | | | 243,660 |
Stride Rite Corp., The | | 9,230 | | | | 139,188 |
Toro Co. | | 7,800 | | | | 363,714 |
Tractor Supply Co.* | | 4,300 | 2 | | | 192,253 |
Total Consumer Discretionary | | | | | | 4,431,563 |
Consumer Staples - 2.4% | | | | | | |
Boston Beer Co., Inc.* | | 4,440 | | | | 159,751 |
Central European Distribution Corp.* | | 5,551 | | | | 164,865 |
Elizabeth Arden, Inc.* | | 7,800 | | | | 148,590 |
Performance Food Group Co.* | | 9,900 | | | | 273,636 |
Sensient Technologies Corp. | | 2,170 | | | | 53,382 |
Sunopta, Inc.* | | 8,590 | | | | 75,592 |
Susser Holdings Corp.* | | 2,870 | | | | 51,660 |
Total Consumer Staples | | | | | | 927,476 |
Energy - 8.9% | | | | | | |
Atwood Oceanics, Inc.* | | 3,600 | 2 | | | 176,292 |
Buckeye Partners LP. | | 1,830 | | | | 85,058 |
Core Laboratories N.V.* | | 2,160 | 2 | | | 174,960 |
Delta Petroleum Corp.* | | 6,365 | 2 | | | 147,413 |
Duvernay Oil Corp.* | | 3,400 | | | | 100,674 |
GMX Resources, Inc.* | | 4,640 | | | | 164,720 |
Niko Resources, Ltd. | | 4,700 | | | | 335,909 |
Oceaneeing International Inc.* | | 2,950 | 2 | | | 117,115 |
OMI Corp. | | 14,700 | | | | 311,199 |
Parallel Petroleum Corp.* | | 16,515 | | | | 290,169 |
Seacor Holdings, Inc.* | | 2,500 | 2 | | | 247,850 |
Superior Well Services, Inc.* | | 2,340 | | | | 59,810 |
Tidewater, Inc. | | 3,575 | | | | 172,887 |
TODCO Class A* | | 11,850 | 2 | | | 404,915 |
Ultra Petroleum Corp.* | | 7,425 | | | | 354,544 |
Warren Resources, Inc.* | | 23,850 | | | | 279,522 |
Total Energy | | | | | | 3,423,037 |
Financials - 4.5% | | | | | | |
Amcore Financial, Inc. | | 6,100 | | | | 199,287 |
Boston Private Financial Holdings, Inc. | | 3,275 | | | | 92,388 |
First Republic Bank | | 2,450 | 2 | | | 95,746 |
First State Bancorporation | | 11,200 | | | | 277,200 |
Hub International, Ltd. | | 3,550 | | | | 111,434 |
NorthStar Realty Finance Corp. | | 15,400 | | | | 255,178 |
Signature Bank* | | 9,860 | | | | 305,463 |
Tejon Ranch Co.* | | 2,600 | | | | 145,184 |
UMB Financial Corp. | | 6,500 | | | | 237,315 |
Total Financials | | | | | | 1,719,195 |
Health Care - 12.2% | | | | | | |
Amedisys, Inc.* | | 4,400 | | | | 144,628 |
America Service Group, Inc.* | | 12,450 | | | | 198,827 |
Analogic Corp. | | 3,600 | | | | 202,104 |
Arrow International, Inc. | | 4,400 | | | | 155,672 |
Cooper Companies, Inc., The | | 5,675 | 2 | | | 252,537 |
Covance, Inc.* | | 4,690 | 2 | | | 276,288 |
Emageon, Inc.* | | 8,650 | | | | 132,864 |
Endo Pharmaceuticals Holdings, Inc.* | | 13,450 | | | | 370,951 |
Inverness Medical Innovations, Inc.* | | 6,300 | | | | 243,810 |
IRIS International, Inc.* | | 13,300 | | | | 168,245 |
Martek Biosciences Corp.* | | 2,300 | | | | 53,682 |
HealthExtras, Inc.* | | 2,930 | | | | 70,613 |
Pediatrix Medical Group, Inc.* | | 3,000 | | | | 146,700 |
PSS World Medical, Inc.* | | 15,025 | 2 | | | 293,438 |
Resmed, Inc.* | | 5,895 | 2 | | | 290,152 |
Respironics, Inc.* | | 8,375 | | | | 316,156 |
Rural/Metro Corp.* | | 45,310 | | | | 368,370 |
The accompanying notes are an integral part of these financial statements.
17
Managers Small Company Fund
Schedule of Portfolio Investments (continued)
| | | | | | |
| | | Shares | | | Value |
Health Care - 12.2% (continued) | | | | | | |
Sonosite, Inc.* | | 19,200 | | | $ | 593,856 |
Sunrise Senior Living, Inc.* | | 5,950 | | | | 182,784 |
United Surgical Partners International, Inc.* | | 8,325 | 2 | | | 236,014 |
Total Health Care | | | | | | 4,697,691 |
Industrials - 19.4% | | | | | | |
Actuant Corp., Class A | | 9,035 | | | | 430,518 |
Aeroflex, Inc.* | | 22,210 | | | | 260,301 |
Alliant Techsystems, Inc.* | | 4,300 | 2 | | | 336,217 |
American Ecology Corp. | | 16,650 | | | | 308,192 |
Carlisle Co., Inc. | | 1,875 | | | | 147,187 |
Chicago Bridge & Iron Co. N.V. | | 11,325 | | | | 309,626 |
ChoicePoint, Inc.* | | 4,425 | | | | 174,256 |
Corrections Corp. of America* | | 8,662 | | | | 391,782 |
CoStar Group, Inc.* | | 1,045 | | | | 55,970 |
DeVry, Inc. | | 12,100 | | | | 338,800 |
DRS Technologies, Inc. | | 6,800 | 2 | | | 358,224 |
Dycom Industries, Inc.* | | 12,850 | | | | 271,392 |
EDO Corp. | | 14,350 | | | | 340,669 |
Encore Wire Corp. | | 3,900 | | | | 85,839 |
Florida East Coast Industries, Inc. | | 7,480 | | | | 445,808 |
HIS, Inc., Class A* | | 5,200 | | | | 205,296 |
K&F Industries Holdings, Inc.* | | 13,450 | | | | 305,450 |
Kennametal, Inc. | | 2,300 | | | | 135,355 |
Laureate Education, Inc.* | | 5,500 | 2 | | | 267,465 |
Learning Tree International, Inc.* | | 16,900 | | | | 150,241 |
Manitowoc Co., The | | 4,350 | | | | 258,521 |
Mobile Mini, Inc.* | | 10,725 | | | | 288,931 |
MSC Industrial Direct Co., Class A | | 6,900 | | | | 270,135 |
Navigant Consulting, Inc.* | | 6,950 | | | | 137,332 |
NCI Building Systems, Inc.* | | 4,550 | | | | 235,462 |
Si International, Inc.* | | 4,550 | | | | 147,511 |
Tetra Technologies, Inc.* | | 10,500 | | | | 189,945 |
UTI Worldwide, Inc. | | 9,900 | | | | 296,010 |
Wabash National Corp. | | 7,360 | | | | 111,136 |
Washington Group International, Inc.* | | 3,350 | | | | 200,297 |
Total Industrials | | | | | | 7,453,868 |
Information Technology - 28.2% | | | | | | |
Actuate Corp.* | | 34,010 | | | | 202,019 |
Acxiom Corp. | | 10,225 | | | | 262,271 |
ADC Telecommunications, Inc.* | | 6,200 | 2 | | | 90,086 |
Alliance Data Systems Corp.* | | 4,200 | 2 | | | 262,374 |
aQuantive, Inc.* | | 4,125 | 2 | | | 101,723 |
Arris Group, Inc.* | | 21,990 | | | | 275,095 |
ATMI, Inc.* | | 9,725 | 2 | | | 296,904 |
Avocent Corp.* | | 13,150 | | | | 445,128 |
Benchmark Electronics, Inc.* | | 10,725 | | | | 261,261 |
Ceridian Corp.* | | 9,375 | 2 | | | 262,312 |
Concur Technologies, Inc.* | | 6,320 | | | | 101,373 |
Cypress Semiconductor Corp.* | | 19,650 | 2 | | | 331,496 |
Diebold, Inc. | | 7,450 | | | | 347,170 |
Diodes, Inc.* | | 2,875 | | | | 102,005 |
DTS, Inc.* | | 12,960 | | | | 313,502 |
Euronet Worldwide, Inc.* | | 4,130 | | | | 122,620 |
Fair Isaac Corp. | | 11,300 | | | | 459,345 |
FEI Co.* | | 5,550 | | | | 146,353 |
Infocrossing, Inc.* | | 42,310 | | | | 689,653 |
Intermec, Inc.* | | 3,830 | 2 | | | 92,954 |
Internap Network Services Corp.* | | 6,050 | | | | 120,213 |
International Rectifier Corp.* | | 3,725 | | | | 143,524 |
Macrovision Corp.* | | 6,700 | 2 | | | 189,342 |
Mantech International Corp., Class A* | | 2,440 | 2 | | | 89,865 |
MPS Group, Inc.* | | 13,870 | | | | 196,677 |
NCI, Inc., Class A* | | 5,900 | 2 | | | 90,211 |
NICE Systems, Ltd. * | | 5,940 | | | | 182,833 |
Occam Networks, Inc.* | | 6,030 | | | | 99,495 |
Online Resources Corp.* | | 5,925 | | | | 60,494 |
OPNET Technologies, Inc.* | | 9,925 | | | | 143,416 |
Polycom, Inc.* | | 9,775 | 2 | | | 302,145 |
Powerwave Technologies, Inc.* | | 48,520 | | | | 312,954 |
Progress Software Corp.* | | 6,975 | | | | 194,812 |
Radisys Corp.* | | 9,225 | | | | 153,781 |
RightNow Technologies, Inc.* | | 8,640 | | | | 148,781 |
Rogers Corp.* | | 4,325 | | | | 255,824 |
Sapient Corp.* | | 37,880 | | | | 207,961 |
Silicon Image, Inc.* | | 32,950 | | | | 419,124 |
SRA International, Inc.* | | 8,310 | | | | 222,209 |
Sybase, Inc.* | | 16,600 | 2 | | | 410,020 |
Symmetricom, Inc.* | | 11,045 | | | | 98,521 |
TALX Corp. | | 9,170 | | | | 251,717 |
Tekelec* | | 18,250 | | | | 270,648 |
Tessera Technologies, Inc.* | | 7,300 | 2 | | | 294,482 |
THQ, Inc.* | | 17,150 | 2 | | | 557,718 |
Valueclick, Inc.* | | 11,450 | 2 | | | 270,564 |
Total Information Technology | | | | | | 10,852,975 |
The accompanying notes are an integral part of these financial statements.
18
Managers Small Company Fund
Schedule of Portfolio Investments (continued)
| | | | | | | |
| | | Shares | | | Value | |
Materials - 6.2% | | | | | | | |
Albemarle Corp. | | 7,125 | | | $ | 511,575 | |
American Vanguard Corp. | | 6,375 | | | | 101,363 | |
Cambrex, Corp. | | 12,600 | | | | 286,272 | |
CF Industries Holdings, Inc. | | 4,900 | | | | 125,636 | |
Foundation Coal Holdings, Inc. | | 8,070 | | | | 256,303 | |
Methanex Corp. | | 10,350 | | | | 283,280 | |
Nalco Holding Co.* | | 5,750 | 2 | | | 117,645 | |
Oregon Steel Mills, Inc.* | | 4,250 | | | | 265,243 | |
Schweitzer-Mauduit International, Inc. | | 4,600 | | | | 119,830 | |
Tronox, Inc. | | 19,050 | | | | 300,800 | |
Total Materials | | | | | | 2,367,947 | |
Other Equities - 1.3% | | | | | | | |
iShares Russell 2000 Index Fund | | 6,725 | | | | 524,886 | |
Telecommunication Services - 1.6% | | | | | | | |
Cbeyond, Inc.* | | 4,985 | | | | 152,491 | |
Cincinnati Bell, Inc.* | | 98,570 | | | | 450,465 | |
Total Telecommunication Services | | | | | | 602,956 | |
Utilities - 0.7% | | | | | | | |
Westar Energy, Inc. | | 10,050 | | | | 260,898 | |
Total Common Stocks
(cost $31,241,806) | | | | | | 37,262,492 | |
Other Investment Companies - 25.0%1 | | | | | | | |
Bank of New York Institutional Cash Reserves Fund, 5.32%3 | | 8,431,145 | | | | 8,431,145 | |
JPMorgan Prime Money Market Fund, Institutional Class Shares, 5.18% | | 1,159,494 | | | | 1,159,494 | |
Total Other Investment Companies
(cost $9,590,639) | | | | | | 9,590,639 | |
Total Investments - 121.9%
(cost $40,832,445) | | | | | | 46,853,131 | |
Other Assets, less Liabilities - (21.9)% | | | | | | (8,415,089 | ) |
Net Assets - 100.0% | | | | | $ | 38,438,042 | |
The accompanying notes are an integral part of these financial statements.
19
Managers International Equity Fund
Portfolio Managers’ Comments
The Managers International Equity Fund’s (the “Fund”) objective is to achieve long-term capital appreciation. Income is the Fund’s secondary objective.
The Managers International Equity Fund ordinarily invests at least 80% of assets in equity securities, and 65% of the assets in common and preferred stocks of companies domiciled outside the United States. The Fund intends to diversify investments among countries and normally to hold securities of non-U.S. companies in not less than three countries. Investments may be made in companies in developed as well as developing countries. The Fund may invest in fixed-income securities denominated in both foreign and domestic currencies and may engage in currency hedging strategies. The Fund may invest in companies of any size. The MSCI EAFE Index is the benchmark for the Fund.
THE PORTFOLIO MANAGERS
The Fund employs multiple portfolio managers who specialize in distinct investment approaches. This “intelligence diversification” not only serves to manage risk, but also helps us tap the markets’ full potential by focusing different analytical insights on each class of investment. Fund management strives to achieve this performance and diversification while ensuring that the Fund operates within the framework of its investment objective and principal investment strategies.
AllianceBernstein L.P.
AllianceBernstein L.P.’s (“Bernstein”) approach to investing is value-based and research driven. The thesis of Bernstein is that human nature leads investors to buy and sell financial assets based on an overreaction to near-term events as they confuse temporary or cyclical characteristics with structural change. Thus, short-term problems, which cause profits and stocks to decline, can create buying opportunities, as investors underestimate the potential for corrective strategies to restore long-term earnings power. The investment team, led by Kevin Simms, attempts to exploit this by using research to separate fact from emotion.
The primary driver of Bernstein’s performance is research-driven security selection. They begin with a broad universe of all companies within the countries of the MSCI All Country World Index ex U.S. universe with a market capitalization greater than $750 million. The investment team screens this universe with a proprietary return model in order to identify the companies with the most attractive value attributes. The model derives an expected return for each company within the universe by assessing companies both from a global industry-based perspective and from a country-based standpoint, based on such factors as price to cash earnings, price to book, return on equity, and price momentum.
The ideal company exhibits many of the following traits:
| | • | | Sound future business prospects |
Portfolio Construction
| | • | | Initial investable universe is comprised of all companies within the countries of the MSCI All Country World Index ex U.S. universe with a market capitalization greater than $750 million |
| | • | | Investment team screens this universe with a proprietary return model in order to identify the companies with the most attractive value attribute |
| | • | | The model derives an expected return for each company within the universe by assessing companies both from a global industry-based perspective and from a country-based standpoint |
| | • | | Factors include price to cash earnings, price to book, return on equity, and price momentum |
| | • | | Analysts perform extensive research, focusing on the most attractively valued stocks |
| | • | | They then build detailed spreadsheets of historical and projected balance-sheet and income-statement information in order to estimate: |
| | • | | Normalized earnings power |
| | • | | Cash flow and asset values for each company for the next five years |
| | • | | Perform simulations to see the potential impact of changes in various financial-statement components |
| | • | | Analysts present their estimates and ratings for each security to the Research Review Committee of the Investment Policy Group (IPG) |
| | • | | The Committee challenges the analysts’ assumptions and conclusions to ensure they are sound. |
The Portfolio
| | • | | Typically holds 35-70 stocks |
��
| | • | | Initial stock weightings are 0.5% - 3.5% |
The following factors influence the sell decision when:
| | • | | A stock has achieved Bernstein’s forecasted target of fair value |
| | • | | A change the long-term earnings forecast reduces the price target to current market levels |
Lazard Asset Management, LLC
Portfolio manager, William (Willy) Holzer believes that there is a single global economy and marketplace within which everything is connected. Within this single market it is important to distinguish between three types of companies: Domestic companies are those which produce, sell, and raise capital all in their home country; International companies are those which produce at home, but sell their products and raise capital anywhere in the world; Global companies are those which produce, sell, and raise capital anywhere. Willy will invest in any of these types in order to capitalize on a theme; however, he prefers global companies which generally have the flexibility and resources to exploit global trends.
Willy Holzer can be described as a “top-down” thematic investor, whose themes are based on “bottom-up” observations and company analysis. He views the world as a single global economic unit as opposed to a collection of separate country economies. Willy focuses his efforts by first analyzing the connections within the global economy, and from this analysis develops global investment themes. These themes target the segments of the global economy that he believes are most likely to provide attractive long-term investment returns, and which also represent an asymmetric investment opportunity in the investor’s favor.
The ideal company exhibits many of the following traits:
| | • | | Attractive fundamentals |
| | • | | Strong company management |
20
Managers International Equity Fund
Portfolio Managers’ Comments
Portfolio Construction
| | • | | Portfolio manager leverages stock ideas and research from top-down “themes” based on “bottom-up” observations and company analysis |
| | • | | Constructs portfolio around about 10 investment themes to diversify opportunity sets and provide risk benefits |
| | • | | Portfolio heavily weights large capitalization, multi-managed companies |
| | • | | Concentrated in the developed markets |
| | • | | May have operations or distribution in the emerging markets. |
The Portfolio
| | • | | Portfolio typically holds 70-90 stocks |
| | • | | Initial stock weightings are 1.0% - 1.5% |
| | • | | Relatively low turnover in the 30% to 40% annual range |
The following factors influence the sell decision when a security:
| | • | | Exceeds price expectations |
| | • | | Underperforms global universe |
Wellington Management Company, LLP
Jean-Marc Berteaux and Andrew S. Offit’s investment philosophy is built on the beliefs that industry is the dominant competitive factor for companies, that companies can dominate industries on a global basis, and that expectations about companies, specifically earnings, drive stock prices. The focus is to identify industry leaders where their earnings forecasts are ahead of market expectations, and where they’ve identified the key drivers for the earnings.
The initial investable universe for the investment team at Wellington Management Company LLP (“Wellington Management”) is comprised of companies in the MSCI EAFE Index with market capitalizations greater than U.S.$1 billion. These companies are researched by Wellington Management’s global industry analysts who perform intensive ongoing fundamental research. Fundamental research consists of comprehensive company meetings, earnings modeling, and valuation analysis. The focus of this research is to update an ongoing assessment of management, current business challenges, and aggregate industry trends. Thorough analysis is done in preparation for and following company contacts to ensure that “the numbers support the story”: that the strategy and challenges outlined by management are coming through in financial results.
The ideal company exhibits many of the following traits:
| | • | | Identified earnings drivers |
| | • | | Above consensus earnings growth expectations |
| | • | | Multiple expansion potential |
| | • | | Reasonable valuation levels |
Portfolio Construction
| | • | | The portfolio typically holds 50-80 stocks |
| | • | | Cash levels are maintained at less than 10% of assets |
| | • | | Maximum of 10% is committed to any single holding |
| | • | | Active sector allocations are entirely built from stock selection |
| | • | | Country allocation is an implicit result of stock selection |
| | • | | Some consideration is given to ensuring country diversification |
| | • | | Emerging market exposure maximum of 15% |
The portfolio management team may sell an investment when:
| | • | | They see deteriorating earnings drivers or company fundamentals |
| | • | | Trend of earnings growth decelerates |
| | • | | They see limited upside potential left in the stock price |
THE YEAR IN REVIEW
For the year 2006, the Managers International Equity Fund returned 27.63% vs. 26.34% for the MSCI EAFE Index. Note that unless otherwise stated, all performance cited in this commentary is in U.S. dollars.
Despite one rather large hiccup in the middle of the year, foreign stock markets’ stocks again appreciated dramatically during the year, enhanced to some degree by generally strong foreign currency prices. Although the Japanese economy slowed from its robust 2005 pace, the eurozone and United Kingdom have demonstrated improving growth rates approaching 3%, and various emerging markets demonstrated growth rates approaching 10%. Overall the global GDP is estimated to have grown approximately 4% in 2006, the fourth consecutive year that it has grown more than 3.5%. Most importantly, corporate profits and profit margins continued to grow across Europe and Asia. With ROE averaging 18% in an environment where the average cost of capital is in the range of 6%, it is no wonder that the stock markets are reaching all-time highs.
Except for the Japanese stock market, which returned a disappointing 6.24% in 2006 after leading the world’s developed markets in 2005, all countries within the MSCI EAFE Index produced strong returns in U.S. dollars and exceeded the return of the S&P 500. In terms of contribution, the United Kingdom had the largest impact as it appreciated more than 30%, half of which was attributable to the strength of the pound. Most of the eurozone countries exceeded a 30% return as well. From a sector perspective, all sectors exhibited double digit appreciation during the year, led by the utilities sector, which rose 50%. Most sectors returned in the mid twenties or higher with the laggards being energy, health care, and information technology, which rose 17.6%, 17.5%, and 14.7%, respectively. Given the relative sector returns it is not surprising that value-oriented benchmarks and investment managers handily outperformed their growth-oriented counterparts.
From a country, sector, or currency perspective, the Fund’s allocations averaged out to produce little value added, leaving virtually all of the relative gains to be the result of proficient stock selection, which was evident across almost all sectors. Given its prominence in the Portfolio, the financials sector provided the largest overall contribution to gains. A modest position in Hong Kong Exchanges and Clearing (the HK stock exchange) rose 165% during the year, clearly benefiting from the rapid growth of China and the capitalization of new public companies. Similarly, two real estate related holdings, China Overseas Land & Development (Hong Kong) and Sumitomo Realty & Development (Japan), rose 213% and 47%,
21
Managers International Equity Fund
Portfolio Managers’ Comments (continued)
respectively. The Fund’s materials and utilities positions also made significant contributions, despite a pullback in commodities prices during the second half of the year. The U.K based global mining company Xstrata Plc, rose 138%, and steel manufacturers JFE Holdings (Japan) and Arcelor (Luxembourg) rose 53% and 114%, respectively. Arcelor was liquidated in July. The weakest sector for the Fund was the health care sector where the Fund’s holdings appreciated slightly more than 17% which was similar to that of the benchmark’s health care sector. The Fund’s consumer discretionary holdings rose only 18% on average, hindered by a position in Rakuten Inc, a Japanese internet commerce business that dropped significantly before recovering somewhat late in the year.
LOOKING FORWARD
Since corporate earnings growth has been strong, the stock market’s rise has not resulted in expanded or lofty valuations. While there is a risk that the earnings companies are experiencing now are unsustainable and peaking, the stock markets seem to be discounting some of that risk as valuations remain modest. Late in the year, the portfolio managers added marginally to the materials and industrials sectors while trimming the consumer discretionary sector and the heavily weighted financials sector.
Our thematic investor, Lazard, eliminated one theme from its portfolio, the “Public/Private Partnerships” theme, as potential investments within the theme have become fully valued. In addition, Lazard has introduced a new theme, “Intergenerational Assets,” which represents various long-duration assets and obligations such as power generation, pension plans, and health care obligations. As the developed world has been focusing on prudent economic stewardship and financial returns, Lazard believes there has been a general underinvestment in the intergenerational issues such as the prudent stewardship of the environment. As the pendulum swings back and more effort is devoted to these issues, Lazard expects there will be undervalued opportunities for investment.
From a country perspective, the Portfolio remains heavily invested yet modestly underweighted in the two largest countries, Japan and the United Kingdom and modestly overweighted to eurozone countries. Outside of the benchmark, the Fund has a 4.5% allocation in Canadian companies and 8.9% of the Portfolio invested in emerging markets.
CUMULATIVE TOTAL RETURN PERFORMANCE
International Equity’s cumulative total return is based on the daily change in net asset value (NAV), and assumes that all distributions were reinvested. The Morgan Stanley Capital International Europe, Australia, Far East (MSCI EAFE) Index (“EAFE”) is composed of over 1,000 large, publicly traded stocks in 22 developed non-U.S. markets Among the countries included are Australia, France, Germany, Italy, Japan, Singapore, Spain and the United Kingdom. Unlike the Fund, the EAFE is unmanaged, is not available for investment, and does not incur expenses. The Index assumes reinvestment of dividends. This graph compares a hypothetical $10,000 investment made in International Equity on December 31, 1996, to a $10,000 investment made in the EAFE for the same time period. The table is not intended to imply any future performance of the Fund. Performance for periods longer than one year is annualized. The graph and table do not reflect the deduction of taxes that a shareholder would pay on a Fund distribution or redemption of shares. The listed returns for the Fund are net
22
Managers International Equity Fund
Portfolio Managers’ Comments (continued)
of expenses and the returns for the index exclude expenses. Past performance is not indicative of future results. Total returns would have been lower had certain expenses not been reduced.
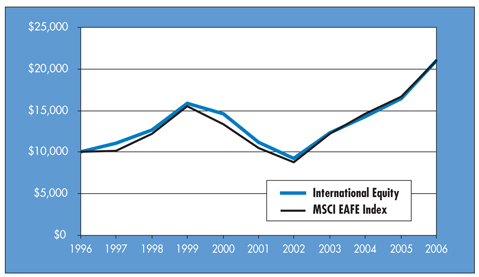
The table below shows the average annual total returns for International Equity and the EAFE since December 31, 1996 through December 31, 2006.
| | | | | | | | | | | |
Average Annualized Total Returns | | One Year | | | Five Years | | | Ten Years | | | Inception Date |
International Equity | | 27.63 | % | | 13.46 | % | | 7.69 | % | | 12/31/85 |
MSCI EAFE Index | | 26.34 | % | | 14.98 | % | | 7.71 | % | | |
23
Managers International Equity Fund
Fund Snapshots
December 31, 2006
Portfolio Breakdown
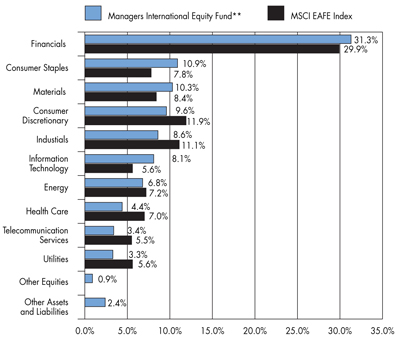
| ** | As a percentage of net assets |
| | | | | | |
Industry | | Managers International Equity Fund** | | | MSCI EAFE
Index | |
Financials | | 31.3 | % | | 29.9 | % |
Consumer Staples | | 10.9 | % | | 7.8 | % |
Materials | | 10.3 | % | | 8.4 | % |
Consumer Discretionary | | 9.6 | % | | 11.9 | % |
Industials | | 8.6 | % | | 11.1 | % |
Information Technology | | 8.1 | % | | 5.6 | % |
Energy | | 6.8 | % | | 7.2 | % |
Health Care | | 4.4 | % | | 7.0 | % |
Telecommunication Services | | 3.4 | % | | 5.5 | % |
Utilities | | 3.3 | % | | 5.6 | % |
Other Equities | | 0.9 | % | | 0.0 | % |
Other Assets and Liabilities | | 2.4 | % | | 0.0 | % |
Top Ten Holdings
| | | |
Security Name | | Percentage
of Net
Assets | |
Japan Tobacco, Inc.* | | 1.8 | % |
ORIX Corp.* | | 1.8 | |
Total SA* | | 1.7 | |
JFE Holdings | | 1.6 | |
Sumitomo Realty & Development Co., Ltd.* | | 1.4 | |
Muenchener Rueckversicherungs AG | | 1.4 | |
Vodafone Group PLC* | | 1.4 | |
ING Groep NV | | 1.3 | |
Xstrata PLC | | 1.2 | |
Tesco PLC | | 1.2 | |
Top Ten as a Group | | 14.8 | % |
| | | |
| * | Top Ten Holding at June 30, 2006 |
Any sectors, industries, or securities discussed should not be perceived as investment recommendations. Mention of a specific security should not be considered a recommendation to buy or solicitation to sell that security.
24
Managers International Equity Fund
Fund Snapshots (continued)
Summary of Investments by Country
| | | | | | |
Country | | Managers
International
Equity Fund* | | | MSCI EAFE
Index | |
Argentina | | 0.0 | % | | 0.0 | % |
Brazil | | 0.9 | % | | 0.0 | % |
China | | 0.5 | % | | 0.0 | % |
Hungary | | 0.3 | % | | 0.0 | % |
India | | 0.4 | % | | 0.0 | % |
South Korea | | 2.0 | % | | 0.0 | % |
Mexico | | 1.0 | % | | 0.0 | % |
Russia | | 0.3 | % | | 0.0 | % |
South Africa | | 0.9 | % | | 0.0 | % |
Taiwan | | 2.6 | % | | 0.0 | % |
Australia | | 0.5 | % | | 5.5 | % |
Austria | | 0.5 | % | | 0.6 | % |
Belgium | | 1.5 | % | | 1.3 | % |
Denmark | | 0.2 | % | | 0.8 | % |
Finland | | 0.3 | % | | 1.4 | % |
France | | 10.9 | % | | 9.6 | % |
Germany | | 8.4 | % | | 7.4 | % |
Greece | | 0.0 | % | | 0.6 | % |
Hong Kong | | 4.7 | % | | 1.4 | % |
Ireland | | 0.8 | % | | 0.9 | % |
Italy | | 1.4 | % | | 3.9 | % |
Japan | | 20.5 | % | | 22.6 | % |
Netherlands | | 5.6 | % | | 3.9 | % |
New Zealand | | 0.0 | % | | 0.2 | % |
Norway | | 0.2 | % | | 0.8 | % |
Portugal | | 0.0 | % | | 0.3 | % |
Singapore | | 1.2 | % | | 1.0 | % |
Spain | | 0.4 | % | | 4.1 | % |
Sweden | | 1.6 | % | | 2.6 | % |
Switzerland | | 6.4 | % | | 6.8 | % |
United Kingdom | | 18.7 | % | | 23.8 | % |
Canada | | 4.7 | % | | 0.0 | % |
United States | | 2.3 | % | | 0.0 | % |
Luxembourg | | 0.2 | % | | 0.1 | % |
Bermuda | | 0.0 | % | | 0.3 | % |
Cayman Islands | | 0.0 | % | | 0.1 | % |
Other | | 0.1 | % | | 0.0 | % |
| | 100.0 | % | | 100.0 | % |
| | | | | | |
| * | As a percentage of total market value of common stocks on December 31, 2006 |
25
Managers International Equity Fund
Schedule of Portfolio Investments
December 31, 2006
| | | | | | |
| | | Shares | | | Value |
Common Stocks - 96.7% | | | | | | |
Consumer Discretionary - 9.6% | | | | | | |
Aristocrat Leisure, Ltd. (Australia) | | 31,448 | | | $ | 393,215 |
Carphone Warehouse Group, The (United | | | | | | |
Kingdom) | | 176,295 | 2 | | | 1,080,362 |
Continental AG (Germany) | | 15,082 | | | | 1,747,207 |
Daiwa House Industry Co., Ltd. (Japan) | | 69,000 | | | | 1,195,765 |
Debenhams (United Kingdom) | | 178,244 | | | | 660,159 |
EMI Group PLC (United Kingdom) | | 255,097 | | | | 1,322,622 |
George Wimpey PLC (United Kingdom) | | 89,700 | | | | 976,326 |
Hyundai Mobis (North Korea)* | | 2,800 | | | | 257,228 |
Kesa Electricals PLC (United Kingdom) | | 171,052 | | | | 1,133,235 |
Koninklijke (Royal) Phillips Electronics N.V. (Netherlands) | | 48,097 | | | | 1,808,597 |
Pearson PLC (United Kingdom) | | 80,853 | | | | 1,218,599 |
Rakuten (Japan)* | | 1,977 | | | | 920,897 |
Renault SA (France) | | 23,200 | | | | 2,777,964 |
Shanghai Forte Land Company Ltd. (Hong Kong) | | 224,000 | | | | 99,967 |
Sharp Corp. (Japan) | | 87,000 | | | | 1,495,884 |
Suzuki Motor (Japan) | | 30,800 | | | | 868,170 |
Swatch Group AG, The (Switzerland) | | 18,448 | | | | 822,625 |
Toyota Motor Corp. (Japan) | | 35,500 | | | | 2,375,909 |
Wolters Kluwer NV (Netherlands) | | 34,800 | | | | 998,336 |
Total Consumer Discretionary | | | | | | 22,153,067 |
Consumer Staples - 10.9% | | | | | | |
Boots Group (United Kingdom) | | 81,564 | | | | 1,335,120 |
British American Tobacco PLC (United | | | | | | |
Kingdom) | | 56,000 | | | | 1,568,072 |
Deutche Luftansa AG (Germany) | | 41,400 | | | | 1,134,346 |
Diageo PLC (United Kingdom) | | 60,912 | | | | 1,196,778 |
Fomento Economico Mexicano SA de CV (Mexico) | | 6,900 | | | | 798,744 |
Heineken N.V. (Netherlands) | | 22,146 | | | | 1,052,222 |
Interbrew (Belgium) | | 18,155 | | | | 1,194,569 |
J Sainsbury PLC (United Kingdom) | | 207,300 | | | | 1,657,993 |
Japan Tobacco, Inc. (Japan) | | 876 | | | | 4,234,106 |
Koninklijke Ahold N.V.(Netherlands)* | | 119,359 | | | | 1,266,201 |
L’Oreal SA (France) | | 9,000 | | | | 899,656 |
Metro AG (Germany) | | 3,800 | | | | 241,688 |
Nestle SA, Registered (Switzerland) | | 2,760 | | | | 978,992 |
Reckitt Benckiser PLC (United Kingdom) | | 25,413 | | | | 1,159,267 |
Royal Numico NV (Netherlands) | | 21,862 | | | | 1,173,993 |
Seven & I Holdings Co., Ltd. (Japan) | | 34,000 | | | | 1,057,230 |
Swedish Match (Sweden) | | 60,000 | | | | 1,120,338 |
Tesco PLC (United Kingdom) | | 354,437 | | | | 2,800,909 |
Uni-President Enterprises Corp. (Taiwan) | | 231,000 | | | | 230,034 |
Total Consumer Staples | | | | | | 25,100,258 |
Energy - 6.8% | | | | | | |
BP PLC (United Kingdom) | | 227,400 | | | | 2,535,757 |
Canadian Natural Resources, Ltd. (Canada) | | 19,500 | 2 | | | 1,039,253 |
China Petroleum and Chemical Corp., Class H (Hong Kong) | | 924,000 | | | | 855,996 |
China Shenhua Energy Co., Ltd. (China) | | 359,000 | | | | 863,051 |
EnCana Corp. (Canada) | | 17,768 | | | | 817,589 |
Eni S.p.A. (Italy) | | 53,800 | | | | 1,809,570 |
MOL Magyar Olaj-es Gazipari Rt. (Hungary) | | 6,100 | | | | 689,912 |
Oao Gazprom-Sponsored ADR (Russia) | | 16,200 | | | | 739,863 |
Petroleo Brasileiro SA, Sponsored ADR (Brazil) | | 14,400 | | | | 1,346,112 |
Petroplus Holdings AG (Switzerland)* | | 2,620 | | | | 159,114 |
Repsol YPF, S.A. (Spain) | | 23,900 | | | | 823,477 |
Total SA (France) | | 55,352 | | | | 3,982,986 |
Total Energy | | | | | | 15,662,680 |
Financials - 31.3% | | | | | | |
Admiral Group plc (United Kingdom) | | 12,156 | | | | 260,747 |
Allianz AG (Germany) | | 8,669 | | | | 1,762,032 |
Aviva PLC (United Kingdom) | | 126,100 | | | | 2,022,932 |
Axa Group (France) | | 25,666 | | | | 1,034,632 |
Bank of East Asia, Ltd. (Hong Kong) | | 69,600 | | | | 392,891 |
Barclays PLC (United Kingdom) | | 93,700 | | | | 1,337,846 |
BNP Paribas SA (France) | | 18,340 | | | | 1,995,177 |
British Land (United Kingdom) | | 23,377 | | | | 782,077 |
CapitaLand Ltd. (Singapore) | | 230,000 | | | | 925,547 |
Cathay Financial Holding Co., Ltd. (Taiwan) | | 105,000 | | | | 238,084 |
China Overseas Land & Investment Ltd. (Hong Kong) | | 952,000 | | | | 1,270,065 |
Chinatrust Financial Holding Co (Taiwan) | | 281,000 | | | | 234,258 |
Credit Agricole SA (France) | | 18,150 | | | | 760,810 |
Credit Suisse Group (Switzerland)* | | 32,400 | | | | 2,258,862 |
Daiwa Securities Group, Inc. (Japan) | | 80,000 | | | | 895,376 |
DBS Group Holdings, Ltd. (Singapore) | | 122,000 | | | | 1,791,080 |
Deutsche Boerse AG (Germany) | | 11,193 | | | | 2,056,845 |
Deutsche Postbank AG (Germany) | | 7,900 | | | | 663,082 |
The accompanying notes are an integral part of these financial statements.
26
Managers International Equity Fund
Schedule of Portfolio Investments (continued)
| | | | | | |
| | | Shares | | | Value |
Financials - 31.3% (continued) | | | | | | |
Erste Bank Der Oesterreichischen Sparkassen AG (Austria) | | 13,943 | | | $ | 1,067,575 |
Fondiaria-Sai SpA (Italy) | | 19,200 | | | | 843,289 |
Fortis (Belgium) | | 30,000 | | | | 1,276,965 |
Friends Provident PLC (United Kingdom) | | 53,100 | | | | 225,160 |
HBOS PLC (United Kingdom) | | 96,800 | | | | 2,139,902 |
HDFC Bank Ltd. (India) | | 15,700 | | | | 376,711 |
Henderson Land Development Co., Ltd. (Hong Kong) | | 155,000 | | | | 864,081 |
Hong Kong Exchanges & Clearing, Ltd. (Hong Kong) | | 184,000 | | | | 2,014,270 |
Indiabulls Financial Services Ltd. (India) | | 11,700 | | | | 174,029 |
ING Groep NV (Netherlands) | | 70,217 | | | | 3,102,762 |
KBC Bank & Insurance Group, Inc. (Belgium) | | 5,114 | | | | 626,049 |
Kennedy-Wilson Japan (Japan) | | 40 | | | | 180,450 |
KK DaVinci Advisors (Japan)* | | 295 | | | | 292,375 |
Kookmin Bank (South Korea) | | 19,874 | | | | 1,597,910 |
Leopalace21 (Japan) | | 19,900 | | | | 635,677 |
Man Group plc (United Kingdom) | | 130,620 | | | | 1,333,248 |
Millea Holdings, Inc. (Japan) | | 19,500 | | | | 690,657 |
Mitsubishi Estate Co., Ltd. (Japan) | | 72,000 | | | | 1,860,435 |
Mitsubishi Tokyo Financial Group, Inc. (Japan) | | 57 | | | | 707,130 |
Mitsui Fudosan Co., Ltd. (Japan) | | 76,000 | | | | 1,851,680 |
Muenchener Rueckversicherungs AG (Germany) | | 18,900 | | | | 3,256,498 |
Nikko Cordial Corp. (Japan) | | 23,000 | | | | 263,766 |
Nomura Holdings, Inc. (Japan) | | 105,700 | | | | 1,994,004 |
ORIX Corp. (Japan) | | 14,420 | | | | 4,181,686 |
Prudential (United Kingdom) | | 95,903 | | | | 1,310,245 |
Royal Bank of Scotland Group PLC (United Kingdom) | | 56,600 | | | | 2,202,769 |
Shun TAK Holdings, Ltd. (Hong Kong) | | 666,000 | | | | 1,015,824 |
Sino Land (Hong Kong) | | 170,300 | | | | 396,071 |
Societe Generale (France) | | 11,340 | | | | 1,918,389 |
Standard Chartered, PLC. (United Kingdom) | | 50,386 | | | | 1,467,810 |
Sumitomo Mitsui Financial Group, Inc. (Japan) | | 222 | | | | 2,272,954 |
Sumitomo Realty & Development Co., Ltd. (Japan) | | 102,000 | | | | 3,270,051 |
Sun Hung Kai Properties, Ltd. (Hong Kong) | | 74,000 | | | | 847,603 |
Swiss Reinsurance (Switzerland) | | 16,740 | | | | 1,418,730 |
T&D Holdings (Japan) | | 15,150 | | | | 1,000,186 |
UBS (Switzerland) | | 12,400 | | | | 750,420 |
Unibail (France) | | 5,069 | | | | 1,236,235 |
Zurich Financial Services AG (Switzerland) | | 3,100 | | | | 831,690 |
Total Financials | | | | | | 72,177,629 |
Health Care - 4.4% | | | | | | |
Actelion, Ltd. (Switzerland)* | | 2,741 | | | | 602,327 |
AstraZeneca PLC (United Kingdom) | | 16,100 | | | | 862,822 |
Daiichi Sankyo (Japan) | | 12,400 | | | | 386,804 |
Eisai Co., Ltd. (Japan) | | 20,700 | | | | 1,137,159 |
Elan Corp., PLC - Sponsored ADR (Ireland)* | | 49,500 | 2 | | | 730,125 |
Essilor International SA (France) | | 3,226 | | | | 346,337 |
GlaxoSmithKline PLC (United Kingdom) | | 60,200 | | | | 1,584,513 |
Nobel Biocare Holding AG (Switzerland) | | 3,580 | | | | 1,055,982 |
Novartis AG (Switzerland) | | 12,600 | | | | 723,823 |
Sanofi - Synthelabo SA (France) | | 26,725 | | | | 2,464,063 |
UCB SA (Belgium) | | 5,722 | | | | 392,126 |
Total Health Care | | | | | | 10,286,081 |
Industrials - 8.6% | | | | | | |
ABB Ltd. (Switzerland) | | 150,920 | | | | 2,702,877 |
Air France-KLM (France) | | 15,200 | | | | 638,094 |
ALSTOM (France)* | | 8,053 | | | | 1,086,879 |
BAE Systems PLC (United Kingdom) | | 117,500 | | | | 976,845 |
Dai Nippon Printing Co., Ltd. (Japan) | | 42,000 | | | | 647,536 |
European Aeronautic Defense and Space Co. (Netherlands) | | 41,820 | | | | 1,434,913 |
FANUC, Ltd. (Japan) | | 7,300 | | | | 716,435 |
Far Eastern Textile Co., Ltd. (Taiwan) | | 264,000 | | | | 230,213 |
Hutchison Whampoa, Ltd. (Hong Kong) | | 108,000 | | | | 1,094,920 |
Komatsu Ltd. (Japan) | | 18,300 | | | | 370,390 |
Mitsui O.S.K. Lines, Ltd. (Japan) | | 157,000 | | | | 1,550,638 |
Rolls Royce Group PLC (United Kingdom)* | | 17,270 | | | | 150,919 |
RT Group PLC (United Kingdom)* | | 360,539 | | | | 28,237 |
Ryanair Holdings PLC (Ireland)* | | 13,500 | 2 | | | 1,100,250 |
Safran SA (France) | | 118 | | | | 2,738 |
Siemens AG (Germany) | | 12,600 | | | | 1,236,564 |
SNC - Lavalin Group, Inc. (Canada) | | 23,100 | | | | 623,382 |
Sumitomo Heavy Industries (Japan) | | 73,000 | | | | 765,021 |
Toll Holdings, Ltd. (Australia) | | 26,855 | | | | 386,812 |
Tostem Inax Holding Corp. (Japan) | | 32,000 | | | | 672,931 |
Vestas Wind Systems A/S (Denmark)* | | 8,800 | | | | 370,345 |
Wright Express Corp. (France) | | 7,069 | | | | 2,042,840 |
Yamato Transport Co., Ltd. (Japan) | | 62,000 | | | | 951,553 |
Total Industrials | | | | | | 19,781,332 |
The accompanying notes are an integral part of these financial statements.
27
Managers International Equity Fund
Schedule of Portfolio Investments (continued)
| | | | | | | |
| | | Shares | | | Value | |
Information Technology - 8.1% | | | | | | | |
ARM Holdings Plc (United Kingdom) | | 321,485 | | | $ | 788,455 | |
ASML Holding N.V. (Netherlands)* | | 41,768 | | | | 1,030,768 | |
Au Optronics Corp., Sponsored ADR (Taiwan) | | 29,760 | 2 | | | 410,986 | |
Baidu.com, Inc. (China)* | | 2,600 | 2 | | | 293,072 | |
Business Objects SA (France)* | | 2,900 | | | | 113,757 | |
Compal Electronics, Inc. (Taiwan) | | 159,961 | 2 | | | 713,042 | |
Elpida Memory, Inc. (Japan)* | | 21,200 | | | | 1,164,312 | |
Ericsson (LM), Class B (Sweden) | | 416,000 | | | | 1,672,803 | |
HON HAI Precision Industry Co., Ltd. (Taiwan) | | 94,494 | | | | 1,348,467 | |
Iliad SA (France) | | 6,734 | | | | 582,006 | |
Logitech International (Switzerland)* | | 72,596 | | | | 2,090,269 | |
Nintendo Co., Ltd. (Japan) | | 7,300 | | | | 1,889,887 | |
Nokia Corp., Sponsored ADR (Finland) | | 35,100 | | | | 713,232 | |
Research In Motion, Ltd. (Canada)* | | 17,600 | 2 | | | 2,248,928 | |
Samsung Electronics Co., Ltd. (South Korea) | | 2,786 | | | | 1,827,640 | |
Taiwan Semiconductor Manufacturing Co., Ltd., Sponsored ADR (Taiwan) | | 158,612 | 2 | | | 1,733,629 | |
Total Information Technology | | | | | | 18,621,253 | |
Materials - 10.3% | | | | | | | |
Air Liquide Sante International (France) | | 4,401 | | | | 1,042,777 | |
Barrick Gold Corp. (Canada) | | 44,086 | | | | 1,355,300 | |
BASF AG (Germany) | | 11,900 | | | | 1,156,753 | |
Brambles, Ltd. (Australia)* | | 35,321 | | | | 356,352 | |
Buzzi Unicem SpA (Italy) | | 16,417 | | | | 465,729 | |
Cameco Corp. (Canada) | | 18,800 | | | | 760,460 | |
Compania Vale do Rio Doce - ADR (Brazil) | | 26,700 | 2 | | | 794,058 | |
Gold Fields, Ltd. (South Africa) | | 65,500 | | | | 1,230,613 | |
Goldcorp (Canada) | | 43,600 | | | | 1,237,915 | |
Impala Platinum Holdings, Ltd. (South Africa) | | 22,400 | 2 | | | 584,562 | |
JFE Holdings (Japan) | | 70,400 | | | | 3,619,800 | |
Meridan Gold (Canada)* | | 37,700 | | | | 1,048,417 | |
Mitsui Petrochemical (Japan) | | 70,000 | | | | 538,172 | |
Mittal Steel Co. NV (Netherlands) | | 27,609 | | | | 1,162,287 | |
POSCO (South Korea) | | 3,270 | | | | 1,080,997 | |
Potash Corp. of Saskatchewan (Canada) | | 4,800 | | | | 688,704 | |
Salzgitter AG (Germany) | | 9,358 | | | | 1,220,333 | |
Svenska Cellulosa AB (Sweden) | | 19,400 | | | | 1,010,902 | |
Symrise AG (Germany)* | | 13,092 | | | | 340,456 | |
Syngenta AG (Switzerland) | | 2,051 | | | | 380,995 | |
Taiwan Fertilizer Co., Ltd. (Taiwan) | | 120,000 | | | | 228,909 | |
Wacker Chemie AG (Germany)* | | 5,285 | | | | 685,976 | |
Xstrata PLC (United Kingdom) | | 57,280 | | | | 2,850,227 | |
Total Materials | | | | | | 23,840,694 | |
Telecommunication Services - 3.4% | | | | | | | |
America Movil, S.A. de C.V. (Mexico) | | 33,000 | 2 | | | 1,492,260 | |
Bharti Tele-Ventures Ltd. (India)* | | 21,200 | | | | 301,810 | |
China Netcom Group (Hong Kong) | | 316,000 | | | | 843,733 | |
Nippon Telegraph & Tel Corp. (Japan) | | 149 | | | | 734,792 | |
Rogers Communications - B (Canada) | | 31,000 | | | | 922,437 | |
Telenor ASA (Norway) | | 26,400 | | | | 494,698 | |
Vodafone Group PLC (United Kingdom) | | 1,146,599 | | | | 3,166,527 | |
Total Telecommunication Services | | | | | | 7,956,257 | |
Utilities - 3.3% | | | | | | | |
E.ON AG (Germany)* | | 12,800 | | | | 1,728,567 | |
Hong Kong & China Gas Co., Ltd. (Hong Kong) | | 527,000 | | | | 1,184,944 | |
National Grid PLC (United Kingdom) | | 74,061 | | | | 1,071,910 | |
RWE AG (Germany) | | 12,050 | | | | 1,321,518 | |
Veolia Environment (France) | | 29,952 | 2 | | | 2,284,255 | |
Total Utilities | | | | | | 7,591,194 | |
Total Common Stocks (cost $155,596,000) | | | | | | 223,170,445 | |
Other Investment Companies - 0.3% | | | | | | | |
Hirco Plc (South Africa) | | 40,800 | | | | 343,508 | |
streetTRACKS Gold Trust | | 7,300 | | | | 461,433 | |
Total Other Investment Companies
(cost $828,097) | | | | | | 804,941 | |
Warrants - 0.6% | | | | | | | |
China Overseas Land & Investment (Hong Kong) | | 119,000 | | | | 91,794 | |
Silicon Precision Industries Co. (Luxembourg) | | 311,400 | | | | 487,652 | |
United Microelectronics Corp. Warrants, Exp. (Taiwan) | | 1,127,271 | | | | 700,035 | |
Total Warrants (cost $1,145,583) | | | | | | 1,279,481 | |
Short-Term Investments - 7.2%1 | | | | | | | |
Bank of New York Institutional Cash Reserves Fund, 5.32% 3 | | 11,857,706 | | | | 11,857,706 | |
JPMorgan Prime Money Market Fund, Institutional Class Shares, 5.18% | | 4,882,961 | | | | 4,882,961 | |
Total Short-Term Investments
(cost $16,740,667) | | | | | | 16,740,667 | |
Total Investments - 104.8%
(cost $174,310,347) | | | | | | 241,995,534 | |
Other Assets, less Liabilities - (4.8)% | | | | | | (11,079,408 | ) |
Net Assets - 100% | | | | | $ | 230,916,126 | |
The accompanying notes are an integral part of these financial statements.
28
Managers Emerging Markets Equity Fund
Portfolio Manager’s Comments
The Managers Emerging Markets Equity Fund’s (the “Fund”) objective is to achieve long-term capital appreciation.
The Managers Emerging Markets Equity Fund invests at least 80% of its assets in equity securities, i.e., common and preferred stocks of companies located in countries designated by the World Bank or the United Nations to be a developing country or an emerging market, such as most countries in Africa, Asia, Latin America, and the Middle East. The Fund may invest in companies of any size. The MSCI Emerging Markets (MSCI EM) Index is the benchmark for the Fund.
The Fund currently employs a subadvisor, Rexiter Capital Management Limited (“Rexiter”), to manage the assets of the Fund. The investment team at Rexiter believes emerging markets are less efficient than developed markets, and an actively managed portfolio, with respect to both country weightings and stock selection, can add value over a market capitalization-weighted index without materially affecting risk. Rexiter’s approach is active in terms of both asset allocation and stock selection. Investment decisions are based on fundamental analysis of countries and stocks. Portfolio management is controlled by a disciplined process that seeks to add to returns through the exploitation of market inefficiency, while at the same time constraining risk.
Rexiter’s investment strategy is to earn investment return and manage investment risk by analyzing and actively managing country and industry exposure, and investing in companies within targeted country and industry ranges that demonstrate strong and most importantly, profitable earnings growth.
The ideal investment exhibits many of the following traits:
| | • | | Ability to generate and maintain strong earnings growth |
| | • | | Established market positions across a diverse range of companies and industries |
Portfolio Construction
| | • | | Use a liquidity-tiered fixed-weight benchmark to determine a neutral position for country allocation |
| | • | | Employ active country allocations away from this neutral position based upon fundamental analysis of macroeconomic variables and equity market valuations |
| | • | | Screen companies based on capitalizations and liquidity parameters to analyze roughly 300 companies in detail by: |
| | • | | Studying published accounts and accounting policies for the underlying development of earnings |
| | • | | Performing a “DuPont Analysis” of return on equity |
| | • | | Analyzing the return of invested capital and the economic value added |
| | • | | Analyzing the cash flow and capital spending and capital requirements of each company |
The investment team will make a sell decision when:
| | • | | The current stock price is not supported by its expectations regarding the company’s future growth potential |
| | • | | The political, economic, or financial health of the country changes |
THE YEAR IN REVIEW
Managers Emerging Markets Equity Fund rose 34.50% in 2006, compared with a gain of 32.59% for its benchmark, the MSCI Emerging Markets (MSCI EM) Index. (Note that unless otherwise stated, all performance cited in this commentary is in U.S. dollars.)
Despite one rather large hiccup in the middle of the year, emerging markets stocks again appreciated dramatically during the year, making 2006 the fourth consecutive year that the MSCI EM Index has gained in excess of 25%. Since the end of 2002, the MSCI EM Index has risen 251% cumulatively, or 36.9% annualized. The virtuous cycle of trends and capital flows has continued despite an eventual reversal in some important commodities and energy prices. The primary catalyst for the steady rise in stock prices has been global economic growth. Overall the global GDP is estimated to have grown approximately 4% in 2006, the fourth consecutive year that it has grown more than 3.5%. Among the primary beneficiaries and drivers of this global growth are emerging economies, including China and India which generated growth of almost 10% during the year. With generally low interest rates and sustained high profitability of companies, there has been an excess of liquidity in the markets, some of which has found its way toward the emerging markets. Furthermore, emerging market companies have made significant strides to improve both corporate transparency and fundamental productivity. Hence, low interest rates, low inflation, and rising productivity have generated plenty of liquidity around the world and emerging markets companies have put capital to good use, created growth and thus have attracted more capital so that stock prices have risen. As long as additional capital flows continue and can be put to good use, the virtuous cycle can continue.
The mid-year hiccup began in mid-May and proved how quickly a virtuous cycle can be interrupted. The MSCI EM Index dropped 24% from a peak in mid-May to mid-June as investors’ expectations for inflation and interest rates rose and investor sentiment reversed from optimism to risk aversion. Eventually, ample liquidity and strong fundamentals prevailed as inflation moderated and the U.S. Federal Open Market Committee ceased its tightening campaign. Investors regained their appetite for risk and the global stock markets recovered.
Across the emerging markets the rally was very broad, with virtually all sectors rising significantly. The only exception was the relatively small health care sector, which dropped more than 8% during the year. Almost half of the benchmark’s health care weighting is represented by Teva Pharmaceutical, an Isreali based drug manufacturer that dropped 27%. Similarly, the vast majority of emerging markets countries rose significantly during the year, while there were only a few minor countries that lost value. Isreal, dropped slightly, mainly because of Teva, while the Turkish and Jordanian markets moved broadly lower. Of the significant markets, the biggest laggard was South Korea, which only rose 12% for the year. Again, this was largely the result of one large company, Sam-sung Electronics, which was practically fl at for the year. Conversely, Chinese stocks traded on local exchanges rose more than 90% for the year while stocks traded in Hong Kong rose 69%. Relatively large markets such as Taiwan, Brazil, and South Africa rose 20%, 46%, and 20%, respectively. Russia, which is dominated by its energy companies, rose 50% even though its energy companies only rose 42%. Emerging markets are gradually becoming more diversified. India, which is very well diversified around a significant IT services industry, rose 48% for the year.
29
Managers Emerging Markets Equity Fund
Portfolio Manager’s Comments
The Fund fully participated in the 2006 rally and modestly outperformed its benchmark. Technically, one can attribute the Fund’s outperformance to be a result of good stock selection. While there were obviously a slew of holdings that appreciated significantly throughout the year, the best way to characterize the Fund’s success is by having avoided disasters. For instance, there were 64 companies in the benchmark that dropped more than 24%, and they collectively detracted more than 2% from the overall return. Conversely, the Fund only owned three of these securities, and with a considerably more concentrated portfolio, these three detracted slightly more than 1% from the return. Meanwhile, the Fund had ten positions that each individually contributed more than 1% to the overall return.
The team at Rexiter has for many years been of the opinion that the basic building blocks of a healthy emerging economy are financial and telecommunications infrastructures. In some cases the most effective way to establish exposure to a country is through its financial or telecommunications companies. Thus, the Portfolio has and will likely continue to have significant and geographically diversified exposure in these sectors. This was quite beneficial in 2006 as these two sectors provided the largest overall contributions to the Fund’s return. In fact five of the top six contributors were from the financial or telecommunications sectors, led by China Overseas Land and Investment, Ltd., a real estate development, property, and project management firm, that appreciated more than 200% since its addition to the Portfolio in February, and Sberbank, a Russian commercial bank, that rose 163% during the year. Conversely, the portfolio managers effectively avoided the health care sector and particularly its weakest components. The Fund’s lone health care holding, Gedeon Richter, a Hungarian pharmaceutical company, rose 29% during the year.
LOOKING FORWARD
Looking forward, there are not likely to be significant shifts in country or sector weightings within the Portfolio. Although South Korea and Taiwan remain among the Fund’s largest country allocations, the portfolio managers at Rexiter gradually reduced exposure throughout 2006, and they are each below 10% heading into the new year. Meanwhile, Rexiter has been adding exposure in Russia and China (both in China and through the Hong Kong market).
Despite the sharp rise in share prices over the past few years, emerging markets securities are not selling at extreme valuations, although they are not cheap. At 19.6, the weighted average price-to-trailing-earnings (P/E) of the MSCI EM Index is only modestly higher than its 18.2 level, three years ago. Although the Fund’s P/E has risen from 14.0, it remains well below the Index at 17.3. There is a legitimate concern that emerging markets companies are at cyclical earnings peaks. In addition, these markets are being driven higher by excess liquidity searching for returns. If the liquidity or the sentiment decreases, the market will move lower regardless of the fundamentals. However, these countries and companies are demonstrating rational business practices, are financially much healthier than only a few years ago, and have diversified their markets; therefore, in some ways they are less risky now than in the past. On the other hand, emerging markets remain acutely dependent upon and sensitive to product demand and capital flows from the developed markets.
CUMULATIVE TOTAL RETURN PERFORMANCE
Emerging Markets Equity’s cumulative total return is based on the daily change in net asset value (NAV), and assumes that all distributions were reinvested. The Morgan Stanley Capital International Emerging Markets Free (MSCI EMF) Index (“EMF”) is composed of all publicly traded stocks issued by 27 emerging countries including Argentina, Brazil, Chile, Greece, India, Israel, Malaysia, Mexico, the Philippines, Poland and Thailand. MSCI designates nations based upon several factors, the most important being per capita GDP. In cases where restrictions on foreign investment exist, the EMF Index limits its coverage to the opportunity set generally available to foreign investors. Unlike the Fund, EMF is unmanaged, is not available for investment, and does not incur expenses. This chart compares a hypothetical $10,000 investment made in Emerging Markets Equity on February 9, 1998, to a $10,000 investment made in the EMF for the same time period. Performance for periods longer than one year is annualized. The graph and table do not reflect the deduction of taxes that a shareholder
30
Managers Emerging Markets Equity Fund
Portfolio Manager’s Comments (continued)
would pay on a Fund distribution or redemption of shares. The listed returns for the Fund are net of expenses and the returns for the index exclude expenses. Past performance is not indicative of future results. Total returns would have been lower had certain expenses not been reduced.
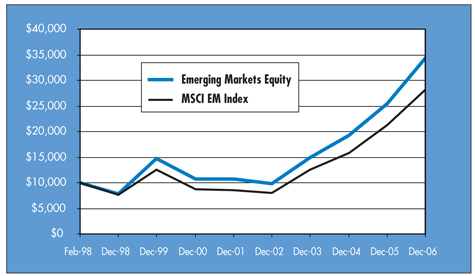
The table below shows the average annual total returns for Emerging Markets Equity and the EMF since inception through December 31, 2006.
| | | | | | | | | | | |
Average Annualized Total Returns | | One Year | | | Five Years | | | Since Inception | | | Inception Date* |
Emerging Markets Equity | | 34.50 | % | | 26.16 | % | | 14.86 | % | | 2/9/98 |
MSCI EM Index | | 32.59 | % | | 26.97 | % | | 12.37 | % | | |
| * | Commencement of operations was February 9, 1998. |
31
Managers Emerging Markets Equity Fund
Fund Snapshots
December 31, 2006
Portfolio Breakdown
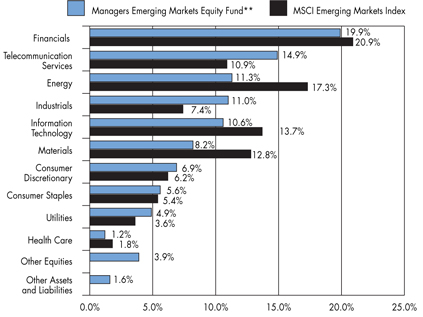
| ** | As a percentage of net assets |
| | | | | | |
Industry | | Managers Emerging Markets Equity Fund** | | | MSCI Emerging Markets Index | |
Financials | | 19.9 | % | | 20.9 | % |
Telecommunication Services | | 14.9 | % | | 10.9 | % |
Energy | | 11.3 | % | | 17.3 | % |
Industrials | | 11.0 | % | | 7.4 | % |
Information Technology | | 10.6 | % | | 13.7 | % |
Materials | | 8.2 | % | | 12.8 | % |
Consumer Discretionary | | 6.9 | % | | 6.2 | % |
Consumer Staples | | 5.6 | % | | 5.4 | % |
Utilities | | 4.9 | % | | 3.6 | % |
Health Care | | 1.2 | % | | 1.8 | % |
Other Equities | | 3.9 | % | | 0.0 | % |
Other Assets and Liabilities | | 1.6 | % | | 0.0 | % |
Top Ten Holdings
| | | |
Security Name | | Percentage of Net Assets | |
Sberbank RF* | | 2.5 | % |
Bharti Tele-Ventures Ltd. | | 2.2 | |
China Petroleum and Chemical Corp., Class H | | 2.1 | |
China Shipping Development Co., Ltd. | | 1.9 | |
China Mobile Ltd. | | 1.9 | |
China Overseas Land & Investment Ltd.* | | 1.9 | |
Infosys Technologies | | 1.8 | |
Anglo American Plc* | | 1.8 | |
Mobile Telesystems, Sponsored ADR | | 1.7 | |
Consorcio ARA, S.A. de C.V. | | 1.7 | |
Top Ten as a Group | | 19.5 | % |
| | | |
| * | Top Ten Holding at June 30, 2006 |
Any sectors, industries, or securities discussed should not be perceived as investment recommendations. Mention of a specific security should not be considered a recommendation to buy or solicitation to sell that security.
32
Managers Emerging Markets Equity Fund
Fund Snapshots (continued)
Summary of Investments by Country
| | | | | | |
Country | | Managers Emerging Markets Equity Fund* | | | MSCI EM Index | |
Argentina | | 0.0 | % | | 0.3 | % |
Brazil | | 12.9 | % | | 10.5 | % |
Chile | | 1.7 | % | | 1.5 | % |
China | | 6.5 | % | | 7.4 | % |
Colombia | | 0.9 | % | | 0.3 | % |
Czech Republic | | 1.3 | % | | 0.7 | % |
Egypt | | 0.0 | % | | 0.8 | % |
Hungary | | 1.1 | % | | 1.1 | % |
India | | 9.2 | % | | 6.5 | % |
Indonesia | | 2.1 | % | | 1.6 | % |
Israel | | 2.0 | % | | 2.0 | % |
Jordan | | 0.0 | % | | 0.1 | % |
South Korea | | 9.2 | % | | 15.5 | % |
Malaysia | | 3.9 | % | | 2.6 | % |
Mexico | | 5.1 | % | | 6.2 | % |
Morocco | | 0.0 | % | | 0.2 | % |
Pakistan | | 0.0 | % | | 0.2 | % |
Peru | | 0.0 | % | | 0.2 | % |
Philippines | | 0.5 | % | | 0.5 | % |
Poland | | 0.0 | % | | 1.7 | % |
Russia | | 12.7 | % | | 9.8 | % |
South Africa | | 4.4 | % | | 8.3 | % |
Taiwan | | 8.8 | % | | 12.5 | % |
Thailand | | 2.0 | % | | 1.4 | % |
Turkey | | 3.9 | % | | 1.4 | % |
Hong Kong | | 5.8 | % | | 3.5 | % |
Netherlands | | 0.0 | % | | 0.1 | % |
United Kingdom | | 1.8 | % | | 0.1 | % |
United States | | 2.2 | % | | 1.3 | % |
Luxembourg | | 0.1 | % | | 0.5 | % |
Bermuda | | 1.4 | % | | 0.6 | % |
Cayman Islands | | 0.0 | % | | 0.5 | % |
Other | | 0.5 | % | | 0.1 | % |
| | 100.0 | % | | 100.0 | % |
| | | | | | |
| * | As a percentage of total market value of common stocks on December 31, 2006 |
33
Managers Emerging Markets Equity Fund
Schedule of Portfolio Investments
December 31, 2006
| | | | | | |
| | | Shares | | | Value |
Common Stocks - 94.5% | | | | | | |
Consumer Discretionary - 6.9% | | | | | | |
Consorcio ARA, S.A. de C.V. (Mexico) | | 392,200 | | | $ | 2,668,398 |
Grupo Famsa SA (Mexico)* | | 140,548 | | | | 630,989 |
Grupo Televisa S. A. (Mexico) | | 87,800 | | | | 2,371,478 |
Hyundai Motor Co., Ltd. (South Korea)* | | 3,430 | | | | 247,879 |
Maruti Udyog Ltd. (India) | | 95,533 | | | | 2,001,232 |
Resorts World Berhad (Malaysia) | | 448,900 | | | | 1,858,139 |
SM Investments Corp. (Philippines) | | 106,080 | | | | 702,061 |
Total Consumer Discretionary | | | | | | 10,480,176 |
Consumer Staples - 5.6% | | | | | | |
Cia Brasileira de Distribuicao Grupo Pao de Acucar (Brazil) | | 69,200 | | | | 2,364,564 |
IOI Corp., Berhad (Malaysia) | | 436,000 | | | | 2,273,132 |
ITC, Ltd. (India) | | 336,621 | | | | 1,339,348 |
OJSC Cherkizovo Group (a) (Russia)* | | 42,118 | | | | 572,805 |
Shinsegae Co., Ltd. (South Korea)* | | 3,169 | | | | 1,973,890 |
Total Consumer Staples | | | | | | 8,523,739 |
Energy - 11.3% | | | | | | |
China Petroleum and Chemical Corp., Class H (Hong Kong) | | 3,400,000 | | | | 3,149,769 |
LUKOIL Holdings, ADR (Russia) | | 20,506 | | | | 1,803,503 |
OAO Rosneft Oil Co. GDR (a) (Russia)* | | 208,618 | | | | 1,908,855 |
PetroChina (China) | | 1,710,000 | | | | 2,410,035 |
Petroleo Brasileiro S.A., Sponsored ADR (Brazil) | | 25,000 | | | | 2,574,750 |
PTT Public Co., Ltd. (Thailand) | | 316,200 | | | | 1,902,894 |
Surgutneftegaz Sponsored ADR (Russia) | | 23,332 | 2 | | | 1,784,898 |
Yanzhou Coal Mining (China) | | 2,148,000 | | | | 1,737,142 |
Total Energy | | | | | | 17,271,846 |
Financials - 19.9% | | | | | | |
Bancolombia S.A. (Colombia) | | 43,001 | | | | 1,339,481 |
Bank Hapoalim, Ltd. (Israel) | | 345,470 | | | | 1,612,081 |
China Merchants Bank Co., Ltd. (China)* | | 73,171 | 2 | | | 155,028 |
China Overseas Land & Investment Ltd. | | | | | | |
(Hong Kong) | | 2,142,000 | | | | 2,857,646 |
Chinatrust Financial Holding, Co. (Taiwan) | | 2,877,280 | | | | 2,398,673 |
Grupo Financiero Banorte S.A. de C.V. (Mexico) | | 554,976 | | | | 2,169,970 |
Haci Omer Sabanci Holding AS (Turkey) | | 494,742 | | | | 1,921,660 |
Kazkommertsbank (a) (Kazakhstan)* | | 33,487 | | | | 773,550 |
Kookmin Bank, Sponsored ADR (South Korea)* | | 22,248 | | | | 1,794,079 |
OAO Open Investments (a) (Russia)* | | 5,564 | | | | 1,240,772 |
OTP Bank Rt. (Hungary) | | 20,402 | | | | 937,359 |
PT Bank Rakyat Indonesia (Indonesia) | | 1,424,000 | | | | 816,813 |
Samsung Fire & Marine Insurance Co., Ltd. (South Korea) | | 10,900 | | | | 1,881,777 |
Sanlam, Ltd. (South Africa) | | 850,883 | | | | 2,218,115 |
Sberbank RF (Russia) | | 1,100 | | | | 3,786,984 |
Turkiye Is Bankasi (Isbank) (Turkey) | | 475,132 | | | | 2,151,940 |
Uniao de Bancos Brasileiros SA (Brazil) | | 25,620 | | | | 2,381,635 |
Total Financials | | | | | | 30,437,563 |
Health Care - 1.2% | | | | | | |
Richter Gedeon Rt (Hungary) | | 7,706 | | | | 1,754,097 |
Industrials - 11.0% | | | | | | |
Barloworld Ltd (South Africa) | | 87,351 | | | | 2,039,461 |
China Shipping Development Co., Ltd. (China) | | 1,912,000 | | | | 2,924,138 |
COSCO Pacific (Bermuda) | | 898,000 | 2 | | | 2,100,776 |
Daewoo Shipbuilding & Marine Engineering (South Korea) | | 70,740 | | | | 2,214,805 |
Hyundai Development Co. (South Korea)* | | 39,900 | | | | 2,436,903 |
Santos-Brasil SA (Brazil)* | | 57,062 | | | | 721,121 |
Siemens India, Ltd. (India) | | 94,219 | | | | 2,417,653 |
Tata Motors, Ltd. (India) | | 100,000 | 2 | | | 2,043,000 |
Total Industrials | | | | | | 16,897,857 |
Information Technology - 10.6% | | | | | | |
Advanced Semiconductor Engineering, Inc. (Taiwan)* | | 1,974,727 | | | | 2,216,928 |
Compal Electronics, Inc. (Taiwan) | | 1,375,038 | | | | 1,221,145 |
Hon Hai Precision Industry Co., Ltd. (Taiwan) | | 351,784 | | | | 2,502,978 |
Infosys Technologies (India) | | 54,916 | | | | 2,775,235 |
Mediatek, Inc. (Taiwan) | | 180,000 | | | | 1,853,698 |
Samsung Electronics Co., Ltd., GDR, (a) (South Korea) | | 6,800 | | | | 2,241,075 |
Taiwan Semiconductor Manufacturing Co., Ltd., Sponsored ADR (Taiwan) | | 182,062 | 2 | | | 1,989,938 |
Taiwan Semiconductor Manufacturing Co., Ltd. (Taiwan) | | 986 | | | | 2,024 |
United Microelectronics Corp. (Taiwan) | | 2,137,504 | | | | 1,331,535 |
Total Information Technology | | | | | | 16,134,556 |
Materials - 8.2% | | | | | | |
Anglo American Plc (United Kingdom) | | 55,123 | | | | 2,682,685 |
Compania Vale do Rio Doce - ADR (Brazil) | | 87,600 | 2 | | | 2,605,224 |
Formosa Chemicals & Fibre Corp. (Taiwan) | | 680 | | | | 1,139 |
The accompanying notes are an integral part of these financial statements.
34
Managers Emerging Markets Equity Fund
Schedule of Portfolio Investments (continued)
| | | | | | | |
| | | Shares | | | Value | |
Materials - 8.2% (continued) | | | | | | | |
GMK Norilsk Nickel, Sponsored ADR (Russia) | | 12,800 | 2 | | $ | 2,009,600 | |
Novolipetsk Steel, Corp. (Russia) | | 59,962 | | | | 1,409,107 | |
Polyus Gold (Russia)* | | 23,990 | 2 | | | 1,180,332 | |
Sappi Ltd. (South Africa) | | 146,235 | | | | 2,450,021 | |
Ternium SA (Luxembourg)* | | 6,800 | 2 | | | 201,076 | |
Total Materials | | | | | | 12,539,184 | |
Telecommunication Services - 14.9% | | | | | | | |
Advanced Information Services PCL (Thailand) | | 510,000 | | | | 1,123,799 | |
Bezeq Israeli Telecommunication Corp., Ltd. (Israel) | | 916,879 | | | | 1,480,489 | |
Bharti Tele-Ventures Ltd. (India)* | | 240,457 | | | | 3,423,225 | |
China Mobile Ltd. (Hong Kong) | | 332,000 | | | | 2,861,823 | |
China Telecom Corp., Ltd., Class H (China) | | 4,842,000 | | | | 2,643,754 | |
Mobile Telesystems, Sponsored ADR (Russia) | | 53,327 | 2 | | | 2,676,482 | |
Telekomunikasi Indonesia (Indonesia) | | 2,153,000 | | | | 2,426,622 | |
Tim Participacoes ADR (Brazil) | | 68,000 | | | | 2,354,160 | |
Turkcell Iletisim Hizmet AS (Turkey) | | 374,000 | | | | 1,833,035 | |
Vivo Participacoes (Brazil) | | 491,100 | 2 | | | 2,013,510 | |
Total Telecommunication Services | | | | | | 22,836,899 | |
Utilities - 4.9% | | | | | | | |
Ceske Energeticke Zavody (Czech Republic) | | 44,512 | | | | 2,038,253 | |
Empresa Nacional de Electricidad SA/ Chile, ADR (Chile) | | 69,879 | 2 | | | 2,568,053 | |
Tenaga Nasional Berhad (Malaysia) | | 579,750 | | | | 1,787,937 | |
Unified Energy System (Russia) | | 11,200 | | | | 1,209,600 | |
Total Utilities | | | | | | 7,603,843 | |
Total Common Stocks (cost $92,795,797) | | | | | | 144,479,760 | |
Preferred Stocks - 3.9% | | | | | | | |
Companhia Energetica de Minas Gerais, 1.58% (Brazil) | | 41,840,000 | | | | 2,056,064 | |
Hyundai Motor Co., Ltd., 3.92% (South Korea) | | 30,560 | | | | 1,302,348 | |
Tam S.A. (Brazil) | | 85,483 | | | | 2,660,716 | |
Total Preferred Stocks (cost $2,559,158) | | | | | | 6,019,128 | |
Other Investment Companies - 13.3%1 | | | | | | | |
Bank of New York Institutional Cash Reserves Fund, 5.32%3 | | 15,391,473 | | | | 15,391,473 | |
JPMorgan Prime Money Market Fund, Institutional Class Shares, 5.18% | | 4,989,754 | | | | 4,989,754 | |
Total Other Investment Companies | | | | | | | |
(cost $20,381,227) | | | | | | 20,381,227 | |
Total Investments - 111.7% | | | | | | | |
(cost $115,736,182) | | | | | | 170,880,115 | |
Other Assets, less Liabilities - (11.7)% | | | | | | (17,897,436 | ) |
Net Assets - 100% | | | | | $ | 152,982,679 | |
The accompanying notes are an integral part of these financial statements.
35
Managers Bond Fund
Portfolio Manager’s Comments
The Managers Bond Fund’s (the “Fund”) objective is to achieve a high level of current income from a diversifi ed portfolio of fi xed income securities. The Fund’s benchmark is the Lehman Brothers Government Credit Index.
The Fund currently employs a subadvisor, Loomis Sayles & Company, L.P. (“Loomis”), to manage the assets of the Fund. The investment team at Loomis believes that there are inherent inef-fi ciencies in bond markets, hence the greatest opportunities to add value, reside in the pricing of credit risk. Their philosophy is to identify attractively valued issues through fundamental research. Portfolio manager Dan Fuss and his investment team at Loomis are focused on issue selection rather than interest rate timing. They employ a “bond picker’s” approach, capitalizing on the fi rm’s commitment to credit research. Dan and the team research debt offerings in the same way equity analysts research stocks, looking for undervalued bonds where they see a yield premium, the potential for price appreciation, or both. They analyze the company’s fi nancial condition in detail, as well as the terms of specifi c bond offerings. They believe price appreciation can come from a variety of catalysts including improving company fundamentals which would lead to credit upgrades, changing market supply and demand forces, improving sector, or economic trends.
The ideal investment typically exhibits some of the following traits:
| | • | | An attractive yield, both absolute and relative to Loomis’ credit research expectations |
| | • | | Good call protection, particularly when prevailing rates are low |
| | • | | Stable or improving fundamentals (for corporate bonds) |
| | • | | Non-market relatedness to counter the impact of systematic risk |
The portfolio:
| | • | | Primarily holds securities rated BBB/Baa or better, but may hold a small portion in below investment grade and in unrated bonds |
| | • | | Can be invested up to 10% in non-U.S. dollar denominated bonds |
In order to mitigate some of the interest rate risk, the Portfolio may be structured with counter cyclical elements. In doing so, Dan Fuss may utilize convertible bonds, municipal bonds, preferred stocks, and foreign corporate and government bonds in addition to the domestic corporate bonds, which are used for alpha generation. In addition, Dan seeks bonds with call protection, either through the terms of the bond structure or through deep price discounts relative to the call price.
In deciding which securities to buy, the investment team will consider:
| | • | | The financial strength of the issuer of the security |
| | • | | Current interest rates, the asset manager’s expectations regarding general trends in interest rates |
| | • | | Comparisons of the level of risk associated with particular investments with the asset manager’s expectations concerning the potential return of those investments |
The investment team may make a sell decision when:
| | • | | There is a change in sovereign, industry, or company fundamentals |
| | • | | The issuer is downgraded by Loomis research |
| | • | | Relative valuation is not consistent with its expected rating category |
| | • | | Other securities or sectors offer greater total return potential |
THE YEAR IN REVIEW
The Managers Bond Fund returned 7.84% for the year ended 2006, compared to its benchmark, the Lehman Government/Credit Index, which returned 3.78%. The U.S. bond market in 2006 was defi ned by two distinct halves - the first, which was marked by escalating inflationary fears, tighter global central bank policy and higher interest rates; and the second, which was marked by a Federal Reserve pause, poor economic data, and sharply falling rates. During the year, the FOMC hiked the Fed Funds rate four times, from 4.25% to 5.25%, as higher energy prices and a resilient U.S. economy led to concerns over higher inflation. In August, however, for the first time in over 2 years, the Fed decided to keep rates on hold, signaling that the tightening cycle may have come to an end. Following the Fed pause in August, economic data releases began to signal a weakening economy, led by poor data in the housing and auto sectors. The economic slowdown sparked a sharp bond rally, as the 10-year Treasury yield fell to 4.60%, well off the year’s high of 5.24% reached in June. As longer-term bonds rallied and rates fell, short-term bonds were anchored by the Fed Funds rate, which led to an inversion in the yield curve. It’s worth noting, if only for comparison sake, yield curve inversions historically have been associated with future economic recessions. U.S. corporate high yield and emerging markets debt were the top-performing sectors returning 840 basis points (8.4%) and 700 basis points (7.0%), respectively, over like-duration treasuries. Furthermore, the interest rate environment became more favorable for mortgage-backed securities toward the latter half of the year allowing such issues to outperform like-duration Treasuries by over 120 basis points (1.2%).
Similar to the two distinct periods of the bond market, the Fund was structured quite differently pre- and post-Fed policy shifts. Portfolio management spent the early part of the year using the liquidity attained through strong cash flows to buy shorter-term treasuries in an effort to keep duration on the defensive side. This was due in part to uncertainty surrounding inflation and how the Fed would influence interest rates going forward. That all changed in an unprecedented move early in the third quarter as Dan Fuss elected to aggressively sell short-term Treasuries in favor of longer-term issues. The move was predicated on anticipation of the Fed pausing in its campaign of 17 consecutive interest rate hikes and proved to be very timely. With the Fund’s duration pushed out over 9 years at that point, the Portfolio was able to take full advantage of the Fed pause and subsequent declining yields. This decision was ultimately a major contributor toward outperformance for the year.
In addition to considerable value added through curve positioning and duration management, the Fund’s corporate bond holdings in financials, industrials, and utilities all returned in excess of 100 basis points (1.0%) over like-duration Treasuries. Furthermore, foreign bonds were a plus for the year aided by the declining dollar.
LOOKING FORWARD
As we move into 2007 and beyond, Loomis is forecasting the bond market to be driven by three main factors: low yield volatility associated with stable monetary policy, a supportive macro backdrop
36
Managers Bond Fund
Portfolio Manager’s Comments (continued)
with solid though slower economic growth accompanied by contained inflation, and generally full valuations putting the focus on security selection. Furthermore, Dan believes we are in the initial stages of a secular period of rising interest rates but at a cyclical peak, and that the Fed will likely begin cutting rates in the first half of 2007. The ten-year Treasury, which is currently yielding approximately 4.5% percent, is forecasted to remain at or near its current level, which could represent a bottom for this cycle. In the meantime, the Fund’s duration at 7.7 years has come in slightly since last quarter, and the Fund’s corporate bond allocation, at about 47%, is roughly the same as it has been for several quarters now. Given the reasonably strong net cash flows this Portfolio has been receiving, Dan and his team will continue to manage duration and curve positioning through the buying and selling of shorter-term U.S. Treasury bonds in addition to adding select corporate issues when the opportunity presents itself.
CUMULATIVE TOTAL RETURN PERFORMANCE
Managers Bond Fund’s cumulative total return is based on the daily change in net asset value (NAV), and assumes that all distributions were reinvested. The Lehman Brothers Government/ Credit Index is comprised of government securities and investment grade corporate securities with maturities between 1 and 10 years. Unlike the Fund, the Lehman Brothers Government/Credit Index is unmanaged, is not available for investment, and does not incur expenses. The Index assumes reinvestment of all income. This graph compares a hypothetical $10,000 investment made in the Managers Bond Fund on December 31, 1996, to a $10,000 investment made in the Lehman Brothers Government/Credit Index for the same time period. Performance for periods longer than one year is annualized. The graph and table do not reflect the deduction of taxes that a shareholder would pay on a Fund distribution or redemption of shares. The listed returns for the Fund are net of expenses and the returns for the index exclude expenses. Past performance is not indicative of future results. Total returns would have been lower had certain expenses not been reduced.
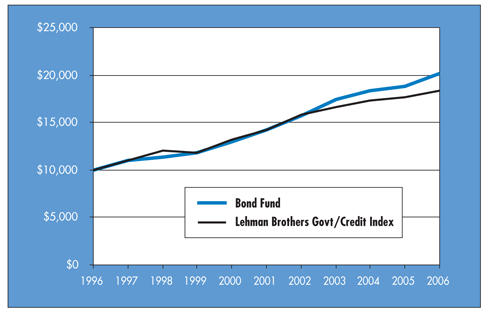
The table below shows the average annual total returns for Managers Bond Fund and the Lehman Brothers Government/Credit Index from December 31, 1996 through December 31, 2006.
| | | | | | | | | | | |
Average Annualized Total Returns | | One Year | | | Five Years | | | Ten Years | | | Inception Date |
Bond Fund | | 7.84 | % | | 7.35 | % | | 7.30 | % | | 6/1/84 |
Lehman Brothers Govt/Credit Index | | 3.78 | % | | 5.17 | % | | 6.26 | % | | |
37
Managers Bond Fund
Fund Snapshots
December 31, 2006
Portfolio Breakdown
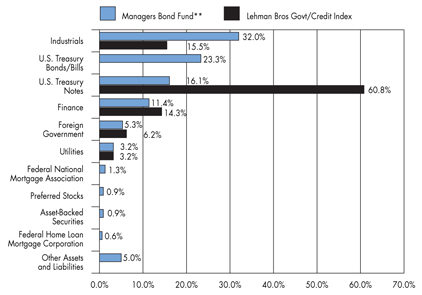
| ** | As a percentage of net assets |
| | | | | | |
Industry | | Managers
Bond Fund** | | | Lehman Bros
Govt/Credit
Index | |
Industrials | | 32.0 | % | | 15.5 | % |
U.S. Treasury Bonds/Bills | | 23.3 | % | | 0.0 | % |
U.S. Treasury Notes | | 16.1 | % | | 60.8 | % |
Finance | | 11.4 | % | | 14.3 | % |
Foreign Government | | 5.3 | % | | 6.2 | % |
Utilities | | 3.2 | % | | 3.2 | % |
Federal National Mortgage Association | | 1.3 | % | | 0.0 | % |
Preferred Stocks | | 0.9 | % | | 0.0 | % |
Asset-Backed Securities | | 0.9 | % | | 0.0 | % |
Federal Home Loan Mortgage Corporation | | 0.6 | % | | 0.0 | % |
Other Assets and Liabilities | | 5.0 | % | | 0.0 | % |
Top Ten Holdings
| | | |
Security Name | | Percentage of Net Assets | |
USTB, 5.375%, 02/15/31* | | 18.9 | % |
USTN, 4.625%, 11/30/08 | | 9.3 | |
USTN, 3.700%, 05/15/08 | | 5.0 | |
USTB, 4.500%, 09/30/11 | | 4.4 | |
Nextel Communications, Inc., 5.950%, 03/15/14 | | 1.9 | |
Canada Government, 4.250%, 09/01/08 | | 1.8 | |
Telefonica Emisiones SAU, 7.045%, 06/20/16* | | 1.4 | |
Verizon Global Funding Corp., 5.850%, 09/15/35* | | 1.2 | |
Mutual of Omaha Insurance Co., 6.800%, 06/15/36 (a) | | 1.2 | |
Comcast Corp., 6.450%, 03/15/37* | | 1.2 | |
Top Ten as a Group | | 46.3 | % |
| | | |
| * | Top Ten Holding at June 30, 2006 |
Any sectors, industries, or securities discussed should not be perceived as investment recommendations. Mention of a specific security should not be considered a recommendation to buy or solicitation to sell that security.
38
Managers Bond Fund
Schedule of Portfolio Investments
December 31, 2006
| | | | | | | |
Security Description | | Principal Amount | | | Value |
Corporate Bonds - 47.5% | | | | | | | |
Asset-Backed Security - 0.9% | | | | | | | |
Bank of America-First Union National Bank Commercial Mortgage, Series 2001-3, Class A-2, 5.464%, 04/11/37 | | $ | 1,500,000 | | | $ | 1,512,217 |
Community Program Loan Trust, Series 87-A, Class A4, 4.500%, 10/01/18 | | | 155,693 | | | | 153,198 |
Community Program Loan Trust, Series 87-A, Class A5, 4.500%, 04/01/29 | | | 3,225,000 | | | | 3,039,245 |
CS First Boston Mortgage Securities Corp., Series 2005-7, Class 3A1, 5.000%, 08/25/20 | | | 3,519,065 | | | | 3,476,485 |
Total Asset-Backed Security | | | | | | | 8,181,145 |
Finance - 11.4% | | | | | | | |
ASIF Global Financial, 2.380%, 02/26/09 (a) | | SGD | 5,800,000 | | | | 3,692,287 |
Bank of American Capital Trust, 5.625%, 03/08/35 | | | 3,085,000 | | | | 2,920,332 |
Barclays Capital Corp., 4.100%, 02/22/10 (a) | | THB | 109,000,000 | | | | 2,856,753 |
Barclays Capital Corp., 4.160%, 02/22/10 (a) | | THB | 25,000,000 | | | | 657,475 |
Barclays Financial LLC., 4.670%, 03/23/09 (a) 6 | | KRW | 160,900,000 | | | | 172,971 |
BNP Paribas SA, 0.000%, 06/31/11 (a) 4 | | IDR | 19,645,500,000 | | | | 1,487,431 |
Cerro Negro Finance, Ltd., 7.900%, 12/01/20 (a) | | | 500,000 | | | | 485,000 |
Cigna Corp., 6.150%, 11/15/36 | | | 3,610,000 | | | | 3,566,413 |
Citibank N.A., 15.000%, 07/02/10 (a) | | BRL | 2,000,000 | | | | 1,046,983 |
Citigroup, Inc., 3.500%, 02/01/08 | | | 2,020,000 | | | | 1,983,652 |
Colonial Realty LP, 4.800%, 04/01/11 | | | 3,485,000 | | | | 3,350,821 |
Colonial Realty LP, 5.500%, 10/01/15 | | | 1,255,000 | | | | 1,223,846 |
EOP Operating LP, 6.750%, 02/15/12 | | | 500,000 | | | | 539,986 |
Ford Motor Credit Co., 8.000%, 12/15/16 | | | 3,500,000 | | | | 3,458,525 |
General Electric Capital Corp., 6.500%, 09/28/15 | | NZD | 11,570,000 | | | | 7,838,670 |
General Electric Capital Corp., 6.625%, 02/04/10 | | NZD | 3,500,000 | | | | 2,410,064 |
General Electric Capital Corp., 6.750%, 09/26/16 | | NZD | 2,865,000 | | | | 1,999,824 |
GMAC International Finance BV, 8.000%, 03/14/07 | | | 950,000 | | | | 667,011 |
GMAC, 5.625%, 05/15/09 | | | 500,000 | | | | 496,052 |
GMAC, 6.125%, 01/22/08 | | | 2,000,000 | | | | 1,995,618 |
GMAC, 6.225%, 03/20/07 6 | | NZD | 1,500,000 | | | | 1,500,099 |
GMAC, 6.875%, 09/15/11 | | | 250,000 | | | | 256,424 |
Highwoods Properties, Inc., 7.500%, 04/15/18 | | | 2,405,000 | | | | 2,671,871 |
Inter-American Development Bank, 0.000%, 05/11/09 4 | | BRL | 6,500,000 | | | | 2,228,528 |
Inter-American Development Bank, 6.000%, 12/15/17 | | NZD | 4,215,000 | 2 | | | 2,838,852 |
JPMorgan Chase & Co., 0.000%, 03/28/11 (a) 4 | | IDR | 932,700,000 | | | | 72,204 |
JPMorgan Chase & Co., 4.000%, 02/01/08 | | | 1,000,000 | | | | 986,734 |
JPMorgan Chase of London, 0.000%, 10/21/10 (a) 4 | | IDR | 16,627,462,500 | | | | 1,345,002 |
JPMorgan Chase Bank, NA, 0.000%, 05/17/10 (a) 4 | | BRL | 3,600,000 | | | | 1,139,925 |
Kinder Morgan Finance Co., 5.700%, 01/05/16 | | | 370,000 | | | | 339,482 |
Kinder Morgan Finance Co., 6.400%, 01/05/36 | | | 735,000 | | | | 655,311 |
Kinder Morgan Inc., 5.150%, 03/01/15 | | | 730,000 | | | | 655,030 |
Marsh & McLennan Cos., Inc., 5.375%, 07/15/14 | | | 4,390,000 | | | | 4,224,203 |
Marsh & McLennan Cos., Inc., 5.750%, 09/15/15 | | | 3,295,000 | | | | 3,241,661 |
The accompanying notes are an integral part of these financial statements.
39
Managers Bond Fund
Schedule of Portfolio Investments (continued)
| | | | | | | |
Security Description | | Principal Amount | | | Value |
Finance - 11.4% (continued) | | | | | | | |
Marsh & McLennan Cos., Inc., 5.875%, 08/01/33 | | $ | 7,365,000 | | | $ | 6,708,116 |
Morgan Stanley & Co., Inc., 3.625%, 04/01/08 | | | 2,100,000 | | | | 2,057,506 |
Mutual of Omaha Insurance Co., 6.800%, 06/15/36 (a) | | | 10,125,000 | | | | 10,913,150 |
SLM Corp., 6.500%, 06/15/10 | | NZD | 500,000 | | | | 342,655 |
Spieker Properties, Inc., 7.350%,12/01/17 | | | 250,000 | | | | 299,747 |
St. Paul Travelers Companies, Inc. 6.750%, 06/20/36 | | | 2,610,000 | | | | 2,884,901 |
Toll Brothers Finance Corp., 5.150%, 05/15/15 | | | 3,785,000 | | | | 3,468,131 |
Travelers Property Casualty Corp., 6.375%, 03/15/33 | | | 3,040,000 | | | | 3,201,725 |
Wells Fargo Co., 5.121%, 05/01/33 6 | | | 8,390,000 | 2 | | | 8,417,100 |
Total Finance | | | | | | | 103,298,071 |
Industrial - 32.0% | | | | | | | |
Abitibi-Consolidated, Inc., 7.500%, 04/01/28 | | | 500,000 | | | | 383,750 |
Albertson’s, Inc., 6.625%, 06/01/28 | | | 1,015,000 | | | | 921,476 |
Albertson’s, Inc., 7.450%, 08/01/29 | | | 595,000 | | | | 581,314 |
Albertson’s Inc., 7.750%, 06/15/26 | | | 915,000 | | | | 912,659 |
Altria Group, Inc., 7.000%, 11/04/13 | | | 1,500,000 | | | | 1,629,774 |
America Movil, S.A. de C.V., 4.125%, 03/01/09 | | | 3,000,000 | 2 | | | 2,919,171 |
American President, Ltd., 8.000%, 01/15/24 | | | 250,000 | 5 | | | 224,375 |
Anadarko Petroleum Corp., 5.950%, 09/15/06 | | | 4,915,000 | | | | 4,925,287 |
Anadarko Petroleum Corp., 6.450%, 09/15/36 | | | 3,630,000 | | | | 3,668,100 |
Arrow Electronics, Inc., 6.875%, 07/01/13 | | | 500,000 | | | | 521,598 |
AT&T, Inc., 6.150%, 09/15/34 | | | 1,375,000 | | | | 1,352,403 |
AT&T, Inc., 6.500%, 03/15/29 | | | 7,650,000 | | | | 7,635,687 |
Avnet, Inc., 2.000%, 03/15/34 | | | 1,425,000 | | | | 1,433,906 |
Avnet, Inc., 6.000%, 09/01/15 | | | 5,105,000 | | | | 5,033,525 |
Avnet, Inc., 6.625%, 09/15/16 | | | 1,370,000 | | | | 1,408,772 |
BellSouth Corp., 6.000%, 11/15/34 | | | 9,740,000 | 2 | | | 9,351,501 |
Bowater, Inc., 6.500%, 06/15/13 | | | 1,675,000 | 2 | | | 1,528,438 |
Bristol-Myers Squibb, 4.860%, 09/15/23 6 | | | 6,060,000 | | | | 6,060,000 |
Centex Corp., 5.250%, 06/15/15 | | | 1,915,000 | | | | 1,808,712 |
Chartered Semiconductor Manufacturing, 6.250%, 04/04/13 | | | 5,600,000 | | | | 5,637,246 |
Cia Brasileira de Bebida, 8.750%, 09/15/13 | | | 3,795,000 | | | | 4,421,175 |
Clear Channel Communications, 4.250%, 05/15/09 | | | 1,500,000 | | | | 1,452,778 |
Clear Channel Communications, 5.750%, 01/15/13 | | | 500,000 | | | | 444,634 |
Comcast Corp., 5.650%, 06/15/35 | | | 4,910,000 | | | | 4,456,989 |
Comcast Corp., 6.450%, 03/15/37 | | | 10,570,000 | | | | 10,575,708 |
Comcast Corp., 6.500%, 11/15/35 | | | 375,000 | | | | 377,649 |
Continental Airlines, Inc., 6.795%, 08/02/20 | | | 53,026 | | | | 52,761 |
Corning, Inc., 6.850%, 03/01/29 | | | 9,142,000 | | | | 9,513,869 |
Corning, Inc., 7.250%, 08/15/36 | | | 1,185,000 | | | | 1,269,914 |
Cummins, Inc., 7.125%, 03/01/28 | | | 50,000 | | | | 51,974 |
D.R. Horton, Inc., 5.250%, 02/15/15 | | | 5,495,000 | 2 | | | 5,129,121 |
Desarrolladora Homex S.A. de C.V., 7.500%, 09/28/15 | | | 2,725,000 | | | | 2,779,500 |
The accompanying notes are an integral part of these financial statements.
40
Managers Bond Fund
Schedule of Portfolio Investments (continued)
| | | | | | | |
Security Description | | Principal Amount | | | Value |
Industrial - 32.0% (continued) | | | | | | | |
Devon Energy Corp., 4.900%, 08/15/08 | | $ | 1,250,000 | | | $ | 1,731,250 |
Devon Energy Corp., 4.950%, 08/15/08 | | | 1,692,000 | | | | 2,343,420 |
Dillards, Inc., 7.000%, 12/01/28 | | | 225,000 | | | | 214,875 |
Duke Energy Field Services LLC, 6.450%, 11/03/36 (a) | | | 2,615,000 | | | | 2,686,837 |
El Paso Corp., 6.750%, 05/15/09 | | | 250,000 | | | | 255,312 |
El Paso Corp., 6.950%, 06/01/28 | | | 1,030,000 | | | | 1,024,850 |
El Paso Corp., 7.000%, 05/15/11 | | | 500,000 | | | | 518,750 |
Energy Transfer Partners LP, 6.125%, 02/15/17 | | | 700,000 | | | | 709,739 |
Energy Transfer Partners LP, 6.625%, 10/15/36 | | | 515,000 | | | | 530,279 |
Foot Locker, Inc., 8.500%, 01/15/22 | | | 570,000 | | | | 560,025 |
Ford Motor Co., 6.375%, 02/01/29 | | | 1,990,000 | | | | 1,427,825 |
Georgia-Pacific Corp., 7.250%, 06/01/28 | | | 1,195,000 | | | | 1,159,150 |
Georgia-Pacific Corp., 7.750%, 11/15/29 | | | 1,510,000 | | | | 1,506,225 |
Georgia-Pacific Corp., 8.000%, 01/15/24 | | | 985,000 | | | | 999,775 |
Georgia-Pacific Corp., 8.875%, 05/15/31 | | | 2,750,000 | | | | 2,908,125 |
GTE Corp., 6.940%, 04/15/28 | | | 130,000 | | | | 136,295 |
HCA, Inc., 6.250%, 02/15/13 | | | 1,940,000 | | | | 1,716,900 |
HCA, Inc., 5.750, 03/15/14 | | | 2,500,000 | | | | 2,075,000 |
HCA, Inc., 7.050%, 12/01/27 | | | 1,600,000 | | | | 1,204,216 |
HCA, Inc., 7.580%, 09/15/25 | | | 730,000 | | | | 593,981 |
Hutchison Whampoa International, Ltd., 5.450%, 11/24/10 (a) | | | 2,225,000 | | | | 2,231,493 |
International Paper Co., 4.000%, 04/01/10 | | | 1,000,000 | | | | 959,807 |
International Paper Co., 4.250%, 01/15/09 | | | 1,000,000 | | | | 978,609 |
Kellwood Co., 7.625%, 10/15/17 | | | 250,000 | | | | 228,500 |
KN Capital Trust III, 7.630%, 04/15/28 | | | 75,000 | | | | 69,688 |
Koninklijke KPN NV, 8.375%, 10/01/30 | | | 815,000 | | | | 933,790 |
Lennar Corp., 5.600%, 05/31/15 | | | 2,740,000 | | | | 2,619,932 |
Lennar Corp., 6.500%, 04/15/16 | | | 2,340,000 | | | | 2,374,183 |
Lowe’s Co., Inc., 6.875%, 02/15/28 | | | 500,000 | | | | 555,706 |
Lubrizol, Corp., 6.500%, 10/01/34 | | | 7,825,000 | | | | 7,874,227 |
Lucent Technologies, Inc., 6.450%, 03/15/29 | | | 1,160,000 | | | | 1,070,100 |
Missouri Pacific Railroad Corp., 5.000%, 01/01/45 | | | 300,000 | | | | 236,576 |
Motorola, Inc., 8.000%, 11/01/11 | | | 1,075,000 | | | | 1,189,558 |
New England Telephone & Telegraph Co., 7.875%, 11/15/29 | | | 2,390,000 | | | | 2,607,655 |
News America, Inc., 6.200%, 12/15/34 | | | 2,790,000 | | | | 2,692,950 |
News America, Inc., 6.400%, 12/15/35 | | | 5,820,000 | | | | 5,781,786 |
Nextel Communications, Inc., 5.950%, 03/15/14 | | | 18,155,000 | | | | 17,679,629 |
NiSource Finance Corp., 6.150%, 03/01/13 | | | 1,250,000 | 2 | | | 1,273,050 |
ONEOK Partners LP, 6.650%, 10/01/36 | | | 1,000,000 | | | | 1,022,832 |
Owens & Minor, Inc., 6.350%, 04/15/16 | | | 1,000,000 | | | | 1,004,049 |
Owens Corning, Inc., 6.500%, 12/01/16 (a) | | | 1,265,000 | | | | 1,285,035 |
Owens Corning, Inc., 7.000%, 12/01/36 (a) | | | 1,895,000 | | | | 1,913,573 |
Pemex Project Funding Master Trust, 8.625%, 12/01/23 | | | 950,000 | | | | 1,169,688 |
The accompanying notes are an integral part of these financial statements.
41
Managers Bond Fund
Schedule of Portfolio Investments (continued)
| | | | | | | |
Security Description | | Principal Amount | | | Value |
Industrial - 32.0% (continued) | | | | | | | |
Penney (JC), Co., 7.125%, 11/15/23 | | $ | 33,000 | | | $ | 35,908 |
PF Export Rec Master Trust, 6.436%, 06/01/15 (a) | | | 685,891 | | | | 699,609 |
Plains All American Pipeline LP, 6.125%, 01/15/17 (a) | | | 2,770,000 | | | | 2,784,434 |
Plains All American Pipeline LP, 6.650%, 01/15/37 (a) | | | 5,960,000 | | | | 6,051,063 |
Pulte Homes, Inc., 5.200%, 02/15/15 | | | 2,935,000 | | | | 2,796,324 |
Pulte Home, Inc., 6.000%, 02/15/35 | | | 10,150,000 | 2 | | | 9,284,449 |
Pulte Homes, Inc., 6.375%, 05/15/33 | | | 4,570,000 | | | | 4,266,831 |
Qantas Airways Ltd., 6.050%, 04/15/16 (a) | | | 11,800,000 | 2 | | | 10,502,378 |
Qwest Capital Funding, Inc., 6.500%, 11/15/18 | | | 315,000 | | | | 294,525 |
Qwest Capital Funding, Inc., 6.875%, 07/15/28 | | | 1,180,000 | | | | 1,078,225 |
Qwest Capital Funding, Inc., 7.625%, 08/03/21 | | | 1,435,000 | | | | 1,413,475 |
Qwest Capital Funding, Inc., 7.750%, 02/15/31 | | | 1,600,000 | | | | 1,570,013 |
Raytheon Co., 7.000%, 11/01/28 | | | 1,500,000 | | | | 1,717,641 |
Raytheon Co., 7.200%, 08/15/27 | | | 800,000 | | | | 931,608 |
Samsung Electronics Co., Ltd., 7.700%, 10/01/27 (a) | | | 4,695,000 | | | | 5,010,889 |
Schering-Plough Corp., 5.300%, 12/01/13 | | | 1,500,000 | | | | 1,504,346 |
Southern Natural Gas Co., 7.350%, 02/15/31 | | | 1,000,000 | | | | 1,100,746 |
Teck Cominco Ltd., 7.000%, 09/15/12 | | | 1,000,000 | | | | 1,057,475 |
Telefonica Emisiones SAU, 7.045%, 06/20/16 | | | 12,125,000 | | | | 12,878,775 |
Telekom Malaysia Berhad, 7.875%, 08/01/25 (a) | | | 250,000 | | | | 305,086 |
Tennessee Gas Pipeline Co., 7.000%, 10/15/28 | | | 2,395,000 | | | | 2,528,828 |
Time Warner, Inc., 6.500%, 11/15/36 | | | 660,000 | | | | 656,914 |
Time Warner, Inc., 6.625%, 05/15/29 | | | 1,995,000 | | | | 2,020,440 |
Time Warner, Inc., 6.950%, 01/15/28 | | | 855,000 | | | | 897,235 |
Time Warner, Inc., 7.625% 04/01/31 | | | 560,000 | | | | 625,610 |
Time Warner, Inc., 7.700%, 05/01/32 | | | 365,000 | | | | 411,827 |
Transocean, Inc., 7.375%, 04/15/18 | | | 500,000 | | | | 548,858 |
US West Communications, Inc., 6.875% 09/15/33 | | | 820,000 | | | | 783,100 |
US West Communications, Inc., 7.250%, 09/15/25 | | | 560,000 | | | | 575,400 |
USG Corp., 6.300%, 11/15/16 (a) | | | 1,410,000 | | | | 1,397,648 |
Vale Overseas Ltd., 6.875%, 11/01/36 | | | 3,200,000 | | | | 3,282,066 |
Verizon Global Funding Corp., 5.850%, 09/15/35 | | | 11,400,000 | | | | 10,918,316 |
Verizon Maryland, Inc., 5.125%, 06/15/33 | | | 845,000 | | | | 693,203 |
Verizon New York, Inc., 7.375%, 04/01/32 | | | 3,090,000 | | | | 3,190,462 |
Viacom, Inc., 6.875%, 04/30/36 | | | 4,160,000 | | | | 4,112,905 |
Watson Pharmaceuticals, Inc., 1.75% 03/01/23 | | | 515,000 | | | | 475,088 |
Weatherford International, Inc., 6.500%, 08/01/36 | | | 1,565,000 | | | | 1,571,057 |
Western Union Co., 6.200%, 11/17/36 (a) | | | 9,085,000 | | | | 8,534,131 |
Williams Co., Inc., Series A, 7.500%, 01/15/31 | | | 1,000,000 | | | | 1,037,500 |
XTO Energy, Inc., 6.100%, 04/01/36 | | | 190,000 | | | | 185,425 |
Total Industrial | | | | | | | 290,248,824 |
The accompanying notes are an integral part of these financial statements.
42
Managers Bond Fund
Schedule of Portfolio Investments (continued)
| | | | | | | |
Security Description | | Principal Amount | | | Value |
Utilities - 3.2% | | | | | | | |
Commonwealth Edison, 4.700%, 04/15/15 | | $ | 1,465,000 | | | $ | 1,364,867 |
Commonwealth Edison, 5.875%, 02/01/33 | | | 5,000,000 | | | | 4,856,970 |
Constellation Energy Group, Inc., 4.550%, 06/15/15 | | | 1,675,000 | | | | 1,550,644 |
Dominion Resources, Inc., 5.950%, 06/15/35 | | | 740,000 | | | | 727,516 |
Empresa Nacional de Electricidad SA, 8.625%, 08/01/15 | | | 300,000 | | | | 353,082 |
Empresa Nacional de Electricidad, Yankee, 7.875%, 02/01/27 | | | 2,900,000 | | | | 3,302,552 |
Enersis SA, Yankee, 7.400%, 12/01/16 | | | 225,000 | | | | 247,227 |
ITC Holdings Corp., 5.875%, 09/30/16 (a) | | | 2,410,000 | | | | 2,391,617 |
ITC Holdings Corp., 6.375%, 09/30/36 (a) | | | 3,605,000 | | | | 3,595,011 |
Methanex Corp., 6.000%, 08/15/15 | | | 2,825,000 | | | | 2,679,616 |
MidAmerican Energy Holdings, 5.875%, 10/01/12 | | | 750,000 | | | | 763,460 |
MidAmerican Energy Holdings Co., 6.125%, 04/01/36 | | | 2,305,000 | | | | 2,323,564 |
Tenaga Nasional Berhad, 7.500%, 11/01/25 (a) | | | 2,000,000 | | | | 2,344,180 |
Toledo Edison Co., 6.150%, 05/15/37 | | | 2,390,000 | | | | 2,352,644 |
Total Utilities | | | | | | | 28,852,950 |
Total Corporate Bonds (cost $419,156,870) | | | | | | | 430,580,990 |
Foreign Government and Agency Obligations - 5.3% | | | | | | | |
British Columbia, Province of, 6.000%, 06/09/08 | | CAD | 560,000 | | | | 492,362 |
Canada Government, 4.250%, 09/01/08 | | CAD | 20,505,000 | | | | 17,640,823 |
Canada Government, 4.250%, 12/01/08 | | CAD | 820,000 | | | | 706,052 |
European Investment Bank, 0.000%, 03/10/21 4 | | AUD | 5,000,000 | | | | 1,699,590 |
European Investment Bank, 0.000%, 09/12/08 (a) 4 | | BRL | 13,323,060 | | | | 5,100,266 |
Government of Canada., 2.750%, 12/07/07 | | CAD | 5,260,000 | | | | 4,455,360 |
Manitoba, Province of, 5.750%, 06/02/08 | | CAD | 3,800,000 | | | | 3,328,417 |
Mexican Fixed Rate Bonds, 8.000%, 12/07/23 | | MXN | 56,500,000 | | | | 5,449,167 |
Mexican Government, 9.000%, 12/20/12 | | MXN | 54,500,000 | | | | 5,442,937 |
Ontario Province, 5.700%, 12/01/08 | | CAD | 545,000 | | | | 480,674 |
Province of Alberta, Series CS, Sinking Fund, 5.930%, 09/16/16 | | CAD | 182,071 | | | | 167,986 |
Republic of Brazil, 12.500%, 01/05/22 | | BRL | 5,160,000 | | | | 2,749,424 |
Total Foreign Government and Agency Obligations (cost $45,136,437) | | | | | | | 47,713,058 |
U.S. Government and Agency Obligations - 41.3% | | | | | | | |
Federal Home Load Mortgage Corporation - 0.6% | | | | | | | |
FHLMC, Gold, 5.000%, 12/01/31 | | | 202,230 | | | | 195,651 |
FHLMC, 5.500%, 09/15/11 | | | 5,090,000 | 2 | | | 5,203,955 |
Total Home Loan Mortgage Corporation | | | | | | | 5,399,606 |
Federal National Mortgage Association - 1.3% | | | | | | | |
FNMA, 2.290%, 02/19/09 | | SGD | 3,800,000 | | | | 2,420,113 |
FNMA, 3.220%, 06/20/07 | | SGD | 500,000 | | | | 325,666 |
FNMA, 4.000%, 10/01/18 | | | 9,550,942 | | | | 9,018,960 |
FNMA, 6.000%, 07/01/29 | | | 22,984 | | | | 23,246 |
Total Federal National Mortgage Association | | | | | | | 11,787,985 |
The accompanying notes are an integral part of these financial statements.
43
Managers Bond Fund
Schedule of Portfolio Investments (continued)
| | | | | | | | |
Security Description | | Principal Amount | | | Value | |
U.S. Treasury Bonds - 23.3% | | | | | | | | |
USTB, 4.500%, 09/30/11 | | $ | 40,000,000 | | | $ | 39,648,440 | |
USTB, 5.375%, 02/15/31 | | | 160,405,000 | 2 | | | 171,821,345 | |
Total U.S. Treasury Bonds | | | | | | | 211,469,785 | |
U.S. Treasury Notes - 16.1% | | | | | | | | |
USTN, 4.250%, 11/30/07 | | | 5,000,000 | 2 | | | 4,965,625 | |
USTN, 3.000%, 02/15/08 | | | 6,815,000 | 2 | | | 6,668,587 | |
USTN, 3.250%, 08/15/08 | | | 5,000,000 | 2 | | | 4,876,560 | |
USTN, 3.700%, 05/15/08 | | | 45,790,000 | 2 | | | 45,088,864 | |
USTN, 4.625%, 11/30/08 | | | 85,000,000 | 2 | | | 84,691,195 | |
Total U.S. Treasury Bonds | | | | | | | 146,290,831 | |
Total U.S. Government and Agency Obligations (cost $365,471,960) | | | | | | | 374,948,207 | |
Municipal Bonds - 0.4% | | | | | | | | |
MI Tobacco Settlement, 7.309%, 06/01/34 (cost $3,209,809) | | | 3,210,000 | | | | 3,351,144 | |
| | |
| | | Shares | | | | |
Preferred Stocks - 0.9% | | | | | | | | |
Entergy New Orleans, Inc., 4.750% | | | 482 | | | | 34,990 | |
Entergy New Orleans, Inc., 5.560% | | | 100 | | | | 8,369 | |
Newell Financial Trust I, 5.250% | | | 84,628 | | | | 4,030,408 | |
Travelers Property Casualty Corp., 4.500%, 04/15/32 | | | 149,275 | | | | 3,902,048 | |
Wisconsin Electric Power Co., 3.600% | | | 3,946 | | | | 277,330 | |
Total Preferred Stocks (cost $7,330,852) | | | | | | | 8,253,145 | |
Other Short-Term Investments - 24.7%1 | | | | | | | | |
Bank of New York Institutional Cash Reserves Fund, 5.32%3 | | | 194,770,969 | | | | 194,770,969 | |
JPMorgan Prime Money Market Fund, Institutional Class Shares, 5.18% | | | 28,892,473 | | | | 28,892,473 | |
Total Other Short-Term Investments (cost $223,663,442) | | | | | | | 223,663,442 | |
Total Investments - 120.1% (cost $1,063,969,370) | | | | | | | 1,088,509,986 | |
Other Assets, less Liabilities - (20.1)% | | | | | | | (181,733,840 | ) |
Net Assets - 100% | | | | | | $ | 906,776,146 | |
The accompanying notes are an integral part of these financial statements.
44
Managers Global Bond Fund
Portfolio Manager’s Comments
The Managers Global Bond Fund’s (the “Fund”) objective is to achieve income and capital appreciation by investing in high quality foreign and domestic fixed-income securities.
The Fund currently employs a single subadvisor, Loomis Sayles & Company, L.P. (“Loomis”), to manage the assets of the Fund. The investment team at Loomis believes that there are inefficiencies inherent in bond markets, hence the greatest opportunities to add value, reside in the pricing of credit risk. Their philosophy is to identify attractively valued issues through fundamental research. The investment team and analysts at Loomis generally seek fixed income securities of issuers whose credit profiles it believes are improving. The investment team also analyzes political, economic, and other fundamental factors and combines this analysis with a comparison of the yield spreads of various fixed income securities throughout the world in an effort to find securities that they believe may produce attractive returns in comparison to their risk. Finally, if a security that is believed to be attractive is denominated in a foreign currency, Loomis analyzes whether to accept or to hedge the currency risk.
Portfolio managers Kenneth Buntrock and David Rolley and their team of credit analysts at Loomis research debt offerings in the same way equity analysts research stocks, looking for undervalued bonds where they see a yield premium, the potential for price appreciation, or both. They analyze in detail the financial condition of individual countries and companies, as well as the terms of specific bond offerings. They believe price appreciation can come from a variety of catalysts including improving country or company fundamentals which would lead to credit upgrades, changing market supply and demand forces, improving sector or economic trends.
The ideal investment typically exhibits some of the following traits:
| | • | | An attractive yield, both absolute and relative to Loomis’ credit research expectations |
| | • | | Good call protection (particularly when prevailing rates are low) |
| | • | | Stable or improving fundamentals (for corporate bonds) |
Portfolio Management:
| | • | | Seeks to identify attractively valued issues through fundamental research |
| | • | | Believes the greatest opportunity to add value is through accurately pricing credit risk |
| | • | | Analyzes stability and volatility of a country’s bond markets, the financial strength of the issuer, current interest rates, and Loomis’ expectations regarding general trends in interest rates |
| | • | | Employs bottom-up security selection approach |
| | • | | Ensures the average portfolio quality is Aa or higher |
The investment team may make a sell decision when:
| | • | | There is a change in sovereign, industry, or company fundamentals |
| | • | | The issuer is downgraded by Loomis research |
| | • | | Relative valuation is not consistent with its expected rating category |
| | • | | Other securities or sectors offer greater total return potential |
THE YEAR IN REVIEW
Managers Global Bond Fund returned 7.36% during 2006, compared to a return of 6.64% for the Lehman Brothers Global Aggregate Bond Index.
Global bond markets provided positive returns for U.S. investors during the year, generally boosted by foreign currency appreciation versus the U.S. Dollar. Most central banks, including the U.S. Federal Reserve were in tightening modes throughout the year, which pushed up on short-term rates. Meanwhile, moderating U.S. and Japanese economic growth along with rather modest global inflation and ample liquidity caused longer term rates to remain stable or drop. Hence most local yield curves flattened and some curves, such as the U.S. Treasury yield curve, inverted. This made the carry trade, where investors seek to borrow short term and invest (lend) long term, to collect the difference, difficult to execute except in the peripheral markets where yield curves remained positively sloped.
Across all bond markets it was the riskiest assets that were rewarded with the highest returns. Despite again starting out with historically low yield spreads, riskier assets continued to outperform and yield premiums tightened further. High levels of liquidity and historically low levels of volatility tempted investors to continue to stretch for yield, and there have yet to be any events to catalyze a widening. High-quality developed markets’ bonds added little or no value in local currency terms, but emerging markets and high yield issues performed extremely well. On a trade weighted basis, the U.S. dollar dropped 4.8%, which was more than all other major currencies except for the Japanese yen, which depreciated 5.55%.
The Fund’s modest outperformance during the year was a result of the portfolio managers’ conservative positioning in terms of interest rates and yield curves while being aggressive in terms of credit and foreign currency exposure. This was particularly effective during the first and fourth quarters when credits rallied. From a country perspective, the Portfolio’s positioning was modestly overweight in U.S. bonds while underexposed to U.S. dollars, which was productive. Its neutral position in yen was not helpful, although its overweight in smaller markets bonds and currencies was profitable during the year.
LOOKING FORWARD
As we move into 2007 and beyond, Loomis expects the bond market to be driven by three main factors: low yield volatility associated with stable monetary policy, a supportive macro backdrop with solid though slower economic growth with contained inflation, and generally full valuations putting the focus on security selection. These factors extend to the foreign markets; Loomis sees “most foreign markets along with their currencies [to be] fairly valued, except for the yen and a handful of smaller currencies.” So while the market as a whole looks to provide unexciting returns, there may be opportunities to add value.
CUMULATIVE TOTAL RETURN PERFORMANCE
Global Bond’s cumulative total return is based on the daily change in net asset value (NAV), and assumes that all distributions were reinvested. The Lehman Brothers Global Aggregate Index is a broad-based index comprised of 10,232 global investment-grade fixed income securities covering the U.S., Europe and Asia. Unlike the Fund, the Lehman Brothers Global Aggregate Index is unmanaged, is not available for investment, and does not incur expenses. This graph compares a hypothetical $10,000 investment made in Global Bond on December 31, 1996, to a $10,000 investment made in the Lehman Brothers Global Aggregate Index for the same time period. Performance for periods longer than one year is annualized. The graph and table do not reflect the deduction of taxes that
45
Managers Global Bond Fund
Portfolio Manager’s Comments (continued)
a shareholder would pay on a Fund distribution or redemption of shares. The listed returns for the Fund are net of expenses and the returns for the index exclude expenses. Past performance is not indicative of future results. Total returns would have been lower had certain expenses not been reduced.
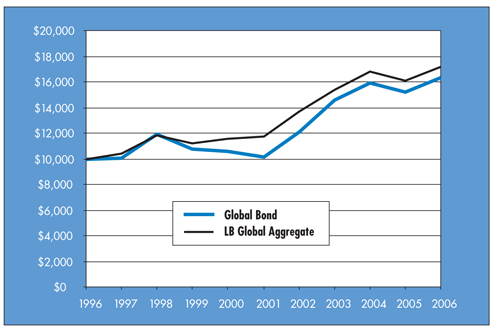
The table below shows the average annual total returns for Global Bond and the Lehman Brothers Global Aggregate Index from December 31, 1996 through December 31, 2006.
| | | | | | | | | | | |
Average Annualized Total Returns | | One Year | | | Five Years | | | Ten Years | | | Inception Date |
Global Bond | | 7.36 | % | | 9.92 | % | | 5.00 | % | | 3/25/94 |
Lehman Brothers Global Aggregate Index | | 6.64 | % | | 7.85 | % | | 5.52 | % | | |
46
Managers Global Bond Fund
Fund Snapshots
December 31, 2006
Portfolio Breakdown
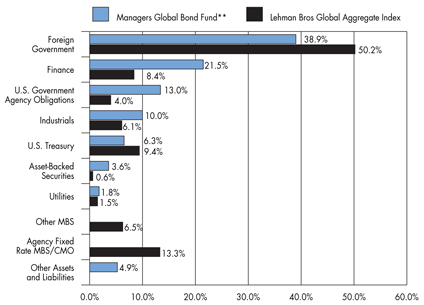
| ** | As a percentage of net assets |
| | | | | | |
Industry | | Managers Global
Bond Fund** | | | Lehman Bros Global
Aggregate Index | |
Foreign Government | | 38.9 | % | | 50.2 | % |
Finance | | 21.5 | % | | 8.4 | % |
U.S. Government Agency Obligations | | 13.0 | % | | 4.0 | % |
Industrials | | 10.0 | % | | 6.1 | % |
U.S. Treasury | | 6.3 | % | | 9.4 | % |
Asset-Backed Securities | | 3.6 | % | | 0.6 | % |
Utilities | | 1.8 | % | | 1.5 | % |
Other MBS | | 0.0 | % | | 6.5 | % |
Agency Fixed Rate MBS/CMO | | 0.0 | % | | 13.3 | % |
Other Assets and Liabilities | | 4.9 | % | | 0.0 | % |
Top Ten Holdings
| | | |
Security Name | | Percentage of
Net Assets | |
USTN, 4.750%, 03/31/11 | | 4.4 | % |
Belgium Government Bond, 3.750%, 03/28/09* | | 3.6 | |
Irish Government, 4.600%, 04/18/16* | | 3.2 | |
Development Bank of Japan, 1.750%, 06/21/10* | | 2.7 | |
KfW International Finance, Inc., 2.050%, 09/21/09* | | 2.4 | |
Depfa ACS Bank, 0.750%, 09/22/08* | | 2.3 | |
Oesterreichische Kontrollbank AG, 1.800%, 03/22/10* | | 2.2 | |
FNMA, 1.750%, 03/26/08* | | 2.2 | |
Canadian Government, 4.500%, 06/01/15 | | 2.2 | |
FHLMC Gold Pool, 5.000%, 07/01/35* | | 2.1 | |
Top Ten as a Group | | 27.3 | % |
| | | |
| * | Top Ten Holding at June 30, 2006 |
Any sectors, industries, or securities discussed should not be perceived as investment recommendations. Mention of a specific security should not be considered a recommendation to buy or solicitation to sell that security.
47
Managers Global Bond Fund
Schedule of Portfolio Investments
December 31, 2006
| | | | | | | |
Security Description | | Principal Amount | | | Value |
Foreign Government and Agency Obligations - 38.9% | | | | | | | |
Foreign Government - 38.9% | | | | | | | |
Argentina, Republic of, 2.000%, 09/30/14 7 | | ARS | 640,000 | | | $ | 230,156 |
Bank of England Euro Note, 3.000%, 01/27/09 | | EUR | 70,000 | | | | 90,657 |
Barclays Financial LLC., 4.670%, 03/23/09 (03/23/2007) 6 | | KRW | 307,770,000 | | | | 330,859 |
Belgium Government Bond, 3.750%, 03/28/09 | | EUR | 1,450,000 | | | | 1,907,498 |
Belgium Kingdom, 5.500%, 09/28/17 | | EUR | 495,000 | | | | 736,851 |
Bundes Immobil, 4.625%, 09/27/12 | | EUR | 525,000 | | | | 708,329 |
Bundes Obligation, 3.250%, 04/17/09 | | EUR | 585,000 | | | | 761,492 |
Canadian Government, 4.500%, 06/01/15 | | CAD | 1,350,000 | | | | 1,191,714 |
Development Bank of Japan, 1.750%, 06/21/10 | | JPY | 171,000,000 | | | | 1,472,610 |
Duetschland Republic, 4.000%, 01/04/37 | | EUR | 800,000 | | | | 1,040,935 |
European Investment Bank, 0.000%, 03/10/21 4 | | AUD | 655,000 | | | | 222,646 |
Irish Government, 4.600%, 04/18/16 | | EUR | 1,230,000 | | | | 1,701,396 |
Kingdom of Norway, 5.500%, 05/15/09 | | NOK | 5,155,000 | 2 | | | 847,440 |
Mexican Fixed Rate Bond, 8.000%, 12/17/15 | | MXN | 6,550,000 | | | | 628,019 |
Mexican Fixed Rate Bonds, 8.000%, 12/07/23 | | MXN | 500,000 | | | | 48,223 |
Mexican Government, 9.000%, 12/20/12 | | MXN | 2,390,000 | | | | 238,690 |
Netherlands Government SA, 5.500%, 01/15/28 | | EUR | 190,000 | | | | 299,079 |
Norwegian Government, 5.000%, 05/15/ 15 | | NOK | 6,145,000 | | | | 1,026,444 |
Norwegian Government, 6.000%, 05/16/11 | | NOK | 1,155,000 | | | | 196,884 |
Republic of Columbia, 7.375%, 01/27/17 | | USD | 100,000 | | | | 107,500 |
Republic of Columbia, 11.750%, 03/01/10 | | COP | 136,000,000 | | | | 65,588 |
Republic of Columbia, 12.000%, 10/22/15 | | COP | 422,000,000 | | | | 222,396 |
Republic of Deutschland, Series 02, 5.000%, 01/04/12 | | EUR | 300,000 | | | | 414,784 |
Republic of Indonesia, 6.875%, 03/09/17 (a) | | USD | 105,000 | | | | 111,562 |
Republic of Poland, 1.020%, 06/09/09 | | JPY | 100,000,000 | | | | 838,200 |
Republic of South Africa, 5.250%, 05/16/13 | | EUR | 350,000 | | | | 476,643 |
Republic of South Africa, 13.000%, 08/31/10 | | ZAR | 2,850,000 | 2 | | | 467,330 |
Republic of Uruguay, 8.000%, 11/18/22 | | USD | 245,000 | | | | 278,075 |
Singapore Government, 4.625%, 07/01/10 | | SGD | 1,120,000 | | | | 769,209 |
Spain, Government of, 3.600%, 01/31/09 | | EUR | 715,000 | | | | 938,169 |
Swedish Government, 5.250%, 03/15/11 | | SEK | 6,960,000 | | | | 1,072,067 |
U.K. Gilts, 4.250%, 03/07/36 | | GBP | 250,000 | | | | 493,118 |
U.K. Treasury, 5.000%, 03/07/12 | | GBP | 265,000 | | | | 519,592 |
U.K. Treasury, 6.250%, 11/25/10 | | GBP | 215,000 | | | | 438,363 |
Total Foreign Government and Agency Obligations (cost $19,450,473) | | | | | | | 20,892,518 |
Corporate Bonds - 36.9% | | | | | | | |
Asset-Backed Securities - 3.6% | | | | | | | |
DaimlerChrysler Auto Trust, Series 2004-B, Class A4, 3.710%, 10/08/09 | | USD | 35,000 | | | | 34,522 |
DaimlerChrysler Auto Trust, Class A4, Series 2005-A, 3.740%, 02/08/10 | | USD | 340,000 | | | | 334,509 |
DaimlerChrysler N.A. Holdings Corp., 4.875%, 06/15/10 | | USD | 95,000 | | | | 92,606 |
The accompanying notes are an integral part of these financial statements.
48
Managers Global Bond Fund
Schedule of Portfolio Investments (continued)
| | | | | | | |
Security Description | | Principal Amount | | | Value |
Asset-Backed Security - 3.6% (continued) | | | | | | | |
Greenwich Capital Commericial Funding Corp., Series 2005-GG5, Class A2, 5.117%, 05/21/10 | | USD | 385,000 | | | $ | 383,631 |
Honda Auto Receivables Owner Trust, Class A4, Series 2005-1, 3.820%, 05/21/10 | | USD | 330,000 | 2 | | | 323,497 |
Honda Auto Receivables Owner Trust, 4.930%, 03/18/11 | | USD | 100,000 | | | | 99,577 |
MBNA Credit Card Master Note Trust, 4.300%, 02/15/11 | | USD | 410,000 | | | | 404,626 |
Merrill Lynch/Countrywide Commercial Mortgage Trust, Series 2006-1, Class A2, 5.439%, 02/12/39 7 | | USD | 235,000 | | | | 236,576 |
Total Asset-Backed Securities | | | | | | | 1,909,544 |
Finance - 21.5% | | | | | | | |
Bank of America Corp., 5.750%, 08/15/16 | | USD | 185,000 | 2 | | | 188,816 |
Barclays Capital Corp., 4.100%, 02/22/10 (a) | | THB | 8,000,000 | | | | 209,670 |
Barclays Capital Corp., 4.160%, 02/22/10 (a) | | THB | 7,000,000 | | | | 184,093 |
Barclays Financial LLC., 4.060%, 09/16/10 (a) | | KRW | 220,000,000 | | | | 231,449 |
Barclays Financial LLC., 4.460%, 09/23/10 (a) | | KRW | 110,000,000 | | | | 117,322 |
BSkyB Finance PLC, 5.750%, 10/20/17 | | GBP | 210,000 | | | | 400,903 |
Cerro Negro Finance, Ltd., 7.900%, 12/01/20 (a) | | USD | 70,000 | | | | 67,900 |
CIT Group, Inc., 5.500%, 12/01/14 | | GBP | 80,000 | | | | 153,283 |
Citibank N.A., 15.000%, 07/02/10 (a) | | BRL | 460,000 | | | | 240,806 |
Couche-Tard US/Finance, 7.500%, 12/15/13 | | USD | 160,000 | | | | 163,600 |
Depfa ACS Bank, 0.750%, 09/22/08 | | JPY | 150,000,000 | | | | 1,260,455 |
Ford Motor Credit Co., 5.700%, 01/15/10 | | USD | 360,000 | | | | 345,097 |
Goldman Sachs Group, Inc., 3.963%, 05/23/16 (02/23/07) 6 | | EUR | 350,000 | | | | 461,215 |
Hypothekenbank in Essen AG, 5.250%, 01/22/08 | | EUR | 810,000 | | | | 1,083,201 |
Instituto de Credito Oficial. 8.000%, 09/28/09 | | JPY | 30,000,000 | | | | 251,186 |
Inter-American Development Bank, 1.900%, 07/08/09 | | JPY | 60,000,000 | | | | 516,705 |
International Bank for Reconstruction & Development, 2.000%, 02/18/08 | | JPY | 58,000,000 | | | | 494,036 |
Japan Bank for International Cooperation, 0.350%, 03/19/08 | | JPY | 18,000,000 | | | | 150,725 |
JP Morgan Chase & Co., 5.125%, 09/15/14 | | USD | 270,000 | | | | 265,496 |
JPMorgan Chase of London, 0.000%, 10/21/10 (a) 4 | | IDR | 2,680,548,500 | | | | 216,831 |
KfW International Finance, Inc., 1.750%, 03/23/10 | | JPY | 20,000,000 | 2 | | | 172,063 |
KfW International Finance, Inc., 2.050%, 09/21/09 | | JPY | 148,000,000 | 2 | | | 1,280,135 |
Kinder Morgan Finance Inc., 5.150%, 03/01/15 | | USD | 35,000 | 2 | | | 31,406 |
Kinder Morgan Finance Co., 5.700%, 01/05/16 | | USD | 65,000 | | | | 59,639 |
Kinder Morgan Finance Co., 6.400%, 01/05/36 | | USD | 90,000 | | | | 80,242 |
Morgan Stanley Co., Series EMTN, 5.375%, 11/14/13 | | GBP | 120,000 | | | | 232,588 |
Muenchener Hypothekenbank eG, 5.000%, 01/16/12 | | EUR | 685,000 | | | | 942,199 |
Oesterreichische Kontrollbank AG, 1.800%, 03/22/10 | | JPY | 140,000,000 | 2 | | | 1,206,287 |
Permanent Financing PLC, 5.100%, 06/11/07 | | EUR | 275,000 | | | | 364,707 |
SLM Corp., 6.500%, 06/15/10 | | NZD | 245,000 | | | | 167,901 |
Total Finance | | | | | | | 11,539,956 |
Industrials - 10.0% | | | | | | | |
Albertson’s, Inc., 6.625%, 06/01/28 | | USD | 35,000 | | | | 31,775 |
Albertson’s, Inc., 7.450%, 08/01/29 | | USD | 165,000 | 2 | | | 161,205 |
Albertson’s, Inc., 7.750%, 06/15/26 | | USD | 40,000 | 2 | | | 39,898 |
Albertson’s, Inc., 8.000%, 05/01/31 | | USD | 40,000 | | | | 40,574 |
The accompanying notes are an integral part of these financial statements.
49
Managers Global Bond Fund
Schedule of Portfolio Investments (continued)
| | | | | | | |
Security Description | | Principal Amount | | | Value |
Industrials - 10.0% (continued) | | | | | | | |
Albertson’s, Inc., 8.700%, 05/01/30 | | USD | 5,000 | | | $ | 5,222 |
America Movil SA, 9.000%, 01/15/16 | | MXN | 1,400,000 | | | | 138,989 |
America Movil, S.A. de C.V., 4.125%, 03/01/09 | | USD | 135,000 | 2 | | | 131,363 |
American Standard, Inc., 8.250%, 06/01/09 | | GBP | 50,000 | | | | 102,138 |
American Stores Co., 8.000%, 06/01/26 | | USD | 25,000 | 2 | | | 26,278 |
ASIF Global Financial, 2.380%, 02/26/09 (a) | | SGD | 500,000 | | | | 318,301 |
Bertelsmann AG, 3.625%, 10/06/15 | | EUR | 180,000 | | | | 218,292 |
Chesapeake Energy Corp., 6.250%, 01/15/17 | | EUR | 105,000 | | | | 141,723 |
Chesapeake Energy Corp., 6.500%, 08/15/17 | | USD | 30,000 | | | | 29,325 |
Chesapeake Energy Corp., 6.875%, 11/15/20 | | USD | 70,000 | | | | 68,775 |
Comcast Corp., 6.450%, 03/15/37 | | USD | 210,000 | | | | 210,113 |
Corning Inc., 6.750%, 09/15/13 | | USD | 125,000 | | | | 132,749 |
Desarrolladora Homex S.A. de C.V., 7.500%, 09/28/15 | | USD | 380,000 | | | | 387,600 |
France Telecom SA, 3.625%, 10/14/15 | | EUR | 210,000 | | | | 256,888 |
Georgia-Pacific Corp., 7.125%, 01/15/17 (a) | | USD | 105,000 | | | | 104,737 |
Georgia-Pacific Corp., 7.250%, 06/01/28 | | USD | 160,000 | | | | 155,200 |
Hanarotelecom, Inc., 7.000%, 02/01/12 (a) | | USD | 50,000 | 2 | | | 50,125 |
Harrahs Operating Co., Inc., 5.750%, 10/01/17 | | USD | 130,000 | | | | 108,915 |
HCA, Inc., 5.500%, 12/01/09 (a) | | USD | 165,000 | | | | 176,756 |
K. Hovnanian Enterprises, Inc., 6.250%, 01/15/16 (a) | | USD | 145,000 | 2 | | | 137,025 |
K. Hovnanian Enterprises, Inc., 6.375%, 12/15/14 | | USD | 5,000 | | | | 4,800 |
K. Hovnanian Enterprises, Inc., 6.500%, 01/15/14 | | USD | 5,000 | | | | 4,850 |
KN Capital Trust III, 7.630%, 04/15/28 | | USD | 5,000 | | | | 4,646 |
LPG International, Inc., 7.250%, 12/20/15 | | USD | 120,000 | | | | 120,600 |
Lucent Technologies, Inc., 6.450%, 03/15/29 | | USD | 115,000 | 2 | | | 106,088 |
News America Holdings, 8.625%, 02/07/14 | | AUD | 350,000 | 5 | | | 294,851 |
Owens & Minor, Inc., 6.350%, 04/15/16 | | USD | 200,000 | | | | 200,810 |
Qwest Capital Funding, Inc., 6.500%, 11/15/18 | | USD | 40,000 | | | | 37,400 |
Qwest Capital Funding, Inc., 6.875%, 07/15/28 | | USD | 15,000 | 2 | | | 13,706 |
Qwest Capital Funding, Inc., 7.250%, 02/15/11 | | USD | 75,000 | 2 | | | 76,594 |
Qwest Capital Funding, Inc., 7.750%, 02/15/31 | | USD | 65,000 | 2 | | | 63,782 |
Qwest Corp., 6.875%, 09/15/33 | | USD | 75,000 | | | | 71,625 |
Qwest Corp., 7.500%, 10/01/14 | | USD | 40,000 | | | | 42,400 |
Qwest Corp., 7.875%, 09/01/11 | | USD | 75,000 | | | | 79,875 |
Qwest, Inc., 7.250%, 09/15/25 | | USD | 5,000 | 2 | | | 5,138 |
Rogers Cable, Inc., 5.500%, 03/15/14 | | USD | 110,000 | 2 | | | 105,181 |
Stena AB, 7.000%, 12/01/16 | | USD | 170,000 | | | | 161,500 |
Stena AB, 7.500%, 11/01/13 | | USD | 75,000 | | | | 74,062 |
Telefonica Emisiones SAU, 6.421%, 06/20/16 | | USD | 265,000 | | | | 273,379 |
Thales SA, 4.375%, 07/22/11 | | EUR | 35,000 | | | | 46,321 |
Time Warner, Inc., 6.625%, 05/15/29 | | USD | 310,000 | | | | 313,953 |
Time Warner, Inc., 6.950%, 01/15/28 | | USD | 85,000 | | | | 89,199 |
Total Industrials | | | | | | | 5,364,726 |
The accompanying notes are an integral part of these financial statements.
50
Managers Global Bond Fund
Schedule of Portfolio Investments (continued)
| | | | | | | |
Security Description | | Principal Amount | | | Value |
Utilities - 1.8% | | | | | | | |
Empresa Nacional de Electricidad, Yankee, 7.875%, 02/01/27 | | USD | 200,000 | | | $ | 227,762 |
Enersis SA, Yankee, 7.400%, 12/01/16 | | USD | 80,000 | | | | 87,903 |
Exelon Generation Co. LLC, 5.350%, 01/15/14 | | USD | 115,000 | | | | 112,641 |
National Grid PLC, 6.300%, 08/01/16 | | USD | 250,000 | | | | 258,921 |
Veolia Environnement, 4.000%, 02/12/16 | | EUR | 205,000 | | | | 255,585 |
Total Utilities | | | | | | | 942,812 |
Total Corporate Bonds (cost $19,621,167) | | | | | | | 19,757,038 |
U.S. Government and Agency Obligations - 19.3% | | | | | | | |
U.S. Government Agency Obligations - 13.0% | | | | | | | |
FHLMC Gold Pool, 4.000%, 02/01/20 | | USD | 60,887 | | | | 57,309 |
FHLMC Gold Pool, 4.500%, 04/01/35 | | USD | 280,832 | | | | 264,379 |
FHLMC Gold Pool, 5.000%, 04/01/20 to 07/01/35 | | USD | 1,388,924 | | | | 1,344,042 |
FHLMC Gold Pool, 6.000%, 05/01/18 to 10/01/20 | | USD | 74,130 | | | | 75,134 |
FHLMC Gold Pool, 6.500%, 08/01/35 to 10/01/35 | | USD | 72,824 | | | | 74,187 |
FNMA, 1.750%, 03/26/08 | | JPY | 140,000,000 | 2 | | | 1,191,769 |
FNMA, 2.290%, 02/19/09 | | SGD | 400,000 | | | | 254,749 |
FNMA, 4.500%, 05/01/20 to 09/01/35 | | USD | 283,890 | | | | 271,595 |
FNMA, 5.000%, 10/01/19 to 09/01/35 | | USD | 718,606 | | | | 696,425 |
FNMA, 5.500%, 11/01/16 to 12/01/35 | | USD | 1,663,680 | | | | 1,645,581 |
FNMA, 6.000%, 06/01/17 to 05/01/35 | | USD | 722,908 | | | | 730,037 |
FNMA, 6.500%, 03/01/33 to 05/01/36 | | USD | 231,710 | | | | 236,795 |
GNMA, 5.500%, 11/20/34 | | USD | 30,837 | | | | 30,631 |
GNMA, 5.500%, 02/20/36 | | USD | 86,908 | | | | 86,273 |
GNMA, 6.000%, 10/20/35 | | USD | 38,740 | | | | 39,187 |
Total U.S. Government Agency Obligations | | | | | | | 6,998,093 |
U.S. Treasury - 6.3% | | | | | | | |
USTB, 5.000%, 03/07/25 | | GBP | 230,000 | | | | 478,272 |
USTN, 4.750%, 03/31/11 | | USD | 2,375,000 | 2 | | | 2,378,990 |
Treasury Inflation Index Bond TII, 2.000%, 01/15/26 | | USD | 544,245 | 2 | | | 511,845 |
Total U.S. Treasury | | | | | | | 3,369,107 |
Total U.S. Government and Agency Obligations (cost $10,364,729) | | | | | | | 10,367,200 |
| | | | | | |
| | | Shares | | | |
Other Investment Companies - 18.8%1 | | | | | | |
Bank of New York Institutional Cash Reserves Fund, 5.32% 3 | | 9,147,517 | | | 9,147,517 | |
JPMorgan Prime Money Market Fund, Institutional Class Shares, 5.18% | | 957,729 | | | 957,729 | |
Total Other Investment Companies (cost $10,105,246) | | | | | 10,105,246 | |
Total Investments - 113.9% (cost $59,541,615) | | | | | 61,122,002 | |
Other Assets, less Liabilities - (13.9)% | | | | | (7,452,465 | ) |
Net Assets - 100.0% | | | | $ | 53,669,537 | |
The accompanying notes are an integral part of these financial statements.
51
Notes to Schedules of Portfolio Investments
The following footnotes and abbreviations should be read in conjunction with each of the Schedules of Portfolio Investments previously presented in this report.
At December 31, 2006, the cost of securities for Federal income tax purposes and the gross aggregate unrealized appreciation and/or depreciation based on tax cost were approximately:
| | | | | | | | | | | | | |
Fund | | Cost | | Appreciation | | Depreciation | | | Net |
Value | | $ | 81,214,437 | | $ | 18,209,751 | | $ | (317,369 | ) | | $ | 17,892,382 |
Managers AMG Essex Large Cap Growth | | | 74,822,498 | | | 9,887,350 | | | (1,155,489 | ) | | | 8,731,861 |
Small Company | | | 40,883,600 | | | 7,115,594 | | | (1,146,063 | ) | | | 5,969,531 |
International Equity | | | 177,327,497 | | | 66,998,456 | | | (2,330,419 | ) | | | 64,668,037 |
Emerging Markets Equity | | | 115,748,481 | | | 55,726,432 | | | (594,798 | ) | | | 55,131,634 |
Bond | | | 1,064,540,978 | | | 29,692,263 | | | (5,723,255 | ) | | | 23,969,008 |
Global Bond | | | 59,543,642 | | | 2,417,390 | | | (839,030 | ) | | | 1,578,360 |
| * | Non-income-producing security. |
| (a) | Security exempt from registration under Rule 144A of the Securities Act of 1933. This security may be resold in transactions exempt from registration, normally to qualifi ed buyers. At December 31, 2006, the value of these securities amounted to the following: |
| | | | | | |
Fund | | Market Value | | % of Net
Assets | |
Emerging Markets Equity | | $ | 6,737,057 | | 4.4 | % |
Bond | | | 80,702,431 | | 8.9 | % |
Global Bond | | | 2,166,577 | | 4.0 | % |
1 | Yield shown for an investment company represents the December 31, 2006, seven-day average yield, which refers to the sum of the previous seven days’ dividends paid, expressed as an annual percentage. |
2 | Some or all of these shares were out on loan to various brokers as of December 31, 2006, amounting to: |
| | | | | | |
Fund | | Market Value | | % of Net Assets | |
Value | | $ | 17,406,911 | | 21.5 | % |
Managers AMG Essex Large Cap Growth | | | 16,906,844 | | 25.6 | |
Small Company | | | 8,125,616 | | 21.1 | |
International Equity | | | 11,624,259 | | 5.0 | |
Emerging Markets Equity | | | 14,806,257 | | 9.7 | |
Bond | | | 190,287,441 | | 21.0 | |
Global Bond | | | 8,711,652 | | 16.2 | |
3 | Collateral received from brokers for securities lending was invested in these short-term investments |
6 | Floating Rate Security. The rate listed is as of December 31, 2006. Date in parenthesis represents the security’s next coupon rate reset. |
7 | Variable Rate Security. The rate listed is as of December 31, 2006 and is periodically reset subject to terms and conditions set forth in the debenture. |
Investments Definitions and Abbreviations:
ADR/GDR: ADR after the name of a holding stands for American Depositary Receipt, representing ownership of foreign securities on deposit with a domestic custodian bank; a GDR (Global Depositary Receipt) is comparable, but foreign securities are held on deposit in a non-U.S. bank. The value of the ADR/GDR securities is determined or significantly influenced by trading on exchanges not located in the United States or Canada. Sponsored ADR/GDRs are initiated by the underlying foreign company.
| | |
FHLMC: | | Federal Home Loan Mortgage Corp. |
FNMA: | | Federal National Mortgage Association |
GNMA: | | Government National Mortgage Association |
USTB: | | United States Treasury Bond |
USTN: | | United States Treasury Note |
GMAC: | | General Motors Acceptance Corp. |
Registered shares: A security whose owner has been recorded with its issuer or issuer’s registrar.
Abbreviations have been used throughout the portfolios to indicate amounts shown in currencies other than the U.S. dollar (USD):
| | |
ARS: | | Argentine Peso |
AUD: | | Australian Dollar |
BRL: | | Brazilian Real |
CAD: | | Canadian Dollar |
COP: | | Columbian Peso |
EUR: | | Euro |
GBP: | | British Pound |
IDR: | | Indonesian Rupiah |
JPY: | | Japanese Yen |
KRW: | | South Korean Won |
MXN: | | Mexican Peso |
NOK: | | Norwegian Krone |
NZD: | | New Zealand Dollar |
SEK: | | Swedish Krona |
SGD: | | Singapore Dollar |
THB: | | Thailand Baht |
ZAR: | | South African Rand |
52
Statements of Assets and Liabilities
December 31, 2006
| | | | | | | | | | | |
| | | Managers Value Fund | | Managers AMG Essex
Large Cap Growth Fund | | | Managers Small
Company Fund | |
Assets: | | | | | | | | | | | |
Investments at value (including securities on loan valued at $17,406,911, $16,906,844, $8,125,616, $11,624,259, $14,806,257, $190,287,441 and $8,711,652, respectively)* | | $ | 99,106,819 | | $ | 83,554,359 | | | $ | 46,853,131 | |
Cash | | | — | | | — | | | | — | |
Foreign currency** | | | — | | | — | | | | — | |
Receivable for investments sold | | | — | | | 64,392 | | | | 38,863 | |
Receivable for Fund shares sold | | | 11,068 | | | 32,705 | | | | 81,032 | |
Unrealized gains on forward foreign currency contracts | | | — | | | — | | | | — | |
Dividends, interest and other receivables | | | 71,609 | | | 58,520 | | | | 18,505 | |
Prepaid expenses | | | 9,023 | | | 9,708 | | | | 8,443 | |
| | | | | | | | | | | |
Total assets | | | 99,198,519 | | | 83,719,684 | | | | 46,999,974 | |
| | | | | | | | | | | |
Liabilities: | | | | | | | | | | | |
Payable to affiliate | | | — | | | 5,157 | | | | — | |
Payable to Custodian | | | 29,992 | | | 97,287 | | | | 11,259 | |
Payable for Fund shares repurchased | | | 90,061 | | | 29,285 | | | | 17,101 | |
Payable upon return of securities loaned | | | 18,027,521 | | | 17,458,431 | | | | 8,431,145 | |
Payable for investments purchased | | | — | | | — | | | | 19,749 | |
Unrealized losses on forward foreign currency contracts | | | — | | | — | | | | — | |
Payable for variation margin on futures | | | — | | | — | | | | — | |
Other payables | | | — | | | — | | | | — | |
Accrued expenses: | | | | | | | | | | | |
Investment advisory and management fees | | | 44,810 | | | 45,665 | | | | 22,958 | |
Administrative fees | | | 17,124 | | | 14,270 | | | | 8,189 | |
Other | | | 72,702 | | | 70,384 | | | | 51,531 | |
| | | | | | | | | | | |
Total liabilities | | | 18,282,210 | | | 17,720,479 | | | | 8,561,932 | |
| | | | | | | | | | | |
Net Assets | | $ | 80,916,309 | | $ | 65,999,205 | | | $ | 38,438,042 | |
| | | | | | | | | | | |
Shares outstanding | | | 2,892,123 | | | 2,261,722 | | | | 3,209,870 | |
| | | | | | | | | | | |
Net asset value, offering and redemption price per share | | $ | 27.98 | | $ | 29.18 | | | $ | 11.97 | |
| | | | | | | | | | | |
Net Assets Represent: | | | | | | | | | | | |
Paid-in capital | | $ | 60,760,869 | | $ | 202,583,674 | | | $ | 33,005,066 | |
Undistributed net investment income (loss) | | | — | | | — | | | | — | |
Accumulated net realized gain (loss) from investments, futures and foreign currency transactions | | | 1,288,419 | | | (145,358,321 | ) | �� | | (587,710 | ) |
Net unrealized appreciation of investments, futures and foreign currency contracts and translations | | | 18,867,021 | | | 8,773,852 | | | | 6,020,686 | |
| | | | | | | | | | | |
Net Assets | | $ | 80,916,309 | | $ | 65,999,205 | | | $ | 38,438,042 | |
| | | | | | | | | | | |
| | | |
* Investments at cost | | $ | 80,239,798 | | $ | 74,780,507 | | | $ | 40,832,445 | |
| | | |
** Foreign currency at cost | | | — | | | — | | | | — | |
The accompanying notes are an integral part of these financial statements.
53
| | | | | | | | | | | | |
Managers International
Equity Fund | | | Managers Emerging
Markets Equity Fund | | Managers Bond Fund | | | Managers Global
Bond Fund |
| $ | 241,995,534 | | | $ | 170,880,115 | | $ | 1,088,509,986 | | | $ | 61,122,002 |
| | — | | | | — | | | 920,550 | | | | 617,788 |
| | 434,462 | | | | 583,437 | | | — | | | | 392,777 |
| | 739,311 | | | | 27,034 | | | — | | | | — |
| | 97,159 | | | | 238,419 | | | 5,031,404 | | | | 38,313 |
| | 349 | | | | — | | | — | | | | 16,130 |
| | 342,067 | | | | 309,660 | | | 11,979,327 | | | | 884,039 |
| | 8,920 | | | | 6,752 | | | 32,745 | | | | 6,590 |
| | | | | | | | | | | | | |
| | 243,617,802 | | | | 172,045,417 | | | 1,106,474,012 | | | | 63,077,639 |
| | | | | | | | | | | | | |
| | — | | | | — | | | — | | | | — |
| | 88,862 | | | | 883,756 | | | 3,031 | | | | — |
| | 259,783 | | | | 196,730 | | | 393,951 | | | | 70,402 |
| | 11,857,706 | | | | 15,391,473 | | | 194,770,969 | | | | 9,147,517 |
| | 2,744 | | | | 2,124,776 | | | 3,652,863 | | | | — |
| | 1,711 | | | | — | | | — | | | | 65,513 |
| | 211 | | | | — | | | — | | | | — |
| | — | | | | 1,740 | | | 12,323 | | | | — |
| | 175,031 | | | | 145,553 | | | 438,088 | | | | 28,934 |
| | 48,620 | | | | 31,642 | | | 185,209 | | | | 9,153 |
| | 267,008 | | | | 287,068 | | | 241,432 | | | | 86,583 |
| | | | | | | | | | | | | |
| | 12,701,676 | | | | 19,062,738 | | | 199,697,866 | | | | 9,408,102 |
| | | | | | | | | | | | | |
| $ | 230,916,126 | | | $ | 152,982,679 | | $ | 906,776,146 | | | $ | 53,669,537 |
| | | | | | | | | | | | | |
| | 3,425,134 | | | | 6,258,400 | | | 36,506,016 | | | | 2,535,652 |
| | | | | | | | | | | | | |
| $ | 67.42 | | | $ | 24.44 | | $ | 24.84 | | | $ | 21.17 |
| | | | | | | | | | | | | |
| $ | 230,886,071 | | | $ | 95,344,742 | | $ | 884,563,521 | | | $ | 52,017,496 |
| | (2,067,376 | ) | | | — | | | (299,283 | ) | | | 61,252 |
| | (65,668,613 | ) | | | 2,418,137 | | | (2,046,691 | ) | | | 33,433 |
| | 67,766,044 | | | | 55,219,800 | | | 24,558,599 | | | | 1,557,356 |
| | | | | | | | | | | | | |
| $ | 230,916,126 | | | $ | 152,982,679 | | $ | 906,776,146 | | | $ | 53,669,537 |
| | | | | | | | | | | | | |
| $ | 174,310,347 | | | $ | 115,736,182 | | $ | 1,063,969,370 | | | $ | 59,541,615 |
| | 434,708 | | | | 571,346 | | | — | | | | 388,781 |
The accompanying notes are an integral part of these financial statements.
54
Statements of Operations
For the year ended December 31, 2006
| | | | | | | | | | | | |
| | | Managers Value Fund | | | Managers AMG Essex
Large Cap Growth Fund | | | Managers Small
Company Fund | |
Investment Income: | | | | | | | | | | | | |
Dividend income | | $ | 1,948,532 | | | $ | 699,762 | | | $ | 227,885 | |
Interest income | | | — | | | | — | | | | — | |
Foreign withholding tax | | | (7,170 | ) | | | (10,124 | ) | | | (1,324 | ) |
Securities lending fees | | | 17,085 | | | | 13,495 | | | | 21,049 | |
| | | | | | | | | | | | |
Total investment income | | | 1,958,447 | | | | 703,133 | | | | 247,610 | |
| | | | | | | | | | | | |
Expenses: | | | | | | | | | | | | |
Investment management fees | | | 708,121 | | | | 613,637 | | | | 334,920 | |
Administrative fees | | | 236,040 | | | | 191,761 | | | | 93,033 | |
Transfer agent | | | 99,826 | | | | 98,735 | | | | 51,867 | |
Professional fees | | | 41,010 | | | | 36,213 | | | | 23,847 | |
Custodian | | | 30,272 | | | | 33,051 | | | | 35,291 | |
Registration fees | | | 21,051 | | | | 19,868 | | | | 17,576 | |
Reports to shareholders | | | 9,819 | | | | 12,267 | | | | 11,850 | |
Trustees fees and expenses | | | 5,725 | | | | 4,289 | | | | 2,120 | |
Miscellaneous | | | 9,269 | | | | 620 | | | | 2,254 | |
| | | | | | | | | | | | |
Total expenses before offsets | | | 1,161,133 | | | | 1,010,441 | | | | 572,758 | |
| | | | | | | | | | | | |
Expense reimbursement | | | (33,400 | ) | | | (21,183 | ) | | | (33,165 | ) |
Expense reductions | | | (22,851 | ) | | | (29,601 | ) | | | (23,293 | ) |
| | | | | | | | | | | | |
Net expenses | | | 1,104,882 | | | | 959,657 | | | | 516,300 | |
| | | | | | | | | | | | |
Net investment income (loss) | | | 853,565 | | | | (256,524 | ) | | | (268,690 | ) |
| | | | | | | | | | | | |
Net Realized and Unrealized Gain (Loss): | | | | | | | | | | | | |
Net realized gain (loss) on investment transactions | | | 12,106,593 | | | | 10,416,894 | | | | 6,115,060 | |
Net realized gain on futures contracts | | | — | | | | — | | | | — | |
Net realized gain (loss) on foreign currency contracts and transactions | | | — | | | | — | | | | — | |
Net unrealized appreciation (depreciation) of investments | | | 2,554,698 | | | | (5,161,247 | ) | | | (1,903,333 | ) |
Net unrealized appreciation of futures contracts | | | — | | | | — | | | | — | |
Net unrealized appreciation (depreciation) of foreign currency contracts and translations | | | — | | | | — | | | | — | |
| | | | | | | | | | | | |
Net realized and unrealized gain | | | 14,661,291 | | | | 5,255,647 | | | | 4,211,727 | |
| | | | | | | | | | | | |
Net Increase in Net Assets Resulting from Operations | | $ | 15,514,856 | | | $ | 4,999,123 | | | $ | 3,943,037 | |
| | | | | | | | | | | | |
The accompanying notes are an integral part of these financial statements.
55
| | | | | | | | | | | | | | |
Managers International
Equity Fund | | | Managers Emerging
Markets Equity Fund | | | Managers Bond Fund | | | Managers Global
Bond Fund | |
| $ | 4,950,745 | | | $ | 3,794,273 | | | $ | 349,422 | | | $ | 60,195 | |
| | — | | | | — | | | | 31,182,936 | | | | 1,909,143 | |
| | (403,028 | ) | | | (362,487 | ) | | | — | | | | (1,064 | ) |
| | 131,877 | | | | 59,651 | | | | 198,133 | | | | 8,026 | |
| | | | | | | | | | | | | | | |
| | 4,679,594 | | | | 3,491,437 | | | | 31,730,491 | | | | 1,976,300 | |
| | | | | | | | | | | | | | | |
| | | | | | | | | | | | | | |
| | 1,956,021 | | | | 1,515,893 | | | | 3,600,603 | | | | 341,727 | |
| | 543,339 | | | | 329,542 | | | | 1,440,241 | | | | 97,636 | |
| | 218,803 | | | | 128,201 | | | | 384,022 | | | | 69,357 | |
| | 55,358 | | | | 46,097 | | | | 115,871 | | | | 37,571 | |
| | 345,280 | | | | 230,261 | | | | 118,339 | | | | 46,686 | |
| | 21,861 | | | | 21,370 | | | | 47,288 | | | | 19,792 | |
| | 8,750 | | | | 17,674 | | | | 103,180 | | | | 2,797 | |
| | 11,942 | | | | 7,234 | | | | 28,201 | | | | 2,889 | |
| | 32,218 | | | | 26,734 | | | | 22,038 | | | | 2,975 | |
| | | | | | | | | | | | | | | |
| | 3,193,572 | | | | 2,323,006 | | | | 5,859,783 | | | | 621,430 | |
| | | | | | | | | | | | | | | |
| | — | | | | — | | | | (155,254 | ) | | | (40,529 | ) |
| | (38,423 | ) | | | — | | | | (999 | ) | | | (218 | ) |
| | | | | | | | | | | | | | | |
| | 3,155,149 | | | | 2,323,006 | | | | 5,703,530 | | | | 580,683 | |
| | | | | | | | | | | | | | | |
| | 1,524,445 | | | | 1,168,431 | | | | 26,026,961 | | | | 1,395,617 | |
| | | | | | | | | | | | | | | |
| | | | | | | | | | | | | | |
| | 36,283,134 | | | | 15,980,762 | | | | (1,407,005 | ) | | | 100,299 | |
| | 72,915 | | | | — | | | | — | | | | — | |
| | (161,927 | ) | | | (101,155 | ) | | | 465,863 | | | | (267,241 | ) |
| | 15,342,649 | | | | 22,161,540 | | | | 19,792,665 | | | | 2,345,699 | |
| | 7,413 | | | | — | | | | — | | | | — | |
| | 18,443 | | | | (2,929 | ) | | | 104,714 | | | | (64,670 | ) |
| | | | | | | | | | | | | | | |
| | 51,562,627 | | | | 38,038,218 | | | | 18,956,237 | | | | 2,114,087 | |
| | | | | | | | | | | | | | | |
| $ | 53,087,072 | | | $ | 39,206,649 | | | $ | 44,983,198 | | | $ | 3,509,704 | |
| | | | | | | | | | | | | | | |
The accompanying notes are an integral part of these financial statements.
56
Statements of Changes in Net Assets
For the year ended December 31,
| | | | | | | | | | | | | | | | | | | | | | | | |
| | | Managers Value Fund | | | Managers AMG Essex Large Cap
Growth Fund | | | Managers Small Company Fund | |
| | | 2006 | | | 2005 | | | 2006 | | | 2005 | | | 2006 | | | 2005 | |
Increase (Decrease) in Net Assets From Operations: | | | | | | | | | | | | | | | | | | | | | | | | |
Net investment income (loss) | | $ | 853,565 | | | $ | 873,773 | | | | ($256,524 | ) | | | ($269,927 | ) | | | ($268,690 | ) | | | ($253,791 | ) |
Net realized gain (loss) on investments, futures and foreign currency transactions | | | 12,106,593 | | | | 14,156,521 | | | | 10,416,894 | | | | 6,056,702 | | | | 6,115,060 | | | | 1,316,218 | |
Net unrealized appreciation (depreciation) of investments and foreign currency translations | | | 2,554,698 | | | | (7,729,948 | ) | | | (5,161,247 | ) | | | (730,839 | ) | | | (1,903,333 | ) | | | 631,127 | |
| | | | | | | | | | | | | | | | | | | | | | | | |
Net increase (decrease) in net assets resulting from operations | | | 15,514,856 | | | | 7,300,346 | | | | 4,999,123 | | | | 5,055,936 | | | | 3,943,037 | | | | 1,693,554 | |
| | | | | | | | | | | | | | | | | | | | | | | | |
Distributions to Shareholders: | | | | | | | | | | | | | | | | | | | | | | | | |
From net investment income | | | (855,868 | ) | | | (974,970 | ) | | | — | | | | — | | | | — | | | | — | |
From net realized gain on investments | | | (11,576,359 | ) | | | (12,602,042 | ) | | | — | | | | — | | | | — | | | | — | |
| | | | | | | | | | | | | | | | | | | | | | | | |
Total distributions to shareholders | | | (12,432,227 | ) | | | (13,577,012 | ) | | | — | | | | — | | | | — | | | | — | |
| | | | | | | | | | | | | | | | | | | | | | | | |
From Capital Share Transactions: | | | | | | | | | | | | | | | | | | | | | | | | |
Proceeds from sale of shares | | | 17,671,554 | | | | 41,625,309 | | | | 13,685,274 | | | | 32,049,419 | | | | 11,120,944 | | | | 13,834,182 | |
Reinvestment of dividends and distributions | | | 12,291,981 | | | | 13,449,285 | | | | | | | | — | | | | | | | | — | |
Cost of shares repurchased | | | (76,772,986 | ) | | | (43,702,003 | ) | | | (57,562,905 | ) | | | (30,575,012 | ) | | | (13,619,300 | ) | | | (6,163,175 | ) |
| | | | | | | | | | | | | | | | | | | | | | | | |
Net increase (decrease) from capital share transactions | | | (46,809,451 | ) | | | 11,372,591 | | | | (43,877,631 | ) | | | 1,474,407 | | | | (2,498,356 | ) | | | 7,671,007 | |
| | | | | | | | | | | | | | | | | | | | | | | | |
Total increase (decrease) in net assets | | | (43,726,822 | ) | | | 5,095,925 | | | | (38,878,508 | ) | | | 6,530,343 | | | | 1,444,681 | | | | 9,364,561 | |
| | | | | | | | | | | | | | | | | | | | | | | | |
Net Assets: | | | | | | | | | | | | | | | | | | | | | | | | |
Beginning of year | | | 124,643,131 | | | | 119,547,206 | | | | 104,877,713 | | | | 98,347,370 | | | | 36,993,361 | | | | 27,628,800 | |
| | | | | | | | | | | | | | | | | | | | | | | | |
End of year | | $ | 80,916,309 | | | $ | 124,643,131 | | | $ | 65,999,205 | | | $ | 104,877,713 | | | $ | 38,438,042 | | | $ | 36,993,361 | |
| | | | | | | | | | | | | | | | | | | | | | | | |
End of year undistributed net investment income (loss) | | | — | | | | — | | | | — | | | | — | | | | — | | | | — | |
| | | | | | | | | | | | | | | | | | | | | | | | |
Share Transactions: | | | | | | | | | | | | | | | | | | | | | | | | |
Sale of shares | | | 599,108 | | | | 1,419,446 | | | | 489,185 | | | | 1,250,037 | | | | 969,613 | | | | 1,346,911 | |
Reinvested shares | | | 439,628 | | | | 479,168 | | | | — | | | | — | | | | — | | | | — | |
Shares repurchased | | | (2,601,246 | ) | | | (1,465,605 | ) | | | (2,000,828 | ) | | | (1,149,831 | ) | | | (1,172,425 | ) | | | (599,977 | ) |
| | | | | | | | | | | | | | | | | | | | | | | | |
Net increase (decrease) in shares | | | (1,562,510 | ) | | | 433,009 | | | | (1,511,643 | ) | | | 100,206 | | | | (202,812 | ) | | | 746,934 | |
| | | | | | | | | | | | | | | | | | | | | | | | |
The accompanying notes are an integral part of these financial statements.
57
| | | | | | | | | | | | | | | | | | | | | | | | | | | | | | |
Managers International Equity
Fund | | | Managers Emerging Markets
Equity Fund | | | Managers Bond Fund | | | Managers Global Bond Fund | |
| 2006 | | | 2005 | | | 2006 | | | 2005 | | | 2006 | | | 2005 | | | 2006 | | | 2005 | |
| $ | 1,524,445 | | | $ | 1,606,669 | | | $ | 1,168,431 | | | $ | 483,564 | | | $ | 26,026,961 | | | $ | 11,379,121 | | | $ | 1,395,617 | | | $ | 924,935 | |
| | 36,194,122 | | | | 27,455,397 | | | | 15,879,607 | | | | 8,194,901 | | | | (941,142 | ) | | | 3,310,368 | | | | (166,942 | ) | | | 783,739 | |
| | 15,368,505 | | | | 884,817 | | | | 22,158,611 | | | | 17,294,853 | | | | 19,897,379 | | | | (6,574,645 | ) | | | 2,281,029 | | | | (3,673,290 | ) |
| | | | | | | | | | | | | | | | | | | | | | | | | | | | | | | |
| | 53,087,072 | | | | 29,946,883 | | | | 39,206,649 | | | | 25,973,318 | | | | 44,983,198 | | | | 8,114,844 | | | | 3,509,704 | | | | (1,964,616 | ) |
| | | | | | | | | | | | | | | | | | | | | | | | | | | | | | | |
| | (4,000,641 | ) | | | (2,001,385 | ) | | | (1,229,899 | ) | | | (299,119 | ) | | | (27,271,077 | ) | | | (12,451,131 | ) | | | (1,211,010 | ) | | | (1,549,265 | ) |
| | — | | | | — | | | | (13,239,958 | ) | | | (9,253,162 | ) | | | — | | | | (2,620,643 | ) | | | (66,866 | ) | | | (599,669 | ) |
| | | | | | | | | | | | | | | | | | | | | | | | | | | | | | | |
| | (4,000,641 | ) | | | (2,001,385 | ) | | | (14,469,857 | ) | | | (9,552,281 | ) | | | (27,271,077 | ) | | | (15,071,774 | ) | | | (1,277,876 | ) | | | (2,148,934 | ) |
| | | | | | | | | | | | | | | | | | | | | | | | | | | | | | | |
| | 48,510,526 | | | | 36,147,458 | | | | 39,305,219 | | | | 51,433,377 | | | | 569,632,303 | | | | 255,440,152 | | | | 19,531,900 | | | | 17,762,867 | |
| | 3,476,492 | | | | 1,625,660 | | | | 13,851,717 | | | | 8,975,928 | | | | 25,707,360 | | | | 14,138,984 | | | | 1,252,232 | | | | 2,136,679 | |
| | (76,550,450 | ) | | | (93,386,057 | ) | | | (42,139,842 | ) | | | (23,168,214 | ) | | | (132,723,734 | ) | | | (95,384,135 | ) | | | (12,477,695 | ) | | | (9,108,361 | ) |
| | | | | | | | | | | | | | | | | | | | | | | | | | | | | | | |
| | (24,563,432 | ) | | | (55,612,939 | ) | | | 11,017,094 | | | | 37,241,091 | | | | 462,615,929 | | | | 174,195,001 | | | | 8,306,437 | | | | 10,791,185 | |
| | | | | | | | | | | | | | | | | | | | | | | | | | | | | | | |
| | 24,522,999 | | | | (27,667,441 | ) | | | 35,753,886 | | | | 53,662,128 | | | | 480,328,050 | | | | 167,238,071 | | | | 10,538,265 | | | | 6,677,635 | |
| | | | | | | | | | | | | | | | | | | | | | | | | | | | | | | |
| | 206,393,127 | | | | 234,060,568 | | | | 117,228,793 | | | | 63,566,665 | | | | 426,448,096 | | | | 259,210,025 | | | | 43,131,272 | | | | 36,453,637 | |
| | | | | | | | | | | | | | | | | | | | | | | | | | | | | | |
| $ | 230,916,126 | | | $ | 206,393,127 | | | $ | 152,982,679 | | | $ | 117,228,793 | | | $ | 906,776,146 | | | $ | 426,448,096 | | | $ | 53,669,537 | | | $ | 43,131,272 | |
| | | | | | | | | | | | | | | | | | | | | | | | | | | | | | | |
| | ($2,067,376 | ) | | | ($409,088 | ) | | | — | | | | ($15,426 | ) | | | ($299,283 | ) | | $ | 133,777 | | | $ | 61,252 | | | $ | 143,886 | |
| | | | | | | | | | | | | | | | | | | | | | | | | | | | | | | |
| | 799,592 | | | | 754,899 | | | | 1,734,005 | | | | 2,819,768 | | | | 23,240,946 | | | | 10,471,518 | | | | 938,126 | | | | 820,950 | |
| | 51,997 | | | | 30,335 | | | | 579,812 | | | | 450,177 | | | | 1,054,166 | | | | 581,998 | | | | 59,123 | | | | 105,882 | |
| | (1,265,801 | ) | | | (1,920,526 | ) | | | (1,886,659 | ) | | | (1,291,342 | ) | | | (5,476,071 | ) | | | (3,910,052 | ) | | | (597,455 | ) | | | (419,719 | ) |
| | | | | | | | | | | | | | | | | | | | | | | | | | | | | | | |
| | (414,212 | ) | | | (1,135,292 | ) | | | 427,158 | | | | 1,978,603 | | | | 18,819,041 | | | | 7,143,464 | | | | 399,794 | | | | 507,113 | |
| | | | | | | | | | | | | | | | | | | | | | | | | | | | | | | |
The accompanying notes are an integral part of these financial statements.
58
Financial Highlights
For a share outstanding throughout each year
| | | | | | | | | | | | | | | | | | | | |
| | | For the year ended December 31, | |
Managers Value Fund | | 2006 | | | 2005 | | | 2004 | | | 2003 | | | 2002 | |
Net Asset Value, Beginning of Year | | $ | 27.98 | | | $ | 29.73 | | | $ | 26.24 | | | $ | 20.69 | | | $ | 27.45 | |
| | | | | | | | | | | | | | | | | | | | |
Income from Investment Operations: | | | | | | | | | | | | | | | | | | | | |
Net investment income | | | 0.27 | 3 | | | 0.23 | | | | 0.17 | | | | 0.11 | | | | 0.15 | |
Net realized and unrealized gain (loss) on investments | | | 4.79 | | | | 1.43 | | | | 3.47 | | | | 5.56 | | | | (6.65 | ) |
| | | | | | | | | | | | | | | | | | | | |
Total from investment operations | | | 5.06 | | | | 1.66 | | | | 3.64 | | | | 5.67 | | | | (6.50 | ) |
| | | | | | | | | | | | | | | | | | | | |
Less Distributions to Shareholders from: | | | | | | | | | | | | | | | | | | | | |
Net investment income | | | (0.35 | ) | | | (0.25 | ) | | | (0.15 | ) | | | (0.12 | ) | | | (0.16 | ) |
Net realized gain on investments | | | (4.71 | ) | | | (3.16 | ) | | | — | | | | — | | | | (0.10 | ) |
| | | | | | | | | | | | | | | | | | | | |
Total distributions to shareholders | | | (5.06 | ) | | | (3.41 | ) | | | (0.15 | ) | | | (0.12 | ) | | | (0.26 | ) |
| | | | | | | | | | | | | | | | | | | | |
Net Asset Value, End of Year | | $ | 27.97 | | | $ | 27.98 | | | $ | 29.73 | | | $ | 26.24 | | | $ | 20.69 | |
| | | | | | | | | | | | | | | | | | | | |
Total Return 1 | | | 18.08 | % | | | 5.53 | % | | | 13.87 | % | | | 27.39 | % | | | (23.79 | )% |
| | | | | | | | | | | | | | | | | | | | |
Ratio of net expenses to average net assets 1 | | | 1.17 | % | | | 1.18 | % | | | 1.22 | % | | | 1.27 | % | | | 1.28 | % |
Ratio of total expenses to average net assets 1, 2 | | | 1.23 | % | | | 1.15 | % | | | 1.38 | % | | | 1.42 | % | | | 1.35 | % |
Ratio of net investment income to average net assets | | | 0.90 | % | | | 0.72 | % | | | 0.62 | % | | | 0.59 | % | | | 0.60 | % |
Portfolio turnover | | | 32 | % | | | 54 | % | | | 39 | % | | | 40 | % | | | 53 | % |
Net assets at end of year (000’s omitted) | | $ | 80,916 | | | $ | 124,643 | | | $ | 119,547 | | | $ | 100,720 | | | $ | 48,001 | |
| | | | | | | | | | | | | | | | | | | | |
| | | | | | | | | | | | | | | | | | | | |
| | | For the year ended December 31, | |
Managers AMG Essex Large Cap Growth Fund | | 2006 | | | 2005 | | | 2004 | | | 2003 | | | 2002 | |
Net Asset Value, Beginning of Year | | $ | 27.79 | | | $ | 26.77 | | | $ | 25.46 | | | $ | 20.36 | | | $ | 29.29 | |
| | | | | | | | | | | | | | | | | | | | |
Income from Investment Operations: | | | | | | | | | | | | | | | | | | | | |
Net investment loss | | | (0.09 | )3 | | | (0.07 | )3 | | | (0.07 | ) | | | (0.16 | ) | | | (0.28 | ) |
Net realized and unrealized gain (loss) on investments | | | 1.48 | | | | 1.09 | | | | 1.38 | | | | 5.26 | | | | (8.65 | ) |
| | | | | | | | | | | | | | | | | | | | |
Total from investment operations | | | 1.39 | | | | 1.02 | | | | 1.31 | | | | 5.10 | | | | (8.93 | ) |
| | | | | | | | | | | | | | | | | | | | |
Net Asset Value, End of Year | | $ | 29.18 | | | $ | 27.79 | | | $ | 26.77 | | | $ | 25.46 | | | $ | 20.36 | |
| | | | | | | | | | | | | | | | | | | | |
Total Return 1 | | | 4.96 | % | | | 3.85 | % | | | 5.14 | % | | | 25.05 | % | | | (30.49 | )% |
| | | | | | | | | | | | | | | | | | | | |
Ratio of net expenses to average net assets 1 | | | 1.25 | % | | | 1.28 | % | | | 1.34 | % | | | 1.33 | % | | | 1.39 | % |
Ratio of total expenses to average net assets 1, 2 | | | 1.32 | % | | | 1.22 | % | | | 1.47 | % | | | 1.52 | % | | | 1.43 | % |
Ratio of net investment loss to average net assets | | | (0.33 | )% | | | (0.27 | )% | | | (0.26 | )% | | | (0.67 | )% | | | (1.07 | )% |
Portfolio turnover | | | 200 | % | | | 97 | % | | | 79 | % | | | 109 | % | | | 141 | % |
Net assets at end of year (000’s omitted) | | $ | 65,999 | | | $ | 104,878 | | | $ | 98,347 | | | $ | 110,903 | | | $ | 107,545 | |
| | | | | | | | | | | | | | | | | | | | |
59
Financial Highlights
For a share outstanding throughout each year
| | | | | | | | | | | | | | | | | | | | |
| | | For the year ended December 31, | |
Managers Small Company Fund | | 2006 | | | 2005 | | | 2004 | | | 2003 | | | 2002 | |
Net Asset Value, Beginning of Year | | $ | 10.84 | | | $ | 10.36 | | | $ | 9.19 | | | $ | 6.40 | | | $ | 8.16 | |
| | | | | | | | | | | | | | | | | | | | |
Income from Investment Operations: | | | | | | | | | | | | | | | | | | | | |
Net investment loss | | | (0.08 | )3 | | | (0.08 | )3 | | | (0.08 | ) | | | (0.09 | ) | | | (0.13 | ) |
Net realized and unrealized gain (loss) on investments | | | 1.21 | | | | 0.56 | | | | 1.25 | | | | 2.88 | | | | (1.63 | ) |
| | | | | | | | | | | | | | | | | | | | |
Total from investment operations | | | 1.13 | | | | 0.48 | | | | 1.17 | | | | 2.79 | | | | (1.76 | ) |
| | | | | | | | | | | | | | | | | | | | |
Net Asset Value, End of Year | | $ | 11.97 | | | $ | 10.84 | | | $ | 10.36 | | | $ | 9.19 | | | $ | 6.40 | |
| | | | | | | | | | | | | | | | | | | | |
Total Return 1 | | | 10.42 | % | | | 4.63 | % | | | 12.73 | % | | | 43.59 | % | | | (21.57 | )% |
| | | | | | | | | | | | | | | | | | | | |
Ratio of net expenses to average net assets 1 | | | 1.39 | % | | | 1.45 | % | | | 1.45 | % | | | 1.45 | % | | | 1.40 | % |
Ratio of total expenses to average net assets 1,2 | | | 1.54 | % | | | 1.41 | % | | | 1.43 | % | | | 1.50 | % | | | 1.70 | % |
Ratio of net investment loss to average net assets | | | (0.72 | )% | | | (0.82 | )% | | | (1.05 | )% | | | (1.20 | )% | | | (1.17 | )% |
Portfolio turnover | | | 126 | % | | | 26 | % | | | 18 | % | | | 48 | % | | | 134 | % |
Net assets at end of year (000’s omitted) | | $ | 38,438 | | | $ | 36,993 | | | $ | 27,629 | | | $ | 18,750 | | | $ | 12,610 | |
| | | | | | | | | | | | | | | | | | | | |
| |
| | | For the year ended December 31, | |
Managers International Equity Fund | | 2006 | | | 2005 | | | 2004 | | | 2003 | | | 2002 | |
Net Asset Value, Beginning of Year | | $ | 53.76 | | | $ | 47.05 | | | $ | 41.13 | | | $ | 31.22 | | | $ | 37.61 | |
| | | | | | | | | | | | | | | | | | | | |
| Income from Investment Operations: | | | | | | | | | | | | | | | | | | | | |
Net investment income | | | 0.69 | | | | 0.37 | | | | 0.27 | | | | 0.34 | | | | 0.19 | |
Net realized and unrealized gain (loss) on investments | | | 14.15 | | | | 6.83 | | | | 5.96 | | | | 10.04 | | | | (6.48 | ) |
| | | | | | | | | | | | | | | | | | | | |
Total from investment operations | | | 14.84 | | | | 7.20 | | | | 6.23 | | | | 10.38 | | | | (6.29 | ) |
| | | | | | | | | | | | | | | | | | | | |
Less Distributions to Shareholders from: | | | | | | | | | | | | | | | | | | | | |
Net investment income | | | (1.18 | ) | | | (0.49 | ) | | | (0.31 | ) | | | (0.47 | ) | | | (0.10 | ) |
| | | | | | | | | | | | | | | | | | | | |
Total distributions to shareholders | | | (1.18 | ) | | | (0.49 | ) | | | (0.31 | ) | | | (0.47 | ) | | | (0.10 | ) |
| | | | | | | | | | | | | | | | | | | | |
Net Asset Value, End of Year | | $ | 67.42 | | | $ | 53.76 | | | $ | 47.05 | | | $ | 41.13 | | | $ | 31.22 | |
| | | | | | | | | | | | | | | | | | | | |
Total Return | | | 27.63 | % | | | 15.30 | % | | | 15.17 | % | | | 33.21 | % | | | (16.71 | )% |
| | | | | | | | | | | | | | | | | | | | |
Ratio of net expenses to average net assets 1 | | | 1.45 | % | | | 1.45 | % | | | 1.62 | % | | | 1.72 | % | | | 1.54 | % |
Ratio of total expenses to average net assets 1, 2 | | | 1.47 | % | | | 1.42 | % | | | 1.70 | % | | | 1.73 | % | | | 1.56 | % |
Ratio of net investment income to average net assets | | | 0.70 | % | | | 0.75 | % | | | 0.57 | % | | | 0.70 | % | | | 0.54 | % |
Portfolio turnover | | | 70 | % | | | 79 | % | | | 93 | % | | | 80 | % | | | 132 | % |
Net assets at end of year (000’s omitted) | | $ | 230,916 | | | $ | 206,393 | | | $ | 234,061 | | | $ | 266,611 | | | $ | 362,561 | |
| | | | | | | | | | | | | | | | | | | | |
60
Financial Highlights
For a share outstanding throughout each year
| | | | | | | | | | | | | | | | | | | | |
| | | For the year ended December 31, | |
Managers Emerging Markets Equity Fund | | 2006 | | | 2005 | | | 2004 | | | 2003 | | | 2002 | |
Net Asset Value, Beginning of Year | | $ | 20.10 | | | $ | 16.50 | | | $ | 13.26 | | | $ | 8.80 | | | $ | 9.56 | |
| | | | | | | | | | | | | | | | | | | | |
Income from Investment Operations: | | | | | | | | | | | | | | | | | | | | |
Net investment income | | | 0.22 | | | | 0.52 | | | | 0.08 | | | | 0.01 | | | | 0.03 | |
Net realized and unrealized gain (loss) on investments | | | 6.66 | | | | 4.84 | | | | 3.74 | | | | 4.50 | | | | (0.79 | ) |
| | | | | | | | | | | | | | | | | | | | |
Total from investment operations | | | 6.88 | | | | 5.36 | | | | 3.82 | | | | 4.51 | | | | (0.76 | ) |
| | | | | | | | | | | | | | | | | | | | |
Less Distributions to Shareholders from: | | | | | | | | | | | | | | | | | | | | |
Net investment income | | | (0.22 | ) | | | (0.55 | ) | | | (0.06 | ) | | | (0.05 | ) | | | — | |
Net realized gain on investments | | | (2.32 | ) | | | (1.21 | ) | | | (0.52 | ) | | | — | | | | — | |
| | | | | | | | | | | | | | | | | | | | |
Total distributions to shareholders | | | (2.54 | ) | | | (1.76 | ) | | | (0.58 | ) | | | (0.05 | ) | | | 0.00 | |
| | | | | | | | | | | | | | | | | | | | |
Net Asset Value, End of Year | | $ | 24.44 | | | $ | 20.10 | | | $ | 16.50 | | | $ | 13.26 | | | $ | 8.80 | |
| | | | | | | | | | | | | | | | | | | | |
Total Return 1 | | | 34.50 | % | | | 32.53 | % | | | 28.85 | % | | | 51.20 | % | | | (7.95 | )% |
| | | | | | | | | | | | | | | | | | | | |
Ratio of net expenses to average net assets 1 | | | 1.76 | % | | | 1.75 | % | | | 1.85 | % | | | 1.99 | % | | | 1.97 | % |
Ratio of total expenses to average net assets 1, 2 | | | 1.76 | % | | | 1.72 | % | | | 1.87 | % | | | 1.97 | % | | | 2.18 | % |
Ratio of net investment income to average net assets | | | 0.89 | % | | | 0.59 | % | | | 0.67 | % | | | 0.08 | % | | | 0.32 | % |
Portfolio turnover | | | 41 | % | | | 35 | % | | | 58 | % | | | 79 | % | | | 68 | % |
Net assets at end of year (000’s omitted) | | $ | 152,983 | | | $ | 117,229 | | | $ | 63,567 | | | $ | 36,728 | | | $ | 22,211 | |
| | | | | | | | | | | | | | | | | | | | |
| |
| | | For the year ended December 31, | |
Managers Bond Fund | | 2006 | | | 2005 | | | 2004 | | | 2003 | | | 2002 | |
Net Asset Value, Beginning of Year | | $ | 24.11 | | | $ | 24.58 | | | $ | 24.58 | | | $ | 23.44 | | | $ | 22.32 | |
| | | | | | | | | | | | | | | | | | | | |
Income from Investment Operations: | | | | | | | | | | | | | | | | | | | | |
Net investment income | | | 1.08 | | | | 0.88 | | | | 0.80 | | | | 1.08 | | | | 1.24 | |
Net realized and unrealized gain (loss) on investments | | | 0.75 | | | | (0.32 | ) | | | 0.30 | | | | 1.40 | | | | 1.12 | |
| | | | | | | | | | | | | | | | | | | | |
Total from investment operations | | | 1.83 | | | | 0.56 | | | | 1.10 | | | | 2.48 | | | | 2.36 | |
| | | | | | | | | | | | | | | | | | | | |
Less Distributions to Shareholders from: | | | | | | | | | | | | | | | | | | | | |
Net investment income | | | (1.10 | ) | | | (0.88 | ) | | | (0.93 | ) | | | (1.11 | ) | | | (1.24 | ) |
Net realized gain on investments | | | — | | | | (0.15 | ) | | | (0.17 | ) | | | (0.23 | ) | | | — | |
| | | | | | | | | | | | | | | | | | | | |
Total distributions to shareholders | | | (1.10 | ) | | | (1.03 | ) | | | (1.10 | ) | | | (1.34 | ) | | | (1.24 | ) |
| | | | | | | | | | | | | | | | | | | | |
Net Asset Value, End of Year | | $ | 24.84 | | | $ | 24.11 | | | $ | 24.58 | | | $ | 24.58 | | | $ | 23.44 | |
| | | | | | | | | | | | | | | | | | | | |
Total Return 1 | | | 7.79 | %4 | | | 2.29 | % | | | 5.14 | % | | | 10.77 | % | | | 10.98 | % |
| | | | | | | | | | | | | | | | | | | | |
Ratio of net expenses to average net assets 1 | | | 0.99 | % | | | 0.99 | % | | | 0.99 | % | | | 0.99 | % | | | 1.00 | % |
Ratio of total expenses to average net assets 1, 2 | | | 1.02 | % | | | 1.02 | % | | | 1.06 | % | | | 1.09 | % | | | 1.17 | % |
Ratio of net investment income to average net assets | | | 4.52 | % | | | 3.36 | % | | | 3.65 | % | | | 4.50 | % | | | 5.55 | % |
Portfolio turnover | | | 46 | % | | | 26 | % | | | 16 | % | | | 73 | % | | | 24 | % |
Net assets at end of year (000’s omitted) | | $ | 906,776 | | | $ | 426,448 | | | $ | 259,210 | | | $ | 179,641 | | | $ | 128,341 | |
| | | | | | | | | | | | | | | | | | | | |
61
Financial Highlights
For a share outstanding throughout each year
| | | | | | | | | | | | | | | | | | | | |
| | | For the year ended December 31, | |
Managers Global Bond Fund | | 2006 | | | 2005 | | | 2004 | | | 2003 | | | 2002 | |
Net Asset Value, Beginning of Year | | $ | 20.19 | | | $ | 22.38 | | | $ | 22.19 | | | $ | 20.58 | | | $ | 17.97 | |
| | | | | | | | | | | | | | | | | | | | |
Income from Investment Operations: | | | | | | | | | | | | | | | | | | | | |
Net investment income | | | 0.45 | | | | 0.63 | | | | 0.65 | | | | 0.80 | | | | 0.81 | |
Net realized and unrealized gain (loss) on investments | | | 1.05 | | | | (1.75 | ) | | | 1.49 | | | | 3.43 | | | | 2.57 | |
| | | | | | | | | | | | | | | | | | | | |
Total from investment operations | | | 1.50 | | | | (1.12 | ) | | | 2.14 | | | | 4.23 | | | | 3.38 | |
| | | | | | | | | | | | | | | | | | | | |
Less Distributions to Shareholders from: | | | | | | | | | | | | | | | | | | | | |
Net investment income | | | (0.49 | ) | | | (0.77 | ) | | | (1.34 | ) | | | (2.09 | ) | | | (0.55 | ) |
Net realized gain on investments | | | (0.03 | ) | | | (0.30 | ) | | | (0.61 | ) | | | (0.53 | ) | | | (0.22 | ) |
| | | | | | | | | | | | | | | | | | | | |
Total distributions to shareholders | | | (0.52 | ) | | | (1.07 | ) | | | (1.95 | ) | | | (2.62 | ) | | | (0.77 | ) |
| | | | | | | | | | | | | | | | | | | | |
Net Asset Value, End of Year | | $ | 21.17 | | | $ | 20.19 | | | $ | 22.38 | | | $ | 22.19 | | | $ | 20.58 | |
| | | | | | | | | | | | | | | | | | | | |
Total Return 1 | | | 7.36 | % | | | (4.94 | )% | | | 9.62 | % | | | 20.69 | % | | | 18.85 | % |
| | | | | | | | | | | | | | | | | | | | |
Ratio of net expenses to average net assets 1 | | | 1.19 | % | | | 1.19 | % | | | 1.29 | % | | | 1.68 | % | | | 1.55 | % |
Ratio of total expenses to average net assets 1, 2 | | | 1.27 | % | | | 1.26 | % | | | 1.49 | % | | | 1.68 | % | | | 1.56 | % |
Ratio of net investment income to average net assets | | | 2.86 | % | | | 2.38 | % | | | 2.73 | % | | | 3.48 | % | | | 4.01 | % |
Portfolio turnover | | | 56 | % | | | 64 | % | | | 130 | % | | | 152 | % | | | 220 | % |
Net assets at end of year (000’s omitted) | | $ | 53,670 | | | $ | 43,131 | | | $ | 36,454 | | | $ | 32,307 | | | $ | 19,746 | |
| | | | | | | | | | | | | | | | | | | | |
The following notes should be read in conjunction with the Financial Highlights of the Funds presented on the preceding pages.
1 | Total returns and net investment income would have been lower had certain expenses not been reduced. (See Note 1(c) to the Notes to Financial Statements.) |
2 | Excludes the impact of expense (reimbursement)/recoupment and expense offsets such as brokerage credits, but includes non-reimbursable expenses such as interest and taxes. (See Note 1c to the Notes to Financial Statements.) |
3 | Per share numbers have been calculated using average shares. |
4 | The Total Return is based on the Financial Statement Net Asset Values as shown above. |
62
Notes to Financial Statements
December 31, 2006
| 1. | Summary of Significant Accounting Policies |
The Managers Funds (the “Trust”) is an open-end management investment company organized as a Massachusetts business trust and registered under the Investment Company Act of 1940, as amended (the “1940 Act”). Currently, the Trust is comprised of a number of investment series. Included in this report are the Managers Value Fund (“Value”), Managers AMG Essex Large Cap Growth Fund (formerly Managers Capital Appreciation Fund) (“Essex Large Cap Growth”), Managers Small Company Fund (“Small Company”), Managers International Equity Fund (“International Equity”), Managers Emerging Markets Equity Fund (“Emerging Markets Equity”), Managers Bond Fund (“Bond”) and Managers Global Bond Fund (“Global Bond”), collectively the “Funds.”
The Funds’ financial statements are prepared in accordance with accounting principles generally accepted in the United States of America, which require management to make estimates and assumptions that affect the reported amount of assets and liabilities and disclosure of contingent assets and liabilities at the date of the financial statements and the reported amounts of income and expenses during the reporting periods. Actual results could differ from those estimates. The following is a summary of significant accounting policies followed by the Funds in the preparation of their financial statements:
| a. | Valuation of Investments |
Equity securities traded on a domestic or international securities exchange are generally valued at the last quoted sale price, or, lacking any sales, at the last quoted bid price. Over-the-counter securities are valued at the Nasdaq Official Closing Price, if one is available. Lacking any sales, over-the-counter securities, are valued at the last quoted bid price. Under certain circumstances, the value of a Fund investment may be based on an evaluation of its fair value, pursuant to procedures established by and under the general supervision of the Board of Trustees of the Fund. A Fund may use the fair value of a portfolio security to calculate its NAV when, for example, (1) market quotations are not readily available because a portfolio security is not traded in a public market or the principal market in which the security trades is closed, (2) trading in a portfolio security is suspended and not resumed prior to the time as of which the Fund calculates its NAV, (3) where a significant event affecting the value of a portfolio security is determined to have occurred between the time of the market quotation provided for a portfolio security and the time as of which the Fund calculates its NAV, (4) a security’s price has remained unchanged over a period of time (often referred to as a “stale price”), or (5) the Investment Manager determines that a market quotation is inaccurate. The Investment Manager monitors intervening events that may affect the value of securities held in each Fund’s portfolio and, in accordance with procedures adopted by the Funds’ Trustees, will adjust the prices of securities traded in foreign markets, as appropriate, to refiect the impact of events occurring subsequent to the close of such markets but prior to the time each Fund’s NAV is calculated. Fixed-income securities are valued based on valuations furnished by independent pricing services that utilize matrix systems, which refiect such factors as security prices, yields, maturities and ratings, and are supplemented by dealer and exchange quotations. Short-term investments having a remaining maturity of 60 days or less are valued at amortized cost, which approximates market value. Investments in other regulated investment companies are valued at their end of day net asset value per share except iShares or other ETF’s, which are valued the same as equity securities. Securities (including derivatives) for which market quotations are not readily available are valued at fair value, as determined in good faith, and pursuant to procedures adopted by the Board of Trustees of the Trust. The values assigned to fair value investments are based on available information and do not necessarily represent amounts that might ultimately be realized, since such amounts depend on future developments inherent in long-term investments. Further, because of the inherent uncertainty of valuation, those estimated values may differ significantly from the values that would have been used had a ready market for the investments existed, and the differences could be material.
Investments in certain mortgage-backed, stripped mortgage-backed, preferred stocks, convertible securities and other debt securities not traded on an organized market, are valued on the basis of valuations provided by dealers or by a pricing service which uses information with respect to transactions in such securities, various relationships between securities and yield to maturity in determining value.
Security transactions are accounted for as of the trade date. Realized gains and losses on securities sold are determined on the basis of identified cost.
| c. | Investment Income and Expenses |
Dividend income is recorded on the ex-dividend date except certain dividends from foreign securities where the ex-dividend date may have passed. These dividends are recorded as soon as the Trust is informed of the ex-dividend date. Dividend income on foreign securities is recorded net of any withholding tax. Interest income, which includes amortization of premium and accretion of discount on debt securities, is accrued as earned. Non-cash dividends included in dividend income, if any, are reported at the fair market value of the securities received. Other income and expenses are recorded on an accrual basis. Expenses that cannot be directly attributed to a fund are apportioned among the Funds in the Trust and in some cases other affiliated funds based upon their relative average net assets or number of shareholders.
The following Funds had certain portfolio trades directed to various brokers who paid a portion of such Fund’s expenses. For the year ended December 31, 2006, under these arrangements the amount by which the Funds’ expenses were reduced and the impact on the expense ratios were as follows: Value - $22,851 or 0.02%: Essex Large Cap Growth - $29,601 or 0.04%,; Small Company - $23,293 or 0.06% and International Equity - $37,913 or 0.02%.
In addition, each of the Funds has a “balance credit” arrangement with The Bank of New York (“BNY”), the Funds’ custodian, whereby each Fund is credited with an interest factor equal to 1% below the effective 90-day T-Bill rate for account balances left uninvested overnight. These credits serve to reduce custody expenses that would otherwise be charged to each Fund. For the year ended December 31, 2006, the custodian expense was reduced as follows: International Equity - $510; Bond - $999; and Global Bond - $218.
Overdrafts will cause a reduction of any earnings credits, computed at 2% above the effective Federal Funds rate on the day of the overdraft. For the year ended December 31, 2006, overdraft fees for International Equity and Emerging Markets Equity equaled $7,229 and $13,822, respectively.
63
Notes to Financial Statements (continued)
Managers Investment Group LLC (the “Investment Manager”), a subsidiary of Affiliated Managers Group, Inc. (“AMG”) and the Investment Manager for the Funds, has contractually agreed, through at least May 1, 2007, to waive fees and pay or reimburse expenses of Small Company, Bond and Global Bond to the extent that the total annual operating expenses (exclusive of brokerage, interest, taxes and extraordinary expenses) of the Fund exceed 1.45%, 0.99% and 1.19%, respectively, of each Fund’s average daily net assets. The Investment Manager has also contractually agreed to waive fees on Value, Essex Large Cap Growth, International Equity and Emerging Markets Equity to the extent that the total annual operating expenses (exclusive of brokerage, interest, taxes and extraordinary expenses) of the Fund exceed 1.19%, 1.29%, 1.55% and 1.79%, respectively, of each Fund’s average daily net assets, provided that the amount of fees waived, paid or reimbursed does not exceed 0.25% per annum of each Fund’s average daily net assets.
Each Fund may be obligated to repay the Investment Manager such amounts waived, paid or reimbursed in future years provided that the repayment occurs within three (3) years after the waiver or reimbursement and that such repayment would not cause the Fund’s expenses in any such year to exceed the previously stated percentages of that Fund’s average daily net assets. For the year ended December 31, 2006, the following Funds made such repayments to the Investment Manager in the following amounts:
Value - $20,162; Essex Large Cap Growth - $28,374 and Emerging Markets Equity - $3,440. At December 31, 2006, the cumulative amount of reimbursement by the Manager subject to repayment by Value, Essex Large Cap Growth, Small Company, Bond and Global Bond equaled $127,995, $62,031, $34,165, $416,348 and $133,499, respectively.
Total returns and net investment income for the Funds would have been lower had certain expenses not been offset.
| d. | Dividends and Distributions |
Dividends resulting from net investment income, if any, normally will be declared and paid annually for all Funds except Bond. Dividends resulting from net investment income, if any, normally will be declared and paid monthly for Bond. Distributions of capital gains, if any, will be made on an annual basis and when required for Federal excise tax purposes. Income and capital gain distributions are determined in accordance with Federal income tax regulations, which may differ from generally accepted accounting principles. These differences are primarily due to differing treatments for losses deferred due to wash sales, equalization accounting for tax purposes, foreign currency and market discount transactions. Permanent book and tax basis differences, if any, relating to shareholder distributions will result in reclassifications to paid-in capital. The tax character of distributions paid during the past two years were as follows:
| | | | | | | | | | | | | | | | |
| | | Value | | | AMG Essex Large Cap | | Small Company |
| | | 2006 | | | 2005 | | | 2006 | | 2005 | | 2006 | | 2005 |
Distributions paid from: | | | | | | | | | | | | | | | | |
Ordinary income | | $ | 855,868 | | | $ | 974,970 | | | — | | — | | — | | — |
Short-term capital gains | | | 1,797,816 | | | | 912,960 | | | — | | — | | — | | — |
Long-term capital gains | | | 9,778,543 | | | | 11,689,082 | | | — | | — | | — | | — |
| | | | | | | | | | | | | | | | |
| | $ | 12,432,227 | | | $ | 13,577,012 | | | — | | — | | — | | — |
| | | | | | | | | | | | | | | | |
As a % of distributions paid: (unaudited) | | | | | | | | | | | | | | | | |
Qualified ordinary income | | | 100.00 | % | | | 100.00 | % | | — | | — | | — | | — |
Ordinary income - dividends received deduction | | | 64.80 | % | | | 100.00 | % | | — | | — | | — | | — |
| | | | | | | | | | | | | | | | |
| | | | | | | | | | | | | | | | | | | | | | | | | | | | | | | | |
| | | International Equity | | | Emerging Markets Equity | | | Bond | | | Global Bond | |
| | | 2006 | | | 2005 | | | 2006 | | | 2005 | | | 2006 | | | 2005 | | | 2006 | | | 2005 | |
Distributions paid from: | | | | | | | | | | | | | | | | | | | | | | | | | | | | | | | | |
Ordinary income | | $ | 4,000,641 | | | $ | 2,001,385 | | | $ | 1,229,899 | | | $ | 299,119 | | | $ | 27,271,077 | | | $ | 12,451,131 | | | $ | 1,211,010 | | | $ | 1,549,265 | |
Short-term capital gains | | | — | | | | — | | | | 3,138,783 | | | | 2,392,307 | | | | — | | | | 129,375 | | | | — | | | | 104,290 | |
Long-term capital gains | | | — | | | | — | | | | 10,101,175 | | | | 6,860,855 | | | | — | | | | 2,491,268 | | | | 66,866 | | | | 495,379 | |
| | | | | | | | | | | | | | | | | | | | | | | | | | | | | | | | |
| | $ | 4,000,641 | | | $ | 2,001,385 | | | $ | 14,469,857 | | | $ | 9,552,281 | | | $ | 27,271,077 | | | $ | 15,071,774 | | | $ | 1,277,876 | | | $ | 2,148,934 | |
| | | | | | | | | | | | | | | | | | | | | | | | | | | | | | | | |
As a % of distributions paid: (unaudited) | | | | | | | | | | | | | | | | | | | | | | | | | | | | | | | | |
Qualified ordinary income | | | 100.00 | % | | | 100.00 | % | | | 100.00 | % | | | 100.00 | % | | | 0.00 | % | | | 0.00 | % | | | 0.00 | % | | | 0.00 | % |
Ordinary income - dividends received deduction | | | 1.17 | % | | | — | | | | — | | | | — | | | | — | | | | — | | | | — | | | | — | |
| | | | | | | | | | | | | | | | | | | | | | | | | | | | | | | | |
64
Notes to Financial Statements (continued)
As of December 31, 2006, the components of distributable earnings (excluding unrealized appreciation/depreciation) on a tax basis consisted of:
| | | | | | | | | | | | | | | | | | | | | |
| | | Value | | AMG Essex
Large Cap | | Small
Company | | International
Equity | | Emerging
Markets Equity | | Bond | | Global
Bond |
Capital loss carryforward | | | — | | $ | 145,316,330 | | $ | 536,555 | | $ | 65,064,308 | | | — | | $ | 2,046,691 | | | — |
Undistributed ordinary income | | | — | | | — | | | — | | | 360,750 | | | — | | | 272,325 | | $ | 18,428 |
Undistributed short-term capital gains | | $ | 88,300 | | | — | | | — | | | — | | $ | 1,431,045 | | | — | | | 34,614 |
Undistributed long-term capital gains | | | 2,174,758 | | | — | | | — | | | — | | | 999,391 | | | — | | | 846 |
Each Fund intends to comply with the requirements under Subchapter M of the Internal Revenue Code of 1986, as amended, to distribute substantially all of its taxable income and gains to its shareholders and to meet certain diversification and income requirements with respect to investment companies. Therefore, no provision for Federal income or excise tax is included in the accompanying financial statements.
Additionally, based on the Fund’s understanding of the tax rules and rates related to income, gains and transactions for the foreign jurisdictions in which it invests, the Fund will provide for foreign taxes, and where appropriate, deferred foreign taxes.
| f. | Capital Loss Carryovers |
As of December 31, 2006, the following Funds had accumulated net realized capital loss carryovers from securities transactions for Federal income tax purposes as shown in the following chart. These amounts may be used to offset realized capital gains, if any, through the expiration dates listed.
| | | | | |
Fund | | Capital Loss
Carryover Amount | | Expires
December 31, |
Essex Large Cap Growth | | $ | 101,428,248 | | 2009 |
| | | 30,988,593 | | 2010 |
| | | 12,899,489 | | 2011 |
Small Company | | | 536,555 | | 2010 |
International Equity | | | 48,892,407 | | 2010 |
| | | 16,171,901 | | 2011 |
Bond Fund | | | 2,046,691 | | 2014 |
For the year ended December 31, 2006, Essex Large Cap Growth, Small Company and International Equity utilized capital loss carryovers in the amounts of $10,339,265, $6,092,081 and $35,745,870, respectively.
The Trust’s Declaration of Trust authorizes for each series the issuance of an unlimited number of shares of beneficial interest, without par value. Each Fund records sales and repurchases of its capital stock on the trade date. Dividends and distributions to shareholders are recorded on the ex-dividend date.
At December 31, 2006, certain unaffiliated shareholders, specifically omnibus accounts, individually held greater than 10% of the outstanding shares of the following Funds: Value - one owns 10%;
Essex Large Cap Growth - one owns 12%; International Equity - one owns 32%; Emerging Markets Equity - two collectively own 61%; Bond - two collectively own 32%. Transactions by these shareholders may have a material impact on the Funds.
Each Fund may enter into repurchase agreements provided that the value of the underlying collateral, including accrued interest, will be equal to or exceed the value of the repurchase agreement during the term of the agreement. The underlying collateral for all repurchase agreements is held in safekeeping by the Fund’s custodian or at the Federal Reserve Bank.
If the seller defaults and the value of the collateral declines, or if bankruptcy proceedings commence with respect to the seller of the security, realization of the collateral by the Fund may be delayed or limited.
| i. | Foreign Currency Translation |
The books and records of the Funds are maintained in U.S. dollars. The value of investments, assets and liabilities denominated in currencies other than U.S. dollars are translated into U.S. dollars based upon current foreign exchange rates. Purchases and sales of foreign investments, income and expenses are converted into U.S. dollars based on currency exchange rates prevailing on the respective dates of such transactions. Net realized and unrealized gain (loss) on foreign currency transactions represent: (1) foreign exchange gains and losses from the sale and holdings of foreign currencies; (2) gains and losses between trade date and settlement date on investment securities transactions and forward foreign currency exchange contracts; and (3) gains and losses from the difference between amounts of interest and dividends recorded and the amounts actually received.
In addition, the Funds do not isolate the net realized and unrealized gain or loss resulting from changes in exchange rates from the fluctuations resulting from changes in market prices of securities held. Such fluctuations are included with the net realized and unrealized gain or loss on investments.
| 2. | Agreements and Transactions with Affiliates |
The Trust has entered into an Investment Management Agreement under which the Investment Manager provides or oversees investment management services to the Funds. The Investment Manager selects subadvisors for each Fund (subject to Trustee approval), allocates assets among subadvisors and monitors the subadvisors’ investment programs and results. Each Fund’s investment portfolio is managed by portfolio managers who serve pursuant to Subadvisory Agreements with the Investment Manager.
65
Notes to Financial Statements (continued)
Investment management fees are paid directly by each Fund to the Investment Manager based on average daily net assets. The annual investment management fee rates, as a percentage of average daily net assets for the year ended December 31, 2006, were as follows:
| | | |
Fund | | Investment
Management Fee | |
Value | | 0.75 | % |
Essex Large Cap Growth | | 0.80 | % |
Small Company | | 0.90 | % |
International Equity | | 0.90 | % |
Emerging Markets Equity | | 1.15 | % |
Bond | | 0.625 | % |
Global Bond | | 0.70 | % |
The Trust has entered into an Administration and Shareholder Servicing Agreement (“Administration Agreement”) under which Managers Investment Group LLC serves as each Fund’s administrator (the “Administrator”) and is responsible for all aspects of managing the Funds’ operations, including administration and shareholder services to each Fund, its shareholders, and certain institutions, such as bank trust departments, broker-dealers and registered investment advisers, that advise or act as an intermediary with the Funds’ shareholders. Under the terms of the Administration Agreement, each of the Funds, except Global Bond, pay a fee to the Administrator at the rate of 0.25% per annum of the Fund’s average daily net assets. Global Bond pays a fee to the Administrator at the rate of 0.20% per annum of the Fund’s average daily net assets.
Prior to July 1, 2005, the aggregate annual retainer paid to each Independent Trustee was $52,000, plus $2,000 for each meeting attended. Effective July 1, 2005, the aggregate annual retainer paid to each Independent Trustee is $55,000, plus $4,000 or $2,000 for each regular or special meeting attended, respectively. The Trustees’ fees and expenses are allocated amongst all of the Funds for which Managers Investment Group LLC serves as the Investment Manager (the “Managers Funds”) based on the relative net assets of such Funds. The Independent Chairman of the Trust receives an additional payment of $10,000 per year. (Prior to July 1, 2005, the Independent Chairman was paid an additional $5,000 per year). Effective July 1, 2005, the Chairman of the Audit Committee receives an additional $2,000 per year. The “Trustee fees and expenses” shown in the financial statements represent each Fund’s allocated portion of the total fees and expenses paid by the Managers Funds.
The Funds are distributed by Managers Distributors, Inc. (the “Distributor”), a wholly-owned subsidiary of Managers Investment Group LLC. Certain Trustees and Officers of the Funds are Officers and/or Directors of the Investment Manager, AMG and/or the Distributor. The Distributor serves as the principal underwriter for each Fund. The Distributor is a registered broker-dealer and member of the National Association of Securities Dealers, Inc. (“NASD”). Shares of each Fund will be continuously offered and will be sold by brokers, dealers or other financial intermediaries who have executed selling agreements with the Distributor. The Distributor bears all the expenses of providing services pursuant to an Underwriting Agreement, including the payment of the expenses relating to the distribution of Prospectuses for sales purposes and any advertising or sales literature.
On December 20, 2006, the Managers Balanced Fund sold the following securities to the Managers Bond Fund under Rule 17a-7 procedures approved by the Board of Trustees.
| | | | | |
Security | | Shares | | Cost |
BNP Paribas SA, 0.000%, 06/31/11 | | 935,500,000 | | $ | 70,212 |
Barclays Financial LLC, 4.470%, 03/23/09 | | 160,900,000 | | | 174,492 |
JPMorgan Chase & Co., 0.000%, 03/28/11 | | 932,700,000 | | | 71,545 |
| | | | | |
Total | | | | $ | 316,249 |
| | | | | |
66
Notes to Financial Statements (continued)
| 3. | Purchases and Sales of Securities |
Purchases and sales of securities, excluding short-term securities, for the year ended December 31, 2006, were as follows:
| | | | | | | | | | | | |
| | | Long-Term Securities | | U.S. Government Securities |
Fund | | Purchases | | Sales | | Purchases | | Sales |
Value | | $ | 29,253,227 | | $ | 86,263,886 | | | N/A | | | N/A |
Essex Large Cap Growth | | | 150,134,284 | | | 192,233,577 | | | N/A | | | N/A |
Small Company | | | 44,693,388 | | | 45,930,327 | | | N/A | | | N/A |
International Equity | | | 148,462,223 | | | 192,019,101 | | | N/A | | | N/A |
Emerging Markets Equity | | | 53,110,589 | | | 57,281,246 | | | N/A | | | N/A |
Bond | | | 344,551,776 | | | 24,428,704 | | $ | 343,396,406 | | $ | 226,763,529 |
Global Bond | | | 22,842,939 | | | 18,830,985 | | | 11,628,148 | | | 7,622,950 |
| 4. | Portfolio Securities Loaned |
The Funds may participate in a securities lending program offered by BNY providing for the lending of equities, corporate bonds and government securities to qualified brokers. Collateral on all securities loaned is accepted in cash and/or government securities. Collateral is maintained at a minimum level of 102% of the market value, plus interest, if applicable, of investments on loan. Collateral received in the form of cash is invested temporarily in institutional money market funds or other short-term investments by BNY. Earnings of such temporary cash investments are divided between BNY, as a fee for its services under the program, and the Fund loaning the security, according to agreed-upon rates.
| 5. | Commitments and Contingencies |
In the normal course of business, the Funds may enter into contracts and agreements that contain a variety of representations and warranties, which provide general indemnifications. The maximum exposure to the Funds under these arrangements is unknown, as this would involve future claims that may be against the Funds that have not yet occurred. However, based on experience, the Funds expect the risks of loss to be remote.
| 6. | Risks Associated with Collateralized Mortgage Obligations (“CMOs”) (Bond Fund) |
The net asset value of Bond Fund may be sensitive to interest rate fluctuations because the Fund may hold several instruments, including CMOs and other derivatives, whose values can be significantly impacted by interest rate movements. CMOs are obligations collateralized by a portfolio of mortgages or mortgage-related securities. Payments of principal and interest on the mortgage are passed through to the holder of the CMOs on the same schedule as they are received, although certain classes of CMOs have priority over others with respect to the receipt of prepayments on the mortgages.
Therefore, the investment in CMOs may be subject to a greater or lesser risk of prepayment than other types of mortgage-related securities. CMOs may have a fixed or variable rate of interest.
Certain transactions, such as futures and forward transactions, dollar roll agreements, or purchases of when-issued or delayed delivery securities may have a similar effect on a Fund’s net asset value as if the Fund had created a degree of leverage in its portfolio. However, if a Fund enters into such a transaction, the Fund will establish a segregated account with its custodian in which it will maintain cash, U.S. Government securities or other liquid securities equal in value to its obligations in respect to such transaction. Securities and other assets held in the segregated account may not be sold while the transaction is outstanding, unless other suitable assets are substituted.
| 8. | Forward Foreign Currency Contracts |
International Equity, Emerging Markets Equity, Bond and Global Bond invest in forward foreign currency exchange contracts to manage currency exposure. These investments may involve greater market risk than the amounts disclosed in the Funds’ financial statements.
A forward foreign currency exchange contract is an agreement between a Fund and another party to buy or sell a currency at a set price at a future date. The market value of the contract will fluctuate with changes in currency exchange rates. The contract is marked-to-market daily, and the change in market value is recorded as an unrealized gain or loss. Gain or loss on the purchase or sale of contracts having the same settlement date, amount and counter party is realized on the date of offset, otherwise gain or loss is realized on settlement date.
67
Notes to Financial Statements (continued)
The Funds, except Value, Essex Large Cap Growth, and Small Company, may invest in non-U.S. dollar denominated instruments subject to limitations, and enter into forward foreign currency exchange contracts to facilitate transactions in foreign securities and to protect against a possible loss resulting from an adverse change in the relationship between the U.S. dollar and such foreign currency.
Risks may arise upon entering into these contracts from the potential inability of counterparties to meet the terms of their contracts and from unanticipated movements in the value of a foreign currency relative to the U.S. dollar.
Open forward foreign currency exchange contracts (in U.S. Dollars) at December 31, 2006 were as follows:
| | | | | | | | | | | | | |
Foreign Currency | | Position | | Settlement Date | | Current Value
(Receivable Amount) | | | Contract Value
(Payable Amount) | | | Unrealized Gain/
(Loss) | |
International Equity Fund | | | | | | | | | | | | | |
euro-dollar Contracts | | Short | | 1/3/07 | | ($189,811 | ) | | ($188,788 | ) | | ($1,023 | ) |
euro-dollar Contracts | | Short | | 1/3/07 | | ($196,120 | ) | | ($195,543 | ) | | ($577 | ) |
Pound Sterling | | Short | | 1/3/07 | | ($83,231 | ) | | ($83,148 | ) | | ($83 | ) |
Pound Sterling | | Short | | 1/3/07 | | ($109,414 | ) | | ($109,739 | ) | | $325 | |
Pound Sterling | | Short | | 1/4/07 | | ($86,204 | ) | | ($86,176 | ) | | ($28 | ) |
Hong Kong Dollar | | Short | | 1/3/07 | | ($28,070 | ) | | ($28,093 | ) | | $23 | |
euro-dollar Contracts | | Long | | 1/4/07 | | 2,744 | | | 2,743 | | | 1 | |
| | | | | | | | | | | | | |
| | | | | | ($690,106 | ) | | ($688,744 | ) | | ($1,362 | ) |
| | | | | | | | | | | | | |
| | | | | | | | | | | | | |
Foreign Currency | | Position | | Settlement Date | | Current Value
(Receivable Amount) | | | Contract Value
(Payable Amount) | | | Unrealized Gain/
(Loss) | |
Global Bond Fund | | | | | | | | | | | | | |
Australian Dollar | | Short | | 2/9/07 | | ($220,772 | ) | | ($216,479 | ) | | ($4,293 | ) |
Australian Dollar | | Short | | 2/26/07 | | (287,664 | ) | | (280,787 | ) | | (6,877 | ) |
Canadian Dollar | | Short | | 2/20/07 | | (55,821 | ) | | (57,221 | ) | | 1,400 | |
Columbian Peso | | Short | | 2/15/07 | | (295,941 | ) | | (289,382 | ) | | (6,559 | ) |
euro-dollar Contracts | | Short | | 1/5/07 | | (501,746 | ) | | (486,012 | ) | | (15,734 | ) |
Mexican Peso | | Short | | 3/16/07 | | (1,130,231 | ) | | (1,123,214 | ) | | (7,017 | ) |
New Zealand Dollar | | Short | | 2/9/07 | | (172,184 | ) | | (163,734 | ) | | (8,450 | ) |
South African Rand | | Short | | 2/14/07 | | (185,848 | ) | | (177,468 | ) | | (8,380 | ) |
South African Rand | | Short | | 2/14/07 | | (312,110 | ) | | (303,951 | ) | | (8,159 | ) |
Canadian Dollar | | Long | | 2/20/07 | | 55,821 | | | 55,866 | | | (45 | ) |
euro-dollar Contracts | | Long | | 1/5/07 | | 501,747 | | | 487,016 | | | 14,731 | |
| | | | | | | | | | | | | |
| | | | | | ($2,604,749 | ) | | ($2,555,366 | ) | | ($49,383 | ) |
| | | | | | | | | | | | | |
International Equity uses Equity Index futures contracts to a limited extent, with the objective of maintaining exposure to equity stock markets while maintaining liquidity. The Fund may purchase or sell futures contracts to achieve a desired level of investment, whether to accommodate portfolio turnover or cash flows from capital shares transactions. There are certain risks associated with futures contracts. Prices may not move as expected or a Fund may not be able to close out the contract when it desires to do so, resulting in losses.
Futures are valued at their quoted daily settlement prices. The aggregate principal amounts of the contracts are not recorded in the financial statements. Fluctuations in the value of the contracts are recorded in the Statement of Assets as an asset (liability) and in the Statement of Operations as unrealized appreciation
68
Notes to Financial Statements (continued)
(depreciation) until the contracts are closed, when they are recorded as realized gains (losses) on futures or forward currency contracts. Cash pledged to cover margin requirements for the open futures positions at December 31, 2006, amounted to $83,364. International Equity had the following open futures contracts as of December 31, 2006:
| | | | | | | | | |
Type | | Number of
Contracts | | Position | | Expiration
Month | | Unrealized
Gain/(Loss) |
3-Month Euro | | 16 | | Long | | 3/16/07 | | $ | 16,643 |
| 10. | New Accounting Pronouncements |
The Financial Accounting Standards Board (“FASB”) has recently issued Interpretation No. 48, “Accounting for Uncertainty in Income Taxes – an Interpretation of FASB Statement No. 109) the “Interpretation”), which applies to all registered investment companies and clarifies the accounting for uncertain tax positions. The Interpretation is effective for financial statements for fiscal years beginning after December 15, 2006. Management has not yet completed their analysis of the Interpretation, and is not currently in a position to estimate the significance, if any, that the impact of adoption will have on the financial statements.
On December 22, 2006, the SEC indicated they had no objection if a fund implemented FIN 48 in the first required financial statement reporting period for fiscal years beginning after December 15, 2006.
In addition, in September 2006, Statement of Financial Accounting Standards No. 157, Fair Value Measurements (“SFAS 157”), was issued and is effective for fiscal years beginning after November 15, 2007. SFAS 157 defines fair value, establishes a framework for measuring fair value and expands disclosures about fair value measurements. Management is currently evaluating the impact, if any, the adoption of SFAS 157 will have on the Funds’ financial statements.
Tax Information (unaudited)
The Funds hereby designate the maximum amount allowable of their net taxable income as qualified dividends as provided in the Jobs and Growth Tax Relief Reconciliation Act of 2003. The 2006 Form 1099-DIV you receive for the Fund, will show the tax status of all distributions paid to you during the year.
Pursuant to section 852 of the Internal Revenue Code, Value, Essex Large Cap Growth, Small Company, International Equity, Emerging Markets Equity, Bond and Global Bond designate $9,988,293, $0, $0, $0, $11,100,566, $0, and $67,712, respectively, as long-term capital gain for the taxable year ended December 31, 2006.
69
Report of Independent Registered Public Accounting Firm
To the Trustees of The Managers Funds and the Shareholders of
Managers Value Fund, Managers AMG Essex Large Cap Growth Fund, Managers Small Company Fund, Managers International Equity Fund, Managers Emerging Markets Equity Fund, Managers Bond Fund and Managers Global Bond Fund:
In our opinion, the accompanying statements of assets and liabilities, including the schedules of portfolio investments, and the related statements of operations and of changes in net assets and the financial highlights present fairly, in all material respects, the financial positions of Managers Value Fund, Managers AMG Essex Large Cap Growth Fund (formerly Managers Capital Appreciation Fund), Managers Small Company Fund, Managers International Equity Fund, Managers Emerging Markets Equity Fund, Managers Bond Fund and Managers Global Bond Fund (seven of the series constituting The Managers Funds, hereafter referred to as the “Funds”), at December 31, 2006, and the results of each of their operations, the changes in each of their net assets and the financial highlights for the periods indicated, in conformity with accounting principles generally accepted in the United States of America. These financial statements and financial highlights (hereafter referred to as “financial statements”) are the responsibility of the Funds’ management; our responsibility is to express an opinion on these financial statements based on our audits. We conducted our audits of these financial statements in accordance with the standards of the Public Company Accounting Oversight Board (United States). Those standards require that we plan and perform the audit to obtain reasonable assurance about whether the financial statements are free of material misstatement. An audit includes examining, on a test basis, evidence supporting the amounts and disclosures in the financial statements, assessing the accounting principles used and significant estimates made by management, and evaluating the overall financial statement presentation. We believe that our audits, which included confirmation of securities at December 31, 2006 by correspondence with the custodian and brokers, provide a reasonable basis for our opinion.
PricewaterhouseCoopers LLP
Boston, Massachusetts
February 21, 2007
70
Trustees and Officers
The Trustees and Officers of the Trust, their business addresses, principal occupations for the past five years and dates of birth are listed below. The Trustees provide broad supervision over the affairs of the Trust and the Funds. The Trustees are experienced executives who meet periodically throughout the year to oversee the Funds’ activities, review contractual arrangements with companies that provide services to the Funds, and review the Funds’ performance. Unless otherwise noted, the address of each Trustee or Officer is the address of the Trust: 800 Connecticut Avenue, Norwalk, Connecticut 06854.
There is no stated term of office for Trustees. Trustees serve until their resignation, retirement or removal in accordance with the Trust’s organizational documents and policies adopted by the Board from time to time. The Chairman of the Trustees, President, Treasurer and Secretary of the Trust are elected by the Trustees annually. Other officers hold office at the pleasure of the Trustees.
Independent Trustees
The following Trustees are not “interested persons” of the Trust within the meaning of the 1940 Act:
| | |
Name, Date of Birth, Number of Funds Overseen in Fund
Complex* | | Principal Occupation(s) During Past 5 Years and Other Directorships Held by Trustee |
| |
Jack W. Aber, 9/9/37 • Trustee since 1999 • Oversees 33 Funds in Fund Complex | | Professor of Finance, Boston University School of Management (1972-Present); Trustee of Appleton Growth Fund (1 portfolio); Trustee of Third Avenue Trust (4 portfolios); Trustee of Third Avenue Variable Trust (1 portfolio). |
| |
William E. Chapman, II, 9/23/41 • Independent Chairman • Trustee since 1999 • Oversees 33 Funds in Fund Complex | | President and Owner, Longboat Retirement Planning Solutions (1998-Present); Hewitt Associates, LLC (part time) (provider of Retirement and Investment Education Seminars); Trustee of Bowdoin College (2002-Present); Trustee of Third Avenue Trust (4 portfolios); Trustee of Third Avenue Variable Trust (1 portfolio). |
| |
Edward J. Kaier, 9/23/45 • Trustee since 1999 • Oversees 33 Funds in Fund Complex | | Attorney at Law and Partner, Hepburn Willcox Hamilton & Putnam, LLP (1977-Present); Trustee of Third Avenue Trust (4 portfolios); Trustee of Third Avenue Variable Trust (1 portfolio). |
| |
Steven J. Paggioli, 4/3/50 • Trustee since 1993 • Oversees 33 Funds in Fund Complex | | Consultant (2001-Present); Formerly Executive Vice President and Director, The Wadsworth Group (1986- 2001); Executive Vice President, Secretary and Director, Investment Company Administration, LLC (1990-2001); Vice President, Secretary and Director, First Fund Distributors, Inc. (1991-2001); Trustee, Professionally Managed Portfolios (22 portfolios); Advisory Board Member, Sustainable Growth Advisors, LP. |
| |
Eric Rakowski, 6/5/58 • Trustee since 1999 • Oversees 33 Funds in Fund Complex | | Professor, University of California at Berkeley School of Law (1990-Present); Trustee of Third Avenue Trust (4 portfolios); Trustee of Third Avenue Variable Trust (1 portfolio). |
| |
Thomas R. Schneeweis, 5/10/47 • Trustee since 1987 • Oversees 33 Funds in Fund Complex | | Professor of Finance, University of Massachusetts (1985-Present); Director, CISDM at the University of Massachusetts, (1996-Present); President, Alternative Investment Analytics, LLC, (formerly Schneeweis Partners, LLC) (2001-Present); Director of Research, Lyra/Starview Capital LLC (2004-2006); Partner, Northampton Capital Management, LLC; Partner, TRS Associates (Sole Proprietorship) and member of Massachusetts Finance Institute (wholly owned subsidiary of Alternative Investment Analytics). No other directorships held by Trustee. |
| * | The Fund Complex consists of Managers AMG Funds, The Managers Funds, Managers Trust I and Managers Trust II. |
Interested Trustee
The following Trustee is an “interested person” of the Trust within the meaning of the 1940 Act by virtue of his positions with, and interest in securities of, Affiliated Managers Group, Inc.
| | |
Name, Date of Birth, Number of
Funds Overseen in Fund
Complex* | | Principal Occupation(s) During Past 5 Years and Other Directorships Held by Trustee |
| |
William J. Nutt, 3/30/45 • Trustee since 2005 • President since 2007 • Oversees 33 Funds in Fund Complex | | Chairman and Founder of Affiliated Managers Group, Inc., (1993-Present); Chief Executive Officer of Affiliated Managers Group, Inc. (1993-2004); Director, Affiliated Managers Group, Inc. (1993-Present); President of Affiliated Managers Group, Inc. (1993-1999); President and Chief Operating Officer, The Boston Company (1989- 1993); Senior Executive Vice President, The Boston Company (1982-1989). |
| * | The Fund Complex consists of Managers AMG Funds, The Managers Funds, Managers Trust I and Managers Trust II. |
Officers
| | |
Name, Date of Birth, Position(s)
Held with Fund and Length of
Time Served | | Principal Occupation(s) During Past 5 Years |
| |
Bruce M. Aronow, 5/31/65 • Chief Financial Officer since 2005 | | Managing Partner, Managers Investment Group LLC (2005-Present); Chief Financial Officer, Managers AMG Funds, Managers Trust I and Managers Trust II (2005- Present); Executive Vice President and Chief Financial Officer and Principal, Rorer Asset Management (1999- 2004); Chief Operating Officer, Rorer Asset Management (2001-2004); Staff Accountant, Manager and Partner, PricewaterhouseCoopers LLP (1987-1998). |
| |
Christine C. Carsman, 4/2/52 • Secretary since 2004 | | Vice President and Chief Regulatory Counsel, Affiliated Managers Group, Inc. (2004-Present); Secretary, Managers AMG Funds, Managers Trust I and Managers Trust II (2004-Present); Senior Counsel, Vice President and Director of Operational Risk Management and Compliance, Wellington Management Company, LLP (1995-2004); Deputy General Counsel, The Boston Company, Inc. (1993-1995); Associate General Counsel, The Boston Company Advisors, Inc. (1991-1993); Associate, Sullivan & Worcester LLP (1987-1991). |
| |
Colin J. Dean, 3/6/77 • Assistant Secretary since 2006 | | Associate Counsel, Affiliated Managers Group, Inc. (2005- Present); Assistant Secretary, Managers AMG Funds, Managers Trust I and Managers Trust II (2006-Present); Assistant Secretary, Skyline Funds (2006-Present); Associate, Dechert LLP (2002-2005). |
| |
Donald S. Rumery, 5/29/58 • Treasurer since 1995 | | Senior Vice-President, Managers Investment Group LLC (2005-Present); Director, Finance and Planning, The Managers Funds LLC, (1994-2004); Treasurer and Chief Financial Officer, Managers Distributors, Inc. (2000- Present); Treasurer, Managers AMG Funds (1999-Present); Treasurer, Managers Trust I and Managers Trust II (2000- Present); Secretary, Managers Trust I and Managers Trust II (2000-2004) and Secretary, The Managers Funds (1997- 2004). |
7173
Investment Manager and Administrator
Managers Investment Group LLC
800 Connecticut Avenue
Norwalk, Connecticut 06854
(203) 299-3500 or (800) 835-3879
Distributor
Managers Distributors, Inc.
800 Connecticut Avenue
Norwalk, Connecticut 06854
(203) 299-3500 or (800) 835-3879
Custodian
The Bank of New York
2 Hanson Place
Brooklyn, New York 11217
Legal Counsel
Ropes & Gray LLP
One International Place
Boston, Massachusetts 02110-2624
Transfer Agent
PFPC, Inc.
attn: Managers
P.O. Box 9769
Providence, Rhode Island 02940
(800) 548-4539
Trustees
Jack W. Aber
William E. Chapman, III
Edward J. Kaier
William J. Nutt
Steven J. Paggioli
Eric Rakowski
Thomas R. Schneeweis
For Managers Choice Only
Managers
c/o PFPC, Inc.
P.O. Box 61204
King of Prussia, Pennsylvania 19406-0851
(800) 358-7668

MANAGERSAND MANAGERS AMG EQUITY FUNDS
EMERGING MARKETS EQUITY
Rexiter Capital Management Limited
ESSEX GROWTH
ESSEX LARGE CAP GROWTH
(formerly known as Capital Appreciation)
ESSEX SMALL/MICRO CAP GROWTH
Essex Investment Management Co., LLC
FQ TAX-MANAGED U.S. EQUITY
FQ U.S. EQUITY
First Quadrant, L.P.
INSTITUTIONAL MICRO-CAP
MICRO-CAP
Kern Capital Management LLC
INTERNATIONAL EQUITY
Alliance Bernstein L.P.
Lazard Asset Management, LLC
Wellington Management Company, LLP
MID-CAP
Chicago Equity Partners, LLC
REAL ESTATE SECURITIES
Urdang Securities Management, Inc.
RORER LARGE-CAP
Rorer Asset Management, LLC
SMALL CAP
TIMESSQUARE MID CAP GROWTH
TIMESSQUARE SMALL CAP GROWTH
TimesSquare Capital Management, LLC
SMALL COMPANY
Epoch Investment Partners, Inc.
Kalmar Investment Advisers, Inc.
SPECIAL EQUITY
Donald Smith & Co., Inc.
Kern Capital Management LLC
Smith Asset Management Group, LP
Veredus Asset Management LLC
Westport Asset Management, Inc.
SYSTEMATIC VALUE
SYSTEMATIC MID-CAP VALUE
Systematic Financial Management, L.P.
VALUE
Armstrong Shaw Associates Inc.
Osprey Partners Investment Mgmt., LLC
MANAGERS BALANCED FUNDS
BALANCED
Chicago Equity Partners, LLC
GLOBAL
Armstrong Shaw Associates Inc.
Alliance Bernstein L.P.
First Quadrant, L.P.
Kern Capital Management LLC
Northstar Capital Management, Inc.
Wellington Management Company, LLP
ALTERNATIVE FUNDS
FQ GLOBAL ALTERNATIVES
First Quadrant, L.P.
MANAGERS
FIXED INCOME FUNDS
BOND (MANAGERS)
FIXED INCOME
GLOBAL BOND
Loomis, Sayles & Company L.P.
BOND (MANAGERS FREMONT)
Pacific Investment Management Co. LLC
CALIFORNIA INTERMEDIATE TAX-FREE
Evergreen Investment Management Co., LLC
HIGH YIELD
J.P. Morgan Investment Management Inc.
INTERMEDIATE DURATION GOVERNMENT
SHORT DURATION GOVERNMENT
Smith Breeden Associates, Inc.
MONEY MARKET
JPMorgan Investment Advisors Inc.
This report is prepared for the Funds’ shareholders. It is authorized for distribution to prospective investors only when preceded or accompanied by an effective prospectus. To receive a free copy of the prospectus or Statement of Additional Information, which includes additional information about Fund Trustees, please contact us by calling 800.835.3879. Distributed by Managers Distributors, Inc., member NASD.
A description of the policies and procedures each Fund uses to vote its proxies is available: (i) without charge, upon request, by calling 800.835.3879, or (ii) on the Securities and Exchange Commission’s (SEC) Web site at www.sec.gov. For information regarding each Fund’s proxy voting record for the 12-month period ended June 30, call 800.835.3879 or visit the SEC Web site at www.sec.gov.
The Funds file their complete schedule of portfolio holdings with the SEC for the first and third quarters of each fiscal year on Form N-Q. The Funds’ Forms N-Q are available on the SEC’s website at www.sec.gov. A Funds’ Forms N-Q may be reviewed and copied at the SEC’s Public Reference Room in Washington, DC. Information on the operation of the Public Reference Room may be obtained by calling 800.SEC.0330. To review a complete list of the Funds’ portfolio holdings, or to view the most recent quarterly holdings report, semiannual report, or annual report, please visit www.managersinvest.com.
| | |
www.managersinvest.com | |  |
73
ANNUAL REPORT
Managers Funds
December 31, 2006
| | • | | Managers Special Equity Fund |
Managers Special Equity Fund
Annual Report - December 31, 2006
TABLE OF CONTENTS
| | |
| | | Page |
LETTER TO SHAREHOLDERS | | 1 |
ABOUT YOUR FUND’S EXPENSES | | 3 |
INVESTMENT MANAGER COMMENTS | | |
FUND SNAPSHOTS | | 9 |
Portfolio breakdown and top ten holdings at December 31, 2006 | | |
SCHEDULE OF PORTFOLIO INVESTMENTS | | 10 |
FINANCIAL STATEMENTS: | | |
Statement of Assets and Liabilities | | 15 |
Fund’s balance sheet, net asset value (NAV) per share computation and cumulative undistributed amount | | |
Statement of Operations | | 16 |
Detail of sources of income, Fund expenses, and realized and unrealized gains (losses) during the year | | |
Statement of Changes in Net Assets | | 17 |
Detail of changes in Fund assets for the past two years | | |
FINANCIAL HIGHLIGHTS | | 18 |
Historical net asset values per share, distributions, total returns, expense ratios, turnover ratios and net assets | | |
NOTES TO FINANCIAL STATEMENTS | | 19 |
Accounting and distribution policies, details of agreements and transactions with Fund management and affiliates, and descriptions of certain investment risks | | |
REPORT OF INDEPENDENT REGISTERED PUBLIC ACCOUNTING FIRM | | 22 |
TRUSTEES AND OFFICERS | | 23 |
Nothing contained herein is to be considered an offer, sale or solicitation of an offer to buy shares of The Managers Funds or Managers AMG Funds. Such offering is made only by Prospectus, which includes details as to offering price and other material information.
Letter to Shareholders
Dear Shareholders and Clients,
We would like to thank you for the opportunity to manage your assets in 2006, and for taking time with us to take a quick glance back at last year’s investment climate.
If all we did was focus on the strong, above-average returns generated by most of the asset classes worldwide during 2006—U.S. stocks up 15.8%, non-U.S. stocks up 26.3%, real estate up 36.1%, global bonds up 6.6% (high quality U.S. bonds offered moderately below average returns of 4.3%)—we would be missing one of the most important lessons that 2006 teaches us about investing; for 2006 was a year in which investors needed to endure a period of negative returns in order to reap the benefi ts the full year had to offer.
Investors with classically diversifi ed portfolios who stuck to their long-term investment plan during the past year should have been pleased with their results. Other investors who were enticed into making asset allocation and investment changes in response to short-term market movements, however, may have experienced below average portfolio results, and certainly took undue risk.
It can be tempting for investors without a solid plan to alter their asset allocations and investment approach. Coming off of three previous years of positive stock market returns, we entered 2006 with the widely reported expectation that the economy was running out of steam. Given the news media’s penchant for pessimism, we were repeatedly told to watch out for: slower economic growth, softer corporate profi ts, signifi cantly higher oil prices, prospects for higher infl ation, expectations for further Federal Reserve interest rate hikes, a collapse in the housing market, the negative impact of a decline in the dollar’s value and of course, a long list of geopolitical concerns. As if that wasn’t enough, the yield curve was borderline inverted, very often a signal of economic weakness.
Investors tried to shrug off this pessimism and through the early part of May the equity markets actually produced positive results. However, the headline risks fi nally became too much for investors to withstand and the market ran out of steam. From May 5 through June 13, the U.S. equity market declined by 4.5%, while from May 9 through June 13, non-U.S. equities fell by 12.7%, with emerging markets leading the slide down 20.5%. Meanwhile, U.S. bonds had been steadily declining with the Lehman Brothers Aggregate Index down 0.7% through the end of June. Near mid-year, it seemed that the bears were developing a stranglehold on the market. More than a few commentators were wondering what then-new Fed Chairman Dr. Bernanke was trying to accomplish. Cash seemed to be king, commodities were headed higher, and hedge funds were constantly in the news—all very enticing options for investors.
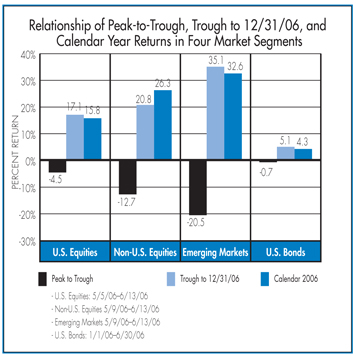
But the whole story was yet to be told. Despite the mixed macro economic news, corporate results were coming through better than many analysts had expected and companies were actually producing positive earnings surprises. In fact, 68% and 76% of S&P 500 companies produced positive earnings surprises in the fi rst and second quarters of 2006, respectively. As the year developed,
1
Letter to Shareholders (continued)
even though economic factors did not dramatically improve, they did not worsen either. The Fed stopped raising rates, oil prices stopped going up (and ultimately finished the year below where they started), inflation concerns tempered, the housing market did not experience the hard landing many had feared, and the mighty consumer did not waver. In retrospect, perhaps it was going to be the soft landing that many had sought.
As more and more positive earnings results came through during the year, even against the backdrop of mixed economic news, the markets staged a broad rally. From the June 13 bottom, the S&P 500 advanced by 17.1%, while the MSCI EAFE increased 20.8%. Meanwhile, the Lehman Aggregate Bond Index advanced 5.1% during the second half of the year.
So what was the lesson to be learned from 2006? Investors who started the year with a reasonably diversified portfolio and simply maintained their long-term perspective had an above-average year and made real progress towards their financial goals. Going into 2006, and for the first part of the year, economic conditions and expectations could easily have compelled an investor to over-think and do something other than stay on plan. The market would have whipsawed these investors, resulting in poor relative returns. Having a well founded long-term plan and sticking with it can improve investors’ odds of reaching their investment goals, and it certainly helped in terms of getting the most out of 2006.
One of our foremost goals at Managers Investment Group (“Managers”) is to structure and manage mutual funds that will help our shareholders and clients become more successful at reaching their investment goals and objectives. Each of our Funds is geared to provide you with exposure to a specific asset class or portion of the market. Investors tend to use our Funds as part of their overall asset allocation in order to structure a well-diversifi ed portfolio intended to meet individual needs. Most of our Funds, therefore, are designed to be building blocks.
Managers International Equity Fund is a great example of how we structure and manage funds for our clients’ benefit. We designed the overall Fund to provide broad exposure to the world’s non-U.S. equity markets, predominately in developed markets. Considering the broad mandate, we believe the best method of accomplishing that goal is by employing a number of investment managers, each with a different focus and approach to investing in the international equity market. As a result, we have built a virtual team of three complimentary institutional investment managers. Each of these three organizations has an experienced team of accomplished professionals and deep resources. Each of them has demonstrated great success in generating attractive investment returns. Yet each has a significantly different outlook and approach to investing. Specifically, the Fund is subadvised by AllianceBernstein, Lazard Asset Management, and Wellington Management Company, whose investment approaches are “bottom-up” value-based, “top-down” thematic, and growth-oriented, respectively. By blending managers with different styles, the portfolio is not held hostage to growth, for example, being out-of-favor. The result is a Fund with expected risk that should be lower than average and that exhibits more stable performance on a relative basis. Though this Fund won’t typically attract performance chasers, it will help investors reach their fi nancial goals without having to zigzag their way through investment styles or fads and give them peace of mind that they have an elegantly diversified portfolio.
At Managers we appreciate the privilege of being part of your investment plan. You can rest assured that under all market conditions our team is focused on delivering excellent investment management services for your benefit. Thank you again for the opportunity to be of service.
| | | | |
| Respectfully, | | | | |
| | |
| | | | |
| John Streur | | | | Thomas G. Hoffman, CFA |
| Senior Managing Partner | | | | Executive Vice President |
| Managers Investment Group LLC | | | | Chief Investment Officer |
| | | | Managers Investment Group LLC |
Note: Source for all data referenced in the letter is FactSet and Russell.
2
About Your Fund’s Expenses
As a shareholder of the Fund, you may incur two types of costs: (1) transaction costs, which may include sales charges (loads) on purchase payments; redemption fees; and exchange fees; and (2) ongoing costs, including management fees; distribution (12b-1) fees; and other Fund expenses. This Fund incurs only ongoing costs. This example is intended to help you understand your ongoing costs (in dollars) of investing in the Fund and to compare these costs with the ongoing costs of investing in other mutual funds. The example is based on an investment of $1,000 invested at the beginning of the period and held for the entire period as indicated below.
Actual Expenses
The first line of the table below provides information about the actual account values and actual expenses. You may use the information in this line, together with the amount you invested, to estimate the expenses that you paid over the period. Simply divide your account value by $1,000 (for example, an $8,600 account value divided by $1,000 = 8.6), then multiply the result by the number in the first line under the heading entitled “Expenses Paid During Period” to estimate the expenses you paid on your account during this period.
Hypothetical Example for Comparison Purposes
The second line of the table below provides information about hypothetical account values and hypothetical expenses based on the Fund’s actual expense ratio and an assumed annual rate of return of 5% before expenses, which is not the Fund’s actual return. The hypothetical account values and expenses may not be used to estimate the actual ending account balance or expenses you paid for the period. You may use this information to compare the ongoing costs of investing in the Fund and other funds by comparing this 5% hypothetical example with the 5% hypothetical examples that appear in the shareholder reports of other funds.
Please note that the expenses shown in the table are meant to highlight your ongoing costs only and do not reflect any transactional costs, such as sales charges (loads), redemption fees, or exchange fees. Therefore, the second line of the table is useful in comparing ongoing costs only, and will not help you determine the relative total costs of owning different funds.
| | | | | | | | | |
Six Months Ended December 31, 2006 | | Beginning
Account
Value
07/01/2006 | | Ending
Account
Value
12/31/2006 | | Expenses
Paid
During
the
Period* |
Managers Special Equity Fund - Managers Shares | | | | | | | | | |
Based on Actual Fund Return | | $ | 1,000 | | $ | 1,058 | | $ | 7.42 |
Based on Hypothetical 5% Annual Return | | $ | 1,000 | | $ | 1,018 | | $ | 7.27 |
Managers Special Equity Fund - Institutional Shares | | | | | | | | | |
Based on Actual Fund Return | | $ | 1,000 | | $ | 1,060 | | $ | 6.18 |
Based on Hypothetical 5% Annual Return | | $ | 1,000 | | $ | 1,019 | | $ | 6.06 |
| * | Expenses are equal to the Fund’s annualized expense ratio multiplied by the average account value over the period, multiplied by the number of days in the most recent fiscal half-year (184), then divided by 365. |
3
Managers Special Equity Fund
Portfolio Managers’ Comments
The Managers Special Equity Fund’s (the “Fund”) objective is to achieve long-term capital appreciation through a diversified portfolio of equity securities of small- and medium-sized companies.
THE PORTFOLIO MANAGERS
The Fund employs multiple portfolio managers who specialize in distinct investment approaches. This “intelligence diversification” not only serves to manage risk, but also helps us tap the markets’ full potential by focusing different analytical insights on each class of investment. Fund management strives to achieve this performance and diversifi cation while ensuring that the Fund operates within the framework of its investment objective and principal investment strategies.
Smith Asset Management Group, L.P.
The Fund’s Board of Trustees approved the addition of Smith Asset Management Group (“Smith Group”) to the lineup of subadvisors for the Fund during the second quarter of 2006. Smith Group’s investment process is based on a combination of a well-conceived quantitative screening process coupled with experienced, intelligent fundamental and qualitative analysis. The team is focused on predicting which attractively valued companies will report a succession of positive earnings surprises. The process begins by seeking companies with attractive risk profiles and valuations, as well as dramatically improving business fundamentals. To manage risk, Smith Group screens for companies with good corporate governance, strong financial quality, attractive valuation, and moderate portfolio beta. To identify high earnings growth companies, Smith Group screens for rising earnings expectations, improving earnings quality, a high-percentage positive earnings surprise, and high earnings growth rate.
Ideal Company:
Low-risk, as evidenced by:
| | • | | Moderate portfolio beta |
| | • | | Strong financial quality |
| | • | | Good corporate governance |
High earnings growth, as evidenced by:
| | • | | Rising earnings expectations |
| | • | | Improving earnings quality |
| | • | | High percentage positive earnings surprise |
| | • | | High earnings growth rate |
Portfolio Construction:
Portfolio Management:
| | • | | Takes a bottom-up stock picking approach |
| | • | | Uses a combination of quantitative and fundamental analysis |
| | • | | Focuses on identifying risks created by corporate governance and fi nancial reporting practices |
| | • | | Builds a portfolio of 100-120 stocks |
The Portfolio:
| | • | | Holdings across all sectors |
| | • | | Individual stock exposure limited to a maximum of 3.0% |
| | • | | Moderate turnover of approximately 50-60% |
| | • | | Sector weighting maximum of two times the Russell 2000 |
Sell Discipline:
Portfolio holdings are sold if:
| | • | | A negative earnings surprise is predicted by either the process or management guidance |
| | • | | A negative earnings surprise is actually reported |
| | • | | The stock’s valuation level is too high |
| | • | | A buyout announcement is made |
Donald Smith & Co., Inc.
Donald Smith & Co., Inc. (“Donald Smith”) is a value manager that invests in out-of-favor small-capitalization companies. Donald Smith’s philosophy seeks to identify companies in the bottom decile of price-to-tangible book value ratios, with a strong balance sheet, and a positive outlook for earnings potential over the next 2-4 years. Donald Smith believes that extremely low P/B ratio companies often trade below replacement value, are inherently less risky, and are more likely to be acquired. Furthermore, because only a few investment managers focus on companies in the lowest P/B ratio decile, their stocks may be inefficiently priced and can offer tremendous value.
Donald Smith’s process begins by looking for companies in the lowest 10% of price-to-tangible book value ratios with a strong balance sheet, and a positive outlook for earnings potential over the next 2-4 years. Donald Smith also assesses price-to-earnings, price-to-sales, and debt-to-capital ratios to form a “watch list” of about 300 securities. After valuations are addressed, Donald Smith performs fundamental research, including company visits, to assess the quality of the company’s balance sheet and book value. The team is looking for a catalyst for an improvement in earnings potential that is not already reflected in the stock price. A concentrated portfolio of 40-50 stocks is the result. Stocks are sold when a target price has been achieved, usually set at less than 2x book value. Positions may also be sold if the stock appreciates rapidly, if a better idea is found, or if fundamentals deteriorate. Portfolio turnover is low at 20-40% annually.
The ideal company exhibits many of the following traits:
| | • | | Low price-to-book value |
| | • | | Positive earnings potential over the next 2-4 years |
Portfolio Management:
| | • | | Focuses on lowest decile of price-to-tangible book value stocks |
| | • | | Price-to-earnings, price-to-sales, and debt-to-capital also assessed from valuation standpoint |
| | • | | Concentrates the portfolio in 40-50 stocks |
The Portfolio:
| | • | | Value oriented holdings |
| | • | | Initial stock weightings are generally 3%-3.5% |
| | • | | Typically holds 40-50 stocks |
| | • | | Average turnover between 20-40% annually |
The following factors influence the sell decision when:
| | • | | Target price is reached, usually less than 2x book value |
| | • | | Stock appreciates rapidly |
| | • | | Fundamentals deteriorate |
4
Managers Special Equity Fund
Portfolio Managers’ Comments (continued)
Kern Capital Management LLC
Kern Capital Management LLC (“KCM”) believes the U.S. smaller company stock universe provides the opportunity to invest in innovative companies with exceptional growth prospects. With minimal research coverage by brokerage firms and low institutional ownership, KCM believes small- and micro-cap stocks represent the least efficient sector of the market.
KCM’s fundamental research is dedicated to uncovering innovative small companies early in their growth cycle while they are still relatively undiscovered. With a huge universe of investment opportunity, KCM’s investment process focuses on what they believe are the most innovative sectors in the U.S. economy (technology, health care, services, and consumer). Research specialization by economic sector provides the depth of knowledge necessary to make high quality investment decisions and minimize fundamental investment mistakes.
KCM believes that the real attraction of small- and micro-cap investing is not the asset class, but the stock selection opportunities within the asset class. KCM defines the small-cap investment universe as the smallest 15% of companies, based on market capitalization on the U.S. stock markets. KCM’s investment process is designed to capitalize on the inefficiencies in the smaller-company market.
KCM builds portfolios one company at a time with investment research focused on the most innovative sectors of the economy (technology, health care, services, and consumer). The team’s hands-on approach to fundamental investment research and financial analysis seeks to answer three basic questions to determine an investment’s attractiveness.
| | • | | How attractive is the business? Companies that are pioneering new markets or revolutionizing existing ones can often sustain rapid growth as they establish leading positions in their targeted markets. |
| | • | | How strong is the management? Successful companies require management capable of capitalizing on attractive growth opportunities. Management’s vision and ability to execute the business plan represent key elements in determining how successful a company will be. |
| | • | | How much is the company worth? The team’s process is valuation sensitive. Depending on the economic sector, different criteria are used to determine a company’s enterprise value, which determines if KCM would buy the entire company at the current market value of its equity. |
Given that KCM is focused on investing in innovative growth companies, the first two questions are answered before determining if the valuation is attractive. In fact, the answers to the fi rst two questions will help determine the appropriate valuation for the company.
The ideal company exhibits many of the following traits:
| | • | | Leading market position in a rapidly growing market with high barriers to entry |
| | • | | Entrepreneurial management team with experience managing a growth business |
| | • | | Focused business plan with tight internal controls |
Portfolio Management:
| | • | | Invests in between 70 and 90 companies which have market capitalizations that, at the time of initial purchase, place them among the smallest 15% of companies listed in the U.S. stock markets |
| | • | | Builds portfolios from the bottom up and seeks to identify companies early in their growth cycle |
| | • | | Utilizes a team approach to cover approximately 600 stocks through an extensive network of contact and other information sources: |
| | • | | Brokerage firm and industry analysts |
| | • | | Corporate management contacts |
| | • | | Trade shows and trade journals |
| | • | | Focuses on economic sectors where KCM believes the level of innovation is greatest, such as technology, health care, services, and consumer |
| | • | | Uses fundamental analysis to identify small, relatively unknown companies that exhibit the potential to become much larger and more successful |
| | • | | Meets with corporate management to discuss business plans and strategies |
The investment team will make a sell decision when:
| | • | | An investment’s growth prospects deteriorate |
| | • | | Investments achieve excessive valuation relative to the growth opportunities and/or addressable markets |
| | • | | There is a negative change in fundamental confidence and/or investment time horizon |
Skyline Asset Management, L.P.
The investment team from Skyline Asset Management, L.P. (“Skyline”) looks for small-capitalization stocks that have below average valuations with above average growth prospects. Through their intensive in-house research, they find good companies that are overlooked or not widely followed.
Skyline’s research effort focuses on finding good companies that are not widely followed. Typically they invest in firms with market caps of less than $2 billion. The selection process involves using outside research services, computer screens, and internally maintained lists of potential companies/stocks to identify new ideas. These ideas are then screened to determine whether they meet certain basic criteria: relative valuation, capitalization, financial strength, and opportunities for continued growth. This screening process reduces the list from 2,000 names to 150-200. This list is then more rigorously analyzed to answer the question, “Why will earnings increase at an above-average rate?” All company documents are analyzed, any available industry or research reports are reviewed and, most importantly, questions are addressed directly to senior company management.
In addition, other companies in the same industry are reviewed to determine relative valuation of the company being investigated. The final portfolio will contain 65-85 stocks and is generally fully invested. The portfolio will tend to be well diversified and the portfolio’s P/E ratio will consistently be below that of the Russell 2000®. Skyline sells stocks when they rise to a sell target, which is usually a P/E equal to the overall stock market, or if the company’s fundamentals have changed so that the original investment thesis is no longer valid.
5
Managers Special Equity Fund
Portfolio Managers’ Comments (continued)
The ideal company exhibits many of the following traits:
| | • | | Market capitalization less than $2 billion |
| | • | | Discounted price/earnings ratio relative to the market |
| | • | | Above average growth prospects |
| | • | | Neglected, under followed, and often out of favor |
Portfolio Management:
| | • | | Broad diversification among economic sectors |
| | • | | Keep attentive to earnings |
| | • | | Maintain favorable risk/reward |
The Portfolio:
| | • | | Stocks have a maximum weighting of 5% for each holding |
| | • | | Typically holds 65-85 stocks |
| | • | | Cash equivalents averaging less than 5% |
The following factors influence the sell decision when:
| | • | | P/E equals the market/industry P/E |
| | • | | Holding reaches 5.0% of the portfolio |
Westport Asset Management, Inc.
The investment team at Westport Asset Management, Inc., (“Westport”) led by Andy Knuth, focuses on small-capitalization companies that are determined to have significant upside potential in earnings and ROE over the next few years. Although investing for growth, Andy will purchase stocks only if they are selling at or below the market’s P/E multiple, or below valuations of other companies in the same industry. Implicit in the strategy is that Andy and his partner Ed Nicklin focus on a small number of issues, and hold them for a long time. The concentration and low turnover enable them to heavily research and monitor each position.
The portfolio manager at Westport is focused on future profits only, and in fact, prefers to find businesses which are inherently good but which have gone through a troubling period. Acquisitions or divestitures, management shake-ups, changes in the business cycle, or the development of a proprietary product in a strong industry are all factors that might improve earnings and investor perceptions. The portfolio manager will typically have a concentrated portfolio, and any industry concentrations are merely an outcome of stock selection. Because some of the companies in which he invests may not have earnings, the price to trailing earnings ratio may be high, although the price to forward earnings will be well below average. The management style is patient, usually turning over less than 20% per year.
The ideal company exhibits many of the following traits:
| | • | | Upside potential in earnings and ROE (Return On Equity) |
| | • | | Low P/E and improving earnings/cash flow |
| | • | | Company driven by entrepreneurial impact |
| | • | | Preference for turnaround story |
Portfolio Management:
| | • | | Has a 2-3 year time horizon on initial investments |
| | • | | Concentrates the portfolio and has low turnover |
| | • | | Views any signifi cant industry concentrations as merely an outcome of bottom-up fundamental analysis |
| | • | | May invest in companies that do not have earnings |
The Portfolio:
| | • | | Initial stock weightings will vary depending on liquidity |
| | • | | May have trailing P/E ratios that are higher than the market, but generally forward P/E ratios will be well below the average, because some of the companies Westport invests in may not have earnings |
| | • | | Has an average turnover of less than 20% per year |
The portfolio management team will make a sell decision when:
| | • | | A stock reaches pre-determined price objective |
| | • | | There are negative changes in a company’s fundamentals |
Veredus Asset Management, LLC
The investment philosophy at Veredus Asset Management, LLC (“Veredus”) is based on their belief that positive earnings surprise and positive estimate revision are the key drivers of stock price change. In particular, the Veredus investment team, led by founder Tony Weber, is concerned about the sustainability of this earnings momentum. To that end, the team tends to focus more on the economic performance of a particular company as opposed to more traditional accounting measures. Specifically, the analysts and portfolio managers at Veredus look for companies with strong asset growth and accelerating rates of economic return in excess of their cost of capital. This is what they view as the true definition of wealth creation, or cash fl ow return on investment (CFROI). Finally, the Veredus team also believes that some technical measures, such as relative strength, flows, and trading volume, can be useful indicators of future stock performance.
The investment team at Veredus starts the research process by screening the entire universe of over 8,000 small companies for upward earnings revisions. Companies are also ranked on the basis of recent estimate changes, considering both absolute and percent change in estimates. This model provides not only a shopping list of potential targets, but the qualification work that Veredus feels is essential to market acceptance. The core of the research effort is placed on calculating the true cash fl ow return on investment (CFROI) potential of companies on the target list and how Veredus’ internally developed work compares with current street expectations. The primary focus is assessing CFROI on a sequential basis as opposed to year over year. This gives the investment team a more detailed picture for possibilities of margin expansion, sales growth, and other sources of CFROI leverage. Contact with company management is also essential in researching companies in the small-cap arena.
The ideal investment exhibits many of the following traits:
| | • | | Positive earnings surprise and subsequent upward estimate revisions |
| | • | | Attacking large markets with high barriers to entry |
| | • | | Balance sheet commensurate with income statement |
Portfolio Management:
| | • | | Screens for companies which rank in the top 20% of all companies based on earnings estimate revisions and quarterly earning surprise |
| | • | | Employs extensive fundamental research |
| | • | | Seeks sustainability of company’s fundamental performance |
6
Managers Special Equity Fund
Portfolio Managers’ Comments (continued)
The investment team will make a sell decision when:
| | • | | There is an anticipated/ actual earnings disappointment |
| | • | | They see deteriorating market mechanics |
| | • | | There is a change in strategic market outlook or better idea develops |
The Year in Review
Over the 12 months ended December 31, 2006, the Managers Special Equity Fund Managers Class of shares returned 11.28% and the Institutional Class of shares returned 11.53% compared to a gain of 18.37% for the Russell 2000® Index and 13.35% for the Russell 2000 Growth Index.
Despite a rough patch mid-way through, it was ultimately a good year to be invested in the equity markets and an even better year to be invested in small-capitalization stocks. Broad markets posted strong gains with small-cap stocks outperforming large (as measured by the Russell Indexes) and value outperforming growth. For small-cap value stocks, this marked the sixth year out of the past seven they have outperformed their growth counterparts. Sector performance was positive across the board, with materials and telecom services posting 40% gains. Health care was the only sector that failed to reach double digit returns for the year as the pharmaceutical industry turned in lackluster performance. As is generally consistent with a value driven market, those stocks with the lowest quintile of price-to-earnings and price-to-book ratios recorded the strongest returns. It’s also worth noting that investors were hesitant to reward future growth prospects as those stocks in the highest quintile of projected EPS growth, performed the worst. This was particularly troublesome for strategies that attempt to take advantage of earnings growth on the basis that it will drive future price appreciation.
Small-cap stocks started the year strongly, with the Russell 2000 rising almost 9% in January alone. Prices moderated somewhat throughout February before pushing higher again in March. Ultimately, the rally was broad-based with almost all economic sectors rising 10% or more. The Fund’s materials and telecommunications holdings participated in this rally and performed quite well. Poor performance of a few stocks in the health care and energy sectors, as well as the automotive-related industries challenged returns. The Portfolio’s largest detractor in the opening quarter, and ultimately for the year, was Dana Corp. The automotive components manufacturer filed for Chapter 11 in early March and dropped almost 79% during the quarter.
The U.S. stock market moved sharply lower and showed increased volatility throughout the second quarter and into the third as investors tried to decipher whether the economy was reaching an inflection point. This broad market correction was particularly painful for small-cap stocks which had risen the most leading up to the May 9th peak and struggled to recover with the same speed as large- cap stocks, which offered greater protection to the downside during the initial sell-off. Returns for the Fund were mixed during the decline but actually held up slightly better on average than those of the Index. Stocks within the energy, materials, and consumer discretionary sectors of the Portfolio all declined less on average than those stocks within the respective sectors of the Index. Conversely, stocks with high forecasted earnings growth, which typically coincides with higher P/E and/or P/B ratios, lost significantly more value than stocks with low earnings growth expectations during this seven week period.
The Final quarter of 2006 was marked by investors continuing to reward the lowest price-to-earnings and price-to-book stocks while shying away from those companies with the highest EPS growth numbers. This had a direct impact on the Portfolio as a majority of holdings achieved positive earnings, yet the subadvisors continued to go unrewarded for this metric. Coldwater Creek is a good example of this, as the firm has consistently grown earnings at a double-digit pace, yet sold off during the final quarter at what was widely perceived to be a market over-reaction to narrowly missed net income forecasts.
Among the Fund’s strongest individual contributors for the full year were AK Steel (+112%), Equinix (+86%), and Air France-KLM (+94%). AK Steel, a long-time holding of Donald Smith, benefited from an overall boost to the industry behind circulating merger and acquisition activity in addition to strong global demand. Visteon (+35%) rallied off first quarter industry troubles to post a nice return and Air France-KLM put up back-to-back quarters of top-ten Fund performance. In addition to the above mentioned Dana Corp., NeoPharm (-85%), Blue Coat Systems (-48%), and Sea Containers (-94%) all challenged returns and were liquidated during various times of the year.
Looking Forward
Heading into 2007, the Fund’s sector weights have not changed significantly as information technology, industrials, and consumer discretionary remain the three largest allocations. Despite the long run of small-cap dominance in the market place, Fund management on the whole remains optimistic about prospects for the coming year. In addition, the Portfolio continues to be attractively valued relative to both its historical and expected earnings growth rates.
Cumulative Total Return Performance
Managers Special Equity Fund’s cumulative total return is based on the daily change in net asset value (NAV), and assumes that all distributions were reinvested. The Russell 2000 Index is comprised of the smallest 2000 companies in the Russell 3000® Index and is widely regarded in the industry as the premier measure of small-cap stock performance. The Russell 3000 Index is composed of 3000 of the largest U.S. companies, as determined by market capitalization which represents approximately 98% of the investable U.S. equity market. Unlike the Fund, the Russell 2000 Index is unmanaged, is not available for investment, and does not incur expenses. The fi rst graph compares a hypothetical $10,000 investment made in Managers Special Equity Fund–Managers Class on
7
Managers Special Equity Fund
Portfolio Managers’ Comments (continued)
December 31, 1996, to a $10,000 investment made in the Russell 2000 Index for the same time period. The second graph compares a hypothetical $10,000 investment made in Managers Special Equity Fund–Institutional Class on May 3, 2004, to a $10,000 investment made in the Russell 2000 Index for the same time period. The graphs and tables do not reflect the deduction of taxes that a shareholder would pay on a Fund distribution or redemption of shares. Past performance is not indicative of future results.
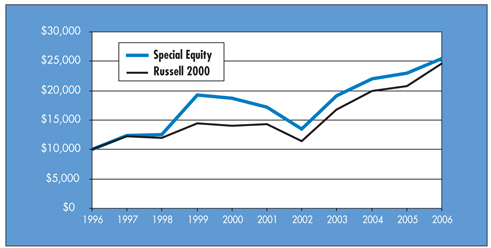
The table below shows the average annual total returns for Managers Special Equity Fund–Managers Class and the Russell 2000 Index since December 31, 1996 through December 31, 2006.
| | | | | | | | | | | |
Average Annualized Total Returns | | One Year | | | Five Years | | | Ten Years | | | Inception Date |
Special Equity - Managers Class | | 11.28 | % | | 8.19 | % | | 9.82 | % | | 6/1/84 |
Russell 2000 Index | | 18.37 | % | | 11.39 | % | | 9.44 | % | | |
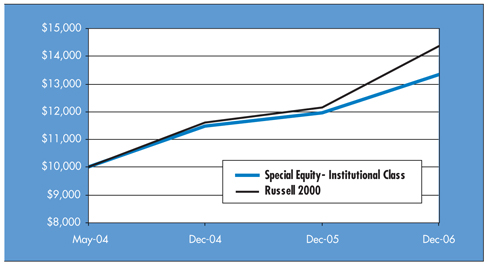
The table below shows the average annual total returns for Special Equity-Institutional Class and the Russell 2000 Index since May 3, 2004 through December 31, 2006.
| | | | | | | | |
Average Annualized Total Returns | | One Year | | | Since Inception | | | Inception Date |
Special Equity - Institutional Class | | 11.53 | % | | 11.42 | % | | 5/3/04 |
Russell 2000 Index | | 18.37 | % | | 14.60 | % | | |
8
Managers Special Equity Fund
Fund Snapshots
December 31, 2006
Portfolio Breakdown
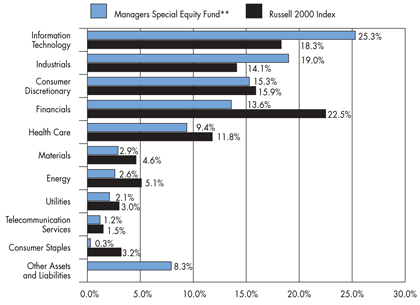
| ** | As a percentage of net assets |
| | | | | | |
Industry | | Managers Special Equity Fund ** | | | Russell 2000 Index | |
Information Technology | | 25.3 | % | | 18.3 | % |
Industrials | | 19.0 | % | | 14.1 | % |
Consumer Discretionary | | 15.3 | % | | 15.9 | % |
Financials | | 13.6 | % | | 22.5 | % |
Health Care | | 9.4 | % | | 11.8 | % |
Materials | | 2.9 | % | | 4.6 | % |
Energy | | 2.6 | % | | 5.1 | % |
Utilities | | 2.1 | % | | 3.0 | % |
Telecommunication Services | | 1.2 | % | | 1.5 | % |
Consumer Staples | | 0.3 | % | | 3.2 | % |
Other Assets and Liabilities | | 8.3 | % | | 0.0 | % |
Top Ten Holdings
| | | |
Security Name | | Percentage of
Net Assets | |
MI Developments, Inc., Class A* | | 1.8 | % |
ITT Educational Services, Inc.* | | 1.7 | |
Reliant Resources, Inc.* | | 1.4 | |
Air France-KLM, ADR | | 1.3 | |
AK Steel Holding Corp.* | | 1.3 | |
Spansion, Inc. | | 1.2 | |
Visteon Corp.* | | 1.2 | |
Semiconductor Manufacturing International Corp. | | 0.9 | |
Dillard’s, Inc., Class A | | 0.9 | |
Downey Financial Corp. | | 0.9 | |
| | | |
Top Ten as a Group | | 12.6 | % |
| | | |
| * | Top Ten Holding at June 30, 2006 |
Any sectors, industries, or securities discussed should not be perceived as investment recommendations. Mention of a specific security should not be considered a recommendation to buy or solicitation to sell that security.
9
Managers Special Equity Fund
Schedule of Portfolio Investments
December 31, 2006
| | | | | | |
| | | Shares | | | Value |
Common Stocks - 91.6% | | | | | | |
Consumer Discretionary - 15.2% | | | | | | |
Aftermarket Technology Corp.* | | 328,500 | | | $ | 6,990,480 |
American Axle & Manufacturing Holdings, Inc. | | 296,500 | | | | 5,630,535 |
Applebee’s International, Inc. | | 388,125 | 2 | | | 9,575,044 |
Bebe Stores, Inc. | | 392,950 | 2 | | | 7,776,480 |
Big 5 Sporting Goods Corp. | | 397,600 | | | | 9,709,392 |
Big Lots, Inc.* | | 907,152 | 2 | | | 20,791,924 |
Bright Horizons Family Solutions, Inc.* | | 52,900 | | | | 2,045,114 |
Brown Show Co., Inc. | | 53,500 | 2 | | | 2,554,090 |
Buckle, Inc., The | | 20,200 | 2 | | | 1,027,170 |
Buffalo Wild Wings, Inc.* | | 34,300 | | | | 1,824,760 |
Charlotte Russe Holding, Inc.* | | 237,180 | | | | 7,293,285 |
Charming Shoppes, Inc. * | | 266,200 | 2 | | | 3,601,686 |
Chipotle Mexican Grill, Inc.* | | 323,600 | 2 | | | 18,445,200 |
CKE Restaurants Inc. | | 169,100 | 2 | | | 3,111,440 |
Coldwater Creek, Inc.* | | 370,650 | 2 | | | 9,088,338 |
Copart, Inc.* | | 564,400 | | | | 16,932,000 |
COX Radio, Inc., Class A* | | 55,100 | 2 | | | 898,130 |
Crocs, Inc.* | | 208,175 | 2 | | | 8,993,160 |
Dana Corp. * | | 1,009,600 | | | | 1,403,344 |
Deckers Outdoor Corp.* | | 13,370 | | | | 801,531 |
Dick’s Sporting Goods, Inc.* | | 158,750 | 2 | | | 7,777,162 |
Dillard’s, Inc., Class A | | 831,200 | | | | 29,067,064 |
Force Protection, Inc.* | | 798,500 | | | | 13,901,885 |
Gaylord Entertainment Co., Class A* | | 161,233 | 2 | | | 8,211,597 |
Guess?, Inc.* | | 150,200 | 2 | | | 9,527,186 |
Gymboree Corp.* | | 157,900 | 2 | | | 6,025,464 |
IMAX Corp.* | | 892,400 | | | | 3,355,424 |
Jack in the Box, Inc.* | | 58,800 | 2 | | | 3,589,152 |
Jos. A. Bank Clothiers, Inc.* | | 359,190 | | | | 10,542,227 |
MarineMax, Inc.* | | 217,000 | | | | 5,626,810 |
Men’s Wearhouse, Inc. | | 136,700 | 2 | | | 5,230,142 |
NutriSystem, Inc.* | | 85,500 | 2 | | | 5,419,845 |
Orient-Express Hotels, Ltd. | | 341,900 | 2 | | | 16,178,708 |
Priceline.com, Inc.* | | 88,400 | 2 | | | 3,855,124 |
Progressive Gaming International Corp.* | | 451,100 | | | | 4,091,477 |
Rare Hospitality International, Inc.* | | 196,300 | | | | 6,464,159 |
Rent-A-Center, Inc.* | | 110,600 | 2 | | | 3,263,806 |
Ross Stores, Inc. | | 930,000 | 2 | | | 27,249,000 |
Ruby Tuesday, Inc. | | 510,900 | 2 | | | 14,019,096 |
Ruth’s Chris Steak House, Inc.* | | 342,050 | | | | 6,252,674 |
Saks, Inc. | | 1,023,000 | 2 | | | 18,229,860 |
Scopus Video Neworks, Ltd. * | | 688,200 | 4 | | | 2,924,850 |
Steak’n Shake Co., The* | | 393,900 | | | | 6,932,640 |
Steiner Leisure, Ltd.* | | 26,400 | | | | 1,201,200 |
Steve Madden, Ltd. | | 209,750 | | | | 7,360,128 |
Talbots, Inc. | | 344,800 | 2 | | | 8,309,680 |
The Wet Seal, Inc., Class A* | | 1,691,900 | | | | 11,284,973 |
Toro Co. | | 260,200 | 2 | | | 12,133,126 |
Under Armour, Inc. * | | 258,025 | 2 | | | 13,017,361 |
United Rentals, Inc.* | | 357,400 | 2 | | | 9,088,682 |
VistaPrint, Ltd.* | | 120,000 | 2 | | | 3,973,200 |
Visteon Corp.* | | 4,395,300 | | | | 37,272,144 |
Warnaco Group, Inc., The* | | 269,675 | | | | 6,844,351 |
Zumiez, Inc.* | | 269,675 | | | | 7,966,200 |
Total Consumer Discretionary | | | | | | 474,679,500 |
Consumer Staples - 0.3% | | | | | | |
NBTY, Inc.* | | 99,100 | 2 | | | 4,119,587 |
Playtex Products, Inc.* | | 83,600 | | | | 1,203,004 |
Ralcorp Holdings, Inc.* | | 59,000 | 2 | | | 3,002,510 |
Total Consumer Staples | | | | | | 8,325,101 |
Energy - 2.6% | | | | | | |
Comstock Resources, Inc.* | | 503,400 | 2 | | | 15,635,604 |
Houston Exploration Co.* | | 192,700 | 2 | | | 9,978,006 |
Key Energy Services, Inc.* | | 456,100 | | | | 7,137,965 |
Newfield Exploration Co.* | | 83,700 | 2 | | | 3,846,015 |
Overseas Shipholding Group, Inc. | | 130,000 | 2 | | | 7,319,000 |
Parker Drilling, Co.* | | 247,000 | | | | 2,017,990 |
PetroQuest Energy, Inc.* | | 205,725 | | | | 2,620,937 |
Pogo Producing Co. | | 484,200 | 2 | | | 23,454,648 |
Stone Energy Corp.* | | 153,200 | 2 | | | 5,415,620 |
W-H Energy Services, Inc.* | | 90,000 | | | | 4,382,100 |
Total Energy | | | | | | 81,807,885 |
Financials - 13.6% | | | | | | |
American Financial Group, Inc. | | 232,950 | 2 | | | 8,365,235 |
American National Insurance Co. | | 68,950 | | | | 7,867,885 |
American Physicians Cap, Inc.* | | 24,450 | | | | 978,978 |
Arthur J. Gallagher & Co. | | 67,800 | 2 | | | 2,003,490 |
Aspen Insurance Holdings, Ltd. | | 412,700 | | | | 10,878,772 |
BankUnited Financial Corp. | | 601,088 | | | | 16,806,420 |
Brown & Brown, Inc. | | 530,200 | 2 | | | 14,956,942 |
Cash America International | | 40,700 | 2 | | | 1,908,830 |
Chittenden Corp. | | 400,000 | 2 | | | 12,276,000 |
Clark, Inc. | | 390,700 | | | | 6,497,341 |
The accompanying notes are an integral part of these financial statements.
10
Managers Special Equity Fund
Schedule of Portfolio Investments (continued)
| | | | | | |
| | | Shares | | | Value |
Financials - 13.6% (continued) | | | | | | |
CompuCredit Corp.* | | 270,200 | 2 | | $ | 10,756,662 |
Cowen Group, Inc.* | | 394,853 | | | | 8,351,141 |
Delphi Financial Group, Inc., Class A | | 230,050 | | | | 9,307,823 |
Downey Financial Corp. | | 393,380 | 2 | | | 28,551,520 |
Financial Federal Corp. | | 52,300 | | | | 1,538,143 |
First Cash Financial Services, Inc.* | | 95,600 | | | | 2,473,172 |
FirstFed Financial Corp.* | | 117,900 | | | | 7,895,763 |
GFI Group Inc.* | | 118,600 | 2 | | | 7,384,036 |
Hancock Holding Co. | | 35,200 | 2 | | | 1,859,968 |
Hanmi Financial Corp. | | 66,883 | | | | 1,506,874 |
Harleysville Group, Inc. | | 18,600 | 2 | | | 647,652 |
Hilb, Rogal & Hamilton Co. | | 305,500 | 2 | | | 12,867,660 |
Investment Technology Group, Inc.* | | 77,300 | 2 | | | 3,314,624 |
iStar Financial, Inc. | | 377,400 | 2 | | | 18,047,268 |
Lazard, Ltd. | | 391,525 | 2 | | | 18,534,793 |
MCG Capital Corp. | | 609,778 | | | | 12,390,689 |
Meadowbrook Insurance Group, Inc.* | | 72,200 | | | | 714,058 |
MI Developments, Inc., Class A | | 1,589,100 | | | | 56,730,870 |
National Western Life Insurance Co., Class A | | 12,000 | | | | 2,761,680 |
Navigators Group, Inc.* | | 12,600 | | | | 607,068 |
Ocwen Financial Corp.* | | 73,200 | | | | 1,160,952 |
Philadelphia Consolidated Holding Co.* | | 113,900 | 2 | | | 5,075,384 |
Placer Sierra Bancshares | | 282,600 | | | | 6,717,402 |
ProAssurance Corp.* | | 34,200 | 2 | | | 1,707,264 |
Prosperity Bancshares, Inc. | | 280,400 | | | | 9,676,604 |
Provident Bankshares Corp. | | 208,465 | 2 | | | 7,421,354 |
RAM Holdings, Ltd.* | | 516,300 | | | | 7,377,927 |
Reinsurance Group of America, Inc. | | 283,500 | 2 | | | 15,790,950 |
Safety Insurance Group, Inc. | | 18,000 | | | | 912,780 |
SeaBright Insurance Holdings, Inc.* | | 424,635 | | | | 7,647,676 |
St. Joe Co., The | | 70,400 | 2 | | | 3,771,328 |
Sterling Financial Corp. | | 473,140 | 2 | | | 15,996,863 |
The Hanover Insurance Group, Inc. | | 246,800 | 2 | | | 12,043,840 |
The South Financial Group, Inc. | | 468,612 | 2 | | | 12,460,393 |
TierOne Corp. | | 22,500 | | | | 711,225 |
Tower Group, Inc. | | 74,700 | | | | 2,320,929 |
TradeStation Group, Inc.* | | 172,900 | | | | 2,377,375 |
Triad Guaranty, Inc.* | | 101,082 | | | | 5,546,369 |
U.S.I. Holdings Corp.* | | 632,201 | | | | 9,710,607 |
United PanAm Financial Corp. * | | 254,700 | | | | 3,504,672 |
Wilshire Bancorp, Inc. | | 31,200 | | | | 591,864 |
World Acceptance Corp.* | | 67,100 | | | | 3,150,345 |
Total Financials | | | | | | 424,455,460 |
Health Care - 9.4% | | | | | | |
Adams Respiratory Therapeutics, Inc.* | | 439,875 | 2 | | | 17,951,299 |
Advisory Board Co., The* | | 33,600 | | | | 1,798,944 |
Allscripts Healthcare Solutions, Inc.* | | 326,100 | 2 | | | 8,801,439 |
AMERIGROUP Corp.* | | 81,600 | 2 | | | 2,928,624 |
Applera Corp - Celera Genomics Group* | | 364,600 | | | | 5,100,754 |
Arthrocare Corp.* | | 52,900 | 2 | | | 2,111,768 |
Cardica, Inc.* | | 154,500 | 2 | | | 729,240 |
Centene Corp.* | | 649,300 | | | | 15,953,301 |
Cepheid, Inc.* | | 521,800 | | | | 4,435,300 |
Charles River Laboratories International, Inc.* | | 335,616 | 2 | | | 14,515,392 |
Cholestech Corp* | | 34,200 | | | | 629,964 |
Cross Country Healthcare, Inc.* | | 301,925 | | | | 6,588,003 |
Cubist Pharmaceuticals, Inc.* | | 216,200 | 2 | | | 3,915,382 |
Cutera, Inc.* | | 77,300 | | | | 2,087,100 |
Cyberonics, Inc.* | | 303,500 | | | | 6,264,240 |
Cytyc Corp.* | | 150,000 | 2 | | | 4,245,000 |
Digene Corp.* | | 68,600 | 2 | | | 3,287,312 |
Eclipsys Corp.* | | 432,700 | | | | 8,896,312 |
Emageon, Inc.* | | 199,000 | | | | 3,056,640 |
Five Star Quality Care, Inc.* | | 55,200 | | | | 615,480 |
Gen-Probe, Inc.* | | 215,900 | 2 | | | 11,306,683 |
Greatbatch, Inc.* | | 28,640 | | | | 770,989 |
Harvard Bioscience, Inc.* | | 537,600 | | | | 2,757,888 |
Hologic, Inc.* | | 297,150 | 2 | | | 14,049,252 |
IMS Health, Inc. | | 820,081 | | | | 22,535,826 |
Intuitive Surgical, Inc.* | | 131,650 | 2 | | | 12,625,235 |
inVentiv Health, Inc. * | | 120,000 | | | | 4,242,000 |
Inverness Medical Innovations, Inc.* | | 243,550 | 2 | | | 9,425,385 |
Lincare Holdings, Inc.* | | 212,100 | 2 | | | 8,450,064 |
Medicines Co.* | | 119,800 | 2 | | | 3,800,056 |
Medicis Pharmaceutical Corp. | | 44,735 | | | | 1,571,541 |
Meridian Bioscience, Inc. | | 58,900 | | | | 1,444,817 |
NxStage Medical, Inc.* | | 280,000 | | | | 2,346,400 |
Omnicell, Inc.* | | 1,334,275 | | | | 24,857,543 |
Owens & Minor, Inc. | | 213,300 | 2 | | | 6,669,891 |
Parexel International Corp.* | | 56,900 | | | | 1,648,393 |
Phase Forward, Inc.* | | 201,300 | | | | 3,015,474 |
Psychiatric Solutions, Inc.* | | 166,800 | 2 | | | 6,258,336 |
The accompanying notes are an integral part of these financial statements.
11
Managers Special Equity Fund
Schedule of Portfolio Investments (continued)
| | | | | | |
| | | Shares | | | Value |
Health Care - 9.4% (continued) | | | | | | |
Res-care inc.* | | 29,200 | | | $ | 529,980 |
Sciele Pharma, Inc.* | | 183,000 | | | | 4,392,000 |
Triad Hospitals, Inc.* | | 410,664 | 2 | | | 17,178,075 |
Universal Health Services, Inc., Class B | | 170,000 | 2 | | | 9,423,100 |
Viasys Healthcare, Inc.* | | 43,100 | | | | 1,199,042 |
WellCare Health Plans, Inc.* | | 89,100 | 2 | | | 6,138,990 |
West Pharmaceutical Services, Inc. | | 38,000 | | | | 1,946,740 |
Total Health Care | | | | | | 292,495,194 |
Industrials - 19.0% | | | | | | |
AAR Corp.* | | 259,200 | | | | 7,566,048 |
Adesa, Inc. | | 261,600 | 2 | | | 7,259,400 |
Administaff, Inc. | | 81,100 | | | | 3,468,647 |
Air France-KLM, ADR | | 948,178 | | | | 39,690,731 |
Airtran Holdings, Inc.* | | 186,089 | | | | 2,184,685 |
Alaska Airgroup, Inc.* | | 615,000 | 2 | | | 24,292,500 |
Allegiant Travel Co.* | | 16,425 | | | | 460,885 |
American Commercial Lines, Inc.* | | 160,475 | 2 | | | 10,512,717 |
American Railcar Industries, Inc. | | 246,050 | | | | 8,375,542 |
Applied Industrial Technologies, Inc. | | 85,950 | | | | 2,261,344 |
Axsys Technologies, Inc.* | | 377,950 | | | | 6,640,582 |
BE Aerospace, Inc.* | | 640,500 | 2 | | | 16,448,040 |
Bucyrus International, Inc. | | 62,225 | | | | 3,220,766 |
Carlisle Co., Inc. | | 116,300 | 2 | | | 9,129,550 |
Cascade Corp. | | 32,600 | | | | 1,724,540 |
Celadon Group, Inc.* | | 75,235 | | | | 1,260,186 |
Ceradyne, Inc.* | | 180,800 | 2 | | | 10,215,200 |
Consolidated Graphics, Inc.* | | 185,800 | | | | 10,975,206 |
Con-way, Inc. | | 30,000 | | | | 1,321,200 |
Corrections Corp. of America* | | 169,650 | | | | 7,673,270 |
Crane Co. | | 394,000 | | | | 14,436,160 |
Curtiss-Wright Corp. | | 170,400 | 2 | | | 6,318,432 |
DeVry, Inc. | | 734,200 | 2 | | | 20,557,600 |
Dycom Industries, Inc.* | | 830,900 | | | | 17,548,608 |
EGL, Inc.* | | 263,500 | | | | 7,847,030 |
EMCOR Group, Inc.* | | 201,800 | | | | 11,472,330 |
First Advantage Corp.* | | 377,100 | 2 | | | 8,658,216 |
Fuel Tech, Inc.* | | 115,400 | | | | 2,843,456 |
Genco Shipping & Trading, Ltd. | | 40,850 | | | | 1,141,349 |
Genlyte Group, Inc.* | | 38,500 | 2 | | | 3,007,235 |
H&E Equipment Services, Inc.* | | 299,875 | | | | 7,427,904 |
Heico Corp. | | 117,475 | | | | 4,561,554 |
Heidrick & Struggles International, Inc. * | | 314,100 | | | | 13,305,276 |
Hub Group, Inc.* | | 130,600 | | | | 3,598,030 |
Infrasource Services, Inc.* | | 484,225 | | | | 10,541,578 |
InnerWorkings, Inc.* | | 64,800 | | | | 1,034,208 |
Interpool, Inc. | | 397,800 | | | | 9,292,608 |
ITT Educational Services, Inc.* | | 789,740 | | | | 52,415,044 |
Kaydon Corp. | | 66,100 | 2 | | | 2,626,814 |
Knoll, Inc. | | 115,900 | | | | 2,549,800 |
Korn/Ferry International* | | 71,200 | | | | 1,634,752 |
LSI Industries, Inc. | | 34,600 | | | | 686,810 |
Lydall, Inc.* | | 202,800 | | | | 2,192,268 |
Manitowoc Co., The | | 253,825 | | | | 15,084,820 |
Middleby Corp., The* | | 24,400 | | | | 2,553,948 |
Mobile Mini, Inc.* | | 390,075 | | | | 10,508,621 |
Moog, Inc.* | | 36,600 | 2 | | | 1,397,754 |
Navigant Consulting, Inc.* | | 607,400 | | | | 12,002,224 |
NCI Building Systems, Inc.* | | 270,200 | 2 | | | 13,982,850 |
Pacer International, Inc. | | 44,700 | 2 | | | 1,330,719 |
Perini Corp. * | | 261,700 | | | | 8,055,126 |
Portfolio Recovery Associates, Inc.* | | 83,400 | | | | 3,893,946 |
Precision Castparts Corp. | | 160,200 | 2 | | | 12,540,456 |
Quanta Services, Inc.* | | 681,325 | 2 | | | 13,401,663 |
Regal-Beloit Corp. | | 58,400 | 2 | | | 3,066,584 |
Republic Airways Holdings Inc.* | | 52,300 | | | | 877,594 |
Ryder System, Inc. | | 82,600 | 2 | | | 4,217,556 |
Sea Containers, Ltd., Class A* | | 658,900 | | | | 461,230 |
Sequa Corp., Class A* | | 99,600 | 2 | | | 11,459,976 |
Sequa Corp., Class B* | | 38,300 | | | | 4,401,436 |
Skywest, Inc. | | 307,460 | 2 | | | 7,843,305 |
Stanley, Inc.* | | 176,800 | | | | 2,989,688 |
Sterling Construction, Inc.* | | 16,310 | | | | 354,906 |
Superior Essex, Inc.* | | 43,700 | | | | 1,453,025 |
Tecumseh Products Co., Class B* | | 175,993 | | | | 2,921,484 |
Teledyne Technologies, Inc.* | | 61,000 | 2 | | | 2,447,930 |
Tennant Co. | | 69,100 | | | | 2,003,900 |
Tetra Technologies, Inc.* | | 676,300 | | | | 12,234,267 |
Trinity Industries, Inc. | | 429,750 | 2 | | | 15,127,200 |
URS Corp.* | | 443,225 | | | | 18,992,191 |
Valmont Industries, Inc. | | 31,900 | 2 | | | 1,770,131 |
Wabtec Corp. | | 91,500 | | | | 2,779,770 |
Walter Industries, Inc. | | 296,400 | 2 | | | 8,017,620 |
Washington Group International, Inc.* | | 194,650 | 2 | | | 11,638,124 |
Watson Wyatt & Co. | | 59,000 | 2 | | | 2,663,850 |
Total Industrials | | | | | | 592,851,995 |
The accompanying notes are an integral part of these financial statements.
12
Managers Special Equity Fund
Schedule of Portfolio Investments (continued)
| | | | | | |
| | | Shares | | | Value |
Information Technology - 25.3% | | | | | | |
Acacia Research Corp.* | | 239,619 | | | $ | 3,206,102 |
Acme Packet, Inc.* | | 177,600 | | | | 3,665,664 |
ADC Telecommunications, Inc.* | | 308,300 | 2 | | | 4,479,599 |
Advanced Energy Industries, Inc.* | | 715,650 | | | | 13,504,316 |
Airspan Networks, Inc.* | | 1,467,819 | 2 | | | 5,430,930 |
Altiris, Inc.* | | 87,700 | | | | 2,225,826 |
AMIS Holdings, Inc.* | | 668,649 | | | | 7,067,620 |
Anaren Microwave, Inc.* | | 207,400 | | | | 3,683,424 |
Andrew Corp.* | | 1,046,900 | 2 | | | 10,709,787 |
ANSYS, Inc.* | | 337,600 | | | | 14,682,224 |
aQuantive, Inc.* | | 556,750 | 2 | | | 13,729,455 |
Arris Group, Inc.* | | 427,800 | 2 | | | 5,351,778 |
ASE Test, Ltd.* | | 162,500 | | | | 1,639,625 |
Aspen Technology, Inc.* | | 545,125 | | | | 6,007,277 |
ATMI, Inc.* | | 882,500 | | | | 26,942,725 |
AudioCodes, Ltd.* | | 1,146,400 | | | | 10,741,768 |
Avocent Corp.* | | 97,600 | 2 | | | 3,303,760 |
Belden CDT, Inc. | | 106,900 | 2 | | | 4,178,721 |
Benchmark Electronics, Inc.* | | 376,350 | 2 | | | 9,167,886 |
Brocade Communications Systems, Inc.* | | 443,300 | 2 | | | 3,639,493 |
Cabot Microelectronics Corp.* | | 17,900 | | | | 607,526 |
CalAmp Corp. * | | 781,600 | | | | 6,596,704 |
Checkpoint Systems, Inc.* | | 443,300 | | | | 8,954,660 |
Ciena Corp.* | | 282,875 | 2 | | | 7,838,466 |
CommScope, Inc.* | | 230,100 | 2 | | | 7,013,448 |
CommVault Systems, Inc.* | | 176,400 | | | | 3,529,764 |
CSG Systems International, Inc.* | | 80,100 | | | | 2,141,073 |
Diebold, Inc. | | 106,400 | 2 | | | 4,958,240 |
Diodes, Inc.* | | 96,100 | | | | 3,409,628 |
eCollege.com* | | 492,400 | | | | 7,706,060 |
eFunds Corp.* | | 364,100 | 2 | | | 10,012,750 |
Electronics for Imaging, Inc.* | | 399,681 | 2 | | | 10,623,521 |
EMCORE Corp.* | | 936,200 | | | | 5,177,186 |
Emulex Corp.* | | 62,460 | | | | 1,218,595 |
Equinix, Inc.* | | 331,300 | 2 | | | 25,052,906 |
Exfo Electro-Optical Engineering, Inc.* | | 1,957,500 | | | | 11,001,150 |
Fairchild Semiconductor International, Inc.* | | 875,500 | 2 | | | 14,717,155 |
FEI Co.* | | 893,200 | | | | 23,553,684 |
Formfactor, Inc.* | | 338,300 | 2 | | | 12,601,675 |
Hittite Microwave Corp.* | | 217,800 | 2 | | | 7,039,296 |
Hutchinson Technology, Inc.* | | 684,200 | | | | 16,126,594 |
Hyperion Solutions Corp.* | | 67,600 | 2 | | | 2,429,544 |
Identity Solutions, Inc.* | | 700,925 | | | | 10,604,995 |
Interactive Intelligence, Inc.* | | 143,100 | | | | 3,208,302 |
Interwoven, Inc.* | | 71,600 | | | | 1,050,372 |
Intevac, Inc.* | | 215,475 | | | | 5,591,576 |
Itron, Inc.* | | 42,700 | 2 | | | 2,213,568 |
Keithley Instruments, Inc. | | 78,400 | | | | 1,030,960 |
Kronos Inc.* | | 72,100 | 2 | | | 2,648,954 |
Macrovision Corp.* | | 109,600 | 2 | | | 3,097,296 |
Manhattan Associates, Inc.* | | 57,300 | | | | 1,723,584 |
MIPS Technologies, Inc.* | | 102,500 | | | | 850,750 |
MoneyGram International, Inc. | | 163,950 | 2 | | | 5,141,472 |
MPS Group, Inc.* | | 303,000 | 2 | | | 4,296,540 |
Net 1 Ueps Technologies, Inc.* | | 387,800 | 2 | | | 11,463,368 |
NICE Systems, Ltd. * | | 69,225 | | | | 2,130,746 |
Nuance Communications, Inc.* | | 1,181,300 | 2 | | | 13,537,698 |
Openwave Systems, Inc.* | | 655,700 | | | | 6,052,111 |
Oplink Communications, Inc.* | | 361,500 | | | | 7,432,440 |
Opsware, Inc.* | | 715,800 | | | | 6,313,356 |
Optical Communication Products, Inc.* | | 1,085,800 | | | | 1,780,712 |
Parametric Technology Corp.* | | 982,820 | 2 | | | 17,710,416 |
Park Electrochemical Corp. | | 255,800 | | | | 6,561,270 |
Perficient, Inc.* | | 491,825 | | | | 8,070,848 |
Perot Systems Corp.* | | 950,410 | 2 | | | 15,577,220 |
Photon Dynamics, Inc.* | | 686,200 | | | | 8,021,678 |
Plexus Corp.* | | 15,800 | | | | 377,304 |
Polycom, Inc.* | | 275,725 | 2 | | | 8,522,660 |
Power Integrations, Inc.* | | 678,800 | | | | 15,917,860 |
RADVision Ltd.* | | 286,800 | | | | 5,758,944 |
Rogers Corp.* | | 153,400 | | | | 9,073,610 |
Salesforce.com, Inc.* | | 74,000 | 2 | | | 2,697,300 |
Semiconductor Manufacturing International Corp.* | | 4,542,500 | 2 | | | 29,253,700 |
SINA Corp.* | | 88,850 | 2 | | | 2,549,995 |
Smart Modular Technologies, Inc.* | | 829,026 | | | | 11,158,690 |
Smith Micro Software, Inc.* | | 160,600 | | | | 2,278,914 |
Solectron Corp.* | | 2,306,200 | 2 | | | 7,425,964 |
Spansion, Inc.* | | 2,571,200 | 2 | | | 38,208,032 |
Stratex Networks, Inc.* | | 1,013,290 | | | | 4,894,191 |
SYKES Enterprises, Inc.* | | 83,400 | | | | 1,471,176 |
SYNNEX Corp.* | | 440,600 | | | | 9,666,764 |
Synopsys, Inc.* | | 356,400 | 2 | | | 9,526,572 |
Tech Data Corp.* | | 685,000 | 2 | | | 25,940,950 |
Technitrol, Inc. | | 55,200 | 2 | | | 1,318,728 |
Terayon Communication Systems, Inc.* | | 5,597,600 | 4 | | | 12,482,648 |
The accompanying notes are an integral part of these financial statements.
13
Managers Special Equity Fund
Schedule of Portfolio Investments (continued)
| | | | | | | |
| | | Shares | | | Value | |
Information Technology - 25.3%(continued) | | | | | | | |
THQ, Inc.* | | 221,600 | 2 | | $ | 7,206,432 | |
Transaction Systems Architects, Inc.* | | 123,800 | 2 | | | 4,032,166 | |
Trident Microsystems, Inc.* | | 949,300 | 2 | | | 17,258,274 | |
Triquint Semiconductor* | | 1,370,650 | | | | 6,167,925 | |
Valueclick, Inc.* | | 418,100 | | | | 9,879,703 | |
Varian Semiconductor Equipment Associates, Inc.* | | 70,000 | 2 | | | 3,186,400 | |
VeriFone Holdings, Inc.* | | 210,100 | 2 | | | 7,437,540 | |
Vishay Intertechnology, Inc.* | | 713,900 | | | | 9,666,206 | |
WebEx Communications, Inc.* | | 421,500 | 2 | | | 14,706,135 | |
WNS Holdings, Ltd.* | | 96,100 | | | | 2,988,710 | |
Wright Express Corp.* | | 439,800 | | | | 13,708,566 | |
Zygo Corp.* | | 56,500 | | | | 929,425 | |
Total Information Technology | | | | | | 787,469,321 | |
Materials - 2.9% | | | | | | | |
AK Steel Holding Corp.* | | 2,307,100 | 2 | | | 38,989,990 | |
Compass Minerals International, Inc. | | 34,000 | | | | 1,073,040 | |
Cytec Industries, Inc. | | 318,600 | 2 | | | 18,004,086 | |
Greif, Inc. | | 21,700 | | | | 2,569,280 | |
Hercules, Inc.* | | 172,900 | 2 | | | 3,338,699 | |
Longview Fibre Co. | | 680,808 | | | | 14,943,736 | |
Rock-Tenn Co. | | 37,100 | | | | 1,005,781 | |
Spartech Corp. | | 47,500 | | | | 1,245,450 | |
Symyx Technologies, Inc.* | | 415,400 | | | | 8,968,486 | |
Total Materials | | | | | | 90,138,548 | |
Telecommunication Services - 1.2% | | | | | | | |
Alaska Communications Systems Group, Inc. | | 79,800 | | | | 1,212,162 | |
Cincinnati Bell, Inc.* | | 2,286,744 | 2 | | | 10,450,420 | |
Cogent Communications Group, Inc.* | | 397,100 | | | | 6,440,962 | |
General Communication, Inc., Class A* | | 878,100 | | | | 13,812,513 | |
InPhonic, Inc.* | | 394,700 | | | | 4,377,223 | |
Total Telecommunication Services | | | | | | 36,293,280 | |
Utilities - 2.1% | | | | | | | |
Avista Corp. | | 690,000 | 2 | | | 17,463,900 | |
Idacorp, Inc. | | 61,000 | 2 | | | 2,357,650 | |
Reliant Resources, Inc.* | | 3,137,200 | 2 | | | 44,579,612 | |
Total Utilities | | | | | | 64,401,162 | |
Total Common Stocks
(cost $2,247,933,893) | | | | | | 2,852,917,446 | |
Other Investment Company - 0.1% | | | | | | | |
iShares Russell 2000 Index Fund (cost $4,437,781) | | 56,500 | 2 | | | 4,409,825 | |
Warrants - 0.3% | | | | | | | |
Air France, ADR (cost $1,361,928) | | 861,980 | | | | 9,162,847 | |
Short-Term Investments - 33.0% | | | | | | | |
Other Investment Companies - 33.0%1 | | | | | | | |
Bank of New York Institutional Cash Reserves Fund, 5.32% 3 | | 774,188,203 | | | | 774,188,503 | |
JPMorgan Prime Money Market Fund, Institutional Class Shares, 5.18% | | 219,493,556 | | | | 219,493,556 | |
Vanguard Prime Money Market Fund, Institutional Class Shares, 5.27% | | 34,032,421 | | | | 34,032,421 | |
Total Other Investment Companies
(cost $1,027,714,480) | | | | | | 1,027,714,480 | |
Total Investments - 125.0%
(cost $3,281,448,082) | | | | | | 3,894,204,598 | |
Other Assets, less Liabilities - (25.0)% | | | | | | (780,507,561 | ) |
Net Assets - 100.0% | | | | | $ | 3,113,697,037 | |
Based on the approximate cost of investments of $3,299,434,788 for Federal income tax purposes at December 31, 2006, the aggregate gross unrealized appreciation and depreciation were $660,475,370 and $65,705,560, respectively, resulting in net unrealized appreciation of investments of $594,769,810.
| * | Non-income-producing securities. |
1 | Yield shown for an investment company represents the December 31, 2006, seven-day average yield, which refers to the sum of the previous seven days’ dividends paid, expressed as an annual percentage. |
2 | Some or all of these shares were out on loan to various brokers as of December 31, 2006, amounting to a market value of $747,242,919, or approximately 24.0 % of net assets. |
3 | Collateral received from brokers for securities lending was invested in this short-term investment. |
4 | Affiliated Company - See Note 6 in the Notes to Financial Statements. |
The accompanying notes are an integral part of these financial statements.
14
Managers Special Equity Fund
Statement of Assets and Liabilities
December 31, 2006
| | | |
Assets: | | | |
Investments at value (including securities on loan valued at $747,242,919) | | $ | 3,894,204,598 |
Receivable for investments sold | | | 10,247,107 |
Receivable for Fund shares sold | | | 1,458,463 |
Dividends, interest and other receivables | | | 2,458,179 |
Prepaid expenses | | | 15,319 |
| | | |
Total assets | | | 3,908,383,666 |
| | | |
Liabilities: | | | |
Payable to Custodian | | | 3,602,341 |
Payable for Fund shares repurchased | | | 3,367,026 |
Payable upon return of securities loaned | | | 774,188,503 |
Payable for investments purchased | | | 8,606,142 |
Accrued expenses: | | | |
Investment advisory and management fees | | | 2,435,952 |
Administrative fees | | | 676,653 |
Other | | | 1,810,012 |
| | | |
Total liabilities | | | 794,686,629 |
| | | |
Net Assets | | $ | 3,113,697,037 |
| | | |
Managers Shares: | | | |
| | | |
Net Assets | | $ | 2,551,703,192 |
| | | |
Shares outstanding | | | 30,756,697 |
| | | |
Net asset value, offering and redemption price per share | | $ | 82.96 |
| | | |
Institutional Class Shares: | | | |
| | | |
Net Assets | | $ | 561,993,845 |
| | | |
Shares outstanding | | | 6,725,945 |
| | | |
Net asset value, offering and redemption price per share | | $ | 83.56 |
| | | |
Net Assets Represent: | | | |
Paid-in capital | | $ | 2,442,366,812 |
Undistributed net investment income | | | 673,439 |
Accumulated net realized gain from investments | | | 57,900,270 |
Net unrealized appreciation of investments | | | 612,756,516 |
| | | |
Net Assets | | $ | 3,113,697,037 |
| | | |
* Investments at cost | | $ | 3,281,448,082 |
The accompanying notes are an integral part of these financial statements.
15
Managers Special Equity Fund
Statement of Operations
For the year ended December 31, 2006
| | | | |
Investment Income: | | | | |
Dividend income | | $ | 39,542,929 | |
Foreign withholding tax | | | (157,572 | ) |
Securities lending fees | | | 2,539,044 | |
| | | | |
Total investment income | | | 41,924,401 | |
| | | | |
Expenses: | | | | |
Investment management fees | | | 29,579,302 | |
Administrative fees | | | 8,216,473 | |
Transfer agent | | | 7,346,036 | |
Custodian | | | 588,169 | |
Professional fees | | | 586,771 | |
Reports to shareholders | | | 267,292 | |
Trustees fees and expenses | | | 208,021 | |
Registration fees | | | 94,141 | |
Miscellaneous | | | 176,320 | |
| | | | |
Total expenses before offsets | | | 47,062,525 | |
| | | | |
Expense reductions | | | (1,571,213 | ) |
| | | | |
Net expenses | | | 45,491,312 | |
| | | | |
Net investment loss | | | (3,566,911 | ) |
| | | | |
Net Realized and Unrealized Gain (Loss): | | | | |
Net realized gain on investment transactions | | | 459,675,943 | |
Net unrealized depreciation of investments | | | (106,987,301 | ) |
| | | | |
Net realized and unrealized gain | | | 352,688,642 | |
| | | | |
Net Increase in Net Assets Resulting from Operations | | $ | 349,121,731 | |
| | | | |
The accompanying notes are an integral part of these financial statements.
16
Managers Special Equity Fund
Statement of Changes in Net Assets
For the year ended December 31,
| | | | | | | | |
| | | 2006 | | | 2005 | |
Increase (Decrease) in Net Assets From Operations: | | | | | | | | |
Net investment loss | | | ($3,566,911 | ) | | | ($20,331,881 | ) |
Net realized gain on investments | | | 459,675,943 | | | | 370,099,739 | |
Net unrealized depreciation of investments | | | (106,987,301 | ) | | | (216,366,681 | ) |
| | | | | | | | |
Net increase in net assets resulting from operations | | | 349,121,731 | | | | 133,401,177 | |
| | | | | | | | |
Distributions to Shareholders: | | | | | | | | |
From net realized gain on investments: | | | | | | | | |
Managers Class | | | (365,600,521 | ) | | | (230,875,965 | ) |
Institutional Class | | | (80,218,690 | ) | | | (39,895,773 | ) |
| | | | | | | | |
Total distributions to shareholders | | | (445,819,211 | ) | | | (270,771,738 | ) |
| | | | | | | | |
From Capital Share Transactions: | | | | | | | | |
Managers Class: | | | | | | | | |
Proceeds from sale of shares | | | 497,790,367 | | | | 698,310,169 | |
Reinvestment of dividends and distributions | | | 333,256,656 | | | | 210,983,200 | |
Cost of shares repurchased | | | (1,038,280,018 | ) | | | (1,368,795,175 | ) |
| | | | | | | | |
Net decrease from capital share transactions | | | (207,232,995 | ) | | | (459,501,806 | ) |
| | | | | | | | |
Institutional Class: | | | | | | | | |
Proceeds from sale of shares | | | 146,171,560 | | | | 318,303,171 | |
Reinvestment of dividends and distributions | | | 70,000,901 | | | | 34,758,890 | |
Cost of shares repurchased | | | (143,399,760 | ) | | | (100,347,591 | ) |
| | | | | | | | |
Net increase from capital share transactions | | | 72,772,701 | | | | 252,714,470 | |
| | | | | | | | |
Net decrease from capital share transactions | | | (134,460,294 | ) | | | (206,787,336 | ) |
| | | | | | | | |
Total decrease in net assets | | | (231,157,774 | ) | | | (344,157,897 | ) |
| | | | | | | | |
Net Assets: | | | | | | | | |
Beginning of year | | | 3,344,854,811 | | | | 3,689,012,708 | |
| | | | | | | | |
End of year | | $ | 3,113,697,037 | | | $ | 3,344,854,811 | |
| | | | | | | | |
End of year undistributed net investment income | | $ | 673,439 | | | $ | 1,227,593 | |
| | | | | | | | |
Share Transactions: | | | | | | | | |
Managers Class: | | | | | | | | |
Sale of shares | | | 5,448,864 | | | | 7,901,047 | |
Reinvested shares from dividends and distribution | | | 4,027,757 | | | | 2,423,708 | |
Shares repurchased | | | (11,381,596 | ) | | | (15,430,176 | ) |
| | | | | | | | |
Net decrease in shares | | | (1,904,975 | ) | | | (5,105,421 | ) |
| | | | | | | | |
Institutional Class: | | | | | | | | |
Sale of shares | | | 1,591,644 | | | | 3,552,228 | |
Reinvested shares from dividends and distribution | | | 840,044 | | | | 397,790 | |
Shares repurchased | | | (1,568,031 | ) | | | (1,113,572 | ) |
| | | | | | | | |
Net increase in shares | | | 863,657 | | | | 2,836,446 | |
| | | | | | | | |
The accompanying notes are an integral part of these financial statements.
17
Managers Special Equity Fund
Financial Highlights
For a share outstanding throughout each year
| | | | | | | | | | | | | | | | | | | | |
| | | For the year ended December 31, | |
| | | 2006 | | | 2005 | | | 2004 | | | 2003 | | | 2002 | |
Managers Class: | | | | | | | | | | | | | | | | | | | | |
Net Asset Value, Beginning of Year | | $ | 86.78 | | | $ | 90.42 | | | $ | 78.48 | | | $ | 55.08 | | | $ | 70.59 | |
| | | | | | | | | | | | | | | | | | | | |
Income from Investment Operations: | | | | | | | | | | | | | | | | | | | | |
Net investment loss | | | (0.14 | )5 | | | (0.54 | )5 | | | (0.56 | ) | | | (0.43 | ) | | | (0.34 | ) |
Net realized and unrealized gain (loss) on investments | | | 9.88 | | | | 4.18 | | | | 12.50 | | | | 23.83 | | | | (15.17 | ) |
| | | | | | | | | | | | | | | | | | | | |
Total from investment operations | | | 9.74 | | | | 3.64 | | | | 11.94 | | | | 23.40 | | | | (15.51 | ) |
| | | | | | | | | | | | | | | | | | | | |
Less Distributions to Shareholders from: | | | | | | | | | | | | | | | | | | | | |
Net realized gain on investments | | | (13.56 | ) | | | (7.28 | ) | | | — | | | | — | | | | — | |
| | | | | | | | | | | | | | | | | | | | |
Net Asset Value, End of Year | | $ | 82.96 | | | $ | 86.78 | | | $ | 90.42 | | | $ | 78.48 | | | $ | 55.08 | |
| | | | | | | | | | | | | | | | | | | | |
Total Return 1 | | | 11.28 | % | | | 4.00 | % | | | 15.18 | % | | | 42.50 | % | | | (21.98 | )% |
Ratio of net expenses to average net assets 1 | | | 1.42 | % | | | 1.40 | % | | | 1.40 | % | | | 1.43 | % | | | 1.31 | % |
Ratio of total expenses to average net assets 1, 4 | | | 1.47 | % | | | 1.45 | % | | | 1.45 | % | | | 1.46 | % | | | 1.32 | % |
Ratio of net investment loss to average net assets | | | (0.15 | )% | | | (0.60 | )% | | | (0.69 | )% | | | (0.72 | )% | | | (0.56 | )% |
Portfolio turnover | | | 76 | % | | | 80 | % | | | 68 | % | | | 64 | % | | | 67 | % |
Net assets at end of year (000’s omitted) | | $ | 2,551,703 | | | $ | 2,834,314 | | | $ | 3,415,003 | | | $ | 3,279,318 | | | $ | 2,020,821 | |
| | | | | | | | | | | | | | | | | | | | |
| | | | | | | | | | | | |
| | | For the year ended
December 31, | | | For the
period* ended December 31, 2004 | |
| | | 2006 | | | 2005 | | |
Institutional Class: | | | | | | | | | | | | |
Net Asset Value, Beginning of Period | | $ | 87.09 | | | $ | 90.56 | | | $ | 78.91 | |
| | | | | | | | | | | | |
Income from Investment Operations: | | | | | | | | | | | | |
Net investment income (loss) | | | 0.10 | 5 | | | (0.33 | )5 | | | (0.21 | ) |
Net realized and unrealized gain on investments | | | 9.93 | | | | 4.14 | | | | 11.86 | |
| | | | | | | | | | | | |
Total from investment operations | | | 10.03 | | | | 3.81 | | | | 11.65 | |
| | | | | | | | | | | | |
Less Distributions to Shareholders from: | | | | | | | | | | | | |
Net realized gain on investments | | | (13.56 | ) | | | (7.28 | ) | | | — | |
| | | | | | | | | | | | |
Net Asset Value, End of Period | | $ | 83.56 | | | $ | 87.09 | | | $ | 90.56 | |
| | | | | | | | | | | | |
Total Return 1 | | | 11.56 | %6 | | | 4.21 | % | | | 14.75 | %2 |
| | | | | | | | | | | | |
Ratio of net expenses to average net assets 1 | | | 1.18 | % | | | 1.20 | % | | | 1.20 | %3 |
Ratio of total expenses to average net assets 1 | | | 1.23 | %4 | | | 1.25 | %4 | | | 1.26 | %3-4 |
Ratio of net investment income (loss) to average net assets | | | 0.09 | % | | | (0.56 | )% | | | (0.49 | )%3 |
Portfolio turnover | | | 76 | % | | | 80 | % | | | 68 | %2 |
Net assets at end of period (000’s omitted) | | $ | 561,994 | | | $ | 510,541 | | | $ | 274,010 | |
| | | | | | | | | | | | |
| * | Commencement of operations was May 3, 2004. |
1 | Total returns and net investment income would have been lower had certain expenses not been reduced. (See Note 1c of Notes to Financial Statements.) |
4 | Excludes the impact of fee waivers and expense offsets such as brokerage credits, but includes non-reimbursable expenses such as interest and taxes. (See Note 1c to the Notes to Financial Statements.) |
5 | Per share numbers have been calculated using average shares. |
6 | The Total Return is based on the Financial Statement Net Asset Values as shown above. |
18
Managers Special Equity Fund
Notes to Financial Statements
December 31, 2006
| 1. | Summary of Significant Accounting Policies |
The Managers Funds (the “Trust”) is an open-end management investment company organized as a Massachusetts business trust and registered under the Investment Company Act of 1940, as amended (the “1940 Act”). Currently, the Trust is comprised of a number of investment series. Included in this report is the Managers Special Equity Fund (the “Fund”).
Special Equity offers both Managers Class shares and Institutional Class shares. The Institutional Class shares, which are designed primarily for institutional investors that meet certain administrative and servicing criteria, have a minimum investment of $2,500,000. Managers Class shares are offered to all other investors. Each class represents interest in the same assets of Special Equity and the classes are identical except for class specific expenses related to different distribution and shareholder servicing arrangements, which may result in differences in the expenses borne indirectly by the shareholders of each class and the returns realized by such shareholders. Investment income, realized and unrealized capital gains and losses, the common expenses of Special Equity, and certain Fund level expense reductions, if any, are allocated on a pro rata basis to each class based on the relative net assets of each class to the total net assets of Special Equity. Both classes have equal voting privileges except that each class has exclusive voting rights with respect to its services and/or distribution plan.
The Fund’s financial statements are prepared in accordance with accounting principles generally accepted in the United States of America, which require management to make estimates and assumptions that affect the reported amount of assets and liabilities and disclosure of contingent assets and liabilities at the date of the financial statements and the reported amounts of income and expenses during the reporting periods. Actual results could differ from those estimates. The following is a summary of significant accounting policies followed by the Fund in the preparation of its financial statements:
| a. | Valuation of Investments |
Equity securities traded on a domestic or international securities exchange are generally valued at the last quoted sale price, or, lacking any sales, at the last quoted bid price. Over-the-counter securities are valued at the Nasdaq Official Closing Price, if one is available. Lacking any sales, over-the-counter securities, are valued at the last quoted bid price. The Fund’s investments are generally valued based on market quotations by third-party pricing services approved by the Board of Trustees of the Fund. Under certain circumstances, the value of a Fund investment may be based on an evaluation of its fair value, pursuant to procedures established by and under the general supervision of the Board of Trustees of the Trust. The Fund may use the fair value of a portfolio security to calculate its NAV when, for example, (1) market quotations are not readily available because a portfolio security is not traded in a public market or the principal market in which the security trades is closed, (2) trading in a portfolio security is suspended and not resumed prior to the time as of which the Fund calculates its NAV, (3) where a significant event affecting the value of a portfolio security is determined to have occurred between the time of the market quotation provided for a portfolio security and the time as of which the Fund calculates its NAV, (4) a security’s price has remained unchanged over a period of time (often referred to as a “stale price”), or (5) the Investment Manager determines that a market quotation is inaccurate. The Investment Manager monitors intervening events that may affect the value of securities held in the Fund’s portfolio and, in accordance with procedures adopted by the Fund’s Trustees, will adjust the prices of securities traded in foreign markets, as appropriate, to reflect the impact of events occurring subsequent to the close of such markets but prior to the time each Fund’s NAV is calculated. Fixed-income securities are valued based on valuations furnished by independent pricing services that utilize matrix systems, which reflect such factors as security prices, yields, maturities and ratings, and are supplemented by dealer and exchange quotations. Short-term investments having a remaining maturity of 60 days or less are valued at amortized cost, which approximates market value. Investments in other regulated investment companies are valued at their end of day net asset value per share except iShares or other ETF’s, which are valued the same as equity securities. Securities (including derivatives) for which market quotations are not readily available are valued at fair value, as determined in good faith, and pursuant to procedures adopted by the Board of Trustees of the Trust.
Investments in certain securities such as preferred stocks are valued on the basis of valuations provided by dealers or by a pricing service which uses information with respect to transactions in such securities, and various relationships between securities in determining value.
The values assigned to fair value investments are based on available information and do not necessarily represent amounts that might ultimately be realized, since such amounts depend on future developments inherent in long-term investments. Further, because of the inherent uncertainty of valuation, those estimated values may differ significantly from the values that would have been used had a ready market for the investments existed, and the differences could be material.
Security transactions are accounted for as of the trade date. Realized gains and losses on securities sold are determined on the basis of identified cost.
| c. | Investment Income and Expenses |
Dividend income is recorded on the ex-dividend date except certain dividends from foreign securities where the ex-dividend date may have passed. These dividends are recorded as soon as the Trust is informed of the ex-dividend date. Dividend income on foreign securities is recorded net of any withholding tax. Interest income, which includes amortization of premium and accretion of discount on debt securities, is accrued as earned. Non-cash dividends included in dividend income, if any, are reported at the fair market value of the securities received. Other income and expenses are recorded on an accrual basis. Expenses that cannot be directly attributed to a fund are apportioned among the Funds in the Trust and in some cases other affiliated funds based upon their relative average net assets or number of shareholders.
The Fund had certain portfolio trades directed to various brokers who paid a portion of the Fund’s expenses. For the year ended December 31, 2006, under these arrangements the amount by which the Fund’s expenses were reduced and the impact on the expense ratios was as follows: $1,564,967 or 0.05%.
The Fund has a “balance credit” arrangement with The Bank of New York (“BNY”), the Fund’s custodian, whereby the Fund is
19
Managers Special Equity Fund
Notes to Financial Statements (continued)
credited with an interest factor equal to 1% below the effective 90-day T-Bill rate for account balances left uninvested overnight. This credit serves to reduce the custody expense that would otherwise be charged to the Fund. For the year ended December 31, 2006, the custodian expense was reduced $6,246 under this arrangement.
Managers Investment Group LLC (the “Investment Manager”) had agreed to waive a portion of its fee or reimburse expenses of Special Equity commensurate with the reduction in the fee paid to Essex Investment Management Company LLC (“Essex”) (subadvisor to Special Equity from December 19, 2003 to January 17, 2005), which was 0.10% of the average daily net assets of the portion of the Fund managed by Essex in excess of $100 million. From January 1, 2005 to January 17, 2005 the amount waived equaled $28,665. On January 18, 2005, Essex was replaced with Veredus Asset Management, and the Investment Manager discontinued waiving a portion of its fee.
Total returns and net investment income for the Fund would have been lower had certain expenses not been offset.
| d. | Dividends and Distributions |
Dividends resulting from net investment income, if any, normally will be declared and paid annually. Distributions of capital gains, if any, will be made on an annual basis and when required for Federal excise tax purposes. Income and capital gain distributions are determined in accordance with Federal income tax regulations, which may differ from generally accepted accounting principles. These differences are primarily due to differing treatments for losses deferred due to wash sales, equalization accounting for tax purposes, foreign currency and market discount transactions. Permanent book and tax basis differences, if any, relating to shareholder distributions will result in reclassifications to paid-in capital. The tax character of distributions paid during the past two years were as follows:
| | | | | | |
| | | 2006 | | 2005 |
Distributions paid from: | | | | | | |
Ordinary income | | | — | | | — |
Short-term capital gains | | | — | | | — |
Long-term capital gains | | $ | 445,819,211 | | $ | 270,771,738 |
| | | | | | |
| | $ | 445,819,211 | | $ | 270,771,738 |
| | | | | | |
As a % of distributions paid: | | | | | | |
Qualified ordinary income | | | — | | | — |
Ordinary income - dividends received deduction | | | — | | | — |
| | | | | | |
As of December 31, 2006, the components of distributable earnings (excluding unrealized appreciation/depreciation) on a tax basis consisted of: | | | | | | |
| | | 2006 | | |
Capital loss carryforward | | | — | | | |
Undistributed ordinary income | | | — | | | |
Undistributed short-term capital gains | | | — | | | |
Undistributed long-term capital gains | | $ | 76,560,415 | | | |
The Fund intends to comply with the requirements under Subchapter M of the Internal Revenue Code of 1986, as amended, to distribute substantially all of its taxable income and gains to its shareholders and to meet certain diversification and income requirements with respect to investment companies. Therefore, no provision for Federal income or excise tax is included in the accompanying financial statements.
| f. | Capital Loss Carryovers |
As of December 31, 2006, the Fund had no accumulated net realized capital loss carryover from securities transactions for Federal income tax purposes.
The Trust’s Declaration of Trust authorizes for each series the issuance of an unlimited number of shares of beneficial interest, without par value. The Fund records sales and repurchases of its capital stock on the trade date. Dividends and distributions to shareholders are recorded on the ex-dividend date.
At December 31, 2006, certain unaffiliated shareholders, specifically omnibus accounts, individually held greater than 10% of the outstanding shares of the Fund: Managers Class shares - three collectively own 47%; Institutional Class shares - three collectively own 36%. Transactions by these shareholders may have a material impact on the Fund.
| 2. | Agreements and Transactions with Affiliates |
The Trust has entered into an Investment Management Agreement under which the Investment Manager provides or oversees investment management services to the Fund. The Investment Manager selects subadvisors for the Fund (subject to Trustee approval), allocates assets among subadvisors and monitors the subadvisor’s investment programs and results. The Fund’s investment portfolio is managed by portfolio managers who serve pursuant to Subadvisory Agreements with the Investment Manager. Investment management fees are paid directly by the Fund to the Investment Manager at the rate of 0.90% per annum.
The Trust has entered into an Administration and Shareholder Servicing Agreement under which Managers Investment Group LLC serves as the Fund’s administrator (the “Administrator”) and is responsible for all aspects of managing the Fund’s operations, including administration and shareholder services to the Fund, its shareholders, and certain institutions, such as bank trust departments, broker-dealers and registered investment advisers, that advise or act as an intermediary with the Fund’s shareholders. The Fund pays a fee to the Administrator at the rate of 0.25% per annum of the Fund’s average daily net assets for this service.
Prior to July 1, 2005, the aggregate annual retainer paid to each Independent Trustee was $52,000, plus $2,000 for each meeting attended. Effective July 1, 2005, the aggregate annual retainer paid to each Independent Trustee is $55,000, plus $4,000 or $2,000 for each regular or special meeting attended, respectively. The Trustees’ fees and expenses are allocated amongst all of the Funds for which Managers Investment Group LLC serves as the Investment Manager based on the relative net assets of such Funds. The Independent Chairman of the Trust receives an additional payment of $10,000 per year. (Prior to July 1, 2005, the Independent Chairman was paid an additional $5,000 per year). Effective July 1, 2005, the Chairman of the Audit Committee receives an additional
20
Managers Special Equity Fund
Notes to Financial Statements (continued)
$2,000 per year. The “Trustee fees and expenses” shown in the financial statements represent the Fund’s allocated portion of the total fees and expenses paid by the Managers Funds.
The Fund is distributed by Managers Distributors, Inc. (“MDI”), a wholly-owned subsidiary of Managers Investment Group LLC. Certain Trustees and Officers of the Fund are Officers and/or Directors of the Investment Manager, AMG and/or MDI. Managers Distributors, Inc. (the “Distributor”) serves as the principal underwriter for the Fund. The Distributor is a registered broker-dealer and member of the National Association of Securities Dealers, Inc. (“NASD”). Shares of the Fund will be continuously offered and will be sold by brokers, dealers or other financial intermediaries who have executed selling agreements with the Distributor. The Distributor bears all the expenses of providing services pursuant to an Underwriting Agreement, including the payment of the expenses relating to the distribution of Prospectuses for sales purposes and any advertising or sales literature.
| 3. | Purchases and Sales of Securities |
Purchases and sales of securities, excluding short-term securities, for the year ended December 31, 2006, were $2,321,815,181 and $3,037,351,919, respectively. There were no purchases or sales of U.S. Government securities.
| 4. | Portfolio Securities Loaned |
The Fund may participate in a securities lending program offered by BNY providing for the lending of equities, corporate bonds and government securities to qualified brokers. Collateral on all securities loaned is accepted in cash and/or government securities. Collateral is maintained at a minimum level of 102% of the market value, plus interest, if applicable, of investments on loan. Collateral received in the form of cash is invested temporarily in institutional money market funds or other short-term investments by BNY. Securities lending fees include earnings of such temporary cash investments, plus or minus any rebate to a borrower. These earnings (after any rebate) are then divided between BNY, as a fee for its services under the program, and the Fund according to agreed-upon rates.
| 5. | Commitments and Contingencies |
In the normal course of business, the Fund may enter into contracts and agreements that contain a variety of representations and warranties, which provide general indemnifications. The maximum exposure to the Fund under these arrangements is unknown, as this would involve future claims that may be against the Fund that have not yet occurred. However, based on experience, the Fund expects the risks of loss to be remote.
| 6. | Transactions with Affiliated Companies |
An affiliated company is a company that is directly or indirectly controlled by a related party or a company in which a fund has ownership of at least 5% of the voting securities. Transactions during the year ended December 31, 2006, with companies which are or were affiliates are as follows:
| 7. | New Accounting Pronouncements |
The Financial Accounting Standards Board (“FASB”) has recently issued Interpretation No. 48, “Accounting for Uncertainty in Income Taxes – an Interpretation of FASB Statement No. 109) the “Interpretation”), which applies to all registered investment companies and clarifies the accounting for uncertain tax positions. The Interpretation is effective for financial statements for fiscal years beginning after December 15, 2006. Management has not yet completed their analysis of the Interpretation, and is not currently in a position to estimate the significance, if any, that the impact of adoption will have on the financial statements.
On December 22, 2006, the SEC indicated they had no objection if a fund implemented FIN 48 in the first required financial statement reporting period for fiscal years beginning after December 15, 2006.
In addition, in September 2006, Statement of Financial Accounting Standards No. 157, Fair Value Measurements (“SFAS 157”), was issued and is effective for fiscal years beginning after November 15, 2007. SFAS 157 defines fair value, establishes a framework for measuring fair value and expands disclosures about fair value measurements. Management is currently evaluating the impact, if any, the adoption of SFAS 157 will have on the financial statements.
Tax Information (unaudited)
The Fund hereby designates the maximum amount allowable of its net taxable income as qualified dividends as provided in the Jobs and Growth Tax Relief Reconciliation Act of 2003. The 2006 Form 1099-DIV you receive for the Fund, will show the tax status of all distributions paid to you during the year.
Pursuant to section 852 of the Internal Revenue Code, the Fund designates $462,193,400 of long-term capital gain for the taxable year ended December 31, 2006.
| | | | | | | | | | | | | | | | | | |
Affiliate | | Purchase Cost | | Sales Cost | | Gain /Loss | | | Dividend
Income | | Market Value
December 31,
2006 | | %
Ownership
of Affiliate | |
Scopus Video Networks, Ltd. | | $ | 690,968 | | | — | | | — | | | — | | $ | 2,924,850 | | 5.3 | % |
Terayon Communications Systems, Inc. | | | 336,583 | | $ | 416,885 | | ($ | 1,313,142 | ) | | — | | | 12,482,648 | | 7.2 | % |
Totals | | $ | 1,027,551 | | $ | 416,885 | | ($ | 1,313,142 | ) | | — | | $ | 15,407,498 | | 1.6 | %* |
* As a percentage of the entire portfolio. | | | | | | | | | | | | | | | | | | |
21
Report of Independent Registered Public Accounting Firm
To the Trustees of The Managers Funds and the Shareholders of Managers Special Equity Fund:
In our opinion, the accompanying statement of assets and liabilities, including the schedule of portfolio investments, and the related statement of operations and of changes in net assets and the financial highlights present fairly, in all material respects, the financial position of Managers Special Equity Fund (hereafter referred to as the “Fund”), at December 31, 2006, and the results of its operations, the changes in its net assets and the financial highlights for the periods indicated, in conformity with accounting principles generally accepted in the United States of America. These financial statements and financial highlights (hereafter referred to as “financial statements”) are the responsibility of the Fund’s management; our responsibility is to express an opinion on these financial statements based on our audits. We conducted our audits of these financial statements in accordance with the standards of the Public Company Accounting Oversight Board (United States). Those standards require that we plan and perform the audit to obtain reasonable assurance about whether the financial statements are free of material misstatement. An audit includes examining, on a test basis, evidence supporting the amounts and disclosures in the financial statements, assessing the accounting principles used and significant estimates made by management, and evaluating the overall financial statement presentation. We believe that our audits, which included confirmation of securities at December 31, 2006 by correspondence with the custodian and brokers, provide a reasonable basis for our opinion.
PricewaterhouseCoopers LLP
Boston, Massachusetts
February 21, 2007
22
Trustees and Officers
The Trustees and Officers of the Trust, their business addresses, principal occupations for the past five years and dates of birth are listed below. The Trustees provide broad supervision over the affairs of the Trust and the Funds. The Trustees are experienced executives who meet periodically throughout the year to oversee the Funds’ activities, review contractual arrangements with companies that provide services to the Funds, and review the Funds’ performance. Unless otherwise noted, the address of each Trustee or Officer is the address of the Trust: 800 Connecticut Avenue, Norwalk, Connecticut 06854.
There is no stated term of office for Trustees. Trustees serve until their resignation, retirement or removal in accordance with the Trust’s organizational documents and policies adopted by the Board from time to time. The Chairman of the Trustees, President, Treasurer and Secretary of the Trust are elected by the Trustees annually. Other officers hold office at the pleasure of the Trustees.
Independent Trustees
The following Trustees are not “interested persons” of the Trust within the meaning of the 1940 Act:
| | |
Name, Date of Birth, Number of
Funds Overseen in Fund
Complex* | | Principal Occupation(s) During Past 5 Years and Other Directorships Held by Trustee |
| |
Jack W. Aber, 9/9/37 • Trustee since 1999 • Oversees 33 Funds in Fund Complex | | Professor of Finance, Boston University School of Management (1972-Present); Trustee of Appleton Growth Fund (1 portfolio); Trustee of Third Avenue Trust (4 portfolios); Trustee of Third Avenue Variable Trust (1 portfolio). |
| |
William E. Chapman, II, 9/23/41 • Independent Chairman • Trustee since 1999 • Oversees 33 Funds in Fund Complex | | President and Owner, Longboat Retirement Planning Solutions (1998-Present); Hewitt Associates, LLC (part time) (provider of Retirement and Investment Education Seminars); Trustee of Bowdoin College (2002-Present); Trustee of Third Avenue Trust (4 portfolios); Trustee of Third Avenue Variable Trust (1 portfolio). |
| |
Edward J. Kaier, 9/23/45 • Trustee since 1999 • Oversees 33 Funds in Fund Complex | | Attorney at Law and Partner, Hepburn Willcox Hamilton & Putnam, LLP (1977-Present); Trustee of Third Avenue Trust (4 portfolios); Trustee of Third Avenue Variable Trust (1 portfolio). |
| |
Steven J. Paggioli, 4/3/50 • Trustee since 1993 • Oversees 33 Funds in Fund Complex | | Consultant (2001-Present); Formerly Executive Vice President and Director, The Wadsworth Group (1986- 2001); Executive Vice President, Secretary and Director, Investment Company Administration, LLC (1990-2001); Vice President, Secretary and Director, First Fund Distributors, Inc. (1991-2001); Trustee, Professionally Managed Portfolios (22 portfolios); Advisory Board Member, Sustainable Growth Advisors, LP. |
| |
Eric Rakowski, 6/5/58 • Trustee since 1999 • Oversees 33 Funds in Fund Complex | | Professor, University of California at Berkeley School of Law (1990-Present); Trustee of Third Avenue Trust (4 portfolios); Trustee of Third Avenue Variable Trust (1 portfolio). |
| |
Thomas R. Schneeweis, 5/10/47 • Trustee since 1987 • Oversees 33 Funds in Fund Complex | | Professor of Finance, University of Massachusetts (1985-Present); Director, CISDM at the University of Massachusetts, (1996-Present); President, Alternative Investment Analytics, LLC, (formerly Schneeweis Partners, LLC) (2001-Present); Director of Research, Lyra/Starview Capital LLC (2004-2006); Partner, Northampton Capital Management, LLC; Partner, TRS Associates (Sole Proprietorship) and member of Massachusetts Finance Institute (wholly owned subsidiary of Alternative Investment Analytics). No other directorships held by Trustee. |
| * | The Fund Complex consists of Managers AMG Funds, The Managers Funds, |
| Managers | Trust I and Managers Trust II. |
Interested Trustee
The following Trustee is an “interested person” of the Trust within the meaning of the 1940 Act by virtue of his positions with, and interest in securities of, Affiliated Managers Group, Inc.
| | |
Name, Date of Birth, Number of
Funds Overseen in Fund
Complex* | | Principal Occupation(s) During Past 5 Years and Other Directorships Held by Trustee |
William J. Nutt, 3/30/45 • Trustee since 2005 • President since 2007 • Oversees 33 Funds in Fund Complex | | Chairman and Founder of Affiliated Managers Group, Inc., (1993-Present); Chief Executive Officer of Affiliated Managers Group, Inc. (1993-2004); Director, Affiliated Managers Group, Inc. (1993-Present); President of Affiliated Managers Group, Inc. (1993-1999); President and Chief Operating Officer, The Boston Company (1989- 1993); Senior Executive Vice President, The Boston Company (1982-1989). |
| * | The Fund Complex consists of Managers AMG Funds, The Managers Funds, |
| Managers | Trust I and Managers Trust II. |
Officers
| | |
Name, Date of Birth, Position(s)
Held with Fund and Length of
Time Served | | Principal Occupation(s) During Past 5 Years |
Bruce M. Aronow, 5/31/65 • Chief Financial Officer since 2005 | | Managing Partner, Managers Investment Group LLC (2005-Present); Chief Financial Officer, Managers AMG Funds, Managers Trust I and Managers Trust II (2005- Present); Executive Vice President and Chief Financial Officer and Principal, Rorer Asset Management (1999- 2004); Chief Operating Officer, Rorer Asset Management (2001-2004); Staff Accountant, Manager and Partner, PricewaterhouseCoopers LLP (1987-1998). |
| |
Christine C. Carsman, 4/2/52 • Secretary since 2004 | | Vice President and Chief Regulatory Counsel, Affiliated Managers Group, Inc. (2004-Present); Secretary, Managers AMG Funds, Managers Trust I and Managers Trust II (2004-Present); Senior Counsel, Vice President and Director of Operational Risk Management and Compliance, Wellington Management Company, LLP (1995-2004); Deputy General Counsel, The Boston Company, Inc. (1993-1995); Associate General Counsel, The Boston Company Advisors, Inc. (1991-1993); Associate, Sullivan & Worcester LLP (1987-1991). |
| |
Colin J. Dean, 3/6/77 • Assistant Secretary since 2006 | | Associate Counsel, Affiliated Managers Group, Inc. (2005- Present); Assistant Secretary, Managers AMG Funds, Managers Trust I and Managers Trust II (2006-Present); Assistant Secretary, Skyline Funds (2006-Present); Associate, Dechert LLP (2002-2005). |
| |
Donald S. Rumery, 5/29/58 • Treasurer since 1995 | | Senior Vice-President, Managers Investment Group LLC (2005-Present); Director, Finance and Planning, The Managers Funds LLC, (1994-2004); Treasurer and Chief Financial Officer, Managers Distributors, Inc. (2000- Present); Treasurer, Managers AMG Funds (1999-Present); Treasurer, Managers Trust I and Managers Trust II (2000- Present); Secretary, Managers Trust I and Managers Trust II (2000-2004) and Secretary, The Managers Funds (1997- 2004). |
23
Investment Manager and Administrator
Managers Investment Group LLC
800 Connecticut Avenue
Norwalk, Connecticut 06854
(203) 299-3500 or (800) 835-3879
Distributor
Managers Distributors, Inc.
800 Connecticut Avenue
Norwalk, Connecticut 06854
(203) 299-3500 or (800) 835-3879
Custodian
The Bank of New York
2 Hanson Place
Brooklyn, New York 11217
Legal Counsel
Ropes & Gray LLP
One International Place
Boston, Massachusetts 02110-2624
Transfer Agent
PFPC, Inc.
attn: Managers
P.O. Box 9769
Providence, Rhode Island 02940
(800) 548-4539
Trustees
Jack W. Aber
William E. Chapman, III
Edward J. Kaier
William J. Nutt
Steven J. Paggioli
Eric Rakowski
Thomas R. Schneeweis
For Managers Choice Only
Managers
c/o PFPC, Inc.
P.O. Box 61204
King of Prussia, Pennsylvania 19406-0851
(800) 358-7668
MANAGERSAND MANAGERS AMG EQUITY FUNDS
EMERGING MARKETS EQUITY
Rexiter Capital Management Limited
ESSEX GROWTH
ESSEX LARGE CAP GROWTH
(formerly known as Capital Appreciation)
ESSEX SMALL/MICRO CAP GROWTH
Essex Investment Management Co., LLC
FQ TAX-MANAGED U.S. EQUITY FQ U.S. EQUITY
First Quadrant, L.P.
INSTITUTIONAL MICRO-CAP MICRO-CAP
Kern Capital Management LLC
INTERNATIONAL EQUITY
Alliance Bernstein L.P.
Lazard Asset Management, LLC
Wellington Management Company, LLP
MID-CAP
Chicago Equity Partners, LLC
REAL ESTATE SECURITIES
Urdang Securities Management, Inc.
RORER LARGE-CAP
Rorer Asset Management, LLC
SMALL CAP
TIMESSQUARE MID CAP GROWTH
TIMESSQUARE SMALL CAP GROWTH
TimesSquare Capital Management, LLC
SMALL COMPANY
Epoch Investment Partners, Inc.
Kalmar Investment Advisers, Inc.
SPECIAL EQUITY
Donald Smith & Co., Inc.
Kern Capital Management LLC
Skyline Asset Management, L.P.
Smith Asset Management Group, LP
Veredus Asset Management LLC
Westport Asset Management, Inc.
SYSTEMATIC VALUE
SYSTEMATIC MID-CAP VALUE
Systematic Financial Management, L.P.
VALUE
Armstrong Shaw Associates Inc.
Osprey Partners Investment Mgmt., LLC
MANAGERS BALANCED FUNDS
BALANCED
Chicago Equity Partners, LLC
GLOBAL
Armstrong Shaw Associates Inc.
Alliance Bernstein L.P.
First Quadrant, L.P.
Kern Capital Management LLC
Northstar Capital Management, Inc.
Wellington Management Company, LLP
ALTERNATIVE FUNDS
FQ GLOBAL ALTERNATIVES
First Quadrant, L.P.
MANAGERS
FIXED INCOME FUNDS
BOND (MANAGERS) FIXED INCOME GLOBAL BOND
Loomis, Sayles & Company L.P.
BOND (MANAGERS FREMONT)
Pacific Investment Management Co. LLC
CALIFORNIA INTERMEDIATE TAX-FREE
Evergreen Investment Management Co., LLC
HIGH YIELD
J.P. Morgan Investment Management Inc.
INTERMEDIATE DURATION GOVERNMENT SHORT DURATION GOVERNMENT
Smith Breeden Associates, Inc.
MONEY MARKET
JPMorgan Investment Advisors Inc.
This report is prepared for the Fund’s shareholders. It is authorized for distribution to prospective investors only when preceded or accompanied by an effective prospectus. To receive a free copy of the prospectus or Statement of Additional Information, which includes additional information about Fund Trustees, please contact us by calling 800.835.3879. Distributed by Managers Distributors, Inc., member NASD.
A description of the policies and procedures the Fund uses to vote its proxies is available: (i) without charge, upon request, by calling 800.835.3879, or (ii) on the Securities and Exchange Commission’s (SEC) Web site at www.sec.gov. For information regarding the Fund’s proxy voting record for the 12-month period ended June 30, call 800.835.3879 or visit the SEC Web site at www.sec.gov.
The Fund file its complete schedule of portfolio holdings with the SEC for the first and third quarters of each fiscal year on Form N-Q. The Fund’s Forms N-Q are available on the SEC’s website at www.sec.gov. A Fund’s Forms N-Q may be reviewed and copied at the SEC’s Public Reference Room in Washington, DC. Information on the operation of the Public Reference Room may be obtained by calling 800.SEC.0330. To review a complete list of the Fund’s portfolio holdings, or to view the most recent quarterly holdings report, semiannual report, or annual report, please visit www.managersinvest.com.
| | |
| www.managersinvest.com | | |
Registrant has adopted a Code of Ethics. See attached Exhibit (a)(1).
| Item 3. | AUDIT COMMITTEE FINANCIAL EXPERT |
Registrant’s Board of Trustees has determined that independent Trustees Mr. Jack W. Aber and Mr. Steven J. Paggioli each qualify as the Audit Committee Financial Expert. Mr. Aber and Mr. Paggioli are “independent” as such term is defined in Form N-CSR.
| Item 4. | PRINCIPAL ACCOUNTANT FEES AND SERVICES |
The aggregate fees billed by PwC to the Fund for the Funds’ two most recent fiscal years for professional services rendered for audits of annual financial statements, or services that are normally provided in connection with statutory and regulatory filings or engagements (“Audit Fees”) were as follows:
| | | | | | |
| | | Fiscal 2006 | | Fiscal 2005 |
Managers Value Fund | | $ | 21,753 | | $ | 21,660 |
Essex Large Cap Growth Fund | | $ | 21,454 | | $ | 23,280 |
Managers Small Company Fund | | $ | 14,660 | | $ | 13,000 |
Managers Special Equity Fund | | $ | 38,267 | | $ | 38,340 |
Managers International Equity Fund | | $ | 34,083 | | $ | 32,460 |
Managers Emerging Markets Equity Fund | | $ | 21,485 | | $ | 19,500 |
Managers Bond Fund | | $ | 30,989 | | $ | 27,600 |
Managers Global Bond Fund | | $ | 27,274 | | $ | 25,975 |
All Funds in the Managers Complex Audited by PwC | | $ | 723,732 | | $ | 709,350 |
Audit-Related Fees
There were no fees billed by PwC to the Funds in its two recent fiscal years for services rendered for assurance and related services that are reasonably related to the performance of the audit or review of the Fund’s financial statements, but are not reported as Audit Fees (“Audit-Related Fees”).
For the Funds’ two most recent fiscal years, there were no Audit-Related Fees billed by PwC for engagements related directly to the operations and financial reporting of one or more Funds by a Fund Service Provider. A Fund Service Provider is (a) any investment adviser to the Fund (not including any Subadvisor whose role is primarily portfolio management and is subcontracted with or overseen by another investment adviser) or (b) any entity that provides ongoing services to the Fund and is controlling, controlled by or under common control with a Fund investment adviser described in (a).
Tax Fees
The aggregate fees billed by PwC to the Funds for the two most recent fiscal years for professional services rendered for tax compliance, tax advice, and tax planning (“Tax Fees”) were as follows:
| | | | | | |
| | | Fiscal 2006 | | Fiscal 2005 |
Managers Value Fund | | $ | 6,325 | | $ | 5,750 |
Essex Large Cap Growth Fund | | $ | 6,600 | | $ | 6,000 |
Managers Small Company Fund | | $ | 6,325 | | $ | 5,750 |
Managers Special Equity Fund | | $ | 8,800 | | $ | 8,000 |
Managers International Equity Fund | | $ | 8,800 | | $ | 8,000 |
Managers Emerging Markets Equity Fund | | $ | 7,975 | | $ | 7,250 |
Managers Bond Fund | | $ | 7,975 | | $ | 7,250 |
Managers Global Bond Fund | | $ | 8,250 | | $ | 7,500 |
For the Funds’ two most recent fiscal years, Tax Fees billed by PwC for engagements by Fund Service Providers that related directly to the operations and financial reporting of the Funds were $0 for fiscal 2006 and $0 for fiscal 2005, respectively.
The services for which Tax Fees were charged comprise all services performed by professional staff in PwC’s tax division except those services related to the audit. Typically, this category would include fees for tax compliance, tax planning, and tax advice. Tax compliance, tax advice, and tax planning services include preparation of original and amended tax returns, claims for refund and tax payment-planning services, assistance with tax audits and appeals, tax advice related to mergers and acquisitions and requests for rulings or technical advice from taxing authorities.
All Other Fees
There were no other fees billed by PwC to the Funds for all other non-audit services (“Other Fees”) during the Funds’ two most recent fiscal years. During the same period, there were no Other Fees billed by PwC for engagements by Fund Service Providers that related directly to the operations and financial reporting of the Funds.
According to policies adopted by the Audit Committee, services provided by PwC to the Funds must be pre-approved by the Audit Committee. On an annual basis, the Audit Committee reviews and pre-approves various types of services that PwC may perform for the Funds without specific approval of each engagement, subject to specified budget limitations. As contemplated by the Sarbanes-Oxley Act of 2002 and related SEC rules, the Audit Committee also pre-approves non-audit services provided by PwC to any Fund Service Provider for any engagement that relates directly to the operations and financial reporting of the Funds. Any engagement that is not already pre-approved or that will exceed a pre-approved budget must be submitted to the Audit Committee for pre-approval. The Chairman of the Audit Committee is authorized on behalf of the Board of Trustees and the Audit Committee to approve the engagement of PwC to perform non-audit services subject to certain conditions, including notification to the Audit Committee of such pre-approval not later than the next meeting of the Audit Committee following the date of such pre-approval.
There were no other fees billed by PwC for non-audit services rendered to the Funds and to Fund Service Providers for the Funds’ two most recent fiscal years.
The Audit Committee has considered whether the provision of non-audit services by PwC to Fund Service Providers that were not required to be pre-approved by the Audit Committee is compatible with maintaining PwC’s independence in its audit of the Funds, taking into account representations from PwC, in accordance with Independence Standards Board Standard No. 1, regarding its independence from the Funds and its related entities.
The following table sets forth the non-audit services provided by PwC to the Funds and its service affiliates defined as the Funds’ investment advisor and any entity controlling, controlled by or under common control with Managers Investment Group LLC that provides ongoing services to the Funds (“Control Affiliates”) for the last two fiscal years.
| | | | | | | | | | | | | | | | | | |
| | | Audit-related fees A | | Tax fees A | | All other fees A |
| | | 2006 | | 2005 | | 2006 | | 2005 | | 2006 | | 2005 |
Control Affiliates | | $ | 357,120 | | $ | 476,755 | | $ | 839,245 | | $ | 172,139 | | $ | 0 | | $ | 75,729 |
A | Aggregate amounts may reflect rounding. |
| Item 5. | AUDIT COMMITTEE OF LISTED REGISTRANTS |
Not applicable.
| Item 6. | SCHEDULE OF INVESTMENTS |
Not applicable.
| Item 7. | DISCLOSURE OF PROXY VOTING POLICIES AND PROCEDURES FOR CLOSED-END MANAGEMENT INVESTMENT COMPANIES |
Not applicable.
| Item 8. | PORTFOLIO MANAGERS OF CLOSED-END MANAGEMENT INVESTMENT COMPANIES |
Not applicable.
| Item 9. | PURCHASES OF EQUITY SECURITIES BY CLOSED-END MANAGEMENT INVESTMENT COMPANIES AND AFFILIATED PURCHASERS |
Not applicable.
| Item 10. | SUBMISSION OF MATTERS TO A VOTE OF SECURITY HOLDERS |
Not applicable.
| Item 11. | CONTROLS AND PROCEDURES |
(a) The Registrant’s principal executive and principal financial officers have concluded, based on their evaluation of the registrant’s disclosure controls and procedures as of a date within 90
days of the filing of this report, that the Registrant’s disclosure controls and procedures are reasonably designed to ensure that information required to be disclosed by the Registrant on Form N-CSR is recorded, processed, summarized and reported within the required time periods and that information required to be disclosed by the registrant in the reports that it files or submits on Form N-CSR is accumulated and communicated to the Registrant’s management, including its principal executive and principal financial officers, as appropriate to allow timely decisions regarding required disclosure.
(b) There were no changes in the Registrant’s internal control over financial reporting during the Registrant’s fourth fiscal quarter of the period covered by this report that have materially affected, or are reasonably likely to affect, the internal control over financial reporting.
| | |
| |
| (a) (1) | | Any Code of Ethics or amendments hereto. Filed herewith. |
| |
| (a) (2) | | Certifications pursuant to Rule 30a-2(a) under the Investment Company Act of 1940 - Filed herewith. |
| |
| (a) (3) | | Not applicable. |
| |
| (b) | | Certifications pursuant to Rule 30a-2(b) under the Investment Company Act of 1940 - Filed herewith. |
SIGNATURES
Pursuant to the requirements of the Securities Exchange Act of 1934 and the Investment Company Act of 1940, the registrant has duly caused this report to be signed on its behalf by the undersigned, thereunto duly authorized.
THE MANAGERS FUNDS
| | |
| |
| By: | | /s/ William J. Nutt |
| | William J. Nutt, President |
| |
| Date: | | March 9, 2007 |
Pursuant to the requirements of the Securities Exchange Act of 1934 and the Investment Company Act of 1940, this report has been signed below by the following persons on behalf of the registrant and in the capacities and on the dates indicated.
| | |
| |
| By: | | /s/ William J. Nutt |
| | William J. Nutt, President |
| |
| Date: | | March 9, 2007 |
| | |
| |
| By: | | /s/ Bruce M. Aronow |
| | Bruce M. Aronow, Chief Financial Officer |
| |
| Date: | | March 9, 2007 |