UNITED STATES
SECURITIES AND EXCHANGE COMMISSION
Washington, D.C. 20549
FORM N-CSR
CERTIFIED SHAREHOLDER REPORT OF
REGISTERED MANAGEMENT INVESTMENT COMPANIES
Investment Company Act file number: 811-03752
THE MANAGERS FUNDS
(Exact name of registrant as specified in charter)
800 Connecticut Avenue, Norwalk, Connecticut 06854
(Address of principal executive offices) (Zip code)
Managers Investment Group LLC
800 Connecticut Avenue, Norwalk, Connecticut 06854
(Name and address of agent for service)
Registrant’s telephone number, including area code: (203) 299-3500
Date of fiscal year end: DECEMBER 31
Date of reporting period: JANUARY 1, 2007 – DECEMBER 31, 2007
(Annual Shareholder Report)
| Item 1. | Reports to Shareholders |
ANNUAL REPORT
Managers Funds
December 31, 2007
Managers Special Equity Fund

Managers Special Equity Fund
Annual Report – December 31, 2007
| | |
TABLE OF CONTENTS | | Page |
LETTER TO SHAREHOLDERS | | 1 |
| |
ABOUT YOUR FUND’S EXPENSES | | 3 |
| |
INVESTMENT MANAGERS’ COMMENTS, FUND SNAPSHOT,
AND SCHEDULE OF PORTFOLIO INVESTMENTS | | |
| |
Managers Special Equity Fund | | 4 |
| |
FINANCIAL STATEMENTS: | | |
| |
Statement of Assets and Liabilities | | 15 |
| |
Fund’s balance sheet, net asset value (NAV) per share computation and cumulative undistributed amount | | |
| |
Statement of Operations | | 16 |
| |
Detail of sources of income, Fund expenses, and realized and unrealized gains (losses) during the year | | |
| |
Statement of Changes in Net Assets | | 17 |
| |
Detail of changes in Fund assets for the past two years | | |
| |
FINANCIAL HIGHLIGHTS | | 18 |
| |
Historical net asset values per share, distributions, total returns, expense ratios, turnover ratios and net assets | | |
| |
NOTES TO FINANCIAL STATEMENTS | | 19 |
| |
Accounting and distribution policies, details of agreements and transactions with Fund management and affiliates, and descriptions of certain investment risks | | |
| |
REPORT OF INDEPENDENT REGISTERED PUBLIC ACCOUNTING FIRM | | 22 |
| |
TRUSTEES AND OFFICERS | | 23 |
Nothing contained herein is to be considered an offer, sale or solicitation of an offer to buy shares of The Managers Funds or Managers AMG Funds. Such offering is made only by Prospectus, which includes details as to offering price and other material information.
Letter to Shareholders
Dear Shareholder:
Financial markets became increasingly unsettled as 2007 progressed, beginning with a brief but strong correction in February and then escalating in June when revelations of significant losses from sub-prime mortgage lending and related structured securities started a domino run that has affected the global economy. While the economy gained strength in the early part of the year, in spite of housing weakness, a liquidity crisis initiated by the spreading weakness in sub-prime mortgage loans increased uncertainty about its sustainability. Bonds of all credit quality and duration became unusually volatile, and credit spreads, having been extremely slim, widened dramatically, raising the cost of capital for many borrowers. Naturally the equity markets followed suit and became more volatile as the rising cost of capital pressured corporate profitability, penalized leverage, and hindered merger and acquisition activity.
As has been well documented in the financial press, the broad deterioration in residential housing prices, combined with gradually rising interest rates, put severe stress on low credit-quality (sub-prime) borrowers. Rising defaults pushed several mortgage lenders and leveraged sub-prime mortgage investors toward bankruptcy, and catalyzed a swift and broad flight from various forms of investment risk over the year. These revelations began creating serious liquidity problems in the credit markets late in the second quarter and have been the root of uncertainty and market volatility ever since.
A rapid and at times seemingly indiscriminate flight from risk created unusual patterns of volatility within the bond market. Credit spreads widened significantly beginning in July, as Moody’s and S&P downgraded hundreds of securities, and price moves forced leveraged investors to raise cash any way they could. Since much of the leverage had been funded with short-term debt, the short end of the yield curve bore the brunt of the liquidity crisis. The typically docile commercial paper market seized as demand dried up, and short-term Treasury yields vacillated between 2.9% and 4.9% as investors raced to safety, causing a dislocation in prices. Since then, as the Federal Reserve pumped liquidity into the system and aggressively lowered policy rates, short-term yields have dropped dramatically and the treasury yield curve has steepened. Yet, credit spreads have continued to expand as investment grade yields have not dropped along with treasuries and non-investment grade (Junk) yields have continued to rise. This is because dominoes have continued to fall as large financial institutions continue to discover weaknesses in their portfolios and write billions of dollars off of their balance sheets.
After rallying strongly off of a February trough, the stock market followed the lead of the credit markets by trading sharply down during the liquidity crisis in July, then recovering from late August through October. Not surprisingly, small- and mid-cap stocks reacted more during the price declines, and underperformed large-cap stocks during the year. Interestingly, however, growth indices, which would normally react poorly to a rise in interest rates or a liquidity squeeze, significantly outperformed value indices during the period. We believe this was due to in part to a reversion to the mean since value indices had outperformed growth indices for an extended period of time, and also to technical supply/demand effects brought on by the liquidity crisis. Importantly, we believe this was also the result of extreme weakness in the financials sector, which has a dominant role in most value indices. Stocks recovered in late August and throughout October, as a result of an infusion of liquidity by the Federal Reserve, but corrected again in November and December with evidence mounting that the economy was slowing, and stock investors expressed disappointment that the Fed was not acting even more aggressively, while revelations of subprime losses continued to emanate from financial companies.
Within this environment, Managers Special Equity Fund slightly outperformed its benchmark, providing a marginally negative return for the year. The Managers Class shares returned -0.60%, the Institutional Class shares returned -0.39%, and the benchmark Russell 2000® Index, returned -1.57% for the year. A detailed review of the performance and positioning of the Fund, including a discussion of the subadvisor change we implemented in December 2007, is included within this report.
Our fear that the credit crisis would extend into 2008 has been realized, as lingering credit problems and further revelations of losses by large financial institutions are hindering not only the financial markets, but the economy as well. The increasing possibility that the economy will slide into recession has driven volatility higher, and stock prices lower. The Federal Reserve has been increasingly aggressive in easing rates, and although we think the risk of recession has increased, we still believe that portions of the U.S. and global economies remain healthy. Although foreign and emerging markets economies are by no means decoupled from U.S. impact, they have become increasingly diversified with respect to trading partners, and have increasingly healthy reserves. In sum,
1
Letter to Shareholders (continued)
we continue to believe that investors should maintain their portfolios with allocations near their long-run targets, rebalance if necessary and take full advantage of opportunities to participate in the growth of the global economy.
One of our foremost goals at Managers Investment Group is to structure and manage mutual funds that will help our shareholders and clients become more successful in reaching their investment goals and objectives. Each of our Funds is geared to provide you with exposure to a specific asset class, combination of asset classes, or segment of the market. Investors tend to use our Funds as part of their overall asset allocation in order to structure a well-diversified portfolio intended to meet individual needs. Most of our Funds, like those detailed in this report, are therefore designed to be building blocks.
The following report covers the year ending December 31, 2007. Should you have any questions about this report, or if you’d like to receive a Prospectus and additional information, including fees and expenses, for this or any of the other Funds in our family, please feel free to contact us at 1-800-835-3879, or visit our website at www.managersinvest.com. As always, please read the Prospectus carefully before you invest or send money.
If you are curious about how you can better diversify your investment program, visit the Knowledge Center on our Web site and view our articles in the investment strategies section. You can rest assured that under all market conditions our team is focused on delivering excellent investment management services for your benefit.
We thank you for your continued confidence and investment in The Managers Funds.
Sincerely,

John H. Streur
Senior Managing Partner
Managers Investment Group LLC
2
About Your Fund’s Expenses (unaudited)
As a shareholder of the Fund, you may incur two types of costs: (1) transaction costs, which may include sales charges (loads) on purchase payments; redemption fees; and exchange fees; and (2) ongoing costs, including management fees; distribution (12b-1) fees; and other Fund expenses. This Fund incurs only ongoing costs. This example is intended to help you understand your ongoing costs (in dollars) of investing in the Fund and to compare these costs with the ongoing costs of investing in other mutual funds. The example is based on an investment of $1,000 invested at the beginning of the period and held for the entire period as indicated below.
Actual Expenses
The first line of the table to the right provides information about the actual account values and actual expenses. You may use the information in this line, together with the amount you invested, to estimate the expenses that you paid over the period. Simply divide your account value by $1,000 (for example, an $8,600 account value divided by $1,000 = 8.6), then multiply the result by the number in the first line under the heading entitled “Expenses Paid During Period” to estimate the expenses you paid on your account during this period.
Hypothetical Example for Comparison Purposes
The second line of the table to the right provides information about hypothetical account values and hypothetical expenses based on the Fund’s actual expense ratio and an assumed annual rate of return of 5% before expenses, which is not the Fund’s actual return. The hypothetical account values and expenses may not be used to estimate the actual ending account balance or expenses you paid for the period. You may use this information to compare the ongoing costs of investing in the Fund and other funds by comparing this 5% hypothetical example with the 5% hypothetical examples that appear in the shareholder reports of other funds.
Please note that the expenses shown in the table are meant to highlight your ongoing costs only and do not reflect any transactional costs, such as sales charges (loads), redemption fees, or exchange fees. Therefore, the second line of the table is useful in comparing ongoing costs only, and will not help you determine the relative total costs of owning different funds.
| | | | | | | | | | | | |
Six Months Ended December 31, 2007 | | Expense
Ratio for the
Period | | | Beginning
Account Value
7/01/2007 | | Ending
Account Value
12/31/2007 | | Expenses
Paid During
the Period* |
Managers Special Equity Fund - Managers Shares | | | | | | | | | | | | |
Based on Actual Fund Return | | 1.39 | % | | $ | 1,000 | | $ | 905 | | $ | 6.67 |
Based on Hypothetical 5% Annual Return | | 1.39 | % | | $ | 1,000 | | $ | 1,018 | | $ | 7.07 |
Managers Special Equity Fund - Institutional Shares | | | | | | | | | | | | |
Based on Actual Fund Return | | 1.18 | % | | $ | 1,000 | | $ | 906 | | $ | 5.69 |
Based on Hypothetical 5% Annual Return | | 1.18 | % | | $ | 1,000 | | $ | 1,019 | | $ | 6.01 |
| * | Expenses are equal to the Fund’s annualized expense ratio multiplied by the average account value over the period, multiplied by the number of days in the most recent fiscal half-year (184), then divided by 365. |
3
Managers Special Equity Fund
Portfolio Managers’ Comments
The Managers Special Equity Fund’s (the “Fund”) objective is to achieve long-term capital appreciation through a diversified portfolio of equity securities of small and medium-sized companies.
THE PORTFOLIO MANAGERS
The Fund employs multiple portfolio managers who specialize in distinct investment approaches. This “intelligence diversification” is designed to not only manage risk but also to help us tap the markets’ full potential by focusing different analytical insights on each class of investment. Fund management strives to achieve this performance and diversification while ensuring that the Fund operates within the framework of its investment objective and principal investment strategies.
Smith Asset Management Group LP
The Fund’s Board of Trustees approved the addition of Smith Asset Management Group LP (“Smith Group”) to the lineup of subadvisors for the Fund during the second quarter of 2006. Smith Group’s investment process is based on a combination of a well-conceived quantitative screening process coupled with experienced, intelligent fundamental and qualitative analysis. The team is focused on predicting which attractively valued companies will report a succession of positive earnings surprises. The process begins by seeking companies with attractive risk profiles and valuations as well as dramatically improving business fundamentals. To manage risk, Smith Group screens for companies with good corporate governance, strong financial quality, attractive valuation, and moderate portfolio beta. To identify high earnings growth companies, Smith Group screens for rising earnings expectations, improving earnings quality, a high-percentage positive earnings surprise, and high earnings growth rate.
Ideal Company:
Low-risk, as evidenced by:
| | • | | Moderate portfolio beta |
| | • | | Strong financial quality |
| | • | | Good corporate governance |
High earnings growth, as evidenced by:
| | • | | Rising earnings expectations |
| | • | | Improving earnings quality |
| | • | | High percentage positive earnings surprise |
| | • | | High earnings growth rate |
Portfolio Management:
| | • | | Takes a bottom-up stock picking approach |
| | • | | Uses a combination of quantitative and fundamental analysis |
| | • | | Focuses on identifying risks created by corporate governance and financial reporting practices |
| | • | | Builds a portfolio of 100-120 stocks |
The Portfolio:
| | • | | Holdings across all sectors |
| | • | | Individual stock exposure limited to a maximum of 3.0% |
| | • | | Moderate turnover of approximately 50-60% |
| | • | | Sector weighting maximum of two times the Russell 2000® Index |
Sell Discipline:
Portfolio holdings are sold if:
| | • | | A negative earnings surprise is predicted by either the process or management guidance |
| | • | | A negative earnings surprise is actually reported |
| | • | | The stock’s valuation level is too high |
| | • | | A buyout announcement is made |
Donald Smith & Co., Inc.
Donald Smith & Co., Inc. (“Donald Smith”) is a value manager that invests in out-of-favor small-capitalization companies. Donald Smith’s philosophy seeks to identify companies in the bottom decile of price-to-tangible-book-value ratios, with a strong balance sheet, and a positive outlook for earnings potential over the next two to four years. Donald Smith believes that extremely low P/B ratio companies often trade below replacement value, are inherently less risky, and are more likely to be acquired. Furthermore, because only a few investment managers focus on companies in the lowest P/B ratio decile, their stocks may be inefficiently priced and can offer tremendous value.
Donald Smith’s process begins by looking for companies in the lowest 10% of price-to-tangible-book-value ratios with a strong balance sheet and a positive outlook for earnings potential over the next two to four years. Donald Smith also assesses price-to-earnings, price-to-sales, and debt-to-capital ratios to form a “watch list” of about 300 securities. After valuations are addressed, Donald Smith performs fundamental research, including company visits, to assess the quality of the company’s balance sheet and book value. The team is looking for a catalyst for an improvement in earnings potential that is not already reflected in the stock price. A concentrated portfolio of 40-50 stocks is the result. Stocks are sold when a target price has been achieved, usually set at less than 2x book value. Positions may also be sold if the stock appreciates rapidly, if a better idea is found, or if fundamentals deteriorate. Portfolio turnover is low at 20-40% annually.
The ideal company exhibits many of the following traits:
| | • | | Low price-to-book value |
| | • | | Positive earnings potential over the next two to four years |
Portfolio Management:
| | • | | Focuses on lowest decile of price-to-tangible book value stocks |
| | • | | Price-to-earnings, price-to-sales, and debt-to-capital also assessed from valuation standpoint |
| | • | | Concentrates the portfolio in 40-50 stocks |
The Portfolio:
| | • | | Value oriented holdings |
| | • | | Initial stock weightings are generally 3% - 3.5% |
| | • | | Typically holds 40-50 stocks |
| | • | | Average turnover between 20-40% annually |
The following factors influence the sell decision when:
| | • | | Target price is reached, usually less than 2x book value |
| | • | | Stock appreciates rapidly |
| | • | | Fundamentals deteriorate |
4
Managers Special Equity Fund
Portfolio Managers’ Comments (continued)
Lord, Abbett & Co. LLC
In December 2007, the Fund’s Board of Trustees approved the addition of Lord, Abbett & Co. LLC (“Lord Abbett”), to the Fund’s lineup of subadvisors. The team at Lord Abbett led by Tom O’Halloran, selects stocks by focusing on companies that have revenue growth of at least 15%, are experiencing year-to-year operating margin improvement, and are experiencing earnings growth that is driven by top-line growth rather than by one-time events or simple cost-cutting measures. The focus is also on identifying companies with higher quality balance sheets (often captured by finding companies with manageable debt-to-total-capital ratios) and that are already profitable. Once this process is completed, the focus for the team is on forecasting both revenue and earnings growth over the next several years. To achieve this goal, and to find companies that will be growing considerably faster than their industry average, members of the team spend an extensive amount of time understanding the competitive advantages of a firm, the industry dynamics within which they operate, and the strength of management.
A position is sold or trimmed if there is a fundamental change in the business, a more attractive alternative is found, or if a holding reaches a 5% weight in the overall Portfolio.
The Portfolio typically holds between 100 and 150 stocks with no individual holding exceeding 5%. There is a risk constraint that prevents any individual industry from being greater than 25% of the total portfolio weight.
Skyline Asset Management, L.P.
The investment team from Skyline Asset Management, L.P. (“Skyline”) looks for small-capitalization stocks that have below-average valuations with above-average growth prospects. Skyline’s research effort focuses on finding good companies that are overlooked or not widely followed. Typically they invest in firms with market caps of less than $2 billion. The selection process involves using outside research services, computer screens, and internally maintained lists of potential companies/stocks to identify new ideas. These ideas are then screened to determine whether they meet certain basic criteria: relative valuation, capitalization, financial strength, and opportunities for continued growth. This screening process reduces the list from 2,000 names to 150 to 200. This list is then more rigorously analyzed to answer the question: “Why will earnings increase at an above-average rate?” All company documents are analyzed, any available industry or research reports are reviewed, and, most importantly, questions are addressed directly to senior company management.
In addition, other companies in the same industry are reviewed to determine relative valuation of the company being investigated. The final Portfolio will contain 65-85 stocks and is generally fully invested. The Portfolio will tend to be well diversified, and the Portfolio’s P/E ratio will consistently be below that of the Russell 2000® Index. Skyline sells stocks when they rise to a sell target, which is usually a P/E equal to the overall stock market, or if the company’s fundamentals have changed so that the original investment thesis is no longer valid.
The ideal company exhibits many of the following traits:
| | • | | Market capitalization less than $2 billion |
| | • | | Discounted price/earnings ratio relative to the market |
| | • | | Above average growth prospects |
| | • | | Neglected, under followed, and often out of favor |
Portfolio Management:
| | • | | Broad diversification among economic sectors |
| | • | | Keep attentive to earnings |
| | • | | Maintain favorable risk/reward |
The Portfolio:
| | • | | Stocks have a maximum weighting of 5% for each holding |
| | • | | Typically holds 65-85 stocks |
| | • | | Cash equivalents averaging less than 5% |
The following factors influence the sell decision when:
| | • | | P/E equals the market/industry P/E |
| | • | | Holding reaches 5.0% of the portfolio |
Westport Asset Management, Inc.
The investment team at Westport Asset Management, Inc. (“Westport”), led by Andy Knuth, focuses on small-capitalization companies that are determined to have significant upside potential in earnings and ROE over the next few years. Although investing for growth, Andy will purchase stocks only if they are selling at or below the market’s P/E multiple, or below valuations of other companies in the same industry. Implicit in the strategy is that Knuth and his partner Ed Nicklin focus on a small number of issues, and hold them for a long time. The concentration and low turnover enable them to heavily research and monitor each position.
The portfolio manager at Westport is focused on future profits only, and in fact prefers to find businesses that are inherently good but which have gone through a troubling period. Acquisitions or divestitures, management shake-ups, changes in the business cycle, or the development of a proprietary product in a strong industry are all factors that might improve earnings and investor perceptions. The portfolio manager will typically have a concentrated portfolio, and any industry concentrations are merely an outcome of stock selection. Because some of the companies in which he invests may not have earnings, the price-to-trailing-earnings ratio may be high, although the price-to-forward-earnings will be well below average. The management style is patient, usually turning over less than 20% per year.
The ideal company exhibits many of the following traits:
| | • | | Upside potential in earnings and ROE (return on equity) |
| | • | | Low P/E and improving earnings/cash flow |
| | • | | Company driven by entrepreneurial impact |
| | • | | Preference for turnaround story |
Portfolio Management:
| | • | | Has a two to three year time horizon on initial investments |
| | • | | Concentrates the Portfolio and has low turnover |
| | • | | Views any significant industry concentrations as merely an outcome of bottom-up fundamental analysis |
| | • | | May invest in companies that do not have earnings |
The Portfolio:
| | • | | Initial stock weightings will vary depending on liquidity |
| | • | | May have trailing P/E ratios that are higher than the market, but generally forward P/E ratios will be well below the average, because some of the companies Westport invests in may not have earnings |
5
Managers Special Equity Fund
Portfolio Managers’ Comments (continued)
| | • | | Has an average turnover of less than 20% per year |
The portfolio management team will make a sell decision when:
| | • | | A stock reaches a pre-determined price objective |
| | • | | There are negative changes in a company’s fundamentals |
Veredus Asset Management, LLC
The investment philosophy at Veredus Asset Management, LLC (“Veredus”) is based on their belief that positive earnings surprise and positive estimate revision are the key drivers of stock price change. In particular, the Veredus investment team, led by founder Tony Weber, is concerned about the sustainability of this earnings momentum. To that end, the team tends to focus more on the economic performance of a particular company as opposed to more traditional accounting measures. Specifically, the analysts and portfolio managers at Veredus look for companies with strong asset growth and accelerating rates of economic return in excess of their cost of capital. This is what they view as the true definition of wealth creation, or cash flow return on investment (CFROI). Finally, the Veredus team also believes that some technical measures, such as relative strength, flows, and trading volume, can be useful indicators of future stock performance.
The investment team at Veredus starts the research process by screening the entire universe of over 8,000 small companies for upward earnings revisions. Companies are also ranked on the basis of recent estimate changes, considering both absolute and percent change in estimates. This model provides not only a shopping list of potential targets, but the qualification work that Veredus feels is essential to market acceptance. The core of the research effort is placed on calculating the CFROI potential of companies on the target list and how Veredus’ internally developed work compares with current street expectations. The primary focus is assessing CFROI on a sequential basis as opposed to year over year. This gives the investment team a more detailed picture for possibilities of margin expansion, sales growth, and other sources of CFROI leverage. Contact with company management is also essential in researching companies in the small-cap arena.
The ideal investment exhibits many of the following traits:
| | • | | Positive earnings surprise and subsequent upward estimate revisions |
| | • | | Attacking large markets with high barriers to entry |
| | • | | Balance sheet commensurate with income statement |
Portfolio Management:
| | • | | Screens for companies which rank in the top 20% of all companies based on earnings estimate revisions and quarterly earning surprise |
| | • | | Employs extensive fundamental research |
| | • | | Seeks sustainability of company’s fundamental performance |
The investment team will make a sell decision when:
| | • | | There is an anticipated/ actual earnings disappointment |
| | • | | They see deteriorating market mechanics |
| | • | | There is a change in strategic market outlook or better idea develops |
THE YEAR IN REVIEW
Over the 12 months ended December 31, 2007, the Managers Special Equity Fund Managers Class of shares returned -0.60% and the Institutional Class of shares returned -0.39%, both outpacing the -1.57% return for the Russell 2000® Index.
Although small-cap stocks finished the year modestly lower, the path taken throughout the year proved to be anything but straight. The first half of the year saw small-cap stocks continue to move higher, building on the strong performance seen from the asset class over the past several years. Even during this period, signs of what would ultimately cause the market to reverse direction were already being seen. Concerns about subprime lending were increasing, and stocks within the financials sector performed poorly during the first half. The health of the U.S. economy was heavily debated, with concerns of a potential recession and inflation fears at the forefront. Ultimately, these fears came home to roost during the third quarter, as investors became increasingly risk averse. Small-cap stocks declined in the third quarter, although a brief rally in September helped to limit the damage. While the fourth quarter got off to a good start, things quickly turned negative as investors continued to weigh their concerns over deterioration in the credit markets and the possibility of a U.S. recession.
In keeping with the risk-aversion theme, investors showed a preference for large-cap stocks over their small-cap counterparts, and growth stocks outperformed value stocks by a fairly wide margin. Within small-caps, those stocks in the top quintile of market capitalization (the largest small-cap stocks) were the best performers, while those in the bottom quintile were the worst performers for the period. For the year, growth stocks held nearly a 17% lead over value stocks within the small-cap space. Interestingly, many of the sectors within the small-cap market finished the year higher, led by strong performance in materials, energy, and health care, all of which posted solid double-digit returns for the year. Not surprisingly, financials and consumer discretionary were the worst-performing sectors for the year. These two sectors represent more than 35% of the small-cap market and therefore ultimately helped to lead the broader market indices lower for the year.
Similar to the broader markets, the Fund performed well during the first half of the year, generating positive absolute returns and outpacing the performance of the benchmark. Much of this relative performance was the result of strong stock picks within the consumer discretionary and financials sectors, as well as the Fund’s underweight position to the financials sector. As we moved into the third quarter, the markets turned negative, and though the Fund also declined, it held up better than the benchmark. The fourth quarter proved to be particularly challenging, as the Fund lost ground on a relative basis, but still finished ahead of the benchmark for the calendar year. Returns in the consumer discretionary, technology and financials sectors particularly weighed on the Fund’s performance during the final quarter. Consistent with the environment, the Fund’s growth-oriented subadvisors performed well, while the Fund’s value-oriented subadvisors encountered more headwinds in the markets. Among the Fund’s best-performing stocks for the year were DeVry Inc (+86%) and ITT Educational Services (+28%), two stocks in the education services space that bucked the broader trend of difficulties in the consumer discretionary sector. Among the Fund’s worst performers were Spansion Inc (-74%) and Visteon Corp (-48%).
6
Managers Special Equity Fund
Portfolio Managers’ Comments (continued)
LOOKING FORWARD
Heading into 2008, stocks within the technology, consumer discretionary, and industrials sectors continue to represent the largest exposures for the Fund, and each of these sector positions represents an overweight relative to the respective exposure in the Index. The Fund continues to hold lower-than-benchmark positions in the financials, materials, and health care sectors. In addition, we believe the Portfolio continues to be attractively valued relative to both its historical and expected earnings growth rates.
On an organizational note, as of December 2007, Kern Capital Management no longer serves as a subadvisor for the Fund.
CUMULATIVE TOTAL RETURN PERFORMANCE
Managers Special Equity Fund’s cumulative total return is based on the daily change in net asset value (NAV), and assumes that all distributions were reinvested. The Russell 2000® Index measures the performance of the 2,000 smallest companies in the Russell 3000® Index, which measures the performance of the 3,000 largest U.S. companies based on total market capitalization. The Index reflects no deduction for fees, expenses, or taxes. Unlike the Fund, the Russell 2000® Index is unmanaged, is not available for investment, and does not incur expenses. The first chart compares a hypothetical $10,000 investment made in Managers Special Equity Fund– Managers Class on December 31, 1997, to a $10,000 investment made in the Russell 2000® Index for the same time period. The second chart compares a hypothetical $10,000 investment made in Managers Special Equity Fund– Institutional Class on May 3, 2004, to a $10,000 investment made in the Russell 2000® Index for the same time period. The graphs and tables do not reflect the deduction of taxes that a shareholder would pay on a Fund distribution or redemption of shares. Past performance is not indicative of future results.
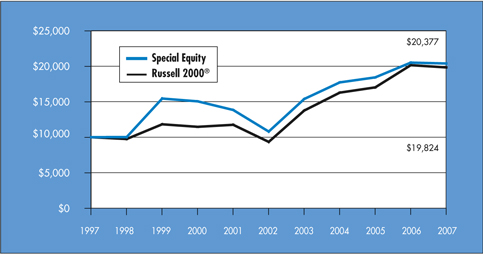
The table below shows the average annual total returns for Managers Special Equity Fund– Managers Class and the Russell 2000® Index since December 31, 1997 through December 31, 2007.
| | | | | | | | | | | |
Average Annual Total Returns 1 | | One Year | | | Five Years | | | Ten Years | | | Inception Date |
Special Equity - Managers Class 2 | | (0.60 | )% | | 13.56 | % | | 7.38 | % | | 6/1/84 |
Russell 2000® Index | | (1.57 | )% | | 16.25 | % | | 7.08 | % | | |
7
Managers Special Equity Fund
Portfolio Managers’ Comments (continued)
CUMULATIVE TOTAL RETURN PERFORMANCE
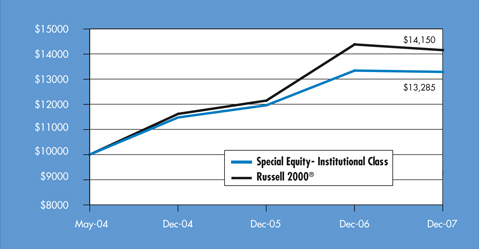
The table below shows the average annual total returns for Special Equity– Institutional Class and the Russell 2000® Index since May 3, 2004 through December 31, 2007.
| | | | | | | | |
Average Annual Total Returns 1 | | One Year | | | Since Inception | | | Inception Date |
Special Equity - Institutional Class 2 | | (0.39 | )% | | 8.06 | % | | 5/3/04 |
Russell 2000® Index | | (1.57 | )% | | 9.94 | % | | |
The performance data shown represents past performance, which is not a guarantee of future results. Current performance may be lower or higher than the performance data quoted. The investment return and principal value of an investment in the Funds will fluctuate so that an investor’s shares, when redeemed, may be worth more or less than their original cost. For performance information through the most recent month end please call (800) 835-3879 or visit our website at www.managersinvest.com.
In choosing a Fund, investors should carefully consider the amount they plan to invest, their investment objectives, the Fund’s investment objectives, risks, charges and expenses before investing. For this and other information, please call 800.835.3879 or visit www.managersinvest.com for a free prospectus. Read it carefully before investing or sending money. Distributed by Managers Distributors, Inc., member FINRA.
The Fund is subject to risks associated with investments in small capitalization companies, such as erratic earnings patterns, competitive conditions, limited earnings history, and a reliance on one or a limited number of products.
The Russell 2000® Index is a trademark of the Frank Russell Company. Frank Russell® is a trademark of the Frank Russell Company.
1 | Total return equals income yield plus share price change and assumes reinvestment of all dividends and capital gain distributions. Returns are net of fees and may reflect offsets of Fund expenses as described in the Prospectus. No adjustment has been made for taxes payable by shareholders on their reinvested dividends and capital gain distributions. Returns for periods greater than one year are annualized. The listed returns on the Fund are net of expenses. All returns are in U.S. dollars($). |
2 | From time to time, the Fund’s advisor has waived its fees and/or absorbed Fund expenses, which has resulted in higher returns. |
8
Managers Special Equity Fund
Fund Snapshots
December 31, 2007
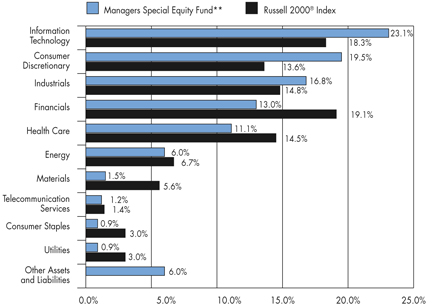
Portfolio Breakdown
| | | | | | |
Industry | | Managers Special
Equity Fund ** | | | Russell 2000®
Index | |
Information Technology | | 23.1 | % | | 18.3 | % |
Consumer Discretionary | | 19.5 | % | | 13.6 | % |
Industrials | | 16.8 | % | | 14.8 | % |
Financials | | 13.0 | % | | 19.1 | % |
Health Care | | 11.1 | % | | 14.5 | % |
Energy | | 6.0 | % | | 6.7 | % |
Materials | | 1.5 | % | | 5.6 | % |
Telecommunication Services | | 1.2 | % | | 1.4 | % |
Consumer Staples | | 0.9 | % | | 3.0 | % |
Utilities | | 0.9 | % | | 3.0 | % |
Other Assets and Liabilities | | 6.0 | % | | 0.0 | % |
| ** | As a percentage of net assets |
Top Ten Holdings
| | | |
Security Name | | Percentage of
Net Assets | |
MI Developments, Inc., Class A* | | 2.3 | % |
DeVry, Inc.* | | 2.3 | |
Air France-KLM, ADR* | | 1.7 | |
Plains Exploration & Production Co. | | 1.6 | |
Semiconductor Manufacturing International Corp.* | | 1.5 | |
ITT Educational Services, Inc.* | | 1.4 | |
Ross Stores, Inc.* | | 1.2 | |
Charles River Laboratories International, Inc. | | 1.2 | |
Saks, Inc. | | 1.1 | |
Illumina, Inc. | | 1.0 | |
| | | |
Top Ten as a Group | | 15.3 | % |
| | | |
| * | Top Ten Holding at June 30, 2007 |
Any sectors, industries, or securities discussed should not be perceived as investment recommendations. Mention of a specific security should not be considered a recommendation to buy or solicitation to sell that security.
9
Managers Special Equity Fund
Schedule of Portfolio Investments
December 31, 2007
| | | | | | |
| | | Shares | | | Value |
Common Stocks - 94.0% | | | | | | |
Consumer Discretionary - 19.5% | | | | | | |
Aftermarket Technology Corp.* | | 46,300 | | | $ | 1,262,138 |
American Axle & Manufacturing Holdings, Inc. | | 163,500 | | | | 3,044,370 |
Amerigon, Inc.* | | 263,725 | | | | 5,575,146 |
Big 5 Sporting Goods Corp. | | 332,500 | | | | 4,794,650 |
Big Lots, Inc.* | | 907,152 | 2 | | | 14,505,360 |
Buckle, Inc., The | | 46,000 | | | | 1,518,000 |
Capella Education Co.* | | 28,800 | | | | 1,885,248 |
Carter’s, Inc.* | | 194,300 | 2 | | | 3,759,705 |
Chipotle Mexican Grill, Inc.* | | 14,400 | | | | 2,117,808 |
Crocs, Inc.* | | 199,825 | | | | 7,355,558 |
Ctrip.com International, Ltd.* | | 59,201 | | | | 3,402,281 |
Deckers Outdoor Corp.* | | 84,430 | | | | 13,091,716 |
Desarrolladora Homex, S.A.B. de C.V. | | 32,429 | | | | 1,603,614 |
DeVry, Inc. | | 832,900 | | | | 43,277,485 |
Dick’s Sporting Goods, Inc.* | | 384,486 | | | | 10,673,331 |
Dillard’s, Inc., Class A | | 831,200 | | | | 15,609,936 |
DXP Enterprises, Inc.* | | 38,400 | | | | 1,792,512 |
Fossil, Inc.* | | 50,210 | | | | 2,107,816 |
GSI Commerce, Inc.* | | 82,113 | | | | 1,601,204 |
Guess?, Inc. | | 256,775 | | | | 9,729,205 |
Gymboree Corp.* | | 117,400 | 2 | | | 3,576,004 |
Home Inns & Hotels Management, Inc., ADR | | 49,909 | | | | 1,778,757 |
IMAX Corp.* | | 519,489 | | | | 3,542,915 |
INVESTools, Inc. | | 72,631 | | | | 1,288,474 |
ITT Educational Services, Inc.* | | 314,100 | | | | 26,783,307 |
J. Crew Group, Inc.* | | 26,614 | | | | 1,283,061 |
Jack in the Box, Inc.* | | 261,250 | 2 | | | 6,732,412 |
Jos. A. Bank Clothiers, Inc.* | | 299,990 | | | | 8,534,716 |
LKQ Corp.* | | 167,200 | | | | 3,514,544 |
MarineMax, Inc.* | | 234,100 | | | | 3,628,550 |
McCormick & Schmick’s Seafood Restaurants, Inc.* | | 162,000 | 2 | | | 1,932,660 |
Morningstar, Inc.* | | 38,685 | | | | 3,007,759 |
New Oriental Education & Technology Group, Inc., ADR* | | 40,543 | | | | 3,267,360 |
Orient-Express Hotels, Ltd. | | 289,900 | | | | 16,675,048 |
Polaris Industries, Inc. | | 60,900 | 2 | | | 2,909,193 |
Priceline.com, Inc.* | | 104,293 | | | | 11,979,094 |
Red Robin Gourmet Burgers, Inc.* | | 131,600 | | | | 4,209,884 |
Ross Stores, Inc. | | 930,000 | 2 | | | 23,780,100 |
Ruby Tuesday, Inc. | | 457,600 | | | | 4,461,600 |
Saks, Inc. | | 1,023,000 | | | | 21,237,480 |
Shutterfly, Inc.* | | 259,650 | | | | 6,652,233 |
Strayer Education, Inc. | | 16,990 | | | | 2,898,154 |
Tempur-Pedic International, Inc. | | 54,038 | | | | 1,403,367 |
Tupperware Corp. | | 128,100 | 2 | | | 4,231,143 |
Ulta Salon, Cosmetics & Fragrance, Inc. | | 74,679 | | | | 1,280,745 |
Under Armour, Inc., Class A* | | 278,394 | 2 | | | 12,157,466 |
Universal Electronics, Inc.* | | 32,100 | | | | 1,073,424 |
Visteon Corp.* | | 4,395,300 | | | | 19,295,367 |
Warnaco Group, Inc., The* | | 468,900 | | | | 16,317,720 |
Wolverine World Wide, Inc. | | 128,100 | 2 | | | 3,141,012 |
Zumiez, Inc.* | | 62,400 | | | | 1,520,064 |
Total Consumer Discretionary | | | | | | 372,800,696 |
Consumer Staples - 0.9% | | | | | | |
B&G Foods, Inc. | | 317,700 | | | | 3,243,717 |
Central European Distribution Corp.* | | 51,482 | | | | 2,990,075 |
China Nepstar Chain Drugstore Ltd. | | 60,408 | | | | 1,061,973 |
Darling International, Inc.* | | 225,900 | 2 | | | 2,611,404 |
Flowers Food, Inc. | | 153,500 | 2 | | | 3,593,434 |
Nash Finch Co. | | 55,200 | | | | 1,947,456 |
WD-40 Co. | | 39,900 | 2 | | | 1,515,003 |
Total Consumer Staples | | | | | | 16,963,062 |
Energy - 6.0% | | | | | | |
ATP Oil & Gas Corp.* | | 72,900 | 2 | | | 3,684,366 |
Cal Dive International, Inc.* | | 66,312 | | | | 877,971 |
Carrizo Oil & Gas, Inc.* | | 187,294 | | | | 10,254,346 |
Comstock Resources, Inc.* | | 552,300 | 2 | | | 18,778,200 |
Core Laboratories N.V.* | | 13,657 | | | | 1,703,301 |
Dawson Geophysical Co.* | | 54,900 | | | | 3,923,154 |
Dril-Quip, Inc. | | 37,352 | | | | 2,079,012 |
Gulfmark Offshore, Inc.* | | 48,000 | 2 | | | 2,245,920 |
Key Energy Services, Inc.* | | 308,400 | 2 | | | 4,437,876 |
Matrix Service Co.* | | 92,600 | | | | 2,020,532 |
Mitcham Industries, Inc.* | | 34,630 | | | | 711,993 |
Oceaneering International, Inc.* | | 20,824 | | | | 1,402,496 |
Overseas Shipholding Group, Inc. | | 84,768 | | | | 6,309,282 |
Parker Drilling Co.* | | 256,300 | | | | 1,935,065 |
Petroquest Energy, Inc.* | | 237,075 | | | | 3,390,172 |
Plains Exploration & Production Co.* | | 574,745 | 2 | | | 31,036,253 |
SandRidge Energy, Inc.* | | 72,400 | 2 | | | 2,596,264 |
The accompanying notes are an integral part of these financial statements.
10
Managers Special Equity Fund
Schedule of Portfolio Investments (continued)
| | | | | | |
| | | Shares | | | Value |
Energy - 6.0 % (continued) | | | | | | |
Stone Energy Corp.* | | 102,600 | | | $ | 4,812,966 |
Superior Energy Services, Inc. | | 31,290 | | | | 1,077,002 |
USEC, Inc.* | | 247,900 | | | | 2,231,100 |
Willbros Group, Inc.* | | 249,925 | | | | 9,569,628 |
Total Energy | | | | | | 115,076,899 |
Financials - 13.0% | | | | | | |
American Financial Group, Inc. | | 39,250 | | | | 1,133,540 |
American National Insurance Co. | | 68,950 | 2 | | | 8,359,498 |
American Physicians Capital, Inc. | | 24,850 | | | | 1,030,281 |
Aspen Insurance Holdings, Ltd. | | 343,700 | | | | 9,912,308 |
Bank of the Ozarks, Inc. | | 22,500 | | | | 589,500 |
BankUnited Financial Corp., Class A | | 601,088 | | | | 4,147,507 |
BioMed Realty Trust, Inc. | | 53,400 | 2 | | | 1,237,278 |
Brown & Brown, Inc. | | 518,700 | | | | 12,189,450 |
Cohen & Steers, Inc. | | 39,012 | | | | 1,169,190 |
Cowen Group, Inc.* | | 262,853 | | | | 2,499,732 |
Delphi Financial Group, Inc., Class A | | 189,950 | | | | 6,701,436 |
Dollar Financial Corp. | | 56,018 | | | | 1,719,192 |
Downey Financial Corp. | | 368,380 | 2 | | | 11,460,302 |
eHealth, Inc. | | 94,200 | | | | 3,024,762 |
Entertainment Properties Trust | | 23,100 | 2 | | | 1,085,700 |
FCStone Group, Inc. | | 81,000 | | | | 3,728,430 |
Financial Federal Corp. | | 159,800 | | | | 3,561,942 |
GFI Group, Inc.* | | 136,711 | | | | 13,085,977 |
Hanover Insurance Group, Inc. | | 206,200 | | | | 9,443,960 |
Harleysville Group, Inc. | | 18,000 | | | | 636,840 |
Hercules Technology Growth Capital, Inc. | | 247,100 | | | | 3,068,982 |
Hilb, Rogal & Hamilton Co. | | 305,500 | | | | 12,394,135 |
IPC Holdings, Ltd. | | 369,100 | 2 | | | 10,655,917 |
iStar Financial, Inc. | | 297,200 | | | | 7,742,060 |
Jefferies Group, Inc. | | 37,959 | | | | 874,955 |
MCG Capital Corp. | | 334,378 | | | | 3,875,441 |
MI Developments, Inc., Class A | | 1,589,100 | 2 | | | 44,288,216 |
MSCI, Inc. | | 25,744 | | | | 988,570 |
National Western Life Insurance Co., Class A | | 12,000 | | | | 2,488,440 |
Navigators Group, Inc.* | | 12,500 | | | | 812,500 |
Northwest Bancorp, Inc. | | 23,800 | 2 | | | 632,366 |
Old Second Bancorp, Inc. | | 21,300 | | | | 570,627 |
Philadelphia Consolidated Holding Co.* | | 117,500 | 2 | | | 4,623,625 |
Phoenix Companies, Inc., The* | | 133,500 | 2 | | | 1,584,645 |
ProAssurance Corp.* | | 35,600 | 2 | | | 1,955,152 |
Prosperity Bancshares, Inc. | | 234,100 | | | | 6,880,199 |
PS Business Parks, Inc. | | 28,000 | | | | 1,471,400 |
RAM Holdings, Ltd.* | | 421,700 | | | | 2,083,198 |
Reinsurance Group of America, Inc. | | 204,600 | | | | 10,737,408 |
RLI Corp. | | 32,600 | 2 | | | 1,851,354 |
Safety Insurance Group, Inc. | | 17,800 | | | | 651,836 |
Saul Centers, Inc. | | 19,500 | | | | 1,041,885 |
SeaBright Insurance Holdings, Inc.* | | 353,235 | | | | 5,326,784 |
South Financial Group, Inc., The | | 225,000 | | | | 3,516,750 |
Sterling Bancshares, Inc. | | 137,000 | | | | 1,528,920 |
Sterling Financial Corp. | | 291,378 | | | | 4,892,237 |
Sunstone Hotel Investors, Inc. | | 56,900 | 2 | | | 1,040,701 |
SVB Financial Group* | | 62,300 | 2 | | | 3,139,920 |
Tower Group, Inc. | | 74,800 | | | | 2,498,320 |
TradeStation Group, Inc.* | | 358,500 | | | | 5,094,285 |
United PanAm Financial Corp.* | | 180,200 | | | | 922,624 |
Universal American Financial Corp.* | | 86,600 | 2 | | | 2,216,094 |
Total Financials | | | | | | 248,166,371 |
Health Care - 11.1% | | | | | | |
Air Methods Corp.* | | 30,100 | | | | 1,495,067 |
Alexion Pharmaceuticals, Inc. | | 40,695 | | | | 3,053,346 |
Align Technology, Inc.* | | 85,824 | | | | 1,431,544 |
Alliance Imaging, Inc.* | | 523,900 | | | | 5,039,918 |
AMAG Pharmaceuticals, Inc. | | 25,329 | | | | 1,523,033 |
Amedisys, Inc.* | | 60,900 | 2 | | | 2,954,868 |
AMERIGROUP Corp.* | | 163,000 | 2 | | | 5,941,350 |
Amsurg Corp.* | | 54,800 | | | | 1,482,888 |
Array BioPharma, Inc. | | 135,900 | | | | 1,144,278 |
Arthrocare Corp.* | | 50,500 | 2 | | | 2,426,525 |
athenahealth, Inc. | | 27,400 | | | | 986,400 |
BioMarin Pharmaceutical, Inc.* | | 88,600 | | | | 3,136,440 |
Bio-Rad Laboratories, Inc.* | | 38,175 | 2 | | | 3,955,694 |
Bio-Reference Labs, Inc.* | | 13,100 | | | | 428,108 |
Centene Corp.* | | 365,500 | | | | 10,029,320 |
Cepheid, Inc.* | | 161,500 | | | | 4,255,525 |
Charles River Laboratories International, Inc.* | | 335,616 | | | | 22,083,532 |
Conceptus, Inc.* | | 481,401 | | | | 9,262,155 |
Conmed Corp.* | | 57,100 | | | | 1,319,581 |
Cubist Pharmaceuticals, Inc.* | | 200,600 | 2 | | | 4,114,306 |
Five Star Quality Care, Inc. | | 455,100 | | | | 3,777,330 |
HMS Holdings Corp.* | | 69,400 | | | | 2,304,774 |
Hologic, Inc.* | | 157,050 | | | | 10,779,912 |
Illumina, Inc.* | | 331,647 | | | | 19,653,401 |
Immucor, Inc.* | | 115,119 | | | | 3,912,895 |
The accompanying notes are an integral part of these financial statements.
11
Managers Special Equity Fund
Schedule of Portfolio Investments (continued)
| | | | | | |
| | | Shares | | | Value |
Health Care - 11.1% (continued) | | | | | | |
IMS Health, Inc. | | 644,952 | | | $ | 14,859,694 |
inVentiv Health, Inc.* | | 16,800 | 2 | | | 520,128 |
K-V Pharmaceutical Co., Class A* | | 45,856 | | | | 1,308,730 |
LifeCell Corp.* | | 79,700 | | | | 3,435,867 |
Martek Biosciences Corp.* | | 83,800 | | | | 2,478,804 |
Masimo Corp.* | | 61,200 | | | | 2,414,340 |
Medicis Pharmaceutical Corp. | | 41,699 | | | | 1,082,923 |
Meridian Bioscience, Inc. | | 90,700 | | | | 2,728,256 |
Merit Medical Systems, Inc.* | | 57,300 | 2 | | | 796,470 |
Molina Healthcare, Inc.* | | 93,400 | 2 | | | 3,614,580 |
NuVasive, Inc.* | | 62,500 | | | | 2,470,000 |
NxStage Medical, Inc.* | | 119,686 | | | | 1,815,637 |
Omnicell, Inc.* | | 150,500 | | | | 4,052,965 |
Onyx Pharmaceuticals, Inc. | | 69,879 | | | | 3,886,670 |
OSI Pharmaceuticals, Inc.* | | 47,100 | 2 | | | 2,284,821 |
Parexel International Corp.* | | 58,800 | 2 | | | 2,840,040 |
Phase Forward, Inc.* | | 181,300 | | | | 3,943,275 |
Quidel Corp.* | | 87,700 | | | | 1,707,519 |
RehabCare Group, Inc.* | | 34,100 | | | | 769,296 |
Salix Pharmaceuticals Ltd.* | | 168,300 | | | | 1,326,204 |
Skilled Healthcare Group, Inc. | | 46,300 | | | | 677,369 |
Sun Healthcare Group, Inc.* | | 130,200 | | | | 2,235,534 |
Thoratec Corp.* | | 119,900 | | | | 2,180,981 |
TomoTherapy, Inc. | | 73,776 | | | | 1,443,059 |
United Therapeutics Corp.* | | 19,580 | | | | 1,911,987 |
Universal Health Services, Inc., Class B | | 170,000 | | | | 8,704,000 |
Varian, Inc.* | | 62,300 | 2 | | | 4,068,190 |
Wright Medical Group, Inc.* | | 255,534 | | | | 7,453,927 |
Total Health Care | | | | | | 213,503,456 |
Industrials - 16.8% | | | | | | |
AAR Corp.* | | 259,200 | | | | 9,857,376 |
Acco Brands Corp.* | | 270,900 | 2 | | | 4,345,236 |
Administaff, Inc. | | 69,900 | | | | 1,976,772 |
Advisory Board Co., The* | | 35,600 | | | | 2,285,164 |
AeroVironment, Inc. | | 64,500 | | | | 1,560,900 |
Air France-KLM, ADR | | 948,178 | | | | 33,062,966 |
Airtran Holdings, Inc.* | | 293,291 | | | | 2,099,964 |
Alaska Airgroup, Inc.* | | 615,000 | | | | 15,381,150 |
Allegiant Travel Co.* | | 229,300 | | | | 7,369,702 |
Applied Industrial Technologies, Inc. | | 94,200 | 2 | | | 2,733,684 |
Axsys Technologies, Inc.* | | 109,367 | 2 | | | 4,008,301 |
Baldor Electric Co. | | 30,154 | | | | 1,014,984 |
Barnes Group, Inc. | | 90,881 | 2 | | | 3,034,517 |
BE Aerospace, Inc.* | | 61,035 | | | | 3,228,752 |
Brady Corp. | | 101,900 | 2 | | | 3,575,671 |
Bucyrus International, Inc. | | 96,277 | | | | 9,568,971 |
CAI International, Inc.* | | 228,500 | | | | 2,403,820 |
Carlisle Co., Inc. | | 165,300 | 2 | | | 6,121,059 |
CBIZ, Inc.* | | 854,900 | | | | 8,386,569 |
CDI Corp. | | 24,900 | | | | 604,074 |
Ceco Environmental Corp.* | | 28,788 | | | | 316,092 |
Columbus McKinnon Corp.* | | 49,100 | | | | 1,601,642 |
Comfort Systems USA, Inc. | | 388,300 | | | | 4,962,474 |
Consolidated Graphics, Inc.* | | 110,540 | | | | 5,286,023 |
Crane Co. | | 183,900 | | | | 7,889,310 |
Ducommun, Inc.* | | 32,000 | | | | 1,216,000 |
EMCOR Group, Inc.* | | 533,450 | | | | 12,605,423 |
Empresas ICA, S.A. de C.V. | | 57,546 | | | | 1,519,214 |
FTI Consulting, Inc.* | | 62,826 | | | | 3,872,595 |
Genco Shipping & Trading, Ltd. | | 138,100 | | | | 7,562,356 |
Geo Group, Inc., The | | 46,152 | | | | 1,292,256 |
Gorman-Rupp Co. | | 24,475 | | | | 763,620 |
GrafTech International Ltd.* | | 217,200 | 2 | | | 3,855,300 |
Heidrick & Struggles International, Inc.* | | 154,200 | | | | 5,722,362 |
HNI Corp. | | 115,800 | 2 | | | 4,059,948 |
Ii-Vi, Inc.* | | 56,700 | 2 | | | 1,732,185 |
JA Solar Holdings Co., Ltd., ADR* | | 124,850 | | | | 8,715,778 |
Kaydon Corp. | | 39,477 | | | | 2,153,076 |
Layne Christensen Co.* | | 167,984 | | | | 8,266,493 |
Middleby Corp., The* | | 53,736 | 2 | | | 4,117,252 |
Miller Herman, Inc. | | 169,100 | 2 | | | 5,477,149 |
NCI Building Systems, Inc.* | | 224,800 | | | | 6,471,992 |
Perini Corp.* | | 192,675 | 2 | | | 7,980,598 |
Quanta Services, Inc.* | | 274,378 | | | | 7,199,679 |
Robbins & Myers, Inc. | | 78,100 | | | | 5,906,703 |
Ryder System, Inc. | | 70,600 | | | | 3,318,906 |
Skywest, Inc. | | 257,660 | | | | 6,918,171 |
Spherion Corp.* | | 735,400 | | | | 5,353,712 |
Stanley, Inc.* | | 11,429 | | | | 365,957 |
Sunpower Corp., Class A* | | 13,957 | | | | 1,819,853 |
Taser International, Inc.* | | 730,250 | | | | 10,508,298 |
Tecumseh Products Co., Class B* | | 191,688 | | | | 3,782,004 |
Teledyne Technologies, Inc.* | | 62,300 | | | | 3,322,459 |
Toro Co., The | | 111,500 | 2 | | | 6,070,060 |
Triumph Group, Inc. | | 55,275 | 2 | | | 4,551,896 |
The accompanying notes are an integral part of these financial statements.
12
Managers Special Equity Fund
Schedule of Portfolio Investments (continued)
| | | | | | |
| | | Shares | | | Value |
Industrials - 16.8% (continued) | | | | | | |
TurboChef Technologies, Inc.* | | 235,350 | 2 | | $ | 3,883,275 |
URS Corp.* | | 264,670 | | | | 14,379,504 |
Valmont Industries, Inc. | | 32,100 | 2 | | | 2,860,752 |
Wabtec Corp. | | 96,200 | 2 | | | 3,313,128 |
Walter Industries, Inc. | | 150,200 | | | | 5,396,686 |
Watson Wyatt & Co. | | 65,800 | 2 | | | 3,053,778 |
Total Industrials | | | | | | 322,063,591 |
Information Technology - 23.1% | | | | | | |
3PAR, Inc. | | 52,309 | | | | 669,555 |
Airspan Networks, Inc.* | | 250,881 | | | | 441,551 |
AMIS Holdings, Inc.* | | 528,349 | | | | 5,294,057 |
Anixter International, Inc. | | 16,946 | | | | 1,055,227 |
ANSYS, Inc.* | | 129,025 | | | | 5,349,376 |
Ariba, Inc. | | 119,900 | | | | 1,336,885 |
Arris Group, Inc.* | | 354,800 | | | | 3,540,904 |
Art Technology Group, Inc.* | | 263,300 | | | | 1,137,456 |
Aruba Networks, Inc.* | | 178,157 | | | | 2,656,321 |
Aspen Technology, Inc.* | | 790,900 | | | | 12,828,398 |
Atheros Communications, Inc.* | | 110,948 | | | | 3,388,352 |
AuthenTec, Inc.* | | 246,875 | | | | 3,587,094 |
Bankrate, Inc.* | | 106,500 | | | | 5,121,585 |
Benchmark Electronics, Inc.* | | 236,850 | | | | 4,199,350 |
Blackboard, Inc.* | | 211,847 | 2 | | | 8,526,842 |
Bladelogic, Inc.* | | 12,000 | | | | 354,840 |
Borland Software Corp.* | | 351,100 | | | | 1,056,811 |
Bottomline Technologies, Inc.* | | 62,300 | | | | 872,200 |
Checkpoint Systems, Inc.* | | 443,300 | | | | 11,516,934 |
Ciena Corp.* | | 231,925 | 2 | | | 7,910,962 |
Commvault Systems, Inc.* | | 193,300 | | | | 4,094,094 |
COMSCORE, Inc. | | 74,500 | | | | 2,430,935 |
Concur Technologies, Inc.* | | 210,320 | | | | 7,615,687 |
Constant Contact, Inc. | | 23,700 | | | | 509,550 |
Convergys Corp.* | | 189,500 | | | | 3,119,170 |
CSG Systems International, Inc.* | | 153,500 | | | | 2,259,520 |
CyberSource Corp.* | | 100,300 | | | | 1,782,331 |
Daktronics, Inc. | | 61,800 | | | | 1,394,826 |
Data Domain, Inc. | | 51,012 | | | | 1,343,656 |
DealerTrack Holdings, Inc.* | | 62,426 | | | | 2,089,398 |
Deltek, Inc. | | 28,427 | | | | 432,943 |
Diodes, Inc.* | | 149,450 | | | | 4,493,962 |
Double-Take Software, Inc.* | | 233,166 | | | | 5,064,366 |
Dycom Industries, Inc.* | | 437,246 | | | | 11,652,606 |
Electronics for Imaging, Inc.* | | 319,181 | | | | 7,175,189 |
EMS Technologies, Inc.* | | 26,000 | 2 | | | 786,240 |
EnerNOC, Inc.* | | 35,300 | | | | 1,733,230 |
Entropic Communications, Inc. | | 322,141 | | | | 2,345,186 |
Equinix, Inc.* | | 49,200 | | | | 4,972,644 |
Exfo Electro-Optical Engineering, Inc.* | | 832,403 | | | | 4,103,747 |
Factset Research Systems, Inc. | | 17,598 | | | | 980,209 |
Fairchild Semiconductor International, Inc.* | | 336,300 | | | | 4,852,809 |
Falconstor Software, Inc.* | | 467,500 | | | | 5,264,050 |
FEI Co.* | | 280,881 | | | | 6,974,275 |
Flextronics International, Ltd.* | | 268,793 | | | | 3,241,644 |
Greenfield Online, Inc.* | | 41,000 | | | | 599,010 |
Harris Stratex Networks, Inc.* | | 211,822 | | | | 3,537,427 |
Hittite Microwave Corp.* | | 223,875 | | | | 10,692,270 |
Infinera Corp. | | 127,372 | | | | 1,890,200 |
Interwoven, Inc.* | | 73,000 | | | | 1,038,060 |
IXYS Corp.* | | 184,400 | | | | 1,478,888 |
Keynote Systems, Inc.* | | 298,899 | | | | 4,199,531 |
L-1 Identity Solutions, Inc.* | | 403,157 | | | | 7,236,668 |
Lawson Software, Inc.* | | 319,800 | 2 | | | 3,274,752 |
Magma Design Automation, Inc.* | | 63,900 | | | | 780,219 |
Manhattan Associates, Inc.* | | 58,800 | | | | 1,549,968 |
Mattson Technology, Inc.* | | 299,100 | | | | 2,560,296 |
MAXIMUS, Inc. | | 37,900 | | | | 1,463,319 |
MercadoLibre, Inc. | | 82,720 | | | | 6,111,354 |
Monolithic Power Systems, Inc.* | | 245,550 | 2 | | | 5,271,958 |
Netgear, Inc.* | | 215,931 | | | | 7,702,259 |
Netlogic Microsystems, Inc.* | | 50,100 | | | | 1,613,220 |
Neutral Tandem, Inc. | | 13,800 | | | | 262,476 |
Novatel Wireless, Inc.* | | 285,600 | | | | 4,626,720 |
Nuance Communications, Inc.* | | 350,600 | | | | 6,549,208 |
Omniture, Inc.* | | 260,600 | | | | 8,675,374 |
Opnext, Inc.* | | 169 | | | | 1,496 |
Parametric Technology Corp.* | | 440,080 | 2 | | | 7,855,428 |
Perficient, Inc.* | | 78,300 | | | | 1,232,442 |
Perot Systems Corp.* | | 502,010 | | | | 6,777,135 |
Photon Dynamics, Inc.* | | 400,994 | | | | 3,328,250 |
Plantronics, Inc. | | 106,900 | 2 | | | 2,779,400 |
Power Integrations, Inc.* | | 459,600 | | | | 15,824,028 |
PROS Holdings, Inc. | | 45,500 | | | | 892,710 |
QLogic Corp.* | | 376,900 | 2 | | | 5,351,980 |
Quest Software, Inc.* | | 178,200 | 2 | | | 3,286,008 |
Rimage Corp.* | | 216,869 | | | | 5,627,751 |
The accompanying notes are an integral part of these financial statements.
13
Managers Special Equity Fund
Schedule of Portfolio Investments (continued)
| | | | | | | |
| | | Shares | | | Value | |
Information Technology - 23.1% (continued) | | | | | | | |
Rogers Corp.* | | 153,400 | | | $ | 6,652,958 | |
Rudolph Technologies, Inc.* | | 172,800 | | | | 1,956,096 | |
Scopus Video Neworks, Ltd.* | | 838,896 | | | | 4,563,594 | |
Semiconductor Manufacturing International Corp.* | | 5,592,500 | 2 | | | 29,025,076 | |
Semtech Corp.* | | 276,400 | 2 | | | 4,289,728 | |
Shanda Interactive Entertainment, Ltd.* | | 66,622 | | | | 2,221,177 | |
ShoreTel, Inc. | | 37,100 | | | | 518,287 | |
SINA Corp.* | | 50,424 | | | | 2,234,287 | |
Skyworks Solutions, Inc.* | | 276,900 | 2 | | | 2,353,650 | |
Smart Modular Technology (WWH), Inc.* | | 528,426 | | | | 5,379,377 | |
SonicWALL, Inc.* | | 188,600 | | | | 2,021,792 | |
Spansion, Inc., Class A* | | 2,571,200 | | | | 10,104,816 | |
Starent Networks Corp.* | | 96,000 | | | | 1,752,000 | |
Stratasys, Inc.* | | 213,900 | | | | 5,527,176 | |
Super Micro Computer, Inc.* | | 295,400 | | | | 2,265,718 | |
Synaptics, Inc.* | | 174,000 | | | | 7,161,840 | |
Synchronoss Technologies, Inc.* | | 59,800 | | | | 2,119,312 | |
SYNNEX Corp.* | | 341,000 | | | | 6,683,600 | |
Synopsys, Inc.* | | 356,400 | 2 | | | 9,241,452 | |
Syntel, Inc. | | 114,444 | | | | 4,408,383 | |
Taleo Corp.* | | 208,325 | | | | 6,203,918 | |
The Knot, Inc.* | | 47,500 | | | | 757,150 | |
TNS, Inc. | | 295,400 | | | | 5,243,350 | |
TTM Technologies, Inc.* | | 373,400 | | | | 4,353,844 | |
Utstarcom, Inc.* | | 850,000 | 2 | | | 2,337,500 | |
Vocus, Inc.* | | 87,475 | | | | 3,020,512 | |
Wright Express Corp.* | | 46,210 | | | | 1,639,993 | |
Zoran Corp.* | | 169,100 | | | | 3,806,441 | |
Total Information Technology | | | | | | 443,469,799 | |
Materials - 1.5% | | | | | | | |
Alpha Natural Resources, Inc.* | | 100,298 | | | | 3,257,679 | |
Century Aluminum Co.* | | 35,147 | | | | 1,895,829 | |
Cleveland-Cliffs, Inc. | | 19,497 | | | | 1,965,298 | |
Cytec Industries, Inc. | | 131,900 | | | | 8,122,402 | |
Olin Corp. | | 153,900 | 2 | | | 2,974,887 | |
OM Group, Inc.* | | 81,425 | 2 | | | 4,685,194 | |
Rock-Tenn Co. | | 109,300 | | | | 2,777,313 | |
Zep, Inc.* | | 44,300 | 2 | | | 614,441 | |
Zoltek Companies, Inc.* | | 53,409 | | | | 2,289,644 | |
Total Materials | | | | | | 28,582,687 | |
Telecommunication Services - 1.2% | | | | | | | |
Cbeyond, Inc.* | | 64,455 | | | | 2,513,100 | |
Cincinnati Bell, Inc.* | | 1,410,719 | | | | 6,700,915 | |
General Communication, Inc., Class A* | | 689,585 | | | | 6,033,869 | |
Premiere Global Services, Inc.* | | 154,800 | | | | 2,298,780 | |
Syniverse Holdings, Inc.* | | 367,800 | | | | 5,730,324 | |
Total Telecommunication Services | | | | | | 23,276,988 | |
Utilities - 0.9% | | | | | | | |
Avista Corp. | | 703,000 | | | | 15,142,620 | |
El Paso Electric Co.* | | 85,300 | | | | 2,181,121 | |
Total Utilities | | | | | | 17,323,741 | |
Total Common Stocks
(cost $1,596,332,820) | | | | | | 1,801,227,290 | |
Other Short-Term Investments - 17.1%1 | | | | | | | |
Bank of New York Institutional Cash Reserves Fund, 5.02%3 | | 188,139,436 | | | | 188,139,436 | |
Dreyfus Cash Management Fund, Institutional Class Shares, 4.85% | | 115,209,951 | | | | 115,209,951 | |
Vanguard Prime Money Market Fund, Institutional Class Shares, 4.74% | | 23,967,770 | | | | 23,967,770 | |
Total Other Short-Term Investments
(cost $327,317,157) | | | | | | 327,317,157 | |
Total Investments - 111.1%
(cost $1,923,649,977) | | | | | | 2,128,544,447 | |
Other Assets, less Liabilities - (11.1)% | | | | | | (213,116,977 | ) |
Net Assets - 100.0% | | | | | $ | 1,915,427,470 | |
Based on the approximate cost of investments of $1,946,572,926 for Federal income tax purposes at December 31, 2007, the aggregate gross unrealized appreciation and depreciation were $355,879,286 and $173,907,765, respectively, resulting in net unrealized appreciation of investments of $181,971,521.
| * | Non-income-producing securities. |
1 | Yield shown for an investment company represents the December 31, 2007, seven-day average yield, which refers to the sum of the previous seven days’ dividends paid, expressed as an annual percentage. |
2 | Some or all of these shares were out on loan to various brokers as of December 31, 2007, amounting to a market value of $180,760,509, or approximately 9.4% of net assets. |
3 | Collateral received from brokers for securities lending was invested in this short-term investment. |
The accompanying notes are an integral part of these financial statements.
14
Managers Special Equity Fund
Statement of Assets and Liabilities
December 31, 2007
| | | |
Assets: | | | |
Investments at value (including securities on loan valued at $180,760,509)* | | $ | 2,128,544,447 |
Receivable for investments sold | | | 10,207,151 |
Receivable for Fund shares sold | | | 3,183,579 |
Dividends, interest and other receivables | | | 1,337,326 |
Prepaid expenses | | | 23,844 |
| | | |
Total assets | | | 2,143,296,347 |
| | | |
Liabilities: | | | |
Payable to Custodian | | | 112,555 |
Payable for Fund shares repurchased | | | 24,722,232 |
Payable upon return of securities loaned | | | 188,139,436 |
Payable for investments purchased | | | 11,619,917 |
Accrued expenses: | | | |
Investment advisory and management fees | | | 1,554,755 |
Administrative fees | | | 431,876 |
Other | | | 1,288,106 |
| | | |
Total liabilities | | | 227,868,877 |
| | | |
Net Assets | | $ | 1,915,427,470 |
| | | |
Managers Shares: | | | |
Net Assets | | $ | 1,668,031,341 |
| | | |
Shares outstanding | | | 25,951,934 |
| | | |
Net asset value, offering and redemption price per share | | $ | 64.27 |
| | | |
Institutional Class Shares: | | | |
Net Assets | | $ | 247,396,129 |
| | | |
Shares outstanding | | | 3,822,918 |
| | | |
Net asset value, offering and redemption price per share | | $ | 64.71 |
| | | |
Net Assets Represent: | | | |
Paid-in capital | | $ | 1,646,019,453 |
Undistributed net investment income | | | 996,473 |
Accumulated net realized gain from investments | | | 63,517,074 |
Net unrealized appreciation of investments | | | 204,894,470 |
| | | |
Net Assets | | $ | 1,915,427,470 |
| | | |
* Investments at cost | | $ | 1,923,649,977 |
The accompanying notes are an integral part of these financial statements.
15
Managers Special Equity Fund
Statement of Operations
For the year ended December 31, 2007
| | | | |
Investment Income: | | | | |
Dividend income | | $ | 20,594,781 | |
Foreign withholding tax | | | (256,622 | ) |
Securities lending fees | | | 1,475,721 | |
| | | | |
Total investment income | | | 21,813,880 | |
| | | | |
Expenses: | | | | |
Investment management fees | | | 23,410,349 | |
Administrative fees | | | 6,502,875 | |
Transfer agent | | | 5,651,419 | |
Professional fees | | | 449,639 | |
Custodian | | | 426,057 | |
Reports to shareholders | | | 196,598 | |
Trustees fees and expenses | | | 141,126 | |
Registration fees | | | 83,243 | |
Miscellaneous | | | 147,362 | |
| | | | |
Total expenses before offsets | | | 37,008,668 | |
| | | | |
Expense reductions | | | (849,457 | ) |
| | | | |
Net expenses | | | 36,159,211 | |
| | | | |
Net investment loss | | | (14,345,331 | ) |
| | | | |
Net Realized and Unrealized Gain (Loss): | | | | |
Net realized gain on investment transactions | | | 468,715,374 | |
Net unrealized depreciation of investments | | | (407,862,046 | ) |
| | | | |
Net realized and unrealized gain | | | 60,853,328 | |
| | | | |
Net Increase in Net Assets Resulting from Operations | | $ | 46,507,997 | |
| | | | |
The accompanying notes are an integral part of these financial statements.
16
Managers Special Equity Fund
Statement of Changes in Net Assets
For the year ended December 31,
| | | | | | | | |
| | | 2007 | | | 2006 | |
Increase (Decrease) in Net Assets From Operations: | | | | | | | | |
Net investment loss | | | ($14,345,331) | | | | ($3,566,911) | |
Net realized gain on investments | | | 468,715,374 | | | | 459,675,943 | |
Net unrealized depreciation of investments | | | (407,862,046 | ) | | | (106,987,301 | ) |
| | | | | | | | |
Net increase in net assets resulting from operations | | | 46,507,997 | | | | 349,121,731 | |
| | | | | | | | |
Distributions to Shareholders: | | | | | | | | |
From net realized gain on investments: | | | | | | | | |
Managers Class | | | (388,900,274 | ) | | | (365,600,521 | ) |
Institutional Class | | | (59,529,931 | ) | | | (80,218,690 | ) |
| | | | | | | | |
Total distributions to shareholders | | | (448,430,205 | ) | | | (445,819,211 | ) |
| | | | | | | | |
From Capital Share Transactions: | | | | | | | | |
Managers Class: | | | | | | | | |
Proceeds from sale of shares | | | 299,186,761 | | | | 497,790,367 | |
Reinvestment of dividends and distributions | | | 359,741,541 | | | | 333,256,656 | |
Cost of shares repurchased | | | (1,188,809,810 | ) | | | (1,038,280,018 | ) |
| | | | | | | | |
Net decrease from capital share transactions | | | (529,881,508 | ) | | | (207,232,995 | ) |
| | | | | | | | |
Institutional Class: | | | | | | | | |
Proceeds from sale of shares | | | 78,116,331 | | | | 146,171,560 | |
Reinvestment of dividends and distributions | | | 53,547,184 | | | | 70,000,901 | |
Cost of shares repurchased | | | (398,129,366 | ) | | | (143,399,760 | ) |
| | | | | | | | |
Net increase (decrease) from capital share transactions | | | (266,465,851 | ) | | | 72,772,701 | |
| | | | | | | | |
Net decrease from capital share transactions | | | (796,347,359 | ) | | | (134,460,294 | ) |
| | | | | | | | |
Total decrease in net assets | | | (1,198,269,567 | ) | | | (231,157,774 | ) |
| | | | | | | | |
Net Assets: | | | | | | | | |
Beginning of year | | | 3,113,697,037 | | | | 3,344,854,811 | |
| | | | | | | | |
End of year | | $ | 1,915,427,470 | | | $ | 3,113,697,037 | |
| | | | | | | | |
End of year undistributed net investment income | | $ | 996,473 | | | $ | 673,439 | |
| | | | | | | | |
Share Transactions: | | | | | | | | |
Managers Class: | | | | | | | | |
Sale of shares | | | 3,523,798 | | | | 5,448,864 | |
Reinvested shares from dividends and distribution | | | 5,443,136 | | | | 4,027,757 | |
Shares repurchased | | | (13,771,697 | ) | | | (11,381,596 | ) |
| | | | | | | | |
Net decrease in shares | | | (4,804,763 | ) | | | (1,904,975 | ) |
| | | | | | | | |
Institutional Class: | | | | | | | | |
Sale of shares | | | 898,887 | | | | 1,591,644 | |
Reinvested shares from dividends and distribution | | | 804,737 | | | | 840,044 | |
Shares repurchased | | | (4,606,651 | ) | | | (1,568,031 | ) |
| | | | | | | | |
Net increase (decrease) in shares | | | (2,903,027 | ) | | | 863,657 | |
| | | | | | | | |
The accompanying notes are an integral part of these financial statements.
17
Managers Special Equity Fund
Financial Highlights
For a share outstanding throughout each year
| | | | | | | | | | | | | | | | | | | | |
| | | For the year ended December 31, | |
Managers Class: | | 2007 | | | 2006 | | | 2005 | | | 2004 | | | 2003 | |
Net Asset Value, Beginning of year | | $ | 82.96 | | | $ | 86.78 | | | $ | 90.42 | | | $ | 78.48 | | | $ | 55.08 | |
| | | | | | | | | | | | | | | | | | | | |
Income from Investment Operations: | | | | | | | | | | | | | | | | | | | | |
Net investment loss | | | (0.51 | )5 | | | (0.14 | )5 | | | (0.54 | )5 | | | (0.56 | ) | | | (0.43 | ) |
Net realized and unrealized gain (loss) on investments | | | 0.55 | 5 | | | 9.88 | 5 | | | 4.18 | 5 | | | 12.50 | | | | 23.83 | |
| | | | | | | | | | | | | | | | | | | | |
Total from investment operations | | | 0.04 | | | | 9.74 | | | | 3.64 | | | | 11.94 | | | | 23.40 | |
| | | | | | | | | | | | | | | | | | | | |
Less Distributions to Shareholders from: | | | | | | | | | | | | | | | | | | | | |
Net realized gain on investments | | | (18.73 | ) | | | (13.56 | ) | | | (7.28 | ) | | | — | | | | — | |
| | | | | | | | | | | | | | | | | | | | |
Net Asset Value, End of year | | $ | 64.27 | | | $ | 82.96 | | | $ | 86.78 | | | $ | 90.42 | | | $ | 78.48 | |
| | | | | | | | | | | | | | | | | | | | |
Total Return 1 | | | (0.60 | )% | | | 11.28 | % | | | 4.00 | % | | | 15.18 | % | | | 42.50 | % |
| | | | | | | | | | | | | | | | | | | | |
Ratio of net expenses to average net assets | | | 1.43 | % | | | 1.42 | % | | | 1.40 | % | | | 1.40 | % | | | 1.43 | % |
Ratio of total expenses to average net assets 4 | | | 1.46 | % | | | 1.47 | % | | | 1.45 | % | | | 1.45 | % | | | 1.46 | % |
Ratio of net investment loss to average net assets 1 | | | (0.59 | )% | | | (0.15 | )% | | | (0.60 | )% | | | (0.69 | )% | | | (0.72 | )% |
Portfolio turnover | | | 67 | % | | | 76 | % | | | 80 | % | | | 68 | % | | | 64 | % |
Net assets at end of year (000’s omitted) | | $ | 1,668,031 | | | $ | 2,551,703 | | | $ | 2,834,314 | | | $ | 3,415,003 | | | $ | 3,279,318 | |
| | | | | | | | | | | | | | | | | | | | |
| | | |
| | | For the year ended December 31, | | | For the
period* ended
December 31, | | | | |
Institutional Class: | | 2007 | | | 2006 | | | 2005 | | | 2004 | | | | |
Net Asset Value, Beginning of Period | | $ | 83.56 | | | $ | 87.09 | | | $ | 90.56 | | | $ | 78.91 | | | | | |
| | | | | | | | | | | | | | | | | | | | |
Income from Investment Operations: | | | | | | | | | | | | | | | | | | | | |
Net investment income (loss) | | | (0.32 | )5 | | | 0.10 | 5 | | | (0.33 | )5 | | | (0.21 | ) | | | | |
Net realized and unrealized gain on investments | | | 0.52 | 5 | | | 9.93 | 5 | | | 4.14 | 5 | | | 11.86 | | | | | |
| | | | | | | | | | | | | | | | | | | | |
Total from investment operations | | | 0.20 | | | | 10.03 | | | | 3.81 | | | | 11.65 | | | | | |
| | | | | | | | | | | | | | | | | | | | |
Less Distributions to Shareholders from: | | | | | | | | | | | | | | | | | | | | |
Net realized gain on investments | | | (19.05 | ) | | | (13.56 | ) | | | (7.28 | ) | | | — | | | | | |
| | | | | | | | | | | | | | | | | | | | |
Net Asset Value, End of Period | | $ | 64.71 | | | $ | 83.56 | | | $ | 87.09 | | | $ | 90.56 | | | | | |
| | | | | | | | | | | | | | | | | | | | |
Total Return 1 | | | (0.39 | )% | | | 11.56 | %6 | | | 4.21 | % | | | 14.75 | %2 | | | | |
| | | | | | | | | | | | | | | | | | | | |
Ratio of net expenses to average net assets | | | 1.20 | % | | | 1.18 | % | | | 1.20 | % | | | 1.20 | %3 | | | | |
Ratio of total expenses to average net assets 4 | | | 1.23 | % | | | 1.23 | % | | | 1.25 | % | | | 1.26 | %3 | | | | |
Ratio of net investment income (loss) to average net assets 1 | | | (0.36 | )% | | | 0.09 | % | | | (0.56 | )% | | | (0.49 | )%3 | | | | |
Portfolio turnover | | | 67 | % | | | 76 | % | | | 80 | % | | | 68 | %2 | | | | |
Net assets at end of period (000’s omitted) | | $ | 247,396 | | | $ | 561,994 | | | $ | 510,541 | | | $ | 274,010 | | | | | |
| | | | | | | | | | | | | | | | | | | | |
| * | Commencement of operations was May 3, 2004. |
1 | Total returns and net investment income would have been lower had certain expenses not been reduced. (See Note 1(c) of Notes to Financial Statements.) |
2 | Not Annualized. (See Note 1(c) to the Notes to Financial Statements.) |
4 | Excludes the impact of fee waivers and expense offsets such as brokerage credits, but includes non-reimbursable expenses such as interest and taxes. (See Note 1(c) to the Notes to Financial Statements.) |
5 | Per share numbers have been calculated using average shares. |
6 | The Total Return is based on the Financial Statement Net Asset Values as shown above. |
18
Managers Special Equity Fund
Notes to Financial Statements
December 31, 2007
| 1. | Summary of Significant Accounting Policies |
The Managers Funds (the “Trust”) is an open-end management investment company organized as a Massachusetts business trust and registered under the Investment Company Act of 1940, as amended (the “1940 Act”). Currently, the Trust is comprised of a number of investment series. Included in this report is the Managers Special Equity Fund (“Special Equity”or the “Fund”).
The Fund offers both Managers Class shares and Institutional Class shares. The Institutional Class shares, which are designed primarily for institutional investors that meet certain administrative and servicing criteria, have a minimum investment of $2,500,000. Managers Class shares are offered to all other investors. Each class represents interest in the same assets of the Fund and the classes are identical except for class specific expenses related to shareholder activity. Investment income, realized and unrealized capital gains and losses, the common expenses of the Fund and certain Fund level expense reductions, if any, are allocated on a pro rata basis to each class based on the relative net assets of each class to the total net assets of the Fund. Both classes have equal voting privileges except that each class has exclusive voting rights with respect to its services and/or distribution plan.
The Fund’s financial statements are prepared in accordance with accounting principles generally accepted in the United States of America, which require management to make estimates and assumptions that affect the reported amount of assets and liabilities and disclosure of contingent assets and liabilities at the date of the financial statements and the reported amounts of income and expenses during the reporting period. Actual results could differ from those estimates and such differences could be material. The following is a summary of significant accounting policies followed by the Fund in the preparation of its financial statements:
| a. | Valuation of Investments |
Equity securities traded on a domestic or international securities exchange are generally valued at the last quoted sale price, or, lacking any sales, at the last quoted bid price. Over-the-counter securities are valued at the NASDAQ Official Closing Price, if one is available. Lacking any sales, over-the-counter securities, are valued at the last quoted bid price. The Fund’s investments are generally valued based on market quotations by third-party pricing services approved by the Board of Trustees of the Fund. Under certain circumstances, the value of a Fund investment may be based on an evaluation of its fair value, pursuant to procedures established by and under the general supervision of the Board of Trustees of the Trust. The Fund may use the fair value of a portfolio security to calculate its NAV when, for example, (1) market quotations are not readily available because a portfolio security is not traded in a public market or the principal market in which the security trades is closed, (2) trading in a portfolio security is suspended and not resumed prior to the time as of which the Fund calculates its NAV, (3) where a significant event affecting the value of a portfolio security is determined to have occurred between the time of the market quotation provided for a portfolio security and the time as of which the Fund calculates its NAV, (4) a security’s price has remained unchanged over a period of time (often referred to as a “stale price”), or (5) the Investment Manager determines that a market quotation is inaccurate. The Investment Manager monitors intervening events that may affect the value of securities held in the Fund’s portfolio and, in accordance with procedures adopted by the Fund’s Trustees, will adjust the prices of securities traded in foreign markets, as appropriate, to reflect the impact of events occurring subsequent to the close of such markets but prior to the time each Fund’s NAV is calculated. Fixed-income securities are valued based on valuations furnished by independent pricing services that utilize matrix systems, which reflect such factors as security prices, yields, maturities and ratings, and are supplemented by dealer and exchange quotations. Short-term investments having a remaining maturity of 60 days or less are valued at amortized cost, which approximates market value. Investments in other regulated investment companies are valued at their end of day net asset value per share except iShares or other ETF’s, which are valued the same as equity securities. Securities (including derivatives) for which market quotations are not readily available are valued at fair value, as determined in good faith, and pursuant to procedures adopted by the Board of Trustees of the Trust.
Investments in certain securities such as preferred stocks are valued on the basis of valuations provided by dealers or by a pricing service which uses information with respect to transactions in such securities, and various relationships between securities in determining value.
The values assigned to fair value investments are based on available information and do not necessarily represent amounts that might ultimately be realized, since such amounts depend on future developments inherent in long-term investments. Further, because of the inherent uncertainty of valuation, those estimated values may differ significantly from the values that would have been used had a ready market for the investments existed, and the differences could be material.
Security transactions are accounted for as of the trade date.
Realized gains and losses on securities sold are determined on the basis of identified cost.
| c. | Investment Income and Expenses |
Dividend income is recorded on the ex-dividend date except certain dividends from foreign securities where the ex-dividend date may have passed. These dividends are recorded as soon as the Trust is informed of the ex-dividend date. Dividend income on foreign securities is recorded net of any withholding tax. Interest income, which includes amortization of premium and accretion of discount on debt securities, is accrued as earned. Non-cash dividends included in dividend income, if any, are reported at the fair market value of the securities received. Other income and expenses are recorded on an accrual basis. Expenses that cannot be directly attributed to a fund are apportioned among the Funds in the Trust and in some cases other affiliated funds based upon their relative average net assets or number of shareholders.
The Fund had certain portfolio trades directed to various brokers who paid a portion of the Fund’s expenses. For the year ended December 31, 2007, under these arrangements the amount by which the Fund’s expenses were reduced and the impact on the expense ratios was as follows: $815,520 or 0.03% annualized.
19
Managers Special Equity Fund
Notes to Financial Statements (continued)
The Fund has a “balance credit” arrangement with The Bank of New York (“BNY”), the Fund’s custodian, whereby the Fund is credited with an interest factor equal to 0.75% below the effective 90-day T-Bill rate for account balances left uninvested overnight. This credit serves to reduce the custody expense that would otherwise be charged to the Fund. For the year ended December 31, 2007, the custodian expense was reduced by $9,736 under this arrangement.
The Trust also has a balance credit arrangement with its Transfer Agent, PFPC Inc., whereby earnings credits are used to offset banking charges. For the year ended December 31, 2007 the Fund’s portion of the transfer agent expense was reduced by $24,201 under this arrangement.
Total returns and net investment income for the Fund would have been lower had certain expenses not been offset.
| d. | Dividends and Distributions |
Dividends resulting from net investment income, if any, normally will be declared and paid annually. Distributions of capital gains, if any, will be made on an annual basis and when required for Federal excise tax purposes. Income and capital gain distributions are determined in accordance with Federal income tax regulations, which may differ from generally accepted accounting principles. These differences are primarily due to differing treatments for losses deferred due to wash sales, equalization accounting for tax purposes, foreign currency and market discount transactions. Permanent book and tax basis differences, if any, relating to shareholder distributions will result in reclassifications to paid-in capital. The tax character of distributions paid during the past two years were as follows:
| | | | | | |
| | | 2007 | | 2006 |
Distributions paid from: | | | | | | |
Ordinary income | | | — | | | — |
Short-term capital gains | | $ | 28,949,941 | | | — |
Long-term capital gains | | | 419,480,264 | | $ | 445,819,211 |
| | | | | | |
| | $ | 448,430,205 | | $ | 445,819,211 |
| | | | | | |
As a % of distributions paid (unaudited): | | | | | | |
Qualified ordinary income | | | — | | | — |
Ordinary income - dividends received deduction | | | — | | | — |
The Fund intends to comply with the requirements under Subchapter M of the Internal Revenue Code of 1986, as amended, to distribute substantially all of its taxable income and gains to its shareholders and to meet certain diversification and income requirements with respect to investment companies. Therefore, no provision for Federal income or excise tax is included in the accompanying financial statements.
| f. | Capital Loss Carryovers |
As of December 31, 2007, the Fund had no accumulated net realized capital loss carryover from securities transactions for Federal income tax purposes.
The Trust’s Declaration of Trust authorizes for each series the issuance of an unlimited number of shares of beneficial interest, without par value. The Fund records sales and repurchases of its capital stock on the trade date. Dividends and distributions to shareholders are recorded on the ex-dividend date.
At December 31, 2007 certain unaffiliated shareholders, specifically omnibus accounts, individually held greater than 10% of the outstanding shares of the Fund: Managers Class shares – three collectively own 56%; Institutional Class shares – four collectively own 56%. Transactions by these shareholders may have a material impact on the Fund or the class.
| 2. | Agreements and Transactions with Affiliates |
The Trust has entered into an Investment Management Agreement under which Managers Investment Group LLC (the “Investment Manager”), an independently managed subsidiary of Affiliated Managers Group, Inc. (“AMG”), provides or oversees investment management services to the Fund. The Investment Manager selects subadvisors for the Fund (subject to Trustee approval), allocates assets among subadvisors and monitors the subadvisor’s investment programs and results. The Fund’s investment portfolio is managed by portfolio managers who serve pursuant to Subadvisory Agreements with the Investment Manager. Investment management fees are paid directly by the Fund to the Investment Manager at the rate of 0.90% per annum.
The Trust has entered into an Administration and Shareholder Servicing Agreement under which Managers Investment Group LLC serves as the Fund’s administrator (the “Administrator”) and is responsible for all aspects of managing the Fund’s operations, including administration and shareholder services to the Fund, its shareholders, and certain institutions, such as bank trust departments, broker-dealers and registered investment advisers, that advise or act as an intermediary with the Fund’s shareholders. The Fund pays a fee to the Administrator at the rate of 0.25% per annum of the Fund’s average daily net assets for this service.
Prior to July 1, 2007, the aggregate annual retainer paid to each Independent Trustee was $55,000, plus $4,000 or $2,000 for each regular or special meeting attended, respectively. Effective July 1, 2007, the aggregate annual retainer paid to each Independent Trustee is $65,000, plus $4,000 or $2,500 for each regular or special meeting attended, respectively. The Trustees’ fees and expenses are allocated amongst all of the Funds for which the Investment Manager serves as the advisor (the “Managers Funds”) based on the relative net assets of such Funds. The Independent Chairman of the Trusts receives an additional payment of $15,000 per year. (Prior to July 1, 2007, the Independent Chairman received an additional payment of $10,000 per year). The Chairman of the Audit Committee receives an additional payment of $5,000 per year. (Prior to July 1, 2007, the Chairman of the Audit Committee received an additional payment of $2,000 per year). The “Trustees fees and expenses” shown in the financial statements represents each Fund’s allocated portion of the total fees and expenses paid by the Managers Funds.
The Funds are distributed by Managers Distributors, Inc. (“MDI” or the “Distributor”) a wholly-owned subsidiary of the Investment Manager. The Distributor serves as the principal underwriter for each Fund. The Distributor is a registered broker-dealer and member of the Financial Industry Regulatory Authority, Inc. (“FINRA”). Shares of each Fund will be continuously offered and will be sold by brokers, dealers or other financial intermediaries who have executed selling agreements with the Distributor. The Distributor bears all the expenses of providing services pursuant to the Underwriting Agreement, including the payment of the expenses relating to the distribution of Prospectuses for sales purposes and any advertising or sales literature. Certain Trustees and Officers of the Funds are Officers and/or Directors of the Investment Manager, AMG and/or the Distributor.
20
Managers Special Equity Fund
Notes to Financial Statements (continued)
| 3. | Purchases and Sales of Securities |
Purchases and sales of securities, excluding short-term securities, for the year ended December 31, 2007, were $1,672,768,529 and $2,810,163,601, respectively. There were no purchases or sales of U.S. Government securities.
| 4. | Portfolio Securities Loaned |
The Fund may participate in a securities lending program offered by BNY providing for the lending of equities, corporate bonds and government securities to qualified brokers. Collateral on all securities loaned is accepted in cash and/or government securities. Collateral is maintained at a minimum level of 102% of the market value, plus interest, if applicable, of investments on loan. Collateral received in the form of cash is invested temporarily in institutional money market funds or other short-term investments by BNY. Securities lending fees include earnings of such temporary cash investments, plus or minus any rebate to a borrower. These earnings (after any rebate) are then divided between BNY, as a fee for its services under the program, and the Fund according to agreed-upon rates.
| 5. | Commitments and Contingencies |
In the normal course of business, the Fund may enter into contracts and agreements that contain a variety of representations and warranties, which provide general indemnifications. The maximum exposure to the Fund under these arrangements is unknown, as this would involve future claims that may be against the Fund that have not yet occurred. However, based on experience, the Fund expects the risks of loss to be remote.
| 6. | New Accounting Pronouncements |
In June 2006, the Financial Accounting Standards Board (“FASB”) issued Interpretation No. 48, “Accounting for Uncertainty in Income Taxes - an Interpretation of FASB Statement No. 109 (“FIN 48”).” FIN 48 applies to all registered investment companies and establishes the minimum threshold for recognizing, and a system for measuring, the benefits of tax-return positions in the financial statements. FIN 48 is effective for fiscal years beginning after December 15, 2006. Management has analyzed the Fund’s tax positions taken on federal income tax returns for all open tax years (through tax years ended December 31, 2004 - 2007) and has concluded that as of December 31, 2007, no provision for income tax is required in the Fund’s financial statements. Additionally, Fund Management is not aware of any events that are reasonably possible to occur in the next twelve months that would result in the amounts of any unrecognized tax benefits significantly increasing or decreasing for the Fund.
In addition, in September 2006, Statement of Financial Accounting Standards No. 157, Fair Value Measurements (“SFAS 157”), was issued and is effective for fiscal years beginning after November 15, 2007. SFAS 157 defines fair value, establishes a framework for measuring fair value and expands disclosures about fair value measurements. Management is currently evaluating the impact, if any, the adoption of SFAS 157 will have on the Fund’s financial statements.
Tax Information (unaudited)
The Fund hereby designates the maximum amount allowable of its net taxable income as qualified dividends as provided in the Jobs and Growth Tax Relief Reconciliation Act of 2003. The 2007 Form 1099-DIV you receive for the Fund, will show the tax status of all distributions paid to you during the year.
Pursuant to section 852 of the Internal Revenue Code, the Fund designates $430,257,892 of long-term capital gain for the taxable year ended December 31, 2007.
21
Report of Independent Registered Public Accounting Firm
To the Board of Trustees of The Managers Funds and the Shareholders of Managers Special Equity Fund:
In our opinion, the accompanying statement of assets and liabilities, including the schedule of portfolio investments, and the related statements of operations and of changes in net assets and the financial highlights present fairly, in all material respects, the financial position of Managers Special Equity Fund, (one of the series constituting The Managers Funds, hereafter referred to as the “Fund”), at December 31, 2007, the results of its operations for the year then ended, the changes in its net assets for each of two years in the period then ended, and the financial highlights for each of the periods indicated, in conformity with accounting principles generally accepted in the United States of America. These financial statements and financial highlights (hereafter referred to as “financial statements”) are the responsibility of the Fund’s management; our responsibility is to express an opinion on these financial statements based on our audits. We conducted our audits of these financial statements in accordance with the standards of the Public Company Accounting Oversight Board (United States). Those standards require that we plan and perform the audit to obtain reasonable assurance about whether the financial statements are free of material misstatement. An audit includes examining, on a test basis, evidence supporting the amounts and disclosures in the financial statements, assessing the accounting principles used and significant estimates made by management, and evaluating the overall financial statement presentation. We believe that our audits, which included confirmation of securities at December 31, 2007 by correspondence with the custodian and brokers, provide a reasonable basis for our opinion.
PricewaterhouseCoopers, LLP
Philadelphia, Pennsylvania
February 20, 2008
22
Trustees and Officers
The Trustees and Officers of the Trust, their business addresses, principal occupations for the past five years and dates of birth are listed below. The Trustees provide broad supervision over the affairs of the Trust and the Funds. The Trustees are experienced executives who meet periodically throughout the year to oversee the Funds’ activities, review contractual arrangements with companies that provide services to the Funds, and review the Funds’ performance. Unless otherwise noted, the address of each Trustee or Officer is the address of the Trust: 800 Connecticut Avenue, Norwalk, Connecticut 06854.
There is no stated term of office for Trustees. Trustees serve until their resignation, retirement or removal in accordance with the Trust’s organizational documents and policies adopted by the Board from time to time. The Chairman of the Trustees, President, Treasurer and Secretary of the Trust are elected by the Trustees annually. Other officers hold office at the pleasure of the Trustees.
Independent Trustees
The following Trustees are not “interested persons” of the Trust within the meaning of the 1940 Act:
| | |
Name, Date of Birth, Number
of Funds Overseen in Fund
Complex* | | Principal Occupation(s) During Past 5 Years and Other Directorships Held by Trustee |
Jack W. Aber, 9/9/37 • Trustee since 1999 • Oversees 32 Funds in Fund Complex | | Professor of Finance, Boston University School of Management (1972-Present); Trustee of Appleton Growth Fund (1 portfolio); Trustee of Third Avenue Trust (4 portfolios); Trustee of Third Avenue Variable Trust (1 portfolio). |
| |
William E. Chapman, II, 9/23/41 • Independent Chairman • Trustee since 1999 • Oversees 32 Funds in
Fund Complex | | President and Owner, Longboat Retirement Planning Solutions (1998-Present); Hewitt Associates, LLC (part time) (provider of Retirement and Investment Education Seminars); Trustee of Bowdoin College (2002-Present); Trustee of Third Avenue Trust (4 portfolios); Trustee of Third Avenue Variable Trust (1 portfolio). |
| |
Edward J. Kaier, 9/23/45 • Trustee since 1999 • Oversees 32 Funds in
Fund Complex | | Attorney at Law and Partner, Teeters Harvey Kilboy & Kaier LLP (2007-Present); Attorney at Law and Partner, Hepburn Willcox Hamilton & Putnam, LLP (1977-2007); Trustee of Third Avenue Trust (4 portfolios); Trustee of Third Avenue Variable Trust (1 portfolio). |
| |
Steven J. Paggioli, 4/3/50 • Trustee since 1993 • Oversees 32 Funds in
Fund Complex | | Consultant (2001-Present); Formerly Executive Vice President and Director, The Wadsworth Group (1986-2001); Executive Vice President, Secretary and Director, Investment Company Administration, LLC (1990-2001); Vice President, Secretary and Director, First Fund Distributors, Inc. (1991-2001); Trustee, Professionally Managed Portfolios (22 portfolios); Advisory Board Member, Sustainable Growth Advisors, LP. |
| |
Eric Rakowski, 6/5/58 • Trustee since 1999 • Oversees 32 Funds in
Fund Complex | | Professor, University of California at Berkeley School of Law (1990-Present); Trustee of Third Avenue Trust (4 portfolios); Trustee of Third Avenue Variable Trust (1 portfolio). |
| |
Thomas R. Schneeweis, 5/10/47 • Trustee since 1987 • Oversees 32 Funds in
Fund Complex | | Professor of Finance, University of Massachusetts (1977-Present); Director, CISDM at the University of Massachusetts, (1996-Present); President, Alternative Investment Analytics, LLC, (formerly Schneeweis Partners, LLC) (2001-Present); Partner, White Bear Partners, LLC (2007-Present); Partner, Schneeweis Capital Management, LLC (2007-Present); Partner, Schneeweis Associates, LLC (2007-Present); Partner, Northampton Capital Management, LLC (2004-Present); Partner, TRS Associates (2007-Present). |
| * | The Fund Complex consists of Managers AMG Funds, The Managers Funds, Managers Trust I and Managers Trust II. |
Interested Trustee
The following Trustee is an “interested person” of the Trust within the meaning of the 1940 Act by virtue of his positions with, and interest in securities of, Affiliated Managers Group, Inc.
| | |
Name, Date of Birth, Number of Funds Overseen in Fund Complex* | | Principal Occupation(s) During Past 5 Years and Other Directorships Held by Trustee |
William J. Nutt, 3/30/45 • Trustee since 2005 • President since 2007 • Oversees 32 Funds in
Fund Complex | | Chairman and Founder of Affiliated Managers Group, Inc., (1993-Present); Chief Executive Officer of Affiliated Managers Group, Inc. (1993-2004); Director, Affiliated Managers Group, Inc. (1993-Present); President of Affiliated Managers Group, Inc. (1993-1999); President and Chief Operating Officer, The Boston Company (1989-1993); Senior Executive Vice President, The Boston Company (1982-1989). |
Officers
| | |
Name, Date of Birth, Position(s) Held with Fund and Length of Time Served | | Principal Occupation(s) During Past 5 Years |
Christine C. Carsman, 4/2/52 • Secretary since 2004 | | Senior Vice President and Chief Regulatory Counsel, Affiliated Managers Group, Inc. (2004-Present); Secretary, Managers AMG Funds, Managers Trust I and II (2004-Present); Senior Counsel, Vice President and Director of Operational Risk Management and Compliance, Wellington Management Company, LLP (1995-2004); Deputy General Counsel, The Boston Company, Inc. (1993-1995); Associate General Counsel, The Boston Company Advisors, Inc. (1991-1993); Associate, Sullivan & Worcester LLP (1987-1991). |
| |
Donald S. Rumery, 5/29/58 • Chief Financial Officer
since 2007 • Treasurer since 1995 | | Senior Vice President, Managers Investment Group LLC (2005-Present); Director, Finance and Planning, The Managers Funds LLC, (1994-2004); Treasurer and Chief Financial Officer, Managers Distributors, Inc. (2000-Present); Treasurer, Managers AMG Funds (1999-Present); Treasurer, Managers Trust I and Managers Trust II (2000-Present); Secretary, Managers Trust I and Managers Trust II (2000-2004) and Secretary, The Managers Funds (1997-2004); Chief Financial Officer, Managers AMG Funds, Managers Trust I and Managers Trust II (2007-Present). |
| |
Keitha L. Kinne, 5/16/58 • Chief Operating
Officer since 2007 | | Managing Partner and Chief Operating Officer, Managers Investment Group LLC (2007-Present); Chief Operating Officer, Managers AMG Funds, Managers Trust I and Managers Trust II (2007-Present); Managing Director, Legg Mason & Co., LLC (2006-2007); Managing Director, Citigroup Asset Management (2004-2006); Senior Vice President, Prudential Investments (1999-2004). |
23
Investment Manager and Administrator
Managers Investment Group LLC
800 Connecticut Avenue
Norwalk, Connecticut 06854
(203) 299-3500 or (800) 835-3879
Distributor
Managers Distributors, Inc.
800 Connecticut Avenue
Norwalk, Connecticut 06854
(203) 299-3500 or (800) 835-3879
Custodian
The Bank of New York
2 Hanson Place
Brooklyn, New York 11217
Legal Counsel
Ropes & Gray LLP
One International Place
Boston, Massachusetts 02110-2624
Transfer Agent
PFPC Inc.
Attn: Managers
P.O. Box 9769
Providence, Rhode Island 02940
(800) 548-4539
For Managers Choice Only
Managers
c/o PFPC Inc.
P.O. Box 61204
King of Prussia, Pennsylvania 19406-0851
(800) 358-7668

MANAGERSAND MANAGERS AMG EQUITY FUNDS
EMERGING MARKETS EQUITY
Rexiter Capital Management Limited
ESSEX GROWTH
ESSEX LARGE CAP GROWTH
ESSEX SMALL/MICRO CAP GROWTH
Essex Investment Management Co., LLC
FQ TAX-MANAGED U.S. EQUITY
FQ U.S. EQUITY
First Quadrant, L.P.
INSTITUTIONAL MICRO-CAP
MICRO-CAP
Lord, Abbett & Co. LLC
WEDGE Capital Management L.L.P.
OFI Institutional Asset Management, Inc.
Next Century Growth Investors, LLC
INTERNATIONAL EQUITY
Alliance Bernstein L.P.
Lazard Asset Management, LLC
Wellington Management Company, LLP
CHICAGO EQUITY PARTNERS
MID-CAP
Chicago Equity Partners, LLC
REAL ESTATE SECURITIES
Urdang Securities Management, Inc.
SKYLINE SPECIAL EQUITIES
PORTFOLIO
Skyline Asset Management, L.P.
SMALL CAP
TIMESSQUARE MID CAP GROWTH
TIMESSQUARE SMALL CAP GROWTH
TimesSquare Capital Management, LLC
SMALL COMPANY
Epoch Investment Partners, Inc.
Kalmar Investment Advisers, Inc.
SPECIAL EQUITY
Donald Smith & Co., Inc.
Lord, Abbett & Co. LLC
Skyline Asset Management, L.P.
Smith Asset Management Group, LP
Veredus Asset Management LLC
Westport Asset Management, Inc.
SYSTEMATIC VALUE
SYSTEMATIC MID CAP VALUE
Systematic Financial Management, L.P.
VALUE
Armstrong Shaw Associates Inc.
Osprey Partners Investment
Management, LLC
This report is prepared for the Fund’s shareholders. It is authorized for distribution to prospective investors only when preceded or accompanied by an effective prospectus. To receive a free copy of the prospectus or Statement of Additional Information, which includes additional information about Fund Trustees, please contact us by calling 800.835.3879. Distributed by Managers Distributors, Inc., member FINRA.
A description of the policies and procedures each Fund uses to vote its proxies is available: (i) without charge, upon request, by calling 800.835.3879, or (ii) on the Securities and Exchange Commission’s (SEC) Web site at www.sec.gov. For information regarding each Fund’s proxy voting record for the 12-month period ended June 30, call 800.835.3879 or visit the SEC Web site at www.sec.gov.
The Fund files its complete schedule of portfolio holdings with the SEC for the first and third quarters of each fiscal year on Form N-Q. The Fund’s Forms N-Q are available on the SEC’s website at www.sec. gov. A Fund’s Forms N-Q may be reviewed and copied at the SEC’s Public Reference Room in Washington, DC. Information on the operation of the Public Reference Room may be obtained by calling 1-800-SEC-0330. To review a complete list of the Fund’s portfolio holdings, or to view the most recent quarterly holdings report, semiannual report, or annual report, please visit www.managersinvest.com.
MANAGERSAND MANAGERS AMG
BALANCED FUNDS
CHICAGO EQUITY PARTNERS BALANCED
Chicago Equity Partners, LLC
GLOBAL
Armstrong Shaw Associates Inc.
Alliance Bernstein L.P.
First Quadrant, L.P.
Northstar Capital Management, Inc.
Wellington Management Company, LLP
ALTERNATIVE FUNDS
FQ GLOBAL ALTERNATIVES
First Quadrant, L.P.
MANAGERS
FIXED INCOME FUNDS
BOND (MANAGERS)
FIXED INCOME
GLOBAL BOND
Loomis, Sayles & Company L.P.
BOND (MANAGERS FREMONT)
Pacific Investment Management Co. LLC
CALIFORNIA INTERMEDIATE TAX-FREE
Evergreen Investment Management Co., LLC
HIGH YIELD
J.P. Morgan Investment Management Inc.
INTERMEDIATE DURATION GOVERNMENT
SHORT DURATION GOVERNMENT
Smith Breeden Associates, Inc.
MONEY MARKET
JPMorgan Investment Advisors Inc.
| | |
| www.managersinvest.com | |  |
27
ANNUAL REPORT
Managers Funds
December 31, 2007
Managers Bond Fund

Managers Bond Fund
Annual Report — December 31, 2007
TABLE OF CONTENTS
| | |
| | | Page |
LETTER TO SHAREHOLDERS | | 1 |
| |
ABOUT YOUR FUNDS’ EXPENSES | | 3 |
| |
| INVESTMENT MANAGER’S COMMENTS, FUND SNAPSHOT, AND SCHEDULE OF PORTFOLIO INVESTMENTS | | |
| |
Managers Bond Fund | | 4 |
| |
NOTES TO SCHEDULE OF PORTFOLIO INVESTMENTS | | |
| |
FINANCIAL STATEMENTS: | | |
| |
Statement of Assets and Liabilities | | 19 |
| |
Fund’s balance sheet, net asset value (NAV) per share computation and cumulative undistributed amount | | |
| |
Statement of Operations | | 20 |
| |
Detail of sources of income, Fund expenses, and realized and unrealized gains (losses) during the year | | |
| |
Statement of Changes in Net Assets | | 21 |
| |
Detail of changes in Fund assets for the past two years | | |
| |
FINANCIAL HIGHLIGHTS | | 22 |
| |
Historical net asset values per share, distributions, total returns, expense ratios, turnover ratios and net assets | | |
| |
NOTES TO FINANCIAL STATEMENTS | | 23 |
| |
Accounting and distribution policies, details of agreements and transactions with Fund management and affiliates, and descriptions of certain investment risks | | |
| |
REPORT OF INDEPENDENT REGISTERED PUBLIC ACCOUNTING FIRM | | 27 |
| |
TRUSTEES AND OFFICERS | | 28 |
Nothing contained herein is to be considered an offer, sale or solicitation of an offer to buy shares of The Managers Funds or Managers AMG Funds. Such offering is made only by Prospectus, which includes details as to offering price and other material information.
Letter to Shareholders
Dear Fellow Shareholder:
Financial markets became increasingly unsettled as 2007 progressed, beginning with a brief but strong correction in February and then escalating in June when revelations of significant losses from sub-prime mortgage lending and related structured securities started a domino run that has affected the global economy. While the economy gained strength in the early part of the year, in spite of housing weakness, a liquidity crisis initiated by the spreading weakness in sub-prime mortgage loans increased uncertainty about its sustainability. Bonds of all credit quality and duration became unusually volatile, and credit spreads, having been extremely slim, widened dramatically, raising the cost of capital for many borrowers. Naturally the equity markets followed suit and became more volatile as the rising cost of capital pressured corporate profitability, penalized leverage, and hindered merger and acquisition activity.
As has been well documented in the financial press, the broad deterioration in residential housing prices, combined with gradually rising interest rates, put severe stress on low credit-quality (sub-prime) borrowers. Rising defaults pushed several mortgage lenders and leveraged sub-prime mortgage investors toward bankruptcy, and catalyzed a swift and broad flight from various forms of investment risk over the year. These revelations began creating serious liquidity problems in the credit markets late in the second quarter and have been the root of uncertainty and market volatility ever since.
A rapid and at times seemingly indiscriminate flight from risk created unusual patterns of volatility within the bond market. Credit spreads widened significantly beginning in July, as Moody’s and S&P downgraded hundreds of securities, and price moves forced leveraged investors to raise cash any way they could. Since much of the leverage had been funded with short-term debt, the short end of the yield curve bore the brunt of the liquidity crisis. The typically docile commercial paper market seized as demand dried up, and short-term Treasury yields vacillated between 2.9% and 4.9% as investors raced to safety, causing a dislocation in prices. Since then, as the Federal Reserve pumped liquidity into the system and aggressively lowered policy rates, short-term yields have dropped dramatically and the treasury yield curve has steepened. Yet, credit spreads have continued to expand as investment grade yields have not dropped along with treasuries and non-investment grade (Junk) yields have continued to rise. This is because dominoes have continued to fall as large financial institutions continue to discover weaknesses in their portfolios and write billions of dollars off of their balance sheets.
After rallying strongly off of a February trough, the stock market followed the lead of the credit markets by trading sharply down during the liquidity crisis in July, then recovering from late August through October. Not surprisingly, small- and mid-cap stocks reacted more during the price declines, and underperformed large-cap stocks during the year. Interestingly however, growth indices, which would normally react poorly to a rise in interest rates or a liquidity squeeze, significantly outperformed value indices during the period. We believe this was due to in part to a reversion to the mean since value indices had outperformed growth indices for an extended period of time, and also to technical supply/demand effects brought on by the liquidity crisis. Importantly, we believe this was also the result of extreme weakness in the financials sector, which has a dominant role in most value indices. Stocks recovered in late August and throughout October, as a result of an infusion of liquidity by the Federal Reserve, but corrected again in November and December with evidence mounting that the economy was slowing, and stock investors expressed disappointment that the Fed was not acting even more aggressively, while revelations of subprime losses continued to emanate from financial companies.
Within this environment, the Fund represented in this report provided positive returns for the year. The Managers Bond Fund returned 7.06% for the year, while its benchmark the Lehman Brothers Govt/Credit Index, returned 7.23%. The Fund benefited from their focus on high credit quality securities, and their general avoidance of securities backed by sub-prime loans. More detailed reviews of the performance and positioning of the Funds are included within this report.
Our fear that the credit crisis would extend into 2008 has been realized, as lingering credit problems and further revelations of losses by large financial institutions are hindering not only the financial markets, but the economy as well. The increasing possibility that the economy will slide into recession has driven volatility higher, and stock prices lower. The Federal Reserve has been increasingly aggressive in easing rates, and although we think the risk of recession has increased,
1
Letter to Shareholders (continued)
we still believe that portions of the U.S. and global economies remain healthy. Although foreign and emerging markets economies are by no means decoupled from U.S. impact, they have become increasingly diversified with respect to trading partners, and have increasingly healthy reserves. In sum, we continue to believe that investors should maintain their portfolios with allocations near their long-run targets, rebalance if necessary and take full advantage of opportunities to participate in the growth of the global economy.
One of our foremost goals at Managers Investment Group is to structure and manage mutual funds that will help our shareholders and clients become more successful in reaching their investment goals and objectives. Each of our Funds is geared to provide you with exposure to a specific asset class, combination of asset classes, or segment of the market. Investors tend to use our Funds as part of their overall asset allocation in order to structure a well-diversified portfolio intended to meet individual needs. Most of our Funds, like those detailed in this report, are therefore designed to be building blocks.
The following report covers the year ending December 31, 2007. Should you have any questions about this report, or if you’d like to receive a Prospectus and additional information, including fees and expenses, for this or any of the other Funds in our family, please feel free to contact us at 1-800-835-3879, or visit our website at www.managersinvest.com. As always, please read the Prospectus carefully before you invest or send money.
If you are curious about how you can better diversify your investment program, visit the Knowledge Center on our Web site and view our articles in the investment strategies section. You can rest assured that under all market conditions our team is focused on delivering excellent investment management services for your benefit.
We thank you for your continued confidence and investment in The Managers Funds.
Sincerely,
|

|
John H. Streur |
Senior Managing Partner |
Managers Investment Group LLC |
2
About Your Fund’s Expenses
As a shareholder of the Fund, you may incur two types of costs: (1) transaction costs, which may include sales charges (loads) on purchase payments; redemption fees; and exchange fees; and (2) ongoing costs, including management fees; distribution (12b-1) fees; and other Fund expenses. This example is intended to help you understand your ongoing costs (in dollars) of investing in the Fund and to compare these costs with the ongoing costs of investing in other mutual funds. The example is based on an investment of $1,000 invested at the beginning of the period and held for the entire period as indicated below.
Actual Expenses
The first line of the table to the right provides information about the actual account values and actual expenses. You may use the information in this line, together with the amount you invested, to estimate the expenses that you paid over the period. Simply divide your account value by $1,000 (for example, an $8,600 account value divided by $1,000 = 8.6), then multiply the result by the number in the first line under the heading entitled “Expenses Paid During Period” to estimate the expenses you paid on your account during this period.
Hypothetical Example for Comparison Purposes
The second line of the table to the right provides information about hypothetical account values and hypothetical expenses based on the Fund’s actual expense ratio and an assumed annual rate of return of 5% before expenses, which is not the Fund’s actual return. The hypothetical account values and expenses may not be used to estimate the actual ending account balance or expenses you paid for the period. You may use this information to compare the ongoing costs of investing in the Fund and other funds by comparing this 5% hypothetical example with the 5% hypothetical examples that appear in the shareholder reports of other funds.
Please note that the expenses shown in the table are meant to highlight your ongoing costs only and do not reflect any transactional costs, such as sales charges (loads), redemption fees, or exchange fees. Therefore, the second line of the table is useful in comparing ongoing costs only, and will not help you determine the relative total costs of owning different funds.
| | | | | | | | | | | | |
Six Months Ended December 31, 2007 | | Expense Ratio
for the Period | | | Beginning
Account Value
7/1/2007 | | Ending
Account Value
12/31/2007 | | Expenses Paid
During
the Period* |
Managers Bond Fund | | | | | | | | | | | | |
Based on Actual Fund Return | | 0.99 | % | | $ | 1,000 | | $ | 1,061 | | $ | 5.14 |
Based on Hypothetical 5% Annual Return | | 0.99 | % | | $ | 1,000 | | $ | 1,020 | | $ | 5.04 |
| * | Expenses are equal to the Fund’s annualized expense ratio multiplied by the average account value over the period, multiplied by the number of days in the most recent fiscal half-year (184), then divided by 365. |
3
Managers Bond Fund
Portfolio Manager’s Comments
The Managers Bond Fund’s (the “Fund”) objective is to achieve a high level of current income from a diversified portfolio of fixed income securities. The Fund’s benchmark is the Lehman Brothers Government/Credit Index.
The Fund currently employs a subadvisor, Loomis Sayles & Company, L.P. (“Loomis”), to manage the assets of the Fund. The investment team at Loomis believes that there are inherent inefficiencies in bond markets, hence the greatest opportunities to add value should reside in the pricing of credit risk. Their philosophy is to identify attractively valued issues through fundamental research. Portfolio manager Dan Fuss and his investment team at Loomis are focused on issue selection rather than interest rate timing. They employ a “bond picker’s” approach, capitalizing on the firm’s commitment to credit research. Fuss and the team research debt offerings in the same way equity analysts research stocks, looking for undervalued bonds where they see a yield premium, the potential for price appreciation, or both. They analyze the company’s financial condition in detail, as well as the terms of specific bond offerings. They believe price appreciation can come from a variety of catalysts, including improving company fundamentals which would lead to credit upgrades, changing market supply and demand forces, and improving sector or economic trends.
The ideal investment typically exhibits some of the following traits:
| | • | | An attractive yield, both absolute and relative to Loomis’ credit research expectations |
| | • | | Good call protection, particularly when prevailing rates are low |
| | • | | Stable or improving fundamentals (for corporate bonds) |
| | • | | Non-market relatedness to counter the impact of systematic risk |
The portfolio:
| | • | | Primarily holds securities rated BBB/Baa or better, but may hold a small portion in below-investment-grade and unrated bonds |
| | • | | Can be invested up to 10% in non-U.S.-dollar denominated bonds |
In order to mitigate some of the interest rate risk, the Portfolio may be structured with counter cyclical elements. In doing so, Dan Fuss may utilize convertible bonds, municipal bonds, preferred stocks, and foreign corporate and government bonds in addition to the domestic corporate bonds, which are used for alpha generation. In addition, Fuss seeks bonds with call protection, either through the terms of the bond structure or through deep price discounts relative to the call price.
In deciding which securities to buy, the investment team will consider:
| | • | | The financial strength of the issuer of the security |
| | • | | Current interest rates and the asset manager’s expectations regarding general trends in interest rates |
| | • | | Comparisons of the level of risk associated with particular investments with the asset manager’s expectations concerning the potential return of those investments |
The investment team may make a sell decision when:
| | • | | There is a change in sovereign, industry, or company fundamentals |
| | • | | The issuer is downgraded by Loomis research |
| | • | | Relative valuation is not consistent with its expected rating category |
| | • | | Other securities or sectors offer greater total return potential |
THE YEAR IN REVIEW
The Managers Bond Fund returned 7.06% for the year ended 2007, compared to its benchmark, the Lehman Brothers Government/ Credit Index, which returned 7.23%. Turmoil in the securitized and credit markets helped lead to a repricing of risk in the second half of 2007. Investors fled to the safety of Treasuries, leading to lower bond yields and wider spreads. Simmering worries about subprime mortgage loans to less credit-worthy borrowers began to boil over at the beginning of the summer. In the chaos of deteriorating collateral, rating downgrades, and forced selling by funds trying to meet collateral calls, apprehensive bondholders worried about exposures and what it might mean for valuations. As buyers balked at the structure and pricing set in the midst of the spring’s abundant risk appetite, new issuance practically halted, and banks became reluctant to lend. The Fed fought the liquidity crunch in stages, ultimately moving aggressively with 100 basis points (1.0%) of rate cuts from September through year end.
Treasury yields fell steadily for most of the second half of 2007 amid the turmoil in the securitized and credit markets. After a protracted period of tight valuations, investment grade corporates underperformed Treasuries, with unusually poor performance for higher quality corporates, particularly among banks and brokers. Performance improved in September, post-easing, but spreads remain wide relative to historical comparisons. High yield was one of the hardest hit by the contraction in risk appetite that characterized 2007.
Government bond yields rallied globally, though most markets failed to keep pace with the decline in U.S. Treasury yields. As a result, global bonds underperformed U.S. Treasuries on a local currency basis; however, the weaker dollar meant significantly higher returns on an unhedged basis.
Duration Themes
A long-duration strategy relative to the benchmark benefited the Fund on the year as broad interest rates trended lower. As would be expected, the impact of the duration stance was most palpable in Treasuries, where yield-curve-generated returns are not diluted by any adverse changes in credit metrics—as they can be for non-Treasury issues. Though the Fund is currently underweight in Treasuries, it is significantly longer in duration in this asset class. A duration position falling in the belly of the yield curve was accretive, as short- and medium-term rates decreased substantially during the past year.
Quality Themes
The Fund gleaned additive return from a quality-rotation strategy initiated several quarters ago, in advance of the recent market upheaval. From the end of 3Q06 until the beginning of 3Q07, Loomis substantially bolstered the Fund’s Treasury allocation and reduced exposure to high-yield bonds. This reflected Loomis Sayles’s view that lower-quality spreads had become unrealistically tight and that, from a valuation stand point, the upside had eroded too far, breaching Loomis’s risk threshold. As U.S. growth fears elevated and began bleeding into the capital markets, positive excess return was realized from having a more defensive quality positioning in the face of volatility and risk aversion. More recently, Loomis has reversed this higher-quality trend as wider spreads have created buying opportunities.
4
Managers Bond Fund
Portfolio Manager’s Comments (continued)
Sector Themes
Given the mortgage and housing-related problems currently scourging the markets, the underweight sector-allocation strategy in financial issues was successful in 2007 and buoyed returns. The underweight allocation to corporate financials was significantly additive, as many financial issues have proved to be relatively more exposed to subprime issues. Security selection in high-yield credits negatively affected performance. Spreads gapped substantially wider in 2007, resulting in depressed valuations and negative excess returns. The spread widening in credit was somewhat caused by lower levels of liquidity in the credit markets. We believe that corporations should be able to weather a slowdown, more so than in past economic cycles, as fundamentals and credit metrics are not overly stressed.
Country/Currency Themes
By far the strategy’s largest international contributor to excess return was the Canadian dollar. Loomis has been bullish on this currency for some time now, only just recently shoring up the allocation slightly as the currency returned to parity with the green-back. High commodity prices and robust econometrics helped lead to strong appreciation versus the U.S. dollar in 2007. During the past year, the currency gained over 18% versus the U.S. dollar, and hit multi-decade highs during the third quarter of 2007. A vigilant central bank, committed to fighting inflation, also buttressed the currency, raising rates several times during the year.
The Fund’s small position in the Brazilian Real also performed very well during the past year, gaining over 20% against the dollar. The real is another commodity currency, which benefited from its reach into many different commodities markets and also from an intemperate demand for yield in the marketplace.
Throughout 2007, Loomis added to the Fund’s position in the Australian dollar. The Australian economy weathered the U.S. subprime debacle fairly well, and third quarter GDP, released in December, rose 1% for an annual growth rate of 4.3%. Growth continues to remain firm, and the Reserve Bank of Australia (RBA) raised rates again during the fourth quarter, its second rate hike of 2007.
LOOKING FORWARD
Investment Grade Corporates
Loomis believes investment grade spreads are quite compelling and have overshot fundamentals during the last few months on the heels of technically-charged and headline-catalyzed spikes in volatility. However, Loomis believes that credit fundamentals have recently shown signs of weakness and they expect housing/mortgage overhang will keep spreads relatively wide throughout 2008. Ultimately, Loomis anticipates modest spread narrowing in 2008 as the U.S. avoids recession, and they see improvement in market liquidity. Loomis belives that spreads on higher-quality AAs and As are at or near their historical wides, due to substantial underperformance in the finance sector (banks, brokers, and finance). Loomis also believes that the finance sector offers potential relative value, especially over the long term, given the spread widening that has occurred. However, Loomis emphasizes its selective, opportunistic strategy in credit, given the perceived currently volatile economic climate and currently skittish temperament of many market participants. Headline risks remain, but the investment team is looking to be modestly overweight credit, believing this sector will be a source of excess return in 2008.
High Yield
Spread widening has been welcome in the high-yield sector, as Loomis believes that spreads had been unrealistically tight for an extended period. High yield has not experienced significant fundamental deterioration, and Loomis will look to add opportunistically at these levels. The Loomis investment team believes high yield spreads will remain elevated but largely range-bound in 2008 (approximately 400 - 600 basis points, or 4.0 to 6.0%), however, the team does expect some potentially concentrated bouts of volatility to cause spreads to temporarily breach the upper bounds of this range as occasional headlines—continued spillover from subprime/ housing/growth concerns—resurface but decelerate in 2008. Loomis expects slower economic growth and higher default rates, but no recession; therefore (as with investment-grade) they expect potential spread narrowing and view high-yield credits as another potential source of excess return in 2008.
Economy
Loomis predicts that the U.S. will escape recession, albeit with sluggish growth through the first quarter of 2008 and housing acting as a key variable in the direction of growth. They believe that central banks will continue to lead the way out of the credit crunch, the Fed potentially cutting rates two more times to 3.50% by March. Loomis also expects yields to rise later in 2008 as the economy gains momentum.
In the short term, Loomis anticipates elevated volatility given uncertainty over the path of growth and financial system distress. Longer term, they expect a recovery in valuations as risk appetites improve, uncertainty wanes, the economy skirts recession, and defaults come in below implied expectations.
Loomis predicts U.S. high-yield returns to be higher in 2008 than 2007, though the market must move past economic uncertainties and its backlog of supply. Loomis believes that prudence and nimble navigation will be needed in a volatile market. Globally, they expect further appreciation in non-Japan Asian currencies and improving returns for non-government sectors of the bond market.
5
Managers Bond Fund
Portfolio Manager’s Comments (continued)
CUMULATIVE TOTAL RETURN PERFORMANCE
Managers Bond Fund’s cumulative total return is based on the daily change in net asset value (NAV), and assumes that all distributions were reinvested. The Lehman Brothers Government/ Credit Index is comprised of government securities and investment grade corporate securities with a maturity between one and ten years. Unlike the Fund, the Lehman Brothers Government/Credit Index is unmanaged, is not available for investment, and does not incur expenses. The Index assumes reinvestment of all income. This chart compares a hypothetical $10,000 investment made in the Managers Bond Fund on December 31, 1997, to a $10,000 investment made in the Lehman Brothers Government/Credit Index for the same time period. The chart is not intended to imply any future performance of the Fund. The graph and chart do not reflect the deduction of taxes that a shareholder would pay on a Fund distribution or redemption of shares. Total returns would have been lower had certain expenses not been reduced. Past performance is not indicative of future results.
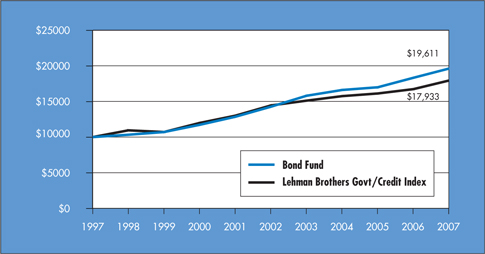
The table below shows the average annual total returns for Managers Bond Fund and the Lehman Brothers Government/Credit Index from December 31, 1997 through December 31, 2007.
| | | | | | | | | | | |
Average Annual Total Returns 1 | | One Year | | | Five Years | | | Ten Years | | | Inception Date |
Bond Fund 2,3,4 | | 7.06 | % | | 6.58 | % | | 6.97 | % | | 6/1/84 |
Lehman Brothers Govt/Credit Index | | 7.23 | % | | 4.44 | % | | 6.01 | % | | |
The performance data shown represents past performance. Past performance is not a guarantee of future results. Current performance may be lower or higher than the performance data quoted. The investment return and principal value of an investment in the Fund will fluctuate so that an investor’s shares, when redeemed, may be worth more or less than their original cost. For performance information through the most recent month end, please call (800) 835-3879 or visit our website at www.managersinvest.com.
In choosing a Fund, investors should carefully consider the amount they plan to invest, their investment objectives, the Fund’s investment objectives, risks, charges and expenses before investing. For this and other information, please call 800.835.3879 or visit www.managersinvest.com for a free prospectus. Read it carefully before investing or sending money. Distributed by Managers Distributors, Inc., member FINRA.
| | 1 | Total return equals income yield plus share price change and assumes reinvestment of all dividends and capital gain distributions. Returns are net of fees and may reflect offsets of Fund expenses as described in the Prospectus. No adjustment has been made for taxes payable by shareholders on their reinvested dividends and capital gain distributions. Returns for periods greater than one year are annualized. The listed returns on the Fund are net of expenses. All returns are in U.S. dollars($). |
| | 2 | From time to time, the Fund’s advisor has waived its fees and/or absorbed Fund expenses, which has resulted in higher returns. |
| | 3 | Fixed-income funds are subject to the risks associated with investments in debt securities, such as default risk, fluctuations in debtor’s perceived ability to pay its creditors. Changing interest rates may adversely affect the value of an investment. An increase in interest rates typically causes the value of bonds and other fixed-income securities to fall. |
| | 4 | Investments in international securities are subject to certain risks of overseas investing including currency fluctuations and changes in political and economic conditions, which could result in significant market fluctuations. These risks are magnified in emerging markets. |
6
Managers Bond Fund
Fund Snapshot
December 31, 2007
Portfolio Breakdown
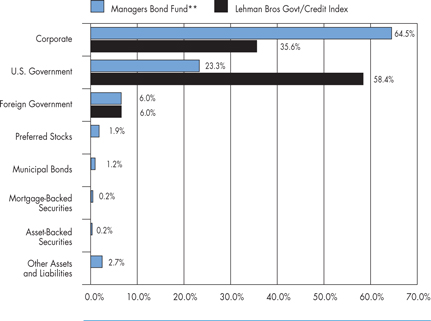
| ** | As a percentage of net assets |
| | | | | | |
Industry | | Managers
Bond Fund** | | | Lehman Bros
Govt/Credit
Index | |
Corporate | | 64.5 | % | | 35.6 | % |
U.S. Government | | 23.3 | % | | 58.4 | % |
Foreign Government | | 6.0 | % | | 6.0 | % |
Preferred Stocks | | 1.9 | % | | 0.0 | % |
Municipal Bonds | | 1.2 | % | | 0.0 | % |
Mortgage-Backed Securities | | 0.2 | % | | 0.0 | % |
Asset-Backed Securities | | 0.2 | % | | 0.0 | % |
Other Assets and Liabilities | | 2.7 | % | | 0.0 | % |
Top Ten Holdings
| | | |
Security Name | | Percentage of
Net Assets | |
USTB, 5.375%, 02/15/31* | | 9.1 | % |
USTN, 4.750%, 02/15/37* | | 4.4 | |
USTB, 4.50%, 02/15/36* | | 3.9 | |
CIT Group, Inc., 7.625%, 11/30/12 | | 3.6 | |
USTN, 4.625%, 11/30/08* | | 3.2 | |
American General Finance Corp., Series MTN, 6.900%, 12/15/17 | | 2.8 | |
USTN, 4.500%, 09/30/11* | | 1.7 | |
Nisource Finance Corp., 6.400%, 03/15/18 | | 1.5 | |
Canada Government, 4.250%, 09/01/08* | | 1.3 | |
Comcast Corp., 6.950%, 08/15/37 | | 1.2 | |
| | | |
Top Ten as a Group | | 32.7 | % |
| | | |
| * | Top Ten Holding at June 30, 2007 |
Any sectors, industries, or securities discussed should not be perceived as investment recommendations. Mention of a specific security should not be considered a recommendation to buy or solicitation to sell that security.
7
Managers Bond Fund
Schedule of Portfolio Investments
December 31, 2007
| | | | | | | | | |
Security Description | | | | Principal Amount | | | Value |
Corporate Bonds 64.5% | | | | | | | | | |
Finance - 18.3% | | | | | | | | | |
American General Finance Corp., Series MTN, 6.900%, 12/15/17 | | | | $ | 57,315,000 | 2 | | $ | 57,372,315 |
ASIF Global Financial, 2.380%, 02/26/09 (a) | | SGD | | | 5,800,000 | | | | 3,984,092 |
Bank of America Capital Trust VI, 5.625%, 03/08/35 | | | | | 3,085,000 | | | | 2,634,828 |
Barclays Capital Corp., | | | | | | | | | |
4.100%, 02/22/10 (a) | | THB | | | 26,000,000 | | | | 745,305 |
4.160%, 02/22/10 (a) | | THB | | | 25,000,000 | | | | 747,366 |
4.870%, 03/23/09 (03/23/08) (a) 6 | | KRW | | | 160,900,000 | | | | 177,238 |
BNP Paribas SA DN, 8.732%, 06/13/11 (a) 4 | | IDR | | | 19,645,500,000 | | | | 1,557,208 |
Caterpillar Financial Services Corp., 5.850%, 09/01/17 | | | | | 13,000,000 | | | | 13,371,761 |
Cigna Corp., 6.150%, 11/15/36 | | | | | 6,830,000 | | | | 6,336,976 |
CIT Group, Inc., | | | | | | | | | |
5.000%, 02/13/14 | | | | | 395,000 | | | | 347,736 |
5.125%, 09/30/14 | | | | | 680,000 | | | | 598,992 |
7.625%, 11/30/12 | | | | | 71,175,000 | | | | 72,143,407 |
Citibank N.A., 15.000%, 07/02/10 (a) | | BRL | | | 2,000,000 | | | | 1,233,371 |
Citigroup, Inc., 3.500%, 02/01/08 | | | | | 2,020,000 | | | | 2,017,404 |
Colonial Realty L.P., | | | | | | | | | |
4.800%, 04/01/11 | | | | | 3,485,000 | | | | 3,400,088 |
5.500%, 10/01/15 | | | | | 1,255,000 | | | | 1,138,205 |
Duke Realty L.P., 6.500%, 01/15/18 | | | | | 5,000,000 | | | | 5,028,350 |
Equity One, Inc., 6.000%, 09/15/17 | | | | | 5,915,000 | | | | 5,551,653 |
First Industrial L.P., 5.950%, 05/15/17 | | | | | 15,000,000 | | | | 14,544,675 |
Ford Motor Credit Co., | | | | | | | | | |
5.700%, 01/15/10 | | | | | 5,795,000 | | | | 5,221,168 |
8.000%, 12/15/16 | | | | | 3,500,000 | | | | 2,972,938 |
General Electric Capital Corp., | | | | | | | | | |
2.960%, 05/18/12 | | SGD | | | 4,400,000 | | | | 2,993,476 |
3.485%, 03/08/12 | | SGD | | | 16,500,000 | | | | 11,475,458 |
6.500%, 09/28/15 | | NZD | | | 14,950,000 | | | | 10,461,388 |
6.625%, 02/04/10 | | NZD | | | 3,500,000 | | | | 2,589,950 |
6.750%, 09/26/16 | | NZD | | | 5,985,000 | | | | 4,288,966 |
General Motors Acceptance Corp., | | | | | | | | | |
6.875%, 08/28/12 | | | | | 290,000 | | | | 243,010 |
8.000%, 11/01/31 | | | | | 1,150,000 | | | | 964,706 |
GMAC LLC, 7.000%, 02/01/12 | | | | | 735,000 | | | | 623,592 |
GMAC, | | | | | | | | | |
5.625%, 05/15/09 | | | | | 500,000 | | | | 471,733 |
6.000%, 12/15/11 | | | | | 950,000 | | | | 796,746 |
6.125%, 01/22/08 | | | | | 2,000,000 | 2 | | | 2,000,298 |
6.625%, 05/15/12 | | | | | 1,120,000 | | | | 931,075 |
The accompanying notes are an integral part of these financial statements.
8
Managers Bond Fund
Schedule of Portfolio Investments (continued)
| | | | | | | | | |
Security Description | | | | Principal Amount | | | Value |
Finance - 18.3% (continued) | | | | | | | | | |
GMAC, | | | | | | | | | |
6.750%, 12/01/14 | | | | $ | 1,375,000 | | | $ | 1,109,005 |
6.875%, 09/15/11 | | | | | 250,000 | | | | 213,874 |
Highwoods Properties, Inc., 7.500%, 04/15/18 | | | | | 2,405,000 | | | | 2,521,986 |
Highwoods Realty L.P., 5.850%, 03/15/17 | | | | | 3,015,000 | | | | 2,836,807 |
HSBC Bank USA, N.A., 2.951%, 04/18/12 (a) 4 | | MYR | | | 11,930,000 | | | | 3,180,732 |
ICICI Bank, Ltd., 6.375%, 04/30/22 (a) 7 | | | | | 900,000 | | | | 814,695 |
iStar Financial Inc., | | | | | | | | | |
5.125%, 04/01/11 | | | | | 280,000 | | | | 249,598 |
5.150%, 03/01/12 | | | | | 3,215,000 | | | | 2,778,458 |
5.375%, 04/15/10 | | | | | 830,000 | | | | 768,388 |
5.650%, 09/15/11 | | | | | 2,830,000 | | | | 2,528,953 |
5.743%, 10/01/12 (04/01/08) 6 | | | | | 7,260,000 | | | | 6,425,100 |
5.800%, 03/15/11 | | | | | 640,000 | | | | 573,339 |
5.950%, 10/15/13 | | | | | 1,765,000 | | | | 1,538,007 |
JPMorgan Chase & Co., | | | | | | | | | |
3.668%, 06/08/12 (a) 4 | | MYR | | | 4,516,015 | | | | 1,162,256 |
4.000%, 02/01/08 | | | | | 1,000,000 | | | | 999,210 |
8.451%, 10/21/10 (a) 4 | | IDR | | | 16,627,462,500 | | | | 1,402,779 |
8.658%, 03/28/11 (a) 4 | | IDR | | | 932,700,000 | | | | 75,450 |
9.030%, 04/12/12 (a) 4 | | IDR | | | 40,733,437,680 | | | | 2,971,579 |
11.844%, 05/17/10 (a) 4 | | BRL | | | 3,600,000 | | | | 1,538,351 |
KFW, 10.000%, 10/27/08 | | ISK | | | 301,500,000 | | | | 4,671,868 |
Kinder Morgan Finance Co., | | | | | | | | | |
5.150%, 03/01/15 | | | | | 730,000 | 2 | | | 642,351 |
5.700%, 01/05/16 | | | | | 370,000 | | | | 334,924 |
6.400%, 01/05/36 | | | | | 3,270,000 | | | | 2,700,533 |
Marsh & McLennan Companies, Inc., | | | | | | | | | |
5.375%, 07/15/14 | | | | | 4,390,000 | | | | 4,275,399 |
5.750%, 09/15/15 | | | | | 11,939,000 | | | | 11,556,725 |
5.875%, 08/01/33 | | | | | 10,360,000 | | | | 9,025,021 |
Merrill Lynch & Co., 10.710%, 03/08/17 | | BRL | | | 2,500,000 | | | | 1,313,202 |
Morgan Stanley & Co., Inc., 3.625%, 04/01/08 | | | | | 2,100,000 | | | | 2,091,111 |
Mutual of Omaha Insurance Co., 6.800%, 06/15/36 (a) | | | | | 10,125,000 | | | | 9,924,930 |
Qwest Capital Funding, Inc., 6.875%, 07/15/28 | | | | | 1,255,000 | | | | 1,060,475 |
Realty Income Corp., 6.750%, 08/15/19 | | | | | 7,675,000 | | | | 7,917,676 |
Residential Capital LLC, | | | | | | | | | |
7.875%, 05/17/13 | | GBP | | | 2,500,000 | | | | 2,737,081 |
8.000%, 06/01/12 | | | | | 2,715,000 | | | | 1,669,725 |
8.375%, 06/30/15 | | | | | 1,095,000 | 2 | | | 662,475 |
SLM Corp., 6.500%, 06/15/10 | | NZD | | | 500,000 | | | | 346,909 |
St. Paul Travelers Companies, Inc., The, 6.750%, 06/20/36 | | | | | 2,610,000 | | | | 2,723,705 |
Toll Brothers Finance Corp., 5.150%, 05/15/15 | | | | | 3,785,000 | | | | 3,434,736 |
Travelers Cos., Inc., 6.250%, 06/15/37 | | | | | 15,435,000 | | | | 14,950,526 |
The accompanying notes are an integral part of these financial statements.
9
Managers Bond Fund
Schedule of Portfolio Investments (continued)
| | | | | | | | | |
Security Description | | | | Principal Amount | | | Value |
Finance - 18.3% (continued) | | | | | | | | | |
Travelers Property Casualty Corp., 6.375%, 03/15/33 | | | | $ | 3,040,000 | | | $ | 3,006,928 |
Wells Fargo Co., 4.661%, 05/01/33 (02/01/08) 6 | | | | | 2,840,000 | 2 | | | 2,826,652 |
White Mountains Insurance Group, 6.375%, 03/20/17 (a) | | | | | 4,555,000 | | | | 4,413,217 |
Willis North America Inc., 6.200%, 03/28/17 | | | | | 5,685,000 | | | | 5,672,487 |
Total Finance | | | | | | | | | 370,612,697 |
Industrial - 41.2% | | | | | | | | | |
Abitibi-Consolidated, Inc., 7.500%, 04/01/28 | | | | | 500,000 | | | | 321,250 |
Agilent Technologies, Inc., 6.500%, 11/01/17 | | | | | 6,945,000 | | | | 7,054,932 |
Albertson’s, Inc., | | | | | | | | | |
6.625%, 06/01/28 | | | | | 1,015,000 | | | | 892,959 |
7.000%, 11/04/13 | | | | | 1,500,000 | | | | 1,677,506 |
7.450%, 08/01/29 | | | | | 3,195,000 | 2 | | | 3,074,993 |
7.750%, 06/15/26 | | | | | 915,000 | | | | 905,044 |
America Movil, S.A. de C.V., 4.125%, 03/01/09 | | | | | 3,000,000 | | | | 2,981,115 |
American President, Ltd., 8.000%, 01/15/24 5 | | | | | 250,000 | | | | 210,000 |
Anadarko Petroleum Corp., | | | | | | | | | |
5.950%, 09/15/16 | | | | | 4,915,000 | | | | 5,004,600 |
6.450%, 09/15/36 | | | | | 13,875,000 | | | | 14,129,413 |
Anheuser-Busch Companies, Inc., | | | | | | | | | |
5.950%, 01/15/33 | | | | | 6,177,000 | | | | 6,249,370 |
6.450%, 09/01/37 | | | | | 7,900,000 | 2 | | | 8,562,842 |
Apache Corp., 6.000%, 01/15/37 | | | | | 12,000,000 | | | | 11,901,876 |
Arrow Electronics, Inc., 6.875%, 07/01/13 | | | | | 500,000 | | | | 532,934 |
AstraZeneca PLC, 6.450%, 09/15/37 | | | | | 13,975,000 | | | | 15,312,072 |
AT&T Corp., | | | | | | | | | |
6.150%, 09/15/34 | | | | | 1,375,000 | | | | 1,372,698 |
6.500%, 03/15/29 | | | | | 7,650,000 | | | | 7,509,378 |
6.500%, 09/01/37 | | | | | 9,605,000 | 2 | | | 10,043,737 |
Avnet, Inc., | | | | | | | | | |
2.000%, 03/15/34 | | | | | 1,425,000 | | | | 1,670,812 |
5.875%, 03/15/14 | | | | | 11,000,000 | | | | 11,118,426 |
6.000%, 09/01/15 | | | | | 5,340,000 | | | | 5,330,644 |
6.625%, 09/15/16 | | | | | 1,370,000 | | | | 1,436,663 |
Bell Canada, 5.000%, 02/15/17 | | CAD | | | 1,000,000 | | | | 834,987 |
BellSouth Corp., 6.000%, 11/15/34 | | | | | 9,740,000 | 2 | | | 9,470,971 |
Bowater, Inc., 6.500%, 06/15/13 | | | | | 1,675,000 | | | | 1,231,125 |
Canadian Pacific Railway Co., 5.950%, 05/15/37 | | | | | 8,010,000 | | | | 7,221,311 |
Centex Corp., 5.250%, 6/15/15 | | | | | 1,915,000 | | | | 1,621,643 |
Chartered Semiconductor Manufacturing, 6.250%, 04/04/13 | | | | | 5,600,000 | | | | 5,783,803 |
Cia Brasileira de Bebida, 8.750%, 09/15/13 | | | | | 3,795,000 | | | | 4,316,812 |
Clear Channel Communications, | | | | | | | | | |
4.250%, 05/15/09 | | | | | 1,500,000 | | | | 1,424,037 |
5.750%, 01/15/13 | | | | | 500,000 | | | | 414,019 |
The accompanying notes are an integral part of these financial statements.
10
Managers Bond Fund
Schedule of Portfolio Investments (continued)
| | | | | | | |
Security Description | | Principal Amount | | | Value |
Industrial - 41.2% (continued) | | | | | | | |
Colonial Realty L.P., 6.050%, 09/01/16 | | $ | 470,000 | | | $ | 435,934 |
Comcast Corp., | | | | | | | |
5.650%, 06/15/35 | | | 12,425,000 | 2 | | | 11,373,137 |
6.450%, 03/15/37 | | | 10,570,000 | | | | 10,762,173 |
6.500%, 11/15/35 | | | 2,320,000 | | | | 2,367,418 |
6.950%, 08/15/37 | | | 23,100,000 | 2 | | | 24,931,183 |
Continental Airlines, Inc., | | | | | | | |
5.983%, 04/19/22 | | | 13,265,000 | | | | 12,397,336 |
6.795%, 08/02/20 | | | 48,352 | | | | 45,934 |
Corn Products International, Inc., 6.625%, 04/15/37 | | | 4,055,000 | | | | 4,224,085 |
Corning, Inc., | | | | | | | |
6.850%, 03/01/29 | | | 9,142,000 | | | | 9,657,993 |
7.250%, 08/15/36 | | | 1,185,000 | | | | 1,289,861 |
Covidien International Finance S.A., | | | | | | | |
6.000%, 10/15/17 (a) | | | 5,965,000 | | | | 6,172,188 |
6.550%, 10/15/37 (a) | | | 6,005,000 | | | | 6,236,409 |
CSX Corp., | | | | | | | |
6.000%, 10/01/36 | | | 11,635,000 | 2 | | | 10,559,810 |
6.250%, 03/15/18 | | | 16,400,000 | | | | 16,483,755 |
Cummins Engine Co., Inc., | | | | | | | |
5.650%, 03/01/98 | | | 11,235,000 | | | | 8,930,994 |
6.750%, 02/15/27 | | | 1,853,000 | | | | 1,886,806 |
7.125%, 03/01/28 | | | 50,000 | | | | 51,707 |
D.R. Horton, Inc., 5.250%, 02/15/15 | | | 5,495,000 | | | | 4,364,810 |
Delta Air Lines, Inc., 8.021%, 08/10/22 (a) | | | 15,955,000 | | | | 15,994,889 |
Desarrolladora Homex, S.A. de C.V., 7.500%, 09/28/15 | | | 2,725,000 | | | | 2,745,438 |
Devon Energy Corp., | | | | | | | |
4.900%, 08/15/08 | | | 1,250,000 | | | | 2,179,688 |
4.950%, 08/15/08 | | | 1,692,000 | | | | 2,950,425 |
Dillards, Inc., 7.000%, 12/01/28 | | | 225,000 | | | | 164,250 |
Duke Energy Field Services LLC, 6.450%, 11/03/36 (a) | | | 2,615,000 | | | | 2,544,055 |
El Paso Corp., | | | | | | | |
6.950%, 06/01/28 | | | 1,030,000 | 2 | | | 975,075 |
7.000%, 05/15/11 | | | 500,000 | 2 | | | 509,305 |
Energy Transfer Partners L.P., | | | | | | | |
6.125%, 02/15/17 | | | 700,000 | | | | 680,696 |
6.625%, 10/15/36 | | | 1,805,000 | | | | 1,729,997 |
Enterprise Products Operating L.P., 6.300%, 09/15/17 | | | 8,440,000 | | | | 8,635,454 |
Equifax, Inc., 7.000%, 07/01/37 | | | 2,170,000 | | | | 2,058,998 |
Federated Retail Holdings, 6.375%, 03/15/37 | | | 13,775,000 | | | | 12,005,684 |
Foot Locker, Inc., 8.500%, 01/15/22 | | | 570,000 | | | | 524,400 |
Ford Motor Co., 6.375%, 02/01/29 | | | 1,990,000 | | | | 1,323,350 |
Freescale Semiconductor, Inc., 10.125%, 12/15/16 | | | 1,275,000 | 2 | | | 1,051,875 |
The accompanying notes are an integral part of these financial statements.
11
Managers Bond Fund
Schedule of Portfolio Investments (continued)
| | | | | | | |
Security Description | | Principal Amount | | | Value |
Industrial - 41.2% (continued) | | | | | | | |
General Motors Corp., | | | | | | | |
7.400%, 09/01/25 | | $ | 570,000 | | | $ | 413,250 |
8.250%, 07/15/23 | | | 3,490,000 | | | | 2,774,550 |
8.375%, 07/15/33 | | | 135,000 | | | | 108,675 |
Georgia-Pacific Corp., | | | | | | | |
7.250%, 06/01/28 | | | 1,245,000 | | | | 1,095,600 |
7.750%, 11/15/29 | | | 1,615,000 | | | | 1,477,725 |
8.000%, 01/15/24 | | | 1,695,000 | | | | 1,576,350 |
8.875%, 05/15/31 | | | 2,750,000 | | | | 2,653,750 |
GTE Corp., 6.940%, 04/15/28 | | | 130,000 | | | | 139,249 |
HCA, Inc., | | | | | | | |
5.750%, 03/15/14 | | | 5,630,000 | | | | 4,672,900 |
6.250%, 02/15/13 | | | 1,940,000 | | | | 1,697,500 |
6.375%, 01/15/15 | | | 1,920,000 | | | | 1,622,400 |
6.625%, 02/15/16 | | | 6,775,000 | | | | 5,724,875 |
7.050%, 12/01/27 | | | 1,685,000 | | | | 1,286,865 |
7.190%, 11/15/15 | | | 195,000 | | | | 167,182 |
7.500%, 11/06/33 | | | 925,000 | | | | 723,812 |
7.500%, 12/15/23 | | | 120,000 | | | | 98,266 |
7.580%, 09/15/25 | | | 1,065,000 | | | | 866,976 |
7.690%, 06/15/25 | | | 995,000 | | | | 823,762 |
Home Depot Inc., The, 5.875%, 12/16/36 | | | 16,635,000 | | | | 14,038,293 |
Hospira, Inc., 6.050%, 03/30/17 | | | 3,395,000 | | | | 3,411,306 |
Hutchison Whampoa International, Ltd., 5.450%, 11/24/10 (a) | | | 2,225,000 | | | | 2,247,030 |
International Paper Co., | | | | | | | |
4.000%, 04/01/10 | | | 1,000,000 | | | | 990,129 |
4.250%, 01/15/09 | | | 1,000,000 | | | | 989,874 |
Intuit, Inc., 5.750%, 03/15/17 | | | 3,560,000 | | | | 3,502,353 |
JC Penney Corp., Inc., 6.375%, 10/15/36 | | | 10,680,000 | | | | 9,543,798 |
Johnson & Johnson, 5.950%, 08/15/37 | | | 15,020,000 | | | | 16,209,645 |
Kellwood Co., 7.625%, 10/15/17 | | | 250,000 | | | | 217,500 |
Kinder Morgan Energy Partners L.P., 5.800%, 03/15/35 | | | 3,360,000 | | | | 3,041,556 |
KN Capital Trust III, 7.630%, 04/15/28 | | | 75,000 | | | | 67,650 |
Koninklijke KPN NV, 8.375%, 10/01/30 | | | 815,000 | | | | 977,209 |
Kraft Foods, Inc., | | | | | | | |
6.500%, 08/11/17 | | | 8,950,000 | | | | 9,259,187 |
6.500%, 11/01/31 | | | 7,635,000 | | | | 7,489,164 |
7.000%, 08/11/37 | | | 7,280,000 | | | | 7,646,220 |
Kroger Co., 6.400%, 08/15/17 | | | 3,060,000 | 2 | | | 3,200,494 |
Lennar Corp., | | | | | | | |
5.500%, 09/01/14 | | | 1,900,000 | | | | 1,439,560 |
5.600%, 05/31/15 | | | 2,740,000 | | | | 2,087,940 |
6.500%, 04/15/16 | | | 2,340,000 | | | | 1,830,748 |
The accompanying notes are an integral part of these financial statements.
12
Managers Bond Fund
Schedule of Portfolio Investments (continued)
| | | | | | | |
Security Description | | Principal Amount | | | Value |
Industrial - 41.2% (continued) | | | | | | | |
Lowe’s Co., Inc., 6.875%, 02/15/28 | | $ | 500,000 | | | $ | 535,303 |
Lowe’s Companies, Inc., 6.650%, 09/15/37 | | | 6,595,000 | | | | 6,688,609 |
Lubrizol Corp., 6.500%, 10/01/34 | | | 7,825,000 | | | | 7,687,742 |
Lucent Technologies, Inc., | | | | | | | |
6.450%, 03/15/29 | | | 4,335,000 | | | | 3,581,794 |
6.500%, 01/15/28 | | | 305,000 | | | | 252,006 |
Macys Retail Holdings, Inc., 6.790%, 07/15/27 | | | 2,885,000 | | | | 2,690,563 |
Masco Corp., 5.850%, 03/15/17 | | | 8,150,000 | | | | 7,907,073 |
Missouri Pacific Railroad, 5.000%, 01/01/45 | | | 825,000 | | | | 561,000 |
Motorola, Inc., | | | | | | | |
6.500%, 09/01/25 | | | 1,145,000 | | | | 1,111,919 |
8.000%, 11/01/11 | | | 1,075,000 | | | | 1,158,809 |
New England Telephone & Telegraph Co., 7.875%, 11/15/29 | | | 2,390,000 | | | | 2,736,127 |
Newmont Mining Corp., 5.875%, 04/01/35 | | | 11,660,000 | | | | 10,250,924 |
News America Inc., | | | | | | | |
6.150%, 03/01/37 | | | 6,075,000 | 2 | | | 5,868,383 |
6.200%, 12/15/34 | | | 3,440,000 | | | | 3,391,118 |
6.400%, 12/15/35 | | | 5,820,000 | | | | 5,887,780 |
Nextel Communications, Inc., | | | | | | | |
5.950%, 03/15/14 | | | 18,220,000 | | | | 17,126,235 |
6.875% 10/31/13 | | | 20,000 | | | | 19,702 |
NGPL Pipeco LLC, Series 144A, 7.119%, 12/15/17 (a) | | | 21,980,000 | | | | 22,537,149 |
Northwest Airlines, Inc., 8.028%, 11/01/17 | | | 9,330,000 | | | | 9,446,625 |
ONEOK Partners, L.P., 6.650%, 10/01/36 | | | 3,500,000 | | | | 3,539,130 |
Owens & Minor, Inc., 6.350%, 04/15/16 | | | 1,355,000 | | | | 1,382,783 |
Owens Corning Inc, | | | | | | | |
6.500%, 12/01/16 | | | 2,025,000 | | | | 1,854,371 |
7.000%, 12/01/36 | | | 4,990,000 | | | | 4,502,302 |
JC Penney Corp., Inc., 7.125%, 11/15/23 | | | 18,000 | | | | 18,554 |
PF Export Rec Master Trust, 6.436%, 06/01/15 (a) | | | 605,200 | | | | 610,253 |
Plains All American Pipeline L.P., | | | | | | | |
6.125%, 01/15/17 | | | 2,770,000 | | | | 2,807,279 |
6.650%, 01/15/37 | | | 5,960,000 | | | | 5,998,114 |
Pulte Homes, Inc., | | | | | | | |
6.000%, 02/15/35 | | | 10,320,000 | 2 | | | 7,781,476 |
6.375%, 05/15/33 | | | 4,670,000 | | | | 3,537,875 |
Series $, 5.200%, 02/15/15 | | | 3,165,000 | | | | 2,617,958 |
Qantas Airways, Ltd., 6.050%, 04/15/16 (a) | | | 11,800,000 | | | | 12,138,943 |
Qwest Capital Funding, Inc., | | | | | | | |
6.500%, 11/15/18 | | | 620,000 | | | | 523,900 |
7.625%, 08/03/21 | | | 1,435,000 | | | | 1,291,500 |
7.750%, 02/15/31 | | | 1,705,000 | 2 | | | 1,534,500 |
The accompanying notes are an integral part of these financial statements.
13
Managers Bond Fund
Schedule of Portfolio Investments (continued)
| | | | | | | | | |
Security Description | | | | Principal
Amount | | | Value |
Industrial - 41.2% (continued) | | | | | | | | | |
Qwest Corp., | | | | | | | | | |
6.875%, 09/15/33 | | | | $ | 820,000 | 2 | | $ | 756,450 |
7.250%, 09/15/25 | | | | | 750,000 | | | | 705,000 |
7.500%, 06/15/23 | | | | | 556,000 | | | | 532,370 |
R.H. Donnelley Corp., Series A-1, 6.875%, 01/15/13 | | | | | 1,345,000 | | | | 1,203,775 |
R.H. Donnelley Corp., Series A-2, 6.875%, 01/15/13 | | | | | 1,200,000 | | | | 1,074,000 |
R.H. Donnelley Corp., | | | | | | | | | |
8.875%, 01/15/16 | | | | | 1,475,000 | | | | 1,379,125 |
8.875%, 10/15/17 (a) | | | | | 165,000 | | | | 152,625 |
Raytheon Co., | | | | | | | | | |
7.000%, 11/01/28 | | | | | 1,500,000 | | | | 1,695,168 |
7.200%, 08/15/27 | | | | | 800,000 | | | | 918,583 |
Reynolds American Inc, | | | | | | | | | |
6.750%, 06/15/17 | | | | | 8,170,000 | | | | 8,321,333 |
7.250%, 06/15/37 | | | | | 2,000,000 | | | | 2,021,360 |
Safeway, Inc., 6.350%, 08/15/17 | | | | | 8,000,000 | | | | 8,338,128 |
Samsung Electronics Co., Ltd., 7.700%, 10/01/27 (a) | | | | | 4,695,000 | | | | 5,247,357 |
Schering-Plough Corp., 5.300%, 12/01/13 | | | | | 1,500,000 | | | | 1,517,668 |
Southern Natural Gas Co., | | | | | | | | | |
5.900%, 04/01/17 (a) | | | | | 4,765,000 | | | | 4,686,697 |
7.350%, 02/15/31 | | | | | 1,000,000 | | | | 1,044,162 |
Sprint Capital Corp., 6.875%, 11/15/28 | | | | | 27,000 | | | | 25,606 |
Sprint Nextel Corp., 6.000%, 12/01/16 | | | | | 48,000 | | | | 45,974 |
Talisman Energy, Inc., | | | | | | | | | |
5.850%, 02/01/37 | | | | | 2,425,000 | | | | 2,267,356 |
6.250%, 02/01/38 | | | | | 3,635,000 | | | | 3,542,522 |
Teck Cominco Ltd., 7.000%, 09/15/12 | | | | | 1,000,000 | | | | 1,086,673 |
Telecom Italia Capital, 6.000%, 09/30/34 | | | | | 3,210,000 | | | | 3,121,423 |
Telecom Italia S.p.A., 6.375%, 11/15/33 | | | | | 3,170,000 | | | | 3,174,882 |
Telefonica Emisiones SAU, 7.045%, 06/20/36 | | | | | 12,125,000 | | | | 13,553,155 |
Telekom Malaysia Berhad, 7.875%, 08/01/25 (a) | | | | | 250,000 | | | | 294,664 |
TELUS Corp., 4.950%, 03/15/17 | | CAD | | | 7,115,000 | | | | 6,644,608 |
Tennessee Gas Pipeline Co., 7.000%, 10/15/28 | | | | | 2,395,000 | | | | 2,417,712 |
Texas Eastern Transmission L.P., 6.000%, 09/15/17 (a) | | | | | 3,000,000 | | | | 3,093,106 |
Time Warner, Inc., | | | | | | | | | |
6.500%, 11/15/36 | | | | | 3,360,000 | | | | 3,269,304 |
6.625%, 05/15/29 | | | | | 1,995,000 | | | | 1,964,125 |
6.950%, 01/15/28 | | | | | 855,000 | | | | 872,469 |
7.625%, 04/15/31 | | | | | 560,000 | | | | 619,707 |
7.700%, 05/01/32 | | | | | 365,000 | | | | 405,535 |
Toro Co., The, 6.625%, 05/01/37 | | | | | 6,810,000 | | | | 7,029,248 |
Transocean, Inc., 7.375%, 04/15/18 | | | | | 500,000 | | | | 533,128 |
The accompanying notes are an integral part of these financial statements.
14
Managers Bond Fund
Schedule of Portfolio Investments (continued)
| | | | | | | |
Security Description | | Principal Amount | | | Value |
Industrial - 41.2% (continued) | | | | | | | |
U.S. Steel Corp., | | | | | | | |
6.050%, 06/01/17 | | $ | 2,115,000 | | | $ | 1,987,747 |
6.650%, 06/01/37 | | | 1,220,000 | | | | 1,088,294 |
Union Pacific Corp., 5.375%, 06/01/33 | | | 2,525,000 | | | | 2,212,529 |
United Airlines, Inc., 6.636%, 07/02/22 | | | 18,640,000 | | | | 17,614,800 |
United States Steel Corp., 7.000%, 02/01/18 | | | 22,850,000 | | | | 22,697,179 |
USG Corp, 6.300%, 11/15/16 | | | 1,410,000 | | | | 1,273,784 |
Vale Overseas Ltd., 6.875%, 11/01/36 | | | 3,665,000 | | | | 3,707,554 |
Verizon Global Funding Corp., 5.850%, 09/15/35 | | | 11,400,000 | 2 | | | 11,151,184 |
Verizon Maryland, Inc., 5.125%, 06/15/33 | | | 845,000 | | | | 728,280 |
Verizon New York, Inc., Series B, 7.375%, 04/1/32 | | | 3,090,000 | | | | 3,392,347 |
Viacom, Inc., 6.875%, 04/30/36 | | | 4,160,000 | | | | 4,171,340 |
Vondafone Group PLC, | | | | | | | |
5.000%, 09/15/15 | | | 4,465,000 | | | | 4,303,282 |
6.150%, 02/27/37 | | | 16,500,000 | | | | 16,295,730 |
Watson Pharmaceuticals, Inc., 1.750%, 03/15/23 | | | 515,000 | | | | 487,962 |
Weatherford International, Inc., 6.500%, 08/01/36 | | | 1,565,000 | | | | 1,562,878 |
Wellpoint, Inc., 6.375%, 06/15/37 | | | 13,650,000 | | | | 13,409,200 |
Western Union Co., 6.200%, 11/17/36 | | | 12,735,000 | | | | 12,222,760 |
White Pine Hydro LLC, | | | | | | | |
6.310%, 07/10/17 (a) 5 | | | 1,700,000 | | | | 1,779,917 |
6.960%, 07/10/37 (a) 5 | | | 1,645,000 | | | | 1,701,409 |
Williams Co., Inc., Series A, 7.500%, 01/15/31 | | | 1,000,000 | | | | 1,075,000 |
XTO Energy, Inc., | | | | | | | |
6.100%, 04/01/36 | | | 190,000 | | | | 185,482 |
6.750%, 08/01/37 | | | 2,770,000 | | | | 2,971,185 |
Total Industrial | | | | | | | 833,123,067 |
Utility - 5.0% | | | | | | | |
Bruce Mansfield Unit 1 2, 6.850%, 06/01/34 | | | 10,805,000 | | | | 11,130,447 |
Cleveland Electric Illuminating Co., The, 5.950%, 12/15/36 | | | 6,910,000 | | | | 6,323,099 |
Commonwealth Edison, | | | | | | | |
4.700%, 04/15/15 | | | 1,465,000 | | | | 1,379,905 |
5.875%, 02/01/33 | | | 5,000,000 | | | | 4,637,695 |
Constellation Energy Group, Inc., 4.550%, 06/15/15 | | | 1,675,000 | 2 | | | 1,544,621 |
Dominion Resources, Inc., 5.950%, 06/15/35 | | | 740,000 | | | | 691,568 |
Empresa Nacional de Electricidad SA, 8.625%, 08/01/15 | | | 300,000 | 2 | | | 346,091 |
Empresa Nacional de Electricidad, Yankee, 7.875%, 02/01/27 | | | 2,900,000 | | | | 3,229,510 |
Enersis SA, Yankee, 7.400%, 12/01/16 | | | 225,000 | | | | 243,828 |
ITC Holdings Corp., | | | | | | | |
5.875%, 09/30/16 (a) | | | 2,410,000 | | | | 2,416,437 |
6.375%, 09/30/36 (a) | | | 3,605,000 | | | | 3,472,844 |
Mackinaw Power LLC, 6.296%, 10/31/23 (a) | | | 10,091,565 | | | | 10,801,002 |
Methanex Corp., 6.000%, 08/15/15 | | | 3,825,000 | | | | 3,732,699 |
The accompanying notes are an integral part of these financial statements.
15
Managers Bond Fund
Schedule of Portfolio Investments (continued)
| | | | | | | | | |
Security Description | | | | Principal Amount | | | Value |
Utility - 5.0% (continued) | | | | | | | | | |
MidAmerican Energy Holdings Co., | | | | | | | | | |
5.875%, 10/01/12 | | | | $ | 750,000 | | | $ | 777,365 |
6.125%, 04/01/36 | | | | | 2,305,000 | 2 | | | 2,299,509 |
6.500%, 09/15/37 | | | | | 6,450,000 | | | | 6,735,645 |
NiSource Finance Corp., | | | | | | | | | |
6.150%, 03/01/13 | | | | | 1,250,000 | | | | 1,288,592 |
6.400%, 03/15/18 | | | | | 31,155,000 | | | | 31,084,933 |
ONEOK, Inc., 6.000%, 06/15/35 | | | | | 4,010,000 | | | | 3,607,837 |
Tenaga Nasional Berhad, 7.500%, 11/01/25 (a) | | | | | 2,000,000 | | | | 2,324,956 |
Toledo Edison Co., 6.150%, 05/15/37 | | | | | 2,390,000 | | | | 2,227,095 |
Total Utility | | | | | | | | | 100,295,678 |
Total Corporate Bonds (cost $ 1,292,556,071) | | | | | | | | | 1,304,031,442 |
Foreign Government Obligations - 6.0% | | | | | | | | | |
Alberta, Province of, Series CS, Sinking Fund, 5.930%, 09/16/16 | | CAD | | | 168,269 | | | | 180,696 |
Brazil, Republic of, | | | | | | | | | |
10.250%, 01/10/28 | | BRL | | | 5,500,000 | 2 | | | 2,966,292 |
12.500%, 01/05/22 | | BRL | | | 5,160,000 | | | | 3,232,247 |
Canada Government, | | | | | | | | | |
4.250%, 09/01/08 | | CAD | | | 25,410,000 | | | | 25,797,476 |
4.250%, 12/01/08 | | CAD | | | 820,000 | | | | 833,584 |
Canada Housing Trust, 4.100%, 12/15/08 | | CAD | | | 3,340,000 | | | | 3,387,243 |
Canadian Government Bond, 5.750%, 06/01/33 | | CAD | | | 2,145,000 | | | | 2,733,438 |
EUROFIMA, 10.000%, 11/03/08 | | ISK | | | 50,700,000 | | | | 782,748 |
European Investment Bank, | | | | | | | | | |
4.600%, 01/30/37 (a) | | CAD | | | 7,270,000 | | | | 7,209,966 |
6.687%, 03/10/21 4 | | AUD | | | 5,000,000 | | | | 1,843,484 |
11.393%, 09/12/08 (a) 4 | | BRL | | | 13,323,060 | | | | 6,926,285 |
Inter-American Development Bank, | | | | | | | | | |
6.000%, 12/15/17 | | NZD | | | 4,215,000 | | | | 2,914,395 |
14.401%, 05/11/09 4 | | BRL | | | 6,500,000 | | | | 3,021,770 |
Mexican Fixed Rate Bonds, 8.000%, 12/07/23 | | MXN | | | 141,360,000 | | | | 12,699,255 |
Mexican Government, 9.000%, 12/20/12 | | MXN | | | 54,500,000 | | | | 5,194,685 |
New South Wales Treasury Corp., | | | | | | | | | |
Series 10RG, 7.000%, 12/01/10 | | AUD | | | 15,465,000 | | | | 13,481,052 |
Series 12RG, 6.000%, 05/01/12 | | AUD | | | 7,990,000 | | | | 6,687,343 |
Nordic Investment Bank, 13.000%, 09/12/08 | | ISK | | | 479,800,000 | | | | 7,548,468 |
Queensland Treasury Corp., | | | | | | | | | |
7.125%, 09/18/17 (a) | | NZD | | | 7,500,000 | | | | 5,619,523 |
Series 11G, 6.000%, 06/14/11 | | AUD | | | 10,250,000 | | | | 8,671,969 |
Total Foreign Government Obligations (cost $ 111,147,831) | | | | | | | | | 121,731,919 |
The accompanying notes are an integral part of these financial statements.
16
Managers Bond Fund
Schedule of Portfolio Investments (continued)
| | | | | | | | | |
Security Description | | | | Principal Amount | | | Value |
U.S. Government and Agency Obligations - 23.3% | | | | | | | | | |
Federal Home Loan Mortgage Corporation - 0.0%# | | | | | | | | | |
FHLMC, Gold, 5.000%, 12/01/31 | | | | $ | 192,304 | | | $ | 188,981 |
Federal National Mortgage Association - 0.5% | | | | | | | | | |
FNMA, 2.290%, 02/19/09 | | SGD | | | 3,800,000 | | | | 2,627,564 |
FNMA, 4.000%, 10/01/18 | | | | | 8,472,030 | | | | 8,153,494 |
FNMA, 6.000%, 07/01/29 | | | | | 19,757 | | | | 20,205 |
Total Federal National Mortgage Association | | | | | | | | | 10,801,263 |
U.S. Treasury Bonds - 13.0% | | | | | | | | | |
USTB, 4.500%, 02/15/36 | | | | | 77,990,000 | 2 | | | 78,386,033 |
USTB, 5.375%, 02/15/31 | | | | | 163,160,000 | 2 | | | 183,822,745 |
Total U.S. Treasury Bonds | | | | | | | | | 262,208,778 |
U.S. Treasury Notes - 9.8% | | | | | | | | | |
USTN, 4.250%, 11/15/17 | | | | | 10,000,000 | | | | 10,174,220 |
USTN, 4.500%, 09/30/11 | | | | | 32,500,000 | 2 | | | 33,906,632 |
USTN, 4.625%, 11/30/08 | | | | | 63,500,000 | 2 | | | 64,278,891 |
USTN, 4.750%, 02/15/37 | | | | | 84,810,000 | 2 | | | 88,758,924 |
Total U.S. Treasury Notes | | | | | | | | | 197,118,667 |
Total U.S. Government and Agency Obligations (cost $ 434,340,413) | | | | | | | | | 470,317,689 |
Municipal Bonds - 1.2% | | | | | | | | | |
Buckeye Tobacco Settlement Financing Authority, Asset-A-2, 5.875%, 06/01/47 | | | | | 5,035,000 | | | | 4,802,433 |
MI Tobacco Settlement, 7.309%, 06/01/34 | | | | | 3,210,000 | | | | 3,020,161 |
Tobacco Settlement Financing Corp., 6.706%, 06/01/46 | | | | | 19,540,000 | | | | 16,960,134 |
Total Municipal Bonds (cost $ 27,580,068) | | | | | | | | | 24,782,728 |
Mortgage-Backed Securities - 0.2% | | | | | | | | | |
Bank of America-First Union, Series 2001, 5.464%, 04/11/37 | | | | | 1,500,000 | | | | 1,533,521 |
CS First Boston Mortgage Securities Corp., Series 2005-7, Class 3A1, 5.000%, 08/25/20 | | | | | 3,172,279 | | | | 3,080,052 |
Total Mortgage-Backed Securities (cost $ 4,520,498) | | | | | | | | | 4,613,573 |
Asset-Backed Securities - 0.2% | | | | | | | | | |
Community Program Loan Trust, Series 87-A, Class A4, 4.500%, 10/01/18 | | | | | 126,419 | | | | 125,607 |
Community Program Loan Trust, Series 87-A, Class A5, 4.500%, 04/01/29 | | | | | 3,225,000 | | | | 3,017,500 |
Total Asset-Backed Securities (cost $ 2,917,166) | | | | | | | | | 3,143,107 |
| | | |
| | | | | Shares | | | |
| Preferred Stocks - 1.9% | | | | | | | | | |
Comcast Corp. Series B, 7.000% | | | | | 207,547 | | | | 4,657,355 |
Entergy New Orleans, Inc., 4.750% | | | | | 482 | | | | 37,009 |
Entergy New Orleans, Inc., 5.560% | | | | | 100 | | | | 8,641 |
FHLMC, 8.375% | | | | | 380,697 | | | | 9,955,227 |
FNMA, 8.250% | | | | | 765,000 | | | | 19,698,749 |
Newell Financial Trust I, 5.250% | | | | | 84,628 | | | | 3,861,152 |
Wisconsin Electric Power Co., 3.600% | | | | | 3,946 | | | | 280,659 |
Total Preferred Stocks (cost $ 36,985,317) | | | | | | | | | 38,498,792 |
The accompanying notes are an integral part of these financial statements.
17
Managers Bond Fund
Schedule of Portfolio Investments (continued)
| | | | | | |
Security Description | | Shares | | Value | |
Other Investment Companies - 26.0% 1 | | | | | | |
Bank of New York Institutional Cash Reserves Fund, 5.02% 3 | | 504,438,175 | | $ | 504,438,175 | |
Dreyfus Cash Management Fund, Institutional Class Shares, 4.85% | | 22,161,773 | | | 22,161,773 | |
Total Other Investment Companies (cost $ 526,599,948) | | | | | 526,599,948 | |
Total Investments - 123.3% (cost $ 2,436,647,312) | | | | | 2,493,719,198 | |
Other Assets, less Liabilities - (23.3)% | | | | | (470,828,623 | ) |
Net Assets - 100.0% | | | | $ | 2,022,890,575 | |
The following footnotes and abbreviations should be read in conjunction with the Schedule of Portfolio Investments previously presented in this report.
Based on the cost of investments of $2,437,730,979 for Federal income tax purposes at December 31, 2007, the aggregate gross unrealized appreciation and depreciation were $84,098,660 and $28,110,441, respectively, resulting in a net unrealized appreciation of investments of $55,988,219.
| (a) | Security exempt from registration under Rule 144A of the Securities Act of 1933. This security may be resold in transactions exempt from registration, normally to qualified buyers. At December 31, 2007, the value of these securities amounted to $158,136,273 or 7.8% of net assets. |
1 | Yield shown for an investment company represents the December 31, 2007, seven-day average yield, which refers to the sum of the previous seven days’ dividends paid, expressed as an annual percentage. |
2 | Some or all of these shares were out on loan to various brokers as of December 31, 2007, amounting to $491,137,427 or 24.3% of net assets. |
3 | Collateral received from brokers for securities lending was invested in these short-term investments. |
4 | Represents yield to maturity at December 31, 2007. |
5 | Security is illiquid: A security not readily convertible into cash such as a stock, bond or commodity that is not actively traded, and would be difficult to sell in a current sale. The Fund may not invest more than 15% of its net assets in illiquid securities. All securities are valued by an independent pricing agent. |
6 | Floating Rate Security. The rate listed is as of December 31, 2007. Date in parenthesis represents the security’s next coupon rate reset. |
7 | Variable Rate Security. The rate listed is as of December 31, 2007 and is periodically reset subject to terms and conditions set forth in the debenture. |
# | Rounds to less than 0.1%. |
Investments Definitions and Abbreviations:
ADR/GDR: ADR after the name of a holding stands for American Depositary Receipt, representing ownership of foreign securities on deposit with a domestic custodian bank; a GDR (Global Depositary Receipt) is comparable, but foreign securities are held on deposit in a non-U.S. bank. The value of the ADR/GDR securities is determined or significantly influenced by trading on exchanges not located in the United States or Canada. Sponsored ADR/GDRs are initiated by the underlying foreign company.
| | |
| FHLMC: | | Federal Home Loan Mortgage Corp. |
| FNMA: | | Federal National Mortgage Association |
| USTB: | | United States Treasury Bond |
| USTN: | | United States Treasury Note |
| GMAC: | | General Motors Acceptance Corp. |
Registered shares: A security whose owner has been recorded with its issuer or issuer’s registrar.
Abbreviations have been used throughout the portfolios to indicate amounts shown in currencies other than the U.S. dollar (USD):
| | |
AUD: | | Australian Dollar |
BRL: | | Brazilian Real |
CAD: | | Canadian Dollar |
GBP: | | British Pound |
IDR: | | Indonesian Rupiah |
ISK: | | Icelandic Krona |
KRW: | | South Korean Won |
MXN: | | Mexican Peso |
MYR: | | Malaysian Ringgit |
NZD: | | New Zealand Dollar |
SGD: | | Singapore Dollar |
THB: | | Thailand Baht |
The accompanying notes are an integral part of these financial statements.
18
Managers Bond Fund
Statement of Assets and Liabilities
December 31, 2007
| | | | |
Assets: | | | | |
Investments at value (including securities on loan valued at $491,137,427)* | | $ | 2,493,719,198 | |
Foreign currency** | | | 6,855 | |
Receivable for Fund shares sold | | | 8,893,802 | |
Dividends, interest and other receivables | | | 29,015,495 | |
Prepaid expenses | | | 73,224 | |
| | | | |
Total assets | | | 2,531,708,574 | |
| | | | |
Liabilities: | | | | |
Payable to affiliate | | | 21,064 | |
Payable to Custodian | | | 227,337 | |
Payable for Fund shares repurchased | | | 1,933,564 | |
Payable upon return of securities loaned | | | 504,438,175 | |
Payable for investments purchased | | | 447,824 | |
Accrued expenses: | | | | |
Investment advisory and management fees | | | 1,043,667 | |
Administrative fees | | | 417,467 | |
Other | | | 288,901 | |
| | | | |
Total liabilities | | | 508,817,999 | |
| | | | |
Net Assets | | $ | 2,022,890,575 | |
| | | | |
Shares outstanding | | | 79,824,361 | |
| | | | |
Net asset value, offering and redemption price per share | | $ | 25.34 | |
| | | | |
Net Assets Represent: | | | | |
Paid-in capital | | $ | 1,966,336,434 | |
Undistributed net investment loss | | | (360,997 | ) |
Accumulated net realized loss from investments and foreign currency transactions | | | (176,206 | ) |
Net unrealized appreciation of investments and foreign currency contracts and translations | | | 57,091,344 | |
| | | | |
Net Assets | | $ | 2,022,890,575 | |
| | | | |
* Investments at cost | | $ | 2,436,647,312 | |
** Foreign currency at cost | | $ | 2,801 | |
The accompanying notes are an integral part of these financial statements.
19
Managers Bond Fund
Statement of Operations
For the year ended December 31, 2007
| | | | |
Investment Income: | | | | |
Interest income | | $ | 81,012,062 | |
Dividend income | | | 3,241,157 | |
Securities lending fees | | | 1,341,331 | |
| | | | |
Total investment income | | | 85,594,550 | |
| | | | |
Expenses: | | | | |
Investment management fees | | | 9,063,151 | |
Administrative fees | | | 3,625,260 | |
Transfer agent | | | 737,961 | |
Custodian | | | 282,414 | |
Professional fees | | | 261,280 | |
Reports to shareholders | | | 177,952 | |
Registration fees | | | 128,539 | |
Trustees fees and expenses | | | 81,001 | |
Miscellaneous | | | 47,786 | |
| | | | |
Total expenses before offsets | | | 14,405,344 | |
| | | | |
Expense reimbursement | | | (25,818 | ) |
Expense reductions | | | (23,495 | ) |
| | | | |
Net expenses | | | 14,356,031 | |
| | | | |
Net investment income | | | 71,238,519 | |
| | | | |
Net Realized and Unrealized Gain (Loss): | | | | |
Net realized gain on investment transactions | | | 2,394,752 | |
Net realized gain on foreign currency contracts and transactions | | | 1,686,667 | |
Net unrealized appreciation of investments | | | 32,078,455 | |
Net unrealized appreciation of foreign currency contracts and translations | | | 454,290 | |
| | | | |
Net realized and unrealized gain | | | 36,614,164 | |
| | | | |
Net Increase in Net Assets Resulting from Operations | | $ | 107,852,683 | |
| | | | |
The accompanying notes are an integral part of these financial statements.
20
Managers Bond Fund
Statement of Changes in Net Assets
For the year ended December 31,
| | | | | | | | |
| | | 2007 | | | 2006 | |
Increase (Decrease) in Net Assets From Operations: | | | | | | | | |
Net investment income | | $ | 71,238,519 | | | $ | 26,026,961 | |
Net realized gain (loss) on investments, futures and foreign currency transactions | | | 4,081,419 | | | | (941,142 | ) |
Net unrealized appreciation of investments and foreign currency translations | | | 32,532,745 | | | | 19,897,379 | |
| | | | | | | | |
Net increase in net assets resulting from operations | | | 107,852,683 | | | | 44,983,198 | |
| | | | | | | | |
Distributions to Shareholders: | | | | | | | | |
From net investment income | | | (73,131,848 | ) | | | (27,271,077 | ) |
From net realized gain on investments | | | (379,319 | ) | | | — | |
| | | | | | | | |
Total distributions to shareholders | | | (73,511,167 | ) | | | (27,271,077 | ) |
| | | | | | | | |
From Capital Share Transactions: | | | | | | | | |
Proceeds from sale of shares | | | 1,324,679,881 | | | | 569,632,303 | |
Reinvestment of dividends and distributions | | | 69,605,331 | | | | 25,707,360 | |
Cost of shares repurchased | | | (312,512,299 | ) | | | (132,723,734 | ) |
| | | | | | | | |
Net increase from capital share transactions | | | 1,081,772,913 | | | | 462,615,929 | |
| | | | | | | | |
Total increase in net assets | | | 1,116,114,429 | | | | 480,328,050 | |
| | | | | | | | |
Net Assets: | | | | | | | | |
Beginning of year | | | 906,776,146 | | | | 426,448,096 | |
| | | | | | | | |
End of year | | $ | 2,022,890,575 | | | $ | 906,776,146 | |
| | | | | | | | |
End of year undistributed net investment loss | | $ | (360,997 | ) | | $ | (299,283 | ) |
| | | | | | | | |
Share Transactions: | | | | | | | | |
Sale of shares | | | 53,069,813 | | | | 23,240,946 | |
Reinvested shares | | | 2,793,409 | | | | 1,054,166 | |
Shares repurchased | | | (12,544,877 | ) | | | (5,476,071 | ) |
| | | | | | | | |
Net increase in shares | | | 43,318,345 | | | | 18,819,041 | |
| | | | | | | | |
The accompanying notes are an integral part of these financial statements.
21
Financial Highlights
For a share outstanding throughout each year
| | | | | | | | | | | | | | | | | | | | |
| | | For the year ended December 31, | |
Managers Bond Fund | | 2007 | | | 2006 | | | 2005 | | | 2004 | | | 2003 | |
Net Asset Value, Beginning of Year | | $ | 24.84 | | | $ | 24.11 | | | $ | 24.58 | | | $ | 24.58 | | | $ | 23.44 | |
| | | | | | | | | | | | | | | | | | | | |
Income from Investment Operations: | | | | | | | | | | | | | | | | | | | | |
Net investment income | | | 1.22 | 5 | | | 1.08 | | | | 0.88 | | | | 0.80 | | | | 1.08 | |
Net realized and unrealized gain (loss) on investments | | | 0.49 | 5 | | | 0.75 | | | | (0.32 | ) | | | 0.30 | | | | 1.40 | |
| | | | | | | | | | | | | | | | | | | | |
Total from investment operations | | | 1.71 | | | | 1.83 | | | | 0.56 | | | | 1.10 | | | | 2.48 | |
| | | | | | | | | | | | | | | | | | | | |
Less Distributions to Shareholders from: | | | | | | | | | | | | | | | | | | | | |
Net investment income | | | (1.21 | ) | | | (1.10 | ) | | | (0.88 | ) | | | (0.93 | ) | | | (1.11 | ) |
Net realized gain on investments | | | (0.00 | )4 | | | — | | | | (0.15 | ) | | | (0.17 | ) | | | (0.23 | ) |
| | | | | | | | | | | | | | | | | | | | |
Total distributions to shareholders | | | (1.21 | ) | | | (1.10 | ) | | | (1.03 | ) | | | (1.10 | ) | | | (1.34 | ) |
| | | | | | | | | | | | | | | | | | | | |
Net Asset Value, End of Year | | $ | 25.34 | | | $ | 24.84 | | | $ | 24.11 | | | $ | 24.58 | | | $ | 24.58 | |
| | | | | | | | | | | | | | | | | | | | |
Total Return 1 | | | 7.06 | % | | | 7.79 | %3 | | | 2.29 | % | | | 5.14 | % | | | 10.77 | % |
| | | | | | | | | | | | | | | | | | | | |
Ratio of net expenses to average net assets | | | 0.99 | % | | | 0.99 | % | | | 0.99 | % | | | 0.99 | % | | | 0.99 | % |
Ratio of total expenses to average net assets 2 | | | 0.99 | % | | | 1.02 | % | | | 1.02 | % | | | 1.06 | % | | | 1.09 | % |
Ratio of net investment income to average net assets 1 | | | 4.91 | % | | | 4.52 | % | | | 3.36 | % | | | 3.65 | % | | | 4.50 | % |
Portfolio turnover | | | 21 | % | | | 46 | % | | | 26 | % | | | 16 | % | | | 73 | % |
Net assets at end of year (000’s omitted) | | $ | 2,022,891 | | | $ | 906,776 | | | $ | 426,448 | | | $ | 259,210 | | | $ | 179,641 | |
| | | | | | | | | | | | | | | | | | | | |
The following notes should be read in conjunction with the Financial Highlights of the Funds presented on the preceding pages.
1 | Total returns and net investment income would have been lower had certain expenses not been reduced. (See Note 1(c) to the Notes to Financial Statements.) |
2 | Excludes the impact of expense (reimbursement)/recoupment and expense offsets such as brokerage credits, but includes non-reimbursable expenses such as interest and taxes. (See Note 1(c) to the Notes to Financial Statements.) |
3 | The Total Return is based on the Financial Statement Net Asset Values as shown above. |
4 | Rounds to less than $0.01. |
5 | Per share numbers have been calculated using average shares. |
22
Notes to Financial Statements
December 31, 2007
| 1. | Summary of Significant Accounting Policies |
The Managers Funds (the “Trust”) is an open-end management investment company organized as a Massachusetts business trust and registered under the Investment Company Act of 1940, as amended (the “1940 Act”). Currently, the Trust is comprised of a number of investment series. Included in this report is the Managers Bond Fund (“the Fund”).
The Fund’s financial statements are prepared in accordance with accounting principles generally accepted in the United States of America, which require management to make estimates and assumptions that affect the reported amount of assets and liabilities and disclosure of contingent assets and liabilities at the date of the financial statements and the reported amounts of income and expenses during the reporting periods. Actual results could differ from those estimates and such differences could be material. The following is a summary of significant accounting policies followed by the Fund in the preparation of their financial statements:
| a. | Valuation of Investments |
Equity securities traded on a domestic or international securities exchange are generally valued at the last quoted sale price, or, lacking any sales, at the last quoted bid price. Over-the-counter securities are valued at the NASDAQ Official Closing Price, if one is available. Lacking any sales, over-the-counter securities, are valued at the last quoted bid price. The Fund’s investments are generally valued based on market quotations provided by third-party pricing services approved by the Board of Trustees of the Trust. Under certain circumstances, the value of each Fund’s investment may be based on an evaluation of its fair value, pursuant to procedures established by and under the general supervision of the Board of Trustees of the Fund. A Fund may use the fair value of a portfolio security to calculate its NAV when, for example, (1) market quotations are not readily available because a portfolio security is not traded in a public market or the principal market in which the security trades is closed, (2) trading in a portfolio security is suspended and has not resumed prior to the time as of which the Fund calculates its NAV, (3) where a significant event affecting the value of a portfolio security is determined to have occurred between the time of the market quotation provided for a portfolio security and the time as of which the Fund calculates its NAV, (4) a security’s price has remained unchanged over a period of time (often referred to as a “stale price”), or (5) the Investment Manager determines that a market quotation is inaccurate. The Investment Manager monitors intervening events that may affect the value of securities held in a Fund’s portfolio and, in accordance with procedures adopted by the Fund’s Trustees, will adjust the prices of securities traded in foreign markets, as appropriate, to reflect the impact of events occurring subsequent to the close of such markets but prior to the time each Fund’s NAV is calculated.
Fixed income securities are valued based on valuations furnished by independent pricing services that utilize matrix systems, which reflect such factors as security prices, yields, maturities, and ratings, and are supplemented by dealer and exchange quotations. Futures contracts for which market quotations are readily available are valued at the settlement price as of the close of the futures exchange. Short-term investments having a remaining maturity of 60 days or less are valued at amortized cost, which approximates market value. Investments in other regulated investment companies are valued at their end of day net asset value per share. Investments in certain mortgage-backed, stripped mortgage-backed, preferred stocks, convertible securities, derivatives and other debt securities not traded on an organized securities market are valued on the basis of valuations provided by dealers or by a pricing service which uses information with respect to transactions in such securities and various relationships between securities and yield to maturity in determining value. Securities (including derivatives) for which market quotations are not readily available are valued at fair value, as determined in good faith, and pursuant to procedures adopted by the Board of Trustees of the Trust. The values assigned to fair value investments are based on available information and do not necessarily represent amounts that might ultimately be realized, since such amounts depend on future developments inherent in long-term investments. Further, because of the inherent uncertainty of valuation, those estimated values may differ significantly from the values that would have been used had a ready market for the investments existed, and the differences could be material.
Security transactions are accounted for as of the trade date. Realized gains and losses on securities sold are determined on the basis of identified cost.
| c. | Investment Income and Expenses |
Dividend income is recorded on the ex-dividend date except certain dividends from foreign securities where the ex-dividend date may have passed. These dividends are recorded as soon as the Trust is informed of the ex-dividend date. Dividend income on foreign securities is recorded net of any withholding tax. Interest income, which includes amortization of premium and accretion of discount on debt securities, as required, is accrued as earned. Non-cash dividends included in dividend income, if any, are reported at the fair market value of the securities received. Other income and expenses are recorded on an accrual basis. Expenses that cannot be directly attributed to a fund are apportioned among the Funds in the Trust and in some cases other affiliated funds based upon their relative average net assets or number of shareholders.
The Fund has a “balance credit” arrangement with The Bank of New York (“BNY”), the Fund’s custodian, whereby the Fund is credited with an interest factor equal to 0.75% below the effective 90-day T-Bill rate for account balances left uninvested overnight. These credits serve to reduce custody expenses that would otherwise be charged to the Fund. For the year ended December 31, 2007, the custodian expense was reduced by $2,156.
Overdrafts will cause a reduction of any earnings credits, computed at 2% above the effective Federal Funds rate on the day of the overdraft. For the year ended December 31, 2007, the Fund had no overdraft fees.
The Trust also has a balance credit arrangement with its Transfer Agent, PFPC Inc., whereby earnings credits are used to offset banking charges. For the year end December 31, 2007, the transfer agent expense was reduced by $21,339.
Total returns and net investment income for the Fund would have been lower had certain expenses not been offset.
| d. | Dividends and Distributions |
Dividends resulting from net investment income, if any, normally will be declared daily and paid monthly. Distributions of capital gains, if any, will be made on an annual basis and when required for Federal excise tax purposes. Income and capital gain distributions are determined in accordance with Federal income tax regulations,
23
Notes to Financial Statements (continued)
which may differ from generally accepted accounting principles. These differences are primarily due to differing treatments for losses deferred due to wash sales, equalization accounting for tax purposes, foreign currency, options, futures and market discount transactions. Permanent book and tax basis differences, if any, relating to shareholder distributions will result in reclassifications to paid-in capital. The tax character of distributions paid during the years ended December 31, 2007 and 2006 were as follows:
| | | | | | |
| | | 2007 | | 2006 |
Distributions paid from: | | | | | | |
Ordinary income | | $ | 73,139,824 | | $ | 27,271,077 |
Short-term capital gains | | | — | | | — |
Long-term capital gains | | | 371,343 | | | — |
| | | | | | |
| | $ | 73,511,167 | | $ | 27,271,077 |
| | | | | | |
As a % of distributions paid: (unaudited) | | | | | | |
Qualified ordinary income | | | — | | | — |
Ordinary income—dividends received deduction | | | — | | | — |
| | | | | | |
The Fund intends to comply with the requirements under Subchapter M of the Internal Revenue Code of 1986, as amended, to distribute substantially all of its taxable income and gains to its shareholders and to meet certain diversification and income requirements with respect to investment companies. Therefore, no provision for Federal income or excise tax is included in the accompanying financial statements.
Additionally, based on the Fund’s understanding of the tax rules and rates related to income, gains and transactions for the foreign jurisdictions in which it invests, the Fund will provide for foreign taxes, and where appropriate, deferred foreign taxes.
| f. | Capital Loss Carryovers |
As of December 31, 2007, the Fund had no accumulated net realized capital loss carryover from securities transactions for Federal income tax purposes.
The Trust’s Declaration of Trust authorizes for each series the issuance of an unlimited number of shares of beneficial interest, without par value. Each Fund records sales and repurchases of its capital stock on the trade date. Dividends and distributions to shareholders are recorded on the ex-dividend date.
At December 31, 2007, certain unaffiliated shareholders of record, specifically omnibus accounts, individually held greater than 10% of the outstanding shares of the Fund as follows: 2 own collectively 38%. Transactions by these shareholders may have a material impact on the Fund.
| h. | Foreign Currency Translation |
The books and records of the Fund are maintained in U.S. dollars. The value of investments, assets and liabilities denominated in currencies other than U.S. dollars are translated into U.S. dollars based upon current foreign exchange rates. Purchases and sales of foreign investments, income and expenses are converted into U.S. dollars based on currency exchange rates prevailing on the respective dates of such transactions. Net realized and unrealized gain (loss) on foreign currency transactions represent: (1) foreign exchange gains and losses from the sale and holdings of foreign currencies; (2) gains and losses between trade date and settlement date on investment securities transactions and forward foreign currency exchange contracts; and (3) gains and losses from the difference between amounts of interest and dividends recorded and the amounts actually received.
In addition, the Fund does not isolate the net realized and unrealized gain or loss resulting from changes in exchange rates from the fluctuations resulting from changes in market prices of securities held. Such fluctuations are included with the net realized and unrealized gain or loss on investments.
| 2. | Agreements and Transactions with Affiliates |
The Trust has entered into an Investment Management Agreement under which the Investment Manager provides or oversees investment management services to the Fund. The Investment Manager selects one or more subadvisors for the Fund (subject to Trustee approval), allocates assets among subadvisors and monitors the subadvisors’ investment programs and results. The Fund’s investment portfolio is currently managed by a portfolio manager who serves pursuant to a Subadvisory Agreement with the Investment Manager.
Investment management fees are paid directly by the Fund to the Investment Manager based on average daily net assets. The annual investment management fee rate, as a percentage of average daily net assets for the fiscal year ended December 31, 2007, was 0.625%.
Managers Investment Group LLC (the “Investment Manager”), an independently managed subsidiary of Affiliated Managers Group, Inc. (“AMG”) and the investment manager for the Fund, has contractually agreed, through at least May 1, 2008, to waive fees and pay or reimburse expenses to the extent that the total annual operating expenses (exclusive of brokerage costs, acquired fund fees and expenses, interest, taxes and extraordinary expenses) of the Fund exceed 0.99% of the Fund’s average daily net assets.
In general, for a period of up to three years from the time of any waiver or payment pursuant to the Fund’s contractual expense limitation, the Investment Manager may recover from the Fund fees waived and expenses paid to the extent that the Fund’s total operating expenses do not exceed the contractual expense limitation percentages of the Fund’s average daily net assets. For the year ended December 31, 2007, the Fund made such repayments to the Investment Manager in the amount of $50,420. At December 31, 2007, the cumulative amount of expense reimbursement for the Fund was $329,735.
The Trust has entered into an Administration and Shareholder Servicing Agreement under which the Investment Manager serves as the Fund’s administrator (the “Administrator”) and is responsible for all aspects of managing the Fund’s operations, including administration and shareholder services to the Fund, its shareholders, and certain institutions, such as bank trust departments, broker-dealers and registered investment advisers, that advise or act as an intermediary with the Fund’s shareholders. For its services, the Administrator is paid a fee at a rate of 0.25% per annum.
24
Notes to Financial Statements (continued)
Prior to July 1, 2007, the aggregate annual retainer paid to each Independent Trustee was $55,000, plus $4,000 or $2,000 for each regular or special meeting attended, respectively. Effective July 1, 2007, the aggregate annual retainer paid to each Independent Trustee is $65,000, plus $4,000 or $2,500 for each regular or special meeting attended, respectively. The Trustees’ fees and expenses are allocated amongst all of the Funds for which the Investment Manager serves as the advisor (the “Managers Funds”) based on the relative net assets of such Funds. The Independent Chairman of the Trusts receives an additional payment of $15,000 per year. (Prior to July 1, 2007, the Independent Chairman received an additional payment of $10,000 per year). The Chairman of the Audit Committee receives an additional payment of $5,000 per year. (Prior to July 1, 2007, the Chairman of the Audit Committee received an additional payment of $2,000 per year). The “Trustees fees and expenses” shown in the financial statements represents each Fund’s allocated portion of the total fees and expenses paid by the Managers Funds.
The Funds are distributed by Managers Distributors, Inc. (the “Distributor”), a wholly-owned subsidiary of Managers Investment Group LLC. The Distributor serves as the principal underwriter for each Fund. The Distributor is a registered broker-dealer and member of the Financial Industry Regulatory Authority, Inc. (“FINRA”). Shares of each Fund will be continuously offered and will be sold by brokers, dealers or other financial intermediaries who have executed selling agreements with the Distributor. The Distributor bears all the expenses of providing services pursuant to an Underwriting Agreement, including the payment of the expenses relating to the distribution of Prospectuses for sales purposes and any advertising or sales literature. Certain Trustees and Officers of the Funds are Officers and/or Directors of the Investment Manager, AMG and/or the Distributor.
| 3. | Purchases and Sales of Securities |
Purchases and sales of securities, excluding short-term securities, for the fiscal year ended December 31, 2007, were $1,004,344,884 and $42,980,339, respectively. Purchases and sales of U.S. Government securities for the fiscal year ended December 31, 2007, were $349,753,141 and $251,318,644, respectively.
| 4. | Portfolio Securities Loaned |
The Fund may participate in a securities lending program offered by BNY providing for the lending of equities, corporate bonds and government securities to qualified brokers. Collateral on all securities loaned is accepted in cash and/or government securities. Collateral is maintained at a minimum level of 102% of the market value, plus interest, if applicable, of investments on loan. Collateral received in the form of cash is invested temporarily in institutional money market funds or other short-term investments by BNY. Securities lending fees include earnings of such temporary cash investments, plus or minus any rebate to a borrower. These earnings (after any rebate) are then divided between BNY, as a fee for its services under the program, and the Fund, according to agreed-upon rates.
| 5. | Commitments and Contingencies |
In the normal course of business, the Fund may enter into contracts and agreements that contain a variety of representations and warranties, which provide general indemnifications. The maximum exposure to the Fund under these arrangements is unknown, as this would involve future claims that may be made against the Fund that have not yet occurred. However, based on experience, the Fund expects the risk of loss to be remote.
| 6. | Risks Associated with Collateralized Mortgage Obligations (“CMOs”) |
The net asset value may be sensitive to interest rate fluctuations because the Fund may hold several instruments, including CMOs and other derivatives, whose values can be significantly impacted by interest rate movements. CMOs are obligations collateralized by a portfolio of mortgages or mortgage-related securities. Payments of principal and interest on the mortgage are passed through to the holder of the CMOs on the same schedule as they are received, although certain classes of CMOs have priority over others with respect to the receipt of prepayments on the mortgages.
Therefore, the investment in CMOs may be subject to a greater or lesser risk of prepayment than other types of mortgage-related securities. CMOs may have a fixed or variable rate of interest.
Certain transactions, such as futures and forward transactions, dollar roll agreements, or purchases of when-issued or delayed delivery securities may have a similar effect on the Fund’s net asset value as if the Fund had created a degree of leverage in its portfolio. However, if the Fund enters into such a transaction, the Fund will establish a segregated account with its custodian in which it will maintain cash, U.S. government securities or other liquid securities equal in value to its obligations in respect to such transaction. Securities and other assets held in the segregated account may not be sold while the transaction is outstanding, unless other suitable assets are substituted.
| 8. | Forward Foreign Currency Contracts |
The Fund may invest in forward foreign currency exchange contracts to manage currency exposure. These investments may involve greater market risk than the amounts disclosed in the Fund’s financial statements.
A forward foreign currency exchange contract is an agreement between a Fund and another party to buy or sell a currency at a set price at a future date. The market value of the contract will fluctuate with changes in currency exchange rates. The contract is marked-to-market daily, and the change in market value is recorded as an unrealized gain or loss. Gain or loss on the purchase or sale of contracts having the same settlement date, amount and counter party is realized on the date of offset, otherwise gain or loss is realized on settlement date.
The Fund, may invest in non-U.S. dollar denominated instruments subject to limitations, and enter into forward foreign currency exchange contracts to facilitate transactions in foreign securities and to protect against a possible loss resulting from an adverse change in the relationship between the U.S. dollar and such foreign currency. Risks may arise upon entering into these contracts from the potential inability of counterparties to meet the terms of their contracts and from unanticipated movements in the value of a foreign currency relative to the U.S. dollar.
25
Notes to Financial Statements (continued)
| 9. | New Accounting Pronouncements |
In June 2006, the Financial Accounting Standards Board (“FASB”) issued Interpretation No. 48, “Accounting for Uncertainty in Income Taxes—an Interpretation of FASB Statement No. 109 (“FIN 48”).” FIN 48 applies to all registered investment companies and establishes the minimum threshold for recognizing, and a system for measuring, the benefits of tax-return positions in the financial statements. FIN 48 is effective for fiscal years beginning after December 15, 2006. Management has analyzed the Fund’s tax positions taken on federal income tax returns for all open tax years (through tax years ended December 31, 2004 - 2007) and has concluded that as of December 31, 2007, no provision for income tax is required in the Fund’s financial statements. Additionally, Fund Management is not aware of any events that are reasonably possible to occur in the next twelve months that would result in the amounts of any unrecognized tax benefits significantly increasing or decreasing for the Fund.
In addition, in September 2006, Statement of Financial Accounting Standards No. 157, Fair Value Measurements (“SFAS 157”), was issued and is effective for fiscal years beginning after November 15, 2007. SFAS 157 defines fair value, establishes a framework for measuring fair value and expands disclosures about fair value measurements. Management is currently evaluating the impact, if any, the adoption of SFAS 157 will have on the Fund’s financial statements.
Tax Information (unaudited)
The Fund hereby designates the maximum amount allowable of its net taxable income as qualified dividends as provided in the Jobs and Growth Tax Relief Reconciliation Act of 2003. The 2007 Form 1099-DIV you receive for the Fund will show the tax status of all distributions paid to you during the year.
Pursuant to section 852 of the Internal Revenue Code, Managers Bond Fund designates $371,343, as long-term capital gains for the taxable year ended December 31, 2007.
26
Report of Independent Registered Public Accounting Firm
To the Board of Trustees of The Managers Funds and the Shareholders of Managers Bond Fund:
In our opinion, the accompanying statement of assets and liabilities, including the schedule of portfolio investments, and the related statements of operations and of changes in net assets and the financial highlights present fairly, in all material respects, the financial position of Managers Bond Fund, (one of the series constituting The Managers Funds, hereafter referred to as the “Fund”), at December 31, 2007, the results of its operations for the year then ended, the changes in its net assets for each of the two years in the period then ended, and the financial highlights for each of the five years in the period then ended, in conformity with accounting principles generally accepted in the United States of America. These financial statements and financial highlights (hereafter referred to as “financial statements”) are the responsibility of the Fund’s management; our responsibility is to express an opinion on these financial statements based on our audits. We conducted our audits of these financial statements in accordance with the standards of the Public Company Accounting Oversight Board (United States). Those standards require that we plan and perform the audit to obtain reasonable assurance about whether the financial statements are free of material misstatement. An audit includes examining, on a test basis, evidence supporting the amounts and disclosures in the financial statements, assessing the accounting principles used and significant estimates made by management, and evaluating the overall financial statement presentation. We believe that our audits, which included confirmation of securities at December 31, 2007 by correspondence with the custodian and brokers, provide a reasonable basis for our opinion.
PricewaterhouseCoopers, LLP
Philadelphia, Pennsylvania
February 20, 2008
27
Trustees and Officers
The Trustees and Officers of the Trust, their business addresses, principal occupations for the past five years and dates of birth are listed below. The Trustees provide broad supervision over the affairs of the Trust and the Funds. The Trustees are experienced executives who meet periodically throughout the year to oversee the Funds’ activities, review contractual arrangements with companies that provide services to the Funds, and review the Funds’ performance. Unless otherwise noted, the address of each Trustee or Officer is the address of the Trust: 800 Connecticut Avenue, Norwalk, Connecticut 06854.
There is no stated term of office for Trustees. Trustees serve until their resignation, retirement or removal in accordance with the Trust’s organizational documents and policies adopted by the Board from time to time. The Chairman of the Trustees, President, Treasurer and Secretary of the Trust are elected by the Trustees annually. Other officers hold office at the pleasure of the Trustees.
Independent Trustees
The following Trustees are not “interested persons” of the Trust within the meaning of the 1940 Act:
| | |
Name, Date of Birth, Number of Funds Overseen
in Fund Complex* | | Principal Occupation(s) During Past 5 Years and Other Directorships Held by Trustee |
Jack W. Aber, 9/9/37 • Trustee since 1999 • Oversees 32 Funds in Fund Complex | | Professor of Finance, Boston University School of Management (1972-Present); Trustee of Appleton Growth Fund (1 portfolio); Trustee of Third Avenue Trust (4 portfolios); Trustee of Third Avenue Variable Trust (1 portfolio). |
| |
William E. Chapman, II, 9/23/41 • Independent Chairman • Trustee since 1999 • Oversees 32 Funds in Fund Complex | | President and Owner, Longboat Retirement Planning Solutions (1998-Present); Hewitt Associates, LLC (part time) (provider of Retirement and Investment Education Seminars); Trustee of Bowdoin College (2002-Present); Trustee of Third Avenue Trust (4 portfolios); Trustee of Third Avenue Variable Trust (1 portfolio). |
| |
Edward J. Kaier, 9/23/45 • Trustee since 1999 • Oversees 32 Funds in Fund Complex | | Attorney at Law and Partner, Teeters Harvey Kilboy & Kaier LLP (2007-Present); Attorney at Law and Partner, Hepburn Willcox Hamilton & Putnam, LLP (1977-2007); Trustee of Third Avenue Trust (4 portfolios); Trustee of Third Avenue Variable Trust (1 portfolio). |
| |
Steven J. Paggioli, 4/3/50 • Trustee since 1993 • Oversees 32 Funds in Fund Complex | | Consultant (2001-Present); Formerly Executive Vice President and Director, The Wadsworth Group (1986-2001); Executive Vice President, Secretary and Director, Investment Company Administration, LLC (1990-2001); Vice President, Secretary and Director, First Fund Distributors, Inc. (1991-2001); Trustee, Professionally Managed Portfolios (22 portfolios); Advisory Board Member, Sustainable Growth Advisors, LP. |
| |
Eric Rakowski, 6/5/58 • Trustee since 1999 • Oversees 32 Funds in Fund Complex | | Professor, University of California at Berkeley School of Law (1990-Present); Trustee of Third Avenue Trust (4 portfolios); Trustee of Third Avenue Variable Trust (1 portfolio). |
| |
Thomas R. Schneeweis, 5/10/47 • Trustee since 1987 • Oversees 32 Funds in Fund Complex | | Professor of Finance, University of Massachusetts (1977-Present); Director, CISDM at the University of Massachusetts, (1996-Present); President, Alternative Investment Analytics, LLC, (formerly Schneeweis Partners, LLC) (2001-Present); Partner, White Bear Partners, LLC (2007-Present); Partner, Schneeweis Capital Management, LLC (2007-Present); Partner, Schneeweis Associates, LLC (2007-Present); Partner, Northampton Capital Management, LLC (2004-Present); Partner, TRS Associates (2007-Present). |
| * | The Fund Complex consists of Managers AMG Funds, The Managers Funds, Managers Trust I and Managers Trust II. |
Interested Trustee
The following Trustee is an “interested person” of the Trust within the meaning of the 1940 Act by virtue of his positions with, and interest in securities of, Affiliated Managers Group, Inc.
| | |
Name, Date of Birth, Number of Funds Overseen
in Fund Complex* | | Principal Occupation(s) During Past 5 Years and Other Directorships Held by Trustee |
William J. Nutt, 3/30/45 • Trustee since 2005 • President since 2007 • Oversees 32 Funds in Fund Complex | | Chairman and Founder of Affiliated Managers Group, Inc., (1993-Present); Chief Executive Officer of Affiliated Managers Group, Inc. (1993-2004); Director, Affiliated Managers Group, Inc. (1993-Present); President of Affiliated Managers Group, Inc. (1993-1999); President and Chief Operating Officer, The Boston Company (1989-1993); Senior Executive Vice President, The Boston Company (1982-1989). |
Officers
| | |
Name, Date of Birth, Position(s) Held with Fund
and Length of Time Served | | Principal Occupation(s) During Past 5 Years |
Christine C. Carsman, 4/2/52 • Secretary since 2004 | | Senior Vice President and Chief Regulatory Counsel, Affiliated Managers Group, Inc. (2004-Present); Secretary, Managers AMG Funds, Managers Trust I and II (2004-Present); Senior Counsel, Vice President and Director of Operational Risk Management and Compliance, Wellington Management Company, LLP (1995-2004); Deputy General Counsel, The Boston Company, Inc. (1993-1995); Associate General Counsel, The Boston Company Advisors, Inc. (1991-1993); Associate, Sullivan & Worcester LLP (1987-1991). |
| |
Donald S. Rumery, 5/29/58 • Chief Financial Officer since 2007 • Treasurer since 1995 | | Senior Vice President, Managers Investment Group LLC (2005-Present); Director, Finance and Planning, The Managers Funds LLC, (1994-2004); Treasurer and Chief Financial Officer, Managers Distributors, Inc. (2000-Present); Treasurer, Managers AMG Funds (1999-Present); Treasurer, Managers Trust I and Managers Trust II (2000-Present); Secretary, Managers Trust I and Managers Trust II (2000-2004) and Secretary, The Managers Funds (1997-2004); Chief Financial Officer, Managers AMG Funds, Managers Trust I and Managers Trust II (2007-Present). |
| |
Keitha L. Kinne, 5/16/58 • Chief Operating Officer since 2007 | | Managing Partner and Chief Operating Officer, Managers Investment Group LLC (2007-Present); Chief Operating Officer, Managers AMG Funds, Managers Trust I and Managers Trust II (2007-Present); Managing Director, Legg Mason & Co., LLC (2006-2007); Managing Director, Citigroup Asset Management (2004-2006); Senior Vice President, Prudential Investments (1999-2004). |
28
THIS PAGE INTENTIONALLY LEFT BLANK
THIS PAGE INTENTIONALLY LEFT BLANK
THIS PAGE INTENTIONALLY LEFT BLANK
Investment Manager and Administrator
Managers Investment Group LLC
800 Connecticut Avenue
Norwalk, Connecticut 06854
(203) 299-3500 or (800) 835-3879
Distributor
Managers Distributors, Inc.
800 Connecticut Avenue
Norwalk, Connecticut 06854
(203) 299-3500 or (800) 835-3879
Custodian
The Bank of New York
2 Hanson Place
Brooklyn, New York 11217
Legal Counsel
Ropes & Gray LLP
One International Place
Boston, Massachusetts 02110-2624
Transfer Agent
PFPC Inc.
Attn: Managers P.O. Box 9769
Providence, Rhode Island 02940
(800) 548-4539
For Managers Choice Only
Managers
c/o PFPC Inc.
P.O. Box 61204
King of Prussia, Pennsylvania 19406-0851
(800) 358-7668

| | |
MANAGERS AND MANAGERS AMG EQUITY FUNDS |
| |
| EMERGING MARKETS EQUITY | | SKYLINE SPECIAL EQUITIES |
| Rexiter Capital Management Limited | | PORTFOLIO |
| | Skyline Asset Management, L.P. |
| ESSEX GROWTH | | |
| ESSEX LARGE CAP GROWTH | | SMALL CAP |
| ESSEX SMALL/MICRO CAP GROWTH | | TIMESSQUARE MID CAP GROWTH |
| Essex Investment Management Co., LLC | | TIMESSQUARE SMALL CAP GROWTH |
| | TimesSquare Capital Management, LLC |
| FQ TAX-MANAGED U.S. EQUITY | | |
| FQ U.S. EQUITY | | SMALL COMPANY |
| First Quadrant, L.P. | | Epoch Investment Partners, Inc. |
| | Kalmar Investment Advisers, Inc. |
| INSTITUTIONAL MICRO-CAP | | |
| MICRO-CAP | | SPECIAL EQUITY |
| Lord, Abbett & Co. LLC | | Donald Smith & Co., Inc. |
| WEDGE Capital Management L.L.P. | | Lord, Abbett & Co. LLC |
| OFI Institutional Asset Management, Inc. | | Skyline Asset Management, L.P. |
| Next Century Growth Investors, LLC | | Smith Asset Management Group, LP |
| | Veredus Asset Management LLC |
| INTERNATIONAL EQUITY | | Westport Asset Management, Inc. |
| Alliance Bernstein L.P. | | |
| Lazard Asset Management, LLC | | SYSTEMATIC VALUE |
| Wellington Management Company, LLP | | SYSTEMATIC MID CAP VALUE |
| | Systematic Financial Management, L.P. |
| CHICAGO EQUITY PARTNERS | | |
| MID-CAP | | VALUE |
| Chicago Equity Partners, LLC | | Armstrong Shaw Associates Inc. |
| | Osprey Partners Investment Management, LLC |
| REAL ESTATE SECURITIES | | |
| Urdang Securities Management, Inc. | | |
|
MANAGERS AND MANAGERS AMG BALANCED FUNDS |
|
| CHICAGO EQUITY PARTNERS BALANCED |
| Chicago Equity Partners, LLC |
|
| GLOBAL |
| Armstrong Shaw Associates Inc. |
| Alliance Bernstein L.P. |
| First Quadrant, L.P. |
| Northstar Capital Management, Inc. |
| Wellington Management Company, LLP |
|
ALTERNATIVE FUNDS |
|
| FQ GLOBAL ALTERNATIVES |
| First Quadrant, L.P. |
|
MANAGERS FIXED INCOME FUNDS |
|
| BOND (MANAGERS) |
| FIXED INCOME |
| GLOBAL BOND |
| Loomis, Sayles & Company L.P. |
|
| BOND (MANAGERS FREMONT) |
| Pacific Investment Management Co. LLC |
|
| CALIFORNIA INTERMEDIATE TAX-FREE |
| Evergreen Investment Management Co., LLC |
|
| HIGH YIELD |
| J.P. Morgan Investment Management Inc. |
|
| INTERMEDIATE DURATION GOVERNMENT |
| SHORT DURATION GOVERNMENT |
| Smith Breeden Associates, Inc. |
|
| MONEY MARKET |
| JPMorgan Investment Advisors Inc. |
This report is prepared for the Fund’s shareholders. It is authorized for distribution to prospective investors only when preceded or accompanied by an effective prospectus. To receive a free copy of the prospectus or Statement of Additional Information, which includes additional information about Fund Trustees, please contact us by calling 800.835.3879. Distributed by Managers Distributors, Inc., member FINRA.
A description of the policies and procedures each Fund uses to vote its proxies is available: (i) without charge, upon request, by calling 800.835.3879, or (ii) on the Securities and Exchange Commission’s (SEC) Web site at www.sec.gov. For information regarding each Fund’s proxy voting record for the 12-month period ended June 30, call 800.835.3879 or visit the SEC Web site at www.sec.gov.
The Fund files its complete schedule of portfolio holdings with the SEC for the first and third quarters of each fiscal year on Form N-Q. The Fund’s Forms N-Q are available on the SEC’s website at www.sec.gov. A Fund’s Forms N-Q may be reviewed and copied at the SEC’s Public Reference Room in Washington, DC. Information on the operation of the Public Reference Room may be obtained by calling 1-800-SEC-0330. To review a complete list of the Fund’s portfolio holdings, or to view the most recent quarterly holdings report, semiannual report, or annual report, please visit www.managersinvest.com.
| | |
| www.managersinvest.com | | 
|
ANNUAL REPORT
Managers Funds
December 31, 2007
Managers Value Fund
Managers AMG Essex Large Cap Growth Fund
Managers Small Company Fund
Managers International Equity Fund
Managers Emerging Markets Equity Fund
Managers Global Bond Fund
Managers Money Market Fund

The Managers Funds
Annual Report — December 31, 2007
TABLE OF CONTENTS
| | |
| | | Page |
| |
LETTER TO SHAREHOLDERS | | 1 |
| |
ABOUT YOUR FUNDS’ EXPENSES | | 3 |
| |
| INVESTMENT MANAGER’S COMMENTS, FUND SNAPSHOTS, AND SCHEDULES OF PORTFOLIO INVESTMENTS | | |
| |
Managers Value Fund | | 4 |
| |
Managers AMG Essex Large Cap Growth Fund | | 9 |
| |
Managers Small Company Fund | | 15 |
| |
Managers International Equity Fund | | 23 |
| |
Managers Emerging Markets Equity Fund | | 33 |
| |
Managers Global Bond Fund | | 40 |
| |
NOTES TO SCHEDULES OF PORTFOLIO INVESTMENTS | | 50 |
| |
FINANCIAL STATEMENTS: | | |
| |
Statements of Assets and Liabilities | | 51 |
| |
Funds’ balance sheet, net asset value (NAV) per share computation and cumulative undistributed amount | | |
| |
Statements of Operations | | 53 |
| |
Detail of sources of income, Fund expenses, and realized and unrealized gains (losses) during the year | | |
| |
Statements of Changes in Net Assets | | 55 |
| |
Detail of changes in Fund assets for the past two years | | |
| |
MANAGERS MONEY MARKET FINANCIAL STATEMENTS: | | |
| |
Statements of Assets and Liabilities | | 57 |
| |
Funds’ balance sheet, net asset value (NAV) per share computation and cumulative undistributed amount | | |
| |
Statements of Operations | | 57 |
| |
Detail of sources of income, Fund expenses, and realized and unrealized gains (losses) during the past two periods | | |
| |
Statements of Changes in Net Assets | | 58 |
| |
Detail of changes in Fund assets for the past three periods | | |
| |
FINANCIAL HIGHLIGHTS | | 58 |
| |
Historical net asset values per share, distributions, total returns, expense ratios, turnover ratios and net assets | | |
| |
NOTES TO FINANCIAL STATEMENTS | | 62 |
| |
Accounting and distribution policies, details of agreements and transactions with Fund management and affiliates, and descriptions of certain investment risks | | |
| |
REPORT OF INDEPENDENT REGISTERED PUBLIC ACCOUNTING FIRM | | 69 |
| |
TRUSTEES AND OFFICERS | | 70 |
Nothing contained herein is to be considered an offer, sale or solicitation of an offer to buy shares of The Managers Funds or Managers AMG Funds. Such offering is made only by Prospectus, which includes details as to offering price and other material information.
Letter to Shareholders
Dear Shareholder:
Financial markets became increasingly unsettled as 2007 progressed, beginning with a brief but strong correction in February and then escalating in June when revelations of significant losses from sub-prime mortgage lending and related structured securities started a domino run that has affected the global economy. While the economy gained strength in the early part of the year, in spite of housing weakness, a liquidity crisis initiated by the spreading weakness in sub-prime mortgage loans increased uncertainty about its sustainability. Bonds of all credit quality and duration became unusually volatile, and credit spreads, having been extremely slim, widened dramatically, raising the cost of capital for many borrowers. Naturally the equity markets followed suit and became more volatile as the rising cost of capital pressured corporate profitability, penalized leverage, and hindered merger and acquisition activity.
As has been well documented in the financial press, the broad deterioration in residential housing prices, combined with gradually rising interest rates, put severe stress on low credit-quality (sub-prime) borrowers. Rising defaults pushed several mortgage lenders and leveraged sub-prime mortgage investors toward bankruptcy, and catalyzed a swift and broad flight from various forms of investment risk over the year. These revelations began creating serious liquidity problems in the credit markets late in the second quarter and have been the root of uncertainty and market volatility ever since.
A rapid and at times seemingly indiscriminate flight from risk created unusual patterns of volatility within the bond market. Credit spreads widened significantly beginning in July, as Moody’s and S&P downgraded hundreds of securities, and price moves forced leveraged investors to raise cash any way they could. Since much of the leverage had been funded with short-term debt, the short end of the yield curve bore the brunt of the liquidity crisis. The typically docile commercial paper market seized as demand dried up, and short-term Treasury yields vacillated between 2.9% and 4.9% as investors raced to safety, causing a dislocation in prices. Since then, as the Federal Reserve pumped liquidity into the system and aggressively lowered policy rates, short-term yields have dropped dramatically and the treasury yield curve has steepened. Yet, credit spreads have continued to expand as investment grade yields have not dropped along with treasuries and non-investment grade (Junk) yields have continued to rise. This is because dominoes have continued to fall as large financial institutions continue to discover weaknesses in their portfolios and write billions of dollars off of their balance sheets.
After rallying strongly off of a February trough, the stock market followed the lead of the credit markets by trading sharply down during the liquidity crisis in July, then recovering from late August through October. Not surprisingly, small- and mid-cap stocks reacted more during the price declines, and underperformed large-cap stocks during the year. Interestingly, however, growth indices, which would normally react poorly to a rise in interest rates or a liquidity squeeze, significantly outperformed value indices during the period. We believe this was due to in part to a reversion to the mean since value indices had outperformed growth indices for an extended period of time, and also to technical supply/demand effects brought on by the liquidity crisis. Importantly, we believe this was also the result of extreme weakness in the financials sector, which has a dominant role in most value indices. Stocks recovered in late August and throughout October, as a result of an infusion of liquidity by the Federal Reserve, but corrected again in November and December with evidence mounting that the economy was slowing, and stock investors expressed disappointment that the Fed was not acting even more aggressively, while revelations of subprime losses continued to emanate from financial companies.
Within this environment, six out of the seven Funds represented in this report provided positive returns for the year. The Managers International Equity Fund returned 14.86% for the year, while its benchmark the MSCI EAFE Index, returned 11.17%. The Managers Emerging Markets Equity Fund provided a strong nominal return of 29.55% during the year, but trailed its benchmark, the MSCI Emerging Markets Index, which returned 39.78%. Conversely, Managers Value Fund returned -7.77% for the year, while its benchmark, the Russell 1000 Value Index, returned -0.17%. Detailed reviews of the performance and positioning of all seven of the Funds are included within this report.
Our fear that the credit crisis would extend into 2008 has been realized, as lingering credit problems and further revelations of losses by large financial institutions are hindering not only the financial markets, but the economy as well. The increasing possibility that the economy will slide
1
Letter to Shareholders (continued)
into recession has driven volatility higher, and stock prices lower. The Federal Reserve has been increasingly aggressive in easing rates, and although we think the risk of recession has increased, we still believe that portions of the U.S. and global economies remain healthy. Although foreign and emerging markets economies are by no means decoupled from U.S. impact, they have become increasingly diversified with respect to trading partners, and have increasingly healthy reserves. In sum, we continue to believe that investors should maintain their portfolios with allocations near their long-run targets, rebalance if necessary and take full advantage of opportunities to participate in the growth of the global economy.
One of our foremost goals at Managers Investment Group is to structure and manage mutual funds that will help our shareholders and clients become more successful in reaching their investment goals and objectives. Each of our Funds is geared to provide you with exposure to a specific asset class, combination of asset classes, or segment of the market. Investors tend to use our Funds as part of their overall asset allocation in order to structure a well-diversified portfolio intended to meet individual needs. Most of our Funds, like those detailed in this report, are therefore designed to be building blocks.
The following report covers the year ending December 31, 2007. Should you have any questions about this report, or if you’d like to receive a Prospectus and additional information, including fees and expenses, for this or any of the other Funds in our family, please feel free to contact us at 1-800-835-3879, or visit our website at www.managersinvest.com. As always, please read the Prospectus carefully before you invest or send money.
If you are curious about how you can better diversify your investment program, visit the Knowledge Center on our Web site and view our articles in the investment strategies section. You can rest assured that under all market conditions our team is focused on delivering excellent investment management services for your benefit.
We thank you for your continued confidence and investment in The Managers Funds.
Sincerely,

John H. Streur
Senior Managing Partner
Managers Investment Group LLC
2
About Your Fund’s Expenses
As a shareholder of the Fund, you may incur two types of costs: (1) transaction costs, which may include sales charges (loads) on purchase payments; redemption fees; and exchange fees; and (2) ongoing costs, including management fees; distribution (12b-1) fees; and other Fund expenses. This example is intended to help you understand your ongoing costs (in dollars) of investing in the Fund and to compare these costs with the ongoing costs of investing in other mutual funds. The example is based on an investment of $1,000 invested at the beginning of the period and held for the entire period as indicated below.
Actual Expenses
The first line of the table to the right provides information about the actual account values and actual expenses. You may use the information in this line, together with the amount you invested, to estimate the expenses that you paid over the period. Simply divide your account value by $1,000 (for example, an $8,600 account value divided by $1,000 = 8.6), then multiply the result by the number in the first line under the heading entitled “Expenses Paid During Period” to estimate the expenses you paid on your account during this period.
Hypothetical Example for Comparison Purposes
The second line of the table to the right provides information about hypothetical account values and hypothetical expenses based on the Fund’s actual expense ratio and an assumed annual rate of return of 5% before expenses, which is not the Fund’s actual return. The hypothetical account values and expenses may not be used to estimate the actual ending account balance or expenses you paid for the period. You may use this information to compare the ongoing costs of investing in the Fund and other funds by comparing this 5% hypothetical example with the 5% hypothetical examples that appear in the shareholder reports of other funds.
Please note that the expenses shown in the table are meant to highlight your ongoing costs only and do not reflect any transactional costs, such as sales charges (loads), redemption fees, or exchange fees. Therefore, the second line of the table is useful in comparing ongoing costs only, and will not help you determine the relative total costs of owning different funds.
| | | | | | | | | | | | |
Six Months Ended December 31, 2007 | | Expense Ratio
for the Period | | | Beginning
Account Value
7/1/2007 | | Ending
Account Value
12/31/2007 | | Expenses Paid
During the
Period* |
Managers Value Fund | | | | | | | | | | | | |
Based on Actual Fund Return | | 1.17 | % | | $ | 1,000 | | $ | 873 | | $ | 5.52 |
Based on Hypothetical 5% Annual Return | | 1.17 | % | | $ | 1,000 | | $ | 1,019 | | $ | 5.96 |
Managers AMG Essex Large Cap Growth Fund | | | | | | | | | | | | |
Based on Actual Fund Return | | 1.22 | % | | $ | 1,000 | | $ | 1,058 | | $ | 6.33 |
Based on Hypothetical 5% Annual Return | | 1.22 | % | | $ | 1,000 | | $ | 1,019 | | $ | 6.21 |
Managers Small Company Fund | | | | | | | | | | | | |
Based on Actual Fund Return | | 1.34 | % | | $ | 1,000 | | $ | 982 | | $ | 6.69 |
Based on Hypothetical 5% Annual Return | | 1.34 | % | | $ | 1,000 | | $ | 1,018 | | $ | 6.82 |
Managers International Equity Fund | | | | | | | | | | | | |
Based on Actual Fund Return | | 1.51 | % | | $ | 1,000 | | $ | 1,047 | | $ | 7.79 |
Based on Hypothetical 5% Annual Return | | 1.51 | % | | $ | 1,000 | | $ | 1,018 | | $ | 7.68 |
Managers Emerging Markets Equity Fund | | | | | | | | | | | | |
Based on Actual Fund Return | | 1.79 | % | | $ | 1,000 | | $ | 1,113 | | $ | 9.53 |
Based on Hypothetical 5% Annual Return | | 1.79 | % | | $ | 1,000 | | $ | 1,016 | | $ | 9.10 |
Managers Global Bond Fund | | | | | | | | | | | | |
Based on Actual Fund Return | | 1.19 | % | | $ | 1,000 | | $ | 1,071 | | $ | 6.21 |
Based on Hypothetical 5% Annual Return | | 1.19 | % | | $ | 1,000 | | $ | 1,019 | | $ | 6.06 |
Managers Money Market Fund 1 | | | | | | | | | | | | |
Based on Actual Fund Return | | 0.39 | % | | $ | 1,000 | | $ | 1,004 | | $ | 2.78 |
Based on Hypothetical 5% Annual Return | | 0.39 | % | | $ | 1,000 | | $ | 1,022 | | $ | 2.80 |
| * | Expenses are equal to the Fund’s annualized expense ratio multiplied by the average account value over the period, multiplied by the number of days in the most recent fiscal half-year (184), then divided by 365. |
1 | Effective December 1, 2007, the Money Market Fund changed its fiscal year end from November 30 to December 31. |
3
Managers Value Fund
Portfolio Managers’ Comments
The Managers Value Fund’s (the “Fund”) objective is to achieve long-term capital appreciation through a diversified portfolio of equity securities. Income is the Fund’s secondary objective.
The Managers Value Fund (the “Fund”) invests primarily in common and preferred stocks of U.S. companies. The Fund generally invests in medium and large companies; that is, companies with capitalizations within the same range as companies represented in the Russell 1000® Value Index, the Fund’s benchmark.
THE PORTFOLIO MANAGERS
The Fund employs multiple portfolio managers who specialize in distinct investment approaches. This “intelligence diversification” not only serves to manage risk, but also helps tap the market’s full potential by focusing different analytical insights on each class of investment. Fund management strives to achieve this performance and diversification while ensuring that the Fund operates within the framework of its investment objective and principal investment strategies.
Armstrong Shaw Associates Inc.
Armstrong Shaw Associates Inc. (“Armstrong Shaw”) has a disciplined, absolute value approach to the equity market. Valuations are determined using a private purchase test to determine the price that a company could bring in a sale to a sophisticated buyer, discounted cash flow analysis, and market comparables.
Armstrong Shaw invests in securities where a rigid cash flow or asset value analysis determines that the company’s stock is selling at a substantial discount to its intrinsic value. While the level of the overall stock market or trends in economic factors may affect the timing in which value is recognized, they are not the basis for investment. Rather, Armstrong Shaw has a classic bottom-up, company-by-company view of investing.
Armstrong Shaw’s decision-making process includes market screening for potential new ideas, fundamental research with financial modeling and management interviews, an in-depth investment committee review, and a strict sell discipline. Idea generation begins with screening the universe for businesses that are growing earnings and generating good returns on capital, but have fallen out of favor in the market. Armstrong Shaw’s fundamental research focuses on forward- and backward-looking financial modeling, including an analysis of the income statement, the balance sheet, and the cash flow statement. The investment team compares each company to its peers, the broader market, and any transactions that may have taken place in its industry. Finally, Armstrong Shaw interviews the management team. During the investment committee review, the investment team challenges the analysis and ultimately decides if the company meets the criteria to be considered for the Portfolio.
The ideal investment exhibits many of the following traits:
| | • | | Defensible business franchise |
| | • | | Ability to generate above average returns |
| | • | | Low risk to technical obsolescence |
| | • | | Low cost provider or niche player |
| | • | | Track record of success |
| | • | | Long-term incentive program aligned with the interest of shareholders |
| | • | | History of being good allocators of capital |
| | • | | Low price to asset value |
| | • | | Favorable price versus comparables in the marketplace |
| | • | | Favorable price versus recent transactions |
| | • | | Valuation check: what have buyers paid per hotel room, per subscriber, per a dollar of sales or earnings or cash flow |
Armstrong Shaw’s goal is to buy good businesses, run by proven, capable managers, at prices equal to or less than 70% of intrinsic value. They believe that investing in superior businesses at attractive prices will provide superior returns over time.
Portfolio Management:
| | • | | Screens the universe of approximately 5,600 NYSE and AMEX issues and the largest NASDAQ stocks for: |
| | • | | Market caps more than $2.5 billion |
| | • | | EPS growth greater than 10% |
| | • | | Relative price/earning multiple less than the market |
| | • | | Return on equity of 15% or greater |
| | • | | Conducts quantitative analysis by: |
| | • | | Analyzing income statement, balance sheet, and cash flow statement |
| | • | | Comparing the stock prices to cash flows, EPS, sales, etc. |
| | • | | Interviewing management team to get a better sense of strategic and financial plans for the company |
| | • | | Estimating the stock’s intrinsic value and purchasing stocks only when they are selling for less than 70% of the estimated intrinsic value |
The investment team will make a sell decision when:
| | • | | A price target is reached |
| | • | | Company’s fundamentals deteriorate |
| | • | | A better opportunity emerges |
Additionally, a drop in price of 25% from average cost triggers an automatic review process for potential sale.
Osprey Partners Investment Management, LLC
As traditional value investors, the investment team at Osprey Partners Investment Management, LLC (“Osprey”) seeks to identify undervalued stocks with low price-to-earnings and price-to-cash flow ratios. At the same time, Osprey’s investment team focuses its in-depth bottom-up analysis to identify fundamentally strong, well-managed companies.
Osprey expects to generate returns from dividend income as well as capital appreciation as a result of improvements to the valuations of the stocks from, among other things, increases in the price-to-earnings ratio.
The ideal company exhibits many of the following traits:
| | • | | Low debt-to-capital ratios |
4
Managers Value Fund
Portfolio Manager’s Comments (continued)
Portfolio Management:
| | • | | Screens the investment universe for companies with a market cap above $1.5 billion and a P/E ratio at least 20% less than the P/E ratio of the S&P 500 |
| | • | | Determines the strength and risks of each company’s business with: |
| | • | | Balance sheet and income statement |
| | • | | Earnings quality and sustainability |
The investment team will make a sell decision when:
| | • | | Stock appreciates to a predetermined price target |
| | • | | A better opportunity emerges |
Additionally, a 20% drop relative to the market prompts an in-depth review and positions exceeding 6% of the portfolio are scaled back. The investment team tends to have an investment time horizon of two years or more.
THE YEAR IN REVIEW
For the year 2007, the Managers Value Fund depreciated -7.77% compared with a return of -0.17% for the Russell 1000® Value Index. Through the first three quarters of 2007 the Fund had modestly appreciated (+3.57%) and modestly trailed the Russell 1000® Value Index (+5.97%) by 140 basis points (1.40%). Fund performance was spurred by the technology holdings and by Armstrong Shaw’s decision to avoid the struggling financials sector. Nokia, First Data, Chevron, Transocean, and Ingersoll-Rand were some of the biggest contributors during the first nine months of 2007.
Unfortunately, the fourth quarter of 2007 was a different story, and the Portfolio struggled on an absolute and relative basis. The Fund’s holdings in the financials sector were the main detractor as the subprime crisis unraveled, larger-than-expected write-downs were reported by many large financial institutions, and the economic outlook for 2008 weakened. Overall, this sector fell -15.62% during the fourth quarter and was by far the worst-performing sector within the Russell 1000® Value Index. Armstrong Shaw’s decision to avoid the financials sector was beneficial to relative performance, but Osprey’s overweight and the few financials Armstrong Shaw held markedly depreciated. More specifically, MBIA (-69.10%), Citigroup (-36.03%), and Fannie Mae (-33.68%) were the three largest detractors during the fourth quarter and three of the biggest detractors during 2007. MBIA suffered severely from factors such as uncertainties surrounding its AAA rating, worries about ultimate insurance losses, and concomitant capital raising concerns. Fannie Mae was hurt as prime borrowers started feeling the effects of a struggling housing market in a number of Midwestern states, where the economic growth has been slow for some years, and more recently in California and Florida. Lastly, Citigroup fell sharply amid mortgage-related losses, management turmoil, and concerns about capital adequacy. As of December 31, 2007, all three positions remain in the Portfolio, as fourth quarter stock depreciation has all three at a substantial discount to fair market value. The financials sector may continue to struggle during the first part of 2008, but falling interest rates and attractive valuations have historically meant strong relative performance for this sector.
Fourth quarter difficulties were not isolated to the financials sector, as the Fund’s consumer discretionary positions also faltered. This was the second worst-performing sector within the Index as recession fears grew and the housing market continued to struggle. Both subadvisors felt this sector was attractive from a valuation perspective, and thus the Fund was hurt by a bottom-up driven overweight throughout 2007. Fund positioning also hurt performance as Comcast (-24.37%), Jarden (-23.69%), and J.C. Penney (-30.38%) were a substantial drag on performance. The Portfolio still remains overweight this sector on expectations of continued easing by the Federal Reserve and the belief that the consumer will continue to be resilient.
LOOKING FORWARD
After a difficult fourth quarter and rampant uncertainty about what 2008 will hold, both subadvisors believe attractive value opportunities still exist.
Armstrong Shaw
The economic backdrop for 2008 looks challenging as the economy is slowing, corporate profits are declining, and unemployment is at a two-year high. We expect global growth to slow but remain stronger than U.S. growth. While rising energy and other commodity prices are providing inflationary pressures, a slowdown in emerging markets, particularly China, could ease these pressures and signal a change in sector leadership. We believe that valuation is reasonable and stocks are more attractive than bonds, with the S&P 500 trading at a 6.8% earnings yield vs. a 3.9% yield for bonds. We believe it will be a year of volatile markets and continued Fed easing. The second half of 2008, in our opinion, has more return potential as the benefits of policy easing in the U.S. and developed markets take effect. Our Portfolio will continue to be weighted toward less economically sensitive stocks and will emphasize high-quality companies with diverse revenue streams. Although we are significantly underweight in financials, we may opportunistically add to our exposure based on continued weakness and potential evidence that the worst of the credit problems are behind us.
Osprey Partners
As we enter the New Year, we are encouraged by the Fed’s apparent realization that perhaps it is behind the easing curve in the current environment. It is fairly amazing to us that the Fed has stayed with its relatively restrictive monetary policy considering the weakness in the housing market and the severity and speed with which the credit crunch developed. While easing short-term rates to more appropriate levels will not immediately alleviate the above problems, it will likely slow the downward trends and help avoid the many contagion effects that could possibly result from a continued restrictive stance. Looking ahead, we believe that much of the ground that was lost in the fourth quarter can be regained as the Fed embarks on its new path. We believe that liquidity should return, the economy should continue to grow, and consumers will regain their footing and confidence. We have continued to add to many of our financial stocks in this current downturn, as we believe they will benefit most from the Fed’s actions, and since many of these stocks present our best relative risk/reward profiles.
5
Managers Value Fund
Portfolio Managers’ Comments (continued)
CUMULATIVE TOTAL RETURN PERFORMANCE
Managers Value Fund’s cumulative total return is based on the daily change in net asset value (NAV), and assumes that all dividends and distributions were reinvested. The Russell 1000® Value Index is a large cap value index measuring the performance of the largest 1,000 U.S. incorporated companies with lower price-to-book ratios and lower forecasted growth values. Unlike the Fund, the Russell 1000® Value Index is unmanaged, is not available for investment, and does not incur expenses. The Index assumes reinvestment of dividends. This chart compares a hypothetical $10,000 investment made in Managers Value Fund on December 31, 1997 to a $10,000 investment made in the Russell 1000® Value Index. The chart is not intended to imply any future performance of the Fund. The graph and chart do not reflect the deduction of taxes that a shareholder would pay on a Fund distribution or redemption of shares. Total Returns would have lower had certain expenses not been reduced. Past performance is not indicative of future results. The Russell 1000® Value Index is a trademark of the Frank Russell Company. Frank Russell® is a trademark of the Frank Russell Company.
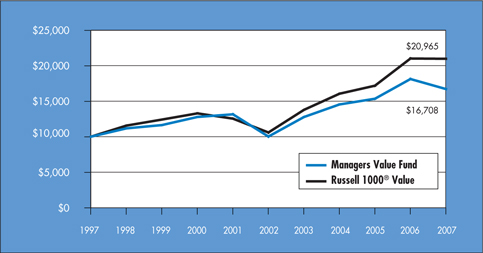
The table below shows the average annual total returns for the Managers Value Fund and the Russell 1000® Value Index since December 31, 1997 through December 31, 2007.
| | | | | | | | | | | |
Average Annual Total Returns 1 | | One Year | | | Five Years | | | Ten Years | | | Inception Date |
Managers Value Fund 2,3 | | (7.77 | )% | | 10.76 | % | | 5.27 | % | | 10/31/84 |
Russell 1000® Value Index | | (0.17 | )% | | 14.63 | % | | 7.68 | % | | |
The performance data shown represents past performance. Past performance is not a guarantee of future results. Current performance may be lower or higher than the performance data quoted. The investment return and principal value of an investment in the Fund will fluctuate so that an investor’s shares, when redeemed, may be worth more or less than their original cost. For performance information through the most recent month end, please call (800) 835-3879 or visit our Web site at www.managersinvest.com.
In choosing a Fund, investors should carefully consider the amount they plan to invest, their investment objectives, the Fund’s investment objectives, risks, charges and expenses before investing. For this and other information, please call 800.835.3879 or visit www.managersinvest.com for a free prospectus. Read it carefully before investing or sending money. Distributed by Managers Distributors, Inc., member FINRA.
| | 1 | Total return equals income yield plus share price change and assumes reinvestment of all dividends and capital gain distributions. Returns are net of fees and may reflect offsets of Fund expenses as described in the Prospectus. No adjustment has been made for taxes payable by shareholders on their reinvested dividends and capital gain distributions. Returns for periods greater than one year are annualized. The listed returns on the Fund are net of expenses. All returns are in U.S. dollars($). |
| | 2 | Fund for which, from time to time, the Fund’s advisor has waived its fees and/or absorbed Fund expenses, which has resulted in higher returns. |
| | 3 | The Fund is subject to risks associated with investments in small capitalization companies, such as erratic earnings patterns, competitive conditions, limited earnings history and a reliance on one or a limited number of products. |
6
Managers Value Fund
Fund Snapshots
December 31, 2007
Portfolio Breakdown
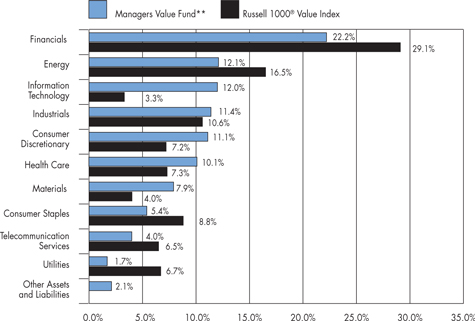
| ** | As a percentage of net assets |
| | | | | | |
Industry | | Managers Value
Fund** | | | Russell 1000®
Value Index | |
Financials | | 22.2 | % | | 29.1 | % |
Energy | | 12.1 | % | | 16.5 | % |
Information Technology | | 12.0 | % | | 3.3 | % |
Industrials | | 11.4 | % | | 10.6 | % |
Consumer Discretionary | | 11.1 | % | | 7.2 | % |
Health Care | | 10.1 | % | | 7.3 | % |
Materials | | 7.9 | % | | 4.0 | % |
Consumer Staples | | 5.4 | % | | 8.8 | % |
Telecommunication Services | | 4.0 | % | | 6.5 | % |
Utilities | | 1.7 | % | | 6.7 | % |
Other Assets and Liabilities | | 2.1 | % | | 0.0 | % |
Top Ten Holdings
| | | |
Security Name | | Percentage of
Net Assets | |
ChevronTexaco Corp.* | | 4.7 | % |
ConocoPhillips Co.* | | 4.2 | |
American International Group, Inc.* | | 4.0 | |
Bank of America Corp.* | | 3.8 | |
Nokia Corp., Sponsored ADR* | | 3.7 | |
Citigroup, Inc.* | | 3.0 | |
Verizon Communications, Inc. | | 2.5 | |
Empresa Brasileira de Aeronautica, S.A. | | 2.2 | |
Fannie Mae Co.* | | 2.2 | |
GlaxoSmithKline PLC, Sponsored ADR | | 2.1 | |
| | | |
Top Ten as a Group | | 32.4 | % |
| | | |
| * | Top Ten Holding at June 30, 2007 |
Any sectors, industries, or securities discussed should not be perceived as investment recommendations. Mention of a specific security should not be considered a recommendation to buy or solicitation to sell that security.
7
Managers Value Fund
Schedule of Portfolio Investments
December 31, 2007
| | | | | | | |
| | | Shares | | | Value | |
Common Stocks - 97.9% | | | | | | | |
Consumer Discretionary - 11.1% | | | | | | | |
Abercrombie & Fitch Co. | | 15,900 | | | $ | 1,271,523 | |
Comcast Corp., Special Class A* | | 44,640 | | | | 808,877 | |
J.C. Penney Co., Inc. | | 28,150 | 2 | | | 1,238,318 | |
Jarden Corp.* | | 35,450 | | | | 836,974 | |
Lowe’s Co., Inc. | | 34,040 | | | | 769,985 | |
Rent-A-Center, Inc.* | | 35,550 | 2 | | | 516,186 | |
Time Warner Co., Inc. | | 62,900 | | | | 1,038,479 | |
Wyndham Worldwide Corp. | | 21,602 | | | | 508,943 | |
Total Consumer Discretionary | | | | | | 6,989,285 | |
Consumer Staples - 5.4% | | | | | | | |
CVS Corp. | | 31,640 | | | | 1,257,690 | |
Kraft Foods, Inc. | | 32,290 | | | | 1,053,623 | |
Procter & Gamble Co. | | 14,600 | | | | 1,071,932 | |
Total Consumer Staples | | | | | | 3,383,245 | |
Energy - 12.1% | | | | | | | |
Baker Hughes, Inc. | | 7,910 | | | | 641,501 | |
ChevronTexaco Corp. | | 31,300 | | | | 2,921,229 | |
ConocoPhillips Co. | | 29,530 | | | | 2,607,500 | |
Devon Energy Corp. | | 10,860 | | | | 965,563 | |
EL Paso Corp. | | 25,710 | | | | 443,240 | |
Total Energy | | | | | | 7,579,033 | |
Financials - 22.2% | | | | | | | |
ACE, Ltd. | | 21,050 | | | | 1,300,469 | |
American Express Co. | | 16,570 | | | | 861,971 | |
American International Group, Inc. | | 42,920 | | | | 2,502,236 | |
Bank of America Corp. | | 57,900 | | | | 2,388,954 | |
Bear, Stearns & Co., Inc. | | 11,220 | 2 | | | 990,165 | |
Citigroup, Inc. | | 63,741 | | | | 1,876,535 | |
Fannie Mae Co. | | 33,800 | | | | 1,351,324 | |
MBIA, Inc. | | 43,900 | | | | 817,857 | |
Merrill Lynch & Co., Inc. | | 20,800 | | | | 1,116,544 | |
Wachovia Corp. | | 19,000 | | | | 722,570 | |
Total Financials | | | | | | 13,928,625 | |
Health Care - 10.1% | | | | | | | |
Abbott Laboratories Co. | | 16,650 | | | | 934,898 | |
Covidien Ltd. | | 18,815 | | | | 833,316 | |
GlaxoSmithKline PLC, Sponsored ADR | | 26,000 | | | | 1,310,140 | |
Johnson & Johnson | | 11,410 | | | | 761,047 | |
McKesson Corp. | | 11,400 | | | | 746,814 | |
Pfizer, Inc. | | 32,300 | | | | 734,179 | |
UnitedHealth Group, Inc. | | 17,540 | | | | 1,020,828 | |
Total Health Care | | | | | | 6,341,222 | |
Industrials - 11.4% | | | | | | | |
Emerson Electric Co. | | 10,500 | | | | 594,930 | |
Empresa Brasileira de Aeronautica, S.A. | | 30,050 | 2 | | | 1,369,980 | |
General Electric Co. | | 31,875 | | | | 1,181,606 | |
Tyco International Ltd. | | 22,325 | | | | 885,186 | |
United Parcel Service, Inc., Class B | | 14,230 | 2 | | | 1,006,346 | |
United Technologies Corp. | | 16,100 | | | | 1,232,294 | |
Wesco International, Inc.* | | 23,100 | | | | 915,684 | |
Total Industrials | | | | | | 7,186,026 | |
Information Technology - 12.0% | | | | | | | |
Cisco Systems, Inc.* | | 42,100 | | | | 1,139,647 | |
Ingram Micro, Inc., Class A* | | 70,400 | | | | 1,270,016 | |
International Business Machines Corp. | | 9,280 | | | | 1,003,168 | |
Nokia Corp., Sponsored ADR | | 59,700 | | | | 2,291,883 | |
Oracle Corp.* | | 41,500 | | | | 937,070 | |
Xerox Corp.* | | 55,110 | | | | 892,231 | |
Total Information Technology | | | | | | 7,534,015 | |
Materials - 7.9% | | | | | | | |
Alcoa, Inc. | | 26,920 | | | | 983,926 | |
Cemex SAB de C.V.* | | 31,955 | | | | 826,037 | |
Dow Chemical Co. | | 28,000 | | | | 1,103,760 | |
E.I. du Pont de Nemours & Co., Inc. | | 22,450 | 2 | | | 989,820 | |
PPG Industries, Inc. | | 14,700 | | | | 1,032,381 | |
Total Materials | | | | | | 4,935,924 | |
Telecommunication Services - 4.0% | | | | | | | |
AT&T, Inc. | | 22,100 | | | | 918,476 | |
Verizon Communications, Inc. | | 36,200 | | | | 1,581,578 | |
Total Telecommunication Services | | | | | | 2,500,054 | |
Utilities - 1.7% | | | | | | | |
Exelon Corp. | | 13,200 | | | | 1,077,648 | |
Total Common Stocks | | | | | | | |
(cost $ 55,311,939) | | | | | | 61,455,077 | |
Other Investment Companies - 10.2%1 | | | | | | | |
Bank of New York Institutional Cash Reserves Fund, 5.02% 3 | | 4,590,061 | | | | 4,590,061 | |
Dreyfus Cash Management Fund, Institutional Class Shares, 4.85% | | 1,819,510 | | | | 1,819,510 | |
Total Other Investment Companies | | | | | | | |
(cost $ 6,409,571) | | | | | | 6,409,571 | |
Total Investments - 108.1% | | | | | | | |
(cost $ 61,721,510) | | | | | | 67,864,648 | |
Other Assets, less Liabilities - (8.1)% | | | | | | (5,085,150 | ) |
Net Assets - 100.0% | | | | | $ | 62,779,498 | |
The accompanying notes are an integral part of these financial statements.
8
Managers AMG Essex Large Cap Growth Fund
Portfolio Manager’s Comments
For the fiscal year ended December 31, 2007, the Managers AMG Essex Large Cap Growth Fund (the “Fund”) gained 14.36%, outperforming the Russell 1000® Growth Index, which returned 11.81%.
REVIEW AND OUTLOOK: YEAR 2007
U.S. equities started strong in 2007 only to give back most of their gains in late February and early March. A number of events transpired to cause investors to reassess their risk tolerances, including worsening conditions among subprime mortgage lenders and weaker economic data. From mid-July to mid-August, stock prices around the world reacted violently to fears that continued distress in subprime lending would extend to other areas of credit. The Federal Reserve responded with a surprise 50 basis point (0.50%) cut in short-term interest rates, igniting a broad-based rebound in equity markets. The final quarter of the year opened on a positive note, with major indices rising to new highs. However, deteriorating credit conditions and record losses by several of the world’s largest financial institutions heightened recession fears, sending stocks lower. Markets stabilized toward the end of the year, supported by falling bond yields and liquidity infusions by central banks. Growth stocks of all sizes performed exceptionally well during the year, far outpacing their value counterparts. Slowing economic growth, lower interest rates, and strong relative earnings in key sectors were the chief contributors to investor preference for growth stocks in 2007.
Portfolio/Sector Commentary
Sector returns were mixed for the period, reflecting the market’s volatility. Further declines in housing activity coupled with evidence of spreading contagion from the subprime lending crisis weighed heavily on consumer discretionary and financial stocks. Investors gravitated to companies with significant international exposure, including energy and industrial commodities, as well as areas that are relatively immune to a slowdown in U.S. economic activity, such as health care and consumer staples. For most of 2007, the global growth theme dominated investor attention, with energy, technology, and capital goods the standout performers.
Consumer-spending-related stocks were among the hardest hit during the period, including retailers, restaurants, and leisure companies. Generally weak stock selection led to underperformance for the period. Rising gasoline prices, declining home values, and low savings rates are expected to restrain consumer spending over the next several quarters. Google Inc. was the standout performer for the sector. Google recently gained U.S. clearance to acquire DoubleClick, which should enhance Google’s position in the advertising market. Laureate Education Inc. was another positive performer. Those gains were offset by negative results from retail companies, including Kohl’s Corp., Tiffany & Co., and Coach Inc. A mild start to the winter season negatively affected Kohl’s. Weak demand for winter clothing combined with a decrease in holiday spending has caused the share price to fall. Tiffany, Coach, and other luxury retailers bore the brunt of fears of worsening consumer confidence. We have since liquidated both positions. We reduced our overall weighting in the consumer discretionary sector over the course of the year. We remain cautious on most of the consumer stocks and made few changes to our generally underweighted positions.
Overall, the energy sector outpaced the market for the period, with the majority of our equipment and services holdings advancing to new highs. Strong stock selection led to outperformance for the period. Schlumberger Ltd. was a significant contributor, and the company expects double-digit growth for the next few years. Southwestern Energy Co., a gas exploration and production company, was also additive to results. Southwestern announced a capital investment program dedicated to further developing its presence in the Arkoma Basin in 2008. This expansion should help improve company costs and productivity. We initiated several new positions during the year, including Chesapeake Energy and Peabody Energy, which were beneficial to the Fund. An increase in drilling activity should improve Chesapeake’s production volumes. In addition, energy stock valuations remain reasonable despite strong relative price returns over the last two years, suggesting further upside potential. Coal producers have started to limit production, which has driven favorable inventory trends and directly benefited Peabody. Looking into 2008, we expect energy costs to ease somewhat as U.S. economic growth cools. However, we continue to believe that oil prices are in a secular uptrend, as rising demand from emerging economies should outstrip global spare production capacity. Our bias remains on the energy services companies with large international operations as exploration budgets will expand further in 2008.
In health care, the Fund’s relative overweight in pharmaceuticals and medical supplies and services contributed to outperformance for the period, with notable returns from Gilead Sciences and Alcon Inc. Gilead’s positive performance was driven by strong HIV franchise sales as well as the upcoming rollout of the company’s Atripla product in Europe. Alcon continues to increase its industry market share with the introduction of three new intraocular lenses. Positive returns also came from CVS Caremark Corp. The merger of CVS and Caremark at the end of March created a very strong company with limited risk, and the resulting company is expected to increase profit margins due to improved buying of pharmaceuticals. Those strong performances were marginally affected by negative returns from Celgene Corp., Genentech Inc., and Vertex Pharmaceuticals Inc. Celgene’s stock retreated upon the lowered expectations for Revlimid, the company’s key growth product. It could be several quarters before investor confidence is restored; thus, we have fully liquidated our position. A mixed earnings report from Genentech weighed on the stock; however, 2008 could see major positive catalysts emerge including Phase III data for Avastin in adjuvant colorectal cancer. In the case of Vertex, data was released for products that may ultimately compete against its key pipeline product, Telaprevir, causing pressure on the stock. While election year debate over health care reform is an important risk to this sector in 2008, we remain overweighted, with a focus on companies that have innovative products or services for large and growing markets.
Returns for the technology sector were mixed; however, solid stock selection contributed to outperformance for the Fund. Research In Motion (RIMM) was the standout performer, as the company continued its market dominance in smart phones. RIMM should also be bolstered by an improving product cycle. Intel and NVIDIA were
9
Managers AMG Essex Large Cap Growth Fund
Portfolio Manager’s Comments (continued)
added during the second quarter, and both companies benefited from the strength in the PC market and contributed strong returns. Dell Inc. was a negative performer during the period, as its turnaround plan has been slow to progress and economic fears weighed on the stock. Brocade Communications Systems issued guidance that was consistent with expectations, but not considered to be extraordinary, which detracted from overall performance. In computer services, software, and systems companies, BEA Systems was the largest contributor. BEA has benefited from the rapid growth in business process management (BPM) technology, and the company has met client demand for a more efficient way to manage a business and the multiple processes that support it. During the fourth quarter, Oracle offered to purchase the company, which allowed the position to be sold at attractive prices. We modestly reduced our technology exposure in the Fund, taking profits in several holdings that had experienced substantial gains in the past year, which included liquidating our positions in BEA and SunPower Corp. In addition, we sense that corporations may be more cautious in their technology spending next year, particularly for the important retail and financial services sectors. Our emphasis remains on the faster growing areas of wireless communications, Internet services, and web-based software.
Aerospace, defense, and transportation stocks, including shipping and airline companies, experienced sharp declines in the fourth quarter, which minimally impacted Fund performance for the period. Deere & Co. was the most notable contributor in producer durables. The company acquired a small tractor company in southern China, which will increase Deere’s international presence. We expect Deere to benefit from the continuation of a strong agriculture cycle as well as from the new energy bill that was recently signed into law. Those gains were offset by disappointing results from General Cable, which has since been sold from the Fund. In materials, fertilizer companies were the standout contributors. Mosaic Co. is the largest fertilizer materials company in North America and benefits from limited capacity coupled with high demand for global grain. In addition, the phosphate cycle should remain strong for the next several years. Similar to phosphate, potash prices have increased due to strong global demand and a lack of capacity. Potash Corp. of Saskatchewan has taken advantage of these market conditions and the company’s growth prospects should continue.
OUTLOOK: GROWTH STOCK LEADERSHIP TO CONTINUE
During the last quarter of 2007, rising credit market strains from the subprime meltdown resulted in a marked change in investor sentiment concerning the direction of the economy and interest rates. We believe the U.S. will avoid a recession in 2008, but faces several quarters of sluggish growth. The bursting of the housing bubble and potentially lower energy costs should result, in our opinion, in an easing of inflation pressures, leaving the Federal Reserve enough runway to aggressively reduce interest rates in coming months. This should restore confidence in the financial markets and set the stage for renewed growth in the second half of 2008.
U.S. stocks may remain in a volatile trading range, as investors sort out the implications of a slowing domestic economy on corporate profits. We believe earnings will likely contract for finance and housing-related sectors, but should expand for others, including energy services, health care, segments of technology, and global industrials. What we believe is certain is that investors will continue to pay for growth, wherever it exists, resulting in sustained growth stock leadership.
10
Managers AMG Essex Large Cap Growth Fund
Portfolio Manager’s Comments (continued)
CUMULATIVE TOTAL RETURN PERFORMANCE
Managers AMG Essex Large Cap Growth Fund’s cumulative total return is based on the daily change in net asset value (NAV), and assumes that all dividends and distributions were reinvested. The Russell 1000® Growth Index measures the performance of those companies in the Russell 1000® Index with higher price-to book ratios and higher forecasted growth values. The Russell 1000® Index measures the performance of the 1,000 largest companies in the Russell 3000® Index, which measures the performance of the 3,000 largest U.S. companies based on total market capitalization. Unlike the Fund, the Russell 1000® Growth Index is unmanaged, is not available for investment, and does not incur expenses. The Index assumes reinvestment of dividends. This graph compares a hypothetical $10,000 investment made in Managers AMG Essex Large Cap Growth Fund on December 31, 1997, to a $10,000 investment made in the Russell 1000® Index for the same time period. Performance for periods longer than one year is annualized. The graph and table do not reflect the deduction of taxes that a shareholder would pay on a Fund distribution or redemption of shares. The listed returns for the Fund are net of expenses and the returns for the index exclude expenses. Past performance is not indicative of future results. Total returns would have been lower had certain expenses not been reduced. The Russell 1000® Growth Index is a trademark of the Frank Russell Company. Frank Russell® is a trademark of the Frank Russell Company.
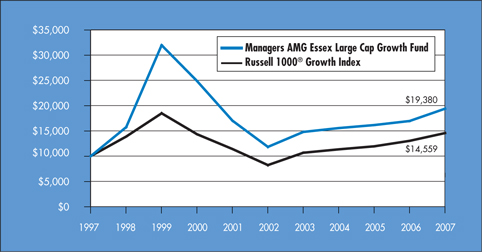
The table below shows the average annual total returns for Managers AMG Essex Large Cap Growth Fund and the Russell 1000® Index since December 31, 1997 through December 31, 2007.
| | | | | | | | | | | |
Average Annual Total Returns 1 | | One Year | | | Five Years | | | Ten Years | | | Inception Date |
Managers AMG Essex Large Cap Growth Fund 2 | | 14.36 | % | | 10.39 | % | | 6.84 | % | | 6/1/84 |
Russell 1000® Growth Index | | 11.81 | % | | 12.10 | % | | 3.83 | % | | |
11
Managers AMG Essex Large Cap Growth Fund
Portfolio Manager’s Comments (continued)
The performance data shown represents past performance. Past performance is not a guarantee of future results. Current performance may be lower or higher than the performance data quoted. The investment return and principal value of an investment in the Fund will fluctuate so that an investor’s shares, when redeemed, may be worth more or less than their original cost. For performance information through the most recent month end, please call (800) 835-3879 or visit our Web site at www.managersinvest.com.
In choosing a Fund, investors should carefully consider the amount they plan to invest, their investment objectives, the Fund’s investment objectives, risks, charges and expenses before investing. For this and other information, please call 800.835.3879 or visit www.managersinvest.com for a free prospectus. Read it carefully before investing or sending money. Distributed by Managers Distributors, Inc., member FINRA.
| | 1 | Total return equals income yield plus share price change and assumes reinvestment of all dividends and capital gain distributions. Returns are net of fees and may reflect offsets of Fund expenses as described in the Prospectus. No adjustment has been made for taxes payable by shareholders on their reinvested dividends and capital gain distributions. Returns for periods greater than one year are annualized. The listed returns on the Fund are net of expenses. All returns are in U.S. dollars($). |
| | 2 | Fund for which, from time to time, the Fund’s advisor has waived its fees and/or absorbed Fund expenses, which has resulted in higher returns. |
12
Managers AMG Essex Large Cap Growth Fund
Fund Snapshots
December 31, 2007
Portfolio Breakdown
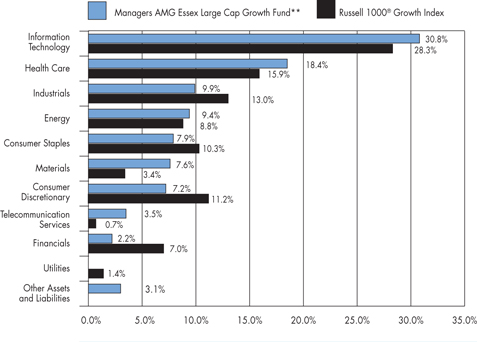
| ** | As a percentage of net assets |
| | | | | | |
Industry | | Managers AMG
Essex Large Cap
Growth Fund** | | | Russell 1000®
Growth Index | |
Information Technology | | 30.8 | % | | 28.3 | % |
Health Care | | 18.4 | % | | 15.9 | % |
Industrials | | 9.9 | % | | 13.0 | % |
Energy | | 9.4 | % | | 8.8 | % |
Consumer Staples | | 7.9 | % | | 10.3 | % |
Materials | | 7.6 | % | | 3.4 | % |
Consumer Discretionary | | 7.2 | % | | 11.2 | % |
Telecommunication Services | | 3.5 | % | | 0.7 | % |
Financials | | 2.2 | % | | 7.0 | % |
Utilities | | 0.0 | % | | 1.4 | % |
Other Assets and Liabilities | | 3.1 | % | | 0.0 | % |
Top Ten Holdings
| | | |
Security Name | | Percentage of
Net Assets | |
Google, Inc.* | | 5.0 | % |
Microsoft Corp. | | 3.2 | |
Abbott Laboratories Co. | | 3.1 | |
Peabody Energy Corp. | | 3.1 | |
Intel Corp. | | 2.9 | |
Mosaic Co. | | 2.8 | |
Potash Corp. of Saskatchewan | | 2.8 | |
Gilead Sciences, Inc.* | | 2.8 | |
Kohl’s Corp.* | | 2.7 | |
Procter & Gamble Co. | | 2.5 | |
| | | |
Top Ten as a Group | | 30.9 | % |
| | | |
| * | Top Ten Holding at June 30, 2007 |
Any sectors, industries, or securities discussed should not be perceived as investment recommendations. Mention of a specific security should not be considered a recommendation to buy or solicitation to sell that security.
13
Managers AMG Essex Large Cap Growth Fund
Schedule of Portfolio Investments
December 31, 2007
| | | | | | | |
| | | Shares | | | Value | |
Common Stocks - 96.9% | | | | | | | |
Consumer Discretionary - 7.2% | | | | | | | |
International Game Technology | | 23,375 | 2 | | $ | 1,026,864 | |
Kohl’s Corp.* | | 30,397 | | | | 1,392,183 | |
News Corp., Inc., Class A | | 63,695 | | | | 1,305,111 | |
Total Consumer Discretionary | | | | | | 3,724,158 | |
Consumer Staples - 7.9% | | | | | | | |
Avon Products, Inc. | | 18,584 | | | | 734,626 | |
CVS Corp. | | 33,092 | | | | 1,315,407 | |
Hansen Natural Corp.* | | 16,720 | 2 | | | 740,529 | |
Procter & Gamble Co. | | 18,009 | | | | 1,322,221 | |
Total Consumer Staples | | | | | | 4,112,783 | |
Energy - 9.4% | | | | | | | |
Chesapeake Energy Corp. | | 21,379 | 2 | | | 838,057 | |
Peabody Energy Corp. | | 25,763 | 2 | | | 1,588,044 | |
Schlumberger, Ltd. | | 13,125 | | | | 1,291,106 | |
Southwestern Energy Co.* | | 20,464 | | | | 1,140,254 | |
Total Energy | | | | | | 4,857,461 | |
Financials - 2.2% | | | | | | | |
CME Group, Inc. | | 1,657 | | | | 1,136,702 | |
Health Care - 18.4% | | | | | | | |
Abbott Laboratories Co. | | 28,295 | | | | 1,588,764 | |
Alcon, Inc. | | 5,363 | | | | 767,124 | |
Baxter International, Inc. | | 14,228 | | | | 825,935 | |
Charles River Laboratories International, Inc.* | | 9,350 | 2 | | | 615,230 | |
Elan Corp., PLC -Sponsored ADR* | | 23,266 | 2 | | | 511,387 | |
Genentech, Inc.* | | 19,243 | | | | 1,290,628 | |
Gilead Sciences, Inc.* | | 31,635 | | | | 1,455,526 | |
Hologic, Inc.* | | 12,667 | 2 | | | 869,463 | |
Intuitive Surgical, Inc.* | | 1,857 | | | | 602,596 | |
Medco Health Solutions, Inc.* | | 6,345 | | | | 643,383 | |
Vertex Pharmaceuticals, Inc.* | | 17,454 | 2 | | | 405,456 | |
Total Health Care | | | | | | 9,575,492 | |
Industrials - 9.9% | | | | | | | |
AMR Corp.* | | 43,597 | | | | 611,666 | |
Chicago Bridge & Iron Co. N.V. | | 20,366 | | | | 1,230,921 | |
Deere & Co. | | 6,235 | | | | 580,603 | |
Foster Wheeler Ltd.* | | 3,812 | | | | 590,936 | |
General Electric Co. | | 33,655 | | | | 1,247,591 | |
Northwest Airlines Corp.* | | 42,661 | | | | 619,011 | |
Quanta Services, Inc.* | | 9,821 | 2 | | | 257,703 | |
Total Industrials | | | | | | 5,138,431 | |
Information Technology - 30.8% | | | | | | | |
Adobe Systems, Inc.* | | 28,856 | 2 | | | 1,233,017 | |
Brocade Communications Systems, Inc.* | | 157,717 | | | | 1,157,643 | |
Cisco Systems, Inc.* | | 36,687 | | | | 993,117 | |
Dell, Inc.* | | 42,628 | | | | 1,044,812 | |
Google, Inc.* | | 3,752 | | | | 2,594,432 | |
Intel Corp. | | 55,852 | | | | 1,489,014 | |
McAfee, Inc.* | | 20,724 | | | | 777,150 | |
Microsoft Corp. | | 46,324 | | | | 1,649,134 | |
Omniture, Inc.* | | 27,724 | 2 | | | 922,932 | |
Oracle Corp.* | | 57,223 | | | | 1,292,095 | |
QUALCOMM, Inc. | | 27,148 | | | | 1,068,274 | |
Seagate Technology | | 20,591 | 2 | | | 525,070 | |
Synchronoss Technologies, Inc.* | | 34,970 | 2 | | | 1,239,337 | |
Total Information Technology | | | | | | 15,986,027 | |
Materials - 7.6% | | | | | | | |
The Mosaic Co.* | | 15,635 | | | | 1,475,006 | |
Newmont Mining Limited | | 20,530 | 2 | | | 1,002,480 | |
Potash Corp. of Saskatchewan | | 10,126 | 2 | | | 1,457,739 | |
Total Materials | | | | | | 3,935,225 | |
Telecommunication Services - 3.5% | | | | | | | |
American Tower Corp., Class A* | | 17,696 | | | | 753,850 | |
NII Holdings, Inc., Class B* | | 21,753 | | | | 1,051,105 | |
Total Telecommunication Services | | | | | | 1,804,955 | |
Total Common Stocks | | | | | | | |
(cost $ 44,589,594) | | | | | | 50,271,234 | |
Other Investment Companies - 25.3%1 | | | | | | | |
Bank of New York Institutional Cash Reserves Fund, 5.02% 3 | | 11,070,206 | | | | 11,070,206 | |
Dreyfus Cash Management Fund, Institutional Class Shares, 4.85% | | 2,074,530 | | | | 2,074,530 | |
Total Other Investment Companies | | | | | | | |
(cost $ 13,144,736) | | | | | | 13,144,736 | |
Total Investments - 122.2% | | | | | | | |
(cost $ 57,734,330) | | | | | | 63,415,970 | |
Other Assets, less Liabilities - (22.2)% | | | | | | (11,539,647 | ) |
Net Assets - 100.0% | | | | | $ | 51,876,323 | |
The accompanying notes are an integral part of these financial statements.
14
Managers Small Company Fund
Portfolio Managers’ Comments
The Managers Small Company Fund’s (the “Fund”) objective is to achieve long-term capital appreciation by investing in equity securities of small companies.
THE PORTFOLIO MANAGERS
The Fund employs two portfolio managers who specialize in distinct investment approaches. This “intelligence diversification” not only serves to manage risk, but also helps tap the market’s full potential by focusing different analytical insights on each class of investment. Fund management strives to achieve this performance and diversification while ensuring that the Fund operates within the framework of its investment objective and principal investment strategies.
Kalmar Investment Advisers, Inc.
Kalmar Investment Advisers, Inc. (“Kalmar”), practices a “Growth-with-Value” approach to small- company investing whereby it seeks to identify high quality growing businesses before they are widely discovered by other institutional investors. Kalmar’s team believes there is a low risk/high reward anomaly offered by the equity market in stocks of such top-notch smaller companies that, for a variety of reasons, have not made the radar screen of most typical growth investors. Because these companies are relatively “invisible” institutionally, they can be purchased at prices which are inefficiently valued to undervalued and yet offer strong growth potential as well. This is the crux of their “growth-with-value” investment style.
The investment team at Kalmar generates investment ideas through different screening methodologies and several sources, employing elements of both top-down and bottom-up analysis in the initial identification process. The members of the investment management team all have strong research backgrounds and are committed to disciplined in-depth, hands-on fundamental analysis. Top-down thinking is used to identify strategic themes and growth areas to prospect for individual “growth-with-value” candidates.
The most intensive research, however, is dedicated to bottom-up fundamental analysis. Kalmar looks for such criteria as proven and sustainable double-digit growth in revenue and EPS, together with a stock that is reasonably to cheaply priced relative to EPS, cash flow, revenues, and enterprise value. Kalmar looks for dynamic businesses that are easily understood, run by equity owners they can count on, and buyable at valuations that they expect to rise. The team’s decision threshold for new holdings is a potential return of 50% in approximately two years. This appreciation is expected to come from two sources: compounding business value, and upward revaluation as greater investor discovery unfolds.
The ideal company exhibits many of the following traits:
| | • | | Market capitalization of $50 million up to $2.5 billion at the time of purchase |
| | • | | Dynamic growth business that Kalmar understands better |
| | • | | Run by committed managements that deliver: |
| | • | | Buyable at inefficient valuations that should rise |
| | • | | Strong improving financials with conservative accounting |
| | • | | Reasonable/cheap valuations, with special positive attributes |
Portfolio Management:
| | • | | Diversified portfolio in terms of sector, security, and market capitalization |
| | • | | Conscious mix of “growth character” companies, from higher growth “Steady Eddies” bought inefficiently valued through to positive surprise / emerging growth situations |
The investment team will make a sell decision when:
| | • | | They see a change in the fundamentals of a company |
| | • | | A better opportunity emerges |
| | • | | Price or fundamental expectations have been met |
| | • | | A position appreciates beyond an optimal allocation |
Epoch Investment Partners, Inc.
Epoch Investment Partners, Inc. (“Epoch”) seeks to create excess return without assuming a high degree of capital risk by creating portfolios of businesses with superior risk/reward profiles. They analyze a business in the same manner a private investor would in looking to purchase the entire company and only invest in those businesses they understand and where they have confidence in their financial statements. They seek businesses that generate free cash flow and securities that have unrecognized potential yet possess a combination of above-average yield, above-average free cash flow growth, and/or below-average valuation.
Ideal Investment
The ideal company exhibits many of the following traits:
| | • | | Top quality management that has entrepreneurial drive and experience, a history of success, a strong strategic vision, and a reward structure determined by shareholder value creation |
| | • | | Strong financial position as determined by cash flow use, financial transparency, hidden or undervalued assets, and low leverage |
| | • | | Competitive positioning in its marketplace, strong demand characteristics, and sustainable free cash flow |
Portfolio Construction
Portfolio management:
| | • | | Screens the Russell 2000® universe using both quantitative and qualitative criteria |
| | • | | Analyzes each business as if they were to buy the entire company, including sustainability of the business, earnings drivers, barriers to entry, and competitive advantages |
| | • | | Evaluates potential companies on the basis of management quality, financial strength, nature of the business, and external factors |
| | • | | Develops an investment thesis outlining potential value creation and growth in cash flow |
| | • | | Diversifies the Portfolio across important sectors utilizing inverse risk weighting, a 5% position maximum, and recognizing liquidity considerations |
Sell Discipline
The investment team will make a sell decision when:
| | • | | The security’s price target is reached |
| | • | | There is a change in the investment thesis |
| | • | | Downside risk becomes too great |
15
Managers Small Company Fund
Portfolio Managers’ Comments (continued)
THE YEAR IN REVIEW
Over the 12 months ended December 31, 2007, the Fund returned 9.13% compared to a loss of - -1.57% for the Russell 2000® Index. Significant performance trend changes occurred within the stock market in 2007, and the last two quarters of the year were particularly difficult for small-cap stocks. Through the end of June, the Russell 2000® Index had appreciated 6.45%, but for various reasons during the last two quarters the Index returned -7.53%, and, as a result, core small-cap indices depreciated slightly for the year. Leadership within small-cap stocks shifted from the outset of the year in favor of growth stocks over value stocks. Similarly, after several years of progressively shrinking volatility and increasingly less discriminating markets that had accorded no stock price premium for higher business quality and greater growth, the reverse finally came back into play in 2007. Helped by these performance influences, but mostly driven by good portfolio decisions by both subadvisors, the Fund performed very well on an absolute and relative basis.
The Fund’s outperformance was primarily driven by strong stock performance across several economic sectors and a large underweight to financials. Stock performance was strongest in the energy, consumer discretionary, and industrials sectors. The consumer discretionary sector was the second worst-performing sector within the Russell 2000 ® Index and returned -15.08% during 2007. Conversely, the Small Company Fund’s positions in this sector appreciated 8.94%, and this differential was the main reason the Fund outperformed the Russell 2000® Index during 2007. Both subadvisors were able to identify strong companies at reasonable valuations that appreciated following positive business developments in what was an otherwise difficult economic sector. Consumer discretionary positions DeVry (+86.03%), GameStop (+125.4%), Service Corp Inter. (+38.45%), and 1-800-FLOWERS.COM (+41.72%) all had strong calendar years and helped the Portfolio’s consumer discretionary allocation outperform. In particular, DeVry benefited from an acquisition completed during the fourth quarter and a 20% increase in its dividend.
Stock performance was also very strong in the industrials and energy sectors. The Fund’s positioning in both sectors significantly outpaced the Index’s and modest overweights were also additive. Atwood Oceanics (+104.70) and Ultra Petroleum (+49.77%) were the Fund’s best-performing positions within the energy sector, while EDO (+136.67%) and Chicago Bridge & Iron (+121.97) led the way in industrials. The Fund’s energy and industrials holdings performed well throughout 2007, but performed best on a relative basis as both sectors depreciated during the last six months of the year. This demonstrates both managers’ focus on bottom-up stock selection and confirms their ability to identify attractive securities in otherwise challenging economic markets and sectors.
Another major contributor to the Fund’s outperformance was the continuation of a substantial underweight to the financials sector, which was by far the worst-performing sector within the Russell 2000®Index. This underweight was driven by Kalmar’s continued avoidance of the financials sector and Epoch’s inability to find attractive investment opportunities within financials. Kalmar has consistently been underweight in this sector because of concerns over potential balance sheet risk in fast-growing financial service companies. While different reasoning drove the decision to underweight the sector, the Fund’s underweight was extremely beneficial as the subprime crisis unraveled and large write-downs raised uncertainty about what might lie ahead.
The abovementioned contributors were partially offset by poor performance within the information technology sector. Both sub-advisors found many attractive investment opportunities within the tech sector, but some of the Fund’s tech positions struggled during 2007. For example, Silicon Image (-64.47%), Powerwave Tech. (-37.52%), and Avocent (-31.14%) all depreciated as the Portfolio’s holdings fell (-1.52%) and the Index’s appreciated (3.52%). Other tech positions, such as Cypress Semiconductor (+113.57%) and Sapient (+60.47%), soared during 2007, but overall stock performance within this sector was a drag on performance. The Fund’s materials sector holdings also appreciated 11.30% during 2007, but trailed the Index’s which returned 26.30%.
Overall, strong stock performance across several sectors and an underweight to small-cap financials resulted in a very strong year for Managers Small Company Fund.
LOOKING FORWARD
Heading into 2008, the Fund is positioned with a familiar underweight to the financials sector and an equally common overweight to the information technology sector. Looking forward, Kalmar and Epoch are both cautious about what 2008 may hold, but feel the opportunity for strong relative, if not absolute, returns still exists. Kalmar’s guarded optimism is based on a belief that monetary policy will remain accommodative, and that slowing U.S. growth will be countered by higher world economic growth and a dollar at historically low levels. Furthermore, Kalmar is even more opportunistic about the second half of 2008 and 2009. Lastly, Epoch will continue to focus on companies generating free cash flow with the ability to increase shareholder yield, and feels 2008 will provide some excellent value opportunities, particularly after the market depreciation during the fourth quarter.
16
Managers Small Company Fund
Portfolio Managers’ Comments (continued)
CUMULATIVE TOTAL RETURN PERFORMANCE
Managers Small Company Fund’s cumulative total return is based on the daily change in net asset value (NAV), and assumes that all distributions were reinvested. The Russell 2000® Index is comprised of the smallest 2000 companies in the Russell 3000® Index and is widely regarded in the industry as the premier measure of small-cap stock performance. The Russell 3000® Index is composed of 3000 of the largest U.S. companies, as determined by market capitalization which represents approximately 98% of the investable U.S. equity market. Unlike the Fund, the Russell 2000® Index is unmanaged, is not available for investment, and does not incur expenses. This chart compares a hypothetical $10,000 investment made in the Managers Small Company Fund on June 19, 2000, to a $10,000 investment made in the Russell 2000® Index for the same time period. The graph and chart do not reflect the deduction of taxes that a shareholder would pay on a Fund distribution or redemption of shares. Past performance is not indicative of future results. Total returns would have been lower had certain expenses not been reduced. The Russell 2000® Index is a trademark of the Frank Russell Company. Frank Russell® is a trademark of the Frank Russell Company.
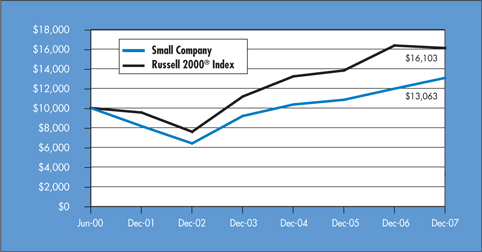
The table below shows the average annual total returns for Managers Small Company Fund and the Russell 2000® Index since inception through December 31, 2007.
| | | | | | | | | | | |
Average Annual Total Returns 1 | | One Year | | | Five Year | | | Since Inception* | | | Inception Date |
Managers Small Company Fund 2,3 | | 9.13 | % | | 15.34 | % | | 3.61 | % | | 6/19/00 |
Russell 2000® Index | | (1.57 | )% | | 16.25 | % | | 6.53 | % | | |
| * | Commencement of operations was June 19, 2000. |
17
Managers Small Company Fund
Portfolio Managers’ Comments (continued)
The performance data shown represents past performance. Past performance is not a guarantee of future results. Current performance may be lower or higher than the performance data quoted. The investment return and principal value of an investment in the Fund will fluctuate so that an investor’s shares, when redeemed, may be worth more or less than their original cost. For performance information through the most recent month end, please call (800) 835-3879 or visit our Web site at www.managersinvest.com.
In choosing a Fund, investors should carefully consider the amount they plan to invest, their investment objectives, the Fund’s investment objectives, risks, charges and expenses before investing. For this and other information, please call 800.835.3879 or visit www.managersinvest.com for a free prospectus. Read it carefully before investing or sending money. Distributed by Managers Distributors, Inc., member FINRA.
| | 1 | Total return equals income yield plus share price change and assumes reinvestment of all dividends and capital gain distributions. Returns are net of fees and may reflect offsets of Fund expenses as described in the Prospectus. No adjustment has been made for taxes payable by shareholders on their reinvested dividends and capital gain distributions. Returns for periods greater than one year are annualized. The listed returns on the Fund are net of expenses. All returns are in U.S. dollars($). |
| | 2 | Fund for which, from time to time, the Fund’s advisor has waived its fees and/or absorbed Fund expenses, which has resulted in higher returns. |
| | 3 | The Fund is subject to risks associated with investments in small capitalization companies, such as erratic earnings patterns, competitive conditions, limited earnings history and a reliance on one or a limited number of products. |
18
Managers Small Company Fund
Fund Snapshots
December 31, 2007
Portfolio Breakdown
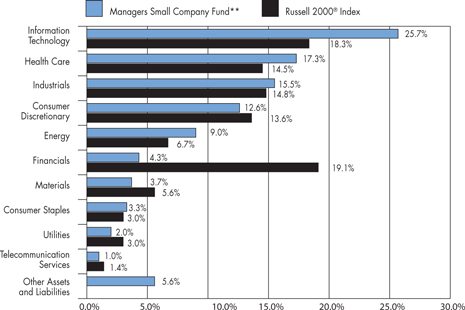
| ** | As a percentage of net assets |
| | | | | | |
Industry | | Managers Small
Company Fund** | | | Russell 2000®
Index | |
Information Technology | | 25.7 | % | | 18.3 | % |
Health Care | | 17.3 | % | | 14.5 | % |
Industrials | | 15.5 | % | | 14.8 | % |
Consumer Discretionary | | 12.6 | % | | 13.6 | % |
Energy | | 9.0 | % | | 6.7 | % |
Financials | | 4.3 | % | | 19.1 | % |
Materials | | 3.7 | % | | 5.6 | % |
Consumer Staples | | 3.3 | % | | 3.0 | % |
Utilities | | 2.0 | % | | 3.0 | % |
Telecommunication Services | | 1.0 | % | | 1.4 | % |
Other Assets and Liabilities | | 5.6 | % | | 0.0 | % |
Top Ten Holdings
| | | |
Security Name | | Percentage of
Net Assets | |
Service Corp. International* | | 2.1 | % |
Respironics, Inc. | | 1.4 | |
DeVry, Inc.* | | 1.4 | |
Ultra Petroleum Corp. | | 1.3 | |
Arbitron, Inc. | | 1.3 | |
Kennametal, Inc.* | | 1.2 | |
Alliant Techsystems, Inc. | | 1.2 | |
SonoSite, Inc.* | | 1.1 | |
Chicago Bridge & Iron Co. N.V. | | 1.1 | |
WABCO Holdings, Inc. | | 1.1 | |
| | | |
Top Ten as a Group | | 13.2 | % |
| | | |
| * | Top Ten Holding at June 30, 2007 |
Any sectors, industries, or securities discussed should not be perceived as investment recommendations. Mention of a specific security should not be considered a recommendation to buy or solicitation to sell that security.
19
Managers Small Company Fund
Schedule of Portfolio Investments
December 31, 2007
| | | | | | |
| | | Shares | | | Value |
Common Stocks - 94.4% | | | | | | |
Consumer Discretionary - 12.6% | | | | | | |
1-800-FLOWERS.COM, Inc.* | | 9,095 | | | $ | 79,399 |
Aaron Rents, Inc. | | 2,335 | 2 | | | 44,925 |
Arbitron, Inc. | | 9,150 | | | | 380,366 |
BJ’s Restaurants, Inc.* | | 3,080 | | | | 50,081 |
Charming Shoppes* | | 12,650 | 2 | | | 68,436 |
DeVry, Inc. | | 7,660 | | | | 398,014 |
Fred’s, Inc. | | 5,910 | | | | 56,913 |
GameStop Corp.* | | 4,870 | | | | 302,476 |
Global Traffic Network, Inc.* | | 4,250 | | | | 27,710 |
Life Time Fitness, Inc.* | | 4,535 | 2 | | | 225,299 |
LKQ Corp.* | | 9,700 | 2 | | | 203,894 |
Multimedia Games, Inc.* | | 24,920 | | | | 207,833 |
NutriSystem, Inc.* | | 5,550 | 2 | | | 149,739 |
O’Reilly Automotive, Inc.* | | 2,735 | | | | 88,696 |
Service Corp. International | | 44,650 | | | | 627,331 |
Shuffle Master, Inc.* | | 11,810 | | | | 141,602 |
Tractor Supply Co.* | | 5,050 | | | | 181,497 |
Tupperware Brands Corp. | | 4,500 | | | | 148,635 |
WABCO Holdings, Inc. | | 6,380 | | | | 319,574 |
Total Consumer Discretionary | | | | | | 3,702,420 |
Consumer Staples - 3.3% | | | | | | |
Central European Distribution Corp.* | | 4,081 | | | | 237,024 |
Elizabeth Arden, Inc.* | | 5,730 | | | | 116,606 |
Longs Drug Stores Corp. | | 4,720 | 2 | | | 221,840 |
Performance Food Group Co.* | | 7,270 | | | | 195,345 |
Sunopta, Inc.* | | 11,920 | | | | 159,132 |
Susser Holdings Corp.* | | 2,110 | | | | 43,255 |
Total Consumer Staples | | | | | | 973,202 |
Energy - 9.0% | | | | | | |
Atwood Oceanics, Inc.* | | 2,120 | 2 | | | 212,509 |
Cal Dive International, Inc.* | | 20,950 | 2 | | | 277,378 |
Clean Energy Fuels Corp.* | | 4,280 | | | | 64,799 |
Core Laboratories N.V.* | | 1,590 | 2 | | | 198,305 |
Delta Petroleum Corp.* | | 8,695 | | | | 163,901 |
Foundation Coal Holdings, Inc. | | 3,820 | | | | 200,550 |
GMX Resources, Inc.* | | 4,840 | | | | 156,235 |
Niko Resources, Ltd. | | 3,170 | | | | 286,663 |
Parallel Petroleum Corp.* | | 8,455 | | | | 149,062 |
Seacor Holdings, Inc.* | | 1,700 | | | | 157,658 |
Tidewater, Inc. | | 2,125 | | | | 116,578 |
Ultra Petroleum Corp.* | | 5,455 | | | | 390,032 |
Warren Resources, Inc.* | | 17,500 | | | | 247,275 |
Total Energy | | | | | | 2,620,945 |
Financials - 4.3% | | | | | | |
Education Realty Trust, Inc. | | 18,100 | | | | 203,444 |
Flushing Financial Corp. | | 7,300 | 2 | | | 117,165 |
National Financial Partners Corp. | | 1,670 | 2 | | | 76,169 |
NorthStar Realty Finance Corp. | | 28,140 | | | | 251,009 |
Pzena Investment Management, Inc., Class A | | 12,050 | 2 | | | 137,370 |
Signature Bank* | | 5,760 | | | | 194,400 |
UMB Financial Corp. | | 4,350 | | | | 166,866 |
Wilshire Bancorp, Inc. | | 13,400 | 2 | | | 105,190 |
Total Financials | | | | | | 1,251,613 |
Health Care - 17.3% | | | | | | |
Analogic Corp. | | 4,000 | | | | 270,880 |
Assisted Living Concepts, Inc. (I-A)* | | 20,739 | | | | 155,542 |
Bio-Reference Labs, Inc.* | | 7,040 | | | | 230,067 |
Cambrex Corp. | | 20,310 | | | | 170,198 |
Covance, Inc.* | | 3,440 | | | | 297,973 |
Endo Pharmaceuticals Holdings, Inc.* | | 4,350 | | | | 116,014 |
Haemonetics Corp.* | | 1,910 | 2 | | | 120,368 |
HealthExtras, Inc.* | | 7,700 | | | | 200,816 |
Healthways, Inc.* | | 3,810 | 2 | | | 222,656 |
inVentiv Health, Inc.* | | 6,750 | 2 | | | 208,980 |
Inverness Medical Innovations, Inc.* | | 4,690 | | | | 263,484 |
IRIS International, Inc.* | | 9,600 | | | | 188,352 |
K-V Pharmaceutical Co., Class A* | | 9,700 | 2 | | | 276,838 |
Landauer, Inc. | | 1,080 | | | | 55,998 |
LifeCell Corp.* | | 4,610 | | | | 198,737 |
Martek Biosciences Corp.* | | 5,980 | | | | 176,888 |
Omnicell, Inc.* | | 5,740 | | | | 154,578 |
Pediatrix Medical Group, Inc.* | | 2,450 | | | | 166,968 |
Phase Forward, Inc.* | | 3,720 | | | | 80,910 |
PSS World Medical, Inc.* | | 9,345 | | | | 182,882 |
Psychiatric Solutions, Inc.* | | 4,050 | 2 | | | 131,625 |
Resmed, Inc.* | | 4,325 | 2 | | | 227,192 |
Respironics, Inc.* | | 6,155 | | | | 403,028 |
SonoSite, Inc.* | | 10,000 | | | | 336,700 |
Sunrise Senior Living, Inc.* | | 8,050 | 2 | | | 246,974 |
Total Health Care | | | | | | 5,084,648 |
The accompanying notes are an integral part of these financial statements.
20
Managers Small Company Fund
Portfolio Manager’s Comments (continued)
| | | | | | |
| | | Shares | | | Value |
Industrials - 15.5% | | | | | | |
Actuant Corp., Class A | | 2,150 | 2 | | $ | 73,122 |
Advisory Board Co., The* | | 2,960 | | | | 190,002 |
Alliant Techsystems, Inc.* | | 3,000 | 2 | | | 341,280 |
American Ecology Corp. | | 11,350 | | | | 266,498 |
Carlisle Co., Inc. | | 1,920 | | | | 71,098 |
Chicago Bridge & Iron Co. N.V. | | 5,395 | | | | 326,074 |
ChoicePoint, Inc.* | | 2,995 | | | | 109,078 |
Corrections Corp. of America* | | 8,644 | | | | 255,084 |
DRS Technologies, Inc. | | 5,550 | | | | 301,198 |
Duff & Phelps Corp., Class A* | | 9,070 | | | | 178,498 |
Encore Wire Corp. | | 12,050 | | | | 191,836 |
Healthcare Services Group | | 6,480 | | | | 137,246 |
Hexcel Corp.* | | 7,380 | 2 | | | 179,186 |
ICT Group, Inc.* | | 7,680 | | | | 91,776 |
IHS, Inc., Class A* | �� | 3,680 | | | | 222,861 |
InnerWorkings, Inc.* | | 6,770 | | | | 116,850 |
Kennametal, Inc. | | 9,160 | | | | 346,798 |
Mobile Mini, Inc.* | | 7,875 | | | | 146,002 |
MSC Industrial Direct Co., Class A | | 4,790 | | | | 193,851 |
Polypore International, Inc.* | | 7,730 | | | | 135,275 |
Telefl ex, Inc. | | 3,450 | | | | 217,384 |
Tetra Technologies, Inc.* | | 9,610 | | | | 206,615 |
URS Corp.* | | 2,039 | | | | 110,779 |
UTI Worldwide, Inc. | | 7,620 | | | | 149,352 |
Total Industrials | | | | | | 4,557,743 |
Information Technology -25.7% | | | | | | |
Actuate Corp.* | | 29,950 | | | | 232,712 |
ADC Telecommunications, Inc.* | | 8,750 | | | | 136,062 |
ANSYS, Inc.* | | 5,910 | | | | 245,029 |
Arris Group, Inc.* | | 17,840 | | | | 178,043 |
ATMI, Inc.* | | 7,145 | | | | 230,426 |
Avocent Corp.* | | 7,050 | 2 | | | 164,336 |
Benchmark Electronics, Inc.* | | 7,875 | | | | 139,624 |
Concur Technologies, Inc.* | | 3,210 | | | | 116,234 |
Constant Contact, Inc. | | 3,710 | 2 | | | 79,765 |
CyberSource Corp.* | | 12,560 | | | | 223,191 |
Cypress Semiconductor Corp.* | | 4,640 | | | | 167,179 |
DealerTrack Holdings, Inc.* | | 5,840 | 2 | | | 195,465 |
Diebold, Inc. | | 6,050 | | | | 175,329 |
Digital River, Inc.* | | 1,600 | 2 | | | 52,912 |
Diodes, Inc.* | | 3,172 | | | | 95,382 |
DivX, Inc.* | | 4,340 | | | | 60,760 |
DTS, Inc.* | | 10,710 | | | | 273,855 |
Dycom Industries, Inc.* | | 5,450 | | | | 145,242 |
Fair Isaac Corp. | | 7,850 | 2 | | | 252,378 |
FEI Co.* | | 5,560 | | | | 138,055 |
Harmonic, Inc.* | | 8,550 | | | | 89,604 |
Heartland Payment Systems, Inc. | | 2,710 | | | | 72,628 |
Hypercom Corp.* | | 44,870 | | | | 223,453 |
Insight Enterprises, Inc.* | | 10,875 | | | | 198,360 |
Ixia, Inc.* | | 6,790 | | | | 64,369 |
Macrovision Corp.* | | 10,350 | 2 | | | 189,716 |
Microsemi Corp.* | | 6,930 | 2 | | | 153,430 |
MPS Group, Inc.* | | 10,190 | | | | 111,479 |
Napco Security Systems, Inc.* | | 21,150 | | | | 132,188 |
NICE Systems, Ltd.* | | 4,700 | | | | 161,304 |
Online Resources Corp.* | | 4,355 | | | | 51,912 |
OPNET Technologies, Inc.* | | 3,345 | | | | 30,306 |
Polycom, Inc.* | | 7,155 | | | | 198,766 |
Powerwave Technologies, Inc.* | | 46,620 | | | | 187,879 |
Progress Software Corp.* | | 5,125 | | | | 172,610 |
RightNow Technologies, Inc.* | | 6,350 | | | | 100,648 |
Rogers Corp.* | | 3,705 | | | | 160,686 |
Sapient Corp.* | | 33,790 | | | | 297,690 |
Silicon Image, Inc.* | | 46,990 | | | | 212,395 |
SkillSoft PLC* | | 10,110 | | | | 96,652 |
Solera Holdings, Inc.* | | 8,250 | | | | 204,435 |
Sybase, Inc.* | | 11,650 | | | | 303,948 |
Symmetricom, Inc.* | | 8,880 | | | | 41,825 |
Tessera Technologies, Inc.* | | 5,360 | | | | 222,976 |
THQ, Inc.* | | 11,200 | | | | 315,728 |
Valueclick, Inc.* | | 8,410 | | | | 184,179 |
Volterra Semiconductor Corp.* | | 6,360 | 2 | | | 70,151 |
Total Information Technology | | | | | | 7,551,296 |
Materials - 3.7% | | | | | | |
Albemarle Corp. | | 5,230 | 2 | | | 215,738 |
Hercules, Inc. | | 8,900 | 2 | | | 172,215 |
Methanex Corp. | | 4,075 | | | | 112,470 |
Nalco Holding Co. | | 5,900 | | | | 142,662 |
Schweitzer-Mauduit International, Inc. | | 3,150 | | | | 81,616 |
Sensient Technologies Corp. | | 2,770 | | | | 78,336 |
Silgan Holdings, Inc. | | 5,540 | | | | 287,748 |
Total Materials | | | | | | 1,090,785 |
The accompanying notes are an integral part of these financial statements.
21
Managers Small Company Fund
Portfolio Manager’s Comments (continued)
| | | | | | | |
| | | Shares | | | Value | |
Telecommunication Services - 1.0% | | | | | | | |
Cbeyond, Inc.* | | 2,540 | | | $ | 99,035 | |
NTELOS Holdings Corp. | | 2,380 | | | | 70,662 | |
Syniverse Holdings, Inc.* | | 7,200 | | | | 112,176 | |
Total Telecommunication Services | | | | | | 281,873 | |
Utilities - 2.0% | | | | | | | |
Vectren Corp. | | 10,050 | 2 | | | 291,550 | |
Westar Energy, Inc. | | 11,350 | | | | 294,419 | |
Total Utilities | | | | | | 585,969 | |
Total Common Stocks | | | | | | | |
(cost $ 23,772,877) | | | | | | 27,700,494 | |
Other Investment Companies - 24.1%1 | | | | | | | |
Bank of New York Institutional Cash Reserves Fund, 5.02% 3 | | 5,181,713 | | | | 5,181,713 | |
Dreyfus Cash Management Fund, Institutional Class Shares, 4.85% | | 1,904,194 | | | | 1,904,194 | |
Total Other Investment Companies | | | | | | | |
(cost $ 7,085,907) | | | | | | 7,085,907 | |
Total Investments - 118.5% | | | | | | | |
(cost $ 30,858,784) | | | | | | 34,786,401 | |
Other Assets, less Liabilities - (18.5)% | | | | | | (5,436,953 | ) |
Net Assets - 100.0% | | | | | $ | 29,349,448 | |
The accompanying notes are an integral part of these financial statements.
22
Managers International Equity Fund
Portfolio Managers’ Comments
The Managers International Equity Fund’s objective is to achieve long-term capital appreciation. Income is the Fund’s secondary objective.
The Managers International Equity Fund (the “Fund”) ordinarily invests at least 80% of assets in equity securities, and 65% of assets in common and preferred stocks of companies domiciled outside the United States. The Fund intends to diversify investments among countries and normally to hold securities of non-U.S. companies in not less than three countries. Investments may be made in companies in developed as well as developing countries. The Fund may invest in fixed-income securities denominated in both foreign and domestic currencies and may engage in currency hedging strategies. The Fund may invest in companies of any size. The MSCI EAFE Index is the benchmark for the Fund.
THE PORTFOLIO MANAGERS
The Fund employs multiple portfolio managers who specialize in distinct investment approaches. This “intelligence diversification” not only serves to manage risk, but also helps us tap the market’s full potential by focusing different analytical insights on each class of investment. Fund management strives to achieve this performance and diversification while ensuring that the Fund operates within the framework of its investment objective and principal investment strategies.
AllianceBernstein L.P.
AllianceBernstein L.P.’s (“Bernstein”) approach to investing is value-based and research-driven. The thesis of Bernstein is that human nature leads investors to buy and sell financial assets based on an overreaction to near-term events as they confuse temporary or cyclical characteristics with structural change. Thus, short-term problems, which cause profits and stocks to decline, can create buying opportunities, as investors underestimate the potential for corrective strategies to restore long-term earnings power. The investment team, led by Kevin Simms, attempts to exploit this by using research to separate fact from emotion.
The primary driver of Bernstein’s performance is research-driven security selection. The investment team begins with a broad universe of all companies within the countries of the MSCI All Country World Index ex - U.S. universe with a market capitalization greater than $750 million. They screen this universe with a proprietary return model in order to identify the companies with the most attractive value attributes. The model derives an expected return for each company within the universe by assessing companies both from a global industry-based perspective and from a country-based standpoint, evaluating such factors as price-to-cash earnings, price-to-book, return on equity, and price momentum.
The ideal company exhibits many of the following traits:
| | • | | Sound future business prospects |
Portfolio Construction
| | • | | Initial investable universe is comprised of all companies within the countries of the MSCI All Country World Index ex-U.S. universe with a market capitalization greater than $750 million |
| | • | | Investment team screens this universe with a proprietary return model in order to identify the companies with the most attractive value attribute |
| | • | | The model derives an expected return for each company within the universe by assessing companies both from a global industry-based perspective and from a country-based standpoint |
| | • | | Factors include price to cash earnings, price to book, return on equity, and price momentum |
| | • | | Analysts perform extensive research, focusing on the most attractively valued stocks |
| | • | | They build detailed spreadsheets of historical and projected balance-sheet and income-statement information in order to estimate: |
| | • | | Normalized earnings power |
| | • | | Cash flow and asset values for each company for the next five years |
| | • | | They then perform simulations to see the potential impact of changes in various financial-statement components |
| | • | | Analysts present their estimates and ratings for each security to the Research Review Committee of the Investment Policy Group (IPG) |
| | • | | The Committee challenges the analysts’ assumptions and conclusions to ensure they are sound. |
The Portfolio
| | • | | Typically holds 35-70 stocks |
| | • | | Initial stock weightings are 0.5% - 3.5% |
The following factors influence the sell decision when:
| | • | | A stock has achieved Bernstein’s forecasted target of fair value |
| | • | | A change the long-term earnings forecast reduces the price target to current market levels |
Lazard Asset Management, LLC
Portfolio manager, William (Willy) Holzer believes that there is a single global economy and marketplace within which everything is connected. Within this single market it is important to distinguish between three types of companies: Domestic companies are those which produce, sell, and raise capital all in their home country; International companies are those which produce at home, but sell their products and raise capital anywhere in the world; Global companies are those which produce, sell, and raise capital anywhere. Willy will invest in any of these types in order to capitalize on a theme; however, he prefers global companies which generally have the flexibility and resources to exploit global trends.
Willy Holzer can be described as a “top-down” thematic investor, whose themes are based on “bottom-up” observations and company analysis. He views the world as a single global economic unit as opposed to a collection of separate country economies. Willy focuses his efforts by first analyzing the connections within the global economy, and from this analysis develops global investment themes. These themes target the segments of the global economy that he believes are most likely to provide attractive long-term investment returns, and which also represent an asymmetric investment opportunity in the investor’s favor.
The ideal company exhibits many of the following traits:
| | • | | Attractive fundamentals |
| | • | | Strong company management |
23
Managers International Equity Fund
Portfolio Managers’ Comments (continued)
Portfolio Construction
| | • | | Portfolio manager leverages stock ideas and research from “top-down” themes based on “bottom-up” observations and company analysis |
| | • | | Constructs portfolio around about 10 investment themes to diversify opportunity sets and provide risk benefits |
| | • | | Portfolio heavily weights large capitalization, multi-managed companies |
| | • | | Concentrated in the developed markets |
| | • | | May have operations or distribution in the emerging markets. |
The Portfolio
| | • | | Portfolio typically holds 70-90 stocks |
| | • | | Initial stock weightings are 1.0% - 1.5% |
| | • | | Relatively low turnover in the 30% to 40% annual range |
The investment manager may sell a security when it:
| | • | | Exceeds price expectations |
| | • | | Underperforms global universe |
Wellington Management Company, LLP
Jean-Marc Berteaux and Andrew S. Offit’s investment philosophy is built on the beliefs that industry is the dominant competitive factor for companies, that companies can dominate industries on a global basis, and that expectations about companies, specifically earnings, drive stock prices. The focus is to identify industry leaders where their earnings forecasts are ahead of market expectations, and where they’ve identified the key drivers for the earnings.
The initial investable universe for the investment team at Wellington Management Company, LLP (“Wellington Management”) is comprised of companies in the MSCI EAFE Index with market capitalizations greater than U.S. $1 billion. These companies are researched by Wellington Management’s global industry analysts, who perform intensive ongoing fundamental research. Fundamental research consists of comprehensive company meetings, earnings modeling, and valuation analysis. The focus of this research is to update an ongoing assessment of management, current business challenges, and aggregate industry trends. Thorough analysis is done in preparation for and following company contacts to ensure that “the numbers support the story” i.e., that the strategy and challenges outlined by management are coming through in financial results.
The ideal company exhibits many of the following traits:
| | • | | Identified earnings drivers |
| | • | | Above consensus earnings growth expectations |
| | • | | Multiple expansion potential |
| | • | | Reasonable valuation levels |
Portfolio Construction
| | • | | The portfolio typically holds 50-80 stocks |
| | • | | Cash levels are maintained at less than 10% of assets |
| | • | | Maximum of 10% is committed to any single holding |
| | • | | Active sector allocations are entirely built from stock selection |
| | • | | Country allocation is an implicit result of stock selection |
| | • | | Some consideration is given to ensuring country diversification |
| | • | | Emerging market exposure maximum of 15% |
The portfolio management team may sell an investment when:
| | • | | They see deteriorating earnings drivers or company fundamentals |
| | • | | Trend of earnings growth decelerates |
| | • | | They see limited upside potential left in the stock price |
THE YEAR IN REVIEW
For the year 2007, the Managers International Equity Fund returned 14.86% versus 11.17% for the MSCI EAFE Index. Note that unless otherwise stated, all performance cited in this commentary is in U.S. dollars.
Foreign stock markets, once again, yielded double-digit results despite global capital markets turmoil towards the end of the year. A large portion of the solid return generated in 2007, approximately 66%, was driven by the appreciation of foreign currencies relative to the U.S. dollar. The Eurozone outperformed Asian markets, while emerging markets once again outperformed their developed market counterparts. Volatility in foreign stock markets rose in 2007 and returned to a more normal level after several years of relative calm. Meanwhile, many central banks responded to the global credit crunch by either lowering their short-term rates or injecting additional liquidity into the markets.
With the exception of the Belgian, Irish, and Japanese stock markets, all other countries within the MSCI EAFE Index produced positive returns in U.S. dollars during 2007. In terms of contribution, Germany had the largest impact as it appreciated more than 35%. However, Japan disappointed, once again, returning -4% for the year. From a sector perspective, all sectors exhibited positive returns during the year, with the exception of the financials sector (-1%), which was led down by concerns about global credit markets. The best-performing sector for the year was materials, which was driven higher primarily by positive earnings surprises that were in turn driven by high global commodity prices. From a style perspective, growth stocks significantly outperformed their value counterparts after years of lagging behind. This was primarily driven by the strong performance in more traditional growth sectors such as information technology and the difficulty of more value-oriented sectors such as financials and consumer discretionary.
Within the Fund, strong performance relative to the MSCI EAFE Index was led by solid broad-based stock selection. In fact, all sectors experienced positive stock selection in 2007, with the exception of the consumer sectors. The positioning of the Fund, particularly at the country level, also added value relative to the benchmark during the year. This solid positioning was led by the underweight to the struggling Japanese equity market and the exposure to non-benchmark countries such as Canada along with select emerging markets such as Brazil.
LOOKING FORWARD
The portfolio managers expect moderate growth around the world in 2008, although worries about the potential impact of tighter credit
24
Managers International Equity Fund
Portfolio Manager’s Comments (continued)
have weakened business confidence. In addition, the portfolio managers expect both Europe and Asia to suffer from declining U.S. imports as the dollar stays weak, and each region is also expected to struggle as a result of lingering global credit distress. As for emerging markets, despite the strong performance over the last couple of years, the majority of the underlying countries and securities continue to sell at reasonable valuations and will, in our opinion, potentially provide an important offset to slowing developed market activity.
From a country perspective, the Portfolio maintains the largest positions in Japan and the United Kingdom, although each of these positions is an underweight relative to the MSCI EAFE Index. Outside the benchmark, the Fund has a 4.1% allocation to Canadian equities and 6.5% of the Portfolio is invested in emerging markets.
CUMULATIVE TOTAL RETURN PERFORMANCE
Managers International Equity Fund’s cumulative total return is based on the daily change in net asset value (NAV), and assumes that all distributions were reinvested. The Morgan Stanley Capital International Europe, Australasia, and Far East (MSCI EAFE) Index is composed of all the publicly traded stocks in developed non-U.S. Markets. Among the countries included are Australia, France, Germany, Italy, Japan, Singapore, Spain, and the United Kingdom. Unlike the Fund, the MSCI EAFE Index is unmanaged, is not available for investment, and does not incur expenses. The Index assumes reinvestment of dividends. This graph compares a hypothetical $10,000 investment made in Managers International Equity Fund on December 31, 1997, to a $10,000 investment made in the MSCI EAFE for the same time period. The table is not intended to imply any future performance of the Fund. Performance for periods longer than one year is annualized. The graph and table do not reflect the deduction of taxes that a shareholder would pay on a Fund distribution or redemption of shares. The listed returns for the Fund are net of expenses and the returns for the index exclude expenses. Past performance is not indicative of future results. Total returns would have been lower had certain expenses not been reduced.
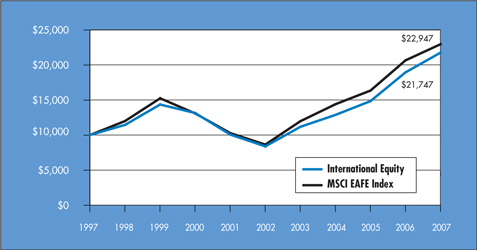
The table below shows the average annual total returns for Managers International Equity Fund and the MSCI EAFE since December 31, 1997 through December 31, 2007.
| | | | | | | | | | | |
Average Annual Total Returns 1 | | One Year | | | Five Years | | | Ten Years | | | Inception Date |
Managers International Equity Fund 2,3,4 | | 14.86 | % | | 21.00 | % | | 8.08 | % | | 12/31/85 |
MSCI EAFE Index | | 11.17 | % | | 21.59 | % | | 8.66 | % | | |
25
Managers International Equity Fund
Portfolio Managers’ Comments (continued)
The performance data shown represents past performance. Past performance is not a guarantee of future results. Current performance may be lower or higher than the performance data quoted. The investment return and principal value of an investment in the Fund will fluctuate so that an investor’s shares, when redeemed, may be worth more or less than their original cost. For performance information through the most recent month end, please call (800) 835-3879 or visit our Web site at www.managersinvest.com.
In choosing a Fund, investors should carefully consider the amount they plan to invest, their investment objectives, the Fund’s investment objectives, risks, charges and expenses before investing. For this and other information, please call 800.835.3879 or visit www.managersinvest.com for a free prospectus. Read it carefully before investing or sending money. Distributed by Managers Distributors, Inc., member FINRA.
| | 1 | Total return equals income yield plus share price change and assumes reinvestment of all dividends and capital gain distributions. Returns are net of fees and may reflect offsets of Fund expenses as described in the Prospectus. No adjustment has been made for taxes payable by shareholders on their reinvested dividends and capital gain distributions. Returns for periods greater than one year are annualized. The listed returns on the Fund are net of expenses. All returns are in U.S. dollars($). |
| | 2 | Fund for which, from time to time, the Fund’s advisor has waived its fees and/or absorbed Fund expenses, which has resulted in higher returns. |
| | 3 | Investments in foreign securities are subject to additional risks such as changing market conditions, economic and political instability, and currency exchange rate fluctuations. |
| | 4 | Performance based on published NAV as of December 31, 2007. |
26
Managers International Equity Fund
Fund Snapshots
December 31, 2007
Portfolio Breakdown
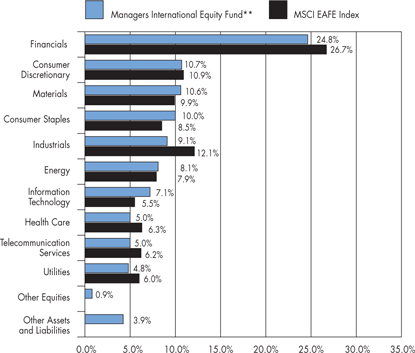
| | | | | | |
Industry | | Managers
International
Equity Fund** | | | MSCI EAFE
Index | |
Financials | | 24.8 | % | | 26.7 | % |
Consumer Discretionary | | 10.7 | % | | 10.9 | % |
Materials | | 10.6 | % | | 9.9 | % |
Consumer Staples | | 10.0 | % | | 8.5 | % |
Industrials | | 9.1 | % | | 12.1 | % |
Energy | | 8.1 | % | | 7.9 | % |
Information Technology | | 7.1 | % | | 5.5 | % |
Health Care | | 5.0 | % | | 6.3 | % |
Telecommunication Services | | 5.0 | % | | 6.2 | % |
Utilities | | 4.8 | % | | 6.0 | % |
Other Equities | | 0.9 | % | | 0.0 | % |
Other Assets and Liabilities | | 3.9 | % | | 0.0 | % |
Top Ten Holdings
| | | |
Security Name | | Percentage of
Net Assets | |
Tesco PLC | | 1.5 | % |
Sanofi -Synthelabo SA | | 1.5 | |
Nokia Oyj | | 1.4 | |
Veolia Environment* | | 1.4 | |
Vodafone Group PLC* | | 1.1 | |
Vestas Wind Systems A/S | | 1.1 | |
Xstrata PLC* | | 1.1 | |
BASF AG | | 1.1 | |
Hong Kong Exchanges & Clearing, Ltd. | | 1.1 | |
Siemens AG* | | 1.1 | |
| | | |
Top Ten as a Group | | 12.4 | % |
| | | |
| * | Top Ten Holding at June 30, 2007 |
Any sectors, industries, or securities discussed should not be perceived as investment recommendations. Mention of a specific security should not be considered a recommendation to buy or solicitation to sell that security.
27
Managers International Equity Fund
Fund Snapshots (continued)
Summary of Investments by Country
| | | | | | |
Country | | Managers International
Equity Fund* | | | MSCI EAFE Index | |
United Kingdom | | 17.7 | % | | 22.1 | % |
Japan | | 13.9 | % | | 19.9 | % |
France | | 10.3 | % | | 10.1 | % |
Germany | | 9.4 | % | | 9.4 | % |
Switzerland | | 7.3 | % | | 6.6 | % |
Hong Kong | | 5.3 | % | | 1.9 | % |
Netherlands | | 4.8 | % | | 3.0 | % |
United States | | 4.5 | % | | 0.1 | % |
Canada | | 4.1 | % | | 0.0 | % |
South Korea | | 2.1 | % | | 0.0 | % |
Brazil | | 2.0 | % | | 0.0 | % |
Luxembourg | | 2.0 | % | | 0.6 | % |
China | | 1.8 | % | | 0.0 | % |
Finland | | 1.7 | % | | 1.9 | % |
Spain | | 1.7 | % | | 4.4 | % |
Taiwan | | 1.2 | % | | 0.0 | % |
Denmark | | 1.2 | % | | 0.9 | % |
Belgium | | 1.1 | % | | 1.2 | % |
Italy | | 1.0 | % | | 4.0 | % |
Russia | | 0.8 | % | | 0.0 | % |
South Africa | | 0.8 | % | | 0.0 | % |
Ireland | | 0.8 | % | | 0.6 | % |
Singapore | | 0.8 | % | | 1.1 | % |
Sweden | | 0.8 | % | | 2.3 | % |
Egypt | | 0.6 | % | | 0.0 | % |
India | | 0.6 | % | | 0.0 | % |
Australia | | 0.5 | % | | 6.4 | % |
Turkey | | 0.3 | % | | 0.0 | % |
Greece | | 0.3 | % | | 0.8 | % |
Norway | | 0.3 | % | | 1.0 | % |
Bermuda | | 0.2 | % | | 0.4 | % |
Cayman Islands | | 0.1 | % | | 0.2 | % |
Austria | | 0.0 | % | | 0.5 | % |
New Zealand | | 0.0 | % | | 0.1 | % |
Portugal | | 0.0 | % | | 0.4 | % |
Jersey, Channel Islands | | 0.0 | % | | 0.1 | % |
Supranational & Other | | 0.0 | % | | 0.0 | % |
| | 100.0 | % | | 100.0 | % |
| | | | | | |
| * | As a percentage of total market value of common stocks on December 31, 2007 |
28
Managers International Equity Fund
Schedule of Portfolio Investments
December 31, 2007
| | | | | | |
| | | Shares | | | Value |
Common Stocks - 95.2% | | | | | | |
Consumer Discretionary - 10.7% | | | | | | |
Alibaba.com, Ltd. (China)* | | 205,800 | 2 | | $ | 729,778 |
Burberry Group PLC (United Kingdom) | | 135,771 | | | | 1,534,544 |
Carphone Warehouse Group, The (United Kingdom) | | 358,197 | | | | 2,437,074 |
China Resources Enterprises, Ltd. (Hong Kong) | | 80,000 | | | | 339,739 |
Compagnie Generale des Etablissements | | | | | | |
Michelin (France) | | 8,400 | | | | 960,360 |
Cyrela Brazil Realty S.A. (Brazil) | | 22,100 | | | | 300,461 |
DaimlerChrylser Ag (Germany) | | 32,062 | | | | 3,107,451 |
Daiwa House Industry Co., Ltd. (Japan) | | 69,000 | | | | 881,556 |
Focus Media Holding, Ltd. (Cayman Islands)* | | 3,200 | 2 | | | 181,792 |
Hyundai Mobis (South Korea) | | 7,700 | | | | 711,497 |
KarstadtQuelle AG (Germany)* | | 112,783 | 2 | | | 2,696,411 |
Kinross Gold Corp. (Canada)* | | 32,700 | 2 | | | 601,680 |
Koninklijke (Royal) Phillips Electronics N.V. (Netherlands) | | 22,787 | | | | 976,429 |
Lagardere (France) | | 11,700 | | | | 876,217 |
LG Electronics, Inc. (South Korea) | | 10,613 | | | | 1,121,217 |
Nissan Motor Co., Ltd. (Japan) | | 250,500 | | | | 2,734,081 |
Pearson PLC (United Kingdom) | | 71,053 | | | | 1,028,981 |
Publicis Groupe (France) | | 12,323 | | | | 482,115 |
Renault SA (France) | | 17,900 | | | | 2,538,625 |
SES Global (Luxembourg) | | 14,975 | | | | 395,297 |
Sharp Corp. (Japan) | | 92,000 | | | | 1,641,111 |
Sony Corp (Japan) | | 28,300 | | | | 1,541,865 |
Suntech Power Holdings Co., Ltd. (China)* | | 27,700 | 2 | | | 2,280,264 |
Taylor Wimpey PLC (United Kingdom) | | 124,808 | | | | 502,664 |
Wolters Kluwer NV (Netherlands) | | 34,800 | | | | 1,144,763 |
Yamada Denki Co., Ltd. (Japan) | | 4,810 | | | | 542,593 |
Total Consumer Discretionary | | | | | | 32,288,565 |
Consumer Staples - 10.0% | | | | | | |
Associated British Foods PLC (United Kingdom) | | 60,000 | | | | 1,070,298 |
British American Tobacco PLC (United Kingdom) | | 30,000 | | | | 1,172,794 |
Cadbury Schweppes PLC (United Kingdom) | | 119,400 | | | | 1,459,891 |
Diageo PLC (United Kingdom) | | 63,612 | | | | 1,365,448 |
Groupe Danone (France) | | 9,900 | | | | 887,276 |
Heineken N.V. (Netherlands) | | 25,346 | | | | 1,636,915 |
Interbrew (Belgium) | | 16,355 | | | | 1,359,607 |
Japan Tobacco, Inc. (Japan) | | 236 | | | | 1,395,408 |
Koninklijke Ahold N.V. (Netherlands)* | | 199,167 | | | | 2,758,238 |
L’Oreal SA (France) | | 9,500 | | | | 1,360,377 |
Metro AG (Germany) | | 11,200 | | | | 942,850 |
Nestle SA, Registered (Switzerland) | | 5,634 | | | | 2,587,078 |
Reckitt Benckiser Group PLC (United Kingdom) | | 40,481 | | | | 2,352,354 |
Seven & i Holdings Co., Ltd. (Japan) | | 43,600 | | | | 1,266,686 |
Tesco PLC (United Kingdom) | | 485,978 | | | | 4,622,888 |
Unilever N.V. (Netherlands) | | 81,262 | | | | 2,985,630 |
Unilever PLC (United Kingdom) | | 12,500 | | | | 468,811 |
Uni-President Enterprises Corp. (Taiwan)* | | 316,860 | | | | 422,812 |
Total Consumer Staples | | | | | | 30,115,361 |
Energy - 8.1% | | | | | | |
BP PLC (United Kingdom) | | 137,900 | | | | 1,685,173 |
Canadian Natural Resources, Ltd. (Canada) | | 19,500 | | | | 1,434,024 |
CGG Veritas (France) | | 930 | | | | 263,059 |
China Petroleum and Chemical Corp., Class H (Hong Kong) | | 766,000 | | | | 1,135,556 |
China Shenhua Energy Co., Ltd. (China) | | 368,500 | | | | 2,170,751 |
EnCana Corp. (Canada) | | 24,168 | | | | 1,652,910 |
Eni S.p.A. (Italy) | | 49,700 | | | | 1,813,871 |
LUKOIL Holdings, ADR (Russia) | | 6,100 | 2 | | | 515,450 |
Gazprom ADR (Russia) | | 34,300 | | | | 1,938,186 |
Petro-Canada (Canada) | | 1,200 | | | | 64,745 |
Petroleo Brasileiro S.A. (Brazil) | | 11,600 | 2 | | | 1,116,152 |
Petroleo Brasileiro S.A., Sponsored ADR (Brazil) | | 18,400 | 2 | | | 2,120,416 |
Petroplus Holdings AG (Switzerland)* | | 10,482 | | | | 814,762 |
Repsol YPF, S.A. (Spain) | | 9,300 | | | | 331,761 |
Royal Dutch Shell PLC, Class A (United Kingdom) | | 73,200 | | | | 3,085,860 |
SeaDrill Ltd. (Bermuda)* | | 29,800 | | | | 727,184 |
StatoilHydro ASA (Norway) | | 29,150 | | | | 899,300 |
Suncor Energy, Inc. (Canada) | | 5,700 | | | | 623,220 |
TOTAL S.A. (France) | | 24,852 | | | | 2,057,757 |
Total Energy | | | | | | 24,450,137 |
Financials - 24.8% | | | | | | |
Allianz AG (Germany) | | 12,900 | | | | 2,779,172 |
Aviva PLC (United Kingdom) | | 97,743 | | | | 1,302,666 |
Banco do Brasil (Brazil) | | 14,500 | | | | 247,640 |
Bank of East Asia, Ltd. (Hong Kong) | | 98,200 | | | | 665,386 |
Barclays PLC (United Kingdom) | | 165,000 | | | | 1,666,388 |
BNP Paribas SA (France) | | 25,440 | | | | 2,760,242 |
Bolsa de Mercadorias & Futuros S.A. (Brazil) | | 59,800 | | | | 839,888 |
The accompanying notes are an integral part of these financial statements.
29
Managers International Equity Fund
Schedule of Portfolio Investments (continued)
| | | | | | |
| | | Shares | | | Value |
Financials - 24.8% (continued) | | | | | | |
CapitaLand Ltd. (Singapore) | | 263,000 | | | $ | 1,131,532 |
Cathay Financial Holding Co., Ltd. (Taiwan) | | 190,000 | | | | 392,586 |
China Overseas Land & Investment Ltd. (Hong Kong) | | 1,057,000 | | | | 2,164,721 |
Chinatrust Financial Holding, Co. (Taiwan)* | | 484,000 | | | | 341,496 |
Credit Agricole SA (France) | | 53,575 | | | | 1,807,423 |
Credit Suisse Group (Switzerland)* | | 32,400 | | | | 1,950,336 |
Daiwa Securities Group, Inc. (Japan) | | 80,000 | | | | 718,212 |
DBS Group Holdings, Ltd. (Singapore) | | 92,000 | | | | 1,305,754 |
Deutsche Bank AG (Germany) | | 15,800 | | | | 2,063,087 |
Deutsche Boerse AG (Germany) | | 13,272 | | | | 2,619,421 |
Deutsche Postbank AG (Germany) | | 7,900 | | | | 704,833 |
Fondiaria-SAI SpA (Italy) | | 19,200 | | | | 711,445 |
Fortis (Belgium) | | 50,000 | | | | 1,308,937 |
Hang Lung Group Ltd. (Hong Kong) | | 51,900 | | | | 280,440 |
Hang Lung Properties Ltd. (Hong Kong) | | 60,000 | | | | 268,083 |
HBOS PLC (United Kingdom) | | 150,950 | | | | 2,194,971 |
HDFC Bank Ltd. (India) | | 28,500 | | | | 1,231,425 |
Henderson Land Development Co., Ltd. (Hong Kong) | | 133,000 | | | | 1,235,189 |
Hong Kong Exchanges & Clearing, Ltd. (Hong Kong) | | 115,000 | | | | 3,223,886 |
ING Groep NV (Netherlands) | | 67,217 | | | | 2,619,139 |
Invesco Ltd. (United States) | | 91,763 | | | | 2,879,507 |
Julias Baer Holding, Ltd. (Switzerland) | | 22,259 | | | | 1,840,253 |
KK DaVinci Advisors (Japan)* | | 114 | | | | 98,764 |
Kookmin Bank (South Korea) | | 19,974 | | | | 1,472,364 |
Leopalace21 Corp. (Japan) | | 2,800 | | | | 75,230 |
Man Group PLC (United Kingdom) | | 259,159 | | | | 2,941,910 |
Mitsubishi Estate Co., Ltd. (Japan) | | 54,000 | | | | 1,286,547 |
Mitsubishi Tokyo Financial Group, Inc. (Japan) | | 221,900 | | | | 2,092,501 |
Mitsui Fudosan Co., Ltd. (Japan) | | 56,000 | | | | 1,207,721 |
Muenchener Rueckversicherungs AG (Germany) | | 9,600 | | | | 1,863,143 |
National Bank of Greece S.A. (Greece) | | 11,737 | | | | 804,866 |
Nomura Holdings, Inc. (Japan) | | 61,100 | | | | 1,023,722 |
ORIX Corp. (Japan) | | 11,920 | | | | 2,004,792 |
Prudential Corp. PLC (United Kingdom) | | 95,903 | | | | 1,350,392 |
Royal Bank of Scotland Group PLC (United Kingdom) | | 284,147 | | | | 2,508,869 |
Schroders PLC (United Kingdom) | | 64,546 | | | | 1,656,100 |
Societe Generale (France) | | 11,340 | | | | 1,640,095 |
Standard Chartered, PLC (United Kingdom) | | 46,700 | | | | 1,704,395 |
Sumitomo Mitsui Financial Group, Inc. (Japan) | | 265 | | | | 1,961,074 |
Sumitomo Realty & Development Co., Ltd. (Japan) | | 44,000 | | | | 1,076,067 |
Sun Hung Kai Properties, Ltd. (Hong Kong) | | 125,000 | | | | 2,625,444 |
T&D Holdings, Inc. (Japan) | | 16,600 | | | | 844,631 |
Unibanco-Uniao de Bancos Brasileiros S.A. (Brazil) | | 18,900 | | | | 262,583 |
Zurich Financial Services AG (Switzerland) | | 4,410 | | | | 1,294,276 |
Total Financials | | | | | | 75,049,544 |
Health Care - 5.0% | | | | | | |
Actelion Ltd. (Switzerland)* | | 21,017 | | | | 960,078 |
AstraZeneca PLC (United Kingdom) | | 14,900 | | | | 641,339 |
CSL Ltd. (Australia) | | 26,442 | | | | 837,679 |
Elan Corp., PLC -Sponsored ADR (Ireland)* | | 73,000 | 2 | | | 1,604,540 |
GlaxoSmithKline PLC (United Kingdom) | | 75,200 | | | | 1,909,823 |
Novartis AG (Switzerland)* | | 18,300 | | | | 1,000,778 |
Phonak Holding AG (Switzerland) | | 24,696 | | | | 2,772,699 |
Roche Holding AG (Switzerland)* | | 5,550 | | | | 959,405 |
Sanofi -Synthelabo SA (France) | | 47,967 | | | | 4,390,920 |
Total Health Care | | | | | | 15,077,261 |
Industrials - 9.1% | | | | | | |
ABB Ltd. (Switzerland) | | 93,600 | | | | 2,695,919 |
Air France-KLM (France) | | 15,200 | | | | 531,218 |
Alstom (France) | | 13,019 | | | | 2,796,392 |
BAE Systems PLC (United Kingdom) | | 117,500 | | | | 1,166,059 |
China Communications Constuction Co., Ltd. (China) | | 118,000 | | | | 305,063 |
Dai Nippon Printing Co., Ltd. (Japan) | | 42,000 | | | | 615,161 |
Deutsche Lufthansa AG (Germany) | | 41,400 | | | | 1,103,579 |
easyJet PLC (United Kingdom)* | | 81,229 | | | | 986,625 |
FANUC, Ltd. (Japan) | | 8,900 | | | | 862,838 |
Far Eastern Textile Co., Ltd. (Taiwan) | | 367,920 | | | | 427,657 |
Gamesa Corporacion Tecnologica, S.A. (Spain) | | 21,597 | | | | 999,306 |
Hansen Transmissions International N.V. (Belgium) | | 97,027 | | | | 556,250 |
HOCHTIEF AG (Germany) | | 2,000 | | | | 268,663 |
Hutchison Whampoa, Ltd. (Hong Kong) | | 99,000 | | | | 1,115,264 |
Kajima Corp. (Japan) | | 129,000 | | | | 418,693 |
Leighton Holdings Limited (Australia) | | 15,036 | 2 | | | 795,602 |
Mitsubishi Heavy Inds., Ltd. (Japan) | | 232,000 | | | | 985,846 |
Mitsui O.S.K. Lines, Ltd. (Japan) | | 67,000 | | | | 847,034 |
Nippon Yusen Kabushiki Kaisha (Japan) | | 79,000 | | | | 622,361 |
Ryanair Holdings PLC (Ireland)* | | 21,900 | 2 | | | 863,736 |
The accompanying notes are an integral part of these financial statements.
30
Managers International Equity Fund
Schedule of Portfolio Investments (continued)
| | | | | | |
| | | Shares | | | Value |
Industrials - 9.1% (continued) | | | | | | |
Shimizu Corp. (Japan) | | 99,000 | | | $ | 429,723 |
Siemens AG (Germany) | | 19,986 | | | | 3,177,824 |
Tostem Inax Holding Corp. (Japan) | | 32,000 | | | | 510,559 |
Vestas Wind Systems A/S (Denmark)* | | 31,950 | | | | 3,449,988 |
Wright Express Corp. (France) | | 672 | | | | 181,751 |
Yamato Transport Co., Ltd. (Japan) | | 62,000 | | | | 891,207 |
Total Industrials | | | | | | 27,604,318 |
Information Technology - 7.1% | | | | | | |
ARM Holdings PLC (United Kingdom) | | 407,366 | | | | 1,004,665 |
ASML Holding N.V. (Netherlands)* | | 76,713 | | | | 2,422,127 |
Au Optronics Corp., Sponsored ADR (Taiwan) | | 30,352 | | | | 582,758 |
Ericsson (LM), Class B (Sweden) | | 582,000 | | | | 1,362,217 |
Fujitsu Ltd. (Japan) | | 215,000 | | | | 1,438,237 |
Hynix Semiconductor, Inc. (South Korea)* | | 22,900 | | | | 627,218 |
Logitech International SA (Switzerland) | | 82,040 | | | | 2,996,157 |
Nintendo Co., Ltd. (Japan) | | 2,500 | | | | 1,467,880 |
Nokia Oyj (Finland) | | 112,120 | | | | 4,307,354 |
Redecard SA (Brazil) | | 24,500 | | | | 396,404 |
Research In Motion, Ltd. (Canada)* | | 6,400 | | | | 725,760 |
Samsung Electronics Co., Ltd. (South Korea) | | 1,700 | | | | 1,000,446 |
Taiwan Semiconductor Manufacturing Co., Ltd. Sponsored ADR (Taiwan) | | 106,623 | | | | 1,061,975 |
Toshiba Corp. (Japan) | | 173,000 | | | | 1,276,734 |
United Microelectronics Corp. (Luxembourg)* (a) | | 1,197,502 | | | | 743,649 |
Total Information Technology | | | | | | 21,413,581 |
Materials - 10.6% | | | | | | |
Air Liquide SA (France) | | 11,402 | | | | 1,696,325 |
Antofagasta PLC (United Kingdom) | | 22,900 | | | | 324,656 |
ArcelorMittal (Luxembourg) | | 20,709 | | | | 1,665,309 |
Barrick Gold Corp. (Canada) | | 55,486 | | | | 2,348,858 |
BASF AG (Germany) | | 21,900 | | | | 3,247,602 |
Buzzi Unicem SpA (Italy) | | 16,417 | | | | 453,705 |
Cia Vale do Rio Doce (Brazil) | | 9,800 | | | | 274,204 |
Compania Vale do Rio Doce—ADR (Brazil) | | 16,800 | | | | 548,856 |
Gold Fields, Ltd. (South Africa) | | 83,200 | | | | 1,197,302 |
Goldcorp, Inc. (Canada) | | 48,600 | | | | 1,664,400 |
Impala Platinum Holdings, Ltd. (South Africa) | | 28,900 | 2 | | | 1,003,243 |
JFE Holdings, Inc. (Japan) | | 36,000 | | | | 1,805,191 |
Kazakmys PLC (United Kingdom) | | 27,300 | | | | 738,620 |
Lonza Group AG (Switzerland) | | 4,630 | | | | 559,957 |
Mitsubishi Chemical Holdings Corp. (Japan) | | 160,000 | | | | 1,220,749 |
Mitsui Petrochemical (Japan) | | 70,000 | | | | 454,429 |
POSCO (South Korea) | | 1,470 | | | | 888,145 |
Potash Corp. of Saskatchewan (Canada) | | 14,800 | | | | 2,130,608 |
Salzgitter AG (Germany) | | 3,233 | | | | 479,401 |
Stora Enso Oyj (Finland) | | 60,700 | | | | 906,122 |
Svenska Cellulosa AB (SCA) (Sweden) | | 58,200 | | | | 1,027,859 |
Syngenta AG (Switzerland)* | | 5,860 | | | | 1,487,035 |
Taiwan Fertilizer Co., Ltd. (Taiwan) | | 198,000 | | | | 480,952 |
Toray Industries, Inc. (Japan) | | 101,000 | | | | 786,103 |
Xstrata PLC (United Kingdom) | | 48,514 | | | | 3,404,274 |
Yamana Gold, Inc. (Canada) | | 84,259 | | | | 1,100,460 |
Total Materials | | | | | | 31,894,365 |
Telecommunication Services - 5.0% | | | | | | |
Bharti Tele-Ventures Ltd. (India)* | | 24,200 | | | | 605,304 |
China Netcom Group Corp Hong K (Hong Kong) | | 316,000 | | | | 941,479 |
France Telecom SA (France) | | 46,683 | | | | 1,674,555 |
Millicom International Cellular S.A. (Luxembourg)* | | 22,500 | 2 | | | 2,653,650 |
Nippon Telegraph & Tel Corp. (Japan) | | 216 | | | | 1,073,721 |
Orascom Telecom Holding SAE (Egypt) | | 21,800 | | | | 1,805,256 |
Telefonica SA (Spain) | | 63,406 | | | | 2,055,390 |
Turkcell Iletisim Hizmetleri Sponsored ADR (Turkey) | | 34,000 | 2 | | | 937,380 |
Vodafone Group PLC (United Kingdom) | | 924,999 | | | | 3,472,374 |
Total Telecommunication Services | | | | | | 15,219,109 |
Utilities - 4.8% | | | | | | |
E.ON AG (Germany) | | 9,700 | | | | 2,062,154 |
Hong Kong & China Gas Co., Ltd. (Hong Kong) | | 579,700 | | | | 1,765,840 |
Iberdrola Renovables SAU (Spain) | | 201,636 | | | | 1,665,634 |
National Grid PLC (United Kingdom) | | 78,561 | | | | 1,302,912 |
RWE AG (Germany) | | 7,780 | | | | 1,090,838 |
Tokyo Electric Power Co., Inc., The (Japan) | | 78,800 | | | | 2,039,837 |
Tokyo Gas Co, Ltd. (Japan) | | 104,000 | | | | 485,818 |
Veolia Environment (France) | | 44,886 | | | | 4,088,609 |
Total Utilities | | | | | | 14,501,642 |
Total Common Stocks (cost $ 224,254,028) | | | | | | 287,613,883 |
Other Equities - 0.6% | | | | | | |
Hirco PLC (South Africa)* | | 40,800 | | | | 306,999 |
StreetTRACKS Gold Trust. (United States) | | 18,300 | 2 | | | 1,509,018 |
Total Other Equities (cost $ 1,645,811) | | | | | | 1,816,017 |
The accompanying notes are an integral part of these financial statements.
31
Managers International Equity Fund
Schedule of Portfolio Investments (continued)
| | | | | | |
| | | Shares | | Value | |
Preferred Stock - 0.1% | | | | | | |
Samsung Electronics Co., Ltd (South Korea) (cost $449,809) | | 900 | | $ | 408,330 | |
Warrants - 0.2% | | | | | | |
ASUSTeK Computer, Inc. 01/19/17 (Luxembourg) | | 151,300 | | | 454,506 | |
China Overseas Land & Investment Ltd. 08/27/08 (Hong Kong) | | 89,250 | | | 48,760 | |
Total Warrants (cost $465,232) | | | | | 503,266 | |
Other Investment Companies - 7.7%1 | | | | | | |
Bank of New York Institutional Cash Reserves Fund, 5.02% 3 | | 15,154,709 | | | 15,154,709 | |
Dreyfus Cash Management Fund, Institutional Class Shares, 4.85% | | 7,924,344 | | | 7,924,344 | |
Total Other Investment Companies (cost $23,079,053) | | | | | 23,079,053 | |
Total Investments - 103.8% (cost $249,893,933) | | | | | 313,420,549 | |
Other Assets, less Liabilities - (3.8)% | | | | | (11,395,278 | ) |
Net Assets - 100.0% | | | | $ | 302,025,271 | |
The accompanying notes are an integral part of these financial statements.
32
Managers Emerging Markets Equity Fund
Portfolio Manager’s Comments
The Managers Emerging Markets Equity Fund’s (the “Fund”) objective is to achieve long-term capital appreciation.
The Fund invests at least 80% of its assets in equity securities, i.e., common and preferred stocks of companies located in countries designated by the World Bank or the United Nations to be a developing country or an emerging market, such as most countries in Africa, Asia, Latin America, and the Middle East. The Fund may invest in companies of any size. The MSCI Emerging Markets (“MSCI EM”) Index is the benchmark for the Fund.
The Fund currently employs a subadvisor, Rexiter Capital Management Limited (“Rexiter”) to manage the assets of the Fund. The investment team at Rexiter believes emerging markets are less efficient than developed markets, and an actively managed portfolio, with respect to both country weightings and stock selection, can add value over a market capitalization-weighted index without materially affecting risk. Rexiter’s approach is active in terms of both asset allocation and stock selection. Investment decisions are based on fundamental analysis of countries and stocks. Portfolio management is controlled by a disciplined process that seeks to add to returns through the exploitation of market inefficiency, while constraining risk.
Rexiter’s investment strategy is to earn investment return and manage investment risk by analyzing and actively managing country and industry exposure, and by investing in companies within targeted country and industry ranges that demonstrate strong and, most importantly, profitable earnings growth.
The ideal investment exhibits many of the following traits:
| | • | | Ability to generate and maintain strong earnings growth |
| | • | | Established market positions across a diverse range of companies and industries |
Portfolio Construction
| | • | | Use a liquidity-tiered fixed-weight benchmark to determine a neutral position for country allocation |
| | • | | Employ active country allocations away from this neutral position based upon fundamental analysis of macroeconomic variables and equity market valuations |
| | • | | Screen companies based on capitalizations and liquidity parameters to analyze roughly 300 companies in detail by: |
| | • | | Studying published accounts and accounting policies for the underlying development of earnings |
| | • | | Performing a “DuPont Analysis” of return on equity |
| | • | | Analyzing the return of invested capital and the economic value added |
| | • | | Analyzing the cash flow, capital spending and capital requirements of each company |
The investment team will make a sell decision when:
| | • | | The current stock price is not supported by its expectations regarding the company’s future growth potential |
| | • | | The political, economic, or financial health of the country changes |
THE YEAR IN REVIEW
The Fund rose 29.55% in 2007, compared with a gain of 39.78% for its benchmark, the MSCI EM Index. (Note that unless otherwise stated, all performance cited in this commentary is in U.S. dollars.)
Emerging markets continued to steamroll forward during 2007, marking the fifth consecutive year the asset class posted returns greater than 25%. Strong performance was widespread among the various markets, with the tiny market of Argentina the only one not to generate positive returns during the calendar year. Among those markets in positive territory during the year, only Taiwan failed to generate double-digit returns, but certainly did not fall short by much, returning over 9%. Brazil, Turkey, India, and China were among the strongest performers for the year, all posting returns in excess of 50%. Of particular note was how emerging markets performed during the second half of the calendar year. As U.S. markets began to reflect increasing concerns over factors such as the fallout from subprime lending, inflation worries, and a possible U.S. recession, emerging markets seemed unaffected. Historically, because of their ties to the U.S. and other developed markets via exports, emerging market performance displayed a fairly strong correlation to the economic outlook in the U.S. Over recent years, countries like China, India, Russia, and Brazil have benefitted from strong capital inflows and strong demand for commodities. The countries have put the capital to good use in the form of paying down debt and turning current account deficits into surpluses. Along with these capital inflows, many of these emerging markets have developed burgeoning domestic economies that are less reliant on global growth than they have been historically. For example, while China may be perceived to be supported by exports to the U.S., in fact only 20% of China’s exports are to the U.S. Rather, investment spending dedicated toward developing infrastructure in China has been a strong driver for that market. Similarly, markets like Brazil and Russia have seen strong performance driven by commodities demand from other emerging market countries like China and India. Given that global markets seem to have begun to discount a slowdown (or even recession) in the U.S. and lower growth in other developed markets, this resilience demonstrates that emerging markets have been able to decouple from their developed counterparts, at least to some extent.
While the Fund participated in the rally during 2007, it was not able to keep pace with the performance of the benchmark. Brazil was the biggest disappointment in terms of relative performance during the year. The largest stock in the market, Petrobras, enjoyed a return of 53% in the fourth quarter alone and more than 120% for the calendar year. The Fund’s underweight position in this stock was one of the primary causes of underperformance during the period. The Fund’s manager, Rexiter, has avoided the stock due to concerns over valuations as well as the belief that other stocks in the market were more attractive on a fundamental basis. Throughout 2007, emerging markets saw strong capital inflows from investors either seeking exposure to economic growth as the rest of the world slowed, or from those simply chasing the strong performance of the asset class. These flows tend to be more short-term, and therefore may target the larger, more liquid stocks. Petrobras, along with large names in Russia and India, saw its stock performance benefit from these flows, regardless of the underlying fundamental
33
Managers Emerging Markets Equity Fund
Portfolio Manager’s Comments (continued)
strength of the company. The analysts at Rexiter prefer to take a longer term view. While there is nothing in their investment process that precludes them from owning the largest stocks in these markets, the fundamental attractiveness of the mid-cap, domestically-oriented names drove their positioning during the year. The Fund performed very well in terms of absolute performance during the calendar year, though results did not keep pace with the benchmark. We are confident that, over the long term, Rexiter’s focus on top-down country analysis, combined with identifying fundamentally attractive companies, should translate into strong performance for the Fund.
LOOKING FORWARD
Global markets appear to remain very nervous, with sentiment swinging from positive to negative on a daily basis. During the first trading sessions of 2008, volatility, as indicated by the VIX (Chicago Board Option Exchange Volatility Index), has returned with much ferocity to the same levels registered during the market correction in the third quarter of 2007. The policy action from the Federal Reserve and other central banks has helped calm the situation, but markets are expecting, and we believe have already priced in, a certain degree of further action. All in all, the fear that rising commodity prices may limit the degree of easing by overseas central banks, along with weak real economy data (ISM survey, non-farm payrolls) suggesting that credit market tension is now spreading to the U.S. real economy, led to a very poor start to 2008. Fortunately, this volatility and increased investor concerns are occurring against a backdrop of global economic growth, solid corporate balance sheets, and a U.S. monetary and fiscal policy that would seem to have a good degree of flexibility.
On an asset allocation basis, the Fund’s positioning is geared toward domestic plays in countries where domestic leverage is low, where the country is a net commodity exporter, and where the currency is structurally undervalued, e.g., Russia and Malaysia. The Portfolio is currently overweight in Russia, India, and Malaysia. The main sources of funding are China, Mexico, Korea, and Tai-wan. At the stock level, the portfolio is overweight in capital goods and materials, and well placed in almost all those sectors that are primarily exposed to domestic demand. This incorporates sectors as diverse as banks, consumer durables, and telecommunications. Rexiter firmly believes that the macro-economic drivers for emerging markets — namely lower and/or falling inflation, high commodity prices, and strong economic growth — continue to look favorable. While they would hesitate to predict the type of performance we have seen from emerging markets in recent years, they do remain optimistic about the overall prospects for the asset class.
CUMULATIVE TOTAL RETURN PERFORMANCE
Managers Emerging Markets Equity Fund’s cumulative total return is based on the daily change in net asset value (NAV), and assumes that all distributions were reinvested. The MSCI EM Index is a free fl oat-adjusted market capitalization index designed to measure equity market performance in the global emerging markets. The MSCI EM Index consists of emerging markets country indexes, including Argentina, Brazil, Chile, Czech Republic, India, Israel, Malaysia, Mexico, the Philippines, Poland, and Thailand. Unlike the Fund, the MSCI EM Index is unmanaged, is not available for investment, and does not incur expenses. This chart compares a hypothetical $10,000 investment made in Managers Emerging Markets Equity Fund on February 9, 1998, to a $10,000 investment made in the MSCI EM for the same time period. Performance for periods longer than one year is annualized. The graph and table do not reflect the deduction of taxes that a shareholder would pay on a Fund distribution or redemption of shares. The listed returns for the Fund are net of expenses and the returns for the index exclude expenses. Past performance is not indicative of future results. Total returns would have been lower had certain expenses not been reduced.
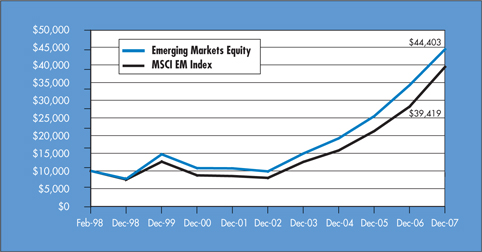
The table below shows the average annual total returns for Manager Emerging Markets Equity Fund and the MSCI EM since inception through December 31, 2007.
| | | | | | | | | | | |
Average Annual Total Returns 1 | | One Year | | | Five Years | | | Since Inception* | | | Inception Date |
Managers Emerging Markets Equity Fund 2,3.4 | | 29.55 | % | | 35.09 | % | | 16.27 | % | | 2/9/98 |
MSCI EM Index | | 39.78 | % | | 37.46 | % | | 14.87 | % | | |
| * | Commencement of operations was February 9, 1998. |
34
Managers Emerging Markets Equity Fund
Portfolio Manager’s Comments (continued)
The performance data shown represents past performance. Past performance is not a guarantee of future results. Current performance may be lower or higher than the performance data quoted. The investment return and principal value of an investment in the Fund will fluctuate so that an investor’s shares, when redeemed, may be worth more or less than their original cost. For performance information through the most recent month end, please call (800) 835-3879 or visit our Web site at www.managersinvest.com.
In choosing a Fund, investors should carefully consider the amount they plan to invest, their investment objectives, the Fund’s investment objectives, risks, charges and expenses before investing. For this and other information, please call 800.835.3879 or visit www.managersinvest. com for a free prospectus. Read it carefully before investing or sending money. Distributed by Managers Distributors, Inc., member FINRA.
| | 1 | Total return equals income yield plus share price change and assumes reinvestment of all dividends and capital gain distributions. Returns are net of fees and may reflect offsets of Fund expenses as described in the Prospectus. No adjustment has been made for taxes payable by shareholders on their reinvested dividends and capital gain distributions. Returns for periods greater than one year are annualized. The listed returns on the Fund are net of expenses. All returns are in U.S. dollars($). |
| | 2 | Fund for which, from time to time, the Fund’s advisor has waived its fees and/or absorbed Fund expenses, which has resulted in higher returns. |
| | 3 | The Fund is subject to the risks associated with investments in emerging markets, such as erratic earnings patterns, economic and political instability, changing exchange controls, limitations on repatriation of foreign capital and changes in local governmental attitudes toward private investment, possibly leading to nationalization or confiscation of investor assets. |
| | 4 | Performance based on published NAV as of December 31, 2007. |
35
Managers Emerging Markets Equity Fund
Fund Snapshots
December 31, 2007
Portfolio Breakdown

| ** | As a percentage of net assets |
| | | | | | |
Industry | | Managers
Emerging Markets
Equity Fund** | | | MSCI EM
Index | |
Financials | | 22.3 | % | | 21.7 | % |
Materials | | 15.7 | % | | 14.7 | % |
Energy | | 14.2 | % | | 18.0 | % |
Industrials | | 12.8 | % | | 9.7 | % |
Information Technology | | 10.5 | % | | 10.1 | % |
Telecommunication Services | | 10.4 | % | | 11.6 | % |
Consumer Discretionary | | 6.2 | % | | 4.9 | % |
Utilities | | 3.9 | % | | 3.5 | % |
Consumer Staples | | 3.6 | % | | 4.2 | % |
Preferred Stock | | 1.6 | % | | 0.0 | % |
Health Care | | 0.4 | % | | 1.6 | % |
Other Assets and Liabilities | | -1.6 | % | | 0.0 | % |
Top Ten Holdings
| | | |
Security Name | | Percentage of
Net Assets | |
OAO Gazaprom ADR | | 4.0 | % |
Tata Steel Ltd. | | 2.1 | |
Compania Vale do Rio Doce - ADR | | 1.9 | |
Mechel - ADR | | 1.9 | |
Bharti Tele-Ventures Ltd. | | 1.9 | |
Hyundai Development Co. | | 1.9 | |
Unitech Ltd. | | 1.9 | |
Mobile Telesystems, Sponsored ADR* | | 1.8 | |
China Mobile Ltd.* | | 1.8 | |
Sasol Ltd. | | 1.7 | |
| | | |
Top Ten as a Group | | 20.9 | % |
| | | |
| * | Top Ten Holding at June 30, 2007 |
Any sectors, industries, or securities discussed should not be perceived as investment recommendations. Mention of a specific security should not be considered a recommendation to buy or solicitation to sell that security.
36
Managers Emerging Markets Equity Fund
Fund Snapshots (continued)
Summary of Investments by Country
| | | | | | |
Country | | Managers Emerging
Markets Equity Fund* | | | MSCI EM Index | |
Russia | | 16.3 | % | | 8.9 | % |
Brazil | | 13.0 | % | | 13.4 | % |
South Korea | | 12.9 | % | | 14.3 | % |
India | | 11.0 | % | | 8.2 | % |
Taiwan | | 9.8 | % | | 10.0 | % |
China | | 6.1 | % | | 9.2 | % |
South Africa | | 4.8 | % | | 6.7 | % |
Malaysia | | 4.8 | % | | 2.4 | % |
Mexico | | 4.0 | % | | 4.5 | % |
Thailand | | 2.6 | % | | 1.3 | % |
Israel | | 2.2 | % | | 2.0 | % |
Indonesia | | 1.9 | % | | 1.6 | % |
Hong Kong | | 1.8 | % | | 5.2 | % |
United Kingdom | | 1.7 | % | | 0.0 | % |
Czech Republic | | 1.7 | % | | 0.6 | % |
Turkey | | 1.6 | % | | 1.7 | % |
Hungary | | 1.5 | % | | 0.8 | % |
Bermuda | | 1.3 | % | | 0.7 | % |
Luxembourg | | 1.2 | % | | 0.3 | % |
Panama | | 0.5 | % | | 0.0 | % |
Philippines | | 0.5 | % | | 0.5 | % |
Egypt | | 0.0 | % | | 0.8 | % |
Cayman Islands | | 0.0 | % | | 0.9 | % |
Argentina | | 0.0 | % | | 0.2 | % |
Chile | | 0.0 | % | | 1.2 | % |
Colombia | | 0.0 | % | | 0.3 | % |
Jordan | | 0.0 | % | | 0.1 | % |
Morocco | | 0.0 | % | | 0.3 | % |
Pakistan | | 0.0 | % | | 0.2 | % |
Peru | | 0.0 | % | | 0.2 | % |
Poland | | 0.0 | % | | 1.7 | % |
United States | | -1.2 | % | | 1.8 | % |
Supranational & Other | | 0.0 | % | | 0.0 | % |
| | 100.0 | % | | 100.0 | % |
| | | | | | |
| * | As a percentage of total market value of common stocks on December 31, 2007 |
37
Managers Emerging Markets Equity Fund
Schedule of Portfolio Investments
December 31, 2007
| | | | | | |
| | | Shares | | | Value |
Common Stocks - 100.0% | | | | | | |
Consumer Discretionary - 6.2% | | | | | | |
Consorcio ARA, S.A. de C.V. (Mexico) | | 1,672,600 | | | $ | 1,869,632 |
Lojas Renner S.A. (Brazil) | | 59,000 | | | | 1,193,258 |
Net Servicos de Comunicacao SA (Brazil)* | | 219,600 | | | | 2,677,146 |
Resorts World Berhad (Malaysia) | | 2,921,600 | | | | 3,404,937 |
Zee Entertainment Enterprises Ltd. (India) | | 394,057 | | | | 3,236,942 |
Total Consumer Discretionary | | | | | | 12,381,915 |
Consumer Staples - 3.6% | | | | | | |
IOI Corp., Berhad (Malaysia)* | | 1,233,735 | | | | 2,870,618 |
Natura Cosmeticos SA (Brazil) | | 61,700 | | | | 589,270 |
OJSC Cherkizovo Group (Russia) (a)* | | 42,118 | | | | 606,499 |
Shinsegae Co., Ltd. (South Korea) | | 4,000 | | | | 3,082,394 |
Total Consumer Staples | | | | | | 7,148,781 |
Energy - 14.2% | | | | | | |
OAO GAZAPROM - ADR (Russia) | | 139,250 | | | | 7,868,582 |
OAO Rosneft Oil Co. GDR (Russia) (a)* | | 238,460 | | | | 2,281,585 |
PetroChina Co., Ltd. (China) | | 1,570,000 | | | | 2,765,308 |
Petroleo Brasileiro S.A., Sponsored ADR (Brazil) | | 28,435 | 2 | | | 3,276,849 |
PTT Public Co., Ltd. (Thailand) | | 270,000 | | | | 2,983,216 |
Sasol Ltd. (South Africa) | | 70,000 | | | | 3,468,745 |
Tenaris S.A. (Luxembourg) | | 53,600 | 2 | | | 2,397,528 |
Yanzhou Coal Mining Co., Ltd. (China) | | 1,570,000 | | | | 3,045,083 |
Total Energy | | | | | | 28,086,896 |
Financials - 22.3% | | | | | | |
Banco Bradesco S.A. (Brazil) | | 90,000 | 2 | | | 2,880,000 |
Bank Hapoalim, Ltd. (Israel) | | 494,143 | | | | 2,463,202 |
Cathay Financial Holding Co., Ltd. (Taiwan) | | 998,000 | | | | 2,062,110 |
China Life Insurance Co., Ltd. (China) | | 183,000 | | | | 935,398 |
Chinatrust Financial Holding Co., Ltd. (Taiwan)* | | 3,796,280 | | | | 2,678,545 |
Grupo Financiero Banorte S.A. de C.V. (Mexico) | | 693,576 | | | | 2,865,990 |
Haci Omer Sabanci Holding AS (Turkey)* | | 543,600 | | | | 2,979,893 |
Kookmin Bank, Sponsored ADR (South Korea)* | | 42,248 | | | | 3,097,623 |
OAO Open Investments (Russia)* | | 5,731 | | | | 1,766,473 |
OTP Bank NyRt. (Hungary) | | 57,649 | | | | 2,907,591 |
PT Bank Rakyat Indonesia (Indonesia) | | 2,107,500 | | | | 1,638,298 |
Samsung Fire & Marine Insurance Co., Ltd. (South Korea) | | 11,168 | | | | 3,005,794 |
Sanlam, Ltd. (South Africa)* | | 853,213 | | | | 2,840,673 |
Savings Bank of the Russian Federation(Sberbank) (Russia) | | 759,000 | | | | 3,197,387 |
Siam Commercial Bank PCL (Thailand) | | 865,100 | | | | 2,199,059 |
Uniao de Bancos Brasileiros SA (Brazil) | | 21,500 | 2 | | | 3,002,260 |
Unitech Ltd. (India) | | 300,000 | | | | 3,676,187 |
Total Financials | | | | | | 44,196,483 |
Health Care - 0.4% | | | | | | |
Dr. Reddy’s Laboratories Ltd. (ADR) (India) | | 48,290 | | | | 888,684 |
Industrials -12.8% | | | | | | |
China Shipping Development Co., Ltd. (China) | | 1,044,000 | | | | 2,710,945 |
Copa Holdings, S.A., Class A (Panama)* | | 28,200 | 2 | | | 1,059,474 |
Cosco Pacific Limited (Bermuda) | | 956,000 | | | | 2,518,115 |
Daewoo Shipbuilding & Marine Engineering Co., Ltd. (South Korea)* | | 59,485 | | | | 3,244,765 |
Hyundai Development Co. (South Korea) | | 38,097 | 2 | | | 3,682,885 |
Hyundai Heavy Industries Co., Ltd. (South Korea) | | 6,751 | | | | 3,146,643 |
Larsen & Toubro Ltd. (India) | | 27,224 | | | | 2,849,846 |
Localiza Rent A Car S.A. (Brazil) | | 116,800 | | | | 1,239,524 |
Santos Brasil Participacoes SA (Brazil) | | 64,962 | | | | 967,131 |
Siemens India, Ltd. (India) | | 61,846 | | | | 2,933,463 |
SM Investments Corp. (Philippines) | | 128,759 | | | | 1,048,251 |
Total Industrials | | | | | | 25,401,042 |
Information Technology - 10.5% | | | | | | |
Advanced Semiconductor Engineering, Inc. (Taiwan) | | 2,526,285 | | | | 2,516,722 |
Delta Electronics, Inc. (Taiwan) | | 577,000 | | | | 1,953,803 |
Hon Hai Precision Industry Co., Ltd. (Taiwan) | | 472,539 | | | | 2,912,485 |
LG.Philips LCD Co., Ltd. (South Korea)* | | 60,000 | 2 | | | 3,172,907 |
Mediatek, Inc. (Taiwan)* | | 213,150 | | | | 2,732,125 |
Samsung Electronics Co., Ltd. (South Korea) | | 2,004 | | | | 1,179,350 |
Samsung Electronics Co., Ltd., GDR, (South Korea) (a) | | 6,100 | | | | 1,811,655 |
Siliconware Precision Industries Co. (Taiwan) | | 1,351,140 | | | | 2,373,372 |
Taiwan Semiconductor Manufacturing Co., Ltd. (Taiwan) | | 989 | | | | 1,875 |
Taiwan Semiconductor Manufacturing Co., Ltd. Sponsored ADR (Taiwan) | | 217,502 | | | | 2,166,320 |
Total Information Technology | | | | | | 20,820,614 |
Materials - 15.7% | | | | | | |
Anglo American PLC (United Kingdom) | | 55,000 | | | | 3,338,578 |
Anhui Conch Cement Company Ltd. (China) | | 316,000 | | | | 2,716,470 |
Compania Vale do Rio Doce - ADR (Brazil) | | 117,900 | | | | 3,851,793 |
The accompanying notes are an integral part of these financial statements.
38
Managers Emerging Markets Equity Fund
Schedule of Portfolio Investments (continued)
| | | | | | | |
| | | Shares | | | Value | |
Materials - 15.7% (continued) | | | | | | | |
Formosa Chemicals & Fibre Corp. (Taiwan) | | 679 | | | $ | 1,726 | |
GMK Norilsk Nickel, Sponsored ADR (Russia) | | 10,200 | 2 | | | 2,703,000 | |
Harmony Gold Mining Co., Ltd. (South Africa) | | 76,995 | | | | 792,424 | |
Harmony Gold Mining Co., Ltd.-Sponsored ADR (United States)* | | 94,100 | 2 | | | 970,171 | |
Mechel OAO - ADR (Russia) | | 39,600 | 2 | | | 3,846,744 | |
Novolipetsk Steel, Corp. (Russia) | | 69,812 | 2 | | | 2,795,971 | |
Raspadskaya OAO (Russia) | | 295,130 | | | | 1,905,655 | |
Sappi Ltd. (South Africa) | | 166,099 | | | | 2,364,736 | |
Tata Steel Ltd. (India) | | 179,580 | | | | 4,215,515 | |
Uralkaliy OAO (Russia) | | 42,147 | | | | 1,569,976 | |
Total Materials | | | | | | 31,072,759 | |
Telecommunication Services - 10.4% | | | | | | | |
America Movil , S.A.B. de C.V. (Mexico) | | 51,300 | 2 | | | 3,149,307 | |
Bezeq Israeli Telecommunication Corp., Ltd. (Israel) | | 846,933 | | | | 1,573,771 | |
Bharti Tele-Ventures Ltd. (India)* | | 147,778 | | | | 3,696,306 | |
China Mobile Ltd. (Hong Kong) | | 206,500 | | | | 3,596,095 | |
Mobile Telesystems, Sponsored ADR (Russia) | | 36,000 | | | | 3,664,440 | |
Telekomunikasi Indonesia Tbk P (Indonesia) | | 2,078,000 | | | | 2,199,854 | |
Tim Participacoes SA-ADR (Brazil) | | 75,700 | 2 | | | 2,645,715 | |
Total Telecommunication Services | | | | | | 20,525,488 | |
Utilities - 3.9% | | | | | | | |
Ceske Energeticke Zavody (Czech Republic) | | 45,000 | | | | 3,344,860 | |
Companhia Energetica de Minas Gerais (Brazil) | | 51,320 | | | | 937,022 | |
Empresa Nacional de Electricidad SA/Chile, ADR (Chile) | | 979 | 2 | | | 36,781 | |
Fifth Power Generation Co. (Russia) | | 1,039,927 | | | | 181,278 | |
Tenaga Nasional Berhad (Malaysia) | | 1,131,050 | | | | 3,263,047 | |
TGC-5 JSC (Russia) | | 34,327,337 | | | | 30,895 | |
Total Utilities | | | | | | 7,793,883 | |
Total Common Stocks (cost $ 139,925,969) | | | | | | 198,316,545 | |
Preferred Stocks - 1.6% | | | | | | | |
TAM S.A. (Brazil) | | 110,783 | | | | 2,654,435 | |
Tata Steel Ltd., 2.000%, 09/01/09 (India) | | 163,124 | | | | 413,863 | |
Total Preferred Stocks (cost $ 2,124,428) | | | | | | 3,068,298 | |
Warrants - 0.0%# | | | | | | | |
China Overseas Land & Investment Ltd. (Hong Kong) | | 127,000 | | | | 69,385 | |
Other Investment Company - 12.5%1,3 | | | | | | | |
Bank of New York Institutional Cash Reserves Fund, 5.02% (cost $ 24,836,384) | | 24,836,384 | | | | 24,836,384 | |
Total Investments - 114.1%
(cost $166,886,781) | | | | | | 226,290,612 | |
Other Assets, less Liabilities - (14.1)% | | | | | | (28,055,718 | ) |
Net Assets - 100.0% | | | | | $ | 198,234,894 | |
The accompanying notes are an integral part of these financial statements.
39
Managers Global Bond Fund
Portfolio Manager’s Comments
The Managers Global Bond Fund’s (the “Fund”) objective is to achieve income and capital appreciation by investing in high-quality foreign and domestic fixed-income securities.
The Fund currently employs a single subadvisor, Loomis Sayles & Company, L.P. (“Loomis”), to manage the assets of the Fund. The investment team at Loomis believes that there are inefficiencies inherent in bond markets, hence the greatest opportunities to add value should reside in the pricing of credit risk. Their philosophy is to identify attractively valued issues through fundamental research. The investment team and analysts at Loomis generally seek fixed income securities of issuers whose credit profiles it believes are improving. The investment team also analyzes political, economic, and other fundamental factors and combines this analysis with a comparison of the yield spreads of various fixed-income securities throughout the world, in an effort to find securities that they believe may produce attractive returns in comparison to their risk. Finally, if a security that is believed to be attractive is denominated in a foreign currency, Loomis analyzes whether to accept or to hedge the currency risk.
Portfolio managers Kenneth Buntrock and David Rolley and their team of credit analysts at Loomis research debt offerings in the same way equity analysts research stocks, looking for undervalued bonds where they see a yield premium, the potential for price appreciation, or both. They analyze in detail the financial condition of individual countries and companies, as well as the terms of specific bond offerings. They believe price appreciation can come from a variety of catalysts, including improving country or company fundamentals that would lead to credit upgrades, changing market supply and demand forces, and improving sector or economic trends.
The ideal investment typically exhibits some of the following traits:
| | • | | An attractive yield, both absolute and relative to Loomis’ credit research expectations |
| | • | | Good call protection (particularly when prevailing rates are low) |
| | • | | Stable or improving fundamentals (for corporate bonds) |
Portfolio Management:
| | • | | Seeks to identify attractively valued issues through fundamental research |
| | • | | Believes the greatest opportunity to add value is through accurately pricing credit risk |
| | • | | Analyzes stability and volatility of a country’s bond markets, the financial strength of the issuer, current interest rates, and Loomis’ expectations regarding general trends in interest rates |
| | • | | Employs bottom-up security selection approach |
| | • | | Ensures the average portfolio quality is Aa or higher |
The investment team may make a sell decision when:
| | • | | There is a change in sovereign, industry, or company fundamentals |
| | • | | The issuer is downgraded by Loomis research |
| | • | | Relative valuation is not consistent with its expected rating category |
| | • | | Other securities or sectors offer greater total return potential |
THE YEAR IN REVIEW
Managers Global Bond Fund returned 7.42% during 2007, compared to a return of 9.48% for the Lehman Brothers Global Aggregate Index.
The Fund underperformed its benchmark, the Lehman Brothers Global Aggregate Index, for the 12-month period ended December 31, 2007. The main driver of this underperformance was the Fund’s overweight allocation in corporate bonds, which sold off in the second half of 2007 as the negative subprime news hit financial markets. The Fund’s currency strategy had a positive impact on relative performance, while the Fund’s duration strategy slightly detracted. Most global government bond markets posted positive returns for the year.
Overall, country allocations contributed positively to performance. The Fund’s overweight positions in Mexico and Singapore and an underweight position in the eurozone added to performance. On the other hand, overweight positions in Malaysia, Norway, and Sweden detracted from performance.
The Fund’s performance also benefited from overweights in the Norwegian krone, Singapore dollar, Icelandic krona, Swedish krona, Uruguay peso, and select Asian positions, as factors such as growth prospects, central bank rate hikes, or already higher yield advantages favored these currencies. Underweight positions in the euro, Polish zloty, and Australian dollar detracted from relative performance.
Throughout the period, the Fund’s manager, Loomis Sayles, maintained an overweight position in corporate bonds. This positioning benefited the Fund during the first half of the year but caused underperformance during the second half, as the subprime melt-down affected credit spreads, and market liquidity caused investors to flee to the safety of Treasuries. The ten-year U.S. Treasury yield fell from a high of 5.32% in June to a low of 3.84% in November. Investment-grade bonds outperformed the high-yield bond market over the past 12 months.
The overall duration strategy had a negative impact on performance. Loomis’ short duration positioning in Japanese yen bond markets was the main driver of underperformance, as yields fell during the year.
LOOKING FORWARD
Loomis believes that small signs of a thaw in the credit crunch emerged at year end. Libor rates have declined significantly from an early December spike above 5.0%, and several major banks have announced measures to increase tier-one capital and bring off-benchmark assets onto the balance sheet. In turn, it appears that the dollar has traded more with economic releases than financial headlines, and has held above its November lows. Loomis’ baseline forecast continues to be for global growth to hold up reasonably well in 2008, driven by strength in Asia ex-Japan, Latin America, and the Mid-East. Loomis still expects a winter U.S. slowdown, with the U.S. consumer on hold, and some echoes of weakness in Japan and Europe. Elsewhere, Loomis expects rising inflation and a trend to higher interest rates to drive currency appreciation in Asia (ex-Japan) and OPEC. Within Europe, Loomis looks for economic activity to weaken enough to shift the policy bias towards ease in coming months. They believe the U.S. Fed will cut rates again at its next meeting. The ECB and Japan are expected to be on hold for now. A cut is expected in the U.K. A retest of dollar lows seems possible in the first quarter of 2008.
Loomis believes that U.S. Treasuries are fully valued after their recent rally. They have trimmed the Fund’s high-quality duration and swapped it for spread duration. In 2008, a gradual improvement
40
Managers Global Bond Fund
Portfolio Managers’s Comments (continued)
in U.S. economic activity could pose a risk for higher yields by mid-year. In Europe, they see Bond yields as range-bound. The same view holds for Japan, where softer domestic data once more looks to delay any rate hikes. Loomis sees higher U.S. and euro yields by mid-2008. Spreads are expected to widen slightly through the winter, as the U.S. potentially slows down and earnings disappointments pressure corporates. Thereafter, Loomis believes bond markets may see stability in spreads through the remainder of 2008, leading to relative outperformance of corporates relative to Treasuries.
Against this backdrop, Loomis may become more defensive in dollar duration positioning, maintaining broadly neutral duration in euro and short duration in Japan. They will likely maintain the Fund’s currency overweight to non-Japan Asian currencies and the increased exposure to credit spread product.
CUMULATIVE TOTAL RETURN PERFORMANCE
Global Bond’s cumulative total return is based on the daily change in net asset value (NAV), and assumes that all distributions were reinvested. The Lehman Brothers Global Aggregate Index is a broad-based index comprised of 10,232 global investment-grade fixed-income securities covering the U.S., Europe and Asia. Unlike the Fund, the Lehman Brothers Global Aggregate Index is unmanaged, is not available for investment, and does not incur expenses. This graph compares a hypothetical $10,000 investment made in Global Bond on December 31, 1997, to a $10,000 investment made in the Lehman Brothers Global Aggregate Index for the same time period. Performance for periods longer than one year is annualized. The graph and table do not reflect the deduction of taxes that a shareholder would pay on a Fund distribution or redemption of shares. The listed returns for the Fund are net of expenses and the returns for the index exclude expenses. Past performance is not indicative of future results. Total returns would have been lower had certain expenses not been reduced.
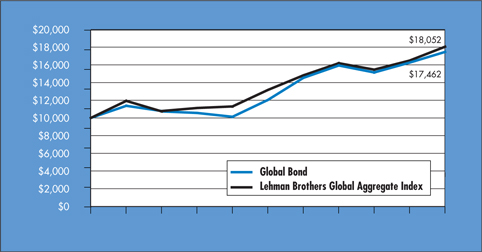
The table below shows the average annual total returns for Global Bond and the Lehman Brothers Global Aggregate Index from December 31, 1997 through December 31, 2007.
| | | | | | | | | | | |
Average Annual Total Returns 1 | | One Year | | | Five Years | | | Ten Years | | | Inception Date |
Global Bond 2,3,4,5 | | 7.42 | % | | 7.72 | % | | 5.73 | % | | 3/25/94 |
Lehman Brothers Global Aggregate Index | | 9.48 | % | | 6.51 | % | | 6.08 | % | | |
41
Managers Global Bond Fund
Portfolio Managers’s Comments (continued)
The performance data shown represents past performance. Past performance is not a guarantee of future results. Current performance may be lower or higher than the performance data quoted. The investment return and principal value of an investment in the Fund will fluctuate so that an investor’s shares, when redeemed, may be worth more or less than their original cost. For performance information through the most recent month end, please call (800) 835-3879 or visit our Web site at www.managersinvest.com.
In choosing a Fund, investors should carefully consider the amount they plan to invest, their investment objectives, the Fund’s investment objectives, risks, charges and expenses before investing. For this and other information, please call 800.835.3879 or visit www.managersinvest.com for a free prospectus. Read it carefully before investing or sending money. Distributed by Managers Distributors, Inc., member FINRA.
| | 1 | Total return equals income yield plus share price change and assumes reinvestment of all dividends and capital gain distributions. Returns are net of fees and may reflect offsets of Fund expenses as described in the Prospectus. No adjustment has been made for taxes payable by shareholders on their reinvested dividends and capital gain distributions. Returns for periods greater than one year are annualized. The listed returns on the Fund are net of expenses. All returns are in U.S. dollars($). |
| | 2 | Fund for which, from time to time, the Fund’s advisor has waived its fees and/or absorbed Fund expenses, which has resulted in higher returns. |
| | 3 | Fixed-income funds are subject to the risks associated with investments in debt securities, such as default risk, fluctuations in debtor’s perceived ability to pay its creditors. Changing interest rates may adversely affect the value of an investment. An increase in interest rates typically causes the value of bonds and other fixed-income securities to fall. |
| | 4 | Investments in foreign securities are subject to additional risks such as changing market conditions, economic and political instability, and currency exchange rate fluctuations. |
| | 5 | Performance based on published NAV as of December 31, 2007. |
42
Managers Global Bond Fund
Fund Snapshots
December 31, 2007
Portfolio Breakdown
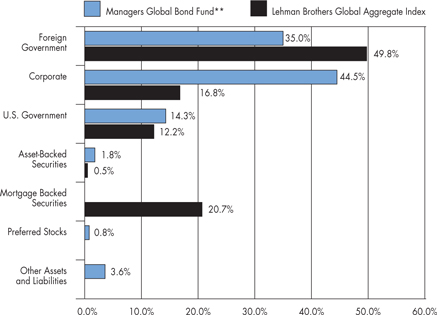
| ** | As a percentage of net assets |
| | | | | | |
Industry | | Managers
Global Bond
Fund** | | | Lehman Brothers
Global Aggregate
Index | |
Foreign Government | | 35.0 | % | | 49.8 | % |
Corporate | | 44.5 | % | | 16.8 | % |
U.S. Government | | 14.3 | % | | 12.2 | % |
Asset-Backed Securities | | 1.8 | % | | 0.5 | % |
Mortgage Backed Securities | | 0.0 | % | | 20.7 | % |
Preferred Stocks | | 0.8 | % | | 0.0 | % |
Other Assets and Liabilities | | 3.6 | % | | 0.0 | % |
Top Ten Holdings
| | | |
Security Name | | Percentage of
Net Assets | |
Belgium Kingdom, 5.500%, 9/28/17* | | 4.3 | % |
Bundesrepublik Deutschland, 4.000%, 04/13/12 | | 3.4 | |
Bundesrepublik Deutschland, 3.750%, 01/04/17 | | 3.4 | |
Kreditanstalt fuer Wiederaufbau, 1.850%, 09/20/10* | | 3.1 | |
Deutschland, Republic of, 3.750%, 07/04/13 | | 3.0 | |
FNMA, 5.500%, 04/01/36* | | 2.8 | |
Bundesrepublik Deutschland, 3.250%, 04/17/09 | | 2.6 | |
Swedish Government, 4.000%, 12/01/09* | | 2.5 | |
European Investment Bank, 1.250%, 09/20/12 | | 2.1 | |
U.K. Gilts, 4.750%, 03/04/20* | | 1.9 | |
| | | |
Top Ten as a Group | | 29.1 | % |
| | | |
| * | Top Ten Holding at June 30, 2007 |
Any sectors, industries, or securities discussed should not be perceived as investment recommendations. Mention of a specific security should not be considered a recommendation to buy or solicitation to sell that security.
43
Managers Global Bond Fund
Schedule of Portfolio Investments
December 31, 2007
| | | | | | | | |
Security Description | | | | Principal Amount | | | Value |
Corporate Bonds - 44.5% | | | | | | | | |
Finance - 23.3% | | | | | | | | |
American Express Co., 6.150%, 08/28/17 | | USD | | 185,000 | | | $ | 189,861 |
ASIF Global Financial, 2.380%, 02/26/09 (a) | | SGD | | 500,000 | | | | 343,456 |
Barclays Financial LLC, | | | | | | | | |
4.060%, 09/16/10 (a) | | KRW | | 220,000,000 | | | | 237,310 |
4.460%, 09/23/10 (a) | | KRW | | 110,000,000 | | | | 113,855 |
5.220%, 03/23/09 (03/23/08) (a) 5 | | KRW | | 307,770,000 | | | | 339,022 |
Bayerische Landesbank, 3.125%, 02/10/09 | | CHF | | 485,000 | | | | 429,668 |
BNP Paribas, 4.730%, 04/12/16 6 | | EUR | | 100,000 | | | | 130,634 |
BSkyB Finance PLC, 5.750%, 10/20/17 | | GBP | | 105,000 | | | | 200,839 |
Canara Bank, 6.365%, 11/28/21 6 | | USD | | 800,000 | 2 | | | 705,516 |
CIT Group, Inc., 5.500%, 12/01/14 | | GBP | | 620,000 | | | | 1,040,220 |
Citigroup, Inc., 5.000%, 09/15/14 | | USD | | 880,000 | | | | 838,503 |
Cosan Finance, Ltd., 7.000%, 02/01/17 (a) | | USD | | 100,000 | | | | 93,750 |
Depfa ACS Bank, 0.750%, 09/22/08 | | JPY | | 150,000,000 | | | | 1,341,561 |
Depfa ACS Bank, 1.875%, 05/07/09 | | CHF | | 140,000 | | | | 122,083 |
Ford Motor Credit Co., 5.700%, 01/15/10 | | USD | | 570,000 | | | | 513,557 |
General Electric Capital Corp., | | | | | | | | |
2.250%, 02/09/09 | | CHF | | 350,000 | | | | 306,425 |
5.250%, 04/15/13 (b) | | USD | | 1,000,000 | | | | 994,153 |
Goldman Sachs Group, Inc., 5.004%, 05/23/16 (02/25/08) 5 | | EUR | | 350,000 | | | | 479,166 |
Host Hotels & Resorts LP, 6.875%, 11/01/14 | | USD | | 400,000 | | | | 398,000 |
Host Marriott, L.P., 6.375%, 03/15/15 | | USD | | 35,000 | | | | 34,125 |
HSBC Bank USA, N.A., 2.951%, 04/18/12 (a) 4 | | MYR | | 3,560,000 | | | | 949,154 |
HSBC Bank, | | | | | | | | |
1.790% 9/18/15 | | JPY | | 100,000,000 | | | | 820,472 |
2.994%, 05/17/12 (a) 4 | | MYR | | 3,000,000 | | | | 796,492 |
ICICI Bank, Ltd., 6.375%, 04/30/22 (a) 6 | | USD | | 280,000 | | | | 253,461 |
Instituto de Credito Oficial. 8.000%, 09/28/09 | | JPY | | 130,000,000 | 2 | | | 1,163,355 |
ISA Capital do Brasil SA, 7.875%, 01/30/12 (a) | | USD | | 100,000 | | | | 102,000 |
JPMorgan Chase & Co., | | | | | | | | |
3.668%, 06/08/12 (a) 4 | | MYR | | 1,935,435 | | | | 498,110 |
5.327%, 11/01/12 (a) 4 | | KRW | | 641,200,000 | | | | 531,291 |
JPMorgan Chase of London, 8.451%, 10/21/10 (a) 4 | | IDR | | 2,680,548,500 | | | | 226,145 |
KfW Bankengruppe, 2.050%, 02/16/26 | | JPY | | 120,000,000 | 2 | | | 1,061,398 |
Kinder Morgan Finance Co., | | | | | | | | |
5.700%, 01/05/16 | | USD | | 245,000 | | | | 221,774 |
6.400%, 01/05/36 | | USD | | 10,000 | | | | 8,259 |
Kreditanstalt fuer Wiederaufbau, 1.850%, 09/20/10 | | JPY | | 315,000,000 | | | | 2,893,751 |
Lloyds TSB Bank PLC, 4.385%, 05/12/17 6 | | EUR | | 125,000 | | | | 155,607 |
Morgan Stanley Co., Series EMTN, 5.375%, 11/14/13 | | GBP | | 120,000 | | | | 228,083 |
The accompanying notes are on integral part of these financial statements.
44
Managers Global Bond Fund
Schedule of Portfolio Investments (continued)
| | | | | | | | |
Security Description | | | | Principal Amount | | | Value |
Finance - 23.3% (continued) | | | | | | | | |
Muenchener Hypothekenbank eG, 5.000%, 01/16/12 (a) | | EUR | | 685,000 | | | $ | 1,021,716 |
Network Rail MTN Finance PLC, 4.875%, 03/06/09 | | GBP | | 110,000 | | | | 218,659 |
Oesterreichische Kontrollbank AG, 1.800%, 03/22/10 | | JPY | | 20,000,000 | | | | 182,843 |
Qwest Capital Funding, Inc., 6.875%, 07/15/28 | | USD | | 15,000 | | | | 12,675 |
RBS Capital Trust C, 4.243%, 01/12/16 6 | | EUR | | 125,000 | | | | 153,689 |
SLM Corp, 5.000%, 10/01/13 | | USD | | 310,000 | | | | 271,717 |
Wells Fargo & Co., 4.625%, 11/02/35 | | GBP | | 350,000 | | | | 592,481 |
White Mountains Re Group, 6.375%, 03/20/17 (a) | | USD | | 285,000 | | | | 276,129 |
Total Finance | | | | | | | | 21,490,965 |
Industrial - 19.0% | | | | | | | | |
Ahold Finance USA, Inc., Series EMTN, 6.500%, 03/14/17 | | GBP | | 195,000 | | | | 379,433 |
Albertson’s, Inc., | | | | | | | | |
6.625%, 06/01/28 | | USD | | 65,000 | | | | 57,185 |
7.450%, 08/01/29 | | USD | | 295,000 | | | | 283,920 |
7.750%, 06/15/26 | | USD | | 5,000 | | | | 4,946 |
Alltel Corp., | | | | | | | | |
6.500%, 11/01/13 | | USD | | 65,000 | | | | 52,000 |
6.800%, 05/01/29 | | USD | | 50,000 | | | | 35,000 |
7.000%, 07/01/12 | | USD | | 95,000 | | | | 81,938 |
7.875%, 07/01/32 | | USD | | 155,000 | 2 | | | 118,575 |
Axtel S.A.B. de CV, 7.625%, 02/01/17 (a) | | USD | | 210,000 | | | | 210,000 |
Bell Aliant Regional Communications, 5.410%, 09/26/16 | | CAD | | 320,000 | | | | 302,566 |
Bell Canada, | | | | | | | | |
5.000%, 02/15/17 | | CAD | | 160,000 | | | | 133,598 |
6.100%, 03/16/35 | | CAD | | 45,000 | | | | 37,216 |
6.550%, 05/01/29 (a) | | CAD | | 10,000 | | | | 8,754 |
7.300%, 02/23/32 | | CAD | | 25,000 | | | | 23,763 |
Bertelsmann AG, 3.625%, 10/06/15 | | EUR | | 180,000 | | | | 229,491 |
Bite Finance International, 8.448%, 03/15/14 (03/15/08) (a) 5 | | EUR | | 170,000 | | | | 224,937 |
Bristol-Myers Squibb Co., 4.625%, 11/15/21 | | EUR | | 150,000 | | | | 193,733 |
Cardinal Health, Inc., 6.000%, 06/15/17 (a) | | USD | | 295,000 | | | | 299,662 |
Cargill, Inc., 5.600%, 09/15/12 (a) | | USD | | 350,000 | | | | 355,736 |
Chesapeake Energy Corp., | | | | | | | | |
6.500%, 8/15/17 | | USD | | 115,000 | | | | 110,975 |
6.875%, 11/15/20 | | USD | | 170,000 | | | | 163,200 |
Community Health Systems, Inc., 8.875%, 07/15/15 | | USD | | 225,000 | | | | 229,219 |
Couche-Tard US LP/Couche-Tard Finance Corp., 7.500%, 12/15/13 | | USD | | 160,000 | | | | 159,600 |
CSX Corp., | | | | | | | | |
5.600%, 05/01/17 | | USD | | 60,000 | | | | 57,761 |
6.000%, 10/01/36 | | USD | | 505,000 | 2 | | | 458,333 |
CVS Caremark Corp, 5.750%, 06/01/17 | | USD | | 670,000 | | | | 674,311 |
DaimlerChrysler N.A. Holdings Corp., 4.875%, 06/15/10 | | USD | | 95,000 | | | | 94,578 |
Delta Air Lines, Inc., 6.821%, 08/10/22 (a) | | USD | | 370,000 | | | | 355,200 |
The accompanying notes are on integral part of these financial statements.
45
Managers Global Bond Fund
Schedule of Portfolio Investments (continued)
| | | | | | | | |
Security Description | | | | Principal Amount | | | Value |
Industrial - 19.0% (continued) | | | | | | | | |
Desarrolladora Homex, S.A. de C.V., 7.500%, 09/28/15 | | USD | | 380,000 | | | $ | 382,850 |
Edcon Proprietary Ltd., 8.198%, 06/15/14 (03/15/08) (a) 5 | | EUR | | 510,000 | 2 | | | 622,615 |
France Telecom, 3.625%, 10/14/15 | | EUR | | 210,000 | | | | 272,703 |
Georgia-Pacific Corp., 7.125%, 01/15/17 (a) | | USD | | 105,000 | 2 | | | 102,112 |
Hanaro Telecom, Inc., 7.000%, 02/01/12 (a) | | USD | | 50,000 | | | | 51,000 |
HCA, Inc., | | | | | | | | |
6.625% 02/15/16 | | USD | | 160,000 | 2 | | | 135,200 |
6.375%, 01/15/15 | | USD | | 70,000 | | | | 59,150 |
7.690%, 06/15/25 | | USD | | 5,000 | 2 | | | 4,140 |
Hilcorp Energy I LP/Hilcorp Finance Co., 7.750%, 11/01/15 (a) | | USD | | 170,000 | | | | 167,025 |
Home Depot Inc., The, 5.875%, 12/16/36 | | USD | | 205,000 | | | | 173,000 |
Hospira, Inc., | | | | | | | | |
5.550%, 03/30/12 | | USD | | 230,000 | | | | 233,881 |
6.050%, 03/30/17 | | USD | | 65,000 | | | | 65,312 |
Host Marriott LP, 6.750%, 06/01/16 | | USD | | 140,000 | | | | 137,900 |
Koninklijke KPN NV, 4.750%, 01/17/17 | | EUR | | 50,000 | | | | 67,004 |
Kraft Foods, Inc., | | | | | | | | |
6.000%, 02/11/13 | | USD | | 450,000 | | | | 462,646 |
6.875%, 02/01/38 | | USD | | 215,000 | | | | 223,211 |
L-3 Communications Corp, | | | | | | | | |
5.875%, 01/15/15 | | USD | | 125,000 | | | | 120,625 |
6.125%, 01/15/14 | | USD | | 15,000 | | | | 14,700 |
6.125%, 07/15/13 | | USD | | 55,000 | | | | 54,038 |
Lafarge SA, 4.750%, 03/23/20 | | EUR | | 215,000 | | | | 270,805 |
LPG International, Inc., 7.250%, 12/20/15 | | USD | | 120,000 | | | | 118,800 |
Lucent Technologies, Inc., 6.450%, 03/15/29 | | USD | | 595,000 | | | | 491,619 |
Motorola Inc., 6.625%, 11/15/37 | | USD | | 240,000 | | | | 232,199 |
News America Inc., 6.150%, 03/01/37 | | USD | | 420,000 | 2 | | | 405,715 |
NGPL Pipeco LLC, Series 144A, 6.514%, 12/15/12 (a) | | USD | | 365,000 | | | | 370,593 |
Owens & Minor, Inc., 6.350%, 04/15/16 | | USD | | 530,000 | | | | 540,867 |
Pemex Project Funding Master Trust, 6.625%, 04/04/10 | | EUR | | 390,000 | | | | 583,371 |
Petrobras International Finance Co., 5.875%, 03/01/18 | | USD | | 140,000 | | | | 139,230 |
PPR, 4.000%, 01/29/13 | | EUR | | 210,000 | | | | 283,766 |
Qwest Capital Funding, Inc., | | | | | | | | |
6.500%, 11/15/18 | | USD | | 40,000 | | | | 33,800 |
7.250%, 02/15/11 | | USD | | 75,000 | 2 | | | 73,875 |
7.750%, 02/15/31 | | USD | | 65,000 | 2 | | | 58,500 |
Qwest Corp., | | | | | | | | |
6.500%, 06/01/17 | | USD | | 46,000 | | | | 44,045 |
6.875%, 09/15/33 | | USD | | 75,000 | 2 | | | 69,188 |
7.250%, 09/15/25 | | USD | | 83,000 | | | | 78,020 |
7.250%, 10/15/35 | | USD | | 158,000 | | | | 148,125 |
The accompanying notes are on integral part of these financial statements.
46
Managers Global Bond Fund
Schedule of Portfolio Investments (continued)
| | | | | | | | |
Security Description | | | | Principal Amount | | | Value |
Industrial - 19.0% (continued) | | | | | | | | |
R.H. Donnelley Corp., Series A-2, 6.875%, 01/15/13 | | USD | | 250,000 | | | $ | 223,750 |
R.H. Donnelley Corp, 6.875%, 01/15/13 | | USD | | 55,000 | 2 | | | 49,225 |
Reynolds American, Inc., 6.750%, 06/15/17 | | USD | | 355,000 | | | | 361,576 |
Sappi Paper Holding AG, 7.500%, 06/15/32 (a) | | USD | | 370,000 | | | | 322,898 |
Shaw Communications, 5.700%, 03/02/17 | | CAD | | 315,000 | | | | 300,864 |
SK Telecom Co. Ltd., 6.625%, 07/20/27 (a) | | USD | | 725,000 | | | | 767,916 |
Sprint Nextel Corp., 6.000%, 12/01/16 | | USD | | 404,000 | | | | 386,948 |
Stena AB, 7.000%, 12/01/16 | | USD | | 90,000 | | | | 86,512 |
Telecom Italia Capital S.p.A., | | | | | | | | |
4.950%, 09/30/14 | | USD | | 290,000 | | | | 279,294 |
6.000%, 09/30/34 | | USD | | 145,000 | 2 | | | 140,999 |
6.375%, 11/15/33 | | USD | | 125,000 | | | | 125,192 |
Time Warner, Inc., | | | | | | | | |
6.625%, 05/15/29 | | USD | | 310,000 | | | | 305,202 |
6.950%, 01/15/28 | | USD | | 85,000 | | | | 86,737 |
Union Pacific Corp., | | | | | | | | |
5.375%, 06/01/33 | | USD | | 86,000 | | | | 75,357 |
5.450%, 01/31/13 | | USD | | 180,000 | | | | 181,570 |
5.650%, 05/01/17 | | USD | | 297,000 | | | | 293,169 |
Vale Overseas Ltd., 6.875%, 11/01/36 | | USD | | 405,000 | | | | 409,702 |
Wendel Investissement, | | | | | | | | |
4.375%, 08/09/17 | | EUR | | 200,000 | | | | 254,747 |
4.875%, 05/26/16 | | EUR | | 200,000 | | | | 270,957 |
Total Industrial | | | | | | | | 17,549,875 |
Utility - 2.2% | | | | | | | | |
Erac USA Finance Co., 6.375%, 10/15/17 (a) | | USD | | 220,000 | | | | 212,545 |
Majapahit Holding BV, 7.250%, 06/28/17 (a) | | USD | | 200,000 | | | | 191,500 |
NiSource Finance Corp., 6.400%, 03/15/18 | | USD | | 365,000 | | | | 364,179 |
Texas Competitive Electric Holdings Co., LLC, 10.250%, 11/01/15 (a) | | USD | | 155,000 | 2 | | | 153,450 |
Transport De Gas Del Sur, 7.875%, 05/14/17 (a) | | USD | | 540,000 | 2 | | | 468,450 |
TXU Corp., 6.500%, 11/15/24 | | USD | | 410,000 | | | | 299,058 |
Veolia Environnement, | | | | | | | | |
4.000%, 02/12/16 | | EUR | | 60,000 | | | | 78,562 |
5.125%, 05/24/22 | | EUR | | 200,000 | | | | 259,858 |
Total Utility | | | | | | | | 2,027,602 |
Total Corporate Bonds (cost $40,222,599) | | | | | | | | 41,068,442 |
Foreign Government Obligations - 35.0% | | | | | | | | |
Argentina, Republic of, 2.000%, 09/30/14 6 | | ARS | | 640,000 | | | | 195,048 |
Belgium Kingdom, 5.500%, 9/28/17 | | EUR | | 2,520,000 | | | | 3,983,852 |
The accompanying notes are on integral part of these financial statements.
47
Managers Global Bond Fund
Schedule of Portfolio Investments (continued)
| | | | | | | | |
Security Description | | | | Principal Amount | | | Value |
Foreign Government Obligations - 35.0% (continued) | | | | | | | | |
Bundesrepublik Deutschland, | | | | | | | | |
3.250%, 04/17/09 | | EUR | | 1,660,000 | | | $ | 2,401,028 |
3.750%, 01/04/17 | | EUR | | 2,214,000 | | | | 3,108,676 |
4.000%, 04/13/12 | | EUR | | 2,150,000 | | | | 3,125,919 |
6.500%, 07/04/27 | | EUR | | 615,000 | | | | 1,113,067 |
Canadian Government, 4.250%, 09/01/09 | | CAD | | 125,000 | 2 | | | 127,556 |
Colombia, Republic of, | | | | | | | | |
7.375%, 01/27/17 | | USD | | 100,000 | 2 | | | 109,750 |
9.850%, 06/28/27 | | COP | | 245,000,000 | | | | 121,015 |
11.750%, 03/01/10 | | COP | | 136,000,000 | | | | 69,873 |
12.000% 10/22/15 | | COP | | 422,000,000 | | | | 233,253 |
Deutschland, Republic of, 3.750%, 07/04/13 | | EUR | | 1,935,000 | | | | 2,772,537 |
Development Bank of Japan, | | | | | | | | |
1.400%, 06/20/12 | | JPY | | 158,000,000 | | | | 1,438,504 |
1.750%, 06/21/10 | | JPY | | 171,000,000 | 2 | | | 1,565,244 |
European Investment Bank, 1.250%, 09/20/12 | | JPY | | 210,000,000 | 2 | | | 1,899,373 |
International Bank for Reconstruction & Development, 2.000%, 02/18/08 | | JPY | | 58,000,000 | | | | 519,759 |
Irish Government, 4.600%, 04/18/16 | | EUR | | 590,000 | | | | 876,584 |
Netherlands Government SA, 5.500%, 01/15/28 | | EUR | | 190,000 | | | | 308,129 |
Republica Orient Uruguay, 4.250%, 04/05/27 | | UYU | | 17,730,000 | | | | 885,182 |
Singapore Government, | | | | | | | | |
3.625%, 07/01/11 | | SGD | | 1,500,000 | | | | 1,097,647 |
4.625%, 07/01/10 | | SGD | | 1,860,000 | | | | 1,378,568 |
South Africa, Republic of, 4.500%, 04/05/16 | | EUR | | 385,000 | | | | 522,193 |
Swedish Government, 4.000%, 12/01/09 | | SEK | | 14,715,000 | 2 | | | 2,271,254 |
U.K. Gilts, 4.750%, 03/04/20 | | GBP | | 875,000 | | | | 1,779,628 |
U.K. Treasury 5.000%, 03/07/25 | | GBP | | 165,000 | | | | 348,630 |
Total Foreign Government Obligations (cost $30,228,705) | | | | | | | | 32,252,269 |
U.S. Government and Agency Obligations - 14.3% | | | | | | | | |
Federal Home Loan Mortgage Corporation - 2.3% | | | | | | | | |
FHLMC Gold Pool, 4.000%, 02/01/20 | | USD | | 53,999 | | | | 51,841 |
FHLMC Gold Pool, 4.500%, 04/01/35 | | USD | | 255,124 | | | | 241,621 |
FHLMC Gold Pool, 5.000%, 07/01/35 | | USD | | 1,050,442 | | | | 1,025,581 |
FHLMC Gold Pool, 5.500%, 12/01/15 | | USD | | 665,237 | | | | 674,395 |
FHLMC Gold Pool, 6.000%, 05/01/18 to 10/01/20 | | USD | | 61,082 | | | | 62,500 |
FHLMC Gold Pool, 6.500%, 08/01/35 to 10/01/20 | | USD | | 58,419 | | | | 60,123 |
Total Federal Home Loan Mortgage Corporation | | | | | | | | 2,116,061 |
Federal National Mortgage Association - 9.4% | | | | | | | | |
FNMA, 1.750%, 03/26/08 | | JPY | | 140,000,000 | | | | 1,255,531 |
FNMA, 2.290%, 02/19/09 | | SGD | | 400,000 | | | | 276,586 |
FNMA, 4.500%, 05/01/20 to 09/01/35 | | USD | | 335,110 | | | | 331,096 |
FNMA, 5.000%, 03/01/20 to 03/01/37 | | USD | | 1,743,179 | | | | 1,710,173 |
FNMA, 5.500%, 11/01/16 to 04/01/36 | | USD | | 2,576,855 | | | | 2,575,554 |
The accompanying notes are on integral part of these financial statements.
48
Managers Global Bond Fund
Schedule of Portfolio Investments (continued)
| | | | | | | | |
Security Description | | Principal Amount | | | Value | |
Federal National Mortgage Association - 9.4% (continued) | | | | | | | | |
FNMA, 6.000%, 06/01/17 to 08/01/37 | | $ | 2,254,870 | | | $ | 2,297,428 | |
FNMA Gold Pool, 6.000%, 10/01/20 to 04/01/35 | | | 191,810 | | | | 195,374 | |
Total Federal National Mortgage Association | | | | | | | 8,641,742 | |
Government National Mortgage Association - 1.7% | | | | | | | | |
GNMA, 5.500%, 11/20/34 to 02/20/36 | | | 104,920 | | | | 105,145 | |
GNMA, 6.000%, 10/20/35 to 07/20/37 | | | 982,967 | | | | 1,003,702 | |
GNMA, 6.500%, 09/20/36 | | | 425,892 | | | | 439,815 | |
Total Government National Mortgage Association | | | | | | | 1,548,662 | |
U.S. Government - 0.9% | | | | | | | | |
USTN, 5.000%, 07/31/08 | | | 850,000 | 2 | | | 857,437 | |
Total U.S. Government and Agency Obligations (cost $ 12,826,301) | | | | | | | 13,163,902 | |
Asset-Backed Securities - 1.8% | | | | | | | | |
Daimler Chrysler Auto Trust, Series 2004-B, Class A4, 3.710%, 10/08/09 | | | 18,520 | | | | 18,495 | |
DaimlerChrysler Auto Trust, Class A4, Series 2005-A, 3.740%, 02/08/10 | | | 247,586 | | | | 246,596 | |
Honda Auto Receivables Owner Trust, 4.930%, 03/18/11 | | | 100,000 | | | | 100,570 | |
Honda Auto Receivables Owner Trust, Class A4, Series 2005-1, 3.820%, 05/21/10 | | | 284,631 | | | | 283,004 | |
MBNA Credit Card Master Note Trust, 4.300%, 02/15/11 | | | 410,000 | | | | 409,482 | |
Greenwich Capital Commercial Funding Corp., Series 2005-GG5, Class A2, 5.117%, 04/10/37 | | | 385,000 | | | | 385,654 | |
Merrill Lynch/Countrywide Mortgage Trust, 5.439%, 2/12/39 6 | | | 235,000 | | | | 237,068 | |
Total Asset-Backed Securities (cost $ 1,682,714) | | | | | | | 1,680,869 | |
| | |
| | | Shares | | | | |
Preferred Stocks - 0.8% | | | | | | | | |
FHLMC, 8.375%, 12/31/12 | | | 15,425 | | | | 403,364 | |
FNMA, 8.250%, 12/31/10 | | | 12,000 | | | | 309,000 | |
Total Preferred Stocks (cost $ 695,353) | | | | | | | 712,364 | |
Other Investment Companies - 13.7%1 | | | | | | | | |
Bank of New York Institutional Cash Reserves Fund, 5.02% 3 | | | 12,370,639 | | | | 12,370,639 | |
Dreyfus Cash Management Fund, Institutional Class Shares, 4.85% | | | 214,100 | | | | 214,100 | |
Total Other Investment Companies (cost $ 12,584,739) | | | | | | | 12,584,739 | |
Total Investments - 110.1% (cost $ 98,240,411) | | | | | | | 101,462,585 | |
Other Assets, less Liabilities - (10.1)% | | | | | | | (9,338,233 | ) |
Net Assets - 100.0% | | | | | | $ | 92,124,352 | |
The accompanying notes are on integral part of these financial statements.
49
Notes to Schedules of Portfolio Investments
The following footnotes and abbreviations should be read in conjunction with each of the Schedules of Portfolio Investments previously presented in this report.
At December 31, 2007, the cost of securities for Federal income tax purposes and the gross aggregate unrealized appreciation and/or depreciation based on tax cost were:
| | | | | | | | | | | | | |
Fund | | Cost | | Appreciation | | Depreciation | | | Net |
Value | | $ | 62,317,053 | | $ | 12,280,769 | | $ | (6,733,174 | ) | | $ | 5,547,595 |
Managers AMG Essex Large Cap Growth | | | 57,950,191 | | | 8,034,846 | | | (2,569,067 | ) | | | 5,465,779 |
Small Company | | | 31,001,120 | | | 5,923,562 | | | (2,138,281 | ) | | | 3,785,281 |
International Equity | | | 251,344,626 | | | 71,160,020 | | | (9,084,097 | ) | | | 62,075,923 |
Emerging Markets Equity | | | 166,958,560 | | | 62,494,418 | | | (3,162,366 | ) | | | 59,332,052 |
Global Bond | | | 98,259,656 | | | 3,904,337 | | | (701,408 | ) | | | 3,202,929 |
| * | Non-income-producing security. |
| (a) | Security exempt from registration under Rule 144A of the Securities Act of 1933. This security may be resold in transactions exempt from registration, normally to qualified buyers. At December 31, 2007, the value of these securities amounted to the following: |
| | | | | | |
Fund | | Market Value | | % of Net
Assets | |
International Equity | | $ | 743,649 | | 0.2 | % |
Emerging Markets Equity | | | 4,699,739 | | 2.4 | % |
Global Bond | | | 10,666,284 | | 11.6 | % |
| (b) | Step Bond. A debt instrument with either deferred interest payments or an interest rate that resets at specific times during its term. |
1 | Yield shown for an investment company represents the December 31, 2007, seven-day average yield, which refers to the sum of the previous seven days’ dividends paid, expressed as an annual percentage. |
2 | Some or all of these shares were out on loan to various brokers as of December 31, 2007, amounting to: |
| | | | | | |
Fund | | Market Value | | % of Net
Assets | |
Value | | $ | 4,437,945 | | 7.1 | % |
Managers AMG Essex Large Cap Growth | | | 10,711,158 | | 20.6 | % |
Small Company | | | 4,979,042 | | 17.0 | % |
International Equity | | | 14,657,646 | | 4.9 | % |
Emerging Markets Equity | | | 24,011,407 | | 12.1 | % |
Global Bond | | | 11,787,332 | | 12.8 | % |
3 | Collateral received from brokers for securities lending was invested in these short-term investments. |
4 | Represents yield to maturity at December 31, 2007. |
5 | Floating Rate Security. The rate listed is as of December 31, 2007. Date in parenthesis represents the security’s next coupon rate reset. |
6 | Variable Rate Security. The rate listed is as of December 31, 2007 and is periodically reset subject to terms and conditions set forth in the debenture. |
# | Rounds to less than 0.1%. |
Investments Definitions and Abbreviations:
ADR/GDR: ADR after the name of a holding stands for American Depositary Receipt, representing ownership of foreign securities on deposit with a domestic custodian bank; a GDR (Global Depositary Receipt) is comparable, but foreign securities are held on deposit in a non-U.S. bank. The value of the ADR/GDR securities is determined or significantly influenced by trading on exchanges not located in the United States or Canada. Sponsored ADR/GDRs are initiated by the underlying foreign company.
| | |
| FHLMC: | | Federal Home Loan Mortgage Corp. |
| FNMA: | | Federal National Mortgage Association |
| GNMA: | | Government National Mortgage Association |
| USTN: | | United States Treasury Note |
Registered shares: A security whose owner has been recorded with its issuer or issuer’s registrar.
Abbreviations have been used throughout the portfolios to indicate amounts shown in currencies other than the U.S. dollar (USD):
| | |
ARS: | | Argentine Peso |
CAD: | | Canadian Dollar |
CHF: | | Swiss Franc |
COP: | | Columbian Peso |
EUR: | | Euro |
GBP: | | British Pound |
IDR: | | Indonesian Rupiah |
JPY: | | Japanese Yen |
KRW: | | South Korean Won |
MYR: | | Malaysian Ringgit |
SEK: | | Swedish Krona |
SGD: | | Singapore Dollar |
UYU: | | Uruguay Peso |
50
Statements of Assets and Liabilities
December 31, 2007
| | | | | | | | | | | |
| | | Managers Value Fund | | | Managers AMG Essex
Large Cap Growth Fund | | | Managers Small
Company Fund |
Assets: | | | | | | | | | | | |
Investments at value (including securities on loan valued at $4,437,945, $10,711,158, $4,979,042, $14,657,646, $24,011,407 and $11,787,332, respectively)* | | $ | 67,864,648 | | | $ | 63,415,970 | | | $ | 34,786,401 |
Cash | | | — | | | | 228 | | | | — |
Foreign currency** | | | — | | | | — | | | | — |
Receivable for investments sold | | | — | | | | — | | | | 20,681 |
Receivable for Fund shares sold | | | 76,516 | | | | 304,404 | | | | 57,130 |
Receivable from affiliate | | | — | | | | — | | | | — |
Unrealized gains on forward foreign currency contracts | | | — | | | | — | | | | — |
Dividends, interest and other receivables | | | 91,405 | | | | 40,429 | | | | 20,734 |
Prepaid expenses | | | 10,652 | | | | 6,618 | | | | 8,039 |
| | | | | | | | | | | |
Total assets | | | 68,043,221 | | | | 63,767,649 | | | | 34,892,985 |
| | | | | | | | | | | |
Liabilities: | | | | | | | | | | | |
Payable to affiliate | | | 12,255 | | | | 9,755 | | | | — |
Payable to Custodian | | | — | | | | — | | | | 20,614 |
Payable for Fund shares repurchased | | | 171,644 | | | | 453,686 | | | | 21,852 |
Payable upon return of securities loaned | | | 4,590,061 | | | | 11,070,206 | | | | 5,181,713 |
Payable for investments purchased | | | 381,885 | | | | 255,076 | | | | 249,457 |
Unrealized losses on forward foreign currency contracts | | | — | | | | — | | | | — |
Accrued expenses: | | | | | | | | | | | |
Investment advisory and management fees | | | 41,019 | | | | 35,696 | | | | 20,604 |
Administrative fees | | | 13,673 | | | | 11,155 | | | | 6,220 |
Other | | | 53,186 | | | | 55,752 | | | | 43,077 |
Total liabilities | | | 5,263,723 | | | | 11,891,326 | | | | 5,543,537 |
| | | | | | | | | | | |
Net Assets | | $ | 62,779,498 | | | $ | 51,876,323 | | | $ | 29,349,448 |
| | | | | | | | | | | |
Shares outstanding | | | 2,876,181 | | | | 1,554,384 | | | | 2,687,163 |
| | | | | | | | | | | |
Net asset value, offering and redemption price per share | | $ | 21.83 | | | $ | 33.37 | | | $ | 10.92 |
| | | | | | | | | | | |
Net Assets Represent: | | | | | | | | | | | |
Paid-in capital | | $ | 57,618,964 | | | $ | 179,471,868 | | | $ | 25,238,023 |
Undistributed net investment income (loss) | | | — | | | | — | | | | 9,154 |
Accumulated net realized gain (loss) from investments, futures and foreign currency transactions | | | (982,604 | ) | | | (133,277,185 | ) | | | 174,654 |
Net unrealized appreciation of investments, futures and foreign currency contracts and translations | | | 6,143,138 | | | | 5,681,640 | | | | 3,927,617 |
| | | | | | | | | | | |
Net Assets | | $ | 62,779,498 | | | $ | 51,876,323 | | | $ | 29,349,448 |
| | | | | | | | | | | |
* Investments at cost | | $ | 61,721,510 | | | $ | 57,734,330 | | | $ | 30,858,784 |
** Foreign currency at cost | | | — | | | | — | | | | — |
The accompanying notes are on integral part of these financial statements.
51
| | | | | | | |
Managers International Equity Fund | | Managers Emerging
Markets Equity Fund | | Managers Global
Bond Fund |
| $ | 313,420,549 | | $ | 226,290,612 | | $ | 101,462,585 |
| | 940,239 | | | — | | | 62,478 |
| | 1,758,737 | | | 1,433,809 | | | 1,791,699 |
| | 701,467 | | | 4,932,108 | | | — |
| | 2,159,231 | | | 541,001 | | | 61,046 |
| | 84,276 | | | — | | | 96,527 |
| | 3,756 | | | — | | | — |
| | 350,998 | | | 189,218 | | | 1,296,532 |
| | 9,975 | | | 8,888 | | | 13,213 |
| | | | | | | | |
| | 319,429,228 | | | 233,395,636 | | | 104,784,080 |
| | | | | | | | |
| | — | | | 43,785 | | | — |
| | — | | | 7,822,148 | | | — |
| | 162,849 | | | 1,514,224 | | | 38,162 |
| | 15,154,709 | | | 24,836,384 | | | 12,370,639 |
| | 1,421,171 | | | 237,199 | | | — |
| | 11,749 | | | — | | | — |
| | 230,946 | | | 201,016 | | | 46,903 |
| | 64,152 | | | 43,699 | | | 15,634 |
| | 358,381 | | | 462,287 | | | 188,390 |
| | | | | | | | |
| | 17,403,957 | | | 35,160,742 | | | 12,659,728 |
| | | | | | | | |
| $ | 302,025,271 | | $ | 198,234,894 | | $ | 92,124,352 |
| | | | | | | | |
| | 3,915,793 | | | 7,395,920 | | | 4,323,191 |
| | | | | | | | |
| $ | 77.13 | | $ | 26.80 | | $ | 21.31 |
| | | | | | | | |
| $ | 270,412,571 | | $ | 124,688,920 | | $ | 88,375,492 |
| | (1,923,650) | | | 50,868 | | | 453,025 |
| | (29,945,571) | | | 14,242,296 | | | 43,598 |
| | 63,481,921 | | | 59,252,810 | | | 3,252,237 |
| | | | | | | | |
| $ | 302,025,271 | | $ | 198,234,894 | | $ | 92,124,352 |
| | | | | | | | |
| $ | 249,893,933 | | $ | 166,886,781 | | $ | 98,240,411 |
| $ | 1,754,607 | | $ | 1,433,124 | | $ | 1,786,636 |
The accompanying notes are on integral part of these financial statements.
52
Statements of Operations
For the year ended December 31, 2007
| | | | | | | | | | | | |
| | | Managers Value Fund | | | Managers AMG Essex
Large Cap Growth Fund | | | Managers Small
Company Fund | |
Investment Income: | | | | | | | | | | | | |
Dividend income | | $ | 1,532,016 | | | $ | 459,688 | | | $ | 570,906 | |
Interest income | | | — | | | | — | | | | — | |
Foreign withholding tax | | | (10,616 | ) | | | (2,337 | ) | | | (1,083 | ) |
Securities lending fees | | | 7,825 | | | | 25,562 | | | | 13,890 | |
| | | | | | | | | | | | |
Total investment income | | | 1,529,225 | | | | 482,913 | | | | 583,713 | |
| | | | | | | | | | | | |
Expenses: | | | | | | | | | | | | |
Investment management fees | | | 574,339 | | | | 502,663 | | | | 337,783 | |
Administrative fees | | | 191,447 | | | | 157,082 | | | | 93,828 | |
Transfer agent | | | 55,525 | | | | 60,399 | | | | 33,186 | |
Professional fees | | | 40,696 | | | | 38,821 | | | | 28,865 | |
Custodian | | | 20,272 | | | | 13,545 | | | | 32,673 | |
Registration fees | | | 20,037 | | | | 23,344 | | | | 18,689 | |
Reports to shareholders | | | 6,905 | | | | 7,833 | | | | 2,804 | |
Trustees fees and expenses | | | 3,772 | | | | 3,272 | | | | 2,110 | |
Miscellaneous | | | 4,326 | | | | 1,759 | | | | 2,437 | |
| | | | | | | | | | | | |
Total expenses before offsets | | | 917,319 | | | | 808,718 | | | | 552,375 | |
| | | | | | | | | | | | |
Expense (reimbursement) recoupment | | | (5,126 | ) | | | 3,141 | | | | (7,678 | ) |
Expense reductions | | | (21,161 | ) | | | (33,604 | ) | | | (32,426 | ) |
| | | | | | | | | | | | |
Net expenses | | | 891,032 | | | | 778,255 | | | | 512,271 | |
| | | | | | | | | | | | |
Net investment income (loss) | | | 638,193 | | | | (295,342 | ) | | | 71,442 | |
| | | | | | | | | | | | |
Net Realized and Unrealized Gain (Loss): | | | | | | | | | | | | |
Net realized gain on investment transactions | | | 7,066,106 | | | | 12,081,136 | | | | 5,644,580 | |
Net realized gain on futures contracts | | | — | | | | — | | | | — | |
Net realized gain (loss) on foreign currency contracts and transactions | | | — | | | | — | | | | — | |
Net unrealized appreciation (depreciation) of investments | | | (12,723,883 | ) | | | (3,092,212 | ) | | | (2,093,069 | ) |
Net unrealized depreciation of futures contracts | | | — | | | | — | | | | — | |
Net unrealized appreciation (depreciation) of foreign currency contracts and translations | | | — | | | | — | | | | — | |
| | | | | | | | | | | | |
Net realized and unrealized gain (loss) | | | (5,657,777 | ) | | | 8,988,924 | | | | 3,551,511 | |
| | | | | | | | | | | | |
Net Increase (Decrease) in Net Assets Resulting from Operations | | $ | (5,019,584 | ) | | $ | 8,693,582 | | | $ | 3,622,953 | |
| | | | | | | | | | | | |
The accompanying notes are on integral part of these financial statements.
53
| | | | | | | | | |
Managers International
Equity Fund | | Managers Emerging
Markets Equity Fund | | | Managers Global
Bond Fund | |
| $ | 5,697,787 | | $ | 3,853,221 | | | $ | 133,145 | |
| | — | | | — | | | | 4,318,216 | |
| | (393,976) | | | (348,669 | ) | | | — | |
| | 87,943 | | | 76,460 | | | | 40,575 | |
| | | | | | | | | | |
| | 5,391,754 | | | 3,581,012 | | | | 4,491,936 | |
| | | | | | | | | | |
| | 2,340,304 | | | 2,159,274 | | | | 708,805 | |
| | 650,084 | | | 469,407 | | | | 202,516 | |
| | 703,282 | | | 442,220 | | | | 152,105 | |
| | 95,787 | | | 73,407 | | | | 46,818 | |
| | 332,423 | | | 390,983 | | | | 122,594 | |
| | 22,400 | | | 25,009 | | | | 18,893 | |
| | 19,332 | | | 19,174 | | | | 9,973 | |
| | 14,417 | | | 10,486 | | | | 6,085 | |
| | 23,108 | | | 30,885 | | | | 3,147 | |
| | | | | | | | | | |
| | 4,201,137 | | | 3,620,845 | | | | 1,270,936 | |
| | | | | | | | | | |
| | (348,741) | | | (281,271 | ) | | | 36,972 | |
| | (9,677) | | | (2,882 | ) | | | (102,638 | ) |
| | | | | | | | | | |
| | 3,842,719 | | | 3,336,692 | | | | 1,205,270 | |
| | | | | | | | | | |
| | 1,549,035 | | | 244,320 | | | | 3,286,666 | |
| | | | | | | | | | |
| | 35,576,927 | | | 43,014,454 | | | | 2,757,908 | |
| | 146,829 | | | — | | | | — | |
| | (36,565) | | | (193,452 | ) | | | 184,253 | |
| | (4,160,274) | | | 4,010,229 | | | | 1,646,252 | |
| | (87,738) | | | — | | | | — | |
| | (36,111) | | | 22,781 | | | | 48,629 | |
| | | | | | | | | | |
| | 31,403,068 | | | 46,854,012 | | | | 4,637,042 | |
| | | | | | | | | | |
| $ | 32,952,103 | | $ | 47,098,332 | | | $ | 7,923,708 | |
| | | | | | | | | | |
The accompanying notes are on integral part of these financial statements.
54
Statements of Changes in Net Assets
For the year ended December 31,
| | | | | | | | | | | | | | | | | | | | | | | | |
| | | Managers
Value Fund | | | Managers AMG
Essex Large Cap
Growth Fund | | | Managers Small
Company Fund | |
| | | 2007 | | | 2006 | | | 2007 | | | 2006 | | | 2007 | | | 2006 | |
Increase (Decrease) in Net Assets From Operations: | | | | | | | | | | | | | | | | | | | | | | | | |
Net investment income (loss) | | $ | 638,193 | | | $ | 853,565 | | | $ | (295,342 | ) | | $ | (256,524 | ) | | $ | 71,442 | | | $ | (268,690 | ) |
Net realized gain (loss) on investments, futures and foreign currency transactions | | | 7,066,106 | | | | 12,106,593 | | | | 12,081,136 | | | | 10,416,894 | | | | 5,644,580 | | | | 6,115,060 | |
Net unrealized appreciation (depreciation) of investments and foreign currency translations | | | (12,723,883 | ) | | | 2,554,698 | | | | (3,092,212 | ) | | | (5,161,247 | ) | | | (2,093,069 | ) | | | (1,903,333 | ) |
| | | | | | | | | | | | | | | | | | | | | | | | |
Net increase (decrease) in net assets resulting from operations | | | (5,019,584 | ) | | | 15,514,856 | | | | 8,693,582 | | | | 4,999,123 | | | | 3,622,953 | | | | 3,943,037 | |
| | | | | | | | | | | | | | | | | | | | | | | | |
Distributions to Shareholders: | | | | | | | | | | | | | | | | | | | | | | | | |
From net investment income | | | (644,259 | ) | | | (855,868 | ) | | | — | | | | — | | | | (72,068 | ) | | | — | |
From net realized gain on investments | | | (9,340,529 | ) | | | (11,576,359 | ) | | | — | | | | — | | | | (4,872,436 | ) | | | — | |
| | | | | | | | | | | | | | | | | | | | | | | | |
Total distributions to shareholders | | | (9,984,788 | ) | | | (12,432,227 | ) | | | — | | | | — | | | | (4,944,504 | ) | | | — | |
| | | | | | | | | | | | | | | | | | | | | | | | |
From Capital Share Transactions: | | | | | | | | | | | | | | | | | | | | | | | | |
Proceeds from sale of shares | | | 16,625,662 | | | | 17,671,554 | | | | 13,177,776 | | | | 13,685,274 | | | | 7,101,231 | | | | 11,120,944 | |
Reinvestment of dividends and distributions | | | 9,480,374 | | | | 12,291,981 | | | | — | | | | — | | | | 4,917,140 | | | | — | |
Cost of shares repurchased | | | (29,238,475 | ) | | | (76,772,986 | ) | | | (35,994,240 | ) | | | (57,562,905 | ) | | | (19,785,414 | ) | | | (13,619,300 | ) |
| | | | | | | | | | | | | | | | | | | | | | | | |
Net increase (decrease) from capital share transactions | | | (3,132,439 | ) | | | (46,809,451 | ) | | | (22,816,464 | ) | | | (43,877,631 | ) | | | (7,767,043 | ) | | | (2,498,356 | ) |
| | | | | | | | | | | | | | | | | | | | | | | | |
Total increase (decrease) in net assets | | | (18,136,811 | ) | | | (43,726,822 | ) | | | (14,122,882 | ) | | | (38,878,508 | ) | | | (9,088,594 | ) | | | 1,444,681 | |
| | | | | | | | | | | | | | | | | | | | | | | | |
Net Assets: | | | | | | | | | | | | | | | | | | | | | | | | |
Beginning of year | | | 80,916,309 | | | | 124,643,131 | | | | 65,999,205 | | | | 104,877,713 | | | | 38,438,042 | | | | 36,993,361 | |
| | | | | | | | | | | | | | | | | | | | | | | | |
End of year | | $ | 62,779,498 | | | $ | 80,916,309 | | | $ | 51,876,323 | | | $ | 65,999,205 | | | $ | 29,349,448 | | | $ | 38,438,042 | |
| | | | | | | | | | | | | | | | | | | | | | | | |
End of year undistributed net investment income (loss) | | | — | | | | — | | | | — | | | | — | | | $ | 9,154 | | | | — | |
| | | | | | | | | | | | | | | | | | | | | | | | |
Share Transactions: | | | | | | | | | | | | | | | | | | | | | | | | |
Sale of shares | | | 584,902 | | | | 599,108 | | | | 401,884 | | | | 489,185 | | | | 555,756 | | | | 969,613 | |
Reinvested shares | | | 425,129 | | | | 439,628 | | | | — | | | | — | | | | 439,422 | | | | — | |
Shares repurchased | | | (1,025,973 | ) | | | (2,601,246 | ) | | | (1,109,222 | ) | | | (2,000,828 | ) | | | (1,517,885 | ) | | | (1,172,425 | ) |
| | | | | | | | | | | | | | | | | | | | | | | | |
Net increase (decrease) in shares | | | (15,942 | ) | | | (1,562,510 | ) | | | (707,338 | ) | | | (1,511,643 | ) | | | (522,707 | ) | | | (202,812 | ) |
| | | | | | | | | | | | | | | | | | | | | | | | |
The accompanying notes are on integral part of these financial statements.
55
| | | | | | | | | | | | | | | | | | | | | |
| Managers International Equity Fund | | | Managers Emerging Markets Equity Fund | | | Managers Global Bond Fund | |
| 2007 | | 2006 | | | 2007 | | | 2006 | | | 2007 | | | 2006 | |
| $ | 1,549,035 | | $ | 1,524,445 | | | $ | 244,320 | | | $ | 1,168,431 | | | $ | 3,286,666 | | | $ | 1,395,617 | |
| | 35,687,191 | | | 36,194,122 | | | | 42,821,002 | | | | 15,879,607 | | | | 2,942,161 | | | | (166,942 | ) |
| | (4,284,123) | | | 15,368,505 | | | | 4,033,010 | | | | 22,158,611 | | | | 1,694,881 | | | | 2,281,029 | |
| | | | | | | | | | | | | | | | | | | | | | |
| | 32,952,103 | | | 53,087,072 | | | | 47,098,332 | | | | 39,206,649 | | | | 7,923,708 | | | | 3,509,704 | |
| | | | | | | | | | | | | | | | | | | | | | |
| | (1,407,436) | | | (4,000,641 | ) | | | — | | | | (1,229,899 | ) | | | (5,790,344 | ) | | | (1,211,010 | ) |
| | — | | | | | | | (31,190,295 | ) | | | (13,239,958 | ) | | | (36,545 | ) | | | (66,866 | ) |
| | | | | | | | | | | | | | | | | | | | | | |
| | (1,407,436) | | | (4,000,641 | ) | | | (31,190,295 | ) | | | (14,469,857 | ) | | | (5,826,889 | ) | | | (1,277,876 | ) |
| | | | | | | | | | | | | | | | | | | | | | |
| | 89,614,996 | | | 48,510,526 | | | | 81,147,105 | | | | 39,305,219 | | | | 70,923,164 | | | | 19,531,900 | |
| | 1,269,831 | | | 3,476,492 | | | | 30,267,900 | | | | 13,851,717 | | | | 5,738,814 | | | | 1,252,232 | |
| | (51,320,349) | | | (76,550,450 | ) | | | (82,070,827 | ) | | | (42,139,842 | ) | | | (40,303,982 | ) | | | (12,477,695 | ) |
| | | | | | | | | | | | | | | | | | | | | | |
| | 39,564,478 | | | (24,563,432 | ) | | | 29,344,178 | | | | 11,017,094 | | | | 36,357,996 | | | | 8,306,437 | |
| | | | | | | | | | | | | | | | | | | | | | |
| | 71,109,145 | | | 24,522,999 | | | | 45,252,215 | | | | 35,753,886 | | | | 38,454,815 | | | | 10,538,265 | |
| | | | | | | | | | | | | | | | | | | | | | |
| | 230,916,126 | | | 206,393,127 | | | | 152,982,679 | | | | 117,228,793 | | | | 53,669,537 | | | | 43,131,272 | |
| | | | | | | | | | | | | | | | | | | | | | |
| $ | 302,025,271 | | $ | 230,916,126 | | | $ | 198,234,894 | | | $ | 152,982,679 | | | $ | 92,124,352 | | | $ | 53,669,537 | |
| | | | | | | | | | | | | | | | | | | | | | |
| $ | (1,923,650) | | $ | (2,067,376 | ) | | $ | 50,868 | | | | — | | | $ | 453,025 | | | $ | 61,252 | |
| | | | | | | | | | | | | | | | | | | | | | |
| | 1,182,441 | | | 799,592 | �� | | | 2,961,645 | | | | 1,734,005 | | | | 3,348,376 | | | | 938,126 | |
| | 16,446 | | | 51,997 | | | | 1,123,113 | | | | 579,812 | | | | 272,628 | | | | 59,123 | |
| | (708,228) | | | (1,265,801 | ) | | | (2,947,238 | ) | | | (1,886,659 | ) | | | (1,833,465 | ) | | | (597,455 | ) |
| | | | | | | | | | | | | | | | | | | | | | |
| | 490,659 | | | (414,212 | ) | | | 1,137,520 | | | | 427,158 | | | | 1,787,539 | | | | 399,794 | |
| | | | | | | | | | | | | | | | | | | | | | |
The accompanying notes are on integral part of these financial statements.
56
Managers Money Market Fund
Statement of Assets and Liabilities
December 31, 2007
| | | |
Assets: | | | |
Investment in JPMorgan Liquid Assets Money Market Fund, Capital Shares (cost $90,937,675) | | $ | 90,937,675 |
Receivable for Fund shares sold | | | 6,176 |
Dividends receivable | | | 391,847 |
Prepaid expenses | | | 9,285 |
| | | |
Total assets | | | 91,344,983 |
| | | |
Liabilities: | | | |
Payable for Fund shares repurchased | | | 7,797 |
Dividends payable to shareholders | | | 55,890 |
Administration fee payable | | | 12,107 |
Other accrued expenses | | | 51,262 |
| | | |
Total liabilities | | | 127,056 |
| | | |
Net Assets | | $ | 91,217,927 |
| | | |
Shares outstanding | | | 91,217,927 |
| | | |
Net asset value, offering and redemption price per share | | $ | 1.00 |
| | | |
Net Assets Represent: | | | |
Paid-in capital | | $ | 91,217,927 |
Managers Money Market Fund
Statements of Operations
| | | | | | | | |
| | | For the
one month ended
December 31, 2007* | | | For the fiscal
year ended
November 30, 2007 | |
Investment Income: | | | | | | | | |
Dividend income | | $ | 391,369 | | | $ | 5,370,617 | |
Expenses: | | | | | | | | |
Administration fees | | | 12,107 | | | | 154,574 | |
Registration fees | | | 10,667 | | | | 34,763 | |
Transfer agent | | | 6,238 | | | | 89,839 | |
Professional fees | | | 3,237 | | | | 30,449 | |
Reports to shareholders | | | 1,951 | | | | 26,957 | |
Trustees fees and expenses | | | 1,397 | | | | 5,753 | |
Accounting fees | | | 500 | | | | 6,000 | |
Miscellaneous expenses | | | 273 | | | | 4,402 | |
| | | | | | | | |
Total expenses before offsets | | | 36,370 | | | | 352,737 | |
| | | | | | | | |
Expense reductions | | | (5,096 | ) | | | (51,525 | ) |
| | | | | | | | |
Net expenses | | | 31,274 | | | | 301,212 | |
| | | | | | | | |
Net Investment Income | | $ | 360,095 | | | $ | 5,069,405 | |
| | | | | | | | |
| * | Effective December 1, 2007, Managers Money Market changed its fiscal year end from November 30 to December 31. |
The accompanying notes are on integral part of these financial statements.
57
Managers Money Market Fund
Statement of Changes in Net Assets
| | | | | | | | | | | | |
| | | For the one
month ended
December 31,
2007* | | | For the fiscal year ended
November 30, | |
| | | 2007 | | | 2006 | |
Increase (Decrease) in Net Assets from Operations: | | | | | | | | | | | | |
| | | | | | | | | | | | |
Net investment income | | $ | 360,095 | | | $ | 5,069,405 | | | $ | 1,515,932 | |
| | | | | | | | | | | | |
Distributions to Shareholders: | | | | | | | | | | | | |
From net investment income | | | (360,095 | ) | | | (5,069,405 | ) | | | (1,515,932 | ) |
| | | | | | | | | | | | |
From Capital Share Transactions (at a constant $1.00 per share): | | | | | | | | | | | | |
Proceeds from sale of shares | | | 9,618,816 | | | | 215,023,349 | | | | 122,399,470 | |
Reinvestment of dividends | | | 333,820 | | | | 4,966,351 | | | | 1,477,635 | |
Cost of shares repurchased | | | (11,840,450 | ) | | | (164,722,861 | ) | | | (123,937,360 | ) |
| | | | | | | | | | | | |
Net increase (decrease) from capital share transactions | | | (1,887,814 | ) | | | 55,266,839 | | | | (60,255 | ) |
| | | | | | | | | | | | |
Total increase (decrease) in net assets | | | (1,887,814 | ) | | | 55,266,839 | | | | (60,255 | ) |
| | | | | | | | | | | | |
Net Assets: | | | | | | | | | | | | |
Beginning of period | | | 93,105,741 | | | | 37,838,902 | | | | 37,899,157 | |
| | | | | | | | | | | | |
End of period | | $ | 91,217,927 | | | $ | 93,105,741 | | | $ | 37,838,902 | |
| | | | | | | | | | | | |
| * | Effective December 1, 2007, Managers Money Market changed its fiscal year end from November 30 to December 31. |
Managers Money Market Financial Highlights
For a share outstanding throughout each period
| | | | | | | | | | | | | | | | | | | | | | | | |
Managers Money Market Fund | | For the one
month ended
December 31,
2007* | | | For the fiscal year ended November 30, | |
| | | 2007 | | | 2006 | | | 2005 | | | 2004 | | | 2003 | |
Net Asset Value, Beginning of Year | | $ | 1.000 | | | $ | 1.000 | | | $ | 1.000 | | | $ | 1.000 | | | $ | 1.000 | | | $ | 1.000 | |
| | | | | | | | | | | | | | | | | | | | | | | | |
Income from Investment Operations: | | | | | | | | | | | | | | | | | | | | | | | | |
Net investment income | | | 0.004 | | | | 0.049 | | | | 0.043 | | | | 0.026 | | | | 0.008 | | | | 0.007 | |
| | | | | | | | | | | | | | | | | | | | | | | | |
Less Distributions to Shareholders from: | | | | | | | | | | | | | | | | | | | | | | | | |
Net investment income | | | (0.004 | ) | | | (0.049 | ) | | | (0.043 | ) | | | (0.026 | ) | | | (0.008 | ) | | | (0.007 | ) |
| | | | | | | | | | | | | | | | | | | | | | | | |
Net Asset Value, End of Year | | $ | 1.000 | | | $ | 1.000 | | | $ | 1.000 | | | $ | 1.000 | | | $ | 1.000 | | | $ | 1.000 | |
| | | | | | | | | | | | | | | | | | | | | | | | |
Total Return 1 | | | 0.37 | %3 | | | 5.05 | % | | | 4.45 | % | | | 2.61 | % | | | 0.82 | % | | | 0.69 | % |
| | | | | | | | | | | | | | | | | | | | | | | | |
Ratio of net expenses to average net assets | | | 0.39 | %4 | | | 0.29 | % | | | 0.40 | % | | | 0.40 | % | | | 0.36 | % | | | 0.38 | % |
Ratio of net investment income to average net assets 1 | | | 4.46 | %4 | | | 4.92 | % | | | 4.42 | % | | | 2.62 | % | | | 0.86 | % | | | 0.69 | % |
Net assets at end of year (000’s omitted) | | $ | 91,218 | | | $ | 93,106 | | | $ | 37,839 | | | $ | 37,896 | | | $ | 47,645 | | | $ | 33,050 | |
| | | | | | | | | | | | | | | | | | | | | | | | |
Ratios absent expense offsets: 2 | | | | | | | | | | | | | | | | | | | | | | | | |
Ratio of total expenses to average net assets | | | 0.44 | %4 | | | 0.34 | % | | | 0.45 | % | | | 0.46 | % | | | 0.44 | % | | | 0.43 | % |
Ratio of net investment income to average net assets 1 | | | 4.41 | %4 | | | 4.87 | % | | | 4.37 | % | | | 2.56 | % | | | 0.78 | % | | | 0.64 | % |
| | | | | | | | | | | | | | | | | | | | | | | | |
| * | Effective December 1, 2007, Managers Money Market Fund changed its fiscal year end from November 30 to December 31. (See Notes to Financial Statements.) |
1 | Total returns and net investment income would have been lower had certain expenses not been reduced. (See Note 1(c) of Notes to Financial Statements.) |
2 | Excludes the impact of expense reimbursements and expense reductions such as brokerage credits, but includes non-reimbursable expenses, if any, such as interest and taxes. (See Note 1(c) of Notes to Financial Statements.) |
The accompanying notes are on integral part of these financial statements.
58
Financial Highlights
For a share outstanding throughout each year
| | | | | | | | | | | | | | | | | | | | |
| | | For the year ended December 31, | |
Managers Value Fund | | 2007 | | | 2006 | | | 2005 | | | 2004 | | | 2003 | |
Net Asset Value, Beginning of Year | | $ | 27.98 | | | $ | 27.98 | | | $ | 29.73 | | | $ | 26.24 | | | $ | 20.69 | |
| | | | | | | | | | | | | | | | | | | | |
Income from Investment Operations: | | | | | | | | | | | | | | | | | | | | |
Net investment income | | | 0.23 | 3 | | | 0.27 | 3 | | | 0.23 | | | | 0.17 | | | | 0.11 | |
Net realized and unrealized gain (loss) on investments | | | (2.32 | )3 | | | 4.79 | 3 | | | 1.43 | | | | 3.47 | | | | 5.56 | |
| | | | | | | | | | | | | | | | | | | | |
Total from investment operations | | | (2.09 | ) | | | 5.06 | | | | 1.66 | | | | 3.64 | | | | 5.67 | |
| | | | | | | | | | | | | | | | | | | | |
Less Distributions to Shareholders from: | | | | | | | | | | | | | | | | | | | | |
Net investment income | | | (0.26 | ) | | | (0.35 | ) | | | (0.25 | ) | | | (0.15 | ) | | | (0.12 | ) |
Net realized gain on investments | | | (3.80 | ) | | | (4.71 | ) | | | (3.16 | ) | | | — | | | | — | |
| | | | | | | | | | | | | | | | | | | | |
Total distributions to shareholders | | | (4.06 | ) | | | (5.06 | ) | | | (3.41 | ) | | | (0.15 | ) | | | (0.12 | ) |
| | | | | | | | | | | | | | | | | | | | |
Net Asset Value, End of Year | | $ | 21.83 | | | $ | 27.98 | | | $ | 27.98 | | | $ | 29.73 | | | $ | 26.24 | |
| | | | | | | | | | | | | | | | | | | | |
Total Return 1 | | | (7.77 | )% | | | 18.08 | % | | | 5.53 | % | | | 13.87 | % | | | 27.39 | % |
| | | | | | | | | | | | | | | | | | | | |
Ratio of net expenses to average net assets | | | 1.16 | % | | | 1.17 | % | | | 1.18 | % | | | 1.22 | % | | | 1.27 | % |
Ratio of total expenses to average net assets 2 | | | 1.20 | % | | | 1.23 | % | | | 1.15 | % | | | 1.38 | % | | | 1.42 | % |
Ratio of net investment income to average net assets 1 | | | 0.83 | % | | | 0.90 | % | | | 0.72 | % | | | 0.62 | % | | | 0.59 | % |
Portfolio turnover | | | 37 | % | | | 32 | % | | | 54 | % | | | 39 | % | | | 40 | % |
Net assets at end of year (000’s omitted) | | $ | 62,779 | | | $ | 80,916 | | | $ | 124,643 | | | $ | 119,547 | | | $ | 100,720 | |
| | | | | | | | | | | | | | | | | | | | |
| |
| | | For the year ended December 31, | |
Managers AMG Essex Large Cap Growth Fund | | 2007 | | | 2006 | | | 2005 | | | 2004 | | | 2003 | |
Net Asset Value, Beginning of Year | | $ | 29.18 | | | $ | 27.79 | | | $ | 26.77 | | | $ | 25.46 | | | $ | 20.36 | |
| | | | | | | | | | | | | | | | | | | | |
Income from Investment Operations: | | | | | | | | | | | | | | | | | | | | |
Net investment loss | | | (0.15 | )3 | | | (0.09 | )3 | | | (0.07 | )3 | | | (0.07 | ) | | | (0.16 | ) |
Net realized and unrealized gain on investments | | | 4.34 | 3 | | | 1.48 | 3 | | | 1.09 | 3 | | | 1.38 | | | | 5.26 | |
| | | | | | | | | | | | | | | | | | | | |
Total from investment operations | | | 4.19 | | | | 1.39 | | | | 1.02 | | | | 1.31 | | | | 5.10 | |
| | | | | | | | | | | | | | | | | | | | |
Net Asset Value, End of Year | | $ | 33.37 | | | $ | 29.18 | | | $ | 27.79 | | | $ | 26.77 | | | $ | 25.46 | |
| | | | | | | | | | | | | | | | | | | | |
Total Return 1 | | | 14.36 | % | | | 4.96 | % | | | 3.85 | % | | | 5.14 | % | | | 25.05 | % |
| | | | | | | | | | | | | | | | | | | | |
Ratio of net expenses to average net assets | | | 1.24 | % | | | 1.25 | % | | | 1.28 | % | | | 1.34 | % | | | 1.33 | % |
Ratio of total expenses to average net assets 2 | | | 1.29 | % | | | 1.32 | % | | | 1.22 | % | | | 1.47 | % | | | 1.52 | % |
Ratio of net investment loss to average net assets 1 | | | (0.47 | )% | | | (0.33 | )% | | | (0.27 | )% | | | (0.26 | )% | | | (0.67 | )% |
Portfolio turnover | | | 116 | % | | | 200 | % | | | 97 | % | | | 79 | % | | | 109 | % |
Net assets at end of year (000’s omitted) | | $ | 51,876 | | | $ | 65,999 | | | $ | 104,878 | | | $ | 98,347 | | | $ | 110,903 | |
| | | | | | | | | | | | | | | | | | | | |
59
Financial Highlights
For a share outstanding throughout each year
| | | | | | | | | | | | | | | | | | | | |
| | | For the year ended December 31, | |
Managers Small Company Fund | | 2007 | | | 2006 | | | 2005 | | | 2004 | | | 2003 | |
Net Asset Value, Beginning of Year | | $ | 11.97 | | | $ | 10.84 | | | $ | 10.36 | | | $ | 9.19 | | | $ | 6.40 | |
| | | | | | | | | | | | | | | | | | | | |
Income from Investment Operations: | | | | | | | | | | | | | | | | | | | | |
Net investment income (loss) | | | 0.02 | 3 | | | (0.08 | )3 | | | (0.08 | )3 | | | (0.08 | ) | | | (0.09 | ) |
Net realized and unrealized gain on investments | | | 1.12 | 3 | | | 1.21 | 3 | | | 0.56 | 3 | | | 1.25 | | | | 2.88 | |
| | | | | | | | | | | | | | | | | | | | |
Total from investment operations | | | 1.14 | | | | 1.13 | | | | 0.48 | | | | 1.17 | | | | 2.79 | |
| | | | | | | | | | | | | | | | | | | | |
Less Distributions to Shareholders from: | | | | | | | | | | | | | | | | | | | | |
Net investment income | | | (0.03 | ) | | | — | | | | — | | | | — | | | | — | |
Net realized gain on investments | | | (2.16 | ) | | | — | | | | — | | | | — | | | | — | |
Total distributions to shareholders | | | (2.19 | ) | | | — | | | | — | | | | — | | | | — | |
| | | | | | | | | | | | | | | | | | | | |
Net Asset Value, End of Year | | $ | 10.92 | | | $ | 11.97 | | | $ | 10.84 | | | $ | 10.36 | | | $ | 9.19 | |
| | | | | | | | | | | | | | | | | | | | |
Total Return 1 | | | 9.13 | % | | | 10.42 | % | | | 4.63 | % | | | 12.73 | % | | | 43.59 | % |
| | | | | | | | | | | | | | | | | | | | |
Ratio of net expenses to average net assets | | | 1.36 | % | | | 1.39 | % | | | 1.45 | % | | | 1.45 | % | | | 1.45 | % |
Ratio of total expenses to average net assets 2 | | | 1.47 | % | | | 1.54 | % | | | 1.41 | % | | | 1.43 | % | | | 1.50 | % |
Ratio of net investment income (loss) to average net assets 1 | | | 0.19 | % | | | (0.72 | )% | | | (0.82 | )% | | | (1.05 | )% | | | (1.20 | )% |
Portfolio turnover | | | 50 | % | | | 126 | % | | | 26 | % | | | 18 | % | | | 48 | % |
Net assets at end of year (000’s omitted) | | $ | 29,349 | | | $ | 38,438 | | | $ | 36,993 | | | $ | 27,629 | | | $ | 18,750 | |
| | | | | | | | | | | | | | | | | | | | |
| |
| | | For the year ended December 31, | |
Managers International Equity Fund | | 2007 | | | 2006 | | | 2005 | | | 2004 | | | 2003 | |
Net Asset Value, Beginning of Year | | $ | 67.42 | | | $ | 53.76 | | | $ | 47.05 | | | $ | 41.13 | | | $ | 31.22 | |
| | | | | | | | | | | | | | | | | | | | |
Income from Investment Operations: | | | | | | | | | | | | | | | | | | | | |
Net investment income | | | 0.47 | | | | 0.69 | | | | 0.37 | | | | 0.27 | | | | 0.34 | |
Net realized and unrealized gain on investments | | | 9.60 | | | | 14.15 | | | | 6.83 | | | | 5.96 | | | | 10.04 | |
| | | | | | | | | | | | | | | | | | | | |
Total from investment operations | | | 10.07 | | | | 14.84 | | | | 7.20 | | | | 6.23 | | | | 10.38 | |
| | | | | | | | | | | | | | | | | | | | |
Less Distributions to Shareholders from: | | | | | | | | | | | | | | | | | | | | |
Net investment income | | | (0.36 | ) | | | (1.18 | ) | | | (0.49 | ) | | | (0.31 | ) | | | (0.47 | ) |
| | | | | | | | | | | | | | | | | | | | |
Total distributions to shareholders | | | (0.36 | ) | | | (1.18 | ) | | | (0.49 | ) | | | (0.31 | ) | | | (0.47 | ) |
| | | | | | | | | | | | | | | | | | | | |
Net Asset Value, End of Year | | $ | 77.13 | | | $ | 67.42 | | | $ | 53.76 | | | $ | 47.05 | | | $ | 41.13 | |
| | | | | | | | | | | | | | | | | | | | |
Total Return 1 | | | 14.94 | %4 | | | 27.63 | % | | | 15.30 | % | | | 15.17 | % | | | 33.21 | % |
| | | | | | | | | | | | | | | | | | | | |
Ratio of net expenses to average net assets | | | 1.48 | % | | | 1.45 | % | | | 1.45 | % | | | 1.62 | % | | | 1.72 | % |
Ratio of total expenses to average net assets 2 | | | 1.61 | % | | | 1.47 | % | | | 1.42 | % | | | 1.70 | % | | | 1.73 | % |
Ratio of net investment income to average net assets 1 | | | 0.60 | % | | | 0.70 | % | | | 0.75 | % | | | 0.57 | % | | | 0.70 | % |
Portfolio turnover | | | 98 | % | | | 70 | % | | | 79 | % | | | 93 | % | | | 80 | % |
Net assets at end of year (000’s omitted) | | $ | 302,025 | | | $ | 230,916 | | | $ | 206,393 | | | $ | 234,061 | | | $ | 266,611 | |
| | | | | | | | | | | | | | | | | | | | |
60
Financial Highlights
For a share outstanding throughout each year
| | | | | | | | | | | | | | | | | | | | |
| | | For the year ended December 31, | |
Managers Emerging Markets Equity Fund | | 2007 | | | 2006 | | | 2005 | | | 2004 | | | 2003 | |
Net Asset Value, Beginning of Year | | $ | 24.44 | | | $ | 20.10 | | | $ | 16.50 | | | $ | 13.26 | | | $ | 8.80 | |
| | | | | | | | | | | | | | | | | | | | |
Income from Investment Operations: | | | | | | | | | | | | | | | | | | | | |
Net investment income | | | 0.04 | 3 | | | 0.22 | | | | 0.52 | | | | 0.08 | | | | 0.01 | |
Net realized and unrealized gain on investments | | | 7.20 | 3 | | | 6.66 | | | | 4.84 | | | | 3.74 | | | | 4.50 | |
| | | | | | | | | | | | | | | | | | | | |
Total from investment operations | | | 7.24 | | | | 6.88 | | | | 5.36 | | | | 3.82 | | | | 4.51 | |
| | | | | | | | | | | | | | | | | | | | |
Less Distributions to Shareholders from: | | | | | | | | | | | | | | | | | | | | |
Net investment income | | | — | | | | (0.22 | ) | | | (0.55 | ) | | | (0.06 | ) | | | (0.05 | ) |
Net realized gain on investments | | | (4.88 | ) | | | (2.32 | ) | | | (1.21 | ) | | | (0.52 | ) | | | — | |
| | | | | | | | | | | | | | | | | | | | |
Total distributions to shareholders | | | (4.88 | ) | | | (2.54 | ) | | | (1.76 | ) | | | (0.58 | ) | | | (0.05 | ) |
| | | | | | | | | | | | | | | | | | | | |
Net Asset Value, End of Year | | $ | 26.80 | | | $ | 24.44 | | | $ | 20.10 | | | $ | 16.50 | | | $ | 13.26 | |
| | | | | | | | | | | | | | | | | | | | |
Total Return 1 | | | 29.50 | %4 | | | 34.50 | % | | | 32.53 | % | | | 28.85 | % | | | 51.20 | % |
| | | | | | | | | | | | | | | | | | | | |
Ratio of net expenses to average net assets | | | 1.78 | % | | | 1.76 | % | | | 1.75 | % | | | 1.85 | % | | | 1.99 | % |
Ratio of total expenses to average net assets 2 | | | 1.93 | % | | | 1.76 | % | | | 1.72 | % | | | 1.87 | % | | | 1.97 | % |
Ratio of net investment income to average net assets 1 | | | 0.13 | % | | | 0.89 | % | | | 0.59 | % | | | 0.67 | % | | | 0.08 | % |
Portfolio turnover | | | 62 | % | | | 41 | % | | | 35 | % | | | 58 | % | | | 79 | % |
Net assets at end of year (000’s omitted) | | $ | 198,235 | | | $ | 152,983 | | | $ | 117,229 | | | $ | 63,567 | | | $ | 36,728 | |
| | | | | | | | | | | | | | | | | | | | |
| |
| | | For the year ended December 31, | |
Managers Global Bond Fund | | 2007 | | | 2006 | | | 2005 | | | 2004 | | | 2003 | |
Net Asset Value, Beginning of Year | | $ | 21.17 | | | $ | 20.19 | | | $ | 22.38 | | | $ | 22.19 | | | $ | 20.58 | |
| | | | | | | | | | | | | | | | | | | | |
Income from Investment Operations: | | | | | | | | | | | | | | | | | | | | |
Net investment income | | | 0.70 | 3 | | | 0.45 | | | | 0.63 | | | | 0.65 | | | | 0.80 | |
Net realized and unrealized gain (loss) on investments | | | 0.88 | 3 | | | 1.05 | | | | (1.75 | ) | | | 1.49 | | | | 3.43 | |
| | | | | | | | | | | | | | | | | | | | |
Total from investment operations | | | 1.58 | | | | 1.50 | | | | (1.12 | ) | | | 2.14 | | | | 4.23 | |
| | | | | | | | | | | | | | | | | | | | |
Less Distributions to Shareholders from: | | | | | | | | | | | | | | | | | | | | |
Net investment income | | | (1.43 | ) | | | (0.49 | ) | | | (0.77 | ) | | | (1.34 | ) | | | (2.09 | ) |
Net realized gain on investments | | | (0.01 | ) | | | (0.03 | ) | | | (0.30 | ) | | | (0.61 | ) | | | (0.53 | ) |
| | | | | | | | | | | | | | | | | | | | |
Total distributions to shareholders | | | (1.44 | ) | | | (0.52 | ) | | | (1.07 | ) | | | (1.95 | ) | | | (2.62 | ) |
| | | | | | | | | | | | | | | | | | | | |
Net Asset Value, End of Year | | $ | 21.31 | | | $ | 21.17 | | | $ | 20.19 | | | $ | 22.38 | | | $ | 22.19 | |
| | | | | | | | | | | | | | | | | | | | |
Total Return 1 | | | 7.52 | %4 | | | 7.36 | % | | | (4.94 | )% | | | 9.62 | % | | | 20.69 | % |
| | | | | | | | | | | | | | | | | | | | |
Ratio of net expenses to average net assets | | | 1.19 | % | | | 1.19 | % | | | 1.19 | % | | | 1.29 | % | | | 1.68 | % |
Ratio of total expenses to average net assets 2 | | | 1.25 | % | | | 1.27 | % | | | 1.26 | % | | | 1.49 | % | | | 1.68 | % |
Ratio of net investment income to average net assets 1 | | | 3.25 | % | | | 2.86 | % | | | 2.38 | % | | | 2.73 | % | | | 3.48 | % |
Portfolio turnover | | | 152 | % | | | 56 | % | | | 64 | % | | | 130 | % | | | 152 | % |
Net assets at end of year (000’s omitted) | | $ | 92,124 | | | $ | 53,670 | | | $ | 43,131 | | | $ | 36,454 | | | $ | 32,307 | |
| | | | | | | | | | | | | | | | | | | | |
The following notes should be read in conjunction with the Financial Highlights of the Funds presented on the preceding pages.
1 | Total returns and net investment income would have been lower had certain expenses not been reduced. (See Note 1(c) to the Notes to Financial Statements.) |
2 | Excludes the impact of expense (reimbursement)/recoupment and expense reductions such as brokerage credits, but includes non-reimbursable expenses, if any, such as interest and taxes. (See Note 1(c) to the Notes to Financial Statements.) |
3 | Per share numbers have been calculated using average shares. |
4 | The Total Return is based on the Financial Statement Net Asset Values as shown above. |
61
Notes to Financial Statements
December 31, 2007
| 1. | Summary of Significant Accounting Policies |
The Managers Funds (the “Trust”) is an open-end management investment company organized as a Massachusetts business trust and registered under the Investment Company Act of 1940, as amended (the “1940 Act”). Currently, the Trust is comprised of a number of investment series. Included in this report are the Managers Value Fund (“Value”), Managers AMG Essex Large Cap Growth Fund (“Essex Large Cap Growth”), Managers Small Company Fund (“Small Company”), Managers International Equity Fund (“International Equity”), Managers Emerging Markets Equity Fund (“Emerging Markets Equity”), Managers Money Market Fund (“Money Market”) and Managers Global Bond Fund (“Global Bond”), collectively the “Funds.”
Money Market invests all of its investable assets in the Capital Shares of the JPMorgan Liquid Assets Money Market Fund (the “Portfolio”), a separate registered open-end management investment company with substantially the same investment objective and policies as the Fund. The Portfolio is a series of the JPMorgan Trust II, a business trust organized under the laws of The Commonwealth of Massachusetts. The investment manager of the Portfolio is JPMorgan Investment Advisors Inc. (“JPMIA”). The performance of the Fund is directly affected by the performance of the Portfolio.
The Funds’ financial statements are prepared in accordance with accounting principles generally accepted in the United States of America, which require management to make estimates and assumptions that affect the reported amount of assets and liabilities and disclosure of contingent assets and liabilities at the date of the financial statements and the reported amounts of income and expenses during the reporting periods. Actual results could differ from those estimates and such differences could be material. The following is a summary of significant accounting policies followed by the Funds in the preparation of their financial statements:
| a. | Valuation of Investments |
Equity securities traded on a domestic or international securities exchange are generally valued at the last quoted sale price, or, lacking any sales, at the last quoted bid price. Over-the-counter securities are valued at the NASDAQ Official Closing Price, if one is available. Lacking any sales, over-the-counter securities, are valued at the last quoted bid price. The Funds’ investments are generally valued based on market quotations provided by third-party pricing services approved by the Board of Trustees of the Trust. Under certain circumstances, the value of a Fund investment may be based on an evaluation of its fair value, pursuant to procedures established by and under the general supervision of the Board of Trustees of the Fund. A Fund may use the fair value of a portfolio security to calculate its NAV when, for example, (1) market quotations are not readily available because a portfolio security is not traded in a public market or the principal market in which the security trades is closed, (2) trading in a portfolio security is suspended and has not resumed prior to the time as of which the Fund calculates its NAV, (3) where a significant event affecting the value of a portfolio security is determined to have occurred between the time of the market quotation provided for a portfolio security and the time as of which the Fund calculates its NAV, (4) a security’s price has remained unchanged over a period of time (often referred to as a “stale price”), or (5) the Investment Manager determines that a market quotation is inaccurate. The Investment Manager monitors intervening events that may affect the value of securities held in each Fund’s portfolio and, in accordance with procedures adopted by the Funds’ Trustees, will adjust the prices of securities traded in foreign markets, as appropriate, to reflect the impact of events occurring subsequent to the close of such markets but prior to the time each Fund’s NAV is calculated. Fixed-income securities are valued based on valuations furnished by independent pricing services that utilize matrix systems, which reflect such factors as security prices, yields, maturities and ratings, and are supplemented by dealer and exchange quotations. Short-term investments having a remaining maturity of 60 days or less are valued at amortized cost, which approximates market value. Investments in other regulated investment companies are valued at their end of day net asset value per share except iShares or other ETF’s, which are valued the same as equity securities. Securities (including derivatives) for which market quotations are not readily available are valued at fair value, as determined in good faith, and pursuant to procedures adopted by the Board of Trustees of the Trust. The values assigned to fair value investments are based on available information and do not necessarily represent amounts that might ultimately be realized, since such amounts depend on future developments inherent in long-term investments. Further, because of the inherent uncertainty of valuation, those estimated values may differ significantly from the values that would have been used had a ready market for the investments existed, and the differences could be material.
Investments in certain mortgage-backed, stripped mortgage-backed, preferred stocks, convertible securities and other debt securities not traded on an organized market, are valued on the basis of valuations provided by dealers or by a pricing service which uses information with respect to transactions in such securities, various relationships between securities and yield to maturity in determining value.
Money Market’s investment in the Portfolio is valued daily at its end of day net asset value per share. The Portfolio’s underlying investments are valued at amortized cost which approximates market value. The amortized cost method of valuation values a security at its cost at the time of purchase and thereafter assumes a constant amortization to maturity of any discount or premium, regardless of the impact of fluctuating interest rates on the market value of the instruments.
Security transactions are accounted for as of the trade date. Realized gains and losses on securities sold are determined on the basis of identified cost.
| c. | Investment Income and Expenses |
Dividend income is recorded on the ex-dividend date except certain dividends from foreign securities where the ex-dividend date may have passed. These dividends are recorded as soon as the Trust is informed of the ex-dividend date. Dividend income on foreign securities is recorded net of any withholding tax. Interest income, which includes amortization of premium and accretion of discount on debt securities, is accrued as earned. Non-cash dividends included in dividend income, if any, are reported at the fair market value of the securities received. As a shareholder of the Portfolio, the Money Market Fund receives its proportionate share of the dividends paid by such class, which takes into consideration the Fund’s proportionate share of net investment income and expenses of such class. Other income and expenses are recorded on an accrual basis. Expenses that cannot be directly attributed to a fund are apportioned among the Funds in the Trust and in some cases other affiliated funds based upon their relative average net assets or number of shareholders.
62
Notes to Financial Statements (continued)
The following Funds had certain portfolio trades directed to various brokers who paid a portion of such Fund’s expenses. For the year ended December 31, 2007, under these arrangements the amount by which the Funds’ expenses were reduced and the impact on the expense ratios were as follows: Value—$20,292 or 0.03%; Essex Large Cap Growth—$32,980 or 0.05%; Small Company—$32,040 or 0.09%; and International Equity—$5,813 or 0.0%.
In addition, each of the Funds has a “balance credit” arrangement with The Bank of New York (“BNY”), the Funds’ custodian, whereby each Fund is credited with an interest factor equal to 0.75% below the effective 90-day T-Bill rate for account balances left uninvested overnight. These credits serve to reduce custody expenses that would otherwise be charged to each Fund. For the year ended December 31, 2007, the custodian expense was reduced as follows: Value—$127; Small Company—$52; International Equity—$418; Emerging Markets Equity—$467 and Global Bond—$336.
Overdrafts will cause a reduction of any earnings credits, computed at 2% above the effective Federal Funds rate on the day of the overdraft. For the year ended December 31, 2007, overdraft fees for Value, Essex Large Cap Growth, Small Company, International Equity, Emerging Markets Equity and Global Bond equaled $39, $691, $106, $33, $13,288 or 0.01% and $301, respectively.
The Trust also has a balance credit arrangement with its Transfer Agent, PFPC Inc., whereby earnings credits are used to offset banking charges. For the year ended December 31, 2007, the Funds’ portion of the transfer agent expense was reduced under this arrangement as follows: Value—$742; Essex Large Cap Growth—$624; Small Company—$334; International Equity—$3,446; Emerging Markets Equity—$2,415; Global Bond—$1,044 and Money Market -$1,061.
The Money Market has an “omnibus account” arrangement with JPMorgan Distribution Services, Inc, (“JPMDS”), the shareholder servicing agent of the Portfolio, whereby the Fund is credited with a factor of 0.05% of the average daily assets invested in the Portfolio. This credit serves to reduce expenses that would otherwise be charged to the Fund. For the fiscal year ended November 30, 2007 and the one month period ended December 31, 2007, expenses were reduced under this arrangement by $51,525 and $4,035, respectively.
Total returns and net investment income for the Funds would have been lower had certain expenses not been offset.
| d. | Dividends and Distributions |
Dividends resulting from net investment income, if any, normally will be declared and paid annually for all Funds except Money Market. Dividends resulting from net investment income, if any, normally will be declared daily and paid monthly for Money Market. Distributions of capital gains, if any, will be made on an annual basis and when required for Federal excise tax purposes. Income and capital gain distributions are determined in accordance with Federal income tax regulations, which may differ from generally accepted accounting principles. These differences are primarily due to differing treatments for losses deferred due to wash sales, equalization accounting for tax purposes, foreign currency and market discount transactions. Permanent book and tax basis differences, if any, relating to shareholder distributions will result in reclassifications to paid-in capital. The tax character of distributions paid during the past two years were as follows:
| | | | | | | | | | | | | | | | | | | | | | | |
| | | Value | | | Essex Large Cap Growth | | | Small Company | |
| | | 2007 | | | 2006 | | | 2007 | | 2006 | | | 2007 | | | 2006 | |
Distributions paid from: | | | | | | | | | | | | | | | | | | | | | | | |
Ordinary income | | $ | 644,259 | | | $ | 855,868 | | | | — | | | — | | | $ | 72,068 | | | | — | |
Short-term capital gains | | | 1,276,223 | | | | 1,797,816 | | | | — | | | — | | | | 593,430 | | | | — | |
Long-term capital gains | | | 8,064,306 | | | | 9,778,543 | | | | — | | | — | | | | 4,279,006 | | | | — | |
| | | | | | | | | | | | | | | | | | | | | | | |
| | $ | 9,984,788 | | | $ | 12,432,227 | | | | — | | | — | | | $ | 4,944,504 | | | | — | |
| | | | | | | | | | | | | | | | | | | | | | | |
As a % of distributions paid: (unaudited) | | | | | | | | | | | | | | | | | | | | | | | |
Qualified ordinary income | | | 100.00 | % | | | 100.00 | % | | | — | | | — | | | | 100.00 | % | | | — | |
Ordinary income—dividends received deduction | | | 66.28 | % | | | 64.80 | % | | | — | | | — | | | | 70.60 | % | | | — | |
| | | | | | | | | | | | | | | | | | | | | | | |
| | | |
| | | International Equity | | | Emerging Markets Equity | | | Global Bond | |
| | | 2007 | | | 2006 | | | 2007 | | 2006 | | | 2007 | | | 2006 | |
Distributions paid from: | | | | | | | | | | | | | | | | | | | | | | | |
Ordinary income | | $ | 1,407,436 | | | $ | 4,000,641 | | | | — | | $ | 1,229,899 | | | $ | 5,790,344 | | | $ | 1,211,010 | |
Short-term capital gains | | | — | | | | — | | | $ | 5,317,862 | | | 3,138,783 | | | | 35,680 | | | | — | |
Long-term capital gains | | | — | | | | — | | | | 25,872,433 | | | 10,101,175 | | | | 865 | | | | 66,866 | |
| | | | | | | | | | | | | | | | | | | | | | | |
| | $ | 1,407,436 | | | $ | 4,000,641 | | | $ | 31,190,295 | | $ | 14,469,857 | | | $ | 5,826,889 | | | $ | 1,277,876 | |
| | | | | | | | | | | | | | | | | | | | | | | |
As a % of distributions paid: (unaudited) | | | | | | | | | | | | | | | | | | | | | | | |
Qualified ordinary income | | | 100.00 | % | | | 100.00 | % | | | — | | | 100.00 | % | | | — | | | | 0.00 | % |
Ordinary income—dividends received deduction | | | 2.41 | % | | | 1.17 | % | | | — | | | — | | | | — | | | | — | |
| | | | | | | | | | | | | | | | | | | | | | | |
63
Notes to Financial Statements (continued)
As of December 31, 2007, the components of distributable earnings (excluding unrealized appreciation/depreciation) on a tax basis consisted of:
| | | | | | | | | | | | | | | | | |
| | | Value | | Essex
Large Cap
Growth | | Small
Company | | International
Equity | | Emerging
Markets Equity | | Global
Bond |
Capital loss carryforward | | — | | $ | 133,061,324 | | | — | | $ | 29,556,999 | | | — | | | — |
Undistributed ordinary income | | — | | | — | | | — | | | — | | $ | 57,088 | | $ | 453,025 |
Undistributed short-term capital gains | | — | | | — | | $ | 131,348 | | | — | | | 2,127,641 | | | — |
Undistributed long-term capital gains | | — | | | — | | | 194,796 | | | — | | | 12,186,434 | | | 62,905 |
The tax character of distributions paid by the Money Market Fund during the past two periods were as follows:
| | | | | | | | | |
| | | Money Market |
| | | For the one month
ended December 31,
2007 | | For the fiscal year ended
November 30, |
| | | | 2007 | | 2006 |
Distributions paid from: | | | | | | | | | |
Ordinary income | | $ | 360,350 | | $ | 5,069,405 | | $ | 1,515,932 |
Short-term capital gains | | | — | | | — | | | — |
Long-term capital gains | | | — | | | — | | | — |
Each Fund intends to comply with the requirements under Subchapter M of the Internal Revenue Code of 1986, as amended, to distribute substantially all of its taxable income and gains to its shareholders and to meet certain diversification and income requirements with respect to investment companies. Therefore, no provision for Federal income or excise tax is included in the accompanying financial statements.
Additionally, based on the Funds’ understanding of the tax rules and rates related to income, gains and transactions for the foreign jurisdictions in which they invest, certain Funds will provide for foreign taxes, and where appropriate, deferred foreign taxes.
| f. | Capital Loss Carryovers |
As of December 31, 2007, the following Funds had accumulated net realized capital loss carryovers from securities transactions for Federal income tax purposes as shown in the following chart. These amounts may be used to offset realized capital gains, if any, through the expiration dates listed.
| | | | | |
Fund | | Capital Loss
Carryover Amount | | Expires December 31, |
Essex Large Cap Growth | | $ | 89,173,242 | | 2009 |
| | | 30,988,593 | | 2010 |
| | | 12,899,489 | | 2011 |
International Equity | | | 13,386,880 | | 2010 |
| | | 16,170,119 | | 2011 |
Money Market | | | 2,266 | | 2008 |
For the year ended December 31, 2007, Essex Large Cap Growth, Small Company and International Equity utilized capital loss carryovers in the amounts of $12,255,006, $536,555 and $35,507,308.
The Trust’s Declaration of Trust authorizes for each series the issuance of an unlimited number of shares of beneficial interest, without par value. Each Fund records sales and repurchases of its capital stock on the trade date. Dividends and distributions to shareholders are recorded on the ex-dividend date.
At December 31, 2007, certain unaffiliated shareholders, specifically omnibus accounts, individually held greater than 10% of the outstanding shares of the following Funds: Value—one owns 10%; Essex Large Cap Growth—one owns 15%; International Equity—two collectively own 38%; Emerging Markets Equity—two collectively own 59%; Money Market – one owns 11%. Transactions by these shareholders may have a material impact on the Funds.
| h. | Foreign Currency Translation |
The books and records of the Funds are maintained in U.S. dollars. The value of investments, assets and liabilities denominated in currencies other than U.S. dollars are translated into U.S. dollars based upon current foreign exchange rates. Purchases and sales of foreign investments, income and expenses are converted into U.S. dollars based on currency exchange rates prevailing on the respective dates of such transactions. Net realized and unrealized gain (loss) on foreign currency transactions represent: (1) foreign exchange gains and losses from the sale and holdings of foreign currencies; (2) gains and losses between trade date and settlement date on investment securities transactions and forward foreign currency exchange contracts; and (3) gains and losses from the difference between amounts of interest and dividends recorded and the amounts actually received.
In addition, the Funds do not isolate the net realized and unrealized gain or loss resulting from changes in exchange rates from the fluctuations resulting from changes in market prices of securities held. Such fluctuations are included with the net realized and unrealized gain or loss on investments.
64
Notes to Financial Statements (continued)
| 2. | Agreements and Transactions with Affiliates |
For each of the Funds other than Money Market, the Trust has entered into an Investment Management Agreement under which the Investment Manager provides or oversees investment management services to the Funds. The Investment Manager selects subadvisors for each Fund (subject to Trustee approval), allocates assets among subadvisors and monitors the subadvisors’ investment programs and results. Each Fund’s investment portfolio is managed by portfolio managers who serve pursuant to Subadvisory Agreements with the Investment Manager.
Investment management fees are paid directly by each Fund to the Investment Manager based on average daily net assets. The annual investment management fee rates, as a percentage of average daily net assets for the year ended December 31, 2007, were as follows:
| | | |
Fund | | Investment
Management Fee | |
Value | | 0.75 | % |
Essex Large Cap Growth | | 0.80 | % |
Small Company | | 0.90 | % |
International Equity | | 0.90 | % |
Emerging Markets Equity | | 1.15 | % |
Global Bond | | 0.70 | % |
The Investment Manager of Global Bond has agreed to contractually waive a portion of its management fee for the Fund until at least March 1, 2008. For the year ended December 31, 2007, the amount waived was $101,258 or 0.10%.
Managers Investment Group LLC (the “Investment Manager”), an independently managed subsidiary of Affiliated Managers Group, Inc. (“AMG”) and the Investment Manager for the Funds, has contractually agreed, through at least May 1, 2008, subject to later reimbursement by the Funds in certain circumstances, that the total annual operating expenses (exclusive of taxes, interest, brokerage costs, acquired fund expenses and extraordinary expenses) will be limited to the following amounts of the Fund’s average daily net assets: Small Company—1.45%; and Global Bond—1.19%. The Investment Manager has also contractually agreed, subject to later reimbursement by the Funds in certain circumstances, that the total annual operating expenses (exclusive of taxes, interest, brokerage costs, acquired fund expenses and extraordinary expenses) will be limited to 1.19%, 1.29%, 1.55% and 1.79%, on Value, Essex Large Cap Growth, International Equity, and Emerging Markets Equity, respectively, of each Fund’s average daily net assets, provided that the amount of fees waived, paid or reimbursed does not exceed 0.25% per annum of each Fund’s average daily net assets.
In general, for a period of up to three years from the time of any waiver or payment pursuant to the Fund’s contractual expense limitation, the Investment Manager may recover from the Fund fees waived and expenses paid to the extent that the Fund’s total annual operating expenses do not exceed the contractual expense limitation amount. For the year ended December 31, 2007, the following Funds made such repayments to the Investment Manager in the following amounts: Value—$12,289; Essex Large Cap Growth—$9,756; Small Company—$1,543; Emerging Markets Equity—$1,892 and Global Bond—$144,121. At December 31, 2007, the cumulative amount of reimbursement by the Manager subject to repayment by Value, Essex Large Cap, Small Company, and Emerging Markets Equity equaled $53,862, $41,872, $51,211, and $66,902, respectively. For the year ended December 31, 2007, the Investment Manager voluntarily waived $348,741 and $214,369 of expenses for International Equity and Emerging Markets Equity which may not be recovered by the Investment Manager.
The Trust has entered into an Administration and Shareholder Servicing Agreement (“Administration Agreement”) under which Managers Investment Group LLC serves as each Fund’s administrator (the “Administrator”) and is responsible for all aspects of managing the Funds’ operations, including administration and shareholder services to each Fund, its shareholders, and certain institutions, such as bank trust departments, broker-dealers and registered investment advisers, that advise or act as an intermediary with the Funds’ shareholders. Under the terms of the Administration Agreement, each of the Funds, except Global Bond and Money Market, pay a fee to the Administrator at the rate of 0.25% per annum of the Fund’s average daily net assets. Global Bond and Money Market pay a fee to the Administrator at the rate of 0.20% and 0.15%, respectively, per annum of the Fund’s average daily net assets.
Prior to July 1, 2007, the aggregate annual retainer paid to each Independent Trustee was $55,000, plus $4,000 or $2,000 for each regular or special meeting attended, respectively. Effective July 1, 2007, the aggregate annual retainer paid to each Independent Trustee is $65,000, plus $4,000 or $2,500 for each regular or special meeting attended, respectively. The Trustees’ fees and expenses are allocated amongst all of the Funds for which the Investment Manager serves as the advisor (the “Managers Funds”) based on the relative net assets of such Funds. The Independent Chairman of the Trusts receives an additional payment of $15,000 per year. (Prior to July 1, 2007, the Independent Chairman received an additional payment of $10,000 per year). The Chairman of the Audit Committee receives an additional payment of $5,000 per year. (Prior to July 1, 2007, the Chairman of the Audit Committee received an additional payment of $2,000 per year). The “Trustee fees and expenses” shown in the financial statements represents each Fund’s allocated portion of the total fees and expenses paid by the Managers Funds.
The Funds are distributed by Managers Distributors, Inc. (the “Distributor”), a wholly-owned subsidiary of Managers Investment Group LLC. The Distributor serves as the principal underwriter for each Fund. The Distributor is a registered broker-dealer and member of the Financial Industry Regulatory Authority, Inc. (“FINRA”). Shares of each Fund will be continuously offered and will be sold by brokers,
dealers or other financial intermediaries who have executed selling agreements with the Distributor. The Distributor bears all the expenses of providing services pursuant to an Underwriting Agreement, including the payment of the expenses relating to the distribution of Prospectuses for sales purposes and any advertising or sales literature. Certain Trustees and Officers of the Funds are Officers and/or Directors of the Investment Manager, AMG and/or the Distributor.
65
Notes to Financial Statements (continued)
| 3. | Purchases and Sales of Securities |
Purchases and sales of securities, excluding short-term securities, for the year ended December 31, 2007, were as follows:
| | | | | | | | | | | | |
Fund | | Long-Term Securities | | U.S. Government Securities |
| | Purchases | | Sales | | Purchases | | Sales |
Value | | $ | 27,465,427 | | $ | 40,673,816 | | | N/A | | | N/A |
Essex Large Cap Growth | | | 71,223,574 | | | 95,721,431 | | | N/A | | | N/A |
Small Company | | | 17,797,041 | | | 30,910,549 | | | N/A | | | N/A |
International Equity | | | 279,544,126 | | | 245,875,854 | | | N/A | | | N/A |
Emerging Markets Equity | | | 118,521,055 | | | 114,840,068 | | | N/A | | | N/A |
Global Bond | | | 125,124,126 | | | 92,834,995 | | $ | 51,439,942 | | $ | 50,163,824 |
| 4. | Portfolio Securities Loaned |
Each of the Funds other than Money Market may participate in a securities lending program offered by BNY providing for the lending of equities, corporate bonds and government securities to qualified brokers. Collateral on all securities loaned is accepted in cash and/ or government securities. Collateral is maintained at a minimum level of 102% of the market value, plus interest, if applicable, of investments on loan. Collateral received in the form of cash is invested temporarily in institutional money market funds or other short-term investments by BNY. Securities lending fees include earnings of such temporary cash investments, plus or minus any rebate to a borrower. These earnings (after any rebate) are then divided between BNY, as a fee for its services under the program, and the Fund according to agreed-upon rates.
| 5. | Commitments and Contingencies |
In the normal course of business, the Funds may enter into contracts and agreements that contain a variety of representations and warranties, which provide general indemnifications. The maximum exposure to the Funds under these arrangements is unknown, as this would involve future claims that may be against the Funds that have not yet occurred. However, based on experience, the Funds expect the risks of loss to be remote.
Certain transactions, such as futures and forward transactions, dollar roll agreements, or purchases of when-issued or delayed delivery securities may have a similar effect on a Fund’s net asset value as if the Fund had created a degree of leverage in its portfolio. However, if a Fund enters into such a transaction, the Fund will establish a segregated account with its custodian in which it will maintain cash, U.S. Government securities or other liquid securities equal in value to its obligations in respect to such transaction. Securities and other assets held in the segregated account may not be sold while the transaction is outstanding, unless other suitable assets are substituted.
| 7. | Forward Foreign Currency Contracts |
International Equity, Emerging Markets Equity, and Global Bond invest in forward foreign currency exchange contracts to manage currency exposure. These investments may involve greater market risk than the amounts disclosed in the Funds’ financial statements.
A forward foreign currency exchange contract is an agreement between a Fund and another party to buy or sell a currency at a set price at a future date. The market value of the contract will fluctuate with changes in currency exchange rates. The contract is marked-to-market daily, and the change in market value is recorded as an unrealized gain or loss. Gain or loss on the purchase or sale of contracts having the same settlement date, amount and counter party is realized on the date of offset, otherwise gain or loss is realized on settlement date.
The Funds, except Value, Essex Large Cap Growth, Money Market and Small Company, may invest in non-U.S. dollar denominated instruments subject to limitations, and enter into forward foreign currency exchange contracts to facilitate transactions in foreign securities and to protect against a possible loss resulting from an adverse change in the relationship between the U.S. dollar and such foreign currency. Risks may arise upon entering into these contracts from the potential inability of counterparties to meet the terms of their contracts and from unanticipated movements in the value of a foreign currency relative to the U.S. dollar.
66
Notes to Financial Statements (continued)
Cash pledged to cover margin requirements for open forward positions in International Equity at December 31, 2007 is $154,427. Open forward foreign currency exchange contracts (in U.S. Dollars) at December 31, 2007 were as follows:
| | | | | | | | | | | | | | | | |
Foreign Currency | | Position | | Settlement Date | | Current Value
(Receivable Amount) | | | Contract Value
(Payable Amount) | | | Unrealized Gain/
(Loss) | |
euro-dollar Contracts | | Short | | 01/02/08-01/03/08 | | $ | (605,646 | ) | | $ | (608,659 | ) | | $ | 3,013 | |
Pound Sterling | | Short | | 01/02/08 | | | (477,745 | ) | | | (478,488 | ) | | | 743 | |
Japanese Yen | | Short | | 01/07/08 | | | (188,129 | ) | | | (185,611 | ) | | | (2,518 | ) |
South African Rand | | Short | | 01/02/08 | | | (124,665 | ) | | | (120,998 | ) | | | (3,667 | ) |
Canadian Dollar | | Long | | 01/02/08 | | | 486,347 | | | | 491,615 | | | | (5,268 | ) |
Swiss Franc | | Long | | 01/07/08 | | | 26,085 | | | | 26,201 | | | | (116 | ) |
Pound Sterling | | Long | | 01/02/08-01/03/08 | | | 128,753 | | | | 128,933 | | | | (180 | ) |
| | | | | | | | | | | | | | | | |
| | | | | | $ | (755,000 | ) | | $ | (747,007 | ) | | $ | (7,993 | ) |
| | | | | | | | | | | | | | | | |
International Equity uses Equity Index futures contracts to a limited extent, with the objective of maintaining exposure to equity stock markets while maintaining liquidity. The Fund may purchase or sell futures contracts to achieve a desired level of investment, whether to accommodate portfolio turnover or cash flows from capital shares transactions. There are certain risks associated with futures contracts. Prices may not move as expected or a Fund may not be able to close out the contract when it desires to do so, resulting in losses.
Futures are valued at their quoted daily settlement prices. The aggregate principal amounts of the contracts are not recorded in the financial statements. Fluctuations in the value of the contracts are recorded in the Statement of Assets and Liabilities as an asset (liability) and in the Statement of Operations as unrealized appreciation (depreciation) until the contracts are closed, when they are recorded as realized gains (losses) on futures or forward currency contracts. Cash pledged to cover margin requirements for the open futures positions at December 31, 2007, amounted to $40,818. International Equity had the following open futures contracts as of December 31, 2007.
| | | | | | | | | | |
Type | | Number of
Contracts | | Position | | Expiration
Month | | Unrealized
Gain/(Loss) | |
3-Month Euro | | 8 | | Long | | 3/13/08 | | ($ | 71,095 | ) |
| 9. | New Accounting Pronouncements |
In June 2006, the Financial Accounting Standards Board (“FASB”) issued Interpretation No. 48, “Accounting for Uncertainty in Income Taxes—an Interpretation of FASB Statement No. 109 (“FIN 48”).” FIN 48 applies to all registered investment companies and establishes the minimum threshold for recognizing, and a system for measuring, the benefits of tax-return positions in the financial statements. FIN 48 is effective for fiscal years beginning after December 15, 2006. Management has analyzed the Funds’ tax positions taken on federal income tax returns for all open tax years (tax years ended December 31, 2004—2007) and has concluded that as of December 31, 2007, no provision for income tax is required in the Funds’ financial statements. Also, Management has analyzed the Managers Money Market Fund’s tax positions taken on federal income tax returns for all open tax years (tax years ended November 30, 2005, 2006, 2007 and for the one month period ended December 31, 2007) and has concluded that as of December 31, 2007, no provision for income tax is required in the Fund’s financial statements. Additionally, Fund Management is not aware of any events that are reasonably possible to occur in the next twelve months that would result in the amounts of any unrecognized tax benefits significantly increasing or decreasing for the Funds.
In addition, in September 2006, Statement of Financial Accounting Standards No. 157, Fair Value Measurements (“SFAS 157”), was issued and is effective for fiscal years beginning after November 15, 2007. SFAS 157 defines fair value, establishes a framework for measuring fair value and expands disclosures about fair value measurements. Management is currently evaluating the impact, if any, the adoption of SFAS 157 will have on the Funds’ financial statements; except that with respect to Money Market, management has concluded that adoption of SFAS 157 did not have any impact on the financial statements for the period from December 1, 2007 to December 31, 2007. The Money Market Fund invests solely in the Capital Shares of the JP Morgan Liquid Assets Money Market Fund, (the “Liquid Assets Fund”). The total fair value of this investment was $90,937,675. The Liquid Assets Fund is traded in an active market and has a net asset value of $1.00 per share. This method of valuation had been used throughout the entire year.
Effective January 1, 2008, the Investment Manager has agreed to amend the expense limitation agreements for International Equity, Emerging Markets Equity and Global Bond such that, subject to the same terms and conditions as previously described in Note 2, the new annual expense limitations will be 1.48%, 1.77% and 1.10%, respectively, through at least May 1, 2009.
67
Tax Information (continued)
Tax Information (unaudited)
The Funds hereby designate the maximum amount allowable of their net taxable income as qualified dividends as provided in the Jobs and Growth Tax Relief Reconciliation Act of 2003. The 2006 Form 1099-DIV you receive for the Fund, will show the tax status of all distributions paid to you during the year.
Pursuant to section 852 of the Internal Revenue Code, Value, Essex Large Cap Growth, Small Company, International Equity, Emerging Markets Equity and Global Bond designate $5,887,700, $0, $4,473,802, $0, $37,059,476 and $62,924, respectively, as long-term capital gain for the taxable year ended December 31, 2007.
68
Report of Independent Registered Public Accounting Firm
To the Board of Trustees of The Managers Funds and the Shareholders of Managers Value Fund, Managers AMG Essex Large Cap Growth Fund, Managers Small Company Fund, Managers International Equity Fund, Managers Emerging Markets Equity Fund, Managers Global Bond Fund and Managers Money Market Fund:
In our opinion, the accompanying statements of assets and liabilities, including the schedules of portfolio investments, the statement of net assets, and the related statements of operations and of changes in net assets and the financial highlights present fairly, in all material respects, the financial position of Managers Value Fund, Managers AMG Essex Large Cap Growth Fund, Managers Small Company Fund, Managers International Equity Fund, Managers Emerging Markets Equity Fund, Managers Global Bond Fund and Managers Money Market Fund, (seven of the series constituting The Managers Funds, hereafter referred to as the “Funds”), at December 31, 2007, and the results of each of their operations, the changes in each of their net assets, and the financial highlights for each of the periods indicated, in conformity with accounting principles generally accepted in the United States of America. These financial statements and financial highlights (hereafter referred to as “financial statements”) are the responsibility of the Funds’ management; our responsibility is to express an opinion on these financial statements based on our audits. We conducted our audits of these financial statements in accordance with the standards of the Public Company Accounting Oversight Board (United States). Those standards require that we plan and perform the audit to obtain reasonable assurance about whether the financial statements are free of material misstatement. An audit includes examining, on a test basis, evidence supporting the amounts and disclosures in the financial statements, assessing the accounting principles used and significant estimates made by management, and evaluating the overall financial statement presentation. We believe that our audits, which included confirmation of securities at December 31, 2007 by correspondence with the custodian and brokers, provide a reasonable basis for our opinion.
PricewaterhouseCoopers, LLP
Philadelphia, Pennsylvania
February 20, 2008
69
Trustees and Officers
The Trustees and Officers of the Trust, their business addresses, principal occupations for the past five years and dates of birth are listed below. The Trustees provide broad supervision over the affairs of the Trust and the Funds. The Trustees are experienced executives who meet periodically throughout the year to oversee the Funds’ activities, review contractual arrangements with companies that provide services to the Funds, and review the Funds’ performance. Unless otherwise noted, the address of each Trustee or Officer is the address of the Trust: 800 Connecticut Avenue, Norwalk, Connecticut 06854.
There is no stated term of office for Trustees. Trustees serve until their resignation, retirement or removal in accordance with the Trust’s organizational documents and policies adopted by the Board from time to time. The Chairman of the Trustees, President, Treasurer and Secretary of the Trust are elected by the Trustees annually. Other officers hold office at the pleasure of the Trustees.
Independent Trustees
The following Trustees are not “interested persons” of the Trust within the meaning of the 1940 Act:
| | |
Name, Date of Birth, Number of Funds Overseen
in Fund Complex* | | Principal Occupation(s) During Past 5 Years and Other Directorships Held by Trustee |
Jack W. Aber, 9/9/37 • Trustee since 1999 • Oversees 32 Funds in Fund Complex | | Professor of Finance, Boston University School of Management (1972-Present); Trustee of Appleton Growth Fund (1 portfolio); Trustee of Third Avenue Trust (4 portfolios); Trustee of Third Avenue Variable Trust (1 portfolio). |
| |
William E. Chapman, II, 9/23/41 • Independent Chairman • Trustee since 1999 • Oversees 32 Funds in Fund Complex | | President and Owner, Longboat Retirement Planning Solutions (1998-Present); Hewitt Associates, LLC (part time) (provider of Retirement and Investment Education Seminars); Trustee of Bowdoin College (2002-Present); Trustee of Third Avenue Trust (4 portfolios); Trustee of Third Avenue Variable Trust (1 portfolio). |
| |
Edward J. Kaier, 9/23/45 • Trustee since 1999 • Oversees 32 Funds in Fund Complex | | Attorney at Law and Partner, Teeters Harvey Kilboy & Kaier LLP (2007-Present); Attorney at Law and Partner, Hepburn Willcox Hamilton & Putnam, LLP (1977-2007); Trustee of Third Avenue Trust (4 portfolios); Trustee of Third Avenue Variable Trust (1 portfolio). |
| |
Steven J. Paggioli, 4/3/50 • Trustee since 1993 • Oversees 32 Funds in Fund Complex | | Consultant (2001-Present); Formerly Executive Vice President and Director, The Wadsworth Group (1986-2001); Executive Vice President, Secretary and Director, Investment Company Administration, LLC (1990-2001); Vice President, Secretary and Director, First Fund Distributors, Inc. (1991-2001); Trustee, Professionally Managed Portfolios (22 portfolios); Advisory Board Member, Sustainable Growth Advisors, LP. |
| |
Eric Rakowski, 6/5/58 • Trustee since 1999 • Oversees 32 Funds in Fund Complex | | Professor, University of California at Berkeley School of Law (1990-Present); Trustee of Third Avenue Trust (4 portfolios); Trustee of Third Avenue Variable Trust (1 portfolio). |
| |
Thomas R. Schneeweis, 5/10/47 • Trustee since 1987 • Oversees 32 Funds in Fund Complex | | Professor of Finance, University of Massachusetts (1977-Present); Director, CISDM at the University of Massachusetts, (1996-Present); President, Alternative Investment Analytics, LLC, (formerly Schneeweis Partners, LLC) (2001-Present); Partner, White Bear Partners, LLC (2007-Present); Partner, Schneeweis Capital Management, LLC (2007-Present); Partner, Schneeweis Associates, LLC (2007-Present); Partner, Northampton Capital Management, LLC (2004-Present); Partner, TRS Associates (2007-Present). |
| * | The Fund Complex consists of Managers AMG Funds, The Managers Funds, Managers Trust I and Managers Trust II. |
Interested Trustee
The following Trustee is an “interested person” of the Trust within the meaning of the 1940 Act by virtue of his positions with, and interest in securities of, Affiliated Managers Group, Inc.
| | |
Name, Date of Birth, Number of Funds Overseen
in Fund Complex* | | Principal Occupation(s) During Past 5 Years and Other Directorships Held by Trustee |
William J. Nutt, 3/30/45 • Trustee since 2005 • President since 2007 • Oversees 32 Funds in Fund Complex | | Chairman and Founder of Affiliated Managers Group, Inc., (1993-Present); Chief Executive Officer of Affiliated Managers Group, Inc. (1993-2004); Director, Affiliated Managers Group, Inc. (1993-Present); President of Affiliated Managers Group, Inc. (1993-1999); President and Chief Operating Officer, The Boston Company (1989-1993); Senior Executive Vice President, The Boston Company (1982-1989). |
Officers
| | |
Name, Date of Birth, Position(s) Held with Fund
and Length of Time Served | | Principal Occupation(s) During Past 5 Years |
Christine C. Carsman, 4/2/52 • Secretary since 2004 | | Senior Vice President and Chief Regulatory Counsel, Affiliated Managers Group, Inc. (2004-Present); Secretary, Managers AMG Funds, Managers Trust I and II (2004-Present); Senior Counsel, Vice President and Director of Operational Risk Management and Compliance, Wellington Management Company, LLP (1995-2004); Deputy General Counsel, The Boston Company, Inc. (1993-1995); Associate General Counsel, The Boston Company Advisors, Inc. (1991-1993); Associate, Sullivan & Worcester LLP (1987-1991). |
| |
Donald S. Rumery, 5/29/58 • Chief Financial Officer since 2007 • Treasurer since 1995 | | Senior Vice President, Managers Investment Group LLC (2005-Present); Director, Finance and Planning, The Managers Funds LLC, (1994-2004); Treasurer and Chief Financial Officer, Managers Distributors, Inc. (2000-Present); Treasurer, Managers AMG Funds (1999-Present); Treasurer, Managers Trust I and Managers Trust II (2000-Present); Secretary, Managers Trust I and Managers Trust II (2000-2004) and Secretary, The Managers Funds (1997-2004); Chief Financial Officer, Managers AMG Funds, Managers Trust I and Managers Trust II (2007-Present). |
| |
Keitha L. Kinne, 5/16/58 • Chief Operating Officer since 2007 | | Managing Partner and Chief Operating Officer, Managers Investment Group LLC (2007-Present); Chief Operating Officer, Managers AMG Funds, Managers Trust I and Managers Trust II (2007-Present); Managing Director, Legg Mason & Co., LLC (2006-2007); Managing Director, Citigroup Asset Management (2004-2006); Senior Vice President, Prudential Investments (1999-2004). |
70
THIS PAGE INTENTIONALLY LEFT BLANK
Investment Manager and Administrator
Managers Investment Group LLC
800 Connecticut Avenue
Norwalk, Connecticut 06854
(203) 299-3500 or (800) 835-3879
Distributor
Managers Distributors, Inc.
800 Connecticut Avenue
Norwalk, Connecticut 06854
(203) 299-3500 or (800) 835-3879
Custodian
The Bank of New York
2 Hanson Place
Brooklyn, New York 11217
Legal Counsel
Ropes & Gray LLP
One International Place
Boston, Massachusetts 02110-2624
Transfer Agent
PFPC Inc.
Attn: Managers
P.O. Box 9769
Providence, Rhode Island 02940
(800) 548-4539
For Managers Choice Only
Managers
c/o PFPC Inc.
P.O. Box 61204
King of Prussia, Pennsylvania 19406-0851
(800) 358-7668
MANAGERS AND MANAGERS AMG EQUITY FUNDS
| | |
| |
| EMERGING MARKETS EQUITY | | SKYLINE SPECIAL EQUITIES |
| Rexiter Capital Management Limited | | PORTFOLIO |
| | Skyline Asset Management, L.P. |
| ESSEX GROWTH | | |
| ESSEX LARGE CAP GROWTH | | SMALL CAP |
| ESSEX SMALL/MICRO CAP GROWTH | | TIMESSQUARE MID CAP GROWTH |
| Essex Investment Management Co., LLC | | TIMESSQUARE SMALL CAP GROWTH |
| | TimesSquare Capital Management, LLC |
| FQ TAX-MANAGED U.S. EQUITY | | |
| FQ U.S. EQUITY | | SMALL COMPANY |
| First Quadrant, L.P. | | Epoch Investment Partners, Inc. |
| | Kalmar Investment Advisers, Inc. |
| INSTITUTIONAL MICRO-CAP | | |
| MICRO-CAP | | SPECIAL EQUITY |
| Lord, Abbett & Co. LLC | | Donald Smith & Co., Inc. |
| WEDGE Capital Management L.L.P. | | Lord, Abbett & Co. LLC |
| OFI Institutional Asset Management, Inc. | | Skyline Asset Management, L.P. |
| Next Century Growth Investors, LLC | | Smith Asset Management Group, LP |
| | Veredus Asset Management LLC |
| INTERNATIONAL EQUITY | | Westport Asset Management, Inc. |
| Alliance Bernstein L.P. | | |
| Lazard Asset Management, LLC | | SYSTEMATIC VALUE |
| Wellington Management Company, LLP | | SYSTEMATIC MID CAP VALUE |
| | Systematic Financial Management, L.P. |
| CHICAGO EQUITY PARTNERS | | |
| MID-CAP | | VALUE |
| Chicago Equity Partners, LLC | | Armstrong Shaw Associates Inc. |
| | Osprey Partners Investment Management, LLC |
| REAL ESTATE SECURITIES | | |
| Urdang Securities Management, Inc. | | |
MANAGERS AND MANAGERS AMG BALANCED FUNDS
CHICAGO EQUITY PARTNERS BALANCED
Chicago Equity Partners, LLC
GLOBAL
Armstrong Shaw Associates Inc.
Alliance Bernstein L.P.
First Quadrant, L.P.
Northstar Capital Management, Inc.
Wellington Management Company, LLP
ALTERNATIVE FUNDS
FQ GLOBAL ALTERNATIVES
First Quadrant, L.P.
MANAGERS FIXED INCOME FUNDS
BOND (MANAGERS)
FIXED INCOME
GLOBAL BOND
Loomis, Sayles & Company L.P.
BOND (MANAGERS FREMONT)
Pacific Investment Management Co. LLC
CALIFORNIA INTERMEDIATE TAX-FREE
Evergreen Investment Management Co., LLC
HIGH YIELD
J.P. Morgan Investment Management Inc.
INTERMEDIATE DURATION GOVERNMENT
SHORT DURATION GOVERNMENT
Smith Breeden Associates, Inc.
MONEY MARKET
JPMorgan Investment Advisors Inc.
This report is prepared for the Funds’ shareholders. It is authorized for distribution to prospective investors only when preceded or accompanied by an effective prospectus. To receive a free copy of the prospectus or Statement of Additional Information, which includes additional information about Fund Trustees, please contact us by calling 800.835.3879. Distributed by Managers Distributors, Inc., member FINRA.
A description of the policies and procedures each Fund uses to vote its proxies is available: (i) without charge, upon request, by calling 800.835.3879, or (ii) on the Securities and Exchange Commission’s (SEC) Web site at www.sec.gov. For information regarding each Fund’s proxy voting record for the 12-month period ended June 30, call 800.835.3879 or visit the SEC Web site at www.sec.gov.
The Funds file their complete schedule of portfolio holdings with the SEC for the first and third quarters of each fiscal year on Form N-Q. The Funds’ Forms N-Q are available on the SEC’s website at www.sec.gov. A Fund’s Forms N-Q may be reviewed and copied at the SEC’s Public Reference Room in Washington, DC. Information on the operation of the Public Reference Room may be obtained by calling 800.SEC.0330. To review a complete list of the Funds’ portfolio holdings, or to view the most recent quarterly holdings report, semiannual report, or annual report, please visit www.managersinvest.com.
| | |
www.managersinvest.com | | |
Registrant has adopted a Code of Ethics. See attached Exhibit (a)(1).
| Item 3. | AUDIT COMMITTEE FINANCIAL EXPERT |
Registrant’s Board of Trustees has determined that independent Trustees Mr. Jack W. Aber and Mr. Steven J. Paggioli each qualify as the Audit Committee Financial Expert. Mr. Aber and Mr. Paggioli are “independent” as such term is defined in Form N-CSR.
| Item 4. | PRINCIPAL ACCOUNTANT FEES AND SERVICES |
The aggregate fees billed by PwC to the Fund for the Funds’ two most recent fiscal years for professional services rendered for audits of annual financial statements, or services that are normally provided in connection with statutory and regulatory filings or engagements (“Audit Fees”) were as follows:
| | | | | | |
| | | Fiscal 2007 | | Fiscal 2006 |
Managers Value Fund | | $ | 22,732 | | $ | 21,753 |
Essex Large Cap Growth Fund | | $ | 22,419 | | $ | 21,454 |
Managers Small Company Fund | | $ | 15,320 | | $ | 14,660 |
Managers Special Equity Fund | | $ | 39,989 | | $ | 38,267 |
Managers International Equity Fund | | $ | 35,617 | | $ | 34,083 |
Managers Emerging Markets Equity Fund | | $ | 25,587 | | $ | 21,485 |
Managers Bond Fund | | $ | 36,564 | | $ | 30,989 |
Managers Global Bond Fund | | $ | 28,501 | | $ | 27,274 |
Managers Money Market Fund | | $ | 10,139 | | $ | 9,702 |
All Funds in the Managers Complex Audited by PwC | | $ | 758,032 | | $ | 723,732 |
Audit-Related Fees
There were no fees billed by PwC to the Funds in its two recent fiscal years for services rendered for assurance and related services that are reasonably related to the performance of the audit or review of the Fund’s financial statements, but are not reported as Audit Fees (“Audit-Related Fees”).
For the Funds’ two most recent fiscal years, there were no Audit-Related Fees billed by PwC for engagements related directly to the operations and financial reporting of one or more Funds by a Fund Service Provider. A Fund Service Provider is (a) any investment adviser to the Fund (not including any Subadvisor whose role is primarily portfolio management and is subcontracted with or overseen by another investment adviser) or (b) any entity that provides ongoing services to the Fund and is controlling, controlled by or under common control with a Fund investment adviser described in (a).
Tax Fees
The aggregate fees billed by PwC to the Funds for the two most recent fiscal years for professional services rendered for tax compliance, tax advice, and tax planning (“Tax Fees”) were as follows:
| | | | | | |
| | | Fiscal 2007 | | Fiscal 2006 |
Managers Value Fund | | $ | 6,400 | | $ | 6,325 |
Essex Large Cap Growth Fund | | $ | 6,400 | | $ | 6,600 |
Managers Small Company Fund | | $ | 6,400 | | $ | 6,325 |
Managers Special Equity Fund | | $ | 8,900 | | $ | 8,800 |
Managers International Equity Fund | | $ | 9,000 | | $ | 8,800 |
Managers Emerging Markets Equity Fund | | $ | 8,500 | | $ | 7,975 |
Managers Bond Fund | | $ | 9,500 | | $ | 7,975 |
Managers Global Bond Fund | | $ | 8,500 | | $ | 8,250 |
Managers Money Market Fund | | $ | 6,700 | | $ | 4,250 |
For the Funds’ two most recent fiscal years, Tax Fees billed by PwC for engagements by Fund Service Providers that related directly to the operations and financial reporting of the Funds were $0 for fiscal 2007 and $0 for fiscal 2006, respectively.
The services for which Tax Fees were charged comprise all services performed by professional staff in PwC’s tax division except those services related to the audit. Typically, this category would include fees for tax compliance, tax planning, and tax advice. Tax compliance, tax advice, and tax planning services include preparation of original and amended tax returns, claims for refund and tax payment-planning services, assistance with tax audits and appeals, tax advice related to mergers and acquisitions and requests for rulings or technical advice from taxing authorities.
All Other Fees
There were no other fees billed by PwC to the Funds for all other non-audit services (“Other Fees”) during the Funds’ two most recent fiscal years. During the same period, there were no Other Fees billed by PwC for engagements by Fund Service Providers that related directly to the operations and financial reporting of the Funds.
According to policies adopted by the Audit Committee, services provided by PwC to the Funds must be pre-approved by the Audit Committee. On an annual basis, the Audit Committee reviews and pre-approves various types of services that PwC may perform for the Funds without specific approval of each engagement, subject to specified budget limitations. As contemplated by the Sarbanes-Oxley Act of 2002 and related SEC rules, the Audit Committee also pre-approves non-audit services provided by PwC to any Fund Service Provider for any engagement that relates directly to the operations and financial reporting of the Funds. Any engagement that is not already pre-approved or that will exceed a pre-approved budget must be submitted to the Audit Committee for pre-approval. The Chairman of the Audit Committee is authorized on behalf of the Board of Trustees and the Audit Committee to approve the engagement of PwC to perform non-audit services subject to certain conditions, including notification to the Audit Committee of such pre-approval not later than the next meeting of the Audit Committee following the date of such pre-approval.
There were no other fees billed by PwC for non-audit services rendered to the Funds and to Fund Service Providers for the Funds’ two most recent fiscal years.
The Audit Committee has considered whether the provision of non-audit services by PwC to Fund Service Providers that were not required to be pre-approved by the Audit Committee is compatible with maintaining PwC’s independence in its audit of the Funds, taking into account representations from PwC, in accordance with Independence Standards Board Standard No. 1, regarding its independence from the Funds and its related entities.
The following table sets forth the non-audit services provided by PwC to the Funds and its service affiliates defined as the Funds’ investment advisor and any entity controlling, controlled by or under common control with Managers Investment Group LLC that provides ongoing services to the Funds (“Control Affiliates”) for the last two fiscal years.
| | | | | | | | | | | | | | | | | | |
| | | Audit-
related fees A | | Tax fees A | | All other fees A |
| | | 2006 | | 2005 | | 2006 | | 2005 | | 2006 | | 2005 |
Control Affiliates | | $ | 357,120 | | $ | 0 | | $ | 839,245 | | $ | 98,304 | | $ | 0 | | $ | 0 |
A | Aggregate amounts may reflect rounding. |
| Item 5. | AUDIT COMMITTEE OF LISTED REGISTRANTS |
Not applicable.
| Item 6. | SCHEDULE OF INVESTMENTS |
The schedule of investments in unaffiliated issuers as of the close of the reporting period is included as part of the shareholder report contained in Item 1 hereof.
| Item 7. | DISCLOSURE OF PROXY VOTING POLICIES AND PROCEDURES FOR CLOSED-END MANAGEMENT INVESTMENT COMPANIES |
Not applicable.
| Item 8. | PORTFOLIO MANAGERS OF CLOSED-END MANAGEMENT INVESTMENT COMPANIES |
Not applicable.
| Item 9. | PURCHASES OF EQUITY SECURITIES BY CLOSED-END MANAGEMENT INVESTMENT COMPANIES AND AFFILIATED PURCHASERS |
Not applicable.
| Item 10. | SUBMISSION OF MATTERS TO A VOTE OF SECURITY HOLDERS |
Not applicable.
| Item 11. | CONTROLS AND PROCEDURES |
(a) The Registrant’s principal executive and principal financial officers have concluded, based on their evaluation of the registrant’s disclosure controls and procedures as of a date within 90 days of the filing of this report, that the Registrant’s disclosure controls and procedures are reasonably designed to ensure that information required to be disclosed by the Registrant on Form N-CSR is recorded, processed, summarized and reported within the required time periods and that information required to be disclosed by the registrant in the reports that it files or submits on Form N-CSR is accumulated and communicated to the Registrant’s management, including its principal executive and principal financial officers, as appropriate to allow timely decisions regarding required disclosure.
(b) There were no changes in the Registrant’s internal control over financial reporting during the Registrant’s fourth fiscal quarter of the period covered by this report that have materially affected, or are reasonably likely to affect, the internal control over financial reporting.
| | |
| (a)(1) | | Any Code of Ethics or amendments hereto. Filed herewith. |
| |
| (a)(2) | | Certifications pursuant to Rule 30a-2(a) under the Investment Company Act of 1940 - Filed herewith. |
| |
| (a)(3) | | Not applicable. |
| |
| (b) | | Certifications pursuant to Rule 30a-2(b) under the Investment Company Act of 1940 - Filed herewith. |
SIGNATURES
Pursuant to the requirements of the Securities Exchange Act of 1934 and the Investment Company Act of 1940, the registrant has duly caused this report to be signed on its behalf by the undersigned, thereunto duly authorized.
| | |
| THE MANAGERS FUNDS |
| |
| By: | | /s/ William J. Nutt |
| | William J. Nutt, President |
Date: February 29, 2008
Pursuant to the requirements of the Securities Exchange Act of 1934 and the Investment Company Act of 1940, this report has been signed below by the following persons on behalf of the registrant and in the capacities and on the dates indicated.
| | |
| |
| By: | | /s/ William J. Nutt |
| | William J. Nutt, President |
Date: February 29, 2008
| | |
| |
| By: | | /s/ Donald S. Rumery |
| | Donald S. Rumery, Chief Financial Officer |
Date: February 29, 2008