UNITED STATES
SECURITIES AND EXCHANGE COMMISSION
Washington, D.C. 20549
FORM N-CSRS
CERTIFIED SHAREHOLDER REPORT OF
REGISTERED MANAGEMENT INVESTMENT COMPANIES
Investment Company Act file number: 811-03752
THE MANAGERS FUNDS
(Exact name of registrant as specified in charter)
800 Connecticut Avenue, Norwalk, Connecticut 06854
(Address of principal executive offices) (Zip code)
Managers Investment Group LLC
800 Connecticut Avenue, Norwalk, Connecticut 06854
(Name and address of agent for service)
Registrant’s telephone number, including area code: (203) 299-3500
| | |
| Date of fiscal year end: | | DECEMBER 31 |
| |
| Date of reporting period: | | JANUARY 1, 2010 – December 31, 2010 |
| | (Annual Shareholder Report) |
| Item 1. | Reports to Shareholders |
AR001-1210
ANNUAL REPORT
Managers Funds
December 31, 2010
Managers International Equity Fund
Managers Emerging Markets Equity Fund
Managers Global Bond Fund
AR001-1210
The Managers Funds
Annual Report — December 31, 2010
| | | | |
| TABLE OF CONTENTS | | Page | |
| |
LETTER TO SHAREHOLDERS | | | 1 | |
| |
ABOUT YOUR FUND’S EXPENSES | | | 3 | |
| |
INVESTMENT MANAGER’S COMMENTS, FUND SNAPSHOTS, AND SCHEDULES OF PORTFOLIO INVESTMENTS | | | | |
| |
Managers International Equity Fund | | | 4 | |
| |
Managers Emerging Markets Equity Fund | | | 13 | |
| |
Managers Global Bond Fund | | | 20 | |
| |
NOTES TO SCHEDULES OF PORTFOLIO INVESTMENTS | | | 27 | |
| |
FINANCIAL STATEMENTS: | | | | |
| |
Statements of Assets and Liabilities | | | 32 | |
| |
Funds’ balance sheets, net asset value (NAV) per share computations and cumulative undistributed amounts | | | | |
| |
Statements of Operations | | | 33 | |
| |
Detail of sources of income, Fund expenses, and realized and unrealized gains (losses) during the year | | | | |
| |
Statements of Changes in Net Assets | | | 34 | |
| |
Detail of changes in Fund assets for the past two years | | | | |
| |
FINANCIAL HIGHLIGHTS | | | 36 | |
| |
Historical net asset values per share, distributions, total returns, expense ratios, turnover ratios and net assets | | | | |
| |
NOTES TO FINANCIAL STATEMENTS | | | 38 | |
| |
Accounting and distribution policies, details of agreements and transactions with Fund management and affiliates, and descriptions of certain investment risks | | | | |
| |
REPORT OF INDEPENDENT REGISTERED PUBLIC ACCOUNTING FIRM | | | 45 | |
| |
TRUSTEES AND OFFICERS | | | 46 | |
Nothing contained herein is to be considered an offer, sale or solicitation of an offer to buy shares of any series of the Managers Family of Funds. Such offering is made only by Prospectus, which includes details as to offering price and other material information.
Letter to Shareholders
Dear Shareholder:
Our foremost goal at Managers Investment Group (“MIG”) is to structure and manage mutual funds that will help our shareholders and clients successfully reach their investment goals and objectives.
Each of our Funds is geared to provide you with exposure to a specific asset class or style of investing. We believe investors tend to use our Funds as part of their broader portfolio in order to tailor their asset allocation to meet their individual needs. Most of our Funds, like those detailed in this report, are therefore designed to be building blocks.
At MIG, we have overall responsibility for the investment management and administration of the Funds. As a “manager of managers,” we work with external investment managers that make the day-to-day investment decisions in the Funds (the “Portfolio Managers”). We devote considerable resources to our disciplined process of identifying and selecting unaffiliated Portfolio Managers for the Funds. As a manager of managers, MIG performs many activities to monitor the ongoing investment, compliance, and administrative aspects of all of the Funds, which we believe gives our shareholders added confidence in their investments.
The prior year has been characterized by two periods. The first portion of the year, with the period ending mid-way through the third quarter, was dominated by macroeconomic news and risk caution by investors. The second portion of the year, the period since August, was characterized by a return to risk seeking by investors. Although the equity rally is nearing two years, the last several months have been witness to the first signs of investors reacting specifically to earnings reports and microeconomic news when evaluating securities. With the consensus expectation amongst economists that the U.S. will only grow modestly over the next several years, investors have set their sights abroad. Europe has its own issues relating to its ongoing sovereign debt crisis and Japan continues to be out of favor with investors. This leaves emerging markets to drive growth over the secular timeframe. The Portfolio Managers within our Managers International Equity and Managers Emerging Markets Equity Funds continue to favor companies that have revenue, at least partially, driven by emerging-market equity consumption to take advantage of this shift in global growth that should continue to trend over the next several years. On the fixed income side, bonds registered another solid year in 2010, however, enter into 2011 with some trepidation. The length of the bond rally coupled with the ongoing sovereign debt crisis in Europe and the expectation of rising rates in the short to intermediate term are all potential headwinds to bond investors going forward. However, selective bond investors, particularly those focused on security selection, will have opportunities in this increasingly challenging bond environment to generate positive returns.
| | | | | | | | | | | | | | | | | | | | | | | | |
Periods Ended 12/31/10 | | 6 Months | | | 1 Year | | | 3 Years | | | 5 Years | | | 10 Years | | | Inception Date | |
Managers International Equity Fund | | | 22.52 | % | | | 4.31 | % | | | (11.14 | )% | | | 0.56 | % | | | 1.51 | % | | | 12/31/1985 | |
MSCI EAFE Index (Net) | | | 24.18 | % | | | 7.75 | % | | | (7.02 | )% | | | 2.46 | % | | | 3.50 | % | | | | |
| | | | | | |
Managers Emerging Markets Equity Fund | | | 24.21 | % | | | 13.84 | % | | | (4.85 | )% | | | 8.46 | % | | | 13.50 | % | | | 2/9/1998 | |
MSCI EM Index (Net) | | | 26.69 | % | | | 18.88 | % | | | (0.32 | )% | | | 12.78 | % | | | 15.89 | % | | | | |
MSCI EM Index (Gross) | | | 26.86 | % | | | 19.20 | % | | | (0.03 | )% | | | 13.11 | % | | | 16.23 | % | | | | |
| | | | | | | | | | | | | | | | | | | | | | | | |
| | | | | | |
Managers Global Bond Fund | | | 7.95 | % | | | 7.27 | % | | | 6.25 | % | | | 6.70 | % | | | 7.08 | % | | | 3/25/1994 | |
Barclays Capital Global Aggregate Bond Index | | | 5.87 | % | | | 5.54 | % | | | 5.75 | % | | | 6.66 | % | | | 6.74 | % | | | | |
For the year ended December 31, 2010, the Managers International Equity Fund returned 4.31% underperforming the return of 7.75% for the MSCI EAFE Index. The Fund’s underperformance relative to the benchmark was generally due to weakness in holdings in certain sectors including consumer discretionary, industrial, and information technology although performance was helped by non-benchmark exposure into emerging markets where each of the Fund’s Portfolio Managers continues to find considerable opportunity.
1
Letter to Shareholders (continued)
For the year ended December 31, 2010, the Managers Emerging Markets Equity Fund returned 13.84%, underperforming the return of 18.88% for the MSCI Emerging Markets Index. Despite a second straight year of strong absolute performance, the Fund did underperform its benchmark in 2010 due to weakness in holdings in certain sectors, including information technology and materials.
For the year ended December 31, 2010, the Managers Global Bond Fund returned 7.27%, outpacing the return of 5.54% for the Barclays Capital Global Aggregate Bond Index. The primary driver of the Fund’s outperformance relative to the benchmark for the year was its exposure to non-U.S. Dollar denominated bonds. More specifically, the Fund benefited most from an underweight to, and strong security selection in, bonds denominated in the Euro. To a minor extent, the Fund’s exposure to preferred bonds detracted from performance.
Our equity Portfolio Managers use fundamental company analysis to determine the strength of an investment. As the equity rally enters into its (potential) third year, we believe the market will begin to sort between the “winners” and “losers,” and differentiate those companies with stronger balance sheets that are poised to grow revenue by taking market share from competitors. This favors active investors such as our Funds’ Portfolio Managers that focus on identifying such characteristics in a company before making an investment. Within our Managers Global Bond Fund, Loomis Sayles, our Portfolio Manager, enters the new year with a constructive view on most spread sectors and a focus on security selection in order to add value. As a result of the sovereign debt burdens in Europe, the Fund is positioned defensively in this segment. Loomis Sayles has a long history of navigating various types of fixed income markets and we believe we are entering another period when experienced portfolio management is the best option for fixed income investors.
The following report covers the year ended December 31, 2010. Should you have any questions about this report, or if you’d like to receive a prospectus and additional information, including fees and expenses for these or any of the other Funds in our family, please feel free to contact us at 1-800-835-3879, or visit our Web site at www.managersinvest.com. As always, please read the prospectus carefully before you invest or send money.
If you are curious about how you can better diversify your investment program, visit the Knowledge Center on our Web site and view our articles in the investment strategies section. You can rest assured that under all market conditions our team is focused on delivering excellent investment management services for your benefit.
We thank you for your continued confidence and investment in The Managers Funds.
Respectfully,

John H. Streur
Senior Managing Partner
Managers Investment Group LLC
2
About Your Fund’s Expenses
As a shareholder of a Fund, you may incur two types of costs: (1) transaction costs, which may include sales charges (loads) on purchase payments; redemption fees; and exchange fees; and (2) ongoing costs, including management fees; distribution (12b-1) fees; and other Fund expenses. This example is intended to help you understand your ongoing costs (in dollars) of investing in the Fund and to compare these costs with the ongoing costs of investing in other mutual funds. The example is based on $1,000 invested at the beginning of the period and held for the entire period as indicated below.
Actual Expenses
The first line of the following table provides information about the actual account values and actual expenses. You may use the information in this line, together with the amount you invested, to estimate the expenses that you paid over the period. Simply divide your account value by $1,000 (for example, an $8,600 account value divided by $1,000 = 8.6), then multiply the result by the number in the first line under the heading entitled “Expenses Paid During Period” to estimate the expenses you paid on your account during this period.
Hypothetical Example for Comparison Purposes
The second line of the following table provides information about hypothetical account values and hypothetical expenses based on the Fund’s actual expense ratio and an assumed annual rate of return of 5% before expenses, which is not the Fund’s actual return. The hypothetical account values and expenses may not be used to estimate the actual ending account balance or expenses you paid for the period. You may use this information to compare the ongoing costs of investing in the Fund and other funds by comparing this 5% hypothetical example with the 5% hypothetical examples that appear in the shareholder reports of other funds.
Please note that the expenses shown in the table are meant to highlight your ongoing costs only and do not reflect any transactional costs, such as sales charges (loads), redemption fees, or exchange fees. Therefore, the second line of the table is useful in comparing ongoing costs only, and will not help you determine the relative total costs of owning different funds.
| | | | | | | | | | | | | | | | |
Six Months Ended
December 31, 2010 | | Expense Ratio
for the Period | | | Beginning
Account Value
07/01/2010 | | | Ending
Account Value
12/31/2010 | | | Expenses Paid
During the
Period* | |
| | | | |
Managers International Equity Fund | | | | | | | | | | | | | | | | |
Based on Actual Fund Return | | | 1.39 | % | | $ | 1,000 | | | $ | 1,225 | | | $ | 7.80 | |
Based on Hypothetical 5% Annual Return | | | 1.39 | % | | $ | 1,000 | | | $ | 1,018 | | | $ | 7.07 | |
| | | | |
Managers Emerging Markets Equity Fund | | | | | | | | | | | | | | | | |
Based on Actual Fund Return | | | 1.74 | % | | $ | 1,000 | | | $ | 1,242 | | | $ | 9.83 | |
Based on Hypothetical 5% Annual Return | | | 1.74 | % | | $ | 1,000 | | | $ | 1,016 | | | $ | 8.84 | |
| | | | |
Managers Global Bond Fund | | | | | | | | | | | | | | | | |
Based on Actual Fund Return | | | 1.10 | % | | $ | 1,000 | | | $ | 1,080 | | | $ | 5.77 | |
Based on Hypothetical 5% Annual Return | | | 1.10 | % | | $ | 1,000 | | | $ | 1,020 | | | $ | 5.60 | |
| * | Expenses are equal to the Fund’s annualized expense ratio multiplied by the average account value over the period, multiplied by the number of days in the most recent fiscal half-year (184), then divided by 365. |
3
Managers International Equity Fund
Investment Manager’s Comments
The Managers International Equity Fund’s (the “Fund”) investment objective is to achieve long-term capital appreciation. Income is the Fund’s secondary objective.
The Managers International Equity Fund ordinarily invests at least 80% of assets in equity securities, and at least 65% of assets in common and preferred stocks of companies domiciled outside the United States. The Fund intends to diversify investments among both countries and sectors. Investments may be made in companies in developed as well as developing countries. The Fund may also engage in currency-hedging strategies and may invest in companies of any size. The MSCI EAFE Index (the “Index”) is the benchmark for the Fund.
THE PORTFOLIO MANAGERS
The Fund employs multiple portfolio managers who specialize in distinct investment approaches. This “intelligence diversification” not only serves to manage risk, but also helps the Fund tap the market’s full potential by focusing different analytical insights on each potential investment. Fund management strives to achieve its performance goals and diversification while ensuring that the Fund operates within the framework of its investment objective and principal investment strategies.
AllianceBernstein L.P.’s Investment Research and Management (“AllianceBernstein”)
AllianceBernstein’s approach to investing is value based and research driven. The thesis of AllianceBernstein’s investment philosophy is that human nature leads investors to buy and sell financial assets based on an overreaction to near-term events. They believe investors confuse temporary or cyclical characteristics with the creation of buying opportunities, as investors underestimate the potential for corrective strategies to restore long-term earnings power. The investment team, led by Kevin Simms, attempts to exploit this disconnect by using research to separate fact from emotion.
The primary driver of AllianceBernstein’s performance is research-driven security selection. AllianceBernstein screens their initial universe with a proprietary return model in order to identify the companies with the most attractive value attributes. The model derives an expected return for each company within the universe by assessing companies both from a global industry-based perspective and from a country-based standpoint, evaluating such factors as price-to-cash earnings, price-to-book, return on equity, and price momentum. The ideal company would exhibit strong fundamentals and have strong future business prospects.
Portfolio Construction
| | • | | Initial investable universe is composed of all companies within the countries of the MSCI All Country World Index ex U.S. universe with a market capitalization greater than $750 million |
| | • | | Investment team screens this universe using a proprietary-return model to identify the companies with the most attractive value attributes |
| | • | | The model derives an expected return for each company in the universe by assessing companies both from a global industry-based perspective and from a country-based standpoint |
| | • | | Factors include price-to-cash earnings, price-to-book, return on equity, and price momentum |
| | • | | Analysts perform extensive research, focusing on the most attractively valued stocks |
| | • | | They then build detailed spreadsheets of historical and projected balance-sheet and income-statement information in order to estimate: |
| | • | | Normalized earnings power |
| | • | | Cash flow and asset values for each company for the next five years |
| | • | | Perform simulations to see the potential impact of changes in various financial-statement components |
| | • | | Analysts present their estimates and ratings for each security to the Research Review Committee of the Investment Policy Group |
| | • | | The Committee challenges the analysts’ assumptions and conclusions to ensure they are sound |
The Portfolio
| | • | | Typically holds 30-85 stocks |
| | • | | Initial stock weightings are 0.5 - 3.5% |
Lazard Asset Management, LLC (“Lazard”)
Portfolio Manager William (Willy) Holzer believes that there is a single global economy and marketplace within which everything is connected. Within this single market it is important to distinguish between three types of companies: domestic companies are those that produce, sell, and raise capital all in their home country; international companies are those that produce at home, but sell their products and raise capital anywhere in the world; and global companies are those that produce, sell, and raise capital anywhere in the world. Holzer will invest in any of these types of companies in order to capitalize on a theme. However, he prefers global companies, which generally have the flexibility and resources to exploit global trends.
4
Managers International Equity Fund
Investment Manager’s Comments (continued)
Willy Holzer can be described as a “top-down” thematic investor whose themes are based on bottom-up observations and company analysis. He views the world as a single global economic unit as opposed to a collection of separate country economies. Willy focuses his efforts by first analyzing the connections within the global economy and from this analysis develops global investment themes. These themes target the segments of the global economy that he believes are most likely to provide attractive long-term investment returns and that also represent an asymmetric investment opportunity in the investor’s favor.
Portfolio Construction
| | • | | Portfolio Manager leverages stock ideas and research from top-down themes based on bottom-up observations and company analysis |
| | • | | Portfolio is constructed around approximately ten investment themes to diversify opportunity sets and provide risk benefits |
| | • | | Portfolio heavily weights large-capitalization, multi-national companies |
| | • | | Concentrated in the developed markets |
| | • | | May have operations or distribution in the emerging markets |
The Portfolio
| | • | | Portfolio typically holds 90 to 110 stocks |
| | • | | Initial stock weightings are 1.0 to 1.5% |
| | • | | Relatively low turnover in the 30% to 40% annual range |
Martin Currie Inc. (“Martin Currie”)
Martin Currie, based in Edinburgh, Scotland, is a 128- year old firm. It specializes in developed market ex-U.S. mandates and currently manages $16.3 billion for a global client base of pension funds, family offices, multi-managers, banks, public funds, foundations, sub-advisory clients and wrap programs. Willie Watt, the firm’s Chief Executive Officer, joined the firm in 2000 and was at the forefront of evolving Martin Currie from a firm that focused on adding value via a top-down investment process to its current process, which uses bottom-up stock selection analysis as its primary portfolio management focus.
James Fairweather, Chief Investment Officer, heads the international equity investment team which has four members who have 71 years of total investment experience. The team is supported in their efforts by an experienced 14- person global sector analyst
staff with no member having less than 8 years of total investment experience. In addition, regional teams also support the stock selection process by contributing insights and ideas on companies within their specific geographic coverage area. Finally, a separate risk management team helps support the portfolio construction.
Portfolio Construction
| | • | | Focused on identifying companies at the earlier stages of change with the thought that the market usually underestimates the amount by which change will take place |
| | • | | Team uses a fully integrated global approach to stock selection and use a high level of communication across regions to build a truly global portfolio |
| | • | | Focus on speaking a common language when doing all stock level research with the emphasis on quality, value, growth, and change |
| | • | | Risk is managed at every level of the investment process including when conducting stock selection and when constructing the portfolio |
The Portfolio
| | • | | Portfolio typically holds 45 to 80 stocks |
| | • | | Holdings tend to have low cross-stock correlations |
| | • | | Holdings tend to have low sensitivity to macro factors |
| | • | | Forecasted tracking error 4% to 6% relative to MSCI EAFE Index |
THE YEAR IN REVIEW
For the year 2010, the Fund returned 4.31%, underperforming the return of 7.75% for the MSCI EAFE Index. (Note that unless otherwise stated, all performance cited in this commentary is in U.S. Dollars).
Non-U.S. equity markets delivered solid returns for the year although they failed to match the strength of the rally of 2009 and failed to keep pace with the returns achieved in both U.S. and emerging equity markets in 2010. Early in 2010, macroeconomic uncertainties in Europe resulted in the market ignoring solid earnings reported by companies benefiting from a more stable environment. In fact, early in the year, equities continued to exhibit high correlation across companies and sectors as the market tended to react only to headline news. In the second part of the year, the market started to further discount the prospect of a double-dip recessionary scenario and began to reward companies with an exposure to cyclical growth stories.
5
Managers International Equity Fund
Investment Manager’s Comments (continued)
For the year, the Fund’s underperformance relative to the benchmark was generally due to weakness in holdings in certain sectors including consumer discretionary, industrial, and information technology although performance was helped by non-benchmark exposure into emerging markets, where each of the Fund’s three subadvisors continues to find considerable opportunity. At the sub-advisor level, AllianceBernstein and Martin Currie underperformed the benchmark while Lazard outperformed. AllianceBernstein was hurt by the high risk aversion in non-U.S. equity markets early in the year when investors shunned the cheap, often “controversial” stocks that AllianceBernstein looks to purchase. Many of AllianceBernstein’s current holdings have dividend yields even higher than the same company’s bond yields. Their analysis reveals that these yields are sustainable and many of these companies have the cash to support these payouts for some time. Focusing on the cash opportunity is a key component of AllianceBernstein’s strategy in 2011 while, more broadly, AllianceBernstein is looking to capture risk across industries and regions by focusing on dislocations created by the recession. As for Martin Currie, they underperformed in 2010 mainly due to stock selection weakness, although the type of high-quality growth companies they prefer were generally out-of-favor. The ongoing equity rally into 2010 continued to favor lower-quality equities and while growth tended to outperform value throughout the year. The higher-quality growth that Martin Currie targets lagged behind leading to their underperformance. It’s worth noting, however, that Martin Currie’s performance (and process) gained traction in the second half of the year despite a setback in December. Growth at a reasonable price tended to perform much better during this period, potentially foreshadowing a resurgence of this type of investing in 2011. As for Lazard, outperformance for the year was driven by its Antimatter (domestic Japan) and commodity themes within its portfolio. Of particular note were Lazard’s holdings in under-loved Japanese financials, which rose strongly towards the end of the year as investors began to believe that inflation may be nearing. Chinese demand, along with the growing threat of inflation in emerging markets, helped drive performance in various commodity stocks which included, but was not limited to, holdings in gold and oil stocks.
LOOKING FORWARD
As we enter into 2011, the correlation across equities continues to fall giving active managers potentially ample opportunity to achieve alpha if they position their portfolios appropriately. A majority of the nearly two-year positive movement in equities has been associated with high correlation across equities along with
outperformance by lower-quality companies, neither scenario which has been favorable to our active and high-quality focused subadvisors within the Fund. To the extent that we begin to see a reversal to this trend and a move closer to market “norms,” this could serve as a favorable tailwind to our subadvisors and our Fund.
Overall, the Fund is positioned to take advantage of an improving economic environment while maintaining some defensive positioning in case of an economic setback. On a sector basis, this results in overweight positions to the more cyclically oriented consumer discretionary and energy sectors and underweight positions to more defensive sectors such as consumer staples and health care. Our subadvisors continue to target well-positioned companies that have the financial flexibility (cash on their balance sheet) to take advantage of opportunities within their industry in this evolving market environment. On a regional basis, the Fund continues to aggressively position to take advantage of emerging-market opportunities with all three of our subadvisors close to their maximum allowable allocation of 15% to these markets. In addition, indirect access to emerging markets is being achieved through developed market holdings that generate at least a portion of their revenue from demand in emerging markets. Our subadvisors will continue to monitor the situation in emerging markets closely to ensure that asset bubbles, rising interest rates, or other “one off” events do not dampen the growth expectations in emerging markets for 2011 and the related holdings currently in the portfolio.
CUMULATIVE TOTAL RETURN PERFORMANCE
Managers International Equity Fund’s cumulative total return is based on the daily change in net asset value (NAV), and assumes that all distributions were reinvested. The Morgan Stanley Capital International Europe, Australasia, and Far East (MSCI EAFE) Index is composed of all the publicly traded stocks in developed non-U.S. Markets. The MSCI EAFE® Index (Europe, Australasia, Far East) is a free float-adjusted market capitalization index that is designed to measure developed market equity performance, excluding the U.S. and Canada. The MSCI EAFE Index consists of the following 22 developed market country indices: Australia, Austria, Belgium, Denmark, Finland, France, Germany, Greece, Hong Kong, Ireland, Israel, Italy, Japan, the Netherlands, New Zealand, Norway, Portugal, Singapore, Spain, Sweden, Switzerland and the United Kingdom. Unlike the Fund, the MSCI EAFE Index is unmanaged, is not available for investment, and does not incur expenses. This graph compares a hypothetical $10,000 investment made in Managers International Equity Fund on December 31, 2000, to a $10,000 investment made in the MSCI EAFE for
6
Managers International Equity Fund
Investment Manager’s Comments (continued)
CUMULATIVE TOTAL RETURN PERFORMANCE (continued)
the same time period. The table is not intended to imply any future performance of the Fund. Performance for periods longer than one year is annualized. The graph and table do not reflect the deduction of taxes that a shareholder would pay on a Fund distribution or redemption of shares. The listed returns for the Fund are net of expenses and the returns for the index exclude expenses. Past performance is not indicative of future results. Total returns would have been lower had certain expenses not been reduced.
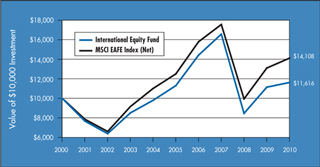
The table below shows the average annual total returns for Managers International Equity Fund and the MSCI EAFE Index from December 31, 2000 through December 31, 2010.
| | | | | | | | | | | | |
Average Annual Total Returns1 | | One Year | | | Five Years | | | Ten Years | |
International Equity Fund2,3,4 | | | 4.31 | % | | | 0.56 | % | | | 1.51 | % |
MSCI EAFE Index (Net) | | | 7.75 | % | | | 2.46 | % | | | 3.50 | % |
The performance data shown represents past performance, which is not a guarantee of future results. Current performance may be lower or higher than the performance data quoted. The investment return and principal value of an investment in the Fund will fluctuate so that an investor’s shares, when redeemed, may be worth more or less than their original cost. For performance information through the most recent month end, please call (800) 835-3879 or visit our Web site at www.managersinvest.com.
In choosing a Fund, investors should carefully consider the amount they plan to invest, their investment objectives, the Fund’s investment objectives, risks, charges and expenses before investing. For this and other information, please call (800) 835-3879 or visit www.managersinvest.com for a free prospectus. Read it carefully before investing or sending money. Funds are distributed by Managers Distributors, Inc., a member of FINRA.
| 1 | Total return equals income yield plus share price change and assumes reinvestment of all dividends and capital gain distributions. Returns are net of fees and may reflect offsets of Fund expenses as described in the Prospectus. No adjustment has been made for taxes payable by shareholders on their reinvested dividends and capital gain distributions. Returns for periods greater than one year are annualized. The listed returns on the Fund are net of expenses and based on the published NAV as of December 31, 2010. All returns are in U.S. dollars($). |
| 2 | Fund for which, from time to time, the Fund’s advisor has waived its fees and/or absorbed Fund expenses, which has resulted in higher returns. |
| 3 | Investments in foreign securities are subject to additional risks such as changing market conditions, economic and political instability, and currency exchange rate fluctuations. |
| 4 | The Fund is subject to currency risk resulting from fluctuations in exchange rates that may affect the total loss or gain on a non-U.S. Dollar security when converted back to U.S. Dollars. |
The MSCI EAFE® Index (Net) (Europe, Australasia, Far East) is a free float-adjusted market capitalization index that is designed to measure developed market equity performance, excluding the U.S. and Canada. The MSCI EAFE Index (Net) consists of the following 22 developed market country indices: Australia, Austria, Belgium, Denmark, Finland, France, Germany, Greece, Hong Kong, Ireland, Israel, Italy, Japan, the Netherlands, New Zealand, Norway, Portugal, Singapore, Spain, Sweden, Switzerland and the United Kingdom. Unlike the Fund, the MSCI EAFE Index is unmanaged, is not available for investment, and does not incur expenses.
All MSCI data is provided “as is.” The products described herein are not sponsored or endorsed and have not been reviewed or passed on by MSCI. In no event shall MSCI, its affiliates or any MSCI data provider have any liability of any kind in connection with the MSCI data or the products described herein. Copying or redistributing the MSCI data is strictly prohibited.
Not FDIC insured, nor bank guaranteed. May lose value.
7
Managers International Equity Fund
Fund Snapshots
December 31, 2010
Portfolio Breakdown
| | | | | | | | |
Industry | | Managers International
Equity Fund** | | | MSCI EAFE Index | |
Financials | | | 24.1 | % | | | 23.8 | % |
Consumer Discretionary | | | 12.9 | % | | | 10.5 | % |
Materials | | | 12.1 | % | | | 11.5 | % |
Energy | | | 10.6 | % | | | 7.9 | % |
Industrials | | | 10.1 | % | | | 12.7 | % |
Health Care | | | 7.3 | % | | | 8.2 | % |
Consumer Staples | | | 7.2 | % | | | 10.0 | % |
Information Technology | | | 5.3 | % | | | 5.0 | % |
Telecommunication Services | | | 4.5 | % | | | 5.4 | % |
Utilities | | | 2.9 | % | | | 5.0 | % |
Other Equities | | | 0.9 | % | | | 0.0 | % |
Warrants | | | 0.5 | % | | | 0.0 | % |
Other Assets and Liabilities | | | 1.6 | % | | | 0.0 | % |
| ** | As a percentage of net assets |
Top Ten Holdings
| | | | |
Security Name | | Percentage of
Net Assets | |
Siemens AG* | | | 1.5 | % |
Sanofi-Aventis SA* | | | 1.4 | |
Vodafone Group PLC* | | | 1.4 | |
British American Tobacco PLC* | | | 1.4 | |
Goldcorp, Inc.* | | | 1.4 | |
Novartis AG | | | 1.3 | |
AstraZeneca PLC* | | | 1.2 | |
Prudential PLC | | | 1.1 | |
BNP Paribas SA | | | 1.1 | |
Xstrata PLC | | | 1.1 | |
| | | | |
Top Ten as a Group | | | 12.9 | % |
| | | | |
| * | Top Ten Holding at June 30, 2010 |
Any sectors, industries, or securities discussed should not be perceived as investment recommendations. Mention of a specific security should not be considered a recommendation to buy or solicitation to sell that security. Specific securities mentioned in this report may have been sold from the Fund’s portfolio of investments by the time you receive this report.
8
Managers International Equity Fund
Fund Snapshots (continued)
Summary of Investments by Country
| | | | | | | | |
Country | | Managers International
Equity Fund* | | | MSCI EAFE Index | |
Australia | | | 2.8 | % | | | 8.8 | % |
Austria | | | 0.0 | % | | | 0.3 | % |
Belgium | | | 0.6 | % | | | 0.9 | % |
Bermuda | | | 0.0 | % | | | 0.4 | % |
Brazil | | | 3.4 | % | | | 0.0 | % |
Canada | | | 7.5 | % | | | 0.0 | % |
Cayman Islands | | | 0.0 | % | | | 0.1 | % |
China | | | 1.8 | % | | | 0.0 | % |
Denmark | | | 0.3 | % | | | 1.0 | % |
Finland | | | 0.0 | % | | | 1.1 | % |
France | | | 10.5 | % | | | 9.0 | % |
Germany | | | 6.7 | % | | | 8.2 | % |
Greece | | | 0.0 | % | | | 0.2 | % |
Hong Kong | | | 4.8 | % | | | 2.4 | % |
India | | | 0.7 | % | | | 0.0 | % |
Ireland | | | 0.0 | % | | | 0.3 | % |
Israel | | | 0.8 | % | | | 0.8 | % |
Italy | | | 1.8 | % | | | 2.5 | % |
Japan | | | 18.5 | % | | | 22.1 | % |
Jersey, Channel Islands | | | 0.0 | % | | | 0.5 | % |
Luxembourg | | | 0.0 | % | | | 0.5 | % |
Netherlands | | | 4.2 | % | | | 2.7 | % |
New Zealand | | | 0.0 | % | | | 0.1 | % |
Norway | | | 0.6 | % | | | 0.7 | % |
Portugal | | | 0.0 | % | | | 0.3 | % |
Russia | | | 0.6 | % | | | 0.0 | % |
Singapore | | | 1.7 | % | | | 1.5 | % |
South Africa | | | 0.7 | % | | | 0.0 | % |
South Korea | | | 1.8 | % | | | 0.0 | % |
Spain | | | 0.7 | % | | | 3.3 | % |
Supranational & Other | | | 0.3 | % | | | 0.2 | % |
Sweden | | | 0.5 | % | | | 3.2 | % |
Switzerland | | | 5.9 | % | | | 8.0 | % |
Taiwan | | | 2.2 | % | | | 0.0 | % |
United Kingdom | | | 17.4 | % | | | 20.8 | % |
United States | | | 3.2 | % | | | 0.1 | % |
| | | | | | | | |
| | | 100.0 | % | | | 100.0 | % |
| | | | | | | | |
| * | As a percentage of total market value on December 31, 2010 |
9
Managers International Equity Fund
Schedule of Portfolio Investments
December 31, 2010
| | | | | | | | |
| | | Shares | | | Value | |
Common Stocks - 97.0% | | | | | | | | |
Consumer Discretionary - 12.9% | |
adidas-Salomon AG (Germany) | | | 12,082 | | | | $ 785,924 | |
Bridgestone Corp. (Japan) | | | 38,400 | | | | 739,161 | |
Bulgari S.p.A. (Italy) | | | 45,373 | | | | 491,225 | |
Compass Group PLC (United Kingdom) | | | 84,359 | | | | 765,635 | |
Ctrip.com International, Ltd. (China)* | | | 11,700 | | | | 473,265 | |
Cyrela Brazil Realty, S.A. (Brazil) | | | 30,200 | | | | 397,512 | |
Esprit Holdings, Ltd. (Hong Kong) | | | 61,647 | | | | 293,249 | |
GKN PLC (United Kingdom) | | | 129,000 | | | | 447,762 | |
Inchcape PLC (United Kingdom)* | | | 74,821 | | | | 417,322 | |
Lagardere (France) | | | 10,100 | | | | 416,418 | |
LG Electronics, Inc. (South Korea) | | | 2,010 | | | | 208,519 | |
Magna International, Inc. (Canada) | | | 7,400 | | | | 386,336 | |
Marks & Spencer Group PLC (United Kingdom) | | | 34,515 | | | | 199,030 | |
Matsushita Electric Industrial Co., Ltd. (Japan) | | | 47,500 | | | | 670,643 | |
New World Department Store China, Ltd. (China) | | | 18,000 | | | | 14,819 | |
Nissan Motor Co., Ltd. (Japan) | | | 60,200 | | | | 569,483 | |
Parkson Retail Group, Ltd. (China) | | | 51,5002 | | | | 79,317 | |
Pearson PLC (United Kingdom) | | | 55,382 | | | | 872,771 | |
Persimmon PLC (United Kingdom) | | | 61,272 | | | | 398,735 | |
Renault SA (France)* | | | 10,200 | | | | 593,765 | |
Sekisui House, Ltd. (Japan) | | | 53,000 | | | | 534,055 | |
SES SA (France) | | | 30,773 | | | | 732,785 | |
Sharp Corp. (Japan) | | | 56,000 | | | | 574,665 | |
SJM Holdings, Ltd. (Hong Kong) | | | 419,000 | | | | 664,680 | |
Sony Corp. (Japan) | | | 11,100 | | | | 396,988 | |
Sumitomo Rubber Industries, Ltd. (Japan) | | | 8,0002 | | | | 83,212 | |
Suzuki Motor Co., Ltd. (Japan) | | | 20,800 | | | | 510,615 | |
Toyota Motor Corp. (Japan) | | | 14,500 | | | | 570,842 | |
Vivendi Universal SA (France) | | | 29,290 | | | | 791,464 | |
Total Consumer Discretionary | | | | | | | 14,080,197 | |
Consumer Staples - 7.2% | | | | | | | | |
British American Tobacco PLC | | | | | | | | |
(United Kingdom) | | | 38,578 | | | | 1,483,939 | |
Delhaize Group (Belgium) | | | 8,300 | | | | 613,814 | |
Groupe Danone SA (France) | | | 7,771 | | | | 488,618 | |
Heineken N.V. (Netherlands) | | | 12,881 | | | | 631,771 | |
Imperial Tobacco Group PLC (United Kingdom) | | | 25,700 | | | | 790,008 | |
Japan Tobacco, Inc. (Japan) | | | 245 | | | | 904,680 | |
| | | | | | | | |
| | | Shares | | | Value | |
Kirin Brewery Co., Ltd. (Japan) | | | 50,000 | | | | $ 699,303 | |
Metro AG (Germany) | | | 4,248 | | | | 306,607 | |
Nestle SA, Registered (Switzerland) | | | 4,333 | | | | 253,843 | |
SABMiller PLC (United Kingdom) | | | 13,922 | | | | 490,459 | |
Seven & i Holdings Co., Ltd. (Japan) | | | 16,500 | | | | 438,968 | |
Tingyi Cayman Islands Holding Corp. (Cayman Islands) | | | 20,000 | | | | 51,191 | |
Unilever PLC (United Kingdom) | | | 15,000 | | | | 460,742 | |
Uni-President Enterprises Corp. (Taiwan) | | | 177,706 | | | | 263,502 | |
Total Consumer Staples | | | | | | | 7,877,445 | |
Energy - 10.6% | | | | | | | | |
BP PLC (United Kingdom) | | | 137,800 | | | | 1,015,714 | |
Cairn Energy PLC (United Kingdom)* | | | 62,307 | | | | 409,053 | |
Canadian Natural Resources, Ltd. (Canada) | | | 14,900 | | | | 664,603 | |
Cenovus Energy, Inc. (Canada) | | | 16,868 | | | | 564,585 | |
China Shenhua Energy Co., Ltd. (China) | | | 145,000 | | | | 607,686 | |
EnCana Corp. (Canada) | | | 9,1682 | | | | 268,226 | |
INPEX Corp. (Japan) | | | 105 | | | | 613,136 | |
Nexen, Inc. (Canada) | | | 33,224 | | | | 761,850 | |
OAO Gazprom, Sponsored ADR (Russia) | | | 28,000 | | | | 707,862 | |
Penn West Energy Trust (Canada) | | | 13,1132 | | | | 314,406 | |
Petrofac, Ltd. (United Kingdom) | | | 30,832 | | | | 766,082 | |
Petroleo Brasileiro, S.A., Sponsored ADR (Brazil) | | | 8,800 | | | | 332,992 | |
Royal Dutch Shell PLC, Class A (Netherlands) | | | 34,284 | | | | 1,136,034 | |
Royal Dutch Shell PLC, Class B (Netherlands) | | | 31,656 | | | | 1,048,274 | |
Straits Asia Resources, Ltd. (Singapore) | | | 172,000 | | | | 333,988 | |
Suncor Energy, Inc. (Canada) | | | 30,600 | | | | 1,178,082 | |
Technip-Coflexip, ADR (France) | | | 8,790 | | | | 812,491 | |
Total Energy | | | | | | | 11,535,064 | |
Financials - 24.1% | | | | | | | | |
AIA Group, Ltd. (Hong Kong)* | | | 95,000 | | | | 267,053 | |
Allianz SE (Germany) | | | 8,100 | | | | 962,407 | |
Amlin (United Kingdom) | | | 64,296 | | | | 410,470 | |
Aviva PLC (United Kingdom) | | | 76,400 | | | | 469,619 | |
Banco do Brasil, S.A. (Brazil) | | | 48,700 | | | | 921,780 | |
Banco Santander, S.A. (Brazil) | | | 29,000 | | | | 393,946 | |
Bank of East Asia, Ltd. (Hong Kong) | | | 43,090 | | | | 180,313 | |
Bank of Yokohama, Ltd., The (Japan) | | | 103,000 | | | | 531,128 | |
Barclays PLC (United Kingdom) | | | 262,184 | | | | 1,083,575 | |
BNP Paribas SA (France) | | | 19,273 | | | | 1,227,431 | |
The accompanying notes are an integral part of these financial statements.
10
Managers International Equity Fund
Schedule of Portfolio Investments (continued)
| | | | | | | | |
| | | Shares | | | Value | |
Financials - 24.1% (continued) | |
CapitaLand, Ltd. (Singapore) | | | 159,500 | | | $ | 461,356 | |
CapitaMalls Asia, Ltd. (Singapore) | | | 102,000 | | | | 154,248 | |
Cathay Financial Holding Co., Ltd. (Taiwan) | | | 156,415 | | | | 277,372 | |
China Life Insurance Co., Ltd. (China) | | | 48,000 | | | | 195,437 | |
China Minsheng Banking Corp., Ltd. (China) | | | 58,100 | | | | 49,666 | |
China Overseas Land & Investment, Ltd. (Hong Kong) | | | 437,360 | | | | 808,577 | |
Chinatrust Financial Holding Co., Ltd. (Taiwan) | | | 304,007 | | | | 223,100 | |
Credit Suisse Group AG (Switzerland) | | | 15,519 | | | | 625,027 | |
Dai-ichi Mutual Life Insurance Co., The (Japan) | | | 536 | | | | 867,447 | |
Daiwa House Industry Co., Ltd. (Japan) | | | 25,000 | | | | 306,242 | |
Daiwa Securities Group, Inc. (Japan) | | | 26,000 | | | | 133,370 | |
Danske Bank A/S (Denmark) | | | 10,093 | | | | 258,839 | |
DBS Group Holdings, Ltd. (Singapore) | | | 45,500 | | | | 507,851 | |
Deutsche Boerse AG (Germany) | | | 3,861 | | | | 266,761 | |
DnB Holding ASA (Norway) | | | 46,000 | | | | 647,130 | |
Hana Financial Group, Inc. (South Korea) | | | 7,000 | | | | 266,415 | |
Hang Lung Group, Ltd. (Hong Kong) | | | 12,900 | | | | 84,755 | |
Hang Lung Properties, Ltd. (Hong Kong) | | | 35,000 | | | | 163,591 | |
HDFC Bank, Ltd. (India) | | | 11,595 | | | | 603,304 | |
Henderson Land Development Co., Ltd. (Hong Kong) | | | 77,000 | | | | 524,495 | |
Hong Kong Exchanges and Clearing, Ltd. (Hong Kong) | | | 46,400 | | | | 1,052,012 | |
Industrial and Commercial Bank of China, Ltd., Class H (China) | | | 287,915 | | | | 214,339 | |
ING Groep N.V. (Netherlands)* | | | 76,612 | | | | 747,407 | |
Itau Unibanco Holding S.A. (Brazil) | | | 21,263 | | | | 509,672 | |
KB Financial Group, Inc. (South Korea) | | | 10,125 | | | | 532,518 | |
Mitsubishi Estate Co., Ltd. (Japan) | | | 46,000 | | | | 850,136 | |
Mitsubishi Tokyo Financial Group, Inc. (Japan) | | | 78,900 | | | | 425,438 | |
Mitsui Fudosan Co., Ltd. (Japan) | | | 39,000 | | | | 775,070 | |
Muenchener Rueckversicherungs AG (Germany) | | | 1,700 | | | | 257,337 | |
National Australia Bank, Ltd. (Australia) | | | 36,300 | | | | 880,693 | |
Nomura Holdings, Inc. (Japan) | | | 55,500 | | | | 352,152 | |
Old Mutual PLC (United Kingdom) | | | 119,504 | | | | 230,129 | |
Oversea-Chinese Banking Corp., Ltd. (Singapore) | | | 57,000 | | | | 438,840 | |
Prudential PLC (United Kingdom) | | | 119,500 | | | | 1,248,438 | |
Societe Generale (France) | | | 13,373 | | | | 719,559 | |
Standard Chartered PLC (United Kingdom) | | | 20,635 | | | | 557,054 | |
| | | | | | | | |
| | | Shares | | | Value | |
Sumitomo Mitsui Financial Group, Inc. (Japan) | | | 12,000 | | | $ | 424,886 | |
Sumitomo Realty & Development Co., Ltd. (Japan) | | | 15,000 | | | | 356,844 | |
Sumitomo Trust & Banking Co., Ltd. (Japan) | | | 29,000 | | | | 181,675 | |
Sun Hung Kai Properties, Ltd. (Hong Kong) | | | 34,000 | | | | 564,115 | |
T&D Holdings, Inc. (Japan) | | | 7,800 | | | | 196,762 | |
UniCredito Italiano SpA (Italy) | | | 284,475 | | | | 589,764 | |
Zurich Financial Services AG (Switzerland) | | | 1,672 | | | | 432,992 | |
Total Financials | | | | | | | 26,410,537 | |
Health Care - 7.3% | | | | | | | | |
Actelion, Ltd. (Switzerland)* | | | 8,631 | | | | 472,628 | |
AstraZeneca PLC (United Kingdom) | | | 28,900 | | | | 1,317,099 | |
Bayer AG (Germany) | | | 10,200 | | | | 756,099 | |
GlaxoSmithKline PLC (United Kingdom) | | | 14,599 | | | | 283,116 | |
Lonza Group AG (Switzerland) | | | 2,322 | | | | 186,120 | |
Mindray Medical International, Ltd., ADR (China) | | | 12,7002 | | | | 335,280 | |
Novartis AG (Switzerland) | | | 23,908 | | | | 1,407,359 | |
Roche Holding AG (Switzerland) | | | 5,513 | | | | 808,166 | |
Sanofi-Aventis SA (France) | | | 23,971 | | | | 1,536,800 | |
Teva Pharmaceutical Industries, Ltd., Sponsored | | | | | | | | |
ADR (Israel) | | | 16,300 | | | | 849,719 | |
Total Health Care | | | | | | | 7,952,386 | |
Industrials - 10.1% | | | | | | | | |
ABB, Ltd. (Switzerland) | | | 44,320 | | | | 989,573 | |
ABB, Ltd., ADR (Switzerland)* | | | 29,530 | | | | 665,407 | |
Asahi Glass Co., Ltd. (Japan) | | | 56,0002 | | | | 651,271 | |
BAE Systems PLC (United Kingdom) | | | 109,800 | | | | 565,556 | |
Bouygues (France) | | | 23,700 | | | | 1,022,859 | |
FANUC, Ltd. (Japan) | | | 4,000 | | | | 611,425 | |
Far Eastern New Century Corp. (Taiwan) | | | 165,318 | | | | 279,953 | |
HOCHTIEF AG (Germany) | | | 4,200 | | | | 356,043 | |
Kajima Corp. (Japan) | | | 40,000 | | | | 106,062 | |
Koninklijke (Royal) Phillips Electronics N.V. (Netherlands) | | | 22,111 | | | | 677,864 | |
Leighton Holdings, Ltd. (Australia) | | | 19,5062 | | | | 614,805 | |
Mitsubishi Corp. (Japan) | | | 25,700 | | | | 692,660 | |
Mitsubishi Heavy Inds., Ltd. (Japan) | | | 82,700 | | | | 309,587 | |
Mitsui & Co., Ltd. (Japan) | | | 26,300 | | | | 432,738 | |
Schneider Electric SA (France) | | | 3,550 | | | | 532,273 | |
Shimizu Corp. (Japan) | | | 31,000 | | | | 132,056 | |
Siemens AG (Germany) | | | 13,352 | | | | 1,653,975 | |
Sumitomo Electric Industries, Ltd. (Japan) | | | 23,900 | | | | 330,278 | |
The accompanying notes are an integral part of these financial statements.
11
Managers International Equity Fund
Schedule of Portfolio Investments (continued)
| | | | | | | | |
| | | Shares | | | Value | |
Industrials - 10.1% (continued) | |
Tostem Inax Holding Corp. (Japan) | | | 11,500 | | | | $ 252,261 | |
Yamato Transport Co., Ltd. (Japan) | | | 15,300 | | | | 217,040 | |
Total Industrials | | | | | | | 11,093,686 | |
Information Technology - 5.3% | |
AIXTRON AG (Germany) | | | 15,7252 | | | | 586,003 | |
AU Optronics Corp., Sponsored ADR (Taiwan) | | | 46,453 | | | | 484,040 | |
Autonomy Corp. PLC (United Kingdom)* | | | 6,416 | | | | 150,944 | |
Cap Gemini SA (France) | | | 12,100 | | | | 565,671 | |
Companhia Brasileira de Meios de Pagamentos (Brazil) | | | 14,900 | | | | 120,726 | |
Ericsson (LM), Class B (Sweden) | | | 44,070 | | | | 510,719 | |
Gemalto NV (France) | | | 13,2542 | | | | 564,612 | |
Redecard, S.A. (Brazil) | | | 16,300 | | | | 206,696 | |
Ricoh Co., Ltd. (Japan) | | | 40,000 | | | | 583,240 | |
Samsung Electronics Co., Ltd. (South Korea) | | | 1,230 | | | | 1,027,217 | |
Taiwan Semiconductor Manufacturing Co., Ltd., Sponsored ADR (Taiwan) | | | 41,520 | | | | 520,661 | |
Toshiba Corp. (Japan) | | | 81,000 | | | | 439,610 | |
Total Information Technology | | | | | | | 5,760,139 | |
Materials - 12.1% | | | | | | | | |
Agrium, Inc. (Canada) | | | 6,900 | | | | 634,969 | |
Air Liquide SA (France) | | | 4,347 | | | | 550,393 | |
ArcelorMittal (Luxembourg) | | | 1 | | | | 18 | |
Barrick Gold Corp. (Canada) | | | 12,186 | | | | 651,031 | |
First Quantum Minerals, Ltd. (Canada) | | | 3,600 | | | | 391,029 | |
Gold Fields, Ltd. (South Africa) | | | 26,763 | | | | 489,615 | |
Goldcorp, Inc. (Canada) | | | 32,100 | | | | 1,481,190 | |
Impala Platinum Holdings, Ltd. (South Africa) | | | 8,000 | | | | 283,120 | |
Incitec Pivot, Ltd. (Australia) | | | 205,523 | | | | 833,187 | |
JFE Holdings, Inc. (Japan) | | | 12,900 | | | | 447,273 | |
Kinross Gold Corp. (Canada) | | | 28,381 | | | | 538,104 | |
Koninklijke DSM N.V. (Netherlands) | | | 6,676 | | | | 380,552 | |
Newcrest Mining, Ltd. (Australia) | | | 18,143 | | | | 752,545 | |
Rhodia SA (France) | | | 11,546 | | | | 382,298 | |
Rio Tinto PLC (United Kingdom) | | | 16,100 | | | | 1,147,630 | |
Syngenta AG (Switzerland) | | | 2,299 | | | | 673,915 | |
Taiwan Fertilizer Co., Ltd. (Taiwan) | | | 84,900 | | | | 317,228 | |
ThyssenKrupp AG (Germany) | | | 9,700 | | | | 402,985 | |
Toray Industries, Inc. (Japan) | | | 66,700 | | | | 397,634 | |
Vale, S.A., ADR (Brazil) | | | 26,500 | | | | 800,831 | |
| | | | | | | | |
| | | Shares | | | Value | |
Xstrata PLC (United Kingdom) | | | 51,349 | | | | $ 1,216,773 | |
Yamana Gold, Inc. (Canada) | | | 35,259 | | | | 452,839 | |
Total Materials | | | | | | | 13,225,159 | |
Telecommunication Services - 4.5% | | | | | | | | |
Bharti Tele-Ventures, Ltd. (India) | | | 19,714 | | | | 158,158 | |
Nippon Telegraph & Telephone Corp. (Japan) | | | 18,500 | | | | 842,449 | |
NTT DoCoMo, Inc. (Japan) | | | 399 | | | | 694,901 | |
Telecom Italia S.p.A. (Italy) | | | 432,100 | | | | 560,631 | |
Telecom Italia S.p.A., RSP (Italy) | | | 349,200 | | | | 380,067 | |
Telefonica, S.A. (Spain) | | | 34,631 | | | | 790,627 | |
Vodafone Group PLC (United Kingdom) | | | 579,496 | | | | 1,521,257 | |
Total Telecommunication Services | | | | | | | 4,948,090 | |
Utilities - 2.9% | | | | | | | | |
E.ON AG (Germany) | | | 32,400 | | | | 989,459 | |
Electricite de France SA (France) | | | 14,400 | | | | 591,373 | |
Hong Kong and China Gas Co., Ltd., The (Hong Kong) | | | 274,337 | | | | 646,425 | |
National Grid PLC (United Kingdom) | | | 51,616 | | | | 446,129 | |
Tokyo Electric Power Company, Inc., The (Japan) | | | 22,300 | | | | 543,731 | |
Total Utilities | | | | | | | 3,217,117 | |
Total Common Stocks (cost $96,119,944) | | | | | | | 106,099,820 | |
Other Equities - 0.9% | | | | | | | | |
SPDR Gold Shares (United States)* (cost $559,915) | | | 7,100 | | | | 984,912 | |
Warrants - 0.5% | | | | | | | | |
Hon Hai Precision Industry Co., Ltd., 09/29/14 (a) (United States) (cost $398,317) | | | 127,007 | | | | 506,758 | |
Short-Term Investments - 4.3%1 | | | | | | | | |
BNY Institutional Cash Reserves Fund, Series B*3,8 | | | 104,356 | | | | 83,174 | |
BNY Mellon Overnight Government Fund, 0.23%3 | | | 2,505,000 | | | | 2,505,000 | |
Dreyfus Cash Management Fund, Institutional Class Shares, 0.14% | | | 2,085,070 | | | | 2,085,070 | |
Total Short-Term Investments
(cost $4,694,426) | | | | | | | 4,673,244 | |
Total Investments - 102.7%
(cost $101,772,602) | | | | | | | 112,264,734 | |
Other Assets, less Liabilities - (2.7)% | | | | | | | (2,914,499 | ) |
Net Assets - 100.0% | | | | | | $ | 109,350,235 | |
The accompanying notes are an integral part of these financial statements.
12
Managers Emerging Markets Equity Fund
Investment Manager’s Comments
The Managers Emerging Markets Equity Fund’s (the “Fund”) objective is to achieve long-term capital appreciation. The Fund invests at least 80% of its assets in equity securities, i.e., common and preferred stocks of companies located in countries included in the MSCI Emerging Markets (“MSCI EM”) Index, mostly countries in Africa, Asia, Latin America, and the Middle East. The Fund may invest in companies of any size. The MSCI EM Index is the benchmark for the Fund.
The Fund employs multiple subadvisors who specialize in distinct investment approaches. This “intelligence diversification” not only serves to manage risk, but also helps the Fund to tap the markets’ full potential by focusing different analytical insights on each prospective investment. Fund management strives to achieve its performance and diversification objectives while ensuring that the Fund operates within the framework of its investment objective and principal investment strategies.
Rexiter Capital Management Limited
The investment team at Rexiter Capital Management Limited (“Rexiter”) believes emerging markets are less efficient than developed markets, and an actively managed portfolio, with respect to both country weightings and stock selection, can add value over a market capitalization-weighted index without materially affecting risk. Rexiter’s approach is active in terms of both asset allocation and stock selection. Investment decisions are based on fundamental analysis of countries and stocks. Portfolio management is controlled by a disciplined process that seeks to add to returns through the exploitation of market inefficiency while constraining risk.
Schroder Investment Management Limited
Schroder Investment Management Limited (“Schroders”) believes that emerging stock markets are inefficient and provide strong potential for adding value through active fund management. This value can be extracted through both country and stock selection. Schroders uses a time-tested quantitative model to aid in their country selection process, and seeks to add value equally over time from both country and stock selection. Schroders further believes that applying a systematic, disciplined approach along with a strong team culture increases the ability to add value. Schroders believes that equal attention should be given to managing both return and risk.
THE YEAR IN REVIEW
The Fund returned 13.84% in 2010, trailing the return of 18.88% for its benchmark, the MSCI EM Index. (Note that unless otherwise stated, all performance cited in this commentary is in U.S. Dollars.)
Although emerging-market equities did not perform nearly as strongly as they did in 2009, they still delivered solid double-digit returns despite a slow start to the year. As investors continue to methodically wade their way back into equities, emerging markets have been an attractive area for many investors, especially given the muted growth expectations for developed Europe. The U.S. leadership within emerging markets was different in 2010 compared to 2009, with the “BRIC” markets collectively lagging their emerging-market counterparts after outperforming them considerably in 2009. It is also worth noting that unlike most positive emerging-market equity years in the past decade, the strong return
in 2010 was not driven by the local market equity return, but instead primarily by appreciation of emerging-market currencies.
Despite a second straight year of strong absolute performance, the Fund did underperform its benchmark in 2010 due to weakness in holdings in certain sectors including information technology and materials. At the country level, the Fund detracted performance by virtue of its underweight to the outperforming Mexican and South African markets. Performance did improve towards the latter portion of the year for the Fund and was driven by a gradual return to a more “normal” market environment following greater clarity in the outlook for worldwide growth.
LOOKING FORWARD
The situation faced by emerging markets is very different to that of the developed world owing to their strong fundamentals and healthier public, private, and corporate finances. Inflationary pressures have increased in several emerging markets leading to policy normalization and tightening measures in some cases. While policy makers will certainly be looking to avoid the build-up of asset bubbles, they will not allow tightening policy to destabilize a sustainable recovery in the economy. The risk of elevated inflationary pressure and a bubble developing in the emerging world has heightened on further quantitative easing being implemented in the developed world. This will likely continue to lead to emerging markets receiving a disproportionate amount of capital flows in search of higher-yielding opportunities. While supportive for stock market returns, the prospect of strong — including speculative — capital inflows can have a destabilizing effect on domestic assets and currencies. Furthermore, in reaction to such strong flows, some emerging economies, including Brazil, Thailand, and more recently Chile, have imposed capital controls to deter excessive foreign money. While government intervention can provoke short-term market volatility, the longer-term impact of such measures tends to be somewhat limited and further currency strengthening can be expected. Furthermore, although shorter-term headline inflation has seen an increase in certain markets, core inflation remains typically subdued and output gaps exist in the majority of markets.
Against this backdrop, the Fund currently maintains its largest sector overweights to the consumer discretionary and materials sectors. The Fund continues to maintain an underweight to the more defensive and counter-cyclical consumer staples and utilities sectors. At the country level, the Fund is well diversified with its largest weight to Brazil, South Korea, and China. Looking at global equities twelve-month forward P/E ratio, we find it broadly in line with its long-term average even after two consecutive years of strong equity returns. With an expectation of earnings growth in the high teens for the next year, this suggests that emerging market equities have room to continue to deliver solid performance in 2011 if the market shocks of several years ago can be avoided.
CUMULATIVE TOTAL RETURN PERFORMANCE
Managers Emerging Markets Equity Fund’s cumulative total return is based on the daily change in net asset value (NAV), and assumes that all distributions were reinvested. The MSCI Emerging Markets Index (“MSCI EM”) is a free float-adjusted market capitalization index that is designed to measure equity market performance of
Managers Emerging Markets Equity Fund
Investment Manager’s Comments (continued)
CUMULATIVE TOTAL RETURN PERFORMANCE (continued)
emerging markets. The MSCI Emerging Markets Index consists of the following 21 emerging market country indices: Brazil, Chile, China, Colombia, Czech Republic, Egypt, Hungary, India, Indonesia, Korea, Malaysia, Mexico, Morocco, Peru, Philippines, Poland, Russia, South Africa, Taiwan, Thailand, and Turkey. Unlike the Fund, the Index is unmanaged, is not available for investment, and does not incur expenses. This chart compares a hypothetical $10,000 investment made in Managers Emerging Markets Equity Fund on December 31, 2000, to a $10,000 investment made in the MSCI EM for the same time period. Performance for periods longer than one year is annualized. The graph and table do not reflect the deduction of taxes that a shareholder would pay on a Fund distribution or redemption of shares. The listed returns for the Fund are net of expenses and the returns for the index exclude expenses. Past performance is not indicative of future results. Total returns would have been lower had certain expenses not been reduced.
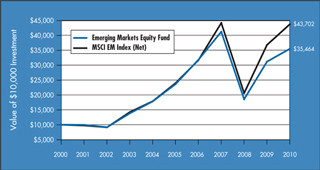
The table below shows the average annual total returns for Managers Emerging Markets Equity Fund and the MSCI EM Index (Net) from December 31, 2000 through December 31, 2010.
| | | | | | | | | | | | |
Average Annual Total Returns1 | | One Year | | | Five Years | | | Ten Years | |
Emerging Markets Equity Fund2,3.4 | | | 13.84 | % | | | 8.46 | % | | | 13.50 | % |
MSCI EM Index (Net)5 | | | 18.88 | % | | | 12.78 | % | | | 15.89 | % |
MSCI EM Index (Gross)6 | | | 19.20 | % | | | 13.11 | % | | | 16.23 | % |
The performance data shown represents past performance, which is not a guarantee of future results. Current performance may be lower or higher than the performance data quoted. The investment return and principal value of an investment in the Fund will fluctuate so that an investor’s shares, when redeemed, may be worth more or less than their original cost. For performance information through the most recent month end, please call (800) 835-3879 or visit our Web site at www.managersinvest.com.
In choosing a Fund, investors should carefully consider the amount they plan to invest, their investment objectives, the Fund’s investment objectives, risks, charges and expenses before investing. For this and other information, please call (800) 835-3879 or visit www.managersinvest.com for a free prospectus. Read it carefully before investing or sending money. Funds are distributed by Managers Distributors, Inc., a member of FINRA.
| 1 | Total return equals income yield plus share price change and assumes reinvestment of all dividends and capital gain distributions. Returns are net of fees and may reflect offsets of Fund expenses as described in the Prospectus. No adjustment has been made for taxes payable by shareholders on their reinvested dividends and capital gain distributions. Returns for periods greater than one year are annualized. The listed returns on the Fund are net of expenses and based on the published NAV as of December 31, 2010. All returns are in U.S. dollars($). |
| 2 | Fund for which, from time to time, the Fund’s advisor has waived its fees and/ or absorbed Fund expenses, which has resulted in higher returns. |
| 3 | The Fund is subject to the risks associated with investments in emerging markets, such as erratic earnings patterns, economic and political instability, changing exchange controls, limitations on repatriation of foreign capital and changes in local governmental attitudes toward private investment, possibly leading to nationalization or confiscation of investor assets. |
| 4 | The Fund is subject to currency risk resulting from fluctuations in exchange rates that may affect the total loss or gain on a non-U.S. Dollar security when converted back to U.S. Dollars. |
| 5 | MSCI EM (Net) approximates the minimum possible dividend reinvestment. The dividend is reinvested after deduction of withholding tax, applying the rate to non-resident individuals who do not benefit from double taxation treaties. MSCI Barra uses withholding tax rates applicable to Luxembourg holding companies, as Luxembourg applies the highest rates. |
| 6 | MSCI EM (Gross) approximates the maximum possible dividend reinvestment. The amount reinvested is the entire dividend distributed to individuals resident in the country of the company, but does not include tax credits. |
The MSCI Emerging Markets Index is a free float-adjusted market capitalization index that is designed to measure equity market performance of emerging markets. The MSCI Emerging Markets Index consists of the following 21 emerging market country indices: Brazil, Chile, China, Colombia, Czech Republic, Egypt, Hungary, India, Indonesia, Korea, Malaysia, Mexico, Morocco, Peru, Philippines, Poland, Russia, South Africa, Taiwan, Thailand, and Turkey. Unlike the Fund, the Index is unmanaged, is not available for investment, and does not incur expenses.
All MSCI data is provided “as is.” The products described herein are not sponsored or endorsed and have not been reviewed or passed on by MSCI. In no event shall MSCI, its affiliates or any MSCI data provider have any liability of any kind in connection with the MSCI data or the products described herein. Copying or redistributing the MSCI data is strictly prohibited.
Not FDIC insured, nor bank guaranteed. May lose value.
14
Managers Emerging Markets Equity Fund
Fund Snapshots
December 31, 2010
Portfolio Breakdown
| | | | | | | | |
Industry | | Managers Emerging
Markets Equity Fund** | | | MSCI EM Index | |
Financials | | | 24.3 | % | | | 25.1 | % |
Materials | | | 16.8 | % | | | 14.9 | % |
Energy | | | 15.6 | % | | | 14.3 | % |
Information Technology | | | 12.7 | % | | | 12.9 | % |
Consumer Discretionary | | | 9.9 | % | | | 6.9 | % |
Industrials | | | 7.2 | % | | | 7.4 | % |
Telecommunication Services | | | 4.7 | % | | | 7.4 | % |
Consumer Staples | | | 3.2 | % | | | 6.7 | % |
Utilities | | | 1.4 | % | | | 3.4 | % |
Warrants | | | 0.9 | % | | | 0.0 | % |
Health Care | | | 0.1 | % | | | 1.0 | % |
Other Assets and Liabilities | | | 3.2 | % | | | 0.0 | % |
| ** | As a percentage of net assets |
Top Ten Holdings
| | | | |
Security Name | | Percentage of
Net Assets | |
Samsung Electronics Co., Ltd.* | | | 3.2 | % |
Vale, S.A., Sponsored ADR* | | | 1.9 | |
China Mobile, Ltd.* | | | 1.9 | |
China Construction Bank Corp.* | | | 1.7 | |
Gazprom OAO, ADR | | | 1.7 | |
Ping An Insurance (Group) Co. of China, Ltd.* | | | 1.7 | |
Petroleo Brasileiro, S.A., Sponsored ADR | | | 1.6 | |
Industrial and Commercial Bank of China, Ltd., Class H | | | 1.6 | |
Itau Unibanco Banco Holding, S.A., ADR | | | 1.5 | |
Shinhan Financial Group Co., Ltd. | | | 1.5 | |
| | | | |
Top Ten as a Group | | | 18.3 | % |
| | | | |
| * | Top Ten Holding at June 30, 2010 |
Any sectors, industries, or securities discussed should not be perceived as investment recommendations. Mention of a specific security should not be considered a recommendation to buy or solicitation to sell that security. Specific securities mentioned in this report may have been sold from the Fund’s portfolio of investments by the time you receive this report.
15
Managers Emerging Markets Equity Fund
Fund Snapshots (continued)
Summary of Investments by Country
| | | | | | | | |
Country | | Managers
Emerging Markets
Equity Fund* | | | MSCI EM Index | |
Bermuda | | | 0.0 | % | | | 0.6 | % |
Brazil | | | 16.5 | % | | | 15.8 | % |
Cayman Islands | | | 0.0 | % | | | 2.7 | % |
Chile | | | 0.0 | % | | | 1.7 | % |
China | | | 9.5 | % | | | 9.9 | % |
Colombia | | | 0.0 | % | | | 0.8 | % |
Czech Republic | | | 0.2 | % | | | 0.3 | % |
Egypt | | | 0.3 | % | | | 0.5 | % |
Hong Kong | | | 7.7 | % | | | 4.1 | % |
Hungary | | | 1.1 | % | | | 0.4 | % |
India | | | 7.4 | % | | | 8.0 | % |
Indonesia | | | 2.3 | % | | | 2.3 | % |
Kazakhstan | | | 0.2 | % | | | 0.0 | % |
Luxembourg | | | 2.9 | % | | | 0.0 | % |
| | | | | | | | |
Country | | Managers
Emerging Markets
Equity Fund* | | | MSCI EM Index | |
Malaysia | | | 0.8 | % | | | 2.8 | % |
Mexico | | | 1.9 | % | | | 4.5 | % |
Morocco | | | 0.0 | % | | | 0.1 | % |
Panama | | | 0.8 | % | | | 0.0 | % |
Peru | | | 0.4 | % | | | 0.0 | % |
Philippines | | | 0.3 | % | | | 0.5 | % |
Poland | | | 1.1 | % | | | 1.6 | % |
Russia | | | 8.7 | % | | | 6.0 | % |
South Africa | | | 3.0 | % | | | 7.8 | % |
South Korea | | | 15.1 | % | | | 13.8 | % |
Supranational & Other | | | 0.2 | % | | | 0.0 | % |
Taiwan | | | 8.8 | % | | | 11.5 | % |
Thailand | | | 3.0 | % | | | 1.7 | % |
Turkey | | | 4.4 | % | | | 1.5 | % |
United States | | | 3.4 | % | | | 1.1 | % |
| | | | | | | | |
| | | 100.0 | % | | | 100.0 | % |
| | | | | | | | |
| * | As a percentage of total market value on December 31, 2010 |
16
Managers Emerging Markets Equity Fund
Schedule of Portfolio Investments
December 31, 2010
| | | | | | | | |
| | | Shares | | | Value | |
Common Stocks - 95.9% | | | | | | | | |
Consumer Discretionary - 9.9% | |
Astra International Tbk PT (Indonesia) | | | 21,000 | | | $ | 126,912 | |
Belle International Holdings, Ltd. (Hong Kong) | | | 384,000 | | | | 648,618 | |
Cheil Communications, Inc. (South Korea) | | | 14,390 | | | | 175,359 | |
CTC Media, Inc. (Russia) | | | 5,100 | | | | 119,493 | |
Ctrip.com International, Ltd. (China)* | | | 9,900 | | | | 400,455 | |
Cyrela Brazil Realty, S.A. (Brazil) | | | 21,700 | | | | 285,630 | |
Foschini, Ltd. (South Africa) | | | 11,098 | | | | 151,774 | |
Genting Malaysia Berhad (Malaysia) | | | 20,700 | | | | 75,000 | |
Golden Eagle Retail Group, Ltd. (China) | | | 88,000 | | | | 216,756 | |
Grupo Televisa, S.A.B. (Mexico) | | | 22,200 | | | | 575,646 | |
Hero Honda Motors, Ltd. (India) | | | 11,684 | | | | 519,457 | |
Hyundai Department Store Co., Ltd. (South Korea) | | | 1,696 | | | | 208,460 | |
Hyundai Mobis Co., Ltd. (South Korea) | | | 892 | | | | 223,336 | |
Hyundai Motor Co., Ltd. (South Korea) | | | 4,932 | | | | 753,015 | |
LG Electronics, Inc. (South Korea) | | | 5,242 | | | | 543,810 | |
Lojas Renner, S.A. (Brazil) | | | 21,300 | | | | 723,686 | |
Parkson Retail Group, Ltd. (China) | | | 146,000 | | | | 224,859 | |
PDG Realty, S.A. Empreendimentos e Participacoes (Brazil) | | | 84,600 | | | | 517,793 | |
Turk Sise ve Cam Fabrikalari A.S. (Turkey) | | | 322,861 | 2 | | | 566,479 | |
Urbi Desarrollos Urbanos, S.A.B. de C.V. (Mexico)* | | | 144,630 | | | | 339,734 | |
Total Consumer Discretionary | | | | | | | 7,396,272 | |
Consumer Staples - 3.2% | | | | | | | | |
Anadolu Efes Biracilik ve Malt Sanayii A.S. (Turkey) | | | 41,382 | | | | 625,023 | |
China Mengniu Dairy Co., Ltd. (Hong Kong) | | | 68,000 | | | | 180,182 | |
Companhia Brasileira de Distribuicao Grupo Pao de Acucar (Brazil) | | | 5,464 | | | | 229,379 | |
Companhia de Bebidas das Americas, PR ADR (Brazil) | | | 6,500 | | | | 201,695 | |
Hengan International Group Co. (Hong Kong) | | | 45,000 | | | | 387,989 | |
LG Household & Health Care, Ltd. (South Korea) | | | 656 | | | | 225,560 | |
Shinsegae Co., Ltd. (South Korea) | | | 839 | | | | 453,913 | |
Shoprite Holdings, Ltd. (South Africa) | | | 7,195 | | | | 108,914 | |
Total Consumer Staples | | | | | | | 2,412,655 | |
Energy - 15.6% | | | | | | | | |
Banpu PCL, NVDR (Thailand) | | | 8,700 | | | | 228,377 | |
China Shenhua Energy Co., Ltd. (China) | | | 76,000 | | | | 318,511 | |
China Suntien Green Energy Corp., Ltd. (China)* | | | 173,000 | | | | 48,743 | |
| | | | | | | | |
| | | Shares | | | Value | |
CNOOC, Ltd. (Hong Kong) | | | 349,790 | | | $ | 832,615 | |
Eurasia Drilling Co., Ltd., GDR (Cyprus)* | | | 2,700 | | | | 87,750 | |
Gazprom OAO, ADR (Russia) | | | 49,650 | | | | 1,255,190 | |
LUKOIL Holdings, ADR (Russia) | | | 11,307 | | | | 646,987 | |
MOL Magyar Olaj-es Gazipari NyRt. (Hungary) | | | 3,846 | | | | 384,160 | |
NovaTek OAO, Sponsored GDR (Russia) | | | 1,450 | | | | 173,476 | |
OGX Petroleo e Gas Participacoes, S.A. (Brazil)* | | | 48,100 | | | | 579,518 | |
Oil & Natural Gas Corp., Ltd. (India) | | | 14,828 | | | | 427,035 | |
PetroChina Co., Ltd. (China) | | | 216,000 | | | | 283,699 | |
Petroleo Brasileiro, S.A. (Brazil) | | | 16,800 | | | | 309,181 | |
Petroleo Brasileiro, S.A., ADR (Brazil) | | | 15,762 | | | | 538,588 | |
Petroleo Brasileiro, S.A., Sponsored ADR (Brazil) | | | 31,727 | | | | 1,200,549 | |
Polski Koncern Naftowy ORLEN SA (Poland) | | | 9,931 | | | | 153,641 | |
PTT PCL, NVDR (Thailand) | | | 44,600 | | | | 472,718 | |
Reliance Industries, Ltd. (India) | | | 14,728 | | | | 348,654 | |
Rosneft Oil Co. OAO, GDR (Russia) | | | 29,800 | | | | 213,608 | |
Rosneft Oil Co. OAO, GDR (a) (Russia)* | | | 39,166 | | | | 266,329 | |
Sasol, Ltd. (South Africa) | | | 12,066 | | | | 634,323 | |
SK Energy Co., Ltd. (South Korea) | | | 1,900 | | | | 324,349 | |
Tenaris, S.A. (Luxembourg) | | | 11,900 | 2 | | | 582,862 | |
Thai Oil PCL (Thailand) | | | 108,000 | | | | 279,715 | |
Tupras Turkiye Petrol Rafine (Turkey) | | | 31,067 | | | | 775,707 | |
Ultrapar Participacoes, S.A. (Brazil) | | | 1,300 | | | | 82,307 | |
Ultrapar Participacoes, S.A., ADR (Brazil) | | | 2,100 | | | | 135,702 | |
Total Energy | | | | | | | 11,584,294 | |
Financials - 24.3% | | | | | | | | |
Banco Bradesco, S.A. (Brazil) | | | 50,721 | | | | 1,029,130 | |
Bangkok Bank PCL (Thailand) | | | 73,400 | | | | 371,292 | |
Bank of China, Ltd., Class H (China) | | | 922,800 | | | | 486,479 | |
Bank of Communications (Hong Kong) | | | 232,000 | | | | 233,476 | |
BM&F Bovespa, S.A. (Brazil) | | | 19,300 | | | | 152,656 | |
BR Malls Participacoes, S.A. (Brazil) | | | 17,000 | | | | 175,120 | |
BR Properties, S.A. (Brazil) | | | 56,700 | | | | 620,284 | |
Cathay Financial Holding Co., Ltd. (Taiwan) | | | 95,000 | | | | 168,464 | |
China Construction Bank Corp. (China) | | | 1,419,659 | | | | 1,271,798 | |
Chinatrust Financial Holding Co., Ltd. (Taiwan) | | | 612,850 | | | | 449,749 | |
Commercial International Bank (Egypt) | | | 13,432 | | | | 109,518 | |
Credicorp, Ltd. (Peru) | | | 1,554 | | | | 184,786 | |
Daegu Bank, Ltd., The (South Korea) | | | 17,630 | | | | 241,733 | |
Emlak Konut Gayrimenkul Yatirim Ortakligi A.S. (Turkey)* | | | 86,906 | | | | 111,447 | |
The accompanying notes are an integral part of these financial statements.
17
Managers Emerging Markets Equity Fund
Schedule of Portfolio Investments (continued)
| | | | | | | | |
| | | Shares | | | Value | |
Financials - 24.3% (continued) | | | | | | | | |
FirstRand, Ltd. (South Africa) | | | 80,995 | | | $ | 240,091 | |
Franshion Properties China, Ltd. (Hong Kong) | | | 758,000 | | | | 228,039 | |
Halyk Savings Bank of Kazakhstan, GDR (Kazakhstan)* | | | 13,461 | 2 | | | 135,311 | |
HDFC Bank, Ltd. (India) | | | 6,573 | | | | 342,002 | |
ICICI Bank, Ltd. (India) | | | 7,880 | | | | 201,657 | |
Industrial and Commercial Bank of China, Ltd., Class H (China) | | | 1,610,556 | | | | 1,198,980 | |
Infrastructure Development Finance Co., Ltd. (India) | | | 126,494 | | | | 516,362 | |
Itau Unibanco Holding, S.A. (Brazil) | | | 18,196 | | | | 436,156 | |
Itau Unibanco Holding, S.A., ADR (Brazil) | | | 47,754 | | | | 1,146,574 | |
Kasikornbank PCL, NVDR (Thailand) | | | 101,700 | | | | 423,150 | |
Komercni banka, a.s. (Czech Republic) | | | 532 | | | | 125,875 | |
OTP Bank NyRt. (Hungary)* | | | 19,179 | | | | 462,709 | |
Ping An Insurance (Group) Co. of China, Ltd. (China) | | | 110,883 | | | | 1,237,640 | |
PKO Bank Polski (Poland) | | | 25,811 | | | | 378,114 | |
Poly (Hong Kong) Investments, Ltd. (Hong Kong) | | | 227,000 | | | | 221,818 | |
Powszechny Zaklad Ubezpieczen SA (Poland) | | | 1,314 | | | | 157,845 | |
PT Bank Mandiri (Indonesia) | | | 741,000 | | | | 532,842 | |
Public Bank Berhad (Malaysia) | | | 80,168 | | | | 338,530 | |
Public Bank Berhad, Foreign Market (Malaysia) | | | 42,100 | | | | 177,493 | |
Samsung Fire & Marine Insurance Co., Ltd. (South Korea) | | | 2,334 | | | | 461,828 | |
Sberbank-CLS (Russia) | | | 180,994 | | | | 615,200 | |
Shinhan Financial Group Co., Ltd. (South Korea) | | | 23,830 | | | | 1,108,072 | |
Siam Commercial Bank PCL (Thailand) | | | 136,800 | | | | 469,705 | |
Talaat Moustafa Group (Egypt)* | | | 57,762 | | | | 85,896 | |
Turkiye Garanti Bankasi A.S. (Turkey) | | | 61,201 | | | | 309,089 | |
Turkiye Halk Bankasi A.S. (Turkey) | | | 13,911 | | | | 118,109 | |
Turkiye Is Bankasi (Isbank) (Turkey) | | | 79,950 | | | | 283,985 | |
Turkiye Sinai Kalkinma Bankasi (Turkey) | | | 77,126 | | | | 129,869 | |
VTB Bank, GDR (Russia) | | | 60,445 | 2 | | | 398,750 | |
Total Financials | | | | | | | 18,087,623 | |
Health Care - 0.1% | | | | | | | | |
Glenmark Pharmaceuticals, Ltd. (India) | | | 11,999 | | | | 97,140 | |
Industrials - 7.2% | | | | | | | | |
Beijing Enterprises Holdings, Ltd. (Hong Kong) | | | 26,000 | | | | 161,150 | |
Bharat Heavy Electricals, Ltd. (India) | | | 4,199 | | | | 218,172 | |
| | | | | | | | |
| | | Shares | | | Value | |
Changsha Zoomlion Heavy Industry Science and Technology Development Co., Ltd. (China) | | | 57,200 | | | $ | 129,224 | |
China Shipping Development Co., Ltd. (China) | | | 312,000 | | | | 415,376 | |
Companhia de Concessoes Rodoviarias (Brazil) | | | 10,762 | | | | 304,059 | |
Copa Holdings, S.A., Class A (Panama) | | | 9,700 | | | | 570,747 | |
COSCO Pacific, Ltd. (Hong Kong) | | | 284,000 | | | | 494,267 | |
Far Eastern New Century Corp. (Taiwan) | | | 102,340 | | | | 173,305 | |
Globaltrans Investment PLC, GDR (Russia)* | | | 5,131 | | | | 87,232 | |
GS Engineering & Construction Corp. (South Korea) | | | 3,381 | | | | 344,947 | |
Hyundai Engineering & Construction Co. (South Korea) | | | 9,740 | | | | 620,299 | |
Hyundai Heavy Industries Co., Ltd. (South Korea) | | | 459 | | | | 178,903 | |
Industries Qatar Q.S.C. (Qatar) | | | 1,629 | | | | 61,632 | |
Iochpe-Maxion, S.A. (Brazil) | | | 6,900 | | | | 100,175 | |
Jaiprakash Associates, Ltd. (India) | | | 43,970 | | | | 104,042 | |
KEPCO Plant Service & Engineering Co., Ltd. (South Korea) | | | 2,005 | | | | 92,641 | |
Larsen & Toubro, Ltd. (India) | | | 13,497 | | | | 597,356 | |
Raubex Group, Ltd. (South Africa) | | | 19,075 | | | | 67,613 | |
Samsung Heavy Industries Co., Ltd. (South Korea) | | | 6,910 | | | | 250,652 | |
SM Investments Corp. (Philippines) | | | 1 | | | | 12 | |
TAV Havalimanlari Holding A.S. (Turkey)* | | | 31,548 | | | | 152,265 | |
United Tractors Tbk PT (Indonesia) | | | 96,500 | | | | 254,509 | |
Total Industrials | | | | | | | 5,378,578 | |
Information Technology - 12.7% | |
Acer, Inc. (Taiwan) | | | 124,055 | | | | 382,903 | |
Asustek Computer, Inc. (Taiwan) | | | 32,650 | | | | 310,094 | |
Asustek Computer, Inc., GDR (Taiwan) | | | 2 | | | | 91 | |
High Tech Computer Corp. (Taiwan) | | | 4,000 | | | | 123,315 | |
Hon Hai Precision Industry Co., Ltd. (Taiwan) | | | 260,724 | | | | 1,050,269 | |
Hon Hai Precision Industry Co., Ltd., ADR (Taiwan) | | | 621 | | | | 4,968 | |
Hynix Semiconductor, Inc. (South Korea)* | | | 2,210 | | | | 46,625 | |
Infosys Technologies (India) | | | 7,005 | | | | 538,693 | |
LG Display Co., Ltd. (South Korea) | | | 13,440 | | | | 470,004 | |
Mail.Ru Group, Ltd., GDR (a) (Russia)* | | | 2,384 | | | | 82,296 | |
Mail.Ru Group, Ltd., Reg S, GDR (Russia) | | | 9,133 | | | | 328,788 | |
MediaTek, Inc. (Taiwan) | | | 34,067 | | | | 487,607 | |
Pegatron Corp. (Taiwan)* | | | 21,186 | | | | 30,489 | |
The accompanying notes are an integral part of these financial statements.
18
Managers Emerging Markets Equity Fund
Schedule of Portfolio Investments (continued)
| | | | | | | | |
| | | Shares | | | Value | |
Information Technology - 12.7% (continued) | |
Samsung Electronics Co., Ltd. (South Korea) | | | 2,860 | | | $ | 2,388,489 | |
Samsung Electronics Co., Ltd., GDR (South Korea) (a) | | | 520 | | | | 217,411 | |
Siliconware Precision Industries Co. (Taiwan) | | | 131,871 | | | | 157,949 | |
Siliconware Precision Industries Co., ADR (Taiwan) | | | 55,700 | | | | 331,415 | |
Taiwan Semiconductor Manufacturing Co., Ltd. (Taiwan) | | | 442,584 | | | | 1,077,382 | |
Tata Consultancy Services, Ltd. (India) | | | 34,611 | | | | 902,217 | |
Tencent Holdings, Ltd. (China) | | | 7,600 | | | | 164,992 | |
WPG Holdings, Ltd. (Taiwan) | | | 83,000 | | | | 160,134 | |
ZTE Corp., Class H (Hong Kong) | | | 42,800 | | | | 169,976 | |
Total Information Technology | | | | | | | 9,426,107 | |
Materials - 16.8% | | | | | | | | |
African Rainbow Minerals, Ltd. (South Africa) | | | 2,524 | | | | 80,565 | |
Anhui Conch Cement Co., Ltd. (China) | | | 95,872 | | | | 448,906 | |
Bradespar, S.A. (Brazil) | | | 2,550 | | | | 66,546 | |
China National Building Materials Co., Ltd. (China) | | | 46,000 | | | | 105,314 | |
China Steel Corp. (Taiwan) | | | 351,484 | | | | 403,718 | |
Compania de Minas Buenaventura SA (Peru) | | | 2,983 | | | | 146,048 | |
Evraz Group, S.A., GDR (Luxembourg)* | | | 8,663 | 2 | | | 311,034 | |
Gerdau, S.A., Sponsored ADR (Brazil) | | | 20,300 | | | | 283,997 | |
GMK Norilsk Nickel, Sponsored ADR (Russia) | | | 300 | | | | 7,212 | |
Gold Fields, Ltd. (South Africa) | | | 7,349 | | | | 134,446 | |
Impala Platinum Holdings, Ltd. (South Africa) | | | 20,569 | | | | 728,491 | |
Indocement Tunggal Prakarsa Tbk PT (Indonesia)* | | | 107,500 | | | | 189,851 | |
KG Chemical Co., Ltd. (South Korea) | | | 2,972 | | | | 1,023,292 | |
KGHM Polska Miedz SA (Poland) | | | 1,871 | | | | 109,471 | |
LSR Group OJSC, GDR (Russia)* | | | 20,088 | | | | 185,207 | |
Mechel OAO (Russia) | | | 5,600 | | | | 163,688 | |
MMC Norilsk Nickel, ADR (Russia) | | | 31,182 | | | | 738,810 | |
MMX Mineracao e Metalicos, S.A. (Brazil)* | | | 60,500 | | | | 409,286 | |
Mongolian Mining Corp. (Hong Kong)* | | | 427,500 | | | | 498,845 | |
POSCO (South Korea) | | | 1,559 | | | | 665,990 | |
Raspadskaya (Russia)* | | | 53,707 | | | | 376,313 | |
Severstal, Reg S, GDR (Russia)* | | | 9,150 | | | | 154,446 | |
Southern Copper Corp. (United States) | | | 6,900 | | | | 336,306 | |
Taiwan Cement Corp. (Taiwan) | | | 278,216 | | | | 312,899 | |
Taiwan Fertilizer Co., Ltd. (Taiwan) | | | 143,000 | | | | 534,317 | |
Tata Steel, Ltd. (India) | | | 11,363 | | | | 172,776 | |
Tata Steel, Ltd., Reg S, GDR (India) | | | 35,418 | | | | 544,729 | |
Ternium, S.A. (Luxembourg) | | | 12,900 | 2 | | | 547,089 | |
| | | | | | | | |
| | | Shares | | | Value | |
Uralkaliy OAO (Russia) | | | 15,363 | | | $ | 564,571 | |
Vale, S.A., ADR (Brazil) | | | 27,799 | | | | 840,086 | |
Vale, S.A., Sponsored ADR (Brazil) | | | 41,667 | | | | 1,440,428 | |
Total Materials | | | | | | | 12,524,677 | |
Telecommunication Services - 4.7% | |
America Movil, S.A.B. de C.V. (Mexico) | | | 9,200 | | | | 527,528 | |
China Mobile, Ltd. (Hong Kong) | | | 145,000 | | | | 1,437,655 | |
Chunghwa Telecom Co., Ltd., ADR (Taiwan) | | | 15,900 | | | | 401,793 | |
KT Corp. (South Korea) | | | 5,250 | | | | 213,216 | |
Mobile Telesystems, Sponsored ADR (Russia) | | | 5,887 | | | | 122,862 | |
MTN Group, Ltd. (South Africa) | | | 4,569 | | | | 93,248 | |
Philippine Long Distance Telephone Co., Sponsored ADR (Philippines) | | | 3,207 | | | | 186,872 | |
Telekomunikasi Indonesia Tbk PT (Indonesia) | | | 110,000 | | | | 97,059 | |
Turk Telekomunikasyon A.S. (Turkey) | | | 56,299 | | | | 236,750 | |
Vivo Participacoes, S.A., ADR (Brazil) | | | 4,811 | | | | 156,790 | |
Total Telecommunication Services | | | | | | | 3,473,773 | |
Utilities - 1.4% | | | | | | | | |
Akenerji Elektrik Uretim A.S. (Turkey) | | | 1 | | | | 2 | |
China Gas Holdings, Ltd. (Hong Kong) | | | 536,000 | | | | 233,769 | |
China Resources Power Holdings Co. (Hong Kong) | | | 1,800 | | | | 3,258 | |
Companhia Energetica de Minas Gerais (Brazil) | | | 2,334 | | | | 37,555 | |
Companhia Energetica de Minas Gerais, Sponsored ADR (Brazil) | | | 16,390 | | | | 271,910 | |
Perusahaan Gas Negara (Persero) Tbk PT (Indonesia) | | | 1,028,500 | | | | 504,595 | |
Total Utilities | | | | | | | 1,051,089 | |
Total Common Stocks (cost $57,858,719) | | | | | | | 71,432,208 | |
Warrants - 0.9% | | | | | | | | |
Sberbank of Russia, 02/28/18 (Luxembourg)
(cost $693,003) | | | 207,128 | | | | 706,306 | |
Short-Term Investments - 5.5%1 | |
BNY Institutional Cash Reserves Fund, Series B*3,8 | | | 110,742 | | | | 88,264 | |
BNY Mellon Overnight Government Fund, 0.23%3 | | | 1,659,000 | | | | 1,659,000 | |
Dreyfus Cash Management Fund, Institutional Class Shares, 0.14% | | | 2,333,376 | | | | 2,333,376 | |
Total Short-Term Investments
(cost $4,103,118) | | | | | | | 4,080,640 | |
Total Investments - 102.3%
(cost $62,654,840) | | | | | | | 76,219,154 | |
Other Assets, less Liabilities - (2.3)% | | | | | | | (1,744,608 | ) |
Net Assets - 100.0% | | | | | | $ | 74,474,546 | |
The accompanying notes are an integral part of these financial statements.
19
Managers Global Bond Fund
Investment Manager’s Comments
THE YEAR IN REVIEW
Managers Global Bond Fund returned 7.27% during the 12-month period ending December 31, 2010, outpacing the return of 5.54% for the Barclays Capital Global Aggregate Bond Index (the “Index”).
Early in the year, concerns about sovereign risk took center stage. Debt-laden Greece came under pressure and as markets reacted, corporate bond spreads widened. As the situation stabilized, corporate spreads began to tighten and compressed to below 10-year average levels. This type of environment, where credit spreads are tightening, is generally favorable for the Portfolio, as it has had an overweight to corporate bonds. Continued market volatility was again on display during the fourth quarter of 2010. On the bearish side, market participants continued to worry about the sovereign debt crisis in peripheral Europe. While Ireland received an €85 billion package, concerns emerged that a much larger European country might be next. Eventually, risky assets ended the year on a positive note backed by an improving U.S. economic picture. The likelihood of a “double-dip” scenario receded and GDP growth expectations were pushed upward to a 3%-3.5% range. As a direct result, the U.S. Treasury curve and other government yields sold off in December. The 10-year U.S. Treasury Bond rose 79 basis points from 2.51% to 3.30% during the quarter, while the 10-year German Bunds rose 66 basis points from 2.31% to 2.97%.
The primary driver of the Fund’s outperformance relative to the benchmark for the year was its exposure to non-U.S. dollar denominated bonds. More specifically, the Fund benefited most from an underweight to and strong security selection in bonds denominated in the Euro. The Fund also benefited from its investment-grade and high-yield exposure. To a minor extent, the Fund’s exposure to preferred bonds detracted from performance.
LOOKING FORWARD
After being challenged in November by renewed Eurozone sovereign debt concerns, global risk markets ended 2010 on a strong note. The key to early 2011 optimism is that the two biggest engines of global growth — the U.S. and Chinese economies — are likely to be pulling together this year.
Chinese sentiment has been challenged by higher inflation and the fear that policy tightening might derail an investment-centric boom. This is still a concern, but it is being overshadowed by hopes for a significant acceleration in Chinese consumer spending. Wages are likely to move significantly higher as Chinese authorities move to deliberately boost private consumption. A further-controlled Chinese Yuan appreciation of 3%-5% versus the U.S. Dollar seems a reasonable prospect.
Fears regarding U.S. growth center on overextended households and government, particularly state and local government, which all need to retrench. But the pace of consumer spending evidently
picked up in the fourth quarter, and there is increasing evidence that the small business credit crunch is easing. Large company capital spending intentions are favorable, and the budget compromise reduced expectations of significant Federal policy tightening and associated policy uncertainty among investors and businesses. QE2 has also had its impact. Investors evidently feel richer and more confident, according to surveys. Job growth may accelerate, and real GDP growth may improve to 3.0% or better.
These improved growth prospects have already been reflected in 10-year U.S. Treasury yields, which moved up 0.60% in December, and are now reasonably priced for early 2011 given still negligible core inflation pressures. But we see more commodity and oil price risks to headline inflation, and would expect yields to end 2011 higher than they have begun. The faster growth expectations are favorable to spread product, but levered/crowded trades are likely to be challenged by volatility once the policy debate shifts to when QE2 will end.
Entering 2011, we have a constructive view on most spread products and we believe that security selection will be crucial for alpha generation. We also expect that the anxiety about large sovereign debt burdens and the governments’ ability to resolve fiscal problems will remain intense during 2011. Consequently, we are positioning the portfolio defensively in the sovereign segment. We remain opportunistic buyers, however, should value arise in this space.
We favor the Dollar versus the Euro and the Yen, with the economic growth differential the key driver, but still see non-Japan EM currencies as undervalued and most likely to appreciate. This may pull other EM currencies higher as well, but some countries are already showing signs of overheating as their current account deficits widen despite highly favorable terms of trade. Our bias is to maintain our non-Japan Asia positions, and look to selectively reduce or reposition some other EM exposures going forward.
This commentary reflects the viewpoints of the portfolio manager, Loomis, Sayles & Company, as of January 20, 2011.
CUMULATIVE TOTAL RETURN PERFORMANCE
Global Bond’s cumulative total return is based on the daily change in net asset value (NAV), and assumes that all distributions were reinvested. The Barclays Capital Global Aggregate Bond Index provides a broad-based measure of the global investment-grade fixed-income markets. The three major components of this index are the U.S. Aggregate, the Pan-European Aggregate, and the Asian-Pacific Aggregate Indices. The Index also includes Eurodollar and Euro-Yen corporate bonds, Canadian government, agency and corporate securities, and U.S. Dollar (USD) investment-grade 144A securities. Unlike the Fund, the Barclays Capital Global Aggregate Bond Index is unmanaged, is not available for investment, and does not incur fees. This graph compares a hypothetical $10,000 investment made in Global Bond on December 31, 2000,
Managers Global Bond Fund
Investment Manager’s Comments (continued)
CUMULATIVE TOTAL RETURN PERFORMANCE (continued)
to a $10,000 investment made in the Barclays Capital Global Aggregate Index for the same time period. Performance for periods longer than one year is annualized. The graph and table do not reflect the deduction of taxes that a shareholder would pay on a Fund distribution or redemption of shares. The listed returns for the Fund are net of expenses and the returns for the index exclude expenses. Past performance is not indicative of future results. Total returns would have been lower had certain expenses not been reduced.
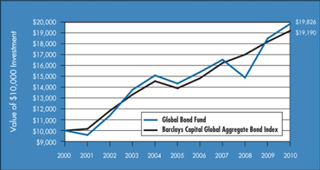
The table below shows the average annual total returns for Global Bond and the Barclays Capital Global Aggregate Bond Index from December 31, 2000 through December 31, 2010.
| | | | | | | | | | | | |
Average Annual Total Returns1 | | One Year | | | Five Years | | | Ten Years | |
Global Bond Fund2,3,4,5,6 | | | 7.27 | % | | | 6.70 | % | | | 7.08 | % |
Barclays Capital Global Aggregate Bond Index7 | | | 5.54 | % | | | 6.66 | % | | | 6.74 | % |
The performance data shown represents past performance, which is not a guarantee of future results. Current performance may be lower or higher than the performance data quoted. The investment return and principal value of an investment in the Fund will fluctuate so that an investor’s shares, when redeemed, may be worth more or less than their original cost. For performance information through the most recent month end, please call (800) 835-3879 or visit our Web site at www.managersinvest.com.
In choosing a Fund, investors should carefully consider the amount they plan to invest, their investment objectives, the Fund’s investment objectives, risks, charges and expenses before investing. For this and other information, please call (800) 835-3879 or visit www.managersinvest.com for a free prospectus. Read it carefully before investing or sending money. Funds are distributed by Managers Distributors, Inc., a member of FINRA.
| | 1 | Total return equals income yield plus share price change and assumes reinvestment of all dividends and capital gain distributions. Returns are net of fees and may reflect offsets of Fund expenses as described in the Prospectus. No adjustment has been made for taxes payable by shareholders on their reinvested dividends and capital gain distributions. Returns for periods greater than one year are annualized. The listed returns on the Fund are net of expenses and based on the published NAV as of December 31, 2010. All returns are in U.S. dollars($). |
| | 2 | Fund for which, from time to time, the Fund’s advisor has waived its fees and/or absorbed Fund expenses, which has resulted in higher returns. |
| | 3 | The Fund is subject to the risks associated with investments in debt securities, such as default risk and fluctuations in the perception of the debtor’s ability to pay its creditors. |
| | 4 | Changing interest rates may adversely affect the value of an investment. An increase in interest rates typically causes the value of bonds and other fixed-income securities to fall. |
| | 5 | Investments in foreign securities are subject to additional risks such as changing market conditions, economic and political instability, and currency exchange rate fluctuations. |
| | 6 | The Fund is subject to currency risk resulting from fluctuations in exchange rates that may affect the total loss or gain on a non-U.S. Dollar security when converted back to U.S. Dollars. |
| | 7 | The Barclays Capital Global Aggregate Bond Index provides a broad-based measure of the global investment-grade fixed-income markets. The three major components of this index are the U.S. Aggregate, the Pan-European Aggregate, and the Asian-Pacific Aggregate Indices. The Index also includes Eurodollar and Euro-Yen corporate bonds, Canadian government, agency and corporate securities, and USD investment-grade 144A securities. Unlike the Fund, the Barclays Capital Global Aggregate Bond Index is unmanaged, is not available for investment, and does not incur fees. |
Not FDIC insured, nor bank guaranteed. May lose value.
21
Managers Global Bond Fund
Fund Snapshots
December 31, 2010
Portfolio Breakdown
| | | | | | | | |
Category | | Managers Global
Bond Fund** | | | Barclays Capital Global
Aggregate Bond Index | |
Foreign Government Obligations | | | 59.8 | % | | | 50.6 | % |
Corporate Bonds | | | 30.1 | % | | | 15.9 | % |
Asset-Backed Securities | | | 3.6 | % | | | 0.2 | % |
U.S. Government Obligations | | | 2.8 | % | | | 16.2 | % |
Mortgage Backed Securities | | | 0.5 | % | | | 17.1 | % |
Other Assets and Liabilities | | | 3.2 | % | | | 0.0 | % |
** As a percentage of net assets
Top Ten Holdings
| | | | |
Security Name | | Percentage of
Net Assets | |
Japan Government, Series 299, 1.300%, 03/20/19 | | | 4.0 | % |
Japan Government, Series 84, 0.700%, 06/20/14 | | | 3.7 | |
Netherlands Government Bond, 4.500%, 07/15/17 | | | 3.6 | |
Bundesrepublik Deutschland, 3.000%, 07/04/20 | | | 3.0 | |
U.K. Gilt, 4.750%, 03/04/20* | | | 2.8 | |
Japan Finance Corporation for Municipal Enterprises, 1.550%, 02/21/12* | | | 2.4 | |
Canadian Government, 3.000%, 12/01/15 | | | 2.2 | |
Norway Government Bond, 4.500%, 05/22/19* | | | 2.2 | |
Singapore Government, 2.250%, 07/01/13* | | | 2.2 | |
Sweden Government Bond, Series 1046, 5.500%, 10/08/12 | | | 2.2 | |
| | | | |
Top Ten as a Group | | | 28.3 | % |
| | | | |
| * | Top Ten Holding at June 30, 2010 |
Any sectors, industries, or securities discussed should not be perceived as investment recommendations. Mention of a specific security should not be considered a recommendation to buy or solicitation to sell that security. Specific securities mentioned in this report may have been sold from the Fund’s portfolio of investments by the time you receive this report.
22
Managers Global Bond Fund
Schedule of Portfolio Investments
December 31, 2010
| | | | | | | | |
Security Description | | Principal Amount | | | Value | |
Corporate Bonds - 30.1% | | | | | | | | |
Financials - 9.8% | | | | | | | | |
Akbank T.A.S., 5.125%, 07/22/15 (a) | | USD | 100,000 | | | $ | 101,000 | |
Bank of America Corp., 4.750%, 05/06/196 | | EUR | 100,000 | | | | 120,280 | |
BBVA Bancomer SA, Texas, 7.250%, 04/22/20 (a) | | USD | 100,000 | | | | 105,780 | |
Citigroup, Inc., 5.500%, 02/15/17 | | USD | 85,000 | | | | 87,978 | |
Crown Castle Towers LLC, 6.113%, 01/15/20 (a) | | USD | 100,000 | | | | 104,332 | |
Ford Motor Credit Co. LLC, 7.000%, 04/15/15 | | USD | 100,000 | | | | 107,461 | |
GMAC, Inc., 6.875%, 08/28/12 | | USD | 45,000 | 2 | | | 47,025 | |
HSBC Bank PLC, 4.125%, 08/12/20 (a) | | USD | 100,000 | | | | 96,112 | |
ICICI Bank, Ltd., 6.375%, 04/30/22 (a)6 | | USD | 140,000 | | | | 140,358 | |
JPMorgan Chase & Co., 4.400%, 07/22/20 | | USD | 75,000 | | | | 73,818 | |
KfW Bankengruppe, 2.600%, 06/20/37 | | JPY | 23,000,000 | | | | 311,142 | |
Landesbank Baden-Wuerttemberg, Series 14, 3.750%, 02/12/14 | | EUR | 65,000 | | | | 91,572 | |
Lloyds TSB Bank PLC, 6.500%, 09/14/20 (a) | | USD | 100,000 | | | | 92,003 | |
Morgan Stanley & Co., Series EMTN, 5.375%, 11/14/13 | | GBP | 40,000 | | | | 64,990 | |
Muenchener Hypothekenbank eG, 5.000%, 01/16/12 (a) | | EUR | 170,000 | | | | 235,896 | |
Network Rail Infrastructure Finance PLC, Series EMTN, 3.500%, 06/17/13 | | USD | 300,000 | | | | 317,639 | |
ProLogis, 6.625%, 05/15/18 | | USD | 60,000 | | | | 63,708 | |
SLM Corp., 5.000%, 10/01/13 | | USD | 150,000 | | | | 150,388 | |
Wells Fargo & Co., 4.625%, 11/02/35 | | GBP | 50,000 | | | | 65,688 | |
White Mountains Insurance Group, Ltd., 6.375%, 03/20/17 (a) | | USD | 140,000 | | | | 135,957 | |
Total Financials | | | | | | | 2,513,127 | |
Industrials - 19.1% | | | | | | | | |
Ahold Finance USA, Inc., Series EMTN, 6.500%, 03/14/17 | | GBP | 100,000 | | | | 173,439 | |
Anadarko Petroleum Corp., 6.375%, 09/15/17 | | USD | 45,000 | | | | 49,019 | |
ArcelorMittal, 5.250%, 08/05/20 | | USD | 100,000 | | | | 98,862 | |
Asciano Finance, Ltd., 4.625%, 09/23/20 (a) | | USD | 125,000 | | | | 115,925 | |
Avnet, Inc., 5.875%, 06/15/20 | | USD | 60,000 | | | | 60,235 | |
Axtel S.A.B. de C.V., 7.625%, 02/01/17 (a) | | USD | 55,000 | | | | 50,875 | |
Bell Aliant Regional Communications, 5.410%, 09/26/16 | | CAD | 160,000 | | | | 170,894 | |
Bell Canada, | | | | | | | | |
6.100%, 03/16/35 (a) | | CAD | 45,000 | | | | 45,936 | |
6.550%, 05/01/29 (a) | | CAD | 10,000 | | | | 10,688 | |
7.300%, 02/23/32 (a) | | CAD | 130,000 | | | | 148,698 | |
British American Tobacco Holdings, The Netherlands, B.V., 4.000%, 07/07/20 | | EUR | 50,000 | | | | 65,686 | |
British Telecommunications PLC, 5.750%, 12/07/28 | | GBP | 100,000 | | | | 148,425 | |
Chesapeake Energy Corp., 6.875%, 11/15/20 | | USD | 55,000 | 2 | | | 55,688 | |
Citizens Communications Co., 6.625%, 03/15/15 | | USD | 115,000 | | | | 120,175 | |
Corus Entertainment, Inc., 7.250%, 02/10/17 (a) | | CAD | 130,000 | | | | 137,609 | |
CSC Holdings LLC, 8.500%, 04/15/14 | | USD | 100,000 | | | | 109,875 | |
Delta Air Lines, Inc., | | | | | | | | |
6.821%, 08/10/22 | | USD | 150,323 | | | | 159,342 | |
8.021%, 08/10/22 | | USD | 97,705 | | | | 99,659 | |
The accompanying notes are an integral part of these financial statements.
23
Managers Global Bond Fund
Schedule of Portfolio Investments (continued)
| | | | | | | | |
Security Description | | Principal Amount | | | Value | |
Industrials - 19.1% (continued) | | | | | | | | |
Desarrolladora Homex, S.A. de C.V., 7.500%, 09/28/15 | | USD | 190,000 | 2 | | $ | 196,175 | |
DP World, Ltd., 6.850%, 07/02/37 (a) | | USD | 250,000 | | | | 229,886 | |
EchoStar DBS Corp., 6.625%, 10/01/14 | | USD | 65,000 | | | | 67,438 | |
Edcon Proprietary Ltd., 4.276%, 06/15/14 (03/15/11) (a)5 | | EUR | 150,000 | | | | 168,375 | |
Embarq Corp., 7.995%, 06/01/36 | | USD | 110,000 | | | | 120,107 | |
ERAC USA Finance Co., | | | | | | | | |
6.375%, 10/15/17 (a) | | USD | 75,000 | | | | 83,260 | |
6.700%, 06/01/34 (a) | | USD | 120,000 | | | | 124,352 | |
7.000%, 10/15/37 (a) | | USD | 20,000 | | | | 21,536 | |
Finmeccanica SpA, 4.875%, 03/24/25 | | EUR | 100,000 | | | | 125,589 | |
HCA, Inc., | | | | | | | | |
6.375%, 01/15/15 | | USD | 35,000 | | | | 34,388 | |
6.625%, 02/15/16 | | USD | 80,000 | | | | 78,200 | |
7.580%, 09/15/25 | | USD | 10,000 | | | | 9,175 | |
7.690%, 06/15/25 | | USD | 15,000 | | | | 14,400 | |
Hologic, Inc., 2.000%, 12/15/37 (b)9 | | USD | 70,000 | | | | 65,538 | |
Motorola Inc., | | | | | | | | |
6.500%, 09/01/25 | | USD | 105,000 | | | | 107,983 | |
6.625%, 11/15/37 | | USD | 120,000 | | | | 118,858 | |
Nabors Industries, Inc., 6.150%, 02/15/18 | | USD | 75,000 | | | | 80,052 | |
New Albertsons, Inc., 7.250%, 05/01/13 | | USD | 40,000 | 2 | | | 40,100 | |
Nextel Communications, Inc., | | | | | | | | |
6.875%, 10/31/13 | | USD | 69,000 | | | | 69,172 | |
7.375%, 08/01/15 | | USD | 65,000 | | | | 65,081 | |
Noble Group, Ltd., 8.500%, 05/30/13 (a) | | USD | 100,000 | | | | 111,740 | |
Odebrecht Drill VIII/IX, Ltd., 6.350%, 06/30/21 (a) | | USD | 100,000 | 2 | | | 104,000 | |
Owens & Minor, Inc., 6.350%, 04/15/167 | | USD | 105,000 | | | | 106,899 | |
Owens-Brockway Glass Container, Inc., 6.750%, 12/01/14 | | EUR | 50,000 | | | | 67,985 | |
Qwest Corp., 7.250%, 10/15/35 | | USD | 158,000 | | | | 154,840 | |
Rowan Companies, Inc., 5.000%, 09/01/17 | | USD | 95,000 | | | | 95,827 | |
SUPERVALU, Inc., 7.500%, 11/15/14 | | USD | 40,000 | | | | 38,600 | |
Telecom Italia Capital S.A., | | | | | | | | |
6.375%, 11/15/33 | | USD | 45,000 | | | | 38,623 | |
7.200%, 07/18/36 | | USD | 20,000 | | | | 18,781 | |
Transport De Gas Del Sur, 7.875%, 05/14/17 (a) | | USD | 270,000 | | | | 272,025 | |
Voto-Votorantim, Ltd., 6.750%, 04/05/21 (a) | | USD | 100,000 | | | | 104,500 | |
Western Union Co., The, 6.200%, 06/21/40 | | USD | 100,000 | | | | 98,929 | |
Windstream Corp., 8.125%, 09/01/18 | | USD | 50,000 | | | | 52,500 | |
Total Industrials | | | | | | | 4,905,944 | |
Utilities - 1.2% | | | | | | | | |
Abu Dhabi National Energy Co., 4.750%, 09/15/14 | | USD | 100,000 | | | | 103,625 | |
Axtel S.A.B. de C.V. 9.000%, 09/22/19 (a) | | USD | 45,000 | | | | 42,750 | |
Dubai Electricity & Water Authority, 6.375%, 10/21/16 (a) | | USD | 100,000 | | | | 96,738 | |
The accompanying notes are an integral part of these financial statements.
24
Managers Global Bond Fund
Schedule of Portfolio Investments (continued)
| | | | | | | | |
Security Description | | Principal Amount | | | Value | |
Utilities - 1.2% (continued) | | | | | | | | |
IPALCO Enterprises, Inc., 7.250%, 04/01/16 (a) | | USD | 30,000 | | | $ | 32,025 | |
NRG Energy, Inc., 8.250%, 09/01/20 (a) | | USD | 45,000 | | | | 46,125 | |
Total Utilities | | | | | | | 321,263 | |
Total Corporate Bonds (cost $7,305,860) | | | | | | | 7,740,334 | |
Foreign Government Obligations- 59.8% | | | | | | | | |
Australian Government Index Linked, Series 2009 25CI, 3.000%, 09/20/25 | | AUD | 180,000 | | | | 196,404 | |
Banco Nacional de Desenvolvimento Economico e Social, 6.500%, 06/10/19 (a) | | USD | 100,000 | | | | 109,750 | |
British Columbia, Series BCUSG-4, 2.850%, 06/15/15 | | USD | 175,000 | | | | 180,157 | |
Bundesrepublik Deutschland, | | | | | | | | |
3.000%, 07/04/20 | | EUR | 575,000 | | | | 772,250 | |
3.250%, 01/04/20 | | EUR | 125,000 | | | | 171,619 | |
3.750%, 07/04/13 | | EUR | 320,000 | | | | 456,380 | |
4.000%, 01/04/37 | | EUR | 100,000 | | | | 144,536 | |
Series 1, 1.250%, 09/16/11 | | EUR | 60,000 | | | | 80,539 | |
Canadian Government, 3.000%, 12/01/15 | | CAD | 555,000 | | | | 573,141 | |
Denmark Government, | | | | | | | | |
4.000%, 11/15/15 | | DKK | 2,500,000 | | | | 487,406 | |
Series EMTN, 1.750%, 10/05/15 | | EUR | 55,000 | | | | 72,006 | |
Series EMTN, 2.250%, 05/14/12 | | USD | 250,000 | | | | 255,666 | |
Eksportfinans ASA, Series GMTN, 1.875%, 04/02/13 | | USD | 170,000 | | | | 171,982 | |
European Bank for Reconstruction & Development, 9.250%, 09/10/12 | | BRL | 180,000 | | | | 108,783 | |
European Investment Bank, | | | | | | | | |
2.375%, 07/10/20 | | CHF | 165,000 | | | | 182,567 | |
4.920%, 04/24/13 (a)4 | | IDR | 4,605,000,000 | | | | 456,728 | |
Export-Import Bank of Korea, The, 4.000%, 11/26/15 (a) | | PHP | 5,000,000 | | | | 113,068 | |
Finland Government Bond, 3.875%, 09/15/17 | | EUR | 245,000 | | | | 352,985 | |
Inter-American Development Bank, | | | | | | | | |
7.378%, 08/20/154 | | IDR | 750,000,000 | | | | 59,492 | |
Series EMTN, 4.750%, 01/10/14 | | INR | 4,200,000 | | | | 93,975 | |
Italian Treasury Bond, 4.000%, 09/01/20 | | EUR | 380,000 | | | | 480,884 | |
Japan Bank for International Cooperation, 2.125%, 11/05/12 (a) | | USD | 500,000 | | | | 509,246 | |
Japan Finance Corporation for Municipal Enterprises, | | | | | | | | |
1.550%, 02/21/12 | | JPY | 49,000,000 | | | | 612,825 | |
1.900%, 06/22/18 | | JPY | 40,000,000 | | | | 531,108 | |
Japan Government, | | | | | | | | |
Series 84, 0.700%, 06/20/14 | | JPY | 76,500,000 | | | | 955,987 | |
Series 299, 1.300%, 03/20/19 | | JPY | 81,000,000 | | | | 1,031,994 | |
Mexican Fixed Rate Bonds, 8.000%, 12/07/23 | | MXN | 3,900,000 | | | | 338,084 | |
Netherlands Government Bond, 4.500%, 07/15/17 | | EUR | 614,000 | | | | 913,580 | |
New South Wales Treasury Corp., Series 2007 CIB1, 2.750%, 11/20/25 | | AUD | 70,000 | | | | 72,462 | |
New Zealand Government Bond, Series 413, 6.500%, 04/15/13 | | NZD | 350,000 | | | | 287,375 | |
Norway Government Bond, 4.500%, 05/22/19 | | NOK | 3,070,000 | | | | 561,511 | |
Ontario, Province of, 2.950%, 02/05/15 | | USD | 245,000 | 2 | | | 252,902 | |
Peruvian Government, 7.840%, 08/12/20 (a) | | PEN | 300,000 | | | | 121,935 | |
The accompanying notes are an integral part of these financial statements.
25
Managers Global Bond Fund
Schedule of Portfolio Investments (continued)
| | | | | | | | |
Security Description | | Principal Amount | | | Value | |
Foreign Government Obligations - 59.8% (continued) | | | | | | | | |
Province of Quebec, Series EMTN, 3.375%, 06/20/16 | | EUR | 150,000 | | | $ | 206,264 | |
Province of Saskatchewan, 7.375%, 07/15/13 | | USD | 225,000 | | | | 258,607 | |
Qatar Government International Bond, 4.000%, 01/20/15 (a) | | USD | 200,000 | | | | 207,000 | |
Republic of Argentina, Series NY, 8.280%, 12/31/33 | | USD | 141,331 | | | | 131,084 | |
Republic of Brazil, 10.250%, 01/10/28 | | BRL | 250,000 | | | | 156,401 | |
Republic of Poland, Series EMTN, 3.000%, 09/23/14 | | CHF | 65,000 | | | | 71,257 | |
Singapore Government, | | | | | | | | |
1.625%, 04/01/13 | | SGD | 325,000 | | | | 258,898 | |
2.250%, 07/01/13 | | SGD | 685,000 | | | | 557,926 | |
Sweden Government Bond, Series 1046, 5.500%, 10/08/12 | | SEK | 3,520,000 | 2 | | | 556,169 | |
U.K. Gilt, | | | | | | | | |
4.000%, 03/07/22 | | GBP | 145,000 | | | | 232,420 | |
4.750%, 03/04/20 | | GBP | 415,000 | | | | 715,412 | |
5.000%, 03/07/25 | | GBP | 40,000 | | | | 69,996 | |
5.250%, 06/07/12 | | GBP | 75,000 | | | | 124,311 | |
Uruguay Government International Bond, | | | | | | | | |
3.700%, 06/26/37 | | UYU | 800,000 | | | | 51,152 | |
5.000%, 09/14/18 | | UYU | 1,000,000 | | | | 77,480 | |
Total Foreign Government Obligations (cost $14,876,901) | | | | | | | 15,383,704 | |
U.S. Government Obligations- 2.8% | | | | | | | | |
USTB, 3.875%, 05/15/40 | | USD | 50,000 | | | | 46,055 | |
USTN, 2.375%, 02/28/15 10 | | USD | 310,000 | | | | 319,495 | |
USTN, 2.625%, 11/15/20 | | USD | 365,000 | 2 | | | 344,298 | |
Total U.S. Government Obligations (cost $712,476) | | | | | | | 709,848 | |
Asset-Backed Securities - 3.6% | | | | | | | | |
Avis Budget Rental Car Funding LLC II, Series 2009 2A, Class A, 5.680%, 02/20/14 (a) | | USD | 100,000 | | | | 107,131 | |
COMET, Series 2004-B7, Class B7, 1.483%, 08/17/17 (01/20/11)5 | | EUR | 100,000 | | | | 123,972 | |
Hertz Vehicle Financing LLC, Series 2009 2A, Class A1, 4.260%, 03/25/16 (a) | | USD | 100,000 | | | | 104,638 | |
Hyundai Capital Auto Funding, Ltd., Series 2010 8A, Class A, 1.261%, 09/20/16 (01/19/11) (a)5 | | USD | 200,000 | | | | 197,419 | |
MBNA Credit Card Master Note Trust, Series 2005 B3, Class B3, 1.146%, 03/19/18 (01/20/11)5 | | EUR | 100,000 | | | | 123,334 | |
Sierra Receivables Funding Company, Series 2009-3A, Class A1, 7.620%, 07/20/26 (a) | | USD | 76,382 | | | | 78,637 | |
Trinity Rail Leasing, L.P., Series 2010 1A, Class A, 5.194%, 10/16/40 (a) | | USD | 99,439 | | | | 99,429 | |
World Financial Credit Card Master Trust, Series 2010-A, Class A, 3.960%, 06/15/15 | | USD | 95,000 | | | | 97,449 | |
Total Asset-Backed Securities (cost $899,617) | | | | | | | 932,009 | |
Mortgage-Backed Securities - 0.5% | | | | | | | | |
Extended Stay America Trust, Series 2010 ESHA, Class D, 5.498%, 11/05/27 (a) (cost $135,000) | | USD | 135,000 | | | | 132,910 | |
| | | Shares | | | | |
Short-Term Investments - 8.0%1 | | | | | | | | |
BNY Institutional Cash Reserves Fund, Series B*3,8 | | | 38,044 | | | | 30,322 | |
BNY Mellon Overnight Government Fund, 0.23%3 | | | 1,600,000 | | | | 1,600,000 | |
Dreyfus Cash Management Fund, Institutional Class Shares, 0.14% | | | 424,177 | | | | 424,177 | |
Total Short-Term Investments (cost $2,062,221) | | | | | | | 2,054,499 | |
Total Investments (cost $25,992,075) | | | | | | | 26,953,304 | |
Other Assets, less Liabilities - (4.8)% | | | | | | | (1,231,042 | ) |
Net Assets - 100.0% | | | | | | $ | 25,722,262 | |
The accompanying notes are an integral part of these financial statements.
26
Notes to Schedules of Portfolio Investments
The following footnotes and abbreviations should be read in conjunction with each of the Schedules of Portfolio Investments previously presented in this report.
At December 31, 2010, the cost of securities for Federal income tax purposes and the gross aggregate unrealized appreciation and/or depreciation based on tax cost were approximately:
| | | | | | | | | | | | | | | | |
Fund | | Cost | | | Appreciation | | | Depreciation | | | Net | |
International Equity | | $ | 103,487,259 | | | $ | 14,010,718 | | | ($ | 5,233,243 | ) | | $ | 8,777,475 | |
Emerging Markets Equity | | | 64,319,151 | | | | 13,118,397 | | | | (1,398,004 | ) | | | 11,720,393 | |
Global Bond | | | 26,002,304 | | | | 1,195,909 | | | | (244,909 | ) | | | 951,000 | |
| | * | Non-income-producing security. |
| | (a) | Security exempt from registration under Rule 144A of the Securities Act of 1933. This security may be resold in transactions exempt from registration, normally to qualified buyers. At December 31, 2010, the value of these securities amounted to the following: |
| | | | | | | | |
Fund | | Market Value | | | % of Net Assets | |
International Equity | | $ | 506,758 | | | | 0.5 | % |
Emerging Markets Equity | | | 566,036 | | | | 0.8 | |
Global Bond | | | 4,687,126 | | | | 18.2 | |
| | (b) | Step Bond. A debt instrument with either deferred interest payments or an interest rate that resets at specific times during its term. |
| | 1 | Yield shown for each investment company represents the December 31, 2010, seven-day average yield, which refers to the sum of the previous seven days’ dividends paid, expressed as an annual percentage. |
| | 2 | Some or all of these shares were out on loan to various brokers as of December 31, 2010, amounting to: |
| | | | | | | | |
Fund | | Market Value | | | % of Net Assets | |
International Equity | | $ | 2,507,437 | | | | 2.3 | % |
Emerging Markets Equity | | | 1,692,455 | | | | 2.3 | |
Global Bond | | | 1,577,396 | | | | 6.1 | |
| | 3 | Collateral received from brokers for securities lending was invested in these short-term investments. |
| | 4 | Represents yield to maturity at December 31, 2010. |
| | 5 | Floating Rate Security. The rate listed is as of December 31, 2010. Date in parentheses represents the security’s next coupon rate reset. |
| | 6 | Variable Rate Security. The rate listed is as of December 31, 2010, and is periodically reset subject to terms and conditions set forth in the debenture. |
| | 7 | Security is illiquid: A security not readily convertible into cash such as a stock, bond or commodity that is not actively traded, and would be difficult to sell in a current sale. The Fund may not invest more than 15% of its net assets in illiquid securities. All securities are valued on the basis of valuations provided by dealers or independent pricing services. Illiquid securities at December 31, 2010, for Global Bond Fund amounted to $106,899, or 0.4% of net assets. |
| | 8 | On September 12, 2008, The Bank of New York Mellon established a separate sleeve of the BNY Institutional Cash Reserves Fund (Series B) to hold certain Lehman Brothers floating rate notes. The Fund’s position in Series B is being fair valued daily. (See Note 4 in the Notes to the Financial Statements.) |
| | 9 | Convertible Bond: A corporate bond, usually a junior debenture, that can be converted, at the option of the holder, for a specific number of shares of the company’s preferred stock or common stock. Convertible bonds at December 31, 2010, amounted to $65,538, or 0.3% of net assets. |
| | 10 | A portion of this security is held as collateral for futures contracts, amounting to a market value of $51,532, or 0.2% of net assets. |
The accompanying notes are an integral part of these financial statements.
27
Notes to Schedules of Portfolio Investments (continued)
The following table summarizes the inputs used to value the Funds’ net assets by the fair value hierarchy levels as of December 31, 2010: (See Note 1(a) in the Notes to Financial Statements.)
| | | | | | | | | | | | | | | | |
| | | Quoted Prices in Active Markets
for Identical Investments
Level 1 | | | Significant Other Observable Inputs
Level 2 | | | Significant Unobservable Inputs
Level 3 | | | Total | |
|
International Equity | |
|
Investments in Securities | |
Common Stocks | | | | | | | | | | | | | | | | |
Materials | | $ | 5,233,113 | | | $ | 7,992,046 | | | | — | | | $ | 13,225,159 | |
Energy | | | 4,084,744 | | | | 7,450,320 | | | | — | | | | 11,535,064 | |
Financials | | | 2,092,451 | | | | 24,318,086 | | | | — | | | | 26,410,537 | |
Health Care | | | 1,657,627 | | | | 6,294,759 | | | | — | | | | 7,952,386 | |
Information Technology | | | 1,332,123 | | | | 4,428,016 | | | | — | | | | 5,760,139 | |
Consumer Discretionary | | | 1,257,113 | | | | 12,823,084 | | | | — | | | | 14,080,197 | |
Industrials | | | — | | | | 11,093,686 | | | | — | | | | 11,093,686 | |
Consumer Staples | | | — | | | | 7,877,445 | | | | — | | | | 7,877,445 | |
Telecommunication Services | | | — | | | | 4,948,090 | | | | — | | | | 4,948,090 | |
Utilities | | | — | | | | 3,217,117 | | | | — | | | | 3,217,117 | |
Other Equities | | | 984,912 | | | | 506,758 | | | | — | | | | 1,491,670 | |
Short-Term Investments | | | 4,590,070 | | | | 83,174 | | | | — | | | | 4,673,244 | |
| | | | | | | | | | | | | | | | |
Total Investments in Securities | | $ | 21,232,153 | | | $ | 91,032,581 | | | | — | | | $ | 112,264,734 | |
| | | | | | | | | | | | | | | | |
Derivatives†† | | | | | | | | | | | | | | | | |
Equity Contracts | | ($ | 7,284 | ) | | | — | | | | — | | | ($ | 7,284 | ) |
| | | | | | | | | | | | | | | | |
| | | | |
| | | Quoted Prices in Active Markets
for Identical Investments
Level 1 | | | Significant Other
Observable Inputs
Level 2 | | | Significant Unobservable Inputs
Level 3 | | | Total | |
Emerging Markets Equity | |
| | | |
Investments in Securities | | | | | | | | | | | | | |
Common Stocks | | | | | | | | | | | | | | | | |
Materials | | $ | 5,284,260 | | | $ | 7,240,417 | | | | — | | | $ | 12,524,677 | |
Energy | | | 4,632,157 | | | | 6,952,137 | | | | — | | | | 11,584,294 | |
Financials | | | 4,033,646 | | | | 14,053,977 | | | | — | | | | 18,087,623 | |
Consumer Discretionary | | | 2,962,437 | | | | 4,433,835 | | | | — | | | | 7,396,272 | |
Telecommunication Services | | | 1,492,904 | | | | 1,980,869 | | | | — | | | | 3,473,773 | |
Industrials | | | 1,171,818 | | | | 4,206,760 | | | | — | | | | 5,378,578 | |
Consumer Staples | | | 884,987 | | | | 1,527,668 | | | | — | | | | 2,412,655 | |
Information Technology | | | 882,582 | | | | 8,543,525 | | | | — | | | | 9,426,107 | |
Utilities | | | 543,234 | | | | 507,855 | | | | — | | | | 1,051,089 | |
Health Care | | | — | | | | 97,140 | | | | — | | | | 97,140 | |
Other Equities | | | — | | | | 706,306 | | | | — | | | | 706,306 | |
Short-Term Investments | | | 3,992,376 | | | | 88,264 | | | | — | | | | 4,080,640 | |
| | | | | | | | | | | | | | | | |
Total Investments in Securities | | $ | 25,880,401 | | | $ | 50,338,753 | | | | — | | | $ | 76,219,154 | |
| | | | | | | | | | | | | | | | |
The accompanying notes are an integral part of these financial statements.
28
Notes to Schedules of Portfolio Investments (continued)
| | | | | | | | | | | | | | | | |
| | | Quoted Prices in Active Markets
for Identical Investments
Level 1 | | | Significant Other
Observable Inputs
Level 2 | | | Significant Unobservable Inputs
Level 3 | | | Total | |
Global Bond | | | | | | | | | | | | | | | | |
Investments in Securities | |
Corporate Bonds† | | | — | | | $ | 7,740,334 | | | | — | | | $ | 7,740,334 | |
Foreign Government Obligations | | | — | | | | 15,383,704 | | | | — | | | | 15,383,704 | |
U.S. Government Obligations | | | — | | | | 709,848 | | | | — | | | | 709,848 | |
Asset-Backed Securities | | | — | | | | 932,009 | | | | — | | | | 932,009 | |
Mortgage-Backed Securities | | | — | | | | 132,910 | | | | — | | | | 132,910 | |
Short-Term Investments | | $ | 2,024,177 | | | | 30,322 | | | | — | | | | 2,054,499 | |
| | | | | | | | | | | | | | | | |
Total Investments | | $ | 2,024,177 | | | $ | 24,929,127 | | | | — | | | $ | 26,953,304 | |
| | | | | | | | | | | | | | | | |
Derivatives†† | | | | | | | | | | | | | | | | |
Equity Contracts | | $ | 20,703 | | | | — | | | | — | | | $ | 20,703 | |
Foreign Exchange Contracts | | | — | | | $ | 11,549 | | | | — | | | | 11,549 | |
| | | | | | | | | | | | | | | | |
Total Derivatives | | $ | 20,703 | | | $ | 11,549 | | | | — | | | $ | 32,252 | |
| | | | | | | | | | | | | | | | |
| † | All corporate bonds held in the Funds are Level 2 securities. For a detailed break-out of the corporate bonds by major industry classification, please refer to the Schedule of Portfolio Investments. |
| †† | Derivative instruments, such as futures, forwards and swap contracts, are not reflected in the Schedules of Portfolio Investments, and are valued at the unrealized appreciation/depreciation of the instrument. |
As of December 31, 2010, the Funds’ had no significant transfers between Level 1 and Level 2 from the beginning of the reporting period.
The fair values of derivative instruments at December 31, 2010, for International Equity and Global Bond were as follows:
| | | | | | | | | | | | | | |
| | | | | Asset Derivatives | | | Liability Derivatives | |
Fund | | Derivatives not accounted for as hedging instruments | | Statement of Assets and Liabilities Location | | Fair Value | | | Statement of Assets and Liabilities Location | | Fair Value | |
International Equity | | Equity futures contracts* | | Receivable for variation margin on futures | | | — | | | Payable for variation margin on futures | | | — | |
| | | | | | | | | | | | | | |
Global Bond | | Interest rate futures contracts* | | Receivable for variation margin on futures | | | — | | | Payable for variation margin on futures | | ($ | 4,062 | ) |
| | Foreign exchange contracts | | Unrealized appreciation of foreign currency contracts | | $ | 33,739 | | | Unrealized depreciation of foreign currency contracts | | | (22,190 | ) |
| | | | | | | | | | | | | | |
Totals | | $ | 33,739 | | | | | ($ | 26,252 | ) |
| | | | | | | | | | | | | | |
| * | Current day variation margin is zero. Prior variation margin is included in the cash value as reflected in the Statement of Assets and Liabilities. |
The accompanying notes are an integral part of these financial statements.
29
Notes to Schedules of Portfolio Investments (continued)
As of December 31, 2010, the effect of derivative instruments on the Statement of Operations for International Equity and Global Bond and the amount of realized gain/ (loss) on derivatives recognized in income were as follows:
| | | | | | | | | | | | | | | | | | |
Fund | | Derivatives not accounted for as hedging
instruments | | | Futures | | | Forward Currency
Contracts | | | Total | |
International Equity | | Equity futures contracts | | | | | | $ | 19,264 | | | | — | | | $ | 19,264 | |
| | | | | |
| | Foreign exchange contracts | | | | | | | — | | | $ | 196,616 | | | | 196,616 | |
| | | | | | | | | | | | | | | | | | |
| | | | | Totals | | | $ | 19,264 | | | $ | 196,616 | | | $ | 215,880 | |
| | | | | | | | | | | | | | | | | | |
Global Bond | | Interest rate futures contracts | | | | | | $ | 9,853 | | | | — | | | $ | 9,853 | |
| | | | | |
| | Foreign exchange contracts | | | | | | | — | | | $ | 43,706 | | | | 43,706 | |
| | | | | | | | | | | | | | | | | | |
| | | | | Totals | | | $ | 9,853 | | | $ | 43,706 | | | $ | 53,559 | |
| | | | | | | | | | | | | | | | | | |
The change in unrealized gain/(loss) on derivatives recognized in income were as follows: | |
| | | | |
Fund | | Derivatives not accounted for as hedging
instruments | | | Futures | | | Forward Currency
Contracts | | | Total | |
International Equity | | Equity contracts | | | | | | ($ | 30,453 | ) | | | — | | | ($ | 30,453 | ) |
| | | | | | | | | | | | | | | | | | |
Global Bond | | Interest rate futures contracts | | | | | | $ | 20,703 | | | | — | | | $ | 20,703 | |
| | Foreign exchange contracts | | | | | | | — | | | $ | 24,163 | | | | 24,163 | |
| | | | | | | | | | | | | | | | | | |
| | | | | Totals | | | $ | 20,703 | | | $ | 24,163 | | | $ | 44,866 | |
| | | | | | | | | | | | | | | | | | |
The open forward foreign currency exchange contracts (in U.S. Dollars) at December 31, 2010, were as follows: (See Note 7a in the Notes to Financial Statements.)
| | | | | | | | | | | | | | | | | | | | | | | | |
Forward Foreign Currency Exchange Contracts | | Position | | | Settlement Date | | | Counterparty | | | Current Value
(Receivable Amount) | | | Contract Value
(Payable Amount) | | | Unrealized Gain/
(Loss) | |
Global Bond | | | | | | | | | | | | | | | | | | | | | | | | |
Canadian Dollar | | | Short | | | | 03/07/11 | | | | CS | | | $ | 256,461 | | | $ | 261,125 | | | ($ | 4,664 | ) |
Danish Krone | | | Short | | | | 03/16/11 | | | | BRC | | | | 472,167 | | | | 476,740 | | | | (4,573 | ) |
Pound Sterling | | | Short | | | | 03/17/11 | | | | UBS | | | | 268,630 | | | | 264,886 | | | | 3,744 | |
Mexican Peso | | | Short | | | | 03/15/11 | | | | CS | | | | 144,578 | | | | 144,937 | | | | (359 | ) |
New Zealand Dollar | | | Short | | | | 02/28/11 | | | | CS | | | | 268,933 | | | | 279,195 | | | | (10,262 | ) |
Malaysian Ringgit | | | Long | | | | 03/21/11 | | | | JPM | | | | 274,244 | | | | 269,670 | | | | 4,574 | |
Polish Zloty | | | Long | | | | 03/02/11 | | | | MSC | | | | 272,561 | | | | 260,099 | | | | 12,462 | |
South Korean Won | | | Long | | | | 03/14/11 | | | | UBS | | | | 754,901 | | | | 756,876 | | | | (1,975 | ) |
South Korean Won | | | Long | | | | 03/14/11 | | | | CS | | | | 149,225 | | | | 149,582 | | | | (357 | ) |
Swiss Franc | | | Long | | | | 03/17/11 | | | | UBS | | | | 281,589 | | | | 268,630 | | | | 12,959 | |
| | | | | | | | | | | | | | | | | | | | | | | | |
| | | | | | | | | | | Totals | | | $ | 3,143,289 | | | $ | 3,131,740 | | | $ | 11,549 | |
| | | | | | | | | | | | | | | | | | | | | | | | |
The accompanying notes are an integral part of these financial statements.
30
Notes to Schedules of Portfolio Investments (continued)
All futures contracts are exchange traded unless otherwise noted. The open futures contracts as of December 31, 2010, were as follows: (See Note 7b in the Notes to Financial Statements.)
| | | | | | | | | | | | | | | | | | | | |
Type | | Currency | | | Number of Contracts | | | Position | | | Expiration Date | | | Unrealized Gain/(Loss) | |
International Equity | | | | | | | | | | | | | | | | | | | | |
DJ Euro Stoxx 50 | | | Euro | | | | 10 | | | | Long | | | | 03/18/11 | | | ($ | 7,284 | ) |
| | | | | | | | | | | | | | | | | | | | |
Global Bond | | | | | | | | | | | | | | | | | | | | |
US 10-Year Note | | | USD | | | | 4 | | | | Short | | | | 03/22/11 | | | $ | 12,847 | |
US Long Bond | | | USD | | | | 2 | | | | Short | | | | 03/22/11 | | | | 7,856 | |
| | | | | | | | | | | | | | | | | | | | |
| | | | | | | | | | | | | | | Total | | | $ | 20,703 | |
| | | | | | | | | | | | | | | | | | | | |
Investments Definitions and Abbreviations:
ADR/GDR: ADR after the name of a holding stands for American Depositary Receipt, representing ownership of foreign securities on deposit with a domestic custodian bank; a GDR (Global Depositary Receipt) is comparable, but foreign securities are held on deposit in a non-U.S. bank. The value of the ADR/GDR securities is determined or significantly influenced by trading on exchanges not located in the United States or Canada. Sponsored ADR/GDRs are initiated by the underlying foreign company.
| | | | | | |
| EMTN: | | European Medium Term Note | | Reg S: | | Regulation S is a series of rules that clarifies the position of the Securities and Exchange Commission (“SEC”) that securities offered and sold outside of the United States do not need to be registered with the SEC. |
| ESHA: | | Extended Stay Hotels America | | | |
| GMAC: | | General Motors Acceptance Corp. | | | |
| GMTN: | | Global Multi-Currency | | RSP: | | Risparmio shares which are saving shares traded on the Italian Stock Exchange |
| NVDR: | | Non-Voting Depository Receipt | | | |
| | | | USTB: | | United States Treasury Bond |
| | | | USTN: | | United States Treasury Note |
Abbreviations have been used throughout the portfolios to indicate amounts shown in currencies other than the U.S. Dollar (USD):
| | | | | | |
| AUD: | | Australian Dollar | | JPY: | | Japanese Yen |
| BRL: | | Brazilian Real | | NOK: | | Norwegian Krone |
| CAD: | | Canadian Dollar | | NZD: | | New Zealand Dollar |
| CHF: | | Swiss Franc | | MXN: | | Mexican Peso |
| DKK: | | Danish Krone | | PEN: | | Peruvian Nuevo Sol |
| EUR: | | euro | | PHP: | | Philippine Peso |
| GBP: | | British Pound | | SEK: | | Swedish Krona |
| IDR: | | Indonesian Rupiah | | SGD: | | Singapore Dollar |
| INR: | | Indian Rupee | | UYU: | | Uruguayan Peso |
Counterparty Abbreviations:
| | | | | | |
| BRC: | | Barclays Bank | | | | |
| CS: | | Credit Suisse | | | | |
| JPM: | | JPMorgan Chase | | | | |
| MSC: | | Morgan Stanley | | | | |
| UBS: | | UBS Securities | | | | |
The accompanying notes are an integral part of these financial statements.
31
Statements of Assets and Liabilities
December 31, 2010
| | | | | | | | | | | | |
| | | Managers
International
Equity Fund | | | Managers Emerging
Markets Equity Fund | | | Managers Global
Bond Fund | |
Assets: | | | | | | | | | | | | |
Investments at value (including securities on loan valued at $2,507,437, $1,692,455 and $1,577,396, respectively)* | | $ | 112,264,734 | | | $ | 76,219,154 | | | $ | 26,953,304 | |
Cash collateral for futures | | | 30,734 | | | | — | | | | — | |
Foreign currency**1 | | | 338,689 | | | | 308,344 | | | | 449,841 | |
Receivable for investments sold | | | 38,983 | | | | — | | | | — | |
Receivable for Fund shares sold | | | 155,140 | | | | 241,137 | | | | 57,802 | |
Receivable from affiliate | | | 19,590 | | | | 13,609 | | | | 5,609 | |
Unrealized appreciation on foreign currency contracts | | | — | | | | — | | | | 33,739 | |
Dividends, interest and other receivables | | | 247,705 | | | | 47,264 | | | | 313,258 | |
Prepaid expenses | | | 9,290 | | | | 9,031 | | | | 8,976 | |
Total assets | | | 113,104,865 | | | | 76,838,539 | | | | 27,822,529 | |
Liabilities: | | | | | | | | | | | | |
Payable for Fund shares repurchased | | | 705,096 | | | | 263,954 | | | | 143,085 | |
Payable upon return of securities loaned | | | 2,609,356 | | | | 1,769,742 | | | | 1,638,044 | |
Payable for investments purchased | | | 176,745 | | | | 62,524 | | | | 221,840 | |
Unrealized depreciation on foreign currency contracts | | | — | | | | — | | | | 22,190 | |
Payable for variation margin on futures | | | — | | | | — | | | | 4,062 | |
Accrued expenses: | | | | | | | | | | | | |
Investment management and advisory fees | | | 83,504 | | | | 72,109 | | | | 15,464 | |
Administrative fees | | | 23,196 | | | | 15,676 | | | | 4,418 | |
Other | | | 156,733 | | | | 179,988 | | | | 51,164 | |
Total liabilities | | | 3,754,630 | | | | 2,363,993 | | | | 2,100,267 | |
Net Assets | | $ | 109,350,235 | | | $ | 74,474,546 | | | $ | 25,722,262 | |
Shares outstanding | | | 2,063,671 | | | | 4,839,348 | | | | 1,330,900 | |
Net asset value, offering and redemption price per share | | $ | 52.99 | | | $ | 15.39 | | | $ | 19.33 | |
Net Assets Represent: | | | | | | | | | | | | |
Paid-in capital | | $ | 168,017,324 | | | $ | 76,917,366 | | | $ | 28,639,892 | |
Undistributed net investment income | | | 406,387 | | | | 257,938 | | | | 247,573 | |
Accumulated net realized loss from investments, futures and foreign currency transactions | | | (69,585,070 | ) | | | (16,270,363 | ) | | | (4,167,297 | ) |
Net unrealized appreciation of investments, futures and foreign currency translations | | | 10,511,594 | | | | 13,569,605 | | | | 1,002,094 | |
Net Assets | | $ | 109,350,235 | | | $ | 74,474,546 | | | $ | 25,722,262 | |
* Investments at cost | | $ | 101,772,602 | | | $ | 62,654,840 | | | $ | 25,992,075 | |
** Foreign currency at cost | | $ | 327,340 | | | $ | 303,195 | | | $ | 443,549 | |
| 1 | A portion of foreign currency is held as collateral for futures contracts in International Equity Fund, amounting to a market value of $26,527, or 0.02% of net assets. |
The accompanying notes are an integral part of these financial statements.
32
Statements of Operations
For the year ended December 31, 2010
| | | | | | | | | | | | |
| | | Managers
International
Equity Fund | | | Managers Emerging
Markets Equity Fund | | | Managers Global
Bond Fund | |
Investment Income: | | | | | | | | | | | | |
Dividend income | | $ | 2,730,444 | | | $ | 2,009,273 | | | $ | 496 | |
Interest income | | | 121 | | | | — | | | | 931,996 | |
Foreign withholding tax | | | (226,164 | ) | | | (214,895 | ) | | | — | |
Securities lending fees | | | 90,989 | | | | 5,213 | | | | 894 | |
Total investment income | | | 2,595,390 | | | | 1,799,591 | | | | 933,386 | |
Expenses: | | | | | | | | | | | | |
Investment management and advisory fees | | | 1,006,150 | | | | 1,009,335 | | | | 177,837 | |
Administrative fees | | | 279,486 | | | | 219,421 | | | | 50,810 | |
Transfer agent | | | 350,009 | | | | 134,073 | | | | 33,656 | |
Custodian | | | 149,960 | | | | 298,626 | | | | 29,791 | |
Professional fees | | | 67,157 | | | | 82,064 | | | | 36,238 | |
Registration fees | | | 22,901 | | | | 30,747 | | | | 22,331 | |
Reports to shareholders | | | 13,751 | | | | 31,100 | | | | 9,553 | |
Trustees fees and expenses | | | 7,316 | | | | 6,509 | | | | 1,710 | |
Miscellaneous | | | 8,277 | | | | 7,125 | | | | 2,466 | |
Total expenses before offsets | | | 1,905,007 | | | | 1,819,000 | | | | 364,392 | |
Expense reimbursements | | | (299,805 | ) | | | (277,054 | ) | | | (84,847 | ) |
Expense reductions | | | (585 | ) | | | (185 | ) | | | (37 | ) |
Net expenses | | | 1,604,617 | | | | 1,541,761 | | | | 279,508 | |
Net investment income | | | 990,773 | | | | 257,830 | | | | 653,878 | |
Net Realized and Unrealized Gain (Loss): | | | | | | | | | | | | |
Net realized gain (loss) on investments | | | 7,241,972 | | | | 13,564,345 | | | | (807,156 | ) |
Net realized gain on futures contracts | | | 19,264 | | | | — | | | | 9,853 | |
Net realized gain (loss) on foreign currency transactions | | | 72,938 | | | | (241,938 | ) | | | 16,186 | |
Net change in unrealized appreciation (depreciation) of investments | | | (4,282,595 | ) | | | (2,627,787 | ) | | | 1,819,712 | |
Net change in unrealized appreciation (depreciation) of futures contracts | | | (30,453 | ) | | | — | | | | 20,703 | |
Net change in unrealized appreciation (depreciation) on foreign currency translations | | | 16,784 | | | | (1,483 | ) | | | 32,802 | |
Net realized and unrealized gain | | | 3,037,910 | | | | 10,693,137 | | | | 1,092,100 | |
Net increase in net assets resulting from operations | | $ | 4,028,683 | | | $ | 10,950,967 | | | $ | 1,745,978 | |
The accompanying notes are an integral part of these financial statements.
33
Statements of Changes in Net Assets
For the year ended December 31,
| | | | | | | | |
| | | Managers International Equity Fund | |
| | | 2010 | | | 2009 | |
Increase (Decrease) in Net Assets From Operations: | | | | | | | | |
Net investment income | | $ | 990,773 | | | $ | 1,655,879 | |
Net realized gain (loss) on investments, futures and foreign currency transactions | | | 7,334,174 | | | | (19,530,869 | ) |
Net change in unrealized appreciation (depreciation) of investments, futures and foreign currency contracts and translations | | | (4,296,264 | ) | | | 51,044,233 | |
Net increase in net assets resulting from operations | | | 4,028,683 | | | | 33,169,243 | |
Distributions to Shareholders: | | | | | | | | |
From net investment income | | | (1,000,087 | ) | | | (850,021 | ) |
From Capital Share Transactions: | | | | | | | | |
Proceeds from sale of shares1 | | | 12,602,849 | | | | 19,062,082 | |
Reinvestment of dividends and distributions | | | 959,416 | | | | 770,986 | |
Cost of shares repurchased | | | (34,035,935 | ) | | | (53,341,397 | ) |
Net decrease from capital share transactions | | | (20,473,670 | ) | | | (33,508,329 | ) |
Total decrease in net assets | | | (17,445,074 | ) | | | (1,189,107 | ) |
Net Assets: | | | | | | | | |
Beginning of year | | | 126,795,309 | �� | | | 127,984,416 | |
End of year | | $ | 109,350,235 | | | $ | 126,795,309 | |
End of year undistributed net investment income | | $ | 406,387 | | | $ | 176,768 | |
| | | | | | | | |
Share Transactions: | | | | | | | | |
Sale of shares | | | 250,788 | | | | 478,162 | |
Reinvested shares | | | 18,274 | | | | 14,997 | |
Shares repurchased | | | (678,900 | ) | | | (1,285,542 | ) |
Net decrease in shares | | | (409,838 | ) | | | (792,383 | ) |
| 1 | For the years ended December 31, 2010 and 2009, the proceeds from the sale of shares for International Equity includes the receipt of market timing settlements of $125,379 and $94,219, respectively. |
The accompanying notes are an integral part of these financial statements.
34
Statements of Changes in Net Assets
For the year ended December 31,
| | | | | | | | | | | | | | | | |
| | | Managers Emerging Markets
Equity Fund | | | Managers Global Bond Fund | |
| | | 2010 | | | 2009 | | | 2010 | | | 2009 | |
Increase (Decrease) in Net Assets From Operations: | | | | | | | | | | | | | | | | |
Net investment income | | $ | 257,830 | | | $ | 236,072 | | | $ | 653,878 | | | $ | 1,906,014 | |
Net realized gain (loss) on investments, futures and foreign currency transactions | | | 13,322,407 | | | | (16,716,106 | ) | | | (781,117 | ) | | | (1,086,939 | ) |
Net change in unrealized appreciation (depreciation) of investments, futures and foreign currency translations | | | (2,629,270 | ) | | | 58,441,013 | | | | 1,873,217 | | | | 8,300,016 | |
Net increase in net assets resulting from operations | | | 10,950,967 | | | | 41,960,979 | | | | 1,745,978 | | | | 9,119,091 | |
Distributions to Shareholders: | | | | | | | | | | | | | | | | |
From net investment income | | | (114,817 | ) | | | (209,563 | ) | | | (1,100,009 | ) | | | (2,806,638 | ) |
From Capital Share Transactions: | | | | | | | | | | | | | | | | |
Proceeds from sale of shares | | | 18,247,454 | | | | 35,544,198 | | | | 10,516,298 | | | | 9,245,127 | |
Reinvestment of dividends and distributions | | | 96,956 | | | | 188,220 | | | | 1,002,689 | | | | 2,757,790 | |
Cost of shares repurchased | | | (50,993,858 | ) | | | (41,551,261 | ) | | | (12,588,977 | ) | | | (39,903,634 | ) |
Net decrease from capital share transactions | | | (32,649,448 | ) | | | (5,818,843 | ) | | | (1,069,990 | ) | | | (27,900,717 | ) |
Total increase (decrease) in net assets | | | (21,813,298 | ) | | | 35,932,573 | | | | (424,021 | ) | | | (21,588,264 | ) |
Net Assets: | | | | | | | | | | | | | | | | |
Beginning of year | | | 96,287,844 | | | | 60,355,271 | | | | 26,146,283 | | | | 47,734,547 | |
End of year | | $ | 74,474,546 | | | $ | 96,287,844 | | | $ | 25,722,262 | | | $ | 26,146,283 | |
End of year undistributed net investment income (loss) | | $ | 257,938 | | | ($ | 12,834 | ) | | $ | 247,573 | | | $ | 410,909 | |
| | | | | | | | | | | | | | | | |
Share Transactions: | | | | | | | | | | | | | | | | |
Sale of shares | | | 1,351,886 | | | | 3,577,894 | | | | 539,170 | | | | 471,568 | |
Reinvested shares | | | 6,421 | | | | 13,983 | | | | 52,579 | | | | 146,344 | |
Shares repurchased | | | (3,630,681 | ) | | | (3,943,771 | ) | | | (649,900 | ) | | | (2,048,613 | ) |
Net decrease in shares | | | (2,272,374 | ) | | | (351,894 | ) | | | (58,151 | ) | | | (1,430,701 | ) |
The accompanying notes are an integral part of these financial statements.
35
Financial Highlights
For a share outstanding throughout each year
| | | | | | | | | | | | | | | | | | | | |
| | | For the year ended December 31, | |
Managers International Equity Fund | | 2010 | | | 2009 | | | 2008 | | | 2007 | | | 2006 | |
Net Asset Value, Beginning of Year | | $ | 51.26 | | | $ | 39.19 | | | $ | 77.13 | | | $ | 67.42 | | | $ | 53.76 | |
Income from Investment Operations: | | | | | | | | | | | | | | | | | | | | |
Net investment income | | | 0.44 | 3 | | | 0.58 | 3 | | | 0.76 | 3 | | | 0.47 | | | | 0.69 | |
Net realized and unrealized gain (loss) on investments | | | 1.77 | 3 | | | 11.84 | 3 | | | (38.52 | )3 | | | 9.60 | | | | 14.15 | |
Total from investment operations | | | 2.21 | | | | 12.42 | | | | (37.76 | ) | | | 10.07 | | | | 14.84 | |
Less Distributions to Shareholders from: | | | | | | | | | | | | | | | | | | | | |
Net investment income | | | (0.48 | ) | | | (0.35 | ) | | | (0.18 | ) | | | (0.36 | ) | | | (1.18 | ) |
Net Asset Value, End of Year | | $ | 52.99 | | | $ | 51.26 | | | $ | 39.19 | | | $ | 77.13 | | | $ | 67.42 | |
Total Return1 | | | 4.33 | %4 | | | 31.68 | % | | | (48.92 | )% | | | 14.94 | %4 | | | 27.63 | % |
Ratio of net expenses to average net assets | | | 1.44 | % | | | 1.48 | % | | | 1.48 | % | | | 1.48 | % | | | 1.45 | % |
Ratio of net investment income to average net assets1 | | | 0.89 | % | | | 1.34 | % | | | 1.24 | % | | | 0.60 | % | | | 0.70 | % |
Portfolio turnover | | | 58 | % | | | 128 | % | | | 142 | % | | | 98 | % | | | 70 | % |
Net assets at end of year (000’s omitted) | | $ | 109,350 | | | $ | 126,795 | | | $ | 127,984 | | | $ | 302,025 | | | $ | 230,916 | |
| | | | | | | | | | | | | | | | | | | | |
Ratios absent expense offsets:2 | | | | | | | | | | | | | | | | | | | | |
Ratio of total expenses to average net assets | | | 1.70 | % | | | 1.73 | % | | | 1.64 | % | | | 1.61 | % | | | 1.47 | % |
Ratio of net investment income to average net assets | | | 0.63 | % | | | 1.09 | % | | | 1.08 | % | | | 0.46 | % | | | 0.68 | % |
| | | | | | | | | | | | | | | | | | | | |
| |
| | | For the year ended December 31, | |
Managers Emerging Markets Equity Fund | | 2010 | | | 2009 | | | 2008 | | | 2007 | | | 2006 | |
Net Asset Value, Beginning of Year | | $ | 13.54 | | | $ | 8.09 | | | $ | 26.80 | | | $ | 24.44 | | | $ | 20.10 | |
Income from Investment Operations: | | | | | | | | | | | | | | | | | | | | |
Net investment income | | | 0.04 | 3 | | | 0.03 | 3 | | | 0.15 | 3 | | | 0.04 | 3 | | | 0.22 | |
Net realized and unrealized gain (loss) on investments | | | 1.83 | 3 | | | 5.45 | 3 | | | (15.02 | )3 | | | 7.20 | 3 | | | 6.66 | |
Total from investment operations | | | 1.87 | | | | 5.48 | | | | (14.87 | ) | | | 7.24 | | | | 6.88 | |
Less Distributions to Shareholders from: | | | | | | | | | | | | | | | | | | | | |
Net investment income | | | (0.02 | ) | | | (0.03 | ) | | | (0.19 | ) | | | — | | | | (0.22 | ) |
Net realized gain on investments | | | — | | | | — | | | | (3.65 | ) | | | (4.88 | ) | | | (2.32 | ) |
Total distributions to shareholders | | | (0.02 | ) | | | (0.03 | ) | | | (3.84 | ) | | | (4.88 | ) | | | (2.54 | ) |
Net Asset Value, End of Year | | $ | 15.39 | | | $ | 13.54 | | | $ | 8.09 | | | $ | 26.80 | | | $ | 24.44 | |
Total Return1 | | | 13.84 | % | | | 67.94 | % | | | (54.87 | )%4 | | | 29.50 | %4 | | | 34.50 | % |
Ratio of net expenses to average net assets | | | 1.76 | % | | | 1.77 | %5 | | | 1.77 | %5 | | | 1.78 | % | | | 1.76 | % |
Ratio of net investment income to average net assets1 | | | 0.29 | % | | | 0.32 | %5 | | | 0.76 | %5 | | | 0.13 | % | | | 0.89 | % |
Portfolio turnover | | | 69 | % | | | 103 | % | | | 49 | % | | | 62 | % | | | 41 | % |
Net assets at end of year (000’s omitted) | | $ | 74,475 | | | $ | 96,288 | | | $ | 60,355 | | | $ | 198,235 | | | $ | 152,983 | |
| | | | | | | | | | | | | | | | | | | | |
Ratios absent expense offsets:2 | | | | | | | | | | | | | | | | | | | | |
Ratio of total expenses to average net assets | | | 2.07 | % | | | 2.13 | % | | | 2.03 | % | | | 1.93 | % | | | 1.76 | % |
Ratio of net investment income (loss) to average net assets | | | (0.02 | )% | | | (0.04 | )% | | | 0.50 | % | | | (0.02 | )% | | | 0.89 | % |
| | | | | | | | | | | | | | | | | | | | |
36
Financial Highlights
For a share outstanding throughout each year
| | | | | | | | | | | | | | | | | | | | |
| | | For the year ended December 31, | |
Managers Global Bond Fund | | 2010 | | | 2009 | | | 2008 | | | 2007 | | | 2006 | |
Net Asset Value, Beginning of Year | | $ | 18.82 | | | $ | 16.93 | | | $ | 21.31 | | | $ | 21.17 | | | $ | 20.19 | |
Income from Investment Operations: | | | | | | | | | | | | | | | | | | | | |
Net investment income | | | 0.50 | 3 | | | 0.89 | 3 | | | 0.76 | 3 | | | 0.70 | 3 | | | 0.45 | |
Net realized and unrealized gain (loss) on investments | | | 0.87 | 3 | | | 3.22 | 3 | | | (2.93 | )3 | | | 0.88 | 3 | | | 1.05 | |
Total from investment operations | | | 1.37 | | | | 4.11 | | | | (2.17 | ) | | | 1.58 | | | | 1.50 | |
Less Distributions to Shareholders from: | | | | | | | | | | | | | | | | | | | | |
Net investment income | | | (0.86 | ) | | | (2.22 | ) | | | (2.18 | ) | | | (1.43 | ) | | | (0.49 | ) |
Net realized gain on investments | | | — | | | | — | | | | (0.03 | ) | | | (0.01 | ) | | | (0.03 | ) |
Total distributions to shareholders | | | (0.86 | ) | | | (2.22 | ) | | | (2.21 | ) | | | (1.44 | ) | | | (0.52 | ) |
Net Asset Value, End of Year | | $ | 19.33 | | | $ | 18.82 | | | $ | 16.93 | | | $ | 21.31 | | | $ | 21.17 | |
Total Return1 | | | 7.27 | % | | | 24.27 | %4 | | | (10.07 | )%4 | | | 7.52 | %4 | | | 7.36 | % |
Ratio of net expenses to average net assets | | | 1.10 | % | | | 1.10 | % | | | 1.10 | % | | | 1.19 | % | | | 1.19 | % |
Ratio of net investment income to average net assets1 | | | 2.57 | % | | | 4.82 | % | | | 3.62 | % | | | 3.25 | % | | | 2.86 | % |
Portfolio turnover | | | 131 | % | | | 102 | % | | | 56 | % | | | 152 | % | | | 56 | % |
Net assets at end of year (000’s omitted) | | $ | 25,722 | | | $ | 26,146 | | | $ | 47,735 | | | $ | 92,124 | | | $ | 53,670 | |
| | | | | | | | | | | | | | | | | | | | |
Ratios absent expense offsets:2 | | | | | | | | | | | | | | | | | | | | |
Ratio of total expenses to average net assets | | | 1.43 | % | | | 1.32 | % | | | 1.25 | % | | | 1.25 | % | | | 1.27 | % |
Ratio of net investment income to average net assets | | | 2.24 | % | | | 4.60 | % | | | 3.47 | % | | | 3.18 | % | | | 2.78 | % |
| | | | | | | | | | | | | | | | | | | | |
The following notes should be read in conjunction with the Financial Highlights of the Funds presented on this page and the preceding page.
| 1 | Total returns and net investment income would have been lower had certain expenses not been reduced. (See Note 1(c) to the Notes to Financial Statements.) |
| 2 | Excludes the impact of expense (reimbursement)/recoupment and expense reductions such as brokerage credits, but includes non-reimbursable expenses, if any, such as interest and taxes. (See Note 1(c) to the Notes to Financial Statements.) |
| 3 | Per share numbers have been calculated using average shares. |
| 4 | The Total Return is based on the Financial Statement Net Asset Values as shown above. |
| 5 | Excludes interest expense for the years ended December 31, 2009 and 2008, of 0.02% and 0.03%, respectively, for Emerging Markets Equity. (See Note 1(c) of Notes to Financial Statements.) |
37
Notes to Financial Statements
December 31, 2010
| 1. | Summary of Significant Accounting Policies |
The Managers Funds (the “Trust”) is an open-end management investment company organized as a Massachusetts business trust, and registered under the Investment Company Act of 1940, as amended (the “1940 Act”). Currently, the Trust is comprised of a number of different funds, each having distinct investment management objectives, strategies, risks, and policies. Included in this report are: Managers International Equity Fund (“International Equity”), Managers Emerging Markets Equity Fund (“Emerging Markets Equity”), and Managers Global Bond Fund (“Global Bond”), collectively the “Funds.”
The Funds’ financial statements are prepared in accordance with accounting principles generally accepted in the United States of America, which require management to make estimates and assumptions that affect the reported amounts of assets and liabilities and disclosure of contingent assets and liabilities at the date of the financial statements and the reported amounts of income and expenses during the reporting period. Actual results could differ from those estimates and such differences could be material. The following is a summary of significant accounting policies followed by the Funds in the preparation of their financial statements:
| a. | Valuation of Investments |
Equity securities traded on a domestic or international securities exchange are valued at the last quoted sale price, or, lacking any sales, at the last quoted bid price. Over-the-counter securities are valued at the Nasdaq Official Closing Price, if one is available. Lacking any sales, over-the-counter securities are valued at the last quoted bid price. The Funds’ investments are generally valued based on market quotations provided by third-party pricing services approved by the Board of Trustees of the Funds. Under certain circumstances, the value of certain Fund investments may be based on an evaluation of fair value, pursuant to procedures established by and under the general supervision of the Board of Trustees of the Trust. Each Fund may use the fair value of a portfolio security to calculate its NAV when, for example, (1) market quotations are not readily available because a portfolio security is not traded in a public market or the principal market in which the security trades is closed, (2) trading in a portfolio security is suspended and has not resumed before the Fund calculates its NAV, (3) a significant event affecting the value of a portfolio security is determined to have occurred between the time of the market quotation provided for a portfolio security and the time as of which the Fund calculates its NAV, (4) a security’s price has remained unchanged over a period of time (often referred to as a “stale price”), or (5) Managers Investment Group LLC (the “Investment Manager”) determines that a market quotation is inaccurate. Portfolio investments that trade primarily on foreign markets are priced based upon the market quotation of such securities as of the close of their respective principal markets,
as adjusted to reflect the Investment Manager’s determination of the impact of events occurring subsequent to the close of such markets but prior to the time as of which the Fund calculates its NAV. In accordance with procedures approved by the Board of Trustees, the Investment Manager relies upon recommendations of a third-party fair valuation service in adjusting the prices of such foreign portfolio investments. The Funds may invest in securities that may be thinly traded. The Board of Trustees has adopted procedures to adjust prices when thinly traded securities are judged to be stale so that they reflect fair value. An investment valued on the basis of its fair value may be valued at a price higher or lower than available market quotations. An investment’s valuation may differ depending on the method used and the factors considered in determining value according to the Fund’s fair value procedures.
Fixed-income securities are valued based on valuations furnished by independent pricing services that utilize matrix systems, which reflect such factors as security prices, yields, maturities, and ratings, and are supplemented by dealer and exchange quotations. Futures contracts for which market quotations are readily available are valued at the settlement price as of the close of the futures exchange. Short-term investments having a remaining maturity of 60 days or less are valued at amortized cost, which approximates market value. Investments in other open-end regulated investment companies are valued at their end of day net asset value per share except iShares or other ETF’s, which are valued the same as equity securities. Investments in certain mortgage-backed and stripped mortgage-backed securities, preferred stocks, convertible securities, derivatives and other debt securities not traded on an organized securities market are valued on the basis of valuations provided by dealers or by a pricing service which uses information with respect to transactions in such securities and various relationships between securities and yield to maturity in determining value. Securities (including derivatives) for which market quotations are not readily available are valued at fair value, as determined in good faith, and pursuant to procedures adopted by the Board of Trustees of the Trust. The values assigned to fair value investments are based on available information and do not necessarily represent amounts that might ultimately be realized, since such amounts depend on future developments inherent in long-term investments. Further, because of the inherent uncertainty of valuation, those estimated values may differ significantly from the values that would have been used had a ready market for the investments existed, and the differences could be material.
Generally Accepted Accounting Principles (GAAP) define fair value as the price that a Fund would receive to sell an asset or pay to transfer a liability in an orderly transaction between market participants at the measurement date. GAAP also establishes a framework for measuring fair value, and a three-level hierarchy
38
Notes to Financial Statements (continued)
for fair value measurements based upon the transparency of inputs to the valuation of an asset or liability. Inputs may be observable or unobservable and refer broadly to the assumptions that market participants would use in pricing the asset or liability. Observable inputs reflect the assumptions market participants would use in pricing the asset or liability based on market data obtained from sources independent of the Funds. Unobservable inputs reflect the Funds’ own assumptions about the assumptions that market participants would use in pricing the asset or liability developed based on the best information available in the circumstances. Each investment is assigned a level based upon the observability of the inputs which are significant to the overall valuation.
The three-tier hierarchy of inputs is summarized below:
Level 1 – inputs are quoted prices in active markets for identical investments (e.g., equity securities, open-end investment companies, futures contracts, options contracts) Level 2 – other observable inputs (including, but not limited to: quoted prices for similar assets or liabilities in markets that are active, quoted prices for identical or similar assets or liabilities in markets that are not active, inputs other than quoted prices that are observable for the assets or liabilities (such as interest rates, yield curves, volatilities, prepayment speeds, loss severities, credit risks and default rates) or other market corroborated inputs) (e.g., debt securities, government securities, swap contracts, foreign currency exchange contracts, foreign securities utilizing international fair value pricing, broker-quoted securities, fair valued securities with observable inputs)
Level 3 – inputs are significant unobservable inputs (including the Fund’s own assumptions used to determine the fair value of investments) (e.g., fair valued securities with unobservable inputs) The inputs or methodologies used for valuing investments are not necessarily an indication of the risk associated with investing in those investments.
Security transactions are accounted for as of trade date. Realized gains and losses on securities sold are determined on the basis of identified cost.
| c. | Investment Income and Expenses |
Dividend income is recorded on the ex-dividend date, except certain dividends from foreign securities where the ex-dividend date may have passed. These dividends are recorded as soon as the Trust is informed of the ex-dividend date. Dividend income on foreign
securities is recorded net of any withholding tax. Interest income, which includes amortization of premium and accretion of discount on debt securities, is accrued as earned. Non-cash dividends included in dividend income, if any, are reported at the fair market value of the securities received. Other income and expenses are recorded on an accrual basis. Expenses that cannot be directly attributed to a fund are apportioned among the Funds in the Trust and in some cases other affiliated funds based upon their relative average net assets or number of shareholders.
The following Funds had certain portfolio trades directed to various brokers, under a brokerage recapture program, which paid a portion of the Fund’s expenses. For the year ended December 31, 2010, under these arrangements the amount by which the Funds’ expenses were reduced and the impact on the expense ratios were as follows: International Equity – $421 or 0.0% and Emerging Markets Equity - $55 or 0.0%.
The Funds have a “balance credit” arrangement with The Bank of New York Mellon (“BNYM”), the Funds’ custodian, whereby each Fund is credited with an interest factor equal to 0.75% below the effective 90-day T-Bill rate for account balances left uninvested overnight. If the T-Bill rate falls below 0.75%, no credits will be earned. These credits serve to reduce custody expenses that would otherwise be charged to each Fund. For the year ended December 31, 2010, the custodian expense was not reduced.
Overdrafts will cause a reduction of any earnings credits, computed at 2% above the effective Federal funds rate on the day of the overdraft. For the year ended December 31, 2010, overdraft fees were as follows: International Equity – $0, Emerging Markets Equity – $91 and Global Bond Fund – $0.
The Trust also has a balance credit arrangement with its Transfer Agent, BNY Mellon Investment Servicing (US) Inc., (formerly PNC Global Investment Servicing (U.S.) Inc.), whereby earnings credits are used to offset banking charges and other out-of-pocket expenses. For the year ended December 31, 2010, the transfer agent expense was reduced as follows: International Equity - $164; Emerging Markets Equity – $130 and Global Bond – $37.
Total returns and net investment income for the Funds would have been lower had certain expenses not been offset. Total expenses before offsets exclude the impact of expense reimbursements or fee waivers and expense reductions such as brokerage recapture credits but include non-reimbursable expenses, if any, such as interest and taxes.
39
Notes to Financial Statements (continued)
| d. | Dividends and Distributions |
Dividends resulting from net investment income and distributions of capital gains, if any, will be made annually in December and when required for Federal excise tax purposes. Income and capital gain distributions are determined in accordance with Federal income tax regulations, which may differ from GAAP. These differences are
primarily due to differing treatments for losses deferred due to wash sales, equalization accounting for tax purposes, foreign currency, futures and market discount transactions. Permanent book and tax basis differences, if any, relating to shareholder distributions will result in reclassifications to paid-in capital. The tax character of distributions paid during the years ended December 31, 2010 and 2009 were as follows:
| | | | | | | | | | | | | | | | | | | | | | | | |
| | | International Equity | | | Emerging Markets Equity | | | Global Bond | |
| | | 2010 | | | 2009 | | | 2010 | | | 2009 | | | 2010 | | | 2009 | |
Distributions paid from: | | | | | �� | | | | | | | | | | | | | | | | | | | |
Ordinary income | | $ | 1,000,087 | | | $ | 850,021 | | | $ | 114,817 | | | $ | 209,563 | | | $ | 1,100,009 | | | $ | 2,806,038 | |
Short-term capital gains | | | — | | | | — | | | | — | | | | — | | | | — | | | | — | |
Long-term capital gains | | | — | | | | — | | | | — | | | | — | | | | — | | | | — | |
| | | | | | | | | | | | | | | | | | | | | | | | |
| | | 1,000,087 | | | $ | 850,021 | | | $ | 114,817 | | | $ | 209,563 | | | $ | 1,100,009 | | | $ | 2,806,038 | |
| | | | | | | | | | | | | | | | | | | | | | | | |
As a % of distributions paid: (unaudited) | | | | | | | | | | | | | | | | | | | | | | | | |
Qualified ordinary income | | | 100.00 | % | | | 100.00 | % | | | 100.00 | % | | | 100.00 | % | | | — | | | | — | |
Ordinary income - dividends received deduction | | | — | | | | — | | | | — | | | | — | | | | — | | | | — | |
| | | | | | | | | | | | | | | | | | | | | | | | |
As of December 31, 2010, the components of distributable earnings (excluding unrealized appreciation/depreciation) on a tax basis consisted of:
| | | | | | | | | | | | |
| | | International
Equity | | | Emerging
Markets Equity | | | Global
Bond | |
Capital loss carryforward | | $ | 67,870,413 | | | $ | 14,606,052 | | | $ | 4,136,365 | |
Undistributed ordinary income | | | 682,086 | | | | 437,548 | | | | 259,121 | |
Undistributed short-term capital gains | | | — | | | | — | | | | — | |
Undistributed long-term capital gains | | | — | | | | — | | | | — | |
Post-October loss deferral | | | — | | | | — | | | | — | |
40
Notes to Financial Statements (continued)
Each Fund intends to comply with the requirements under Subchapter M of the Internal Revenue Code of 1986, as amended, to distribute substantially all of their taxable income and gains to their shareholders and to meet certain diversification and income requirements with respect to investment companies. Therefore, no provision for Federal income or excise tax is included in the accompanying financial statements.
Additionally, based on each Fund’s understanding of the tax rules and rates related to income, gains and transactions for the foreign jurisdictions in which it invests, each Fund will provide for foreign taxes, and where appropriate, deferred foreign taxes.
Management has analyzed the Funds’ tax positions taken on federal income tax returns for all open tax years (tax years ended December 31, 2007-2010), and has concluded that no provision for federal income tax is required in the Funds’ financial statements. Additionally, the Funds are not aware of any tax position for which it is reasonably possible that the total amounts of unrecognized tax benefits will change materially in the next twelve months.
| f. | Capital Loss Carryovers |
As of December 31, 2010 the following Funds had accumulated net realized capital loss carryovers from securities transactions for Federal income tax purposes as shown in the following chart. These amounts may be used to offset realized capital gains, if any, through the expiration dates listed.
| | | | | | |
Fund | | Capital Loss
Carryover Amount | | | Expires December 31, |
International Equity | | $ | 16,170,119 | | | 2011 |
| | | 19,998,844 | | | 2016 |
| | | 26,006,476 | | | 2017 |
| | | 5,694,974 | | | 2018 |
| | | | | | |
Total | | $ | 67,870,413 | | | |
| | | | | | |
Emerging Markets | | $ | 14,606,052 | | | 2017 |
| | |
Global Bond * | | $ | 906,645 | | | 2016 |
| | | 2,196,208 | | | 2017 |
| | | 1,033,512 | | | 2018 |
| | | | | | |
Total | | $ | 4,136,365 | | | |
| | | | | | |
| * | The Fund’s ability to utilize capital loss carryforwards in the future may be limited under the Internal Revenue Code and related regulations based on results of share ownership activity. |
For the year ended December 31, 2010, International Equity, Emerging Markets Equity and Global Bond utilized $0, $12,180,338 and $0, respectively, of capital loss carryovers.
The Trust’s Declaration of Trust authorizes for each series the issuance of an unlimited number of shares of beneficial interest, without par value. Each Fund records sales and repurchases of its capital stock on the trade date. The cost of securities contributed to the Funds in connection with the issuance of shares is based on the valuation of those securities in accordance with the Funds’ policy on investment valuation. Dividends and distributions to shareholders are recorded on the ex-dividend date.
At December 31, 2010, certain unaffiliated shareholders of record, specifically omnibus accounts, individually or collectively held greater than 10% of the outstanding shares of the following Funds: International Equity – one owns 15%; Emerging Markets Equity – two collectively own 30% and Global Bond – two collectively own 23%. Transactions by these shareholders may have a material impact on the Funds.
| h. | Foreign Currency Translation |
The books and records of the Funds are maintained in U.S. dollars. The value of investments, assets and liabilities denominated in currencies other than U.S. dollars are translated into U.S. dollars based upon current foreign exchange rates. Purchases and sales of foreign investments, income and expenses are converted into U.S. dollars based on currency exchange rates prevailing on the respective dates of such transactions. Net realized and unrealized gain (loss) on foreign currency transactions represent: (1) foreign exchange gains and losses from the sale and holdings of foreign currencies; (2) gains and losses between trade date and settlement date on investment securities transactions and forward foreign currency exchange contracts; and (3) gains and losses from the difference between amounts of interest and dividends recorded and the amounts actually received.
The Funds do not isolate the net realized and unrealized gain or loss resulting from changes in exchange rates from the fluctuations in market prices of securities held. Such fluctuations are included with the net realized and unrealized gain or loss on investments.
| 2. | Agreements and Transactions with Affiliates |
For each of the Funds, the Trust has entered into an Investment Management Agreement under which the Investment Manager, an independently managed subsidiary of Affiliated Managers Group, Inc. (“AMG”), serves as investment manager to the Funds and is responsible for the Funds’ overall administration. The Investment Manager selects subadvisors for the Funds (subject to Trustee approval) and monitors each subadvisor’s investment programs and results. Each Fund’s investment portfolio is managed by one or more portfolio managers who serve pursuant to a Subadvisory Agreement with the Investment Manager.
Investment management fees are paid directly by the Funds to the Investment Manager based on average daily net assets. For the year ended December 31, 2010, the annual investment management fee rates, as a percentage of average daily net assets, were as follows: International Equity – 0.90%; Emerging Markets Equity – 1.15%; and Global Bond – 0.70%.
Notes to Financial Statements (continued)
The Trust has entered into an Administration and Shareholder Servicing Agreement under which the Investment Manager serves as each Fund’s administrator (the “Administrator”) and is responsible for all aspects of managing the Funds’ operations, including administration and shareholder services to each Fund, its shareholders, and certain institutions, such as bank trust departments, broker-dealers and registered investment advisers, that advise or act as an intermediary with the Funds’ shareholders. Under the terms of the Administration Agreement, each of the Funds, except Global Bond, pay a fee to the Administrator at the rate of 0.25% per annum of the Funds’ average daily net assets. Global Bond pays a fee to the Administrator at the rate of 0.20% per annum of the Fund’s average daily net assets.
At a meeting held on June 10-11, 2010, the Trust’s Board of Trustees approved a new contractual expense limitation with respect to International Equity and Emerging Markets Equity. Effective July 1, 2010, Managers has contractually agreed, until at least May 1, 2012, to limit total annual operating expenses (exclusive of taxes, interest, brokerage commissions, acquired fund fees and expenses, and extraordinary items) of International Equity and Emerging Markets Equity to 1.39% and 1.74%, respectively, of each Fund’s average daily net assets. Immediately prior to July 1, 2010, the Funds had contractual expense limitations of 1.48% and 1.77%, respectively.
The Investment Manager for Global Bond has contractually agreed, through at least April 1, 2011, subject to later reimbursement by the Fund in certain circumstances, that the total annual operating expenses (exclusive of taxes, interest, brokerage commissions, acquired fund fees and expenses, and extraordinary items) will be limited to 1.10% of the Fund’s average daily net assets.
Each Fund is obligated to repay the Investment Manager such amounts waived, paid or reimbursed in future years provided that the repayment occurs within thirty-six (36) months after the waiver or reimbursement occurs and that such repayment would not cause the Fund’s total operating expenses in any such future year to exceed that Fund’s respective expense cap. For the year ended December 31, 2010, each Fund’s components of reimbursement are detailed in the following chart:
| | | | | | | | |
| | | International
Equity | | | Emerging
Markets Equity | |
Reimbursement Available - 12/31/09 | | $ | 652,606 | | | $ | 653,953 | |
| | |
Additional Reimbursements | | | 299,805 | | | | 277,054 | |
| | |
Repayments | | | — | | | | — | |
| | |
Expired Reimbursements | | | — | | | | (66,902 | ) |
| | | | | | | | |
| | |
Reimbursement Available - 12/31/10 | | $ | 952,411 | | | $ | 864,105 | |
| | | | | | | | |
| | | | |
| | | Global Bond | |
Reimbursement Available - 12/31/09 | | $ | 91,406 | |
| |
Additional Reimbursements | | | 84,847 | |
| |
Repayments | | | — | |
| |
Expired Reimbursements | | | — | |
| | | | |
Reimbursement Available - 12/31/10 | | $ | 176,253 | |
| | | | |
The aggregate annual retainer paid to each Independent Trustee is $65,000, plus $4,000 or $2,500 for each regular or special meeting attended, respectively. The Trustees’ fees and expenses are allocated among all of the Funds for which the Investment Manager serves as the advisor (the “Managers Funds”) based on the relative net assets of such Funds. The Independent Chairman of the Trusts receives an additional payment of $15,000 per year. The Chairman of the Audit Committee receives an additional payment of $5,000 per year. The “Trustee fees and expenses” shown in the financial statements represents each Fund’s allocated portion of the total fees and expenses paid by the Managers Funds.
The Funds are distributed by Managers Distributors, Inc. (the “Distributor” or “MDI”), a wholly-owned subsidiary of the Investment Manager. MDI serves as the principal underwriter for each Fund and is a registered broker-dealer and member of the Financial Industry Regulatory Authority, Inc. (“FINRA”). Shares of each Fund will be continuously offered and will be sold by brokers, dealers or other financial intermediaries who have executed selling agreements with the Distributor. MDI bears all the expenses of providing services pursuant to the Underwriting Agreement, including the payment of the expenses relating to the distribution of Prospectuses for sales purposes and any advertising or sales literature. Certain Trustees and Officers of the Funds are Officers and/or Directors of the Investment Manager, AMG and/or the Distributor.
On June 23, 2009, the Securities and Exchange Commission granted an exemptive order that permits the Funds to lend and borrow money for certain temporary purposes directly to and from other eligible Funds in the Managers Family of Funds (the “Fund Family”). Participation in this interfund lending program is voluntary for both borrowing and lending Funds, and an interfund loan is only made if it benefits each participating Fund. The Investment Manager administers the program according to procedures approved by the Funds’ Board of Trustees (the “Board”), and the Board monitors the operation of the program. An interfund loan must comply with certain conditions set out in the exemptive order, which are designed to assure fairness and protect all participating Funds. For the year ended December 31, 2010, the following Funds either borrowed from or lent to other Funds in the Fund Family: International Equity lent varying amounts up to $506,524 for 7 days earning interest of $51; Emerging Markets Equity borrowed varying amounts up to $2,470,476 for 11 days paying interest of $360. The interest amounts are included in the Statement of Operations in interest income or as miscellaneous expense.
| 3. | Purchases and Sales of Securities |
Purchases and sales of securities (excluding short-term securities and U.S. Government obligations) for the year ended December 31, 2010, were as follows:
| | | | | | | | | | |
| | | Long-Term Securities | | U.S. Government Obligations | |
Fund | | Purchases | | Sales | | Purchases | | Sales | |
International Equity | | $62,583,242 | | $79,938,498 | | N/A | | | N/A | |
| | | | |
Emerging Markets Equity | | 58,846,013 | | 93,271,232 | | N/A | | | N/A | |
| | | | |
Global Bond | | 22,100,153 | | 20,358,839 | | $9,732,966 | | $ | 12,487,412 | |
Notes to Financial Statements (continued)
| 4. | Portfolio Securities Loaned |
For the year ended December 31, 2010, the Funds participated in a securities lending program offered by BNYM, providing for the lending of securities to qualified brokers. Securities lending fees include earnings of temporary cash investments, plus or minus any rebate to a borrower. These earnings (after any rebate) are then divided between BNYM, as a fee for its services under the program, and the Fund, according to agreed-upon rates. Collateral on all securities loaned is accepted in cash and/or government securities and is maintained at a minimum level of 102% (105% in the case of certain foreign securities) of the market value, plus interest, if applicable, of investments on loan. It is the Funds’ policy to obtain additional collateral from or return excess collateral to the borrower by the end of the next business day, following the valuation date of the securities loaned. Therefore, the value of the collateral held may be temporarily less than the value of the securities on loan. Lending securities entails a risk of loss to the Funds if and to the extent that the market value of the securities loaned were to increase and the borrower did not increase the collateral accordingly, and the borrower fails to return the securities. The Funds bear the risk of any deficiency in the amount of the collateral available for return to the borrower due to any loss on the collateral invested. Collateral received in the form of cash is invested temporarily in the BNY Mellon Overnight Government Fund, formerly the BNY Institutional Cash Reserves Fund (the “ICRF”), or other short-term investments as defined in the Securities Lending Agreement with BNYM.
Effective August 2, 2010, the Trust, on behalf of each applicable Fund, entered into an agreement with The Bank of New York Mellon and the Bank of New York Mellon Corporation (“BNYMC”) with respect to each Fund’s position in the ICRF, pursuant to which (i) BNYMC will support the value of certain defaulted securities issued by Lehman Brothers Holdings, Inc. and held by ICRF, and (ii) if certain conditions are met, BNYMC will purchase the defaulted securities from each Fund in September 2011. Each applicable Fund is fair valuing its position in the ICRF daily based on the agreement. Each Fund’s position in the separate sleeve of the ICRF is included in the Schedule of Portfolio Investments and the unrealized loss on such investment is included in Net Unrealized Appreciation on the Statement of Assets and Liabilities and the Statement of Operations.
| 5. | Commitments and Contingencies |
In the normal course of business, the Funds may enter into contracts and agreements that contain a variety of representations and warranties, which provide general indemnifications. The maximum exposure to the Funds under these arrangements is unknown, as this would involve future claims that may be made against a Fund that have not yet occurred. However, based on experience, the Funds expect the risks of loss to be remote.
Certain transactions, such as futures and forward transactions, dollar roll agreements, or purchases of when-issued or delayed delivery securities may have a similar effect on a Fund’s net asset value as if the Fund had created a degree of leverage in its portfolio. However, if a Fund enters into such a transaction, the Fund will establish a segregated account with its custodian in which it will maintain cash, U.S. government securities or other liquid securities equal in value to its obligations in respect to such transaction. Securities and other assets held in the segregated account may not be sold while the transaction is outstanding, unless other suitable assets are substituted.
The following disclosures contain information on how and why the Funds use derivative instruments, the credit risk and how derivative instruments affect the Funds’ financial position, results of operations and cash flows. The location and fair value amounts of these instruments on the Statement of Assets and Liabilities and the realized and changes in unrealized gains and losses on the Statement of Operations, each categorized by type of derivative contract, are included in a table in the Notes to Schedules of Portfolio Investments. The derivative instruments outstanding as of year end as disclosed in the Statement of Assets and Liabilities and the realized and changes in unrealized gains and losses on derivative instruments during the period as disclosed in the Statement of Operations serve as indicators of the volume of derivative activity for the Funds.
| a. | Forward Foreign Currency Contracts |
During the year ended December 31, 2010, International Equity and Global Bond entered into forward foreign currency exchange contracts to facilitate transactions in foreign securities and to hedge against foreign currency exchange rate risk on its non-U.S. dollar denominated investment securities.
A forward foreign currency exchange contract is an agreement between a Fund and another party to buy or sell a currency at a set price at a future date. The market value of the contract will fluctuate with changes in currency exchange rates. The contract is marked-to-market daily, and the change in market value is recorded as an unrealized gain or loss. Gain or loss on the purchase or sale of contracts having the same settlement date, amount and counterparty is realized on the date of offset, otherwise gain or loss is realized on the settlement date.
Risks may arise upon entering into these contracts from the potential inability of counterparties to meet the terms of their contracts and from unanticipated movements in the value of a foreign currency relative to the U.S. dollar.
Notes to Financial Statements (continued)
International Equity and Global Bond entered into futures contracts, including futures contracts on global equity and fixed-income securities, interest rate futures contracts, foreign currency futures contracts and futures contracts on security indices (including broad-based security indices). The Funds purchased or sold futures contracts to achieve a desired level of investment, whether to accommodate portfolio turnover or cash flows from capital shares transactions. There are certain risks associated with futures contracts. Prices may not move as expected or a Fund may not be able to close out the contract when it desires to do so, resulting in losses.
On entering into a futures contract, either cash or securities in an amount equal to a certain percentage of the contract value (initial margin) must be deposited with the futures broker. Subsequent payments (variation margin) are made or received each day. The variation margin payments equal the daily changes in the contract value and are recorded as unrealized gains or losses. The Funds recognize a realized gain or loss when the contract is closed or expires equal to the difference between the value of the contract at the time it was opened and the value at the time it was closed. Futures are valued at their quoted daily settlement prices. The aggregate principal amounts of the contracts are not recorded in the financial statements. Fluctuations in the value of the contracts are recorded in the Statement of Assets and Liabilities as an asset (liability) and in the Statement of Operations as unrealized appreciation (depreciation) until the contracts are closed, when they are recorded as realized gains (losses) on futures or forward currency contracts.
The Funds have determined that no material events or transactions occurred through the issuance date of the Funds’ financial statements which require additional disclosure in or adjustment of the Funds’ financial statements.
On February 15, 2011, International Equity Fund received a class action settlement from the Parmalat Securities Litigation Settlement in the amount of $214,556, or $0.12 per share.
| Tax | Information (unaudited) |
Each Fund hereby designates the maximum amount allowable of its net taxable income as qualified dividends as provided in the Jobs and Growth Tax Relief Reconciliation Act of 2003. The 2010 Form 1099-DIV you receive for each Fund will show the tax status of all distributions paid to you during the respective calendar year.
In accordance with federal tax law, the following Funds elect to provide foreign taxes paid and the income sourced from foreign countries. Accordingly, each Fund hereby makes the following designations regarding its year ended December 31, 2010:
| | • | | The total amount of taxes paid and income sourced from foreign countries was $219,941 and $1,175,849, respectively. |
| | • | | The total amount of taxes paid and income sourced from foreign countries was $214,663 and $467,179, respectively. |
Pursuant to section 852 of the Internal Revenue Code, International Equity, Emerging Markets Equity, and Global Bond hereby designate as a capital gain distribution with respect to the taxable year ended December 31, 2010, $0, $0, and $0, respectively, or, if subsequently determined to be different, the net capital gains of such year.
44
Report of Independent Registered Public Accounting Firm
To the Board of Trustees of The Managers Funds and the Shareholders of Managers International Equity Fund, Managers Emerging Markets Equity Fund and Managers Global Bond Fund:
In our opinion, the accompanying statements of assets and liabilities, including the schedules of portfolio investments, and the related statements of operations and of changes in net assets and the financial highlights present fairly, in all material respects, the financial position of Managers International Equity Fund, Managers Emerging Markets Equity Fund and Managers Global Bond Fund (three of the series constituting The Managers Funds, hereafter referred to as the “Funds”) at December 31, 2010, the results of each of their operations for the year then ended, the changes in each of their net assets for each of the two years in the period then ended and the financial highlights for each of the five years in the period then ended, in conformity with accounting principles generally accepted in the United States of America. These financial statements and financial highlights (hereafter referred to as “financial statements”) are the responsibility of the Funds’ management; our responsibility is to express an opinion on these financial statements based on our audits. We conducted our audits of these financial statements in accordance with the standards of the Public Company Accounting Oversight Board (United States). Those standards require that we plan and perform the audit to obtain reasonable assurance about whether the financial statements are free of material misstatement. An audit includes examining, on a test basis, evidence supporting the amounts and disclosures in the financial statements, assessing the accounting principles used and significant estimates made by management, and evaluating the overall financial statement presentation. We believe that our audits, which included confirmation of securities at December 31, 2010 by correspondence with the custodian, provide a reasonable basis for our opinion.
PricewaterhouseCoopers LLP
Philadelphia, Pennsylvania
February 24, 2011
45
Trustees and Officers
The Trustees and Officers of the Trust, their business addresses, principal occupations for the past five years and dates of birth are listed below. The Trustees provide broad supervision over the affairs of the Trust and the Funds. The Trustees are experienced executives who meet periodically throughout the year to oversee the Funds’ activities, review contractual arrangements with companies that provide services to the Funds, and review the Funds’ performance. Unless otherwise noted, the address of each Trustee or Officer is the address of the Trust: 800 Connecticut Avenue, Norwalk, Connecticut 06854.
There is no stated term of office for Trustees. Trustees serve until their resignation, retirement or removal in accordance with the Trust’s organizational documents and policies adopted by the Board from time to time. The Chairman of the Trustees, President, Treasurer and Secretary of the Trust are elected by the Trustees annually. Other officers hold office at the pleasure of the Trustees.
Independent Trustees
The following Trustees are not “interested persons” of the Trust within the meaning of the 1940 Act:
| | |
Name, Date of Birth, Number
of Funds Overseen in Fund
Complex* | | Principal Occupation(s) During Past 5 Years and Other Directorships Held by Trustee |
Jack W. Aber, 9/9/37 • Trustee since 1999 • Oversees 41 Funds in Fund Complex | | Professor of Finance, Boston University School of Management (1972-Present); Trustee of Appleton Growth Fund (1 portfolio); Trustee of Third Avenue Trust (5 portfolios); Trustee of Third Avenue Variable Trust (1 portfolio); Trustee of Aston Funds (24 portfolios). |
| |
William E. Chapman, II, 9/23/41 • Independent Chairman • Trustee since 1999 • Oversees 41 Funds in Fund Complex | | President and Owner, Longboat Retirement Planning Solutions (1998-Present); Hewitt Associates, LLC (part time) (provider of Retirement and Investment Education Seminars) (2002-2009); Trustee of Bowdoin College (2002-Present);Director of Harding, Loevner Funds, Inc. (6 portfolios); Trustee of Third Avenue Trust (5 portfolios); Trustee of Third Avenue Variable Trust (1 portfolio); Trustee of Aston Funds (24 portfolios). |
| |
Edward J. Kaier, 9/23/45 • Trustee since 1999 • Oversees 41 Funds in Fund Complex | | Attorney at Law and Partner, Teeters Harvey Gilboy & Kaier LLP (2007-Present); Attorney at Law and Partner, Hepburn Willcox Hamilton & Putnam, LLP (1977-2007); Trustee of Third Avenue Trust (5 portfolios); Trustee of Third Avenue Variable Trust (1 portfolio); Trustee of Aston Funds (24 portfolios). |
| |
Steven J. Paggioli, 4/3/50 • Trustee since 1993 • Oversees 41 Funds in Fund Complex | | Consultant (2001-Present); Formerly Executive Vice President and Director, The Wadsworth Group (1986- 2001); Executive Vice President, Secretary and Director, Investment Company Administration, LLC (1990-2001); Vice President, Secretary and Director, First Fund Distributors, Inc. (1991-2001); Trustee, Professionally Managed Portfolios (40 portfolios); Advisory Board Member, Sustainable Growth Advisors, LP; Independent Director, Chase Investment Counsel (2008 – Present); Trustee of Aston Funds (24 portfolios). |
| |
Eric Rakowski, 6/5/58 • Trustee since 1999 • Oversees 41 Funds in Fund Complex | | Professor, University of California at Berkeley School of Law (1990-Present); Director of Harding, Loevner Funds, Inc. (6 portfolios); Trustee of Third Avenue Trust (5 portfolios); Trustee of Third Avenue Variable Trust (1 portfolio); Trustee of Aston Funds (24 portfolios). |
| |
Thomas R. Schneeweis, 5/10/47 • Trustee since 1987 • Oversees 41 Funds in Fund Complex | | Professor of Finance, University of Massachusetts (1977-Present); Director, CISDM at the University of Massachusetts, (1996-Present); President, Alternative Investment Analytics, LLC, (formerly Schneeweis Partners, LLC) (2001-Present); Partner, S Capital Management, LLC (2007-Present); Partner, TRS Associates (1982-Present); Trustee of Aston Funds (24 portfolios). |
| * | The Fund Complex consists of Managers AMG Funds, The Managers Funds, Managers Trust I and Managers Trust II. |
Interested Trustees
The following Trustees are “interested persons” of the Trust within the meaning of the 1940 Act. Mr. Dalton is an interested person by virtue of his positions with, and interest in securities of, Affiliated Managers Group, Inc. and his position with Managers Distributors, Inc. Mr. Streur is an interested person by virtue of his positions with Managers Investment Group LLC.
| | |
Name, Date of Birth, Number
of Funds Overseen in Fund
Complex* | | Principal Occupation(s) During Past 5 Years and Other Directorships Held by Trustee |
Nathaniel Dalton, 9/29/66 • Trustee since 2008 • Oversees 41 Funds in Fund Complex | | Executive Vice President and Chief Operating Officer, Affliated Managers Group, Inc., (2006-Present); Executive Vice President, Affiliated Managers Group, Inc., (2002 -2006); Executive Vice President and General Counsel, Affiliated Managers Group, Inc. (2001-2002); Senior Vice President and General Counsel, Affiliated Managers Group, Inc. (1996-2001). Director, Managers Distributors, Inc. (2000-Present). |
| |
John H. Streur, 2/6/60 • Trustee since 2008 • President since 2008 • Oversees 41 Funds in Fund Complex | | Senior Managing Partner, Managers Investment Group LLC (2006-Present); President, Managers Distributors, Inc. (2006-Present); Managing Partner, Managers Investment Group LLC (2005-2006); Chief Executive Officer, President and Chief Operating Officer, The Burridge Group LLC (1996-2004). |
| |
| Officers | | |
| |
Name, Date of Birth, Position(s) Held with Fund and Length of Time Served | | Principal Occupation(s) During Past 5 Years |
Christine C. Carsman, 4/2/52 • Secretary since 2004 • Chief Legal Officer since 2004 | | Senior Vice President and Chief Regulatory Counsel, Affiliated Managers Group, Inc. (2004-Present); Secretary, Managers AMG Funds, Managers Trust I and Managers Trust II (2004-Present); Senior Counsel, Vice President and Director of Operational Risk Management and Compliance, Wellington Management Company, LLP (1995-2004); Deputy General Counsel, The Boston Company, Inc. (1993-1995); Associate General Counsel, The Boston Company Advisors, Inc. (1991-1993); Associate, Sullivan & Worcester LLP (1987-1991). |
| |
Donald S. Rumery, 5/29/58 • Chief Financial Officer since 2007 • Treasurer since 1995 | | Senior Vice President, Managers Investment Group LLC (2005-Present); Treasurer and Chief Financial Officer, Managers Distributors, Inc. (2000-Present); Treasurer, Managers AMG Funds (1999-Present); Treasurer, Managers Trust I and Managers Trust II (2000-Present); Chief Financial Officer, Managers AMG Funds, Managers Trust I and Managers Trust II (2007-Present); Vice President, The Managers Funds LLC, (1994-2004). |
| |
Keitha L. Kinne, 5/16/58 • Chief Operating Officer since 2007 | | Managing Partner and Chief Operating Officer, Managers Investment Group LLC (2007-Present); Chief Investment Officer, Managers Investment Group LLC (2008-Present); Chief Operating Officer, Managers AMG Funds, Managers Trust I and Managers Trust II (2007-Present); Managing Director, Legg Mason & Co., LLC (2006-2007); Managing Director, Citigroup Asset Management (2004-2006). |
| |
David Kurzweil, 6/22/74 • Assistant Secretary since 2008 | | Senior Vice President and Associate Counsel, Managers Investment Group LLC (2008-Present); Assistant Secretary, Managers AMG Funds, Managers Trust I and Managers Trust II (2008-Present); Counsel and Senior Vice President, Lazard Asset Management LLC (2003-2008). |
| |
John J. Ferencz, 3/09/62 • Chief Compliance Officer • Code of Ethics Reporting Officer • AML Compliance Officer • Sarbanes-Oxley Code of Ethics Compliance Officer since 2010 | | Vice President, Legal and Compliance, Managers Investment Group LLC (2010-Present); Senior Compliance Analyst, Mutual Funds and Regulatory, GE Asset Management Incorporated (2005-2010). |
46
THIS PAGE INTENTIONALLY LEFT BLANK
Investment Manager and Administrator
Managers Investment Group LLC
333 W. Wacker Drive
Suite 1200
Chicago, IL 60606
(800) 835-3879
Distributor
Managers Distributors, Inc.
333 W. Wacker Drive
Suite 1200
Chicago, IL 60606
(800) 835-3879
Custodian
The Bank of New York Mellon
2 Hanson Place
Brooklyn, New York 11217
Legal Counsel
Ropes & Gray LLP
Prudential Tower, 800 Boylston Street
Boston, Massachusetts 02199-3600
Transfer Agent
BNY Mellon Investment Servicing (US) Inc.*
Attn: Managers
P.O. Box 9769
Providence, Rhode Island 02940
(800) 548-4539
For Managers Choice Only
Managers
c/o BNY Mellon Investment Servicing (US) Inc.*
P.O. Box 9847
Providence, Rhode Island 02940-8047
(800) 358-7668
| * | Formerly PNC Global Investment Servicing (U.S.) Inc. |

MANAGERSAND MANAGERS AMG FUNDS
| | | | |
EQUITY FUNDS | | BALANCED FUNDS |
CADENCE CAPITAL APPRECIATION CADENCE FOCUSED GROWTH CADENCE MID-CAP CADENCE EMERGING COMPANIES Cadence Capital Management, LLC CHICAGO EQUITY PARTNERS MID-CAP Chicago Equity Partners, LLC EMERGING MARKETS EQUITY Rexiter Capital Management Limited Schroder Investment Management North America Inc. ESSEX SMALL/MICRO CAP GROWTH Essex Investment Management Co., LLC FQ TAX-MANAGED U.S. EQUITY FQ U.S. EQUITY First Quadrant, L.P. FRONTIER SMALL CAP GROWTH Frontier Capital Management Company, LLC GW&K SMALL CAP EQUITY Gannett Welsh & Kotler, LLC INSTITUTIONAL MICRO-CAP MICRO-CAP Lord, Abbett & Co. LLC WEDGE Capital Management L.L.P. Next Century Growth Investors LLC RBC Global Asset Management (U.S.) Inc. | | INTERNATIONAL EQUITY AllianceBernstein L.P. Lazard Asset Management, LLC Martin Currie Inc. REAL ESTATE SECURITIES Urdang Securities Management, Inc. RENAISSANCE LARGE CAP GROWTH Renaissance Group LLC SKYLINE SPECIAL EQUITIES PORTFOLIO Skyline Asset Management, L.P. SPECIAL EQUITY Ranger Investment Management, L.P. Lord, Abbett & Co. LLC Smith Asset Management Group, L.P. Federated MDTA LLC SYSTEMATIC VALUE SYSTEMATIC MID CAP VALUE Systematic Financial Management, L.P. TIMESSQUARE MID CAP GROWTH TIMESSQUARE SMALL CAP GROWTH TSCM GROWTH EQUITY TimesSquare Capital Management, LLC TRILOGY GLOBAL EQUITY TRILOGY EMERGING MARKETS EQUITY TRILOGY INTERNATIONAL SMALL CAP Trilogy Global Advisors, L.P. | | CHICAGO EQUITY PARTNERS BALANCED Chicago Equity Partners, LLC ALTERNATIVE FUNDS FQ GLOBAL ALTERNATIVES FQ GLOBAL ESSENTIALS First Quadrant, L.P. INCOME FUNDS BOND (MANAGERS) FIXED INCOME GLOBAL BOND Loomis, Sayles & Co., L.P. BOND (MANAGERS PIMCO) Pacific Investment Management Co. LLC CALIFORNIA INTERMEDIATE TAX-FREE Miller Tabak Asset Management LLC GW&K MUNICIPAL BOND GW&K MUNICIPAL ENHANCED YIELD Gannett Welsh & Kotler, LLC HIGH YIELD J.P. Morgan Investment Management LLC INTERMEDIATE DURATION GOVERNMENT SHORT DURATION GOVERNMENT Smith Breeden Associates, Inc. |
| | |
| | |
| | |
| | |
| | |
| | |
| | |
| | |
| | |
| | |
| | |
| | |
| | |
| | |
| | |
| | |
| | |
| | |
| | |
| | |
| | |
| | |
| | |
| | |
| | |
| | |
| | |
| | |
| | |
| | |
| | |
| | |
| | |
| | | | |
This report is prepared for the Funds’ shareholders. It is authorized for distribution to prospective investors only when preceded or accompanied by an effective prospectus. To receive a free copy of the prospectus or Statement of Additional Information, which includes additional information about Fund Trustees, please contact us by calling 800.835.3879. Distributed by Managers Distributors, Inc., member FINRA. A description of the policies and procedures each Fund uses to vote its proxies is available: (i) without charge, upon request, by calling 800.835.3879, or (ii) on the Securities and Exchange Commission’s (SEC) Web site at www. sec.gov. For information regarding each Fund’s proxy voting record for the 12-month period ended June 30, call 800.835.3879 or visit the SEC Web site at www.sec.gov. The Funds file their complete schedule of portfolio holdings with the SEC for the first and third quarters of each fiscal year on Form N-Q. The Funds’ Forms N-Q are available on the SEC’s website at www.sec.gov. A Fund’s Forms N-Q may be reviewed and copied at the SEC’s Public Reference Room in Washington, DC. Information on the operation of the Public Reference Room may be obtained by calling 800.SEC.0330. To review a complete list of the Funds’ portfolio holdings, or to view the most recent quarterly holdings report, semiannual report, or annual report, please visit www.managersinvest.com. | |  |
www.managersinvest.com

ANNUAL REPOR T
Managers Funds
December 31, 2010
Managers Special Equity Fund
Managers
INVESTMENTGROUP
AR003-1210
AR003-1210
Managers Special Equity Fund
Annual Report — December 31, 2010
| | | | |
| TABLE OF CONTENTS | | Page | |
| |
LETTER TO SHAREHOLDERS | | | 1 | |
| |
ABOUT YOUR FUND’S EXPENSES | | | 3 | |
| |
INVESTMENT MANAGER’S COMMENTS, FUND SNAPSHOTS, AND SCHEDULE OF PORTFOLIO INVESTMENTS | | | 4 | |
| |
FINANCIAL STATEMENTS: | | | | |
| |
Statement of Assets and Liabilities | | | 13 | |
| |
Fund’s balance sheet, net asset value (NAV) per share computation and cumulative undistributed amounts | | | | |
| |
Statement of Operations | | | 14 | |
| |
Detail of sources of income, Fund expenses, and realized and unrealized gains (losses) during the year | | | | |
| |
Statement of Changes in Net Assets | | | 15 | |
| |
Detail of changes in Fund assets for the past two years | | | | |
| |
FINANCIAL HIGHLIGHTS | | | 16 | |
| |
Historical net asset values per share, distributions, total returns, expense ratios, turnover ratios and net assets | | | | |
| |
NOTES TO FINANCIAL STATEMENTS | | | 17 | |
| |
Accounting and distribution policies, details of agreements and transactions with Fund management and affiliates, and descriptions of certain investment risks | | | | |
| |
REPORT OF INDEPENDENT REGISTERED PUBLIC ACCOUNTING FIRM | | | 22 | |
| |
TRUSTEES AND OFFICERS | | | 23 | |
Nothing contained herein is to be considered an offer, sale or solicitation of an offer to buy shares of any series of the Managers Family of Funds. Such offering is made only by Prospectus, which includes details as to offering price and other material information.
Letter to Shareholders
Dear Shareholder:
Our foremost goal at Managers Investment Group (“MIG”) is to structure and manage mutual funds that will help our shareholders and clients successfully reach their investment goals and objectives.
Each of our Funds is geared to provide you with exposure to a specific asset class or style of investing. We believe investors tend to use our Funds as part of their broader portfolio in order to tailor their asset allocation to meet their individual needs. Most of our Funds, like the Fund detailed in this report, are therefore designed to be building blocks.
At MIG, we have overall responsibility for the investment management and administration of the Funds. As a “manager of managers,” we work with external investment managers that make the day-to-day investment decisions in the Funds (the “Portfolio Managers”). We devote considerable resources to our disciplined process of identifying and selecting Portfolio Managers for the Funds. As a manager of managers, MIG performs many activities to monitor the ongoing investment, compliance, and administrative aspects of all of the Funds, which we believe gives our shareholders added confidence in their investments.
The prior year has been characterized by two periods. The first portion of the year, the period ended mid-way through the third quarter, was dominated by macroeconomic news and risk caution by investors. The second portion of the year, the period since August, was characterized by a return to risk seeking by investors and, importantly, a return to fundamentals when it came to investing in stocks. The risk-seeking aspect of the market rally during the latter portion of the year was particularly beneficial to small-capitalization equities, as small-capitalization stocks outperformed their large-capitalization counterparts. Meanwhile, growth outperformed value as investors were willing to pay a premium for growth companies that have the ability to maintain their growth over a secular timeframe. As we enter into 2011, we are encouraged to see the market begin to focus less on macroeconomic news and instead, increasingly reward companies with strong balance sheets that are generating positive earnings surprises relative to market expectations. That certainly was not the case during the initial portion of the equity rally that started back in March 2010. However, since the small-capitalization Portfolio Managers that make up our Managers Special Equity Fund maintain a focus on finding high-quality companies that have the ability to sustain growth while surprising the market, we’re encouraged by this recent turn of events.
For the year ended December 31, 2010, the Managers Special Equity Fund (Managers Class) returned 33.11%, compared to 29.09% for the Russell 2000® Growth Index. Particularly encouraging was that three of our four managers contributed with positive outperformance during the year, with the fourth only modestly underperforming. Both positioning and solid stock selection contributed to the outperformance. On the positioning side, the Fund benefited from underweights to areas of the market that failed to keep up with the broader market rally, including underweights to the consumer staples, health care, and telecomm services sectors. As far as stock selection, the best gains were achieved in two areas, consumer discretionary and information technology, where our managers have their largest absolute weightings in the portfolio. Looking ahead, our managers continue to find opportunity in these more cyclically oriented areas of the market and are positioned to benefit from a recovery that continues to charge forward into 2011.
| | | | | | | | | | | | | | | | | | | | | | | | | | | | |
Periods Ended 12/31/10 | | 6 Months | | | 1 Year | | | 3 Years | | | 5 Years | | | 10 Years | | | Since
Inception | | | Inception Date | |
Managers Special Equity Fund | | | | | | | | | | | | | | | | | | | | | | | | | | | | |
Managers Class | | | 36.38 | % | | | 33.11 | % | | | (0.54 | )% | | | 1.70 | % | | | 2.91 | % | | | 11.23 | % | | | 06/01/1984 | |
Institutional Class | | | 36.54 | % | | | 33.41 | % | | | (0.32 | )% | | | 1.93 | % | | | — | | | | 4.21 | % | | | 05/03/2004 | |
Russell 2000® Growth Index | | | 32.14 | % | | | 29.09 | % | | | 2.18 | % | | | 5.30 | % | | | 3.78 | % | | | | | | | | |
1
Letter to Shareholders (continued)
The following report covers the year ended December 31, 2010. Should you have any questions about this report, or if you’d like to receive a prospectus and additional information, including fees and expenses for these or any of the other Funds in our family, please feel free to contact us at 1-800-835-3879, or visit our Web site at www.managersinvest.com. As always, please read the prospectus carefully before you invest or send money.
If you are curious about how you can better diversify your investment program, visit the Knowledge Center on our Web site and view our articles in the investment strategies section. You can rest assured that under all market conditions our team is focused on delivering excellent investment management services for your benefit.
We thank you for your continued confidence and investment in The Managers Funds.
Respectfully,

John H. Streur
Senior Managing Partner
Managers Investment Group LLC
2
About Your Fund’s Expenses
As a shareholder of a Fund, you may incur two types of costs: (1) transaction costs, which may include sales charges (loads) on purchase payments; redemption fees; and exchange fees; and (2) ongoing costs, including management fees; distribution (12b-1) fees; and other Fund expenses. This example is intended to help you understand your ongoing costs (in dollars) of investing in the Fund and to compare these costs with the ongoing costs of investing in other mutual funds. The example is based on $1,000 invested at the beginning of the period and held for the entire period as indicated below.
Actual Expenses
The first line of the following table provides information about the actual account values and actual expenses. You may use the information in this line, together with the amount you invested, to estimate the expenses that you paid over the period. Simply divide your account value by $1,000 (for example, an $8,600 account value divided by $1,000 = 8.6), then multiply the result by the number in the first line under the heading entitled “Expenses Paid During Period” to estimate the expenses you paid on your account during this period.
Hypothetical Example for Comparison Purposes
The second line of the following table provides information about hypothetical account values and hypothetical expenses based on the Fund’s actual expense ratio and an assumed annual rate of return of 5% before expenses, which is not the Fund’s actual return. The hypothetical account values and expenses may not be used to estimate the actual ending account balance or expenses you paid for the period. You may use this information to compare the ongoing costs of investing in the Fund and other funds by comparing this 5% hypothetical example with the 5% hypothetical examples that appear in the shareholder reports of other funds.
Please note that the expenses shown in the table are meant to highlight your ongoing costs only and do not reflect any transactional costs, such as sales charges (loads), redemption fees, or exchange fees. Therefore, the second line of the table is useful in comparing ongoing costs only, and will not help you determine the relative total costs of owning different funds.
| | | | | | | | | | | | | | | | |
Six Months Ended
December 31, 2010 | | Expense
Ratio for the
Period | | | Beginning
Account Value
07/01/2010 | | | Ending
Account Value
12/31/2010 | | | Expenses
Paid During
the Period* | |
Managers Special Equity
Fund - Managers Class | | | | | | | | | | | | | |
Based on Actual Fund Return | | | 1.46 | % | | $ | 1,000 | | | $ | 1,364 | | | $ | 8.70 | |
Based on Hypothetical 5% Annual Return | | | 1.46 | % | | $ | 1,000 | | | $ | 1,018 | | | $ | 7.43 | |
| | | | |
Managers Special Equity Fund - Institutional Class | | | | | | | | | | | | | | | | |
Based on Actual Fund Return | | | 1.19 | % | | $ | 1,000 | | | $ | 1,365 | | | $ | 7.09 | |
Based on Hypothetical 5% Annual Return | | | 1.19 | % | | $ | 1,000 | | | $ | 1,019 | | | $ | 6.06 | |
| * | Expenses are equal to the Fund’s annualized expense ratio multiplied by the average account value over the period, multiplied by the number of days in the most recent fiscal half-year (184), then divided by 365. |
3
Managers Special Equity Fund
Investment Manager’s Comments
The Managers Special Equity Fund’s (the “Fund”) investment objective is to achieve long-term capital appreciation through a diversified portfolio of equity securities of small- and medium-sized companies.
THE PORTFOLIO MANAGERS
The Fund employs multiple subadvisors who specialize in distinct investment approaches. This “intelligence diversification” not only serves to manage risk, but also helps us tap the markets’ full potential by focusing different analytical insights on each prospective investment. Fund management strives to achieve its performance and diversification objectives while ensuring that the Fund operates within the framework of its investment objective and principal investment strategies.
Federated MDTA, LLC
Federated MDTA, LLC (“MDT”) utilizes a quantitative process to score stocks based on earnings estimate momentum, long-term growth rates, share buyback and issuance, cash earnings-to-price ratios, tangible book-to-price ratios, and earnings risk. A decision-tree approach provides an intuitive, non-linear way to score companies. Stocks are grouped into clusters determined by analyzing different combinations of factor scores and returns, with each cluster containing companies with a different pattern of fundamental characteristics. Optimization is then used to build a portfolio that maximizes the stock selection score, while adhering to diversification constraints and trading costs. A position is sold or trimmed if the quantitative model identifies a more attractive opportunity (net of trading costs) or if a holding exceeds the maximum company weight of 1.3%. The portfolio typically holds between 100 and 110 stocks, with no position exceeding 1.3% of the portfolio. Industry weights are limited to +/- 13.5% of the benchmark weight, while sector weights are limited to +/- 22.5% of the benchmark weight.
Lord, Abbett & Co., LLC
The team at Lord, Abbett & Co., LLC (“Lord Abbett”), led by Tom O’Halloran, focuses its stock selection effort on companies that have revenue growth of at least 15% and are experiencing year-to-year operating margin improvement and earnings growth driven by top-line growth, rather than being driven by one-time events or simple cost cutting measures. The focus is also on identifying companies with higher-quality balance sheets (often captured by finding companies with manageable debt-to-total-capital ratios) and that are already profitable. Once this process is completed, the focus for the team is on forecasting both revenue and earnings growth over the next several years. To achieve this goal, and to find companies that will be growing considerably faster than their industry average, members of the team spend an extensive amount of time understanding the competitive advantages of a firm, the industry dynamics within which they operate, and the strength of management. A position is sold or trimmed if there is a fundamental change in the business, a more attractive alternative is
found, or if a holding reaches a 5% weight in the overall portfolio. The portion of the Fund managed by Lord Abbett typically holds between 100 and 150 stocks with no individual holding exceeding 5%. Lord Abbett has established a risk constraint that prevents any individual industry from being greater than 25% of the total weight of its portion of the Fund.
Ranger Investment Management, L.P.
The team at Ranger Investment Management, L.P. (“Ranger”), led by Conrad Doenges, starts with a universe of stocks with market capitalization between $100 million and $2 billion, from which they establish a list of approximately 250 to 300 companies on which they conduct detailed research. Each Ranger sector manager builds detailed earnings and cash-flow models for the companies they follow, and also qualitatively gauge, through a stock scoring model, their conviction level in each stock. Companies in the Fund’s portfolio managed by Ranger will typically have a high degree of recurring revenue, steady and/or accelerating sales and earnings growth, solid balance sheets, strong free-cash flows, conservative accounting practices, and a seasoned management team. The portfolio typically contains 35 and 60 stocks, with individual position sizes capped at 5%. Sector exposures are also limited to a maximum of 30%. A stock may be reduced or sold if material changes occur in the company’s earnings estimates, the company’s valuations exceed historical levels, a pre-determined price target is achieved, the stock reaches the maximum position size of 5%, capitalization limit of $5 billion, or it can be replaced with a better risk/reward opportunity.
Smith Asset Management Group, L.P.
Smith Asset Management Group, L.P.’s (“Smith Group”) investment process is based on a combination of a well-conceived quantitative screening process coupled with experienced, intelligent fundamental and qualitative analysis. The team is focused on predicting which attractively valued companies will report a succession of positive earnings surprises. The process begins by seeking companies with attractive risk profiles and valuations, as well as dramatically improving business fundamentals. To manage risk, Smith screens for companies with good corporate governance, strong financial quality, attractive valuation, and moderate portfolio beta. To identify high-earnings-growth companies, Smith screens for rising earnings expectations, improving earnings quality, a high percentage of positive earnings surprise, and high earnings growth rate. The Fund’s portfolio managed by Smith will typically hold 100 to 120 stocks, with no individual position greater than 3.0%. Sector weightings are limited to no more than two times the weighting in the Russell 2000® Index. Stocks are sold from the portfolio if a negative earnings surprise is predicted by either the process or management guidance, a negative earnings surprise is actually reported, the stock’s valuation level is too high, or a buyout announcement is made.
4
Managers Special Equity Fund
Investment Manager’s Comments (continued)
THE YEAR IN REVIEW
For the year ended December 31, 2010, the Managers Special Equity Fund Managers Class returned 33.11% and the Institutional Class returned 33.41%, both beating the 29.09% return of the Russell 2000 Growth® Index.
The prior year was characterized by two periods. The first portion of the year, defined as the period that ended mid-way through the third quarter, was dominated by macroeconomic news and risk caution by investors. The second portion of the year, defined as the period since August, was characterized by a return to risk seeking by investors and, importantly, a return to fundamentals when it came to investing in stocks. The risk-seeking aspect of the market rally during the latter portion of the year was particularly beneficial to small-capitalization equities as small-capitalization stocks outperformed their large-capitalization counterparts. Towards the end of the year, there was a significant rally in the U.S. equity market that put further distance between the current investor mindset and the lows of the Great Recession from little more than a year and a half ago. Several factors were behind the strong performance of equities over the last several months, including encouraging macroeconomic readings, the results of the November elections, and the extension of the Bush tax cuts. This resulted in a renewed appetite for equity risk and for U.S. small-caps, in particular. Within small-cap growth, all sectors posted positive double-digit returns for the year, with the exception of telecomm services. Performance was led by more cyclically geared sectors such as energy, materials, and information technology. Along with the aforementioned telecomm services, other sectors that struggled to keep the pace were more defensive in nature including consumer staples and health care.
The Fund delivered both solid absolute and relative returns for the year. The outperformance was driven by three of our four managers, with the fourth manager only modestly underperforming the benchmark for the year. Both positioning and solid stock selection contributed to the outperformance. On the positioning side, the Fund benefited from underweights to areas of the market that failed to keep up with the broader market rally, including underweights to the consumer staples, health care, and telecomm services sectors. As far as stock selection, the best gains were achieved in two areas, consumer discretionary and information technology, where our managers have their largest absolute weighting in the portfolio. The Fund outperformed the benchmark consistently throughout the course of the year, but performed particularly well during periods when fundamentals were being rewarded. In addition, the Fund tended to perform better during the year during periods when the market showed increased optimism for equities in general, which resulted in outperformance from the more cyclically oriented sectors that our managers favored throughout 2010 and continue to favor as we move into 2011.
LOOKING FORWARD
The team at Managers continues to spend considerable time evaluating the Fund and reaffirming our confidence in the subadvisors within the Fund. This past year was the first full calendar year with our existing group of subadvisors, all of whom maintain a growth bias. As we articulated a year ago, we believe that the changes we made to the Fund lineup in 2009 would produce an improved long-term performance track record and we were encouraged by the solid performance delivered by the Fund in 2010 as a result of these changes.
Heading into 2011, stocks within the consumer discretionary and information technology sectors continue to represent the largest exposures for the Fund while the Fund maintains its largest relative underweights to the health care and industrials sectors. Overall, the Fund is positioned to take advantage of any potential ongoing economic recovery while maintaining the flexibility to adjust positioning accordingly if that beginning-of-year thesis changes based upon macro or microeconomic events. Overall, we believe there continues to remain a solid opportunity for outperformance of small-cap growth equities in general in 2011, albeit likely with more volatility for these stocks than experienced in 2010. We also believe that the opportunity for active skilled managers who can take advantage of mispricings continues to grow if correlation amongst equities continues to fall and the market begins to focus on company fundamentals and less on headline news.
CUMULATIVE TOTAL RETURN PERFORMANCE
Managers Special Equity Fund’s cumulative total return is based on the daily change in net asset value (NAV), and assumes that all distributions were reinvested. The Russell 2000® Growth Index measures the performance of the Russell 2000® Index companies with higher price-to-book ratios and higher forecasted growth values. The Index reflects no deduction for fees, expenses, or taxes. Unlike the Fund, the Russell 2000® Growth Index and the Russell 2000® Index are unmanaged, are not available for investment, and do not incur expenses. The first chart compares a hypothetical $10,000 investment made in Managers Special Equity Fund– Managers Class on December 31, 2000, to a $10,000 investment made in the Russell 2000® Growth Index for the same time period. The second chart compares a hypothetical $10,000 investment made in Managers Special Equity Fund– Institutional Class on May 3, 2004, to a $10,000 investment made in the Russell 2000® Growth Index for the same time period. The graphs and tables do not reflect the deduction of taxes that a shareholder would pay on a Fund distribution or redemption of shares. Past performance is not indicative of future results.
5
Managers Special Equity Fund
Investment Manager’s Comments (continued)
CUMULATIVE TOTAL RETURN PERFORMANCE (continued)
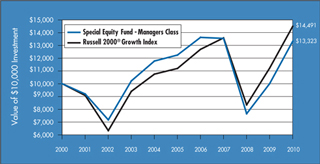
The table below shows the average annual total returns for Special Equity Fund–Managers Class and the Russell 2000® Growth Index since December 31, 2000 through December 31, 2010.
| | | | | | | | | | | | |
Average Annual Total Returns1 | | One Year | | | Five Years | | | Ten Years | |
Special Equity Fund–Managers Class2,3 | | | 33.11 | % | | | 1.70 | % | | | 2.91 | % |
Russell 2000® Growth Index4 | | | 29.09 | % | | | 5.30 | % | | | 3.78 | % |
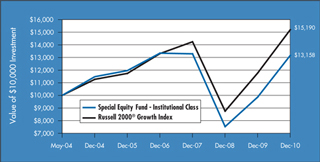
The table below shows the average annual total returns for Special Equity Fund–Institutional Class and the Russell 2000® Growth Index since May 3, 2004 through December 31, 2010.
| | | | | | | | | | | | | | | | |
Average Annual Total Returns1 | | One Year | | | Five Years | | | Since Inception | | | Inception Date | |
Special Equity Fund- Institutional Class2,3 | | | 33.41 | % | | | 1.93 | % | | | 4.21 | % | | | 5/3/2004 | |
Russell 2000® Growth Index4 | | | 29.09 | % | | | 5.30 | % | | | 6.47 | % | | | 5/3/2004 | |
The performance data shown represents past performance, which is not a guarantee of future results. Current performance may be lower or higher than the performance data quoted. The investment return and principal value of an investment in the Fund will fluctuate so that an investor’s shares, when redeemed, may be worth more or less than their original cost. For performance information through the most recent month end please call (800) 835-3879 or visit our Web site at www.managersinvest.com.
| | In choosing a Fund, investors should carefully consider the amount they plan to invest, their investment objectives, the Fund’s investment objectives, risks, charges and expenses before investing. For this and other information, please call (800) 835-3879 or visit www.managersinvest.com for a free prospectus. Read it carefully before investing or sending money. Distributed by Managers Distributors, Inc., member FINRA. |
| 1 | Total return equals income yield plus share price change and assumes reinvestment of all dividends and capital gain distributions. Returns are net of fees and may reflect offsets of Fund expenses as described in the Prospectus. No adjustment has been made for taxes payable by shareholders on their reinvested dividends and capital gain distributions. Returns for periods greater than one year are annualized. The listed returns on the Fund are net of expenses and based on the published NAV as of December 31, 2010. All returns are in U.S. dollars($). |
| 2 | From time to time, the Fund’s advisor has waived its fees and/or absorbed Fund expenses, which has resulted in higher returns. |
| 3 | The Fund is subject to risks associated with investments in small capitalization companies, such as erratic earnings patterns, competitive conditions, limited earnings history, and a reliance on one or a limited number of products. |
| 4 | The Russell 2000® Growth Index measures the performance of the Russell 2000® Index companies with higher price-to-book ratios and higher forecasted growth values. |
The Russell 2000® Growth Index and the Russell 2000® Index are trademarks of Russell Investments. Russell® is a trademark of Russell Investments.
Not FDIC insured, nor bank guaranteed. May lose value.
6
Managers Special Equity Fund
Fund Snapshots
December 31, 2010
Portfolio Breakdown
| | | | | | | | |
Industry | | Managers Special
Equity Fund ** | | | Russell 2000®
Growth Index | |
Information Technology | | | 27.3 | % | | | 27.3 | % |
Consumer Discretionary | | | 18.9 | % | | | 17.3 | % |
Industrials | | | 14.6 | % | | | 17.2 | % |
Health Care | | | 14.2 | % | | | 19.0 | % |
Financials | | | 8.7 | % | | | 4.8 | % |
Energy | | | 4.8 | % | | | 5.0 | % |
Materials | | | 4.4 | % | | | 5.0 | % |
Consumer Staples | | | 2.0 | % | | | 2.9 | % |
Telecommunication Services | | | 0.3 | % | | | 1.4 | % |
Utilities | | | 0.0 | % | | | 0.1 | % |
Other Assets and Liabilities | | | 4.8 | % | | | 0.0 | % |
| ** | As a percentage of net assets |
Top Ten Holdings
| | | | |
Security Name | | Percentage of
Net Assets | |
SXC Health Solutions Corp.* | | | 1.8 | % |
Prosperity Bancshares, Inc. | | | 1.2 | |
Steven Madden, Ltd.* | | | 1.2 | |
HMS Holdings Corp.* | | | 1.0 | |
VeriFone Holdings, Inc. | | | 1.0 | |
Texas Capital Bancshares, Inc. | | | 1.0 | |
TPC Group, Inc. | | | 1.0 | |
BE Aerospace, Inc. | | | 0.9 | |
Aruba Networks, Inc.* | | | 0.9 | |
Triumph Group, Inc. | | | 0.9 | |
| | | | |
Top Ten as a Group | | | 10.9 | % |
| | | | |
| * | Top Ten Holding at June 30, 2010 |
Any sectors, industries, or securities discussed should not be perceived as investment recommendations. Mention of a specific security should not be considered a recommendation to buy or solicitation to sell that security. Specific securities mentioned in this report may have been sold from the Fund’s portfolio of investments by the time you receive this report.
7
Managers Special Equity Fund
Schedule of Portfolio Investments
December 31, 2010
| | | | | | | | |
| | | Shares | | | Value | |
Common Stocks - 95.2% | | | | | | | | |
Consumer Discretionary - 18.9% | | | | | | | | |
America’s Car-Mart, Inc.* | | | 59,510 | | | $ | 1,611,531 | |
AnnTaylor Stores Corp.* | | | 38,563 | | | | 1,056,241 | |
BJ’s Restaurants, Inc.* | | | 50,300 | | | | 1,782,129 | |
Bravo Brio Restaurant Group, Inc.* | | | 52,058 | | | | 997,952 | |
Bridgepoint Education, Inc.* | | | 7,620 | 2 | | | 144,780 | |
Brunswick Corp. | | | 10,169 | | | | 190,567 | |
Carter’s, Inc.* | | | 1,698 | | | | 50,108 | |
Cato Corporation, The, Class A | | | 19,290 | | | | 528,739 | |
Cheesecake Factory, Inc., The* | | | 15,020 | | | | 460,513 | |
Children’s Place Retail Stores, Inc., The* | | | 33,616 | | | | 1,668,698 | |
Chipotle Mexican Grill, Inc.* | | | 2,455 | | | | 522,080 | |
Coinstar, Inc.* | | | 22,312 | | | | 1,259,289 | |
Collective Brands, Inc.* | | | 4,491 | | | | 94,760 | |
Cracker Barrel Old Country Store, Inc. | | | 7,460 | | | | 408,584 | |
Crocs, Inc.* | | | 51,245 | | | | 877,314 | |
Deckers Outdoor Corp.* | | | 22,413 | | | | 1,787,213 | |
Dick’s Sporting Goods, Inc.* | | | 23,968 | | | | 898,800 | |
DineEquity, Inc.* | | | 2,234 | | | | 110,315 | |
DSW, Inc.* | | | 11,549 | | | | 451,566 | |
Eastman Kodak Co.* | | | 44,785 | | | | 240,048 | |
E-Commerce China Dangdang, Inc., | | | | | | | | |
Sponsored ADR* | | | 29,580 | 2 | | | 800,731 | |
Fossil, Inc.* | | | 29,889 | | | | 2,106,577 | |
Fuel Systems Solutions, Inc.* | | | 7,140 | | | | 209,773 | |
G-III Apparel Group, Ltd.* | | | 45,850 | | | | 1,611,628 | |
Global Sources, Ltd.* | | | 29,730 | 2 | | | 283,030 | |
Group 1 Automotive, Inc.* | | | 40,540 | | | | 1,692,950 | |
Hibbett Sports, Inc.* | | | 15,979 | | | | 589,625 | |
HSN, Inc.* | | | 13,141 | | | | 402,640 | |
IMAX Corp.* | | | 26,899 | | | | 754,517 | |
iRobot Corp.* | | | 22,407 | | | | 557,486 | |
Jo-Ann Stores, Inc.* | | | 12,121 | | | | 729,927 | |
Jos. A. Bank Clothiers, Inc.* | | | 21,410 | | | | 863,251 | |
K12, Inc.* | | | 13,067 | | | | 374,500 | |
Lululemon Athletica, Inc.* | | | 17,946 | 2 | | | 1,227,865 | |
Maidenform Brands, Inc.* | | | 5,430 | | | | 129,071 | |
Overstock.com, Inc. | | | 19,273 | | | | 317,619 | |
Oxford Industries, Inc. | | | 41,909 | | | | 1,073,289 | |
P.F. Chang’s China Bistro, Inc. | | | 28,490 | 2 | | | 1,380,625 | |
Panera Bread Co., Class A* | | | 15,080 | | | | 1,526,247 | |
| | | | | | | | |
| | | Shares | | | Value | |
Polaris Industries, Inc. | | | 19,159 | | | $ | 1,494,785 | |
Sally Beauty Holdings, Inc.* | | | 39,561 | 2 | | | 574,821 | |
Select Comfort Corp.* | | | 60,200 | | | | 549,626 | |
Sotheby’s | | | 23,749 | | | | 1,068,705 | |
Steven Madden, Ltd.* | | | 80,627 | | | | 3,363,758 | |
TAL Education Group, ADR* | | | 23,879 | 2 | | | 384,452 | |
Tempur-Pedic International, Inc.* | | | 44,842 | 2 | | | 1,796,371 | |
Tenneco Automotive, Inc.* | | | 24,441 | | | | 1,005,992 | |
Texas Roadhouse, Inc., Class A* | | | 125,810 | | | | 2,160,158 | |
Timberland Co.* | | | 42,164 | | | | 1,036,813 | |
Tractor Supply Co. | | | 21,118 | | | | 1,024,012 | |
Tupperware Brands Corp. | | | 16,830 | | | | 802,286 | |
Ulta Salon, Cosmetics & Fragrance, Inc.* | | | 25,948 | | | | 882,232 | |
Under Armour, Inc., Class A* | | | 13,856 | 2 | | | 759,863 | |
Universal Technical Institute, Inc. | | | 11,930 | 2 | | | 262,699 | |
Vitamin Shoppe, Inc.* | | | 20,117 | | | | 676,736 | |
Warnaco Group, Inc., The* | | | 9,270 | | | | 510,499 | |
WMS Industries, Inc.* | | | 7,513 | | | | 339,888 | |
Wolverine World Wide, Inc. | | | 73,780 | | | | 2,352,106 | |
Zumiez, Inc.* | | | 28,128 | | | | 755,799 | |
Total Consumer Discretionary | | | | | | | 53,574,179 | |
Consumer Staples - 2.0% | | | | | | | | |
Boston Beer Co., Inc.* | | | 11,277 | | | | 1,072,330 | |
Casey’s General Stores, Inc. | | | 13,342 | | | | 567,168 | |
Nu Skin Enterprises, Inc., Class A | | | 37,677 | | | | 1,140,106 | |
Prestige Brands Holdings, Inc.* | | | 35,800 | | | | 427,810 | |
TreeHouse Foods, Inc.* | | | 45,850 | | | | 2,342,477 | |
Total Consumer Staples | | | | | | | 5,549,891 | |
Energy - 4.8% | | | | | | | | |
Approach Resources, Inc.* | | | 93,205 | | | | 2,153,036 | |
CARBO Ceramics, Inc. | | | 12,312 | | | | 1,274,784 | |
Complete Production Services, Inc.* | | | 11,458 | | | | 338,584 | |
ION Geophysical Corp.* | | | 43,748 | | | | 370,983 | |
Kodiak Oil & Gas Corp.* | | | 147,635 | | | | 974,391 | |
Lufkin Industries, Inc. | | | 14,850 | | | | 926,492 | |
Oasis Petroleum, Inc.* | | | 33,541 | | | | 909,632 | |
OYO Geospace Corp.* | | | 9,160 | | | | 907,848 | |
Rosetta Resources, Inc.* | | | 57,030 | | | | 2,146,608 | |
RPC, Inc. | | | 74,539 | 2 | | | 1,350,647 | |
Superior Energy Services, Inc.* | | | 51,600 | | | | 1,805,484 | |
W&T Offshore, Inc. | | | 31,750 | | | | 567,372 | |
Total Energy | | | | | | | 13,725,861 | |
The accompanying notes are an integral part of these financial statements.
8
Managers Special Equity Fund
Schedule of Portfolio Investments (continued)
| | | | | | | | |
| | | Shares | | | Value | |
Financials - 8.7% | | | | | | | | |
Altisource Portfolio Solutions S.A.* | | | 13,851 | | | $ | 397,662 | |
BOK Financial Corp. | | | 20,142 | | | | 1,075,583 | |
Calamos Asset Management, Inc., Class A | | | 61,879 | | | | 866,306 | |
Credit Acceptance Corp.* | | | 4,913 | | | | 308,389 | |
Financial Engines, Inc.* | | | 66,042 | 2 | | | 1,309,613 | |
GAMCO Investors, Inc., Class A | | | 5,749 | | | | 276,009 | |
Green Dot Corp., Class A* | | | 16,257 | | | | 922,422 | |
Horace Mann Educators Corp. | | | 25,570 | | | | 461,283 | |
Iberia Bank Corp. | | | 22,740 | | | | 1,344,616 | |
MarketAxess Holdings, Inc. | | | 83,310 | | | | 1,733,681 | |
Noah Holdings, Ltd., ADR* | | | 31,127 | 2 | | | 608,533 | |
optionsXpress, Inc.* | | | 8,856 | 2 | | | 138,774 | |
Portfolio Recovery Associates, Inc.* | | | 12,563 | | | | 944,738 | |
PrivateBancorp, Inc. | | | 72,670 | | | | 1,044,995 | |
Prosperity Bancshares, Inc. | | | 87,680 | | | | 3,444,069 | |
PS Business Parks, Inc. | | | 6,180 | | | | 344,350 | |
Signature Bank* | | | 37,383 | 2 | | | 1,869,150 | |
Stifel Financial Corp.* | | | 2,936 | | | | 182,149 | |
SVB Financial Group* | | | 34,256 | | | | 1,817,281 | |
Texas Capital Bancshares, Inc.* | | | 127,600 | 2 | | | 2,714,052 | |
Washington Banking Co. | | | 79,900 | | | | 1,095,429 | |
Western Alliance Bancorp* | | | 67,432 | | | | 496,300 | |
World Acceptance Corp.* | | | 22,004 | | | | 1,161,811 | |
Total Financials | | | | | | | 24,557,195 | |
Health Care - 14.2% | | | | | | | | |
Acorda Therapeutics, Inc.* | | | 27,205 | | | | 741,608 | |
Align Technology, Inc.* | | | 28,026 | | | | 547,628 | |
Almost Family, Inc.* | | | 8,420 | | | | 323,496 | |
Amedisys, Inc.* | | | 8,299 | | | | 278,016 | |
AMERIGROUP Corp.* | | | 32,310 | | | | 1,419,056 | |
Analogic Corp. | | | 3,730 | | | | 184,672 | |
Ariad Pharmaceuticals, Inc.* | | | 55,054 | | | | 280,775 | |
Arqule, Inc.* | | | 42,730 | | | | 250,825 | |
Array BioPharma, Inc.* | | | 47,410 | | | | 141,756 | |
athenahealth, Inc.* | | | 21,745 | | | | 891,110 | |
Atrion Corp. | | | 530 | 2 | | | 95,114 | |
Auxilium Pharmaceuticals, Inc.* | | | 2,001 | 2 | | | 42,221 | |
BioMarin Pharmaceutical, Inc.* | | | 19,890 | | | | 535,638 | |
Cantel Medical Corp. | | | 14,480 | | | | 338,832 | |
Catalyst Health Solutions, Inc.* | | | 55,789 | | | | 2,593,631 | |
Celera* | | | 23,550 | | | | 148,365 | |
| | | | | | | | |
| | | Shares | | | Value | |
Cepheid* | | | 48,710 | 2 | | $ | 1,108,152 | |
Chemed Corp. | | | 6,880 | | | | 436,949 | |
CorVel Corp.* | | | 41,900 | | | | 2,025,866 | |
DexCom, Inc.* | | | 39,187 | | | | 534,903 | |
Emergency Medical Services Corp., Class A* | | | 2,587 | | | | 167,146 | |
Endologix, Inc.* | | | 117,905 | | | | 843,021 | |
Exelixis, Inc.* | | | 37,510 | | | | 307,957 | |
HeartWare International, Inc.* | | | 3,859 | 2 | | | 337,933 | |
HMS Holdings Corp.* | | | 45,600 | | | | 2,953,512 | |
Human Genome Sciences, Inc.* | | | 11,176 | | | | 266,995 | |
Idenix Pharmaceuticals, Inc.* | | | 22,370 | | | | 112,745 | |
Immunomedics, Inc.* | | | 47,840 | 2 | | | 171,267 | |
Impax Laboratories, Inc.* | | | 18,029 | | | | 362,563 | |
Incyte Genomics, Inc.* | | | 48,099 | 2 | | | 796,519 | |
Inovio Pharmaceuticals, Inc.* | | | 89,620 | | | | 103,063 | |
Insulet Corp.* | | | 24,934 | | | | 386,477 | |
Integra LifeSciences Holdings Corp.* | �� | | 9,952 | | | | 470,730 | |
InterMune, Inc.* | | | 11,800 | 2 | | | 429,520 | |
Invacare Corp. | | | 2,034 | | | | 61,345 | |
IPC The Hospitalist Co., Inc.* | | | 57,710 | | | | 2,251,267 | |
Kensey Nash Corp.* | | | 14,080 | | | | 391,846 | |
LHC Group, Inc.* | | | 10,100 | | | | 303,000 | |
Masimo Corp. | | | 5,678 | | | | 165,059 | |
Medicis Pharmaceutical Corp., Class A | | | 19,290 | | | | 516,779 | |
Micromet, Inc.* | | | 23,010 | 2 | | | 186,841 | |
Momenta Pharmaceutical, Inc.* | | | 11,683 | 2 | | | 174,895 | |
Nabi Biopharmaceuticals* | | | 31,110 | | | | 180,127 | |
National Research | | | 5,230 | | | | 179,128 | |
Neurocrine Biosciences, Inc.* | | | 22,700 | | | | 173,428 | |
NxStage Medical, Inc.* | | | 43,664 | | | | 1,086,360 | |
Onyx Pharmaceuticals, Inc.* | | | 10,098 | 2 | | | 372,313 | |
Pacific Biosciences of California, Inc.* | | | 34,003 | | | | 540,988 | |
PAREXEL International Corp.* | | | 28,202 | 2 | | | 598,728 | |
Providence Service Corp.* | | | 18,970 | | | | 304,848 | |
Quality Systems, Inc. | | | 22,370 | | | | 1,561,873 | |
Questcor Pharmaceuticals, Inc.* | | | 10,606 | | | | 156,226 | |
Salix Pharmaceuticals, Ltd.* | | | 21,582 | | | | 1,013,491 | |
Sirona Dental Systems, Inc.* | | | 23,107 | | | | 965,410 | |
Steris Corp. | | | 10,120 | | | | 368,975 | |
SXC Health Solutions Corp.* | | | 120,642 | | | | 5,170,717 | |
Thoratec Corp.* | | | 12,672 | | | | 358,871 | |
TomoTherapy, Inc.* | | | 46,140 | | | | 166,565 | |
The accompanying notes are an integral part of these financial statements.
9
Managers Special Equity Fund
Schedule of Portfolio Investments (continued)
| | | | | | | | |
| | | Shares | | | Value | |
Health Care - 14.2% (continued) | | | | | | | | |
Vanda Pharmaceuticals, Inc.* | | | 17,260 | | | $ | 163,280 | |
Volcano Corp.* | | | 34,623 | | | | 945,554 | |
Zoll Medical Corp.* | | | 36,400 | | | | 1,355,172 | |
Total Health Care | | | | | | | 40,341,147 | |
Industrials - 14.6% | | | | | | | | |
A.O. Smith Corp. | | | 13,779 | 2 | | | 524,704 | |
Acacia Research Corp.* | | | 44,610 | | | | 1,157,183 | |
Actuant Corp., Class A | | | 18,953 | | | | 504,529 | |
Acuity Brands, Inc. | | | 101 | | | | 5,825 | |
Alaska Airgroup, Inc.* | | | 9,980 | | | | 565,766 | |
American Superconductor Corp.* | | | 11,282 | 2 | | | 322,552 | |
Applied Industrial Technologies, Inc. | | | 37,112 | | | | 1,205,398 | |
BE Aerospace, Inc.* | | | 71,953 | 2 | | | 2,664,421 | |
Belden CDT, Inc. | | | 10,689 | 2 | | | 393,569 | |
Chart Industries, Inc.* | | | 47,745 | | | | 1,612,826 | |
China Valves Technology, Inc.* | | | 33,365 | | | | 349,665 | |
Clean Harbors, Inc.* | | | 12,427 | | | | 1,044,862 | |
Corporate Executive Board Co. | | | 42,664 | | | | 1,602,033 | |
Cubic Corp. | | | 12,150 | | | | 572,872 | |
Deluxe Corp. | | | 44,940 | | | | 1,034,519 | |
DigitalGlobe, Inc.* | | | 10,107 | 2 | | | 320,493 | |
EMCOR Group, Inc.* | | | 12,040 | | | | 348,919 | |
EnerNOC, Inc.* | | | 2,402 | | | | 57,432 | |
EnerSys* | | | 77,860 | | | | 2,500,864 | |
Forward Air Corp. | | | 7,497 | | | | 212,765 | |
Genesee & Wyoming, Inc.,
Class A* | | | 25,718 | | | | 1,361,768 | |
Graham Corp. | | | 17,160 | | | | 343,200 | |
Great Lakes Dredge & Dock Corp. | | | 12,360 | | | | 91,093 | |
HEICO Corp. | | | 10,990 | 2 | | | 560,820 | |
Hexcel Corp.* | | | 59,555 | | | | 1,077,350 | |
Higher One Holdings, Inc.* | | | 39,028 | 2 | | | 789,536 | |
HNI Corp. | | | 10,263 | | | | 320,206 | |
Hub Group, Inc.* | | | 32,260 | | | | 1,133,616 | |
Interface, Inc., Class A | | | 18,243 | | | | 285,503 | |
Kaydon Corp. | | | 14,380 | | | | 585,554 | |
Lindsay Corp. | | | 10,540 | 2 | | | 626,392 | |
Middleby Corp., The* | | | 12,245 | | | | 1,033,723 | |
NACCO Industries, Inc., Class A | | | 4,442 | | | | 481,380 | |
Nordson Corp. | | | 16,532 | | | | 1,518,960 | |
Old Dominion Freight Line, Inc.* | | | 29,252 | | | | 935,771 | |
Park-Ohio Holdings Corp.* | | | 16,090 | | | | 336,442 | |
| | | | | | | | |
| | | Shares | | | Value | |
Polypore International, Inc.* | | | 42,026 | | | $ | 1,711,719 | |
Powell Industries, Inc.* | | | 6,905 | | | | 227,036 | |
Quanex Building Products Corp. | | | 7,955 | | | | 150,906 | |
RBC Bearings, Inc.* | | | 19,521 | | | | 762,881 | |
Robert Half International, Inc. | | | 5,965 | | | | 182,529 | |
Satcon Technology Corp.* | | | 74,843 | 2 | | | 336,794 | |
Team, Inc.* | | | 13,150 | | | | 318,230 | |
Tennant Co. | | | 10,540 | | | | 404,841 | |
Textainer Group Holdings, Ltd. | | | 21,996 | | | | 626,666 | |
Triumph Group, Inc. | | | 29,350 | | | | 2,624,184 | |
Twin Disc, Inc. | | | 17,910 | | | | 534,793 | |
United Rentals, Inc.* | | | 4,556 | 2 | | | 103,649 | |
UTI Worldwide, Inc. | | | 109,000 | | | | 2,310,800 | |
Wabtec Corp. | | | 32,560 | | | | 1,722,098 | |
Westport Innovations, Inc.* | | | 43,097 | | | | 798,156 | |
Total Industrials | | | | | | | 41,297,793 | |
Information Technology - 27.3% | |
Acme Packet, Inc.* | | | 34,743 | | | | 1,846,938 | |
Acxiom Corp.* | | | 12,661 | 2 | | | 217,136 | |
ADTRAN, Inc. | | | 14,096 | | | | 510,416 | |
Allot Communications, Ltd.* | | | 37,093 | | | | 431,763 | |
Amkor Technology, Inc.* | | | 21,442 | | | | 158,456 | |
Ancestry.com, Inc.* | | | 37,772 | | | | 1,069,703 | |
Anixter International, Inc. | | | 17,218 | | | | 1,028,431 | |
Applied Micro Circuits Corp.* | | | 10,005 | | | | 106,853 | |
Ariba, Inc.* | | | 63,460 | | | | 1,490,675 | |
Aruba Networks, Inc.* | | | 127,427 | | | | 2,660,677 | |
Atheros Communications, Inc.* | | | 24,263 | | | | 871,527 | |
Axcelis Technologies, Inc.* | | | 194,780 | | | | 673,939 | |
CACI International, Inc.,
Class A* | | | 17,304 | 2 | | | 924,034 | |
Camelot Information Systems, Inc., ADR* | | | 3,914 | | | | 93,623 | |
Cavium Networks, Inc.* | | | 30,978 | 2 | | | 1,167,251 | |
ChinaCache International Holdings, Ltd., | | | | | | | | |
Sponsored ADR* | | | 14,928 | 2 | | | 310,502 | |
Cirrus Logic, Inc.* | | | 24,735 | 2 | | | 395,265 | |
Cognex Corp. | | | 20,096 | | | | 591,224 | |
Coherent, Inc.* | | | 12,990 | | | | 586,369 | |
Concur Technologies, Inc.* | | | 14,726 | | | | 764,721 | |
Constant Contact, Inc.* | | | 14,276 | | | | 442,413 | |
CSG Systems International, Inc.* | | | 59,579 | | | | 1,128,426 | |
Diodes, Inc.* | | | 14,380 | | | | 388,116 | |
Energy Conversion Devices, Inc.* | | | 71,500 | 2 | | | 328,900 | |
FARO Technologies, Inc.* | | | 22,024 | | | | 723,268 | |
The accompanying notes are an integral part of these financial statements.
10
Managers Special Equity Fund
Schedule of Portfolio Investments (continued)
| | | | | | | | |
| | | Shares | | | Value | |
Information Technology - 27.3% (continued) | |
Fortinet, Inc.* | | | 46,421 | | | $ | 1,501,719 | |
GSI Commerce, Inc.* | | | 11,355 | | | | 263,436 | |
GT Solar International, Inc.* | | | 20,770 | | | | 189,422 | |
hiSoft Technology International, Sponsored ADR* | | | 33,642 | | | | 1,015,988 | |
Hittite Microwave Corp.* | | | 11,804 | | | | 720,516 | |
Hollysys Automation Technologies, Ltd.* | | | 31,382 | | | | 475,751 | |
Informatica Corp.* | | | 35,780 | | | | 1,575,393 | |
Inphi Corp.* | | | 31,212 | | | | 627,049 | |
InterDigital, Inc.* | | | 25,182 | | | | 1,048,578 | |
IntraLinks Holdings, Inc.* | | | 36,548 | | | | 683,813 | |
IPG Photonics Corp.* | | | 52,236 | | | | 1,651,702 | |
Ixia* | | | 78,540 | 2 | | | 1,317,901 | |
J2 Global Communications, Inc.* | | | 7,585 | | | | 219,586 | |
JinkoSolar Holding Co., Ltd., Sponsored ADR* | | | 8,530 | 2 | | | 171,624 | |
Lattice Semiconductor Corp.* | | | 114,340 | | | | 692,900 | |
Limelight Networks, Inc.* | | | 228,390 | | | | 1,326,946 | |
Liquidity Services, Inc.* | | | 8,991 | | | | 126,324 | |
Littelfuse, Inc.* | | | 8,099 | | | | 381,139 | |
LogMeIn, Inc.* | | | 22,780 | | | | 1,010,065 | |
Longtop Financial Technologies, Ltd., ADR* | | | 9,287 | 2 | | | 336,004 | |
Manhattan Associates, Inc.* | | | 21,227 | | | | 648,273 | |
MAXIMUS, Inc. | | | 36,930 | | | | 2,421,870 | |
Maxwell Technologies, Inc.* | | | 35,215 | | | | 665,211 | |
MercadoLibre, Inc.* | | | 11,397 | | | | 759,610 | |
Microsemi Corp.* | | | 14,347 | | | | 328,546 | |
MIPS Technologies, Inc.* | | | 124,020 | | | | 1,880,143 | |
Motricity, Inc.* | | | 117,593 | | | | 2,183,702 | |
Net 1 UEPS Technologies, Inc.* | | | 22,910 | | | | 280,877 | |
NetLogic Microsystems, Inc.* | | | 27,857 | | | | 874,988 | |
NetSuite, Inc.* | | | 27,979 | | | | 699,475 | |
Newport Corp.* | | | 45,557 | | | | 791,325 | |
OpenTable, Inc.* | | | 21,550 | 2 | | | 1,518,844 | |
OSI Systems, Inc.* | | | 13,740 | | | | 499,586 | |
Parametric Technology Corp.* | | | 16,279 | | | | 366,766 | |
Plantronics, Inc. | | | 37,149 | | | | 1,382,687 | |
Quest Software, Inc.* | | | 28,860 | | | | 800,576 | |
Rackspace Hosting, Inc.* | | | 18,187 | 2 | | | 571,254 | |
RealPage, Inc.* | | | 15,960 | | | | 493,643 | |
Renaissance Learning, Inc. | | | 20,770 | | | | 245,917 | |
RF Micro Devices, Inc.* | | | 61,270 | | | | 450,334 | |
| | | | | | | | |
| | | Shares | | | Value | |
RightNow Technologies, Inc.* | | | 58,486 | | | $ | 1,384,364 | |
Riverbed Technology, Inc.* | | | 53,655 | | | | 1,887,046 | |
Rofin-Sinar Technologies, Inc.* | | | 15,683 | | | | 555,806 | |
Sanmina-SCI Corp.* | | | 8,684 | | | | 99,692 | |
SemiLEDs Corp.* | | | 20,105 | | | | 584,050 | |
SolarWinds, Inc.* | | | 6,874 | | | | 132,324 | |
Sonic Solutions, Inc.* | | | 113,153 | | | | 1,697,295 | |
Sourcefire, Inc.* | | | 92,980 | | | | 2,410,972 | |
SS&C Technologies Holdings, Inc.* | | | 33,706 | | | | 691,310 | |
STEC, Inc.* | | | 11,871 | | | | 209,523 | |
SuccessFactors, Inc.* | | | 80,357 | | | | 2,327,139 | |
Synchronoss Technologies, Inc.* | | | 97,249 | 2 | | | 2,597,522 | |
Syntel, Inc. | | | 6,478 | | | | 309,584 | |
Taleo Corp.* | | | 44,310 | | | | 1,225,172 | |
TIBCO Software, Inc.* | | | 111,727 | | | | 2,202,140 | |
Trident Microsystems, Inc.* | | | 145,340 | | | | 258,705 | |
Trina Solar ADR* | | | 23,050 | | | | 539,831 | |
ValueClick, Inc.* | | | 42,538 | | | | 681,884 | |
VanceInfo Technologies, Inc., Sponsored ADR* | | | 24,646 | | | | 851,273 | |
VeriFone Holdings, Inc.* | | | 70,472 | 2 | | | 2,717,400 | |
Volterra Semiconductor Corp.* | | | 44,920 | | | | 1,040,347 | |
Wright Express Corp.* | | | 20,771 | | | | 955,467 | |
Total Information Technology | | | | | | | 77,468,955 | |
Materials - 4.4% | |
Brush Engineered Materials, Inc.* | | | 18,144 | | | | 701,084 | |
Clearwater Paper Corp.* | | | 5,860 | | | | 458,838 | |
Koppers Holdings, Inc. | | | 7,222 | 2 | | | 258,403 | |
Kraton Performance Polymers, Inc.* | | | 72,312 | | | | 2,238,056 | |
Minerals Technologies, Inc. | | | 9,050 | | | | 591,960 | |
PolyOne Corp.* | | | 73,078 | | | | 912,744 | |
Rock-Tenn Co., Class A | | | 12,457 | | | | 672,055 | |
Rockwood Holdings, Inc.* | | | 54,553 | 2 | | | 2,134,113 | |
Solutia, Inc.* | | | 49,694 | | | | 1,146,938 | |
STR Holdings, Inc.* | | | 31,555 | 2 | | | 631,100 | |
TPC Group, Inc.* | | | 89,040 | | | | 2,699,694 | |
Total Materials | | | | | | | 12,444,985 | |
Telecommunication Services - 0.3% | |
Consolidated Communications Holdings, Inc. | | | 19,290 | | | | 372,297 | |
USA Mobility, Inc. | | | 22,220 | | | | 394,849 | |
Total Telecommunication Services | | | | | | | 767,146 | |
Total Common Stocks
(cost $208,427,582) | | | | | | | 269,727,152 | |
The accompanying notes are an integral part of these financial statements.
11
Managers Special Equity Fund
Schedule of Portfolio Investments (continued)
| | | | | | | | |
| | | Shares | | | Value | |
Short-Term Investments - 12.1%1 | |
BNY Institutional Cash Reserves Fund, Series B*3,4 | | | 2,499,559 | | | $ | 1,992,201 | |
BNY Mellon Overnight Government Fund, 0.23%3 | | | 12,471,000 | | | | 12,471,000 | |
Dreyfus Cash Management Fund, Institutional Class Shares, 0.14% | | | 19,856,507 | | | | 19,856,507 | |
Total Short-Term Investments
(cost $34,827,066) | | | | 34,319,708 | |
| | | | | | | | |
| | | Principal Amount | | | Value | |
Corporate Bonds - 0.0%# | |
GAMCO Investors, Inc., 0.000%, 12/15/15
(cost $17,341) | | $ | 17,300 | | | $ | 13,112 | |
Total Investments - 107.3%
(cost $243,271,989) | | | | 304,059,972 | |
Other Assets, less Liabilities - (7.3)% | | | | (20,569,840 | ) |
Net Assets - 100.0% | | | $ | 283,490,132 | |
The following footnotes and abbreviations should be read in conjunction with the Schedule of Portfolio Investments.
Based on the cost of investments of $245,697,168 for Federal income tax purposes at December 31, 2010, the aggregate gross unrealized appreciation and depreciation were approximately $60,404,705 and $2,041,901, respectively, resulting in net unrealized appreciation of investments of $58,362,804.
| * | Non-income producing security. |
| # | Rounds to less than 0.1% |
| 1 | Yield shown for an investment company represents the December 31, 2010, seven-day average yield, which refers to the sum of the previous seven days’ dividends paid, expressed as an annual percentage. |
| 2 | Some or all of these shares were out on loan to various brokers as of December 31, 2010, amounting to a market value of $14,482,573, or approximately 5.1% of net assets. |
| 3 | Collateral received from brokers for securities lending was invested in this short-term investment. |
| 4 | On September 12, 2008, The Bank of New York Mellon established a separate sleeve of the BNY Institutional Cash Reserves Fund (Series B) to hold certain Lehman Brothers floating rate notes. The Fund’s position in Series B is being fair valued daily. (See Note 4 in the Notes to the Financial Statements.) |
The following table summarizes the inputs used to value the Fund’s net assets by the above fair value hierarchy levels as of December 31, 2010: (See Note 1(a) in the Notes to Financial Statements.)
| | | | | | | | | | | | | | | | |
| | | Quoted Prices in Active Markets
for Identical Investments
Level 1 | | | Significant Other
Observable Inputs
Level 2 | | | Significant Unobservable Inputs
Level 3 | | | Total | |
Special Equity | | | | | | | | | |
| | |
Investments in Securities | | | | | | | | | |
Common Stocks† | | $ | 269,727,152 | | | | — | | | | — | | | $ | 269,727,152 | |
Corporate Bonds | | | — | | | $ | 13,112 | | | | — | | | | 13,112 | |
Short-Term Investments | | | 32,327,507 | | | | 1,992,201 | | | | — | | | | 34,319,708 | |
| | | | | | | | | | | | | | | | |
Total Investments in Securities | | $ | 302,054,659 | | | $ | 2,005,313 | | | | — | | | $ | 304,059,972 | |
| | | | | | | | | | | | | | | | |
| † | All common stocks held in the Fund are Level 1 securities. For a detailed break-out of the common stocks by major industry classification, please refer to the Schedule of Portfolio Investments. |
As of December 31, 2010, the Fund had no significant transfers between Level 1 and Level 2 from the beginning of the reporting period.
Investments Definitions and Abbreviations:
ADR: ADR after the name of a holding stands for American Depositary Receipt, representing ownership of foreign securities on deposit with a domestic custodian bank. The value of the ADR security is determined or significantly influenced by trading on exchanges not located in the United States or Canada. Sponsored ADRs are initiated by the underlying foreign company.
The accompanying notes are an integral part of these financial statements.
12
Managers Special Equity Fund
Statement of Assets and Liabilities
December 31, 2010
| | | | |
Assets: | | | | |
Investments at value (including securities on loan valued at $14,482,573)* | | $ | 304,059,972 | |
Receivable for investments sold | | | 175,671 | |
Receivable for Fund shares sold | | | 4,162,003 | |
Receivable from affiliate | | | 7,572 | |
Receivable from affiliate for interfund lending | | | 1,708,614 | |
Dividends, interest and other receivables | | | 106,863 | |
Prepaid expenses | | | 14,132 | |
Total assets | | | 310,234,827 | |
| |
Liabilities: | | | | |
Payable upon return of securities loaned | | | 14,970,559 | |
Payable for investments purchased | | | 9,909,661 | |
Payable for Fund shares repurchased | | | 1,398,413 | |
Accrued expenses: | | | | |
Investment advisory and management fees | | | 199,201 | |
Administrative fees | | | 55,334 | |
Other | | | 211,527 | |
Total liabilities | | | 26,744,695 | |
| |
Net Assets | | $ | 283,490,132 | |
| |
Managers Shares: | | | | |
Net Assets | | $ | 278,703,973 | |
Shares outstanding | | | 5,287,563 | |
Net asset value, offering and redemption price per share | | $ | 52.71 | |
| |
Institutional Class Shares: | | | | |
Net Assets | | $ | 4,786,159 | |
Shares outstanding | | | 89,582 | |
Net asset value, offering and redemption price per share | | $ | 53.43 | |
| |
Net Assets Represent: | | | | |
Paid-in capital | | $ | 505,834,121 | |
Undistributed net investment income | | | — | |
Accumulated net realized loss from investments | | | (283,131,972 | ) |
Net unrealized appreciation of investments | | | 60,787,983 | |
| |
Net Assets | | $ | 283,490,132 | |
* Investments at cost | | $ | 243,271,989 | |
The accompanying notes are an integral part of these financial statements.
13
Managers Special Equity Fund
Statement of Operations
For the year ended December 31, 2010
| | | | |
Investment Income: | | | | |
Dividend income | | $ | 882,947 | |
Securities lending fees | | | 256,277 | |
Interest income | | | 174 | |
Foreign withholding tax | | | (636 | ) |
Total investment income | | | 1,138,762 | |
| |
Expenses: | | | | |
Investment management and advisory fees | | | 1,923,155 | |
Administrative fees | | | 534,210 | |
Transfer agent | | | 600,240 | |
Custodian | | | 99,330 | |
Reports to shareholders | | | 45,292 | |
Registration fees | | | 38,458 | |
Professional fees | | | 37,024 | |
Trustees fees and expenses | | | 7,511 | |
Miscellaneous | | | 14,450 | |
Total expenses before offsets | | | 3,299,670 | |
Expense reimbursements | | | (108,681 | ) |
Expense reductions | | | (44,142 | ) |
Fee waivers | | | (104 | ) |
Net expenses | | | 3,146,743 | |
Net investment loss | | | (2,007,981 | ) |
| |
Net Realized and Unrealized Gain (Loss): | | | | |
Net realized gain on investments | | | 53,728,169 | |
Net change in unrealized appreciation of investments | | | 8,739,851 | |
Net realized and unrealized gain | | | 62,468,020 | |
| |
Net increase in net assets resulting from operations | | $ | 60,460,039 | |
The accompanying notes are an integral part of these financial statements.
14
Managers Special Equity Fund
Statement of Changes in Net Assets
For the year ended December 31,
| | | | | | | | |
| | | 2010 | | | 2009 | |
Increase (Decrease) in Net Assets From Operations: | | | | | | | | |
Net investment loss | | ($ | 2,007,981 | ) | | ($ | 3,341,765 | ) |
Net realized gain (loss) on investments | | | 53,728,169 | | | | (68,748,383 | ) |
Net change in unrealized appreciation of investments | | | 8,739,851 | | | | 146,181,404 | |
Net increase in net assets resulting from operations | | | 60,460,039 | | | | 74,091,256 | |
| | |
From Capital Share Transactions: | | | | | | | | |
| | |
Managers Class: | | | | | | | | |
Proceeds from sale of shares | | | 72,554,710 | | | | 31,884,153 | |
Cost of shares repurchased | | | (74,147,024 | ) | | | (225,493,111 | ) |
Net decrease from Managers Class share transactions | | | (1,592,314 | ) | | | (193,608,958 | ) |
| | |
Institutional Class: | | | | | | | | |
Proceeds from sale of shares | | | 641,061 | | | | 12,754,238 | |
Cost of shares repurchased | | | (5,205,756 | ) | | | (108,594,167 | ) |
Net decrease from Institutional Class share transactions | | | (4,564,695 | ) | | | (95,839,929 | ) |
Net decrease from capital share transactions | | | (6,157,009 | ) | | | (289,448,887 | ) |
Total increase (decrease) in net assets | | | 54,303,030 | | | | (215,357,631 | ) |
| | |
Net Assets: | | | | | | | | |
Beginning of year | | | 229,187,102 | | | | 444,544,733 | |
End of year | | $ | 283,490,132 | | | $ | 229,187,102 | |
End of year undistributed net investment income | | | — | | | | — | |
| | | | | | | | |
| | |
Share Transactions: | | | | | | | | |
| | |
Managers Class: | | | | | | | | |
Sale of shares | | | 1,453,344 | | | | 1,041,783 | |
Shares repurchased | | | (1,750,832 | ) | | | (7,084,785 | ) |
Net decrease in shares | | | (297,488 | ) | | | (6,043,002 | ) |
| | |
Institutional Class: | | | | | | | | |
Sale of shares | | | 14,182 | | | | 421,778 | |
Shares repurchased | | | (125,107 | ) | | | (3,245,866 | ) |
Net decrease in shares | | | (110,925 | ) | | | (2,824,088 | ) |
The accompanying notes are an integral part of these financial statements.
15
Managers Special Equity Fund
Financial Highlights
For a share outstanding throughout each year
| | | | | | | | | | | | | | | | | | | | |
| | | For the year ended December 31, | |
Managers Class: | | 2010 | | | 2009 | | | 2008 | | | 2007 | | | 2006 | |
Net Asset Value, Beginning of Year | | $ | 39.60 | | | $ | 30.28 | | | $ | 64.27 | | | $ | 82.96 | | | $ | 86.78 | |
Income from Investment Operations: | | | | | | | | | | | | | | | | | | | | |
Net investment loss | | | (0.41 | )3 | | | (0.34 | )3 | | | (0.28 | )3 | | | (0.51 | )3 | | | (0.14 | )3 |
Net realized and unrealized gain (loss) on investments | | | 13.52 | 3 | | | 9.66 | 3 | | | (27.93 | )3 | | | 0.55 | 3 | | | 9.88 | 3 |
Total from investment operations | | | 13.11 | | | | 9.32 | | | | (28.21 | ) | | | 0.04 | | | | 9.74 | |
Less Distributions to Shareholders from: | | | | | | | | | | | | | | | | | | | | |
Net realized gain on investments | | | — | | | | — | | | | (5.78 | ) | | | (18.73 | ) | | | (13.56 | ) |
Net Asset Value, End of Year | | $ | 52.71 | | | $ | 39.60 | | | $ | 30.28 | | | $ | 64.27 | | | $ | 82.96 | |
Total Return1 | | | 33.11 | % | | | 30.78 | % | | | (43.49 | )% | | | (0.60 | )% | | | 11.28 | % |
Ratio of net expenses to average net assets | | | 1.48 | % | | | 1.58 | % | | | 1.48 | % | | | 1.43 | % | | | 1.42 | % |
Ratio of net investment loss to average net assets1 | | | (0.95 | )% | | | (1.08 | )% | | | (0.52 | )% | | | (0.59 | )% | | | (0.15 | )% |
Portfolio turnover | | | 138 | % | | | 186 | % | | | 138 | % | | | 67 | % | | | 76 | % |
Net assets at end of year (000’s omitted) | | $ | 278,701 | | | $ | 221,159 | | | $ | 352,106 | | | $ | 1,668,031 | | | $ | 2,551,703 | |
| | | | | | | | | | | | | | | | | | | | |
Ratios absent expense offsets:2 | | | | | | | | | | | | | | | | | | | | |
Ratio of total expenses to average net assets | | | 1.55 | % | | | 1.61 | % | | | 1.51 | % | | | 1.46 | % | | | 1.47 | % |
Ratio of net investment loss to average net assets | | | (1.02 | )% | | | (1.11 | )% | | | (0.55 | )% | | | (0.62 | )% | | | (0.20 | )% |
| | | | | | | | | | | | | | | | | | | | |
| |
| | | For the year ended December 31, | |
Institutional Class: | | 2010 | | | 2009 | | | 2008 | | | 2007 | | | 2006 | |
Net Asset Value, Beginning of Year | | $ | 40.04 | | | $ | 30.56 | | | $ | 64.71 | | | $ | 83.56 | | | $ | 87.09 | |
Income from Investment Operations: | | | | | | | | | | | | | | | | | | | | |
Net investment income (loss) | | | (0.30 | )3 | | | (0.26 | )3 | | | (0.15 | )3 | | | (0.32 | )3 | | | 0.10 | 3 |
Net realized and unrealized gain (loss) on investments | | | 13.69 | 3 | | | 9.74 | 3 | | | (28.16 | )3 | | | 0.52 | 3 | | | 9.93 | 3 |
Total from investment operations | | | 13.39 | | | | 9.48 | | | | (28.31 | ) | | | 0.20 | | | | 10.03 | 3 |
Less Distributions to Shareholders from: | | | | | | | | | | | | | | | | | | | | |
Net realized gain on investments | | | — | | | | — | | | | (5.84 | ) | | | (19.05 | ) | | | (13.56 | ) |
Net Asset Value, End of Year | | $ | 53.43 | | | $ | 40.04 | | | $ | 30.56 | | | $ | 64.71 | | | $ | 83.56 | |
Total Return1 | | | 33.44 | %4 | | | 31.02 | %4 | | | (43.35 | )% | | | (0.39 | )% | | | 11.56 | %4 |
Ratio of net expenses to average net assets | | | 1.23 | % | | | 1.33 | % | | | 1.23 | % | | | 1.20 | % | | | 1.18 | % |
Ratio of net investment income (loss) to average net assets1 | | | (0.70 | )% | | | (0.83 | )% | | | (0.29 | )% | | | (0.36 | )% | | | 0.09 | % |
Portfolio turnover | | | 138 | % | | | 186 | % | | | 138 | % | | | 67 | % | | | 76 | % |
Net assets at end of year (000’s omitted) | | $ | 4,786 | | | $ | 8,028 | | | $ | 92,439 | | | $ | 247,396 | | | $ | 561,994 | |
| | | | | | | | | | | | | | | | | | | | |
Ratios absent expense offsets:2 | | | | | | | | | | | | | | | | | | | | |
Ratio of total expenses to average net assets | | | 1.30 | % | | | 1.36 | % | | | 1.26 | % | | | 1.23 | % | | | 1.23 | % |
Ratio of net investment income (loss) to average net assets | | | (0.77 | )% | | | (0.86 | )% | | | (0.32 | )% | | | (0.39 | )% | | | 0.04 | % |
| | | | | | | | | | | | | | | | | | | | |
| 1 | Total returns and net investment income would have been lower had certain expenses not been reduced. (See Note 1(c) of Notes to Financial Statements.) |
| 2 | Excludes the impact of fee waivers and expense offsets such as brokerage credits, but includes non-reimbursable expenses, if any, such as interest and taxes. (See Note 1(c) to the Notes to Financial Statements.) |
| 3 | Per share numbers have been calculated using average shares. |
| 4 | The Total Return is based on the Financial Statement Net Asset Values as shown above. |
16
Managers Special Equity Fund
Notes to Financial Statements
December 31, 2010
| 1. | Summary of Significant Accounting Policies |
The Managers Funds (the “Trust”) is an open-end management investment company organized as a Massachusetts business trust and registered under the Investment Company Act of 1940, as amended (the “1940 Act”). Currently, the Trust is comprised of a number of different funds, each having distinct investment management objectives, strategies, risks and policies. Included in this report is the Managers Special Equity Fund (“Special Equity” or the “Fund”).
The Fund offers both Managers Class shares and Institutional Class shares. The Institutional Class shares, which are designed primarily for institutional investors that meet certain administrative and servicing criteria, have a minimum investment of $2,500,000. Managers Class shares are offered to all other investors. Each class represents an interest in the same assets of the Fund and the classes are identical except for class specific expenses related to shareholder activity. Each class has equal voting privileges except that each class has exclusive voting rights with respect to its services and/or distribution plan. Please refer to a current prospectus for additional information on each share class.
The Fund’s financial statements are prepared in accordance with accounting principles generally accepted in the United States of America, which require management to make estimates and assumptions that affect the reported amounts of assets and liabilities and disclosure of contingent assets and liabilities at the date of the financial statements and the reported amounts of income and expenses during the reporting periods. Actual results could differ from those estimates and such differences could be material. The following is a summary of significant accounting policies followed by the Fund in the preparation of its financial statements:
| a. | Valuation of Investments |
Equity securities traded on a domestic or international securities exchange are valued at the last quoted sale price, or, lacking any sales, at the last quoted bid price. Over-the-counter securities are valued at the Nasdaq Official Closing Price, if one is available. Lacking any sales, over-the-counter securities are valued at the last quoted bid price. The Fund’s investments are generally valued based on market quotations provided by third-party pricing services approved by the Board of Trustees of the Fund. Under certain circumstances, the value of certain Fund investments may be based on an evaluation of fair value, pursuant to procedures established by and under the general supervision of the Board of Trustees of the Fund. The Fund may use the fair value of a portfolio security to calculate its NAV when, for example, (1) market quotations are not readily available because a portfolio security is not traded in a public market or the principal market in which the security trades
is closed, (2) trading in a portfolio security is suspended and has not resumed before the Fund calculates its NAV, (3) a significant event affecting the value of a portfolio security is determined to have occurred between the time of the market quotation provided for a portfolio security and the time as of which the Fund calculates its NAV, (4) a security’s price has remained unchanged over a period of time (often referred to as a “stale price”), or (5) Managers Investment Group LLC (the “Investment Manager”) determines that a market quotation is inaccurate. Portfolio investments that trade primarily on foreign markets are priced based upon the market quotation of such securities as of the close of their respective principal markets, as adjusted to reflect the Investment Manager’s determination of the impact of events occurring subsequent to the close of such markets but prior to the time as of which the Fund calculates its NAV. In accordance with procedures approved by the Board of Trustees, the Investment Manager relies upon recommendations of a third-party fair valuation service in adjusting the prices of such foreign portfolio investments. The Fund may invest in securities that may be thinly traded. The Board of Trustees has adopted procedures to adjust prices when thinly traded securities are judged to be stale so that they reflect fair value. An investment valued on the basis of its fair value may be valued at a price higher or lower than available market quotations. An investment’s valuation may differ depending on the method used and the factors considered in determining value according to the Fund’s fair value procedures.
Short-term investments having a remaining maturity of 60 days or less are valued at amortized cost, which approximates market value. Investments in other open-end regulated investment companies are valued at their end of day net asset value per share except iShares or other ETF’s, which are valued the same as equity securities. Investments in certain mortgage-backed and stripped mortgage-backed securities, preferred stocks, convertible securities, derivatives and other debt securities not traded on an organized securities market are valued on the basis of valuations provided by dealers or by a pricing service which uses information with respect to transactions in such securities and various relationships between securities and yield to maturity in determining value. Securities (including derivatives) for which market quotations are not readily available are valued at fair value, as determined in good faith, and pursuant to procedures adopted by the Board of Trustees of the Trust. The values assigned to fair value investments are based on available information and do not necessarily represent amounts that might ultimately be realized, since such amounts depend on future developments inherent in long-term investments. Further, because of the inherent uncertainty of valuation, those estimated values may differ significantly from the values that would have been used had a ready market for the investments existed, and the differences could be material.
17
Managers Special Equity Fund
Notes to Financial Statements (continued)
Generally Accepted Accounting Principles (GAAP) define fair value as the price that a Fund would receive to sell an asset or pay to transfer a liability in an orderly transaction between market participants at the measurement date. GAAP also establishes a framework for measuring fair value, and a three-level hierarchy for fair value measurements based upon the transparency of inputs to the valuation of an asset or liability. Inputs may be observable or unobservable and refer broadly to the assumptions that market participants would use in pricing the asset or liability. Observable inputs reflect the assumptions market participants would use in pricing the asset or liability based on market data obtained from sources independent of the Fund. Unobservable inputs reflect the Fund’s own assumptions about the assumptions that market participants would use in pricing the asset or liability developed based on the best information available in the circumstances. Each investment is assigned a level based upon the observability of the inputs which are significant to the overall valuation.
The three-tier hierarchy of inputs is summarized below:
Level 1 – inputs are quoted prices in active markets for identical investments (e.g., equity securities, open-end investment companies, futures contracts, options contracts)
Level 2 – other observable inputs (including, but not limited to: quoted prices for similar assets or liabilities in markets that are active, quoted prices for identical or similar assets or liabilities in markets that are not active, inputs other than quoted prices that are observable for the assets or liabilities (such as interest rates, yield curves, volatilities, prepayment speeds, loss severities, credit risks and default rates) or other market corroborated inputs) (e.g., debt securities, government securities, swap contracts, foreign currency exchange contracts, foreign securities utilizing international fair value pricing, broker-quoted securities)
Level 3 – inputs are significant unobservable inputs (including the Fund’s own assumptions used to determine the fair value of investments) (e.g., fair valued securities)
The inputs or methodologies used for valuing investments are not necessarily an indication of the risk associated with investing in those investments.
Security transactions are accounted for as of trade date. Realized gains and losses on securities sold are determined on the basis of identified cost.
| c. | Investment Income and Expenses |
Dividend income is recorded on the ex-dividend date except certain dividends from foreign securities where the ex-dividend date may have passed. These dividends are recorded as soon as the Trust is informed of the ex-dividend date. Dividend income on foreign
securities is recorded net of any withholding tax. Interest income, which includes amortization of premium and accretion of discount on debt securities, is accrued as earned. Non-cash dividends included in dividend income, if any, are reported at the fair market value of the securities received. Other income and expenses are recorded on an accrual basis. Expenses that cannot be directly attributed to a fund are apportioned among the Funds in the Trust and in some cases other affiliated funds based upon their relative average net assets or number of shareholders. Investment income, realized and unrealized capital gains and losses, the common expenses of the Fund and certain Fund level expense reductions, if any, are allocated on a pro rata basis to each class based on the relative net assets of each class to the total net assets of the Fund.
The Fund had certain portfolio trades directed to various brokers, under a brokerage recapture program, which paid a portion of the Fund’s expenses. For the year ended December 31, 2010, under these arrangements the amount by which the Fund’s expenses were reduced and the impact on the expense ratio was as follows: $43,838 or 0.02% annualized.
The Fund has a “balance credit” arrangement with The Bank of New York Mellon (“BNYM”), the Fund’s custodian, whereby the Fund is credited with an interest factor equal to 0.75% below the effective 90-day T-Bill rate for account balances left uninvested overnight. If the T-Bill rate falls below 0.75%, no credits will be earned. These credits serve to reduce custody expenses that would otherwise be charged to the Fund. For the year ended December 31, 2010, the custodian expense was not reduced.
Overdrafts will cause a reduction of any earnings credits, computed at 2% above the effective Federal Funds rate on the day of the overdraft. For the year ended December 31, 2010, the Fund incurred overdraft fees of $19.
The Trust also has a balance credit arrangement with its Transfer Agent, BNY Mellon Investment Servicing (US) Inc., (formerly PNC Global Investment Servicing (U.S.) Inc.), whereby earnings credits are used to offset banking charges and other out-of-pocket expenses. For the year ended December 31, 2010, the transfer agent expense was reduced by $304.
The Investment Manager has agreed to waive a portion of its management fee in consideration of shareholder servicing fees that it has received from JPMorgan Distribution Services, Inc., with respect to short-term cash investments the Fund has made in the JPMorgan Liquid Assets Money Market Fund - Capital Shares. For the year ended December 31, 2010, the management fee was reduced by $104.
Total returns and net investment income for the Funds would have been lower had certain expenses not been offset. Total expenses before offsets exclude the impact of expense reimbursements or fee waivers and expense offsets such as brokerage recapture credits, but include non-reimburseable expenses, if any, such as interest and taxes.
18
Managers Special Equity Fund
Notes to Financial Statements (continued)
| d. | Dividends and Distributions |
Dividends resulting from net investment income and distributions of capital gains, if any, normally will be declared and paid annually in December and when required for Federal excise tax purposes. Distributions are recorded on the ex-dividend date and are declared separately for each class. Income and capital gain distributions are determined in accordance with Federal income tax regulations, which may differ from GAAP. These differences are primarily due to differing treatments for losses deferred due to wash sales, REITs, equalization accounting for tax purposes and market discount transactions. Permanent book and tax basis differences, if any, relating to shareholder distributions will result in reclassifications to paid-in capital.
As of December 31, 2010, the components of distributable earnings (excluding unrealized appreciation/depreciation) on a tax basis consisted of:
| | | | |
Capital loss carryforward | | $ | 280,706,793 | |
Undistributed ordinary income | | | — | |
Undistributed short-term capital gains | | | — | |
Undistributed long-term capital gains | | | — | |
The Fund intends to comply with the requirements under Subchapter M of the Internal Revenue Code of 1986, as amended, to distribute substantially all of its taxable income and gains to its shareholders and to meet certain diversification and income requirements with respect to investment companies. Therefore, no provision for Federal income or excise tax is included in the accompanying financial statements.
Additionally, based on the Fund’s understanding of the tax rules and rates related to income, gains and transactions for the foreign jurisdictions in which it invests, the Fund will provide for foreign taxes, and where appropriate, deferred foreign taxes.
Management has analyzed the Fund’s tax positions taken on federal income tax returns for all open tax years (tax years ended December 31, 2007-2010), and has concluded that no provision for federal income tax is required in the Fund’s financial statements. Additionally, the Fund is not aware of any tax position for which it is reasonably possible that the total amounts of unrecognized tax benefits will change materially in the next twelve months.
| f. | Capital Loss Carryovers |
As of December 31, 2010, the Fund had accumulated net realized capital loss carryover from securities transactions for Federal income tax purposes as shown in the following chart. These amounts may be used to offset realized capital gains, if any, through the expiration dates listed.
| | | | | | | | | | | | |
Fund | | | | | Capital Loss
Carryover Amount | | | Expires
December 31, | |
Special Equity | | | | | | $ | 97,085,016 | | | | 2016 | |
| | | | | | | 183,621,777 | | | | 2017 | |
| | | | | | | | | | | | |
| | | Total | | | $ | 280,706,793 | | | | | |
| | | | | | | | | | | | |
For the year ended December 31, 2010, the Fund utilized $47,936,093 of capital loss carryovers.
The Trust’s Declaration of Trust authorizes for each series the issuance of an unlimited number of shares of beneficial interest, without par value. The Fund records sales and repurchases of its capital stock on the trade date. The cost of securities contributed to the Fund in connection with the issuance of shares is based on the valuation of those securities in accordance with the Fund’s policy on investment valuation. Dividends and distributions to shareholders are recorded on the ex-dividend date.
At December 31, 2010, certain unaffiliated shareholders of record, specifically omnibus accounts, individually or collectively held greater than 10% of the outstanding shares of the Fund as follows: two collectively own 56%. Transactions by these shareholders may have a material impact on the Fund.
| 2. | Agreements and Transactions with Affiliates |
The Trust has entered into an Investment Management Agreement under which the Investment Manager, an independently managed subsidiary of Affiliated Managers Group, Inc. (“AMG”), serves as investment manager to the Fund and is responsible for the Fund’s overall administration. The Investment Manager selects subadvisors for the Fund (subject to Trustee approval) and monitors each subadvisor’s investment programs and results. The Fund’s investment portfolio is managed by portfolio managers who serve pursuant to a Subadvisory Agreement with the Investment Manager.
Investment management fees are paid directly by the Fund to the Investment Manager based on average daily net assets. The annual investment management fee rate, as a percentage of average daily net assets, is 0.90%.
19
Managers Special Equity Fund
Notes to Financial Statements (continued)
The Trust has entered into an Administration and Shareholder Servicing Agreement under which the Investment Manager serves as the Fund’s administrator (the “Administrator”) and is responsible for all aspects of managing the Fund’s operations, including administration and shareholder services to the Fund, its shareholders, and certain institutions, such as bank trust departments, broker-dealers and registered investment advisers, that advise or act as an intermediary with the Fund’s shareholders. The Fund pays a fee to the Administrator at the rate of 0.25% per annum of the Fund’s average daily net assets for this service.
At a meeting held on June 10-11, 2010, the Trust’s Board of Trustees established a contractual expense limitation with respect to the Fund. Effective July 1, 2010, Managers has contractually agreed, until at least May 1, 2012, to limit the Fund’s total annual operating expenses (exclusive of taxes, interest, shareholder servicing fees, brokerage commissions, acquired fund fees and expenses, and extraordinary items) to 1.19% of average daily net assets of the Fund. Prior to July 1, 2010, the Fund did not have a contractual expense limitation.
The Fund is obligated to repay the Investment Manager such amounts waived, paid or reimbursed in future years provided that the repayment occurs within thirty-six (36) months after the waiver or reimbursement and that such repayment would not cause the Fund’s total operating expenses in any such future year to exceed that Fund’s respective expense cap. For the year ended December 31, 2010, the Fund made no such repayments to the Investment Manager. For the year ended December 31, 2010, the Fund’s components of reimbursement are detailed in the following chart:
| | | | |
Reimbursement Available - 12/31/09 | | | — | |
Additional Reimbursements | | $ | 108,681 | |
Repayments | | | — | |
Expired Reimbursements | | | — | |
| | | | |
Reimbursement Available - 12/31/10 | | $ | 108,681 | |
| | | | |
The aggregate annual retainer paid to each Independent Trustee is $65,000, plus $4,000 or $2,500 for each regular or special meeting attended, respectively. The Trustees’ fees and expenses are allocated amongst all of the Funds for which the Investment Manager serves as the advisor (the “Managers Funds”) based on the relative
net assets of such Funds. The Independent Chairman of the Trusts receives an additional payment of $15,000 per year. The Chairman of the Audit Committee receives an additional payment of $5,000 per year. The “Trustees fees and expenses” shown in the financial statements represents the Fund’s allocated portion of the total fees and expenses paid by the Managers Funds.
The Fund is distributed by Managers Distributors, Inc. (the “Distributor” or “MDI”), a wholly-owned subsidiary of the Investment Manager. MDI serves as the principal underwriter for the Fund and is a registered broker-dealer and member of the Financial Industry Regulatory Authority, Inc. (“FINRA”). Shares of the Fund will be continuously offered and will be sold by brokers, dealers or other financial intermediaries who have executed selling agreements with MDI. MDI bears all the expenses of providing services pursuant to the Underwriting Agreement, including the payment of the expenses relating to the distribution of Prospectuses for sales purposes and any advertising or sales literature. Certain Trustees and Officers of the Fund are Officers and/or Directors of the Investment Manager, AMG and/or the Distributor.
On June 23, 2009, the Securities and Exchange Commission granted an exemptive order that permits the Funds to lend and borrow money for certain temporary purposes directly to and from other eligible Funds in the Managers Family of Funds (the “Fund Family”). Participation in this interfund lending program is voluntary for both borrowing and lending Funds, and an interfund loan is only made if it benefits each participating Fund. The Investment Manager administers the program according to procedures approved by the Funds’ Board of Trustees (the “Board”), and the Board monitors the operation of the program. An interfund loan must comply with certain conditions set out in the exemptive order, which are designed to assure fairness and protect all participating Funds. For the year ended December 31, 2010, the Fund lent to other Funds in the Fund Family varying amounts up to $1,708,614 over 2 days earning interest of $174. The interest amounts are presented in the Statement of Operations in interest income. For the same period, the Fund did not borrow from any Fund in the Fund Family.
| 3. | Purchases and Sales of Securities |
Purchases and sales of securities, excluding short-term securities and U.S. government obligations, for the year ended December 31, 2010, were $286,929,802 and $294,363,123, respectively. There were no purchases or sales of U.S. government obligations.
20
Managers Special Equity Fund
Notes to Financial Statements (continued)
| 4. | Portfolio Securities Loaned |
For the year ended December 31, 2010, the Fund participated in a securities lending program offered by BNYM, providing for the lending of securities to qualified brokers. Securities lending fees include earnings of such temporary cash investments, plus or minus any rebate to a borrower. These earnings (after any rebate) are then divided between BNYM, as a fee for its services under the program, and the Fund, according to agreed-upon rates. Collateral on all securities loaned is accepted in cash and/or government securities and is maintained at a minimum level of 102% (105% in the case of certain foreign securities) of the market value, plus interest, if applicable, of investments on loan. It is the Fund’s policy to obtain additional collateral from or return excess collateral to the borrower by the end of the next business day, following the valuation date of the securities loaned. Therefore, the value of the collateral held may be temporarily less than the value of the securities on loan. Lending securities entails a risk of loss to the Fund if and to the extent that the market value of the securities loaned were to increase and the borrower did not increase the collateral accordingly, and the borrower fails to return the securities. The Fund bears the risk of any deficiency in the amount of the collateral available for return to the borrower due to any loss on the collateral invested. Collateral received in the form of cash is invested temporarily in the BNY Mellon Overnight Government Fund, formerly the BNY Institutional Cash Reserves Fund (the “ICRF”), or other short-term investments as defined in the Securities Lending Agreement with BNYM.
Effective August 2, 2010, the Trust, on behalf of the Fund, entered into an agreement with The Bank of New York Mellon and the Bank of New York Mellon Corporation (“BNYMC”) with respect to the Fund’s position in the ICRF, pursuant to which (i) BNYMC will support the value of certain defaulted securities issued by Lehman Brothers Holdings, Inc. and held by ICRF, and (ii) if certain conditions are met, BNYMC will purchase the defaulted securities from the Fund in September 2011. The Fund is fair valuing its position in the ICRF daily based on the agreement. The Fund’s position in the separate sleeve of the ICRF Fund is included in the Schedule of Portfolio Investments and the unrealized loss on such investment is included in Net Unrealized Appreciation on the Statement of Assets and Liabilities and the Statement of Operations.
| 5. | Commitments and Contingencies |
In the normal course of business, the Fund may enter into contracts and agreements that contain a variety of representations and warranties, which provide general indemnifications. The maximum exposure to the Fund under these arrangements is unknown, as this would involve future claims that may be made against the Fund that have not yet occurred. However, based on experience, the Fund expects the risk of loss to be remote.
The Fund has determined that no material events or transactions occurred through the issuance date of the Fund’s financial statements which require additional disclosure in or adjustment of the Fund’s financial statements.
Tax Information (unaudited)
The Fund hereby designates the maximum amount allowable of its net taxable income as qualified dividends as provided in the Jobs and Growth Tax Relief Reconciliation Act of 2003. The 2010 Form 1099-DIVs you receive for the Fund will show the tax status of all distributions paid to you during the respective calendar year.
Pursuant to section 852 of the Internal Revenue Code, the Fund hereby designates as a capital gain distribution with respect to the taxable year ended December 31, 2010, $0, or, if subsequently determined to be different, the net capital gains of such year.
21
Report of Independent Registered Public Accounting Firm
To the Board of Trustees of The Managers Funds and the Shareholders of Managers Special Equity Fund:
In our opinion, the accompanying statement of assets and liabilities, including the schedule of portfolio investments, and the related statements of operations and of changes in net assets and the financial highlights present fairly, in all material respects, the financial position of Managers Special Equity Fund (one of the series constituting The Managers Funds, hereafter referred to as the “Fund”) at December 31, 2010, the results of its operations for the year then ended, the changes in its net assets for each of the two years in the period then ended and the financial highlights for each of the five years in the period then ended, in conformity with accounting principles generally accepted in the United States of America. These financial statements and financial highlights (hereafter referred to as “financial statements”) are the responsibility of the Fund’s management; our responsibility is to express an opinion on these financial statements based on our audits. We conducted our audits of these financial statements in accordance with the standards of the Public Company Accounting Oversight Board (United States). Those standards require that we plan and perform the audit to obtain reasonable assurance about whether the financial statements are free of material misstatement. An audit includes examining, on a test basis, evidence supporting the amounts and disclosures in the financial statements, assessing the accounting principles used and significant estimates made by management, and evaluating the overall financial statement presentation. We believe that our audits, which included confirmation of securities at December 31, 2010 by correspondence with the custodian, provide a reasonable basis for our opinion.
PricewaterhouseCoopers LLP
Philadelphia, Pennsylvania
February 18, 2011
22
Trustees and Officers
The Trustees and Officers of the Trust, their business addresses, principal occupations for the past five years and dates of birth are listed below. The Trustees provide broad supervision over the affairs of the Trust and the Funds. The Trustees are experienced executives who meet periodically throughout the year to oversee the Funds’ activities, review contractual arrangements with companies that provide services to the Funds, and review the Funds’ performance. Unless otherwise noted, the address of each Trustee or Officer is the address of the Trust: 800 Connecticut Avenue, Norwalk, Connecticut 06854.
There is no stated term of office for Trustees. Trustees serve until their resignation, retirement or removal in accordance with the Trust’s organizational documents and policies adopted by the Board from time to time. The Chairman of the Trustees, President, Treasurer and Secretary of the Trust are elected by the Trustees annually. Other officers hold office at the pleasure of the Trustees.
Independent Trustees
The following Trustees are not “interested persons” of the Trust within the meaning of the 1940 Act:
| | |
Name, Date of
Birth, Number of
Funds Overseen in
Fund Complex* | | Principal Occupation(s) During Past 5 Years and
Other Directorships Held by Trustee |
Jack W. Aber, 9/9/37 • Trustee since 1999 • Oversees 41 Funds in Fund Complex | | Professor of Finance, Boston University School of Management (1972-Present); Trustee of Appleton Growth Fund (1 portfolio); Trustee of Third Avenue Trust (5 portfolios); Trustee of Third Avenue Variable Trust (1 portfolio); Trustee of Aston Funds (24 portfolios). |
| |
William E. Chapman, II, 9/23/41 • Independent Chairman • Trustee since 1999 • Oversees 41 Funds in Fund Complex | | President and Owner, Longboat Retirement Planning Solutions (1998-Present); Hewitt Associates, LLC (part time) (provider of Retirement and Investment Education Seminars) (2002-2009); Trustee of Bowdoin College (2002-Present);Director of Harding, Loevner Funds, Inc. (6 portfolios); Trustee of Third Avenue Trust (5 portfolios); Trustee of Third Avenue Variable Trust (1 portfolio); Trustee of Aston Funds (24 portfolios). |
| |
Edward J. Kaier, 9/23/45 • Trustee since 1999 • Oversees 41 Funds in Fund Complex | | Attorney at Law and Partner, Teeters Harvey Gilboy & Kaier LLP (2007-Present); Attorney at Law and Partner, Hepburn Willcox Hamilton & Putnam, LLP (1977-2007); Trustee of Third Avenue Trust (5 portfolios); Trustee of Third Avenue Variable Trust (1 portfolio); Trustee of Aston Funds (24 portfolios). |
| |
Steven J. Paggioli, 4/3/50 • Trustee since 1993 • Oversees 41 Funds in Fund Complex | | Consultant (2001-Present); Formerly Executive Vice President and Director, The Wadsworth Group (1986- 2001); Executive Vice President, Secretary and Director, Investment Company Administration, LLC (1990-2001); Vice President, Secretary and Director, First Fund Distributors, Inc. (1991-2001); Trustee, Professionally Managed Portfolios (40 portfolios); Advisory Board Member, Sustainable Growth Advisors, LP; Independent Director, Chase Investment Counsel (2008 – Present); Trustee of Aston Funds (24 portfolios). |
| |
Eric Rakowski, 6/5/58 • Trustee since 1999 • Oversees 41 Funds in Fund Complex | | Professor, University of California at Berkeley School of Law (1990-Present); Director of Harding, Loevner Funds, Inc. (6 portfolios); Trustee of Third Avenue Trust (5 portfolios); Trustee of Third Avenue Variable Trust (1 portfolio); Trustee of Aston Funds (24 portfolios). |
| |
Thomas R. Schneeweis, 5/10/47 • Trustee since 1987 • Oversees 41 Funds in Fund Complex | | Professor of Finance, University of Massachusetts (1977-Present); Director, CISDM at the University of Massachusetts, (1996-Present); President, Alternative Investment Analytics, LLC, (formerly Schneeweis Partners, LLC) (2001-Present); Partner, S Capital Management, LLC (2007-Present); Partner, TRS Associates (1982-Present); Trustee of Aston Funds (24 portfolios). |
| * | The Fund Complex consists of Managers AMG Funds, The Managers Funds, Managers Trust I and Managers Trust II. |
Interested Trustees
The following Trustees are “interested persons” of the Trust within the meaning of the 1940 Act. Mr. Dalton is an interested person by virtue of his positions with, and interest in securities of, Affiliated Managers Group, Inc. and his position with Managers Distributors, Inc. Mr. Streur is an interested person by virtue of his positions with Managers Investment Group LLC.
| | |
Name, Date of
Birth, Number of
Funds Overseen in
Fund Complex* | | Principal Occupation(s) During Past 5 Years and
Other Directorships Held by Trustee |
Nathaniel Dalton, 9/29/66 • Trustee since 2008 • Oversees 41 Funds in Fund Complex | | Executive Vice President and Chief Operating Officer, Affiliated Managers Group, Inc., (2006-Present); Executive Vice President, Affiliated Managers Group, Inc., (2002 -2006); Executive Vice President and General Counsel, Affiliated Managers Group, Inc. (2001-2002); Senior Vice President and General Counsel, Affiliated Managers Group, Inc. (1996-2001). Director, Managers Distributors, Inc. (2000-Present). |
| |
John H. Streur, 2/6/60 • Trustee since 2008 • President since 2008 • Oversees 41 Funds in Fund Complex | | Senior Managing Partner, Managers Investment Group LLC (2006-Present); President, Managers Distributors, Inc. (2006-Present); Managing Partner, Managers Investment Group LLC (2005-2006); Chief Executive Officer, President and Chief Operating Officer, The Burridge Group LLC (1996-2004). |
Officers | | |
Name, Date of
Birth, Position(s)
Held with Fund and Length of Time
Served | | Principal Occupation(s) During Past 5 Years |
Christine C. Carsman, 4/2/52 • Secretary since 2004 • Chief Legal Officer since 2004 | | Senior Vice President and Chief Regulatory Counsel, Affiliated Managers Group, Inc. (2004-Present); Secretary, Managers AMG Funds, Managers Trust I and Managers Trust II (2004-Present); Senior Counsel, Vice President and Director of Operational Risk Management and Compliance, Wellington Management Company, LLP (1995-2004); Deputy General Counsel, The Boston Company, Inc. (1993-1995); Associate General Counsel, The Boston Company Advisors, Inc. (1991-1993); Associate, Sullivan & Worcester LLP (1987-1991). |
| |
Donald S. Rumery, 5/29/58 • Chief Financial Officer since 2007 • Treasurer since 1995 | | Senior Vice President, Managers Investment Group LLC (2005-Present); Treasurer and Chief Financial Officer, Managers Distributors, Inc. (2000-Present); Treasurer, Managers AMG Funds (1999-Present); Treasurer, Managers Trust I and Managers Trust II (2000-Present); Chief Financial Officer, Managers AMG Funds, Managers Trust I and Managers Trust II (2007-Present); Vice President, The Managers Funds LLC, (1994-2004). |
| |
Keitha L. Kinne, 5/16/58 • Chief Operating Officer since 2007 | | Managing Partner and Chief Operating Officer, Managers Investment Group LLC (2007-Present); Chief Investment Officer, Managers Investment Group LLC (2008-Present); Chief Operating Officer, Managers AMG Funds, Managers Trust I and Managers Trust II (2007-Present); Managing Director, Legg Mason & Co., LLC (2006-2007); Managing Director, Citigroup Asset Management (2004-2006). |
| |
David Kurzweil, 6/22/74 • Assistant Secretary since 2008 | | Senior Vice President and Associate Counsel, Managers Investment Group LLC (2008-Present); Assistant Secretary, Managers AMG Funds, Managers Trust I and Managers Trust II (2008-Present); Counsel and Senior Vice President, Lazard Asset Management LLC (2003-2008). |
| |
John J. Ferencz, 3/09/62 • Chief Compliance Officer • Code of Ethics Reporting Officer • AML Compliance Officer • Sarbanes-Oxley Code of Ethics Compliance Officer since 2010 | | Vice President, Legal and Compliance, Managers Investment Group LLC (2010-Present); Senior Compliance Analyst, Mutual Funds and Regulatory, GE Asset Management Incorporated (2005-2010). |
23
Investment Manager and Administrator
Managers Investment Group LLC
333 W. Wacker Drive
Suite 1200
Chicago, IL 60606
(800) 835-3879
Distributor
Managers Distributors, Inc.
333 W. Wacker Drive
Suite 1200
Chicago, IL 60606
(800) 835-3879
Custodian
The Bank of New York Mellon
2 Hanson Place
Brooklyn, New York 11217
Legal Counsel
Ropes & Gray LLP
Prudential Tower, 800 Boylston Street
Boston, Massachusetts 02199-3600
Transfer Agent
BNY Mellon Investment Servicing (US) Inc.*
Attn: Managers
P.O. Box 9769
Providence, Rhode Island 02940
(800) 548-4539
For Managers Choice Only
Managers
c/o BNY Mellon Investment Servicing (US) Inc.*
P.O. Box 9847
Providence, Rhode Island 02940-8047
(800) 358-7668
| * | Formerly PNC Global Investment Servicing (U.S.) Inc. |

MANAGERS AND MANAGERS AMG FUNDS
| | | | |
EQUITY FUNDS | | BALANCED FUNDS |
CADENCE CAPITAL APPRECIATION | | INTERNATIONAL EQUITY | | CHICAGO EQUITY PARTNERS BALANCED |
CADENCE FOCUSED GROWTH | | AllianceBernstein L.P. | | Chicago Equity Partners, LLC |
CADENCE MID-CAP | | Lazard Asset Management, LLC | | |
| CADENCE EMERGING COMPANIES | | Martin Currie Inc. | | ALTERNATIVE FUNDS |
Cadence Capital Management, LLC | | | | |
| | REAL ESTATE SECURITIES | | FQ GLOBAL ALTERNATIVES |
CHICAGO EQUITY PARTNERS MID-CAP | | Urdang Securities Management, Inc. | | FQ GLOBAL ESSENTIALS |
Chicago Equity Partners, LLC | | | | First Quadrant, L.P. |
| | RENAISSANCE LARGE CAP GROWTH | | |
| EMERGING MARKETS EQUITY | | Renaissance Group LLC | | INCOME FUNDS |
Rexiter Capital Management Limited | | | | BOND (MANAGERS) |
Schroder Investment Management North America Inc. | | SKYLINE SPECIAL EQUITIES | | FIXED INCOME |
| | PORTFOLIO | | GLOBAL BOND |
ESSEX SMALL/MICRO CAP GROWTH | | Skyline Asset Management, L.P. | | Loomis, Sayles & Co., L.P. |
Essex Investment Management Co., LLC | | | | |
| | SPECIAL EQUITY | | |
FQ TAX-MANAGED U.S. EQUITY | | Ranger Investment Management, L.P. | | BOND (MANAGERS PIMCO) |
FQ U.S. EQUITY | | Lord, Abbett & Co. LLC | | Pacific Investment Management Co. LLC |
First Quadrant, L.P. | | Smith Asset Management Group, L.P. | | CALIFORNIA INTERMEDIATE TAX-FREE |
| | Federated MDTA LLC | | Miller Tabak Asset Management LLC |
FRONTIER SMALL CAP GROWTH | | | | |
Frontier Capital Management Company, LLC | | SYSTEMATIC VALUE | | GW&K MUNICIPAL BOND |
| | SYSTEMATIC MID CAP VALUE | | GW&K MUNICIPAL ENHANCED YIELD |
GW&K SMALL CAP EQUITY | | Systematic Financial Management, L.P. | | Gannett Welsh & Kotler, LLC |
Gannett Welsh & Kotler, LLC | | | | |
| | TIMESSQUARE MID CAP GROWTH | | HIGH YIELD |
INSTITUTIONAL MICRO-CAP | | TIMESSQUARE SMALL CAP GROWTH | | J.P. Morgan Investment Management LLC |
MICRO-CAP | | TSCM GROWTH EQUITY | | |
Lord, Abbett & Co. LLC | | TimesSquare Capital Management, LLC | | INTERMEDIATE DURATION GOVERNMENT |
WEDGE Capital Management L.L.P. | | | | SHORT DURATION GOVERNMENT |
Next Century Growth Investors LLC | | TRILOGY GLOBAL EQUITY | | Smith Breeden Associates, Inc. |
RBC Global Asset Management (U.S.) Inc. | | TRILOGY EMERGING MARKETS EQUITY | | |
| | TRILOGY INTERNATIONAL SMALL CAP | | |
| | | Trilogy Global Advisors, L.P. | | |
This report is prepared for the Fund’s shareholders. It is authorized for distribution to prospective investors only when preceded or accompanied by an effective prospectus. To receive a free copy of the prospectus or Statement of Additional Information, which includes additional information about Fund Trustees, please contact us by calling 800.835.3879. Distributed by Managers Distributors, Inc., member FINRA. A description of the policies and procedures each Fund uses to vote its proxies is available: (i) without charge, upon request, by calling 800.835.3879, or (ii) on the Securities and Exchange Commission’s (SEC) Web site at www.sec.gov. For information regarding each Fund’s proxy voting record for the 12-month period ended June 30, call 800.835.3879 or visit the SEC Web site at www.sec.gov. The Fund files its complete schedule of portfolio holdings with the SEC for the first and third quarters of each fiscal year on Form N-Q. The Fund’s Forms N-Q are available on the SEC’s website at www.sec.gov. A Fund’s Forms N-Q may be reviewed and copied at the SEC’s Public Reference Room in Washington, DC. Information on the operation of the Public Reference Room may be obtained by calling 1-800-SEC-0330. To review a complete list of the Fund’s portfolio holdings, or to view the most recent quarterly holdings report, semiannual report, or annual report, please visit www.managersinvest.com. | |  |
www.managersinvest.com 
| | | | |
ANNUAL REPORT
Managers Funds
December 31, 2010
Managers Bond Fund
AR019-1210
Managers Bond Fund
Annual Report — December 31, 2010
| | | | |
TABLE OF CONTENTS | | Page | |
| |
LETTER TO SHAREHOLDERS | | | 1 | |
| |
ABOUT YOUR FUND’S EXPENSES | | | 3 | |
| |
INVESTMENT MANAGER’S COMMENTS, FUND SNAPSHOTS, AND SCHEDULE OF PORTFOLIO INVESTMENTS | | | 4 | |
| |
FINANCIAL STATEMENTS: | | | | |
| |
Statement of Assets and Liabilities | | | 19 | |
Fund’s balance sheet, net asset value (NAV) per share computation and cumulative undistributed amounts | | | | |
| |
Statement of Operations | | | 20 | |
Detail of sources of income, Fund expenses, and realized and unrealized gains (losses) during the year | | | | |
| |
Statement of Changes in Net Assets | | | 21 | |
Detail of changes in Fund assets for the past two years | | | | |
| |
FINANCIAL HIGHLIGHTS | | | 22 | |
Historical net asset values per share, distributions, total returns, expense ratios, turnover ratios and net assets | | | | |
| |
NOTES TO FINANCIAL STATEMENTS | | | 23 | |
Accounting and distribution policies, details of agreements and transactions with Fund management and affiliates, and descriptions of certain investment risks | | | | |
| |
REPORT OF INDEPENDENT REGISTERED PUBLIC ACCOUNTING FIRM | | | 28 | |
| |
TRUSTEES AND OFFICERS | | | 29 | |
Nothing contained herein is to be considered an offer, sale or solicitation of an offer to buy shares of any series of the Managers Family of Funds. Such offering is made only by Prospectus, which includes details as to offering price and other material information.
Letter to Shareholders
Dear Shareholder:
Our foremost goal at Managers Investment Group (“MIG”) is to structure and manage mutual funds that will help our shareholders and clients successfully reach their investment goals and objectives.
Each of our Funds is geared to provide you with exposure to a specific asset class or style of investing. The Managers Bond Fund (“the Fund”) generally provides investors with diversified fixed income exposure but normally maintains an emphasis on corporate bonds. This focus enables Loomis Sayles (“Loomis”), the Fund’s subadvisor, to take advantage of its expertise in assessing the value of bond issuers. That being said, Loomis’ approach is flexible, which gives it the ability to adapt to new environments. Loomis has successfully guided the Fund though many different types of markets since becoming its subadvisor in 1984.
On average, fixed income markets posted solid results for calendar year 2010, as evidenced by the Barclays Capital U.S. Aggregate Bond Index’s return of 6.54%. However, the path to achieving those returns was volatile with investors expressing a heightened sense of risk aversion in the first half of the year due in part to concerns over sovereign debt as well as the possibility of experiencing a double-dip recession. Fears about slowing economic growth subsided later in the year as corporate earnings proved to be better than expected and worries about sovereign debt eased when Ireland became the second “PIIGS” nation this year to receive a financial lifeline. These events combined with Federal Reserve Chairman Benjamin Bernanke’s comments on August 27, 2010, which foreshadowed the second round of quantitative easing, triggered a renewed interest in risk taking and led to very strong performance for credit-sensitive fixed income securities, an area of emphasis for the Fund.
Against this backdrop, the performance of the Fund was strong on an absolute and relative basis, as detailed below:
| | | | | | | | | | | | | | | | | | | | | | | | |
Periods Ended 12/31/10 | | 6 Months | | | 1 Year | | | 3 Years | | | 5 Years | | | 10 Years | | | Inception
Date | |
Managers Bond Fund | | | 4.41 | % | | | 10.43 | % | | | 6.62 | % | | | 6.95 | % | | | 7.33 | % | | | 6/1/1984 | |
Barclays Capital U.S. Government/ Credit Bond Index | | | 1.05 | % | | | 6.59 | % | | | 5.60 | % | | | 5.56 | % | | | 5.83 | % | | | | |
For the 12-month period ending December 31, 2010, the Managers Bond Fund returned 10.43%, easily outpacing the 6.59% return for the Barclays Capital U.S. Government/Credit Bond Index (the “Index”). The primary driver of the solid results was the Fund’s exposures to investment-grade and high-yield corporate bonds. To a lesser extent, the Fund also benefited from its non-U.S. dollar holdings.
Looking ahead, the fixed income environment could be very different from what we have experienced over the past couple of years. Interest rates have moved up recently and we could be entering a period in which rates continue to trend higher. In this type of framework, owning securities with less sensitivity to interest rates such as high-yield and lower-rated investment-grade bonds would be beneficial. We believe the Fund is well positioned for this type of market and the team at Loomis continues to search the globe for securities that will enable the Fund to take advantage of any challenges that lie ahead.
1
Letter to Shareholders (continued)
The Loomis Sayles portfolio management team has provided more detailed information on the performance of the Fund during 2010 and its perspective on the investment environment in the Investment Manager’s Comments section of this report.
The following report covers the one-year period ended December 31, 2010. Should you have any questions about this report, or if you’d like to receive a prospectus and additional information, including fees and expenses for this or any of the other Funds in our family, please feel free to contact us at 1-800-835-3879, or visit our Web site at www.managersinvest.com. As always, please read the prospectus carefully before you invest or send money.
If you are curious about how you can better diversify your investment program, visit the Knowledge Center on our Web site and view our articles in the investment strategies section. You can rest assured that under all market conditions our team is focused on delivering excellent investment management services for your benefit.
We thank you for your continued confidence and investment in The Managers Funds.
Respectfully,

John H. Streur
Senior Managing Partner
Managers Investment Group LLC
2
About Your Fund’s Expenses
As a shareholder of a Fund, you may incur two types of costs: (1) transaction costs, which may include sales charges (loads) on purchase payments; redemption fees; and exchange fees; and (2) ongoing costs, including management fees; distribution (12b-1) fees; and other Fund expenses. This example is intended to help you understand your ongoing costs (in dollars) of investing in the Fund and to compare these costs with the ongoing costs of investing in other mutual funds. The example is based on $1,000 invested at the beginning of the period and held for the entire period as indicated below.
Actual Expenses
The first line of the following table provides information about the actual account values and actual expenses. You may use the information in this line, together with the amount you invested, to estimate the expenses that you paid over the period. Simply divide your account value by $1,000 (for example, an $8,600 account value divided by $1,000 = 8.6), then multiply the result by the number in the first line under the heading entitled “Expenses Paid During Period” to estimate the expenses you paid on your account during this period.
Hypothetical Example for Comparison Purposes
The second line of the following table provides information about hypothetical account values and hypothetical expenses based on the Fund’s actual expense ratio and an assumed annual rate of return of 5% before expenses, which is not the Fund’s actual return. The hypothetical account values and expenses may not be used to estimate the actual ending account balance or expenses you paid for the period. You may use this information to compare the ongoing costs of investing in the Fund and other funds by comparing this 5% hypothetical example with the 5% hypothetical examples that appear in the shareholder reports of other funds.
Please note that the expenses shown in the table are meant to highlight your ongoing costs only and do not reflect any transactional costs, such as sales charges (loads), redemption fees, or exchange fees. Therefore, the second line of the table is useful in comparing ongoing costs only, and will not help you determine the relative total costs of owning different funds.
| | | | | | | | | | | | | | | | |
Six Months Ended December 31, 2010 | | Expense Ratio
for the Period | | | Beginning
Account
Value
07/01/2010 | | | Ending
Account
Value
12/31/2010 | | | Expenses Paid
During the
Period* | |
Managers Bond Fund | | | | | | | | | | | | | | | | |
Based on Actual Fund Return | | | 0.99 | % | | $ | 1,000 | | | $ | 1,104 | | | $ | 5.25 | |
Based on Hypothetical 5% Annual Return | | | 0.99 | % | | $ | 1,000 | | | $ | 1,020 | | | $ | 5.04 | |
| * | Expenses are equal to the Fund’s annualized expense ratio multiplied by the average account value over the period, multiplied by the number of days in the most recent fiscal half-year (184), then divided by 365. |
3
Managers Bond Fund
Investment Manager’s Comments
The Year in Review
The Managers Bond Fund returned 10.43% for the year ended December 31, 2010, widely outpacing the Barclays Capital U.S. Government/Credit Bond Index, which returned 6.59%.
At the beginning of 2010, attention shifted from economic recovery to economic growth, as investors began to displace lingering economic pessimism with overdue optimism. The transition was far from smooth, however, as new concerns materialized and old ones resurfaced. Increased anxiety over sovereign debt solvency in Europe and China’s lending restrictions percolated through global credit markets, tempering investor sentiment early in the year. In the U.S., unsteady economic readings and regulatory reform risk led some market participants back into defensive mode, but these challenges failed to offset a persistent overall positive market tone, which led to another solid year for the fixed-income markets. For the entire year, the government and investment-grade bond sectors earned returns of 4% to 9%, while the high yield and emerging markets sectors posted double-digit gains. The modest rise in yields and spread tightening forecast by our macro and sector teams suggest returns will be less generous in 2011.
The primary driver of the Fund’s performance relative to the Index during 2010 was its emphasis on corporate bonds and related underweight to U.S. Treasuries, the same two factors that led to strong results for the prior year. Credit spreads contracted substantially in 2009 and this pattern extended into 2010. The Fund benefited most from its exposure to U.S. investment-grade bonds. A sizeable portion of the Fund’s corporate exposure is invested in BBB-rated securities, the lowest and most credit-sensitive part of the investment-grade spectrum. As a group, BBB-rated securities performed very well during 2010 after posting exceptional returns in the prior year. Moving even further down on the credit spectrum, the Fund also benefited from its high yield exposure. The majority of the rest of the Fund’s solid results were attributable to its non-U.S. Dollar denominated bonds.
Looking Forward
Bond returns may be more tempered in 2011 due in part to the current low level of yields and the possibility for rates to move higher. Low current yields as of December 31, 2010, are particularly problematic for the government and investment-grade sectors. The 10-year Treasury could earn 3.3% in one year if
rates are unchanged, but lose 1.8% if rates rise to just 4.0% (the peak in 2010). The corporate market offers more yield and we like that many company balance sheets are generally in good shape, with strong cash balances and growing profits. We anticipate that economic trends will remain supportive of credit quality, allowing the sector to earn higher returns than Treasuries, but we see the sector’s low 4.0% yield as capping its upside. In addition to shopping the investment-grade corporate market, we see the securitized sector as offering attractive opportunities. Many managers are underweight MBS due to the government’s involvement in the sector, but we see recent improvements in valuations as a chance to reduce those under weights. Selected securities in the non-agency markets have particular appeal.
The speculative-grade market yield of 7.4% also may limit the upside as the sector typically offers more generous yields. High yield bonds remain one of our favored sectors, though, as we believe the incremental income may shore up returns in an environment where yields may be flat to rising. High yield loans, too, will become even more attractive when yield increases are more worrisome. Equity markets (and their proxies, convertible bonds) could earn higher returns than high yield in 2011 if investors reduce over weights to fixed income. But for those who prefer a potentially lower volatility strategy with income, we believe the high yield market remains very attractive.
On the international front, we expect a continuation of China as a growth engine for the world, with faster growth and higher yields in developing countries than in developed nations. While we have a slight preference for the U.S. Dollar over Euro or Yen, we are not enamored by any of them, and continue to see emerging markets as having greater return potential. We see both Asia ex-Japan and Latin America as benefiting from China’s commodity demands. Our sovereign analysts are forecasting, for example, growth near 4% for commodity exporters like Australia and Brazil. This faster growth and higher yields continue to attract investor inflows, boosting the return potential for both the bonds and currencies.
Cumulative Total Return Performance
Managers Bond Fund’s cumulative total return is based on the daily change in net asset value (NAV), and assumes that all distributions were reinvested. The Barclays Capital U.S. Government/ Credit Bond Index is an index of investment-grade government and
4
Managers Bond Fund
Investment Manager’s Comments (continued)
CUMULATIVE TOTAL RETURN PERFORMANCE (continued)
corporate bonds with a maturity rate of more than one year. Unlike the Fund, the Barclays Capital U.S. Government/Credit Bond Index is unmanaged, is not available for investment, and does not incur expenses. The Index assumes reinvestment of all income. This chart compares a hypothetical $10,000 investment made in the Managers Bond Fund on December 31, 2000, to a $10,000 investment made in the Barclays Capital U.S. Government/Credit Bond Index for the same time period. The chart is not intended to imply any future performance of the Fund. The graph and chart do not reflect the deduction of taxes that a shareholder would pay on a Fund distribution or redemption of shares. Total returns would have been lower had certain expenses not been reduced. Past performance is not indicative of future results.
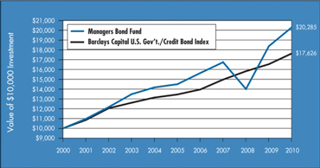
The table below shows the average annual total returns from December 31, 2000 through December 31, 2010 of the Managers Bond Fund and the Barclays Capital U.S. Government/ Credit Bond Index for the same time periods.
| | | | | | | | | | | | |
Average Annual Total Returns1 | | One Year | | | Five Years | | | Ten Years | |
Managers Bond Fund2,3,4,5 | | | 10.43 | % | | | 6.95 | % | | | 7.33 | % |
Barclays Capital U.S. Gov’t./Credit Bond Index6 | | | 6.59 | % | | | 5.56 | % | | | 5.83 | % |
The performance data shown represents past performance, which is not a guarantee of future results. Current performance may be lower or higher than the performance data quoted. The investment return and principal value of an investment in the Fund will fluctuate so that an investor’s shares, when redeemed, may be worth more or less than their original cost. For performance information through the most recent month end, please call (800) 835-3879 or visit our Web site at www.managersinvest.com.
In choosing a Fund, investors should carefully consider the amount they plan to invest, their investment objectives, the Fund’s investment objectives, risks, charges and expenses before investing. For this and other information, please call (800) 835-3879 or visit www.managersinvest.com for a free prospectus. Read it carefully before investing or sending money. Funds are distributed by Managers Distributors, Inc., a member of FINRA.
| 1 | Total return equals income yield plus share price change and assumes reinvestment of all dividends and capital gain distributions. Returns are net of fees and may reflect offsets of Fund expenses as described in the Prospectus. No adjustment has been made for taxes payable by shareholders on their reinvested dividends and capital gain distributions. Returns for periods greater than one year are annualized. The listed returns on the Fund are net of expenses and based on the published NAV as of December 31, 2010. All returns are in U.S. dollars($). |
| 2 | From time to time, the Fund’s advisor has waived its fees and/or absorbed Fund expenses, which has resulted in higher returns. |
| 3 | The Fund is subject to the risks associated with investments in debt securities, such as default risk, and fluctuations in a debtor’s perceived ability to pay its creditors. Changing interest rates may adversely affect the value of an investment. An increase in interest rates typically causes the value of bonds and other fixed-income securities to fall. |
| 4 | Investments in international securities are subject to certain risks of overseas investing including currency fluctuations and changes in political and economic conditions, which could result in significant market fluctuations. These risks are magnified in emerging markets. |
| 5 | High yield bonds (also known as “junk bonds”) are subject to additional risks such as the risk of default. |
| 6 | The Barclays Capital U.S. Government/ Credit Bond Index is an index of investment-grade government and corporate bonds with a maturity rate of more than one year. Unlike the Fund, the Barclays Capital U.S. Government/Credit Bond Index is unmanaged, is not available for investment, and does not incur expenses. |
Not FDIC insured, nor bank guaranteed. May lose value.
5
Managers Bond Fund
Fund Snapshots
December 31, 2010
Portfolio Breakdown
| | | | | | | | |
Category | | Managers Bond Fund** | | | Barclays Capital U.S. Gov’t./
Credit Bond Index | |
Corporate Bonds | | | 74.9 | % | | | 29.1 | % |
U.S. Government and Agency Obligations | | | 8.2 | % | | | 63.5 | % |
Foreign Government Obligations | | | 4.5 | % | | | 7.4 | % |
Asset-Backed Securities | | | 4.5 | % | | | 0.0 | % |
Municipal Bonds | | | 1.3 | % | | | 0.0 | % |
Mortgage-Backed Securities | | | 1.3 | % | | | 0.0 | % |
Preferred Stocks | | | 1.0 | % | | | 0.0 | % |
Other Assets and Liabilities | | | 4.3 | % | | | 0.0 | % |
| ** | As a percentage of net assets |
Top Ten Holdings
| | | | |
Security Name | | Percentage of
Net Assets | |
Kinder Morgan Energy Partners L.P., 5.950%, 02/15/18* | | | 2.5 | % |
American General Finance Corp., MTN, Series J, 6.900%, 12/15/17* | | | 2.3 | |
Southwestern Electric Power Co., 6.450%, 01/15/19* | | | 2.2 | |
USTB, 3.875%, 11/15/40 | | | 2.0 | |
Equitable Resources, Inc., 6.500%, 04/01/18* | | | 1.9 | |
Dun & Bradstreet Corp., The, 6.000%, 04/01/13* | | | 1.8 | |
Merrill Lynch & Co., Inc., 6.110%, 01/29/37* | | | 1.7 | |
FNMA, 1.375%, 04/28/11* | | | 1.7 | |
Nisource Finance Corp., 6.400%, 03/15/18 | | | 1.6 | |
Panhandle Eastern Pipe Line Co., L.P., 7.000%, 06/15/18 | | | 1.5 | |
| | | | |
Top Ten as a Group | | | 19.2 | % |
| | | | |
| * | Top Ten Holding at June 30, 2010 |
Any sectors, industries, or securities discussed should not be perceived as investment recommendations. Mention of a specific security should not be considered a recommendation to buy or solicitation to sell that security. Specific securities mentioned in this report may have been sold from the Fund’s portfolio of investments by the time you receive this report.
6
Managers Bond Fund
Schedule of Portfolio Investments
December 31, 2010
| | | | | | | | |
Security Description | | Principal Amount† | | | Value | |
Corporate Bonds - 74.9% | | | | | | | | |
Financials - 24.7% | | | | | | | | |
Alta Wind Holdings LLC, 7.000%, 06/30/35 (a) | | $ | 8,700,000 | | | $ | 9,279,072 | |
American General Finance Corp., | | | | | | | | |
5.400%, 12/01/15 | | | 5,000,000 | 2 | | | 3,943,750 | |
MTN, Series J, 6.900%, 12/15/17 | | | 57,315,000 | | | | 46,281,863 | |
American International Group, Inc., | | | | | | | | |
MTN, Series G, 5.850%, 01/16/18 | | | 1,940,000 | | | | 2,000,415 | |
MTN, Series MP, 5.450%, 05/18/17 | | | 485,000 | | | | 491,130 | |
Bank of America Capital Trust VI, 5.625%, 03/08/35 | | | 3,085,000 | | | | 2,612,455 | |
BNP Paribas SA DN, 5.346%, 06/13/11 (a)4 | | IDR | 19,645,500,000 | | | | 2,128,517 | |
Camden Property Trust, 5.700%, 05/15/17 | | | 5,205,000 | | | | 5,492,696 | |
Cantor Fitzgerald L.P., | | | | | | | | |
6.375%, 06/26/15 (a) | | | 8,710,000 | | | | 8,806,637 | |
7.875%, 10/15/19 (a)5 | | | 10,805,000 | | | | 11,127,238 | |
CIT Group, Inc., | | | | | | | | |
7.000%, 05/01/13 | | | 106,487 | | | | 108,617 | |
7.000%, 05/01/14 | | | 509,731 | | | | 514,828 | |
7.000%, 05/01/15 | | | 509,731 | | | | 511,005 | |
7.000%, 05/01/16 | | | 516,223 | | | | 518,159 | |
7.000%, 05/01/17 | | | 822,711 | | | | 824,768 | |
Citigroup, Inc., | | | | | | | | |
5.500%, 10/15/14 | | | 21,385,000 | 2 | | | 23,041,204 | |
6.125%, 08/25/36 | | | 10,760,000 | 2 | | | 10,310,307 | |
Colonial Realty, L.P., 4.800%, 04/01/11 | | | 1,005,000 | | | | 1,007,336 | |
Crown Castle Towers LLC, 6.113%, 01/15/20 (a) | | | 13,725,000 | | | | 14,319,581 | |
Duke Realty, L.P., | | | | | | | | |
5.950%, 02/15/17 | | | 2,210,000 | | | | 2,301,664 | |
6.500%, 01/15/18 | | | 5,000,000 | | | | 5,335,205 | |
Equity One, Inc., 6.000%, 09/15/17 | | | 5,915,000 | | | | 5,867,556 | |
ERP Operating, L.P., | | | | | | | | |
5.125%, 03/15/16 | | | 600,000 | | | | 647,312 | |
5.750%, 06/15/17 | | | 1,450,000 | | | | 1,588,743 | |
First Industrial L.P., 5.950%, 05/15/17 | | | 15,000,000 | | | | 13,193,085 | |
GE Capital Australia Funding Pty., Ltd., Series EMTN, 8.000%, 02/13/12 | | AUD | 3,965,000 | | | | 4,141,775 | |
GE Capital Corp., Series GMTN, 7.625%, 12/10/14 | | NZD | 9,365,000 | | | | 7,765,645 | |
General Electric Capital Corp., | | | | | | | | |
2.960%, 05/18/12 | | SGD | 4,400,000 | | | | 3,465,116 | |
3.485%, 03/08/12 | | SGD | 16,500,000 | | | | 13,059,152 | |
6.500%, 09/28/15 | | NZD | 15,265,000 | | | | 12,182,311 | |
6.750%, 09/26/16 | | NZD | 6,390,000 | | | | 5,077,430 | |
The accompanying notes are an integral part of these financial statements.
7
Managers Bond Fund
Schedule of Portfolio Investments (continued)
| | | | | | | | |
Security Description | | Principal Amount† | | | Value | |
Financials - 24.7% (continued) | | | | | | | | |
GMAC, Inc., | | | | | | | | |
6.750%, 12/01/14 | | $ | 1,019,000 | 2 | | $ | 1,072,498 | |
7.500%, 12/31/13 | | | 584,000 | 2 | | | 626,340 | |
8.000%, 12/31/18 | | | 1,366,000 | 2 | | | 1,444,545 | |
8.000%, 11/01/31 | | | 1,427,000 | | | | 1,537,592 | |
Hanover Insurance Group, Inc., The, 7.500%, 03/01/20 | | | 6,475,000 | | | | 6,823,038 | |
Highwoods Realty, L.P., | | | | | | | | |
5.850%, 03/15/17 | | | 3,680,000 | | | | 3,788,564 | |
7.500%, 04/15/18 | | | 2,405,000 | | | | 2,684,223 | |
ICICI Bank, Ltd., 6.375%, 04/30/22 (a)7 | | | 900,000 | | | | 902,304 | |
iStar Financial, Inc., | | | | | | | | |
5.125%, 04/01/11 | | | 4,360,000 | | | | 4,120,200 | |
5.150%, 03/01/12 | | | 280,000 | 2 | | | 272,300 | |
5.500%, 06/15/12 | | | 260,000 | | | | 243,750 | |
5.650%, 09/15/11 | | | 3,095,000 | 2 | | | 3,067,919 | |
5.700%, 03/01/14 | | | 15,000 | 2 | | | 13,538 | |
5.743%, 10/01/12 (04/01/11)6,9 | | | 8,095,000 | 2 | | | 7,204,550 | |
5.800%, 03/15/11 | | | 370,000 | 2 | | | 370,000 | |
5.850%, 03/15/17 | | | 325,000 | | | | 279,906 | |
5.875%, 03/15/16 | | | 1,340,000 | 2 | | | 1,154,075 | |
5.950%, 10/15/13 | | | 4,725,000 | | | | 4,335,188 | |
6.050%, 04/15/15 | | | 620,000 | | | | 538,625 | |
8.625%, 06/01/13 | | | 425,000 | | | | 395,250 | |
JPMorgan Chase & Co., | | | | | | | | |
4.509%, 03/28/11 (a)4 | | IDR | 932,700,000 | | | | 102,390 | |
6.880%, 04/12/12 (a)4 | | IDR | 40,733,437,680 | | | | 4,145,814 | |
Lloyds TSB Bank PLC, 6.500%, 09/14/20 (a) | | | 17,940,000 | 2 | | | 16,505,374 | |
Marsh & McLennan Companies, Inc., | | | | | | | | |
5.375%, 07/15/14 | | | 4,390,000 | | | | 4,670,073 | |
5.875%, 08/01/33 | | | 10,360,000 | | | | 9,472,904 | |
MBIA Insurance Corp., 14.000%, 01/15/33 (a)7 | | | 525,000 | | | | 282,188 | |
Merrill Lynch & Co., Inc., | | | | | | | | |
4.625%, 09/14/18 | | EUR | 1,750,000 | | | | 2,077,758 | |
6.110%, 01/29/37 | | | 38,050,000 | | | | 34,346,822 | |
10.710%, 03/08/17 | | BRL | 2,500,000 | | | | 1,490,964 | |
MTN, Series C, 6.050%, 06/01/34 | | | 22,100,000 | | | | 20,624,361 | |
Morgan Stanley, | | | | | | | | |
4.750%, 04/01/14 | | | 10,715,000 | | | | 10,972,449 | |
5.550%, 04/27/17 | | | 11,000,000 | 2 | | | 11,459,800 | |
5.500%, 07/24/20 | | | 17,600,000 | 2 | | | 17,780,822 | |
6.625%, 04/01/18 | | | 3,095,000 | | | | 3,357,360 | |
GMTN, Series F, 5.625%, 09/23/19 | | | 6,700,000 | | | | 6,831,876 | |
The accompanying notes are an integral part of these financial statements.
8
Managers Bond Fund
Schedule of Portfolio Investments (continued)
| | | | | | | | |
Security Description | | Principal Amount† | | | Value | |
Financials - 24.7% (continued) | | | | | | | | |
Mutual of Omaha Insurance Co., 6.800%, 06/15/36 (a) | | $ | 13,925,000 | | | $ | 13,170,223 | |
National City Bank of Indiana, 4.250%, 07/01/18 | | | 6,310,000 | | | | 6,132,702 | |
National City Corp., 6.875%, 05/15/19 | | | 1,905,000 | | | | 2,138,852 | |
National Life Insurance Co., 10.500%, 09/15/39 (a) | | | 5,000,000 | | | | 5,852,570 | |
Penn Mutual Life Insurance Co., The, 7.625%, 06/15/40 (a) | | | 8,885,000 | | | | 8,756,310 | |
PF Export Rec Master Trust, 6.436%, 06/01/15 (a) | | | 363,127 | | | | 386,730 | |
ProLogis Trust, | | | | | | | | |
5.625%, 11/15/15 | | | 345,000 | 2 | | | 362,058 | |
5.750%, 04/01/16 | | | 280,000 | | | | 290,711 | |
Realty Income Corp., | | | | | | | | |
5.750%, 01/15/21 | | | 1,435,000 | 2 | | | 1,483,688 | |
6.750%, 08/15/19 | | | 6,240,000 | | | | 7,051,812 | |
Simon Property Group, L.P., 5.750%, 12/01/15 | | | 445,000 | 2 | | | 494,391 | |
SLM Corp., | | | | | | | | |
5.000%, 04/15/15 | | | 50,000 | | | | 48,168 | |
5.375%, 05/15/14 | | | 300,000 | | | | 301,478 | |
8.450%, 06/15/18 | | | 18,665,000 | 2 | | | 19,399,692 | |
WEA Finance LLC / WT Finance Australia, 6.750%, 09/02/19 (a) | | | 8,325,000 | | | | 9,274,241 | |
White Mountains Insurance Group, Ltd., 6.375%, 03/20/17 (a) | | | 4,555,000 | | | | 4,423,461 | |
Willis North America, Inc., | | | | | | | | |
6.200%, 03/28/17 | | | 5,685,000 | | | | 5,841,644 | |
7.000%, 09/29/19 | | | 2,860,000 | | | | 2,980,884 | |
Total Financials | | | | | | | 491,329,547 | |
Industrials - 39.6% | | | | | | | | |
Agilent Technologies, Inc., 6.500%, 11/01/17 | | | 6,945,000 | | | | 7,697,491 | |
Albertson’s, Inc., | | | | | | | | |
6.625%, 06/01/28 | | | 1,015,000 | | | | 710,500 | |
7.450%, 08/01/29 | | | 3,195,000 | | | | 2,396,250 | |
7.750%, 06/15/26 | | | 915,000 | | | | 704,550 | |
American President, Ltd., 8.000%, 01/15/245 | | | 250,000 | | | | 171,250 | |
Anadarko Petroleum Corp., 6.450%, 09/15/36 | | | 13,875,000 | 2 | | | 13,838,772 | |
AT&T Corp., 6.500%, 03/15/29 | | | 6,415,000 | 2 | | | 6,693,219 | |
Avnet, Inc., | | | | | | | | |
5.875%, 03/15/14 | | | 7,455,000 | | | | 7,953,411 | |
6.625%, 09/15/16 | | | 1,370,000 | 2 | | | 1,514,183 | |
Bell Atlantic Pennsylvania, Inc., 6.000%, 12/01/28 | | | 1,335,000 | | | | 1,247,368 | |
BellSouth Corp., 6.000%, 11/15/34 | | | 2,370,000 | 2 | | | 2,360,558 | |
Canadian Pacific Railway Co., 5.750%, 03/15/33 | | | 195,000 | | | | 196,176 | |
CenturyTel, Series P, 7.600%, 09/15/39 | | | 9,335,000 | | | | 9,408,718 | |
Choice Hotels International, Inc., 5.700%, 08/28/20 | | | 11,900,000 | | | | 11,555,602 | |
CIGNA Corp., 6.150%, 11/15/36 | | | 6,830,000 | | | | 7,055,595 | |
The accompanying notes are an integral part of these financial statements.
9
Managers Bond Fund
Schedule of Portfolio Investments (continued)
| | | | | | | | |
Security Description | | Principal Amount† | | | Value | |
Industrials - 39.6% (continued) | | | | | | | | |
Comcast Corp., | | | | | | | | |
5.650%, 06/15/35 | | $ | 3,820,000 | | | $ | 3,711,000 | |
6.950%, 08/15/37 | | | 19,230,000 | | | | 21,750,438 | |
Continental Airlines, Inc., | | | | | | | | |
5.983%, 04/19/22 | | | 17,493,407 | | | | 18,455,545 | |
6.795%, 08/02/20 | | | 35,551 | | | | 35,551 | |
6.903%, 04/19/22 | | | 5,495,884 | | | | 5,605,802 | |
8.048%, 11/01/20 | | | 85,803 | | | | 96,957 | |
Corn Products International, Inc., 6.625%, 04/15/37 | | | 4,055,000 | | | | 4,238,740 | |
Corning, Inc., | | | | | | | | |
6.850%, 03/01/29 | | | 9,142,000 | | | | 10,111,601 | |
7.250%, 08/15/36 | | | 1,185,000 | | | | 1,348,557 | |
Cummins Engine Co., Inc., | | | | | | | | |
5.650%, 03/01/98 | | | 11,235,000 | | | | 8,783,602 | |
6.750%, 02/15/27 | | | 2,853,000 | 2 | | | 2,975,611 | |
7.125%, 03/01/28 | | | 50,000 | | | | 54,558 | |
Cytec Industries, Inc., 6.000%, 10/01/15 | | | 875,000 | | | | 958,454 | |
Darden Restaurants, Inc., 6.000%, 08/15/35 | | | 2,635,000 | | | | 2,489,495 | |
Delta Air Lines, Inc., | | | | | | | | |
8.021%, 08/10/22 | | | 12,990,801 | | | | 13,250,617 | |
Pass Through Certificate, Series 2010-1A, 6.200%, 07/02/18 | | | 5,175,000 | 2 | | | 5,498,438 | |
Dillards, Inc., 7.000%, 12/01/28 | | | 225,000 | | | | 194,625 | |
DP World, Ltd., 6.850%, 07/02/37 (a) | | | 28,350,000 | | | | 26,069,101 | |
Duke Energy Field Services LLC, 6.450%, 11/03/36 (a) | | | 2,615,000 | | | | 2,715,233 | |
Dun & Bradstreet Corp., The, 6.000%, 04/01/13 | | | 32,120,000 | | | | 34,992,235 | |
El Paso Corp., 6.950%, 06/01/28 | | | 1,030,000 | | | | 951,786 | |
Energy Transfer Partners, L.P., | | | | | | | | |
6.125%, 02/15/17 | | | 700,000 | | | | 769,500 | |
6.625%, 10/15/36 | | | 1,805,000 | 2 | | | 1,902,860 | |
Enterprise Products Operating L.P., 6.300%, 09/15/17 | | | 8,440,000 | 2 | | | 9,523,553 | |
Equifax, Inc., 7.000%, 07/01/37 | | | 4,421,000 | | | | 4,814,124 | |
Equitable Resources, Inc., 6.500%, 04/01/18 | | | 35,420,000 | | | | 38,380,048 | |
ERAC USA Finance Co., | | | | | | | | |
6.375%, 10/15/17 (a) | | | 4,910,000 | | | | 5,450,753 | |
6.700%, 06/01/34 (a) | | | 1,250,000 | | | | 1,295,334 | |
7.000%, 10/15/37 (a) | | | 19,033,000 | | | | 20,495,210 | |
Foot Locker, Inc., 8.500%, 01/15/22 | | | 570,000 | | | | 547,200 | |
Ford Motor Co., 6.375%, 02/01/29 | | | 1,990,000 | | | | 1,895,475 | |
Freescale Semiconductor, Inc., 10.125%, 12/15/16 | | | 270,000 | 2 | | | 284,175 | |
GATX Corp., 4.750%, 10/01/12 | | | 8,965,000 | | | | 9,391,097 | |
GTE Corp., 6.940%, 04/15/28 | | | 130,000 | 2 | | | 146,770 | |
The accompanying notes are an integral part of these financial statements.
10
Managers Bond Fund
Schedule of Portfolio Investments (continued)
| | | | | | | | |
Security Description | | Principal Amount† | | | Value | |
Industrials - 39.6% (continued) | | | | | | | | |
Intel Corp., | | | | | | | | |
2.950%, 12/15/359 | | $ | 6,230,000 | | | $ | 6,206,638 | |
3.250%, 08/01/399 | | | 15,000,000 | 2 | | | 17,981,250 | |
Intuit, Inc., 5.750%, 03/15/17 | | | 3,560,000 | | | | 3,881,094 | |
Kinder Morgan Energy Partners L.P., | | | | | | | | |
5.800%, 03/15/35 | | | 3,360,000 | | | | 3,200,437 | |
5.950%, 02/15/18 | | | 44,630,000 | | | | 49,151,644 | |
KLA Instruments Corp., 6.900%, 05/01/18 | | | 9,000,000 | | | | 9,900,054 | |
Lowe’s Companies, Inc., 6.875%, 02/15/28 | | | 500,000 | | | | 578,210 | |
Lucent Technologies, Inc., | | | | | | | | |
6.450%, 03/15/29 | | | 4,335,000 | | | | 3,424,650 | |
6.500%, 01/15/28 | | | 305,000 | | | | 242,475 | |
Marks & Spencer Group PLC, 7.125%, 12/01/37 (a) | | | 4,725,000 | | | | 4,709,965 | |
Masco Corp., | | | | | | | | |
5.850%, 03/15/17 | | | 8,150,000 | 2 | | | 8,121,931 | |
6.500%, 08/15/32 | | | 955,000 | 2 | | | 840,372 | |
7.125%, 03/15/20 | | | 9,065,000 | 2 | | | 9,483,150 | |
7.750%, 08/01/29 | | | 820,000 | | | | 803,693 | |
Methanex Corp., 6.000%, 08/15/15 | | | 3,825,000 | | | | 3,680,319 | |
Missouri Pacific Railroad Co., 5.000%, 01/01/455 | | | 825,000 | | | | 597,655 | |
Motorola, Inc., | | | | | | | | |
6.500%, 09/01/25 | | | 1,345,000 | | | | 1,383,210 | |
6.500%, 11/15/28 | | | 1,430,000 | 2 | | | 1,407,472 | |
New England Telephone & Telegraph Co., 7.875%, 11/15/29 | | | 2,390,000 | | | | 2,590,765 | |
News America, Inc., 6.150%, 03/01/37 | | | 4,075,000 | 2 | | | 4,248,526 | |
NGPL Pipeco LLC, 7.119%, 12/15/17 (a) | | | 21,980,000 | 2 | | | 24,063,198 | |
Northwest Airlines, Inc., 8.028%, 11/01/17 | | | 6,600,067 | | | | 6,831,069 | |
ONEOK Partners, L.P., | | | | | | | | |
6.000%, 06/15/35 | | | 9,210,000 | | | | 8,921,902 | |
6.650%, 10/01/36 | | | 2,650,000 | | | | 2,873,713 | |
Owens & Minor, Inc., 6.350%, 04/15/165 | | | 1,355,000 | | | | 1,379,511 | |
Owens Corning, Inc., | | | | | | | | |
6.500%, 12/01/16 | | | 4,560,000 | 2 | | | 4,829,592 | |
7.000%, 12/01/36 | | | 9,175,000 | | | | 9,453,103 | |
Panhandle Eastern Pipe Line Co., L.P., | | | | | | | | |
6.200%, 11/01/17 | | | 5,520,000 | | | | 5,881,063 | |
7.000%, 06/15/18 | | | 26,505,000 | 2 | | | 29,412,731 | |
Plains All American Pipeline L.P., | | | | | | | | |
6.125%, 01/15/17 | | | 2,770,000 | | | | 3,041,394 | |
6.500%, 05/01/18 | | | 8,975,000 | | | | 10,049,963 | |
6.650%, 01/15/37 | | | 5,960,000 | | | | 6,264,413 | |
The accompanying notes are an integral part of these financial statements.
11
Managers Bond Fund
Schedule of Portfolio Investments (continued)
| | | | | | | | |
Security Description | | Principal Amount† | | | Value | |
Industrials - 39.6% (continued) | | | | | | | | |
Pulte Homes, Inc., | | | | | | | | |
6.000%, 02/15/35 | | $ | 10,320,000 | | | $ | 7,636,800 | |
6.375%, 05/15/33 | | | 4,670,000 | | | | 3,525,850 | |
Qantas Airways, Ltd., 6.050%, 04/15/16 (a) | | | 11,800,000 | | | | 12,556,628 | |
Qwest Capital Funding, Inc., | | | | | | | | |
6.500%, 11/15/18 | | | 620,000 | | | | 615,350 | |
6.875%, 07/15/28 | | | 1,190,000 | 2 | | | 1,112,650 | |
7.625%, 08/03/21 | | | 2,135,000 | | | | 2,113,650 | |
Qwest Corp., | | | | | | | | |
6.500%, 06/01/17 | | | 155,000 | | | | 168,175 | |
6.875%, 09/15/33 | | | 7,209,000 | | | | 7,082,842 | |
7.200%, 11/10/26 | | | 435,000 | | | | 424,125 | |
7.250%, 09/15/25 | | | 1,185,000 | | | | 1,244,250 | |
7.250%, 10/15/35 | | | 2,165,000 | | | | 2,121,700 | |
7.500%, 06/15/23 | | | 739,000 | | | | 733,458 | |
Reynolds American, Inc., | | | | | | | | |
6.750%, 06/15/17 | | | 8,170,000 | 2 | | | 9,131,748 | |
7.250%, 06/15/37 | | | 2,000,000 | | | | 2,079,466 | |
Rowan Cos., Inc., 7.875%, 08/01/19 | | | 4,710,000 | | | | 5,465,964 | |
Samsung Electronics Co., Ltd., 7.700%, 10/01/27 (a) | | | 3,740,000 | | | | 4,229,910 | |
Southern Natural Gas Co., 5.900%, 04/01/17 (a) | | | 4,765,000 | | | | 5,109,810 | |
Telecom Italia Capital S.p.A., | | | | | | | | |
6.000%, 09/30/34 | | | 3,210,000 | | | | 2,663,725 | |
6.375%, 11/15/33 | | | 3,170,000 | | | | 2,720,801 | |
Telekom Malaysia Berhad, 7.875%, 08/01/25 (a) | | | 250,000 | | | | 314,683 | |
Texas Eastern Transmission, L.P., 6.000%, 09/15/17 (a) | | | 3,000,000 | | | | 3,364,626 | |
Toll Brothers Finance Corp., 5.150%, 05/15/15 | | | 3,665,000 | | | | 3,746,477 | |
Toro Co., The, 6.625%, 05/01/375 | | | 6,810,000 | | | | 6,237,817 | |
Transocean, Inc., 7.375%, 04/15/18 | | | 500,000 | | | | 552,928 | |
U.S. Steel Corp., | | | | | | | | |
6.650%, 06/01/37 | | | 3,595,000 | | | | 3,019,800 | |
7.000%, 02/01/18 | | | 7,310,000 | 2 | | | 7,419,650 | |
United Airlines, Inc., 6.636%, 07/02/22 | | | 16,195,278 | | | | 16,235,766 | |
UnitedHealth Group, Inc., | | | | | | | | |
5.800%, 03/15/36 | | | 13,506,000 | | | | 13,702,269 | |
6.500%, 06/15/37 | | | 310,000 | | | | 342,291 | |
6.625%, 11/15/37 | | | 1,540,000 | 2 | | | 1,727,646 | |
USG Corp., 6.300%, 11/15/16 | | | 1,410,000 | 2 | | | 1,233,750 | |
V.F. Corp., 6.450%, 11/01/37 | | | 9,334,000 | 2 | | | 10,498,024 | |
Vale Overseas Ltd., 6.875%, 11/01/36 | | | 3,665,000 | | | | 4,031,434 | |
Verizon Maryland, Inc., 5.125%, 06/15/33 | | | 1,055,000 | | | | 928,820 | |
The accompanying notes are an integral part of these financial statements.
12
Managers Bond Fund
Schedule of Portfolio Investments (continued)
| | | | | | | | |
Security Description | | Principal Amount† | | | Value | |
Industrials - 39.6% (continued) | | | | | | | | |
Verizon New York, Inc., Series B, 7.375%, 04/01/32 | | $ | 1,755,000 | | | $ | 1,969,349 | |
Weatherford International, Inc., 6.500%, 08/01/36 | | | 1,565,000 | | | | 1,598,394 | |
Wellpoint, Inc., 6.375%, 06/15/37 | | | 11,710,000 | 2 | | | 12,782,425 | |
Western Union Co., | | | | | | | | |
6.200%, 11/17/36 | | | 8,945,000 | 2 | | | 8,841,954 | |
6.200%, 06/21/40 | | | 130,000 | | | | 128,607 | |
Weyerhaeuser Co., | | | | | | | | |
6.875%, 12/15/33 | | | 12,890,000 | | | | 12,094,055 | |
7.375%, 10/01/19 | | | 3,915,000 | | | | 4,277,063 | |
7.375%, 03/15/32 | | | 1,930,000 | | | | 1,951,010 | |
White Pine Hydro LLC, | | | | | | | | |
6.310%, 07/10/17 (a)5 | | | 1,700,000 | | | | 1,711,679 | |
6.960%, 07/10/37 (a)5 | | | 1,645,000 | | | | 1,534,456 | |
Williams Cos., Inc., Series A, 7.500%, 01/15/31 | | | 741,000 | 2 | | | 832,182 | |
Wyndham Worldwide Corp., | | | | | | | | |
5.750%, 02/01/18 | | | 950,000 | | | | 965,994 | |
6.000%, 12/01/16 | | | 6,430,000 | 2 | | | 6,728,577 | |
7.375%, 03/01/20 | | | 7,220,000 | | | | 7,937,278 | |
Total Industrials | | | | | | | 785,568,756 | |
Utilities - 10.6% | | | | | | | | |
Abu Dhabi National Energy Co., 7.250%, 08/01/18 (a) | | | 21,130,000 | | | | 23,403,482 | |
Ameren Energy Generating Co., 7.000%, 04/15/18 | | | 22,700,000 | 2 | | | 22,376,139 | |
Ameren Illinois Co., 6.250%, 04/01/18 | | | 26,000,000 | 2 | | | 28,692,872 | |
Baltimore Gas & Electric Co., 5.200%, 06/15/33 | | | 1,470,000 | | | | 1,377,347 | |
Bruce Mansfield Unit 1 2, 6.850%, 06/01/345 | | | 10,600,854 | 2 | | | 11,251,142 | |
Cleveland Electric Illuminating Co., The, 5.950%, 12/15/36 | | | 15,155,000 | | | | 14,478,920 | |
Empresa Nacional de Electricidad, 7.875%, 02/01/27 | | | 2,900,000 | | | | 3,213,478 | |
ITC Holdings Corp., | | | | | | | | |
5.875%, 09/30/16 (a) | | | 2,410,000 | | | | 2,694,231 | |
6.375%, 09/30/36 (a) | | | 3,605,000 | | | | 3,708,240 | |
Mackinaw Power LLC, 6.296%, 10/31/23 (a) | | | 8,657,445 | | | | 9,249,787 | |
Nisource Finance Corp., | | | | | | | | |
6.400%, 03/15/18 | | | 27,910,000 | 2 | | | 30,939,742 | |
6.800%, 01/15/19 | | | 11,625,000 | | | | 13,450,137 | |
Southwestern Electric Power Co., 6.450%, 01/15/19 | | | 39,195,000 | | | | 43,042,068 | |
Tenaga Nasional Berhad, 7.500%, 11/01/25 (a) | | | 2,000,000 | | | | 2,426,094 | |
Total Utilities | | | | | | | 210,303,679 | |
Total Corporate Bonds (cost $1,397,277,134) | | | | | | | 1,487,201,982 | |
The accompanying notes are an integral part of these financial statements.
13
Managers Bond Fund
Schedule of Portfolio Investments (continued)
| | | | | | | | |
Security Description | | Principal Amount† | | | Value | |
Foreign Government Obligations - 4.5% | | | | | | | | |
Alberta, Province of, 5.930%, 09/16/16 | | CAD | 121,679 | | | $ | 134,848 | |
Brazil, Republic of, | | | | | | | | |
10.250%, 01/10/28 | | BRL | 5,750,000 | | | | 3,597,214 | |
12.500%, 01/05/22 | | BRL | 5,160,000 | | | | 3,691,265 | |
Canadian Government, | | | | | | | | |
1.000%, 09/01/11 | | CAD | 510,000 | | | | 512,021 | |
1.250%, 12/01/11 | | CAD | 400,000 | | | | 401,782 | |
3.500%, 06/01/13 | | CAD | 5,964,000 | | | | 6,237,757 | |
European Bank for Reconstruction & Development, 9.250%, 09/10/12 | | BRL | 2,000,000 | | | | 1,208,699 | |
European Investment Bank, | | | | | | | | |
4.920%, 04/24/13 (a)4 | | IDR | 50,074,770,000 | | | | 4,966,461 | |
7.000%, 01/18/12 | | NZD | 5,508,000 | | | | 4,429,893 | |
7.101%, 03/10/214 | | AUD | 5,000,000 | | | | 2,511,450 | |
11.250%, 02/14/13 | | BRL | 13,490,000 | | | | 8,475,133 | |
Inter-American Development Bank, | | | | | | | | |
6.000%, 12/15/177 | | NZD | 4,215,000 | | | | 3,369,937 | |
7.164%, 05/20/134 | | IDR | 45,580,000,000 | | | | 4,276,729 | |
Series EMTN, 8.961%, 09/23/134 | | IDR | 33,430,000,000 | | | | 3,052,111 | |
International Bank for Reconstruction & Development, Series GDIF, 1.430%, 03/05/14 | | SGD | 5,800,000 | | | | 4,517,655 | |
Manitoba, Province of, 6.360%, 09/01/15 | | NZD | 5,450,000 | | | | 4,435,204 | |
Mexican Government, | | | | | | | | |
8.000%, 12/07/23 | | MXN | 141,360,000 | | | | 12,254,253 | |
9.000%, 12/20/12 | | MXN | 26,900,000 | | | | 2,333,874 | |
Series M 10, 7.250%, 12/15/16 | | MXN | 31,000,000 | | | | 2,606,510 | |
New Zealand Government Bond, Series 413, 6.500%, 04/15/13 | | NZD | 11,870,000 | | | | 9,746,133 | |
Queensland Treasury Corp., 7.125%, 09/18/17 (a) | | NZD | 7,500,000 | | | | 6,201,816 | |
Total Foreign Government Obligations (cost $79,280,570) | | | | | | | 88,960,745 | |
U.S. Government and Agency Obligations - 8.2% | | | | | | | | |
U.S. Government Obligations - 2.7% | | | | | | | | |
USTB, 3.875%, 11/15/40 | | $ | 41,390,000 | | | | 40,717,412 | |
USTN, 1.000%, 08/31/11 | | | 13,530,000 | | | | 13,598,178 | |
Total U.S. Government Obligations | | | | | | | 54,315,590 | |
Federal Home Loan Bank Corporation - 0.9% | | | | | | | | |
FHLB, 1.875%, 06/21/13 | | | 16,600,000 | | | | 16,986,880 | |
Federal Home Loan Mortgage Corporation - 2.2% | | | | | | | | |
FHLMC, 1.625%, 04/15/13 | | | 16,595,000 | 2 | | | 16,885,894 | |
FHLMC, 2.125%, 09/21/12 | | | 24,895,000 | | | | 25,532,262 | |
FHLMC, Gold, 5.000%, 12/01/31 | | | 115,890 | | | | 122,217 | |
Total Federal Home Loan Mortgage Corporation | | | | | | | 42,540,373 | |
The accompanying notes are an integral part of these financial statements.
14
Managers Bond Fund
Schedule of Portfolio Investments (continued)
| | | | | | | | |
Security Description | | Principal Amount† | | | Value | |
Federal National Mortgage Association - 2.4% | | | | | | | | |
FNMA, 1.375%, 04/28/11 | | $ | 33,195,000 | | | $ | 33,322,601 | |
FNMA, 1.875%, 04/20/12 | | | 10,325,000 | | | | 10,509,952 | |
FNMA, 4.000%, 10/01/18 | | | 4,378,124 | | | | 4,570,351 | |
FNMA, 6.000%, 07/01/29 | | | 9,667 | | | | 10,649 | |
Total Federal National Mortgage Association | | | | | | | 48,413,553 | |
Total U.S. Government and Agency Obligations (cost $159,209,173) | | | | | | | 162,256,396 | |
Municipal Bonds - 1.3% | | | | | | | | |
Buckeye Tobacco Settlement Financing Authority, Series 2007 A-2, 5.875%, 06/01/475 | | | 5,035,000 | | | | 3,309,002 | |
Chicago Illinois O’Hare International Airport Revenue Bond, Series 2008 A, 4.500%, 01/01/38, (AGM Insured) | | | 315,000 | | | | 266,881 | |
Michigan Tobacco Settlement Financial Authority, Series 2006 A, 7.309%, 06/01/345 | | | 3,025,000 | | | | 2,153,376 | |
San Jose California Redevelopment Agency Tax Allocation, Series 2006 C, 3.750%, 08/01/28, (BHAC Insured) | | | 280,000 | | | | 218,128 | |
San Jose California Redevelopment Agency Tax Allocation, Series 2006 C, 3.750%, 08/01/28, (NATL-RE Insured) | | | 765,000 | | | | 584,705 | |
State of California, 4.500%, 08/01/27, (AMBAC Insured) | | | 950,000 | | | | 831,744 | |
State of California, 4.500%, 10/01/29 | | | 2,655,000 | | | | 2,264,954 | |
State of California, 4.500%, 08/01/30 | | | 730,000 | | | | 620,982 | |
State of California, 4.500%, 08/01/30, (AMBAC Insured) | | | 770,000 | | | | 655,008 | |
State of California, Variable Purpose Bond, 3.250%, 12/01/27, (NATL-RE Insured) | | | 495,000 | | | | 359,642 | |
State of California, Variable Purpose Bond, 4.500%, 12/01/33, (AMBAC Insured) | | | 2,330,000 | | | | 1,948,602 | |
Virginia Tobacco Settlement Financing Corp., 6.706%, 06/01/465 | | | 21,620,000 | | | | 13,517,690 | |
Total Municipal Bonds (cost $37,413,531) | | | | | | | 26,730,714 | |
Asset-Backed Securities - 4.5% | | | | | | | | |
Chase Issuance Trust, Series 2007-B1, Class B1, 2.721%, 04/15/19 (01/18/11)6 | | | 17,040,000 | | | | 16,375,997 | |
Chrysler Financial Lease Trust, Series 2010-A, Class B, 3.460%, 09/16/13 (a) | | | 10,010,000 | | | | 10,019,304 | |
CIT Equipment Collateral, Series 2008-VT1, Class A3, 6.590%, 12/22/14 | | | 3,442,061 | | | | 3,529,007 | |
Citibank Credit Card Issuance Trust, Series 2008-C6, Class C6, 6.300%, 06/20/14 | | | 8,945,000 | | | | 9,462,256 | |
Marriott Vacation Club Owner Trust, Series 2009-2A, Class A, 4.809%, 07/20/31 (a) | | | 13,239,010 | | | | 13,638,452 | |
MBNA Credit Card Master Note Trust, Series 2002-C1, Class C1, 6.800%, 07/15/14 | | | 6,911,000 | | | | 7,271,623 | |
Merrill Auto Trust Securitization, Series 2008-1, Class B, 6.750%, 04/15/15 | | | 4,035,000 | | | | 4,292,881 | |
Sierra Receivables Funding Co., Series 2010 2A, Class A, 3.840%, 11/20/25 (a) | | | 19,797,032 | | | | 19,823,844 | |
Trinity Rail Leasing LP, Series 2009-1A, Class A, 6.657%, 11/16/39 (a) | | | 4,810,582 | | | | 5,168,145 | |
World Financial Network Credit Card Master Trust, Series 2010 A, Class B, 6.750%, 06/15/15 | | | 1,000,000 | | | | 1,070,630 | |
Total Asset-Backed Securities (cost $86,037,315) | | | | | | | 90,652,139 | |
Mortgage-Backed Securities - 1.3% | | | | | | | | |
Bank of America-First Union, Series 2001, 5.464%, 04/11/37 | | | 1,318,615 | | | | 1,335,816 | |
Community Program Loan Trust, Series 87-A, Class A5, 4.500%, 04/01/29 | | | 3,325,000 | | | | 3,132,250 | |
Credit Suisse Mortgage Capital, Series 2007-C5, Class A4, 5.695%, 09/15/407 | | | 1,704,000 | | | | 1,749,517 | |
The accompanying notes are an integral part of these financial statements.
15
Managers Bond Fund
Schedule of Portfolio Investments (continued)
| | | | | | | | |
Security Description | | Principal Amount† | | | Value | |
Mortgage-Backed Securities - 1.3% (continued) | | | | | | | | |
Extended Stay America Trust, Series 2010 ESHA, Class C, 4.860%, 11/05/27 (a) | | $ | 19,090,000 | | | $ | 18,710,695 | |
JPMorgan Chase Commercial Mortgage Securities Corp., Series 2007-LD11, Class A4, 5.817%, 06/15/497 | | | 305,000 | | | | 319,108 | |
Total Mortgage-Backed Securities (cost $24,346,924) | | | | | | | 25,247,386 | |
| Preferred Stocks - 1.0% | | Shares | | | | |
Bank of America Corp., 6.375% | | | 20,000 | | | | 439,800 | |
Bank of America Corp., Series L, 7.250%9 | | | 7,808 | | | | 7,472,021 | |
Comcast Corp., Series B, 7.000% | | | 207,547 | | | | 5,250,939 | |
Entergy New Orleans, Inc., 4.750% | | | 482 | | | | 40,985 | |
Entergy New Orleans, Inc., 5.560% | | | 100 | | | | 9,141 | |
Newell Financial Trust I, 5.250%9 | | | 90,628 | | | | 3,806,376 | |
SLM Corp., 6.000% | | | 41,250 | | | | 839,025 | |
Sovereign Capital Trust IV, 4.375%9 | | | 34,236 | | | | 1,403,676 | |
Wisconsin Electric Power Co., 3.600% | | | 3,946 | | | | 288,019 | |
Total Preferred Stocks (cost $18,122,043) | | | | | | | 19,549,982 | |
Short-Term Investments - 6.9%1 | | | | | | | | |
BNY Institutional Cash Reserves Fund, Series B*3,8 | | | 1,652,054 | | | | 1,316,722 | |
BNY Mellon Overnight Government Fund, 0.23%3 | | | 109,039,000 | | | | 109,039,000 | |
Dreyfus Cash Management Fund, Institutional Class Shares, 0.14% | | | 27,812,200 | | | | 27,812,200 | |
Total Short-Term Investments (cost $138,503,254) | | | | | | | 138,167,922 | |
Total Investments - 102.6% (cost $1,940,189,944) | | | | | | | 2,038,767,266 | |
Other Assets, less Liabilities - (2.6)% | | | | | | | (52,391,442 | ) |
Net Assets - 100.0% | | | | | | $ | 1,986,375,824 | |
The accompanying notes are an integral part of these financial statements.
16
Notes to Schedule of Portfolio Investments
The following footnotes and abbreviations should be read in conjunction with the Schedule of Portfolio Investments.
Based on the approximate cost of investments of $1,940,621,931 for Federal income tax purposes at December 31, 2010, the aggregate gross unrealized appreciation and depreciation were $132,836,450 and $34,691,115, respectively, resulting in a net unrealized appreciation of investments of $98,145,335.
| * | Non-income-producing security. |
| † | Principal Amount stated in U.S. dollars unless otherwise noted. |
| (a) | Securities exempt from registration under Rule 144A of the Securities Act of 1933. These securities may be resold in transactions exempt from registration, normally to qualified buyers. At December 31, 2010, the value of these securities amounted to $343,093,787, or 17.3% of net assets. |
| 1 | Yield shown for an investment company represents the December 31, 2010, seven-day average yield, which refers to the sum of the previous seven days’ dividends paid, expressed as an annual percentage. |
| 2 | Some or all of these shares were out on loan to various brokers as of December 31, 2010, amounting to $107,368,394, or 5.4% of net assets. |
| 3 | Collateral received from brokers for securities lending was invested in these short-term investments. |
| 4 | Represents yield to maturity at December 31, 2010. |
| 5 | Security is illiquid: A security not readily convertible into cash such as a stock, bond or commodity that is not actively traded, and would be difficult to sell in a current sale. The Fund may not invest more than 15% of its net assets in illiquid securities. All securities are valued by an independent pricing agent or broker. Illiquid securities at December 31, 2010, amounted to $52,990,816, or 2.7% of net assets. |
| 6 | Floating Rate Security. The rate listed is as of December 31, 2010. Date in parentheses represents the security’s next coupon rate reset. |
| 7 | Variable Rate Security. The rate listed is as of December 31, 2010, and is periodically reset subject to terms and conditions set forth in the debenture. |
| 8 | On September 12, 2008, The Bank of New York Mellon established a separate sleeve of the BNY Institutional Cash Reserves Fund (Series B) to hold certain Lehman Brothers floating rate notes. The Fund’s position in Series B is being fair valued daily. (See Note 4 in the Notes to the Financial Statements.) |
| 9 | Convertible Security. A corporate bond or preferred stock, usually a junior debenture, that can be converted, at the option of the holder, for a specific number of shares of the company’s preferred stock or common stock. Convertible Bonds and Convertible Preferred Stocks at December 31, 2010, amounted to $31,392,438, or 1.6% of net assets and $12,682,073, or 0.6% of net assets, respectively. |
The following table summarizes the inputs used to value the Fund’s net assets by the above fair value hierarchy levels as of December 31, 2010: (See Note 1(a) in the Notes to Financial Statements.)
| | | | | | | | | | | | | | | | |
| | | Quoted Prices in Active
Markets for Identical
Investments
Level 1 | | | Significant Other
Observable Inputs
Level 2 | | | Significant Unobservable Inputs
Level 3 | | | Total | |
Managers Bond Fund | | | | | | | | | | | | | | | | |
Investments in Securities | | | | | | | | | | | | | | | | |
Corporate Bonds† | | | — | | | $ | 1,487,201,982 | | | | — | | | $ | 1,487,201,982 | |
Foreign Government Obligations | | | — | | | | 88,960,745 | | | | — | | | | 88,960,745 | |
Municipal Bonds | | | — | | | | 26,730,714 | | | | — | | | | 26,730,714 | |
Asset-Backed Securities | | | — | | | | 90,652,139 | | | | — | | | | 90,652,139 | |
U.S. Government and Agency Obligations†† | | | — | | | | 162,256,396 | | | | — | | | | 162,256,396 | |
Mortgage-Backed Securities | | | — | | | | 25,247,386 | | | | — | | | | 25,247,386 | |
Preferred Stocks | | $ | 19,549,982 | | | | — | | | | — | | | | 19,549,982 | |
Short-Term Investments | | | 136,851,200 | | | | 1,316,722 | | | | — | | | | 138,167,922 | |
| | | | | | | | | | | | | | | | |
Total Investments | | $ | 156,401,182 | | | $ | 1,882,366,084 | | | | — | | | $ | 2,038,767,266 | |
| | | | | | | | | | | | | | | | |
| † | All corporate bonds held in the Fund are Level 2 securities. For a detailed break-out of the corporate bonds by major industry classification, please refer to the Schedule of Portfolio Investments. |
| †† | All U.S. Government and Agency Obligations held in the Fund are Level 2 securities. For a detailed break-out of these securities, please refer to the Schedule of Portfolio Investments. |
As of December 31, 2010, the Fund had no significant transfers between Level 1 and Level 2 from the beginning of the reporting period.
The accompanying notes are an integral part of these financial statements.
17
Notes to Schedule of Portfolio Investments (continued)
| | |
| Investments Definitions and Abbreviations: |
| AGM: | | Assured Guaranty Municipal Corp. |
| AMBAC: | | American Municipal Bond Assurance Corp. |
| BHAC: | | Berkshire Hathaway Assurance Corp. |
EMTN: | | European Medium Term Note |
FHLMC: | | Federal Home Loan Mortgage Corp. |
FHLB: | | Federal Home Loan Bank |
FNMA: | | Federal National Mortgage Association |
GDIF: | | Global Debt Insurance Facility |
GMAC: | | General Motors Acceptance Corp. |
GMTN: | | Global Multi-Currency Notes |
MBIA: | | MBIA Insurance Corp. |
MTN: | | Medium Term Note |
NATL-RE: | | National Public Finance Guarantee Corporation |
USTB: | | United States Treasury Bonds |
USTN: | | United States Treasury Notes |
Abbreviations have been used throughout the portfolios to indicate amounts shown in currencies other than the U.S. Dollar (USD):
| | |
AUD: | | Australian Dollar |
BRL: | | Brazilian Real |
CAD: | | Canadian Dollar |
EUR: | | euro |
IDR: | | Indonesian Rupiah |
MXN: | | Mexican Peso |
NZD: | | New Zealand Dollar |
SGD: | | Singapore Dollar |
The accompanying notes are an integral part of these financial statements.
18
Managers Bond Fund
Statement of Assets and Liabilities
December 31, 2010
| | | | |
Assets: | | | | |
Investments at value (including securities on loan valued at $107,368,394)* | | $ | 2,038,767,266 | |
Foreign currency** | | | 10,927,515 | |
Receivable for investments sold | | | 31,035,779 | |
Receivable for Fund shares sold | | | 3,474,363 | |
Receivable from affiliate | | | 106,655 | |
Dividends, interest and other receivables | | | 26,773,082 | |
Prepaid expenses | | | 39,901 | |
Total assets | | | 2,111,124,561 | |
Liabilities: | | | | |
Payable for Fund shares repurchased | | | 11,874,869 | |
Payable upon return of securities loaned | | | 110,691,054 | |
Accrued expenses: | | | | |
Investment advisory and management fees | | | 1,074,145 | |
Administrative fees | | | 429,658 | |
Other | | | 679,011 | |
Total liabilities | | | 124,748,737 | |
Net Assets | | $ | 1,986,375,824 | |
Shares outstanding | | | 77,574,413 | |
Net asset value, offering and redemption price per share | | $ | 25.61 | |
Net Assets Represent: | | | | |
Paid-in capital | | $ | 1,971,113,960 | |
Undistributed net investment income | | | 1,680,657 | |
Accumulated net realized loss from investments and foreign currency transactions | | | (85,704,107 | ) |
Net unrealized appreciation of investments and foreign currency translations | | | 99,285,314 | |
Net Assets | | $ | 1,986,375,824 | |
* Investments at cost | | $ | 1,940,189,944 | |
** Foreign currency at cost | | $ | 10,350,024 | |
The accompanying notes are an integral part of these financial statements.
19
Managers Bond Fund
Statement of Operations
For the year ended December 31, 2010
| | | | |
Investment Income: | | | | |
Interest income | | $ | 119,099,015 | |
Dividend income | | | 1,628,993 | |
Securities lending fees | | | 125,498 | |
Total investment income | | | 120,853,506 | |
Expenses: | | | | |
Investment management and advisory fees | | | 13,533,289 | |
Administrative fees | | | 5,413,316 | |
Transfer agent | | | 2,598,695 | |
Professional fees | | | 394,488 | |
Custodian | | | 372,480 | |
Reports to shareholders | | | 328,521 | |
Trustees fees and expenses | | | 181,126 | |
Registration fees | | | 111,213 | |
Miscellaneous | | | 134,507 | |
Total expenses before offsets | | | 23,067,635 | |
Expense reimbursements | | | (1,627,692 | ) |
Fee waivers | | | (20,078 | ) |
Expense reductions | | | (3,164 | ) |
Net expenses | | | 21,416,701 | |
Net investment income | | | 99,436,805 | |
Net Realized and Unrealized Gain (Loss): | | | | |
Net realized loss on investments | | | (9,953,553 | ) |
Net realized loss on foreign currency transactions | | | (767,099 | ) |
Net change in unrealized appreciation of investments | | | 127,953,704 | |
Net change in unrealized appreciation of foreign currency translations | | | 674,959 | |
Net realized and unrealized gain | | | 117,908,011 | |
Net increase in net assets resulting from operations | | $ | 217,344,816 | |
The accompanying notes are an integral part of these financial statements.
20
Managers Bond Fund
Statement of Changes in Net Assets
For the year ended December 31,
| | | | | | | | |
| | | 2010 | | | 2009 | |
Increase (Decrease) in Net Assets From Operations: | | | | | | | | |
Net investment income | | $ | 99,436,805 | | | $ | 120,096,032 | |
Net realized loss on investments and foreign currency transactions | | | (10,720,652 | ) | | | (59,485,276 | ) |
Net change in unrealized appreciation of investments and foreign currency translations | | | 128,628,663 | | | | 486,057,459 | |
Net increase in net assets resulting from operations | | | 217,344,816 | | | | 546,668,215 | |
Distributions to Shareholders: | | | | | | | | |
From net investment income | | | (100,016,927 | ) | | | (118,309,043 | ) |
From Capital Share Transactions: | | | | | | | | |
Proceeds from sale of shares | | | 514,097,164 | | | | 684,473,826 | |
Reinvestment of dividends and distributions | | | 92,243,870 | | | | 108,826,420 | |
Cost of shares repurchased | | | (930,994,796 | ) | | | (916,876,877 | ) |
Net decrease from capital share transactions | | | (324,653,762 | ) | | | (123,576,631 | ) |
Total increase (decrease) in net assets | | | (207,325,873 | ) | | | 304,782,541 | |
Net Assets: | | | | | | | | |
Beginning of year | | | 2,193,701,697 | | | | 1,888,919,156 | |
End of year | | $ | 1,986,375,824 | | | $ | 2,193,701,697 | |
End of year undistributed net investment income | | $ | 1,680,657 | | | ($ | 2,015,831 | ) |
| | | | | | | | |
Share Transactions: | | | | | | | | |
Sale of shares | | | 20,305,382 | | | | 31,756,529 | |
Reinvested shares | | | 3,644,161 | | | | 5,009,261 | |
Shares repurchased | | | (36,671,325 | ) | | | (42,593,625 | ) |
Net decrease in shares | | | (12,721,782 | ) | | | (5,827,835 | ) |
The accompanying notes are an integral part of these financial statements.
21
Financial Highlights
For a share outstanding throughout each year
| | | | | | | | | | | | | | | | | | | | |
| | | For the year ended December 31, | |
Managers Bond Fund | | 2010 | | | 2009 | | | 2008 | | | 2007 | | | 2006 | |
Net Asset Value, Beginning of Year | | $ | 24.29 | | | $ | 19.65 | | | $ | 25.34 | | | $ | 24.84 | | | $ | 24.11 | |
| | | | | |
Income from Investment Operations: | | | | | | | | | | | | | | | | | | | | |
Net investment income | | | 1.16 | 5 | | | 1.30 | 5 | | | 1.42 | 5 | | | 1.22 | 5 | | | 1.08 | |
Net realized and unrealized gain (loss) on investments | | | 1.34 | 5 | | | 4.62 | 5 | | | (5.42 | )5 | | | 0.49 | 5 | | | 0.75 | |
Total from investment operations | | | 2.50 | | | | 5.92 | | | | (4.00 | ) | | | 1.71 | | | | 1.83 | |
| | | | | |
Less Distributions to Shareholders from: | | | | | | | | | | | | | | | | | | | | |
Net investment income | | | (1.18 | ) | | | (1.28 | ) | | | (1.41 | ) | | | (1.21 | ) | | | (1.10 | ) |
Net realized gain on investments | | | — | | | | — | | | | (0.28 | ) | | | (0.00 | )4 | | | — | |
Total distributions to shareholders | | | (1.18 | ) | | | (1.28 | ) | | | (1.69 | ) | | | (1.21 | ) | | | (1.10 | ) |
| | | | | |
Net Asset Value, End of Year | | $ | 25.61 | | | $ | 24.29 | | | $ | 19.65 | | | $ | 25.34 | | | $ | 24.84 | |
Total Return1 | | | 10.47 | %3 | | | 31.12 | %3 | | | (16.31 | )% | | | 7.06 | % | | | 7.79 | %3 |
Ratio of net expenses to average net assets | | | 0.99 | % | | | 0.99 | % | | | 0.99 | % | | | 0.99 | % | | | 0.99 | % |
Ratio of net investment income to average net assets1 | | | 4.59 | % | | | 5.93 | % | | | 6.10 | % | | | 4.91 | % | | | 4.52 | % |
Portfolio turnover | | | 17 | % | | | 23 | % | | | 39 | % | | | 21 | % | | | 46 | % |
Net assets at end of year (000’s omitted) | | $ | 1,986,376 | | | $ | 2,193,702 | | | $ | 1,888,919 | | | $ | 2,022,891 | | | $ | 906,776 | |
| | | | | | | | | | | | | | | | | | | | |
Ratios absent expense offsets:2 | | | | | | | | | | | | | | | | | | | | |
Ratio of total expenses to average net assets | | | 1.06 | % | | | 1.10 | % | | | 1.10 | % | | | 0.99 | % | | | 1.02 | % |
Ratio of net investment income to average net assets | | | 4.52 | % | | | 5.82 | % | | | 5.99 | % | | | 4.91 | % | | | 4.49 | % |
| | | | | | | | | | | | | | | | | | | | |
| 1 | Total returns and net investment income would have been lower had certain expenses not been reduced. (See Note 1(c) to the Notes to Financial Statements.) |
| 2 | Excludes the impact of expense reimbursement and expense offsets such as brokerage credits, but includes non-reimbursable expenses, if any, such as interest and taxes. (See Note 1(c) to the Notes to Financial Statements.) |
| 3 | The Total Return is based on the Financial Statement Net Asset Values as shown above. |
| 4 | Rounds to less than $0.01. |
| 5 | Per share numbers have been calculated using average shares. |
22
Notes to Financial Statements
December 31, 2010
| 1. | Summary of Significant Accounting Policies |
The Managers Funds (the “Trust”) is an open-end management investment company organized as a Massachusetts business trust and registered under the Investment Company Act of 1940, as amended (the “1940 Act”). Currently, the Trust is comprised of a number of different funds, each having distinct investment management objectives, strategies, risks and policies. Included in this report is the Managers Bond Fund (“the Fund”).
The Fund’s financial statements are prepared in accordance with accounting principles generally accepted in the United States of America, which require management to make estimates and assumptions that affect the reported amounts of assets and liabilities and disclosure of contingent assets and liabilities at the date of the financial statements and the reported amounts of income and expenses during the reporting periods. Actual results could differ from those estimates and such differences could be material. The following is a summary of significant accounting policies followed by the Fund in the preparation of its financial statements:
| a. | Valuation of Investments |
Equity securities traded on a domestic or international securities exchange are valued at the last quoted sale price, or, lacking any sales, at the last quoted bid price. Over-the-counter securities are valued at the Nasdaq Official Closing Price, if one is available. Lacking any sales, over-the-counter securities are valued at the last quoted bid price. The Fund’s investments are generally valued based on market quotations provided by third-party pricing services approved by the Board of Trustees of the Fund. Under certain circumstances, the value of certain Fund investments may be based on an evaluation of its fair value, pursuant to procedures established by and under the general supervision of the Board of Trustees of the Fund. The Fund may use the fair value of a portfolio security to calculate its NAV when, for example, (1) market quotations are not readily available because a portfolio security is not traded in a public market or the principal market in which the security trades is closed, (2) trading in a portfolio security is suspended and has not resumed before the Fund calculates its NAV, (3) a significant event affecting the value of a portfolio security is determined to have occurred between the time of the market quotation provided for a portfolio security and the time as of which the Fund calculates its NAV, (4) a security’s price has remained unchanged over a period of time (often referred to as a “stale price”), or (5) Managers Investment Group LLC (the “Investment Manager”) determines that a market quotation is inaccurate. Portfolio investments that trade primarily on foreign markets are priced based upon the market quotation of such securities as of the close of their respective principal markets, as adjusted to reflect the Investment Manager’s determination of the impact of events occurring subsequent to the close of such markets but prior to the time as of which the Fund calculates its NAV. In accordance with procedures approved by the Board of Trustees, the Investment Manager relies upon recommendations of a third-
party fair valuation service in adjusting the prices of such foreign portfolio investments. The Fund may invest in securities that may be thinly traded. The Board of Trustees has adopted procedures to adjust prices when thinly traded securities are judged to be stale so that they reflect fair value. An investment valued on the basis of its fair value may be valued at a price higher or lower than available market quotations. An investment’s valuation may differ depending on the method used and the factors considered in determining value according to the Fund’s fair value procedures.
Fixed-income securities are valued based on valuations furnished by independent pricing services that utilize matrix systems, which reflect such factors as security prices, yields, maturities, and ratings, and are supplemented by dealer and exchange quotations. Short-term investments having a remaining maturity of 60 days or less are valued at amortized cost, which approximates market value. Investments in other open-end regulated investment companies are valued at their end of day net asset value per share. Investments in certain mortgage-backed and stripped mortgage-backed securities, preferred stocks, convertible securities, derivatives and other debt securities not traded on an organized securities market are valued on the basis of valuations provided by dealers or by a pricing service which uses information with respect to transactions in such securities and various relationships between securities and yield to maturity in determining value. Securities (including derivatives) for which market quotations are not readily available are valued at fair value, as determined in good faith, and pursuant to procedures adopted by the Board of Trustees of the Trust. The values assigned to fair value investments are based on available information and do not necessarily represent amounts that might ultimately be realized, since such amounts depend on future developments inherent in long-term investments. Further, because of the inherent uncertainty of valuation, those estimated values may differ significantly from the values that would have been used had a ready market for the investments existed, and the differences could be material.
Generally Accepted Accounting Principles (GAAP) define fair value as the price that a Fund would receive to sell an asset or pay to transfer a liability in an orderly transaction between market participants at the measurement date. GAAP also establishes a framework for measuring fair value, and a three-level hierarchy for fair value measurements based upon the transparency of inputs to the valuation of an asset or liability. Inputs may be observable or unobservable and refer broadly to the assumptions that market participants would use in pricing the asset or liability. Observable inputs reflect the assumptions market participants would use in pricing the asset or liability based on market data obtained from sources independent of the Fund. Unobservable inputs reflect the Fund’s own assumptions about the assumptions that market participants would use in pricing the asset or liability developed based on the best information available in the circumstances. Each investment is assigned a level based upon the observability of the inputs which are significant to the overall valuation.
Notes to Financial Statements (continued)
The three-tier hierarchy of inputs is summarized below:
Level 1 – inputs are quoted prices in active markets for identical investments (e.g., equity securities, open-end investment companies, futures contracts, options contracts)
Level 2 – other observable inputs (including, but not limited to: quoted prices for similar assets or liabilities in markets that are active, quoted prices for identical or similar assets or liabilities in markets that are not active, inputs other than quoted prices that are observable for the assets or liabilities (such as interest rates, yield curves, volatilities, prepayment speeds, loss severities, credit risks and default rates) or other market corroborated inputs) (e.g., debt securities, government securities, swap contracts, foreign currency exchange contracts, foreign securities utilizing international fair value pricing, broker-quoted securities, fair valued securities with observable inputs)
Level 3 – inputs are significant unobservable inputs (including the Fund’s own assumptions used to determine the fair value of investments) (e.g., fair valued securities with unobservable inputs)
The inputs or methodologies used for valuing investments are not necessarily an indication of the risk associated with investing in those investments.
Security transactions are accounted for as of trade date. Realized gains and losses on securities sold are determined on the basis of identified cost.
| c. | Investment Income and Expenses |
Dividend income is recorded on the ex-dividend date except certain dividends from foreign securities where the ex-dividend date may have passed. These dividends are recorded as soon as the Trust is informed of the ex-dividend date. Dividend income on foreign securities is recorded net of any withholding tax. Interest income, which includes amortization of premium and accretion of discount on debt securities, is accrued as earned. Non-cash dividends included in dividend income, if any, are reported at the fair market value of the securities received. Other income and expenses are recorded on an accrual basis. Expenses that cannot be directly attributed to a fund are apportioned among the Funds in the Trust and in some cases other affiliated funds based upon their relative average net assets or number of shareholders.
The Fund has a “balance credit” arrangement with The Bank of New York Mellon (“BNYM”), the Fund’s custodian, whereby the Fund is credited with an interest factor equal to 0.75% below the effective 90-day T-Bill rate for account balances left uninvested overnight. If the T-Bill rate falls below 0.75%, no credits will be earned. These credits serve to reduce custody expenses that would otherwise be charged to the Fund. For the year ended December 31, 2010, the custodian expense was not reduced.
Overdrafts will cause a reduction of any earnings credits, computed at 2% above the effective Federal Funds rate on the day of the overdraft. For the year ended December 31, 2010, the Fund had no overdraft fees.
The Trust also has a balance credit arrangement with its Transfer Agent, BNY Mellon Investment Servicing (US) Inc., (formerly PNC Global Investment Servicing (U.S.) Inc.), whereby earnings credits are used to offset banking charges and other out-of-pocket expenses. For the year ended December 31, 2010, the transfer agent expense was reduced by $3,164
The Investment Manager has agreed to waive a portion of its management fee in consideration of shareholder servicing fees that it has received from JPMorgan Distribution Services, Inc., with respect to short-term cash investments the Fund has made in JPMorgan Liquid Assets Money Market Fund, Capital Shares. For the year ended December 31, 2010, the management fee was reduced by $20,078.
Total returns and net investment income for the Fund would have been lower had certain expenses not been offset. Total expenses before offsets exclude the impact of expense reimbursements or fee waivers and expense offsets such as brokerage recapture credits, but include non-reimbursable expenses if any, such as interest and taxes.
| d. | Dividends and Distributions |
Dividends resulting from net investment income, if any, normally will be declared and paid monthly. Distributions of capital gains, if any, will be made annually in December and when required for Federal excise tax purposes. Income and capital gain distributions are determined in accordance with Federal income tax regulations, which may differ from GAAP. These differences are primarily due to differing treatments for losses deferred due to wash sales, equalization accounting for tax purposes, foreign currency, options, futures and market discount transactions. Permanent book and tax basis differences, if any, relating to shareholder distributions will result in reclassifications to paid-in capital. The tax character of distributions paid during the fiscal years ended December 31, 2010 and 2009 were as follows:
| | | | | | | | |
| | | 2010 | | | 2009 | |
Distributions paid from: | | | | | | | | |
Ordinary income | | $ | 100,016,927 | | | $ | 118,309,043 | |
Short-term capital gains | | | — | | | | — | |
Long-term capital gains | | | — | | | | — | |
| | | | | | | | |
Totals | | $ | 100,016,927 | | | $ | 118,309,043 | |
| | | | | | | | |
As a % of distributions paid: (unaudited) | |
Qualified ordinary income | | | — | | | | — | |
Ordinary income - dividends received deduction | | | — | | | | — | |
| | | | | | | | |
24
Notes to Financial Statements (continued)
As of December 31, 2010, the components of distributable earnings (excluding unrealized appreciation/depreciation) on a tax basis consisted of:
| | | | |
| | | 2010 | |
Capital loss carryforward | | $ | 85,272,120 | |
Undistributed ordinary income | | | 1,680,657 | |
Undistributed short-term capital gains | | | — | |
Undistributed long-term capital gains | | | — | |
The Fund intends to comply with the requirements under Subchapter M of the Internal Revenue Code of 1986, as amended, to distribute substantially all of its taxable income and gains to its shareholders and to meet certain diversification and income requirements with respect to investment companies. Therefore, no provision for Federal income or excise tax is included in the accompanying financial statements.
Additionally, based on the Fund’s understanding of the tax rules and rates related to income, gains and transactions for the foreign jurisdictions in which it invests, the Fund will provide for foreign taxes, and where appropriate, deferred foreign taxes.
Management has analyzed the Fund’s tax positions taken on federal income tax returns for all open tax years (tax years ended December 31, 2007-2010), and has concluded that no provision for federal income tax is required in the Fund’s financial statements. Additionally, the Fund is not aware of any tax position for which it is reasonably possible that the total amounts of unrecognized tax benefits will change materially in the next twelve months.
| f. | Capital Loss Carryovers |
As of December 31, 2010, the Fund had accumulated net realized capital loss carryover from securities transactions for Federal income tax purposes as shown in the following chart. These amounts may be used to offset realized capital gains, if any, through the expiration dates listed.
| | | | | | | | |
Fund | | Capital Loss
Carryover Amount | | | Expires
December 31, | |
Bond Fund | | $ | 69,964,824 | | | | 2017 | |
| | | 15,307,296 | | | | 2018 | |
| | | | | | | | |
Total | | $ | 85,272,120 | | | | | |
| | | | | | | | |
For the year ended December 31, 2010, the Fund did not utilize any capital loss carryovers.
The Trust’s Declaration of Trust authorizes for each series the issuance of an unlimited number of shares of beneficial interest, without par value. The Fund records sales and repurchases of its capital stock on the trade date. The cost of securities contributed to the Fund in connection with the issuance of shares is based on the valuation of those securities in accordance with the Fund’s policy on investment valuation. Dividends and distributions to shareholders are recorded on the ex-dividend date.
At December 31, 2010, certain unaffiliated shareholders of record, specifically omnibus accounts, individually held greater than 10% of the outstanding shares of the Fund as follows: three collectively own 63%. Transactions by these shareholders may have a material impact on the Fund.
| h. | Foreign Currency Translation |
The books and records of the Fund are maintained in U.S. dollars. The value of investments, assets and liabilities denominated in currencies other than U.S. dollars are translated into U.S. dollars based upon current foreign exchange rates. Purchases and sales of foreign investments, income and expenses are converted into U.S. dollars based on currency exchange rates prevailing on the respective dates of such transactions. Net realized and unrealized gain (loss) on foreign currency transactions represent: (1) foreign exchange gains and losses from the sale and holdings of foreign currencies; (2) gains and losses between trade date and settlement date on investment securities transactions and forward foreign currency exchange contracts; and (3) gains and losses from the difference between amounts of interest and dividends recorded and the amounts actually received.
The Fund does not isolate the net realized and unrealized gain or loss resulting from changes in exchange rates from the fluctuations in market prices of securities held. Such fluctuations are included with the net realized and unrealized gain or loss on investments.
| 2. | Agreements and Transactions with Affiliates |
The Trust has entered into an Investment Management Agreement under which the Investment Manager, an independently managed subsidiary of Affiliated Managers Group, Inc. (“AMG”), serves as investment manager to the Fund and is responsible for the Fund’s overall administration. The Investment Manager selects subadvisors for the Fund (subject to Trustee approval) and monitors each subadvisor’s investment programs and results. The Fund’s investment portfolio is managed by a portfolio manager who serves pursuant to a Subadvisory Agreement with the Investment Manager.
Investment management fees are paid directly by the Fund to the Investment Manager based on average daily net assets. For the year ended December 31, 2010, the annual investment management fee rate, as a percentage of average daily net assets, was 0.625%.
25
Notes to Financial Statements (continued)
The Trust has entered into an Administration and Shareholder Servicing Agreement under which the Investment Manager serves as the Fund’s administrator (the “Administrator”) and is responsible for all aspects of managing the Fund’s operations, including administration and shareholder services to the Fund, its shareholders, and certain institutions, such as bank trust departments, broker-dealers and registered investment advisers, that advise or act as an intermediary with the Fund’s shareholders. The Fund pays a fee to the Administrator at the rate of 0.25% per annum of the Fund’s average daily net assets for this service.
The Investment Manager has contractually agreed, through at least May 1, 2011, to waive fees and pay or reimburse expenses to the extent that the total annual operating expenses (exclusive of taxes, interest, brokerage costs, acquired fund expenses, and extraordinary expenses) of the Fund exceed 0.99% of the Fund’s average daily net assets.
The Fund is obligated to repay the Investment Manager such amounts waived, paid or reimbursed in future years provided that the repayment occurs within thirty-six (36) months after the waiver or reimbursement and that such repayment would not cause the Fund’s total operating expenses in any such future year to exceed that Fund’s respective expense cap. For the year ended December 31, 2010, the Fund made no such repayments to the Investment Manager. For the year ended December 31, 2010, the Fund’s components of reimbursement are detailed in the following chart:
| | | | |
Reimbursement Available - 12/31/09 | | $ | 4,827,421 | |
Additional Reimbursements | | | 1,627,692 | |
Repayments | | | — | |
Expired Reimbursements | | | (76,238 | ) |
| | | | |
Reimbursement Available - 12/31/10 | | $ | 6,378,875 | |
| | | | |
The aggregate annual retainer paid to each Independent Trustee is $65,000, plus $4,000 or $2,500 for each regular or special meeting attended, respectively. The Trustees’ fees and expenses are allocated amongst all of the Funds for which the Investment Manager serves as the advisor (the “Managers Funds”) based on the relative net assets of such Funds. The Independent Chairman of the Trusts receives an additional payment of $15,000 per year. The Chairman of the Audit Committee receives an additional payment of $5,000 per year. The “Trustees fees and expenses” shown in the financial statements represents the Fund’s allocated portion of the total fees and expenses paid by the Managers Funds.
The Fund is distributed by Managers Distributors, Inc. (the “Distributor” or “MDI”), a wholly-owned subsidiary of the Investment Manager. MDI serves as the principal underwriter for the Fund and is a registered broker-dealer and member of the Financial Industry Regulatory Authority, Inc. (“FINRA”). Shares of the Fund will be continuously offered and will be sold by brokers, dealers or other financial intermediaries who have executed selling agreements with the
Distributor. MDI bears all the expenses of providing services pursuant to the Underwriting Agreement, including the payment of the expenses relating to the distribution of Prospectuses for sales purposes and any advertising or sales literature. Certain Trustees and Officers of the Fund are Officers and/or Directors of the Investment Manager, AMG and/or the Distributor.
On June 23, 2009, the Securities and Exchange Commission granted an exemptive order that permits the Fund to lend and borrow money for certain temporary purposes directly to and from other eligible Funds in the Managers Family of Funds (the “Fund Family”). Participation in this interfund lending program is voluntary for both borrowing and lending Funds, and an interfund loan is only made if it benefits each participating Fund. The Investment Manager administers the program according to procedures approved by the Funds’ Board of Trustees (the “Board”), and the Board monitors the operation of the program. An interfund loan must comply with certain conditions set out in the exemptive order, which are designed to assure fairness and protect all participating Funds. For the year ended December 31, 2010, the Fund lent to other Funds in the Fund Family varying amounts up to $2,081,574 for 7 days earning interest of $159. The interest amounts are included in the Statement of Operations in interest income. For the same period, the Fund did not borrow from any Fund in the Fund Family.
| 3. | Purchases and Sales of Securities |
Purchases and sales of securities (excluding short-term securities and U.S. government obligations) for the year ended December 31, 2010, were $239,799,212 and $458,571,702, respectively. Purchases and sales of U.S. government obligations for the year ended December 31, 2010, were $94,268,532 and $137,700,824, respectively.
| 4. | Portfolio Securities Loaned |
For the year ended December 31, 2010, the Fund participated in a securities lending program offered by BNYM, providing for the lending of securities to qualified brokers. Securities lending fees include earnings of such temporary cash investments, plus or minus any rebate to a borrower. These earnings (after any rebate) are then divided between BNYM, as a fee for its services under the program, and the Fund, according to agreed-upon rates. Collateral on all securities loaned is accepted in cash and/or government securities and is maintained at a minimum level of 102% (105% in the case of certain foreign securities) of the market value, plus interest, if applicable, of investments on loan. It is the Fund’s policy to obtain additional collateral from or return excess collateral to the borrower by the end of the next business day, following the valuation date of the securities loaned. Therefore, the value of the collateral held may be temporarily less than the value of the securities on loan. Lending securities entails a risk of loss to the Fund if and to the extent that the market value of the securities loaned were to increase and the borrower did not increase the collateral accordingly, and the borrower fails to return the securities. The Fund bears the risk of any deficiency in the amount of the collateral available for return
26
Notes to Financial Statements (continued)
to the borrower due to any loss on the collateral invested. Collateral received in the form of cash is invested temporarily in the BNY Mellon Overnight Government Fund, formerly the BNY Institutional Cash Reserves Fund (the “ICRF”), or other short-term investments as defined in the Securities Lending Agreement with BNYM.
Effective August 2, 2010, the Trust, on behalf of the Fund, entered into an agreement with The Bank of New York Mellon and the Bank of New York Mellon Corporation (“BNYMC”) with respect to the Fund’s position in the ICRF, pursuant to which (i) BNYMC will support the value of certain defaulted securities issued by Lehman Brothers Holdings, Inc. and held by ICRF, and (ii) if certain conditions are met, BNYMC will purchase the defaulted securities from the Fund in September 2011. The Fund is fair valuing its position in the ICRF daily based on the agreement. The Fund’s position in the separate sleeve of the ICRF is included in the Schedule of Portfolio Investments and the unrealized loss on such investment is included in Net Unrealized Appreciation on the Statement of Assets and Liabilities and the Statement of Operations.
| 5. | Commitments and Contingencies |
In the normal course of business, the Fund enters into contracts and agreements that contain a variety of representations and warranties, which provide general indemnifications. The maximum exposure to the Fund under these arrangements is unknown, as this would involve future claims that may be made against the Fund that have not yet occurred. However, based on experience, the Fund expects the risk of loss to be remote.
| 6. | Risks Associated with High Yield Securities |
Investing in high yield securities involves greater risks and considerations not typically associated with U.S. Government and other high quality/investment grade securities. High Yield securities are generally below investment grade securities and do not have an established retail secondary market. Economic downturns may disrupt the high yield market and impair the issuer’s ability to repay principal and interest. Also, an increase in interest rates would likely have an adverse impact on the value of such obligations and could cause the securities to become less liquid.
Certain transactions, such as futures and forward transactions, dollar roll agreements, or purchases of when-issued or delayed delivery securities may have a similar effect on the Fund’s net asset value as if the Fund had created a degree of leverage in its portfolio. For the year ended December 31, 2010, the fund did not enter any Forward Commitments. However, if the Fund enters into such a transaction, the Fund will establish a segregated account with its custodian in which it will maintain cash, U.S. government securities or other liquid securities equal in value to its obligations in respect to such transaction. Securities and other assets held in the segregated account may not be sold while the transaction is outstanding, unless other suitable assets are substituted.
The Fund has determined that no material events or transactions occurred through the issuance date of the Fund’s financial statements which require additional disclosure in or adjustment of the Fund’s financial statements.
Tax Information (unaudited)
The Fund hereby designates the maximum amount allowable of its net taxable income as qualified dividends as provided in the Jobs and Growth Tax Relief Reconciliation Act of 2003. The 2010 Form 1099-DIVs you receive for the Fund will show the tax status of all distributions paid to you during the respective calendar year.
Pursuant to section 852 of the Internal Revenue Code, the Fund hereby designates as a capital gain distribution with respect to the taxable year ended December 31, 2010, $0, or, if subsequently determined to be different, the net capital gains of such year.
27
Report of Independent Registered Public Accounting Firm
To the Board of Trustees of The Managers Funds and the Shareholders of Managers Bond Fund:
In our opinion, the accompanying statement of assets and liabilities, including the schedule of portfolio investments, and the related statements of operations and of changes in net assets and the financial highlights present fairly, in all material respects, the financial position of Managers Bond Fund (one of the series constituting The Managers Funds, hereafter referred to as the “Fund”) at December 31, 2010, the results of its operations for the year then ended, the changes in its net assets for each of the two years in the period then ended and the financial highlights for each of the five years in the period then ended, in conformity with accounting principles generally accepted in the United States of America. These financial statements and financial highlights (hereafter referred to as “financial statements”) are the responsibility of the Fund’s management; our responsibility is to express an opinion on these financial statements based on our audits. We conducted our audits of these financial statements in accordance with the standards of the Public Company Accounting Oversight Board (United States). Those standards require that we plan and perform the audit to obtain reasonable assurance about whether the financial statements are free of material misstatement. An audit includes examining, on a test basis, evidence supporting the amounts and disclosures in the financial statements, assessing the accounting principles used and significant estimates made by management, and evaluating the overall financial statement presentation. We believe that our audits, which included confirmation of securities at December 31, 2010 by correspondence with the custodian, provide a reasonable basis for our opinion.
PricewaterhouseCoopers, LLP
Philadelphia, Pennsylvania
February 18, 2011
28
Trustees and Officers
The Trustees and Officers of the Trust, their business addresses, principal occupations for the past five years and dates of birth are listed below. The Trustees provide broad supervision over the affairs of the Trust and the Funds. The Trustees are experienced executives who meet periodically throughout the year to oversee the Funds’ activities, review contractual arrangements with companies that provide services to the Funds, and review the Funds’ performance. Unless otherwise noted, the address of each Trustee or Officer is the address of the Trust: 800 Connecticut Avenue, Norwalk, Connecticut 06854.
There is no stated term of office for Trustees. Trustees serve until their resignation, retirement or removal in accordance with the Trust’s organizational documents and policies adopted by the Board from time to time. The Chairman of the Trustees, President, Treasurer and Secretary of the Trust are elected by the Trustees annually. Other officers hold office at the pleasure of the Trustees.
Independent Trustees
The following Trustees are not “interested persons” of the Trust within the meaning of the 1940 Act:
| | |
Name, Date of Birth, Number of Funds Overseen in Fund Complex* | | Principal Occupation(s) During Past 5
Years and Other Directorships Held by Trustee |
Jack W. Aber, 9/9/37 • Trustee since 1999 • Oversees 41 Funds in Fund Complex | | Professor of Finance, Boston University School of Management (1972-Present); Trustee of Appleton Growth Fund (1 portfolio); Trustee of Third Avenue Trust (5 portfolios); Trustee of Third Avenue Variable Trust (1 portfolio); Trustee of Aston Funds (24 portfolios). |
| |
William E. Chapman, II, 9/23/41 • Independent Chairman • Trustee since 1999 • Oversees 41 Funds in Fund Complex | | President and Owner, Longboat Retirement Planning Solutions (1998-Present); Hewitt Associates, LLC (part time) (provider of Retirement and Investment Education Seminars) (2002-2009); Trustee of Bowdoin College (2002-Present);Director of Harding, Loevner Funds, Inc. (6 portfolios); Trustee of Third Avenue Trust (5 portfolios); Trustee of Third Avenue Variable Trust (1 portfolio); Trustee of Aston Funds (24 portfolios). |
| |
Edward J. Kaier, 9/23/45 • Trustee since 1999 • Oversees 41 Funds in Fund Complex | | Attorney at Law and Partner, Teeters Harvey Gilboy & Kaier LLP (2007-Present); Attorney at Law and Partner, Hepburn Willcox Hamilton & Putnam, LLP (1977-2007); Trustee of Third Avenue Trust (5 portfolios); Trustee of Third Avenue Variable Trust (1 portfolio); Trustee of Aston Funds (24 portfolios). |
| |
Steven J. Paggioli, 4/3/50 • Trustee since 1993 • Oversees 41 Funds in Fund Complex | | Consultant (2001-Present); Formerly Executive Vice President and Director, The Wadsworth Group (1986- 2001); Executive Vice President, Secretary and Director, Investment Company Administration, LLC (1990-2001); Vice President, Secretary and Director, First Fund Distributors, Inc. (1991-2001); Trustee, Professionally Managed Portfolios (40 portfolios); Advisory Board Member, Sustainable Growth Advisors, LP; Independent Director, Chase Investment Counsel (2008 – Present); Trustee of Aston Funds (24 portfolios). |
| |
Eric Rakowski, 6/5/58 • Trustee since 1999 • Oversees 41 Funds in Fund Complex | | Professor, University of California at Berkeley School of Law (1990-Present); Director of Harding, Loevner Funds, Inc. (6 portfolios); Trustee of Third Avenue Trust (5 portfolios); Trustee of Third Avenue Variable Trust (1 portfolio); Trustee of Aston Funds (24 portfolios). |
| |
Thomas R. Schneeweis, 5/10/47 • Trustee since 1987 • Oversees 41 Funds in Fund Complex | | Professor of Finance, University of Massachusetts (1977-Present); Director, CISDM at the University of Massachusetts, (1996-Present); President, Alternative Investment Analytics, LLC, (formerly Schneeweis Partners, LLC) (2001-Present); Partner, S Capital Management, LLC (2007-Present); Partner, TRS Associates (1982-Present); Trustee of Aston Funds (24 portfolios). |
| * | The Fund Complex consists of Managers AMG Funds, The Managers Funds, Managers Trust I and Managers Trust II. |
Interested Trustees
The following Trustees are “interested persons” of the Trust within the meaning of the 1940 Act. Mr. Dalton is an interested person by virtue of his positions with, and interest in securities of, Affiliated Managers Group, Inc. and his position with Managers Distributors, Inc. Mr. Streur is an interested person by virtue of his positions with Managers Investment Group LLC.
| | |
Name, Date of Birth, Number of Funds Overseen in Fund Complex* | | Principal Occupation(s) During Past 5
Years and Other Directorships Held by Trustee |
Nathaniel Dalton, 9/29/66 • Trustee since 2008 • Oversees 41 Funds in Fund Complex | | Executive Vice President and Chief Operating Officer, Affiliated Managers Group, Inc., (2006-Present); Executive Vice President, Affiliated Managers Group, Inc., (2002 -2006); Executive Vice President and General Counsel, Affiliated Managers Group, Inc. (2001-2002); Senior Vice President and General Counsel, Affiliated Managers Group, Inc. (1996-2001). Director, Managers Distributors, Inc. (2000-Present). |
| |
John H. Streur, 2/6/60 • Trustee since 2008 • President since 2008 • Oversees 41 Funds in Fund Complex | | Senior Managing Partner, Managers Investment Group LLC (2006-Present); President, Managers Distributors, Inc. (2006-Present); Managing Partner, Managers Investment Group LLC (2005-2006); Chief Executive Officer, President and Chief Operating Officer, The Burridge Group LLC (1996-2004). |
Officers
| | |
Name, Date of Birth, Position(s) Held with Fund and Length of Time Served | | Principal Occupation(s) During Past 5
Years |
Christine C. Carsman, 4/2/52 • Secretary since 2004 • Chief Legal Officer since 2004 | | Senior Vice President and Chief Regulatory Counsel, Affiliated Managers Group, Inc. (2004-Present); Secretary, Managers AMG Funds, Managers Trust I and Managers Trust II (2004-Present); Senior Counsel, Vice President and Director of Operational Risk Management and Compliance, Wellington Management Company, LLP (1995-2004); Deputy General Counsel, The Boston Company, Inc. (1993-1995); Associate General Counsel, The Boston Company Advisors, Inc. (1991-1993); Associate, Sullivan & Worcester LLP (1987-1991). |
| |
Donald S. Rumery, 5/29/58 • Chief Financial Officer since 2007 • Treasurer since 1995 | | Senior Vice President, Managers Investment Group LLC (2005-Present); Treasurer and Chief Financial Officer, Managers Distributors, Inc. (2000-Present); Treasurer, Managers AMG Funds (1999-Present); Treasurer, Managers Trust I and Managers Trust II (2000-Present); Chief Financial Officer, Managers AMG Funds, Managers Trust I and Managers Trust II (2007-Present); Vice President, The Managers Funds LLC, (1994-2004). |
| |
Keitha L. Kinne, 5/16/58 • Chief Operating Officer since 2007 | | Managing Partner and Chief Operating Officer, Managers Investment Group LLC (2007-Present); Chief Investment Officer, Managers Investment Group LLC (2008-Present); Chief Operating Officer, Managers AMG Funds, Managers Trust I and Managers Trust II (2007-Present); Managing Director, Legg Mason & Co., LLC (2006-2007); Managing Director, Citigroup Asset Management (2004-2006). |
| |
David Kurzweil, 6/22/74 • Assistant Secretary since 2008 | | Senior Vice President and Associate Counsel, Managers Investment Group LLC (2008-Present); Assistant Secretary, Managers AMG Funds, Managers Trust I and Managers Trust II (2008-Present); Counsel and Senior Vice President, Lazard Asset Management LLC (2003-2008). |
| |
John J. Ferencz, 3/09/62 • Chief Compliance Officer • Code of Ethics Reporting Officer • AML Compliance Officer • Sarbanes-Oxley Code of Ethics Compliance Officer since 2010 | | Vice President, Legal and Compliance, Managers Investment Group LLC (2010-Present); Senior Compliance Analyst, Mutual Funds and Regulatory, GE Asset Management Incorporated (2005-2010). |
29
THIS PAGE INTENTIONALLY LEFT BLANK
THIS PAGE INTENTIONALLY LEFT BLANK
Investment Manager and Administrator
Managers Investment Group LLC
333 W. Wacker Drive
Suite 1200
Chicago, IL 60606
(800) 835-3879
Distributor
Managers Distributors, Inc.
333 W. Wacker Drive
Suite 1200
Chicago, IL 60606
(800) 835-3879
Custodian
The Bank of New York Mellon
2 Hanson Place
Brooklyn, New York 11217
Legal Counsel
Ropes & Gray LLP
Prudential Tower, 800 Boylston Street
Boston, Massachusetts 02199-3600
Transfer Agent
BNY Mellon Investment Servicing (US) Inc.*
Attn: Managers
P.O. Box 9769
Providence, Rhode Island 02940
(800) 548-4539
For Managers Choice Only
Managers
c/o BNY Mellon Investment Servicing (US) Inc.*
P.O. Box 9847
Providence, Rhode Island 02940-8047
(800) 358-7668
| * | Formerly PNC Global Investment Servicing (U.S.) Inc. |

MANAGERS AND MANAGERS AMG FUNDS
| | | | |
EQUITY FUNDS | | BALANCED FUNDS |
CADENCE CAPITAL APPRECIATION CADENCE FOCUSED GROWTH CADENCE MID-CAP CADENCE EMERGING COMPANIES Cadence Capital Management, LLC CHICAGO EQUITY PARTNERS MID-CAP Chicago Equity Partners, LLC EMERGING MARKETS EQUITY Rexiter Capital Management Limited Schroder Investment Management North America Inc. ESSEX SMALL/MICRO CAP GROWTH Essex Investment Management Co., LLC FQ TAX-MANAGED U.S. EQUITY FQ U.S. EQUITY First Quadrant, L.P. FRONTIER SMALL CAP GROWTH Frontier Capital Management Company, LLC GW&K SMALL CAP EQUITY Gannett Welsh & Kotler, LLC INSTITUTIONAL MICRO-CAP MICRO-CAP Lord, Abbett & Co. LLC WEDGE Capital Management L.L.P. Next Century Growth Investors LLC RBC Global Asset Management (U.S.) Inc. | | INTERNATIONAL EQUITY AllianceBernstein L.P. Lazard Asset Management, LLC Martin Currie Inc. REAL ESTATE SECURITIES Urdang Securities Management, Inc. RENAISSANCE LARGE CAP GROWTH Renaissance Group LLC SKYLINE SPECIAL EQUITIES PORTFOLIO Skyline Asset Management, L.P. SPECIAL EQUITY Ranger Investment Management, L.P. Lord, Abbett & Co. LLC Smith Asset Management Group, L.P. Federated MDTA LLC SYSTEMATIC VALUE SYSTEMATIC MID CAP VALUE Systematic Financial Management, L.P. TIMESSQUARE MID CAP GROWTH TIMESSQUARE SMALL CAP GROWTH TSCM GROWTH EQUITY TimesSquare Capital Management, LLC TRILOGY GLOBAL EQUITY TRILOGY EMERGING MARKETS EQUITY TRILOGY INTERNATIONAL SMALL CAP Trilogy Global Advisors, L.P. | | CHICAGO EQUITY PARTNERS BALANCED Chicago Equity Partners, LLC ALTERNATIVE FUNDS FQ GLOBAL ALTERNATIVES FQ GLOBAL ESSENTIALS First Quadrant, L.P. INCOME FUNDS BOND (MANAGERS) FIXED INCOME GLOBAL BOND Loomis, Sayles & Co., L.P. BOND (MANAGERS PIMCO) Pacific Investment Management Co. LLC CALIFORNIA INTERMEDIATE TAX-FREE Miller Tabak Asset Management LLC GW&K MUNICIPAL BOND GW&K MUNICIPAL ENHANCED YIELD Gannett Welsh & Kotler, LLC HIGH YIELD J.P. Morgan Investment Management LLC INTERMEDIATE DURATION GOVERNMENT SHORT DURATION GOVERNMENT Smith Breeden Associates, Inc. |
| | |
| | |
| | |
| | |
| | |
| | |
| | |
| | |
| | |
| | |
| | |
| | |
| | |
| | |
| | |
| | |
| | |
| | |
| | |
| | |
| | |
| | |
| | |
| | |
| | |
| | |
| | |
| | |
| | |
| | |
| | |
| | |
| | |
| | | | |
This report is prepared for the Fund’s shareholders. It is authorized for distribution to prospective investors only when preceded or accompanied by an effective prospectus. To receive a free copy of the prospectus or Statement of Additional Information, which includes additional information about Fund Trustees, please contact us by calling 800.835.3879. Distributed by Managers Distributors, Inc., member FINRA. A description of the policies and procedures each Fund uses to vote its proxies is available: (i) without charge, upon request, by calling 800.835.3879, or (ii) on the Securities and Exchange Commission’s (SEC) Web site at www.sec.gov. For information regarding each Fund’s proxy voting record for the 12-month period ended June 30, call 800.835.3879 or visit the SEC Web site at www.sec.gov. The Fund files its complete schedule of portfolio holdings with the SEC for the first and third quarters of each fiscal year on Form N-Q. The Fund’s Forms N-Q are available on the SEC’s website at www.sec.gov. A Fund’s Forms N-Q may be reviewed and copied at the SEC’s Public Reference Room in Washington, DC. Information on the operation of the Public Reference Room may be obtained by calling 1-800-SEC-0330. To review a complete list of the Fund’s portfolio holdings, or to view the most recent quarterly holdings report, semiannual report, or annual report, please visit www.managersinvest.com. | | |
www.managersinvest.com
Registrant has adopted a Code of Ethics. See attached Exhibit (a) (1).
| Item 3. | AUDIT COMMITTEE FINANCIAL EXPERT |
Registrant’s Board of Trustees has determined that independent Trustees Mr. Jack W. Aber and Mr. Steven J. Paggioli each qualify as the Audit Committee Financial Expert. Mr. Aber and Mr. Paggioli are “independent” as such term is defined in Form N-CSR.
| Item 4. | PRINCIPAL ACCOUNTANT FEES AND SERVICES |
The aggregate fees billed by PwC to the Fund for the Funds’ two most recent fiscal years for professional services rendered for audits of annual financial statements, or services that are normally provided in connection with statutory and regulatory filings or engagements (“Audit Fees”) were as follows:
| | | | | | | | |
| | | Fiscal 2010 | | | Fiscal 2009 | |
Essex Large Cap Growth Fund | | | 18,458 | | | $ | 19,419 | |
Managers Special Equity Fund | | | 26,430 | | | $ | 31,489 | |
Managers International Equity Fund | | | 31,002 | | | $ | 32,617 | |
Managers Emerging Markets Equity Fund | | | 27,172 | | | $ | 28,587 | |
Managers Bond Fund | | | 38,556 | | | $ | 40,564 | |
Managers Global Bond Fund | | | 25,189 | | | $ | 26,501 | |
All Funds in the Managers Complex Audited by PwC | | | 994,109 | | | $ | 850,498 | |
Audit-Related Fees
There were no fees billed by PwC to the Funds in its two recent fiscal years for services rendered for assurance and related services that are reasonably related to the performance of the audit or review of the Fund’s financial statements, but are not reported as Audit Fees (“Audit-Related Fees”).
For the Funds’ two most recent fiscal years, there were no Audit-Related Fees billed by PwC for engagements related directly to the operations and financial reporting of one or more Funds by a Fund Service Provider. A Fund Service Provider is (a) any investment adviser to the Fund (not including any Subadvisor whose role is primarily portfolio management and is subcontracted with or overseen by another investment adviser) or (b) any entity that provides ongoing services to the Fund and is controlling, controlled by or under common control with a Fund investment adviser described in (a).
Tax Fees
The aggregate fees billed by PwC to the Funds for the two most recent fiscal years for professional services rendered for tax compliance, tax advice, and tax planning (“Tax Fees”) were as follows:
| | | | | | | | |
| | | Fiscal 2010 | | | Fiscal 2009 | |
Essex Large Cap Growth Fund | | | 7,200 | | | $ | 5,800 | |
Managers Special Equity Fund | | | 7,200 | | | $ | 8,050 | |
Managers International Equity Fund | | | 10,000 | | | $ | 9,100 | |
Managers Emerging Markets Equity Fund | | | 10,000 | | | $ | 10,100 | |
Managers Bond Fund | | | 10,000 | | | $ | 9,000 | |
Managers Global Bond Fund | | | 10,000 | | | $ | 8,550 | |
For the Funds’ two most recent fiscal years, Tax Fees billed by PwC for engagements by Fund Service Providers that related directly to the operations and financial reporting of the Funds were $0 for fiscal 2008 and $0 for fiscal 2007, respectively.
The services for which Tax Fees were charged comprise all services performed by professional staff in PwC’s tax division except those services related to the audit. Typically, this category would include fees for tax compliance, tax planning, and tax advice. Tax compliance, tax advice, and tax planning services include preparation of original and amended tax returns, claims for refund and tax payment-planning services, assistance with tax audits and appeals, tax advice related to mergers and acquisitions and requests for rulings or technical advice from taxing authorities.
All Other Fees
There were no other fees billed by PwC to the Funds for all other non-audit services (“Other Fees”) during the Funds’ two most recent fiscal years. During the same period, there were no Other Fees billed by PwC for engagements by Fund Service Providers that related directly to the operations and financial reporting of the Funds.
According to policies adopted by the Audit Committee, services provided by PwC to the Funds must be pre-approved by the Audit Committee. On an annual basis, the Audit Committee reviews and pre-approves various types of services that PwC may perform for the Funds without specific approval of each engagement, subject to specified budget limitations. As contemplated by the Sarbanes-Oxley Act of 2002 and related SEC rules, the Audit Committee also pre-approves non-audit services provided by PwC to any Fund Service Provider for any engagement that relates directly to the operations and financial reporting of the Funds. Any engagement that is not already pre-approved or that will exceed a pre-approved budget must be submitted to the Audit Committee for pre-approval. The Chairman of the Audit Committee is authorized on behalf of the Board of Trustees and the Audit Committee to approve the engagement of PwC to perform non-audit services subject to certain conditions, including notification to the Audit Committee of such pre-approval not later than the next meeting of the Audit Committee following the date of such pre-approval.
There were no other fees billed by PwC for non-audit services rendered to the Funds and to Fund Service Providers for the Funds’ two most recent fiscal years.
The Audit Committee has considered whether the provision of non-audit services by PwC to Fund Service Providers that were not required to be pre-approved by the Audit Committee is compatible with maintaining PwC’s independence in its audit of the Funds, taking into account representations from PwC, in accordance with Independence Standards Board Standard No. 1, regarding its independence from the Funds and its related entities.
The following table sets forth the non-audit services provided by PwC to the Funds and its service affiliates defined as the Funds’ investment advisor and any entity controlling, controlled by or under common control with Managers Investment Group LLC that provides ongoing services to the Funds (“Control Affiliates”) for the last two fiscal years.
| | | | | | | | | | | | | | | | | | | | | | | | |
| | | Audit-related fees A | | | Tax fees A | | | All other fees A | |
| | | 2009 | | | 2008 | | | 2009 | | | 2008 | | | 2009 | | | 2008 | |
Control Affiliates | | $ | 580,765 | | | $ | 343,015 | | | $ | 467,485 | | | $ | 897,895 | | | $ | 0 | | | $ | 0 | |
| A | Aggregate amounts may reflect rounding. |
| Item 5. | AUDIT COMMITTEE OF LISTED REGISTRANTS |
Not applicable.
| Item 6. | SCHEDULE OF INVESTMENTS |
Not applicable.
| Item 7. | DISCLOSURE OF PROXY VOTING POLICIES AND PROCEDURES FOR CLOSED-END MANAGEMENT INVESTMENT COMPANIES |
Not applicable.
| Item 8. | PORTFOLIO MANAGERS OF CLOSED-END MANAGEMENT INVESTMENT COMPANIES |
Not applicable.
| Item 9. | PURCHASES OF EQUITY SECURITIES BY CLOSED-END MANAGEMENT INVESTMENT COMPANIES AND AFFILIATED PURCHASERS |
Not applicable.
| Item 10. | SUBMISSION OF MATTERS TO A VOTE OF SECURITY HOLDERS |
Not applicable.
| Item 11. | CONTROLS AND PROCEDURES |
(a) The Registrant’s principal executive and principal financial officers have concluded, based on their evaluation of the registrant’s disclosure controls and procedures as of a date within 90 days of the filing of this report, that the Registrant’s disclosure
controls and procedures are reasonably designed to ensure that information required to be disclosed by the Registrant on Form N-CSR is recorded, processed, summarized and reported within the required time periods and that information required to be disclosed by the registrant in the reports that it files or submits on Form N-CSR is accumulated and communicated to the Registrant’s management, including its principal executive and principal financial officers, as appropriate to allow timely decisions regarding required disclosure.
(b) There were no changes in the Registrant’s internal control over financial reporting during the Registrant’s fourth fiscal quarter of the period covered by this report that have materially affected, or are reasonably likely to affect, the internal control over financial reporting.
| | |
(a) (1) | | Any Code of Ethics or amendments hereto. Filed herewith. |
| |
(a) (2) | | Certifications pursuant to Rule 30a-2(a) under the Investment Company Act of 1940 - Filed herewith. |
| |
(a) (3) | | Not applicable. |
| |
(b) | | Certifications pursuant to Rule 30a-2(b) under the Investment Company Act of 1940 - Filed herewith. |
SIGNATURES
Pursuant to the requirements of the Securities Exchange Act of 1934 and the Investment Company Act of 1940, the registrant has duly caused this report to be signed on its behalf by the undersigned, thereunto duly authorized.
| | |
| THE MANAGERS FUNDS |
| |
| By: | | /s/ John H. Streur |
| | John H. Streur, President |
| |
| Date: | | March 9, 2011 |
Pursuant to the requirements of the Securities Exchange Act of 1934 and the Investment Company Act of 1940, this report has been signed below by the following persons on behalf of the registrant and in the capacities and on the dates indicated.
| | |
| By: | | /s/ John H. Streur |
| | John H. Streur, President |
| |
| Date: | | March 9, 2011 |
| |
| By: | | /s/ Donald S. Rumery |
| | Donald S. Rumery, Chief Financial Officer |
| |
| Date: | | March 9, 2011 |