UNITED STATES
SECURITIES AND EXCHANGE COMMISSION
Washington, D.C. 20549
FORM N-CSR
CERTIFIED SHAREHOLDER REPORT OF REGISTERED
MANAGEMENT INVESTMENT COMPANIES
Investment Company Act file number: 811-03752
THE MANAGERS FUNDS
(Exact name of registrant as specified in charter)
800 Connecticut Avenue, Norwalk, Connecticut 06854
(Address of principal executive offices) (Zip code)
Managers Investment Group LLC
800 Connecticut Avenue, Norwalk, Connecticut 06854
(Name and address of agent for service)
Registrant’s telephone number, including area code: (203) 299-3500
| | |
| Date of fiscal year end: | | DECEMBER 31 |
| |
| Date of reporting period: | | JANUARY 1, 2011 – December 31, 2011 (Annual Shareholder Report) |
Item 1. Reports to Shareholders
The Managers Funds
Annual Report — December 31, 2011
| | | | |
TABLE OF CONTENTS | | Page | |
| |
LETTER TO SHAREHOLDERS | | | 1 | |
| |
ABOUT YOUR FUND’S EXPENSES | | | 3 | |
| |
INVESTMENT MANAGER’S COMMENTS, FUND SNAPSHOTS, AND SCHEDULES OF PORTFOLIO INVESTMENTS | | | | |
| |
Managers International Equity Fund | | | 4 | |
| |
Managers Emerging Markets Equity Fund | | | 12 | |
| |
Managers Global Bond Fund | | | 19 | |
| |
NOTES TO SCHEDULES OF PORTFOLIO INVESTMENTS | | | 27 | |
| |
FINANCIAL STATEMENTS: | | | | |
| |
Statements of Assets and Liabilities | | | 33 | |
Funds’ balance sheets, net asset value (NAV) per share computations and cumulative undistributed amounts | | | | |
| |
Statements of Operations | | | 34 | |
Detail of sources of income, Fund expenses, and realized and unrealized gains (losses) during the year | | | | |
| |
Statements of Changes in Net Assets | | | 35 | |
Detail of changes in Fund assets for the past two years | | | | |
| |
FINANCIAL HIGHLIGHTS | | | 37 | |
Historical net asset values per share, distributions, total returns, expense ratios, turnover ratios and net assets | | | | |
| |
NOTES TO FINANCIAL STATEMENTS | | | 39 | |
Accounting and distribution policies, details of agreements and transactions with Fund management and affiliates, and descriptions of certain investment risks | | | | |
| |
REPORT OF INDEPENDENT REGISTERED PUBLIC ACCOUNTING FIRM | | | 47 | |
| |
TRUSTEES AND OFFICERS | | | 48 | |
Nothing contained herein is to be considered an offer, sale or solicitation of an offer to buy shares of any series of the Managers Family of Funds. Such offering is made only by Prospectus, which includes details as to offering price and other material information.
Letter to Shareholders
Dear Shareholder:
Our foremost goal at Managers Investment Group (“MIG”) is to structure and manage mutual funds that will help our shareholders and clients successfully reach their investment goals and objectives.
Each of our Funds is geared to provide you with exposure to a specific asset class or style of investing. We believe investors tend to use our Funds as part of their broader portfolio in order to tailor their asset allocation to meet their individual needs. Most of our Funds, like those detailed in this report, are therefore designed to be building blocks.
At MIG, we have overall responsibility for the investment management and administration of the Funds. As a “manager of managers,” we work with external investment managers that make the day-to-day investment decisions in the Funds (the “Portfolio Managers”). We devote considerable resources to our disciplined process of identifying and selecting unaffiliated Portfolio Managers for the Funds. As a manager of managers, MIG performs many activities to monitor the ongoing investment, compliance, and administrative aspects of all of the Funds, which we believe gives our shareholders added confidence in their investments.
Both non-U.S. developed and emerging markets struggled in 2011, with a majority of losses concentrated in the third quarter. Early in the year, markets were surprisingly resilient given significant macroeconomic events such as the Arab Spring and the devastating consequences of the Japanese tsunami. However, markets were not nearly as resilient during the summer months as the fear of European sovereign debt contagion shook equity markets. In addition, the stalemate in Washington involving the U.S. debt ceiling along with the S&P downgrade of U.S. sovereign credit rating had a debilitating effect on non-U.S. equities as well. The end of September and into the fourth quarter, however, featured almost a complete reversal of the “risk off” trade from the summer months with markets responding positively both to the coordinated efforts of European policymakers to head off issues surrounding their collective sovereign debt crisis. International equities, however, were never able to fully recover as they did in the U.S. As for global bond markets, a low interest rate environment throughout the year continued to reinforce the reach for yield. Bond markets were generally positive amidst the volatility and were led by government issues as measured by the Barclays Capital Global Government Bond Index which returned 9.13% for the year.
| | | | | | | | | | | | | | | | | | | | | | | | |
Periods Ended 12/31/11 | | 6 Months | | | 1 Year | | | 3 Years | | | 5 Years | | | 10 Years | | | Inception Date | |
Managers International Equity Fund | | | (17.81) | % | | | (13.98) | % | | | 5.72 | % | | | (7.07) | % | | | 2.69 | % | | | 12/31/1985 | |
MSCI EAFE Index (Net) | | | (16.31) | % | | | (12.14) | % | | | 7.65 | % | | | (4.72) | % | | | 4.67 | % | | | | |
Managers Emerging Markets Equity Fund | | | (20.77) | % | | | (20.31) | % | | | 15.07 | % | | | (2.32) | % | | | 11.01 | % | | | 2/9/1998 | |
MSCI EM Index (Net) | | | (19.13) | % | | | (18.42) | % | | | 20.07 | % | | | 2.40 | % | | | 13.86 | % | | | | |
MSCI EM Index (Gross) | | | (19.01) | % | | | (18.17) | % | | | 20.42 | % | | | 2.70 | % | | | 14.20 | % | | | | |
| |
Managers Global Bond Fund | | | (1.50) | % | | | 3.39 | % | | | 11.28 | % | | | 5.90 | % | | | 7.89 | % | | | 3/25/1994 | |
Barclays Capital Global Aggregate Bond Index | | | 1.21 | % | | | 5.64 | % | | | 6.04 | % | | | 6.46 | % | | | 7.16 | % | | | | |
For the year ended December 31, 2011, the Managers International Equity Fund returned -13.98%, underperforming the return of -12.14% for the MSCI EAFE Index. For the year ended December 31, 2011, the Managers Emerging Markets Equity Fund returned -20.31%, underperforming the return of -18.42% for the MSCI Emerging Markets Index. At a meeting held on January 17, 2012, The Managers Funds Board of Trustees approved a plan to liquidate both the Managers International Equity and Managers Emerging Market Equity Funds. The liquidations are expected to occur on or about March 9, 2012.
Letter to Shareholders (continued)
For the year ended December 31, 2011, the Managers Global Bond Fund returned 3.39%, underperforming the return of 5.64% for the Barclays Capital Global Aggregate Bond Index. The major drivers of the Fund’s underperformance relative to the benchmark were its emphasis on higher yielding corporate bonds, with a related underweight to Treasuries, and select positioning among emerging market currencies. Effective February 1, 2012, the name of the Managers Global Bond Fund was changed to Managers Global Income Opportunity Fund. In addition to the name change, the Fund made enhancements to supply the manager with greater flexibility to implement its best global investment ideas in the Fund.
The following report covers the one-year period ended December 31, 2011. Should you have any questions about this report, or if you’d like to receive a prospectus and additional information, including fees and expenses for this or any of the other Funds in our family, please feel free to contact us at 1-800-835-3879, or visit our web site at www.managersinvest.com. As always, please read the prospectus carefully before you invest or send money.
If you are curious about how you can better diversify your investment program, visit our web site for information on other MIG product offerings. You can rest assured that under all market conditions our team is focused on delivering excellent investment management services for your benefit.
We thank you for your continued confidence and investment in The Managers Funds.
Respectfully,

Keitha Kinne
Managing Partner
Managers Investment Group LLC
About Your Fund’s Expenses
| | |
As a shareholder of a Fund, you may incur two types of costs: (1) transaction costs, which may include sales charges (loads) on purchase payments; redemption fees; and exchange fees; and (2) ongoing costs, including management fees; distribution (12b-1) fees; and other Fund expenses. This example is intended to help you understand your ongoing costs (in dollars) of investing in the Fund and to compare these costs with the ongoing costs of investing in other mutual funds. The example is based on $1,000 invested at the beginning of the period and held for the entire period as indicated below. | | |
Actual Expenses | | |
The first line of the following table provides information about the actual account values and actual expenses. You may use the information in this line, together with the amount you invested, to estimate the expenses that you paid over the period. Simply divide your account value by $1,000 (for example, an $8,600 account value divided by $1,000 = 8.6), then multiply the result by the number in the first line under the heading entitled “Expenses Paid During Period” to estimate the expenses you paid on your account during this period. | | |
Hypothetical Example for Comparison Purposes | | |
The second line of the following table provides information about hypothetical account values and hypothetical expenses based on the Fund’s actual expense ratio and an assumed annual rate of return of 5% before expenses, which is not the Fund’s actual return. The hypothetical account values and expenses may not be used to estimate the actual ending account balance or expenses you paid for the period. You may use this information to compare the ongoing costs of investing in the Fund and other funds by comparing this 5% hypothetical example with the 5% hypothetical examples that appear in the shareholder reports of other funds. | | |
Please note that the expenses shown in the table are meant to highlight your on going costs only and do not reflect any transactional costs, such as sales charges (loads), redemption fees, or exchange fees. Therefore, the second line of the table is useful in comparing ongoing costs only, and will not help you determine the relative total costs of owning different funds. | | |
| | | | | | | | | | | | | | | | |
Six Months Ended December 31, 2011 | | Expense Ratio
for the Period | | | Beginning
Account Value
07/01/2011 | | | Ending
Account Value
12/31/2011 | | | Expenses Paid
During the
Period* | |
Managers International Equity Fund | |
Based on Actual Fund Return | | | 1.34 | % | | $ | 1,000 | | | $ | 822 | | | $ | 6.15 | |
Based on
Hypothetical 5% Annual Return | | | 1.34 | % | | $ | 1,000 | | | $ | 1,018 | | | $ | 6.82 | |
Managers Emerging Markets Equity Fund | |
Based on Actual Fund Return | | | 1.64 | % | | $ | 1,000 | | | $ | 792 | | | $ | 7.41 | |
Based on
Hypothetical 5% Annual Return | | | 1.64 | % | | $ | 1,000 | | | $ | 1,017 | | | $ | 8.34 | |
Managers Global Bond Fund | |
Based on Actual Fund Return | | | 1.10 | % | | $ | 1,000 | | | $ | 985 | | | $ | 5.50 | |
Based on
Hypothetical 5% Annual Return | | | 1.10 | % | | $ | 1,000 | | | $ | 1,020 | | | $ | 5.60 | |
| * | Expenses are equal to the Fund’s annualized expense ratio multiplied by the average account value over the period, multiplied by the number of days in the most recent fiscal half-year (184), then divided by 365. |
3
Managers International Equity Fund
Investment Manager’s Comments
The Managers International Equity Fund’s (the “Fund”) investment objective is to achieve long-term capital appreciation. Income is the Fund’s secondary objective.
The Managers International Equity Fund ordinarily invests at least 80% of assets in equity securities, and at least 65% of assets in common and preferred stocks of companies domiciled outside the United States. The Fund intends to diversify investments among both countries and sectors. Investments may be made in companies in developed as well as developing countries. The Fund may also engage in currency-hedging strategies and may invest in companies of any size. The MSCI EAFE Index (the “Index”) is the benchmark for the Fund.
THE PORTFOLIO MANAGERS
The Fund employs multiple portfolio managers who specialize in distinct investment approaches. This “intelligence diversification” not only serves to manage risk, but also helps the Fund tap the market’s full potential by focusing different analytical insights on each potential investment. Fund management strives to achieve its performance goals and diversification while ensuring that the Fund operates within the framework of its investment objective and principal investment strategies.
AllianceBernstein L.P.’s Investment Research and Management (“AllianceBernstein”)
AllianceBernstein’s approach to investing is value based and research driven. The thesis of AllianceBernstein’s investment philosophy is that human nature leads investors to buy and sell financial assets based on an overreaction to near-term events. They believe investors confuse temporary or cyclical characteristics with the creation of buying opportunities, as investors underestimate the potential for corrective strategies to restore long-term earnings power. The investment team, led by Kevin Simms, attempts to exploit this disconnect by using research to separate fact from emotion.
The primary driver of AllianceBernstein’s performance is research-driven security selection. AllianceBernstein screens their initial universe with a proprietary return model in order to identify the companies with the most attractive value attributes. The model derives an expected return for each company within the universe by assessing companies both from a global industry-based perspective and from a country-based standpoint, evaluating such factors as price-to-cash earnings, price-to-book, return on equity, and price momentum. The ideal company would exhibit strong fundamentals and have strong future business prospects.
Portfolio Construction
| | • | | Initial investable universe is composed of all companies within the countries of the MSCI All Country World Index ex U.S. universe with a market capitalization greater than $750M |
| | • | | Investment team screens this universe using a proprietary-return model to identify the companies with the most attractive value attributes |
| | • | | The model derives an expected return for each company in the universe by assessing companies both from a global industry-based perspective and from a country-based standpoint |
| | • | | Factors include price-to-cash earnings, price-to-book, return on equity, and price momentum |
| | • | | Analysts perform extensive research, focusing on the most attractively valued stocks |
| | • | | They then build detailed spreadsheets of historical and projected balance-sheet and income-statement information in order to estimate: |
| | — | Normalized earnings power |
| | — | Cash flow and asset values for each company for the next five years |
| | • | | Perform simulations to see the potential impact of changes in various financial-statement components |
| | • | | Analysts present their estimates and ratings for each security to the Research Review Committee of the Investment Policy Group |
| | • | | The Committee challenges the analysts’ assumptions and conclusions to ensure they are sound |
The Portfolio
| | • | | Typically holds 30-85 stocks |
| | • | | Initial stock weightings are 0.5% - 3.5% |
Lazard Asset Management, LLC (“Lazard”)
Portfolio Manager William (Willy) Holzer believes that there is a single global economy and marketplace within which everything is connected. Within this single market it is important to distinguish between three types of companies: domestic companies are those that produce, sell, and raise capital all in their home country; international companies are those that produce at home, but sell their products and raise capital anywhere in the world; and global companies are those that produce, sell, and raise capital anywhere in the world. Holzer will invest in any of these types of companies in order to capitalize on a theme. However, he prefers global companies, which generally have the flexibility and resources to exploit global trends.
Willy Holzer can be described as a “top-down” thematic investor whose themes are based on bottom-up observations and company analysis. He views the world as a single global economic unit as opposed to a collection of separate country economies. Willy focuses his efforts by first analyzing the connections within the global economy and from this analysis develops global investment themes. These themes target the segments of the global economy
Managers International Equity Fund
Investment Manager’s Comments (continued)
that he believes are most likely to provide attractive long-term investment returns and that also represent an asymmetric investment opportunity in the investor’s favor.
Portfolio Construction
| | • | | Portfolio Manager leverages stock ideas and research from top-down themes based on bottom-up observations and company analysis |
| | • | | Portfolio is constructed around approximately ten investment themes to diversify opportunity sets and provide risk benefits |
| | • | | Portfolio heavily weights large-capitalization, multi-national companies |
| | • | | Concentrated in the developed markets |
| | • | | May have operations or distribution in the emerging markets |
The Portfolio
| | • | | Portfolio typically holds 90 to 110 stocks |
| | • | | Initial stock weightings are 1.0% to 1.5% |
| | • | | Relatively low turnover in the 30% to 40% annual range |
Martin Currie Inc. (“Martin Currie”)
Martin Currie, based in Edinburgh, Scotland, is a 129- year old firm. It specializes in developed market ex-U.S. mandates and currently manages $8.6B for a global client base of pension funds, family offices, multi-managers, banks, public funds, foundations, sub-advisory clients and wrap programs. Willie Watt, the firm’s Chief Executive Officer, joined the firm in 2000 and was at the forefront of evolving Martin Currie from a firm that focused on adding value via a top-down investment process to its current process, which uses bottom-up stock selection analysis as its primary portfolio management focus.
James Fairweather, Chief Investment Officer, heads the international equity investment team which has four members who have 75 years of total investment experience. The team is supported in their efforts by an experienced 14- person global sector analyst staff with no member having less than 9 years of total investment experience. In addition, regional teams also support the stock selection process by contributing insights and ideas on companies within their specific geographic coverage area. Finally, a separate risk management team helps support the portfolio construction.
Portfolio Construction
| | • | | Focused on identifying companies at the earlier stages of change with the thought that the market usually underestimates the amount by which change will take place |
| | • | | Team uses a fully integrated global approach to stock selection and use a high level of communication across regions to build a truly global portfolio |
| | • | | Focus on speaking a common language when doing all stock level research with the emphasis on quality, value, growth, and change |
| | • | | Risk is managed at every level of the investment process including when conducting stock selection and when constructing the portfolio |
The Portfolio
| | • | | Portfolio typically holds 45 to 80 stocks |
| | • | | Holdings tend to have low cross-stock correlations |
| | • | | Holdings tend to have low sensitivity to macro factors |
| | • | | Forecasted tracking error 4% to 6% relative to MSCI EAFE Index |
THE YEAR IN REVIEW
For the year 2011, the Fund returned -13.98%, underperforming the return of -12.14% for the MSCI EAFE Index. (Note that unless otherwise stated, all performance cited in this commentary is in U.S. Dollars).
International equity markets struggled in 2011, with a majority of losses concentrated in the third quarter. Early in the year, markets were surprisingly resilient given significant macroeconomic events such as the Arab Spring and the devastating consequences of the Japanese tsunami. However, markets were not nearly as resilient during the summer months as the fear of European sovereign debt contagion shook equity markets. In addition, the stalemate in Washington involving the U.S. debt ceiling along with the S&P downgrade of U.S. sovereign credit rating had a debilitating effect on non-U.S. equities as well. The end of September and into the fourth quarter, however, featured almost a complete reversal of the “risk off” trade from the summer months with markets responding positively both to the coordinated efforts of European policymakers to head off issues surrounding their collective sovereign debt crisis. For the full calendar year, there was a sharp dichotomy in performance at the sector level within non-US. equities with the defensive consumer staples (4.5%) and health care (6.3%) sectors offering modest but positive returns while more cyclically geared sectors such as information technology (-18.3%) and materials (-22.6%) struggled amid the uncertainty.
For the year, the Fund’s underperformance was primarily driven by stock selection, particularly within the energy sector. In addition, the Fund’s underweight to the defensive consumer staples sector was a net detractor to performance. The losses were mitigated, however, by strong stock selection within the Fund’s information technology and telecomm holdings. At the manager level, both Lazard and Martin Currie outperformed in 2011 while Bernstein failed to keep pace with the benchmark. Martin Currie, in particular, performed well boosted by strong stock selection as well as by their higher quality focus.
Managers International Equity Fund
Investment Manager’s Comments (continued)
CUMULATIVE TOTAL RETURN PERFORMANCE
Managers International Equity Fund’s cumulative total return is based on the daily change in net asset value (NAV), and assumes that all distributions were reinvested. This graph compares a hypothetical $10,000 investment made in Managers International Equity Fund on December 31, 2001, to a $10,000 investment made in the MSCI EAFE for the same time period. The table is not intended to imply any future performance of the Fund. Performance for periods longer than one year is annualized. The graph and table do not reflect the deduction of taxes that a shareholder would pay on a Fund distribution or redemption of shares. The listed returns for the Fund are net of expenses and the returns for the index exclude expenses. Past performance is not indicative of future results. Total returns would have been lower had certain expenses not been reduced.
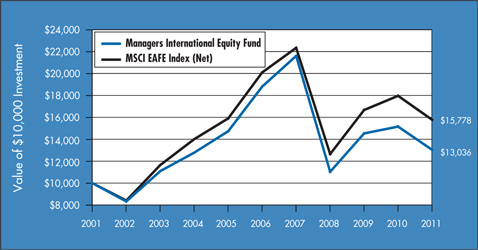
The table below shows the average annual total returns for Managers International Equity Fund and the MSCI EAFE Index from December 31, 2001 through December 31, 2011.
| | | | | | | | | | | | |
Average Annual Total Returns1 | | One Year | | | Five Years | | | Ten Years | |
Managers International Equity Fund2,3,4 | | | (13.98 | )% | | | (7.07 | )% | | | 2.69 | % |
MSCI EAFE Index(Net) | | | (12.14 | )% | | | (4.72 | )% | | | 4.67 | % |
The performance data shown represents past performance, which is not a guarantee of future results. Current performance may be lower or higher than the performance data quoted. The investment return and principal value of an investment in the Fund will fluctuate so that an investor’s shares, when redeemed, may be worth more or less than their original cost. For performance information through the most recent month end, please call (800) 835-3879 or visit our Web site at www.managersinvest.com.
In choosing a Fund, investors should carefully consider the amount they plan to invest, their investment objectives, the Fund’s investment objectives, risks, charges and expenses before investing. For this and other information, please call (800) 835-3879 or visit www.managersinvest.com for a free prospectus. Read it carefully before investing or sending money. Funds are distributed by Managers Distributors, Inc., a member of FINRA.
| 1 | Total return equals income yield plus share price change and assumes reinvestment of all dividends and capital gain distributions. Returns are net of fees and may reflect offsets of Fund expenses as described in the Prospectus. No adjustment has been made for taxes payable by shareholders on their reinvested dividends and capital gain distributions. Returns for periods greater than one year are the average annual return. The listed returns on the Fund are net of expenses and based on the published NAV as of December 31, 2011. All returns are in U.S. dollars ($). | |
| 2 | Fund for which, from time to time, the Fund’s advisor has waived its fees and/or absorbed Fund expenses, which has resulted in higher returns. |
| | |
| | | 3 Investments in foreign securities are subject to additional risks such as changing market conditions, economic and political instability, and currency exchange rate fluctuations. 4 The Fund is subject to currency risk resulting from fluctuations in exchange rates that may affect the total loss or gain on a non-U.S. Dollar security when converted back to U.S. Dollars. The MSCI EAFE® Index (Net) (Europe, Australasia, Far East) is a free float-adjusted market capitalization index that is designed to measure developed market equity performance, excluding the U.S. and Canada. The MSCI EAFE Index (Net) consists of the following 22 developed market country indices: Australia, Austria, Belgium, Denmark, Finland, France, Germany, Greece, Hong Kong, Ireland, Israel, Italy, Japan, the Netherlands, New Zealand, Norway, Portugal, Singapore, Spain, Sweden, Switzerland and the United Kingdom. Unlike the Fund, the MSCI EAFE Index is unmanaged, is not available for investment, and does not incur expenses. All MSCI data is provided “as is.” The products described herein are not sponsored or endorsed and have not been reviewed or passed on by MSCI. In no event shall MSCI, its affiliates or any MSCI data provider have any liability of any kind in connection with the MSCI data or the products described herein. Copying or redistributing the MSCI data is strictly prohibited. Not FDIC insured, nor bank guaranteed. May lose value. |
6
Managers International Equity Fund
Fund Snapshots (unaudited)
December 31, 2011
Portfolio Breakdown
| | | | | | | | |
Industry | | Managers International
Equity Fund** | | | MSCI EAFE Index® | |
Financials | | | 21.5 | % | | | 21.4 | % |
Materials | | | 11.4 | % | | | 10.1 | % |
Consumer Discretionary | | | 10.9 | % | | | 10.0 | % |
Energy | | | 10.5 | % | | | 9.2 | % |
Industrials | | | 9.9 | % | | | 12.5 | % |
Health Care | | | 8.9 | % | | | 10.0 | % |
Consumer Staples | | | 8.4 | % | | | 11.5 | % |
Information Technology | | | 6.3 | % | | | 4.7 | % |
Telecommunication Services | | | 5.7 | % | | | 6.1 | % |
Utilities | | | 2.9 | % | | | 4.5 | % |
Other Assets and Liabilities | | | 3.6 | % | | | 0.0 | % |
** As a percentage of net assets
Top Ten Holdings
| | | | |
Security Name | | % of Net
Assets | |
Vodafone Group PLC* | | | 2.4 | % |
Novartis AG* | | | 2.1 | |
BP PLC | | | 1.9 | |
GlaxoSmithKline PLC | | | 1.8 | |
AstraZeneca PLC* | | | 1.5 | |
Nestle SA, Registered | | | 1.4 | |
Royal Dutch Shell PLC, Class B | | | 1.3 | |
Prudential PLC* | | | 1.2 | |
Air Liquide SA | | | 1.1 | |
ING Groep N.V.* | | | 1.1 | |
| | | | |
Top Ten as a Group | | | 15.8 | % |
| | | | |
| * | Top Ten Holding at June 30, 2011 |
|
| Any sectors, industries, or securities discussed should not be perceived as investment recommendations. Mention of a specific security should not be considered a recommendation to buy or solicitation to sell that security. Specific securities mentioned in this report may have been sold from the Fund’s portfolio of investments by the time you receive this report. |
7
Managers International Equity Fund
Fund Snapshots (continued)
Summary of Investments by Country
| | | | | | | | |
Country | | Managers International
Equity Fund* | | | MSCI EAFE Index® | |
Australia | | | 2.6 | % | | | 8.6 | % |
Austria | | | 0.0 | % | | | 1.0 | % |
Belgium | | | 0.2 | % | | | 0.9 | % |
Bermuda | | | 0.4 | % | | | 0.4 | % |
Brazil | | | 3.6 | % | | | 0.0 | % |
Canada | | | 4.4 | % | | | 0.0 | % |
Cayman Islands | | | 0.0 | % | | | 0.8 | % |
China | | | 1.3 | % | | | 0.0 | % |
Denmark | | | 0.0 | % | | | 0.8 | % |
Finland | | | 0.0 | % | | | 0.5 | % |
France | | | 7.1 | % | | | 8.7 | % |
Germany | | | 6.6 | % | | | 7.8 | % |
Greece | | | 0.0 | % | | | 0.3 | % |
Hong Kong | | | 5.1 | % | | | 2.4 | % |
India | | | 0.7 | % | | | 0.0 | % |
Ireland | | | 0.0 | % | | | 0.2 | % |
Israel | | | 0.7 | % | | | 0.7 | % |
Italy | | | 0.8 | % | | | 2.2 | % |
Japan | | | 18.8 | % | | | 21.6 | % |
Jersey, Channel Islands | | | 0.0 | % | | | 0.2 | % |
Luxembourg | | | 0.0 | % | | | 0.1 | % |
Netherlands | | | 5.3 | % | | | 2.7 | % |
New Zealand | | | 0.0 | % | | | 0.1 | % |
Norway | | | 0.4 | % | | | 0.8 | % |
Portugal | | | 0.4 | % | | | 0.2 | % |
Russia | | | 1.9 | % | | | 0.0 | % |
Singapore | | | 1.3 | % | | | 1.5 | % |
South Africa | | | 0.6 | % | | | 0.0 | % |
South Korea | | | 2.8 | % | | | 0.0 | % |
Spain | | | 0.5 | % | | | 3.3 | % |
Supranational & Other | | | 0.1 | % | | | 0.2 | % |
Sweden | | | 1.0 | % | | | 3.0 | % |
Switzerland | | | 7.9 | % | | | 8.5 | % |
Taiwan | | | 2.4 | % | | | 0.0 | % |
Thailand | | | 0.4 | % | | | 0.0 | % |
Turkey | | | 0.2 | % | | | 0.0 | % |
United Kingdom | | | 19.1 | % | | | 22.4 | % |
United States | | | 3.4 | % | | | 0.1 | % |
| | | | | | | | |
| | | 100.0 | % | | | 100.0 | % |
| | | | | | | | |
| * | As a percentage of total market value on December 31, 2011. |
Managers International Equity Fund
Schedule of Portfolio Investments
December 31, 2011
| | | | | | | | |
| | | Shares | | | Value | |
| | | | | | | | |
Common Stocks - 96.4% | | | | | | | | |
Consumer Discretionary - 10.9% | | | | | |
adidas-Salomon AG (Germany) | | | 6,293 | | | $ | 408,875 | |
Bridgestone Corp. (Japan) | | | 29,000 | | | | 656,796 | |
British Sky Broadcasting PLC (United Kingdom) | | | 25,674 | | | | 292,099 | |
Compagnie Financiere Richemont SA (Switzerland) | | | 7,156 | | | | 359,966 | |
Cyrela Brazil Realty, S.A. (Brazil) | | | 22,200 | | | | 176,624 | |
Daimler AG (Germany) | | | 8,623 | | | | 377,760 | |
GKN PLC (United Kingdom) | | | 213,563 | | | | 606,454 | |
Magna International, Inc. (Canada) | | | 9,500 | | | | 317,055 | |
Mazda Motor (Japan)* | | | 151,000 | | | | 265,500 | |
New World Department Store China, Ltd. (Hong Kong) | | | 7,000 | | | | 3,984 | |
Nissan Motor Co., Ltd. (Japan) | | | 53,600 | | | | 479,993 | |
Parkson Retail Group, Ltd. (China) | | | 30,500 | | | | 37,354 | |
Pearson PLC (United Kingdom) | | | 39,216 | | | | 736,026 | |
Persimmon PLC (United Kingdom) | | | 41,547 | | | | 303,098 | |
Renault SA (France) | | | 13,010 | | | | 449,278 | |
Sekisui House, Ltd. (Japan) | | | 42,000 | | | | 373,229 | |
Sharp Corp. (Japan) | | | 52,000 | | | | 453,287 | |
SJM Holdings, Ltd. (Hong Kong) | | | 192,000 | | | | 311,569 | |
Sony Corp. (Japan) | | | 31,100 | | | | 560,764 | |
Volkswagen AG (Germany) | | | 17,300 | | | | 207,744 | |
Vivendi Universal SA (France) | | | 13,250 | | | | 289,241 | |
Sumitomo Rubber Industries, Ltd. (Japan) | | | 3,510 | | | | 524,784 | |
Total Consumer Discretionary | | | | | | | 8,191,480 | |
Consumer Staples - 8.4% | | | | | | | | |
Asahi Breweries, Ltd. (Japan) | | | 13,200 | | | | 289,567 | |
British American Tobacco PLC (United Kingdom) | | | 8,171 | | | | 387,632 | |
Groupe Danone SA (France) | | | 5,771 | | | | 362,144 | |
Heineken N.V. (Netherlands) | | | 8,344 | | | | 386,287 | |
Henkel AG & Co., KGaA (Germany) | | | 6,363 | | | | 366,815 | |
Japan Tobacco, Inc. (Japan) | | | 151 | | | | 710,080 | |
Koninklijke Ahold N.V. (Netherlands) | | | 31,260 | | | | 420,152 | |
Lawson,, Inc. (Japan) | | | 5,900 | | | | 367,602 | |
Metro AG (Germany) | | | 3,148 | | | | 114,786 | |
Nestle SA, Registered (Switzerland) | | | 17,718 | | | | 1,017,430 | |
Seven & i Holdings Co., Ltd. (Japan) | | | 12,500 | | | | 348,372 | |
South African Brewing (United Kingdom) | | | 7,662 | | | | 269,368 | |
Tate & Lyle PLC (United Kingdom) | | | 29,832 | | | | 326,136 | |
Tingyi Cayman Islands Holding Corp. (China) | | | 40,000 | 2 | | | 121,161 | |
| | | | | | | | |
| | | Shares | | | Value | |
| | | | | | | | |
Unilever PLC (United Kingdom) | | | 11,700 | | | $ | 392,346 | |
Uni-President Enterprises Corp. (Taiwan) | | | 136,788 | | | | 199,602 | |
X5 Retail Group, N.V., GDR (Russia)* | | | 9,200 | | | | 209,706 | |
Total Consumer Staples | | | | | | | 6,289,186 | |
Energy - 10.5% | | | | | | | | |
BP PLC (United Kingdom) | | | 200,590 | | | | 1,428,849 | |
Canadian Natural Resources, Ltd. (Canada) | | | 11,400 | | | | 426,906 | |
Cenovus Energy, Inc. (Canada) | | | 12,868 | 2 | | | 427,312 | |
China Shenhua Energy Co., Ltd. (China) | | | 110,000 | | | | 475,670 | |
EnCana Corp. (Canada) | | | 6,768 | 2 | | | 125,494 | |
Gazprom OAO, Sponsored ADR (Russia) | | | 76,669 | | | | 816,826 | |
INPEX Corp. (Japan) | | | 68 | | | | 428,144 | |
Lukoil OAO, Sponsored ADR (Russia) | | | 8,148 | | | | 431,267 | |
Nexen, Inc. (Canada) | | | 21,898 | | | | 348,434 | |
Petrofac, Ltd. (United Kingdom) | | | 22,583 | | | | 505,071 | |
Petroleo Brasileiro, S.A., ADR (Brazil) | | | 14,325 | | | | 336,494 | |
Petroleo Brasileiro, S.A., Sponsored ADR (Brazil) | | | 6,500 | | | | 161,525 | |
Royal Dutch Shell PLC, Class A (Netherlands) | | | 3,400 | | | | 123,933 | |
Royal Dutch Shell PLC, Class B (Netherlands) | | | 24,820 | | | | 944,093 | |
SeaDrill, Ltd. (Bermuda)* | | | 7,910 | | | | 263,791 | |
Technip-Coflexip, ADR (France) | | | 4,584 | | | | 429,749 | |
Woodside Petroleum, Ltd. (Australia) | | | 6,100 | | | | 190,948 | |
Total Energy | | | | | | | 7,864,506 | |
Financials - 21.5% | | | | | | | | |
Aegon (Netherlands)* | | | 66,020 | | | | 263,861 | |
AIA Group, Ltd. (Hong Kong) | | | 238,400 | | | | 742,121 | |
Allianz SE (Germany) | | | 5,810 | | | | 554,878 | |
Banco do Brasil, S.A. (Brazil) | | | 31,200 | | | | 396,430 | |
Banco Santander, S.A. (Brazil) | | | 21,600 | | | | 173,240 | |
Bank of East Asia, Ltd. (Hong Kong) | | | 30,490 | 2 | | | 115,047 | |
Bank of Yokohama, Ltd., The (Japan) | | | 80,000 | | | | 377,439 | |
BNP Paribas SA (France) | | | 13,738 | | | | 534,948 | |
CapitaLand, Ltd. (Singapore) | | | 120,500 | | | | 205,073 | |
CapitaMalls Asia, Ltd. (Singapore) | | | 69,000 | | | | 60,091 | |
Cathay Financial Holding Co., Ltd. (Taiwan) | | | 115,783 | | | | 124,824 | |
China Life Insurance Co., Ltd. (China) | | | 34,000 | | | | 83,795 | |
China Overseas Land & Investment, Ltd. (Hong Kong) | | | 334,189 | | | | 554,614 | |
Chinatrust Financial Holding Co., Ltd. (Taiwan) | | | 235,839 | | | | 146,967 | |
Chuo Mitsui Trust Holdings, Inc. (Japan) | | | 31,760 | | | | 93,137 | |
Dai-ichi Mutual Life Insurance Co., The (Japan) | | | 110 | | | | 107,987 | |
|
The accompanying notes are an integral part of these financial statements. 9 |
Managers International Equity Fund
Schedule of Portfolio Investments (continued)
| | | | | | | | |
| | | Shares | | | Value | |
| | | | | | | | |
| | | | | | | | |
Financials—21.5% (continued) | | | | | | | | |
Daiwa House Industry Co., Ltd. (Japan) | | | 17,000 | | | $ | 203,230 | |
Daiwa Securities Group, Inc. (Japan) | | | 16,000 | | | | 49,750 | |
DBS Group Holdings, Ltd. (Singapore) | | | 33,500 | | | | 297,355 | |
Deutsche Boerse AG (Germany)* | | | 915 | | | | 47,889 | |
DnB Holding ASA (Norway) | | | 29,600 | | | | 288,504 | |
Hana Financial Group, Inc. (South Korea) | | | 4,400 | | | | 136,344 | |
Hang Lung Properties, Ltd. (Hong Kong) | | | 29,000 | | | | 82,319 | |
HDFC Bank, Ltd. (India) | | | 22,575 | | | | 181,554 | |
Henderson Land Development Co., Ltd. (Hong Kong) | | | 61,000 | | | | 302,179 | |
Hong Kong Exchanges and Clearing, Ltd. (Hong Kong) | | | 35,900 | | | | 571,241 | |
HSBC Holdings PLC (United Kingdom) | | | 95,783 | | | | 731,206 | |
ING Groep N.V. (Netherlands)* | | | 117,981 | | | | 843,751 | |
Itau Unibanco Holding, S.A. (Brazil) | | | 16,000 | | | | 291,564 | |
Kasikornbank PCL (Thailand) | | | 85,200 | | | | 335,604 | |
KB Financial Group, Inc. (South Korea) | | | 11,395 | | | | 359,061 | |
KBC Bank & Insurance Group, Inc. (Belgium) | | | 10,400 | | | | 130,039 | |
Legal & General Group PLC (United Kingdom) | | | 248,628 | | | | 397,323 | |
Lloyds TSB Group PLC (United Kingdom)* | | | 662,800 | | | | 266,232 | |
Macquarie Group, Ltd. (Australia) | | | 11,527 | | | | 279,910 | |
Mitsubishi Estate Co., Ltd. (Japan) | | | 34,000 | | | | 506,988 | |
Mitsubishi Tokyo Financial Group, Inc. (Japan) | | | 171,300 | | | | 725,195 | |
Mitsui Fudosan Co., Ltd. (Japan) | | | 13,000 | | | | 189,562 | |
Muenchener Rueckversicherungs AG (Germany) | | | 2,670 | | | | 327,188 | |
National Australia Bank, Ltd. (Australia) | | | 22,200 | | | | 528,837 | |
Nomura Holdings, Inc. (Japan) | | | 41,100 | | | | 123,741 | |
Oversea-Chinese Banking Corp., Ltd. (Singapore) | | | 66,000 | | | | 398,036 | |
Prudential PLC (United Kingdom) | | | 93,413 | | | | 924,237 | |
Societe Generale (France) | | | 19,185 | | | | 423,520 | |
Standard Chartered PLC (United Kingdom) | | | 16,035 | | | | 350,723 | |
Sumitomo Mitsui Financial Group, Inc. (Japan) | | | 10,200 | | | | 282,874 | |
Sumitomo Realty & Development Co., Ltd. (Japan) | | | 11,000 | | | | 192,194 | |
Sun Hung Kai Properties, Ltd. (Hong Kong) | | | 26,000 | | | | 324,920 | |
T&D Holdings, Inc. (Japan) | | | 11,200 | | | | 104,282 | |
Turkiye Is Bankasi A.S. (Isbank) (Turkey) | | | 73,200 | | | | 127,693 | |
Zurich Financial Services AG (Switzerland)* | | | 1,197 | | | | 269,693 | |
Total Financials | | | | | | | 16,129,190 | |
| | | | | | | | |
| | | Shares | | | Value | |
| | | | | | | | |
| | | | | | | | |
Health Care - 8.9% | | | | | | | | |
Actelion, Ltd. (Switzerland)* | | | 6,531 | | | $ | 223,405 | |
AstraZeneca PLC (United Kingdom) | | | 24,570 | | | | 1,134,929 | |
Fresenius Medical Care AG (Germany) | | | 5,277 | | | | 358,435 | |
GlaxoSmithKline PLC (United Kingdom) | | | 58,109 | | | | 1,324,057 | |
Mindray Medical International, Ltd., Sponsored ADR (China) | | | 10,200 | 2 | | | 261,528 | |
Novartis AG (Switzerland) | | | 27,786 | | | | 1,586,389 | |
Roche Holding AG (Switzerland) | | | 3,500 | | | | 591,914 | |
Sanofi-Aventis SA (France) | | | 9,812 | | | | 717,233 | |
Teva Pharmaceutical Industries, Ltd., Sponsored ADR (Israel) | | | 4,400 | | | | 177,584 | |
Yamanouchi Pharmaceutical Co., Ltd. (Japan) | | | 7,900 | | | | 320,798 | |
Total Health Care | | | | | | | 6,696,272 | |
Industrials - 9.9% | | | | | | | | |
ABB, Ltd. (Switzerland)* | | | 25,367 | | | | 476,551 | |
ABB, Ltd., ADR (Switzerland)* | | | 22,630 | | | | 424,518 | |
Asahi Glass Co., Ltd. (Japan) | | | 52,000 | 2 | | | 434,715 | |
Atlas Copco AB (Sweden) | | | 18,560 | | | | 397,676 | |
Bouygues (France) | | | 17,664 | | | | 555,544 | |
China Merchants Holdings International Co., Ltd. (Hong Kong) | | | 106,000 | | | | 306,586 | |
Daikin Industries, Ltd. (Japan) | | | 10,600 | | | | 289,349 | |
FANUC, Ltd. (Japan) | | | 4,700 | | | | 716,902 | |
Far Eastern New Century Corp. (Taiwan) | | | 123,927 | | | | 143,710 | |
Kajima Corp. (Japan) | | | 26,000 | | | | 79,794 | |
Mitsubishi Corp. (Japan) | | | 13,600 | | | | 274,105 | |
Mitsubishi Heavy Industries., Ltd. (Japan) | | | 59,700 | | | | 253,558 | |
Mitsui & Co., Ltd. (Japan) | | | 29,400 | | | | 455,678 | |
QR National, Ltd. (Australia)* | | | 95,339 | 2 | | | 333,044 | |
Safran SA (France) | | | 9,528 | | | | 284,944 | |
Schneider Electric SA (France) | | | 8,654 | | | | 452,442 | |
Serco Group PLC (United Kingdom) | | | 42,310 | | | | 311,311 | |
Shimizu Corp. (Japan) | | | 20,000 | | | | 84,059 | |
Siemens AG (Germany) | | | 3,360 | | | | 321,470 | |
Sumitomo Electric Industries, Ltd. (Japan) | | | 41,000 | | | | 443,894 | |
Tostem Inax Holding Corp. (Japan) | | | 8,500 | | | | 162,910 | |
Yamato Transport Co., Ltd. (Japan) | | | 11,000 | | | | 185,137 | |
Total Industrials | | | | | | | 7,387,897 | |
|
The accompanying notes are an integral part of these financial statements. 10 |
Managers International Equity Fund
Schedule of Portfolio Investments (continued)
| | | | | | | | |
| | | Shares | | | Value | |
| | | | | | | | |
Information Technology - 6.3% | | | | | | | | |
Advanced Semiconductor Engineering, Inc. (Taiwan) | | | 433,464 | | | $ | 371,362 | |
AU Optronics Corp., Sponsored ADR (Taiwan) | | | 68,053 | | | | 293,989 | |
Check Point Software Technologies, Ltd. (Israel)* | | | 6,200 | | | | 325,748 | |
Companhia Brasileira de Meios de Pagamentos (Brazil) | | | 2,620 | | | | 67,704 | |
Ericsson (LM), Class B (Sweden) | | | 33,370 | | | | 338,392 | |
Fujitsu, Ltd. (Japan) | | | 49,000 | | | | 254,062 | |
Gemalto N.V. (Netherlands) | | | 8,952 | | | | 433,871 | |
Infosys Technologies, Ltd., Sponsored ADR (India) | | | 5,700 | 2 | | | 292,866 | |
LG Display Co., Ltd. (South Korea) | | | 19,370 | | | | 411,146 | |
Redecard, S.A. (Brazil) | | | 4,100 | | | | 64,163 | |
Samsung Electronics Co., Ltd. (South Korea) | | | 730 | | | | 671,483 | |
Samsung Electronics Co., Ltd., GDR (South Korea) | | | 1,108 | | | | 509,500 | |
SAP AG (Germany) | | | 5,170 | | | | 273,449 | |
Taiwan Semiconductor Manufacturing Co., Ltd., Sponsored ADR (Taiwan) | | | 31,420 | | | | 405,632 | |
Total Information Technology | | | | | | | 4,713,367 | |
Materials - 11.4% | | | | | | | | |
Air Liquide SA (France) | | | 6,978 | | | | 862,595 | |
Anglo American PLC (United Kingdom) | | | 16,963 | | | | 626,611 | |
Barrick Gold Corp. (Canada)* | | | 8,286 | | | | 375,361 | |
Gold Fields, Ltd. (South Africa) | | | 20,263 | | | | 310,710 | |
Goldcorp, Inc. (Canada) | | | 12,800 | | | | 568,037 | |
Impala Platinum Holdings, Ltd. (South Africa) | | | 5,700 | 2 | | | 117,477 | |
Incitec Pivot, Ltd. (Australia) | | | 74,930 | | | | 237,871 | |
JFE Holdings, Inc. (Japan) | | | 16,400 | | | | 296,512 | |
Johnson Matthey PLC (United Kingdom) | | | 11,089 | | | | 315,946 | |
Kinross Gold Corp. (Canada) | | | 24,881 | | | | 283,643 | |
Koninklijke DSM N.V. (Netherlands) | | | 11,730 | | | | 542,176 | |
Newcrest Mining, Ltd. (Australia) | | | 12,111 | | | | 369,083 | |
Rio Tinto PLC (United Kingdom) | | | 10,930 | | | | 533,889 | |
Syngenta AG (Switzerland)* | | | 2,411 | | | | 708,475 | |
Taiwan Fertilizer Co., Ltd. (Taiwan) | | | 60,900 | | | | 141,550 | |
| | | | | | | | |
| | | Shares | | | Value | |
| | | | | | | | |
ThyssenKrupp AG (Germany) | | | 25,403 | | | $ | 582,813 | |
Toray Industries, Inc. (Japan) | | | 50,700 | | | | 362,740 | |
Vale, S.A., ADR (Brazil) | | | 31,400 | | | | 646,840 | |
Xstrata PLC (Switzerland) | | | 19,110 | | | | 290,951 | |
Yamana Gold, Inc. (Canada) | | | 26,559 | | | | 391,574 | |
Total Materials | | | | | | | 8,564,854 | |
Telecommunication Services - 5.7% | | | | | | | | |
Bharti Tele-Ventures, Ltd. (India) | | | 13,614 | | | | 87,968 | |
Nippon Telegraph & Telephone Corp. (Japan) | | | 16,400 | | | | 834,923 | |
NTT DoCoMo, Inc. (Japan) | | | 313 | | | | 574,674 | |
Telecom Italia S.p.A. (Italy) | | | 294,260 | | | | 314,522 | |
Telecom Italia S.p.A., RSP (Italy) | | | 349,200 | | | | 312,466 | |
Tim Participacoes, S.A., ADR (Brazil) | | | 14,761 | 2 | | | 380,834 | |
Vodafone Group PLC (United Kingdom) | | | 647,486 | | | | 1,805,247 | |
Total Telecommunication Services | | | | | | | 4,310,634 | |
Utilities - 2.9% | | | | | | | | |
E.ON AG (Germany) | | | 26,900 | | | | 579,698 | |
Eletricidade de Portugal, S.A. (Portugal) | | | 94,300 | | | | 291,233 | |
Gas Natural SDG, S.A. (Spain) | | | 21,700 | 2 | | | 371,913 | |
Hong Kong and China Gas Co., Ltd., The (Hong Kong) | | | 230,470 | | | | 533,624 | |
National Grid PLC (United Kingdom) | | | 40,116 | | | | 387,750 | |
Total Utilities | | | | | | | 2,164,218 | |
Total Common Stocks (cost $78,452,714) | | | | | | | 72,311,604 | |
Exchange Traded Funds - 1.1% | | | | | | | | |
SPDR Gold Shares (United States)* | | | 5,500 | | | | 835,945 | |
Total Exchange Traded Funds (cost $441,409) | | | | | | | 835,945 | |
Short-Term Investments - 6.1%1 | | | | | | | | |
BNY Mellon Overnight Government Fund, 0.04%3 | | | 2,942,388 | | | | 2,942,388 | |
Dreyfus Cash Management Fund, Institutional Class Shares, 0.05% | | | 1,616,644 | | | | 1,616,644 | |
Total Short-Term Investments (cost $4,559,032) | | | | | | | 4,559,032 | |
Total Investments - 103.6% (cost $83,453,155) | | | | | | | 77,706,581 | |
Other Assets, less Liabilities - (3.6)% | | | | | | | (2,677,259 | ) |
Net Assets - 100.0% | | | | | | $ | 75,029,322 | |
|
The accompanying notes are an integral part of these financial statements. 11 |
Managers Emerging Markets Equity Fund
Investment Manager’s Comments
The Managers Emerging Markets Equity Fund’s (the “Fund”) objective is to achieve long-term capital appreciation.
The Fund invests at least 80% of its assets in equity securities, i.e., common and preferred stocks of companies located in countries included in the MSCI Emerging Markets (“MSCI EM”) Index, mostly countries in Africa, Asia, Latin America, and the Middle East. The Fund may invest in companies of any size. The MSCI EM Index is the benchmark for the Fund.
The Fund employs multiple subadvisors who specialize in distinct investment approaches. This “intelligence diversification” not only serves to manage risk, but also helps the Fund to tap the markets’ full potential by focusing different analytical insights on each prospective investment. Fund management strives to achieve its performance and diversification objectives while ensuring that the Fund operates within the framework of its investment objective and principal investment strategies.
Rexiter Capital Management Limited
The investment team at Rexiter Capital Management Limited (“Rexiter”) believes emerging markets are less efficient than developed markets, and an actively managed portfolio, with respect to both country weightings and stock selection, can add value over a market capitalization-weighted index without materially affecting risk. Rexiter’s approach is active in terms of both asset allocation and stock selection. Investment decisions are based on fundamental analysis of countries and stocks. Portfolio management is controlled by a disciplined process that seeks to add to returns through the exploitation of market inefficiency while constraining risk.
Schroder Investment Management Limited
Schroder Investment Management Limited (“Schroders”) believes that emerging stock markets are inefficient and provide strong potential for adding value through active fund management. This value can be extracted through both country and stock selection. Schroders uses a time-tested quantitative model to aid in their country selection process, and seeks to add value equally over time from both country and stock selection. Schroders further believes that applying a systematic, disciplined approach along with a strong team culture increases the ability to add value. Schroders believes that equal attention should be given to managing both return and risk.
THE YEAR IN REVIEW
The Fund returned -20.31% in 2011, trailing the return of -18.42% for its benchmark, the MSCI EM Index. (Note that unless otherwise stated, all performance cited in this commentary is in U.S. Dollars.)
Emerging market equities had a difficult 2011 amid the global volatility and uncertainty spurred by one off macroeconomic events in the first quarter, such as the Arab Spring and the Japanese tsunami, and market related events in the third quarter including an increasingly untenable sovereign debt situation in Europe and the downgrade of U.S. sovereign debt. As a result, emerging market equities underperformed developed market equities after several years of outperformance. In fact, it was just the second time that emerging markets had underperformed developed markets over the course of the past 10 years. At the country level, there were only a handful of positive performers for the year with several countries in Asia, most notably Indonesia and Malaysia, leading the way. On the downside, the Indian market dropped -37.1% for the year while Egypt, only a minor constituent of the MSCI EM Index, dropped -46.8% partially as fallout from the geopolitical impact on markets from the Arab Spring earlier in the year. On a sector basis, only the defensive minded consumer staples sector added positive performance for the year and modest positive performance at that (0.7%). The worst performing sectors, not surprisingly, were those most closely tied to global growth prospects including industrials (-28.6%) and materials (-27.0%).
The Fund underperformed its benchmark for the year primarily driven by stock selection weakness within the consumer discretionary and materials sectors. The Fund’s underweight to the more defensive consumer staples sector was also a detractor to performance as this was the only sector to post positive returns within emerging markets for the year. At the country level, the Fund was able to add value via both solid stock selection from its holdings in South Korea and by virtue of its overweight to that same market, as South Korea was an outperforming market during 2011.
Managers Emerging Markets Equity Fund
Investment Manager’s Comments (continued)
CUMULATIVE TOTAL RETURN PERFORMANCE
Managers Emerging Markets Equity Fund’s cumulative total return is based on the daily change in net asset value (NAV), and assumes that all distributions were reinvested. This chart compares a hypothetical $10,000 investment made in Managers Emerging Markets Equity Fund on December 31, 2000, to a $10,000 investment made in the MSCI EM for the same time period. Performance for periods longer than one year is annualized. The graph and table do not reflect the deduction of taxes that a shareholder would pay on a Fund distribution or redemption of shares. The listed returns for the Fund are net of expenses and the returns for the index exclude expenses. Past performance is not indicative of future results. Total returns would have been lower had certain expenses not been reduced.
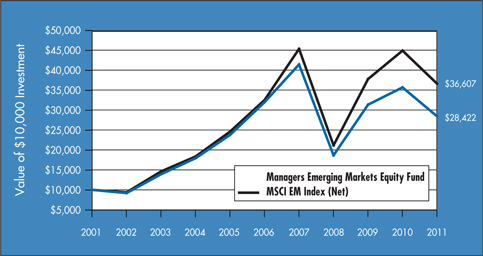
The table below shows the average annual total returns for Managers Emerging Markets Equity Fund and the MSCI EM Index (Net) from December 31, 2001 through December 31, 2011.
| | | | | | | | | | | | |
Average Annual Total Returns1 | | One Year | | | Five Years | | | Ten Years | |
Managers Emerging Markets Equity Fund2,3.4 | | | (20.31) | % | | | (2.32) | % | | | 11.01 | % |
MSCI EM Index (Net)5,7 | | | (18.42) | % | | | 2.40 | % | | | 13.86 | % |
MSCI EM Index (Gross)6,7 | | | (18.17) | % | | | 2.70 | % | | | 14.20 | % |
The performance data shown represents past performance, which is not a guarantee of future results. Current performance may be lower or higher than the performance data quoted. The investment return and principal value of an investment in the Fund will fluctuate so that an investor’s shares, when redeemed, may be worth more or less than their original cost. For performance information through the most recent month end, please call (800) 835-3879 or visit our Web site at www.managersinvest.com.
In choosing a Fund, investors should carefully consider the amount they plan to invest, their investment objectives, the Fund’s investment objectives, risks, charges and expenses before investing. For this and other information, please call (800) 835-3879 or visit www.managersinvest.com for a free prospectus. Read it carefully before investing or sending money. Funds are distributed by Managers Distributors, Inc., a member of FINRA.
| | 1 | Total return equals income yield plus share price change and assumes reinvestment of all dividends and capital gain distributions. Returns are net of fees and may reflect offsets of Fund expenses as described in the Prospectus. No adjustment has been made for taxes payable by shareholders on their reinvested dividends and capital gain distributions. Returns for periods greater than one year are the average annual return. The listed returns on the Fund are net of expenses and based on the published NAV as of December 31, 2011. All returns are in U.S. dollars($). |
|
2 Fund for which, from time to time, the Fund’s advisor has waived its fees and/or absorbed Fund expenses, which has resulted in higher returns. 3 The Fund is subject to the risks associated with investments in emerging markets, such as erratic earnings patterns, economic and political instability, changing exchange controls, limitations on repatriation of foreign capital and changes in local governmental attitudes toward private investment, possibly leading to nationalization or confiscation of investor assets. 4 The Fund is subject to currency risk resulting from fluctuations in exchange rates that may affect the total loss or gain on a non-U.S. Dollar security when converted back to U.S. Dollars. 5 MSCI EM (Net) approximates the minimum possible dividend reinvestment. The dividend is reinvested after deduction of withholding tax, applying the rate to non-resident individuals who do not benefit from double taxation treaties. MSCI Barra uses withholding tax rates applicable to Luxembourg holding companies, as Luxembourg applies the highest rates. 6 MSCI EM (Gross) approximates the maximum possible dividend reinvestment. The amount reinvested is the entire dividend distributed to individuals resident in the country of the company, but does not include tax credits. 7 The MSCI Emerging Markets Index is a free float-adjusted market capitalization index that is designed to measure equity market performance of emerging markets. The MSCI Emerging Markets Index consists of the following 21 emerging market country indices: Brazil, Chile, China, Colombia, Czech Republic, Egypt, Hungary, India, Indonesia, Korea, Malaysia, Mexico, Morocco, Peru, Philippines, Poland, Russia, South Africa, Taiwan, Thailand, and Turkey. Unlike the Fund, the Index is unmanaged, is not available for investment, and does not incur expenses. All MSCI data is provided “as is.” The products described herein are not sponsored or endorsed and have not been reviewed or passed on by MSCI. In no event shall MSCI, its affiliates or any MSCI data provider have any liability of any kind in connection with the MSCI data or the products described herein. Copying or redistributing the MSCI data is strictly prohibited. Not FDIC insured, nor bank guaranteed. May lose value. |
13
Managers Emerging Markets Equity Fund
Fund Snapshots (unaudited)
December 31, 2011
Portfolio Breakdown
| | | | | | | | |
Industry | | Managers Emerging
Markets Equity Fund** | | | MSCI EM Index® | |
Financials | | | 20.9 | % | | | 23.8 | % |
Information Technology | | | 16.1 | % | | | 13.1 | % |
Energy | | | 15.9 | % | | | 14.0 | % |
Materials | | | 12.6 | % | | | 13.3 | % |
Consumer Discretionary | | | 12.0 | % | | | 8.1 | % |
Consumer Staples | | | 6.4 | % | | | 8.1 | % |
Industrials | | | 5.9 | % | | | 6.4 | % |
Telecommunication Services | | | 5.7 | % | | | 8.5 | % |
Utilities | | | 1.8 | % | | | 3.7 | % |
Health Care | | | 0.4 | % | | | 1.0 | % |
Other Assets and Liabilities | | | 2.3 | % | | | 0.0 | % |
| ** | As a percentage of net assets |
Top Ten Holdings
| | | | |
Security Name | | % of Net
Assets | |
Samsung Electronics Co., Ltd.* | | | 4.8 | % |
Gazprom OAO, ADR* | | | 2.5 | |
Hyundai Motor Co.* | | | 2.1 | |
Industrial and Commercial Bank of China, Ltd., Class H* | | | 1.9 | |
China Mobile, Ltd. | | | 1.8 | |
China Construction Bank Corp.* | | | 1.8 | |
Itau Unibanco Holding, S.A., ADR* | | | 1.5 | |
America Movil, S.A.B. de C.V., Series L | | | 1.5 | |
Lukoil OAO, Sponsored ADR | | | 1.4 | |
Vale, S.A., Sponsored ADR* | | | 1.4 | |
| | | | |
Top Ten as a Group | | | 20.7 | % |
| | | | |
| * | Top Ten Holding at June 30, 2011 |
|
| Any sectors, industries, or securities discussed should not be perceived as investment recommendations. Mention of a specific security should not be considered a recommendation to buy or solicitation to sell that security. Specific securities mentioned in this report may have been sold from the Fund’s portfolio of investments by the time you receive this report. |
14
Managers Emerging Markets Equity Fund
Fund Snapshots (continued)
Summary of Investments by Country
| | | | | | | | |
Country | | Managers
Emerging Markets
Equity Fund* | | | MSCI EM Index® | |
Argentina | | | 0.2 | % | | | 0.0 | % |
Bermuda | | | 0.0 | % | | | 0.6 | % |
Brazil | | | 14.8 | % | | | 14.9 | % |
Cayman Islands | | | 0.0 | % | | | 2.9 | % |
Chile | | | 0.0 | % | | | 1.8 | % |
China | | | 13.4 | % | | | 9.9 | % |
Colombia | | | 0.0 | % | | | 1.0 | % |
Czech Republic | | | 0.0 | % | | | 0.3 | % |
Egypt | | | 0.6 | % | | | 0.3 | % |
Hong Kong | | | 5.8 | % | | | 4.5 | % |
Hungary | | | 0.0 | % | | | 0.3 | % |
India | | | 5.0 | % | | | 6.2 | % |
Indonesia | | | 3.2 | % | | | 3.0 | % |
Kazakhstan | | | 0.1 | % | | | 0.0 | % |
Luxembourg | | | 0.1 | % | | | 0.0 | % |
Malaysia | | | 3.4 | % | | | 3.5 | % |
| | | | | | | | |
Country | | Managers
Emerging Markets
Equity Fund* | | | MSCI EM Index® | |
Mexico | | | 2.4 | % | | | 4.7 | % |
Morocco | | | 0.0 | % | | | 0.2 | % |
Netherlands | | | 0.1 | % | | | 0.0 | % |
Panama | | | 0.7 | % | | | 0.0 | % |
Peru | | | 0.4 | % | | | 0.1 | % |
Philippines | | | 0.4 | % | | | 0.7 | % |
Poland | | | 0.6 | % | | | 1.3 | % |
Russia | | | 9.5 | % | | | 6.0 | % |
Singapore | | | 0.6 | % | | | 0.0 | % |
South Africa | | | 3.6 | % | | | 7.9 | % |
South Korea | | | 17.1 | % | | | 15.0 | % |
Supranational & Other | | | 1.2 | % | | | 0.0 | % |
Taiwan | | | 7.0 | % | | | 10.8 | % |
Thailand | | | 4.3 | % | | | 2.0 | % |
Turkey | | | 2.4 | % | | | 1.2 | % |
United Kingdom | | | 2.1 | % | | | 0.0 | % |
United States | | | 1.0 | % | | | 0.9 | % |
| | | | | | | | |
| | | 100.0 | % | | | 100.0 | % |
| | | | | | | | |
| * | As a percentage of total market value on December 31, 2011. |
Managers Emerging Markets Equity Fund
Schedule of Portfolio Investments
December 31, 2011
| | | | | | | | |
| | | Shares | | | Value | |
| | | | | | | | |
| | | | | | | | |
Common Stocks - 97.7% | | | | | | | | |
Consumer Discretionary - 12.0% | | | | | | | | |
Astra International Tbk PT (Indonesia) | | | 23,500 | | | $ | 191,504 | |
Belle International Holdings, Ltd. (Hong Kong) | | | 286,000 | | | | 496,859 | |
Cheil Communications, Inc. (South Korea) | | | 9,370 | | | | 154,285 | |
Ctrip.com International, Ltd. (China)* | | | 7,400 | | | | 173,160 | |
Cyfrowy Polsat SA (Poland)* | | | 12,053 | | | | 47,078 | |
Dongfeng Motor Group Co., Ltd. (China) | | | 140,000 | | | | 239,049 | |
Far Eastern Department Stores, Ltd. (Taiwan) | | | 146,680 | | | | 172,743 | |
Foschini, Ltd. (South Africa)* | | | 3,826 | | | | 49,675 | |
Genting Malaysia Berhad (Malaysia) | | | 174,100 | | | | 603,549 | |
GOME Electrical Appliances Holdings, Ltd. (China) | | | 872,000 | | | | 200,589 | |
Hero Honda Motors, Ltd. (India) | | | 5,162 | | | | 185,092 | |
Hyundai Mobis Co., Ltd. (South Korea) | | | 1,004 | | | | 255,088 | |
Hyundai Motor Co. (South Korea) | | | 5,013 | | | | 928,546 | |
Imperial Holdings, Ltd. (South Africa) | | | 4,146 | | | | 63,432 | |
Kia Motors Corp. (South Korea) | | | 4,806 | | | | 278,881 | |
Kroton Educacional, S.A.
(Brazil)* | | | 29,400 | | | | 289,862 | |
Lojas Renner, S.A. (Brazil) | | | 5,000 | | | | 129,768 | |
Mahindra & Mahindra, Ltd. (India) | | | 4,753 | | | | 60,952 | |
MGM China Holdings, Ltd. (Macau)* | | | 167,200 | | | | 217,512 | |
Mr Price Group, Ltd. (South Africa) | | | 4,787 | | | | 47,282 | |
Naspers, Ltd. (South Africa) | | | 3,490 | | | | 152,448 | |
Parkson Retail Group, Ltd. (China) | | | 85,500 | | | | 104,713 | |
PDG Realty S.A. Empreendimentos e Participacoes (Brazil) | | | 115,941 | | | | 366,735 | |
Total Consumer Discretionary | | | | | | | 5,408,802 | |
Consumer Staples - 6.4% | | | | | | | | |
Anadolu Efes Biracilik ve Malt Sanayii A.S. (Turkey) | | | 27,627 | | | | 332,210 | |
BRF - Brasil Foods, S.A., ADR (Brazil) | | | 6,600 | | | | 129,030 | |
China Mengniu Dairy Co., Ltd. (Hong Kong) | | | 41,000 | | | | 95,756 | |
Companhia de Bebidas das Americas, PR ADR (Brazil) | | | 7,600 | | | | 274,284 | |
CP All PCL (Thailand) | | | 141,400 | | | | 231,667 | |
E-Mart Co., Ltd. (South Korea)* | | | 501 | | | | 121,147 | |
Grupo Bimbo, S.A.B. de C.V., Class A (Mexico) | | | 24,829 | | | | 50,709 | |
Hengan International Group Co. (China) | | | 39,500 | | | | 368,268 | |
Indofood Sukses Makmur Tbk PT (Indonesia) | | | 63,500 | | | | 32,180 | |
KT&G Corp. (South Korea)* | | | 1,934 | | | | 136,656 | |
| | | | | | | | |
| | | Shares | | | Value | |
| | | | | | | | |
| | | | | | | | |
LG Household & Health Care, Ltd. (South Korea) | | | 679 | | | $ | 287,380 | |
Olam International, Inc. (Singapore) | | | 172,000 | | | | 281,937 | |
Perusahaan Perkebunan London Sumatra Indonesia Tbk PT (Indonesia) | | | 315,500 | | | | 78,183 | |
Shinsegae Co., Ltd. (South Korea) | | | 471 | | | | 100,278 | |
Tingyi Cayman Islands Holding Corp. (China) | | | 18,000 | | | | 54,522 | |
Wal-Mart de Mexico S.A.B. de C.V. (Mexico) | | | 84,717 | | | | 232,514 | |
X5 Retail Group, N.V., GDR (Russia)* | | | 3,976 | | | | 90,630 | |
Total Consumer Staples | | | | | | | 2,897,351 | |
Energy - 15.9% | | | | | | | | |
Banpu PCL, NVDR (Thailand) | | | 15,400 | | | | 266,016 | |
China Petroleum and Chemical Corp., Class H (China) | | | 316,000 | | | | 331,725 | |
China Shenhua Energy Co., Ltd. (China) | | | 74,500 | | | | 322,158 | |
CNOOC, Ltd. (Hong Kong) | | | 287,790 | | | | 501,832 | |
Gazprom OAO, ADR (Russia) | | | 106,795 | | | | 1,137,787 | |
Lukoil OAO, Sponsored ADR (Russia) | | | 12,146 | | | | 642,878 | |
NovaTek OAO, Sponsored GDR (Russia) | | | 3,523 | | | | 440,711 | |
OGX Petroleo e Gas Participacoes, S.A. (Brazil)* | | | 40,400 | | | | 295,000 | |
Oil & Natural Gas Corp., Ltd. (India) | | | 46,942 | | | | 226,666 | |
Petroleo Brasileiro, S.A. (Brazil) | | | 12,000 | | | | 147,969 | |
Petroleo Brasileiro, S.A., ADR (Brazil) | | | 11,365 | | | | 266,964 | |
Petroleo Brasileiro, S.A., Sponsored ADR (Brazil) | | | 21,127 | | | | 525,006 | |
PTT PCL, NVDR (Thailand) | | | 37,100 | | | | 373,260 | |
QGEP Participacoes, S.A. (Brazil) | | | 37,500 | | | | 331,725 | |
Reliance Industries, Ltd. (India)* | | | 4,335 | | | | 56,472 | |
Rosneft Oil Co. OAO, GDR (a) (Russia) | | | 33,966 | | | | 226,859 | |
Rosneft Oil Co. OAO, GDR (Russia) | | | 13,900 | | | | 91,477 | |
Sasol, Ltd. (South Africa) | | | 4,210 | | | | 200,409 | |
SK Energy Co., Ltd. (South Korea) | | | 1,214 | | | | 149,891 | |
Thai Oil PCL (Thailand) | | | 64,100 | | | | 118,578 | |
Tupras Turkiye Petrol Rafine (Turkey) | | | 16,995 | | | | 357,956 | |
Ultrapar Participacoes, S.A. (Brazil) | | | 6,252 | | | | 107,292 | |
Ultrapar Participacoes, S.A., ADR (Brazil) | | | 4,000 | | | | 68,800 | |
Total Energy | | | | | | | 7,187,431 | |
Financials - 20.9% | | | | | | | | |
ABSA Group, Ltd. (South Africa) | | | 23,042 | | | | 401,844 | |
Ayala Land, Inc. (Philippines) | | | 226,700 | | | | 78,485 | |
Banco Bradesco, S.A., ADR (Brazil) | | | 25,221 | | | | 420,686 | |
|
The accompanying notes are an integral part of these financial statements. 16 |
Managers Emerging Markets Equity Fund
Schedule of Portfolio Investments (continued)
| | | | | | | | |
| | | Shares | | | Value | |
| | | | | | | | |
| | | | | | | | |
Financials - 20.9% (continued) | | | | | | | | |
Bangkok Bank PCL (Thailand) | | | 62,200 | | | $ | 322,847 | |
BR Malls Participacoes, S.A. (Brazil) | | | 14,000 | | | | 136,003 | |
BR Properties, S.A. (Brazil) | | | 48,100 | | | | 477,067 | |
Bumiputra-Commerce Holdings Berhad (Malaysia) | | | 38,200 | | | | 89,574 | |
China Construction Bank Corp. (China) | | | 1,169,907 | | | | 812,631 | |
China Overseas Land & Investment, Ltd. (Hong Kong) | | | 258,000 | | | | 428,172 | |
China Pacific Insurance (Group) Co., Ltd. (China) | | | 56,600 | | | | 160,588 | |
Chinatrust Financial Holding Co., Ltd. (Taiwan) | | | 270,118 | | | | 168,328 | |
Commercial International Bank (Egypt) | | | 29,289 | | | | 91,085 | |
Credicorp, Ltd. (Peru) | | | 761 | | | | 83,307 | |
DGB Financial Group, Inc. (South Korea)* | | | 9,170 | | | | 103,084 | |
EFG-Hermes (Egypt)* | | | 38,965 | | | | 65,244 | |
FirstRand, Ltd. (South Africa) | | | 26,760 | | | | 68,668 | |
Grupo Financiero Banorte, S.A.B. de C.V. (Mexico) | | | 10,400 | | | | 31,488 | |
Grupo Financiero Galicia, S.A., ADR (Argentina) | | | 16,800 | | | | 99,624 | |
Halyk Savings Bank of Kazakhstan, GDR (Kazakhstan)* | | | 7,782 | 2 | | | 37,806 | |
Hana Financial Group, Inc. (South Korea) | | | 13,370 | | | | 414,300 | |
HDFC Bank, Ltd. (India) | | | 36,542 | | | | 293,880 | |
ICICI Bank, Ltd., Sponsored ADR (India) | | | 39 | | | | 1,031 | |
Industrial and Commercial Bank of China, Ltd., Class H (China) | | | 1,420,556 | | | | 839,062 | |
Infrastructure Development Finance Co., Ltd. (India) | | | 159,223 | | | | 274,277 | |
Itau Unibanco Holding, S.A. (Brazil) | | | 5,200 | | | | 94,758 | |
Itau Unibanco Holding, S.A., ADR (Brazil) | | | 36,154 | | | | 671,019 | |
Kasikornbank PCL, NVDR (Thailand) | | | 75,000 | | | | 289,428 | |
Ping An Insurance (Group) Co. of China, Ltd. (China) | | | 42,883 | 2 | | | 281,346 | |
Powszechny Zaklad Ubezpieczen SA (Poland) | | | 1,683 | | | | 150,170 | |
PT Bank Mandiri (Indonesia) | | | 545,906 | | | | 405,712 | |
PT Bank Rakyat Indonesia (Indonesia) | | | 271,000 | | | | 201,441 | |
Public Bank Berhad (Malaysia) | | | 48,369 | | | | 204,064 | |
Public Bank Berhad, Foreign Market (Malaysia) | | | 44,200 | | | | 183,997 | |
Samsung Fire & Marine Insurance Co., Ltd. (South Korea) | | | 1,210 | | | | 221,890 | |
Shinhan Financial Group Co., Ltd. (South Korea) | | | 4,129 | | | | 142,782 | |
Siam Commercial Bank PCL (Thailand) | | | 92,800 | | | | 342,024 | |
| | | | | | | | |
| | | Shares | | | Value | |
| | | | | | | | |
| | | | | | | | |
Turkiye Garanti Bankasi A.S. (Turkey) | | | 26,793 | | | $ | 83,296 | |
Turkiye Halk Bankasi A.S. (Turkey) | | | 13,903 | | | | 72,458 | |
VTB Bank, GDR (Russia) | | | 45,817 | | | | 164,933 | |
Warsaw Stock Exchange (Poland) | | | 1,475 | 2 | | | 15,038 | |
Total Financials | | | | | | | 9,423,437 | |
Health Care - 0.4% | | | | | | | | |
Dr. Reddy’s Laboratories, Ltd. (ADR) (India) | | | 6,117 | | | | 181,289 | |
Industrials - 5.9% | | | | | | | | |
China Shipping Development Co., Ltd. (China) | | | 458,000 | | | | 284,882 | |
Companhia de Concessoes Rodoviarias (Brazil) | | | 27,848 | | | | 182,443 | |
Copa Holdings, S.A., Class A (Panama) | | | 5,700 | | | | 334,419 | |
Enka Insaat ve Sanayi A.S. (Turkey)* | | | 35,985 | | | | 77,629 | |
Globaltrans Investment PLC, GDR (Russia) | | | 5,333 | | | | 73,219 | |
GS Engineering & Construction Corp. (South Korea) | | | 2,272 | | | | 182,071 | |
Hyundai Heavy Industries Co., Ltd. (South Korea) | | | 402 | | | | 89,883 | |
Industries Qatar Q.S.C. (Qatar) | | | 3,999 | | | | 146,270 | |
Iochpe-Maxion, S.A. (Brazil) | | | 6,200 | | | | 83,930 | |
Larsen & Toubro, Ltd. (India) | | | 12,279 | | | | 229,678 | |
Orascom Construction Industries, GDR (Egypt) | | | 2,706 | | | | 91,733 | |
Samsung Heavy Industries Co., Ltd. (South Korea) | | | 14,061 | | | | 341,586 | |
Sime Darby Berhad (Malaysia) | | | 68,600 | | | | 199,022 | |
SM Investments Corp. (Philippines) | | | 6,900 | | | | 91,834 | |
TAV Havalimanlari Holding A.S. (Turkey)* | | | 14,238 | | | | 60,444 | |
Weichai Power Co., Ltd. (China) | | | 37,000 | | | | 181,507 | |
Total Industrials | | | | | | | 2,650,550 | |
Information Technology - 16.1% | | | | | | | | |
Asustek Computer, Inc. (Taiwan) | | | 15,873 | | | | 112,787 | |
Baidu.com, Inc.
(China)* | | | 3,800 | | | | 442,586 | |
Daum Communications Corp. (South Korea) | | | 506 | | | | 52,779 | |
Hon Hai Precision Industry Co., Ltd. (Taiwan) | | | 120,296 | | | | 328,978 | |
Hon Hai Precision Industry Co., Ltd., ADR (Taiwan) | | | 23 | | | | 126 | |
Hynix Semiconductor, Inc. (South Korea) | | | 2,950 | | | | 56,326 | |
Infosys Technologies, Ltd. (India) | | | 3,216 | | | | 167,386 | |
Infosys Technologies, Ltd., Sponsored ADR (India) | | | 7,100 | 2 | | | 364,798 | |
Largan Precision Co., Ltd. (Taiwan) | | | 5,000 | | | | 93,349 | |
Lenovo Group, Ltd. (United States) | | | 168,000 | | | | 111,759 | |
LG Display Co., Ltd. (South Korea) | | | 13,000 | | | | 275,937 | |
Mail.Ru Group, Ltd., Reg S, GDR
(Russia)* | | | 11,023 | | | | 286,122 | |
MediaTek, Inc. (Taiwan) | | | 30,067 | | | | 275,203 | |
|
The accompanying notes are an integral part of these financial statements. 17 |
Managers Emerging Markets Equity Fund
Schedule of Portfolio Investments (continued)
| | | | | | | | |
| | | Shares | | | Value | |
| | | | | | | | |
| | | | | | | | |
Information Technology - 16.1% (continued) | | | | | | | | |
NCSoft Corp. (South Korea) | | | 1,099 | | | $ | 293,789 | |
Samsung Electronics Co., Ltd. (South Korea) | | | 2,368 | | | | 2,178,176 | |
Siliconware Precision Industries Co., ADR (Taiwan) | | | 51,000 | | | | 222,360 | |
Simplo Technology Co., Ltd. (Taiwan) | | | 53,000 | | | | 308,444 | |
Taiwan Semiconductor Manufacturing Co., Ltd. (Taiwan) | | | 244,584 | | | | 611,118 | |
Taiwan Semiconductor Manufacturing Co., Ltd., Sponsored ADR (Taiwan) | | | 24,200 | | | | 312,422 | |
Tencent Holdings, Ltd. (China) | | | 12,500 | | | | 250,292 | |
WPG Holdings, Ltd. (Taiwan) | | | 90,470 | | | | 104,167 | |
Yandex, N.V., Class A (Netherlands)* | | | 1,400 | 2 | | | 27,580 | |
ZTE Corp., Class H (China) | | | 123,000 | 2 | | | 384,195 | |
Total Information Technology | | | | | | | 7,260,679 | |
Materials - 12.6% | | | | | | | | |
AngloGold Ashanti, Ltd. (South Africa) | | | 3,989 | | | | 169,386 | |
Anhui Conch Cement Co., Ltd. (China) | | | 140,308 | 2 | | | 414,021 | |
Antofagasta PLC (United Kingdom) | | | 18,295 | | | | 346,003 | |
Centamin PLC (Channel Islands)* | | | 23,020 | | | | 29,458 | |
Compania de Minas Buenaventura SA (Peru) | | | 2,000 | | | | 76,680 | |
Evraz PLC (United Kingdom)* | | | 32,292 | | | | 187,909 | |
Gerdau, S.A., Sponsored ADR (Brazil) | | | 13,400 | | | | 104,654 | |
Grupo Mexico, S.A.B. de C.V., Class B (Mexico) | | | 35,190 | | | | 92,522 | |
Impala Platinum Holdings, Ltd. (South Africa) | | | 15,584 | | | | 322,650 | |
KG Chemical Co., Ltd. (South Korea) | | | 2,241 | | | | 617,970 | |
KGHM Polska Miedz SA (Poland) | | | 1,206 | | | | 38,469 | |
LSR Group OJSC, GDR (Russia) | | | 15,279 | 2 | | | 51,466 | |
MMC Norilsk Nickel, ADR (Russia) | | | 14,761 | | | | 225,560 | |
MMX Mineracao e Metalicos,
S.A. (Brazil)* | | | 81,600 | | | | 291,796 | |
Mongolian Mining Corp. (Mongolia)* | | | 194,000 | 2 | | | 145,447 | |
Nan Ya Plastics Corp. (Taiwan) | | | 24,000 | | | | 47,596 | |
Polymetal International PLC (Russia)* | | | 4,203 | | | | 71,408 | |
POSCO (South Korea) | | | 948 | | | | 312,708 | |
PT Semen Gresik Persero Tbk (Indonesia) | | | 129,000 | | | | 162,769 | |
Raspadskaya (Russia) | | | 50,441 | | | | 155,280 | |
Taiwan Cement Corp. (Taiwan) | | | 137,216 | | | | 158,365 | |
Tata Steel, Ltd., Reg S, GDR (India) | | | 27,613 | | | | 198,676 | |
Ternium, S.A. (Luxembourg) | | | 3,500 | | | | 64,365 | |
Uralkaliy OAO (Russia) | | | 12,057 | | | | 434,162 | |
Vale, S.A., ADR (Brazil) | | | 15,499 | | | | 319,279 | |
Vale, S.A., Sponsored ADR (Brazil) | | | 29,167 | | | | 625,632 | |
Total Materials | | | | | | | 5,664,231 | |
| | | | | | | | |
| | | Shares | | | Value | |
| | | | | | | | |
| | | | | | | | |
Telecommunication Services - 5.7% | | | | | | | | |
America Movil, S.A.B. de C.V., Series L (Mexico) | | | 29,200 | | | $ | 659,920 | |
Axiata Group Berhad (Malaysia) | | | 134,500 | | | | 218,101 | |
China Mobile, Ltd. (Hong Kong) | | | 85,000 | | | | 825,824 | |
Chunghwa Telecom Co., Ltd., ADR (Taiwan) | | | 2,033 | | | | 67,658 | |
Mobile Telesystems OJSC, Sponsored ADR (Russia) | | | 11,400 | | | | 167,352 | |
MTN Group, Ltd. (South Africa) | | | 8,066 | | | | 143,311 | |
Sistema JSFC, Sponsored GDR (United Kingdom)* | | | 4,043 | | | | 67,858 | |
Taiwan Mobile Co., Ltd. (Taiwan) | | | 56,100 | | | | 174,783 | |
Telef Brasil, ADR (Brazil) | | | 4,712 | | | | 128,779 | |
Telekomunikacja Polksa SA (Poland) | | | 5,698 | | | | 28,399 | |
Turk Telekomunikasyon A.S. (Turkey) | | | 25,300 | | | | 93,636 | |
Total Telecommunication Services | | | | | | | 2,575,621 | |
Utilities - 1.8% | | | | | | | | |
China Resources Power Holdings Co. (Hong Kong) | | | 128,000 | | | | 246,451 | |
Companhia Energetica de Minas Gerais, Sponsored ADR (Brazil) | | | 11,390 | | | | 202,628 | |
Perusahaan Gas Negara (Persero) Tbk PT (Indonesia) | | | 1,016,000 | | | | 355,379 | |
Total Utilities | | | | | | | 804,458 | |
Total Common Stocks
(cost $48,178,637) | | | | | | | 44,053,849 | |
Rights - 0.0%# | | | | | | | | |
Kroton Educacional, S.A., Rights (Brazil)* | | | 11,853 | | | | 3,368 | |
Total Rights
(cost $0) | | | | | | | 3,368 | |
Warrants - 0.8% | | | | | | | | |
Sberbank of Russia Warrant, 02/28/18 (United Kingdom)* | | | 138,513 | | | | 340,742 | |
Total Warrants (cost $468,374) | | | | | | | 340,742 | |
Other Investment Companies - 4.4%1 | | | | | | | | |
BNY Mellon Overnight Government Fund, 0.04%3 | | | 1,411,233 | | | | 1,411,233 | |
Dreyfus Cash Management Fund, Institutional Class Shares, 0.05% | | | 574,404 | | | | 574,404 | |
Total Other Investment Companies
(cost $1,985,637) | | | | | | | 1,985,637 | |
Total Investments - 102.9%
(cost $50,632,648) | | | | | | | 46,383,596 | |
Other Assets, less Liabilities - (2.9)% | | | | | | | (1,290,151 | ) |
Net Assets - 100.0% | | | | | | $ | 45,093,445 | |
|
The accompanying notes are an integral part of these financial statements. 18 |
Managers Global Bond Fund
Investment Manager’s Comments
THE YEAR IN REVIEW
Managers Global Bond Fund returned 3.39% during the year ended December 31, 2011, lagging the return of 5.64% for the Barclays Capital Global Aggregate Bond Index (the “Index”). At the beginning of 2011, a low interest rate environment continued to reinforce the reach for yield at a time when economic conditions were slowly improving. These conditions supported demand for fixed income over the next few months as new issuance continued its torrid pace, reaching $167.9 Billion by the end of the first half of 2011, well ahead of last year’s record pace. Despite negative headline risk out of Japan, the Middle East and the northern Africa region, ongoing European sovereign issues, rising concerns of a Chinese economic slowdown, and ratings downgrades in peripheral corporate names, global bond market returns mostly held in positive territory with a notable exception being European High Yield.
The seemingly endless buildup of stress on the European banking system and global financial markets increased the downside risk of global growth and led to increased market volatility during the summer months and early fall. Continued market volatility from a lack of resolution regarding the European debt crisis impacted riskier assets, particularly high yield and emerging market bonds. Downgrade fears within Europe and continued bickering in Washington around two key items with growth implications for 2012 (payroll taxes and unemployment benefits) kept pressure on markets during the remainder of the year. During the fourth quarter, some optimism returned with better than expected economic releases in the U.S. helping to strengthen investor beliefs that the U.S. economic recovery would continue into 2012.
The major drivers of the Fund’s underperformance relative to benchmark during 2011 were its emphasis on higher yielding corporate bonds, with a related underweight to Treasuries, and select positioning among emerging market currencies. On a security selection basis, the Fund also lagged through its selections in U.S. Banking and U.S. dollar-pay Emerging Market Sovereign bonds. Furthermore, underperformance can be attributed to a lower-quality bias in investment grade security selection as well as off-benchmark high yield securities. As measured by Barclays Capital Indices, government bonds outperformed investment-grade and high yield corporate bonds during 2011. For example, the Barclays Capital Global High Yield Index returned 3.12% compared to a total return of 4.32% for the Barclays Capital Global Corporate Bond Index and 9.13% for the Barclays Capital Global Government Bond Index. On a positive note, the Fund strongly outperformed from a country allocation perspective as overweight positioning in peripheral markets opposed to core markets—Euro Area, U.S. and
Japan—proved beneficial. In particular, the Fund’s outperforming positions in Northern Europe and the U.K. were funded through underweight positioning to the Euro Area.
LOOKING FORWARD
Markets took a year-end holiday from the Euro-zone crisis, after digesting the December Summit and the arguably more important European Central Bank (ECB) decision to offer three-year repo in huge size to European banks. This LTRO (long-term refinancing operation) arguably gives banks enough liquidity to at least slow their balance sheet shrinkage. We believe that massive deleverage by Euro-zone banks was a key driver of wider spreads in the second half of 2011. However, liquidity is not equity, and realized losses on Greek paper this quarter may lead to renewed pressures on banks and risk appetite.
For 2012, we expect the U.S. recovery to be sustained, with GDP growth of 2 percent to slightly higher. Economic data has been improving in recent months, and we find more reasons to be positive than negative on the outlook (a likely bottom in housing starts, the shale gas boom, better auto sales). In Europe, we expect recession, with the ECB providing just enough liquidity to avoid a collapse. We remain underweight the Euro. In Asia, we have grown more cautious, and have reduced some currency positions.
Reviewing sector positioning, we are less negative on U.S. mortgages after the recent spread widening, but still prefer corporates. We see little long-term value in lending money to the U.S. Government for ten years at 2.0%. This is our medium term U.S. core inflation forecast, so we would prefer to capture a positive yield in corporates. Quality yield is scarce worldwide and is expected to remain so, as Europe has elected a fiscal contraction solution to its policy dilemmas. We see Europe following a Japan-type path, where fiscal contraction will be employed to deflate domestic demand to a point where Europe as a bloc is in current account surplus, and hence can be self-financing. Ireland is in current account surplus, and Spain may be just getting there. Despite the recent weakness of the Euro, and very one-sided (short) technical trading positions among currency traders, we still see good reason to retain our underweight to the Euro-zone.
This commentary reflects the viewpoints of the portfolio manager, Loomis, Sayles & Company, as of January 20, 2011.
CUMULATIVE TOTAL RETURN PERFORMANCE
Global Bond’s cumulative total return is based on the daily change in net asset value (NAV), and assumes that all distributions were reinvested. This graph compares a hypothetical $10,000 investment
Managers Global Bond Fund
Investment Manager’s Comments (continued)
CUMULATIVE TOTAL RETURN PERFORMANCE (continued)
made in Global Bond on December 31, 2001, to a $10,000 investment made in the Barclays Capital Global Aggregate Bond Index for the same time period. Performance for periods longer than one year is the average annual return. The graph and table do not reflect the deduction of taxes that a shareholder would pay on a Fund distribution or redemption of shares. The listed returns for the Fund are net of expenses and the returns for the index exclude expenses. Past performance is not indicative of future results. Total returns would have been lower had certain expenses not been reduced.
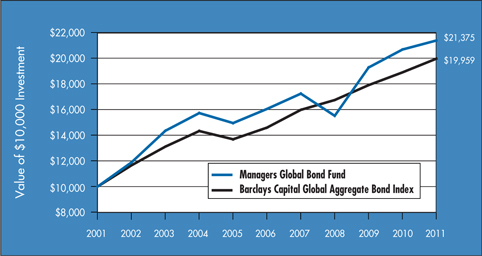
The table below shows the average annual total returns for Global Bond and the Barclays Capital Global Aggregate Bond Index from December 31, 2001 through December 31, 2011.
| | | | | | |
Average Annual Total Returns1 | | One Year | | Five Years | | Ten Years |
Managers Global Bond Fund2,3,4,5,6 | | 3.39% | | 5.90% | | 7.89% |
Barclays Capital Global Aggregate Bond Index7 | | 5.64% | | 6.46% | | 7.16% |
The performance data shown represents past performance, which is not a guarantee of future results. Current performance may be lower or higher than the performance data quoted. The investment return and principal value of an investment in the Fund will fluctuate so that an investor’s shares, when redeemed, may be worth more or less than their original cost. For performance information through the most recent month end, please call (800) 835-3879 or visit our Web site at www.managersinvest.com.
In choosing a Fund, investors should carefully consider the amount they plan to invest, their investment objectives, the Fund’s investment objectives, risks, charges and expenses before investing. For this and other information, please call (800) 835-3879 or visit www.managersinvest.com for a free prospectus. Read it carefully before investing or sending money. Funds are distributed by Managers Distributors, Inc., a member of FINRA.
| | 1 | Total return equals income yield plus share price change and assumes reinvestment of all dividends and capital gain distributions. Returns are net of fees and may reflect offsets of Fund expenses as described in the Prospectus. No adjustment has been made for taxes payable by shareholders on their reinvested dividends and capital gain distributions. Returns for periods greater than one year are annualized. The listed returns on the Fund are net of expenses and based on the published NAV as of December 31, 2011. All returns are in U.S. dollars ($). |
| | 2 | Fund for which, from time to time, the Fund’s advisor has waived its fees and/or absorbed Fund expenses, which has resulted in higher returns. |
| | 3 | The Fund is subject to the risks associated with investments in debt securities, such as default risk and fluctuations in the perception of the debtor’s ability to pay its creditors. |
| | |
| | | 4 Changing interest rates may adversely affect the value of an investment. An increase in interest rates typically causes the value of bonds and other fixed-income securities to fall. 5 Investments in foreign securities are subject to additional risks such as changing market conditions, economic and political instability, and currency exchange rate fluctuations. 6 The Fund is subject to currency risk resulting from fluctuations in exchange rates that may affect the total loss or gain on a non-U.S. Dollar security when converted back to U.S. Dollars. 7 The Barclays Capital Global Aggregate Bond Index provides a broad-based measure of the global investment-grade fixed-income markets. The three major components of this index are the U.S. Aggregate, the Pan-European Aggregate, and the Asian-Pacific Aggregate Indices. The Index also includes Eurodollar and Euro-Yen corporate bonds, Canadian government, agency and corporate securities, and USD investment-grade 144A securities. Unlike the Fund, the Barclays Capital Global Aggregate Bond Index is unmanaged, is not available for investment, and does not incur fees. Not FDIC insured, nor bank guaranteed. May lose value. |
20
Managers Global Bond Fund
Fund Snapshots (unaudited)
December 31, 2011
Portfolio Breakdown
| | | | | | | | |
Category | | Managers
Global
Bond Fund** | | | Barclays Capital
Global
Aggregate
Bond Index | |
Foreign Government Obligations | | | 44.9 | % | | | 51.6 | % |
Corporate Bonds | | | 35.9 | % | | | 15.5 | % |
U.S. Government Obligations | | | 5.1 | % | | | 16.0 | % |
Asset-Backed Securities | | | 3.8 | % | | | 0.2 | % |
Mortgage Backed Securities | | | 2.4 | % | | | 16.7 | % |
Municipal Bonds | | | 0.5 | % | | | 0.0 | % |
Other Assets and Liabilities | | | 7.4 | % | | | 0.0 | % |
| ** | As a percentage of net assets |
| | | | | | | | |
Rating | | Managers
Global
Bond Fund** | | | Barclays Capital
Global
Aggregate
Bond Index | |
U.S. Treasury & Agency | | | 5.5 | % | | | 28.2 | % |
Aaa | | | 25.7 | % | | | 22.6 | % |
Aa | | | 23.3 | % | | | 28.6 | % |
A | | | 16.6 | % | | | 13.8 | % |
Baa | | | 16.7 | % | | | 6.8 | % |
Ba & lower | | | 11.0 | % | | | 0.0 | % |
Not Rated | | | 1.2 | % | | | 0.0 | % |
| ** | As a percentage of net assets |
Top Ten Holdings
| | | | |
Security Name | | % of Net
Assets | |
Japan Government, Bonds, Series 299, 1.300%, 03/20/19* | | | 5.6 | % |
Japan Government Notes, Series 84, 0.700%, 06/20/14* | | | 3.8 | |
Mexican Fixed Rate Bonds, 8.000%, 12/07/23 | | | 2.2 | |
Japan Finance Corporation for Municipal Enterprises Bonds, 1.550%, 02/21/12* | | | 2.1 | |
Norway Government Bonds, 4.500%, 05/22/19* | | | 2.0 | |
Canada Government Notes, 3.000%, 12/01/15* | | | 1.8 | |
Singapore Government Notes, 1.625%, 04/01/13 | | | 1.7 | |
Italian Treasury Bonds, 4.000%, 09/01/20* | | | 1.7 | |
Japan Government Bonds, Series 123, 2.100%, 12/20/30 | | | 1.7 | |
United States Treasury Notes, 1.375%, 02/15/12* | | | 1.6 | |
| | | | |
Top Ten as a Group | | | 24.2 | % |
| | | | |
| * | Top Ten Holding at June 30, 2011 |
|
| Any sectors, industries, or securities discussed should not be perceived as investment recommendations. Mention of a specific security should not be considered a recommendation to buy or solicitation to sell that security. Specific securities mentioned in this report may have been sold from the Fund’s portfolio of investments by the time you receive this report. |
21
Managers Global Bond Fund
Schedule of Portfolio Investments
December 31, 2011
| | | | | | | | | | | | |
| Security Description | | | | | Principal Amount | | | Value | |
| | | | | | | | | | | | |
| | | | | | | | | | | | |
Asset-Backed Securities - 3.8% | | | | | | | | | | | | |
Avis Budget Rental Car Funding LLC II, Series 2009 2A, Class A, 5.680%,
02/20/14 (a) | | | USD | | | | 100,000 | | | $ | 103,295 | |
COMET, Series 2004-B7, Class B7, 2.068%, 08/17/17 (01/19/12)5 | | | EUR | | | | 100,000 | | | | 124,633 | |
Hertz Vehicle Financing LLC, Series 2009 2A, Class A1, 4.260%, 03/25/16 (a) | | | USD | | | | 100,000 | | | | 102,368 | |
Hyundai Capital Auto Funding, Ltd., Series 2010 8A, Class A, 1.285%, 09/20/16 (01/18/12) (a)5 | | | USD | | | | 200,000 | | | | 201,098 | |
MBNA Credit Card Master Note Trust, Series 2005 B3, Class B3, 1.878%, 03/19/18 (01/19/12)5 | | | EUR | | | | 100,000 | | | | 121,440 | |
Santander Drive Auto Receivables Trust, Series 2011 S2A, Class D, 3.350%, 06/15/17 (a) | | | USD | | | | 72,459 | | | | 71,372 | |
Sierra Receivables Funding Company, Series 2009-3A, Class A1, 7.620%,
07/20/26 (a) | | | USD | | | | 22,138 | | | | 22,176 | |
Trinity Rail Leasing, L.P., Series 2010 1A, Class A, 5.194%, 10/16/40 (a) | | | USD | | | | 95,972 | | | | 92,721 | |
World Financial Credit Card Master Trust, Series 2010-A, Class A, 3.960%, 06/15/15 | | | USD | | | | 95,000 | | | | 101,373 | |
Total Asset-Backed Securities
(cost $917,003) | | | | | | | | | | | 940,476 | |
Corporate Bonds and Notes - 35.9% | | | | | | | | | | | | |
Financials - 15.7% | | | | | | | | | | | | |
ABB Treasury Center USA, Inc., 2.500%, 06/15/16 (a) | | | USD | | | | 80,000 | | | $ | 80,442 | |
Allianz Finance II, B.V., EMTN, 5.750%, 07/08/416 | | | EUR | | | | 100,000 | | | | 110,119 | |
AXA SA, 7.125%, 12/15/20 | | | GBP | | | | 100,000 | | | | 143,857 | |
Bank of America Corp., 4.750%, 05/06/196 | | | EUR | | | | 100,000 | | | | 92,798 | |
Barclays Bank PLC, 6.050%, 12/04/17 | | | USD | | | | 100,000 | | | | 90,426 | |
BBVA Bancomer SA, 6.500%, 03/10/21 (a) | | | USD | | | | 100,000 | | | | 96,375 | |
BNP Paribas SA, Series BKNT, 5.000%, 01/15/21 | | | USD | | | | 125,000 | | | | 120,312 | |
BNZ International Funding, Ltd., EMTN, 4.000%, 03/08/17 | | | EUR | | | | 100,000 | | | | 129,179 | |
Citigroup, Inc., 5.500%, 02/15/17 | | | USD | | | | 85,000 | | | | 85,642 | |
Crown Castle Towers LLC, 6.113%, 01/15/20 (a) | | | USD | | | | 100,000 | | | | 110,334 | |
Dolphin Subsidiary II, Inc., 6.500%, 10/15/16 (a) | | | USD | | | | 90,000 | | | | 95,850 | |
Ford Motor Credit Co. LLC, 7.000%, 04/15/15 | | | USD | | | | 100,000 | | | | 107,500 | |
GMAC, Inc., 6.750%, 12/01/14 | | | USD | | | | 135,000 | | | | 135,675 | |
Goldman Sachs Group, Inc., 4.750%, 01/28/14 | | | EUR | | | | 85,000 | | | | 109,499 | |
HSBC Bank PLC, 4.125%, 08/12/20 (a) | | | USD | | | | 100,000 | | | | 98,676 | |
JPMorgan Chase & Co., 4.400%, 07/22/20 | | | USD | | | | 75,000 | | | | 76,591 | |
KfW Bankengruppe, 2.600%, 06/20/37 | | | JPY | | | | 23,000,000 | | | | 335,914 | |
Lloyds TSB Bank PLC, 6.500%, 09/14/20 (a) | | | USD | | | | 100,000 | | | | 83,676 | |
Morgan Stanley, | | | | | | | | | | | | |
5.500%, 07/24/20 | | | USD | | | | 100,000 | | | | 90,923 | |
EMTN, 5.375%, 11/14/13 | | | GBP | | | | 40,000 | | | | 61,566 | |
National Australia Bank, Ltd., Series GMTN, 4.750%, 07/15/16 | | | EUR | | | | 100,000 | | | | 137,611 | |
Network Rail Infrastructure Finance PLC, EMTN, 3.500%, 06/17/13 | | | USD | | | | 300,000 | | | | 311,638 | |
Rabobank Nederland, EMTN, 4.375%, 01/22/14 | | | EUR | | | | 85,000 | | | | 115,489 | |
SLM Corp., 5.000%, 10/01/13 | | | USD | | | | 150,000 | | | | 150,000 | |
Societe Generale SA, 5.200%, 04/15/21 (a) | | | USD | | | | 200,000 | | | | 169,935 | |
Videotron, Ltee., 6.875%, 07/15/21 (a) | | | CAD | | | | 65,000 | | | | 63,806 | |
Wells Fargo & Co., 4.625%, 11/02/35 | | | GBP | | | | 50,000 | | | | 73,974 | |
|
The accompanying notes are an integral part of these financial statements. 22 |
Managers Global Bond Fund
Schedule of Portfolio Investments (continued)
| | | | | | | | | | | | |
| Security Description | | | | | Principal Amount | | | Value | |
| | | | | | | | | | | | |
| | | | | | | | | | | | |
Financials - 15.7% (continued) | | | | | | | | | | | | |
Westpac Banking Corp., 2.450%, 11/28/16 (a) | | | USD | | | | 200,000 | | | $ | 198,280 | |
White Mountains Insurance Group, Ltd., 6.375%, 03/20/17 (a) | | | USD | | | | 140,000 | | | | 146,839 | |
Zurich Finance USA, Inc., | | | | | | | | | | | | |
EMTN, 4.500%, 06/15/256 | | | EUR | | | | 100,000 | | | | 122,525 | |
EMTN, 5.750%, 10/02/236 | | | EUR | | | | 100,000 | | | | 127,831 | |
Total Financials | | | | | | | | | | | 3,873,282 | |
Industrials - 16.9% | | | | | | | | | | | | |
Alstom SA, 4.125%, 02/01/17 | | | EUR | | | | 100,000 | | | | 128,164 | |
Asciano Finance, Ltd., 4.625%, 09/23/20 (a) | | | USD | | | | 125,000 | | | | 117,305 | |
Avnet, Inc., 5.875%, 06/15/20 | | | USD | | | | 60,000 | | | | 63,060 | |
Axtel S.A.B. de C.V., 7.625%, 02/01/17 (a) | | | USD | | | | 55,000 | | | | 39,050 | |
Bell Aliant Regional Communications, 5.410%, 09/26/16 | | | CAD | | | | 160,000 | | | | 170,545 | |
Bell Canada, | | | | | | | | | | | | |
6.100%, 03/16/35 (a) | | | CAD | | | | 45,000 | | | | 49,961 | |
6.550%, 05/01/29 (a) | | | CAD | | | | 10,000 | | | | 11,576 | |
7.300%, 02/23/32 (a) | | | CAD | | | | 130,000 | | | | 158,460 | |
British Telecommunications PLC, 5.750%, 12/07/28 | | | GBP | | | | 100,000 | | | | 166,036 | |
Cameron International Corp., 5.950%, 06/01/41 | | | USD | | | | 35,000 | | | | 40,306 | |
Citizens Communications Co., 6.625%, 03/15/15 | | | USD | | | | 115,000 | | | | 113,850 | |
Corus Entertainment, Inc., 7.250%, 02/10/17 (a) | | | CAD | | | | 130,000 | | | | 132,712 | |
Delta Air Lines, Inc., 8.021%, 08/10/22 | | | USD | | | | 86,044 | | | | 84,427 | |
Desarrolladora Homex, S.A. de C.V., 7.500%, 09/28/15 | | | USD | | | | 190,000 | | | | 185,250 | |
Deutsche Telekom International Finance, B.V., EMTN, 4.875%, 04/22/25 | | | EUR | | | | 50,000 | | | | 68,222 | |
Dish DBS Corp., 6.750%, 06/01/21 | | | USD | | | | 50,000 | | | | 53,875 | |
DP World, Ltd., 6.850%, 07/02/37 (a) | | | USD | | | | 250,000 | | | | 226,250 | |
Edcon Proprietary Ltd., 4.676%, 06/15/14 (05/15/12) (a)5 | | | EUR | | | | 150,000 | | | | 143,176 | |
ERAC USA Finance Co., 6.700%, 06/01/34 (a) | | | USD | | | | 120,000 | | | | 135,662 | |
Fibria Overseas Finance, Ltd., 6.750%, 03/03/21 (a) | | | USD | | | | 150,000 | | | | 136,875 | |
Finmeccanica SpA, 4.875%, 03/24/25 | | | EUR | | | | 100,000 | | | | 84,502 | |
HCA, Inc., | | | | | | | | | | | | |
6.375%, 01/15/15 | | | USD | | | | 35,000 | | | | 35,656 | |
6.625%, 02/15/16 | | | USD | | | | 80,000 | | | | 81,200 | |
7.580%, 09/15/25 | | | USD | | | | 10,000 | | | | 8,850 | |
7.690%, 06/15/25 | | | USD | | | | 15,000 | | | | 13,275 | |
Hyatt Hotels Corp., 5.375%, 08/15/21 | | | USD | | | | 90,000 | 2 | | | 92,005 | |
International Paper Co., 6.000%, 11/15/41 | | | USD | | | | 50,000 | | | | 54,281 | |
Koninklijke KPN, N.V., Series GMTN, 5.625%, 09/30/24 | | | EUR | | | | 50,000 | | | | 72,048 | |
Lafarge SA, EMTN, Series 2010, 5.375%, 11/29/18 | | | EUR | | | | 50,000 | | | | 56,332 | |
Nabors Industries, Inc., 4.625%, 09/15/21 (a) | | | USD | | | | 75,000 | | | | 76,178 | |
Nextel Communications, Inc., 7.375%, 08/01/15 | | | USD | | | | 135,000 | | | | 123,525 | |
NII Capital Corp., 7.625%, 04/01/21 | | | USD | | | | 95,000 | | | | 94,288 | |
Odebrecht Drill VIII/IX, Ltd., 6.350%, 06/30/21 (a) | | | USD | | | | 100,000 | | | | 103,000 | |
|
The accompanying notes are an integral part of these financial statements. 23 |
Managers Global Bond Fund
Schedule of Portfolio Investments (continued)
| | | | | | | | | | | | |
| Security Description | | | | | Principal Amount | | | Value | |
| | | | | | | | | | | | |
| | | | | | | | | | | | |
Industrials - 16.9% (continued) | | | | | | | | | | | | |
Owens-Illinois, Inc., 7.800%, 05/15/18 | | | USD | | | | 125,000 | | | $ | 138,125 | |
Qwest Corp., 7.250%, 10/15/35 | | | USD | | | | 158,000 | | | | 157,549 | |
Reynolds Group Issuer, Inc., 6.875%, 02/15/21 (a) | | | USD | | | | 100,000 | | | | 99,500 | |
Rowan Companies, Inc., 5.000%, 09/01/17 | | | USD | | | | 60,000 | | | | 63,045 | |
Telecom Italia Capital S.A., | | | | | | | | | | | | |
6.375%, 11/15/33 | | | USD | | | | 45,000 | | | | 34,081 | |
7.200%, 07/18/36 | | | USD | | | | 20,000 | | | | 16,519 | |
Telefonica Emisiones, S.A.U., | | | | | | | | | | | | |
5.134%, 04/27/20 | | | USD | | | | 75,000 | | | | 70,449 | |
7.045%, 06/20/36 | | | USD | | | | 75,000 | | | | 73,130 | |
Transport De Gas Del Sur, 7.875%, 05/14/17 (a) | | | USD | | | | 245,000 | | | | 220,500 | |
Valeant Pharmaceuticals International, Inc., 6.750%, 08/15/21 (a) | | | USD | | | | 60,000 | | | | 57,900 | |
Voto-Votorantim, Ltd., 6.750%, 04/05/21 (a) | | | USD | | | | 100,000 | | | | 105,750 | |
Total Industrials | | | | | | | | | | | 4,156,450 | |
Utilities - 3.3% | | | | | | | | | | | | |
Axtel S.A.B. de C.V 9.000%, 09/22/19 (a) | | | USD | | | | 45,000 | | | | 33,525 | |
Centrais Eletricas Brasileiras, S.A., 5.750%, 10/27/21 (a) | | | USD | | | | 200,000 | | | | 207,800 | |
Dubai Electricity & Water Authority, 6.375%, 10/21/16 (a) | | | USD | | | | 100,000 | | | | 102,250 | |
EDP Finance, B.V., | | | | | | | | | | | | |
EMTN, 4.750%, 09/26/16 | | | EUR | | | | 50,000 | | | | 53,711 | |
EMTN, 8.625%, 01/04/24 | | | GBP | | | | 50,000 | | | | 64,837 | |
Emgesa SA ESP, 8.750%, 01/25/21 (a) | | | COP | | | | 120,000,000 | | | | 66,435 | |
Empresas Publicas de Medellin ESP, 8.375%, 02/02/21 (a) | | | COP | | | | 180,000,000 | | | | 97,433 | |
Iberdrola Finance Ireland, Ltd., 5.000%, 09/11/19 (a) | | | USD | | | | 150,000 | | | | 146,503 | |
IPALCO Enterprises, Inc., 7.250%, 04/01/16 (a) | | | USD | | | | 30,000 | | | | 32,400 | |
Total Utilities | | | | | | | | | | | 804,894 | |
Total Corporate Bonds and Notes (cost $8,850,442) | | | | | | | | | | | 8,834,626 | |
Foreign Government Obligations - 44.9% | | | | | | | | | | | | |
Australian Government Index Linked Bonds, Series 2009 25CI, 3.000%, 09/20/25 | | | AUD | | | | 180,000 | | | | 237,102 | |
Bundesrepublik Deutschland Bonds, 4.000%, 01/04/37 | | | EUR | | | | 110,000 | | | | 182,977 | |
Canadian Government Notes, 3.000%, 12/01/15 | | | CAD | | | | 425,000 | | | | 446,155 | |
Eksportfinans ASA, 2.000%, 09/15/15 | | | USD | | | | 40,000 | | | | 33,135 | |
European Investment Bank, | | | | | | | | | | | | |
Bonds, 2.375%, 07/10/20 | | | CHF | | | | 165,000 | | | | 188,396 | |
Notes, 5.687%, 04/24/13 (a)4 | | | IDR | | | | 1,842,000,000 | | | | 188,685 | |
Export-Import Bank of Korea Notes, The, 4.000%, 11/26/15 (a) | | | PHP | | | | 5,000,000 | | | | 111,196 | |
Inter-American Development Bank Notes, 6.946%, 08/20/154 | | | IDR | | | | 750,000,000 | | | | 64,516 | |
International Bank for Reconstruction & Development, GMTN, 2.300%, 02/26/08 | | | KRW | | | | 130,000,000 | | | | 114,842 | |
Italian Treasury, | | | | | | | | | | | | |
Bonds, 4.000%, 09/01/20 | | | EUR | | | | 380,000 | | | | 409,794 | |
Bonds, 5.000%, 09/01/40 | | | EUR | | | | 60,000 | | | | 61,101 | |
Notes, 4.750%, 09/15/16 | | | EUR | | | | 195,000 | | | | 240,390 | |
|
The accompanying notes are an integral part of these financial statements. 24 |
Managers Global Bond Fund
Schedule of Portfolio Investments (continued)
| | | | | | | | | | | | |
| Security Description | | | | | Principal Amount | | | Value | |
| | | | | | | | | | | | |
| | | | | | | | | | | | |
Foreign Government Obligations - 44.9% (continued) | | | | | | | | | | | | |
Japan Finance Corporation for Municipal Enterprises Bonds, | | | | | | | | | | | | |
1.550%, 02/21/12 | | | JPY | | | | 39,000,000 | | | $ | 507,328 | |
1.900%, 06/22/18 | | | JPY | | | | 20,000,000 | | | | 281,421 | |
Series INTL, 1.350%, 11/26/13 | | | JPY | | | | 20,000,000 | | | | 265,295 | |
Japan Government, | | | | | | | | | | | | |
Bonds, Series 123, 2.100%, 12/20/30 | | | JPY | | | | 29,500,000 | | | | 406,360 | |
Bonds, Series 299, 1.300%, 03/20/19 | | | JPY | | | | 101,500,000 | | | | 1,383,773 | |
Notes, Series 84, 0.700%, 06/20/14 | | | JPY | | | | 71,850,000 | | | | 945,608 | |
Malaysian Government Bond, Series 1/06, 4.262%, 09/15/16 | | | MYR | | | | 375,000 | | | | 123,115 | |
Mexican Fixed Rate Bonds, | | | | | | | | | | | | |
8.000%, 12/07/23 | | | MXN | | | | 6,800,000 | | | | 545,977 | |
Series M 30, 8.500%, 11/18/38 | | | MXN | | | | 4,500,000 | | | | 348,045 | |
New South Wales Treasury Corp. Bonds, Series 2007 CIB1, 2.750%, 11/20/25 | | | AUD | | | | 70,000 | | | | 84,939 | |
New Zealand Government Bonds, Series 521, 6.000%, 05/15/21 | | | NZD | | | | 335,000 | | | | 305,388 | |
Norway Government Bonds, | | | | | | | | | | | | |
4.250%, 05/19/17 | | | NOK | | | | 1,300,000 | | | | 242,466 | |
4.500%, 05/22/19 | | | NOK | | | | 2,570,000 | | | | 493,860 | |
Poland Government, Notes, EMTN, 3.000%, 09/23/14 | | | CHF | | | | 65,000 | | | | 70,017 | |
Quebec Notes, | | | | | | | | | | | | |
Province of, EMTN, Series 2005, 3.625%, 02/10/15 | | | EUR | | | | 100,000 | | | | 138,044 | |
Province of, EMTN, 3.375%, 06/20/16 | | | EUR | | | | 150,000 | | | | 207,567 | |
Republic of Argentina Bonds, Series NY, 8.280%, 12/31/33 | | | USD | | | | 144,901 | 2 | | | 105,778 | |
Singapore Government, | | | | | | | | | | | | |
Bonds, 2.250%, 06/01/21 | | | SGD | | | | 210,000 | | | | 170,857 | |
Notes, 1.625%, 04/01/13 | | | SGD | | | | 535,000 | | | | 419,012 | |
Notes, 2.250%, 07/01/13 | | | SGD | | | | 120,000 | | | | 95,158 | |
Spain Government Bonds, | | | | | | | | | | | | |
4.100%, 07/30/18 | | | EUR | | | | 100,000 | | | | 125,464 | |
5.500%, 04/30/21 | | | EUR | | | | 145,000 | | | | 191,757 | |
U.K. Gilt Bonds, | | | | | | | | | | | | |
4.000%, 03/07/22 | | | GBP | | | | 145,000 | | | | 266,059 | |
4.000%, 09/07/16 | | | GBP | | | | 170,000 | | | | 301,893 | |
4.250%, 03/07/36 | | | GBP | | | | 120,000 | | | | 228,681 | |
4.750%, 03/04/20 | | | GBP | | | | 90,000 | | | | 172,768 | |
5.000%, 03/07/25 | | | GBP | | | | 110,000 | | | | 222,892 | |
Uruguay Government International Bonds, | | | | | | | | | | | | |
3.700%, 06/26/37 | | | UYU | | | | 800,000 | | | | 48,044 | |
4.375%, 12/15/28 | | | UYU | | | | 1,630,109 | | | | 81,615 | |
Total Foreign Government Obligations (cost $10,649,848) | | | | | | | | | | | 11,057,470 | |
|
The accompanying notes are an integral part of these financial statements. 25 |
Managers Global Bond Fund
Schedule of Portfolio Investments (continued)
| | | | | | | | | | | | |
| Security Description | | | | | Principal Amount | | | Value | |
| | | | | | | | | | | | |
| | | | | | | | | | | | |
Mortgage-Backed Securities - 2.4% | | | | | | | | | | | | |
Bear Stearns Commercial Mortgage Securities, Inc., Series 2007-PW15, Class A4, 5.331%, 02/11/44 | | | USD | | | | 25,000 | | | $ | 26,325 | |
Extended Stay America Trust, Series 2010 ESHA, Class D,
5.498%, 11/05/27 (a) | | | USD | | | | 135,000 | | | | 135,495 | |
Greenwich Capital Commercial Funding Corp., 5.444%, 10/03/39 | | | USD | | | | 100,000 | | | | 108,239 | |
Series 2007-GG11, Class A4, 5.736%, 12/10/49 | | | USD | | | | 75,000 | | | | 80,908 | |
GS Mortgage Securities Corp. II, Series 2007-GG10, Class A4,
5.790%, 08/10/456 | | | USD | | | | 91,000 | 2 | | | 98,825 | |
LB-UBS Commercial Mortgage Trust, Series 2007-C2, Class A3,
5.430%, 02/15/40 | | | USD | | | | 25,000 | | | | 26,666 | |
Morgan Stanley Capital Group, Inc., Series 2007-IQ14, Class A4,
5.692%, 04/15/496 | | | USD | | | | 50,000 | | | | 52,941 | |
Wachovia Bank Commercial Mortgage Trust, Series 2007-C30,
Class A5, 5.342%, 12/15/43 | | | USD | | | | 50,000 | 2 | | | 52,707 | |
Total Mortgage-Backed Securities (cost $575,707) | | | | | | | | | | | 582,106 | |
Municipal Bonds - 0.5% | | | | | | | | | | | | |
California Statewide Communities Development Authority Revenue, Series 2007 A, 4.750%, 04/01/33 | | | USD | | | | 55,000 | | | | 54,200 | |
California Statewide Communities Development Authority Revenue, Sutter Health, Series 2008 B, 5.250%, 11/15/48 | | | USD | | | | 65,000 | | | | 65,626 | |
Total Municipal Bonds (cost $104,150) | | | | | | | | | | | 119,826 | |
U.S. Government Obligations - 5.1% | | | | | | | | | | | | |
USTB, 4.375%, 05/15/41 | | | USD | | | | 100,000 | | | | 130,297 | |
USTN, 1.375%, 02/15/127 | | | USD | | | | 405,000 | | | | 405,633 | |
USTN, 1.375%, 11/30/15 | | | USD | | | | 120,000 | | | | 123,656 | |
USTN, 1.500%, 07/31/16 | | | USD | | | | 240,000 | | | | 248,119 | |
USTN, 2.000%, 03/31/16 | | | USD | | | | 250,000 | | | | 266,660 | |
USTN, 3.500%, 02/15/39 | | | USD | | | | 70,000 | | | | 78,739 | |
Total U.S. Government Obligations (cost $1,230,502) | | | | | | | | | | | 1,253,104 | |
Other Investment Companies - 5.3%1 | | | | | | | | | | | | |
| | | | | | Shares | | | | |
BNY Mellon Overnight Government Fund, 0.04%3 | | | USD | | | | 337,110 | | | | 337,110 | |
Dreyfus Cash Management Fund, Institutional Class Shares, 0.05% | | | USD | | | | 972,752 | | | | 972,752 | |
Total Other Investment Companies (cost $1,309,862) | | | | | | | | | | | 1,309,862 | |
Total Investments - 97.9% (cost $23,637,514) | | | | | | | | | | | 24,097,470 | |
Other Assets, less Liabilities - 2.1% | | | | | | | | | | | 510,419 | |
Net Assets - 100.0% | | | | | | | | | | $ | 24,607,889 | |
|
The accompanying notes are an integral part of these financial statements. 26 |
Notes to Schedules of Portfolio Investments
The following footnotes and abbreviations should be read in conjunction with each of the Schedules of Portfolio Investments previously presented in this report.
At December 31, 2011, the cost of securities for Federal income tax purposes and the gross aggregate unrealized appreciation and/or depreciation based on tax cost were approximately:
| | | | | | | | | | | | | | | | |
Fund | | Cost | | | Appreciation | | | Depreciation | | | Net | |
Managers International Equity | | $ | 84,510,103 | | | $ | 6,870,972 | | | ($ | 13,674,494 | ) | | ($ | 6,803,522 | ) |
Managers Emerging Markets Equity | | | 52,038,547 | | | | 2,516,776 | | | | (8,171,727 | ) | | | (5,654,951 | ) |
Managers Global Bond | | | 23,637,775 | | | | 1,186,094 | | | | (726,399 | ) | | | 459,695 | |
| * | Non-income-producing security. |
| # | Rounds to less than 0.1%. |
| (a) | Security exempt from registration under Rule 144A of the Securities Act of 1933. This security may be resold in transactions exempt from registration, normally to qualified buyers. At December 31, 2011, the value of these securities amounted to the following: |
| | | | | | | | |
Fund | | Market Value | | | % of Net Assets | |
Managers Emerging Markets Equity | | | 226,859 | | | | 0.5 | % |
Managers Global Bond | | | 4,672,820 | | | | 19.0 | |
| (b) | Step Bond. A debt instrument with either deferred interest payments or an interest rate that resets at specific times during its term. |
| 1 | Yield shown for each investment company represents the December 31, 2011, seven-day average yield, which refers to the sum of the previous seven days’ dividends paid, expressed as an annual percentage. |
| 2 | Some or all of these shares were out on loan to various brokers as of December 31, 2011, amounting to: |
| | | | | | | | |
Fund | | Market Value | | | % of Net Assets | |
Managers International Equity | | $ | 2,832,042 | | | | 3.8 | % |
Managers Emerging Markets Equity | | | 1,348,911 | | | | 3.0 | |
Managers Global Bond | | | 323,837 | | | | 1.3 | |
| 3 | Collateral received from brokers for securities lending was invested in these short-term investments. |
| 4 | Represents yield to maturity at December 31, 2011. |
| 5 | Floating Rate Security. The rate listed is as of December 31, 2011. Date in parentheses represents the security’s next coupon rate reset. |
| 6 | Variable Rate Security. The rate listed is as of December 31, 2011, and is periodically reset subject to terms and conditions set forth in the debenture. |
| 7 | A portion of this investment is held as collateral for futures contracts for Managers Global Bond Fund, amounting to a market value of $25,039 or 0.1% of net assets. |
|
The accompanying notes are an integral part of these financial statements. 27 |
Notes to Schedules of Portfolio Investments (continued)
The following table summarizes the inputs used to value the Funds’ net assets by the fair value hierarchy levels as of December 31, 2011: (See Note 1(a) in the Notes to Financial Statements.)
| | | | | | | | | | | | | | | | |
| | | Quoted Prices in Active Markets
for Identical Investments
Level 1 | | | Significant Other Observable Inputs
Level 2 | | | Significant Unobservable Inputs
Level 3 | | | Total | |
Managers International Equity Fund | | | | | | | | | | | | | |
Investments in Securities | | | | | | | | | | | | | | | | |
Common Stocks | | | | | | | | | | | | | | | | |
Materials | | $ | 2,382,932 | | | $ | 6,181,922 | | | | — | | | $ | 8,564,854 | |
Energy | | | 1,826,165 | | | | 6,038,341 | | | | — | | | | 7,864,506 | |
Information Technology | | | 1,450,102 | | | | 3,263,265 | | | | — | | | | 4,713,367 | |
Financials | | | 1,220,295 | | | | 14,908,895 | | | | — | | | | 16,129,190 | |
Consumer Discretionary | | | 493,679 | | | | 7,697,801 | | | | — | | | | 8,191,480 | |
Telecommunication Services | | | 380,834 | | | | 3,929,800 | | | | — | | | | 4,310,634 | |
Health Care | | | 439,112 | | | | 6,257,160 | | | | — | | | | 6,696,272 | |
Consumer Staples | | | 386,287 | | | | 5,902,899 | | | | — | | | | 6,289,186 | |
Industrials | | | — | | | | 7,387,897 | | | | — | | | | 7,387,897 | |
Utilities | | | — | | | | 2,164,218 | | | | — | | | | 2,164,218 | |
Other Equities | | | 835,945 | | | | — | | | | — | | | | 835,945 | |
Other Investment Companies | | | 4,559,032 | | | | — | | | | — | | | | 4,559,032 | |
| | | | | | | | | | | | | | | | |
Total Investments in Securities | | $ | 13,974,383 | | | $ | 63,732,198 | | | | — | | | $ | 77,706,581 | |
| | | | | | | | | | | | | | | | |
Financial Derivative Instruments - Assets†† | | | | | | | | | | | | | | | | |
Foreign Exchange Contracts | | | — | | | $ | 5,422 | | | | — | | | $ | 5,422 | |
Equity Contracts | | $ | 1,860 | | | | — | | | | — | | | | 1,860 | |
| | | | | | | | | | | | | | | | |
| | | 1,860 | | | | 5,422 | | | | — | | | | 7,282 | |
| | | | | | | | | | | | | | | | |
Financial Derivative Instruments - Liabilities†† | | | | | | | | | | | | | | | | |
Foreign Exchange Contracts | | | — | | | | (1,149 | ) | | | — | | | | (1,149 | ) |
Equity Contracts | | | — | | | | — | | | | — | | | | — | |
| | | | | | | | | | | | | | | | |
| | | — | | | | (1,149 | ) | | | — | | | | (1,149 | ) |
| | | | | | | | | | | | | | | | |
Total Financial Derivative Instruments | | $ | 1,860 | | | $ | 4,273 | | | | — | | | $ | 6,133 | |
| | | | | | | | | | | | | | | | |
|
The accompanying notes are an integral part of these financial statements. 28 |
Notes to Schedules of Portfolio Investments (continued)
| | | | | | | | | | | | | | | | |
| | | Quoted Prices in Active Markets
for Identical Investments
Level 1 | | | Significant Other
Observable Inputs
Level 2 | | | Significant Unobservable Inputs
Level 3 | | | Total | |
Managers Emerging Markets Equity Fund | | | | | | | | | | | | | |
Investments in Securities | | | | | | | | | | | | | | | | |
Common Stocks | | | | | | | | | | | | | | | | |
Financials | | $ | 2,014,983 | | | $ | 7,408,454 | | | | — | | | $ | 9,423,437 | |
Materials | | | 2,375,087 | | | | 3,289,144 | | | | — | | | | 5,664,231 | |
Consumer Discretionary | | | 959,525 | | | | 4,449,277 | | | | — | | | | 5,408,802 | |
Energy | | | 1,969,615 | | | | 5,217,816 | | | | — | | | | 7,187,431 | |
Consumer Staples | | | 823,193 | | | | 2,074,158 | | | | — | | | | 2,897,351 | |
Health Care | | | — | | | | 181,289 | | | | — | | | | 181,289 | |
Information Technology | | | 1,369,746 | | | | 5,890,933 | | | | — | | | | 7,260,679 | |
Telecommunication Services | | | 1,023,709 | | | | 1,551,912 | | | | — | | | | 2,575,621 | |
Industrials | | | 692,525 | | | | 1,958,025 | | | | — | | | | 2,650,550 | |
Utilities | | | 202,628 | | | | 601,830 | | | | — | | | | 804,458 | |
Other Equities | | | 3,368 | | | | 340,742 | | | | — | | | | 344,110 | |
Other Investment Companies | | | 1,985,637 | | | | — | | | | — | | | | 1,985,637 | |
| | | | | | | | | | | | | | | | |
Total Investments in Securities | | $ | 13,420,016 | | | $ | 32,963,580 | | | | — | | | $ | 46,383,596 | |
| | | | | | | | | | | | | | | | |
| | | | | | | | | | | | | | | | |
| | | Quoted Prices in Active Markets
for Identical Investments
Level 1 | | | Significant Other
Observable Inputs
Level 2 | | | Significant Unobservable Inputs
Level 3 | | | Total | |
Managers Global Bond Fund | | | | | | | | | | | | | |
Investments in Securities | | | | | | | | | | | | | |
Foreign Government Obligations | | | — | | | $ | 11,057,470 | | | | — | | | $ | 11,057,470 | |
Corporate Bonds† | | | — | | | | 8,834,626 | | | | — | | | | 8,834,626 | |
U.S. Government Obligations | | | — | | | | 1,253,104 | | | | — | | | | 1,253,104 | |
Asset-Backed Securities | | | — | | | | 940,476 | | | | — | | | | 940,476 | |
Mortgage-Backed Securities | | | — | | | | 582,106 | | | | — | | | | 582,106 | |
Municipal Bonds | | | — | | | | 119,826 | | | | | | | | 119,826 | |
Other Investment Companies | | $ | 1,309,862 | | | | — | | | | — | | | | 1,309,862 | |
| | | | | | | | | | | | | | | | |
Total Investments | | $ | 1,309,862 | | | $ | 22,787,608 | | | | — | | | $ | 24,097,470 | |
| | | | | | | | | | | | | | | | |
Financial Derivative Instruments - Assets†† | | | | | | | | | | | | | |
Foreign Exchange Contracts | | | — | | | $ | 44,349 | | | | — | | | $ | 44,349 | |
Equity Contracts | | $ | 1,981 | | | | — | | | | — | | | | 1,981 | |
| | | | | | | | | | | | | | | | |
| | | 1,981 | | | | 44,349 | | | | — | | | | 46,330 | |
| | | | | | | | | | | | | | | | |
Financial Derivative Instruments - Liabilities†† | | | | | | | | | | | | | | | | |
Foreign Exchange Contracts | | | — | | | | (46,508 | ) | | | — | | | | (46,508 | ) |
Equity Contracts | | | (5,726 | ) | | | — | | | | — | | | | (5,726 | ) |
| | | | | | | | | | | | | | | | |
| | | (5,726 | ) | | | (46,508 | ) | | | — | | | | (52,234 | ) |
| | | | | | | | | | | | | | | | |
Total Financial Derivative Instruments | | ($ | 3,745 | ) | | ($ | 2,159 | ) | | | — | | | ($ | 5,904 | ) |
| | | | | | | | | | | | | | | | |
| † | All corporate bonds held in the Funds are Level 2 securities. For a detailed break-out of the corporate bonds by major industry classification, please refer to the Schedule of Portfolio Investments. |
| †† | Derivative instruments, such as futures and foreign exchange contracts, are not reflected in the Schedules of Portfolio Investments, and are valued at the unrealized appreciation/depreciation of the instrument. |
|
The accompanying notes are an integral part of these financial statements. 29 |
Notes to Schedules of Portfolio Investments (continued)
As of December 31, 2011, the Funds’ had no significant transfers between Level 1 and Level 2 from the beginning of the reporting period.
The fair value of derivative instruments at December 31, 2011, for Managers International Equity Fund (“International Equity”) and Managers Global Bond Fund (“Global Bond”) were as follows:
| | | | | | | | | | | | | | |
| | | | | Asset Derivatives | | | Liability Derivatives | |
Fund | | Derivatives not accounted for as
hedging instruments | | Statement of Assets and Liabilities
Location | | Fair Value | | | Statement of Assets and Liabilities
Location | | Fair Value | |
International Equity | | Equity contracts | | Receivable for variation margin on futures | | $ | 1,941 | | | Payable for variation
margin on futures | | | — | |
| | Foreign exchange contracts | | Unrealized appreciation of foreign currency contracts | | | 5,422 | | | Unrealized depreciation
of foreign currency
contracts | | $ | 1,149 | |
| | | | | | | | | | | | | | |
| | | | Totals | | $ | 7,363 | | | | | $ | 1,149 | |
| | | | | | | | | | | | | | |
| | | | | |
Global Bond | | Interest rate contracts | | Receivable for variation margin on futures | | $ | 625 | | | Payable for variation
margin on futures | | $ | 1,703 | |
| | Foreign exchange contracts | | Unrealized appreciation of foreign currency contracts | | | 44,349 | | | Unrealized depreciation
of foreign currency
contracts | | | 46,508 | |
| | | | | | | | | | | | | | |
| | | | Totals | | $ | 44,974 | | | | | $ | 48,211 | |
| | | | | | | | | | | | | | |
For the year ended December 31, 2011, the effect of derivative instruments on the Statement of Operations for International Equity and Global Bond and the amount of realized gain/(loss) on derivatives recognized in income were as follows:
| | | | | | | | | | | | | | |
Fund | | Derivatives not accounted for as hedging
instruments | | Futures | | | Forward Currency
Contracts | | | Total | |
International Equity | | Equity contracts | | ($ | 25,405 | ) | | | — | | | ($ | 25,405 | ) |
| | Foreign exchange contracts | | | — | | | $ | 470 | | | | 470 | |
| | | | | | | | | | | | | | |
| | Totals | | ($ | 25,405 | ) | | $ | 470 | | | ($ | 24,935 | ) |
| | | | | | | | | | | | | | |
| | | | |
Global Bond | | Interest Rate Contracts | | $ | 18,829 | | | | — | | | $ | 18,829 | |
| | Foreign exchange contracts | | | — | | | ($ | 60,279 | ) | | | (60,279 | ) |
| | | | | | | | | | | | | | |
| | Totals | | $ | 18,829 | | | ($ | 60,279 | ) | | ($ | 41,450 | ) |
| | | | | | | | | | | | | | |
The change in unrealized gain/(loss) on derivatives recognized in income were as follows:
| | | | | | | | | | | | | | |
Fund | | Derivatives not accounted for as hedging
instruments | | Futures | | | Forward Currency
Contracts | | | Total | |
International Equity | | Equity contracts | | $ | 9,144 | | | | — | | | $ | 9,144 | |
| | Foreign exchange contracts | | | — | | | $ | 4,273 | | | | 4,273 | |
| | | | | | | | | | | | | | |
| | Totals | | $ | 9,144 | | | $ | 4,273 | | | $ | 13,417 | |
| | | | | | | | | | | | | | |
| | | | |
Global Bond | | Interest Rate Contracts | | ($ | 24,448 | ) | | | — | | | ($ | 24,448 | ) |
| | Foreign exchange contracts | | | — | | | ($ | 13,708 | ) | | | (13,708 | ) |
| | | | | | | | | | | | | | |
| | Totals | | ($ | 24,448 | ) | | ($ | 13,708 | ) | | ($ | 38,156 | ) |
| | | | | | | | | | | | | | |
|
The accompanying notes are an integral part of these financial statements. 30 |
Notes to Schedules of Portfolio Investments (continued)
The open forward foreign currency exchange contracts (in U.S. Dollars) at December 31, 2011, were as follows: (See Note 7a in the Notes to Financial Statements.)
| | | | | | | | | | | | | | | | | | | | | | |
Forward Foreign Currency Exchange Contracts | | Position | | Settlement Date | | | Counterparty | | | Current Value
(Receivable Amount) | | | Contract Value
(Payable Amount) | | | Unrealized Gain/
(Loss) | |
Managers International Equity | | | | | | | | | | | | | | | | | | | | | | |
Australian Dollar | | Long | | | 2/15/12 | | | | BNYM | | | $ | 211,593 | | | $ | 209,352 | | | $ | 2,241 | |
Australian Dollar | | Short | | | 2/15/12 | | | | BNYM | | | | 211,131 | | | | 211,593 | | | | (462 | ) |
Canadian Dollar | | Long | | | 2/15/12 | | | | BNYM | | | | 87,270 | | | | 85,873 | | | | 1,397 | |
Canadian Dollar | | Short | | | 2/15/12 | | | | BNYM | | | | 647,971 | | | | 646,187 | | | | 1,784 | |
Japanese Yen | | Short | | | 2/15/12 | | | | BNYM | | | | 167,105 | | | | 167,792 | | | | (687 | ) |
| | | | | | | | | | | | | | | | | | | | | | |
| | | | | | | | | Totals | | | $ | 1,325,070 | | | $ | 1,320,797 | | | $ | 4,273 | |
| | | | | | | | | | | | | | | | | | | | | | |
Managers Global Bond | | | | | | | | | | | | | | | | | | | | | | |
Australian Dollar | | Short | | | 2/28/12 | | | | CS | | | $ | 301,760 | | | $ | 314,923 | | | ($ | 13,163 | ) |
Canadian Dollar | | Short | | | 3/7/12 | | | | CS | | | | 252,146 | | | | 254,828 | | | | (2,682 | ) |
Pound Sterling | | Short | | | 3/28/12 | | | | BARC | | | | 263,711 | | | | 263,780 | | | | (69 | ) |
Mexican Nuevo Peso | | Short | | | 3/2/12 | | | | DB | | | | 273,412 | | | | 266,632 | | | | 6,780 | |
New Zealand Dollar | | Short | | | 1/31/12 | | | | BARC | | | | 309,788 | | | | 295,110 | | | | 14,678 | |
Singapore Dollar | | Short | | | 1/31/12 | | | | DB | | | | 255,055 | | | | 244,376 | | | | 10,679 | |
Swiss Franc | | Short | | | 3/21/12 | | | | MSC | | | | 64,861 | | | | 63,990 | | | | 871 | |
Japanese Yen | | Long | | | 1/31/12 | | | | DB | | | | 250,752 | | | | 255,056 | | | | (4,304 | ) |
Malaysian Ringgit | | Long | | | 2/21/12 | | | | JPM | | | | 267,283 | | | | 268,818 | | | | (1,535 | ) |
New Turkish Lira | | Short | | | 2/2/12 | | | | CS | | | | 220,860 | | | | 209,519 | | | | 11,341 | |
New Turkish Lira | | Long | | | 2/2/12 | | | | CS | | | | 209,519 | | | | 222,235 | | | | (12,716 | ) |
South Korean Won | | Long | | | 3/12/12 | | | | BARC | | | | 503,093 | | | | 512,402 | | | | (9,309 | ) |
South Korean Won | | Long | | | 3/12/12 | | | | CS | | | | 146,858 | | | | 149,588 | | | | (2,730 | ) |
| | | | | | | | | | | | | | | | | | | | | | |
| | | | | | | | | Totals | | | $ | 3,319,098 | | | $ | 3,321,257 | | | ($ | 2,159 | ) |
| | | | | | | | | | | | | | | | | | | | | | |
All futures contracts are exchange traded unless otherwise noted. The open futures contracts as of December 31, 2011, were as follows: (See Note 7b in the Notes to Financial Statements.)
| | | | | | | | | | | | | | |
Type | | Currency | | Number of Contracts | | Position | | Expiration Date | | | Unrealized Gain/(Loss) | |
Managers International Equity | | | | | | | | | | |
DJ Euro Stoxx 50 | | Euro | | 5 | | Long | | | 3/16/12 | | | $ | 1,860 | |
| | | | | | | | | | | | | | |
Managers Global Bond | | | | | | | | | | | | | | |
US 5-Year Note | | USD | | 5 | | Short | | | 3/30/12 | | | ($ | 2,275 | ) |
US 10-Year Note | | USD | | 3 | | Short | | | 3/21/12 | | | | (3,451 | ) |
US Long Bond | | USD | | 2 | | Long | | | 3/21/12 | | | | 1,981 | |
| | | | | | | | | | | | | | |
| | | | | | | | | Total | | | ($ | 3,745 | ) |
| | | | | | | | | | | | | | |
|
The accompanying notes are an integral part of these financial statements. 31 |
Notes to Schedules of Portfolio Investments (continued)
Investments Definitions and Abbreviations:
ADR/GDR: ADR after the name of a holding stands for American Depositary Receipt, representing ownership of foreign securities on deposit with a domestic custodian bank; a GDR (Global Depositary Receipt) is comparable, but foreign securities are held on deposit in a non-U.S. bank. The value of the ADR/GDR securities is determined or significantly influenced by trading on exchanges not located in the United States or Canada. Sponsored ADR/GDRs are initiated by the underlying foreign company.
| | | | | | |
EMTN: ESHA: GMTN: MTN: NVDR: | | European Medium Term Note Extended Stay Hotels America Global Multi-Currency Note Medium Term Note Non-Voting Depository Receipt | | Reg S: | | Regulation S is a series of rules that clarifies the position of the Securities and Exchange Commission (“SEC”) that securities offered and sold outside of the United States do not need to be registered with the SEC. |
| | | USTN: | | United States Treasury Note |
Abbreviations have been used throughout the portfolios to indicate amounts shown in currencies other than the U.S. Dollar (USD):
| | | | | | |
AUD: | | Australian Dollar | | JPY: | | Japanese Yen |
CAD: | | Canadian Dollar | | NOK: | | Norwegian Krone |
CHF: | | Swiss Franc | | NZD: | | New Zealand Dollar |
COP: | | Colombian Peso | | MXN: | | Mexican Peso |
DKK: | | Danish Krone | | PHP: | | Philippine Peso |
EUR: | | Euro | | PLN: | | Polish Zloty |
GBP: | | British Pound | | SEK: | | Swedish Krona |
IDR: | | Indonesian Rupiah | | SGD: | | Singapore Dollar |
INR: | | Indian Rupee | | UYU: | | Uruguayan Peso |
| | |
Counterparty Abbreviations: |
| |
BNYM: | | The Bank of New York Mellon |
BRC: | | Barclays Bank |
CS: | | Credit Suisse |
MS: | | Morgan Stanley |
UBS: | | UBS Securities |
|
The accompanying notes are an integral part of these financial statements. 32 |
Statements of Assets and Liabilities
December 31, 2011
| | | | | | | | | | | | |
| | | Managers
International
Equity Fund | | | Managers Emerging
Markets Equity Fund | | | Managers Global
Bond Fund | |
Assets: | | | | | | | | | | | | |
Investments at value (including securities on loan valued at $2,832,042, $1,348,911, and $323,837, respectively)* | | $ | 77,706,581 | | | $ | 46,383,596 | | | $ | 24,097,470 | |
Cash collateral for futures | | | 38,807 | | | | — | | | | — | |
Foreign currency** | | | 248,673 | | | | 90,134 | | | | 677,064 | |
Receivable for investments sold | | | — | | | | 328,557 | | | | — | |
Receivable for Fund shares sold | | | 78,554 | | | | 28,973 | | | | 21,743 | |
Receivable from affiliate | | | 18,856 | | | | 11,359 | | | | 5,501 | |
Unrealized appreciation on foreign currency contracts | | | 5,422 | | | | — | | | | 44,349 | |
Receivable for variation margin on futures | | | 1,941 | | | | — | | | | 625 | |
Dividends, interest and other receivables | | | 263,193 | | | | 35,791 | | | | 274,218 | |
Prepaid expenses | | | 13,156 | | | | 9,129 | | | | 6,226 | |
Total assets | | | 78,375,183 | | | | 46,887,539 | | | | 25,127,196 | |
Liabilities: | | | | | | | | | | | | |
Payable to custodian | | | — | | | | — | | | | 13,782 | |
Payable for Fund shares repurchased | | | 183,254 | | | | 130,245 | | | | 42,816 | |
Payable upon return of securities loaned | | | 2,942,388 | | | | 1,411,233 | | | | 337,110 | |
Payable for investments purchased | | | 15,201 | | | | 2,882 | | | | — | |
Unrealized depreciation on foreign currency contracts | | | 1,149 | | | | — | | | | 46,508 | |
Payable for variation margin on futures | | | — | | | | — | | | | 1,703 | |
Accrued expenses: | | | | | | | | | | | | |
Investment management and advisory fees | | | 57,909 | | | | 45,515 | | | | 14,653 | |
Administrative fees | | | 16,086 | | | | 9,895 | | | | 4,186 | |
Other | | | 129,874 | | | | 194,324 | | | | 58,549 | |
Total liabilities | | | 3,345,861 | | | | 1,794,094 | | | | 519,307 | |
Net Assets | | $ | 75,029,322 | | | $ | 45,093,445 | | | $ | 24,607,889 | |
Shares outstanding | | | 1,670,397 | | | | 3,726,223 | | | | 1,275,001 | |
Net asset value, offering and redemption price per share | | $ | 44.92 | | | $ | 12.10 | | | $ | 19.30 | |
Net Assets Represent: | | | | | | | | | | | | |
Paid-in capital | | $ | 132,929,787 | | | $ | 60,182,457 | | | $ | 27,530,644 | |
Undistributed net investment income (loss) | | | 566,745 | | | | (45,420 | ) | | | 316,720 | |
Accumulated net realized loss from investments, futures and foreign currency transactions | | | (52,721,769 | ) | | | (10,792,655 | ) | | | (3,676,445 | ) |
Net unrealized appreciation (depreciation) of investments, futures and foreign currency translations | | | (5,745,441 | ) | | | (4,250,937 | ) | | | 436,970 | |
Net Assets | | $ | 75,029,322 | | | $ | 45,093,445 | | | $ | 24,607,889 | |
* Investments at cost | | $ | 83,453,155 | | | $ | 50,632,648 | | | $ | 23,637,514 | |
** Foreign currency at cost | | $ | 254,199 | | | $ | 91,575 | | | $ | 686,752 | |
|
The accompanying notes are an integral part of these financial statements. 33 |
Statements of Operations
For the year ended December 31, 2011
| | | | | | | | | | | | |
| | | Managers
International
Equity Fund | | | Managers Emerging
Markets Equity Fund | | | Managers Global
Bond Fund | |
Investment Income: | | | | | | | | | | | | |
Dividend income | | $ | 2,576,522 | | | $ | 1,384,096 | | | $ | 239 | |
Interest income | | | 2,017 | | | | 104 | | | | 954,366 | |
Foreign withholding tax | | | (207,773 | ) | | | (126,553 | ) | | | (3,796 | ) |
Securities lending fees | | | 107,257 | | | | 6,800 | | | | 1,175 | |
Total investment income | | | 2,478,023 | | | | 1,264,447 | | | | 951,984 | |
Expenses: | | | | | | | | | | | | |
Investment management and advisory fees | | | 823,971 | | | | 649,646 | | | | 178,685 | |
Administrative fees | | | 228,881 | | | | 141,227 | | | | 51,053 | |
Transfer agent | | | 195,798 | | | | 27,095 | | | | 15,601 | |
Custodian | | | 144,106 | | | | 254,620 | | | | 33,716 | |
Professional fees | | | 48,722 | | | | 70,968 | | | | 36,781 | |
Registration fees | | | 24,326 | | | | 26,521 | | | | 27,292 | |
Reports to shareholders | | | 17,220 | | | | 21,594 | | | | 9,549 | |
Trustees fees and expenses | | | 6,394 | | | | 4,510 | | | | 1,728 | |
Miscellaneous | | | 3,573 | | | | 18,729 | | | | 1,003 | |
Total expenses before offsets | | | 1,492,991 | | | | 1,214,910 | | | | 355,408 | |
Expense reimbursements | | | (240,796 | ) | | | (241,231 | ) | | | (74,431 | ) |
Expense reductions | | | (828 | ) | | | (64 | ) | | | (30 | ) |
Net expenses | | | 1,251,367 | | | | 973,615 | | | | 280,947 | |
Net investment income | | | 1,226,656 | | | | 290,832 | | | | 671,037 | |
Net Realized and Unrealized Gain (Loss): | | | | | | | | | | | | |
Net realized gain on investments | | | 3,201,609 | | | | 5,565,189 | | | | 726,867 | |
Net realized gain (loss) on futures contracts | | | (25,405 | ) | | | — | | | | 18,829 | |
Net realized loss on foreign currency transactions | | | (32,573 | ) | | | (106,412 | ) | | | (6,577 | ) |
Net change in unrealized depreciation of investments | | | (16,238,707 | ) | | | (17,813,367 | ) | | | (501,272 | ) |
Net change in unrealized appreciation (depreciation) of futures contracts | | | 9,144 | | | | — | | | | (24,448 | ) |
Net change in unrealized depreciation on foreign currency translations | | | (27,472 | ) | | | (7,175 | ) | | | (39,404 | ) |
Net realized and unrealized gain (loss) | | | (13,113,404 | ) | | | (12,361,765 | ) | | | 173,995 | |
Net increase (decrease) in net assets resulting from operations | | ($ | 11,886,748 | ) | | ($ | 12,070,933 | ) | | $ | 845,032 | |
|
The accompanying notes are an integral part of these financial statements. 34 |
Statements of Changes in Net Assets
For the year ended December 31,
| | | | | | | | |
| | | Managers International Equity Fund | |
| | | 2011 | | | 2010 | |
Increase (Decrease) in Net Assets From Operations: | | | | | | | | |
Net investment income | | $ | 1,226,656 | | | $ | 990,773 | |
Net realized gain on investments, futures and foreign currency transactions | | | 3,143,631 | | | | 7,334,174 | |
Net change in unrealized depreciation of investments, futures and foreign currency contracts and translations | | | (16,257,035 | ) | | | (4,296,264 | ) |
Net increase (decrease) in net assets resulting from operations | | | (11,886,748 | ) | | | 4,028,683 | |
Distributions to Shareholders: | | | | | | | | |
From net investment income | | | (1,099,815 | ) | | | (1,000,087 | ) |
From Capital Share Transactions: | | | | | | | | |
Proceeds from sale of shares1 | | | 11,580,200 | | | | 12,602,849 | |
Reinvestment of dividends and distributions | | | 1,062,019 | | | | 959,416 | |
Cost of shares repurchased | | | (33,976,569 | ) | | | (34,035,935 | ) |
Net decrease from capital share transactions | | | (21,334,350 | ) | | | (20,473,670 | ) |
Total decrease in net assets | | | (34,320,913 | ) | | | (17,445,074 | ) |
Net Assets: | | | | | | | | |
Beginning of year | | | 109,350,235 | | | | 126,795,309 | |
End of year | | $ | 75,029,322 | | | $ | 109,350,235 | |
End of year undistributed net investment income | | $ | 566,745 | | | $ | 406,387 | |
| | | | | | | | |
Share Transactions: | | | | | | | | |
Sale of shares | | | 230,217 | | | | 250,788 | |
Reinvested shares | | | 23,553 | | | | 18,274 | |
Shares repurchased | | | (647,044 | ) | | | (678,900 | ) |
Net decrease in shares | | | (393,274 | ) | | | (409,838 | ) |
| 1 | For the year ended December 31, 2011 and 2010, the proceeds from the sale of shares for Managers International Equity includes the receipt of market timing settlements of $65,757 and $125,379, respectively. |
|
The accompanying notes are an integral part of these financial statements. 35 |
Statements of Changes in Net Assets
For the year ended December 31, (continued)
| | | | | | | | | | | | | | | | |
| | | Managers Emerging Markets
Equity Fund | | | Managers Global Bond Fund | |
| | | 2011 | | | 2010 | | | 2011 | | | 2010 | |
Increase (Decrease) in Net Assets From Operations: | | | | | | | | | | | | | | | | |
Net investment income | | $ | 290,832 | | | $ | 257,830 | | | $ | 671,037 | | | $ | 653,878 | |
Net realized gain (loss) on investments, futures and foreign currency transactions | | | 5,458,777 | | | | 13,322,407 | | | | 739,119 | | | | (781,117 | ) |
Net change in unrealized appreciation (depreciation) of investments, futures and foreign currency translations | | | (17,820,542 | ) | | | (2,629,270 | ) | | | (565,124 | ) | | | 1,873,217 | |
Net increase (decrease) in net assets resulting from operations | | | (12,070,933 | ) | | | 10,950,967 | | | | 845,032 | | | | 1,745,978 | |
Distributions to Shareholders: | | | | | | | | | | | | | | | | |
From net investment income | | | (615,107 | ) | | | (114,817 | ) | | | (850,157 | ) | | | (1,100,009 | ) |
From Capital Share Transactions: | | | | | | | | | | | | | | | | |
Proceeds from sale of shares | | | 22,261,491 | | | | 18,247,454 | | | | 9,189,578 | | | | 10,516,298 | |
Reinvestment of dividends and distributions | | | 569,796 | | | | 96,956 | | | | 751,971 | | | | 1,002,689 | |
Cost of shares repurchased | | | (39,526,348 | ) | | | (50,993,858 | ) | | | (11,050,797 | ) | | | (12,588,977 | ) |
Net decrease from capital share transactions | | | (16,695,061 | ) | | | (32,649,448 | ) | | | (1,109,248 | ) | | | (1,069,990 | ) |
Total decrease in net assets | | | (29,381,101 | ) | | | (21,813,298 | ) | | | (1,114,373 | ) | | | (424,021 | ) |
Net Assets: | | | | | | | | | | | | | | | | |
Beginning of year | | | 74,474,546 | | | | 96,287,844 | | | | 25,722,262 | | | | 26,146,283 | |
End of year | | $ | 45,093,445 | | | $ | 74,474,546 | | | $ | 24,607,889 | | | $ | 25,722,262 | |
End of year undistributed net investment income (loss) | | ($ | 45,420 | ) | | $ | 257,938 | | | $ | 316,720 | | | $ | 247,573 | |
| | | | | | | | | | | | | | | | |
Share Transactions: | | | | | | | | | | | | | | | | |
Sale of shares | | | 1,520,228 | | | | 1,351,886 | | | | 459,246 | | | | 539,170 | |
Reinvested shares | | | 46,552 | | | | 6,421 | | | | 39,104 | | | | 52,579 | |
Shares repurchased | | | (2,679,905 | ) | | | (3,630,681 | ) | | | (554,249 | ) | | | (649,900 | ) |
Net decrease in shares | | | (1,113,125 | ) | | | (2,272,374 | ) | | | (55,899 | ) | | | (58,151 | ) |
|
The accompanying notes are an integral part of these financial statements. 36 |
Financial Highlights
For a share outstanding throughout each year
| | | | | | | | | | | | | | | | | | | | |
| | | For the year ended December 31, | |
Managers International Equity Fund | | 2011 | | | 2010 | | | 2009 | | | 2008 | | | 2007 | |
Net Asset Value, Beginning of Year | | $ | 52.99 | | | $ | 51.26 | | | $ | 39.19 | | | $ | 77.13 | | | $ | 67.42 | |
Income from Investment Operations: | | | | | | | | | | | | | | | | | | | | |
Net investment income | | | 0.69 | 3 | | | 0.44 | 3 | | | 0.58 | 3 | | | 0.76 | 3 | | | 0.47 | |
Net realized and unrealized gain (loss) on investments | | | (8.09 | )3 | | | 1.77 | 3 | | | 11.84 | 3 | | | (38.52 | )3 | | | 9.60 | |
Total from investment operations | | | (7.40 | ) | | | 2.21 | | | | 12.42 | | | | (37.76 | ) | | | 10.07 | |
Less Distributions to Shareholders from: | | | | | | | | | | | | | | | | | | | | |
Net investment income | | | (0.67 | ) | | | (0.48 | ) | | | (0.35 | ) | | | (0.18 | ) | | | (0.36 | ) |
Net Asset Value, End of Year | | $ | 44.92 | | | $ | 52.99 | | | $ | 51.26 | | | $ | 39.19 | | | $ | 77.13 | |
Total Return1 | | | (13.98 | )%4 | | | 4.33 | %4 | | | 31.68 | % | | | (48.92 | )% | | | 14.94 | %4 |
Ratio of net expenses to average net assets | | | 1.37 | %6 | | | 1.44 | % | | | 1.48 | % | | | 1.48 | % | | | 1.48 | % |
Ratio of net investment income to average net assets1 | | | 1.34 | % | | | 0.89 | % | | | 1.34 | % | | | 1.24 | % | | | 0.60 | % |
Portfolio turnover | | | 47 | % | | | 58 | % | | | 128 | % | | | 142 | % | | | 98 | % |
Net assets at end of year (000’s omitted) | | $ | 75,029 | | | $ | 109,350 | | | $ | 126,795 | | | $ | 127,984 | | | $ | 302,025 | |
| | | | | | | | | | | | | | | | | | | | |
Ratios absent expense offsets:2 | | | | | | | | | | | | | | | | | | | | |
Ratio of total expenses to average net assets | | | 1.63 | % | | | 1.70 | % | | | 1.73 | % | | | 1.64 | % | | | 1.61 | % |
Ratio of net investment income to average net assets | | | 1.08 | % | | | 0.63 | % | | | 1.09 | % | | | 1.08 | % | | | 0.46 | % |
| | | | | | | | | | | | | | | | | | | | |
| |
| | | For the year ended December 31, | |
Managers Emerging Markets Equity Fund | | 2011 | | | 2010 | | | 2009 | | | 2008 | | | 2007 | |
Net Asset Value, Beginning of Year | | $ | 15.39 | | | $ | 13.54 | | | $ | 8.09 | | | $ | 26.80 | | | $ | 24.44 | |
Income from Investment Operations: | | | | | | | | | | | | | | | | | | | | |
Net investment income | | | 0.07 | 3 | | | 0.04 | 3 | | | 0.03 | 3 | | | 0.15 | 3 | | | 0.04 | 3 |
Net realized and unrealized gain (loss) on investments | | | (3.19 | )3 | | | 1.83 | 3 | | | 5.45 | 3 | | | (15.02 | )3 | | | 7.20 | 3 |
Total from investment operations | | | (3.12 | ) | | | 1.87 | | | | 5.48 | | | | (14.87 | ) | | | 7.24 | |
Less Distributions to Shareholders from: | | | | | | | | | | | | | | | | | | | | |
Net investment income | | | (0.17 | ) | | | (0.02 | ) | | | (0.03 | ) | | | (0.19 | ) | | | — | |
Net realized gain on investments | | | — | | | | — | | | | — | | | | (3.65 | ) | | | (4.88 | ) |
Total distributions to shareholders | | | (0.17 | ) | | | (0.02 | ) | | | (0.03 | ) | | | (3.84 | ) | | | (4.88 | ) |
Net Asset Value, End of Year | | $ | 12.10 | | | $ | 15.39 | | | $ | 13.54 | | | $ | 8.09 | | | $ | 26.80 | |
Total Return1 | | | (20.31 | )% | | | 13.84 | % | | | 67.94 | % | | | (54.87 | )%4 | | | 29.50 | %4 |
Ratio of net expenses to average net assets | | | 1.72 | %7 | | | 1.76 | % | | | 1.77 | %5 | | | 1.77 | %5 | | | 1.78 | % |
Ratio of net investment income to average net assets1 | | | 0.52 | % | | | 0.29 | % | | | 0.32 | %5 | | | 0.76 | %5 | | | 0.13 | % |
Portfolio turnover | | | 68 | % | | | 69 | % | | | 103 | % | | | 49 | % | | | 62 | % |
Net assets at end of year (000’s omitted) | | $ | 45,093 | | | $ | 74,475 | | | $ | 96,288 | | | $ | 60,355 | | | $ | 198,235 | |
| | | | | | | | | | | | | | | | | | | | |
Ratios absent expense offsets:2 | | | | | | | | | | | | | | | | | | | | |
Ratio of total expenses to average net assets | | | 2.15 | % | | | 2.07 | % | | | 2.13 | % | | | 2.03 | % | | | 1.93 | % |
Ratio of net investment income (loss) to average net assets | | | 0.09 | % | | | (0.02 | )% | | | (0.04 | )% | | | 0.50 | % | | | (0.02 | )% |
| | | | | | | | | | | | | | | | | | | | |
Financial Highlights
For a share outstanding throughout each year
| | | | | | | | | | | | | | | | | | | | |
| | | For the year ended December 31, | |
Managers Global Bond Fund | | 2011 | | | 2010 | | | 2009 | | | 2008 | | | 2007 | |
Net Asset Value, Beginning of Year | | $ | 19.33 | | | $ | 18.82 | | | $ | 16.93 | | | $ | 21.31 | | | $ | 21.17 | |
Income from Investment Operations: | | | | | | | | | | | | | | | | | | | | |
Net investment income | | | 0.53 | 3 | | | 0.50 | 3 | | | 0.89 | 3 | | | 0.76 | 3 | | | 0.70 | 3 |
Net realized and unrealized gain (loss) on investments | | | 0.12 | 3 | | | 0.87 | 3 | | | 3.22 | 3 | | | (2.93 | )3 | | | 0.88 | 3 |
Total from investment operations | | | 0.65 | | | | 1.37 | | | | 4.11 | | | | (2.17 | ) | | | 1.58 | |
Less Distributions to Shareholders from: | | | | | | | | | | | | | | | | | | | | |
Net investment income | | | (0.68 | ) | | | (0.86 | ) | | | (2.22 | ) | | | (2.18 | ) | | | (1.43 | ) |
Net realized gain on investments | | | — | | | | — | | | | — | | | | (0.03 | ) | | | (0.01 | ) |
Total distributions to shareholders | | | (0.68 | ) | | | (0.86 | ) | | | (2.22 | ) | | | (2.21 | ) | | | (1.44 | ) |
Net Asset Value, End of Year | | $ | 19.30 | | | $ | 19.33 | | | $ | 18.82 | | | $ | 16.93 | | | $ | 21.31 | |
Total Return1 | | | 3.39 | % | | | 7.27 | % | | | 24.27 | %4 | | | (10.07 | )%4 | | | 7.52 | %4 |
Ratio of net expenses to average net assets | | | 1.10 | % | | | 1.10 | % | | | 1.10 | % | | | 1.10 | % | | | 1.19 | % |
Ratio of net investment income to average net assets1 | | | 2.63 | % | | | 2.57 | % | | | 4.82 | % | | | 3.62 | % | | | 3.25 | % |
Portfolio turnover | | | 91 | % | | | 131 | % | | | 102 | % | | | 56 | % | | | 152 | % |
Net assets at end of year (000’s omitted) | | $ | 24,608 | | | $ | 25,722 | | | $ | 26,146 | | | $ | 47,735 | | | $ | 92,124 | |
| | | | | | | | | | | | | | | | | | | | |
Ratios absent expense offsets:2 | | | | | | | | | | | | | | | | | | | | |
Ratio of total expenses to average net assets | | | 1.39 | % | | | 1.43 | % | | | 1.32 | % | | | 1.25 | % | | | 1.25 | % |
Ratio of net investment income to average net assets | | | 2.34 | % | | | 2.24 | % | | | 4.60 | % | | | 3.47 | % | | | 3.18 | % |
| | | | | | | | | | | | | | | | | | | | |
Notes to Financial Highlights
The following notes should be read in conjunction with the Financial Highlights of the Funds presented on this page and the preceding page.
| 1 | Total returns and net investment income would have been lower had certain expenses not been reduced. (See Note 1(c) to the Notes to Financial Statements.) |
| 2 | Excludes the impact of expense (reimbursement)/recoupment and expense reductions such as brokerage credits, but includes non-reimbursable expenses, if any, such as interest and taxes. (See Note 1(c) to the Notes to Financial Statements.) |
| 3 | Per share numbers have been calculated using average shares. |
| 4 | The Total Return is based on the Financial Statement Net Asset Values as shown above. |
| 5 | Excludes interest expense for the years ended December 31, 2009 and 2008, of 0.02% and 0.03%, respectively, for Emerging Markets Equity. (See Note 1(c) of Notes to Financial Statements.) |
| 6 | Effective July 1, 2011, as described in the current prospectus, the Fund’s expense cap was reduced to 1.34% from 1.39% |
| 7 | Effective July 1, 2011, as described in the current prospectus, the Fund’s expense cap was reduced to 1.64% from 1.74% |
Notes to Financial Statements
December 31, 2011
| 1. | Summary of Significant Accounting Policies |
The Managers Funds (the “Trust”) is an open-end management investment company organized as a Massachusetts business trust, and registered under the Investment Company Act of 1940, as amended (the “1940 Act”). Currently, the Trust consists of a number of different funds, each having distinct investment management objectives, strategies, risks, and policies. Included in this report are: Managers International Equity Fund (“International Equity”), Managers Emerging Markets Equity Fund (“Emerging Markets Equity”), and Managers Global Bond Fund (“Global Bond”), each a “Fund” and collectively the “Funds.”
At a meeting held on December 1-2, 2011, the Board of Trustees of the Global Bond Fund approved a name change from Managers Global Bond Fund to Managers Global Income Opportunity Fund, effective February 1, 2012.
The Funds’ financial statements are prepared in accordance with accounting principles generally accepted in the United States of America (“U.S. GAAP”), which require management to make estimates and assumptions that affect the reported amounts of assets and liabilities and disclosure of contingent assets and liabilities at the date of the financial statements and the reported amounts of income and expenses during the reporting period. Actual results could differ from those estimates and such differences could be material. The following is a summary of significant accounting policies followed by the Funds in the preparation of their financial statements:
| a. | Valuation of Investments |
Equity securities traded on a domestic or international securities exchange are valued at the last quoted sale price, or, lacking any sales, at the last quoted bid price. Over-the-counter securities are valued at the Nasdaq Official Closing Price, if one is available. Lacking any sales, over-the-counter securities are valued at the last quoted bid price. The Funds’ investments are generally valued based on market quotations provided by third-party pricing services approved by the Board of Trustees of the Funds (the “Board”). Under certain circumstances, the value of certain Fund investments may be based on an evaluation of fair value, pursuant to procedures established by and under the general supervision of the Board. Each Fund may use the fair value of a portfolio investment to calculate its NAV when, for example, (1) market quotations are not readily available because a portfolio investment is not traded in a public market or the principal market in which the investment trades is closed, (2) trading in a portfolio investment is suspended and has not resumed before the Fund calculates its NAV, (3) a significant event affecting the value of a portfolio investment is determined to have occurred between the time of the market quotation provided for a portfolio investment and the time as of which the Fund calculates its NAV, (4) an investment’s price has remained unchanged over a
period of time (often referred to as a “stale price”), or (5) Managers Investment Group LLC (the “Investment Manager”) determines that a market quotation is inaccurate. Portfolio investments that trade primarily on foreign markets are priced based upon the market quotation of such securities as of the close of their respective principal markets, as adjusted to reflect the Investment Manager’s determination of the impact of events occurring subsequent to the close of such markets but prior to the time as of which the Fund calculates its NAV. In accordance with procedures approved by the Board, the Investment Manager relies upon recommendations of a third-party fair valuation service in adjusting the prices of such foreign portfolio investments. The Funds may invest in securities that may be thinly traded. The Board has adopted procedures to adjust prices when thinly traded securities are judged to be stale so that they reflect fair value. An investment valued on the basis of its fair value may be valued at a price higher or lower than available market quotations. An investment’s valuation may differ depending on the method used and the factors considered in determining value according to the Fund’s fair value procedures.
Fixed-income securities are valued based on valuations furnished by independent pricing services that utilize matrix systems, which reflect such factors as security prices, yields, maturities, and ratings, and are supplemented by dealer and exchange quotations. The valuations provided by the pricing services for fixed-income securities reflect the evaluated bid price of such securities. Futures contracts for which market quotations are readily available are valued at the settlement price as of the close of the futures exchange. Short-term investments having a remaining maturity of 60 days or less are generally valued at amortized cost, which approximates market value. Investments in other open-end regulated investment companies are valued at their end of day net asset value per share except iShares or other ETF’s, which are valued the same as equity securities. Investments in certain mortgage-backed and stripped mortgage-backed securities, preferred stocks, convertible securities, derivatives and other debt securities not traded on an organized securities market are valued on the basis of valuations provided by dealers or by a pricing service which uses information with respect to transactions in such securities and various relationships between securities and yield to maturity in determining value. Securities (including derivatives) for which market quotations are not readily available are valued at fair value, as determined in good faith, and pursuant to procedures adopted by the Board. The values assigned to fair value investments are based on available information and do not necessarily represent amounts that might ultimately be realized, since such amounts depend on future developments inherent in long-term investments. Further, because of the inherent uncertainty of valuation, those estimated values may differ significantly from the values that would have been used had a ready market for the investments existed, and the differences could be material.
Notes to Financial Statements
December 31, 2011
U.S. GAAP defines fair value as the price that a Fund would receive to sell an asset or pay to transfer a liability in an orderly transaction between market participants at the measurement date. U.S. GAAP also establishes a framework for measuring fair value, and a three-level hierarchy for fair value measurements based upon the transparency of inputs to the valuation of an asset or liability. Inputs may be observable or unobservable and refer broadly to the assumptions that market participants would use in pricing the asset or liability. Observable inputs reflect the assumptions market participants would use in pricing the asset or liability based on market data obtained from sources independent of the Funds. Unobservable inputs reflect the Funds’ own assumptions about the assumptions that market participants would use in pricing the asset or liability developed based on the best information available in the circumstances. Each investment is assigned a level based upon the observability of the inputs which are significant to the overall valuation.
The three-tier hierarchy of inputs is summarized below:
Level 1 – inputs are quoted prices in active markets for identical investments (e.g., equity securities, open-end investment companies, futures contracts, options contracts)
Level 2 – other observable inputs (including, but not limited to: quoted prices for similar assets or liabilities in markets that are active, quoted prices for identical or similar assets or liabilities in markets that are not active, inputs other than quoted prices that are observable for the assets or liabilities (such as interest rates, yield curves, volatilities, prepayment speeds, loss severities, credit risks and default rates) or other market corroborated inputs) (e.g., debt securities, government securities, swap contracts, foreign currency exchange contracts, foreign securities utilizing international fair value pricing, broker-quoted securities, fair valued securities with observable inputs)
Level 3 – inputs are significant unobservable inputs (including the Fund’s own assumptions used to determine the fair value of investments) (e.g., fair valued securities)
The inputs or methodologies used for valuing investments are not necessarily an indication of the risk associated with investing in those investments.
Security transactions are accounted for as of trade date. Realized gains and losses on securities sold are determined on the basis of identified cost.
| c. | Investment Income and Expenses |
Dividend income is recorded on the ex-dividend date, except certain dividends from foreign securities where the ex-dividend date may have passed. Dividends from foreign securities are recorded as soon as the Trust becomes aware of the ex-dividend date. Dividend income on foreign securities is recorded net of any withholding tax. Interest income, which includes amortization of premium and accretion of discount on debt securities, is accrued as earned. Non-cash dividends included in dividend income, if any, are reported at the fair market value of the securities received. Other income and expenses are recorded on an accrual basis. Expenses that cannot be directly attributed to a fund are apportioned among the Funds in the Trust and in some cases other affiliated funds based upon their relative average net assets or number of shareholders.
The following Fund had certain portfolio trades directed to various brokers, under a brokerage recapture program, which paid a portion of the Fund’s expenses. For the year ended December 31, 2011, under these arrangements the amount by which the Fund expenses were reduced and the impact on the expense ratio was as follows: International Equity – $722 or 0.00%.
The Funds have a “balance credit” arrangement with The Bank of New York Mellon (“BNYM”), the Funds’ custodian, whereby each Fund is credited with an interest factor equal to 0.75% below the effective 90-day T-Bill rate for account balances left uninvested overnight. If the T-Bill rate falls below 0.75%, no credits will be earned. These credits serve to reduce custody expenses that would otherwise be charged to each Fund. For the year ended December 31, 2011, the custodian expense was not reduced.
Overdrafts will cause a reduction of any earnings credits, computed at 2% above the effective Federal funds rate on the day of the over-draft. For the year ended December 31, 2011, overdraft fees were as follows: International Equity – $27, Emerging Markets Equity – $134 and Global Bond Fund – $0.
The Trust also has a balance credit arrangement with its Transfer Agent, BNY Mellon Investment Servicing (US) Inc. (formerly PNC Global Investment Servicing (U.S.) Inc.), whereby earnings credits are used to offset banking charges and other out-of-pocket expenses. For the year ended December 31, 2011, the transfer agent expense was reduced as follows: International Equity - $106; Emerging Markets Equity – $64 and Global Bond – $30.
Total returns and net investment income for the Funds would have been lower had certain expenses not been offset. Total expenses before offsets exclude the impact of expense reimbursements or fee waivers and expense reductions such as brokerage recapture credits but include non-reimbursable expenses, if any, such as interest and taxes.
Notes to Financial Statements (continued)
| d. | Dividends and Distributions |
Dividends resulting from net investment income and distributions of capital gains, if any, will be made annually in December and when required for Federal excise tax purposes. Income and capital gain distributions are determined in accordance with Federal income tax regulations, which may differ from U.S. GAAP. These differences are
primarily due to differing treatments for losses deferred due to wash sales, equalization accounting for tax purposes, foreign currency, futures and market discount transactions. Permanent book and tax basis differences, if any, relating to shareholder distributions will result in reclassifications to paid-in capital. The tax character of distributions paid during the years ended December 31, 2011 and 2010 were as follows:
| | | | | | | | | | | | | | | | | | | | | | | | |
| | | International Equity | | | Emerging Markets Equity | | | Global Bond | |
| | | 2011 | | | 2010 | | | 2011 | | | 2010 | | | 2011 | | | 2010 | |
Distributions paid from: | | | | | | | | | | | | | | | | | | | | | |
Ordinary income | | $ | 1,099,815 | | | $ | 1,000,087 | | | $ | 615,107 | | | $ | 114,817 | | | $ | 850,157 | | | $ | 1,100,009 | |
Short-term capital gains | | | — | | | | — | | | | — | | | | — | | | | — | | | | — | |
Long-term capital gains | | | — | | | | — | | | | — | | | | — | | | | — | | | | — | |
| | | | | | | | | | | | | | | | | | | | | | | | |
| | $ | 1,099,815 | | | $ | 1,000,087 | | | $ | 615,107 | | | $ | 114,817 | | | $ | 850,157 | | | $ | 1,100,009 | |
| | | | | | | | | | | | | | | | | | | | | | | | |
As of December 31, 2011, the components of distributable earnings (excluding unrealized appreciation/depreciation) on a tax basis consisted of:
| | | | | | | | | | | | |
| | | International
Equity | | | Emerging
Markets Equity | | | Global
Bond | |
Capital loss carryforward | | $ | 51,701,883 | | | $ | 8,845,926 | | | $ | 3,679,929 | |
Undistributed ordinary income | | | 828,785 | | | | — | | | | 369,335 | |
Undistributed short-term capital gains | | | — | | | | — | | | | — | |
Undistributed long-term capital gains | | | — | | | | — | | | | — | |
Post-October loss deferral | | | 220,667 | | | | 586,262 | | | | 59,615 | |
Notes to Financial Statements (continued)
Each Fund intends to comply with the requirements under Subchapter M of the Internal Revenue Code of 1986, as amended, and to distribute substantially all of its taxable income and gains to its shareholders and to meet certain diversification and income requirements with respect to investment companies. Therefore, no provision for Federal income or excise tax is included in the accompanying financial statements.
Additionally, based on the Funds’ understanding of the tax rules and rates related to income, gains and transactions for the foreign jurisdictions in which they invest, the Funds will provide for foreign taxes, and where appropriate, deferred foreign taxes.
Management has analyzed the Funds’ tax positions taken on federal income tax returns for all open tax years (tax years ended December 31, 2008-2011), and has concluded that no provision for federal income tax is required in the Funds’ financial statements. Additionally, the Funds are not aware of any tax position for which it is reasonably possible that the total amounts of unrecognized tax benefits will change materially in the next twelve months.
New Tax Law–Regulated Investment Company Modernization Act: Under the recently enacted Regulated Investment Company Modernization Act of 2010 (the “Act”), the Act modernizes several of the federal income and excise tax provisions related to regulated investment companies (“RIC”). Some highlights of the enacted provisions are as follows:
New post-enactment capital losses may now be carried forward for an unlimited time period. However, any new losses incurred will be required to be utilized prior to any loss carryovers incurred in pre-enactment taxable years, which generally expire eight years following the close of the taxable year in which they were incurred. As a result of this ordering rule, pre-enactment capital loss carryovers may be more likely to expire unused. Additionally, post-enactment capital losses that are carried forward will retain their tax character as either short-term or long-term capital losses rather than being considered all short-term as under previous law.
The Act contains simplification provisions, which are aimed at preventing disqualification of a RIC for “inadvertent” failures of the asset diversification and/or qualifying income tests. Additionally, the Act repealed the 60-day designation requirement for certain types of pay-through income and gains.
Finally, the Act contains several provisions aimed at preserving the character of distributions made by a fiscal year RIC during the portion of its taxable year ending after October 31, or December 31, reducing the circumstances under which a RIC might be required to send shareholders amended Forms 1099 to restate previously reported distributions.
Except for the simplification provisions related to RIC qualification, the Act is effective for taxable years beginning after December 22, 2010. The Funds’ first taxable year subject to the Act is the current year ended December 31, 2011.
| f. | Capital Loss Carryovers and Deferrals |
As of December 31, 2011, the following Funds had accumulated net realized capital loss carryovers from securities transactions for Federal income tax purposes as shown in the following chart. The amounts may be used to offset future realized capital gains, if any, through the expiration dates listed or in the case of post-enactment losses, for an unlimited time period.
| | | | | | | | | | | | |
| | | Capital Loss Carryover Amounts | | | | |
Fund | | Short-Term | | | Long- Term | | | Expires
December 31, | |
International Equity | | | | | | | | | | | | |
(Pre-Enactment) | | $ | 19,998,844 | | | | — | | | | 2016 | |
(Pre-Enactment) | | | 26,006,476 | | | | — | | | | 2017 | |
(Pre-Enactment) | | | 5,696,563 | | | | — | | | | 2018 | |
| | | | | | | | | | | | |
Total | | $ | 51,701,883 | | | | — | | | | | |
| | | | | | | | | | | | |
Emerging Markets | | | | | |
(Pre-Enactment) | | $ | 8,845,926 | | | | — | | | | 2017 | |
| | | | | | | | | | | | |
Global Bond | | | | | | | | | | | | |
(Pre-Enactment) | | $ | 450,209 | | | | — | | | | 2016 | |
(Pre-Enactment) | | | 2,196,208 | | | | — | | | | 2017 | |
(Pre-Enactment) | | | 1,033,512 | | | | — | | | | 2018 | |
| | | | | | | | | | | | |
Total | | $ | 3,679,929 | | | | — | | | | | |
| | | | | | | | | | | | |
For the year ended December 31, 2011, the following Funds utilized capital loss carryovers in the amount of:
| | | | | | | | |
| | | Capital Loss Carryovers Utilized | |
Fund | | Short-Term | | | Long-Term | |
International Equity | | $ | 2,417,158 | | | | — | |
Emerging Markets | | $ | 5,785,559 | | | | — | |
Global Bond | | $ | 456,436 | | | | — | |
| * | The Fund’s ability to utilize capital loss carryforwards in the future may be limited under the Internal Revenue Code and related regulations based on results of share ownership activity. |
The Trust’s Declaration of Trust authorizes for each series the issuance of an unlimited number of shares of beneficial interest, without par value. Each Fund records sales and repurchases of its capital stock on the trade date. The cost of securities contributed to the Funds in connection with the issuance of shares is based on the valuation of those securities in accordance with the Funds’ policy on investment valuation. Dividends and distributions to shareholders are recorded on the ex-dividend date.
Notes to Financial Statements (continued)
At December 31, 2011, certain unaffiliated shareholders of record, specifically omnibus accounts, individually or collectively held greater than 10% of the outstanding shares of the following Funds: International Equity – one owns 11%, Emerging Markets Equity – one owns 22% and Global Bond – two collectively own 28%. Transactions by these shareholders may have a material impact on the Funds.
| h. | Foreign Currency Translation |
The books and records of the Funds are maintained in U.S. dollars. The value of investments, assets and liabilities denominated in currencies other than U.S. dollars are translated into U.S. dollars based upon current foreign exchange rates. Purchases and sales of foreign investments, income and expenses are converted into U.S. dollars based on currency exchange rates prevailing on the respective dates of such transactions. Net realized and unrealized gain (loss) on foreign currency transactions represent: (1) foreign exchange gains and losses from the sale and holdings of foreign currencies; (2) gains and losses between trade date and settlement date on investment securities transactions and forward foreign currency exchange contracts; and (3) gains and losses from the difference between amounts of interest and dividends recorded and the amounts actually received.
The Funds do not isolate the net realized and unrealized gain or loss resulting from changes in exchange rates from the fluctuations in market prices of securities held. Such fluctuations are included with the net realized and unrealized gain or loss on investments.
Certain Portfolios invest in securities of foreign entities and in instruments denominated in foreign currencies which involve risks not typically associated with investments in domestic securities. Non-domestic securities carry special risks, such as exposure to currency fluctuations, less developed or less efficient trading markets, political instability, a lack of company information, differing auditing and legal standards, and, potentially, less liquidity.
Realized gains in certain countries may be subject to foreign taxes at the Fund level, at rates ranging from approximately 10% to 15%. The Fund would pay such taxes foreign taxes on net realized gains at the appropriate rate for each jurisdiction.
| 3. | Agreements and Transactions with Affiliates |
For each of the Funds, the Trust has entered into investment management agreements (each, an “Investment Management Agreement”) under which the Investment Manager, an independently managed subsidiary of Affiliated Managers Group, Inc. (“AMG”), serves as investment manager to the Funds and is responsible for the Funds’ overall administration. The Investment Manager selects
subadvisors for the Funds (subject to Trustee approval) and monitors each subadvisor’s investment programs and results. Each Fund’s investment portfolio is managed by one or more portfolio managers who serve pursuant to a subadvisory agreement with the Investment Manager.
Investment management fees are paid directly by the Funds to the Investment Manager based on average daily net assets. For the year ended December 31, 2011, the annual investment management fee rates, as a percentage of average daily net assets, were as follows: International Equity – 0.90%; Emerging Markets Equity – 1.15%; and Global Bond – 0.70%.
The Trust has entered into an Administration and Shareholder Servicing Agreement under which the Investment Manager serves as each Fund’s administrator (the “Administrator”) and is responsible for all aspects of managing the Funds’ operations, including administration and shareholder services to each Fund, its shareholders, and certain institutions, such as bank trust departments, broker-dealers and registered investment advisers, that advise or act as an intermediary with the Funds’ shareholders. Under the terms of the Administration Agreement, each of the Funds, except Global Bond, pay a fee to the Administrator at the rate of 0.25% per annum of the Funds’ average daily net assets. Global Bond pays a fee to the Administrator at the rate of 0.20% per annum of the Fund’s average daily net assets.
The Investment Manager for Global Bond has contractually agreed, through at least May 1, 2012, to waive management fees and/or reimburse Fund expenses in order to limit total annual operating expenses (exclusive of taxes, interest, brokerage commissions, acquired fund fees and expenses, and extraordinary items) to 1.10%, of the Fund’s average daily net assets.
Effective July 1, 2011, the Investment Manager for International Equity and Emerging Markets Equity contractually agreed, through at least May 1, 2013, to waive management fees and /or reimburse Fund expenses in order to limit total annual operating expenses after fee waiver and expense reimbursements (exclusive of taxes, interest (including interest incurred in connection with bank and custody over-drafts), brokerage commissions and other transaction costs, acquired fund fees and expenses and extraordinary expenses) of International Equity and Emerging Markets Equity to 1.34% and 1.64%, respectively, of each Fund’s average daily net assets. (Prior to July 1, 2011, the respective expense limitations were 1.39% and 1.74%, subject to similar exclusions.)
Each Fund is obligated to repay the Investment Manager such amounts waived, paid or reimbursed in future years provided that the repayment occurs within thirty-six (36) months after the waiver or reimbursement occurs and that such repayment would not cause
Notes to Financial Statements (continued)
the Fund’s total operating expenses in any such future year to exceed that Fund’s respective expense cap. For the year ended December 31, 2011, each Fund’s components of reimbursement are detailed in the following chart:
| | | | | | | | |
| | | International
Equity | | | Emerging
Markets Equity | |
Reimbursement Available-12/31/10 | | $ | 952,411 | | | $ | 864,105 | |
Additional Reimbursements | | | 240,796 | | | | 241,231 | |
Repayments | | | — | | | | — | |
Expired Reimbursements | | | (349,132 | ) | | | (319,184 | ) |
| | | | | | | | |
Reimbursement Available-12/31/11 | | $ | 844,075 | | | $ | 786,152 | |
| | | | | | | | |
| | | | |
| | | Global Bond | |
Reimbursement Available-12/31/10 | | $ | 176,253 | |
Additional Reimbursements | | | 74,431 | |
Repayments | | | — | |
Expired Reimbursements | | | (38,750 | ) |
| | | | |
Reimbursement Available-12/31/11 | | $ | 211,934 | |
| | | | |
Effective January 1, 2011, the aggregate annual retainer paid to each Independent Trustee of the Board is $80,000, plus $5,000 or $2,500 for each regular or special meeting attended, respectively. The Independent Chairman of the Trusts receives an additional payment of $20,000 per year. The Chairman of the Audit Committee receives an additional payment of $8,000 per year. (Prior to January 1, 2011, the aggregate annual retainer paid to each Independent Trustee of the Board was $65,000, plus $4,000 or $2,500 for each regular or special meeting attended, respectively. The Independent Chairman of the Trusts received an additional payment of $15,000 per year. The Chairman of the Audit Committee received an additional payment of $5,000 per year.) The Trustees’ fees and expenses are allocated among all of the funds for which the Investment Man-ager serves as the advisor (the “Managers Funds”) based on the relative net assets of such funds. The “Trustees fees and expenses” shown in the financial statements represents the Funds’ allocated portion of the total fees and expenses paid by the Managers Funds.
The Funds are distributed by Managers Distributors, Inc. (the “Distributor” or “MDI”), a wholly-owned subsidiary of the Investment Manager. MDI serves as the principal distributor and underwriter for each Fund and is a registered broker-dealer and member of the Financial Industry Regulatory Authority, Inc. (“FINRA”). Shares of each Fund will be continuously offered and will be sold directly to prospective purchasers through brokers, dealers or other financial intermediaries who have executed selling agreements with the Distributor. Subject to the compensation arrangement discussed below, generally MDI bears all or a portion of the expenses of providing services pursuant to the distribution agreement, including the payment of the expenses relating to the distribution of Prospectuses for sales purposes and any advertising or sales literature. Certain Trustees and Officers of the Funds are Officers and/or Directors of the Investment Manager, AMG and/or the Distributor.
The Securities and Exchange Commission granted an exemptive order that permits the Funds to lend and borrow money for certain temporary purposes directly to and from other eligible Funds in the Managers Funds. Participation in this interfund lending program is voluntary for both borrowing and lending Funds, and an interfund loan is only made if it benefits each participating Fund. The Investment Manager administers the program according to procedures approved by the Board, and the Board monitors the operation of the program. An interfund loan must comply with certain conditions set out in the exemptive order, which are designed to assure fairness and protect all participating Funds. For the year ended December 31, 2011, the following Funds lent to other Managers Funds: International Equity lent $1,781,138 for one day earning interest of $53 and Emerging Markets Equity lent $2,837,591 for 1 day earning interest of $81. For the year ended December 31, 2011, the following Funds borrowed to other Managers Funds: Emerging Markets Equity borrowed varying amounts up to $4,766,224 for 17 days paying interest of $1,769 and Global Bond borrowed $822,854 for 1 day paying interest of $26. The interest amounts are included in the Statements of Operations in interest income or in miscellaneous expense.
| 4. | Purchases and Sales of Securities |
Purchases and sales of securities (excluding short-term securities and U.S. Government obligations). For the year ended December 31, 2011, were as follows:
| | | | | | | | | | | | | | | | |
| | | Long- Term
Securities | | | U.S. Government
Obligations | |
Fund | | Purchases | | | Sales | | | Purchases | | | Sales | |
International Equity | | $ | 42,277,180 | | | $ | 63,767,198 | | | | N/A | | | | N/A | |
Emerging Markets Equity | | | 37,845,820 | | | | 53,547,525 | | | | N/A | | | | N/A | |
Global Bond | | | 15,663,533 | | | | 18,630,147 | | | $ | 6,794,115 | | | $ | 6,140,146 | |
| 5. | Portfolio Securities Loaned |
For the year ended December 31, 2011, the Funds participated in a securities lending program offered by BNYM, providing for the lending of securities to qualified brokers. Securities lending fees include earnings of temporary cash investments, plus or minus any rebate to a borrower. These earnings (after any rebate) are then divided between BNYM, as a fee for its services under the program, and the Fund, according to agreed-upon rates. Collateral on all securities loaned is accepted in cash and/or government securities and is maintained at a minimum level of 102% (105% in the case of certain foreign securities) of the market value, plus interest, if applicable, of investments on loan. It is the Funds’ policy to obtain additional collateral from or return excess collateral to the borrower by the end of the next business day, following the valuation date of the securities loaned. Therefore, the value of the collateral held may be temporarily less than the value of the securities on loan. Lending securities entails a risk of loss to the Funds if and to the extent that the market value of the securities loaned were to increase and the borrower did not increase the collateral accordingly, and the borrower fails to return the securities. Under the terms of the Program, each Fund is indemnified for such losses by BNYM. The Funds bear the risk of any deficiency in the amount of
Notes to Financial Statements (continued)
the collateral available for return to the borrower due to any loss on the collateral invested. Collateral received in the form of cash is invested temporarily in the BNY Mellon Overnight Government Fund (formerly the BNY Institutional Cash Reserves Fund (the “ICRF”)), or other short-term investments as defined in the Securities Lending Agreement with BNYM.
Effective August 2, 2010, the Trust, on behalf of the Fund, entered into an agreement with The Bank of New York Mellon and the Bank of New York Mellon Corporation (“BNYMC”) with respect to each Fund’s position in Series B of the BNY Institutional Cash Reserves Fund (the “ICRF”), pursuant to which (i) BNYMC would support the value of certain defaulted securities issued by Lehman Brothers Holdings, Inc. (the “Lehman Securities”) and held by Series B of the ICRF, and (ii) once certain conditions were met, BNYMC would purchase the defaulted securities from the Fund. On October 17, 2011, after certifying that the Fund had met all necessary conditions, BNYMC purchased the Lehman Securities from the Fund at a pre-determined price, which represented a premium over the fair market value of the Lehman Securities at that date.
| 6. | Commitments and Contingencies |
In the normal course of business, the Funds may enter into contracts and agreements that contain a variety of representations and warranties, which provide general indemnifications. The maximum exposure to the Funds under these arrangements is unknown, as this would involve future claims that may be made against a Fund that have not yet occurred. However, the Funds have not had prior claims or losses and expect the risks of material loss to be remote.
Certain transactions, such as futures and forward transactions, dollar roll agreements, or purchases of when-issued or delayed delivery securities may have a similar effect on a Fund’s net asset value as if the Fund had created a degree of leverage in its portfolio. However, if a Fund enters into such a transaction, the Fund will establish a segregated account with its custodian in which it will maintain cash, U.S. government securities or other liquid securities equal in value to its obligations in respect to such transaction. Securities and other assets held in the segregated account may not be sold while the transaction is outstanding, unless other suitable assets are substituted.
The following disclosures contain information on how and why the Funds use derivative instruments, the credit risk and how derivative instruments affect the Funds’ financial position, results of operations and cash flows. The location and fair value amounts of these instruments on the Statement of Assets and Liabilities and the realized and changes in unrealized gains and losses on the Statement of Operations, each categorized by type of derivative contract, are included in a table in the Notes to Schedules of Portfolio Investments. The derivative instruments outstanding as of year end as disclosed in the Statement of Assets and Liabilities and the realized and changes in unrealized gains
and losses on derivative instruments during the period as disclosed in the Statement of Operations serve as indicators of the volume of derivative activity for the Funds.
| a. | Forward Foreign Currency Contracts |
During the year ended December 31, 2011, International Equity and Global Bond entered into forward foreign currency exchange contracts to facilitate transactions in foreign securities and to hedge against foreign currency exchange rate risk on its non-U.S. dollar denominated investment securities.
A forward foreign currency exchange contract is an agreement between a Fund and another party to buy or sell a currency at a set price at a future date. The market value of the contract will fluctuate with changes in currency exchange rates. The contract is marked-to-market daily, and the change in market value is recorded as an unrealized gain or loss. Gain or loss on the purchase or sale of contracts having the same settlement date, amount and counterparty is realized on the date of offset, otherwise gain or loss is realized on the settlement date.
Risks may arise upon entering into these contracts from the potential inability of counterparties to meet the terms of their contracts and from unanticipated movements in the value of a foreign currency relative to the U.S. dollar.
International Equity and Global Bond entered into futures contracts, including futures contracts on global equity and fixed-income securities, interest rate futures contracts, foreign currency futures contracts and futures contracts on security indices (including broad-based security indices). The Funds purchased or sold futures contracts to achieve a desired level of investment, whether to accommodate portfolio turnover or cash flows from capital shares transactions. There are certain risks associated with futures contracts. Prices may not move as expected or a Fund may not be able to close out the contract when it desires to do so, resulting in losses.
On entering into a futures contract, either cash or securities in an amount equal to a certain percentage of the contract value (initial margin) must be deposited with the futures broker. Subsequent payments (variation margin) are made or received each day. The variation margin payments equal the daily changes in the contract value and are recorded as unrealized gains or losses. The Funds recognize a realized gain or loss when the contract is closed or expires equal to the difference between the value of the contract at the time it was opened and the value at the time it was closed. Futures are valued at their quoted daily settlement prices. The aggregate principal amounts of the contracts are not recorded in the financial statements. Fluctuations in the value of the contracts are recorded in the Statement of Assets and Liabilities as an asset (liability) and in the Statement of Operations as unrealized appreciation (depreciation) until the contracts are closed, when they are recorded as realized gains (losses) on futures or forward currency contracts.
Notes to Financial Statements (continued)
| 9. | New Accounting Standards |
In May 2011, the FASB issued ASU No. 2011-04 “Amendments to Achieve Common Fair Value Measurement and Disclosure Requirements in U.S. GAAP and IFRSs.” ASU No. 2011-04 requires common fair value measurement and disclosure requirements between U.S. GAAP and International Financial Reporting Standards. The new and revised disclosures are effective for interim and annual reporting periods beginning after December 15, 2011. At this time, management is evaluating the implications of ASU No. 2011-04 and its impact on the financial statements.
At a meeting held on January 17, 2012, the Board of Trustees voted to liquidate the Managers International Equity Fund and the Managers Emerging Markets Equity Fund on or about March 9, 2012.
The Funds have determined that no other material events or transactions occurred through the issuance date of the Funds’ financial statements which require additional disclosure in or adjustment of the Funds’ financial statements.
Tax Information (unaudited)
Each Fund hereby designates the maximum amount allowable of its net taxable income as qualified dividends as provided in the Jobs and Growth Tax Relief Reconciliation Act of 2003. The 2011 Form 1099-DIV you receive for each Fund will show the tax status of all distributions paid to you during the respective calendar year.
The percentage of Qualified Dividend Income (“QDI”) and the Dividends Received Deduction (“DRD”) for distributions paid is as follows:
In accordance with federal tax law, the following Funds elect to provide foreign taxes paid and the income sourced from foreign countries. Accordingly, each Fund hereby makes the following designations regarding its year ended December 31, 2011:
| | | | | | | | |
| | | 2011 | | | 2010 | |
Managers International Equity | | | | | | | | |
Ordinary Income - QDI | | | 100.00 | % | | | 100.00 | % |
| |
Ordinary Income - DRD | | | — | | | | — | |
| |
Managers Emerging Markets Equity | |
Ordinary Income - QDI | | | 100.00 | % | | | 100.00 | % |
| |
Ordinary Income - DRD | | | 0.77 | % | | | — | |
| |
Managers Global Bond | | | | | | | | |
Ordinary Income - QDI | | | — | | | | — | |
| |
Ordinary Income - DRD | | | — | | | | — | |
| |
International Equity
| | • | | The total amount of taxes paid and income sourced from foreign countries was $207,773 and $1,375,237, respectively. |
Emerging Markets
| | • | | The total amount of taxes paid and income sourced from foreign countries was $124,268 and $415,463, respectively. |
Pursuant to section 852 of the Internal Revenue Code, International Equity, Emerging Markets Equity, and Global Bond hereby designate as a capital gain distribution with respect to the taxable year ended December 31, 2010, $0, $0, and $0, respectively, or, if subsequently determined to be different, the net capital gains of such year.
Report of Independent Registered Public Accounting Firm
To the Board of Trustees of The Managers Funds and the Shareholders of Managers International Equity Fund, Managers Emerging Markets Equity Fund and Managers Global Bond Fund (currently known as Managers Global Income Opportunity Fund):
In our opinion, the accompanying statements of assets and liabilities, including the schedules of portfolio investments, and the related statements of operations and of changes in net assets and the financial highlights present fairly, in all material respects, the financial position of Managers International Equity Fund, Managers Emerging Markets Equity Fund and Managers Global Bond Fund (currently known as Managers Global Income Opportunity Fund) (three of the series constituting The Managers Funds, hereafter referred to as the “Funds”) at December 31, 2011, the results of each of their operations for the year then ended, the changes in each of their net assets for each of the two years in the period then ended and the financial highlights for each of the five years in the periods indicated, in conformity with accounting principles generally accepted in the United States of America. These financial statements and financial highlights (hereafter referred to as “financial statements”) are the responsibility of the Funds’ management; our responsibility is to express an opinion on these financial statements based on our audits. We conducted our audits of these financial statements in accordance with the standards of the Public Company Accounting Oversight Board (United States). Those standards require that we plan and perform the audit to obtain reasonable assurance about whether the financial statements are free of material misstatement. An audit includes examining, on a test basis, evidence supporting the amounts and disclosures in the financial statements, assessing the accounting principles used and significant estimates made by management, and evaluating the overall financial statement presentation. We believe that our audits, which included confirmation of securities at December 31, 2011 by correspondence with the custodian and brokers, provide a reasonable basis for our opinion.
PricewaterhouseCoopers LLP
Philadelphia, Pennsylvania
February 27, 2012
Trustees and Officers
The Trustees and Officers of the Trust, their business addresses, principal occupations for the past five years and dates of birth are listed below. The Trustees provide broad supervision over the affairs of the Trust and the Funds. The Trustees are experienced executives who meet periodically throughout the year to oversee the Funds’ activities, review contractual arrangements with companies that provide services to the Funds, and review the Funds’ performance. Unless otherwise noted, the address of each Trustee or Officer is the address of the Trust: 800 Connecticut Avenue, Norwalk, Connecticut 06854.
There is no stated term of office for Trustees. Trustees serve until their resignation, retirement or removal in accordance with the Trust’s organizational documents and policies adopted by the Board from time to time. The Chairman of the Trustees, President, Treasurer and Secretary of the Trust are elected by the Trustees annually. Other officers hold office at the pleasure of the Trustees.
Independent Trustees
The following Trustees are not “interested persons” of the Trust within the meaning of the 1940 Act:
| | |
Name, Date of Birth, Number of Funds Overseen in Fund Complex* | | Principal Occupation(s) During Past 5 Years and Other Directorships Held by Trustee |
Jack W. Aber, 9/9/37 • Trustee since 1999 • Oversees 38 Funds in Fund Complex | | Professor of Finance, Boston University School of Management (1972-Present); Trustee of Appleton Growth Fund (1 portfolio); Trustee of Third Avenue Trust (5 portfolios); Trustee of Third Avenue Variable Trust (1 portfolio); Trustee of Aston Funds (26 portfolios). |
William E. Chapman, II, 9/23/41 • Independent Chairman • Trustee since 1999 • Oversees 38 Funds in Fund Complex | | President and Owner, Longboat Retirement Planning Solutions (1998-Present); Hewitt Associates, LLC (part time) (provider of Retirement and Investment Education Seminars) (2002-2009); Trustee of Bowdoin College (2002-Present); Director of Harding, Loevner Funds, Inc. (6 portfolios); Trustee of Third Avenue Trust (5 portfolios); Trustee of Third Avenue Variable Trust (1 portfolio); Trustee of Aston Funds (26 portfolios). |
Edward J. Kaier, 9/23/45 • Trustee since 1999 • Oversees 38 Funds in Fund Complex | | Attorney at Law and Partner, Teeters Harvey Gilboy & Kaier LLP (2007-Present); Attorney at Law and Partner, Hepburn Willcox Hamilton & Putnam, LLP (1977-2007); Trustee of Third Avenue Trust (5 portfolios); Trustee of Third Avenue Variable Trust (1 portfolio); Trustee of Aston Funds (26 portfolios). |
Steven J. Paggioli, 4/3/50 • Trustee since 1993 • Oversees 38 Funds in Fund Complex | | Independent Consultant (2002-Present); Formerly Executive Vice President and Director, The Wadsworth Group (1986-2001); Executive Vice President, Secretary and Director, Investment Company Administration, LLC (1990-2001); Vice President, Secretary and Director, First Fund Distributors, Inc. (1991-2001); Trustee, Professionally Managed Portfolios (43 portfolios); Advisory Board Member, Sustainable Growth Advisors, LP; Independent Director, Chase Investment Counsel (2008 – Present); Trustee of Aston Funds (26 portfolios). |
Eric Rakowski, 6/5/58 • Trustee since 1999 • Oversees 38 Funds in Fund Complex | | Professor, University of California at Berkeley School of Law (1990-Present); Director of Harding, Loevner Funds, Inc. (6 portfolios); Trustee of Third Avenue Trust (5 portfolios); Trustee of Third Avenue Variable Trust (1 portfolio); Trustee of Aston Funds (26 portfolios). |
Thomas R. Schneeweis, 5/10/47 • Trustee since 1987 • Oversees 38 Funds in Fund Complex | | Professor of Finance, University of Massachusetts (1977-Present); Director, CISDM at the University of Massachusetts, (1996-Present); President, Alternative Investment Analytics, LLC, (formerly Schneeweis Partners, LLC) (2001-Present); Partner, S Capital Management, LLC (2007-Present); President, TRS Associates (1982-Present); Partner, White Bear Partners, LLC (2007-2010); Partner, Northampton Capital Management, LLC (2004-2010); Trustee of Aston Funds (26 portfolios). |
| * | The Fund Complex consists of Managers AMG Funds, The Managers Funds, Managers Trust I and Managers Trust II. |
Interested Trustees
Each Trustee in the following table is an “interested person” of the Trust within the meaning of the 1940 Act. Ms. Carsman is an interested person of the Trust within the meaning of the 1940 Act by virtue of her position with, and interest in securities of, AMG, and her former position as Chief Legal Officer of the Trust.
| | |
Name, Date of Birth, Number of Funds Overseen in Fund Complex* | | Principal Occupation(s) During
Past 5 Years and Other Directorships Held by Trustee |
Christine C. Carsman, 4/2/52 • Trustee since 2011 • Oversees 38 Funds in Fund Complex | | Deputy General Counsel, Affiliated Managers Group, Inc. (2011-Present); Senior Vice President and Chief Regulatory Counsel, Affiliated Managers Group, Inc. (2004-Present); Secretary and Chief Legal Officer, Managers AMG Funds, The Managers Funds, Managers Trust I and Managers Trust II (2004-2011); Senior Counsel, Vice President and Director of Operational Risk Management and Compliance, Wellington Management Company, LLP (1995-2004) |
Officers
| | |
Name, Date of Birth, Position(s) Held with Fund and Length of Time Served | | Principal Occupation(s) During
Past 5 Years |
| |
Keitha L. Kinne, 5/16/58 • President since 2012 • Chief Operating Officer since 2007 | | Managing Partner and Chief Operating Officer, Managers Investment Group LLC (2007-Present); Chief Investment Officer, Managers Investment Group LLC (2008-Present); President, Managers Distributors, Inc. (2012-Present); Chief Operating Officer, Managers AMG Funds, Managers Trust I and Managers Trust II (2007-Present); Managing Director, Legg Mason & Co., LLC (2006-2007); Managing Director, Citigroup Asset Management (2004-2006). |
Lewis Collins, 2/22/66 • Secretary since 2011 • Chief Legal Officer since 2011 | | Senior Vice President and Senior Counsel, Affiliated Managers Group, Inc. (2010-Present); Vice President and Senior Counsel, Affiliated Managers Group, Inc. (2006- 2010); Senior Counsel, Affiliated Managers Group, Inc. (2002-2006); Attorney, Ropes & Gray LLP (1998-2002) |
Donald S. Rumery, 5/29/58 • Chief Financial Officer since 2007 • Treasurer since 1995 | | Senior Vice President, Managers Investment Group LLC (2005-Present); Treasurer and Chief Financial Officer, Managers Distributors, Inc. (2000-Present); Treasurer, Managers AMG Funds (1999-Present); Treasurer, Managers Trust I and Managers Trust II (2000-Present); Chief Financial Officer, Managers AMG Funds, Managers Trust I and Managers Trust II (2007-Present); Vice President, The Managers Funds LLC, (1994-2004). |
John J. Ferencz, 3/09/62 • Chief Compliance Officer since 2010 | | Vice President, Legal and Compliance, Managers Investment Group LLC (2010-Present); Senior Compliance Analyst, Mutual Funds and Regulatory, GE Asset Management Incorporated (2005-2010). |
Michael S. Ponder, 9/12/73 • Assistant Secretary since 2011 | | Senior Vice President and Counsel, Managers Investment Group LLC (2011-Present); Attorney, DeNovo Legal (2009-2010); Vice President, Credit Suisse (2007-2009); Associate, Willkie Farr & Gallagher LLP (2006-2007) |
THIS PAGE INTENTIONALLY LEFT BLANK
THIS PAGE INTENTIONALLY LEFT BLANK
THIS PAGE INTENTIONALLY LEFT BLANK
Investment Manager and Administrator
Managers Investment Group LLC
333 W. Wacker Drive
Suite 1200
Chicago, IL 60606
(800) 835-3879
Distributor
Managers Distributors, Inc.
333 W. Wacker Drive
Suite 1200
Chicago, IL 60606
(800) 835-3879
Custodian
The Bank of New York Mellon
2 Hanson Place
Brooklyn, NY 11217
Legal Counsel
Ropes & Gray LLP
Prudential Tower, 800 Boylston Street
Boston, MA 02199-3600
Transfer Agent
BNY Mellon Investment Servicing (US) Inc.*
Attn: Managers
P.O. Box 9769
Providence, RI 02940
(800) 548-4539
For Managers Choice Only
Managers
c/o BNY Mellon Investment Servicing (US) Inc.*
P.O. Box 9847
Providence, RI 02940-8047
(800) 358-7668
| | * | Formerly PNC Global Investment Servicing (U.S.) Inc. |
|
IMPORTANT NOTICE OF REVISIONS TO MANAGERS GLOBAL INCOME OPPORTUNITY FUND’S REDEMPTION AND EXCHANGE FEE POLICY Effective on May 1, 2012, the Global Income Opportunity Fund’s Redemption and Exchange policy will be modified. The modified policy is provided below. The Fund will deduct a redemption/exchange fee of 1.00% (the “Redemption/Exchange Fee”) from the proceeds of any redemption (including a redemption by exchange) of shares if the redemption occurs within 30 days of the purchase of those shares. For the purpose of determining whether a redemption is subject to the Redemption/Exchange Fee, redemptions of shares of the Fund are conducted on a first in/first out (FIFO) basis such that shares with the longest holding period will be treated as being redeemed first and shares with the shortest holding period will be treated as being redeemed last. The Redemption/Exchange Fee is paid to the Fund and is intended to offset transaction and other expenses caused by short-term trading. The Redemption/Exchange Fee will not apply to redemptions (including redemptions by exchange) (1) of shares purchased through reinvestment of dividend or capital gain distributions, (2) under hardship circumstances (as determined by the Investment Manager in its discretion, based on a case-by-case analysis), (3) of shares purchased through certain asset allocation programs, as determined by the Investment Manager, (4) of shares where the application of the Redemption/Exchange Fee would cause the Fund, or an asset allocation program of which the Fund is a part, to fail to be considered a “qualified default investment alternative” under the Employee Retirement Income Security Act of 1974, as amended, and the rules and regulations thereunder, or (5) of shares of a Fund after the announcement or other initial public disclosure by such Fund of the liquidation of such Fund or of the merger or reorganization of such Fund into another Fund. Short-term trades not subject to a Redemption/Exchange Fee as a result of these exceptions may result in additional costs to the Fund that would have been otherwise recouped, in whole or in part, if a Redemption/Exchange Fee were applied. The Redemption/ Exchange Fee will only apply to redemptions of shares purchased through a financial intermediary such as a broker, retirement plan administrator, or bank or trust company if the financial intermediary has indicated that it will administer the Redemption/Exchange Fee. If you invest through a financial intermediary, contact your intermediary to determine whether the Redemption/Exchange Fee applies to you and any restrictions on your trading activity. The Fund reserves the right to modify the terms of, or terminate, the Redemption/Exchange Fee at any time upon 60 days’ advance notice to shareholders. |

MANAGERSAND MANAGERS AMG FUNDS
| | | | |
EQUITY FUNDS | | BALANCED FUNDS |
CADENCE CAPITAL APPRECIATION CADENCE FOCUSED GROWTH CADENCE MID-CAP CADENCE EMERGING COMPANIES Cadence Capital Management, LLC CHICAGO EQUITY PARTNERS MID-CAP Chicago Equity Partners, LLC EMERGING MARKETS EQUITY Rexiter Capital Management Limited Schroder Investment Management North America Inc. ESSEX SMALL/MICRO CAP GROWTH Essex Investment Management Co., LLC FQ TAX-MANAGED U.S. EQUITY FQ U.S. EQUITY First Quadrant, L.P. FRONTIER SMALL CAP GROWTH Frontier Capital Management Company, LLC GW&K SMALL CAP EQUITY Gannett Welsh & Kotler, LLC MICRO-CAP Lord, Abbett & Co. LLC WEDGE Capital Management L.L.P. Next Century Growth Investors LLC RBC Global Asset Management (U.S.) Inc. | | INTERNATIONAL EQUITY AllianceBernstein L.P. Lazard Asset Management, LLC Martin Currie Inc. REAL ESTATE SECURITIES Urdang Securities Management, Inc. RENAISSANCE LARGE CAP GROWTH Renaissance Group LLC SKYLINE SPECIAL EQUITIES PORTFOLIO Skyline Asset Management, L.P. SPECIAL EQUITY Ranger Investment Management, L.P. Lord, Abbett & Co. LLC Smith Asset Management Group, L.P. Federated MDTA LLC SYSTEMATIC VALUE SYSTEMATIC MID CAP VALUE Systematic Financial Management, L.P. TIMESSQUARE MID CAP GROWTH TIMESSQUARE SMALL CAP GROWTH TSCM GROWTH EQUITY TimesSquare Capital Management, LLC TRILOGY GLOBAL EQUITY TRILOGY EMERGING MARKETS EQUITY TRILOGY INTERNATIONAL SMALL CAP Trilogy Global Advisors, L.P. | | CHICAGO EQUITY PARTNERS BALANCED Chicago Equity Partners, LLC ALTERNATIVE FUNDS FQ GLOBAL ALTERNATIVES FQ GLOBAL ESSENTIALS First Quadrant, L.P. INCOME FUNDS BOND (MANAGERS) FIXED INCOME GLOBAL INCOME OPPORTUNITY Loomis, Sayles & Co., L.P. BOND (MANAGERS PIMCO) Pacific Investment Management Co. LLC CALIFORNIA INTERMEDIATE TAX-FREE Miller Tabak Asset Management LLC GW&K MUNICIPAL BOND GW&K MUNICIPAL ENHANCED YIELD Gannett Welsh & Kotler, LLC HIGH YIELD J.P. Morgan Investment Management LLC INTERMEDIATE DURATION GOVERNMENT SHORT DURATION GOVERNMENT Smith Breeden Associates, Inc. |
| | |
This report is prepared for the Funds’ shareholders. It is authorized for distribution to prospective investors only when preceded or accompanied by an effective prospectus. To receive a free copy of the prospectus or Statement of Additional Information, which includes additional information about Fund Trustees, please contact us by calling 800.835.3879. Distributed by Managers Distributors, Inc., member FINRA. A description of the policies and procedures each Fund uses to vote its proxies is available: (i) without charge, upon request, by calling 800.835.3879, or (ii) on the Securities and Exchange Commission’s (SEC) Web site at www.sec.gov. For information regarding each Fund’s proxy voting record for the 12-month period ended June 30, call 800.835.3879 or visit the SEC Web site at www.sec.gov. The Funds file their complete schedule of portfolio holdings with the SEC for the first and third quarters of each fiscal year on Form N-Q. The Funds’ Forms N-Q are available on the SEC’s website at www.sec.gov. A Fund’s Forms N-Q may be reviewed and copied at the SEC’s Public Reference Room in Washington, DC. Information on the operation of the Public Reference Room may be obtained by calling 800.SEC.0330. To review a complete list of the Funds’ portfolio holdings, or to view the most recent quarterly holdings report, semiannual report, or annual report, please visit www.managersinvest.com. | |  |

Managers Special Equity Fund
Annual Report — December 31, 2011
| | | | |
TABLE OF CONTENTS | | Page | |
| |
LETTER TO SHAREHOLDERS | | | 1 | |
| |
ABOUT YOUR FUND’S EXPENSES | | | 3 | |
| |
INVESTMENT MANAGER’S COMMENTS, FUND SNAPSHOTS, AND SCHEDULE OF PORTFOLIO INVESTMENTS | | | 4 | |
| |
FINANCIAL STATEMENTS: | | | | |
| |
Statement of Assets and Liabilities | | | 13 | |
Fund’s balance sheet, net asset value (NAV) per share computations and cumulative undistributed amounts | | | | |
| |
Statement of Operations | | | 14 | |
Detail of sources of income, Fund expenses, and realized and unrealized gains (losses) during the year | | | | |
| |
Statement of Changes in Net Assets | | | 15 | |
Detail of changes in Fund assets for the past two years | | | | |
| |
FINANCIAL HIGHLIGHTS | | | 16 | |
Historical net asset values per share, distributions, total returns, expense ratios, turnover ratios and net assets | | | | |
| |
NOTES TO FINANCIAL STATEMENTS | | | 17 | |
Accounting and distribution policies, details of agreements and transactions with Fund management and affiliates, and descriptions of certain investment risks | | | | |
| |
REPORT OF INDEPENDENT REGISTERED PUBLIC ACCOUNTING FIRM | | | 22 | |
| |
TRUSTEES AND OFFICERS | | | 23 | |
Nothing contained herein is to be considered an offer, sale or solicitation of an offer to buy shares of any series of the Managers Family of Funds. Such offering is made only by Prospectus, which includes details as to offering price and other material information.
Letter to Shareholders
Dear Shareholder:
Our foremost goal at Managers Investment Group (“MIG”) is to structure and manage mutual funds that will help our shareholders and clients successfully reach their investment goals and objectives.
Each of our funds are geared to provide you with exposure to a specific asset class or style of investing. We believe investors tend to use our funds as part of their broader portfolio in order to tailor their asset allocation to meet their individual needs. Most of our funds, like the Fund detailed in this report, are therefore designed to be building blocks.
At MIG, we have overall responsibility for the investment management and administration of the funds. As a “manager of managers,” we work with external investment managers that make the day-to-day investment decisions in the funds (the “Portfolio Managers”). We devote considerable resources to our disciplined process of identifying and selecting unaffiliated portfolio managers for the funds. As a manager of managers, MIG performs many activities to monitor the ongoing investment, compliance, and administrative aspects of all of the funds, which we believe gives our shareholders added confidence in their investments.
Although U.S. equity markets generally ended the year flat or modestly negative, investors in those markets certainly experienced high levels of volatility along the way. After markets shook off macroeconomic events in the first half of the year such as the Arab Spring and the devastating consequences of the Japanese tsunami, markets were not nearly as resilient in the summer months as the political stalemate in Washington involving the U.S. debt ceiling, the S&P downgrade of U.S. sovereign credit rating, and the fear of European sovereign debt contagion shook equity markets, particularly those more closely tied to growth such as small-cap growth equities. The end of September and into the fourth quarter, however, featured almost a complete reversal of the “risk off” trade from the summer months with markets responding positively both to the coordinated efforts of European policymakers to head off issues surrounding their collective sovereign debt crisis as well as to generally positive earnings reports at the company level in the U.S. For the full calendar year, there was a sharp dichotomy in performance at the sector level within small-cap growth equities with the defensive consumer staples sector returning 13% while all other sectors, with the exception of financials (+1.1%), generating negative returns. Generally speaking, more cyclically geared sectors, such as consumer discretionary and materials, struggled the most.
For the year ended December 31, 2011, the Managers Special Equity Fund (Managers Class shares) returned 3.40% compared to -2.91% for the Russell 2000® Growth Index. The outperformance was primarily driven by strong stock selection in several sectors including consumer discretionary, health care, industrials, and information technology. In addition, the Fund was rewarded for its relative positioning versus the benchmark which, by the end of the year, included underweights to the struggling information technology and materials sectors. In a year characterized by heightened volatility, the Fund protected performance well during periods of market pressure while participating solidly during periods of market outperformance as was experienced in the last several months of the year.
| | | | | | | | | | | | | | | | | | | | | | | | | | | | |
Periods Ended 12/31/11 | | 6 Months | | | 1 Year | | | 3 Years | | | 5 Years | | | 10 Years | | | Since
Inception | | | Inception Date | |
Managers Special Equity Fund | | | | | | | | | | | | | | | | | | | | | | | | | | | | |
Managers Class | | | (9.53 | )% | | | 3.40 | % | | | 21.64 | % | | | 0.22 | % | | | 4.13 | % | | | 10.94 | % | | | 06/01/1984 | |
Institutional Class | | | (9.31 | )% | | | 3.78 | % | | | 21.97 | % | | | 0.47 | % | | | — | | | | 4.15 | % | | | 05/03/2004 | |
Russell 2000® Growth Index | | | (10.59 | )% | | | (2.91 | )% | | | 19.00 | % | | | 2.09 | % | | | 4.48 | % | | | | | | | | |
Letter to Shareholders (continued)
The following report covers the one-year period ended December 31, 2011. Should you have any questions about this report, or if you’d like to receive a prospectus and additional information, including fees and expenses for this or any of the other Funds in our family, please feel free to contact us at 1-800-835-3879, or visit our Web site at www.managersinvest.com. As always, please read the prospectus carefully before you invest or send money.
If you are curious about how you can better diversify your investment program, visit our web site for information on other MIG product offerings. You can rest assured that under all market conditions our team is focused on delivering excellent investment management services for your benefit.
We thank you for your continued confidence and investment in The Managers Funds.
Respectfully,

Keitha Kinne
Managing Partner
Managers Investment Group LLC
About Your Fund’s Expenses
| | |
As a shareholder of a Fund, you may incur two types of costs: (1) transaction costs, which may include sales charges (loads) on purchase payments; redemption fees; and exchange fees; and (2) ongoing costs, including management fees; distribution (12b-1) fees; and other Fund expenses. This example is intended to help you understand your ongoing costs (in dollars) of investing in the Fund and to compare these costs with the ongoing costs of investing in other mutual funds. The example is based on $1,000 invested at the beginning of the period and held for the entire period as indicated below. | | |
Actual Expenses | | |
The first line of the following table provides information about the actual account values and actual expenses. You may use the information in this line, together with the amount you invested, to estimate the expenses that you paid over the period. Simply divide your account value by $1,000 (for example, an $8,600 account value divided by $1,000 = 8.6), then multiply the result by the number in the first line under the heading entitled “Expenses Paid During Period” to estimate the expenses you paid on your account during this period. | | |
Hypothetical Example for Comparison Purposes | | |
The second line of the following table provides information about hypothetical account values and hypothetical expenses based on the Fund’s actual expense ratio and an assumed annual rate of return of 5% before expenses, which is not the Fund’s actual return. The hypothetical account values and expenses may not be used to estimate the actual ending account balance or expenses you paid for the period. You may use this information to compare the ongoing costs of investing in the Fund and other funds by comparing this 5% hypothetical example with the 5% hypothetical examples that appear in the shareholder reports of other funds. | | |
Please note that the expenses shown in the table are meant to highlight your on going costs only and do not reflect any transactional costs, such as sales charges (loads), redemption fees, or exchange fees. Therefore, the second line of the table is useful in comparing ongoing costs only, and will not help you determine the relative total costs of owning different funds. | | |
| | | | | | | | | | | | | | | | |
Six Months Ended December 31, 2011 | | Expense
Ratio for the
Period | | | Beginning
Account
Value
07/01/11 | | | Ending
Account
Value
12/31/11 | | | Expenses
Paid
During
the
Period* | |
Managers Special Equity Fund - Managers Class | | | | | |
Based on Actual Fund Return | | | 1.36 | % | | $ | 1,000 | | | $ | 905 | | | $ | 6.53 | |
Based on Hypothetical 5% Annual Return | | | 1.36 | % | | $ | 1,000 | | | $ | 1,018 | | | $ | 6.92 | |
Managers Special Equity Fund - Institutional Class | | | | | |
Based on Actual Fund Return | | | 1.11 | % | | $ | 1,000 | | | $ | 907 | | | $ | 5.34 | |
Based on Hypothetical 5% Annual Return | | | 1.11 | % | | $ | 1,000 | | | $ | 1,020 | | | $ | 5.65 | |
| * | Expenses are equal to the Fund’s annualized expense ratio multiplied by the average account value over the period, multiplied by the number of days in the most recent fiscal half-year (184), then divided by 365. |
3
Managers Special Equity Fund
Investment Manager’s Comments
The Managers Special Equity Fund’s (the “Fund”) investment objective is to achieve long-term capital appreciation through a diversified portfolio of equity securities of small- and medium-sized companies.
THE PORTFOLIO MANAGERS
The Fund employs multiple subadvisors who specialize in distinct investment approaches. This “intelligence diversification” not only serves to manage risk, but also helps us tap the markets’ full potential by focusing different analytical insights on each prospective investment. Fund management strives to achieve its performance and diversification objectives while ensuring that the Fund operates within the framework of its investment objective and principal investment strategies.
Federated MDTA, LLC
Federated MDTA, LLC (“MDT”) utilizes a quantitative process to score stocks based on earnings estimate momentum, long-term growth rates, share buyback and issuance, cash earnings-to-price ratios, tangible book-to-price ratios, and earnings risk. A decision-tree approach provides an intuitive, non-linear way to score companies. Stocks are grouped into clusters determined by analyzing different combinations of factor scores and returns, with each cluster containing companies with a different pattern of fundamental characteristics. Optimization is then used to build a portfolio that maximizes the stock selection score, while adhering to diversification constraints and trading costs. A position is sold or trimmed if the quantitative model identifies a more attractive opportunity (net of trading costs) or if a holding exceeds the maximum company weight of 1.3%. The portfolio typically holds between 100 and 110 stocks, with no position exceeding 1.3% of the portfolio. Industry weights are limited to +/- 13.5% of the benchmark weight, while sector weights are limited to +/- 22.5% of the benchmark weight.
Lord, Abbett & Co., LLC
The team at Lord, Abbett & Co., LLC (“Lord Abbett”), led by Tom O’Halloran, focuses its stock selection effort on companies that have revenue growth of at least 15% and are experiencing year-to-year operating margin improvement and earnings growth driven by top-line growth, rather than being driven by one-time events or simple cost cutting measures. The focus is also on identifying companies with higher-quality balance sheets (often captured by finding companies with manageable debt-to-total-capital ratios) and that are already profitable. Once this process is completed, the focus for the team is on forecasting both revenue and earnings growth over the next several years. To achieve this goal, and to find companies that will be growing considerably faster than their industry average, members of the team spend an extensive amount of time understanding the competitive advantages of a firm, the industry dynamics within which they operate, and the strength of management. A position is sold or trimmed if there is a fundamental change in the business, a more attractive alternative is found,
or if a holding reaches a 5% weight in the overall portfolio. The portion of the Fund managed by Lord Abbett typically holds between 100 and 150 stocks with no individual holding exceeding 5%. Lord Abbett has established a risk constraint that prevents any individual industry from being greater than 25% of the total weight of its portion of the Fund.
Ranger Investment Management, L.P.
The team at Ranger Investment Management, L.P. (“Ranger”), led by Conrad Doenges, starts with a universe of stocks with market capitalization between $100M and $2B, from which they establish a list of approximately 250 to 300 companies on which they conduct detailed research. Each Ranger sector manager builds detailed earnings and cash-flow models for the companies they follow, and also qualitatively gauge, through a stock scoring model, their conviction level in each stock. Companies in the Fund’s portfolio managed by Ranger will typically have a high degree of recurring revenue, steady and/or accelerating sales and earnings growth, solid balance sheets, strong free-cash flows, conservative accounting practices, and a seasoned management team. The portfolio typically contains 35 and 60 stocks, with individual position sizes capped at 5%. Sector exposures are also limited to a maximum of 30%. A stock may be reduced or sold if material changes occur in the company’s earnings estimates, the company’s valuations exceed historical levels, a predetermined price target is achieved, the stock reaches the maximum position size of 5%, capitalization limit of $5 billion, or can be replaced with a better risk/reward opportunity.
Smith Asset Management Group, L.P.
Smith Asset Management Group, L.P.’s (“Smith Group”) investment process is based on a combination of a well-conceived quantitative screening process coupled with experienced, intelligent fundamental and qualitative analysis. The team is focused on predicting which attractively valued companies will report a succession of positive earnings surprises. The process begins by seeking companies with attractive risk profiles and valuations, as well as dramatically improving business fundamentals. To manage risk, Smith screens for companies with good corporate governance, strong financial quality, attractive valuation, and moderate portfolio beta. To identify high-earnings-growth companies, Smith screens for rising earnings expectations, improving earnings quality, a high percentage of positive earnings surprise, and high earnings growth rate. The Fund’s portfolio managed by Smith will typically hold 100 to 120 stocks, with no individual position greater than 3.0%. Sector weightings are limited to no more than two times the weighting in the Russell 2000® Index. Stocks are sold from the portfolio if a negative earnings surprise is predicted by the process or management guidance, a negative earnings surprise is actually reported, the stock’s valuation level is too high, or a buyout announcement is made.
Managers Special Equity Fund
Investment Manager’s Comments (continued)
THE YEAR IN REVIEW
For the year ended December 31, 2011, the Managers Special Equity Fund Managers Class returned 3.40% and the Institutional Class returned 3.78%, both beating the -2.91% return of the Russell 2000 Growth® Index.
Although U.S. equity markets generally ended the year flat or modestly negative, investors in those markets certainly experienced high levels of volatility along the way. After markets shook off macroeconomic events in the first half of the year such as the Arab Spring and the devastating consequences of the Japanese tsunami, markets were not nearly as resilient in the summer months as the political stalemate in Washington involving the U.S. debt ceiling, the S&P downgrade of U.S. sovereign credit rating, and the fear of European sovereign debt contagion shook equity markets, particularly those more closely tied to growth such as small-cap growth equities. The end of September and into the fourth quarter, however, featured almost a complete reversal of the “risk off” trade from the summer months with markets responding positively both to the coordinated efforts of European policymakers to head off issues surrounding their collective sovereign debt crisis as well as to generally positive earnings reports at the company level in the U.S. For the full calendar year, there was a sharp dichotomy in performance at the sector level within small-cap growth equities with the defensive consumer staples sector returning 13% while all other sectors, with the exception of financials (+1.1%), generating negative returns. Generally speaking, more cyclically geared sectors, such as consumer discretionary and materials, struggled the most.
The Fund delivered strong performance relative to the benchmark with the outperformance being led by all four of our managers, each of whom outperformed the benchmark Russell 2000 Growth® Index. The outperformance was primarily driven by strong stock selection in several sectors including consumer discretionary, health care, industrials, and information technology. In addition, the Fund was rewarded for its relative positioning versus the bench-mark which, by the end of the year, included underweights to the struggling information technology and materials sectors. In a year characterized by heightened volatility, the Fund protected performance well during periods of market pressure while participating solidly during periods of market outperformance as was experienced in the last several months of the year.
LOOKING FORWARD
The team at Managers continues to spend considerable time evaluating the Fund and reaffirming our confidence in the subadvisors within the Fund. This past year was our second full calendar year with our existing group of subadvisors, all of whom maintain a growth bias. As we mentioned last year, we continue to believe that the changes we made to the Fund sub adviser lineup in 2009 will continue to be beneficial to shareholders and we continue to be encouraged by the solid performance delivered by the Fund in the last two plus years as a result of these changes.
Heading into 2012, stocks within the consumer discretionary and information technology sectors continue to represent the largest exposures for the Fund, although the information technology weight still represents a relative underweight versus the benchmark. Mean-while, the Fund maintains its largest relative underweight to the health care sector. Despite becoming more defensively positioned during the third quarter as a result of global economic uncertainty, the Fund is, overall, still positioned to take advantage of the ongoing economic recovery with 40% of the Portfolio in the cyclically geared consumer discretionary and information technology sectors. We believe the difficult year in 2011 for small-cap growth equities provides excellent opportunity for active managers within this space in 2012. Towards the end of 2011 we began to see investors sort through the macroeconomic headlines and reward companies that are well capitalized and able to take advantage of growth opportunities in a low growth environment. The continuation of this trend, we believe, provides an excellent opportunity for active managers such as those that manage our Fund.
CUMULATIVE TOTAL RETURN PERFORMANCE
Managers Special Equity Fund’s cumulative total return is based on the daily change in net asset value (NAV), and assumes that all distributions were reinvested. The first chart compares a hypothetical $10,000 investment made in Managers Special Equity Fund– Managers Class on December 31, 2001, to a $10,000 investment made in the Russell 2000® Growth Index for the same time period. The second chart compares a hypothetical $10,000 investment made in Managers Special Equity Fund– Institutional Class on May 3, 2004, to a $10,000 investment made in the Russell 2000® Growth Index for the same time period. The graphs and tables do not reflect the deduction of taxes that a shareholder would pay on a Fund distribution or redemption of shares. Past performance is not indicative of future results.
Managers Special Equity Fund
Investment Manager’s Comments (continued)
CUMULATIVE TOTAL RETURN PERFORMANCE (continued)
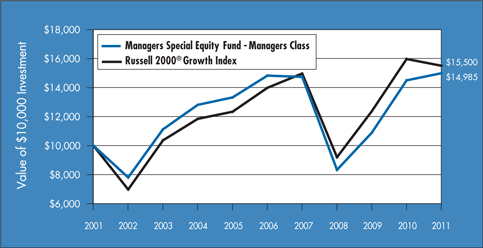
The table below shows the average annual total returns for Special Equity Fund–Managers Class and the Russell 2000® Growth Index since December 31, 2001 through December 31, 2011.
| | | | | | | | | | | | |
Average Annual Total Returns1 | | One Year | | | Five Years | | | Ten Years | |
Managers Special Equity Fund - Managers Class2,3 | | | 3.40 | % | | | 0.22 | % | | | 4.13 | % |
Russell 2000® Growth Index4 | | | (2.91 | )% | | | 2.09 | % | | | 4.48 | % |
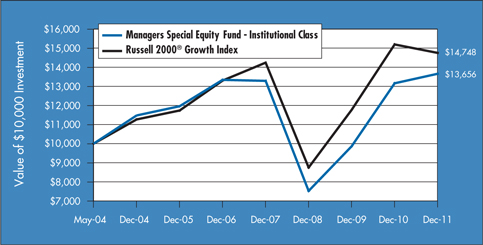
The table below shows the average annual total returns for Special Equity Fund–Institutional Class and the Russell 2000® Growth Index since May 3, 2004 through December 31, 2011.
| | | | | | | | | | | | | | | | |
Average Annual Total Returns1 | | One Year | | | Five Years | | | Since Inception | | | Inception Date | |
Managers Special Equity Fund - Institutional Class2,3 | | | 3.78 | % | | | 0.47 | % | | | 4.15 | % | | | 5/3/2004 | |
Russell 2000® Growth Index4 | | | (2.91) | % | | | 2.09 | % | | | 5.20 | % | | | 5/3/2004 | † |
The performance data shown represents past performance, which is not a guarantee of future results. Current performance may be lower or higher than the performance data quoted. The investment return and principal value of an investment in the Fund will fluctuate so that an investor’s shares, when redeemed, may be worth more or less than their original cost. For performance information through the most recent month end please call (800) 835-3879 or visit our Web site at www.managersinvest.com.
|
In choosing a Fund, investors should carefully consider the amount they plan to invest, their investment objectives, the Fund’s investment objectives, risks, charges and expenses before investing. For this and other information, please call (800) 835-3879 or visit www.managersinvest.com for a free prospectus. Read it carefully before investing or sending money. Distributed by Managers Distributors, Inc., member FINRA. † The date reflects the inception date of the Fund, not the index. 1 Total return equals income yield plus share price change and assumes reinvestment of all dividends and capital gain distributions. Returns are net of fees and may reflect offsets of Fund expenses as described in the Prospectus. No adjustment has been made for taxes payable by shareholders on their reinvested dividends and capital gain distributions. Returns for periods greater than one year are the average annual return. The listed returns on the Fund are net of expenses and based on the published NAV as of December 31, 2011. All returns are in U.S. dollars($). 2 From time to time, the Fund’s advisor has waived its fees and/or absorbed Fund expenses, which has resulted in higher returns. 3 The Fund is subject to risks associated with investments in small capitalization companies, such as erratic earnings patterns, competitive conditions, limited earnings history, and a reliance on one or a limited number of products. 4 The Russell 2000® Growth Index measures the performance of the Russell 2000® Index companies with higher price-to-book ratios and higher forecasted growth values. Unlike the fund, the index is unmanaged, is not available for investment and does not incur expenses. The Russell 2000® Growth Index and the Russell 2000® Index are trademarks of Russell Investments. Russell® is a trademark of Russell Investments. Not FDIC insured, nor bank guaranteed. May lose value. |
6
Managers Special Equity Fund
Fund Snapshots (unaudited)
December 31, 2011
Portfolio Breakdown
| | | | | | | | |
Industry | | Managers
Special Equity Fund ** | | | Russell 2000®
Growth Index | |
Information Technology | | | 21.1 | % | | | 23.3 | % |
Consumer Discretionary | | | 19.5 | % | | | 14.4 | % |
Health Care | | | 17.0 | % | | | 20.0 | % |
Industrials | | | 15.9 | % | | | 16.5 | % |
Financials | | | 9.4 | % | | | 7.6 | % |
Energy | | | 7.3 | % | | | 8.8 | % |
Consumer Staples | | | 3.4 | % | | | 4.2 | % |
Materials | | | 3.3 | % | | | 4.1 | % |
Telecommunication Services | | | 0.3 | % | | | 1.0 | % |
Utilities | | | 0.0 | % | | | 0.1 | % |
Other Assets and Liabilities | | | 2.8 | % | | | 0.0 | % |
| ** | As a percentage of net assets |
Top Ten Holdings
| | | | |
Security Name | | % of Net
Assets | |
SXC Health Solutions Corp.* | | | 1.8 | % |
HMS Holdings Corp. | | | 1.4 | |
Synchronoss Technologies, Inc. | | | 1.4 | |
MarketAxess Holdings, Inc. | | | 1.3 | |
Approach Resources, Inc. | | | 1.3 | |
Pier 1 Imports, Inc. | | | 1.2 | |
Acacia Research Corp.* | | | 1.2 | |
BE Aerospace, Inc.* | | | 1.2 | |
Triumph Group, Inc. | | | 1.2 | |
Signature Bank* | | | 1.2 | |
| | | | |
Top Ten as a Group | | | 13.2 | % |
| | | | |
| * | Top Ten Holding at June 30, 2011 |
|
|
|
Any sectors, industries, or securities discussed should not be perceived as investment recommendations. Mention of a specific security should not be considered a recommendation to buy or solicitation to sell that security. Specific securities mentioned in this report may have been sold from the Fund’s portfolio of investments by the time you receive this report. |
Managers Special Equity Fund
Schedule of Portfolio Investments
December 31, 2011
| | | | | | | | |
| | | Shares | | | Value | |
| | | | | | | | |
Common Stocks - 97.2% | | | | | | | | |
Consumer Discretionary - 19.5% | | | | | | | | |
Aeropostale, Inc. | | | 40,033 | | | $ | 610,503 | |
America’s Car-Mart, Inc.* | | | 31,387 | | | | 1,229,743 | |
Ameristar Casinos, Inc.* | | | 32,930 | | | | 569,360 | |
ANN, Inc. | | | 42,762 | | | | 1,059,642 | |
Ascena Retail Group, Inc.* | | | 41,997 | | | | 1,248,151 | |
Biglari Holdings, Inc.* | | | 1,492 | | | | 549,414 | |
BJ’s Restaurants, Inc.* | | | 44,643 | | | | 2,023,221 | |
Bravo Brio Restaurant Group, Inc.* | | | 54,610 | | | | 936,562 | |
Bridgepoint Education, Inc.* | | | 18,943 | 2 | | | 435,689 | |
Brunswick Corp. | | | 26,743 | | | | 482,979 | |
Buckle, Inc., The | | | 13,345 | 2 | | | 545,410 | |
Carter’s, Inc. | | | 27,747 | | | | 1,104,608 | |
Cato Corp., The, Class A | | | 17,715 | | | | 428,703 | |
Cheesecake Factory, Inc., The | | | 12,395 | | | | 363,793 | |
Children’s Place Retail Stores, Inc., The | | | 3,263 | | | | 173,331 | |
Coinstar, Inc.* | | | 16,816 | 2 | | | 767,482 | |
Collective Brands, Inc.* | | | 2,294 | | | | 32,965 | |
Columbia Sportswear Co., Inc. | | | 11,574 | 2 | | | 538,770 | |
Cracker Barrel Old Country Store, Inc.* | | | 14,839 | | | | 748,034 | |
Crocs, Inc. | | | 51,245 | | | | 756,889 | |
Dana Holding Corp. | | | 64,642 | | | | 785,400 | |
Dick’s Sporting Goods, Inc. | | | 13,357 | | | | 492,606 | |
DineEquity, Inc. | | | 11,195 | | | | 472,541 | |
Express, Inc.* | | | 34,866 | | | | 695,228 | |
Finish Line, Inc., The, Class A | | | 91,765 | | | | 1,769,688 | |
Genesco, Inc. | | | 29,360 | | | | 1,812,686 | |
Global Sources, Ltd.* | | | 27,190 | | | | 131,872 | |
Group 1 Automotive, Inc. | | | 31,710 | | | | 1,642,578 | |
Hibbett Sports, Inc. | | | 45,041 | | | | 2,034,952 | |
HSN, Inc. | | | 13,841 | | | | 501,875 | |
iRobot Corp. | | | 19,035 | | | | 568,195 | |
Jos. A. Bank Clothiers, Inc. | | | 19,477 | | | | 949,699 | |
K12, Inc.* | | | 8,400 | | | | 150,696 | |
Lions Gate Entertainment Corp. | | | 73,190 | | | | 608,941 | |
Monro Muffler Brake, Inc. | | | 15,468 | 2 | | | 600,004 | |
Panera Bread Co., Class A* | | | 7,220 | | | | 1,021,269 | |
Peet’s Coffee & Tea, Inc. | | | 7,217 | 2 | | | 452,362 | |
| | | | | | | | |
| | | Shares | | | Value | |
| | | | | | | | |
Penske Automotive Group, Inc.* | | | 37,090 | | | $ | 713,982 | |
Pier 1 Imports, Inc.* | | | 221,310 | | | | 3,082,848 | |
Polaris Industries, Inc.* | | | 10,665 | | | | 597,027 | |
Pool Corp.* | | | 21,541 | | | | 648,384 | |
Saks, Inc.* | | | 24,869 | 2 | | | 242,473 | |
Sally Beauty Holdings, Inc.* | | | 52,449 | | | | 1,108,247 | |
Select Comfort Corp.* | | | 26,775 | | | | 580,750 | |
Shutterfly, Inc.* | | | 2,281 | | | | 51,916 | |
Sodastream International, Ltd.* | | | 7,966 | | | | 260,409 | |
Sotheby’s* | | | 6,890 | | | | 196,572 | |
Steven Madden, Ltd.* | | | 58,851 | | | | 2,030,360 | |
Strayer Education, Inc.* | | | 10,729 | 2 | | | 1,042,752 | |
Sturm, Ruger & Co., Inc.* | | | 3,010 | | | | 100,715 | |
Teavana Holdings, Inc.* | | | 49,881 | 2 | | | 936,765 | |
Tempur-Pedic International, Inc.* | | | 3,204 | | | | 168,306 | |
Tenneco Automotive, Inc.* | | | 38,428 | | | | 1,144,386 | |
Tesla Motors, Inc.* | | | 20,903 | 2 | | | 596,990 | |
Tractor Supply Co. | | | 251 | | | | 17,608 | |
True Religion Apparel, Inc.* | | | 10,054 | | | | 347,667 | |
Tupperware Brands Corp. | | | 16,830 | | | | 941,975 | |
Ulta Salon, Cosmetics & Fragrance, Inc.* | | | 15,523 | | | | 1,007,753 | |
Under Armour, Inc., Class A* | | | 4,550 | | | | 326,644 | |
Valassis Communications, Inc.* | | | 28,480 | | | | 547,670 | |
Vitamin Shoppe, Inc.* | | | 7,834 | | | | 312,420 | |
Warnaco Group, Inc., The* | | | 32,460 | | | | 1,624,298 | |
Wolverine World Wide, Inc.* | | | 67,338 | | | | 2,399,926 | |
Total Consumer Discretionary | | | | | | | 50,324,684 | |
Consumer Staples - 3.4% | | | | | |
Cal-Maine Foods, Inc. | | | 8,270 | | | | 302,434 | |
Casey’s General Stores, Inc. | | | 12,367 | | | | 637,024 | |
Coca-Cola Bottling Co. Consolidated | | | 2,965 | | | | 173,601 | |
Nu Skin Enterprises, Inc., Class A* | | | 36,757 | | | | 1,785,287 | |
PriceSmart, Inc.* | | | 6,714 | | | | 467,227 | |
Revlon, Inc., Class A* | | | 23,070 | | | | 343,051 | |
Ruddick Corp. | | | 19,646 | | | | 837,705 | |
Smart Balance, Inc.* | | | 54,790 | | | | 293,674 | |
TreeHouse Foods, Inc.* | | | 42,050 | | | | 2,749,229 | |
United Natural Foods, Inc.* | | | 22,005 | | | | 880,420 | |
USANA Health Sciences, Inc.* | | | 6,570 | | | | 199,531 | |
Total Consumer Staples | | | | | | | 8,669,183 | |
|
The accompanying notes are an integral part of these financial statements. 8 |
Managers Special Equity Fund
Schedule of Portfolio Investments (continued)
| | | | | | | | |
| | | Shares | | | Value | |
| | | | | | | | |
Energy - 7.3% | | | | | | | | |
Approach Resources, Inc.* | | | 114,120 | | | $ | 3,356,269 | |
C&J Energy Services, Inc.* | | | 46,224 | | | | 967,468 | |
CARBO Ceramics, Inc. | | | 4,357 | | | | 537,349 | |
Cloud Peak Energy, Inc.* | | | 23,755 | | | | 458,947 | |
CVR Energy, Inc.* | | | 17,530 | | | | 328,337 | |
Dawson Geophysical Co. | | | 34,210 | | | | 1,352,321 | |
Golar LNG, Ltd.* | | | 30,799 | | | | 1,369,016 | |
Gulfmark Offshore, Inc., Class A | | | 4,115 | | | | 172,871 | |
Kodiak Oil & Gas Corp.* | | | 153,122 | | | | 1,454,659 | |
Lufkin Industries, Inc. | | | 33,661 | | | | 2,265,722 | |
Mitcham Industries, Inc.* | | | 12,165 | | | | 265,684 | |
Oasis Petroleum, Inc.* | | | 21,852 | | | | 635,675 | |
Parker Drilling, Co.* | | | 17,900 | | | | 128,343 | |
Rex Energy Corp.* | | | 42,200 | | | | 622,872 | |
Rosetta Resources, Inc.* | | | 44,543 | | | | 1,937,620 | |
Stone Energy Corp.* | | | 46,431 | | | | 1,224,850 | |
VAALCO Energy, Inc.* | | | 43,255 | | | | 261,260 | |
W&T Offshore, Inc.* | | | 42,721 | | | | 906,112 | |
Western Refining, Inc.* | | | 50,448 | | | | 670,454 | |
Total Energy | | | | | | | 18,915,829 | |
Financials - 9.4% | | | | | | | | |
Advance America Cash Advance Centers, Inc.* | | | 65,025 | | | | 581,974 | |
Altisource Portfolio Solutions S.A.* | | | 13,698 | | | | 687,366 | |
Bank of the Ozarks, Inc. | | | 34,304 | | | | 1,016,428 | |
Cardtronics, Inc. | | | 16,870 | | | | 456,502 | |
Cohen & Steers, Inc.* | | | 9,854 | 2 | | | 284,781 | |
eSpeed, Inc., Class A* | | | 21,355 | 2 | | | 126,849 | |
EZCORP, Inc., Class A | | | 25,328 | | | | 667,899 | |
Financial Engines, Inc. | | | 54,033 | | | | 1,206,557 | |
Green Dot Corp.,
Class A* | | | 15,073 | 2 | | | 470,579 | |
Highwoods Properties, Inc. | | | 3,265 | | | | 96,873 | |
Home Bancshares, Inc. | | | 93,599 | | | | 2,425,150 | |
MarketAxess Holdings, Inc.* | | | 113,277 | | | | 3,410,770 | |
Ocwen Financial Corp.* | | | 33,880 | | | | 490,582 | |
Omega Healthcare Investors, Inc.* | | | 5,695 | | | | 110,198 | |
Prosperity Bancshares, Inc.* | | | 65,970 | | | | 2,661,890 | |
Signature Bank* | | | 50,235 | | | | 3,013,598 | |
SVB Financial Group* | | | 52,267 | | | | 2,492,613 | |
Texas Capital Bancshares, Inc.* | | | 95,244 | | | | 2,915,419 | |
| | | | | | | | |
| | | Shares | | | Value | |
| | | | | | | | |
WisdomTree Investments, Inc.* | | | 66,975 | | | $ | 405,199 | |
World Acceptance Corp.* | | | 9,365 | | | | 688,328 | |
Total Financials | | | | | | | 24,209,555 | |
Health Care - 17.0% | | | | | |
Align Technology, Inc. | | | 43,169 | | | | 1,024,185 | |
Amarin Corp. PLC, Sponsored ADR | | | 42,495 | | | | 318,288 | |
Amedisys, Inc. | | | 629 | | | | 6,862 | |
AMERIGROUP Corp.* | | | 28,640 | | | | 1,692,051 | |
ArQule, Inc.* | | | 39,415 | | | | 222,301 | |
Array BioPharma, Inc.* | | | 86,820 | | | | 187,531 | |
ArthroCare Corp. | | | 11,820 | | | | 374,458 | |
Astex Pharmaceuticals, Inc.* | | | 83,175 | | | | 157,201 | |
athenahealth, Inc.* | | | 6,468 | | | | 317,708 | |
BioMarin Pharmaceutical, Inc.* | | | 18,821 | | | | 647,066 | |
Catalyst Health Solutions, Inc.* | | | 52,410 | | | | 2,725,320 | |
Celldex Therapeutics, Inc.* | | | 70,400 | | | | 183,040 | |
Centene Corp.* | | | 52,665 | | | | 2,085,007 | |
Cepheid* | | | 9,770 | | | | 336,186 | |
Chemed Corp.* | | | 16,829 | | | | 861,813 | |
Codexis, Inc. | | | 21,505 | | | | 113,976 | |
Computer Programs & Systems, Inc. | | | 31,225 | | | | 1,595,910 | |
CorVel Corp. | | | 23,540 | | | | 1,217,253 | |
CryoLife, Inc. | | | 23,040 | | | | 110,592 | |
Cubist Pharmaceuticals, Inc. | | | 28,564 | | | | 1,131,706 | |
DexCom, Inc. | | | 17,113 | | | | 159,322 | |
Endologix, Inc.* | | | 91,795 | | | | 1,053,807 | |
Genomic Health, Inc.* | | | 20,346 | | | | 516,585 | |
Halozyme Therapeutics, Inc.* | | | 14,385 | | | | 136,801 | |
HealthStream, Inc.* | | | 19,636 | | | | 362,284 | |
HMS Holdings Corp.* | | | 114,738 | | | | 3,669,321 | |
Impax Laboratories, Inc.* | | | 57,315 | | | | 1,156,044 | |
Incyte Corp.* | | | 24,464 | 2 | | | 367,205 | |
Infinity Pharmaceuticals* | | | 16,220 | | | | 143,385 | |
Insulet Corp.* | | | 18,303 | | | | 344,645 | |
Integra LifeSciences Holdings Corp. | | | 12,002 | | | | 370,022 | |
Invacare Corp. | | | 4,665 | | | | 71,328 | |
IPC The Hospitalist Co., Inc.* | | | 58,540 | | | | 2,676,449 | |
Jazz Pharmaceuticals, Inc. | | | 12,960 | | | | 500,645 | |
Kensey Nash Corp. | | | 12,955 | | | | 248,606 | |
Ligand Pharmaceuticals, Inc.* | | | 11,105 | | | | 131,816 | |
Luminex Corp.* | | | 15,281 | | | | 324,416 | |
|
The accompanying notes are an integral part of these financial statements. 9 |
Managers Special Equity Fund
Schedule of Portfolio Investments (continued)
| | | | | | | | |
| | | Shares | | | Value | |
| | | | | | | | |
Health Care - 17.0% (continued) | | | | | |
Medicines Co., The* | | | 26,914 | | | $ | 501,677 | |
Medicis Pharmaceutical Corp., Class A* | | | 15,585 | | | | 518,201 | |
National Research* | | | 4,815 | | | | 186,870 | |
Neurocrine Biosciences, Inc.* | | | 39,280 | | | | 333,880 | |
NxStage Medical, Inc.* | | | 7,359 | | | | 130,843 | |
Omnicell, Inc.* | | | 57,065 | | | | 942,714 | |
Onyx Pharmaceuticals, Inc.* | | | 15,392 | | | | 676,478 | |
Owens & Minor, Inc.* | | | 35,032 | | | | 973,539 | |
Par Pharmaceutical Co., Inc.* | | | 15,450 | | | | 505,678 | |
PAREXEL International Corp.* | | | 20,784 | | | | 431,060 | |
Providence Service Corp.* | | | 17,595 | | | | 242,107 | |
PSS World Medical, Inc.* | | | 29,748 | | | | 719,604 | |
Quality Systems, Inc.* | | | 24,410 | | | | 902,926 | |
Questcor Pharmaceuticals, Inc.* | | | 19,692 | | | | 818,793 | |
RTI Biologics, Inc.* | | | 123,215 | | | | 547,075 | |
Salix Pharmaceuticals, Ltd.* | | | 11,807 | | | | 564,965 | |
Spectrum Pharmaceuticals* | | | 11,090 | 2 | | | 162,247 | |
Steris Corp.* | | | 29,388 | | | | 876,350 | |
SXC Health Solutions Corp.* | | | 80,669 | | | | 4,556,185 | |
Tornier, N.V.* | | | 18,248 | | | | 328,464 | |
Vanda Pharmaceuticals, Inc.* | | | 28,370 | | | | 135,041 | |
Vical, Inc.* | | | 38,800 | | | | 171,108 | |
WellCare Health Plans, Inc.* | | | 17,938 | | | | 941,745 | |
Zeltiq Aesthetics, Inc.* | | | 14,115 | | | | 160,346 | |
Total Health Care | | | | | | | 43,869,031 | |
Industrials - 15.9% | | | | | | | | |
Acacia Research Corp. | | | 83,696 | | | | 3,055,741 | |
Actuant Corp.,
Class A* | | | 18,033 | | | | 409,169 | |
Acuity Brands, Inc.* | | | 29,050 | | | | 1,539,650 | |
Advisory Board Co., The* | | | 18,715 | | | | 1,388,840 | |
Applied Industrial Technologies, Inc.* | | | 34,280 | | | | 1,205,628 | |
Barnes Group, Inc. | | | 14,303 | | | | 344,845 | |
BE Aerospace, Inc. | | | 78,339 | | | | 3,032,503 | |
Belden, Inc. | | | 21,931 | | | | 729,864 | |
Brink’s Co., The | | | 30,502 | | | | 819,894 | |
Chart Industries, Inc.* | | | 32,230 | | | | 1,742,676 | |
Clean Harbors, Inc. | | | 23,454 | | | | 1,494,723 | |
Colfax Corp. | | | 19,475 | 2 | | | 554,648 | |
Consolidated Graphics, Inc. | | | 3,575 | | | | 172,601 | |
CoStar Group, Inc.* | | | 12,760 | | | | 851,475 | |
Cubic Corp. | | | 11,165 | | | | 486,682 | |
| | | | | | | | |
| | | Shares | | | Value | |
| | | | | | | | |
Deluxe Corp. | | | 37,934 | | | $ | 863,378 | |
Dollar Thrifty Automotive Group, Inc. | | | 15,120 | | | | 1,062,331 | |
EMCOR Group, Inc.* | | | 7,350 | | | | 197,054 | |
Exponent, Inc.* | | | 12,990 | | | | 597,150 | |
Generac Holdings, Inc. | | | 20,000 | | | | 560,600 | |
Genesee & Wyoming, Inc., Class A | | | 16,145 | | | | 978,064 | |
HEICO Corp. | | | 5,773 | 2 | | | 337,605 | |
Hexcel Corp. | | | 61,147 | | | | 1,480,369 | |
Higher One Holdings, Inc.* | | | 27,066 | | | | 499,097 | |
HNI Corp. | | | 14,910 | | | | 389,151 | |
Hub Group, Inc. | | | 38,635 | | | | 1,252,933 | |
Insperity, Inc.* | | | 16,820 | | | | 426,387 | |
Interface, Inc., Class A | | | 25,241 | | | | 291,281 | |
Knoll, Inc. | | | 31,836 | | | | 472,765 | |
Meritor, Inc.* | | | 31,300 | | | | 166,516 | |
Middleby Corp., The | | | 8,760 | | | | 823,790 | |
MYR Group, Inc.* | | | 17,118 | | | | 327,639 | |
NACCO Industries, Inc., Class A* | | | 6,556 | | | | 584,926 | |
Nordson Corp. | | | 7,340 | | | | 302,261 | |
Polypore International, Inc.* | | | 3,419 | 2 | | | 150,402 | |
Primoris Services Corp.* | | | 32,400 | | | | 483,732 | |
RBC Bearings, Inc.* | | | 20,423 | | | | 851,639 | |
Robbins & Myers, Inc.* | | | 23,413 | | | | 1,136,701 | |
Standex International Corp.* | | | 3,290 | | | | 112,419 | |
Tredegar Corp.* | | | 17,630 | | | | 391,739 | |
Triumph Group, Inc.* | | | 51,650 | | | | 3,018,942 | |
United Rentals, Inc.* | | | 30,897 | 2 | | | 913,006 | |
United Stationers, Inc.* | | | 9,891 | | | | 322,051 | |
Viad Corp.* | | | 17,397 | | | | 304,100 | |
Wabtec Corp.* | | | 22,495 | | | | 1,573,525 | |
Watsco, Inc.* | | | 19,012 | | | | 1,248,328 | |
Westport Innovations, Inc.* | | | 26,792 | | | | 890,566 | |
Zipcar, Inc.* | | | 17,053 | | | | 228,851 | |
Total Industrials | | | | | | | 41,068,237 | |
Information Technology - 21.1% | | | | | |
ACI Worldwide, Inc. | | | 16,560 | | | | 474,278 | |
Acme Packet, Inc. | | | 5,066 | | | | 156,590 | |
Allot Communications, Ltd.* | | | 147,440 | | | | 2,241,088 | |
Amkor Technology, Inc. | | | 8,354 | | | | 36,423 | |
Ancestry.com, Inc. | | | 20,040 | 2 | | | 460,118 | |
Angie’s List, Inc. | | | 26,889 | | | | 432,913 | |
Anixter International, Inc. | | | 23,282 | | | | 1,388,538 | |
|
The accompanying notes are an integral part of these financial statements. 10 |
Managers Special Equity Fund
Schedule of Portfolio Investments (continued)
| | | | | | | | |
| | | Shares | | | Value | |
| | | | | | | | |
Information Technology - 21.1% (continued) | | | | | |
Applied Micro Circuits Corp.* | | | 10,005 | | | $ | 67,234 | |
Ariba, Inc.* | | | 78,937 | | | | 2,216,551 | |
Aruba Networks, Inc. | | | 83,772 | 2 | | | 1,551,457 | |
Axcelis Technologies, Inc. | | | 178,165 | | | | 236,959 | |
Bankrate, Inc.* | | | 49,330 | | | | 1,060,595 | |
BroadSoft, Inc.* | | | 14,895 | | | | 449,829 | |
CACI International, Inc., Class A | | | 19,039 | | | | 1,064,661 | |
Carbonite, Inc. | | | 9,754 | | | | 108,269 | |
Cavium, Inc. | | | 16,708 | | | | 475,008 | |
Ceva, Inc. | | | 55,990 | | | | 1,694,257 | |
Cognex Corp. | | | 17,526 | | | | 627,256 | |
CommVault Systems, Inc. | | | 14,087 | | | | 601,797 | |
Concur Technologies, Inc. | | | 10,273 | | | | 521,766 | |
Constant Contact, Inc. | | | 71,610 | 2 | | | 1,662,068 | |
Cornerstone OnDemand, Inc.* | | | 28,384 | | | | 517,724 | |
Cypress Semiconductor Corp. | | | 30,657 | | | | 517,797 | |
DealerTrack Holdings, Inc. | | | 20,099 | | | | 547,899 | |
Echelon Corp.* | | | 35,111 | | | | 170,991 | |
Fair Isaac Corp. | | | 36,307 | | | | 1,301,243 | |
FARO Technologies, Inc. | | | 21,118 | | | | 971,428 | |
Fortinet, Inc.* | | | 36,204 | | | | 789,609 | |
Fusion-io, Inc.* | | | 19,226 | 2 | | | 465,269 | |
GT Advanced Technologies, Inc.* | | | 51,018 | | | | 369,370 | |
Imperva, Inc.* | | | 6,852 | | | | 238,518 | |
Inphi Corp.* | | | 147,870 | | | | 1,768,525 | |
Intermolecular, Inc.* | | | 18,021 | | | | 154,620 | |
IPG Photonics Corp.* | | | 1,763 | | | | 59,713 | |
Jive Software, Inc.* | | | 13,081 | | | | 209,296 | |
Lattice Semiconductor Corp. | | | 83,815 | | | | 497,861 | |
Liquidity Services, Inc.* | | | 23,095 | | | | 852,206 | |
LivePerson, Inc. | | | 49,629 | | | | 622,844 | |
Manhattan Associates, Inc.* | | | 28,382 | | | | 1,148,903 | |
MAXIMUS, Inc.* | | | 62,270 | | | | 2,574,864 | |
Maxwell Technologies, Inc.* | | | 33,568 | | | | 545,144 | |
MercadoLibre, Inc.* | | | 14,763 | | | | 1,174,249 | |
MicroStrategy, Inc.* | | | 4,778 | | | | 517,553 | |
Moneygram International, Inc.* | | | 15,494 | | | | 275,018 | |
Monotype Imaging Holdings, Inc.* | | | 10,085 | | | | 157,225 | |
MTS Systems Corp. | | | 10,100 | | | | 411,575 | |
| | | | | | | | |
| | | Shares | | | Value | |
| | | | | | | | |
NetSuite, Inc.* | | | 24,231 | | | $ | 982,567 | |
Newport Corp.* | | | 37,062 | | | | 504,414 | |
OPNET Technologies, Inc.* | | | 47,430 | | | | 1,739,258 | |
Plantronics, Inc.* | | | 14,340 | | | | 511,078 | |
Progress Software Corp.* | | | 29,339 | | | | 567,710 | |
Quest Software, Inc.* | | | 36,875 | | | | 685,875 | |
Responsys, Inc.* | | | 42,693 | | | | 379,541 | |
Riverbed Technology, Inc.* | | | 27,525 | | | | 646,838 | |
ServiceSource International, Inc.* | | | 102,554 | | | | 1,609,072 | |
Silicon Laboratories, Inc.* | | | 9,326 | 2 | | | 404,935 | |
SolarWinds, Inc.* | | | 36,333 | | | | 1,015,507 | |
Sourcefire, Inc.* | | | 82,421 | | | | 2,668,792 | |
SS&C Technologies Holdings, Inc.* | | | 13,895 | | | | 250,944 | |
Synaptics, Inc.* | | | 14,923 | | | | 449,928 | |
Synchronoss Technologies, Inc.* | | | 116,249 | | | | 3,511,883 | |
Taleo Corp.* | | | 13,488 | | | | 521,851 | |
TeleNav, Inc.* | | | 26,345 | | | | 205,754 | |
Teradyne, Inc.* | | | 23,334 | | | | 318,042 | |
TIBCO Software, Inc.* | | | 19,630 | | | | 469,353 | |
Unisys Corp.* | | | 36,281 | | | | 715,099 | |
Universal Display Corp.* | | | 12,922 | 2 | | | 474,108 | |
Veeco Instruments, Inc.* | | | 32,418 | 2 | | | 674,294 | |
Vocus, Inc.* | | | 11,736 | | | | 259,248 | |
Websense, Inc.* | | | 23,801 | | | | 445,793 | |
Total Information Technology | | | | | | | 54,398,983 | |
Materials - 3.3% | | | | | |
Buckeye Technologies, Inc. | | | 3,349 | | | | 111,991 | |
Coeur d’Alene Mines Corp. | | | 16,630 | | | | 401,448 | |
Koppers Holdings, Inc.* | | | 14,908 | | | | 512,239 | |
Kraton Performance Polymers, Inc.* | | | 56,850 | | | | 1,154,055 | |
LSB Industries, Inc.* | | | 18,392 | | | | 515,528 | |
Materion Corp.* | | | 12,325 | | | | 299,251 | |
Minerals Technologies, Inc.* | | | 8,340 | | | | 471,460 | |
Molycorp* | | | 6,753 | 2 | | | 161,937 | |
NewMarket Corp.* | | | 5,526 | 2 | | | 1,094,756 | |
PolyOne Corp.* | | | 14,800 | | | | 170,940 | |
Rockwood Holdings, Inc.* | | | 40,956 | | | | 1,612,438 | |
TPC Group, Inc.* | | | 49,680 | | | | 1,159,034 | |
Worthington Industries, Inc.* | | | 47,082 | | | | 771,203 | |
Total Materials | | | | | | | 8,436,280 | |
|
The accompanying notes are an integral part of these financial statements. 11 |
Managers Special Equity Fund
Schedule of Portfolio Investments (continued)
| | | | | | | | |
| | | Shares | | | Value | |
| | | | | | | | |
Telecommunication Services - 0.3% | | | | | | | | |
Leap Wireless International, Inc. | | | 33,631 | 2 | | $ | 312,432 | |
Vonage Holdings Corp.* | | | 153,345 | | | | 375,695 | |
Total Telecommunication Services | | | | | | | 688,127 | |
Total Common Stocks
(cost $226,800,004) | | | | | | | 250,579,909 | |
Other Investment
Companies - 8.3%1 | | | | | | | | |
BNY Institutional Cash Reserves Fund, Series A, 0.04%3 | | | 13,063,170 | | | | 13,063,170 | |
| | | | | | | | |
| | | Shares | | | Value | |
| | | | | | | | |
Dreyfus Cash Management Fund, Institutional Class Shares, 0.05% | | | 8,476,784 | | | $ | 8,476,784 | |
Total Other Investment Companies
(cost $21,539,954) | | | | | | | 21,539,954 | |
Total Investments - 105.5%
(cost $248,339,958) | | | | | | | 272,119,863 | |
Other Assets, less
Liabilities - (5.5)% | | | | | | | (14,300,455 | ) |
Net Assets - 100.0% | | | | | | $ | 257,819,408 | |
The following footnotes and abbreviations should be read in conjunction with the Schedule of Portfolio Investments.
Based on the cost of investments of $252,950,125 for Federal income tax purposes at December 31, 2011, the aggregate gross unrealized appreciation and depreciation were approximately $30,350,789 and $11,181,051, respectively, resulting in net unrealized appreciation of investments of $19,169,738.
| * | Non-income producing security. |
| 1 | Yield shown for an investment company represents the December 31, 2011, seven-day average yield, which refers to the sum of the previous seven days’ dividends paid, expressed as an annual percentage. |
| 2 | Some or all of these shares were out on loan to various brokers as of December 31, 2011, amounting to a market value of $12,623,426, or approximately 4.9% of net assets. |
| 3 | Collateral received from brokers for securities lending was invested in this short-term investment. |
As of December 31, 2011, the securities in Special Equity were all Level 1 inputs. For a detailed break-out of the common stocks by major industry classification, please refer to the Schedule of Portfolio Investments. (See Note 1(a) in the Notes to Financial Statements.)
As of December 31, 2011, the Fund had no significant transfers between Level 1 and Level 2 from the beginning of the reporting period.
Investments Definitions and Abbreviations:
ADR: ADR after the name of a holding stands for American Depositary Receipt, representing ownership of foreign securities on deposit with a domestic custodian bank. The value of the ADR security is determined or significantly influenced by trading on exchanges not located in the United States or Canada. Sponsored ADRs are initiated by the underlying foreign company.
|
The accompanying notes are an integral part of these financial statements. 12 |
Managers Special Equity Fund
Statement of Assets and Liabilities
December 31, 2011
| | | | |
Assets: | | | | |
Investments at value (including securities on loan valued at $12,623,426)* | | $ | 272,119,863 | |
Receivable for investments sold | | | 694,019 | |
Receivable for Fund shares sold | | | 201,930 | |
Receivable from affiliate | | | 54,874 | |
Dividends, interest and other receivables | | | 88,342 | |
Prepaid expenses | | | 29,410 | |
Total assets | | | 273,188,438 | |
Liabilities: | | | | |
Payable upon return of securities loaned | | | 13,063,170 | |
Payable for investments purchased | | | 758,722 | |
Payable for Fund shares repurchased | | | 1,099,149 | |
Accrued expenses: | | | | |
Investment advisory and management fees | | | 201,561 | |
Administrative fees | | | 55,989 | |
Other | | | 190,439 | |
Total liabilities | | | 15,369,030 | |
Net Assets | | $ | 257,819,408 | |
Managers Shares: | | | | |
Net Assets | | $ | 243,858,393 | |
Shares outstanding | | | 4,473,922 | |
Net asset value, offering and redemption price per share | | $ | 54.51 | |
Institutional Class Shares: | | | | |
Net Assets | | $ | 13,961,015 | |
Shares outstanding | | | 251,772 | |
Net asset value, offering and redemption price per share | | $ | 55.45 | |
Net Assets Represent: | | | | |
Paid-in capital | | $ | 474,831,983 | |
Undistributed net investment loss | | | (53,875 | ) |
Accumulated net realized loss from investments | | | (240,738,605 | ) |
Net unrealized appreciation of investments | | | 23,779,905 | |
Net Assets | | $ | 257,819,408 | |
* Investments at cost | | $ | 248,339,958 | |
|
The accompanying notes are an integral part of these financial statements. 13 |
Managers Special Equity Fund
Statement of Operations
For the year ended December 31, 2011
| | | | |
Investment Income: | | | | |
Dividend income | | $ | 1,326,632 | |
Securities lending fees | | | 206,218 | |
Interest income | | | 133 | |
Total investment income | | | 1,532,983 | |
Expenses: | | | | |
Investment management and advisory fees | | | 2,877,355 | |
Administrative fees | | | 799,265 | |
Transfer agent | | | 875,491 | |
Custodian | | | 130,688 | |
Professional fees | | | 55,123 | |
Registration fees | | | 55,202 | |
Reports to shareholders | | | 37,908 | |
Trustees fees and expenses | | | 20,775 | |
Miscellaneous | | | 10,615 | |
Total expenses before offsets | | | 4,862,422 | |
Expense reimbursements | | | (441,440 | ) |
Expense reductions | | | (37,509 | ) |
Net expenses | | | 4,383,473 | |
Net investment loss | | | (2,850,490 | ) |
Net Realized and Unrealized Gain (Loss): | | | | |
Net realized gain on investments | | | 42,550,826 | |
Net change in unrealized appreciation of investments | | | (37,008,078 | ) |
Net realized and unrealized gain | | | 5,542,748 | |
Net increase in net assets resulting from operations | | $ | 2,692,258 | |
|
The accompanying notes are an integral part of these financial statements. 14 |
Managers Special Equity Fund
Statement of Changes in Net Assets
For the year ended December 31,
| | | | | | | | |
Increase (Decrease) in Net Assets From Operations: | | | 2011 | | | | 2010 | |
Net investment loss | | ($ | 2,850,490 | ) | | ($ | 2,007,981 | ) |
Net realized gain on investments | | | 42,550,826 | | | | 53,728,169 | |
Net change in unrealized appreciation (depreciation) of investments | | | (37,008,078 | ) | | | 8,739,851 | |
Net increase in net assets resulting from operations | | | 2,692,258 | | | | 60,460,039 | |
From Capital Share Transactions: | | | | | | | | |
Managers Class: | | | | | | | | |
Proceeds from sale of shares | | | 152,829,719 | | | | 72,554,710 | |
Cost of shares repurchased | | | (189,754,386 | ) | | | (74,147,024 | ) |
Net decrease from Managers Class share transactions | | | (36,924,667 | ) | | | (1,592,314 | ) |
Institutional Class: | | | | | | | | |
Proceeds from sale of shares | | | 11,950,135 | | | | 641,061 | |
Cost of shares repurchased | | | (3,388,450 | ) | | | (5,205,756 | ) |
Net increase (decrease) from Institutional Class share transactions | | | 8,561,685 | | | | (4,564,695 | ) |
Net decrease from capital share transactions | | | (28,362,982 | ) | | | (6,157,009 | ) |
Total increase (decrease) in net assets | | | (25,670,724 | ) | | | 54,303,030 | |
Net Assets: | | | | | | | | |
Beginning of year | | | 283,490,132 | | | | 229,187,102 | |
End of year | | $ | 257,819,408 | | | $ | 283,490,132 | |
End of year undistributed net investment income (loss) | | | ($53,875 | ) | | | — | |
| | | | | | | | |
Share Transactions: | | | | | | | | |
Managers Class: | | | | | | | | |
Sale of shares | | | 2,679,236 | | | | 1,453,344 | |
Shares repurchased | | | (3,492,876 | ) | | | (1,750,832 | ) |
Net decrease in shares | | | (813,641 | ) | | | (297,488 | ) |
Institutional Class: | | | | | | | | |
Sale of shares | | | 224,397 | | | | 14,182 | |
Shares repurchased | | | (62,207 | ) | | | (125,107 | ) |
Net increase (decrease) in shares | | | 162,190 | | | | (110,925 | ) |
|
The accompanying notes are an integral part of these financial statements. 15 |
Managers Special Equity Fund
Financial Highlights
For a share outstanding throughout each year
| | | | | | | | | | | | | | | | | | | | |
| | | For the year ended December 31, | |
Managers Class: | | 2011 | | | 2010 | | | 2009 | | | 2008 | | | 2007 | |
Net Asset Value, Beginning of Year | | $ | 52.71 | | | $ | 39.60 | | | $ | 30.28 | | | $ | 64.27 | | | $ | 82.96 | |
Income from Investment Operations: | | | | | | | | | | | | | | | | | | | | |
Net investment loss | | | (0.50 | )3 | | | (0.41 | )3 | | | (0.34 | )3 | | | (0.28 | )3 | | | (0.51 | )3 |
Net realized and unrealized gain (loss) on investments | | | 2.30 | 3 | | | 13.52 | 3 | | | 9.66 | 3 | | | (27.93 | )3 | | | 0.55 | 3 |
Total from investment operations | | | 1.80 | | | | 13.11 | | | | 9.32 | | | | (28.21 | ) | | | 0.04 | |
Less Distributions to Shareholders from: | | | | | | | | | | | | | | | | | | | | |
Net realized gain on investments | | | — | | | | — | | | | — | | | | (5.78 | ) | | | (18.73 | ) |
Net Asset Value, End of Year | | $ | 54.51 | | | $ | 52.71 | | | $ | 39.60 | | | $ | 30.28 | | | $ | 64.27 | |
Total Return1 | | | 3.41 | %4 | | | 33.11 | % | | | 30.78 | % | | | (43.49 | )% | | | (0.60 | )% |
Ratio of net expenses to average net assets | | | 1.37 | %5 | | | 1.48 | % | | | 1.58 | % | | | 1.48 | % | | | 1.43 | % |
Ratio of net investment loss to average net assets1 | | | (0.89 | )% | | | (0.95 | )% | | | (1.08 | )% | | | (0.52 | )% | | | (0.59 | )% |
Portfolio turnover | | | 126 | % | | | 138 | % | | | 186 | % | | | 138 | % | | | 67 | % |
Net assets at end of year (000’s omitted) | | $ | 243,858 | | | $ | 278,701 | | | $ | 221,159 | | | $ | 352,106 | | | $ | 1,668,031 | |
| | | | | | | | | | | | | | | | | | | | |
Ratios absent expense offsets:2 | | | | | | | | | | | | | | | | | | | | |
Ratio of total expenses to average net assets | | | 1.54 | % | | | 1.55 | % | | | 1.61 | % | | | 1.51 | % | | | 1.46 | % |
Ratio of net investment loss to average net assets | | | (1.06 | )% | | | (1.02 | )% | | | (1.11 | )% | | | (0.55 | )% | | | (0.62 | )% |
| | | | | | | | | | | | | | | | | | | | |
| |
| | | For the year ended December 31, | |
Institutional Class: | | 2011 | | | 2010 | | | 2009 | | | 2008 | | | 2007 | |
Net Asset Value, Beginning of Year | | $ | 53.43 | | | $ | 40.04 | | | $ | 30.56 | | | $ | 64.71 | | | $ | 83.56 | |
Income from Investment Operations: | | | | | | | | | | | | | | | | | | | | |
Net investment loss | | | (0.29 | )3 | | | (0.30 | )3 | | | (0.26 | )3 | | | (0.15 | )3 | | | (0.32 | )3 |
Net realized and unrealized gain (loss) on investments | | | 2.31 | 3 | | | 13.69 | 3 | | | 9.74 | 3 | | | (28.16 | )3 | | | 0.52 | 3 |
Total from investment operations | | | 2.02 | | | | 13.39 | | | | 9.48 | | | | (28.31 | ) | | | 0.20 | |
Less Distributions to Shareholders from: | | | | | | | | | | | | | | | | | | | | |
Net realized gain on investments | | | — | | | | — | | | | — | | | | (5.84 | ) | | | (19.05 | ) |
Net Asset Value, End of Year | | $ | 55.45 | | | $ | 53.43 | | | $ | 40.04 | | | $ | 30.56 | | | $ | 64.71 | |
Total Return1 | | | 3.78 | % | | | 33.44 | %4 | | | 31.02 | %4 | | | (43.35 | )% | | | (0.39 | )% |
Ratio of net expenses to average net assets | | | 1.12 | %5 | | | 1.23 | % | | | 1.33 | % | | | 1.23 | % | | | 1.20 | % |
Ratio of net investment loss to average net assets1 | | | (0.53 | )% | | | (0.70 | )% | | | (0.83 | )% | | | (0.29 | )% | | | (0.36 | )% |
Portfolio turnover | | | 126 | % | | | 138 | % | | | 186 | % | | | 138 | % | | | 67 | % |
Net assets at end of year (000’s omitted) | | $ | 13,961 | | | $ | 4,786 | | | $ | 8,028 | | | $ | 92,439 | | | $ | 247,396 | |
| | | | | | | | | | | | | | | | | | | | |
Ratios absent expense offsets:2 | | | | | | | | | | | | | | | | | | | | |
Ratio of total expenses to average net assets | | | 1.29 | % | | | 1.30 | % | | | 1.36 | % | | | 1.26 | % | | | 1.23 | % |
Ratio of net investment loss to average net assets | | | (0.70 | )% | | | (0.77 | )% | | | (0.86 | )% | | | (0.32 | )% | | | (0.39 | )% |
| | | | | | | | | | | | | | | | | | | | |
| 1 | Total returns and net investment income would have been lower had certain expenses not been reduced. (See Note 1(c) of Notes to Financial Statements.) |
| 2 | Excludes the impact of fee waivers and expense offsets such as brokerage credits, but includes non-reimbursable expenses, if any, such as interest and taxes. (See Note 1(c) to the Notes to Financial Statements.) |
| 3 | Per share numbers have been calculated using average shares. |
| 4 | The Total Return is based on the Financial Statement Net Asset Values as shown above. |
| 5 | Effective July 1, 2011, as described in the current prospectus, the Fund’s expense cap was reduced to 1.11% from 1.14%. For the period April 1, 2011 through June 30, 2011, the Fund’s expense cap was 1.14%. From January 1, 2011 through March 31, 2011, the Fund’s expense cap was 1.19%. The expense ratio shown reflects the weighted average expense ratio for the full year ended December 31, 2011. |
Managers Special Equity Fund
Notes to Financial Statements
December 31, 2011
| 1. | Summary of Significant Accounting Policies |
The Managers Funds (the “Trust”) is an open-end management investment company, organized as a Massachusetts business trust, and registered under the Investment Company Act of 1940, as amended (the “1940 Act”). Currently, the Trust consists of a number of different funds, each having distinct investment management objectives, strategies, risks and policies. Included in this report is the Managers Special Equity Fund (“Special Equity” or the “Fund”).
The Fund offers both Managers Class shares and Institutional Class shares. The Institutional Class shares, which are designed primarily for institutional investors that meet certain administrative and servicing criteria, have a minimum investment of $2,500,000. Managers Class shares are offered to all other investors. Each class represents an interest in the same assets of the Fund and the classes are identical except for class specific expenses related to shareholder activity. Each class has equal voting privileges except that each class has exclusive voting rights with respect to its services and/or distribution plan. Please refer to a current prospectus for additional information on each share class.
The Fund’s financial statements are prepared in accordance with accounting principles generally accepted in the United States of America, (“U.S. GAAP”), which require management to make estimates and assumptions that affect the reported amounts of assets and liabilities and disclosure of contingent assets and liabilities at the date of the financial statements and the reported amounts of income and expenses during the reporting periods. Actual results could differ from those estimates and such differences could be material. The following is a summary of significant accounting policies followed by the Fund in the preparation of its financial statements:
| a. | Valuation of Investments |
Equity securities traded on a domestic or international securities exchange are valued at the last quoted sale price, or, lacking any sales, at the last quoted bid price. Over-the-counter securities are valued at the Nasdaq Official Closing Price, if one is available. Lacking any sales, over-the-counter securities are valued at the last quoted bid price. The Fund’s investments are generally valued based on market quotations provided by third-party pricing services approved by the Board of Trustees of the Funds (the “Board”). Under certain circumstances, the value of certain Fund investments may be based on an evaluation of fair value, pursuant to procedures established by and under the general supervision of the Board. The Fund may use the fair value of a portfolio investment to calculate its NAV when, for example, (1) market quotations are not readily available because a portfolio investment is not traded in a public market or the principal market in which the investment trades is closed, (2) trading in a investment security is suspended and has not resumed before the Fund calculates its NAV, (3) a significant event affecting the value of a portfolio investment is determined to have occurred between the time of the market quotation provided for a portfolio investment and the time as of which the Fund calculates
its NAV, (4) an investment’s price has remained unchanged over a period of time (often referred to as a “stale price”), or (5) Managers Investment Group LLC (the “Investment Manager”) determines that a market quotation is inaccurate. Portfolio investments that trade primarily on foreign markets are priced based upon the market quotation of such securities as of the close of their respective principal markets, as adjusted to reflect the Investment Manager’s determination of the impact of events occurring subsequent to the close of such markets but prior to the time as of which the Fund calculates its NAV. The Fund may invest in securities that may be thinly traded. The Board has adopted procedures to adjust prices when thinly traded securities are judged to be stale so that they reflect fair value. An investment valued on the basis of its fair value may be valued at a price higher or lower than available market quotations. An investment’s valuation may differ depending on the method used and the factors considered in determining value according to the Fund’s fair value procedures.
Short-term investments having a remaining maturity of 60 days or less are generally valued at amortized cost, which approximates market value. Investments in other open-end regulated investment companies are valued at their end of day net asset value per share except iShares or other ETF’s, which are valued the same as equity securities. Investments in preferred stocks not traded on an organized securities market are valued on the basis of valuations provided by dealers or by a pricing service which uses information with respect to transactions in such securities and various relationships between securities and yield to maturity in determining value. Securities (including derivatives) for which market quotations are not readily available are valued at fair value, as determined in good faith, and pursuant to procedures adopted by the Board. The values assigned to fair value investments are based on available information and do not necessarily represent amounts that might ultimately be realized, since such amounts depend on future developments inherent in long-term investments. Further, because of the inherent uncertainty of valuation, those estimated values may differ significantly from the values that would have been used had a ready market for the investments existed, and the differences could be material.
U.S. GAAP defines fair value as the price that a Fund would receive to sell an asset or pay to transfer a liability in an orderly transaction between market participants at the measurement date. U.S. GAAP also establish a framework for measuring fair value, and a three-level hierarchy for fair value measurements based upon the transparency of inputs to the valuation of an asset or liability. Inputs may be observable or unobservable and refer broadly to the assumptions that market participants would use in pricing the asset or liability. Observable inputs reflect the assumptions market participants would use in pricing the asset or liability based on market data obtained from sources independent of the Fund. Unobservable inputs reflect the Fund’s own assumptions about the assumptions that market participants would use in pricing the asset or liability developed based on the best information available in the circumstances. Each investment is assigned a level based upon the observability of the inputs which are significant to the overall valuation.
Managers Special Equity Fund
Notes to Financial Statements (continued)
The three-tier hierarchy of inputs is summarized below:
Level 1 – inputs are quoted prices in active markets for identical investments (e.g., equity securities, open-end investment companies, futures contracts, options contracts)
Level 2 – other observable inputs (including, but not limited to: quoted prices for similar assets or liabilities in markets that are active, quoted prices for identical or similar assets or liabilities in markets that are not active, inputs other than quoted prices that are observable for the assets or liabilities (such as interest rates, yield curves, volatilities, prepayment speeds, loss severities, credit risks and default rates) or other market corroborated inputs) (e.g., debt securities, government securities, swap contracts, foreign currency exchange contracts, foreign securities utilizing international fair value pricing, broker-quoted securities)
Level 3 –inputs are significant unobservable inputs (including the Fund’s own assumptions used to determine the fair value of investments) (e.g., fair valued securities)
The inputs or methodologies used for valuing investments are not necessarily an indication of the risk associated with investing in those investments.
Security transactions are accounted for as of trade date. Realized gains and losses on securities sold are determined on the basis of identified cost.
| c. | Investment Income and Expenses |
Dividend income is recorded on the ex-dividend date except certain dividends from foreign securities where the ex-dividend date may have passed. Dividends from foreign securities are recorded as soon as the Trust becomes aware of the ex-dividend date. Dividend income on foreign securities is recorded net of any withholding tax. Interest income, which includes amortization of premium and accretion of discount on debt securities, is accrued as earned. Non-cash dividends included in dividend income, if any, are reported at the fair market value of the securities received. Other income and expenses are recorded on an accrual basis. Expenses that cannot be directly attributed to a fund are apportioned among the Funds in the Trust and in some cases other affiliated funds based upon their relative average net assets or number of shareholders. Investment income, realized and unrealized capital gains and losses, the common expenses of the Fund and certain Fund level expense reductions, if any, are allocated on a pro rata basis to each class based on the relative net assets of each class to the total net assets of the Fund.
The Fund had certain portfolio trades directed to various brokers, under a brokerage recapture program, which paid a portion of the Fund’s expenses. For the year ended December 31, 2011, under
these arrangements the amount by which the Fund’s expenses were reduced and the impact on the expense ratio was as follows: $37,126 or 0.01% annualized.
The Fund has a “balance credit” arrangement with The Bank of New York Mellon (“BNYM”), the Fund’s custodian, whereby the Fund is credited with an interest factor equal to 0.75% below the effective 90-day T-Bill rate for account balances left uninvested overnight. If the T-Bill rate falls below 0.75%, no credits will be earned. These credits serve to reduce custody expenses that would otherwise be charged to the Fund. For the year ended December 31, 2011, the custodian expense was not reduced.
Overdrafts will cause a reduction of any earnings credits, computed at 2% above the effective Federal Funds rate on the day of the over-draft. For the year ended December 31, 2011, the Fund incurred overdraft fees of $91.
The Trust also has a balance credit arrangement with its Transfer Agent, BNY Mellon Investment Servicing (US) Inc., (formerly PNC Global Investment Servicing (U.S.) Inc.), whereby earnings credits are used to offset banking charges and other out-of-pocket expenses. For the year ended December 31, 2011, the transfer agent expense was reduced by $383.
Total returns and net investment income for the Fund would have been lower had certain expenses not been offset. Total expenses before off-sets exclude the impact of expense reimbursements or fee waivers and expense offsets such as brokerage recapture credits, but include non-reimburseable expenses, if any, such as interest and taxes.
| d. | Dividends and Distributions |
Dividends resulting from net investment income and distributions of capital gains, if any, normally will be declared and paid annually in December and when required for Federal excise tax purposes. Distributions are recorded on the ex-dividend date and are declared separately for each class. Income and capital gain distributions are determined in accordance with Federal income tax regulations, which may differ from U.S. GAAP. These differences are primarily due to differing treatments for losses deferred due to wash sales, REITs, equalization accounting for tax purposes and market discount transactions. Permanent book and tax basis differences, if any, relating to shareholder distributions will result in reclassifications to paid-in capital.
As of December 31, 2011, the components of distributable earnings (excluding unrealized appreciation/depreciation) on a tax basis consisted of:
| | | | |
Capital loss carryforward | | $ | 235,129,348 | |
Undistributed ordinary income | | | — | |
Undistributed short-term capital gains | | | — | |
Undistributed long-term capital gains | | | — | |
Managers Special Equity Fund
Notes to Financial Statements (continued)
Each Fund intends to comply with the requirements under Subchapter M of the Internal Revenue Code of 1986, as amended, and to distribute substantially all of its taxable income and gains to its shareholders and to meet certain diversification and income requirements with respect to investment companies. Therefore, no provision for Federal income or excise tax is included in the accompanying financial statements.
Additionally, based on the Funds’ understanding of the tax rules and rates related to income, gains and transactions for the foreign jurisdictions in which they invest, the Funds will provide for foreign taxes, and where appropriate, deferred foreign taxes.
Management has analyzed the Funds’ tax positions taken on federal income tax returns for all open tax years (tax years ended December 31, 2008-2011), and has concluded that no provision for federal income tax is required in the Funds’ financial statements. Additionally, the Funds are not aware of any tax position for which it is reasonably possible that the total amounts of unrecognized tax benefits will change materially in the next twelve months.
New Tax Law–Regulated Investment Company Modernization Act:
Under the recently enacted Regulated Investment Company Modernization Act of 2010 (the “Act”), the Act modernizes several of the federal income and excise tax provisions related to regulated investment companies (“RIC”). Some highlights of the enacted provisions are as follows:
New post-enactment capital losses may now be carried forward for an unlimited time period. However, any new losses incurred will be required to be utilized prior to any loss carryovers incurred in pre-enactment taxable years, which generally expire eight years following the close of the taxable year in which they were incurred. As a result of this ordering rule, pre-enactment capital loss carryovers may be more likely to expire unused. Additionally, post-enactment capital losses that are carried forward will retain their tax character as either short-term or long-term capital losses rather than being considered all short-term as under previous law.
The Act contains simplification provisions, which are aimed at preventing disqualification of a RIC for “inadvertent” failures of the asset diversification and/or qualifying income tests. Additionally, the Act repealed the 60-day designation requirement for certain types of pass-through income and gains.
Finally, the Act contains several provisions aimed at preserving the character of distributions made by a fiscal year RIC during the portion of its taxable year ending after October 31, or December 31, reducing the circumstances under which a RIC might be required to send shareholders amended Forms 1099 to restate previously reported distributions.
Except for the simplification provisions related to RIC qualification, the Act is effective for taxable years beginning after December 22, 2010. The Fund’s first taxable year subject to the Act is the current year ended December 31, 2011.
| f. | Capital Loss Carryovers and Deferrals |
As of December 31, 2011, the Fund had accumulated net realized capital loss carryovers from securities transactions for Federal income tax purposes as shown in the following chart. The amounts may be used to offset future realized capital gains, if any, through the expiration dates listed or in the case of post-enactment losses, for an unlimited time period.
| | | | | | | | | | | | |
| | | Capital Loss Carryover
Amounts | | | Expires | |
Fund | | Short-
Term | | | Long-
Term | | | December 31, | |
Special Equity | | | | | | | | | | | | |
(Pre-Enactment) | | $ | 51,507,571 | | | | — | | | | 2016 | |
(Pre-Enactment) | | | 183,621,777 | | | | — | | | | 2017 | |
| | | | | | | | | | | | |
Total | | $ | 235,129,348 | | | | — | | | | | |
| | | | | | | | | | | | |
For the year ended December 31, 2011, the Fund utilized capital loss carryovers in the amount of:
| | | | | | | | |
| | | Capital Loss Carryover
Utilized | |
Fund | | Short-
Term | | | Long-
Term | |
Special Equity | | $ | 45,734,904 | | | | — | |
The Trust’s Declaration of Trust authorizes for each series the issuance of an unlimited number of shares of beneficial interest, without par value. The Fund records sales and repurchases of its capital stock on the trade date. The cost of securities contributed to the Fund in connection with the issuance of shares is based on the valuation of those securities in accordance with the Fund’s policy on investment valuation. Dividends and distributions to shareholders are recorded on the ex-dividend date.
At December 31, 2011, certain unaffiliated shareholders of record, specifically omnibus accounts, individually or collectively held greater than 10% of the outstanding shares of the Fund as follows: two collectively own 56%. Transactions by these shareholders may have a material impact on the Fund.
| 2. | Agreements and Transactions with Affiliates |
The Trust has entered into an investment management agreement (“Investment Management Agreement”) under which the Investment Manager, an independently managed subsidiary of Affiliated Managers Group, Inc. (“AMG”), serves as investment manager to the Fund and is responsible for the Fund’s overall administration. The Investment Manager selects subadvisors for the Fund (subject to Trustee approval) and monitors each subadvisor’s investment programs and results. The Fund’s investment portfolio is managed by portfolio managers who serve pursuant to a subadvisory agreement with the Investment Manager.
Managers Special Equity Fund
Notes to Financial Statements (continued)
Investment management fees are paid directly by the Fund to the Investment Manager based on average daily net assets. The annual investment management fee rate, as a percentage of average daily net assets, is 0.90%.
The Trust has entered into an Administration and Shareholder Servicing Agreement under which the Investment Manager serves as the Fund’s administrator (the “Administrator”) and is responsible for all aspects of managing the Fund’s operations, including administration and shareholder services to the Fund, its shareholders, and certain institutions, such as bank trust departments, broker-dealers and registered investment advisers, that advise or act as an intermediary with the Fund’s shareholders. The Fund pays a fee to the Administrator at the rate of 0.25% per annum of the Fund’s average daily net assets for this service.
At a meeting held on June 9-10, 2011, the Board approved a new contractual expense limitation with respect to the fund. Effective July 1, 2011, Managers has contractually agreed, until at least May 1, 2013, to waive management fees and/or reimburse Fund expenses, in order to limit total annual Fund operating expenses after fee waiver and expense reimbursements (exclusive of taxes, interest (including interest incurred in connection with bank and custody overdrafts), shareholder servicing fees, brokerage commissions and other transaction costs, acquired fund fees and expenses, and extraordinary expenses) to 1.11%, respectively, of the Fund’s average daily net assets. For the period April 1, 2011 to June 30, 2011, the Fund had a contractual expense limitation of 1.14%. From January 1, 2011 to April 1, 2011, the Fund’s contractual expense limitation was 1.19%.
The Fund is obligated to repay the Investment Manager such amounts waived, paid or reimbursed in future years provided that the repayment occurs within thirty-six (36) months after the waiver or reimbursement and that such repayment would not cause the Fund’s total operating expenses in any such future year to exceed that Fund’s respective expense cap. For the year ended December 31, 2011, the Fund made no such repayments to the Investment Manager. For the year ended December 31, 2011, the Fund’s components of reimbursement are detailed in the following chart:
| | | | |
Reimbursement Available - 12/31/10 | | $ | 108,681 | |
Additional Reimbursements | | | 441,440 | |
Repayments | | | — | |
Expired Reimbursements | | | — | |
| | | | |
Reimbursement Available - 12/31/11 | | $ | 550,121 | |
| | | | |
Effective January 1, 2011, the aggregate annual retainer paid to each Independent Trustee of the Board is $80,000, plus $5,000 or $2,500 for each regular or special meeting attended, respectively. The Independent Chairman of the Trusts receives an additional payment of $20,000 per year. The Chairman of the Audit Committee receives an additional payment of $8,000 per year. (Prior to January 1, 2011, the aggregate annual retainer paid to each Independent Trustee of the Board was $65,000, plus $4,000 or $2,500 for each regular or special meeting attended, respectively. The Independent Chairman of the Trusts received an additional payment of $15,000 per year. The Chairman of the Audit Committee received an additional payment of $5,000 per year.) The Trustees’ fees and expenses are allocated among all of the funds for which the Investment Manager serves as the advisor (the “Managers Funds”) based on the relative net assets of such funds. The “Trustees fees and expenses” shown in the financial statements represents the Funds’ allocated portion of the total fees and expenses paid by the Managers Funds.
The Fund is distributed by Managers Distributors, Inc. (the “Distributor” or “MDI”), a wholly-owned subsidiary of the Investment Manager. MDI serves as the principal distributor and underwriter for the Fund and is a registered broker-dealer and member of the Financial Industry Regulatory Authority, Inc. (“FINRA”). Shares of the Fund will be continuously offered and will be sold directly to prospective purchasers through brokers, dealers or other financial intermediaries who have executed selling agreements with MDI. Subject to the compensation arrangement discussed below, generally MDI bears all or a portion of the expenses of providing services pursuant to the distribution agreement, including the payment of the expenses relating to the distribution of Prospectuses for sales purposes and any advertising or sales literature. Certain Trustees and Officers of the Fund are Officers and/or Directors of the Investment Manager, AMG and/or the Distributor.
The Securities and Exchange Commission granted an exemptive order that permits the Fund to lend and borrow money for certain temporary purposes directly to and from other eligible Managers Funds. Participation in this interfund lending program is voluntary for both borrowing and lending Funds, and an interfund loan is only made if it benefits each participating Fund. The Investment Manager administers the program according to procedures approved by the Board, and the Board monitors the operation of the program. An interfund loan must comply with certain conditions set out in the exemptive order, which are designed to assure fairness and protect all participating Funds. For the year ended December 31, 2011, the Fund lent to other Managers Funds varying amounts
Managers Special Equity Fund
Notes to Financial Statements (continued)
up to $1,708,614 over 4 days earning interest of $133. The interest amount is presented in the Statement of Operations in interest income. For the same period, the Fund did not borrow from any of the other Managers Funds.
| 3. | Purchases and Sales of Securities |
Purchases and sales of securities, excluding short-term securities and U.S. Government obligations, for the year ended December 31, 2011, were $390,972,063 and $417,667,366, respectively. There were no purchases or sales of U.S. government obligations.
| 4. | Portfolio Securities Loaned |
The Fund participated in a securities lending program offered by BNYM, providing for the lending of securities to qualified brokers. Securities lending fees include earnings of such temporary cash investments, plus or minus any rebate to a borrower. These earnings (after any rebate) are then divided between BNYM, as a fee for its services under the program, and the Fund, according to agreed-upon rates. Collateral on all securities loaned is accepted in cash and/or government securities and is maintained at a minimum level of 102% (105% in the case of certain foreign securities) of the market value, plus interest, if applicable, of investments on loan. It is the Fund’s policy to obtain additional collateral from or return excess collateral to the borrower by the end of the next business day, following the valuation date of the securities loaned. Therefore, the value of the collateral held may be temporarily less than the value of the securities on loan. Lending securities entails a risk of loss to the Fund if and to the extent that the market value of the securities loaned were to increase and the borrower did not increase the collateral accordingly, and the borrower fails to return the securities. Under the terms of the Program, the Fund is indemnified for such losses by BNYM. The Fund bears the risk of any deficiency in the amount of the collateral available for return to the borrower due to any loss on the collateral invested. Collateral received in the form of cash is invested temporarily in the BNY Mellon Overnight Government Fund, formerly BNY Institutional Cash Reserves Fund (the “ICRF”), formerly the BNY Institutional Cash Reserves Fund (the “ICRF”), or other short-term investments as defined in the Securities Lending Agreement with BNYM.
Effective August 2, 2010, the Trust, on behalf of the Fund, entered into an agreement with the Bank of New York Mellon Corporation (“BNYMC”) with respect to the Fund’s position in the ICRF, pursuant to which (i) BNYMC would support the value of certain defaulted securities issued by Lehman Brothers Holdings, Inc. (the “Lehman Securities”) and held by Series B of the ICRF, and (ii) once certain conditions were met, BNYMC would purchase the defaulted securities from the Fund. On October 17, 2011, after certifying that the Fund had met all necessary conditions, BNYMC purchased the Lehman Securities from the Fund at a predetermined price, which represented a premium over the fair market value of the Lehman Securities at that date.
| 5. | Commitments and Contingencies |
In the normal course of business, the Fund may enter into contracts and agreements that contain a variety of representations and warranties, which provide general indemnifications. The maximum exposure to the Fund under these arrangements is unknown, as this would involve future claims that may be made against the Fund that have not yet occurred. However, the Fund has not had prior claims or losses and expects the risks of material loss to be remote.
| 6. | New Accounting Standards |
In May 2011, the Financial Accounting Standards Board issued ASU No. 2011-04 “Amendments to Achieve Common Fair Value Measurement and Disclosure Requirements in U.S. GAAP and IFRSs.” ASU 2011-04 requires common fair value measurement and disclosure requirements between U.S. GAAP and International Financial Reporting Standards. The new and revised disclosures are effective for interim and annual reporting periods beginning after December 15, 2011. At this time, management is evaluating the implications of ASU No. 2011-04 and its impact on the financial statements.
The Fund has determined that no material events or transactions occurred through the issuance date of the Fund’s financial statements which require additional disclosure in or adjustment of the Fund’s financial statements.
Tax Information (unaudited)
The Fund hereby designates the maximum amount allowable of its net taxable income as qualified dividends as provided in the Jobs and Growth Tax Relief Reconciliation Act of 2003. The 2011 Form 1099-DIVs you receive for the Fund will show the tax status of all distributions paid to you during the respective calendar year.
Pursuant to section 852 of the Internal Revenue Code, Special Equity hereby designates as a capital gain distribution with respect to the taxable year ended December 31, 2011, $0, or, if subsequently determined to be different, the net capital gains of such year.
Report of Independent Registered Public Accounting Firm
To the Board of Trustees of The Managers Funds and the Shareholders of Managers Special Equity Fund:
In our opinion, the accompanying statement of assets and liabilities, including the schedule of portfolio investments, and the related statements of operations and of changes in net assets and the financial highlights present fairly, in all material respects, the financial position of Managers Special Equity Fund (one of the series constituting The Managers Funds, hereafter referred to as the “Fund”) at December 31, 2011, the results of its operations for the year then ended, the changes in its net assets for each of the two years in the period then ended and the financial highlights for each of the five years in the periods indicated, in conformity with accounting principles generally accepted in the United States of America. These financial statements and financial highlights (hereafter referred to as “financial statements”) are the responsibility of the Fund’s management; our responsibility is to express an opinion on these financial statements based on our audits. We conducted our audits of these financial statements in accordance with the standards of the Public Company Accounting Oversight Board (United States). Those standards require that we plan and perform the audit to obtain reasonable assurance about whether the financial statements are free of material misstatement. An audit includes examining, on a test basis, evidence supporting the amounts and disclosures in the financial statements, assessing the accounting principles used and significant estimates made by management, and evaluating the overall financial statement presentation. We believe that our audits, which included confirmation of securities at December 31, 2011 by correspondence with the custodian and brokers, provide a reasonable basis for our opinion.
PricewaterhouseCoopers LLP
Philadelphia, Pennsylvania
February 27, 2012
Trustees and Officers
The Trustees and Officers of the Trust, their business addresses, principal occupations for the past five years and dates of birth are listed below. The Trustees provide broad supervision over the affairs of the Trust and the Funds. The Trustees are experienced executives who meet periodically throughout the year to oversee the Funds’ activities, review contractual arrangements with companies that provide services to the Funds, and review the Funds’ performance. Unless otherwise noted, the address of each Trustee or Officer is the address of the Trust: 800 Connecticut Avenue, Norwalk, Connecticut 06854.
There is no stated term of office for Trustees. Trustees serve until their resignation, retirement or removal in accordance with the Trust’s organizational documents and policies adopted by the Board from time to time. The Chairman of the Trustees, President, Treasurer and Secretary of the Trust are elected by the Trustees annually. Other officers hold office at the pleasure of the Trustees.
Independent Trustees
The following Trustees are not “interested persons” of the Trust within the meaning of the 1940 Act:
| | |
Name, Date of Birth, Number of Funds Overseen in Fund Complex* | | Principal Occupation(s) During Past 5
Years and Other Directorships Held by
Trustee |
Jack W. Aber, 9/9/37 • Trustee since 1999 • Oversees 38 Funds in Fund Complex | | Professor of Finance, Boston University School of Management (1972-Present); Trustee of Appleton Growth Fund (1 portfolio); Trustee of Third Avenue Trust (5 portfolios); Trustee of Third Avenue Variable Trust (1 portfolio); Trustee of Aston Funds (26 portfolios). |
William E. Chapman, II, 9/23/41 • Independent Chairman • Trustee since 1999 • Oversees 38 Funds in Fund Complex | | President and Owner, Longboat Retirement Planning Solutions (1998-Present); Hewitt Associates, LLC (part time) (provider of Retirement and Investment Education Seminars) (2002-2009); Trustee of Bowdoin College (2002-Present); Director of Harding, Loevner Funds, Inc. (6 portfolios); Trustee of Third Avenue Trust (5 portfolios); Trustee of Third Avenue Variable Trust (1 portfolio); Trustee of Aston Funds (26 portfolios). |
Edward J. Kaier, 9/23/45 • Trustee since 1999 • Oversees 38 Funds in Fund Complex | | Attorney at Law and Partner, Teeters Harvey Gilboy & Kaier LLP (2007-Present); Attorney at Law and Partner, Hepburn Willcox Hamilton & Putnam, LLP (1977-2007); Trustee of Third Avenue Trust (5 portfolios); Trustee of Third Avenue Variable Trust (1 portfolio); Trustee of Aston Funds (26 portfolios). |
Steven J. Paggioli, 4/3/50 • Trustee since 1993 • Oversees 38 Funds in Fund Complex | | Independent Consultant (2002-Present); Formerly Executive Vice President and Director, The Wadsworth Group (1986-2001); Executive Vice President, Secretary and Director, Investment Company Administration, LLC (1990-2001); Vice President, Secretary and Director, First Fund Distributors, Inc. (1991-2001); Trustee, Professionally Managed Portfolios (43 portfolios); Advisory Board Member, Sustainable Growth Advisors, LP; Independent Director, Chase Investment Counsel (2008 – Present); Trustee of Aston Funds (26 portfolios). |
| Eric Rakowski, 6/5/58 | | Professor, University of California at Berkeley School |
• Trustee since 1999 | | of Law (1990-Present); Director of Harding, Loevner |
• Oversees 38 Funds in Fund Complex | | Funds, Inc. (6 portfolios); Trustee of Third Avenue Trust (5 portfolios); Trustee of Third Avenue Variable Trust (1 portfolio); Trustee of Aston Funds (26 portfolios). |
Thomas R. Schneeweis, 5/10/47 • Trustee since 1987 • Oversees 38 Funds in Fund Complex | | Professor of Finance, University of Massachusetts (1977-Present); Director, CISDM at the University of Massachusetts, (1996-Present); President, Alternative Investment Analytics, LLC, (formerly Schneeweis Partners, LLC) (2001-Present); Partner, S Capital Management, LLC (2007-Present); President, TRS Associates (1982-Present); Partner, White Bear Partners, LLC (2007-2010); Partner, Northampton Capital Management, LLC (2004-2010); Trustee of Aston Funds (26 portfolios). |
| * | The Fund Complex consists of Managers AMG Funds, The Managers Funds, Managers Trust I and Managers Trust II. |
Interested Trustees
Each Trustee in the following table is an “interested person” of the Trust within the meaning of the 1940 Act. Ms. Carsman is an interested person of the Trust within the meaning of the 1940 Act by virtue of her position with, and interest in securities of, AMG, and her former position as Chief Legal Officer of the Trust.
| | |
Name, Date of Birth, Number of Funds Overseen in Fund Complex* | | Principal Occupation(s) During Past 5
Years and Other Directorships Held by
Trustee |
Christine C. Carsman, 4/2/52 • Trustee since 2011 • Oversees 38 Funds in Fund Complex | | Deputy General Counsel, Affiliated Managers Group, Inc. (2011-Present); Senior Vice President and Chief Regulatory Counsel, Affiliated Managers Group, Inc. (2004-Present); Secretary and Chief Legal Officer, Managers AMG Funds, The Managers Funds, Managers Trust I and Managers Trust II (2004-2011); Senior Counsel, Vice President and Director of Operational Risk Management and Compliance, Wellington Management Company, LLP (1995-2004) |
Officers
| | |
Name, Date of Birth, Position(s) Held with Fund and Length of Time Served | | Principal Occupation(s) During Past 5 Years |
Keitha L. Kinne, 5/16/58 • President since 2012 • Chief Operating Officer since 2007 | | Managing Partner and Chief Operating Officer, Managers Investment Group LLC (2007-Present); Chief Investment Officer, Managers Investment Group LLC (2008-Present); President, Managers Distributors, Inc. (2012-Present); Chief Operating Officer, Managers AMG Funds, Managers Trust I and Managers Trust II (2007-Present); Managing Director, Legg Mason & Co., LLC (2006-2007); Managing Director, Citigroup Asset Management (2004-2006). |
Lewis Collins, 2/22/66 • Secretary since 2011 • Chief Legal Officer since 2011 | | Senior Vice President and Senior Counsel, Affiliated Managers Group, Inc. (2010-Present); Vice President and Senior Counsel, Affiliated Managers Group, Inc. (2006- 2010); Senior Counsel, Affiliated Managers Group, Inc. (2002-2006); Attorney, Ropes & Gray LLP (1998-2002) |
Donald S. Rumery, 5/29/58 • Chief Financial Officer since 2007 • Treasurer since 1995 | | Senior Vice President, Managers Investment Group LLC (2005-Present); Treasurer and Chief Financial Officer, Managers Distributors, Inc. (2000-Present); Treasurer, Managers AMG Funds (1999-Present); Treasurer, Managers Trust I and Managers Trust II (2000-Present); Chief Financial Officer, Managers AMG Funds, Managers Trust I and Managers Trust II (2007-Present); Vice President, The Managers Funds LLC, (1994-2004). |
John J. Ferencz, 3/09/62 • Chief Compliance Officer since 2010 | | Vice President, Legal and Compliance, Managers Investment Group LLC (2010-Present); Senior Compliance Analyst, Mutual Funds and Regulatory, GE Asset Management Incorporated (2005-2010). |
Michael S. Ponder, 9/12/73 • Assistant Secretary since 2011 | | Senior Vice President and Counsel, Managers Investment Group LLC (2011-Present); Attorney, DeNovo Legal (2009-2010); Vice President, Credit Suisse (2007-2009); Associate, Willkie Farr & Gallagher LLP (2006-2007) |
Investment Manager and Administrator
Managers Investment Group LLC
333 W. Wacker Drive
Suite 1200
Chicago, IL 60606
(800) 835-3879
Distributor
Managers Distributors, Inc.
333 W. Wacker Drive
Suite 1200
Chicago, IL 60606
(800) 835-3879
Custodian
The Bank of New York Mellon
2 Hanson Place
Brooklyn, NY 11217
Legal Counsel
Ropes & Gray LLP
Prudential Tower, 800 Boylston Street
Boston, MA 02199-3600
Transfer Agent
BNY Mellon Investment Servicing (US) Inc.*
Attn: Managers
P.O. Box 9769
Providence, RI 02940
(800) 548-4539
For Managers Choice Only
Managers
c/o BNY Mellon Investment Servicing (US) Inc.*
P.O. Box 9847
Providence, RI 02940-8047
(800) 358-7668
| * | Formerly PNC Global Investment Servicing (U.S.) Inc. |
MANAGERSAND MANAGERS AMG FUNDS
| | | | |
EQUITY FUNDS | | BALANCED FUNDS |
CADENCE CAPITAL APPRECIATION CADENCE FOCUSED GROWTH CADENCE MID-CAP CADENCE EMERGING COMPANIES Cadence Capital Management, LLC CHICAGO EQUITY PARTNERS MID-CAP Chicago Equity Partners, LLC EMERGING MARKETS EQUITY Rexiter Capital Management Limited Schroder Investment Management North America Inc. ESSEX SMALL/MICRO CAP GROWTH Essex Investment Management Co., LLC FQ TAX-MANAGED U.S. EQUITY FQ U.S. EQUITY First Quadrant, L.P. FRONTIER SMALL CAP GROWTH Frontier Capital Management Company, LLC GW&K SMALL CAP EQUITY Gannett Welsh & Kotler, LLC MICRO-CAP Lord, Abbett & Co. LLC WEDGE Capital Management L.L.P. Next Century Growth Investors LLC RBC Global Asset Management (U.S.) Inc. | | INTERNATIONAL EQUITY Alliancebernstein L.P. Lazard Asset Management, LLC Martin Currie Inc. REAL ESTATE SECURITIES Urdang Securities Management, Inc. RENAISSANCE LARGE CAP GROWTH Renaissance Group LLC SKYLINE SPECIAL EQUITIES PORTFOLIO Skyline Asset Management, L.P. SPECIAL EQUITY Ranger Investment Management, L.P. Lord, Abbett & Co. LLC Smith Asset Management Group, L.P. Federated MDTA LLC SYSTEMATIC VALUE SYSTEMATIC MID CAP VALUE Systematic Financial Management, L.P. TIMESSQUARE MID CAP GROWTH TIMESSQUARE SMALL CAP GROWTH TSCM GROWTH EQUITY TimesSquare Capital Management, LLC TRILOGY GLOBAL EQUITY TRILOGY EMERGING MARKETS EQUITY TRILOGY INTERNATIONAL SMALL CAP Trilogy Global Advisors, L.P. | | CHICAGO EQUITY PARTNERS BALANCED Chicago Equity Partners, LLC ALTERNATIVE FUNDS FQ GLOBAL ALTERNATIVES FQ GLOBAL ESSENTIALS First Quadrant, L.P. INCOME FUNDS BOND (MANAGERS) FIXED INCOME GLOBAL INCOME OPPORTUNITY Loomis, Sayles & Co., L.P. BOND (MANAGERS PIMCO) Pacific Investment Management Co. LLC CALIFORNIA INTERMEDIATE TAX-FREE Miller Tabak Asset Management LLC GW&K MUNICIPAL BOND GW&K MUNICIPAL ENHANCED YIELD Gannett Welsh & Kotler, LLC HIGH YIELD J.P. Morgan Investment Management LLC INTERMEDIATE DURATION GOVERNMENT SHORT DURATION GOVERNMENT Smith Breeden Associates, Inc. |
| | |
This report is prepared for the Fund’s shareholders. It is authorized for distribution to prospective investors only when preceded or accompanied by an effective prospectus. To receive a free copy of the prospectus or Statement of Additional Information, which includes additional information about Fund Trustees, please contact us by calling 800.835.3879. Distributed by Managers Distributors, Inc., member FINRA. A description of the policies and procedures each Fund uses to vote its proxies is available: (i) without charge, upon request, by calling 800.835.3879, or (ii) on the Securities and Exchange Com mission’s (SEC) Web site at www.sec.gov. For information regarding each Fund’s proxy voting record for the 12-month period ended June 30, call 800.835.3879 or visit the SEC Web site at www.sec.gov. The Fund files its complete schedule of portfolio holdings with the SEC for the first and third quarters of each fiscal year on Form N-Q. The Fund’s Forms N-Q are available on the SEC’s website at www.sec.gov. A Fund’s Forms N-Q may be reviewed and copied at the SEC’s Public Reference Room in Washington, DC. Information on the operation of the Public Reference Room may be obtained by calling 1-800-SEC-0330. To review a complete list of the Fund’s portfolio holdings, or to view the most recent quarterly holdings report, semiannual report, or annual report, please visit www.managersinvest.com. | | |

Managers Bond Fund
Annual Report — December 31, 2011
| | | | |
| | | Page | |
TABLE OF CONTENTS | | | | |
| |
LETTER TO SHAREHOLDERS | | | 1 | |
| |
ABOUT YOUR FUND’S EXPENSES | | | 3 | |
| |
INVESTMENT MANAGER’S COMMENTS, FUND SNAPSHOT, AND SCHEDULE OF PORTFOLIO INVESTMENTS | | | 4 | |
| |
FINANCIAL STATEMENTS | | | | |
| |
Statement of Assets and Liabilities | | | 18 | |
Fund’s balance sheet, net asset value (NAV) per share computation and cumulative undistributed amounts | | | | |
| |
Statement of Operations | | | 19 | |
Detail of sources of income, Fund expenses, and realized and unrealized gains (losses) during the year | | | | |
| |
Statement of Changes in Net Assets | | | 20 | |
Detail of changes in Fund assets for the past two years | | | | |
| |
FINANCIAL HIGHLIGHTS | | | 21 | |
Historical net asset values per share, distributions, total returns, expense ratios, turnover ratios and net assets | | | | |
| |
NOTES TO FINANCIAL STATEMENTS | | | 22 | |
Accounting and distribution policies, details of agreements and transactions with Fund management and affiliates, and descriptions of certain investment risks | | | | |
| |
REPORT OF INDEPENDENT REGISTERED PUBLIC ACCOUNTING FIRM | | | 28 | |
| |
TRUSTEES AND OFFICERS | | | 29 | |
Nothing contained herein is to be considered an offer, sale or solicitation of an offer to buy shares of any series of the Managers Family of Funds. Such offering is made only by Prospectus, which includes details as to offering price and other material information.
Letter to Shareholders
Dear Shareholder:
Our foremost goal at Managers Investment Group (“MIG”) is to structure and manage mutual funds that will help our shareholders and clients successfully reach their investment goals and objectives.
Each of our Funds is geared to provide you with exposure to a specific asset class or style of investing. We believe investors tend to use our Funds as part of their broader portfolio in order to tailor their asset allocation to meet their individual needs. Most of our Funds, like the one detailed in this report, are therefore designed to be building blocks.
At MIG, we have overall responsibility for the investment management and administration of the Funds. As a “manager of managers,” we work with external investment managers that make the day-to-day investment decisions in the Funds (the “Portfolio Managers”). We devote considerable resources to our disciplined process of identifying and selecting unaffiliated Portfolio Managers for the Funds. As a manager of managers, MIG performs many activities to monitor the ongoing investment, compliance, and administrative aspects of all of the Funds, which we believe gives our shareholders added confidence in their investments.
Our parent company, Affiliated Managers Group (“AMG”) is a global asset management company with ownership interests in a diverse group of boutique investment management firms (its “Affiliates”). MIG has the unique opportunity to access the investment skills and acumen of some of AMG’s Affiliates. The set of our Funds managed by these proprietary firms also benefits from our activities to monitor the investment, compliance, and administrative aspects of the Funds.
Below is a brief overview of the securities markets and the performance results for the Fund. Following this letter, we also provide the Portfolio Manager’s discussion of its investment management approach, performance results, and market outlook.
Fixed income markets generally rose during another turbulent year for capital markets. The beginning of 2011 began a period of turmoil as unexpected events such as the Arab Spring and the Japanese earthquake and its aftermath weighed on investors’ minds. This generally boosted fixed income returns. Bonds also generally gained during the second quarter of 2011 helped by a decline in treasury yields amid slower U.S. growth and concern about the sovereign debt crisis in the Eurozone. The summer months were highlighted by bond gains as a sharp decline in treasury yields amid a flight to safety boosted demand for treasuries. The flight to quality move occurred as confidence waned that the U.S. recovery would continue, the European debt crisis would be contained and developing nation growth was sustainable, particularly in China. This reversed in October as risk aversion began to ease across global markets amid optimism that the European debt crisis could be contained. As a result, U.S. treasury yields rose during October and riskier areas of the fixed income market, such as high yield and credit, outperformed. This reversed again during November, before markets normalized during December. Overall, fixed income securities generated decent absolute returns, but it was a volatile year with multiple shifts in market leadership.
Against this backdrop, for the 12-month period ended December 31, 2011, the Managers Bond Fund (the “Fund”) posted a return of 6.06%. This results in underperformance versus its benchmark, the Barclays Capital U.S. Government/Credit Bond Index, which posted a return of 8.74% for that same period as detailed further below.
| | | | | | | | | | | | | | | | | | | | | | | | |
Periods Ended 12/31/11 | | 6 Months | | | 1 Year | | | 3 Years | | | 5 Years | | | 10 Years | | | Inception Date | |
Managers Bond Fund | | | 1.01 | % | | | 6.06 | % | | | 15.39 | % | | | 6.60 | % | | | 6.97 | % | | | 06/01/84 | |
Barclays Capital U.S. Government/Credit Bond Index | | | 5.98 | % | | | 8.74 | % | | | 6.60 | % | | | 6.55 | % | | | 5.85 | % | | | | |
1
Letter to Shareholders (continued)
The primary driver of the Fund’s underperformance during 2011 was its emphasis on below investment grade bonds and its underweight to U.S. treasuries. U.S. treasuries generated strong returns during 2011, particularly on the long-end, so the underweight was a meaningful detractor. U.S. treasuries represent over 50% of the Index and were a key driver of the Index’s absolute return. High yield bonds generated decent returns during 2011, but were volatile as market fear fluctuated throughout the year and did not perform as well as other areas of the market. Overall, the Fund’s exposure to high yield debt hurt as higher-rated bonds outperformed. Relative performance was also hindered by an above average cash position due to decreased liquidity and the possibility of rising rates during early-2012. Lastly, the Fund’s non-US Dollar exposure also hurt performance. Foreign bonds did not perform as well as U.S. bonds.
We expect the deflationary pressures from Europe and the hangover from the financial crisis to remain intense during 2012. This is expected to keep high-quality bond yields around the world at very low levels. Cooling emerging market economies, especially China, Brazil, and India, have also contributed to lower global bond yields. Commodity price pressures have eased, which should help reduce inflation and allow for more central bank rate cuts around the world. The continued low-rate environment will make the search for yield a theme in 2012 and suggests bonds across the quality spectrum trading at a premium to government bonds could achieve respectable risk-adjusted returns.
The following report covers the one-year period ended December 31, 2011. Should you have any questions about this report, or if you’d like to receive a prospectus and additional information, including fees and expenses for these or any of the other Funds in our family, please feel free to contact us at 1-800-835-3879, or visit our Web site at www.managersinvest.com. As always, please read the prospectus carefully before you invest or send money.
You can rest assured that under all market conditions our team is focused on delivering excellent investment management services for your benefit.
We thank you for your continued confidence and investment in The Managers Funds.
Respectfully,
Keitha Kinne
Managing Partner
Managers Investment Group LLC
About Your Fund’s Expenses
| | |
As a shareholder of a Fund, you may incur two types of costs: (1) transaction costs, which may include sales charges (loads) on purchase payments; redemption fees; and exchange fees; and (2) ongoing costs, including management fees; distribution (12b-1) fees; and other Fund expenses. This example is intended to help you understand your ongoing costs (in dollars) of investing in the Fund and to compare these costs with the ongoing costs of investing in other mutual funds. The example is based on $1,000 invested at the beginning of the period and held for the entire period as indicated below. Actual Expenses The first line of the following table provides information about the actual account values and actual expenses. You may use the information in this line, together with the amount you invested, to estimate the expenses that you paid over the period. Simply divide your account value by $1,000 (for example, an $8,600 account value divided by $1,000 = 8.6), then multiply the result by the number in the first line under the heading entitled “Expenses Paid During Period” to estimate the expenses you paid on your account during this period. Hypothetical Example for Comparison Purposes The second line of the following table provides information about hypothetical account values and hypothetical expenses based on the Fund’s actual expense ratio and an assumed annual rate of return of 5% before expenses, which is not the Fund’s actual return. The hypothetical account values and expenses may not be used to estimate the actual ending account balance or expenses you paid for the period. You may use this information to compare the ongoing costs of investing in the Fund and other funds by comparing this 5% hypothetical example with the 5% hypothetical examples that appear in the shareholder reports of other funds. Please note that the expenses shown in the table are meant to highlight your ongoing costs only and do not reflect any transactional costs, such as sales charges (loads), redemption fees, or exchange fees. Therefore, the second line of the table is useful in comparing ongoing costs only, and will not help you determine the relative total costs of owning different funds. | | |
| | | | | | | | | | | | | | | | |
Six Months Ended December 31, 2011 | | Expense
Ratio for
the Period | | | Beginning
Account Value
07/01/11 | | | Ending
Account Value
12/31/11 | | | Expenses
Paid During
the Period* | |
Managers Bond Fund | | | | | | | | | | | | | | | | |
Based on Actual Fund Return | | | 0.99 | % | | $ | 1,000 | | | $ | 1,010 | | | $ | 5.02 | |
Hypothetical (5% return before expenses) | | | 0.99 | % | | $ | 1,000 | | | $ | 1,020 | | | $ | 5.04 | |
| * | Expenses are equal to the Fund’s annualized expense ratio multiplied by the average account value over the period, multiplied by the number of days in the most recent fiscal half-year (184), then divided by 365. |
3
Managers Bond Fund
Portfolio Manager’s Comments
The Year in Review
The Managers Bond Fund returned 6.06% for the year ended December 31, 2011, lagging the Barclays Capital U.S. Government/ Credit Bond Index, which returned 8.74%.
At the beginning of 2011, a low interest rate environment continued to reinforce the reach for yield at a time when economic conditions had been slowly improving and the outlook for growth expectations was slightly less optimistic. These conditions supported demand for fixed income over the next few months as new issuance continued its torrid pace, reaching $167.9 billion by the end of the first half of 2011, well ahead of last year’s record pace. Despite negative headline risk out of Japan, the Middle East and the northern Africa region, ongoing European sovereign issues and ratings downgrades in peripheral corporate names, the financial markets had been mostly resilient through the first half of 2011 thanks to positive technicals and fundamentals.
However, growing contagion fears within Europe and an inability to grasp the reach of the global economic slowdown continued to keep investors wary, which affected high yield markets. The seemingly endless buildup of stress on the European banking system and global financial markets increased the downside risk of global growth and led to increased market volatility during the summer months and early fall. Continued market volatility from a lack of resolution regarding the European debt crisis impacted high yield and investment grade corporate bond liquidity into November. Downgrade fears within Europe and continued bickering in Washington around two key items with growth implications for 2012 (payroll taxes and unemployment benefits) kept pressure on markets during the fourth quarter. Better than expected economic releases in the U.S. helped to solidify investors’ beliefs that the slow domestic economic recovery will continue into 2012. Low yielding investment alternatives and strong corporate fundamentals continue to bode well for high yield demand.
The primary driver of the Fund’s underperformance relative to the Index during 2011 was its emphasis on below investment-grade bonds and its underweight to U.S. Treasuries. Strong performance from overweight positions within corporate bonds was the main returns driver, limiting the extent of underperformance. Credit spreads drifted wider in 2011, following several years of tightening. The Fund benefited most from its exposure to U.S. investment-grade bonds. A sizeable portion of the Fund’s corporate exposure is invested in BBB-rated securities, the lowest and most credit-sensitive part of the investment-grade spectrum. As a group, BBB-rated securities performed very well during 2011 after posting exceptional returns in the prior year. Moving even further down on the credit spectrum, the Fund gave back some of those gains due to its high-yield exposure. Cash was also a drag because cash positions were higher than normal due to decreased liquidity and a general thesis that rates, in early 2011, could begin to rise. Non-dollar holdings in the Fund did not keep pace with domestic markets during 2011. The majority of the rest of the Fund’s positive results were attributable to its small exposure to municipal bonds.
LOOKING FORWARD
Central banks around the world began to provide more liquidity to the capital markets in the fourth quarter, and risk-oriented assets
rejoiced. It was a very good quarter for equities, corporate credit and high yield bonds. However, the all-clear signal has not been given, as the sovereign debt crisis in Europe remains unresolved and signs of a slowdown in China continue to accumulate.
Some significant central bank policy actions during the fourth quarter included:
| | • | | Coordinated efforts by the U.S., Canada, Britain, Japan, Switzerland and Europe to ease the global liquidity crunch by lowering the cost of existing dollar swap lines by 50 basis points (0.50%) and arranging bilateral swaps to provide liquidity for other currencies |
| | • | | China’s move to cut its bank reserve requirements |
| | • | | The European Central Bank’s decision to cut rates by 50 basis points (0.50%) to 1.0% and its provision of 3-year loans to banks |
| | • | | The Bank of England’s announcement of another round of quantitative easing |
| | • | | The IMF’s decision to grant Greece another tranche of its emergency loan program |
| | • | | Interest rate cuts by central banks in Australia, Sweden, and Brazil |
These actions were certainly welcome, and markets responded by posting strong returns for the fourth quarter. However, the European economy may be slipping into recession, which should make it much harder to implement fiscal austerity, reduce budget deficits, and convince investors that debt ratios will eventually stabilize.
The negative feedback loop from weak sovereign credit metrics to weak bank balance sheets will likely continue to be a source of risk in 2012. To comply with new European Banking Austerity requirements that take effect in June 2012, banks must increase their capitalization ratios and can do so by raising equity, shrinking assets, or cutting staff, bonuses and dividends to retain more earnings. As such, there is evidence that European banks are restricting credit, shrinking their balance sheets and reducing staff to meet tougher capitalization standards. Ultimately, we see these actions reinforcing the negative feedback loop between sovereign credit and bank balance sheets.
We expect the deflationary pressures from Europe and the hangover from the financial crisis to remain intense during 2012, which should keep high-quality bond yields very low around the world. Cooling emerging market economies, especially China, Brazil, and India, have also contributed to lower global bond yields. Commodity price pressures have eased, which should help reduce inflation and allow for more central bank rate cuts around the world.
In this enduring environment of zero policy rates and low yields on high-quality bonds, we believe the global search for yield will remain a key theme in 2012. This environment suggests bonds across the quality spectrum trading at a premium to government bonds could achieve respectable risk-adjusted returns. With that in mind, we favor U.S. high yield bonds, bank loans, and investment-grade credit along with select non-dollar currencies and securities.
This commentary reflects the viewpoints of the portfolio manager, Loomis, Sayles & Company, as of 12/31/2011 and is not intended as a forecast or guarantee of future results.
Managers Bond Fund
Portfolio Manager’s Comments (continued)
Cumulative Total Return Performance
Managers Bond Fund’s cumulative total return is based on the daily change in net asset value (NAV), and assumes that all distributions were reinvested. This chart compares a hypothetical $10,000 investment made in the Managers Bond Fund on December 31, 2001, to a $10,000 investment made in the Barclays Capital U.S. Government/Credit Bond Index for the same time period. The chart is not intended to imply any future performance of the Fund. The graph and chart do not reflect the deduction of taxes that a shareholder would pay on a Fund distribution or redemption of shares. Total returns would have been lower had certain expenses not been reduced. Past performance is not indicative of future results.
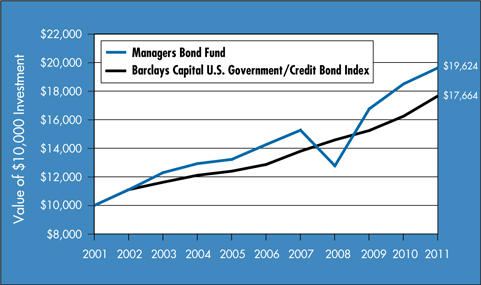
The table below shows the average annual total returns for the Managers Bond Fund and the Barclays Capital U.S. Government/Credit Bond Index from December 31, 2001 through December 31, 2011.
| | | | | | | | | | | | |
| | | Average Annual Total Returns1 | |
| | | One Year | | | Five Years | | | Ten Years | |
Managers Bond Fund 2,3,4,5 | | | 6.06 | % | | | 6.60 | % | | | 6.97 | % |
Barclays Capital U.S. Government/Credit Bond Index6 | | | 8.74 | % | | | 6.55 | % | | | 5.85 | % |
The performance data shown represents past performance. Past performance is not a guarantee of future results. Current performance may be lower or higher than the performance data quoted. The investment return and principal value of an investment in the Fund will fluctuate so that an investor’s shares, when redeemed, may be worth more or less than their original cost. For performance information through the most recent month end, please call (800) 835-3879 or visit our Web site at www.managersinvest.com.
Investors should carefully consider the Fund’s investment objectives, risks, charges and expenses before investing. For this and other information, please call (800) 835-3879 or visit our Web site at www.managersinvest.com for a free prospectus. Read it carefully before investing or sending money. Funds are distributed by Managers Distributors, Inc., member FINRA.
| | |
| | 1 Total return equals income yield plus share price change and assumes reinvestment of all dividends and capital gain distributions. Returns are net of fees and may reflect offsets of Fund expenses as described in the Prospectus. No adjustment has been made for taxes payable by shareholders on their reinvested dividends and capital gain distributions. Returns for periods greater than one year are annualized. The listed returns on the Fund are net of expenses and based on the published NAV as of December 31, 2011. All returns are in U.S. dollars($). 2 From time to time, the Fund’s advisor has waived its fees and/or absorbed Fund expenses, which has resulted in higher returns. 3 The Fund is subject to the risks associated with investments in debt securities, such as default risk, and fluctuations in a debtor’s perceived ability to pay its creditors. Changing interest rates may adversely affect the value of an investment. An increase in interest rates typically causes the value of bonds and other fixed-income securities to fall. 4 Investments in international securities are subject to certain risks of overseas investing including currency fluctuations and changes in political and economic conditions, which could result in significant market fluctuations. These risks are magnified in emerging markets. 5�� High yield bonds (also known as “junk bonds”) are subject to additional risks such as the risk of default. 6 The Barclays Capital U.S. Government/Credit Bond Index is an index of investment grade government and corporate bonds with a maturity rate of more than one year. Unlike the Fund, the Barclays Capital U.S. Government/Credit Bond Index is unmanaged, is not available for investment, and does not incur expenses. The Index assumes reinvestment of all income. Not FDIC insured, nor bank guaranteed. May lose value. |
5
Managers Bond Fund
Fund Snapshots (unaudited)
December 31, 2011
Portfolio Breakdown
| | | | | | | | |
Category | | Managers
Bond Fund** | | | Barclays Capital
U.S. Government/
Credit Bond Index | |
Corporate Bonds and Notes | | | 68.6 | % | | | 30.2 | % |
Foreign Government and Agency Obligations | | | 6.4 | % | | | 8.0 | % |
Asset-Backed Securities | | | 3.7 | % | | | 0.0 | % |
U.S. Government and Agency Obligations | | | 3.4 | % | | | 61.8 | % |
Municipal Bonds | | | 1.5 | % | | | 0.0 | % |
Mortgage-Backed Securities | | | 1.2 | % | | | 0.0 | % |
Preferred Stocks | | | 0.9 | % | | | 0.0 | % |
Common Stocks | | | 0.6 | % | | | 0.0 | % |
Other Assets and Liabilities | | | 13.7 | % | | | 0.0 | % |
| ** | As a percentage of net assets |
| | | | | | | | |
Rating | | Managers
Bond Fund** | | | Barclays Capital
U.S. Government/
Credit Bond Index | |
U.S. Treasury & Agency | | | 4.0 | % | | | 61.8 | % |
Aaa | | | 6.8 | % | | | 3.7 | % |
Aa | | | 3.8 | % | | | 5.4 | % |
A | | | 26.2 | % | | | 15.6 | % |
Baa | | | 49.8 | % | | | 13.5 | % |
Ba & lower | | | 9.2 | % | | | 0.0 | % |
Not Rated | | | 0.2 | % | | | 0.0 | % |
| ** | As a percentage of market value of fixed income securities |
Chart does not include equity securities.
Top Ten Holdings
| | | | |
Security Name | | % of
Net Assets | |
Southwestern Electric Power Co.,
6.450%, 01/15/19* | | | 2.2 | % |
Kinder Morgan Energy Partners, L.P.,
5.950%, 02/15/18* | | | 2.0 | |
Springleaf Finance Corp., MTN, Series J,
6.900%, 12/15/17* | | | 1.9 | |
EQT Corp., 6.500%, 04/01/18* | | | 1.9 | |
Dun & Bradstreet Corp., The,
6.000%, 04/01/13* | | | 1.6 | |
Nisource Finance Corp., 6.400%, 03/15/18* | | | 1.5 | |
New Zealand Government Bonds, Series 413,
6.500%, 04/15/13 | | | 1.5 | |
Panhandle Eastern Pipeline Co., L.P.,
7.000%, 06/15/18* | | | 1.4 | |
Ameren Illinois Co., 6.250%, 04/01/18* | | | 1.4 | |
Merrill Lynch & Co., Inc.,
6.110%, 01/29/37* | | | 1.4 | |
| | | | |
Top Ten as a Group | | | 16.8 | % |
| | | | |
| * | Top Ten Holding at June 30, 2011 |
|
Any sectors, industries, or securities discussed should not be perceived as investment recommendations. Mention of a specific security should not be considered a recommendation to buy or solicitation to sell that security. Specific securities mentioned in this report may have been sold from the Fund’s portfolio of investments by the time you receive this report. |
Managers Bond Fund
Schedule of Portfolio Investments
December 31, 2011
| | | | | | | | | | | | |
| | | | | | Principal Amount† | | | Value | |
| | | | | | | | | | | | |
| | | | | | | | | | | | |
Asset-Backed Securities - 3.7% | | | | | | | | | | | | |
Chase Issuance Trust, Series 2007-B1, Class B-1, 0.528%, 04/15/19 (01/17/12)1 | | | | | | $ | 17,040,000 | | | $ | 16,391,595 | |
Citibank Credit Card Issuance Trust, Series 2008-C6, Class C6, 6.300%, 06/20/14 | | | | | | | 8,945,000 | | | | 9,159,819 | |
Marriott Vacation Club Owner Trust, Series 2009-2A, Class A, 4.809%,
07/20/31 (a) | | | | | | | 9,767,028 | | | | 9,976,992 | |
MBNA Credit Card Master Note Trust, Series 2002-C1, Class C1, 6.800%, 07/15/14 | | | | | | | 6,911,000 | | | | 6,958,105 | |
Merrill Auto Trust Securitization, Series 2008-1, Class B, 6.750%, 04/15/15 | | | | | | | 4,035,000 | | | | 4,101,819 | |
Sierra Receivables Funding Company, Series 2010-2A, Class A, 3.840%, 11/20/25 (a) | | | | | | | 11,751,203 | | | | 11,997,981 | |
Trinity Rail Leasing, L.P., Series 2009-1A, Class A, 6.657%, 11/16/39 (a) | | | | | | | 4,583,165 | | | | 5,187,801 | |
Trip Rail Master Funding LLC, Series 2011-1A, Class A1A, 4.370%,
07/15/41 (a) | | | | | | | 14,169,490 | | | | 14,260,780 | |
World Financial Network Credit Card Master Note Trust, Series 2010-A, 6.750%, 04/15/19 | | | | | | | 1,000,000 | | | | 1,104,534 | |
Total Asset-Backed Securities (cost $75,443,498) | | | | | | | | | | | 79,139,426 | |
| | | |
| | | | | | Shares | | | | |
Common Stocks - 0.6% | | | | | | | | | | | | |
PPG Industries, Inc. (Materials) (cost $10,696,329) | | | | | | | 145,736 | | | | 12,167,499 | |
| | | |
| | | | | | Principal Amount† | | | | |
Corporate Bonds and Notes - 68.6% | | | | | | | | | | | | |
Financials - 22.8% | | | | | | | | | | | | |
Ally Financial, Inc., 8.000%, 11/01/31 | | | | | | $ | 1,427,000 | | | | 1,377,055 | |
Alta Wind Holdings LLC, 7.000%, 06/30/35 (a) | | | | | | | 8,217,432 | | | | 9,033,423 | |
American International Group, Inc., | | | | | | | | | | | | |
8.175%, 05/15/582 | | | | | | | 10,530,000 | | | | 9,371,700 | |
MTN, Series MP, 5.450%, 05/18/17 | | | | | | | 485,000 | | | | 463,485 | |
MTN, Series G, 5.850%, 01/16/18 | | | | | | | 1,940,000 | | | | 1,897,349 | |
Bank of America Corp., | | | | | | | | | | | | |
7.625%, 06/01/19 | | | | | | | 2,906,000 | | | | 3,005,435 | |
MTN, 5.000%, 05/13/21 | | | | | | | 2,475,000 | | | | 2,254,317 | |
Camden Property Trust, 5.700%, 05/15/17 | | | | | | | 5,205,000 | | | | 5,699,345 | |
Cantor Fitzgerald, L.P., | | | | | | | | | | | | |
6.375%, 06/26/15 (a) | | | | | | | 8,710,000 | | | | 8,296,676 | |
7.875%, 10/15/19 (a)3 | | | | | | | 10,805,000 | | | | 10,419,910 | |
Citigroup, Inc., | | | | | | | | | | | | |
5.500%, 10/15/14 | | | | | | | 21,385,000 | | | | 21,984,785 | |
6.125%, 08/25/36 | | | | | | | 10,760,000 | | | | 9,307,508 | |
Crown Castle Towers LLC, 6.113%, 01/15/20 (a) | | | | | | | 13,725,000 | | | | 15,143,328 | |
Duke Realty, L.P., | | | | | | | | | | | | |
5.950%, 02/15/17 | | | | | | | 2,210,000 | | | | 2,376,026 | |
6.500%, 01/15/18 | | | | | | | 5,000,000 | | | | 5,525,095 | |
Equifax, Inc., 7.000%, 07/01/37 | | | | | | | 4,421,000 | | | | 4,992,021 | |
Equity One, Inc., 6.000%, 09/15/17 | | | | | | | 5,915,000 | | | | 6,163,548 | |
ERP Operating, L.P., | | | | | | | | | | | | |
5.125%, 03/15/16 | | | | | | | 600,000 | | | | 642,854 | |
5.750%, 06/15/17 | | | | | | | 925,000 | | | | 1,025,583 | |
Export-Import Bank of Korea, The, 8.300%, 03/15/14 (a) | | | IDR | | | | 1,400,000,000 | | | | 153,255 | |
|
The accompanying notes are an integral part of these financial statements. 7 |
Managers Bond Fund
Schedule of Portfolio Investments (continued)
| | | | | | | | | | | | |
| | | | | | Principal Amount† | | | Value | |
| | | | | | | | | | | | |
| | | | | | | | | | | | |
Financials - 22.8% (continued) | | | | | | | | | | | | |
First Industrial, L.P., 5.950%, 05/15/17 | | | | | | $ | 15,000,000 | | | $ | 13,963,170 | |
General Electric Capital Australia Funding Pty., Ltd., EMTN, 8.000%, 02/13/12 | | | AUD | | | | 3,965,000 | | | | 4,065,801 | |
General Electric Capital Corp., | | | | | | | | | | | | |
2.960%, 05/18/12 | | | SGD | | | | 4,400,000 | | | | 3,409,919 | |
3.485%, 03/08/12 | | | SGD | | | | 16,500,000 | | | | 12,752,482 | |
6.500%, 09/28/15 | | | NZD | | | | 15,265,000 | | | | 12,529,803 | |
6.750%, 09/26/16 | | | NZD | | | | 6,390,000 | | | | 5,315,753 | |
GMTN, 7.625%, 12/10/14 | | | NZD | | | | 9,365,000 | | | | 7,958,125 | |
Goldman Sachs Group, Inc., The, 6.750%, 10/01/37 | | | | | | | 1,120,000 | | | | 1,042,175 | |
Hanover Insurance Group, Inc., The, 7.500%, 03/01/20 | | | | | | | 6,475,000 | | | | 7,420,447 | |
Highwoods Realty, L.P., | | | | | | | | | | | | |
5.850%, 03/15/17 | | | | | | | 3,680,000 | | | | 3,892,303 | |
7.500%, 04/15/18 | | | | | | | 2,405,000 | | | | 2,708,441 | |
ICICI Bank, Ltd., 6.375%, 04/30/22 (a)2 | | | | | | | 900,000 | | | | 783,000 | |
Instituto de Credito Oficial, MTN, 5.500%, 10/11/12 | | | AUD | | | | 3,735,000 | | | | 3,706,540 | |
iStar Financial, Inc., | | | | | | | | | | | | |
5.700%, 03/01/144 | | | | | | | 15,000 | | | | 12,488 | |
5.850%, 03/15/17 | | | | | | | 325,000 | | | | 257,563 | |
5.875%, 03/15/164 | | | | | | | 1,340,000 | | | | 1,085,400 | |
6.050%, 04/15/15 | | | | | | | 620,000 | | | | 506,850 | |
JPMorgan Chase & Co., | | | | | | | | | | | | |
6.120%, 04/12/12 (a)5 | | | IDR | | | | 40,733,437,680 | | | | 4,416,911 | |
7.700%, 06/01/16 (a) | | | IDR | | | | 19,000,000,000 | | | | 2,126,408 | |
Lloyds TSB Bank PLC, 6.500%, 09/14/20 (a)4 | | | | | | | 17,940,000 | | | | 15,011,474 | |
Marsh & McLennan Cos., Inc., 5.875%, 08/01/33 | | | | | | | 10,360,000 | | | | 11,382,553 | |
MBIA Insurance Corp., 14.000%, 01/15/33 (a)2 | | | | | | | 525,000 | | | | 294,000 | |
Merrill Lynch & Co., Inc., | | | | | | | | | | | | |
4.625%, 09/14/18 | | | EUR | | | | 1,750,000 | | | | 1,659,212 | |
6.050%, 05/16/16 | | | | | | | 900,000 | | | | 848,303 | |
6.110%, 01/29/37 | | | | | | | 38,050,000 | | | | 29,334,077 | |
10.710%, 03/08/17 | | | BRL | | | | 2,500,000 | | | | 1,206,273 | |
MTN, Series C, 6.050%, 06/01/34 | | | | | | | 22,100,000 | | | | 16,958,568 | |
Morgan Stanley, | | | | | | | | | | | | |
4.750%, 04/01/14 | | | | | | | 10,715,000 | | | | 10,555,207 | |
5.500%, 07/24/20 | | | | | | | 29,000,000 | | | | 26,367,670 | |
5.750%, 01/25/21 | | | | | | | 400,000 | | | | 373,122 | |
GMTN, 5.500%, 01/26/20 | | | | | | | 500,000 | | | | 455,138 | |
GMTN, 5.625%, 09/23/19 | | | | | | | 7,500,000 | | | | 6,945,593 | |
MTN, 6.625%, 04/01/18 | | | | | | | 3,095,000 | | | | 3,056,136 | |
Mutual of Omaha Insurance Co., 6.800%, 06/15/36 (a) | | | | | | | 13,925,000 | | | | 14,852,071 | |
National City Bank of Indiana, 4.250%, 07/01/18 | | | | | | | 6,310,000 | | | | 6,355,180 | |
National City Corp., 6.875%, 05/15/19 | | | | | | | 1,905,000 | | | | 2,140,972 | |
National Life Insurance Co., 10.500%, 09/15/39 (a) | | | | | | | 5,000,000 | | | | 6,143,625 | |
Nationwide Mutual Insurance Co., 6.600%, 04/15/34 (a) | | | | | | | 3,325,000 | | | | 3,048,417 | |
|
The accompanying notes are an integral part of these financial statements. 8 |
Managers Bond Fund
Schedule of Portfolio Investments (continued)
| | | | | | | | |
| | | Principal Amount† | | | Value | |
| | | | | | | | |
| | |
Financials - 22.8% (continued) | | | | | | | | |
Old Republic International Corp., 3.750%, 03/15/184,6 | | $ | 9,220,000 | | | $ | 8,102,075 | |
Penn Mutual Life Insurance Co., The, 7.625%, 06/15/40 (a) | | | 8,885,000 | | | | 10,894,050 | |
ProLogis, L.P., | | | | | | | | |
5.625%, 11/15/15 | | | 345,000 | | | | 366,926 | |
5.750%, 04/01/16 | | | 280,000 | | | | 296,258 | |
Realty Income Corp., | | | | | | | | |
5.750%, 01/15/21 | | | 1,435,000 | | | | 1,561,485 | |
6.750%, 08/15/19 | | | 6,240,000 | | | | 7,113,388 | |
Simon Property Group, L.P., 5.750%, 12/01/15 | | | 445,000 | | | | 497,852 | |
Sirius International Group Ltd., 6.375%, 03/20/17 (a) | | | 4,555,000 | | | | 4,777,507 | |
SLM Corp., | | | | | | | | |
5.000%, 04/15/15 | | | 50,000 | | | | 48,113 | |
5.375%, 05/15/14 | | | 300,000 | | | | 300,210 | |
8.450%, 06/15/18 | | | 18,665,000 | | | | 19,224,950 | |
Societe Generale SA, 5.200%, 04/15/21 (a) | | | 4,000,000 | | | | 3,398,708 | |
Springleaf Finance Corp., | | | | | | | | |
MTN, 5.400%, 12/01/15 | | | 5,000,000 | | | | 3,637,500 | |
MTN, Series J, 6.900%, 12/15/17 | | | 57,315,000 | | | | 41,266,800 | |
WEA Finance LLC/WT Finance Australia, 6.750%, 09/02/19 (a) | | | 8,325,000 | | | | 9,285,255 | |
Willis North America, Inc., | | | | | | | | |
6.200%, 03/28/17 | | | 5,685,000 | | | | 6,250,737 | |
7.000%, 09/29/19 | | | 2,860,000 | | | | 3,183,658 | |
Total Financials | | | | | | | 484,279,340 | |
Industrials - 35.6% | | | | | | | | |
Agilent Technologies, Inc., 6.500%, 11/01/17 | | | 6,945,000 | | | | 8,042,622 | |
Alcatel-Lucent USA, Inc., | | | | | | | | |
6.450%, 03/15/29 | | | 4,335,000 | | | | 3,110,362 | |
6.500%, 01/15/28 | | | 305,000 | | | | 218,838 | |
APL, Ltd., 8.000%, 01/15/243 | | | 250,000 | | | | 162,500 | |
ArcelorMittal, | | | | | | | | |
5.500%, 03/01/21 | | | 150,000 | | | | 137,686 | |
6.125%, 06/01/18 | | | 4,580,000 | | | | 4,523,034 | |
6.750%, 03/01/41 | | | 7,700,000 | | | | 6,924,071 | |
7.000%, 10/15/39 | | | 1,925,000 | | | | 1,788,929 | |
Aristotle Holding, Inc., 4.750%, 11/15/21 (a) | | | 15,920,000 | | | | 16,473,554 | |
AT&T Corp., 6.500%, 03/15/29 | | | 6,415,000 | | | | 7,669,684 | |
BellSouth Corp., 6.000%, 11/15/34 | | | 2,370,000 | | | | 2,689,175 | |
Canadian Pacific Railway Co., 5.750%, 03/15/33 | | | 195,000 | | | | 195,838 | |
CenturyLink, Inc., | | | | | | | | |
6.450%, 06/15/21 | | | 13,395,000 | | | | 13,419,673 | |
Series P, 7.600%, 09/15/39 | | | 9,335,000 | | | | 9,160,109 | |
Choice Hotels International, Inc., 5.700%, 08/28/204 | | | 11,900,000 | | | | 12,373,918 | |
Cigna Corp., 6.150%, 11/15/36 | | | 6,830,000 | | | | 7,326,493 | |
Comcast Corp., 5.650%, 06/15/35 | | | 3,820,000 | | | | 4,220,053 | |
|
The accompanying notes are an integral part of these financial statements. 9 |
Managers Bond Fund
Schedule of Portfolio Investments (continued)
| | | | | | | | |
| | | Principal Amount† | | | Value | |
| | | | | | | | |
Industrials - 35.6% (continued) | | | | | | | | |
Continental Airlines, Inc., | | | | | | | | |
1999-1 Class B Pass Through Trust, Series 991B, 6.795%, 08/02/18 | | $ | 27,840 | | | $ | 26,621 | |
2000-1 Class A-1 Pass Through Trust, Series 00A1, 8.048%, 11/01/20 | | | 84,829 | | | | 90,869 | |
2007-1 Class A Pass Through Trust, Series 071B, 5.983%, 04/19/22 | | | 16,856,069 | | | | 17,550,539 | |
Series B, 6.903%, 04/19/22 | | | 5,391,291 | | | | 5,243,030 | |
Corn Products International, Inc., 6.625%, 04/15/37 | | | 4,055,000 | | | | 4,821,107 | |
Corning, Inc., | | | | | | | | |
6.850%, 03/01/29 | | | 9,142,000 | | | | 11,237,438 | |
7.250%, 08/15/36 | | | 1,185,000 | | | | 1,429,534 | |
Cummins, Inc., | | | | | | | | |
5.650%, 03/01/98 | | | 11,235,000 | | | | 11,013,479 | |
6.750%, 02/15/27 | | | 2,853,000 | | | | 3,475,687 | |
Cytec Industries, Inc., 6.000%, 10/01/15 | | | 875,000 | | | | 956,240 | |
Darden Restaurants, Inc., 6.000%, 08/15/35 | | | 2,635,000 | | | | 2,697,318 | |
Delta Air Lines, Inc., | | | | | | | | |
2007-1 Class B Pass Through Trust, Series 071B, 8.021%, 08/10/22 | | | 11,440,442 | | | | 11,225,361 | |
Series 2010-1A, Pass Through Certificate, 6.200%, 07/02/184 | | | 4,881,400 | | | | 5,198,691 | |
Dillard’s, Inc., 7.000%, 12/01/28 | | | 225,000 | | | | 207,000 | |
DP World, Ltd., 6.850%, 07/02/37 (a) | | | 28,350,000 | | | | 25,656,750 | |
Dun & Bradstreet Corp., The, 6.000%, 04/01/13 | | | 32,120,000 | | | | 33,869,737 | |
Embarq Corp., 7.995%, 06/01/36 | | | 5,830,000 | | | | 6,040,976 | |
Energy Transfer Partners, L.P., | | | | | | | | |
6.125%, 02/15/17 | | | 700,000 | | | | 768,550 | |
6.625%, 10/15/36 | | | 1,805,000 | | | | 1,897,956 | |
Enterprise Products Operating LLC, 4.050%, 02/15/22 | | | 8,450,000 | | | | 8,609,401 | |
EQT Corp., 6.500%, 04/01/18 | | | 35,420,000 | | | | 39,493,513 | |
ERAC USA Finance LLC, | | | | | | | | |
6.375%, 10/15/17 (a) | | | 4,910,000 | | | | 5,673,765 | |
6.700%, 06/01/34 (a) | | | 1,250,000 | | | | 1,413,146 | |
7.000%, 10/15/37 (a) | | | 19,033,000 | | | | 22,898,107 | |
Foot Locker, Inc., 8.500%, 01/15/22 | | | 570,000 | | | | 588,525 | |
Ford Motor Co., 6.375%, 02/01/29 | | | 1,990,000 | | | | 2,044,450 | |
Georgia-Pacific LLC, 5.400%, 11/01/20 (a) | | | 5,175,000 | | | | 5,732,078 | |
GTE Corp., 6.940%, 04/15/28 | | | 130,000 | | | | 163,478 | |
Intel Corp., | | | | | | | | |
2.950%, 12/15/356 | | | 8,030,000 | | | | 8,361,237 | |
3.250%, 08/01/396 | | | 15,000,000 | | | | 18,787,500 | |
Intuit, Inc., 5.750%, 03/15/17 | | | 3,560,000 | | | | 3,993,473 | |
Kinder Morgan Energy Partners, L.P., | | | | | | | | |
5.300%, 09/15/20 | | | 8,100,000 | | | | 8,821,256 | |
5.800%, 03/15/35 | | | 3,360,000 | | | | 3,462,295 | |
5.950%, 02/15/18 | | | 36,530,000 | | | | 41,733,479 | |
Lowe’s Cos., Inc., 6.875%, 02/15/28 | | | 500,000 | | | | 627,500 | |
Marks & Spencer PLC, 7.125%, 12/01/37 (a) | | | 4,725,000 | | | | 4,702,986 | |
|
The accompanying notes are an integral part of these financial statements. 10 |
Managers Bond Fund
Schedule of Portfolio Investments (continued)
| | | | | | | | |
| | | Principal Amount† | | | Value | |
| | | | | | | | |
| | | | | | | | |
Industrials - 35.6% (continued) | | | | | | | | |
Masco Corp., | | | | | | | | |
5.850%, 03/15/17 | | $ | 8,150,000 | | | $ | 8,135,477 | |
6.500%, 08/15/32 | | | 955,000 | | | | 854,195 | |
7.125%, 03/15/20 | | | 9,065,000 | | | | 9,148,616 | |
7.750%, 08/01/29 | | | 820,000 | | | | 795,948 | |
Mead Corp., 7.550%, 03/01/47 | | | 970,000 | | | | 944,949 | |
Methanex Corp., 6.000%, 08/15/15 | | | 3,825,000 | | | | 3,938,587 | |
Micron Technology, Inc., 1.875%, 06/01/146 | | | 200,000 | | | | 191,000 | |
Missouri Pacific Railroad Co., 5.000%, 01/01/453 | | | 825,000 | | | | 625,606 | |
New Albertsons, Inc., | | | | | | | | |
6.625%, 06/01/28 | | | 1,015,000 | | | | 723,187 | |
7.450%, 08/01/29 | | | 3,195,000 | | | | 2,492,100 | |
7.750%, 06/15/26 | | | 915,000 | | | | 752,587 | |
NGPL Pipeco LLC, 7.119%, 12/15/17 (a) | | | 21,980,000 | | | | 21,698,216 | |
Northwest Airlines, 2007-1 Class B Pass Through Trust, 8.028%, 11/01/17 | | | 5,609,775 | | | | 5,336,018 | |
ONEOK, Inc., 6.000%, 06/15/35 | | | 9,210,000 | | | | 9,857,859 | |
ONEOK Partners, L.P., 6.650%, 10/01/36 | | | 2,650,000 | | | | 3,133,946 | |
Owens & Minor, Inc., 6.350%, 04/15/163 | | | 1,355,000 | | | | 1,471,373 | |
Owens Corning, | | | | | | | | |
6.500%, 12/01/16 | | | 4,560,000 | | | | 4,976,702 | |
7.000%, 12/01/36 | | | 9,175,000 | | | | 9,377,456 | |
Panhandle Eastern Pipeline Co., L.P., | | | | | | | | |
6.200%, 11/01/17 | | | 5,520,000 | | | | 6,280,838 | |
7.000%, 06/15/18 | | | 26,505,000 | | | | 30,379,315 | |
Plains All American Pipeline L.P./PAA Finance Corp., | | | | | | | | |
6.125%, 01/15/17 | | | 2,770,000 | | | | 3,131,596 | |
6.500%, 05/01/18 | | | 8,975,000 | | | | 10,438,858 | |
6.650%, 01/15/37 | | | 5,960,000 | | | | 7,101,680 | |
PulteGroup, Inc., | | | | | | | | |
6.000%, 02/15/35 | | | 10,320,000 | | | | 6,849,900 | |
6.375%, 05/15/33 | | | 4,670,000 | | | | 3,233,975 | |
Qwest Capital Funding, Inc., | | | | | | | | |
6.500%, 11/15/18 | | | 620,000 | | | | 611,964 | |
6.875%, 07/15/28 | | | 1,190,000 | | | | 1,117,373 | |
7.625%, 08/03/21 | | | 2,135,000 | | | | 2,177,173 | |
Qwest Corp., | | | | | | | | |
6.875%, 09/15/334 | | | 7,209,000 | | | | 7,160,628 | |
7.200%, 11/10/26 | | | 435,000 | | | | 434,000 | |
7.250%, 09/15/25 | | | 1,185,000 | | | | 1,297,076 | |
7.250%, 10/15/35 | | | 2,165,000 | | | | 2,158,819 | |
7.500%, 06/15/23 | | | 739,000 | | | | 739,221 | |
Reynolds American, Inc., | | | | | | | | |
6.750%, 06/15/17 | | | 8,170,000 | | | | 9,286,251 | |
|
The accompanying notes are an integral part of these financial statements. 11 |
Managers Bond Fund
Schedule of Portfolio Investments (continued)
| | | | | | | | |
| | | Principal Amount† | | | Value | |
| | | | | | | | |
| | |
Industrials - 35.6% (continued) | | | | | | | | |
7.250%, 06/15/37 | | $ | 2,000,000 | | | $ | 2,319,940 | |
Rowan Cos., Inc., 7.875%, 08/01/19 | | | 4,710,000 | | | | 5,521,524 | |
Samsung Electronics Co., Ltd., 7.700%, 10/01/27 (a) | | | 3,520,000 | | | | 4,238,974 | |
Telecom Italia Capital S.A., | | | | | | | | |
6.000%, 09/30/34 | | | 4,130,000 | | | | 3,060,218 | |
6.375%, 11/15/33 | | | 3,485,000 | | | | 2,639,347 | |
Telekom Malaysia Bhd, 7.875%, 08/01/25 (a) | | | 250,000 | | | | 331,283 | |
Texas Eastern Transmission, L.P., 6.000%, 09/15/17 (a) | | | 3,000,000 | | | | 3,547,566 | |
Toro Co., The, 6.625%, 05/01/373 | | | 6,810,000 | | | | 7,119,371 | |
Transocean, Inc., 7.375%, 04/15/18 | | | 500,000 | | | | 538,095 | |
UAL, Series 2007-1, 6.636%, 07/02/22 | | | 14,925,601 | | | | 14,925,601 | |
United States Steel Corp., | | | | | | | | |
6.650%, 06/01/37 | | | 3,595,000 | | | | 2,804,100 | |
7.000%, 02/01/184 | | | 7,310,000 | | | | 7,236,900 | |
UnitedHealth Group, Inc., | | | | | | | | |
5.800%, 03/15/36 | | | 13,506,000 | | | | 16,158,227 | |
6.500%, 06/15/37 | | | 310,000 | | | | 394,269 | |
6.625%, 11/15/37 | | | 1,540,000 | | | | 1,977,098 | |
US Airways, 2011-1 Class A Pass Through Trust, Series 2011 A, 7.125%, 10/22/23 | | | 3,843,000 | | | | 3,650,850 | |
USG Corp., 6.300%, 11/15/16 | | | 1,410,000 | | | | 1,099,800 | |
Vale Overseas Ltd., 6.875%, 11/21/36 | | | 3,665,000 | | | | 4,172,789 | |
Verizon Maryland, Inc., 5.125%, 06/15/33 | | | 885,000 | | | | 925,172 | |
Verizon New England, Inc., 7.875%, 11/15/29 | | | 2,390,000 | | | | 2,902,433 | |
Verizon Pennsylvania, Inc., 6.000%, 12/01/28 | | | 1,335,000 | | | | 1,428,533 | |
VF Corp., 6.450%, 11/01/37 | | | 9,334,000 | | | | 12,157,983 | |
WellPoint, Inc., 6.375%, 06/15/37 | | | 11,710,000 | | | | 14,778,945 | |
Western Union Co., The, | | | | | | | | |
6.200%, 11/17/36 | | | 4,690,000 | | | | 4,990,254 | |
6.200%, 06/21/40 | | | 130,000 | | | | 139,212 | |
Weyerhaeuser Co., | | | | | | | | |
6.875%, 12/15/33 | | | 12,890,000 | | | | 12,690,102 | |
7.375%, 10/01/19 | | | 3,915,000 | | | | 4,410,905 | |
7.375%, 03/15/32 | | | 1,930,000 | | | | 2,025,790 | |
White Pine Hydro LLC, | | | | | | | | |
6.310%, 07/10/17 (a)3 | | | 1,700,000 | | | | 1,828,163 | |
6.960%, 07/10/37 (a)3 | | | 1,645,000 | | | | 1,770,941 | |
Wyndham Worldwide Corp., | | | | | | | | |
5.750%, 02/01/18 | | | 950,000 | | | | 1,005,690 | |
6.000%, 12/01/16 | | | 6,430,000 | | | | 6,934,112 | |
7.375%, 03/01/20 | | | 7,220,000 | | | | 8,240,728 | |
Total Industrials | | | | | | | 753,767,015 | |
Utilities - 10.2% | | | | | | | | |
Abu Dhabi National Energy Co., 7.250%, 08/01/18 (a) | | | 21,130,000 | | | | 24,193,850 | |
|
The accompanying notes are an integral part of these financial statements. 12 |
Managers Bond Fund
Schedule of Portfolio Investments (continued)
| | | | | | | | | | | | |
| | | | | | Principal Amount† | | | Value | |
| | | | | | | | | | | | |
Utilities - 10.2% (continued) | | | | | | | | | | | | |
Ameren Energy Generating Co., Series H, 7.000%, 04/15/184 | | | | | | $ | 22,700,000 | | | $ | 23,403,700 | |
Ameren Illinois Co., 6.250%, 04/01/18 | | | | | | | 26,000,000 | | | | 30,018,690 | |
Baltimore Gas & Electric Co., 5.200%, 06/15/33 | | | | | | | 1,470,000 | | | | 1,607,595 | |
Bruce Mansfield Unit 12, 6.850%, 06/01/34 | | | | | | | 10,477,605 | | | | 11,386,059 | |
Cleveland Electric Illuminating Co., The, 5.950%, 12/15/36 | | | | | | | 11,370,000 | | | | 12,117,350 | |
DCP Midstream LLC, 6.450%, 11/03/36 (a) | | | | | | | 2,615,000 | | | | 2,982,329 | |
Endesa SA/Cayman Islands, 7.875%, 02/01/27 | | | | | | | 2,900,000 | | | | 3,611,683 | |
Enel Finance International N.V., 6.000%, 10/07/39 (a) | | | | | | | 3,300,000 | | | | 2,655,992 | |
ITC Holdings Corp., 5.875%, 09/30/16 (a) | | | | | | | 2,410,000 | | | | 2,743,744 | |
Mackinaw Power LLC, 6.296%, 10/31/23 (a)3 | | | | | | | 8,014,200 | | | | 8,117,343 | |
Nisource Finance Corp., | | | | | | | | | | | | |
6.400%, 03/15/18 | | | | | | | 27,910,000 | | | | 32,092,369 | |
6.800%, 01/15/19 | | | | | | | 11,625,000 | | | | 13,615,735 | |
Southwestern Electric Power Co., 6.450%, 01/15/19 | | | | | | | 39,195,000 | | | | 45,752,676 | |
Tenaga Nasional Bhd, 7.500%, 11/01/25 (a) | | | | | | | 2,000,000 | | | | 2,489,310 | |
Total Utilities | | | | | | | | | | | 216,788,425 | |
Total Corporate Bonds and Notes (cost $1,360,006,597) | | | | | | | | | | | 1,454,834,780 | |
Foreign Government and Agency Obligations - 6.4% | | | | | | | | | | | | |
Alberta Notes, Province of, 5.930%, 09/16/16 | | | CAD | | | | 104,243 | | | $ | 113,814 | |
Brazil Bonds, Republic of: | | | | | | | | | | | | |
10.250%, 01/10/28 | | | BRL | | | | 5,750,000 | | | | 3,514,274 | |
12.500%, 01/05/22 | | | BRL | | | | 5,160,000 | | | | 3,540,973 | |
Canadian Government Bonds: | | | | | | | | | | | | |
1.750%, 03/01/13 | | | CAD | | | | 400,000 | | | | 396,121 | |
3.500%, 06/01/13 | | | CAD | | | | 5,964,000 | | | | 6,061,532 | |
European Bank for Reconstruction & Development Notes,
9.250%, 09/10/12 | | | BRL | | | | 2,000,000 | | | | 1,072,242 | |
European Investment Bank: | | | | | | | | | | | | |
Bonds, 6.446%, 03/10/215 | | | AUD | | | | 5,000,000 | | | | 2,823,296 | |
Notes, 5.687%, 04/24/13 (a)5 | | | IDR | | | | 50,074,770,000 | | | | 5,129,413 | |
Notes, 7.000%, 01/18/12 | | | NZD | | | | 5,508,000 | | | | 4,293,954 | |
Notes, 11.250%, 02/14/13 | | | BRL | | | | 13,490,000 | | | | 7,394,278 | |
Inter-American Development Bank: | | | | | | | | | | | | |
Bonds, 6.000%, 12/15/17 | | | NZD | | | | 4,215,000 | | | | 3,603,015 | |
Notes, 7.079%, 05/20/135 | | | IDR | | | | 45,580,000,000 | | | | 4,563,781 | |
Notes, EMTN, 7.037%, 09/23/135 | | | IDR | | | | 33,430,000,000 | | | | 3,270,923 | |
International Bank for Reconstruction & Development Notes, GDIF, 1.430%, 03/05/14 | | | SGD | | | | 5,800,000 | | | | 4,536,181 | |
Manitoba Bonds, Province of, 6.375%, 09/01/15 | | | NZD | | | | 5,450,000 | | | | 4,612,033 | |
Mexican Fixed Rate Bonds, 8.000%, 12/07/23 | | | MXN | | | | 141,360,000 | | | | 11,349,897 | |
New South Wales Treasury Corp., Series 813, 5.500%, 08/01/13 | | | AUD | | | | 21,225,000 | | | | 22,253,567 | |
New Zealand Government Bonds, Series 413, 6.500%, 04/15/13 | | | NZD | | | | 37,850,000 | | | | 30,962,289 | |
Norway Government Bonds, 6.500%, 05/15/13 | | | NOK | | | | 53,065,000 | | | | 9,482,557 | |
Queensland Treasury Corp. Bonds, 7.125%, 09/18/17 (a) | | | NZD | | | | 7,500,000 | | | | 6,677,130 | |
Total Foreign Government and Agency Obligations (cost $127,577,038) | | | | | | | | | | | 135,651,270 | |
|
The accompanying notes are an integral part of these financial statements. 13 |
Managers Bond Fund
Schedule of Portfolio Investments (continued)
| | | | | | | | |
| | | Principal Amount† | | | Value | |
| | | | | | | | |
Mortgage-Backed Securities - 1.2% | | | | | | | | |
Community Program Loan Trust, Series 87-A, Class A5, 4.500%, 04/01/29 | | $ | 3,325,000 | | | $ | 3,198,703 | |
Credit Suisse Mortgage Capital, Series 2007-C5, Class A4, 5.695%, 09/15/402 | | | 1,704,000 | | | | 1,777,846 | |
Extended Stay America Trust, Series 2010 ESHA, Class C, 4.860%, 11/05/27 (a) | | | 19,090,000 | | | | 19,326,812 | |
JPMorgan Chase Commercial Mortgage Securities Corp., Series 2007-LD11,
Class A4, 6.005%, 06/15/492 | | | 305,000 | | | | 324,132 | |
Total Mortgage-Backed Securities (cost $23,121,937) | | | | | | | 24,627,493 | |
Municipal Bonds - 1.5% | | | | | | | | |
Buckeye Tobacco Settlement Financing Authority, Series 2007 A-2, Series 2007 A-2, 5.875%, 06/01/473 | | | 5,035,000 | | | | 3,607,477 | |
Chicago Illinois O’Hare International Airport Revenue Bond, Series 2008 A, Series 2008-A, 4.500%, 01/01/38 (AGM Insured)7 | | | 315,000 | | | | 306,523 | |
Illinois State General Obligation, Series 2003, 5.100%, 06/01/33 | | | 2,880,000 | | | | 2,614,003 | |
Michigan Tobacco Settlement Finance Authority, Series 2006 A, Series 2006 A, 7.309%, 06/01/343 | | | 2,985,000 | | | | 2,186,901 | |
San Jose California Redevelopment Agency Tax Allocation, Series 2006 C, 3.750%, 08/01/28 (BHAC Insured)7 | | | 280,000 | | | | 250,200 | |
San Jose California Redevelopment Agency Tax Allocation, Series 2006 C, 3.750%, 08/01/28 (NATL- RE Insured)7 | | | 765,000 | | | | 575,188 | |
State of California, 4.500%, 08/01/27(AMBAC Insured)7 | | | 950,000 | | | | 986,167 | |
State of California, 4.500%, 10/01/29 | | | 2,655,000 | | | | 2,713,941 | |
State of California, 4.500%, 08/01/30 | | | 730,000 | | | | 744,907 | |
State of California, 4.500%, 08/01/30 (AMBAC Insured)7 | | | 770,000 | | | | 785,723 | |
State of California, Variable Purpose Bond, 3.250%, 12/01/27 (NATL-RE Insured)7 | | | 495,000 | | | | 446,718 | |
State of California, Variable Purpose Bond, 4.500%, 12/01/33 (AMBAC Insured)7 | | | 2,330,000 | | | | 2,349,292 | |
Virginia Tobacco Settlement Financing Corp., Series 2007 A-1, 6.706%, 06/01/463 | | | 21,620,000 | | | | 13,564,820 | |
Total Municipal Bonds (cost $39,601,288) | | | | | | | 31,131,860 | |
| | |
| | | Shares | | | | |
Preferred Stocks - 0.9% | | | | | | | | |
Consumer Discretionary - 0.5% | | | | | | | | |
Comcast Corp., Series B, 7.000% | | | 207,547 | | | | 5,311,128 | |
Newell Financial Trust I, 5.250%6 | | | 90,628 | | | | 3,829,033 | |
Total Consumer Discretionary | | | | | | | 9,140,161 | |
Financials - 0.4% | | | | | | | | |
Bank of America Corp., 6.375% | | | 20,000 | | | | 364,600 | |
Bank of America Corp., Series L, 7.250%6 | | | 7,808 | | | | 6,152,860 | |
SLM Corp., 6.000% | | | 41,250 | | | | 785,400 | |
Sovereign Capital Trust IV, 4.375%6 | | | 34,236 | | | | 1,626,210 | |
Total Financials | | | | | | | 8,929,070 | |
Utilities - 0.0%# | | | | | | | | |
Entergy New Orleans, Inc., 4.750% | | | 482 | | | | 47,763 | |
Entergy New Orleans, Inc., 5.560% | | | 100 | | | | 9,925 | |
Wisconsin Electric Power Co., 3.600% | | | 3,946 | | | | 319,873 | |
Total Utilities | | | | | | | 377,561 | |
Total Preferred Stocks (cost $18,122,043) | | | | | | | 18,446,792 | |
|
The accompanying notes are an integral part of these financial statements. 14 |
Managers Bond Fund
Schedule of Portfolio Investments (continued)
| | | | | | | | |
| | | Principal Amount† | | | Value | |
| | | | | | | | |
| | | | | | | | |
| | |
U.S. Government and Agency Obligations - 3.4% | | | | | | | | |
Federal Home Loan Banks - 0.8% | | | | | | | | |
FHLB, 1.875%, 06/21/13 | | $ | 16,600,000 | | | $ | 16,971,077 | |
Federal Home Loan Mortgage Corporation - 2.0% | | | | | | | | |
FHLMC, 1.625%, 04/15/13 | | | 16,595,000 | | | | 16,873,862 | |
FHLMC, 2.125%, 09/21/12 | | | 24,895,000 | | | | 25,236,659 | |
FHMLC Gold, 5.000%, 12/01/31 | | | 89,766 | | | | 96,775 | |
Total Federal Home Loan Mortgage Corporation | | | | | | | 42,207,296 | |
Federal National Mortgage Association - 0.6% | | | | | | | | |
FNMA, 1.875%, 04/20/12 | | | 10,325,000 | | | | 10,379,754 | |
FNMA, 4.000%, 10/01/18 | | | 3,010,049 | | | | 3,201,857 | |
FNMA, 6.000%, 07/01/29 | | | 7,183 | | | | 8,007 | |
Total Federal National Mortgage Association | | | | | | | 13,589,618 | |
Total U.S. Government and Agency Obligations (cost $71,750,267) | | | | | | | 72,767,991 | |
| | |
| | | Shares | | | | |
Other Investment Companies - 13.5%8 | | | | | | | | |
BNY Mellon Overnight Government Fund, 0.04%9 | | | 33,504,336 | | | | 33,504,336 | |
Dreyfus Cash Management Fund, Institutional Class Shares, 0.05% | | | 113,949,839 | | | | 113,949,839 | |
JPMorgan Liquid Assets Money Market Fund, Capital Shares, 0.14% | | | 140,060,261 | | | | 140,060,261 | |
Total Other Investment Companies
(cost $287,514,436) | | | | | | | 287,514,436 | |
Total Investments - 99.8% (cost $2,013,833,433) | | | | | | | 2,116,281,547 | |
Other Assets, less Liabilities - 0.2% | | | | | | | 5,209,321 | |
Net Assets - 100.0% | | | | | | $ | 2,121,490,868 | |
|
The accompanying notes are an integral part of these financial statements. 15 |
Managers Bond Fund
Notes to Schedule of Portfolio Investments
The following footnotes and abbreviations should be read in conjunction with the Schedule of Portfolio Investments previously presented in this report.
Note: Based on the cost of investments of $2,013,833,433 for Federal income tax purposes at December 31, 2011, the aggregate gross unrealized appreciation and depreciation were $157,034,918 and $54,586,804, respectively, resulting in net unrealized appreciation of investments of $102,448,114.
| | † | Principal Amount stated in U.S. dollars unless otherwise noted. |
| | # | Rounds to less than 0.1%. |
| | (a) | Security exempt from registration under Rule 144A of the Securities Act of 1933. This security may be resold in transactions exempt from registration, normally to qualified buyers. At December 31, 2011, the value of these securities amounted to $349,783,025, or 16.5% of net assets. |
| | 1 | Floating Rate Security. The rate listed is as of December 31, 2011. Date in parentheses represents the security’s next coupon rate reset. |
| | 2 | Variable Rate Security. The rate listed is as of December 31, 2011, and is periodically reset subject to terms and conditions set forth in the debenture. |
| | 3 | Illiquid Security. A security not readily convertible into cash such as a stock, bond or commodity that is not actively traded and would be difficult to sell in a current sale. The Fund may not invest more than 15% of its net assets in illiquid securities. Illiquid securities at December 31, 2011, amounted to $50,874,405, or 2.4% of net assets. |
| | 4 | Some or all of these securities, amounting to a market value of $32,354,068, or 1.5% of net assets, were out on loan to various brokers. |
| | 5 | Represents yield to maturity at December 31, 2011. |
| | 6 | Convertible Security. A corporate bond or preferred stock, usually a junior debenture, that can be converted, at the option of the holder, for a specific number of shares of the company’s preferred stock or common stock. Convertible Bonds and Convertible Preferred Stocks at December 31, 2011, amounted to $35,441,812, or 1.7% of net assets, and $11,608,103, or 0.5% of net assets, respectively. |
| | 7 | Securities in the portfolio backed by insurance of financial institutions and financial guaranty assurance agencies amounted to $5,699,811, or 0.3% of net assets. |
| | 8 | Yield shown represents the December 31, 2011, seven-day average yield, which refers to the sum of the previous seven days’ dividends paid, expressed as an annual percentage. |
| | 9 | Collateral received from brokers for securities lending was invested in this short-term investment. |
Investment Abbreviations and Definitions:
| | |
| |
AGM: | | Assured Guaranty Municipal Corp. |
AMBAC: | | American Municipal Bond Assurance Corp. |
BHAC: | | Berkshire Hathaway Assurance Corp. |
EMTN: | | European Medium Term Note |
FHLB: | | Federal Home Loan Bank |
FHLMC: | | Federal Home Loan Mortgage Corp. |
FNMA: | | Federal National Mortgage Association |
GMTN: | | Global Multi-Currency Notes |
MBIA: | | MBIA Insurance Corp. |
MTN: | | Medium Term Note |
NATL-RE: | | National Public Finance Guarantee Corporation |
|
Currency Abbreviations have been used throughout the portfolio to indicate amounts shown in currencies other than the U.S. dollar (USD): |
| |
AUD: | | Australian Dollar |
BRL: | | Brazilian Real |
CAD: | | Canadian Dollar |
EUR: | | Euro |
IDR: | | Indonesian Rupiah |
MXN: | | Mexican Peso |
NOK: | | Norwegian Krone |
NZD: | | New Zealand Dollar |
SGD: | | Singapore Dollar |
|
The accompanying notes are an integral part of these financial statements. 16 |
Managers Bond Fund
Notes to Schedule of Portfolio Investments (continued)
The following table summarizes the inputs used to value the Fund’s net assets by the above fair value hierarchy levels as of December 31, 2011: (See Note 1 (a) in the Notes to the Financial Statements.)
| | | | | | | | | | | | | | | | |
| | | Quoted Prices in Active
Markets for Identical
Investments
Level 1 | | | Significant Other
Observable Inputs
Level 2 | | | Significant Unobservable Inputs
Level 3 | | | Total | |
Managers Bond Fund | | | | | | | | | | | | | | | | |
Investments in Securities | | | | | | | | | | | | | | | | |
Asset-Backed Securities | | | — | | | $ | 79,139,426 | | | | — | | | $ | 79,139,426 | |
Common Stocks† | | $ | 12,167,499 | | | | — | | | | — | | | | 12,167,499 | |
Corporate Bonds and Notes†† | | | — | | | | 1,454,834,780 | | | | — | | | | 1,454,834,780 | |
Foreign Government and Agency Obligations | | | — | | | | 135,651,270 | | | | — | | | | 135,651,270 | |
Mortgage-Backed Securities | | | — | | | | 24,627,493 | | | | — | | | | 24,627,493 | |
Municipal Bonds | | | — | | | | 31,131,860 | | | | — | | | | 31,131,860 | |
Preferred Stocks† | | | 18,446,792 | | | | — | | | | — | | | | 18,446,792 | |
U.S. Government and Agency Obligations†† | | | — | | | | 72,767,991 | | | | — | | | | 72,767,991 | |
Other Investment Companies | | | 287,514,436 | | | | — | | | | — | | | | 287,514,436 | |
| | | | | | | | | | | | | | | | |
Total Investments in Securities | | $ | 318,128,727 | | | $ | 1,798,152,820 | | | | — | | | $ | 2,116,281,547 | |
| | | | | | | | | | | | | | | | |
| † | All common stocks and preferred stocks held in the Fund are level 1 securities. For a detailed breakout of these securities, please refer to the Schedule of Portfolio Investments. |
| †† | All corporate bonds and notes and U.S. government and agency obligations held in the Fund are level 2 securities. For a detailed breakout of the corporate bonds and notes and U.S. government and agency obligations by major industry or agency classification, please refer to the Schedule of Portfolio Investments. |
As of December 31, 2011, the Fund had no significant transfers between Level 1 and Level 2 from the beginning of the reporting period.
|
The accompanying notes are an integral part of these financial statements. 17 |
Managers Bond Fund
Statement of Assets and Liabilities
December 31, 2011
| | | | |
Assets: | | | | |
Investments at value* (including securities on loan valued at $32,354,068) | | $ | 2,116,281,547 | |
Cash | | | 453,752 | |
Foreign currency** | | | 10,927,508 | |
Dividends, interest and other receivables | | | 25,784,415 | |
Receivable for Fund shares sold | | | 6,899,935 | |
Receivable from affiliate | | | 84,912 | |
Prepaid expenses | | | 70,521 | |
Total assets | | | 2,160,502,590 | |
Liabilities: | | | | |
Payable upon return of securities loaned | | | 33,504,336 | |
Payable for Fund shares repurchased | | | 3,362,470 | |
Accrued expenses: | | | | |
Investment advisory and management fees | | | 1,105,878 | |
Administrative fees | | | 445,206 | |
Other | | | 593,832 | |
Total liabilities | | | 39,011,722 | |
Net Assets | | $ | 2,121,490,868 | |
Shares outstanding | | | 81,704,329 | |
Net asset value, offering and redemption price per share | | $ | 25.97 | |
Net Assets Represent: | | | | |
Paid-in capital | | $ | 2,080,437,992 | |
Undistributed net investment income | | | 143,958 | |
Accumulated net realized loss from investments and foreign currency transactions | | | (61,741,088 | ) |
Net unrealized appreciation of investments and foreign currency translations | | | 102,650,006 | |
Net Assets | | $ | 2,121,490,868 | |
* Investments at cost | | $ | 2,013,833,433 | |
** Foreign currency at cost | | $ | 10,590,725 | |
|
The accompanying notes are an integral part of these financial statements. 18 |
Managers Bond Fund
Statement of Operations
For the year ended December 31, 2011
| | | | |
Investment Income: | | | | |
Interest income | | $ | 107,604,848 | |
Dividend income | | | 1,591,942 | |
Securities lending fees | | | 290,910 | |
Foreign withholding tax | | | (108,663 | ) |
Total investment income | | | 109,379,037 | |
Expenses: | | | | |
Investment advisory and management fees | | | 12,772,266 | |
Administrative fees | | | 5,108,906 | |
Transfer agent | | | 2,421,895 | |
Professional fees | | | 288,976 | |
Custodian | | | 257,589 | |
Reports to shareholders | | | 256,416 | |
Trustees fees and expenses | | | 128,751 | |
Registration fees | | | 123,933 | |
Miscellaneous | | | 79,377 | |
Total expenses before offsets | | | 21,438,109 | |
Expense reimbursements | | | (1,204,284 | ) |
Fee waivers | | | (40,052 | ) |
Expense reductions | | | (2,428 | ) |
Net expenses | | | 20,191,345 | |
Net investment income | | | 89,187,692 | |
Net Realized and Unrealized Gain (Loss): | | | | |
Net realized gain on investments | | | 24,234,901 | |
Net realized gain on foreign currency transactions | | | 443,045 | |
Net change in unrealized appreciation of investments | | | 3,870,792 | |
Net change in unrealized depreciation of foreign currency transactions | | | (506,100 | ) |
Net realized and unrealized gain | | | 28,042,638 | |
Net increase in net assets resulting from operations | | $ | 117,230,330 | |
|
The accompanying notes are an integral part of these financial statements. 19 |
Managers Bond Fund
Statement of Changes in Net Assets
For the year ended December 31,
| | | | | | | | |
| | | 2011 | | | 2010 | |
Increase in Net Assets From Operations: | | | | | | | | |
Net investment income | | $ | 89,187,692 | | | $ | 99,436,805 | |
Net realized gain (loss) on investments and foreign currency transactions | | | 24,677,946 | | | | (10,720,652 | ) |
Net change in unrealized appreciation of investments and foreign currency translations | | | 3,364,692 | | | | 128,628,663 | |
Net increase in net assets resulting from operations | | | 117,230,330 | | | | 217,344,816 | |
Distributions to Shareholders: | | | | | | | | |
From net investment income | | | (91,439,318 | ) | | | (100,016,927 | ) |
From Capital Share Transactions: | | | | | | | | |
Proceeds from sale of shares | | | 675,736,563 | | | | 514,097,164 | |
Reinvestment of dividends and distributions | | | 83,384,606 | | | | 92,243,870 | |
Cost of shares repurchased | | | (649,797,137 | ) | | | (930,994,796 | ) |
Net increase (decrease) from capital share transactions | | | 109,324,032 | | | | (324,653,762 | ) |
Total increase (decrease) in net assets | | | 135,115,044 | | | | (207,325,873 | ) |
Net Assets: | | | | | | | | |
Beginning of year | | | 1,986,375,824 | | | | 2,193,701,697 | |
End of year | | $ | 2,121,490,868 | | | $ | 1,986,375,824 | |
End of year undistributed net investment income | | $ | 143,958 | | | $ | 1,680,657 | |
| | | | | | | | |
Share Transactions: | | | | | | | | |
Sale of shares | | | 25,821,719 | | | | 20,305,382 | |
Shares issued in connection with reinvestments of dividends and distributions | | | 3,201,464 | | | | 3,644,161 | |
Shares repurchased | | | (24,893,267 | ) | | | (36,671,325 | ) |
Net increase (decrease) in shares | | | 4,129,916 | | | | (12,721,782 | ) |
|
The accompanying notes are an integral part of these financial statements. 20 |
Managers Bond Fund
Financial Highlights
For a share outstanding throughout each year
| | | | | | | | | | | | | | | | | | | | |
| | | For the year ended December 31, | |
| | | 2011 | | | 2010 | | | 2009 | | | 2008 | | | 2007 | |
Net Asset Value, Beginning of Year | | $ | 25.61 | | | $ | 24.29 | | | $ | 19.65 | | | $ | 25.34 | | | $ | 24.84 | |
Income from Investment Operations: | | | | | | | | | | | | | | | | | | | | |
Net investment income1 | | | 1.14 | | | | 1.16 | | | | 1.30 | | | | 1.42 | | | | 1.22 | |
Net realized and unrealized gain (loss) on investments1 | | | 0.39 | | | | 1.34 | | | | 4.62 | | | | (5.42 | ) | | | 0.49 | |
Total from investment operations | | | 1.53 | | | | 2.50 | | | | 5.92 | | | | (4.00 | ) | | | 1.71 | |
Less Distributions to Shareholders from: | | | | | | | | | | | | | | | | | | | | |
Net investment income | | | (1.17 | ) | | | (1.18 | ) | | | (1.28 | ) | | | (1.41 | ) | | | (1.21 | ) |
Net realized gain on investments | | | — | | | | — | | | | — | | | | (0.28 | ) | | | (0.00 | )5 |
Total distributions to shareholders | | | (1.17 | ) | | | (1.18 | ) | | | (1.28 | ) | | | (1.69 | ) | | | (1.21 | ) |
Net Asset Value, End of Year | | $ | 25.97 | | | $ | 25.61 | | | $ | 24.29 | | | $ | 19.65 | | | $ | 25.34 | |
Total Return2 | | | 6.06 | % | | | 10.47 | %4 | | | 31.12 | %4 | | | (16.31 | )% | | | 7.06 | % |
Ratio of net expenses to average net assets | | | 0.99 | % | | | 0.99 | % | | | 0.99 | % | | | 0.99 | % | | | 0.99 | % |
Ratio of net investment income to average net assets2 | | | 4.36 | % | | | 4.59 | % | | | 5.93 | % | | | 6.10 | % | | | 4.91 | % |
Portfolio turnover | | | 17 | % | | | 17 | % | | | 23 | % | | | 39 | % | | | 21 | % |
Net assets at end of year (000’s omitted) | | $ | 2,121,491 | | | $ | 1,986,376 | | | $ | 2,193,702 | | | $ | 1,888,919 | | | $ | 2,022,891 | |
| | | | | | | | | | | | | | | | | | | | |
Ratios absent expense offsets:3 | | | | | | | | | | | | | | | | | | | | |
Ratio of total expenses to average net assets | | | 1.05 | % | | | 1.06 | % | | | 1.10 | % | | | 1.10 | % | | | 0.99 | % |
Ratio of net investment income to average net assets | | | 4.30 | % | | | 4.52 | % | | | 5.82 | % | | | 5.99 | % | | | 4.91 | % |
| | | | | | | | | | | | | | | | | | | | |
| 1 | Per share numbers have been calculated using average shares. |
| 2 | Total returns and net investment income would have been lower had certain expenses not been reduced. (See Note 1(c) of Notes to Financial Statements.) |
| 3 | Excludes the impact of expense reimbursements or fee waivers and expense reductions such as brokerage credits, but includes non-reimbursable expenses, if any, such as interest and taxes. (See Note 1(c) of Notes to Financial Statements.) |
| 4 | The Total Return is based on the Financial Statement Net Asset Values as shown above. |
| 5 | Rounds to less than $0.01. |
Notes to Financial Statements
December 31, 2011
| 1. | Summary of Significant Accounting Policies |
The Managers Funds (the “Trust”) is an open-end management investment company organized as a Massachusetts business trust and registered under the Investment Company Act of 1940, as amended (the “1940 Act”). Currently, the Trust consists of a number of different funds, each having distinct investment management objectives, strategies, risks, and policies. Included in this report is the Managers Bond Fund (the “Fund”).
The Fund’s financial statements are prepared in accordance with accounting principles generally accepted in the United States of America (“U.S. GAAP”), which require management to make estimates and assumptions that affect the reported amounts of assets and liabilities and disclosure of contingent assets and liabilities at the date of the financial statements and the reported amounts of income and expenses during the reporting period. Actual results could differ from those estimates and such differences could be material. The following is a summary of significant accounting policies followed by the Fund in the preparation of its financial statements:
| a. | Valuation of Investments |
Equity securities traded on a domestic or international securities exchange are valued at the last quoted sale price, or, lacking any sales, at the last quoted bid price. Over-the-counter securities are valued at the Nasdaq Official Closing Price, if one is available. Lacking any sales, over-the-counter securities are valued at the last quoted bid price. The Fund’s investments are generally valued based on market quotations provided by third-party pricing services approved by the Board of Trustees of the Fund (the “Board”). Under certain circumstances, the value of certain Fund investments may be based on an evaluation of fair value, pursuant to procedures established by and under the general supervision of the Board. The Fund may use the fair value of a portfolio investment to calculate its Net Asset Value (“NAV”) when, for example, (1) market quotations are not readily available because a portfolio investment is not traded in a public market or the principal market in which the investment trades is closed, (2) trading in a portfolio investment is suspended and has not resumed before the Fund calculates its NAV, (3) a significant event affecting the value of a portfolio investment is determined to have occurred between the time of the market quotation provided for a portfolio investment and the time as of which the Fund calculates its NAV, (4) an investment’s price has remained unchanged over a period of time (often referred to as a “stale price”), or (5) Managers Investment Group LLC (“the Investment Manager”) determines that a market quotation is inaccurate. Portfolio
investments that trade primarily on foreign markets are priced based upon the market quotation of such securities as of the close of their respective principal markets, as adjusted to reflect the Investment Manager’s determination of the impact of events occurring subsequent to the close of such markets but prior to the time as of which the Fund calculates its NAV. In accordance with procedures approved by the Board, the Investment Manager relies upon recommendations of a third-party fair valuation service in adjusting the prices of such foreign portfolio investments. Under certain circumstances, the Investment Manager may adjust such prices based on its determination of the impact of events occurring subsequent to the close of such markets but prior to the time as of which the Fund calculates its NAV. The Fund may invest in securities that may be thinly traded. The Board has adopted procedures to adjust prices of thinly traded securities that are judged to be stale so that they reflect fair value. An investment valued on the basis of its fair value may be valued at a price higher or lower than available market quotations. An investment’s valuation may differ depending on the method used and the factors considered in determining value according to the Fund’s fair value procedures.
Fixed-income securities are valued based on valuations furnished by independent pricing services that utilize matrix systems, which reflect such factors as security prices, yields, maturities, and ratings, and are supplemented by dealer and exchange quotations. Short-term investments having a remaining maturity of 60 days or less are generally valued at amortized cost, which approximates market value. Investments in other open-end regulated investment companies are valued at their end of day net asset value per share. Investments in certain mortgage-backed and stripped mortgage-backed securities, preferred stocks, convertible securities, derivatives and other debt securities not traded on an organized securities market are valued on the basis of valuations provided by dealers or by a pricing service which uses information with respect to transactions in such securities and various relationships between securities and yield to maturity in determining value. Securities (including derivatives) for which market quotations are not readily available are valued at fair value, as determined in good faith, and pursuant to procedures adopted by the Board. The values assigned to fair value investments are based on available information and do not necessarily represent amounts that might ultimately be realized, since such amounts depend on future developments inherent in long-term investments. Further, because of the inherent uncertainty of valuation, those estimated values may differ significantly from the values that would have been used had a ready market for the investments existed, and the differences could be material.
Notes to Financial Statements (continued)
U.S. GAAP defines fair value as the price that a Fund would receive to sell an asset or pay to transfer a liability in an orderly transaction between market participants at the measurement date. U.S. GAAP also establishes a framework for measuring fair value, and a three-level hierarchy for fair value measurements based upon the transparency of inputs to the valuation of an asset or liability. Inputs may be observable or unobservable and refer broadly to the assumptions that market participants would use in pricing the asset or liability. Observable inputs reflect the assumptions market participants would use in pricing the asset or liability based on market data obtained from sources independent of the Fund. Unobservable inputs reflect the Fund’s own assumptions about the assumptions that market participants would use in pricing the asset or liability developed based on the best information available in the circumstances. Each investment is assigned a level based upon the observability of the inputs which are significant to the overall valuation.
The three-tier hierarchy of inputs is summarized below:
Level 1 – inputs are quoted prices in active markets for identical investments (e.g., equity securities, open-end investment companies)
Level 2 – other observable inputs (including, but not limited to: quoted prices for similar assets or liabilities in markets that are active, quoted prices for identical or similar assets or liabilities in markets that are not active, inputs other than quoted prices that are observable for the assets or liabilities (such as interest rates, yield curves, volatilities, prepayment speeds, loss severities, credit risks and default rates) or other market corroborated inputs) (e.g., debt securities, government securities, foreign currency exchange contracts, foreign securities utilizing international fair value pricing, broker-quoted securities, fair valued securities with observable inputs)
Level 3 – inputs are significant unobservable inputs (including the Fund’s own assumptions used to determine the fair value of investments) (e.g., fair valued securities with unobservable inputs)
The inputs or methodologies used for valuing investments are not necessarily an indication of the risk associated with investing in those investments.
Security transactions are accounted for as of trade date. Realized gains and losses on securities sold are determined on the basis of identified cost.
| c. | Investment Income and Expenses |
Dividend income is recorded on the ex-dividend date, except certain dividends from foreign securities where the ex-dividend date may have passed. Dividends from foreign securities are recorded as soon as the Trust becomes aware of the ex-dividend date. Dividend income on foreign securities is recorded net of any withholding tax. Interest income, which includes amortization of premium and accretion of discount on debt securities, is accrued as earned. Non-cash dividends included in dividend income, if any, are reported at the fair market value of the securities received. Other income and expenses are recorded on an accrual basis. Expenses that cannot be directly attributed to a Fund are apportioned among the Funds in
the Trust and in some cases other affiliated funds based upon their relative average net assets or number of shareholders.
The Fund has a “balance credit” agreement with The Bank of New York Mellon (“BNYM”), the Fund’s custodian, whereby the Fund is credited with an interest factor equal to 0.75% below the effective 90-day T-Bill rate for account balances left uninvested overnight. If the T-Bill rate falls below 0.75%, no credits will be earned. These credits serve to reduce custody expenses that would otherwise be charged to the Fund. For the year ended December 31, 2011, the custodian expense was not reduced.
Overdrafts will cause a reduction of any earnings credits, computed at 2% above the Federal funds rate on the day of the overdraft. For the year ended December 31, 2011, the Fund had no overdraft fees.
The Fund also has a balance credit arrangement with its Transfer Agent, BNY Mellon Investment Servicing (US) Inc., whereby earnings credits are used to offset banking charges and other out-of-pocket expenses. For the year ended December 31, 2011, the transfer agent expense was reduced by $2,428.
The Investment Manager has agreed to waive a portion of its management fee in consideration of shareholder servicing fees that it has received from JPMorgan Distribution Services, Inc., with respect to short-term cash investments the Fund has made in JPMorgan Liquid Assets Money Market Fund, Capital Shares. For the year ended December 31, 2011, the management fee was reduced by $40,052.
Total returns and net investment income for the Fund would have been lower had certain expenses not been offset. Total expenses before offsets exclude the impact of expense reimbursements or fee waivers and expense offsets such as brokerage recapture credits, but include non-reimbursable expenses, if any, such as interest and taxes.
| d. | Dividends and Distributions |
Dividends resulting from net investment income, if any, normally will be declared daily and paid monthly. Distributions of capital gains, if any, will be made on an annual basis and when required for Federal excise tax purposes. Income and capital gain distributions are determined in accordance with Federal income tax regulations, which may differ from U.S. GAAP. These differences are primarily due to differing treatments for losses deferred due to wash sales, equalization accounting for tax purposes, foreign currency, options, futures and market discount transactions. Permanent book and tax basis differences, if any, relating to shareholder distributions will result in reclassifications to paid-in capital. The tax character of distributions paid during the years ended December 31, 2011 and 2010 were as follows:
| | | | | | | | |
| Distributions paid from: | | 2011 | | | 2010 | |
Ordinary income | | $ | 91,439,318 | | | $ | 100,016,927 | |
Short-term capital gains | | | — | | | | — | |
Long-term capital gains | | | — | | | | — | |
| | | | | | | | |
Totals | | $ | 91,439,318 | | | $ | 100,016,927 | |
| | | | | | | | |
Notes to Financial Statements (continued)
As of December 31, 2011, the components of distributable earnings (excluding unrealized appreciation/depreciation) on a tax basis consisted of:
| | | | |
Capital loss carryforward | | $ | 61,741,088 | |
Undistributed ordinary income | | | 180,296 | |
Undistributed short-term capital gains | | | — | |
Undistributed long-term capital gains | | | — | |
Post-October loss deferral | | | — | |
The Fund intends to comply with the requirements under Subchapter M of the Internal Revenue Code of 1986, as amended, and to distribute substantially all of its taxable income and gains to its shareholders and to meet certain diversification and income requirements with respect to investment companies. Therefore, no provision for Federal income or excise tax is included in the accompanying financial statements.
Additionally, based on the Fund’s understanding of the tax rules and rates related to income, gains and transactions for the foreign jurisdictions in which it invests, the Fund will provide for foreign taxes, and where appropriate, deferred foreign taxes.
Management has analyzed the Fund’s tax positions taken on federal income tax returns for all open tax years (tax years ended December 31, 2008-2011), and has concluded that no provision for federal income tax is required in the Fund’s financial statements. Additionally, the Fund is not aware of any tax position for which it is reasonably possible that the total amounts of unrecognized tax benefits will change materially in the next twelve months.
New Tax Law: Regulated Investment Company Modernization Act:
Under the recently enacted Regulated Investment Company Modernization Act of 2010 (the “Act”), the Act modernizes several of the federal income and excise tax provisions related to regulated investment companies (“RIC”). Some highlights of the enacted provisions are as follows:
New post-enactment capital losses may now be carried forward for an unlimited time period. However, any new losses incurred will be required to be utilized prior to any loss carryovers incurred in pre-enactment taxable years, which generally expire eight years following the close of the taxable year in which they were incurred. As a result of this ordering rule, pre-enactment capital loss carryovers may be more likely to expire unused. Additionally, post-enactment capital losses that are carried forward will retain their tax character as either short-term or long-term capital losses rather than being considered all short-term as under previous law.
The Act contains simplification provisions, which are aimed at preventing disqualification of a RIC for “inadvertent” failures of the asset diversification and/or qualifying income tests. Additionally, the Act repealed the 60-day designation requirement for certain types of pass-through income and gains.
Finally, the Act contains several provisions aimed at preserving the character of distributions made by a fiscal year RIC during the portion of its taxable year ending after October 31, or December 31, reducing the circumstances under which a RIC might be required to
send shareholders amended Forms 1099 to restate previously reported distributions.
Except for the simplification provisions related to RIC qualification, the Act is effective for taxable years beginning after December 22, 2010. The Fund’s first taxable year subject to the Act is the current year ended December 31. 2011.
| f. | Capital Loss Carryovers and Deferrals |
As of December 31, 2011, the Fund had accumulated net realized capital loss carryovers from securities transactions for Federal income tax purposes as shown in the following chart. The amounts may be used to offset future realized capital gains, if any, through the expiration dates listed or in the case of post-enactment losses, for an unlimited time period.
| | | | | | | | | | | | |
| | | Capital Loss Carryover Amounts | |
| | | |
Bond Fund | | Short-Term | | | Long-Term | | | Expires
December 31, | |
(Pre-Enactment) | | $ | 46,433,792 | | | | — | | | | 2017 | |
(Pre-Enactment) | | | 15,307,296 | | | | — | | | | 2018 | |
| | | | | | | | | | | | |
Totals | | $ | 61,741,088 | | | | — | | | | | |
| | | | | | | | | | | | |
For the year ended December 31, 2011, the Fund utilized capital loss carryovers in the amount of:
| | | | | | | | |
| | | Capital Loss Carryovers Utilized | |
| | |
| | | Short-Term | | | Long-Term | |
Bond Fund | | $ | 23,531,032 | | | | — | |
The Trust’s Declaration of Trust authorizes for each series the issuance of an unlimited number of shares of beneficial interest, without par value. The Fund records sales and repurchases of its capital stock on the trade date. The cost of securities contributed to the Fund in connection with the issuance of shares is based on the valuation of those securities in accordance with the Fund’s policy on investment valuation. Dividends and distributions to shareholders are recorded on the ex-dividend date.
At December 31, 2011, certain unaffiliated shareholders of record, specifically omnibus accounts, individually or collectively held greater than 10% of the outstanding shares of the Fund as follows: three collectively own 62%. Transactions by these shareholders may have a material impact on the Fund.
| h. | Foreign Currency Translation |
The books and records of the Fund are maintained in U.S. dollars. The value of investments, assets and liabilities denominated in currencies other than U.S. dollars are translated into U.S. dollars based upon current foreign exchange rates. Purchases and sales of foreign investments, income and expenses are converted into U.S. dollars based on currency exchange rates prevailing on the respective dates of such transactions. Net realized and unrealized gain (loss) on foreign currency transactions represent: (1) foreign exchange gains and losses from the sale and holdings of foreign currencies; (2) gains and
Notes to Financial Statements (continued)
losses between trade date and settlement date on investment securities transactions and forward foreign currency exchange contracts; and (3) gains and losses from the difference between amounts of interest and dividends recorded and the amounts actually received.
The Fund does not isolate the net realized and unrealized gain or loss resulting from changes in exchange rates from the fluctuations in market prices of securities held. Such fluctuations are included with the net realized and unrealized gain or loss on investments.
The Fund invests in securities of foreign entities and in instruments denominated in foreign currencies which involve risks not typically associated with investments in domestic securities. Non-domestic securities carry special risks, such as exposure to currency fluctuations, less developed or less efficient trading markets, political instability, a lack of company information, differing auditing and legal standards, and, potentially, less liquidity.
Realized gains in certain countries may be subject to foreign taxes at the Fund level, at rates ranging from approximately 10% to 15%. The Fund would pay such foreign taxes on net realized gains at the appropriate rate for each jurisdiction.
| 2. | Agreements and Transactions with Affiliates |
The Trust has entered into an Investment Management Agreement under which the Investment Manager, an independently managed subsidiary of Affiliated Managers Group, Inc. (“AMG”), serves as investment manager to the Fund and is responsible for the Fund’s overall administration. The Investment Manager selects subadvisors for the Fund (subject to Board approval) and monitors the subadvisor’s investment programs and results. The Fund’s investment portfolio is managed by a portfolio manager who serves pursuant to a subadvisory agreement with the Investment Manager.
Investment management fees are paid directly by the Fund to the Investment Manager based on average net assets. The annual investment management fee rates, as a percentage of average daily net assets, for the year ended December 31, 2011, was 0.625%.
The Trust has entered into an Administration and Shareholder Servicing Agreement under which the Investment Manager serves as the Fund’s administrator (the “Administrator”) and is responsible for all aspects of managing the Fund’s operations, including administration and shareholder services to the Fund, its shareholders, and certain institutions, such as bank trust departments, broker-dealers and registered investment advisers, that advise or act as an intermediary with the Fund’s shareholders. The Fund pays a fee to the Administrator at the rate of 0.20% per annum of the Fund’s average daily net assets for this service.
The Investment Manager has contractually agreed, through at least May 1, 2012, to waive management fees and/or reimburse Fund expenses in order to limit Total Annual Fund Operating Expenses After Fee Waiver and Expense Reimbursements (exclusive of taxes, interest, brokerage commissions, acquired fund fees and expenses, and extraordinary items) to 0.99% of the Fund’s average daily net assets subject to later reimbursement by the Fund in certain circumstances. In general, for a period of up to 36 months from the time of any waiver, reimbursement, or payment pursuant to the Fund’s contractual expense limitation, the Investment Manager may recover
from the Fund fees waived and expenses paid to the extent that such repayment would not cause the Fund’s Total Annual Fund Operating Expenses After Fee Waiver and Expense Reimbursements to exceed the contractual expense limitation amount. The contractual expense limitation may only be terminated upon termination of the Fund’s investment advisory agreement with the Investment Manager or by mutual agreement between the Investment Manager and the Fund’s Board of Trustees.
For the year ended December 31, 2011, the Fund’s components of reimbursement available are detailed in the following chart:
| | | | |
| | | Managers
Bond Fund | |
Reimbursement Available - 12/31/10 | | $ | 6,378,875 | |
Additional Reimbursements | | | 1,204,284 | |
Repayments | | | — | |
Expired Reimbursements | | | (2,432,313 | ) |
| | | | |
Reimbursement Available - 12/31/11 | | $ | 5,150,846 | |
| | | | |
Effective January 1, 2011, the aggregate annual retainer paid to each Independent Trustee of the Board is $80,000, plus $5,000 or $2,500 for each regular or special meeting attended, respectively. The Independent Chairman of the Trust receives an additional payment of $20,000 per year. The Chairman of the Audit Committee receives an additional payment of $8,000 per year. Prior to January 1, 2011, the aggregate annual retainer paid to each Independent Trustee of the Board was $65,000, plus $4,000 or $2,500 for each regular or special meeting attended, respectively. The Independent Chairman of the Trusts received an additional payment of $15,000 per year. The Chairman of the Audit Committee received an additional payment of $5,000 per year. The Trustees’ fees and expenses are allocated among all of the funds for which the Investment Manager serves as the advisor (the “Managers Funds”) based on the relative net assets of such funds. The “Trustees fees and expenses” shown in the financial statements represents the Fund’s allocated portion of the total fees and expenses paid by the Managers Funds.
The Fund is distributed by Managers Distributors, Inc. (the “Distributor” or “MDI”), a wholly-owned subsidiary of the Investment Manager. MDI serves as the distributor and underwriter for the Fund and is a registered broker-dealer and member of the Financial Industry Regulatory Authority, Inc. (“FINRA”). Shares of the Fund will be continuously offered and will be sold directly to prospective purchasers through brokers, dealers or other financial intermediaries who have executed selling agreements with MDI. Subject to the compensation arrangement discussed below, generally MDI bears all or a portion of the expenses of providing services pursuant to the distribution agreement, including the payment of the expenses relating to the distribution of prospectuses for sales purposes and any advertising or sales literature. Certain Trustees and Officers of the Fund are Officers and/or Directors of the Investment Manager, AMG and/or the Distributor.
The Securities and Exchange Commission granted an exemptive order that permits the Fund to lend and borrow money for certain temporary purposes directly to and from other eligible Managers Funds. Participation in this interfund lending program is voluntary for both borrowing and lending funds, and an interfund loan is only
Notes to Financial Statements (continued)
made if it benefits each participating fund. The Investment Manager administers the program according to procedures approved by the Board, and the Board monitors the operation of the program. An interfund loan must comply with certain conditions set out in the exemptive order, which are designed to assure fairness and protect all participating funds. For the year ended December 31, 2011, the Fund loaned to other Managers Funds varying amounts up to $4,865,965 for 2 days receiving interest of $229. The interest amounts are included in the Statement of Operations as interest income. For the same period, the Fund did not borrow from any other Managers Funds.
| 3. | Purchases and Sales of Securities |
Purchases and sales of securities (excluding short-term securities and U.S. Government obligations) for the year ended December 31, 2011, were $212,616,901 and $221,084,775, respectively. Purchases and sales of U.S. Government obligations for the year ended December 31, 2011, were $99,648,575 and $195,585,646, respectively.
| 4. | Portfolio Securities Loaned |
The Fund participated in a securities lending program offered by BNYM (the “Program”), providing for the lending of securities to qualified brokers. Securities lending fees include earnings of such temporary cash investments, plus or minus any rebate to a borrower. These earnings (after any rebate) are then divided between BNYM, as a fee for its services under the program, and the Fund, according to agreed-upon rates. Collateral on all securities loaned is accepted in cash and/or government securities and is maintained at a minimum level of 102% (105% in the case of certain foreign securities) of the market value, plus interest, if applicable, of investments on loan. It is the Fund’s policy to obtain additional collateral from or return excess collateral to the borrower by the end of the next business day, following the valuation date of the securities loaned. Therefore, the value of the collateral held may be temporarily less than the value of the securities on loan. Lending securities entails a risk of loss to the Fund if and to the extent that the market value of the securities loaned were to increase and the borrower did not increase the collateral accordingly, and the borrower fails to return the securities. Under the terms of the Program, the Fund is indemnified for such losses by BNYM. The Fund bears the risk of any deficiency in the amount of the collateral available for return to the borrower due to any loss on the collateral invested. Collateral received in the form of cash is invested temporarily in the BNY Mellon Overnight Government Fund, formerly the BNY Institutional Cash Reserves Fund (the “ICRF”), or other short-term investments as defined in the Securities Lending Agreement with BNYM.
Effective August 2, 2010, the Trust, on behalf of the Fund, entered into an agreement with BNYM and the Bank of New York Mellon Corporation (“BNYMC”) with respect to the Fund’s position in ICRF, pursuant to which (i) BNYMC would support the value of certain defaulted securities issued by Lehman Brothers Holdings, Inc. (the “Lehman Securities”) and held by Series B of the ICRF, and (ii) once certain conditions were met, BNYMC would purchase the defaulted securities from the Fund. On October 17, 2011, after certifying that the Fund had met all necessary conditions, BNYMC purchased the Lehman Securities from the Fund at a predetermined
price, which represented a premium over the fair market value of the Lehman Securities at that date.
| 5. | Commitments and Contingencies |
In the normal course of business, the Fund may enter into contracts and agreements that contain a variety of representations and warranties, which provide general indemnifications. The maximum exposure to the Fund under these arrangements is unknown, as this would involve future claims that may be made against the Fund that have not yet occurred. However, the Fund has not had prior claims or losses and expects the risk of material loss to be remote.
| 6. | Risks Associated with High Yield Securities |
Investing in high yield securities involves greater risks and considerations not typically associated with U.S. Government and other high quality/investment grade securities. High Yield securities are generally below investment grade securities and do not have an established retail secondary market. Economic downturns may disrupt the high yield market and impair the issuer’s ability to repay principal and interest. Also, an increase in interest rates would likely have an adverse impact on the value of such obligations and could cause the securities to become less liquid.
Certain transactions, such as futures and forward transactions, dollar roll agreements, or purchases of when-issued or delayed delivery securities may have a similar effect on the Fund’s net asset value as if the Fund had created a degree of leverage in its portfolio. However, if the Fund enters into such a transaction, the Fund will establish a segregated account with its custodian in which it will maintain cash, U.S. government securities or other liquid securities equal in value to its obligations in respect to such transaction. Securities and other assets held in the segregated account may not be sold while the transaction is outstanding, unless other suitable assets are substituted.
The following disclosures contain information on how and why the Fund uses derivative instruments, the credit risk and how derivative instruments affect the Fund’s financial position, results of operations and cash flows. The location and fair value amounts of these instruments would be on the Statement of Assets and Liabilities and the realized and changes in unrealized gains and losses on the Statement of Operations, each categorized by type of derivative contract, are included in a table in the Schedule of Portfolio Investments. The derivative instruments outstanding as of the fiscal year end as disclosed in the Statement of Assets and Liabilities and the realized and unrealized changes in gains and losses on derivative instruments during the fiscal year as disclosed in the Statement of Operations serve as indicators of the volume of derivative activity for the Fund.
| 9. | Forward Foreign Currency Contracts |
During the fiscal year ended December 31, 2011, the Fund invested in forward foreign currency contracts to facilitate transactions in foreign securities and to hedge against foreign currency exchange rate risk on its non-U.S. dollar denominated investment securities.
A forward foreign currency contract is an agreement between a fund and another party to buy or sell a currency at a set price at a future
Notes to Financial Statements (continued)
date. The market value of the contract will fluctuate with changes in currency exchange rates. The contract is marked-to-market daily, and the change in market value is recorded as an unrealized gain or loss. Gain or loss on the purchase or sale of contracts having the same settlement date, amount and counterparty is realized on the date of offset, otherwise gain or loss is realized on the settlement date.
Risks may arise upon entering into these contracts from the potential inability of counterparties to meet the terms of their contracts and from unanticipated movements in the value of a foreign currency relative to the U.S. dollar.
| 10. | New Accounting Pronouncements |
In April 2011, the Financial Accounting Standards Board (“FASB”) issued Accounting Standards Update (“ASU”) No. 2011-03, “Reconsideration of Effective Control for Repurchase Agreements.” ASU No. 2011-03 changes the assessment of effective control for repurchase agreements including dollar roll transactions. The new and revised disclosures are effective for interim and annual reporting periods beginning after December 15, 2011. At this time, management is evaluating the implications of ASU No. 2011-03 and its impact on the financial statements.
In May 2011, the FASB issued ASU No. 2011-04, “Amendments to Achieve Common Fair Value Measurement and Disclosure Requirements in U.S. GAAP and IFRSs.” ASU No. 2011-04 requires common fair value measurement and disclosure requirements between U.S. GAAP and International Financial Reporting Standards. The new and revised disclosures are effective for interim and annual reporting periods beginning after December 15, 2011. At this time, management is evaluating the implications of ASU No. 2011-04 and its impact on the financial statements.
In December 2011, the FASB issued ASU No. 2011-11, “Disclosures about Offsetting Assets and Liabilities.” ASU 2011-11 requires disclosures to make financial statements that are prepared
under U.S. GAAP more comparable to those prepared under IFRS. The new disclosure requirements mandate that entities disclose both gross and net information about instruments and transactions eligible for offset in the statement of assets and liabilities as well as instruments and transactions subject to an agreement similar to a master netting arrangement. In addition, ASU 2011-11 requires disclosure of collateral received and posted in connection with master netting agreements or similar arrangements. New disclosures are required for annual reporting periods beginning on or after January 1, 2013, and interim periods within those annual periods. Management is evaluating the impact of ASU 2011-11 on the financial statements and disclosures.
The Fund has determined that no material events or transactions occurred through the issuance date of the Fund’s financial statements, which require additional disclosure in or adjustment of the Fund’s financial statements.
Tax Information (unaudited)
The Fund hereby designates the maximum amount allowable of its net taxable income as qualified dividends as provided in the Jobs and Growth Tax Relief Reconciliation Act of 2003. The 2011 Form 1099-DIV you receive for the Fund will show the tax status of all distributions paid to you during the year.
| | | | | | | | |
| | | 2011 | | | 2010 | |
Ordinary Income - QDI | | | 1.60 | % | | | 0.00 | % |
Ordinary Income - DRD | | | 0.61 | % | | | 0.00 | % |
Pursuant to section 852 of the Internal Revenue Code, Managers Bond Fund hereby designates $0, as a capital gain distribution with respect to the taxable year ended December 31, 2011, or if subsequently determined to be different, the net capital gains of such year.
Report of Independent Registered Public Accounting Firm
To the Board of Trustees of The Managers Fund and the Shareholders of Managers Bond Fund:
In our opinion, the accompanying statement of assets and liabilities, including the schedule of portfolio investments, and the related statements of operations and of changes in net assets and the financial highlights present fairly, in all material respects, the financial position of Managers Bond Fund (one of the series constituting The Managers Funds, hereafter referred to as the “Fund”) at December 31, 2011, the results of its operations for the year then ended, the changes in its net assets for each of the two years in the period then ended and the financial highlights for each of the five years in the periods indicated, in conformity with accounting principles generally accepted in the United States of America. These financial statements and financial highlights (hereafter referred to as “financial statements”) are the responsibility of the Fund’s management; our responsibility is to express an opinion on these financial statements based on our audits. We conducted our audits of these financial statements in accordance with the standards of the Public Company Accounting Oversight Board (United States). Those standards require that we plan and perform the audit to obtain reasonable assurance about whether the financial statements are free of material misstatement. An audit includes examining, on a test basis, evidence supporting the amounts and disclosures in the financial statements, assessing the accounting principles used and significant estimates made by management, and evaluating the overall financial statement presentation. We believe that our audits, which included confirmation of securities at December 31, 2011 by correspondence with the custodian and brokers, provide a reasonable basis for our opinion.
PricewaterhouseCoopers LLP
Philadelphia, Pennsylvania
February 27, 2012
Trustees and Officers
The Trustees and Officers of the Trust, their business addresses, principal occupations for the past five years and dates of birth are listed below. The Trustees provide broad supervision over the affairs of the Trust and the Funds. The Trustees are experienced executives who meet periodically throughout the year to oversee the Funds’ activities, review contractual arrangements with companies that provide services to the Funds, and review the Funds’ performance. Unless otherwise noted, the address of each Trustee or Officer is the address of the Trust: 800 Connecticut Avenue, Norwalk, Connecticut 06854.
There is no stated term of office for Trustees. Trustees serve until their resignation, retirement or removal in accordance with the Trust’s organizational documents and policies adopted by the Board from time to time. The Chairman of the Trustees, President, Treasurer and Secretary of the Trust are elected by the Trustees annually. Other officers hold office at the pleasure of the Trustees.
Independent Trustees
The following Trustees are not “interested persons” of the Trust within the meaning of the 1940 Act:
| | |
Name, Date of Birth, Number of Funds Overseen in Fund Complex* | | Principal Occupation(s) During Past 5 Years and Other Directorships Held by Trustee |
Jack W. Aber, 9/9/37 • Trustee since 1999 • Oversees 38 Funds in Fund Complex | | Professor of Finance, Boston University School of Management (1972-Present); Trustee of Appleton Growth Fund (1 portfolio); Trustee of Third Avenue Trust (5 portfolios); Trustee of Third Avenue Variable Trust (1 portfolio); Trustee of Aston Funds (26 portfolios). |
William E. Chapman, II, 9/23/41 • Independent Chairman • Trustee since 1999 • Oversees 38 Funds in Fund Complex | | President and Owner, Longboat Retirement Planning Solutions (1998-Present); Hewitt Associates, LLC (part time) (provider of Retirement and Investment Education Seminars) (2002-2009); Trustee of Bowdoin College (2002-Present); Director of Harding, Loevner Funds, Inc. (6 portfolios); Trustee of Third Avenue Trust (5 portfolios); Trustee of Third Avenue Variable Trust (1 portfolio); Trustee of Aston Funds (26 portfolios). |
Edward J. Kaier, 9/23/45 • Trustee since 1999 • Oversees 38 Funds in Fund Complex | | Attorney at Law and Partner, Teeters Harvey Gilboy & Kaier LLP (2007-Present); Attorney at Law and Partner, Hepburn Willcox Hamilton & Putnam, LLP (1977-2007); Trustee of Third Avenue Trust (5 portfolios); Trustee of Third Avenue Variable Trust (1 portfolio); Trustee of Aston Funds (26 portfolios). |
Steven J. Paggioli, 4/3/50 • Trustee since 1993 • Oversees 38 Funds in Fund Complex | | Independent Consultant (2002-Present); Formerly Executive Vice President and Director, The Wadsworth Group (1986-2001); Executive Vice President, Secretary and Director, Investment Company Administration, LLC (1990-2001); Vice President, Secretary and Director, First Fund Distributors, Inc. (1991-2001); Trustee, Professionally Managed Portfolios (43 portfolios); Advisory Board Member, Sustainable Growth Advisors, LP; Independent Director, Chase Investment Counsel (2008 – Present); Trustee of Aston Funds (26 portfolios). |
Eric Rakowski, 6/5/58 • Trustee since 1999 • Oversees 38 Funds in Fund Complex | | Professor, University of California at Berkeley School of Law (1990-Present); Director of Harding, Loevner Funds, Inc. (6 portfolios); Trustee of Third Avenue Trust (5 portfolios); Trustee of Third Avenue Variable Trust (1 portfolio); Trustee of Aston Funds (26 portfolios). |
Thomas R. Schneeweis, 5/10/47 • Trustee since 1987 • Oversees 38 Funds in Fund Complex | | Professor of Finance, University of Massachusetts (1977-Present); Director, CISDM at the University of Massachusetts, (1996-Present); President, Alternative Investment Analytics, LLC, (formerly Schneeweis Partners, LLC) (2001-Present); Partner, S Capital Management, LLC (2007-Present); President, TRS Associates (1982-Present); Partner, White Bear Partners, LLC (2007-2010); Partner, Northampton Capital Management, LLC (2004-2010); Trustee of Aston Funds (26 portfolios). |
| * | The Fund Complex consists of Managers AMG Funds, The Managers Funds, Managers Trust I and Managers Trust II. |
Interested Trustees
Each Trustee in the following table is an “interested person” of the Trust within the meaning of the 1940 Act. Ms. Carsman is an interested person of the Trust within the meaning of the 1940 Act by virtue of her position with, and interest in securities of, AMG, and her former position as Chief Legal Officer of the Trust.
| | |
Name, Date of Birth, Number of Funds Overseen in Fund Complex* | | Principal Occupation(s) During Past 5 Years and Other Directorships Held by Trustee |
Christine C. Carsman, 4/2/52 • Trustee since 2011 • Oversees 38 Funds in Fund Complex | | Deputy General Counsel, Affiliated Managers Group, Inc. (2011-Present); Senior Vice President and Chief Regulatory Counsel, Affiliated Managers Group, Inc. (2004-Present); Secretary and Chief Legal Officer, Managers AMG Funds, The Managers Funds, Managers Trust I and Managers Trust II (2004-2011); Senior Counsel, Vice President and Director of Operational Risk Management and Compliance, Wellington Management Company, LLP (1995-2004). |
Officers | | |
Name, Date of Birth, Position(s) Held with Fund and Length of Time Served | | Principal Occupation(s) During Past 5 Years |
Keitha L. Kinne, 5/16/58 • President since 2012 Chief Operating Officer since 2007 | | Managing Partner and Chief Operating Officer, Managers Investment Group LLC (2007-Present); Chief Investment Officer, Managers Investment Group LLC (2008-Present); President, Managers Distributors, Inc. (2012-Present); Chief Operating Officer, Managers AMG Funds, Managers Trust I and Managers Trust II (2007-Present); Managing Director, Legg Mason & Co., LLC (2006-2007); Managing Director, Citigroup Asset Management (2004-2006). |
Lewis Collins, 2/22/66 • Secretary since 2011 • Chief Legal Officer since 2011 | | Senior Vice President and Senior Counsel, Affiliated Managers Group, Inc. (2010-Present); Vice President and Senior Counsel, Affiliated Managers Group, Inc. (2006-2010); Senior Counsel, Affiliated Managers Group, Inc. (2002-2006); Attorney, Ropes & Gray LLP (1998-2002). |
Donald S. Rumery, 5/29/58 • Chief Financial Officer since 2007 • Treasurer since 1995 | | Senior Vice President, Managers Investment Group LLC (2005-Present); Treasurer and Chief Financial Officer, Managers Distributors, Inc. (2000-Present); Treasurer, Managers AMG Funds (1999-Present); Treasurer, Managers Trust I and Managers Trust II (2000-Present); Chief Financial Officer, Managers AMG Funds, Managers Trust I and Managers Trust II (2007-Present); Vice President, The Managers Funds LLC, (1994-2004). |
John J. Ferencz, 3/09/62 • Chief Compliance Officer since 2010 | | Vice President, Legal and Compliance, Managers Investment Group LLC (2010-Present); Senior Compliance Analyst, Mutual Funds and Regulatory, GE Asset Management Incorporated (2005-2010). |
Michael S. Ponder, 9/12/73 • Assistant Secretary since 2011 | | Senior Vice President and Counsel, Managers Investment Group LLC (2011-Present); Attorney, DeNovo Legal (2009-2010); Vice President, Credit Suisse (2007-2009); Associate, Willkie Farr & Gallagher LLP (2006-2007). |
Investment Manager and Administrator
Managers Investment Group LLC
333 W. Wacker Drive
Suite 1200
Chicago, IL 60606
(800) 835-3879
Distributor
Managers Distributors, Inc.
333 W. Wacker Drive
Suite 1200
Chicago, IL 60606
(800) 835-3879
Custodian
The Bank of New York Mellon
2 Hanson Place
Brooklyn, New York 11217
Legal Counsel
Ropes & Gray LLP
Prudential Tower, 800 Boylston Street
Boston, Massachusetts 02199-3600
Transfer Agent
BNY Mellon Investment Servicing (US) Inc.*
Attn: Managers
P.O. Box 9769
Providence, Rhode Island 02940
(800) 548-4539
For Managers Choice Only
Managers
c/o BNY Mellon Investment Servicing (US) Inc.*
P.O. Box 9847
Providence, Rhode Island 02940-8047
(800) 358-7668
| * | formerly PNC Global Investment Servicing (U.S.) Inc. |
THIS PAGE INTENTIONALLY LEFT BLANK
THIS PAGE INTENTIONALLY LEFT BLANK
MANAGERSAND MANAGERS AMG FUNDS
| | | | |
EQUITY FUNDS | | BALANCED FUNDS |
CADENCE CAPITAL APPRECIATION CADENCE FOCUSED GROWTH CADENCE MID-CAP CADENCE EMERGING COMPANIES Cadence Capital Management, LLC CHICAGO EQUITY PARTNERS MID-CAP Chicago Equity Partners, LLC EMERGING MARKETS EQUITY Rexiter Capital Management Limited Schroder Investment Management North America Inc. ESSES SMALL/MICRO CAP GROWTH Essex Investment Management Co., LLC FQ TAX-MANAGED U.S. EQUITY FQ U.S. EQUITY First Quadrant, L.P. FRONTIER SMALL CAP GROWTH Frontier Capital Management Company, LLC GW&K SMALL CAP EQUITY Gannett Welsh & Kotler, LLC MICRO-CAP Lord, Abbett & Co. LLC WEDGE Capital Management L.L.P. Next Century Growth Investors LLC RBC Global Asset Management (U.S.) Inc. | | INTERNATIONAL EQUITY AllianceBernstein L.P. Lazard Asset Management, LLC
Martin Currie Inc. REAL ESTATE SECURITIES Urdang Securities Management, Inc. RENAISSANCE LARGE CAP GROWTH Renaissance Group LLC SKYLINE SPECIAL EQUITIES PORTFOLIO Skyline Asset Management, L.P. SPECIAL EQUITY Ranger Investment Management, L.P. Lord, Abbett & Co. LLC Smith Asset Management Group, L.P. Federated MDTA LLC SYSTEMATIC VALUE SYSTEMATIC MID CAP VALUE Systematic Financial Management, L.P. TIMESSQUARE MID CAP GROWTH TIMESSQUARE SMALL CAP GROWTH TSCM GROWTH EQUITY TimesSquare Capital Management, LLC TRILOGY GLOBAL EQUITY TRILOGY EMERGING MARKETS EQUITY TRILOGY INTERNATIONAL SMALL CAP Trilogy Global Advisors, L.P. | | CHICAGO EQUITY PARTNERS BALANCED Chicago Equity Partners, LLC ALTERNATIVE FUNDS FQ GLOBAL ALTERNATIVES FQ GLOBAL ESSENTIALS First Quadrant, L.P. INCOME FUNDS BOND (MANAGERS) FIXED INCOME GLOBAL INCOME OPPORTUNITY Loomis, Sayles & Co., L.P. BOND (MANAGERS PIMCO) Pacific Investment Management Co. LLC CALIFORNIA INTERMEDIATE TAX-FREE Miller Tabak Asset Management LLC GW&K MUNICIPAL BOND GW&K MUNICIPAL ENHANCED YIELD Gannett Welsh & Kotler, LLC HIGH YIELD J.P. Morgan Investment Management LLC INTERMEDIATE DURATION GOVERNMENT SHORT DURATION GOVERNMENT Smith Breeden Associates, Inc. |
| | | | |
This report is prepared for the Fund’s shareholders. It is authorized for distribution to prospective investors only when preceded or accompanied by an effective prospectus. To receive a free copy of the prospectus or Statement of Additional Information, which includes additional information about Fund Trustees, please contact us by calling 800.835.3879. Distributed by Managers Distributors, Inc., member FINRA. A description of the policies and procedures each Fund uses to vote its proxies is available: (i) without charge, upon request, by calling 800.835.3879, or (ii) on the Securities and Exchange Commission’s (SEC) Web site at www. sec.gov. For information regarding each Fund’s proxy voting record for the 12-month period ended June 30, call 800.835.3879 or visit the SEC Web site at www.sec.gov. The Fund files its complete schedule of portfolio holdings with the SEC for the first and third quarters of each fiscal year on Form N-Q. The Funds’ Forms N-Q are available on the SEC’s Web site at www.sec.gov. A Fund’s Forms N-Q may be reviewed and copied at the SEC’s Public Reference Room in Washington, DC. Information on the operation of the Public Reference Room may be obtained by calling 800.SEC.0330. To review a complete list of the Fund’s portfolio holdings, or to view the most recent quarterly holdings report, semiannual report, or annual report, please visit www.managersinvest.com. | | | | |

Item 2. CODE OF ETHICS
Registrant has adopted a Code of Ethics. See attached Exhibit (a)(1).
Item 3. AUDIT COMMITTEE FINANCIAL EXPERT
Registrant’s Board of Trustees has determined that independent Trustees Mr. Jack W. Aber and Mr. Steven J. Paggioli each qualify as the Audit Committee Financial Expert. Mr. Aber and Mr. Paggioli are “independent” as such term is defined in Form N-CSR.
Item 4. PRINCIPAL ACCOUNTANT FEES AND SERVICES
The aggregate fees billed by PwC to the Fund for the Funds’ two most recent fiscal years for professional services rendered for audits of annual financial statements, or services that are normally provided in connection with statutory and regulatory filings or engagements (“Audit Fees”) were as follows:
| | | | | | | | |
| | | Fiscal 2011 | | | Fiscal 2010 | |
Managers Special Equity Fund | | $ | 23,389 | | | $ | 26,430 | |
Managers International Equity Fund | | $ | 31,622 | | | $ | 31,002 | |
Managers Emerging Markets Equity Fund | | $ | 27,715 | | | $ | 27,172 | |
Managers Bond Fund | | $ | 39,327 | | | $ | 38,556 | |
Managers Global Bond Fund | | $ | 25,693 | | | $ | 25,189 | |
All Funds in the Managers Complex Audited by PwC | | $ | 994,830 | | | $ | 994,109 | |
Audit-Related Fees
There were no fees billed by PwC to the Funds in its two recent fiscal years for services rendered for assurance and related services that are reasonably related to the performance of the audit or review of the Fund’s financial statements, but are not reported as Audit Fees (“Audit-Related Fees”).
For the Funds’ two most recent fiscal years, there were no Audit-Related Fees billed by PwC for engagements related directly to the operations and financial reporting of one or more Funds by a Fund Service Provider. A Fund Service Provider is (a) any investment adviser to the Fund (not including any Subadvisor whose role is primarily portfolio management and is subcontracted with or overseen by another investment adviser) or (b) any entity that provides ongoing services to the Fund and is controlling, controlled by or under common control with a Fund investment adviser described in (a).
Tax Fees
The aggregate fees billed by PwC to the Funds for the two most recent fiscal years for professional services rendered for tax compliance, tax advice, and tax planning (“Tax Fees”) were as follows:
| | | | | | | | |
| | | Fiscal 2011 | | | Fiscal 2010 | |
Managers Special Equity Fund | | $ | 7,340 | | | $ | 7,200 | |
Managers International Equity Fund | | $ | 10,200 | | | $ | 10,000 | |
Managers Emerging Markets Equity Fund | | $ | 10,200 | | | $ | 10,000 | |
Managers Bond Fund | | $ | 9,190 | | | $ | 10,000 | |
Managers Global Bond Fund | | $ | 10,200 | | | $ | 10,000 | |
For the Funds’ two most recent fiscal years, Tax Fees billed by PwC for engagements by Fund Service Providers that related directly to the operations and financial reporting of the Funds were $0 for fiscal 2008 and $0 for fiscal 2007, respectively.
The services for which Tax Fees were charged comprise all services performed by professional staff in PwC’s tax division except those services related to the audit. Typically, this category would include fees for tax compliance, tax planning, and tax advice. Tax compliance, tax advice, and tax planning services include preparation of original and amended tax returns, claims for refund and tax payment-planning services, assistance with tax audits and appeals, tax advice related to mergers and acquisitions and requests for rulings or technical advice from taxing authorities.
All Other Fees
There were no other fees billed by PwC to the Funds for all other non-audit services (“Other Fees”) during the Funds’ two most recent fiscal years. During the same period, there were no Other Fees billed by PwC for engagements by Fund Service Providers that related directly to the operations and financial reporting of the Funds.
According to policies adopted by the Audit Committee, services provided by PwC to the Funds must be pre-approved by the Audit Committee. On an annual basis, the Audit Committee reviews and pre-approves various types of services that PwC may perform for the Funds without specific approval of each engagement, subject to specified budget limitations. As contemplated by the Sarbanes-Oxley Act of 2002 and related SEC rules, the Audit Committee also pre-approves non-audit services provided by PwC to any Fund Service Provider for any engagement that relates directly to the operations and financial reporting of the Funds. Any engagement that is not already pre-approved or that will exceed a pre-approved budget must be submitted to the Audit Committee for pre-approval. The Chairman of the Audit Committee is authorized on behalf of the Board of Trustees and the Audit Committee to approve the engagement of PwC to perform non-audit services subject to certain conditions, including notification to the Audit Committee of such pre-approval not later than the next meeting of the Audit Committee following the date of such pre-approval.
There were no other fees billed by PwC for non-audit services rendered to the Funds and to Fund Service Providers for the Funds’ two most recent fiscal years.
The Audit Committee has considered whether the provision of non-audit services by PwC to Fund Service Providers that were not required to be pre-approved by the Audit Committee is compatible with maintaining PwC’s independence in its audit of the Funds, taking into account representations from PwC, in accordance with Independence Standards Board Standard No. 1, regarding its independence from the Funds and its related entities.
The following table sets forth the non-audit services provided by PwC to the Funds and its service affiliates defined as the Funds’ investment advisor and any entity controlling, controlled by or under common control with Managers Investment Group LLC that provides ongoing services to the Funds (“Control Affiliates”) for the last two fiscal years.
| | | | | | | | | | | | | | | | | | | | | | | | |
| | | Audit-related fees A | | | Tax fees A | | | All other fees A | |
| | | 2010 | | | 2009 | | | 2010 | | | 2009 | | | 2010 | | | 2009 | |
Control Affiliates | | $ | 424,730 | | | $ | 580,765 | | | $ | 747,820 | | | $ | 479,175 | | | $ | 0 | | | $ | 0 | |
| A | Aggregate amounts may reflect rounding. |
Item 5. AUDIT COMMITTEE OF LISTED REGISTRANTS
Not applicable.
Item 6. SCHEDULE OF INVESTMENTS
Not applicable.
Item 7. DISCLOSURE OF PROXY VOTING POLICIES AND PROCEDURES FOR CLOSED-END MANAGEMENT INVESTMENT COMPANIES
Not applicable.
Item 8. PORTFOLIO MANAGERS OF CLOSED-END MANAGEMENT INVESTMENT COMPANIES
Not applicable.
Item 9. PURCHASES OF EQUITY SECURITIES BY CLOSED-END MANAGEMENT INVESTMENT COMPANIES AND AFFILIATED PURCHASERS
Not applicable.
Item 10. SUBMISSION OF MATTERS TO A VOTE OF SECURITY HOLDERS
Not applicable.
Item 11. CONTROLS AND PROCEDURES
(a) The Registrant’s principal executive and principal financial officers have concluded, based on their evaluation of the registrant’s disclosure controls and procedures as of a date within 90 days of the filing of this report, that the Registrant’s disclosure
controls and procedures are reasonably designed to ensure that information required to be disclosed by the Registrant on Form N-CSR is recorded, processed, summarized and reported within the required time periods and that information required to be disclosed by the registrant in the reports that it files or submits on Form N-CSR is accumulated and communicated to the Registrant’s management, including its principal executive and principal financial officers, as appropriate to allow timely decisions regarding required disclosure.
(b) There were no changes in the Registrant’s internal control over financial reporting during the Registrant’s fourth fiscal quarter of the period covered by this report that have materially affected, or are reasonably likely to affect, the internal control over financial reporting.
Item 12. EXHIBITS
| | |
| (a) (1) | | Any Code of Ethics or amendments hereto. Filed herewith. |
| |
| (a) (2) | | Certifications pursuant to Rule 30a-2(a) under the Investment Company Act of 1940 - Filed herewith. |
| |
| (a) (3) | | Not applicable. |
| |
| (b) | | Certifications pursuant to Rule 30a-2(b) under the Investment Company Act of 1940 - Filed herewith. |
SIGNATURES
Pursuant to the requirements of the Securities Exchange Act of 1934 and the Investment Company Act of 1940, the registrant has duly caused this report to be signed on its behalf by the undersigned, thereunto duly authorized.
THE MANAGERS FUNDS
| | |
| By: | | /s/ Keitha L. Kinne |
| | Keitha L. Kinne, President |
| |
| Date: | | March 5, 2012 |
Pursuant to the requirements of the Securities Exchange Act of 1934 and the Investment Company Act of 1940, this report has been signed below by the following persons on behalf of the registrant and in the capacities and on the dates indicated.
| | |
| By: | | /s/ Keitha L. Kinne |
| | Keitha L. Kinne, President |
| |
| Date: | | March 5, 2012 |
| |
| By: | | /s/ Donald S. Rumery |
| | Donald S. Rumery, Chief Financial Officer |
| |
| Date: | | March 5, 2012 |