UNITED STATES
SECURITIES AND EXCHANGE COMMISSION
Washington, D.C. 20549
FORM N-CSR
CERTIFIED SHAREHOLDER REPORT OF REGISTERED
MANAGEMENT INVESTMENT COMPANIES
Investment Company Act file number: 811-03752
THE MANAGERS FUNDS
(Exact name of registrant as specified in charter)
800 Connecticut Avenue, Norwalk, Connecticut 06854
(Address of principal executive offices) (Zip code)
Managers Investment Group LLC
800 Connecticut Avenue, Norwalk, Connecticut 06854
(Name and address of agent for service)
Registrant’s telephone number, including area code: (203) 299-3500
Date of fiscal year end: DECEMBER 31
Date of reporting period: JANUARY 1, 2009 – December 31, 2009
(Annual Shareholder Report)
| Item 1. | Reports to Shareholders |
ANNUAL REPORT
Managers Funds
December 31, 2009
Managers AMG Essex Large Cap Growth Fund
Managers International Equity Fund
Managers Emerging Markets Equity Fund
Managers Global Bond Fund
Managers Money Market Fund

AR001-1209
The Managers Funds
Annual Report — December 31, 2009
TABLE OF CONTENTS
| | |
| | | Page |
LETTER TO SHAREHOLDERS | | 1 |
| |
ABOUT YOUR FUND’S EXPENSES | | 3 |
| |
INVESTMENT MANAGER’S COMMENTS, FUND SNAPSHOTS, AND SCHEDULES OF PORTFOLIO INVESTMENTS | | |
| |
Managers AMG Essex Large Cap Growth Fund | | 4 |
| |
Managers International Equity Fund | | 9 |
| |
Managers Emerging Markets Equity Fund | | 18 |
| |
Managers Global Bond Fund | | 25 |
| |
NOTES TO SCHEDULES OF PORTFOLIO INVESTMENTS | | 32 |
| |
FINANCIAL STATEMENTS: | | |
| |
Statements of Assets and Liabilities | | 33 |
Funds’ balance sheets, net asset value (NAV) per share computations and cumulative undistributed amounts | | |
| |
Statements of Operations | | 34 |
Detail of sources of income, Fund expenses, and realized and unrealized gains (losses) during the year | | |
| |
Statements of Changes in Net Assets | | 35 |
Detail of changes in Fund assets for the past two years | | |
| |
| MANAGERS MONEY MARKET FINANCIAL STATEMENTS: | | |
| |
Statement of Assets and Liabilities | | 37 |
Fund balance sheet, net asset value (NAV) per share computation and cumulative undistributed amount | | |
| |
Statement of Operations | | 37 |
Detail of sources of income, Fund expenses, and realized and unrealized gains (losses) during the year | | |
| |
Statement of Changes in Net Assets | | 38 |
Detail of changes in Fund assets for the past two years | | |
| |
| FINANCIAL HIGHLIGHTS | | 38 |
Historical net asset values per share, distributions, total returns, expense ratios, turnover ratios and net assets | | |
| |
| NOTES TO FINANCIAL STATEMENTS | | 41 |
Accounting and distribution policies, details of agreements and transactions with Fund management and affiliates, and descriptions of certain investment risks | | |
| |
| REPORT OF INDEPENDENT REGISTERED PUBLIC ACCOUNTING FIRM | | 51 |
| |
| TRUSTEES AND OFFICERS | | 52 |
Nothing contained herein is to be considered an offer, sale or solicitation of an offer to buy shares of any series of the Managers Family of Funds. Such offering is made only by Prospectus, which includes details as to offering price and other material information.
Letter to Shareholders
Dear Shareholder:
Our foremost goal at Managers Investment Group (“MIG”) is to structure and manage mutual funds that will help our shareholders and clients successfully reach their investment goals and objectives.
Each of our Funds is geared to provide you with exposure to a specific asset class or style of investing. Investors tend to use our Funds as part of their broader portfolio in order to tailor their asset allocation to meet their individual needs. Most of our Funds, like those detailed in this report, are therefore designed to be building blocks.
At MIG, we have overall responsibility for the investment management and administration of the Funds. As a “manager of managers,” we work with external investment managers that make the day-to-day investment decisions in the Funds (the “Portfolio Managers”). We devote considerable resources to our disciplined process of identifying and selecting unaffiliated Portfolio Managers for the Funds. As a manager of managers, MIG performs many activities to monitor the ongoing investment, compliance, and administrative aspects of all of the Funds, which gives our shareholders added confidence in their investments.
Our parent company, Affiliated Managers Group (“AMG”) is a global asset management company with ownership interests in a diverse group of boutique investment management firms (its “Affiliates”). MIG has the unique opportunity to access the investment skills and acumen of some of AMG’s Affiliates. The set of our Funds managed by these proprietary firms also benefit from our activities to monitor the investment, compliance, and administrative aspects of the Funds.
Below is a brief overview of the securities markets and the performance results for the Funds. Following this letter, we also provide the Portfolio Managers’ discussion of their investment management approach, performance results, and market outlook.
The year 2009 will go down in the history books as one in which securities markets sank to unimaginable levels and some investors briefly questioned the viability of capitalism. As it turned out, capitalism did not cease to exist and equities, as well as credit-sensitive fixed income securities, managed to regroup and record one of the most impressive rebounds in the history of the capital markets. The government’s unprecedented efforts with respect to healing the economy and stabilizing the securities markets via programs such as the Troubled Asset Relief Program (“TARP”), the Public-Private Investment Program (“PPIP”) and the Term Asset-Backed Securities Loan Facility (“TALF”) seem to have achieved their desired short-term effects, although some would argue that the programs played a minor role in the stabilization of the markets and that free market forces simply corrected oversold conditions, just as they have on numerous occasions in the past.
Against this backdrop, the Managers AMG Essex Large Cap Growth Fund, Managers International Equity Fund, Managers Emerging Markets Equity Fund, and the Managers Global Bond Fund, (each a “Fund” and collectively the “Funds”), generated strong absolute returns in this historic environment, as detailed below. (Note that unless otherwise stated, all performance cited in these commentaries is in U.S. Dollars.)
| | | | | | | | | | | | | | | | | |
Periods Ended 12/31/09 | | 6 Months | | | 1 Year | | | 3 Years | | | 5 Years | | | 10 Years | | | Inception Date |
| | | | | | |
Managers AMG Essex Large Cap Growth Fund | | 16.78 | % | | 32.39 | % | | (4.08 | )% | | (0.77 | )% | | (7.31 | )% | | 6/1/1984 |
| | | | | | |
Russell 1000® Growth Index | | 23.03 | % | | 37.21 | % | | (1.89 | )% | | 1.63 | % | | (3.99 | )% | | |
| | | | | | |
Managers International Equity Fund | | 19.04 | % | | 31.68 | % | | (8.24 | )% | | 2.60 | % | | 0.19 | % | | 12/31/1985 |
| | | | | | |
MSCI EAFE Index | | 22.07 | % | | 31.78 | % | | (6.04 | )% | | 3.54 | % | | 1.17 | % | | |
| | | | | | |
Managers Emerging Markets Equity Fund | | 29.60 | % | | 67.94 | % | | (0.67 | )% | | 11.80 | % | | 8.61 | % | | 2/9/1998 |
| | | | | | |
MSCI EM Index (Net) | | 31.24 | % | | 78.51 | % | | 5.11 | % | | 15.51 | % | | 9.78 | % | | |
| | | | | | |
MSCI EM Index (Gross) | | 31.42 | % | | 79.02 | % | | 5.42 | % | | 15.88 | % | | 10.11 | % | | |
| | | | | | |
Managers Global Bond Fund | | 12.50 | % | | 24.26 | % | | 6.30 | % | | 4.15 | % | | 6.16 | % | | 3/25/1994 |
| | | | | | |
Barclays Capital Global Aggregate Bond Index | | 5.33 | % | | 6.93 | % | | 7.05 | % | | 4.56 | % | | 6.49 | % | | |
| | | | | | |
Money Market Fund | | 0.00 | % | | 0.27 | % | | 2.64 | % | | 3.05 | % | | 2.80 | % | | 6/1/1984 |
| | | | | | |
Merrill 3 Month T-Bill | | 0.11 | % | | 0.21 | % | | 2.41 | % | | 3.02 | % | | 2.99 | % | | |
1
Letter to Shareholders (continued)
As noted above, for the year ended December 31, 2009, the Managers AMG Essex Large Cap Growth Fund returned 32.39%, underperforming the Russell 1000® Growth Index, which returned 37.21%. In 2009, large-cap growth stocks performed very well on an absolute basis and also fared well versus other major domestic investment categories For example, large-cap growth stocks outperformed small-cap value stocks by almost 17% for the year thanks partly to strength in the technology sector. The primary driver of the Fund’s underperformance for the year relative to the benchmark was weak relative stock selection in the healthcare and industrial segments. In industrials, the key detractor was the Fund’s exposure to airlines while in health care, biotechnology exposure weighed heavily on results.
As noted above, for the year ended December 31, 2009, the Managers International Equity Fund returned 31.68%, trailing the return of 31.78% for its benchmark, the MSCI EAFE Index. Solid results for the Fund were primarily driven by non-benchmark exposure to the emerging markets and solid stock selection within the financials sector. This solid stock selection was somewhat mitigated, however, by weakness within the industrials sector and by holdings within Japan which failed to keep up with the broader global equity rally.
As noted in the table above, for the year ended December 31, 2009, the Managers Emerging Markets Fund returned 67.94%, trailing the return of 78.51% for its benchmark, the MSCI Emerging Markets Index. Much of the underperformance was concentrated during the first quarter of the year, prior to the markets’ recovery. The Fund was early in positioning for the eventual recovery, which weighed on first quarter performance. For the full year, stock selection within India and South Africa were the largest detractors from relative performance. On the other hand, the Fund benefited from an overweight position in Russia, an underweight to Mexico, and strong stock selection within Brazil.
As noted in the table above, for the year ended December 31, 2009, the Managers Global Bond Fund returned 24.26%, widely outpacing the return of 6.93% for the Barclay’s Capital Global Aggregate Bond Index. The Fund’s greater-than-benchmark allocation to U.S. investment-grade corporate bonds and an underweight to U.S. Treasuries were the primary drivers of excess performance during the period. The Fund’s overweight Norwegian Krone, South Korean Won, and Canadian Dollar positions enhanced returns as these currencies appreciated on increasing global growth prospects and increasing risk appetites.
The following report covers the one-year period ended December 31, 2009. Should you have any questions about this report, or if you’d like to receive a prospectus and additional information, including fees and expenses for these or any of the other Funds in our family, please feel free to contact us at 1-800-835-3879, or visit our Web site at www.managersinvest.com. As always, please read the prospectus carefully before you invest or send money.
If you are curious about how you can better diversify your investment program, visit the Knowledge Center on our Web site and view our articles in the investment strategies section. You can rest assured that under all market conditions our team is focused on delivering excellent investment management services for your benefit.
We thank you for your continued confidence and investment in The Managers Funds.
Respectfully,
|
 |
| John H. Streur |
| Senior Managing Partner |
| Managers Investment Group LLC |
2
About Your Fund’s Expenses
As a shareholder of a Fund, you may incur two types of costs: (1) transaction costs, which may include sales charges (loads) on purchase payments; redemption fees; and exchange fees; and (2) ongoing costs, including management fees; distribution (12b-1) fees; and other Fund expenses. This example is intended to help you understand your ongoing costs (in dollars) of investing in the Fund and to compare these costs with the ongoing costs of investing in other mutual funds. The example is based on $1,000 invested at the beginning of the period and held for the entire period as indicated below.
Actual Expenses
The first line of the following table provides information about the actual account values and actual expenses. You may use the information in this line, together with the amount you invested, to estimate the expenses that you paid over the period. Simply divide your account value by $1,000 (for example, an $8,600 account value divided by $1,000 = 8.6), then multiply the result by the number in the first line under the heading entitled “Expenses Paid During Period” to estimate the expenses you paid on your account during this period.
Hypothetical Example for Comparison Purposes
The second line of the following table provides information about hypothetical account values and hypothetical expenses based on the Fund’s actual expense ratio and an assumed annual rate of return of 5% before expenses, which is not the Fund’s actual return. The hypothetical account values and expenses may not be used to estimate the actual ending account balance or expenses you paid for the period. You may use this information to compare the ongoing costs of investing in the Fund and other funds by comparing this 5% hypothetical example with the 5% hypothetical examples that appear in the shareholder reports of other funds.
Please note that the expenses shown in the table are meant to highlight your ongoing costs only and do not reflect any transactional costs, such as sales charges (loads), redemption fees, or exchange fees. Therefore, the second line of the table is useful in comparing ongoing costs only, and will not help you determine the relative total costs of owning different funds.
| | | | | | | | | | | | |
Six Months Ended December 31, 2009 | | Expense Ratio
for the Period | | | Beginning
Account Value
7/1/2009 | | Ending
Account Value
12/31/2009 | | Expenses Paid
During the
Period* |
| | | | |
Managers AMG Essex Large Cap Growth Fund | | | | | | | | | | | | |
| | | | |
Based on Actual Fund Return | | 1.61 | % | | $ | 1,000 | | $ | 1,168 | | $ | 8.80 |
| | | | |
Based on Hypothetical 5% Annual Return | | 1.61 | % | | $ | 1,000 | | $ | 1,017 | | $ | 8.19 |
| | | | |
Managers International Equity Fund | | | | | | | | | | | | |
| | | | |
Based on Actual Fund Return | | 1.48 | % | | $ | 1,000 | | $ | 1,190 | | $ | 8.17 |
| | | | |
Based on Hypothetical 5% Annual Return | | 1.48 | % | | $ | 1,000 | | $ | 1,018 | | $ | 7.53 |
| | | | |
Managers Emerging Markets Equity Fund | | | | | | | | | | | | |
| | | | |
Based on Actual Fund Return | | 1.77 | % | | $ | 1,000 | | $ | 1,296 | | $ | 10.24 |
| | | | |
Based on Hypothetical 5% Annual Return | | 1.77 | % | | $ | 1,000 | | $ | 1,016 | | $ | 9.00 |
| | | | |
Managers Global Bond Fund | | | | | | | | | | | | |
| | | | |
Based on Actual Fund Return | | 1.10 | % | | $ | 1,000 | | $ | 1,125 | | $ | 5.89 |
| | | | |
Based on Hypothetical 5% Annual Return | | 1.10 | % | | $ | 1,000 | | $ | 1,020 | | $ | 5.60 |
| | | | |
Managers Money Market Fund | | | | | | | | | | | | |
| | | | |
Based on Actual Fund Return | | 0.45 | %1 | | $ | 1,000 | | $ | 1,000 | | $ | 2.27 |
| | | | |
Based on Hypothetical 5% Annual Return | | 0.45 | %1 | | $ | 1,000 | | $ | 1,023 | | $ | 2.29 |
| * | Expenses are equal to the Fund’s annualized expense ratio multiplied by the average account value over the period, multiplied by the number of days in the most recent fiscal half-year (184), then divided by 365. |
| 1 | The ratio reflects the combined expenses of the Fund and the Capital Shares of the JPMorgan Liquid Assets Money Market Fund, the portfolio in which the Fund invests all of its assets. |
3
Managers AMG Essex Large Cap Growth Fund
Investment Manager’s Comments
For the year ended December 31, 2009, the Managers AMG Essex Large Cap Growth Fund (the “Fund”) returned 32.39%, under-performing the Russell 1000® Growth Index (the “Index), which returned 37.21%.
THE YEAR IN REVIEW:
Stabilizing home prices, improving global trade, and narrowing credit spreads boosted investor confidence that world economies are responding to the unprecedented policy actions implemented earlier in 2009. After several quarters of deteriorating U.S. economic conditions and falling economies overseas, rising expectations of global economic recovery benefited industrial, energy, and technology sectors. After bottoming out at half its value in 2008, financials staged an impressive rebound in March on the heels of the public/private bank plan. Investors then gravitated toward the sector, with banks and brokerage stocks leading in the second quarter of 2009, but finishing the calendar year lower as trading slowed as a result of corporate intentions to hang onto gains for the year. Consumer discretionary stocks also stepped to the front, outperforming most sectors for the year. Health care stocks remained in the penalty box as the debate on reform winds its way through Congress. Along the market capitalization and style spectrums, smaller-cap companies led the advance ceding to larger-sized companies in the fourth quarter, with growth stocks of all sizes outpacing the market averages.
Following a drumbeat of negative economic news early in the period, industrials rebounded based on expectations of an economic recovery but trailed the return of the Index. The Fund’s exposure in this segment weighed on relative performance. Specifically, returns were hampered by the Fund’s emphasis on engineering and contracting companies, which continued to be dragged down by the delayed impact of stimulus spending. The Fund’s holdings in AECOM Technology Corp., Quanta Services Inc., and URS Corp. were notable detractors. In addition, the Fund’s results were also negatively impacted by its exposure to air transport, which retreated following news that the industry issued downward short-term guidance.
The Fund benefited from its exposure to the materials segment with Freeport-McMoRan Copper & Gold Inc. and United States Steel Corp. leading the way. International pricing firmed during the period given an increase in coal and iron ore pricing. Both companies benefitted from these trends. Freeport-McMoRan Copper & Gold Inc. surpassed expectations, driven by commodity price increases for copper and gold. Following a turbulent year, fertilizer fundamentals bottomed during the fourth quarter, setting the stage for meaningful reacceleration in the near term. With fertilizer usage ultimately relying on firm crop pricing, strong phosphate trends show a tightened market with returning demand and thus upward pressure on pricing. This environment should have a positive impact on Potash Corp. of Saskatchewan Inc., which was a key contributor during the year.
In energy, a detrimental overweight allocation was more than offset by favorable stock selection. Offshore drilling company Transocean Ltd. benefitted from firm pricing as oil prices strengthened. Shares of Walter Energy, Inc. benefitted from an upsurge in metallurgical coal demand, with increased buying in China driving spot rates higher and generating positive sentiment for 2010 contract negotiations. Walter also began delivering more carry-over tonnage previously contracted at all-time record prices.
The 12-month period was volatile for consumer stocks. The group initially traded off on concerns about consumer spending in light of weakening employment and housing trends, but performance later rebounded as consumer sentiment was lifted. The Fund’s underweight position in the consumer staples sector had a positive impact but was partially offset by weak stock selection. The Fund’s results in the consumer discretionary sector were mixed. In retail, TJX Cos. and Kohl’s Corp. were both contributors for the period. Essex believes Kohl’s has a sustainable cost structure, thus implying that earnings flow will be even greater during a recovery. In contrast, the less cyclical education sector was a relative underperformer as investors worried about possible negative regulatory changes. The Fund’s holdings in the education sector included a position in Apollo Group Inc.
Financials experienced a robust turnaround in the middle of the period, led by banks and brokerage stocks. The Fund’s stock selection, however, led to underperformance relative to the benchmark. Financial services firms, Goldman Sachs Group Inc. and JPMorgan Chase & Co. accelerated in the first half of the period, driven by record capital markets revenues, a more favorable trading environment and stronger equity markets. Shares of JPMorgan pulled back later in the year, reflecting seasonal trends as the private equity market became more focused on protecting gains. Similarly, Intercontinental Exchange Inc. gave back gains, as its growth opportunities were dampened by regulatory risks limiting commodity speculation. Insurance companies, PartnerRe Ltd. and ACE Ltd., were detractors due to investor rotation out of more conservative financial stocks.
4
Managers AMG Essex Large Cap Growth Fund
Investment Manager’s Comments (continued)
Health care performance moderated in 2009, lagging the overall market as investors dealt with the uncertainties of political reform. The Fund’s overweight position detracted from performance. Genentech was the top contributor in the Fund for the 12-month period. Roche purchased the remainder of Genentech during the first quarter, causing the share price to leap. Also in biotech, Human Genome Sciences Inc. continued to benefit from positive Phase III results for its Lupus drug, Benlysta. Physicians remain optimistic as Benlysta is the first promising drug for Lupus to emerge in fifty years. Shares of Vertex Pharmaceuticals Inc. responded positively to late-stage trial results for their current Hepatitis C drug, and rumors of a potential suitor for acquisition. However, this was not enough to offset losses from Celgene Corp. and Baxter International Inc., which failed to participate in the market’s rally. St. Jude Medical Inc. suffered from near-term concerns over lower patient volumes and softness in hospital purchasing patterns. This position was eliminated during the fourth quarter. Gilead Sciences Inc., another detractor, took a hit following the news that Darusentan had failed its Phase III trial. Investors reacted pessimistically to the news as they questioned two of the company’s recent acquisitions, Myogen and CV Therapeutics. Essex believes this news event had a modest financial impact on the company and should not prove to be damaging long term.
Despite pressure early in the period due to economic concerns, technology stocks rose dramatically over the 12-month period. Overly bearish estimates were exceeded, and expectations for a turn in cyclical demand continue to propel the sector. In computer technology, Google, Inc. and Apple, Inc. both continued their upward march. Google continues to dominate market share for online searching, and Essex believes the advertising arena will improve in the coming quarter. Shares of Apple remain resilient upon continued strong adoption of the iPhone, international expansion, further penetration of markets as carrier contracts roll off, solid Mac sales trends, and the widely anticipated release of a new product, a tablet PC, in the first quarter. EMC Corp. also contributed to returns. These gains were offset by losses from Palm Inc. and STEC Inc. STEC suffered from competitive concerns and near-term inventory overhang at EMC Corp. Sales of Palm’s products at Sprint failed to show material upside, and investors have concerns about the success of the company’s smartphones against competition from Android, iPhone, and Blackberry. In software, the Fund’s holdings in Salesforce.com Inc. contributed to performance. The company’s cloud computing products continue to gain market share and customer loyalty based on its proven business model consistency.
LOOKING FORWARD
A year ago investors feared the worst, with the U.S. economy on the edge of a debt-deflation led downturn. Bold fiscal and monetary intervention averted this scenario, asset prices recovered, and the economy returned to growth in the third quarter of 2009. As we enter a new year, forecasters are divided on the shape and durability of the rebound: will it be a “V,” “W,” or something else? While the pace of recovery is likely to remain uneven over the next few quarters, Essex believes the positives of inventory restocking, rising exports to developing countries, and unspent government stimulus funds outweigh the negative headwinds of deleveraging. Essex expects inflation to be subdued for some time, allowing the Federal Reserve to keep interest rate hikes on hold for most of 2010. This benign interest rate backdrop coupled with an abundance of cash looking for higher returns should continue to provide support to stock prices.
Following a nearly 65% rise from the market lows last March, equity investors face a number of crosscurrents in the year ahead. Unexpected economic setbacks, worries about the budget deficit, and the speed by which the U.S. monetary authorities retreat from their accommodative policies will likely test financial markets. More importantly, further advances in stocks will require increasing earnings, and the outlook remains encouraging. Essex believes corporate profits have the potential to surprise on the upside in 2010, as operating leverage in an expanding global economy could be significant. In an earnings driven market, sector and stock selection will become more important in achieving superior relative returns. Essex continues to focus its efforts on companies across a number of industries with accelerating revenues and strong financial management, which should result in sustained earnings growth over the next several years.
CUMULATIVE TOTAL RETURN PERFORMANCE
Managers AMG Essex Large Cap Growth Fund’s cumulative total return is based on the daily change in net asset value (NAV), and assumes that all dividends and distributions were reinvested. The Russell 1000® Growth Index is a market capitalization weighted index that measures the performance of those Russell 1000® companies with higher price-to-book ratio and higher forecasted growth values. Unlike the Fund, the Russell 1000® Growth Index is unmanaged, is not available for investment, and does not incur expenses. The Russell 1000® Growth Index is a trademark of Russell Investments. Russell® is a trademark of Russell Investments. The Index assumes reinvestment of dividends. This graph compares a hypothetical $10,000 investment made in Managers AMG
5
Managers AMG Essex Large Cap Growth Fund
Investment Manager’s Comments (continued)
CUMULATIVE TOTAL RETURN PERFORMANCE (continued)
Essex Large Cap Growth Fund on December 31, 1999, to a $10,000 investment made in the Russell 1000® Growth Index for the same time period. Performance for periods longer than one year is annualized. The graph and table do not reflect the deduction of taxes that a shareholder would pay on a Fund distribution or redemption of shares. The listed returns for the Fund are net of expenses and the returns for the index exclude expenses. Past performance is not indicative of future results. Total returns would have been lower had certain expenses not been reduced.
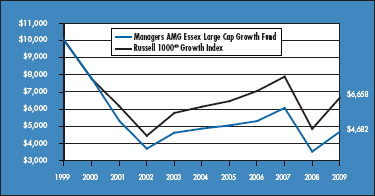
The table below shows the average annual total returns for Managers AMG Essex Large Cap Growth Fund and the Russell 1000® Growth Index from December 31, 1999 through December 31, 2009.
| | | | | | | | | |
Average Annual Total Returns1 | | One Year | | | Five Years | | | Ten Years | |
| | | |
Managers AMG Essex Large Cap Growth Fund2,3 | | 32.39 | % | | (0.77 | )% | | (7.31 | )% |
| | | |
Russell 1000® Growth Index | | 37.21 | % | | 1.63 | % | | (3.99 | )% |
The performance data shown represents past performance. Past performance is not a guarantee of future results. Current performance may be lower or higher than the performance data quoted. The investment return and principal value of an investment in the Fund will fluctuate so that an investor’s shares, when redeemed, may be worth more or less than their original cost. For performance information through the most recent month end, please call (800) 835-3879 or visit our Web site at www.managersinvest.com.
In choosing a Fund, investors should carefully consider the amount they plan to invest, their investment objectives, the Fund’s investment objectives, risks, charges and expenses before investing. For this and other information, please call (800) 835-3879 or visit www.managersinvest.com for a free prospectus. Read it carefully before investing or sending money. Distributed by Managers Distributors, Inc., member FINRA.
| 1 | Total return equals income yield plus share price change and assumes reinvestment of all dividends and capital gain distributions. Returns are net of fees and may reflect offsets of Fund expenses as described in the Prospectus. No adjustment has been made for taxes payable by shareholders on their reinvested dividends and capital gain distributions. Returns for periods greater than one year are annualized. The listed returns on the Fund are net of expenses and based on the published NAV as of December 31, 2009. All returns are in U.S. dollars($). |
| 2 | Fund for which, from time to time, the Fund’s advisor has waived its fees and/or absorbed Fund expenses, which has resulted in higher returns. |
| 3 | The Fund invests in large-capitalization companies that may underperform other stock funds (such as funds that focus on small- and medium-capitalization companies) when stocks of large-capitalization companies are out of favor. The Fund invests in growth stocks, which may be more sensitive to market movements because their prices tend to reflect future investor expectations rather than just current profits. Growth stocks may underperform value stocks during given periods. |
Not FDIC insured, nor bank guaranteed. May lose value.
6
Managers AMG Essex Large Cap Growth Fund
Fund Snapshots
December 31, 2009
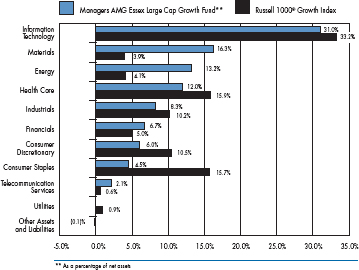
Portfolio Breakdown
| | | | | | |
Industry | | Managers AMG
Essex Large Cap
Growth Fund** | | | Russell 1000®
Growth Index | |
Information Technology | | 31.0 | % | | 33.2 | % |
Materials | | 16.3 | % | | 3.9 | % |
Energy | | 13.2 | % | | 4.1 | % |
Health Care | | 12.0 | % | | 15.9 | % |
Industrials | | 8.3 | % | | 10.2 | % |
Financials | | 6.7 | % | | 5.0 | % |
Consumer Discretionary | | 6.0 | % | | 10.5 | % |
Consumer Staples | | 4.5 | % | | 15.7 | % |
Telecommunication Services | | 2.1 | % | | 0.6 | % |
Utilities | | 0.0 | % | | 0.9 | % |
Other Assets and Liabilities | | (0.1 | )% | | 0.0 | % |
Top Ten Holdings
| | | |
Security Name | | Percentage of
Net Assets | |
Google, Inc.* | | 4.6 | % |
U.S. Steel Corp. | | 4.2 | |
Apple, Inc. | | 3.3 | |
Microsoft Corp.* | | 3.0 | |
Anadarko Petroleum Corp. | | 2.8 | |
FedEx Corp. | | 2.8 | |
Cisco Systems, Inc.* | | 2.7 | |
Goldman Sachs Group, Inc.* | | 2.4 | |
Celgene Corp. | | 2.2 | |
Walter Industries, Inc. | | 2.1 | |
| | | |
Top Ten as a Group | | 30.1 | % |
| | | |
| * | Top Ten Holding at June 30, 2009 |
Any sectors, industries, or securities discussed should not be perceived as investment recommendations. Mention of a specific security should not be considered a recommendation to buy or solicitation to sell that security. Specific securities mentioned in this report may have been sold from the Fund’s portfolio of investments by the time you receive this report.
7
Managers AMG Essex Large Cap Growth Fund
Schedule of Portfolio Investments
December 31, 2009
| | | | | | | |
| | | Shares | | | Value | |
Common Stocks - 100.1% | | | | | | | |
Consumer Discretionary - 6.0% | | | | | | | |
Harman International Industries, Inc. | | 4,669 | | | $ | 164,722 | |
Kohl’s Corp.* | | 5,466 | | | | 294,781 | |
Omnicom Group, Inc. | | 3,810 | | | | 149,162 | |
TJX Cos., Inc., The | | 7,271 | | | | 265,755 | |
Total Consumer Discretionary | | | | | | 874,420 | |
Consumer Staples - 4.5% | | | | | | | |
Costco Wholesale Corp. | | 3,704 | | | | 219,166 | |
PepsiCo, Inc. | | 4,901 | | | | 297,980 | |
Wal-Mart Stores, Inc. | | 2,646 | | | | 141,429 | |
Total Consumer Staples | | | | | | 658,575 | |
Energy - 13.2% | | | | | | | |
Anadarko Petroleum Corp. | | 6,612 | | | | 412,721 | |
Halliburton Co. | | 9,735 | | | | 292,926 | |
Occidental Petroleum Corp. | | 1,813 | | | | 147,488 | |
Petrohawk Energy Corp.* | | 7,817 | | | | 187,530 | |
Range Resources Corp. | | 2,952 | | | | 147,157 | |
Southwestern Energy Co.* | | 6,064 | | | | 292,285 | |
Tenaris, S.A. | | 7,011 | 2 | | | 299,019 | |
Weatherford International, Ltd.* | | 8,462 | | | | 151,554 | |
Total Energy | | | | | | 1,930,680 | |
Financials - 6.7% | | | | | | | |
Ameriprise Financial, Inc. | | 5,530 | | | | 214,675 | |
Goldman Sachs Group, Inc. | | 2,112 | | | | 356,590 | |
IntercontinentalExchange, Inc.* | | 721 | | | | 80,968 | |
Morgan Stanley Co. | | 5,830 | | | | 172,568 | |
State Street Corp. | | 3,394 | | | | 147,775 | |
Total Financials | | | | | | 972,576 | |
Health Care - 12.0% | | | | | | | |
Baxter International, Inc. | | 5,161 | | | | 302,847 | |
Celgene Corp.* | | 5,760 | | | | 320,717 | |
Genzyme Corp.* | | 3,518 | | | | 172,417 | |
Gilead Sciences, Inc.* | | 3,286 | | | | 142,218 | |
Human Genome Sciences, Inc.* | | 7,676 | | | | 234,886 | |
Medco Health Solutions, Inc.* | | 2,351 | | | | 150,252 | |
Teva Pharmaceutical Industries, Ltd., | | | | | | | |
Sponsored ADR | | 4,112 | | | | 231,012 | |
Vertex Pharmaceuticals, Inc.* | | 4,710 | | | | 201,824 | |
Total Health Care | | | | | | 1,756,173 | |
Industrials - 8.3% | | | | | | | |
Aecom Technology Corp.* | | 8,165 | | | | 224,538 | |
FedEx Corp. | | 4,826 | | | | 402,730 | |
Parker Hannifin Corp. | | 3,724 | | | | 200,649 | |
Quanta Services, Inc.* | | 7,881 | | | | 164,240 | |
United Technologies Corp. | | 3,179 | | | | 220,654 | |
Total Industrials | | | | | | 1,212,811 | |
Information Technology - 31.0% | | | | | | | |
Apple, Inc.* | | 2,296 | | | | 484,135 | |
ASML Holding, N.V. | | 5,489 | | | | 187,120 | |
Cisco Systems, Inc.* | | 16,613 | | | | 397,715 | |
CommScope, Inc.* | | 7,385 | | | | 195,924 | |
EMC Corp.* | | 17,681 | | | | 308,887 | |
Google, Inc.* | | 1,091 | | | | 676,398 | |
Marvell Technology Group, Ltd.* | | 14,741 | | | | 305,876 | |
MEMC Electronic Materials, Inc.* | | 12,732 | | | | 173,410 | |
Microsoft Corp. | | 14,465 | | | | 441,038 | |
Motorola, Inc. | | 36,556 | | | | 283,675 | |
ON Semiconductor Corp.* | | 27,045 | | | | 238,266 | |
Paychex, Inc. | | 6,631 | | | | 203,174 | |
QUALCOMM, Inc. | | 4,812 | | | | 222,603 | |
Salesforce.com, Inc.* | | 3,012 | | | | 222,195 | |
Yahoo!, Inc.* | | 11,240 | | | | 188,607 | |
Total Information Technology | | | | | | 4,529,023 | |
Materials - 16.3% | | | | | | | |
AK Steel Holding Corp. | | 13,673 | | | | 291,919 | |
Air Products & Chemicals, Inc. | | 1,749 | | | | 141,774 | |
Freeport McMoRan Copper & Gold, Inc., Class B* | | 2,567 | | | | 206,104 | |
Goldcorp, Inc. | | 7,684 | | | | 302,289 | |
Mosaic Co., The | | 3,843 | | | | 229,542 | |
Potash Corp. of Saskatchewan, Inc. | | 2,607 | | | | 282,860 | |
U.S. Steel Corp. | | 11,207 | | | | 617,729 | |
Walter Industries, Inc. | | 4,157 | | | | 313,064 | |
Total Materials | | | | | | 2,385,281 | |
Telecommunication Services - 2.1% | | | | | | | |
NII Holdings, Inc., Class B* | | 9,151 | | | | 307,291 | |
Total Common Stocks
(cost $12,042,850) | | | | | | 14,626,830 | |
Short-Term Investments - 2.2%1 | | | | | | | |
BNY Institutional Cash Reserves Fund, Series A, 0.05%3 | | 189,000 | | | | 189,000 | |
BNY Institutional Cash Reserves Fund, Series B*3,8 | | 119,397 | | | | 23,282 | |
Dreyfus Cash Management Fund, Institutional Class Shares, 0.08% | | 111,531 | | | | 111,531 | |
Total Short-Term Investments
(cost $419,928) | | | | | | 323,813 | |
Total Investments - 102.3%
(cost $12,462,778) | | | | | | 14,950,643 | |
Other Assets, less Liabilities - (2.3)% | | | | | | (338,325 | ) |
Net Assets - 100.0% | | | | | $ | 14,612,318 | |
The accompanying notes are an integral part of these financial statements.
8
Managers International Equity Fund
Investment Manager’s Comments
The Managers International Equity Fund’s (the “Fund”) investment objective is to achieve long-term capital appreciation. Income is the Fund’s secondary objective.
The Managers International Equity Fund ordinarily invests at least 80% of assets in equity securities, and at least 65% of assets in common and preferred stocks of companies domiciled outside the United States. The Fund intends to diversify investments among both countries and sectors. Investments may be made in companies in developed as well as developing countries. The Fund may also engage in currency-hedging strategies and may invest in companies of any size. The MSCI EAFE Index (the “Index”) is the benchmark for the Fund.
THE PORTFOLIO MANAGERS
The Fund employs multiple portfolio managers who specialize in distinct investment approaches. This “intelligence diversification” not only serves to manage risk, but also helps the Fund tap the market’s full potential by focusing different analytical insights on each potential investment. Fund management strives to achieve its performance goals and diversification while ensuring that the Fund operates within the framework of its investment objective and principal investment strategies.
AllianceBernstein L.P.’s Investment Research and Management (“AllianceBernstein”)
AllianceBernstein’s approach to investing is value-based and research-driven. The thesis of Bernstein’s investment philosophy is that human nature leads investors to buy and sell financial assets based on an overreaction to near-term events. They believe investors confuse temporary or cyclical characteristics with the creation of buying opportunities, as investors underestimate the potential for corrective strategies to restore long-term earnings power. The investment team, led by Kevin Simms, attempts to exploit this disconnect by using research to separate fact from emotion.
The primary driver of AllianceBernstein’s performance is research-driven security selection. AllianceBernstein screens their initial universe with a proprietary return model in order to identify the companies with the most attractive value attributes. The model derives an expected return for each company within the universe by assessing companies both from a global industry-based perspective and from a country-based standpoint, evaluating such factors as price-to-cash earnings, price-to-book, return on equity, and price momentum. The ideal company would exhibit strong fundamentals and have strong future business prospects.
Portfolio Construction
| • | | Initial investable universe is composed of all companies within the countries of the MSCI All Country World Index ex U.S. universe with a market capitalization greater than $750 million |
| • | | Investment team screens this universe using a proprietary-return model to identify the companies with the most attractive value attributes |
| | • | | The model derives an expected return for each company in the universe by assessing companies both from a global industry-based perspective and from a country-based standpoint |
| | • | | Factors include price-to-cash earnings, price-to-book, return on equity, and price momentum |
| • | | Analysts perform extensive research, focusing on the most attractively valued stocks |
| | • | | They then build detailed spreadsheets of historical and projected balance-sheet and income-statement information in order to estimate: |
| | • | | Normalized earnings power |
| | • | | Cash flow and asset values for each company for the next five years |
| | • | | Perform simulations to see the potential impact of changes in various financial-statement component |
| • | | Analysts present their estimates and ratings for each security to the Research Review Committee of the Investment Policy Group |
| | • | | The Committee challenges the analysts’ assumptions and conclusions to ensure they are sound |
The Portfolio
| • | | Typically holds 30-85 stocks |
| • | | Initial stock weightings are 0.5% - 3.5% |
Lazard Asset Management, LLC (“Lazard”)
Portfolio Manager William (Willy) Holzer believes that there is a single global economy and marketplace within which everything is connected. Within this single market it is important to distinguish between three types of companies: domestic companies are those that produce, sell, and raise capital all in their home country; international companies are those that produce at home, but sell their products and raise capital anywhere in the world; and global companies are those that produce, sell, and raise capital anywhere in the world. Holzer will invest in any of these types of companies
9
Managers International Equity Fund
Investment Manager’s Comments (continued)
in order to capitalize on a theme. However, he prefers global companies, which generally have the flexibility and resources to exploit global trends.
Willy Holzer can be described as a “top-down” thematic investor whose themes are based on bottom-up observations and company analysis. He views the world as a single global economic unit as opposed to a collection of separate country economies. Willy focuses his efforts by first analyzing the connections within the global economy and from this analysis develops global investment themes. These themes target the segments of the global economy that he believes are most likely to provide attractive long-term investment returns and that also represent an asymmetric investment opportunity in the investor’s favor.
Portfolio Construction
| • | | Portfolio Manager leverages stock ideas and research from top-down themes based on bottom-up observations and company analysis |
| • | | Portfolio is constructed around approximately ten investment themes to diversify opportunity sets and provide risk benefits |
| • | | Portfolio heavily weights large-capitalization, multi-national companies |
| | • | | Concentrated in the developed markets |
| | • | | May have operations or distribution in the emerging markets |
The Portfolio
| • | | Portfolio typically holds 90 to 110 stocks |
| • | | Initial stock weightings are 1.0% to 1.5% |
| • | | Relatively low turnover in the 30% to 40% annual range |
Martin Currie Inc. (“Martin Currie”)
Martin Currie, based in Edinburgh, Scotland, is a 128 year old firm. It specializes in developed market ex-U.S. mandates and currently manages $16.3 billion for a global client-base of pension funds, family offices, multi-managers, banks, public funds, foundations, sub-advisory clients and wrap programs. Willie Watt, the firm’s Chief Executive Officer, joined the firm in 2000 and was at the forefront of evolving Martin Currie from a firm that focused on adding value via a top-down investment process to its current process which uses bottom-up stock selection analysis as its primary portfolio management focus.
James Fairweather, Chief Investment Officer, heads the international equity investment team which has four members who have 71 years of total investment experience. The team is supported in their efforts by an experienced 14 person global sector analyst staff with no member having less than 8 years of total investment experience. In addition, regional teams also support the stock selection process by contributing insights and ideas on companies within their specific geographic coverage area. Finally, a separate risk management team helps support the portfolio construction.
Portfolio Construction
| • | | Focused on identifying companies at the earlier stages of change with the thought that the market usually underestimates the amount by which change will take place |
| • | | Team uses a fully integrated global approach to stock selection and use a high level of communication across regions to build a truly global portfolio |
| • | | Focus on speaking a common language when doing all stock level research with the emphasis on quality, value, growth, and change |
| • | | Risk is managed at every level of the investment process including when conducting stock selection and when constructing the portfolio |
The Portfolio
| • | | Portfolio typically holds 45 to 80 stocks |
| • | | Holdings tend to have low cross-stock correlations |
| • | | Holdings tend to have low sensitivity to macro factors |
| • | | Forecasted tracking error 4% to 6% relative to MSCI EAFE Index |
THE YEAR IN REVIEW
For the year 2009, the Fund returned 31.68% versus 31.78% for the Index. (Note that unless otherwise stated, all performance cited in this commentary is in U.S. Dollars).
Non-U.S. equity markets delivered strong returns in 2009, led by huge returns in emerging markets which returned 79%. After a tumultuous 2008, the coordinated fiscal and monetary efforts of global governments and central banks in 2009 resulted in increased liquidity throughout the year and served to thaw previously frozen credit markets. At the sector level, more cyclically oriented issues led the surge in performance as during the initial rebound investors’ favored higher beta, lower- quality stocks on speculation that the worst of the economic downturn was behind us. By the fourth quarter, however, the low-quality portion of the rally began to slow as investors became more selective and looked to companies with higher-quality balance sheets and sustainable business models.
10
Managers International Equity Fund
Investment Manager’s Comments (continued)
For the year 2009, positive results within the Fund were primarily driven by non-benchmark exposure in emerging markets. Each of the subadvisors within the Fund opportunistically invested in these developing markets and this paid off in 2009 as emerging markets appreciated more significantly than developed markets. Stock selection was mixed for the Fund throughout the year as solid performance within the Fund’s financial holdings was offset by weakness within the industrials sector. At the subadvisor level, AllianceBernstein was the Fund’s best performer driven by solid stock selection. AllianceBernstein’s strong stock selection was most evident in its financials holdings and within its technology and energy positions. AllianceBernstein diversified its risk within the financials sector in 2009 by adding to the number of holdings within this sector to minimize potential idiosyncratic stock risk and this strategy worked well as the sector enjoyed a large rebound. Lazard, the Fund’s best performer in 2008, modestly underperformed in 2009. Lazard largely maintained the same mix of themes they had identified at the start of 2008 and avoided any major portfolio changes. The best performing theme was related to opportunities in the emerging markets and, more specifically, related to opportunities in China and India where companies whose fortunes are tied to growth in infrastructure performed very well. On the downside, Lazard’s “Antimatter” theme which focuses on finding investment opportunities within Japan and taking advantage of positive political and economic change, detracted value as the Japanese equity market failed to keep pace with the broader global recovery in equities. Lazard remains committed to this theme and finds encouragement in the political changes that Japan experienced in 2009 as well as the valuations of its Japanese holdings. Finally, Martin Currie joined the Fund as a growth subadvisor in early 2009 and underperformed the benchmark for the portion of the year it was included in the Portfolio. Martin Currie’s underperformance was due, in part, to the weakness of growth investing in general for international equity managers in 2009 as well as due to its higher quality bias which left a good portion of Martin Currie’s holdings with solid positive performance that, nevertheless, trailed the broader international equity universe.
LOOKING FORWARD
As we enter into 2010, investors will be looking to find companies with sustainable earnings models now that the worst part of the recession appears behind us. Improved earnings are already being achieved by many international companies, although more often than not as a result of cost-cutting measures, not top-line growth. Regardless, the Fund’s subadvisors expect an improved macroeconomic environment going forward and suspect that the low-quality rally that dominated returns over the course of the last several quarters to come to an end. Our subadvisors anticipate increased stock selection opportunities as stock dispersion expands and the market sorts out who is better positioned as we enter a period of expected lower nominal GDP growth.
Overall, the Fund is positioned conservatively as our subadvisors remain cautious but optimistic about the opportunities that lie ahead. Developed equity markets look to face a headwind from continued deleveraging and tougher lending policies, fiscal tightening, and a potentially muted recovery in capital expenditures and jobs in 2010. If this scenario plays out, an above average premium will be paid for companies able to offer superior growth. Our subadvisors are finding opportunity in several areas of the market including exposure to emerging markets (either directly or through exposure to developed market companies with an emerging market client base). On a sector level, the Fund continues to maintain its largest weighting to the recovering financials sector and maintains an overweight to the information technology sector. Meanwhile, the Fund continues to maintain an underweight to the consumer areas of the market and will likely continue to do so, for the time being, as consumers take time to improve their personal balance sheets and pay down debt.
CUMULATIVE TOTAL RETURN PERFORMANCE
Managers International Equity Fund’s cumulative total return is based on the daily change in net asset value (NAV), and assumes that all distributions were reinvested. The Morgan Stanley Capital International Europe, Australasia, and Far East (MSCI EAFE) Index is composed of all the publicly traded stocks in developed non-U.S. Markets. The MSCI EAFE Index consisted of the following 21 developed market country indices: Australia, Austria, Belgium, Denmark, Finland, France, Germany, Greece, Hong Kong, Ireland, Italy, Japan, the Netherlands, New Zealand, Norway, Portugal, Singapore, Spain, Sweden, Switzerland and the United Kingdom. Unlike the Fund, the MSCI EAFE Index is unmanaged, is not available for investment, and does not incur expenses. The Index assumes reinvestment of dividends. This graph compares a hypothetical $10,000 investment made in Managers International Equity Fund on December 31, 1999, to a $10,000 investment made
11
Managers International Equity Fund
Investment Manager’s Comments (continued)
CUMULATIVE TOTAL RETURN PERFORMANCE (continued)
in the MSCI EAFE for the same time period. The table is not intended to imply any future performance of the Fund. Performance for periods longer than one year is annualized. The graph and table do not reflect the deduction of taxes that a shareholder would pay on a Fund distribution or redemption of shares. The listed returns for the Fund are net of expenses and the returns for the index exclude expenses. Past performance is not indicative of future results. Total returns would have been lower had certain expenses not been reduced.
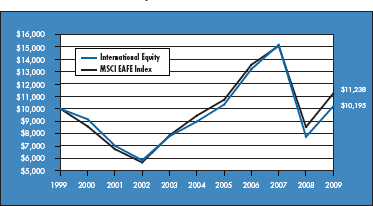
The table below shows the average annual total returns for Managers International Equity Fund and the MSCI EAFE from December 31, 1999 through December 31, 2009.
| | | | | | | | | |
Average Annual Total Returns1 | | One Year | | | Five Years | | | Ten Years | |
| | | |
Managers International Equity Fund2,3,4 | | 31.68 | % | | 2.60 | % | | 0.19 | % |
| | | |
MSCI EAFE Index | | 31.78 | % | | 3.54 | % | | 1.17 | % |
The performance data shown represents past performance. Past performance is not a guarantee of future results. Current performance may be lower or higher than the performance data quoted. The investment return and principal value of an investment in the Fund will fluctuate so that an investor’s shares, when redeemed, may be worth more or less than their original cost. For performance information through the most recent month end, please call (800) 835-3879 or visit our Web site at www.managersinvest.com.
In choosing a Fund, investors should carefully consider the amount they plan to invest, their investment objectives, the Fund’s investment objectives, risks, charges and expenses before investing. For this and other information, please call (800) 835-3879 or visit www.managersinvest.com for a free prospectus. Read it carefully before investing or sending money. Distributed by Managers Distributors, Inc., member FINRA.
| 1 | Total return equals income yield plus share price change and assumes reinvestment of all dividends and capital gain distributions. Returns are net of fees and may reflect offsets of Fund expenses as described in the Prospectus. No adjustment has been made for taxes payable by shareholders on their reinvested dividends and capital gain distributions. Returns for periods greater than one year are annualized. The listed returns on the Fund are net of expenses an based on the published NAV as of December 31, 2009. All returns are in U.S. dollars($). |
| 2 | Fund for which, from time to time, the Fund’s advisor has waived its fees and/ or absorbed Fund expenses, which has resulted in higher returns. |
| 3 | Investments in foreign securities are subject to additional risks such as changing market conditions, economic and political instability, and currency exchange rate fluctuations. |
| 4 | The Fund is subject to currency risk resulting from fluctuations in exchange rates that may affect the total loss or gain on a non-U.S. Dollar security when converted back to U.S. Dollars. |
All MSCI data is provided “as is.” The products described herein are not sponsored or endorsed and have not been reviewed or passed on by MSCI. In no event shall MSCI, its affiliates or any MSCI data provider have any liability of any kind in connection with the MSCI data or the products described herein. Copying or redistributing the MSCI data is strictly prohibited.
Not FDIC insured, nor bank guaranteed. May lose value.
12
Managers International Equity Fund
Fund Snapshots
December 31, 2009
Portfolio Breakdown

| | | | | | |
Industry | | Managers
International
Equity Fund** | | | MSCI EAFE
Index | |
Financials | | 27.7 | % | | 25.5 | % |
Industrials | | 10.9 | % | | 11.2 | % |
Materials | | 9.0 | % | | 10.4 | % |
Health Care | | 8.6 | % | | 8.4 | % |
Energy | | 8.4 | % | | 8.3 | % |
Information Technology | | 7.9 | % | | 4.7 | % |
Consumer Staples | | 7.2 | % | | 10.1 | % |
Consumer Discretionary | | 7.0 | % | | 9.7 | % |
Telecommunication Services | | 5.1 | % | | 5.8 | % |
Utilities | | 3.7 | % | | 5.9 | % |
Other Equities | | 0.7 | % | | 0.0 | % |
Other Assets and Liabilities | | 3.8 | % | | 0.0 | % |
Top Ten Holdings
| | | |
Security Name | | Percentage of
Net Assets | |
Sanofi-Aventis SA* | | 2.2 | % |
Banco Santander Central Hispano, S.A. | | 1.9 | |
Vodafone Group PLC* | | 1.7 | |
BP PLC* | | 1.7 | |
E.ON AG* | | 1.7 | |
GlaxoSmithKline PLC* | | 1.6 | |
Societe Generale* | | 1.6 | |
Roche Holding AG | | 1.4 | |
Mitsui Fudosan Co., Ltd. | | 1.4 | |
Royal Dutch Shell PLC, Class A | | 1.3 | |
| | | |
Top Ten as a Group | | 16.5 | % |
| | | |
| * | Top Ten Holding at June 30, 2009 |
Any sectors, industries, or securities discussed should not be perceived as investment recommendations. Mention of a specific security should not be considered a recommendation to buy or solicitation to sell that security. Specific securities mentioned in this report may have been sold from the Fund’s portfolio of investments by the time you receive this report.
13
Managers International Equity Fund
Fund Snapshots (continued)
Summary of Investments by Country
| | | | | | |
Country | | Managers International
Equity Fund* | | | MSCI EAFE Index | |
Australia | | 0.9 | % | | 8.4 | % |
Austria | | 0.4 | % | | 0.3 | % |
Belgium | | 0.0 | % | | 1.0 | % |
Bermuda | | 0.0 | % | | 0.4 | % |
Brazil | | 3.1 | % | | 0.0 | % |
Canada | | 3.7 | % | | 0.0 | % |
Cayman Islands | | 0.5 | % | | 0.1 | % |
China | | 2.4 | % | | 0.0 | % |
Denmark | | 0.9 | % | | 0.9 | % |
Finland | | 0.8 | % | | 1.1 | % |
France | | 11.1 | % | | 10.5 | % |
Germany | | 9.4 | % | | 8.0 | % |
Greece | | 0.0 | % | | 0.5 | % |
Hong Kong | | 4.3 | % | | 1.9 | % |
India | | 0.5 | % | | 0.0 | % |
Ireland | | 0.0 | % | | 0.3 | % |
Israel | | 0.6 | % | | 0.0 | % |
Italy | | 2.3 | % | | 3.4 | % |
Japan | | 12.7 | % | | 20.7 | % |
Jersey, Channel Islands | | 0.0 | % | | 0.4 | % |
Luxembourg | | 0.5 | % | | 0.6 | % |
Netherlands | | 5.3 | % | | 2.9 | % |
New Zealand | | 0.0 | % | | 0.1 | % |
Norway | | 1.1 | % | | 0.7 | % |
Portugal | | 0.6 | % | | 0.3 | % |
Russia | | 1.1 | % | | 0.0 | % |
Singapore | | 1.1 | % | | 1.4 | % |
South Africa | | 0.7 | % | | 0.0 | % |
South Korea | | 2.5 | % | | 0.0 | % |
Spain | | 2.4 | % | | 4.6 | % |
Supranational & Other | | 0.0 | % | | 0.1 | % |
Sweden | | 0.4 | % | | 2.5 | % |
Switzerland | | 7.3 | % | | 7.6 | % |
Taiwan | | 2.4 | % | | 0.0 | % |
Turkey | | 0.4 | % | | 0.0 | % |
United Kingdom | | 16.4 | % | | 21.2 | % |
United States | | 4.2 | % | | 0.1 | % |
| | | | | | |
| | 100.0 | % | | 100.0 | % |
| | | | | | |
| * | As a percentage of total market value on December 31, 2009. |
14
Managers International Equity Fund
Schedule of Portfolio Investments
December 31, 2009
| | | | | | |
| | | Shares | | | Value |
Common Stocks - 95.5% | | | | | | |
Consumer Discretionary - 7.0% | | | | | | |
Bayerische Motoren Werke AG (Germany) | | 14,400 | | | $ | 655,520 |
Bridgestone Corp. (Japan) | | 32,000 | | | | 564,474 |
Cyrela Brazil Realty, S.A. (Brazil) | | 37,800 | | | | 531,936 |
Esprit Holdings Limited (Hong Kong) | | 35,147 | | | | 233,191 |
Lagardere (France) | | 11,700 | | | | 473,681 |
Marks & Spencer Group PLC (United Kingdom) | | 52,800 | | | | 341,138 |
Matsushita Electric Industrial Co., Ltd. (Japan) | | 39,300 | | | | 565,779 |
New World Department Store China, Ltd. (China) | | 53,000 | | | | 48,376 |
Nikon Corp. (Japan) | | 36,000 | | | | 710,873 |
Nissan Motor Co., Ltd. (Japan)* | | 80,700 | | | | 709,185 |
Parkson Retail Group, Ltd. (China) | | 78,500 | | | | 138,137 |
Pearson PLC (United Kingdom) | | 63,815 | | | | 914,976 |
Persimmon PLC (United Kingdom)* | | 73,517 | | | | 555,914 |
Toyota Motor Corp. (Japan) | | 28,800 | | | | 1,214,235 |
Vivendi Universal SA (France) | | 33,820 | | | | 1,003,767 |
Wolters Kluwer, N.V. (Netherlands) | | 1,837 | | | | 40,175 |
WPP PLC (United Kingdom) | | 17,000 | | | | 166,265 |
Total Consumer Discretionary | | | | | | 8,867,622 |
Consumer Staples - 7.2% | | | | | | |
Associated British Foods PLC (United Kingdom) | | 14,100 | | | | 186,928 |
British American Tobacco PLC (United Kingdom) | | 13,671 | | | | 443,805 |
Cadbury PLC (United Kingdom) | | 17,179 | | | | 220,880 |
Carlsberg A/S, Class B (Denmark) | | 12,407 | | | | 913,337 |
Casino Guichard-Perrachon SA (France) | | 5,000 | | | | 445,475 |
Diageo PLC (United Kingdom) | | 29,766 | | | | 519,300 |
Groupe Danone SA (France) | | 4,452 | | | | 272,916 |
Heineken N.V. (Netherlands) | | 17,977 | | | | 853,431 |
Koninklijke Ahold, N.V. (Netherlands) | | 89,542 | | | | 1,186,315 |
Metro AG (Germany) | | 10,348 | | | | 631,981 |
Nestle SA, Registered (Switzerland) | | 5,333 | | | | 258,830 |
Seven & i Holdings Co., Ltd. (Japan) | | 20,600 | | | | 420,620 |
Uni-President Enterprises Corp. (Taiwan) | | 209,098 | | | | 257,802 |
Unilever PLC (United Kingdom) | | 18,700 | | | | 599,434 |
Unilever N.V. (Netherlands) | | 34,781 | | | | 1,132,009 |
William Morrison Supermarkets PLC (United Kingdom) | | 182,054 | | | | 812,257 |
Total Consumer Staples | | | | | | 9,155,320 |
Energy - 8.4% | | | | | | |
BP PLC (United Kingdom) | | 223,240 | | | | 2,155,641 |
Canadian Natural Resources, Ltd. (Canada) | | 8,700 | | | | 632,213 |
Cenovus Energy, Inc. (Canada) | | 11,468 | | | | 290,579 |
China Shenhua Energy Co., Ltd. (China) | | 179,500 | | | | 871,348 |
EnCana Corp. (Canada) | | 10,968 | | | | 357,717 |
INPEX Corp. (Japan) | | 78 | | | | 589,766 |
LUKOIL Holdings, ADR (Russia) | | 16,400 | 2 | | | 924,960 |
Nexen, Inc. (Canada) | | 21,246 | | | | 512,334 |
Petroleo Brasileiro, S.A., Sponsored ADR (Brazil) | | 10,300 | | | | 491,104 |
Petroplus Holdings AG (Switzerland)* | | 29,280 | | | | 535,675 |
Rosneft Oil, GDR (Russia) | | 53,550 | | | | 457,047 |
Royal Dutch Shell PLC, Class A (Netherlands) | | 53,900 | | | | 1,624,113 |
StatoilHydro ASA (Norway) | | 35,600 | | | | 887,851 |
Suncor Energy, Inc. (Canada) | | 9,684 | | | | 344,544 |
Total Energy | | | | | | 10,674,892 |
Financials - 27.7% | | | | | | |
Allianz SE (Germany) | | 8,700 | | | | 1,078,451 |
Aviva PLC (United Kingdom) | | 32,243 | | | | 205,102 |
Banco do Brasil, S.A. (Brazil) | | 45,800 | | | | 781,310 |
Banco Santander, S.A. (Brazil) | | 34,600 | | | | 474,980 |
Banco Santander Central Hispano, S.A. (Spain) | | 145,829 | | | | 2,409,774 |
Bank of China, Ltd., Class H (China) | | 1,489,000 | | | | 800,176 |
Bank of East Asia, Ltd. (Hong Kong) | | 57,390 | 2 | | | 225,460 |
Bank of Yokohama, Ltd., The (Japan) | | 114,000 | | | | 519,779 |
Barclays PLC (United Kingdom)* | | 255,809 | | | | 1,127,210 |
BNP Paribas SA (France) | | 14,410 | | | | 1,142,972 |
CapitaLand, Ltd. (Singapore) | | 198,500 | | | | 588,862 |
CapitaMalls Asia, Ltd. (Singapore)* | | 130,000 | | | | 235,043 |
Cathay Financial Holding Co., Ltd. (Taiwan)* | | 184,300 | | | | 343,123 |
China Life Insurance Co., Ltd. (China) | | 170,000 | | | | 831,857 |
China Minsheng Banking Corp., Ltd. (China)* | | 78,500 | | | | 88,286 |
China Overseas Land & Investment, Ltd. (Hong Kong) | | 537,360 | 2 | | | 1,125,923 |
Chinatrust Financial Holding Co., Ltd. (Taiwan) | | 378,917 | | | | 235,559 |
Credit Agricole SA (France) | | 43,569 | | | | 764,629 |
Credit Suisse Group AG (Switzerland) | | 14,524 | | | | 719,539 |
Daiwa House Industry Co., Ltd. (Japan) | | 32,000 | | | | 344,087 |
Daiwa Securities Group, Inc. (Japan) | | 36,000 | | | | 181,175 |
The accompanying notes are an integral part of these financial statements.
15
Managers International Equity Fund
Schedule of Portfolio Investments (continued)
| | | | | | |
| | | Shares | | | Value |
Financials - 27.7% (continued) | | | | | | |
Danske Bank A/S (United States)* | | 9,700 | | | $ | 217,759 |
DBS Group Holdings, Ltd. (Singapore) | | 54,500 | | | | 592,468 |
Deutsche Bank AG (Germany) | | 16,300 | | | | 1,152,572 |
Deutsche Boerse AG (Germany) | | 4,022 | | | | 333,060 |
Hang Lung Group, Ltd. (Hong Kong) | | 18,900 | | | | 93,470 |
Hang Lung Properties, Ltd. (Hong Kong) | | 41,000 | | | | 160,734 |
HDFC Bank, Ltd. (India) | | 13,795 | | | | 502,654 |
Henderson Land Development Co., Ltd. (Hong Kong) | | 67,000 | | | | 500,673 |
Hong Kong Exchanges and Clearing, Ltd. (Hong Kong) | | 56,400 | | | | 1,003,491 |
HSBC Holdings PLC (United Kingdom) | | 136,748 | | | | 1,560,065 |
Industrial and Commercial Bank of China, Ltd., Class H (China) | | 341,000 | 2 | | | 280,835 |
Itau Unibanco Banco Holding S.A. (Brazil) | | 21,964 | | | | 488,101 |
KB Financial Group, Inc. (South Korea)* | | 12,125 | | | | 617,408 |
Klepierre (France) | | 5,400 | | | | 218,782 |
Mitsubishi Estate Co., Ltd. (Japan) | | 23,000 | | | | 367,215 |
Mitsubishi Tokyo Financial Group, Inc. (Japan) | | 37,800 | | | | 186,195 |
Mitsui Fudosan Co., Ltd. (Japan) | | 103,000 | | | | 1,741,547 |
National Australia Bank, Ltd. (Australia) | | 18,400 | | | | 449,034 |
Nomura Holdings, Inc. (Japan) | | 123,100 | | | | 915,455 |
Old Mutual PLC (United Kingdom)* | | 291,700 | | | | 510,823 |
Prudential Corp. PLC (United Kingdom) | | 46,676 | | | | 477,787 |
Societe Generale (France) | | 28,475 | | | | 1,978,441 |
Standard Bank Group, Ltd. (South Africa) | | 11,600 | | | | 159,328 |
Standard Chartered PLC (United Kingdom) | | 21,998 | | | | 555,358 |
Storebrand ASA (Norway)* | | 64,996 | | | | 442,344 |
Sumitomo Mitsui Financial Group, Inc. (Japan) | | 9,200 | | | | 263,998 |
Sumitomo Realty & Development Co., Ltd. (Japan) | | 20,000 | | | | 377,550 |
Sun Hung Kai Properties, Ltd. (Hong Kong) | | 93,000 | | | | 1,382,828 |
T&D Holdings, Inc. (Japan) | | 10,500 | | | | 215,936 |
Turkiye Garanti Bankasi A.S. (Turkey) | | 103,200 | | | | 439,623 |
Unibail (France) | | 2,000 | | | | 439,359 |
UniCredito Italiano SpA (Italy)* | | 372,761 | | | | 1,246,422 |
Zurich Financial Services AG (Switzerland) | | 4,941 | | | | 1,080,220 |
Total Financials | | | | | | 35,174,832 |
Health Care - 8.6% | | | | | | |
Actelion, Ltd. (Switzerland)* | | 10,081 | | | | 538,430 |
AstraZeneca PLC (United Kingdom) | | 11,700 | | | | 549,867 |
Bayer AG (Germany) | | 16,400 | | | | 1,312,385 |
GlaxoSmithKline PLC (United Kingdom) | | 98,284 | | | | 2,084,196 |
Lonza Group AG (Switzerland) | | 3,122 | | | | 219,973 |
Novartis AG (Switzerland) | | 22,858 | | | | 1,248,258 |
Roche Holding AG (Switzerland) | | 10,611 | | | | 1,814,618 |
Sanofi-Aventis SA (France) | | 34,895 | | | | 2,744,240 |
Teva Pharmaceutical Industries, Ltd., Sponsored ADR (Israel) | | 7,100 | | | | 398,878 |
Total Health Care | | | | | | 10,910,845 |
Industrials - 10.9% | | | | | | |
ABB, Ltd. (Switzerland)* | | 49,291 | | | | 949,804 |
ABB, Ltd., ADR (Switzerland)* | | 39,030 | | | | 750,928 |
Adecco SA (Switzerland) | | 5,700 | | | | 314,440 |
Alstom SA (France) | | 8,013 | | | | 560,396 |
Babcock International Group PLC (United Kingdom) | | 50,247 | | | | 482,027 |
BAE Systems PLC (United Kingdom) | | 10,700 | | | | 61,928 |
Cie de Saint-Gobain (France) | | 22,842 | | | | 1,239,093 |
Deutsche Post AG (Germany) | | 52,050 | | | | 1,005,959 |
FANUC, Ltd. (Japan) | | 5,700 | | | | 531,252 |
Far Eastern Textile Co., Ltd. (Taiwan) | | 211,784 | | | | 264,811 |
HOCHTIEF AG (Germany) | | 5,400 | | | | 411,841 |
JGC Corp. (Japan) | | 36,000 | | | | 663,396 |
Kajima Corp. (Japan) | | 60,000 | | | | 121,401 |
MAN AG (Germany) | | 8,312 | | | | 644,946 |
Mitsubishi Corp. (Japan) | | 25,700 | | | | 640,151 |
Mitsubishi Heavy Inds., Ltd. (Japan) | | 107,000 | 2 | | | 377,385 |
Randstad Holding, N.V. (Netherlands)* | | 15,800 | | | | 786,165 |
Rolls-Royce Group PLC (United Kingdom) | | 64,300 | | | | 500,730 |
Rolls-Royce Group PLC, C Shares (United Kingdom) | | 3,858,000 | | | | 6,231 |
Shimizu Corp. (Japan) | | 44,000 | | | | 158,040 |
Siemens AG (Germany) | | 17,683 | | | | 1,622,783 |
Tostem Inax Holding Corp. (Japan) | | 15,000 | | | | 258,222 |
Vestas Wind Systems A/S (Denmark)* | | 4,070 | | | | 247,793 |
Wienerberger AG (Austria)* | | 26,470 | | | | 480,364 |
Wolseley PLC (United Kingdom)* | | 22,400 | | | | 448,377 |
Yamato Transport Co., Ltd. (Japan) | | 19,700 | | | | 274,225 |
Total Industrials | | | | | | 13,802,688 |
Information Technology - 7.9% | | | | | | |
ASML Holding, N.V. (Netherlands) | | 24,214 | | | | 826,709 |
AU Optronics Corp., Sponsored ADR (Taiwan) | | 46,453 | | | | 556,971 |
Autonomy Corporation PLC (United Kingdom)* | | 34,542 | | | | 838,831 |
Cia Brasileira de Meios de Pagamentos (Brazil) | | 19,100 | | | | 168,291 |
Ericsson (LM), Class B (Sweden) | | 54,370 | | | | 500,533 |
The accompanying notes are an integral part of these financial statements.
16
Managers International Equity Fund
Schedule of Portfolio Investments (continued)
| | | | | | | |
| | | Shares | | | Value | |
Information Technology - 7.9% (continued) | | | | | | | |
Gemalto NV (France)* | | 14,784 | 2 | | $ | 643,167 | |
Hynix Semiconductor, Inc. (South Korea)* | | 43,500 | | | | 865,051 | |
Murata Manufacturing Co., Ltd. (Japan) | | 8,200 | | | | 409,239 | |
NetEase.com, Inc., ADR (Cayman Islands)* | | 16,500 | 2 | | | 620,565 | |
Nokia Oyj (Finland) | | 79,400 | | | | 1,026,640 | |
Redecard, S.A. (Brazil) | | 19,500 | | | | 324,813 | |
Samsung Electronics Co., Ltd. (South Korea) | | 1,370 | | | | 939,450 | |
Samsung Electronics Co., Ltd., GDR, (South | | | | | | | |
Korea) (a)* | | 2,251 | | | | 772,258 | |
Taiwan Semiconductor Manufacturing Co., | | | | | | | |
Ltd., Sponsored ADR (Taiwan) | | 88,220 | | | | 1,009,237 | |
Toshiba Corp. (Japan)* | | 92,000 | | | | 510,499 | |
Total Information Technology | | | | | | 10,012,254 | |
Materials - 9.0% | | | | | | | |
Air Liquide SA (France) | | 4,938 | | | | 587,265 | |
ArcelorMittal (Luxembourg) | | 13,548 | | | | 619,250 | |
Barrick Gold Corp. (Canada) | | 25,086 | | | | 994,469 | |
BASF SE (Germany) | | 7,300 | | | | 451,802 | |
Gold Fields, Ltd. (South Africa) | | 31,763 | | | | 417,107 | |
Goldcorp, Inc. (Canada) | | 19,600 | | | | 774,929 | |
Impala Platinum Holdings, Ltd. (South Africa) | | 9,400 | | | | 256,620 | |
Incitec Pivot, Ltd. (Australia) | | 229,237 | | | | 725,103 | |
Israel Chemicals, Ltd. (Israel) | | 29,500 | | | | 387,367 | |
Kinross Gold Corp. (Canada) | | 15,900 | 2 | | | 292,560 | |
Koninklijke DSM, N.V. (Netherlands) | | 5,400 | | | | 265,321 | |
Rio Tinto PLC (United Kingdom) | | 22,550 | | | | 1,217,626 | |
Shin-Etsu Chemical Co., Ltd. (Japan) | | 15,600 | | | | 880,750 | |
Svenska Cellulosa AB (SCA) (Sweden) | | 1,700 | | | | 22,666 | |
Syngenta AG (Switzerland) | | 2,871 | | | | 810,793 | |
Taiwan Fertilizer Co., Ltd. (Taiwan) | | 106,000 | | | | 377,434 | |
Toray Industries, Inc. (Japan) | | 84,700 | | | | 460,821 | |
Vale, S.A., Sponsored ADR (Brazil) | | 27,000 | | | | 670,140 | |
Xstrata PLC (United Kingdom)* | | 40,510 | | | | 722,538 | |
Yamana Gold, Inc. (Canada) | | 42,159 | | | | 483,729 | |
Total Materials | | | | | | 11,418,290 | |
Telecommunication Services - 5.1% | | | | | | | |
Bharti Tele-Ventures, Ltd. (India) | | 24,314 | | | | 171,797 | |
France Telecom SA (France) | | 39,779 | | | | 994,008 | |
Nippon Telegraph & Telephone Corp. (Japan) | | 24,700 | | | | 975,726 | |
Portugal Telecom SGPS SA (Portugal) | | 67,026 | | | | 817,857 | |
Telecom Italia S.p.A. (Italy) | | 506,800 | | | | 790,580 | |
Telecom Italia S.p.A. RSP (Italy) | | 464,100 | | | | 515,470 | |
Vodafone Group PLC (United Kingdom) | | 937,796 | | | | 2,171,662 | |
Total Telecommunication Services | | | | | | 6,437,100 | |
Utilities - 3.7% | | | | | | | |
E.ON AG (Germany) | | 50,795 | | | | 2,132,071 | |
Electricite de France SA (France) | | 9,800 | | | | 582,446 | |
Enel S.p.A. (Italy) | | 52,300 | | | | 302,785 | |
Hong Kong and China Gas Co., Ltd., The (Hong Kong) | | 307,670 | | | | 771,683 | |
Iberdrola Renovables SAU (Spain) | | 119,310 | | | | 568,153 | |
National Grid PLC (United Kingdom) | | 30,290 | | | | 330,612 | |
Total Utilities | | | | | | 4,687,750 | |
Total Common Stocks
(cost $106,442,031) | | | | | | 121,141,593 | |
Other Equities - 0.7% | | | | | | | |
Hirco PLC (South Africa)* | | 11,900 | | | | 28,659 | |
SPDR Gold Shares (United States)* | | 8,200 | | | | 879,942 | |
Total Other Equities
(cost $749,429) | | | | | | 908,601 | |
Short-Term Investments - 5.9%1 | | | | | | | |
BNY Institutional Cash Reserves Fund, | | | | | | | |
Series A, 0.05%3 | | 3,764,000 | | | | 3,764,000 | |
BNY Institutional Cash Reserves Fund, Series B*3,8 | | 104,356 | | | | 20,349 | |
Dreyfus Cash Management Fund, Institutional Class Shares, 0.08% | | 3,694,060 | | | | 3,694,060 | |
Total Short-Term Investments
(cost $7,562,416) | | | | | | 7,478,409 | |
Total Investments - 102.1%
(cost $114,753,876) | | | | | | 129,528,603 | |
Other Assets, less Liabilities - (2.1)% | | | | | | (2,733,294 | ) |
Net Assets - 100.0% | | | | | $ | 126,795,309 | |
The accompanying notes are an integral part of these financial statements.
17
Managers Emerging Markets Equity Fund
Investment Manager’s Comments
The Managers Emerging Markets Equity Fund’s (the “Fund”) objective is to achieve long-term capital appreciation.
The Fund invests at least 80% of its assets in equity securities, i.e., common and preferred stocks of companies located in countries included in the MSCI Emerging Markets (“MSCI EM”) Index, mostly countries in Africa, Asia, Latin America, and the Middle East. The Fund may invest in companies of any size. The MSCI EM Index is the benchmark for the Fund.
THE PORTFOLIO MANAGERS
The Fund employs multiple subadvisors who specialize in distinct investment approaches. This “intelligence diversification” not only serves to manage risk, but also helps the Fund to tap the markets’ full potential by focusing different analytical insights on each prospective investment. Fund management strives to achieve its performance and diversification objectives while ensuring that the Fund operates within the framework of its investment objective and principal investment strategies.
Rexiter Capital Management Limited
The investment team at Rexiter Capital Management Limited (“Rexiter”) believes emerging markets are less efficient than developed markets, and an actively managed portfolio, with respect to both country weightings and stock selection, can add value over a market capitalization-weighted index without materially affecting risk. Rexiter’s approach is active in terms of both asset allocation and stock selection. Investment decisions are based on fundamental analysis of countries and stocks. Portfolio management is controlled by a disciplined process that seeks to add to returns through the exploitation of market inefficiency, while constraining risk.
Schroder Investment Management Limited
Schroder Investment Management Limited (“Schroders”) believes that emerging stock markets are inefficient and provide strong potential for adding value through active fund management. This value can be extracted through both country and stock selection. Schroders uses a time-tested quantitative model to aid in their country selection process, and seeks to add value equally over time from both country and stock selection. Schroders further believes that applying a systematic, disciplined approach along, with a strong team culture increases the ability to add value. Schroders believes that equal attention should be given to managing both return and risk.
THE YEAR IN REVIEW
The Fund returned 67.94% in 2009, trailing the return of 78.51% for its benchmark, the MSCI EM Index. (Note that unless otherwise stated, all performance cited in this commentary is in U.S. Dollars.) Despite and the year’s slow start and continuing the decline of 2008, emerging markets rallied sharply after bottoming in March to finish 2009 significantly higher. Liquidity and increased appetite for risk were the key themes driving the markets. With the U.S. and other developed countries undertaking massive government stimulus programs and with global interest rates hovering around zero, capital flows sought out riskier, higher-yielding assets, and emerging markets were a clear beneficiary. After a record $49.5 billion flowed out of emerging market equities during 2008, nearly double that amount ($81 billion) 3 owed back into the asset class during 2009.
While we are pleased with the strong absolute performance during the year, the Fund was not able to keep pace with the rapid advance of the benchmark during the calendar year. Much of the underperformance was concentrated during the first quarter of the year, prior to the markets’ recovery. The Fund was early in positioning for the eventual recovery, which weighed on first quarter performance. As the markets raced forward, simple compounding caused that initial performance gap to widen. For the full year, stock selection within India and South Africa were the largest detractors from relative performance. On the other hand, the Fund benefited from an overweight position in Russia, an underweight to Mexico, and strong stock selection within Brazil.
LOOKING FORWARD
The pick-up in economic indicators has generated a sharp improvement in investor sentiment and produced a strong recovery in markets, which although losing momentum somewhat, seems to be well supported. Although a modest tightening in some emerging countries is underway, liquidity in the developed world is likely to remain abundant. Moreover, earnings momentum is improving. Furthermore, emerging markets earnings growth is expected to be stronger than in the developed markets at 25-30% over the next 12 months and valuations still appear to be reasonable. Following strong returns in 2009 during which period the MSCI EM Index gained 78.5% in USD terms, one of the key risks for emerging markets in the near term is stronger than expected U.S. growth. The probability of much stronger U.S. growth in the near term and a strengthening U.S. Dollar appears to be increasing. This would be negative for emerging markets, as higher interest rates in the west could attract flows away from emerging markets — although exporters could benefit. A global recovery appears to be well underway. In particular, growth in the U.S. appears to be gaining momentum. U.S. activity seems to be well supported with loose monetary conditions that are likely to continue for a while longer; thus there is a risk that U.S. growth will be stronger than expected.
Against this background of recovering OECD (Organization for Economic Cooperation and Development) growth and accommodative central bank policy, we would expect that emerging markets would maintain their historic premium growth trend. The recovery in the emerging world has been very strong. The bulk of growth in the emerging world is driven by domestic demand, but if developed growth does recover more quickly than expected, then clearly their export sectors will benefit. Although the medium- to longer-term outlook for emerging markets remains positive, and a degree of profit taking in the near term is quite possible, particularly if stronger than expected U.S. growth leads to a stronger U.S. Dollar.
On an organizational note, the Fund’s Board of Trustees approved the addition of Schroders as a subadvisor to the Fund during the period. This change was made with the goal of improving the consistency of the Fund’s performance over time. While Rexiter’s investment process seeks to add value primarily through bottom-up stock selection, Schroders’ process looks for excess return opportunities equally from both stock selection and top-down country allocation decisions. The performance patterns of these two subadvisors have been complementary over time, and we believe their combination will translate into more consistent performance results, leaving the Fund less susceptible to periods where its style is “out of favor” in the markets.
CUMULATIVE TOTAL RETURN PERFORMANCE
Managers Emerging Markets Equity Fund’s cumulative total return is based on the daily change in net asset value (NAV), and assumes that all distributions were reinvested. The MSCI EM Index is a free float-adjusted market capitalization index designed to measure equity market performance in the global emerging markets. The
18
Managers Emerging Markets Equity Fund
Investment Manager’s Comments (continued)
CUMULATIVE TOTAL RETURN PERFORMANCE (continued)
MSCI EM Index consists of the following 22 emerging markets country indices: Brazil, Chile, China, Colombia, Czech Republic, Egypt, Hungary, India, Indonesia, Israel, Korea, Malaysia, Mexico, Morocco, Peru, Philippines, Poland, Russia, South Africa, Taiwan, Thailand and Turkey. Unlike the Fund, the MSCI EM Index is unmanaged, is not available for investment, and does not incur expenses. This chart compares a hypothetical $10,000 investment made in Managers Emerging Markets Equity Fund on December 31, 1999, to a $10,000 investment made in the MSCI EM for the same time period. Performance for periods longer than one year is annualized. The graph and table do not reflect the deduction of taxes that a shareholder would pay on a Fund distribution or redemption of shares. The listed returns for the Fund are net of expenses and the returns for the index exclude expenses. Past performance is not indicative of future results. Total returns would have been lower had certain expenses not been reduced.
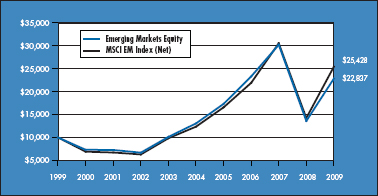
The table below shows the average annual total returns for Manager Emerging Markets Equity Fund and the MSCI EM Index (Net) from December 31, 1999 through December 31, 2009.
| | | | | | | | | |
Average Annual Total Returns1 | | One Year | | | Five Years | | | Ten Years | |
| | | |
Managers Emerging Markets Equity Fund2,3.4 | | 67.94 | % | | 11.80 | % | | 8.61 | % |
| | | |
MSCI EM Index (Net)5 | | 78.51 | % | | 15.51 | % | | 9.78 | % |
| | | |
MSCI EM Index (Gross)6 | | 79.02 | % | | 15.88 | % | | 10.11 | % |
The performance data shown represents past performance. Past performance is not a guarantee of future results. Current performance may be lower or higher than the performance data quoted. The investment return and principal value of an investment in the Fund will fluctuate so that an investor’s shares, when redeemed, may be worth more or less than their original cost. For performance information through the most recent month end, please call (800) 835-3879 or visit our Web site at www.managersinvest.com.
In choosing a Fund, investors should carefully consider the amount they plan to invest, their investment objectives, the Fund’s investment objectives, risks, charges and expenses before investing. For this and other information, please call (800) 835-3879 or visit www.managersinvest.com for a free prospectus. Read it carefully before investing or sending money. Distributed by Managers Distributors, Inc., member FINRA.
| 1 | Total return equals income yield plus share price change and assumes reinvestment of all dividends and capital gain distributions. Returns are net of fees and may reflect offsets of Fund expenses as described in the Prospectus. No adjustment has been made for taxes payable by shareholders on their reinvested dividends and capital gain distributions. Returns for periods greater than one year are annualized. The listed returns on the Fund are net of expenses and based on the published NAV as of December 31, 2009. All returns are in U.S. dollars($). |
| 2 | Fund for which, from time to time, the Fund’s advisor has waived its fees and/or absorbed Fund expenses, which has resulted in higher returns. |
| 3 | The Fund is subject to the risks associated with investments in emerging markets, such as erratic earnings patterns, economic and political instability, changing exchange controls, limitations on repatriation of foreign capital and changes in local governmental attitudes toward private investment, possibly leading to nationalization or confiscation of investor assets. |
| 4 | The Fund is subject to currency risk resulting from fluctuations in exchange rates that may affect the total loss or gain on a non-U.S. Dollar security when converted back to U.S. Dollars. |
| 5 | MSCI EM (Net) approximates the minimum possible dividend reinvestment. The dividend is reinvested after deduction of withholding tax, applying the rate to nonresident individuals who do not benefit from double taxation treaties. MSCI Barra uses withholding tax rates applicable to Luxembourg holding companies, as Luxembourg applies the highest rates. |
| 6 | MSCI EM (Gross) approximates the maximum possible dividend reinvestment. The amount reinvested is the entire dividend distributed to individuals resident in the country of the company, but does not include tax credits. |
All MSCI data is provided “as is.” The products described herein are not sponsored or endorsed and have not been reviewed or passed on by MSCI. In no event shall MSCI, its affiliates or any MSCI data provider have any liability of any kind in connection with the MSCI data or the products described herein. Copying or redistributing the MSCI data is strictly prohibited.
Not FDIC insured, nor bank guaranteed. May lose value.
19
Managers Emerging Markets Equity Fund
Fund Snapshots
December 31, 2009
Portfolio Breakdown
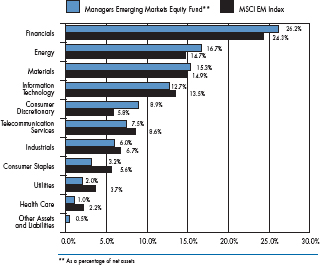
| | | | | | |
Industry | | Managers
Emerging Markets
Equity Fund** | | | MSCI EM
Index | |
Financials | | 26.2 | % | | 24.3 | % |
Energy | | 16.7 | % | | 14.7 | % |
Materials | | 15.3 | % | | 14.9 | % |
Information Technology | | 12.7 | % | | 13.5 | % |
Consumer Discretionary | | 8.9 | % | | 5.8 | % |
Telecommunication Services | | 7.5 | % | | 8.6 | % |
Industrials | | 6.0 | % | | 6.7 | % |
Consumer Staples | | 3.2 | % | | 5.6 | % |
Utilities | | 2.0 | % | | 3.7 | % |
Health Care | | 1.0 | % | | 2.2 | % |
Other Assets and Liabilities | | 0.5 | % | | 0.0 | % |
Top Ten Holdings
| | | |
Security Name | | Percentage of
Net Assets | |
Samsung Electronics Co., Ltd.* | | 2.6 | % |
OAO Gazprom, ADR* | | 2.3 | |
POSCO | | 2.1 | |
China Construction Bank Corp.* | | 1.8 | |
Hon Hai Precision Industry Co., Ltd.* | | 1.7 | |
CNOOC, Ltd.* | | 1.7 | |
Vale, S.A. Sponsored ADR | | 1.6 | |
Bank of China, Ltd., Class H* | | 1.5 | |
Itau Unibanco Banco Holding S.A., ADR | | 1.5 | |
Petroleo Brasileiro, S.A., Sponsored ADR | | 1.4 | |
| | | |
Top Ten as a Group | | 18.2 | % |
| | | |
| * | Top Ten Holding at June 30, 2009 |
Any sectors, industries, or securities discussed should not be perceived as investment recommendations. Mention of a specific security should not be considered a recommendation to buy or solicitation to sell that security. Specific securities mentioned in this report may have been sold from the Fund’s portfolio of investments by the time you receive this report.
20
Managers Emerging Markets Equity Fund
Fund Snapshots (continued)
Summary of Investments by Country
| | | | | | |
Country | | Managers
Emerging Markets
Equity Fund* | | | MSCI EM
Index | |
Bermuda | | 0.3 | % | | 0.5 | % |
Brazil | | 14.0 | % | | 16.9 | % |
Cayman Islands | | 0.0 | % | | 2.5 | % |
Chile | | 0.0 | % | | 1.4 | % |
China | | 11.5 | % | | 10.3 | % |
Colombia | | 0.0 | % | | 0.7 | % |
Czech Republic | | 0.3 | % | | 0.4 | % |
Egypt | | 0.3 | % | | 0.5 | % |
Hong Kong | | 6.6 | % | | 4.5 | % |
Hungary | | 1.2 | % | | 0.6 | % |
India | | 7.6 | % | | 7.5 | % |
Indonesia | | 2.2 | % | | 1.9 | % |
Israel | | 2.1 | % | | 2.6 | % |
Luxembourg | | 1.5 | % | | 0.0 | % |
Malaysia | | 1.5 | % | | 2.6 | % |
Mexico | | 3.2 | % | | 4.3 | % |
Morocco | | 0.0 | % | | 0.2 | % |
Pakistan | | 0.4 | % | | 0.0 | % |
Panama | | 0.5 | % | | 0.0 | % |
Philippines | | 0.6 | % | | 0.4 | % |
Poland | | 0.2 | % | | 1.3 | % |
Russia | | 9.2 | % | | 5.7 | % |
South Africa | | 5.0 | % | | 6.9 | % |
South Korea | | 15.0 | % | | 12.7 | % |
Taiwan | | 8.5 | % | | 11.4 | % |
Thailand | | 3.4 | % | | 1.3 | % |
Turkey | | 3.5 | % | | 1.5 | % |
United Kingdom | | 0.8 | % | | 0.0 | % |
United States | | 0.6 | % | | 1.4 | % |
| | | | | | |
| | 100.0 | % | | 100.0 | % |
| | | | | | |
| * | As a percentage of total market value on December 31, 2009. |
21
Managers Emerging Markets Equity Fund
Schedule of Portfolio Investments
December 31, 2009
| | | | | | |
| | | Shares | | | Value |
Common Stocks - 99.5% | | | | | | |
Consumer Discretionary - 8.9% | | | | | | |
B2W Cia Global do Varejo (Brazil) | | 4,717 | | | $ | 129,508 |
Belle International Holdings, Ltd. (Hong Kong) | | 552,000 | | | | 639,476 |
Ctrip.com International, Ltd. (China)* | | 7,600 | | | | 546,136 |
Cyfrowy Polsat SA (Poland)* | | 38,494 | | | | 182,437 |
Desarrolladora Homex, S.A.B. de C.V. (Mexico)* | | 13,378 | 2 | | | 449,768 |
Far Eastern Department Stores, Ltd. (Taiwan) | | 5,180 | | | | 5,941 |
Genting Malaysia Berhad (Malaysia) | | 103,300 | | | | 220,182 |
Golden Eagle Retail Group, Ltd. (China) | | 156,000 | | | | 316,431 |
Grupo Televisa SA (Mexico) | | 27,900 | | | | 579,204 |
Hero Honda Motors, Ltd. (India) | | 18,337 | | | | 674,450 |
Hyundai Department Store Co., Ltd. (South Korea) | | 2,847 | | | | 274,769 |
Hyundai Motor Co., Ltd. (South Korea) | | 7,426 | | | | 768,677 |
JD Group, Ltd. (South Africa) | | 52,917 | | | | 351,696 |
LG Electronics, Inc. (South Korea) | | 7,182 | | | | 748,712 |
Lojas Renner, S.A. (Brazil) | | 23,100 | | | | 521,442 |
Maruti Udyog, Ltd. (India) | | 4,578 | | | | 152,703 |
MegaStudy Co., Ltd. (South Korea) | | 1,575 | | | | 323,767 |
Naspers, Ltd. (South Africa) | | 11,086 | | | | 448,652 |
Parkson Retail Group, Ltd. (China) | | 75,500 | | | | 132,858 |
PDG Realty SA Empreendimentos e Participacoes (Brazil) | | 23,200 | | | | 231,200 |
Urbi Desarrollos Urbanos, SA de CV (Mexico)* | | 122,930 | | | | 277,208 |
Zee Entertainment Enterprises, Ltd. (India) | | 104,138 | | | | 570,846 |
Total Consumer Discretionary | | | | | | 8,546,063 |
Consumer Staples - 3.2% | | | | | | |
Anadolu Efes Biracilik ve Malt Sanayii A.S. (Turkey) | | 25,711 | | | | 287,164 |
BRF - Brasil Foods SA (Brazil) | | 14,960 | | | | 389,854 |
China Mengniu Dairy Co., Ltd. (Hong Kong)* | | 112,000 | | | | 398,139 |
Cia Brasileira de Distribuicao Grupo Pao de Acucar (Brazil) | | 5,332 | | | | 400,540 |
Hengan International Group Co. (Hong Kong) | | 31,000 | | | | 229,532 |
Kuala Lumpur Kepong Berhad (Malaysia) | | 89,600 | | | | 430,857 |
Perusahaan Perkebunan London Sumatra Indonesia Tbk PT (Indonesia) | | 155,000 | | | | 136,507 |
Shinsegae Co., Ltd. (South Korea) | | 1,235 | | | | 570,431 |
Uni-President Enterprises Corp. (Taiwan) | | 206,348 | | | | 254,412 |
Total Consumer Staples | | | | | | 3,097,436 |
Energy - 16.7% | | | | | | |
Cairn India, Ltd. (India)* | | 37,427 | | | | 225,743 |
China Coal Energy Co., Ltd. (China) | | 210,000 | | | | 381,060 |
China Shenhua Energy Co., Ltd. (China) | | 174,500 | | | | 847,077 |
CNOOC, Ltd. (Hong Kong) | | 1,030,790 | | | | 1,605,912 |
Integra Group Holdings, GDR (Russia)* | | 45,105 | | | | 132,580 |
LUKOIL Holdings, ADR (Russia) | | 19,035 | | | | 1,073,574 |
MOL Magyar Olaj-es Gazipari NyRt. (Hungary)* | | 1,976 | | | | 178,109 |
NovaTek OAO, Sponsored GDR (Russia) | | 1,950 | | | | 127,376 |
OAO Gazprom, ADR (Russia) | | 87,242 | | | | 2,203,048 |
OAO Rosneft Oil Co., GDR (Russia) (a)* | | 62,218 | | | | 523,876 |
OGX Petroleo e Gas Participacoes, S.A. (Brazil) | | 115,600 | | | | 1,135,416 |
Oil & Gas Development Co., Ltd. (Pakistan) | | 314,628 | | | | 412,701 |
PetroChina Co., Ltd. (China) | | 218,000 | | | | 259,169 |
Petroleo Brasileiro, S.A., ADR (Brazil) | | 29,788 | | | | 1,262,713 |
Petroleo Brasileiro, S.A., Sponsored ADR (Brazil) | | 27,960 | | | | 1,333,133 |
PTT PLC, NVDR (Thailand) | | 55,500 | | | | 409,726 |
Reliance Industries, Ltd. (India) | | 28,866 | | | | 674,478 |
| | | | | |
Rosneft Oil, GDR (Russia) | | 60,700 | | | 518,072 |
Sasol, Ltd. (South Africa) | | 15,373 | | | 616,058 |
SK Energy Co., Ltd. (South Korea) | | 2,166 | | | 217,616 |
Tenaris, S.A. (Luxembourg) | | 17,400 | 2 | | 742,110 |
Tupras Turkiye Petrol Rafine (Turkey) | | 54,671 | | | 1,084,728 |
Ultrapar Participacoes, S.A. (Brazil) | | 1,673 | | | 76,981 |
Total Energy | | | | | 16,041,256 |
Financials - 26.2% | | | | | |
ABSA Group, Ltd. (South Africa) | | 27,319 | | | 473,779 |
Banco Bradesco, S.A. (Brazil) | | 25,343 | | | 554,251 |
Bangkok Bank PCL (Thailand) | | 157,800 | | | 552,419 |
Bank Hapoalim, Ltd. (Israel)* | | 56,515 | | | 245,824 |
Bank of China, Ltd., Class H (China) | | 2,636,000 | | | 1,416,564 |
Bank of India (India) | | 54,589 | | | 449,476 |
BM&F BOVESPA, S.A. (Brazil) | | 39,500 | | | 277,929 |
Bumiputra-Commerce Holdings Berhad (Malaysia) | | 162,700 | | | 608,839 |
Cathay Financial Holding Co., Ltd. (Taiwan)* | | 204,000 | | | 379,800 |
China Construction Bank Corp. (China) | | 2,081,000 | | | 1,777,478 |
China Life Insurance Co., Ltd. (China) | | 149,000 | | | 729,098 |
China Overseas Land & Investment, Ltd. (Hong Kong) | | 210,000 | 2 | | 440,010 |
China Pacific Insurance (Group) Co., Ltd. (China)* | | 41,400 | | | 164,993 |
Chinatrust Financial Holding Co., Ltd. (Taiwan) | | 1,067,326 | | | 663,518 |
The accompanying notes are an integral part of these financial statements.
22
Managers Emerging Markets Equity Fund
Schedule of Portfolio Investments (continued)
| | | | | | |
| | | Shares | | | Value |
Financials - 26.2% (continued) | | | | | | |
Commercial International Bank (Egypt) | | 15,466 | | | $ | 153,693 |
Daegu Bank, Ltd., The (South Korea) | | 20,020 | | | | 294,529 |
Franshion Properties China, Ltd. (Hong Kong) | | 1,056,000 | | | | 369,545 |
Grupo Financiero Banorte, S.A.B. de C.V. (Mexico) | | 130,800 | | | | 471,728 |
Hana Financial Group, Inc. (South Korea) | | 14,690 | | | | 415,203 |
HDFC Bank, Ltd. (India) | | 11,504 | | | | 419,176 |
Housing Development Finance Corp., Ltd. (India) | | 3,479 | | | | 199,051 |
ICICI Bank, Ltd. (India) | | 18,227 | | | | 341,570 |
Industrial and Commercial Bank of China, Ltd., Class H (China) | | 1,172,958 | 2 | | | 966,005 |
Itau Unibanco Banco Holding S.A. (Brazil) | | 27,796 | | | | 617,707 |
Itau Unibanco Banco Holding S.A., ADR (Brazil) | | 61,326 | | | | 1,400,686 |
Kasikornbank PLC, NVDR (Thailand) | | 478,300 | | | | 1,218,813 |
KB Financial Group, Inc. (South Korea)* | | 6,530 | | | | 332,509 |
KGI Securities Co., Ltd., GDR (Taiwan)* | | 12,616 | | | | 112,913 |
Komercni banka, a.s. (Czech Republic) | | 1,150 | | | | 246,420 |
Land and Houses PCL, NVDR (Thailand) | | 1,802,100 | | | | 339,300 |
OTP Bank NyRt. (Hungary)* | | 22,374 | | | | 641,002 |
Ping An Insurance (Group) Co. of China, Ltd. (China) | | 149,883 | | | | 1,303,258 |
PT Bank Mandiri (Indonesia) | | 1,541,500 | | | | 759,774 |
Samsung Fire & Marine Insurance Co., Ltd. (South Korea) | | 3,044 | | | | 521,038 |
Sberbank (Russia) | | 244,263 | | | | 671,892 |
Sberbank, GDR (Russia) | | 2,181 | | | | 596,566 |
Shanghai Lujiazui Finance & Trade Zone Development Co., Ltd. (China) | | 55,194 | | | | 106,254 |
Shinhan Financial Group Co., Ltd. (South Korea)* | | 30,510 | | | | 1,128,995 |
Siam Commercial Bank PCL (Thailand) | | 167,000 | | | | 434,585 |
Standard Bank Group, Ltd. (South Africa) | | 37,445 | | | | 514,312 |
Talaat Moustafa Group (Egypt)* | | 86,953 | | | | 109,378 |
Turkiye Garanti Bankasi A.S. (Turkey) | | 156,886 | | | | 668,320 |
Turkiye Halk Bankasi A.S. (Turkey) | | 44,927 | | | | 359,617 |
Turkiye Is Bankasi (Isbank) (Turkey) | | 87,823 | | | | 370,847 |
VTB Bank, GDR (Russia) | | 95,590 | | | | 446,322 |
Total Financials | | | | | | 25,264,986 |
Health Care - 1.0% | | | | | | |
Teva Pharmaceutical Industries, Ltd., Sponsored ADR (Israel) | | 17,272 | | | | 970,341 |
Industrials - 6.0% | | | | | | |
All America Latina Logistica SA (Brazil) | | 21,560 | | | | 201,854 |
Aveng, Ltd. (South Africa) | | 53,500 | | | | 288,232 |
Beijing Enterprises Holdings, Ltd. (Hong Kong) | | 52,000 | | | | 376,623 |
Bharat Heavy Electricals, Ltd. (India) | | 8,293 | | | | 426,925 |
China Merchants Holdings International Co., Ltd. (Hong Kong) | | 112,000 | | | | 361,305 |
China Shipping Development Co., Ltd. (China) | | 314,000 | | | | 466,989 |
Copa Holdings, S.A., Class A (Panama)* | | 9,100 | | | | 495,677 |
COSCO Pacific, Ltd. (Bermuda) | | 258,000 | | | | 327,426 |
Far Eastern New Century Corp. (Taiwan) | | 65,000 | | | | 81,275 |
GS Engineering & Construction Corp. (South Korea) | | 4,655 | | | | 431,607 |
Hyundai Engineering & Construction Co. (South Korea) | | 20,138 | | | | 1,221,538 |
IJM Corp. Berhad (Malaysia) | | 103,300 | | | | 134,766 |
Jiangsu Expressway Co., Ltd. (China) | | 86,000 | | | | 76,452 |
Korean Air Lines Co., Ltd. (South Korea)* | | 13,068 | | | | 614,620 |
Raubex Group, Ltd. (South Africa) | | 39,223 | | | | 127,015 |
Santos Brasil Participacoes, S.A. (Brazil)* | | 13,263 | | | | 133,316 |
SM Investments Corp. (Philippines) | | 1 | | | | 7 |
Total Industrials | | | | | | 5,765,627 |
| | | | |
Information Technology - 12.7% | | | | |
Acer, Inc. (Taiwan) | | 120,580 | | 361,828 |
Advanced Semiconductor Engineering, Inc. (Taiwan) | | 819,893 | | 735,932 |
AU Optronics Corp., Sponsored ADR (Taiwan) | | 11,300 | | 135,487 |
Hon Hai Precision Industry Co., Ltd., ADR (Taiwan) | | 555 | | 5,134 |
Hon Hai Precision Industry Co., Ltd. (Taiwan) | | 358,611 | | 1,677,100 |
Infosys Technologies (India) | | 13,143 | | 731,475 |
LG Display Co., Ltd. (South Korea) | | 32,490 | | 1,098,500 |
MediaTek, Inc. (Taiwan) | | 53,445 | | 928,583 |
NHN Corp. (South Korea)* | | 1,927 | | 318,491 |
Samsung Electronics Co., Ltd. (South Korea) | | 3,716 | | 2,548,174 |
Samsung Electronics Co., Ltd., GDR, (South Korea)(a)* | | 1,320 | | 452,856 |
Siliconware Precision Industries Co., ADR (Taiwan) | | 89,100 | | 624,591 |
Siliconware Precision Industries Co. (Taiwan) | | 5,871 | | 8,003 |
Taiwan Semiconductor Manufacturing Co., Ltd. (Taiwan) | | 343,582 | | 692,481 |
Taiwan Semiconductor Manufacturing Co., Ltd., Sponsored ADR (Taiwan) | | 56,335 | | 644,472 |
Tata Consultancy Services, Ltd. (India) | | 62,491 | | 1,007,554 |
Tencent Holdings, Ltd. (China) | | 14,400 | | 311,439 |
Total Information Technology | | | | 12,282,100 |
The accompanying notes are an integral part of these financial statements.
23
Managers Emerging Markets Equity Fund
Schedule of Portfolio Investments (continued)
| | | | | | | |
| | | Shares | | | Value | |
Materials - 15.3% | | | | | | | |
African Rainbow Minerals, Ltd. (South Africa) | | 13,796 | | | $ | 323,326 | |
Anglo American PLC (United Kingdom)* | | 18,085 | | | | 783,216 | |
Anhui Conch Cement Co., Ltd. (China) | | 74,936 | 2 | | | 478,838 | |
Bradespar, S.A. (Brazil) | | 10,650 | | | | 235,695 | |
CEMEX, S.A.B. de C.V. (Mexico)* | | 57,600 | 2 | | | 680,832 | |
China Shanshui Cement Group, Ltd. (China) | | 491,000 | | | | 356,427 | |
China Steel Corp. (Taiwan) | | 351,739 | | | | 362,686 | |
Companhia Siderurgica Nacional, S.A., Sponsored ADR (Brazil) | | 6,513 | | | | 207,960 | |
Evraz Group SA, GDR (Luxembourg)* | | 13,966 | 2 | | | 390,271 | |
Formosa Chemicals & Fibre Corp. (Taiwan) | | 699 | | | | 1,515 | |
GMK Norilsk Nickel, Sponsored ADR (Russia)* | | 31,350 | | | | 449,872 | |
Gold Fields, Ltd. (South Africa) | | 33,155 | | | | 435,386 | |
Hidili Industry International Development, Ltd. (China)* | | 311,000 | | | | 386,909 | |
Impala Platinum Holdings, Ltd. (South Africa) | | 11,783 | | | | 322,079 | |
Indocement Tunggal Prakarsa Tbk PT (Indonesia)* | | 198,000 | | | | 286,217 | |
LSR Group OJSC, GDR (Russia)* | | 12,723 | | | | 115,779 | |
Makhteshim-Agan Industries, Ltd. (Israel) | | 26,100 | | | | 123,949 | |
Mechel OAO (Russia) | | 8,300 | | | | 156,206 | |
MMC Norilsk Nickel, ADR (Russia)* | | 14,300 | | | | 202,879 | |
POSCO (South Korea) | | 3,767 | | | | 1,986,609 | |
Raspadskaya (Russia)* | | 79,963 | | | | 381,395 | |
Sappi, Ltd. (South Africa)* | | 117,046 | 2 | | | 559,926 | |
Severstal, GDR, Reg S (Russia)* | | 16,200 | | | | 153,008 | |
Taiwan Fertilizer Co., Ltd. (Taiwan) | | 143,000 | | | | 509,179 | |
Tata Steel, Ltd. (India) | | 26,933 | | | | 355,306 | |
Ternium SA (Luxembourg)* | | 9,000 | 2 | | | 318,780 | |
Turk Sise ve Cam Fabrikalari A.S. (Turkey)* | | 145,721 | | | | 182,869 | |
Uralkaliy OAO (Russia)* | | 24,161 | | | | 502,351 | |
Usinas Siderurgicas de Minas Gerais, S.A. (Brazil) | | 22,900 | | | | 658,852 | |
Usinas Siderurgicas de Minas Gerais, S.A., ADR (Brazil) | | 6,900 | | | | 195,744 | |
Vale, S.A. Sponsored ADR (Brazil) | | 53,467 | | | | 1,552,148 | |
Vale, S.A., ADR (Brazil) | | 42,999 | | | | 1,067,236 | |
Total Materials | | | | | | 14,723,445 | |
Telecommunication Services - 7.5% | | | | | | | |
Advanced Information Services PCL (Thailand) | | 128,900 | | | | 334,431 | |
America Movil, S.A.B. de C.V. (Mexico) | | 13,900 | | | | 653,022 | |
Bezeq Israeli Telecommunication Corp., Ltd. (Israel) | | 286,610 | | | | 722,627 | |
China Mobile, Ltd. (Hong Kong) | | 126,500 | | | | 1,177,020 | |
China Unicom, Ltd. (Hong Kong) | | 354,000 | | | | 464,542 | |
Chunghwa Telecom Co., Ltd., ADR (Taiwan) | | 351 | | | | 6,518 | |
Magyar Telekom Telecommunications PLC (Hungary) | | 81,151 | | | | 314,743 | |
Mobile Telesystems, Sponsored ADR (Russia) | | 10,195 | | | | 498,434 | |
MTN Group, Ltd. (South Africa) | | 24,172 | | | | 384,730 | |
Philippine Long Distance Telephone Co. (Philippines) | | 4,930 | | | | 278,324 | |
Philippine Long Distance Telephone Co., Sponsored ADR (Philippines) | | 5,107 | | | | 289,414 | |
SK Telecom (South Korea) | | 1,501 | | | | 219,097 | |
Tele Norte Leste Participacoes, S.A. (Brazil) | | 11,755 | | | | 251,792 | |
Telekomunikasi Indonesia Tbk PT (Indonesia) | | 961,567 | | | | 957,169 | |
Turkcell Iletisim Hizmetleri A.S. (Turkey) | | 42,551 | | | | 301,801 | |
Vivo Participacoes SA, ADR (Brazil) | | 11,325 | | | | 351,075 | |
Total Telecommunication Services | | | | | | 7,204,739 | |
Utilities - 2.0% | | | | | | | |
Akenerji Elektrik Uretim AS (Turkey) | | 9,769 | | | | 91,698 | |
China Resources Power Holdings Co. (Hong Kong) | | 153,800 | | | | 304,682 | |
Companhia Energetica de Minas Gerais (Brazil) | | 9,213 | | | | 167,220 | |
EDP - Energias do Brasil S.A. (Brazil) | | 6,345 | | | | 122,272 | |
Gail India Ltd. (India) | | 73,377 | | | | 650,256 | |
Inter-Regional Distribution Network Co Center and Privolzhya OJSC (Russia)* | | 25,134,248 | | | | 138,238 | |
Reliance Infrastructure, Ltd. (India) | | 8,409 | | | | 206,635 | |
Tata Power Co., Ltd. (India) | | 8,034 | | | | 236,410 | |
Total Utilities | | | | | | 1,917,411 | |
Total Common Stocks
(cost $79,532,709) | | | | | | 95,813,404 | |
Short-Term Investments - 4.2%1 | | | | | | | |
BNY Instistutional Cash Reserves Fund, Series A, 0.05%3 | | 2,400,000 | | | | 2,400,000 | |
BNY Institutional Cash Reserves Fund, Series B*3,8 | | 110,742 | | | | 21,595 | |
Dreyfus Cash Management Fund, Institutional Class Shares, 0.08% | | 1,614,135 | | | | 1,614,135 | |
Total Short-Term Investments
(cost $4,124,877) | | | | | | 4,035,730 | |
Total Investments - 103.7%
(cost $83,657,586) | | | | | | 99,849,134 | |
Other Assets, less Liabilities - (3.7)% | | | | | | (3,561,290 | ) |
Net Assets - 100.0% | | | | | $ | 96,287,844 | |
The accompanying notes are an integral part of these financial statements.
24
Managers Global Bond Fund
Investment Manager’s Comments
THE YEAR IN REVIEW
Managers Global Bond Fund returned 24.26% during the 12-month period ending December 31, 2009, widely outpacing the return of 6.93% for the Barclay’s Capital Global Aggregate Bond Index (the “Index”).
For investors, 2009 was a large improvement over what most experienced in 2008. After fixed income markets saw credit spreads widen to historic levels in 2008, spreads narrowed considerably during the current period as investors realized the economy was experiencing a deep recession rather than a full-blown depression. At the onset of 2009, we saw global central banks and governments continue to provide fiscal and monetary support to avert another collapse. As the global financial system was stabilized, the result thereafter was an extremely strong asset recovery. At the end of the fourth quarter, the market began to focus on central banks’ exit strategies, rising yields, and the pace of global economic recovery.
As indicated above, the Fund outperformed the Index for the 12-month period ended December 31, 2009. The main driver of this excess was the Fund’s overweight allocation to corporate bonds and a related underweight in U.S. Treasuries. The Fund’s subadvisor, Loomis Sayles & Co., L.P. (“Loomis”), built an overweight in corporate bonds throughout the credit crisis in 2008, and the strategy paid off in the form of excess returns relative to the benchmark. Country allocation was also marginally positive during the year. Additionally, the Fund’s currency strategy contributed positively to relative performance during the period. Underweights to the Canadian Dollar and the Euro, combined with a reduction in the exposure to non-Japanese Asian currencies during the second half of the year all contributed favorably.
LOOKING FORWARD
In 2009, a flood of monetary and fiscal support for global economies overcame the massive deleveraging and risk aversion that followed the collapse of Lehman Brothers and the near collapse of inter-bank lending. The peak in risk aversion- March 9 th – was followed by one of the strongest risk asset recoveries in history. Now we start 2010 with investment-grade credit spreads at about 170 basis points over government yields in both the U.S. and Euro markets. This is arguably “fair,” given the risks of a growth slowdown in the second half of 2010.
Loomis has few concerns about growth in the first quarter of 2010; U.S. GDP has been tracking above 4% in the fourth quarter, and most recent indicators ex-housing have shown slight upside surprises. U.S. housing data may have been rendered more volatile by the perceived expiration of the new home buyer tax credit in November — subsequently extended to April. Elsewhere, Chinese PMI and output data appear strong, and Euro-zone confidence has again moved higher. With inventory restocking hardly begun and industrial production momentum satisfactory, the start of the year looks solid at this point.
However, the subsequent outlook is rendered uncertain by two sizeable risks. The first is fiscal. Loomis believes that the U.S., U.K., and other countries must cut spending and raise taxes to help bring deficits under control. This could be a major fiscal drag on global growth. Also, China must wean itself from its export dependence on the U.S. consumer. The current construction surge is most likely not sustainable. Loomis believes either a yuan appreciation or a significant hike in wages would help in this respect. In Japan, the new year has brought a new Finance Minister, and Loomis is expecting more quantitative easing and a weaker Japanese Yen to follow.
The Fund remains overweight to credit and emerging markets exposures, but Loomis has reduced the size of the corporate credit exposure. Loomis continues to look to shorten duration, but they believe the December sell-off was excessive and driven by specific, large investor repositioning in holiday-thinned markets. They do not expect serious inflation during 2010, given the excess capacity in the OECD (Organization for Economic Cooperation and Development), but see a revival in private credit demand driving real yields higher. Within currencies, the Fund remains overweight in Norway and Sweden, while also favoring the British Pound Sterling over the Euro. Within Asia, the Fund is overweight Korea and Singapore, while underweight to the Japanese Yen. Loomis still favors the Mexican Peso and Brazilian Real.
CUMULATIVE TOTAL RETURN PERFORMANCE
Global Bond’s cumulative total return is based on the daily change in net asset value (NAV), and assumes that all distributions were reinvested. The Barclays Capital Global Aggregate Bond Index provides a broad-based measure of the global investment-grade fixed income markets. The three major components of this index are the U.S. Aggregate, the Pan-European Aggregate, and the Asian-Pacific Aggregate Indices. The Index also includes Eurodollar and Euro-Yen corporate bonds, Canadian government, agency and corporate securities, and USD investment-grade 144A securities. Unlike the Fund, the Barclays Capital Global Aggregate Bond Index is unmanaged, is not available for investment, and does not incur fees. This graph compares a hypothetical $10,000 investment
25
Managers Global Bond Fund
Investment Manager’s Comments (continued)
CUMULATIVE TOTAL RETURN PERFORMANCE (continued)
made in Global Bond on December 31, 1999, to a $10,000 investment made in the Barclays Capital Global Aggregate Index for the same time period. Performance for periods longer than one year is annualized. The graph and table do not reflect the deduction of taxes that a shareholder would pay on a Fund distribution or redemption of shares. The listed returns for the Fund are net of expenses and the returns for the index exclude expenses. Past performance is not indicative of future results. Total returns would have been lower had certain expenses not been reduced.
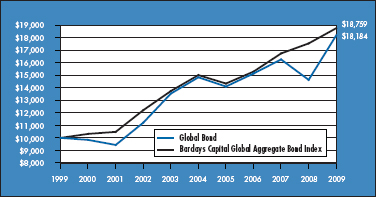
The table below shows the average annual total returns for Global Bond and the Barclays Capital Global Aggregate Bond Index from December 31, 1999 through December 31, 2009.
| | | | | | | | | |
Average Annual Total Returns 1 | | One Year | | | Five Years | | | Ten Years | |
Global Bond 2,3,4,5,6 | | 24.26 | % | | 4.15 | % | | 6.16 | % |
Barclays Capital Global Aggregate Bond Index | | 6.93 | % | | 4.56 | % | | 6.49 | % |
The performance data shown represents past performance. Past performance is not a guarantee of future results. Current performance may be lower or higher than the performance data quoted. The investment return and principal value of an investment in the Fund will fluctuate so that an investor’s shares, when redeemed, may be worth more or less than their original cost. For performance information through the most recent month end, please call (800) 835-3879 or visit our Web site at www.managersinvest.com.
In choosing a Fund, investors should carefully consider the amount they plan to invest, their investment objectives, the Fund’s investment objectives, risks, charges and expenses before investing. For this and other information, please call (800) 835-3879 or visit www.managersinvest.com for a free prospectus. Read it carefully before investing or sending money. Distributed by Managers Distributors, Inc., member FINRA.
| 1 | Total return equals income yield plus share price change and assumes reinvestment of all dividends and capital gain distributions. Returns are net of fees and may reflect offsets of Fund expenses as described in the Prospectus. No adjustment has been made for taxes payable by shareholders on their reinvested dividends and capital gain distributions. Returns for periods greater than one year are annualized. The listed returns on the Fund are net of expenses and based on the published NAV as of December 31, 2009. All returns are in U.S. dollars($). |
| 2 | Fund for which, from time to time, the Fund’s advisor has waived its fees and/or absorbed Fund expenses, which has resulted in higher returns. |
| 3 | The Fund is subject to the risks associated with investments in debt securities, such as default risk and fluctuations in the perception of the debtor’s ability to pay its creditors. |
| 4 | Changing interest rates may adversely affect the value of an investment. An increase in interest rates typically causes the value of bonds and other fixed-income securities to fall. |
| 5 | Investments in foreign securities are subject to additional risks such as changing market conditions, economic and political instability, and currency exchange rate fluctuations. |
| 6 | The Fund is subject to currency risk resulting from fluctuations in exchange rates that may affect the total loss or gain on a non-U.S. Dollar security when converted back to U.S. Dollars. |
Not FDIC insured, nor bank guaranteed. May lose value.
26
Managers Global Bond Fund
Fund Snapshots
December 31, 2009
Portfolio Breakdown
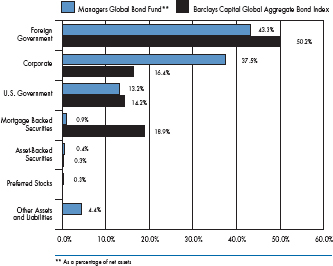
| | | | | | |
Industry | | Managers
Global Bond
Fund** | | | Barclays Capital
Global Aggregate
Bond Index | |
Foreign Government | | 43.3 | % | | 50.2 | % |
Corporate | | 37.5 | % | | 16.4 | % |
U.S. Government | | 13.2 | % | | 14.2 | % |
Mortgage Backed Securities | | 0.9 | % | | 18.9 | % |
Asset-Backed Securities | | 0.4 | % | | 0.3 | % |
Preferred Stocks | | 0.3 | % | | 0.0 | % |
Other Assets and Liabilities | | 4.4 | % | | 0.0 | % |
Top Ten Holdings
| | | |
Security Name | | Percentage of
Net Assets | |
USTN, 1.500%, 07/15/12 | | 5.7 | % |
Deutschland, Republic of, 3.750%, 07/04/13 | | 5.0 | |
USTN, 1.000%, 09/30/11 | | 4.3 | |
Belgium Kingdom, 5.500%, 09/28/17* | | 4.2 | |
Bundesrepublik Deutschland, 3.750%, 01/04/17* | | 4.2 | |
HSBC Finance Corp., 1.790%, 09/18/15* | | 3.7 | |
Government of France, 5.000%, 10/25/16 | | 3.5 | |
USTN, 1.000%, 10/31/11 | | 3.2 | |
U.K. Gilts, 4.750%, 03/04/20 | | 2.8 | |
Depfa ACS Bank, 1.650%, 12/20/16 | | 2.4 | |
| | | |
Top Ten as a Group | | 39.0 | % |
| | | |
| * | Top Ten Holding at June 30, 2009 |
Any sectors, industries, or securities discussed should not be perceived as investment recommendations. Mention of a specific security should not be considered a recommendation to buy or solicitation to sell that security. Specific securities mentioned in this report may have been sold from the Fund’s portfolio of investments by the time you receive this report.
27
Managers Global Bond Fund
Schedule of Portfolio Investments
December 31, 2009
| | | | | | |
Security Description | | Principal Amount | | Value |
Corporate Bonds - 37.5% | | | | | | |
Financials - 15.1% | | | | | | |
Abbey National Treasury Services PLC, 3.875%, 11/10/14 (a) | | USD | 100,000 | | $ | 100,356 |
Bank of America Corp., 4.750%, 05/06/196 | | EUR | 100,000 | | | 129,079 |
Barclays Bank PLC, 6.050%, 12/04/17 (a) | | USD | 100,000 | | | 101,770 |
Canara Bank, 6.365%, 11/28/216 | | USD | 150,000 | | | 140,754 |
Citigroup, Inc., 5.000%, 09/15/14 | | USD | 145,000 | | | 139,783 |
Depfa ACS Bank, 1.650%, 12/20/16 | | JPY | 70,000,000 | | | 635,097 |
Goldman Sachs Group, Inc., 1.065%, 05/23/16 (02/23/10)5 | | EUR | 100,000 | | | 130,492 |
HSBC Finance Corp., 1.790%, 09/18/15 | | JPY | 100,000,000 | | | 971,305 |
ICICI Bank, Ltd., 6.375%, 04/30/22 (a)6 | | USD | 140,000 | | | 125,680 |
KfW Bankengruppe, | | | | | | |
2.050%, 02/16/26 | | JPY | 10,000,000 | | | 107,617 |
2.600%, 06/20/37 | | JPY | 23,000,000 | | | 252,922 |
Landesbank Baden-Wuerttemberg, Series 14, 3.750%, 02/12/14 | | EUR | 120,000 | | | 179,425 |
Morgan Stanley Co., Series EMTN, 5.375%, 11/14/13 | | GBP | 60,000 | | | 101,218 |
Muenchener Hypothekenbank eG, 5.000%, 01/16/12 (a) | | EUR | 170,000 | | | 258,421 |
Nordea Bank AB, 3.700%, 11/13/14 (a) | | USD | 100,000 | | | 99,807 |
ProLogis, 6.625%, 05/15/18 | | USD | 60,000 | | | 56,902 |
SLM Corp., 5.000%, 10/01/13 | | USD | 150,000 | | | 137,991 |
Wells Fargo & Co., 4.625%, 11/02/35 | | GBP | 100,000 | | | 140,161 |
White Mountains Insurance Group, Ltd., 6.375%, 03/20/17 (a) | | USD | 140,000 | | | 131,386 |
Total Financials | | | | | | 3,940,166 |
Industrials - 20.4% | | | | | | |
Ahold Finance USA, Inc., Series EMTN, 6.500%, 03/14/17 | | GBP | 100,000 | | | 172,739 |
Albertson’s, Inc., 7.450%, 08/01/29 | | USD | 60,000 | | | 51,450 |
America Movil S.A.B. de C.V., 5.500%, 03/01/14 | | USD | 65,000 | | | 68,992 |
Axtel S.A.B. de C.V., 7.625%, 02/01/17 (a) | | USD | 100,000 | | | 98,000 |
Bell Aliant Regional Communications, 5.410%, 09/26/16 | | CAD | 160,000 | | | 157,826 |
Bell Canada, | | | | | | |
6.100%, 03/16/35 (a) | | CAD | 45,000 | | | 39,989 |
6.550%, 05/01/29 (a) | | CAD | 10,000 | | | 9,374 |
7.300%, 02/23/32 (a) | | CAD | 130,000 | | | 132,348 |
Bertelsmann AG, 3.625%, 10/06/15 | | EUR | 50,000 | | | 68,711 |
Boston Scientific Corp., 4.500%, 01/15/15 | | USD | 60,000 | | | 60,122 |
Chesapeake Energy Corp., | | | | | | |
6.875%, 11/15/20 | | USD | 55,000 | | | 53,075 |
7.500%, 06/15/14 | | USD | 50,000 | | | 51,000 |
Citizens Communications Co., 6.625%, 03/15/15 | | USD | 115,000 | | | 111,838 |
CSC Holdings Inc., 8.500%, 04/15/14 (a) | | USD | 100,000 | | | 106,500 |
The accompanying notes are an integral part of these financial statements.
28
Managers Global Bond Fund
Schedule of Portfolio Investments (continued)
| | | | | | |
Security Description | | Principal Amount | | Value |
Industrials - 20.4% (continued) | | | | | | |
Delta Air Lines, Inc., | | | | | | |
6.821%, 08/10/22 | | USD | 161,940 | | $ | 154,652 |
8.021%, 08/10/22 | | USD | 105,430 | | | 92,515 |
Desarrolladora Homex, S.A. de C.V., 7.500%, 09/28/15 | | USD | 190,000 | | | 180,500 |
DP World, Ltd., 6.850%, 07/02/37 (a) | | USD | 250,000 | | | 192,307 |
Edcon Proprietary Ltd., 3.964%, 06/15/14, (03/15/10) (a)5 | | EUR | 150,000 | | | 136,115 |
Elan Corp. PLC, 8.750%, 10/15/16 (a) | | USD | 100,000 | | | 95,500 |
Embarq Corp., 7.995%, 06/01/36 | | USD | 110,000 | | | 118,327 |
ERAC USA Finance Co., | | | | | | |
6.375%, 10/15/17 (a) | | USD | 75,000 | | | 75,755 |
6.700%, 06/01/34 (a) | | USD | 120,000 | | | 106,055 |
7.000%, 10/15/37 (a) | | USD | 20,000 | | | 19,576 |
Finmeccanica SpA, 4.875%, 03/24/25 | | EUR | 100,000 | | | 139,462 |
HCA, Inc., | | | | | | |
6.375%, 01/15/15 | | USD | 35,000 | | | 33,031 |
6.625%, 02/15/16 | | USD | 80,000 | | | 76,000 |
7.580%, 09/15/25 | | USD | 10,000 | | | 8,900 |
7.690%, 06/15/25 | | USD | 15,000 | | | 13,736 |
Hilcorp Energy I LP/Hilcorp Finance Co., 7.750%, 11/01/15 (a) | | USD | 170,000 | | | 166,600 |
Hologic, Inc., 2.000%, 12/15/37 (b)9 | | USD | 70,000 | | | 59,762 |
Incitec Pivot Finance LLC, 6.000%, 12/10/19 (a) | | USD | 110,000 | | | 108,838 |
Kinder Morgan Energy Partners L.P., 5.800%, 03/15/35 | | USD | 120,000 | | | 111,179 |
Lafarge S.A., 4.750%, 03/23/20 | | EUR | 115,000 | | | 155,687 |
Mexichem SAB de CV, 8.750%, 11/06/19 (a) | | USD | 100,000 | | | 107,500 |
Motorola Inc., | | | | | | |
6.500%, 09/01/25 | | USD | 105,000 | | | 91,225 |
6.625%, 11/15/37 | | USD | 120,000 | | | 104,400 |
Nabors Industries, Inc., 6.150%, 02/15/18 | | USD | 125,000 | | | 129,918 |
New Albertsons, Inc., 7.250%, 05/01/13 | | USD | 40,000 | | | 40,500 |
Nextel Communications, Inc., 7.375%, 08/01/15 | | USD | 50,000 | | | 48,625 |
Noble Group, Ltd., 8.500%, 05/30/13 (a) | | USD | 100,000 | | | 111,750 |
Owens & Minor, Inc., 6.350%, 04/15/167 | | USD | 105,000 | | | 96,041 |
Owens-Brockway Glass Container, Inc., 6.750%, 12/01/14 | | EUR | 50,000 | | | 69,885 |
Qwest Capital Funding, Inc., 6.500%, 11/15/18 | | USD | 40,000 | | | 34,600 |
Qwest Corp., | | | | | | |
7.250%, 09/15/25 | | USD | 83,000 | | | 76,775 |
7.250%, 10/15/35 | | USD | 158,000 | | | 139,040 |
Steel Dynamics, Inc., 7.375%, 11/01/12 | | USD | 70,000 | | | 72,100 |
SUPERVALU, Inc., 7.500%, 11/15/14 | | USD | 40,000 | | | 40,500 |
Time Warner, Inc., 6.625%, 05/15/29 | | USD | 195,000 | | | 203,327 |
Transport De Gas Del Sur, 7.875%, 05/14/17 (a) | | USD | 270,000 | | | 238,949 |
UnitedHealth Group, Inc., 5.800%, 03/15/36 | | USD | 220,000 | | | 197,173 |
The accompanying notes are an integral part of these financial statements.
29
Managers Global Bond Fund
Schedule of Portfolio Investments (continued)
| | | | | | |
Security Description | | Principal Amount | | Value |
Industrials - 20.4% (continued) | | | | | | |
Wendel Investissement, | | | | | | |
4.375%, 08/09/17 | | EUR | 100,000 | | $ | 113,250 |
4.875%, 05/26/16 | | EUR | 100,000 | | | 121,135 |
WPP Finance S.A., 5.250%, 01/30/15 | | EUR | 50,000 | | | 73,643 |
Total Industrials | | | | | | 5,336,797 |
Utilities - 2.0% | | | | | | |
Abu Dhabi National Energy Co., PJSC, 4.750%, 09/15/14 | | USD | 100,000 | | | 96,500 |
AES Corp., 8.750%, 05/15/13 (a) | | USD | 105,000 | | | 107,625 |
Edison Mission Energy, 7.625%, 05/15/27 | | USD | 155,000 | | | 105,012 |
IPALCO Enterprises, Inc., 7.250%, 04/01/16 (a) | | USD | 30,000 | | | 30,075 |
Majapahit Holding BV, 7.250%, 06/28/17 (a) | | USD | 100,000 | | | 102,250 |
Sprint Capital Corp., 8.375%, 03/15/12 | | USD | 84,000 | | | 86,940 |
Total Utilities | | | | | | 528,402 |
Total Corporate Bonds
(cost $9,563,474) | | | | | | 9,805,365 |
Foreign Government Obligations - 43.3% | | | | | | |
Banco Nacional de Desenvolvimento Economico e Social, 6.500%, 06/10/19 (a) | | USD | 100,000 | | | 107,500 |
Belgium Kingdom, 5.500%, 09/28/17 | | EUR | 680,000 | | | 1,110,944 |
Brazil, Republic of, 10.250%, 01/10/28 | | BRL | 250,000 | | | 143,596 |
Bundesobligation, Series 153, 4.000%, 10/11/13 | | EUR | 185,000 | | | 283,190 |
Bundesrepublik Deutschland, | | | | | | |
3.750%, 01/04/17 | | EUR | 739,000 | | | 1,109,045 |
4.250%, 07/04/17 | | EUR | 125,000 | | | 192,904 |
Canadian Government, 4.500%, 06/01/15 | | CAD | 505,000 | | | 521,765 |
Croatia, 6.750%, 11/05/19 (a) | | USD | 100,000 | | | 107,708 |
Deutschland, Republic of, 3.750%, 07/04/13 | | EUR | 860,000 | | | 1,305,379 |
Development Bank of Japan, 1.750%, 06/21/10 | | JPY | 45,000,000 | | | 486,272 |
European Investment Bank, 8.609%, 04/24/13 (a)4 | | IDR | 4,605,000,000 | | | 370,704 |
France, Government of, 5.000%, 10/25/16 | | EUR | 575,000 | | | 921,144 |
Japan Bank for International Cooperation, 2.125%, 11/05/12 | | USD | 500,000 | | | 497,754 |
Japan Finance Corporation for Municipal Enterprises, 1.550%, 02/21/12 | | JPY | 54,000,000 | | | 593,830 |
Mexican Fixed Rate Bond, | | | | | | |
8.000%, 12/17/15 | | MXN | 1,500,000 | | | 116,679 |
8.000%, 12/07/23 | | MXN | 3,900,000 | | | 287,805 |
New South Wales Treasury Corp., Series 10RG, 7.000%, 12/01/10 | | AUD | 190,000 | | | 174,609 |
Norway Government Bond, | | | | | | |
4.250%, 05/19/17 | | NOK | 970,000 | | | 170,298 |
5.000%, 05/15/15 | | NOK | 100,000 | | | 18,310 |
6.000%, 05/16/11 | | NOK | 1,715,000 | | | 310,328 |
6.500%, 05/15/13 | | NOK | 1,710,000 | | | 326,373 |
Province of Quebec, Series EMTN, 3.375%, 06/20/16 | | EUR | 150,000 | | | 212,861 |
Qatar Government International Bond, 4.000%, 01/20/15 (a) | | USD | 200,000 | | | 200,500 |
Singapore, Government of, 2.250%, 07/01/13 | | SGD | 335,000 | | | 249,302 |
The accompanying notes are an integral part of these financial statements.
30
Managers Global Bond Fund
Schedule of Portfolio Investments (continued)
| | | | | | | | |
Security Description | | Principal Amount | | | Value | |
Foreign Government Obligations - 43.3% (continued) | | | | | | | | |
Sweden Government Bond, Series 1046, 5.500%, 10/08/12 | | SEK | 2,520,000 | | | $ | 387,666 | |
U.K. Gilts, | | | | | | | | |
4.750%, 03/04/20 | | GBP | 435,000 | | | | 738,689 | |
5.000%, 09/07/14 | | GBP | 210,000 | | | | 371,774 | |
Total Foreign Government Obligations
(cost $10,961,879) | | | | | | | 11,316,929 | |
U.S. Government Obligations - 13.2% | | | | | | | | |
USTN, 1.000%, 09/30/11 | | USD | 1,130,000 | 2 | | | 1,129,692 | |
USTN, 1.000%, 10/31/11 | | USD | 830,000 | 2 | | | 829,253 | |
USTN, 1.500%, 07/15/12 | | USD | 1,500,000 | 2 | | | 1,502,343 | |
Total U.S. Government Obligations
(cost $3,466,896) | | | | | | | 3,461,288 | |
Asset-Backed Security - 0.4% | | | | | | | | |
COMET, Series 2004-B7, Class B7, 1.230%, 08/17/17, (01/20/10)5 (cost $85,883) | | EUR | 100,000 | | | | 111,257 | |
Mortgage-Backed Security - 0.9% | | | | | | | | |
Merrill Lynch/Countrywide Mortgage Trust, 5.439%, 02/12/396 (cost $236,143) | | USD | 235,000 | | | | 238,495 | |
| | |
| | | Shares | | | | |
Preferred Stocks - 0.3% | | | | | | | | |
FHLMC, Series Z, 8.375%* | | | 21,825 | | | | 22,916 | |
FNMA, Series S, 8.250%* | | | 37,350 | | | | 41,085 | |
Total Preferred Stocks
(cost $1,510,918) | | | | | | | 64,001 | |
Short-Term Investments - 10.2%1 | | | | | | | | |
BNY Institutional Cash Reserves Fund, Series A, 0.05%3 | | | 2,439,000 | | | | 2,439,000 | |
BNY Institutional Cash Reserves Fund, Series B*3,8 | | | 38,044 | | | | 7,419 | |
Dreyfus Cash Management Fund, Institutional Class Shares, 0.08% | | | 216,146 | | | | 216,146 | |
Total Short-Term Investments
(cost $2,693,190) | | | | | | | 2,662,565 | |
Total Investments - 105.8%
(cost $28,518,383) | | | | | | | 27,659,900 | |
Other Assets, less Liabilities - (5.8)% | | | | | | | (1,513,617 | ) |
Net Assets - 100.0% | | | | | | $ | 26,146,283 | |
The accompanying notes are an integral part of these financial statements.
31
Notes to Schedules of Portfolio Investments
The following footnotes and abbreviations should be read in conjunction with each of the Schedules of Portfolio Investments previously presented in this report.
At December 31, 2009, the cost of securities for Federal income tax purposes and the gross aggregate unrealized appreciation and/or depreciation based on tax cost were approximately:
| | | | | | | | | | | | | | |
Fund | | Cost | | Appreciation | | Depreciation | | | Net | |
Managers AMG Essex Large Cap Growth | | $ | 12,539,481 | | $ | 2,659,951 | | $ | (248,789 | ) | | $ | 2,411,162 | |
International Equity | | | 118,259,985 | | | 19,079,266 | | | (7,810,648 | ) | | | 11,268,618 | |
Emerging Markets Equity | | | 85,997,904 | | | 18,199,432 | | | (4,348,202 | ) | | | 13,851,230 | |
Global Bond | | | 28,518,915 | | | 1,116,885 | | | (1,975,900 | ) | | | (859,015 | ) |
| * | Non-income-producing security. |
| (a) | Security exempt from registration under Rule 144A of the Securities Act of 1933. This security may be resold in transactions exempt from registration, normally to qualified buyers. At December 31, 2009, the value of these securities amounted to the following: |
| | | | | | |
Fund | | Market Value | | % of Net
Assets | |
International Equity | | $ | 772,258 | | 0.6 | % |
Emerging Markets Equity | | | 976,732 | | 1.0 | % |
Global Bond | | | 3,588,937 | | 13.7 | % |
| (b) | Step Bond. A debt instrument with either deferred interest payments or an interest rate that resets at specific times during its term. |
| 1 | Yield shown for each short term investment represents the December 31, 2009, seven-day average yield, which refers to the sum of the previous seven days’ dividends paid, expressed as an annual percentage. |
| 2 | Some or all of these shares were out on loan to various brokers as of December 31, 2009, amounting to: |
| | | | | | |
Fund | | Market Value | | % of Net
Assets | |
Managers AMG Essex Large Cap Growth | | $ | 299,019 | | 2.0 | % |
International Equity | | | 3,705,146 | | 2.9 | % |
Emerging Markets Equity | | | 2,390,857 | | 2.5 | % |
Global Bond | | | 2,411,617 | | 9.2 | % |
| 3 | Collateral received from brokers for securities lending was invested in these short-term investments. |
| 4 | Represents yield to maturity at December 31, 2009. |
| 5 | Floating Rate Security. The rate listed is as of December 31, 2009. Date in parentheses represents the security’s next coupon rate reset. |
| 6 | Variable Rate Security. The rate listed is as of December 31, 2009, and is periodically reset subject to terms and conditions set forth in the debenture. |
| 7 | Security is illiquid: A security not readily convertible into cash such as a stock, bond or commodity that is not actively traded, and would be difficult to sell in a current sale. The Fund may not invest more than 15% of its net assets in illiquid securities. All securities are valued on the basis of valuations provided by dealers or independent pricing services. Illiquid securities at December 31, 2009, for Global Bond Fund amounted to $96,041 or 0.4% of net assets. |
| 8 | On September 12, 2008, The Bank of New York Mellon established a separate sleeve of the BNY Institutional Cash Reserves Fund (Series B) to hold certain Lehman Brothers floating rate notes. The Fund’s position in Series B is being marked to market daily. |
| 9 | Convertible Bond: A corporate bond, usually a junior debenture, that can be converted, at the option of the holder, for a specific number of shares of the company’s preferred stock or common stock. Convertible bonds at December 31, 2009 amounted to $59,762 or 0.2% of net assets. |
Investments Definitions and Abbreviations:
ADR/GDR: ADR after the name of a holding stands for American Depositary Receipt, representing ownership of foreign securities on deposit with a domestic custodian bank; a GDR (Global Depositary Receipt) is comparable, but foreign securities are held on deposit in a non-U.S. bank. The value of the ADR/GDR securities is determined or significantly influenced by trading on exchanges not located in the United States or Canada. Sponsored ADR/GDRs are initiated by the underlying foreign company.
| | |
| EMTN: | | European Medium Term Note |
| FHLMC: | | Federal Home Loan Mortgage Corp. |
| FNMA: | | Federal National Mortgage Association |
| RSP: | | Risparmio shares which are saving shares |
| | traded on the Italian Stock Exchange |
| USTN: | | United States Treasury Note |
|
| Abbreviations have been used throughout the portfolios to indicate amounts shown in currencies other than the U.S. dollar (USD): |
| |
| AUD: | | Australian Dollar |
| BRL: | | Brazilian Real |
| CAD: | | Canadian Dollar |
| EUR: | | euro |
| GBP: | | British Pound |
| IDR: | | Indonesian Rupiah |
| JPY: | | Japanese Yen |
| NOK: | | Norwegian Krone |
| MXN: | | Mexican Peso |
| SEK: | | Swedish Krona |
| SGD: | | Singapore Dollar |
32
Statements of Assets and Liabilities
December 31, 2009
| | | | | | | | | | | | | | | | |
| | | Managers AMG
Essex Large Cap
Growth Fund | | | Managers
International
Equity Fund | | | Managers Emerging
Markets Equity
Fund | | | Managers Global
Bond Fund | |
Assets: | | | | | | | | | | | | | | | | |
Investments at value (including securities on loan valued at $299,019, $3,705,146, $2,390,857 and $2,411,617, respectively)* | | $ | 14,950,643 | | | $ | 129,528,603 | | | $ | 99,849,134 | | | $ | 27,659,900 | |
Cash | | | — | | | | 30,758 | | | | 2,493 | | | | — | |
Cash collateral for futures | | | — | | | | 39,996 | | | | — | | | | — | |
Foreign currency** | | | — | | | | 733,758 | | | | 399,516 | | | | 705,716 | |
Receivable for investments sold | | | 201,823 | | | | 384,875 | | | | 328,694 | | | | — | |
Receivable for Fund shares sold | | | 2,730 | | | | 176,978 | | | | 90,657 | | | | 102,328 | |
Receivable from affiliate | | | 3,059 | | | | 12,033 | | | | 34,153 | | | | 2,017 | |
Dividends, interest and other receivables | | | 7,127 | | | | 309,717 | | | | 111,984 | | | | 335,884 | |
Prepaid expenses | | | 7,390 | | | | 8,710 | | | | 11,541 | | | | 6,379 | |
Total assets | | | 15,172,772 | | | | 131,225,428 | | | | 100,828,172 | | | | 28,812,224 | |
Liabilities: | | | | | | | | | | | | | | | | |
Payable for Fund shares repurchased | | | 10,534 | | | | 187,137 | | | | 1,662,175 | | | | 96,280 | |
Payable upon return of securities loaned | | | 308,397 | | | | 3,868,356 | | | | 2,510,742 | | | | 2,477,044 | |
Payable for investments purchased | | | 178,836 | | | | 99,876 | | | | 111,143 | | | | — | |
Unrealized depreciation of foreign currency contracts | | | — | | | | — | | | | — | | | | 12,614 | |
Accrued expenses: | | | | | | | | | | | | | | | | |
Investment management and advisory fees | | | 9,790 | | | | 97,498 | | | | 93,710 | | | | 16,395 | |
Administrative fees | | | 3,059 | | | | 27,083 | | | | 20,372 | | | | 4,684 | |
Other | | | 49,838 | | | | 150,169 | | | | 142,186 | | | | 58,924 | |
Total liabilities | | | 560,454 | | | | 4,430,119 | | | | 4,540,328 | | | | 2,665,941 | |
| | | | |
Net Assets | | $ | 14,612,318 | | | $ | 126,795,309 | | | $ | 96,287,844 | | | $ | 26,146,283 | |
Shares outstanding | | | 567,410 | | | | 2,473,509 | | | | 7,111,722 | | | | 1,389,051 | |
Net asset value, offering and redemption price per share | | $ | 25.75 | | | $ | 51.26 | | | $ | 13.54 | | | $ | 18.82 | |
Net Assets Represent: | | | | | | | | | | | | | | | | |
Paid-in capital | | $ | 68,333,466 | | | $ | 202,003,253 | | | $ | 109,576,098 | | | $ | 29,709,882 | |
Undistributed net investment income (loss) | | | — | | | | 176,768 | | | | (12,834 | ) | | | 410,909 | |
Accumulated net realized loss from investments, futures and foreign currency transactions | | | (56,209,013 | ) | | | (90,192,570 | ) | | | (29,474,295 | ) | | | (3,103,385 | ) |
Net unrealized appreciation (depreciation) of investments, futures and foreign currency contracts and translations | | | 2,487,865 | | | | 14,807,858 | | | | 16,198,875 | | | | (871,123 | ) |
Net Assets | | $ | 14,612,318 | | | $ | 126,795,309 | | | $ | 96,287,844 | | | $ | 26,146,283 | |
| |
* Investments at cost | | $ | 12,462,778 | | | $ | 114,753,876 | | | $ | 83,657,586 | | | $ | 28,518,383 | |
** Foreign currency at cost | | | — | | | $ | 771,590 | | | $ | 394,971 | | | $ | 705,556 | |
The accompanying notes are an integral part of these financial statements.
33
Statements of Operations
For the year ended December 31, 2009
| | | | | | | | | | | | | | | | |
| | | Managers AMG
Essex Large Cap
Growth Fund | | | Managers
International
Equity Fund | | | Managers Emerging
Markets Equity Fund | | | Managers Global
Bond Fund | |
Investment Income: | | | | | | | | | | | | | | | | |
Dividend income | | $ | 169,054 | | | $ | 3,876,501 | | | $ | 1,845,397 | | | $ | 21,937 | |
Interest income | | | — | | | | 3 | | | | 23 | | | | 2,317,487 | |
Foreign withholding tax | | | (2,801 | ) | | | (395,630 | ) | | | (177,192 | ) | | | — | |
Securities lending fees | | | 1,030 | | | | 6,188 | | | | 2,923 | | | | 2,105 | |
Total investment income | | | 167,283 | | | | 3,487,062 | | | | 1,671,151 | | | | 2,341,529 | |
Expenses: | | | | | | | | | | | | | | | | |
Investment management and advisory fees | | | 169,392 | | | | 1,110,083 | | | | 920,080 | | | | 277,001 | |
Administrative fees | | | 52,935 | | | | 308,356 | | | | 200,018 | | | | 79,143 | |
Transfer agent | | | 72,636 | | | | 398,205 | | | | 230,875 | | | | 61,492 | |
Professional fees | | | 31,914 | | | | 77,905 | | | | 84,793 | | | | 43,707 | |
Registration fees | | | 19,984 | | | | 25,709 | | | | 31,364 | | | | 20,120 | |
Custodian | | | 9,165 | | | | 158,652 | | | | 148,335 | | | | 27,922 | |
Reports to shareholders | | | 3,957 | | | | 34,830 | | | | 60,735 | | | | 2,718 | |
Trustees fees and expenses | | | 2,173 | | | | 7,913 | | | | 4,115 | | | | 5,342 | |
Miscellaneous | | | 1,756 | | | | 15,827 | | | | 22,938 | | | | 3,261 | |
Total expenses before offsets | | | 363,912 | | | | 2,137,480 | | | | 1,703,253 | | | | 520,706 | |
Expense reimbursements | | | (52,935 | ) | | | (303,475 | ) | | | (267,866 | ) | | | (52,657 | ) |
Expense reductions | | | (10,872 | ) | | | (2,822 | ) | | | (308 | ) | | | (167 | ) |
Fee waivers | | | — | | | | — | | | | — | | | | (32,367 | ) |
Net expenses | | | 300,105 | | | | 1,831,183 | | | | 1,435,079 | | | | 435,515 | |
| | | | |
Net investment income (loss) | | | (132,822 | ) | | | 1,655,879 | | | | 236,072 | | | | 1,906,014 | |
Net Realized and Unrealized Gain (Loss): | | | | | | | | | | | | | | | | |
Net realized loss on investments | | | (819,515 | ) | | | (18,935,135 | ) | | | (16,581,576 | ) | | | (1,262,123 | ) |
Net realized gain on futures contracts | | | — | | | | 183,813 | | | | — | | | | — | |
Net realized gain (loss) on foreign currency contracts and transactions | | | — | | | | (779,547 | ) | | | (134,530 | ) | | | 175,184 | |
Net unrealized appreciation of investments | | | 6,594,887 | | | | 50,990,743 | | | | 58,434,039 | | | | 8,295,502 | |
Net unrealized appreciation of futures contracts | | | — | | | | 24,119 | | | | — | | | | — | |
Net unrealized appreciation of foreign currency contracts and translations | | | — | | | | 29,371 | | | | 6,974 | | | | 4,514 | |
Net realized and unrealized gain | | | 5,775,372 | | | | 31,513,364 | | | | 41,724,907 | | | | 7,213,077 | |
| | | | |
Net increase in net assets resulting from operations | | $ | 5,642,550 | | | $ | 33,169,243 | | | $ | 41,960,979 | | | $ | 9,119,091 | |
The accompanying notes are an integral part of these financial statements.
34
Statements of Changes in Net Assets
For the year ended December 31,
| | | | | | | | | | | | | | | | |
| | | Managers AMG Essex Large Cap
Growth Fund | | | Managers International Equity Fund | |
| | | 2009 | | | 2008 | | | 2009 | | | 2008 | |
Increase (Decrease) in Net Assets From Operations: | | | | | | | | | | | | | | | | |
Net investment income (loss) | | $ | (132,822 | ) | | $ | (217,145 | ) | | $ | 1,655,879 | | | $ | 2,768,049 | |
Net realized gain (loss) on investments, futures and foreign currency transactions | | | (819,515 | ) | | | (11,285,555 | ) | | | (19,530,869 | ) | | | (41,702,975 | ) |
Net unrealized appreciation (depreciation) of investments and foreign currency contracts and translations | | | 6,594,887 | | | | (9,788,662 | ) | | | 51,044,233 | | | | (99,695,283 | ) |
Net increase (decrease) in net assets resulting from operations | | | 5,642,550 | | | | (21,291,362 | ) | | | 33,169,243 | | | | (138,630,209 | ) |
Distributions to Shareholders: | | | | | | | | | | | | | | | | |
From net investment income | | | — | | | | — | | | | (850,021 | ) | | | (579,286 | ) |
From net realized gain on investments | | | — | | | | — | | | | — | | | | — | |
Total distributions to shareholders | | | — | | | | — | | | | (850,021 | ) | | | (579,286 | ) |
From Capital Share Transactions: | | | | | | | | | | | | | | | | |
Proceeds from sale of shares1 | | | 2,304,747 | | | | 8,636,662 | | | | 19,062,082 | | | | 47,873,956 | |
Reinvestment of dividends and distributions | | | — | | | | — | | | | 770,986 | | | | 525,450 | |
Cost of shares repurchased | | | (22,294,449 | ) | | | (10,262,153 | ) | | | (53,341,397 | ) | | | (83,230,766 | ) |
Net decrease from capital share transactions | | | (19,989,702 | ) | | | (1,625,491 | ) | | | (33,508,329 | ) | | | (34,831,360 | ) |
| | | | |
Total increase (decrease) in net assets | | | (14,347,152 | ) | | | (22,916,853 | ) | | | (1,189,107 | ) | | | (174,040,855 | ) |
Net Assets: | | | | | | | | | | | | | | | | |
Beginning of year | | | 28,959,470 | | | | 51,876,323 | | | | 127,984,416 | | | | 302,025,271 | |
End of year | | $ | 14,612,318 | | | $ | 28,959,470 | | | $ | 126,795,309 | | | $ | 127,984,416 | |
End of year undistributed net investment income (loss) | | | — | | | | — | | | $ | 176,768 | | | $ | (23,558 | ) |
| | | | | | | | | | | | | | | | |
Share Transactions: | | | | | | | | | | | | | | | | |
Sale of shares | | | 112,176 | | | | 326,270 | | | | 478,162 | | | | 830,645 | |
Reinvested shares | | | — | | | | — | | | | 14,997 | | | | 13,882 | |
Shares repurchased | | | (1,033,907 | ) | | | (391,513 | ) | | | (1,285,542 | ) | | | (1,494,428 | ) |
Net increase (decrease) in shares | | | (921,731 | ) | | | (65,243 | ) | | | (792,383 | ) | | | (649,901 | ) |
| 1 | For the year ended December 31, 2009, the proceeds from the sale of shares for International Equity includes the receipt of a market timing settlement of $94,219. |
The accompanying notes are an integral part of these financial statements.
35
| | | | | | | | | | | | | | |
Managers Emerging Markets Equity Fund | | | Managers Global Bond Fund | |
| 2009 | | | 2008 | | | 2009 | | | 2008 | |
| | | |
| $ | 236,072 | | | $ | 1,030,654 | | | $ | 1,906,014 | | | $ | 2,847,226 | |
| | (16,716,106 | ) | | | (3,403,946 | ) | | | (1,086,939 | ) | | | 1,526,739 | |
| | | |
| | 58,441,013 | | | | (101,316,338 | ) | | | 8,300,016 | | | | (12,423,376 | ) |
| | 41,960,979 | | | | (103,689,630 | ) | | | 9,119,091 | | | | (8,049,411 | ) |
| | | |
| | (209,563 | ) | | | (990,986 | ) | | | (2,806,638 | ) | | | (5,511,710 | ) |
| | — | | | | (19,178,599 | ) | | | — | | | | (63,791 | ) |
| | (209,563 | ) | | | (20,169,585 | ) | | | (2,806,638 | ) | | | (5,575,501 | ) |
| | | |
| | 35,544,198 | | | | 53,517,690 | | | | 9,245,127 | | | | 9,573,497 | |
| | 188,220 | | | | 19,578,962 | | | | 2,757,790 | | | | 5,410,372 | |
| | (41,551,261 | ) | | | (87,117,060 | ) | | | (39,903,634 | ) | | | (45,748,762 | ) |
| | (5,818,843 | ) | | | (14,020,408 | ) | | | (27,900,717 | ) | | | (30,764,893 | ) |
| | 35,932,573 | | | | (137,879,623 | ) | | | (21,588,264 | ) | | | (44,389,805 | ) |
| | | |
| | 60,355,271 | | | | 198,234,894 | | | | 47,734,547 | | | | 92,124,352 | |
| $ | 96,287,844 | | | $ | 60,355,271 | | | $ | 26,146,283 | | | $ | 47,734,547 | |
| $ | (12,834 | ) | | $ | 18,683 | | | $ | 410,909 | | | $ | 201,732 | |
| | | | | | | | | | | | | | | |
| | | |
| | 3,577,894 | | | | 2,584,081 | | | | 471,568 | | | | 449,639 | |
| | 13,983 | | | | 2,523,148 | | | | 146,344 | | | | 322,430 | |
| | (3,943,771 | ) | | | (5,039,533 | ) | | | (2,048,613 | ) | | | (2,275,508 | ) |
| | (351,894 | ) | | | 67,696 | | | | (1,430,701 | ) | | | (1,503,439 | ) |
The accompanying notes are an integral part of these financial statements.
36
Managers Money Market Fund
Statement of Assets and Liabilities
December 31, 2009
| | | |
Assets: | | | |
Investment in JPMorgan Liquid Assets Money Market Fund, Capital Shares (cost $68,963,057) | | $ | 68,963,057 |
Receivable for Fund shares sold | | | 65,040 |
Dividends receivable | | | 11,372 |
Receivable from affiliate | | | 8,857 |
Prepaid expenses | | | 11,818 |
Total assets | | | 69,060,144 |
Liabilities: | | | |
Payable for Fund shares repurchased | | | 74,897 |
Administration fee payable | | | 9,201 |
Other accrued expenses | | | 38,875 |
Total liabilities | | | 122,973 |
Net Assets | | $ | 68,937,171 |
Shares outstanding | | | 68,937,171 |
Net asset value, offering and redemption price per share | | $ | 1.00 |
Net Assets Represent: | | | |
Paid-in capital | | $ | 68,937,171 |
| | | |
Managers Money Market Fund
Statement of Operations
| | | | |
| | | For the year ended
December 31, 2009 | |
Investment Income: | | | | |
Dividend income | | $ | 480,690 | |
Expenses: | | | | |
Administration fees | | | 120,390 | |
Transfer agent | | | 80,711 | |
Registration fees | | | 40,178 | |
Professional fees | | | 34,820 | |
U.S. Treasury guarantee program | | | 21,753 | |
Trustees fees and expenses | | | 8,771 | |
Accounting fees | | | 6,000 | |
Reports to shareholders | | | 1,426 | |
Miscellaneous expenses | | | 5,498 | |
Total expenses before offsets | | | 319,547 | |
Fee waivers | | | (67,137 | ) |
Expense reductions | | | (337 | ) |
Net expenses | | | 252,073 | |
Net Investment Income | | $ | 228,617 | |
The accompanying notes are an integral part of these financial statements.
37
Managers Money Market Fund
Statement of Changes in Net Assets
| | | | | | | | |
| | | For the year ended December 31, | |
| | | 2009 | | | 2008 | |
Increase (Decrease) in Net Assets from Operations: | | | | | | | | |
Net investment income | | $ | 228,617 | | | $ | 2,304,236 | |
Distributions to Shareholders: | | | | | | | | |
From net investment income | | | (228,617 | ) | | | (2,304,236 | ) |
From Capital Share Transactions (at a constant $1.00 per share): | | | | | | | | |
Proceeds from sale of shares | | | 103,330,793 | | | | 165,086,227 | |
Reinvestment of dividends | | | 238,299 | | | | 2,255,961 | |
Cost of shares repurchased | | | (115,056,129 | ) | | | (178,135,907 | ) |
Net decrease from capital share transactions | | | (11,487,037 | ) | | | (10,793,719 | ) |
| | |
Total decrease in net assets | | | (11,487,037 | ) | | | (10,793,719 | ) |
Net Assets: | | | | | | | | |
Beginning of year | | | 80,424,208 | | | | 91,217,927 | |
End of year | | $ | 68,937,171 | | | $ | 80,424,208 | |
The accompanying notes are an integral part of these financial statements.
Financial Highlights
For a share outstanding throughout each period
| | | | | | | | | | | | | | | | | | | | | | | | |
| | | | | | For one
month ended | | | | |
| | | For the year ended December 31, | | | December 31, | | | For the fiscal year ended November 30, | |
Managers Money Market Fund | | 2009 | | | 2008 | | | 2007** | | | 2007 | | | 2006 | | | 2005* | |
Net Asset Value, Beginning of Period | | $ | 1.000 | | | $ | 1.000 | | | $ | 1.000 | | | $ | 1.000 | | | $ | 1.000 | | | $ | 1.000 | |
Income from Investment Operations: | | | | | | | | | | | | | | | | | | | | | | | | |
Net investment income | | | 0.003 | | | | 0.027 | | | | 0.004 | | | | 0.049 | | | | 0.043 | | | | 0.026 | |
Less Distributions to Shareholders from: | | | | | | | | | | | | | | | | | | | | | | | | |
Net investment income | | | (0.003 | ) | | | (0.027 | ) | | | (0.004 | ) | | | (0.049 | ) | | | (0.043 | ) | | | (0.026 | ) |
Net Asset Value, End of Period | | $ | 1.000 | | | $ | 1.000 | | | $ | 1.000 | | | $ | 1.000 | | | $ | 1.000 | | | $ | 1.000 | |
Total Return1 | | | 0.27 | % | | | 2.73 | % | | | 0.37 | %3 | | | 5.05 | % | | | 4.45 | % | | | 2.61 | % |
Ratio of net expenses to average net assets | | | 0.32 | % | | | 0.26 | % | | | 0.39 | %4 | | | 0.29 | % | | | 0.40 | % | | | 0.40 | % |
Ratio of net investment income to average net assets1 | | | 0.28 | % | | | 2.75 | % | | | 4.46 | %4 | | | 4.92 | % | | | 4.42 | % | | | 2.62 | % |
Net assets at end of period (000’s omitted) | | $ | 68,937 | | | $ | 80,424 | | | $ | 91,218 | | | $ | 93,106 | | | $ | 37,839 | | | $ | 37,896 | |
| | | | | | | | | | | | | | | | | | | | | | | | |
Ratios absent expense offsets:2 | | | | | | | | | | | | | | | | | | | | | | | | |
Ratio of total expenses to average net assets | | | 0.40 | % | | | 0.31 | % | | | 0.44 | %4 | | | 0.34 | % | | | 0.45 | % | | | 0.46 | % |
Ratio of net investment income to average net assets | | | 0.20 | % | | | 2.70 | % | | | 4.41 | %4 | | | 4.87 | % | | | 4.37 | % | | | 2.56 | % |
| | | | | | | | | | | | | | | | | | | | | | | | |
| * | Prior to February 19, 2005 the Fund invested all of its assets in the Institutional Class Shares of the JPMorgan Liquid Assets Money Market Fund. |
| ** | Effective December 1, 2007, Managers Money Market Fund changed its fiscal year end from November 30 to December 31. |
| 1 | Total returns and net investment income would have been lower had certain expenses not been reduced. (See Note 1(c) of Notes to Financial Statements.) |
| 2 | Excludes the impact of expense reimbursements and expense reductions such as brokerage credits, but includes non-reimbursable expenses, if any, such as interest and taxes. (See Note 1(c) of Notes to Financial Statements.) |
38
Financial Highlights
For a share outstanding throughout each year
| | | | | | | | | | | | | | | | | | | | |
| | | For the year ended December 31, | |
Managers AMG Essex Large Cap Growth Fund | | 2009 | | | 2008 | | | 2007 | | | 2006 | | | 2005 | |
Net Asset Value, Beginning of Year | | $ | 19.45 | | | $ | 33.37 | | | $ | 29.18 | | | $ | 27.79 | | | $ | 26.77 | |
Income from Investment Operations: | | | | | | | | | | | | | | | | | | | | |
Net investment loss | | | (0.13 | )3 | | | (0.14 | )3 | | | (0.15 | )3 | | | (0.09 | )3 | | | (0.07 | )3 |
Net realized and unrealized gain (loss) on investments | | | 6.43 | 3 | | | (13.78 | )3 | | | 4.34 | 3 | | | 1.48 | 3 | | | 1.09 | 3 |
Total from investment operations | | | 6.30 | | | | (13.92 | ) | | | 4.19 | | | | 1.39 | | | | 1.02 | |
Net Asset Value, End of Year | | $ | 25.75 | | | $ | 19.45 | | | $ | 33.37 | | | $ | 29.18 | | | $ | 27.79 | |
Total Return1 | | | 32.39 | % | | | (41.71 | )% | | | 14.36 | % | | | 4.96 | % | | | 3.85 | % |
Ratio of net expenses to average net assets | | | 1.42 | % | | | 1.24 | % | | | 1.24 | % | | | 1.25 | % | | | 1.28 | % |
Ratio of net investment loss to average net assets1 | | | (0.63 | )% | | | (0.52 | )% | | | (0.47 | )% | | | (0.33 | )% | | | (0.27 | )% |
Portfolio turnover | | | 108 | % | | | 119 | % | | | 116 | % | | | 200 | % | | | 97 | % |
Net assets at end of year (000’s omitted) | | $ | 14,612 | | | $ | 28,959 | | | $ | 51,876 | | | $ | 65,999 | | | $ | 104,878 | |
| | | | | | | | | | | | | | | | | | | | |
Ratios absent expense offsets:2 | | | | | | | | | | | | | | | | | | | | |
Ratio of total expenses to average net assets | | | 1.72 | % | | | 1.61 | % | | | 1.29 | % | | | 1.32 | % | | | 1.22 | % |
Ratio of net investment loss to average net assets | | | (0.93 | )% | | | (0.89 | )% | | | (0.52 | )% | | | (0.40 | )% | | | (0.21 | )% |
| | | | | | | | | | | | | | | | | | | | |
| |
| | | For the year ended December 31, | |
Managers International Equity Fund | | 2009 | | | 2008 | | | 2007 | | | 2006 | | | 2005 | |
Net Asset Value, Beginning of Year | | $ | 39.19 | | | $ | 77.13 | | | $ | 67.42 | | | $ | 53.76 | | | $ | 47.05 | |
Income from Investment Operations: | | | | | | | | | | | | | | | | | | | | |
Net investment income | | | 0.58 | 3 | | | 0.76 | 3 | | | 0.47 | | | | 0.69 | | | | 0.37 | |
Net realized and unrealized gain (loss) on investments | | | 11.84 | 3 | | | (38.52 | )3 | | | 9.60 | | | | 14.15 | | | | 6.83 | |
Total from investment operations | | | 12.42 | | | | (37.76 | ) | | | 10.07 | | | | 14.84 | | | | 7.20 | |
Less Distributions to Shareholders from: | | | | | | | | | | | | | | | | | | | | |
Net investment income | | | (0.35 | ) | | | (0.18 | ) | | | (0.36 | ) | | | (1.18 | ) | | | (0.49 | ) |
Net Asset Value, End of Year | | $ | 51.26 | | | $ | 39.19 | | | $ | 77.13 | | | $ | 67.42 | | | $ | 53.76 | |
Total Return1 | | | 31.68 | % | | | (48.92 | )% | | | 14.94 | %4 | | | 27.63 | % | | | 15.30 | % |
Ratio of net expenses to average net assets | | | 1.48 | % | | | 1.48 | % | | | 1.48 | % | | | 1.45 | % | | | 1.45 | % |
Ratio of net investment income to average net assets1 | | | 1.34 | % | | | 1.24 | % | | | 0.60 | % | | | 0.70 | % | | | 0.75 | % |
Portfolio turnover | | | 128 | % | | | 142 | % | | | 98 | % | | | 70 | % | | | 79 | % |
Net assets at end of year (000’s omitted) | | $ | 126,795 | | | $ | 127,984 | | | $ | 302,025 | | | $ | 230,916 | | | $ | 206,393 | |
| | | | | | | | | | | | | | | | | | | | |
Ratios absent expense offsets:2 | | | | | | | | | | | | | | | | | | | | |
Ratio of total expenses to average net assets | | | 1.73 | % | | | 1.64 | % | | | 1.61 | % | | | 1.47 | % | | | 1.42 | % |
Ratio of net investment income to average net assets | | | 1.09 | % | | | 1.08 | % | | | 0.46 | % | | | 0.68 | % | | | 0.79 | % |
| | | | | | | | | | | | | | | | | | | | |
39
Financial Highlights
For a share outstanding throughout each year
| | | | | | | | | | | | | | | | | | | | |
| | | For the year ended December 31, | |
Managers Emerging Markets Equity Fund | | 2009 | | | 2008 | | | 2007 | | | 2006 | | | 2005 | |
Net Asset Value, Beginning of Year | | $ | 8.09 | | | $ | 26.80 | | | $ | 24.44 | | | $ | 20.10 | | | $ | 16.50 | |
Income from Investment Operations: | | | | | | | | | | | | | | | | | | | | |
Net investment income | | | 0.03 | 3 | | | 0.15 | 3 | | | 0.04 | 3 | | | 0.22 | | | | 0.52 | |
Net realized and unrealized gain (loss) on investments | | | 5.45 | 3 | | | (15.02 | )3 | | | 7.20 | 3 | | | 6.66 | | | | 4.84 | |
Total from investment operations | | | 5.48 | | | | (14.87 | ) | | | 7.24 | | | | 6.88 | | | | 5.36 | |
Less Distributions to Shareholders from: | | | | | | | | | | | | | | | | | | | | |
Net investment income | | | (0.03 | ) | | | (0.19 | ) | | | — | | | | (0.22 | ) | | | (0.55 | ) |
Net realized gain on investments | | | — | | | | (3.65 | ) | | | (4.88 | ) | | | (2.32 | ) | | | (1.21 | ) |
Total distributions to shareholders | | | (0.03 | ) | | | (3.84 | ) | | | (4.88 | ) | | | (2.54 | ) | | | (1.76 | ) |
Net Asset Value, End of Year | | | 13.54 | | | $ | 8.09 | | | $ | 26.80 | | | $ | 24.44 | | | $ | 20.10 | |
Total Return1 | | | 67.94 | % | | | (54.87 | )%4 | | | 29.50 | %4 | | | 34.50 | % | | | 32.53 | % |
Ratio of net expenses to average net assets | | | 1.77 | %5 | | | 1.77 | %5 | | | 1.78 | % | | | 1.76 | % | | | 1.75 | % |
Ratio of net investment income to average net assets1 | | | 0.32 | %5 | | | 0.76 | %5 | | | 0.13 | % | | | 0.89 | % | | | 0.59 | % |
Portfolio turnover | | | 103 | % | | | 49 | % | | | 62 | % | | | 41 | % | | | 35 | % |
Net assets at end of year (000’s omitted) | | $ | 96,288 | | | $ | 60,355 | | | $ | 198,235 | | | $ | 152,983 | | | $ | 117,229 | |
| | | | | | | | | | | | | | | | | | | | |
Ratios absent expense offsets:2 | | | | | | | | | | | | | | | | | | | | |
Ratio of total expenses to average net assets | | | 2.13 | % | | | 2.03 | % | | | 1.93 | % | | | 1.76 | % | | | 1.72 | % |
Ratio of net investment income (loss) to average net assets | | | (0.04 | )% | | | 0.50 | % | | | (0.02 | )% | | | 0.89 | % | | | 0.62 | % |
| | | | | | | | | | | | | | | | | | | | |
| |
| | | For the year ended December 31, | |
Managers Global Bond Fund | | 2009 | | | 2008 | | | 2007 | | | 2006 | | | 2005 | |
Net Asset Value, Beginning of Year | | $ | 16.93 | | | $ | 21.31 | | | $ | 21.17 | | | $ | 20.19 | | | $ | 22.38 | |
Income from Investment Operations: | | | | | | | | | | | | | | | | | | | | |
Net investment income | | | 0.89 | 3 | | | 0.76 | 3 | | | 0.70 | 3 | | | 0.45 | | | | 0.63 | |
Net realized and unrealized gain (loss) on investments | | | 3.22 | 3 | | | (2.93 | )3 | | | 0.88 | 3 | | | 1.05 | | | | (1.75 | ) |
Total from investment operations | | | 4.11 | | | | (2.17 | ) | | | 1.58 | | | | 1.50 | | | | (1.12 | ) |
Less Distributions to Shareholders from: | | | | | | | | | | | | | | | | | | | | |
Net investment income | | | (2.22 | ) | | | (2.18 | ) | | | (1.43 | ) | | | (0.49 | ) | | | (0.77 | ) |
Net realized gain on investments | | | — | | | | (0.03 | ) | | | (0.01 | ) | | | (0.03 | ) | | | (0.30 | ) |
Total distributions to shareholders | | | (2.22 | ) | | | (2.21 | ) | | | (1.44 | ) | | | (0.52 | ) | | | (1.07 | ) |
Net Asset Value, End of Year | | $ | 18.82 | | | $ | 16.93 | | | $ | 21.31 | | | $ | 21.17 | | | $ | 20.19 | |
Total Return1 | | | 24.27 | %4 | | | (10.07 | )%4 | | | 7.52 | %4 | | | 7.36 | % | | | (4.94 | )% |
Ratio of net expenses to average net assets | | | 1.10 | % | | | 1.10 | % | | | 1.19 | % | | | 1.19 | % | | | 1.19 | % |
Ratio of net investment income to average net assets1 | | | 4.82 | % | | | 3.62 | % | | | 3.25 | % | | | 2.86 | % | | | 2.38 | % |
Portfolio turnover | | | 102 | % | | | 56 | % | | | 152 | % | | | 56 | % | | | 64 | % |
Net assets at end of year (000’s omitted) | | $ | 26,146 | | | $ | 47,735 | | | $ | 92,124 | | | $ | 53,670 | | | $ | 43,131 | |
| | | | | | | | | | | | | | | | | | | | |
Ratios absent expense offsets:2 | | | | | | | | | | | | | | | | | | | | |
Ratio of total expenses to average net assets | | | 1.32 | % | | | 1.25 | % | | | 1.25 | % | | | 1.27 | % | | | 1.26 | % |
Ratio of net investment income to average net assets | | | 4.60 | % | | | 3.47 | % | | | 3.18 | % | | | 2.78 | % | | | 2.31 | % |
| | | | | | | | | | | | | | | | | | | | |
The following notes should be read in conjunction with the Financial Highlights of the Funds presented on the preceding pages.
| 1 | Total returns and net investment income would have been lower had certain expenses not been reduced. (See Note 1(c) to the Notes to Financial Statements.) |
| 2 | Excludes the impact of expense (reimbursement)/recoupment and expense reductions such as brokerage credits, but includes non-reimbursable expenses, if any, such as interest and taxes. (See Note 1(c) to the Notes to Financial Statements.) |
| 3 | Per share numbers have been calculated using average shares. |
| 4 | The Total Return is based on the Financial Statement Net Asset Values as shown above. |
| 5 | Excludes interest expense for the years ended December 31, 2009 and 2008, of 0.02% and 0.03%, respectively, for Emerging Markets Equity. (See Note 1(c) of Notes to Financial Statements.) |
40
Notes to Financial Statements
December 31, 2009
1. Summary of Significant Accounting Policies
The Managers Funds (the “Trust”) is an open-end management investment company organized as a Massachusetts business trust, and registered under the Investment Company Act of 1940, as amended (the “1940 Act”). Currently, the Trust is comprised of a number of different funds, each having distinct investment management objectives, strategies, risks, and policies. Included in this report are: Managers AMG Essex Large Cap Growth Fund (“Essex Large Cap Growth”), Managers International Equity Fund (“International Equity”), Managers Emerging Markets Equity Fund (“Emerging Markets Equity”), Managers Money Market Fund (“Money Market”) and Managers Global Bond Fund (“Global Bond”), collectively the “Funds.”
Money Market invests all of its investable assets in the Capital Shares of the JPMorgan Liquid Assets Money Market Fund (the “Portfolio”), a separate registered open-end management investment company with substantially the same investment objective and policies as the Fund. The Portfolio is a series of the JPMorgan Trust II, a business trust organized under the laws of The Commonwealth of Massachusetts. The investment manager of the Portfolio is JPMorgan Investment Advisors Inc. (“JPMIA”). The performance of the Fund is directly affected by the performance of the Portfolio.
The Funds’ financial statements are prepared in accordance with accounting principles generally accepted in the United States of America, which require management to make estimates and assumptions that affect the reported amounts of assets and liabilities and disclosure of contingent assets and liabilities at the date of the financial statements and the reported amounts of income and expenses during the reporting period. Actual results could differ from those estimates and such differences could be material. The following is a summary of significant accounting policies followed by the Funds in the preparation of their financial statements:
a. Valuation of Investments
Equity securities traded on a domestic or international securities exchange are valued at the last quoted sale price, or, lacking any sales, at the last quoted bid price. Over-the-counter securities are valued at the Nasdaq Official Closing Price, if one is available. Lacking any sales, over-the-counter securities are valued at the last quoted bid price. The Funds’ investments are generally valued based on market quotations provided by third-party pricing services approved by the Board of Trustees of the Funds. Under certain circumstances, the value of certain Fund investments may be based on an evaluation of fair value, pursuant to procedures established by and under the general supervision of the Board of Trustees of the Trust. Each Fund may use the fair value of a portfolio security to calculate its NAV when, for example, (1) market quotations are not readily available because a portfolio security is not traded in a public market or the principal market in which the security trades is closed, (2) trading in a portfolio security is suspended and has not resumed before the Fund calculates its NAV, (3) a significant event affecting the value of a portfolio security is determined to have occurred between the time of the market quotation provided for a portfolio security and the time as of which the Fund calculates its NAV, (4) a security’s price has remained unchanged over a period of time (often referred to as a “stale price”), or (5) Managers Investment Group LLC (the “Investment Manager”) determines that a market quotation is inaccurate. Portfolio investments that trade primarily on foreign markets are priced based upon the market quotation of such securities as of the close of their respective principal markets, as adjusted to reflect the Investment Manager’s determination of the impact of events occurring subsequent to the close of such markets but prior to the time as of which the Fund calculates its NAV. In accordance with procedures approved by the Board of Trustees, the Investment Manager relies upon recommendations of a third-party fair valuation service in adjusting the prices of such foreign portfolio investments. The Funds may invest in securities that may be thinly traded. The Board of Trustees has adopted procedures to adjust prices when thinly traded securities are judged to be stale so that they reflect fair value. An investment valued on the basis of its fair value may be valued at a price higher or lower than available market quotations. An investment’s valuation may differ depending on the method used and the factors considered in determining value according to the Fund’s fair value procedures.
Fixed-income securities are valued based on valuations furnished by independent pricing services that utilize matrix systems, which reflect such factors as security prices, yields, maturities, and ratings, and are supplemented by dealer and exchange quotations. Futures contracts for which market quotations are readily available are valued at the settlement price as of the close of the futures exchange. Short-term investments having a remaining maturity of 60 days or less are valued at amortized cost, which approximates market value. Investments in other open-end regulated investment companies are valued at their end of day net asset value per share except ishares or other ETF’s, which are valued the same as equity securities. Investments in certain mortgage-backed and stripped mortgage-backed securities, preferred stocks, convertible securities, derivatives and other debt securities not traded on an organized securities market are valued on the basis of valuations provided by dealers or by a pricing service which uses information with respect to transactions in such securities and various relationships between securities and yield to maturity in determining value. Securities (including derivatives) for which market quotations are not readily available are valued at fair value, as determined in good faith, and pursuant to procedures adopted by the Board of Trustees of the Trust. The values assigned to fair value investments are based on available information and do not necessarily represent amounts that might ultimately be realized, since such amounts depend on future developments inherent in long-term investments. Further, because of the inherent uncertainty of valuation, those estimated values may differ significantly from the values that would have been used had a ready market for the investments existed, and the differences could be material.
Money Market’s investment in the Portfolio is valued daily at its end of day net asset value per share. The Portfolio’s underlying investments are valued at amortized cost which approximates market value. The amortized cost method of valuation values a security at its cost at the time of purchase and thereafter assumes a constant amortization to maturity of any discount or premium, regardless of the impact of fluctuating interest rates on the market value of the instruments.
Generally Accepted Accounting Principles (GAAP) define fair value as the price that a Fund would receive to sell an asset or pay
41
Notes to Financial Statements (continued)
to transfer a liability in an orderly transaction between market participants at the measurement date. GAAP also establishes a framework for measuring fair value, and a three-level hierarchy for fair value measurements based upon the transparency of inputs to the valuation of an asset or liability. Inputs may be observable or unobservable and refer broadly to the assumptions that market participants would use in pricing the asset or liability. Observable inputs reflect the assumptions market participants would use in pricing the asset or liability based on market data obtained from sources independent of the Funds. Unobservable inputs reflect the Funds’ own assumptions about the assumptions that market participants would use in pricing the asset or liability developed based on the best information available in the circumstances. Each investment is assigned a level based upon the observability of the inputs which are significant to the overall valuation.
The three-tier hierarchy of inputs is summarized below:
Level 1 – quoted prices in active markets for identical investments
Level 2 – other significant observable inputs (including quoted prices for similar investments, interest rates, prepayment speeds, credit risk)
Level 3 – significant unobservable inputs (including the Funds’ own assumptions in determining the fair value of investments)
The inputs or methodologies used for valuing investments are not necessarily an indication of the risk associated with investing in those investments. The following table summarizes the inputs used to value the Funds’ net assets by the above fair value hierarchy levels as of December 31, 2009:
| | | | | | | | | | | |
| | | Level 1 | | Level 2 | | Level 3 | | Total |
Essex Large Cap Growth | | | | | | | | | | | |
Investments in Securities | | | | | | | | | | | |
Common Stocks 1 | | $ | 14,626,830 | | | — | | — | | $ | 14,626,830 |
Short-Term Investments | | | 300,531 | | $ | 23,282 | | — | | | 323,813 |
| | | | | | | | | | | |
Total Investments in Securities | | $ | 14,927,361 | | $ | 23,282 | | — | | $ | 14,950,643 |
| | | | | | | | | | | |
| | | | |
| | | Level 1 | | Level 2 | | Level 3 | | Total |
International Equity | | | | | | | | | | | |
Investments in Securities | | | | | | | | | | | |
Common Stocks | | | | | | | | | | | |
Energy | | $ | 3,553,451 | | $ | 7,121,441 | | — | | $ | 10,674,892 |
Materials | | | 3,472,447 | | | 7,945,843 | | — | | | 11,418,290 |
Information Technology | | | 3,452,135 | | | 6,560,119 | | — | | | 10,012,254 |
Financials | | | 2,067,720 | | | 33,107,112 | | — | | | 35,174,832 |
Consumer Discretionary | | | 531,936 | | | 8,335,686 | | — | | | 8,867,622 |
Health Care | | | 398,878 | | | 10,511,967 | | — | | | 10,910,845 |
Industrials | | | — | | | 13,802,688 | | — | | | 13,802,688 |
Consumer Staples | | | — | | | 9,155,320 | | — | | | 9,155,320 |
Telecommunication Services | | | — | | | 6,437,100 | | — | | | 6,437,100 |
Utilities | | | — | | | 4,687,750 | | — | | | 4,687,750 |
Other Equitites | | | 879,942 | | | 28,659 | | — | | | 908,601 |
Short-Term Investments | | | 7,458,060 | | | 20,349 | | — | | | 7,478,409 |
| | | | | | | | | | | |
Total Investments in Securities | | | 21,814,569 | | | 107,714,034 | | — | | | 129,528,603 |
Other Financial Instruments 3 | | | 23,169 | | | — | | — | | | 23,169 |
| | | | | | | | | | | |
Totals | | $ | 21,837,738 | | $ | 107,714,034 | | — | | $ | 129,551,772 |
| | | | | | | | | | | |
42
Notes to Financial Statements (continued)
| | | | | | | | | | | | | |
| | | Level 1 | | Level 2 | | | Level 3 | | Total | |
Emerging Markets Equity | | | | | | | | | | | | | |
Investments in Securities | | | | | | | | | | | | | |
Common Stocks | | | | | | | | | | | | | |
Energy | | $ | 6,560,504 | | $ | 9,480,752 | | | — | | $ | 16,041,256 | |
Materials | | | 5,639,104 | | | 9,084,341 | | | — | | | 14,723,445 | |
Financials | | | 4,272,099 | | | 20,992,887 | | | — | | | 25,264,986 | |
Consumer Discretionary | | | 2,734,466 | | | 5,811,597 | | | — | | | 8,546,063 | |
Telecommunication Services | | | 2,050,255 | | | 5,154,484 | | | — | | | 7,204,739 | |
Information Technology | | | 1,862,540 | | | 10,419,560 | | | — | | | 12,282,100 | |
Health Care | | | 970,341 | | | — | | | — | | | 970,341 | |
Industrials | | | 830,847 | | | 4,934,780 | | | — | | | 5,765,627 | |
Consumer Staples | | | 790,394 | | | 2,307,042 | | | — | | | 3,097,436 | |
Utilities | | | 427,730 | | | 1,489,681 | | | — | | | 1,917,411 | |
Short-Term Investments | | | 4,014,135 | | | 21,595 | | | — | | | 4,035,730 | |
| | | | | | | | | | | | | |
Total Investments in Securities | | $ | 30,152,415 | | $ | 69,696,719 | | | — | | $ | 99,849,134 | |
| | | | | | | | | | | | | |
| | | | |
| | | Level 1 | | Level 2 | | | Level 3 | | Total | |
Global Bond | | | | | | | | | | | | | |
Investments in Securities | | | | | | | | | | | | | |
Corporate Bonds2 | | | — | | $ | 9,805,365 | | | — | | $ | 9,805,365 | |
Foreign Government Obligations | | | — | | | 11,316,929 | | | — | | | 11,316,929 | |
U.S. Government Obligations | | | — | | | 3,461,288 | | | — | | | 3,461,288 | |
Asset-Backed Security | | | — | | | 111,257 | | | — | | | 111,257 | |
Mortgage-Backed Security | | | — | | | 238,495 | | | — | | | 238,495 | |
Preferred Stocks | | $ | 64,001 | | | — | | | — | | | 64,001 | |
Short-Term Investments | | | 2,655,146 | | | 7,419 | | | — | | | 2,662,565 | |
| | | | | | | | | | | | | |
Total Investments | | | 2,719,147 | | | 24,940,753 | | | — | | | 27,659,900 | |
Other Financial Instruments3 | | | — | | | (12,614 | ) | | — | | | (12,614 | ) |
| | | | | | | | | | | | | |
Totals | | $ | 2,719,147 | | $ | 24,928,139 | | | — | | $ | 27,647,286 | |
| | | | | | | | | | | | | |
| | | | |
| | | Level 1 | | Level 2 | | | Level 3 | | Total | |
Money Market | | | | | | | | | | | | | |
Investments in Securities | | | | | | | | | | | | | |
Short-Term Investments | | $ | 68,963,057 | | | — | | | — | | $ | 68,963,057 | |
| | | | | | | | | | | | | |
Total Investments in Securities | | $ | 68,963,057 | | | — | | | — | | $ | 68,963,057 | |
| | | | | | | | | | | | | |
| 1 | All common stocks held in the Funds are Level 1 securities. For a detailed break-out of the common stocks by major industry classification, please refer to the Schedule of Portfolio Investments. |
| 2 | All corporate bonds held in the Funds are Level 2 securities. For a detailed break-out of the corporate bonds by major industry classification, please refer to the Schedule of Portfolio Investments. |
| 3 | Other financial instruments are derivative instruments not reflected in the Schedule of Portfolio Investments, such as futures, forwards and swap contracts, which are valued at the unrealized appreciation/depreciation of the instrument. |
43
Notes to Financial Statements (continued)
The fair values of derivative instruments at December 31, 2009 for International Equity and Global Bond were as follows:
| | | | | | | | | | | |
| | | | | Asset Derivatives | | Liability Derivatives |
Fund | | Derivatives not accounted
for as hedging instruments | | Statement of Assets and Liabilities Location | | Fair Value | | Statement of Assets and Liabilities Location | | Fair Value |
International Equity | | Equity contracts* | | Receivable for variation margin on futures | | — | | Payable for variation margin on futures | | | — |
| | | | | | | | | | | |
Global Bond | | Foreign exchange contracts | | Unrealized appreciation of foreign currency contracts | | — | | Unrealized depreciation of foreign currency contracts | | $ | 12,614 |
| | | | | | | | | | | |
| * | Current day variation margin is zero. Prior variation margin is included in the cash value as reflected in the Statement of Assets and Liabilities. |
For the year ended December 31, 2009, the effect of derivative instruments on the Statement of Operations for International Equity and Global Bond and the amount of realized gain/(loss) on derivatives recognized in income were as follows:
| | | | | | | | | | | | | |
Fund | | Derivatives not
accounted for as
hedging instruments | | Futures | | Forward Currency
Contracts | | | Total | |
International Equity | | Equity contracts | | $ | 183,813 | | | — | | | $ | 183,813 | |
| | Foreign exchange contracts | | | — | | $ | (652,306 | ) | | | (652,306 | ) |
| | | | | | | | | | | | | |
Totals | | | | $ | 183,813 | | $ | (652,306 | ) | | $ | (468,493 | ) |
| | | | | | | | | | | | | |
Global Bond | | Foreign exchange contracts | | | — | | $ | 70,228 | | | $ | 70,228 | |
| | | | | | | | | | | | | |
|
The change in unrealized gain/(loss) on derivatives recognized in income were as follows: | |
| | | | |
Fund | | Derivatives not
accounted for as
hedging instruments | | Futures | | Forward Currency
Contracts | | | Total | |
International Equity | | Equity contracts | | $ | 24,119 | | | — | | | $ | 24,119 | |
| | | | | | | | | | | | | |
Global Bond | | Foreign exchange contracts | | | — | | $ | (11,504 | ) | | $ | (11,504 | ) |
| | | | | | | | | | | | | |
b. Security Transactions
Security transactions are accounted for as of trade date. Realized gains and losses on securities sold are determined on the basis of identified cost.
c. Investment Income and Expenses
Dividend income is recorded on the ex-dividend date, except certain dividends from foreign securities where the ex-dividend date may have passed. These dividends are recorded as soon as the Trust is informed of the ex-dividend date. Dividend income on foreign securities is recorded net of any withholding tax. Interest income, which includes amortization of premium and accretion of discount on debt securities, is accrued as earned. Non-cash dividends included in dividend income, if any, are reported at the fair market value of the securities received. As a shareholder of the Portfolio, the Money Market Fund receives its proportionate share of the dividends paid by such class, which takes into consideration the Fund’s proportionate share of net investment income and expenses of such class. Other income and expenses are recorded on an accrual basis. Expenses that cannot be directly attributed to a fund are apportioned among the Funds in the Trust and in some cases other affiliated funds based upon their relative average net assets or number of shareholders.
The following Funds had certain portfolio trades directed to various brokers, under a brokerage recapture program, which paid a portion of the Fund’s expenses. For the year ended December 31, 2009, under these arrangements the amount by which the Funds’ expenses were reduced and the impact on the expense ratios were as follows: Essex Large Cap Growth – $10,779 or 0.05% and International Equity – $2,326 or 0.0%.
The Funds have a “balance credit” arrangement with The Bank of New York Mellon (“BNYM”), the Funds’ custodian, whereby each Fund is credited with an interest factor equal to 0.75% below the effective 90-day T-Bill rate for account balances left uninvested overnight. If the T-Bill rate falls below 0.75%, no credits will be earned. These credits serve to reduce custody expenses that would otherwise be charged to each Fund. For the year ended December 31, 2009, the custodian expense was not reduced for any Fund.
Overdrafts will cause a reduction of any earnings credits, computed at 2% above the effective Federal funds rate on the day of the overdraft. For the year ended December 31, 2009, overdraft fees and the impact on the expense ratios were as follows: Essex Large Cap Growth – $9; International Equity – $2,155, Emerging Markets Equity – $5,899 and Global Bond Fund – $227.
The Trust also has a balance credit arrangement with its Transfer Agent, PNC Global Investment Servicing (U.S.) Inc., whereby earnings credits are used to offset banking charges and other out-of-pocket expenses. For the year ended December 31, 2009, the transfer agent expense was reduced as follows: Essex Large
44
Notes to Financial Statements (continued)
Cap Growth –$93; International Equity – $496; Emerging Markets Equity – $308; Global Bond – $167 and Money Market – $337.
The Investment Manager has agreed to waive a portion of its management fee in consideration of shareholder servicing fees that it has received from JPMorgan Distribution Services, Inc., with respect to short-term cash investments each Fund may have made in the JPMorgan Liquid Assets Money Market Fund- Capital Share Class. For the year ended December 31, 2009, the management fee was reduced as follows: Money Market – $40,438.
Total returns and net investment income for the Funds would have been lower had certain expenses not been offset. Total expenses before offsets exclude the impact of expense reimbursements or fee waivers and expense reductions such as brokerage recapture credits but include non-reimbursable expenses, if any, such as interest and taxes.
d. Dividends and Distributions
Dividends resulting from net investment income and distributions of capital gains, if any, will be made annually in December and when required for Federal excise tax purposes, for all Funds except Money Market. Money Market dividends resulting from net investment income and capital gains distributions, if any, normally will be declared daily and paid monthly. Income and capital gain distributions are determined in accordance with Federal income tax regulations, which may differ from GAAP. These differences are primarily due to differing treatments for losses deferred due to wash sales, REITS, equalization accounting for tax purposes, foreign currency, options, futures and market discount transactions. Permanent book and tax basis differences, if any, relating to shareholder distributions will result in reclassifications to paid-in capital. The tax character of distributions paid during the years ended December 31, 2009 and 2008 were as follows:
| | | | | | | | | | | | | | | | | | | | |
| | | Essex Large Cap Growth | | International Equity | | | Emerging Markets Equity | |
| | | 2009 | | 2008 | | 2009 | | | 2008 | | | 2009 | | | 2008 | |
Distributions paid from: | | | | | | | | | | | | | | | | | | | | |
Ordinary income | | — | | — | | $ | 850,021 | | | $ | 579,286 | | | $ | 209,563 | | | $ | 990,986 | |
Short-term capital gains | | — | | — | | | — | | | | — | | | | — | | | | 2,127,641 | |
Long-term capital gains | | — | | — | | | — | | | | — | | | | — | | | | 17,050,958 | |
| | | | | | | | | | | | | | | | | | | | |
| | — | | — | | $ | 850,021 | | | $ | 579,286 | | | $ | 209,563 | | | $ | 20,169,585 | |
| | | | | | | | | | | | | | | | | | | | |
| | | | | | |
As a % of distributions paid: (unaudited) | | | | | | | | | | | | | | | | | | | | |
Qualified ordinary income | | — | | — | | | 100.00 | % | | | 100.00 | % | | | 100.00 | % | | | 100.00 | % |
Ordinary income - dividends received deduction | | — | | — | | | — | | | | — | | | | — | | | | — | |
| | | | | | | | | | | | | | | | | | | | |
| | | | | | | | | | | | |
| | | Global Bond | | Money Market |
| | | 2009 | | 2008 | | 2009 | | 2008 |
Distributions paid from: | | | | | | | | | | | | |
Ordinary income | | $ | 2,806,038 | | $ | 5,512,596 | | $ | 228,617 | | $ | 2,303,877 |
Short-term capital gains | | | — | | | — | | | — | | | — |
Long-term capital gains | | | — | | | 62,905 | | | — | | | — |
| | | | | | | | | | | | |
| | $ | 2,806,038 | | $ | 5,575,501 | | $ | 228,617 | | $ | 2,303,877 |
| | | | | | | | | | | | |
| | | | |
As a % of distributions paid: (unaudited) | | | | | | | | | | | | |
Qualified ordinary income | | | — | | | — | | | — | | | — |
Ordinary income - dividends received deduction | | | — | | | — | | | — | | | — |
As of December 31, 2009, the components of distributable earnings (excluding unrealized appreciation/depreciation) on a tax basis consisted of:
| | | | | | | | | | | | | | |
| | | Essex Large
Cap Growth | | International
Equity | | Emerging
Markets Equity | | Global Bond | | Money
Market |
Capital loss carryforward | | $ | 56,132,310 | | $ | 75,562,319 | | $ | 26,786,390 | | $ | 3,102,853 | | — |
Undistributed ordinary income | | | — | | | 468,606 | | | 114,085 | | | 398,295 | | — |
Undistributed short-term capital gains | | | — | | | — | | | — | | | — | | — |
Undistributed long-term capital gains | | | — | | | — | | | — | | | — | | — |
Post-October loss deferral | | | — | | | 11,407,915 | | | — | | | — | | — |
| | | | | | | | | | | | | | |
45
Notes to Financial Statements (continued)
e. Federal Taxes
Each Fund intends to comply with the requirements under Subchapter M of the Internal Revenue Code of 1986, as amended, to distribute substantially all of their taxable income and gains to their shareholders and to meet certain diversification and income requirements with respect to investment companies. Therefore, no provision for Federal income or excise tax is included in the accompanying financial statements.
Additionally, based on each Fund’s understanding of the tax rules and rates related to income, gains and transactions for the foreign jurisdictions in which it invests, each Fund will provide for foreign taxes, and where appropriate, deferred foreign taxes.
Management has analyzed the Funds’ tax positions taken on federal income tax returns for all open tax years (tax years ended December 31, 2006-2009), and has concluded that no provision for federal income tax is required in the Funds’ financial statements. Addition- ally, the Funds are not aware of any tax position for which it is reasonably possible that the total amounts of unrecognized tax benefits will change materially in the next twelve months.
f. Capital Loss Carryovers
As of December 31, 2009, the following Funds had accumulated net realized capital loss carryovers from securities transactions for Federal income tax purposes as shown in the following chart. These amounts may be used to offset realized capital gains, if any, through the expiration dates listed.
| | | | | |
Fund | | Capital Loss
Carryover Amount | | Expires December 31, |
Essex Large Cap Growth | | $ | 30,988,593 | | 2010 |
| | | 12,899,489 | | 2011 |
| | | 7,531,988 | | 2016 |
| | | 4,712,240 | | 2017 |
| | | | | |
Total | | $ | 56,132,310 | | |
| | | | | |
International Equity | | $ | 13,386,880 | | 2010 |
| | | 16,170,119 | | 2011 |
| | | 19,998,844 | | 2016 |
| | | 26,006,476 | | 2017 |
| | | | | |
Total | | $ | 75,562,319 | | |
| | | | | |
Emerging Markets | | $ | 26,786,390 | | 2017 |
Global Bond * | | $ | 906,645 | | 2016 |
| | | 2,196,208 | | 2017 |
| | | | | |
Total | | $ | 3,102,853 | | |
| | | | | |
| * | The Fund’s ability to utilize capital loss carryforward in the future may be limited under the Internal Revenue Code and related regulations based on results of share ownership activity. |
For the year ended December 31, 2009, Essex Large Cap Growth, International Equity, Emerging Markets Equity and Global Bond did not utilize any capital loss carryovers.
g. Capital Stock
The Trust’s Declaration of Trust authorizes for each series the issuance of an unlimited number of shares of beneficial interest, without par value. Each Fund records sales and repurchases of its capital stock on the trade date. The cost of securities contributed to the Funds in connection with the issuance of shares is based on the valuation of those securities in accordance with the Funds’ policy on investment valuation. Dividends and distributions to shareholders are recorded on the ex-dividend date.
At December 31, 2009, certain unaffiliated shareholders of record, specifically omnibus accounts, individually or collectively held greater than 10% of the outstanding shares of the following Funds: Essex Large Cap Growth – two collectively own 38.7%; International Equity – one owns 19.4%; Emerging Markets Equity – two collectively own 49.2% and Global Bond – two collectively own 30.5%. Transactions by these shareholders may have a material impact on the Funds.
h. Foreign Currency Translation
The books and records of the Funds are maintained in U.S. dollars. The value of investments, assets and liabilities denominated in currencies other than U.S. dollars are translated into U.S. dollars based upon current foreign exchange rates. Purchases and sales of foreign investments, income and expenses are converted into U.S. dollars based on currency exchange rates prevailing on the respective dates of such transactions. Net realized and unrealized gain (loss) on foreign currency transactions represent: (1) foreign exchange gains and losses from the sale and holdings of foreign currencies; (2) gains and losses between trade date and settlement date on investment securities transactions and forward foreign currency exchange contracts; and (3) gains and losses from the difference between amounts of interest and dividends recorded and the amounts actually received.
The Funds do not isolate the net realized and unrealized gain or loss resulting from changes in exchange rates from the fluctuations in market prices of securities held. Such fluctuations are included with the net realized and unrealized gain or loss on investments.
2. Agreements and Transactions with Affiliates
For each of the Funds other than Money Market, the Trust has entered into an Investment Management Agreement under which the Investment Manager, an independently managed subsidiary of Affiliated Managers Group, Inc. (“AMG”), serves as investment manager to the Funds and is responsible for the Funds’ overall administration. The Investment Manager selects subadvisors for the Funds (subject to Trustee approval) and monitors each subadvisor’s investment programs and results. Each Fund’s investment portfolio is managed by one or more portfolio managers who serve pursuant to a Subadvisory Agreement with the Investment Manager.
Investment management fees are paid directly by the Funds to the Investment Manager based on average daily net assets. For the year ended December 31, 2009, the annual investment management fee rates, as a percentage of average daily net assets, were as follows:
| | | |
Fund | | Investment
Management Fee | |
Essex Large Cap Growth | | 0.80 | % |
International Equity | | 0.90 | % |
Emerging Markets Equity | | 1.15 | % |
Global Bond | | 0.70 | % |
| | | |
46
Notes to Financial Statements (continued)
The Investment Manager of Global Bond had agreed to contractually waive a portion of its management fee for the Fund for as long as the Managers Fremont Global Fund was invested in the Fund. Effective September 28, 2009, Managers AMG Global Essentials (formerly Managers Fremont Global Fund) redeemed its position in the Managers Global Bond Fund. As a result, the Investment Manager stopped waiving a portion of its management fee with respect to those assets invested in Managers Global Bond Fund. The amount waived for the period January 1, 2009 to September 27, 2009 was $32,367 or 0.08%.
The Trust has entered into an Administration and Shareholder Servicing Agreement under which the Investment Manager serves as each Fund’s administrator (the “Administrator”) and is responsible for all aspects of managing the Funds’ operations, including administration and shareholder services to each Fund, its shareholders, and certain institutions, such as bank trust departments, broker-dealers and registered investment advisers, that advise or act as an intermediary with the Funds’ shareholders. Under the terms of the Administration Agreement, each of the Funds, except Global Bond and Money Market, pay a fee to the Administrator at the rate of 0.25% per annum of the Funds’ average daily net assets. Global Bond and Money Market pay a fee to the Administrator at the rate of 0.20% and 0.15%, respectively, per annum of the Funds’ average daily net assets. During the year ended December 31, 2009, the Administrator waived a portion of its fees for Money Market in the amount of $26,700 or 0.03%.
The Investment Manager for the Funds has contractually agreed, through at least May 1, 2010, subject to later reimbursement by the Funds in certain circumstances, that the total annual operating expenses (exclusive of taxes, interest, brokerage costs, acquired fund expenses and extraordinary expenses) will be limited to the following amounts of the following Funds’ average daily net assets: International Equity – 1.48%; Emerging Markets Equity – 1.77%; and Global Bond—1.10%. The Investment Manager has also contractually agreed, subject to later reimbursement by the Funds in certain circumstances, that the total annual operating expenses (exclusive of taxes, interest, brokerage costs, acquired fund expenses and extraordinary expenses) on Essex Large Cap Growth, will be limited to 1.29% of the Fund’s average daily net assets, provided that the amount of fees waived, paid or reimbursed does not exceed 0.25% per annum. For the year ended December 31, 2009, the total amount that exceeded the 0.25% maximum waiver was $37,727 or 0.18%.
Each Fund is obligated to repay the Investment Manager such amounts waived, paid or reimbursed in future years provided that the repayment occurs within thirty-six (36) months after the waiver or reimbursement occurs and that such repayment would not cause the Funds’ total operating expenses in any such future year to exceed that Funds’ respective expense cap. For the year ended December 31, 2009, the Funds made no repayments to the Investment Manager. At December 31, 2009, the cumulative amount of reimbursement by the Investment Manager subject to repayment by Essex Large Cap, International Equity, Emerging Markets Equity and Global Bond equaled $164,108, $652,606, $653,653 and $91,406, respectively.
The aggregate annual retainer paid to each Independent Trustee is $65,000, plus $4,000 or $2,500 for each regular or special meeting attended, respectively. The Trustees’ fees and expenses are allocated amongst all of the Funds for which the Investment Manager serves as the advisor (the “Managers Funds”) based on the relative net assets of such Funds. The Independent Chairman of the Trusts receives an additional payment of $15,000 per year. The Chairman of the Audit Committee receives an additional payment of $5,000 per year. The “Trustee fees and expenses” shown in the financial statements represents each Fund’s allocated portion of the total fees and expenses paid by the Managers Funds.
The Funds are distributed by Managers Distributors, Inc. (the “Distributor” or “MDI”), a wholly-owned subsidiary of the Investment Manager. MDI serves as the principal underwriter for each Fund and is a registered broker-dealer and member of the Financial Industry Regulatory Authority, Inc. (“FINRA”). Shares of each Fund will be continuously offered and will be sold by brokers, dealers or other financial intermediaries who have executed selling agreements with the Distributor. MDI bears all the expenses of providing services pursuant to the Underwriting Agreement, including the payment of the expenses relating to the distribution of Prospectuses for sales purposes and any advertising or sales literature. Certain Trustees and Officers of the Funds are Officers and/or Directors of the Investment Manager, AMG and/or the Distributor.
On June 23, 2009, the Securities and Exchange Commission granted an exemptive order that permits the Funds to lend and borrow money for certain temporary purposes directly to and from other eligible Funds in the Managers Family of Funds (the “Fund Family”). Participation in this interfund lending program is voluntary for both borrowing and lending Funds, and an interfund loan is only made if it benefits each participating Fund. The Investment Manager administers the program according to procedures approved by the Funds’ Board of Trustees (the “Board”), and the Board monitors the operation of the program. An interfund loan must comply with certain conditions set out in the exemptive order, which are designed to assure fairness and protect all participating Funds. For the period from June 23, 2009 through December 31, 2009, the following Funds either borrowed from or lent to other Funds in the Fund Family: Essex Large Cap borrowed $109,363 for 1 day paying interest of $3; International Equity lent $109,363 for 1 day earning interest of $3; Emerging Markets Equity borrowed up to $275,166 for 2 days paying interest of $14 and lent up to $688,828 for 2 days earning interest of $23. The interest amounts are included in the Statement of Operations in interest income or as miscellaneous expense.
47
Notes to Financial Statements (continued)
Global Bond Fund executed the following transactions with an affiliate of the subadvisor utilizing the mean price of two broker quotations with no commissions under procedures approved by the Board of Trustees under Rule 17a-7 of the Investment Company Act of 1940:
September 24, 2009 – sold bonds to the Loomis Global Bond Fund
| | | | | | |
Security | | Principal
Amount | | Proceeds |
Abu Dhabi National Energy Co., 7.250%, 08/01/18 | | $ | 250,000 | | $ | 249,612 |
Ahold Finance USA, Inc., Series EMTN, 6.500%, 03/14/17 | | | 95,000 | | | 186,717 |
Albertson’s, Inc., 7.450%, 08/01/29 | | | 145,000 | | | 129,152 |
Axtel S.A.B. de C.V., 7.625%, 02/01/17 | | | 110,000 | | | 110,938 |
Banco Nacional de Desenvolvimento Economico e Social, 6.500%, 06/10/19 | | | 100,000 | | | 99,666 |
Bank of America Corp., 4.750%, 05/06/19 | | | 175,000 | | | 141,978 |
Bell Aliant Regional Communications, 5.410%, 09/26/16 | | | 160,000 | | | 138,592 |
Bertelsmann AG, 3.625%, 10/06/15 | | | 180,000 | | | 217,251 |
Brazil, Republic of, 10.250%, 01/10/28 | | | 250,000 | | | 132,698 |
Canara Bank, 6.365%, 11/28/21 | | | 150,000 | | | 139,650 |
Chesapeake Energy Corp., 6.500%, 08/15/17 | | | 60,000 | | | 57,304 |
Chesapeake Energy Corp., 6.875%, 11/15/20 | | | 85,000 | | | 82,090 |
Citigroup, Inc., 5.000%, 09/15/14 | | | 375,000 | | | 361,845 |
CSX Corp., 6.000%, 10/01/36 | | | 196,000 | | | 188,609 |
Delta Air Lines, Inc., 6.821%, 08/10/22 | | | 161,940 | | | 161,940 |
Desarrolladora Homex, S.A. de C.V., 7.500%, 09/28/15 | | | 190,000 | | | 189,569 |
DP World, Ltd., 6.850%, 07/02/37 | | | 450,000 | | | 387,762 |
Edcon Proprietary Ltd., 4.023%, 06/15/14 | | | 160,000 | | | 213,895 |
Energy Transfer Partners, L.P., 6.625%, 10/15/36 | | | 215,000 | | | 202,779 |
ERAC USA Finance Co., 6.375%, 10/15/17 | | | 79,000 | | | 78,862 |
ERAC USA Finance Co., 6.700%, 06/01/34 | | | 120,000 | | | 81,929 |
ERAC USA Finance Co., 7.000%, 10/15/37 | | | 22,000 | | | 18,027 |
Export-Import Bank of Korea, 5.875%, 01/14/15 | | | 100,000 | | | 99,426 |
Finmeccanica SpA, 4.875%, 03/24/25 | | | 100,000 | | | 107,089 |
General Electric Capital Corp., 5.250%, 04/15/13 | | | 230,000 | | | 226,742 |
Goldman Sachs Group, Inc., 1.201%, 05/23/16 | | | 100,000 | | | 127,431 |
Goldman Sachs Group, Inc., 6.875%, 01/18/38 | | | 100,000 | | | 195,475 |
HCA, Inc., 6.375%, 01/15/15 | | | 35,000 | | | 30,747 |
HCA, Inc., 6.625%, 02/15/16 | | | 80,000 | | | 69,775 |
HCA, Inc., 7.580%, 09/15/25 | | | 10,000 | | | 8,172 |
HCA, Inc., 7.690%, 06/15/25 | | | 10,000 | | | 8,074 |
ICICI Bank, Ltd., 6.375%, 04/30/22 | | | 140,000 | | | 139,519 |
Indonesia Government International Bond, 7.750%, 01/17/38 | | | 230,000 | | | 219,650 |
Kinder Morgan Energy Partners L.P., 5.800%, 03/15/35 | | | 120,000 | | | 86,648 |
Lafarge S.A., 4.750%, 03/23/20 | | | 100,000 | | | 127,262 |
Lafarge S.A., 5.375%, 06/26/17 | | | 50,000 | | | 70,198 |
Majapahit Holding BV, 7.250%, 06/28/17 | | | 100,000 | | | 99,127 |
Morgan Stanley Co., Series EMTN, 5.375%, 11/14/13 | | | 60,000 | | | 107,683 |
Morgan Stanley, 4.750%, 04/01/14 | | | 90,000 | | | 84,299 |
Motorola, Inc., 6.500%, 09/01/25 | | | 110,000 | | | 83,334 |
Motorola, Inc., 6.625%, 11/15/37 | | | 120,000 | | | 119,267 |
Nabors Industries, Inc. 6.150%, 02/15/18 | | | 125,000 | | | 111,922 |
Nextel Communications, Inc., 7.375%, 08/01/15 | | | 50,000 | | | 46,514 |
NiSource Finance Corp., 6.400%, 03/15/18 | | | 180,000 | | | 179,829 |
Owens & Minor, Inc., 6.350%, 04/15/16 | | | 110,000 | | | 109,884 |
PEMEX Project Funding Master Trust, 6.625%, 04/04/10 | | | 190,000 | | | 247,231 |
Qwest Capital Funding, Inc., 6.875%, 07/15/28 | | | 15,000 | | | 13,978 |
Qwest Capital Funding, Inc., 7.750%, 02/15/31 | | | 65,000 | | | 62,537 |
Qwest Corp., 6.875%, 09/15/33 | | | 75,000 | | | 65,556 |
Reynolds American, Inc., 6.750%, 06/15/17 | | | 180,000 | | | 181,348 |
SK Telecom Co., Ltd., 6.625%, 07/20/27 | | | 375,000 | | | 370,504 |
SLM Corp., 5.000%, 10/01/13 | | | 145,000 | | | 131,277 |
South Africa, Republic of, 4.500%, 04/05/16 | | | 185,000 | | | 245,953 |
Sprint Nextel Corp., 6.000%, 12/01/16 | | | 100,000 | | | 97,624 |
Transport De Gas Del Sur, 7.875%, 05/14/17 | | | 270,000 | | | 274,757 |
UnitedHealth Group, Inc., 5.800%, 03/15/36 | | | 220,000 | | | 188,977 |
Vale Overseas Ltd., 6.875%, 11/01/36 | | | 138,000 | | | 134,165 |
Veolia Environment, 5.125%, 05/24/22 | | | 100,000 | | | 130,561 |
Wells Fargo & Co., 4.625%, 11/02/35 | | | 100,000 | | | 180,167 |
Wendel Investissement, 4.375%, 08/09/17 | | | 100,000 | | | 126,712 |
Wendel Investissement, 4.875%, 05/26/16 | | | 100,000 | | | 132,091 |
White Mountains Insurance Group, Ltd., 6.375%, 03/20/17 | | | 145,000 | | | 144,587 |
| | | | | | |
Total | | | | | $ | 8,756,957 |
| | | | | | |
48
Notes to Financial Statements (continued)
3. Purchases and Sales of Securities
Purchases and sales of securities (excluding short-term securities and U.S. government obligations) for the year ended December 31, 2009, were as follows:
| | | | | | | | | | | | |
| | | Long-Term Securities | | U.S. Government Obligations |
Fund | | Purchases | | Sales | | Purchases | | Sales |
Essex Large Cap Growth | | $ | 21,910,337 | | $ | 41,774,307 | | | N/A | | | N/A |
International Equity | | | 150,950,320 | | | 182,507,649 | | | N/A | | | N/A |
Emerging Markets Equity | | | 79,368,843 | | | 87,033,322 | | | N/A | | | N/A |
Global Bond | | | 44,852,440 | | | 73,254,341 | | $ | 24,601,414 | | $ | 21,629,152 |
4. Portfolio Securities Loaned
Each of the Funds other than Money Market may participate in a securities lending program offered by BNYM, providing for the lending of securities to qualified brokers. Securities lending fees include earnings of such temporary cash investments, plus or minus any rebate to a borrower. These earnings (after any rebate) are then divided between BNYM, as a fee for its services under the program, and the Fund, according to agreed-upon rates. Collateral on all securities loaned is accepted in cash and/or government securities and is maintained at a minimum level of 102% (105% in the case of certain foreign securities) of the market value, plus interest, if applicable, of investments on loan. It is the Funds’ policy to obtain additional collateral from or return excess collateral to the borrower by the end of the next business day, following the valuation date of the securities loaned. Therefore, the value of the collateral held may be temporarily less than the value of the securities on loan. Lending securities entails a risk of loss to the Funds if and to the extent that the market value of the securities loaned were to increase and the borrower did not increase the collateral accordingly, and the borrower fails to return the securities. The Funds bear the risk of any deficiency in the amount of the collateral available for return to the borrower due to any loss on the collateral invested. Collateral received in the form of cash is invested temporarily in the BNY Institutional Cash Reserves Fund (the “ICRF”), or other short-term investments as defined in the Securities Lending Agreement with BNYM.
In September of 2008, BNYM advised the Investment Manager that the ICRF had exposure to certain defaulted debt obligations, and that BNYM had established a separate sleeve of the ICRF to hold these securities. The net impact of these positions is not material to each Fund. Each Fund’s position in the separate sleeve of the ICRF is included in the Schedule of Portfolio Investments and the unrealized loss on such investment is included in Net Unrealized Depreciation on the Statement of Assets and Liabilities and the Statement of Operations.
5. Commitments and Contingencies
In the normal course of business, the Funds may enter into contracts and agreements that contain a variety of representations and warranties, which provide general indemnifications. The maximum exposure to the Funds under these arrangements is unknown, as this would involve future claims that may be made against a Fund that have not yet occurred. However, based on experience, the Funds expect the risks of loss to be remote.
6. Forward Commitments
Certain transactions, such as futures and forward transactions, dollar roll agreements, or purchases of when-issued or delayed delivery securities may have a similar effect on a Fund’s net asset value as if the Fund had created a degree of leverage in its portfolio. However, if a Fund enters into such a transaction, the Fund will establish a segregated account with its custodian in which it will maintain cash, U.S. government securities or other liquid securities equal in value to its obligations in respect to such transaction. Securities and other assets held in the segregated account may not be sold while the transaction is outstanding, unless other suitable assets are substituted.
7. Forward Foreign Currency Contracts
International Equity, Emerging Markets Equity, and Global Bond may invest in forward foreign currency exchange contracts to manage currency exposure. These investments may involve greater market risk than the amounts disclosed in the Funds’ financial statements.
A forward foreign currency exchange contract is an agreement between a Fund and another party to buy or sell a currency at a set price at a future date. The market value of the contract will fluctuate with changes in currency exchange rates. The contract is marked-to-market daily, and the change in market value is recorded as an unrealized gain or loss. Gain or loss on the purchase or sale of contracts having the same settlement date, amount and counterparty is realized on the date of offset, otherwise gain or loss is realized on the settlement date.
The Funds, except Essex Large Cap Growth and Money Market, may invest in non-U.S. dollar denominated instruments subject to limitations, and enter into forward foreign currency exchange contracts to facilitate transactions in foreign securities and to hedge against currency exchange rate risk on non-U.S. dollar denominated investment securities. Risks may arise upon entering into these contracts from the potential inability of counterparties to meet the terms of their contracts and from unanticipated movements in the value of a foreign currency relative to the U.S. dollar.
49
Notes to Financial Statements (continued)
Open forward foreign currency exchange contracts (in U.S. Dollars) at December 31, 2009 were as follows:
| | | | | | | | | | | | | | |
Foreign Currency | | Position | | Settlement Date | | Current Value
(Receivable Amount) | | Contract Value
(Payable Amount) | | Unrealized Gain/
(Loss) | |
Global Bond | | | | | | | | | | | | | | |
Chinese Yuan Renminbi | | Long | | 11/16/10 | | $ | 278,981 | | $ | 288,228 | | $ | (9,247 | ) |
South Korean Won | | Long | | 3/15/10 | | | 736,641 | | | 740,008 | | | (3,367 | ) |
| | | | | | | | | | | | | | |
| | | | | | $ | 1,015,622 | | $ | 1,028,236 | | $ | (12,614 | ) |
| | | | | | | | | | | | | | |
8. Futures Contracts
International Equity may use futures contracts, including futures contracts on global equity and fixed-income securities, interest rate futures contracts, foreign currency futures contracts and futures contracts on security indices (including broad-based security indices), for any purpose. The Funds may purchase or sell futures contracts to achieve a desired level of investment, whether to accommodate portfolio turnover or cash flows from capital shares transactions. There are certain risks associated with futures contracts. Prices may not move as expected or a Fund may not be able to close out the contract when it desires to do so, resulting in losses.
On entering into a futures contract, either cash or securities in an amount equal to a certain percentage of the contract value (initial margin) must be deposited with the futures broker. Subsequent payments (variation margin) are made or received each day. The variation margin payments equal the daily changes in the contract value and are recorded as unrealized gains or losses. The Funds recognize a realized gain or loss when the contract is closed or expires equal to the difference between the value of the contract at the time it was opened and the value at the time it was closed. Futures are valued at their quoted daily settlement prices. The aggregate principal amounts of the contracts are not recorded in the financial statements. Fluctuations in the value of the contracts are recorded in the Statement of Assets and Liabilities as an asset (liability) and in the Statement of Operations as unrealized appreciation (depreciation) until the contracts are closed, when they are recorded as realized gains (losses) on futures or forward currency contracts.
Cash pledged to cover margin requirements for the open futures positions at December 31, 2009, amounted to $39,996. Open futures contracts (in U.S. Dollars) at December 31, 2009, were as follows:
| | | | | | | | | |
Type | | Number of
Contracts | | Position | | Expiration
Date | | Unrealized
Gain/(Loss) |
International Equity | | | | | | | | | |
DJ Euro Stoxx 50 | | 10 | | Long | | 3/19/10 | | $ | 23,169 |
9. Subsequent Events
The Funds have determined that no additional material events or transactions occurred subsequent to December 31, 2009, and through February 25, 2010, the date of issuance of the Funds’ financial statements, which require additional disclosure in the Funds’ financial statements.
Tax Information (unaudited)
Each Fund hereby designates the maximum amounts allowable of its net taxable income as qualified dividends as provided in the Jobs and Growth Tax Relief Reconciliation Act of 2003.
In accordance with federal tax law, the following Funds elect to provide foreign taxes paid and the income sourced from foreign countries. Accordingly, each Fund hereby makes the following designations regarding its year ended December 31, 2009:
International Equity
| | • | | The total amount of taxes paid and income sourced from foreign countries was $386,521 and $2,025,204, respectively. |
Emerging Markets
| | • | | The total amount of taxes paid and income sourced from foreign countries was $177,192 and $409,807, respectively. |
Pursuant to section 852 of the Internal Revenue Code, Essex Large Cap Growth, International Equity, Emerging Markets Equity, Global Bond and Money Market hereby designate as a capital gain distribution with respect to the taxable year ended December 31, 2009, $0, $0, $0, $0 and $0, respectively or, if subsequently determined to be different, the net capital gains of such year.
The 2009 Form 1099-DIVs you receive for the Funds will show the tax status of all distributions paid to you during the respective calendar year.
50
Report of Independent Registered Public Accounting Firm
To the Board of Trustees of The Managers Funds and the Shareholders of Managers AMG Essex Large Cap Growth Fund, Managers International Equity Fund, Managers Emerging Markets Equity Fund, Managers Global Bond Fund and Managers Money Market Fund:
In our opinion, the accompanying statements of assets and liabilities, including the schedules of portfolio investments, and the related statements of operations and of changes in net assets and the financial highlights present fairly, in all material respects, the financial position of Managers AMG Essex Large Cap Growth Fund, Managers International Equity Fund, Managers Emerging Markets Equity Fund, Managers Global Bond Fund and Managers Money Market Fund (five of the series constituting The Managers Funds, hereafter referred to as the “Funds”), at December 31, 2009, the results of each of their operations for the year then ended, the changes in each of their net assets for each of the two years in the period then ended and the financial highlights for each of the periods indicated, in conformity with accounting principles generally accepted in the United States of America. These financial statements and financial highlights (hereafter referred to as “financial statements”) are the responsibility of the Funds’ management; our responsibility is to express an opinion on these financial statements based on our audits. We conducted our audits of these financial statements in accordance with the standards of the Public Company Accounting Oversight Board (United States). Those standards require that we plan and perform the audit to obtain reasonable assurance about whether the financial statements are free of material misstatement. An audit includes examining, on a test basis, evidence supporting the amounts and disclosures in the financial statements, assessing the accounting principles used and significant estimates made by management, and evaluating the overall financial statement presentation. We believe that our audits, which included confirmation of securities at December 31, 2009 by correspondence with the custodian and brokers, provide a reasonable basis for our opinion.
PricewaterhouseCoopers LLP
Philadelphia, Pennsylvania
February 25, 2010
51
Trustees and Officers
The Trustees and Officers of the Trust, their business addresses, principal occupations for the past five years and dates of birth are listed below. The Trustees provide broad supervision over the affairs of the Trust and the Funds. The Trustees are experienced executives who meet periodically throughout the year to oversee the Funds’ activities, review contractual arrangements with companies that provide services to the Funds, and review the Funds’ performance. Unless otherwise noted, the address of each Trustee or Officer is the address of the Trust: 800 Connecticut Avenue, Norwalk, Connecticut 06854.
There is no stated term of office for Trustees. Trustees serve until their resignation, retirement or removal in accordance with the Trust’s organizational documents and policies adopted by the Board from time to time. The Chairman of the Trustees, President, Treasurer and Secretary of the Trust are elected by the Trustees annually. Other officers hold office at the pleasure of the Trustees.
Independent Trustees
The following Trustees are not “interested persons” of the Trust within the meaning of the 1940 Act:
| | |
Name, Date of Birth, Number of Funds Overseen in Fund
Complex* | | Principal Occupation(s) During Past 5 Years and Other Directorships Held by Trustee |
Jack W. Aber, 9/9/37 • Trustee since 1999 • Oversees 34 Funds in Fund Complex | | Professor of Finance, Boston University School of Management (1972-Present); Trustee of Appleton Growth Fund (1 portfolio); Trustee of Third Avenue Trust (5 portfolios); Trustee of Third Avenue Variable Trust (1 portfolio). |
| |
William E. Chapman, II, 9/23/41 • Independent Chairman • Trustee since 1999 • Oversees 34 Funds in Fund Complex | | President and Owner, Longboat Retirement Planning Solutions (1998-Present); Hewitt Associates, LLC (part time) (provider of Retirement and Investment Education Seminars) (resigned Nov. 2009); Trustee of Bowdoin College (2002-Present); Director of Harding, Loevner Funds, Inc. (6 portfolios); Trustee of Third Avenue Trust (5 portfolios); Trustee of Third Avenue Variable Trust (1 portfolio). |
| |
Edward J. Kaier, 9/23/45 • Trustee since 1999 • Oversees 34 Funds in Fund Complex | | Attorney at Law and Partner, Teeters Harvey Gilboy & Kaier LLP (2007-Present); Attorney at Law and Partner, Hepburn Willcox Hamilton & Putnam, LLP (1977-2007); Trustee of Third Avenue Trust (5 portfolios); Trustee of Third Avenue Variable Trust (1 portfolio). |
| |
Steven J. Paggioli, 4/3/50 • Trustee since 1993 • Oversees 34 Funds in Fund Complex | | Consultant (2001-Present); Formerly Executive Vice President and Director, The Wadsworth Group (1986- 2001); Executive Vice President, Secretary and Director, Investment Company Administration, LLC (1990-2001); Vice President, Secretary and Director, First Fund Distributors, Inc. (1991-2001); Trustee, Professionally Managed Portfolios (22 portfolios); Advisory Board Member, Sustainable Growth Advisors, LP; Independent Director, Chase Investment Counsel (2008 – Present). |
| |
Eric Rakowski, 6/5/58 • Trustee since 1999 • Oversees 34 Funds in Fund Complex | | Professor, University of California at Berkeley School of Law (1990-Present); Director of Harding, Loevner Funds, Inc. (6 portfolios); Trustee of Third Avenue Trust (5 portfolios); Trustee of Third Avenue Variable Trust (1 portfolio). |
| |
Thomas R. Schneeweis, 5/10/47 • Trustee since 1987 • Oversees 34 Funds in Fund Complex | | Professor of Finance, University of Massachusetts (1977-Present); Director, CISDM at the University of Massachusetts, (1996-Present); President, Alternative Investment Analytics, LLC, (formerly Schneeweis Partners, LLC) (2001-Present); Partner, White Bear Partners, LLC (2007-Present); Partner, Schneeweis Capital Management, LLC (2007-Present); Partner, Schneeweis Associates, LLC (2007-Present); Partner, Northampton Capital Management, LLC (2004-Present); Partner, TRS Associates (2007-Present). |
| |
| Interested Trustees | | |
|
| The following Trustees are “interested persons” of the Trust within the meaning of the 1940 Act. Mr. Dalton is an interested person by virtue of his positions with, and interest in securities of, Affiliated Managers Group, Inc. and his position with Managers Distributors, Inc. Mr. Streur is an interested person by virtue of his positions with Managers Investment Group LLC. |
| |
Name, Date of Birth, Number of Funds Overseen in Fund
Complex* | | Principal Occupation(s) During Past 5 Years and Other Directorships Held by Trustee |
Nathaniel Dalton, 9/29/66 • Trustee since 2008 • Oversees 34 Funds in Fund Complex | | Executive Vice President and Chief Operating Officer, Affiliated Managers Group, Inc., (2006-Present); Executive Vice President, Affiliated Managers Group, Inc., (2002 -2006); Executive Vice President and General Counsel, Affiliated Managers Group, Inc. (2001-2002); Senior Vice President and General Counsel, Affiliated Managers Group, Inc. (1996-2001). Director, Managers Distributors, Inc. (2000-Present). |
| |
John H. Streur, 2/6/60 • Trustee since 2008 • President since 2008 • Oversees 34 Funds in Fund Complex | | Senior Managing Partner, Managers Investment Group LLC (2006-Present); President, Managers Distributors, Inc. (2006-Present); Managing Partner, Managers Investment Group LLC (2005-2006); Chief Executive Officer, President and Chief Operating Officer, The Burridge Group LLC (1996-2004). |
| |
| Officers | | |
| |
Name, Date of Birth, Position(s) Held with Fund
and Length of Time Served | | Principal Occupation(s) During Past 5 Years |
Christine C. Carsman, 4/2/52 • Secretary since 2004 | | Senior Vice President and Chief Regulatory Counsel, Affiliated Managers Group, Inc. (2004-Present); Secretary, Managers AMG Funds, Managers Trust I and II (2004-Present); Senior Counsel, Vice President and Director of Operational Risk Management and Compliance, Wellington Management Company, LLP (1995-2004); Deputy General Counsel, The Boston Company, Inc. (1993-1995); Associate General Counsel, The Boston Company Advisors, Inc. (1991-1993); Associate, Sullivan & Worcester LLP (1987-1991). |
| |
Donald S. Rumery, 5/29/58 • Chief Financial Officer since 2007 • Treasurer since 1995 | | Senior Vice President, Managers Investment Group LLC (2005-Present); Director, Finance and Planning, The Managers Funds LLC, (1994-2004); Treasurer and Chief Financial Officer, Managers Distributors, Inc. (2000-Present); Treasurer, Managers AMG Funds (1999-Present); Treasurer, Managers Trust I and Managers Trust II (2000-Present); Secretary, Managers Trust I and Managers Trust II (2000-2004) and Secretary, The Managers Funds (1997-2004); Chief Financial Officer, Managers AMG Funds, Managers Trust I and Managers Trust II (2007-Present). |
| |
Keitha L. Kinne, 5/16/58 • Chief Operating Officer since 2007 | | Managing Partner and Chief Operating Officer, Managers Investment Group LLC (2007-Present); Chief Investment Officer, Managers Investment Group LLC (2008-Present); Chief Operating Officer, Managers AMG Funds, Managers Trust I and Managers Trust II (2007-Present); Managing Director, Legg Mason & Co., LLC (2006-2007); Managing Director, Citigroup Asset Management (2004-2006); Senior Vice President, Prudential Investments (1999-2004). |
| |
David Kurzweil, 6/22/74 • Assistant Secretary since 2008 | | Senior Vice President and Associate Counsel, Managers Investment Group LLC (2008-Present); Assistant Secretary, The Managers Funds, Managers Trust I, Managers Trust II, and Managers AMG Funds (2008-Present); Counsel and Senior Vice President, Lazard Asset Management LLC (2003-2008). |
| * | The Fund Complex consists of Managers AMG Funds, The Managers Funds, Managers Trust I and Managers Trust II. |
52
THIS PAGE INTENTIONALLY LEFT BLANK
THIS PAGE INTENTIONALLY LEFT BLANK
THIS PAGE INTENTIONALLY LEFT BLANK
Investment Manager and Administrator
Managers Investment Group LLC
333 W. Wacker Drive
Suite 1200
Chicago, IL 60606
(800) 835-3879
Distributor
Managers Distributors, Inc.
333 W. Wacker Drive
Suite 1200
Chicago, IL 60606
(800) 835-3879
Custodian
The Bank of New York Mellon
2 Hanson Place
Brooklyn, New York 11217
Legal Counsel
Ropes & Gray LLP
One International Place
Boston, Massachusetts 02110-2624
Transfer Agent
PNC Global Investment Servicing (U.S.) Inc.
Attn: Managers
P.O. Box 9769
Providence, Rhode Island 02940
(800) 548-4539
For Managers Choice Only
Managers
c/o PNC Global Investment Servicing (U.S.) Inc.
P.O. Box 61204
King of Prussia, Pennsylvania 19406-0851
(800) 358-7668
 Managers INVESTMENT GROUP
MANAGERSAND MANAGERS AMG FUNDS
| | | | |
EQUITY FUNDS | | BALANCED FUNDS |
EMERGING MARKETS EQUITY Rexiter Capital Management Limited Schroder Investment Management North America Inc. ESSEX GROWTH ESSEX LARGE CAP GROWTH ESSEX SMALL/MICRO CAP GROWTH Essex Investment Management Co., LLC FQ TAX-MANAGED U.S. EQUITY FQ U.S. EQUITY First Quadrant, L.P. GW&K SMALL CAP EQUITY Gannett Welsh & Kotler, LLC INSTITUTIONAL MICRO-CAP MICRO-CAP Lord, Abbett & Co. LLC WEDGE Capital Management L.L.P. Next Century Growth Investors LLC RBC Global Asset Management (U.S.) Inc. INTERNATIONAL EQUITY AllianceBernstein L.P. Lazard Asset Management, LLC Martin Currie Inc. | | CHICAGO EQUITY PARTNERS MID-CAP Chicago Equity Partners, LLC REAL ESTATE SECURITIES Urdang Securities Management, Inc. RENAISSANCE LARGE CAP GROWTH Renaissance Group LLC SKYLINE SPECIALEQUITIES PORTFOLIO Skyline Asset Management, L.P. FRONTIER SMALL CAP GROWTH Frontier Capital Management Company, LLC SPECIAL EQUITY Ranger Investment Management, L.P. Lord, Abbett & Co. LLC Smith Asset Management Group, L.P. Federated MDTA LLC SYSTEMATIC VALUE SYSTEMATIC MID CAP VALUE Systematic Financial Management, L.P. TIMESSQUARE MID CAP GROWTH TIMESSQUARE SMALL CAP GROWTH TimesSquare Capital Management, LLC | | CHICAGO EQUITY PARTNERS BALANCED Chicago Equity Partners, LLC |
| | | ALTERNATIVE FUNDS |
| | | FQ GLOBAL ALTERNATIVES FQ GLOBAL ESSENTIALS First Quadrant, L.P. |
| | |
| | |
| | | INCOME FUNDS |
| | | BOND (MANAGERS) FIXED INCOME GLOBAL BOND Loomis, Sayles & Co., L.P. BOND (MANAGERS PIMCO) Pacific Investment Management Co. LLC CALIFORNIA INTERMEDIATE TAX-FREE Miller Tabak Asset Management LLC GW&K MUNICIPAL BOND GW&K MUNICIPAL ENHANCED YIELD Gannett Welsh & Kotler, LLC HIGH YIELD J.P. Morgan Investment Management LLC INTERMEDIATE DURATION GOVERNMENT SHORT DURATION GOVERNMENT Smith Breeden Associates, Inc. |
This report is prepared for the Funds’ shareholders. It is authorized for distribution to prospective investors only when preceded or accompanied by an effective prospectus. To receive a free copy of the prospectus or Statement of Additional Information, which includes additional information about Fund Trustees, please contact us by calling 800.835.3879. Distributed by Managers Distributors, Inc., member FINRA. A description of the policies and procedures each Fund uses to vote its proxies is available: (i) without charge, upon request, by calling 800.835.3879, or (ii) on the Securities and Exchange Commission’s (SEC) Web site at www.sec.gov. For information regarding each Fund’s proxy voting record for the 12-month period ended December 31, call 800.835.3879 or visit the SEC Web site at www.sec.gov. The Funds file their complete schedule of portfolio holdings with the SEC for the first and third quarters of each fiscal year on Form N-Q. The Funds’ Forms N-Q are available on the SEC’s website at www.sec.gov. A Fund’s Forms N-Q may be reviewed and copied at the SEC’s Public Reference Room in Washington, DC. Information on the operation of the Public Reference Room may be obtained by calling 800.SEC.0330. To review a complete list of the Funds’ portfolio holdings, or to view the most recent quarterly holdings report, semiannual report, or annual report, please visit www.managersinvest.com. | | MONEY MARKET JPMorgan Investment Advisors Inc. |
| |  |
| www.managersinvest.com | | | | |

ANNUAL REPORT
Managers Funds
December 31, 2009
Managers Special Equity Fund

AR003-1209
Managers Special Equity Fund
Annual Report - December 31, 2009
TABLE OF CONTENTS
| | |
| | | Page |
LETTER TO SHAREHOLDERS | | 1 |
| |
ABOUT YOUR FUND’S EXPENSES | | 3 |
| |
| INVESTMENT MANAGER’S COMMENTS, FUND SNAPSHOTS, AND SCHEDULE OF PORTFOLIO INVESTMENTS | | |
| |
| |
Managers Special Equity Fund | | 4 |
| |
FINANCIAL STATEMENTS: | | |
| |
Statement of Assets and Liabilities | | 13 |
Fund’s balance sheet, net asset value (NAV) per share computation and cumulative undistributed amounts | | |
| |
Statement of Operations | | 14 |
Detail of sources of income, Fund expenses, and realized and unrealized gains (losses) during the year | | |
| |
Statement of Changes in Net Assets | | 15 |
Detail of changes in Fund assets for the past two years | | |
| |
FINANCIAL HIGHLIGHTS | | 16 |
Historical net asset values per share, distributions, total returns, expense ratios, turnover ratios and net assets | | |
| |
NOTES TO FINANCIAL STATEMENTS | | 17 |
Accounting and distribution policies, details of agreements and transactions with Fund management and affiliates, and descriptions of certain investment risks | | |
| |
REPORT OF INDEPENDENT REGISTERED PUBLIC ACCOUNTING FIRM | | 22 |
| |
TRUSTEES AND OFFICERS | | 23 |
Nothing contained herein is to be considered an offer, sale or solicitation of an offer to buy shares of any series of the Managers Family of Funds. Such offering is made only by Prospectus, which includes details as to offering price and other material information.
Letter to Shareholders
Dear Shareholder:
Our foremost goal at Managers Investment Group (“MIG”) is to structure and manage mutual funds that will help our shareholders and clients successfully reach their investment goals and objectives.
Each of our Funds is geared to provide you with exposure to a specific asset class or style of investing. Investors tend to use our Funds as part of their broader portfolio in order to tailor their asset allocation to meet their individual needs. Most of our Funds, like those detailed in this report, are therefore designed to be building blocks.
At MIG, we have overall responsibility for the investment management and administration of the Funds. As a “manager of managers,” we work with external investment managers that make the day-to-day investment decisions in the Funds (the “Portfolio Managers”). We devote considerable resources to our disciplined process of identifying and selecting Portfolio Managers for the Funds. As a manager of managers, MIG performs many activities to monitor the ongoing investment, compliance, and administrative aspects of all of the Funds, which gives our shareholders added confidence in their investments.
Our parent company, Affiliated Managers Group (“AMG”) is a global asset management company with ownership interests in a diverse group of boutique investment management firms (its “Affiliates”). MIG has the unique opportunity to access the investment skills and acumen of some of AMG’s Affiliates. The set of our Funds managed by these proprietary firms also benefits from our activities to monitor the investment, compliance, and administrative aspects of the Funds.
Below is a brief overview of the securities markets and the performance results for the Fund.
The year 2009 will go down in the history books as one in which securities markets sank to unimaginable levels and some investors briefly questioned the viability of capitalism. As it turned out, capitalism did not cease to exist and equities, as well as credit-sensitive fixed income securities, managed to regroup and record one of the most impressive rebounds in the history of the capital markets. The government’s unprecedented efforts with respect to healing the economy and stabilizing the securities markets via programs such as the Troubled Asset Relief Program (“TARP”), the Public-Private Investment Program (“PPIP”) and the Term Asset Backed Securities Loan Facility (“TALF”) seem to have achieved their desired short-term effects, although some would argue that the programs played a minor role in the stabilization of the markets and that free market forces simply corrected oversold conditions, just as they have on numerous occasions in the past.
Against this backdrop, the performance of the Managers Special Equity Fund (the “Fund”) was strong on an absolute basis, as detailed below.
| | | | | | | | | | | | | | | | | | | | |
Periods Ended 12/31/09 | | 6 Months | | | 1 Year | | | 3 Years | | | 5 Years | | | 10 Years | | | Since
Inception | | | Inception
Date |
Managers Special Equity Fund | | | | | | | | | | | | | | | | | | | | |
Managers Class | | 22.03 | % | | 30.78 | % | | (9.77 | )% | | (3.19 | )% | | (0.25 | )% | | 10.45 | % | | 06/01/1984 |
Institutional Class | | 22.14 | % | | 31.05 | % | | (9.57 | )% | | (2.98 | )% | | — | | | (0.24 | )% | | 05/30/2004 |
Russell 2000® Growth Index | | 20.75 | % | | 34.47 | % | | (4.00 | )% | | 0.87 | % | | (1.37 | )% | | | | | |
Over the 12 months ended December 31, 2009, the Managers Special Equity Fund (Managers Class shares) returned 30.78% and the Institutional Class of shares returned 31.05%, both trailing the 34.47% return of the Russell 2000 Growth® Index. While the Fund delivered a solid absolute return during the period, it was not able to keep pace in the low-quality rally that characterized the markets, particularly in the second and third quarters where the bulk of the Fund’s underperformance was concentrated. Low-quality leadership finally
1
Letter to Shareholders (continued)
ended in September, with higher-quality stocks at least keeping pace during the last four months of the year. As the market environment changed, there was a noticeable improvement in the Fund’s relative performance. The Fund outperformed its benchmark during the final month of the third quarter as well as throughout the fourth quarter.
The following report covers the one-year period ended December 31, 2009. Should you have any questions about this report, or if you’d like to receive a prospectus and additional information, including fees and expenses for this or any of the other Funds in our family, please feel free to contact us at 1-800-835-3879, or visit our Web site at www.managersinvest.com. As always, please read the prospectus carefully before you invest or send money.
If you are curious about how you can better diversify your investment program, visit the Knowledge Center on our Web site and view our articles in the investment strategies section. You can rest assured that under all market conditions our team is focused on delivering excellent investment management services for your benefit.
We thank you for your continued confidence and investment in The Managers Funds.
|
Respectfully, |
|
 |
John H. Streur |
Senior Managing Partner |
Managers Investment Group LLC |
2
About Your Fund’s Expenses
As a shareholder of a Fund, you may incur two types of costs: (1) transaction costs, which may include sales charges (loads) on purchase payments; redemption fees; and exchange fees; and (2) ongoing costs, including management fees; distribution (12b-1) fees; and other Fund expenses. This example is intended to help you understand your ongoing costs (in dollars) of investing in the Fund and to compare these costs with the ongoing costs of investing in other mutual funds. The example is based on $1,000 invested at the beginning of the period and held for the entire period as indicated below.
Actual Expenses
The first line of the following table provides information about the actual account values and actual expenses. You may use the information in this line, together with the amount you invested, to estimate the expenses that you paid over the period. Simply divide your account value by $1,000 (for example, an $8,600 account value divided by $1,000 = 8.6), then multiply the result by the number in the first line under the heading entitled “Expenses Paid During Period” to estimate the expenses you paid on your account during this period.
Hypothetical Example for Comparison Purposes
The second line of the following table provides information about hypothetical account values and hypothetical expenses based on the Fund’s actual expense ratio and an assumed annual rate of return of 5% before expenses, which is not the Fund’s actual return. The hypothetical account values and expenses may not be used to estimate the actual ending account balance or expenses you paid for the period. You may use this information to compare the ongoing costs of investing in the Fund and other funds by comparing this 5% hypothetical example with the 5% hypothetical examples that appear in the shareholder reports of other funds.
Please note that the expenses shown in the table are meant to highlight your ongoing costs only and do not reflect any transactional costs, such as sales charges (loads), redemption fees, or exchange fees. Therefore, the second line of the table is useful in comparing ongoing costs only, and will not help you determine the relative total costs of owning different funds.
| | | | | | | | | | | | |
Six Months Ended December 31, 2009 | | Expense
Ratio for the
Period | | | Beginning
Account Value
07/01/2009 | | Ending
Account Value
12/31/2009 | | Expenses
Paid During
the Period* |
Managers Special Equity Fund - Managers Shares | | | | | | | | | | | | |
Based on Actual Fund Return | | 1.61 | % | | $ | 1,000 | | $ | 1,220 | | $ | 9.01 |
Based on Hypothetical 5% Annual Return | | 1.61 | % | | $ | 1,000 | | $ | 1,017 | | $ | 8.19 |
Managers Special Equity Fund - Institutional Shares | | | | | | | | | | | | |
Based on Actual Fund Return | | 1.36 | % | | $ | 1,000 | | $ | 1,221 | | $ | 7.61 |
Based on Hypothetical 5% Annual Return | | 1.36 | % | | $ | 1,000 | | $ | 1,018 | | $ | 6.92 |
| * | Expenses are equal to the Fund’s annualized expense ratio multiplied by the average account value over the period, multiplied by the number of days in the most recent fiscal half-year (184), then divided by 365. |
3
Managers Special Equity Fund
Investment Manager’s Comments
The Managers Special Equity Fund’s (the “Fund”) investment objective is to achieve long-term capital appreciation through a diversified portfolio of equity securities of small- and medium-sized companies.
THE PORTFOLIO MANAGERS
The Fund employs multiple subadvisors who specialize in distinct investment approaches. This “intelligence diversification” not only serves to manage risk, but also helps us tap the markets’ full potential by focusing different analytical insights on each prospective investment. Fund management strives to achieve its performance and diversification objectives while ensuring that the Fund operates within the framework of its investment objective and principal investment strategies.
Federated MDTA, LLC
Federated MDTA, LLC (“MDT”) utilizes a quantitative process to score stocks based on earnings estimate momentum, long-term growth rates, share buyback and issuance, cash earnings to price ratios, tangible book to price ratios, and earnings risk. A decision-tree approach provides an intuitive, non-linear way to score companies. Stocks are grouped into clusters determined by analyzing different combinations of factor scores and returns, with each cluster containing companies with a different pattern of fundamental characteristics. Optimization is then used to build a portfolio that maximizes the stock-selection score, while adhering to diversification constraints and trading costs. A position is sold or trimmed if the quantitative model identifies a more attractive opportunity (net of trading costs) or if a holding exceeds the maximum company weight of 1.3%. The portfolio typically holds between 100 and 110 stocks, with no position exceeding 1.3% of the portfolio. Industry weights are limited to +/- 13.5% of the benchmark weight, while sector weights are limited to +/- 22.5% of the benchmark weight.
Lord, Abbett & Co., LLC
The team at Lord, Abbett & Co., LLC (“Lord Abbett”), led by Tom O’Halloran, focuses its stock-selection effort on companies that have revenue growth of at least 15% and are experiencing year-to-year operating margin improvement and earnings growth driven by top-line growth, rather than being driven by one-time events or simple cost cutting measures. The focus is also on identifying companies with higher-quality balance sheets (often captured by finding companies with manageable debt-to-total-capital ratios) and that are already profitable. Once this process is completed, the focus for the team is on forecasting both revenue and earnings growth over the next several years. To achieve this goal, and to find companies that will be growing considerably faster than their industry average, members of the team spend an extensive amount of time understanding the competitive advantages of a firm, the industry dynamics within which they operate, and the strength of management. A position is sold or trimmed if there is a fundamental change in the business, a more attractive alternative is found, or if a holding reaches a 5% weight in the overall portfolio. The portion of the Fund managed by Lord Abbett typically holds between 100 and 150 stocks with no individual holding exceeding 5%. Lord Abbett has established a risk constraint that prevents any individual industry from being greater than 25% of the total weight of its portion of the Fund.
Ranger Investment Management, L.P.
The team at Ranger Investment Management, L.P. (“Ranger”), led by Conrad Doenges, starts with a universe of stocks with market capitalization between $100 million and $2 billion, from which they establish a list of approximately 250 to 300 companies on which they conduct detailed research. Each Ranger sector manager builds detailed earnings and cash-flow models for the companies they follow, and also qualitatively gauges, through a stock scoring model, their conviction level in each stock. Companies in the Fund’s portfolio managed by Ranger will typically have a high degree of recurring revenue, steady and/or accelerating sales and earnings growth, solid balance sheets, strong free-cash flows, conservative accounting practices, and a seasoned management team. The portfolio typically contains 35 and 60 stocks, with individual position sizes capped at 5%. Sector exposures are also limited to a maximum of 30%. A stock may be reduced or sold if: material changes occur in the company’s earnings estimates, the company’s valuations exceed historical levels, a pre-determined price target is achieved, the stock reaches the maximum position size of 5%, the stock reaches a capitalization limit of $5 billion, or it can be replaced with a better risk/reward opportunity.
Smith Asset Management Group, L.P.
Smith Asset Management Group, L.P.’s (“Smith Group”) investment process is based on a combination of a well-conceived quantitative screening process coupled with experienced, intelligent fundamental and qualitative analysis. The team is focused on predicting which attractively valued companies will report a succession of positive earnings surprises. The process begins by seeking companies with attractive risk profiles and valuations, as well as dramatically improving business fundamentals. To manage risk, Smith screens for companies with good corporate governance, strong financial quality, attractive valuation, and moderate portfolio beta. To identify high-earnings-growth companies, Smith screens for rising earnings expectations, improving earnings quality, a high percentage of positive earnings surprise, and high earnings growth rate. The Fund’s portfolio managed by Smith will typically hold 100 to 120 stocks, with no individual position greater than 3.0%. Sector weightings are limited to no more than two times the weighting in the Russell 2000® Index. Stocks are sold from the portfolio if a negative earnings surprise is predicted by either the process or management guidance, a negative earnings surprise is actually reported, the stock’s valuation level is too high, or a buyout announcement is made.
4
Managers Special Equity Fund
Investment Manager’s Comments (continued)
The Year in Review
Over the 12 months ended December 31, 2009, the Managers Special Equity Fund Managers Class of shares returned 30.78% and the Institutional Class of shares returned 31.05%, both trailing the 34.47% return of the Russell 2000® Growth Index.
Early in 2009, equity markets continued to suffer from the sell-off that dominated 2008. Markets bottomed on March 9th, and from there moved sharply higher throughout the year. The Russell 2000® Growth Index rallied just over 80% from its March low to the end of the year. As is the case during the early stages of an economic recovery, lower-quality, higher-risk stocks lead the markets as investors began to realize economic conditions were not quite as dire as once imagined. Companies that ranked among the worst with respect to profitability, earnings growth expectations, earnings surprise, and return on equity were among the worst performers during the market rally. Those companies that were hardest hit during the 2008 sell-off tended to be among the best performers during the 2009 rally. Across sectors, consumer discretionary and information technology stocks were among the best performers for the year, while financials and industrials were the worst performing sectors.
While the Fund delivered a solid absolute return during the period, it was not able to keep pace in the low-quality rally that characterized the markets, particularly in the second and third quarters where the bulk of the Fund’s underperformance was concentrated. Two of the Fund’s subadvisors, Smith Group and MDT, found performance particularly challenged during the second and third quarters. Both managers utilize quantitative processes to identify stocks that have high exposure to factors they believe will be rewarded by the markets over time. In the case of Smith Group, earnings surprise is one such factor they seek to exploit. MDT favors stocks that have a combination of high earnings estimate momentum, attractive valuations, and low external financing requirements. The factors utilized by both managers were sharply out of favor during the early part of the rally, and relative performance suffered as a result. Ranger, which employs a more traditional growth-oriented investment process, finished the year in line with the benchmark thanks in part to an overweight position combined with strong stock selection within the energy sector. Lord Abbett turned in the best performance of the Fund’s subadvisors, driven by stock selection spread across several sectors, including industrials, information technology, energy, and health care. Lord Abbett also has a bias toward higher beta stocks which served as a tailwind during the rally. Low-quality leadership finally ended in September, with higher-quality stocks at least keeping pace during the last four months of the year. As the market environment changed, there was a noticeable improvement in the Fund’s relative performance. The Fund outperformed its benchmark during the final month of the third quarter as well as throughout the fourth quarter. Over those four months, the Fund led the Russell 2000® Growth Index by nearly 2.8%.
Looking Forward
In recent years, the team at Managers has spent considerable time evaluating the Fund and affirming our confidence in the subadvisors and in the portfolio construction, resulting in changes to the Fund’s subadvisor lineup. During 2009, Skyline Asset Management, LP and Westport Asset Management were removed from the Fund’s lineup. Both managers utilized value-oriented investment processes, and their removal completes the Fund’s shift to emphasize small-cap growth investing. We firmly believe that the changes made to the Fund’s subadvisor line-up will produce improved and more consistent long-term performance. While we are disappointed this was not fully achieved during 2009, we are encouraged by the Fund’s more recent performance. In addition to the changes in the subadvisor lineup, the Fund’s benchmark was changed during the period from the Russell 2000® Index to the Russell 2000® Growth Index to better reflect the emphasis on small cap growth stocks.
Heading into 2010, stocks within the information technology and consumer discretionary sectors continue to represent the largest exposures for the Fund and each of these sector positions represents an overweight relative to the respective exposure in the Index. The Fund continues to hold lower-than-benchmark positions in the health care, industrials, and telecommunication services sectors.
CUMULATIVE TOTAL RETURN PERFORMANCE
Managers Special Equity Fund’s cumulative total return is based on the daily change in net asset value (NAV), and assumes that all distributions were reinvested. The Russell 2000® Growth Index measures the performance of the Russell 2000® Index companies with higher price-to-book ratios and higher forecasted growth values. The Index reflects no deduction for fees, expenses, or taxes. Unlike the Fund, the Russell 2000® Growth Index and the Russell 2000® Index are unmanaged, are not available for investment, and do not incur expenses. The first chart compares a hypothetical $10,000 investment made in Managers Special Equity Fund– Managers Class on December 31, 1999, to a $10,000 investment made in the Russell 2000® Growth Index for the same time period. The second chart compares a hypothetical $10,000 investment made in Managers Special Equity Fund– Institutional Class on May 3, 2004, to a $10,000 investment made in the Russell 2000® Growth Index for the same time period. The graphs and tables do not reflect the deduction of taxes that a shareholder would pay on a Fund distribution or redemption of shares. Past performance is not indicative of future results.
5
Managers Special Equity Fund
Investment Manager’s Comments (continued)
CUMULATIVE TOTAL RETURN PERFORMANCE (continued)
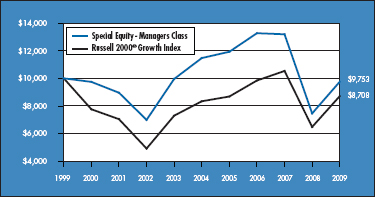
The table below shows the average annual total returns for Special Equity Fund–Managers Class, the Russell 2000® Growth Index and the Russell 2000® Index (former benchmark) since December 31, 1999 through December 31, 2009.
| | | | | | | | | |
Average Annual Total Returns 1 | | One Year | | | Five Years | | | Ten Years | |
Special Equity - Managers Class2,3 | | 30.78 | % | | (3.19 | )% | | (0.25 | )% |
Russell 2000® Growth Index4 | | 34.47 | % | | 0.87 | % | | (1.37 | )% |
Russell 2000® Index (former benchmark)5 | | 27.17 | % | | 0.51 | % | | 3.51 | % |
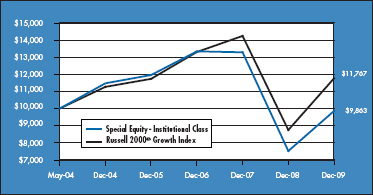
The table below shows the average annual total returns for Special Equity Fund–Institutional Class, the Russell 2000® Growth Index and the Russell 2000® Index (former benchmark) since May 3, 2004 through December 31, 2009.
| | | | | | | | | | | |
Average Annual Total Returns 1 | | One Year | | | Five Years | | | Since Inception | | | Inception Date |
Special Equity - Institutional Class2,3 | | 31.05 | % | | (2.98 | )% | | (0.24 | )% | | 05/03/2004 |
Russell 2000® Growth Index4 | | 34.47 | % | | 0.87 | % | | 2.91 | % | | 05/03/2004 |
Russell 2000® Index (former benchmark)5 | | 27.17 | % | | 0.51 | % | | 3.14 | % | | 05/03/2004 |
The performance data shown represents past performance, which is not a guarantee of future results. Current performance may be lower or higher than the performance data quoted. The investment return and principal value of an investment in the Fund will fluctuate so that an investor’s shares, when redeemed, may be worth more or less than their original cost. For performance information through the most recent month end please call (800) 835-3879 or visit our Web site at www.managersinvest.com.
In choosing a Fund, investors should carefully consider the amount they plan to invest, their investment objectives, the Fund’s investment objectives, risks, charges and expenses before investing. For this and other information, please call (800) 835-3879 or visit www.managersinvest.com for a free prospectus. Read it carefully before investing or sending money. Distributed by Managers Distributors, Inc., member FINRA.
| 1 | Total return equals income yield plus share price change and assumes reinvestment of all dividends and capital gain distributions. Returns are net of fees and may reflect offsets of Fund expenses as described in the Prospectus. No adjustment has been made for taxes payable by shareholders on their reinvested dividends and capital gain distributions. Returns for periods greater than one year are annualized. The listed returns on the Fund are net of expenses and based on the published NAV as of December 31, 2009. All returns are in U.S. dollars($). |
| 2 | From time to time, the Fund’s advisor has waived its fees and/or absorbed Fund expenses, which has resulted in higher returns. |
| 3 | The Fund is subject to risks associated with investments in small capitalization companies, such as erratic earnings patterns, competitive conditions, limited earnings history, and a reliance on one or a limited number of products. |
| 4 | The Russell 2000® Growth Index measures the performance of the Russell 2000® Index companies with higher price-to-book ratios and higher forecasted growth values. |
| 5 | The Russell 2000® Index was the Fund’s prior benchmark. The Investment Manager changed the benchmark to the Russell 2000® Growth Index because it determined the Russell 2000® Growth Index more accurately reflects the types of securities in which the Fund invests. The Russell 2000® Index is composed of the 2,000 smallest stocks in the Russell 3000® Index and is widely regarded in the industry as the premier measure of small-cap stock performance. Unlike the Fund, the Russell 2000® Growth Index and the Russell 2000® Index are unmanaged, are not available for investment, and do not incur expenses. |
The Russell 2000® Growth Index and the Russell 2000® Index are trademarks of Russell Investments. Russell® is a trademark of Russell Investments.
Not FDIC insured, nor bank guaranteed. May lose value.
6
Managers Special Equity Fund
Fund Snapshots
December 31, 2009
Portfolio Breakdown

| | | | | | | | | |
Industry | | Managers
Special Equity
Fund ** | | | Russell 2000®
Growth Index | | | Russell
2000® Index | |
Information Technology | | 29.7 | % | | 26.8 | % | | 18.3 | % |
Consumer Discretionary | | 18.2 | % | | 16.0 | % | | 13.8 | % |
Health Care | | 16.5 | % | | 24.2 | % | | 14.3 | % |
Industrials | | 10.5 | % | | 14.7 | % | | 15.8 | % |
Energy | | 6.6 | % | | 4.3 | % | | 5.2 | % |
Financials | | 5.5 | % | | 5.8 | % | | 20.2 | % |
Consumer Staples | | 3.5 | % | | 4.1 | % | | 3.5 | % |
Materials | | 3.5 | % | | 2.4 | % | | 4.7 | % |
Telecommunication Services | | 0.2 | % | | 1.5 | % | | 1.0 | % |
Utilities | | 0.1 | % | | 0.2 | % | | 3.2 | % |
Other Assets and Liabilities | | 5.7 | % | | 0.0 | % | | 0.0 | % |
Top Ten Holdings
| | | |
Security Name | | Percentage of
Net Assets | |
Steven Madden, Ltd. | | 1.6 | % |
NetLogic Microsystems, Inc.* | | 1.5 | |
Amedisys, Inc. | | 1.5 | |
SXC Health Solutions Corp. | | 1.5 | |
HMS Holdings Corp.* | | 1.4 | |
Chico’s FAS, Inc.* | | 1.2 | |
Atheros Communications, Inc. | | 1.2 | |
Bucyrus International, Inc. | | 1.2 | |
CARBO Ceramics, Inc. | | 1.1 | |
Deckers Outdoor Corp. | | 1.1 | |
| | | |
Top Ten as a Group | | 13.3 | % |
| | | |
| | | |
| * | Top Ten Holding at June 30, 2009 |
Any sectors, industries, or securities discussed should not be perceived as investment recommendations. Mention of a specific security should not be considered a recommendation to buy or solicitation to sell that security. Specific securities mentioned in this report may have been sold from the Fund’s portfolio of investments by the time you receive this report.
7
Managers Special Equity Fund
Schedule of Portfolio Investments
December 31, 2009
| | | | | | |
| | | Shares | | | Value |
Common Stocks - 94.3% | | | | | | |
Consumer Discretionary - 18.2% | | | | | | |
99 Cents Only Stores* | | 145,796 | | | $ | 1,905,554 |
Aaron Rents, Inc. | | 7,349 | | | | 203,788 |
Aeropostale, Inc.* | | 7,300 | | | | 248,565 |
America’s Car-Mart, Inc.* | | 88,970 | 2 | | | 2,342,580 |
Ameristar Casinos, Inc. | | 3,914 | | | | 59,610 |
BJ’s Restaurants, Inc.* | | 15,663 | 2 | | | 294,778 |
Blue Nile, Inc.* | | 4,923 | 2 | | | 311,774 |
Bridgepoint Education, Inc.* | | 19,910 | 2 | | | 299,048 |
Carter’s, Inc.* | | 43,682 | | | | 1,146,652 |
Cheesecake Factory, Inc., The* | | 27,845 | 2 | | | 601,174 |
Chico’s FAS, Inc.* | | 203,841 | | | | 2,863,966 |
Chipotle Mexican Grill, Inc.* | | 11,315 | | | | 997,530 |
Citi Trends, Inc.* | | 12,300 | 2 | | | 339,726 |
Coinstar, Inc.* | | 6,000 | | | | 166,680 |
Collective Brands, Inc.* | | 14,892 | | | | 339,091 |
Cooper Tire & Rubber Co. | | 19,400 | | | | 388,970 |
Corinthian Colleges, Inc.* | | 30,840 | 2 | | | 424,667 |
Cracker Barrel Old Country Store, Inc. | | 7,700 | | | | 292,523 |
Ctrip.com International, Ltd.* | | 800 | | | | 57,488 |
Deckers Outdoor Corp.* | | 24,648 | | | | 2,507,195 |
Deer Consumer Products, Inc.* | | 16,900 | | | | 191,308 |
Dick’s Sporting Goods, Inc.* | | 6,118 | | | | 152,155 |
Fossil, Inc.* | | 43,756 | | | | 1,468,451 |
Fuel Systems Solutions, Inc.* | | 5,800 | 2 | | | 239,192 |
Gafisa SA, ADR | | 17,800 | 2 | | | 576,008 |
Gymboree Corp.* | | 35,010 | | | | 1,522,585 |
IMAX Corp.* | | 38,100 | | | | 506,730 |
J. Crew Group, Inc.* | | 29,560 | 2 | | | 1,322,514 |
Jos. A. Bank Clothiers, Inc.* | | 21,679 | | | | 914,637 |
K12, Inc.* | | 7,479 | | | | 151,599 |
Liz Claiborne, Inc. | | 174,340 | 2 | | | 981,534 |
Lululemon Athletica, Inc.* | | 27,069 | 2 | | | 814,777 |
Lumber Liquidators, Inc.* | | 38,000 | 2 | | | 1,018,400 |
Men’s Wearhouse, Inc. | | 14,200 | | | | 299,052 |
Netflix, Inc.* | | 11,473 | 2 | | | 632,621 |
Oxford Industries, Inc. | | 15,200 | | | | 314,336 |
P.F. Chang’s China Bistro, Inc.* | | 21,400 | 2 | | | 811,274 |
Pacific Sunwear of California, Inc.* | | 202,310 | | | | 805,194 |
Panera Bread Co., Class A* | | 15,480 | | | | 1,036,696 |
Polaris Industries, Inc. | | 17,185 | | | | 749,782 |
Rue21, Inc.* | | 21,894 | 2 | | | 615,002 |
Steven Madden, Ltd.* | | 89,157 | | | | 3,676,836 |
Strayer Education, Inc. | | 2,129 | 2 | | | 452,391 |
Tempur-Pedic International, Inc.* | | 47,653 | 2 | | | 1,126,040 |
Timberland Co.* | | 18,379 | | | | 329,535 |
Tractor Supply Co.* | | 5,900 | | | | 312,464 |
Tupperware Brands Corp. | | 30,450 | | | | 1,418,056 |
Ulta Salon, Cosmetics & Fragrance, Inc.* | | 49,720 | | | | 902,915 |
Valassis Communications, Inc.* | | 16,934 | | | | 309,215 |
Warnaco Group, Inc., The* | | 13,591 | | | | 573,404 |
Westport Innovations, Inc.* | | 49,260 | | | | 570,431 |
WMS Industries, Inc.* | | 20,490 | | | | 819,600 |
Wonder Auto Technology, Inc.* | | 27,900 | | | | 328,104 |
Total Consumer Discretionary | | | | | | 41,734,197 |
Consumer Staples - 3.5% | | | | | | |
American Italian Pasta Co.* | | 10,500 | | | | 365,295 |
Bare Escentuals, Inc.* | | 38,600 | | | | 472,078 |
Boston Beer Co., Inc.* | | 2,063 | | | | 96,136 |
Calavo Growers, Inc. | | 6,825 | | | | 116,025 |
Casey’s General Stores, Inc. | | 29,600 | | | | 944,832 |
Green Mountain Coffee Roasters, Inc.* | | 9,700 | 2 | | | 790,259 |
Lancaster Colony Corp. | | 19,241 | | | | 956,278 |
Nu Skin Enterprises, Inc., Class A | | 43,558 | | | | 1,170,403 |
Prestige Brands Holdings, Inc.* | | 36,800 | | | | 289,248 |
Revlon, Inc., Class A* | | 18,809 | 2 | | | 319,941 |
Sanderson Farms, Inc. | | 743 | | | | 31,325 |
TreeHouse Foods, Inc.* | | 63,100 | | | | 2,452,066 |
Total Consumer Staples | | | | | | 8,003,886 |
Energy - 6.6% | | | | | | |
Arena Resources, Inc.* | | 22,144 | | | | 954,849 |
Brigham Exploration Co.* | | 38,600 | | | | 523,030 |
Cal Dive International, Inc.* | | 26,800 | | | | 202,608 |
CARBO Ceramics, Inc. | | 37,081 | | | | 2,527,811 |
Carrizo Oil & Gas, Inc.* | | 13,281 | | | | 351,814 |
Clean Energy Fuels Corp.* | | 48,900 | 2 | | | 753,549 |
EXCO Resources, Inc.* | | 79,155 | | | | 1,680,461 |
Gulfport Energy Corp.* | | 35,500 | | | | 406,475 |
ION Geophysical Corp.* | | 40,100 | | | | 237,392 |
The accompanying notes are an integral part of these financial statements.
8
Managers Special Equity Fund
Schedule of Portfolio Investments (continued)
| | | | | | |
| | | Shares | | | Value |
Energy - 6.6% (continued) | | | | | | |
Oceaneering International, Inc.* | | 21,252 | | | $ | 1,243,667 |
PetroQuest Energy, Inc.* | | 181,623 | 2 | | | 1,113,349 |
Rosetta Resources, Inc.* | | 124,000 | 2 | | | 2,471,320 |
Superior Energy Services, Inc.* | | 69,952 | | | | 1,699,134 |
W&T Offshore, Inc. | | 43,261 | 2 | | | 506,154 |
World Fuel Services Corp. | | 12,500 | | | | 334,875 |
Total Energy | | | | | | 15,006,488 |
Financials - 5.5% | | | | | | |
BOK Financial Corp. | | 32,760 | 2 | | | 1,556,755 |
Broadpoint Gleacher Securities Group, Inc.* | | 45,036 | | | | 200,861 |
Calamos Asset Management, Inc., Class A | | 36,722 | 2 | | | 423,405 |
China Real Estate Information Corp., ADR* | | 36,692 | 2 | | | 402,878 |
CNinsure, Inc., ADR* | | 14,200 | 2 | | | 285,136 |
Cohen & Steers, Inc. | | 13,306 | | | | 303,909 |
Evercore Partners, Inc., Class A | | 8,500 | | | | 258,400 |
First Cash Financial Services, Inc.* | | 3,089 | | | | 68,545 |
Greenhill & Co., Inc. | | 3,770 | 2 | | | 302,505 |
Horace Mann Educators Corp. | | 26,200 | | | | 327,500 |
Iberia Bank Corp. | | 33,430 | | | | 1,798,868 |
KBW, Inc.* | | 12,300 | | | | 336,528 |
PS Business Parks, Inc. | | 4,400 | | | | 220,220 |
Pinnacle Financial Partners, Inc.* | | 95,330 | 2 | | | 1,355,593 |
Signature Bank* | | 38,130 | | | | 1,216,347 |
Stifel Financial Corp.* | | 10,200 | | | | 604,248 |
SVB Financial Group* | | 12,334 | 2 | | | 514,204 |
Texas Capital Bancshares, Inc.* | | 105,725 | | | | 1,475,921 |
World Acceptance Corp.* | | 29,007 | 2 | | | 1,039,321 |
Total Financials | | | | | | 12,691,144 |
Health Care - 16.5% | | | | | | |
Acorda Therapeutics, Inc.* | | 19,689 | | | | 496,557 |
Air Methods Corp.* | | 8,255 | | | | 277,533 |
Alexion Pharmaceuticals, Inc.* | | 16,300 | | | | 795,766 |
Align Technology, Inc.* | | 45,047 | | | | 802,738 |
Allos Therapeutics, Inc.* | | 10,300 | | | | 67,671 |
Amedisys, Inc.* | | 68,715 | 2 | | | 3,336,800 |
American Medical Systems Holdings, Inc.* | | 68,021 | | | | 1,312,125 |
AMERIGROUP Corp.* | | 1,275 | | | | 34,374 |
AMN Healthcare Services, Inc.* | | 39,800 | | | | 360,588 |
AmSurg Corp.* | | 13,700 | | | | 301,674 |
Ariad Pharmaceuticals, Inc.* | | 110,774 | | | | 252,565 |
athenahealth, Inc.* | | 44,651 | 2 | | | 2,020,011 |
Auxilium Pharmaceuticals, Inc.* | | 15,000 | | | | 449,700 |
Catalyst Health Solutions, Inc.* | | 10,123 | | | | 369,186 |
Chemed Corp. | | 628 | | | | 30,125 |
Computer Programs & Systems, Inc. | | 28,930 | | | | 1,332,226 |
Conceptus, Inc.* | | 25,979 | 2 | | | 487,366 |
Crucell, ADR* | | 12,383 | | | | 249,889 |
Cyberonics, Inc.* | | 11,446 | | | | 233,956 |
DexCom, Inc.* | | 83,091 | | | | 671,375 |
Emergency Medical Services Corp., Class A* | | 6,557 | | | | 355,062 |
Endologix, Inc.* | | 44,124 | | | | 232,975 |
Eurand N.V.* | | 32,000 | | | | 412,800 |
Exelixis, Inc.* | | 38,400 | | | | 283,008 |
Gentiva Health Services, Inc.* | | 32,411 | | | | 875,421 |
Health Management Associates, Inc.* | | 239,900 | | | | 1,744,073 |
HMS Holdings Corp.* | | 64,813 | | | | 3,155,745 |
Human Genome Sciences, Inc.* | | 30,700 | | | | 939,420 |
ICON PLC, Sponsored ADR* | | 43,725 | | | | 950,144 |
Insulet Corp.* | | 71,300 | 2 | | | 1,018,164 |
Invacare Corp. | | 16,034 | | | | 399,888 |
Kensey Nash Corp.* | | 11,420 | | | | 291,210 |
LHC Group, Inc.* | | 7,180 | | | | 241,320 |
Martek Biosciences Corp.* | | 13,500 | | | | 255,690 |
Masimo Corp.* | | 27,400 | | | | 833,508 |
MedAssets, Inc.* | | 38,320 | | | | 812,767 |
Medicis Pharmaceutical Corp., Class A | | 19,700 | | | | 532,885 |
NuVasive, Inc.* | | 22,900 | 2 | | | 732,342 |
Odyssey HealthCare, Inc.* | | 25,500 | | | | 397,290 |
PDL BioPharma, Inc. | | 31,500 | | | | 216,090 |
Pharmerica Corp.* | | 1,299 | | | | 20,628 |
Phase Forward, Inc.* | | 27,914 | | | | 428,480 |
Providence Service Corp.* | | 18,500 | | | | 292,300 |
Psychiatric Solutions, Inc.* | | 7,929 | | | | 167,619 |
Regeneron Pharmaceuticals, Inc.* | | 27,148 | | | | 656,439 |
RehabCare Group, Inc.* | | 9,900 | | | | 301,257 |
Salix Pharmaceuticals, Ltd.* | | 29,500 | | | | 749,300 |
Savient Pharmaceuticals, Inc.* | | 8,500 | | | | 115,685 |
Sirona Dental Systems, Inc.* | | 24,772 | | | | 786,263 |
Steris Corp. | | 21,948 | | | | 613,886 |
SXC Health Solutions Corp.* | | 61,683 | | | | 3,327,798 |
Thoratec Corp.* | | 23,698 | | | | 637,950 |
United Therapeutics Corp.* | | 4,800 | 2 | | | 252,720 |
Valeant Pharmaceuticals International* | | 13,800 | 2 | | | 438,702 |
The accompanying notes are an integral part of these financial statements.
9
Managers Special Equity Fund
Schedule of Portfolio Investments (continued)
| | | | | | |
| | | Shares | | | Value |
Health Care - 16.5% (continued) | | | | | | |
Vanda Pharmaceuticals, Inc.* | | 23,796 | | | $ | 267,467 |
Viropharma, Inc.* | | 25,900 | 2 | | | 217,301 |
Total Health Care | | | | | | 37,835,822 |
Industrials - 10.5% | | | | | | |
Acuity Brands, Inc. | | 14,197 | 2 | | | 505,981 |
Allegiant Travel Co.* | | 7,700 | 2 | | | 363,209 |
American Superconductor Corp.* | | 18,539 | 2 | | | 758,245 |
Avis Budget Group, Inc.* | | 14,152 | 2 | | | 185,674 |
BE Aerospace, Inc.* | | 79,812 | | | | 1,875,582 |
Beacon Roofing Supply, Inc.* | | 23,872 | | | | 381,952 |
Bucyrus International, Inc. | | 46,930 | | | | 2,645,445 |
Chart Industries, Inc.* | | 21,339 | | | | 353,160 |
Colfax Corp.* | | 14,234 | | | | 171,377 |
Copa Holdings, S.A., Class A* | | 14,468 | | | | 788,072 |
Copart, Inc.* | | 20,540 | | | | 752,380 |
Corporate Executive Board Co. | | 11,363 | | | | 259,304 |
Cubic Corp. | | 7,800 | | | | 290,940 |
Deluxe Corp. | | 21,300 | | | | 315,027 |
DigitalGlobe, Inc.* | | 21,400 | | | | 517,880 |
DynCorp International, Inc.* | | 29,609 | | | | 424,889 |
EMCOR Group, Inc.* | | 12,200 | | | | 328,180 |
Energy Recovery, Inc.* | | 17,800 | | | | 122,464 |
EnerNOC, Inc.* | | 19,989 | | | | 607,466 |
EnerSys* | | 93,140 | | | | 2,036,972 |
Geo Group, Inc., The* | | 86,240 | | | | 1,886,931 |
GrafTech International, Ltd.* | | 33,462 | | | | 520,334 |
Graham Corp. | | 17,500 | | | | 362,250 |
HNI Corp. | | 11,095 | | | | 306,555 |
Harbin Electric, Inc.* | | 23,060 | 2 | | | 473,652 |
II-VI, Inc.* | | 18,181 | | | | 578,156 |
Kforce, Inc.* | | 33,700 | 2 | | | 421,250 |
Middleby Corp., The* | | 5,500 | | | | 269,610 |
MYR Group, Inc.* | | 20,407 | | | | 368,959 |
Nordson Corp. | | 20,600 | 2 | | | 1,260,308 |
Orion Marine Group, Inc.* | | 34,385 | | | | 724,148 |
Powell Industries, Inc.* | | 6,985 | | | | 220,237 |
Quanex Building Products Corp. | | 20,557 | | | | 348,852 |
Resources Connection, Inc.* | | 19,600 | | | | 415,912 |
Simpson Manufacturing Co., Inc. | | 15,136 | | | | 407,007 |
Tennant Co. | | 10,800 | | | | 282,852 |
Wabtec Corp. | | 30,280 | | | | 1,236,635 |
Watson Wyatt & Co. | | 6,600 | | | | 313,632 |
Total Industrials | | | | | | 24,081,479 |
Information Technology - 29.7% | | | | | | |
3PAR, Inc.* | | 22,782 | 2 | | | 269,967 |
Advent Software, Inc.* | | 21,913 | | | | 892,516 |
Amkor Technology, Inc.* | | 124,725 | | | | 893,031 |
Ancestry.com, Inc.* | | 19,382 | | | | 271,542 |
Archipelago Learning, Ltd.* | | 11,120 | 2 | | | 230,184 |
Arcsight, Inc.* | | 23,200 | | | | 593,456 |
Ariba, Inc.* | | 167,024 | | | | 2,091,140 |
Aruba Networks, Inc.* | | 206,140 | | | | 2,197,452 |
AsiaInfo Holdings, Inc.* | | 15,765 | 2 | | | 480,360 |
Atheros Communications, Inc.* | | 81,460 | | | | 2,789,190 |
Benchmark Electronics, Inc.* | | 19,100 | | | | 361,181 |
Blue Coat Systems, Inc.* | | 18,595 | | | | 530,701 |
Brightpoint, Inc.* | | 38,400 | | | | 282,240 |
Broadridge Financial Solutions, Inc. | | 17,500 | | | | 394,800 |
CACI International, Inc., Class A* | | 17,504 | | | | 855,070 |
Cavium Networks, Inc.* | | 40,787 | | | | 971,954 |
CSG Systems International, Inc.* | | 64,688 | | | | 1,234,894 |
Ceva, Inc.* | | 75,630 | | | | 972,602 |
Compellent Technologies, Inc.* | | 22,461 | 2 | | | 509,415 |
Concur Technologies, Inc.* | | 8,100 | | | | 346,275 |
Constant Contact, Inc.* | | 20,184 | | | | 322,944 |
CyberSource Corp.* | | 51,590 | | | | 1,037,475 |
Cymer, Inc.* | | 14,800 | | | | 568,024 |
DragonWave, Inc.* | | 27,917 | 2 | | | 319,929 |
Equinix, Inc.* | | 3,800 | | | | 403,370 |
Euronet Worldwide, Inc.* | | 11,900 | | | | 261,205 |
F5 Networks, Inc.* | | 9,255 | | | | 490,330 |
Fortinet, Inc.* | | 28,300 | | | | 497,231 |
GSI Commerce, Inc.* | | 33,957 | | | | 862,168 |
Global Cash Access Holdings, Inc.* | | 5,321 | | | | 39,854 |
Hollysys Automation Technologies, Ltd.* | | 28,000 | | | | 336,280 |
Informatica Corp.* | | 84,520 | | | | 2,185,687 |
InterDigital, Inc.* | | 26,263 | | | | 697,020 |
Intersil Corp., Class A | | 106,640 | | | | 1,635,858 |
IPG Photonics Corp.* | | 34,873 | | | | 583,774 |
The accompanying notes are an integral part of these financial statements.
10
Managers Special Equity Fund
Schedule of Portfolio Investments (continued)
| | | | | | |
| | | Shares | | | Value |
Information Technology - 29.7% (continued) | | | | | | |
Ixia* | | 96,680 | | | $ | 719,299 |
J2 Global Communications, Inc.* | | 7,585 | 2 | | | 154,355 |
Knot, Inc., The* | | 43,183 | | | | 434,853 |
LogMeIn, Inc.* | | 24,900 | | | | 496,755 |
Longtop Financial Technologies, Ltd., ADR* | | 19,722 | | | | 730,108 |
Manhattan Associates, Inc.* | | 12,000 | | | | 288,360 |
Maxwell Technologies, Inc.* | | 11,900 | | | | 212,296 |
MercadoLibre, Inc.* | | 11,400 | | | | 591,318 |
MicroStrategy, Inc.* | | 8,378 | | | | 787,700 |
Monolithic Power Systems, Inc.* | | 18,112 | | | | 434,145 |
Multi-Fineline Electronix, Inc.* | | 14,000 | | | | 397,180 |
Net 1 UEPS Technologies, Inc.* | | 14,000 | | | | 271,880 |
Netezza Corp.* | | 61,399 | | | | 595,570 |
Netgear, Inc.* | | 15,100 | | | | 327,519 |
NetLogic Microsystems, Inc.* | | 73,238 | | | | 3,387,991 |
NetSuite, Inc.* | | 29,612 | | | | 473,200 |
OpenTable, Inc.* | | 22,200 | 2 | | | 565,212 |
Oplink Communications, Inc.* | | 17,300 | | | | 283,547 |
OSI Systems, Inc.* | | 14,000 | | | | 381,920 |
Palm, Inc.* | | 24,300 | 2 | | | 243,972 |
Pegasystems, Inc. | | 19,062 | | | | 648,108 |
Plantronics, Inc. | | 49,966 | | | | 1,298,117 |
PMC-Sierra, Inc.* | | 67,074 | | | | 580,861 |
Power Integrations, Inc. | | 27,021 | | | | 982,484 |
QLogic Corp.* | | 81,192 | | | | 1,532,093 |
Rackspace Hosting, Inc.* | | 69,552 | 2 | | | 1,450,159 |
RF Micro Devices, Inc.* | | 52,600 | | | | 250,902 |
RightNow Technologies, Inc.* | | 50,455 | | | | 876,403 |
Riverbed Technology, Inc.* | | 12,673 | | | | 291,099 |
Rovi Corp.* | | 78,450 | | | | 2,500,202 |
S1 Corp.* | | 49,659 | | | | 323,777 |
ScanSource, Inc.* | | 7,918 | | | | 211,411 |
Semtech Corp.* | | 26,420 | | | | 449,404 |
Silicon Laboratories, Inc.* | | 13,200 | | | | 638,088 |
SINA Corp.* | | 5,600 | 2 | | | 253,008 |
Skyworks Solutions, Inc.* | | 95,160 | | | | 1,350,320 |
SolarWinds, Inc.* | | 31,600 | 2 | | | 727,116 |
Solera Holdings, Inc. | | 18,924 | | | | 681,453 |
STEC, Inc.* | | 3,858 | 2 | | | 63,040 |
SuccessFactors, Inc.* | | 62,400 | 2 | | | 1,034,592 |
Sybase, Inc.* | | 11,700 | | | | 507,780 |
Synaptics, Inc.* | | 2,474 | | | | 75,828 |
Synchronoss Technologies, Inc.* | | 30,036 | | | | 474,869 |
SYNNEX Corp.* | | 9,000 | | | | 275,940 |
Syntel, Inc. | | 17,791 | | | | 676,592 |
Taleo Corp.* | | 96,123 | 2 | | | 2,260,813 |
TeleTech Holdings, Inc.* | | 65,160 | | | | 1,305,155 |
Teradyne, Inc.* | | 49,000 | | | | 525,770 |
Tessera Technologies, Inc.* | | 3,678 | | | | 85,587 |
TIBCO Software, Inc.* | | 3,748 | | | | 36,093 |
TNS, Inc.* | | 15,710 | | | | 403,590 |
Veeco Instruments, Inc.* | | 49,419 | | | | 1,632,804 |
VeriFone Holdings, Inc.* | | 60,601 | | | | 992,644 |
Vistaprint N.V.* | | 13,305 | | | | 753,861 |
Vocus, Inc.* | | 61,556 | | | | 1,108,008 |
Websense, Inc.* | | 4,629 | | | | 80,822 |
Wright Express Corp.* | | 40,719 | | | | 1,297,307 |
Zoran Corp.* | | 31,400 | | | | 346,970 |
Total Information Technology | | | | | | 68,169,369 |
Materials - 3.5% | | | | | | |
AK Steel Holding Corp. | | 68,210 | | | | 1,456,284 |
Bway Holding Co.* | | 46,432 | | | | 892,423 |
Chemspec International, Ltd., ADR* | | 24,008 | | | | 158,453 |
NewMarket Corp. | | 11,716 | | | | 1,344,645 |
Rock-Tenn Co., Class A | | 24,452 | | | | 1,232,625 |
Schweitzer-Mauduit International, Inc. | | 23,840 | | | | 1,677,144 |
Scotts Co., The, Class A | | 8,500 | | | | 334,135 |
Silgan Holdings, Inc. | | 5,559 | | | | 321,755 |
STR Holdings, Inc.* | | 39,548 | 2 | | | 621,299 |
Total Materials | | | | | | 8,038,763 |
Telecommunication Services - 0.2% | | | | | | |
Consolidated Communications Holdings, Inc. | | 19,700 | | | | 344,750 |
Syniverse Holdings, Inc.* | | 4,961 | | | | 86,718 |
Total Telecommunication Services | | | | | | 431,468 |
Utilities - 0.1% | | | | | | |
ITC Holdings Corp. | | 4,180 | | | | 217,736 |
Total Common Stocks
(cost $162,150,075) | | | | | | 216,210,352 |
The accompanying notes are an integral part of these financial statements.
11
Managers Special Equity Fund
Schedule of Portfolio Investments (continued)
| | | | | | |
| | | Shares | | Value | |
Short-Term Investments - 31.1%1 | | | | | | |
BNY Institutional Cash Reserves Fund, Series A, 0.05%3 | | 18,661,000 | | $ | 18,661,000 | |
BNY Institutional Cash Reserves Fund, Series B*3,4 | | 2,499,559 | | | 487,414 | |
Dreyfus Cash Management Fund, Institutional Class Shares, 0.08% | | 32,137,401 | | | 32,137,401 | |
JPMorgan Liquid Assets Money Market Fund, Capital Shares, 0.19% | | 19,923,085 | | | 19,923,085 | |
Total Short-Term Investments
(cost $73,221,045) | | | | | 71,208,900 | |
Total Investments - 125.4%
(cost $235,371,120) | | | | | 287,419,252 | |
Other Assets, less Liabilities - (25.4)% | | | | | (58,232,150 | ) |
Net Assets - 100.0% | | | | $ | 229,187,102 | |
The following footnotes and abbreviations should be read in conjunction with the Schedule of Portfolio Investments.
Based on the cost of investments of $243,588,375 for Federal income tax purposes at December 31, 2009, the aggregate gross unrealized appreciation and depreciation were approximately $47,993,391 and $4,162,514, respectively, resulting in net unrealized appreciation of investments of $43,830,877.
| * | Non-income producing security. |
| 1 | Yield shown for an investment company represents the December 31, 2009, seven-day average yield, which refers to the sum of the previous seven days’ dividends paid, expressed as an annual percentage. |
| 2 | Some or all of these shares were out on loan to various brokers as of December 31, 2009, amounting to a market value of $20,418,832, or approximately 8.9% of net assets. |
| 3 | Collateral received from brokers for securities lending was invested in this short-term investment. |
| 4 | On September 12, 2008, The Bank of New York Mellon established a separate sleeve of the BNY Institutional Cash Reserves Fund (Series B) to hold certain Lehman Brothers floating rate notes. The Fund’s position in Series B is being marked to market daily. |
Investments Definitions and Abbreviations:
ADR: ADR after the name of a holding stands for American Depositary Receipt, representing ownership of foreign securities on deposit with a domestic custodian bank. The value of the ADR security is determined or significantly influenced by trading on exchanges not located in the United States or Canada. Sponsored ADRs are initiated by the underlying foreign company.
The accompanying notes are an integral part of these financial statements.
12
Managers Special Equity Fund
Statement of Assets and Liabilities
December 31, 2009
| | | | |
Assets: | | | | |
Investments at value (including securities on loan valued at $20,418,832)* | | $ | 287,419,252 | |
Receivable for investments sold | | | 18,882,222 | |
Receivable for Fund shares sold | | | 66,933 | |
Dividends, interest and other receivables | | | 51,317 | |
Prepaid expenses | | | 13,408 | |
Total assets | | | 306,433,132 | |
Liabilities: | | | | |
Payable for Fund shares repurchased | | | 32,603,758 | |
Payable for investments purchased | | | 22,959,828 | |
Payable upon return of securities loaned | | | 21,160,559 | |
Accrued expenses: | | | | |
Investment advisory and management fees | | | 198,743 | |
Administrative fees | | | 55,206 | |
Other | | | 267,936 | |
Total liabilities | | | 77,246,030 | |
Net Assets | | $ | 229,187,102 | |
Managers Shares: | | | | |
Net Assets | | $ | 221,158,719 | |
Shares outstanding | | | 5,585,051 | |
Net asset value, offering and redemption price per share | | $ | 39.60 | |
Institutional Class Shares: | | | | |
Net Assets | | $ | 8,028,383 | |
Shares outstanding | | | 200,507 | |
Net asset value, offering and redemption price per share | | $ | 40.04 | |
Net Assets Represent: | | | | |
Paid-in capital | | $ | 513,999,111 | |
Undistributed net investment income | | | — | |
Accumulated net realized loss from investments | | | (336,860,141 | ) |
Net unrealized appreciation of investments | | | 52,048,132 | |
Net Assets | | $ | 229,187,102 | |
| |
* Investments at cost | | $ | 235,371,120 | |
The accompanying notes are an integral part of these financial statements.
13
Managers Special Equity Fund
Statement of Operations
For the year ended December 31, 2009
| | | | |
Investment Income: | | | | |
Dividend income | | $ | 1,371,507 | |
Securities lending fees | | | 244,638 | |
Interest income | | | 14 | |
Foreign withholding tax | | | (6,807 | ) |
Total investment income | | | 1,609,352 | |
Expenses: | | | | |
Investment management and advisory fees | | | 2,905,178 | |
Administrative fees | | | 806,994 | |
Transfer agent | | | 804,566 | |
Reports to shareholders | | | 162,899 | |
Custodian | | | 147,919 | |
Professional fees | | | 124,622 | |
Registration fees | | | 54,154 | |
Trustees fees and expenses | | | 8,262 | |
Miscellaneous | | | 31,532 | |
Total expenses before offsets | | | 5,046,126 | |
Expense reductions | | | (94,982 | ) |
Fee waivers | | | (27 | ) |
Net expenses | | | 4,951,117 | |
Net investment loss | | | (3,341,765 | ) |
Net Realized and Unrealized Gain (Loss): | | | | |
Net realized loss on investments | | | (68,748,383 | ) |
Net unrealized appreciation of investments | | | 146,181,404 | |
Net realized and unrealized gain | | | 77,433,021 | |
Net increase in net assets resulting from operations | | $ | 74,091,256 | |
The accompanying notes are an integral part of these financial statements.
14
Managers Special Equity Fund
Statement of Changes in Net Assets
For the year ended December 31,
| | | | | | | | |
| | | 2009 | | | 2008 | |
Increase (Decrease) in Net Assets From Operations: | | | | | | | | |
Net investment loss | | $ | (3,341,765 | ) | | $ | (5,943,300 | ) |
Net realized loss on investments | | | (68,748,383 | ) | | | (262,909,241 | ) |
Net unrealized appreciation (depreciation) of investments | | | 146,181,404 | | | | (299,027,742 | ) |
Net increase (decrease) in net assets resulting from operations | | | 74,091,256 | | | | (567,880,283 | ) |
Distributions to Shareholders: | | | | | | | | |
From net realized gain on investments: | | | | | | | | |
Managers Class | | | — | | | | (60,482,450 | ) |
Institutional Class | | | — | | | | (14,942,810 | ) |
Total distributions to shareholders | | | — | | | | (75,425,260 | ) |
From Capital Share Transactions: | | | | | | | | |
Managers Class: | | | | | | | | |
Proceeds from sale of shares | | | 31,884,153 | | | | 187,952,090 | |
Reinvestment of dividends and distributions | | | — | | | | 56,640,818 | |
Cost of shares repurchased | | | (225,493,111 | ) | | | (997,437,797 | ) |
Net decrease from Managers Class share transactions | | | (193,608,958 | ) | | | (752,844,889 | ) |
Institutional Class: | | | | | | | | |
Proceeds from sale of shares | | | 12,754,238 | | | | 116,771,071 | |
Reinvestment of dividends and distributions | | | — | | | | 12,946,151 | |
Cost of shares repurchased | | | (108,594,167 | ) | | | (204,449,527 | ) |
Net decrease from Institutional Class share transactions | | | (95,839,929 | ) | | | (74,732,305 | ) |
Net decrease from capital share transactions | | | (289,448,887 | ) | | | (827,577,194 | ) |
Total decrease in net assets | | | (215,357,631 | ) | | | (1,470,882,737 | ) |
Net Assets: | | | | | | | | |
Beginning of year | | | 444,544,733 | | | | 1,915,427,470 | |
End of year | | $ | 229,187,102 | | | $ | 444,544,733 | |
End of year undistributed net investment income | | | — | | | | — | |
| | | | | | | | |
Share Transactions: | | | | | | | | |
Managers Class: | | | | | | | | |
Sale of shares | | | 1,041,783 | | | | 3,473,798 | |
Reinvested shares from dividends and distributions | | | — | | | | 1,951,786 | |
Shares repurchased | | | (7,084,785 | ) | | | (19,749,465 | ) |
Net decrease in shares | | | (6,043,002 | ) | | | (14,323,881 | ) |
Institutional Class: | | | | | | | | |
Sale of shares | | | 421,778 | | | | 2,489,353 | |
Reinvested shares from dividends and distributions | | | — | | | | 441,999 | |
Shares repurchased | | | (3,245,866 | ) | | | (3,729,675 | ) |
Net decrease in shares | | | (2,824,088 | ) | | | (798,323 | ) |
The accompanying notes are an integral part of these financial statements.
15
Managers Special Equity Fund
Financial Highlights
For a share outstanding throughout each year
| | | | | | | | | | | | | | | | | | | | |
| | | For the year ended December 31, | |
Managers Class: | | 2009 | | | 2008 | | | 2007 | | | 2006 | | | 2005 | |
Net Asset Value, Beginning of Year | | $ | 30.28 | | | $ | 64.27 | | | $ | 82.96 | | | $ | 86.78 | | | $ | 90.42 | |
Income from Investment Operations: | | | | | | | | | | | | | | | | | | | | |
Net investment loss | | | (0.34 | )3 | | | (0.28 | )3 | | | (0.51 | )3 | | | (0.14 | )3 | | | (0.54 | )3 |
Net realized and unrealized gain (loss) on investments | | | 9.66 | 3 | | | (27.93 | )3 | | | 0.55 | 3 | | | 9.88 | 3 | | | 4.18 | 3 |
Total from investment operations | | | 9.32 | | | | (28.21 | ) | | | 0.04 | | | | 9.74 | | | | 3.64 | |
Less Distributions to Shareholders from: | | | | | | | | | | | | | | | | | | | | |
Net realized gain on investments | | | — | | | | (5.78 | ) | | | (18.73 | ) | | | (13.56 | ) | | | (7.28 | ) |
Net Asset Value, End of Year | | $ | 39.60 | | | $ | 30.28 | | | $ | 64.27 | | | $ | 82.96 | | | $ | 86.78 | |
Total Return 1 | | | 30.78 | % | | | (43.49 | )% | | | (0.60 | )% | | | 11.28 | % | | | 4.00 | % |
Ratio of net expenses to average net assets | | | 1.58 | % | | | 1.48 | % | | | 1.43 | % | | | 1.42 | % | | | 1.40 | % |
Ratio of net investment loss to average net assets1 | | | (1.08 | )% | | | (0.52 | )% | | | (0.59 | )% | | | (0.15 | )% | | | (0.60 | )% |
Portfolio turnover | | | 186 | % | | | 138 | % | | | 67 | % | | | 76 | % | | | 80 | % |
Net assets at end of year (000’s omitted) | | $ | 221,159 | | | $ | 352,106 | | | $ | 1,668,031 | | | $ | 2,551,703 | | | $ | 2,834,314 | |
| | | | | | | | | | | | | | | | | | | | |
Ratios absent expense offsets:2 | | | | | | | | | | | | | | | | | | | | |
Ratio of total expenses to average net assets | | | 1.61 | % | | | 1.51 | % | | | 1.46 | % | | | 1.47 | % | | | 1.45 | % |
Ratio of net investment loss to average net assets | | | (1.11 | )% | | | (0.55 | )% | | | (0.62 | )% | | | (0.20 | )% | | | (0.65 | )% |
| | | | | | | | | | | | | | | | | | | | |
| | | | | | | | | | | | | | | | | | | | |
| | | For the year ended December 31, | |
Institutional Class: | | 2009 | | | 2008 | | | 2007 | | | 2006 | | | 2005 | |
Net Asset Value, Beginning of Year | | $ | 30.56 | | | $ | 64.71 | | | $ | 83.56 | | | $ | 87.09 | | | $ | 90.56 | |
Income from Investment Operations: | | | | | | | | | | | | | | | | | | | | |
Net investment income (loss) | | | (0.26 | )3 | | | (0.15 | )3 | | | (0.32 | )3 | | | 0.10 | 3 | | | (0.33 | )3 |
Net realized and unrealized gain (loss) on investments | | | 9.74 | 3 | | | (28.16 | )3 | | | 0.52 | 3 | | | 9.93 | 3 | | | 4.14 | 3 |
Total from investment operations | | | 9.48 | | | | (28.31 | ) | | | 0.20 | | | | 10.03 | | | | 3.81 | |
Less Distributions to Shareholders from: | | | | | | | | | | | | | | | | | | | | |
Net realized gain on investments | | | — | | | | (5.84 | ) | | | (19.05 | ) | | | (13.56 | ) | | | (7.28 | ) |
Net Asset Value, End of Year | | $ | 40.04 | | | $ | 30.56 | | | $ | 64.71 | | | $ | 83.56 | | | $ | 87.09 | |
Total Return 1 | | | 31.02 | %4 | | | (43.35 | )% | | | (0.39 | )% | | | 11.56 | %4 | | | 4.21 | % |
Ratio of net expenses to average net assets | | | 1.33 | % | | | 1.23 | % | | | 1.20 | % | | | 1.18 | % | | | 1.20 | % |
Ratio of net investment income (loss) to average net assets1 | | | (0.83 | )% | | | (0.29 | )% | | | (0.36 | )% | | | 0.09 | % | | | (0.56 | )% |
Portfolio turnover | | | 186 | % | | | 138 | % | | | 67 | % | | | 76 | % | | | 80 | % |
Net assets at end of year (000’s omitted) | | $ | 8,028 | | | $ | 92,439 | | | $ | 247,396 | | | $ | 561,994 | | | $ | 510,541 | |
| | | | | | | | | | | | | | | | | | | | |
Ratios absent expense offsets:2 | | | | | | | | | | | | | | | | | | | | |
Ratio of total expenses to average net assets | | | 1.36 | % | | | 1.26 | % | | | 1.23 | % | | | 1.23 | % | | | 1.25 | % |
Ratio of net investment income (loss) to average net assets | | | (0.86 | )% | | | (0.32 | )% | | | (0.39 | )% | | | 0.04 | % | | | (0.61 | )% |
| | | | | | | | | | | | | | | | | | | | |
| 1 | Total returns and net investment income would have been lower had certain expenses not been reduced. (See Note 1(c) of Notes to Financial Statements.) |
| 2 | Excludes the impact of fee waivers and expense offsets such as brokerage credits, but includes non-reimbursable expenses, if any, such as interest and taxes. (See Note 1(c) to the Notes to Financial Statements.) |
| 3 | Per share numbers have been calculated using average shares. |
| 4 | The Total Return is based on the Financial Statement Net Asset Values as shown above. |
16
Managers Special Equity Fund
Notes to Financial Statements
December 31, 2009
1. Summary of Significant Accounting Policies
The Managers Funds (the “Trust”) is an open-end management investment company organized as a Massachusetts business trust and registered under the Investment Company Act of 1940, as amended (the “1940 Act”). Currently, the Trust is comprised of a number of different funds, each having distinct investment management objectives, strategies, risks and policies. Included in this report is the Managers Special Equity Fund (“Special Equity” or the “Fund”).
The Fund offers both Managers Class shares and Institutional Class shares. The Institutional Class shares, which are designed primarily for institutional investors that meet certain administrative and servicing criteria, have a minimum investment of $2,500,000. Managers Class shares are offered to all other investors. Each class represents an interest in the same assets of the Fund and the classes are identical except for class specific expenses related to shareholder activity. Each class has equal voting privileges except that each class has exclusive voting rights with respect to its services and/or distribution plan. Please refer to a current prospectus for additional information on each share class.
The Fund’s financial statements are prepared in accordance with accounting principles generally accepted in the United States of America, which require management to make estimates and assumptions that affect the reported amounts of assets and liabilities and disclosure of contigent assets and liabilities at the date of the financial statements and the reported amounts of income and expenses during the reporting periods. Actual results could differ from those estimates and such differences could be material. The following is a summary of significant accounting policies followed by the Fund in the preparation of its financial statements:
a. Valuation of Investments
Equity securities traded on a domestic or international securities exchange are valued at the last quoted sale price, or, lacking any sales, at the last quoted bid price. Over-the-counter securities are valued at the Nasdaq Official Closing Price, if one is available. Lacking any sales, over-the-counter securities are valued at the last quoted bid price. The Fund’s investments are generally valued based on market quotations provided by third-party pricing services approved by the Board of Trustees of the Fund. Under certain circumstances, the value of certain Fund investments may be based on an evaluation of fair value, pursuant to procedures established by and under the general supervision of the Board of Trustees of the Fund. The Fund may use the fair value of a portfolio security to calculate its NAV when, for example, (1) market quotations are not readily available because a portfolio security is not traded in a public market or the principal market in which the security trades is closed, (2) trading in a portfolio security is suspended and has not resumed before the Fund calculates its NAV, (3) a significant event affecting the value of a portfolio security is determined to have occurred between the time of the market quotation provided for a portfolio security and the time as of which the Fund calculates its NAV, (4) a security’s price has remained unchanged over a period of time (often referred to as a “stale price”), or (5) Managers Investment Group LLC (the “Investment Manager”) determines that a market quotation is inaccurate. Portfolio investments that trade primarily on foreign markets are priced based upon the market quotation of such securities as of the close of their respective principal markets, as adjusted to reflect the Investment Manager’s determination of the impact of events occurring subsequent to the close of such markets but prior to the time as of which the Fund calculates its NAV. In accordance with procedures approved by the Board of Trustees, the Investment Manager relies upon recommendations of a third-party fair valuation service in adjusting the prices of such foreign portfolio investments. The Fund may invest in securities that may be thinly traded. The Board of Trustees has adopted procedures to adjust prices when thinly traded securities are judged to be stale so that they reflect fair value. An investment valued on the basis of its fair value may be valued at a price higher or lower than available market quotations. An investment’s valuation may differ depending on the method used and the factors considered in determining value according to the Fund’s fair value procedures.
Short-term investments having a remaining maturity of 60 days or less are valued at amortized cost, which approximates market value. Investments in other open-end regulated investment companies are valued at their end of day net asset value per share except iShares or other ETF’s, which are valued the same as equity securities. Investments in certain mortgage-backed and stripped mortgage-backed securities, preferred stocks, convertible securities, derivatives and other debt securities not traded on an organized securities market are valued on the basis of valuations provided by dealers or by a pricing service which uses information with respect to transactions in such securities and various relationships between securities and yield to maturity in determining value. Securities (including derivatives) for which market quotations are not readily available are valued at fair value, as determined in good faith, and pursuant to procedures adopted by the Board of Trustees of the Trust. The values assigned to fair value investments are based on available information and do not necessarily represent amounts that might ultimately be realized, since such amounts depend on future developments inherent in long-term investments. Further, because of the inherent uncertainty of valuation, those estimated values may differ significantly from the values that would have been used had a ready market for the investments existed, and the differences could be material.
17
Managers Special Equity Fund
Notes to Financial Statements (continued)
Generally Accepted Accounting Principles (GAAP) define fair value as the price that a Fund would receive to sell an asset or pay to transfer a liability in an orderly transaction between market participants at the measurement date. GAAP also establishes a framework for measuring fair value, and a three-level hierarchy for fair value measurements based upon the transparency of inputs to the valuation of an asset or liability. Inputs may be observable or unobservable and refer broadly to the assumptions that market participants would use in pricing the asset or liability. Observable inputs reflect the assumptions market participants would use in pricing the asset or liability based on market data obtained from sources independent of the Fund. Unobservable inputs reflect the Fund’s own assumptions about the assumptions that market participants would use in pricing the asset or liability developed based on the best information available in the circumstances. Each investment is assigned a level based upon the observability of the inputs which are significant to the overall valuation.
The three-tier hierarchy of inputs is summarized below:
Level 1 – quoted prices in active markets for identical investments
Level 2 – other significant observable inputs (including quoted prices for similar investments, interest rates, prepayment speeds, credit risk)
Level 3 – significant unobservable inputs (including the Fund’s own assumptions in determining the fair value of investments)
The inputs or methodologies used for valuing investments are not necessarily an indication of the risk associated with investing in those investments. The following table summarizes the inputs used to value the Fund’s net assets by the above fair value hierarchy levels as of December 31, 2009:
| | | | | | | | | | | |
| | | Level 1 | | Level 2 | | Level 3 | | Total |
Special Equity | | | | | | | | | | | |
Investments in Securities | | | | | | | | | | | |
Common Stocks1 | | $ | 216,210,352 | | | — | | — | | $ | 216,210,352 |
Short-Term Investments | | | 70,721,486 | | $ | 487,414 | | — | | | 71,208,900 |
| | | | | | | | | | | |
Total Investments in Securities | | $ | 286,931,838 | | $ | 487,414 | | — | | $ | 287,419,252 |
| | | | | | | | | | | |
| 1 | All common stocks held in the Fund are Level 1 securities. For a detailed break-out of the common stocks by major industry classification, please refer to the Schedule of Portfolio Investments. |
b. Security Transactions
Security transactions are accounted for as of trade date. Realized gains and losses on securities sold are determined on the basis of identified cost.
18
Managers Special Equity Fund
Notes to Financial Statements (continued)
c. Investment Income and Expenses
Dividend income is recorded on the ex-dividend date except certain dividends from foreign securities where the ex-dividend date may have passed. These dividends are recorded as soon as the Trust is informed of the ex-dividend date. Dividend income on foreign securities is recorded net of any withholding tax. Interest income, which includes amortization of premium and accretion of discount on debt securities, is accrued as earned. Non-cash dividends included in dividend income, if any, are reported at the fair market value of the securities received. Other income and expenses are recorded on an accrual basis. Expenses that cannot be directly attributed to a fund are apportioned among the Funds in the Trust and in some cases other affiliated funds based upon their relative average net assets or number of shareholders. Investment income, realized and unrealized capital gains and losses, the common expenses of the Fund and certain Fund level expense reductions, if any, are allocated on a pro rata basis to each class based on the relative net assets of each class to the total net assets of the Fund.
The Fund had certain portfolio trades directed to various brokers, under a brokerage recapture program, which paid a portion of the Fund’s expenses. For the year ended December 31, 2009, under these arrangements the amount by which the Fund’s expenses were reduced and the impact on the expense ratios was as follows: $93,612 or 0.03% annualized.
The Fund has a “balance credit” arrangement with The Bank of New York Mellon (“BNYM”), the Fund’s custodian, whereby the Fund is credited with an interest factor equal to 0.75% below the effective 90-day T-Bill rate for account balances left uninvested overnight. If the T-Bill rate falls below 0.75%, no credits will be earned. These credits serve to reduce custody expenses that would otherwise be charged to the Fund. For the year ended December 31, 2009, the custodian expense was not reduced.
Overdrafts will cause a reduction of any earnings credits, computed at 2% above the effective Federal Funds rate on the day of the overdraft. For the year ended December 31, 2009, the Fund incurred overdraft fees of $2,445.
The Trust also has a balance credit arrangement with its Transfer Agent, PNC Global Investment Servicing (U.S.) Inc., whereby earnings credits are used to offset banking charges and other out-of-pocket expenses. For the year ended December 31, 2009, the transfer agent expense was reduced by $1,370.
The Investment Manager has agreed to waive a portion of its management fee in consideration of shareholder servicing fees that it has received from JPMorgan Distribution Services, Inc., with respect to short-term cash investments the Fund has made in the JPMorgan Liquid Assets Money Market Fund, Capital Shares. For the year ended December 31, 2009, the management fee was reduced $27.
Total returns and net investment income for the Funds would have been lower had certain expenses not been offset. Total expenses before offsets exclude the impact of expense reimbursements or fee waivers and expense offsets such as brokerage recapture credits, but include non-reimburseable expenses, if any, such as interest and taxes.
d. Dividends and Distributions
Dividends resulting from net investment income and distributions of capital gains, if any, normally will be declared and paid annually in December and when required for Federal excise tax purposes. Distributions are recorded on the ex-dividend date and are declared separately for each class. Income and capital gain distributions are determined in accordance with Federal income tax regulations, which may differ from GAAP. These differences are primarily due to differing treatments for losses deferred due to wash sales, REITs, equalization accounting for tax purposes, foreign currency, options, futures and market discount transactions. Permanent book and tax basis differences, if any, relating to shareholder distributions will result in reclassifications to paid-in capital. The tax character of distributions paid during the past two years were as follows:
| | | | | |
| | | 2009 | | 2008 |
Distributions paid from: | | | | | |
Ordinary income | | — | | | — |
Short-term capital gains | | — | | $ | 517,105 |
Long-term capital gains | | — | | | 74,908,155 |
| | | | | |
| | — | | $ | 75,425,260 |
| | | | | |
| | |
As a % of distributions paid (unaudited): | | | | | |
Qualified ordinary income | | — | | | — |
Ordinary income - dividends received deduction | | — | | | — |
As of December 31, 2009, the components of distributable earnings (excluding unrealized appreciation/depreciation) on a tax basis consisted of:
| | | |
Capital loss carryforward | | $ | 328,642,886 |
Undistributed ordinary income | | | — |
Undistributed short-term capital gains | | | — |
Undistributed long-term capital gains | | | — |
19
Managers Special Equity Fund
Notes to Financial Statements (continued)
e. Federal Taxes
The Fund intends to comply with the requirements under Subchapter M of the Internal Revenue Code of 1986, as amended, to distribute substantially all of its taxable income and gains to its shareholders and to meet certain diversification and income requirements with respect to investment companies. Therefore, no provision for Federal income or excise tax is included in the accompanying financial statements.
Additionally, based on the Fund’s understanding of the tax rules and rates related to income, gains and transactions for the foreign jurisdictions in which it invests, the Fund will provide for foreign taxes, and where appropriate, deferred foreign taxes.
Management has analyzed the Fund’s tax positions taken on federal income tax returns for all open tax years (tax years ended December 31, 2006-2009), and has concluded that no provision for federal income tax is required in the Fund’s financial statements. Additionally, the Fund is not aware of any tax position for which it is reasonably possible that the total amounts of unrecognized tax benefits will change materially in the next twelve months.
f. Capital Loss Carryovers
As of December 31, 2009, the Fund had accumulated net realized capital loss carryover from securities transactions for Federal income tax purposes as shown in the following chart. These amounts may be used to offset realized capital gains, if any, through the expiration dates listed.
| | | | | |
Fund | | Capital Loss
Carryover Amount | | Expires
December 31, |
Special Equity | | $ | 145,021,109 | | 2016 |
| | | 183,621,777 | | 2017 |
| | | | | |
Total | | $ | 328,642,886 | | |
| | | | | |
For the year ended December 31, 2009, the Fund did not utilize any capital loss carryovers.
g. Capital Stock
The Trust’s Declaration of Trust authorizes for each series the issuance of an unlimited number of shares of beneficial interest, without par value. The Fund records sales and repurchases of its capital stock on the trade date. The cost of securities contributed to the Fund in connection with the issuance of shares is based on the valuation of those securities in accordance with the Fund’s policy on investment valuation. Dividends and distributions to shareholders are recorded on the ex-dividend date.
At December 31, 2009, certain unaffiliated shareholders of record, specifically omnibus accounts, individually or collectively held greater than 10% of the outstanding shares of the Fund as follows: three collectively own 60%. Transactions by these shareholders may have a material impact on the Fund.
2. Agreements and Transactions with Affiliates
The Trust has entered into an Investment Management Agreement under which the Investment Manager, an independently managed subsidiary of Affiliated Managers Group, Inc. (“AMG”), serves as investment manager to the Fund and is responsible for the Fund’s overall administration. The Investment Manager selects subadvisors for the Fund (subject to Trustee approval) and monitors each subadvisor’s investment programs and results. The Fund’s investment portfolio is managed by portfolio managers who serve pursuant to a Subadvisory Agreement with the Investment Manager.
Investment management fees are paid directly by the Fund to the Investment Manager based on average daily net assets. The annual investment management fee rate, as a percentage of average daily net assets, is 0.90%.
The Trust has entered into an Administration and Shareholder Servicing Agreement under which the Investment Manager serves as the Fund’s administrator (the “Administrator”) and is responsible for all aspects of managing the Fund’s operations, including administration and shareholder services to the Fund, its shareholders, and certain institutions, such as bank trust departments, broker-dealers and registered investment advisers, that advise or act as an intermediary with the Fund’s shareholders. The Fund pays a fee to the Administrator at the rate of 0.25% per annum of the Fund’s average daily net assets for this service.
The aggregate annual retainer paid to each Independent Trustee is $65,000, plus $4,000 or $2,500 for each regular or special meeting attended, respectively. The Trustees’ fees and expenses are allocated amongst all of the Funds for which the Investment Manager serves as the advisor (the “Managers Funds”) based on the relative net assets of such Funds. The Independent Chairman of the Trusts receives an additional payment of $15,000 per year. The Chairman of the Audit Committee receives an additional payment of $5,000 per year. The “Trustees fees and expenses” shown in the financial statements represents the Fund’s allocated portion of the total fees and expenses paid by the Managers Funds.
The Fund is distributed by Managers Distributors, Inc. (the “Distributor” or “MDI”), a wholly-owned subsidiary of the Investment Manager. MDI serves as the principal underwriter for the Fund and is a registered broker-dealer and member of the Financial Industry
20
Managers Special Equity Fund
Notes to Financial Statements (continued)
Regulatory Authority, Inc. (“FINRA”). Shares of the Fund will be continuously offered and will be sold by brokers, dealers or other financial intermediaries who have executed selling agreements with MDI. MDI bears all the expenses of providing services pursuant to the Underwriting Agreement, including the payment of the expenses relating to the distribution of Prospectuses for sales purposes and any advertising or sales literature. Certain Trustees and Officers of the Fund are Officers and/or Directors of the Investment Manager, AMG and/or the Distributor.
On June 23, 2009, the Securities and Exchange Commission granted an exemptive order that permits the Funds to lend and borrow money for certain temporary purposes directly to and from other eligible Funds in the Managers Family of Funds (the “Fund Family”). Participation in this interfund lending program is voluntary for both borrowing and lending Funds, and an interfund loan is only made if it benefits each participating Fund. The Investment Manager administers the program according to procedures approved by the Funds’ Board of Trustees (the “Board”), and the Board monitors the operation of the program. An interfund loan must comply with certain conditions set out in the exemptive order, which are designed to assure fairness and protect all participating Funds. For the period from June 23, 2009 through December 31, 2009, the Fund borrowed varying amounts up to $7,491,947 over 7 days paying interest of $573 from other Funds in the Fund Family. The Fund also lent varying amounts up to $275,166 over 2 days earning interest of $14 to other Funds in the Fund Family. The interest amounts are presented in the Statement of Operations in interest income or as miscellaneous expense.
3. Purchases and Sales of Securities
Purchases and sales of securities, excluding short-term securities and U.S. government obligations, for the year ended December 31, 2009, were $584,636,518 and $881,924,642, respectively. There were no purchases or sales of U.S. government obligations.
4. Portfolio Securities Loaned
The Fund may participate in a securities lending program offered by BNYM, providing for the lending of securities to qualified brokers. Securities lending fees include earnings of such temporary cash investments, plus or minus any rebate to a borrower. These earnings (after any rebate) are then divided between BNYM, as a fee for its services under the program, and the Fund, according to
agreed-upon rates. Collateral on all securities loaned is accepted in cash and/or government securities and is maintained at a minimum level of 102% (105% in the case of certain foreign securities) of the market value, plus interest, if applicable, of investments on loan. It is the Fund’s policy to obtain additional collateral from or return excess collateral to the borrower by the end of the next business day, following the valuation date of the securities loaned. Therefore, the value of the collateral held may be temporarily less than the value of the securities on loan. Lending securities entails a risk of loss to the Fund if and to the extent that the market value of the securities loaned were to increase and the borrower did not increase the collateral accordingly, and the borrower fails to return the securities. The Fund bears the risk of any deficiency in the amount of the collateral available for return to the borrower due to any loss on the collateral invested. Collateral received in the form of cash is invested temporarily in the BNY Institutional Cash Reserves Fund (the “ICRF”), or other short-term investments as defined in the Securities Lending Agreement with BNYM.
In September of 2008, BNYM advised the Investment Manager that the ICRF had exposure to certain defaulted debt obligations, and that BNYM had established a separate sleeve of the ICRF to hold these securities. The net impact of this position is not material to the Fund. The Fund’s position in the separate sleeve of the ICRF Fund is included in the Schedule of Portfolio Investments and the unrealized loss on such investment is included in Net Unrealized Depreciation on the Statement of Assets and Liabilities and the Statement of Operations.
5. Commitments and Contingencies
In the normal course of business, the Fund may enter into contracts and agreements that contain a variety of representations and warranties, which provide general indemnifications. The maximum exposure to the Fund under these arrangements is unknown, as this would involve future claims that may be made against the Fund that have not yet occurred. However, based on experience, the Fund expects the risk of loss to be remote.
6. Subsequent Events
The Fund has determined that no additional material events or transactions occurred subsequent to December 31, 2009, and through February 25, 2010, the date of the issuance of the Fund’s financial statements, which require additional disclosure in the Fund’s financial statements.
Tax Information (unaudited)
The Fund hereby designates the maximum amount allowable of its net taxable income as qualified dividends as provided in the Jobs and Growth Tax Relief Reconciliation Act of 2003. The 2009 Form 1099-DIV you receive for the Fund will show the tax status of all distributions paid to you during the year.
Pursuant to section 852 of the Internal Revenue Code, the Fund hereby designates as a capital gain distribution with respect to the taxable year ended December 31, 2009, $0 or, if subsequently determined to be different, the net capital gains of such year.
21
Report of Independent Registered Public Accounting Firm
To the Board of Trustees of The Managers Funds and the Shareholders of Managers Special Equity Fund:
In our opinion, the accompanying statement of assets and liabilities, including the schedule of portfolio investments, and the related statements of operations and of changes in net assets and the financial highlights present fairly, in all material respects, the financial position of Managers Special Equity Fund (one of the series constituting The Managers Funds, hereafter referred to as the “Fund”) at December 31, 2009, the results of its operations for the year then ended, the changes in its net assets for each of the two years in the period then ended and the financial highlights for each of the five years in the period then ended, in conformity with accounting principles generally accepted in the United States of America. These financial statements and financial highlights (hereafter referred to as “financial statements”) are the responsibility of the Fund’s management; our responsibility is to express an opinion on these financial statements based on our audits. We conducted our audits of these financial statements in accordance with the standards of the Public Company Accounting Oversight Board (United States). Those standards require that we plan and perform the audit to obtain reasonable assurance about whether the financial statements are free of material misstatement. An audit includes examining, on a test basis, evidence supporting the amounts and disclosures in the financial statements, assessing the accounting principles used and significant estimates made by management, and evaluating the overall financial statement presentation. We believe that our audits, which included confirmation of securities at December 31, 2009 by correspondence with the custodian and brokers, provide a reasonable basis for our opinion.
PricewaterhouseCoopers LLP
Philadelphia, Pennsylvania
February 25, 2010
22
Trustees and Officers
The Trustees and Officers of the Trust, their business addresses, principal occupations for the past five years and dates of birth are listed below. The Trustees provide broad supervision over the affairs of the Trust and the Funds. The Trustees are experienced executives who meet periodically throughout the year to oversee the Funds’ activities, review contractual arrangements with companies that provide services to the Funds, and review the Funds’ performance. Unless otherwise noted, the address of each Trustee or Officer is the address of the Trust: 800 Connecticut Avenue, Norwalk, Connecticut 06854.
There is no stated term of office for Trustees. Trustees serve until their resignation, retirement or removal in accordance with the Trust’s organizational documents and policies adopted by the Board from time to time. The Chairman of the Trustees, President, Treasurer and Secretary of the Trust are elected by the Trustees annually. Other officers hold office at the pleasure of the Trustees.
Independent Trustees
The following Trustees are not “interested persons” of the Trust within the meaning of the 1940 Act:
| | |
Name, Date of Birth, Number of Funds Overseen in Fund Complex* | | Principal Occupation(s) During Past 5 Years and Other Directorships Held by Trustee |
Jack W. Aber, 9/9/37 • Trustee since 1999 • Oversees 34 Funds in Fund Complex | | Professor of Finance, Boston University School of Management (1972-Present); Trustee of Appleton Growth Fund (1 portfolio); Trustee of Third Avenue Trust (5 portfolios); Trustee of Third Avenue Variable Trust (1 portfolio). |
| |
William E. Chapman, II, 9/23/41 • Independent Chairman • Trustee since 1999 • Oversees 34 Funds in Fund Complex | | President and Owner, Longboat Retirement Planning Solutions (1998-Present); Hewitt Associates, LLC (part time) (provider of Retirement and Investment Education Seminars) (resigned Nov. 2009); Trustee of Bowdoin College (2002-Present); Director of Harding, Loevner Funds, Inc. (6 portfolios); Trustee of Third Avenue Trust (5 portfolios); Trustee of Third Avenue Variable Trust (1 portfolio). |
| |
Edward J. Kaier, 9/23/45 • Trustee since 1999 • Oversees 34 Funds in Fund Complex | | Attorney at Law and Partner, Teeters Harvey Gilboy & Kaier LLP (2007-Present); Attorney at Law and Partner, Hepburn Willcox Hamilton & Putnam, LLP (1977-2007); Trustee of Third Avenue Trust (5 portfolios); Trustee of Third Avenue Variable Trust (1 portfolio). |
| |
Steven J. Paggioli, 4/3/50 • Trustee since 1993 • Oversees 34 Funds in Fund Complex | | Consultant (2001-Present); Formerly Executive Vice President and Director, The Wadsworth Group (1986- 2001); Executive Vice President, Secretary and Director, Investment Company Administration, LLC (1990-2001); Vice President, Secretary and Director, First Fund Distributors, Inc. (1991-2001); Trustee, Professionally Managed Portfolios (22 portfolios); Advisory Board Member, Sustainable Growth Advisors, LP; Independent Director, Chase Investment Counsel (2008 – Present). |
| |
Eric Rakowski, 6/5/58 • Trustee since 1999 • Oversees 34 Funds in Fund Complex | | Professor, University of California at Berkeley School of Law (1990-Present); Director of Harding, Loevner Funds, Inc. (6 portfolios); Trustee of Third Avenue Trust (5 portfolios); Trustee of Third Avenue Variable Trust (1 portfolio). |
| |
Thomas R. Schneeweis, 5/10/47 • Trustee since 1987 • Oversees 34 Funds in Fund Complex | | Professor of Finance, University of Massachusetts (1977-Present); Director, CISDM at the University of Massachusetts, (1996-Present); President, Alternative Investment Analytics, LLC, (formerly Schneeweis Partners, LLC) (2001-Present); Partner, White Bear Partners, LLC (2007-Present); Partner, Schneeweis Capital Management, LLC (2007-Present); Partner, Schneeweis Associates, LLC (2007-Present); Partner, Northampton Capital Management, LLC (2004-Present); Partner, TRS Associates (2007-Present). |
* The Fund Complex consists of Managers AMG Funds, The Managers Funds, Managers Trust I and Managers Trust II. |
Interested Trustees
The following Trustees are “interested persons” of the Trust within the meaning of the 1940 Act. Mr. Dalton is an interested person by virtue of his positions with, and interest in securities of, Affiliated Managers Group, Inc. and his position with Managers Distributors, Inc. Mr. Streur is an interested person by virtue of his positions with Managers Investment Group LLC.
| | |
Name, Date of Birth, Number of Funds
Overseen in Fund Complex* | | Principal Occupation(s) During Past 5 Years and Other Directorships Held by Trustee |
Nathaniel Dalton, 9/29/66 • Trustee since 2008 • Oversees 34 Funds in Fund Complex | | Executive Vice President and Chief Operating Officer, Affiliated Managers Group, Inc., (2006-Present); Executive Vice President, Affiliated Managers Group, Inc., (2002 -2006); Executive Vice President and General Counsel, Affiliated Managers Group, Inc. (2001-2002); Senior Vice President and General Counsel, Affiliated Managers Group, Inc. (1996-2001). Director, Managers Distributors, Inc. (2000-Present). |
| |
John H. Streur, 2/6/60 • Trustee since 2008 • President since 2008 • Oversees 34 Funds in Fund Complex | | Senior Managing Partner, Managers Investment Group LLC (2006-Present); President, Managers Distributors, Inc. (2006-Present); Managing Partner, Managers Investment Group LLC (2005-2006); Chief Executive Officer, President and Chief Operating Officer, The Burridge Group LLC (1996-2004). |
| |
| Officers | | |
| |
Name, Date of Birth, Position(s) Held with Fund and Length of Time Served | | Principal Occupation(s) During Past 5 Years |
Christine C. Carsman, 4/2/52 • Secretary since 2004 | | Senior Vice President and Chief Regulatory Counsel, Affiliated Managers Group, Inc. (2004-Present); Secretary, Managers AMG Funds, Managers Trust I and II (2004-Present); Senior Counsel, Vice President and Director of Operational Risk Management and Compliance, Wellington Management Company, LLP (1995-2004); Deputy General Counsel, The Boston Company, Inc. (1993-1995); Associate General Counsel, The Boston Company Advisors, Inc. (1991-1993); Associate, Sullivan & Worcester LLP (1987-1991). |
| |
Donald S. Rumery, 5/29/58 • Chief Financial Officer since 2007 • Treasurer since 1995 | | Senior Vice President, Managers Investment Group LLC (2005-Present); Director, Finance and Planning, The Managers Funds LLC, (1994-2004); Treasurer and Chief Financial Officer, Managers Distributors, Inc. (2000-Present); Treasurer, Managers AMG Funds (1999-Present); Treasurer, Managers Trust I and Managers Trust II (2000-Present); Secretary, Managers Trust I and Managers Trust II (2000-2004) and Secretary, The Managers Funds (1997-2004); Chief Financial Officer, Managers AMG Funds, Managers Trust I and Managers Trust II (2007-Present). |
| |
Keitha L. Kinne, 5/16/58 • Chief Operating Officer since 2007 | | Managing Partner and Chief Operating Officer, Managers Investment Group LLC (2007-Present); Chief Investment Officer, Managers Investment Group LLC (2008-Present); Chief Operating Officer, Managers AMG Funds, Managers Trust I and Managers Trust II (2007-Present); Managing Director, Legg Mason & Co., LLC (2006-2007); Managing Director, Citigroup Asset Management (2004-2006); Senior Vice President, Prudential Investments (1999-2004). |
| |
David Kurzweil, 6/22/74 • Assistant Secretary since 2008 | | Senior Vice President and Associate Counsel, Managers Investment Group LLC (2008-Present); Assistant Secretary, The Managers Funds, Managers Trust I, Managers Trust II, and Managers AMG Funds (2008-Present); Counsel and Senior Vice President, Lazard Asset Management LLC (2003-2008). |
23
Investment Manager and Administrator
Managers Investment Group LLC
333 W. Wacker Drive
Suite 1200
Chicago, IL 60606
(800) 835-3879
Distributor
Managers Distributors, Inc.
333 W. Wacker Drive
Suite 1200
Chicago, IL 60606
(800) 835-3879
Custodian
The Bank of New York Mellon
2 Hanson Place
Brooklyn, New York 11217
Legal Counsel
Ropes & Gray LLP
One International Place
Boston, Massachusetts 02110-2624
Transfer Agent
PNC Global Investment Servicing (U.S.) Inc.
Attn: Managers
P.O. Box 9769 Providence,
Rhode Island 02940
(800) 548-4539
For Managers Choice Only
Managers
c/o PNC Global Investment Servicing (U.S.) Inc.
P.O. Box 61204
King of Prussia, Pennsylvania 19406-0851
(800) 358-7668

MANAGERSAND MANAGERS AMG FUNDS
| | | | |
EQUITY FUNDS | | BALANCED FUNDS |
EMERGING MARKETS EQUITY Rexiter Capital Management Limited Schroder Investment Management North America Inc. | | CHICAGO EQUITY PARTNERS MID-CAP Chicago Equity Partners, LLC | | CHICAGO EQUITY PARTNERS BALANCED Chicago Equity Partners, LLC |
| | | | ALTERNATIVE FUNDS |
| | |
ESSEX GROWTH ESSEX LARGE CAP GROWTH ESSEX SMALL/MICRO CAP GROWTH Essex Investment Management Co., LLC | | REAL ESTATE SECURITIES Urdang Securities Management, Inc. RENAISSANCE LARGE CAP GROWTH Renaissance Group LLC | | FQ GLOBAL ALTERNATIVES FQ GLOBAL ESSENTIALS First Quadrant, L.P. |
| | | | | INCOMEFUNDS |
FQ TAX-MANAGED U.S. EQUITY FQ U.S. EQUITY First Quadrant, L.P. GW&K SMALL CAP EQUITY Gannett Welsh & Kotler, LLC INSTITUTIONAL MICRO-CAP MICRO-CAP Lord, Abbett & Co. LLC WEDGE Capital Management L.L.P. Next Century Growth Investors LLC RBC Global Asset Management (U.S.) Inc. INTERNATIONAL EQUITY AllianceBernstein L.P. Lazard Asset Management, LLC Martin Currie Inc. | | SKYLINE SPECIAL EQUITIES PORTFOLIO Skyline Asset Management, L.P. FRONTIER SMALL CAP GROWTH Frontier Capital Management Company, LLC SPECIAL EQUITY Ranger Investment Management, L.P. Lord, Abbett & Co. LLC Smith Asset Management Group, L.P. Federated MDTA LLC SYSTEMATIC VALUE SYSTEMATIC MID CAP VALUE Systematic Financial Management, L.P. TIMESSQUARE MID CAP GROWTH TIMESSQUARE SMALL CAP GROWTH TimesSquare Capital Management, LLC | | BOND (MANAGERS) FIXED INCOME GLOBAL BOND Loomis, Sayles & Co., L.P. BOND (MANAGERS PIMCO) Pacific Investment Management Co. LLC CALIFORNIA INTERMEDIATE TAX-FREE Miller Tabak Asset Management LLC GW&K MUNICIPAL BOND GW&K MUNICIPAL ENHANCED YIELD Gannett Welsh & Kotler, LLC HIGH YIELD J.P. Morgan Investment Management LLC INTERMEDIATE DURATION GOVERNMENT SHORT DURATION GOVERNMENT Smith Breeden Associates, Inc. |
This report is prepared for the Fund’s shareholders. It is authorized for distribution to prospective investors only when preceded or accompanied by an effective prospectus. To receive a free copy of the prospectus or Statement of Additional Information, which includes additional information about Fund Trustees, please contact us by calling 800.835.3879. Distributed by Managers Distributors, Inc., member FINRA. A description of the policies and procedures each Fund uses to vote its proxies is available: (i) without charge, upon request, by calling 800.835.3879, or (ii) on the Securities and Exchange Commission’s (SEC) Web site at www.sec.gov. For information regarding each Fund’s proxy voting record for the 12-month period ended December 31, call 800.835.3879 or visit the SEC Web site at www.sec.gov. The Fund files its complete schedule of portfolio holdings with the SEC for the first and third quarters of each fiscal year on Form N-Q. The Fund’s Forms N-Q are available on the SEC’s website at www.sec.gov. A Fund’s Forms N-Q may be reviewed and copied at the SEC’s Public Reference Room in Washington, DC. Information on the operation of the Public Reference Room may be obtained by calling 1-800-SEC-0330. To review a complete list of the Fund’s portfolio holdings, or to view the most recent quarterly holdings report, semiannual report, or annual report, please visit www.managersinvest.com. | | MONEY MARKET JPMorgan Investment Advisors Inc. |
| www.managersinvest.com | |  |

ANNUAL REPORT
Managers Funds
December 31, 2009
Managers Bond Fund

AR019-1209
Managers Bond Fund
Annual Report – December 31, 2009
TABLE OF CONTENTS
| | |
| | | Page |
| |
| LETTER TO SHAREHOLDERS | | 1 |
| |
| ABOUT YOUR FUND’S EXPENSES | | 3 |
| |
| INVESTMENT MANAGER’S COMMENTS, FUND SNAPSHOT, AND SCHEDULE OF PORTFOLIO INVESTMENTS | | 4 |
| |
| |
| FINANCIAL STATEMENTS: | | |
| |
Statement of Assets and Liabilities | | 19 |
Fund’s balance sheet, net asset value (NAV) per share computation and cumulative undistributed amount | | |
| |
Statement of Operations | | 20 |
Detail of sources of income, Fund expenses, and realized and unrealized gains (losses) during the year | | |
| |
Statement of Changes in Net Assets | | 21 |
Detail of changes in Fund assets for the past two years | | |
| |
| FINANCIAL HIGHLIGHTS | | 22 |
Historical net asset values per share, distributions, total returns, expense ratios, turnover ratios and net assets | | |
| |
| NOTES TO FINANCIAL STATEMENTS | | 23 |
Accounting and distribution policies, details of agreements and transactions with Fund management and affiliates, and descriptions of certain investment risks | | |
| |
| REPORT OF INDEPENDENT REGISTERED PUBLIC ACCOUNTING FIRM | | 29 |
| |
| TRUSTEES AND OFFICERS | | 30 |
Nothing contained herein is to be considered an offer, sale or solicitation of an offer to buy shares of any series of the Managers Family of Funds. Such offering is made only by Prospectus, which includes details as to offering price and other material information.
Letter to Shareholders
Dear Shareholder:
Our foremost goal at Managers Investment Group (“MIG”) is to structure and manage mutual funds that will help our shareholders and clients successfully reach their investment goals and objectives.
Each of our Funds is geared to provide you with exposure to a specific asset class or style of investing. Investors tend to use our Funds as part of their broader portfolio in order to tailor their asset allocation to meet their individual needs. Most of our Funds, like the one detailed in this report, are therefore designed to be building blocks.
At MIG, we have overall responsibility for the investment management and administration of the Funds. As a “manager of managers,” we work with external investment managers that make the day-to-day investment decisions in the Funds (the “Portfolio Managers”). We devote considerable resources to our disciplined process of identifying and selecting unaffiliated Portfolio Managers for the Funds. As a manager of managers, MIG performs many activities to monitor the ongoing investment, compliance, and administrative aspects of all of the Funds, which gives our shareholders added confidence in their investments.
Our parent company, Affiliated Managers Group (“AMG”), is a global asset management company with ownership interests in a diverse group of boutique investment management firms (its “Affiliates”). MIG has the unique opportunity to access the investment skills and acumen of some of AMG’s Affiliates. The set of our Funds managed by these proprietary firms also benefits from our activities to monitor the investment, compliance, and administrative aspects of the Funds.
Below is a brief overview of the securities markets and the performance results for the Fund. Following this letter, we also provide the Portfolio Manager’s discussion of its investment management approach, performance results, and market outlook.
The year 2009 will go down in the history books as one in which securities markets sank to unimaginable levels and some investors briefly questioned the viability of capitalism. As it turned out, capitalism did not cease to exist and equities, as well as credit-sensitive fixed income securities, managed to regroup and record one of the most impressive rebounds in the history of the capital markets. The government’s unprecedented efforts with respect to healing the economy and stabilizing the securities markets via programs such as the Troubled Asset Relief Program (“TARP”), the Public-Private Investment Program (“PPIP”) and the Term Asset-Backed Securities Loan Facility (“TALF”) seem to have achieved their desired short-term effects, although some would argue that the programs played a minor role in the stabilization of the markets and that free market forces simply corrected oversold conditions, just as they have on numerous occasions in the past.
Against this backdrop, the performance of the Managers Bond Fund (the “Fund”), was exceptionally strong on an absolute and relative basis, as detailed below.
| | | | | | | | | | | | | | | | | |
Periods Ended 12/31/09 | | 6 Months | | | 1 Year | | | 3 Years | | | 5 Years | | | 10 Years | | | Inception Date |
Managers Bond Fund | | 13.30 | % | | 31.17 | % | | 5.53 | % | | 5.33 | % | | 7.23 | % | | 6/1/1984 |
Barclays Capital U.S. Government/Credit Bond Index | | 3.94 | % | | 4.52 | % | | 5.81 | % | | 4.71 | % | | 6.34 | % | | |
1
Letter to Shareholders (continued)
For the 12-month period ending December 31, 2009, Managers Bond Fund returned 31.17%, easily outpacing the 4.52% return for the Barclays Capital U.S. Government/Credit Bond Index (the “Index”). Much of the Fund’s solid performance, both absolute and relative to the Index, was driven by a greater than benchmark exposure to investment-grade corporate bonds and the related underweight to U.S. Treasuries. After widening to historic levels during the 2008 crisis, yield spreads on corporate bonds narrowed throughout 2009, driving prices on these bonds higher. This trend was the primary driver of the Fund’s performance during the period. For more detailed information on market conditions and drivers of performance, please see the management discussion and analysis section of this report.
The following report covers the one-year period ended December 31, 2009. Should you have any questions about this report, or if you’d like to receive a prospectus and additional information, including fees and expenses for this or any of the other Funds in our family, please feel free to contact us at 1-800-835-3879, or visit our Web site at www.managersinvest.com. As always, please read the prospectus carefully before you invest or send money.
If you are curious about how you can better diversify your investment program, visit the Knowledge Center on our Web site and view our articles in the investment strategies section. You can rest assured that under all market conditions our team is focused on delivering excellent investment management services for your benefit.
We thank you for your continued confidence and investment in The Managers Funds.
Respectfully,

John H. Streur
Senior Managing Partner
Managers Investment Group LLC
2
About Your Fund’s Expenses
As a shareholder of a Fund, you may incur two types of costs: (1) transaction costs, which may include sales charges (loads) on purchase payments; redemption fees; and exchange fees; and (2) ongoing costs, including management fees; distribution (12b-1) fees; and other Fund expenses. This example is intended to help you understand your ongoing costs (in dollars) of investing in the Fund and to compare these costs with the ongoing costs of investing in other mutual funds. The example is based on $1,000 invested at the beginning of the period and held for the entire period as indicated below.
Actual Expenses
The first line of the following table provides information about the actual account values and actual expenses. You may use the information in this line, together with the amount you invested, to estimate the expenses that you paid over the period. Simply divide your account value by $1,000 (for example, an $8,600 account value divided by $1,000 = 8.6), then multiply the result by the number in the first line under the heading entitled “Expenses Paid During Period” to estimate the expenses you paid on your account during this period.
Hypothetical Example for Comparison Purposes
The second line of the following table provides information about hypothetical account values and hypothetical expenses based on the Fund’s actual expense ratio and an assumed annual rate of return of 5% before expenses, which is not the Fund’s actual return. The hypothetical account values and expenses may not be used to estimate the actual ending account balance or expenses you paid for the period. You may use this information to compare the ongoing costs of investing in the Fund and other funds by comparing this 5% hypothetical example with the 5% hypothetical examples that appear in the shareholder reports of other funds.
Please note that the expenses shown in the table are meant to highlight your ongoing costs only and do not reflect any transactional costs, such as sales charges (loads), redemption fees, or exchange fees. Therefore, the second line of the table is useful in comparing ongoing costs only, and will not help you determine the relative total costs of owning different funds.
| | | | | | | | | | | | |
Six Months Ended December 31, 2009 | | Expense
Ratio for
the Period | | | Beginning
Account Value
07/01/2009 | | Ending
Account Value
12/31/2009 | | Expenses Paid
During the
Period* |
| | | | |
Managers Bond Fund | | | | | | | | | | | | |
| | | | |
Based on Actual Fund Return | | 0.99 | % | | $ | 1,000 | | $ | 1,133 | | $ | 5.32 |
| | | | |
Based on Hypothetical 5% Annual Return | | 0.99 | % | | $ | 1,000 | | $ | 1,020 | | $ | 5.04 |
| * | Expenses are equal to the Fund’s annualized expense ratio multiplied by the average account value over the period, multiplied by the number of days in the most recent fiscal half-year (184), then divided by 365. |
3
Managers Bond Fund
Investment Manager’s Comments
The Year in Review
The Managers Bond Fund returned 31.17% for the year ended December 31, 2009, widely outpacing the Barclays Capital U.S. Government/Credit Bond Index, which returned 4.52%.
Just a year ago, much of the globe faced a deep recession and a significant financial crisis. Yield spreads on corporate bonds had widened to historic levels, reflecting investors’ fear of the potential for a sizeable uptick in defaults. Liquidity in the fixed income markets was nearly non-existent. Following months of global policy intervention on a scale never before seen, the economy has begun to claw back, banks are stronger, and financial markets are operating more efficiently. Yield spreads on corporate bonds have narrowed dramatically, reflecting the prospects of slow growth rather than the disaster scenario from last year. Spreads on investment-grade corporate bonds peaked at the end of last year at roughly 600 basis points over U.S. Treasuries. That spread shrunk to roughly 170 basis points by the end of 2009.
The Fund’s performance relative to the Index during 2009 was primarily driven by an overweight in corporate bonds and a related underweight in U.S. Treasuries. While this exact exposure detracted from performance in 2008, the Fund benefited from the narrowing of spreads in 2009. A sizeable portion of the Fund’s corporate exposure is in BBB-rated securities, which are at the lower end of the investment-grade credit scale. These securities were among the hardest hit in 2008, and bounced back strongest in 2009. The Fund’s exposure to non-U.S. Dollar denominated securities contributed positively during the period, particularly those tied to commodity-related currencies such as the Australian Dollar, New Zealand Dollar, and the Canadian Dollar. A modest exposure to both asset-backed and convertible securities also benefited the Fund, as both segments of the market performed well.
Looking Forward
The Fund’s subadvisor, Loomis Sayles & Co., L.P. (“Loomis”), believes we are in the early stages of economic recovery and valuations broadly reflect that. They expect yields to remain low, with a bias to move higher during the year as economic conditions likely improve. If this happens, U.S. Treasuries will likely underperform. Investor appetite for risk assets may remain strong as they continue to seek incremental yield. Underlying that bid is the belief that economic growth and market liquidity will be sufficiently supportive. Loomis believes that market opportunities are fewer and farther between, relative to a year ago. It suggests that we’ve exited the crisis period when many investments were priced at or near distressed levels. After the tremendous rally in risk assets in 2009, it would be hard to call any major market sector “cheap.” Within each sector, however, lie pockets of value waiting to be found. The constituents within each sector are by no means identical, with a diverse set of characteristics and range of valuations. Global markets provide a broad example, with a spectrum of offerings (bond and currency) from high-grade developed sovereigns to lower-rated emerging markets. The economies of Europe and Japan have their challenges, and Loomis thinks the U.S. Dollar will hold up against those currencies. However, the Dollar may weaken against non-Japan Asian currencies if that region continues to experience stronger growth.
Within securitized assets, Loomis is cautious on agency mortgage-backed securities but views carefully selected non-agency offerings as potentially attractive where the credit fundamentals are satisfactorily supported by their economic outlook, liquidity is good, and supply scarce. Within the corporate bond market, particularly in the BBB to B-rated buckets, lies a diverse set of industries and issuers priced at a wide range of spreads. Loomis currently advocates a specific risk strategy in the Fund, as opposed to a strategy that emphasizes market risk. This approach requires extra diligence in identifying attractive bonds, but also provides the opportunity to capture additional yield, which may ultimately help offset future price declines. While Loomis expects U.S. Treasuries to underperform in 2010 as they did in 2009, they believe the performance for most other sectors is likely to look very different this year. Returns may be positive but lower, and probably more varied, as the major sectors are no longer wildly mispriced. Still, if the economy continues to chug along, Loomis believes investors may be able to earn positive returns. Loomis plans to stay nimble, because if the economy tilts weaker, it might be necessary to take some risk off the table.
Cumulative Total Return Performance
Managers Bond Fund’s cumulative total return is based on the daily change in net asset value (NAV), and assumes that all distributions were reinvested. The Barclays Capital U.S. Government/Credit Bond Index is an index of investment-grade government and corporate
4
Managers Bond Fund
Investment Manager’s Comments (continued)
bonds with a maturity rate of more than one year. Unlike the Fund, the Barclays Capital U.S. Government/Credit Bond Index is unmanaged, is not available for investment, and does not incur expenses. The Index assumes reinvestment of all income. This chart compares a hypothetical $10,000 investment made in the Managers Bond Fund on December 31, 1999, to a $10,000 investment made in the Barclays Capital U.S. Government/Credit Bond Index for the same time period. The chart is not intended to imply any future performance of the Fund. The graph and chart do not reflect the deduction of taxes that a shareholder would pay on a Fund distribution or redemption of shares. Total returns would have been lower had certain expenses not been reduced. Past performance is not indicative of future results.
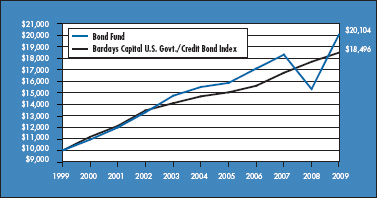
The table below shows the average annual total returns from December 31, 1999 through December 31, 2009 of the Managers Bond Fund and the Barclays Capital U.S. Government / Credit Bond Index for the same time periods.
| | | | | | | | | |
Average Annual Total Returns 1 | | One Year | | | Five Years | | | Ten Years | |
Bond Fund 2,3,4,5 | | 31.17 | % | | 5.33 | % | | 7.23 | % |
Barclays Capital U.S. Govt./Credit Bond Index | | 4.52 | % | | 4.71 | % | | 6.34 | % |
The performance data shown represents past performance. Past performance is not a guarantee of future results. Current performance may be lower or higher than the performance data quoted. The investment return and principal value of an investment in the Fund will fluctuate so that an investor’s shares, when redeemed, may be worth more or less than their original cost. For performance information through the most recent month end, please call (800) 835-3879 or visit our Web site at www.managersinvest.com.
In choosing a Fund, investors should carefully consider the amount they plan to invest, their investment objectives, the Fund’s investment objectives, risks, charges and expenses before investing. For this and other information, please call (800) 835-3879 or visit www.managersinvest.com for a free prospectus. Read it carefully before investing or sending money. Distributed by Managers Distributors, Inc., member FINRA.
| 1 | Total return equals income yield plus share price change and assumes reinvestment of all dividends and capital gain distributions. Returns are net of fees and may reflect offsets of Fund expenses as described in the Prospectus. No adjustment has been made for taxes payable by shareholders on their reinvested dividends and capital gain distributions. Returns for periods greater than one year are annualized. The listed returns on the Fund are net of expenses and based on the published NAV as of December 31, 2009. All returns are in U.S. dollars($). |
| 2 | From time to time, the Fund’s advisor has waived its fees and/or absorbed Fund expenses, which has resulted in higher returns. |
| 3 | The Fund is subject to the risks associated with investments in debt securities, such as default risk, and fluctuations in a debtor’s perceived ability to pay its creditors. Changing interest rates may adversely affect the value of an investment. An increase in interest rates typically causes the value of bonds and other fixed-income securities to fall. |
| 4 | Investments in international securities are subject to certain risks of overseas investing including currency fluctuations and changes in political and economic conditions, which could result in significant market fluctuations. These risks are magnified in emerging markets. |
| 5 | High yield bonds (also known as “junk bonds”) are subject to additional risks such as the risk of default. |
Not FDIC insured, nor bank guaranteed. May lose value.
5
Managers Bond Fund
Fund Snapshot
December 31, 2009
Portfolio Breakdown
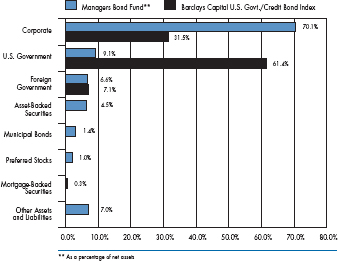
| | | | | | |
Industry | | Managers
Bond Fund** | | | Barclays Capital
U.S. Govt./
Credit Bond
Index | |
Corporate | | 70.1 | % | | 31.5 | % |
U.S. Government | | 9.1 | % | | 61.4 | % |
Foreign Government | | 6.6 | % | | 7.1 | % |
Asset-Backed Securities | | 4.5 | % | | 0.0 | % |
Municipal Bonds | | 1.4 | % | | 0.0 | % |
Preferred Stocks | | 1.0 | % | | 0.0 | % |
Mortgage-Backed Securities | | 0.3 | % | | 0.0 | % |
Other Assets and Liabilities | | 7.0 | % | | 0.0 | % |
Top Ten Holdings
| | | |
Security Name | | Percentage
of Net Assets | |
International Paper Co., 7.950%, 06/15/18* | | 2.5 | % |
Kinder Morgan Energy Partners L.P., 5.950%, 02/15/18* | | 2.2 | |
USTN, 1.000%, 08/31/11 | | 2.0 | |
Southwestern Electric Power Co., 4.650%, 01/15/19* | | 1.9 | |
American General Finance Corp., Series MTN, Series J, 6.900%, 12/15/17 | | 1.8 | |
Canadian Government Bond, 2.000%, 09/01/12 | | 1.8 | |
Equitable Resources, Inc., 6.500%, 04/01/18* | | 1.7 | |
Merrill Lynch & Co., Inc., 6.110%, 11/29/37* | | 1.6 | |
FNMA, 1.375%, 04/28/11 | | 1.5 | |
Dun & Bradstreet Corp., The, 6.000%, 04/01/13* | | 1.5 | |
| | | |
Top Ten as a Group | | 18.5 | % |
| | | |
| * | Top Ten Holding at June 30, 2009 |
Any sectors, industries, or securities discussed should not be perceived as investment recommendations. Mention of a specific security should not be considered a recommendation to buy or solicitation to sell that security. Specific securities mentioned in this report may have been sold from the Fund’s portfolio of investments by the time you receive this report.
6
Managers Bond Fund
Schedule of Portfolio Investments
December 31, 2009
| | | | | | | |
Security Description | | Principal Amount | | | Value |
Corporate Bonds - 70.1% | | | | | | | |
Financials - 17.4% | | | | | | | |
American General Finance Corp., | | | | | | | |
5.400%, 12/01/15 | | $ | 5,000,000 | | | $ | 3,437,560 |
MTN, Series J, 6.900%, 12/15/17 | | | 57,315,000 | | | | 39,796,901 |
Bank of America Capital Trust VI, 5.625%, 03/08/35 | | | 3,085,000 | | | | 2,469,379 |
Barclays Capital Corp., | | | | | | | |
4.160%, 02/22/10 (a) | | THB | 25,000,000 | | | | 754,078 |
Series EMTN, 4.100%, 03/22/10 (a) | | THB | 26,000,000 | | | | 786,903 |
BNP Paribas SA DN, 8.475%, 06/13/11 (a)4 | | IDR | 19,645,500,000 | | | | 1,853,933 |
Camden Property Trust, 5.700%, 05/15/17 | | | 5,205,000 | | | | 4,909,413 |
Cantor Fitzgerald L.P., 7.875%, 10/15/19 (a)5 | | | 10,805,000 | | | | 10,574,367 |
CIT Group, Inc., | | | | | | | |
7.000%, 05/01/13 | | | 106,487 | 2 | | | 99,299 |
7.000%, 05/01/14 | | | 509,731 | | | | 473,413 |
7.000%, 05/01/15 | | | 509,731 | | | | 456,209 |
7.000%, 05/01/16 | | | 516,223 | | | | 454,276 |
7.000%, 05/01/17 | | | 822,711 | | | | 713,702 |
Citibank, NA, 15.000%, 07/02/10 (a) | | BRL | 2,000,000 | | | | 1,182,079 |
Citigroup, Inc., 5.500%, 10/15/14 | | | 21,385,000 | | | | 21,652,975 |
Colonial Realty, L.P., 4.800%, 04/01/11 | | | 1,005,000 | | | | 978,915 |
Duke Realty, L.P., | | | | | | | |
5.950%, 02/15/17 | | | 2,210,000 | | | | 2,056,845 |
6.500%, 01/15/18 | | | 5,000,000 | | | | 4,735,400 |
Equity One, Inc., 6.000%, 09/15/17 | | | 5,915,000 | | | | 5,312,321 |
ERP Operating, L.P., | | | | | | | |
5.125%, 03/15/16 | | | 600,000 | | | | 584,893 |
5.750%, 06/15/17 | | | 1,450,000 | | | | 1,450,164 |
First Industrial L.P., 5.950%, 05/15/17 | | | 15,000,000 | | | | 10,675,470 |
GE Capital Australia Funding Pty., Ltd., Series EMTN, 8.000%, 02/13/12 | | AUD | 3,965,000 | | | | 3,686,548 |
General Electric Capital Corp., | | | | | | | |
2.960%, 05/18/12 | | SGD | 4,400,000 | | | | 3,103,136 |
3.485%, 03/08/12 | | SGD | 16,500,000 | | | | 11,779,650 |
6.500%, 09/28/15 | | NZD | 14,950,000 | | | | 10,578,657 |
6.625%, 02/04/10 | | NZD | 3,500,000 | | | | 2,545,929 |
6.750%, 09/26/16 | | NZD | 6,390,000 | | | | 4,504,302 |
The accompanying notes are an integral part of these financial statements.
7
Managers Bond Fund
Schedule of Portfolio Investments (continued)
| | | | | | | |
Security Description | | Principal Amount | | | Value |
Financials - 17.4% (continued) | | | | | | | |
GMAC LLC, | | | | | | | |
6.000%, 12/15/11 (a) | | $ | 1,127,000 | | | $ | 1,104,460 |
6.625%, 05/15/12 (a) | | | 1,374,000 | | | | 1,346,520 |
6.750%, 12/01/14 (a) | | | 1,019,000 | | | | 968,050 |
6.875%, 09/15/11 (a) | | | 158,000 | | | | 155,630 |
6.875%, 08/28/12 (a) | | | 253,000 | | | | 247,940 |
7.000%, 02/01/12 (a) | | | 763,000 | 2 | | | 751,555 |
7.250%, 03/02/11 (a) | | | 816,000 | | | | 807,840 |
7.500%, 12/31/13 (a) | | | 584,000 | | | | 563,560 |
8.000%, 12/31/18 (a) | | | 1,366,000 | | | | 1,202,080 |
8.000%, 11/01/31 (a) | | | 1,427,000 | | | | 1,284,300 |
Highwoods Realty, L.P., | | | | | | | |
5.850%, 03/15/17 | | | 3,680,000 | | | | 3,357,058 |
7.500%, 04/15/18 | | | 2,405,000 | | | | 2,341,051 |
ICICI Bank, Ltd., 6.375%, 04/30/22 (a)7 | | | 900,000 | | | | 807,942 |
International Lease Finance Corp., | | | | | | | |
5.000%, 04/15/10 | | | 320,000 | | | | 315,196 |
5.125%, 11/01/10 | | | 720,000 | | | | 691,250 |
5.550%, 09/05/12 | | | 345,000 | | | | 287,279 |
6.375%, 03/25/13 | | | 1,730,000 | | | | 1,422,371 |
iStar Financial, Inc., | | | | | | | |
0.751%, 10/01/12 (04/01/10)6,9 | | | 8,095,000 | | | | 4,462,774 |
5.125%, 04/01/11 | | | 280,000 | 2 | | | 204,400 |
5.150%, 03/01/12 | | | 4,360,000 | 2 | | | 2,659,600 |
5.375%, 04/15/10 | | | 830,000 | | | | 791,612 |
5.500%, 06/15/12 | | | 260,000 | | | | 156,000 |
5.650%, 09/15/11 | | | 3,095,000 | 2 | | | 2,274,825 |
5.700%, 03/01/14 | | | 15,000 | | | | 8,400 |
5.800%, 03/15/11 | | | 640,000 | 2 | | | 480,000 |
5.850%, 03/15/17 | | | 325,000 | | | | 182,000 |
5.875%, 03/15/16 | | | 1,340,000 | | | | 753,750 |
5.950%, 10/15/13 | | | 4,725,000 | | | | 2,752,312 |
6.050%, 04/15/15 | | | 620,000 | | | | 348,750 |
8.625%, 06/01/13 | | | 425,000 | | | | 272,000 |
JPMorgan Chase & Co., | | | | | | | |
7.567%, 03/28/11 (a)4 | | IDR | 932,700,000 | | | | 90,530 |
8.777%, 04/12/12 (a)4 | | IDR | 40,733,437,680 | | | | 3,564,338 |
11.923%, 05/17/10 (a)4 | | BRL | 3,600,000 | | | | 1,978,656 |
JPMorgan International, 7.059%, 10/21/10 (a)4 | | IDR | 16,627,462,500 | | | | 1,673,011 |
KfW Bankengruppe, 10.750%, 02/01/10 | | ISK | 20,000,000 | | | | 159,958 |
The accompanying notes are an integral part of these financial statements.
8
Managers Bond Fund
Schedule of Portfolio Investments (continued)
| | | | | | | |
Security Description | | Principal Amount | | | Value |
Financials - 17.4% (continued) | | | | | | | |
Marsh & McLennan Companies, Inc., | | | | | | | |
5.375%, 07/15/14 | | $ | 4,390,000 | | | $ | 4,489,723 |
5.750%, 09/15/15 | | | 11,939,000 | | | | 12,455,589 |
5.875%, 08/01/33 | | | 10,360,000 | | | | 9,197,276 |
MBIA Insurance Corp., 14.000%, 01/15/33 (a)7 | | | 525,000 | 2 | | | 225,750 |
Merrill Lynch & Co., Inc., | | | | | | | |
4.625%, 09/14/18 | | EUR | 1,750,000 | | | | 2,234,035 |
6.110%, 01/29/37 | | | 38,050,000 | | | | 35,079,133 |
10.710%, 03/08/17 | | BRL | 2,500,000 | | | | 1,364,159 |
Series MTN, 6.050%, 06/01/34 | | | 22,100,000 | | | | 19,838,065 |
Morgan Stanley, | | | | | | | |
4.750%, 04/01/14 | | | 10,715,000 | | | | 10,776,579 |
5.550%, 04/27/17 | | | 11,000,000 | | | | 11,048,697 |
6.625%, 04/01/18 | | | 3,095,000 | | | | 3,346,215 |
Mutual of Omaha Insurance Co., 6.800%, 06/15/36 (a) | | | 13,925,000 | | | | 11,713,390 |
National City Bank of Indiana, 4.250%, 07/01/18 | | | 6,310,000 | | | | 5,760,683 |
National City Corp., 6.875%, 05/15/19 | | | 1,905,000 | | | | 2,016,444 |
National Life Insurance Co., 10.500%, 09/15/39 (a) | | | 5,000,000 | | | | 5,204,815 |
PF Export Receivable Master Trust, 6.436%, 06/01/15 (a) | | | 443,818 | | | | 450,475 |
ProLogis Trust, | | | | | | | |
5.625%, 11/15/15 | | | 345,000 | | | | 328,057 |
5.750%, 04/01/16 | | | 280,000 | | | | 262,987 |
Realty Income Corp., 6.750%, 08/15/19 | | | 7,675,000 | | | | 7,515,475 |
Simon Property Group, L.P., 5.750%, 12/01/15 | | | 445,000 | | | | 453,790 |
SLM Corp., | | | | | | | |
5.000%, 10/01/13 | | | 2,060,000 | | | | 1,895,076 |
5.000%, 04/15/15 | | | 50,000 | | | | 43,557 |
5.125%, 08/27/12 | | | 540,000 | | | | 506,236 |
5.375%, 01/15/13 | | | 2,460,000 | | | | 2,320,592 |
5.375%, 05/15/14 | | | 300,000 | | | | 276,711 |
5.400%, 10/25/11 | | | 520,000 | | | | 519,541 |
6.500%, 06/15/105 | | NZD | 500,000 | | | | 353,322 |
8.450%, 06/15/18 | | | 18,665,000 | | | | 18,417,745 |
WEA Finance LLC / WT Finance Australia Ltd., 6.750%, 09/02/19 (a) | | | 8,325,000 | | | | 8,938,910 |
White Mountains Insurance Group, Ltd., 6.375%, 03/20/17 (a) | | | 4,555,000 | | | | 4,274,735 |
Willis North America, Inc., | | | | | | | |
6.200%, 03/28/17 | | | 5,685,000 | | | | 5,635,677 |
7.000%, 09/29/19 | | | 2,860,000 | | | | 2,912,212 |
Total Financials | | | | | | | 381,929,366 |
The accompanying notes are an integral part of these financial statements.
9
Managers Bond Fund
Schedule of Portfolio Investments (continued)
| | | | | | | |
Security Description | | Principal Amount | | | Value |
Industrials - 43.4% | | | | | | | |
Agilent Technologies, Inc., 6.500%, 11/01/17 | | $ | 6,945,000 | | | $ | 7,349,525 |
Albertson’s, Inc., | | | | | | | |
6.625%, 06/01/28 | | | 1,015,000 | | | | 772,669 |
7.450%, 08/01/29 | | | 3,195,000 | | | | 2,739,712 |
7.750%, 06/15/26 | | | 915,000 | | | | 818,925 |
American President, Ltd., 8.000%, 01/15/245 | | | 250,000 | | | | 230,000 |
Anadarko Petroleum Corp., 6.450%, 09/15/36 | | | 13,875,000 | | | | 14,490,620 |
Anheuser-Busch Companies, Inc., 5.950%, 01/15/33 | | | 6,177,000 | | | | 6,048,105 |
AT&T Corp., | | | | | | | |
6.500%, 03/15/29 | | | 6,415,000 | | | | 6,385,690 |
6.500%, 09/01/37 | | | 1,230,000 | | | | 1,274,895 |
Avnet, Inc., | | | | | | | |
5.875%, 03/15/14 | | | 11,000,000 | | | | 11,405,262 |
6.000%, 09/01/15 | | | 5,340,000 | | | | 5,421,969 |
6.625%, 09/15/16 | | | 1,370,000 | | | | 1,413,411 |
Bell Atlantic Pennsylvania, Inc., 6.000%, 12/01/28 | | | 1,335,000 | | | | 1,190,875 |
BellSouth Corp., 6.000%, 11/15/34 | | | 2,370,000 | | | | 2,312,724 |
Canadian Pacific Railway Co., | | | | | | | |
5.750%, 03/15/33 | | | 195,000 | | | | 179,968 |
5.950%, 05/15/37 | | | 9,340,000 | | | | 8,867,583 |
Chartered Semiconductor Manufacturing, Ltd., 6.250%, 04/04/13 | | | 5,600,000 | | | | 5,589,114 |
CIGNA Corp., 6.150%, 11/15/36 | | | 6,830,000 | | | | 6,101,396 |
Comcast Corp., | | | | | | | |
5.650%, 06/15/35 | | | 10,210,000 | | | | 9,543,573 |
6.500%, 11/15/35 | | | 925,000 | | | | 959,096 |
6.950%, 08/15/37 | | | 19,230,000 | | | | 20,958,642 |
Continental Airlines, Inc., | | | | | | | |
5.983%, 04/19/22 | | | 18,135,000 | | | | 17,500,275 |
6.795%, 08/02/20 | | | 41,251 | | | | 37,125 |
Series 00A1, 8.048%, 11/01/20 | | | 100,659 | | | | 98,897 |
Series B, 6.903%, 04/19/22 | | | 5,595,000 | 2 | | | 4,867,650 |
Corn Products International, Inc., 6.625%, 04/15/37 | | | 4,055,000 | | | | 3,805,094 |
Corning, Inc., | | | | | | | |
6.850%, 03/01/29 | | | 9,142,000 | | | | 9,131,203 |
7.250%, 08/15/36 | | | 1,185,000 | | | | 1,207,426 |
CSX Corp., 6.000%, 10/01/36 | | | 7,909,000 | | | | 7,814,733 |
Cummins Engine Co., Inc., | | | | | | | |
5.650%, 03/01/98 | | | 11,235,000 | | | | 7,006,595 |
6.750%, 02/15/27 | | | 2,853,000 | | | | 2,743,801 |
7.125%, 03/01/28 | | | 50,000 | | | | 49,318 |
The accompanying notes are an integral part of these financial statements.
10
Managers Bond Fund
Schedule of Portfolio Investments (continued)
| | | | | | |
Security Description | | Principal Amount | | Value |
Industrials - 43.4% (continued) | | | | | | |
Cytec Industries, Inc., 6.000%, 10/01/15 | | $ | 875,000 | | $ | 922,442 |
Darden Restaurants, Inc., 6.000%, 08/15/35 | | | 2,635,000 | | | 2,392,517 |
Delta Air Lines, Inc., 8.021%, 08/10/22 | | | 14,017,885 | | | 12,300,694 |
Dillards, Inc., 7.000%, 12/01/28 | | | 225,000 | | | 165,375 |
DP World, Ltd., 6.850%, 07/02/37 (a) | | | 28,350,000 | | | 21,807,444 |
Duke Energy Field Services LLC, 6.450%, 11/03/36 (a) | | | 2,615,000 | | | 2,474,512 |
Dun & Bradstreet Corp., The, 6.000%, 04/01/13 | | | 32,120,000 | | | 33,065,934 |
El Paso Corp., 6.950%, 06/01/28 | | | 1,030,000 | | | 883,418 |
Energy Transfer Partners, L.P., | | | | | | |
6.125%, 02/15/17 | | | 700,000 | | | 726,053 |
6.625%, 10/15/36 | | | 1,805,000 | | | 1,801,390 |
Enterprise Products Operating L.P., 6.300%, 09/15/17 | | | 8,440,000 | | | 9,085,854 |
Equifax, Inc., 7.000%, 07/01/37 | | | 4,421,000 | | | 4,346,855 |
Equitable Resources, Inc., 6.500%, 04/01/18 | | | 35,420,000 | | | 36,338,477 |
ERAC USA Finance Co., | | | | | | |
6.375%, 10/15/17 (a) | | | 4,910,000 | | | 4,959,429 |
6.700%, 06/01/34 (a) | | | 1,250,000 | | | 1,104,738 |
7.000%, 10/15/37 (a) | | | 19,033,000 | | | 18,629,653 |
Foot Locker, Inc., 8.500%, 01/15/22 | | | 570,000 | | | 538,650 |
Ford Motor Co., 6.375%, 02/01/29 | | | 1,990,000 | | | 1,537,275 |
Freescale Semiconductor, Inc., 10.125%, 12/15/16 | | | 270,000 | | | 217,350 |
GATX Corp., 4.750%, 10/01/12 | | | 8,965,000 | | | 9,154,502 |
GTE Corp., 6.940%, 04/15/28 | | | 130,000 | | | 133,366 |
HCA, Inc., | | | | | | |
5.750%, 03/15/14 | | | 5,960,000 | | | 5,602,400 |
6.250%, 02/15/13 | | | 2,200,000 | | | 2,139,500 |
6.375%, 01/15/15 | | | 2,330,000 | | | 2,198,938 |
6.625%, 02/15/16 | | | 6,850,000 | | | 6,507,500 |
7.050%, 12/01/27 | | | 1,685,000 | | | 1,444,888 |
7.750%, 07/15/36 | | | 330,000 | | | 293,700 |
Home Depot, Inc., The, 5.875%, 12/16/36 | | | 12,325,000 | | | 11,896,793 |
Hospira, Inc., 6.050%, 03/30/17 | | | 3,395,000 | | | 3,553,258 |
Intel Corp., | | | | | | |
2.950%, 12/15/359 | | | 6,230,000 | | | 6,011,950 |
3.250%, 08/01/39 (a)9 | | | 15,000,000 | | | 17,231,250 |
International Paper Co., | | | | | | |
7.500%, 08/15/21 | | | 1,000,000 | | | 1,120,471 |
7.950%, 06/15/18 | | | 48,010,000 | | | 55,375,215 |
Intuit, Inc., 5.750%, 03/15/17 | | | 3,560,000 | | | 3,687,281 |
The accompanying notes are an integral part of these financial statements.
11
Managers Bond Fund
Schedule of Portfolio Investments (continued)
| | | | | | | |
Security Description | | Principal Amount | | | Value |
Industrials - 43.4% (continued) | | | | | | | |
Kinder Morgan Energy Partners L.P., | | | | | | | |
5.800%, 03/15/35 | | $ | 3,360,000 | | | $ | 3,113,013 |
5.950%, 02/15/18 | | | 44,630,000 | | | | 47,272,766 |
KLA Instruments Corp., 6.900%, 05/01/18 | | | 24,365,000 | | | | 25,635,415 |
Koninklijke Philips Electronics, N.V., 6.875%, 03/11/38 | | | 6,155,000 | | | | 6,982,183 |
Kraft Foods, Inc., 6.500%, 11/01/31 | | | 8,210,000 | | | | 8,247,158 |
Lowe’s Companies, Inc., 6.875%, 02/15/28 | | | 500,000 | | | | 561,984 |
Lubrizol Corp., 6.500%, 10/01/34 | | | 16,940,000 | | | | 17,316,813 |
Lucent Technologies, Inc., | | | | | | | |
6.450%, 03/15/29 | | | 4,335,000 | | | | 3,104,944 |
6.500%, 01/15/28 | | | 305,000 | | | | 216,931 |
Marks & Spencer Group PLC, 7.125%, 12/01/37 (a) | | | 4,725,000 | | | | 4,801,800 |
Masco Corp., 5.850%, 03/15/17 | | | 8,150,000 | | | | 7,583,233 |
Methanex Corp., 6.000%, 08/15/15 | | | 3,825,000 | | | | 3,262,641 |
Missouri Pacific Railroad Co., 5.000%, 01/01/455 | | | 825,000 | | | | 552,750 |
Motorola, Inc., | | | | | | | |
5.220%, 10/01/97 | | | 895,000 | | | | 462,451 |
6.500%, 09/01/25 | | | 1,345,000 | | | | 1,168,552 |
6.500%, 11/15/28 | | | 1,430,000 | 2 | | | 1,230,073 |
8.000%, 11/01/11 | | | 1,075,000 | | | | 1,149,700 |
New England Telephone & Telegraph Co., 7.875%, 11/15/29 | | | 2,390,000 | | | | 2,614,672 |
News America, Inc., | | | | | | | |
6.150%, 03/01/37 | | | 4,075,000 | | | | 4,054,169 |
6.200%, 12/15/34 | | | 3,440,000 | | | | 3,457,252 |
6.400%, 12/15/35 | | | 5,820,000 | | | | 5,976,203 |
Nextel Communications, Inc., 5.950%, 03/15/14 | | | 13,220,000 | | | | 12,344,175 |
NGPL Pipeco LLC, 7.119%, 12/15/17 (a) | | | 21,980,000 | | | | 24,254,315 |
Northwest Airlines, Inc., 8.028%, 11/01/17 | | | 8,326,007 | 2 | | | 6,619,175 |
ONEOK Partners, L.P., | | | | | | | |
6.000%, 06/15/35 | | | 9,210,000 | | | | 8,595,923 |
6.650%, 10/01/36 | | | 2,650,000 | | | | 2,702,796 |
Owens & Minor, Inc., 6.350%, 04/15/165 | | | 1,355,000 | | | | 1,239,389 |
Owens Corning, Inc., | | | | | | | |
6.500%, 12/01/16 | | | 4,560,000 | | | | 4,669,773 |
7.000%, 12/01/36 | | | 8,895,000 | | | | 8,295,842 |
Panhandle Eastern Pipe Line Co., L.P., | | | | | | | |
6.200%, 11/01/17 | | | 5,520,000 | | | | 5,836,699 |
7.000%, 06/15/18 | | | 26,505,000 | | | | 29,267,298 |
Plains All American Pipeline L.P., | | | | | | | |
6.125%, 01/15/17 | | | 2,770,000 | | | | 2,909,506 |
6.500%, 05/01/18 | | | 8,975,000 | | | | 9,597,748 |
6.650%, 01/15/37 | | | 5,960,000 | | | | 6,080,630 |
The accompanying notes are an integral part of these financial statements.
12
Managers Bond Fund
Schedule of Portfolio Investments (continued)
| | | | | | |
Security Description | | Principal Amount | | Value |
Industrials - 43.4% (continued) | | | | | | |
Pulte Homes, Inc., | | | | | | |
6.000%, 02/15/35 | | $ | 10,320,000 | | $ | 8,152,800 |
6.375%, 05/15/33 | | | 4,670,000 | | | 3,771,025 |
Qantas Airways, Ltd., 6.050%, 04/15/16 (a) | | | 11,800,000 | | | 11,903,698 |
Questar Market Resources, Inc., 6.800%, 04/01/18 | | | 27,465,000 | | | 28,621,386 |
Qwest Capital Funding, Inc., | | | | | | |
6.500%, 11/15/18 | | | 620,000 | | | 536,300 |
6.875%, 07/15/28 | | | 1,190,000 | | | 963,900 |
7.625%, 08/03/21 | | | 2,135,000 | | | 1,900,150 |
Qwest Corp., | | | | | | |
6.500%, 06/01/17 | | | 155,000 | | | 152,288 |
6.875%, 09/15/33 | | | 7,209,000 | | | 6,343,920 |
7.200%, 11/10/26 | | | 435,000 | | | 393,675 |
7.250%, 09/15/25 | | | 1,185,000 | | | 1,096,125 |
7.250%, 10/15/35 | | | 2,165,000 | | | 1,905,200 |
7.500%, 06/15/23 | | | 739,000 | | | 698,355 |
Reynolds American, Inc., | | | | | | |
6.750%, 06/15/17 | | | 8,170,000 | | | 8,460,901 |
7.250%, 06/15/37 | | | 2,000,000 | | | 2,014,156 |
Rowan Cos., Inc., 7.875%, 08/01/19 | | | 4,710,000 | | | 5,240,304 |
Samsung Electronics Co., Ltd., 7.700%, 10/01/27 (a) | | | 3,960,000 | | | 4,139,253 |
Southern Natural Gas Co., 5.900%, 04/01/17 (a) | | | 4,765,000 | | | 4,893,350 |
Talisman Energy, Inc., | | | | | | |
5.850%, 02/01/37 | | | 3,674,000 | | | 3,510,287 |
6.250%, 02/01/38 | | | 3,635,000 | | | 3,639,100 |
Telecom Italia Capital S.p.A., | | | | | | |
6.000%, 09/30/34 | | | 3,210,000 | | | 3,035,655 |
6.375%, 11/15/33 | | | 3,170,000 | | | 3,125,363 |
Telekom Malaysia Berhad, 7.875%, 08/01/25 (a) | | | 250,000 | | | 294,435 |
Texas Eastern Transmission, L.P., 6.000%, 09/15/17 (a) | | | 3,000,000 | | | 3,157,275 |
Toll Brothers Finance Corp., 5.150%, 05/15/15 | | | 3,785,000 | | | 3,621,708 |
Toro Co., The, 6.625%, 05/01/375 | | | 6,810,000 | | | 5,497,509 |
Transocean, Inc., 7.375%, 04/15/18 | | | 500,000 | | | 569,177 |
U.S. Steel Corp., | | | | | | |
6.650%, 06/01/37 | | | 3,595,000 | | | 2,892,113 |
7.000%, 02/01/18 | | | 17,850,000 | | | 17,483,968 |
United Airlines, Inc., 6.636%, 07/02/22 | | | 16,967,082 | | | 14,422,019 |
UnitedHealth Group, Inc., | | | | | | |
5.800%, 03/15/36 | | | 13,506,000 | | | 12,104,644 |
6.500%, 06/15/37 | | | 310,000 | | | 305,690 |
6.625%, 11/15/37 | | | 1,540,000 | | | 1,542,755 |
The accompanying notes are an integral part of these financial statements.
13
Managers Bond Fund
Schedule of Portfolio Investments (continued)
| | | | | | |
Security Description | | Principal Amount | | Value |
Industrials - 43.4% (continued) | | | | | | |
USG Corp., 6.300%, 11/15/16 | | $ | 1,410,000 | | $ | 1,261,950 |
V.F. Corp., 6.450%, 11/01/37 | | | 9,334,000 | | | 9,819,545 |
Vale Overseas Ltd., 6.875%, 11/01/36 | | | 3,665,000 | | | 3,661,925 |
Verizon Global Funding Corp., 5.850%, 09/15/35 | | | 5,990,000 | | | 5,841,041 |
Verizon Maryland, Inc., 5.125%, 06/15/33 | | | 1,055,000 | | | 834,685 |
Verizon New York, Inc., Series B, 7.375%, 04/01/32 | | | 1,755,000 | | | 1,890,491 |
Viacom, Inc., 6.875%, 04/30/36 | | | 302,000 | | | 326,554 |
Weatherford International, Inc., 6.500%, 08/01/36 | | | 1,565,000 | | | 1,494,617 |
Wellpoint, Inc., 6.375%, 06/15/37 | | | 13,650,000 | | | 13,889,926 |
Western Union Co., 6.200%, 11/17/36 | | | 12,735,000 | | | 12,667,836 |
Weyerhaeuser Co., 6.875%, 12/15/33 | | | 12,890,000 | | | 11,428,738 |
White Pine Hydro LLC, | | | | | | |
6.310%, 07/10/17 (a)5 | | | 1,700,000 | | | 1,427,675 |
6.960%, 07/10/37 (a)5 | | | 1,645,000 | | | 1,134,190 |
Williams Cos., Inc., Series A, 7.500%, 01/15/31 | | | 1,000,000 | | | 1,078,733 |
Total Industrials | | | | | | 952,289,305 |
Utilities - 9.3% | | | | | | |
Abu Dhabi National Energy Co., 7.250%, 08/01/18 (a) | | | 21,130,000 | | | 21,542,162 |
Ameren Energy Generating Co., 7.000%, 04/15/18 | | | 22,700,000 | | | 23,527,574 |
Baltimore Gas & Electric Co., 5.200%, 06/15/33 | | | 1,470,000 | | | 1,282,800 |
Bruce Mansfield Unit 1 2, 6.850%, 06/01/345 | | | 10,716,013 | | | 10,791,102 |
Cleveland Electric Illuminating Co., The, 5.950%, 12/15/36 | | | 15,645,000 | | | 14,573,552 |
Empresa Nacional de Electricidad, 7.875%, 02/01/27 | | | 2,900,000 | | | 3,230,296 |
Illinois Power Co., 6.250%, 04/01/18 | | | 26,000,000 | | | 27,552,122 |
ITC Holdings Corp., | | | | | | |
5.875%, 09/30/16 (a) | | | 2,410,000 | | | 2,434,004 |
6.375%, 09/30/36 (a) | | | 3,605,000 | | | 3,337,459 |
Mackinaw Power LLC, 6.296%, 10/31/23 (a) | | | 9,200,513 | | | 9,023,495 |
Nisource Finance Corp., | | | | | | |
6.400%, 03/15/18 | | | 27,910,000 | | | 29,008,648 |
6.800%, 01/15/19 | | | 11,625,000 | | | 12,432,321 |
Southwestern Electric Power Co., 6.450%, 01/15/19 | | | 39,195,000 | | | 41,979,413 |
Tenaga Nasional Berhad, 7.500%, 11/01/25 (a) | | | 2,000,000 | | | 2,248,428 |
Toledo Edison Co., 6.150%, 05/15/37 | | | 1,975,000 | | | 1,951,373 |
Total Utilities | | | | | | 204,914,749 |
Total Corporate Bonds
(cost $1,520,223,792) | | | | | | 1,539,133,420 |
The accompanying notes are an integral part of these financial statements.
14
Managers Bond Fund
Schedule of Portfolio Investments (continued)
| | | | | | | |
Security Description | | Principal Amount | | | Value |
Foreign Government Obligations - 6.6% | | | | | | | |
Alberta, Province of, 5.930%, 09/16/16 | | CAD | 138,125 | | | $ | 145,766 |
Brazil, Republic of, | | | | | | | |
10.250%, 01/10/28 | | BRL | 5,750,000 | | | | 3,302,700 |
12.500%, 01/05/22 | | BRL | 5,160,000 | 2 | | | 3,349,110 |
Canadian Government, | | | | | | | |
1.000%, 09/01/11 | | CAD | 2,660,000 | | | | 2,530,389 |
1.250%, 12/01/11 | | CAD | 400,000 | | | | 380,800 |
2.000%, 09/01/12 | | CAD | 41,000,000 | | | | 39,274,304 |
2.750%, 12/01/10 | | CAD | 7,940,000 | | | | 7,735,474 |
3.500%, 06/01/13 | | CAD | 5,964,000 | | | | 5,929,272 |
3.750%, 09/01/11 | | CAD | 4,160,000 | | | | 4,135,776 |
3.750%, 06/01/12 | | CAD | 12,235,000 | | | | 12,241,200 |
Eurofima, 11.000%, 02/05/10 | | ISK | 60,000,000 | | | | 479,875 |
European Investment Bank, | | | | | | | |
7.000%, 01/18/12 | | NZD | 4,746,000 | | | | 3,603,937 |
7.233%, 03/10/214 | | AUD | 5,000,000 | | | | 2,027,648 |
8.609%, 04/24/13 (a)4 | | IDR | 50,074,770,000 | | | | 4,031,032 |
11.250%, 02/14/13 | | BRL | 13,490,000 | 2 | | | 7,990,171 |
Inter-American Development Bank, | | | | | | | |
6.000%, 12/15/17 | | NZD | 4,215,000 | | | | 3,002,326 |
9.615%, 05/20/134 | | IDR | 45,580,000,000 | | | | 3,529,964 |
Series EMTN, 11.203%, 09/23/134 | | IDR | 33,430,000,000 | | | | 2,502,891 |
International Bank for Reconstruction & Development, | | | | | | | |
9.500%, 05/27/10 | | ISK | 179,000,000 | | | | 1,439,575 |
Series GDIF, 1.430%, 03/05/14 | | SGD | 5,800,000 | | | | 3,978,622 |
Mexican Government, | | | | | | | |
8.000%, 12/07/23 | | MXN | 141,360,000 | | | | 10,431,810 |
9.000%, 12/20/12 | | MXN | 26,900,000 | | | | 2,177,786 |
Series M 10, 7.250%, 12/15/16 | | MXN | 31,000,000 | | | | 2,330,640 |
New South Wales Treasury Corp., Series 10RG, 7.000%, 12/01/10 | | AUD | 10,320,000 | | | | 9,484,031 |
Province of Manitoba Canada, 6.360%, 09/01/15 | | NZD | 5,000,000 | | | | 3,594,608 |
Queensland Treasury Corp., 7.125%, 09/18/17 (a) | | NZD | 7,500,000 | | | | 5,670,245 |
Total Foreign Government Obligations
(cost $142,302,936) | | | | | | | 145,299,952 |
Municipal Bonds - 1.4% | | | | | | | |
Buckeye Tobacco Settlement Financing Authority, Asset-A-2, 5.875%, 06/01/475 | | $ | 5,035,000 | | | | 3,785,263 |
California State, 4.500%, 08/01/27 (AMBAC Insured) | | | 950,000 | | | | 840,778 |
California State, 4.500%, 10/01/29 | | | 2,655,000 | | | | 2,284,999 |
California State, 4.500%, 08/01/30 | | | 665,000 | | | | 571,694 |
The accompanying notes are an integral part of these financial statements.
15
Managers Bond Fund
Schedule of Portfolio Investments (continued)
| | | | | | | |
Security Description | | Principal Amount | | | Value |
Municipal Bonds - 1.4% (continued) | | | | | | | |
California State, 4.500%, 08/01/30 (AMBAC Insured) | | $ | 770,000 | | | $ | 657,272 |
California State, Variable Purpose Bond, 3.250%, 12/01/27 (NATL-RE Insured) | | | 495,000 | | | | 363,830 |
California State, Variable Purpose Bond, 4.500%, 12/01/33 (AMBAC Insured) | | | 2,330,000 | | | | 1,932,502 |
Chicago Illinois O’Hare International Airport Revenue, Series A, 4.500%, 01/01/38 (AGM Insured) | | | 315,000 | | | | 298,674 |
Michigan Tobacco Settlement Financial Authority, Series A, 7.309%, 06/01/345 | | | 3,075,000 | | | | 2,456,986 |
Omaha Public Power District (Nebraska), Electric System Subordinated Revenue, Series AA, 4.500%, 02/01/34 | | | 1,060,000 | | | | 1,062,830 |
San Jose California Redevelopment Agency Tax Allocation, Series C, 3.750%, 08/01/28 (NATL-RE Insured) | | | 765,000 | | | | 586,441 |
San Jose Redevelopment Agency, 3.750%, 08/01/28 (MBIA Insured) | | | 280,000 | | | | 235,662 |
Tobacco Settlement Financing Corp., VA, 6.706%, 06/01/465 | | | 21,620,000 | | | | 15,596,236 |
Total Municipal Bonds
(cost $38,331,901) | | | | | | | 30,673,167 |
Asset-Backed Securities - 4.5% | | | | | | | |
CIT Equipment Collateral, Series 2008-VT1, Class A3, 6.590%, 12/22/14 | | | 7,270,000 | | | | 7,461,383 |
Capital One Auto Finance Trust 2006-C A4, 0.263%, 05/15/13 (01/15/10)6 | | | 13,289,469 | | | | 13,128,030 |
Chase Issuance Trust, Series 2005-C1, Class C1, 0.603%, 11/15/12 (01/15/10)6 | | | 1,175,000 | | | | 1,172,880 |
Chase Issuance Trust, Series 2007-B1, Class B1, 0.483%, 04/15/19 (01/15/10)6 | | | 17,040,000 | | | | 14,734,075 |
Citibank Credit Card Issuance Trust, Series 2008-C6, Class C6, 6.300%, 06/20/14 | | | 15,450,000 | | | | 15,950,822 |
Community Program Loan Trust, Series 87-A, Class A5, 4.500%, 04/01/29 | | | 3,225,000 | | | | 2,887,568 |
Marriott Vacation Club Owner Trust, Series 2009-2A, Class A, 4.810%, 07/20/31 (a) | | | 17,813,169 | | | | 17,698,223 |
MBNA Credit Card Master Note Trust, Series 2002-C1, Class C1, 6.800%, 07/15/14 | | | 6,911,000 | | | | 7,089,830 |
MBNA Credit Card Master Note Trust, Series 2005-B2, Class B, 0.413%, 12/17/12 (01/15/10)6 | | | 10,405,000 | | | | 10,324,657 |
Merrill Auto Trust Securitization, Series 2008-1, Class B, 6.750%, 04/15/15 | | | 4,035,000 | | | | 4,058,330 |
Trinity Rail Leasing LP, Series 2009-1A, Class A, 6.657%, 11/16/39 (a) | | | 4,986,569 | | | | 4,822,619 |
Total Asset-Backed Securities
(cost $95,610,814) | | | | | | | 99,328,417 |
U.S. Government and Agency Obligations - 9.1% | | | | | | | |
Federal Home Loan Mortgage Corporation - 1.9% | | | | | | | |
FHLMC, 1.625%, 09/26/12 | | | 16,600,000 | 2 | | | 16,533,135 |
FHLMC, 2.125%, 09/21/12 | | | 24,895,000 | | | | 25,159,784 |
FHLMC, Gold, 5.000%, 12/01/31 | | | 140,710 | | | | 145,087 |
Total Federal Home Loan Mortgage Corporation | | | | | | | 41,838,006 |
Federal National Mortgage Association - 3.0% | | | | | | | |
FNMA, 1.375%, 04/28/11 | | | 33,195,000 | | | | 33,439,116 |
FNMA, 1.750%, 08/10/12 | | | 16,595,000 | | | | 16,591,664 |
FNMA, 1.875%, 04/20/12 | | | 10,325,000 | 2 | | | 10,432,525 |
FNMA, 4.000%, 10/01/18 | | | 5,889,361 | | | | 6,039,077 |
FNMA, 6.000%, 07/01/29 | | | 12,539 | | | | 13,440 |
Total Federal National Mortgage Association | | | | | | | 66,515,822 |
The accompanying notes are an integral part of these financial statements.
16
Managers Bond Fund
Schedule of Portfolio Investments (continued)
| | | | | | | |
Security Description | | Principal Amount | | | Value |
U.S. Treasury Notes - 4.2% | | | | | | | |
USTN, 1.000%, 08/31/11 | | $ | 43,530,000 | | | $ | 43,552,113 |
USTN, 3.125%, 05/15/19 | | | 20,000,000 | | | | 18,940,620 |
USTN, 4.375%, 11/15/39 | | | 30,000,000 | | | | 28,715,640 |
Total U.S. Treasury Notes | | | | | | | 91,208,373 |
Total U.S. Government and Agency Obligations
(cost $199,280,786) | | | | | | | 199,562,201 |
Mortgage-Backed Securities - 0.3% | | | | | | | |
Bank of America-First Union, Series 2001, 5.464%, 04/11/37 | | | 1,495,382 | | | | 1,552,518 |
CS First Boston Mortgage Securities Corp., Series 2005-7, Class 3A1, 5.000%, 08/25/20 | | | 2,368,589 | | | | 2,309,374 |
Credit Suisse Mortgage Capital, Series 2007-C5, Class A4, 5.695%, 09/15/407 | | | 1,704,000 | | | | 1,359,504 |
JP Morgan Chase Commercial Mortgage, Series 2007-LD11, Class A4, 5.818%, 06/15/497 | | | 305,000 | | | | 265,610 |
Total Mortgage-Backed Securities
(cost $4,797,447) | | | | | | | 5,487,006 |
| | |
| | | Shares | | | |
Preferred Stocks - 1.0% | | | | | | | |
Bank of America Corp., 6.375% | | | 20,000 | | | | 381,000 |
Bank of America Corp., Series L, 7.250% | | | 7,808 | 2 | | | 6,863,233 |
Comcast Corp. Series B, 7.000% | | | 207,547 | | | | 5,196,978 |
Entergy New Orleans, Inc., 4.750% | | | 482 | | | | 32,821 |
Entergy New Orleans, Inc., 5.560% | | | 100 | | | | 7,747 |
FHLMC, Series F, 5.000%* | | | 15,400 | | | | 27,104 |
FHLMC, Series K, 5.790%* | | | 45,200 | | | | 76,388 |
FHLMC, Series O, 5.810%* | | | 15,850 | | | | 27,420 |
FHLMC, Series P, 6.000%* | | | 19,800 | | | | 33,264 |
FHLMC, Series R, 5.700%* | | | 24,500 | | | | 46,305 |
FHLMC, Series T, 6.420%* | | | 14,300 | | | | 25,597 |
FHLMC, Series U, 5.900%* | | | 35,100 | | | | 30,186 |
FHLMC, Series V, 5.570%* | | | 307,950 | | | | 307,950 |
FHLMC, Series W, 5.660%* | | | 70,700 | | | | 67,165 |
FHLMC, Series Y, 6.550%* | | | 67,825 | | | | 68,503 |
FHLMC, Series Z, 8.375%* | | | 605,747 | | | | 636,034 |
FNMA, Series H, 5.810%* | | | 9,050 | | | | 13,846 |
FNMA, Series I, 5.375%* | | | 21,500 | | | | 34,400 |
FNMA, Series L, 5.125%* | | | 28,100 | | | | 41,588 |
FNMA, Series M, 4.750%* | | | 30,700 | | | | 44,515 |
FNMA, Series Q, 6.750%* | | | 13,950 | | | | 12,694 |
FNMA, Series S, 8.250%* | | | 1,125,850 | | | | 1,238,435 |
GMAC, LLC, 9.000%, (a) | | | 1,560 | | | | 1,028,235 |
Newell Financial Trust I, 5.250% | | | 90,628 | | | | 3,171,980 |
SLM Corp., 6.000% | | | 41,250 | | | | 644,738 |
Sovereign Capital Trust IV, 4.375% | | | 34,236 | | | | 1,059,176 |
Wisconsin Electric Power Co., 3.600% | | | 3,946 | | | | 235,650 |
Total Preferred Stocks
(cost $68,451,358) | | | | | | | 21,352,952 |
The accompanying notes are an integral part of these financial statements.
17
Managers Bond Fund
Schedule of Portfolio Investments (continued)
| | | | | |
Security Description | | Shares | | Value |
Short-Term Investments - 6.0%1 | | | | | |
BNY Institutional Cash Reserves Fund, Series A, 0.05%3 | | 37,721,000 | | $ | 37,721,000 |
BNY Institutional Cash Reserves Fund, Series B*3,8 | | 1,652,054 | | | 322,150 |
Dreyfus Cash Management Fund, Institutional Class Shares, 0.08% | | 77,782,580 | | | 77,782,580 |
JPMorgan Liquid Assets Money Market Fund, Capital Shares, 0.19% | | 16,165,272 | | | 16,165,272 |
Total Short-Term Investments
(cost $133,320,906) | | | | | 131,991,002 |
Total Investments - 99.0%
(cost $2,202,319,940) | | | | | 2,172,828,117 |
Other Assets, less Liabilities - 1.0% | | | | | 20,873,580 |
Net Assets - 100.0% | | | | $ | 2,193,701,697 |
The following footnotes and abbreviations should be read in conjunction with the Schedule of Portfolio Investments.
Based on the approximate cost of investments of $2,203,061,961 for Federal income tax purposes at December 31, 2009, the aggregate gross unrealized appreciation and depreciation were $89,783,082 and $120,016,926, respectively, resulting in a net unrealized depreciation of investments of $30,233,844.
| * | Non-income-producing security. |
| (a) | Security exempt from registration under Rule 144A of the Securities Act of 1933. This security may be resold in transactions exempt from registration, normally to qualified buyers. At December 31, 2009, the value of these securities amounted to $256,554,766 or 11.7% of net assets. |
| 1 | Yield shown for an investment company represents the December 31, 2009, seven-day average yield, which refers to the sum of the previous seven days’ dividends paid, expressed as an annual percentage. |
| 2 | Some or all of these shares were out on loan to various brokers as of December 31, 2009, amounting to $37,899,675 or 1.7% of net assets. |
| 3 | Collateral received from brokers for securities lending was invested in these short-term investments. |
| 4 | Represents yield to maturity at December 31, 2009. |
| 5 | Security is illiquid: A security not readily convertible into cash such as a stock, bond or commodity that is not actively traded, and would be difficult to sell in a current sale. The Fund may not invest more than 15% of its net assets in illiquid securities. All securities are valued by an independent pricing agent or broker. Illiquid securities at December 31, 2009 amounted to $53,638,789 or 2.4% of net assets. |
| 6 | Floating Rate Security. The rate listed is as of December 31, 2009. Date in parentheses represents the security’s next coupon rate reset. |
| 7 | Variable Rate Security. The rate listed is as of December 31, 2009 and is periodically reset subject to terms and conditions set forth in the debenture. |
| 8 | On September 12, 2008, The Bank of New York Mellon established a separate sleeve of the BNY Institutional Cash Reserves Fund (Series B) to hold certain Lehman Brothers floating rate notes. The Fund’s position in Series B is being marked to market daily. |
| 9 | Convertible bond. A corporate bond, usually a junior debenture, that can be converted, at the option of the holder, for a specific number of shares of the company’s preferred stock or common stock. Convertible bonds at December 31, 2009 amounted to $27,705,974 or 1.3% of net assets. |
| | |
| Investments Definitions and Abbreviations: |
| |
| AGM: | | Assured Guaranty Municipal Corp. |
| AMBAC: | | American Municipal Bond Assurance Corp. |
| EMTN: | | European Medium Term Note |
| FHLMC: | | Federal Home Loan Mortgage Corp. |
| FNMA: | | Federal National Mortgage Association |
| GDIF: | | Global Debt Insurance Facility |
| GMAC: | | General Motors Acceptance Corp. |
| MBIA: | | MBIA Insurance Corp. |
| MTN: | | Medium Term Note |
| NATL-RE: | | National Public Finance Guarantee Corporation |
| USTN: | | United States Treasury Note |
|
| Abbreviations have been used throughout the portfolios to indicate amounts shown in currencies other than the U.S. dollar (USD): |
| |
| AUD: | | Australian Dollar |
| BRL: | | Brazilian Real |
| CAD: | | Canadian Dollar |
| EUR: | | euro |
| IDR: | | Indonesian Rupiah |
| ISK: | | Icelandic Krona |
| MXN: | | Mexican Peso |
| NZD: | | New Zealand Dollar |
| SGD: | | Singapore Dollar |
| THB: | | Thailand Baht |
The accompanying notes are an integral part of these financial statements.
18
Managers Bond Fund
Statement of Assets and Liabilities
December 31, 2009
| | | | |
Assets: | | | | |
Investments at value (including securities on loan valued at $37,899,675)* | | $ | 2,172,828,117 | |
Cash | | | 300 | |
Foreign currency** | | | 2,600 | |
Receivable for investments sold | | | 38,838,185 | |
Receivable for Fund shares sold | | | 2,749,711 | |
Receivable from affiliate | | | 184,535 | |
Dividends, interest and other receivables | | | 29,142,977 | |
Prepaid expenses | | | 15,479 | |
Total assets | | | 2,243,761,904 | |
Liabilities: | | | | |
Payable for Fund shares repurchased | | | 8,390,247 | |
Payable upon return of securities loaned | | | 39,373,054 | |
Accrued expenses: | | | | |
Investment advisory and management fees | | | 1,175,703 | |
Administrative fees | | | 470,281 | |
Other | | | 650,922 | |
Total liabilities | | | 50,060,207 | |
Net Assets | | $ | 2,193,701,697 | |
Shares outstanding | | | 90,296,195 | |
Net asset value, offering and redemption price per share | | $ | 24.29 | |
Net Assets Represent: | | | | |
Paid-in capital | | $ | 2,295,767,722 | |
Undistributed net investment loss | | | (2,015,831 | ) |
Accumulated net realized loss from investments and foreign currency transactions | | | (70,706,845 | ) |
Net unrealized depreciation of investments and foreign currency translations | | | (29,343,349 | ) |
Net Assets | | $ | 2,193,701,697 | |
* Investments at cost | | $ | 2,202,319,940 | |
** Foreign currency at cost | | $ | 2,595 | |
The accompanying notes are an integral part of these financial statements.
19
Managers Bond Fund
Statement of Operations
For the year ended December 31, 2009
| | | | |
Investment Income: | | | | |
Interest income | | $ | 138,070,231 | |
Dividend income | | | 1,983,394 | |
Securities lending fees | | | 71,703 | |
Total investment income | | | 140,125,328 | |
Expenses: | | | | |
Investment management and advisory fees | | | 12,650,107 | |
Administrative fees | | | 5,060,043 | |
Transfer agent | | | 2,919,327 | |
Professional fees | | | 559,971 | |
Reports to shareholders | | | 380,495 | |
Custodian | | | 349,134 | |
Trustees fees and expenses | | | 188,826 | |
Registration fees | | | 124,669 | |
Miscellaneous | | | 132,216 | |
Total expenses before offsets | | | 22,364,788 | |
Expense reimbursements | | | (2,318,871 | ) |
Fee waivers | | | (8,474 | ) |
Expense reductions | | | (8,147 | ) |
Net expenses | | | 20,029,296 | |
Net investment income | | | 120,096,032 | |
Net Realized and Unrealized Gain (Loss): | | | | |
Net realized loss on investments | | | (59,422,299 | ) |
Net realized loss on foreign currency transactions | | | (62,977 | ) |
Net unrealized appreciation of investments | | | 457,994,772 | |
Net unrealized appreciation of foreign currency translations | | | 28,062,687 | |
Net realized and unrealized gain | | | 426,572,183 | |
Net increase in net assets resulting from operations | | $ | 546,668,215 | |
The accompanying notes are an integral part of these financial statements.
20
Managers Bond Fund
Statement of Changes in Net Assets
For the year ended December 31,
| | | | | | | | |
| | | 2009 | | | 2008 | |
Increase (Decrease) in Net Assets From Operations: | | | | | | | | |
Net investment income | | $ | 120,096,032 | | | $ | 136,714,173 | |
Net realized gain (loss) on investments and foreign currency transactions | | | (59,485,276 | ) | | | 10,641,730 | |
Net unrealized appreciation (depreciation) of investments and foreign currency translations | | | 486,057,459 | | | | (572,492,152 | ) |
Net increase (decrease) in net assets resulting from operations | | | 546,668,215 | | | | (425,136,249 | ) |
Distributions to Shareholders: | | | | | | | | |
From net investment income | | | (118,309,043 | ) | | | (136,203,930 | ) |
From net realized gain on investments | | | — | | | | (27,020,555 | ) |
Total distributions to shareholders | | | (118,309,043 | ) | | | (163,224,485 | ) |
From Capital Share Transactions: | | | | | | | | |
Proceeds from sale of shares | | | 684,473,826 | | | | 1,260,249,492 | |
Reinvestment of dividends and distributions | | | 108,826,420 | | | | 152,445,157 | |
Cost of shares repurchased | | | (916,876,877 | ) | | | (958,305,334 | ) |
Net increase (decrease) from capital share transactions | | | (123,576,631 | ) | | | 454,389,315 | |
Total increase (decrease) in net assets | | | 304,782,541 | | | | (133,971,419 | ) |
Net Assets: | | | | | | | | |
Beginning of year | | | 1,888,919,156 | | | | 2,022,890,575 | |
End of year | | $ | 2,193,701,697 | | | $ | 1,888,919,156 | |
End of year undistributed net investment loss | | $ | (2,015,831 | ) | | $ | (807,216 | ) |
| | | | | | | | |
Share Transactions: | | | | | | | | |
Sale of shares | | | 31,756,529 | | | | 52,689,979 | |
Reinvested shares | | | 5,009,261 | | | | 6,912,748 | |
Shares repurchased | | | (42,593,625 | ) | | | (43,303,058 | ) |
Net increase (decrease) in shares | | | (5,827,835 | ) | | | 16,299,669 | |
The accompanying notes are an integral part of these financial statements.
21
Financial Highlights
For a share outstanding throughout each year
| | | | | | | | | | | | | | | | | | | | |
| | | For the year ended December 31, | |
Managers Bond Fund | | 2009 | | | 2008 | | | 2007 | | | 2006 | | | 2005 | |
Net Asset Value, Beginning of Year | | $ | 19.65 | | | $ | 25.34 | | | $ | 24.84 | | | $ | 24.11 | | | $ | 24.58 | |
Income from Investment Operations: | | | | | | | | | | | | | | | | | | | | |
Net investment income | | | 1.30 | 5 | | | 1.42 | 5 | | | 1.22 | 5 | | | 1.08 | | | | 0.88 | |
Net realized and unrealized gain (loss) on investments | | | 4.62 | 5 | | | (5.42 | )5 | | | 0.49 | 5 | | | 0.75 | | | | (0.32 | ) |
Total from investment operations | | | 5.92 | | | | (4.00 | ) | | | 1.71 | | | | 1.83 | | | | 0.56 | |
Less Distributions to Shareholders from: | | | | | | | | | | | | | | | | | | | | |
Net investment income | | | (1.28 | ) | | | (1.41 | ) | | | (1.21 | ) | | | (1.10 | ) | | | (0.88 | ) |
Net realized gain on investments | | | — | | | | (0.28 | ) | | | (0.00 | )4 | | | — | | | | (0.15 | ) |
Total distributions to shareholders | | | (1.28 | ) | | | (1.69 | ) | | | (1.21 | ) | | | (1.10 | ) | | | (1.03 | ) |
Net Asset Value, End of Year | | $ | 24.29 | | | $ | 19.65 | | | $ | 25.34 | | | $ | 24.84 | | | $ | 24.11 | |
Total Return1 | | | 31.12 | %3 | | | (16.31 | )% | | | 7.06 | % | | | 7.79 | %3 | | | 2.29 | % |
Ratio of net expenses to average net assets | | | 0.99 | % | | | 0.99 | % | | | 0.99 | % | | | 0.99 | % | | | 0.99 | % |
Ratio of net investment income to average net assets 1 | | | 5.93 | % | | | 6.10 | % | | | 4.91 | % | | | 4.52 | % | | | 3.36 | % |
Portfolio turnover | | | 23 | % | | | 39 | % | | | 21 | % | | | 46 | % | | | 26 | % |
Net assets at end of year (000’s omitted) | | $ | 2,193,702 | | | $ | 1,888,919 | | | $ | 2,022,891 | | | $ | 906,776 | | | $ | 426,448 | |
| | | | | | | | | | | | | | | | | | | | |
Ratios absent expense offsets:2 | | | | | | | | | | | | | | | | | | | | |
Ratio of total expenses to average net assets | | | 1.10 | % | | | 1.10 | % | | | 0.99 | % | | | 1.02 | % | | | 1.02 | % |
Ratio of net investment income to average net assets | | | 5.82 | % | | | 5.99 | % | | | 4.91 | % | | | 4.49 | % | | | 3.33 | % |
| | | | | | | | | | | | | | | | | | | | |
| 1 | Total returns and net investment income would have been lower had certain expenses not been reduced. (See Note 1(c) to the Notes to Financial Statements.) |
| 2 | Excludes the impact of expense reimbursement and expense offsets such as brokerage credits, but includes non-reimbursable expenses, if any, such as interest and taxes. (See Note 1(c) to the Notes to Financial Statements.) |
| 3 | The Total Return is based on the Financial Statement Net Asset Values as shown above. |
| 4 | Rounds to less than $0.01. |
| 5 | Per share numbers have been calculated using average shares. |
22
Notes to Financial Statements
December 31, 2009
1. Summary of Significant Accounting Policies
The Managers Funds (the “Trust”) is an open-end management investment company organized as a Massachusetts business trust and registered under the Investment Company Act of 1940, as amended (the “1940 Act”). Currently, the Trust is comprised of a number of different funds, each having distinct investment management objectives, strategies, risks and policies. Included in this report is the Managers Bond Fund (“the Fund”).
The Fund’s financial statements are prepared in accordance with accounting principles generally accepted in the United States of America, which require management to make estimates and assumptions that affect the reported amounts of assets and liabilities and disclosure of contingent assets and liabilities at the date of the financial statements and the reported amounts of income and expenses during the reporting periods. Actual results could differ from those estimates and such differences could be material. The following is a summary of significant accounting policies followed by the Fund in the preparation of its financial statements:
a. Valuation of Investments
Equity securities traded on a domestic or international securities exchange are valued at the last quoted sale price, or, lacking any sales, at the last quoted bid price. Over-the-counter securities are valued at the Nasdaq Official Closing Price, if one is available. Lacking any sales, over-the-counter securities are valued at the last quoted bid price. The Fund’s investments are generally valued based on market quotations provided by third-party pricing services approved by the Board of Trustees of the Fund. Under certain circumstances, the value of certain Fund investments may be based on an evaluation of its fair value, pursuant to procedures established by and under the general supervision of the Board of Trustees of the Fund. The Fund may use the fair value of a portfolio security to calculate its NAV when, for example, (1) market quotations are not readily available because a portfolio security is not traded in a public market or the principal market in which the security trades is closed, (2) trading in a portfolio security is suspended and has not resumed before the Fund calculates its NAV, (3) a significant event affecting the value of a portfolio security is determined to have occurred between the time of the market quotation provided for a portfolio security and the time as of which the Fund calculates its NAV, (4) a security’s price has remained unchanged over a period of time (often referred to as a “stale price”), or (5) Managers Investment Group LLC (the “Investment Manager”) determines that a market quotation is inaccurate. Portfolio investments that trade primarily on foreign markets are priced based upon the market quotation of such securities as of the close of their respective principal markets, as adjusted to reflect the Investment Manager’s determination of the impact of events occurring subsequent to the close of such markets but prior to the time as of which the Fund calculates its NAV. In accordance with procedures approved by the Board of Trustees, the Investment Manager relies upon recommendations of a third-party fair valuation service in adjusting the prices of such foreign portfolio investments. The Fund may invest in securities that may be thinly traded. The Board of Trustees has adopted procedures to adjust prices when thinly traded securities are judged to be stale so that they reflect fair value. An investment valued on the basis of its fair value may be valued at a price higher or lower than available market quotations. An investment’s valuation may differ depending on the method used and the factors considered in determining value according to the Fund’s fair value procedures.
Fixed-income securities are valued based on valuations furnished by independent pricing services that utilize matrix systems, which reflect such factors as security prices, yields, maturities, and ratings, and are supplemented by dealer and exchange quotations. Futures contracts for which market quotations are readily available are valued at the settlement price as of the close of the futures exchange. Short-term investments having a remaining maturity of 60 days or less are valued at amortized cost, which approximates market value. Investments in other open-end regulated investment companies are valued at their end of day net asset value per share. Investments in certain mortgage-backed and stripped mortgage-backed securities, preferred stocks, convertible securities, derivatives and other debt securities not traded on an organized securities market are valued on the basis of valuations provided by dealers or by a pricing service which uses information with respect to transactions in such securities and various relationships between securities and yield to maturity in determining value. Securities (including derivatives) for which market quotations are not readily available are valued at fair value, as determined in good faith, and pursuant to procedures adopted by the Board of Trustees of the Trust. The values assigned to fair value investments are based on available information and do not necessarily represent amounts that might ultimately be realized, since such amounts depend on future developments inherent in long-term investments. Further, because of the inherent uncertainty of valuation, those estimated values may differ significantly from the values that would have been used had a ready market for the investments existed, and the differences could be material.
Generally Accepted Accounting Principles (GAAP) define fair value as the price that a Fund would receive to sell an asset or pay to transfer a liability in an orderly transaction between market participants at the measurement date. GAAP also establishes a framework for measuring fair value, and a three-level hierarchy for fair value measurements based upon the transparency of inputs to the valuation of an asset or liability. Inputs may be observable or unobservable and refer broadly to the assumptions that market participants would use in pricing the asset or liability. Observable inputs reflect the assumptions market participants would use in pricing the asset or liability based on market data obtained from sources independent of the Fund. Unobservable inputs reflect the Fund’s own assumptions about the assumptions that market participants would use in pricing the asset or liability developed based on the best information available in the circumstances. Each investment is assigned a level based upon the observability of the inputs which are significant to the overall valuation.
23
Notes to Financial Statements (continued)
The three-tier hierarchy of inputs is summarized below:
Level 1 – quoted prices in active markets for identical investments
Level 2 – other significant observable inputs (including quoted prices for similar investments, interest rates, prepayment speeds, credit risk)
Level 3 – significant unobservable inputs (including the Fund’s own assumptions in determining the fair value of investments)
The inputs or methodologies used for valuing investments are not necessarily an indication of the risk associated with investing in those investments. The following table summarizes the inputs used to value the Fund’s net assets by the above fair value hierarchy levels as of December 31, 2009:
| | | | | | | | | | | |
| | | Level 1 | | Level 2 | | Level 3 | | Total |
Managers Bond | | | | | | | | | | | |
Investments in Securities | | | | | | | | | | | |
Corporate Bonds1 | | | — | | $ | 1,539,133,420 | | — | | $ | 1,539,133,420 |
Foreign Government Obligations | | | — | | | 145,299,952 | | — | | | 145,299,952 |
Municipal Bonds | | | — | | | 30,673,167 | | — | | | 30,673,167 |
Asset-Backed Securities | | | — | | | 99,328,417 | | — | | | 99,328,417 |
U.S. Government and Agency Obligations2 | | | — | | | 199,562,201 | | — | | | 199,562,201 |
Mortgage-Backed Securities | | | — | | | 5,487,006 | | — | | | 5,487,006 |
Preferred Stocks | | $ | 21,352,952 | | | — | | — | | | 21,352,952 |
Short-Term Investments | | | 131,668,852 | | | 322,150 | | — | | | 131,991,002 |
| | | | | | | | | | | |
Total Investments | | | 153,021,804 | | | 2,019,806,313 | | — | | | 2,172,828,117 |
Other Financial Instruments3 | | | — | | | — | | — | | | — |
| | | | | | | | | | | |
Totals | | $ | 153,021,804 | | $ | 2,019,806,313 | | — | | $ | 2,172,828,117 |
| | | | | | | | | | | |
| 1 | All corporate bonds held in the Fund are Level 2 securities. For a detailed break-out of the corporate bonds by major industry classification, please refer to the Schedule of Portfolio Investments. |
| 2 | All U.S. Government and Agency Obligations held in the Funds are Level 2 securities. For a detailed break-out of these securities by major industry classification, please refer to the Schedule of Portfolio Investments. |
| 3 | Other financial instruments are derivative instruments not reflected in the Schedule of Portfolio Investments, such as futures, forwards and swap contracts, which are valued at the unrealized appreciation/depreciation of the instrument. |
24
Notes to Financial Statements (continued)
b. Security Transactions
Security transactions are accounted for as of trade date. Realized gains and losses on securities sold are determined on the basis of identified cost.
c. Investment Income and Expenses
Dividend income is recorded on the ex-dividend date except certain dividends from foreign securities where the ex-dividend date may have passed. These dividends are recorded as soon as the Trust is informed of the ex-dividend date. Dividend income on foreign securities is recorded net of any withholding tax. Interest income, which includes amortization of premium and accretion of discount on debt securities, is accrued as earned. Non-cash dividends included in dividend income, if any, are reported at the fair market value of the securities received. Other income and expenses are recorded on an accrual basis. Expenses that cannot be directly attributed to a fund are apportioned among the Funds in the Trust and in some cases other affiliated funds based upon their relative average net assets or number of shareholders.
The Fund has a “balance credit” arrangement with The Bank of New York Mellon (“BNYM”), the Fund’s custodian, whereby the Fund is credited with an interest factor equal to 0.75% below the effective 90-day T-Bill rate for account balances left uninvested overnight. If the T-Bill rate falls below 0.75%, no credits will be earned. These credits serve to reduce custody expenses that would otherwise be charged to the Fund. For the year ended December 31, 2009, the custodian expense was not reduced.
Overdrafts will cause a reduction of any earnings credits, computed at 2% above the effective Federal Funds rate on the day of the overdraft. For the year ended December 31, 2009, the Fund had no overdraft fees.
The Trust also has a balance credit arrangement with its Transfer Agent, PNC Global Investment Servicing (U.S.) Inc., whereby earnings credits are used to offset banking charges and other out-of-pocket expenses. For the year ended December 31, 2009, the transfer agent expense was reduced by $8,147.
The Investment Manager has agreed to waive a portion of its management fee in consideration of shareholder servicing fees that it has received from JPMorgan Distribution Services, Inc., with respect to short-term cash investments the Fund has made in JPMorgan Liquid Assets Money Market Fund, Capital Shares. For the year ended December 31, 2009, the management fee was reduced by $8,474.
Total returns and net investment income for the Fund would have been lower had certain expenses not been offset. Total expenses before offsets exclude the impact of expense reimbursements or fee waivers and expense offsets such as brokerage recapture credits, but include non-reimbursable expenses if any, such as interest and taxes.
d. Dividends and Distributions
Dividends resulting from net investment income, if any, normally will be declared and paid monthly. Distributions of capital gains, if any, will be made annually in December and when required for Federal excise tax purposes. Income and capital gain distributions are determined in accordance with Federal income tax regulations, which may differ from GAAP. These differences are primarily due to differing treatments for losses deferred due to wash sales, REITS, equalization accounting for tax purposes, foreign currency, options, futures and market discount transactions. Permanent book and tax basis differences, if any, relating to shareholder distributions will result in reclassifications to paid-in capital. The tax character of distributions paid during the fiscal years ended December 31, 2009 and 2008 were as follows:
| | | | | | |
| | | 2009 | | 2008 |
Distributions paid from: | | | | | | |
Ordinary income | | $ | 118,309,043 | | $ | 126,983,618 |
Short-term capital gains | | | — | | | 20,495,479 |
Long-term capital gains | | | — | | | 15,745,388 |
| | | | | | |
| | $ | 118,309,043 | | $ | 163,224,485 |
| | | | | | |
As a % of distributions paid: (unaudited) | | | | | | |
Qualified ordinary income | | | — | | | — |
Ordinary income - dividends received deduction | | | — | | | — |
| | | | | | |
As of December 31, 2009, the components of distributable earnings (excluding unrealized appreciation/depreciation) on a tax basis consisted of:
| | | |
| | | 2009 |
Capital loss carryforward | | $ | 69,964,824 |
Undistributed ordinary income | | | 1,101,568 |
Undistributed short-term capital gains | | | — |
Undistributed long-term capital gains | | | — |
e. Federal Taxes
The Fund intends to comply with the requirements under Subchapter M of the Internal Revenue Code of 1986, as amended, to distribute substantially all of its taxable income and gains to its shareholders and to meet certain diversification and income requirements with respect to investment companies. Therefore, no provision for Federal income or excise tax is included in the accompanying financial statements.
25
Notes to Financial Statements (continued)
Additionally, based on the Fund’s understanding of the tax rules and rates related to income, gains and transactions for the foreign jurisdictions in which it invests, the Fund will provide for foreign taxes, and where appropriate, deferred foreign taxes.
Management has analyzed the Fund’s tax positions taken on federal income tax returns for all open tax years (tax years ended December 31, 2006-2009), and has concluded that no provision for federal income tax is required in the Fund’s financial statements. Additionally, the Fund is not aware of any tax position for which it is reasonably possible that the total amounts of unrecognized tax benefits will change materially in the next twelve months.
f. Capital Loss Carryovers
As of December 31, 2009, the Fund had $69,964,824 in accumulated net realized capital loss carryover from securities transactions for Federal income tax purposes. This amount may be used to offset realized capital gains, if any, through December 31, 2017.
For the year ended December 31, 2009, the Fund did not utilize any capital loss carryovers.
g. Capital Stock
The Trust’s Declaration of Trust authorizes for each series the issuance of an unlimited number of shares of beneficial interest, without par value. The Fund records sales and repurchases of its capital stock on the trade date. The cost of securities contributed to the Fund in connection with the issuance of shares is based on the valuation of those securities in accordance with the Fund’s policy on investment valuation. Dividends and distributions to shareholders are recorded on the ex-dividend date.
At December 31, 2009, certain unaffiliated shareholders of record, specifically omnibus accounts, individually held greater than 10% of the outstanding shares of the Fund as follows: four collectively own 66%. Transactions by these shareholders may have a material impact on the Fund.
h. Foreign Currency Translation
The books and records of the Fund are maintained in U.S. dollars. The value of investments, assets and liabilities denominated in currencies other than U.S. dollars are translated into U.S. dollars based upon current foreign exchange rates. Purchases and sales of foreign investments, income and expenses are converted into U.S. dollars based on currency exchange rates prevailing on the respective dates of such transactions. Net realized and unrealized gain (loss) on foreign currency transactions represent: (1) foreign exchange gains and losses from the sale and holdings of foreign currencies; (2) gains and losses between trade date and settlement date on investment securities transactions and forward foreign currency exchange contracts; and (3) gains and losses from the difference between amounts of interest and dividends recorded and the amounts actually received.
The Fund does not isolate the net realized and unrealized gain or loss resulting from changes in exchange rates from the fluctuations in market prices of securities held. Such fluctuations are included with the net realized and unrealized gain or loss on investments.
2. Agreements and Transactions with Affiliates
The Trust has entered into an Investment Management Agreement under which the Investment Manager, an independently managed subsidiary of Affiliated Managers Group, Inc. (“AMG”), serves as investment manager to the Fund and is responsible for the Fund’s overall administration. The Investment Manager selects subadvisors for the Fund (subject to Trustee approval) and monitors each subadvisor’s investment programs and results. The Fund’s investment portfolio is managed by a portfolio manager who serves pursuant to a Subadvisory Agreement with the Investment Manager.
Investment management fees are paid directly by the Fund to the Investment Manager based on average daily net assets. For the year ended December 31, 2009, the annual investment management fee rate, as a percentage of average daily net assets, was 0.625%.
The Trust has entered into an Administration and Shareholder Servicing Agreement under which the Investment Manager serves as the Fund’s administrator (the “Administrator”) and is responsible for all aspects of managing the Fund’s operations, including administration and shareholder services to the Fund, its shareholders, and certain institutions, such as bank trust departments, broker-dealers and registered investment advisers, that advise or act as an intermediary with the Fund’s shareholders. The Fund pays a fee to the Administrator at the rate of 0.25% per annum of the Fund’s average daily net assets for this service.
The Investment Manager has contractually agreed, through at least May 1, 2010, to waive fees and pay or reimburse expenses to the extent that the total annual operating expenses (exclusive of taxes, interest, brokerage costs, acquired fund expenses, and extraordinary expenses) of the Fund exceed 0.99% of the Fund’s average daily net assets.
The Fund is obligated to repay the Investment Manager such amounts waived, paid or reimbursed in future years provided that the repayment occurs within thirty-six (36) months after the waiver or reimbursement and that such repayment would not cause the Fund’s total operating expenses in any such future year to exceed that Fund’s respective expense cap. For the year ended December 31, 2009, the Fund made no such repayments to the Investment Manager. At December 31, 2009, the cumulative amount of expense reimbursement by the Investment Manager subject to repayment by the Fund equaled $4,827,421.
26
Notes to Financial Statements (continued)
The aggregate annual retainer paid to each Independent Trustee is $65,000, plus $4,000 or $2,500 for each regular or special meeting attended, respectively. The Trustees’ fees and expenses are allocated amongst all of the Funds for which the Investment Manager serves as the advisor (the “Managers Funds”) based on the relative net assets of such Funds. The Independent Chairman of the Trusts receives an additional payment of $15,000 per year. The Chairman of the Audit Committee receives an additional payment of $5,000 per year. The “Trustees fees and expenses” shown in the financial statements represents the Fund’s allocated portion of the total fees and expenses paid by the Managers Funds.
The Fund is distributed by Managers Distributors, Inc. (the “Distributor” or “MDI”), a wholly-owned subsidiary of the Investment Manager. MDI serves as the principal underwriter for the Fund and is a registered broker-dealer and member of the Financial Industry Regulatory Authority, Inc. (“FINRA”). Shares of the Fund will be continuously offered and will be sold by brokers, dealers or other financial intermediaries who have executed selling agreements with the Distributor. MDI bears all the expenses of providing services pursuant to the Underwriting Agreement, including the payment of the expenses relating to the distribution of Prospectuses for sales purposes and any advertising or sales literature. Certain Trustees and Officers of the Fund are Officers and/or Directors of the Investment Manager, AMG and/or the Distributor.
On June 23, 2009, the Securities and Exchange Commission granted an exemptive order that permits the Fund to lend and borrow money for certain temporary purposes directly to and from other eligible Funds in the Managers Family of Funds (the “Fund Family”). Participation in this interfund lending program is voluntary for both borrowing and lending Funds, and an interfund loan is only made if it benefits each participating Fund. The Investment Manager administers the program according to procedures approved by the Funds’ Board of Trustees (the “Board”), and the Board monitors the operation of the program. An interfund loan must comply with certain conditions set out in the exemptive order, which are designed to assure fairness and protect all participating Funds. For the period from June 23, 2009 through December 31, 2009, the Fund lent varying amounts up to $117,390 for 4 days earning interest of $14 to other Funds in the Fund Family. The interest amounts are included in the Statement of Operations in interest income.
3. Purchases and Sales of Securities
Purchases and sales of securities, excluding short-term securities and U.S. government obligations, for the year ended December 31, 2009, were $242,083,530 and $623,187,680, respectively. Purchases and sales of U.S. government obligations for the year ended December 31, 2009, were $193,406,698 and $1,374,247, respectively.
4. Portfolio Securities Loaned
The Fund may participate in a securities lending program offered by BNYM, providing for the lending of securities to qualified brokers. Securities lending fees include earnings of such temporary cash investments, plus or minus any rebate to a borrower. These earnings (after any rebate) are then divided between BNYM, as a fee for its services under the program, and the Fund, according to agreed-upon rates. Collateral on all securities loaned is accepted in cash and/or government securities and is maintained at a minimum level of 102% (105% in the case of certain foreign securities) of the market value, plus interest, if applicable, of investments on loan. It is the Fund’s policy to obtain additional collateral from or return excess collateral to the borrower by the end of the next business day, following the valuation date of the securities loaned. Therefore, the value of the collateral held may be temporarily less than the value of the securities on loan. Lending securities entails a risk of loss to the Fund if and to the extent that the market value of the securities loaned were to increase and the borrower did not increase the collateral accordingly, and the borrower fails to return the securities. The Fund bears the risk of any deficiency in the amount of the collateral available for return to the borrower due to any loss on the collateral invested. Collateral received in the form of cash is invested temporarily in the BNY Institutional Cash Reserves Fund (the “ICRF”), or other short-term investments as defined in the Securities Lending Agreement with BNYM.
In September of 2008, BNYM advised the Investment Manager that the ICRF had exposure to certain defaulted debt obligations, and that BNYM had established a separate sleeve of the ICRF to hold these securities. The net impact of this position is not material to the Fund. The Fund’s position in the separate sleeve of the ICRF is included in the Schedule of Portfolio Investments and the unrealized loss on such investment is included in Net Unrealized Depreciation on the Statement of Assets and Liabilities and the Statement of Operations.
5. Commitments and Contingencies
In the normal course of business, the Fund may enter into contracts and agreements that contain a variety of representations and warranties, which provide general indemnifications. The maximum exposure to the Fund under these arrangements is unknown, as this would involve future claims that may be made against the Fund that have not yet occurred. However, based on experience, the Fund expects the risk of loss to be remote.
27
Notes to Financial Statements (continued)
6. Risks Associated with High Yield Securities (High Yield)
Investing in high yield securities involves greater risks and considerations not typically associated with U.S. Government and other high quality/investment grade securities. High Yield securities are generally below investment grade securities and do not have an established retail secondary market. Economic downturns may disrupt the high yield market and impair the issuer’s ability to repay principal and interest. Also, an increase in interest rates would likely have an adverse impact on the value of such obligations and could cause the securities to become less liquid.
7. Forward Commitments
Certain transactions, such as futures and forward transactions, dollar roll agreements, or purchases of when-issued or delayed delivery securities may have a similar effect on the Fund’s net asset value as if the Fund had created a degree of leverage in its portfolio. However, if the Fund enters into such a transaction, the Fund will establish a segregated account with its custodian in which it will maintain cash, U.S. government securities or other liquid securities equal in value to its obligations in respect to such transaction. Securities and other assets held in the segregated account may not be sold while the transaction is outstanding, unless other suitable assets are substituted.
8. Forward Foreign Currency Contracts
The Fund may invest in forward foreign currency exchange contracts to manage currency exposure. These investments may involve greater market risk than the amounts disclosed in the Fund’s financial statements.
A forward foreign currency exchange contract is an agreement between a Fund and another party to buy or sell a currency at a set price at a future date. The market value of the contract will fluctuate with changes in currency exchange rates. The contract is marked-to-market daily, and the change in market value is recorded as an unrealized gain or loss. Gain or loss on the purchase or sale of contracts having the same settlement date, amount and counterparty is realized on the date of offset, otherwise gain or loss is realized on the settlement date. There were no forward currency contracts held during the year.
The Fund may invest in non-U.S. dollar denominated instruments subject to limitations, and enter into forward foreign currency exchange contracts to facilitate transactions in foreign securities and to hedge foreign currency exchange rate risk on its non-U.S. Dollar denominated investment securities. Risks may arise upon entering into these contracts from the potential inability of counterparties to meet the terms of their contracts and from unanticipated movements in the value of a foreign currency relative to the U.S. dollar.
9. Subsequent Events
The Fund has determined that no additional material events or transactions occurred subsequent to December 31, 2009, and through February 22, 2010, the date of the issuance of the Fund’s financial statements, which require additional disclosure in the Fund’s financial statements.
Tax Information (unaudited)
The Fund hereby designates the maximum amount allowable of its net taxable income as qualified dividends as provided in the Jobs and Growth Tax Relief Reconciliation Act of 2003. The 2009 Form 1099-DIV you receive for the Fund will show the tax status of all distributions paid to you during the year.
Pursuant to section 852 of the Internal Revenue Code, the Fund hereby designates as a capital gain distribution with respect to the taxable year ended December 31, 2009, $0 or, if subsequently determined to be different, the net capital gains of such year.
28
Report of Independent Registered Public Accounting Firm
To the Board of Trustees of The Managers Funds and the Shareholders of Managers Bond Fund:
In our opinion, the accompanying statement of assets and liabilities, including the schedule of portfolio investments, and the related statements of operations and of changes in net assets and the financial highlights present fairly, in all material respects, the financial position of Managers Bond Fund (one of the series constituting The Managers Funds, hereafter referred to as the “Fund”) at December 31, 2009, the results of its operations for the year then ended, the changes in its net assets for each of the two years in the period then ended and the financial highlights for each of the five years in the period then ended, in conformity with accounting principles generally accepted in the United States of America. These financial statements and financial highlights (hereafter referred to as “financial statements”) are the responsibility of the Fund’s management; our responsibility is to express an opinion on these financial statements based on our audits. We conducted our audits of these financial statements in accordance with the standards of the Public Company Accounting Oversight Board (United States). Those standards require that we plan and perform the audit to obtain reasonable assurance about whether the financial statements are free of material misstatement. An audit includes examining, on a test basis, evidence supporting the amounts and disclosures in the financial statements, assessing the accounting principles used and significant estimates made by management, and evaluating the overall financial statement presentation. We believe that our audits, which included confirmation of securities at December 31, 2009 by correspondence with the custodian, provide a reasonable basis for our opinion.
PricewaterhouseCoopers LLP
Philadelphia, Pennsylvania
February 22, 2010
29
Trustees and Officers
The Trustees and Officers of the Trust, their business addresses, principal occupations for the past five years and dates of birth are listed below. The Trustees provide broad supervision over the affairs of the Trust and the Funds. The Trustees are experienced executives who meet periodically throughout the year to oversee the Funds’ activities, review contractual arrangements with companies that provide services to the Funds, and review the Funds’ performance. Unless otherwise noted, the address of each Trustee or Officers is the address of the Trust: 800 Connecticut Avenue, Norwalk, Connecticut 06854.
There is no stated term of office for Trustees. Trustees serve until their resignation, retirement or removal in accordance with the Trust’s organizational documents and policies adopted by the Board from time to time. The Chairman of the Trustees, President, Treasurer and Secretary of the Trust are elected by the Trustees annually. Other officers hold office at the pleasure of the Trustees.
Independent Trustees
The following Trustees are not “interested persons” of the Trust within the meaning of the 1940 Act:
| | |
Name, Date of Birth, Number of Funds Overseen in Fund Complex* | | Principal Occupation(s) During Past 5 Years and Other Directorships Held by Trustee |
Jack W. Aber, 9/9/37 • Trustee since 1999 • Oversees 34 Funds in Fund Complex | | Professor of Finance, Boston University School of Management (1972-Present); Trustee of Appleton Growth Fund (1 portfolio); Trustee of Third Avenue Trust (5 portfolios); Trustee of Third Avenue Variable Trust (1 portfolio). |
| |
William E. Chapman, II, 9/23/41 • Independent Chairman • Trustee since 1999 • Oversees 34 Funds in Fund Complex | | President and Owner, Longboat Retirement Planning Solutions (1998-Present); Hewitt Associates, LLC (part time) (provider of Retirement and Investment Education Seminars) (resigned Nov. 2009); Trustee of Bowdoin College (2002-Present); Director of Harding, Loevner Funds, Inc. (6 portfolios); Trustee of Third Avenue Trust (5 portfolios); Trustee of Third Avenue Variable Trust (1 portfolio). |
| |
Edward J. Kaier, 9/23/45 • Trustee since 1999 • Oversees 34 Funds in Fund Complex | | Attorney at Law and Partner, Teeters Harvey Gilboy & Kaier LLP (2007-Present); Attorney at Law and Partner, Hepburn Willcox Hamilton & Putnam, LLP (1977-2007); Trustee of Third Avenue Trust (5 portfolios); Trustee of Third Avenue Variable Trust (1 portfolio). |
| |
Steven J. Paggioli, 4/3/50 • Trustee since 1993 • Oversees 34 Funds in Fund Complex | | Consultant (2001-Present); Formerly Executive Vice President and Director, The Wadsworth Group (1986- 2001); Executive Vice President, Secretary and Director, Investment Company Administration, LLC (1990-2001); Vice President, Secretary and Director, First Fund Distributors, Inc. (1991-2001); Trustee, Professionally Managed Portfolios (22 portfolios); Advisory Board Member, Sustainable Growth Advisors, LP; Independent Director, Chase Investment Counsel (2008 – Present). |
| |
Eric Rakowski, 6/5/58 • Trustee since 1999 • Oversees 34 Funds in Fund Complex | | Professor, University of California at Berkeley School of Law (1990-Present); Director of Harding, Loevner Funds, Inc. (6 portfolios); Trustee of Third Avenue Trust (5 portfolios); Trustee of Third Avenue Variable Trust (1 portfolio). |
| |
Thomas R. Schneeweis, 5/10/47 • Trustee since 1987 • Oversees 34 Funds in Fund Complex | | Professor of Finance, University of Massachusetts (1977-Present); Director, CISDM at the University of Massachusetts, (1996-Present); President, Alternative Investment Analytics, LLC, (formerly Schneeweis Partners, LLC) (2001-Present); Partner, White Bear Partners, LLC (2007-Present); Partner, Schneeweis Capital Management, LLC (2007-Present); Partner, Schneeweis Associates, LLC (2007-Present); Partner, Northampton Capital Management, LLC (2004-Present); Partner, TRS Associates (2007-Present). |
* The Fund Complex consists of Managers AMG Funds, The Managers Funds, Managers Trust I and Managers Trust II. |
Interested Trustees
The following Trustees are “interested persons” of the Trust within the meaning of the 1940 Act. Mr. Dalton is an interested person by virtue of his positions with, and interest in securities of, Affiliated Managers Group, Inc. and his position with Managers Distributors, Inc. Mr. Streur is an interested person by virtue of his positions with Managers Investment Group LLC.
| | |
Name, Date of Birth, Number of Funds Overseen in Fund Complex* | | Principal Occupation(s) During Past 5 Years and Other Directorships Held by Trustee |
Nathaniel Dalton, 9/29/66 • Trustee since 2008 • Oversees 34 Funds in Fund Complex | | Executive Vice President and Chief Operating Officer, Affiliated Managers Group, Inc., (2006-Present); Executive Vice President, Affiliated Managers Group, Inc., (2002 -2006); Executive Vice President and General Counsel, Affiliated Managers Group, Inc. (2001-2002); Senior Vice President and General Counsel, Affiliated Managers Group, Inc. (1996-2001). Director, Managers Distributors, Inc. (2000-Present). |
| |
John H. Streur, 2/6/60 • Trustee since 2008 • President since 2008 • Oversees 34 Funds in Fund Complex | | Senior Managing Partner, Managers Investment Group LLC (2006-Present); President, Managers Distributors, Inc. (2006-Present); Managing Partner, Managers Investment Group LLC (2005-2006); Chief Executive Officer, President and Chief Operating Officer, The Burridge Group LLC (1996-2004). |
| |
| Officers | | |
| |
Name, Date of Birth,
Position(s) Held with Fund and Length of Time Served | | Principal Occupation(s) During Past 5 Years |
Christine C. Carsman, 4/2/52 • Secretary since 2004 | | Senior Vice President and Chief Regulatory Counsel, Affiliated Managers Group, Inc. (2004-Present); Secretary, Managers AMG Funds, Managers Trust I and II (2004-Present); Senior Counsel, Vice President and Director of Operational Risk Management and Compliance, Wellington Management Company, LLP (1995-2004); Deputy General Counsel, The Boston Company, Inc. (1993-1995); Associate General Counsel, The Boston Company Advisors, Inc. (1991-1993); Associate, Sullivan & Worcester LLP (1987-1991). |
| |
Donald S. Rumery, 5/29/58 • Chief Financial Officer since 2007 • Treasurer since 1995 | | Senior Vice President, Managers Investment Group LLC (2005-Present); Director, Finance and Planning, The Managers Funds LLC, (1994-2004); Treasurer and Chief Financial Officer, Managers Distributors, Inc. (2000-Present); Treasurer, Managers AMG Funds (1999-Present); Treasurer, Managers Trust I and Managers Trust II (2000-Present); Secretary, Managers Trust I and Managers Trust II (2000-2004) and Secretary, The Managers Funds (1997-2004); Chief Financial Officer, Managers AMG Funds, Managers Trust I and Managers Trust II (2007-Present). |
| |
Keitha L. Kinne, 5/16/58 • Chief Operating Officer since 2007 | | Managing Partner and Chief Operating Officer, Managers Investment Group LLC (2007-Present); Chief Investment Officer, Managers Investment Group LLC (2008-Present); Chief Operating Officer, Managers AMG Funds, Managers Trust I and Managers Trust II (2007-Present); Managing Director, Legg Mason & Co., LLC (2006-2007); Managing Director, Citigroup Asset Management (2004-2006); Senior Vice President, Prudential Investments (1999-2004). |
| |
David Kurzweil, 6/22/74 • Assistant Secretary since 2008 | | Senior Vice President and Associate Counsel, Managers Investment Group LLC (2008-Present); Assistant Secretary, The Managers Funds, Managers Trust I, Managers Trust II, and Managers AMG Funds (2008-Present); Counsel and Senior Vice President, Lazard Asset Management LLC (2003-2008). |
30
THIS PAGE INTENTIONALLY LEFT BLANK
Investment Manager and Administrator
Managers Investment Group LLC
333 W. Wacker Drive
Suite 1200
Chicago, IL 60606
(800) 835-3879
Distributor
Managers Distributors, Inc.
333 W. Wacker Drive
Suite 1200
Chicago, IL 60606
(800) 835-3879
Custodian
The Bank of New York Mellon
2 Hanson Place
Brooklyn, New York 11217
Legal Counsel
Ropes & Gray LLP
One International Place
Boston, Massachusetts 02110-2624
Transfer Agent
PNC Global Investment Servicing (U.S.) Inc.
Attn: Managers
P.O. Box 9769
Providence, Rhode Island 02940
(800) 548-4539
For Managers Choice Only
Managers
c/o PNC Global Investment Servicing (U.S.) Inc.
P.O. Box 61204
King of Prussia, Pennsylvania 19406-0851
(800) 358-7668

MANAGERSAND MANAGERS AMG FUNDS
| | | | |
EQUITY FUNDS | | BALANCED FUNDS |
| EMERGING MARKETS EQUITY | | CHICAGO EQUITY PARTNERS | | CHICAGO EQUITY PARTNERS BALANCED |
| Rexiter Capital Management Limited | | MID-CAP | | Chicago Equity Partners, LLC |
Schroder Investment Management North America Inc. | | Chicago Equity Partners, LLC | | |
| | | | ALTERNATIVE FUNDS |
| | REAL ESTATE SECURITIES | | |
| ESSEX GROWTH | | Urdang Securities Management, Inc. | | FQ GLOBAL ALTERNATIVES |
| ESSEX LARGE CAP GROWTH | | | | FQ GLOBAL ESSENTIALS |
| ESSEX SMALL/MICRO CAP GROWTH | | RENAISSANCE LARGE CAP GROWTH | | First Quadrant, L.P. |
| Essex Investment Management Co., LLC | | Renaissance Group LLC | | |
| | | | | INCOME FUNDS |
| FQ TAX-MANAGED U.S. EQUITY | | SKYLINE SPECIAL EQUITIES | | BOND (MANAGERS) |
| FQ U.S. EQUITY | | PORTFOLIO | | FIXED INCOME |
| First Quadrant, L.P. | | Skyline Asset Management, L.P. | | GLOBAL BOND |
GW&K SMALL CAP EQUITY | | FRONTIER SMALL CAP GROWTH | | Loomis, Sayles & Co., L.P. |
| Gannett Welsh & Kotler, LLC | | Frontier Capital Management Company, LLC | | BOND (MANAGERS PIMCO) |
| | | | Pacific Investment Management Co. LLC |
| INSTITUTIONAL MICRO-CAP | | SPECIAL EQUITY | | |
| MICRO-CAP | | Ranger Investment Management, L.P. | | CALIFORNIA INTERMEDIATE TAX-FREE |
| Lord, Abbett & Co. LLC | | Lord, Abbett & Co. LLC | | Miller Tabak Asset Management LLC |
| WEDGE Capital Management L.L.P. | | Smith Asset Management Group, L.P. | | |
| Next Century Growth Investors LLC | | Federated MDTA LLC | | GW&K MUNICIPAL BOND |
| RBC Global Asset Management (U.S.) Inc. | | | | GW&K MUNICIPAL ENHANCED YIELD |
| | SYSTEMATIC VALUE | | Gannett Welsh & Kotler, LLC |
| INTERNATIONAL EQUITY | | SYSTEMATIC MID CAP VALUE | | |
| AllianceBernstein L.P. | | Systematic Financial Management, L.P. | | HIGH YIELD |
| Lazard Asset Management, LLC | | | | J.P. Morgan Investment Management LLC |
| Martin Currie Inc. | | TIMESSQUARE MID CAP GROWTH | | |
| | TIMESSQUARE SMALL CAP GROWTH | | INTERMEDIATE DURATION GOVERNMENT |
| | TimesSquare Capital Management, LLC | | SHORT DURATION GOVERNMENT |
| | | | Smith Breeden Associates, Inc. |
| | MONEY MARKET JPMorgan Investment Advisors Inc. |
This report is prepared for the Fund’s shareholders. It is authorized for distribution to prospective investors only when preceded or accompanied by an effective prospectus. To receive a free copy of the prospectus or Statement of Additional Information, which includes additional information about Fund Trustees, please contact us by calling 800.835.3879. Distributed by Managers Distributors, Inc., member FINRA. A description of the policies and procedures each Fund uses to vote its proxies is available: (i) without charge, upon request, by calling 800.835.3879, or (ii) on the Securities and Exchange Commission’s (SEC) Web site at www.sec.gov. For information regarding each Fund’s proxy voting record for the 12-month period ended December 31, call 800.835.3879 or visit the SEC Web site at www.sec.gov. The Fund files its complete schedule of portfolio holdings with the SEC for the first and third quarters of each fiscal year on Form N-Q. The Fund’s Forms N-Q are available on the SEC’s website at www.sec.gov. A Fund’s Forms N-Q may be reviewed and copied at the SEC’s Public Reference Room in Washington, DC. Information on the operation of the Public Reference Room may be obtained by calling 1-800-SEC-0330. To review a complete list of the Fund’s portfolio holdings, or to view the most recent quarterly holdings report, semiannual report, or annual report, please visit www.managersinvest.com | |
www.managersinvest.com. | |  |

Registrant has adopted a Code of Ethics. See attached Exhibit (a)(1).
| Item 3. | AUDIT COMMITTEE FINANCIAL EXPERT |
Registrant’s Board of Trustees has determined that independent Trustees Mr. Jack W. Aber and Mr. Steven J. Paggioli each qualify as the Audit Committee Financial Expert. Mr. Aber and Mr. Paggioli are “independent” as such term is defined in Form N-CSR.
| Item 4. | PRINCIPAL ACCOUNTANT FEES AND SERVICES |
The aggregate fees billed by PwC to the Fund for the Funds’ two most recent fiscal years for professional services rendered for audits of annual financial statements, or services that are normally provided in connection with statutory and regulatory filings or engagements (“Audit Fees”) were as follows:
| | | | | | |
| | | Fiscal 2009 | | Fiscal 2008 |
Essex Large Cap Growth Fund | | $ | 19,419 | | $ | 18,899 |
Managers Special Equity Fund | | $ | 31,489 | | $ | 32,146 |
Managers International Equity Fund | | $ | 32,617 | | $ | 31,779 |
Managers Emerging Markets Equity Fund | | $ | 28,587 | | $ | 27,840 |
Managers Bond Fund | | $ | 40,564 | | $ | 39,556 |
Managers Global Bond Fund | | $ | 26,501 | | $ | 27,756 |
Managers Money Market Fund | | $ | 10,139 | | $ | 9,800 |
All Funds in the Managers Complex Audited by PwC | | $ | 850,498 | | $ | 769,183 |
Audit-Related Fees
There were no fees billed by PwC to the Funds in its two recent fiscal years for services rendered for assurance and related services that are reasonably related to the performance of the audit or review of the Fund’s financial statements, but are not reported as Audit Fees (“Audit-Related Fees”).
For the Funds’ two most recent fiscal years, there were no Audit-Related Fees billed by PwC for engagements related directly to the operations and financial reporting of one or more Funds by a Fund Service Provider. A Fund Service Provider is (a) any investment adviser to the Fund (not including any Subadvisor whose role is primarily portfolio management and is subcontracted with or overseen by another investment adviser) or (b) any entity that provides ongoing services to the Fund and is controlling, controlled by or under common control with a Fund investment adviser described in (a).
Tax Fees
The aggregate fees billed by PwC to the Funds for the two most recent fiscal years for professional services rendered for tax compliance, tax advice, and tax planning (“Tax Fees”) were as follows:
| | | | | | |
| | | Fiscal 2009 | | Fiscal 2008 |
Essex Large Cap Growth Fund | | $ | 5,800 | | $ | 6,471 |
Managers Special Equity Fund | | $ | 8,050 | | $ | 8,580 |
Managers International Equity Fund | | $ | 9,100 | | $ | 9,298 |
Managers Emerging Markets Equity Fund | | $ | 10,100 | | $ | 9,298 |
Managers Bond Fund | | $ | 9,000 | | $ | 8,484 |
Managers Global Bond Fund | | $ | 8,550 | | $ | 8,771 |
Managers Money Market Fund | | $ | 4,150 | | $ | 4,218 |
For the Funds’ two most recent fiscal years, Tax Fees billed by PwC for engagements by Fund Service Providers that related directly to the operations and financial reporting of the Funds were $0 for fiscal 2008 and $0 for fiscal 2007, respectively.
The services for which Tax Fees were charged comprise all services performed by professional staff in PwC’s tax division except those services related to the audit. Typically, this category would include fees for tax compliance, tax planning, and tax advice. Tax compliance, tax advice, and tax planning services include preparation of original and amended tax returns, claims for refund and tax payment-planning services, assistance with tax audits and appeals, tax advice related to mergers and acquisitions and requests for rulings or technical advice from taxing authorities.
All Other Fees
There were no other fees billed by PwC to the Funds for all other non-audit services (“Other Fees”) during the Funds’ two most recent fiscal years. During the same period, there were no Other Fees billed by PwC for engagements by Fund Service Providers that related directly to the operations and financial reporting of the Funds.
According to policies adopted by the Audit Committee, services provided by PwC to the Funds must be pre-approved by the Audit Committee. On an annual basis, the Audit Committee reviews and pre-approves various types of services that PwC may perform for the Funds without specific approval of each engagement, subject to specified budget limitations. As contemplated by the Sarbanes-Oxley Act of 2002 and related SEC rules, the Audit Committee also pre-approves non-audit services provided by PwC to any Fund Service Provider for any engagement that relates directly to the operations and financial reporting of the Funds. Any engagement that is not already pre-approved or that will exceed a pre-approved budget must be submitted to the Audit Committee for pre-approval. The Chairman of the Audit Committee is authorized on behalf of the Board of Trustees and the Audit Committee to approve the engagement of PwC to perform non-audit services subject to certain conditions, including notification to the Audit Committee of such pre-approval not later than the next meeting of the Audit Committee following the date of such pre-approval.
There were no other fees billed by PwC for non-audit services rendered to the Funds and to Fund Service Providers for the Funds’ two most recent fiscal years.
The Audit Committee has considered whether the provision of non-audit services by PwC to Fund Service Providers that were not required to be pre-approved by the Audit Committee is compatible with maintaining PwC’s independence in its audit of the Funds, taking into account representations from PwC, in accordance with Independence Standards Board Standard No. 1, regarding its independence from the Funds and its related entities.
The following table sets forth the non-audit services provided by PwC to the Funds and its service affiliates defined as the Funds’ investment advisor and any entity controlling, controlled by or under common control with Managers Investment Group LLC that provides ongoing services to the Funds (“Control Affiliates”) for the last two fiscal years.
| | | | | | | | | | | | | | | | | | |
| | | Audit-related fees A | | Tax fees A | | All other fees A |
| | | 2008 | | 2007 | | 2008 | | 2007 | | 2008 | | 2007 |
Control Affiliates | | $ | 343,015 | | $ | 467,485 | | $ | 897,895 | | $ | 1,264,360 | | $ | 0 | | $ | 0 |
| A | Aggregate amounts may reflect rounding. |
| Item 5. | AUDIT COMMITTEE OF LISTED REGISTRANTS |
Not applicable.
| Item 6. | SCHEDULE OF INVESTMENTS |
Not applicable.
| Item 7. | DISCLOSURE OF PROXY VOTING POLICIES AND PROCEDURES FOR CLOSED-END MANAGEMENT INVESTMENT COMPANIES |
Not applicable.
| Item 8. | PORTFOLIO MANAGERS OF CLOSED-END MANAGEMENT INVESTMENT COMPANIES |
Not applicable.
| Item 9. | PURCHASES OF EQUITY SECURITIES BY CLOSED-END MANAGEMENT INVESTMENT COMPANIES AND AFFILIATED PURCHASERS |
Not applicable.
| Item 10. | SUBMISSION OF MATTERS TO A VOTE OF SECURITY HOLDERS |
Not applicable.
| Item 11. | CONTROLS AND PROCEDURES |
(a) The Registrant’s principal executive and principal financial officers have concluded, based on their evaluation of the registrant’s disclosure controls and procedures as of a date within 90 days of the filing of this report, that the Registrant’s disclosure
controls and procedures are reasonably designed to ensure that information required to be disclosed by the Registrant on Form N-CSR is recorded, processed, summarized and reported within the required time periods and that information required to be disclosed by the registrant in the reports that it files or submits on Form N-CSR is accumulated and communicated to the Registrant’s management, including its principal executive and principal financial officers, as appropriate to allow timely decisions regarding required disclosure.
(b) There were no changes in the Registrant’s internal control over financial reporting during the Registrant’s fourth fiscal quarter of the period covered by this report that have materially affected, or are reasonably likely to affect, the internal control over financial reporting.
| | |
| (a) (1) | | Any Code of Ethics or amendments hereto. Filed herewith. |
| |
| (a) (2) | | Certifications pursuant to Rule 30a-2(a) under the Investment Company Act of 1940 - Filed herewith. |
| |
| (a) (3) | | Not applicable. |
| |
| (b) | | Certifications pursuant to Rule 30a-2(b) under the Investment Company Act of 1940 - Filed herewith. |
SIGNATURES
Pursuant to the requirements of the Securities Exchange Act of 1934 and the Investment Company Act of 1940, the registrant has duly caused this report to be signed on its behalf by the undersigned, thereunto duly authorized.
| | |
| THE MANAGERS FUNDS |
| |
| By: | | /S/ JOHN H. STREUR |
| | John H. Streur, President |
| |
| Date: | | March 9, 2010 |
Pursuant to the requirements of the Securities Exchange Act of 1934 and the Investment Company Act of 1940, this report has been signed below by the following persons on behalf of the registrant and in the capacities and on the dates indicated.
| | |
| By: | | /S/ JOHN H. STREUR |
| | John H. Streur, President |
| |
| Date: | | March 9, 2010 |
| |
| By: | | /S/ DONALD S. RUMERY |
| | Donald S. Rumery, Chief Financial Officer |
| |
| Date: | | March 9, 2010 |