UNITED STATES
SECURITIES AND EXCHANGE COMMISSION
Washington, D.C. 20549
FORM N-CSR
CERTIFIED SHAREHOLDER REPORT OF
REGISTERED MANAGEMENT INVESTMENT COMPANIES
| | |
Investment Company Act file number: | | 811-03752 |
THE MANAGERS FUNDS
|
| (Exact name of registrant as specified in charter) |
| | |
| 800 Connecticut Avenue, Norwalk, Connecticut | | 06854 |
| (Address of principal executive offices) | | (Zip code) |
Managers Investment Group LLC
800 Connecticut Avenue, Norwalk, Connecticut 06854
|
| (Name and address of agent for service) |
Registrant’s telephone number, including area code: (203) 299-3500
Date of fiscal year end: DECEMBER 31
Date of reporting period: JANUARY 1, 2008 – December 31, 2008 (Annual Shareholder Report)
| Item 1. | Reports to Shareholders |
ANNUAL REPORT
Managers Funds
December 31, 2008
Managers AMG Essex Large Cap Growth Fund
Managers International Equity Fund
Managers Emerging Markets Equity Fund
Managers Global Bond Fund
Managers Money Market Fund
AR001-1208
The Managers Funds
Annual Report—December 31, 2008
TABLE OF CONTENTS
| | |
| | | Page |
| LETTER TO SHAREHOLDERS | | 1 |
| |
| ABOUT YOUR FUNDS’ EXPENSES | | 3 |
| |
INVESTMENT MANAGER’S COMMENTS, FUND SNAPSHOTS, AND SCHEDULES OF PORTFOLIO INVESTMENTS | | |
| |
Managers AMG Essex Large Cap Growth Fund | | 4 |
| |
Managers International Equity Fund | | 9 |
| |
Managers Emerging Markets Equity Fund | | 18 |
| |
Managers Global Bond Fund | | 25 |
| |
| NOTES TO SCHEDULES OF PORTFOLIO INVESTMENTS | | 34 |
| |
| FINANCIAL STATEMENTS: | | |
| |
Statements of Assets and Liabilities | | 35 |
| |
Funds’ balance sheet, net asset value (NAV) per share computations and cumulative undistributed amounts | | |
| |
Statements of Operations | | 36 |
Detail of sources of income, Fund expenses, and realized and unrealized gains (losses) during the year | | |
| |
Statements of Changes in Net Assets | | 37 |
Detail of changes in Fund assets for the past two years | | |
| |
| MANAGERS MONEY MARKET FUND FINANCIAL STATEMENTS: | | |
| |
Statement of Assets and Liabilities | | 39 |
| |
Fund balance sheet, net asset value (NAV) per share computation and cumulative undistributed amount | | |
| |
Statements of Operations | | 39 |
Detail of sources of income, Fund expenses, and realized and unrealized gains (losses) during the past two periods | | |
| |
Statements of Changes in Net Assets | | 40 |
Detail of changes in Fund assets for the past three periods | | |
| |
| FINANCIAL HIGHLIGHTS | | 41 |
| |
Historical net asset values per share, distributions, total returns, expense ratios, turnover ratios and net assets | | |
| |
| NOTES TO FINANCIAL STATEMENTS | | 43 |
| |
Accounting and distribution policies, details of agreements and transactions with Fund management and affiliates, and descriptions of certain investment risks | | |
| |
REPORT OF INDEPENDENT REGISTERED PUBLIC ACCOUNTING FIRM | | 50 |
| |
| TRUSTEES AND OFFICERS | | 51 |
Nothing contained herein is to be considered an offer, sale or solicitation of an offer to buy shares of The Managers Funds or Managers AMG Funds. Such offering is made only by Prospectus, which includes details as to offering price and other material information.
Letter to Shareholders
Dear Shareholder:
2008 will go down in the history books as one of the most challenging investment periods in decades. Equities sank and Treasuries soared amid ongoing reports of deteriorating credit conditions and weakening economic growth in both the U.S. and abroad. The epicenter of the crisis continued to be in the financial sector, where escalating concerns about toxic mortgage assets culminated in a crisis of confidence in the strength of our most prominent financial institutions. As the trust that is so sorely needed between counterparties across the global financial system evaporated, so did the availability of credit. The scarce availability of credit, along with high levels of leverage, led to numerous firm mergers, bailouts and failures. While the total number of financial firm failures fell well short of levels reached during previous periods of crises, the casualties among the largest and most well-regarded corporations has been unprecedented. The list of firms included the likes of Bear Stearns, Lehman Brothers, Countrywide Financial, Washington Mutual, American International Group, Wachovia, Fannie Mae, Freddie Mac, Citigroup, Merrill Lynch and others.
Meanwhile, the U.S. Government, along with other global leaders, took unprecedented steps to attempt to resolve the credit crisis, contain the damage to real economies, and attempt to restore investor confidence. While the previous U.S. administration, via the Treasury and the Federal Reserve, acted aggressively in an attempt to alleviate the problems associated with the crisis, their efforts will likely require more time before we start to see meaningful results.
The impact of the credit crisis on the equity markets was widespread and severe across all market capitalizations. For the period, the Russell 1000® (large cap), Russell 2000® (small cap), and the Russell 3000® (all cap) Indices returned -37.6%, -33.8% and -37.3%, respectively. In contrast to calendar year 2007, value indices outperformed their growth counterparts for the period, with the Russell 3000® Value Index falling -36.3% while the Russell 3000® Growth Index declined -38.4%. Within the Russell 3000® Index, all sectors declined sharply, with financials leading the way, dropping -49.8% followed by materials, which fell -47.1%. The more defensive sectors such as consumer staples and health care held up the best, losing -16.6% and -23.4%, respectively. After several years of strong relative performance versus their domestic counterparts, developed international stocks suffered even steeper declines for the period, as the U.S. Dollar strengthened sharply against several major currencies. The MSCI EAFE Index, a barometer for the performance of developed foreign equities, declined - -43.4% while the MSCI Emerging Markets Index sank -53.3%.
Within the fixed income markets, performance varied notably along the credit spectrum, as higher-quality securities easily outperformed lower-quality issues. For the period, the Barclays Capital U.S. Treasury Index gained +13.7% while the Barclays Capital U.S. High Yield Index returned -26.2%. Broader fixed income indexes held up reasonably well, with the Barclays Capital U.S. Aggregate Index and the Barclays Capital Global Aggregate Ex-U.S. Dollar Index gaining +5.2% and +4.4%, respectively.
Against this backdrop, the Managers AMG Essex Large Cap Growth Fund, Managers International Equity Fund, Managers Emerging Markets Equity Fund, and the Managers Global Bond Fund, (each a “Fund” and collectively the “Funds”), generated mostly disappointing absolute and relative returns in this challenging environment, as detailed below. (Note that unless otherwise stated, all performance cited in these commentaries is in U.S. dollars.)
| | | | | | | | | | | | | | | | | | | | |
Periods Ended 12/31/08 | | 6 Months | | | 1 Year | | | 3 Years | | | 5 Years | | | 10 Years | | | Since
Inception | | | Inception Date |
Managers AMG Essex Large Cap Growth Fund | | (37.96 | )% | | (41.71 | )% | | (11.22 | )% | | (5.24 | )% | | (3.26 | )% | | 8.65 | % | | 6/1/1984 |
Russell 1000® Growth Index | | (32.31 | )% | | (38.44 | )% | | (9.11 | )% | | (3.42 | )% | | (4.27 | )% | | N/A | | | 6/1/1984 |
S&P 500 Index | | (28.48 | )% | | (37.00 | )% | | (8.36 | )% | | (2.19 | )% | | (1.38 | )% | | 10.18 | % | | 6/1/1984 |
| | | | | | | | | | | | | | | | | | | | |
Managers International Equity Fund | | (40.59 | )% | | (48.92 | )% | | (9.19 | )% | | (0.11 | )% | | (0.31 | )% | | 7.57 | % | | 12/31/1985 |
MSCI EAFE Index | | (36.41 | )% | | (43.38 | )% | | (7.35 | )% | | 1.66 | % | | 0.80 | % | | 7.27 | % | | 12/31/1985 |
Managers Emerging Markets Equity Fund | | (50.11 | )% | | (54.95 | )% | | (7.75 | )% | | 6.03 | % | | 9.96 | % | | 6.57 | % | | 2/9/1998 |
MSCI EM Index (Net) | | (47.11 | )% | | (53.33 | )% | | (4.91 | )% | | 7.66 | % | | 9.02 | % | | N/A | | | 2/9/1998 |
MSCI EM Index (Gross) | | (47.01 | )% | | (53.18 | )% | | (4.62 | )% | | 8.02 | % | | 9.31 | % | | 5.78 | % | | 2/9/1998 |
| | | | | | | | | | | | | | | | | | | | |
Managers Global Bond Fund | | (11.71 | )% | | (10.01 | )% | | 1.24 | % | | 1.58 | % | | 2.80 | % | | 4.54 | % | | 3/25/1994 |
Barclays Capital Global Aggregate Index | | 1.22 | % | | 4.79 | % | | 6.95 | % | | 5.01 | % | | 5.22 | % | | N/A | | | 3/25/1994 |
Money Market Fund | | 1.17 | % | | 2.73 | % | | 4.08 | % | | 3.19 | % | | 3.27 | % | | 4.79 | % | | 6/1/1984 |
Merrill 3 Month T-Bill | | 0.85 | % | | 2.06 | % | | 3.97 | % | | 3.25 | % | | 3.45 | % | | N/A | | | 6/1/1984 |
1
Letter to Shareholders (continued)
As noted above, for the year ended December 31, 2008, the Managers AMG Essex Large Cap Growth Fund (“Essex Large Cap Growth”) returned -41.71%, underperforming the Russell 1000® Growth Index, which returned -38.44%. The primary driver of Essex Large Cap Growth’s underperformance for the year was weak relative stock performance in the industrials and information technology sectors. In technology, several of Essex Large Cap Growth’s largest detractors for the year were sold during the fourth quarter, including Brocade Communications Systems Inc. (-56.4%) and Research In Motion Ltd. (-73.6%). In the industrials sector, Essex Large Cap Growth’s top detractors from performance included DryShips Inc. (-84.6%) and Walter Industries, Inc. (-81.8%). Partially offsetting the aforementioned detractors was solid sector positioning and strong relative stock performance with respect to Essex Large Cap Growth’s exposure to the resilient health care sector.
As noted above, for the year ended December 31, 2008, the Managers International Equity Fund (“International Equity”) returned -48.92%, compared with a return of -43.38% for its benchmark, the MSCI EAFE Index. Despite this recent performance difficulty, International Equity has maintained a solid track record since 2004 when International Equity’s current subadvisors collectively began managing this portfolio. In fact, 2008 is the first year since 2004 that International Equity has underperformed its benchmark. For the year, weak relative performance compared with that of the MSCI EAFE Index was driven by stock-selection difficulties in the consumer discretionary, energy, and financials sectors. Also, country positioning, more specifically exposure to non-benchmark countries such as Brazil and South Korea, detracted from performance. This exposure had been, at least partially, a driver of the solid performance generated in International Equity in the years prior to 2008. Despite the challenging performance of two of the three subadvisors, Lazard Asset Management, LLC, International Equity’s global thematic subadvisor, did add value relative to the benchmark based on its thematic investment approach, including its exposure to the Japanese market and its exposure to gold related equities.
As noted in the table above, for the fiscal year ended December 31, 2008, the Managers Emerging Markets Equity Fund (“Emerging Markets”) returned - -54.95% in 2008, compared with a return of -53.33% for its benchmark, the MSCI Emerging Markets (MSCI EM) Index. The Fund’s performance held up better than the Index during the first half of the year, only to lose ground in the second half leading to underperformance for the year. The Fund’s holdings in Russia provided the biggest boost to performance during the first half. However, the impact of rapidly falling commodity prices, combined with an onslaught of selling by some of the market’s larger investors to cover margin calls caused Russia to reverse course. The Fund’s overweight to the Russian market during the second half detracted from relative performance. A modest overweight to India also weighed on performance results. The Fund’s performance within Brazil trailed the country’s return, held back mainly by TAM, an airline company which was down 65% for the year. On a positive note, the Fund’s performance in China was better than the Index as the main contributors to the strong relative performance in China were China Railway Construction (+5.6%), and Ping An Insurance (+56.3%). Despite the challenging performance during 2008, the Fund has delivered strong absolute performance over the trailing 5 and 10 year periods.
As noted in the table above, for the year ended December 31, 2008, Managers Global Bond Fund (“Global Bond”) returned -10.01%, compared with a return of +4.79% for the Barclays Capital Global Aggregate Bond Index. The main driver of this underperformance was Global Bond’s overweight in corporate bonds, and a related underweight in U.S. Treasuries. Country allocation was marginally negative during the year, as all major global bond markets had positive local returns, but the underweight to U.S. Treasuries outweighed any benefit. Conversely, Global Bond’s currency strategy was a positive contributor to relative performance during the period. An underweight in the Canadian Dollar and the Euro, combined with a reduction in the exposure to non-Japanese Asian currencies during the second half of the year all contributed favorably.
The following report covers the one-year period ended December 31, 2008. Should you have any questions about this report, or if you’d like to receive a prospectus and additional information, including fees and expenses for these or any of the other Funds in our family, please feel free to contact us at 1-800-835-3879, or visit our Web site at www.managersinvest.com. As always, please read the prospectus carefully before you invest or send money.
If you are curious about how you can better diversify your investment program, visit the Knowledge Center on our Web site and view our articles in the investment strategies section. You can rest assured that under all market conditions our team is focused on delivering excellent investment management services for your benefit.
We thank you for your continued confidence and investment in The Managers Funds.
Respectfully,
|
 |
| John H. Streur |
Senior Managing Partner Managers Investment Group LLC |
|
2
About Your Funds’ Expenses
As a shareholder of a Fund, you may incur two types of costs: (1) transaction costs, which may include sales charges (loads) on purchase payments; redemption fees; and exchange fees; and (2) ongoing costs, including management fees; distribution (12b-1) fees; and other Fund expenses. This example is intended to help you understand your ongoing costs (in dollars) of investing in the Fund and to compare these costs with the ongoing costs of investing in other mutual funds. The example is based on $1,000 invested at the beginning of the period and held for the entire period as indicated below.
Actual Expenses
The first line of the following table provides information about the actual account values and actual expenses. You may use the information in this line, together with the amount you invested, to estimate the expenses that you paid over the period. Simply divide your account value by $1,000 (for example, an $8,600 account value divided by $1,000 = 8.6), then multiply the result by the number in the first line under the heading entitled “Expenses Paid During Period” to estimate the expenses you paid on your account during this period.
Hypothetical Example for Comparison Purposes
The second line of the following table provides information about hypothetical account values and hypothetical expenses based on the Fund’s actual expense ratio and an assumed annual rate of return of 5% before expenses, which is not the Fund’s actual return. The hypothetical account values and expenses may not be used to estimate the actual ending account balance or expenses you paid for the period. You may use this information to compare the ongoing costs of investing in the Fund and other funds by comparing this 5% hypothetical example with the 5% hypothetical examples that appear in the shareholder reports of other funds.
Please note that the expenses shown in the table are meant to highlight your ongoing costs only and do not reflect any transactional costs, such as sales charges (loads), redemption fees, or exchange fees. Therefore, the second line of the table is useful in comparing ongoing costs only, and will not help you determine the relative total costs of owning different funds.
| | | | | | | | | | | | |
Six Months Ended December 31, 2008 | | Expense Ratio
for the Period | | | Beginning
Account Value
7/1/2008 | | Ending
Account Value
12/31/2008 | | Expenses Paid
During the
Period* |
Managers AMG Essex Large Cap Growth Fund | | | | | | | | | | | | |
Based on Actual Fund Return | | 1.29 | % | | $ | 1,000 | | $ | 620 | | $ | 5.25 |
Based on Hypothetical 5% Annual Return | | 1.29 | % | | $ | 1,000 | | $ | 1,019 | | $ | 6.55 |
Managers International Equity Fund | | | | | | | | | | | | |
Based on Actual Fund Return | | 1.48 | % | | $ | 1,000 | | $ | 594 | | $ | 5.93 |
Based on Hypothetical 5% Annual Return | | 1.48 | % | | $ | 1,000 | | $ | 1,018 | | $ | 7.51 |
Managers Emerging Markets Equity Fund | | | | | | | | | | | | |
Based on Actual Fund Return | | 1.77 | % | | $ | 1,000 | | $ | 499 | | $ | 6.67 |
Based on Hypothetical 5% Annual Return | | 1.77 | % | | $ | 1,000 | | $ | 1,016 | | $ | 8.97 |
Managers Global Bond Fund | | | | | | | | | | | | |
Based on Actual Fund Return | | 1.10 | % | | $ | 1,000 | | $ | 878 | | $ | 5.19 |
Based on Hypothetical 5% Annual Return | | 1.10 | % | | $ | 1,000 | | $ | 1,020 | | $ | 5.58 |
Managers Money Market Fund 1 | | | | | | | | | | | | |
Based on Actual Fund Return | | 0.26 | % | | $ | 1,000 | | $ | 1,012 | | $ | 2.13 |
Based on Hypothetical 5% Annual Return | | 0.26 | % | | $ | 1,000 | | $ | 1,023 | | $ | 2.14 |
| * | Expenses are equal to the Fund’s annualized expense ratio multiplied by the average account value over the period, multiplied by the number of days in the most recent fiscal half-year (184), then divided by 366. |
1 | Effective December 1, 2007, the Money Market Fund changed its fiscal year end from November 30 to December 31. |
3
Managers AMG Essex Large Cap Growth Fund
Portfolio Manager’s Comments
For the year ended December 31, 2008, the Managers AMG Essex Large Cap Growth Fund (the “Fund”) returned -41.71%, underperforming the Russell 1000® Growth Index, which returned -38.44%.
THE PERIOD IN REVIEW:
The past quarter and year rank among the most challenging investment periods in a generation. While we have previously outlined the probabilities of further market volatility and economic weakness, the unprecedented speed and severity with which events unfolded caught investors off guard. Escalating worldwide recession fears along with concerns about the U.S. Treasury’s deployment of TARP funds fueled uncertainty, resulting in steep price declines across global equity, bond and commodity markets in the final quarter. Policymakers around the world instituted rescue packages and interest rate cuts to alleviate financial stresses, which helped stocks recover from their November lows. For the fourth quarter, major averages retreated over -20%, bringing 2008 roughly 35-40% below the prior year’s close. The decline for the year was broad based, sparing few sectors, styles, or market caps. Growth stocks moderately underperformed value stocks, and small-cap stocks were somewhat favored over larger sized companies.
Fund/Sector Commentary
Sector leadership varied considerably throughout the year. Previous sector leaders including energy, materials, and capital goods-related stocks dropped sharply late in the year, on the heels of a downturn in commodity prices and growing evidence of a slowdown in emerging economies, most notably China. For the year, financials were among the worst performers, with many losing half their value in 2008. On a relative basis defensive groups, such as consumer staples and health care, returned to favor.
Consumer discretionary stocks modestly outperformed market averages for the year despite sobering headlines of falling home prices, rising unemployment, and weak holiday sales. The Fund benefited from strong stock selection in this sector and Apollo Group Inc. (+18.1%) was a top contributor in the education services space. Apollo Group is the largest accredited post secondary education institution in the United States. The company stands to benefit from rising enrollments in a tough job market. Retail stock prices, however, dropped as the recession deepened and hurt the Fund’s holding in Amazon.com Inc. (-36.4%). This position has since been sold from the Fund. While plummeting fuel costs and lower mortgage rates may provide some temporary relief, the Fund’s subadvisor, Essex Investment Management Company Co., LLC (“Essex”) retains a cautious outlook on the consumer discretionary sector.
Stocks in the energy sector came under pressure in the back half of the year, retracting a significant portion of their earlier gains. The declines were most severe during the fourth quarter, as plummeting oil & gas prices pummeled the energy sector, with the drilling and services companies being particularly hard hit. With that said, the Fund benefited from its energy exposure on a relative basis, as an underweight position and solid stock selection led to outperformance within the sector versus the benchmark. Essex made no changes to the underweighted position in the Fund as slowing worldwide demand, mounting inventories, and liquidations from hedge funds will likely keep a lid on energy stock prices in the near term. Essex is looking for opportunities to increase the Fund’s exposure, as relative valuations are below prior cyclical downturns. In addition, the positive structural backdrop for the sector remains intact given the lack of major new discoveries and accelerated production declines for existing oil and gas fields. Once economic growth recovers, a return to tight supplies appears probable, setting the stage for an upturn in energy prices. Importantly, President Obama is expected to include in his fiscal stimulus package investment incentives for both traditional and alternative energy sources, which may provide added support to the sector in the year ahead.
Health care, one of the Fund’s largest weightings during the year, was a substantial contributor to performance relative to the Index. Investors embraced this industry’s defensive characteristics in the past year, led by generic drug, biotechnology, and medical device companies. Genentech Inc. (+23.6%) was one highlight for the year, after bouncing back from a disappointing second quarter. The company is expected to be acquired by Roche Holding at a premium. Vertex Pharmaceuticals Inc. (+30.8%) is leading the field in developing anti-viral drugs for the Hepatitis C Virus (HCV), and was another top contributor to Fund performance. Gilead Sciences Inc. (+11.2%) was another top contributor to the Fund. The pharmaceutical company is entering a new product cycle, and expected product launches in the U.S. and Europe should sustain company growth for the coming years. In contrast, selected life science tools and equipment stocks underperformed on fears of cutbacks in hospital and research spending budgets. These concerns negatively impacted the Fund’s holdings in Charles River Laboratories Inc. (-26.9%), Varian Medical Systems Inc. (-39.2%), and Intuitive Surgical Inc. (-45.8%). All three companies were liquidated from the Fund. Alcon Inc. (-37.4%) was also a large detractor to performance in this sector. Despite a positive run earlier in the second quarter, Alcon was sold late in the year after Essex lost confidence in the company’s ability to execute. Essex remains overweight in health care in the Fund.
In technology, weak stock returns resulted in underperformance versus the benchmark. Semiconductors and computer hardware makers were the primary laggards, hurt by rising inventories and significantly reduced earnings estimates. Internet software and services stocks also experienced steeper-than-market declines on fears of profit shortfalls. Several of the Fund’s largest detractors for the year were sold during the fourth quarter, including Brocade Communications Systems Inc. (-56.4%) and Research In Motion Ltd. (-73.6%). Google (-55.5%), another detractor, came under pressure during the first quarter on worries of a slowdown in their paid search revenues. Salesforce.com Inc. (+10.3%) was a positive contributor in the software area before being eliminated on expectations of slowing demand for its products. McAfee Inc. (-7.8%), a leader in anti-virus, security, and related systems management software, was another relative contributor in this sector.
4
Managers AMG Essex Large Cap Growth Fund
Portfolio Manager’s Comments (continued)
McAfee’s recurring revenue model has provided some insulation from the current downturn in technology spending. Despite cyclical economic stresses, Essex believes that secular trends in information technology spending remain positive, specifically in the areas of wireless data, security software, and broadband communications equipment, the latter of which could receive an added boost from the current administration’s fiscal stimulus plan.
In the industrials and materials sectors, weak stock performance partly related to decelerating growth in the U.S. and abroad resulted in relative underperformance. In materials, Essex sold the Fund’s position in Freeport-McMoRan Copper & Gold Inc. (-70.6%) due to a sharp drop in metal prices. Certain fertilizer prices have also begun declining, leading to the liquidation of the Fund’s holding in Mosaic Co. (-60.6%). Potash Corp. of Saskatchewan Inc. (-49.0%) posted disappointing returns due to expected short-term weakness in production volumes, although underlying potash prices remain strong. The Fund’s top detractors from performance in the industrials sector included DryShips Inc. (-84.6%) and Walter Industries, Inc. (-81.8%).
OUTLOOK: PREMIUM FOR GROWTH
Key indicators such as employment, retail sales, and consumer confidence have deteriorated in recent months, as the recession continues to deepen. The underpinning of the economic weakness remains housing and tighter credit. However, there are several positives, most notably that a significant amount of monetary and fiscal stimulus has been injected into the economy and is expected to take effect later this year. In addition, Essex believes inflation has crested for this cycle, as decelerating growth has resulted in lower food and energy prices. Further, Essex believes that given this disinflationary environment and credit market uncertainty, rates will likely stay low for a prolonged period of time.
U.S. equity prices are likely to remain in a trading range until there are more visible signs that the government’s actions are working to support the economy and restore confidence. However, if history repeats, stock markets around the world should resume an upward trajectory before it is clear that the economy has recovered. Investors will be more selective this year as earnings slow by placing a greater premium on companies of all sizes with dynamic growth characteristics. Essex continues to find opportunities across a number of areas, including health care, internet services, software and global industrials.
CUMULATIVE TOTAL RETURN PERFORMANCE
Managers AMG Essex Large Cap Growth Fund’s cumulative total return is based on the daily change in net asset value (NAV), and assumes that all dividends and distributions were reinvested. The Russell 1000® Growth Index measures the performance of those companies in the Russell 1000® Index with higher price-to book ratios and higher forecasted growth values. The Russell 1000® Index measures the performance of the 1,000 largest companies in the Russell 3000® Index, which measures the performance of the 3,000 largest U.S. companies based on total market capitalization. Unlike the Fund, the Russell 1000® Growth Index is unmanaged, is not available for investment, and does not incur expenses. The Index assumes reinvestment of dividends. This graph compares a hypothetical $10,000 investment made in Managers AMG Essex Large Cap Growth Fund on December 31, 1998, to a $10,000 investment made in the Russell 1000® Index for the same time period. Performance for periods longer than one year is annualized. The graph and table do not reflect the deduction of taxes that a shareholder would pay on a Fund distribution or redemption of shares. The listed returns for the Fund are net of expenses and the returns for the index exclude expenses. Past performance is not indicative of future results. Total returns would have been lower had certain expenses not been reduced. The Russell 1000® Growth Index is a trademark of the Frank Russell Company. Frank Russell® is a trademark of the Frank Russell Company.
5
Managers AMG Essex Large Cap Growth Fund
Portfolio Manager’s Comments (continued)
CUMULATIVE TOTAL RETURN PERFORMANCE (continued)
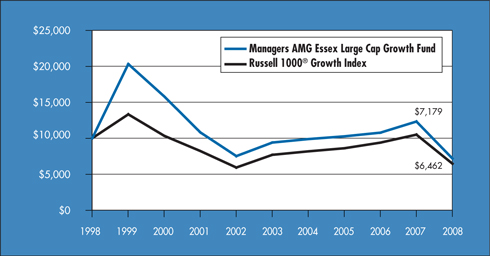
The table below shows the average annual total returns for Managers AMG Essex Large Cap Growth Fund and the Russell 1000® Growth Index since December 31, 1998 through December 31, 2008.
| | | | | | | | | | | |
Average Annual Total Returns 1 | | One Year | | | Five Years | | | Ten Years | | | Inception Date |
Managers AMG Essex Large Cap Growth Fund 2 | | (41.71 | )% | | (5.24 | )% | | (3.26 | )% | | 6/1/84 |
Russell 1000® Growth Index | | (38.44 | )% | | (3.42 | )% | | (4.27 | )% | | |
The performance data shown represents past performance. Past performance is not a guarantee of future results. Current performance may be lower or higher than the performance data quoted. The investment return and principal value of an investment in the Fund will fluctuate so that an investor’s shares, when redeemed, may be worth more or less than their original cost. For performance information through the most recent month end, please call (800) 835-3879 or visit our Web site at www.managersinvest.com.
In choosing a Fund, investors should carefully consider the amount they plan to invest, their investment objectives, the Fund’s investment objectives, risks, charges and expenses before investing. For this and other information, please call (800) 835-3879 or visit www.managersinvest.com for a free prospectus. Read it carefully before investing or sending money. Distributed by Managers Distributors, Inc., member FINRA.
| | 1 | Total return equals income yield plus share price change and assumes reinvestment of all dividends and capital gain distributions. Returns are net of fees and may reflect offsets of Fund expenses as described in the Prospectus. No adjustment has been made for taxes payable by shareholders on their reinvested dividends and capital gain distributions. Returns for periods greater than one year are annualized. The listed returns on the Fund are net of expenses. All returns are in U.S. dollars($). |
| | 2 | Fund for which, from time to time, the Fund’s advisor has waived its fees and/or absorbed Fund expenses, which has resulted in higher returns. |
Not FDIC insured, nor bank guaranteed. May lose value.
6
Managers AMG Essex Large Cap Growth Fund
Fund Snapshots
December 31, 2008
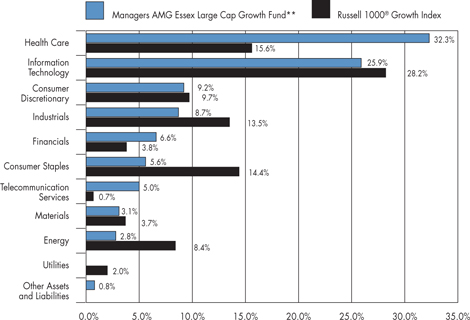
Portfolio Breakdown
| | | | | | |
Industry | | Managers AMG
Essex Large Cap
Growth Fund** | | | Russell 1000®
Growth Index | |
Health Care | | 32.3 | % | | 15.6 | % |
Information Technology | | 25.9 | % | | 28.2 | % |
Consumer Discretionary | | 9.2 | % | | 9.7 | % |
Industrials | | 8.7 | % | | 13.5 | % |
Financials | | 6.6 | % | | 3.8 | % |
Consumer Staples | | 5.6 | % | | 14.4 | % |
Telecommunication Services | | 5.0 | % | | 0.7 | % |
Materials | | 3.1 | % | | 3.7 | % |
Energy | | 2.8 | % | | 8.4 | % |
Utilities | | 0.0 | % | | 2.0 | % |
Other Assets and Liabilities | | 0.8 | % | | 0.0 | % |
| | ** | As a percentage of net assets |
Top Ten Holdings
| | | |
| | | Percentage of | |
Security Name | | Net Assets | |
Genentech, Inc.* | | 5.5 | % |
Abbott Laboratories Co.* | | 5.2 | |
Gilead Sciences, Inc.* | | 4.5 | |
Procter & Gamble Co., The | | 3.7 | |
Kohl’s Corp. | | 3.7 | |
Apollo Group, Inc., Class A | | 3.5 | |
Vertex Pharmaceuticals, Inc.* | | 3.5 | |
International Business Machines Corp. | | 3.4 | |
QUALCOMM, Inc. | | 3.3 | |
Apple, Inc. | | 3.2 | |
| | | |
Top Ten as a Group | | 39.5 | % |
| | | |
| | * | Top Ten Holding at June 30, 2008 |
Any sectors, industries, or securities discussed should not be perceived as investment recommendations. Mention of a specific security should not be considered a recommendation to buy or solicitation to sell that security.
7
Managers AMG Essex Large Cap Growth Fund
Schedule of Portfolio Investments
December 31, 2008
| | | | | | | |
| | | Shares | | | Value | |
Common Stocks—99.2% | | | | | | | |
Consumer Discretionary—9.2% | | | | | | | |
Apollo Group, Inc., Class A* | | 13,323 | | | $ | 1,020,808 | |
Kohl’s Corp.* | | 29,558 | | | | 1,070,000 | |
TJX Cos., Inc., The | | 27,913 | | | | 574,170 | |
Total Consumer Discretionary | | | | | | 2,664,978 | |
Consumer Staples—5.6% | | | | | | | |
CVS Caremark Corp. | | 19,606 | | | | 563,476 | |
Procter & Gamble Co., The | | 17,360 | | | | 1,073,196 | |
Total Consumer Staples | | | | | | 1,636,672 | |
Energy—2.8% | | | | | | | |
Southwestern Energy Co.* | | 27,603 | | | | 799,659 | |
Financials—6.6% | | | | | | | |
ACE, Ltd. | | 5,674 | | | | 300,268 | |
Charles Schwab Corp., The | | 33,674 | | | | 544,509 | |
Goldman Sachs Group, Inc. | | 2,724 | | | | 229,878 | |
PartnerRe Ltd. | | 5,652 | 2 | | | 402,818 | |
State Street Corp. | | 11,222 | | | | 441,361 | |
Total Financials | | | | | | 1,918,834 | |
Health Care—32.3% | | | | | | | |
Abbott Laboratories Co. | | 28,091 | | | | 1,499,216 | |
Amgen, Inc.* | | 4,656 | | | | 268,884 | |
Baxter International, Inc. | | 16,751 | | | | 897,686 | |
Celgene Corp.* | | 15,281 | | | | 844,734 | |
Genentech, Inc.* | | 19,149 | | | | 1,587,643 | |
Gilead Sciences, Inc.* | | 25,683 | | | | 1,313,429 | |
Medco Health Solutions, Inc.* | | 12,700 | | | | 532,257 | |
Shire Pharmaceuticals PLC | | 16,078 | | | | 719,973 | |
Teva Pharmaceutical Industries, Ltd., Sponsored ADR | | 15,930 | 2 | | | 678,140 | |
Vertex Pharmaceuticals, Inc.* | | 33,225 | | | | 1,009,376 | |
Total Health Care | | | | | | 9,351,338 | |
Industrials—8.7% | | | | | | | |
Aecom Technology Corp.* | | 9,682 | | | | 297,528 | |
AMR Corp.* | | 43,493 | | | | 464,070 | |
Delta Air Lines, Inc.* | | 38,238 | | | | 438,207 | |
Quanta Services, Inc.* | | 37,723 | | | | 746,916 | |
URS Corp.* | | 13,936 | | | | 568,171 | |
Total Industrials | | | | | | 2,514,892 | |
Information Technology—25.9% | | | | | | | |
Activision Blizzard, Inc.* | | 62,825 | | | | 542,808 | |
Alliance Data Systems Corp.* | | 3,660 | | | | 170,300 | |
Apple, Inc.* | | 10,864 | | | | 927,242 | |
Cisco Systems, Inc.* | | 33,192 | | | | 541,030 | |
EMC Corp.* | | 48,169 | | | | 504,329 | |
Google, Inc.* | | 2,688 | | | | 826,963 | |
International Business Machines Corp. | | 11,791 | | | | 992,331 | |
McAfee, Inc.* | | 22,145 | | | | 765,553 | |
Microsoft Corp. | | 44,576 | | | | 866,557 | |
Oracle Corp.* | | 22,842 | | | | 404,989 | |
QUALCOMM, Inc. | | 26,382 | | | | 945,267 | |
Total Information Technology | | | | | | 7,487,369 | |
Materials—3.1% | | | | | | | |
Agnico—Eagle Mines, Ltd. | | 4,608 | 2 | | | 236,529 | |
Cliffs Natural Resources, Inc. | | 7,875 | | | | 201,679 | |
Potash Corp. of Saskatchewan, Inc. | | 6,490 | 2 | | | 475,197 | |
Total Materials | | | | | | 913,405 | |
Telecommunication Services—5.0% | | | | | | | |
MetroPCS Communications, Inc.* | | 54,268 | | | | 805,880 | |
NII Holdings, Inc., Class B* | | 34,925 | | | | 634,936 | |
Total Telecommunication Services | | | | | | 1,440,816 | |
Total Common Stocks (cost $32,726,334) | | | | | | 28,727,963 | |
Other Investment Companies—4.9%1 | | | | | | | |
BNY Institutional Cash Reserves Fund, Series A, 0.07%3 | | 1,085,002 | | | | 1,085,002 | |
BNY Institutional Cash Reserves Fund, Series B*3,8 | | 119,397 | | | | 10,746 | |
BNY Institutional Cash Reserves, Series C*3,9 | | 60,187 | | | | 60,187 | |
Dreyfus Cash Management Fund, Institutional Class Shares, 1.53%10 | | 259,299 | | | | 259,299 | |
Total Other Investment Companies (cost $1,523,885) | | | | | | 1,415,234 | |
Total Investments—104.1% (cost $34,250,219) | | | | | | 30,143,197 | |
Other Assets, less Liabilities—(4.1)% | | | | | | (1,183,727 | ) |
Net Assets—100.0% | | | | | $ | 28,959,470 | |
The accompanying notes are an integral part of these financial statements.
8
Managers International Equity Fund
Portfolio Managers’ Comments
The Managers International Equity Fund’s (the “Fund”) investment objective is to achieve long-term capital appreciation. Income is the Fund’s secondary objective.
The Fund ordinarily invests at least 80% of assets in equity securities, and at least 65% of assets in common and preferred stocks of companies domiciled outside the United States. The Fund intends to diversify investments among both countries and sectors. Investments may be made in companies in developed as well as developing countries. The Fund may also engage in currency-hedging strategies. The Fund may invest in companies of any size. The MSCI EAFE Index (the “Index”) is the benchmark for the Fund.
THE PORTFOLIO MANAGERS
The Fund employs multiple portfolio managers who specialize in distinct investment approaches. This “intelligence diversification” not only serves to manage risk, but also helps the Fund tap the market’s full potential by focusing different analytical insights on each potential investment. Fund management strives to achieve this performance and diversification while ensuring that the Fund operates within the framework of its investment objective and principal investment strategies.
AllianceBernstein L.P. (“Bernstein”)
Bernstein’s approach to investing is value based and research driven. The thesis of Bernstein’s investment philosophy is that human nature leads investors to buy and sell financial assets based on an overreaction to near-term events, as they confuse temporary or cyclical characteristics with the creation of buying opportunities, as investors underestimate the potential for corrective strategies to restore long-term earnings power. The investment team, led by Kevin Simms, attempts to exploit this disconnect by using research to separate fact from emotion.
The primary driver of Bernstein’s performance is research-driven security selection. Bernstein screens their initial universe with a proprietary return model in order to identify the companies with the most attractive value attributes. The model derives an expected return for each company within the universe by assessing companies both from a global industry-based perspective and from a country-based standpoint, evaluating such factors as price-to-cash earnings, price-to-book, return on equity, and price momentum. The ideal company would exhibit strong fundamentals and have strong future business prospects.
Portfolio Construction
| | • | | Initial investable universe is comprised of all companies within the countries of the MSCI All Country World Index ex-U.S. universe with a market capitalization greater than $750 million |
| | • | | Investment team screens this universe using a proprietary-return model to identify the companies with the most attractive value attributes |
| | • | | The model derives an expected return for each company in the universe by assessing companies both from a global industry-based perspective and from a country-based standpoint |
| | • | | Factors include price-to-cash earnings, price-to-book, return on equity, and price momentum |
| | • | | Analysts perform extensive research, focusing on the most attractively valued stocks |
| | • | | They then build detailed spreadsheets of historical and projected balance-sheet and income-statement information in order to estimate: |
| | • | | Normalized earnings power |
| | • | | Cash flow and asset values for each company for the next five years |
| | • | | Perform simulations to see the potential impact of changes in various financial statement components |
| | • | | Analysts present their estimates and ratings for each security to the Research Review Committee of the Investment Policy Group (IPG) |
| | • | | The Committee challenges the analysts’ assumptions and conclusions to ensure they are sound |
The Portfolio
| | • | | Typically holds 30 – 85 stocks |
| | • | | Initial stock weightings are 0.5 – 3.5% |
The following factors influence the sell decision:
| | • | | A stock has achieved Bernstein’s forecasted target of fair value |
| | • | | A change in the long-term earnings forecast reduces the price target to current market levels |
Lazard Asset Management, LLC (“Lazard”)
Portfolio manager William (Willy) Holzer believes that there is a single global economy and marketplace within which everything is connected. Within this single market it is important to distinguish between three types of companies: domestic companies are those that produce, sell, and raise capital all in their home country; international companies are those that produce at home, but sell their products and raise capital anywhere in the world; and global companies are those that produce, sell, and raise capital anywhere. Holzer will invest in any of these types of companies in order to capitalize on a theme. However, he prefers global companies, which generally have the flexibility and resources to exploit global trends.
Willy Holzer can be described as a “top-down” thematic investor whose themes are based on bottom-up observations and company analysis. He views the world as a single global economic unit as opposed to a collection of separate country economies. Willy focuses his efforts by first analyzing the connections within the global economy and from this analysis develops global investment themes. These themes target the segments of the global economy that he believes are most likely to provide attractive long-term investment returns and that also represent an asymmetric investment opportunity in the investor’s favor.
The ideal company exhibits many of the following traits:
| | • | | Attractive Fundamentals |
| | • | | Strong Company Management |
Portfolio Construction
| | • | | Portfolio manager leverages stock ideas and research from top-down themes based on bottom-up observations and company analysis |
| | • | | Constructs portfolio around approximately ten investment themes to diversify opportunity sets and provide risk benefits |
| | • | | Portfolio heavily weights large-capitalization, multi-national companies |
9
Managers International Equity Fund
Portfolio Managers’ Comments (continued)
| | • | | Concentrated in the developed markets |
| | • | | May have operations or distribution in the emerging markets. |
The Portfolio
| | • | | Portfolio typically holds 90 – 110 stocks |
| | • | | Initial stock weightings are 1.0 – 1.5% |
| | • | | Relatively low turnover in the 30% to 40% annual range |
Lazard may sell a security when it:
| | • | | Exceeds price expectations |
| | • | | Fundamental breakdown occurs at company |
Wellington Management Company, LLP (“Wellington Management”)
Andrew S. Offit’s and Jean-Marc Berteaux’s investment philosophy is built on the belief that industry is the dominant competitive factor for companies, that companies can dominate industries on a global basis, and that expectations about companies, specifically earnings, drive stock prices. The focus is to identify industry leaders whose earnings forecasts are ahead of market expectations and where they have identified the key drivers for the earnings.
The initial investable universe for the investment team at Wellington Management is composed of companies in the MSCI EAFE Index with market capitalizations greater than U.S. $1 billion. These companies are researched by Wellington Management’s global industry analysts who perform intensive ongoing fundamental research. Fundamental research consists of comprehensive company meetings, earnings modeling, and valuation analysis. The focus of this research is to update an ongoing assessment of management, current business challenges, and aggregate industry trends. Thorough analysis is done in preparation for and following company contacts to ensure that “the numbers support the story,” i.e., that the strategy and challenges outlined by management are coming through in financial results.
The ideal company exhibits many of the following traits:
| | • | | Identified earnings drivers |
| | • | | Above consensus earning growth expectations |
| | • | | Multiple expansion potential |
| | • | | Reasonable valuation levels |
Portfolio Construction
| | • | | The portfolio typically holds 50 – 85 stocks |
| | • | | Cash levels are maintained at less than 10% of assets |
| | • | | Maximum of 10% is committed to any single holding |
| | • | | Active sector allocations are entirely built from stock selection |
| | • | | Country allocation is an implicit result of stock selection |
| | • | | Some consideration is given to ensuring country diversification |
| | • | | Emerging market exposure maximum of 15% |
Wellington Management may sell an investment when:
| | • | | They see deteriorating earnings drivers or company fundamentals |
| | • | | Trend of earnings growth decelerates |
| | • | | They see limited upside potential left in the stock price |
THE YEAR IN REVIEW
For the year 2008, the Fund returned -48.92% versus -43.38% for the Index. (Note that unless otherwise stated, all performance cited in this commentary is in U.S. Dollars.)
Turmoil spread throughout developed equity markets in 2008, with all markets posting large negative double-digit returns amid a global recession. Volatility continued throughout the course of the year as deleveraging left no market unscathed. Commodity prices reached record heights in the early part of the year but plunged in the latter half of 2008 amid slowing economic growth. Unprecedented fiscal and monetary policy was enacted on a coordinated basis worldwide in an effort to stop the global economy from falling into an even deeper recession.
Many developed equity markets returned worse than -50% during the course of the year, with markets such as Austria and Belgium plunging nearly -70%. In fact, only Japan and Switzerland returned better than a -30% return for the year (-29% for each market). U.S. Dollar denominated investors performed even worse when investing in international markets as the U.S. Dollar strengthened relative to local currencies. On a sector basis, the worst performers were the financials and materials sectors while the best performers were the more defensive health care and utilities sectors.
Within the Fund, weak relative performance compared with that of the Index was driven by stock selection difficulties in the consumer discretionary, energy, and financials sectors. Also, country positioning, more specifically exposure to non-benchmark countries such as Brazil and South Korea, detracted from performance. However, Lazard, the Fund’s global thematic subadvisor, did add value relative to the benchmark through several of its themes, including its exposure to the Japanese market as well as its exposure to gold-related equities.
LOOKING FORWARD
The volatility of global equity markets has created a sizable opportunity for active managers, and the subadvisors of this Fund have been shifting positioning in an attempt to take advantage of some of the current market dislocations. The Fund’s subadvisors are finding compelling opportunities based upon low valuations in a number of different sectors and currently maintain overweights in the energy, financials, and materials sectors after extraordinarily difficult performance in each of these areas in 2008. The opportunity within the commodity sectors, both energy and materials, is being largely driven by a longer term secular thesis about the limited supply and the long-term expectation for global demand for these resources. As for the financials sector, the focus for the Fund’s subadvisors has been on finding the highest quality names that have been brought down “in sympathy” with the rest of the sector. Although the Fund’s subadvisors maintain a longer term focus, they will continue to take advantage of shorter term volatility in an effort to add to well managed, high quality companies that have been oversold by the market.
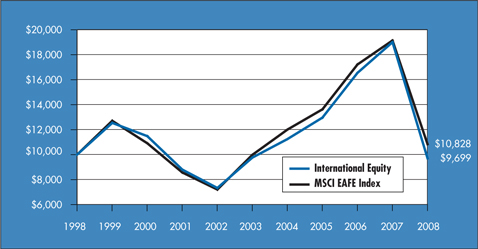
CUMULATIVE TOTAL RETURN PERFORMANCE
Managers International Equity Fund’s cumulative total return is based on the daily change in net asset value (NAV), and assumes that all distributions were reinvested. The Morgan Stanley Capital International Europe, Australasia, and Far East (MSCI EAFE) Index is composed of all the publicly traded stocks in developed non-U.S. Markets. The MSCI EAFE Index consisted of the following 21 developed market country indices: Australia, Austria,
10
Managers International Equity Fund
Portfolio Managers’ Comments (continued)
CUMULATIVE TOTAL RETURN PERFORMANCE (continued)
Belgium, Denmark, Finland, France, Germany, Greece, Hong Kong, Ireland, Italy, Japan, the Netherlands, New Zealand, Norway, Portugal, Singapore, Spain, Sweden, Switzerland and the United Kingdom. Unlike the Fund, the MSCI EAFE Index is unmanaged, is not available for investment, and does not incur expenses. The Index assumes reinvestment of dividends. This graph compares a hypothetical $10,000 investment made in Managers International Equity Fund on December 31, 1998, to a $10,000 investment made in the MSCI EAFE for the same time period. The table is not intended to imply any future performance of the Fund. Performance for periods longer than one year is annualized. The graph and table do not reflect the deduction of taxes that a shareholder would pay on a Fund distribution or redemption of shares. The listed returns for the Fund are net of expenses and the returns for the index exclude expenses. Past performance is not indicative of future results. Total returns would have been lower had certain expenses not been reduced.
The table below shows the average annual total returns for Managers International Equity Fund and the MSCI EAFE since December 31, 1998 through December 31, 2008.
| | | | | | | | | | | |
Average Annual Total Returns 1 | | One Year | | | Five Years | | | Ten Years | | | Inception Date |
Managers International Equity Fund 2,3 | | (48.92 | )% | | (0.11 | )% | | (0.31 | )% | | 12/31/85 |
MSCI EAFE Index | | (43.38 | )% | | 1.66 | % | | 0.80 | % | | |
The performance data shown represents past performance. Past performance is not a guarantee of future results. Current performance may be lower or higher than the performance data quoted. The investment return and principal value of an investment in the Fund will fluctuate so that an investor’s shares, when redeemed, may be worth more or less than their original cost. For performance information through the most recent month end, please call (800) 835-3879 or visit our Web site at www.managersinvest.com.
In choosing a Fund, investors should carefully consider the amount they plan to invest, their investment objectives, the Fund’s investment objectives, risks, charges and expenses before investing. For this and other information, please call (800) 835-3879 or visit www.managersinvest.com for a free prospectus. Read it carefully before investing or sending money. Distributed by Managers Distributors, Inc., member FINRA.
| | 1 | Total return equals income yield plus share price change and assumes reinvestment of all dividends and capital gain distributions. Returns are net of fees and may reflect offsets of Fund expenses as described in the Prospectus. No adjustment has been made for taxes payable by shareholders on their reinvested dividends and capital gain distributions. Returns for periods greater than one year are annualized. The listed returns on the Fund are net of expenses. All returns are in U.S. dollars($). |
| | 2 | Fund for which, from time to time, the Fund’s advisor has waived its fees and/or absorbed Fund expenses, which has resulted in higher returns. |
| | 3 | Investments in foreign securities are subject to additional risks such as changing market conditions, economic and political instability, and currency exchange rate fiuctuations. |
Not FDIC insured, nor bank guaranteed. May lose value.
11
Managers International Equity Fund
Fund Snapshots
December 31, 2008
Portfolio Breakdown
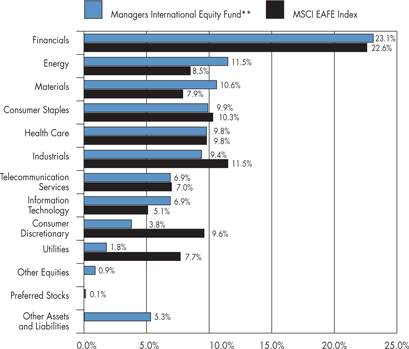
| | | | | | |
Industry | | Managers
International
Equity Fund** | | | MSCI EAFE
Index | |
Financials | | 23.1 | % | | 22.6 | % |
Energy | | 11.5 | % | | 8.5 | % |
Materials | | 10.6 | % | | 7.9 | % |
Consumer Staples | | 9.9 | % | | 10.3 | % |
Health Care | | 9.8 | % | | 9.8 | % |
Industrials | | 9.4 | % | | 11.5 | % |
Telecommunication Services | | 6.9 | % | | 7.0 | % |
Information Technology | | 6.9 | % | | 5.1 | % |
Consumer Discretionary | | 3.8 | % | | 9.6 | % |
Utilities | | 1.8 | % | | 7.7 | % |
Other Equities | | 0.9 | % | | 0.0 | % |
Preferred Stocks | | 0.1 | % | | 0.0 | % |
Other Assets and Liabilities | | 5.3 | % | | 0.0 | % |
| | ** | As a percentage of net assets |
Top Ten Holdings
| | | |
Security Name | | Percentage of
Net Assets | |
Sanofi-Aventis SA | | 2.3 | % |
Vodafone Group PLC | | 2.0 | |
Koninklijke Ahold, N.V. * | | 1.6 | |
Royal Dutch Shell PLC, Class A * | | 1.5 | |
BP PLC | | 1.5 | |
Total SA | | 1.5 | |
Allianz SE* | | 1.4 | |
Muenchener Rueckversicherungs AG | | 1.4 | |
Roche Holding AG | | 1.2 | |
UBS AG * | | 1.1 | |
| | | |
Top Ten as a Group | | 15.5 | % |
| | | |
| |
* Top Ten Holding at June 30, 2008 | |
Any sectors, industries, or securities discussed should not be perceived as investment recommendations. Mention of a specific security should not be considered a recommendation to buy or solicitation to sell that security.
12
Managers International Equity Fund
Fund Snapshots (continued)
Summary of Investments by Country
| | | | | | |
Country | | Managers International
Equity Fund* | | | MSCI EAFE Index | |
Australia | | 0.5 | % | | 5.9 | % |
Austria | | 0.0 | % | | 0.3 | % |
Belgium | | 0.8 | % | | 0.8 | % |
Bermuda | | 0.1 | % | | 0.3 | % |
Brazil | | 1.5 | % | | 0.0 | % |
Canada | | 6.4 | % | | 0.0 | % |
China | | 2.2 | % | | 0.0 | % |
Denmark | | 0.6 | % | | 0.9 | % |
Finland | | 1.0 | % | | 1.4 | % |
France | | 9.7 | % | | 10.4 | % |
Germany | | 9.0 | % | | 8.7 | % |
Greece | | 0.0 | % | | 0.5 | % |
Hong Kong | | 3.6 | % | | 1.7 | % |
India | | 0.6 | % | | 0.0 | % |
Ireland | | 0.0 | % | | 0.3 | % |
Israel | | 1.0 | % | | 0.0 | % |
Italy | | 1.8 | % | | 3.6 | % |
Japan | | 14.2 | % | | 25.3 | % |
Jersey, Channel Islands | | 0.0 | % | | 0.3 | % |
Luxembourg | | 0.6 | % | | 0.4 | % |
Netherlands | | 5.8 | % | | 2.6 | % |
New Zealand | | 0.0 | % | | 0.1 | % |
Norway | | 0.6 | % | | 0.6 | % |
Portugal | | 0.0 | % | | 0.3 | % |
Russia | | 0.8 | % | | 0.0 | % |
Singapore | | 0.6 | % | | 1.0 | % |
South Africa | | 0.6 | % | | 0.0 | % |
South Korea | | 1.1 | % | | 0.0 | % |
Spain | | 0.7 | % | | 4.6 | % |
Sweden | | 1.6 | % | | 2.0 | % |
Switzerland | | 8.7 | % | | 8.3 | % |
Taiwan | | 1.9 | % | | 0.0 | % |
United Kingdom | | 18.3 | % | | 19.6 | % |
United States | | 5.7 | % | | 0.1 | % |
| | | | | | |
| | 100.0 | % | | 100.0 | % |
| | | | | | |
| |
* As a percentage of total market value on December 31, 2008 | |
13
Managers International Equity Fund
Schedule of Portfolio Investments
December 31, 2008
| | | | | | |
| | | Shares | | | Value |
Common Stocks—93.7% | | | | | | |
Consumer Discretionary—3.8% | | | | | | |
Compagnie Generale des Etablissements Michelin SCA (France) | | 8,400 | | | $ | 443,803 |
Ctrip.com International, Ltd. (China) | | 8,500 | 2 | | | 202,300 |
Cyrela Brazil Realty, S.A. (Brazil) | | 26,700 | | | | 105,334 |
Hennes & Mauritz AB (Sweden) | | 4,902 | | | | 194,978 |
Inditex SA (Spain) | | 6,054 | | | | 269,589 |
Lagardere (France) | | 11,700 | | | | 475,350 |
New World Department Store China, Ltd. (China) | | 90,000 | | | | 49,589 |
Next PLC (United Kingdom) | | 9,593 | | | | 150,746 |
Nissan Motor Co., Ltd. (Japan) | | 185,500 | | | | 667,361 |
Parkson Retail Group, Ltd. (China) | | 112,500 | | | | 128,794 |
Pearson PLC (United Kingdom) | | 8,704 | | | | 82,038 |
PPR SA (France) | | 2,487 | | | | 162,837 |
Renault SA (France) | | 27,900 | | | | 728,078 |
Sharp Corp. (Japan) | | 93,000 | | | | 670,390 |
Vivendi Universal SA (France) | | 13,219 | | | | 430,860 |
Wolters Kluwer, N.V. (Netherlands) | | 5,431 | | | | 102,975 |
Total Consumer Discretionary | | | | | | 4,865,022 |
Consumer Staples—9.9% | | | | | | |
Associated British Foods PLC (United Kingdom) | | 60,000 | | | | 631,641 |
Barry Callebaut AG (Switzerland)* | | 190 | | | | 124,387 |
British American Tobacco PLC (United Kingdom) | | 44,099 | | | | 1,150,405 |
Cadbury PLC (United Kingdom) | | 101,849 | | | | 899,984 |
Delhaize Group (Belgium) | | 6,600 | | | | 407,989 |
Diageo PLC (United Kingdom) | | 47,076 | | | | 661,458 |
Groupe Danone SA (France) | | 7,212 | | | | 435,747 |
J Sainsbury PLC (United Kingdom) | | 136,893 | | | | 653,257 |
Koninklijke Ahold, N.V. (Netherlands) | | 167,918 | | | | 2,069,238 |
L’Oreal SA (France) | | 6,932 | | | | 604,962 |
Metro AG (Germany) | | 13,559 | | | | 539,221 |
Nestle SA, Registered (Switzerland) | | 25,699 | | | | 1,017,633 |
Reckitt Benckiser Group PLC (United Kingdom) | | 11,115 | | | | 416,490 |
Seven & i Holdings Co., Ltd. (Japan) | | 32,400 | | | | 1,113,640 |
Swedish Match AB (Sweden) | | 26,424 | | | | 381,479 |
Unicharm Corp. (Japan) | | 7,400 | | | | 556,715 |
Uni-President Enterprises Corp. (Taiwan) | | 323,653 | | | | 286,538 |
William Morrison Supermarkets, PLC (United Kingdom) | | 164,427 | | | | 666,480 |
Total Consumer Staples | | | | | | 12,617,264 |
Energy—11.5% | | | | | | |
BG Group PLC (United Kingdom) | | 17,742 | | | | 245,577 |
BP PLC (United Kingdom) | | 247,836 | | | | 1,913,156 |
Canadian Natural Resources, Ltd. (Canada) | | 25,500 | | | | 1,006,987 |
China Petroleum and Chemical Corp., Class H (China) | | 1,114,000 | | | | 684,735 |
China Shenhua Energy Co., Ltd. (China) | | 273,000 | | | | 585,273 |
EnCana Corp. (Canada) | | 18,068 | | | | 833,660 |
Eni S.p.A. (Italy) | | 41,900 | | | | 1,008,266 |
LUKOIL Holdings, ADR (Russia) | | 22,050 | 2 | | | 729,855 |
Petro-Canada (Canada) | | 30,500 | | | | 660,154 |
Petroleo Brasileiro, S.A., Sponsored ADR (Brazil) | | 35,900 | | | | 879,191 |
Petroplus Holdings AG (Switzerland)* | | 6,698 | | | | 135,405 |
Royal Dutch Shell PLC, Class A (Netherlands) | | 33,439 | | | | 878,546 |
Royal Dutch Shell PLC, Class A (United Kingdom) | | 73,500 | | | | 1,943,309 |
SeaDrill, Ltd. (Bermuda) | | 17,900 | | | | 145,885 |
StatoilHydro ASA (Norway) | | 46,050 | | | | 770,177 |
Suncor Energy, Inc. (Canada) | | 23,200 | | | | 445,771 |
Total SA (France) | | 33,828 | | | | 1,859,834 |
Total Energy | | | | | | 14,725,781 |
Financials—23.1% | | | | | | |
3i Group PLC (United Kingdom) | | 70,482 | | | | 276,013 |
Allianz SE (Germany) | | 17,439 | | | | 1,855,521 |
Australia and New Zealand Banking Group, Ltd. (Australia) | | 30,500 | | | | 329,284 |
Aviva PLC (United Kingdom) | | 97,743 | | | | 553,860 |
Banca Intesa S.p.A. (Italy) | | 118,400 | | | | 430,110 |
Banco do Brasil, S.A. (Brazil) | | 13,000 | | | | 81,835 |
Bank of East Asia, Ltd. (Hong Kong) | | 78,900 | | | | 166,429 |
Barclays PLC (United Kingdom) | | 430,800 | | | | 979,161 |
BNP Paribas SA (France) | | 13,400 | | | | 578,404 |
CapitaLand, Ltd. (Singapore) | | 193,000 | | | | 421,113 |
Cathay Financial Holding Co., Ltd. (Taiwan) | | 276,300 | | | | 311,296 |
China Life Insurance Co., Ltd. (China) | | 83,000 | | | | 255,016 |
China Merchants Bank Co., Ltd. (China) | | 104,500 | | | | 195,527 |
China Overseas Land & Investment, Ltd. (Hong Kong) | | 784,000 | | | | 1,100,844 |
The accompanying notes are an integral part of these financial statements.
14
Managers International Equity Fund
Schedule of Portfolio Investments (continued)
| | | | | |
| | | Shares | | Value |
Financials—23.1% (continued) | | | | | |
Chinatrust Financial Holding Co., Ltd., (Taiwan) | | 570,109 | | $ | 244,003 |
Credit Agricole SA (France) | | 77,993 | | | 876,027 |
Credit Suisse Group AG (Switzerland) | | 32,400 | | | 907,996 |
Daiwa House Industry Co., Ltd. (Japan) | | 51,000 | | | 500,034 |
Daiwa Securities Group, Inc. (Japan) | | 57,000 | | | 342,189 |
DBS Group Holdings, Ltd. (Singapore) | | 55,000 | | | 323,971 |
Deutsche Bank AG (Germany) | | 32,000 | | | 1,265,478 |
Deutsche Boerse AG (Germany) | | 3,181 | | | 230,142 |
Deutsche Postbank AG (Germany) | | 8,648 | | | 190,186 |
Hang Lung Group, Ltd. (Hong Kong) | | 34,900 | | | 106,614 |
Hang Lung Properties, Ltd. (Hong Kong) | | 55,000 | | | 120,756 |
HBOS PLC (United Kingdom) | | 438,604 | | | 454,032 |
HDFC Bank, Ltd. (India) | | 21,095 | | | 436,000 |
Henderson Land Development Co., Ltd. (Hong Kong) | | 102,000 | | | 381,498 |
Hong Kong Exchanges and Clearing, Ltd. (Hong Kong) | | 85,300 | | | 818,960 |
HSBC Holdings PLC (United Kingdom) | | 56,200 | | | 550,040 |
Industrial and Commercial Bank of China, Ltd. - Class H (China) | | 465,000 | | | 246,876 |
ING Groep, N.V. (Netherlands) | | 47,217 | | | 519,667 |
Julius Baer Holding, Ltd. (Switzerland) | | 15,291 | | | 592,638 |
KB Financial Group, Inc. (South Korea)* | | 19,511 | | | 522,028 |
Lloyds TSB Group PLC (United Kingdom) | | 81,400 | | | 154,068 |
Mitsubishi Estate Co., Ltd. (Japan) | | 38,000 | | | 627,718 |
Mitsui Fudosan Co., Ltd. (Japan) | | 61,000 | | | 1,017,006 |
Mizuho Financial Group, Inc. (Japan) | | 123 | | | 349,665 |
Muenchener Rueckversicherungs AG (Germany) | | 11,589 | | | 1,775,663 |
Nomura Holdings, Inc. (Japan) | | 93,000 | | | 774,348 |
ORIX Corp. (Japan) | | 1,200 | | | 68,521 |
Prudential Corp. PLC (United Kingdom) | | 71,376 | | | 433,269 |
Royal Bank of Scotland Group PLC (United Kingdom) | | 718,191 | | | 528,680 |
Societe Generale (France) | | 19,475 | | | 988,023 |
Standard Chartered PLC (United Kingdom) | | 85,885 | | | 1,098,989 |
Sumitomo Mitsui Financial Group, Inc. (Japan) | | 131 | | | 543,365 |
Sumitomo Realty & Development Co., Ltd. (Japan) | | 32,000 | | | 481,029 |
Sun Hung Kai Properties, Ltd. (Hong Kong) | | 65,000 | | | 546,945 |
T&D Holdings, Inc. (Japan) | | 17,100 | | | 723,773 |
UBS AG (Switzerland)* | | 97,777 | | | 1,422,592 |
Unibanco-Uniao de Bancos Brasileiros, S.A. (Brazil) | | 16,900 | | | 107,618 |
Zurich Financial Services AG (Switzerland) | | 3,273 | | | 715,088 |
Total Financials | | | | | 29,519,908 |
Health Care—9.8% | | | | | |
Actelion, Ltd. (Switzerland)* | | 22,262 | | | 1,259,396 |
AstraZeneca PLC (United Kingdom) | | 29,431 | | | 1,204,035 |
Celesio AG (Germany) | | 6,030 | | | 163,157 |
CSL, Ltd. (Australia) | | 14,272 | | | 336,560 |
Eisai Co., Ltd. (Japan) | | 6,800 | | | 283,761 |
Fresenius Medical Care AG (Germany) | | 8,653 | | | 401,495 |
GlaxoSmithKline PLC (United Kingdom) | | 66,309 | | | 1,233,198 |
Lonza Group AG (Switzerland) | | 3,702 | | | 343,217 |
Novartis AG (Switzerland) | | 13,498 | | | 675,999 |
Roche Holding AG (Switzerland) | | 9,764 | | | 1,511,634 |
Sanofi-Aventis SA (France) | | 45,391 | | | 2,903,351 |
Shire PLC (United Kingdom) | | 22,544 | | | 332,073 |
Synthes, Inc. (Switzerland) | | 2,753 | | | 349,097 |
Teva Pharmaceutical Industries, Ltd., Sponsored ADR (Israel) | | 29,100 | | | 1,238,787 |
Yamanouchi Pharmaceutical Co., Ltd. (Japan) | | 6,500 | | | 266,060 |
Total Health Care | | | | | 12,501,820 |
Industrials—9.4% | | | | | |
ABB, Ltd., ADR (Switzerland)* | | 61,000 | | | 930,692 |
ABB, Ltd. (Switzerland)* | | 19,296 | | | 294,267 |
Capita Group PLC (United Kingdom) | | 91,402 | | | 980,465 |
China Communications Construction Co., Ltd. (China) | | 295,000 | | | 368,594 |
Deutsche Lufthansa AG (Germany) | | 41,400 | | | 680,775 |
East Japan Railway Co. (Japan) | | 52 | | | 395,234 |
easyJet PLC (United Kingdom)* | | 233,886 | | | 961,498 |
European Aeronautic Defense and Space Co. (Netherlands) | | 27,650 | | | 468,263 |
Fanuc, Ltd. (Japan) | | 9,000 | | | 645,046 |
Far Eastern Textile Co., Ltd. (Taiwan) | | 317,278 | | | 204,227 |
Hansen Transmissions International, N.V. (Belgium)* | | 215,663 | | | 357,240 |
Hochtief AG (Germany) | | 7,540 | | | 388,810 |
Hutchison Whampoa, Ltd. (Hong Kong) | | 43,000 | | | 217,073 |
Kajima Corp. (Japan) | | 100,000 | | | 352,219 |
Komatsu, Ltd. (Japan) | | 17,500 | | | 223,239 |
Koninklijke (Royal) Philips Electronics N.V. (Netherlands) | | 12,610 | | | 250,015 |
The accompanying notes are an integral part of these financial statements.
15
Managers International Equity Fund
Schedule of Portfolio Investments (continued)
| | | | | | |
| | | Shares | | | Value |
Industrials—9.4% (continued) | | | | | | |
Michael Page International PLC (United Kingdom) | | 129,419 | | | $ | 406,698 |
Mitsubishi Corp. (Japan) | | 23,900 | | | | 338,521 |
Mitsubishi Heavy Inds., Ltd. (Japan) | | 170,000 | | | | 759,773 |
Shimizu Corp. (Japan) | | 73,000 | | | | 428,542 |
Siemens AG (Germany) | | 10,829 | | | | 815,243 |
Tostem Inax Holding Corp. (Japan) | | 24,300 | | | | 375,502 |
Vestas Wind Systems A/S (Denmark)* | | 13,756 | | | | 809,496 |
Yamato Transport Co., Ltd. (Japan) | | 31,000 | | | | 405,381 |
Total Industrials | | | | | | 12,056,813 |
Information Technology—6.9% | | | | | | |
ARM Holdings PLC (United Kingdom) | | 442,993 | | | | 560,822 |
ASML Holding, N.V. (Netherlands) | | 18,038 | | | | 325,174 |
AU Optronics Corp., Sponsored ADR (Taiwan) | | 58,300 | | | | 447,744 |
Autonomy Corporation PLC (United Kingdom)* | | 56,252 | | | | 782,755 |
Ericsson (LM), Class B (Sweden) | | 164,700 | | | | 1,283,981 |
Fujitsu, Ltd. (Japan) | | 137,000 | | | | 666,094 |
LDK Solar Co., Ltd., ADR (China)* | | 5,300 | 2 | | | 69,536 |
Neopost SA (France) | | 2,454 | | | | 222,672 |
Nintendo Co., Ltd. (Japan) | | 2,100 | | | | 802,518 |
Nokia Oyj (Finland) | | 40,300 | | | | 632,402 |
Redecard, S.A. (Brazil) | | 23,300 | | | | 256,780 |
Research In Motion, Ltd. (Canada)* | | 10,000 | | | | 405,800 |
Samsung Electronics Co., Ltd. (South Korea) | | 1,946 | | | | 709,493 |
Taiwan Semiconductor Manufacturing Co., Ltd., Sponsored ADR (Taiwan) | | 77,761 | | | | 614,309 |
Toshiba Corp. (Japan) | | 125,000 | | | | 514,349 |
Yahoo Japan Corp. (Japan) | | 1,157 | | | | 474,733 |
Total Information Technology | | | | | | 8,769,162 |
Materials—10.6% | | | | | | |
Air Liquide SA (France) | | 7,648 | | | | 700,399 |
Anglo American PLC (United Kingdom) | | 23,219 | | | | 541,865 |
Antofagasta PLC (United Kingdom) | | 22,900 | | | | 143,448 |
ArcelorMittal (Luxembourg) | | 19,209 | | | | 458,208 |
Barrick Gold Corp. (Canada) | | 59,486 | | | | 2,166,076 |
BASF SE (Germany) | | 29,500 | | | | 1,146,182 |
Bayer AG (Germany) | | 3,600 | | | | 209,766 |
BHP Billiton PLC (United Kingdom) | | 38,049 | | | | 737,983 |
Compania Vale do Rio Doce—ADR (Brazil) | | 29,800 | 2 | | | 360,878 |
Compania Vale do Rio Doce (Brazil) | | 17,000 | 2 | | | 181,050 |
GMK Norilsk Nickel, Sponsored ADR (Russia) | | 54,724 | 2 | | | 344,761 |
Gold Fields, Ltd. (South Africa) | | 49,063 | | | | 489,117 |
Goldcorp, Inc. (Canada) | | 29,700 | | | | 923,599 |
Impala Platinum Holdings, Ltd. (South Africa) | | 13,900 | | | | 204,330 |
Kinross Gold Corp. (Canada) | | 24,900 | 2 | | | 458,658 |
Mitsubishi Chemical Holdings Corp. (Japan) | | 97,000 | | | | 429,817 |
Potash Corp. of Saskatchewan, Inc. (Canada) | | 5,900 | | | | 431,998 |
Salzgitter AG (Germany) | | 5,492 | | | | 426,889 |
Solvay SA (Belgium) | | 3,700 | | | | 274,749 |
Stora Enso Oyj (Finland) | | 60,700 | | | | 480,836 |
Svenska Cellulosa AB (SCA) (Sweden) | | 27,200 | | | | 236,162 |
Syngenta AG (Switzerland) | | 4,321 | | | | 839,421 |
Taiwan Fertilizer Co., Ltd. (Taiwan) | | 167,000 | | | | 267,532 |
Toray Industries, Inc. (Japan) | | 133,700 | | | | 680,422 |
Yamana Gold, Inc. (Canada) | | 64,859 | | | | 496,491 |
Total Materials | | | | | | 13,630,637 |
Telecommunication Services—6.9% | | | | | | |
Bharti Tele-Ventures, Ltd. (India)* | | 18,507 | | | | 272,808 |
China Mobile, Ltd. (Hong Kong) | | 35,500 | | | | 360,187 |
Deutsche Telekom AG (Germany) | | 24,192 | | | | 365,766 |
France Telecom SA (France) | | 32,482 | | | | 905,360 |
Nippon Telegraph & Telephone Corp. (Japan) | | 114 | | | | 588,549 |
NTT DoCoMo, Inc. (Japan) | | 124 | | | | 244,071 |
Rogers Communications, Inc., Class B (Canada) | | 14,300 | | | | 423,845 |
Royal KPN NV (Netherlands) | | 56,137 | | | | 816,144 |
Softbank Corp. (Japan) | | 47,500 | | | | 862,657 |
Telecom Italia S.p.A. (Italy) | | 405,600 | | | | 667,281 |
Telecom Italia S.p.A., RSP (Italy) | | 193,700 | | | | 220,539 |
Telefonica S.A. (Spain) | | 26,591 | | | | 600,203 |
Vodafone Group PLC (United Kingdom) | | 1,239,737 | | | | 2,538,552 |
Total Telecommunication Services | | | | | | 8,865,962 |
Utilities—1.8% | | | | | | |
E.ON AG (Germany) | | 22,200 | | | | 871,731 |
Fortum Oyj (Finland) | | 7,443 | | | | 161,776 |
Hong Kong and China Gas Co., Ltd., The (Hong Kong) | | 467,670 | | | | 709,206 |
National Grid PLC (United Kingdom) | | 48,430 | | | | 478,559 |
Veolia Environnement (France) | | 3,917 | | | | 123,553 |
Total Utilities | | | | | | 2,344,825 |
Total Common Stocks (cost $154,913,172) | | | | | | 119,897,194 |
The accompanying notes are an integral part of these financial statements.
16
Managers International Equity Fund
Schedule of Portfolio Investments (continued)
| | | | | | |
| | | Shares | | Value | |
Other Equities—0.9% | | | | | | |
Hirco PLC (South Africa)* | | 32,800 | | $ | 35,171 | |
SPDR Gold Shares (United States)* | | 12,600 | | | 1,090,530 | |
Total Other Equities (cost $1,233,383) | | | | | 1,125,701 | |
Preferred Stock—0.1% | | | | | | |
Samsung Electronics Co., Ltd. (South Korea) (cost $449,809) | | 900 | | | 187,018 | |
Warrants—0.2% | | | | | | |
United Microelectronics Corp., 0.000001, 01/24/17 (Luxembourg) (a) (cost $1,087,560) | | 1,249,915 | | | 283,731 | |
Rights—0.1% | | | | | | |
China Overseas Land & Investment, Ltd. 01/21/09 (Hong Kong) | | 33,360 | | | 11,966 | |
DBS Group Holdings, Ltd. 01/14/09 (Singapore) | | 27,500 | | | 57,262 | |
Total Rights (cost $0) | | | | | 69,228 | |
Other Investment Companies—5.8% | | | | | | |
BNY Institutional Cash Reserves Fund, Series A, 0.07%3 | | 2,248,004 | | | 2,248,004 | |
BNY Institutional Cash Reserves Fund, Series B* 3,8 | | 104,356 | | | 9,392 | |
BNY Institutional Cash Reserves Fund, Series C* 3,9 | | 89,915 | | | 89,915 | |
Dreyfus Cash Management Fund, Institutional Class Shares, 1.53%10 | | 5,103,752 | | | 5,103,752 | |
Total Other Investment Companies (cost $7,546,027) | | | | | 7,451,063 | |
Total Investments—100.8% (cost $165,229,951) | | | | | 129,013,935 | |
Other Assets, less Liabilities—(0.8)% | | | | | (1,029,519 | ) |
Net Assets—100.0% | | | | $ | 127,984,416 | |
The accompanying notes are an integral part of these financial statements.
17
Managers Emerging Markets Equity Fund
Portfolio Manager’s Comments
The Managers Emerging Markets Equity Fund’s (the “Fund”) objective is to achieve long-term capital appreciation.
The Fund invests at least 80% of its assets in equity securities, i.e., common and preferred stocks of companies located in countries included in the MSCI Emerging Markets (MSCI EM) Index, such as most countries in Africa, Asia, Latin America, and the Middle East. The Fund may invest in companies of any size. The MSCI Emerging Markets (MSCI EM) Index is the benchmark for the Fund.
The Fund currently employs a subadvisor, Rexiter Capital Management Limited (“Rexiter”), to manage the assets of the Fund. The investment team at Rexiter believes emerging markets are less efficient than developed markets, and an actively managed portfolio, with respect to both country weightings and stock selection, can add value over a market capitalization-weighted index without materially affecting risk. Rexiter’s approach is active in terms of both asset allocation and stock selection. Investment decisions are based on fundamental analysis of countries and stocks. Portfolio management is controlled by a disciplined process that seeks to add to returns through the exploitation of market inefficiency, while constraining risk.
Rexiter’s investment strategy is to earn investment return and manage investment risk by analyzing and actively managing country and industry exposure, and by investing in companies within targeted country and industry ranges that demonstrate strong and, most importantly, profitable earnings growth.
The ideal investment exhibits many of the following traits:
| | • | | Ability to generate and maintain strong earnings growth |
| | • | | Established market positions across a diverse range of companies and industries |
Portfolio Construction
| | • | | Use a liquidity-tiered, fixed-weight benchmark to determine a neutral position for country allocation |
| | • | | Employ active country allocations away from this neutral position based upon fundamental analysis of macroeconomic variables and equity market valuations |
| | • | | Screen companies based on capitalizations and liquidity parameters to analyze roughly 300 companies in detail by: |
| | • | | Studying published accounts and accounting policies for the underlying development of earnings |
| | • | | Performing a “DuPont Analysis” of return on equity |
| | • | | Analyzing the return of invested capital and the economic value added |
| | • | | Analyzing the cash flow and capital spending and capital requirements of each company |
Rexiter will make a sell decision when:
| | • | | The current stock price is not supported by its expectations regarding the company’s future growth potential |
| | • | | The political, economic, or financial health of the country changes |
THE YEAR IN REVIEW
The Fund returned -54.95% in 2008, compared with a return of -53.33% for its benchmark, the MSCI Emerging Markets (MSCI EM) Index. (Note that unless otherwise stated, all performance cited in this commentary is in U.S. Dollars.)
After five consecutive years of posting double-digit returns, emerging markets reversed course during 2008, giving back a good portion of the gains accumulated in those bull market years. Volatility and risk aversion were the overriding themes driving the performance of the markets. While emerging markets economies were able to avoid the sharp decline in economic growth seen in the developed markets, they were not able to avoid some degree of slowdown. Despite this, investors were more focused on the prospects of a global economic slowdown, and the crisis in global credit markets. Investors ignored the relatively solid fundamentals in emerging markets and fled the asset class for areas of the market perceived to offer more safety. Falling commodity prices also negatively impacted returns. Volatility increased throughout the year, reaching an all-time high during November. Looking at the monthly returns pattern for emerging markets was akin to watching a roller coaster, and provided a good illustration of the uncertainty in the markets. During the first quarter, emerging markets fell 11.5%, rebounded 7.4%, only to fall an additional 5.4%. Later in the year, the return pattern became more of a one way street. In July, markets were weak (-3.2%), weaker in August (-8.2%) and free falling in September (-17.5%). In December, markets finally began to show some signs of recovering, as emerging markets stocks staged a 10% rally. Performance across markets varied widely, although no market produced anything better than double-digit declines for the year. The larger markets of Russia and India were among the worst performers, returning -74% and -65%, respectively. Israel and Czech Republic, two relatively small markets, turned in the best performance with returns of -29% and -37%, respectively.
The Fund’s performance held up better than that of the Index during the first half of the year, only to lose ground in the second half, leading to underperformance for the full year. The Fund’s holdings in Russia provided the biggest boost to performance during the first half. However, the impact of rapidly falling commodity prices, combined with an onslaught of selling by some of the market’s larger investors to cover margin calls caused Russia to reverse course. The Fund’s overweight in the Russian market during the second half detracted from relative performance. A modest overweight in India also weighed on performance results. The Fund’s performance within Brazil trailed the country’s return, held back mainly
18
Managers Emerging Markets Equity Fund
Portfolio Manager’s Comments (continued)
by TAM, an airline company whose stock declined 65% for the year. On a positive note, the Fund’s performance in China was better than that of the Index, with the main contributors to the strong relative performance in China being China Railway Construction (+5.6%), and Ping An Insurance (+56.3%).
LOOKING FORWARD
Growth in the U.S. and Europe collapsed in the face of the credit crunch. While emerging economies may have proved capable of decoupling from normal cyclical swings in developed economies, it seems unlikely they will be immune from infection if the U.S. and much of Europe fall into a long recession. It is true that strong currencies and current account surpluses give some emerging economies (particularly in Asia) the tools to mitigate the impact, but there is a difference between mitigation and decoupling. Thus, Rexiter believes emerging markets will likely realize a period of slower growth.
These markets have now lost half the gains made from the trough of the 1998 Asia crisis. They are currently trading at close to lows in terms of historic P/E ratios. Emerging markets are clearly reflecting some part of the deterioration in the economic environment. The big question is how much are they discounting? Valuations and most historic precedents suggest the falls are overdone, but clearly markets are grappling with an unprecedented environment. On a one-year view, Rexiter believes that emerging economies will be able to prove their resilience and that confidence will return to capital markets. This generally positive outlook is dependent upon the Chinese economy recovering from the current sharp slowdown, and developed markets not facing a long deflationary period of zero growth.
In light of these views, Rexiter is not moving to a more defensive portfolio or reducing risk in the portfolio. In Rexiter’s opinion, defensive companies do not currently offer an attractive risk-return profile. In keeping with their process, Rexiter is seeking to ensure that risk is diversified throughout the portfolio across countries and sectors. The Fund maintains overweight positions in India, Russia, and Thailand, while holding underweight positions in Mexico, South Africa, and Korea.
CUMULATIVE TOTAL RETURN PERFORMANCE
Managers Emerging Markets Equity Fund’s cumulative total return is based on the daily change in net asset value (NAV), and assumes that all distributions were reinvested. The MSCI EM Index is a free float-adjusted market capitalization index designed to measure equity market performance in the global emerging markets. The MSCI EM Index consists of emerging markets country indexes, including Argentina, Brazil, Chile, Czech Republic, India, Israel, Malaysia, Mexico, the Philippines, Poland, and Thailand. Unlike the Fund, the MSCI EM Index is unmanaged, is not available for investment, and does not incur expenses. This chart compares a hypothetical $10,000 investment made in Managers Emerging Markets Equity Fund on December 31, 1998, to a $10,000 investment made in the MSCI EM for the same time period. Performance for periods longer than one year is annualized. The graph and table do not reflect the deduction of taxes that a shareholder would pay on a
19
Managers Emerging Markets Equity Fund
Portfolio Manager’s Comments (continued)
CUMULATIVE TOTAL RETURN PERFORMANCE (continued)
Fund distribution or redemption of shares. The listed returns for the Fund are net of expenses and the returns for the index exclude expenses. Past performance is not indicative of future results. Total returns would have been lower had certain expenses not been reduced.
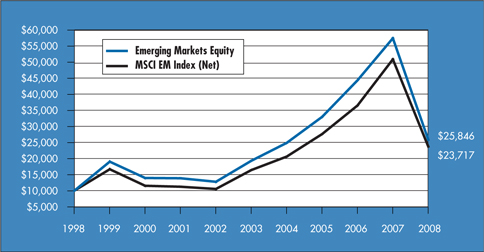
The table below shows the average annual total returns for Manager Emerging Markets Equity Fund and the MSCI EM since inception through December 31, 2008.
| | | | | | | | | | | |
Average Annual Total Returns 1 | | One Year | | | Five Years | | | Ten Years | | | Inception Date |
Managers Emerging Markets Equity Fund 2,3,4 | | (54.95 | )% | | 6.03 | % | | 9.96 | % | | 2/9/98 |
MSCI EM Index (Net) 5 | | (53.33 | )% | | 7.66 | % | | 9.02 | % | | |
MSCI EM Index (Gross) 6 | | (53.18 | )% | | 8.02 | % | | 9.31 | % | | |
The performance data shown represents past performance. Past performance is not a guarantee of future results. Current performance may be lower or higher than the performance data quoted. The investment return and principal value of an investment in the Fund will fluctuate so that an investor’s shares, when redeemed, may be worth more or less than their original cost. For performance information through the most recent month end, please call (800) 835-3879 or visit our Web site at www.managersinvest.com.
In choosing a Fund, investors should carefully consider the amount they plan to invest, their investment objectives, the Fund’s investment objectives, risks, charges and expenses before investing. For this and other information, please call (800) 835-3879 or visit www.managersinvest.com for a free prospectus. Read it carefully before investing or sending money. Distributed by Managers Distributors, Inc., member FINRA.
| | 1 | Total return equals income yield plus share price change and assumes reinvestment of all dividends and capital gain distributions. Returns are net of fees and may reflect offsets of Fund expenses as described in the Prospectus. No adjustment has been made for taxes payable by shareholders on their reinvested dividends and capital gain distributions. Returns for periods greater than one year are annualized. The listed returns on the Fund are net of expenses. All returns are in U.S. dollars($). |
| | 2 | Fund for which, from time to time, the Fund’s advisor has waived its fees and/or absorbed Fund expenses, which has resulted in higher returns. |
| | 3 | The Fund is subject to the risks associated with investments in emerging markets, such as erratic earnings patterns, economic and political instability, changing exchange controls, limitations on repatriation of foreign capital and changes in local governmental attitudes toward private investment, possibly leading to nationalization or confiscation of investor assets. |
| | 4 | Performance based on published NAV as of December 31, 2008. |
| | 5 | MSCI EM (Net) approximates the minimum possible dividend reinvestment. The dividend is reinvested after deduction of withholding tax, applying the rate to nonresident individuals who do not benefit from double taxation treaties. MSCI Barra uses withholding tax rates applicable to Luxembourg holding companies, as Luxembourg applies the highest rates. |
| | 6 | MSCI EM (Gross) approximates the maximum possible dividend reinvestment. The amount reinvested is the entire dividend distributed to individuals resident in the country of the company, but does not include tax credits. |
Not FDIC insured, nor bank guaranteed. May lose value.
20
Managers Emerging Markets Equity Fund
Fund Snapshots
December 31, 2008
Portfolio Breakdown
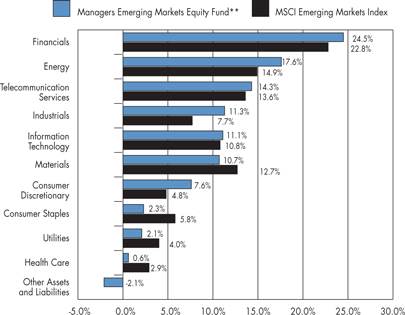
| | | | | | |
Industry | | Managers
Emerging Markets
Equity Fund** | | | MSCI EM
Index | |
Financials | | 24.5 | % | | 22.8 | % |
Energy | | 17.6 | % | | 14.9 | % |
Telecommunication Services | | 14.3 | % | | 13.6 | % |
Industrials | | 11.3 | % | | 7.7 | % |
Information Technology | | 11.1 | % | | 10.8 | % |
Materials | | 10.7 | % | | 12.7 | % |
Consumer Discretionary | | 7.6 | % | | 4.8 | % |
Consumer Staples | | 2.3 | % | | 5.8 | % |
Utilities | | 2.1 | % | | 4.0 | % |
Health Care | | 0.6 | % | | 2.9 | % |
Other Assets and Liabilities | | -2.1 | % | | 0.0 | % |
| | ** | As a percentage of net assets |
Top Ten Holdings
| | | |
Security Name | | Percentage of
Net Assets | |
China Mobile Ltd.* | | 3.2 | % |
CNOOC, Ltd. | | 2.5 | |
Shinsegae Co., Ltd. | | 2.3 | |
Samsung Fire & Marine Insurance Co., Ltd. | | 2.3 | |
OAO Gazprom—ADR* | | 2.2 | |
Ceske Energeticke Zavody* | | 2.2 | |
Compania Vale do Rio Doce—ADR* | | 2.0 | |
Sasol, Ltd. | | 2.0 | |
Sappi, Ltd. | | 2.0 | |
China Railway Construction Corp. | | 1.9 | |
| | | |
Top Ten as a Group | | 22.6 | % |
| | | |
| | | |
* Top Ten Holding at June 30, 2008 | | | |
Any sectors, industries, or securities discussed should not be perceived as investment recommendations. Mention of a specific security should not be considered a recommendation to buy or solicitation to sell that security.
21
Managers Emerging Markets Equity Fund
Fund Snapshots (continued)
Summary of Investments by Country
| | | | | | |
Country | | Managers
Emerging Markets
Equity Fund* | | | MSCI EM Index | |
Argentina | | 0.0 | % | | 0.1 | % |
Bermuda | | 1.7 | % | | 0.5 | % |
Brazil | | 10.7 | % | | 12.9 | % |
Cayman Islands | | 0.0 | % | | 1.5 | % |
Chile | | 0.0 | % | | 1.4 | % |
China | | 9.8 | % | | 10.2 | % |
Colombia | | 0.0 | % | | 0.6 | % |
Czech Republic | | 2.1 | % | | 0.8 | % |
Egypt | | 0.0 | % | | 0.7 | % |
Hong Kong | | 6.8 | % | | 6.2 | % |
Hungary | | 0.4 | % | | 0.6 | % |
India | | 10.5 | % | | 6.5 | % |
Indonesia | | 3.2 | % | | 1.5 | % |
Israel | | 2.0 | % | | 3.2 | % |
Luxembourg | | 1.5 | % | | 0.0 | % |
Malaysia | | 1.1 | % | | 3.0 | % |
Mexico | | 2.5 | % | | 5.2 | % |
Morocco | | 0.0 | % | | 0.5 | % |
Netherlands | | 0.0 | % | | 0.1 | % |
Pakistan | | 0.0 | % | | 0.1 | % |
Panama | | 1.1 | % | | 0.0 | % |
Peru | | 2.0 | % | | 0.3 | % |
Philippines | | 2.5 | % | | 0.5 | % |
Poland | | 0.8 | % | | 1.6 | % |
Russia | | 8.1 | % | | 5.1 | % |
South Africa | | 5.9 | % | | 8.4 | % |
South Korea | | 11.5 | % | | 13.6 | % |
Taiwan | | 11.0 | % | | 10.9 | % |
Thailand | | 3.4 | % | | 1.4 | % |
Turkey | | 2.1 | % | | 1.5 | % |
United Kingdom | | 1.7 | % | | 0.1 | % |
United States | | -2.4 | % | | 1.0 | % |
| | | | | | |
| | 100.0 | % | | 100.0 | % |
| | | | | | |
| |
* As a percentage of total market value on December 31, 2008 | |
22
Managers Emerging Markets Equity Fund
Schedule of Portfolio Investments
December 31, 2008
| | | | | | |
| | | Shares | | | Value |
Common Stocks—102.1% | | | | | | |
Consumer Discretionary—7.6% | | | | | | |
Cyfrowy Polsat SA (Poland) | | 101,175 | | | $ | 462,125 |
LG Electronics, Inc. (South Korea) | | 16,456 | | | | 999,257 |
Lojas Renner, S.A. (Brazil) | | 62,500 | | | | 419,972 |
Net Servicos de Comunicacao, S.A. (Brazil)* | | 164,900 | | | | 939,760 |
Resorts World Berhad (Malaysia) | | 978,400 | | | | 641,822 |
Urbi Desarrollos Urbanos S.A. de C.V. (Mexico)* | | 238,930 | | | | 326,084 |
Zee Entertainment Enterprises, Ltd. (India) | | 270,104 | | | | 779,253 |
Total Consumer Discretionary | | | | | | 4,568,273 |
Consumer Staples—2.3% | | | | | | |
Shinsegae Co., Ltd. (South Korea) | | 3,569 | | | | 1,386,598 |
Energy—17.6% | | | | | | |
China Resources Power Holdings Co. (Hong Kong) | | 356,000 | | | | 692,183 |
CNOOC, Ltd. (Hong Kong) | | 1,562,000 | | | | 1,485,735 |
LUKOIL Holdings, ADR (Russia) | | 19,512 | 2 | | | 645,847 |
OAO Gazprom—ADR (Russia) | | 91,533 | | | | 1,318,743 |
OAO Rosneft Oil Co. GDR (Russia) (a)* | | 186,045 | | | | 697,669 |
OGX Petroleo e Gas Participacoes, S.A. (Brazil)* | | 2,100 | | | | 473,680 |
Petroleo Brasileiro, S.A., ADR (Brazil) | | 24,000 | 2 | | | 489,840 |
Petroleo Brasileiro, S.A., Sponsored ADR (Brazil) | | 38,970 | | | | 954,375 |
PT Bumi Resources, Tbk. (Indonesia) | | 2,411,000 | | | | 203,380 |
PTT Public Co., Ltd. (Thailand) | | 206,400 | | | | 1,052,105 |
Sasol, Ltd. (South Africa) | | 40,261 | | | | 1,224,406 |
Tenaris, S.A. (Luxembourg) | | 43,100 | | | | 904,238 |
Tupras Turkiye Petrol Rafine (Turkey) | | 45,833 | | | | 485,050 |
Total Energy | | | | | | 10,627,251 |
Financials—24.5% | | | | | | |
Bank Hapoalim, Ltd. (Israel)* | | 182,001 | | | | 392,148 |
Bank of China, Ltd., Class H (China) | | 2,824,000 | | | | 778,083 |
Cathay Financial Holding Co., Ltd. (Taiwan) | | 819,200 | | | | 922,961 |
Chinatrust Financial Holding Co., Ltd., (Taiwan) | | 2,200,470 | | | | 941,785 |
Credicorp, Ltd. (Peru) | | 23,400 | 2 | | | 1,169,064 |
Haci Omer Sabanci Holding A.S. (Turkey) | | 345,021 | | | | 793,810 |
Housing Development Finance Corp., Ltd. (India) | | 30,989 | | | | 948,322 |
Industrial and Commercial Bank of China, Ltd., Class H (China) | | 1,642,000 | | | | 871,766 |
Infrastructure Development Finance Co., Ltd. (India) | | 782,787 | | | | 1,081,072 |
OAO Open Investments (Russia)* | | 674 | | | | 41,114 |
OTP Bank NyRt. (Hungary)* | | 15,788 | | | | 239,721 |
Ping An Insurance (Group) Co. of China, Ltd. (China) | | 228,000 | | | | 1,120,465 |
PT Bank Rakyat Indonesia (Indonesia) | | 1,764,500 | | | | 750,356 |
Samsung Fire & Marine Insurance Co., Ltd. (South Korea) | | 9,000 | | | | 1,367,637 |
Sanlam, Ltd. (South Africa) | | 613,547 | | | | 1,127,828 |
Savings Bank of the Russian Federation(Sberbank) (Russia) | | 592,687 | | | | 443,451 |
Siam Commercial Bank PCL (Thailand) | | 727,800 | | | | 1,020,433 |
Uniao de Bancos Brasileiros, S.A. (Brazil) | | 11,600 | | | | 749,592 |
Total Financials | | | | | | 14,759,608 |
Health Care—0.6% | | | | | | |
Dr. Reddy’s Laboratories, Ltd. ADR (India) | | 37,973 | | | | 368,021 |
Industrials—11.3% | | | | | | |
China Railway Construction Corp. (China)* | | 782,500 | | | | 1,171,488 |
China Shipping Development Co., Ltd. (China) | | 842,000 | | | | 848,496 |
Copa Holdings, S.A., Class A (Panama) | | 21,700 | | | | 657,944 |
COSCO Pacific, Ltd. (Bermuda) | | 1,032,000 | | | | 1,061,067 |
Hyundai Development Co. (South Korea) | | 33,585 | | | | 889,199 |
Larsen & Toubro, Ltd. (India) | | 60,166 | | | | 961,930 |
Localiza Rent A Car, S.A. (Brazil) | | 123,600 | | | | 376,312 |
Santos Brasil Participacoes, S.A. (Brazil) | | 51,762 | | | | 142,057 |
Siemens India, Ltd. (India) | | 76,873 | | | | 456,500 |
SM Investments Corp. (Philippines) | | 63,589 | | | | 261,891 |
Total Industrials | | | | | | 6,826,884 |
Information Technology—11.1% | | | | | | |
Advanced Semiconductor Engineering, Inc. (Taiwan) | | 2,050,893 | | | | 741,615 |
Hon Hai Precision Industry Co., Ltd. (Taiwan) | | 441,619 | | | | 870,767 |
LG Display Co., Ltd. (South Korea) | | 66,890 | | | | 1,114,832 |
MediaTek, Inc. (Taiwan) | | 137,331 | | | | 928,839 |
Samsung Electronics Co., Ltd. (South Korea) | | 2,004 | | | | 730,639 |
Samsung Electronics Co., Ltd., GDR (South Korea) (a) | | 2,800 | | | | 501,290 |
Siliconware Precision Industries Co. (Taiwan) | | 11,871 | | | | 10,337 |
The accompanying notes are an integral part of these financial statements.
23
Managers Emerging Markets Equity Fund
Schedule of Portfolio Investments (continued)
| | | | | | | |
| | | Shares | | | Value | |
Information Technology—11.1% (continued) | | | | | | | |
Taiwan Semiconductor Manufacturing Co., Ltd. (Taiwan) | | 993 | | | $ | 1,355 | |
Taiwan Semiconductor Manufacturing Co., Ltd., Sponsored ADR (Taiwan) | | 132,727 | | | | 1,048,543 | |
Tata Consultancy Services, Ltd. (India) | | 78,272 | | | | 772,753 | |
Total Information Technology | | | | | | 6,720,970 | |
Materials—10.7% | | | | | | | |
Anglo American PLC (United Kingdom) | | 45,187 | | | | 1,054,535 | |
Anhui Conch Cement Co., Ltd. (China)* | | 242,936 | | | | 1,129,842 | |
Compania Vale do Rio Doce—ADR (Brazil) | | 101,800 | | | | 1,232,799 | |
Formosa Chemicals & Fibre Corp. (Taiwan) | | 679 | | | | 832 | |
GMK Norilsk Nickel, Sponsored ADR (Russia) | | 40,510 | 2 | | | 255,213 | |
Mechel OAO (Russia) | | 43,900 | 2 | | | 175,600 | |
Raspadskaya (Russia)* | | 216,495 | | | | 211,973 | |
Sappi, Ltd. (South Africa) | | 300,000 | | | | 1,214,807 | |
Taiwan Fertilizer Co., Ltd. (Taiwan) | | 212,000 | | | | 339,621 | |
Uralkaliy OAO (Russia) | | 27,835 | | | | 249,957 | |
Usinas Siderurgicas de Minas Gerais, S.A. (Brazil) | | 55,000 | | | | 609,670 | |
Total Materials | | | | | | 6,474,849 | |
Telecommunication Services—14.3% | | | | | | | |
America Movil, S.A.B. de C.V. (Mexico) | | 34,700 | | | | 1,075,353 | |
Bezeq Israeli Telecommunication Corp., Ltd. (Israel) | | 500,000 | | | | 822,001 | |
Bharti Tele-Ventures, Ltd. (India)* | | 67,799 | | | | 999,413 | |
China Mobile, Ltd. (Hong Kong) | | 193,000 | | | | 1,958,200 | |
Chunghwa Telecom Company, Ltd. (Taiwan) | | 464,390 | | | | 748,041 | |
Comstar—United Telesystems GDR (Russia) | | 91,441 | | | | 365,237 | |
Mobile Telesystems, Sponsored ADR (Russia) | | 16,400 | | | | 437,552 | |
Philippine Long Distance Telephone Co., ADR (Philippines) | | 12,351 | | | | 579,879 | |
Philippine Long Distance Telephone Co. (Philippines) | | 14,140 | | | | 646,231 | |
Telekomunikasi Indonesia Tbk PT (Indonesia) | | 1,526,500 | | | | 975,620 | |
Total Telecommunication Services | | | | | | 8,607,527 | |
Utilities—2.1% | | | | | | | |
Ceske Energeticke Zavody (Czech Republic) | | 30,502 | | | | 1,297,622 | |
Total Common Stocks (cost $103,778,764) | | | | | | 61,637,603 | |
Other Investment Companies—4.4%1 | | | | | | | |
BNY Institutional Cash Reserves Fund, Series A, 0.07%3 | | 2,547,005 | | | | 2,547,005 | |
BNY Institutional Cash Reserves Fund, Series B*3,8 | | 110,742 | | | | 9,967 | |
BNY Institutional Cash Reserves Fund, Series C*3,9 | | 63,435 | | | | 63,435 | |
Total Other Investment Companies (cost $2,721,182) | | | | | | 2,620,407 | |
Total Investments—106.5% (cost $106,499,946) | | | | | | 64,258,010 | |
Other Assets, less Liabilities—(6.5)% | | | | | | (3,902,739 | ) |
Net Assets—100.0% | | | | | $ | 60,355,271 | |
The accompanying notes are an integral part of these financial statements.
24
Managers Global Bond Fund
Portfolio Manager’s Comments
The Managers Global Bond Fund’s (the “Fund”) investment objective is to achieve income and capital appreciation by investing in high-quality foreign and domestic fixed-income securities.
The Fund’s assets are managed by Loomis Sayles & Company, L.P. (“Loomis”), who serves as subadvisor to Fund. The investment team at Loomis believes that there are inefficiencies inherent in bond markets, hence the greatest opportunities to add value reside in the pricing of credit risk. Their philosophy is to identify attractively valued issues through fundamental research. The investment team and analysts at Loomis generally seek fixed-income securities of issuers whose credit profiles it believes are improving. The investment team also analyzes political, economic, and other fundamental factors and combines this analysis with a comparison of the yield spreads of various fixed-income securities throughout the world, in an effort to find securities that they believe may produce attractive returns in comparison to their risk. Finally, if a security that is believed to be attractive is denominated in a foreign currency, Loomis analyzes whether to accept or to hedge the currency risk.
Portfolio managers, Kenneth Buntrock and David Rolley, and their team of credit analysts at Loomis research debt offerings in the same way equity analysts research stocks, looking for undervalued bonds where they see a yield premium, the potential for price appreciation, or both. They analyze in detail the financial condition of individual countries and companies, as well as the terms of specific bond offerings. They believe price appreciation can come from a variety of catalysts, including improving country or company fundamentals that would lead to credit upgrades, changing market supply and demand forces, and improving sector or economic trends.
The ideal investment typically exhibits some of the following traits:
| | • | | An attractive yield, both absolute and relative to Loomis’ credit research expectations |
| | • | | Good call protection (particularly when prevailing rates are low) |
| | • | | Stable or improving fundamentals (for corporate bonds) |
Portfolio management:
| | • | | Seeks to identify attractively valued issues through fundamental research |
| | • | | Believes the greatest opportunity to add value is through accurately pricing credit risk |
| | • | | Analyzes stability and volatility of a country’s bond markets, the financial strength of the issuer, current interest rates, and Loomis’ expectations regarding general trends in interest rates |
| | • | | Employs a bottom-up security-selection approach |
| | • | | Ensures the average portfolio quality is Aa or higher |
The Loomis investment team may make a sell decision when:
| | • | | There is a change in sovereign, industry, or company fundamentals |
| | • | | The issuer is downgraded by Loomis research |
| | • | | Relative valuation is not consistent with its expected rating category |
| | • | | Other securities or sectors offer greater total return potential |
THE YEAR IN REVIEW
Managers Global Bond Fund returned -10.01% during 2008, compared with a return of 4.79% for the Barclays Capital Global Aggregate Index (“Index”).
For investors, 2008 turned out to be a year that many would rather soon forget. The fixed-income markets were no exception, marred by widening of credit spreads to historic levels, and credit markets struggling to function normally. In the first half of the year, the markets seemed to be tussling with the typical bear market challenges. The second half, though, proved to be anything but normal. Policymakers responded with immediate and aggressive action, recognizing the importance of keeping credit flowing through the markets. With no playbook to follow, there were stumbles along the way and some inconsistent application of policy. Investors shunned risky assets, preferring instead the safe haven of U.S. government securities. This flight to quality persisted even though, as it turns out, investors were paid little to nothing to invest, as Treasury bills yields moved toward zero. For the year, investment-grade corporate bonds underperformed Treasury securities by nearly 20%. That differential grew wider with a decline in credit quality, with high yield securities underperforming Treasuries by 38% for the year. By the end of the fourth quarter, there were some tentative signs that the damage was being contained. Short rates began to ease, a few new issues came to market, and corporate spreads narrowed marginally.
The Fund underperformed the Index for the year ended December 31, 2008. The main driver of this underperformance was the Fund’s overweight allocation in corporate bonds and a related underweight in U.S. Treasuries. Country allocation was also marginally negative during the year. While all major global bond markets had positive local returns, the underweight in U.S. Treasuries overshadowed any beneficial exposure to other countries. Conversely, the Fund’s currency strategy contributed positively to relative performance during the period. Underweights to the Canadian Dollar and the Euro, combined with a reduction in the exposure to non-Japanese Asian currencies during the second half of the year all contributed favorably.
LOOKING FORWARD
Loomis expects a moderate narrowing of global investment-grade corporate spreads from their recent levels of about 500bps over U.S. Treasuries to perhaps 400-450bps by the end of the first quarter of 2009. Further spread compression to a normalized recession level of perhaps 300bps will likely wait upon a recovery of bank capital, which should be followed by greater allocation of trading capital to bond desks. In currencies, Loomis is inclined to reduce U.S. Dollar currency exposure while maintaining U.S. Dollar credit exposure. It will also look for opportunities to shift from Japanese Yen into commodity and emerging-markets currencies, but has waited to do so until the extent of the downturn is clear. Loomis continues to believe that the Fund is well positioned for a recovery in the global credit markets.
CUMULATIVE TOTAL RETURN PERFORMANCE
Global Bond’s cumulative total return is based on the daily change in net asset value (NAV), and assumes that all distributions were reinvested. The Barclays Capital Global Aggregate Index is a broad-based index comprised of 10,232 global investment-grade fixed-income securities covering the U.S., Europe and Asia. Unlike the Fund, the Barclays Capital Global Aggregate Index is unmanaged, is not available for investment, and does not incur expenses. This graph compares a hypothetical $10,000 investment made in Global Bond on December 31, 1998, to a $10,000 investment made in the Barclays Capital Global Aggregate Index for the same time
25
Managers Global Bond Fund
Portfolio Manager’s Comments (continued)
CUMULATIVE TOTAL RETURN PERFORMANCE (continued)
period. Performance for periods longer than one year is annualized. The graph and table do not reflect the deduction of taxes that a shareholder would pay on a Fund distribution or redemption of shares. The listed returns for the Fund are net of expenses and the returns for the index exclude expenses. Past performance is not indicative of future results. Total returns would have been lower had certain expenses not been reduced.
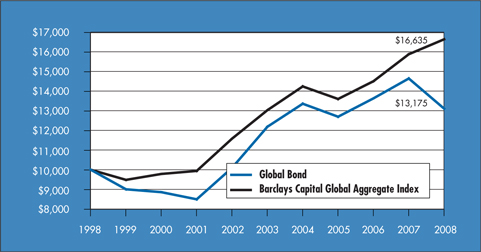
The table below shows the average annual total returns for Global Bond and the Barclays Capital Global Aggregate Index from December 31, 1998 through December 31, 2008.
| | | | | | | | | | | |
Average Annual Total Returns 1 | | One Year | | | Five Years | | | Ten Years | | | Inception Date |
Global Bond 2,3,4,5 | | (10.01 | )% | | 1.58 | % | | 2.80 | % | | 3/25/94 |
Barclays Capital Global Aggregate Index | | 4.79 | % | | 5.01 | % | | 5.22 | % | | |
The performance data shown represents past performance. Past performance is not a guarantee of future results. Current performance may be lower or higher than the performance data quoted. The investment return and principal value of an investment in the Fund will fluctuate so that an investor’s shares, when redeemed, may be worth more or less than their original cost. For performance information through the most recent month end, please call (800) 835-3879 or visit our Web site at www.managersinvest.com.
In choosing a Fund, investors should carefully consider the amount they plan to invest, their investment objectives, the Fund’s investment objectives, risks, charges and expenses before investing. For this and other information, please call (800) 835-3879 or visit www.managersinvest.com for a free prospectus. Read it carefully before investing or sending money. Distributed by Managers Distributors, Inc., member FINRA.
| | 1 | Total return equals income yield plus share price change and assumes reinvestment of all dividends and capital gain distributions. Returns are net of fees and may reflect offsets of Fund expenses as described in the Prospectus. No adjustment has been made for taxes payable by shareholders on their reinvested dividends and capital gain distributions. Returns for periods greater than one year are annualized. The listed returns on the Fund are net of expenses. All returns are in U.S. dollars($). |
| | 2 | Fund for which, from time to time, the Fund’s advisor has waived its fees and/or absorbed Fund expenses, which has resulted in higher returns. |
| | 3 | Fixed-income funds are subject to the risks associated with investments in debt securities, such as default risk, fluctuations in debtor’s perceived ability to pay its creditors. Changing interest rates may adversely affect the value of an investment. An increase in interest rates typically causes the value of bonds and other fixed-income securities to fall. |
| | 4 | Investments in foreign securities are subject to additional risks such as changing market conditions, economic and political instability, and currency exchange rate fluctuations. |
| | 5 | Performance based on published NAV as of December 31, 2008. |
Not FDIC insured, nor bank guaranteed. May lose value.
26
Managers Global Bond Fund
Fund Snapshots
December 31, 2008
Portfolio Breakdown
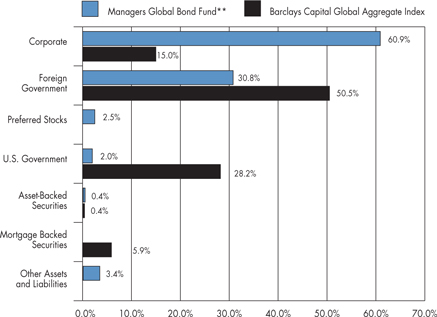
| | | | | | |
Industry | | Managers
Global Bond
Fund** | | | Barclays Capital
Global Aggregate
Index | |
Corporate | | 60.9 | % | | 15.0 | % |
Foreign Government | | 30.8 | % | | 50.5 | % |
Preferred Stocks | | 2.5 | % | | 0.0 | % |
U.S. Government | | 2.0 | % | | 28.2 | % |
Asset-Backed Securities | | 0.4 | % | | 0.4 | % |
Mortgage Backed Securities | | 0.0 | % | | 5.9 | % |
Other Assets and Liabilities | | 3.4 | % | | 0.0 | % |
| | ** | As a percentage of net assets |
Top Ten Holdings
| | | |
Security Name | | Percentage of
Net Assets | |
Belgium Kingdom, 5.500%, 09/28/17* | | 8.3 | % |
Bundesrepublik Deutschland, 3.750%, 01/04/17* | | 3.8 | |
Development Bank of Japan, 1.750%, 06/21/10* | | 2.2 | |
Muenchener Hypothekenbank eG, 5.000%, 01/16/12 | | 2.1 | |
Oesterreichische Kontrollbank AG, 1.800%, 03/22/10 | | 2.1 | |
General Electric Capital Corp., 3.250%, 04/15/13 | | 2.0 | |
U.S. Treasury Notes, 1.500%, 12/31/13 | | 2.0 | |
Kingdom of Norway, 5.500%, 05/15/09 | | 2.0 | |
Japan Finance Corporation for Municipal Enterprises, 1.550%, 02/21/12 | | 1.8 | |
HSBC Finance Corp., 1.790%, 09/18/15 | | 1.7 | |
| | | |
Top Ten as a Group | | 28.0 | % |
| | | |
| | * | Top Ten Holding at June 30, 2008 |
Any sectors, industries, or securities discussed should not be perceived as investment recommendations. Mention of a specific security should not be considered a recommendation to buy or solicitation to sell that security.
27
Managers Global Bond Fund
Schedule of Portfolio Investments
December 31, 2008
| | | | | | |
Security Description | | Principal Amount | | Value |
Corporate Bonds—60.9% | | | | | | |
Finance—26.2% | | | | | | |
American Express Co., 6.150%, 08/28/17 | | USD | 65,000 | | $ | 62,664 |
ASIF Global Financial, 2.380%, 02/26/09 (a) | | SGD | 500,000 | | | 252,356 |
BNP Paribas, 4.730%, 04/12/166 | | EUR | 100,000 | | | 90,575 |
BSkyB Finance PLC, 5.750%, 10/20/17 | | GBP | 105,000 | | | 127,158 |
Canara Bank, 6.365%, 11/28/216 | | USD | 800,000 | | | 533,067 |
CIT Group, Inc., | | | | | | |
4.250%, 03/17/15 | | EUR | 50,000 | | | 37,759 |
4.650%, 09/19/16 | | EUR | 50,000 | | | 37,753 |
5.500%, 12/01/14 | | GBP | 620,000 | | | 478,486 |
Citigroup, Inc., 5.000%, 09/15/14 | | USD | 880,000 | | | 774,032 |
Credit Suisse/London, Series EMTN, 6.125%, 08/05/13 | | EUR | 195,000 | | | 278,162 |
Depfa ACS Bank, 1.650%, 12/20/16 | | JPY | 70,000,000 | | | 498,263 |
ERAC USA Finance Co., | | | | | | |
6.375%, 10/15/17 (a) | | USD | 220,000 | | | 152,683 |
6.700%, 06/01/34 (a) | | USD | 240,000 | | | 131,884 |
7.000%, 10/15/37 (a) | | USD | 90,000 | | | 49,570 |
General Electric Capital Corp., 3.250%, 04/15/13 (b) | | USD | 1,000,000 | | | 961,109 |
Goldman Sachs Group, Inc., | | | | | | |
4.185%, 05/23/16 (02/23/09) 5 | | EUR | 350,000 | | | 329,340 |
6.875%, 01/18/38 | | GBP | 200,000 | | | 199,042 |
Host Hotels & Resorts, L.P., | | | | | | |
6.375%, 03/15/15 | | USD | 35,000 | | | 26,075 |
6.875%, 11/01/14 | | USD | 400,000 | | | 308,000 |
HSBC Finance Corp., 1.790%,0 9/18/15 | | JPY | 100,000,000 | | | 815,294 |
ICICI Bank, Ltd., 6.375%, 04/30/22 (a) 6 | | USD | 280,000 | | | 147,031 |
ISA Capital do Brasil SA, 7.875%, 01/30/12 (a) | | USD | 100,000 | | | 94,500 |
JPMorgan Chase & Co., 7.900%, 04/30/186 | | USD | 485,000 | | | 403,438 |
KfW Bankengruppe, | | | | | | |
1.350%, 01/20/14 | | JPY | 49,000,000 | | | 540,352 |
2.050%, 02/16/26 | | JPY | 35,000,000 | | | 353,325 |
2.600%, 06/20/37 | | JPY | 68,000,000 | | | 767,222 |
Kinder Morgan Finance Co., 5.700%, 01/05/16 | | USD | 245,000 | | | 182,525 |
Lloyds TSB Bank PLC, 4.385%, 05/12/176 | | EUR | 215,000 | | | 171,217 |
Morgan Stanley | | | | | | |
4.750%, 04/01/14 | | USD | 275,000 | | | 209,519 |
Series EMTN, 5.375%, 11/14/13 | | GBP | 120,000 | | | 141,967 |
Muenchener Hypothekenbank eG, 5.000%, 01/16/12 (a) | | EUR | 685,000 | | | 995,655 |
Network Rail MTN Finance PLC, 4.875%, 03/06/09 | | GBP | 110,000 | | | 159,146 |
Oesterreichische Kontrollbank AG, 1.800%, 03/22/10 | | JPY | 86,000,000 | | | 961,617 |
The accompanying notes are an integral part of these financial statements.
28
Managers Global Bond Fund
Schedule of Portfolio Investments (continued)
| | | | | | |
Security Description | | Principal Amount | | Value |
Finance—26.2% (continued) | | | | | | |
ProLogis, 6.625%, 05/15/18 | | USD | 60,000 | | $ | 28,699 |
Qwest Capital Funding, Inc., 6.875%, 07/15/28 | | USD | 15,000 | | | 9,000 |
RBS Capital Trust C, 4.243%, 01/12/166 | | EUR | 195,000 | | | 118,290 |
SLM Corp., | | | | | | |
4.000%, 01/15/10 | | USD | 55,000 | | | 49,786 |
5.000%, 10/01/13 | | USD | 425,000 | | | 304,096 |
5.375%, 05/15/14 | | USD | 5,000 | | | 3,374 |
5.400%, 10/25/11 | | USD | 10,000 | | | 7,564 |
8.450%, 06/15/18 | | USD | 100,000 | | | 79,062 |
Wells Fargo & Co., 4.625%, 11/02/35 | | GBP | 350,000 | | | 416,808 |
White Mountains Insurance Group, Ltd., 6.375%, 03/20/17 (a) | | USD | 285,000 | | | 235,683 |
Total Finance | | | | | | 12,523,148 |
Industrials—31.1% | | | | | | |
Ahold Finance USA, Inc., Series EMTN, 6.500%, 03/14/17 | | GBP | 195,000 | | | 232,700 |
Albertson’s, Inc., | | | | | | |
6.625%, 06/01/28 | | USD | 65,000 | | | 34,450 |
7.450%, 08/01/29 | | USD | 295,000 | | | 174,050 |
7.750%, 06/15/26 | | USD | 5,000 | | | 3,050 |
Axtel S.A.B. de C.V., 7.625%, 02/01/17 (a) | | USD | 210,000 | | | 142,800 |
Bell Aliant Regional Communications, 5.410%, 09/26/16 | | CAD | 320,000 | | | 226,512 |
Bell Canada, | | | | | | |
5.000%, 02/15/17 (a) | | CAD | 160,000 | | | 109,486 |
6.100%, 03/16/35 (a) | | CAD | 45,000 | | | 27,986 |
6.550%, 05/01/29 (a) | | CAD | 10,000 | | | 6,561 |
7.300%, 02/23/32 (a) | | CAD | 25,000 | | | 16,411 |
Bertelsmann AG, 3.625%, 10/06/15 | | EUR | 380,000 | | | 454,247 |
Bite Finance International, 7.385%, 03/15/14 (03/15/09) (a) 5 | | EUR | 170,000 | | | 68,529 |
Bristol-Myers Squibb Co., 4.625%, 11/15/21 | | EUR | 150,000 | | | 181,850 |
British Sky Broadcasting Group PLC, 6.100%, 02/15/18 (a) | | USD | 460,000 | | | 377,706 |
Canadian Pacific Railway Co., | | | | | | |
5.750%, 03/15/33 | | USD | 30,000 | | | 20,743 |
5.950%, 05/15/37 | | USD | 55,000 | | | 38,785 |
Cemex Finance Europe BV, 4.750%, 03/05/14 | | EUR | 350,000 | | | 214,943 |
Chesapeake Energy Corp., | | | | | | |
6.250%, 01/15/17 | | EUR | 100,000 | | | 83,403 |
6.500%, 08/15/17 | | USD | 115,000 | | | 87,975 |
6.875%, 11/15/20 | | USD | 170,000 | | | 122,400 |
Citizens Communications Co., | | | | | | |
6.250%, 01/15/13 | | USD | 125,000 | | | 106,250 |
6.625%, 03/15/15 | | USD | 115,000 | | | 83,950 |
7.125%, 03/15/19 | | USD | 130,000 | | | 87,100 |
9.000%, 08/15/31 | | USD | 65,000 | | | 40,950 |
The accompanying notes are an integral part of these financial statements.
29
Managers Global Bond Fund
Schedule of Portfolio Investments (continued)
| | | | | | | |
Security Description | | Principal Amount | | | Value |
Industrials—31.1% (continued) | | | | | | | |
Community Health Systems, Inc., 8.875%, 07/15/15 | | USD | 225,000 | | | $ | 207,000 |
Couche-Tard US LP/Couche-Tard Finance Corp., 7.500%, 12/15/13 | | USD | 160,000 | | | | 126,400 |
CSX Corp., | | | | | | | |
5.600%, 05/01/17 | | USD | 60,000 | 2 | | | 53,303 |
6.000%, 10/01/36 | | USD | 386,000 | | | | 305,726 |
6.250%, 03/15/18 | | USD | 40,000 | | | | 36,791 |
Delta Air Lines, Inc., | | | | | | | |
6.821%, 08/10/22 | | USD | 345,926 | | | | 219,663 |
8.021%, 08/10/22 | | USD | 115,073 | | | | 60,845 |
Desarrolladora Homex, S.A. de C.V., 7.500%, 09/28/15 | | USD | 380,000 | | | | 273,600 |
DP World, Ltd., 6.850%, 07/02/37 (a) | | USD | 900,000 | | | | 463,561 |
Edcon Proprietary Ltd., 7.395%, 06/15/14 (03/15/09) (a) 5 | | EUR | 510,000 | | | | 283,570 |
Embarq Corp., 7.995%, 06/01/36 | | USD | 110,000 | | | | 74,250 |
Energy Transfer Partners, L.P., | | | | | | | |
6.625%, 10/15/36 | | USD | 425,000 | | | | 297,480 |
6.700%, 07/01/18 | | USD | 90,000 | | | | 75,860 |
Finmeccanica SpA, 4.875%, 03/24/25 | | EUR | 150,000 | | | | 149,378 |
France Telecom, 3.625%, 10/14/15 | | EUR | 150,000 | | | | 193,814 |
Georgia-Pacific Corp., 7.125%, 01/15/17 (a) | | USD | 105,000 | | | | 88,200 |
Hanaro Telecom, Inc., 7.000%, 02/01/12 (a) | | USD | 50,000 | | | | 41,000 |
HCA, Inc., | | | | | | | |
6.375%, 01/15/15 | | USD | 70,000 | | | | 42,700 |
6.625%, 02/15/16 | | USD | 160,000 | | | | 98,400 |
7.580%, 09/15/25 | | USD | 20,000 | | | | 9,239 |
7.690%, 06/15/25 | | USD | 25,000 | | | | 11,736 |
Hilcorp Energy I LP/Hilcorp Finance Co., 7.750%, 11/01/15 (a) | | USD | 170,000 | | | | 119,850 |
Home Depot, Inc., The, 5.875%, 12/16/36 | | USD | 250,000 | | | | 196,026 |
Host Hotels & Resorts, L.P., 6.750%, 06/01/16 | | USD | 140,000 | | | | 102,200 |
Imperial Tobacco Finance PLC, 4.375%, 11/22/13 | | EUR | 50,000 | | | | 56,867 |
International Paper Co., 7.950%, 06/15/18 | | USD | 215,000 | | | | 169,927 |
Kinder Morgan Energy Partners L.P., 5.800%, 03/15/35 | | USD | 240,000 | | | | 167,087 |
KLA Instruments Corp., 6.900%, 05/01/18 | | USD | 345,000 | | | | 260,934 |
Koninklijke KPN, N.V., 4.750%, 01/17/17 | | EUR | 250,000 | | | | 309,400 |
Kraft Foods, Inc., 6.875%, 02/01/38 | | USD | 215,000 | | | | 214,851 |
Lafarge S.A., | | | | | | | |
4.750%, 03/23/20 | | EUR | 215,000 | | | | 192,466 |
5.375%, 06/26/17 | | EUR | 150,000 | | | | 144,963 |
Level 3 Financing, Inc., 8.750%, 02/15/17 | | USD | 180,000 | | | | 90,900 |
LPG International, Inc., 7.250%, 12/20/15 | | USD | 120,000 | | | | 108,000 |
Lucent Technologies, Inc., 6.450%, 03/15/29 | | USD | 595,000 | | | | 238,000 |
The accompanying notes are an integral part of these financial statements.
30
Managers Global Bond Fund
Schedule of Portfolio Investments (continued)
| | | | | | |
Security Description | | Principal Amount | | Value |
Industrials—31.1% (continued) | | | | | | |
Motorola, Inc., | | | | | | |
6.500%, 09/01/25 | | USD | 215,000 | | $ | 106,414 |
6.625%, 11/15/37 | | USD | 240,000 | | | 112,800 |
Nextel Communications, Inc., 7.375%, 08/01/15 | | USD | 100,000 | | | 42,000 |
Noble Group, Ltd., 8.500%, 05/30/13 (a) | | USD | 210,000 | | | 144,900 |
Owens & Minor, Inc., 6.350%, 04/15/16 7 | | USD | 530,000 | | | 446,618 |
Owens-Brockway Glass Container, Inc., 6.750%, 12/01/14 | | EUR | 50,000 | | | 54,212 |
Pemex Project Funding Master Trust, 6.625%, 04/04/10 | | EUR | 390,000 | | | 536,697 |
Qwest Capital Funding, Inc., | | | | | | |
6.500%, 11/15/18 | | USD | 40,000 | | | 26,200 |
7.250%, 02/15/11 | | USD | 75,000 | | | 63,000 |
7.750%, 02/15/31 | | USD | 65,000 | | | 40,625 |
Qwest Corp., | | | | | | |
6.500%, 06/01/17 | | USD | 46,000 | | | 34,040 |
6.875%, 09/15/33 | | USD | 75,000 | | | 44,625 |
7.250%, 09/15/25 | | USD | 83,000 | | | 55,610 |
7.250%, 10/15/35 | | USD | 158,000 | | | 98,750 |
Reynolds American, Inc., 6.750%, 06/15/17 | | USD | 355,000 | | | 281,794 |
Rogers Communications, Inc., 7.500%, 08/15/38 | | USD | 140,000 | | | 151,706 |
Sappi Papier Holding AG, 7.500%, 06/15/32 (a) | | USD | 370,000 | | | 246,651 |
Shaw Communications, Inc., 5.700%, 03/02/17 | | CAD | 315,000 | | | 230,814 |
SK Telecom Co., Ltd., 6.625%, 07/20/27 (a) | | USD | 725,000 | | | 603,494 |
Sprint Nextel Corp., 6.000%, 12/01/16 | | USD | 404,000 | | | 284,820 |
Telecom Italia Capital S.p.A., | | | | | | |
4.950%, 09/30/14 | | USD | 290,000 | | | 220,762 |
6.375%, 11/15/33 | | USD | 125,000 | | | 87,500 |
Time Warner, Inc., | | | | | | |
6.625%, 05/15/29 | | USD | 310,000 | | | 274,906 |
6.750%, 07/01/18 | | USD | 190,000 | | | 182,933 |
6.950%, 01/15/28 | | USD | 85,000 | | | 78,391 |
7.300%, 07/01/38 | | USD | 260,000 | | | 270,106 |
UnitedHealth Group, Inc., | | | | | | |
5.800%, 03/15/36 | | USD | 440,000 | | | 335,232 |
6.000%, 02/15/18 | | USD | 130,000 | | | 119,942 |
Vale Overseas Ltd., 6.875%, 11/01/36 | | USD | 278,000 | | | 252,341 |
Verizon Wireless Capital LLC, 8.750%, 12/18/15 | | EUR | 275,000 | | | 390,264 |
Vivendi, 3.875%, 02/15/12 | | EUR | 90,000 | | | 118,686 |
Wendel Investissement, | | | | | | |
4.375%, 08/09/17 | | EUR | 200,000 | | | 145,137 |
4.875%, 05/26/16 | | EUR | 200,000 | | | 145,200 |
The accompanying notes are an integral part of these financial statements.
31
Managers Global Bond Fund
Schedule of Portfolio Investments (continued)
| | | | | | |
Security Description | | Principal Amount | | Value |
Industrials—31.1% (continued) | | | | | | |
Wolters Kluwer, N.V., 5.125%, 01/27/14 | | EUR | 60,000 | | $ | 76,922 |
WPP Finance S.A., 5.250%, 01/30/15 | | EUR | 100,000 | | | 108,069 |
Total Industrials | | | | | | 14,838,985 |
Utilities—3.6% | | | | | | |
Abu Dhabi National Energy Co. PJSC, 7.250%, 08/01/18 (a) | | USD | 500,000 | | | 428,847 |
Edison Mission Energy, 7.625%, 05/15/27 | | USD | 155,000 | | | 120,125 |
Majapahit Holding BV, 7.250%, 06/28/17 (a) | | USD | 200,000 | | | 104,000 |
NiSource Finance Corp., 6.400%, 03/15/18 | | USD | 365,000 | | | 227,788 |
Transport De Gas Del Sur, 7.875%, 05/14/17 (a) | | USD | 540,000 | | | 280,800 |
TXU Corp., 6.500%, 11/15/24 | | USD | 410,000 | | | 145,053 |
Veolia Environnement, | | | | | | |
4.000%, 02/12/16 | | EUR | 75,000 | | | 89,437 |
5.125%, 05/24/22 | | EUR | 200,000 | | | 230,369 |
6.000%, 06/01/18 | | USD | 80,000 | | | 70,912 |
Total Utilities | | | | | | 1,697,331 |
Total Corporate Bonds (cost $37,023,165) | | | | | | 29,059,464 |
Foreign Government Obligations—30.8% | | | | | | |
Asian Development Bank, 2.350%, 06/21/27 | | JPY | 20,000,000 | | | 218,675 |
Belgium Kingdom, 5.500%, 09/28/17 | | EUR | 2,520,000 | | | 3,957,016 |
Bundesrepublik Deutschland, | | | | | | |
3.750%, 01/04/17 | | EUR | 1,219,000 | | | 1,796,067 |
4.000%, 04/13/12 | | EUR | 460,000 | | | 675,421 |
Development Bank of Japan, | | | | | | |
1.400%, 06/20/12 | | JPY | 39,000,000 | | | 442,285 |
1.750%, 06/21/10 | | JPY | 95,000,000 | | | 1,064,262 |
European Investment Bank, | | | | | | |
1.250%, 09/20/12 | | JPY | 50,000,000 | | | 551,949 |
17.938%, 04/24/13 (a) 4,7 | | IDR | 8,021,910,000 | | | 350,756 |
Indonesia Government International Bond, 7.750%, 01/17/38 (a) | | USD | 460,000 | | | 381,800 |
Japan Finance Corporation for Municipal Enterprises, | | | | | | |
Series INTL, 1.350%, 11/26/13 | | JPY | 37,000,000 | | | 416,360 |
1.550%, 02/21/12 | | JPY | 76,000,000 | | | 857,759 |
Kingdom of Norway, 5.500%, 05/15/09 | | NOK | 6,525,000 | | | 936,346 |
Mexican Fixed Rate Bonds, 8.000%, 12/07/23 | | MXN | 3,900,000 | | | 275,592 |
Netherlands Government SA, 5.500%, 01/15/28 | | EUR | 190,000 | | | 319,337 |
New South Wales Treasury Corp., Series 10RG, 7.000%, 12/01/10 | | AUD | 410,000 | | | 301,256 |
Nordic Investment Bank, The, 1.700%, 04/27/17 | | JPY | 50,000,000 | | | 556,167 |
Norway Government Bond, 6.500%, 05/15/13 | | NOK | 1,500,000 | | | 242,733 |
Republica Oriental del Uruguay, 4.250%, 04/05/27 | | UYU | 17,730,000 | | | 444,419 |
South Africa, Republic of, 4.500%, 04/05/16 | | EUR | 385,000 | | | 401,751 |
U.K. Gilts, 4.750%, 03/04/20 | | GBP | 310,000 | | | 499,589 |
Total Foreign Government Obligations (cost $14,066,426) | | | | | | 14,689,540 |
The accompanying notes are an integral part of these financial statements.
32
Managers Global Bond Fund
Schedule of Portfolio Investments (continued)
| | | | | | | |
Security Description | | Principal Amount | | | Value |
U.S. Government and Agency Obligations—2.0% | | | | | | | |
U.S. Government—2.0% | | | | | | | |
USTN, 1.500%, 12/31/13 | | USD | 940,000 | | | $ | 937,870 |
Federal Home Loan Mortgage Corporation—0.0%# | | | | | | | |
FHLMC Gold Pool, 6.000%, 05/01/18 | | USD | 17,206 | | | | 17,843 |
Total U.S. Government and Agency Obligations (cost $959,257) | | | | | | | 955,713 |
Asset-Backed Security—0.4% | | | | | | | |
Merrill Lynch/Countrywide Mortgage Trust, 5.439%, 02/12/39 6 (cost $236,181) | | USD | 235,000 | | | | 203,795 |
| | |
| | | Shares | | | |
Preferred Stocks—2.5% | | | | | | | |
Bank of America Corp., Series H, 8.200% | | | 35,950 | 2 | | | 727,988 |
FHLMC, 8.375%* | | | 21,825 | | | | 8,512 |
FNMA, 8.250%* | | | 37,350 | | | | 31,000 |
Merrill Lynch & Co., Inc., 8.625% | | | 21,325 | | | | 421,808 |
Total Preferred Stocks (cost $2,932,156) | | | | | | | 1,189,308 |
Other Investment Companies—1.8%1 | | | | | | | |
BNY Institutional Cash Reserves Fund, Series A, 0.07%3 | | | 725,001 | | | | 725,001 |
BNY Institutional Cash Reserves Fund, Series B*3,8 | | | 38,044 | | | | 3,424 |
BNY Institutional Cash Reserves Fund, Series C* 3,9 | | | 33,424 | | | | 33,424 |
Dreyfus Cash Management Fund, Institutional Class Shares, 1.53%10 | | | 118,201 | | | | 118,201 |
Total Other Investment Companies (cost $914,670) | | | | | | | 880,050 |
Total Investments—98.4% (cost $56,131,855) | | | | | | | 46,977,870 |
Other Assets, less Liabilities—1.6% | | | | | | | 756,677 |
Net Assets—100.0% | | | | | | $ | 47,734,547 |
The accompanying notes are an integral part of these financial statements.
33
Notes to Schedules of Portfolio Investments
The following footnotes and abbreviations should be read in conjunction with each of the Schedules of Portfolio Investments previously presented in this report.
At December 31, 2008, the cost of securities for Federal income tax purposes and the gross aggregate unrealized appreciation and/or depreciation based on tax cost were:
| | | | | | | | | | | | | | |
Fund | | Cost | | Appreciation | | Depreciation | | | Net | |
Managers AMG Essex Large Cap Growth | | $ | 34,442,690 | | $ | 2,318,019 | | $ | (6,617,512 | ) | | $ | (4,299,493 | ) |
International Equity | | | 175,184,992 | | | 7,951,162 | | | (54,122,219 | ) | | | (46,171,057 | ) |
Emerging Markets Equity | | | 108,711,452 | | | 1,118,850 | | | (45,572,292 | ) | | | (44,453,442 | ) |
Global Bond | | | 56,131,855 | | | 2,115,134 | | | (11,269,119 | ) | | | (9,153,985 | ) |
| * | Non-income producing security. |
| (a) | Security exempt from registration under Rule 144A of the Securities Act of 1933. This security may be resold in transactions exempt from registration, normally to qualified buyers. At December 31, 2008, the value of these securities amounted to the following: |
| | | | | | |
Fund | | Market Value | | % of Net
Assets | |
International Equity | | $ | 283,731 | | 0.2 | % |
Emerging Markets Equity | | | 1,198,959 | | 2.0 | % |
Global Bond | | | 6,346,270 | | 13.3 | % |
| (b) | Step Bond. A debt instrument with either deferred interest payments or an interest rate that resets at specific times during its term. |
1 | Yield shown for each investment company represents the December 31, 2008, seven-day average yield, which refers to the sum of the previous seven days’ dividends paid, expressed as an annual percentage. |
2 | Some or all of these shares were out on loan to various brokers as of December 31, 2008, amounting to: |
| | | | | | |
Fund | | Market Value | | % of Net
Assets | |
Managers AMG Essex Large Cap Growth | | $ | 1,253,243 | | 4.3 | % |
International Equity | | | 2,328,698 | | 1.8 | % |
Emerging Markets Equity | | | 2,598,854 | | 4.3 | % |
Global Bond | | | 781,291 | | 1.6 | % |
3 | Collateral received from brokers for securities lending was invested in these short-term investments. |
4 | Represents yield to maturity at December 31, 2008. |
5 | Floating Rate Security. The rate listed is as of December 31, 2008. Date in parentheses represents the security’s next coupon rate reset. |
6 | Variable Rate Security. The rate listed is as of December 31, 2008 and is periodically reset subject to terms and conditions set forth in the debenture. |
7 | Security is illiquid: A security not readily convertible into cash such as a stock, bond or commodity that is not actively traded, and would be difficult to sell in a current sale. The Fund may not invest more than 15% of its net assets in illiquid securities. All securities are valued on the basis of valuations provided by dealers or independent pricing services. Illiquid securities at December 31, 2008 for Global Bond Fund amounted to $797,374 or 1.7% of net assets. |
8 | On September 12, 2008, The Bank of New York Mellon (“BNYM”) established a separate sleeve of the BNY Institutional Cash Reserves Fund (“ICRF”) (Series B) to hold certain Lehman Brothers floating rate notes. The Fund’s position in Series B is being marked to market daily. |
9 | On October 6, 2008, BNYM established a separate sleeve of the ICRF (Series C) to hold a security issued by Whistlejacket Capital Ltd. The Fund’s position in Series C is being marked to market daily. |
10 | Each Fund’s investment in the Dreyfus Cash Management Fund is covered under the U.S. Treasury Temporary Money Market Fund Guarantee Program up to a maximum of: |
| | | |
Fund | | Market Value |
Managers AMG Essex Large Cap Growth | | $ | 1,474,284 |
International Equity | | | 6,597,699 |
Global Bond | | | 819,695 |
| # | Rounds to less than 0.1%. |
Investments Definitions and Abbreviations:
ADR/GDR: ADR after the name of a holding stands for American Depositary Receipt, representing ownership of foreign securities on deposit with a domestic custodian bank; a GDR (Global Depositary Receipt) is comparable, but foreign securities are held on deposit in a non-U.S. bank. The value of the ADR/GDR securities is determined or significantly influenced by trading on exchanges not located in the United States or Canada. Sponsored ADR/GDRs are initiated by the underlying foreign company.
| | |
| FHLMC: | | Federal Home Loan Mortgage Corp. |
| FNMA: | | Federal National Mortgage Association |
| GNMA: | | Government National Mortgage Association |
| USTN: | | United States Treasury Note |
| RSP: | | Risparmio shares which are saving shares traded on the Italian Stock Exchange. |
Registered shares: A security whose owner has been recorded with its issuer or issuer’s registrar.
Abbreviations have been used throughout the portfolios to indicate amounts shown in currencies other than the U.S. dollar (USD):
| | |
| ARS: | | Argentine Peso |
| AUD: | | Australian Dollar |
| CAD: | | Canadian Dollar |
| CHF: | | Swiss Franc |
| COP: | | Columbian Peso |
| EUR: | | euro |
| GBP: | | British Pound |
| IDR: | | Indonesian Rupiah |
| JPY: | | Japanese Yen |
| KRW: | | South Korean Won |
| MYR: | | Malaysian Ringgit |
| NOK: | | Norwegian Krone |
| MXN: | | Mexican Peso |
| SEK: | | Swedish Krona |
| SGD: | | Singapore Dollar |
| UYU: | | Uruguay Peso |
34
Statements of Assets and Liabilities
December 31, 2008
| | | | | | | | | | | | | | | | |
| | | Managers AMG
Essex Large Cap
Growth Fund | | | Managers
International
Equity Fund | | | Managers Emerging
Markets Equity
Fund | | | Managers Global
Bond Fund | |
Assets: | | | | | | | | | | | | | | | | |
Investments at value (including securities on loan valued at $1,253,243, $2,328,698, $2,598,854 and $781,291, respectively)* | | $ | 30,143,197 | | | $ | 129,013,935 | | | $ | 64,258,010 | | | $ | 46,977,870 | |
Cash | | | — | | | | — | | | | — | | | | 138,337 | |
Cash collateral for futures | | | — | | | | 33,487 | | | | — | | | | — | |
Foreign currency** | | | — | | | | 382,920 | | | | 542,947 | | | | 467,414 | |
Receivable for investments sold | | | 163,244 | | | | 238,266 | | | | 1,945,675 | | | | 1,171,184 | |
Receivable for Fund shares sold | | | 43,706 | | | | 1,643,185 | | | | 479,827 | | | | 29,739 | |
Unrealized appreciation of foreign currency contracts | | | — | | | | — | | | | — | | | | 7,040 | |
Dividends, interest and other receivables | | | 13,665 | | | | 351,804 | | | | 210,729 | | | | 986,333 | |
Prepaid expenses | | | 10,637 | | | | 13,167 | | | | 18,012 | | | | 9,002 | |
Total assets | | | 30,374,449 | | | | 131,676,764 | | | | 67,455,200 | | | | 49,786,919 | |
Liabilities: | | | | | | | | | | | | | | | | |
Payable to Custodian | | | — | | | | 6,053 | | | | 3,306,842 | | | | — | |
Payable for Fund shares repurchased | | | 64,719 | | | | 591,773 | | | | 847,556 | | | | 187,090 | |
Payable upon return of securities loaned | | | 1,264,586 | | | | 2,442,275 | | | | 2,721,182 | | | | 796,469 | |
Payable for investments purchased | | | — | | | | 384,247 | | | | — | | | | 941,766 | |
Unrealized depreciation of foreign currency contracts | | | — | | | | — | | | | — | | | | 8,150 | |
Other payables | | | — | | | | 1,194 | | | | — | | | | — | |
Accrued expenses: | | | | | | | | | | | | | | | | |
Investment advisory and management fees | | | 13,563 | | | | 87,677 | | | | 44,826 | | | | 24,261 | |
Administrative fees | | | 5,936 | | | | 25,978 | | | | 13,074 | | | | 8,087 | |
Other | | | 66,175 | | | | 153,151 | | | | 166,449 | | | | 86,549 | |
Total liabilities | | | 1,414,979 | | | | 3,692,348 | | | | 7,099,929 | | | | 2,052,372 | |
| | | | |
Net Assets | | $ | 28,959,470 | | | $ | 127,984,416 | | | $ | 60,355,271 | | | $ | 47,734,547 | |
Shares outstanding | | | 1,489,141 | | | | 3,265,892 | | | | 7,463,616 | | | | 2,819,752 | |
Net asset value, offering and redemption price per share | | $ | 19.45 | | | $ | 39.19 | | | $ | 8.09 | | | $ | 16.93 | |
Net Assets Represent: | | | | | | | | | | | | | | | | |
Paid-in capital | | $ | 177,629,232 | | | $ | 235,605,801 | | | $ | 115,399,026 | | | $ | 57,610,599 | |
Undistributed net investment income (loss) | | | — | | | | (23,558 | ) | | | 18,683 | | | | 201,732 | |
Accumulated net realized loss from investments, futures and foreign currency transactions | | | (144,562,740 | ) | | | (71,361,452 | ) | | | (12,820,300 | ) | | | (906,645 | ) |
Net unrealized depreciation of investments, futures and foreign currency contracts and translations | | | (4,107,022 | ) | | | (36,236,375 | ) | | | (42,242,138 | ) | | | (9,171,139 | ) |
Net Assets | | $ | 28,959,470 | | | $ | 127,984,416 | | | $ | 60,355,271 | | | $ | 47,734,547 | |
* Investments at cost | | $ | 34,250,219 | | | $ | 165,229,951 | | | $ | 106,499,946 | | | $ | 56,131,855 | |
** Foreign currency at cost | | | — | | | $ | 398,120 | | | $ | 540,810 | | | $ | 455,253 | |
The accompanying notes are an integral part of these financial statements.
35
Statements of Operations
For the year ended December 31, 2008
| | | | | | | | | | | | | | | | |
| | | Managers AMG
Essex Large Cap
Growth Fund | | | Managers
International
Equity Fund | | | Managers Emerging
Markets Equity Fund | | | Managers Global
Bond Fund | |
Investment Income: | | | | | | | | | | | | | | | | |
Dividend income | | $ | 271,595 | | | $ | 6,586,382 | | | $ | 3,929,823 | | | $ | 169,233 | |
Interest income | | | — | | | | — | | | | — | | | | 3,518,739 | |
Foreign withholding tax | | | (5,666 | ) | | | (619,810 | ) | | | (415,497 | ) | | | — | |
Securities lending fees | | | 33,769 | | | | 89,503 | | | | 63,546 | | | | 25,168 | |
Total investment income | | | 299,698 | | | | 6,056,075 | | | | 3,577,872 | | | | 3,713,140 | |
Expenses: | | | | | | | | | | | | | | | | |
Investment management fees | | | 334,584 | | | | 2,004,112 | | | | 1,629,177 | | | | 550,523 | |
Administrative fees | | | 104,558 | | | | 556,698 | | | | 354,169 | | | | 157,292 | |
Transfer agent | | | 128,032 | | | | 635,896 | | | | 400,044 | | | | 116,897 | |
Professional fees | | | 38,144 | | | | 103,966 | | | | 89,774 | | | | 56,390 | |
Reports to shareholders | | | 27,760 | | | | 28,952 | | | | 43,393 | | | | 6,461 | |
Registration fees | | | 22,019 | | | | 27,353 | | | | 33,595 | | | | 28,181 | |
Custodian | | | 14,394 | | | | 250,616 | | | | 253,274 | | | | 55,752 | |
Trustees fees and expenses | | | 3,720 | | | | 22,725 | | | | 15,040 | | | | 6,236 | |
Miscellaneous | | | 1,884 | | | | 17,938 | | | | 49,630 | | | | 6,661 | |
Total expenses before offsets | | | 675,095 | | | | 3,648,256 | | | | 2,868,096 | | | | 984,393 | |
Fee waivers | | | (30,507 | ) | | | (51 | ) | | | — | | | | (78,646 | ) |
Expense reimbursement | | | (104,558 | ) | | | (349,131 | ) | | | (319,185 | ) | | | (38,743 | ) |
Expense reductions | | | (23,187 | ) | | | (11,048 | ) | | | (1,693 | ) | | | (1,090 | ) |
Net expenses | | | 516,843 | | | | 3,288,026 | | | | 2,547,218 | | | | 865,914 | |
| | | | |
Net investment income (loss) | | | (217,145 | ) | | | 2,768,049 | | | | 1,030,654 | | | | 2,847,226 | |
Net Realized and Unrealized Gain (Loss): | | | | | | | | | | | | | | | | |
Net realized gain (loss) on investment transactions | | | (11,285,555 | ) | | | (41,101,352 | ) | | | (2,969,480 | ) | | | 1,433,887 | |
Net realized loss on futures contracts | | | — | | | | (233,668 | ) | | | — | | | | — | |
Net realized gain (loss) on foreign currency contracts and transactions | | | — | | | | (367,955 | ) | | | (434,466 | ) | | | 92,852 | |
Net unrealized depreciation of investments and reversal of foreign capital gains tax | | | (9,788,662 | ) | | | (99,742,632 | ) | | | (101,283,154 | ) | | | (12,390,494 | ) |
Net unrealized appreciation of futures contracts | | | — | | | | 70,145 | | | | — | | | | — | |
Net unrealized depreciation of foreign currency contracts and translations | | | — | | | | (22,796 | ) | | | (33,184 | ) | | | (32,882 | ) |
Net realized and unrealized loss | | | (21,074,217 | ) | | | (141,398,258 | ) | | | (104,720,284 | ) | | | (10,896,637 | ) |
| | | | |
Net decrease in net assets resulting from operations | | $ | (21,291,362 | ) | | $ | (138,630,209 | ) | | $ | (103,689,630 | ) | | $ | (8,049,411 | ) |
The accompanying notes are an integral part of these financial statements.
36
Statements of Changes in Net Assets
For the year ended December 31,
| | | | | | | | | | | | | | | | |
| | | Managers AMG Essex Large Cap
Growth Fund | | | Managers International Equity Fund | |
| | | 2008 | | | 2007 | | | 2008 | | | 2007 | |
Increase (Decrease) in Net Assets From Operations: | | | | | | | | | | | | | | | | |
Net investment income (loss) | | $ | (217,145 | ) | | $ | (295,342 | ) | | $ | 2,768,049 | | | $ | 1,549,035 | |
Net realized gain (loss) on investments, futures and foreign currency transactions | | | (11,285,555 | ) | | | 12,081,136 | | | | (41,702,975 | ) | | | 35,687,191 | |
Net unrealized appreciation (depreciation) of investments and foreign currency translations | | | (9,788,662 | ) | | | (3,092,212 | ) | | | (99,695,283 | ) | | | (4,284,123 | ) |
Net increase (decrease) in net assets resulting from operations | | | (21,291,362 | ) | | | 8,693,582 | | | | (138,630,209 | ) | | | 32,952,103 | |
Distributions to Shareholders: | | | | | | | | | | | | | | | | |
From net investment income | | | — | | | | — | | | | (579,286 | ) | | | (1,407,436 | ) |
From net realized gain on investments | | | — | | | | — | | | | — | | | | — | |
Total distributions to shareholders | | | — | | | | — | | | | (579,286 | ) | | | (1,407,436 | ) |
From Capital Share Transactions: | | | | | | | | | | | | | | | | |
Proceeds from sale of shares | | | 8,636,662 | | | | 13,177,776 | | | | 47,873,956 | | | | 89,614,996 | |
Reinvestment of dividends and distributions | | | — | | | | — | | | | 525,450 | | | | 1,269,831 | |
Cost of shares repurchased | | | (10,262,153 | ) | | | (35,994,240 | ) | | | (83,230,766 | ) | | | (51,320,349 | ) |
Net increase (decrease) from capital share transactions | | | (1,625,491 | ) | | | (22,816,464 | ) | | | (34,831,360 | ) | | | 39,564,478 | |
| | | | |
Total increase (decrease) in net assets | | | (22,916,853 | ) | | | (14,122,882 | ) | | | (174,040,855 | ) | | | 71,109,145 | |
Net Assets: | | | | | | | | | | | | | | | | |
Beginning of year | | | 51,876,323 | | | | 65,999,205 | | | | 302,025,271 | | | | 230,916,126 | |
End of year | | $ | 28,959,470 | | | $ | 51,876,323 | | | $ | 127,984,416 | | | $ | 302,025,271 | |
End of year undistributed net investment income (loss) | | | — | | | | — | | | $ | (23,558 | ) | | $ | (1,923,650 | ) |
| | | | | | | | | | | | | | | | |
Share Transactions: | | | | | | | | | | | | | | | | |
Sale of shares | | | 326,270 | | | | 401,884 | | | | 830,645 | | | | 1,182,441 | |
Reinvested shares | | | — | | | | — | | | | 13,882 | | | | 16,446 | |
Shares repurchased | | | (391,513 | ) | | | (1,109,222 | ) | | | (1,494,428 | ) | | | (708,228 | ) |
Net increase (decrease) in shares | | | (65,243 | ) | | | (707,338 | ) | | | (649,901 | ) | | | 490,659 | |
The accompanying notes are an integral part of these financial statements.
37
| | | | | | | | | | | | | |
Managers Emerging Markets
Equity Fund | | | Managers Global Bond Fund | |
| 2008 | | 2007 | | | 2008 | | | 2007 | |
| | | | | | | | | | | | | |
| $ | 1,030,654 | | $ | 244,320 | | | $ | 2,847,226 | | | $ | 3,286,666 | |
| | (3,403,946) | | | 42,821,002 | | | | 1,526,739 | | | | 2,942,161 | |
| | (101,316,338) | | | 4,033,010 | | | | (12,423,376 | ) | | | 1,694,881 | |
| | (103,689,630) | | | 47,098,332 | | | | (8,049,411 | ) | | | 7,923,708 | |
| | | | | | | | | | | | | |
| | (990,986) | | | — | | | | (5,511,710 | ) | | | (5,790,344 | ) |
| | (19,178,599) | | | (31,190,295 | ) | | | (63,791 | ) | | | (36,545 | ) |
| | (20,169,585) | | | (31,190,295 | ) | | | (5,575,501 | ) | | | (5,826,889 | ) |
| | | | | | | | | | | | | |
| | 53,517,690 | | | 81,147,105 | | | | 9,573,497 | | | | 70,923,164 | |
| | 19,578,962 | | | 30,267,900 | | | | 5,410,372 | | | | 5,738,814 | |
| | (87,117,060) | | | (82,070,827 | ) | | | (45,748,762 | ) | | | (40,303,982 | ) |
| | (14,020,408) | | | 29,344,178 | | | | (30,764,893 | ) | | | 36,357,996 | |
| | (137,879,623) | | | 45,252,215 | | | | (44,389,805 | ) | | | 38,454,815 | |
| | | | | | | | | | | | | |
| | 198,234,894 | | | 152,982,679 | | | | 92,124,352 | | | | 53,669,537 | |
| $ | 60,355,271 | | $ | 198,234,894 | | | $ | 47,734,547 | | | $ | 92,124,352 | |
| $ | 18,683 | | $ | 50,868 | | | $ | 201,732 | | | $ | 453,025 | |
| | | | | | | | | | | | | | |
| | | | | | | | | | | | | |
| | 2,584,081 | | | 2,961,645 | | | | 449,639 | | | | 3,348,376 | |
| | 2,523,148 | | | 1,123,113 | | | | 322,430 | | | | 272,628 | |
| | (5,039,533) | | | (2,947,238 | ) | | | (2,275,508 | ) | | | (1,833,465 | ) |
| | 67,696 | | | 1,137,520 | | | | (1,503,439 | ) | | | 1,787,539 | |
The accompanying notes are an integral part of these financial statements.
38
Managers Money Market Fund
Statement of Assets and Liabilities
December 31, 2008
| | | |
Assets: | | | |
Investment in JPMorgan Liquid Assets Money Market Fund, Capital Shares (cost $79,809,831) | | $ | 79,809,831 |
Receivable for Fund shares sold | | | 519,200 |
Dividends receivable | | | 155,765 |
Prepaid expenses | | | 40,177 |
Total assets | | | 80,524,973 |
Liabilities: | | | |
Payable for Fund shares repurchased | | | 31,053 |
Dividends payable to shareholders | | | 11,495 |
Administration fee payable | | | 10,910 |
Other accrued expenses | | | 47,307 |
Total liabilities | | | 100,765 |
| |
Net Assets | | $ | 80,424,208 |
Shares outstanding | | | 80,424,208 |
Net asset value, offering and redemption price per share | | $ | 1.00 |
Net Assets Represent: | | | |
Paid-in capital | | $ | 80,424,208 |
| | | |
Managers Money Market Fund
Statement of Operations
| | | | |
| | | For the
year ended
December 31, 2008 | |
Investment Income: | | | | |
Dividend income | | $ | 2,523,279 | |
| |
Expenses: | | | | |
Administration fees | | | 125,595 | |
Transfer agent | | | 43,933 | |
Professional fees | | | 35,065 | |
Registration fees | | | 21,660 | |
Reports to shareholders | | | 8,808 | |
Trustees fees and expenses | | | 6,010 | |
Accounting fees | | | 6,000 | |
Miscellaneous expenses | | | 14,244 | |
Total expenses before offsets | | | 261,315 | |
Fee waivers | | | (41,323 | ) |
Expense reductions | | | (949 | ) |
Net expenses | | | 219,043 | |
| |
Net Investment Income | | $ | 2,304,236 | |
The accompanying notes are an integral part of these financial statements.
39
Managers Money Market Fund
Statement of Changes in Net Assets
| | | | | | | | | | | | |
| | | For the
year ended
December 31,
2008 | | | For the
one month ended
December 31,
2007* | | | For the
fiscal year ended
November 30,
2007 | |
Increase (Decrease) in Net Assets from Operations: | | | | | | | | | | | | |
Net investment income | | $ | 2,304,236 | | | $ | 360,095 | | | $ | 5,069,405 | |
Distributions to Shareholders: | | | | | | | | | | | | |
From net investment income | | | (2,304,236 | ) | | | (360,095 | ) | | | (5,069,405 | ) |
From Capital Share Transactions (at a constant $1.00 per share): | | | | | | | | | | | | |
Proceeds from sale of shares | | | 165,086,227 | | | | 9,618,816 | | | | 215,023,349 | |
Reinvestment of dividends | | | 2,255,961 | | | | 333,820 | | | | 4,966,351 | |
Cost of shares repurchased | | | (178,135,907 | ) | | | (11,840,450 | ) | | | (164,722,861 | ) |
Net increase (decrease) from capital share transactions | | | (10,793,719 | ) | | | (1,887,814 | ) | | | 55,266,839 | |
Total increase (decrease) in net assets | | | (10,793,719 | ) | | | (1,887,814 | ) | | | 55,266,839 | |
Net Assets: | | | | | | | | | | | | |
Beginning of period | | | 91,217,927 | | | | 93,105,741 | | | | 37,838,902 | |
End of period | | $ | 80,424,208 | | | $ | 91,217,927 | | | $ | 93,105,741 | |
| * | Effective December 1, 2007, Managers Money Market changed its fiscal year end from November 30 to December 31. |
Managers Money Market Financial Highlights
For a share outstanding throughout each period
| | | | | | | | | | | | | | | | | | | | | | | | |
| | | For the
year ended
December 31,
2008 | | | For one
month ended
December 31,
2007*** | | | For the fiscal year ended November 30, | |
| | | | 2007 | | | 2006 | | | 2005** | | | 2004* | |
Net Asset Value, Beginning of Period | | $ | 1.000 | | | $ | 1.000 | | | $ | 1.000 | | | $ | 1.000 | | | $ | 1.000 | | | $ | 1.000 | |
Income from Investment Operations: | | | | | | | | | | | | | | | | | | | | | | | | |
Net investment income | | | 0.027 | | | | 0.004 | | | | 0.049 | | | | 0.043 | | | | 0.026 | | | | 0.008 | |
Less Distributions to Shareholders from: | | | | | | | | | | | | | | | | | | | | | | | | |
Net investment income | | | (0.027 | ) | | | (0.004 | ) | | | (0.049 | ) | | | (0.043 | ) | | | (0.026 | ) | | | (0.008 | ) |
Net Asset Value, End of Period | | $ | 1.000 | | | $ | 1.000 | | | $ | 1.000 | | | $ | 1.000 | | | $ | 1.000 | | | $ | 1.000 | |
Total Return1 | | | 2.73 | % | | | 0.37 | %3 | | | 5.05 | % | | | 4.45 | % | | | 2.61 | % | | | 0.82 | % |
Ratio of net expenses to average net assets | | | 0.26 | % | | | 0.39 | %4 | | | 0.29 | % | | | 0.40 | % | | | 0.40 | % | | | 0.36 | % |
Ratio of net investment income to average net assets1 | | | 2.75 | % | | | 4.46 | %4 | | | 4.92 | % | | | 4.42 | % | | | 2.62 | % | | | 0.86 | % |
Net assets at end of year (000’s omitted) | | $ | 80,424 | | | $ | 91,218 | | | $ | 93,106 | | | $ | 37,839 | | | $ | 37,896 | | | $ | 47,645 | |
| | | | | | | | | | | | | | | | | | | | | | | | |
Expense Waivers/Offsets2 | | | | | | | | | | | | | | | | | | | | | | | | |
Ratio of total expenses to average net assets | | | 0.31 | % | | | 0.44 | %4 | | | 0.34 | % | | | 0.45 | % | | | 0.46 | % | | | 0.44 | % |
Ratio of net investment income to average net assets | | | 2.70 | % | | | 4.41 | %4 | | | 4.87 | % | | | 4.37 | % | | | 2.56 | % | | | 0.78 | % |
| | | | | | | | | | | | | | | | | | | | | | | | |
| * | Prior to May 14, 2004 the Fund invested all of its assets in the Institutional Class Shares of the JPMorgan Prime Money Market Fund. (See Notes to Financial Statements). |
| ** | Prior to February 19, 2005 the Fund invested all of its assets in the Institutional Class Shares of the JPMorgan Liquid Assets Money Market Fund. (See Notes to Financial Statements). |
| *** | Effective December 1, 2007, Managers Money Market Fund changed its fiscal year end from November 30 to December 31. (See Notes to Financial Statements.) |
1 | Total returns and net investment income would have been lower had certain expenses not been reduced. (See Note 1(c) of Notes to Financial Statements.) |
2 | Excludes the impact of expense reimbursements and expense reductions such as brokerage credits, but includes non-reimbursable expenses, if any, such as interest and taxes. (See Note 1(c) of Notes to Financial Statements.) |
The accompanying notes are an integral part of these financial statements.
40
Financial Highlights
For a share outstanding throughout each year
| | | | | | | | | | | | | | | | | | | | |
| | | For the year ended December 31, | |
Managers AMG Essex Large Cap Growth Fund | | 2008 | | | 2007 | | | 2006 | | | 2005 | | | 2004 | |
Net Asset Value, Beginning of Year | | $ | 33.37 | | | $ | 29.18 | | | $ | 27.79 | | | $ | 26.77 | | | $ | 25.46 | |
Income from Investment Operations: | | | | | | | | | | | | | | | | | | | | |
Net investment loss | | | (0.14 | )3 | | | (0.15 | )3 | | | (0.09 | )3 | | | (0.07 | )3 | | | (0.07 | ) |
Net realized and unrealized gain (loss) on investments | | | (13.78 | )3 | | | 4.34 | 3 | | | 1.48 | 3 | | | 1.09 | 3 | | | 1.38 | |
Total from investment operations | | | (13.92 | ) | | | 4.19 | | | | 1.39 | | | | 1.02 | | | | 1.31 | |
Net Asset Value, End of Year | | $ | 19.45 | | | $ | 33.37 | | | $ | 29.18 | | | $ | 27.79 | | | $ | 26.77 | |
Total Return1 | | | (41.71 | )% | | | 14.36 | % | | | 4.96 | % | | | 3.85 | % | | | 5.14 | % |
Ratio of net expenses to average net assets | | | 1.24 | % | | | 1.24 | % | | | 1.25 | % | | | 1.28 | % | | | 1.34 | % |
Ratio of net investment loss to average net assets1 | | | (0.52 | )% | | | (0.47 | )% | | | (0.33 | )% | | | (0.27 | )% | | | (0.26 | )% |
Portfolio turnover | | | 119 | % | | | 116 | % | | | 200 | % | | | 97 | % | | | 79 | % |
Net assets at end of year (000’s omitted) | | $ | 28,959 | | | $ | 51,876 | | | $ | 65,999 | | | $ | 104,878 | | | $ | 98,347 | |
| | | | | | | | | | | | | | | | | | | | |
Ratios absent expense offsets:2 | | | | | | | | | | | | | | | | | | | | |
Ratio of total expenses to average net assets | | | 1.61 | % | | | 1.29 | % | | | 1.32 | % | | | 1.22 | % | | | 1.47 | % |
Ratio of net investment loss to average net assets | | | (0.89 | )% | | | (0.52 | )% | | | (0.40 | )% | | | (0.21 | )% | | | (0.39 | )% |
| | | | | | | | | | | | | | | | | | | | |
| |
| | | For the year ended December 31, | |
Managers International Equity Fund | | 2008 | | | 2007 | | | 2006 | | | 2005 | | | 2004 | |
Net Asset Value, Beginning of Year | | $ | 77.13 | | | $ | 67.42 | | | $ | 53.76 | | | $ | 47.05 | | | $ | 41.13 | |
Income from Investment Operations: | | | | | | | | | | | | | | | | | | | | |
Net investment income | | | 0.76 | 3 | | | 0.47 | | | | 0.69 | | | | 0.37 | | | | 0.27 | |
Net realized and unrealized gain (loss) on investments | | | (38.52 | )3 | | | 9.60 | | | | 14.15 | | | | 6.83 | | | | 5.96 | |
Total from investment operations | | | (37.76 | ) | | | 10.07 | | | | 14.84 | | | | 7.20 | | | | 6.23 | |
Less Distributions to Shareholders from: | | | | | | | | | | | | | | | | | | | | |
Net investment income | | | (0.18 | ) | | | (0.36 | ) | | | (1.18 | ) | | | (0.49 | ) | | | (0.31 | ) |
Total distributions to shareholders | | | (0.18 | ) | | | (0.36 | ) | | | (1.18 | ) | | | (0.49 | ) | | | (0.31 | ) |
Net Asset Value, End of Year | | $ | 39.19 | | | $ | 77.13 | | | $ | 67.42 | | | $ | 53.76 | | | $ | 47.05 | |
Total Return1 | | | (48.92 | )% | | | 14.94 | %4 | | | 27.63 | % | | | 15.30 | % | | | 15.17 | % |
Ratio of net expenses to average net assets | | | 1.48 | % | | | 1.48 | % | | | 1.45 | % | | | 1.45 | % | | | 1.62 | % |
Ratio of net investment income to average net assets1 | | | 1.24 | % | | | 0.60 | % | | | 0.70 | % | | | 0.75 | % | | | 0.57 | % |
Portfolio turnover | | | 142 | % | | | 98 | % | | | 70 | % | | | 79 | % | | | 93 | % |
Net assets at end of year (000’s omitted) | | $ | 127,984 | | | $ | 302,025 | | | $ | 230,916 | | | $ | 206,393 | | | $ | 234,061 | |
| | | | | | | | | | | | | | | | | | | | |
Ratios absent expense offsets:2 | | | | | | | | | | | | | | | | | | | | |
Ratio of total expenses to average net assets | | | 1.64 | % | | | 1.61 | % | | | 1.47 | % | | | 1.42 | % | | | 1.70 | % |
Ratio of net investment income to average net assets | | | 1.08 | % | | | 0.46 | % | | | 0.68 | % | | | 0.79 | % | | | 0.50 | % |
| | | | | | | | | | | | | | | | | | | | |
41
Financial Highlights
For a share outstanding throughout each year
| | | | | | | | | | | | | | | | | | | | |
| | | For the year ended December 31, | |
Managers Emerging Markets Equity Fund | | 2008 | | | 2007 | | | 2006 | | | 2005 | | | 2004 | |
Net Asset Value, Beginning of Year | | $ | 26.80 | | | $ | 24.44 | | | $ | 20.10 | | | $ | 16.50 | | | $ | 13.26 | |
Income from Investment Operations: | | | | | | | | | | | | | | | | | | | | |
Net investment income | | | 0.15 | 3 | | | 0.04 | 3 | | | 0.22 | | | | 0.52 | | | | 0.08 | |
Net realized and unrealized gain (loss) on investments | | | (15.02 | )3 | | | 7.20 | 3 | | | 6.66 | | | | 4.84 | | | | 3.74 | |
Total from investment operations | | | (14.87 | ) | | | 7.24 | | | | 6.88 | | | | 5.36 | | | | 3.82 | |
Less Distributions to Shareholders from: | | | | | | | | | | | | | | | | | | | | |
Net investment income | | | (0.19 | ) | | | — | | | | (0.22 | ) | | | (0.55 | ) | | | (0.06 | ) |
Net realized gain on investments | | | (3.65 | ) | | | (4.88 | ) | | | (2.32 | ) | | | (1.21 | ) | | | (0.52 | ) |
Total distributions to shareholders | | | (3.84 | ) | | | (4.88 | ) | | | (2.54 | ) | | | (1.76 | ) | | | (0.58 | ) |
Net Asset Value, End of Year | | $ | 8.09 | | | $ | 26.80 | | | $ | 24.44 | | | $ | 20.10 | | | $ | 16.50 | |
Total Return1 | | | (54.87 | )%4 | | | 29.50 | %4 | | | 34.50 | % | | | 32.53 | % | | | 28.85 | % |
Ratio of net expenses to average net assets | | | 1.77 | %5 | | | 1.78 | % | | | 1.76 | % | | | 1.75 | % | | | 1.85 | % |
Ratio of net investment income to average net assets1 | | | 0.76 | %5 | | | 0.13 | % | | | 0.89 | % | | | 0.59 | % | | | 0.67 | % |
Portfolio turnover | | | 49 | % | | | 62 | % | | | 41 | % | | | 35 | % | | | 58 | % |
Net assets at end of year (000’s omitted) | | $ | 60,355 | | | $ | 198,235 | | | $ | 152,983 | | | $ | 117,229 | | | $ | 63,567 | |
| | | | | | | | | | | | | | | | | | | | |
Ratios absent expense offsets:2 | | | | | | | | | | | | | | | | | | | | |
Ratio of total expenses to average net assets | | | 2.03 | % | | | 1.93 | % | | | 1.76 | % | | | 1.72 | % | | | 1.87 | % |
Ratio of net investment income (loss) to average net assets | | | 0.50 | % | | | (0.02 | )% | | | 0.89 | % | | | 0.62 | % | | | 0.66 | % |
| | | | | | | | | | | | | | | | | | | | |
| |
| | | For the year ended December 31, | |
Managers Global Bond Fund | | 2008 | | | 2007 | | | 2006 | | | 2005 | | | 2004 | |
Net Asset Value, Beginning of Year | | $ | 21.31 | | | $ | 21.17 | | | $ | 20.19 | | | $ | 22.38 | | | $ | 22.19 | |
Income from Investment Operations: | | | | | | | | | | | | | | | | | | | | |
Net investment income | | | 0.76 | 3 | | | 0.70 | 3 | | | 0.45 | | | | 0.63 | | | | 0.65 | |
Net realized and unrealized gain (loss) on investments | | | (2.93 | )3 | | | 0.88 | 3 | | | 1.05 | | | | (1.75 | ) | | | 1.49 | |
Total from investment operations | | | (2.17 | ) | | | 1.58 | | | | 1.50 | | | | (1.12 | ) | | | 2.14 | |
Less Distributions to Shareholders from: | | | | | | | | | | | | | | | | | | | | |
Net investment income | | | (2.18 | ) | | | (1.43 | ) | | | (0.49 | ) | | | (0.77 | ) | | | (1.34 | ) |
Net realized gain on investments | | | (0.03 | ) | | | (0.01 | ) | | | (0.03 | ) | | | (0.30 | ) | | | (0.61 | ) |
Total distributions to shareholders | | | (2.21 | ) | | | (1.44 | ) | | | (0.52 | ) | | | (1.07 | ) | | | (1.95 | ) |
Net Asset Value, End of Year | | $ | 16.93 | | | $ | 21.31 | | | $ | 21.17 | | | $ | 20.19 | | | $ | 22.38 | |
Total Return1 | | | (10.07 | )%4 | | | 7.52 | %4 | | | 7.36 | % | | | (4.94 | )% | | | 9.62 | % |
Ratio of net expenses to average net assets | | | 1.10 | % | | | 1.19 | % | | | 1.19 | % | | | 1.19 | % | | | 1.29 | % |
Ratio of net investment income to average net assets1 | | | 3.62 | % | | | 3.25 | % | | | 2.86 | % | | | 2.38 | % | | | 2.73 | % |
Portfolio turnover | | | 56 | % | | | 152 | % | | | 56 | % | | | 64 | % | | | 130 | % |
Net assets at end of year (000’s omitted) | | $ | 47,735 | | | $ | 92,124 | | | $ | 53,670 | | | $ | 43,131 | | | $ | 36,454 | |
| | | | | | | | | | | | | | | | | | | | |
Ratios absent expense offsets:2 | | | | | | | | | | | | | | | | | | | | |
Ratio of total expenses to average net assets | | | 1.25 | % | | | 1.25 | % | | | 1.27 | % | | | 1.26 | % | | | 1.49 | % |
Ratio of net investment income to average net assets | | | 3.47 | % | | | 3.18 | % | | | 2.78 | % | | | 2.31 | % | | | 2.53 | % |
| | | | | | | | | | | | | | | | | | | | |
The following notes should be read in conjunction with the Financial Highlights of the Funds presented on the preceding pages.
1 | Total returns and net investment income would have been lower had certain expenses not been reduced. (See Note 1(c) to the Notes to Financial Statements.) |
2 | Excludes the impact of expense (reimbursement)/recoupment and expense reductions such as brokerage credits, but includes non-reimbursable expenses, if any, such as interest and taxes. (See Note 1(c) to the Notes to Financial Statements.) |
3 | Per share numbers have been calculated using average shares. |
4 | The Total Return is based on the Financial Statement Net Asset Values as shown above. |
5 | Excludes interest expense for the year ended December 31, 2008, of 0.03% for Emerging Markets Equity. (See Note 1(c) of Notes to Financial Statements.) |
42
Notes to Financial Statements
December 31, 2008
| 1. | Summary of Significant Accounting Policies |
The Managers Funds (the “Trust”) is an open-end management investment company organized as a Massachusetts business trust and registered under the Investment Company Act of 1940, as amended (the “1940 Act”). Currently, the Trust is comprised of a number of different funds. Included in this report are the Managers AMG Essex Large Cap Growth Fund (“Essex Large Cap Growth”), Managers International Equity Fund (“International Equity”), Managers Emerging Markets Equity Fund (“Emerging Markets Equity”), Managers Money Market Fund (“Money Market”) and Managers Global Bond Fund (“Global Bond”), collectively the “Funds.”
Money Market invests all of its investable assets in the Capital Shares of the JPMorgan Liquid Assets Money Market Fund (the “Portfolio”), a separate registered open-end management investment company with substantially the same investment objective and policies as the Fund. The Portfolio is a series of the JPMorgan Trust II, a business trust organized under the laws of The Commonwealth of Massachusetts. The investment manager of the Portfolio is JPMorgan Investment Advisors Inc. (“JPMIA”). The performance of the Fund is directly affected by the performance of the Portfolio.
The Funds’ financial statements are prepared in accordance with accounting principles generally accepted in the United States of America, which require management to make estimates and assumptions that affect the reported amounts of assets and liabilities and disclosure of contingent assets and liabilities at the date of the financial statements and the reported amounts of income and expenses during the reporting period. Actual results could differ from those estimates and such differences could be material. The following is a summary of significant accounting policies followed by the Funds in the preparation of their financial statements:
| a. | Valuation of Investments |
Equity securities traded on a domestic or international securities exchange are valued at the last quoted sale price, or, lacking any sales, at the last quoted bid price. Over-the-counter securities are valued at the Nasdaq Official Closing Price, if one is available. Lacking any sales, over-the-counter securities are valued at the last quoted bid price. The Funds’ investments are generally valued based on market quotations provided by third party pricing services approved by the Board of Trustees of the Funds. Under certain circumstances, the value of a specific investment may be based on an evaluation of its fair value, pursuant to procedures established by and under the general supervision of the Board of Trustees of the Trust. A Fund may use the fair value of a portfolio security to calculate its NAV when, for example, (1) market quotations are not readily available because a portfolio security is not traded in a public market or the principal market in which the security trades is closed, (2) trading in a portfolio security is suspended and has not resumed before the Fund calculates its NAV, (3) a significant event affecting the value of a portfolio security is determined to have occurred between the time of the market quotation provided for a portfolio security and the time as of which the Fund calculates its NAV, (4) a security’s price has remained unchanged over a period of time (often referred to as a “stale price”), or (5) Managers Investment Group LLC (the “Investment Manager”) determines that a market quotation is inaccurate. Portfolio investments that trade primarily on foreign markets are priced based upon the market quotation of such securities as of the close of their respective principal markets, as adjusted to reflect the Investment Manager’s determination of the impact of events occurring subsequent to the close of such markets but prior to the time as of which the Fund calculates its NAV. In accordance with procedures approved by the Board of Trustees, the Investment Manager relies upon recommendations of a third-party fair valuation service in adjusting the prices of such foreign portfolio investments. The Funds may invest in securities that may be thinly traded. The Board of Trustees has adopted procedures to adjust prices when thinly traded securities are judged to be stale so that they reflect fair value. An investment valued on the basis of its fair value may be valued at a price higher or lower than available market quotations. An investment’s valuation may differ depending on the method used and the factors considered in determining value according to the Fund’s fair value procedures.
Fixed-income securities are valued based on valuations furnished by independent pricing services that utilize matrix systems, which reflect such factors as security prices, yields, maturities, and ratings, and are supplemented by dealer and exchange quotations. Futures contracts for which market quotations are readily available are valued at the settlement price as of the close of the futures exchange. Short-term investments having a remaining maturity of 60 days or less are valued at amortized cost, which approximates market value. Investments in other open-end regulated investment companies are valued at their end of day net asset value per share except ishares or other ETF’s, which are valued the same as equity securities. Investments in certain mortgage-backed and stripped mortgage-backed securities, preferred stocks, convertible securities, derivatives and other debt securities not traded on an organized securities market are valued on the basis of valuations provided by dealers or by a pricing service which uses information with respect to transactions in such securities and various relationships between securities and yield to maturity in determining value. Securities (including derivatives) for which market quotations are not readily available are valued at fair value, as determined in good faith, and pursuant to procedures adopted by the Board of Trustees of the Trust. The values assigned to fair value investments are based on available information and do not necessarily represent amounts that might ultimately be realized, since such amounts depend on future developments inherent in long-term investments. Further, because of the inherent uncertainty of valuation, those estimated values may differ significantly from the values that would have been used had a ready market for the investments existed, and the differences could be material.
Money Market’s investment in the Portfolio is valued daily at its end of day net asset value per share. The Portfolio’s underlying investments are valued at amortized cost which approximates market value. The amortized cost method of valuation values a security at its cost at the time of purchase and thereafter assumes a constant amortization to maturity of any discount or premium, regardless of the impact of fluctuating interest rates on the market value of the instruments.
The Funds adopted Financial Accounting Standards Board Statement of Financial Accounting Standards No. 157, Fair Value Measurements (“FAS 157”), effective January 1, 2008. In accordance with FAS 157, fair value is defined as the price that the Fund would receive to sell an asset or pay to transfer a liability in an orderly transaction between market participants at the measurement date. FAS 157 also establishes a framework for measuring fair value, and a three-level hierarchy for fair value measurements based upon the transparency of inputs to the valuation of an asset or liability.
43
Notes to Financial Statements (continued)
Inputs may be observable or unobservable and refer broadly to the assumptions that market participants would use in pricing the asset or liability. Observable inputs reflect the assumptions market participants would use in pricing the asset or liability based on market data obtained from sources independent of the Funds. Unobservable inputs reflect the Funds’ own assumptions about the assumptions that market participants would use in pricing the asset or liability developed based on the best information available in the circumstances. Each investment is assigned a level based upon the observability of the inputs which are significant to the overall valuation. The three-tier hierarchy of inputs is summarized below.
Level 1 – quoted prices in active markets for identical investments
Level 2 – other significant observable inputs (including quoted prices for similar investments, interest rates, prepayment speeds, credit risk, etc.)
Level 3 –significant unobservable inputs (including the Funds’ own assumptions in determining the fair value of investments)
The following table summarizes the valuation of the Funds’ investments by the above fair value hierarchy levels as of December 31, 2008:
| | | | | | | |
Level | | Investments in
Securities | | Other
Financial
Instruments* | |
Essex Large Cap Growth | | | | | | | |
Level 1 | | $ | 30,072,264 | | | — | |
Level 2 | | | 70,933 | | | — | |
Level 3 | | | — | | | — | |
| | | | | | | |
Total | | $ | 30,143,197 | | | — | |
| | | | | | | |
International Equity | | | | | | | |
Level 1 | | $ | 25,204,880 | | $ | (950 | ) |
Level 2 | | | 103,809,055 | | | | |
Level 3 | | | — | | | — | |
| | | | | | | |
Total | | $ | 129,013,935 | | $ | (950 | ) |
| | | | | | | |
Emerging Markets Equity | | | | | | | |
Level 1 | | $ | 14,700,982 | | | — | |
Level 2 | | | 49,557,028 | | | — | |
Level 3 | | | | | | — | |
| | | | | | | |
Total | | $ | 64,258,010 | | | — | |
| | | | | | | |
| | | | | | | |
Level | | Investments in
Securities | | Other
Financial
Instruments* | |
Global Bond | | | | | | | |
Level 1 | | $ | 2,032,510 | | | — | |
Level 2 | | | 44,945,360 | | $ | (1,110 | ) |
Level 3 | | | — | | | — | |
| | | | | | | |
Total | | $ | 46,977,870 | | $ | (1,110 | ) |
| | | | | | | |
Money Market | | | | | | | |
Level 1 | | $ | 79,809,831 | | | — | |
Level 2 | | | — | | | — | |
Level 3 | | | — | | | — | |
| | | | | | | |
Total | | $ | 79,809,831 | | | — | |
| | | | | | | |
* Other financial instruments are derivative instruments not reflected in the Schedule of Portfolio of Investments, such as futures, forwards and swap contracts, which are valued at the unrealized appreciation/depreciation on the instrument. | |
Security transactions are accounted for as of the trade date. Realized gains and losses on securities sold are determined on the basis of identified cost.
| c. | Investment Income and Expenses |
Dividend income is recorded on the ex-dividend date except certain dividends from foreign securities where the ex-dividend date may have passed. These dividends are recorded as soon as the Trust is informed of the ex-dividend date. Dividend income on foreign securities is recorded net of any withholding tax. Interest income, which includes amortization of premium and accretion of discount on debt securities, is accrued as earned. Non-cash dividends included in dividend income, if any, are reported at the fair market value of the securities received. As a shareholder of the Portfolio, the Money Market Fund receives its proportionate share of the dividends paid by such class, which takes into consideration the Fund’s proportionate share of net investment income and expenses of such class. Other income and expenses are recorded on an accrual basis. Expenses that cannot be directly attributed to a fund are apportioned among the Funds in the Trust and in some cases other affiliated funds based upon their relative average net assets or number of shareholders.
The following Funds had certain portfolio trades directed to various brokers who paid a portion of such Fund’s expenses. For the year ended December 31, 2008, under these arrangements the amount by which the Funds’ expenses were reduced and the impact on the expense ratios were as follows: Essex Large Cap Growth—$22,676 or 0.05% and International Equity – $8,111 or 0.00%.
The Funds have a “balance credit” arrangement with The Bank of New York Mellon (“BNYM”) (formerly The Bank of New York), the Fund’s custodian, whereby the Funds are credited with an interest factor equal to 0.75% below the effective 90-day T-Bill rate for account balances left uninvested overnight. If the T-Bill rate falls below 0.75%, no credits will be earned. These credits serve to reduce custody expenses that would otherwise be charged to the Funds. For the year ended December 31, 2008, the custodian expense was reduced as follows: Essex Large Cap Growth—$41; International Equity—$411; Emerging Markets Equity—$95 and Global Bond—$204.
Overdrafts will cause a reduction of any earnings credits, computed at 2% above the Federal funds rate on the day of the overdraft. For the year ended December 31, 2008, overdraft fees were as follows: Essex Large Cap Growth—$2 or 0.00%, International Equity – $536 or 0.00%, Emerging Markets Equity—$39,702 or 0.03% and Global Bond Fund – $806 or 0.00%.
The Trust also has a balance credit arrangement with its Transfer Agent, PNC Global Investment Servicing (U.S.) Inc. (formerly PFPC, Inc.), whereby earnings credits are used to offset banking charges
44
Notes to Financial Statements (continued)
and other out-of-pocket expenses. For the year ended December 31, 2008, the Funds’ portion of the transfer agent expense was reduced under this arrangement as follows: Essex Large Cap Growth—$470; International Equity—$2,526; Emerging Markets Equity—$1,598; Global Bond—$886 and Money Market—$949.
The Investment Manager has agreed to waive a portion of its management or administrative fee in consideration of shareholder servicing fees that it has received from JPMorgan Distribution Services, Inc., with respect to short-term cash investments the Funds have made in the JPMorgan Liquid Assets Portfolio- Capital Share Class. For the year ended December 31, 2008, the management fee was reduced as follows: International Equity—$51. For the year ended December 31, 2008, the Money Market’s administrative fee was reduced by $41,323.
Total returns and net investment income for the Funds would have been lower had certain expenses not been offset. Total expenses before offsets exclude the impact of expense reimbursements or fee waivers and expense reductions such as brokerage recapture credits but include non-reimbursable expenses, if any, such as interest and taxes.
| d. | Dividends and Distributions |
Dividends resulting from net investment income, if any, normally will be declared and paid annually for all Funds except Money Market. Dividends resulting from net investment income, if any, normally will be declared daily and paid monthly for Money Market. Distributions of capital gains, if any, will be made annually in December and when required for Federal excise tax purposes. Income and capital gain distributions are determined in accordance with Federal income tax regulations, which may differ from generally accepted accounting principles. These differences are primarily due to differing treatments for losses deferred due to wash sales, REITS, equalization accounting for tax purposes, foreign currency, options, futures and market discount transactions. Permanent book and tax basis differences, if any, relating to shareholder distributions will result in reclassifications to paid-in capital. The tax character of distributions paid during the past two years were as follows:
| | | | | | | | | | | | | | | | | | | | | | | | | |
| | | Essex Large Cap Growth | | International Equity | | | Emerging Markets Equity | | Global Bond |
| | | 2008 | | 2007 | | 2008 | | | 2007 | | | 2008 | | | 2007 | | 2008 | | 2007 |
Distributions paid from: | | | | | | | | | | | | | | | | | | | | | | | | | |
Ordinary income | | — | | — | | $ | 579,286 | | | $ | 1,407,436 | | | $ | 990,986 | | | | — | | $ | 5,512,596 | | $ | 5,790,344 |
Short-term capital gains | | — | | — | | | — | | | | — | | | | 2,127,641 | | | $ | 5,317,862 | | | — | | | 35,680 |
Long-term capital gains | | — | | — | | | — | | | | — | | | | 17,050,958 | | | | 25,872,433 | | | 62,905 | | | 865 |
| | | | | | | | | | | | | | | | | | | | | | | | | |
| | — | | — | | $ | 579,286 | | | $ | 1,407,436 | | | $ | 20,169,585 | | | $ | 31,190,295 | | $ | 5,575,501 | | $ | 5,826,889 |
| | | | | | | | | | | | | | | | | | | | | | | | | |
As a % of distributions paid: (unaudited) | | | | | | | | | | | | | | | | | | |
Qualified ordinary income | | — | | — | | | 100.00 | % | | | 100.00 | % | | | 100.00 | % | | | — | | | — | | | — |
Ordinary income—dividends received deduction | | — | | — | | | — | | | | 2.41 | % | | | — | | | | — | | | — | | | — |
| | | | | | | | | | | | | | | | | | | | | | | | | |
As of December, 2008, the components of distributable earnings (excluding unrealized appreciation/ deprecation) on a tax basis consisted of:
| | | | | | | | | | | | |
| | | Essex
Large Cap Growth | | International
Equity | | Emerging
Markets Equity | | Global
Bond |
Capital loss carryforward | | $ | 140,593,312 | | $ | 49,555,843 | | | — | | $ | 906,645 |
Undistributed ordinary income | | | — | | | 161,644 | | $ | 98,193 | | | 223,383 |
Undistributed short-term capital gains | | | — | | | — | | | — | | | — |
Undistributed long-term capital gains | | | — | | | — | | | — | | | — |
The tax character of distributions paid by the Money Market Fund during the past three fiscal periods were as follows:
| | | | | | | | | |
| | | Money Market |
| | | For the fiscal year
ended December 31,
2008 | | For the one month
ended December 31,
2007 | | For the fiscal year
ended November 30,
2007 |
Distributions paid from: | | | | | | | | | |
Ordinary income | | $ | 2,303,877 | | $ | 360,350 | | $ | 5,069,405 |
Short-term capital gains | | | — | | | — | | | — |
Long-term capital gains | | | — | | | — | | | — |
45
Notes to Financial Statements (continued)
Each Fund intends to comply with the requirements under Subchapter M of the Internal Revenue Code of 1986, as amended, to distribute substantially all of their taxable income and gains to their shareholders and to meet certain diversification and income requirements with respect to investment companies. Therefore, no provision for Federal income or excise tax is included in the accompanying financial statements.
Additionally, based on each Fund’s understanding of the tax rules and rates related to income, gains and transactions for the foreign jurisdictions in which it invests, each Fund will provide for foreign taxes, and where appropriate, deferred foreign taxes.
Management has analyzed the Funds’ tax positions taken on federal income tax returns for all open tax years (tax years ended December 31, 2005-2008), and has concluded that no provision for federal income tax is required in the Funds’ financial statements. The Funds are not aware of any tax position for which it is reasonably possible that the total amounts of unrecognized tax benefits will change materially in the next twelve months.
| f. | Capital Loss Carryovers |
As of December 31, 2008, the following Funds had accumulated net realized capital loss carryovers from securities transactions for Federal income tax purposes as shown in the following chart. These amounts may be used to offset realized capital gains, if any, through the expiration dates listed.
| | | | | |
Fund | | Capital Loss
Carryover Amount | | Expires
December 31, |
Essex Large Cap Growth | | $ | 89,173,242 | | 2009 |
| | | 30,988,593 | | 2010 |
| | | 12,899,489 | | 2011 |
| | | 7,531,988 | | 2016 |
| | | | | |
Total | | $ | 140,593,312 | | |
| | | | | |
International Equity | | $ | 13,386,880 | | 2010 |
| | | 16,170,119 | | 2011 |
| | | 19,998,844 | | 2016 |
| | | | | |
Total | | $ | 49,555,843 | | |
| | | | | |
Global Bond | | $ | 906,645 | | 2016 |
For the year ended December 31, 2008, the Funds did not utilize any capital loss carryovers.
The Trust’s Declaration of Trust authorizes for each series the issuance of an unlimited number of shares of beneficial interest, without par value, for each fund. Each Fund records sales and repurchases of its capital stock on the trade date. Dividends and distributions to shareholders are recorded on the ex-dividend date.
At December 31, 2008, certain unaffiliated shareholders, specifically omnibus accounts, individually held greater than 10% of the outstanding shares of the following Funds: Essex Large Cap Growth – one owns 13%; International Equity – one owns 18% and Emerging Markets Equity – two collectively own 46%. Transactions by these shareholders may have a material impact on the Funds.
| h. | Foreign Currency Translation |
The books and records of the Funds are maintained in U.S. dollars. The value of investments, assets and liabilities denominated in currencies other than U.S. dollars are translated into U.S. dollars based upon current foreign exchange rates. Purchases and sales of foreign investments, income and expenses are converted into U.S. dollars based on currency exchange rates prevailing on the respective dates of such transactions. Net realized and unrealized gain (loss) on foreign currency transactions represent: (1) foreign exchange gains and losses from the sale and holdings of foreign currencies; (2) gains and losses between trade date and settlement date on investment securities transactions and forward foreign currency exchange contracts; and (3) gains and losses from the difference between amounts of interest and dividends recorded and the amounts actually received.
The Funds do not isolate the net realized and unrealized gain or loss resulting from changes in exchange rates from the fluctuations in market prices of securities held. Such fluctuations are included with the net realized and unrealized gain or loss on investments.
| 2. | Agreements and Transactions with Affiliates |
For each of the Funds other than Money Market, the Trust has entered into an Investment Management Agreement under which the Investment Manager, an independently managed subsidiary of Affiliated Managers Group, Inc. (“AMG”), serves as investment manager to the Funds and is responsible for the Funds’ overall administration. The Investment Manager selects subadvisors for the Funds (subject to Trustee approval) and monitors each subadvisor’s investment programs and results. The Funds’ investment portfolio is managed by portfolio managers who serve pursuant to a Subadvisory Agreement with the Investment Manager.
Investment management fees are paid directly by the Funds to the Investment Manager based on average daily net assets. For the year ended December 31, 2008, the annual investment management fee rates, as a percentage of average daily net assets, were as follows:
| | | |
Fund | | Investment
Management Fee | |
Essex Large Cap Growth | | 0.80 | % |
International Equity | | 0.90 | % |
Emerging Markets Equity | | 1.15 | % |
Global Bond | | 0.70 | % |
The Investment Manager of Global Bond has agreed to contractually waive a portion of its management fee for the Fund until at least March 1, 2009. For the year ended December 31, 2008, the amount waived was $78,646 or 0.10%.
The Trust has entered into an Administration and Shareholder Servicing Agreement under which the Investment Manager serves as each Fund’s administrator (the “Administrator”) and is responsible for all aspects of managing the Funds’ operations, including administration
46
Notes to Financial Statements (continued)
and shareholder services to each Fund, its shareholders, and certain institutions, such as bank trust departments, broker-dealers and registered investment advisers, that advise or act as an intermediary with the Funds’ shareholders. Under the terms of the Administration Agreement, each of the Funds, except Global Bond and Money Market, pay a fee to the Administrator at the rate of 0.25% per annum of the Funds’ average daily net assets. Global Bond and Money Market pay a fee to the Administrator at the rate of 0.20% and 0.15%, respectively, per annum of the Funds’ average daily net assets.
The Investment Manager for the Funds has contractually agreed, through at least May 1, 2009, subject to later reimbursement by the Funds in certain circumstances, that the total annual operating expenses (exclusive of taxes, interest, brokerage costs, acquired fund expenses and extraordinary expenses) will be limited to the following amounts of the Funds’ average daily net assets: International Equity – 1.48%; Emerging Markets Equity – 1.77%; and Global Bond - 1.10%. The Investment Manager has also contractually agreed, subject to later reimbursement by the Funds in certain circumstances, that the total annual operating expenses (exclusive of taxes, interest, brokerage costs, acquired fund expenses and extraordinary expenses) on Essex Large Cap Growth, will be limited to 1.29% of the Fund’s average daily net assets, provided that the amount of fees waived, paid or reimbursed does not exceed 0.25% per annum. Prior to January 1, 2008, the expense limitations for International Equity, Emerging Markets Equity, and Global Bond were 1.55%, 1.79%, and 1.19%, respectively.
Each Fund is obligated to repay the Investment Manager such amounts waived, paid or reimbursed in future years provided that the repayment occurs within thirty-six (36) months after the waiver or reimbursement occurs and that such repayment would not cause the Funds’ total operating expenses in any such future year to exceed that Funds’ respective expense cap. For the year ended December 31, 2008, the Funds made no such repayments to the Investment Manager. At December 31, 2008, the cumulative amount of reimbursement by the Investment Manager subject to repayment by Essex Large Cap, International Equity, Emerging Markets Equity and Global Bond equaled $146,429, $349,131, $386,086 and $38,749, respectively. For the year ended December 31, 2008, the Investment Manager voluntarily waived $30,507 of expenses for Essex Large Cap which may not be recovered by the Investment Manager.
Prior to July 1, 2007, the aggregate annual retainer paid to each Independent Trustee was $55,000, plus $4,000 or $2,000 for each regular or special meeting attended, respectively. Effective July 1, 2007, the aggregate annual retainer paid to each Independent Trustee is $65,000, plus $4,000 or $2,500 for each regular or special meeting attended, respectively. The Trustees’ fees and expenses are allocated amongst all of the Funds for which the Investment Manager serves as the advisor (the “Managers Funds”) based on the relative net assets of such Funds. The Independent Chairman of the Trusts receives an additional payment of $15,000 per year. (Prior to July 1, 2007, the Independent Chairman received an additional payment of $10,000 per year). The Chairman of the Audit Committee receives an additional payment of $5,000 per year. (Prior to July 1, 2007, the Chairman of the Audit Committee received an additional payment of $2,000 per year). The “Trustee fees and expenses” shown in the financial statements represents each Fund’s allocated portion of the total fees and expenses paid by the Managers Funds.
The Funds are distributed by Managers Distributors, Inc. (the “Distributor” or “MDI”), a wholly-owned subsidiary of the Investment Manager. MDI serves as the principal underwriter for each Fund in the Trust. MDI is a registered broker-dealer and member of the Financial Industry Regulatory Authority, Inc. (“FINRA”). Shares of each Fund will be continuously offered and will be sold by brokers, dealers or other financial intermediaries who have executed selling agreements with the Distributor. MDI bears all the expenses of providing services pursuant to the Underwriting Agreement, including the payment of the expenses relating to the distribution of Prospectuses for sales purposes and any advertising or sales literature. Certain Trustees and Officers of the Funds are Officers and/or Directors of the Investment Manager, AMG and/or the Distributor.
| 3. | Purchases and Sales of Securities |
Purchases and sales of securities, excluding short-term securities, for the year ended December 31, 2008, were as follows:
| | | | | | | | | | | | |
| | | Long-Term Securities | | U.S. Government Securities |
Fund | | Purchases | | Sales | | Purchases | | Sales |
Essex Large Cap Growth | | $ | 48,361,224 | | $ | 48,819,532 | | | N/A | | | N/A |
International Equity | | | 308,234,327 | | | 335,247,917 | | | N/A | | | N/A |
Emerging Markets Equity | | | 68,381,416 | | | 103,572,826 | | | N/A | | | N/A |
Global Bond | | | 32,581,086 | | | 64,009,621 | | $ | 9,363,561 | | $ | 9,598,192 |
| 4. | Portfolio Securities Loaned |
Each of the Funds other than Money Market may participate in a securities lending program offered by BNYM, providing for the lending of securities to qualified brokers. Securities lending fees include earnings of such temporary cash investments, plus or minus any rebate to a borrower. These earnings (after any rebate) are then divided between BNYM, as a fee for its services under the program, and the Fund, according to agreed-upon rates. Collateral on all securities loaned is accepted in cash and/or government securities and is maintained at a minimum level of 102% (105% in the case of certain foreign securities) of the market value, plus interest, if applicable, of investments on loan. It is the Funds’ policy to obtain additional collateral from or return excess collateral to the borrower by the end of the next business day, following the valuation date of the securities loaned. Therefore, the value of the collateral held may be temporarily less than the value of the securities on loan. Lending securities entails a risk of loss to the Funds if and to the extent that the market value of the securities loaned were to increase and the borrower did not increase the collateral accordingly, and the borrower fails to return the securities. The Funds bear the risk of any deficiency in the amount of the collateral available for return to the borrower due to any loss on the
47
Notes to Financial Statements (continued)
collateral invested. Collateral received in the form of cash is invested temporarily in the BNY Institutional Cash Reserves Fund (the “ICRF”), or other short-term investments as defined in the Securities Lending Agreement with BNYM.
In September and October of 2008, BNYM advised the Investment Manager that the ICRF had exposure to certain defaulted debt obligations, and that BNYM had established separate sleeves of the ICRF to hold these securities. The net impact of these positions is not material to each Fund. Each Fund’s position in the separate sleeves of the ICRF Fund is included in the Schedule of Portfolio Investments and the unrealized loss on such investment is included in Net Unrealized Depreciation on the Statement of Assets and Liabilities and the Statement of Operations.
| 5. | Commitments and Contingencies |
In the normal course of business, the Funds may enter into contracts and agreements that contain a variety of representations and warranties, which provide general indemnifications. The maximum exposure to the Funds under these arrangements is unknown, as this would involve future claims that may be made against a Fund that have not yet occurred. However, based on experience, the Funds expect the risks of loss to be remote.
Certain transactions, such as futures and forward transactions, dollar roll agreements, or purchases of when-issued or delayed delivery securities may have a similar effect on a Fund’s net asset value as if the Fund had created a degree of leverage in its portfolio. However, if a Fund enters into such a transaction, the Fund will establish a segregated account with its custodian in which it will maintain cash, U.S. government securities or other liquid securities equal in value to its obligations in respect to such transaction. Securities and other assets held in the segregated account may not be sold while the transaction is outstanding, unless other suitable assets are substituted.
| 7. | Forward Foreign Currency Contracts |
International Equity, Emerging Markets Equity, and Global Bond may invest in forward foreign currency exchange contracts to manage currency exposure. These investments may involve greater market risk than the amounts disclosed in the Funds’ financial statements.
A forward foreign currency exchange contract is an agreement between a Fund and another party to buy or sell a currency at a set price at a future date. The market value of the contract will fluctuate with changes in currency exchange rates. The contract is marked-to-market daily, and the change in market value is recorded as an unrealized gain or loss. Gain or loss on the purchase or sale of contracts having the same settlement date, amount and counterparty is realized on the date of offset, otherwise gain or loss is realized on the settlement date.
The Funds, except Essex Large Cap Growth and Money Market, may invest in non-U.S. dollar denominated instruments subject to limitations, and enter into forward foreign currency exchange contracts to facilitate transactions in foreign securities and to protect against a possible loss resulting from an adverse change in the relationship between the U.S. dollar and such foreign currency. Risks may arise upon entering into these contracts from the potential inability of counterparties to meet the terms of their contracts and from unanticipated movements in the value of a foreign currency relative to the U.S. dollar.
Open forward foreign currency exchange contracts (in U.S. Dollars) at December 31, 2008 were as follows:
| | | | | | | | | | | | | | |
Foreign Currency | | Position | | Settlement Date | | Current Value
(Receivable Amount) | | Contract Value
(Payable Amount) | | Unrealized Gain/
(Loss) | |
Global Bond | | | | | | | | | | | | | | |
Singapore Dollar | | Short | | 01/15/09 | | $ | 335,242 | | $ | 343,392 | | $ | (8,150 | ) |
Singapore Dollar | | Long | | 01/15/09 | | | 145,681 | | | 138,641 | | | 7,040 | |
| | | | | | | | | | | | | | |
| | | | | | $ | 480,923 | | $ | 482,033 | | $ | (1,110 | ) |
| | | | | | | | | | | | | | |
48
Notes to Financial Statements (continued)
| 8. | Futures Contracts Held or Issued for Purposes other than Trading |
International Equity may purchase or sell futures contracts to achieve a desired level of investment, whether to accommodate portfolio turnover or cash flows from capital shares transactions. There are certain risks associated with futures contracts. Prices may not move as expected or a Fund may not be able to close out the contract when it desires to do so, resulting in losses.
On entering into a futures contract, either cash or securities in an amount equal to a certain percentage of the contract value (initial margin) must be deposited with the futures broker. Subsequent payments (variation margin) are made or received each day. The variation margin payments equal the daily changes in the contract value and are recorded as unrealized gains or losses. The Funds recognize a realized gain or loss when the contract is closed or expires equal to the difference between the value of the contract at the time it was opened and the value at the time it was closed. Futures are valued at their quoted daily settlement prices. The aggregate principal amounts of the contracts are not recorded in the financial statements. Fluctuations in the value of the contracts are recorded in the Statement of Assets and Liabilities as an asset (liability) and in the Statement of Operations as unrealized appreciation (depreciation) until the contracts are closed, when they are recorded as realized gains (losses) on futures or forward currency contracts.
Cash pledged to cover margin requirements for the open futures positions at December 31, 2008, amounted to $33,487. Open futures contracts (in U.S. Dollars) at December 31, 2008, were as follows:
| | | | | | | | | | |
Type | | Number of
Contracts | | Position | | Expiration
Date | | Unrealized
Gain/(Loss) | |
DJ Euro Stoxx 50 | | 7 | | Long | | 03/20/09 | | $ | (950 | ) |
| 9. | New Accounting Pronouncement |
In March 2008, Statement of Financial Accounting Standards No. 161, “Disclosures about Derivative Instruments and Hedging Activities” (“SFAS 161”) was issued and is effective for fiscal years and interim periods beginning after November 15, 2008. SFAS 161 is intended to improve financial reporting for derivative instruments by requiring enhanced disclosure that enables investors to understand how and why a fund uses derivatives, how derivatives are accounted for, and how derivative instruments affect a fund’s results of operations and financial position. Management is currently evaluating the impact, if any, of SFAS 161 the Funds’ financial statement disclosures.
Tax Information (unaudited)
Each Fund hereby designates the maximum amount allowable of its net taxable income as qualified dividends as provided in the Jobs and Growth Tax Relief Reconciliation Act of 2003. The 2008 Form 1099-DIV you receive for the Fund will show the tax status of all distributions paid to you during the year.
Pursuant to section 852 of the Internal Revenue Code, Essex Large Cap Growth, International Equity, Emerging Markets Equity and Global Bond designate $0, $0, $17,050,958 and $62,905, respectively, as a capital gain distribution with respect to the taxable year ended December 31, 2008, or, if subsequently determined to be different, the net capital gains of such year.
49
Report of Independent Registered Public Accounting Firm
To the Board of Trustees of The Managers Funds and the Shareholders of Managers AMG Essex Large Cap Growth Fund, Managers International Equity Fund, Managers Emerging Markets Equity Fund, Managers Global Bond Fund and Managers Money Market Fund:
In our opinion, the accompanying statements of assets and liabilities, including the schedules of portfolio investments, and the related statements of operations and of changes in net assets and the financial highlights present fairly, in all material respects, the financial position of Managers AMG Essex Large Cap Growth Fund, Managers International Equity Fund, Managers Emerging Markets Equity Fund, Managers Global Bond Fund and Managers Money Market Fund (five of the series constituting The Managers Funds, hereafter referred to as the “Funds”), at December 31, 2008, the results of each of their operations for the year then ended, and the changes in each of their net assets and the financial highlights for each of the periods indicated, in conformity with accounting principles generally accepted in the United States of America. These financial statements and financial highlights (hereafter referred to as “financial statements”) are the responsibility of the Funds’ management; our responsibility is to express an opinion on these financial statements based on our audits. We conducted our audits of these financial statements in accordance with the standards of the Public Company Accounting Oversight Board (United States). Those standards require that we plan and perform the audit to obtain reasonable assurance about whether the financial statements are free of material misstatement. An audit includes examining, on a test basis, evidence supporting the amounts and disclosures in the financial statements, assessing the accounting principles used and significant estimates made by management, and evaluating the overall financial statement presentation. We believe that our audits, which included confirmation of securities at December 31, 2008 by correspondence with the custodian and brokers, provide a reasonable basis for our opinion.
PricewaterhouseCoopers LLP
Philadelphia, Pennsylvania
February 27, 2009
50
Trustees and Officers
The Trustees and Officers of the Trust, their business addresses, principal occupations for the past five years and dates of birth are listed below. The Trustees provide broad supervision over the affairs of the Trust and the Funds. The Trustees are experienced executives who meet periodically throughout the year to oversee the Funds’ activities, review contractual arrangements with companies that provide services to the Funds, and review the Funds’ performance. Unless otherwise noted, the address of each Trustee or Officer is the address of the Trust: 800 Connecticut Avenue, Norwalk, Connecticut 06854.
There is no stated term of office for Trustees. Trustees serve until their resignation, retirement or removal in accordance with the Trust’s organizational documents and policies adopted by the Board from time to time. The Chairman of the Trustees, President, Treasurer and Secretary of the Trust are elected by the Trustees annually. Other officers hold office at the pleasure of the Trustees.
Independent Trustees
The following Trustees are not “interested persons” of the Trust within the meaning of the 1940 Act:
| | |
Name, Date of Birth, Number of Funds Overseen in Fund Complex* | | Principal Occupation(s) During Past 5 Years and Other Directorships Held by Trustee |
Jack W. Aber, 9/9/37 • Trustee since 1999 • Oversees 32 Funds in Fund Complex | | Professor of Finance, Boston University School of Management (1972-Present); Trustee of Appleton Growth Fund (1 portfolio); Trustee of Third Avenue Trust (4 portfolios); Trustee of Third Avenue Variable Trust (1 portfolio). |
| |
William E. Chapman, II, 9/23/41 • Independent Chairman • Trustee since 1999 • Oversees 32 Funds in Fund Complex | | President and Owner, Longboat Retirement Planning Solutions (1998-Present); Hewitt Associates, LLC (part time) (provider of Retirement and Investment Education Seminars); Trustee of Bowdoin College (2002-Present); Director of Harding, Loevner Funds, Inc. (6 portfolios); Trustee of Third Avenue Trust (4 portfolios); Trustee of Third Avenue Variable Trust (1 portfolio). |
| |
Edward J. Kaier, 9/23/45 • Trustee since 1999 • Oversees 32 Funds in Fund Complex | | Attorney at Law and Partner, Teeters Harvey Gilboy & Kaier LLP (2007-Present); Attorney at Law and Partner, Hepburn Willcox Hamilton & Putnam, LLP (1977-2007); Trustee of Third Avenue Trust (4 portfolios); Trustee of Third Avenue Variable Trust (1 portfolio). |
| |
Steven J. Paggioli, 4/3/50 • Trustee since 1993 • Oversees 32 Funds in Fund Complex | | Consultant (2001-Present); Formerly Executive Vice President and Director, The Wadsworth Group (1986- 2001); Executive Vice President, Secretary and Director, Investment Company Administration, LLC (1990-2001); Vice President, Secretary and Director, First Fund Distributors, Inc. (1991-2001); Trustee, Professionally Managed Portfolios (22 portfolios); Advisory Board Member, Sustainable Growth Advisors, LP; Independent Director, Chase Investment Counsel (2008 – Present). |
| |
Eric Rakowski, 6/5/58 • Trustee since 1999 • Oversees 32 Funds in Fund Complex | | Professor, University of California at Berkeley School of Law (1990-Present); Director of Harding, Loevner Funds, Inc. (6 portfolios); Trustee of Third Avenue Trust (4 portfolios); Trustee of Third Avenue Variable Trust (1 portfolio). |
| |
Thomas R. Schneeweis, 5/10/47 • Trustee since 1987 • Oversees 32 Funds in Fund Complex | | Professor of Finance, University of Massachusetts (1977-Present); Director, CISDM at the University of Massachusetts, (1996-Present); President, Alternative Investment Analytics, LLC, (formerly Schneeweis Partners, LLC) (2001-Present); Partner, White Bear Partners, LLC (2007-Present); Partner, Schneeweis Capital Management, LLC (2007-Present); Partner, Schneeweis Associates, LLC (2007-Present); Partner, Northampton Capital Management, LLC (2004-Present); Partner, TRS Associates (2007-Present). |
| * | The Fund Complex consists of Managers AMG Funds, The Managers Funds, Managers Trust I and Managers Trust II. |
Interested Trustees
The following Trustees are “interested persons” of the Trust within the meaning of the 1940 Act. Mr. Dalton is an interested person by virtue of his positions with, and interest in securities of, Affiliated Managers Group, Inc. Mr. Streur is an interested person by virtue of his positions with Managers Investment Group LLC.
| | |
Name, Date of Birth, Number of Funds
Overseen in Fund Complex* | | Principal Occupation(s) During Past 5 Years and Other Directorships Held by Trustee |
Nathaniel Dalton, 9/29/66 • Trustee since 2008 • Oversees 32 Funds in Fund Complex | | Executive Vice President and Chief Operating Officer, Affiliated Managers Group, Inc., (2006-Present); Executive Vice President, Affiliated Managers Group, Inc., (2002 -2006); Executive Vice President and General Counsel, Affiliated Managers Group, Inc. (2001-2002); Senior Vice President and General Counsel, Affiliated Managers Group, Inc. (1996-2001). Director, Managers Distributors, Inc. (2000-Present). |
| |
John H. Streur, 2/6/60 • Trustee since 2008 • President since 2008 • Oversees 32 Funds in Fund Complex | | Senior Managing Partner, Managers Investment Group LLC (2006-Present); President, Managers Distributors, Inc. (2006-Present); Managing Partner, Managers Investment Group LLC (2005-2006); Chief Executive Officer, President and Chief Operating Officer, The Burridge Group LLC (1996-2004). |
Officers
| | |
Name, Date of Birth, Position(s) Held
with Fund and Length of Time Served | | Principal Occupation(s) During Past 5 Years |
Christine C. Carsman, 4/2/52 • Secretary since 2004 | | Senior Vice President and Chief Regulatory Counsel, Affiliated Managers Group, Inc. (2004-Present); Secretary, Managers AMG Funds, Managers Trust I and II (2004-Present); Senior Counsel, Vice President and Director of Operational Risk Management and Compliance, Wellington Management Company, LLP (1995-2004); Deputy General Counsel, The Boston Company, Inc. (1993-1995); Associate General Counsel, The Boston Company Advisors, Inc. (1991-1993); Associate, Sullivan & Worcester LLP (1987-1991). |
| |
Donald S. Rumery, 5/29/58 • Chief Financial Officer since 2007 • Treasurer since 1995 | | Senior Vice President, Managers Investment Group LLC (2005-Present); Director, Finance and Planning, The Managers Funds LLC, (1994-2004); Treasurer and Chief Financial Officer, Managers Distributors, Inc. (2000-Present); Treasurer, Managers AMG Funds (1999-Present); Treasurer, Managers Trust I and Managers Trust II (2000-Present); Secretary, Managers Trust I and Managers Trust II (2000-2004) and Secretary, The Managers Funds (1997-2004); Chief Financial Officer, Managers AMG Funds, Managers Trust I and Managers Trust II (2007-Present). |
| |
Keitha L. Kinne, 5/16/58 • Chief Operating Officer since 2007 | | Managing Partner and Chief Operating Officer, Managers Investment Group LLC (2007-Present); Chief Investment Officer, Managers Investment Group LLC (2008-Present); Chief Operating Officer, Managers AMG Funds, Managers Trust I and Managers Trust II (2007-Present); Managing Director, Legg Mason & Co., LLC (2006-2007); Managing Director, Citigroup Asset Management (2004-2006); Senior Vice President, Prudential Investments (1999-2004). |
| |
David Kurzweil, 6/22/74 • Assistant Secretary since 2008 | | Senior Vice President and Associate Counsel, Managers Investment Group LLC (2008-Present); Assistant Secretary, The Managers Funds, Managers Trust I, Managers Trust II, and Managers AMG Funds (2008-Present); Counsel and Senior Vice President, Lazard Asset Management LLC (2003-2008). |
51
Investment Manager and Administrator
Managers Investment Group LLC
800 Connecticut Avenue
Norwalk, Connecticut 06854
(203) 299-3500 or (800) 835-3879
Distributor
Managers Distributors, Inc.
800 Connecticut Avenue
Norwalk, Connecticut 06854
(203) 299-3500 or (800) 835-3879
Custodian
The Bank of New York Mellon
2 Hanson Place
Brooklyn, New York 11217
Legal Counsel
Ropes & Gray LLP
One International Place
Boston, Massachusetts 02110-2624
Transfer Agent
PNC Global Investment Servicing (U.S.) Inc.
Attn: Managers
P.O. Box 9769
Providence, Rhode Island 02940
(800) 548-4539
For Managers Choice Only
Managers
c/o PNC Global Investment Servicing (U.S.) Inc.
P.O. Box 61204
King of Prussia, Pennsylvania 19406-0851
(800) 358-7668

MANAGERSAND MANAGERS AMG FUNDS
EQUITY FUNDS
EMERGING MARKETS EQUITY
Rexiter Capital Management Limited
ESSEX GROWTH
ESSEX LARGE CAP GROWTH
ESSEX SMALL/MICRO CAP GROWTH
Essex Investment Management Co., LLC
FQ TAX-MANAGED U.S. EQUITY
FQ U.S. EQUITY
First Quadrant, L.P.
GW&K MULTI-CAP EQUITY
Gannet Welsh & Kotler, LLC
INSTITUTIONAL MICRO-CAP
MICRO-CAP
Lord, Abbett & Co. LLC
WEDGE Capital Management L.L.P.
OFI Institutional Asset Management, Inc.
Next Century Growth Investors LLC
INTERNATIONAL EQUITY
AllianceBernstein L.P.
Lazard Asset Management, LLC
Wellington Management Company, LLP
CHICAGO EQUITY PARTNERS
MID-CAP
Chicago Equity Partners, LLC
REAL ESTATE SECURITIES
Urdang Securities Management, Inc.
SKYLINE SPECIAL EQUITIES
PORTFOLIO
Skyline Asset Management, L.P.
SMALL CAP
TIMESSQUARE MID CAP GROWTH
TIMESSQUARE SMALL CAP GROWTH
TimesSquare Capital Management, LLC
SPECIAL EQUITY
Ranger Investment Management, L.P.
Lord, Abbett & Co. LLC
Skyline Asset Management, L.P.
Smith Asset Management Group, L.P.
Federated MDTA LLC
Westport Asset Management, Inc.
SYSTEMATIC VALUE
SYSTEMATIC MID CAP VALUE
Systematic Financial Management, L.P.
BALANCED FUNDS
CHICAGO EQUITY PARTNERS BALANCED
Chicago Equity Partners, LLC
GLOBAL
AllianceBernstein L.P.
First Quadrant, L.P.
Wellington Management Company, LLP
ALTERNATIVE FUNDS
FQ GLOBAL ALTERNATIVES
First Quadrant, L.P.
INCOME FUNDS
BOND (MANAGERS)
FIXED INCOME
GLOBAL BOND
Loomis, Sayles & Co., L.P.
BOND (MANAGERS FREMONT)
Pacific Investment Management Co. LLC
CALIFORNIA INTERMEDIATE TAX-FREE
Miller Tabak Asset Management LLC
GW&K MUNICIPAL ENHANCED YIELD
Gannet Welsh & Kotler, LLC
HIGH YIELD
J.P. Morgan Investment Management LLC
INTERMEDIATE DURATION GOVERNMENT
SHORT DURATION GOVERNMENT
Smith Breeden Associates, Inc.
MONEY MARKET
JPMorgan Investment Advisors Inc.
This report is prepared for the Funds’ shareholders. It is authorized for distribution to prospective investors only when preceded or accompanied by an effective prospectus. To receive a free copy of the prospectus or Statement of Additional Information, which includes additional information about Fund Trustees, please contact us by calling 800.835.3879. Distributed by Managers Distributors, Inc., member FINRA.
A description of the policies and procedures each Fund uses to vote its proxies is available: (i) without charge, upon request, by calling 800.835.3879, or (ii) on the Securities and Exchange Commission’s (SEC) Web site at www.sec.gov. For information regarding each Fund’s proxy voting record for the 12-month period ended June 30, call 800.835.3879 or visit the SEC Web site at www.sec.gov.
The Funds file their complete schedule of portfolio holdings with the SEC for the first and third quarters of each fiscal year on Form N-Q. The Funds’ Forms N-Q are available on the SEC’s website at www.sec.gov. A Fund’s Forms N-Q may be reviewed and copied at the SEC’s Public Reference Room in Washington, DC. Information on the operation of the Public Reference Room may be obtained by calling 800.SEC.0330. To review a complete list of the Funds’ portfolio holdings, or to view the most recent quarterly holdings report, semiannual report, or annual report, please visit www.managersinvest.com.
www.managersinvest.com


ANNUAL REPORT
Managers Funds
December 31, 2008
Managers Bond Fund

AR019-1208
Managers Bond Fund
Annual Report — December 31, 2008
TABLE OF CONTENTS
| | |
| | | Page |
LETTER TO SHAREHOLDERS | | 1 |
| |
ABOUT YOUR FUND’S EXPENSES | | 3 |
| |
PORTFOLIO MANAGER’S COMMENTS, FUND SNAPSHOT, AND SCHEDULE OF PORTFOLIO INVESTMENTS | | 4 |
| |
NOTES TO SCHEDULE OF PORTFOLIO INVESTMENTS | | 21 |
| |
FINANCIAL STATEMENTS: | | |
| |
Statement of Assets and Liabilities | | 22 |
Fund’s balance sheet, net asset value (NAV) per share computation and cumulative undistributed amount | | |
| |
Statement of Operations | | 23 |
Detail of sources of income, Fund expenses, and realized and unrealized gains (losses) during the year | | |
| |
Statement of Changes in Net Assets | | 24 |
Detail of changes in Fund assets for the past two years | | |
| |
FINANCIAL HIGHLIGHTS | | 25 |
Historical net asset values per share, distributions, total returns, expense ratios, turnover ratios and net assets | | |
| |
NOTES TO FINANCIAL STATEMENTS | | 26 |
Accounting and distribution policies, details of agreements and transactions with Fund management and affiliates, and descriptions of certain investment risks | | |
| |
REPORT OF INDEPENDENT REGISTERED PUBLIC ACCOUNTING FIRM | | 30 |
| |
TRUSTEES AND OFFICERS | | 31 |
Nothing contained herein is to be considered an offer, sale or solicitation of an offer to buy shares of The Managers Funds or Managers AMG Funds. Such offering is made only by Prospectus, which includes details as to offering price and other material information.
Letter to Shareholders
Dear Shareholder:
2008 will go down in the history books as one of the most challenging investment periods in decades. Equities sank and Treasuries soared amid ongoing reports of deteriorating credit conditions and weakening economic growth in both the U.S. and abroad. The epicenter of the crisis continued to be in the financial sector, where escalating concerns about toxic mortgage assets culminated in a crisis of confidence in the strength of our most prominent financial institutions. As the trust that is so sorely needed between counterparties across the global financial system evaporated, so did the availability of credit. The scarce availability of credit, along with high levels of leverage, led to numerous firm mergers, bailouts and failures. While the total number of financial firm failures has fallen well short of levels reached during previous periods of crises, the casualties among the largest and most well-regarded corporations has been unprecedented. The list of firms included the likes of Bear Stearns, Lehman Brothers, Countrywide Financial, Washington Mutual, American International Group, Wachovia, Fannie Mae, Freddie Mac, Citigroup, Merrill Lynch and others.
Meanwhile, the U.S. Government, along with other global leaders, took unprecedented steps to assist in resolving the credit crisis, contain the damage to real economies, and attempt to restore investor confidence. While the previous U.S. administration, via the Treasury and the Federal Reserve, acted aggressively in an attempt to alleviate the problems associated with the crisis, their efforts will likely require more time before we start to see meaningful results.
The credit crisis has weighed heavily on the returns of both equity and fixed-income markets in the U.S. and abroad. Unlike the equity markets, however, the dispersion of returns amongst the various fixed-income markets was substantial. Within the debt markets, performance varied most notably along the credit spectrum, as higher quality securities easily outperformed lower quality issues. For the period, the Barclays Capital U.S. Treasury Index gained +13.7% while the Barclays Capital U.S. High Yield Index returned -26.2%. Broader fixed-income indexes held up reasonably well, with the Barclays Capital U.S. Aggregate Bond Index and the Barclays Capital Global Aggregate Ex-U.S. Dollar Bond Index gaining +5.2% and +4.4%, respectively.
Against this backdrop, the performance of the Managers Bond Fund (the “Fund”), while exceeding equity returns, was challenged, as detailed below.
| | | | | | | | | | | | | | | | | | | | |
Periods Ended 12/31/08 | | 6 Months | | | 1 Year | | | 3 Years | | | 5 Years | | | 10 Years | | | Since
Inception | | | Inception
Date |
Managers Bond Fund | | (15.71 | )% | | (16.31 | )% | | (1.14 | )% | | 0.77 | % | | 4.74 | % | | 8.23 | % | | 6/1/1984 |
| | | | | | | |
Barclays Capital U.S. Government/ Credit Bond Index | | 4.68 | % | | 5.70 | % | | 5.56 | % | | 4.64 | % | | 5.64 | % | | 8.64 | % | | 6/1/1984 |
As noted above, for the year ended December 31, 2008, the Fund returned -16.31%, compared to a return of +5.70% for the Barclays Capital U.S. Government/Credit Index (the “Index”), the Fund’s primary benchmark. The Fund’s performance relative to the Index during 2008 was primarily driven by an overweight in corporate bonds and a related underweight in U.S. Treasuries. Throughout the year, as yield spreads widened and valuations on corporate bonds declined, Loomis Sayles & Company, L.P. (“Loomis”), the Fund’s subadvisor, shifted the Fund’s assets away from Treasuries into corporate bonds. In hindsight, the timing of this shift was premature. The negative impact of the shift to corporates was magnified by meaningful exposure to BBB-rated securities, which are at the lower end of the investment-grade credit scale. As mentioned above, there was a direct correlation between credit quality and performance throughout the year. Nevertheless, Loomis still feels strongly that corporate bonds are severely undervalued and thinks that the Fund’s current allocation should be well-positioned for strong excess performance as spreads narrow further. In addition to the sector
1
Letter to Shareholders (continued)
allocation decisions, security selection had a modest impact on performance. While exposure to the headline names was modest, the Fund did hold positions in Lehman Brothers, as well as Fannie Mae and Freddie Mac. Lastly, the Fund’s non-U.S. holdings were negatively impacted by the rally in the Dollar relative to most major currencies. The Dollar was pushed higher as investors viewed it as another safe haven.
Looking ahead, with a weak and eventually recovering economy, central banks around the globe are expected to remain accommodative throughout the coming year. Treasury yields could fall further in the near term, but Loomis believes the bias will be for stable-to-higher yields later in the year assuming the economy begins to improve, credit demands rise, and the flight to safety reverses as Loomis anticipates. Risky assets are priced at extremely wide spreads relative to Treasuries. This is true partly because Treasury yields are so low, but a good portion of the gap reflects illiquid market conditions and fear of deteriorating fundamentals. Valuations are so cheap now that spreads would not need to tighten further for the Fund to earn an attractive yield. Loomis believes yield spreads can narrow in the coming year if the economy begins to move out of a recession and lending patterns begin to normalize. The timing of such a move is uncertain, as there are a number of hurdles to clear. Investors need to see more clarity surrounding policymakers’ intentions, especially with a new administration coming on board. Additionally, investors need to develop more confidence that the government will succeed in stabilizing housing and restoring lending. The global corporate bond markets are likely to remain volatile, and there could certainly be increases in defaults and downgrades. Despite this, Loomis believes the Fund is positioned to deliver attractive returns by maintaining its well-diversified exposure to the credit markets, and by leveraging their experience and research resources to avoid the credit blow-ups in the market.
The following report covers the one-year period ended December 31, 2008. Should you have any questions about this report, or if you’d like to receive a prospectus and additional information, including fees and expenses for this or any of the other Funds in our family, please feel free to contact us at 1-800-835-3879, or visit our Web site at www.managersinvest.com. As always, please read the prospectus carefully before you invest or send money.
If you are curious about how you can better diversify your investment program, visit the Knowledge Center on our Web site and view our articles in the investment strategies section. You can rest assured that under all market conditions our team is focused on delivering excellent investment management services for your benefit.
We thank you for your continued confidence and investment in The Managers Funds.
|
| Respectfully, |
|
 |
| John H. Streur |
Senior Managing Partner Managers Investment Group LLC |
2
About Your Fund’s Expenses
As a shareholder of a Fund, you may incur two types of costs: (1) transaction costs, which may include sales charges (loads) on purchase payments; redemption fees; and exchange fees; and (2) ongoing costs, including management fees; distribution (12b-1) fees; and other Fund expenses. This example is intended to help you understand your ongoing costs (in dollars) of investing in the Fund and to compare these costs with the ongoing costs of investing in other mutual funds. The example is based on $1,000 invested at the beginning of the period and held for the entire period as indicated below.
Actual Expenses
The first line of the following table provides information about the actual account values and actual expenses. You may use the information in this line, together with the amount you invested, to estimate the expenses that you paid over the period. Simply divide your account value by $1,000 (for example, an $8,600 account value divided by $1,000 = 8.6), then multiply the result by the number in the first line under the heading entitled “Expenses Paid During Period” to estimate the expenses you paid on your account during this period.
Hypothetical Example for Comparison Purposes
The second line of the following table provides information about hypothetical account values and hypothetical expenses based on the Fund’s actual expense ratio and an assumed annual rate of return of 5% before expenses, which is not the Fund’s actual return. The hypothetical account values and expenses may not be used to estimate the actual ending account balance or expenses you paid for the period. You may use this information to compare the ongoing costs of investing in the Fund and other funds by comparing this 5% hypothetical example with the 5% hypothetical examples that appear in the shareholder reports of other funds.
Please note that the expenses shown in the table are meant to highlight your ongoing costs only and do not reflect any transactional costs, such as sales charges (loads), redemption fees, or exchange fees. Therefore, the second line of the table is useful in comparing ongoing costs only, and will not help you determine the relative total costs of owning different funds.
| | | | | | | | | | | | |
Six Months Ended December 31, 2008 | | Expense Ratio
for the Period | | | Beginning
Account Value
7/1/2008 | | Ending
Account Value
12/31/2008 | | Expenses Paid
During the
Period* |
Managers Bond Fund | | | | | | | | | | | | |
Based on Actual Fund Return | | 0.99 | % | | $ | 1,000 | | $ | 843 | | $ | 4.59 |
Based on Hypothetical 5% Annual Return | | 0.99 | % | | $ | 1,000 | | $ | 1,020 | | $ | 5.03 |
| | * | Expenses are equal to the Fund’s annualized expense ratio multiplied by the average account value over the period, multiplied by the number of days in the most recent fiscal half-year (184), then divided by 366. |
3
Managers Bond Fund
Portfolio Manager’s Comments
The Managers Bond Fund’s (the “Fund”) objective is to achieve a high level of current income from a diversified portfolio of fixed income securities. The Fund’s benchmark is the Barclays Capital U.S. Government/Credit Index (the “Index”).
The Fund’s assets are managed by Loomis Sayles & Company, L.P. (“Loomis”), who serves as subadvisor to the Fund. The investment team at Loomis believes that there are inherent inefficiencies in bond markets, hence the greatest opportunities to add value reside in the pricing of credit risk. Their philosophy is to identify attractively valued issues through fundamental research. Portfolio manager Dan Fuss and his investment team at Loomis are focused on issue selection rather than interest-rate timing. They employ a “bond picker’s” approach, capitalizing on the firm’s commitment to credit research. Mr. Fuss and the team research debt offerings in the same way equity analysts research stocks, looking for undervalued bonds where they see a yield premium, the potential for price appreciation, or both. They analyze the company’s financial condition in detail, as well as the terms of specific bond offerings. They believe price appreciation can come from a variety of catalysts, including improving company fundamentals which would lead to credit upgrades, changing market supply and demand forces, and improving sector or economic trends.
The ideal investment typically exhibits some of the following traits:
| | • | | An attractive yield, both absolute and relative to Loomis’ credit research expectations |
| | • | | Good call protection, particularly when prevailing rates are low |
| | • | | Stable or improving fundamentals (for corporate bonds) |
| | • | | Non-market relatedness to counter the impact of systematic risk |
The portfolio:
| | • | | Primarily holds securities rated BBB/Baa or better, but may hold a small portion in below-investment-grade and unrated bonds |
| | • | | Can be invested up to 10% in non-U.S. Dollar denominated bonds |
In order to mitigate some of the interest rate risk, the Fund may be structured with counter-cyclical elements. In doing so, Dan Fuss may utilize convertible bonds, municipal bonds, preferred stocks, and foreign corporate and government bonds in addition to the domestic corporate bonds, which are used for alpha generation. In addition, Mr. Fuss seeks bonds with call protection, either through the terms of the bond structure or through deep price discounts relative to the call price.
In deciding which securities to buy, Loomis will consider:
| | • | | The financial strength of the issuer of the security |
| | • | | Current interest rates and expectations regarding general trends in interest rates |
| | • | | Comparison of the level of risk associated with particular investments with the asset manager’s expectations concerning the potential return of those investments |
The investment team may make a sell decision when:
| | • | | There is a change in sovereign, industry, or company fundamentals |
| | • | | The issue is downgraded by Loomis’ research |
| | • | | Relative valuation is not consistent with its expected rating category |
| | • | | Other securities or sectors offer greater total return potential. |
The Year in Review
The Fund returned -16.31% for the year ended December 31, 2008, compared to the Index, which returned +5.70%.
For investors, 2008 turned out to be a year that many would rather soon forget. The fixed income markets were no exception, marred by the widening of credit spreads to historic levels, and credit markets struggling to function normally. In the first half of the year, the markets seemed to be tussling with the typical bear market challenges. The second half, though, proved to be anything but normal. Policymakers responded with immediate and aggressive action, recognizing the importance of keeping credit flowing through the markets. With no playbook to follow, there were stumbles along the way and some inconsistent application of policy. Investors shunned risky assets, preferring instead the safe haven of U.S. Government securities. This flight to quality persisted even though, as it turns out, investors were paid little to nothing, as Treasury bills moved toward zero. For the year, investment-grade corporate bonds underperformed Treasury securities by nearly 20%. That differential grew wider with a decline in credit quality, with high-yield securities underperforming Treasuries by 38% for the year. By the end of the fourth quarter, there were some tentative signs that the damage was being contained. Short-term rates began to ease, a few new issues came to market, and corporate spreads narrowed marginally.
The Fund’s performance relative to the Index during 2008 was primarily driven by an overweight in corporate bonds and a related underweight in U.S. Treasuries. Throughout the year, as yield spreads widened and valuations on corporate bonds declined, Loomis shifted the Fund’s assets away from Treasuries into corporate bonds. A sizeable portion of the Fund’s corporate exposure is in BBB-rated securities, which are at the lower end of the investment grade credit scale. As mentioned above, there was a direct correlation between credit quality and performance throughout the year. In hindsight, the timing of this shift was premature. However, Loomis still feels strongly that corporate bonds are severely undervalued, and believe that the Fund’s current allocation should be well-positioned for strong performance as spreads narrow further. In addition to the sector-allocation decisions, security selection had a modest impact on performance. While exposure to the headline names was modest, the Fund did hold positions in Lehman Brothers, as well as Fannie Mae and Freddie Mac. Lastly, the Fund’s non-U.S. holdings were negatively impacted by the rally in the Dollar relative to most major currencies. The Dollar was pushed higher as investors viewed this as another safe haven.
Looking Forward
With a weak and eventually recovering economy, central banks around the globe are expected to remain accommodative throughout the coming year. Treasury yields could fall further in the near term, but Loomis believes the bias will be for stable-to-higher yields later in the year as the economy begins to improve, credit demands rise, and the flight to safety reverses. Risky assets are priced at extremely wide spreads relative to Treasuries. This is true partly because Treasury yields are so low, but a good portion of the gap reflects illiquid market conditions and fear of deteriorating fundamentals. Valuations are so cheap now that spreads would not need to tighten further for the Fund to earn an attractive yield. Loomis believes yield spreads can narrow in the coming year if the economy begins to move out of recession and lending patterns
4
Managers Bond Fund
Portfolio Manager’s Comments (continued)
begin to normalize. The timing of such a move is uncertain, as there are a number of hurdles to clear. Investors need to see more clarity surrounding policymakers’ intentions, especially with a new administration in place. Additionally, investors need to develop more confidence that the government will succeed in stabilizing housing and restoring lending. The global corporate bond markets are likely to remain volatile, and there could certainly be increases in defaults and downgrades. Despite this, Loomis believes the Fund can deliver attractive returns by maintaining its well-diversified exposure to the credit markets, and by leveraging their experience and research resources to avoid the credit blow-ups in the market.
Cumulative Total Return Performance
Managers Bond Fund’s cumulative total return is based on the daily change in net asset value (NAV), and assumes that all distributions were reinvested. The Barclays Capital U.S. Government/Credit Index is comprised of government securities and investment grade corporate securities with a maturity between one and ten years. Unlike the Fund, the Barclays Capital U.S. Government/Credit Index is unmanaged, is not available for investment, and does not incur expenses. The Index assumes reinvestment of all income. This chart compares a hypothetical $10,000 investment made in the Managers Bond Fund on December 31, 1998, to a $10,000 investment made in the Barclays Capital U.S. Government/Credit Index for the same time period. The chart is not intended to imply any future performance of the Fund. The graph and chart do not reflect the deduction of taxes that a shareholder would pay on a Fund distribution or redemption of shares. Total returns would have been lower had certain expenses not been reduced. Past performance is not indicative of future results.
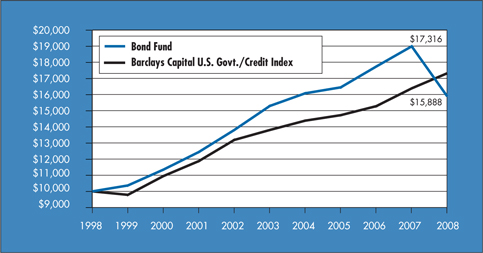
The table below shows the average annual total returns for Managers Bond Fund and the Barclays Capital U.S. Government/Credit Index from December 31, 1998 through December 31, 2008.
| | | | | | | | | | | |
Average Annual Total Returns 1 | | One Year | | | Five Years | | | Ten Years | | | Inception Date |
Bond Fund 2,3,4,5 | | (16.31 | )% | | 0.77 | % | | 4.74 | % | | 6/1/84 |
Barclays Capital U.S. Govt./Credit Index | | 5.70 | % | | 4.64 | % | | 5.64 | % | | 6/1/84 |
The performance data shown represents past performance. Past performance is not a guarantee of future results. Current performance may be lower or higher than the performance data quoted. The investment return and principal value of an investment in the Fund will fluctuate so that an investor’s shares, when redeemed, may be worth more or less than their original cost. For performance information through the most recent month end, please call (800) 835-3879 or visit our Web site at www.managersinvest.com.
In choosing a Fund, investors should carefully consider the amount they plan to invest, their investment objectives, the Fund’s investment objectives, risks, charges and expenses before investing. For this and other information, please call (800) 835-3879 or visit www.managersinvest.com for a free prospectus. Read it carefully before investing or sending money. Distributed by Managers Distributors, Inc., member FINRA.
| | 1 | Total return equals income yield plus share price change and assumes reinvestment of all dividends and capital gain distributions. Returns are net of fees and may reflect offsets of Fund expenses as described in the Prospectus. No adjustment has been made for taxes payable by shareholders on their reinvested dividends and capital gain distributions. Returns for periods greater than one year are annualized. The listed returns on the Fund are net of expenses. All returns are in U.S. dollars($). |
| | 2 | From time to time, the Fund’s advisor has waived its fees and/or absorbed Fund expenses, which has resulted in higher returns. |
| | 3 | The Fund is subject to the risks associated with investments in debt securities, such as default risk, fluctuations in debtor’s perceived ability to pay its creditors. Changing interest rates may adversely affect the value of an investment. An increase in interest rates typically causes the value of bonds and other fixed-income securities to fall. |
| | 4 | Investments in international securities are subject to certain risks of overseas investing including currency fluctuations and changes in political and economic conditions, which could result in significant market fluctuations. These risks are magnified in emerging markets. |
| | 5 | High yield bonds (also known as “junk bonds”) are subject to additional risks such as the risk of default. |
Barclays Capital U.S. Govt./Credit Index is an index of all investment grade government and corporate bonds with a maturity between one and ten years. Unlike the Fund, the Barclays Capital U.S. Govt./Credit Index is unmanaged, is not available for investment, and does not incur expenses.
Not FDIC insured, nor bank guaranteed. May lose value.
5
Managers Bond Fund
Fund Snapshot
December 31, 2008
Portfolio Breakdown
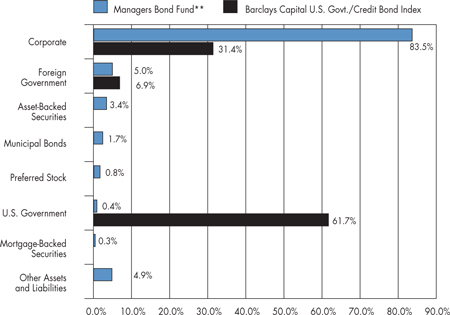
| | | | | | |
Industry | | Managers
Bond Fund** | | | Barclays Capital
U.S. Govt./Credit
Bond Index | |
Corporate | | 83.5 | % | | 31.4 | % |
Foreign Government | | 5.0 | % | | 6.9 | % |
Asset-Backed Securities | | 3.4 | % | | 0.0 | % |
Municipal Bonds | | 1.7 | % | | 0.0 | % |
Preferred Stock | | 0.8 | % | | 0.0 | % |
U.S. Government | | 0.4 | % | | 61.7 | % |
Mortgage-Backed Securities | | 0.3 | % | | 0.0 | % |
Other Assets and Liabilities | | 4.9 | % | | 0.0 | % |
| | ** | As a percentage of net assets |
Top Ten Holdings
| | | |
Security Name | | Percentage of
Net Assets | |
Merrill Lynch & Co., Inc., 6.110%, 11/29/37 * | | 2.9 | % |
Southwestern Electric Power Co., 4.650%, 01/15/19 * | | 2.0 | |
Kinder Morgan Energy Partners L.P., 5.950%, 02/15/18 * | | 2.0 | |
International Paper Co., 7.950%, 06/15/18 * | | 2.0 | |
PPG Industries, Inc., 6.650%, 03/18/18 | | 1.8 | |
Equitable Resources, Inc., 6.500%, 04/01/18 * | | 1.8 | |
Medco Health Solutions, Inc., 7.125%, 03/15/18 * | | 1.6 | |
Dun & Bradstreet, Corp., The, 6.000%, 04/01/13 | | 1.6 | |
Questar Market Resources, Inc., 6.800%, 04/01/18 | | 1.4 | |
CIT Group, Inc., 12.000%, 12/18/18 | | 1.4 | |
| | | |
Top Ten as a Group | | 18.5 | % |
| | | |
| | * | Top Ten Holding at June 30, 2008 |
Any sectors, industries, or securities discussed should not be perceived as investment recommendations. Mention of a specific security should not be considered a recommendation to buy or solicitation to sell that security.
6
Managers Bond Fund
Schedule of Portfolio Investments
December 31, 2008
| | | | | | |
Security Description | | Principal Amount | | Value |
Corporate Bonds—83.5% | | | | | | |
Finance—20.4% | | | | | | |
American General Finance Corp., | | | | | | |
5.400%, 12/01/15 | | $ | 5,000,000 | | $ | 1,867,895 |
Series MTN, 6.900%, 12/15/17 | | | 57,315,000 | | | 24,804,385 |
ASIF Global Financial, 2.380%, 02/26/09 (a) | | SGD | 5,800,000 | | | 2,927,326 |
Bank of America Capital Trust VI, 5.625%, 03/08/35 | | | 3,085,000 | | | 2,591,665 |
Barclays Capital Corp., | | | | | | |
2.899%, 03/23/09 (03/23/09) (a) 6 | | KRW | 160,900,000 | | | 128,408 |
4.160%, 02/22/10 (a) | | THB | 25,000,000 | | | 737,390 |
Series EMTN, 4.100%, 03/22/10 (a) | | THB | 26,000,000 | | | 731,409 |
BNP Paribas SA DN, 19.975%, 06/13/11 (a) 4 | | IDR | 19,645,500,000 | | | 1,130,608 |
Caterpillar Financial Services Corp., 5.850%, 09/01/17 | | | 13,000,000 | | | 12,725,648 |
CIGNA Corp., 6.150%, 11/15/36 | | | 6,830,000 | | | 5,196,954 |
CIT Group, Inc., | | | | | | |
5.000%, 02/13/14 | | | 120,000 | | | 87,216 |
5.125%, 09/30/14 | | | 206,000 | | | 147,030 |
5.500%, 12/20/16 | | GBP | 1,900,000 | | | 1,470,782 |
7.625%, 11/30/12 | | | 21,513,000 | | | 18,160,608 |
12.000%, 12/18/18 (a) | | | 33,607,000 | | | 25,877,391 |
Citibank, N.A., 15.000%, 07/02/10 (a) | | BRL | 2,000,000 | | | 891,569 |
Colonial Realty, L.P., | | | | | | |
4.800%, 04/01/11 | | | 3,485,000 | | | 2,778,239 |
5.500%, 10/01/15 | | | 1,255,000 | | | 707,034 |
Duke Realty, L.P., | | | | | | |
5.950%, 02/15/17 | | | 2,210,000 | | | 1,104,125 |
6.500%, 01/15/18 | | | 5,000,000 | | | 2,231,645 |
Equity One, Inc., 6.000%, 09/15/17 | | | 5,915,000 | | | 3,337,976 |
ERAC USA Finance Co., | | | | | | |
6.375%, 10/15/17 (a) | | | 4,910,000 | | | 3,407,599 |
6.700%, 06/01/34 (a) | | | 1,250,000 | | | 686,895 |
7.000%, 10/15/37 (a) | | | 19,033,000 | | | 10,482,920 |
ERP Operating, L.P., | | | | | | |
5.125%, 03/15/16 | | | 600,000 | | | 424,506 |
5.750%, 06/15/17 | | | 1,450,000 | | | 1,000,862 |
First Industrial L.P., 5.950%, 05/15/17 | | | 15,000,000 | | | 7,671,990 |
Ford Motor Credit Company LLC, | | | | | | |
5.700%, 01/15/10 | | | 6,815,000 | | | 5,791,591 |
7.000%, 10/01/13 | | | 200,000 | | | 138,185 |
8.000%, 12/15/16 | | | 3,500,000 | | | 2,279,784 |
8.625%, 11/01/10 | | | 195,000 | | | 147,620 |
9.750%, 09/15/10 | | | 445,000 | | | 355,997 |
The accompanying notes are an integral part of these financial statements.
7
Managers Bond Fund
Schedule of Portfolio Investments (continued)
| | | | | | | |
Security Description | | Principal Amount | | | Value |
Finance—20.4% (continued) | | | | | | | |
GE Capital Australia Funding Pty., Ltd., 8.000%, Series EMTN, 02/13/12 | | AUD | 3,965,000 | | | $ | 2,651,473 |
General Electric Capital Corp., | | | | | | | |
2.960%, 05/18/12 | | SGD | 4,400,000 | | | | 2,701,217 |
3.485%, 03/08/12 | | SGD | 16,500,000 | | | | 10,375,571 |
6.500%, 09/28/15 | | NZD | 14,950,000 | | | | 6,933,705 |
6.625%, 02/04/10 | | NZD | 3,500,000 | | | | 1,953,298 |
6.750%, 09/26/16 | | NZD | 6,390,000 | | | | 3,115,175 |
GMAC LLC, | | | | | | | |
5.625%, 05/15/09 | | $ | 265,000 | | | | 254,656 |
6.000%, 12/15/11 | | | 1,127,000 | | | | 911,675 |
6.625%, 05/15/12 | | | 1,374,000 | | | | 1,069,357 |
6.750%, 12/01/14 | | | 1,019,000 | | | | 700,073 |
6.875%, 08/28/12 | | | 253,000 | | | | 194,198 |
6.875%, 09/15/11 | | | 158,000 | | | | 129,443 |
7.000%, 02/01/12 | | | 763,000 | | | | 609,256 |
7.250%, 03/02/11 | | | 816,000 | | | | 701,262 |
7.500%, 12/31/13 | | | 584,000 | | | | 408,800 |
8.000%, 11/01/31 | | | 1,805,000 | 2 | | | 1,056,104 |
8.000%, 11/01/31 | | | 319,000 | | | | 189,610 |
8.000%, 12/31/18 | | | 1,366,000 | | | | 683,000 |
Highwoods Realty, L.P., | | | | | | | |
5.850%, 03/15/17 | | | 3,680,000 | | | | 2,276,426 |
7.500%, 04/15/18 | | | 2,405,000 | | | | 1,560,633 |
ICICI Bank, Ltd., 6.375%, 04/30/22 (a) 7 | | | 900,000 | | | | 472,601 |
International Lease Finance Corp., | | | | | | | |
5.000%, 04/15/10 | | | 1,040,000 | | | | 844,116 |
5.550%, 09/05/12 | | | 345,000 | | | | 237,991 |
6.375%, 03/25/13 | | | 1,730,000 | | | | 1,175,182 |
6.625%, 12/07/09 | | GBP | 9,140,000 | | | | 10,968,407 |
iStar Financial Inc., | | | | | | | |
5.150%, 03/01/12 | | | 4,360,000 | | | | 1,373,400 |
5.125%, 04/01/11 | | | 280,000 | | | | 98,000 |
5.375%, 04/15/10 | | | 830,000 | | | | 381,800 |
5.500%, 06/15/12 | | | 260,000 | | | | 81,900 |
5.650%, 09/15/11 | | | 3,095,000 | | | | 990,400 |
5.700%, 3/01/14 | | | 15,000 | 2 | | | 4,650 |
5.743%, 10/01/12,(04/01/09) 6 | | | 8,095,000 | | | | 2,367,788 |
5.800%, 03/15/11 | | | 640,000 | | | | 224,000 |
5.850%, 03/15/17 | | | 325,000 | | | | 97,500 |
5.875%, 03/15/16 | | | 1,340,000 | | | | 381,900 |
5.950%, 10/15/13 | | | 4,725,000 | | | | 1,488,375 |
6.050%, 04/15/15 | | | 620,000 | | | | 182,900 |
8.625%, 06/01/13 | | | 425,000 | | | | 131,750 |
The accompanying notes are an integral part of these financial statements.
8
Managers Bond Fund
Schedule of Portfolio Investments (continued)
| | | | | | |
Security Description | | Principal Amount | | Value |
Finance—20.4% (continued) | | | | | | |
JPMorgan Chase & Co., | | | | | | |
16.650%, 05/17/10 (a) 4 | | BRL | 3,600,000 | | $ | 1,238,454 |
23.792%, 03/28/11 (a) 4 | | IDR | 932,700,000 | | | 51,735 |
25.218%, 04/12/12 (a) 4 | | IDR | 40,733,437,680 | | | 1,714,541 |
JPMorgan International, 19.517%, 10/21/10 (a) 4 | | IDR | 16,627,462,500 | | | 1,089,862 |
Kaupthing Bank, | | | | | | |
3.413%, 01/15/10 (a) 8 | | $ | 1,000,000 | | | 60,000 |
5.750%, 10/04/11 (a) 8 | | | 10,000,000 | | | 600,000 |
6.125%, 10/04/16 (a) 8 | | | 1,800,000 | | | 108,000 |
KfW Bankengruppe, 10.750%, 02/01/10 | | ISK | 20,000,000 | | | 156,076 |
Kinder Morgan Finance Co., | | | | | | |
5.150%, 03/01/15 | | | 680,000 | | | 506,600 |
5.700%, 01/05/16 | | | 370,000 | | | 275,650 |
Lehman Brothers Holdings, Inc., | | | | | | |
6.000%, 05/03/32 8 | | | 1,380,000 | | | 138 |
6.875%, 07/17/37 8 | | | 17,410,000 | | | 1,741 |
Marsh & McLennan Companies, Inc., | | | | | | |
5.375%, 07/15/14 | | | 4,390,000 | | | 3,894,711 |
5.750%, 09/15/15 | | | 11,939,000 | | | 10,634,378 |
5.875%, 08/01/33 | | | 10,360,000 | | | 7,632,202 |
MBIA Insurance Corp., 14.000%, 01/15/33 (a) 7 | | | 525,000 | | | 267,750 |
Merrill Lynch & Co., Inc., | | | | | | |
4.625%, 09/14/18 | | EUR | 1,750,000 | | | 1,543,839 |
6.110%, 01/29/37 | | | 60,150,000 | | | 54,070,340 |
10.710%, 03/08/17 | | BRL | 2,500,000 | | | 862,993 |
Morgan Stanley, | | | | | | |
5.550%, 04/27/17 | | | 6,500,000 | | | 5,367,602 |
6.625%, 04/01/18 | | | 18,310,000 | | | 16,063,180 |
Mutual of Omaha Insurance Co., 6.800%, 06/15/36 (a) | | | 13,925,000 | | | 12,826,944 |
PNC Bank, N.A., 6.875%, 04/01/18 | | | 8,050,000 | | | 8,564,942 |
ProLogis Trust, | | | | | | |
5.625%, 11/15/15 | | | 345,000 | | | 171,694 |
5.750%, 04/01/16 | | | 280,000 | | | 139,640 |
Qwest Capital Funding, Inc., 6.875%, 07/15/28 | | | 1,190,000 | | | 714,000 |
Realty Income Corp., 6.750%, 08/15/19 | | | 7,675,000 | | | 4,441,638 |
SLM Corp., | | | | | | |
5.000%, 10/01/13 | | | 2,060,000 | | | 1,473,971 |
5.000%, 04/15/15 | | | 50,000 | | | 31,720 |
5.125%, 08/27/12 | | | 540,000 | | | 404,114 |
5.375%, 01/15/13 | | | 2,460,000 | | | 1,803,488 |
5.375%, 05/15/14 | | | 300,000 | | | 202,462 |
The accompanying notes are an integral part of these financial statements.
9
Managers Bond Fund
Schedule of Portfolio Investments (continued)
| | | | | | |
Security Description | | Principal Amount | | Value |
Finance—20.4% (continued) | | | | | | |
SLM Corp. (continued) | | | | | | |
5.400%, 10/25/11 | | $ | 520,000 | | $ | 393,346 |
6.500%, 06/15/10 | | NZD | 500,000 | | | 256,652 |
8.450%, 06/15/18 | | | 18,665,000 | | | 14,756,941 |
Toll Brothers Finance Corp., 5.150%, 05/15/15 | | | 3,785,000 | | | 2,719,288 |
Travelers Cos., Inc., The, | | | | | | |
6.250%, 06/15/37 | | | 15,435,000 | | | 14,840,305 |
6.375%, 03/15/33 | | | 3,040,000 | | | 2,876,986 |
6.750%, 06/20/36 | | | 2,610,000 | | | 2,717,140 |
White Mountains Insurance Group, Ltd., 6.375%, 03/20/17 (a) | | | 4,555,000 | | | 3,766,794 |
Willis North America, Inc., 6.200%, 03/28/17 | | | 5,685,000 | | | 3,938,483 |
Total Finance | | | | | | 385,181,184 |
Industrial—52.8% | | | | | | |
Abitibi-Consolidated, Inc., 7.500%, 04/01/28 | | | 500,000 | | | 35,000 |
Agilent Technologies, Inc., 6.500%, 11/01/17 | | | 6,945,000 | | | 4,774,014 |
Albertson’s, Inc., | | | | | | |
6.625%, 06/01/28 | | | 1,015,000 | | | 537,950 |
7.450%, 08/01/29 | | | 3,195,000 | | | 1,885,050 |
7.750%, 06/15/26 | | | 915,000 | | | 558,150 |
American President, Ltd., 8.000%, 01/15/24 5 | | | 250,000 | | | 131,980 |
Anadarko Petroleum Corp., | | | | | | |
5.950%, 09/15/16 | | | 4,915,000 | | | 4,341,464 |
6.450%, 09/15/36 | | | 13,875,000 | | | 10,945,072 |
Anheuser-Busch Companies, Inc., | | | | | | |
5.950%, 01/15/33 | | | 6,177,000 | | | 5,129,807 |
6.450%, 09/01/37 | | | 7,900,000 | | | 7,114,424 |
Arrow Electronics, Inc., 6.875%, 07/01/13 | | | 410,000 | | | 370,718 |
AT&T Corp., | | | | | | |
6.150%, 09/15/34 | | | 1,375,000 | | | 1,413,211 |
6.500%, 03/15/29 | | | 7,650,000 | | | 7,409,583 |
6.500%, 09/01/37 | | | 4,970,000 | | | 5,352,640 |
Avnet, Inc., | | | | | | |
2.000%, 03/15/34 | | | 1,425,000 | | | 1,401,844 |
5.875%, 03/15/14 | | | 11,000,000 | | | 9,241,936 |
6.000%, 09/01/15 | | | 5,340,000 | | | 4,089,041 |
6.625%, 09/15/16 | | | 1,370,000 | | | 1,054,531 |
Bell Canada, 5.000%, 02/15/17 (a) | | CAD | 1,000,000 | | | 684,285 |
BellSouth Corp., | | | | | | |
6.000%, 11/15/34 | | | 7,940,000 | | | 7,799,152 |
6.550%, 06/15/34 | | | 1,800,000 | | | 1,825,198 |
Bowater, Inc., 6.500%, 06/15/13 | | | 1,675,000 | | | 167,500 |
Camden Property Trust, 5.700%, 05/15/17 | | | 5,205,000 | | | 2,788,860 |
The accompanying notes are an integral part of these financial statements.
10
Managers Bond Fund
Schedule of Portfolio Investments (continued)
| | | | | | |
Security Description | | Principal Amount | | Value |
Industrial—52.8% (continued) | | | | | | |
Canadian Pacific Railway Co., | | | | | | |
5.750%, 03/15/33 | | $ | 195,000 | | $ | 134,827 |
5.950%, 05/15/37 | | | 9,340,000 | | | 6,586,437 |
Centex Corp., 5.250%, 06/15/15 | | | 1,915,000 | | | 1,187,300 |
Chartered Semiconductor Manufacturing, Ltd., 6.250%, 04/04/13 | | | 5,600,000 | | | 3,548,798 |
Cia Brasileira de Bebida, 8.750%, 09/15/13 | | | 3,795,000 | | | 3,984,750 |
Clear Channel Communications, | | | | | | |
4.250%, 05/15/09 | | | 1,500,000 | | | 1,320,000 |
5.750%, 01/15/13 | | | 500,000 | | | 72,500 |
Colonial Realty, L.P., 6.050%, 09/01/16 | | | 470,000 | | | 273,872 |
Comcast Corp., | | | | | | |
5.650%, 06/15/35 | | | 13,285,000 | | | 11,810,777 |
6.500%, 11/15/35 | | | 1,320,000 | | | 1,313,717 |
6.950%, 08/15/37 | | | 19,230,000 | | | 20,250,190 |
Continental Airlines, Inc., | | | | | | |
5.983%, 04/19/22 | | | 16,735,000 | | | 11,212,450 |
6.795%, 08/02/20 | | | 45,522 | | | 26,858 |
Series B, 6.903%, 04/19/22 | | | 5,595,000 | | | 3,189,150 |
Corn Products International, Inc., 6.625%, 04/15/37 | | | 4,055,000 | | | 3,453,080 |
Corning, Inc., | | | | | | |
6.850%, 03/01/29 | | | 9,142,000 | | | 7,063,411 |
7.250%, 08/15/36 | | | 1,185,000 | | | 954,631 |
CSX Corp., | | | | | | |
6.000%, 10/01/36 | | | 11,635,000 | | | 9,215,339 |
6.250%, 03/15/18 | | | 16,400,000 | | | 15,084,294 |
Cummins Engine Co., Inc., | | | | | | |
5.650%, 03/01/98 | | | 11,235,000 | | | 4,996,272 |
6.750%, 02/15/27 | | | 2,853,000 | | | 2,141,057 |
7.125%, 03/01/28 | | | 50,000 | | | 38,881 |
D.R. Horton, Inc., 5.250%, 02/15/15 | | | 5,495,000 | | | 3,461,850 |
Delta Air Lines, Inc., 8.021%, 08/10/22 | | | 15,300,065 | | | 8,089,909 |
Desarrolladora Homex, S.A. de C.V., 7.500%, 09/28/15 | | | 2,725,000 | | | 1,962,000 |
Dillards, Inc., 7.000%, 12/01/28 | | | 225,000 | | | 73,125 |
DP World, Ltd., 6.850%, 07/02/37 (a) | | | 28,350,000 | | | 14,602,178 |
Duke Energy Field Services LLC, 6.450%, 11/03/36 (a) | | | 2,615,000 | | | 1,899,499 |
Dun & Bradstreet Corp., The, 6.000%, 04/01/13 | | | 32,120,000 | | | 30,338,850 |
El Paso Corp., | | | | | | |
6.950%, 06/01/28 | | | 1,030,000 | | | 622,643 |
7.000%, 05/15/11 | | | 500,000 | | | 454,892 |
Energy Transfer Partners, L.P., | | | | | | |
6.125%, 02/15/17 | | | 700,000 | | | 578,079 |
6.625%, 10/15/36 | | | 1,805,000 | | | 1,263,413 |
The accompanying notes are an integral part of these financial statements.
11
Managers Bond Fund
Schedule of Portfolio Investments (continued)
| | | | | | | |
Security Description | | Principal Amount | | | Value |
Industrial—52.8% (continued) | | | | | | | |
Enterprise Products Operating L.P., 6.300%, 09/15/17 | | $ | 8,440,000 | | | $ | 7,143,346 |
Equifax, Inc., 7.000%, 07/01/37 | | | 5,470,000 | | | | 3,422,502 |
Equitable Resources, Inc., 6.500%, 04/01/18 | | | 35,420,000 | | | | 33,084,547 |
Eurofima, 11.000%, 02/05/10 | | ISK | 60,000,000 | | | | 490,830 |
Federated Retail Holdings, Inc., 6.375%, 03/15/37 | | | 14,065,000 | | | | 7,920,086 |
Foot Locker, Inc., 8.500%, 01/15/22 | | | 570,000 | | | | 433,200 |
Ford Motor Co., 6.375%, 02/01/29 | | | 1,990,000 | | | | 437,800 |
Freescale Semiconductor, Inc., 10.125%, 12/15/16 | | | 1,275,000 | 2 | | | 522,750 |
General Motors Corp., | | | | | | | |
7.400%, 09/01/25 | | | 570,000 | | | | 94,050 |
8.250%, 07/15/23 | | | 3,535,000 | 2 | | | 583,275 |
8.375%, 07/15/33 | | | 135,000 | | | | 23,625 |
Georgia-Pacific Corp., | | | | | | | |
7.250%, 06/01/28 | | | 1,245,000 | | | | 759,450 |
7.750%, 11/15/29 | | | 1,615,000 | | | | 1,017,450 |
8.000%, 01/15/24 | | | 1,695,000 | | | | 1,144,125 |
8.875%, 05/15/31 | | | 2,750,000 | | | | 1,897,500 |
GTE Corp., 6.940%, 04/15/28 | | | 130,000 | | | | 120,298 |
HCA, Inc., | | | | | | | |
5.750%, 03/15/14 | | | 5,960,000 | | | | 3,605,800 |
6.250%, 02/15/13 | | | 2,200,000 | | | | 1,375,000 |
6.375%, 01/15/15 | | | 2,330,000 | | | | 1,421,300 |
6.625%, 02/15/16 | | | 6,850,000 | | | | 4,212,750 |
6.750%, 07/15/13 | | | 190,000 | | | | 119,700 |
7.050%, 12/01/27 | | | 1,685,000 | | | | 712,401 |
7.190%, 11/15/15 | | | 1,090,000 | | | | 603,732 |
7.500%, 11/06/33 | | | 925,000 | | | | 430,125 |
7.500%, 12/15/23 | | | 1,172,000 | | | | 550,431 |
7.580%, 09/15/25 | | | 1,680,000 | | | | 776,061 |
7.690%, 06/15/25 | | | 2,589,000 | | | | 1,215,411 |
7.750%, 07/15/36 | | | 330,000 | | | | 146,318 |
8.360%, 04/15/24 | | | 2,105,000 | | | | 1,077,408 |
Home Depot, Inc., | | | | | | | |
5.400%, 03/01/16 | | | 330,000 | | | | 295,324 |
5.875%, 12/16/36 | | | 19,772,000 | | | | 15,503,265 |
Hospira, Inc., 6.050%, 03/30/17 | | | 3,395,000 | | | | 2,757,480 |
Hutchison Whampoa International, Ltd., 5.450%, 11/24/10 (a) | | | 2,225,000 | | | | 2,242,088 |
International Paper Co., | | | | | | | |
4.000%, 04/01/10 | | | 1,000,000 | | | | 962,308 |
4.250%, 01/15/09 | | | 1,000,000 | | | | 999,655 |
5.500%, 01/15/14 | | | 550,000 | | | | 411,199 |
7.950%, 06/15/18 | | | 48,010,000 | | | | 37,945,184 |
The accompanying notes are an integral part of these financial statements.
12
Managers Bond Fund
Schedule of Portfolio Investments (continued)
| | | | | | |
Security Description | | Principal Amount | | Value |
Industrial—52.8% (continued) | | | | | | |
Intuit, Inc., 5.750%, 03/15/17 | | $ | 3,560,000 | | $ | 2,632,609 |
J.C. Penney Co., Inc., | | | | | | |
5.750%, 02/15/18 | | | 4,660,000 | | | 3,093,322 |
6.375%, 10/15/36 | | | 12,955,000 | | | 7,841,636 |
7.125%, 11/15/23 | | | 18,000 | | | 12,675 |
7.400%, 04/01/37 | | | 4,205,000 | | | 2,768,522 |
7.625%, 03/01/97 | | | 5,035,000 | | | 3,322,909 |
Johnson & Johnson, 5.950%, 08/15/37 | | | 15,020,000 | | | 18,337,152 |
Kellwood Co., 7.625%, 10/15/17 5 | | | 250,000 | | | 22,500 |
Kinder Morgan Energy Partners L.P., | | | | | | |
5.800%, 03/15/35 | | | 3,360,000 | | | 2,339,222 |
5.950%, 02/15/18 | | | 44,630,000 | | | 38,090,142 |
KLA Instruments Corp., 6.900%, 05/01/18 | | | 24,365,000 | | | 18,428,005 |
Koninklijke KPN, N.V., 8.375%, 10/01/30 | | | 815,000 | | | 920,535 |
Koninklijke Philips Electronics, N.V., 6.875%, 03/11/38 | | | 22,735,000 | | | 21,579,380 |
Kraft Foods, Inc., | | | | | | |
6.500%, 08/11/17 | | | 8,950,000 | | | 8,996,021 |
6.500%, 11/01/31 | | | 13,635,000 | | | 13,086,409 |
7.000%, 08/11/37 | | | 7,280,000 | | | 7,387,948 |
Kroger Co., The, 6.400%, 08/15/17 | | | 3,060,000 | | | 3,085,897 |
Lennar Corp., | | | | | | |
5.500%, 09/01/14 | | | 1,900,000 | | | 1,197,000 |
5.600%, 05/31/15 | | | 2,740,000 | | | 1,671,400 |
6.500%, 04/15/16 | | | 2,340,000 | | | 1,427,400 |
Lowe’s Companies, Inc., | | | | | | |
5.500%, 10/15/35 | | | 175,000 | | | 141,102 |
6.650%, 09/15/37 | | | 6,420,000 | | | 6,119,897 |
6.875%, 02/15/28 | | | 500,000 | | | 489,751 |
Lubrizol Corp., 6.500%, 10/01/34 | | | 16,940,000 | | | 13,746,844 |
Lucent Technologies, Inc., | | | | | | |
6.450%, 03/15/29 | | | 4,335,000 | | | 1,734,000 |
6.500%, 01/15/28 | | | 305,000 | | | 118,950 |
Macy’s Retail Holdings, Inc., | | | | | | |
6.790%, 07/15/27 | | | 3,600,000 | | | 1,954,685 |
6.900%, 04/01/29 | | | 340,000 | | | 185,501 |
Marks & Spencer Group PLC, 7.125%, 12/01/37 (a) | | | 4,725,000 | | | 2,243,071 |
Masco Corp., 5.850%, 03/15/17 | | | 8,150,000 | | | 5,271,795 |
Medco Health Solutions, Inc., 7.125%, 03/15/18 | | | 33,040,000 | | | 30,532,066 |
Missouri Pacific Railroad Co., 5.000%, 01/01/45 5 | | | 825,000 | | | 387,750 |
Motorola, Inc., | | | | | | |
5.220%, 10/01/97 | | | 895,000 | | | 297,601 |
6.500%, 09/01/25 | | | 1,345,000 | | | 665,704 |
The accompanying notes are an integral part of these financial statements.
13
Managers Bond Fund
Schedule of Portfolio Investments (continued)
| | | | | | | |
Security Description | | Principal Amount | | | Value |
Industrial—52.8% (continued) | | | | | | | |
Motorola Inc. (continued) | | | | | | | |
6.500%, 11/15/28 | | $ | 1,430,000 | | | $ | 631,737 |
6.625%, 11/15/37 | | | 1,890,000 | | | | 888,300 |
8.000%, 11/01/11 | | | 1,075,000 | | | | 897,057 |
New England Telephone & Telegraph Co., 7.875%, 11/15/29 | | | 2,390,000 | | | | 2,100,674 |
Newmont Mining Corp., 5.875%, 04/01/35 | | | 11,660,000 | | | | 7,171,320 |
News America, Inc., | | | | | | | |
6.150%, 03/01/37 | | | 4,075,000 | | | | 3,802,089 |
6.200%, 12/15/34 | | | 3,440,000 | | | | 3,139,162 |
6.400%, 12/15/35 | | | 5,820,000 | | | | 5,379,182 |
Nextel Communications, Inc., | | | | | | | |
5.950%, 03/15/14 | | | 18,220,000 | | | | 7,652,400 |
6.875%, 10/31/13 | | | 20,000 | | | | 8,500 |
7.375%, 08/01/15 | | | 3,775,000 | | | | 1,585,500 |
NGPL Pipeco LLC, 7.119%, 12/15/17 (a) | | | 21,980,000 | | | | 19,786,264 |
Northwest Airlines, Inc., 8.028%, 11/01/17 | | | 9,330,000 | 2 | | | 4,105,200 |
ONEOK Partners, L.P., 6.650%, 10/01/36 | | | 2,650,000 | | | | 2,053,286 |
Owens & Minor, Inc., 6.350%, 04/15/16 5 | | | 1,355,000 | | | | 1,141,826 |
Owens Corning, Inc., | | | | | | | |
6.500%, 12/01/16 | | | 2,655,000 | | | | 1,922,770 |
7.000%, 12/01/36 | | | 4,990,000 | | | | 3,272,148 |
Panhandle Eastern Pipe Line Co., L.P., | | | | | | | |
6.200%, 11/01/17 | | | 5,520,000 | | | | 4,241,176 |
7.000%, 06/15/18 | | | 26,505,000 | | | | 21,164,428 |
PF Export Receivables Master Trust, 6.436%, 06/01/15 (a) | | | 524,509 | | | | 529,754 |
Plains All American Pipeline L.P., | | | | | | | |
6.125%, 01/15/17 | | | 2,770,000 | | | | 2,202,679 |
6.500%, 05/01/18 | | | 8,975,000 | | | | 7,157,545 |
6.650%, 01/15/37 | | | 5,960,000 | | | | 4,100,897 |
PPG Industries, Inc., 6.650%, 03/15/18 | | | 34,640,000 | | | | 34,122,340 |
Pulte Homes, Inc., | | | | | | | |
6.000%, 02/15/35 | | | 10,320,000 | | | | 5,263,200 |
6.375%, 05/15/33 | | | 4,670,000 | | | | 2,475,100 |
Series $, 5.200%, 02/15/15 | | | 3,165,000 | | | | 2,152,200 |
Qantas Airways, Ltd., 6.050%, 04/15/16 (a) | | | 11,800,000 | | | | 10,791,419 |
Questar Market Resources, Inc., 6.800%, 04/01/18 | | | 27,465,000 | | | | 26,427,070 |
Qwest Capital Funding, Inc., | | | | | | | |
6.500%, 11/15/18 | | | 620,000 | | | | 406,100 |
7.625%, 08/03/21 | | | 2,135,000 | | | | 1,419,775 |
Qwest Corp., | | | | | | | |
6.500%, 06/01/17 | | | 155,000 | | | | 114,700 |
6.875%, 09/15/33 | | | 7,209,000 | | | | 4,289,355 |
The accompanying notes are an integral part of these financial statements.
14
Managers Bond Fund
Schedule of Portfolio Investments (continued)
| | | | | | |
Security Description | | Principal Amount | | Value |
Industrial—52.8% (continued) | | | | | | |
Qwest Corp. (continued) | | | | | | |
7.200%, 11/10/26 | | $ | 435,000 | | $ | 280,575 |
7.250%, 09/15/25 | | | 1,085,000 | | | 726,950 |
7.250%, 10/15/35 | | | 2,165,000 | | | 1,353,125 |
7.500%, 06/15/23 | | | 839,000 | | | 587,300 |
R.H. Donnelley Corp., Series A-1, 6.875%, 01/15/13 | | | 1,345,000 | | | 181,575 |
R.H. Donnelley Corp., Series A-2, 6.875%, 01/15/13 | | | 1,060,000 | | | 143,100 |
R.H. Donnelley Corp., | | | | | | |
6.875%, 01/15/13 | | | 430,000 | | | 58,050 |
8.875%, 01/15/16 | | | 1,535,000 | | | 230,250 |
8.875%, 10/15/17 | | | 245,000 | | | 36,750 |
Raytheon Co., | | | | | | |
7.000%, 11/01/28 | | | 1,500,000 | | | 1,712,798 |
7.200%, 08/15/27 | | | 800,000 | | | 922,541 |
Reynolds American, Inc., | | | | | | |
6.750%, 06/15/17 | | | 8,170,000 | | | 6,485,232 |
7.250%, 06/15/37 | | | 2,000,000 | | | 1,346,738 |
Samsung Electronics Co., Ltd., 7.700%, 10/01/27 (a) | | | 4,180,000 | | | 4,362,963 |
Simon Property Group, L.P., 5.750%, 12/01/15 | | | 445,000 | | | 290,671 |
Southern Natural Gas Co., 5.900%, 04/01/17 (a) | | | 4,765,000 | | | 3,776,062 |
Sprint Capital Corp., | | | | | | |
6.000%, 12/01/16 | | | 48,000 | | | 33,840 |
6.875%, 11/15/28 | | | 27,000 | | | 16,065 |
Talisman Energy, Inc., | | | | | | |
5.850%, 02/01/37 | | | 3,674,000 | | | 2,555,583 |
6.250%, 02/01/38 | | | 3,635,000 | | | 2,639,344 |
Target Corp., | | | | | | |
6.500%, 10/15/37 | | | 1,381,000 | | | 1,185,825 |
7.000%, 01/15/38 | | | 25,054,000 | | | 23,219,922 |
Teck Cominco Ltd., 7.000%, 09/15/12 | | | 1,000,000 | | | 522,880 |
Telecom Italia Capital S.p.A., | | | | | | |
6.000%, 09/30/34 | | | 3,210,000 | | | 2,214,900 |
6.375%, 11/15/33 | | | 3,170,000 | | | 2,219,000 |
Telekom Malaysia Berhad, 7.875%, 08/01/25 (a) | | | 250,000 | | | 251,774 |
TELUS Corp., 4.950%, 03/15/17 | | CAD | 7,115,000 | | | 5,003,900 |
Tennessee Gas Pipeline Co., 7.000%, 10/15/28 | | | 1,605,000 | | | 1,228,043 |
Texas Eastern Transmission, L.P., 6.000%, 09/15/17 (a) | | | 3,000,000 | | | 2,616,948 |
Time Warner, Inc., 6.500%, 11/15/36 | | | 3,360,000 | | | 3,046,132 |
Toro Co., The, 6.625%, 05/01/37 5 | | | 6,810,000 | | | 5,341,968 |
Transocean, Inc., 7.375%, 04/15/18 | | | 500,000 | | | 483,922 |
The accompanying notes are an integral part of these financial statements.
15
Managers Bond Fund
Schedule of Portfolio Investments (continued)
| | | | | | |
Security Description | | Principal Amount | | Value |
Industrial—52.8% (continued) | | | | | | |
U.S. Steel Corp., | | | | | | |
6.050%, 06/01/17 | | $ | 2,115,000 | | $ | 1,382,825 |
6.650%, 06/01/37 | | | 3,595,000 | | | 1,834,676 |
7.000%, 02/01/18 | | | 22,850,000 | | | 15,573,189 |
Union Pacific Corp., 5.375%, 06/01/33 | | | 2,525,000 | | | 2,016,364 |
United Airlines, Inc., 6.636%, 07/02/22 | | | 17,735,189 | | | 10,995,817 |
UnitedHealth Group, Inc., | | | | | | |
5.800%, 03/15/36 | | | 13,506,000 | | | 10,290,100 |
6.500%, 06/15/37 | | | 310,000 | | | 260,199 |
6.625%, 11/15/37 | | | 1,540,000 | | | 1,298,126 |
USG Corp., 6.300%, 11/15/16 | | | 1,410,000 | | | 863,625 |
V.F. Corp., 6.450%, 11/01/37 | | | 9,334,000 | | | 7,343,207 |
Vale Overseas Ltd., 6.875%, 11/01/36 | | | 3,665,000 | | | 3,326,720 |
Verizon Global Funding Corp., 5.850%, 09/15/35 | | | 8,900,000 | | | 8,855,055 |
Verizon Maryland, Inc., 5.125%, 06/15/33 | | | 1,055,000 | | | 768,063 |
Verizon New England, Inc., 6.500%, 09/15/11 | | | 850,000 | | | 843,775 |
Verizon New York, Inc., Series B, 7.375%, 04/01/32 | | | 3,090,000 | | | 2,581,046 |
Viacom, Inc., 6.875%, 04/30/36 | | | 4,160,000 | | | 3,287,552 |
Vodafone Group PLC, 6.150%, 02/27/37 | | | 13,185,000 | | | 13,032,476 |
Watson Pharmaceuticals, Inc., Convertible 1.750%, 03/15/23 | | | 515,000 | | | 478,950 |
Weatherford International, Inc., 6.500%, 08/01/36 | | | 1,565,000 | | | 1,174,788 |
Wellpoint, Inc., 6.375%, 06/15/37 | | | 13,650,000 | | | 12,681,696 |
Western Union Co., 6.200%, 11/17/36 | | | 12,735,000 | | | 9,867,906 |
Weyerhaeuser Co., 6.875%, 12/15/33 | | | 12,890,000 | | | 8,560,185 |
White Pine Hydro LLC, | | | | | | |
6.310%, 07/10/17 (a) 5 | | | 1,700,000 | | | 1,551,451 |
6.960%, 07/10/37 (a) 5 | | | 1,645,000 | | | 1,569,402 |
Williams Co., Inc., Series A, 7.500%, 01/15/31 | | | 1,000,000 | | | 670,000 |
XTO Energy, Inc., | | | | | | |
6.100%, 04/01/36 | | | 190,000 | | | 157,766 |
6.750%, 08/01/37 | | | 2,770,000 | | | 2,594,282 |
Total Industrial | | | | | | 998,172,734 |
Utility—10.3% | | | | | | |
Abu Dhabi National Energy Co. PJSC, 7.250%, 08/01/18 (a) | | | 21,130,000 | | | 18,123,032 |
Ameren Energy Generating Co., 7.000%, 04/15/18 | | | 22,700,000 | | | 20,881,571 |
Baltimore Gas & Electric Co., 5.200%, 06/15/33 | | | 1,470,000 | | | 1,038,643 |
Bruce Mansfield Unit 1 2, 6.850%, 06/01/34 5 | | | 10,805,000 | | | 9,212,106 |
Cleveland Electric Illuminating Co., The, 5.950%, 12/15/36 | | | 15,645,000 | | | 12,101,298 |
Commonwealth Edison Co., | | | | | | |
4.700%, 04/15/15 | | | 1,465,000 | | | 1,313,274 |
5.875%, 02/01/33 | | | 5,000,000 | | | 4,179,225 |
Constellation Energy Group, Inc., 4.550%, 06/15/15 | | | 1,675,000 | | | 1,272,069 |
The accompanying notes are an integral part of these financial statements.
16
Managers Bond Fund
Schedule of Portfolio Investments (continued)
| | | | | | | |
Security Description | | Principal Amount | | | Value |
Utility—10.3% (continued) | | | | | | | |
Dominion Resources, Inc., 5.950%, 06/15/35 | | $ | 740,000 | | | $ | 632,283 |
Empresa Nacional de Electricidad, Yankee, 7.875%, 02/01/27 | | | 2,900,000 | | | | 3,105,975 |
Enersis SA, Yankee, 7.400%, 12/01/16 | | | 225,000 | | | | 226,310 |
Illinois Power Co., 6.250%, 04/01/18 | | | 26,000,000 | | | | 23,220,574 |
ITC Holdings Corp., | | | | | | | |
5.875%, 09/30/16 (a) | | | 2,410,000 | | | | 2,298,198 |
6.375%, 09/30/36 (a) | | | 3,605,000 | | | | 3,294,819 |
Mackinaw Power LLC, 6.296%, 10/31/23 (a) | | | 9,647,621 | | | | 7,877,379 |
Methanex Corp., 6.000%, 08/15/15 | | | 3,825,000 | | | | 2,510,137 |
MidAmerican Energy Holdings Co., | | | | | | | |
5.875%, 10/01/12 | | | 750,000 | | | | 748,134 |
6.125%, 04/01/36 | | | 2,305,000 | | | | 2,143,286 |
6.500%, 09/15/37 | | | 6,450,000 | | | | 6,296,135 |
NiSource Finance Corp., | | | | | | | |
6.150%, 03/01/13 | | | 1,250,000 | | | | 963,176 |
6.400%, 03/15/18 | | | 27,910,000 | | | | 17,417,989 |
6.800%, 01/15/19 | | | 11,625,000 | | | | 7,309,254 |
ONEOK, Inc., 6.000%, 06/15/35 | | | 9,210,000 | | | | 6,311,549 |
Southwestern Electric Power Co., 6.450%, 1/15/19 | | | 39,195,000 | | | | 38,347,407 |
Tenaga Nasional Berhad, 7.500%, 11/01/25 (a) | | | 2,000,000 | | | | 1,894,502 |
Toledo Edison Co., 6.150%, 05/15/37 | | | 2,390,000 | | | | 1,922,043 |
Total Utility | | | | | | | 194,640,368 |
Total Corporate Bonds (cost $1,976,885,126) | | | | | | | 1,577,994,286 |
Foreign Government Obligations—5.0% | | | | | | | |
Alberta, Province of, Series CS, Sinking Fund, 5.930%, 09/16/16 | | CAD | 153,637 | | | | 138,636 |
Brazil, Republic of, | | | | | | | |
10.250%, 01/10/28 | | BRL | 5,750,000 | | | | 2,219,125 |
12.500%, 01/05/22 | | BRL | 5,160,000 | 2 | | | 2,290,137 |
Canadian Government, | | | | | | | |
2.750%, 12/01/10 | | CAD | 7,940,000 | 2 | | | 6,631,138 |
3.750%, 09/01/11 | | CAD | 4,160,000 | | | | 3,581,543 |
3.750%, 06/01/12 | | CAD | 12,235,000 | | | | 10,642,320 |
5.250%, 06/01/12 | | CAD | 7,870,000 | | | | 7,162,497 |
5.750%, 06/01/33 | | CAD | 2,145,000 | | | | 2,363,861 |
European Investment Bank, | | | | | | | |
4.600%, 01/30/37 (a) | | CAD | 7,270,000 | | | | 5,837,907 |
4.827%, 03/10/21 4 | | AUD | 5,000,000 | | | | 1,948,808 |
7.000%, 01/18/12 | | NZD | 4,746,000 | | | | 2,981,111 |
11.250%, 02/14/13 | | BRL | 13,490,000 | 2 | | | 6,073,971 |
17.938%, 04/24/13 (a) 4, 5 | | IDR | 50,074,770,000 | | | | 2,189,508 |
The accompanying notes are an integral part of these financial statements.
17
Managers Bond Fund
Schedule of Portfolio Investments (continued)
| | | | | | |
Security Description | | Principal Amount | | Value |
Foreign Government Obligations—5.0% (continued) | | | | | | |
Inter-American Development Bank, | | | | | | |
6.000%, 12/15/17 | | NZD | 4,215,000 | | $ | 2,684,002 |
13.867%, 05/20/13 4 | | IDR | 45,580,000,000 | | | 2,322,489 |
24.993%, 05/11/09 4 | | BRL | 6,500,000 | | | 2,543,418 |
Series EmTN, 13.694%, 09/23/13 4 | | IDR | 33,430,000,000 | | | 1,639,603 |
International Bank for Reconstruction & Development, 9.500%, 05/27/10 | | ISK | 179,000,000 | | | 1,416,925 |
Mexican Fixed Rate Bonds, 8.000%, 12/07/23 | | MXN | 141,360,000 | | | 9,989,161 |
Mexican Government, 9.000%, 12/20/12 | | MXN | 54,500,000 | | | 4,117,262 |
New South Wales Treasury Corp., Series 10RG, 7.000%, 12/01/10 | | AUD | 10,320,000 | | | 7,582,827 |
Province of Manitoba Canada, 6.360%, 09/01/15 | | NZD | 5,000,000 | | | 3,094,228 |
Queensland Treasury Corp., 7.125%, 09/18/17 (a) | | NZD | 7,500,000 | | | 5,154,183 |
Total Foreign Government Obligations (cost $110,076,177) | | | | | | 94,604,660 |
Municipal Bonds—1.7% | | | | | | |
Alabama Public School & College Authority, Capital Improvement Bond, 4.500%, 12/01/26 | | $ | 600,000 | | | 538,920 |
Buckeye Tobacco Settlement Financing Authority, Asset-A-2, 5.875%, 06/01/47 5 | | | 5,035,000 | | | 2,733,552 |
Chicago Illinois Board of Education, Dedicated-Series B, 4.750%, 12/01/31 | | | 1,040,000 | | | 909,033 |
Chicago Illinois O’Hare International Airport Revenue Bond, Series A, 4.500%, 01/01/38 | | | 315,000 | | | 244,720 |
District of Columbia, Series A, 4.750%, 06/01/36 | | | 600,000 | | | 498,192 |
Florida State Turnpike Authority, Revenue Bond, Department of Transportation, Series A, 3.500%, 07/01/27 | | | 600,000 | | | 433,482 |
Green Bay Wisconsin, Water System Revenue Refunding Bonds, 3.500%, 11/01/26 (FSA Insured) | | | 410,000 | | | 317,492 |
Green Bay Wisconsin, Water System Revenue Refunding Bonds, 3.500%, 11/01/29 (FSA Insured) | | | 445,000 | | | 327,507 |
Grosse Pointe Michigan Public School System, 3.000%, 05/01/27 | | | 365,000 | | | 254,379 |
Harris County Texas, Road Bonds, Series B, 4.500%, 10/01/31 | | | 1,715,000 | | | 1,536,657 |
JEA Florida Water & Sewer System Revenue Bond, Series B, 4.750%, 10/01/41 | | | 955,000 | | | 788,142 |
Louisiana State, Series C, 3.250%, 05/01/26 (FSA Insured) | | | 605,000 | | | 425,817 |
Massachusetts State School Building Authority, Dedicated Sales Tax Revenue Bond, Series A, 4.750%, 08/15/32 | | | 600,000 | | | 524,388 |
Michigan Tobacco Settlement Financial Authority Series A, 7.309%, 06/01/34 5 | | | 3,135,000 | | | 1,819,115 |
Omaha Public Power District (Nebraska), Electric System Subordinated Revenue Bonds, Series AA, 4.500%, 02/01/34 | | | 1,505,000 | | | 1,264,125 |
San Diego California Unified School District, Refunding Bonds, Election 1998, Series F-1, 4.500%, 07/01/29 | | | 630,000 | | | 534,064 |
San Jose California Redevelopment Agency Tax Allocation, Series C, 3.750%, 08/01/28 | | | 765,000 | | | 463,054 |
San Jose Redevelopment Agency, 3.750%, 08/01/28 | | | 280,000 | | | 178,489 |
State of California, 4.500%, 08/01/27 (AMBAC Insured) | | | 950,000 | | | 783,132 |
State of California, 4.500%, 08/01/30 (AMBAC Insured) | | | 770,000 | | | 613,775 |
State of California, 4.500%, 08/01/30 | | | 665,000 | | | 530,078 |
State of California, 4.500%, 10/01/29 | | | 2,655,000 | | | 2,144,205 |
State of California, Variable Purpose Bond, 3.250%, 12/01/27 | | | 495,000 | | | 323,275 |
State of California, Variable Purpose Bond, 4.500%, 12/01/33 | | | 2,330,000 | | | 1,795,778 |
The accompanying notes are an integral part of these financial statements.
18
Managers Bond Fund
Schedule of Portfolio Investments (continued)
| | | | | | |
Security Description | | Principal Amount | | Value |
Municipal Bonds—1.7% (continued) | | | | | | |
Tobacco Settlement Financing Corp., Virginia, 6.706%, 06/01/46 5 | | $ | 22,190,000 | | $ | 12,132,603 |
University of California Regents Medical Center, Series A, 4.750%, 05/15/31 | | | 165,000 | | | 142,339 |
Wisconsin Housing & Economic Development Authority, Revenue Bonds, Series E, 4.900%, 11/01/35 | | | 155,000 | | | 122,134 |
Total Municipal Bonds (cost $47,158,084) | | | | | | 32,378,447 |
Asset-Backed Securities—3.4% | | | | | | |
ARG Funding Corp., Series 2005-2A, Class A5, 2.639%, 05/20/11 (01/20/09) (a) 6 | | | 14,830,000 | | | 12,489,773 |
Capital One Auto Finance Trust 2006-C A4, 2.746%, 05/15/13 (01/15/09) 6 | | | 14,765,000 | | | 10,234,998 |
Citibank Credit Card Issuance Trust, Series 2008-C6, Class C6, 6.300%, 06/20/14 | | | 15,450,000 | | | 10,086,679 |
Chase Issuance Trust, Series 2007-B1, Class B1, 2.721%, 04/15/19 (01/15/09) 6 | | | 17,040,000 | | | 5,259,212 |
Chase Issuance Trust, Series 2005-C1, Class C1, 2.828%, 11/15/12 (01/15/09) 6 | | | 1,175,000 | | | 941,794 |
CIT Equipment Collateral, Series 2008-VT1, Class A3, 6.590%, 12/22/14 | | | 7,270,000 | | | 6,943,461 |
Community Program Loan Trust, Series 87-A, Class A4, 4.500%, 10/01/18 | | | 95,738 | | | 95,915 |
Community Program Loan Trust, Series 87-A, Class A5, 4.500%, 04/01/29 | | | 3,225,000 | | | 2,987,227 |
MBNA Credit Card Master Note Trust, Series 2002-C1, Class C1, 6.800%, 07/15/14 | | | 6,911,000 | | | 3,660,734 |
MBNA Credit Card Master Note Trust, Series 2005-B2, Class B, 2.694%, 12/17/12 (01/15/09) 6 | | | 10,405,000 | | | 8,566,696 |
Merrill Auto Trust Securitization, Series 2008-1, Class B, 6.750%, 04/15/15 | | | 4,035,000 | | | 3,352,932 |
Total Asset-Backed Securities (cost $87,102,473) | | | | | | 64,619,421 |
U.S. Government Agency Obligations—0.4% | | | | | | |
Federal Home Loan Mortgage Corporation—0.0%# | | | | | | |
FHLMC, Gold, 5.000%, 12/01/31 | | | 178,514 | | | 183,217 |
Federal National Mortgage Association—0.4% | | | | | | |
FNMA, 4.000%, 10/01/18 | | | 3,701,690 | | | 3,798,198 |
FNMA, 4.000%, 10/01/18 | | | 3,519,961 | | | 3,611,731 |
FNMA, 6.000%, 07/01/29 | | | 16,692 | | | 17,301 |
Total Federal National Mortgage Association | | | | | | 7,427,230 |
Total U.S. Government Agency Obligations (cost $7,261,374) | | | | | | 7,610,447 |
Mortgage-Backed Securities—0.3% | | | | | | |
Bank of America-First Union, Series 2001, 5.464%, 04/11/37 | | | 1,500,000 | | | 1,427,649 |
Credit Suisse Mortgage Capital, Series 2007-C5, Class A4, 5.695%, 09/15/40 7 | | | 1,704,000 | | | 1,127,079 |
CS First Boston Mortgage Securities Corp., Series 2005-7, Class 3A1, 5.000%, 08/25/20 | | | 2,693,896 | | | 2,091,136 |
JPMorgan Chase Commercial Mortgage, Series 2007-LD11, Class A4, 5.819%, 06/15/49 7 | | | 305,000 | | | 215,399 |
Total Mortgage-Backed Securities (cost $5,097,748) | | | | | | 4,861,263 |
| | |
| | | Shares | | |
Preferred Stocks—0.8% | | | | | | |
Bank of America Corp., Series L, 7.250% | | | 7,808 | | | 5,075,200 |
CIT Group, Inc., The, Series C, 8.750% | | | 2,500 | | | 72,150 |
Comcast Corp. Series B, 7.000% | | | 207,547 | | | 4,566,034 |
Entergy New Orleans, Inc., 4.750% | | | 482 | | | 40,488 |
Entergy New Orleans, Inc., 5.560% | | | 100 | | | 9,831 |
FHLMC, Series F, 5.000%* | | | 15,400 | | | 8,316 |
FHLMC, Series K, 5.790%* | | | 45,200 | | | 33,448 |
FHLMC, Series O, 5.810%* | | | 15,850 | | | 8,718 |
The accompanying notes are an integral part of these financial statements.
19
Managers Bond Fund
Schedule of Portfolio Investments (continued)
| | | | | | |
Security Description | | Shares | | | Value |
Preferred Stocks—0.8% (continued) | | | | | | |
FHLMC, Series P, 6.000%* | | 19,800 | | | $ | 12,870 |
FHLMC, Series R, 5.700%* | | 24,500 | | | | 12,985 |
FHLMC, Series T, 6.420%* | | 14,300 | | | | 8,580 |
FHLMC, Series U, 5.900%* | | 35,100 | | | | 10,881 |
FHLMC, Series V, 5.570%* | | 307,950 | | | | 92,385 |
FHLMC, Series W, 5.660%* | | 70,700 | | | | 35,350 |
FHLMC, Series Y, 6.550%* | | 67,825 | | | | 19,669 |
FHLMC, Series Z, 8.375%* | | 605,747 | 2 | | | 236,241 |
FNMA, Series H, 5.810%* | | 9,050 | | | | 11,041 |
FNMA, Series I, 5.375%* | | 21,500 | | | | 24,725 |
FNMA, Series L, 5.125%* | | 28,100 | | | | 28,100 |
FNMA, Series M, 4.750%* | | 30,700 | | | | 31,621 |
FNMA, Series Q, 6.750%* | | 13,950 | | | | 9,068 |
FNMA, Series S, 8.250%* | | 1,125,850 | 2 | | | 934,456 |
Lehman Brothers Holdings Capital Trust V, Series M, 6.000% | | 7,550 | | | | 38 |
Lehman Brothers Holdings, Inc. 7.950% 8 | | 67,204 | | | | 101 |
Lehman Brothers Holdings, Inc., 5.670% 8 | | 14,058 | | | | 56 |
Lehman Brothers Holdings, Inc., 6.500% 8 | | 65,312 | | | | 98 |
Lehman Brothers Holdings, Inc., Series C, 5.940% 8 | | 14,887 | | | | 1 |
Lehman Brothers Holdings, Inc., Series P, 7.250% 8 | | 7,180 | | | | 3,590 |
Merrill Lynch & Co., Inc., Series 3, 6.375% | | 20,000 | | | | 298,600 |
Newell Financial Trust I, 5.250% | | 90,628 | | | | 2,356,328 |
Preferred Blocker, Inc., 9.000% | | 1,283 | | | | 320,750 |
SLM Corp., 6.000% | | 41,250 | | | | 429,000 |
Sovereign Capital Trust IV, 4.375% | | 34,236 | | | | 648,344 |
Wisconsin Electric Power Co., 3.600% | | 3,946 | | | | 228,868 |
Total Preferred Stocks (cost $77,483,026) | | | | | | 15,567,931 |
Other Investment Companies—3.3%1 | | | | | | |
BNY Institutional Cash Reserves Fund, Series A, 0.07%3 | | 6,219,011 | | | | 6,219,011 |
BNY Institutional Cash Reserves Fund, Series B*3.9 | | 1,652,054 | | | | 148,685 |
BNY Institutional Cash Reserves Fund, Series C*3,10 | | 1,219,810 | | | | 1,219,810 |
Dreyfus Cash Management Fund, Institutional Class Shares, 1.53%11 | | 37,495,453 | | | | 37,495,453 |
JPMorgan Liquid Assets Money Market Fund, Capital Shares, 2.02%11 | | 16,044,481 | | | | 16,044,481 |
Total Other Investment Companies (cost $62,630,809) | | | | | | 61,127,440 |
Total Investments—98.4% (cost $2,373,694,817) | | | | | | 1,858,763,895 |
Other Assets, less Liabilities—1.6% | | | | | | 30,155,261 |
Net Assets—100.0% | | | | | $ | 1,888,919,156 |
The accompanying notes are an integral part of these financial statements.
20
Notes to Schedule of Portfolio Investments
The following footnotes and abbreviations should be read in conjunction with the Schedule of Portfolio Investments.
Based on the cost of investments of $2,374,172,585 for Federal income tax purposes at December 31, 2008, the aggregate gross unrealized appreciation and depreciation were $15,466,444 and $530,875,134, respectively, resulting in a net unrealized depreciation of investments of $515,408,690.
| * | Non-income producing security. |
(a) | Security exempt from registration under Rule 144A of the Securities Act of 1933. This security may be resold in transactions exempt from registration, normally to qualified buyers. At December 31, 2008, the value of these securities amounted to $195,264,655 or 10.3% of net assets. |
1 | Yield shown for an investment company represents the December 31, 2008, seven-day average yield, which refers to the sum of the previous seven days’ dividends paid, expressed as an annual percentage. |
2 | Some or all of these shares were out on loan to various brokers as of December 31, 2008, amounting to $7,475,809 or 0.4% of net assets. |
3 | Collateral received from brokers for securities lending was invested in these short-term investments. |
4 | Represents yield to maturity at December 31, 2008. |
5 | Security is illiquid: A security not readily convertible into cash such as a stock, bond or commodity that is not actively traded, and would be difficult to sell in a current sale. The Fund may not invest more than 15% of its net assets in illiquid securities. All securities are valued by an independent pricing agent or broker. Illiquid securities at December 31, 2008 amounted to $38,233,761 or 2.02% of net assets. |
6 | Floating Rate Security. The rate listed is as of December 31, 2008. Date in parentheses represents the security’s next coupon rate reset. |
7 | Variable Rate Security. The rate listed is as of December 31, 2008 and is periodically reset subject to terms and conditions set forth in the debenture. |
8 | Security is in default. Issuer has failed to make a timely payment of either principal or interest or has failed to comply with some provision of the bond indenture. |
9 | On September 12, 2008, The Bank of New York Mellon (“BNYM”) established a separate sleeve of the BNY Institutional Cash Reserves Fund (“ICRF”) (Series B) to hold certain Lehman Brothers floating rate notes. The Fund’s position in Series B is being marked to market daily. |
10 | On October 6, 2008, BNYM established a separate sleeve of the ICRF (Series C) to hold a security issued by Whistlejacket Capital Ltd. The Fund’s position in Series C is being marked to market daily. |
11 | The Fund’s investments in Dreyfus Cash Management Fund and JPMorgan Liquid Assets Money Market Fund are covered under the U.S. Treasury Temporary Money Market Fund Guarantee Program up to a maximum of $18,257,748 and $16,146,303, respectively. |
# | Rounds to less than 0.1%. |
Investments Definitions and Abbreviations:
ADR/GDR: ADR after the name of a holding stands for American Depositary Receipt, representing ownership of foreign securities on deposit with a domestic custodian bank; a GDR (Global Depositary Receipt) is comparable, but foreign securities are held on deposit in a non-U.S. bank. The value of the ADR/GDR securities is determined or significantly influenced by trading on exchanges not located in the United States or Canada. Sponsored ADR/GDRs are initiated by the underlying foreign company.
| | |
| FHLMC: | | Federal Home Loan Mortgage Corp. |
| FNMA: | | Federal National Mortgage Association |
| USTB: | | United States Treasury Bond |
| USTN: | | United States Treasury Note |
| GMAC: | | General Motors Acceptance Corp. |
Registered shares: A security whose owner has been recorded with its issuer or issuer’s registrar.
Abbreviations have been used throughout the portfolios to indicate amounts shown in currencies other than the U.S. dollar (USD):
| | |
| AUD: | | Australian Dollar |
| BRL: | | Brazilian Real |
| CAD: | | Canadian Dollar |
| EUR: | | euro |
| GBP: | | British Pound |
| IDR: | | Indonesian Rupiah |
| ISK: | | Icelandic Krona |
| KRW: | | South Korean Won |
| MXN: | | Mexican Peso |
| NZD: | | New Zealand Dollar |
| SGD: | | Singapore Dollar |
| THB: | | Thailand Baht |
21
Managers Bond Fund
Statement of Assets and Liabilities
December 31, 2008
| | | | |
Assets: | | | | |
Investments at value (including securities on loan valued at $7,475,809)* | | $ | 1,858,763,895 | |
Cash | | | 4,401,292 | |
Foreign currency** | | | 2,001 | |
Receivable for investments sold | | | 7,824,528 | |
Receivable for Fund shares sold | | | 3,499,187 | |
Dividends, interest and other receivables | | | 36,562,718 | |
Prepaid expenses | | | 78,760 | |
Total assets | | | 1,911,132,381 | |
Liabilities: | | | | |
Payable for Fund shares repurchased | | | 10,985,050 | |
Payable upon return of securities loaned | | | 9,090,875 | |
Payable for investments purchased | | | 535,900 | |
Accrued expenses: | | | | |
Investment advisory and management fees | | | 733,630 | |
Administrative fees | | | 396,473 | |
Other | | | 471,297 | |
Total liabilities | | | 22,213,225 | |
| |
Net Assets | | $ | 1,888,919,156 | |
Shares outstanding | | | 96,124,030 | |
Net asset value, offering and redemption price per share | | $ | 19.65 | |
Net Assets Represent: | | | | |
Paid-in capital | | $ | 2,419,344,353 | |
Accumulated net investment loss | | | (807,216 | ) |
Accumulated net realized loss from investments and foreign currency transactions | | | (14,217,173 | ) |
Net unrealized depreciation of investments and foreign currency contracts and translations | | | (515,400,808 | ) |
Net Assets | | $ | 1,888,919,156 | |
* Investments at cost | | $ | 2,373,694,817 | |
** Foreign currency at cost | | $ | 1,972 | |
The accompanying notes are an integral part of these financial statements.
22
Managers Bond Fund
Statement of Operations
For the year ended December 31, 2008
| | | | |
Investment Income: | | | | |
Interest income | | $ | 149,822,624 | |
Dividend income | | | 7,978,018 | |
Securities lending fees | | | 1,049,702 | |
Total investment income | | | 158,850,344 | |
| |
Expenses: | | | | |
Investment management fees | | | 13,995,636 | |
Administrative fees | | | 5,598,254 | |
Transfer agent | | | 3,247,339 | |
Professional fees | | | 561,326 | |
Custodian | | | 401,202 | |
Reports to shareholders | | | 347,253 | |
Registration fees | | | 189,886 | |
Trustees fees and expenses | | | 177,562 | |
Miscellaneous | | | 95,853 | |
Total expenses before offsets | | | 24,614,311 | |
Expense waiver | | | (35,058 | ) |
Expense reimbursement | | | (2,414,706 | ) |
Expense reductions | | | (28,376 | ) |
Net expenses | | | 22,136,171 | |
Net investment income | | | 136,714,173 | |
Net Realized and Unrealized Gain (Loss): | | | | |
Net realized gain on investment transactions | | | 23,280,883 | |
Net realized loss on foreign currency contracts and transactions | | | (12,639,153 | ) |
Net unrealized depreciation of investments | | | (572,002,809 | ) |
Net unrealized depreciation of foreign currency contracts and translations | | | (489,343 | ) |
Net realized and unrealized loss | | | (561,850,422 | ) |
| |
Net decrease in net assets resulting from operations | | $ | (425,136,249 | ) |
The accompanying notes are an integral part of these financial statements.
23
Managers Bond Fund
Statement of Changes in Net Assets
For the year ended December 31,
| | | | | | | | |
| | | 2008 | | | 2007 | |
Increase (Decrease) in Net Assets From Operations: | | | | | | | | |
Net investment income | | $ | 136,714,173 | | | $ | 71,238,519 | |
Net realized gain on investments and foreign currency transactions | | | 10,641,730 | | | | 4,081,419 | |
Net unrealized appreciation (depreciation) of investments and foreign currency translations | | | (572,492,152 | ) | | | 32,532,745 | |
Net increase (decrease) in net assets resulting from operations | | | (425,136,249 | ) | | | 107,852,683 | |
Distributions to Shareholders: | | | | | | | | |
From net investment income | | | (136,203,930 | ) | | | (73,131,848 | ) |
From net realized gain on investments | | | (27,020,555 | ) | | | (379,319 | ) |
Total distributions to shareholders | | | (163,224,485 | ) | | | (73,511,167 | ) |
From Capital Share Transactions: | | | | | | | | |
Proceeds from sale of shares | | | 1,260,249,492 | | | | 1,324,679,881 | |
Reinvestment of dividends and distributions | | | 152,445,157 | | | | 69,605,331 | |
Cost of shares repurchased | | | (958,305,334 | ) | | | (312,512,299 | ) |
Net increase from capital share transactions | | | 454,389,315 | | | | 1,081,772,913 | |
| | |
Total increase (decrease) in net assets | | | (133,971,419 | ) | | | 1,116,114,429 | |
Net Assets: | | | | | | | | |
Beginning of year | | | 2,022,890,575 | | | | 906,776,146 | |
End of year | | $ | 1,888,919,156 | | | $ | 2,022,890,575 | |
End of year undistributed net investment loss | | $ | (807,216 | ) | | $ | (360,997 | ) |
| | | | | | | | |
Share Transactions: | | | | | | | | |
Sale of shares | | | 52,689,979 | | | | 53,069,813 | |
Reinvested shares | | | 6,912,748 | | | | 2,793,409 | |
Shares repurchased | | | (43,303,058 | ) | | | (12,544,877 | ) |
Net increase in shares | | | 16,299,669 | | | | 43,318,345 | |
The accompanying notes are an integral part of these financial statements.
24
Financial Highlights
For a share outstanding throughout each year
| | | | | | | | | | | | | | | | | | | | |
| | | For the year ended December 31, | |
Managers Bond Fund | | 2008 | | | 2007 | | | 2006 | | | 2005 | | | 2004 | |
Net Asset Value, Beginning of Year | | $ | 25.34 | | | $ | 24.84 | | | $ | 24.11 | | | $ | 24.58 | | | $ | 24.58 | |
Income from Investment Operations: | | | | | | | | | | | | | | | | | | | | |
Net investment income | | | 1.42 | 5 | | | 1.22 | 5 | | | 1.08 | | | | 0.88 | | | | 0.80 | |
Net realized and unrealized gain (loss) on investments | | | (5.42 | )5 | | | 0.49 | 5 | | | 0.75 | | | | (0.32 | ) | | | 0.30 | |
Total from investment operations | | | (4.00 | ) | | | 1.71 | | | | 1.83 | | | | 0.56 | | | | 1.10 | |
Less Distributions to Shareholders from: | | | | | | | | | | | | | | | | | | | | |
Net investment income | | | (1.41 | ) | | | (1.21 | ) | | | (1.10 | ) | | | (0.88 | ) | | | (0.93 | ) |
Net realized gain on investments | | | (0.28 | ) | | | (0.00 | )4 | | | — | | | | (0.15 | ) | | | (0.17 | ) |
Total distributions to shareholders | | | (1.69 | ) | | | (1.21 | ) | | | (1.10 | ) | | | (1.03 | ) | | | (1.10 | ) |
Net Asset Value, End of Year | | $ | 19.65 | | | $ | 25.34 | | | $ | 24.84 | | | $ | 24.11 | | | $ | 24.58 | |
Total Return 1 | | | (16.31 | )% | | | 7.06 | % | | | 7.79 | %3 | | | 2.29 | % | | | 5.14 | % |
Ratio of net expenses to average net assets | | | 0.99 | % | | | 0.99 | % | | | 0.99 | % | | | 0.99 | % | | | 0.99 | % |
Ratio of net investment income to average net assets 1 | | | 6.10 | % | | | 4.91 | % | | | 4.52 | % | | | 3.36 | % | | | 3.65 | % |
Portfolio turnover | | | 39 | % | | | 21 | % | | | 46 | % | | | 26 | % | | | 16 | % |
Net assets at end of year (000’s omitted) | | $ | 1,888,919 | | | $ | 2,022,891 | | | $ | 906,776 | | | $ | 426,448 | | | $ | 259,210 | |
| | | | | | | | | | | | | | | | | | | | |
Ratios absent expense offsets: 2 | | | | | | | | | | | | | | | | | | | | |
Ratio of total expenses to average net assets | | | 1.10 | % | | | 0.99 | % | | | 1.02 | % | | | 1.02 | % | | | 1.06 | % |
Ratio of net investment income to average net assets | | | 5.99 | % | | | 4.91 | % | | | 4.49 | % | | | 3.33 | % | | | 3.58 | % |
| | | | | | | | | | | | | | | | | | | | |
1 | Total returns and net investment income would have been lower had certain expenses not been reduced. (See Note 1(c) to the Notes to Financial Statements.) |
2 | Excludes the impact of expense reimbursement and expense offsets such as brokerage credits, but includes non-reimbursable expenses, if any, such as interest and taxes. (See Note 1(c) to the Notes to Financial Statements.) |
3 | The Total Return is based on the Financial Statement Net Asset Values as shown above. |
4 | Rounds to less than $0.01. |
5 | Per share numbers have been calculated using average shares. |
25
Notes to Financial Statements
December 31, 2008
| 1. | Summary of Significant Accounting Policies |
The Managers Funds (the “Trust”) is an open-end management investment company organized as a Massachusetts business trust and registered under the Investment Company Act of 1940, as amended (the “1940 Act”). Currently, the Trust is comprised of a number of different funds, each having distinct investment management objectives, strategies, risks and policies. Included in this report is the Managers Bond Fund (“the Fund”).
The Fund’s financial statements are prepared in accordance with accounting principles generally accepted in the United States of America, which require management to make estimates and assumptions that affect the reported amounts of assets and liabilities and disclosure of contingent assets and liabilities at the date of the financial statements and the reported amounts of income and expenses during the reporting periods. Actual results could differ from those estimates and such differences could be material. The following is a summary of significant accounting policies followed by the Fund in the preparation of its financial statements:
| a. | Valuation of Investments |
Equity securities traded on a domestic or international securities exchange are valued at the last quoted sale price, or, lacking any sales, at the last quoted bid price. Over-the-counter securities are valued at the Nasdaq Official Closing Price, if one is available. Lacking any sales, over-the-counter securities are valued at the last quoted bid price. The Fund’s investments are generally valued based on market quotations provided by the third party pricing services approved by the Board of Trustees of the Fund. Under certain circumstances, the value of certain Fund investments may be based on an evaluation of its fair value, pursuant to procedures established by and under the general supervision of the Board of Trustees of the Fund. The Fund may use the fair value of a portfolio security to calculate its NAV when, for example, (1) market quotations are not readily available because a portfolio security is not traded in a public market or the principal market in which the security trades is closed, (2) trading in a portfolio security is suspended and has not resumed before the Fund calculates its NAV, (3) a significant event affecting the value of a portfolio security is determined to have occurred between the time of the market quotation provided for a portfolio security and the time as of which the Fund calculates its NAV, (4) a security’s price has remained unchanged over a period of time (often referred to as a “stale price”), or (5) Managers Investment Group LLC (the “Investment Manager”) determines that a market quotation is inaccurate. Portfolio investments that trade primarily on foreign markets are priced based upon the market quotation of such securities as of the close of their respective principal markets, as adjusted to reflect the Investment Manager’s determination of the impact of events occurring subsequent to the close of such markets but prior to the time as of which the Fund calculates its NAV. In accordance with procedures approved by the Board of Trustees, the Investment Manager relies upon recommendations of a third-party fair valuation service in adjusting the prices of such foreign portfolio investments. The Fund may invest in securities that may be thinly traded. The Board of Trustees has adopted procedures to adjust prices when thinly traded securities are judged to be stale so that they reflect fair value. An investment valued on the basis of its fair value may be valued at a price higher or lower than available market quotations. An investment’s valuation may differ depending on the method used and the factors considered in determining value according to the Fund’s fair value procedures.
Fixed-income securities are valued based on valuations furnished by independent pricing services that utilize matrix systems, which reflect such factors as security prices, yields, maturities, and ratings, and are supplemented by dealer and exchange quotations. Futures contracts for which market quotations are readily available are valued at the settlement price as of the close of the futures exchange. Short-term investments having a remaining maturity of 60 days or less are valued at amortized cost, which approximates market value. Investments in other open-end regulated investment companies are valued at their end of day net asset value per share. Investments in certain mortgage-backed and stripped mortgage-backed securities, preferred stocks, convertible securities, derivatives and other debt securities not traded on an organized securities market are valued on the basis of valuations provided by dealers or by a pricing service which uses information with respect to transactions in such securities and various relationships between securities and yield to maturity in determining value. Securities (including derivatives) for which market quotations are not readily available are valued at fair value, as determined in good faith, and pursuant to procedures adopted by the Board of Trustees of the Trust. The values assigned to fair value investments are based on available information and do not necessarily represent amounts that might ultimately be realized, since such amounts depend on future developments inherent in long-term investments. Further, because of the inherent uncertainty of valuation, those estimated values may differ significantly from the values that would have been used had a ready market for the investments existed, and the differences could be material.
The Fund adopted Financial Accounting Standards Board Statement of Financial Accounting Standards No. 157, Fair Value Measurements (“FAS 157”), effective January 1, 2008. In accordance with FAS 157, fair value is defined as the price that a Fund would receive to sell an asset or pay to transfer a liability in an orderly transaction between market participants at the measurement date. FAS 157 also establishes a framework for measuring fair value, and a three-level hierarchy for fair value measurements based upon the transparency of inputs to the valuation of an asset or liability. Inputs may be observable or unobservable and refer broadly to the assumptions that market participants would use in pricing the asset or liability. Observable inputs reflect the assumptions market participants would use in pricing the asset or liability based on market data obtained from sources independent of the Fund. Unobservable inputs reflect the Fund’s own assumptions about the assumptions that market participants would use in pricing the asset or liability developed based on the best information available in the circumstances. Each investment is assigned a level based upon the observability of the inputs which are significant to the overall valuation. The three-tier hierarchy of inputs is summarized below:
Level 1 – quoted prices in active markets for identical investments
Level 2 – other significant observable inputs (including quoted prices for similar investments, interest rates, prepayment speeds, credit risk)
Level 3 –significant unobservable inputs (including the Fund’s own assumptions in determining the fair value of investments)
The inputs or methodologies used for valuing investments are not necessarily an indication of the risk associated with investing in
26
Notes to Financial Statements (continued)
those investments. The following table summarizes the valuation of the Fund’s investments by the above fair value hierarchy levels as of December 31, 2008:
| | | | | |
Level | | Investments in
Securities | | Other
Financial
Instruments* |
Bond Fund | | | | | |
Level 1 | | $ | 75,326,876 | | — |
Level 2 | | | 1,783,437,019 | | — |
Level 3 | | | — | | — |
| | | | | |
Total | | $ | 1,858,763,895 | | — |
| | | | | |
* Other financial instruments are derivative instruments not reflected in the Schedule of Portfolio Investments, such as futures, forwards and swap contracts, which are valued at the unrealized appreciation/depreciation of the instrument. |
Security transactions are accounted for as of the trade date. Realized gains and losses on securities sold are determined on the basis of identified cost.
| c. | Investment Income and Expenses |
Dividend income is recorded on the ex-dividend date except certain dividends from foreign securities where the ex-dividend date may have passed. These dividends are recorded as soon as the Trust is informed of the ex-dividend date. Dividend income on foreign securities is recorded net of any withholding tax. Interest income, which includes amortization of premium and accretion of discount on debt securities, is accrued as earned. Non-cash dividends included in dividend income, if any, are reported at the fair market value of the securities received. Other income and expenses are recorded on an accrual basis. Expenses that cannot be directly attributed to a fund are apportioned among the Funds in the Trust and in some cases other affiliated funds based upon their relative average net assets or number of shareholders.
The Fund has a “balance credit” arrangement with The Bank of New York Mellon (“BNYM”) (formerly The Bank of New York), the Fund’s custodian, whereby the Fund is credited with an interest factor equal to 0.75% below the effective 90-day T-Bill rate for account balances left uninvested overnight. If the T-Bill rate falls below 0.75%, no credits will be earned. These credits serve to reduce custody expenses that would otherwise be charged to the Fund. For the year ended December 31, 2008, the custodian expense was reduced by $3,137.
Overdrafts will cause a reduction of any earnings credits, computed at 2% above the effective Federal Funds rate on the day of the over- draft. For the year ended December 31, 2008, the Fund had $2,143 in overdraft fees.
The Trust also has a balance credit arrangement with its Transfer Agent, PNC Global Investment Servicing (U.S.) Inc. (formerly PFPC, Inc.), whereby earnings credits are used to offset banking charges and other out-of-pocket expenses. For the year ended December 31, 2008, the transfer agent expense was reduced by $25,239.
The Investment Manager has agreed to waive a portion of its management fee in consideration of shareholder servicing fees that it has received from JPMorgan Distribution Services, Inc., with respect to short-term cash investments the Fund has made in the JPMorgan Liquid Assets Portfolio. For the year ended December 31, 2008, the management fee was reduced by $35,058.
Total returns and net investment income for the Fund would have been lower had certain expenses not been offset. Total expenses before offsets exclude the impact of expense reimbursements or fee waivers and expense offsets such as brokerage recapture credits, but include non-reimburseable expenses if any, such as interest and taxes.
��
| d. | Dividends and Distributions |
Dividends resulting from net investment income, if any, normally will be declared and paid monthly. Distributions of capital gains, if any, will be made annually in December and when required for Federal excise tax purposes. Income and capital gain distributions are determined in accordance with Federal income tax regulations, which may differ from generally accepted accounting principles. These differences are primarily due to differing treatments for losses deferred due to wash sales, REITS, equalization accounting for tax purposes, foreign currency, options, futures and market discount transactions. Permanent book and tax basis differences, if any, relating to shareholder distributions will result in reclassifications to paid-in capital. The tax character of distributions paid during the past two years were as follows:
| | | | | | |
| | | 2008 | | 2007 |
Distributions paid from: | | | | | | |
Ordinary income | | $ | 126,983,618 | | $ | 73,139,824 |
Short-term capital gains | | | 20,495,479 | | | — |
Long-term capital gains | | | 15,745,388 | | | 371,343 |
| | | | | | |
| | $ | 163,224,485 | | $ | 73,511,167 |
| | | | | | |
| | |
As a % of distributions paid: (unaudited) | | | | | | |
| | |
Qualified ordinary income | | | — | | | — |
Ordinary income—dividends received deduction | | | — | | | — |
As of December 31, 2008, the components of distributable earnings (excluding unrealized appreciation/depreciation) on a tax basis consisted of:
| | |
| | | 2008 |
Capital loss carryforward | | — |
Undistributed ordinary income | | — |
Undistributed short-term capital gains | | — |
Undistributed long-term capital gains | | — |
The Fund intends to comply with the requirements under Subchapter M of the Internal Revenue Code of 1986, as amended, to distribute substantially all of its taxable income and gains to its shareholders and to meet certain diversification and income requirements with respect to investment companies. Therefore, no provision for Federal income or excise tax is included in the accompanying financial statements.
Additionally, based on the Fund’s understanding of the tax rules and rates related to income, gains and transactions for the foreign jurisdictions in which it invests, the Fund will provide for foreign taxes, and where appropriate, deferred foreign taxes.
Management has analyzed the Fund’s tax positions taken on federal income tax returns for all open tax years (tax years ended December 31, 2005-2008), and has concluded that no provision for federal income tax is required in the Fund’s financial statements. The Fund is not aware of any tax position for which it is reasonably possible that the total amounts of unrecognized tax benefits will change materially in the next twelve months.
27
Notes to Financial Statements (continued)
| f. | Capital Loss Carryovers |
As of December 31, 2008, the Fund had no accumulated net realized capital loss carryover from securities transactions for Federal income tax purposes.
The Trust’s Declaration of Trust authorizes for each series the issuance of an unlimited number of shares of beneficial interest, without par value. Each Fund records sales and repurchases of its capital stock on the trade date. Dividends and distributions to shareholders are recorded on the ex-dividend date.
At December 31, 2008, certain unaffiliated shareholders of record, specifically omnibus accounts, individually held greater than 10% of the outstanding shares of the Fund as follows: three collectively own 45%. Transactions by these shareholders may have a material impact on the Fund.
| h. | Foreign Currency Translation |
The books and records of the Fund are maintained in U.S. dollars. The value of investments, assets and liabilities denominated in currencies other than U.S. dollars are translated into U.S. dollars based upon current foreign exchange rates. Purchases and sales of foreign investments, income and expenses are converted into U.S. dollars based on currency exchange rates prevailing on the respective dates of such transactions. Net realized and unrealized gain (loss) on foreign currency transactions represent: (1) foreign exchange gains and losses from the sale and holdings of foreign currencies; (2) gains and losses between trade date and settlement date on investment securities transactions and forward foreign currency exchange contracts; and (3) gains and losses from the difference between amounts of interest and dividends recorded and the amounts actually received.
The Fund does not isolate the net realized and unrealized gain or loss resulting from changes in exchange rates from the fluctuations in market prices of securities held. Such fluctuations are included with the net realized and unrealized gain or loss on investments.
| 2. | Agreements and Transactions with Affiliates |
The Trust has entered into an Investment Management Agreement under which the Investment Manager, an independently managed subsidiary of Affiliated Managers Group, Inc. (“AMG”), serves as investment manager to the Fund and is responsible for the Fund’s overall administration. The Investment Manager selects subadvisors for the Fund (subject to Trustee approval) and monitors each subadvisor’s investment programs and results. The Fund’s investment portfolio is managed by a portfolio manager who serves pursuant to a Subadvisory Agreement with the Investment Manager.
Investment management fees are paid directly by the Fund to the Investment Manager based on average daily net assets. For the year ended December 31, 2008, the annual investment management fee rate, as a percentage of average daily net assets, was 0.625%.
The Trust has entered into an Administration and Shareholder Servicing Agreement under which the Investment Manager serves as the Fund’s administrator (the “Administrator”) and is responsible for all aspects of managing the Fund’s operations, including administration and shareholder services to the Fund, its shareholders, and certain institutions, such as bank trust departments, broker-dealers and registered investment advisers, that advise or act as an intermediary with the Fund’s shareholders. The Fund pays a fee to the Administrator at the rate of 0.25% per annum of the Fund’s average daily net assets for this service.
The Investment Manager has contractually agreed, through at least May 1, 2009, to waive fees and pay or reimburse expenses to the extent that the total annual operating expenses (exclusive of brokerage costs, acquired fund fees and expenses, interest, taxes and extraordinary expenses) of the Fund exceed 0.99% of the Fund’s average daily net assets.
The Fund is obligated to repay the Investment Manager such amounts waived, paid or reimbursed in future years provided that the repayment occurs within thirty-six (36) months after the waiver or reimbursement and that such repayment would not cause the Fund’s total operating expenses in any such future year to exceed that Fund’s respective expense cap. For the year ended December 31, 2008, the Fund made no such repayments to the Investment Manager. At December 31, 2008, the cumulative amount of expense reimbursement by the Investment Manager subject to repayment by the Fund equaled $2,663,804.
Prior to July 1, 2007, the aggregate annual retainer paid to each Independent Trustee was $55,000, plus $4,000 or $2,000 for each regular or special meeting attended, respectively. Effective July 1, 2007, the aggregate annual retainer paid to each Independent Trustee is $65,000, plus $4,000 or $2,500 for each regular or special meeting attended, respectively. The Trustees’ fees and expenses are allocated amongst all of the Funds for which the Investment Manager serves as the advisor (the “Managers Funds”) based on the relative net assets of such Funds. The Independent Chairman of the Trusts receives an additional payment of $15,000 per year. (Prior to July 1, 2007, the Independent Chairman received an additional payment of $10,000 per year). The Chairman of the Audit Committee receives an additional payment of $5,000 per year. (Prior to July 1, 2007, the Chairman of the Audit Committee received an additional payment of $2,000 per year). The “Trustees fees and expenses” shown in the financial statements represents the Fund’s allocated portion of the total fees and expenses paid by the Fund and other affiliated funds in the Managers Funds.
The Fund is distributed by Managers Distributors, Inc. (the “Distributor” or “MDI”), a wholly-owned subsidiary of the Investment Manager. MDI serves as the principal underwriter for the Fund. MDI is a registered broker-dealer and member of the Financial Industry Regulatory Authority, Inc. (“FINRA”). Shares of the Fund will be continuously offered and will be sold by brokers, dealers or other financial intermediaries who have executed selling agreements with the Distributor. MDI bears all the expenses of providing services pursuant to the Underwriting Agreement, including the payment of the expenses relating to the distribution of Prospectuses for sales purposes and any advertising or sales literature. Certain Trustees and Officers of the Fund are Officers and/or Directors of the Investment Manager, AMG and/or the Distributor.
| 3. | Purchases and Sales of Securities |
Purchases and sales of securities, excluding short-term securities, for the year ended December 31, 2008, were $1,159,376,558 and $341,393,211, respectively. Purchases and sales of U.S. Government securities for the year ended December 31, 2008, were $19,754,704 and $470,473,252, respectively.
| 4. | Portfolio Securities Loaned |
The Fund may participate in a securities lending program offered by BNYM, providing for the lending of securities to qualified
28
Notes to Financial Statements (continued)
brokers. Securities lending fees include earnings of such temporary cash investments, plus or minus any rebate to a borrower. These earnings (after any rebate) are then divided between BNYM, as a fee for its services under the program, and the Fund, according to agreed-upon rates. Collateral on all securities loaned is accepted in cash and/or government securities and is maintained at a minimum level of 102% (105% in the case of certain foreign securities) of the market value, plus interest, if applicable, of investments on loan. It is the Funds policy to obtain additional collateral from or return excess collateral to the borrower by the end of the next business day, following the valuation date of the securities loaned. Therefore, the value of the collateral held may be temporarily less than the value of the securities on loan. Lending securities entails a risk of loss to the Fund if and to the extent that the market value of the securities loaned were to increase and the borrower did not increase the collateral accordingly, and the borrower fails to return the securities. The Fund bears the risk of any deficiency in the amount of the collateral available for return to the borrower due to any loss on the collateral invested. Collateral received in the form of cash is invested temporarily in the BNY Institutional Cash Reserves Fund (the “ICRF”), or other short-term investments as defined in the Securities Lending Agreement with BNYM.
In September and October of 2008, BNYM advised the Investment Manager that the ICRF had exposure to certain defaulted debt obligations, and that BNYM had established separate sleeves of the ICRF to hold these securities. The net impact of these positions is not material to the Fund. The Fund’s position in the separate sleeves of the ICRF Fund is included in the Schedule of Portfolio Investments and the unrealized loss on such investment is included in Net Unrealized Depreciation on the Statement of Assets and Liabilities and the Statement of Operations.
| 5. | Commitments and Contingencies |
In the normal course of business, the Fund may enter into contracts and agreements that contain a variety of representations and warranties, which provide general indemnifications. The maximum exposure to the Fund under these arrangements is unknown, as this would involve future claims that may be made against the Fund that have not yet occurred. However, based on experience, the Fund expects the risk of loss to be remote.
| 6. | Risks Associated with Collateralized Mortgage Obligations (“CMOs”) |
The net asset value of the Fund may be sensitive to interest rate fluctuations because the Fund may hold several instruments, including CMOs and other derivatives, whose values can be significantly impacted by interest rate movements. CMOs are obligations collateralized by a portfolio of mortgages or mortgage-related securities. Payments of principal and interest on the mortgage are passed through to the holder of the CMOs on the same schedule as they are received, although certain classes of CMOs have priority over others with respect to the receipt of prepayments on the mortgages.
Therefore, the investment in CMOs may be subject to a greater or lesser risk of prepayment than other types of mortgage-related securities. CMOs may have a fixed or variable rate of interest.
Certain transactions, such as futures and forward transactions, dollar roll agreements, or purchases of when-issued or delayed delivery securities may have a similar effect on the Fund’s net asset value as if the Fund had created a degree of leverage in its portfolio.
However, if the Fund enters into such a transaction, the Fund will establish a segregated account with its custodian in which it will maintain cash, U.S. government securities or other liquid securities equal in value to its obligations in respect to such transaction. Securities and other assets held in the segregated account may not be sold while the transaction is outstanding, unless other suitable assets are substituted.
| 8. | Forward Foreign Currency Contracts |
The Fund may invest in forward foreign currency exchange contracts to manage currency exposure. These investments may involve greater market risk than the amounts disclosed in the Fund’s financial statements.
A forward foreign currency exchange contract is an agreement between a Fund and another party to buy or sell a currency at a set price at a future date. The market value of the contract will fluctuate with changes in currency exchange rates. The contract is marked-to-market daily, and the change in market value is recorded as an unrealized gain or loss. Gain or loss on the purchase or sale of contracts having the same settlement date, amount and counterparty is realized on the date of offset, otherwise gain or loss is realized on the settlement date.
The Fund may invest in non-U.S. dollar denominated instruments subject to limitations, and enter into forward foreign currency exchange contracts to facilitate transactions in foreign securities and to protect against a possible loss resulting from an adverse change in the relationship between the U.S. dollar and such foreign currency. Risks may arise upon entering into these contracts from the potential inability of counterparties to meet the terms of their contracts and from unanticipated movements in the value of a foreign currency relative to the U.S. dollar.
| 9. | New Accounting Pronouncement |
In March 2008, Statement of Financial Accounting Standards No. 161,“Disclosures about Derivative Instruments and Hedging Activities” (“SFAS 161”) was issued and is effective for fiscal years and interim periods beginning after November 15, 2008. SFAS 161 is intended to improve financial reporting for derivative instruments by requiring enhanced disclosure that enables investors to understand how and why a fund uses derivatives, how derivatives are accounted for, and how derivative instruments affect a fund’s results of operations and financial position. Management is currently evaluating the impact of SFAS 161 on the Fund’s financial statement disclosures, if any.
Tax Information (unaudited)
The Fund hereby designates the maximum amount allowable of its net taxable income as qualified dividends as provided in the Jobs and Growth Tax Relief Reconciliation Act of 2003. The 2008 Form 1099-DIV you receive for the Fund will show the tax status of all distributions paid to you during the year.
Pursuant to section 852 of the Internal Revenue Code, the Fund hereby designate as a capital gain distribution with respect to the taxable year ended December 31, 2008, $15,745,388 or, if subsequently determined to be different, the net capital gains of such year.
29
Report of Independent Registered Public Accounting Firm
To the Board of Trustees of The Managers Funds and the Shareholders of Managers Bond Fund:
In our opinion, the accompanying statement of assets and liabilities, including the schedule of portfolio investments, and the related statements of operations and of changes in net assets and the financial highlights present fairly, in all material respects, the financial position of Managers Bond Fund (one of the series constituting The Managers Funds, hereafter referred to as the “Fund”) at December 31, 2008, the results of its operations for the year then ended, the changes in its net assets for each of the two years in the period then ended and the financial highlights for each of the five years in the period then ended, in conformity with accounting principles generally accepted in the United States of America. These financial statements and financial highlights (hereafter referred to as “financial statements”) are the responsibility of the Fund’s management; our responsibility is to express an opinion on these financial statements based on our audits. We conducted our audits of these financial statements in accordance with the standards of the Public Company Accounting Oversight Board (United States). Those standards require that we plan and perform the audit to obtain reasonable assurance about whether the financial statements are free of material misstatement. An audit includes examining, on a test basis, evidence supporting the amounts and disclosures in the financial statements, assessing the accounting principles used and significant estimates made by management, and evaluating the overall financial statement presentation. We believe that our audits, which included confirmation of securities at December 31, 2008 by correspondence with the custodian, provide a reasonable basis for our opinion.
PricewaterhouseCoopers LLP
Philadelphia, Pennsylvania
February 24, 2009
30
Trustees and Officers
The Trustees and Officers of the Trust, their business addresses, principal occupations for the past five years and dates of birth are listed below. The Trustees provide broad supervision over the affairs of the Trust and the Funds. The Trustees are experienced executives who meet periodically throughout the year to oversee the Funds’ activities, review contractual arrangements with companies that provide services to the Funds, and review the Funds’ performance. Unless otherwise noted, the address of each Trustee or Officer is the address of the Trust: 800 Connecticut Avenue, Norwalk, Connecticut 06854.
There is no stated term of office for Trustees. Trustees serve until their resignation, retirement or removal in accordance with the Trust’s organizational documents and policies adopted by the Board from time to time. The Chairman of the Trustees, President, Treasurer and Secretary of the Trust are elected by the Trustees annually. Other officers hold office at the pleasure of the Trustees.
Independent Trustees
The following Trustees are not “interested persons” of the Trust within the meaning of the 1940 Act:
| | |
Name, Date of Birth, Number of Funds Overseen in Fund Complex* | | Principal Occupation(s) During Past 5 Years and Other Directorships Held by Trustee |
Jack W. Aber, 9/9/37 • Trustee since 1999 • Oversees 32 Funds in Fund Complex | | Professor of Finance, Boston University School of Management (1972-Present); Trustee of Appleton Growth Fund (1 portfolio); Trustee of Third Avenue Trust (4 portfolios); Trustee of Third Avenue Variable Trust (1 portfolio). |
| |
William E. Chapman, II, 9/23/41 • Independent Chairman • Trustee since 1999 • Oversees 32 Funds in Fund Complex | | President and Owner, Longboat Retirement Planning Solutions (1998-Present); Hewitt Associates, LLC (part time) (provider of Retirement and Investment Education Seminars); Trustee of Bowdoin College (2002-Present);Director of Harding, Loevner Funds, Inc. (6 portfolios); Trustee of Third Avenue Trust (4 portfolios); Trustee of Third Avenue Variable Trust (1 portfolio). |
| |
Edward J. Kaier, 9/23/45 • Trustee since 1999 • Oversees 32 Funds in Fund Complex | | Attorney at Law and Partner, Teeters Harvey Gilboy & Kaier LLP (2007-Present); Attorney at Law and Partner, Hepburn Willcox Hamilton & Putnam, LLP (1977-2007); Trustee of Third Avenue Trust (4 portfolios); Trustee of Third Avenue Variable Trust (1 portfolio). |
| |
Steven J. Paggioli, 4/3/50 • Trustee since 1993 • Oversees 32 Funds in Fund Complex | | Consultant (2001-Present); Formerly Executive Vice President and Director, The Wadsworth Group (1986- 2001); Executive Vice President, Secretary and Director, Investment Company Administration, LLC (1990-2001); Vice President, Secretary and Director, First Fund Distributors, Inc. (1991-2001); Trustee, Professionally Managed Portfolios (22 portfolios); Advisory Board Member, Sustainable Growth Advisors, LP; Independent Director, Chase Investment Counsel (2008 – Present). |
| |
Eric Rakowski, 6/5/58 • Trustee since 1999 • Oversees 32 Funds in Fund Complex | | Professor, University of California at Berkeley School of Law (1990-Present); Director of Harding, Loevner Funds, Inc. (6 portfolios); Trustee of Third Avenue Trust (4 portfolios); Trustee of Third Avenue Variable Trust (1 portfolio). |
| |
Thomas R. Schneeweis, 5/10/47 • Trustee since 1987 • Oversees 32 Funds in Fund Complex | | Professor of Finance, University of Massachusetts (1977-Present); Director, CISDM at the University of Massachusetts, (1996-Present); President, Alternative Investment Analytics, LLC, (formerly Schneeweis Partners, LLC) (2001-Present); Partner, White Bear Partners, LLC (2007-Present); Partner, Schneeweis Capital Management, LLC (2007-Present); Partner, Schneeweis Associates, LLC (2007-Present); Partner, Northampton Capital Management, LLC (2004-Present); Partner, TRS Associates (2007-Present). |
| * | The Fund Complex consists of Managers AMG Funds, The Managers Funds, Managers Trust I and Managers Trust II. |
Interested Trustees
The following Trustees are “interested persons” of the Trust within the meaning of the 1940 Act. Mr. Dalton is an interested person by virtue of his positions with, and interest in securities of, Affiliated Managers Group, Inc. Mr. Streur is an interested person by virtue of his positions with Managers Investment Group LLC.
| | |
Name, Date of Birth, Number of Funds Overseen in Fund Complex* | | Principal Occupation(s) During Past 5 Years and Other Directorships Held by Trustee |
Nathaniel Dalton, 9/29/66 • Trustee since 2008 • Oversees 32 Funds in Fund Complex | | Executive Vice President and Chief Operating Officer, Affiliated Managers Group, Inc., (2006-Present); Executive Vice President, Affiliated Managers Group, Inc., (2002 -2006); Executive Vice President and General Counsel, Affiliated Managers Group, Inc. (2001-2002); Senior Vice President and General Counsel, Affiliated Managers Group, Inc. (1996-2001). Director, Managers Distributors, Inc. (2000-Present). |
| |
John H. Streur, 2/6/60 • Trustee since 2008 • President since 2008 • Oversees 32 Funds in Fund Complex | | Senior Managing Partner, Managers Investment Group LLC (2006-Present); President, Managers Distributors, Inc. (2006-Present); Managing Partner, Managers Investment Group LLC (2005-2006); Chief Executive Officer, President and Chief Operating Officer, The Burridge Group LLC (1996-2004). |
Officers
| | |
Name, Date of Birth, Position(s) Held with Fund and Length of Time Served | | Principal Occupation(s) During Past 5 Years |
Christine C. Carsman, 4/2/52 • Secretary since 2004 | | Senior Vice President and Chief Regulatory Counsel, Affiliated Managers Group, Inc. (2004-Present); Secretary, Managers AMG Funds, Managers Trust I and II (2004-Present); Senior Counsel, Vice President and Director of Operational Risk Management and Compliance, Wellington Management Company, LLP (1995-2004); Deputy General Counsel, The Boston Company, Inc. (1993-1995); Associate General Counsel, The Boston Company Advisors, Inc. (1991-1993); Associate, Sullivan & Worcester LLP (1987-1991). |
| |
Donald S. Rumery, 5/29/58 • Chief Financial Officer since 2007 • Treasurer since 1995 | | Senior Vice President, Managers Investment Group LLC (2005-Present); Director, Finance and Planning, The Managers Funds LLC, (1994-2004); Treasurer and Chief Financial Officer, Managers Distributors, Inc. (2000-Present); Treasurer, Managers AMG Funds (1999-Present); Treasurer, Managers Trust I and Managers Trust II (2000-Present); Secretary, Managers Trust I and Managers Trust II (2000-2004) and Secretary, The Managers Funds (1997-2004); Chief Financial Officer, Managers AMG Funds, Managers Trust I and Managers Trust II (2007-Present). |
| |
Keitha L. Kinne, 5/16/58 • Chief Operating Officer since 2007 | | Managing Partner and Chief Operating Officer, Managers Investment Group LLC (2007-Present); Chief Investment Officer, Managers Investment Group LLC (2008-Present); Chief Operating Officer, Managers AMG Funds, Managers Trust I and Managers Trust II (2007-Present); Managing Director, Legg Mason & Co., LLC (2006-2007); Managing Director, Citigroup Asset Management (2004-2006); Senior Vice President, Prudential Investments (1999-2004). |
| |
David Kurzweil, 6/22/74 • Assistant Secretary since 2008 | | Senior Vice President and Associate Counsel, Managers Investment Group LLC (2008-Present); Assistant Secretary, The Managers Funds, Managers Trust I, Managers Trust II, and Managers AMG Funds (2008-Present); Counsel and Senior Vice President, Lazard Asset Management LLC (2003-2008). |
31
Investment Manager and Administrator
Managers Investment Group LLC
800 Connecticut Avenue
Norwalk, Connecticut 06854
(203) 299-3500 or (800) 835-3879
Distributor
Managers Distributors, Inc.
800 Connecticut Avenue
Norwalk, Connecticut 06854
(203) 299-3500 or (800) 835-3879
Custodian
The Bank of New York Mellon
2 Hanson Place
Brooklyn, New York 11217
Legal Counsel
Ropes & Gray LLP
One International Place
Boston, Massachusetts 02110-2624
Transfer Agent
PNC Global Investment Servicing (U.S.) Inc.
Attn: Managers
P.O. Box 9769
Providence, Rhode Island 02940
(800) 548-4539
For Managers Choice Only
Managers
c/o PNC Global Investment Servicing (U.S.) Inc.
P.O. Box 61204
King of Prussia, Pennsylvania 19406-0851
(800) 358-7668

MANAGERSAND MANAGERS AMG FUNDS
EQUITY FUNDS
EMERGING MARKETS EQUITY
Rexiter Capital Management Limited
ESSEX GROWTH
ESSEX LARGE CAP GROWTH
ESSEX SMALL/MICRO CAP GROWTH
Essex Investment Management Co., LLC
FQ TAX-MANAGED U.S. EQUITY
FQ U.S. EQUITY
First Quadrant, L.P.
GW&K MULTI-CAP EQUITY
Gannet Welsh & Kotler, LLC
INSTITUTIONAL MICRO-CAP
MICRO-CAP
Lord, Abbett & Co. LLC
WEDGE Capital Management L.L.P.
OFI Institutional Asset Management, Inc.
Next Century Growth Investors LLC
INTERNATIONAL EQUITY
AllianceBernstein L.P.
Lazard Asset Management, LLC
Wellington Management Company, LLP
CHICAGO EQUITY PARTNERS
MID-CAP
Chicago Equity Partners, LLC
REAL ESTATE SECURITIES
Urdang Securities Management, Inc.
SKYLINE SPECIAL EQUITIES
PORTFOLIO
Skyline Asset Management, L.P.
SMALL CAP
TIMESSQUARE MID CAP GROWTH
TIMESSQUARE SMALL CAP GROWTH
TimesSquare Capital Management, LLC
SPECIAL EQUITY
Ranger Investment Management, L.P.
Lord, Abbett & Co. LLC
Skyline Asset Management, L.P.
Smith Asset Management Group, L.P.
Federated MDTA LLC
Westport Asset Management, Inc.
SYSTEMATIC VALUE
SYSTEMATIC MID CAP VALUE
Systematic Financial Management, L.P.
BALANCED FUNDS
CHICAGO EQUITY PARTNERS BALANCED
Chicago Equity Partners, LLC
GLOBAL
AllianceBernstein L.P.
First Quadrant, L.P.
Wellington Management Company, LLP
ALTERNATIVE FUNDS
FQ GLOBAL ALTERNATIVES
First Quadrant, L.P.
INCOME FUNDS
BOND (MANAGERS)
FIXED INCOME
GLOBAL BOND
Loomis, Sayles & Co., L.P.
BOND (MANAGERS FREMONT)
Pacific Investment Management Co. LLC
CALIFORNIA INTERMEDIATE TAX-FREE
Miller Tabak Asset Management LLC
GW&K MUNICIPAL ENHANCED YIELD
Gannet Welsh & Kotler, LLC
HIGH YIELD
J.P. Morgan Investment Management LLC
INTERMEDIATE DURATION GOVERNMENT
SHORT DURATION GOVERNMENT
Smith Breeden Associates, Inc.
MONEY MARKET
JPMorgan Investment Advisors Inc.
This report is prepared for the Fund’s shareholders. It is authorized for distribution to prospective investors only when preceded or accompanied by an effective prospectus. To receive a free copy of the prospectus or Statement of Additional Information, which includes additional information about Fund Trustees, please contact us by calling 800.835.3879. Distributed by Managers Distributors, Inc., member FINRA.
A description of the policies and procedures each Fund uses to vote its proxies is available: (i) without charge, upon request, by calling 800.835.3879, or (ii) on the Securities and Exchange Commission’s (SEC) Web site at www.sec.gov. For information regarding each Fund’s proxy voting record for the 12-month period ended December 31, call 800.835.3879 or visit the SEC Web site at www.sec.gov.
The Fund files its complete schedule of portfolio holdings with the SEC for the first and third quarters of each fiscal year on Form N-Q. The Fund’s Forms N-Q are available on the SEC’s website at www.sec.gov. A Fund’s Forms N-Q may be reviewed and copied at the SEC’s Public Reference Room in Washington, DC. Information on the operation of the Public Reference Room may be obtained by calling 1-800-SEC-0330. To review a complete list of the Fund’s portfolio holdings, or to view the most recent quarterly holdings report, semiannual report, or annual report, please visit www.managersinvest.com.
www.managersinvest.com


ANNUAL REPORT
Managers Funds
December 31, 2008
Managers Special Equity Fund

AR003-1208
Managers Special Equity Fund
Annual Report — December 31, 2008
TABLE OF CONTENTS
| | |
| | | Page |
LETTER TO SHAREHOLDERS | | 1 |
| |
ABOUT YOUR FUND’S EXPENSES | | 3 |
| |
INVESTMENT MANAGERS’ COMMENTS, FUND SNAPSHOT, AND SCHEDULE OF PORTFOLIO INVESTMENTS | | |
Managers Special Equity Fund | | 4 |
| |
FINANCIAL STATEMENTS: | | |
| |
Statement of Assets and Liabilities | | 13 |
Fund’s balance sheet, net asset value (NAV) per share computation and cumulative undistributed amount | | |
| |
Statement of Operations | | 14 |
Detail of sources of income, Fund expenses, and realized and unrealized gains (losses) during the year | | |
| |
Statement of Changes in Net Assets | | 15 |
Detail of changes in Fund assets for the past two years | | |
| |
FINANCIAL HIGHLIGHTS | | 16 |
Historical net asset values per share, distributions, total returns, expense ratios, turnover ratios and net assets | | |
| |
NOTES TO FINANCIAL STATEMENTS | | 17 |
Accounting and distribution policies, details of agreements and transactions with Fund management and affiliates, and descriptions of certain investment risks | | |
| |
REPORT OF INDEPENDENT REGISTERED PUBLIC ACCOUNTING FIRM | | 22 |
| |
TRUSTEES AND OFFICERS | | 23 |
Nothing contained herein is to be considered an offer, sale or solicitation of an offer to buy shares of The Managers Funds or Managers AMG Funds. Such offering is made only by Prospectus, which includes details as to offering price and other material information.
Letter to Shareholders
Dear Shareholder:
2008 will go down in the history books as one of the most challenging investment periods in decades. Equities sank and Treasuries soared amid ongoing reports of deteriorating credit conditions and weakening economic growth in both the U.S. and abroad. The epicenter of the crisis continued to be in the financial sector, where escalating concerns about toxic mortgage assets culminated in a crisis of confidence in the strength of our most prominent financial institutions. As the trust that is so sorely needed between counterparties across the global financial system evaporated, so did the availability of credit. The scarce availability of credit, along with high levels of leverage, led to numerous firm mergers, bailouts and failures. While the total number of financial firm failures fell well short of levels reached during previous periods of crises, the casualties among the largest and most well-regarded corporations has been unprecedented. The list of firms included the likes of Bear Stearns, Lehman Brothers, Countrywide Financial, Washington Mutual, American International Group, Wachovia, Fannie Mae, Freddie Mac, Citigroup, Merrill Lynch and others.
Meanwhile, the U.S. Government, along with other global leaders, took unprecedented steps to attempt to resolve the credit crisis, contain the damage to real economies, and attempt to restore investor confidence. While the previous U.S. administration, via the Treasury and the Federal Reserve, acted aggressively in an attempt to alleviate the problems associated with the crisis, their efforts will likely require more time before we start to see meaningful results.
The impact of the credit crisis on the equity markets was widespread and severe across all market capitalizations. For the period, the Russell 1000® (large cap), Russell 2000® (small cap), and the Russell 3000® (all cap) Indices returned -37.6%, -33.8% and -37.3%, respectively. In contrast to calendar year 2007, value indices outperformed their growth counterparts for the period, with the Russell 2000® Value Index falling -28.9% while the Russell 2000® Growth Index lost -38.5%. Within the Russell 2000® Index, all sectors declined sharply, with energy and telecommunication services leading the way, dropping - -50.1% and -49.2%, respectively. The more defensive sectors such as utilities and consumer staples held up the best, losing -11.2% and -19.2%, respectively.
Against this backdrop, the performance of the Managers Special Equity Fund (the “Fund”), which is discussed in this report, was challenged as detailed below.
| | | | | | | | | | | | | | | | | | | | |
Periods Ended 12/31/08 | | 6 Months | | | 1 Year | | | 3 Years | | | 5 Years | | | 10 Years | | | Since
Inception | | | Inception
Date |
Managers Special Equity Fund |
Institutional Class | | (35.05 | )% | | (43.35 | )% | | (14.30 | )% | | — | | | — | | | (5.91 | )% | | 5/30/2004 |
Managers Class | | (35.13 | )% | | (43.49 | )% | | (14.50 | )% | | (5.62 | )% | | 1.40 | % | | 9.70 | % | | 6/1/1984 |
Russell 2000® Index | | (26.94 | )% | | (33.79 | )% | | (8.29 | )% | | (0.93 | )% | | 3.02 | % | | 8.51 | % | | 6/1/1984 |
As noted above, for the fiscal year ended December 31, 2008, the Managers Special Equity Fund – Managers Class returned -43.49%, compared to a return of -33.79% for the Russell 2000® Index (the “Index”), the Fund’s primary benchmark.
Similar to the broader markets, the Fund’s performance was disappointing during the year, as it suffered sharp declines, particularly in the first and fourth quarters. Stocks within the energy sector were the worst performers for the year, as the rapid decline in commodity prices sent these stocks tumbling. Surprisingly, financials stocks were among the better performers during the year, apparently propped up by the various rescue packages proposed by the government. The Fund held an underweight position in the sector and the Fund’s finance stocks lagged those in the Index, which detracted from relative performance. Several of the Fund’s stocks within the industrials and information technology sectors also underperformed the broader sector, hurting relative performance. On a positive note, the Fund’s holdings in the consumer discretionary sector held up much better than the sector in general, as education services stocks were the primary contributors in the sector. Lastly, an underweight position, combined with better-than-sector performance in the materials sector also contributed modestly to relative performance for the year.
1
Letter to Shareholders (continued)
As we move forward into 2009, investors will likely continue to debate the length and severity of the current economic recession. This continued uncertainty will likely bring continued volatility to the markets in the short-term. While equity markets have typically responded strongly coming out of past economic recessions, it is difficult to predict if and when that potential rally will happen. In this environment, the Fund’s subadvisors continue to emphasize the tenets of their investment processes that have translated into solid performance for each of them over longer time periods. The Fund remains overweight in the consumer discretionary and health care sectors, while holding a sizeable underweight in the financials sector. Given the Fund’s emphasis on growth, it should be noted that the exposure to financials is slightly greater than that of the Russell 2000® Growth Index.
On an organizational note, the Fund’s Board of Trustees recently approved the addition of Federated MDTA, LLC (“MDT”) and Ranger Investments, LP (“Ranger”) as subadvisors to the Fund. Concurrently, the Board of Trustees approved the removal of Donald Smith & Co. and Veredus Asset Management from the Fund’s list of subadvisors. These changes were made with the goal of re-establishing a growth-style orientation while seeking to improve the consistency of the Fund’s performance results. We believe the enhancements made to the Fund’s subadvisor lineup may translate into improved performance for the Fund, and we remain confident in the ability of each of the Fund’s subadvisors to deliver positive performance over time.
The following report covers the one-year period ended December 31, 2008. Should you have any questions about this report, or if you’d like to receive a prospectus and additional information, including fees and expenses for this or any of the other Funds in our family, please feel free to contact us at 1-800-835-3879, or visit our Web site at www.managersinvest.com. As always, please read the prospectus carefully before you invest or send money.
If you are curious about how you can better diversify your investment program, visit the Knowledge Center on our Web site and view our articles in the investment strategies section. You can rest assured that under all market conditions our team is focused on delivering excellent investment management services for your benefit.
We thank you for your continued confidence and investment in The Managers Funds.
Respectfully,
|
 |
John H. Streur |
Senior Managing Partner Managers Investment Group LLC |
2
About Your Fund’s Expenses
As a shareholder of a Fund, you may incur two types of costs: (1) transaction costs, which may include sales charges (loads) on purchase payments; redemption fees; and exchange fees; and (2) ongoing costs, including management fees; distribution (12b-1) fees; and other Fund expenses. This example is intended to help you understand your ongoing costs (in dollars) of investing in the Fund and to compare these costs with the ongoing costs of investing in other mutual funds. The example is based on $1,000 invested at the beginning of the period and held for the entire period as indicated below.
Actual Expenses
The first line of the following table provides information about the actual account values and actual expenses. You may use the information in this line, together with the amount you invested, to estimate the expenses that you paid over the period. Simply divide your account value by $1,000 (for example, an $8,600 account value divided by $1,000 = 8.6), then multiply the result by the number in the first line under the heading entitled “Expenses Paid During Period” to estimate the expenses you paid on your account during this period.
Hypothetical Example for Comparison Purposes
The second line of the following table provides information about hypothetical account values and hypothetical expenses based on the Fund’s actual expense ratio and an assumed annual rate of return of 5% before expenses, which is not the Fund’s actual return. The hypothetical account values and expenses may not be used to estimate the actual ending account balance or expenses you paid for the period. You may use this information to compare the ongoing costs of investing in the Fund and other funds by comparing this 5% hypothetical example with the 5% hypothetical examples that appear in the shareholder reports of other funds.
Please note that the expenses shown in the table are meant to highlight your ongoing costs only and do not reflect any transactional costs, such as sales charges (loads), redemption fees, or exchange fees. Therefore, the second line of the table is useful in comparing ongoing costs only, and will not help you determine the relative total costs of owning different funds.
| | | | | | | | | | | | |
Six Months Ended December 31, 2008 | | Expense
Ratio for the
Period | | | Beginning
Account Value
7/01/2008 | | Ending
Account Value
12/31/2008 | | Expenses
Paid During
the Period* |
Managers Special Equity Fund - Managers Shares | | | | | | | | | | | | |
Based on Actual Fund Return | | 1.58 | % | | $ | 1,000 | | $ | 649 | | $ | 6.55 |
Based on Hypothetical 5% Annual Return | | 1.58 | % | | $ | 1,000 | | $ | 1,017 | | $ | 8.01 |
Managers Special Equity Fund - Institutional Shares | | | | | | | | | | | | |
Based on Actual Fund Return | | 1.33 | % | | $ | 1,000 | | $ | 650 | | $ | 5.52 |
Based on Hypothetical 5% Annual Return | | 1.33 | % | | $ | 1,000 | | $ | 1,018 | | $ | 6.75 |
| * | Expenses are equal to the Fund’s annualized expense ratio multiplied by the average account value over the period, multiplied by the number of days in the most recent fiscal half-year (184), then divided by 366. |
3
Managers Special Equity Fund
Portfolio Managers’ Comments
The Managers Special Equity Fund’s (the “Fund”) investment objective is to achieve long-term capital appreciation through a diversified portfolio of equity securities of small- and medium-sized companies.
THE PORTFOLIO MANAGERS
The Fund employs multiple subadvisors who specialize in distinct investment approaches. This “intelligence diversification” not only serves to manage risk, but also helps us tap the markets’ full potential by focusing different analytical insights on each prospective investment. Fund management strives to achieve its performance and diversification objectives while ensuring that the Fund operates within the framework of its investment objective and principal investment strategies.
Federated MDTA, LLC
Federated MDTA LLC (“MDT”) utilizes a quantitative process to score stocks based on earnings estimate momentum, long-term growth rates, share buyback and issuance, cash earnings to price ratios, tangible book to price ratios, and earnings risk. A decision-tree approach provides an intuitive, non-linear way to score companies. Stocks are grouped into clusters determined by analyzing different combinations of factor scores and returns, with each cluster containing companies with a different pattern of fundamental characteristics. Optimization is then used to build a portfolio that maximizes the stock-selection score, while adhering to diversification constraints and trading costs. A position is sold or trimmed if the quantitative model identifies a more attractive opportunity (net of trading costs) or if a holding exceeds the maximum company weight of 1.3%. The portfolio typically holds between 100-110 stocks, with no position exceeding 1.3% of the portfolio. Industry weights are limited to +/- 13.5% of the benchmark weight, while sector weights are limited to +/- 22.5% of the benchmark weight.
Lord, Abbett & Co, LLC
The team at Lord, Abbett & Co, LLC (“Lord Abbett”), led by Tom O’Halloran, focuses its stock-selection effort on companies that have revenue growth of at least 15%, are experiencing year-to-year operating margin improvement and earnings growth driven by top-line growth, rather than being driven by one-time events or simple cost cutting measures. The focus is also on identifying companies with higher-quality balance sheets (often captured by finding companies with manageable debt-to-total-capital ratios) and that are already profitable. Once this process is completed, the focus for the team is on forecasting both revenue and earnings growth over the next several years. To achieve this goal, and to find companies that will be growing considerably faster than their industry average, members of the team spend an extensive amount of time understanding the competitive advantages of a firm, the industry dynamics within which they operate and the strength of management. A position is sold or trimmed if there is a fundamental change in the business, a more attractive alternative is found or if a holding reaches a 5% weight in the overall portfolio. The portion of the Fund managed by Lord Abbett typically holds between 100 and 150 stocks with no individual holding exceeding 5%. Lord Abbett has established a risk constraint that prevents any individual industry from being greater than 25% of the total weight of its portion of the Fund.
Ranger Investment Management, L.P.
The team at Ranger Investment Management, L.P. (“Ranger”), led by Conrad Doenges, starts with a universe of stocks with market capitalization between $100 million and $2 billion, from which they establish a list of approximately 250-300 companies on which they conduct detailed research. Each Ranger sector manager builds detailed earnings and cash-flow models for the companies they follow, and also qualitatively gauge, through a stock scoring model, their conviction level in each stock. Companies in the Fund’s portfolio managed by Ranger will typically have a high degree of recurring revenue, steady and/or accelerating sales and earnings growth, solid balance sheet, strong free-cash flows, conservative accounting practices and a seasoned management team. The portfolio typically contains 35-60 stocks, with individual position sizes capped at 5%. Sector exposures are also limited to a maximum of 30%. A stock may be reduced or sold if material changes occur in the company’s earnings estimates, the company’s valuations exceed historical levels, a pre-determined price target is achieved, the stock reaches the maximum position size of 5%, capitalization limit of $5 billion, or it can be replaced with a better risk/reward opportunity.
Skyline Asset Management, L.P.
Skyline Asset Management L.P.’s (“Skyline”) research effort focuses on finding good companies that are not widely followed. Typically they invest in firms with market caps of less than $2 billion. The selection process involves using outside research services, computer screens, and internally maintained lists of potential companies/stocks to identify new ideas. These ideas are then screened to determine whether they meet certain basic criteria: relative valuation, capitalization, financial strength, and opportunities for continued growth. This screening process reduces the list from 2,000 names to 150-200. This list is then analyzed more rigorously to answer the question, “Why will earnings increase at an above-average rate?” All company documents are analyzed, any available industry or research reports are reviewed and, most importantly, questions are addressed directly to senior company management. The final portfolio managed by Skyline will contain 65-85 stocks and is generally fully invested. The portfolio will tend to be well diversified and the portfolio’s P/E ratio will be consistently below that of the Russell 2000®. Skyline sells stocks when they reach a sell target, which is usually a P/E equal to the overall stock market, or if the company’s fundamentals have changed so that the original investment thesis is no longer valid.
Smith Asset Management Group, L.P.
Smith Asset Management Group, L.P.’s (“Smith Group”) investment process is based on a combination of a well-conceived quantitative screening process coupled with experienced, intelligent fundamental and qualitative analysis. The team is focused on predicting which attractively valued companies will report a succession of positive earnings surprises. The process begins by seeking companies with attractive risk profiles and valuations, as well as dramatically improving business fundamentals. To manage risk, Smith screens for companies with good corporate governance, strong financial quality, attractive valuation, and moderate portfolio beta. To identify high earnings growth companies, Smith screens for rising earnings expectations, improving earnings quality, a
4
Managers Special Equity Fund
Portfolio Managers’ Comments (continued)
high percentage of positive earnings surprise, and high earnings growth rate. The Fund’s portfolio managed by Smith will typically hold 100-120 stocks, with no individual position greater than 3.0%. Sector weightings are limited to no more than two times the weighting in the Russell 2000®. Stocks are sold from the portfolio if a negative earnings surprise is predicted by either the process or management guidance, a negative earnings surprise is actually reported, the stock’s valuation level is too high, or a buyout announcement is made.
Westport Asset Management, Inc.
The portfolio management team at Westport Asset Management, Inc. (“Westport”), led by Andy Knuth, is focused on future profits only, and, in fact, prefers to find businesses which are inherently good but which have gone through a troubling period. Acquisitions or divestitures, management shake-ups, changes in the business cycle, or the development of a proprietary product in a strong industry are all factors that might improve earnings and investor perceptions. The Westport managed portion of the Fund will typically be concentrated, and any industry concentrations are merely an outcome of stock selection. Because some of the companies in which Westport invests may not have earnings, the price to trailing earnings ratio may be high, although the price-to-forward-earnings will be well below average. The management style is patient, usually turning over less than 20% per year.
THE YEAR IN REVIEW
Over the 12 months ended December 31, 2008, the Managers Special Equity Fund Managers Class of shares returned -43.49% and the Institutional Class of shares returned -43.35%, both trailing the -33.79% return of the Russell 2000® Index.
Equity markets were challenged right out of the gate in 2008, with small cap-equities falling nearly 10% in the first quarter. Evidence had already begun mounting regarding a recession in the U.S., and investors’ macro-economic concerns seemed to outweigh their attention to company fundamentals. Markets saw a brief rally in the second quarter, as the Federal Reserve’s move to establish a credit facility for primary dealers seemed to restore some confidence in the markets. Ultimately, though, concerns over the impact of sustained higher energy prices and rising food prices continued to take their toll on the markets. The months of September, October, and November proved to be the most difficult, as small-cap stocks declined an additional 35%, and volatility in the equity markets reached an all-time high during the fourth quarter. Ultimately, the markets appeared to be dominated more by macro-economic themes rather than by company fundamentals. Somewhat surprisingly, small-cap stocks held up better than large-cap stocks for the year. Within small-caps, value stocks outperformed growth stocks by nearly 10% for the year.
Similar to the broader markets, the Fund’s performance was disappointing during the year, as it suffered sharp declines, particularly in the first and fourth quarters. Stocks within the energy sector were the worst performers for the year, as the rapid decline in commodity prices sent these stocks tumbling. While the Fund did hold some strong performers in the sector, namely Comstock Resources (+39%), stocks such as Plains Exploration (-57%) and Atwood Oceanics (-58%) offset those positive results. Surprisingly, financials were among the better performers during the year, apparently benefiting from the various government rescue packages . The Fund was underweighted in the sector, however, which detracted from relative performance. Additionally, positions in Downey Financial (-95%) and SVB Financial (-48%) detracted further. Several of the Fund’s stocks within the industrials sector, most notably Dycom Industries (-53%), underperformed the broader sector. On a positive note, the Fund’s holdings in the consumer discretionary sector held up much better than the sector in general. Education services stocks were the primary contributors in the sector, with DeVry Inc (+11%), ITT Educational Services (+11%), and Corinthian Colleges (+28%) all turning in double digit returns while in the portfolio. Lastly, an underweight position, combined with better-than-index stock performance in the materials sector also contributed modestly to relative performance for the year.
LOOKING FORWARD
On an organizational note, the Fund’s Board of Trustees approved the addition of MDT and Ranger as subadvisors to the Fund in September 2008. Concurrently, the Board of Trustees approved the removal of Donald Smith & Co. and Veredus Asset Management from the Fund’s list of subadvisors. These changes were made with the goal of re-establishing a growth style orientation while seeking to improve the consistency of the Fund’s performance results.
Heading into 2009, stocks within the health care, information technology, and consumer discretionary sectors continue to represent the largest exposures for the Fund, and each of these sector positions represents an overweight relative to the respective exposure in the Index. The Fund continues to hold lower-than-benchmark positions in the financials, materials, and utilities sectors. As a result of the subadvisor changes outlined above, these sector positions are more closely aligned with the small-cap growth benchmark. In addition, we believe the Portfolio continues to be attractively valued relative to both its historical and expected earnings growth rates, and we believe the changes made to the Fund’s subadvisor line-up will produce improved and more consistent long-term performance.
CUMULATIVE TOTAL RETURN PERFORMANCE
Managers Special Equity Fund’s cumulative total return is based on the daily change in net asset value (NAV), and assumes that all distributions were reinvested. The Russell 2000® Index measures the performance of the 2,000 smallest companies in the Russell 3000® Index, which measures the performance of the 3,000 largest U.S. companies based on total market capitalization. The Index reflects no deduction for fees, expenses, or taxes. Unlike the Fund, the Russell 2000® Index is unmanaged, is not available for investment, and does not incur expenses. The first chart compares a hypothetical $10,000 investment made in Managers Special Equity Fund– Managers Class on December 31, 1998, to a $10,000 investment made in the Russell 2000® Index for the same time period. The second chart compares a hypothetical $10,000 investment made in Managers Special Equity Fund– Institutional Class on May 3, 2004, to a $10,000 investment made in the Russell 2000® Index for the same time period. The graphs and tables do not reflect the deduction of taxes that a shareholder would pay on a Fund distribution or redemption of shares. Past performance is not indicative of future results.
5
Managers Special Equity Fund
Portfolio Managers’ Comments (continued)
CUMULATIVE TOTAL RETURN PERFORMANCE (continued)
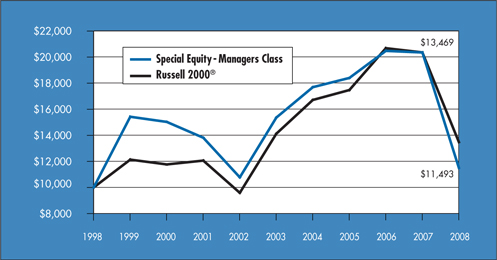
The table below shows the average annual total returns for Managers Special Equity Fund– Managers Class and the Russell 2000® Index since December 31, 1998 through December 31, 2008.
| | | | | | | | | | | |
Average Annual Total Returns 1 | | One Year | | | Five Years | | | Ten Years | | | Inception Date |
| Special Equity - Managers Class 2 | | (43.49 | )% | | (5.62 | )% | | 1.40 | % | | 6/1/84 |
Russell 2000® Index | | (33.79 | )% | | (0.93 | )% | | 3.02 | % | | |
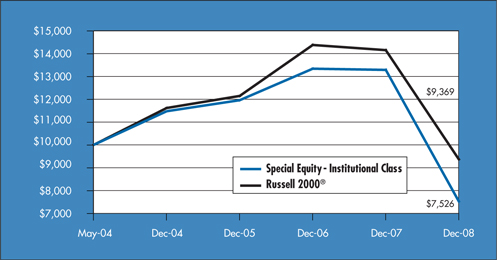
The table below shows the average annual total returns for Special Equity– Institutional Class and the Russell 2000® Index since May 3, 2004 through December 31, 2008.
| | | | | | | | |
Average Annual Total Returns 1 | | One Year | | | Since Inception | | | Inception Date |
Special Equity - Institutional Class 2 | | (43.35 | )% | | (5.91 | )% | | 5/3/04 |
Russell 2000® Index | | (33.79 | )% | | (1.39 | )% | | |
The performance data shown represents past performance, which is not a guarantee of future results. Current performance may be lower or higher than the performance data quoted. The investment return and principal value of an investment in the Funds will fluctuate so that an investor’s shares, when redeemed, may be worth more or less than their original cost. For performance information through the most recent month end please call (800) 835-3879 or visit our Web site at www.managersinvest.com.
In choosing a Fund, investors should carefully consider the amount they plan to invest, their investment objectives, the Fund’s investment objectives, risks, charges and expenses before investing. For this and other information, please call (800) 835-3879 or visit www.managersinvest.com for a free prospectus. Read it carefully before investing or sending money. Distributed by Managers Distributors, Inc., member FINRA.
The Fund is subject to risks associated with investments in small capitalization companies, such as erratic earnings patterns, competitive conditions, limited earnings history, and a reliance on one or a limited number of products.
The Russell 2000® Index is composed of the 2,000 smallest stocks in the Russell 3000® Index of the 3,000 largest U.S. companies as measured by market capitalization, and is widely regarded in the industry as the premier measure of small-cap stock performance. Unlike the Fund, the Russell 2000® Index is unmanaged, is not available for investment, and does not incur expenses.
The Russell 2000® Index is a trademark of Russell Investments. Russell® is a trademark of Russell Investments.
1 | Total return equals income yield plus share price change and assumes reinvestment of all dividends and capital gain distributions. Returns are net of fees and may reflect offsets of Fund expenses as described in the Prospectus. No adjustment has been made for taxes payable by shareholders on their reinvested dividends and capital gain distributions. Returns for periods greater than one year are annualized. The listed returns on the Fund are net of expenses. All returns are in U.S. dollars($). |
2 | From time to time, the Fund’s advisor has waived its fees and/or absorbed Fund expenses, which has resulted in higher returns. |
Not FDIC insured, nor bank guaranteed. May lose value.
6
Managers Special Equity Fund
Fund Snapshots
December 31, 2008
Portfolio Breakdown
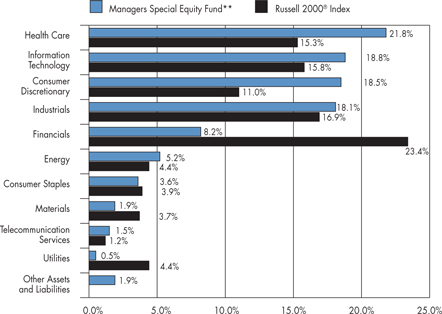
| | | | | | |
Industry | | Managers Special
Equity Fund ** | | | Russell 2000®
Index | |
Health Care | | 21.8 | % | | 15.3 | % |
Information Technology | | 18.8 | % | | 15.8 | % |
Consumer Discretionary | | 18.5 | % | | 11.0 | % |
Industrials | | 18.1 | % | | 16.9 | % |
Financials | | 8.2 | % | | 23.4 | % |
Energy | | 5.2 | % | | 4.4 | % |
Consumer Staples | | 3.6 | % | | 3.9 | % |
Materials | | 1.9 | % | | 3.7 | % |
Telecommunication Services | | 1.5 | % | | 1.2 | % |
Utilities | | 0.5 | % | | 4.4 | % |
Other Assets and Liabilities | | 1.9 | % | | 0.0 | % |
| | ** | As a percentage of net assets |
Top Ten Holdings
| | | |
Security Name | | Percentage of
Net Assets | |
DeVry, Inc. * | | 1.6 | % |
Masimo Corp. | | 1.3 | |
HMS Holdings Corp. | | 1.2 | |
Wabtec Corp. | | 1.1 | |
AAR Corp. | | 1.1 | |
Phase Forward, Inc. | | 1.1 | |
ITT Educational Services, Inc. | | 1.0 | |
Immucor, Inc. | | 1.0 | |
Parametric Technology Corp. | | 1.0 | |
Vocus, Inc. | | 1.0 | |
| | | |
Top Ten as a Group | | 11.4 | % |
| | | |
| | * | Top Ten Holding at June 30, 2008 |
Any sectors, industries, or securities discussed should not be perceived as investment recommendations. Mention of a specific security should not be considered a recommendation to buy or solicitation to sell that security.
7
Managers Special Equity Fund
Schedule of Portfolio Investments
December 31, 2008
| | | | | | |
| | | Shares | | | Value |
| Common Stocks—98.1% | | | | | | |
Consumer Discretionary—18.5% | | | | | | |
99 Cents Only Stores* | | 371,823 | | | $ | 4,064,026 |
Aaron Rents, Inc. | | 25,800 | 2 | | | 686,796 |
Aeropostale, Inc.* | | 56,500 | | | | 909,650 |
American Public Education, Inc.* | | 87,407 | | | | 3,250,666 |
ArvinMeritor, Inc. | | 67,861 | | | | 193,404 |
ATC Technology Corp.* | | 25,500 | | | | 373,065 |
Bally Technologies, Inc.* | | 39,300 | | | | 944,379 |
Big 5 Sporting Goods Corp. | | 78,600 | | | | 409,506 |
Big Lots, Inc.* | | 239,902 | | | | 3,476,181 |
Blount International, Inc.* | | 24,015 | | | | 227,662 |
Buckle, Inc., The | | 68,493 | | | | 1,494,517 |
Capella Education Co.* | | 45,113 | | | | 2,650,840 |
Carter’s, Inc.* | | 28,197 | | | | 543,074 |
CEC Entertainment, Inc.* | | 31,761 | | | | 770,204 |
Chipotle Mexican Grill, Inc.* | | 21,950 | 2 | | | 1,360,461 |
Chipotle Mexican Grill, Inc., Class B* | | 12,138 | | | | 695,386 |
CKE Restaurants, Inc. | | 72,983 | | | | 633,492 |
Corinthian Colleges, Inc.* | | 181,714 | 2 | | | 2,974,658 |
Ctrip.com International, Ltd. | | 30,300 | 2 | | | 721,140 |
Deckers Outdoor Corp.* | | 49,010 | | | | 3,914,429 |
DeVry, Inc. | | 121,523 | | | | 6,976,636 |
Dick’s Sporting Goods, Inc.* | | 75,208 | 2 | | | 1,061,185 |
Dress Barn, Inc., The* | | 62,600 | | | | 672,324 |
Drew Industries, Inc.* | | 21,400 | | | | 256,800 |
Fossil, Inc.* | | 21,799 | 2 | | | 364,043 |
Fuel Systems Solutions, Inc.* | | 62,983 | 2 | | | 2,063,323 |
G-III Apparel Group, Ltd.* | | 29,594 | | | | 189,106 |
Gildan Activewear, Inc., Class A* | | 106,400 | 2 | | | 1,251,264 |
Grand Canyon Education, Inc.* | | 60,958 | | | | 1,144,791 |
Gymboree Corp.* | | 32,500 | | | | 847,925 |
Hawk Corp., Class A* | | 17,425 | | | | 289,255 |
Hillenbrand, Inc. | | 33,213 | | | | 553,993 |
Hot Topic, Inc.* | | 97,340 | | | | 902,342 |
ITT Educational Services, Inc.* | | 49,300 | | | | 4,682,514 |
J. Crew Group, Inc.* | | 11,200 | 2 | | | 136,640 |
Jo-Ann Stores, Inc.* | | 46,147 | | | | 714,817 |
Jos. A. Bank Clothiers, Inc.* | | 48,990 | | | | 1,281,088 |
K12, Inc.* | | 105,606 | | | | 1,980,112 |
Lululemon Athletica, Inc.* | | 87,585 | 2 | | | 694,549 |
MarineMax, Inc.* | | 55,300 | | | | 187,467 |
Marvel Entertainment, Inc.* | | 39,700 | | | | 1,220,775 |
McCormick & Schmick’s Seafood Restaurants, Inc.* | | 70,600 | | | | 283,812 |
Netflix, Inc.* | | 84,711 | 2 | | | 2,532,012 |
New Oriental Education & Technology Group, Inc., ADR* | | 17,607 | 2 | | | 966,800 |
Orient-Express Hotels, Ltd. | | 202,048 | | | | 1,547,688 |
Panera Bread Co., Class A* | | 26,255 | 2 | | | 1,371,561 |
PetMed Express, Inc.* | | 81,129 | | | | 1,430,304 |
Polaris Industries, Inc. | | 54,856 | 2 | | | 1,571,624 |
Prestige Brands Holdings, Inc.* | | 125,700 | | | | 1,326,135 |
Ross Stores, Inc. | | 26,600 | | | | 790,818 |
Saks, Inc.* | | 720,800 | | | | 3,157,104 |
Sally Beauty Holdings, Inc.* | | 111,000 | | | | 631,590 |
Sonic Corp.* | | 47,300 | | | | 575,641 |
Steven Madden, Ltd.* | | 70,690 | | | | 1,507,111 |
Strayer Education, Inc. | | 10,100 | | | | 2,165,541 |
True Religion Apparel, Inc.* | | 100,283 | | | | 1,247,521 |
Under Armour, Inc., Class A* | | 20,900 | 2 | | | 498,256 |
Westport Innovations, Inc.* | | 134,160 | | | | 684,216 |
WMS Industries, Inc.* | | 61,090 | 2 | | | 1,643,321 |
Wolverine World Wide, Inc. | | 34,831 | | | | 732,844 |
Total Consumer Discretionary | | | | | | 82,428,384 |
Consumer Staples—3.6% | | | | | | |
B&G Foods, Inc. | | 148,800 | | | | 803,520 |
Casey’s General Stores, Inc. | | 34,225 | | | | 779,303 |
Central European Distribution Corp.* | | 42,687 | | | | 840,934 |
Chattem, Inc.* | | 21,299 | 2 | | | 1,523,517 |
Flowers Foods, Inc. | | 73,900 | | | | 1,800,204 |
Green Mountain Coffee Roasters, Inc.* | | 77,972 | 2 | | | 3,017,517 |
Hansen Natural Corp.* | | 42,700 | 2 | | | 1,431,731 |
Nash Finch Co. | | 16,345 | | | | 733,727 |
Ralcorp Holdings, Inc.* | | 13,300 | | | | 776,720 |
TreeHouse Foods, Inc.* | | 73,720 | | | | 2,008,133 |
USANA Health Sciences, Inc.* | | 24,126 | | | | 826,074 |
Zhongpin, Inc.* | | 108,884 | | | | 1,306,608 |
Total Consumer Staples | | | | | | 15,847,988 |
Energy—5.2% | | | | | | |
Arena Resources, Inc.* | | 99,688 | | | | 2,800,236 |
Bill Barrett Corp.* | | 11,500 | | | | 242,995 |
Brigham Exploration Co.* | | 201,180 | | | | 643,776 |
Bristow Group, Inc.* | | 11,800 | | | | 316,122 |
CARBO Ceramics, Inc. | | 102,955 | 2 | | | 3,657,991 |
Complete Production Services, Inc. | | 51,180 | | | | 417,117 |
Comstock Resources, Inc.* | | 3,385 | | | | 159,941 |
The accompanying notes are an integral part of these financial statements.
8
Managers Special Equity Fund
Schedule of Portfolio Investments (continued)
| | | | | | |
| | | Shares | | | Value |
Energy—5.2% (continued) | | | | | | |
Core Laboratories, N.V. | | 25,320 | | | $ | 1,515,655 |
Dril-Quip, Inc.* | | 29,100 | | | | 596,841 |
Encore Acquisition Co.* | | 33,001 | | | | 842,186 |
EXCO Resources, Inc.* | | 151,543 | | | | 1,372,980 |
Goodrich Petroleum Corp.* | | 27,340 | | | | 818,833 |
Gulfmark Offshore, Inc.* | | 30,800 | | | | 732,732 |
Key Energy Services, Inc.* | | 40,700 | | | | 179,487 |
Matrix Service Co.* | | 135,068 | | | | 1,035,972 |
Oceaneering International, Inc.* | | 30,324 | | | | 883,641 |
Penn Virginia Corp. | | 17,800 | | | | 462,444 |
Plains Exploration & Production Co.* | | 162,508 | | | | 3,776,695 |
Quicksilver Resources, Inc.* | | 134,500 | 2 | | | 749,165 |
Tesoro Corp. | | 69,400 | | | | 913,998 |
Tidewater, Inc. | | 25,600 | | | | 1,030,912 |
Total Energy | | | | | | 23,149,719 |
Financials—8.2% | | | | | | |
Amtrust Financial Services, Inc. | | 32,973 | | | | 382,487 |
Aspen Insurance Holdings, Ltd. | | 30,000 | | | | 727,500 |
Astoria Financial Corp. | | 44,800 | 2 | | | 738,304 |
Bank of the Ozarks, Inc. | | 29,640 | 2 | | | 878,530 |
BioMed Realty Trust, Inc. | | 33,600 | | | | 393,792 |
Cash America International, Inc. | | 25,039 | | | | 684,817 |
Catalyst Health Solutions, Inc.* | | 49,500 | | | | 1,205,325 |
Community Bank System, Inc. | | 54,200 | | | | 1,321,938 |
Cowen Group, Inc.* | | 62,153 | | | | 387,835 |
Delphi Financial Group, Inc., Class A | | 44,850 | | | | 827,034 |
Entertainment Properties Trust | | 22,800 | 2 | | | 679,440 |
EZCORP, Inc., Class A* | | 40,176 | | | | 611,077 |
Financial Federal Corp. | | 37,800 | | | | 879,606 |
First BanCorp | | 109,100 | | | | 1,215,374 |
Glacier Bancorp, Inc. | | 60,000 | 2 | | | 1,141,200 |
Greenhill & Co., Inc. | | 16,625 | 2 | | | 1,159,926 |
Hanover Insurance Group, Inc. | | 27,700 | | | | 1,190,269 |
Harleysville Group, Inc. | | 24,025 | | | | 834,388 |
Inland Real Estate Corp. | | 51,900 | | | | 673,662 |
Interactive Brokers Group, Inc., Class A* | | 41,199 | | | | 737,050 |
Investors Bancorp, Inc.* | | 52,133 | | | | 700,146 |
KBW, Inc.* | | 42,900 | | | | 986,700 |
Knight Capital Group, Inc., Class A* | | 49,948 | | | | 806,660 |
Life Partners Holdings, Inc. | | 20,986 | | | | 915,829 |
National Western Life Insurance Co., Class A | | 10,371 | | | | 1,754,462 |
Oriental Financial Group, Inc. | | 54,275 | | | | 328,364 |
Oritani Financial Corp.* | | 19,594 | | | | 330,159 |
Penson Worldwide, Inc.* | | 51,400 | | | | 391,668 |
PrivateBancorp, Inc. | | 12,974 | | | | 421,136 |
Prosperity Bancshares, Inc. | | 27,900 | | | | 825,561 |
Provident Financial Services, Inc. | | 44,300 | | | | 677,790 |
PS Business Parks, Inc. | | 14,500 | | | | 647,570 |
RAM Holdings, Ltd.* | | 92,200 | | | | 34,114 |
Reinsurance Group of America, Inc. | | 34,100 | | | | 1,460,162 |
Saul Centers, Inc. | | 15,900 | | | | 628,050 |
SeaBright Insurance Holdings, Inc.* | | 79,135 | | | | 929,045 |
Senior Housing Properties Trust | | 34,100 | | | | 611,072 |
South Financial Group, Inc., The | | 225,000 | | | | 972,000 |
SVB Financial Group* | | 84,864 | 2 | | | 2,225,983 |
thinkorswim Group, Inc.* | | 62,903 | | | | 353,515 |
Tower Group, Inc. | | 36,200 | | | | 1,021,202 |
TradeStation Group, Inc.* | | 84,800 | | | | 546,960 |
UMB Financial Corp. | | 26,200 | | | | 1,287,468 |
United PanAm Financial Corp.* | | 33,000 | | | | 52,800 |
Validus Holdings, Ltd. | | 35,900 | | | | 939,144 |
Total Financials | | | | | | 36,517,114 |
Health Care—21.8% | | | | | | |
Acorda Therapeutics, Inc.* | | 52,289 | | | | 1,072,447 |
Albany Molecular Research, Inc.* | | 8,646 | | | | 84,212 |
Alexion Pharmaceuticals, Inc.* | | 65,100 | | | | 2,355,969 |
Alkermes, Inc.* | | 59,457 | | | | 633,217 |
Alliance Imaging, Inc.* | | 116,300 | | | | 926,911 |
Amedisys, Inc.* | | 49,262 | | | | 2,036,491 |
American Medical Systems Holdings, Inc.* | | 76,900 | | | | 691,331 |
AmSurg Corp.* | | 26,400 | | | | 616,176 |
athenahealth, Inc.* | | 43,257 | | | | 1,627,328 |
CardioNet, Inc.* | | 94,227 | | | | 2,322,696 |
Charles River Laboratories International, Inc.* | | 86,960 | | | | 2,278,352 |
Chemed Corp. | | 41,376 | | | | 1,645,524 |
Computer Programs & Systems, Inc. | | 57,033 | | | | 1,528,484 |
CONMED Corp.* | | 47,700 | | | | 1,141,938 |
Covance, Inc.* | | 19,200 | 2 | | | 883,776 |
Cubist Pharmaceuticals, Inc.* | | 70,058 | 2 | | | 1,692,601 |
Cyberonics, Inc.* | | 50,926 | | | | 843,844 |
Dionex Corp.* | | 20,600 | | | | 923,910 |
Emergency Medical Services Corp., Class A* | | 23,486 | | | | 859,822 |
Emergent BioSolutions, Inc.* | | 31,654 | | | | 826,486 |
eResearch Technology, Inc.* | | 166,872 | | | | 1,106,361 |
Eurand N.V.* | | 99,200 | | | | 854,112 |
Five Star Quality Care, Inc.* | | 185,372 | | | | 283,619 |
Genoptix, Inc.* | | 79,123 | | | | 2,696,512 |
The accompanying notes are an integral part of these financial statements.
9
Managers Special Equity Fund
Schedule of Portfolio Investments (continued)
| | | | | | |
| | | Shares | | | Value |
Health Care—21.8% (continued) | | | | | | |
Gen-Probe, Inc.* | | 55,360 | | | $ | 2,371,622 |
Gentiva Health Services, Inc.* | | 28,924 | | | | 846,316 |
Haemonetics Corp.* | | 13,935 | | | | 787,328 |
HMS Holdings Corp.* | | 163,323 | | | | 5,147,941 |
ICON PLC* | | 99,631 | | | | 1,961,734 |
Illumina, Inc.* | | 71,700 | 2 | | | 1,867,785 |
Immucor, Inc.* | | 175,519 | | | | 4,665,295 |
inVentiv Health, Inc.* | | 35,100 | | | | 405,054 |
Kendle International, Inc.* | | 63,920 | | | | 1,644,022 |
Kensey Nash Corp.* | | 57,099 | | | | 1,108,292 |
LHC Group, Inc.* | | 47,170 | | | | 1,698,120 |
Martek Biosciences Corp.* | | 59,883 | | | | 1,815,054 |
Masimo Corp.* | | 198,760 | | | | 5,929,010 |
Matrixx Initiatives, Inc.* | | 31,697 | | | | 522,684 |
MedAssets, Inc.* | | 47,603 | | | | 695,004 |
Meridian Bioscience, Inc. | | 44,000 | | | | 1,120,680 |
Merit Medical Systems, Inc.* | | 107,253 | | | | 1,923,046 |
Myriad Genetics, Inc.* | | 31,900 | | | | 2,113,694 |
Natus Medical, Inc.* | | 168,440 | | | | 2,181,298 |
Noven Pharmaceuticals, Inc.* | | 57,407 | | | | 631,477 |
NuVasive, Inc.* | | 46,287 | 2 | | | 1,603,845 |
Odyssey HealthCare, Inc.* | | 86,300 | | | | 798,275 |
Onyx Pharmaceuticals, Inc.* | | 53,955 | | | | 1,843,103 |
OSI Pharmaceuticals, Inc.* | | 62,000 | 2 | | | 2,421,100 |
Owens & Minor, Inc. | | 21,100 | | | | 794,415 |
Perrigo Co. | | 27,000 | | | | 872,370 |
Phase Forward, Inc.* | | 381,080 | | | | 4,771,122 |
Psychiatric Solutions, Inc.* | | 90,660 | 2 | | | 2,524,881 |
Questcor Pharmaceuticals, Inc.* | | 86,357 | | | | 803,984 |
Quidel Corp.* | | 127,753 | | | | 1,669,732 |
Rochester Medical Corp.* | | 14,209 | | | | 218,534 |
Steris Corp. | | 27,600 | | | | 659,364 |
Sun Healthcare Group, Inc.* | | 139,481 | | | | 1,234,407 |
Synovis Life Technologies, Inc.* | | 25,295 | | | | 474,028 |
Thoratec Corp.* | | 93,973 | 2 | | | 3,053,183 |
United Therapeutics Corp.* | | 16,700 | 2 | | | 1,044,585 |
VNUS Medical Technologies, Inc.* | | 63,600 | | | | 1,031,592 |
Wright Medical Group, Inc.* | | 48,869 | | | | 998,394 |
Xenoport, Inc.* | | 20,251 | | | | 507,895 |
Total Health Care | | | | | | 96,692,384 |
Industrials—18.1% | | | | | | |
AAR Corp.* | | 259,200 | | | | 4,771,871 |
Acco Brands Corp.* | | 287,000 | | | | 990,150 |
AeroVironment, Inc.* | | 13,573 | | | | 499,622 |
Allegiant Travel Co.* | | 32,932 | | | | 1,599,507 |
Altra Holdings, Inc.* | | 27,900 | | | | 220,689 |
American Commercial Lines, Inc.* | | 163,255 | | | | 799,950 |
American Science & Engineering, Inc. | | 10,473 | | | | 774,583 |
American Superconductor Corp.* | | 88,519 | 2 | | | 1,443,745 |
Applied Signal Technology, Inc. | | 4,795 | | | | 86,022 |
Axsys Technologies, Inc.* | | 33,884 | | | | 1,858,876 |
AZZ, Inc.* | | 65,673 | | | | 1,648,392 |
Baldor Electric Co. | | 17,500 | | | | 312,375 |
BE Aerospace, Inc.* | | 38,700 | | | | 297,603 |
Beacon Roofing Supply, Inc.* | | 146,242 | | | | 2,029,839 |
Brady Corp. | | 24,400 | 2 | | | 584,380 |
Bucyrus International, Inc. | | 20,200 | | | | 374,104 |
CAI International, Inc.* | | 53,900 | | | | 170,863 |
Carlisle Cos., Inc. | | 18,800 | | | | 389,160 |
CBIZ, Inc.* | | 211,700 | | | | 1,831,205 |
Chart Industries, Inc.* | | 34,400 | | | | 365,672 |
Clean Harbors, Inc.* | | 23,900 | | | | 1,516,216 |
Colfax Corp.* | | 156,561 | | | | 1,626,669 |
Consolidated Graphics, Inc.* | | 42,140 | | | | 954,050 |
Con-way, Inc. | | 15,700 | 2 | | | 417,620 |
Cornell Companies, Inc.* | | 171,110 | | | | 3,180,935 |
Crane Co. | | 21,700 | | | | 374,108 |
DXP Enterprises, Inc.* | | 41,853 | | | | 611,472 |
DynCorp International, Inc.* | | 28,070 | | | | 425,822 |
EMCOR Group, Inc.* | | 41,100 | | | | 921,873 |
Energy Conversion Devices, Inc.* | | 39,958 | 2 | | | 1,007,341 |
Energy Recovery, Inc.* | | 135,000 | | | | 1,023,300 |
EnerNOC, Inc.* | | 172,825 | | | | 1,285,818 |
EnerSys* | | 36,302 | | | | 399,322 |
Exponent, Inc.* | | 29,895 | | | | 899,242 |
Franklin Electric Co., Inc. | | 12,521 | | | | 351,965 |
FTI Consulting, Inc.* | | 31,500 | | | | 1,407,420 |
Furmanite Corp.* | | 66,257 | | | | 357,125 |
Genesee & Wyoming, Inc., Class A* | | 114,250 | | | | 3,484,625 |
Geo Group, Inc., The* | | 135,290 | | | | 2,439,279 |
GeoEye, Inc.* | | 19,901 | | | | 382,696 |
Gorman-Rupp Co., The | | 11,900 | | | | 370,328 |
GrafTech International, Ltd.* | | 71,500 | | | | 594,880 |
Heidrick & Struggles International, Inc. | | 29,700 | | | | 639,738 |
Herman Miller, Inc. | | 39,900 | | | | 519,897 |
Hexcel Corp.* | | 225,400 | | | | 1,665,706 |
Huron Consulting Group, Inc.* | | 54,710 | | | | 3,133,242 |
The accompanying notes are an integral part of these financial statements.
10
Managers Special Equity Fund
Schedule of Portfolio Investments (continued)
| | | | | | |
| | | Shares | | | Value |
Industrials—18.1% (continued) | | | | | | |
II-VI, Inc.* | | 32,181 | | | $ | 614,335 |
Kaydon Corp. | | 11,500 | | | | 395,025 |
LaBarge, Inc.* | | 22,918 | | | | 328,873 |
LMI Aerospace, Inc.* | | 58,975 | | | | 670,546 |
Marten Transport, Ltd.* | | 44,000 | | | | 834,240 |
Middleby Corp., The* | | 48,200 | | | | 1,314,414 |
MYR Group, Inc./Delaware* | | 103,585 | | | | 1,035,850 |
NCI Building Systems, Inc.* | | 23,900 | | | | 389,570 |
Pike Electric Corp.* | | 62,724 | | | | 771,505 |
RBC Bearings, Inc.* | | 34,700 | | | | 703,716 |
Resources Connection, Inc.* | | 31,400 | | | | 514,332 |
Ritchie Bros. Auctioneers, Inc. | | 116,590 | | | | 2,497,358 |
Robbins & Myers, Inc. | | 18,409 | | | | 297,674 |
Robert Half International, Inc. | | 20,300 | | | | 422,646 |
SkyWest, Inc. | | 26,360 | | | | 490,296 |
Spherion Corp.* | | 155,800 | | | | 344,318 |
Stanley, Inc.* | | 25,045 | | | | 907,130 |
SunPower Corp., Class B* | | 37,381 | | | | 1,137,878 |
Sykes Enterprises, Inc.* | | 41,822 | | | | 799,637 |
TAL International Group, Inc. | | 5,929 | | | | 83,599 |
Team, Inc.* | | 72,620 | | | | 2,011,574 |
Teledyne Technologies, Inc.* | | 32,992 | | | | 1,469,794 |
Tetra Technologies, Inc.* | | 15,438 | | | | 372,828 |
Toro Co., The | | 15,500 | 2 | | | 511,500 |
Triumph Group, Inc. | | 58,443 | | | | 2,481,490 |
Valmont Industries, Inc. | | 26,865 | | | | 1,648,436 |
Wabtec Corp. | | 128,320 | | | | 5,100,719 |
Waste Connections, Inc.* | | 27,719 | | | | 875,089 |
Woodward Governor Co. | | 17,800 | | | | 409,756 |
Total Industrials | | | | | | 80,473,425 |
Information Technology—18.8% | | | | | | |
3PAR, Inc.* | | 101,992 | | | | 778,199 |
ACI Worldwide, Inc.* | | 7,682 | | | | 122,144 |
ADC Telecommunications, Inc.* | | 54,900 | | | | 300,303 |
Ariba, Inc.* | | 88,383 | | | | 637,241 |
Arris Group, Inc.* | | 83,800 | | | | 666,210 |
Aruba Networks, Inc.* | | 257,897 | | | | 657,637 |
AsiaInfo Holdings, Inc.* | | 75,565 | | | | 894,690 |
Atheros Communications, Inc.* | | 40,022 | | | | 572,715 |
Bankrate, Inc.* | | 48,471 | | | | 1,841,898 |
Benchmark Electronics, Inc.* | | 55,950 | | | | 714,482 |
Blackboard, Inc.* | | 31,500 | | | | 826,245 |
Brocade Communications Systems, Inc.* | | 116,793 | | | | 327,020 |
CACI International, Inc., Class A* | | 28,800 | | | | 1,298,592 |
Cavium Networks, Inc.* | | 70,683 | | | | 742,878 |
Checkpoint Systems, Inc.* | | 397,300 | | | | 3,909,432 |
Cirrus Logic, Inc.* | | 23,013 | | | | 61,675 |
Comtech Telecommunications Corp.* | | 36,072 | | | | 1,652,819 |
Concur Technologies, Inc.* | | 57,567 | 2 | | | 1,889,349 |
CSG Systems International, Inc.* | | 110,089 | | | | 1,923,255 |
CyberSource Corp.* | | 63,890 | | | | 766,041 |
Data Domain, Inc.* | | 52,628 | 2 | | | 989,406 |
Electronics for Imaging, Inc.* | | 39,381 | | | | 376,482 |
Equinix, Inc.* | | 33,030 | | | | 1,756,866 |
Euronet Worldwide, Inc.* | | 31,000 | | | | 359,910 |
F5 Networks, Inc.* | | 79,355 | | | | 1,814,055 |
Fairchild Semiconductor International, Inc.* | | 55,600 | | | | 271,884 |
FLIR Systems, Inc.* | | 20,645 | | | | 633,389 |
GSI Commerce, Inc.* | | 85,600 | | | | 900,512 |
Harris Stratex Networks, Inc.* | | 31,622 | | | | 163,170 |
Hittite Microwave Corp.* | | 21,800 | | | | 642,228 |
iGATE Corp.* | | 43,855 | | | | 285,496 |
Infinera Corp.* | | 27,805 | | | | 249,133 |
Informatica Corp.* | | 138,690 | | | | 1,904,214 |
Integral Systems, Inc.* | | 2,007 | | | | 24,184 |
Interwoven, Inc.* | | 110,720 | | | | 1,395,072 |
IPG Photonics Corp.* | | 40,273 | | | | 530,798 |
Itron, Inc.* | | 18,000 | 2 | | | 1,147,320 |
Knot, Inc., The* | | 16,600 | | | | 138,112 |
ManTech International Corp., Class A* | | 34,492 | | | | 1,869,122 |
MEMC Electronic Materials, Inc.* | | 40,500 | | | | 578,340 |
MercadoLibre, Inc.* | | 53,000 | | | | 869,730 |
Monolithic Power Systems, Inc.* | | 224,642 | | | | 2,832,736 |
Netezza Corp.* | | 112,526 | | | | 747,173 |
NetLogic Microsystems, Inc.* | | 164,117 | | | | 3,612,215 |
NetSuite, Inc.* | | 91,112 | | | | 768,985 |
NeuStar, Inc., Class A* | | 27,800 | 2 | | | 531,814 |
Neutral Tandem, Inc.* | | 49,998 | | | | 810,968 |
NICE Systems, Ltd.* | | 75,490 | | | | 1,696,260 |
ON Semiconductor Corp.* | | 129,051 | | | | 438,773 |
OPNET Technologies, Inc.* | | 25,628 | | | | 252,692 |
Parametric Technology Corp.* | | 344,985 | | | | 4,364,060 |
Perot Systems Corp.* | | 71,010 | | | | 970,707 |
Polycom, Inc.* | | 33,068 | | | | 446,749 |
Power Integrations, Inc.* | | 18,700 | | | | 371,756 |
Quality Systems, Inc. | | 79,655 | 2 | | | 3,474,551 |
Rackspace Hosting, Inc.* | | 103,309 | | | | 555,802 |
The accompanying notes are an integral part of these financial statements.
11
Managers Special Equity Fund
Schedule of Portfolio Investments (continued)
| | | | | | | |
| | | Shares | | | Value | |
Information Technology—18.8% (continued) | | | | | | | |
Riverbed Technology, Inc.* | | 83,573 | | | $ | 951,896 | |
Rudolph Technologies, Inc.* | | 40,900 | | | | 144,377 | |
S1 Corp.* | | 99,617 | | | | 785,978 | |
Silicon Laboratories, Inc.* | | 33,600 | | | | 832,608 | |
SINA Corp.* | | 16,800 | 2 | | | 388,920 | |
Sohu.com, Inc.* | | 9,506 | | | | 450,014 | |
Solera Holdings, Inc.* | | 92,850 | | | | 2,237,685 | |
Starent Networks Corp.* | | 104,608 | | | | 1,247,973 | |
Super Micro Computer, Inc.* | | 69,500 | | | | 439,935 | |
Sybase, Inc.* | | 39,300 | | | | 973,461 | |
Synaptics, Inc.* | | 85,862 | | | | 1,421,875 | |
SYNNEX Corp.* | | 34,500 | | | | 390,885 | |
Synopsys, Inc.* | | 53,063 | | | | 982,727 | |
TeleCommunication Systems, Inc.* | | 90,265 | | | | 775,376 | |
TNS, Inc.* | | 44,600 | | | | 418,794 | |
TTM Technologies, Inc.* | | 74,900 | | | | 390,229 | |
Tyler Technologies, Inc.* | | 23,625 | | | | 283,028 | |
Ultratech Stepper, Inc.* | | 54,975 | | | | 657,501 | |
VASCO Data Security International, Inc.* | | 168,444 | | | | 1,740,027 | |
Virtusa Corp.* | | 46,331 | | | | 261,307 | |
Vocus, Inc.* | | 237,009 | | | | 4,315,934 | |
Websense, Inc.* | | 128,098 | | | | 1,917,627 | |
Wind River Systems, Inc.* | | 87,445 | | | | 789,628 | |
Yucheng Technologies, Ltd.* | | 188,920 | | | | 1,377,227 | |
Total Information Technology | | | | | | 83,532,501 | |
Materials—1.9% | | | | | | | |
Allegheny Technologies, Inc. | | 23,200 | | | | 592,296 | |
Calgon Carbon Corp.* | | 56,243 | | | | 863,892 | |
Compass Minerals International, Inc. | | 15,800 | | | | 926,828 | |
Cytec Industries, Inc. | | 19,600 | | | | 415,912 | |
Haynes International, Inc.* | | 30,720 | | | | 756,326 | |
Koppers Holdings, Inc. | | 23,200 | | | | 501,584 | |
Olin Corp. | | 49,300 | | | | 891,344 | |
Rock-Tenn Co. | | 46,880 | | | | 1,602,359 | |
Scotts Miracle - Gro Co., The, Class A | | 28,700 | | | | 852,964 | |
Steel Dynamics, Inc. | | 102,135 | | | | 1,141,869 | |
Total Materials | | | | | | 8,545,374 | |
Telecommunication Services—1.5% | | | | | | | |
Cincinnati Bell, Inc.* | | 333,319 | | | | 643,306 | |
NTELOS Holdings Corp. | | 66,947 | | | | 1,650,913 | |
Shenandoah Telecommunications Co. | | 12,355 | | | | 346,558 | |
Syniverse Holdings, Inc.* | | 344,448 | | | | 4,112,709 | |
Total Telecommunication Services | | | | | | 6,753,486 | |
Utilities—0.5% | | | | | | | |
ITC Holdings Corp. | | 34,563 | | | $ | 1,509,712 | |
Ormat Technologies, Inc. | | 26,500 | 2 | | | 844,555 | |
Total Utilities | | | | | | 2,354,267 | |
Total Common Stocks (cost $528,153,315) | | | | | | 436,294,642 | |
Other Investment Companies—8.3%1 | | | | | | | |
BNY Institutional Cash Reserves Fund, Series A, 0.07%3 | | 27,964,050 | | | | 27,964,050 | |
BNY Institutional Cash Reserves Fund, Series B*3.4 | | 2,499,559 | | | | 224,960 | |
BNY Institutional Cash Reserves Fund, Series C*3,5 | | 1,714,004 | | | | 1,714,004 | |
Dreyfus Cash Management Fund, Institutional Class Shares, 1.53%6 | | 7,133,506 | | | | 7,133,506 | |
Total Other Investment Companies
(cost $39,311,119) | | | | | | 37,036,520 | |
Total Investments—106.4%
(cost $567,464,434) | | | | | | 473,331,162 | |
| Other Assets, less Liabilities—(6.4)% | | | | | | (28,786,429 | ) |
Net Assets—100.0% | | | | | $ | 444,544,733 | |
Based on the approximate cost of investments of $600,947,698 for Federal income tax purposes at December 31, 2008, the aggregate gross unrealized appreciation and depreciation were $28,390,370 and $156,006,906, respectively, resulting in net unrealized depreciation of investments of $127,616,536.
| * | Non-income producing security. |
1 | Yield shown for an investment company represents the December 31, 2008, seven-day average yield, which refers to the sum of the previous seven days’ dividends paid, expressed as an annual percentage. |
2 | Some or all of these shares were out on loan to various brokers as of December 31, 2008, amounting to a market value of $31,893,188, or approximately 7.2% of net assets. |
3 | Collateral received from brokers for securities lending was invested in this short-term investment. |
4 | On September 12, 2008, The Bank of New York Mellon (“BNYM”) established a separate sleeve of the BNY Institutional Cash Reserves Fund (“ICRF”) (Series B) to hold certain Lehman Brothers floating rate notes. The Fund’s position in Series B is being marked to market daily. |
5 | On October 6, 2008, BNYM established a separate sleeve of the ICRF (Series C) to hold a security issued by Whistlejacket Capital Ltd. The Fund’s position in Series C is being marked to market daily. |
6 | The Fund’s investment is covered under the U.S. Treasury Temporary Money Market Fund Guarantee Program up to a maximum of $105,626,374. |
Investments Definitions and Abbreviations:
ADR/GDR: ADR after the name of a holding stands for American Depositary Receipt, representing ownership of foreign securities on deposit with a domestic custodian bank; a GDR (Global Depositary Receipt) is comparable, but foreign securities are held on deposit in a non-U.S. bank. The value of the ADR/GDR securities is determined or significantly influenced by trading on exchanges not located in the United States or Canada. Sponsored ADR/GDRs are initiated by the underlying foreign company.
The accompanying notes are an integral part of these financial statements.
12
Managers Special Equity Fund
Statement of Assets and Liabilities
December 31, 2008
| | | | |
Assets: | | | | |
Investments at value (including securities on loan valued at $31,893,188)* | | $ | 473,331,162 | |
Cash | | | 4,416 | |
Receivable for investments sold | | | 30,284,972 | |
Receivable for Fund shares sold | | | 918,711 | |
Dividends, interest and other receivables | | | 280,384 | |
Prepaid expenses | | | 25,426 | |
Total assets | | | 504,845,071 | |
Liabilities: | | | | |
Payable for Fund shares repurchased | | | 24,662,468 | |
Payable upon return of securities loaned | | | 32,177,613 | |
Payable for investments purchased | | | 2,700,036 | |
Accrued expenses: | | | | |
Investment advisory and management fees | | | 349,522 | |
Administrative fees | | | 97,089 | |
Other | | | 313,610 | |
Total liabilities | | | 60,300,338 | |
Net Assets | | $ | 444,544,733 | |
Managers Shares: | | | | |
Net Assets | | $ | 352,106,024 | |
Shares outstanding | | | 11,628,053 | |
Net asset value, offering and redemption price per share | | $ | 30.28 | |
Institutional Class Shares: | | | | |
Net Assets | | $ | 92,438,709 | |
Shares outstanding | | | 3,024,595 | |
Net asset value, offering and redemption price per share | | $ | 30.56 | |
Net Assets Represent: | | | | |
Paid-in capital | | $ | 806,924,442 | |
Undistributed net investment loss | | | — | |
Accumulated net realized loss from investments | | | (268,246,437 | ) |
Net unrealized depreciation of investments | | | (94,133,272 | ) |
Net Assets | | $ | 444,544,733 | |
* Investments at cost | | $ | 567,464,434 | |
The accompanying notes are an integral part of these financial statements.
13
Managers Special Equity Fund
Statement of Operations
For the year ended December 31, 2008
| | | | |
Investment Income: | | | | |
Dividend income | | $ | 8,712,923 | |
Foreign withholding tax | | | (231,354 | ) |
Securities lending fees | | | 1,820,619 | |
Total investment income | | | 10,302,188 | |
Expenses: | | | | |
Investment management fees | | | 10,079,959 | |
Administrative fees | | | 2,799,989 | |
Transfer agent | | | 2,679,841 | |
Professional fees | | | 267,140 | |
Reports to shareholders | | | 249,708 | |
Custodian | | | 239,939 | |
Trustees fees and expenses | | | 121,900 | |
Registration fees | | | 76,383 | |
Miscellaneous | | | 103,407 | |
Total expenses before offsets | | | 16,618,266 | |
Expense waiver | | | (5,926 | ) |
Expense reductions | | | (366,852 | ) |
Net expenses | | | 16,245,488 | |
Net investment loss | | | (5,943,300 | ) |
Net Realized and Unrealized Gain (Loss): | | | | |
Net realized loss on investment transactions | | | (262,909,241 | ) |
Net unrealized depreciation of investments | | | (299,027,742 | ) |
Net realized and unrealized loss | | | (561,936,983 | ) |
Net decrease in net assets resulting from operations | | $ | (567,880,283 | ) |
The accompanying notes are an integral part of these financial statements.
14
Managers Special Equity Fund
Statement of Changes in Net Assets
For the year ended December 31, 2008
| | | | | | | | |
| | | 2008 | | | 2007 | |
Increase (Decrease) in Net Assets From Operations: | | | | | | | | |
Net investment loss | | $ | (5,943,300 | ) | | $ | (14,345,331 | ) |
Net realized gain (loss) on investments | | | (262,909,241 | ) | | | 468,715,374 | |
Net unrealized depreciation of investments | | | (299,027,742 | ) | | | (407,862,046 | ) |
Net increase (decrease) in net assets resulting from operations | | | (567,880,283 | ) | | | 46,507,997 | |
Distributions to Shareholders: | | | | | | | | |
From net realized gain on investments: | | | | | | | | |
Managers Class | | | (60,482,450 | ) | | | (388,900,274 | ) |
Institutional Class | | | (14,942,810 | ) | | | (59,529,931 | ) |
Total distributions to shareholders | | | (75,425,260 | ) | | | (448,430,205 | ) |
From Capital Share Transactions: | | | | | | | | |
Managers Class: | | | | | | | | |
Proceeds from sale of shares | | | 187,952,090 | | | | 299,186,761 | |
Reinvestment of dividends and distributions | | | 56,640,818 | | | | 359,741,541 | |
Cost of shares repurchased | | | (997,437,797 | ) | | | (1,188,809,810 | ) |
Net decrease from Managers Class share transactions | | | (752,844,889 | ) | | | (529,881,508 | ) |
Institutional Class: | | | | | | | | |
Proceeds from sale of shares | | | 116,771,071 | | | | 78,116,331 | |
Reinvestment of dividends and distributions | | | 12,946,151 | | | | 53,547,184 | |
Cost of shares repurchased | | | (204,449,527 | ) | | | (398,129,366 | ) |
Net decrease from Institutional Class share transactions | | | (74,732,305 | ) | | | (266,465,851 | ) |
Net decrease from capital share transactions | | | (827,577,194 | ) | | | (796,347,359 | ) |
Total decrease in net assets | | | (1,470,882,737 | ) | | | (1,198,269,567 | ) |
Net Assets: | | | | | | | | |
Beginning of year | | | 1,915,427,470 | | | | 3,113,697,037 | |
End of year | | $ | 444,544,733 | | | $ | 1,915,427,470 | |
End of year undistributed net investment income (loss) | | | — | | | $ | 996,473 | |
| | | | | | | | |
Share Transactions: | | | | | | | | |
Managers Class: | | | | | | | | |
Sale of shares | | | 3,473,798 | | | | 3,523,798 | |
Reinvested shares from dividends and distribution | | | 1,951,786 | | | | 5,443,136 | |
Shares repurchased | | | (19,749,465 | ) | | | (13,771,697 | ) |
Net decrease in shares | | | (14,323,881 | ) | | | (4,804,763 | ) |
Institutional Class: | | | | | | | | |
Sale of shares | | | 2,489,353 | | | | 898,887 | |
Reinvested shares from dividends and distribution | | | 441,999 | | | | 804,737 | |
Shares repurchased | | | (3,729,675 | ) | | | (4,606,651 | ) |
Net decrease in shares | | | (798,323 | ) | | | (2,903,027 | ) |
The accompanying notes are an integral part of these financial statements.
15
Managers Special Equity Fund
Financial Highlights
For a share outstanding throughout each year
| | | | | | | | | | | | | | | | | | | | |
| | | For the year ended December 31, | |
Managers Class: | | 2008 | | | 2007 | | | 2006 | | | 2005 | | | 2004 | |
Net Asset Value, Beginning of Year | | $ | 64.27 | | | $ | 82.96 | | | $ | 86.78 | | | $ | 90.42 | | | $ | 78.48 | |
Income from Investment Operations: | | | | | | | | | | | | | | | | | | | | |
Net investment loss | | | (0.28 | )5 | | | (0.51 | )5 | | | (0.14 | )5 | | | (0.54 | )5 | | | (0.56 | ) |
Net realized and unrealized gain (loss) on investments | | | (27.93 | )5 | | | 0.55 | 5 | | | 9.88 | 5 | | | 4.18 | 5 | | | 12.50 | |
Total from investment operations | | | (28.21 | ) | | | 0.04 | | | | 9.74 | | | | 3.64 | | | | 11.94 | |
Less Distributions to Shareholders from: | | | | | | | | | | | | | | | | | | | | |
Net realized gain on investments | | | (5.78 | ) | | | (18.73 | ) | | | (13.56 | ) | | | (7.28 | ) | | | — | |
Net Asset Value, End of Year | | $ | 30.28 | | | $ | 64.27 | | | $ | 82.96 | | | $ | 86.78 | | | $ | 90.42 | |
Total Return 1 | | | (43.49 | )% | | | (0.60 | )% | | | 11.28 | % | | | 4.00 | % | | | 15.18 | % |
Ratio of net expenses to average net assets | | | 1.48 | % | | | 1.43 | % | | | 1.42 | % | | | 1.40 | % | | | 1.40 | % |
Ratio of net investment loss to average net assets 1 | | | (0.52 | )% | | | (0.59 | )% | | | (0.15 | )% | | | (0.60 | )% | | | (0.69 | )% |
Portfolio turnover | | | 138 | % | | | 67 | % | | | 76 | % | | | 80 | % | | | 68 | % |
Net assets at end of year (000’s omitted) | | $ | 352,106 | | | $ | 1,668,031 | | | $ | 2,551,703 | | | $ | 2,834,314 | | | $ | 3,415,003 | |
| | | | | | | | | | | | | | | | | | | | |
Ratios absent expense offsets: 4 | | | | | | | | | | | | | | | | | | | | |
Ratio of total expenses to average net assets | | | 1.51 | % | | | 1.46 | % | | | 1.47 | % | | | 1.45 | % | | | 1.45 | % |
Ratio of net investment loss to average net assets | | | (0.55 | )% | | | (0.62 | )% | | | (0.20 | )% | | | (0.65 | )% | | | (0.74 | )% |
| | | | | | | | | | | | | | | | | | | | |
| | |
| | | For the year ended December 31, | | | For the
period* ended
December 31,
2004 | |
Institutional Class: | | 2008 | | | 2007 | | | 2006 | | | 2005 | | |
Net Asset Value, Beginning of Period | | $ | 64.71 | | | $ | 83.56 | | | $ | 87.09 | | | $ | 90.56 | | | $ | 78.91 | |
Income from Investment Operations: | | | | | | | | | | | | | | | | | | | | |
Net investment income (loss) | | | (0.15 | )5 | | | (0.32 | )5 | | | 0.10 | 5 | | | (0.33 | )5 | | | (0.21 | ) |
Net realized and unrealized gain (loss) on investments | | | (28.16 | )5 | | | 0.52 | 5 | | | 9.93 | 5 | | | 4.14 | 5 | | | 11.86 | |
Total from investment operations | | | (28.31 | ) | | | 0.20 | | | | 10.03 | | | | 3.81 | | | | 11.65 | |
Less Distributions to Shareholders from: | | | | | | | | | | | | | | | | | | | | |
Net realized gain on investments | | | (5.84 | ) | | | (19.05 | ) | | | (13.56 | ) | | | (7.28 | ) | | | — | |
Net Asset Value, End of Period | | $ | 30.56 | | | $ | 64.71 | | | $ | 83.56 | | | $ | 87.09 | | | $ | 90.56 | |
Total Return 1 | | | (43.35 | )% | | | (0.39 | )% | | | 11.56 | %6 | | | 4.21 | % | | | 14.75 | %2 |
Ratio of net expenses to average net assets | | | 1.23 | % | | | 1.20 | % | | | 1.18 | % | | | 1.20 | % | | | 1.20 | %3 |
Ratio of net investment income (loss) to average net assets 1 | | | (0.29 | )% | | | (0.36 | )% | | | 0.09 | % | | | (0.56 | )% | | | (0.49 | )%3 |
Portfolio turnover | | | 138 | % | | | 67 | % | | | 76 | % | | | 80 | % | | | 68 | %2 |
Net assets at end of period (000’s omitted) | | $ | 92,439 | | | $ | 247,396 | | | $ | 561,994 | | | $ | 510,541 | | | $ | 274,010 | |
| | | | | | | | | | | | | | | | | | | | |
Ratios absent expense offsets: 4 | | | | | | | | | | | | | | | | | | | | |
Ratio of total expenses to average net assets | | | 1.26 | % | | | 1.23 | % | | | 1.23 | % | | | 1.25 | % | | | 1.26 | %3 |
Ratio of net investment income (loss) to average net assets | | | (0.32 | )% | | | (0.39 | )% | | | 0.04 | % | | | (0.61 | )% | | | (0.55 | )%3 |
| | | | | | | | | | | | | | | | | | | | |
| * | Commencement of operations was May 3, 2004. |
1 | Total returns and net investment income would have been lower had certain expenses not been reduced. (See Note 1(c) of Notes to Financial Statements.) |
2 | Not Annualized. (See Note 1(c) to the Notes to Financial Statements.) |
4 | Excludes the impact of fee waivers and expense offsets such as brokerage credits, but includes non-reimbursable expenses, if any, such as interest and taxes. (See Note 1(c) to the Notes to Financial Statements.) |
5 | Per share numbers have been calculated using average shares. |
6 | The Total Return is based on the Financial Statement Net Asset Values as shown above. |
16
Managers Special Equity Fund
Notes to Financial Statements
December 31, 2008
| 1. | Summary of Significant Accounting Policies |
The Managers Funds (the “Trust”) is an open-end management investment company organized as a Massachusetts business trust and registered under the Investment Company Act of 1940, as amended (the “1940 Act”). Currently, the Trust is comprised of a number of different funds, each having distinct investment management objectives, strategies, risks and policies. Included in this report is the Managers Special Equity Fund (“Special Equity” or the “Fund”).
The Fund offers both Managers Class shares and Institutional Class shares. The Institutional Class shares, which are designed primarily for institutional investors that meet certain administrative and servicing criteria, have a minimum investment of $2,500,000. Managers Class shares are offered to all other investors. Each class represents interest in the same assets of the Fund and the classes are identical except for class specific expenses related to shareholder activity. Investment income, realized and unrealized capital gains and losses, the common expenses of the Fund and certain Fund level expense reductions, if any, are allocated on a pro rata basis to each class based on the relative net assets of each class to the total net assets of the Fund. Both classes have equal voting privileges except that each class has exclusive voting rights with respect to its services and/or distribution plan.
The Fund’s financial statements are prepared in accordance with accounting principles generally accepted in the United States of America, which require management to make estimates and assumptions that affect the reported amounts of assets and liabilities and disclosure of contingent assets and liabilities at the date of the financial statements and the reported amounts of income and expenses during the reporting periods. Actual results could differ from those estimates and such differences could be material. The following is a summary of significant accounting policies followed by the Fund in the preparation of its financial statements:
| a. | Valuation of Investments |
Equity securities traded on a domestic or international securities exchange are valued at the last quoted sale price, or, lacking any sales, at the last quoted bid price. Over-the-counter securities are valued at the Nasdaq Official Closing Price, if one is available. Lacking any sales, over-the-counter securities are valued at the last quoted bid price. The Fund’s investments are generally valued based on market quotations provided by third party pricing services approved by the Board of Trustees of the Fund. Under certain circumstances, the value of certain Fund investments may be based on an evaluation of fair value, pursuant to procedures established by and under the general supervision of the Board of Trustees of the Fund. The Fund may use the fair value of a portfolio security to calculate its NAV when, for example, (1) market quotations are not readily available because a portfolio security is not traded in a public market or the principal market in which the security trades is closed, (2) trading in a portfolio security is suspended and has not resumed before the Fund calculates its NAV, (3) a significant event affecting the value of a portfolio security is determined to have occurred between the time of the market quotation provided for a portfolio security and the time as of which the Fund calculates its NAV, (4) a security’s price has remained unchanged over a period of time (often referred to as a “stale price”), or (5) Managers Investment Group LLC (the “Investment Manager”) determines that a market quotation is inaccurate. Portfolio investments that trade primarily on foreign markets are priced based upon the market quotation of such securities as of the close of their respective principal markets, as adjusted to reflect the Investment Manager’s determination of the impact of events occurring subsequent to the close of such markets but prior to the time as of which the Fund calculates its NAV. In accordance with procedures approved by the Board of Trustees, the Investment Manager relies upon recommendations of a third-party fair valuation service in adjusting the prices of such foreign portfolio investments. The Fund may invest in securities that may be thinly traded. The Board of Trustees has adopted procedures to adjust prices when thinly traded securities are judged to be stale so that they reflect fair value. An investment valued on the basis of its fair value may be valued at a price higher or lower than available market quotations. An investment’s valuation may differ depending on the method used and the factors considered in determining value according to the Fund’s fair value procedures.
Fixed-income securities are valued based on valuations furnished by independent pricing services that utilize matrix systems, which reflect such factors as security prices, yields, maturities, and ratings, and are supplemented by dealer and exchange quotations. Futures contracts for which market quotations are readily available are valued at the settlement price as of the close of the futures exchange. Short-term investments having a remaining maturity of 60 days or less are valued at amortized cost, which approximates market value. Investments in other open-end regulated investment companies are valued at their end of day net asset value per share except iShares or other ETF’s, which are valued the same as equity securities. Investments in certain mortgage-backed and stripped mortgage-backed securities, preferred stocks, convertible securities, derivatives and other debt securities not traded on an organized securities market are valued on the basis of valuations provided by dealers or by a pricing service which uses information with respect to transactions in such securities and various relationships between securities and yield to maturity in determining value. Securities (including derivatives) for which market quotations are not readily available are valued at fair value, as determined in good faith, and pursuant to procedures adopted by the Board of Trustees of the Trust. The values assigned to fair value investments are based on available information and do not necessarily represent amounts that might ultimately be realized, since such amounts depend on future developments inherent in long-term investments. Further, because of the inherent uncertainty of valuation, those estimated values may differ significantly from the values that would have been used had a ready market for the investments existed, and the differences could be material.
The Fund adopted Financial Accounting Standards Board Statement of Financial Accounting Standards No. 157, Fair Value Measurements (“FAS 157”), effective January 1, 2008. In accordance with FAS 157, fair value is defined as the price that a Fund would receive to sell an asset or pay to transfer a liability in an orderly transaction between market participants at the measurement date. FAS 157 also establishes a framework for measuring fair value, and a three-level hierarchy for fair value measurements based upon the transparency of inputs to the valuation of an asset or liability. Inputs may be observable or unobservable and refer broadly to the assumptions that market participants would use in pricing the asset or liability. Observable inputs reflect the assumptions market participants would use in pricing the asset or liability based on market data obtained
17
Managers Special Equity Fund
Notes to Financial Statements (continued)
from sources independent of the Fund. Unobservable inputs reflect the Fund’s own assumptions about the assumptions that market participants would use in pricing the asset or liability developed based on the best information available in the circumstances. Each investment is assigned a level based upon the observability of the inputs which are significant to the overall valuation. The three-tier hierarchy of inputs is summarized below:
Level 1 – quoted prices in active markets for identical investments
Level 2 – other significant observable inputs (including quoted prices for similar investments, interest rates, prepayment speeds, credit risk)
Level 3 – significant unobservable inputs (including the Funds’ own assumptions in determining the fair value of investments)
The inputs or methodologies used for valuing investments are not necessarily an indication of the risk associated with investing in those investments. The following table summarizes the valuation of the Fund’s investments by the above fair value hierarchy levels as of December 31, 2008:
| | | | | |
Level | | Investments in
Securities | | Other Financial
Instruments* |
Special Equity | | | | | |
Level 1 | | $ | 471,392,198 | | — |
Level 2 | | | 1,938,964 | | — |
Level 3 | | | — | | — |
| | | | | |
Total | | $ | 473,331,162 | | — |
| | | | | |
| | * | Other financial instruments are derivative instruments not reflected in the Schedule of Portfolio Investments, such as futures, forwards and swap contracts, which are valued at the unrealized appreciation/depreciation of the instrument. |
Security transactions are accounted for as of the trade date. Realized gains and losses on securities sold are determined on the basis of identified cost.
| c. | Investment Income and Expenses |
Dividend income is recorded on the ex-dividend date except certain dividends from foreign securities where the ex-dividend date may have passed. These dividends are recorded as soon as the Trust is informed of the ex-dividend date. Dividend income on foreign securities is recorded net of any withholding tax. Interest income, which includes amortization of premium and accretion of discount on debt securities, is accrued as earned. Non-cash dividends included in dividend income, if any, are reported at the fair market value of the securities received. Other income and expenses are recorded on an accrual basis. Expenses that cannot be directly attributed to a fund are apportioned among the Funds in the Trust and in some cases other affiliated funds based upon their relative average net assets or number of shareholders.
The Fund had certain portfolio trades directed to various brokers who paid a portion of the Fund’s expenses. For the year ended December 31, 2008, under these arrangements the amount by which the Fund’s expenses were reduced and the impact on the expense ratios was as follows: $347,918 or 0.03% annualized.
The Fund has a “balance credit” arrangement with The Bank of New York Mellon (“BNYM”) (formerly The Bank of New York), the Fund’s custodian, whereby the Fund is credited with an interest factor equal to 0.75% below the effective 90-day T-Bill rate for account balances left un-invested overnight. If the T-Bill rate falls below 0.75%, no credits will be earned. These credits serve to reduce custody expenses that would otherwise be charged to the Fund. For the year ended December 31, 2008, the custodian expense was reduced by $6,339.
Overdrafts will cause a reduction of any earnings credits, computed at 2% above the effective Federal Funds rate on the day of the overdraft. For the year ended December 31, 2008, the Fund incurred overdraft fees of $12,616.
The Trust also has a balance credit arrangement with its Transfer Agent, PNC Global Investment Servicing (U.S.) Inc. (formerly PFPC, Inc.), whereby earnings credits are used to offset banking charges and other out-of-pocket expenses. For the year end December 31, 2008, the transfer agent expense was reduced by $12,595.
The Investment Manager has agreed to waive a portion of its management fee in consideration of shareholder servicing fees that it has received from JPMorgan Distribution Services, Inc., with respect to short-term cash investments the Fund has made in the JPMorgan Liquid Assets Money Market Fund or the JPMorgan U.S. Government Money Market Fund. For the year ended December 31, 2008, the management fee was reduced by $5,926.
Total returns and net investment income for the Funds would have been lower had certain expenses not been offset. Total expenses before offsets exclude the impact of expense reimbursements or fee waivers and expense offsets such as brokerage recapture credits, but include non-reimburseable expenses, if any, such as interest and taxes.
| d. | Dividends and Distributions |
Dividends resulting from net investment income, if any, normally will be declared and paid annually. Distributions of capital gains, if any, will be made annually in December and when required for Federal excise tax purposes. Distributions are recorded on the ex-dividend date and are declared separately for each class. Income and capital gain distributions are determined in accordance with Federal income tax regulations, which may differ from generally accepted accounting principles. These differences are primarily due to differing treatments for losses deferred due to wash sales, REITs, equalization accounting for tax purposes, foreign currency, options, futures and market discount transactions. Permanent book and tax basis differences, if any, relating to shareholder distributions will result in reclassifications to paid-in capital. The tax character of distributions paid during the past two years were as follows:
| | | | | | |
| | | 2008 | | 2007 |
Distributions paid from: | | | | | | |
Ordinary income | | | — | | | — |
Short-term capital gains | | $ | 517,105 | | $ | 28,949,941 |
Long-term capital gains | | | 74,908,155 | | | 419,480,264 |
| | | | | | |
| | $ | 75,425,260 | | $ | 448,430,205 |
| | | | | | |
As a % of distributions paid (unaudited): | | | | | | |
Qualified ordinary income | | | — | | | — |
Ordinary income - dividends received deduction | | | — | | | — |
18
Managers Special Equity Fund
Notes to Financial Statements (continued)
As of December 31, 2008, the components of distributable earnings (excluding unrealized appreciation/deprecation) on a tax basis consisted of:
| | | |
Capital loss carryforward | | $ | 145,119,718 |
Undistributed ordinary income | | | — |
Undistributed short-term capital gains | | | — |
Undistributed long-term capital gains | | | — |
The Fund intends to comply with the requirements under Subchapter M of the Internal Revenue Code of 1986, as amended, to distribute substantially all of its taxable income and gains to its shareholders and to meet certain diversification and income requirements with respect to investment companies. Therefore, no provision for Federal income or excise tax is included in the accompanying financial statements.
Management has analyzed the Fund’s tax positions taken on federal income tax returns for all open tax years (tax years ended December 31, 2005-2008), and has concluded that no provision for federal income tax is required in the Fund’s financial statements. The Fund is not aware of any tax position for which it is reasonably possible that the total amounts of unrecognized tax benefits will change materially in the next twelve months.
| f. | Capital Loss Carryovers |
As of December 31, 2008, the Fund had accumulated net realized capital loss carryover from securities transactions for Federal income tax purposes of $145,119,718 expiring December 31, 2016. For the year ended December 31, 2008, the Fund utilized no capital loss carryovers.
The Trust’s Declaration of Trust authorizes for each series the issuance of an unlimited number of shares of beneficial interest, without par value, for each fund. The Fund records sales and repurchases of its capital stock on the trade date. Dividends and distributions to shareholders are recorded on the ex-dividend date.
At December 31, 2008 certain unaffiliated shareholders, specifically omnibus accounts, individually held greater than 10% of the outstanding shares of the Fund as follows: Managers Class shares – two collectively own 41%; Institutional Class shares – three collectively own 88%. Transactions by these shareholders may have a material impact on the Fund or the class.
| 2. | Agreements and Transactions with Affiliates |
The Trust has entered into an Investment Management Agreement under which the Investment Manager, an independently managed subsidiary of Affiliated Managers Group, Inc. (“AMG”), serves as investment manager to the Fund and is responsible for the Fund’s overall administration. The Investment Manager selects subadvisors for the Fund (subject to Trustee approval) and monitors each subadvisor’s investment programs and results. The Fund’s investment portfolio is managed by portfolio managers who serve pursuant to a Subadvisory Agreement with the Investment Manager.
Investment management fees are paid directly by the Fund to the Investment Manager based on average daily net assets. For the year ended December 31, 2008, the annual investment management fee rate, as a percentage of average daily net assets, was 0.90%.
The Trust has entered into an Administration and Shareholder Servicing Agreement under which the Investment Manager serves as the Fund’s administrator (the “Administrator”) and is responsible for all aspects of managing the Fund’s operations, including administration and shareholder services to the Fund, its shareholders, and certain institutions, such as bank trust departments, broker-dealers and registered investment advisers, that advise or act as an intermediary with the Fund’s shareholders. The Fund pays a fee to the Administrator at the rate of 0.25% per annum of the Fund’s average daily net assets for this service.
Prior to July 1, 2007, the aggregate annual retainer paid to each Independent Trustee was $55,000, plus $4,000 or $2,000 for each regular or special meeting attended, respectively. Effective July 1, 2007, the aggregate annual retainer paid to each Independent Trustee is $65,000, plus $4,000 or $2,500 for each regular or special meeting attended, respectively. The Trustees’ fees and expenses are allocated amongst all of the Funds for which the Investment Manager serves as the advisor (the “Managers Funds”) based on the relative net assets of such Funds. The Independent Chairman of the Trusts receives an additional payment of $15,000 per year. (Prior to July 1, 2007, the Independent Chairman received an additional payment of $10,000 per year). The Chairman of the Audit Committee receives an additional payment of $5,000 per year. (Prior to July 1, 2007, the Chairman of the Audit Committee received an additional payment of $2,000 per year). The “Trustees fees and expenses” shown in the financial statements represents the Fund’s allocated portion of the total fees and expenses paid by the Fund and other affiliated funds in the Managers Funds.
The Fund is distributed by Managers Distributors, Inc. (the “Distributor” or “MDI”), a wholly-owned subsidiary of the Investment Manager. MDI serves as the principal underwriter for the Fund. MDI is a registered broker-dealer and member of the Financial Industry Regulatory Authority, Inc. (“FINRA”). Shares of the Fund will be continuously offered and will be sold by brokers, dealers or other financial intermediaries who have executed selling agreements with the Distributor. MDI bears all the expenses of providing services pursuant to the Underwriting Agreement, including the payment of the expenses relating to the distribution of Prospectuses for sales purposes and any advertising or sales literature. Certain Trustees and Officers of the Fund are Officers and/or Directors of the Investment Manager, AMG and/or the Distributor.
During the year ended December 31, 2008, the Fund executed the following transactions at the closing price of the security and with no commissions under Rule 17a-7 procedures approved by the Board of Trustees:
January 2, 2008 – sold securities to the Skyline Opportunity Fund
| | | | | |
Security | | Shares | | Cost |
AirTran Holdings, Inc. | | 5,600 | | $ | 38,808 |
Aspen Insurance Holdings, Ltd. | | 6,500 | | | 184,340 |
Arris Group, Inc. | | 6,700 | | | 63,181 |
American Axle & Manufacturing Holdings, Inc. | | 3,100 | | | 56,265 |
Big 5 Sporting Goods Corp. | | 6,300 | | | 90,216 |
B&G Foods, Inc. | | 6,000 | | | 60,660 |
Borland Software Corp. | | 6,600 | | | 19,140 |
19
Managers Special Equity Fund
Notes to Financial Statements (continued)
| | | | | |
Security | | Shares | | Cost |
CAI International, Inc. | | 4,300 | | $ | 42,484 |
Cincinnati Bell, Inc. | | 26,700 | | | 120,684 |
Crane Co. | | 3,500 | | | 148,995 |
Carlisle Cos., Inc. | | 3,100 | | | 116,033 |
Convergys Corp. | | 3,600 | | | 57,744 |
Delphi Financial Group, Inc., Class A | | 3,600 | | | 121,464 |
Electronics for Imaging, Inc. | | 6,000 | | | 131,880 |
Fairchild Semiconductor International, Inc. | | 6,400 | | | 89,024 |
Financial Federal Corp. | | 3,000 | | | 67,200 |
Comfort Systems USA, Inc. | | 7,300 | | | 89,936 |
Harris Stratex Networks, Inc. | | 4,000 | | | 67,000 |
Hercules Technology Growth Capital, Inc. | | 4,700 | | | 55,366 |
MarineMax, Inc. | | 4,400 | | | 65,164 |
Key Energy Services, Inc. | | 5,800 | | | 83,926 |
MCG Capital Corp. | | 5,300 | | | 61,109 |
Miller Herman, Inc. | | 3,200 | | | 103,072 |
Mattson Technology, Inc. | | 5,700 | | | 47,823 |
Prosperity Bancshares, Inc. | | 4,400 | | | 124,872 |
Ryder System, Inc. | | 1,300 | | | 59,683 |
RAM Holdings, Ltd. | | 8,000 | | | 37,760 |
Reinsurance Group of America, Inc. | | 3,500 | | | 179,515 |
Rudolph Technologies, Inc. | | 3,300 | | | 36,993 |
SeaBright Insurance Holdings, Inc. | | 6,700 | | | 98,825 |
iStar Financial, Inc. | | 300 | | | 7,725 |
Spherion Corp. | | 12,500 | | | 86,875 |
SkyWest, Inc. | | 4,900 | | | 130,536 |
Super Micro Computer, Inc. | | 5,600 | | | 47,208 |
SYNNEX Corp. | | 5,300 | | | 100,859 |
TNS, Inc. | | 5,600 | | | 93,744 |
TradeStation Group, Inc. | | 6,800 | | | 94,588 |
TTM Technologies, Inc. | | 7,100 | | | 83,212 |
| | | | | |
Total | | 216,700 | | $ | 3,163,909 |
| | | | | |
January 15, 2008 – bought securities from the Managers Fremont Global Fund
| | | | | |
| | |
Security | | Shares | | Cost |
Aruba Networks, Inc. | | 700 | | $ | 8,050 |
January 15, 2008 – bought securities from the Managers Fremont Micro-Cap Fund
| | | | | |
| | |
Security | | Shares | | Cost |
Aruba Networks, Inc. | | 12,443 | | $ | 143,095 |
Calgon Carbon Corp. | | 95,500 | | | 1,353,235 |
Omniture, Inc. | | 56,200 | | | 1,511,780 |
| | | | | |
Total | | 164,143 | | $ | 3,008,110 |
| | | | | |
May 12, 2008 – sold securities to the Investment Fund for Foundations Multi-Asset Fund
| | | | | |
| | |
Security | | Shares | | Cost |
General Communication, Inc., Class A | | 230,000 | | $ | 1,492,700 |
September 16, 2008 – bought securities from the Managers Small Company Fund
| | | | | |
Security | | Shares | | Cost |
Psychiatric Solutions, Inc. | | 4,890 | | $ | 180,588 |
Enersys, Inc. | | 4,940 | | | 95,984 |
Immucor, Inc. | | 5,220 | | | 167,040 |
Phase Forward, Inc. | | 8,300 | | | 165,917 |
NICE Systems, Ltd. | | 4,700 | | | 123,328 |
Atwood Oceanics, Inc. | | 3,340 | | | 127,187 |
Microsemi Corp. | | 6,930 | | | 180,873 |
Tetra Technologies, Inc. | | 6,530 | | | 177,877 |
eResearch Technology, Inc. | | 7,416 | | | 85,581 |
Digital River, Inc. | | 2,730 | | | 108,463 |
Pediatrix Medical Group, Inc. | | 1,250 | | | 71,950 |
Syniverse Holdings, Inc. | | 6,400 | | | 117,120 |
Tupperware Brands Corp. | | 4,500 | | | 153,585 |
NTELOS Holdings Corp | | 5,580 | | | 159,979 |
Solera Holdings, Inc. | | 2,464 | | | 71,456 |
Alkermes, Inc. | | 9,599 | | | 122,771 |
| | | | | |
Total | | 84,789 | | $ | 2,109,699 |
| | | | | |
| 3. | Purchases and Sales of Securities |
Purchases and sales of securities, excluding short-term securities, for the year ended December 31, 2008, were $1,581,331,530 and $2,383,157,971, respectively. There were no purchases or sales of U.S. Government securities.
| 4. | Portfolio Securities Loaned |
The Fund may participate in a securities lending program offered by BNYM, providing for the lending of securities to qualified brokers. Securities lending fees include earnings of such temporary cash investments, plus or minus any rebate to a borrower. These earnings (after any rebate) are then divided between BNYM, as a fee for its services under the program, and the Fund, according to agreed-upon rates. Collateral on all securities loaned is accepted in cash and/or government securities and is maintained at a minimum level of 102% (105% in the case of certain foreign securities) of the market value, plus interest, if applicable, of investments on loan. It is the Funds policy to obtain additional collateral from or return excess collateral to the borrower by the end of the next business day, following the valuation date of the securities loaned. Therefore, the value of the collateral held may be temporarily less than the value of the securities on loan. Lending securities entails a risk of loss to the Fund if and to the extent that the market value
20
Managers Special Equity Fund
Notes to Financial Statements (continued)
of the securities loaned were to increase and the borrower did not increase the collateral accordingly, and the borrower fails to return the securities. The Fund bears the risk of any deficiency in the amount of the collateral available for return to the borrower due to any loss on the collateral invested. Collateral received in the form of cash is invested temporarily in the BNY Institutional Cash Reserves Fund (the “ICRF”), or other short-term investments as defined in the Securities Lending Agreement with BNYM.
In September and October of 2008, BNYM advised the Investment Manager that the ICRF had exposure to certain defaulted debt obligations, and that BNYM had established separate sleeves of the ICRF to hold these securities. The net impact of these positions is not material to the Fund. The Fund’s position in the separate sleeves of the ICRF Fund is included in the Schedule of Portfolio Investments and the unrealized loss on such investment is included in Net Unrealized Depreciation on the Statement of Assets and Liabilities and the Statement of Operations.
| 5. | Commitments and Contingencies |
In the normal course of business, the Fund may enter into contracts and agreements that contain a variety of representations and warranties, which provide general indemnifications. The maximum exposure to the Fund under these arrangements is unknown, as this would involve future claims that may be made against the Fund that have not yet occurred. However, based on experience, the Fund expects the risk of loss to be remote.
| 6. | New Accounting Pronouncement |
In March 2008, Statement of Financial Accounting Standards No. 161, “Disclosures about Derivative Instruments and Hedging Activities” (“SFAS161”) was issued and is effective for fiscal years and interim periods beginning after November 15, 2008. SFAS 161 is intended to improve financial reporting for derivative instruments by requiring enhanced disclosure that enables investors to understand how and why a fund uses derivatives, how derivatives are accounted for, and how derivative instruments affect a fund’s results of operations and financial position. Management is currently evaluating the impact, if any, of SFAS 161 on financial statement disclosures.
Tax Information (unaudited)
The Fund hereby designates the maximum amount allowable of its net taxable income as qualified dividends as provided in the Jobs and Growth Tax Relief Reconciliation Act of 2003. The 2008 Form 1099-DIV you receive for the Fund will show the tax status of all distributions paid to you during the year.
Pursuant to section 852 of the Internal Revenue Code, the Fund hereby designate as a capital gain distribution with respect to the taxable year ended December 31, 2008, $74,908,155 or, if subsequently determined to be different, the net capital gains of such year.
21
Report of Independent Registered Public Accounting Firm
To the Board of Trustees of The Managers Funds and the Shareholders of Managers Special Equity Fund:
In our opinion, the accompanying statement of assets and liabilities, including the schedule of portfolio investments, and the related statements of operations and of changes in net assets and the financial highlights present fairly, in all material respects, the financial position of Managers Special Equity Fund (one of the series constituting The Managers Funds, hereafter referred to as the “Fund”) at December 31, 2008, the results of its operations for the year then ended, the changes in its net assets for each of the two years in the period then ended and the financial highlights for each of the periods indicated, in conformity with accounting principles generally accepted in the United States of America. These financial statements and financial highlights (hereafter referred to as “financial statements”) are the responsibility of the Fund’s management; our responsibility is to express an opinion on these financial statements based on our audits. We conducted our audits of these financial statements in accordance with the standards of the Public Company Accounting Oversight Board (United States). Those standards require that we plan and perform the audit to obtain reasonable assurance about whether the financial statements are free of material misstatement. An audit includes examining, on a test basis, evidence supporting the amounts and disclosures in the financial statements, assessing the accounting principles used and significant estimates made by management, and evaluating the overall financial statement presentation. We believe that our audits, which included confirmation of securities at December 31, 2008 by correspondence with the custodian, provide a reasonable basis for our opinion.
PricewaterhouseCoopers LLP
Philadelphia, Pennsylvania
February 27, 2009
22
Trustees and Officers
The Trustees and Officers of the Trust, their business addresses, principal occupations for the past five years and dates of birth are listed below. The Trustees provide broad supervision over the affairs of the Trust and the Funds. The Trustees are experienced executives who meet periodically throughout the year to oversee the Funds’ activities, review contractual arrangements with companies that provide services to the Funds, and review the Funds’ performance. Unless otherwise noted, the address of each Trustee or Officer is the address of the Trust: 800 Connecticut Avenue, Norwalk, Connecticut 06854.
There is no stated term of office for Trustees. Trustees serve until their resignation, retirement or removal in accordance with the Trust’s organizational documents and policies adopted by the Board from time to time. The Chairman of the Trustees, President, Treasurer and Secretary of the Trust are elected by the Trustees annually. Other officers hold office at the pleasure of the Trustees.
Independent Trustees
The following Trustees are not “interested persons” of the Trust within the meaning of the 1940 Act:
| | |
Name, Date of Birth, Number of Funds Overseen in Fund Complex* | | Principal Occupation(s) During Past 5 Years and Other Directorships Held by Trustee |
Jack W. Aber, 9/9/37 • Trustee since 1999 • Oversees 32 Funds in Fund Complex | | Professor of Finance, Boston University School of Management (1972-Present); Trustee of Appleton Growth Fund (1 portfolio); Trustee of Third Avenue Trust (4 portfolios); Trustee of Third Avenue Variable Trust (1 portfolio). |
| |
William E. Chapman, II, 9/23/41 • Independent Chairman • Trustee since 1999 • Oversees 32 Funds in Fund Complex | | President and Owner, Longboat Retirement Planning Solutions (1998-Present); Hewitt Associates, LLC (part time) (provider of Retirement and Investment Education Seminars); Trustee of Bowdoin College (2002-Present); Director of Harding, Loevner Funds, Inc. (6 portfolios); Trustee of Third Avenue Trust (4 portfolios); Trustee of Third Avenue Variable Trust (1 portfolio). |
| |
Edward J. Kaier, 9/23/45 • Trustee since 1999 • Oversees 32 Funds in Fund Complex | | Attorney at Law and Partner, Teeters Harvey Gilboy & Kaier LLP (2007-Present); Attorney at Law and Partner, Hepburn Willcox Hamilton & Putnam, LLP (1977-2007); Trustee of Third Avenue Trust (4 portfolios); Trustee of Third Avenue Variable Trust (1 portfolio). |
| |
Steven J. Paggioli, 4/3/50 • Trustee since 1993 • Oversees 32 Funds in Fund Complex | | Consultant (2001-Present); Formerly Executive Vice President and Director, The Wadsworth Group (1986- 2001); Executive Vice President, Secretary and Director, Investment Company Administration, LLC (1990-2001); Vice President, Secretary and Director, First Fund Distributors, Inc. (1991-2001); Trustee, Professionally Managed Portfolios (22 portfolios); Advisory Board Member, Sustainable Growth Advisors, LP; Independent Director, Chase Investment Counsel (2008 – Present). |
| |
Eric Rakowski, 6/5/58 • Trustee since 1999 • Oversees 32 Funds in Fund Complex | | Professor, University of California at Berkeley School of Law (1990-Present); Director of Harding, Loevner Funds, Inc. (6 portfolios); Trustee of Third Avenue Trust (4 portfolios); Trustee of Third Avenue Variable Trust (1 portfolio). |
| |
Thomas R. Schneeweis, 5/10/47 • Trustee since 1987 • Oversees 32 Funds in Fund Complex | | Professor of Finance, University of Massachusetts (1977-Present); Director, CISDM at the University of Massachusetts, (1996-Present); President, Alternative Investment Analytics, LLC, (formerly Schneeweis Partners, LLC) (2001-Present); Partner, White Bear Partners, LLC (2007-Present); Partner, Schneeweis Capital Management, LLC (2007-Present); Partner, Schneeweis Associates, LLC (2007-Present); Partner, Northampton Capital Management, LLC (2004-Present); Partner, TRS Associates (2007-Present). |
| * | The Fund Complex consists of Managers AMG Funds, The Managers Funds, Managers Trust I and Managers Trust II. |
Interested Trustees
The following Trustees are “interested persons” of the Trust within the meaning of the 1940 Act. Mr. Dalton is an interested person by virtue of his positions with, and interest in securities of, Affiliated Managers Group, Inc. Mr. Streur is an interested person by virtue of his positions with Managers Investment Group LLC.
| | |
Name, Date of Birth, Number of Funds Overseen in Fund
Complex* | | Principal Occupation(s) During Past 5 Years and Other Directorships Held by Trustee |
Nathaniel Dalton, 9/29/66 • Trustee since 2008 • Oversees 32 Funds in Fund Complex | | Executive Vice President and Chief Operating Officer, Affiliated Managers Group, Inc., (2006-Present); Executive Vice President, Affiliated Managers Group, Inc., (2002 -2006); Executive Vice President and General Counsel, Affiliated Managers Group, Inc. (2001-2002); Senior Vice President and General Counsel, Affiliated Managers Group, Inc. (1996-2001). Director, Managers Distributors, Inc. (2000-Present). |
| |
John H. Streur, 2/6/60 • Trustee since 2008 • President since 2008 • Oversees 32 Funds in Fund Complex | | Senior Managing Partner, Managers Investment Group LLC (2006-Present); President, Managers Distributors, Inc. (2006-Present); Managing Partner, Managers Investment Group LLC (2005-2006); Chief Executive Officer, President and Chief Operating Officer, The Burridge Group LLC (1996-2004). |
Officers
| | |
Name, Date of Birth, Position(s) Held with Fund and Length of Time Served | | Principal Occupation(s) During Past 5 Years |
Christine C. Carsman, 4/2/52 • Secretary since 2004 | | Senior Vice President and Chief Regulatory Counsel, Affiliated Managers Group, Inc. (2004-Present); Secretary, Managers AMG Funds, Managers Trust I and II (2004-Present); Senior Counsel, Vice President and Director of Operational Risk Management and Compliance, Wellington Management Company, LLP (1995-2004); Deputy General Counsel, The Boston Company, Inc. (1993-1995); Associate General Counsel, The Boston Company Advisors, Inc. (1991-1993); Associate, Sullivan & Worcester LLP (1987-1991). |
| |
Donald S. Rumery, 5/29/58 • Chief Financial Officer since 2007 • Treasurer since 1995 | | Senior Vice President, Managers Investment Group LLC (2005-Present); Director, Finance and Planning, The Managers Funds LLC, (1994-2004); Treasurer and Chief Financial Officer, Managers Distributors, Inc. (2000-Present); Treasurer, Managers AMG Funds (1999-Present); Treasurer, Managers Trust I and Managers Trust II (2000-Present); Secretary, Managers Trust I and Managers Trust II (2000-2004) and Secretary, The Managers Funds (1997-2004); Chief Financial Officer, Managers AMG Funds, Managers Trust I and Managers Trust II (2007-Present). |
| |
Keitha L. Kinne, 5/16/58 • Chief Operating Officer since 2007 | | Managing Partner and Chief Operating Officer, Managers Investment Group LLC (2007-Present); Chief Investment Officer, Managers Investment Group LLC (2008-Present); Chief Operating Officer, Managers AMG Funds, Managers Trust I and Managers Trust II (2007-Present); Managing Director, Legg Mason & Co., LLC (2006-2007); Managing Director, Citigroup Asset Management (2004-2006); Senior Vice President, Prudential Investments (1999-2004). |
| |
David Kurzweil, 6/22/74 • Assistant Secretary since 2008 | | Senior Vice President and Associate Counsel, Managers Investment Group LLC (2008-Present); Assistant Secretary, The Managers Funds, Managers Trust I, Managers Trust II, and Managers AMG Funds (2008-Present); Counsel and Senior Vice President, Lazard Asset Management LLC (2003-2008). |
23
Investment Manager and Administrator
Managers Investment Group LLC
800 Connecticut Avenue
Norwalk, Connecticut 06854
(203) 299-3500 or (800) 835-3879
Distributor
Managers Distributors, Inc.
800 Connecticut Avenue
Norwalk, Connecticut 06854
(203) 299-3500 or (800) 835-3879
Custodian
The Bank of New York Mellon
2 Hanson Place
Brooklyn, New York 11217
Legal Counsel
Ropes & Gray LLP
One International Place
Boston, Massachusetts 02110-2624
Transfer Agent
PNC Global Investment Servicing (U.S.) Inc.
Attn: Managers
P.O. Box 9769
Providence, Rhode Island 02940
(800) 548-4539
For Managers Choice Only
Managers
c/o PNC Global Investment Servicing (U.S.) Inc.
P.O. Box 61204
King of Prussia, Pennsylvania 19406-0851
(800) 358-7668
MANAGERS AND MANAGERS AMG FUNDS
EQUITY FUNDS
EMERGING MARKETS EQUITY
Rexiter Capital Management Limited
ESSEX GROWTH
ESSEX LARGE CAP GROWTH
ESSEX SMALL/MICRO CAP GROWTH
Essex Investment Management Co., LLC
FQ TAX-MANAGED U.S. EQUITY
FQ U.S. EQUITY
First Quadrant, L.P.
GW&K MULTI-CAP EQUITY
Gannet Welsh & Kotler, LLC
INSTITUTIONAL MICRO-CAP
MICRO-CAP
Lord, Abbett & Co. LLC
WEDGE Capital Management L.L.P.
OFI Institutional Asset Management, Inc.
Next Century Growth Investors LLC
INTERNATIONAL EQUITY
AllianceBernstein L.P.
Lazard Asset Management, LLC
Wellington Management Company, LLP
CHICAGO EQUITY PARTNERS
MID-CAP
Chicago Equity Partners, LLC
REAL ESTATE SECURITIES
Urdang Securities Management, Inc.
SKYLINE SPECIAL EQUITIES
PORTFOLIO
Skyline Asset Management, L.P.
SMALL CAP
TIMESSQUARE MID CAP GROWTH
TIMESSQUARE SMALL CAP GROWTH
TimesSquare Capital Management, LLC
SPECIAL EQUITY
Ranger Investment Management, L.P.
Lord, Abbett & Co. LLC
Skyline Asset Management, L.P.
Smith Asset Management Group, L.P.
Federated MDTA LLC
Westport Asset Management, Inc.
SYSTEMATIC VALUE
SYSTEMATIC MID CAP VALUE
Systematic Financial Management, L.P.
BALANCED FUNDS
CHICAGO EQUITY PARTNERS BALANCED
Chicago Equity Partners, LLC
GLOBAL
AllianceBernstein L.P.
First Quadrant, L.P.
Wellington Management Company, LLP
ALTERNATIVE FUNDS
FQ GLOBAL ALTERNATIVES
First Quadrant, L.P.
INCOME FUNDS
BOND (MANAGERS)
FIXED INCOME
GLOBAL BOND
Loomis, Sayles & Co., L.P.
BOND (MANAGERS FREMONT)
Pacific Investment Management Co. LLC
CALIFORNIA INTERMEDIATE TAX-FREE
Miller Tabak Asset Management LLC
GW&K MUNICIPAL ENHANCED YIELD
Gannet Welsh & Kotler, LLC
HIGH YIELD
J.P. Morgan Investment Management LLC
INTERMEDIATE DURATION GOVERNMENT
SHORT DURATION GOVERNMENT
Smith Breeden Associates, Inc.
MONEY MARKET
JPMorgan Investment Advisors Inc.
This report is prepared for the Fund’s shareholders. It is authorized for distribution to prospective investors only when preceded or accompanied by an effective prospectus. To receive a free copy of the prospectus or Statement of Additional Information, which includes additional information about Fund Trustees, please contact us by calling 800.835.3879. Distributed by Managers Distributors, Inc., member FINRA.
A description of the policies and procedures each Fund uses to vote its proxies is available: (i) without charge, upon request, by calling 800.835.3879, or (ii) on the Securities and Exchange Commission’s (SEC) Web site at www.sec.gov. For information regarding each Fund’s proxy voting record for the 12-month period ended December 31, call 800.835.3879 or visit the SEC Web site at www.sec.gov.
The Fund files its complete schedule of portfolio holdings with the SEC for the first and third quarters of each fiscal year on Form N-Q. The Fund’s Forms N-Q are available on the SEC’s website at www.sec.gov. A Fund’s Forms N-Q may be reviewed and copied at the SEC’s Public Reference Room in Washington, DC. Information on the operation of the Public Reference Room may be obtained by calling 1-800-SEC-0330. To review a complete list of the Fund’s portfolio holdings, or to view the most recent quarterly holdings report, semiannual report, or annual report, please visit www.managersinvest.com.
www.managersinvest.com


Registrant has adopted a Code of Ethics. See attached Exhibit (a)(1).
| Item 3. | AUDIT COMMITTEE FINANCIAL EXPERT |
Registrant’s Board of Trustees has determined that independent Trustees Mr. Jack W. Aber and Mr. Steven J. Paggioli each qualify as the Audit Committee Financial Expert. Mr. Aber and Mr. Paggioli are “independent” as such term is defined in Form N-CSR.
| Item 4. | PRINCIPAL ACCOUNTANT FEES AND SERVICES |
The aggregate fees billed by PwC to the Fund for the Funds’ two most recent fiscal years for professional services rendered for audits of annual financial statements, or services that are normally provided in connection with statutory and regulatory filings or engagements (“Audit Fees”) were as follows:
| | | | | | |
| | | Fiscal 2008 | | Fiscal 2007 |
Essex Large Cap Growth Fund | | $ | 18,899 | | $ | 22,419 |
Managers Special Equity Fund | | $ | 32,146 | | $ | 39,989 |
Managers International Equity Fund | | $ | 31,779 | | $ | 35,617 |
Managers Emerging Markets Equity Fund | | $ | 27,840 | | $ | 25,587 |
Managers Bond Fund | | $ | 39,556 | | $ | 36,564 |
Managers Global Bond Fund | | $ | 27,756 | | $ | 28,501 |
Managers Money Market Fund | | $ | 9,800 | | $ | 10,139 |
All Funds in the Managers Complex Audited by PwC | | $ | 769,183 | | $ | 758,032 |
Audit-Related Fees
There were no fees billed by PwC to the Funds in its two recent fiscal years for services rendered for assurance and related services that are reasonably related to the performance of the audit or review of the Fund’s financial statements, but are not reported as Audit Fees (“Audit-Related Fees”).
For the Funds’ two most recent fiscal years, there were no Audit-Related Fees billed by PwC for engagements related directly to the operations and financial reporting of one or more Funds by a Fund Service Provider. A Fund Service Provider is (a) any investment adviser to the Fund (not including any Subadvisor whose role is primarily portfolio management and is subcontracted with or overseen by another investment adviser) or (b) any entity that provides ongoing services to the Fund and is controlling, controlled by or under common control with a Fund investment adviser described in (a).
Tax Fees
The aggregate fees billed by PwC to the Funds for the two most recent fiscal years for professional services rendered for tax compliance, tax advice, and tax planning (“Tax Fees”) were as follows:
| | | | | | |
| | | Fiscal 2008 | | Fiscal 2007 |
Essex Large Cap Growth Fund | | $ | 6,471 | | $ | 6,400 |
Managers Special Equity Fund | | $ | 8,580 | | $ | 8,900 |
Managers International Equity Fund | | $ | 9,298 | | $ | 9,000 |
Managers Emerging Markets Equity Fund | | $ | 9,298 | | $ | 8,500 |
Managers Bond Fund | | $ | 8,484 | | $ | 9,500 |
Managers Global Bond Fund | | $ | 8,771 | | $ | 8,500 |
Managers Money Market Fund | | $ | 4,218 | | $ | 6,700 |
For the Funds’ two most recent fiscal years, Tax Fees billed by PwC for engagements by Fund Service Providers that related directly to the operations and financial reporting of the Funds were $0 for fiscal 2008 and $0 for fiscal 2007, respectively.
The services for which Tax Fees were charged comprise all services performed by professional staff in PwC’s tax division except those services related to the audit. Typically, this category would include fees for tax compliance, tax planning, and tax advice. Tax compliance, tax advice, and tax planning services include preparation of original and amended tax returns, claims for refund and tax payment-planning services, assistance with tax audits and appeals, tax advice related to mergers and acquisitions and requests for rulings or technical advice from taxing authorities.
All Other Fees
There were no other fees billed by PwC to the Funds for all other non-audit services (“Other Fees”) during the Funds’ two most recent fiscal years. During the same period, there were no Other Fees billed by PwC for engagements by Fund Service Providers that related directly to the operations and financial reporting of the Funds.
According to policies adopted by the Audit Committee, services provided by PwC to the Funds must be pre-approved by the Audit Committee. On an annual basis, the Audit Committee reviews and pre-approves various types of services that PwC may perform for the Funds without specific approval of each engagement, subject to specified budget limitations. As contemplated by the Sarbanes-Oxley Act of 2002 and related SEC rules, the Audit Committee also pre-approves non-audit services provided by PwC to any Fund Service Provider for any engagement that relates directly to the operations and financial reporting of the Funds. Any engagement that is not already pre-approved or that will exceed a pre-approved budget must be submitted to the Audit Committee for pre-approval. The Chairman of the Audit Committee is authorized on behalf of the Board of Trustees and the Audit Committee to approve the engagement of PwC to perform non-audit services subject to certain conditions, including notification to the Audit Committee of such pre-approval not later than the next meeting of the Audit Committee following the date of such pre-approval.
There were no other fees billed by PwC for non-audit services rendered to the Funds and to Fund Service Providers for the Funds’ two most recent fiscal years.
The Audit Committee has considered whether the provision of non-audit services by PwC to Fund Service Providers that were not required to be pre-approved by the Audit Committee is compatible with maintaining PwC’s independence in its audit of the Funds, taking into account representations from PwC, in accordance with Independence Standards Board Standard No. 1, regarding its independence from the Funds and its related entities.
The following table sets forth the non-audit services provided by PwC to the Funds and its service affiliates defined as the Funds’ investment advisor and any entity controlling, controlled by or under common control with Managers Investment Group LLC that provides ongoing services to the Funds (“Control Affiliates”) for the last two fiscal years.
| | | | | | | | | | | | | | | | | | |
| | | Audit-related fees A | | Tax fees A | | All other fees A |
| | | 2007 | | 2006 | | 2007 | | 2006 | | 2007 | | 2006 |
Control Affiliates | | $ | 467,485 | | $ | 357,120 | | $ | 1,264,360 | | $ | 839,245 | | $ | 0 | | $ | 0 |
A | Aggregate amounts may reflect rounding. |
| Item 5. | AUDIT COMMITTEE OF LISTED REGISTRANTS |
Not applicable.
| Item 6. | SCHEDULE OF INVESTMENTS |
Not applicable.
| Item 7. | DISCLOSURE OF PROXY VOTING POLICIES AND PROCEDURES FOR CLOSED-END MANAGEMENT INVESTMENT COMPANIES |
Not applicable.
| Item 8. | PORTFOLIO MANAGERS OF CLOSED-END MANAGEMENT INVESTMENT COMPANIES |
Not applicable.
| Item 9. | PURCHASES OF EQUITY SECURITIES BY CLOSED-END MANAGEMENT INVESTMENT COMPANIES AND AFFILIATED PURCHASERS |
Not applicable.
| Item 10. | SUBMISSION OF MATTERS TO A VOTE OF SECURITY HOLDERS |
Not applicable.
| Item 11. | CONTROLS AND PROCEDURES |
(a) The Registrant’s principal executive and principal financial officers have concluded, based on their evaluation of the registrant’s disclosure controls and procedures as of a date within 90 days of the filing of this report, that the Registrant’s disclosure
controls and procedures are reasonably designed to ensure that information required to be disclosed by the Registrant on Form N-CSR is recorded, processed, summarized and reported within the required time periods and that information required to be disclosed by the registrant in the reports that it files or submits on Form N-CSR is accumulated and communicated to the Registrant’s management, including its principal executive and principal financial officers, as appropriate to allow timely decisions regarding required disclosure.
(b) There were no changes in the Registrant’s internal control over financial reporting during the Registrant’s fourth fiscal quarter of the period covered by this report that have materially affected, or are reasonably likely to affect, the internal control over financial reporting.
| | |
| (a)(1) | | Any Code of Ethics or amendments hereto. Filed herewith. |
| |
| (a)(2) | | Certifications pursuant to Rule 30a-2(a) under the Investment Company Act of 1940 - Filed herewith. |
| |
| (a)(3) | | Not applicable. |
| |
| (b) | | Certifications pursuant to Rule 30a-2(b) under the Investment Company Act of 1940 - Filed herewith. |
SIGNATURES
Pursuant to the requirements of the Securities Exchange Act of 1934 and the Investment Company Act of 1940, the registrant has duly caused this report to be signed on its behalf by the undersigned, thereunto duly authorized.
| | |
| THE MANAGERS FUNDS |
| |
| By: | | /s/ John H. Streur |
| | John H. Streur, President |
| |
| Date: | | February 27, 2009 |
Pursuant to the requirements of the Securities Exchange Act of 1934 and the Investment Company Act of 1940, this report has been signed below by the following persons on behalf of the registrant and in the capacities and on the dates indicated.
| | |
| By: | | /s/ John H. Streur |
| | John H. Streur, President |
| |
| Date: | | February 27, 2009 |
| |
| By: | | /s/ Donald S. Rumery |
| | Donald S. Rumery, Chief Financial Officer |
| |
| Date: | | February 27, 2009 |