UNITED STATES
SECURITIES AND EXCHANGE COMMISSION
Washington, D.C. 20549
FORM N-CSR
CERTIFIED SHAREHOLDER REPORT OF REGISTERED
MANAGEMENT INVESTMENT COMPANIES
Investment Company Act file number: 811-03752
The Managers Funds
(Exact name of registrant as specified in charter)
800 Connecticut Avenue, Norwalk, Connecticut 06854
(Address of principal executive offices) (Zip code)
Managers Investment Group LLC
800 Connecticut Avenue, Norwalk, Connecticut 06854
(Name and address of agent for service)
Registrant’s telephone number, including area code: (203) 299-3500
Date of fiscal year end: May 31
Date of reporting period: July 1, 2010 – May 31, 2011
(Annual Shareholder Report)
| Item 1. | Reports to Shareholders |
ANNUAL REPORT
Managers Funds
May 31, 2011
Managers Cadence Capital Appreciation Fund
(formerly Allianz CCM Capital Appreciation Fund)
Managers Cadence Focused Growth Fund
(formerly Allianz CCM Focused Growth Fund)
Managers Cadence Mid-Cap Fund
(formerly Allianz CCM Mid-Cap Fund)
Managers Cadence Emerging Companies Fund
(formerly Allianz CCM Emerging Companies Fund)

AR065-0511
[THIS PAGE INTENTIONALLY LEFT BLANK]
The Managers Cadence Funds
Annual Report – May 31, 2011
| | | | |
TABLE OF CONTENTS | | Page | |
| |
| LETTER TO SHAREHOLDERS | | | 1 | |
| |
| ABOUT YOUR FUND’S EXPENSES | | | 3 | |
| |
| INVESTMENT MANAGER’S COMMENTS, FUND SNAPSHOTS, AND SCHEDULES OF PORTFOLIO INVESTMENTS | | | | |
| |
Managers Cadence Capital Appreciation Fund | | | 5 | |
| |
Managers Cadence Focused Growth Fund | | | 11 | |
| |
Managers Cadence Mid-Cap Fund | | | 16 | |
| |
Managers Cadence Emerging Companies Fund | | | 22 | |
| |
NOTES TO SCHEDULES OF PORTFOLIO INVESTMENTS | | | 28 | |
| |
FINANCIAL STATEMENTS: | | | | |
| |
Statements of Assets and Liabilities | | | 29 | |
Funds’ balance sheets, net asset value (NAV) per share computations and cumulative undistributed amounts | | | | |
| |
Statements of Operations | | | 31 | |
Detail of sources of income, Fund expenses, and realized and unrealized gains (losses) during the period | | | | |
| |
Statements of Changes in Net Assets | | | 33 | |
Detail of changes in Fund assets for the past two periods | | | | |
| |
FINANCIAL HIGHLIGHTS | | | 35 | |
Historical net asset values per share, distributions, total returns, expense ratios, turnover ratios and net assets | | | | |
| |
NOTES TO FINANCIAL STATEMENTS | | | 43 | |
Accounting and distribution policies, details of agreements and transactions with Fund management and affiliates, and descriptions of certain investment risks | | | | |
| |
REPORT OF INDEPENDENT REGISTERED PUBLIC ACCOUNTING FIRM | | | 53 | |
| |
TRUSTEES AND OFFICERS | | | 54 | |
Nothing contained herein is to be considered an offer, sale or solicitation of an offer to buy shares of any series of the Managers Family of Funds. Such offering is made only by Prospectus, which includes details as to offering price and other material information.
Letter to Shareholders
Dear Shareholder:
Our foremost goal at Managers Investment Group is to structure and manage mutual funds that will help our shareholders and clients successfully reach their investment goals and objectives.
Each of our Funds is geared to provide you with exposure to a specific asset class or style of investing. Our mutual fund offerings include four that are subadvised by Cadence Capital Management, LLC (“Cadence”) and focus on specific segments of the domestic equity market. The Managers Cadence Capital Appreciation Fund seeks to provide investors with diversified, large-cap growth domestic equity exposure, while the Managers Cadence Focused Growth Fund is a more concentrated portfolio of U.S. large-cap growth stocks. Cadence also oversees the Managers Cadence Mid-Cap Fund, which focuses on domestic mid-cap growth stocks, and the Managers Cadence Emerging Companies Fund, which invests in attractively valued growth stocks in the micro-cap and small-cap space. Cadence has been managing equity portfolios since the late 1980s and has overseen the Funds since their inception. Cadence implements a growth-at-a-reasonable price equity investment process with an initial screen that narrows the universe before in-depth, fundamental research is undertaken to identify the most attractive securities.
Below is a brief overview of the equity markets and the performance results for the Funds. Following this letter, we also provide the Portfolio Managers’ discussion of their investment management approach, performance results and market outlook.
The economic recovery began in 2009 and extended into 2010, thanks in part to a concerted effort by global governments to provide a framework conducive to growth and asset inflation. This accommodative monetary policy proved to be very successful in the short run as economies continued to recover and riskier assets appreciated substantially. That being said, the path higher has been choppy as fears over sovereign debt default and the potential for a double-dip recession weighed on the minds of investors. Fear turned into courage in the second half of 2010, as corporate earnings proved to be better than expected and a sovereign crisis was averted when European government officials agreed to provide the Irish government with an $89 billion rescue package. The risk trade was in favor on the equity side of the ledger and benefited greatly from strong corporate earnings as well as the Federal Reserve’s plan to stimulate the U.S. economy via another round of quantitative easing (QE2). The rising trend continued into 2011 up through the first few weeks of February, before unrest in the Middle East caused oil prices to increase and equity markets to fall. The Japanese catastrophe in mid-March also dragged down equity markets as investors questioned the ripple-effect of a sharp slowdown in Japan and wondered about the potential impact of an evolving nuclear disaster. Equity markets eventually stabilized during April and continued the trend higher. As of late, fear has returned to the forefront causing equity markets to trend downward since late-April. Investors are again concerned about European debt issues, slowing Chinese growth, the sustainability of the U.S. recovery and continued unrest in the Middle East. Nevertheless, the trailing 12-month period has been quite strong for U.S. equities as the Russell 1000® Growth Index appreciated 29.43%, the Russell Midcap® Growth Index returned 36.31% and the Russell 2000 Growth® Index returned 36.79%.
Against this backdrop, the absolute performance of the Managers Cadence Funds was very strong, but the relative returns were somewhat disappointing with the exception of Managers Cadence Emerging Companies Fund. The absolute and relative returns are summarized below:
| | | | | | | | | | | | | | | | | | | | | | | | | | | | |
| | | | | | | | | | | | | | | | | | Since | | | Inception | |
Periods Ended 05/31/11 | | 6 Months | | | 1 Year | | | 3 Years | | | 5 Years | | | 10 Years | | | Inception | | | Date | |
Managers Cadence Capital Appreciation Fund | | | | | | | | | | | | | | | | | | | | | | | | | | | | |
Institutional Class | | | 12.35 | % | | | 25.05 | % | | | (2.79 | )% | | | 1.23 | % | | | 1.70 | % | | | 9.34 | % | | | 3/8/1991 | |
Russell 1000® Growth Index | | | 14.36 | % | | | 29.43 | % | | | 2.92 | % | | | 5.55 | % | | | 2.15 | % | | | 9.28 | % | | | | |
Managers Cadence Focused Growth Fund | | | | | | | | | | | | | | | | | | | | | | | | | | | | |
Institutional Class | | | 12.60 | % | | | 26.98 | % | | | (2.03 | )% | | | 0.73 | % | | | 2.02 | % | | | 0.89 | % | | | 8/31/1999 | |
Russell 1000® Growth Index | | | 14.36 | % | | | 29.43 | % | | | 2.92 | % | | | 5.55 | % | | | 2.15 | % | | | 0.27 | % | | | | |
Managers Cadence Mid-Cap Fund | | | | | | | | | | | | | | | | | | | | | | | | | | | | |
Institutional Class | | | 18.55 | % | | | 35.47 | % | | | (0.43 | )% | | | 3.76 | % | | | 4.52 | % | | | 10.40 | % | | | 8/26/1991 | |
Russell Midcap® Growth Index | | | 18.31 | % | | | 36.31 | % | | | 4.47 | % | | | 6.54 | % | | | 5.70 | % | | | N/A | | | | | |
Managers Cadence Emerging Companies Fund | | | | | | | | | | | | | | | | | | | | | | | | | | | | |
Institutional Class | | | 24.14 | % | | | 49.20 | % | | | 8.54 | % | | | 3.68 | % | | | 7.74 | % | | | 11.69 | % | | | 6/25/1993 | |
Russell Microcap® Growth Index | | | 20.06 | % | | | 34.69 | % | | | 6.60 | % | | | 2.48 | % | | | 4.46 | % | | | 6.25 | % | | | | |
Russell 2000® Growth Index | | | 19.39 | % | | | 36.79 | % | | | 6.92 | % | | | 6.26 | % | | | 5.14 | % | | | 6.25 | % | | | | |
1
Letter to Shareholders (continued)
For the 12-month period ending May 31, 2011, the Managers Cadence Capital Appreciation Fund Institutional Class returned 25.05%, behind the 29.43% return for the Russell 1000® Growth Index. The Fund’s underperformance is most attributable to poor relative performance in the health care, consumer discretionary and financials sectors. Sector weightings also detracted as an overweight to health care and an underweight to energy hurt relative performance.
For the 12-month period ending May 31, 2011, the Managers Cadence Focused Growth Fund Institutional Class returned 26.98%, underperforming the 29.43% return of the Russell 1000® Growth Index. Like the Managers Cadence Capital Appreciation Fund, the underperformance is due to a combination of poor relative stock performance and sector weightings. Stock performance detracted the most within the health care, materials and financials sectors. Overweights to health care and telecomm along with underweights to energy and materials hurt relative returns too.
For the 12-month period ending May 31, 2011, the Managers Cadence Mid-Cap Fund Institutional Class returned 35.47%, slightly behind the 36.31% return for the Russell Midcap® Growth Index. The primary driver of underperformance was a small allocation to cash as mid-cap growth stocks appreciated sharply. Relative performance within the consumer discretionary, materials and financials sector also hurt performance, but was mostly offset by strong performance in the industrials and energy sectors.
For the 12-month period ending May 31, 2011, the Managers Cadence Emerging Companies Fund Institutional Class returned 49.20%, markedly beating the 34.69% return for the Russell Microcap® Growth Index. The primary driver of the solid results was exceptional strong stock selection in information technology as numerous holdings appreciated more than 100%. Additionally, an underweight to health care and strong performance in the industrials and consumer staples sectors also contributed to relative returns.
Going forward, Cadence believes there is still cause to be cautiously optimistic. While the market is pricing in an economic slowdown, Cadence is confident about the prospects of its individual holdings. In this world of low but rising inflation, improving economic growth and still historically low interest rates, Cadence believes its Funds have the potential to perform well as investors focus more on company fundamentals rather than macro concerns.
Cadence believes the greatest challenge is the extraordinary short-term price volatility and sector rotation, as the market continues to reassess the evolving economic landscape. Longer term, an important concern is potential profit margin compression. Adding to this challenge are the high costs of production in such areas as energy and metals. For these reasons, a company’s ability to raise prices is a key component of Cadence’s investment framework for 2011.
Cadence is emphasizing companies that can manage rising cost inputs by increasing prices and/or controlling costs, in particular, emphasizing companies with specialized or scarce products that can most easily raise prices and companies able to generate significant free cash flow. In the long run, strong free cash flow could prove to be even more attractive as it would mitigate the effect of future high interest rates.
Should you have any questions about this report, or if you’d like to receive a prospectus and additional information, including fees and expenses for this or any of the other Funds in our family, please feel free to contact us at 1-800-835-3879, or visit our Web site at www.managersinvest.com. As always, please read the prospectus carefully before you invest or send money.
If you are curious about how you can better diversify your investment program, visit the Knowledge Center on our web site. You can rest assured that under all market conditions, our team is focused on delivering excellent investment management services for your benefit.
We thank you for your continued confidence and investment in The Managers Funds.
|
| Respectfully, |
|
 |
John H. Streur Senior Managing Partner Managers Investment Group LLC |
2
About Your Fund’s Expenses
As a shareholder of a Fund, you may incur two types of costs: (1) transaction costs, which may include sales charges (loads) on purchase payments; redemption fees; and exchange fees; and (2) ongoing costs, including management fees; distribution (12b-1) fees; and other Fund expenses. This example is intended to help you understand your ongoing costs (in dollars) of investing in the Fund and to compare these costs with the ongoing costs of investing in other mutual funds. The example is based on $1,000 invested at the beginning of the period and held for the entire period as indicated below.
Actual Expenses
The first line of the following table provides information about the actual account values and actual expenses. You may use the information in this line, together with the amount you invested, to estimate the expenses that you paid over the period. Simply divide your account value by $1,000 (for example, an $8,600 account value divided by $1,000 = 8.6), then multiply the result by the number in the first line under the heading entitled “Expenses Paid During Period” to estimate the expenses you paid on your account during this period.
Hypothetical Example for Comparison Purposes
The second line of the following table provides information about hypothetical account values and hypothetical expenses based on the Fund’s actual expense ratio and an assumed annual rate of return of 5% before expenses, which is not the Fund’s actual return. The hypothetical account values and expenses may not be used to estimate the actual ending account balance or expenses you paid for the period. You may use this information to compare the ongoing costs of investing in the Fund and other funds by comparing this 5% hypothetical example with the 5% hypothetical examples that appear in the shareholder reports of other funds.
Please note that the expenses shown in the table are meant to highlight your ongoing costs only and do not reflect any transactional costs, such as sales charges (loads), redemption fees, or exchange fees. Therefore, the second line of the table is useful in comparing ongoing costs only, and will not help you determine the relative total costs of owning different funds.
| | | | | | | | | | | | | | | | |
Six Months Ended May 31, 2011 | | Expense Ratio
for the Period | | | Beginning
Account Value
12/01/2010 | | | Ending
Account Value
05/31/2011 | | | Expenses
Paid During
the Period* | |
Managers Cadence Capital Appreciation Fund | | | | | | | | | | | | | | | | |
Class A | | | | | | | | | | | | | | | | |
Based on Actual Fund Return | | | 1.10 | % | | $ | 1,000 | | | $ | 1,121 | | | $ | 5.82 | |
Based on Hypothetical 5% Annual Return | | | 1.10 | % | | $ | 1,000 | | | $ | 1,019 | | | $ | 5.54 | |
Class B | | | | | | | | | | | | | | | | |
Based on Actual Fund Return | | | 1.86 | % | | $ | 1,000 | | | $ | 1,117 | | | $ | 9.84 | |
Based on Hypothetical 5% Annual Return | | | 1.86 | % | | $ | 1,000 | | | $ | 1,016 | | | $ | 9.37 | |
Class C | | | | | | | | | | | | | | | | |
Based on Actual Fund Return | | | 1.82 | % | | $ | 1,000 | | | $ | 1,117 | | | $ | 9.61 | |
Based on Hypothetical 5% Annual Return | | | 1.82 | % | | $ | 1,000 | | | $ | 1,016 | | | $ | 9.15 | |
Class D | | | | | | | | | | | | | | | | |
Based on Actual Fund Return | | | 1.11 | % | | $ | 1,000 | | | $ | 1,121 | | | $ | 5.89 | |
Based on Hypothetical 5% Annual Return | | | 1.11 | % | | $ | 1,000 | | | $ | 1,019 | | | $ | 5.61 | |
Institutional Class | | | | | | | | | | | | | | | | |
Based on Actual Fund Return | | | 0.71 | % | | $ | 1,000 | | | $ | 1,124 | | | $ | 3.78 | |
Based on Hypothetical 5% Annual Return | | | 0.71 | % | | $ | 1,000 | | | $ | 1,021 | | | $ | 3.60 | |
Administrative Class | | | | | | | | | | | | | | | | |
Based on Actual Fund Return | | | 0.96 | % | | $ | 1,000 | | | $ | 1,122 | | | $ | 5.10 | |
Based on Hypothetical 5% Annual Return | | | 0.96 | % | | $ | 1,000 | | | $ | 1,020 | | | $ | 4.86 | |
Class P | | | | | | | | | | | | | | | | |
Based on Actual Fund Return | | | 0.81 | % | | $ | 1,000 | | | $ | 1,123 | | | $ | 4.28 | |
Based on Hypothetical 5% Annual Return | | | 0.81 | % | | $ | 1,000 | | | $ | 1,021 | | | $ | 4.07 | |
Class R | | | | | | | | | | | | | | | | |
Based on Actual Fund Return | | | 1.36 | % | | $ | 1,000 | | | $ | 1,120 | | | $ | 7.21 | |
Based on Hypothetical 5% Annual Return | | | 1.36 | % | | $ | 1,000 | | | $ | 1,018 | | | $ | 6.86 | |
Managers Cadence Focused Growth Fund | | | | | | | | | | | | | | | | |
Class A | | | | | | | | | | | | | | | | |
Based on Actual Fund Return | | | 1.05 | % | | $ | 1,000 | | | $ | 1,124 | | | $ | 5.56 | |
Based on Hypothetical 5% Annual Return | | | 1.05 | % | | $ | 1,000 | | | $ | 1,020 | | | $ | 5.29 | |
Class C | | | | | | | | | | | | | | | | |
Based on Actual Fund Return | | | 1.84 | % | | $ | 1,000 | | | $ | 1,119 | | | $ | 9.71 | |
Based on Hypothetical 5% Annual Return | | | 1.84 | % | | $ | 1,000 | | | $ | 1,016 | | | $ | 9.24 | |
Class D | | | | | | | | | | | | | | | | |
Based on Actual Fund Return | | | 1.10 | % | | $ | 1,000 | | | $ | 1,123 | | | $ | 3.96 | |
Based on Hypothetical 5% Annual Return | | | 1.10 | % | | $ | 1,000 | | | $ | 1,019 | | | $ | 3.76 | |
Institutional Class | | | | | | | | | | | | | | | | |
Based on Actual Fund Return | | | 0.75 | % | | $ | 1,000 | | | $ | 1,126 | | | $ | 3.96 | |
Based on Hypothetical 5% Annual Return | | | 0.75 | % | | $ | 1,000 | | | $ | 1,021 | | | $ | 3.77 | |
Administrative Class | | | | | | | | | | | | | | | | |
Based on Actual Fund Return | | | 0.97 | % | | $ | 1,000 | | | $ | 1,124 | | | $ | 5.16 | |
Based on Hypothetical 5% Annual Return | | | 0.97 | % | | $ | 1,000 | | | $ | 1,020 | | | $ | 4.90 | |
Class P | | | | | | | | | | | | | | | | |
Based on Actual Fund Return | | | 0.79 | % | | $ | 1,000 | | | $ | 1,124 | | | $ | 4.28 | |
Based on Hypothetical 5% Annual Return | | | 0.79 | % | | $ | 1,000 | | | $ | 1,021 | | | $ | 4.07 | |
3
About Your Fund’s Expenses (continued)
| | | | | | | | | | | | | | | | |
Six Months Ended May 31, 2011 | | Expense Ratio
for the Period | | | Beginning
Account Value
12/01/2010 | | | Ending
Account Value
05/31/2011 | | | Expenses
Paid During
the Period* | |
Managers Cadence Mid-Cap Fund | | | | | | | | | | | | | | | | |
Class A | | | | | | | | | | | | | | | | |
Based on Actual Fund Return | | | 1.10 | % | | $ | 1,000 | | | $ | 1,183 | | | $ | 5.97 | |
Based on Hypothetical 5% Annual Return | | | 1.10 | % | | $ | 1,000 | | | $ | 1,019 | | | $ | 5.52 | |
Class B | | | | | | | | | | | | | | | | |
Based on Actual Fund Return | | | 1.85 | % | | $ | 1,000 | | | $ | 1,179 | | | $ | 10.04 | |
Based on Hypothetical 5% Annual Return | | | 1.85 | % | | $ | 1,000 | | | $ | 1,016 | | | $ | 9.28 | |
Class C | | | | | | | | | | | | | | | | |
Based on Actual Fund Return | | | 1.82 | % | | $ | 1,000 | | | $ | 1,179 | | | $ | 9.90 | |
Based on Hypothetical 5% Annual Return | | | 1.82 | % | | $ | 1,000 | | | $ | 1,016 | | | $ | 9.16 | |
Class D | | | | | | | | | | | | | | | | |
Based on Actual Fund Return | | | 1.10 | % | | $ | 1,000 | | | $ | 1,183 | | | $ | 5.97 | |
Based on Hypothetical 5% Annual Return | | | 1.10 | % | | $ | 1,000 | | | $ | 1,019 | | | $ | 5.53 | |
Institutional Class | | | | | | | | | | | | | | | | |
Based on Actual Fund Return | | | 0.70 | % | | $ | 1,000 | | | $ | 1,186 | | | $ | 3.80 | |
Based on Hypothetical 5% Annual Return | | | 0.70 | % | | $ | 1,000 | | | $ | 1,021 | | | $ | 3.51 | |
Administrative Class | | | | | | | | | | | | | | | | |
Based on Actual Fund Return | | | 0.95 | % | | $ | 1,000 | | | $ | 1,185 | | | $ | 5.16 | |
Based on Hypothetical 5% Annual Return | | | 0.95 | % | | $ | 1,000 | | | $ | 1,020 | | | $ | 4.77 | |
Class P | | | | | | | | | | | | | | | | |
Based on Actual Fund Return | | | 0.78 | % | | $ | 1,000 | | | $ | 1,185 | | | $ | 4.27 | |
Based on Hypothetical 5% Annual Return | | | 0.78 | % | | $ | 1,000 | | | $ | 1,021 | | | $ | 3.95 | |
Class R | | | | | | | | | | | | | | | | |
Based on Actual Fund Return | | | 1.35 | % | | $ | 1,000 | | | $ | 1,182 | | | $ | 5.71 | |
Based on Hypothetical 5% Annual Return | | | 1.35 | % | | $ | 1,000 | | | $ | 1,018 | | | $ | 6.78 | |
Managers Cadence Emerging Companies Fund | | | | | | | | | | | | | | | | |
Insitutional Class | | | | | | | | | | | | | | | | |
Based on Actual Fund Return | | | 1.41 | % | | $ | 1,000 | | | $ | 1,241 | | | $ | 7.85 | |
Based on Hypothetical 5% Annual Return | | | 1.41 | % | | $ | 1,000 | | | $ | 1,018 | | | $ | 7.07 | |
Administrative Class | | | | | | | | | | | | | | | | |
Based on Actual Fund Return | | | 1.68 | % | | $ | 1,000 | | | $ | 1,240 | | | $ | 9.39 | |
Based on Hypothetical 5% Annual Return | | | 1.68 | % | | $ | 1,000 | | | $ | 1,017 | | | $ | 8.45 | |
| * | Expenses are equal to the Fund’s annualized expense ratio multiplied by the average account value over the period, multiplied by the number of days in the most recent fiscal half-year (182), then divided by 365. |
4
Managers Cadence Capital Appreciation Fund
Investment Manager’s Comments
THE YEAR IN REVIEW
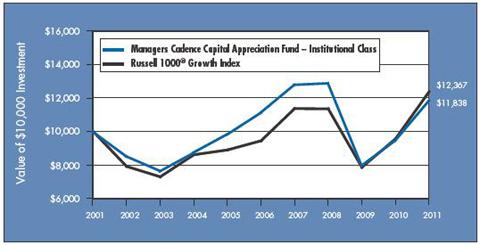
Over the 12 months ended May 31, 2011, the Managers Cadence Capital Appreciation Fund’s (the “Fund”) Institutional Class returned 25.05%, underperforming the 29.43% return of the Russell 1000® Growth Index.
The trailing 12-month period was a strong one for stocks in general, with major averages posting double-digit returns. The Russell 1000® Index gained 26.8%, while the Russell Midcap® and Russell 2000® Indices advanced 32.6% and 29.8%, respectively. Growth-style indices outperformed their value counterparts overall, with the Russell 1000® Growth, Russell Midcap® Growth and Russell 2000® Growth Indices returning 29.4%, 36.3%, and 36.8%, respectively.
U.S. corporate earnings continued to improve over the 12-month period, first with effective cost-cutting measures and later with productivity enhancements. Perhaps most importantly for active stock pickers, at times, investors seemed to finally focus on company fundamentals – rewarding stocks with above-average earnings growth and reasonable valuations – rather than discounting stocks on a wholesale basis in reaction to distressing macroeconomic events.
What the strong equity market returns don’t show, however, is the wild ride investors took to get there. While the Great Recession formally ended in June 2009, the U.S. recovery has been sluggish, and the economic environment has been difficult for investors, businesses and individuals alike. Unemployment has remained stubbornly high, concerns about credit markets have yet to be resolved and the critical housing sector has yet to return to growth. Indeed, it has been hard to tell at times whether the economy was in fact recovering at all.
If anyone needed yet more proof of the near impossibility of successfully timing the market, they got it over the last 12 months, with the U.S. equity market experiencing several ups and downs. The causes were varied: fears of sovereign debt default in Europe and a double-dip recession in the United States, slowing growth in China, and concern that the policy responses in each of these regions would fail to ensure the emergence of a self-reinforcing, global economic recovery. Lately, the greatest local concerns have been continued weakness in the housing market, high unemployment, four-dollar-per-gallon gas prices and dangerous weather patterns that have caused states-of-emergencies in several areas.
Abroad, the backdrop of events has been nothing short of astounding. In a mere six months, the world was rocked by events ranging from the historic uprisings in the Middle East and the resultant spike in the price of oil; to the horrific natural and nuclear disasters in Japan; to the death of Osama bin Laden. Despite all this, the U.S. market proved to be generally resilient, posting some of the best returns investors have seen since 1999.
After the major benchmarks peaked at the end of April, however, they began to correct in May. The about-face reflects growing concern over the Federal Reserve’s withdrawal of its Quantitative Easing policy (QE2) and questions over the U.S. economy’s ability to self-sustain without the cash infusion. Continued social unrest in the Middle East, decelerating growth in China, continued concerns over sovereign debt and economic and social instability in Greece are adding to the fears. Even if the U.S. does not double dip into a recession (which we don’t believe it will), a modest 2% growth rate will likely continue to feel recessionary to many Americans.
Against this backdrop, the Fund generated a strong absolute return, but lagged its primary benchmark, the Russell 1000® Growth Index, by roughly 400 basis points.
While all sectors within the Fund posted positive absolute returns over the 12-month period, stock selection and sector weightings both contributed to the Fund’s underperformance. The Fund’s health care, consumer discretionary and financials holdings detracted the most from results. Diversified investment services companies Morgan Stanley Co. (-20.2%) and Lincoln National Corp. (-1.6%) dragged down the financials sector, while medical technology company Medtronic, Inc. (-14.2%) and health care device supplier Covidien PLC (-11.5%) detracted from health care holdings. Relative underperformance in the consumer discretionary sector was due in part to losses in electronics retailer Best Buy Co., Inc. (-25.4%) and home furnishings and commercial products manufacturer Leggett & Platt, Inc., (-10.5%). From a sector standpoint, a modest overweight to health care and an underweight to energy were the most notable detractors. The energy sector was the best performing sector within the Russell 1000® Growth Index. As markets retreated the last few months, the overweight to health care has proven beneficial. However, it is one of the laggards (+25.7%) over the entire fiscal year as many other sectors are up over 30%.
Three economically sensitive sectors – energy, materials and industrials – had significant impact on return. The Fund’s energy holdings returned 52.2%, led by National Oilwell Varco, Inc. (+92.0%), an oil service company focused primarily on offshore oil production, and Peabody Energy Corp. (+58.4%), a coal mining and production concern.
5
Managers Cadence Capital Appreciation Fund
Investment Manager’s Comments (continued)
The Fund’s materials holdings returned 40.1%. This sector was led by Cliffs Natural Resources, Inc. (+61.6%), a company which produces both iron ore and coal; and E.I. du Pont de Nemours & Co. (+52.4%), whose markets include seeds and agricultural products, specialty chemicals, coatings and materials. Industrials returned 26.3% overall, led by gains in Joy Global, Inc. (+77.6%), a leader in mining equipment and services and Dover Corp. (+52.7%), a diversified manufacturer of industrial products and engineered systems.
Consumer staples also posted significant gains, advancing 33.9% for the year. Within consumer staples, the Fund’s top-performing holdings included Philip Morris International, Inc. (+70.2%), which manufactures and markets tobacco products outside of the United States and Whole Foods Market, Inc. (+70.4%), natural and organic food supermarkets.
LOOKING FORWARD
Going forward, we at Cadence believe there is still cause to be cautiously optimistic for the second half of the year. While the market is pricing in an economic slowdown, we are constructive on the prospects of our individual holdings. In this world of low but rising inflation, improving economic growth and still historically low interest rates, we believe our Fund will perform well as investors continue to focus more on company fundamentals rather than macro concerns. In particular, our investments in the energy, materials and industrials sectors should benefit most from rising inflation.
We believe the greatest challenge is the extraordinary short-term price volatility and sector rotation, as the market continues to reassess the evolving economic landscape. Longer term, an important concern is the issue of companies’ potential profit margin compression. With economic conditions improving and measures of corporate profit margins at historically high levels, companies will have to start adding to their labor force. While the creation of jobs is good news, it also creates a challenge: adding resources to meet demand. Adding to this challenge are the high costs of production in areas such as energy and metals. For these reasons, a company’s ability to raise prices is a key component of our investment framework for 2011.
Specifically, we are buying more companies that can manage rising cost inputs by increasing prices and/or controlling costs. In particular, we are attracted to companies with specialized or scarce products that can raise prices most easily. We are also focusing on companies that generate significant free cash flow, because they are more able to self-fund their growth and return cash to shareholders in the form of increased dividends and share buybacks. In the long run, strong free cash flow could prove to be even more attractive as it would mitigate the effect of future high interest rates.
In summary, we will continue to seek the right balance between playing offense and defense in the Funds. We will invest in companies that should benefit from global economic expansion but balance them with holdings in defensive sectors such as health care and consumer staples that may act as anchors. Through it all, you can be confident that we will stick to the investment discipline that has seen Cadence clients through challenges and opportunities since 1988.
This commentary reflects the viewpoints of Cadence Capital Management, LLC. The viewpoints and performance figures are based on a 12-month period ending May 31, 2011. The following financial statements presented in this report represent the Fund’s actual 11-month fiscal period from July 1, 2010, to May 31, 2011.
CUMULATIVE TOTAL RETURN PERFORMANCE
Managers Cadence Capital Appreciation Fund’s cumulative total return is based on the daily change in net asset value (NAV), and assumes that all dividends and distributions were reinvested. The Russell 1000® Growth Index is a market capitalization weighted index that measures the performance of those Russell 1000® companies with higher price-to-book ratio and higher forecasted growth values. Unlike the Fund, the Russell 1000® Growth Index is unmanaged, is not available for investment, and does not incur expenses. The Index assumes reinvestment of dividends. This graph compares a hypothetical $10,000 investment made in Managers Cadence Capital Appreciation Fund’s Institutional Class on May 31, 2001, compared to a $10,000 investment made in the Russell 1000® Growth Index for the same time period. Performance for periods longer than one year is annualized. The graph and table do not reflect the deduction of taxes that a shareholder would pay on a Fund distribution or redemption of shares. The listed returns for the Fund are net of expenses and the returns for the index exclude expenses. Past performance is not indicative of future results. Total returns would have been lower had certain expenses not been reduced.
6
Managers Cadence Capital Appreciation Fund
Investment Manager’s Comments (continued)
Cumulative Total Return Performance (continued)
The table below shows the average annual total returns for Managers Cadence Capital Appreciation Fund since inception through May 31, 2011, and the Russell 1000® Growth Index for the same time period.
| | | | | | | | | | | | | | | | | | | | | | |
| | | | | Average Annual Total Returns1 | |
| | | | | One | | | Five | | | Ten | | | Since | | | Inception | |
| | | | | Year | | | Years | | | Years | | | Inception | | | Date | |
Managers Cadence Capital Appreciation Fund2,3,4,5,6,* | | | | | | | | | | | | | | | | | | | | |
Class A | | No Load | | | 24.58 | % | | | 0.82 | % | | | 1.30 | % | | | 5.37 | % | | | 01/20/97 | |
Class A | | With Load | | | 17.44 | % | | | (0.37 | )% | | | 0.70 | % | | | 4.93 | % | | | | |
Class B | | No Load | | | 23.70 | % | | | 0.06 | % | | | 0.54 | % | | | 4.58 | % | | | 01/20/97 | |
Class B | | With Load | | | 18.70 | % | | | (0.28 | )% | | | 0.54 | % | | | 4.58 | % | | | | |
Class C | | No Load | | | 23.70 | % | | | 0.08 | % | | | 0.55 | % | | | 4.59 | % | | | 01/20/97 | |
Class C | | With Load | | | 22.70 | % | | | 0.08 | % | | | 0.55 | % | | | 4.59 | % | | | | |
Class D | | | | | 24.58 | % | | | 0.82 | % | | | 1.30 | % | | | 3.11 | % | | | 04/08/98 | |
Institutional Class | | | | | 25.05 | % | | | 1.23 | % | | | 1.70 | % | | | 9.34 | % | | | 03/08/91 | |
Administrative Class | | | | | 24.83 | % | | | 0.97 | % | | | 1.48 | % | | | 6.99 | % | | | 07/31/96 | |
Class P | | | | | 25.06 | % | | | — | | | | — | | | | 0.50 | % | | | 07/07/08 | |
Class R | | | | | 24.24 | % | | | 0.57 | % | | | — | | | | 5.93 | % | | | 12/31/02 | |
Russell 1000® Growth Index7 | | | | | 29.43 | % | | | 5.55 | % | | | 2.15 | % | | | 9.28 | % | | | 03/08/91 | † |
The performance data shown represents past performance, which is not a guarantee of future results. Current performance may be lower or higher than the performance data quoted. The investment return and principal value of an investment in the Fund will fluctuate so that an investor’s shares, when redeemed, may be worth more or less than their original cost. For performance information through the most recent month end, please call (800) 835-3879 or visit our Web site at www.managersinvest.com.
Performance differences among the share classes are due to differences in sales charge structures and class expenses. Returns shown reflect a maximum sales charge of 5.75% on Class A shares, as well as the applicable contingent deferred sales charge (CDSC) on Class B and Class C shares. Class C shares held for less than one year are subject to a 1% CDSC.
In choosing a Fund, investors should carefully consider the amount they plan to invest, their investment objectives, the Fund’s investment objectives, risks, charges and expenses before investing. For this and other information, please call (800) 835-3879 or visit www.managersinvest.com for a free prospectus. Read it carefully before investing or sending money. Distributed by Managers Distributors, Inc., member FINRA.
| † | Date reflects the inception date of the Fund, not the index. |
| * | The Fund changed its fiscal year end from June 30 to May 31 in 2011. |
| 1 | Total return equals income yield plus share price change and assumes reinvestment of all dividends and capital gain distributions. Returns are net of fees and may reflect offsets of Fund expenses as described in the Prospectus. No adjustment has been made for taxes payable by shareholders on their reinvested dividends and capital gain distributions. Returns for periods greater than one year are annualized. The listed returns on the Fund are net of expenses and based on the published NAV as of May 31, 2011. All returns are in U.S. dollars($). |
| 2 | Fund for which, from time to time, the Fund’s advisor has waived its fees and/ or absorbed Fund expenses, which has resulted in higher returns. |
| 3 | A greater percentage of the Fund’s holdings may be focused in a smaller number of securities which may place the Fund at greater risk than a more diversified fund. |
| 4 | The Fund invests in growth stocks, which may be more sensitive to market movements because their prices tend to reflect future investor expectations rather than just current profits. Growth stocks may underperform value stocks during given periods. |
| 5 | The Fund invests in large-capitalization companies that may underperform other stock funds (such as funds that focus on small- and medium-capitalization companies) when stocks of large-capitalization companies are out of favor. |
| 6 | The Fund is subject to special risk considerations similar to those associated with the direct ownership of real estate. Real Estate valuations may be subject to factors such as changing general and local economic, financial, competitive, and environmental conditions. |
| 7 | The Russell 1000® Growth Index is a market capitalization weighted index that measures the performance of those Russell 1000® companies with higher price-to-book ratio and higher forecasted growth values. Unlike the Fund, the Russell 1000® Growth Index is unmanaged, is not available for investment, and does not incur expenses. |
The Russell 1000® Growth Index is a trademark of Russell Investments. Russell® is a trademark of Russell Investments.
Not FDIC insured, nor bank guaranteed. May lose value.
7
Managers Cadence Capital Appreciation Fund
Fund Snapshots
May 31, 2011
Portfolio Breakdown
| | | | | | | | |
Industry | | Managers Cadence Capital
Appreciation Fund** | | | Russell 1000®
Growth Index | |
Information Technology | | | 31.9 | % | | | 30.2 | % |
Consumer Discretionary | | | 13.6 | % | | | 14.5 | % |
Health Care | | | 12.5 | % | | | 9.9 | % |
Consumer Staples | | | 10.1 | % | | | 9.9 | % |
Industrials | | | 9.6 | % | | | 13.3 | % |
Energy | | | 9.5 | % | | | 11.4 | % |
Materials | | | 5.0 | % | | | 5.1 | % |
Financials | | | 4.1 | % | | | 4.8 | % |
Telecommunication Services | | | 1.2 | % | | | 0.8 | % |
Utilities | | | 0.0 | % | | | 0.1 | % |
Other Assets and Liabilities | | | 2.5 | % | | | 0.0 | % |
| ** | As a percentage of net assets |
Top Ten Holdings
| | | | |
Security Name | | Percentage
of Net Assets | |
Apple, Inc.* | | | 4.1 | % |
International Business Machines Corp.* | | | 2.6 | |
Oracle Corp.* | | | 2.3 | |
Exxon Mobil Corp. | | | 2.2 | |
Google, Inc.* | | | 2.2 | |
QUALCOMM, Inc. | | | 2.0 | |
McDonald’s Corp. | | | 1.6 | |
Phillip Morris International, Inc. | | | 1.6 | |
EMC Corp. | | | 1.5 | |
Coco-Cola Co., The | | | 1.5 | |
| | | | |
Top Ten as a Group | | | 21.6 | % |
| | | | |
| * | Top Ten Holding at December 31, 2010 |
Any sectors, industries, or securities discussed should not be perceived as investment recommendations. Mention of a special security should not be considered a recommendation to buy or solicitation to sell that security. Special securities mentioned in this report may have been sold from the Fund’s portfolio of investments by the time you receive this report.
8
Managers Cadence Capital Appreciation Fund
Schedule of Portfolio Investments
May 31, 2011
| | | | | | | | |
| | | Shares | | | Value | |
Common Stocks - 97.5% | | | | | | | | |
Consumer Discretionary - 13.6% | | | | | | | | |
Amazon.com, Inc.* | | | 52,620 | | | $ | 10,349,828 | |
Coach, Inc. | | | 147,500 | | | | 9,389,850 | |
DIRECTV, Class A* | | | 219,890 | | | | 11,051,671 | |
Ford Motor Co.* | | | 660,720 | | | | 9,857,942 | |
Johnson Controls, Inc. | | | 243,216 | | | | 9,631,354 | |
McDonald’s Corp. | | | 159,640 | | | | 13,017,046 | |
Nike, Inc. | | | 114,290 | | | | 9,651,791 | |
Starbucks Corp. | | | 290,060 | | | | 10,671,307 | |
Starwood Hotels & Resorts Worldwide, Inc. | | | 151,580 | | | | 9,243,348 | |
TJX Cos., Inc., The | | | 191,590 | | | | 10,158,102 | |
Walt Disney Co., The | | | 238,770 | | | | 9,939,995 | |
Total Consumer Discretionary | | | | | | | 112,962,234 | |
Consumer Staples - 10.1% | | | | | | | | |
Brown-Forman Corp., Class B | | | 116,910 | | | | 8,473,637 | |
Coca-Cola Co., The | | | 184,200 | | | | 12,306,402 | |
Costco Wholesale Corp. | | | 132,970 | | | | 10,967,366 | |
Estee Lauder Co., Class A | | | 105,530 | | | | 10,817,880 | |
H.J. Heinz Co. | | | 163,970 | | | | 9,005,232 | |
Hershey Foods Corp. | | | 178,470 | | | | 9,946,133 | |
Philip Morris International, Inc. | | | 180,240 | | | | 12,932,220 | |
Whole Foods Market, Inc. | | | 157,150 | | | | 9,611,294 | |
Total Consumer Staples | | | | | | | 84,060,164 | |
Energy - 9.5% | | | | | | | | |
Baker Hughes, Inc. | | | 137,590 | | | | 10,172,029 | |
Chevron Corp. | | | 105,270 | | | | 11,043,876 | |
Exxon Mobil Corp. | | | 224,020 | | | | 18,698,949 | |
Hess Corp. | | | 51,020 | | | | 4,032,110 | |
Marathon Oil Corp. | | | 193,070 | | | | 10,458,602 | |
National Oilwell Varco, Inc. | | | 99,490 | | | | 7,220,984 | |
Occidental Petroleum Corp. | | | 95,960 | | | | 10,349,286 | |
Peabody Energy Corp. | | | 113,130 | | | | 6,941,657 | |
Total Energy | | | | | | | 78,917,493 | |
Financials - 4.1% | | | | | | | | |
American Express Co. | | | 128,500 | | | | 6,630,600 | |
Ameriprise Financial, Inc. | | | 155,550 | | | | 9,524,327 | |
Metlife, Inc. | | | 220,720 | | | | 9,733,752 | |
Morgan Stanley Co. | | | 329,420 | | | | 7,958,787 | |
Total Financials | | | | | | | 33,847,466 | |
Health Care - 12.5% | | | | | | | | |
Allergan, Inc. | | | 109,810 | | | | 9,084,581 | |
Baxter International, Inc. | | | 178,200 | | | | 10,606,464 | |
Cardinal Health, Inc. | | | 255,140 | | | | 11,588,459 | |
CareFusion Corp.* | | | 288,250 | | | | 8,353,485 | |
CR Bard, Inc. | | | 101,940 | | | | 11,394,853 | |
Laboratory Corp. of America Holdings* | | | 110,200 | | | | 11,111,466 | |
Mylan Laboratories, Inc.* | | | 434,810 | | | | 10,237,602 | |
Stryker Corp. | | | 165,880 | | | | 10,350,912 | |
Varian Medical Systems, Inc.* | | | 150,065 | | | | 10,135,390 | |
Waters Corp.* | | | 116,540 | | | | 11,486,182 | |
Total Health Care | | | | | | | 104,349,394 | |
Industrials - 9.6% | | | | | | | | |
Cooper Industries PLC | | | 142,980 | | | | 8,986,293 | |
Deere & Co. | | | 116,540 | | | | 10,031,763 | |
Dover Corp. | | | 158,850 | | | | 10,679,485 | |
Goodrich Corp. | | | 106,680 | | | | 9,312,097 | |
Joy Global, Inc. | | | 109,532 | | | | 9,819,544 | |
Norfolk Southern Corp. | | | 153,400 | | | | 11,245,754 | |
Stericycle, Inc.* | | | 113,530 | | | | 10,114,388 | |
United Parcel Service, Inc., Class B | | | 135,040 | | | | 9,924,090 | |
Total Industrials | | | | | | | 80,113,414 | |
Information Technology - 31.9% | | | | | | | | |
Accenture PLC, Class A | | | 193,720 | | | | 11,117,591 | |
Apple, Inc.* | | | 98,820 | | | | 34,372,561 | |
Applied Materials, Inc. | | | 609,580 | | | | 8,400,012 | |
Autodesk, Inc.* | | | 240,850 | | | | 10,351,733 | |
Avago Technologies, Ltd. | | | 229,610 | | | | 7,758,522 | |
BMC Software, Inc.* | | | 203,010 | | | | 11,334,048 | |
Citrix Systems, Inc.* | | | 90,150 | | | | 7,898,943 | |
Cognizant Technology Solutions Corp.* | | | 129,950 | | | | 9,881,398 | |
Dell, Inc.* | | | 629,590 | | | | 10,123,807 | |
eBay, Inc.* | | | 317,600 | | | | 9,899,592 | |
EMC Corp.* | | | 434,120 | | | | 12,359,396 | |
Google, Inc.* | | | 35,160 | | | | 18,600,343 | |
International Business Machines Corp. | | | 128,280 | | | | 21,670,340 | |
Intuit, Inc.* | | | 124,700 | | | | 6,730,059 | |
Juniper Networks, Inc.* | | | 233,280 | | | | 8,540,381 | |
KLA-Tencor Corp. | | | 232,760 | | | | 10,031,956 | |
NetApp, Inc.* | | | 137,550 | | | | 7,533,614 | |
The accompanying notes are an integral part of these financial statements.
9
Managers Cadence Capital Appreciation Fund
Schedule of Portfolio Investments (continued)
| | | | | | | | |
| | | Shares | | | Value | |
Information Technology - 31.9% (continued) | | | | | | | | |
Oracle Corp. | | | 569,560 | | | $ | 19,490,343 | |
QUALCOMM, Inc. | | | 276,960 | | | | 16,227,086 | |
Teradata Corp.* | | | 81,630 | | | | 4,554,138 | |
Visa, Inc., Class A | | | 134,930 | | | | 10,937,426 | |
Western Digital Corp.* | | | 228,150 | | | | 8,361,698 | |
Total Information Technology | | | | | | | 266,174,987 | |
Materials - 5.0% | | | | | | | | |
Cliffs Natural Resources, Inc. | | | 46,300 | | | | 4,199,410 | |
E.I. du Pont de Nemours & Co. | | | 190,080 | | | | 10,131,264 | |
Freeport McMoRan Copper & Gold, Inc., Class B | | | 178,542 | | | | 9,219,909 | |
Mosaic Co., The | | | 134,070 | | | | 9,498,860 | |
PPG Industries, Inc. | | | 98,420 | | | | 8,729,854 | |
Total Materials | | | | | | | 41,779,297 | |
Telecommunication Services - 1.2% | | | | | | | | |
American Tower Corp., Class A* | | | 182,030 | | | | 10,099,024 | |
Total Common Stocks (cost $651,340,654) | | | | | | | 812,303,473 | |
Short-Term Investments - 4.0%1 | | | | | | | | |
Dreyfus Cash Management Fund, Institutional Class Shares, 0.10% (cost $33,308,617) | | | 33,308,617 | | | | 33,308,617 | |
Total Investments - 101.5%
(cost $684,649,271) | | | | | | | 845,612,090 | |
Other Assets, less Liabilities - (1.5)% | | | | | | | (12,227,468 | ) |
Net Assets - 100.0% | | | | | | $ | 833,384,622 | |
The accompanying notes are an integral part of these financial statements.
10
Managers Cadence Focused Growth Fund
Investment Manager’s Comments
THE YEAR IN REVIEW
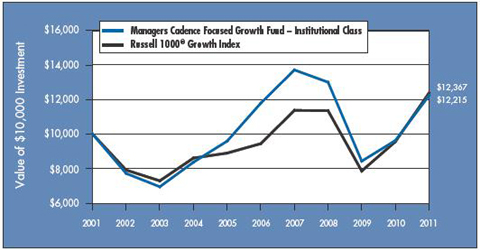
Over the 12 months ended May 31, 2011, the Managers Cadence Focused Growth Fund’s (the “Fund”) Institutional Class returned 26.98%, underperforming the 29.43% return of the Russell 1000® Growth Index.
The trailing 12-month period was a strong one for stocks in general, with major averages posting double-digit returns. The Russell 1000® Index gained 26.8%, while the Russell Midcap® and Russell 2000® Indices advanced 32.6% and 29.8%, respectively. Growth-style indices outperformed their value counterparts overall, with the Russell 1000® Growth, Russell Midcap® Growth and Russell 2000® Growth Indices returning 29.4%, 36.3%, and 36.8%, respectively.
U.S. corporate earnings continued to improve over the 12-month period, first with effective cost-cutting measures and later with productivity enhancements. Perhaps most importantly for active stock pickers, at times, investors seemed to finally focus on company fundamentals—rewarding stocks with above-average earnings growth and reasonable valuations—rather than discounting stocks on a wholesale basis in reaction to distressing macroeconomic events.
What the strong equity market returns don’t show, however, is the wild ride investors took to get there. While the Great Recession formally ended in June 2009, the U.S. recovery has been sluggish, and the economic environment has been difficult for investors, businesses and individuals alike. Unemployment has remained stubbornly high, concerns about credit markets have yet to be resolved, and the critical housing sector has yet to return to growth. Indeed, it has been hard to tell at times whether the economy was in fact recovering at all.
If anyone needed yet more proof of the near-impossibility of successfully timing the market, they got it over the last 12 months with the U.S. equity market experiencing several ups and downs. The causes were varied: fears of sovereign debt default in Europe and a double-dip recession in the United States, slowing growth in China, and concern that the policy responses in each of these regions would fail to ensure the emergence of a self-reinforcing, global economic recovery. Lately, the greatest local concerns have been continued weakness in the housing market, high unemployment, four-dollar-per-gallon gas prices and dangerous weather patterns that have caused state-of-emergencies in several areas.
Abroad, the backdrop of events has been nothing short of astounding. In a mere six months, the world was rocked by events ranging from the historic uprisings in the Middle East and the resultant spike in the price of oil; to the horrific natural and nuclear disasters in Japan; to the death of Osama bin Laden. Despite all this, the U.S. market proved to be generally resilient, posting some of the best returns investors have seen since 1999.
After the major benchmarks peaked at the end of April, however, they began to correct in May. The about-face reflects growing concern over the Federal Reserve’s withdrawal of its Quantitative Easing policy (QE2) and questions over the U.S. economy’s ability to self-sustain without the cash infusion. Continued social unrest in the Middle East, decelerating growth in China, continued concerns over sovereign debt, and economic and social instability in Greece are adding to the fears. Even if the U.S. does not double dip into a recession (which we don’t believe it will), a modest 2% growth rate will likely continue to feel recessionary to many Americans.
Against this backdrop, the Fund generated a strong absolute return, but lagged its primary benchmark, the Russell 1000® Growth Index, by roughly 250 basis points. The Fund’s underperformance is attributable to a combination of poor stock selection and sector weightings.
The Fund’s health care, materials and financials holdings detracted most from performance. Within health care, information technology concern McKesson Corp. (+11.7%), biopharmaceutical company Gilead Sciences, Inc. (+7.2%) and global pharmaceutical leader Abbott Laboratories (+0.7%) detracted from overall return. The Financial sector was negatively impacted by diversified financial services companies Morgan Stanley Co. (+20.2%) and investment management organization Blackrock, Inc. (+14.1%). From a sector standpoint, the Fund’s overweights to health care and telecomm detracted from results.
Three economically sensitive sectors—energy, materials and industrials—had significant impact on returns. The Fund’s energy holdings returned 46.20% for the period, led by strong gains in SM Energy Co. (+78.8%), an exploration and production company focused on natural gas and crude oil, and Alpha Natural Resources, Inc. (+42.8%), a leading producer of coal. The Fund’s materials holdings returned 20.5%, driven primarily by E.I. du Pont de Nemours & Co. which gained 52.4% over the 12-month period.
11
Managers Cadence Focused Growth Fund
Investment Manager’s Comments (continued)
Industrials gained 28.8% overall, benefiting from healthy gains in Joy Global, Inc. (+77.6%), a leader in mining equipment and services, and SPX Corp. (+29%), a global manufacturer and supplier of industrial equipment.
LOOKING FORWARD
Going forward, we at Cadence believe there is still cause to be cautiously optimistic for the second half of the year. While the market is pricing in an economic slowdown, we are constructive on the prospects of our individual holdings. In this world of low but rising inflation, improving economic growth and still historically low interest rates, we believe our Fund will perform well as investors continue to focus more on company fundamentals rather than macro concerns. In particular, our investments in the energy, materials and industrials sectors should benefit most from rising inflation.
We believe the greatest challenge is the extraordinary short-term price volatility and sector rotation, as the market continues to reassess the evolving economic landscape. Longer term, an important concern is the issue of companies’ potential profit margin compression. With economic conditions improving and measures of corporate profit margins at historically high levels, companies will have to start adding to their labor force. While the creation of jobs is good news, it also creates a challenge: adding resources to meet demand. Adding to this challenge are the high costs of production in areas such as energy and metals. For these reasons, a company’s ability to raise prices is a key component of our investment framework for 2011.
Specifically, we are buying more companies that can manage rising cost inputs by increasing prices and/or controlling costs. In particular, we are attracted to companies with specialized or scarce products that can raise prices most easily. We are also focusing on companies that generate significant free cash flow, because they are more able to self-fund their growth and return cash to shareholders in the form of increased dividends and share buybacks. In the long run, strong free cash flow could prove to be even more attractive as it would mitigate the effect of future high interest rates.
In summary, we will continue to seek the right balance between playing offense and defense in the Fund. We will invest in companies that should benefit from global economic expansion but balance them with holdings in defensive sectors such as health care and consumer staples that may act as anchors. Through it all, you can be confident that we will stick to the investment discipline that has seen Cadence clients through challenges and opportunities since 1988.
This commentary reflects the viewpoints of Cadence Capital Management, LLC. The viewpoints and performance figures are based on a 12-month period ending May 31, 2011. The following financial statements presented in this report represent the Fund’s actual 11-month fiscal period from July 1, 2010, to May 31, 2011.
CUMULATIVE TOTAL RETURN PERFORMANCE
Managers Cadence Focused Growth Fund’s cumulative total return is based on the daily change in net asset value (NAV), and assumes that all dividends and distributions were reinvested. The Russell 1000® Growth Index is a market capitalization weighted index that measures the performance of those Russell 1000® companies with higher price-to-book ratio and higher forecasted growth values. Unlike the Fund, the Russell 1000® Growth Index is unmanaged, is not available for investment, and does not incur expenses. The Index assumes reinvestment of dividends. This graph compares a hypothetical $10,000 investment made in Managers Cadence Focused Growth Fund’s Institutional Class on May 31, 2001, compared to a $10,000 investment made in the Russell 1000® Growth Index for the same time period. Performance for periods longer than one year is annualized. The graph and table do not reflect the deduction of taxes that a shareholder would pay on a Fund distribution or redemption of shares. The listed returns for the Fund are net of expenses and the returns for the index exclude expenses. Past performance is not indicative of future results. Total returns would have been lower had certain expenses not been reduced.
12
Managers Cadence Focused Growth Fund
Investment Manager’s Comments (continued)
Cumulative Total Return Performance (continued)
The table below shows the average annual total returns for Managers Cadence Focused Growth Fund since inception through May 31, 2011, and the Russell 1000® Growth Index for the same time period.
| | | | | | | | | | | | | | | | | | | | | | | | |
| | | | | | Average Annual Total Returns1 | |
| | | | | | One | | | Five | | | Ten | | | Since | | | Inception | |
| | | | | | Year | | | Years | | | Years | | | Inception | | | Date | |
Managers Cadence Focused Growth Fund 2,3,4,5,6,* | | | | | | | | | | | | | | | | | | | | | | | | |
Class A | | | No Load | | | | 26.55 | % | | | — | | | | — | | | | 0.66 | % | | | 07/05/06 | |
Class A | | | With Load | | | | 19.26 | % | | | — | | | | — | | | | (0.55 | )% | | | | |
Class C | | | No Load | | | | 25.47 | % | | | — | | | | — | | | | (0.11 | )% | | | 07/05/06 | |
Class C | | | With Load | | | | 24.47 | % | | | — | | | | — | | | | (0.11 | )% | | | | |
Class D | | | | | | | 26.55 | % | | | — | | | | — | | | | 1.04 | % | | | 07/05/06 | |
Institutional Class | | | | | | | 26.98 | % | | | 0.73 | % | | | 2.02 | % | | | 0.89 | % | | | 08/31/99 | |
Administrative Class | | | | | | | 27.30 | % | | | — | | | | — | | | | 1.31 | % | | | 09/15/06 | |
Class P | | | | | | | 26.91 | % | | | — | | | | — | | | | 0.47 | % | | | 07/07/08 | |
Russell 1000® Growth Index7 | | | | | | | 29.43 | % | | | 5.55 | % | | | 2.15 | % | | | 0.27 | % | | | 08/31/99 | † |
The performance data shown represents past performance, which is not a guarantee of future results. Current performance may be lower or higher than the performance data quoted. The investment return and principal value of an investment in the Fund will fluctuate so that an investor’s shares, when redeemed, may be worth more or less than their original cost. For performance information through the most recent month end, please call (800) 835-3879 or visit our Web site at www.managersinvest.com.
Performance differences among the share classes are due to differences in sales charge structures and class expenses. Returns shown reflect a maximum sales charge of 5.75% on Class A shares, as well as the applicable contingent deferred sales charge (CDSC) on Class C shares. Class C shares held for less than one year are subject to a 1% CDSC.
In choosing a Fund, investors should carefully consider the amount they plan to invest, their investment objectives, the Fund’s investment objectives, risks, charges and expenses before investing. For this and other information, please call (800) 835-3879 or visit www.managersinvest.com for a free prospectus. Read it carefully before investing or sending money. Distributed by Managers Distributors, Inc., member FINRA.
| † | Date reflects the inception date of the Fund, not the index. |
| * | The Fund changed its fiscal year end from June 30 to May 31 in 2011. |
| 1 | Total return equals income yield plus share price change and assumes reinvestment of all dividends and capital gain distributions. Returns are net of fees and may reflect offsets of Fund expenses as described in the Prospectus. No adjustment has been made for taxes payable by shareholders on their reinvested dividends and capital gain distributions. Returns for periods greater than one year are annualized. The listed returns on the Fund are net of expenses and based on the published NAV as of May 31, 2011. All returns are in U.S. dollars($). |
| 2 | Fund for which, from time to time, the Fund’s advisor has waived its fees and/ or absorbed Fund expenses, which has resulted in higher returns. |
| 3 | A greater percentage of the Fund’s holdings may be focused in a smaller number of securities which may place the Fund at greater risk than a more diversified fund. |
| 4 | The Fund invests in growth stocks, which may be more sensitive to market movements because their prices tend to reflect future investor expectations rather than just current profits. Growth stocks may underperform value stocks during given periods. |
| 5 | The Fund invests in large-capitalization companies that may underperform other stock funds (such as funds that focus on small- and medium-capitalization companies) when stocks of large-capitalization companies are out of favor. |
| 6 | The Fund is subject to special risk considerations similar to those associated with the direct ownership of real estate. Real estate valuations may be subject to factors such as changing general and local economic, financial, competitive, and environmental conditions. |
| 7 | The Russell 1000® Growth Index is a market capitalization weighted index that measures the performance of those Russell 1000® companies with higher price-to-book ratio and higher forecasted growth values. Unlike the Fund, the Russell 1000® Growth Index is unmanaged, is not available for investment, and does not incur expenses. |
The Russell 1000® Growth Index is a trademark of Russell Investments. Russell® is a trademark of Russell Investments.
Not FDIC insured, nor bank guaranteed. May lose value.
13
Managers Cadence Focused Growth Fund
Fund Snapshots
May 31, 2011
Portfolio Breakdown
| | | | | | | | |
Industry | | Managers Cadence
Focused
Growth Fund** | | | Russell 1000®
Growth
Index | |
Information Technology | | | 29.3 | % | | | 30.2 | % |
Consumer Discretionary | | | 15.0 | % | | | 14.5 | % |
Health Care | | | 13.2 | % | | | 9.9 | % |
Consumer Staples | | | 12.8 | % | | | 9.9 | % |
Industrials | | | 10.2 | % | | | 13.3 | % |
Energy | | | 7.5 | % | | | 11.4 | % |
Financials | | | 4.4 | % | | | 4.8 | % |
Materials | | | 4.1 | % | | | 5.1 | % |
Telecommunication Services | | | 2.4 | % | | | 0.8 | % |
Utilities | | | 0.0 | % | | | 0.1 | % |
Other Assets and Liabilities | | | 1.1 | % | | | 0.0 | % |
| ** | As a percentage of net assets |
Top Ten Holdings
| | | | |
Security Name | | Percentage of Net
Assets | |
Apple, Inc.* | | | 4.7 | % |
EMC Corp. | | | 2.9 | |
Waters Corp. | | | 2.9 | |
Cardinal Heatlh, Inc. | | | 2.8 | |
QUALCOMM, Inc. | | | 2.8 | |
Exxon Mobil Corp.* | | | 2.7 | |
SPX Corp. | | | 2.7 | |
Phillip Morris International, Inc. | | | 2.7 | |
Marathon Oil Corp. | | | 2.7 | |
United Parcel Service, Inc., Class B* | | | 2.6 | |
| | | | |
Top Ten as a Group | | | 29.5 | % |
| | | | |
| * | Top Ten Holding at December 31, 2010 |
Any sectors, industries, or securities discussed should not be perceived as investment recommendations. Mention of a specific security should not be considered a recommendation to buy or solicitation to sell that security. Specific securities mentioned in this report may have been sold from the Fund’s portfolio of investments by the time you receive this report.
14
Managers Cadence Focused Growth Fund
Schedule of Portfolio Investments
May 31, 2011
| | | | | | | | |
| | | Shares | | | Value | |
Common Stocks - 98.9% | | | | | | | | |
Consumer Discretionary - 15.0% | | | | | | | | |
Amazon.com, Inc.* | | | 2,330 | | | $ | 458,288 | |
DIRECTV, Class A* | | | 9,510 | | | | 477,973 | |
McDonald’s Corp. | | | 5,860 | | | | 477,824 | |
Nike, Inc. | | | 5,490 | | | | 463,631 | |
Starbucks Corp. | | | 12,550 | | | | 461,714 | |
TJX Cos., Inc., The | | | 8,870 | | | | 470,287 | |
Total Consumer Discretionary | | | | | | | 2,809,717 | |
Consumer Staples - 12.8% | | | | | | | | |
Coca-Cola Co., The | | | 7,210 | | | | 481,700 | |
Estee Lauder Co., Class A | | | 4,790 | | | | 491,023 | |
Hershey Foods Corp. | | | 8,580 | | | | 478,163 | |
Philip Morris International, Inc. | | | 6,980 | | | | 500,815 | |
Whole Foods Market, Inc. | | | 7,250 | | | | 443,410 | |
Total Consumer Staples | | | | | | | 2,395,111 | |
Energy - 7.5% | | | | | | | | |
Alpha Natural Resources, Inc.* | | | 6,940 | | | | 380,243 | |
Exxon Mobil Corp. | | | 6,140 | | | | 512,506 | |
Marathon Oil Corp. | | | 9,230 | | | | 499,989 | |
Total Energy | | | | | | | 1,392,738 | |
Financials - 4.4% | | | | | | | | |
Ameriprise Financial, Inc. | | | 7,220 | | | | 442,081 | |
Morgan Stanley Co. | | | 15,550 | | | | 375,688 | |
Total Financials | | | | | | | 817,769 | |
Health Care - 13.2% | | | | | | | | |
Allergan, Inc. | | | 5,870 | | | | 485,625 | |
Cardinal Health, Inc. | | | 11,530 | | | | 523,693 | |
Laboratory Corp. of America Holdings* | | | 4,220 | | | | 425,503 | |
Stryker Corp. | | | 7,810 | | | | 487,344 | |
Waters Corp.* | | | 5,470 | | | | 539,123 | |
Total Health Care | | | | | | | 2,461,288 | |
Industrials - 10.2% | | | | | | | | |
Deere & Co. | | | 5,430 | | | | 467,414 | |
Joy Global, Inc. | | | 4,940 | | | | 442,871 | |
SPX Corp. | | | 6,060 | | | | 502,435 | |
United Parcel Service, Inc., Class B | | | 6,770 | | | | 497,527 | |
Total Industrials | | | | | | | 1,910,247 | |
Information Technology - 29.3% | | | | | | | | |
Apple, Inc.* | | | 2,500 | | | | 869,575 | |
Applied Materials, Inc. | | | 28,640 | | | | 394,659 | |
Citrix Systems, Inc.* | | | 5,220 | | | | 457,376 | |
eBay, Inc.* | | | 13,890 | | | | 432,951 | |
EMC Corp.* | | | 18,970 | | | | 540,076 | |
Google, Inc.* | | | 790 | | | | 417,926 | |
International Business Machines Corp. | | | 2,830 | | | | 478,072 | |
Juniper Networks, Inc.* | | | 10,660 | | | | 390,263 | |
NetApp, Inc.* | | | 9,070 | | | | 496,764 | |
Oracle Corp. | | | 14,060 | | | | 481,133 | |
QUALCOMM, Inc. | | | 8,870 | | | | 519,693 | |
Total Information Technology | | | | | | | 5,478,488 | |
Materials - 4.1% | | | | | | | | |
E.I. du Pont de Nemours & Co. | | | 7,210 | | | | 384,293 | |
Mosaic Co., The | | | 5,380 | | | | 381,173 | |
Total Materials | | | | | | | 765,466 | |
Telecommunication Services - 2.4% | | | | | | | | |
American Tower Corp., Class A* | | | 8,040 | | | | 446,059 | |
Total Common Stocks
(cost $15,287,024) | | | | | | | 18,476,883 | |
Short-Term Investments - 2.1%1 | | | | | | | | |
Dreyfus Cash Management Fund, Institutional | | | | | | | | |
Class Shares, 0.10% (cost $385,022) | | | 385,022 | | | | 385,022 | |
Total Investments - 101.0% | | | | | | | | |
(cost $15,672,046) | | | | | | | 18,861,905 | |
Other Assets, less Liabilities - (1.0)% | | | | | | | (189,757 | ) |
Net Assets - 100.0% | | | | | | $ | 18,672,148 | |
The accompanying notes are an integral part of these financial statements.
15
Managers Cadence Mid-Cap Fund
Investment Manager’s Comments
THE YEAR IN REVIEW
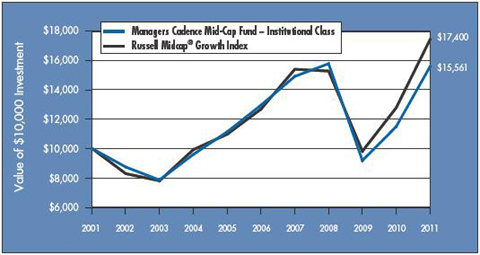
Over the 12 months ended May 31, 2011, the Managers Cadence Mid-Cap Fund’s (the “Fund”) Institutional Class returned 35.47%, slightly underperforming the 36.31% return of the Russell Midcap® Growth Index.
The trailing 12-month period was a strong one for stocks in general, with major averages posting double-digit returns. The Russell 1000® Index gained 26.8%, while the Russell Midcap® and Russell 2000® Indices advanced 32.6% and 29.8%, respectively. Growth-style indices outperformed their value counterparts overall, with the Russell 1000® Growth, Russell Midcap® Growth and Russell 2000® Growth Indices returning 29.4%, 36.3%, and 36.8%, respectively.
U.S. corporate earnings continued to improve over the 12-month period, first with effective cost-cutting measures and later with productivity enhancements. Perhaps most importantly for active stock pickers, at times, investors seemed to finally focus on company fundamentals—rewarding stocks with above-average earnings growth and reasonable valuations—rather than discounting stocks on a wholesale basis in reaction to distressing macroeconomic events.
What the strong equity market returns don’t show, however, is the wild ride investors took to get there. While the Great Recession formally ended in June 2009, the U.S. recovery has been sluggish, and the economic environment has been difficult for investors, businesses and individuals alike. Unemployment has remained stubbornly high, concerns about credit markets have yet to be resolved, and the critical housing sector has yet to return to growth. Indeed, it has been hard to tell at times whether the economy was in fact recovering at all.
If anyone needed yet more proof of the near-impossibility of successfully timing the market, they got it over the last 12 months with the U.S. equity market experiencing several ups and downs. The causes were varied: fears of sovereign debt default in Europe and a double-dip recession in the United States, slowing growth in China and concern that the policy responses in each of these regions would fail to ensure the emergence of a self-reinforcing, global economic recovery. Lately, the greatest local concerns have been continued weakness in the housing market, high unemployment, four-dollar-per-gallon gas prices, and dangerous weather patterns that have caused state-of-emergencies in several areas.
Abroad, the backdrop of events has been nothing short of astounding. In a mere six months, the world was rocked by events ranging from the historic uprisings in the Middle East and the resultant spike in the price of oil; to the horrific natural and nuclear disasters in Japan; to the death of Osama bin Laden. Despite all this, the U.S. market proved to be generally resilient, posting some of the best returns investors have seen since 1999.
After the major benchmarks peaked at the end of April, however, they began to correct in May. The about-face reflects growing concern over the Federal Reserve’s withdrawal of its Quantitative Easing policy (QE2) and questions over the U.S. economy’s ability to self-sustain without the cash infusion. Continued social unrest in the Middle East, decelerating growth in China, continued concerns over sovereign debt, and economic and social instability in Greece are adding to the fears. Even if the U.S. does not double dip into a recession (which we don’t believe it will), a modest 2% growth rate will likely continue to feel recessionary to many Americans.
Against this backdrop, the Fund generated a very strong absolute return, but lagged its primary benchmark, the Russell Midcap® Growth Index, by roughly 90 basis points. The Fund’s modest underperformance is most attributable to its small cash position as mid-cap growth stocks were up sharply. Otherwise the Fund benefited from strong performance in industrials and energy. Strength in those sectors was entirely offset by weakness in consumer discretionary, materials and financials. Excluding the cash drag, portfolio weightings did not meaningfully impact performance.
The Fund’s industrials and energy holdings were the greatest positive contributors to relative performance over the period. Our energy holdings climbed 62.3%, led by gains in Alpha Natural Resources, Inc. (+42.8%), a leading producer of coal, and SM Energy Co. (+54.1%), an exploration and production company focused on natural gas and crude oil.
16
Managers Cadence Mid-Cap Fund
Investment Manager’s Comments (continued)
The Fund’s industrials holdings returned 41.7% for the period. Several companies posted high double-digit returns over the year, including WABCO Holdings, Inc. (+92.0%), a leader in automotive technology and safety systems, and HIS, Inc., Class A (+69.5%), a provider of information and analysis to industrial companies.
While the Fund’s materials, consumer discretionary and financials holdings all posted positive returns on average for the period, they lagged the benchmark on a relative basis. Specialty chemical company Ashland, Inc. (-7.6%) and Titanium Metals Corp. (-15.4%) detracted from the materials sector, while used car retailer CarMax, Inc. (-25.8%) and major appliance manufacturer Whirlpool Corp. (-28.0%) dragged down consumer discretionary stocks. Disappointing relative performance in financials was due in part to losses in investment banking firm Greenhill & Co., Inc. (-25.2%) and insurance provider Genworth Financial, Inc., Class A (-30.5%).
LOOKING FORWARD
Going forward, we at Cadence believe there is still cause to be cautiously optimistic for the second half of the year. While the market is pricing in an economic slowdown, we are constructive on the prospects of our individual holdings. In this world of low but rising inflation, improving economic growth and still historically low interest rates, we believe our Fund will perform well as investors continue to focus more on company fundamentals rather than macro concerns. In particular, our investments in the energy, materials and industrials sectors should benefit most from rising inflation.
We believe the greatest challenge is the extraordinary short-term price volatility and sector rotation, as the market continues to reassess the evolving economic landscape. Longer term, an important concern is the issue of companies’ potential profit margin compression. With economic conditions improving and measures of corporate profit margins at historically high levels, companies will have to start adding to their labor force. While the creation of jobs is good news, it also creates a challenge: adding resources to meet demand. Adding to this challenge are the high costs of production in areas such as energy and metals. For these reasons, a company’s ability to raise prices is a key component of our investment framework for 2011.
Specifically, we are buying more companies that can manage rising cost inputs by increasing prices and/or controlling costs. In particular, we are attracted to companies with specialized or scarce products that can raise prices most easily. We are also focusing on companies that generate significant free cash flow, because they are more able to self-fund their growth and return cash to shareholders in the form of increased dividends and share buybacks. In the long run, strong free cash flow could prove to be even more attractive as it would mitigate the effect of future high interest rates.
In summary, we will continue to seek the right balance between playing offense and defense in the Fund. We will invest in companies that should benefit from global economic expansion but balance them with holdings in defensive sectors such as health care and consumer staples that may act as anchors. Through it all, you can be confident that we will stick to the investment discipline that has seen Cadence clients through challenges and opportunities since 1988.
This commentary reflects the viewpoints of Cadence Capital Management, LLC. The viewpoints and performance figures are based on a 12-month period ending May 31, 2011. The following financial statements presented in this report represent the Fund’s actual 11-month fiscal period from July 1, 2010, to May 31, 2011.
CUMULATIVE TOTAL RETURN PERFORMANCE
Managers Cadence Mid-Cap Fund’s cumulative total return is based on the daily change in net asset value (NAV), and assumes that all dividends and distributions were reinvested. The Russell Midcap® Growth Index is a market capitalization weighted index that measures the performance of those Russell Midcap companies with higher price-to-book ratio and higher forecasted growth values. Unlike the Fund, the Russell Midcap® Growth Index is unmanaged, is not available for investment, and does not incur expenses. The Index assumes reinvestment of dividends. This graph compares a hypothetical $10,000 investment made in Managers Cadence Mid-Cap Fund’s Institutional Class on May 31, 2001, compared to a $10,000 investment made in the Russell Midcap® Growth Index for the same time period. Performance for periods longer than one year is annualized. The graph and table do not reflect the deduction of taxes that a shareholder would pay on a Fund distribution or redemption of shares. The listed returns for the Fund are net of expenses and the returns for the index exclude expenses. Past performance is not indicative of future results. Total returns would have been lower had certain expenses not been reduced.
17
Managers Cadence Mid-Cap Fund
Investment Manager’s Comments (continued)
Cumulative Total Return Performance (continued)
The table below shows the average annual total returns for Managers Cadence Mid-Cap Fund since inception through May 31, 2011, and the Russell Midcap® Growth Index for the same time period.
| | | | | | | | | | | | | | | | | | | | | | | | |
| | | | | | Average Annual Total Returns1 | |
| | | | | | One
Year | | | Five
Years | | | Ten
Years | | | Since
Inception | | | Inception
Date | |
| | | | | | |
Managers Cadence Mid-Cap Fund2,3,4,5,* | | | | | | | | | | | | | | | | | | | | | | | | |
Class A | | | No Load | | | | 34.90 | % | | | 3.35 | % | | | 4.11 | % | | | 7.35 | % | | | 01/13/97 | |
Class A | | | With Load | | | | 27.15 | % | | | 2.13 | % | | | 3.50 | % | | | 6.91 | % | | | | |
Class B | | | No Load | | | | 33.93 | % | | | 2.58 | % | | | 3.33 | % | | | 6.55 | % | | | 01/13/97 | |
Class B | | | With Load | | | | 28.93 | % | | | 2.25 | % | | | 3.33 | % | | | 6.55 | % | | | | |
Class C | | | No Load | | | | 33.91 | % | | | 2.57 | % | | | 3.33 | % | | | 6.55 | % | | | 01/13/97 | |
Class C | | | With Load | | | | 32.91 | % | | | 2.57 | % | | | 3.33 | % | | | 6.55 | % | | | | |
Class D | | | | | | | 34.87 | % | | | 3.34 | % | | | 4.12 | % | | | 5.36 | % | | | 04/08/98 | |
Institutional Class | | | | | | | 35.47 | % | | | 3.76 | % | | | 4.52 | % | | | 10.40 | % | | | 08/26/91 | |
Administrative Class | | | | | | | 35.16 | % | | | 3.51 | % | | | 4.25 | % | | | 10.21 | % | | | 11/30/94 | |
Class P | | | | | | | 35.31 | % | | | — | | | | — | | | | 3.11 | % | | | 07/07/08 | |
Class R | | | | | | | 34.62 | % | | | 3.09 | % | | | — | | | | 9.12 | % | | | 12/31/02 | |
Russell Midcap® Growth Index6 | | | | | | | 36.31 | % | | | 6.54 | % | | | 5.70 | % | | | — | 7 | | | 08/26/91 | † |
The performance data shown represents past performance, which is not a guarantee of future results. Current performance may be lower or higher than the performance data quoted. The investment return and principal value of an investment in the Fund will fluctuate so that an investor’s shares, when redeemed, may be worth more or less than their original cost. For performance information through the most recent month end, please call (800) 835-3879 or visit our Web site at www.managersinvest.com.
Performance differences among the share classes are due to differences in sales charge structures and class expenses. Returns shown reflect a maximum sales charge of 5.75% on Class A shares, as well as the applicable contingent deferred sales charge (CDSC) on Class B and Class C shares. Class C shares held for less than one year are subject to a 1% CDSC.
In choosing a Fund, investors should carefully consider the amount they plan to invest, their investment objectives, the Fund’s investment objectives, risks, charges and expenses before investing. For this and other information, please call (800) 835-3879 or visit www.managersinvest.com for a free prospectus. Read it carefully before investing or sending money. Distributed by Managers Distributors, Inc., member FINRA.
| † | Date reflects the inception date of the Fund, not the index. |
| * | The Fund changed its fiscal year end from June 30 to May 31 in 2011. |
| 1 | Total return equals income yield plus share price change and assumes reinvestment of all dividends and capital gain distributions. Returns are net of fees and may reflect offsets of Fund expenses as described in the Prospectus. No adjustment has been made for taxes payable by shareholders on their reinvested dividends and capital gain distributions. Returns for periods greater than one year are annualized. The listed returns on the Fund are net of expenses and based on the published NAV as of May 31, 2011. All returns are in U.S. dollars($). |
| 2 | Fund for which, from time to time, the Fund’s advisor has waived its fees and/ or absorbed Fund expenses, which has resulted in higher returns. |
| 3 | The Fund invests in growth stocks, which may be more sensitive to market movements because their prices tend to reflect future investor expectations rather than just current profits. Growth stocks may underperform value stocks during given periods. |
| 4 | The Fund is subject to risks associated with investments in mid-capitalization companies such as erratic earnings patterns, competitive conditions, limited earnings history, and a reliance on one or a limited number of products. |
| 5 | The Fund is subject to special risk considerations similar to those associated with the direct ownership of real estate. Real estate valuations may be subject to factors such as changing general and local economic, financial, competitive, and environmental conditions. |
| 6 | The Russell Midcap® Growth Index measures the performance of the Russell Midcap companies with higher price-to-book ratios and higher forecasted growth values. The stocks are also members of the Russell 1000® Growth Index. Unlike the Fund, the Index is unmanaged, is not available for investment, and does not incur expenses. |
| 7 | Since the Russell Midcap® Growth Index’s inception date of June 1, 1995, the average annual total return for the index was 6.95%. |
The Russell Midcap® Growth Index is a trademark of Russell Investments. Russell® is a trademark of Russell Investments.
Not FDIC insured, nor bank guaranteed. May lose value.
18
Managers Cadence Mid-Cap Fund
Fund Snapshots
May 31, 2011
Portfolio Breakdown
[LOGO TO COME]
| | | | | | | | |
Industry | | Managers Cadence
Mid-Cap Fund** | | | Russell Midcap®
Growth Index | |
Information Technology | | | 22.4 | % | | | 22.9 | % |
Consumer Discretionary | | | 18.1 | % | | | 20.4 | % |
Industrials | | | 15.0 | % | | | 15.4 | % |
Health Care | | | 11.8 | % | | | 13.6 | % |
Energy | | | 7.8 | % | | | 5.9 | % |
Consumer Staples | | | 7.6 | % | | | 5.6 | % |
Materials | | | 7.0 | % | | | 7.1 | % |
Financials | | | 4.8 | % | | | 7.1 | % |
Utilities | | | 1.3 | % | | | 0.3 | % |
Telecommunication Services | | | 1.2 | % | | | 1.7 | % |
Other Assets and Liabilities | | | 3.0 | % | | | 0.0 | % |
** As a percentage of net assets
Top Ten Holdings
| | | | |
Security Name | | Percentage of Net
Assets | |
Hansen Natural Corp. | | | 1.5 | % |
F5 Networks, Inc. | | | 1.4 | |
Cooper Companies, Inc., The | | | 1.4 | |
Estee Lauder Co., Class A | | | 1.4 | |
AmerisourceBergen Corp. | | | 1.4 | |
CR Bard, Inc. | | | 1.3 | |
Atmel Corp. | | | 1.3 | |
Wyndham Worldwide Corp. | | | 1.3 | |
CF Industries Holdings, Inc. | | | 1.3 | |
MICROS Systems, Inc. | | | 1.3 | |
| | | | |
Top Ten as a Group | | | 13.6 | % |
| | | | |
Any sectors, industries, or securities discussed should not be perceived as investment recommendations. Mention of a specific security should not be considered a recommendation to buy or solicitation to sell that security. Specific securities mentioned in this report may have been sold from the Fund’s portfolio of investments by the time you receive this report.
19
Managers Cadence Mid-Cap Fund
Schedule of Portfolio Investments
May 31, 2011
| | | | | | | | |
| | | Shares | | | Value | |
Common Stocks - 97.0% | | | | | | | | |
Consumer Discretionary - 18.1% | | | | | | | | |
Abercrombie & Fitch Co. | | | 107,500 | | | $ | 8,145,275 | |
Carmax, Inc.* | | | 226,520 | | | | 6,718,583 | |
Coach, Inc. | | | 135,410 | | | | 8,620,201 | |
Darden Restaurants, Inc. | | | 141,880 | | | | 7,186,222 | |
Gentex Corp. | | | 247,840 | | | | 7,274,104 | |
Interpublic Group of Companies, Inc. | | | 648,690 | | | | 7,738,872 | |
Lear Corp. | | | 134,220 | | | | 6,821,060 | |
Limited Brands, Inc. | | | 188,990 | | | | 7,552,040 | |
Panera Bread Co., Class A* | | | 58,160 | | | | 7,271,745 | |
PetSmart, Inc. | | | 185,710 | | | | 8,412,663 | |
Polo Ralph Lauren Corp. | | | 68,150 | | | | 8,639,376 | |
SIRIUS XM Radio, Inc.* | | | 3,495,960 | | | | 8,215,506 | |
Tractor Supply Co. | | | 121,800 | | | | 7,692,888 | |
Williams-Sonoma, Inc. | | | 182,420 | | | | 7,141,743 | |
Wyndham Worldwide Corp. | | | 256,350 | | | | 8,923,543 | |
Wynn Resorts, Ltd. | | | 46,750 | | | | 6,849,810 | |
Total Consumer Discretionary | | | | | | | 123,203,631 | |
Consumer Staples - 7.6% | | | | | | | | |
Estee Lauder Co., Class A | | | 91,320 | | | | 9,361,213 | |
H.J. Heinz Co. | | | 157,270 | | | | 8,637,268 | |
Hansen Natural Corp.* | | | 138,010 | | | | 9,888,417 | |
Herbalife, Ltd. | | | 151,470 | | | | 8,524,732 | |
McCormick & Co., Inc. | | | 157,480 | | | | 7,903,921 | |
Whole Foods Market, Inc. | | | 124,120 | | | | 7,591,179 | |
Total Consumer Staples | | | | | | | 51,906,730 | |
Energy - 7.8% | | | | | | | | |
Alpha Natural Resources, Inc.* | | | 128,530 | | | | 7,042,159 | |
Cimarex Energy Co. | | | 87,890 | | | | 8,431,288 | |
Core Laboratories, N.V. | | | 80,670 | | | | 8,284,002 | |
FMC Technologies, Inc.* | | | 144,230 | | | | 6,436,985 | |
Holly Corp. | | | 108,990 | | | | 6,791,167 | |
Oil States International, Inc.* | | | 84,630 | | | | 6,690,001 | |
St. Mary Land & Exploration Co. | | | 46,490 | | | | 3,091,120 | |
Whiting Petroleum Corp.* | | | 95,060 | | | | 6,378,526 | |
Total Energy | | | | | | | 53,145,248 | |
Financials - 4.8% | | | | | | | | |
Ameriprise Financial, Inc. | | | 125,490 | | | | 7,683,753 | |
CB Richard Ellis Group, Inc.* | | | 325,810 | | | | 8,611,158 | |
Greenhill & Co., Inc. | | | 87,790 | | | | 4,886,391 | |
Huntington Bancshares, Inc. | | | 509,450 | | | | 3,362,370 | |
Marsh & McLennan Co., Inc. | | | 264,780 | | | | 8,120,803 | |
Total Financials | | | | | | | 32,664,475 | |
Health Care - 11.8% | | | | | | | | |
AmerisourceBergen Corp. | | | 227,070 | | | | 9,359,825 | |
CareFusion Corp.* | | | 259,490 | | | | 7,520,020 | |
Cooper Companies, Inc., The | | | 126,200 | | | | 9,453,642 | |
CR Bard, Inc. | | | 81,170 | | | | 9,073,183 | |
Hill-Rom Holdings, Inc. | | | 182,210 | | | | 8,316,064 | |
Illumina, Inc.* | | | 113,250 | | | | 8,163,060 | |
Intuitive Surgical, Inc.* | | | 21,800 | | | | 7,608,200 | |
Mylan Laboratories, Inc.* | | | 329,560 | | | | 7,759,490 | |
Pharmaceutical Product Development, Inc. | | | 241,570 | | | | 6,969,295 | |
Varian Medical Systems, Inc.* | | | 88,720 | | | | 5,992,149 | |
Total Health Care | | | | | | | 80,214,928 | |
Industrials - 15.0% | | | | | | | | |
Cummins, Inc. | | | 71,130 | | | | 7,485,721 | |
Eaton Corp. | | | 158,080 | | | | 8,167,994 | |
Hubbell, Inc., Class B | | | 124,480 | | | | 8,235,597 | |
IHS, Inc., Class A* | | | 92,580 | | | | 8,121,118 | |
Kirby Corp.* | | | 144,770 | | | | 8,319,932 | |
Pall Corp. | | | 116,600 | | | | 6,541,260 | |
Rockwell Automation, Inc. | | | 94,170 | | | | 7,826,469 | |
Roper Industries, Inc. | | | 103,250 | | | | 8,618,277 | |
SPX Corp. | | | 104,670 | | | | 8,678,190 | |
Thomas & Betts Corp.* | | | 149,350 | | | | 8,176,911 | |
United Continental Holdings, Inc.* | | | 328,050 | | | | 7,922,408 | |
Valmont Industries, Inc. | | | 69,050 | | | | 6,920,191 | |
Waste Connections, Inc. | | | 230,710 | | | | 7,253,522 | |
Total Industrials | | | | | | | 102,267,590 | |
Information Technology - 22.4% | | | | | | | | |
Akamai Technologies, Inc.* | | | 97,800 | | | | 3,318,843 | |
Amphenol Corp., Class A | | | 110,537 | | | | 5,975,630 | |
Analog Devices, Inc. | | | 194,040 | | | | 7,988,627 | |
Atmel Corp.* | | | 601,890 | | | | 9,040,388 | |
Avago Technologies, Ltd. | | | 202,200 | | | | 6,832,338 | |
F5 Networks, Inc.* | | | 85,460 | | | | 9,706,547 | |
Factset Research Systems, Inc. | | | 64,800 | | | | 7,183,728 | |
Gartner, Inc.* | | | 186,080 | | | | 7,262,702 | |
The accompanying notes are an integral part of these financial statements.
20
Managers Cadence Mid-Cap Fund
Schedule of Portfolio Investments (continued)
| | | | | | | | |
| | | Shares | | | Value | |
Information Technology - 22.4% (continued) | | | | | | | | |
Informatica Corp.* | | | 59,970 | | | $ | 3,517,840 | |
Intuit, Inc.* | | | 141,950 | | | | 7,661,042 | |
Microchip Technology, Inc. | | | 220,090 | | | | 8,700,158 | |
MICROS Systems, Inc.* | | | 171,390 | | | | 8,751,173 | |
NetApp, Inc.* | | | 147,060 | | | | 8,054,476 | |
Red Hat, Inc.* | | | 187,360 | | | | 8,168,896 | |
SanDisk Corp.* | | | 74,340 | | | | 3,532,637 | |
Synopsys, Inc.* | | | 274,200 | | | | 7,496,628 | |
Teradata Corp.* | | | 131,090 | | | | 7,313,511 | |
Trimble Navigation, Ltd.* | | | 187,380 | | | | 8,186,632 | |
WebMD Health Corp.* | | | 156,300 | | | | 7,452,384 | |
Western Digital Corp.* | | | 223,670 | | | | 8,197,506 | |
Zebra Technologies Corp.* | | | 178,260 | | | | 7,923,657 | |
Total Information Technology | | | | | | | 152,265,343 | |
Materials - 7.0% | | | | | | | | |
Allegheny Technologies, Inc. | | | 110,380 | | | | 7,395,460 | |
CF Industries Holdings, Inc. | | | 57,410 | | | | 8,828,510 | |
Crown Holdings, Inc.* | | | 203,060 | | | | 8,246,266 | |
Scotts Miracle-Gro Co., The, Class A | | | 129,940 | | | | 7,497,538 | |
Titanium Metals Corp.* | | | 448,190 | | | | 8,394,599 | |
Valspar Corp., The | | | 196,770 | | | | 7,569,742 | |
Total Materials | | | | | | | 47,932,115 | |
Telecommunication Services - 1.2% | | | | | | | | |
MetroPCS Communications, Inc.* | | | 467,260 | | | | 8,363,954 | |
Utilities - 1.3% | | | | | | | | |
ITC Holdings Corp. | | | 119,690 | | | | 8,652,390 | |
Total Common Stocks
(cost $515,399,817) | | | | | | | 660,616,404 | |
Short-Term Investments - 5.4%1 | | | | | | | | |
Dreyfus Cash Management Fund, Institutional
Class Shares, 0.10% (cost $ 36,944,143) | | | 36,944,143 | | | | 36,944,143 | |
Total Investments - 102.4%
(cost $ 552,343,960) | | | | | | | 697,560,547 | |
Other Assets, less Liabilities - (2.4)% | | | | | | | (16,035,614 | ) |
Net Assets - 100.0% | | | | | | $ | 681,524,933 | |
The accompanying notes are an integral part of these financial statements.
21
Managers Cadence Emerging Companies Fund
Investment Manager’s Comments
THE YEAR IN REVIEW
Over the 12 months ended May 31, 2011, the Managers Cadence Emerging Companies Fund’s (the “Fund”) Institutional Class returned 49.20%, significantly outperforming the 34.69% return of the Russell Microcap® Growth Index.
The trailing 12-month period was a strong one for stocks in general, with major averages posting double-digit returns. The Russell 1000® Index gained 26.8%, while the Russell Midcap® and Russell 2000® Indices advanced 32.6% and 29.8%, respectively. Growth-style indices outperformed their value counterparts overall, with the Russell 1000® Growth, Russell Midcap® Growth and Russell 2000® Growth Indices returning 29.4%, 36.3%, and 36.8%, respectively.
U.S. corporate earnings continued to improve over the 12-month period, first with effective cost-cutting measures and later with productivity enhancements. Perhaps most importantly for active stock pickers, at times, investors seemed to finally focus on company fundamentals—rewarding stocks with above-average earnings growth and reasonable valuations—rather than discounting stocks on a wholesale basis in reaction to distressing macroeconomic events. What the strong equity market returns don’t show, however, is the wild ride investors took to get there. While the Great Recession formally ended in June 2009, the U.S. recovery has been sluggish, and the economic environment has been difficult for investors, businesses and individuals alike. Unemployment has remained stubbornly high, concerns about credit markets have yet to be resolved, and the critical housing sector has yet to return to growth. Indeed, it has been hard to tell at times whether the economy was in fact recovering at all.
If anyone needed yet more proof of the near impossibility of successfully timing the market, they got it over the last 12 months with the U.S. equity market experiencing several ups and downs. The causes were varied: fears of sovereign debt default in Europe and a double-dip recession in the United States, slowing growth in China, and concern that the policy responses in each of these regions would fail to ensure the emergence of a self-reinforcing, global economic recovery. Lately, the greatest local concerns have been continued weakness in the housing market, high unemployment, four-dollar-per-gallon gas prices and dangerous weather patterns that have caused state-of-emergencies in several areas.
Abroad, the backdrop of events has been nothing short of astounding. In a mere six months, the world was rocked by events ranging from the historic uprisings in the Middle East and the resultant spike in the price of oil; to the horrific natural and nuclear disasters in Japan; to the death of Osama bin Laden. Despite all this, the U.S. market proved to be generally resilient, posting some of the best returns investors have seen since 1999.
After the major benchmarks peaked at the end of April, however, they began to correct in May. The about-face reflects growing concern over the Federal Reserve’s withdrawal of its Quantitative Easing policy (QE2) and questions over the U.S. economy’s ability to self-sustain without the cash infusion. Continued social unrest in the Middle East, decelerating growth in China, continued concerns over sovereign debt, and economic and social instability in Greece are adding to the fears. Even if the U.S. does not double dip into a recession (which we don’t believe it will), a modest 2% growth rate will likely continue to feel recessionary to many Americans.
Against this backdrop, the Fund was up almost 50% and markedly outperformed its primary benchmark, the Russell Microcap® Growth Index. The Fund’s strong performance relative to the Russell Microcap® Growth Index is attributable to exceptional stock selection across several sectors. Additionally, an underweight to health care also added value.
The Fund benefited from substantial gains in the information technology sector, which returned 64.1% and represented almost one quarter of the portfolio. Five companies posted triple-digit returns over the 12-month period. These were fiber optic designer and manufacturer Alliance Fiber Optic Products, Inc. (+194.1%), semiconductor manufacturer Amtech Systems, Inc. (+123.4%), software and performance-analysis company OPNET Technologies, Inc. (+158.0%), website builder Web.com Group, Inc. (+109.7%) and online travel site Travelzoo, Inc. (+190.7%).
While an overweight to the health care sector helped performance so did strong performance within the sector. Small health care companies were also significant contributors to overall Fund return, with this sector advancing 37.0% over the 12-month period. Top stocks included health care research provider HealthStream, Inc. (+175.4%), specialty pharmaceutical company Jazz Pharmaceuticals, Inc. (+148.9%) and niche generic pharmaceutical concern Akorn, Inc. (+129.3%).
22
Managers Cadence Emerging Companies Fund
Investment Manager’s Comments (continued)
The Fund’s industrials and consumer staples holdings were also positive contributors to Fund return, gaining 51.2% and 63.5%, respectively, over the period.
The only sector that did not produce a positive return on average during the 12 months ending May 31, 2011 was utilities, which lost 22.4%. This sector, on average, represented less than 0.5% of the Fund during the fiscal year and only included one stock. Consolidated Water Co. Ltd. (-22.4%) was the lone holding and it struggled during the trailing 12-month period. The Fund’s relative performance was also hurt by the materials sector. A slight underweight hurt performance as did poor performance from Verso Paper Corp. (-22.8%), Wausau Paper Corp. (-21.8%) and Horsehead Holding Corp. (-11.4%). Lastly, the Fund’s small cash position also detracted as micro-cap stocks were up sharply.
LOOKING FORWARD
Going forward, we at Cadence believe there is still cause to be cautiously optimistic for the second half of the year. While the market is pricing in an economic slowdown, we are constructive on the prospects of our individual holdings. In this world of low but rising inflation, improving economic growth and still historically low interest rates, we believe our Fund will perform well as investors continue to focus more on company fundamentals rather than macro concerns. In particular, our investments in the energy, materials and industrials sectors should benefit most from rising inflation.
We believe the greatest challenge is the extraordinary short-term price volatility and sector rotation, as the market continues to reassess the evolving economic landscape. Longer term, an important concern is the issue of companies’ potential profit margin compression. With economic conditions improving and measures of corporate profit margins at historically high levels, companies will have to start adding to their labor force. While the creation of jobs is good news, it also creates a challenge: adding resources to meet demand. Adding to this challenge are the high costs of production in areas such as energy and metals. For these reasons, a company’s ability to raise prices is a key component of our investment framework for 2011.
Specifically, we are buying more companies that can manage rising cost inputs by increasing prices and/or controlling costs. In particular, we are attracted to companies with specialized or scarce products that can raise pricesmost easily. We are also focusing on companies that generate significant free cash flow, because they are more able to self-fund their growth and return cash to shareholders in the form of increased dividends and share buybacks. In the long run, strong free cash flow could prove to be even more attractive as it would mitigate the effect of future high interest rates.
In summary, we will continue to seek the right balance between playing offense and defense in the Fund. We will invest in companies that should benefit from global economic expansion but balance them with holdings in defensive sectors such as health care and consumer staples that may act as anchors. Through it all, you can be confident that we will stick to the investment discipline that has seen Cadence clients through challenges and opportunities since 1988.
This commentary reflects the viewpoints of Cadence Capital Management, LLC. The viewpoints and performance figures are based on a 12-month period ending May 31, 2011. The following financial statements presented in this report represent the Fund’s actual 11-month fiscal period from July 1, 2010, to May 31, 2011.
CUMULATIVE TOTAL RETURN PERFORMANCE
Managers Cadence Emerging Companies Fund’s cumulative total return is based on the daily change in net asset value (NAV), and assumes that all dividends and distributions were reinvested. The Russell Microcap® Growth Index measures the performance of the micro-cap growth segment of the U.S. equity market. It includes those Russell Microcap Index companies with higher price-to-book ratio and higher forecasted growth values. The Russell 2000® Growth Index measures the performance of the Russell 2000 companies with higher price-to-book ratios and higher forecasted growth values. Unlike the Fund, the indices are unmanaged, are not available for investment, and do not incur expenses. The Index assumes reinvestment of dividends. This graph compares a hypothetical $10,000 investment made in Managers Cadence Emerging Companies Fund’s Institutional Class on May 31, 2001, to a $10,000 investment made in the Russell Microcap® Growth Index and the Russell 2000® Growth Index for the same time period. Performance for periods longer than one year is annualized. The graph and table do not reflect the deduction of taxes that a shareholder would pay on a Fund distribution or redemption of
23
Managers Cadence Emerging Companies Fund
Investment Manager’s Comments (continued)
Cumulative Total Return Performance (continued)
shares. The listed returns for the Fund are net of expenses and the returns for the index exclude expenses. Past performance is not indicative of future results. Total returns would have been lower had certain expenses not been reduced.
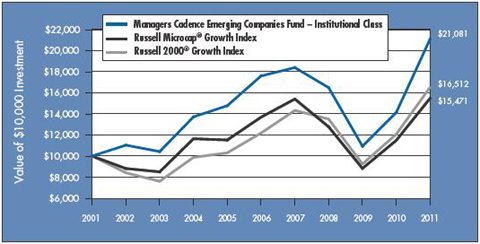
The table below shows the average annual total returns for Managers Cadence Emerging Companies Fund since inception through May 31, 2011, and the Russell Microcap® Growth Index and the Russell 2000® Growth Index for the same time period.
| | | | | | | | | | | | | | | | | | | | |
| | | Average Annual Total Returns1 | |
| | | One
Year | | | Five
Years | | | Ten
Years | | | Since
Inception | | | Inception
Date | |
Managers Cadence Emerging Companies Fund2,3,4,5,* | | | | | | | | | | | | | | | | | | | | |
Institutional Class | | | 49.20 | % | | | 3.68 | % | | | 7.74 | % | | | 11.69 | % | | | 06/25/93 | |
Administrative Class | | | 48.84 | % | | | 3.41 | % | | | 7.47 | % | | | 9.73 | % | | | 04/01/96 | |
Russell Microcap® Growth Index6 | | | 34.69 | % | | | 2.48 | % | | | 4.46 | % | | | 6.25 | % | | | 06/25/93 | † |
Russell 2000® Growth Index7 | | | 36.79 | % | | | 6.26 | % | | | 5.14 | % | | | 6.25 | % | | | 06/25/93 | † |
The performance data shown represents past performance, which is not a guarantee of future results. Current performance may be lower or higher than the performance data quoted. The investment return and principal value of an investment in the Fund will fluctuate so that an investor’s shares, when redeemed, may be worth more or less than their original cost. For performance information through the most recent month end, please call (800) 835-3879 or visit our Web site at www.managersinvest.com.
In choosing a Fund, investors should carefully consider the amount they plan to invest, their investment objectives, the Fund’s investment objectives, risks, charges and expenses before investing. For this and other information, please call (800) 835-3879 or visit www.managersinvest.com for a free prospectus. Read it carefully before investing or sending money. Distributed by Managers Distributors, Inc., member FINRA.
| † | Date reflects the inception date of the Fund, not the index. |
| * | The Fund changed its fiscal year end from June 30 to May 31 in 2011. |
| 1 | Total return equals income yield plus share price change and assumes reinvestment of all dividends and capital gain distributions. Returns are net of fees and may reflect offsets of Fund expenses as described in the Prospectus. No adjustment has been made for taxes payable by shareholders on their reinvested dividends and capital gain distributions. Returns for periods greater than one year are annualized. The listed returns on the Fund are net of expenses and based on the published NAV as of May 31, 2011. All returns are in U.S. dollars($). |
| 2 | Fund for which, from time to time, the Fund’s advisor has waived its fees and/ or absorbed Fund expenses, which has resulted in higher returns. |
| 3 | The Fund invests in growth stocks, which may be more sensitive to market movements because their prices tend to reflect future investor expectations rather than just current profits. Growth stocks may underperform value stocks during given periods. |
| 4 | The Fund is subject to special risk considerations similar to those associated with the direct ownership of real estate. Real estate valuations may be subject to factors such as changing general and local economic, financial, competitive, and environmental conditions. |
| 5 | The Fund is subject to risks associated with investments in small-capitalization companies, such as erratic earnings patterns, competitive conditions, limited earnings history, and a reliance on one or a limited number of products. |
| 6 | The Russell Microcap® Growth Index measures the performance of the micro-cap growth segment of the U.S. equity market. It includes those Russell Microcap Index companies with higher price-to-book ratios and higher forecasted growth values. Unlike the Fund, the Index is unmanaged, is not available for investment, and does not incur expenses. |
| 7 | The Russell 2000® Growth Index measures the performance of the Russell 2000 companies with higher price-to-book ratios and higher forecasted growth values. Unlike the Fund, the Index is unmanaged, is not available for investment, and does not incur expenses. |
The Russell Microcap® Growth Index is a trademark of Russell Investments. The Russell 2000® Growth Index is a trademark of Russell Investments. Russell® is a trademark of Russell Investments.
Not FDIC insured, nor bank guaranteed. May lose value.
24
Managers Cadence Emerging Companies Fund
Fund Snapshots
May 31, 2011
Portfolio Breakdown
| | | | | | | | | | | | |
Industry | | Managers Cadence
Emerging
Companies Fund** | | | Russell 2000®
Growth
Index | | | Russell Microcap®
Growth
Index | |
Information Technology | | | 22.1 | % | | | 27.9 | % | | | 27.3 | % |
Health Care | | | 21.9 | % | | | 19.7 | % | | | 30.3 | % |
Industrials | | | 19.2 | % | | | 16.2 | % | | | 12.5 | % |
Consumer Discretionary | | | 14.1 | % | | | 16.6 | % | | | 11.8 | % |
Financials | | | 8.4 | % | | | 4.9 | % | | | 4.3 | % |
Energy | | | 4.7 | % | | | 5.4 | % | | | 5.0 | % |
Consumer Staples | | | 3.4 | % | | | 3.1 | % | | | 2.4 | % |
Materials | | | 3.3 | % | | | 5.0 | % | | | 4.5 | % |
Utilities | | | 0.0 | % | | | 0.1 | % | | | 0.4 | % |
Telecommunication Services | | | 0.0 | % | | | 1.1 | % | | | 1.5 | % |
Other Assets and Liabilities | | | 2.9 | % | | | 0.0 | % | | | 0.0 | % |
| ** | As a percentage of net assets |
Top Ten Holdings
| | | | |
Security Name | | Percentage of Net
Assets | |
Astronics Corp. | | | 1.5 | % |
Magma Design Automation, Inc. | | | 1.4 | |
Kenexa Corp. | | | 1.4 | |
Ultratech Stepper, Inc. | | | 1.3 | |
Altra Holdings, Inc. | | | 1.3 | |
Amerigon, Inc. | | | 1.3 | |
Radiant Systems, Inc. | | | 1.3 | |
FARO Technologies, Inc. | | | 1.3 | |
Exlservice Holdings, Inc. | | | 1.2 | |
AFC Enterprises, Inc. | | | 1.2 | |
| | | | |
Top Ten as a Group | | | 13.2 | % |
| | | | |
Any sectors, industries, or securities discussed should not be perceived as investment recommendations. Mention of a specific security should not be considered a recommendation to buy or solicitation to sell that security. Specific securities mentioned in this report may have been sold from the Fund’s portfolio of investments by the time you receive this report.
25
Managers Cadence Emerging Companies Fund
Schedule of Portfolio Investments
May 31, 2011
| | | | | | | | |
| | | Shares | | | Value | |
Common Stocks - 97.1% | | | | | | | | |
Consumer Discretionary - 14.1% | | | | | | | | |
AFC Enterprises, Inc.* | | | 51,380 | | | $ | 851,880 | |
Amerigon, Inc.* | | | 55,360 | | | | 920,637 | |
Caribou Coffee Co., Inc.* | | | 23,930 | | | | 254,376 | |
Cost Plus, Inc.* | | | 66,530 | | | | 601,431 | |
Destination Maternity Corp.* | | | 30,040 | | | | 619,425 | |
G-III Apparel Group, Ltd.* | | | 16,550 | | | | 710,326 | |
Interclick, Inc.* | | | 111,350 | | | | 763,861 | |
Krispy Kreme Doughnuts, Inc.* | | | 71,140 | | | | 597,576 | |
Nexstar Broadcasting Group, Inc., Class A* | | | 89,570 | | | | 618,033 | |
Oxford Industries, Inc. | | | 21,290 | | | | 807,956 | |
Perry Ellis International, Inc.* | | | 26,020 | | | | 811,954 | |
Rick’s Cabaret International, Inc.* | | | 64,320 | | | | 616,829 | |
Select Comfort Corp.* | | | 39,920 | | | | 652,293 | |
Shuffle Master, Inc.* | | | 34,660 | | | | 377,447 | |
Zumiez, Inc.* | | | 20,570 | | | | 624,917 | |
Total Consumer Discretionary | | | | | | | 9,828,941 | |
Consumer Staples - 3.4% | | | | | | | | |
B&G Foods, Inc. | | | 37,930 | | | | 703,222 | |
Inter Parfums, Inc. | | | 37,030 | | | | 825,029 | |
National Beverage Corp. | | | 34,770 | | | | 491,996 | |
Prestige Brands Holdings, Inc.* | | | 27,440 | | | | 354,250 | |
Total Consumer Staples | | | | | | | 2,374,497 | |
Energy - 4.7% | | | | | | | | |
Abraxas Petroleum Corp.* | | | 109,840 | | | | 483,296 | |
Bolt Technology Corp.* | | | 46,490 | | | | 637,843 | |
Geokinetics, Inc.* | | | 85,350 | | | | 746,812 | |
OYO Geospace Corp.* | | | 7,220 | | | | 655,576 | |
VAALCO Energy, Inc.* | | | 101,080 | | | | 717,668 | |
Total Energy | | | | | | | 3,241,195 | |
Financials - 8.4% | | | | | | | | |
Associated Estates Realty Corp. | | | 42,430 | | | | 715,370 | |
Calamos Asset Management, Inc., Class A | | | 48,670 | | | | 729,563 | |
Crawford & Co., Class B | | | 66,450 | | | | 484,421 | |
Evercore Partners, Inc., Class A | | | 19,410 | | | | 718,364 | |
FBL Financial Group, Inc., Class A | | | 22,690 | | | | 720,861 | |
HFF, Inc., Class A* | | | 40,990 | | | | 669,367 | |
Internet Capital Group, Inc.* | | | 53,190 | | | | 693,066 | |
Marlin Business Services Corp.* | | | 51,910 | | | | 641,088 | |
Urstadt Biddle Properties, Inc., Class A | | | 25,920 | | | | 496,627 | |
Total Financials | | | | | | | 5,868,727 | |
Health Care - 21.9% | | | | | | | | |
Akorn, Inc.* | | | 74,430 | | | | 506,868 | |
Ariad Pharmaceuticals, Inc.* | | | 48,040 | | | | 416,987 | |
Caliper Life Sciences, Inc.* | | | 77,240 | | | | 553,811 | |
Cutera, Inc.* | | | 79,470 | | | | 726,356 | |
Derma Sciences, Inc.* | | | 80,220 | | | | 804,607 | |
HealthStream, Inc.* | | | 66,170 | | | | 843,668 | |
iCAD, Inc.* | | | 717,080 | | | | 810,300 | |
Immunomedics, Inc.* | | | 102,420 | | | | 452,696 | |
IntegraMed America, Inc.* | | | 82,570 | | | | 833,957 | |
LeMaitre Vascular, Inc.* | | | 96,240 | | | | 679,454 | |
MEDTOX Scientific, Inc.* | | | 43,700 | | | | 738,093 | |
Micromet, Inc.* | | | 75,810 | | | | 469,264 | |
National Research Corp. | | | 18,860 | | | | 671,039 | |
Omnicell, Inc.* | | | 49,660 | | | | 765,261 | |
OraSure Technologies, Inc.* | | | 43,200 | | | | 372,384 | |
Palomar Medical Technologies, Inc.* | | | 50,950 | | | | 722,471 | |
SonoSite, Inc.* | | | 22,190 | | | | 792,405 | |
Synergetics USA, Inc.* | | | 113,400 | | �� | | 637,308 | |
Synovis Life Technologies, Inc.* | | | 41,510 | | | | 728,708 | |
Transcend Services, Inc.* | | | 24,280 | | | | 646,819 | |
U.S. Physical Therapy, Inc. | | | 26,560 | | | | 683,654 | |
Vascular Solutions, Inc.* | | | 62,490 | | | | 824,243 | |
Young Innovations, Inc. | | | 22,320 | | | | 638,129 | |
Total Health Care | | | | | | | 15,318,482 | |
Industrials - 19.2% | | | | | | | | |
A.T. Cross Co., Class A* | | | 57,740 | | | | 699,809 | |
AAON, Inc. | | | 10,720 | | | | 361,264 | |
Altra Holdings, Inc.* | | | 35,040 | | | | 923,304 | |
Astronics Corp.* | | | 39,010 | | | | 1,045,858 | |
CAI International, Inc.* | | | 29,810 | | | | 696,362 | |
DXP Enterprises, Inc.* | | | 32,010 | | | | 829,059 | |
Dynamic Materials Corp. | | | 28,460 | | | | 640,919 | |
Furmanite Corp.* | | | 86,590 | | | | 656,352 | |
GP Strategies Corp.* | | | 59,722 | | | | 827,747 | |
Hurco Companies, Inc.* | | | 26,110 | | | | 781,472 | |
The accompanying notes are an integral part of these financial statements.
26
Managers Cadence Emerging Companies Fund
Schedule of Portfolio Investments (continued)
| | | | | | | | |
| | | Shares | | | Value | |
Industrials - 19.2% (continued) | | | | | | | | |
Interface, Inc., Class A | | | 40,040 | | | $ | 770,770 | |
LB Foster Co., Class A | | | 16,570 | | | | 600,828 | |
NN, Inc.* | | | 47,590 | | | | 690,531 | |
On Assignment, Inc.* | | | 73,260 | | | | 818,314 | |
Park-Ohio Holdings Corp.* | | | 29,036 | | | | 617,305 | |
Quality Distribution, Inc.* | | | 44,158 | | | | 530,338 | |
Raven Industries, Inc. | | | 13,340 | | | | 747,040 | |
Tennant Co. | | | 15,140 | | | | 584,858 | |
Twin Disc, Inc. | | | 18,610 | | | | 620,830 | |
Total Industrials | | | | | | | 13,442,960 | |
Information Technology - 22.1% | | | | | | | | |
Bottomline Technologies, Inc.* | | | 26,940 | | | | 700,440 | |
Computer Task Group, Inc.* | | | 51,010 | | | | 684,554 | |
Datalink Corp.* | | | 113,090 | | | | 816,510 | |
Dice Holdings, Inc.* | | | 46,740 | | | | 690,350 | |
Exlservice Holdings, Inc.* | | | 36,720 | | | | 862,186 | |
FARO Technologies, Inc.* | | | 19,530 | | | | 874,163 | |
Forrester Research, Inc. | | | 20,190 | | | | 766,008 | |
Kenexa Corp.* | | | 29,430 | | | | 930,577 | |
Keynote Systems, Inc. | | | 32,700 | | | | 694,221 | |
Knot, Inc., The* | | | 60,010 | | | | 615,703 | |
Lecroy Corp.* | | | 51,640 | | | | 668,222 | |
Magma Design Automation, Inc.* | | | 138,350 | | | | 965,683 | |
OPNET Technologies, Inc. | | | 14,750 | | | | 577,757 | |
PDF Solutions, Inc.* | | | 97,200 | | | | 613,332 | |
Perficient, Inc.* | | | 60,470 | | | | 674,240 | |
Radiant Systems, Inc.* | | | 43,680 | | | | 917,280 | |
Stratasys, Inc.* | | | 17,020 | | | | 599,104 | |
Super Micro Computer, Inc.* | | | 32,340 | | | | 542,665 | |
Ultratech Stepper, Inc.* | | | 29,270 | | | | 929,908 | |
Web.com Group, Inc.* | | | 57,050 | | | | 680,606 | |
Westell Technologies, Inc.* | | | 195,600 | | | | 670,908 | |
Total Information Technology | | | | | | | 15,474,417 | |
Materials - 3.3% | | | | | | | | |
Haynes International, Inc. | | | 14,170 | | | | 797,346 | |
Horsehead Holding Corp.* | | | 57,440 | | | | 766,250 | |
Universal Stainless & Alloy Products, Inc.* | | | 20,820 | | | | 758,056 | |
Total Materials | | | | | | | 2,321,652 | |
Total Common Stocks
(cost $53,609,842) | | | | | | | 67,870,871 | |
Short-Term Investments - 3.0%1 | | | | | | | | |
Dreyfus Cash Management Fund, Institutional Class Shares, 0.10%
(cost $2,089,509) | | | 2,089,509 | | | | 2,089,509 | |
| | |
Total Investments - 100.1%
(cost $55,699,351) | | | | | | | 69,960,380 | |
Other Assets, less Liabilities - (0.1)% | | | | | | | (31,949 | ) |
Net Assets - 100.0% | | | | | | $ | 69,928,431 | |
The accompanying notes are an integral part of these financial statements.
27
Notes to Schedules of Portfolio Investments
The following footnotes and abbreviations should be read in conjunction with each of the Schedules of Portfolio Investments previously presented in this report.
At May 31, 2011, the cost of securities for Federal income tax purposes and the gross aggregate unrealized appreciation and/or depreciation based on tax cost were approximately:
| | | | | | | | | | | | | | | | |
Fund | | Cost | | | Appreciation | | | Depreciation | | | Net | |
Managers Cadence Capital Appreciation Fund | | $ | 685,319,707 | | | $ | 168,215,123 | | | ($ | 7,922,740 | ) | | $ | 160,292,383 | |
| | | | |
Managers Cadence Focused Growth Fund | | | 15,738,060 | | | | 3,508,592 | | | | (384,747 | ) | | | 3,123,845 | |
| | | | |
Managers Cadence Mid-Cap Fund | | | 552,637,696 | | | | 150,399,428 | | | | (5,476,577 | ) | | | 144,922,851 | |
| | | | |
Managers Cadence Emerging Companies Fund | | | 56,427,775 | | | | 14,770,618 | | | | (1,238,013 | ) | | | 13,532,605 | |
| * | Non-income-producing security. |
| 1 | Yield shown for each investment company represents the May 31, 2011, seven-day average yield, which refers to the sum of the previous seven days’ dividends paid, expressed as an annual percentage. |
The following table summarizes the inputs used to value the Fund’s net assets by the fair value hierarchy levels as of May 31, 2011: (See Note 1 (a) in the Notes to Financial Statements.)
| | | | | | | | | | | | | | | | |
| | | Quoted Prices in Active Markets
for Identical Investments
Level 1 | | | Significant Other
Observable Inputs
Level 2 | | | Significant
Unobservable Inputs
Level 3 | | | Total | |
Managers Cadence Captial Appreciation Fund | | | | | | | | | | | | | | | | |
Investments in Securities | | | | | | | | | | | | | | | | |
Common Stocks† | | $ | 812,303,473 | | | | — | | | | — | | | $ | 812,303,473 | |
Short-Term Investments | | | 33,308,617 | | | | — | | | | — | | | | 33,308,617 | |
| | | | | | | | | | | | | | | | |
Total Investments in Securities | | $ | 845,612,090 | | | | — | | | | — | | | $ | 845,612,090 | |
| | | | | | | | | | | | | | | | |
| | | | |
| | | Quoted Prices in Active Markets
for Identical Investments
Level 1 | | | Significant Other
Observable Inputs
Level 2 | | | Significant
Unobservable Inputs
Level 3 | | | Total | |
Managers Cadence Focused Growth Fund | | | | | | | | | | | | | | | | |
Investments in Securities | | | | | | | | | | | | | | | | |
Common Stocks† | | $ | 18,476,883 | | | | — | | | | — | | | $ | 18,476,883 | |
Short-Term Investments | | | 385,022 | | | | — | | | | — | | | | 385,022 | |
| | | | | | | | | | | | | | | | |
Total Investments in Securities | | $ | 18,861,905 | | | | — | | | | — | | | $ | 18,861,905 | |
| | | | | | | | | | | | | | | | |
| | | | |
| | | Quoted Prices in Active Markets
for Identical Investments
Level 1 | | | Significant Other
Observable Inputs
Level 2 | | | Significant
Unobservable Inputs
Level 3 | | | Total | |
Managers Cadence Mid-Cap Fund | | | | | | | | | | | | | | | | |
Investments in Securities | | | | | | | | | | | | | | | | |
Common Stocks† | | $ | 660,616,404 | | | | — | | | | — | | | $ | 660,616,404 | |
Short-Term Investments | | | 36,944,143 | | | | — | | | | — | | | | 36,944,143 | |
| | | | | | | | | | | | | | | | |
Total Investments in Securities | | $ | 697,560,547 | | | | — | | | | — | | | $ | 697,560,547 | |
| | | | | | | | | | | | | | | | |
| | | | |
| | | Quoted Prices in Active Markets
for Identical Investments
Level 1 | | | Significant Other
Observable Inputs
Level 2 | | | Significant
Unobservable Inputs
Level 3 | | | Total | |
Managers Cadence Emerging Companies Fund | | | | | | | | | | | | | | | | |
Investments in Securities | | | | | | | | | | | | | | | | |
Common Stocks† | | $ | 67,870,871 | | | | — | | | | — | | | $ | 67,870,871 | |
Short-Term Investments | | | 2,089,509 | | | | — | | | | — | | | | 2,089,509 | |
| | | | | | | | | | | | | | | | |
Total Investments in Securities | | $ | 69,960,380 | | | | — | | | | — | | | $ | 69,960,380 | |
| | | | | | | | | | | | | | | | |
| † | All common stocks held in the Fund are Level 1 securities. For a detailed break-out of the common stocks by major industry classification, please refer to the Schedule of Portfolio Investments. |
For the fiscal year ended May 31, 2011, the Funds had no Significant transfers between Level 1 and Level 2.
The accompanying notes are an integral part of these financial statements.
28
Statements of Assets and Liabilities
May 31, 2011
| | | | | | | | | | | | | | | | |
| | | Managers Cadence
Capital Appreciation
Fund | | | Managers Cadence
Focused Growth
Fund | | | Managers Cadence
Mid-Cap Fund | | | Managers Cadence
Emerging Companies
Fund | |
Assets: | | | | | | | | | | | | | | | | |
Investments at value* | | $ | 845,612,090 | | | $ | 18,861,905 | | | $ | 697,560,547 | | | $ | 69,960,380 | |
Receivable for investments sold | | | 7,273,168 | | | | — | | | | 3,989,292 | | | | 779,613 | |
Receivable for Fund shares sold | | | 1,537,324 | | | | 716 | | | | 572,064 | | | | 51,300 | |
Dividends, interest and other receivables | | | 1,274,479 | | | | 33,970 | | | | 426,024 | | | | 17,482 | |
Prepaid expenses | | | 77,479 | | | | 3,438 | | | | 45,645 | | | | 1,316 | |
Total assets | | | 855,774,540 | | | | 18,900,029 | | | | 702,593,572 | | | | 70,810,091 | |
Liabilities: | | | | | | | | | | | | | | | | |
Payable for Fund shares repurchased | | | 13,647,116 | | | | 175,744 | | | | 1,831,024 | | | | 482,638 | |
Payable for investments purchased | | | 7,795,260 | | | | — | | | | 18,473,237 | | | | 265,647 | |
Accrued expenses: | | | | | | | | | | | | | | | | |
Investment management and advisory fees | | | 322,042 | | | | 3,074 | | | | 260,457 | | | | 71,863 | |
Administrative fees | | | 178,912 | | | | 3,983 | | | | 144,698 | | | | 14,622 | |
Distribution Fees - Class A | | | 23,748 | | | | 789 | | | | 37,306 | | | | N/A | |
Distribution Fees - Class B | | | 5,308 | | | | N/A | | | | 8,799 | | | | N/A | |
Distribution Fees - Class C | | | 30,700 | | | | 1,421 | | | | 23,287 | | | | N/A | |
Distribution Fees - Class D | | | 72,774 | | | | 418 | | | | 3,174 | | | | N/A | |
Distribution Fees - Administrative Class | | | — | | | | 4 | | | | — | | | | — | |
Distribution Fees - Class R | | | 1,675 | | | | N/A | | | | 9,154 | | | | N/A | |
Other | | | 312,383 | | | | 42,448 | | | | 277,503 | | | | 46,890 | |
Total liabilities | | | 22,389,918 | | | | 227,881 | | | | 21,068,639 | | | | 881,660 | |
Net Assets | | $ | 833,384,622 | | | $ | 18,672,148 | | | $ | 681,524,933 | | | $ | 69,928,431 | |
Net Assets Represent: | | | | | | | | | | | | | | | | |
Paid-in capital | | $ | 933,290,532 | | | $ | 26,501,249 | | | $ | 716,824,816 | | | $ | 105,514,499 | |
Undistributed net investment income (loss) | | | 405,641 | | | | 69,040 | | | | — | | | | 47,966 | |
Accumulated net realized loss from investments | | | (261,274,370 | ) | | | (11,088,000 | ) | | | (180,516,470 | ) | | | (49,895,063 | ) |
Net unrealized appreciation of investments | | | 160,962,819 | | | | 3,189,859 | | | | 145,216,587 | | | | 14,261,029 | |
Net Assets | | $ | 833,384,622 | | | $ | 18,672,148 | | | $ | 681,524,933 | | | $ | 69,928,431 | |
* Investments at cost | | $ | 684,649,271 | | | $ | 15,672,046 | | | $ | 552,343,960 | | | $ | 55,699,351 | |
The accompanying notes are an integral part of these financial statements.
29
Statements of Assets and Liabilities (continued)
May 31, 2011
| | | | | | | | | | | | | | | | |
| | | Managers Cadence
Capital Appreciation
Fund | | | Managers Cadence
Focused Growth
Fund | | | Managers Cadence
Mid-Cap Fund | | | Managers Cadence
Emerging Companies
Fund | |
Class A Shares - Net Assets | | $ | 110,902,948 | | | $ | 3,736,921 | | | $ | 174,948,342 | | | | N/A | |
Shares outstanding | | | 6,312,442 | | | | 416,352 | | | | 6,654,494 | | | | N/A | |
Net asset value and redemption price per share | | $ | 17.57 | | | $ | 8.98 | | | $ | 26.29 | | | | N/A | |
Offering price per share based on a maximum sales charge of 5.75%
(Net asset value per share/(100% - maximum sales charge)) | | $ | 18.64 | | | $ | 9.52 | | | $ | 27.89 | | | | N/A | |
| | | | |
Class B Shares - Net Assets | | $ | 6,127,968 | | | | N/A | | | $ | 10,203,493 | | | | N/A | |
Shares outstanding | | | 390,107 | | | | N/A | | | | 440,369 | | | | N/A | |
Net asset value and offering price per share | | $ | 15.71 | | | | N/A | | | $ | 23.17 | | | | N/A | |
Class C Shares - Net Assets | | $ | 35,880,995 | | | $ | 1,667,370 | | | $ | 27,311,012 | | | | N/A | |
Shares outstanding | | | 2,276,690 | | | | 189,434 | | | | 1,177,864 | | | | N/A | |
Net asset value and offering price per share | | $ | 15.76 | | | $ | 8.80 | | | $ | 23.19 | | | | N/A | |
Class D Shares - Net Assets | | $ | 351,467,065 | | | $ | 1,979,703 | | | $ | 14,974,033 | | | | N/A | |
Shares outstanding | | | 20,292,849 | | | | 220,906 | | | | 565,293 | | | | N/A | |
Net asset value, offering and redemption price per share | | $ | 17.32 | | | $ | 8.96 | | | $ | 26.49 | | | | N/A | |
Institutional Class Shares - Net Assets | | $ | 178,990,422 | | | $ | 11,066,839 | | | $ | 299,908,745 | | | $ | 65,221,942 | |
Shares outstanding | | | 9,813,216 | | | | 1,219,220 | | | | 10,756,008 | | | | 2,792,886 | |
Net asset value, offering and redemption price per share | | $ | 18.24 | | | $ | 9.08 | | | $ | 27.88 | | | $ | 23.35 | |
Administrative Class Shares - Net Assets | | $ | 143,233,278 | | | $ | 12,008 | | | $ | 129,964,078 | | | $ | 4,706,489 | |
Shares outstanding | | | 8,107,946 | | | | 1,326 | | | | 4,836,673 | | | | 215,078 | |
Net asset value, offering and redemption price per share | | $ | 17.67 | | | $ | 9.06 | | | $ | 26.87 | | | $ | 21.88 | |
Class P Shares - Net Assets | | $ | 2,858,195 | | | $ | 209,307 | | | $ | 2,967,250 | | | | N/A | |
Shares outstanding | | | 157,418 | | | | 23,277 | | | | 106,728 | | | | N/A | |
Net asset value, offering and redemption price per share | | $ | 18.16 | | | $ | 8.99 | | | $ | 27.80 | | | | N/A | |
Class R Shares - Net Assets | | $ | 3,923,751 | | | | N/A | | | $ | 21,247,980 | | | | N/A | |
Shares outstanding | | | 223,202 | | | | N/A | | | | 809,435 | | | | N/A | |
Net asset value, offering and redemption price per share | | $ | 17.58 | | | | N/A | | | $ | 26.25 | | | | N/A | |
The accompanying notes are an integral part of these financial statements.
30
Statements of Operations
| | | | | | | | | | | | | | | | |
| | | Managers Cadence
Capital Appreciation Fund | | | Managers Cadence
Focused Growth Fund | |
| | | For the fiscal period
from July 1, 2010
to May 31, 2011 | | | Fiscal
year ended
June 30, 2010 | | | For the fiscal period
from July 1, 2010
to May 31, 2011 | | | Fiscal
year ended
June 30, 2010 | |
Investment Income: | | | | | | | | | | | | | | | | |
Dividend income | | $ | 10,927,182 | | | $ | 12,449,481 | | | $ | 283,203 | | | $ | 851,999 | |
Interest income | | | 400 | | | | 8,540 | | | | — | | | | 865 | |
Foreign withholding tax | | | — | | | | — | | | | — | | | | — | |
Miscellaneous income | | | — | | | | 186 | | | | — | | | | 11 | |
Total investment income | | | 10,927,582 | | | | 12,458,207 | | | | 283,203 | | | | 852,875 | |
Expenses: | | | | | | | | | | | | | | | | |
Investment management and advisory fees | | | 3,530,243 | | | | 4,153,147 | | | | 92,503 | | | | 287,827 | |
Administrative fees | | | 2,104,721 | | | | 3,044,624 | | | | 55,831 | | | | 184,571 | |
Distribution fees - Class A | | | 196,404 | | | | — | | | | 6,289 | | | | — | |
Distribution fees - Class B | | | 65,228 | | | | 105,881 | | | | N/A | | | | N/A | |
Distribution fees - Class C | | | 364,293 | | | | 432,972 | | | | 14,702 | | | | 15,633 | |
Distribution fees - Class D | | | 500,383 | | | | — | | | | 3,118 | | | | — | |
Distribution fees - Administrative Class | | | 116,740 | | | | — | | | | 10 | | | | — | |
Distribution fees - Class R | | | 15,976 | | | | 18,287 | | | | N/A | | | | N/A | |
Transfer agent | | | 1,177,864 | | | | 1,596,699 | | | | 20,120 | | | | 20,165 | |
Reports to shareholders | | | 118,623 | | | | — | | | | 8,674 | | | | — | |
Professional fees | | | 90,216 | | | | — | | | | 25,212 | | | | — | |
Custodian | | | 66,956 | | | | — | | | | 7,635 | | | | — | |
Registration fees | | | 42,396 | | | | — | | | | 24,574 | | | | — | |
Trustees fees and expenses | | | 42,139 | | | | 103,077 | | | | 1,221 | | | | 6,484 | |
Miscellaneous | | | 21,475 | | | | 35,372 | | | | 7,582 | | | | 1,607 | |
Total expenses before offsets | | | 8,453,657 | | | | 9,490,059 | | | | 267,471 | | | | 516,287 | |
Expense reimbursements | | | (395,154 | ) | | | — | | | | (75,545 | ) | | | — | |
Expense reductions | | | (25,494 | ) | | | (166,554 | ) | | | (1,629 | ) | | | — | |
Net expenses | | | 8,033,009 | | | | 9,323,505 | | | | 190,297 | | | | 516,287 | |
Net investment income | | | 2,894,573 | | | | 3,134,702 | | | | 92,906 | | | | 336,588 | |
Net Realized and Unrealized Gain (Loss): | | | | | | | | | | | | | | | | |
Net realized gain on investments | | | 97,122,182 | | | | 87,941,085 | | | | 2,855,858 | | | | 14,309,303 | |
Net change in unrealized appreciation (depreciation) of investments | | | 136,376,505 | | | | 28,811,634 | | | | 3,936,822 | | | | (2,924,435 | ) |
Net realized and unrealized gain | | | 233,498,687 | | | | 116,752,719 | | | | 6,792,680 | | | | 11,384,868 | |
Net increase in net assets resulting from operations | | $ | 236,393,260 | | | $ | 119,887,421 | | | $ | 6,885,586 | | | $ | 11,721,456 | |
The accompanying notes are an integral part of these financial statements.
31
Statements of Operations
| | | | | | | | | | | | | | | | |
| | | Managers Cadence
Mid-Cap Fund | | | Managers Cadence
Emerging Companies Fund | |
| | | For the fiscal period
from July 1, 2010
to May 31, 2011 | | | Fiscal
year ended
June 30, 2010 | | | For the fiscal period
from July 1, 2010
to May 31, 2011 | | | Fiscal
year ended
June 30, 2010 | |
Investment Income: | | | | | | | | | | | | | | | | |
Dividend income | | $ | 6,726,580 | | | $ | 7,560,313 | | | $ | 659,934 | | | $ | 538,960 | |
Interest income | | | 311 | | | | 4,320 | | | | 26 | | | | 808 | |
Foreign withholding tax | | | (6,374 | ) | | | — | | | | — | | | | — | |
Miscellaneous income | | | — | | | | 2,161 | | | | — | | | | 19 | |
Total investment income | | | 6,720,517 | | | | 7,566,794 | | | | 659,960 | | | | 539,787 | |
Expenses: | | | | | | | | | | | | | | | | |
Investment management and advisory fees | | | 2,874,006 | | | | 3,516,673 | | | | 715,103 | | | | 964,662 | |
Administrative fees | | | 1,685,422 | | | | 2,538,234 | | | | 143,021 | | | | 216,818 | |
Distribution fees - Class A | | | 297,268 | | | | — | | | | N/A | | | | N/A | |
Distribution fees - Class B | | | 96,429 | | | | 128,473 | | | | N/A | | | | N/A | |
Distribution fees - Class C | | | 280,969 | | | | 331,716 | | | | N/A | | | | N/A | |
Distribution fees - Class D | | | 24,419 | | | | — | | | | N/A | | | | N/A | |
Distribution fees - Administrative Class | | | 73,035 | | | | — | | | | 1,340 | | | | — | |
Distribution fees - Class R | | | 87,573 | | | | 73,248 | | | | N/A | | | | N/A | |
Transfer agent | | | 777,079 | | | | 1,113,665 | | | | 13,796 | | | | 31,368 | |
Reports to shareholders | | | 96,197 | | | | — | | | | 13,653 | | | | — | |
Professional fees | | | 94,671 | | | | — | | | | 30,081 | | | | — | |
Custodian | | | 56,653 | | | | — | | | | 9,229 | | | | — | |
Registration fees | | | 36,850 | | | | — | | | | 23,579 | | | | — | |
Trustees fees and expenses | | | 36,173 | | | | 86,602 | | | | 3,038 | | | | 8,536 | |
Miscellaneous | | | 32,427 | | | | 2,295 | | | | 5,532 | | | | 5,266 | |
Total expenses before offsets | | | 6,549,171 | | | | 7,790,906 | | | | 958,372 | | | | 1,226,650 | |
Expense reimbursements | | | (402,960 | ) | | | — | | | | (140,302 | ) | | | (77,173 | ) |
Expense reductions | | | (80,720 | ) | | | (161,658 | ) | | | (4,400 | ) | | | (23,886 | ) |
Net expenses | | | 6,065,491 | | | | 7,629,248 | | | | 813,670 | | | | 1,125,591 | |
Net investment income (loss) | | | 655,026 | | | | (62,454 | ) | | | (153,710 | ) | | | (585,804 | ) |
Net Realized and Unrealized Gain (Loss): | | | | | | | | | | | | | | | | |
Net realized gain on investments | | | 140,583,056 | | | | 132,606,154 | | | | 14,220,407 | | | | 21,068,670 | |
Net change in unrealized appreciation (depreciation) of investments | | | 116,309,195 | | | | (1,819,138 | ) | | | 14,038,159 | | | | 5,270,056 | |
Net realized and unrealized gain | | | 256,892,251 | | | | 130,787,016 | | | | 28,258,566 | | | | 26,338,726 | |
Net increase in net assets resulting from operations | | $ | 257,547,277 | | | $ | 130,724,562 | | | $ | 28,104,856 | | | $ | 25,752,922 | |
The accompanying notes are an integral part of these financial statements.
32
Statements of Changes in Net Assets
| | | | | | | | | | | | | | | | | | | | | | | | |
| | | Managers Cadence Capital Appreciation Fund | | | Managers Cadence Focused Growth Fund | |
| | | For the fiscal period
from July 1, 2010
to May 31, 2011 | | | Fiscal
year ended
June 30, 2010 | | | Fiscal
year ended
June 30, 2009 | | | For the fiscal period
from July 1, 2010
to May 31, 2011 | | | Fiscal
year ended
June 30,
2010 | | | Fiscal
year ended
June 30,
2009 | |
Increase (Decrease) in Net Assets From Operations: | | | | | | | | | | | | | | | | | | | | | | | | |
Net investment income | | $ | 2,894,573 | | | $ | 3,134,702 | | | $ | 3,967,495 | | | $ | 92,906 | | | $ | 336,588 | | | $ | 614,954 | |
Net realized gain (loss) on investments | | | 97,122,182 | | | | 87,941,085 | | | | (438,089,358 | ) | | | 2,855,858 | | | | 14,309,303 | | | | (44,721,083 | ) |
Capital contribution from Affiliate (See Note 4 of Notes to Financial Statements) | | | — | | | | — | | | | 9,847,503 | | | | — | | | | — | | | | — | |
Net change in unrealized appreciation (depreciation) of investments | | | 136,376,505 | | | | 28,811,634 | | | | (88,156,577 | ) | | | 3,936,822 | | | | (2,924,435 | ) | | | 1,347,887 | |
Net increase (decrease) in net assets resulting from operations | | | 236,393,260 | | | | 119,887,421 | | | | (512,430,937 | ) | | | 6,885,586 | | | | 11,721,456 | | | | (42,758,242 | ) |
Distributions to Shareholders: | | | | | | | | | | | | | | | | | | | | | | | | |
From net investment income: | | | | | | | | | | | | | | | | | | | | | | | | |
Class A | | | (476,286 | ) | | | (295,140 | ) | | | (157 | ) | | | (21,767 | ) | | | (51,428 | ) | | | (92 | ) |
Class B | | | — | | | | (23 | ) | | | (70 | ) | | | N/A | | | | N/A | | | | N/A | |
Class C | | | — | | | | (44 | ) | | | (174 | ) | | | — | | | | (6,572 | ) | | | (314 | ) |
Class D | | | (1,358,363 | ) | | | (1,113,708 | ) | | | (84,532 | ) | | | (12,472 | ) | | | (19,677 | ) | | | (6 | ) |
Institutional Class | | | (1,431,683 | ) | | | (1,805,828 | ) | | | (611,353 | ) | | | (163,809 | ) | | | (485,230 | ) | | | (307,768 | ) |
Administrative Class | | | (1,052,092 | ) | | | (1,084,217 | ) | | | (171,136 | ) | | | (79 | ) | | | (115 | ) | | | (2 | ) |
Class P | | | (20,264 | ) | | | (51,533 | ) | | | (17 | ) | | | (1,850 | ) | | | (2,860 | ) | | | (43 | ) |
Class R | | | — | | | | (6 | ) | | | (9 | ) | | | N/A | | | | N/A | | | | N/A | |
From net realized gain on investments: | | | | | | | | | | | — | | | | | | | | | | | | | |
Class A | | | — | | | | — | | | | — | | | | (110,707 | ) | | | — | | | | — | |
Class C | | | — | | | | — | | | | — | | | | (52,511 | ) | | | — | | | | — | |
Class D | | | — | | | | — | | | | — | | | | (54,534 | ) | | | — | | | | — | |
Institutional Class | | | — | | | | — | | | | — | | | | (550,692 | ) | | | — | | | | — | |
Administrative Class | | | — | | | | — | | | | — | | | | (336 | ) | | | — | | | | — | |
Class P | | | — | | | | — | | | | — | | | | (6,219 | ) | | | — | | | | — | |
Total distributions to shareholders | | | (4,338,688 | ) | | | (4,350,499 | ) | | | (867,448 | ) | | | (974,976 | ) | | | (565,882 | ) | | | (308,225 | ) |
From Capital Share Transactions: | | | | | | | | | | | | | | | | | | | | | | | | |
Proceeds from sale of shares | | | 198,499,649 | | | | 309,681,375 | | | | 287,870,704 | | | | 1,188,182 | | | | 6,815,491 | | | | 22,949,546 | |
Reinvestment of dividends and distributions | | | 4,159,200 | | | | 4,012,522 | | | | 798,552 | | | | 900,806 | | | | 558,664 | | | | 227,549 | |
Cost of shares repurchased | | | (364,009,067 | ) | | | (514,442,034 | ) | | | (435,699,556 | ) | | | (11,856,898 | ) | | | (95,228,271 | ) | | | (15,689,956 | ) |
Net increase (decrease) from capital share transactions | | | (161,350,218 | ) | | | (200,748,137 | ) | | | (147,030,300 | ) | | | (9,767,910 | ) | | | (87,854,116 | ) | | | 7,487,139 | |
Total increase (decrease) in net assets | | | 70,704,354 | | | | (85,211,215 | ) | | | (660,328,685 | ) | | | (3,857,300 | ) | | | (76,698,542 | ) | | | (35,579,328 | ) |
Net Assets: | | | | | | | | | | | | | | | | | | | | | | | | |
Beginning of period | | | 762,680,268 | | | | 847,891,483 | | | | 1,508,220,168 | | | | 22,529,448 | | | | 99,227,990 | | | | 134,807,318 | |
End of period | | $ | 833,384,622 | | | $ | 762,680,268 | | | $ | 847,891,483 | | | $ | 18,672,148 | | | $ | 22,529,448 | | | $ | 99,227,990 | |
End of period undistributed net investment income | | $ | 405,641 | | | $ | 1,921,409 | | | $ | 3,113,077 | | | $ | 69,040 | | | $ | 176,127 | | | $ | 405,422 | |
| | | | | | | | | | | | | | | | | | | | | | | | |
The accompanying notes are an integral part of these financial statements.
33
Statements of Changes in Net Assets
| | | | | | | | | | | | | | | | | | | | | | | | |
| | | Managers Cadence Mid-Cap Fund | | | Managers Cadence Emerging Companies Fund | |
| | | For the fiscal period
from July 1, 2010
to May 31, 2011 | | | Fiscal
year ended
June 30, 2010 | | | Fiscal
year ended
June 30, 2009 | | | For the fiscal period
from July 1, 2010
to May 31, 2011 | | | Fiscal
year ended
June 30, 2010 | | | Fiscal
year ended
June 30, 2009 | |
Increase (Decrease) in Net Assets From Operations: | | | | | | | | | | | | | | | | | | | | | | | | |
Net investment income (loss) | | $ | 655,026 | | | ($ | 62,454 | ) | | ($ | 823,256 | ) | | ($ | 153,710 | ) | | ($ | 585,804 | ) | | ($ | 909,700 | ) |
Net realized gain (loss) on investments | | | 140,583,056 | | | | 132,606,154 | | | | (457,229,435 | ) | | | 14,220,407 | | | | 21,068,700 | | | | (62,029,283 | ) |
Capital contribution from Affiliate (See Note 4 of Notes to Financial Statements) | | | — | | | | — | | | | 10,539,263 | | | | — | | | | — | | | | — | |
Net change in unrealized appreciation (depreciation) of investments | | | 116,309,195 | | | | (1,819,138 | ) | | | (87,578,300 | ) | | | 14,038,159 | | | | (5,270,056 | ) | | | (4,216,798 | ) |
Net increase (decrease) in net assets resulting from operations | | | 257,547,277 | | | | 130,724,562 | | | | (535,091,728 | ) | | | 28,104,856 | | | | 15,212,840 | | | | (67,155,781 | ) |
Distributions to Shareholders: | | | | | | | | | | | | | | | | | | | | | | | | |
From net investment income: | | | | | | | | | | | | | | | | | | | | | | | | |
Class A | | | (206,078 | ) | | | — | | | | — | | | | N/A | | | | N/A | | | | N/A | |
Class B | | | — | | | | — | | | | — | | | | N/A | | | | N/A | | | | N/A | |
Class C | | | — | | | | — | | | | — | | | | N/A | | | | N/A | | | | N/A | |
Class D | | | (12,298 | ) | | | — | | | | — | | | | N/A | | | | N/A | | | | N/A | |
Institutional Class | | | (1,262,080 | ) | | | — | | | | — | | | | — | | | | — | | | | — | |
Administrative Class | | | (223,568 | ) | | | — | | | | — | | | | — | | | | — | | | | — | |
Class P | | | (13,056 | ) | | | — | | | | — | | | | N/A | | | | N/A | | | | N/A | |
Class R | | | — | | | | — | | | | — | | | | N/A | | | | N/A | | | | N/A | |
From net realized gain on investments: | | | | | | | | | | | | | | | | | | | | | | | | |
Class A | | | — | | | | — | | | | — | | | | N/A | | | | N/A | | | | N/A | |
Class C | | | — | | | | — | | | | — | | | | N/A | | | | N/A | | | | N/A | |
Class D | | | — | | | | — | | | | — | | | | N/A | | | | N/A | | | | N/A | |
Institutional Class | | | — | | | | — | | | | — | | | | — | | | | — | | | | — | |
Administrative Class | | | — | | | | — | | | | — | | | | — | | | | — | | | | — | |
Class P | | | — | | | | — | | | | — | | | | N/A | | | | N/A | | | | N/A | |
Total distributions to shareholders | | | (1,717,080 | ) | | | — | | | | — | | | | — | | | | — | | | | — | |
From Capital Share Transactions: | | | | | | | | | | | | | | | | | | | | | | | | |
Proceeds from sale of shares | | | 118,147,528 | | | | 159,407,898 | | | | 233,936,267 | | | | 12,354,565 | | | | 6,712,589 | | | | 20,789,592 | |
Reinvestment of dividends and distributions | | | 1,579,885 | | | | — | | | | — | | | | — | | | | — | | | | — | |
Cost of shares repurchased | | | (362,320,270 | ) | | | (356,761,266 | ) | | | (385,290,732 | ) | | | (27,526,509 | ) | | | (46,178,201 | ) | | | (102,641,511 | ) |
Net decrease from capital share transactions | | | (242,592,857 | ) | | | (197,353,368 | ) | | | (151,354,465 | ) | | | (15,171,944 | ) | | | (39,465,612 | ) | | | (81,851,919 | ) |
Total increase (decrease) in net assets | | | 13,237,340 | | | | (66,628,806 | ) | | | (686,446,193 | ) | | | 12,932,912 | | | | (24,252,772 | ) | | | (149,007,700 | ) |
Net Assets: | | | | | | | | | | | | | | | | | | | | | | | | |
Beginning of period | | | 668,287,593 | | | | 734,916,399 | | | | 1,421,362,592 | | | | 56,995,519 | | | | 81,248,291 | | | | 230,255,991 | |
End of period | | $ | 681,524,933 | | | $ | 668,287,593 | | | $ | 734,916,399 | | | $ | 69,928,431 | | | $ | 56,995,519 | | | $ | 81,248,291 | |
End of period undistributed net investment income (loss) | | | — | | | $ | 28,215 | | | ($ | 75,168 | ) | | $ | 47,966 | | | ($ | 18,557 | ) | | ($ | 20,638 | ) |
| | | | | | | | | | | | | | | | | | | | | | | | |
The accompanying notes are an integral part of these financial statements.
34
Financial Highlights
For a share outstanding throughout each fiscal period
| | | | | | | | | | | | | | | | | | | | | | | | | | | | | | | | |
| | | Fiscal year
ended: | | | Net Asset
Value
Beginning
of Period | | | Net Investment
Income (Loss) | | | Net Realized
and Unrealized
Gain (Loss) on
Investments | | | Total from
Investment
Operations | | | Distributions to
Shareholders
from Net
Investment
Income | | | Distributions to
Shareholders
from Net
Realized Gain
on Investments | | | Total
Distributions to
Shareholders | |
MANAGERS CADENCE CAPITAL APPRECIATION FUND* | |
Class A | | | 5/31/2011 | ** | | $ | 13.34 | | | $ | 0.04 | 3 | | $ | 4.26 | 3 | | $ | 4.30 | | | ($ | 0.07 | ) | | | — | | | ($ | 0.07 | ) |
| | | 6/30/2010 | | | | 11.91 | | | | 0.03 | 3 | | | 1.43 | 3 | | | 1.46 | | | | (0.03 | ) | | | — | | | | (0.03 | ) |
| | | 6/30/2009 | | | | 18.14 | | | | 0.04 | 3 | | | (6.27 | )3 | | | (6.23 | ) | | | (0.00 | )# | | | — | | | | (0.00 | )# |
| | | 6/30/2008 | | | | 21.00 | | | | 0.02 | 3 | | | (0.92 | )3 | | | (0.90 | ) | | | (0.06 | ) | | ($ | 1.90 | ) | | | (1.96 | ) |
| | | 6/30/2007 | | | | 19.71 | | | | 0.04 | 3 | | | 2.64 | 3 | | | 2.68 | | | | (0.02 | ) | | | (1.37 | ) | | | (1.39 | ) |
| | | 6/30/2006 | | | | 17.93 | | | | 0.04 | 3 | | | 1.74 | 3 | | | 1.78 | | | | (0.00 | )# | | | — | | | | (0.00 | )# |
| | | | | | | | | | | | | | | | | | | | | | | | | | | | | | | | |
Class B | | | 5/31/2011 | ** | | $ | 11.96 | | | $ | (0.06 | )3 | | $ | 3.81 | 3 | | $ | 3.75 | | | | — | | | | — | | | | — | |
| | | 6/30/2010 | | | | 10.74 | | | | (0.06 | )3 | | | 1.28 | 3 | | | 1.22 | | | ($ | 0.00 | )# | | | — | | | ($ | 0.00 | )# |
| | | 6/30/2009 | | | | 16.48 | | | | (0.06 | )3 | | | (5.68 | )3 | | | (5.74 | ) | | | (0.00 | )# | | | — | | | | (0.00 | )# |
| | | 6/30/2008 | | | | 19.33 | | | | (0.12 | )3 | | | (0.83 | )3 | | | (0.95 | ) | | | (0.00 | )# | | ($ | 1.90 | ) | | | (1.90 | ) |
| | | 6/30/2007 | | | | 18.35 | | | | (0.10 | )3 | | | 2.45 | 3 | | | 2.35 | | | | (0.00 | )# | | | (1.37 | ) | | | (1.37 | ) |
| | | 6/30/2006 | | | | 16.82 | | | | (0.10 | )3 | | | 1.63 | 3 | | | 1.53 | | | | (0.00 | )# | | | — | | | | (0.00 | )# |
| | | | | | | | | | | | | | | | | | | | | | | | | | | | | | | | |
Class C | | | 5/31/2011 | ** | | $ | 12.00 | | | $ | (0.05 | )3 | | $ | 3.81 | 3 | | $ | 3.76 | | | | — | | | | — | | | | — | |
| | | 6/30/2010 | | | | 10.77 | | | | (0.06 | )3 | | | 1.29 | 3 | | | 1.23 | | | ($ | 0.00 | )# | | | — | | | ($ | 0.00 | )# |
| | | 6/30/2009 | | | | 16.53 | | | | (0.06 | )3 | | | (5.70 | )3 | | | (5.76 | ) | | | (0.00 | )# | | | — | | | | (0.00 | )# |
| | | 6/30/2008 | | | | 19.37 | | | | (0.12 | )3 | | | (0.82 | )3 | | | (0.94 | ) | | | (0.00 | )# | | ($ | 1.90 | ) | | | (1.90 | ) |
| | | 6/30/2007 | | | | 18.39 | | | | (0.10 | )3 | | | 2.45 | 3 | | | 2.35 | | | | (0.00 | )# | | | (1.37 | ) | | | (1.37 | ) |
| | | 6/30/2006 | | | | 16.85 | | | | (0.10 | )3 | | | 1.64 | 3 | | | 1.54 | | | | (0.00 | )# | | | — | | | | (0.00 | )# |
| | | | | | | | | | | | | | | | | | | | | | | | | | | | | | | | |
Class D | | | 5/31/2011 | ** | | $ | 13.16 | | | $ | 0.04 | 3 | | $ | 4.20 | 3 | | $ | 4.24 | | | ($ | 0.08 | ) | | | — | | | ($ | 0.08 | ) |
| | | 6/30/2010 | | | | 11.79 | | | | 0.04 | 3 | | | 1.41 | 3 | | | 1.45 | | | | (0.08 | ) | | | — | | | | (0.08 | ) |
| | | 6/30/2009 | | | | 17.99 | | | | 0.05 | 3 | | | (6.23 | )3 | | | (6.18 | ) | | | (0.02 | ) | | | — | | | | (0.02 | ) |
| | | 6/30/2008 | | | | 20.85 | | | | 0.02 | 3 | | | (0.91 | )3 | | | (0.89 | ) | | | (0.07 | ) | | ($ | 1.90 | ) | | | (1.97 | ) |
| | | 6/30/2007 | | | | 19.58 | | | | 0.04 | 3 | | | 2.63 | 3 | | | 2.67 | | | | (0.03 | ) | | | (1.37 | ) | | | (1.40 | ) |
| | | 6/30/2006 | | | | 17.83 | | | | 0.04 | 3 | | | 1.73 | 3 | | | 1.77 | | | | (0.02 | ) | | | — | | | | (0.02 | ) |
| | | | | | | | | | | | | | | | | | | | | | | | | | | | | | | | |
Institutional Class | | | 5/31/2011 | ** | | $ | 13.84 | | | $ | 0.10 | 3 | | $ | 4.42 | 3 | | $ | 4.52 | | | ($ | 0.12 | ) | | | — | | | ($ | 0.12 | ) |
| | | 6/30/2010 | | | | 12.36 | | | | 0.09 | 3 | | | 1.48 | 3 | | | 1.57 | | | | (0.09 | ) | | | — | | | | (0.09 | ) |
| | | 6/30/2009 | | | | 18.79 | | | | 0.10 | 3 | | | (6.51 | )3 | | | (6.41 | ) | | | (0.02 | ) | | | — | | | | (0.02 | ) |
| | | 6/30/2008 | | | | 21.64 | | | | 0.10 | 3 | | | (0.95 | )3 | | | (0.85 | ) | | | (0.10 | ) | | ($ | 1.90 | ) | | | (2.00 | ) |
| | | 6/30/2007 | | | | 20.22 | | | | 0.12 | 3 | | | 2.73 | 3 | | | 2.85 | | | | (0.06 | ) | | | (1.37 | ) | | | (1.43 | ) |
| | | 6/30/2006 | | | | 18.36 | | | | 0.12 | 3 | | | 1.78 | 3 | | | 1.90 | | | | (0.04 | ) | | | — | | | | (0.04 | ) |
| | | | | | | | | | | | | | | | | | | | | | | | | | | | | | | | |
Administrative Class | | | 5/31/2011 | ** | | $ | 13.40 | | | $ | 0.06 | 3 | | $ | 4.29 | 3 | | $ | 4.35 | | | ($ | 0.08 | ) | | | — | | | ($ | 0.08 | ) |
| | | 6/30/2010 | | | | 11.98 | | | | 0.05 | 3 | | | 1.43 | 3 | | | 1.48 | | | | (0.06 | ) | | | — | | | | (0.06 | ) |
| | | 6/30/2009 | | | | 18.22 | | | | 0.06 | 3 | | | (6.29 | )3 | | | (6.23 | ) | | | (0.01 | ) | | | — | | | | (0.01 | ) |
| | | 6/30/2008 | | | | 21.11 | | | | 0.05 | 3 | | | (0.92 | )3 | | | (0.87 | ) | | | (0.12 | ) | | ($ | 1.90 | ) | | | (2.02 | ) |
| | | 6/30/2007 | | | | 19.78 | | | | 0.07 | 3 | | | 2.66 | 3 | | | 2.73 | | | | (0.03 | ) | | | (1.37 | ) | | | (1.40 | ) |
| | | 6/30/2006 | | | | 17.99 | | | | 0.07 | 3 | | | 1.74 | 3 | | | 1.81 | | | | (0.02 | ) | | | — | | | | (0.02 | ) |
| | | | | | | | | | | | | | | | | | | | | | | | | | | | | | | | |
Class P | | | 5/31/2011 | ** | | $ | 13.78 | | | $ | 0.08 | 3 | | $ | 4.42 | 3 | | $ | 4.50 | | | ($ | 0.12 | ) | | | — | | | ($ | 0.12 | ) |
| | | 6/30/2010 | | | | 12.33 | | | | 0.07 | 3 | | | 1.48 | 3 | | | 1.55 | | | | (0.10 | ) | | | — | | | | (0.10 | ) |
| | | 6/30/2009 | † | | | 18.19 | | | | 0.08 | 3 | | | (5.91 | )3 | | | (5.83 | ) | | | (0.03 | ) | | | — | | | | (0.03 | ) |
| | | | | | | | | | | | | | | | | | | | | | | | | | | | | | | | |
Class R | | | 5/31/2011 | ** | | $ | 13.32 | | | $ | 0.01 | 3 | | $ | 4.25 | 3 | | $ | 4.26 | | | | — | | | | — | | | | — | |
| | | 6/30/2010 | | | | 11.90 | | | | (0.00 | )#,3 | | | 1.42 | 3 | | | 1.42 | | | ($ | 0.00 | )# | | | — | | | ($ | 0.00 | )# |
| | | 6/30/2009 | | | | 18.17 | | | | 0.01 | 3 | | | (6.28 | )3 | | | (6.27 | ) | | | (0.00 | )# | | | — | | | | (0.00 | )# |
| | | 6/30/2008 | | | | 21.04 | | | | (0.03 | )3 | | | (0.93 | )3 | | | (0.96 | ) | | | (0.01 | ) | | ($ | 1.90 | ) | | | (1.91 | ) |
| | | 6/30/2007 | | | | 19.79 | | | | (0.01 | )3 | | | 2.66 | 3 | | | 2.65 | | | | (0.03 | ) | | | (1.37 | ) | | | (1.40 | ) |
| | | 6/30/2006 | | | | 18.07 | | | | (0.01 | )3 | | | 1.75 | 3 | | | 1.74 | | | | (0.02 | ) | | | — | | | | (0.02 | ) |
| | | | | | | | | | | | | | | | | | | | | | | | | | | | | | | | |
| * | At the start of business on September 27, 2010, the Allianz CCM Capital Appreciation Fund, a series of the Allianz Funds, was re-organized into the Managers Cadence Capital Appreciation Fund. |
| ** | For the period from July 1, 2010, to May 31, 2011. |
| † | Commencement of operations was July 7, 2008. |
| # | Rounds to less than $0.01 per share. |
| 1 | Total returns and net investment income would have been lower had certain expenses not been reduced. (See Note 1(c) of Notes to Financial Statements.) |
| 2 | Excludes the impact of expense reimbursements or fee waivers and expense reductions such as brokerage credits, but includes expense repayments and non-reimbursable expenses, if any, such as interest and taxes. (See Note 1 (c) of Notes to Financial Statements.) |
35
| | | | | | | | | | | | | | | | | | | | | | | | | | | | | | | | |
| | | Net Asset
Value
End of
Period | | | Total Return1 | | | Ratio of Net
Expenses to
Average Net
Assets | | | Ratio of Net
Investment
Income (Loss)
to Average
Net Assets | | | Portfolio
Turnover Rate | | | Net Assets End
of Period
(000’s omitted) | | | Ratio of Total
Expenses
(Absent
Expense Offsets)
to Average
Net Assets2 | | | Ratio of Net
Investment
Income (loss)
(Absent Expense
Offsets)
to Average
Net Assets2 | |
MANAGERS CADENCE CAPITAL APPRECIATION FUND | |
Class A | | $ | 17.57 | | | | 32.23 | %5 | | | 1.10 | %6 | | | 0.30 | %6 | | | 75 | %5 | | $ | 110,903 | | | | 1.16 | %6 | | | 0.24 | %6 |
| | | 13.34 | | | | 12.23 | % | | | 1.11 | % | | | 0.24 | % | | | 103 | % | | | 108,395 | | | | 1.11 | % | | | 0.24 | % |
| | | 11.91 | 4 | | | (34.34 | )%4 | | | 1.11 | % | | | 0.26 | % | | | 154 | % | | | 157,543 | | | | 1.11 | % | | | 0.26 | % |
| | | 18.14 | | | | (5.43 | )% | | | 1.09 | % | | | 0.08 | % | | | 134 | % | | | 399,869 | | | | 1.09 | % | | | 0.08 | % |
| | | 21.00 | | | | 14.18 | % | | | 1.08 | % | | | 0.21 | % | | | 150 | % | | | 448,379 | | | | 1.08 | % | | | 0.21 | % |
| | | 19.71 | | | | 9.95 | % | | | 1.12 | % | | | 0.19 | % | | | 161 | % | | | 361,002 | | | | 1.12 | % | | | 0.19 | % |
| | | | | | | | | | | | | | | | | | | | | | | | | | | | | | | | |
Class B | | $ | 15.71 | | | | 31.35 | %5 | | | 1.86 | %6 | | | (0.45 | )%6 | | | 75 | %5 | | $ | 6,128 | | | | 1.92 | %6 | | | (0.51 | )%6 |
| | | 11.96 | | | | 11.36 | % | | | 1.86 | % | | | (0.52 | )% | | | 103 | % | | | 9,420 | | | | 1.86 | % | | | (0.52 | )% |
| | | 10.74 | 4 | | | (34.83 | )%4 | | | 1.86 | % | | | (0.49 | )% | | | 154 | % | | | 14,963 | | | | 1.86 | % | | | (0.49 | )% |
| | | 16.48 | | | | (6.17 | )% | | | 1.84 | % | | | (0.66 | )% | | | 134 | % | | | 41,429 | | | | 1.84 | % | | | (0.66 | )% |
| | | 19.33 | | | | 13.36 | % | | | 1.83 | % | | | (0.52 | )% | | | 150 | % | | | 60,862 | | | | 1.83 | % | | | (0.52 | )% |
| | | 18.35 | | | | 9.10 | % | | | 1.87 | % | | | (0.56 | )% | | | 161 | % | | | 75,309 | | | | 1.87 | % | | | (0.56 | )% |
| | | | | | | | | | | | | | | | | | | | | | | | | | | | | | | | |
Class C | | $ | 15.76 | | | | 31.33 | %5 | | | 1.83 | %6 | | | (0.42 | )%6 | | | 75 | %5 | | $ | 35,881 | | | | 1.89 | %6 | | | (0.48 | )%6 |
| | | 12.00 | | | | 11.42 | % | | | 1.86 | % | | | (0.51 | )% | | | 103 | % | | | 49,075 | | | | 1.86 | % | | | (0.51 | )% |
| | | 10.77 | 4 | | | (34.81 | )%4 | | | 1.86 | % | | | (0.46 | )% | | | 154 | % | | | 55,445 | | | | 1.86 | % | | | (0.46 | )% |
| | | 16.53 | | | | (6.16 | )% | | | 1.84 | % | | | (0.67 | )% | | | 134 | % | | | 113,744 | | | | 1.84 | % | | | (0.67 | )% |
| | | 19.37 | | | | 13.33 | % | | | 1.83 | % | | | (0.53 | )% | | | 150 | % | | | 134,475 | | | | 1.83 | % | | | (0.53 | )% |
| | | 18.39 | | | | 9.14 | % | | | 1.87 | % | | | (0.56 | )% | | | 161 | % | | | 138,280 | | | | 1.87 | % | | | (0.56 | )% |
| | | | | | | | | | | | | | | | | | | | | | | | | | | | | | | | |
Class D | | $ | 17.32 | | | | 32.25 | %5 | | | 1.11 | %6 | | | 0.28 | %6 | | | 75 | %5 | | $ | 351,467 | | | | 1.17 | %6 | | | 0.22 | %6 |
| | | 13.16 | | | | 12.26 | % | | | 1.11 | % | | | 0.26 | % | | | 103 | % | | | 197,251 | | | | 1.11 | % | | | 0.26 | % |
| | | 11.79 | 4 | | | (34.36 | )%4 | | | 1.11 | % | | | 0.39 | % | | | 154 | % | | | 82,956 | | | | 1.11 | % | | | 0.39 | % |
| | | 17.99 | | | | (5.44 | )% | | | 1.09 | % | | | 0.08 | % | | | 134 | % | | | 37,601 | | | | 1.09 | % | | | 0.08 | % |
| | | 20.85 | | | | 14.18 | % | | | 1.08 | % | | | 0.22 | % | | | 150 | % | | | 38,714 | | | | 1.08 | % | | | 0.22 | % |
| | | 19.58 | | | | 9.91 | % | | | 1.12 | % | | | 0.20 | % | | | 161 | % | | | 34,210 | | | | 1.12 | % | | | 0.20 | % |
| | | | | | | | | | | | | | | | | | | | | | | | | | | | | | | | |
Institutional Class | | $ | 18.24 | | | | 32.73 | %5 | | | 0.71 | %6 | | | 0.69 | %6 | | | 75 | %5 | | $ | 178,990 | | | | 0.77 | %6 | | | 0.63 | %6 |
| | | 13.84 | | | | 12.67 | % | | | 0.71 | % | | | 0.62 | % | | | 103 | % | | | 187,350 | | | | 0.71 | % | | | 0.59 | % |
| | | 12.36 | 4 | | | (34.08 | )%4 | | | 0.71 | % | | | 0.71 | % | | | 154 | % | | | 276,437 | | | | 0.71 | % | | | 0.71 | % |
| | | 18.79 | | | | (5.05 | )% | | | 0.69 | % | | | 0.47 | % | | | 134 | % | | | 459,142 | | | | 0.69 | % | | | 0.47 | % |
| | | 21.64 | | | | 14.67 | % | | | 0.68 | % | | | 0.61 | % | | | 150 | % | | | 424,762 | | | | 0.68 | % | | | 0.61 | % |
| | | 20.22 | | | | 10.33 | % | | | 0.72 | % | | | 0.60 | % | | | 161 | % | | | 383,054 | | | | 0.72 | % | | | 0.60 | % |
| | | | | | | | | | | | | | | | | | | | | | | | | | | | | | | | |
Administrative Class | | $ | 17.67 | | | | 32.47 | %5 | | | 0.96 | %6 | | | 0.43 | %6 | | | 75 | %5 | | $ | 143,233 | | | | 1.02 | %6 | | | 0.37 | %6 |
| | | 13.40 | | | | 12.43 | % | | | 0.96 | % | | | 0.39 | % | | | 103 | % | | | 199,889 | | | | 0.99 | % | | | 0.36 | % |
| | | 11.98 | 4 | | | (34.26 | )%4 | | | 0.96 | % | | | 0.45 | % | | | 154 | % | | | 245,686 | | | | 0.96 | % | | | 0.45 | % |
| | | 18.22 | | | | (5.32 | )% | | | 0.93 | % | | | 0.24 | % | | | 134 | % | | | 439,571 | | | | 0.93 | % | | | 0.24 | % |
| | | 21.11 | | | | 14.37 | % | | | 0.93 | % | | | 0.37 | % | | | 150 | % | | | 518,562 | | | | 0.93 | % | | | 0.37 | % |
| | | 19.78 | | | | 10.09 | % | | | 0.97 | % | | | 0.35 | % | | | 161 | % | | | 459,715 | | | | 0.97 | % | | | 0.35 | % |
| | | | | | | | | | | | | | | | | | | | | | | | | | | | | | | | |
Class P | | $ | 18.16 | | | | 32.68 | %5 | | | 0.82 | %6 | | | 0.59 | %6 | | | 75 | %5 | | $ | 2,858 | | | | 0.88 | %6 | | | 0.53 | %6 |
| | | 13.78 | | | | 12.51 | % | | | 0.85 | % | | | 0.52 | % | | | 103 | % | | | 7,121 | | | | 0.85 | % | | | 0.52 | % |
| | | 12.33 | 4 | | | (32.04 | )%4 | | | 0.79 | %6 | | | 0.67 | % | | | 154 | % | | | 4,308 | | | | 0.79 | %6 | | | 0.67 | %6 |
| | | | | | | | | | | | | | | | | | | | | | | | | | | | | | | | |
Class R | | $ | 17.58 | | | | 31.98 | %5 | | | 1.36 | %6 | | | 0.04 | %6 | | | 75 | %5 | | $ | 3,924 | | | | 1.42 | %6 | | | (0.02 | )%6 |
| | | 13.32 | | | | 11.93 | % | | | 1.36 | % | | | (0.02 | )% | | | 103 | % | | | 4,179 | | | | 1.36 | % | | | (0.02 | )% |
| | | 11.90 | 4 | | | (34.51 | )%4 | | | 1.36 | % | | | 0.06 | % | | | 154 | % | | | 10,553 | | | | 1.36 | % | | | 0.06 | % |
| | | 18.17 | | | | (5.68 | )% | | | 1.34 | % | | | (0.16 | )% | | | 134 | % | | | 16,864 | | | | 1.34 | % | | | (0.16 | )% |
| | | 21.04 | | | | 13.92 | % | | | 1.33 | % | | | (0.04 | )% | | | 150 | % | | | 18,552 | | | | 1.33 | % | | | (0.04 | )% |
| | | 19.79 | | | | 9.62 | % | | | 1.37 | % | | | (0.05 | )% | | | 161 | % | | | 13,019 | | | | 1.37 | % | | | (0.05 | )% |
| | | | | | | | | | | | | | | | | | | | | | | | | | | | | | | | |
| 3 | Per share numbers have been calculated using average shares. |
| 4 | Capital contribution from Affiliate increased the end of year net asset value and the total return. If the Affiliate had not made these payments, end of year net asset value and total return would have been reduced for Class A, Class B, Class C, Class D, Institutional Class, Administrative Class, Class P, and Class R, by $0.13 per share and 0.72%, $0.12 per share and 0.73%, $0.12 per share and 0.72%, $0.12 per share and 0.67%, $0.13 per share and 0.70%, $0.13 per share and 0.66%, $0.12 per share and 0.66%, and $0.13 per share and 0.71%, respectively. |
| 5 | Reflects the 11 month period from July 1, 2010 to May 31, 2011. |
36
Financial Highlights
For a share outstanding throughout each fiscal period
| | | | | | | | | | | | | | | | | | | | | | | | | | | | | | | | |
| | | Fiscal year
ended: | | | Net Asset
Value
Beginning
of Period | | | Net Investment
Income (Loss) | | | Net Realized
and
Unrealized
Gain (Loss)
on
Investments | | | Total from
Investment
Operations | | | Distributions to
Shareholders
from Net
Investment
Income | | | Distributions to
Shareholders
from Net
Realized Gain
on Investments | | | Total
Distributions to
Shareholders | |
MANAGERS CADENCE FOCUSED GROWTH FUND* | |
Class A | | | 5/31/2011 | ** | | $ | 6.98 | | | $ | 0.02 | 3 | | $ | 2.29 | 3 | | $ | 2.31 | | | ($ | 0.05 | ) | | ($ | 0.26 | ) | | ($ | 0.31 | ) |
| | | 6/30/2010 | | | | 6.59 | | | | 0.02 | 3 | | | 0.46 | 3 | | | 0.48 | | | | (0.09 | ) | | | — | | | | (0.09 | ) |
| | | 6/30/2009 | | | | 9.67 | | | | 0.02 | 3 | | | (3.10 | )3 | | | (3.08 | ) | | | (0.00 | )# | | | — | | | | (0.00 | )# |
| | | 6/30/2008 | | | | 10.47 | | | | (0.01 | )3 | | | (0.78 | )3 | | | (0.79 | ) | | | (0.01 | ) | | | (0.00 | )# | | | (0.01 | ) |
| | | 6/30/2007 | † | | | 9.30 | | | | (0.02 | )3 | | | 1.36 | 3 | | | 1.34 | | | | (0.03 | ) | | | (0.14 | ) | | | (0.17 | ) |
| | | | | | | | | | | | | | | | | | | | | | | | | | | | | | | | |
Class C | | | 5/31/2011 | ** | | $ | 6.85 | | | $ | (0.04 | )3 | | $ | 2.25 | 3 | | $ | 2.21 | | | | — | | | ($ | 0.26 | ) | | ($ | 0.26 | ) |
| | | 6/30/2010 | | | | 6.46 | | | | (0.04 | )3 | | | 0.45 | 3 | | | 0.41 | | | ($ | 0.02 | ) | | | — | | | | (0.02 | ) |
| | | 6/30/2009 | | | | 9.55 | | | | (0.03 | )3 | | | (3.06 | )3 | | | (3.09 | ) | | | (0.00 | )# | | | — | | | | (0.00 | )# |
| | | 6/30/2008 | | | | 10.42 | | | | (0.09 | )3 | | | (0.78 | )3 | | | (0.87 | ) | | | (0.00 | )# | | | (0.00 | )# | | | (0.00 | )# |
| | | 6/30/2007 | † | | | 9.30 | | | | (0.09 | )3 | | | 1.36 | 3 | | | 1.27 | | | | (0.01 | ) | | | (0.14 | ) | | | (0.15 | ) |
| | | | | | | | | | | | | | | | | | | | | | | | | | | | | | | | |
Class D | | | 5/31/2011 | ** | | $ | 6.98 | | | $ | 0.02 | 3 | | $ | 2.28 | 3 | | $ | 2.30 | | | ($ | 0.06 | ) | | ($ | 0.26 | ) | | ($ | 0.32 | ) |
| | | 6/30/2010 | | | | 6.59 | | | | 0.02 | 3 | | | 0.47 | 3 | | | 0.49 | | | | (0.10 | ) | | | — | | | | (0.10 | ) |
| | | 6/30/2009 | | | | 9.67 | | | | 0.02 | 3 | | | (3.10 | )3 | | | (3.08 | ) | | | (0.00 | )# | | | — | | | | (0.00 | )# |
| | | 6/30/2008 | | | | 10.47 | | | | (0.01 | )3 | | | (0.79 | )3 | | | (0.80 | ) | | | (0.00 | )# | | | (0.00 | )# | | | (0.00 | )# |
| | | 6/30/2007 | † | | | 9.30 | | | | (0.01 | )3 | | | 1.36 | 3 | | | 1.35 | | | | (0.04 | ) | | | (0.14 | ) | | | (0.18 | ) |
| | | | | | | | | | | | | | | | | | | | | | | | | | | | | | | | |
Institutional Class | | | 5/31/2011 | ** | | $ | 7.06 | | | $ | 0.05 | 3 | | $ | 2.31 | 3 | | $ | 2.36 | | | ($ | 0.08 | ) | | ($ | 0.26 | ) | | ($ | 0.34 | ) |
| | | 6/30/2010 | | | | 6.65 | | | | 0.04 | 3 | | | 0.47 | 3 | | | 0.51 | | | | (0.10 | ) | | | — | | | | (0.10 | ) |
| | | 6/30/2009 | | | | 9.75 | | | | 0.05 | 3 | | | (3.13 | )3 | | | (3.08 | ) | | | (0.02 | ) | | | — | | | | (0.02 | ) |
| | | 6/30/2008 | | | | 10.54 | | | | 0.03 | 3 | | | (0.80 | )3 | | | (0.77 | ) | | | (0.02 | ) | | | (0.00 | )# | | | (0.02 | ) |
| | | 6/30/2007 | | | | 9.34 | | | | 0.03 | 3 | | | 1.33 | 3 | | | 1.36 | | | | (0.02 | ) | | | (0.14 | ) | | | (0.16 | ) |
| | | 6/30/2006 | | | | 7.82 | | | | 0.04 | 3 | | | 1.50 | 3 | | | 1.54 | | | | (0.02 | ) | | | — | | | | (0.02 | ) |
| | | | | | | | | | | | | | | | | | | | | | | | | | | | | | | | |
Administrative Class | | | 5/31/2011 | ** | | $ | 7.01 | | | $ | 0.03 | 3 | | $ | 2.34 | 3 | | $ | 2.37 | | | ($ | 0.06 | ) | | ($ | 0.26 | ) | | ($ | 0.32 | ) |
| | | 6/30/2010 | | | | 6.62 | | | | 0.03 | 3 | | | 0.46 | 3 | | | 0.49 | | | | (0.10 | ) | | | — | | | | (0.10 | ) |
| | | 6/30/2009 | | | | 9.71 | | | | 0.03 | 3 | | | (3.12 | )3 | | | (3.09 | ) | | | (0.00 | )# | | | — | | | | (0.00 | )# |
| | | 6/30/2008 | | | | 10.50 | | | | 0.00 | #3 | | | (0.79 | )3 | | | (0.79 | ) | | | (0.00 | )# | | | (0.00 | )# | | | (0.00 | )# |
| | | 6/30/2007 | †† | | | 9.14 | | | | 0.01 | 3 | | | 1.52 | 3 | | | 1.53 | | | | (0.03 | ) | | | (0.14 | ) | | | (0.17 | ) |
| | | | | | | | | | | | | | | | | | | | | | | | | | | | | | | | |
Class P | | | 5/31/2011 | ** | | $ | 7.00 | | | $ | 0.04 | 3 | | $ | 2.29 | 3 | | $ | 2.33 | | | ($ | 0.08 | ) | | ($ | 0.26 | ) | | ($ | 0.34 | ) |
| | | 6/30/2010 | | | | 6.61 | | | | 0.04 | | | | 0.47 | | | | 0.51 | | | | (0.12 | ) | | | — | | | | (0.12 | ) |
| | | 6/30/2009 | ‡ | | | 9.44 | | | | 0.04 | | | | (2.83 | ) | | | (2.79 | ) | | | (0.04 | ) | | | — | | | | (0.04 | ) |
| | | | | | | | | | | | | | | | | | | | | | | | | | | | | | | | |
| * | At the start of business on September 27, 2010, the Allianz CCM Focused Growth Fund, a series of the Allianz Funds, was re-organized into the Managers Cadence Focused Growth Fund. |
| ** | For the period from July 1, 2010, to May 31, 2011. |
| † | Commencement of operations was July 5, 2006. |
| †† | Commencement of operations was September 15, 2006. ‡ Commencement of operations was July 7, 2008. |
| # | Rounds to less than $0.01 per share. |
| 1 | Total returns and net investment income would have been lower had certain expenses not been reduced. (See Note 1(c) of Notes to Financial Statements.) |
| 2 | Excludes the impact of expense reimbursements or fee waivers and expense reductions such as brokerage credits, but includes expense repayments and non-reimbursable expenses, if any, such as interest and taxes. (See Note 1 (c) of Notes to Financial Statements.) |
| 3 | Per share numbers have been calculated using average shares. |
| 4 | Rounds to less than 0.01% |
| 5 | Reflects the 11 month period from July 1, 2010 to May 31, 2011. |
37
| | | | | | | | | | | | | | | | | | | | | | | | | | | | | | | | |
| | | Net Asset Value
End of Period | | | Total Return1 | | | Ratio of Net
Expenses to
Average Net
Assets | | | Ratio of Net
Investment Income
(Loss) to Average Net
Assets | | | Portfolio
Turnover Rate | | | Net Assets End of
Period (000’s
omitted) | | | Ratio of Total
Expenses (Absent
Expense Offsets) to
Average Net Assets2 | | | Ratio of Net Investment
Income (loss) (Absent
Expense Offsets) to
Average Net Assets2 | |
MANAGERS CADENCE FOCUSED GROWTH FUND | |
Class A | | $ | 8.98 | | | | 33.44 | %5 | | | 1.08 | %6 | | | 0.27 | %6 | | | 83 | %5 | | $ | 3,737 | | | | 1.47 | %6 | | | (0.12 | )%6 |
| | | 6.98 | | | | 7.21 | % | | | 1.12 | % | | | 0.24 | % | | | 120 | % | | | 3,602 | | | | 1.12 | % | | | 0.24 | % |
| | | 6.59 | | | | (31.85 | )% | | | 1.11 | % | | | 0.26 | % | | | 156 | % | | | 4,803 | | | | 1.11 | % | | | 0.26 | % |
| | | 9.67 | | | | (7.55 | )% | | | 1.12 | % | | | (0.13 | )% | | | 143 | % | | | 7,418 | | | | 1.12 | % | | | (0.13 | )% |
| | | 10.47 | | | | 14.60 | % | | | 1.11 | %6 | | | (0.23 | )%6 | | | 106 | % | | | 1,704 | | | | 1.11 | %6 | | | (0.23 | )%6 |
| | | | | | | | | | | | | | | | | | | | | | | | | | | | | | | | |
Class C | | $ | 8.80 | | | | 32.43 | %5 | | | 1.85 | %6 | | | (0.49 | )%6 | | | 83 | %5 | | $ | 1,667 | | | | 2.24 | %6 | | | (0.88 | )%6 |
| | | 6.85 | | | | 6.38 | % | | | 1.87 | % | | | (0.51 | )% | | | 120 | % | | | 1,624 | | | | 1.87 | % | | | (0.51 | )% |
| | | 6.46 | | | | (32.34 | )% | | | 1.86 | % | | | (0.48 | )% | | | 156 | % | | | 2,343 | | | | 1.86 | % | | | (0.48 | )% |
| | | 9.55 | | | | (8.30 | )% | | | 1.86 | % | | | (0.89 | )% | | | 143 | % | | | 2,706 | | | | 1.86 | % | | | (0.89 | )% |
| | | 10.42 | | | | 13.81 | % | | | 1.86 | %6 | | | (0.91 | )%6 | | | 106 | % | | | 1,351 | | | | 1.86 | %6 | | | (0.91 | )%6 |
| | | | | | | | | | | | | | | | | | | | | | | | | | | | | | | | |
Class D | | $ | 8.96 | | | | 33.25 | %5 | | | 1.12 | %6 | | | 0.23 | %6 | | | 83 | %5 | | $ | 1,980 | | | | 1.51 | %6 | | | (0.16 | )%6 |
| | | 6.98 | | | | 7.25 | % | | | 1.12 | % | | | 0.27 | % | | | 120 | % | | | 1,375 | | | | 1.12 | % | | | 0.27 | % |
| | | 6.59 | | | | (31.85 | )% | | | 1.11 | % | | | 0.28 | % | | | 156 | % | | | 1,271 | | | | 1.11 | % | | | 0.28 | % |
| | | 9.67 | | | | (7.61 | )% | | | 1.12 | % | | | (0.13 | )% | | | 143 | % | | | 1,811 | | | | 1.12 | % | | | (0.13 | )% |
| | | 10.47 | | | | 14.16 | % | | | 1.11 | %6 | | | (0.06 | )%6 | | | 106 | % | | | 1,225 | | | | 1.11 | %6 | | | (0.06 | )%6 |
| | | | | | | | | | | | | | | | | | | | | | | | | | | | | | | | |
Institutional Class | | $ | 9.08 | | | | 33.81 | %5 | | | 0.75 | %6 | | | 0.64 | %6 | | | 83 | %5 | | $ | 11,067 | | | | 1.14 | %6 | | | 0.25 | %6 |
| | | 7.06 | | | | 7.50 | % | | | 0.74 | % | | | 0.60 | % | | | 120 | % | | | 15,695 | | | | 0.74 | % | | | 0.60 | % |
| | | 6.65 | | | | (31.54 | )% | | | 0.71 | % | | | 0.67 | % | | | 156 | % | | | 90,722 | | | | 0.71 | % | | | 0.67 | % |
| | | 9.75 | | | | (7.30 | )% | | | 0.72 | % | | | 0.30 | % | | | 143 | % | | | 122,861 | | | | 0.72 | % | | | 0.30 | % |
| | | 10.54 | | | | 14.72 | % | | | 0.71 | % | | | 0.30 | % | | | 106 | % | | | 50,850 | | | | 0.71 | % | | | 0.30 | % |
| | | 9.34 | | | | 19.68 | % | | | 0.73 | % | | | 0.48 | %6 | | | 153 | % | | | 4,600 | | | | 0.73 | % | | | 0.48 | %6 |
| | | | | | | | | | | | | | | | | | | | | | | | | | | | | | | | |
Administrative Class | | $ | 9.06 | | | | 34.20 | %5 | | | 1.00 | %6 | | | 0.35 | %6 | | | 83 | %5 | | $ | 12 | | | | 1.39 | %6 | | | (0.04 | )%6 |
| | | 7.01 | | | | 7.34 | % | | | 1.00 | % | | | 0.38 | % | | | 120 | % | | | 8 | | | | 1.00 | % | | | 0.38 | % |
| | | 6.62 | | | | (31.80 | )% | | | 0.97 | % | | | 0.40 | % | | | 156 | % | | | 7 | | | | 0.97 | % | | | 0.40 | % |
| | | 9.71 | | | | (7.49 | )% | | | 0.96 | % | | | 0.00 | %4 | | | 143 | % | | | 11 | | | | 0.96 | % | | | 0.00 | %4 |
| | | 10.50 | | | | 16.96 | % | | | 0.96 | %6 | | | 0.13 | %6 | | | 106 | % | | | 12 | | | | 0.96 | %6 | | | 0.13 | %6 |
| | | | | | | | | | | | | | | | | | | | | | | | | | | | | | | | |
Class P | | $ | 8.99 | | | | 33.62 | %5 | | | 0.82 | %6 | | | 0.53 | %6 | | | 83 | %5 | | $ | 209 | | | | 1.21 | %6 | | | 0.14 | %6 |
| | | 7.00 | | | | 7.63 | % | | | 0.85 | % | | | 0.53 | % | | | 120 | % | | | 225 | | | | 0.85 | % | | | 0.53 | % |
| | | 6.61 | | | | (29.52 | )% | | | 0.80 | %6 | | | 0.53 | %6 | | | 156 | % | | | 82 | | | | 0.80 | %6 | | | 0.53 | %6 |
| | | | | | | | | | | | | | | | | | | | | | | | | | | | | | | | |
38
Financial Highlights
For a share outstanding throughout each fiscal period
| | | | | | | | | | | | | | | | | | | | | | | | | | | | | | | | |
| | | Fiscal year ended: | | | Net Asset Value
Beginning of
Period | | | Net Investment
Income (Loss) | | | Net Realized
and Unrealized
Gain (Loss) on
Investments | | | Total from
Investment
Operations | | | Distributions to
Shareholders from
Net Investment
Income | | | Distributions to
Shareholders from
Net Realized Gain on
Investments | | | Total
Distributions to
Shareholders | |
MANAGERS CADENCE MID-CAP FUND* | |
Class A | | | 5/31/2011 | ** | | $ | 18.23 | | | $ | (0.01 | )3 | | $ | 8.10 | 3 | | $ | 8.09 | | | ($ | 0.03 | ) | | | — | | | ($ | 0.03 | ) |
| | | 6/30/2010 | | | | 15.57 | | | | (0.03 | )3 | | | 2.69 | 3 | | | 2.66 | | | | — | | | | — | | | | — | |
| | | 6/30/2009 | | | | 25.56 | | | | (0.03 | )3 | | | (9.96 | )3 | | | (9.99 | ) | | | — | | | | — | | | | — | |
| | | 6/30/2008 | | | | 28.34 | | | | (0.07 | )3 | | | 0.36 | 3 | | | 0.29 | | | | — | | | ($ | 3.07 | ) | | | (3.07 | ) |
| | | 6/30/2007 | | | | 27.57 | | | | (0.01 | )3 | | | 3.65 | 3 | | | 3.64 | | | | — | | | | (2.87 | ) | | | (2.87 | ) |
| | | 6/30/2006 | | | | 24.47 | | | | (0.02 | )3 | | | 3.12 | 3 | | | 3.10 | | | | — | | | | — | | | | — | |
| | | | | | | | | | | | | | | | | | | | | | | | | | | | | | | | |
Class B | | | 5/31/2011 | ** | | $ | 16.16 | | | $ | (0.15 | )3 | | $ | 7.16 | 3 | | $ | 7.01 | | | | — | | | | — | | | | — | |
| | | 6/30/2010 | | | | 13.91 | | | | (0.15 | )3 | | | 2.40 | 3 | | | 2.25 | | | | — | | | | — | | | | — | |
| | | 6/30/2009 | | | | 23.00 | | | | (0.15 | )3 | | | (8.94 | )3 | | | (9.09 | ) | | | — | | | | — | | | | — | |
| | | 6/30/2008 | | | | 25.97 | | | | (0.25 | )3 | | | 0.35 | 3 | | | 0.10 | | | | — | | | ($ | 3.07 | ) | | ($ | 3.07 | ) |
| | | 6/30/2007 | | | | 25.68 | | | | (0.19 | )3 | | | 3.35 | 3 | | | 3.16 | | | | — | | | | (2.87 | ) | | | (2.87 | ) |
| | | 6/30/2006 | | | | 22.96 | | | | (0.20 | )3 | | | 2.92 | 3 | | | 2.72 | | | | — | | | | — | | | | — | |
| | | | | | | | | | | | | | | | | | | | | | | | | | | | | | | | |
Class C | | | 5/31/2011 | ** | | $ | 16.17 | | | $ | (0.14 | )3 | | $ | 7.16 | 3 | | $ | 7.02 | | | | — | | | | — | | | | — | |
| | | 6/30/2010 | | | | 13.91 | | | | (0.15 | )3 | | | 2.41 | 3 | | | 2.26 | | | | — | | | | — | | | | — | |
| | | 6/30/2009 | | | | 23.01 | | | | (0.15 | )3 | | | (8.95 | )3 | | | (9.10 | ) | | | — | | | | — | | | | — | |
| | | 6/30/2008 | | | | 25.99 | | | | (0.25 | )3 | | | 0.34 | 3 | | | 0.09 | | | | — | | | ($ | 3.07 | ) | | ($ | 3.07 | ) |
| | | 6/30/2007 | | | | 25.69 | | | | (0.20 | )3 | | | 3.37 | 3 | | | 3.17 | | | | — | | | | (2.87 | ) | | | (2.87 | ) |
| | | 6/30/2006 | | | | 22.97 | | | | (0.20 | )3 | | | 2.92 | 3 | | | 2.72 | | | | — | | | | — | | | | — | |
| | | | | | | | | | | | | | | | | | | | | | | | | | | | | | | | |
Class D | | | 5/31/2011 | ** | | $ | 18.36 | | | $ | (0.01 | )3 | | $ | 8.16 | 3 | | $ | 8.15 | | | ($ | 0.02 | ) | | | — | | | ($ | 0.02 | ) |
| | | 6/30/2010 | | | | 15.69 | | | | (0.03 | )3 | | | 2.70 | 3 | | | 2.67 | | | | — | | | | — | | | | — | |
| | | 6/30/2009 | | | | 25.75 | | | | (0.07 | )3 | | | (9.99 | )3 | | | (10.06 | ) | | | — | | | | — | | | | — | |
| | | 6/30/2008 | | | | 28.53 | | | | (0.10 | )3 | | | 0.39 | 3 | | | 0.29 | | | | — | | | ($ | 3.07 | ) | | | (3.07 | ) |
| | | 6/30/2007 | | | | 27.73 | | | | (0.01 | )3 | | | 3.68 | 3 | | | 3.67 | | | | — | | | | (2.87 | ) | | | (2.87 | ) |
| | | 6/30/2006 | | | | 24.61 | | | | (0.01 | )3 | | | 3.13 | 3 | | | 3.12 | | | | — | | | | — | | | | — | |
| | | | | | | | | | | | | | | | | | | | | | | | | | | | | | | | |
Institutional Class | | | 5/31/2011 | ** | | $ | 19.32 | | | $ | 0.08 | 3 | | $ | 8.58 | 3 | | $ | 8.66 | | | ($ | 0.10 | ) | | | — | | | ($ | 0.10 | ) |
| | | 6/30/2010 | | | | 16.44 | | | | 0.05 | 3 | | | 2.83 | 3 | | | 2.88 | | | | — | | | | — | | | | — | |
| | | 6/30/2009 | | | | 26.87 | | | | 0.04 | 3 | | | (10.47 | )3 | | | (10.43 | ) | | | — | | | | — | | | | — | |
| | | 6/30/2008 | | | | 29.54 | | | | 0.04 | 3 | | | 0.36 | 3 | | | 0.40 | | | | — | | | ($ | 3.07 | ) | | | (3.07 | ) |
| | | 6/30/2007 | | | | 28.50 | | | | 0.10 | 3 | | | 3.81 | 3 | | | 3.91 | | | | — | | | | (2.87 | ) | | | (2.87 | ) |
| | | 6/30/2006 | | | | 25.20 | | | | 0.10 | 3 | | | 3.20 | 3 | | | 3.30 | | | | — | | | | — | | | | — | |
| | | | | | | | | | | | | | | | | | | | | | | | | | | | | | | | |
Administrative Class | | | 5/31/2011 | ** | | $ | 18.61 | | | $ | 0.02 | 3 | | $ | 8.28 | 3 | | $ | 8.30 | | | ($ | 0.04 | ) | | | — | | | ($ | 0.04 | ) |
| | | 6/30/2010 | | | | 15.88 | | | | 0.00 | #3 | | | 2.73 | 3 | | | 2.73 | | | | — | | | | — | | | | — | |
| | | 6/30/2009 | | | | 26.02 | | | | (0.01 | )3 | | | (10.13 | )3 | | | (10.14 | ) | | | — | | | | — | | | | — | |
| | | 6/30/2008 | | | | 28.76 | | | | (0.03 | )3 | | | 0.36 | 3 | | | 0.33 | | | | — | | | ($ | 3.07 | ) | | | (3.07 | ) |
| | | 6/30/2007 | | | | 27.89 | | | | 0.03 | 3 | | | 3.71 | 3 | | | 3.74 | | | | — | | | | (2.87 | ) | | | (2.87 | ) |
| | | 6/30/2006 | | | | 24.71 | | | | 0.02 | 3 | | | 3.16 | 3 | | | 3.18 | | | | — | | | | — | | | | — | |
| | | | | | | | | | | | | | | | | | | | | | | | | | | | | | | | |
Class P | | | 5/31/2011 | ** | | $ | 19.28 | | | $ | 0.05 | 3 | | $ | 8.56 | 3 | | $ | 8.61 | | | ($ | 0.09 | ) | | | — | | | ($ | 0.09 | ) |
| | | 6/30/2010 | | | | 16.42 | | | | 0.03 | 3 | | | 2.83 | 3 | | | 2.86 | | | | — | | | | — | | | | — | |
| | | 6/30/2009 | † | | | 25.53 | | | | 0.02 | 3 | | | (9.13 | )3 | | | (9.11 | ) | | | — | | | | — | | | | — | |
| | | | | | | | | | | | | | | | | | | | | | | | | | | | | | | | |
Class R | | | 5/31/2011 | ** | | $ | 18.22 | | | $ | (0.06 | )3 | | $ | 8.09 | 3 | | $ | 8.03 | | | | — | | | | — | | | | — | |
| | | 6/30/2010 | | | | 15.61 | | | | (0.07 | )3 | | | 2.68 | 3 | | | 2.61 | | | | — | | | | — | | | | — | |
| | | 6/30/2009 | | | | 25.67 | | | | (0.07 | )3 | | | (9.99 | )3 | | | (10.06 | ) | | | — | | | | — | | | | — | |
| | | 6/30/2008 | | | | 28.52 | | | | (0.14 | )3 | | | 0.36 | 3 | | | 0.22 | | | | — | | | ($ | 3.07 | ) | | ($ | 3.07 | ) |
| | | 6/30/2007 | | | | 27.79 | | | | (0.08 | )3 | | | 3.68 | 3 | | | 3.60 | | | | — | | | | (2.87 | ) | | | (2.87 | ) |
| | | 6/30/2006 | | | | 24.73 | | | | (0.08 | )3 | | | 3.14 | 3 | | | 3.06 | | | | — | | | | — | | | | — | |
| | | | | | | | | | | | | | | | | | | | | | | | | | | | | | | | |
| * | At the start of business on September 27, 2010, the Allianz CCM Mid-Cap Fund, a series of the Allianz Funds, was re-organized into the Managers Cadence Mid-Cap Fund. |
| ** | For the period from July 1, 2010, to May 31, 2011. |
| † | Commencement of operations was July 7, 2008. # Rounds to less than $0.01 per share. |
| 1 | Total returns and net investment income would have been lower had certain expenses not been reduced. (See Note 1(c) of Notes to Financial Statements.) |
| 2 | Excludes the impact of expense reimbursements or fee waivers and expense reductions such as brokerage credits, but includes expense repayments and non-reimbursable expenses, if any, such as interest and taxes. (See Note 1 (c) of Notes to Financial Statements.) |
| 3 | Per share numbers have been calculated using average shares. |
39
| | | | | | | | | | | | | | | | | | | | | | | | | | | | | | | | |
| | | Net Asset Value
End of Period | | | Total Return1 | | | Ratio of Net
Expenses to
Average Net
Assets | | | Ratio of Net
Investment Income
(Loss) to Average
Net Assets | | | Portfolio
Turnover Rate | | | Net Assets End
of Period
(000’s omitted) | | | Ratio of Total
Expenses (Absent
Expense Offsets) to
Average Net Assets2 | | | Ratio of Net Investment
Income (loss)
(Absent Expense
Offsets) to Average
Net Assets2 | |
MANAGERS CADENCE MID-CAP FUND | |
Class A | | $ | 26.29 | | | | 44.38 | %6 | | | 1.10 | %7 | | | (0.05 | )%7 | | | 85 | %6 | | $ | 174,948 | | | | 1.18 | %7 | | | (0.13 | )%7 |
| | | 18.23 | | | | 17.08 | % | | | 1.11 | % | | | (0.14 | )% | | | 107 | % | | | 155,574 | | | | 1.11 | % | | | (0.14 | )% |
| | | 15.57 | 5 | | | (39.08 | )%5 | | | 1.11 | % | | | (0.20 | )% | | | 148 | % | | | 175,461 | | | | 1.11 | % | | | (0.20 | )% |
| | | 25.56 | | | | 0.31 | % | | | 1.09 | % | | | (0.28 | )% | | | 149 | % | | | 307,962 | | | | 1.09 | % | | | (0.28 | )% |
| | | 28.34 | | | | 14.52 | % | | | 1.09 | % | | | (0.05 | )% | | | 164 | % | | | 334,271 | | | | 1.09 | % | | | (0.05 | )% |
| | | 27.57 | 4 | | | 12.67 | %4 | | | 1.11 | % | | | (0.06 | )% | | | 174 | % | | | 353,019 | | | | 1.11 | % | | | (0.06 | )% |
| | | | | | | | | | | | | | | | | | | | | | | | | | | | | | | | |
Class B | | $ | 23.17 | | | | 43.38 | %6 | | | 1.85 | %7 | | | (0.81 | )%7 | | | 85 | %6 | | $ | 10,203 | | | | 1.93 | %7 | | | (0.89 | )%7 |
| | | 16.16 | | | | 16.18 | % | | | 1.86 | % | | | (0.90 | )% | | | 107 | % | | | 12,120 | | | | 1.86 | % | | | (0.90 | )% |
| | | 13.91 | 5 | | | (39.52 | )%5 | | | 1.86 | % | | | (0.98 | )% | | | 148 | % | | | 17,882 | | | | 1.86 | % | | | (0.98 | )% |
| | | 23.00 | | | | (0.44 | )% | | | 1.84 | % | | | (1.02 | )% | | | 149 | % | | | 47,947 | | | | 1.84 | % | | | (1.02 | )% |
| | | 25.99 | | | | 13.67 | % | | | 1.84 | % | | | (0.79 | )% | | | 164 | % | | | 64,763 | | | | 1.84 | % | | | (0.79 | )% |
| | | 25.68 | 4 | | | 11.85 | %4 | | | 1.86 | % | | | (0.81 | )% | | | 174 | % | | | 85,023 | | | | 1.86 | % | | | (0.81 | )% |
| | | | | | | | | | | | | | | | | | | | | | | | | | | | | | | | |
Class C | | $ | 23.19 | | | | 43.41 | %6 | | | 1.83 | %7 | | | (0.81 | )%7 | | | 85 | %6 | | $ | 27,311 | | | | 1.91 | %7 | | | (0.89 | )%7 |
| | | 16.17 | | | | 16.25 | % | | | 1.86 | % | | | (0.89 | )% | | | 107 | % | | | 39,374 | | | | 1.86 | % | | | (0.89 | )% |
| | | 13.91 | 5 | | | (39.55 | )%5 | | | 1.86 | % | | | (0.96 | )% | | | 148 | % | | | 41,542 | | | | 1.86 | % | | | (0.96 | )% |
| | | 23.01 | | | | (0.48 | )% | | | 1.84 | % | | | (1.02 | )% | | | 149 | % | | | 86,421 | | | | 1.84 | % | | | (1.02 | )% |
| | | 25.99 | | | | 13.71 | % | | | 1.84 | % | | | (0.80 | )% | | | 164 | % | | | 102,361 | | | | 1.84 | % | | | (0.80 | )% |
| | | 25.69 | 4 | | | 11.84 | %4 | | | 1.86 | % | | | (0.80 | )% | | | 174 | % | | | 122,217 | | | | 1.86 | % | | | (0.80 | )% |
| | | | | | | | | | | | | | | | | | | | | | | | | | | | | | | | |
Class D | | $ | 26.49 | | | | 44.40 | %6 | | | 1.10 | %7 | | | (0.07 | )%7 | | | 85 | %6 | | $ | 14,974 | | | | 1.18 | %7 | | | (0.15 | )%7 |
| | | 18.36 | | | | 17.02 | % | | | 1.11 | % | | | (0.16 | )% | | | 107 | % | | | 13,012 | | | | 1.86 | % | | | (0.91 | )% |
| | | 15.69 | 5 | | | (39.07 | )%5 | | | 1.11 | % | | | (0.34 | )% | | | 148 | % | | | 22,739 | | | | 1.86 | % | | | (1.09 | )% |
| | | 25.75 | | | | 0.31 | % | | | 1.09 | % | | | (0.38 | )% | | | 149 | % | | | 193,222 | | | | 1.84 | % | | | (1.13 | )% |
| | | 28.53 | | | | 14.55 | % | | | 1.09 | % | | | (0.05 | )% | | | 164 | % | | | 27,561 | | | | 1.84 | % | | | (0.80 | )% |
| | | 27.73 | 4 | | | 12.68 | %4 | | | 1.11 | % | | | (0.04 | )% | | | 174 | % | | | 30,758 | | | | 1.86 | % | | | (0.79 | )% |
| | | | | | | | | | | | | | | | | | | | | | | | | | | | | | | | |
Institutional Class | | $ | 27.88 | | | | 44.87 | %6 | | | 0.70 | %7 | | | 0.36 | %7 | | | 85 | %6 | | $ | 299,909 | | | | 0.78 | %7 | | | 0.28 | %7 |
| | | 19.32 | | | | 17.52 | % | | | 0.71 | % | | | 0.26 | % | | | 107 | % | | | 292,232 | | | | 0.74 | % | | | 0.23 | % |
| | | 16.44 | 5 | | | (38.82 | )%5 | | | 0.71 | % | | | 0.21 | % | | | 148 | % | | | 312,484 | | | | 0.71 | % | | | 0.21 | % |
| | | 26.87 | | | | 0.69 | % | | | 0.69 | % | | | 0.12 | % | | | 149 | % | | | 522,366 | | | | 0.69 | % | | | 0.12 | % |
| | | 29.54 | | | | 15.02 | % | | | 0.69 | % | | | 0.35 | % | | | 164 | % | | | 482,027 | | | | 0.69 | % | | | 0.35 | % |
| | | 28.50 | 4 | | | 13.10 | %4 | | | 0.71 | % | | | 0.35 | % | | | 174 | % | | | 470,705 | | | | 0.71 | % | | | 0.35 | % |
| | | | | | | | | | | | | | | | | | | | | | | | | | | | | | | | |
Administrative Class | | $ | 26.87 | | | | 44.60 | %6 | | | 0.94 | %7 | | | 0.11 | %7 | | | 85 | %6 | | $ | 129,964 | | | | 1.02 | %7 | | | 0.03 | %7 |
| | | 18.61 | | | | 17.19 | % | | | 0.96 | % | | | 0.01 | % | | | 107 | % | | | 130,157 | | | | 0.99 | % | | | (0.02 | )% |
| | | 15.88 | 5 | | | (38.97 | )%5 | | | 0.96 | % | | | (0.04 | )% | | | 148 | % | | | 129,640 | | | | 0.96 | % | | | (0.04 | )% |
| | | 26.02 | | | | 0.45 | % | | | 0.94 | % | | | (0.11 | )% | | | 149 | % | | | 214,673 | | | | 0.94 | % | | | (0.11 | )% |
| | | 28.76 | | | | 14.73 | % | | | 0.94 | % | | | 0.11 | % | | | 164 | % | | | 278,073 | | | | 0.94 | % | | | 0.11 | % |
| | | 27.89 | 4 | | | 12.87 | %4 | | | 0.96 | % | | | 0.09 | % | | | 174 | % | | | 304,305 | | | | 0.96 | % | | | 0.09 | % |
| | | | | | | | | | | | | | | | | | | | | | | | | | | | | | | | |
Class P | | $ | 27.80 | | | | 44.71 | %6 | | | 0.81 | %7 | | | 0.24 | %7 | | | 85 | %6 | | $ | 2,967 | | | | 0.89 | %7 | | | 0.16 | %7 |
| | | 19.28 | | | | 17.42 | % | | | 0.84 | % | | | 0.14 | % | | | 107 | % | | | 3,334 | | | | 0.84 | % | | | 0.14 | % |
| | | 16.42 | 5 | | | (35.68 | )%5 | | | 0.80 | %7 | | | 0.12 | %7 | | | 148 | % | | | 3,099 | | | | 0.80 | %7 | | | 0.12 | %7 |
| | | | | | | | | | | | | | | | | | | | | | | | | | | | | | | | |
Class R | | $ | 26.25 | | | | 44.07 | %6 | | | 1.35 | %7 | | | (0.31 | )%7 | | | 85 | %6 | | $ | 21,248 | | | | 1.43 | %7 | | | (0.39 | )%7 |
| | | 18.22 | | | | 16.72 | % | | | 1.36 | % | | | (0.39 | )% | | | 107 | % | | | 22,485 | | | | 1.36 | % | | | (0.39 | )% |
| | | 15.61 | 5 | | | (39.19 | )%5 | | | 1.36 | % | | | (0.43 | )% | | | 148 | % | | | 32,069 | | | | 1.36 | % | | | (0.43 | )% |
| | | 25.67 | | | | 0.04 | % | | | 1.34 | % | | | (0.52 | )% | | | 149 | % | | | 48,771 | | | | 1.34 | % | | | (0.52 | )% |
| | | 28.52 | | | | 14.25 | % | | | 1.34 | % | | | (0.31 | )% | | | 164 | % | | | 47,308 | | | | 1.34 | % | | | (0.31 | )% |
| | | 27.79 | 4 | | | 12.37 | %4 | | | 1.36 | % | | | (0.31 | )% | | | 174 | % | | | 40,579 | | | | 1.36 | % | | | (0.31 | )% |
| | | | | | | | | | | | | | | | | | | | | | | | | | | | | | | | |
| 4 | Payments from Affiliates increased the end of period net asset value and the total return. If the Affiliates had not made these payments, the end of period net asset value and total return would have been reduced by $0.02 per share and 0.06% to 0.07%, respectively. |
| 5 | Capital contribution from Affiliate increased the end of year net asset value and the total return. If the Affiliate had not made these payments, end of year net asset value and total return would have been reduced for Class A, Class B, Class C, Class D, Institutional Class, Administrative Class, Class P, and Class R, by $0.21 per share and 0.83%, $0.19 per share and 0.83%, $0.19 per share and 0.82%, $0.24 per share and 0.93%, $0.22 per share and 0.82%, $0.21 per share and 0.81%, $0.20 per share and 0.79%, and $0.21 per share and 0.82%, respectively. |
| 6 | Reflects the 11 month period from July 1, 2010 to May 31, 2011. |
40
Financial Highlights
For a share outstanding throughout each fiscal period
| | | | | | | | | | | | | | | | | | | | | | | | |
| | | Fiscal year ended: | | | Net Asset Value
Beginning of
Period | | | Net Investment
Income (Loss) | | | Net Realized
and Unrealized
Gain (Loss) on
Investments | | | Total from
Investment
Operations | | | Distributions to
Shareholders from
Net Realized Gain
on Investments | |
MANAGERS CADENCE EMERGING COMPANIES FUND* | |
Institutional Class | | | 5/31/2011 | ** | | $ | 14.62 | | | ($ | 0.04 | )3 | | $ | 8.77 | 3 | | $ | 8.73 | | | | — | |
| | | 6/30/2010 | | | | 12.44 | | | | (0.11 | )3 | | | 2.29 | 3 | | | 2.18 | | | | — | |
| | | 6/30/2009 | | | | 17.28 | | | | (0.08 | )3 | | | (4.76 | )3 | | | (4.84 | ) | | | — | |
| | | 6/30/2008 | | | | 23.21 | | | | (0.14 | )3 | | | (3.04 | )3 | | | (3.18 | ) | | ($ | 2.75 | ) |
| | | 6/30/2007 | | | | 24.55 | | | | (0.11 | )3 | | | 1.14 | 3 | | | 1.03 | | | | (2.37 | ) |
| | | 6/30/2006 | | | | 23.27 | | | | (0.20 | )3 | | | 3.40 | 3 | | | 3.20 | | | | (1.92 | ) |
| | | | | | | | | | | | | | | | | | | | | | | | |
Administrative Class | | | 5/31/2011 | ** | | $ | 13.73 | | | ($ | 0.12 | )3 | | $ | 8.27 | 3 | | $ | 8.15 | | | | — | |
| | | 6/30/2010 | | | | 11.72 | | | | (0.12 | )3 | | | 2.13 | 3 | | | 2.01 | | | | — | |
| | | 6/30/2009 | | | | 16.32 | | | | (0.11 | )3 | | | (4.49 | )3 | | | (4.60 | ) | | | — | |
| | | 6/30/2008 | | | | 22.12 | | | | (0.19 | )3 | | | (2.86 | )3 | | | (3.05 | ) | | ($ | 2.75 | ) |
| | | 6/30/2007 | | | | 23.57 | | | | (0.16 | )3 | | | 1.08 | 3 | | | 0.92 | | | | (2.37 | ) |
| | | 6/30/2006 | | | | 22.46 | | | | (0.25 | )3 | | | 3.28 | 3 | | | 3.03 | | | | (1.92 | ) |
| | | | | | | | | | | | | | | | | | | | | | | | |
| * | At the start of business on September 27, 2010, the Allianz CCM Emerging Companies Fund, a series of the Allianz Funds, was re-organized into the Managers Cadence Emerging Companies Fund. |
| ** | For the period from July 1, 2010, to May 31, 2011. |
| # | Rounds to less than $0.01 per share. |
| 1 | Total Returns and net investment income would have been lower had certain expenses not been reduced. (See Note 1(c) of Notes to Financial Statements.) |
| 2 | Excludes the impact of expense reimbursements or fee waivers and expense reductions such as brokerage credits, but includes expense repayments and non-reimbursable expenses, if any, such as interest and taxes. (See Note 1 (c) of Notes to Financial Statements.) |
| 3 | Per share numbers have been calculated using average shares. |
| 4 | Reflects the 11 month period from July 1, 2010 to May 31, 2011. |
41
| | | | | | | | | | | | | | | | | | | | | | | | | | | | | | | | |
| | | Net Asset Value
End of Period | | | Total Return1 | | | Ratio of Net
Expenses to
Average Net
Assets | | | Ratio of Net
Investment Income
(Loss) to Average
Net Assets | | | Portfolio
Turnover Rate | | | Net Assets End
of Period
(000’s omitted) | | | Ratio of Total
Expenses (Absent
Expense Offsets) to
Average Net Assets2 | | | Ratio of Net Investment
Income (loss) (Absent
Expense Offsets) to
Average Net Assets2 | |
MANAGERS CADENCE EMERGING COMPANIES FUND | |
Institutional
Class | | $ | 23.35 | | | | 59.71 | %4 | | | 1.41 | %5 | | | (0.24 | )%5 | | | 93 | %4 | | $ | 65,222 | | | | 1.67 | %5 | | | (0.50 | )%5 |
| | | 14.62 | | | | 17.52 | % | | | 1.42 | % | | | (0.73 | )% | | | 129 | % | | | 55,166 | | | | 1.55 | % | | | (0.86 | )% |
| | | 12.44 | | | | (28.01 | )% | | | 1.42 | % | | | (0.65 | )% | | | 142 | % | | | 67,382 | | | | 1.42 | % | | | (0.65 | )% |
| | | 17.28 | | | | (15.22 | )% | | | 1.50 | % | | | (0.69 | )% | | | 140 | % | | | 206,444 | | | | 1.50 | % | | | (0.69 | )% |
| | | 23.21 | | | | 4.71 | % | | | 1.51 | % | | | (0.49 | )% | | | 188 | % | | | 420,835 | | | | 1.51 | % | | | (0.49 | )% |
| | | 24.55 | | | | 14.08 | % | | | 1.52 | % | | | (0.81 | )% | | | 155 | % | | | 597,208 | | | | 1.52 | % | | | (0.81 | )% |
| | | | | | | | | | | | | | | | | | | | | | | | | | | | | | | | |
Administrative
Class | | $ | 21.88 | | | | 59.36 | %4 | | | 1.66 | %5 | | | (0.71 | )%5 | | | 93 | %4 | | $ | 4,706 | | | | 1.92 | %5 | | | (0.97 | )%5 |
| | | 13.73 | | | | 17.15 | % | | | 1.67 | % | | | (0.90 | )% | | | 129 | % | | | 1,830 | | | | 1.80 | % | | | (1.03 | )% |
| | | 11.72 | | | | (28.19 | )% | | | 1.67 | % | | | (0.91 | )% | | | 142 | % | | | 13,866 | | | | 1.67 | % | | | (0.91 | )% |
| | | 16.32 | | | | (15.43 | )% | | | 1.75 | % | | | (0.95 | )% | | | 140 | % | | | 23,812 | | | | 1.75 | % | | | (0.95 | )% |
| | | 22.12 | | | | 4.47 | % | | | 1.76 | % | | | (0.74 | )% | | | 188 | % | | | 54,701 | | | | 1.76 | % | | | (0.74 | )% |
| | | 23.57 | | | | 13.82 | % | | | 1.77 | % | | | (1.06 | )% | | | 155 | % | | | 62,776 | | | | 1.77 | % | | | (1.06 | )% |
| | | | | | | | | | | | | | | | | | | | | | | | | | | | | | | | |
42
Notes to Financial Statements
May 31, 2011
1. Summary of Significant Accounting Policies
The Managers Funds (the “Trust”) is an open-end management investment company organized as a Massachusetts business trust, and registered under the Investment Company Act of 1940, as amended (the “1940 Act”). Currently, the Trust is comprised of a number of different funds, each having distinct investment management objectives, strategies, risks, and policies. Included in this report are: Managers Cadence Capital Appreciation Fund (“Capital Appreciation”) (formerly Allianz CCM Capital Appreciation Fund), Managers Cadence Focused Growth Fund (“Focused Growth”) (formerly Allianz CCM Focused Growth Fund), Managers Cadence Mid-Cap Fund (“Mid-Cap”) (formerly Allianz CCM Mid-Cap Fund), and Managers Cadence Emerging Companies Fund (“Emerging Companies”) ( formerly Allianz CCM Emerging Companies Fund), each a “Fund” and collectively the “Funds.”
At the start of business on September 27, 2010, the Allianz CCM Capital Appreciation Fund, Allianz CCM Focused Growth Fund, Allianz CCM Mid-Cap Fund, and the Allianz CCM Emerging Companies Fund, each a series of the Allianz Funds (the “Predecessor Funds”), were reorganized into a respective series of the Trust, as described above.
Capital Appreciation and Mid-Cap offer Class A shares, Class B shares, Class C shares, Class D shares, Class P shares, Class R shares, Institutional Class shares and Administrative Class shares. Focused Growth offers Class A shares, Class C shares, Class D shares, Class P shares, Institutional Class shares and Administrative Class shares. Emerging Companies offers Institutional Class shares and Administrative Class Shares. Sales of Class A shares may be subject to a front-end sales charge of up to 5.75%. Redemptions of Class B shares, Class C shares and certain Class A shares may be subject to a contingent-deferred sales charge (as a percentage of the original offering price or the net asset value at the time of sale, whichever is less). Each class represents an interest in the same assets of the Fund and the classes are identical except for class specific expenses related to shareholder activity. Each class has equal voting privileges except that each class has exclusive voting rights with respect to its services and/or distribution plan. Please refer to a current prospectus for additional information on each share class.
The Funds’ financial statements are prepared in accordance with accounting principles generally accepted in the United States of America (“U.S. GAAP”), which require management to make estimates and assumptions that affect the reported amounts of assets and liabilities and disclosure of contingent assets and liabilities at the date of the financial statements and the reported amounts of income and expenses during the reporting period. Actual results could differ from those estimates and such differences could be material. The following is a summary of significant accounting policies followed by the Funds in the preparation of their financial statements:
a. Valuation of Investments
Equity securities traded on a domestic or international securities exchange are valued at the last quoted sale price, or, lacking any sales, at the last quoted bid price. Over-the-counter securities are valued at the Nasdaq Official Closing Price, if one is available. Lacking any sales, over-the-counter securities are valued at the last quoted bid price. The Funds’ investments are generally valued based on market quotations provided by third-party pricing services approved by the Board of Trustees of the Funds (the “Board”). Under certain circumstances, the value of certain Fund investments may be based on an evaluation of fair value, pursuant to procedures established by and under the general supervision of the Board. Each Fund may use the fair value of a portfolio security to calculate its net asset value (“NAV”) when, for example, (1) market quotations are not readily available because a portfolio security is not traded in a public market or the principal market in which the security trades is closed, (2) trading in a portfolio security is suspended and has not resumed before the Fund calculates its NAV, (3) a significant event affecting the value of a portfolio security is determined to have occurred between the time of the market quotation provided for a portfolio security and the time as of which the Fund calculates its NAV, (4) a security’s price has remained unchanged over a period of time (often referred to as a “stale price”), or (5) Managers Investment Group LLC (the “Investment Manager”) determines that a market quotation is inaccurate. Portfolio investments that trade primarily on foreign markets are priced based upon the market quotation of such securities as of the close of their respective principal markets, as adjusted to reflect the Investment Manager’s determination of the impact of events occurring subsequent to the close of such markets but prior to the time as of which the Fund calculates its NAV. In accordance with procedures approved by the Board, the Investment Manager relies upon recommendations of a third-party fair valuation service in adjusting the prices of such foreign portfolio investments. The Funds may invest in securities that may be thinly traded. The Board has adopted procedures to adjust prices when thinly traded securities are judged to be stale so that they reflect fair value. An investment valued on the basis of its fair value may be valued at a price higher or lower than available market quotations. An investment’s valuation may differ depending on the method used and the factors considered in determining value according to the Fund’s fair value procedures.
Short-term investments having a remaining maturity of 60 days or less are valued at amortized cost, which approximates market value. Investments in other open-end regulated investment companies are valued at their end of day net asset value per share. Securities (including derivatives) for which market quotations are not readily available are fair valued, as determined in good faith, and pursuant to procedures adopted by the Board. The values assigned to fair value investments are based on available information and do not necessarily represent amounts that might ultimately be realized, since such amounts depend on future developments inherent in long-term investments. Further, because of the inherent uncertainty of valuation, those estimated values may differ significantly from the values that would have been used had a ready market for the investments existed, and the differences could be material.
U.S. GAAP defines fair value as the price that a Fund would receive to sell an asset or pay to transfer a liability in an orderly transaction between market participants at the measurement date. U.S. GAAP also establishes a framework for measuring fair value, and a three-level hierarchy for fair value measurements based upon the transparency of inputs to the valuation of an asset or liability.
43
Notes to Financial Statements (continued)
Inputs may be observable or unobservable and refer broadly to the assumptions that market participants would use in pricing the asset or liability. Observable inputs reflect the assumptions market participants would use in pricing the asset or liability based on market data obtained from sources independent of the Funds. Unobservable inputs reflect the Funds’ own assumptions about the assumptions that market participants would use in pricing the asset or liability developed based on the best information available in the circumstances. Each investment is assigned a level based upon the observability of the inputs which are significant to the overall valuation.
The three-tier hierarchy of inputs is summarized below:
Level 1 – inputs are quoted prices in active markets for identical investments (e.g., equity securities, open-end investment companies)
Level 2 – other observable inputs (including, but not limited to: quoted prices for similar assets or liabilities in markets that are active, quoted prices for identical or similar assets or liabilities in markets that are not active, inputs other than quoted prices that are observable for the assets or liabilities (such as interest rates, yield curves, volatilities, prepayment speeds, loss severities, credit risks and default rates) or other market corroborated inputs) (e.g., foreign securities utilizing international fair value pricing, broker-quoted securities, fair valued securities with observable inputs)
Level 3 – Significant unobservable inputs (including the Funds’ own assumptions in determining the fair value of investments) (e.g., fair valued securities with unobservable inputs) The inputs or methodologies used for valuing investments are not necessarily an indication of the risk associated with investing in those investments.
b. Security Transactions
Security transactions are accounted for as of trade date. Realized gains and losses on securities sold are determined on the basis of identified cost.
c. Investment Income and Expenses
Dividend income is recorded on the ex-dividend date, except certain dividends from foreign securities where the ex-dividend date may have passed. These dividends are recorded as soon as the Trust is informed of the ex-dividend date. Dividend income on foreign securities is recorded net of any withholding tax. Non-cash dividends included in dividend income, if any, are reported at the fair market value of the securities received. Other income and expenses are recorded on an accrual basis. Expenses that cannot be directly attributed to a Fund are apportioned among the Funds in the Trust and in some cases other affiliated funds based upon their relative average net assets or number of shareholders. Investment income, realized and unrealized capital gains and losses, the common expenses of each Fund, and certain Fund level expense reductions, if any, are allocated on a pro rata basis to each class based on the relative net assets of each class to the total net assets of each Fund.
The following Funds had certain portfolio trades directed to various brokers, under a brokerage recapture program, which paid a portion of the Fund’s expenses. For the period from September 27, 2010, to May 31, 2011, under these arrangements the amount by which the Funds’ expenses were reduced and the impact on the expense ratios were as follows: Capital Appreciation – $25,055 or 0.003%, Focused Growth – $1,586 or 0.008%, Mid-Cap – $80,365 or 0.012%, and Emerging Companies – $4,368 or 0.006%. Prior to September 27, 2010, the Funds did not participate in a brokerage recapture program.
The Funds have a “balance credit” arrangement with The Bank of New York Mellon (“BNYM”), the Funds’ custodian, whereby each Fund is credited with an interest factor equal to 0.75% below the effective 90-day T-Bill rate for account balances left uninvested overnight. If the T-Bill rate falls below 0.75%, no credits will be earned. These credits serve to reduce custody expenses that would otherwise be charged to each Fund. For the period from September 27, 2010, to May 31, 2011, the custodian expense was not reduced. Prior to September 27, 2010, the Predecessor Funds had no balance credit arrangement with the predecessor custodian, State Street Bank & Trust Co.
Overdrafts will cause a reduction of any earnings credits, computed at 2% above the effective Federal funds rate on the day of the overdraft. For the period September 27, 2010, through May 31, 2011, the overdraft fees were as follows: Focused Growth – $5, Mid-Cap – $4, and Emerging Companies – $13. Prior to September 27, 2010, the Predecessor Funds had a similar agreement with State Street Bank & Trust Co., and the overdraft fees for the period from July 1, 2010, to September 27, 2010, were as follows: Capital Appreciation – $66; Focused Growth – $1,658, and Emerging Companies Fund – $271.
The Trust also has a balance credit arrangement with its Transfer Agent, BNY Mellon Investment Servicing (US) Inc., whereby earnings credits are used to offset banking charges and other out-of-pocket expenses. For the period from September 27, 2010, through May 31, 2011, the transfer agent expense was reduced as follows: Capital Appreciation – $439; Focused Growth – $43; Mid-Cap – $355 and Emerging Companies – $32. Prior to September 27, 2010, the Predecessor Funds had no balance credit arrangement with the predecessor Transfer Agent, Boston Financial Data Services-Midwest, Inc.
Total returns and net investment income for the Funds would have been lower had certain expenses not been offset. Total expenses before offsets exclude the impact of expense reimbursements or fee waivers and expense reductions such as brokerage recapture credits but include non-reimbursable expenses, if any, such as interest and taxes.
d. Dividends and Distributions
Dividends resulting from net investment income and distributions of capital gains, if any, will be declared and made annually in December and when required for Federal excise tax purposes. Distributions are recorded on the ex-dividend date and are declared separately for each class. Income and capital gain distributions are determined in accordance with Federal income tax regulations, which may differ from U.S. GAAP. These differences are primarily due to differing treatments for losses deferred due to wash sales, REITS, equalization accounting for tax purposes, and market discount transactions. Permanent book and tax basis differences, if any, relating to shareholder distributions will result in reclassifications to paid-in capital.
44
Notes to Financial Statements (continued)
The tax character of distributions paid during the 11 months ended May 31, 2011, and the fiscal year ended June 30, 2010 were as follows:
| | | | | | | | | | | | | | | | | | | | | | | | | | | | | | |
| | | Capital Appreciation | | | Focused Growth | | | Mid-Cap | | Emerging Companies | |
| | | 2011 | | | 2010 | | | 2011 | | | 2010 | | | 2011 | | | 2010 | | 2011 | | | 2010 | |
| | | | | | | | | | | | | | | | | | | | | | | | | | | | | | |
Distributions paid from: | | | | | | | | | | | | | | | | | | | | | | | | | | | | | | |
Ordinary income | | $ | 4,338,688 | | | $ | 4,350,499 | | | $ | 199,993 | | | $ | 565,882 | | | $ | 1,717,080 | | | — | | | — | | | | — | |
Short-term capital gains | | | — | | | | — | | | | 774,983 | | | | — | | | | — | | | — | | | — | | | | — | |
Long-term capital gains | | | — | | | | — | | | | — | | | | — | | | | — | | | — | | | — | | | | — | |
| | | | | | | | | | | | | | | | | | | | | | | | | | | | | | |
Totals | | $ | 4,338,688 | | | $ | 4,350,499 | | | $ | 974,976 | | | $ | 565,882 | | | $ | 1,717,080 | | | — | | | — | | | | — | |
| | | | | | | | | | | | | | | | | | | | | | | | | | | | | | |
As of May 31, 2011, the components of distributable earnings (excluding appreciation/depreciation) on a tax basis consisted of:
| | | | | | | | | | | | | | | | |
| | | Capital
Appreciation | | | Focused
Growth | | | Mid-Cap | | | Emerging
Companies | |
Capital loss carryforward | | $ | 260,602,996 | | | $ | 11,940,744 | | | $ | 180,224,078 | | | $ | 49,117,561 | |
Undistributed ordinary income | | | 403,088 | | | | 69,630 | | | | — | | | | — | |
Undistributed short-term capital gains | | | — | | | | — | | | | — | | | | — | |
Undistributed long-term capital gains | | | — | | | | 917,771 | | | | — | | | | — | |
e. Federal Taxes
Each Fund intends to comply with the requirements under Subchapter M of the Internal Revenue Code of 1986, as amended, to distribute substantially all of their taxable income and gains to their shareholders and to meet certain diversification cation and income requirements with respect to investment companies. Therefore, no provision for Federal income or excise tax is included in the accompanying financial statements.
Additionally, based on each Fund’s understanding of the tax rules and rates related to income, gains and transactions for the foreign jurisdictions in which it invests, each Fund will provide for foreign taxes, and where appropriate, deferred foreign taxes.
Management has analyzed the Funds’ tax positions taken on federal income tax returns for all open tax years (tax years ended June 30, 2008-2010 and May 31, 2011), and has concluded that no provision for federal income tax is required in the Funds’ financial statements. Additionally, the Funds are not aware of any tax position for which it is reasonably possible that the total amounts of unrecognized tax benefits will change materially in the next twelve months.
f. Capital Loss Carryovers
As of May 31, 2011, the following Funds had accumulated net realized capital loss carryovers from securities transactions for Federal income tax purposes as shown in the following chart. These amounts may be used to offset realized capital gains, if any, through the expiration dates listed.
| | | | | | |
| | | Capital Loss
Carryover Amount | | | Expires June 30, |
Capital Appreciation | | $ | 66,720,364 | | | 2017 |
| | | 193,882,632 | | | 2018 |
| | | | | | |
Total | | $ | 260,602,996 | | | |
| | | | | | |
Focused Growth | | $ | 11,940,744 | * | | 2017 |
| | | | | | |
Mid-Cap | | $ | 13,095,649 | | | 2017 |
| | | 167,128,429 | | | 2018 |
| | | | | | |
Total | | $ | 180,224,078 | | | |
| | | | | | |
Emerging Companies | | $ | 29,205,574 | | | 2017 |
| | | 19,911,987 | | | 2018 |
| | | | | | |
Total | | $ | 49,117,561 | | | |
| | | | | | |
| * | The Fund’s ability to utilize capital loss carryforward in the future may be limited under the Internal Revenue Code and related regulations based on results of share ownership activity. |
For the 11 months ended May 31, 2011, the following Funds utilized capital loss carryovers: Capital Appreciation – $96,910,341, Focused Growth – $1,824,280, Mid-Cap – $140,469,415, and Emerging Companies – $14,261,286.
g. Capital Stock
The Trust’s Declaration of Trust authorizes for each series the issuance of an unlimited number of shares of beneficial interest, without par value. Each Fund records sales and repurchases of
45
Notes to Financial Statements (continued)
its capital stock on the trade date. The cost of securities contributed to the Funds in connection with the issuance of shares is based on the valuation of those securities in accordance with the Funds’ policy on investment valuation. Dividends and distributions to shareholders are recorded on the ex-dividend date. For the 11 months ended May 31, 2011, and the fiscal year ended June 30, 2010, the capital stock transactions by class for the Funds were:
| | | | | | | | | | | | | | | | |
| | | Capital Appreciation | |
| | | 2011 | | | 2010 | |
| | | Shares | | | Amount | | | Shares | | | Amount | |
Class A | | | | | | | | | | | | | | | | |
Proceeds from sale of shares | | | 1,629,758 | | | $ | 25,636,167 | | | | 1,986,588 | | | $ | 27,914,472 | |
Reinvestment of dividends and distributions | | | 23,868 | | | | 395,006 | | | | 15,682 | | | | 220,333 | |
Cost of shares repurchased | | | (3,468,732 | ) | | | (54,761,509 | ) | | | (7,104,496 | ) | | | (98,336,298 | ) |
| | | | | | | | | | | | | | | | |
Net Decrease – Class A | | | (1,815,106 | ) | | ($ | 28,730,336 | ) | | | (5,102,226 | ) | | ($ | 70,201,493 | ) |
| | | | | | | | | | | | | | | | |
Class B | | | | | | | | | | | | | | | | |
Proceeds from sale of shares | | | 2,481 | | | $ | 33,159 | | | | 31,602 | | | $ | 393,345 | |
Reinvestment of dividends and distributions | | | — | | | | — | | | | 2 | | | | 19 | |
Cost of shares repurchased | | | (400,011 | ) | | | (5,509,583 | ) | | | (637,536 | ) | | | (8,072,346 | ) |
| | | | | | | | | | | | | | | | |
Net Decrease – Class B | | | (397,530 | ) | | ($ | 5,476,424 | ) | | | (605,932 | ) | | ($ | 7,678,982 | ) |
| | | | | | | | | | | | | | | | |
Class C | | | | | | | | | | | | | | | | |
Proceeds from sale of shares | | | 294,326 | | | $ | 4,041,911 | | | | 268,277 | | | $ | 3,389,017 | |
Reinvestment of dividends and distributions | | | — | | | | — | | | | 3 | | | | 36 | |
Cost of shares repurchased | | | (2,108,219 | ) | | | (29,676,598 | ) | | | (1,325,555 | ) | | | (16,672,233 | ) |
| | | | | | | | | | | | | | | | |
Net Decrease – Class C | | | (1,813,893 | ) | | ($ | 25,634,687 | ) | | | (1,057,275 | ) | | ($ | 13,283,180 | ) |
| | | | | | | | | | | | | | | | |
Class D | | | | | | | | | | | | | | | | |
Proceeds from sale of shares | | | 7,941,642 | | | $ | 126,503,208 | | | | 14,163,055 | | | $ | 193,449,222 | |
Reinvestment of dividends and distributions | | | 82,784 | | | | 1,351,046 | | | | 80,010 | | | | 1,109,734 | |
Cost of shares repurchased | | | (2,719,247 | ) | | | (43,377,723 | ) | | | (6,289,592 | ) | | | (90,202,761 | ) |
| | | | | | | | | | | | | | | | |
Net Increase – Class D | | | 5,305,179 | | | $ | 84,476,531 | | | | 7,953,473 | | | $ | 104,356,195 | |
| | | | | | | | | | | | | | | | |
Institutional Class | | | | | | | | | | | | | | | | |
Proceeds from sale of shares | | | 1,235,615 | | | $ | 20,966,114 | | | | 3,409,728 | | | $ | 50,047,627 | |
Reinvestment of dividends and distributions | | | 79,220 | | | | 1,358,626 | | | | 110,323 | | | | 1,605,193 | |
Cost of shares repurchased | | | (5,037,941 | ) | | | (84,892,884 | ) | | | (12,351,646 | ) | | | (184,461,259 | ) |
| | | | | | | | | | | | | | | | |
Net Decrease – Institutional Class | | | (3,723,106 | ) | | ($ | 62,568,144 | ) | | | (8,831,595 | ) | | ($ | 132,808,439 | ) |
| | | | | | | | | | | | | | | | |
Administrative Class | | | | | | | | | | | | | | | | |
Proceeds from sale of shares | | | 1,238,592 | | | $ | 19,876,662 | | | | 1,951,507 | | | $ | 27,407,534 | |
Reinvestment of dividends and distributions | | | 62,925 | | | | 1,046,443 | | | | 75,644 | | | | 1,067,334 | |
Cost of shares repurchased | | | (8,108,256 | ) | | | (137,394,391 | ) | | | (7,628,411 | ) | | | (103,861,980 | ) |
| | | | | | | | | | | | | | | | |
Net Decrease – Administrative Class | | | (6,806,739 | ) | | ($ | 116,471,286 | ) | | | (5,601,260 | ) | | ($ | 75,387,112 | ) |
| | | | | | | | | | | | | | | | |
Class P | | | | | | | | | | | | | | | | |
Proceeds from sale of shares | | | 47,881 | | | $ | 794,152 | | | | 411,323 | | | $ | 5,666,328 | |
Reinvestment of dividends and distributions | | | 473 | | | | 8,079 | | | | 680 | | | | 9,866 | |
Cost of shares repurchased | | | (407,619 | ) | | | (6,379,149 | ) | | | (244,715 | ) | | | (3,540,289 | ) |
| | | | | | | | | | | | | | | | |
Net Increase (Decrease) – Class P | | | (359,265 | ) | | ($ | 5,576,918 | ) | | | 167,288 | | | $ | 2,135,905 | |
| | | | | | | | | | | | | | | | |
Class R | | | | | | | | | | | | | | | | |
Proceeds from sale of shares | | | 40,671 | | | $ | 648,276 | | | | 102,777 | | | $ | 1,413,829 | |
Reinvestment of dividends and distributions | | | — | | | | — | | | | 1 | | | | 6 | |
Cost of shares repurchased | | | (131,079 | ) | | | (2,017,230 | ) | | | (675,753 | ) | | | (9,294,919 | ) |
| | | | | | | | | | | | | | | | |
Net Decrease – Class R | | | (90,408 | ) | | ($ | 1,368,954 | ) | | | (572,975 | ) | | ($ | 7,881,084 | ) |
| | | | | | | | | | | | | | | | |
46
Notes to Financial Statements (continued)
| | | | | | | | | | | | | | | | |
| | | Focused Growth | |
| | | 2011 | | | 2010 | |
| | | Shares | | | Amount | | | Shares | | | Amount | |
Class A | | | | | | | | | | | | | | | | |
Proceeds from sale of shares | | | 70,918 | | | $ | 599,209 | | | | 48,014 | | | $ | 364,167 | |
Reinvestment of dividends and distributions | | | 15,324 | | | | 128,417 | | | | 6,352 | | | | 48,149 | |
Cost of shares repurchased | | | (185,966 | ) | | | (1,512,597 | ) | | | (267,369 | ) | | | (2,004,002 | ) |
| | | | | | | | | | | | | | | | |
Net Decrease – Class A | | | (99,724 | ) | | ($ | 784,971 | ) | | | (213,003 | ) | | ($ | 1,591,686 | ) |
| | | | | | | | | | | | | | | | |
Class C | | | | | | | | | | | | | | | | |
Proceeds from sale of shares | | | 5,744 | | | $ | 45,352 | | | | 27,425 | | | $ | 200,215 | |
Reinvestment of dividends and distributions | | | 5,290 | | | | 43,643 | | | | 726 | | | | 5,426 | |
Cost of shares repurchased | | | (58,752 | ) | | | (474,633 | ) | | | (153,859 | ) | | | (1,115,314 | ) |
| | | | | | | | | | | | | | | | |
Net Decrease – Class C | | | (47,718 | ) | | ($ | 385,638 | ) | | | (125,708 | ) | | ($ | 909,673 | ) |
| | | | | | | | | | | | | | | | |
Class D | | | | | | | | | | | | | | | | |
Proceeds from sale of shares | | | 24,677 | | | $ | 204,296 | | | | 28,600 | | | $ | 213,939 | |
Reinvestment of dividends and distributions | | | 7,996 | | | | 66,924 | | | | 2,583 | | | | 19,581 | |
Cost of shares repurchased | | | (8,822 | ) | | | (75,639 | ) | | | (26,978 | ) | | | (209,485 | ) |
| | | | | | | | | | | | | | | | |
Net Increase – Class D | | | 23,851 | | | $ | 195,581 | | | | 4,205 | | | $ | 24,035 | |
| | | | | | | | | | | | | | | | |
Institutional Class | | | | | | | | | | | | | | | | |
Proceeds from sale of shares | | | 38,101 | | | $ | 325,537 | | | | 768,979 | | | $ | 5,850,102 | |
Reinvestment of dividends and distributions | | | 77,582 | | | | 657,117 | | | | 63,330 | | | | 485,111 | |
Cost of shares repurchased | | | (1,119,655 | ) | | | (9,711,022 | ) | | | (12,258,860 | ) | | | (91,853,768 | ) |
| | | | | | | | | | | | | | | | |
Net Decrease – Institutional Class | | | (1,003,972 | ) | | ($ | 8,728,368 | ) | | | (11,426,551 | ) | | ($ | 85,518,555 | ) |
| | | | | | | | | | | | | | | | |
Administrative Class | | | | | | | | | | | | | | | | |
Proceeds from sale of shares | | | 1,277 | | | $ | 10,000 | | | | — | | | | — | |
Reinvestment of dividends and distributions | | | 49 | | | | 415 | | | | 15 | | | $ | 116 | |
Cost of shares repurchased | | | (1,130 | ) | | | (8,825 | ) | | | — | | | | — | |
| | | | | | | | | | | | | | | | |
Net Increase – Administrative Class | | | 196 | | | $ | 1,590 | | | | 15 | | | $ | 116 | |
| | | | | | | | | | | | | | | | |
Class P | | | | | | | | | | | | | | | | |
Proceeds from sale of shares | | | 452 | | | $ | 3,788 | | | | 25,576 | | | $ | 187,068 | |
Reinvestment of dividends and distributions | | | 511 | | | | 4,290 | | | | 37 | | | | 281 | |
Cost of shares repurchased | | | (9,860 | ) | | | (74,182 | ) | | | (5,885 | ) | | | (45,702 | ) |
| | | | | | | | | | | | | | | | |
Net Increase (Decrease) – Class P | | | (8,897 | ) | | ($ | 66,104 | ) | | | 19,728 | | | $ | 141,647 | |
| | | | | | | | | | | | | | | | |
47
Notes to Financial Statements (continued)
| | | | | | | | | | | | | | | | |
| | | Mid-Cap | |
| | | 2011 | | | 2010 | |
| | | Shares | | | Amount | | | Shares | | | Amount | |
Class A | | | | | | | | | | | | | | | | |
Proceeds from sale of shares | | | 1,441,563 | | | $ | 32,077,739 | | | | 1,806,576 | | | $ | 33,350,675 | |
Reinvestment of dividends and distributions | | | 7,893 | | | | 187,226 | | | | — | | | | — | |
Cost of shares repurchased | | | (3,328,429 | ) | | | (74,391,231 | ) | | | (4,541,409 | ) | | | (84,882,571 | ) |
| | | | | | | | | | | | | | | | |
Net Decrease – Class A | | | (1,878,973 | ) | | ($ | 42,126,266 | ) | | | (2,734,833 | ) | | ($ | 51,531,896 | ) |
| | | | | | | | | | | | | | | | |
Class B | | | | | | | | | | | | | | | | |
Proceeds from sale of shares | | | 6,567 | | | $ | 118,753 | | | | 18,957 | | | $ | 306,631 | |
Cost of shares repurchased | | | (316,169 | ) | | | (6,164,351 | ) | | | (554,843 | ) | | | (9,253,000 | ) |
| | | | | | | | | | | | | | | | |
Net Decrease – Class B | | | (309,602 | ) | | ($ | 6,045,598 | ) | | | (535,886 | ) | | ($ | 8,946,369 | ) |
| | | | | | | | | | | | | | | | |
Class C | | | | | | | | | | | | | | | | |
Proceeds from sale of shares | | | 118,798 | | | $ | 2,312,985 | | | | 143,375 | | | $ | 2,366,309 | |
Cost of shares repurchased | | | (1,376,173 | ) | | | (26,787,002 | ) | | | (693,781 | ) | | | (11,330,977 | ) |
| | | | | | | | | | | | | | | | |
Net Decrease – Class C | | | (1,257,375 | ) | | ($ | 24,474,017 | ) | | | (550,406 | ) | | ($ | 8,964,668 | ) |
| | | | | | | | | | | | | | | | |
Class D | | | | | | | | | | | | | | | | |
Proceeds from sale of shares | | | 56,909 | | | $ | 1,334,619 | | | | 78,074 | | | $ | 1,463,884 | |
Reinvestment of dividends and distributions | | | 498 | | | | 11,905 | | | | — | | | | — | |
Cost of shares repurchased | | | (200,695 | ) | | | (4,467,045 | ) | | | (819,240 | ) | | | (14,707,061 | ) |
| | | | | | | | | | | | | | | | |
Net Decrease – Class D | | | (143,288 | ) | | ($ | 3,120,521 | ) | | | (741,166 | ) | | ($ | 13,243,177 | ) |
| | | | | | | | | | | | | | | | |
Institutional Class | | | | | | | | | | | | | | | | |
Proceeds from sale of shares | | | 2,539,900 | | | $ | 60,903,202 | | | | 3,627,289 | | | $ | 71,968,901 | |
Reinvestment of dividends and distributions | | | 45,950 | | | | 1,153,807 | | | | — | | | | — | |
Cost of shares repurchased | | | (6,956,009 | ) | | | (168,256,179 | ) | | | (7,514,096 | ) | | | (146,646,025 | ) |
| | | | | | | | | | | | | | | | |
Net Decrease – Institutional Class | | | (4,370,159 | ) | | ($ | 106,199,170 | ) | | | (3,886,807 | ) | | ($ | 74,677,124 | ) |
| | | | | | | | | | | | | | | | |
Administrative Class | | | | | | | | | | | | | | | | |
Proceeds from sale of shares | | | 664,649 | | | $ | 15,774,101 | | | | 2,224,816 | | | $ | 41,288,004 | |
Reinvestment of dividends and distributions | | | 9,175 | | | | 222,314 | | | | — | | | | — | |
Cost of shares repurchased | | | (2,829,422 | ) | | | (65,817,863 | ) | | | (3,398,662 | ) | | | (66,149,625 | ) |
| | | | | | | | | | | | | | | | |
Net Decrease – Administrative Class | | | (2,155,598 | ) | | ($ | 49,821,448 | ) | | | (1,173,846 | ) | | ($ | 24,861,621 | ) |
| | | | | | | | | | | | | | | | |
Class P | | | | | | | | | | | | | | | | |
Proceeds from sale of shares | | | 27,796 | | | $ | 649,630 | | | | 61,399 | | | $ | 1,208,929 | |
Reinvestment of dividends and distributions | | | 185 | | | | 4,633 | | | | — | | | | — | |
Cost of shares repurchased | | | (94,202 | ) | | | (2,243,379 | ) | | | (77,204 | ) | | | (1,509,989 | ) |
| | | | | | | | | | | | | | | | |
Net Decrease – Class P | | | (66,221 | ) | | ($ | 1,589,116 | ) | | | (15,805 | ) | | ($ | 301,060 | ) |
| | | | | | | | | | | | | | | | |
Class R | | | | | | | | | | | | | | | | |
Proceeds from sale of shares | | | 219,112 | | | $ | 4,976,499 | | | | 403,829 | | | $ | 7,454,566 | |
Cost of shares repurchased | | | (643,498 | ) | | | (14,193,220 | ) | | | (1,225,020 | ) | | | (22,283,277 | ) |
| | | | | | | | | | | | | | | | |
Net Decrease – Class R | | | (424,386 | ) | | ($ | 9,216,721 | ) | | | (821,191 | ) | | ($ | 14,828,711 | ) |
| | | | | | | | | | | | | | | | |
48
Notes to Financial Statements (continued)
| | | | | | | | | | | | | | | | |
| | | Emerging Companies | |
| | | 2011 | | | 2010 | |
| | | Shares | | | Amount | | | Shares | | | Amount | |
Institutional Class | | | | | | | | | | | | | | | | |
Proceeds from sale of shares | | | 339,213 | | | $ | 6,709,463 | | | | 373,355 | | | $ | 5,352,100 | |
Cost of shares repurchased | | | (1,319,475 | ) | | | (23,687,492 | ) | | | (2,015,999 | ) | | | (28,702,892 | ) |
| | | | | | | | | | | | | | | | |
Net Decrease – Institutional Class | | | (980,262 | ) | | ($ | 16,978,029 | ) | | | (1,642,644 | ) | | ($ | 23,350,792 | ) |
| | | | | | | | | | | | | | | | |
Administrative Class | | | | | | | | | | | | | | | | |
Proceeds from sale of shares | | | 282,540 | | | $ | 5,645,102 | | | | 102,404 | | | $ | 1,360,489 | |
Cost of shares repurchased | | | (200,762 | ) | | | (3,839,017 | ) | | | (1,152,448 | ) | | | (17,475,317 | ) |
| | | | | | | | | | | | | | | | |
Net Increase (Decrease) – Administrative Class | | | 81,778 | | | $ | 1,806,085 | | | | (1,050,044 | ) | | ($ | 16,114,828 | ) |
| | | | | | | | | | | | | | | | |
At May 31, 2011, certain unaffiliated shareholders of record, specifically omnibus accounts, individually or collectively held greater than 10% of the outstanding shares of the following Funds: Capital Appreciation – one owns 21%; Focused Growth – one owns 19%; Mid-Cap – one owns 31% and Emerging Companies – one owns 55%. Transactions by these shareholders may have a material impact on the Funds.
2. Agreements and Transactions with Affiliates
For each of the Funds, the Trust has entered into an Investment Management Agreement under which the Investment Manager, an independently managed subsidiary of Affiliated Managers Group, Inc. (“AMG”), serves as investment manager to the Funds and is responsible for the Funds’ overall administration. Prior to September 27, 2010, the Predecessor Funds had a similar Investment Management Agreement with Allianz Global Investors Fund Management LLC (“Allianz”). The Funds’ investment portfolios are managed by Cadence Capital Management, LLC (“Cadence” or the “Subadvisor”), which serves pursuant to a
Subadvisory Agreement between the Investment Manager and Cadence with respect to each of the Funds. Prior to September 27, 2010, Cadence served as the subadvisor to the Funds pursuant to a subadvisory agreement between Allianz and Cadence with respect to each of the Predecessor Funds.
Investment management fees are paid directly by the Funds to the Investment Manager based on average daily net assets. For the period from September 27, 2010, to May 31, 2011, the annual investment management fee rates, as a percentage of average daily net assets, were as follows:
| | | | |
Fund | | Investment
Management Fee | |
Capital Appreciation | | | 0.45 | % |
Focused Growth | | | 0.45 | % |
Mid-Cap | | | 0.45 | % |
Emerging Companies | | | 1.25 | % |
49
Notes to Financial Statements (continued)
Prior to September 27, 2010, all of the Predecessor Funds, except Allianz CCM Emerging Companies Fund, paid an investment management fee of 0.45%. Allianz CCM Emerging Companies Fund paid an investment management fee of 1.25%, of which Allianz voluntarily waived 0.10%.
Effective September 27, 2010, each Fund entered into an Administration and Shareholder Servicing Agreement under which the Investment Manager serves as each Fund’s administrator (the “Administrator”) and is responsible for all aspects of managing the Funds’ operations, including administration and shareholder services to each Fund, its shareholders, and certain institutions, such as bank trust departments, broker-dealers and registered investment advisers, that advise or act as an intermediary with the Funds’ shareholders. For its services, the Administrator is paid a fee at a rate of 0.25% of average net assets per annum. Prior to September 27, 2010, the predecessor Funds participated in a “unitary” fee structure where Allianz provided administrative services to the Funds and would also bear the cost of most third-party administrative services required by the Funds, including audit, custodial, portfolio accounting, legal and transfer agency.
The Investment Manager for the Funds has contractually agreed, through at least November 1, 2012, to waive fees and pay or reimburse Fund expenses of Capital Appreciation, Focused Growth, Mid-Cap, and Emerging Companies, in order to limit total annual Fund operating expenses after fee waiver and expense reimbursements (exclusive of taxes, interest (including interest incurred in connection with bank and custody overdrafts), shareholder servicing fees, distribution and service (12b-1) fees, brokerage commissions and other transaction costs, acquired fund fees, and expenses and extraordinary items) to 0.72%, 0.71%, 0.72% and 1.42%, respectively, of each Fund’s average daily net assets.
The Funds are obligated to repay the Investment Manager such amounts waived, paid, or reimbursed in future years provided that the repayment occurs within thirty-six (36) months after the waiver or reimbursement and that such repayment would not cause the Fund’s expenses in any such future year to exceed the above percentages, based on the Fund’s average daily net assets. Prior to September 27, 2010, Allianz voluntarily agreed to waive certain investment management and administrative fees to reduce Fund expenses. For the period prior to September 27, 2010, these fees were not subject to repayment. For the period from September 27, 2010 through May 31, 2011, the Funds made no repayments to the Investment Manager. For the 11 months ended May 31, 2011, each Fund’s components of reimbursement are detailed in the following chart:
| | | | | | | | | | | | | | | | |
| | | Capital Appreciation | | | Focused Growth | | | Mid-Cap | | | Emerging Companies | |
Reimbursement Available – 9/27/10 | | | — | | | | — | | | | — | | | | — | |
Additional Reimbursements | | $ | 395,154 | | | $ | 75,545 | | | $ | 402,960 | | | $ | 140,302 | |
Repayments | | | — | | | | — | | | | — | | | | — | |
Expired Reimbursements | | | — | | | | — | | | | — | | | | — | |
| | | | | | | | | | | | | | | | |
Reimbursement Available – 05/31/11 | | $ | 395,154 | | | $ | 75,545 | | | $ | 402,960 | | | $ | 140,302 | |
| | | | | | | | | | | | | | | | |
50
Notes to Financial Statements (continued)
Effective January 1, 2011, the aggregate retainer paid to each Independent Trustee is $80,000, plus $5,000 or $2,500 for each regular or special meeting attended, respectively. The Independent Chairman of the Trusts receives an additional payment of $20,000 per year. The Chairman of the Audit Committee receives an additional payment of $8,000 per year. (Prior to January 1, 2011, the aggregate annual retainer paid to each Independent Trustee was $65,000, plus $4,000 or $2,500 for each regular or special meeting attended, respectively. The Independent Chairman of the Trusts received an additional payment of $15,000 per year. The Chairman of the Audit Committee received an additional payment of $5,000 per year.) The Trustees’ fees and expenses are allocated amongst all of the Funds for which the Investment Manager serves as the advisor (the “Managers Funds”) based on the relative net assets of such Funds. The “Trustees fees and expenses” shown in the financial statements represents each Fund’s allocated portion of the total fees and expenses paid by the Managers Funds. Prior to September 27, 2010, the Predecessor Funds had adopted a deferred compensation plan for the Trustees, which permitted the Trustees to defer their receipt of compensation from the Funds. The remaining portion of deferred Trustee fees and expenses were paid prior to September 27, 2010, by the Predecessor Funds to their former Trustees, amounting to: Capital Appreciation – $2,653; Focused Growth – $67; Mid-Cap – $2,277 and Emerging Companies – $177.
The Funds are distributed by Managers Distributors, Inc. (“MDI”), a wholly owned subsidiary of the Investment Manager. Prior to September 27, 2010, the distributor was Allianz Global Investors Distributors LLC (“AGID”). MDI serves as the principal underwriter for each Fund and is a registered broker-dealer and member of the Financial Industry Regulatory Authority, Inc. (“FINRA”). Shares of each Fund will be continuously offered and will be sold by brokers, dealers or other financial intermediaries who have executed selling agreements with MDI. MDI bears all the expenses of providing services pursuant to the Underwriting Agreement, including the payment of the expenses relating to the distribution of Prospectuses for sales purposes and any advertising or sales literature. Certain Trustees and Officers of the Funds are Officers and/or Directors of the Investment Manager, AMG and/or MDI.
Effective September 27, 2010, the Funds adopted a distribution and service plan (the “plan”) with respect to the shares of certain classes of the Funds, in accordance with the requirements of Rule 12b-1 under the 1940 Act and the requirements of the applicable rules of the FINRA regarding asset-based sales charges. Pursuant to the Plan, each Fund may compensate the Distributor for its expenditures in financing any activity primarily intended to result in the sale of such class of the Fund’s shares and for maintenance and personal service provided to existing shareholders of that class. The Plan authorizes payments to the Distributors up to a certain percentage annually of the Fund’s average daily net assets attributable to each respective class shares. The Plan further provides for periodic payments by MDI to brokers, dealers and other financial intermediaries for providing shareholder services and for promotional and other sales related costs. The portion of payments by each class’s shares for shareholder servicing may not exceed a certain annual percentage rate of the average daily net asset value of the Fund’s shares of each class owned by its clients of such broker, dealer or financial intermediary. The annual percentages of daily net assets for 12b-1 fees congruent with the Plan for each applicable share class of the Funds are detailed in the chart below:
| | | | |
Fund | | 12b-1 Fees | |
Capital Appreciation | | | | |
Class A | | | 0.25 | % |
Class B | | | 1.00 | % |
Class C | | | 1.00 | % |
Class D | | | 0.25 | % |
Class R | | | 0.50 | % |
Focused Growth | | | | |
Administrative Class | | | 0.05 | % |
Class A | | | 0.25 | % |
Class C | | | 1.00 | % |
Class D | | | 0.25 | % |
Mid-Cap Fund | | | | |
Class A | | | 0.25 | % |
Class B | | | 1.00 | % |
Class C | | | 1.00 | % |
Class D | | | 0.25 | % |
Class R | | | 0.50 | % |
Prior to September 27, 2010, the Predecessor Funds paid 12b-1 fees to AGID of 1.00% on all Class B and Class C shares, 0.25% on all Class A and Class D shares, and 0.50% on all Class R shares. Other share classes did not pay a 12b-1 fee prior to September 27, 2010.
The Securities and Exchange Commission granted an exemptive order that permits the Funds to lend and borrow money for certain temporary purposes directly to and from other eligible Managers Funds. Participation in this interfund lending program is voluntary for both borrowing and lending Funds, and an interfund loan is only made if it benefits each participating Fund. The Investment Manager administers the program according to procedures approved by the Board and the Board monitors the operation of the program. An interfund loan must comply with certain conditions set out in the exemptive order, which are designed to assure fairness and protect all participating Funds. For the period from September 27, 2010, to May 31, 2011, the following Funds lent to other Managers Funds: Capital Appreciation lent $4,479,634 for 4 days earning interest of $400, Emerging Companies lent $822,854 for 1 day earning interest of $26, Mid-Cap lent $2,470,476 for 6 days earning interest of $311. The interest amount is included in the Statement of Operations in interest income. For the period from September 27, 2010, to May 31, 2011, the following Funds borrowed from other Managers Funds: Capital Appreciation borrowed $2,921,344 for 1 day paying interest of $83, Focused Growth borrowed varying amounts up to $4,914,168 for 7 days paying interest of $648, Mid-Cap borrowed
51
Notes to Financial Statements (continued)
varying amounts up to $31,378,806 for 10 days paying interest of $3,316. The interest amount is included in the Statement of Operations as part of miscellaneous expense.
3. Purchases and Sales of Securities
Purchases and sales of securities (excluding short-term securities and U.S. Government obligations) for the 11 months ended May 31, 2011, were as follows:
| | | | | | | | |
Fund | | Purchases | | | Sales | |
Capital Appreciation | | $ | 624,325,837 | | | $ | 791,344,925 | |
Focused Growth | | | 17,950,691 | | | | 28,459,866 | |
Mid-Cap | | | 576,874,225 | | | | 826,796,351 | |
Emerging Companies | | | 56,736,514 | | | | 72,799,555 | |
The Funds had no purchases or sales of U.S. Government obligations for the 11 months ended May 31, 2011.
4. Affiliated Transactions
On March 13, 2009, Allianz purchased all of the securities issued by Axon Financial Funding LLC (“Axon Notes”) and Gryphon Funding Limited (including certain residual notes issued by SIV Portfolio PLC, a predecessor entity of Gryphon Funding Limited (“Gryphon Notes”), and together with the Axon Notes, the “Notes”) held as investments of collateral for securities on loan under the Predecessor Funds’ securities lending program. An additional amount was contributed to each Fund by Allianz, so that, in effect, each Fund received from the sale the full principal value of the Notes, plus accrued interest. In connection with the sale, the irrevocable letter of credit issued by The Bank of New York to the Predecessor Funds, which provided financial support to each of the affected Funds with the result that the Funds effectively valued each Axon Note and Gryphon Note position at its full principal amount, was surrendered without being drawn upon by the Predecessor Funds.
The total of the purchase price and the capital contribution amounts received by the Funds were as follows:
| | | | | | | | |
| | | | | | Capital | |
| | | Purchase Price | | | Contribution | |
Fund | | Amount | | | Amount | |
Capital Appreciation | | $ | 12,011,584 | | | $ | 9,847,503 | |
Mid-Cap | | | 13,036,352 | | | | 10,539,263 | |
5. Commitments and Contingencies
In the normal course of business, the Funds may enter into contracts and agreements that contain a variety of representations and warranties, which provide general indemnifications. The maximum exposure to the Funds under these arrangements is unknown, as this would involve future claims that may be made against a Fund that have not yet occurred. However, based on experience, the Funds expect the risks of loss to be remote.
6. New Accounting Standards
In May 2011, the Financial Accounting Standards Board issued Accounting Standards Update (“ASU”) No. 2011-04 “Amendments to Achieve Common Fair Value Measurement and Disclosure Requirements in U.S. GAAP and IFRSs.” ASU 2011-04 requires common fair value measurement and disclosure requirements between U.S. GAAP and International Financial Reporting Standards. The new and revised disclosures are effective for interim and annual reporting periods beginning after December 15, 2011. At this time, management is evaluating the implications of ASU No. 2011-04 and its impact on the financial statements.
7. Subsequent Events
At a meeting of the Trust’s Board of Trustees held on June 9-10, 2011, Nathaniel Dalton, who was a Trustee of the Trust, delivered his resignation to the Board of Trustees, effective June 9, 2011. The Board appointed Christine C. Carsman as Trustee to fill the vacancy; like Mr. Dalton, Ms. Carsman is considered an “interested person” of the Trust under the Investment Company Act of 1940.
The Funds have determined that no additional material events or transactions occurred through the issuance of the Funds’ financial statements, which require additional disclosure in or adjustment of the Funds’ financial statements.
Tax Information (unaudited)
Each Fund hereby designates the maximum amount allowable of its net taxable income as qualified ed dividends as provided in the Jobs and Growth Tax Relief Reconciliation Act of 2003.
Pursuant to section 852 of the Internal Revenue Code, Managers Cadence Capital Appreciation, Managers Cadence Focused Growth, Managers Cadence Mid-Cap, and Managers Cadence Emerging Companies hereby designate as a capital gain distribution with respect to the taxable year ended May 31, 2011, $0, $917,771, $0, and $0, respectively, or, if subsequently determined to be different, the net capital gains of such year.
52
Report of Independent Registered Public Accounting Firm
To the Board of Trustees of the Managers Funds and Shareholders of the Managers Cadence Capital Appreciation Fund Managers Cadence Focused Growth Fund Managers Cadence Mid-Cap Fund Managers Cadence Emerging Companies Fund
In our opinion, the accompanying statements of assets and liabilities, including the portfolios of investments, and the related statements of operations and of changes in net assets and the financial highlights present fairly, in all material respects, the financial position of Managers Cadence Capital Appreciation Fund (formerly Allianz CCM Capital Appreciation Fund), Managers Cadence Focused Growth Fund (formerly Allianz CCM Focused Growth Fund), Managers Cadence Mid-Cap Fund (formerly Allianz CCM Mid-Cap Fund) and Managers Cadence Emerging Companies Fund (formerly Allianz CCM Emerging Companies Fund) (four of the Funds constituting Managers funds, hereafter referred to as the “Funds”) as of and for the periods ended May 31, 2011, and the results of each of their operations, the changes in net assets and the financial highlights for the periods presented, in conformity with accounting principles generally accepted in the United States of America. These financial statements and financial highlights (hereafter referred to as “financial statements”) are the responsibility of the Funds’ management; our responsibility is to express an opinion on these financial statements based on our audits. We conducted our audits of these financial statements in accordance with the standards of the Public Company Accounting Oversight Board (United States). Those standards require that we plan and perform the audit to obtain reasonable assurance about whether the financial statements are free of material misstatement. An audit includes examining, on a test basis, evidence supporting the amounts and disclosures in the financial statements, assessing the accounting principles used and significant estimates made by management, and evaluating the overall financial statement presentation. We believe that our audits, which included confirmation of securities at May 31, 2011 by correspondence with the custodian and brokers, provide a reasonable basis for our opinion.
PricewaterhouseCoopers LLP
July 20, 2011
53
Trustees and Officers
The Trustees and Officers of the Trust, their business addresses, principal occupations for the past five years and dates of birth are listed below. The Trustees provide broad supervision over the affairs of the Trust and the Funds. The Trustees are experienced executives who meet periodically throughout the year to oversee the Funds’ activities, review contractual arrangements with companies that provide services to the Funds, and review the Funds’ performance. Unless otherwise noted, the address of each Trustee or Officer is the address of the Trust: 800 Connecticut Avenue, Norwalk, Connecticut 06854.
There is no stated term of office for Trustees. Trustees serve until their resignation, retirement or removal in accordance with the Trust’s organizational documents and policies adopted by the Board from time to time. The Chairman of the Trustees, President, Treasurer and Secretary of the Trust are elected by the Trustees annually. Other officers hold office at the pleasure of the Trustees.
Independent Trustees
The following Trustees are not “interested persons” of the Trust within the meaning of the 1940 Act:
| | |
Name, Date of Birth, Number of Funds
Overseen in Fund Complex* | | Principal Occupation(s) During Past 5 Years and Other Directorships Held by Trustee |
Jack W. Aber, 9/9/37 • Trustee since 1999 • Oversees 39 Funds in Fund Complex | | Professor of Finance, Boston University School of Management (1972-Present); Trustee of Appleton Growth Fund (1 portfolio); Trustee of Third Avenue Trust (5 portfolios); Trustee of Third Avenue Variable Trust (1 portfolio); Trustee of Aston Funds (26 portfolios). |
| |
William E. Chapman, II, 9/23/41 • Independent Chairman • Trustee since 1999 • Oversees 39 Funds in Fund Complex | | President and Owner, Longboat Retirement Planning Solutions (1998-Present); Hewitt Associates, LLC (part time) (provider of Retirement and Investment Education Seminars) (2002-2009); Trustee of Bowdoin College (2002-Present); Director of Harding, Loevner Funds, Inc. (6 portfolios); Trustee of Third Avenue Trust (5 portfolios); Trustee of Third Avenue Variable Trust (1 portfolio); Trustee of Aston Funds (26 portfolios). |
| |
Edward J. Kaier, 9/23/45 • Trustee since 1999 • Oversees 39 Funds in Fund Complex | | Attorney at Law and Partner, Teeters Harvey Gilboy & Kaier LLP (2007-Present); Attorney at Law and Partner, Hepburn Willcox Hamilton & Putnam, LLP (1977-2007); Trustee of Third Avenue Trust (5 portfolios); Trustee of Third Avenue Variable Trust (1 portfolio); Trustee of Aston Funds (26 portfolios). |
| |
Steven J. Paggioli, 4/3/50 • Trustee since 1993 • Oversees 39 Funds in Fund Complex | | Consultant (2001-Present); Formerly Executive Vice President and Director, The Wadsworth Group (1986- 2001); Executive Vice President, Secretary and Director, Investment Company Administration, LLC (1990-2001); Vice President, Secretary and Director, First Fund Distributors, Inc. (1991-2001); Trustee, Professionally Managed Portfolios (40 portfolios); Advisory Board Member, Sustainable Growth Advisors, LP; Independent Director, Chase Investment Counsel (2008 – Present); Trustee of Aston Funds (26 portfolios). |
| |
Eric Rakowski, 6/5/58 • Trustee since 1999 • Oversees 39 Funds in Fund Complex | | Professor, University of California at Berkeley School of Law (1990-Present); Director of Harding, Loevner Funds, Inc. (6 portfolios); Trustee of Third Avenue Trust (5 portfolios); Trustee of Third Avenue Variable Trust (1 portfolio); Trustee of Aston Funds (26 portfolios). |
| |
Thomas R. Schneeweis, 5/10/47 • Trustee since 1987 • Oversees 39 Funds in Fund Complex | | Professor of Finance, University of Massachusetts (1977-Present); Director, CISDM at the University of Massachusetts, (1996-Present); President, Alternative Investment Analytics, LLC, (formerly Schneeweis Partners, LLC) (2001-Present); Partner, S Capital Management, LLC (2007-Present); Partner, TRS Associates (1982-Present); Trustee of Aston Funds (26 portfolios). |
| * | The Fund Complex consists of Managers AMG Funds, The Managers Funds, Managers Trust I and Managers Trust II. |
Interested Trustees
The following Trustees are “interested persons” of the Trust within the meaning of the 1940 Act. Mr. Dalton is an interested person by virtue of his positions with, and interest in securities of, Affiliated Managers Group, Inc. and his position with Managers Distributors, Inc. Mr. Streur is an interested person by virtue of his positions with Managers Investment Group LLC.
| | |
Name, Date of Birth, Number of Funds Overseen in Fund Complex* | | Principal Occupation(s) During Past 5 Years and Other Directorships Held by Trustee |
Nathaniel Dalton, 9/29/66 • Trustee since 2008 • Oversees 39 Funds in Fund Complex | | Executive Vice President and Chief Operating Officer, Affiliated Managers Group, Inc., (2006-Present); Executive Vice President, Affiliated Managers Group, Inc., (2002 -2006); Executive Vice President and General Counsel, Affiliated Managers Group, Inc. (2001-2002); Senior Vice President and General Counsel, Affiliated Managers Group, Inc. (1996-2001). Director, Managers Distributors, Inc. (2000-Present). |
| |
John H. Streur, 2/6/60 • Trustee since 2008 • President since 2008 • Oversees 39 Funds in Fund Complex | | Senior Managing Partner, Managers Investment Group LLC (2006-Present); President, Managers Distributors, Inc. (2006-Present); Managing Partner, Managers Investment Group LLC (2005-2006); Chief Executive Officer, President and Chief Operating Officer, The Burridge Group LLC (1996-2004). |
Officers
| | |
Name, Date of Birth, Position(s) Held with Fund and Length of Time Served | | Principal Occupation(s) During Past 5 Years |
Christine C. Carsman, 4/2/52 • Secretary since 2004 • Chief Legal Officer since 2004 | | Senior Vice President and Chief Regulatory Counsel, Affiliated Managers Group, Inc. (2004-Present); Secretary, Managers AMG Funds, Managers Trust I and Managers Trust II (2004-Present); Senior Counsel, Vice President and Director of Operational Risk Management and Compliance, Wellington Management Company, LLP (1995-2004); Deputy General Counsel, The Boston Company, Inc. (1993-1995); Associate General Counsel, The Boston Company Advisors, Inc. (1991-1993); Associate, Sullivan & Worcester LLP (1987-1991). |
| |
Donald S. Rumery, 5/29/58 • Chief Financial Officer since 2007 • Treasurer since 1995 | | Senior Vice President, Managers Investment Group LLC (2005-Present); Treasurer and Chief Financial Officer, Managers Distributors, Inc. (2000-Present); Treasurer, Managers AMG Funds (1999-Present); Treasurer, Managers Trust I and Managers Trust II (2000-Present); Chief Financial Officer, Managers AMG Funds, Managers Trust I and Managers Trust II (2007-Present); Vice President, The Managers Funds LLC, (1994-2004). |
| |
Keitha L. Kinne, 5/16/58 • Chief Operating Officer since 2007 | | Managing Partner and Chief Operating Officer, Managers Investment Group LLC (2007-Present); Chief Investment Officer, Managers Investment Group LLC (2008-Present); Chief Operating Officer, Managers AMG Funds, Managers Trust I and Managers Trust II (2007-Present); Managing Director, Legg Mason & Co., LLC (2006-2007); Managing Director, Citigroup Asset Management (2004-2006). |
| |
John J. Ferencz, 3/09/62 • Chief Compliance Officer since 2010 | | Vice President, Legal and Compliance, Managers Investment Group LLC (2010-Present); Senior Compliance Analyst, Mutual Funds and Regulatory, GE Asset Management Incorporated (2005-2010). |
54
THIS PAGE INTENTIONALLY LEFT BLANK
Investment Manager and Administrator
Managers Investment Group LLC
333 W. Wacker Drive
Suite 1200
Chicago, IL 60606
(800) 835-3879
Distributor
Managers Distributors, Inc.
333 W. Wacker Drive
Suite 1200
Chicago, IL 60606
(800) 835-3879
Custodian
The Bank of New York Mellon
2 Hanson Place
Brooklyn, NY 11217
Legal Counsel
Ropes & Gray LLP
Prudential Tower, 800 Boylston Street
Boston, MA 02199-3600
Transfer Agent
BNY Mellon Investment Servicing (US) Inc.
Attn: Managers
P.O. Box 9769
Providence, RI 02940
(800) 548-4539

MANAGERSAND MANAGERS AMG FUNDS
| | |
EQUITY FUNDS | | |
CADENCE CAPITAL APPRECIATION | | |
| CADENCE FOCUSED GROWTH | | |
| CADENCE MID-CAP | | |
| CADENCE EMERGING COMPANIES | | |
| Cadence Capital Management, LLC | | |
| | |
| CHICAGO EQUITY PARTNERS MID-CAP | | |
| Chicago Equity Partners, LLC | | |
| | |
| EMERGING MARKETS EQUITY | | |
| Rexiter Capital Management Limited | | |
| Schroder Investment Management North America Inc. | | |
| | |
| ESSEX SMALL/MICRO CAP GROWTH | | |
| Essex Investment Management Co., LLC | | |
| | |
| FQ TAX-MANAGED U.S. EQUITY | | |
| FQ U.S. EQUITY | | |
| First Quadrant, L.P. | | |
| | |
| FRONTIER SMALL CAP GROWTH | | |
| Frontier Capital Management Company, LLC | | |
| | |
| GW&K SMALL CAP EQUITY | | |
| Gannett Welsh & Kotler, LLC | | |
| | |
| INSTITUTIONAL MICRO-CAP | | |
| MICRO-CAP | | |
| Lord, Abbett & Co. LLC | | |
| WEDGE Capital Management L.L.P. | | |
| Next Century Growth Investors LLC | | |
| RBC Global Asset Management (U.S.) Inc. | | |
| | |
| INTERNATIONAL EQUITY | | |
| AllianceBernstein L.P. | | |
| Lazard Asset Management, LLC | | |
| Martin Currie Inc. | | |
| | |
| REAL ESTATE SECURITIES | | |
| Urdang Securities Management, Inc. | | |
| | |
| RENAISSANCE LARGE CAP GROWTH | | |
| Renaissance Group LLC | | |
| | |
| SKYLINE SPECIAL EQUITIES | | |
| PORTFOLIO | | |
| Skyline Asset Management, L.P. | | |
| | |
| SPECIAL EQUITY | | |
| Ranger Investment Management, L.P. | | |
| Lord, Abbett & Co. LLC | | |
| Smith Asset Management Group, L.P. | | |
| Federated MDTA LLC | | |
| | |
| SYSTEMATIC VALUE | | |
| SYSTEMATIC MID CAP VALUE | | |
| Systematic Financial Management, L.P. | | |
| | |
| TIMESSQUARE MID CAP GROWTH | | |
| TIMESSQUARE SMALL CAP GROWTH | | |
| TSCM GROWTH EQUITY | | |
| TimesSquare Capital Management, LLC | | |
| | |
| TRILOGY GLOBAL EQUITY | | |
| TRILOGY EMERGING MARKETS EQUITY | | |
| TRILOGY INTERNATIONAL SMALL CAP | | |
| Trilogy Global Advisors, L.P. | | |
| |
BALANCED FUNDS | | |
| |
| CHICAGO EQUITY PARTNERS BALANCED | | |
| Chicago Equity Partners, LLC | | |
| |
ALTERNATIVE FUNDS | | |
| |
| FQ GLOBAL ALTERNATIVES | | |
| FQ GLOBAL ESSENTIALS | | |
| First Quadrant, L.P. | | |
| |
INCOME FUNDS | | |
| |
| BOND (MANAGERS) | | |
| FIXED INCOME | | |
| GLOBAL BOND | | |
| Loomis, Sayles & Co., L.P. | | |
| |
| BOND (MANAGERS PIMCO) | | |
| Pacific Investment Management Co. LLC | | |
| |
| CALIFORNIA INTERMEDIATE TAX-FREE | | |
| Miller Tabak Asset Management LLC | | |
| |
| GW&K MUNICIPAL BOND | | |
| GW&K MUNICIPAL ENHANCED YIELD | | |
| Gannett Welsh & Kotler, LLC | | |
| |
| HIGH YIELD | | |
| J.P. Morgan Investment Management LLC | | |
| |
| INTERMEDIATE DURATION GOVERNMENT | | |
| SHORT DURATION GOVERNMENT | | |
| Smith Breeden Associates, Inc. | | |
This report is prepared for the Funds’ shareholders. It is authorized for distribution to prospective investors only when preceded or accompanied by an effective prospectus. To receive a free copy of the prospectus or Statement of Additional Information, which includes additional information about Fund Trustees, please contact us by calling 800.835.3879. Distributed by Managers Distributors, Inc., member FINRA.
A description of the policies and procedures each Fund uses to vote its proxies is available: (i) without charge, upon request, by calling 800.835.3879, or (ii) on the Securities and Exchange Commission’s (SEC) Web site at www. sec.gov. For information regarding each Fund’s proxy voting record for the 12-month period ended June 30, call 800.835.3879 or visit the SEC Web site at www.sec.gov.
The Funds file their complete schedule of portfolio holdings with the SEC for the first and third quarters of each fiscal year on Form N-Q. The Funds’ Forms N-Q are available on the SEC’s website at www.sec.gov. A Fund’s Forms N-Q may be reviewed and copied at the SEC’s Public Reference Room in Washington, DC. Information on the operation of the Public Reference Room may be obtained by calling 800.SEC.0330. To review a complete list of the Funds’ portfolio holdings, or to view the most recent quarterly holdings report, semiannual report, or annual report, please visit www.managersinvest.com.

www.managersinvest.com

Registrant has adopted a Code of Ethics. See attached Exhibit (a)(1).
| Item 3. | AUDIT COMMITTEE FINANCIAL EXPERT |
Registrant’s Board of Trustees has determined that independent Trustees Mr. Jack W. Aber and Mr. Steven J. Paggioli each qualify as the Audit Committee Financial Expert. Mr. Aber and Mr. Paggioli are “independent” as such term is defined in Form N-CSR.
| Item 4. | PRINCIPAL ACCOUNTANT FEES AND SERVICES |
The aggregate fees billed by PwC to the Fund for the Funds’ two most recent fiscal years for professional services rendered for audits of annual financial statements, or services that are normally provided in connection with statutory and regulatory filings or engagements (“Audit Fees”) were as follows:
| | | | | | | | |
| | | Fiscal
2011 | | | Fiscal
2010 | |
Managers Cadence Capital Appreciation Fund | | $ | 29,500 | | | | N/A | |
Managers Cadence Focused Growth Fund | | $ | 25,500 | | | | N/A | |
Managers Cadence Mid-Cap Fund | | $ | 29,500 | | | | N/A | |
Managers Cadence Emerging Companies Fund | | $ | 24,500 | | | | N/A | |
Audit-Related Fees
There were no fees billed by PwC to the Funds in its two recent fiscal years for services rendered for assurance and related services that are reasonably related to the performance of the audit or review of the Fund’s financial statements, but are not reported as Audit Fees (“Audit-Related Fees”).
For the Funds’ two most recent fiscal years, there were no Audit-Related Fees billed by PwC for engagements related directly to the operations and financial reporting of one or more Funds by a Fund Service Provider. A Fund Service Provider is (a) any investment adviser to the Fund (not including any Subadvisor whose role is primarily portfolio management and is subcontracted with or overseen by another investment adviser) or (b) any entity that provides ongoing services to the Fund and is controlling, controlled by or under common control with a Fund investment adviser described in (a).
Tax Fees
The aggregate fees billed by PwC to the Funds for the two most recent fiscal years for professional services rendered for tax compliance, tax advice, and tax planning (“Tax Fees”) were as follows:
| | | | | | | | |
| | | Fiscal
2011 | | | Fiscal
2010 | |
Managers Cadence Capital Appreciation Fund | | $ | 6,500 | | | | N/A | |
Managers Cadence Focused Growth Fund | | $ | 5,800 | | | | N/A | |
Managers Cadence Mid-Cap Fund | | $ | 6,500 | | | | N/A | |
Managers Cadence Emerging Companies Fund | | $ | 5,800 | | | | N/A | |
For the Funds’ two most recent fiscal years, Tax Fees billed by PwC for engagements by Fund Service Providers that related directly to the operations and financial reporting of the Funds were $0 for fiscal 2008 and $0 for fiscal 2007, respectively.
The services for which Tax Fees were charged comprise all services performed by professional staff in PwC’s tax division except those services related to the audit. Typically, this category would include fees for tax compliance, tax planning, and tax advice. Tax compliance, tax advice, and tax planning services include preparation of original and amended tax returns, claims for refund and tax payment-planning services, assistance with tax audits and appeals, tax advice related to mergers and acquisitions and requests for rulings or technical advice from taxing authorities.
All Other Fees
There were no other fees billed by PwC to the Funds for all other non-audit services (“Other Fees”) during the Funds’ two most recent fiscal years. During the same period, there were no Other Fees billed by PwC for engagements by Fund Service Providers that related directly to the operations and financial reporting of the Funds.
According to policies adopted by the Audit Committee, services provided by PwC to the Funds must be pre-approved by the Audit Committee. On an annual basis, the Audit Committee reviews and pre-approves various types of services that PwC may perform for the Funds without specific approval of each engagement, subject to specified budget limitations. As contemplated by the Sarbanes-Oxley Act of 2002 and related SEC rules, the Audit Committee also pre-approves non-audit services provided by PwC to any Fund Service Provider for any engagement that relates directly to the operations and financial reporting of the Funds. Any engagement that is not already pre-approved or that will exceed a pre-approved budget must be submitted to the Audit Committee for pre-approval. The Chairman of the Audit Committee is authorized on behalf of the Board of Trustees and the Audit Committee to approve the engagement of PwC to perform non-audit services subject to certain conditions, including notification to the Audit Committee of such pre-approval not later than the next meeting of the Audit Committee following the date of such pre-approval.
There were no other fees billed by PwC for non-audit services rendered to the Funds and to Fund Service Providers for the Funds’ two most recent fiscal years.
The Audit Committee has considered whether the provision of non-audit services by PwC to Fund Service Providers that were not required to be pre-approved by the Audit Committee is compatible with maintaining PwC’s independence in its audit of the Funds, taking into account representations from PwC, in accordance with Independence Standards Board Standard No. 1, regarding its independence from the Funds and its related entities.
The following table sets forth the non-audit services provided by PwC to the Funds and its service affiliates defined as the Funds’ investment advisor and any entity controlling, controlled by or under common control with Managers Investment Group LLC that provides ongoing services to the Funds (“Control Affiliates”) for the last two fiscal years.
| | | | | | | | | | | | | | | | | | | | | | | | |
| | | Audit-related fees A | | | Tax fees A | | | All other fees A | |
| | | 2010 | | | 2009 | | | 2010 | | | 2009 | | | 2010 | | | 2009 | |
| | | | | | | | | | | | | | | | | | | | | | | | |
Control Affiliates | | $ | 424,730 | | | | N/A | | | $ | 747,820 | | | | N/A | | | $ | 0 | | | | N/A | |
| A | Aggregate amounts may reflect rounding. |
| Item 5. | AUDIT COMMITTEE OF LISTED REGISTRANTS |
Not applicable.
| Item 6. | SCHEDULE OF INVESTMENTS |
The schedule of investments in unaffiliated issuers as of the close of the reporting period is included as part of the shareholder report contained in Item 1 hereof.
| Item 7. | DISCLOSURE OF PROXY VOTING POLICIES AND PROCEDURES FOR CLOSED-END MANAGEMENT INVESTMENT COMPANIES |
Not applicable.
| Item 8. | PORTFOLIO MANAGERS OF CLOSED-END MANAGEMENT INVESTMENT COMPANIES |
Not applicable.
| Item 9. | PURCHASES OF EQUITY SECURITIES BY CLOSED-END MANAGEMENT INVESTMENT COMPANIES AND AFFILIATED PURCHASERS |
Not applicable.
| Item 10. | SUBMISSION OF MATTERS TO A VOTE OF SECURITY HOLDERS |
Not applicable.
| Item 11. | CONTROLS AND PROCEDURES |
(a) The Registrant’s principal executive and principal financial officers have concluded, based on their evaluation of the
registrant’s disclosure controls and procedures as of a date within 90 days of the filing of this report, that the Registrant’s disclosure controls and procedures are reasonably designed to ensure that information required to be disclosed by the Registrant on Form N-CSR is recorded, processed, summarized and reported within the required time periods and that information required to be disclosed by the registrant in the reports that it files or submits on Form N-CSR is accumulated and communicated to the Registrant’s management, including its principal executive and principal financial officers, as appropriate to allow timely decisions regarding required disclosure.
(b) There were no changes in the Registrant’s internal control over financial reporting during the Registrant’s fourth fiscal quarter of the period covered by this report that have materially affected, or are reasonably likely to affect, the internal control over financial reporting.
| | |
| (a) (1) | | Any Code of Ethics or amendments hereto. Filed herewith. |
| |
| (a) (2) | | Certifications pursuant to Rule 30a-2(a) under the Investment Company Act of 1940 - Filed herewith. |
| |
| (a) (3) | | Not applicable. |
| |
| (b) | | Certifications pursuant to Rule 30a-2(b) under the Investment Company Act of 1940 - Filed herewith. |
SIGNATURES
Pursuant to the requirements of the Securities Exchange Act of 1934 and the Investment Company Act of 1940, the registrant has duly caused this report to be signed on its behalf by the undersigned, thereunto duly authorized.
| | |
| MANAGERS TRUST II |
| |
| By: | | /S/ JOHN H. STREUR |
| | John H. Streur, President |
| |
| Date: | | August 3, 2011 |
Pursuant to the requirements of the Securities Exchange Act of 1934 and the Investment Company Act of 1940, this report has been signed below by the following persons on behalf of the registrant and in the capacities and on the dates indicated.
| | |
| By: | | /S/ JOHN H. STREUR |
| | John H. Streur, President |
| |
| Date: | | August 3, 2011 |
| |
| By: | | /S/ DONALD S. RUMERY |
| | Donald S. Rumery, Chief Financial Officer |
| |
| Date: | | August 3, 2011 |