UNITED STATES
SECURITIES AND EXCHANGE COMMISSION
Washington, D.C. 20549
FORM N-CSR
CERTIFIED SHAREHOLDER REPORT OF REGISTERED
MANAGEMENT INVESTMENT COMPANIES
Investment Company Act file number: 811-03752
The Managers Funds
(Exact name of registrant as specified in charter)
800 Connecticut Avenue, Norwalk, Connecticut 06854
(Address of principal executive offices) (Zip code)
Managers Investment Group LLC
800 Connecticut Avenue, Norwalk, Connecticut 06854
(Name and address of agent for service)
Registrant’s telephone number, including area code: (203) 299-3500
Date of fiscal year end: May 31
Date of reporting period: July 1, 2011 – May 31, 2012
(Annual Shareholder Report)
| Item 1. | Reports to Shareholders |
ANNUAL REPORT
Managers Funds
May 31, 2012
Managers Cadence Capital Appreciation Fund
Managers Cadence Focused Growth Fund
Managers Cadence Mid-Cap Fund
Managers Cadence Emerging Companies Fund

Managers Funds
Annual Report — May 31, 2012
| | | | |
TABLE OF CONTENTS | | Page | |
| |
LETTER TO SHAREHOLDERS | | | 1 | |
| |
ABOUT YOUR FUND’S EXPENSES | | | 3 | |
| |
INVESTMENT MANAGER’S COMMENTS, FUND SNAPSHOTS, AND SCHEDULES OF PORTFOLIO INVESTMENTS | | | | |
| |
Managers Cadence Capital Appreciation Fund | | | 5 | |
| |
Managers Cadence Focused Growth Fund | | | 11 | |
| |
Managers Cadence Mid-Cap Fund | | | 16 | |
| |
Managers Cadence Emerging Companies Fund | | | 22 | |
| |
NOTES TO SCHEDULES OF PORTFOLIO INVESTMENTS | | | 28 | |
| |
FINANCIAL STATEMENTS | | | | |
| |
Statements of Assets and Liabilities | | | 29 | |
Balance sheets, net asset value (NAV) per share computations and cumulative undistributed amounts | | | | |
| |
Statements of Operations | | | 31 | |
Detail of sources of income, expenses, and realized and unrealized gains (losses) during the fiscal year | | | | |
| |
Statements of Changes in Net Assets | | | 32 | |
Detail of changes in assets for the past three fiscal periods | | | | |
| |
FINANCIAL HIGHLIGHTS | | | 35 | |
Historical net asset values per share, distributions, total returns, income and expense ratios, turnover ratios and net assets | | | | |
| |
NOTES TO FINANCIAL STATEMENTS | | | 43 | |
Accounting and distribution policies, details of agreements and transactions with Fund management and affiliates, and descriptions of certain investment risks | | | | |
| |
REPORT OF INDEPENDENT REGISTERED PUBLIC ACCOUNTING FIRM | | | 53 | |
| |
TRUSTEES AND OFFICERS | | | 54 | |
Nothing contained herein is to be considered an offer, sale or solicitation of an offer to buy shares of any series of the Managers Family of Funds. Such offering is made only by Prospectus, which includes details as to offering price and other material information.
Letter to Shareholders
Dear Shareholder:
Our foremost goal at Managers Investment Group is to structure and manage mutual funds that will help our shareholders and clients successfully reach their investment goals and objectives.
Each of our funds is geared to provide you with exposure to a specific asset class or style of investing. The Managers Cadence Capital Appreciation Fund and the Managers Cadence Focused Growth Fund invest in large-cap growth companies, while the Managers Cadence Mid-Cap Fund emphasizes mid-cap growth stocks and the Managers Cadence Emerging Companies Fund focuses on small-cap and micro-cap growth names.
The U.S. equity market generated slightly negative returns as the Russell 3000® Index, a popular barometer for the broad U.S. equity market, returned (-1.87%) through May 31, 2012 over the trailing 12 months. During the last 12 months, large-cap stocks outperformed small-cap stocks and growth beat value. Investors favored safety more often than risk as the financials sector struggled and falling commodity prices hurt the energy sector. Poor performance within the financials sector was a contributing factor to growth stocks’ relative outperformance. As a result of market preferences, the best performing segment of the U.S. equity market was large-cap growth. The Russell 1000® Growth Index returned (+1.49%) and handily outperformed the Russell 1000® Value Index, which returned (-3.88%). Over the same time period the Russell 1000® Index returned (-1.23%), compared to (-8.88%) for the Russell 2000® Index. Micro-cap stocks performed even worse as the Russell Microcap® Index returned (-9.20%) during a volatile 12-month period ended May 31, 2012.
The above-mentioned returns do not tell the full story of the 12 months ended May 31, 2012, which were dominated by macro, global developments such as the Arab Spring and the European debt crisis. During the third quarter of 2011, markets turned negative after a decent start to 2011. This was most attributable to increased concerns about a double-dip recession in the U.S. and a hard landing in developing countries. The U.S. debt ceiling debate, and a subsequent S&P downgrade of U.S. long-term debt, added to investor uncertainty. Between June 1, 2011 and September 30, 2011, the Russell 3000® Index returned roughly (-17%). This quickly changed in early-October, as domestic economic data improved. This caused investor concerns of a double-dip recession to evaporate and a strong rally ensued. Additionally, signs of progress in resolving the European debt crisis comforted investors and led to a return to the “risk-on” trade. The rally continued into the first quarter of 2012. In fact, the first quarter of 2012 was the strongest first quarter since 1998. Between October 1, 2011 and March 31, 2012, the Russell 3000® Index rallied nearly (+27%). Unfortunately, those developments have not led to much change in Europe as we continue to await a long-term solution. The European debt crisis reappeared on center stage during the second quarter and investors quickly adopted the “risk off” trade. Through May 31, 2012 the Russell 3000® Index was down nearly (+7%) during the second quarter. The end result of this choppy period was a modestly negative 12-month return for the Russell 3000® Index. Markets were volatile and investors remain uneasy. Most of the macro factors that caused markets to turn negative in mid-2011 remain.
Against this backdrop, the Managers Cadence Funds generated negative returns and, with the exception of Managers Cadence Emerging Companies Fund, lagged their respective benchmarks.
| | | | | | | | | | | | | | | | | | | | |
Periods Ended 05/31/2012 | | Six Months | | | One Year | | | Three Years | | | Five Years | | | Ten Years | |
Managers Cadence Capital Appreciation Fund | | | | | | | | | | | | | | | | | | | | |
Institutional Class | | | 1.17 | % | | | (5.10 | )% | | | 12.11 | % | | | (2.57 | )% | | | 2.80 | % |
Russell 1000® Growth Index | | | 6.82 | % | | | 1.49 | % | | | 16.89 | % | | | 2.01 | % | | | 4.72 | % |
Managers Cadence Focused Growth Fund | | | | | | | | | | | | | | | | | | | | |
Institutional Class | | | 1.82 | % | | | (5.13 | )% | | | 11.20 | % | | | (3.29 | )% | | | 4.15 | % |
Russell 1000® Growth Index | | | 6.82 | % | | | 1.49 | % | | | 16.89 | % | | | 2.01 | % | | | 4.72 | % |
Managers Cadence Mid-Cap Fund | | | | | | | | | | | | | | | | | | | | |
Institutional Class | | | 1.06 | % | | | (7.96 | )% | | | 16.01 | % | | | (0.78 | )% | | | 5.07 | % |
Russell Midcap® Growth Index | | | 4.50 | % | | | (6.31 | )% | | | 18.45 | % | | | 1.17 | % | | | 7.00 | % |
1
Letter to Shareholders (continued)
| | | | | | | | | | | | | | | | | | | | |
Periods Ended 05/31/2012 | | Six Months | | | One Year | | | Three Years | | | Five Years | | | Ten Years | |
Managers Cadence Emerging Companies Fund | | | | | | | | | | | | | | | | | | | | |
Institutional Class | | | 3.96 | % | | | (6.60 | )% | | | 21.63 | % | | | 1.38 | % | | | 5.96 | % |
Russell Microcap® Growth Index | | | 5.47 | % | | | (12.37 | )% | | | 15.37 | % | | | (2.52 | )% | | | 4.39 | % |
Russell 2000® Growth Index | | | 3.24 | % | | | (9.46 | )% | | | 17.37 | % | | | 0.85 | % | | | 5.91 | % |
For the fiscal year ended May 31, 2012, the Managers Cadence Capital Appreciation Fund returned (-5.10%), compared to (+1.49%) for the Russell 1000® Growth Index. The primary causes of underperformance were poor performance in the information technology and energy sectors, a slight tilt towards higher-beta stocks, and headwind from an unfavorable investment environment that often ignored fundamentals and was very macro driven. Decent results within the consumer staples sector were the most noteworthy positive during the fiscal year.
For the fiscal year ended May 31, 2012, the Managers Cadence Focused Growth Fund returned (-5.13%), compared to (+1.49%) for the Russell 1000® Growth Index. The primary causes of underperformance were poor performance in the information technology, industrials and energy sectors, and headwind from an unfavorable investment environment that often ignored fundamentals and was very macro driven. Strong performance in the consumer staples and consumer discretionary sectors partly offset the above detractors.
For the fiscal year ended May 31, 2012, the Managers Cadence Mid-Cap Fund returned (-7.96%), compared to Russell Midcap® Growth Index’s return of (-6.31%). Negative absolute results are consistent with the market’s preference for large-cap stocks during “risk off” time periods. The modest underperformance is due to a combination of factors. Poor performance within the industrials sector and unfavorable positioning in a challenging investment environment were the most notable detractors. Conversely, decent performance within the consumer staples sector helped relative performance and offset some of the detractors.
For the fiscal year ended May 31, 2012, the Managers Cadence Emerging Companies Fund returned (-6.60%) during the trailing 12 months and significantly outperformed the Russell Microcap® Growth Index, which returned (-12.37%). Disappointing absolute returns were driven by market preferences for large-cap stocks. Nevertheless, the Fund held up better than its Index due to strong performance within the consumer discretionary and materials sectors. Conversely, beta positioning relative to the Index and a challenging investment environment detracted from relative results.
The Cadence portfolio management team has provided a more detailed discussion of the performance of the Funds during the last year and its perspective on the investment environment in the management discussion and analysis section of this report.
The following report covers the one-year period ended May 31, 2012. Should you have any questions about this report, or if you’d like to receive a prospectus and additional information, including fees and expenses for these or any of the other Funds in our family, please feel free to contact us at 1-800-835-3879, or visit our Web site at www.managersinvest.com. As always, please read the prospectus carefully before you invest or send money.
You can rest assured that under all market conditions our team is focused on delivering excellent investment management services for your benefit.
We thank you for your continued confidence and investment in The Managers Funds.
|
| Respectfully, |
|
/s/ Keitha Kinne |
| Keitha Kinne |
| Managing Partner |
| Managers Investment Group LLC |
2
About Your Fund’s Expenses
As a shareholder of a Fund, you may incur two types of costs: (1) transaction costs, which may include sales charges (loads) on purchase payments; redemption fees; and exchange fees; and (2) ongoing costs, including management fees; distribution (12b-1) fees; and other Fund expenses. This example is intended to help you understand your ongoing costs (in dollars) of investing in the Fund and to compare these costs with the ongoing costs of investing in other mutual funds. The example is based on $1,000 invested at the beginning of the period and held for the entire period as indicated below.
Actual Expenses
The first line of the following table provides information about the actual account values and actual expenses. You may use the information in this line, together with the amount you invested, to estimate the expenses that you paid over the period. Simply divide your account value by $1,000 (for example, an $8,600 account value divided by $1,000 = 8.6), then multiply the result by the number in the first line under the heading entitled “Expenses Paid During Period” to estimate the expenses you paid on your account during this period.
Hypothetical Example for Comparison Purposes
The second line of the following table provides information about hypothetical account values and hypothetical expenses based on the Fund’s actual expense ratio and an assumed annual rate of return of 5% before expenses, which is not the Fund’s actual return. The hypothetical account values and expenses may not be used to estimate the actual ending account balance or expenses you paid for the period. You may use this information to compare the ongoing costs of investing in the Fund and other funds by comparing this 5% hypothetical example with the 5% hypothetical examples that appear in the shareholder reports of other funds.
Please note that the expenses shown in the table are meant to highlight your ongoing costs only and do not reflect any transactional costs, such as sales charges (loads), redemption fees, or exchange fees. Therefore, the second line of the table is useful in comparing ongoing costs only, and will not help you determine the relative total costs of owning different funds.
| | | | | | | | | | | | | | | | |
Six Months Ended May 31, 2012 | | Expense
Ratio for
the Period | | | Beginning
Account Value
12/01/2011 | | | Ending
Account Value
05/31/2012 | | | Expenses
Paid During
the Period* | |
Managers Cadence Capital Appreciation Fund | | | | | | | | | | | | | | | | |
Class A | | | | | | | | | | | | | | | | |
Based on Actual Fund Return | | | 1.12 | % | | $ | 1,000 | | | $ | 936 | | | $ | 5.42 | |
Hypothetical (5% return before expenses) | | | 1.12 | % | | $ | 1,000 | | | $ | 1,019 | | | $ | 5.65 | |
Class B | | | | | | | | | | | | | | | | |
Based on Actual Fund Return | | | 1.87 | % | | $ | 1,000 | | | $ | 933 | | | $ | 9.03 | |
Hypothetical (5% return before expenses) | | | 1.87 | % | | $ | 1,000 | | | $ | 1,016 | | | $ | 9.42 | |
Class C | | | | | | | | | | | | | | | | |
Based on Actual Fund Return | | | 1.88 | % | | $ | 1,000 | | | $ | 933 | | | $ | 9.08 | |
Hypothetical (5% return before expenses) | | | 1.88 | % | | $ | 1,000 | | | $ | 1,016 | | | $ | 9.47 | |
Class D | | | | | | | | | | | | | | | | |
Based on Actual Fund Return | | | 1.12 | % | | $ | 1,000 | | | $ | 937 | | | $ | 5.42 | |
Hypothetical (5% return before expenses) | | | 1.12 | % | | $ | 1,000 | | | $ | 1,019 | | | $ | 5.65 | |
Institutional Class | | | | | | | | | | | | | | | | |
Based on Actual Fund Return | | | 0.72 | % | | $ | 1,000 | | | $ | 938 | | | $ | 3.49 | |
Hypothetical (5% return before expenses) | | | 0.72 | % | | $ | 1,000 | | | $ | 1,021 | | | $ | 3.64 | |
Administrative Class | | | | | | | | | | | | | | | | |
Based on Actual Fund Return | | | 0.97 | % | | $ | 1,000 | | | $ | 937 | | | $ | 4.70 | |
Hypothetical (5% return before expenses) | | | 0.97 | % | | $ | 1,000 | | | $ | 1,020 | | | $ | 4.90 | |
Class P | | | | | | | | | | | | | | | | |
Based on Actual Fund Return | | | 0.79 | % | | $ | 1,000 | | | $ | 938 | | | $ | 3.83 | |
Hypothetical (5% return before expenses) | | | 0.79 | % | | $ | 1,000 | | | $ | 1,021 | | | $ | 3.99 | |
Class R | | | | | | | | | | | | | | | | |
Based on Actual Fund Return | | | 1.37 | % | | $ | 1,000 | | | $ | 935 | | | $ | 6.63 | |
Hypothetical (5% return before expenses) | | | 1.37 | % | | $ | 1,000 | | | $ | 1,018 | | | $ | 6.91 | |
3
About Your Fund’s Expenses (continued)
| | | | | | | | | | | | | | | | |
Six Months Ended May 31, 2012 | | Expense
Ratio for
the Period | | | Beginning
Account Value
12/01/2011 | | | Ending
Account Value
05/31/2012 | | | Expenses
Paid During
the Period* | |
Managers Cadence Focused Growth Fund | | | | | | | | | | | | | | | | |
Class A | | | | | | | | | | | | | | | | |
Based on Actual Fund Return | | | 1.07 | % | | $ | 1,000 | | | $ | 930 | | | $ | 5.16 | |
Hypothetical (5% return before expenses) | | | 1.07 | % | | $ | 1,000 | | | $ | 1,020 | | | $ | 5.40 | |
Class C | | | | | | | | | | | | | | | | |
Based on Actual Fund Return | | | 1.85 | % | | $ | 1,000 | | | $ | 927 | | | $ | 8.91 | |
Hypothetical (5% return before expenses) | | | 1.85 | % | | $ | 1,000 | | | $ | 1,016 | | | $ | 9.32 | |
Class D | | | | | | | | | | | | | | | | |
Based on Actual Fund Return | | | 1.13 | % | | $ | 1,000 | | | $ | 931 | | | $ | 5.45 | |
Hypothetical (5% return before expenses) | | | 1.13 | % | | $ | 1,000 | | | $ | 1,019 | | | $ | 5.70 | |
Institutional Class | | | | | | | | | | | | | | | | |
Based on Actual Fund Return | | | 0.76 | % | | $ | 1,000 | | | $ | 932 | | | $ | 3.67 | |
Hypothetical (5% return before expenses) | | | 0.76 | % | | $ | 1,000 | | | $ | 1,021 | | | $ | 3.84 | |
Administrative Class | | | | | | | | | | | | | | | | |
Based on Actual Fund Return | | | 0.79 | % | | $ | 1,000 | | | $ | 932 | | | $ | 3.81 | |
Hypothetical (5% return before expenses) | | | 0.79 | % | | $ | 1,000 | | | $ | 1,021 | | | $ | 3.99 | |
Class P | | | | | | | | | | | | | | | | |
Based on Actual Fund Return | | | 0.82 | % | | $ | 1,000 | | | $ | 932 | | | $ | 3.96 | |
Hypothetical (5% return before expenses) | | | 0.82 | % | | $ | 1,000 | | | $ | 1,021 | | | $ | 4.14 | |
Managers Cadence Mid-Cap Fund | | | | | | | | | | | | | | | | |
Class A | | | | | | | | | | | | | | | | |
Based on Actual Fund Return | | | 1.12 | % | | $ | 1,000 | | | $ | 909 | | | $ | 5.34 | |
Hypothetical (5% return before expenses) | | | 1.12 | % | | $ | 1,000 | | | $ | 1,019 | | | $ | 5.65 | |
Class B | | | | | | | | | | | | | | | | |
Based on Actual Fund Return | | | 1.87 | % | | $ | 1,000 | | | $ | 906 | | | $ | 8.91 | |
Hypothetical (5% return before expenses) | | | 1.87 | % | | $ | 1,000 | | | $ | 1,016 | | | $ | 9.42 | |
Class C | | | | | | | | | | | | | | | | |
Based on Actual Fund Return | | | 1.87 | % | | $ | 1,000 | | | $ | 906 | | | $ | 8.91 | |
Hypothetical (5% return before expenses) | | | 1.87 | % | | $ | 1,000 | | | $ | 1,016 | | | $ | 9.42 | |
Class D | | | | | | | | | | | | | | | | |
Based on Actual Fund Return | | | 1.12 | % | | $ | 1,000 | | | $ | 909 | | | $ | 5.35 | |
Hypothetical (5% return before expenses) | | | 1.12 | % | | $ | 1,000 | | | $ | 1,019 | | | $ | 5.65 | |
Institutional Class | | | | | | | | | | | | | | | | |
Based on Actual Fund Return | | | 0.72 | % | | $ | 1,000 | | | $ | 911 | | | $ | 3.44 | |
Hypothetical (5% return before expenses) | | | 0.72 | % | | $ | 1,000 | | | $ | 1,021 | | | $ | 3.64 | |
Administrative Class | | | | | | | | | | | | | | | | |
Based on Actual Fund Return | | | 0.97 | % | | $ | 1,000 | | | $ | 910 | | | $ | 4.63 | |
Hypothetical (5% return before expenses) | | | 0.97 | % | | $ | 1,000 | | | $ | 1,020 | | | $ | 4.90 | |
Class P | | | | | | | | | | | | | | | | |
Based on Actual Fund Return | | | 0.84 | % | | $ | 1,000 | | | $ | 910 | | | $ | 4.01 | |
Hypothetical (5% return before expenses) | | | 0.84 | % | | $ | 1,000 | | | $ | 1,021 | | | $ | 4.24 | |
Class R | | | | | | | | | | | | | | | | |
Based on Actual Fund Return | | | 1.37 | % | | $ | 1,000 | | | $ | 908 | | | $ | 6.53 | |
Hypothetical (5% return before expenses) | | | 1.37 | % | | $ | 1,000 | | | $ | 1,018 | | | $ | 6.91 | |
Managers Cadence Emerging Companies Fund | | | | | | | | | | | | | | | | |
Institutional Class | | | | | | | | | | | | | | | | |
Based on Actual Fund Return | | | 1.42 | % | | $ | 1,000 | | | $ | 899 | | | $ | 6.74 | |
Hypothetical (5% return before expenses) | | | 1.42 | % | | $ | 1,000 | | | $ | 1,018 | | | $ | 7.16 | |
Administrative Class | | | | | | | | | | | | | | | | |
Based on Actual Fund Return | | | 1.64 | % | | $ | 1,000 | | | $ | 897 | | | $ | 7.78 | |
Hypothetical (5% return before expenses) | | | 1.64 | % | | $ | 1,000 | | | $ | 1,017 | | | $ | 8.27 | |
| * | Expenses are equal to the Fund’s annualized expense ratio multiplied by the average account value over the period, multiplied by the number of days in the most recent fiscal half-year (183), then divided by 366. |
4
Managers Cadence Capital Appreciation Fund
Investment Manager’s Comments
For the fiscal year ended May 31, 2012, the Managers Cadence Capital Appreciation Fund (the “Fund”) returned (-5.10%), lagging its benchmark, the Russell 1000® Growth Index, which returned (+1.49%).
Market Review
While we had some good news and periods of strong performance, the fiscal year ending May 31, 2012 started on a shaky note. After months of carefully planned financial stimulus and cautiously optimistic reports of a strengthening economy, even the Federal Reserve had to admit in Spring 2011 that the economic data was worse than expected. Not coincidentally, U.S. equity market benchmarks turned negative during the middle of 2011 before a sharp decline in late-Summer. The market volatility reflected growing concern over the Federal Reserve’s withdrawal of its Quantitative Easing policy (QE2), which was recently extended in June 2012, and questions over the U.S. economy’s ability to self-sustain without the cash infusion. Continued social unrest in the Middle East, decelerating growth in China, continued concerns over Eurozone sovereign debt and a potential collapse of the Euro added to the fears. Even though the U.S. did not double-dip into a recession, the modest (+2%) growth rate continued to feel recessionary to many Americans.
Macroeconomic drivers returned to the forefront of the investment landscape in the fall of 2011, and the backdrop turned gloomy. The U.S. continued to face high unemployment, volatile commodity prices, a persistently weak housing sector and widening credit spreads, indicating market stress. Fiscal and political turmoil in Washington led to a U.S. debt downgrade, and expectations for growth in America were muted at best. Abroad, Eurozone countries continued to struggle through their financial crisis, while growth in China slowed and Greece hovered on the precipice of default.
Understandably, investors were nervous. In the fall of 2011, we saw many investors questioning their investment strategies, and even large institutions pulling out of stocks at potentially the worst time. Yet at the same time, counter-intuitively, we saw companies thriving across all sectors. We were able to make sound, well-priced investments in companies with strong revenues and earnings, high levels of productivity, and record cash on their balance sheets. While market downturns are often painful, they can provide compelling buying opportunities for long-term investors.
During October the market rebounded sharply. Some broad indexes were up over (+20%). Strong performance was driven by increased confidence about the U.S. recovery and that the Eurozone crisis would be resolved. The last two months of 2011 were relatively flat, but volatile, after the sharp October rebound. The first quarter of 2012 saw an acceleration of the upward trend. Most U.S. equity indexes were up another 15-20% before markets turned downward in April as Eurozone issues returned to the forefront. Additionally, U.S. economic data was less favorable and caused investors to, again, question the sustainability of the economic recovery. Investors were also concerned about slowing growth in China and if emerging market growth would be enough to overshadow major fiscal issues in developed nations. Markets fell 5-10% during the first two months of 2012.
Performance Review
The Fund generated a negative absolute return and lagged its benchmark during the trailing 12-month period. The Fund was hurt by an unfavorable investment environment that created headwind for the process, poor performance within the information technology and energy sectors, and a tilt towards higher-beta stocks. During the trailing 12-month period, macro factors frequently dominated and fundamentals were often ignored. This often creates headwind for our fundamentally-based, growth-at-a-reasonable-price investment strategy. Correlations across stocks were often elevated and volatility indicators fluctuated with macro concerns. This creates a less favorable environment for fundamentally-based investment managers. We believe volatility creates good long-term investment opportunities, but the macro-environment was a headwind.
From an attribution perspective, stock selection within the information technology sector was the key detractor. The largest individual detractor, on a relative basis, was Apple, Inc. (“Apple”). Apple returned (+66.1%) during the fiscal year. We like Apple as an investment and held it in the Fund throughout the fiscal year. However, our investment process limits us from matching the position size within the Index. As a result, our underweight was a significant contributor to relative returns. BMC Software, Inc. (-42.7%) and Autodesk, Inc. (-37.0%) were additional information technology stocks that hurt performance.
Our investment process and quantitative screens have produced a tilt towards higher-beta stocks relative to the Index. This is primarily a bottom-up decision because these stocks have a more attractive combination of growth potential and valuations. Many “defensive” stocks appear overvalued relative to their history. This tilt hurt performance because during the trailing 12-month period, the highest-beta quintile of the Russell 1000® Growth Index returned (-20.6%), compared to (+10.4%) for the lowest-beta quintile. The Fund had a slight overweight to higher-beta stocks and a slight underweight to lower-beta stocks. We continue to believe our patience will be rewarded as these stocks remain attractive.
The abovementioned detractors were partly offset by decent performance within the consumer staples sector. Whole Foods Market, Inc. (+45.9%), The Hershey Company (+10.8%) and Estee Lauder Co., Class A (+10.5%) all helped relative performance. Very good results in this sector were not enough to overcome headwind from market preferences, portfolio positioning and the information technology sector.
Outlook
We believe the remainder of 2012 is likely to feature a slow-growth world and a slowly recovering market. We believe the Cadence portfolios should do well in this environment. The data show that while cheapness tends to move stocks off their troughs, quality and dependability buoy companies in tough markets. This is because when growth is perceived as scarce, investors tend to be skeptical and will therefore pay up for quality, growing companies. Our disciplined strategies thrived in a similar environment in 2004, as we transitioned away from the sharp initial upturn in 2003.
5
Managers Cadence Capital Appreciation Fund
Investment Manager’s Comments (continued)
Overall, we have taken a balanced approach to investing in growth companies, including both secular and cyclical growers in the Fund. We have also remained true to our valuation discipline, buying growing companies at prices that make sense. Short-term our insistence on good value has been a headwind, but long-term it has served our investors well. We believe the Fund is comprised of high-quality companies purchased at reasonable prices. While larger companies have been more affected by global macroeconomic events in general, Cadence portfolios tend to exhibit greater percentages of rising estimates and positive surprises than the Russell 1000® Growth Index. Similarly, the Fund has often produced a smaller percentage of negative surprises than the index.
In this environment, we feel patience is the key. With the market so distracted by macroeconomic events — and market swings a reaction to broad-based news rather than specific company fundamentals — bottom-up investors who pick each stock based on its individual merit must weather the storm. We continue to believe fundamentals matter and our disciplined investment process will be rewarded.
This commentary reflects the viewpoints of Cadence Capital Management, LLC as of May 31, 2012 and is not intended as a forecast or guarantee of future results.
CUMULATIVE TOTAL RETURN PERFORMANCE
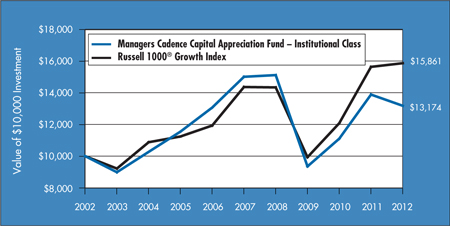
Managers Cadence Capital Appreciation Fund’s cumulative total return is based on the daily change in net asset value (NAV), and assumes that all dividends and distributions were reinvested. This graph compares a hypothetical $10,000 investment made in Managers Cadence Capital Appreciation Fund’s Institutional Class on May 31, 2002, compared to a $10,000 investment made in the Russell 1000® Growth Index for the same time period. Performance for periods longer than one year is annualized. The graph and table do not reflect the deduction of taxes that a shareholder would pay on a Fund distribution or redemption of shares. The listed returns for the Fund are net of expenses and the returns for the index exclude expenses. Past performance is not indicative of future results. Total returns would have been lower had certain expenses not been reduced.
6
Managers Cadence Capital Appreciation Fund
Investment Manager’s Comments (continued)
CUMULATIVE TOTAL RETURN PERFORMANCE (continued)
The table below shows the average annual total returns for the Managers Cadence Capital Appreciation Fund since inception through May 31, 2012, and the Russell 1000® Growth Index for the same periods.
| | | | | | | | | | | | | | | | | | | | | | |
| | | | | Average Annual Total Returns1 | |
| | | | | One Year | | | Five Years | | | Ten Years | | | Since
Inception | | | Inception
Date | |
Managers Cadence Capital Appreciation Fund 2,3,4,5,6,* | | | | | | | | | | | | | | | | | | | | |
Class A | | No Load | | | (5.50 | )% | | | (2.96 | )% | | | 2.38 | % | | | 4.62 | % | | | 01/20/1997 | |
Class A | | With Load | | | (10.93 | )% | | | (4.11 | )% | | | 1.78 | % | | | 4.22 | % | | | 01/20/1997 | |
Class B | | No Load | | | (6.24 | )% | | | (3.69 | )% | | | 1.61 | % | | | 3.84 | % | | | 01/20/1997 | |
Class B | | With Load | | | (10.93 | )% | | | (4.04 | )% | | | 1.61 | % | | | 3.84 | % | | | 01/20/1997 | |
Class C | | No Load | | | (6.22 | )% | | | (3.67 | )% | | | 1.63 | % | | | 3.85 | % | | | 01/20/1997 | |
Class C | | With Load | | | (7.16 | )% | | | (3.67 | )% | | | 1.63 | % | | | 3.85 | % | | | 01/20/1997 | |
Class D | | | | | (5.52 | )% | | | (2.96 | )% | | | 2.39 | % | | | 2.48 | % | | | 04/08/1998 | |
Institutional Class | | | | | (5.10 | )% | | | (2.57 | )% | | | 2.80 | % | | | 8.62 | % | | | 03/08/1991 | |
Administrative Class | | | | | (5.38 | )% | | | (2.81 | )% | | | 2.56 | % | | | 6.17 | % | | | 07/31/1996 | |
Class P | | | | | (5.18 | )% | | | — | | | | — | | | | (0.99 | )% | | | 07/07/2008 | |
Class R | | | | | (5.75 | )% | | | (3.20 | )% | | | — | | | | 4.62 | % | | | 12/31/2002 | |
Russell 1000® Growth Index 7 | | | 1.49 | % | | | 2.01 | % | | | 4.72 | % | | | — | 8 | | | 03/08/1991 | † |
The performance data shown represents past performance. Past performance is not a guarantee of future results. Current performance may be lower or higher than the performance data quoted. The investment return and principal value of an investment in the Fund will fluctuate so that an investor’s shares, when redeemed, may be worth more or less than their original cost. For performance information through the most recent month end, please call (800) 835-3879 or visit our Web site at www.managersinvest.com.
Performance differences among the share classes are due to differences in sales charge structures and class expenses. Returns shown reflect maximum sales charge of 5.75% on Class A shares. Maximum sales charge on Class B shares is 5.00% up to six years from the date of purchase. Class C shares held for less than one year are subject to a 1.00% contingent deferred sales charge (CDSC).
|
Investors should carefully consider the Fund’s investment objectives, risks, charges, and expenses before investing. For this and other information, please call 800.835.3879 or visit |
| | |
www.managersinvest.com for a free prospectus. Read it carefully before investing or sending money. Funds are distributed by Managers Distributors, Inc., a member of FINRA. † Date reflects inception date of the Fund, not the index. * The Fund changed its fiscal year end from June 30 to May 31 in 2011. 1 Total return equals income yield plus share price change and assumes reinvestment of all dividends and capital gain distributions. Returns are net of fees and may reflect offsets of Fund expenses as described in the Prospectus. No adjustment has been made for taxes payable by shareholders on their reinvested dividends and capital gain distributions. Returns for periods greater than one year are annualized. The listed returns on the Fund are net of expenses and based on the published NAV as of May 31, 2012. All returns are in U.S. dollars ($). 2 From time to time, the Fund’s advisor has waived its fees and/or absorbed Fund expenses, which has resulted in higher returns. 3 A greater percentage of the Fund’s holdings may be focused in a smaller number of securities which may place the Fund at greater risk than a more diversified fund. 4 The Fund invests in growth stocks, which may be more sensitive to market movements because their prices tend to reflect future investor expectations rather than just current profits. Growth stocks may underperform value stocks during given periods. |
5 | | The Fund invests in large-capitalization companies that may underperform other stock funds (such as funds that focus on small-and medium-capitalization companies) when stocks of large-capitalization companies are out of favor. |
6 The Fund is subject to special risk considerations similar to those associated with the direct ownership of real estate. Real estate valuations may be subject to factors such as changing general and local economic, financial, competitive, and environmental conditions. 7 The Russell 1000® Growth Index is a market capitalization weighted index that measures the performance of those Russell 1000® companies with higher price-to-book ratios and higher forecasted growth values. Unlike the Fund, the Russell 1000® Growth Index is unmanaged, is not available for investment and does not incur expenses. 8 Since the Russell 1000® Growth Index’s Inception date of June 1, 1995, the average annual total return for the index was 6.68%. The Russell 1000® Growth Index is a registered trademark of Russell Investments. Russell® is a trademark of Russell Investments. Not FDIC insured, nor bank guaranteed. May lose value. |
7
Managers Cadence Capital Appreciation Fund
Fund Snapshots
May 31, 2012
Portfolio Breakdown (unaudited)
| | | | | | | | |
Industry | | Managers Cadence Capital
Appreciation Fund** | | | Russell 1000®
Growth Index | |
Information Technology | | | 30.0 | % | | | 29.6 | % |
Consumer Discretionary | | | 19.9 | % | | | 14.8 | % |
Industrials | | | 12.7 | % | | | 12.2 | % |
Health Care | | | 11.0 | % | | | 10.7 | % |
Energy | | | 8.3 | % | | | 9.5 | % |
Consumer Staples | | | 7.3 | % | | | 12.7 | % |
Financials | | | 6.2 | % | | | 4.3 | % |
Materials | | | 3.8 | % | | | 5.2 | % |
Telecommunication Services | | | 0.0 | % | | | 0.9 | % |
Utilities | | | 0.0 | % | | | 0.1 | % |
Other Assets and Liabilities | | | 0.8 | % | | | 0.0 | % |
| ** | As a percentage of net assets |
Top Ten Holdings (unaudited)
| | | | |
Security Name | | % of
Net Assets | |
Google, Inc., Class A* | | | 2.5 | % |
QUALCOMM, Inc.* | | | 2.5 | |
JPMorgan Chase & Co. | | | 1.8 | |
Procter & Gamble Co., The | | | 1.6 | |
Paychex, Inc. | | | 1.5 | |
Norfolk Southern Corp. | | | 1.5 | |
Stryker Corp. | | | 1.4 | |
Clorox Co., The | | | 1.4 | |
Cooper Cos., Inc., The | | | 1.4 | |
Occidental Petroleum Corp. | | | 1.4 | |
| | | | |
Top Ten as a Group | | | 17.0 | % |
| | | | |
| * | Top Ten Holding at November 30, 2011 |
|
| Any sectors, industries, or securities discussed should not be perceived as investment recommendations. Mention of a specific security should not be considered a recommendation to buy or solicitation to sell that security. Specific securities mentioned in this report may have been sold from the Fund’s portfolio of investments by the time you receive this report. |
8
Managers Cadence Capital Appreciation Fund
Schedule of Portfolio Investments
May 31, 2012
| | | | | | | | |
| | | Shares | | | Value | |
| | | | | | | | |
Common Stocks - 99.2% | | | | | | | | |
Consumer Discretionary - 19.9% | | | | | |
Bed Bath & Beyond, Inc.* | | | 99,920 | | | $ | 7,219,220 | |
CBS Corp., Class B | | | 250,340 | | | | 7,990,853 | |
Chipotle Mexican Grill, Inc.* | | | 16,790 | | | | 6,935,445 | |
Coach, Inc. | | | 116,880 | | | | 7,883,556 | |
Ford Motor Co. | | | 743,720 | | | | 7,853,683 | |
Genuine Parts Co. | | | 105,650 | | | | 6,655,950 | |
Harley-Davidson, Inc. | | | 165,790 | | | | 7,987,762 | |
Limited Brands, Inc. | | | 147,620 | | | | 6,548,423 | |
Lululemon Athletica, Inc.* | | | 69,940 | | | | 5,080,442 | |
McDonald’s Corp. | | | 72,650 | | | | 6,490,551 | |
NIKE, Inc., Class B | | | 76,140 | | | | 8,236,825 | |
Nordstrom, Inc. | | | 155,200 | | | | 7,351,824 | |
Omnicom Group, Inc. | | | 175,270 | | | | 8,356,874 | |
priceline.com, Inc.* | | | 9,730 | | | | 6,086,018 | |
PVH Corp. | | | 67,750 | | | | 5,487,750 | |
Ralph Lauren Corp. | | | 53,490 | | | | 7,959,312 | |
Starbucks Corp. | | | 125,260 | | | | 6,875,521 | |
TJX Cos., Inc. | | | 161,910 | | | | 6,874,699 | |
Total Consumer Discretionary | | | | | | | 127,874,708 | |
Consumer Staples - 7.3% | | | | | |
Clorox Co., The | | | 135,440 | | | | 9,318,272 | |
Costco Wholesale Corp. | | | 96,270 | | | | 8,316,765 | |
Kroger Co., The | | | 343,530 | | | | 7,561,095 | |
Philip Morris International, Inc. | | | 95,620 | | | | 8,080,846 | |
Procter & Gamble Co., The | | | 165,380 | | | | 10,301,520 | |
Whole Foods Market, Inc. | | | 42,270 | | | | 3,745,545 | |
Total Consumer Staples | | | | | | | 47,324,043 | |
Energy - 8.3% | | | | | | | | |
Anadarko Petroleum Corp. | | | 145,460 | | | | 8,873,060 | |
Chevron Corp. | | | 79,260 | | | | 7,792,051 | |
Halliburton Co. | | | 275,090 | | | | 8,269,205 | |
Murphy Oil Corp. | | | 155,130 | | | | 7,232,161 | |
National Oilwell Varco, Inc. | | | 134,610 | | | | 8,985,218 | |
Occidental Petroleum Corp. | | | 115,030 | | | | 9,118,428 | |
Range Resources Corp. | | | 49,880 | | | | 2,865,107 | |
Total Energy | | | | | | | 53,135,230 | |
Financials - 6.2% | | | | | | | | |
Discover Financial Services | | | 211,460 | | | | 7,001,441 | |
JPMorgan Chase & Co. | | | 356,340 | | | | 11,812,671 | |
Northern Trust Corp. | | | 150,080 | | | | 6,480,454 | |
T. Rowe Price Group, Inc. | | | 109,260 | | | | 6,292,283 | |
| | | | | | | | |
| | | Shares | | | Value | |
| | | | | | | | |
Wells Fargo & Co. | | | 255,620 | | | $ | 8,192,621 | |
Total Financials | | | | | | | 39,779,470 | |
Health Care - 11.0% | | | | | | | | |
Abbott Laboratories | | | 134,310 | | | | 8,299,015 | |
Agilent Technologies, Inc. | | | 193,010 | | | | 7,847,787 | |
Biogen Idec, Inc.* | | | 56,010 | | | | 7,323,308 | |
Cardinal Health, Inc. | | | 188,230 | | | | 7,788,957 | |
Cooper Cos., Inc., The | | | 107,680 | | | | 9,172,182 | |
Covidien PLC | | | 157,160 | | | | 8,137,745 | |
Intuitive Surgical, Inc.* | | | 9,880 | | | | 5,168,228 | |
Johnson & Johnson | | | 128,670 | | | | 8,032,868 | |
Stryker Corp. | | | 182,220 | | | | 9,375,219 | |
Total Health Care | | | | | | | 71,145,309 | |
Industrials - 12.7% | | | | | | | | |
Chicago Bridge & Iron Co., N.V. | | | 170,360 | | | | 6,122,738 | |
Cummins, Inc. | | | 59,100 | | | | 5,729,745 | |
Expeditors International of Washington, Inc. | | | 221,170 | | | | 8,459,753 | |
Honeywell International, Inc. | | | 137,020 | | | | 7,626,533 | |
Joy Global, Inc. | | | 117,152 | | | | 6,544,111 | |
Norfolk Southern Corp. | | | 143,190 | | | | 9,381,809 | |
Owens Corning* | | | 199,520 | | | | 6,157,187 | |
PACCAR, Inc. | | | 211,840 | | | | 7,958,829 | |
Parker Hannifin Corp. | | | 79,230 | | | | 6,476,260 | |
Stericycle, Inc.* | | | 96,830 | | | | 8,449,386 | |
United Technologies Corp. | | | 119,750 | | | | 8,874,673 | |
Total Industrials | | | | | | | 81,781,024 | |
Information Technology - 30.0% | | | | | |
Accenture PLC, Class A | | | 118,980 | | | | 6,793,758 | |
Adobe Systems, Inc.* | | | 256,960 | | | | 7,978,608 | |
Amphenol Corp., Class A | | | 144,920 | | | | 7,708,295 | |
Apple, Inc.* | | | 14,330 | | | | 8,278,871 | |
Applied Materials, Inc. | | | 683,080 | | | | 7,056,216 | |
Autodesk, Inc.* | | | 204,120 | | | | 6,535,922 | |
Broadcom Corp.,
Class A* | | | 229,260 | | | | 7,416,561 | |
Cisco Systems, Inc. | | | 144,080 | | | | 2,352,826 | |
Citrix Systems, Inc.* | | | 85,800 | | | | 6,270,264 | |
Cognizant Technology Solutions Corp.,
Class A* | | | 119,680 | | | | 6,971,360 | |
EMC Corp.* | | | 381,030 | | | | 9,087,566 | |
F5 Networks, Inc.* | | | 71,600 | | | | 7,409,168 | |
Fortinet, Inc.* | | | 244,230 | | | | 5,189,888 | |
Google, Inc., Class A* | | | 27,360 | | | | 15,892,330 | |
Lam Research Corp.* | | | 128,410 | | | | 4,789,693 | |
Marvell Technology Group, Ltd. | | | 479,700 | | | | 6,010,641 | |
The accompanying notes are an integral part of these financial statements.
9
Managers Cadence Capital Appreciation Fund
Schedule of Portfolio Investments (continued)
| | | | | | | | |
| | | Shares | | | Value | |
| | | | | | | | |
Information Technology - 30.0% (continued) | | | | | | | | |
Microsoft Corp. | | | 285,130 | | | $ | 8,322,945 | |
Paychex, Inc. | | | 314,260 | | | | 9,418,372 | |
QUALCOMM, Inc. | | | 276,640 | | | | 15,854,238 | |
Red Hat, Inc.* | | | 106,880 | | | | 5,491,494 | |
Teradata Corp.* | | | 75,210 | | | | 4,999,961 | |
TIBCO Software, Inc.* | | | 271,680 | | | | 7,267,440 | |
Trimble Navigation, Ltd.* | | | 164,170 | | | | 7,743,078 | |
VeriFone Systems, Inc.* | | | 193,630 | | | | 6,991,979 | |
Visa, Inc., Class A | | | 43,560 | | | | 5,018,112 | |
VMware, Inc., Class A* | | | 67,530 | | | | 6,280,965 | |
Total Information Technology | | | | | | | 193,130,551 | |
Materials - 3.8% | | | | | | | | |
CF Industries Holdings, Inc. | | | 46,430 | | | | 7,937,673 | |
| | | | | | | | |
| | | Shares | | | Value | |
| | | | | | | | |
Cliffs Natural Resources, Inc. | | | 130,540 | | | $ | 6,237,201 | |
Freeport-McMoRan Copper & Gold, Inc., Class B | | | 206,832 | | | | 6,626,897 | |
Sherwin-Williams Co., The | | | 26,410 | | | | 3,423,792 | |
Total Materials | | | | | | | 24,225,563 | |
Total Common Stocks
(cost $638,471,882) | | | | | | | 638,395,898 | |
Other Investment Companies - 0.7%1 | | | | | | | | |
Dreyfus Cash Management Fund, Institutional Class Shares, 0.09%
(cost $4,516,454) | | | 4,516,454 | | | | 4,516,454 | |
Total Investments - 99.9%
(cost $642,988,336) | | | | | | | 642,912,352 | |
Other Assets, less Liabilities - 0.1% | | | | 541,781 | |
Net Assets - 100.0% | | | | | | $ | 643,454,133 | |
The accompanying notes are an integral part of these financial statements.
10
Managers Cadence Focused Growth Fund
Investment Manager’s Comments
For the fiscal year ended May 31, 2012, the Managers Cadence Focused Growth Fund (the “Fund”) returned (-5.13%), lagging its benchmark, the Russell 1000® Growth Index, which returned (+1.49%).
Market Review
While we had some good news and periods of strong performance, the fiscal year ending May 31, 2012 started on a shaky note. After months of carefully planned financial stimulus and cautiously optimistic reports of a strengthening economy, even the Federal Reserve had to admit in Spring 2011 that the economic data was worse than expected. Not coincidentally, U.S. equity market benchmarks turned negative during the middle of 2011 before a sharp decline in late-Summer. The market volatility reflected growing concern over the Federal Reserve’s withdrawal of its Quantitative Easing policy (QE2), which was recently extended in June 2012, and questions over the U.S. economy’s ability to self-sustain without the cash infusion. Continued social unrest in the Middle East, decelerating growth in China, continued concerns over Eurozone sovereign debt and a potential collapse of the euro added to the fears. Even though the U.S. did not double-dip into a recession, the modest (+2%) growth rate continued to feel recessionary to many Americans.
Macroeconomic drivers returned to the forefront of the investment landscape in the fall of 2011, and the backdrop turned gloomy. The U.S. continued to face high unemployment, volatile commodity prices, a persistently weak housing sector and widening credit spreads, indicating market stress. Fiscal and political turmoil in Washington led to a U.S. debt downgrade, and expectations for growth in America were muted at best. Abroad, Eurozone countries continued to struggle through their financial crisis, while growth in China slowed and Greece hovered on the precipice of default.
Understandably, investors were nervous. In the fall of 2011, we saw many investors questioning their investment strategies, and even large institutions pulling out of stocks at potentially the worst time. Yet at the same time, counter-intuitively, we saw companies thriving across all sectors. We were able to make sound, well-priced investments in companies with strong revenues and earnings, high levels of productivity, and record cash on their balance sheets. While market downturns are often painful, they can provide compelling buying opportunities for long-term investors.
During October the market rebounded sharply. Some broad indexes were up over (+20%). Strong performance was driven by increased confidence about the U.S. recovery and that the Eurozone crisis would be resolved. The last two months of 2011 were relatively flat, but volatile, after the sharp October rebound. The first quarter of 2012 saw an acceleration of the upward trend. Most U.S. equity indexes were up another 15-20% before markets turned downward in April as Eurozone issues returned to the forefront. Additionally, U.S. economic data was less favorable and caused investors to, again, question the sustainability of the economic recovery. Investors were also concerned about slowing growth in China and if emerging market growth would be enough to overshadow major fiscal issues in developed nations. Markets fell 5-10% during the first two months of 2012.
Performance Review
The Fund generated a negative absolute return and meaningfully lagged its benchmark during the trailing 12-month period. A combination of factors contributed to the underperformance. In particular, the Fund was hurt by an unfavorable investment environment that created headwind and poor performance within the information technology, industrials and energy sectors. Beta positioning relative to the Index also hurt performance. During the trailing 12-month period, macro factors frequently dominated and fundamentals were often ignored. This often creates headwind for our fundamentally-based, growth-at-a-reasonable-price investment strategy. Correlations across stocks were often elevated and volatility indicators fluctuated with macro concerns. This creates a less favorable environment for fundamentally-based investment managers. We believe volatility creates good long-term investment opportunities, but the macro-environment was a headwind.
From an attribution perspective, stock selection within the information technology sector was the key detractor. The largest individual detractor, on a relative basis, was Apple, Inc. (“Apple”). Apple returned (+66.1%) during the fiscal year. We like Apple as an investment and held it in the Fund throughout the fiscal year. However, our investment process limits us from matching the position size within the Index. As a result, our underweight was a significant contributor to relative returns. Juniper Networks, Inc. (-42.3%) and Applied Materials, Inc. (-30.2%) were other information technology holdings that weighed on relative results. Additionally, performance within industrials and energy hurt performance. Notable detractors include Joy Global, Inc. (-37.0%), SPX Corp. (-32.9%), Halliburton Co.
(-42.5%) and Baker Hughes, Inc. (-32.5%).
Our investment process and quantitative screens have produced a slight tilt towards higher-beta stocks relative to the Index. This is primarily a bottom-up decision because these stocks have a more attractive combination of growth potential and valuations. Many “defensive” stocks appear overvalued relative to their history. This tilt hurt performance because during the trailing 12-month period.
The abovementioned detractors were partly offset by decent performance within the consumer staples and consumer discretionary sectors. TJX Cos., Inc. (+62.1%), Starbucks Corp. (+51.3%) and McDonald’s Corp. (+24.3%) were strong consumer discretionary performers that helped relative and absolute returns. Within consumer staples, Whole Foods Market, Inc. (+45.9%) and The Hershey Company (+10.8%) led the way. Very good results in these sectors were not enough to overcome significant headwind from market preferences and portfolio positioning.
Outlook
We believe the remainder of 2012 is likely to feature a slow-growth world and a slowly recovering market. We believe the Cadence portfolios should do well in this environment. The data shows that while cheapness tends to move stocks off their troughs, quality and dependability buoy companies in tough markets. This is because when growth is perceived as scarce, investors tend to be skeptical and will therefore pay up for quality, growing companies. Our
11
Managers Cadence Focused Growth Fund
Investment Manager’s Comments (continued)
disciplined strategies thrived in a similar environment in 2004, as we transitioned away from the sharp initial upturn in 2003.
Overall, we have taken a balanced approach to investing in growth companies, including both secular and cyclical growers in the Fund. We have also remained true to our valuation discipline, buying growing companies at prices that make sense. Short-term our insistence on good value has been a headwind, but long-term it has served our investors well. We believe the Fund is comprised of high-quality companies purchased at reasonable prices. While larger companies have been more affected by global macroeconomic events in general, Cadence portfolios tend to exhibit greater percentages of rising estimates and positive surprises than the Russell 1000® Growth Index. Similarly the Fund has often produced a smaller percentage of negative surprises than the Index.
In this environment, we feel patience is the key. With the market so distracted by macroeconomic events — and market swings a reaction to broad-based news rather than specific company fundamentals — bottom-up investors who pick each stock based on its individual merit must weather the storm. We continue to believe fundamentals matter and our disciplined investment process will be rewarded.
This commentary reflects the viewpoints of Cadence Capital Management, LLC as of May 31, 2012 and is not intended as a forecast or guarantee of future results.
CUMULATIVE TOTAL RETURN PERFORMANCE
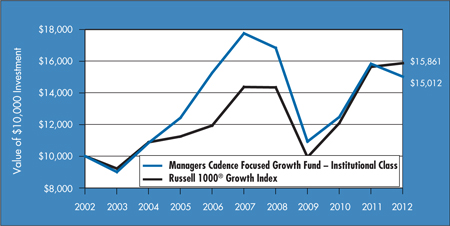
Managers Cadence Focused Growth Fund’s cumulative total return is based on the daily change in net asset value (NAV), and assumes that all dividends and distributions were reinvested. This graph compares a hypothetical $10,000 investment made in Managers Cadence Focused Growth Fund’s Institutional Class on May 31, 2002, compared to a $10,000 investment made in the Russell 1000® Growth Index for the same time period. Performance for periods longer than one year is annualized. The graph and table do not reflect the deduction of taxes that a shareholder would pay on a Fund distribution or redemption of shares. The listed returns for the Fund are net of expenses and the returns for the index exclude expenses. Past performance is not indicative of future results. Total returns would have been lower had certain expenses not been reduced.
12
Managers Cadence Capital Appreciation Fund
Investment Manager’s Comments (continued)
CUMULATIVE TOTAL RETURN PERFORMANCE (continued)
The table below shows the average annual total returns for the Managers Cadence Focused Growth Fund since inception through May 31, 2012, and the Russell 1000® Index for the same time periods.
| | | | | | | | | | | | | | | | | | | | | | |
| | | | | Average Annual Total Returns1 | |
| | | | | One Year | | | Five Years | | | Ten Years | | | Since
Inception | | | Inception
Date | |
Managers Cadence Focused Growth Fund 2,3,4,5,6,* | | | | | | | | | | | | | | | | | | | | |
Class A | | No Load | | | (5.47 | )% | | | (3.63 | )% | | | — | | | | (0.40 | )% | | | 07/05/2006 | |
Class A | | With Load | | | (10.93 | )% | | | (4.76 | )% | | | — | | | | (1.40 | )% | | | 07/05/2006 | |
Class C | | No Load | | | (6.07 | )% | | | (4.34 | )% | | | — | | | | (1.14 | )% | | | 07/05/2006 | |
Class C | | With Load | | | (6.94 | )% | | | (4.34 | )% | | | — | | | | (1.14 | )% | | | 07/05/2006 | |
Class D | | | | | (5.47 | )% | | | (3.64 | )% | | | — | | | | (0.09 | )% | | | 07/05/2006 | |
Institutional Class | | | | | (5.13 | )% | | | (3.29 | )% | | | 4.15 | % | | | 0.40 | % | | | 08/31/1999 | |
Administrative Class | | | | | (5.14 | )% | | | (3.38 | )% | | | — | | | | 0.15 | % | | | 09/15/2006 | |
Class P | | | | | (5.20 | )% | | | — | | | | — | | | | (1.02 | )% | | | 07/07/2008 | |
Russell 1000® Growth Index7 | | | 1.49 | % | | | 2.01 | % | | | 4.72 | % | | | 0.36 | % | | | 08/31/1999 | † |
The performance data shown represents past performance. Past performance is not a guarantee of future results. Current performance may be lower or higher than the performance data quoted. The investment return and principal value of an investment in the Fund will fluctuate so that an investor’s shares, when redeemed, may be worth more or less than their original cost. For performance information through the most recent month end, please call (800) 835-3879 or visit our Web site at www.managersinvest.com.
Performance differences among the share classes are due to differences in sales charge structures and class expenses. Returns shown reflect maximum sales charge of 5.75% on Class A shares, as well as the applicable contingent deferred sales charge (CDSC) on Class C shares. Class C shares held for less than one year are subject to a 1% CDSC.
Investors should carefully consider the Fund’s investment objectives, risks, charges and expenses before investing. For this and other information, please call 800.835.3879 or visit www.managersinvest.com for a free prospectus. Read it carefully before investing or sending money. Funds are distributed by Managers Distributors, Inc., a member of FINRA.
|
† Date reflects inception date of the Fund, not the index. * The Fund changed its fiscal year end from June 30 to May 31 in 2011. 1 Total return equals income yield plus share price change and assumes reinvestment of all dividends and capital gain distributions. Returns are net of fees and may reflect offsets of Fund expenses as described in the Prospectus. No adjustment has been made for taxes payable by shareholders on their reinvested dividends and capital gain distributions. Returns for periods greater than one year are annualized. The listed returns on the Fund are net of expenses and based on the published NAV as of May 31, 2012. All returns are in U.S. dollars ($). 2 From time to time, the Fund’s advisor has waived its fees and/or absorbed Fund expenses, which has resulted in higher returns. 3 A greater percentage of the Fund’s holdings may be focused in a smaller number of securities which may place the Fund at greater risk than a more diversified fund. 4 The Fund invests in growth stocks, which may be more sensitive to market movements because their prices tend to reflect future investor expectations rather than just current profits. Growth stocks may underperform value stocks during given periods. 5 The Fund invests in large-capitalization companies that may underperform other stock funds (such as funds that focus on small- and medium-capitalization companies) when stocks of large-capitalization companies are out of favor. 6 The Fund is subject to special risk considerations similar to those associated with the direct ownership of real estate. Real estate valuations may be subject to factors such as changing general and local economic, financial, competitive, and environmental conditions. 7 The Russell 1000® Growth Index is a market capitalization weighted index that measures the performance of those Russell 1000® companies with higher price-to-book ratios and higher forecasted growth values. Unlike the Fund, the Russell 1000® Growth Index is unmanaged, is not available for investment and does not incur expenses. The Russell 1000® Growth Index is a registered trademark of Russell Investments. Russell® is a trademark of Russell Investments. Not FDIC insured, nor bank guaranteed. May lose value. |
13
Managers Cadence Focused Growth Fund
Fund Snapshots
May 31, 2012
Portfolio Breakdown (unaudited)
| | | | | | | | |
Industry | | Managers Cadence Focused
Growth Fund** | | | Russell 1000®
Growth Index | |
Information Technology | | | 31.4 | % | | | 29.6 | % |
Consumer Discretionary | | | 15.3 | % | | | 14.8 | % |
Industrials | | | 12.8 | % | | | 12.2 | % |
Health Care | | | 11.6 | % | | | 10.7 | % |
Financials | | | 9.0 | % | | | 4.3 | % |
Energy | | | 8.6 | % | | | 9.5 | % |
Consumer Staples | | | 6.9 | % | | | 12.7 | % |
Materials | | | 3.7 | % | | | 5.2 | % |
Telecommunication Services | | | 0.0 | % | | | 0.9 | % |
Utilities | | | 0.0 | % | | | 0.1 | % |
Other Assets and Liabilities | | | 0.7 | % | | | 0.0 | % |
| ** | As a percentage of net assets |
Top Ten Holdings (unaudited)
| | | | |
Security Name | | % of
Net Assets | |
Google, Inc., Class A* | | | 3.2 | % |
QUALCOMM, Inc.* | | | 2.9 | |
Philip Morris International, Inc.* | | | 2.9 | |
JPMorgan Chase & Co. | | | 2.8 | |
Omnicom Group, Inc. | | | 2.6 | |
Mastercard, Inc., Class A | | | 2.6 | |
Adobe Systems, Inc. | | | 2.6 | |
Paychex, Inc. | | | 2.6 | |
Coach, Inc.* | | | 2.5 | |
Stryker Corp. | | | 2.5 | |
| | | | |
Top Ten as a Group | | | 27.2 | % |
| | | | |
| * | Top Ten Holding at November 30, 2011 |
|
| Any sectors, industries, or securities discussed should not be perceived as investment recommendations. Mention of a specific security should not be considered a recommendation to buy or solicitation to sell that security. Specific securities mentioned in this report may have been sold from the Fund’s portfolio of investments by the time you receive this report. |
14
Managers Cadence Focused Growth Fund
Schedule of Portfolio Investments
May 31, 2012
| | | | | | | | |
| | | Shares | | | Value | |
| | | | | | | | |
Common Stocks - 99.3% | | | | | | | | |
Consumer Discretionary - 15.3% | | | | | |
Coach, Inc. | | | 3,170 | | | $ | 213,817 | |
Nordstrom, Inc. | | | 3,310 | | | | 156,795 | |
Omnicom Group, Inc. | | | 4,690 | | | | 223,619 | |
priceline.com, Inc.* | | | 260 | | | | 162,627 | |
Ralph Lauren Corp. | | | 1,010 | | | | 150,288 | |
Starbucks Corp. | | | 3,320 | | | | 182,235 | |
TJX Cos., Inc. | | | 4,860 | | | | 206,356 | |
Total Consumer Discretionary | | | | | | | 1,295,737 | |
Consumer Staples - 6.9% | | | | | | | | |
Clorox Co., The | | | 2,870 | | | | 197,456 | |
Philip Morris International, Inc. | | | 2,850 | | | | 240,854 | |
Whole Foods Market, Inc. | | | 1,620 | | | | 143,548 | |
Total Consumer Staples | | | | | | | 581,858 | |
Energy - 8.6% | | | | | | | | |
Anadarko Petroleum Corp. | | | 2,640 | | | | 161,040 | |
Halliburton Co. | | | 5,520 | | | | 165,931 | |
National Oilwell Varco, Inc. | | | 2,930 | | | | 195,577 | |
Occidental Petroleum Corp. | | | 2,530 | | | | 200,553 | |
Total Energy | | | | | | | 723,101 | |
Financials - 9.0% | | | | | | | | |
Discover Financial Services | | | 5,530 | | | | 183,098 | |
JPMorgan Chase & Co. | | | 7,080 | | | | 234,702 | |
T. Rowe Price Group, Inc. | | | 2,880 | | | | 165,859 | |
Wells Fargo & Co. | | | 5,470 | | | | 175,314 | |
Total Financials | | | | | | | 758,973 | |
Health Care - 11.6% | | | | | | | | |
Cardinal Health, Inc. | | | 4,750 | | | | 196,555 | |
Cooper Cos., Inc., The | | | 2,360 | | | | 201,025 | |
Covidien PLC | | | 3,620 | | | | 187,444 | |
Johnson & Johnson | | | 2,860 | | | | 178,550 | |
Stryker Corp. | | | 4,150 | | | | 213,518 | |
Total Health Care | | | | | | | 977,092 | |
Industrials - 12.8% | | | | | | | | |
Expeditors International of Washington, Inc. | | | 5,080 | | | | 194,310 | |
| | | | | | | | |
| | | Shares | | | Value | |
| | | | | | | | |
Honeywell International, Inc. | | | 3,700 | | | $ | 205,942 | |
Joy Global, Inc. | | | 3,070 | | | | 171,490 | |
Norfolk Southern Corp. | | | 3,040 | | | | 199,181 | |
PACCAR, Inc. | | | 4,750 | | | | 178,458 | |
Parker Hannifin Corp. | | | 1,560 | | | | 127,514 | |
Total Industrials | | | | | | | 1,076,895 | |
Information Technology - 31.4% | | | | | |
Accenture PLC, Class A | | | 3,040 | | | | 173,584 | |
Adobe Systems, Inc.* | | | 6,990 | | | | 217,039 | |
Apple, Inc.* | | | 310 | | | | 179,096 | |
Applied Materials, Inc. | | | 18,640 | | | | 192,551 | |
Autodesk, Inc.* | | | 5,550 | | | | 177,711 | |
Cisco Systems, Inc. | | | 3,510 | | | | 57,318 | |
Citrix Systems, Inc.* | | | 2,270 | | | | 165,892 | |
Google, Inc., Class A* | | | 460 | | | | 267,196 | |
Mastercard, Inc., Class A | | | 540 | | | | 219,515 | |
Paychex, Inc. | | | 7,200 | | | | 215,784 | |
QUALCOMM, Inc. | | | 4,310 | | | | 247,006 | |
Red Hat, Inc.* | | | 3,180 | | | | 163,388 | |
Teradata Corp.* | | | 2,390 | | | | 158,887 | |
VMware, Inc., Class A* | | | 2,270 | | | | 211,133 | |
Total Information Technology | | | | | | | 2,646,100 | |
Materials - 3.7% | | | | | | | | |
Freeport-McMoRan Copper & Gold, Inc., Class B | | | 5,580 | | | | 178,783 | |
Sherwin-Williams Co., The | | | 1,030 | | | | 133,529 | |
Total Materials | | | | | | | 312,312 | |
Total Common Stocks
(cost $8,273,101) | | | | | | | 8,372,068 | |
Other Investment Companies - 0.4%1 | | | | | | | | |
Dreyfus Cash Management Fund, Institutional Class Shares, 0.09%
(cost $38,884) | | | 38,884 | | | | 38,884 | |
Total Investments - 99.7%
(cost $8,311,985) | | | | | | | 8,410,952 | |
Other Assets, less Liabilities - 0.3% | | | | 22,200 | |
Net Assets - 100.0% | | | | | | $ | 8,433,152 | |
The accompanying notes are an integral part of these financial statements.
15
Managers Cadence Mid-Cap Fund
Investment Manager’s Comments
For the fiscal year ended May 31, 2012, the Managers Cadence Mid-Cap Fund (the “Fund”) returned (-7.96%) lagging its benchmark, the Russell MidCap® Growth Index, which returned (-6.31%).
Market Review
While we had some good news and periods of strong performance, the fiscal year ending May 31, 2012 started on a shaky note. After months of carefully planned financial stimulus and cautiously optimistic reports of a strengthening economy, even the Federal Reserve had to admit in Spring 2011 that the economic data was worse than expected. Not coincidentally, U.S. equity market benchmarks turned negative during the middle of 2011 before a sharp decline in late-Summer. The market volatility reflected growing concern over the Federal Reserve’s withdrawal of its Quantitative Easing policy (QE2), which was recently extended in June 2012, and questions over the U.S. economy’s ability to self-sustain without the cash infusion. Continued social unrest in the Middle East, decelerating growth in China, continued concerns over Eurozone sovereign debt and a potential collapse of the euro added to the fears. Even though the U.S. did not double-dip into a recession, the modest (+2%) growth rate continued to feel recessionary to many Americans.
Macroeconomic drivers returned to the forefront of the investment landscape in the fall of 2011, and the backdrop turned gloomy. The U.S. continued to face high unemployment, volatile commodity prices, a persistently weak housing sector and widening credit spreads, indicating market stress. Fiscal and political turmoil in Washington led to a U.S. debt downgrade, and expectations for growth in America were muted at best. Abroad, Eurozone countries continued to struggle through their financial crisis, while growth in China slowed and Greece hovered on the precipice of default.
Understandably, investors were nervous. In the fall of 2011, we saw many investors questioning their investment strategies, and even large institutions pulling out of stocks at potentially the worst time. Yet at the same time, counter-intuitively, we saw companies thriving across all sectors. We were able to make sound, well-priced investments in companies with strong revenues and earnings, high levels of productivity, and record cash on their balance sheets. While market downturns are often painful, they can provide compelling buying opportunities for long-term investors.
During October the market rebounded sharply. Some broad indexes were up over (+20%). Strong performance was driven by increased confidence about the U.S. recovery and that the Eurozone crisis would be resolved. The last two months of 2011 were relatively flat, but volatile, after the sharp October rebound. The first quarter of 2012 saw an acceleration of the upward trend. Most U.S. equity indexes were up another 15-20% before markets turned downward in April as Eurozone issues returned to the forefront. Additionally, U.S. economic data was less favorable and caused investors to, again, question the sustainability of the economic recovery. Investors were also concerned about slowing growth in China and if emerging market growth would be enough to overshadow major fiscal issues in developed nations. Markets fell 5-10% during the first two months of 2012.
Performance Review
The Fund generated a negative absolute return and lagged its benchmark during the trailing 12-month period. Several factors contributed to the underperformance. In particular, the Fund was hurt by an unfavorable investment environment, poor performance within the industrials sector and unfavorable portfolio positioning. During the trailing 12-month period, macro factors frequently dominated and fundamentals were often ignored. This often creates headwind for our fundamentally-based, growth-at-a-reasonable-price investment strategy. Correlations across stocks were often elevated and volatility indicators fluctuated with macro concerns. This creates a less favorable environment for fundamentally-based investment managers. We believe volatility creates good long-term investment opportunities, but the macro-environment was a headwind.
From an attribution perspective, stock selection within the industrials sector was the key detractor. The largest individual detractors were Gardner Denver, Inc. (-38.2%), SPX Corp. (-32.9%) and Joy Global, Inc. (-34.3%). In aggregate our industrials holdings returned (-10.8%), compared to (-3.7%) during the prior 12-months. Our information technology stocks also hurt relative returns. Bankrate, Inc. (-27.3%), Skyworks Solutions, Inc. (-18.6%) and Atmel Corp. (-35.0%) struggled the most. We subsequently liquidated Skyworks Solutions, Inc. and Atmel Corp., but continue to hold Bankrate, Inc. as of May 31, 2012.
Our investment process and quantitative screens have produced a tilt towards higher-beta stocks relative to the Index. This is primarily a bottom-up decision because these stocks have a more attractive combination of growth potential and valuations. Many “defensive” stocks appear overvalued relative to their history. Nevertheless, the highest-beta quintile of the Russell MidCap® Growth Index returned (-19.6%), compared to (+6.1%) for the lowest-beta quintile. The Fund had a slight overweight to higher-beta stocks and a slight underweight to lower-beta stocks. This tilt hurt relative results during the fiscal year. We continue to believe our patience will be rewarded as these stocks remain attractive. The Fund was also hurt by overweights to the energy and information technology sectors, which were the two worst performing sectors within the Index. Information technology stocks appear very attractively valued, especially relative to other investment alternatives and their valuation history.
The abovementioned detractors were partly offset by decent performance within the consumer staples sector. Monster Beverage Corp. (+102.7%) and Whole Foods Market, Inc. (+45.9%) were up significantly and notable positive contributors to relative results. Underweights to the financials and consumer discretionary sectors also made modesly positive contributions to relative returns.
Outlook
We believe the remainder of 2012 is likely to feature a slow-growth world and a slowly recovering market. We believe the Cadence portfolios should do well in this environment. The data shows that while cheapness tends to move stocks off their troughs, quality and dependability buoy companies in tough markets. This is because
16
Managers Cadence Mid-Cap Fund
Investment Manager’s Comments (continued)
when growth is perceived as scarce, investors tend to be skeptical and will therefore pay up for quality, growing companies. Our disciplined strategies thrived in a similar environment in 2004, as we transitioned away from the sharp initial upturn in 2003.
Overall, we have taken a balanced approach to investing in growth companies, including both secular and cyclical growers in the Fund. We have also remained true to our valuation discipline, buying growing companies at prices that make sense. Short-term our insistence on good value has been a headwind, but long-term it has served our investors well. We believe the Fund is comprised of high-quality companies purchased at reasonable prices.
In this environment, we feel patience is the key. With the market so distracted by macroeconomic events — and market swings a reaction to broad-based news rather than specific company fundamentals — bottom-up investors who pick each stock based on its individual merit must weather the storm. We continue to believe fundamentals matter and our disciplined investment process will be rewarded.
This commentary reflects the viewpoints of Cadence Capital Management, LLC as of May 31, 2012 and is not intended as a forecast or guarantee of future results.
CUMULATIVE TOTAL RETURN PERFORMANCE
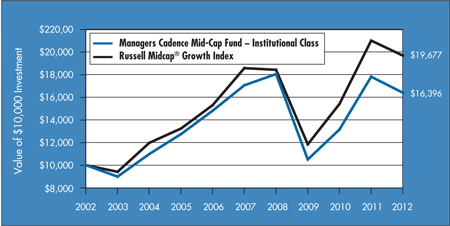
Managers Cadence Mid-Cap Fund’s cumulative total return is based on the daily change in net asset value (NAV), and assumes that all dividends and distributions were reinvested. This graph compares a hypothetical $10,000 investment made in Managers Cadence Mid-Cap Fund’s Institutional Class on May 31, 2002, compared to a $10,000 investment made in the Russell Midcap® Growth Index for the same time period. Performance for periods longer than one year is annualized. The graph and table do not reflect the deduction of taxes that a shareholder would pay on a Fund distribution or redemption of shares. The listed returns for the Fund are net of expenses and the returns for the index exclude expenses. Past performance is not indicative of future results. Total returns would have been lower had certain expenses not been reduced.
17
Managers Cadence Capital Appreciation Fund
Investment Manager’s Comments (continued)
CUMULATIVE TOTAL RETURN PERFORMANCE (continued)
The table below shows the average annual total returns for the Managers Cadence Mid-Cap Fund since inception through May 31, 2012, and the Russell Midcap® Growth Index for the same time periods.
| | | | | | | | | | | | | | | | | | | | | | |
| | | | | Average Annual Total Returns1 | |
| | | | | One Year | | | Five Years | | | Ten Years | | | Since
Inception | | | Inception
Date | |
Managers Cadence Mid-Cap Fund 2,3,4,5,* | | | | | | | | | | | | | | | | | | | | |
Class A | | No Load | | | (8.33 | )% | | | (1.18 | )% | | | 4.65 | % | | | 6.25 | % | | | 01/13/1997 | |
Class A | | With Load | | | (13.59 | )% | | | (2.34 | )% | | | 4.03 | % | | | 5.84 | % | | | 01/13/1997 | |
Class B | | No Load | | | (9.02 | )% | | | (1.92 | )% | | | 3.86 | % | | | 5.46 | % | | | 01/13/1997 | |
Class B | | With Load | | | (13.57 | )% | | | (2.27 | )% | | | 3.86 | % | | | 5.46 | % | | | 01/13/1997 | |
Class C | | No Load | | | (8.97 | )% | | | (1.91 | )% | | | 3.87 | % | | | 5.46 | % | | | 01/13/1997 | |
Class C | | With Load | | | (9.88 | )% | | | (1.91 | )% | | | 3.87 | % | | | 5.46 | % | | | 01/13/1997 | |
Class D | | | | | (8.31 | )% | | | (1.18 | )% | | | 4.66 | % | | | 4.33 | % | | | 04/08/1998 | |
Institutional Class | | | | | (7.96 | )% | | | (0.78 | )% | | | 5.07 | % | | | 9.44 | % | | | 08/26/1991 | |
Administrative Class | | | | | (8.19 | )% | | | (1.02 | )% | | | 4.82 | % | | | 9.07 | % | | | 11/30/1994 | |
Class P | | | | | (8.06 | )% | | | — | | | | — | | | | 0.12 | % | | | 07/07/2008 | |
Class R | | | | | (8.57 | )% | | | (1.42 | )% | | | — | | | | 7.09 | % | | | 12/31/2002 | |
Russell Midcap® Growth Index6 | | | (6.31 | )% | | | 1.17 | % | | | 7.00 | % | | | — | 7 | | | 08/26/1991 | † |
The performance data shown represents past performance, which is not a guarantee of future results. Current performance may be lower or higher than the performance data quoted. The investment return and principal value of an investment in the Fund will fluctuate so that an investor’s shares, when redeemed, may be worth more or less than their original cost. For performance information through the most recent month end please call (800) 835-3879 or visit our Web site at www.managersinvest.com.
Performance differences among the share classes are due to differences in sales charge structures and class expenses. Returns shown reflect maximum sales charge of 5.75% on Class A shares. Maximum sales charge on Class B Shares is 5.00% up to six years from the date of purchase. Class C shares held for less than one year are subject to a 1.00% contingent deferred sales charge (CDSC).
| | |
Investors should carefully consider the Fund’s investment objectives, risks, charges and expenses before investing. For this and other information, please call 800.835.3879 or visit www.managersinvest.com for a free prospectus. Read it carefully before investing or sending money. Funds are distributed by Managers Distributors, Inc., a member of FINRA. † Date reflects inception date of the Fund, not the index. * The Fund changed its fiscal year end from June 30 to May 31 in 2011. 1 Total return equals income yield plus share price change and assumes reinvestment of all dividends and capital gain distributions. Returns are net of fees and may reflect offsets of Fund expenses as described in the Prospectus. No adjustment has been made for taxes payable by shareholders on their reinvested dividends and capital gain distributions. Returns for periods greater than one year are annualized. The listed returns on the Fund are net of expenses and based on the published NAV as of May 31, 2012. All returns are in U.S. dollars ($). 2 From time to time, the Fund’s advisor has waived its fees and/or absorbed Fund expenses, which has resulted in higher returns. 3 The Fund invests in growth stocks, which may be more sensitive to market movements because their prices tend to reflect future investor expectations rather than just current profits. Growth stocks may underperform value stocks during given periods. |
| 4 | | The Fund is subject to risks associated with investments in mid-capitalization companies such as erratic earnings patterns, competitive conditions, limited earnings history, and a reliance on one or a limited number of products. |
5 The Fund is subject to special risk considerations similar to those associated with the direct ownership of real estate. Real estate valuations may be subject to factors such as changing general and local economic, financial, competitive, and environmental conditions. 6 The Russell Midcap® Growth Index measures the performance of the Russell Midcap companies with higher price-to-book ratios and higher forecasted growth values. The stocks are also members of the Russell 1000® Growth Index. Unlike the Fund, the Index is unmanaged, is not available for investment, and does not incur expenses. 7 Since the Russell Midcap® Growth Index’s inception date of June 1, 1995, the average annual total return for the index was 8.07%. The Russell MidCap® Growth Index is a registered trademark of Russell Investments. Russell® is a trademark of Russell Investments. Not FDIC insured, nor bank guaranteed. May lose value. |
18
Managers Cadence Mid-Cap Fund
Fund Snapshots
May 31, 2012
Portfolio Breakdown (unaudited)
| | | | | | | | |
Industry | | Managers Cadence
Mid-Cap Fund** | | | Russell Midcap®
Growth Index | |
Consumer Discretionary | | | 21.1 | % | | | 21.4 | % |
Information Technology | | | 20.9 | % | | | 18.0 | % |
Industrials | | | 14.6 | % | | | 15.0 | % |
Health Care | | | 12.1 | % | | | 14.2 | % |
Energy | | | 8.9 | % | | | 7.5 | % |
Materials | | | 6.5 | % | | | 8.7 | % |
Financials | | | 6.0 | % | | | 7.0 | % |
Consumer Staples | | | 5.5 | % | | | 6.2 | % |
Telecommunication Services | | | 1.2 | % | | | 1.7 | % |
Utilities | | | 0.0 | % | | | 0.3 | % |
Other Assets and Liabilities | | | 3.2 | % | | | 0.0 | % |
| ** | As a percentage of net assets |
Top Ten Holdings (unaudited)
| | | | |
Security Name | | % of
Net Assets | |
Steven Madden, Ltd. | | | 1.6 | % |
Agilent Technologies, Inc. | | | 1.5 | |
Watson Pharmaceuticals, Inc. | | | 1.4 | |
Michael Kors Holdings, Ltd. | | | 1.4 | |
Waste Connections, Inc. | | | 1.4 | |
DSW, Inc., Class A | | | 1.4 | |
CareFusion Corp. | | | 1.4 | |
Intuitive Surgical, Inc. | | | 1.3 | |
Ross Stores, Inc. | | | 1.3 | |
Bankrate, Inc. | | | 1.3 | |
| | | | |
Top Ten as a Group | | | 14.0 | % |
| | | | |
|
| Any sectors, industries, or securities discussed should not be perceived as investment recommendations. Mention of a specific security should not be considered a recommendation to buy or solicitation to sell that security. Specific securities mentioned in this report may have been sold from the Fund’s portfolio of investments by the time you receive this report. |
19
Managers Cadence Mid-Cap Fund
Schedule of Portfolio Investments
May 31, 2012
| | | | | | | | |
| | | Shares | | | Value | |
| | | | | | | | |
Common Stocks - 96.8% | | | | | | | | |
Consumer Discretionary - 21.1% | | | | | |
Abercrombie & Fitch Co., Class A | | | 86,470 | | | $ | 2,900,204 | |
BorgWarner, Inc.* | | | 89,240 | | | | 6,402,970 | |
Chipotle Mexican Grill, Inc.* | | | 15,386 | | | | 6,355,495 | |
Dick’s Sporting Goods, Inc. | | | 136,130 | | | | 6,330,045 | |
DSW, Inc., Class A | | | 123,600 | | | | 7,376,448 | |
Gentex Corp. | | | 244,070 | | | | 5,442,761 | |
Ltd. Brands, Inc. | | | 127,140 | | | | 5,639,930 | |
MGM Resorts International* | | | 535,450 | | | | 5,798,923 | |
Michael Kors Holdings, Ltd.* | | | 190,040 | | | | 7,483,775 | |
PetSmart, Inc. | | | 105,900 | | | | 6,824,196 | |
PulteGroup, Inc.* | | | 299,210 | | | | 2,800,606 | |
Ralph Lauren Corp. | | | 37,620 | | | | 5,597,856 | |
Ross Stores, Inc. | | | 112,360 | | | | 7,104,523 | |
Steven Madden, Ltd.* | | | 215,040 | | | | 8,717,722 | |
Toll Brothers, Inc.* | | | 239,270 | | | | 6,527,286 | |
Ulta Salon Cosmetics & Fragrance, Inc. | | | 78,090 | | | | 6,978,903 | |
VF Corp. | | | 39,120 | | | | 5,517,485 | |
Weight Watchers International, Inc. | | | 47,310 | | | | 2,684,369 | |
Wendy’s Co., The | | | 1,476,810 | | | | 6,778,558 | |
Total Consumer Discretionary | | | | | | | 113,262,055 | |
Consumer Staples - 5.5% | | | | | |
Beam, Inc. | | | 105,900 | | | | 6,413,304 | |
Boston Beer Co. Inc., The, Class A* | | | 57,110 | | | | 5,987,984 | |
Herbalife, Ltd. | | | 41,970 | | | | 1,879,836 | |
McCormick & Co., Inc. | | | 108,890 | | | | 6,137,040 | |
Monster Beverage Corp.* | | | 54,630 | | | | 3,966,138 | |
Whole Foods Market, Inc. | | | 59,460 | | | | 5,268,751 | |
Total Consumer Staples | | | | | | | 29,653,053 | |
Energy - 8.9% | | | | | | | | |
Cabot Oil & Gas Corp. | | | 164,470 | | | | 5,351,854 | |
Cimarex Energy Co. | | | 78,580 | | | | 4,185,957 | |
Core Laboratories N.V. | | | 45,850 | | | | 5,864,215 | |
EQT Corp. | | | 116,270 | | | | 5,392,603 | |
FMC Technologies, Inc.* | | | 121,280 | | | | 4,880,307 | |
HollyFrontier Corp. | | | 92,230 | | | | 2,718,940 | |
Oceaneering International, Inc. | | | 125,040 | | | | 5,779,349 | |
Oil States International, Inc.* | | | 58,310 | | | | 3,881,697 | |
SM Energy Co. | | | 86,070 | | | | 4,655,526 | |
Whiting Petroleum Corp.* | | | 112,420 | | | | 4,857,668 | |
Total Energy | | | | | | | 47,568,116 | |
Financials - 6.0% | | | | | | | | |
CBRE Group, Inc., Class A* | | | 219,050 | | | | 3,603,373 | |
Hudson City Bancorp, Inc. | | | 838,380 | | | | 5,197,956 | |
Huntington Bancshares, Inc. | | | 1,003,980 | | | | 6,566,029 | |
Marsh & McLennan Cos., Inc. | | | 206,170 | | | | 6,593,317 | |
| | | | | | | | |
| | | Shares | | | Value | |
| | | | | | | | |
People’s United Financial, Inc. | | | 325,340 | | | $ | 3,783,704 | |
T. Rowe Price Group, Inc. | | | 115,050 | | | | 6,625,729 | |
Total Financials | | | | | | | 32,370,108 | |
Health Care - 12.1% | | | | | | | | |
Agilent Technologies, Inc. | | | 203,650 | | | | 8,280,409 | |
CareFusion Corp.* | | | 301,410 | | | | 7,306,178 | |
Cooper Cos., Inc., The | | | 68,540 | | | | 5,838,237 | |
DENTSPLY International, Inc. | | | 185,470 | | | | 6,862,390 | |
Endo Health Solutions, Inc.* | | | 195,960 | | | | 6,372,619 | |
Intuitive Surgical, Inc.* | | | 13,620 | | | | 7,124,622 | |
MAKO Surgical Corp.* | | | 83,430 | | | | 1,894,695 | |
United Therapeutics Corp.* | | | 156,010 | | | | 6,901,882 | |
Waters Corp.* | | | 87,400 | | | | 6,972,772 | |
Watson Pharmaceuticals, Inc.* | | | 106,950 | | | | 7,624,465 | |
Total Health Care | | | | | | | 65,178,269 | |
Industrials - 14.6% | | | | | | | | |
Clean Harbors, Inc.* | | | 92,080 | | | | 5,715,406 | |
Delta Air Lines, Inc.* | | | 563,470 | | | | 6,817,987 | |
Expeditors International of Washington, Inc. | | | 151,940 | | | | 5,811,705 | |
Gardner Denver, Inc. | | | 111,360 | | | | 6,022,349 | |
Joy Global, Inc. | | | 100,110 | | | | 5,592,145 | |
Kansas City Southern | | | 99,190 | | | | 6,544,556 | |
KBR, Inc. | | | 167,100 | | | | 4,256,037 | |
Kirby Corp.* | | | 101,120 | | | | 5,337,114 | |
Pall Corp. | | | 102,690 | | | | 5,715,725 | |
Roper Industries, Inc. | | | 61,560 | | | | 6,231,103 | |
Valmont Industries, Inc. | | | 52,290 | | | | 5,987,205 | |
Wabtec Corp. | | | 96,260 | | | | 6,989,439 | |
Waste Connections, Inc. | | | 239,640 | | | | 7,416,858 | |
Total Industrials | | | | | | | 78,437,629 | |
Information Technology - 20.9% | | | | | |
Alliance Data Systems Corp.* | | | 52,520 | | | | 6,617,520 | |
Altera Corp. | | | 148,300 | | | | 4,954,703 | |
Autodesk, Inc.* | | | 204,610 | | | | 6,551,612 | |
Avnet, Inc.* | | | 169,940 | | | | 5,181,471 | |
Bankrate, Inc.* | | | 403,838 | | | | 7,018,704 | |
Cadence Design Systems, Inc.* | | | 561,710 | | | | 5,729,442 | |
F5 Networks, Inc.* | | | 67,350 | | | | 6,969,378 | |
Fortinet, Inc.* | | | 272,540 | | | | 5,791,475 | |
Fusion-io, Inc.* | | | 258,270 | | | | 5,392,678 | |
Gartner, Inc.* | | | 85,610 | | | | 3,482,615 | |
LSI Corp.* | | | 709,320 | | | | 4,716,978 | |
Marvell Technology Group, Ltd. | | | 469,570 | | | | 5,883,712 | |
MICROS Systems, Inc.* | | | 110,480 | | | | 5,828,925 | |
NCR Corp.* | | | 270,750 | | | | 5,799,465 | |
ON Semiconductor Corp.* | | | 519,010 | | | | 3,498,127 | |
Red Hat, Inc.* | | | 103,490 | | | | 5,317,316 | |
The accompanying notes are an integral part of these financial statements.
20
Managers Cadence Mid-Cap Fund
Schedule of Portfolio Investments (continued)
| | | | | | | | |
| | | Shares | | | Value | |
| | | | | | | | |
Information Technology - 20.9% (continued) | | | | | | | | |
Teradata Corp.* | | | 84,880 | | | $ | 5,642,822 | |
TIBCO Software, Inc.* | | | 229,060 | | | | 6,127,355 | |
Trimble Navigation, Ltd.* | | | 112,470 | | | | 5,304,648 | |
VeriFone Systems, Inc.* | | | 181,570 | | | | 6,556,493 | |
Total Information Technology | | | | | | | 112,365,439 | |
Materials - 6.5% | | | | | | | | |
Airgas, Inc. | | | 75,910 | | | | 6,589,747 | |
CF Industries Holdings, Inc. | | | 32,790 | | | | 5,605,778 | |
Crown Holdings, Inc.* | | | 158,150 | | | | 5,391,334 | |
Huntsman Corp. | | | 432,770 | | | | 5,539,456 | |
Rockwood Holdings, Inc.* | | | 115,250 | | | | 5,578,100 | |
Sherwin-Williams Co., The | | | 49,960 | | | | 6,476,814 | |
Total Materials | | | | | | | 35,181,229 | |
| | | | | | | | |
| | | Shares | | | Value | |
| | | | | | | | |
Telecommunication Services - 1.2% | | | | | |
Crown Castle International Corp.* | | | 118,150 | | | $ | 6,450,990 | |
Total Common Stocks
(cost $503,637,224) | | | | | | | 520,466,888 | |
Other Investment Companies - 3.4%1 | | | | | |
Dreyfus Cash Management Fund, Institutional Class Shares, 0.09%
(cost $18,272,344) | | | 18,272,344 | | | | 18,272,344 | |
Total Investments - 100.2%
(cost $521,909,568) | | | | | | | 538,739,232 | |
Other Assets, less Liabilities - (0.2)% | | | | (905,629 | ) |
Net Assets - 100.0% | | | | | | $ | 537,833,603 | |
The accompanying notes are an integral part of these financial statements.
21
Managers Cadence Emerging Companies Fund
Investment Manager’s Comments
For the fiscal year ended May 31, 2012, the Managers Cadence Emerging Companies Fund (the “Fund”) returned (-6.60%), outperforming its benchmark, the Russell Microcap® Growth Index, which returned (-12.37%).
Market Review
While we had some good news and periods of strong performance, the fiscal year ending May 31, 2012 started on a shaky note. After months of carefully planned financial stimulus and cautiously optimistic reports of a strengthening economy, even the Federal Reserve had to admit in Spring 2011 that the economic data were worse than expected. Not coincidentally, U.S. equity market benchmarks turned negative during the middle of 2011 before a sharp decline in late-Summer. The market volatility reflected growing concern over the Federal Reserve’s withdrawal of its Quantitative Easing policy (QE2), which was recently extended in June 2012, and questions over the U.S. economy’s ability to self-sustain without the cash infusion. Continued social unrest in the Middle East, decelerating growth in China, continued concerns over Eurozone sovereign debt and a potential collapse of the euro added to the fears. Even though the U.S. did not double-dip into a recession, the modest (+2%) growth rate continued to feel recessionary to many Americans.
Macroeconomic drivers returned to the forefront of the investment landscape in the fall of 2011, and the backdrop turned gloomy. The U.S. continued to face high unemployment, volatile commodity prices, a persistently weak housing sector and widening credit spreads, indicating market stress. Fiscal and political turmoil in Washington led to a U.S. debt downgrade, and expectations for growth in America were muted at best. Abroad, Eurozone countries continued to struggle through their financial crisis, while growth in China slowed and Greece hovered on the precipice of default.
Understandably, investors were nervous. In the fall of 2011, we saw many investors questioning their investment strategies, and even large institutions pulling out of stocks at potentially the worst time. Yet at the same time, counter-intuitively, we saw companies thriving across all sectors. We were able to make sound, well-priced investments in companies with strong revenues and earnings, high levels of productivity, and record cash on their balance sheets. While market downturns are often painful, they can provide compelling buying opportunities for long-term investors.
During October the market rebounded sharply. Some broad indexes were up over (+20%). Strong performance was driven by increased confidence about the U.S. recovery and that the Eurozone crisis would be resolved. The last two months of 2011 were relatively flat, but volatile, after the sharp October rebound. The first quarter of 2012 saw an acceleration of the upward trend. Most U.S. equity indexes were up another 15-20% before markets turned downward in April as Eurozone issues returned to the forefront. Additionally, U.S. economic data was less favorable and caused investors to, again, question the sustainability of the economic recovery. Investors were also concerned about slowing growth in China and if emerging market growth would be enough to overshadow major fiscal issues in developed nations. Markets fell 5-10% during the first two months of 2012.
Overall it was a tough period for small-cap and micro-cap stocks. Macro difficulties caused very negative returns during “risk-off”
time periods. The Russell 2000® Growth Index, a proxy for small-cap growth stocks, returned (-9.5%) and the Russell Microcap® Growth Index, a proxy for micro-cap growth stocks, returned (-12.4%). The negative returns were primarily generated during the middle of 2011 and the first two months of the second quarter of 2012. More specifically, both indexes were down over (-20%) June 1, 2011 to September 30, 2011, and each index was down about (-9%) during the first two months of the quarter.
Performance Review
The Fund generated a negative absolute return in a challenging environment for small-cap and micro-cap stocks, but was well ahead of its benchmark during the recently completely fiscal year. Strong relative performance across sectors drove the Fund’s outperformance. In particular, the Fund’s outperformance was helped by good relative results in the consumer discretionary and materials sectors. Within the consumer discretionary sector, Cost Plus, Inc. (+144.5%), Conn’s, Inc. (+102.9%) and Carrols Restaurant Group, Inc. (+113.7%) all doubled during the 12-month time period. The materials sector was the second worst performing sector within the Index with a return of (-23.0%). The Fund’s holdings performed much better at (+10.2%), as OMNOVA Solutions, Inc. (+55.2%) led the way. Stock selection within the information technology and industrials sectors also added value.
The financials sector was the notable detractor during the fiscal year. ICG Group, Inc. (-28.2%), Virtus Investment Partners (-17.4%) and Evercore Partners, Inc., Class C (-20.2%) were three notable laggards. The investment process strives to identify high-quality stocks with good growth potential at attractive prices. Currently Cadence’s investment process is tilting the Fund toward higher-beta stocks, which appear to have a better combination of growth potential and valuation. The Fund’s beta postitioning was also a drag as, generally speaking, lower-beta stocks outperformed higher-beta stocks during a down period for the index.
Lastly, during the trailing 12-month period, macro factors frequently dominated and fundamentals were often ignored. This often creates headwind for our fundamentally-based, growth-at-a-reasonable-price investment strategy. Correlations across stocks were often elevated and volatility indicators fluctuated with macro concerns. This creates a less favorable environment for fundamentally-based investment managers. We believe volatility creates good long-term investment opportunities, but the macro-driven investment environment was a headwind.
Outlook
We believe the remainder of 2012 is likely to feature a slow-growth world and a slowly recovering market. We believe the Cadence portfolios should do well in this environment. The data show that while cheapness tends to move stocks off their troughs, quality and dependability buoy companies in tough markets. This is because when growth is perceived as scarce, investors tend to be skeptical and will therefore pay up for quality, growing companies. Our disciplined strategies thrived in a similar environment in 2004, as we transitioned away from the sharp initial upturn in 2003.
Overall, we have taken a balanced approach to investing in growth companies, including both secular and cyclical growers in the Fund. We have also remained true to our valuation discipline,
22
Managers Cadence Emerging Companies Fund
Investment Manager’s Comments (continued)
buying growing companies at prices that make sense. Short-term our insistence on good value has been a headwind, but long-term it has served our investors well. We believe the Fund is comprised of high-quality companies purchased at reasonable prices.
In this environment, we feel patience is the key. With the market so distracted by macroeconomic events — and market swings a reaction to broad-based news rather than specific company fundamentals — bottom-up investors who pick each stock based on its individual merit must weather the storm. We continue to believe fundamentals matter and our disciplined investment process will be rewarded.
This commentary reflects the viewpoints of Cadence Capital Management, LLC as of May 31, 2012 and is not intended as a forecast or guarantee of future results.
CUMULATIVE TOTAL RETURN PERFORMANCE
Managers Cadence Emerging Companies Fund’s cumulative total return is based on the daily change in net asset value (NAV), and assumes that all dividends and distributions were reinvested. This graph compares a hypothetical $10,000 investment made in Managers Cadence Emerging Companies Fund’s Institutional Class on May 31, 2002, to a $10,000 investment made in the Russell Microcap® Growth Index and the Russell 2000® Growth Index for the same time period. Performance for periods longer than one year is annualized. The graph and table do not reflect the deduction of taxes that a shareholder would pay on a Fund distribution or redemption of shares. The listed returns for the Fund are net of expenses and the returns for the index exclude expenses. Past performance is not indicative of future results. Total returns would have been lower had certain expenses not been reduced.
23
Managers Cadence Emerging Companies Fund
Investment Manager’s Comments (continued)
CUMULATIVE TOTAL RETURN PERFORMANCE (continued)
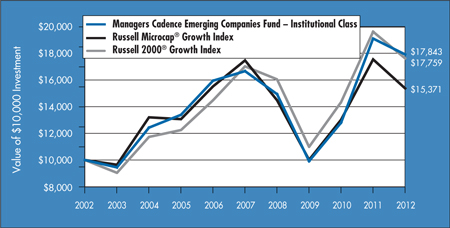
The table below shows the average annual total returns for the Managers Cadence Emerging Companies Fund from May 31, 2002, through May 31, 2012, and the Russell Microcap® Growth Index and the Russell 2000® Growth Index for the same time periods.
| | | | | | | | | | | | |
| | | Average Annual Total Returns1 | |
| | | One Year | | | Five Years | | | Ten Years | |
Managers Cadence Capital Appreciation Fund 2,3,4,5,* | | | | | | | | | | | | |
Institutional Class | | | (6.60 | )% | | | 1.38 | % | | | 5.96 | % |
Administrative Class | | | (6.81 | )% | | | 1.12 | % | | | 5.70 | % |
Russell Microcap® Growth Index6 | | | (12.37 | )% | | | (2.52 | )% | | | 4.39 | % |
Russell 2000® Growth Index7 | | | (9.46 | )% | | | 0.85 | % | | | 5.91 | % |
The performance data shown represents past performance, which is not a guarantee of future results. Current performance may be lower or higher than the performance data quoted. The investment return and principal value of an investment in the Fund will fluctuate so that an investor’s shares, when redeemed, may be worth more or less than their original cost. For performance information through the most recent month end please call (800) 835-3879 or visit our Web site at www.managersinvest.com.
Investors should carefully consider the Fund’s investment objectives, risks, charges and expenses before investing. For this and other information, please call 800.835.3879 or visit www.managersinvest.com for a free prospectus. Read it carefully before investing or sending money. Funds are distributed by Managers Distributors, Inc., a member of FINRA.
|
* The Fund changed its fiscal year end from June 30 to May 31 in 2011. 1 Total return equals income yield plus share price change and assumes reinvestment of all dividends and capital gain distributions. Returns are net of fees and may reflect offsets of Fund expenses as described in the Prospectus. No adjustment has been made for taxes payable by shareholders on their reinvested dividends and capital gain distributions. Returns for periods greater than one year are annualized. The listed returns on the Fund are net of expenses and based on the published NAV as of May 31, 2012. All returns are in U.S. dollars ($). 2 From time to time, the Fund’s advisor has waived its fees and/or absorbed Fund expenses, which has resulted in higher returns. 3 The Fund invests in growth stocks, which may be more sensitive to market movements because their prices tend to reflect future investor expectations rather than just current profits. Growth stocks may underperform value stocks during given periods. 4 The Fund is subject to risks associated with investments in small-capitalization companies such as erratic earnings patterns, competitive conditions, limited earnings history, and a reliance on one or a limited number of products. 5 The Fund is subject to special risk considerations similar to those associated with the direct ownership of real estate. Real estate valuations may be subject to factors such as changing general and local economic, financial, competitive, and environmental conditions. 6 The Russell Microcap® Growth Index measures the performance of the microcap growth segment of the U.S. equity market. It includes those Russell Microcap Index companies with higher price-to-book ratios and higher forecasted growth values. Unlike the Fund, the Index is unmanaged, is not available for investment, and does not incur expenses. 7 The Russell 2000® Growth Index measures the performance of the Russell 2000® companies with higher price-to-book ratios and higher forecasted growth values. Unlike the Fund, the Index is unmanaged, is not available for investment, and does not incur expenses. The Russell Microcap® Growth Index is a registered trademark of Russell Investments. The Russell 2000® Growth Index is a trademark of Russell Investments. Russell® is a trademark of Russell Investments. Not FDIC insured, nor bank guaranteed. May lose value. |
24
Managers Cadence Emerging Companies Fund
Fund Snapshots
May 31, 2012
Portfolio Breakdown (unaudited)
| | | | | | | | | | | | |
Industry | | Managers Cadence
Emerging Companies Fund** | | | Russell Microcap®
Growth Index | | | Russell 2000®
Growth Index | |
Health Care | | | 23.2 | % | | | 32.0 | % | | | 20.9 | % |
Information Technology | | | 22.7 | % | | | 21.4 | % | | | 22.2 | % |
Consumer Discretionary | | | 17.1 | % | | | 13.0 | % | | | 15.6 | % |
Industrials | | | 11.2 | % | | | 14.3 | % | | | 16.5 | % |
Energy | | | 8.8 | % | | | 5.0 | % | | | 7.2 | % |
Financials | | | 8.2 | % | | | 5.2 | % | | | 8.1 | % |
Materials | | | 3.7 | % | | | 5.0 | % | | | 4.1 | % |
Consumer Staples | | | 1.7 | % | | | 2.3 | % | | | 4.3 | % |
Telecommunication Services | | | 0.0 | % | | | 1.5 | % | | | 1.0 | % |
Utilities | | | 0.0 | % | | | 0.3 | % | | | 0.1 | % |
Other Assets and Liabilities | | | 3.4 | % | | | 0.0 | % | | | 0.0 | % |
| ** | As a percentage of net assets |
Top Ten Holdings (unaudited)
| | | | |
Security Name | | % of
Net Assets | |
Cost Plus, Inc. | | | 1.5 | % |
Wilshire Bancorp, Inc. | | | 1.4 | |
Willbros Group, Inc. | | | 1.4 | |
SciQuest, Inc. | | | 1.4 | |
Integramed America, Inc. | | | 1.4 | |
Clicksoftware Technologies, Ltd. | | | 1.3 | |
Conn’s, Inc. | | | 1.3 | |
Kona Grill, Inc. | | | 1.3 | |
Universal Stainless & Alloy | | | 1.3 | |
Abraxas Petroleum Corp.* | | | 1.3 | |
Top Ten as a Group | | | 13.6 | % |
| | | | |
| * | Top Ten Holding at November 30, 2011 |
|
| Any sectors, industries, or securities discussed should not be perceived as investment recommendations. Mention of a specific security should not be considered a recommendation to buy or solicitation to sell that security. Specific securities mentioned in this report may have been sold from the Fund’s portfolio of investments by the time you receive this report. |
25
Managers Cadence Emerging Companies Fund
Schedule of Portfolio Investments
May 31, 2012
| | | | | | | | |
| | | Shares | | | Value | |
| | | | | | | | |
Common Stocks - 96.6% | | | | | | | | |
Consumer Discretionary - 17.1% | | | | | |
Amerigon, Inc.* | | | 31,690 | | | $ | 379,646 | |
Body Central Corp.* | | | 20,130 | | | | 294,904 | |
Cache, Inc.* | | | 56,766 | | | | 279,289 | |
Caribou Coffee Co., Inc.* | | | 35,450 | | | | 421,855 | |
Carrols Restaurant Group, Inc.* | | | 32,530 | | | | 198,433 | |
Conn’s, Inc.* | | | 27,480 | | | | 480,625 | |
Cost Plus, Inc.* | | | 24,870 | | | | 549,627 | |
Dorman Products, Inc.* | | | 9,070 | | | | 436,630 | |
Drew Industries, Inc.* | | | 14,960 | | | | 397,188 | |
Fiesta Restaurant Group, Inc.* | | | 32,530 | | | | 396,866 | |
Gordmans Stores, Inc.* | | | 21,860 | | | | 389,327 | |
Kona Grill, Inc.* | | | 61,890 | | | | 480,266 | |
LIN TV Corp., Class A* | | | 101,274 | | | | 291,669 | |
Movado Group, Inc. | | | 16,290 | | | | 451,233 | |
Nexstar Broadcasting Group, Inc., Class A* | | | 38,450 | | | | 254,924 | |
Peet’s Coffee & Tea, Inc.* | | | 5,670 | | | | 337,819 | |
Red Robin Gourmet Burgers, Inc.* | | | 11,340 | | | | 362,880 | |
Total Consumer Discretionary | | | | | | | 6,403,181 | |
Consumer Staples - 1.7% | | | | | | | | |
Prestige Brands Holdings, Inc.* | | | 29,600 | | | | 406,408 | |
Schiff Nutrition International, Inc.* | | | 14,220 | | | | 238,896 | |
Total Consumer Staples | | | | | | | 645,304 | |
Energy - 8.8% | | | | | | | | |
Abraxas Petroleum Corp.* | | | 171,297 | | | | 472,780 | |
Double Eagle Petroleum Co.* | | | 60,190 | | | | 252,798 | |
Gulf Island Fabrication, Inc. | | | 13,550 | | | | 338,750 | |
Matrix Service Co.* | | | 30,310 | | | | 314,921 | |
Mitcham Industries, Inc.* | | | 16,360 | | | | 309,204 | |
OYO Geospace Corp.* | | | 4,170 | | | | 386,934 | |
RigNet, Inc.* | | | 24,470 | | | | 381,977 | |
Triangle Petroleum Corp.* | | | 55,250 | | | | 281,775 | |
Willbros Group, Inc.* | | | 93,910 | | | | 537,165 | |
Total Energy | | | | | | | 3,276,304 | |
Financials - 8.2% | | | | | | | | |
Associated Estates Realty Corp. | | | 23,950 | | | | 378,649 | |
Bryn Mawr Bank Corp. | | | 19,770 | | | | 404,692 | |
Epoch Holding Corp. | | | 16,050 | | | | 368,829 | |
HFF, Inc., Class A* | | | 13,480 | | | | 176,318 | |
Marlin Business Services Corp. | | | 27,198 | | | | 391,923 | |
Virtus Investment Partners, Inc.* | | | 5,080 | | | | 360,070 | |
West Coast Bancorp* | | | 24,000 | | | | 451,200 | |
Wilshire Bancorp, Inc.* | | | 107,700 | | | | 539,577 | |
Total Financials | | | | | | | 3,071,258 | |
Health Care - 23.2% | | | | | | | | |
Aegerion Pharmaceuticals, Inc.* | | | 19,470 | | | | 296,139 | |
| | | | | | | | |
| | | Shares | | | Value | |
| | | | | | | | |
Arqule, Inc.* | | | 26,530 | | | $ | 157,588 | |
AtriCure, Inc.* | | | 35,961 | | | | 323,289 | |
Auxilium Pharmaceuticals, Inc.* | | | 10,480 | | | | 200,168 | |
BioScrip, Inc.* | | | 63,000 | | | | 425,880 | |
Conceptus, Inc.* | | | 21,920 | | | | 369,133 | |
Cumberland Pharmaceuticals, Inc.* | | | 41,900 | | | | 257,266 | |
Derma Sciences, Inc.* | | | 45,300 | | | | 404,982 | |
Dusa Pharmaceuticals, Inc.* | | | 69,240 | | | | 357,278 | |
Ensign Group, Inc., The | | | 15,040 | | | | 382,016 | |
Immunomedics, Inc.* | | | 81,270 | | | | 269,816 | |
Integramed America, Inc.* | | | 47,712 | | | | 530,080 | |
National Research Corp. | | | 7,539 | | | | 323,951 | |
Omnicell, Inc.* | | | 21,800 | | | | 285,362 | |
OraSure Technologies, Inc.* | | | 43,050 | | | | 445,567 | |
Pacira Pharmaceuticals, Inc.* | | | 31,570 | | | | 335,273 | |
Palomar Medical Technologies, Inc.* | | | 55,650 | | | | 463,008 | |
Pernix Therapeutics Holdings* | | | 43,020 | | | | 278,339 | |
Quidel Corp.* | | | 20,817 | | | | 327,243 | |
Raptor Pharmaceutical Corp.* | | | 40,500 | | | | 217,485 | |
Rigel Pharmaceuticals, Inc.* | | | 33,620 | | | | 249,797 | |
RTI Biologics, Inc.* | | | 128,900 | | | | 462,751 | |
Spectranetics Corp.* | | | 31,780 | | | | 313,669 | |
Synergetics USA, Inc.* | | | 84,580 | | | | 302,796 | |
Trius Therapeutics, Inc.* | | | 63,360 | | | | 325,037 | |
US Physical Therapy, Inc. | | | 15,180 | | | | 368,874 | |
Total Health Care | | | | | | | 8,672,787 | |
Industrials - 11.2% | | | | | | | | |
Astronics Corp.* | | | 13,444 | | | | 343,091 | |
CDI Corp. | | | 23,170 | | | | 388,793 | |
DXP Enterprises, Inc.* | | | 3,840 | | | | 180,480 | |
Dynamic Materials Corp. | | | 22,710 | | | | 383,345 | |
Flow International Corp.* | | | 142,100 | | | | 419,195 | |
GP Strategies Corp.* | | | 26,482 | | | | 417,356 | |
H&E Equipment Services, Inc.* | | | 28,210 | | | | 447,693 | |
Quality Distribution, Inc.* | | | 34,538 | | | | 366,794 | |
Raven Industries, Inc. | | | 5,830 | | | | 388,395 | |
Roadrunner Transportation Systems, Inc.* | | | 24,390 | | | | 409,752 | |
Trex Co, Inc.* | | | 14,710 | | | | 428,061 | |
Total Industrials | | | | | | | 4,172,955 | |
Information Technology - 22.7% | | | | | | | | |
Alliance Fiber Optic Products, Inc.* | | | 55,753 | | | | 452,714 | |
CalAmp Corp.* | | | 65,130 | | | | 399,247 | |
ClickSoftware Technologies, Ltd. | | | 57,650 | | | | 494,637 | |
Computer Task Group, Inc.* | | | 26,140 | | | | 318,124 | |
CVD Equipment Corp.* | | | 566 | | | | 6,735 | |
Datalink Corp.* | | | 38,840 | | | | 385,293 | |
Deltek, Inc.* | | | 36,680 | | | | 384,773 | |
The accompanying notes are an integral part of these financial statements.
26
Managers Cadence Emerging Companies Fund
Schedule of Portfolio Investments (continued)
| | | | | | | | |
| | | Shares | | | Value | |
| | | | | | | | |
Information Technology - 22.7% (continued) | | | | | |
Electro Scientific Industries, Inc. | | | 31,470 | | | $ | 347,114 | |
ExlService Holdings, Inc.* | | | 14,000 | | | | 303,380 | |
Guidance Software, Inc.* | | | 46,740 | | | | 383,268 | |
IXYS Corp.* | | | 39,090 | | | | 404,972 | |
Liquidity Services, Inc.* | | | 4,900 | | | | 313,061 | |
LivePerson, Inc.* | | | 10,350 | | | | 178,641 | |
LRAD Corp.* | | | 143,888 | | | | 188,493 | |
Monolithic Power Systems, Inc.* | | | 22,910 | | | | 430,479 | |
OCZ Technology Group, Inc.* | | | 60,880 | | | | 272,742 | |
Oplink Communications, Inc.* | | | 29,640 | | | | 379,985 | |
Procera Networks, Inc.* | | | 19,510 | | | | 407,759 | |
PROS Holdings, Inc.* | | | 28,750 | | | | 432,113 | |
SciQuest, Inc.* | | | 33,800 | | | | 532,012 | |
Silicon Image, Inc.* | | | 68,990 | | | | 304,936 | |
SPS Commerce, Inc.* | | | 14,420 | | | | 398,569 | |
Web.com Group, Inc.* | | | 22,470 | | | | 357,722 | |
XO Group, Inc.* | | | 47,150 | | | | 416,335 | |
Total Information Technology | | | | | | | 8,493,104 | |
| | | | | | | | |
| | | Shares | | | Value | |
| | | | | | | | |
Materials - 3.7% | | | | | | | | |
Flotek Industries, Inc.* | | | 15,050 | | | $ | 160,283 | |
Horsehead Holding Corp.* | | | 47,300 | | | | 419,078 | |
OMNOVA Solutions, Inc.* | | | 43,679 | | | | 314,489 | |
Universal Stainless & Alloy* | | | 11,840 | | | | 476,442 | |
Total Materials | | | | | | | 1,370,292 | |
Total Common Stocks
(cost $36,141,421) | | | | | | | 36,105,185 | |
Other Investment Companies - 4.0%1 | | | | | |
Dreyfus Cash Management Fund, Institutional Class Shares, 0.09%
(cost $1,504,019) | | | 1,504,019 | | | | 1,504,019 | |
Total Investments - 100.6%
(cost $37,645,440) | | | | | | | 37,609,204 | |
Other Assets, less Liabilities - (0.6)% | | | | (220,856 | ) |
Net Assets - 100.0% | | | | | | $ | 37,388,348 | |
The accompanying notes are an integral part of these financial statements.
27
Notes to Schedule of Portfolio Investments
The following footnotes should be read in conjunction with each of the Schedules of Portfolio Investments previously presented in this report.
At May 31, 2012, the cost of securities for Federal income tax purposes and the gross aggregate unrealized appreciation and/or depreciation based on tax cost were approximately:
| | | | | | | | | | | | | | | | |
Fund | | Cost | | | Appreciation | | | Depreciation | | | Net | |
Managers Cadence Capital Appreciation Fund | | $ | 646,599,748 | | | $ | 40,496,225 | | | $ | (44,183,621 | ) | | $ | (3,687,396 | ) |
Managers Cadence Focused Growth Fund | | | 8,400,030 | | | | 695,355 | | | | (684,433 | ) | | | 10,922 | |
Managers Cadence Mid-Cap Fund | | | 524,734,051 | | | | 52,337,445 | | | | (38,332,264 | ) | | | 14,005,181 | |
Managers Cadence Emerging Companies Fund | | | 37,959,549 | | | | 3,647,854 | | | | (3,998,199 | ) | | | (350,345 | ) |
| * | Non-income-producing security. |
| 1 | Yield shown represents the May 31, 2012, seven-day average yield, which refers to the sum of the previous seven days’ dividends paid, expressed as an annual percentage. |
As of May 31, 2012, the securities in the Funds were all valued using Level 1 inputs. For a detailed break-out of the common stocks by major industry classification, please refer to the respective Schedule of Portfolio Investments previously presented in this report.
For the fiscal year ended May 31, 2012, the Funds had no significant transfers between Level 1 and Level 2 from the beginning of the reporting period.
The accompanying notes are an integral part of these financial statements.
28
Statements of Assets and Liabilities
May 31, 2012
| | | | | | | | | | | | | | | | |
| | | Managers Cadence
Capital Appreciation
Fund | | | Managers Cadence
Focused Growth
Fund | | | Managers Cadence
Mid-Cap
Fund | | | Managers Cadence
Emerging
Companies
Fund | |
Assets: | | | | | | | | | | | | | | | | |
Investments at value* | | $ | 642,912,352 | | | $ | 8,410,952 | | | $ | 538,739,232 | | | $ | 37,609,204 | |
Receivable for Fund shares sold | | | 1,343,362 | | | | — | | | | 145,418 | | | | 22,114 | |
Dividends, interest and other receivables | | | 1,248,707 | | | | 14,515 | | | | 247,296 | | | | 10,230 | |
Receivable from affiliate | | | 69,932 | | | | 21,262 | | | | 35,299 | | | | 16,502 | |
Receivable for investments sold | | | 22,926 | | | | — | | | | — | | | | 223,562 | |
Prepaid expenses | | | 77,714 | | | | 24,138 | | | | 61,062 | | | | 19,021 | |
Total assets | | | 645,674,993 | | | | 8,470,867 | | | | 539,228,307 | | | | 37,900,633 | |
Liabilities: | | | | | | | | | | | | | | | | |
Payable for Fund shares repurchased | | | 1,428,477 | | | | 3,599 | | | | 803,036 | | | | 16,767 | |
Payable for investments purchased | | | — | | | | — | | | | — | | | | 391,161 | |
Accrued expenses: | | | | | | | | | | | | | | | | |
Investment management and advisory fees | | | 257,342 | | | | 3,355 | | | | 215,051 | | | | 44,716 | |
Administrative fees | | | 142,968 | | | | 1,864 | | | | 119,473 | | | | 8,943 | |
Shareholder servicing fees | | | 79,881 | | | | 1,574 | | | | 48,601 | | | | 1,188 | |
Distribution fees | | | 125,093 | | | | 1,672 | | | | 63,233 | | | | — | |
Custodian | | | 37,285 | | | | 1,929 | | | | 31,875 | | | | 6,418 | |
Professional fees | | | 36,446 | | | | 19,008 | | | | 35,033 | | | | 27,453 | |
Trustees fees and expenses | | | 11,760 | | | | 595 | | | | 10,305 | | | | 1,695 | |
Other | | | 101,608 | | | | 4,119 | | | | 68,097 | | | | 13,944 | |
Total liabilities | | | 2,220,860 | | | | 37,715 | | | | 1,394,704 | | | | 512,285 | |
| | | | |
Net Assets | | $ | 643,454,133 | | | $ | 8,433,152 | | | $ | 537,833,603 | | | $ | 37,388,348 | |
Net Assets Represent: | | | | | | | | | | | | | | | | |
Paid-in capital | | $ | 789,978,672 | | | $ | 18,186,617 | | | $ | 628,110,783 | | | $ | 77,847,373 | |
Undistributed net investment income (loss) | | | 930,999 | | | | 49,139 | | | | (479,114 | ) | | | (213,491 | ) |
Accumulated net realized loss from investments | | | (147,379,554 | ) | | | (9,901,571 | ) | | | (106,627,730 | ) | | | (40,209,300 | ) |
Net unrealized appreciation (depreciation) of investments | | | (75,984 | ) | | | 98,967 | | | | 16,829,664 | | | | (36,234 | ) |
Net Assets | | $ | 643,454,133 | | | $ | 8,433,152 | | | $ | 537,833,603 | | | $ | 37,388,348 | |
* Investments at cost | | $ | 642,988,336 | | | $ | 8,311,985 | | | $ | 521,909,568 | | | $ | 37,645,440 | |
The accompanying notes are an integral part of these financial statements.
29
Statements of Assets and Liabilities
May 31, 2012 (continued)
| | | | | | | | | | | | | | | | |
| | | Managers Cadence
Capital Appreciation
Fund | | | Managers Cadence
Focused Growth
Fund | | | Managers Cadence
Mid-Cap
Fund | | | Managers Cadence
Emerging
Companies
Fund | |
Class A Shares: | | | | | | | | | | | | | | | | |
Net Assets | | $ | 68,310,211 | | | $ | 1,321,012 | | | $ | 138,115,434 | | | | n/a | |
Shares outstanding | | | 4,117,592 | | | | 169,017 | | | | 5,731,192 | | | | n/a | |
Net asset value, offering and redemption price per share | | $ | 16.59 | | | $ | 7.82 | | | $ | 24.10 | | | | n/a | |
Offering price per share based on a maximum sales charge of 5.75% (NAV per share/(100% - 5.75%) | | $ | 17.60 | | | $ | 8.30 | | | $ | 25.57 | | | | n/a | |
Class B Shares: | | | | | | | | | | | | | | | | |
Net Assets | | $ | 2,977,1271 | | | | n/a | | | $ | 5,158,7681 | | | | n/a | |
Shares outstanding | | | 202,055 | | | | n/a | | | | 244,715 | | | | n/a | |
Net asset value, offering and redemption price per share | | $ | 14.73 | | | | n/a | | | $ | 21.08 | | | | n/a | |
Class C Shares: | | | | | | | | | | | | | | | | |
Net Assets | | $ | 21,715,263 | | | $ | 1,078,551 | | | $ | 15,042,624 | | | | n/a | |
Shares outstanding | | | 1,469,006 | | | | 141,591 | | | | 713,056 | | | | n/a | |
Net asset value, offering and redemption price per share | | $ | 14.78 | | | $ | 7.62 | | | $ | 21.10 | | | | n/a | |
Class D Shares: | | | | | | | | | | | | | | | | |
Net Assets | | $ | 391,953,399 | | | $ | 1,853,618 | | | $ | 35,751,172 | | | | n/a | |
Shares outstanding | | | 23,998,064 | | | | 238,522 | | | | 1,472,180 | | | | n/a | |
Net asset value, offering and redemption price per share | | $ | 16.33 | | | $ | 7.77 | | | $ | 24.28 | | | | n/a | |
Institutional Class Shares: | | | | | | | | | | | | | | | | |
Net Assets | | $ | 85,337,530 | | | $ | 4,052,568 | | | $ | 234,346,482 | | | $ | 34,883,134 | |
Shares outstanding | | | 4,959,634 | | | | 515,136 | | | | 9,132,382 | | | | 1,599,341 | |
Net asset value, offering and redemption price per share | | $ | 17.21 | | | $ | 7.87 | | | $ | 25.66 | | | $ | 21.81 | |
Administrative Class Shares: | | | | | | | | | | | | | | | | |
Net Assets | | $ | 67,536,478 | | | $ | 11,391 | | | $ | 92,851,031 | | | $ | 2,505,214 | |
Shares outstanding | | | 4,042,537 | | | | 1,450 | | | | 3,764,051 | | | | 122,894 | |
Net asset value, offering and redemption price per share | | $ | 16.71 | | | $ | 7.86 | | | $ | 24.67 | | | $ | 20.39 | |
Class P Shares: | | | | | | | | | | | | | | | | |
Net Assets | | $ | 2,514,369 | | | $ | 116,012 | | | $ | 2,136,444 | | | | n/a | |
Shares outstanding | | | 146,793 | | | | 14,883 | | | | 83,596 | | | | n/a | |
Net asset value, offering and redemption price per share | | $ | 17.13 | | | $ | 7.79 | | | $ | 25.56 | | | | n/a | |
Class R Shares: | | | | | | | | | | | | | | | | |
Net Assets | | $ | 3,109,756 | | | | n/a | | | $ | 14,431,648 | | | | n/a | |
Shares outstanding | | | 187,658 | | | | n/a | | | | 601,282 | | | | n/a | |
Net asset value, offering and redemption price per share | | $ | 16.57 | | | | n/a | | | $ | 24.00 | | | | n/a | |
| 1 | Effective at the close of business on June 30, 2011, shares are no longer available for purchase. |
The accompanying notes are an integral part of these financial statements.
30
Statements of Operations
For the fiscal year ended May 31, 2012
| | | | | | | | | | | | | | | | |
| | | Managers Cadence
Capital Appreciation
Fund | | | Managers Cadence
Focused Growth
Fund | | | Managers Cadence
Mid-Cap
Fund | | | Managers Cadence
Emerging
Companies
Fund | |
Investment Income: | | | | | | | | | | | | | | | | |
Dividend income | | $ | 9,536,733 | | | $ | 177,342 | | | $ | 5,138,291 | | | $ | 238,618 | |
Interest income | | | — | | | | — | | | | 899 | | | | 51 | |
Foreign withholding tax | | | (3,392 | ) | | | — | | | | (10,326 | ) | | | (848 | ) |
Total investment income | | | 9,533,341 | | | | 177,342 | | | | 5,128,864 | | | | 237,821 | |
Expenses: | | | | | | | | | | | | | | | | |
Investment management and advisory fees | | | 3,210,044 | | | | 59,892 | | | | 2,662,660 | | | | 688,118 | |
Administrative fees | | | 1,783,357 | | | | 33,199 | | | | 1,479,255 | | | | 137,624 | |
Distribution fees - Class A | | | 215,127 | | | | 5,333 | | | | 375,253 | | | | — | |
Distribution fees - Class B | | | 43,874 | | | | — | | | | 71,932 | | | | — | |
Distribution fees - Class C | | | 286,393 | | | | 13,481 | | | | 209,738 | | | | — | |
Distribution fees - Class D | | | 946,178 | | | | 4,649 | | | | 84,852 | | | | — | |
Distribution fees - Administrative Class | | | — | | | | 6 | | | | — | | | | — | |
Distribution fees - Class R | | | 17,416 | | | | — | | | | 86,508 | | | | — | |
Transfer agent | | | 1,140,818 | | | | 15,175 | | | | 765,848 | | | | 22,485 | |
Registration fees | | | 142,993 | | | | 53,438 | | | | 97,250 | | | | 19,799 | |
Professional fees | | | 140,850 | | | | 36,263 | | | | 104,018 | | | | 51,528 | |
Trustees fees and expenses | | | 69,509 | | | | 1,536 | | | | 55,701 | | | | 6,192 | |
Miscellaneous | | | 277,650 | | | | 7,954 | | | | 181,403 | | | | 41,411 | |
Total expenses before offsets | | | 8,274,209 | | | | 230,926 | | | | 6,174,418 | | | | 967,157 | |
Expense reimbursements | | | (649,797 | ) | | | (101,920 | ) | | | (478,852 | ) | | | (169,375 | ) |
Expense reductions | | | (33,851 | ) | | | (1,881 | ) | | | (37,049 | ) | | | (28,678 | ) |
Net expenses | | | 7,590,561 | | | | 127,125 | | | | 5,658,517 | | | | 769,104 | |
Net investment income (loss) | | | 1,942,780 | | | | 50,217 | | | | (529,653 | ) | | | (531,283 | ) |
Net Realized and Unrealized Gain (Loss): | | | | | | | | | | | | | | | | |
Net realized gain on investments | | | 113,963,157 | | | | 2,104,454 | | | | 73,940,372 | | | | 9,637,419 | |
Net change in unrealized appreciation (depreciation) of investments | | | (161,038,803 | ) | | | (3,090,892 | ) | | | (128,386,923 | ) | | | (14,297,263 | ) |
Net realized and unrealized loss | | | (47,075,646 | ) | | | (986,438 | ) | | | (54,446,551 | ) | | | (4,659,844 | ) |
Net decrease in net assets resulting from operations | | $ | (45,132,866 | ) | | $ | (936,221 | ) | | $ | (54,976,204 | ) | | $ | (5,191,127 | ) |
The accompanying notes are an integral part of these financial statements.
31
Statements of Changes in Net Assets
| | | | | | | | | | | | | | | | | | | | | | | | |
| | | Managers Cadence Capital
Appreciation Fund | | | Managers Cadence Focused
Growth Fund | |
| | | Fiscal
year ended
May 31, 2012 | | | For the fiscal period
from July 1, 2010
to May 31, 2011 | | | Fiscal
year ended
June 30, 2010 | | | Fiscal
year ended
May 31, 2012 | | | For the fiscal period
from July 1, 2010
to May 31, 2011 | | | Fiscal
year ended
June 30, 2010 | |
Increase (Decrease) in Net Assets From Operations: | | | | | | | | | | | | | | | | | | | | | | | | |
Net investment income | | $ | 1,942,780 | | | $ | 2,894,573 | | | $ | 3,134,702 | | | $ | 50,217 | | | $ | 92,906 | | | $ | 336,588 | |
Net realized gain on investments | | | 113,963,157 | | | | 97,122,182 | | | | 87,941,085 | | | | 2,104,454 | | | | 2,855,858 | | | | 14,309,303 | |
Net change in unrealized appreciation (depreciation) of investments | | | (161,038,803 | ) | | | 136,376,505 | | | | 28,811,634 | | | | (3,090,892 | ) | | | 3,936,822 | | | | (2,924,435 | ) |
Net increase (decrease) in net assets resulting from operations | | | (45,132,866 | ) | | | 236,393,260 | | | | 119,887,421 | | | | (936,221 | ) | | | 6,885,586 | | | | 11,721,456 | |
Distributions to Shareholders: | | | | | | | | | | | | | | | | | | | | | | | | |
From net investment income: | | | | | | | | | | | | | | | | | | | | | | | | |
Class A | | | (63,775 | ) | | | (476,286 | ) | | | (295,140 | ) | | | (861 | ) | | | (21,767 | ) | | | (51,428 | ) |
Class B | | | — | | | | — | | | | (23 | ) | | | n/a | | | | n/a | | | | n/a | |
Class C | | | — | | | | — | | | | (44 | ) | | | — | | | | — | | | | (6,572 | ) |
Class D | | | (785,148 | ) | | | (1,358,363 | ) | | | (1,113,708 | ) | | | (8,072 | ) | | | (12,472 | ) | | | (19,677 | ) |
Institutional Class | | | (582,221 | ) | | | (1,431,683 | ) | | | (1,805,828 | ) | | | (59,852 | ) | | | (163,809 | ) | | | (485,230 | ) |
Administrative Class | | | (41,323 | ) | | | (1,052,092 | ) | | | (1,084,217 | ) | | | (82 | ) | | | (79 | ) | | | (115 | ) |
Class P | | | (13,296 | ) | | | (20,264 | ) | | | (51,533 | ) | | | (1,251 | ) | | | (1,850 | ) | | | (2,860 | ) |
Class R | | | — | | | | — | | | | (6 | ) | | | n/a | | | | n/a | | | | n/a | |
From net realized gain on investments: | | | | | | | | | | | | | | | | | | | | | | | | |
Class A | | | — | | | | — | | | | — | | | | (102,673 | ) | | | (110,707 | ) | | | — | |
Class C | | | — | | | | — | | | | — | | | | (100,884 | ) | | | (52,511 | ) | | | — | |
Class D | | | — | | | | — | | | | — | | | | (137,059 | ) | | | (54,534 | ) | | | — | |
Institutional Class | | | — | | | | — | | | | — | | | | (564,059 | ) | | | (550,692 | ) | | | — | |
Administrative Class | | | — | | | | — | | | | — | | | | (864 | ) | | | (336 | ) | | | — | |
Class P | | | — | | | | — | | | | — | | | | (12,486 | ) | | | (6,219 | ) | | | — | |
Total distributions to shareholders | | | (1,485,763 | ) | | | (4,338,688 | ) | | | (4,350,499 | ) | | | (988,143 | ) | | | (974,976 | ) | | | (565,882 | ) |
From Capital Share Transactions:1 | | | | | | | | | | | | | | | | | | | | | | | | |
Proceeds from sale of shares | | | 168,352,965 | | | | 198,499,649 | | | | 309,681,375 | | | | 937,609 | | | | 1,188,182 | | | | 6,815,491 | |
Reinvestment of dividends and distributions | | | 1,454,305 | | | | 4,159,200 | | | | 4,012,522 | | | | 859,746 | | | | 900,806 | | | | 558,664 | |
Cost of shares repurchased | | | (313,119,130 | ) | | | (364,009,067 | ) | | | (514,442,034 | ) | | | (10,111,987 | ) | | | (11,856,898 | ) | | | (95,228,271 | ) |
Net decrease from capital share transactions | | | (143,311,860 | ) | | | (161,350,218 | ) | | | (200,748,137 | ) | | | (8,314,632 | ) | | | (9,767,910 | ) | | | (87,854,116 | ) |
Total increase (decrease) in net assets | | | (189,930,489 | ) | | | 70,704,354 | | | | (85,211,215 | ) | | | (10,238,996 | ) | | | (3,857,300 | ) | | | (76,698,542 | ) |
Net Assets: | | | | | | | | | | | | | | | | | | | | | | | | |
Beginning of period | | | 833,384,622 | | | | 762,680,268 | | | | 847,891,483 | | | | 18,672,148 | | | | 22,529,448 | | | | 99,227,990 | |
End of period | | $ | 643,454,133 | | | $ | 833,384,622 | | | $ | 762,680,268 | | | $ | 8,433,152 | | | $ | 18,672,148 | | | $ | 22,529,448 | |
End of period undistributed net investment income | | $ | 930,999 | | | $ | 405,641 | | | $ | 1,921,409 | | | $ | 49,139 | | | $ | 69,040 | | | $ | 176,127 | |
| | | | | | | | | | | | | | | | | | | | | | | | |
Share Transactions:1 | | | | | | | | | | | | | | | | | | | | | | | | |
Sale of shares | | | 10,166,652 | | | | 12,430,966 | | | | 22,324,857 | | | | 114,139 | | | | 141,169 | | | | 898,594 | |
Reinvested shares from dividends and distributions | | | 89,526 | | | | 249,270 | | | | 282,345 | | | | 113,111 | | | | 106,752 | | | | 73,043 | |
Shares repurchased | | | (18,706,709 | ) | | | (22,381,104 | ) | | | (36,257,704 | ) | | | (1,217,166 | ) | | | (1,384,185 | ) | | | (12,712,951 | ) |
Net decrease in shares | | | (8,450,531 | ) | | | (9,700,868 | ) | | | (13,650,502 | ) | | | (989,916 | ) | | | (1,136,264 | ) | | | (11,741,314 | ) |
| 1 | See note 1(g) of the Notes to Financial Statements. |
The accompanying notes are an integral part of these financial statements.
32
Statements of Changes in Net Assets (continued)
| | | | | | | | | | | | | | | | | | | | | | | | |
| | | Managers Cadence
Mid-Cap Fund | | | Managers Cadence
Emerging Companies Fund | |
| | | Fiscal
year ended
May 31, 2012 | | | For the fiscal period
from July 1, 2010
to May 31, 2011 | | | Fiscal
year ended
June 30, 2010 | | | Fiscal
year ended
May 31, 2012 | | | For the fiscal period
from July 1, 2010
to May 31, 2011 | | | Fiscal
year ended
June 30, 2010 | |
Increase (Decrease) in Net Assets From Operations: | | | | | | | | | | | | | | | | | | | | | | | | |
Net investment income (loss) | | $ | (529,653 | ) | | $ | 655,026 | | | $ | (62,454 | ) | | $ | (531,283 | ) | | $ | (153,710 | ) | | $ | (585,804 | ) |
Net realized gain on investments | | | 73,940,372 | | | | 140,583,056 | | | | 132,606,154 | | | | 9,637,419 | | | | 14,220,407 | | | | 21,068,700 | |
Net change in unrealized appreciation (depreciation) of investments | | | (128,386,923 | ) | | | 116,309,195 | | | | (1,819,138 | ) | | | (14,297,263 | ) | | | 14,038,159 | | | | (5,270,056 | ) |
Net increase (decrease) in net assets resulting from operations | | | (54,976,204 | ) | | | 257,547,277 | | | | 130,724,562 | | | | (5,191,127 | ) | | | 28,104,856 | | | | 15,212,840 | |
Distributions to Shareholders: | | | | | | | | | | | | | | | | | | | | | | | | |
From net investment income: | | | | | | | | | | | | | | | | | | | | | | | | |
Class A | | | — | | | | (206,078 | ) | | | — | | | | n/a | | | | n/a | | | | n/a | |
Class B | | | — | | | | — | | | | — | | | | n/a | | | | n/a | | | | n/a | |
Class C | | | — | | | | — | | | | — | | | | n/a | | | | n/a | | | | n/a | |
Class D | | | — | | | | (12,298 | ) | | | — | | | | n/a | | | | n/a | | | | n/a | |
Institutional Class | | | — | | | | (1,262,080 | ) | | | — | | | | — | | | | — | | | | — | |
Administrative Class | | | — | | | | (223,568 | ) | | | — | | | | — | | | | — | | | | — | |
Class P | | | — | | | | (13,056 | ) | | | — | | | | n/a | | | | n/a | | | | n/a | |
Class R | | | — | | | | — | | | | — | | | | n/a | | | | n/a | | | | n/a | |
Total distributions to shareholders | | | — | | | | (1,717,080 | ) | | | — | | | | — | | | | — | | | | — | |
From Capital Share Transactions:1 | | | | | | | | | | | | | | | | | | | | | | | | |
Proceeds from sale of shares | | | 119,087,000 | | | | 118,147,528 | | | | 159,407,898 | | | | 14,847,574 | | | | 12,354,565 | | | | 6,712,589 | |
Reinvestment of dividends and distributions | | | — | | | | 1,579,885 | | | | — | | | | — | | | | — | | | | — | |
Cost of shares repurchased | | | (207,802,125 | ) | | | (362,320,270 | ) | | | (356,761,266 | ) | | | (42,196,530 | ) | | | (27,526,509 | ) | | | (46,178,201 | ) |
Net decrease from capital share transactions | | | (88,715,125 | ) | | | (242,592,857 | ) | | | (197,353,368 | ) | | | (27,348,956 | ) | | | (15,171,944 | ) | | | (39,465,612 | ) |
Total increase (decrease) in net assets | | | (143,691,329 | ) | | | 13,237,340 | | | | (66,628,806 | ) | | | (32,540,083 | ) | | | 12,932,912 | | | | (24,252,772 | ) |
Net Assets: | | | | | | | | | | | | | | | | | | | | | | | | |
Beginning of period | | | 681,524,933 | | | | 668,287,593 | | | | 734,916,399 | | | | 69,928,431 | | | | 56,995,519 | | | | 81,248,291 | |
End of period | | $ | 537,833,604 | | | $ | 681,524,933 | | | $ | 668,287,593 | | | $ | 37,388,348 | | | $ | 69,928,431 | | | $ | 56,995,519 | |
End of period undistributed net investment income (loss) | | $ | (479,114 | ) | | | — | | | $ | 28,215 | | | $ | (213,491 | ) | | $ | 47,966 | | | $ | (18,557 | ) |
| | | | | | | | | | | | | | | | | | | | | | | | |
Share Transactions:1 | | | | | | | | | | | | | | | | | | | | | | | | |
Sale of shares | | | 4,858,854 | | | | 5,075,294 | | | | 8,364,315 | | | | 710,691 | | | | 621,753 | | | | 475,759 | |
Reinvested shares from dividends and distributions | | | — | | | | 63,701 | | | | — | | | | — | | | | — | | | | — | |
Shares repurchased | | | (8,463,264 | ) | | | (15,744,597 | ) | | | (18,824,255 | ) | | | (1,996,420 | ) | | | (1,520,237 | ) | | | (3,168,447 | ) |
Net decrease in shares | | | (3,604,410 | ) | | | (10,605,602 | ) | | | (10,459,940 | ) | | | (1,285,729 | ) | | | (898,484 | ) | | | (2,692,688 | ) |
| 1 | See note 1(g) of the Notes to Financial Statements. |
The accompanying notes are an integral part of these financial statements.
33
THIS PAGE INTENTIONALLY LEFT BLANK
Financial Highlights
For a share outstanding throughout each fiscal period
| | | | | | | | | | | | | | | | | | | | | | | | | | | | | | | | |
| | | Fiscal period ended: | | | Net Asset Value
Beginning of
Period | | | Net Investment
Income (Loss)1 | | | Net Realized
and Unrealized
Gain (Loss) on
Investments1 | | | Total from
Investment
Operations | | | Distributions to
Shareholders from
Net Investment
Income | | | Distributions to
Shareholders from
Net Realized Gain
on Investments | | | Total
Distributions to
Shareholders | |
MANAGERS CADENCE CAPITAL APPRECIATION FUND* | |
Class A | | | 5/31/2012 | | | $ | 17.57 | | | $ | 0.04 | | | $ | (1.01 | ) | | $ | (0.97 | ) | | $ | (0.01 | ) | | | — | | | $ | (0.01 | ) |
| | | 5/31/2011 | ** | | | 13.34 | | | | 0.04 | | | | 4.26 | | | | 4.30 | | | | (0.07 | ) | | | — | | | | (0.07 | ) |
| | | 6/30/2010 | | | | 11.91 | | | | 0.03 | | | | 1.43 | | | | 1.46 | | | | (0.03 | ) | | | — | | | | (0.03 | ) |
| | | 6/30/2009 | | | | 18.14 | | | | 0.04 | | | | (6.27 | ) | | | (6.23 | ) | | | (0.00 | )# | | | — | | | | (0.00 | )# |
| | | 6/30/2008 | | | | 21.00 | | | | 0.02 | | | | (0.92 | ) | | | (0.90 | ) | | | (0.06 | ) | | $ | (1.90 | ) | | | (1.96 | ) |
| | | | 6/30/2007 | | | | 19.71 | | | | 0.04 | | | | 2.64 | | | | 2.68 | | | | (0.02 | ) | | | (1.37 | ) | | | (1.39 | ) |
Class B | | | 5/31/2012 | | | $ | 15.71 | | | $ | (0.08 | ) | | $ | (0.90 | ) | | $ | (0.98 | ) | | | — | | | | — | | | | — | |
| | | 5/31/2011 | ** | | | 11.96 | | | | (0.06 | ) | | | 3.81 | | | | 3.75 | | | | — | | | | — | | | | — | |
| | | 6/30/2010 | | | | 10.74 | | | | (0.06 | ) | | | 1.28 | | | | 1.22 | | | $ | (0.00 | )# | | | — | | | $ | (0.00 | )# |
| | | 6/30/2009 | | | | 16.48 | | | | (0.06 | ) | | | (5.68 | ) | | | (5.74 | ) | | | (0.00 | )# | | | — | | | | (0.00 | )# |
| | | 6/30/2008 | | | | 19.33 | | | | (0.12 | ) | | | (0.83 | ) | | | (0.95 | ) | | | (0.00 | )# | | $ | (1.90 | ) | | | (1.90 | ) |
| | | | 6/30/2007 | | | | 18.35 | | | | (0.10 | ) | | | 2.45 | | | | 2.35 | | | | (0.00 | )# | | | (1.37 | ) | | | (1.37 | ) |
Class C | | | 5/31/2012 | | | $ | 15.76 | | | $ | (0.08 | ) | | $ | (0.90 | ) | | $ | (0.98 | ) | | | — | | | | — | | | | — | |
| | | 5/31/2011 | ** | | | 12.00 | | | | (0.05 | ) | | | 3.81 | | | | 3.76 | | | | — | | | | — | | | | — | |
| | | 6/30/2010 | | | | 10.77 | | | | (0.06 | ) | | | 1.29 | | | | 1.23 | | | $ | (0.00 | )# | | | — | | | $ | (0.00 | )# |
| | | 6/30/2009 | | | | 16.53 | | | | (0.06 | ) | | | (5.70 | ) | | | (5.76 | ) | | | (0.00 | )# | | | — | | | | (0.00 | )# |
| | | 6/30/2008 | | | | 19.37 | | | | (0.12 | ) | | | (0.82 | ) | | | (0.94 | ) | | | (0.00 | )# | | $ | (1.90 | ) | | | (1.90 | ) |
| | | | 6/30/2007 | | | | 18.39 | | | | (0.10 | ) | | | 2.45 | | | | 2.35 | | | | (0.00 | )# | | | (1.37 | ) | | | (1.37 | ) |
Class D | | | 5/31/2012 | | | $ | 17.32 | | | $ | 0.04 | | | $ | (1.00 | ) | | $ | (0.96 | ) | | $ | (0.03 | ) | | | — | | | $ | (0.03 | ) |
| | | 5/31/2011 | ** | | | 13.16 | | | | 0.04 | | | | 4.20 | | | | 4.24 | | | | (0.08 | ) | | | — | | | | (0.08 | ) |
| | | 6/30/2010 | | | | 11.79 | | | | 0.04 | | | | 1.41 | | | | 1.45 | | | | (0.08 | ) | | | — | | | | (0.08 | ) |
| | | 6/30/2009 | | | | 17.99 | | | | 0.05 | | | | (6.23 | ) | | | (6.18 | ) | | | (0.02 | ) | | | — | | | | (0.02 | ) |
| | | 6/30/2008 | | | | 20.85 | | | | 0.02 | | | | (0.91 | ) | | | (0.89 | ) | | | (0.07 | ) | | $ | (1.90 | ) | | | (1.97 | ) |
| | | | 6/30/2007 | | | | 19.58 | | | | 0.04 | | | | 2.63 | | | | 2.67 | | | | (0.03 | ) | | | (1.37 | ) | | | (1.40 | ) |
Institutional Class | | | 5/31/2012 | | | $ | 18.24 | | | $ | 0.10 | | | $ | (1.03 | ) | | $ | (0.93 | ) | | $ | (0.10 | ) | | | — | | | $ | (0.10 | ) |
| | | 5/31/2011 | ** | | | 13.84 | | | | 0.10 | | | | 4.42 | | | | 4.52 | | | | (0.12 | ) | | | — | | | | (0.12 | ) |
| | | 6/30/2010 | | | | 12.36 | | | | 0.09 | | | | 1.48 | | | | 1.57 | | | | (0.09 | ) | | | — | | | | (0.09 | ) |
| | | 6/30/2009 | | | | 18.79 | | | | 0.10 | | | | (6.51 | ) | | | (6.41 | ) | | | (0.02 | ) | | | — | | | | (0.02 | ) |
| | | 6/30/2008 | | | | 21.64 | | | | 0.10 | | | | (0.95 | ) | | | (0.85 | ) | | | (0.10 | ) | | $ | (1.90 | ) | | | (2.00 | ) |
| | | | 6/30/2007 | | | | 20.22 | | | | 0.12 | | | | 2.73 | | | | 2.85 | | | | (0.06 | ) | | | (1.37 | ) | | | (1.43 | ) |
Administrative Class | | | 5/31/2012 | | | $ | 17.67 | | | $ | 0.06 | | | $ | (1.01 | ) | | $ | (0.95 | ) | | $ | (0.01 | ) | | | — | | | $ | (0.01 | ) |
| | | 5/31/2011 | ** | | | 13.40 | | | | 0.06 | | | | 4.29 | | | | 4.35 | | | | (0.08 | ) | | | — | | | | (0.08 | ) |
| | | 6/30/2010 | | | | 11.98 | | | | 0.05 | | | | 1.43 | | | | 1.48 | | | | (0.06 | ) | | | — | | | | (0.06 | ) |
| | | 6/30/2009 | | | | 18.22 | | | | 0.06 | | | | (6.29 | ) | | | (6.23 | ) | | | (0.01 | ) | | | — | | | | (0.01 | ) |
| | | 6/30/2008 | | | | 21.11 | | | | 0.05 | | | | (0.92 | ) | | | (0.87 | ) | | | (0.12 | ) | | $ | (1.90 | ) | | | (2.02 | ) |
| | | | 6/30/2007 | | | | 19.78 | | | | 0.07 | | | | 2.66 | | | | 2.73 | | | | (0.03 | ) | | | (1.37 | ) | | | (1.40 | ) |
Class P | | | 5/31/2012 | | | $ | 18.16 | | | $ | 0.10 | | | $ | (1.04 | ) | | $ | (0.94 | ) | | $ | (0.09 | ) | | | — | | | $ | (0.09 | ) |
| | | 5/31/2011 | ** | | | 13.78 | | | | 0.08 | | | | 4.42 | | | | 4.50 | | | | (0.12 | ) | | | — | | | | (0.12 | ) |
| | | 6/30/2010 | | | | 12.33 | | | | 0.07 | | | | 1.48 | | | | 1.55 | | | | (0.10 | ) | | | — | | | | (0.10 | ) |
| | | | 6/30/2009 | † | | | 18.19 | | | | 0.08 | | | | (5.91 | ) | | | (5.83 | ) | | | (0.03 | ) | | | — �� | | | | (0.03 | ) |
Class R | | | 5/31/2012 | | | $ | 17.58 | | | $ | 0.00 | # | | $ | (1.01 | ) | | $ | (1.01 | ) | | | — | | | | — | | | | — | |
| | | 5/31/2011 | ** | | | 13.32 | | | | 0.01 | | | | 4.25 | | | | 4.26 | | | | — | | | | — | | | | — | |
| | | 6/30/2010 | | | | 11.90 | | | | (0.00 | )# | | | 1.42 | | | | 1.42 | | | $ | (0.00 | )# | | | — | | | $ | (0.00 | )# |
| | | 6/30/2009 | | | | 18.17 | | | | 0.01 | | | | (6.28 | ) | | | (6.27 | ) | | | (0.00 | )# | | | — | | | | (0.00 | )# |
| | | 6/30/2008 | | | | 21.04 | | | | (0.03 | ) | | | (0.93 | ) | | | (0.96 | ) | | | (0.01 | ) | | $ | (1.90 | ) | | | (1.91 | ) |
| | | | 6/30/2007 | | | | 19.79 | | | | (0.01 | ) | | | 2.66 | | | | 2.65 | | | | (0.03 | ) | | | (1.37 | ) | | | (1.40 | ) |
35
| | | | | | | | | | | | | | | | | | | | | | | | | | | | | | | | |
| | | Net Asset Value
End of Period | | | Total Return2 | | | Ratio of Net
Expenses to
Average Net
Assets | | | Ratio of Net
Investment Income
(Loss) to Average
Net Assets | | | Portfolio
Turnover Rate | | | Net Assets End
of Period
(000’s omitted) | | | Ratio of Total
Expenses (Absent
Expense Offsets) to
Average Net Assets3 | | | Ratio of Net Investment
Income (loss) (Absent
Expense Offsets) to
Average Net Assets3 | |
MANAGERS CADENCE CAPITAL APPRECIATION FUND | |
Class A | | $ | 16.59 | | | | (5.50 | )% | | | 1.11 | % | | | 0.21 | % | | | 163 | % | | $ | 68,310 | | | | 1.21 | % | | | 0.11 | % |
| | | 17.57 | | | | 32.23 | %5,6 | | | 1.10 | %7 | | | 0.30 | %7 | | | 75 | %5,6 | | | 110,903 | | | | 1.16 | %7 | | | 0.24 | %7 |
| | | 13.34 | | | | 12.23 | % | | | 1.11 | % | | | 0.24 | % | | | 103 | % | | | 108,395 | | | | 1.11 | % | | | 0.24 | % |
| | | 11.91 | 4 | | | (34.34 | )%4 | | | 1.11 | % | | | 0.26 | % | | | 154 | % | | | 157,543 | | | | 1.11 | % | | | 0.26 | % |
| | | 18.14 | | | | (5.43 | )% | | | 1.09 | % | | | 0.08 | % | | | 134 | % | | | 399,869 | | | | 1.09 | % | | | 0.08 | % |
| | | | 21.00 | | | | 14.18 | % | | | 1.08 | % | | | 0.21 | % | | | 150 | % | | | 448,379 | | | | 1.08 | % | | | 0.21 | % |
Class B | | $ | 14.73 | | | | (6.24 | )% | | | 1.86 | % | | | (0.55 | )% | | | 163 | % | | $ | 2,977 | 10 | | | 1.96 | % | | | (0.65 | )% |
| | | 15.71 | | | | 31.35 | %5,6 | | | 1.86 | %7 | | | (0.45 | )%7 | | | 75 | %5,6 | | | 6,128 | | | | 1.92 | %7 | | | (0.51 | )%7 |
| | | 11.96 | | | | 11.36 | % | | | 1.86 | % | | | (0.52 | )% | | | 103 | % | | | 9,420 | | | | 1.86 | % | | | (0.52 | )% |
| | | 10.74 | 4 | | | (34.83 | )%4 | | | 1.86 | % | | | (0.49 | )% | | | 154 | % | | | 14,963 | | | | 1.86 | % | | | (0.49 | )% |
| | | 16.48 | | | | (6.17 | )% | | | 1.84 | % | | | (0.66 | )% | | | 134 | % | | | 41,429 | | | | 1.84 | % | | | (0.66 | )% |
| | | | 19.33 | | | | 13.36 | % | | | 1.83 | % | | | (0.52 | )% | | | 150 | % | | | 60,862 | | | | 1.83 | % | | | (0.52 | )% |
Class C | | $ | 14.78 | | | | (6.22 | )% | | | 1.86 | % | | | (0.54 | )% | | | 163 | % | | $ | 21,715 | | | | 1.96 | % | | | (0.64 | )% |
| | | 15.76 | | | | 31.33 | %5,6 | | | 1.83 | %7 | | | (0.42 | )%7 | | | 75 | %5,6 | | | 35,881 | | | | 1.89 | %7 | | | (0.48 | )%7 |
| | | 12.00 | | | | 11.42 | % | | | 1.86 | % | | | (0.51 | )% | | | 103 | % | | | 49,075 | | | | 1.86 | % | | | (0.51 | )% |
| | | 10.77 | 4 | | | (34.81 | )%4 | | | 1.86 | % | | | (0.46 | )% | | | 154 | % | | | 55,445 | | | | 1.86 | % | | | (0.46 | )% |
| | | 16.53 | | | | (6.16 | )% | | | 1.84 | % | | | (0.67 | )% | | | 134 | % | | | 113,744 | | | | 1.84 | % | | | (0.67 | )% |
| | | | 19.37 | | | | 13.33 | % | | | 1.83 | % | | | (0.53 | )% | | | 150 | % | | | 134,475 | | | | 1.83 | % | | | (0.53 | )% |
Class D | | $ | 16.33 | | | | (5.52 | )% | | | 1.11 | % | | | 0.24 | % | | | 163 | % | | $ | 391,953 | | | | 1.21 | % | | | 0.14 | % |
| | | 17.32 | | | | 32.25 | %5,6 | | | 1.11 | %7 | | | 0.28 | %7 | | | 75 | %5,6 | | | 351,467 | | | | 1.17 | %7 | | | 0.22 | %7 |
| | | 13.16 | | | | 12.26 | % | | | 1.11 | % | | | 0.26 | % | | | 103 | % | | | 197,251 | | | | 1.11 | % | | | 0.26 | % |
| | | 11.79 | 4 | | | (34.36 | )%4 | | | 1.11 | % | | | 0.39 | % | | | 154 | % | | | 82,956 | | | | 1.11 | % | | | 0.39 | % |
| | | 17.99 | | | | (5.44 | )% | | | 1.09 | % | | | 0.08 | % | | | 134 | % | | | 37,601 | | | | 1.09 | % | | | 0.08 | % |
| | | | 20.85 | | | | 14.18 | % | | | 1.08 | % | | | 0.22 | % | | | 150 | % | | | 38,714 | | | | 1.08 | % | | | 0.22 | % |
Institutional Class | | $ | 17.21 | | | | (5.10 | )% | | | 0.71 | % | | | 0.58 | % | | | 163 | % | | $ | 85,338 | | | | 0.81 | % | | | 0.48 | % |
| | | 18.24 | | | | 32.73 | %5,6 | | | 0.71 | %7 | | | 0.69 | %7 | | | 75 | %5,6 | | | 178,990 | | | | 0.77 | %7 | | | 0.63 | %7 |
| | | 13.84 | | | | 12.67 | % | | | 0.71 | % | | | 0.62 | % | | | 103 | % | | | 187,350 | | | | 0.71 | % | | | 0.59 | % |
| | | 12.36 | 4 | | | (34.08 | )%4 | | | 0.71 | % | | | 0.71 | % | | | 154 | % | | | 276,437 | | | | 0.71 | % | | | 0.71 | % |
| | | 18.79 | | | | (5.05 | )% | | | 0.69 | % | | | 0.47 | % | | | 134 | % | | | 459,142 | | | | 0.69 | % | | | 0.47 | % |
| | | | 21.64 | | | | 14.67 | % | | | 0.68 | % | | | 0.61 | % | | | 150 | % | | | 424,762 | | | | 0.68 | % | | | 0.61 | % |
Administrative Class | | $ | 16.71 | | | | (5.38 | )% | | | 0.96 | % | | | 0.34 | % | | | 163 | % | | $ | 67,536 | | | | 1.06 | % | | | 0.24 | % |
| | | 17.67 | | | | 32.47 | %5,6 | | | 0.96 | %7 | | | 0.43 | %7 | | | 75 | %5,6 | | | 143,233 | | | | 1.02 | %7 | | | 0.37 | %7 |
| | | 13.40 | | | | 12.43 | % | | | 0.96 | % | | | 0.39 | % | | | 103 | % | | | 199,889 | | | | 0.99 | % | | | 0.36 | % |
| | | 11.98 | 4 | | | (34.26 | )%4 | | | 0.96 | % | | | 0.45 | % | | | 154 | % | | | 245,686 | | | | 0.96 | % | | | 0.45 | % |
| | | 18.22 | | | | (5.32 | )% | | | 0.93 | % | | | 0.24 | % | | | 134 | % | | | 439,571 | | | | 0.93 | % | | | 0.24 | % |
| | | | 21.11 | | | | 14.37 | % | | | 0.93 | % | | | 0.37 | % | | | 150 | % | | | 518,562 | | | | 0.93 | % | | | 0.37 | % |
Class P | | $ | 17.13 | | | | (5.18 | )% | | | 0.76 | % | | | 0.58 | % | | | 163 | % | | $ | 2,514 | | | | 0.86 | % | | | 0.48 | % |
| | | 18.16 | | | | 32.68 | %5,6 | | | 0.82 | %7 | | | 0.59 | %7 | | | 75 | %5,6 | | | 2,858 | | | | 0.88 | %7 | | | 0.53 | %7 |
| | | 13.78 | | | | 12.51 | % | | | 0.85 | % | | | 0.52 | % | | | 103 | % | | | 7,121 | | | | 0.85 | % | | | 0.52 | % |
| | | | 12.33 | 4 | | | (32.04 | )%4,6 | | | 0.79 | %7 | | | 0.67 | %7 | | | 154 | %6 | | | 4,308 | | | | 0.79 | %7 | | | 0.67 | %7 |
Class R | | $ | 16.57 | | | | (5.75 | )% | | | 1.36 | % | | | (0.03 | )% | | | 163 | % | | $ | 3,110 | | | | 1.46 | % | | | (0.13 | )% |
| | | 17.58 | | | | 31.98 | %5,6 | | | 1.36 | %7 | | | 0.04 | %7 | | | 75 | %5,6 | | | 3,924 | | | | 1.42 | %7 | | | (0.02 | )%7 |
| | | 13.32 | | | | 11.93 | % | | | 1.36 | % | | | (0.02 | )% | | | 103 | % | | | 4,179 | | | | 1.36 | % | | | (0.02 | )% |
| | | 11.90 | 4 | | | (34.51 | )%4 | | | 1.36 | % | | | 0.06 | % | | | 154 | % | | | 10,553 | | | | 1.36 | % | | | 0.06 | % |
| | | 18.17 | | | | (5.68 | )% | | | 1.34 | % | | | (0.16 | )% | | | 134 | % | | | 16,864 | | | | 1.34 | % | | | (0.16 | )% |
| | | | 21.04 | | | | 13.92 | % | | | 1.33 | % | | | (0.04 | )% | | | 150 | % | | | 18,552 | | | | 1.33 | % | | | (0.04 | )% |
36
Financial Highlights
For a share outstanding throughout each fiscal period
| | | | | | | | | | | | | | | | | | | | | | | | | | | | | | | | |
| | | Fiscal period ended: | | | Net Asset Value
Beginning of
Period | | | Net Investment
Income (Loss) | | | Net Realized
and Unrealized
Gain (Loss) on
Investments | | | Total from
Investment
Operations | | | Distributions to
Shareholders from
Net Investment
Income | | | Distributions to
Shareholders from
Net Realized Gain
on Investments | | | Total
Distributions to
Shareholders | |
MANAGERS CADENCE FOCUSED GROWTH FUND* | |
Class A | | | 5/31/2012 | | | $ | 8.98 | | | $ | 0.02 | 1 | | $ | (0.53 | )1 | | $ | (0.51 | ) | | $ | (0.01 | ) | | $ | (0.64 | ) | | $ | (0.65 | ) |
| | | 5/31/2011 | ** | | | 6.98 | | | | 0.02 | 1 | | | 2.29 | 1 | | | 2.31 | | | | (0.05 | ) | | | (0.26 | ) | | | (0.31 | ) |
| | | 6/30/2010 | | | | 6.59 | | | | 0.02 | 1 | | | 0.46 | 1 | | | 0.48 | | | | (0.09 | ) | | | — | | | | (0.09 | ) |
| | | 6/30/2009 | | | | 9.67 | | | | 0.02 | 1 | | | (3.10 | )1 | | | (3.08 | ) | | | (0.00 | )# | | | — | | | | (0.00 | )# |
| | | 6/30/2008 | | | | 10.47 | | | | (0.01 | )1 | | | (0.78 | )1 | | | (0.79 | ) | | | (0.01 | ) | | | (0.00 | )# | | | (0.01 | ) |
| | | | 6/30/2007 | †† | | | 9.30 | | | | (0.02 | )1 | | | 1.36 | 1 | | | 1.34 | | | | (0.03 | ) | | | (0.14 | ) | | | (0.17 | ) |
Class C | | | 5/31/2012 | | | $ | 8.80 | | | $ | (0.04 | )1 | | $ | (0.51 | )1 | | $ | (0.55 | ) | | | — | | | $ | (0.63 | ) | | $ | (0.63 | ) |
| | | 5/31/2011 | ** | | | 6.85 | | | | (0.04 | )1 | | | 2.25 | 1 | | | 2.21 | | | | — | | | | (0.26 | ) | | | (0.26 | ) |
| | | 6/30/2010 | | | | 6.46 | | | | (0.04 | )1 | | | 0.45 | 1 | | | 0.41 | | | $ | (0.02 | ) | | | — | | | | (0.02 | ) |
| | | 6/30/2009 | | | | 9.55 | | | | (0.03 | )1 | | | (3.06 | )1 | | | (3.09 | ) | | | (0.00 | )# | | | — | | | | (0.00 | )# |
| | | 6/30/2008 | | | | 10.42 | | | | (0.09 | )1 | | | (0.78 | )1 | | | (0.87 | ) | | | (0.00 | )# | | | (0.00 | )# | | | (0.00 | )# |
| | | | 6/30/2007 | †† | | | 9.30 | | | | (0.09 | )1 | | | 1.36 | 1 | | | 1.27 | | | | (0.01 | ) | | | (0.14 | ) | | | (0.15 | ) |
Class D | | | 5/31/2012 | | | $ | 8.96 | | | $ | 0.02 | 1 | | $ | (0.53 | )1 | | $ | (0.51 | ) | | $ | (0.04 | ) | | $ | (0.64 | ) | | $ | (0.68 | ) |
| | | 5/31/2011 | ** | | | 6.98 | | | | 0.02 | 1 | | | 2.28 | 1 | | | 2.30 | | | | (0.06 | ) | | | (0.26 | ) | | | (0.32 | ) |
| | | 6/30/2010 | | | | 6.59 | | | | 0.02 | 1 | | | 0.47 | 1 | | | 0.49 | | | | (0.10 | ) | | | — | | | | (0.10 | ) |
| | | 6/30/2009 | | | | 9.67 | | | | 0.02 | 1 | | | (3.10 | )1 | | | (3.08 | ) | | | (0.00 | )# | | | — | | | | (0.00 | )# |
| | | 6/30/2008 | | | | 10.47 | | | | (0.01 | )1 | | | (0.79 | )1 | | | (0.80 | ) | | | (0.00 | )# | | | (0.00 | )# | | | (0.00 | )# |
| | | | 6/30/2007 | †† | | | 9.30 | | | | (0.01 | )1 | | | 1.36 | 1 | | | 1.35 | | | | (0.04 | ) | | | (0.14 | ) | | | (0.18 | ) |
Institutional Class | | | 5/31/2012 | | | $ | 9.08 | | | $ | 0.05 | 1 | | $ | (0.54 | )1 | | $ | (0.49 | ) | | $ | (0.07 | ) | | $ | (0.65 | ) | | $ | (0.72 | ) |
| | | 5/31/2011 | ** | | | 7.06 | | | | 0.05 | 1 | | | 2.31 | 1 | | | 2.36 | | | | (0.08 | ) | | | (0.26 | ) | | | (0.34 | ) |
| | | 6/30/2010 | | | | 6.65 | | | | 0.04 | 1 | | | 0.47 | 1 | | | 0.51 | | | | (0.10 | ) | | | — | | | | (0.10 | ) |
| | | 6/30/2009 | | | | 9.75 | | | | 0.05 | 1 | | | (3.13 | )1 | | | (3.08 | ) | | | (0.02 | ) | | | — | | | | (0.02 | ) |
| | | 6/30/2008 | | | | 10.54 | | | | 0.03 | 1 | | | (0.80 | )1 | | | (0.77 | ) | | | (0.02 | ) | | | (0.00 | )# | | | (0.02 | ) |
| | | | 6/30/2007 | | | | 9.34 | | | | 0.03 | 1 | | | 1.33 | 1 | | | 1.36 | | | | (0.02 | ) | | | (0.14 | ) | | | (0.16 | ) |
Administrative Class | | | 5/31/2012 | | | $ | 9.06 | | | $ | 0.05 | 1 | | $ | (0.54 | )1 | | $ | (0.49 | ) | | $ | (0.06 | ) | | $ | (0.65 | ) | | $ | (0.71 | ) |
| | | 5/31/2011 | ** | | | 7.01 | | | | 0.03 | 1 | | | 2.34 | 1 | | | 2.37 | | | | (0.06 | ) | | | (0.26 | ) | | | (0.32 | ) |
| | | 6/30/2010 | | | | 6.62 | | | | 0.03 | 1 | | | 0.46 | 1 | | | 0.49 | | | | (0.10 | ) | | | — | | | | (0.10 | ) |
| | | 6/30/2009 | | | | 9.71 | | | | 0.03 | 1 | | | (3.12 | )1 | | | (3.09 | ) | | | (0.00 | )# | | | — | | | | (0.00 | )# |
| | | 6/30/2008 | | | | 10.50 | | | | 0.00 | #,1 | | | (0.79 | )1 | | | (0.79 | ) | | | (0.00 | )# | | | (0.00 | )# | | | (0.00 | )# |
| | | | 6/30/2007 | ††† | | | 9.14 | | | | 0.01 | 1 | | | 1.52 | 1 | | | 1.53 | | | | (0.03 | ) | | | (0.14 | ) | | | (0.17 | ) |
Class P | | | 5/31/2012 | | | $ | 8.99 | | | $ | 0.05 | 1 | | $ | (0.54 | )1 | | $ | (0.49 | ) | | $ | (0.06 | ) | | $ | (0.65 | ) | | $ | (0.71 | ) |
| | | 5/31/2011 | ** | | | 7.00 | | | | 0.04 | 1 | | | 2.29 | 1 | | | 2.33 | | | | (0.08 | ) | | | (0.26 | ) | | | (0.34 | ) |
| | | 6/30/2010 | | | | 6.61 | | | | 0.04 | | | | 0.47 | | | | 0.51 | | | | (0.12 | ) | | | — | | | | (0.12 | ) |
| | | | 6/30/2009 | † | | | 9.44 | | | | 0.04 | | | | (2.83 | ) | | | (2.79 | ) | | | (0.04 | ) | | | — | | | | (0.04 | ) |
37
| | | | | | | | | | | | | | | | | | | | | | | | | | | | | | | | |
| | | Net Asset Value
End of Period | | | Total Return2 | | | Ratio of Net
Expenses to
Average Net
Assets | | | Ratio of Net
Investment Income
(Loss) to Average
Net Assets | | | Portfolio
Turnover Rate | | | Net Assets End
of Period
(000’s omitted) | | | Ratio of Total
Expenses (Absent
Expense Offsets) to
Average Net Assets3 | | | Ratio of Net Investment
Income (loss) (Absent
Expense Offsets) to
Average Net Assets3 | |
MANAGERS CADENCE FOCUSED GROWTH FUND | |
Class A | | $ | 7.82 | | | | (5.47 | )% | | | 1.06 | % | | | 0.22 | % | | | 129 | % | | $ | 1,321 | | | | 1.78 | % | | | (0.50 | )% |
| | | 8.98 | | | | 33.44 | %5,6 | | | 1.08 | %7 | | | 0.27 | %7 | | | 83 | %5,6 | | | 3,737 | | | | 1.47 | %7 | | | (0.12 | )%7 |
| | | 6.98 | | | | 7.21 | % | | | 1.12 | % | | | 0.24 | % | | | 120 | % | | | 3,602 | | | | 1.12 | % | | | 0.24 | % |
| | | 6.59 | | | | (31.85 | )% | | | 1.11 | % | | | 0.26 | % | | | 156 | % | | | 4,803 | | | | 1.11 | % | | | 0.26 | % |
| | | 9.67 | | | | (7.55 | )% | | | 1.12 | % | | | (0.13 | )% | | | 143 | % | | | 7,418 | | | | 1.12 | % | | | (0.13 | )% |
| | | | 10.47 | | | | 14.60 | %6 | | | 1.11 | %7 | | | (0.23 | )%7 | | | 106 | %6 | | | 1,704 | | | | 1.11 | %7 | | | (0.23 | )%7 |
Class C | | $ | 7.62 | | | | (6.07 | )% | | | 1.80 | % | | | (0.44 | )% | | | 129 | % | | $ | 1,079 | | | | 2.67 | % | | | (1.31 | )% |
| | | 8.80 | | | | 32.43 | %5,6 | | | 1.85 | %7 | | | (0.49 | )%7 | | | 83 | %5,6 | | | 1,667 | | | | 2.24 | %7 | | | (0.88 | )%7 |
| | | 6.85 | | | | 6.38 | % | | | 1.87 | % | | | (0.51 | )% | | | 120 | % | | | 1,624 | | | | 1.87 | % | | | (0.51 | )% |
| | | 6.46 | | | | (32.34 | )% | | | 1.86 | % | | | (0.48 | )% | | | 156 | % | | | 2,343 | | | | 1.86 | % | | | (0.48 | )% |
| | | 9.55 | | | | (8.30 | )% | | | 1.86 | % | | | (0.89 | )% | | | 143 | % | | | 2,706 | | | | 1.86 | % | | | (0.89 | )% |
| | | | 10.42 | | | | 13.81 | %6 | | | 1.86 | %7 | | | (0.91 | )%7 | | | 106 | %6 | | | 1,351 | | | | 1.86 | %7 | | | (0.91 | )%7 |
Class D | | $ | 7.77 | | | | (5.47 | )% | | | 1.10 | % | | | 0.29 | % | | | 129 | % | | $ | 1,854 | | | | 2.06 | % | | | (0.67 | )% |
| | | 8.96 | | | | 33.25 | %5,6 | | | 1.12 | %7 | | | 0.23 | %7 | | | 83 | %5,6 | | | 1,980 | | | | 1.51 | %7 | | | (0.16 | )%7 |
| | | 6.98 | | | | 7.25 | % | | | 1.12 | % | | | 0.27 | % | | | 120 | % | | | 1,375 | | | | 1.12 | % | | | 0.27 | % |
| | | 6.59 | | | | (31.85 | )% | | | 1.11 | % | | | 0.28 | % | | | 156 | % | | | 1,271 | | | | 1.11 | % | | | 0.28 | % |
| | | 9.67 | | | | (7.61 | )% | | | 1.12 | % | | | (0.13 | )% | | | 143 | % | | | 1,811 | | | | 1.12 | % | | | (0.13 | )% |
| | | | 10.47 | | | | 14.16 | %6 | | | 1.11 | %7 | | | (0.06 | )%7 | | | 106 | %6 | | | 1,225 | | | | 1.11 | %7 | | | (0.06 | )%7 |
Institutional Class | | $ | 7.87 | | | | (5.13 | )% | | | 0.75 | % | | | 0.58 | % | | | 129 | % | | $ | 4,053 | | | | 1.49 | % | | | (0.16 | )% |
| | | 9.08 | | | | 33.81 | %5,6 | | | 0.75 | %7 | | | 0.64 | %7 | | | 83 | %5,6 | | | 11,067 | | | | 1.14 | %7 | | | 0.25 | %7 |
| | | 7.06 | | | | 7.50 | % | | | 0.74 | % | | | 0.60 | % | | | 120 | % | | | 15,695 | | | | 0.74 | % | | | 0.60 | % |
| | | 6.65 | | | | (31.54 | )% | | | 0.71 | % | | | 0.67 | % | | | 156 | % | | | 90,722 | | | | 0.71 | % | | | 0.67 | % |
| | | 9.75 | | | | (7.30 | )% | | | 0.72 | % | | | 0.30 | % | | | 143 | % | | | 122,861 | | | | 0.72 | % | | | 0.30 | % |
| | | | 10.54 | | | | 14.72 | % | | | 0.71 | % | | | 0.30 | % | | | 106 | % | | | 50,850 | | | | 0.71 | % | | | 0.30 | % |
Administrative Class | | $ | 7.86 | | | | (5.14 | )% | | | 0.76 | % | | | 0.64 | % | | | 129 | % | | $ | 11 | | | | 1.67 | % | | | (0.27 | )% |
| | | 9.06 | | | | 34.20 | %5,6 | | | 1.00 | %7 | | | 0.35 | %7 | | | 83 | %5,6 | | | 12 | | | | 1.39 | %7 | | | (0.04 | )%7 |
| | | 7.01 | | | | 7.34 | % | | | 1.00 | % | | | 0.38 | % | | | 120 | % | | | 8 | | | | 1.00 | % | | | 0.38 | % |
| | | 6.62 | | | | (31.80 | )% | | | 0.97 | % | | | 0.40 | % | | | 156 | % | | | 7 | | | | 0.97 | % | | | 0.40 | % |
| | | 9.71 | | | | (7.49 | )% | | | 0.96 | % | | | 0.00 | %# | | | 143 | % | | | 11 | | | | 0.96 | % | | | 0.00 | %# |
| | | | 10.50 | | | | 16.96 | %6 | | | 0.96 | %7 | | | 0.13 | %7 | | | 106 | %6 | | | 12 | | | | 0.96 | %7 | | | 0.13 | %7 |
Class P | | $ | 7.79 | | | | (5.20 | )% | | | 0.80 | % | | | 0.56 | % | | | 129 | % | | $ | 116 | | | | 1.65 | % | | | (0.29 | )% |
| | | 8.99 | | | | 33.62 | %5,6 | | | 0.82 | %7 | | | 0.53 | %7 | | | 83 | %5,6 | | | 209 | | | | 1.21 | %7 | | | 0.14 | %7 |
| | | 7.00 | | | | 7.63 | % | | | 0.85 | % | | | 0.53 | % | | | 120 | % | | | 225 | | | | 0.85 | % | | | 0.53 | % |
| | | | 6.61 | | | | 29.52 | %6 | | | 0.80 | %7 | | | 0.53 | %7 | | | 156 | %6 | | | 82 | | | | 0.80 | %7 | | | 0.53 | %7 |
38
Financial Highlights
For a share outstanding throughout each fiscal period
| | | | | | | | | | | | | | | | | | | | | | | | | | | | | | | | |
| | | Fiscal period ended: | | | Net Asset Value
Beginning of
Period | | | Net Investment
Income (Loss)1 | | | Net Realized
and Unrealized
Gain (Loss) on
Investments1 | | | Total from
Investment
Operations | | | Distributions to
Shareholders from
Net Investment
Income | | | Distributions to
Shareholders from
Net Realized Gain
on Investments | | | Total
Distributions to
Shareholders | |
MANAGERS CADENCE MID-CAP FUND* | |
Class A | | | 5/31/2012 | | | $ | 26.29 | | | $ | (0.06 | ) | | $ | (2.13 | ) | | $ | (2.19 | ) | | | — | | | | — | | | | — | |
| | | 5/31/2011 | ** | | | 18.23 | | | | (0.01 | ) | | | 8.10 | | | | 8.09 | | | $ | (0.03 | ) | | | — | | | $ | (0.03 | ) |
| | | 6/30/2010 | | | | 15.57 | | | | (0.03 | ) | | | 2.69 | | | | 2.66 | | | | — | | | | — | | | | — | |
| | | 6/30/2009 | | | | 25.56 | | | | (0.03 | ) | | | (9.96 | ) | | | (9.99 | ) | | | — | | | | — | | | | — | |
| | | 6/30/2008 | | | | 28.34 | | | | (0.07 | ) | | | 0.36 | | | | 0.29 | | | | — | | | $ | (3.07 | ) | | | (3.07 | ) |
| | | | 6/30/2007 | | | | 27.57 | | | | (0.01 | ) | | | 3.65 | | | | 3.64 | | | | — | | | | (2.87 | ) | | | (2.87 | ) |
Class B | | | 5/31/2012 | | | $ | 23.17 | | | $ | (0.21 | ) | | $ | (1.88 | ) | | $ | (2.09 | ) | | | — | | | | — | | | | — | |
| | | 5/31/2011 | ** | | | 16.16 | | | | (0.15 | ) | | | 7.16 | | | | 7.01 | | | | — | | | | — | | | | — | |
| | | 6/30/2010 | | | | 13.91 | | | | (0.15 | ) | | | 2.40 | | | | 2.25 | | | | — | | | | — | | | | — | |
| | | 6/30/2009 | | | | 23.00 | | | | (0.15 | ) | | | (8.94 | ) | | | (9.09 | ) | | | — | | | | — | | | | — | |
| | | 6/30/2008 | | | | 25.97 | | | | (0.25 | ) | | | 0.35 | | | | 0.10 | | | | — | | | $ | (3.07 | ) | | $ | (3.07 | ) |
| | | | 6/30/2007 | | | | 25.68 | | | | (0.19 | ) | | | 3.35 | | | | 3.16 | | | | — | | | | (2.87 | ) | | | (2.87 | ) |
Class C | | | 5/31/2012 | | | $ | 23.19 | | | $ | (0.21 | ) | | $ | (1.88 | ) | | $ | (2.09 | ) | | | — | | | | — | | | | — | |
| | | 5/31/2011 | ** | | | 16.17 | | | | (0.14 | ) | | | 7.16 | | | | 7.02 | | | | — | | | | — | | | | — | |
| | | 6/30/2010 | | | | 13.91 | | | | (0.15 | ) | | | 2.41 | | | | 2.26 | | | | — | | | | — | | | | — | |
| | | 6/30/2009 | | | | 23.01 | | | | (0.15 | ) | | | (8.95 | ) | | | (9.10 | ) | | | — | | | | — | | | | — | |
| | | 6/30/2008 | | | | 25.99 | | | | (0.25 | ) | | | 0.34 | | | | 0.09 | | | | — | | | $ | (3.07 | ) | | $ | (3.07 | ) |
| | | | 6/30/2007 | | | | 25.69 | | | | (0.20 | ) | | | 3.37 | | | | 3.17 | | | | — | | | | (2.87 | ) | | | (2.87 | ) |
Class D | | | 5/31/2012 | | | $ | 26.49 | | | $ | (0.07 | ) | | $ | (2.14 | ) | | $ | (2.21 | ) | | | — | | | | — | | | | — | |
| | | 5/31/2011 | ** | | | 18.36 | | | | (0.01 | ) | | | 8.16 | | | | 8.15 | | | $ | (0.02 | ) | | | — | | | $ | (0.02 | ) |
| | | 6/30/2010 | | | | 15.69 | | | | (0.03 | ) | | | 2.70 | | | | 2.67 | | | | — | | | | — | | | | — | |
| | | 6/30/2009 | | | | 25.75 | | | | (0.07 | ) | | | (9.99 | ) | | | (10.06 | ) | | | — | | | | — | | | | — | |
| | | 6/30/2008 | | | | 28.53 | | | | (0.10 | ) | | | 0.39 | | | | 0.29 | | | | — | | | $ | (3.07 | ) | | | (3.07 | ) |
| | | | 6/30/2007 | | | | 27.73 | | | | (0.01 | ) | | | 3.68 | | | | 3.67 | | | | — | | | | (2.87 | ) | | | (2.87 | ) |
Institutional Class | | | 5/31/2012 | | | $ | 27.88 | | | $ | 0.04 | | | $ | (2.26 | ) | | $ | (2.22 | ) | | | — | | | | — | | | | — | |
| | | 5/31/2011 | ** | | | 19.32 | | | | 0.08 | | | | 8.58 | | | | 8.66 | | | $ | (0.10 | ) | | | — | | | $ | (0.10 | ) |
| | | 6/30/2010 | | | | 16.44 | | | | 0.05 | | | | 2.83 | | | | 2.88 | | | | — | | | | — | | | | — | |
| | | 6/30/2009 | | | | 26.87 | | | | 0.04 | | | | (10.47 | ) | | | (10.43 | ) | | | — | | | | — | | | | — | |
| | | 6/30/2008 | | | | 29.54 | | | | 0.04 | | | | 0.36 | | | | 0.40 | | | | — | | | $ | (3.07 | ) | | | (3.07 | ) |
| | | | 6/30/2007 | | | | 28.50 | | | | 0.10 | | | | 3.81 | | | | 3.91 | | | | — | | | | (2.87 | ) | | | (2.87 | ) |
Administrative Class | | | 5/31/2012 | | | $ | 26.87 | | | $ | (0.02 | ) | | $ | (2.18 | ) | | $ | (2.20 | ) | | | — | | | | — | | | | — | |
| | | 5/31/2011 | ** | | | 18.61 | | | | 0.02 | | | | 8.28 | | | | 8.30 | | | $ | (0.04 | ) | | | — | | | $ | (0.04 | ) |
| | | 6/30/2010 | | | | 15.88 | | | | 0.00 | # | | | 2.73 | | | | 2.73 | | | | — | | | | — | | | | — | |
| | | 6/30/2009 | | | | 26.02 | | | | (0.01 | ) | | | (10.13 | ) | | | (10.14 | ) | | | — | | | | — | | | | — | |
| | | 6/30/2008 | | | | 28.76 | | | | (0.03 | ) | | | 0.36 | | | | 0.33 | | | | — | | | $ | (3.07 | ) | | | (3.07 | ) |
| | | | 6/30/2007 | | | | 27.89 | | | | 0.03 | | | | 3.71 | | | | 3.74 | | | | — | | | | (2.87 | ) | | | (2.87 | ) |
Class P | | | 5/31/2012 | | | $ | 27.80 | | | $ | 0.05 | | | $ | (2.29 | ) | | $ | (2.24 | ) | | | — | | | | — | | | | — | |
| | | 5/31/2011 | ** | | | 19.28 | | | | 0.05 | | | | 8.56 | | | | 8.61 | | | $ | (0.09 | ) | | | — | | | $ | (0.09 | ) |
| | | 6/30/2010 | | | | 16.42 | | | | 0.03 | | | | 2.83 | | | | 2.86 | | | | — | | | | — | | | | — | |
| | | | 6/30/2009 | † | | | 25.53 | | | | 0.02 | | | | (9.13 | ) | | | (9.11 | ) | | | — | | | | — | | | | — | |
Class R | | | 5/31/2012 | | | $ | 26.25 | | | $ | (0.12 | ) | | $ | (2.13 | ) | | $ | (2.25 | ) | | | — | | | | — | | | | — | |
| | | 5/31/2011 | ** | | | 18.22 | | | | (0.06 | ) | | | 8.09 | | | | 8.03 | | | | — | | | | — | | | | — | |
| | | 6/30/2010 | | | | 15.61 | | | | (0.07 | ) | | | 2.68 | | | | 2.61 | | | | — | | | | — | | | | — | |
| | | 6/30/2009 | | | | 25.67 | | | | (0.07 | ) | | | (9.99 | ) | | | (10.06 | ) | | | — | | | | — | | | | — | |
| | | 6/30/2008 | | | | 28.52 | | | | (0.14 | ) | | | 0.36 | | | | 0.22 | | | | — | | | $ | (3.07 | ) | | $ | (3.07 | ) |
| | | | 6/30/2007 | | | | 27.79 | | | | (0.08 | ) | | | 3.68 | | | | 3.60 | | | | — | | | | (2.87 | ) | | | (2.87 | ) |
39
| | | | | | | | | | | | | | | | | | | | | | | | | | | | | | | | |
| | | Net Asset Value
End of Period | | | Total Return2 | | | Ratio of Net
Expenses to
Average Net
Assets | | | Ratio of Net
Investment Income
(Loss) to Average
Net Assets | | | Portfolio
Turnover Rate | | | Net Assets End
of Period
(000’s omitted) | | | Ratio of Total
Expenses (Absent
Expense Offsets) to
Average Net Assets3 | | | Ratio of Net Investment
Income (loss) (Absent
Expense Offsets) to
Average Net Assets3 | |
MANAGERS CADENCE MID-CAP FUND | |
Class A | | $ | 24.10 | | | | (8.33 | )% | | | 1.11 | % | | | (0.25 | )% | | | 127 | % | | $ | 138,115 | | | | 1.20 | % | | | (0.34 | )% |
| | | 26.29 | | | | 44.38 | %5,6 | | | 1.10 | %7 | | | (0.05 | )%7 | | | 85 | %5,6 | | | 174,948 | | | | 1.18 | %7 | | | (0.13 | )%7 |
| | | 18.23 | | | | 17.08 | % | | | 1.11 | % | | | (0.14 | )% | | | 107 | % | | | 155,574 | | | | 1.11 | % | | | (0.14 | )% |
| | | 15.57 | 8 | | | (39.08 | )%8 | | | 1.11 | % | | | (0.20 | )% | | | 148 | % | | | 175,461 | | | | 1.11 | % | | | (0.20 | )% |
| | | 25.56 | | | | 0.31 | % | | | 1.09 | % | | | (0.28 | )% | | | 149 | % | | | 307,962 | | | | 1.09 | % | | | (0.28 | )% |
| | | | 28.34 | | | | 14.52 | % | | | 1.09 | % | | | (0.05 | )% | | | 164 | % | | | 334,271 | | | | 1.09 | % | | | (0.05 | )% |
Class B | | $ | 21.08 | | | | (9.02 | )% | | | 1.86 | % | | | (0.98 | )% | | | 127 | % | | $ | 5,15910 | | | | 1.95 | % | | | (1.07 | )% |
| | | 23.17 | | | | 43.38 | %5,6 | | | 1.85 | %7 | | | (0.81 | )%7 | | | 85 | %5,6 | | | 10,203 | | | | 1.93 | %7 | | | (0.89 | )%7 |
| | | 16.16 | | | | 16.18 | % | | | 1.86 | % | | | (0.90 | )% | | | 107 | % | | | 12,120 | | | | 1.86 | % | | | (0.90 | )% |
| | | 13.91 | 8 | | | (39.52 | )%8 | | | 1.86 | % | | | (0.98 | )% | | | 148 | % | | | 17,882 | | | | 1.86 | % | | | (0.98 | )% |
| | | 23.00 | | | | (0.44 | )% | | | 1.84 | % | | | (1.02 | )% | | | 149 | % | | | 47,947 | | | | 1.84 | % | | | (1.02 | )% |
| | | | 25.99 | | | | 13.67 | % | | | 1.84 | % | | | (0.79 | )% | | | 164 | % | | | 64,763 | | | | 1.84 | % | | | (0.79 | )% |
Class C | | $ | 21.10 | | | | (9.01 | )%9 | | | 1.86 | % | | | (0.98 | )% | | | 127 | % | | $ | 15,043 | | | | 1.95 | % | | | (1.07 | )% |
| | | 23.19 | | | | 43.41 | %5,6 | | | 1.83 | %7 | | | (0.81 | )%7 | | | 85 | %5,6 | | | 27,311 | | | | 1.91 | %7 | | | (0.89 | )%7 |
| | | 16.17 | | | | 16.25 | % | | | 1.86 | % | | | (0.89 | )% | | | 107 | % | | | 39,374 | | | | 1.86 | % | | | (0.89 | )% |
| | | 13.91 | 8 | | | (39.55 | )%8 | | | 1.86 | % | | | (0.96 | )% | | | 148 | % | | | 41,542 | | | | 1.86 | % | | | (0.96 | )% |
| | | 23.01 | | | | (0.48 | )% | | | 1.84 | % | | | (1.02 | )% | | | 149 | % | | | 86,421 | | | | 1.84 | % | | | (1.02 | )% |
| | | | 25.99 | | | | 13.71 | % | | | 1.84 | % | | | (0.80 | )% | | | 164 | % | | | 102,361 | | | | 1.84 | % | | | (0.80 | )% |
Class D | | $ | 24.28 | | | | (8.34 | )%9 | | | 1.11 | % | | | (0.28 | )% | | | 127 | % | | $ | 35,751 | | | | 1.20 | % | | | (0.37 | )% |
| | | 26.49 | | | | 44.40 | %5,6 | | | 1.10 | %7 | | | (0.07 | )%7 | | | 85 | %5,6 | | | 14,974 | | | | 1.18 | %7 | | | (0.15 | )%7 |
| | | 18.36 | | | | 17.02 | % | | | 1.11 | % | | | (0.16 | )% | | | 107 | % | | | 13,012 | | | | 1.86 | % | | | (0.91 | )% |
| | | 15.69 | 8 | | | (39.07 | )%8 | | | 1.11 | % | | | (0.34 | )% | | | 148 | % | | | 22,739 | | | | 1.86 | % | | | (1.09 | )% |
| | | 25.75 | | | | 0.31 | % | | | 1.09 | % | | | (0.38 | )% | | | 149 | % | | | 193,222 | | | | 1.84 | % | | | (1.13 | )% |
| | | | 28.53 | | | | 14.55 | % | | | 1.09 | % | | | (0.05 | )% | | | 164 | % | | | 27,561 | | | | 1.84 | % | | | (0.80 | )% |
Institutional Class | | $ | 25.66 | | | | (7.96 | )% | | | 0.71 | % | | | 0.15 | % | | | 127 | % | | $ | 234,346 | | | | 0.80 | % | | | 0.06 | % |
| | | 27.88 | | | | 44.87 | %5,6 | | | 0.70 | %7 | | | 0.36 | %7 | | | 85 | %5,6 | | | 299,909 | | | | 0.78 | %7 | | | 0.28 | %7 |
| | | 19.32 | | | | 17.52 | % | | | 0.71 | % | | | 0.26 | % | | | 107 | % | | | 292,232 | | | | 0.74 | % | | | 0.23 | % |
| | | 16.44 | 8 | | | (38.82 | )%8 | | | 0.71 | % | | | 0.21 | % | | | 148 | % | | | 312,484 | | | | 0.71 | % | | | 0.21 | % |
| | | 26.87 | | | | 0.69 | % | | | 0.69 | % | | | 0.12 | % | | | 149 | % | | | 522,366 | | | | 0.69 | % | | | 0.12 | % |
| | | | 29.54 | | | | 15.02 | % | | | 0.69 | % | | | 0.35 | % | | | 164 | % | | | 482,027 | | | | 0.69 | % | | | 0.35 | % |
Administrative Class | | $ | 24.67 | | | | (8.19 | )% | | | 0.96 | % | | | (0.09 | )% | | | 127 | % | | $ | 92,851 | | | | 1.05 | % | | | (0.18 | )% |
| | | 26.87 | | | | 44.60 | %5,6 | | | 0.94 | %7 | | | 0.11 | %7 | | | 85 | %5,6 | | | 129,964 | | | | 1.02 | %7 | | | 0.03 | %7 |
| | | 18.61 | | | | 17.19 | % | | | 0.96 | % | | | 0.01 | % | | | 107 | % | | | 130,157 | | | | 0.99 | % | | | (0.02 | )% |
| | | 15.88 | 8 | | | (38.97 | )%8 | | | 0.96 | % | | | (0.04 | )% | | | 148 | % | | | 129,640 | | | | 0.96 | % | | | (0.04 | )% |
| | | 26.02 | | | | 0.45 | % | | | 0.94 | % | | | (0.11 | )% | | | 149 | % | | | 214,673 | | | | 0.94 | % | | | (0.11 | )% |
| | | | 28.76 | | | | 14.73 | % | | | 0.94 | % | | | 0.11 | % | | | 164 | % | | | 278,073 | | | | 0.94 | % | | | 0.11 | % |
Class P | | $ | 25.56 | | | | (8.06 | )% | | | 0.78 | % | | | 0.20 | % | | | 127 | % | | $ | 2,136 | | | | 0.87 | % | | | 0.11 | % |
| | | 27.80 | | | | 44.71 | %5,6 | | | 0.81 | %7 | | | 0.24 | %7 | | | 85 | %5,6 | | | 2,967 | | | | 0.89 | %7 | | | 0.16 | %7 |
| | | 19.28 | | | | 17.42 | % | | | 0.84 | % | | | 0.14 | % | | | 107 | % | | | 3,334 | | | | 0.84 | % | | | 0.14 | % |
| | | | 16.42 | 8 | | | (35.68 | )%8 | | | 0.80 | %7 | | | 0.12 | %7 | | | 148 | %6 | | | 3,099 | | | | 0.80 | %7 | | | 0.12 | %7 |
Class R | | $ | 24.00 | | | | (8.57 | )% | | | 1.36 | % | | | (0.49 | )% | | | 127 | % | | $ | 14,432 | | | | 1.45 | % | | | (0.58 | )% |
| | | 26.25 | | | | 44.07 | %5,6 | | | 1.35 | %7 | | | (0.31 | )%7 | | | 85 | %5,6 | | | 21,248 | | | | 1.43 | %7 | | | (0.39 | )%7 |
| | | 18.22 | | | | 16.72 | % | | | 1.36 | % | | | (0.39 | )% | | | 107 | % | | | 22,485 | | | | 1.36 | % | | | (0.39 | )% |
| | | 15.61 | 8 | | | (39.19 | )%8 | | | 1.36 | % | | | (0.43 | )% | | | 148 | % | | | 32,069 | | | | 1.36 | % | | | (0.43 | )% |
| | | 25.67 | | | | 0.04 | % | | | 1.34 | % | | | (0.52 | )% | | | 149 | % | | | 48,771 | | | | 1.34 | % | | | (0.52 | )% |
| | | | 28.52 | | | | 14.25 | % | | | 1.34 | % | | | (0.31 | )% | | | 164 | % | | | 47,308 | | | | 1.34 | % | | | (0.31 | )% |
40
Financial Highlights
For a share outstanding throughout each fiscal period
| | | | | | | | | | | | | | | | | | | | | | | | |
| | | Fiscal period ended: | | | Net Asset Value
Beginning of
Period | | | Net Investment
Loss1 | | | Net Realized
and Unrealized
Gain (Loss) on
Investments1 | | | Total from
Investment
Operations | | | Distributions to
Shareholders from
Net Investment
Income | |
MANAGERS CADENCE EMERGING COMPANIES FUND* | |
Institutional Class | | | 5/31/2012 | | | $ | 23.35 | | | $ | (0.20 | ) | | $ | (1.34 | ) | | $ | (1.54 | ) | | | — | |
| | | 5/31/2011 | ** | | | 14.62 | | | | (0.04 | ) | | | 8.77 | | | | 8.73 | | | | — | |
| | | 6/30/2010 | | | | 12.44 | | | | (0.11 | ) | | | 2.29 | | | | 2.18 | | | | — | |
| | | 6/30/2009 | | | | 17.28 | | | | (0.08 | ) | | | (4.76 | ) | | | (4.84 | ) | | | — | |
| | | 6/30/2008 | | | | 23.21 | | | | (0.14 | ) | | | (3.04 | ) | | | (3.18 | ) | | $ | (2.75 | ) |
| | | | 6/30/2007 | | | | 24.55 | | | | (0.11 | ) | | | 1.14 | | | | 1.03 | | | | (2.37 | ) |
Administrative Class | | | 5/31/2012 | | | $ | 21.88 | | | $ | (0.24 | ) | | $ | (1.25 | ) | | $ | (1.49 | ) | | | — | |
| | | 5/31/2011 | ** | | | 13.73 | | | | (0.12 | ) | | | 8.27 | | | | 8.15 | | | | — | |
| | | 6/30/2010 | | | | 11.72 | | | | (0.12 | ) | | | 2.13 | | | | 2.01 | | | | — | |
| | | 6/30/2009 | | | | 16.32 | | | | (0.11 | ) | | | (4.49 | ) | | | (4.60 | ) | | | — | |
| | | 6/30/2008 | | | | 22.12 | | | | (0.19 | ) | | | (2.86 | ) | | | (3.05 | ) | | $ | (2.75 | ) |
| | | | 6/30/2007 | | | | 23.57 | | | | (0.16 | ) | | | 1.08 | | | | 0.92 | | | | (2.37 | ) |
41
Financial Highlights
For a share outstanding throughout each fiscal period
| | | | | | | | | | | | | | | | | | | | | | | | | | | | | | | | |
| | | Net Asset Value
End of Period | | | Total Return2 | | | Ratio of Net
Expenses to
Average Net
Assets | | | Ratio of Net
Investment
Loss to Average
Net Assets | | | Portfolio
Turnover Rate | | | Net Assets End
of Period
(000’s omitted) | | | Ratio of Total
Expenses (Absent
Expense Offsets) to
Average Net Assets3 | | | Ratio of Net Investment
Loss (Absent
Expense Offsets) to
Average Net Assets3 | |
MANAGERS CADENCE EMERGING COMPANIES FUND | |
Institutional Class | | $ | 21.81 | | | | (6.60 | )% | | | 1.37 | % | | | (0.94 | )% | | | 120 | % | | $ | 34,883 | | | | 1.73 | % | | | (1.30 | )% |
| | | 23.35 | | | | 59.71 | %5,6 | | | 1.41 | %7 | | | (0.24 | )%7 | | | 93 | %5,6 | | | 65,222 | | | | 1.67 | %7 | | | (0.50 | )%7 |
| | | 14.62 | | | | 17.52 | % | | | 1.42 | % | | | (0.73 | )% | | | 129 | % | | | 55,166 | | | | 1.55 | % | | | (0.86 | )% |
| | | 12.44 | | | | (28.01 | )% | | | 1.42 | % | | | (0.65 | )% | | | 142 | % | | | 67,382 | | | | 1.42 | % | | | (0.65 | )% |
| | | 17.28 | | | | (15.22 | )% | | | 1.50 | % | | | (0.69 | )% | | | 140 | % | | | 206,444 | | | | 1.50 | % | | | (0.69 | )% |
| | | | 23.21 | | | | 4.71 | % | | | 1.51 | % | | | (0.49 | )% | | | 188 | % | | | 420,835 | | | | 1.51 | % | | | (0.49 | )% |
Administrative Class | | $ | 20.39 | | | | (6.81 | )% | | | 1.60 | % | | | (1.16 | )% | | | 120 | % | | $ | 2,505 | | | | 1.98 | % | | | (1.54 | )% |
| | | 21.88 | | | | 59.36 | %5,6 | | | 1.66 | %7 | | | (0.71 | )%7 | | | 93 | %5,6 | | | 4,706 | | | | 1.92 | %7 | | | (0.97 | )%7 |
| | | 13.73 | | | | 17.15 | % | | | 1.67 | % | | | (0.90 | )% | | | 129 | % | | | 1,830 | | | | 1.80 | % | | | (1.03 | )% |
| | | 11.72 | | | | (28.19 | )% | | | 1.67 | % | | | (0.91 | )% | | | 142 | % | | | 13,866 | | | | 1.67 | % | | | (0.91 | )% |
| | | 16.32 | | | | (15.43 | )% | | | 1.75 | % | | | (0.95 | )% | | | 140 | % | | | 23,812 | | | | 1.75 | % | | | (0.95 | )% |
| | | | 22.12 | | | | 4.47 | % | | | 1.76 | % | | | (0.74 | )% | | | 188 | % | | | 54,701 | | | | 1.76 | % | | | (0.74 | )% |
Notes to Financial Highlights
The following should be read in conjunction with each of the Financial Highlights of the Funds previously presented in this report.
| * | At the start of business on September 27, 2010, the Predecessor Funds, each a series of the Allianz Funds, were re-organized into a respective series of the Managers Funds. |
| ** | For the period from July 1, 2010, to May 31, 2011. |
| # | Rounds to less than $0.01 per share or 0.01%. |
| † | Commencement of operations was July 7, 2008. |
| †† | Commencement of operations was July 5, 2006. |
| ††† | Commencement of operations was September 15, 2006. |
| 1 | Per share numbers have been calculated using average shares. |
| 2 | Total returns and net investment income would have been lower had certain expenses not been reduced. (See Note 1(c) of Notes to Financial Statements.) |
| 3 | Excludes the impact of expense reimbursements or fee waivers and expense reductions such as brokerage credits, but includes expense repayments and non-reimbursable expenses, if any, such as interest and taxes. (See Note 1(c) of Notes to Financial Statements.) |
| 4 | Capital contribution from Affiliate increased the end of year net asset value and the total return. If the Affiliate had not made these payments, end of year net asset value and total return would have been reduced for Class A, Class B, Class C, Class D, Institutional Class, Administrative Class, Class P and Class R, by $0.13 per share and 0.72%, $0.12 per share and 0.73%, $0.12 per share and 0.72%, $0.12 per share and 0.67%, $0.13 per share and 0.70%, $0.13 per share and 0.66%, $0.12 per share and 0.66%, and $0.13 per share and 0.71%, respectively. |
| 5 | Reflects the 11 month period from July 1, 2010 to May 31, 2011. |
| 8 | Capital contribution from Affiliate increased the end of year net asset value and the total return. If the Affiliate had not made these payments, end of year net asset value and total return would have been reduced for Class A, Class B, Class C, Class D, Institutional Class, Administrative Class, Class P and Class R, by $0.21 per share and 0.83%, $0.19 per share and 0.83%, $0.19 per share and 0.82%, $0.24 per share and 0.93%, $0.22 per share and 0.82%, $0.21 per share and 0.81%, $0.20 per share and 0.79%, and $0.21 per share and 0.82%, respectively. |
| 9 | The Total Return is based on the Financial Statement Net Asset Values as shown in this table. |
| 10 | Effective at the close of business on June 30, 2011, shares are no longer available for purchase. |
42
Notes to Financial Statements
May 31, 2012
1. Summary of Significant Accounting Policies
The Managers Funds (the “Trust”) is an open-end management investment company organized as a Massachusetts business trust, and registered under the Investment Company Act of 1940, as amended (the “1940 Act”). Currently, the Trust consists of a number of different funds, each having distinct investment management objectives, strategies, risks, and policies. Included in this report are: Managers Cadence Capital Appreciation Fund (“Capital Appreciation”) (formerly Allianz CCM Capital Appreciation Fund), Managers Cadence Focused Growth Fund (“Focused Growth”) (formerly Allianz CCM Focused Growth Fund), Managers Cadence Mid-Cap Fund (“Mid-Cap”) (formerly Allianz CCM Mid-Cap Fund), and Managers Cadence Emerging Companies Fund (“Emerging Companies”) (formerly Allianz CCM Emerging Companies Fund), each a “Fund” and collectively the “Funds.”
At the start of business on September 27, 2010, the Allianz CCM Capital Appreciation Fund, Allianz CCM Focused Growth Fund, Allianz CCM Mid-Cap Fund, and the Allianz CCM Emerging Companies Fund, each a series of the Allianz Funds (the “Predecessor Funds”), were reorganized into a respective series of the Trust, as described above.
Effective June 30, 2011, Class B shares of Capital Appreciation and Mid-Cap were closed to all new investors and will no longer be available for purchase by existing shareholders, including purchase by exchange, except for purhases made by automatic reinvestment of dividends and capital gains pursuant to the Funds’ automatic reinvestment plan. Shareholders who redeem Class B shares of the Funds will continue to be subject to the deferred sales charges described in the Prospectus.
Capital Appreciation and Mid-Cap offer Class A shares, Class B shares, Class C shares, Class D shares, Class P shares, Class R shares, Institutional Class shares and Administrative Class shares. Focused Growth offers Class A shares, Class C shares, Class D shares, Class P shares, Institutional Class shares and Administrative Class shares. Emerging Companies offers Institutional Class shares and Administrative Class Shares. Sales of Class A shares may be subject to a front-end sales charge of up to 5.75%. Redemptions of Class B shares, Class C shares and certain Class A shares may be subject to a contingent-deferred sales charge (as a percentage of the original offering price or the net asset value at the time of sale, whichever is less). Each class represents an interest in the same assets of the Fund and the classes are identical except for class specific expenses related to shareholder activity. Each class has equal voting privileges except that each class has exclusive voting rights with respect to its services and/or distribution plan. Please refer to a current prospectus for additional information on each share class.
The Funds’ financial statements are prepared in accordance with accounting principles generally accepted in the United States of America (“U.S. GAAP”), which require management to make estimates and assumptions that affect the reported amounts of assets and liabilities and disclosure of contingent assets and liabilities at the date of the financial statements and the reported amounts of income and expenses during the reporting period. Actual results could differ from those estimates and such differences could be material. The following is a summary of significant accounting
policies followed by the Funds in the preparation of their financial statements:
a. Valuation of Investments
Equity securities traded on a domestic or international securities exchange are valued at the last quoted sale price, or, lacking any sales, at the last quoted bid price. Over-the-counter securities are valued at the Nasdaq Official Closing Price, if one is available. Lacking any sales, over-the-counter securities are valued at the last quoted bid price. The Funds’ investments are generally valued based on market quotations provided by third-party pricing services approved by the Board of Trustees of the Funds (the “Board”). Under certain circumstances, the value of certain Fund investments may be based on an evaluation of fair value, pursuant to procedures established by and under the general supervision of the Board. Each Fund may use the fair value of a portfolio investment to calculate its Net Asset Value (“NAV”) when, for example, (1) market quotations are not readily available because a portfolio investment is not traded in a public market or the principal market in which the investment trades is closed, (2) trading in a portfolio investment is suspended and has not resumed before the Fund calculates its NAV, (3) a significant event affecting the value of a portfolio investment is determined to have occurred between the time of the market quotation provided for a portfolio investment and the time as of which the Fund calculates its NAV, (4) an investment’s price has remained unchanged over a period of time (often referred to as a “stale price”), or (5) Managers Investment Group LLC (the “Investment Manager”) determines that a market quotation is inaccurate. Portfolio investments that trade primarily on foreign markets are priced based upon the market quotation of such securities as of the close of their respective principal markets, as adjusted to reflect the Investment Manager’s determination of the impact of events occurring subsequent to the close of such markets but prior to the time as of which each Fund calculates its NAV. Under certain circumstances, the Investment Manager may adjust such prices based on its determination of the impact of events occurring subsequent to the close of such markets but prior to the time as of which the Fund calculates its NAV. The Funds may invest in securities that may be thinly traded. The Board has adopted procedures to adjust prices of thinly traded securities that are judged to be stale so that they reflect fair value. An investment valued on the basis of its fair value may be valued at a price higher or lower than available market quotations. An investment’s valuation may differ depending on the method used and the factors considered in determining value according to the Fund’s fair value procedures.
43
Notes to Financial Statements (continued)
Short-term investments having a remaining maturity of 60 days or less are generally valued at amortized cost, which approximates market value. Investments in other open-end regulated investment companies are valued at their end of day net asset value per share. Securities (including derivatives) for which market quotations are not readily available are valued at fair value, as determined in good faith, and pursuant to procedures adopted by the Board. The values assigned to fair value investments are based on available information and do not necessarily represent amounts that might ultimately be realized, since such amounts depend on future developments inherent in long-term investments. Further, because of the inherent uncertainty of valuation, those estimated values may differ significantly from the values that would have been used had a ready market for the investments existed, and the differences could be material
U.S. GAAP defines fair value as the price that a Fund would receive to sell an asset or pay to transfer a liability in an orderly transaction between market participants at the measurement date. U.S. GAAP also establishes a framework for measuring fair value, and a three-level hierarchy for fair value measurements based upon the transparency of inputs to the valuation of an asset or liability. Inputs may be observable or unobservable and refer broadly to the assumptions that market participants would use in pricing the asset or liability. Observable inputs reflect the assumptions market participants would use in pricing the asset or liability based on market data obtained from sources independent of the Funds. Unobservable inputs reflect the Funds’ own assumptions about the assumptions that market participants would use in pricing the asset or liability developed based on the best information available in the circumstances. Each investment is assigned a level based upon the observability of the inputs which are significant to the overall valuation.
The three-tier hierarchy of inputs is summarized below:
Level 1 – inputs are quoted prices in active markets for identical investments (e.g., equity securities, open-end investment companies)
Level 2 – other observable inputs (including, but not limited to: quoted prices for similar assets or liabilities in markets that are active, quoted prices for identical or similar assets or liabilities in markets that are not active, inputs other than quoted prices that are observable for the assets or liabilities (such as interest rates, yield curves, volatilities, prepayment speeds, loss severities, credit risks and default rates) or other market corroborated inputs) (e.g., debt securities, government securities, foreign securities utilizing international fair value pricing, broker-quoted securities, fair valued securities with observable inputs)
Level 3 – inputs are significant unobservable inputs (including the Fund’s own assumptions used to determine the fair value of investments) (e.g., fair valued securities with unobservable inputs)
Changes in inputs or methodologies used for valuing investments may result in a transfer in or out of levels within the fair value hierarchy. Transfers between different levels in the fair value hierarchy are deemed to have occurred as of the beginning of the reporting period. The inputs or methodologies used for valuing investments are not necessarily an indication of the risk associated with investing in those investments.
b. Security Transactions
Security transactions are accounted for as of trade date. Realized gains and losses on securities sold are determined on the basis of identified cost.
c. Investment Income and Expenses
Dividend income is recorded on the ex-dividend date. Dividend income on foreign securities is recorded net of any withholding tax. Interest income, which includes amortization of premium and accretion of discount on debt securities, is accrued as earned. Non-cash dividends included in dividend income, if any, are reported at the fair market value of the securities received. Other income and expenses are recorded on an accrual basis. Expenses that cannot be directly attributed to a Fund are apportioned among the Funds in the Trust and in some cases other affiliated funds based upon their relative average net assets or number of shareholders. Investment income, realized and unrealized capital gains and losses, the common expenses of each Fund, and certain Fund level expense reductions, if any, are allocated on a pro-rata basis to each class based on the relative net assets of each class to the total net assets of each Fund.
The following Funds had certain portfolio trades directed to various brokers, under a brokerage recapture program, which paid a portion of such Fund’s expenses. For the fiscal year ended May 31, 2012, the amount by which each Fund’s expenses were reduced and the impact on the expense ratios, if any, were as follows: Capital Appreciation - $33,000 or 0.005%, Focused Growth - $1,863 or 0.014%, Mid-Cap - $36,345 or 0.006% and Emerging Companies - $28,608 or 0.052%.
The Funds have a “balance credit” arrangement with The Bank of New York Mellon (“BNYM”), the Funds’ custodian, whereby each Fund is credited with an interest factor equal to 0.75% below the effective 90-day T-Bill rate for account balances left uninvested overnight. If the T-Bill rate falls below 0.75%, no credits will be earned. These credits serve to reduce custody expenses that would otherwise be charged to each Fund. For the fiscal year ended May 31, 2012, the custodian expense was not reduced.
Overdrafts will cause a reduction of any earnings credits, computed at 2% above the effective Federal funds rate on the day of the overdraft. For the fiscal year ended May 31, 2012, overdraft fees for Capital Appreciation, Focused Growth and Emerging Companies equaled $4, $291 and $38, respectively.
The Trust also has a balance credit arrangement with its Transfer Agent, BNY Mellon Investment Servicing (US) Inc., whereby earnings credits are used to offset banking charges and other out-of-pocket expenses. For the fiscal year ended May 31, 2012, the transfer agent expense was reduced as follows: Capital Appreciation - $851, Focused Growth - $18, Mid-Cap - $704 and Emerging Companies - $70.
Total returns and net investment income for the Funds would have been lower had certain expenses not been offset. Total expenses before offsets exclude the impact of expense reimbursements or fee waivers and expense reductions such as brokerage recapture credits, but include non-reimbursable expenses, if any, such as interest and taxes.
44
Notes to Financial Statements (continued)
d. Dividends and Distributions
Dividends resulting from net investment income and distributions of capital gains, if any, normally will be declared and paid annually in December and when required for Federal excise tax purposes. Dividends and distributions to shareholders are recorded on the ex-dividend date. Income and capital gain distributions are determined in accordance with Federal income tax regulations, which may differ from U.S. GAAP. These differences are primarily due to differing treatments for losses deferred due to wash sales, REITs, equalization accounting for tax purposes, and market discount transactions. Permanent book and tax basis differences, if any, relating to shareholder distributions will result in reclassifications to paid-in capital.
The tax character of distributions paid during the fiscal year ended May 31, 2012, the eleven months ended May 31, 2011, and the fiscal year ended June 30, 2010 were as follows:
| | | | | | | | | | | | | | | | | | | | | | | | |
| | | Capital Appreciation | | | Focused Growth | |
| | | 2012 | | | 2011 | | | 2010 | | | 2012 | | | 2011 | | | 2010 | |
Distributions paid from: | | | | | | | | | | | | | | | | | | | | | | | | |
Ordinary income | | $ | 1,485,763 | | | $ | 4,338,688 | | | $ | 4,350,499 | | | $ | 70,118 | | | $ | 199,993 | | | $ | 565,882 | |
Short-term capital gains | | | — | | | | — | | | | — | | | | — | | | | 774,983 | | | | — | |
Long-term capital gains | | | — | | | | — | | | | — | | | | 918,025 | | | | — | | | | — | |
Return of capital | | | — | | | | — | | | | — | | | | — | | | | — | | | | — | |
| | | | | | | | | | | | | | | | | | | | | | | | |
Totals | | $ | 1,485,763 | | | $ | 4,338,688 | | | $ | 4,350,499 | | | $ | 988,143 | | | $ | 974,976 | | | $ | 565,882 | |
| | | | | | | | | | | | | | | | | | | | | | | | |
| | |
| | | Mid-Cap | | | Emerging Companies | |
| | | 2012 | | | 2011 | | | 2010 | | | 2012 | | | 2011 | | | 2010 | |
Distributions paid from: | | | | | | | | | | | | | | | | | | | | | | | | |
Ordinary income | | | — | | | $ | 1,717,080 | | | | — | | | | — | | | | — | | | | — | |
Short-term capital gains | | | — | | | | — | | | | — | | | | — | | | | — | | | | — | |
Long-term capital gains | | | — | | | | — | | | | — | | | | — | | | | — | | | | — | |
Return of capital | | | — | | | | — | | | | — | | | | — | | | | — | | | | — | |
| | | | | | | | | | | | | | | | | | | | | | | | |
Totals | | | — | | | $ | 1,717,080 | | | | — | | | | — | | | | — | | | | — | |
| | | | | | | | | | | | | | | | | | | | | | | | |
As of May 31, 2012, the components of distributable earnings (excluding unrealized appreciation/depreciation) on a tax basis consisted of:
| | | | | | | | | | | | | | | | |
| | | Capital
Appreciation | | | Focused Growth | | | Mid-Cap | | | Emerging
Companies | |
Capital loss carryforward | | $ | 143,767,204 | | | $ | 9,950,620 | | | $ | 103,804,591 | | | $ | 39,883,224 | |
Undistributed ordinary income | | | 928,446 | | | | 49,729 | | | | — | | | | — | |
Undistributed short-term capital gains | | | — | | | | — | | | | — | | | | — | |
Undistributed long-term capital gains | | | — | | | | 136,107 | | | | — | | | | — | |
Post-October loss deferral | | | — | | | | — | | | | — | | | | — | |
45
Notes to Financial Statements (continued)
e. Federal Taxes
Each Fund intends to comply with the requirements under Subchapter M of the Internal Revenue Code of 1986, as amended, and to distribute substantially all of its taxable income and gains to its shareholders and to meet certain diversification and income requirements with respect to investment companies. Therefore, no provision for Federal income or excise tax is included in the accompanying financial statements.
Additionally, based on the Funds’ understanding of the tax rules and rates related to income, gains and transactions for the foreign jurisdictions in which they invest, the Funds will provide for foreign taxes, and where appropriate, deferred foreign taxes.
Management has analyzed the Funds’ tax positions taken on Federal income tax returns for all open tax years (tax years ended June 30, 2009-2010 and May 31, 2011-2012), and has concluded that no provision for federal income tax is required in the Funds’ financial statements. Additionally, the Funds are not aware of any tax position for which it is reasonably possible that the total amounts of unrecognized tax benefits will change materially in the next twelve months.
Under the Regulated Investment Company Modernization Act of 2010 (the “Act”), post-enactment capital losses may be carried forward for an unlimited time period. However, any new losses incurred will be required to be utilized prior to any loss carryovers incurred in pre-enactment taxable years, which generally expire eight years following the close of the taxable year in which they were incurred. As a result of this ordering rule, pre-enactment capital loss carryovers may be more likely to expire unused. Additionally, post-enactment capital losses that are carried forward will retain their tax character as either short-term or long-term capital losses rather than being considered all short-term as under previous law.
f. Capital Loss Carryovers and Deferrals
As of May 31, 2012, the following Funds had accumulated net realized capital loss carryovers from securities transactions for Federal income tax purposes as shown in the following chart. The amounts may be used to offset future realized capital gains, if any, through the expiration dates listed or in the case of post-enactment losses, for an unlimited time period.
| | | | | | | | | | | | |
| | | Capital Loss Carryover Amount | | | Expires
May 31, | |
Fund | | Short-Term | | | Long-Term | | |
Capital Appreciation | | | | | | | | | | | | |
(Pre-Enactment) | | $ | 143,767,204 | | | | — | | | | 2018 | |
| | | | | | | | | | | | |
Focused Growth | | | | | | | | | | | | |
(Pre-Enactment) | | $ | 9,950,620 | * | | | — | | | | 2017 | |
| | | | | | | | | | | | |
Mid-Cap | | | | | | | | | | | | |
(Pre-Enactment) | | $ | 103,804,591 | | | | — | | | | 2018 | |
| | | | | | | | | | | | |
Emerging Companies | | | | | | | | | | | | |
(Pre-Enactment) | | $ | 19,971,237 | | | | — | | | | 2017 | |
(Pre-Enactment) | | $ | 19,911,987 | | | | — | | | | 2018 | |
| | | | | | | | | | | | |
| | $ | 39,883,224 | | | | — | | | | | |
| | | | | | | | | | | | |
| * | The Fund’s ability to utilze capital loss carryforward in the future may be limited under the Internal Revenue Code and related regulations based on results of share ownership activity. |
For the fiscal year ended May 31, 2012, the following Funds utilized capital loss carryovers in the amount of:
| | | | | | | | |
| | | Capital Loss Carryovers Utilized | |
| | | Short-Term | | | Long-Term | |
Capital Appreciation | | $ | 116,835,792 | | | | — | |
Focused Growth | | | 1,990,124 | | | | — | |
Mid-Cap | | | 76,419,487 | | | | — | |
Emerging Companies | | | 9,234,337 | | | | — | |
g. Capital Stock
The Trust’s Declaration of Trust authorizes for each series the issuance of an unlimited number of shares of beneficial interest, without par value. Each Fund records sales and repurchases of its capital stock on the trade date. The cost of securities contributed to the Funds in connection with the issuance of shares is based on the valuation of those securities in accordance with the Funds’ policy on investment valuation. Dividends and distributions to shareholders are recorded on the ex-dividend date.
46
Notes to Financial Statements (continued)
For the fiscal year ended May 31, 2012, the eleven months ended May 31, 2011, and the fiscal year ended June 30, 2010, the capital stock transactions by class for Capital Appreciation, Focused Growth, Mid-Cap and Emerging Companies were:
| | | | | | | | | | | | | | | | | | | | | | | | |
| | | Capital Appreciation | |
| | | May 31, 2012 | | | May 31, 2011 | | | June 30, 2010 | |
| | | Shares | | | Amount | | | Shares | | | Amount | | | Shares | | | Amount | |
Class A: | | | | | | | | | | | | | | | | | | | | | | | | |
Proceeds from sale of shares | | | 648,887 | | | $ | 10,949,282 | | | | 1,629,758 | | | $ | 25,636,167 | | | | 1,986,588 | | | $ | 27,914,472 | |
Reinvestment of distributions | | | 3,350 | | | | 54,127 | | | | 23,868 | | | | 395,006 | | | | 15,682 | | | | 220,333 | |
Cost of shares repurchased | | | (2,847,087 | ) | | | (48,493,348 | ) | | | (3,468,732 | ) | | | (54,761,509 | ) | | | (7,104,496 | ) | | | (98,336,298 | ) |
| | | | | | | | | | | | | | | | | | | | | | | | |
Net Decrease | | | (2,194,850 | ) | | $ | (37,489,939 | ) | | | (1,815,106 | ) | | $ | (28,730,336 | ) | | | (5,102,226 | ) | | $ | (70,201,493 | ) |
| | | | | | | | | | | | | | | | | | | | | | | | |
Class B: | | | | | | | | | | | | | | | | | | | | | | | | |
Proceeds from sale of shares | | | — | | | | — | | | | 2,481 | | | $ | 33,159 | | | | 31,602 | | | $ | 393,345 | |
Reinvestment of distributions | | | — | | | | — | | | | — | | | | — | | | | 2 | | | | 19 | |
Cost of shares repurchased | | | (188,052 | ) | | $ | (2,827,049 | ) | | | (400,011 | ) | | | (5,509,583 | ) | | | (637,536 | ) | | | (8,072,346 | ) |
| | | | | | | | | | | | | | | | | | | | | | | | |
Net Decrease | | | (188,052 | )1 | | $ | (2,827,049 | )1 | | | (397,530 | ) | | $ | (5,476,424 | ) | | | (605,932 | ) | | $ | (7,678,982 | ) |
| | | | | | | | | | | | | | | | | | | | | | | | |
Class C: | | | | | | | | | | | | | | | | | | | | | | | | |
Proceeds from sale of shares | | | 13,719 | | | $ | 206,170 | | | | 294,326 | | | $ | 4,041,911 | | | | 268,277 | | | $ | 3,389,017 | |
Reinvestment of distributions | | | — | | | | — | | | | — | | | | — | | | | 3 | | | | 36 | |
Cost of shares repurchased | | | (821,403 | ) | | | (12,413,568 | ) | | | (2,108,219 | ) | | | (29,676,598 | ) | | | (1,325,555 | ) | | | (16,672,233 | ) |
| | | | | | | | | | | | | | | | | | | | | | | | |
Net Decrease | | | (807,684 | ) | | $ | (12,207,398 | ) | | | (1,813,893 | ) | | $ | (25,634,687 | ) | | | (1,057,275 | ) | | $ | (13,283,180 | ) |
| | | | | | | | | | | | | | | | | | | | | | | | |
Class D: | | | | | | | | | | | | | | | | | | | | | | | | |
Proceeds from sale of shares | | | 8,072,378 | | | $ | 132,522,971 | | | | 7,941,642 | | | $ | 126,503,208 | | | | 14,163,055 | | | $ | 193,449,222 | |
Reinvestment of distributions | | | 49,195 | | | | 782,686 | | | | 82,784 | | | | 1,351,046 | | | | 80,010 | | | | 1,109,734 | |
Cost of shares repurchased | | | (4,416,358 | ) | | | (73,672,593 | ) | | | (2,719,247 | ) | | | (43,377,723 | ) | | | (6,289,592 | ) | | | (90,202,761 | ) |
| | | | | | | | | | | | | | | | | | | | | | | | |
Net Increase | | | 3,705,215 | | | $ | 59,633,064 | | | | 5,305,179 | | | $ | 84,476,531 | | | | 7,953,473 | | | $ | 104,356,195 | |
| | | | | | | | | | | | | | | | | | | | | | | | |
Institutional Class: | | | | | | | | | | | | | | | | | | | | | | | | |
Proceeds from sale of shares | | | 632,916 | | | $ | 11,148,276 | | | | 1,235,615 | | | $ | 20,966,114 | | | | 3,409,728 | | | $ | 50,047,627 | |
Reinvestment of distributions | | | 34,276 | | | | 573,430 | | | | 79,220 | | | | 1,358,626 | | | | 110,323 | | | | 1,605,193 | |
Cost of shares repurchased | | | (5,520,774 | ) | | | (96,088,240 | ) | | | (5,037,941 | ) | | | (84,892,884 | ) | | | (12,351,646 | ) | | | (184,461,259 | ) |
| | | | | | | | | | | | | | | | | | | | | | | | |
Net Decrease | | | (4,853,582 | ) | | $ | (84,366,534 | ) | | | (3,723,106 | ) | | $ | (62,568,144 | ) | | | (8,831,595 | ) | | $ | (132,808,439 | ) |
| | | | | | | | | | | | | | | | | | | | | | | | |
Administrative Class: | | | | | | | | | | | | | | | | | | | | | | | | |
Proceeds from sale of shares | | | 702,750 | | | $ | 11,833,316 | | | | 1,238,592 | | | $ | 19,876,662 | | | | 1,951,507 | | | $ | 27,407,534 | |
Reinvestment of distributions | | | 2,532 | | | | 41,167 | | | | 62,925 | | | | 1,046,443 | | | | 75,644 | | | | 1,067,334 | |
Cost of shares repurchased | | | (4,770,691 | ) | | | (77,146,991 | ) | | | (8,108,256 | ) | | | (137,394,391 | ) | | | (7,628,411 | ) | | | (103,861,980 | ) |
| | | | | | | | | | | | | | | | | | | | | | | | |
Net Decrease | | | (4,065,409 | ) | | $ | (65,272,508 | ) | | | (6,806,739 | ) | | $ | (116,471,286 | ) | | | (5,601,260 | ) | | $ | (75,387,112 | ) |
| | | | | | | | | | | | | | | | | | | | | | | | |
Class P: | | | | | | | | | | | | | | | | | | | | | | | | |
Proceeds from sale of shares | | | 70,063 | | | $ | 1,254,292 | | | | 47,881 | | | $ | 794,152 | | | | 411,323 | | | $ | 5,666,328 | |
Reinvestment of distributions | | | 173 | | | | 2,895 | | | | 473 | | | | 8,079 | | | | 680 | | | | 9,866 | |
Cost of shares repurchased | | | (80,861 | ) | | | (1,439,848 | ) | | | (407,619 | ) | | | (6,379,149 | ) | | | (244,715 | ) | | | (3,540,289 | ) |
| | | | | | | | | | | | | | | | | | | | | | | | |
Net Increase (Decrease) | | | (10,625 | ) | | $ | (182,661 | ) | | | (359,265 | ) | | $ | (5,576,918 | ) | | | 167,288 | | | $ | 2,135,905 | |
| | | | | | | | | | | | | | | | | | | | | | | | |
Class R: | | | | | | | | | | | | | | | | | | | | | | | | |
Proceeds from sale of shares | | | 25,939 | | | $ | 438,658 | | | | 40,671 | | | $ | 648,276 | | | | 102,777 | | | $ | 1,413,829 | |
Reinvestment of distributions | | | — | | | | — | | | | — | | | | — | | | | 1 | | | | 6 | |
Cost of shares repurchased | | | (61,483 | ) | | | (1,037,493 | ) | | | (131,079 | ) | | | (2,017,230 | ) | | | (675,753 | ) | | | (9,294,919 | ) |
| | | | | | | | | | | | | | | | | | | | | | | | |
Net Decrease | | | (35,544 | ) | | $ | (598,835 | ) | | | (90,408 | ) | | $ | (1,368,954 | ) | | | (572,975 | ) | | $ | (7,881,084 | ) |
| | | | | | | | | | | | | | | | | | | | | | | | |
| 1 | Effective at the close of business on June 30, 2011, shares are no longer available for purchase. |
47
Notes to Financial Statements (continued)
| | | | | | | | | | | | | | | | | | | | | | | | |
| | | Focused Growth | |
| | | May 31, 2012 | | | May 31, 2011 | | | June 30, 2010 | |
| | | Shares | | | Amount | | | Shares | | | Amount | | | Shares | | | Amount | |
Class A: | | | | | | | | | | | | | | | | | | | | | | | | |
Proceeds from sale of shares | | | 19,870 | | | $ | 165,915 | | | | 70,918 | | | $ | 599,209 | | | | 48,014 | | | $ | 364,167 | |
Reinvestment of distributions | | | 12,777 | | | | 97,103 | | | | 15,324 | | | | 128,417 | | | | 6,352 | | | | 48,149 | |
Cost of shares repurchased | | | (279,982 | ) | | | (2,268,239 | ) | | | (185,966 | ) | | | (1,512,597 | ) | | | (267,369 | ) | | | (2,004,002 | ) |
| | | | | | | | | | | | | | | | | | | | | | | | |
Net Decrease | | | (247,335 | ) | | $ | (2,005,221 | ) | | | (99,724 | ) | | $ | (784,971 | ) | | | (213,003 | ) | | $ | (1,591,686 | ) |
| | | | | | | | | | | | | | | | | | | | | | | | |
Class C: | | | | | | | | | | | | | | | | | | | | | | | | |
Proceeds from sale of shares | | | 6,270 | | | $ | 50,483 | | | | 5,744 | | | $ | 45,352 | | | | 27,425 | | | $ | 200,215 | |
Reinvestment of distributions | | | 10,920 | | | | 81,135 | | | | 5,290 | | | | 43,643 | | | | 726 | | | | 5,426 | |
Cost of shares repurchased | | | (65,033 | ) | | | (521,250 | ) | | | (58,752 | ) | | | (474,633 | ) | | | (153,859 | ) | | | (1,115,314 | ) |
| | | | | | | | | | | | | | | | | | | | | | | | |
Net Decrease | | | (47,843 | ) | | $ | (389,632 | ) | | | (47,718 | ) | | $ | (385,638 | ) | | | (125,708 | ) | | $ | (909,673 | ) |
| | | | | | | | | | | | | | | | | | | | | | | | |
Class D: | | | | | | | | | | | | | | | | | | | | | | | | |
Proceeds from sale of shares | | | 35,392 | | | $ | 287,911 | | | | 24,677 | | | $ | 204,296 | | | | 28,600 | | | $ | 213,939 | |
Reinvestment of distributions | | | 19,193 | | | | 145,101 | | | | 7,996 | | | | 66,924 | | | | 2,583 | | | | 19,581 | |
Cost of shares repurchased | | | (36,969 | ) | | | (307,393 | ) | | | (8,822 | ) | | | (75,639 | ) | | | (26,978 | ) | | | (209,485 | ) |
| | | | | | | | | | | | | | | | | | | | | | | | |
Net Increase | | | 17,616 | | | $ | 125,619 | | | | 23,851 | | | $ | 195,581 | | | | 4,205 | | | $ | 24,035 | |
| | | | | | | | | | | | | | | | | | | | | | | | |
Institutional Class: | | | | | | | | | | | | | | | | | | | | | | | | |
Proceeds from sale of shares | | | 51,891 | | | $ | 427,881 | | | | 38,101 | | | $ | 325,537 | | | | 768,979 | | | $ | 5,850,102 | |
Reinvestment of distributions | | | 68,998 | | | | 527,143 | | | | 77,582 | | | | 657,117 | | | | 63,330 | | | | 485,111 | |
Cost of shares repurchased | | | (824,973 | ) | | | (6,929,621 | ) | | | (1,119,655 | ) | | | (9,711,022 | ) | | | (12,258,860 | ) | | | (91,853,768 | ) |
| | | | | | | | | | | | | | | | | | | | | | | | |
Net Decrease | | | (704,084 | ) | | $ | (5,974,597 | ) | | | (1,003,972 | ) | | $ | (8,728,368 | ) | | | (11,426,551 | ) | | $ | (85,518,555 | ) |
| | | | | | | | | | | | | | | | | | | | | | | | |
Administrative Class: | | | | | | | | | | | | | | | | | | | | | | | | |
Proceeds from sale of shares | | | — | | | | — | | | | 1,277 | | | $ | 10,000 | | | | — | | | | — | |
Reinvestment of distributions | | | 124 | | | $ | 946 | | | | 49 | | | | 415 | | | | 15 | | | $ | 116 | |
Cost of shares repurchased | | | — | | | | — | | | | (1,130 | ) | | | (8,825 | ) | | | — | | | | — | |
| | | | | | | | | | | | | | | | | | | | | | | | |
Net Increase | | | 124 | | | $ | 946 | | | | 196 | | | $ | 1,590 | | | | 15 | | | $ | 116 | |
| | | | | | | | | | | | | | | | | | | | | | | | |
Class P: | | | | | | | | | | | | | | | | | | | | | | | | |
Proceeds from sale of shares | | | 716 | | | $ | 5,419 | | | | 452 | | | $ | 3,788 | | | | 25,576 | | | $ | 187,068 | |
Reinvestment of distributions | | | 1,099 | | | | 8,318 | | | | 511 | | | | 4,290 | | | | 37 | | | | 281 | |
Cost of shares repurchased | | | (10,209 | ) | | | (85,484 | ) | | | (9,860 | ) | | | (74,182 | ) | | | (5,885 | ) | | | (45,702 | ) |
| | | | | | | | | | | | | | | | | | | | | | | | |
Net Increase (Decrease) | | | (8,394 | ) | | $ | (71,747 | ) | | | (8,897 | ) | | $ | (66,104 | ) | | | 19,728 | | | $ | 141,647 | |
| | | | | | | | | | | | | | | | | | | | | | | | |
48
Notes to Financial Statements (continued)
| | | | | | | | | | | | | | | | | | | | | | | | |
| | | Mid-Cap | |
| | | May 31, 2012 | | | May 31, 2011 | | | June 30, 2010 | |
| | | Shares | | | Amount | | | Shares | | | Amount | | | Shares | | | Amount | |
Class A: | | | | | | | | | | | | | | | | | | | | | | | | |
Proceeds from sale of shares | | | 759,801 | | | $ | 18,795,993 | | | | 1,441,563 | | | $ | 32,077,739 | | | | 1,806,576 | | | $ | 33,350,675 | |
Reinvestment of distributions | | | — | | | | — | | | | 7,893 | | | | 187,226 | | | | — | | | | — | |
Cost of shares repurchased | | | (1,683,103 | ) | | | (41,216,107 | ) | | | (3,328,429 | ) | | | (74,391,231 | ) | | | (4,541,409 | ) | | | (84,882,571 | ) |
| | | | | | | | | | | | | | | | | | | | | | | | |
Net Decrease | | | (923,302 | ) | | $ | (22,420,114 | ) | | | (1,878,973 | ) | | $ | (42,126,266 | ) | | | (2,734,833 | ) | | $ | (51,531,896 | ) |
| | | | | | | | | | | | | | | | | | | | | | | | |
Class B: | | | | | | | | | | | | | | | | | | | | | | | | |
Proceeds from sale of shares | | | — | | | | — | | | | 6,567 | | | $ | 118,753 | | | | 18,957 | | | $ | 306,631 | |
Cost of shares repurchased | | | (195,654 | ) | | $ | (4,233,139 | ) | | | (316,169 | ) | | | (6,164,351 | ) | | | (554,843 | ) | | | (9,253,000 | ) |
| | | | | | | | | | | | | | | | | | | | | | | | |
Net Decrease | | | (195,654 | )1 | | $ | (4,233,139 | )1 | | | (309,602 | ) | | $ | (6,045,598 | ) | | | (535,886 | ) | | $ | (8,946,369 | ) |
| | | | | | | | | | | | | | | | | | | | | | | | |
Class C: | | | | | | | | | | | | | | | | | | | | | | | | |
Proceeds from sale of shares | | | 22,894 | | | $ | 491,982 | | | | 118,798 | | | $ | 2,312,985 | | | | 143,375 | | | $ | 2,366,309 | |
Cost of shares repurchased | | | (487,702 | ) | | | (10,664,322 | ) | | | (1,376,173 | ) | | | (26,787,002 | ) | | | (693,781 | ) | | | (11,330,977 | ) |
| | | | | | | | | | | | | | | | | | | | | | | | |
Net Decrease | | | (464,808 | ) | | $ | (10,172,340 | ) | | | (1,257,375 | ) | | $ | (24,474,017 | ) | | | (550,406 | ) | | $ | (8,964,668 | ) |
| | | | | | | | | | | | | | | | | | | | | | | | |
Class D: | | | | | | | | | | | | | | | | | | | | | | | | |
Proceeds from sale of shares | | | 1,218,581 | | | $ | 28,306,396 | | | | 56,909 | | | $ | 1,334,619 | | | | 78,074 | | | $ | 1,463,884 | |
Reinvestment of distributions | | | — | | | | — | | | | 498 | | | | 11,905 | | | | — | | | | — | |
Cost of shares repurchased | | | (311,694 | ) | | | (7,713,573 | ) | | | (200,695 | ) | | | (4,467,045 | ) | | | (819,240 | ) | | | (14,707,061 | ) |
| | | | | | | | | | | | | | | | | | | | | | | | |
Net Increase (Decrease) | | | 906,887 | | | $ | 20,592,823 | | | | (143,288 | ) | | $ | (3,120,521 | ) | | | (741,166 | ) | | $ | (13,243,177 | ) |
| | | | | | | | | | | | | | | | | | | | | | | | |
Institutional Class: | | | | | | | | | | | | | | | | | | | | | | | | |
Proceeds from sale of shares | | | 2,076,808 | | | $ | 52,186,218 | | | | 2,539,900 | | | $ | 60,903,202 | | | | 3,627,289 | | | $ | 71,968,901 | |
Reinvestment of distributions | | | — | | | | — | | | | 45,950 | | | | 1,153,807 | | | | — | | | | — | |
Cost of shares repurchased | | | (3,700,434 | ) | | | (92,817,980 | ) | | | (6,956,009 | ) | | | (168,256,179 | ) | | | (7,514,096 | ) | | | (146,646,025 | ) |
| | | | | | | | | | | | | | | | | | | | | | | | |
Net Decrease | | | (1,623,626 | ) | | $ | (40,631,762 | ) | | | (4,370,159 | ) | | $ | (106,199,170 | ) | | | (3,886,807 | ) | | $ | (74,677,124 | ) |
| | | | | | | | | | | | | | | | | | | | | | | | |
Administrative Class: | | | | | | | | | | | | | | | | | | | | | | | | |
Proceeds from sale of shares | | | 387,506 | | | $ | 9,756,311 | | | | 664,649 | | | $ | 15,774,101 | | | | 2,224,816 | | | $ | 41,288,004 | |
Reinvestment of distributions | | | — | | | | — | | | | 9,175 | | | | 222,314 | | | | — | | | | — | |
Cost of shares repurchased | | | (1,460,128 | ) | | | (35,780,932 | ) | | | (2,829,422 | ) | | | (65,817,863 | ) | | | (3,398,662 | ) | | | (66,149,625 | ) |
| | | | | | | | | | | | | | | | | | | | | | | | |
Net Decrease | | | (1,072,622 | ) | | $ | (26,024,621 | ) | | | (2,155,598 | ) | | $ | (49,821,448 | ) | | | (1,173,846 | ) | | $ | (24,861,621 | ) |
| | | | | | | | | | | | | | | | | | | | | | | | |
Class P: | | | | | | | | | | | | | | | | | | | | | | | | |
Proceeds from sale of shares | | | 219,705 | | | $ | 5,282,896 | | | | 27,796 | | | $ | 649,630 | | | | 61,399 | | | $ | 1,208,929 | |
Reinvestment of distributions | | | — | | | | — | | | | 185 | | | | 4,633 | | | | — | | | | — | |
Cost of shares repurchased | | | (242,837 | ) | | | (5,983,038 | ) | | | (94,202 | ) | | | (2,243,379 | ) | | | (77,204 | ) | | | (1,509,989 | ) |
| | | | | | | | | | | | | | | | | | | | | | | | |
Net Decrease | | | (23,132 | ) | | $ | (700,142 | ) | | | (66,221 | ) | | $ | (1,589,116 | ) | | | (15,805 | ) | | $ | (301,060 | ) |
| | | | | | | | | | | | | | | | | | | | | | | | |
Class R: | | | | | | | | | | | | | | | | | | | | | | | | |
Proceeds from sale of shares | | | 173,559 | | | $ | 4,267,204 | | | | 219,112 | | | $ | 4,976,499 | | | | 403,829 | | | $ | 7,454,566 | |
Cost of shares repurchased | | | (381,712 | ) | | | (9,393,034 | ) | | | (643,498 | ) | | | (14,193,220 | ) | | | (1,225,020 | ) | | | (22,283,277 | ) |
| | | | | | | | | | | | | | | | | | | | | | | | |
Net Decrease | | | (208,153 | ) | | $ | (5,125,830 | ) | | | (424,386 | ) | | $ | (9,216,721 | ) | | | (821,191 | ) | | $ | (14,828,711 | ) |
| | | | | | | | | | | | | | | | | | | | | | | | |
| 1 | Effective at the close of business on June 30, 2011, shares are no longer available for purchase. |
49
Notes to Financial Statements (continued)
| | | | | | | | | | | | | | | | | | | | | | | | |
| | | Emerging Companies | |
| | | May 31, 2012 | | | May 31, 2011 | | | June 30, 2010 | |
| | | Shares | | | Amount | | | Shares | | | Amount | | | Shares | | | Amount | |
Institutional Class: | | | | | | | | | | | | | | | | | | | | | | | | |
Proceeds from sale of shares | | | 227,938 | | | $ | 4,950,185 | | | | 339,213 | | | $ | 6,709,463 | | | | 373,355 | | | $ | 5,352,100 | |
Cost of shares repurchased | | | (1,421,483 | ) | | | (30,696,571 | ) | | | (1,319,475 | ) | | | (23,687,492 | ) | | | (2,015,999 | ) | | | (28,702,892 | ) |
| | | | | | | | | | | | | | | | | | | | | | | | |
Net Decrease | | | (1,193,545 | ) | | $ | (25,746,386 | ) | | | (980,262 | ) | | $ | (16,978,029 | ) | | | (1,642,644 | ) | | $ | (23,350,792 | ) |
| | | | | | | | | | | | | | | | | | | | | | | | |
Administrative Class: | | | | | | | | | | | | | | | | | | | | | | | | |
Proceeds from sale of shares | | | 482,753 | | | $ | 9,897,389 | | | | 282,540 | | | $ | 5,645,102 | | | | 102,404 | | | $ | 1,360,489 | |
Cost of shares repurchased | | | (574,937 | ) | | | (11,499,959 | ) | | | (200,762 | ) | | | (3,839,017 | ) | | | (1,152,448 | ) | | | (17,475,317 | ) |
| | | | | | | | | | | | | | | | | | | | | | | | |
Net Increase (Decrease) | | | (92,184 | ) | | $ | (1,602,570 | ) | | | 81,778 | | | $ | 1,806,085 | | | | (1,050,044 | ) | | $ | (16,114,828 | ) |
| | | | | | | | | | | | | | | | | | | | | | | | |
At May 31, 2012, certain unaffiliated shareholders of record, specifically omnibus accounts, individually or collectively held greater than 10% of the outstanding shares of the following Funds: Capital Appreciation – 2 collectively own 72%; Focused Growth – 3 collectively own 54%; Mid-Cap – 1 owns 32% and Emerging Companies – 3 collectively own 56%. Transactions by these shareholders may have a material impact on the Funds.
| 2.Agreements | and Transactions with Affiliates |
For each of the Funds, the Trust has entered into an Investment Management Agreement under which the Investment Manager, a subsidiary of Affiliated Managers Group, Inc. (“AMG”), serves as investment manager to the Funds and is responsible for the Funds’ overall administration and operations. The Investment Manager selects subadvisors for the Funds (subject to Board approval) and monitors the subadvisors’ investment performance, security holdings, and investment strategies. Each Fund’s investment portfolio is managed by portfolio managers who serve pursuant to a subadvisory agreement with the Investment Manager.
Investment management fees are paid directly by each Fund to the Investment Manager based on average daily net assets. The annual investment management fee rates, as a percentage of average daily net assets for the fiscal year ended May 31, 2012, were as follows:
| | | | |
Fund | | Investment
Management Fee | |
Capital Appreciation | | | 0.45 | % |
Focused Growth | | | 0.45 | % |
Mid-Cap | | | 0.45 | % |
Emerging Companies | | | 1.25 | % |
Prior to September 27, 2010, all of the Predecessor Funds, except Allianz CCM Emerging Companies Fund, paid an investment management fee of 0.45%. Allianz CCM Emerging Companies Fund paid an investment management fee of 1.25%, of which 0.10% was voluntarily waived.
Effective September 27, 2010, each Fund entered into an Administration and Shareholder Servicing Agreement under which the Investment Manager serves as each Fund’s administrator (the “Administrator”) and is responsible for all aspects of managing the Funds’ operations, including administration and shareholder services to each Fund, its shareholders, and certain institutions, such as bank trust departments, broker-dealers and registered
investment advisers, that advise or act as an intermediary with the Funds’ shareholders. For its services, the Administrator is paid a fee at a rate of 0.25% of average net assets per annum. Prior to September 27, 2010, the Predecessor Funds participated in a “unitary” fee structure where Allianz Global Investors Fund Management LLC provided administrative services and would also bear the the cost of most third-party administrative services, including audit, custodial, portfolio accounting, legal and transfer agency.
Managers has contractually agreed, until at least October 13, 2013, to waive management fees and/or reimburse Fund expenses of Capital Appreciation, Focused Growth, Mid-Cap, and Emerging Companies, in order to limit total annual Fund operating expenses after fee waiver and expense reimbursements (exclusive of taxes, interest (including interest incurred in connection with bank and custody overdrafts), shareholder servicing fees, distribution and service (12b-1) fees, brokerage commissions and other transaction costs, acquired fund fees and expenses, and extraordinary expenses) to 0.72%, 0.71%, 0.72% and 1.42%, respectively, of each Fund’s average daily net assets.
Each of Capital Appreciation, Focused Growth, Mid-Cap, and Emerging Companies is obligated to repay the Investment Manager such amounts waived, paid, or reimbursed in future years provided that the repayment occurs within thirty-six (36) months after the waiver or reimbursement and that such repayment would not cause the Fund’s expenses in any such year to exceed the previously stated expense limitation percentages of the Fund’s average daily net assets. For the fiscal year ended May 31, 2012, each Fund’s components of reimbursement are detailed in the following chart:
| | | | | | | | | | | | | | | | |
| | | Capital
Appreciation | | | Focused
Growth | | | Mid-Cap | | | Emerging
Companies | |
Reimbursement Available - 5/31/11 | | $ | 395,154 | | | $ | 75,545 | | | $ | 402,960 | | | $ | 140,302 | |
Additional | | | | | | | | | | | | | | | | |
Reimbursements | | | 649,797 | | | | 101,920 | | | | 478,852 | | | | 169,375 | |
Repayments | | | — | | | | — | | | | — | | | | — | |
Expired | | | | | | | | | | | | | | | | |
Reimbursements | | | — | | | | — | | | | — | | | | — | |
| | | | | | | | | | | | | | | | |
Reimbursement Available - 5/31/12 | | $ | 1,044,951 | | | $ | 177,465 | | | $ | 881,812 | | | $ | 309,677 | |
| | | | | | | | | | | | | | | | |
50
Notes to Financial Statements (continued)
The aggregate annual retainer paid to each Independent Trustee of the Board is $80,000, plus $5,000 or $2,500 for each regular or special meeting attended, respectively. The Independent Chairman of the Trust receives an additional payment of $20,000 per year. The Chairman of the Audit Committee receives an additional payment of $8,000 per year. The Trustees’ fees and expenses are allocated among all of the Managers’ Funds for which the Investment Manager serves as the advisor based on the relative net assets of such funds. The “Trustees fees and expenses” shown in the financial statements represents each Fund’s allocated portion of the total fees and expenses paid.
The Funds are distributed by Managers Distributors, Inc. (the “Distributor” or “MDI”), a wholly-owned subsidiary of the Investment Manager. MDI serves as the distributor and underwriter for each Fund and is a registered broker-dealer and member of the Financial Industry Regulatory Authority, Inc. (“FINRA”). Shares of each Fund will be continuously offered and will be sold directly to prospective purchasers through brokers, dealers or other financial intermediaries who have executed selling agreements with MDI. Subject to the compensation arrangement discussed below, generally MDI bears all or a portion of the expenses of providing services pursuant to the distribution agreement, including the payment of the expenses relating to the distribution of prospectuses for sales purposes and any advertising or sales literature. Certain Trustees and Officers of the Funds are Officers and/or Directors of the Investment Manager, AMG and/or the Distributor.
The Trust has adopted a distribution and service plan (the “Plan”) with respect to the shares of certain classes of the Funds, in accordance with the requirements of Rule 12b-1 under the 1940 Act and the requirements of the applicable rules of the FINRA regarding asset-based sales charges. Pursuant to the Plan, each Fund may compensate the Distributor for its expenditures in financing any activity primarily intended to result in the sale of each such class of the Fund’s shares and for maintenance and personal service provided to existing shareholders of that class. The Plan authorizes payments to the Distributor up to a certain percentage annually of each Fund’s average daily net assets attributable to each respective class of shares.
The Plan further provides for periodic payments by the Trust or MDI to brokers, dealers and other financial intermediaries for providing shareholder services and for promotional and other sales related costs. The portion of payments by each class’s shares for shareholder servicing may not exceed a certain annual percentage rate of the average daily net asset value of the Fund’s shares of each class owned by its clients of such broker, dealer or financial intermediary. The annual percentages of daily net assets for 12b-1 fees congruent with the Plan for each applicable share class of the Funds are detailed in the chart below:
| | | | |
Fund | | 12b-1 Fees | |
Capital Appreciation | | | | |
Class A | | | 0.25 | % |
Class B | | | 1.00 | % |
Class C | | | 1.00 | % |
Class D | | | 0.25 | % |
Class R | | | 0.50 | % |
Focused Growth | | | | |
Administrative Class | | | 0.05 | % |
Class A | | | 0.25 | % |
Class C | | | 1.00 | % |
Class D | | | 0.25 | % |
Mid-Cap Fund | | | | |
Class A | | | 0.25 | % |
Class B | | | 1.00 | % |
Class C | | | 1.00 | % |
Class D | | | 0.25 | % |
Class R | | | 0.50 | % |
The Securities and Exchange Commission has granted an exemptive order that permits the Funds to lend and borrow money for certain temporary purposes directly to and from other eligible Managers Funds. Participation in this interfund lending program is voluntary for both borrowing and lending funds, and an interfund loan is only made if it benefits each participating fund. The Investment Manager administers the program according to procedures approved by the Board, and the Board monitors the operation of the program. An interfund loan must comply with certain conditions set out in the exemptive order, which are designed to assure fairness and protect all participating Funds. For the fiscal year ended May 31, 2012, Capital Appreciation borrowed varying amounts up to $3,663,160 for 17 days paying interest of $1,205, Focused Growth borrowed varying amounts up to $1,846,890 for 15 days paying interest of $496, Mid-Cap borrowed varying amounts up to $1,147,487 for 3 days paying interest of $91, and Emerging Companies borrowed varying amounts up to $18,086,305 for 9 days paying interest of $980. The interest amounts are included in the Statement of Operations as miscellaneous expense. For the same period, Mid-Cap lent varying amounts up to $4,761,074 for 12 days earning interest of $899 and Emerging Companies lent varying amounts up to $1,103,205 for 2 days earning interest of $50. The interest amounts are included in the Statements of Operations in interest income.
3. Purchases and Sales of Securities
Purchases and sales of securities (excluding short-term securities) for the fiscal year ended May 31, 2012, were as follows:
| | | | | | | | |
Fund | | Purchases | | | Sales | |
Capital Appreciation | | $ | 1,075,703,070 | | | $ | 1,202,534,999 | |
Focused Growth | | | 16,240,086 | | | | 25,358,463 | |
Mid-Cap | | | 743,017,196 | | | | 828,720,161 | |
Emerging Companies | | | 61,912,715 | | | | 89,018,555 | |
51
Notes to Financial Statements (continued)
The Funds had no purchases or sales of U.S. Government obligations for the fiscal year ended May 31, 2012.
4. Commitments and Contingencies
In the normal course of business, the Funds may enter into contracts and agreements that contain a variety of representations and warranties, which provide general indemnifications. The maximum exposure to the Funds under these arrangements is unknown, as this would involve future claims that may be made against a Fund that have not yet occurred. However, based on experience, the Funds have not had prior claims or losses and expect the risk of material loss to be remote.
5. New Accounting Pronouncements
In May 2011, the Financial Accounting Standards Board issued Accounting Standards Update (“ASU”) No. 2011-04, “Amendments to Achieve Common Fair Value Measurement and Disclosure Requirements in U.S. GAAP and IFRSs.” ASU 2011-04 requires common fair value measurement and disclosure requirements between U.S. GAAP and International Financial Reporting Standards. The new and revised disclosures are effective for interim and annual reporting periods beginning after December 15, 2011. At this time, management is evaluating the implications of ASU No. 2011-04 and its impact on the financial statements.
In December 2011, the FASB issued ASU No. 2011-11, “Disclosures about Offsetting Assets and Liabilities.” ASU 2011-11 requires disclosures to make financial statements that are prepared under U.S. GAAP more comparable to those prepared under IFRS.
The new disclosure requirements mandate that entities disclose both gross and net information about instruments and transactions eligible for offset in the statement of assets and liabilities as well as instruments and transactions subject to an agreement similar to a master netting arrangement. In addition, ASU 2011-11 requires disclosure of collateral received and posted in connection with master netting agreements or similar arrangements. New disclosures are required for annual reporting periods beginning on or after January 1, 2013, and interim periods within those annual periods. Management is evaluating the impact of ASU 2011-11 on the financial statements and disclosures.
6. Subsequent Events
The Funds have determined that no material events or transactions occurred through the issuance date of the Funds’ financial statements which require additional disclosure in or adjustment of the Funds’ financial statements.
Tax Information (unaudited)
Each Fund hereby designates the maximum amount allowable of its net taxable income as qualified dividends as provided in the Jobs and Growth Tax Relief Reconciliation Act of 2003. The 2011/2012 Form 1099-DIV you receive for each Fund will show the tax status of all distributions paid to you during the year.
The percentage of Qualified Dividend Income (“QDI”) and the Dividends Received Deduction (“DRD”) for distributions paid is as follows:
| | | | | | | | |
| | | 2011 | | | 2010 | |
Capital Appreciation | | | | | | | | |
Ordinary Income - QDI | | | 100.00 | % | | | 100.00 | % |
Ordinary Income - DRD | | | 100.00 | % | | | 100.00 | % |
Focused Growth | | | | | | | | |
Ordinary Income - QDI | | | 100.00 | % | | | 79.00 | % |
Ordinary Income - DRD | | | 100.00 | % | | | 76.62 | % |
Mid-Cap | | | | | | | | |
Ordinary Income - QDI | | | n/a | | | | 100.00 | % |
Ordinary Income - DRD | | | n/a | | | | 100.00 | % |
Pursuant to section 852 of the Internal Revenue Code, Capital Appreciation, Focused Growth, Mid-Cap and Emerging Companies hereby designate $0, $918,025, $0 and $0, respectively, as a capital gain distribution with respect to the taxable fiscal year ended May 31, 2012, or if subsequently determined to be different, the net capital gains of such fiscal year.
52
Report of Independent Registered Public Accounting Firm
To the Board of Trustees of The Managers Funds and Shareholders of the Managers Cadence Capital Appreciation Fund, Managers Cadence Focused Growth Fund, Managers Cadence Mid-Cap Fund and Managers Cadence Emerging Companies Fund:
In our opinion, the accompanying statements of assets and liabilities, including the schedules of portfolio investments, and the related statements of operations and of changes in net assets and the financial highlights present fairly, in all material respects, the financial position of Managers Cadence Capital Appreciation Fund, Managers Cadence Focused Growth Fund, Managers Cadence Mid-Cap Fund and Managers Cadence Emerging Companies Fund (four of the Funds constituting The Managers Funds, hereafter referred to as the “Funds”) at May 31, 2012, the results of each of their operations for the year then ended, the changes in net assets and the financial highlights for the periods presented, in conformity with accounting principles generally accepted in the United States of America. These financial statements and financial highlights (hereafter referred to as “financial statements”) are the responsibility of the Funds’ management. Our responsibility is to express an opinion on these financial statements based on our audits. We conducted our audits of these financial statements in accordance with the standards of the Public Company Accounting Oversight Board (United States). Those standards require that we plan and perform the audit to obtain reasonable assurance about whether the financial statements are free of material misstatement. An audit includes examining, on a test basis, evidence supporting the amounts and disclosures in the financial statements, assessing the accounting principles used and significant estimates made by management, and evaluating the overall financial statement presentation. We believe that our audits, which included confirmation of securities at May 31, 2012 by correspondence with the custodian, brokers and the application of alternative auditing procedures where securities purchased had not been received, provide a reasonable basis for our opinion.
PricewaterhouseCoopers LLP
Boston, Massachusetts
July 24, 2012
53
Trustees and Officers
The Trustees and Officers of the Trust, their business addresses, principal occupations for the past five years and dates of birth are listed below. The Trustees provide broad supervision over the affairs of the Trust and the Funds. The Trustees are experienced executives who meet periodically throughout the year to oversee the Funds’ activities, review contractual arrangements with companies that provide services to the Funds, and review the Funds’ performance. Unless otherwise noted, the address of each Trustee or Officer is the address of the Trust: 800 Connecticut Avenue, Norwalk, Connecticut 06854.
There is no stated term of office for Trustees. Trustees serve until their resignation, retirement or removal in accordance with the Trust’s organizational documents and policies adopted by the Board from time to time. The Chairman of the Trustees, President, Treasurer and Secretary of the Trust are elected by the Trustees annually. Other officers hold office at the pleasure of the Trustees.
Independent Trustees
The following Trustees are not “interested persons” of the Trust within the meaning of the 1940 Act:
| | |
Name, Date of Birth, Number of Funds Overseen in Fund
Complex* | | Principal Occupation(s) During Past
5 Years and Other Directorships
Held by Trustee |
Jack W. Aber, 9/9/37 • Trustee since 1999 • Oversees 36 Funds in Fund Complex | | Professor of Finance, Boston University School of Management (1972-Present); Trustee of Appleton Growth Fund (1 portfolio); Trustee of Third Avenue Trust (5 portfolios); Trustee of Third Avenue Variable Trust (1 portfolio); Trustee of Aston Funds (26 portfolios). |
William E. Chapman, II, 9/23/41 • Independent Chairman • Trustee since 1999 • Oversees 36 Funds in Fund Complex | | President and Owner, Longboat Retirement Planning Solutions (1998-Present); Hewitt Associates, LLC (part time) (provider of Retirement and Investment Education Seminars) (2002-2009); Trustee of Bowdoin College (2002-Present); Director of Harding, Loevner Funds, Inc. (6 portfolios); Trustee of Third Avenue Trust (5 portfolios); Trustee of Third Avenue Variable Trust (1 portfolio); Trustee of Aston Funds (26 portfolios). |
Edward J. Kaier, 9/23/45 • Trustee since 1999 • Oversees 36 Funds in Fund Complex | | Attorney at Law and Partner, Teeters Harvey Gilboy & Kaier LLP (2007-Present); Attorney at Law and Partner, Hepburn Willcox Hamilton & Putnam, LLP (1977-2007); Trustee of Third Avenue Trust (5 portfolios); Trustee of Third Avenue Variable Trust (1 portfolio); Trustee of Aston Funds (26 portfolios). |
Steven J. Paggioli, 4/3/50 • Trustee since 1993 • Oversees 36 Funds in Fund Complex | | Independent Consultant (2002-Present); Formerly Executive Vice President and Director, The Wadsworth Group (1986-2001); Executive Vice President, Secretary and Director, Investment Company Administration, LLC (1990-2001); Vice President, Secretary and Director, First Fund Distributors, Inc. (1991-2001); Trustee, Professionally Managed Portfolios (43 portfolios); Advisory Board Member, Sustainable Growth Advisors, LP; Independent Director, Chase Investment Counsel (2008 – Present); Trustee of Aston Funds (26 portfolios). |
Eric Rakowski, 6/5/58 • Trustee since 1999 • Oversees 36 Funds in Fund Complex | | Professor, University of California at Berkeley School of Law (1990-Present); Director of Harding, Loevner Funds, Inc. (6 portfolios); Trustee of Third Avenue Trust (5 portfolios); Trustee of Third Avenue Variable Trust (1 portfolio); Trustee of Aston Funds (26 portfolios). |
Thomas R. Schneeweis, 5/10/47 • Trustee since 1987 • Oversees 36 Funds in Fund Complex | | Professor of Finance, University of Massachusetts (1977-Present); Director, CISDM at the University of Massachusetts, (1996-Present); President, Alternative Investment Analytics, LLC, (formerly Schneeweis Partners, LLC) (2001-Present); Partner, S Capital Management, LLC (2007-Present); President, TRS Associates (1982-Present); White Bear Partners, LLC (2007-2010); Partner, Northampton Capital Management, LLC (2004-2010); Trustee of Aston Funds (26 portfolios). |
| * | The Fund Complex consists of Managers AMG Funds, The Managers Funds, Managers Trust I and Managers Trust II. |
Interested Trustees
Each Trustee in the following table is an “interested person” of the Trust within the meaning of the 1940 Act. Ms. Carsman is an interested person of the Trust within the meaning of the 1940 Act by virtue of her position with, and interest in securities of, AMG, and her former position as Chief Legal Officer of the Trust.
| | |
Name, Date of Birth, Number of Funds Overseen in Fund
Complex* | | Principal Occupation(s) During Past
5 Years and Other Directorships
Held by Trustee |
Christine C. Carsman, 4/2/52 • Trustee since 2011 • Oversees 36 Funds in Fund Complex | | Deputy General Counsel, Affiliated Managers Group, Inc. (2011-Present); Senior Vice President and Chief Regulatory Counsel, Affiliated Managers Group, Inc. (2004-Present); Secretary and Chief Legal Officer, Managers AMG Funds, The Managers Funds, Managers Trust I and Managers Trust II (2004-2011); Senior Counsel, Vice President and Director of Operational Risk Management and Compliance, Wellington Management Company, LLP (1995-2004). |
| Officers | | |
| |
Name, Date of Birth, Position(s) Held with Fund and Length of Time Served | | Principal Occupation(s) During Past
5 Years |
Keitha L. Kinne, 5/16/58 • President since 2012 Chief Operating Officer since 2007 | | Managing Partner and Chief Operating Officer, Managers Investment Group LLC (2007-Present); Chief Investment Officer, Managers Investment Group LLC (2008-Present); President, Managers Distributors, Inc. (2012-Present); Chief Operating Officer, Managers AMG Funds, Managers Trust I and Managers Trust II (2007-Present); Managing Director, Legg Mason & Co., LLC (2006-2007); Managing Director, Citigroup Asset Management (2004-2006). |
Lewis Collins, 2/22/66 • Secretary since 2011 • Chief Legal Officer since 2011 | | Senior Vice President and Senior Counsel, Affiliated Managers Group, Inc. (2010-Present); Vice President and Senior Counsel, Affiliated Managers Group, Inc. (2006-2010); Senior Counsel, Affiliated Managers Group, Inc. (2002-2006); Attorney, Ropes & Gray LLP (1998-2002). |
Donald S. Rumery, 5/29/58 • Chief Financial Officer since 2007 • Treasurer since 1995 | | Senior Vice President, Managers Investment Group LLC (2005-Present); Treasurer and Chief Financial Officer, Managers Distributors, Inc. (2000-Present); Treasurer, Managers AMG Funds (1999-Present); Treasurer, Managers Trust I and Managers Trust II (2000-Present); Chief Financial Officer, Managers AMG Funds, Managers Trust I and Managers Trust II (2007-Present); Vice President, The Managers Funds LLC (1994-2004). |
John J. Ferencz, 3/09/62 • Chief Compliance Officer since 2010 | | Vice President, Legal and Compliance, Managers Investment Group LLC (2010-Present); Senior Compliance Analyst, Mutual Funds and Regulatory, GE Asset Management Incorporated (2005-2010). |
Michael S. Ponder, 9/12/73 • Assistant Secretary since 2011 | | Senior Vice President and Counsel, Managers Investment Group LLC (2011-Present); Attorney, DeNovo Legal (2009-2010); Vice President, Credit Suisse (2007-2009); Associate, Willkie Farr & Gallagher LLP (2006-2007). |
54
THIS PAGE INTENTIONALLY LEFT BLANK
Investment Manager and Administrator
Managers Investment Group LLC
800 Connecticut Ave.
Norwalk, CT 06854
(800) 835-3879
Subadvisor
Cadence Capital Management LLC
265 Franklin Street, 11th Floor
Boston, MA 02110
Distributor
Managers Distributors, Inc.
800 Connecticut Ave.
Norwalk, CT 06854
(800) 835-3879
Custodian
The Bank of New York Mellon
2 Hanson Place
Brooklyn, NY 11217
Legal Counsel
Ropes & Gray LLP
Prudential Tower, 800 Boylston Street
Boston, MA 02199-3600
Transfer Agent
BNY Mellon Investment Servicing (US) Inc.
Attn: Managers
P.O. Box 9769
Providence, RI 02940
(800) 548-4539

MANAGERS AND MANAGERS AMG FUNDS
| | | | |
EQUITY FUNDS | | BALANCED FUNDS |
| CADENCE CAPITAL APPRECIATION | | REAL ESTATE SECURITIES | | CHICAGO EQUITY PARTNERS BALANCED |
| CADENCE FOCUSED GROWTH | | Urdang Securities Management, Inc. | | Chicago Equity Partners, LLC |
| CADENCE MID-CAP | | | | |
| CADENCE EMERGING COMPANIES | | RENAISSANCE LARGE CAP GROWTH | | ALTERNATIVE FUNDS |
| Cadence Capital Management, LLC | | Renaissance Group LLC | | |
| | | | FQ GLOBAL ALTERNATIVES |
| CHICAGO EQUITY PARTNERS MID-CAP | | SKYLINE SPECIAL EQUITIES | | FQ GLOBAL ESSENTIALS |
| Chicago Equity Partners, LLC | | PORTFOLIO | | First Quadrant, L.P. |
| | Skyline Asset Management, L.P. | | |
| ESSEX SMALL/MICRO CAP GROWTH | | | | INCOME FUNDS |
| Essex Investment Management Co., LLC | | SPECIAL EQUITY | | |
| | Ranger Investment Management, L.P. | | BOND (MANAGERS) |
| FQ TAX-MANAGED U.S. EQUITY | | Lord, Abbett & Co. LLC | | FIXED INCOME |
| FQ U.S. EQUITY | | Smith Asset Management Group, L.P. | | GLOBAL INCOME OPPORTUNITY |
| First Quadrant, L.P. | | Federated MDTA LLC | | Loomis, Sayles & Co., L.P. |
| | |
| FRONTIER SMALL CAP GROWTH | | SYSTEMATIC VALUE | | BOND (MANAGERS PIMCO) |
| Frontier Capital Management Company, LLC | | SYSTEMATIC MID CAP VALUE | | Pacific Investment Management Co. LLC |
| | Systematic Financial Management, L.P. | | |
| GW&K SMALL CAP EQUITY | | | | CALIFORNIA INTERMEDIATE TAX-FREE |
| Gannett Welsh & Kotler, LLC | | TIMESSQUARE MID CAP GROWTH | | Miller Tabak Asset Management LLC |
| | TIMESSQUARE SMALL CAP GROWTH | | |
| MICRO-CAP | | TSCM GROWTH EQUITY | | GW&K MUNICIPAL BOND |
| Lord, Abbett & Co. LLC | | TimesSquare Capital Management, LLC | | GW&K MUNICIPAL ENHANCED YIELD |
| WEDGE Capital Management L.L.P. | | | | Gannett Welsh & Kotler, LLC |
| Next Century Growth Investors LLC | | TRILOGY GLOBAL EQUITY | | |
| RBC Global Asset Management (U.S.) Inc. | | TRILOGY EMERGING MARKETS EQUITY | | HIGH YIELD |
| | TRILOGY INTERNATIONAL SMALL CAP | | J.P. Morgan Investment Management LLC |
| | Trilogy Global Advisors, L.P. | | |
| | | | INTERMEDIATE DURATION GOVERNMENT |
| | YACKTMAN FUND | | SHORT DURATION GOVERNMENT |
| | YACKTMAN FOCUSED FUND | | Smith Breeden Associates, Inc. |
| | Yacktman Asset Management L.P. | | |
This report is prepared for the Funds’ shareholders. It is authorized for distribution to prospective investors only when preceded or accompanied by an effective prospectus. To receive a free copy of the prospectus or Statement of Additional Information, which includes additional information about Fund Trustees, please contact us by calling 800.835.3879. Distributed by Managers Distributors, Inc., member FINRA. A description of the policies and procedures each Fund uses to vote its proxies is available: (i) without charge, upon request, by calling 800.835.3879, or (ii) on the Securities and Exchange Commission’s (SEC) Web site at www.sec.gov. For information regarding each Fund’s proxy voting record for the 12-month period ended June 30, call 800.835.3879 or visit the SEC Web site at www.sec.gov. The Funds file their complete schedule of portfolio holdings with the SEC for the first and third quarters of each fiscal year on Form N-Q. The Funds’ Forms N-Q are available on the SEC’s website at www.sec.gov. A Fund’s Forms N-Q may be reviewed and copied at the SEC’s Public Reference Room in Washington, DC. Information on the operation of the Public Reference Room may be obtained by calling 800.SEC.0330. To review a complete list of the Funds’ portfolio holdings, or to view the most recent quarterly holdings report, semiannual report, or annual report, please visit www.managersinvest.com. | |  |

Registrant has adopted a Code of Ethics. See attached Exhibit (a)(1).
| Item 3. | AUDIT COMMITTEE FINANCIAL EXPERT |
Registrant’s Board of Trustees has determined that independent Trustees Mr. Jack W. Aber and Mr. Steven J. Paggioli each qualify as the Audit Committee Financial Expert. Mr. Aber and Mr. Paggioli are “independent” as such term is defined in Form N-CSR.
| Item 4. | PRINCIPAL ACCOUNTANT FEES AND SERVICES |
The aggregate fees billed by PwC to the Fund for the Funds’ two most recent fiscal years for professional services rendered for audits of annual financial statements, or services that are normally provided in connection with statutory and regulatory filings or engagements (“Audit Fees”) were as follows:
| | | | | | | | |
| | | Fiscal 2012 | | | Fiscal 2011 | |
Managers Cadence Capital Appreciation Fund | | | 25,550 | | | $ | 29,500 | |
Managers Cadence Focused Growth Fund | | | 21,470 | | | $ | 29,500 | |
Managers Cadence Mid-Cap Fund | | | 22,490 | | | $ | 29,500 | |
Managers Cadence Emerging Companies Fund | | | 25,550 | | | $ | 24,500 | |
Audit-Related Fees
There were no fees billed by PwC to the Funds in its two recent fiscal years for services rendered for assurance and related services that are reasonably related to the performance of the audit or review of the Fund’s financial statements, but are not reported as Audit Fees (“Audit-Related Fees”).
For the Funds’ two most recent fiscal years, there were no Audit-Related Fees billed by PwC for engagements related directly to the operations and financial reporting of one or more Funds by a Fund Service Provider. A Fund Service Provider is (a) any investment adviser to the Fund (not including any Subadvisor whose role is primarily portfolio management and is subcontracted with or overseen by another investment adviser) or (b) any entity that provides ongoing services to the Fund and is controlling, controlled by or under common control with a Fund investment adviser described in (a).
Tax Fees
The aggregate fees billed by PwC to the Funds for the two most recent fiscal years for professional services rendered for tax compliance, tax advice, and tax planning (“Tax Fees”) were as follows:
| | | | | | | | |
| | | Fiscal 2012 | | | Fiscal 2011 | |
Managers Cadence Capital Appreciation Fund | | | 7,340 | | | $ | 6,500 | |
Managers Cadence Focused Growth Fund | | | 7,340 | | | $ | 5,800 | |
Managers Cadence Mid-Cap Fund | | | 7,340 | | | $ | 6,500 | |
Managers Cadence Emerging Companies Fund | | | 7,340 | | | $ | 5,800 | |
For the Funds’ two most recent fiscal years, Tax Fees billed by PwC for engagements by Fund Service Providers that related directly to the operations and financial reporting of the Funds were $0 for fiscal 2008 and $0 for fiscal 2007, respectively.
The services for which Tax Fees were charged comprise all services performed by professional staff in PwC’s tax division except those services related to the audit. Typically, this category would include fees for tax compliance, tax planning, and tax advice. Tax compliance, tax advice, and tax planning services include preparation of original and amended tax returns, claims for refund and tax payment-planning services, assistance with tax audits and appeals, tax advice related to mergers and acquisitions and requests for rulings or technical advice from taxing authorities.
All Other Fees
There were no other fees billed by PwC to the Funds for all other non-audit services (“Other Fees”) during the Funds’ two most recent fiscal years. During the same period, there were no Other Fees billed by PwC for engagements by Fund Service Providers that related directly to the operations and financial reporting of the Funds.
According to policies adopted by the Audit Committee, services provided by PwC to the Funds must be pre-approved by the Audit Committee. On an annual basis, the Audit Committee reviews and pre-approves various types of services that PwC may perform for the Funds without specific approval of each engagement, subject to specified budget limitations. As contemplated by the Sarbanes-Oxley Act of 2002 and related SEC rules, the Audit Committee also pre-approves non-audit services provided by PwC to any Fund Service Provider for any engagement that relates directly to the operations and financial reporting of the Funds. Any engagement that is not already pre-approved or that will exceed a pre-approved budget must be submitted to the Audit Committee for pre-approval. The Chairman of the Audit Committee is authorized on behalf of the Board of Trustees and the Audit Committee to approve the engagement of PwC to perform non-audit services subject to certain conditions, including notification to the Audit Committee of such pre-approval not later than the next meeting of the Audit Committee following the date of such pre-approval.
There were no other fees billed by PwC for non-audit services rendered to the Funds and to Fund Service Providers for the Funds’ two most recent fiscal years.
The Audit Committee has considered whether the provision of non-audit services by PwC to Fund Service Providers that were not required to be pre-approved by the Audit Committee is compatible with maintaining PwC’s independence in its audit of the Funds, taking into account representations from PwC, in accordance with Independence Standards Board Standard No. 1, regarding its independence from the Funds and its related entities.
The following table sets forth the non-audit services provided by PwC to the Funds and its service affiliates defined as the Funds’ investment advisor and any entity controlling, controlled by or under common control with Managers Investment Group LLC that provides ongoing services to the Funds (“Control Affiliates”) for the last two fiscal years.
| | | | | | | | | | | | | | | | | | | | | | | | |
| | | Audit-related fees A | | | Tax fees A | | | All other fees A | |
| | | 2011 | | | 2010 | | | 2011 | | | 2010 | | | 2011 | | | 2010 | |
Control Affiliates | | $ | 417,385 | | | $ | 424,730 | | | $ | 1,647,710 | | | $ | 747,820 | | | $ | 0 | | | $ | 0 | |
| A | Aggregate amounts may reflect rounding. |
| Item 5. | AUDIT COMMITTEE OF LISTED REGISTRANTS |
Not applicable.
| Item 6. | SCHEDULE OF INVESTMENTS |
The schedule of investments in unaffiliated issuers as of the close of the reporting period is included as part of the shareholder report contained in Item 1 hereof.
| Item 7. | DISCLOSURE OF PROXY VOTING POLICIES AND PROCEDURES FOR CLOSED-END MANAGEMENT INVESTMENT COMPANIES |
Not applicable.
| Item 8. | PORTFOLIO MANAGERS OF CLOSED-END MANAGEMENT INVESTMENT COMPANIES |
Not applicable.
| Item 9. | PURCHASES OF EQUITY SECURITIES BY CLOSED-END MANAGEMENT INVESTMENT COMPANIES AND AFFILIATED PURCHASERS |
Not applicable.
| Item 10. | SUBMISSION OF MATTERS TO A VOTE OF SECURITY HOLDERS |
Not applicable.
| Item 11. | CONTROLS AND PROCEDURES |
(a) The Registrant’s principal executive and principal financial officers have concluded, based on their evaluation of the
registrant’s disclosure controls and procedures as of a date within 90 days of the filing of this report, that the Registrant’s disclosure controls and procedures are reasonably designed to ensure that information required to be disclosed by the Registrant on Form N-CSR is recorded, processed, summarized and reported within the required time periods and that information required to be disclosed by the registrant in the reports that it files or submits on Form N-CSR is accumulated and communicated to the Registrant’s management, including its principal executive and principal financial officers, as appropriate to allow timely decisions regarding required disclosure.
(b) There were no changes in the Registrant’s internal control over financial reporting during the Registrant’s fourth fiscal quarter of the period covered by this report that have materially affected, or are reasonably likely to affect, the internal control over financial reporting.
| (a)(1) | Any Code of Ethics or amendments hereto. Filed herewith. |
| (a)(2) | Certifications pursuant to Rule 30a-2(a) under the Investment Company Act of 1940—Filed herewith. |
| (b) | Certifications pursuant to Rule 30a-2(b) under the Investment Company Act of 1940—Filed herewith. |
SIGNATURES
Pursuant to the requirements of the Securities Exchange Act of 1934 and the Investment Company Act of 1940, the registrant has duly caused this report to be signed on its behalf by the undersigned, thereunto duly authorized.
| | |
| MANAGERS TRUST II |
| |
| By: | | /s/ Keitha L. Kinne |
| | Keitha L. Kinne, President |
| |
| Date: | | August 1, 2012 |
Pursuant to the requirements of the Securities Exchange Act of 1934 and the Investment Company Act of 1940, this report has been signed below by the following persons on behalf of the registrant and in the capacities and on the dates indicated.
| | |
| By: | | /s/ Keitha L. Kinne |
| | Keitha L. Kinne, President |
| |
| Date: | | August 1, 2012 |
| | |
| By: | | /s/ Donald S. Rumery |
| | Donald S. Rumery, Chief Financial Officer |
| |
| Date: | | August 1, 2012 |