UNITED STATES
SECURITIES AND EXCHANGE COMMISSION
Washington, D.C. 20549
FORM N-CSR
CERTIFIED SHAREHOLDER REPORT OF REGISTERED
MANAGEMENT INVESTMENT COMPANIES
Investment Company Act file number: 811-03752
THE MANAGERS FUNDS
(Exact name of registrant as specified in charter)
800 Connecticut Avenue, Norwalk, Connecticut 06854
(Address of principal executive offices) (Zip code)
Managers Investment Group LLC
800 Connecticut Avenue, Norwalk, Connecticut 06854
(Name and address of agent for service)
Registrant’s telephone number, including area code: (203) 299-3500
Date of fiscal year end: DECEMBER 31
Date of reporting period: JANUARY 1, 2012 – December 31, 2012
(Annual Shareholder Report)
The Report relates solely to Managers Bond Fund, Managers Global Income Opportunity Fund and Managers Special Equity Fund, each a series of The Managers Trust (the “Trust”). The Report does not relate to any other series of the Trust.
| Item 1. | Reports to Shareholders |
Managers Special Equity Fund
Annual Report — December 31, 2012
| | | | |
TABLE OF CONTENTS | | Page | |
| |
LETTER TO SHAREHOLDERS | | | 1 | |
| |
ABOUT YOUR FUND’S EXPENSES | | | 2 | |
| |
PORTFOLIO MANAGER’S COMMENTS, FUND SNAPSHOTS, AND SCHEDULE OF PORTFOLIO INVESTMENTS | | | 3 | |
| |
NOTES TO SCHEDULE OF PORTFOLIO INVESTMENTS | | | 11 | |
| |
FINANCIAL STATEMENTS | | | | |
| |
Statement of Assets and Liabilities | | | 12 | |
Balance sheet, net asset value (NAV) per share computations and cumulative undistributed amounts | | | | |
| |
Statement of Operations | | | 13 | |
Detail of sources of income, expenses, and realized and unrealized gains (losses) during the year | | | | |
| |
Statements of Changes in Net Assets | | | 14 | |
Detail of changes in assets for the past two years | | | | |
| |
FINANCIAL HIGHLIGHTS | | | 15 | |
Historical net asset values per share, distributions, total returns, income and expense ratios, turnover ratios and net assets | | | | |
| |
NOTES TO FINANCIAL HIGHLIGHTS | | | 16 | |
| |
NOTES TO FINANCIAL STATEMENTS | | | 17 | |
Accounting and distribution policies, details of agreements and transactions with Fund management and affiliates, and descriptions of certain investment risks | | | | |
| |
REPORT OF INDEPENDENT REGISTERED PUBLIC ACCOUNTING FIRM | | | 22 | |
| |
TRUSTEES AND OFFICERS | | | 23 | |
Nothing contained herein is to be considered an offer, sale or solicitation of an offer to buy shares of any series of the Managers Family of Funds. Such offering is made only by Prospectus, which includes details as to offering price and other material information.
Letter to Shareholders
Dear Shareholder:
Thank you for your investment in The Managers Funds. Our foremost goal at Managers Investment Group (MIG) is to provide investment products and solutions that help our shareholders and clients successfully reach their investment goals and objectives. We do this by offering a broad selection of funds managed by a collection of Affiliated Managers Group’s (AMG) Affiliate investment boutiques, along with a complementary series of open-architecture mutual funds.
The past year has been an exciting one for us at MIG. In connection with AMG’s investment in Yacktman Asset Management (“Yacktman”), MIG partnered with Yacktman in reorganizing the Yacktman Focused Fund and the Yacktman Fund into The Managers Funds. The addition of the Yacktman Funds to our platform brought our total assets under management to over $25 billion at the end of 2012.
Additionally, in an effort to better meet our shareholders’ needs as well as bring consistency across our funds, we restructured our share class offerings across many of our Funds, which included discontinuing certain share classes with sales charges (commonly called sales loads). As a result, many of our Funds now offer three No Load share classes – Investor, Service, and Institutional Share Classes. We believe this simplified structure makes it easier for our clients as well as Financial Advisors to select the appropriate share class to match their needs.
During 2012, we also executed on other changes to certain Funds, which included reducing expense ratios on several Funds to ensure that our offerings remain competitive and affordable for our clients.
As we enter into 2013, both known and unknown risks remain to the global economy and its growth prospects. Nevertheless, we remain optimistic that the collective fiscal and monetary efforts undertaken over the past several years will continue to have a positive impact on the global economy. In the meantime, we remain confident that our Funds are well positioned to weather an uncertain economic environment.
We thank you for your continued confidence and investment in The Managers Funds. You can rest assured that under all market conditions our team is focused on delivering excellent investment management services for your benefit.
Respectfully,

Keitha Kinne
President
The Managers Funds
About Your Fund’s Expenses
| | |
As a shareholder of a Fund, you may incur two types of costs: (1) transaction costs, which may include sales charges (loads) on purchase payments; redemption fees; and exchange fees; and (2) ongoing costs, including management fees; distribution (12b-1) fees; and other Fund expenses. This example is intended to help you understand your ongoing costs (in dollars) of investing in the Fund and to compare these costs with the ongoing costs of investing in other mutual funds. The example is based on $1,000 invested at the beginning of the period and held for the entire period as indicated below. Actual Expenses The first line of the following table provides information about the actual account values and actual expenses. You may use the information in this line, together with the amount you invested, to estimate the expenses that you paid over the period. Simply divide your account value by $1,000 (for example, an $8,600 account value divided by $1,000 = 8.6), then multiply the result by the number in the first line under the heading entitled “Expenses Paid During Period” to estimate the expenses you paid on your account during this period. Hypothetical Example for Comparison Purposes The second line of the following table provides information about hypothetical account values and hypothetical expenses based on the Fund’s actual expense ratio and an assumed annual rate of return of 5% before expenses, which is not the Fund’s actual return. The hypothetical account values and expenses may not be used to estimate the actual ending account balance or expenses you paid for the period. You may use this information to compare the ongoing costs of investing in the Fund and other funds by comparing this 5% hypothetical example with the 5% hypothetical examples that appear in the shareholder reports of other funds. Please note that the expenses shown in the table are meant to highlight your ongoing costs only and do not reflect any transactional costs, such as sales charges (loads), redemption fees, or exchange fees. Therefore, the second line of the table is useful in comparing ongoing costs only, and will not help you determine the relative total costs of owning different funds. | | |
| | | | | | | | | | | | | | | | |
Six Months Ended
December 31, 2012 | | Expense Ratio
for the Period | | | Beginning
Account Value
07/01/12 | | | Ending
Account Value
12/31/2012 | | | Expenses
Paid During
the Period* | |
Managers Special Equity Fund | |
Managers Class | |
Based on Actual Fund Return | | | 1.36 | % | | $ | 1,000 | | | $ | 1,022 | | | $ | 6.91 | |
Hypothetical (5% return before expenses) | | | 1.36 | % | | $ | 1,000 | | | $ | 1,018 | | | $ | 6.90 | |
Institutional Class | |
Based on Actual Fund Return | | | 1.11 | % | | $ | 1,000 | | | $ | 1,023 | | | $ | 5.64 | |
Hypothetical (5% return before expenses) | | | 1.11 | % | | $ | 1,000 | | | $ | 1,020 | | | $ | 5.63 | |
| * | Expenses are equal to the Fund’s annualized expense ratio multiplied by the average account value over the period, multiplied by the number of days in the period (184), then divided by 366. |
2
Managers Special Equity Fund
Portfolio Manager’s Comments
The Managers Special Equity Fund’s (the “Fund”) investment objective is to achieve long-term capital appreciation through a diversified portfolio of equity securities of small- and medium-sized companies.
THE PORTFOLIO MANAGERS
The Fund employs multiple subadvisors who specialize in distinct investment approaches. This ���intelligence diversification” not only serves to manage risk, but also helps us tap the markets’ full potential by focusing different analytical insights on each prospective investment. Fund management strives to achieve its performance and diversification objectives while ensuring that the Fund operates within the framework of its investment objective and principal investment strategies.
Federated MDTA, LLC
Federated MDTA, LLC (“MDT”) utilizes a quantitative process to score stocks based on earnings estimate momentum, long-term growth rates, share buyback and issuance, cash earnings-to-price ratios, tangible book-to-price ratios and earnings risk. A decision-tree approach provides an intuitive, non-linear way to score companies. Stocks are grouped into clusters determined by analyzing different combinations of factor scores and returns, with each cluster containing companies with a different pattern of fundamental characteristics. Optimization is then used to build a portfolio that maximizes the stock selection score, while adhering to diversification constraints and trading costs. A position is sold or trimmed if the quantitative model identifies a more attractive opportunity (net of trading costs) or if a holding exceeds the maximum company weight of 1.3%. The Portfolio typically holds between 100 and 110 stocks, with no position exceeding 1.3% of the Portfolio. Industry weights are limited to +/- 13.5% of the benchmark weight, while sector weights are limited to +/- 22.5% of the benchmark weight.
Lord, Abbett & Co., LLC
The team at Lord, Abbett & Co., LLC (“Lord Abbett”), led by Tom O’Halloran, focuses its stock selection effort on companies that have revenue growth of at least 15% and are experiencing year-to-year operating margin improvement and earnings growth driven by top-line growth, rather than being driven by one-time events or simple cost cutting measures. The focus is also on identifying companies with higher-quality balance sheets (often captured by finding companies with manageable debt-to-total-capital ratios) and that are already profitable. Once this process is completed, the focus for the team is on forecasting both revenue and earnings growth over the next several years. To achieve this goal and to find companies that will be growing considerably faster than their industry average, members of the team spend an extensive amount of time understanding the competitive advantages of a firm, the industry dynamics within which they operate and the strength of management. A position is sold or trimmed if there is a fundamental change in the business, a more attractive alternative is found, or if a holding reaches a 5% weight in the overall portfolio. The portion of the Fund managed by Lord Abbett typically holds between 100 and 150 stocks with no individual holding exceeding 5%. Lord Abbett has established a risk constraint that prevents any individual industry from being greater than 25% of the total weight of its portion of the Fund.
Ranger Investment Management, LLC
The team at Ranger Investment Management, L.P. (“Ranger”), led by Conrad Doenges, starts with a universe of stocks with market capitalization between $100M and $2B, from which they establish a list of approximately 250 to 300 companies on which they conduct detailed research. Each Ranger sector manager builds detailed earnings and cash-flow models for the companies they follow, and also qualitatively gauge, through a stock scoring model, their conviction level in each stock. Companies in the Fund’s portfolio managed by Ranger will typically have a high degree of recurring revenue, steady and/or accelerating sales and earnings growth, solid balance sheets, strong free-cash flows, conservative accounting practices and a seasoned management team. The Portfolio typically contains 35 and 60 stocks, with individual position sizes capped at 5%. Sector exposures are also limited to a maximum of 30%. A stock may be reduced or sold if material changes occur in the company’s earnings estimates, the company’s valuations exceed historical levels, a pre-determined price target is achieved, the stock reaches the maximum position size of 5%, capitalization limit of $5 billion or it can be replaced with a better risk/reward opportunity.
Smith Asset Management Group, L.P.
Smith Asset Management Group, L.P.’s (“Smith Group”) investment process is based on a combination of a well-conceived quantitative screening process coupled with experienced, intelligent fundamental and qualitative analysis. The team is focused on predicting which attractively valued companies will report a succession of positive earnings surprises. The process begins by seeking companies with attractive risk profiles and valuations, as well as dramatically improving business fundamentals. To manage risk, Smith screens for companies with good corporate governance, strong financial quality, attractive valuation and moderate portfolio beta. To identify high-earnings-growth companies, Smith screens for rising earnings expectations, improving earnings quality, a high percentage of positive earnings surprise and high earnings growth rate. The Fund’s portfolio managed by Smith will typically hold 100 to 120 stocks, with no individual position greater than 3.0%. Sector weightings are limited to no more than two times the weighting in the Russell 2000® Index. Stocks are sold from the portfolio if a negative earnings surprise is predicted by the process or management guidance, a negative earnings surprise is actually reported, the stock’s valuation level is too high or a buyout announcement is made.
THE YEAR IN REVIEW
For the year ended December 31, 2012, the Managers Special Equity Fund Managers Class returned 10.35% and the Institutional Class returned 10.62%, both underperforming the 14.59% return of the Russell 2000® Growth Index.
Managers Special Equity Fund
Portfolio Manager’s Comments (continued)
U.S. equity markets posted solid double-digit returns for the year shaking off concerns about the fiscal cliff crisis here in the U.S. and the potential impact to the domestic economy from a recession in Europe and a slowing China. The year started with a continuation of the increased optimism surrounding a potential resolution to the European debt crisis that we witnessed at the end of 2011. This was visible not just via strong double-digit equity returns globally, but also through the sharp reduction in global equity market volatility. However, during the second quarter debt and growth issues dominated the headlines again causing a muted version of the “risk off” trade to return to prominence. The summer months were dominated by the anticipation of a Federal Reserve action in the form of another round of quantitative easing in response to weak economic growth and a sluggish domestic job market. Investors’ expectations were met when the Fed announced their third round of quantitative easing (QE3) in September with a promise of increased purchases of agency mortgage-backed securities and an extension of the promise to keep short-term interest rates at “exceptionally low levels” until mid-2015. As expected the fourth quarter economic landscape was dominated by the U.S. Presidential and Congressional elections and their collective impact on the fiscal cliff. After the elections were completed, markets nervously awaited the outcome of the fiscal cliff negotiations as economists generally predicted dire consequences for the U.S. economy in 2013 if a timely resolution was not reached by the end of the year. Despite a resolution on the tax aspects of the fiscal cliff not being reached until just beyond the final hours, equities and other risk based assets generally held their returns from earlier in the year. For the full calendar year, there was a sharp dichotomy in performance at the sector level within small-cap growth equities with the cyclically geared consumer discretionary, financials and materials sectors posting returns greater than 20%. Meanwhile, energy and utility equities posted negative returns for the year.
The Fund delivered strong absolute performance but underperformed the benchmark Russell 2000® Growth Index. The underperformance was primarily driven by relative weakness within the Fund’s health care and information technology sectors.
LOOKING FORWARD
The team at Managers continues to spend considerable time evaluating the Fund and reaffirming our confidence in the subadvisors within the Fund. This past year was our third calendar year with our existing group of subadvisors, all of whom maintain a growth bias. Although the Fund did not outperform this year as it had in the two years prior, we continue to believe that the changes we made to the Fund subadviser lineup in 2009 will to be beneficial to shareholders long term.
Heading into 2013, the Fund has its largest exposures to more cyclically geared sectors as a healing economy provides this area of the market sufficient opportunities. Entering the year, the consumer discretionary sector is the Fund’s largest absolute and relative sector exposure. While the Fund’s exposure to information technology sector is a slight underweight relative to the benchmark, it still represents 20% of the Fund’s holdings. As macroeconomic headwinds continue to be addressed domestically, the combination of pent-up demand and compelling valuations, particularly relative to historically low-yielding bonds, make small-cap growth equities look compelling even after strong results were generated by the asset class in 2012.
This commentary reflects the viewpoints of Federated MDTA, LLC. Lord, Abbett & Co., LLC, Ranger Investment Management, L.P. and Smith Asset Management Group, L.P. as of December 31, 2012 and is not intended as a forecast or guarantee of future results.
Cumulative Total Return Performance
Managers Special Equity Fund’s cumulative total return is based on the daily change in net asset value (NAV), and assumes that all distributions were reinvested. The first chart compares a hypothetical $10,000 investment made in Managers Special Equity Fund – Managers Class on December 31, 2002, to a $10,000 investment made in the Russell 2000® Growth Index for the same time period. Performance for periods longer than one year is annualized. The graphs and tables do not reflect the deduction of taxes that a shareholder would pay on a Fund distribution or redemption of shares. The listed returns for the Fund are net of expenses and the returns for the index exclude expenses. Past performance is not indicative of future results. Total returns would have been lower had certain expenses not been reduced.
Managers Special Equity Fund
Portfolio Manager’s Comments (continued)
Cumulative Total Return Performance (continued)
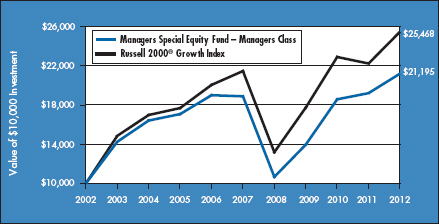
The table below shows the average annual total returns for Managers Special Equity Fund–Managers Class and the Russell 2000® Growth Index for the same time periods ended December 31, 2012.
| | | | | | | | | | | | |
Average Annualized Total Returns1 | | One
Year | | | Five
Years | | | Ten
Years | |
Managers Special Equity Fund - Managers Class 2,3 | | | 10.35 | % | | | 2.34 | % | | | 7.80 | % |
Russell 2000® Growth Index 4 | | | 14.59 | % | | | 3.49 | % | | | 9.80 | % |
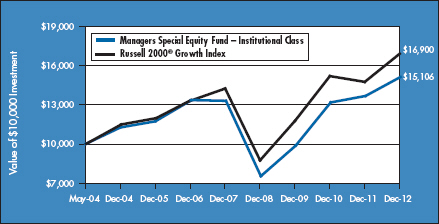
The table below shows the average annual total returns for Managers Special Equity Fund–Institutional Class and the Russell 2000® Growth Index for the same time periods ended December 31, 2012.
| | | | | | | | | | | | | | | | |
Average Annualized Total Returns1 | | One
Year | | | Five
Years | | | Since
Inception | | | Inception
Date | |
Managers Special Equity Fund - Institutional Class 2,3 | | | 10.62 | % | | | 2.60 | % | | | 4.88 | % | | | 05/03/04 | |
Russell 2000® Growth Index 4 | | | 14.59 | % | | | 3.49 | % | | | 6.38 | % | | | 05/03/04 | † |
The performance data shown represents past performance. Past performance is not a guarantee of future results. Current performance may be lower or higher than the performance data quoted. The investment return and principal value of an investment in the Fund will fluctuate so that an investor’s shares, when redeemed, may be worth more or less than their original cost. For performance information through the most recent month end, please call (800) 835-3879 or visit our Web site at www.managersinvest.com.
| | |
| | | Investors should carefully consider the Fund’s investment objectives, risks, charges and expenses before investing. For this and other information, please call (800) 835-3879 or visit at www.managersinvest.com for a free prospectus. Read it carefully before investing or sending money. Funds are distributed by Managers Distributors, Inc., a member of FINRA. † Date reflects inception date of the Fund, not the index. 1 Total return equals income yield plus share price change and assumes reinvestment of all dividends and capital gain distributions. Returns are net of fees and may reflect offsets of Fund expenses as described in the Prospectus. No adjustment has been made for taxes payable by shareholders on their reinvested dividends and capital gain distributions. Returns for periods greater than one year are annualized. The listed returns on the Fund are net of expenses and based on the published NAV as of December 31, 2012. All returns are in U.S. dollars($). 2 From time to time, the Fund’s advisor has waived its fees and/or absorbed Fund expenses, which has resulted in higher returns. 3 The Fund is subject to risks associated with investments in small capitalization companies, such as erratic earnings patterns, competitive conditions, limited earnings history, and a reliance on one or a limited number of products. 4 The Russell 2000® Growth Index measures the performance of the Russell 2000 companies with higher price-to-book ratios and higher forecasted growth values. Unlike the fund, the index is unmanaged, is not available for investment and does not incur expenses. The Russell 2000® Growth Index and the Russell 2000® Index are trademarks of Russell Investments. Russell® is a trademark of Russell Investments. Not FDIC insured, nor bank guaranteed. May lose value. |
5
Managers Special Equity Fund
Fund Snapshots
December 31, 2012
Portfolio Breakdown (unaudited)
| | | | | | | | |
Industry | | Managers
Special Equity Fund** | | | Russell
2000®
Growth Index | |
Consumer Discretionary | | | 21.7 | % | | | 16.2 | % |
Information Technology | | | 19.6 | % | | | 21.5 | % |
Health Care | | | 17.7 | % | | | 20.3 | % |
Industrials | | | 16.0 | % | | | 18.0 | % |
Financials | | | 8.0 | % | | | 7.8 | % |
Energy | | | 6.2 | % | | | 5.7 | % |
Consumer Staples | | | 5.3 | % | | | 4.6 | % |
Materials | | | 2.3 | % | | | 4.8 | % |
Telecommunication Services | | | 0.0 | %# | | | 0.8 | % |
Utilities | | | 0.0 | % | | | 0.3 | % |
Other Assets and Liabilities | | | 3.2 | % | | | 0.0 | % |
| ** | As a percentage of net assets. |
| # | Rounds to less than 0.1% |
Top Ten Holdings (unaudited)
| | | | |
Security Name | | % of
Net Assets | |
Air Methods Corp.* | | | 1.8 | % |
Pier 1 Imports, Inc.* | | | 1.5 | |
Wabtec Corp.* | | | 1.4 | |
Coinstar, Inc. | | | 1.3 | |
Centene Corp. | | | 1.2 | |
Steven Madden, Ltd. | | | 1.1 | |
Akorn, Inc. | | | 1.0 | |
Bank of the Ozarks, Inc. | | | 1.0 | |
Healthcare Services Group, Inc. | | | 1.0 | |
HMS Holdings Corp. | | | 0.9 | |
Top Ten as a Group | | | 12.2 | % |
| | | | |
| * | Top Ten Holding at June 30, 2012 |
Any sectors, industries, or securities discussed should not be perceived as investment recommendations. Mention of a specific security should not be considered a recommendation to buy or solicitation to sell that security. Specific securities mentioned in this report may have been sold from the Fund’s portfolio of investments by the time you receive this report.
6
Managers Special Equity Fund
Schedule of Portfolio Investments
December 31, 2012
| | | | | | | | |
| | | Shares | | | Value | |
| | | | | | | | |
Common Stocks - 96.8% | | | | | | | | |
Consumer
Discretionary - 21.7% | | | | | |
Aeropostale, Inc.* | | | 23,206 | | | $ | 301,910 | |
ANN, Inc.* | | | 31,883 | | | | 1,078,921 | |
Asbury Automotive Group, Inc.* | | | 43,660 | | | | 1,398,430 | |
Ascena Retail Group, Inc.* | | | 52,365 | | | | 968,229 | |
Belo Corp., Class A | | | 50,600 | | | | 388,102 | |
Bridgepoint Education, Inc.* | | | 18,943 | | | | 195,113 | |
Brunswick Corp. | | | 26,743 | | | | 777,954 | |
Buckle, Inc., The | | | 9,380 | | | | 418,723 | |
Buffalo Wild Wings, Inc.* | | | 21,317 | | | | 1,552,304 | |
Cabela’s, Inc.* | | | 16,088 | | | | 671,674 | |
Capella Education Co.* | | | 9,255 | | | | 261,269 | |
Cheesecake Factory, Inc., The | | | 10,275 | | | | 336,198 | |
Children’s Place Retail Stores, Inc., The* | | | 5,817 | | | | 257,635 | |
Coinstar, Inc.*,1 | | | 51,460 | | | | 2,676,435 | |
Columbia Sportswear Co.1 | | | 11,574 | | | | 617,589 | |
Cooper Tire & Rubber Co. | | | 3,400 | | | | 86,224 | |
Cracker Barrel Old Country Store, Inc. | | | 17,964 | | | | 1,154,367 | |
Crocs, Inc.* | | | 31,402 | | | | 451,875 | |
Ctrip.com International, Ltd., ADR*,1 | | | 12,035 | | | | 274,278 | |
Dana Holding Corp. | | | 64,642 | | | | 1,009,062 | |
Deckers Outdoor Corp.*,1 | | | 14,733 | | | | 593,298 | |
Dick’s Sporting Goods, Inc. | | | 5,579 | | | | 253,789 | |
Domino’s Pizza, Inc. | | | 1,700 | | | | 74,035 | |
DSW, Inc., Class A | | | 11,452 | | | | 752,282 | |
Ethan Allen Interiors, Inc. | | | 9,588 | | | | 246,507 | |
Express, Inc.* | | | 20,618 | | | | 311,126 | |
Francesca’s Holdings Corp.*,1 | | | 42,161 | | | | 1,094,500 | |
Genesco, Inc.* | | | 6,085 | | | | 334,675 | |
GNC Holdings, Inc., Class A | | | 14,481 | | | | 481,928 | |
Group 1 Automotive, Inc. | | | 24,200 | | | | 1,500,158 | |
Groupon, Inc.*,1 | | | 52,652 | | | | 256,942 | |
Hibbett Sports, Inc.* | | | 18,347 | | | | 966,887 | |
HSN, Inc. | | | 20,608 | | | | 1,135,089 | |
Interval Leisure Group, Inc. | | | 22,840 | | | | 442,868 | |
Jos. A. Bank Clothiers, Inc.* | | | 19,477 | | | | 829,331 | |
LifeLock, Inc.* | | | 46,857 | | | | 380,947 | |
Lumber Liquidators Holdings, Inc.* | | | 7,649 | | | | 404,097 | |
Meritage Homes Corp.* | | | 19,860 | | | | 741,771 | |
Movado Group, Inc. | | | 12,500 | | | | 383,500 | |
Overstock.com, Inc.* | | | 24,420 | | | | 349,450 | |
PetMed Express, Inc. | | | 14,100 | | | | 156,510 | |
Pier 1 Imports, Inc. | | | 151,170 | | | | 3,023,400 | |
| | | | | | | | |
| | | Shares | | | Value | |
| | | | | | | | |
Pool Corp. | | | 18,800 | | | $ | 795,616 | |
Red Robin Gourmet Burgers, Inc.* | | | 23,260 | | | | 820,845 | |
Restoration Hardware Holdings, Inc.*,1 | | | 10,001 | | | | 337,334 | |
Saks, Inc.* | | | 24,869 | | | | 261,373 | |
Sally Beauty Holdings, Inc.* | | | 52,449 | | | | 1,236,223 | |
Select Comfort Corp.* | | | 14,531 | | | | 380,276 | |
Six Flags Entertainment Corp. | | | 6,740 | | | | 412,488 | |
SodaStream International, Ltd.* | | | 2,500 | | | | 112,225 | |
Sonic Corp.* | | | 152,635 | | | | 1,588,930 | |
Steven Madden, Ltd.* | | | 53,334 | | | | 2,254,428 | |
Sturm Ruger & Co., Inc. | | | 5,540 | | | | 251,516 | |
Tenneco, Inc.* | | | 38,428 | | | | 1,349,207 | |
Tesla Motors, Inc.*,1 | | | 16,684 | | | | 565,087 | |
Tumi Holdings, Inc.*,1 | | | 25,751 | | | | 536,908 | |
Tupperware Brands Corp. | | | 16,830 | | | | 1,078,803 | |
Ulta Salon Cosmetics & Fragrance, Inc. | | | 2,864 | | | | 281,417 | |
Under Armour, Inc., Class A* | | | 2,499 | | | | 121,276 | |
Valassis Communications, Inc. | | | 28,480 | | | | 734,214 | |
Vera Bradley, Inc.*,1 | | | 1,094 | | | | 27,459 | |
Vitamin Shoppe, Inc.* | | | 9,700 | | | | 556,392 | |
World Wrestling Entertainment, Inc., Class A | | | 34,700 | | | | 273,783 | |
Total Consumer Discretionary | | | | | | | 43,565,182 | |
Consumer Staples - 5.3% | | | | | |
Annie’s, Inc.* | | | 31,869 | | | | 1,065,381 | |
Boston Beer Co., Inc., The, Class A* | | | 1,857 | | | | 249,674 | |
Cal-Maine Foods, Inc. | | | 9,445 | | | | 379,878 | |
Casey’s General Stores, Inc. | | | 13,725 | | | | 728,798 | |
Coca-Cola Bottling Co. Consolidated | | | 2,045 | | | | 135,992 | |
Fresh Market, Inc., The* | | | 5,125 | | | | 246,461 | |
Hain Celestial Group, Inc., The* | | | 9,750 | | | | 528,645 | |
Harris Teeter Supermarkets, Inc. | | | 19,646 | | | | 757,550 | |
Inter Parfums, Inc. | | | 37,950 | | | | 738,507 | |
Nu Skin Enterprises, Inc., Class A | | | 20,601 | | | | 763,267 | |
Pilgrim’s Pride Corp.* | | | 40,800 | | | | 295,800 | |
Prestige Brands Holdings, Inc.* | | | 35,510 | | | | 711,265 | |
Pricesmart, Inc. | | | 8,155 | | | | 628,343 | |
Revlon, Inc., Class A* | | | 16,095 | | | | 233,378 | |
Rite Aid Corp.* | | | 221,025 | | | | 300,594 | |
TreeHouse Foods, Inc.* | | | 14,250 | | | | 742,853 | |
United Natural Foods, Inc.* | | | 35,023 | | | | 1,876,883 | |
USANA Health Sciences, Inc.* | | | 8,445 | | | | 278,094 | |
Total Consumer Staples | | | | | | | 10,661,363 | |
Energy - 6.2% | | | | | | | | |
Approach Resources, Inc.* | | | 62,000 | | | | 1,550,620 | |
|
The accompanying notes are an integral part of these financial statements. 7 |
Managers Special Equity Fund
Schedule of Portfolio Investments (continued)
| | | | | | | | |
| | | Shares | | | Value | |
| | | | | | | | |
Energy - 6.2% (continued) | | | | | | | | |
Atwood Oceanics, Inc.* | | | 11,204 | | | $ | 513,031 | |
Berry Petroleum Co., Class A | | | 11,185 | | | | 375,257 | |
Bonanza Creek Energy, Inc.* | | | 1,778 | | | | 49,411 | |
Callon Petroleum Co.* | | | 166,200 | | | | 781,140 | |
CARBO Ceramics, Inc.1 | | | 3,152 | | | | 246,928 | |
Cheniere Energy, Inc.* | | | 27,659 | | | | 519,436 | |
Delek US Holdings, Inc. | | | 4,600 | | | | 116,472 | |
Dril-Quip, Inc.* | | | 9,465 | | | | 691,418 | |
Energy XXI Bermuda, Ltd. | | | 46,411 | | | | 1,493,970 | |
GasLog, Ltd. | | | 34,899 | | | | 433,795 | |
Geospace Technologies Corp.* | | | 3,938 | | | | 349,970 | |
Gulfport Energy Corp.* | | | 20,260 | | | | 774,337 | |
Hornbeck Offshore Services, Inc.* | | | 7,239 | | | | 248,587 | |
Pacific Drilling SA* | | | 140,010 | | | | 1,321,694 | |
Stone Energy Corp.* | | | 18,764 | | | | 385,037 | |
Vaalco Energy, Inc.* | | | 48,650 | | | | 420,822 | |
W&T Offshore, Inc.1 | | | 36,901 | | | | 591,523 | |
Western Refining, Inc. | | | 52,651 | | | | 1,484,232 | |
Total Energy | | | | | | | 12,347,680 | |
Financials - 8.0% | | | | | | | | |
Altisource Asset Management Corp.*,1 | | | 224 | | | | 18,368 | |
Altisource Portfolio Solutions SA* | | | 2,241 | | | | 194,194 | |
Altisource Residential Corp., Class B*,1 | | | 747 | | | | 11,832 | |
Amtrust Financial Services, Inc. | | | 7,300 | | | | 209,437 | |
Bank of the Ozarks, Inc. | | | 57,080 | | | | 1,910,467 | |
Cash America International, Inc.1 | | | 8,077 | | | | 320,415 | |
eHealth, Inc.* | | | 22,906 | | | | 629,457 | |
Evercore Partners, Inc., Class A | | | 12,600 | | | | 380,394 | |
Financial Engines, Inc.* | | | 24,883 | | | | 690,503 | |
Hilltop Holdings, Inc.* | | | 75,286 | | | | 1,019,372 | |
Home BancShares, Inc. | | | 34,206 | | | | 1,129,482 | |
MarketAxess Holdings, Inc. | | | 27,925 | | | | 985,753 | |
Navigators Group, Inc., The* | | | 8,000 | | | | 408,560 | |
Netspend Holdings, Inc.* | | | 22,085 | | | | 261,045 | |
Ocwen Financial Corp.* | | | 11,216 | | | | 387,961 | |
PrivateBancorp, Inc. | | | 116,780 | | | | 1,789,070 | |
Signature Bank* | | | 25,571 | | | | 1,824,235 | |
SVB Financial Group* | | | 22,790 | | | | 1,275,556 | |
Texas Capital Bancshares, Inc.* | | | 33,243 | | | | 1,489,951 | |
Western Alliance Bancorp* | | | 29,739 | | | | 313,152 | |
WisdomTree Investments, Inc.* | | | 7,111 | | | | 43,519 | |
| | | | | | | | |
| | | Shares | | | Value | |
| | | | | | | | |
World Acceptance Corp.* | | | 6,470 | | | $ | 482,403 | |
Zillow, Inc., Class A* | | | 8,568 | | | | 237,762 | |
Total Financials | | | | | | | 16,012,888 | |
Health Care - 17.7% | | | | | | | | |
Affymax, Inc.* | | | 3,400 | | | | 64,600 | |
Agenus, Inc.* | | | 24,100 | | | | 98,810 | |
Air Methods Corp. | | | 96,942 | | | | 3,576,190 | |
Akorn, Inc.* | | | 145,630 | | | | 1,945,617 | |
Align Technology, Inc.* | | | 13,412 | | | | 372,183 | |
Alnylam Pharmaceuticals, Inc.* | | | 9,905 | | | | 180,766 | |
AMAG Pharmaceuticals, Inc.* | | | 8,510 | | | | 125,182 | |
Amedisys, Inc.* | | | 629 | | | | 7,089 | |
AMN Healthcare Services, Inc.* | | | 37,690 | | | | 435,319 | |
Analogic Corp. | | | 5,425 | | | | 403,077 | |
Arena Pharmaceuticals, Inc.* | | | 10,960 | | | | 98,859 | |
Ariad Pharmaceuticals, Inc.* | | | 19,554 | | | | 375,046 | |
Array BioPharma, Inc.* | | | 43,655 | | | | 162,397 | |
athenahealth, Inc.*,1 | | | 19,352 | | | | 1,421,404 | |
BioMarin Pharmaceutical, Inc.* | | | 17,844 | | | | 878,817 | |
Celldex Therapeutics, Inc.* | | | 24,755 | | | | 166,106 | |
Centene Corp.* | | | 59,179 | | | | 2,426,339 | |
Cepheid, Inc.* | | | 7,803 | | | | 263,819 | |
Chemed Corp. | | | 5,275 | | | | 361,812 | |
ChemoCentryx, Inc.* | | | 6,300 | | | | 68,922 | |
Computer Programs & Systems, Inc. | | | 22,040 | | | | 1,109,494 | |
CryoLife, Inc. | | | 16,095 | | | | 100,272 | |
Cubist Pharmaceuticals, Inc.* | | | 8,997 | | | | 378,414 | |
Cyberonics, Inc.* | | | 4,904 | | | | 257,607 | |
Cynosure, Inc.,
Class A* | | | 16,300 | | | | 392,993 | |
DexCom, Inc.* | | | 40,645 | | | | 553,178 | |
Genomic Health, Inc.* | | | 6,056 | | | | 165,087 | |
HeartWare International, Inc.*,1 | | | 7,047 | | | | 591,596 | |
HMS Holdings Corp.* | | | 72,824 | | | | 1,887,598 | |
ICU Medical, Inc.* | | | 2,000 | | | | 121,860 | |
Impax Laboratories, Inc.* | | | 86,155 | | | | 1,765,316 | |
Incyte Corp., Ltd.*,1 | | | 18,825 | | | | 312,683 | |
Insulet Corp.* | | | 19,283 | | | | 409,185 | |
Integra LifeSciences Holdings Corp.* | | | 12,002 | | | | 467,718 | |
InterMune, Inc.*,1 | | | 12,100 | | | | 117,249 | |
Invacare Corp. | | | 4,665 | | | | 76,039 | |
Jazz Pharmaceuticals PLC* | | | 9,010 | | | | 479,332 | |
Medidata Solutions, Inc.* | | | 26,029 | | | | 1,020,077 | |
Medivation, Inc.* | | | 9,505 | | | | 486,276 | |
|
The accompanying notes are an integral part of these financial statements. 8 |
Managers Special Equity Fund
Schedule of Portfolio Investments (continued)
| | | | | | | | |
| | | Shares | | | Value | |
| | | | | | | | |
Health Care - 17.7% (continued) | | | | | | | | |
Merrimack Pharmaceuticals, Inc.* | | | 20,700 | | | $ | 126,063 | |
Molina Healthcare, Inc.* | | | 15,505 | | | | 419,565 | |
MWI Veterinary Supply, Inc.* | | | 7,033 | | | | 773,630 | |
National Research Corp. | | | 3,280 | | | | 177,776 | |
Natus Medical, Inc.* | | | 17,832 | | | | 199,362 | |
OncoGenex Pharmaceutical, Inc.* | | | 5,500 | | | | 72,160 | |
Onyx Pharmaceuticals, Inc.* | | | 6,557 | | | | 495,250 | |
Orexigen Therapeutics, Inc.* | | | 29,700 | | | | 156,519 | |
Owens & Minor, Inc.1 | | | 35,032 | | | | 998,762 | |
PAREXEL International Corp.* | | | 22,590 | | | | 668,438 | |
Pharmacyclics, Inc.*,1 | | | 13,122 | | | | 759,764 | |
Questcor Pharmaceuticals, Inc.1 | | | 10,193 | | | | 272,357 | |
RTI Biologics, Inc.* | | | 65,715 | | | | 280,603 | |
Sarepta Therapeutics, Inc.* | | | 18,841 | | | | 486,098 | |
Spectrum Pharmaceuticals, Inc. | | | 7,675 | | | | 85,883 | |
STERIS Corp. | | | 40,588 | | | | 1,409,621 | |
Team Health Holdings, Inc.* | | | 36,529 | | | | 1,050,939 | |
Theravance, Inc.*,1 | | | 4,225 | | | | 94,091 | |
Trius Therapeutics, Inc.* | | | 29,255 | | | | 139,839 | |
Vanda Pharmaceuticals, Inc.* | | | 29,210 | | | | 108,077 | |
Vical, Inc.* | | | 26,990 | | | | 78,541 | |
Vocera Communications, Inc.* | | | 67,282 | | | | 1,688,778 | |
WellCare Health Plans, Inc.* | | | 15,913 | | | | 774,804 | |
Total Health Care | | | | | | | 35,441,248 | |
Industrials - 16.0% | | | | | | | | |
Advisory Board Co., The* | | | 38,910 | | | | 1,820,599 | |
Alaska Air Group, Inc.* | | | 23,586 | | | | 1,016,321 | |
Allegiant Travel Co. | | | 9,131 | | | | 670,307 | |
American Science & Engineering, Inc. | | | 7,465 | | | | 486,793 | |
American Woodmark Corp.* | | | 4,500 | | | | 125,190 | |
Applied Industrial Technologies, Inc. | | | 21,925 | | | | 921,069 | |
AZZ, Inc. | | | 14,700 | | | | 564,921 | |
Beacon Roofing Supply, Inc.* | | | 36,041 | | | | 1,199,444 | |
Belden, Inc. | | | 4,347 | | | | 195,572 | |
Brink’s Co., The | | | 41,326 | | | | 1,179,031 | |
Chart Industries, Inc.* | | | 24,710 | | | | 1,647,416 | |
Corporate Executive Board Co., The | | | 16,612 | | | | 788,406 | |
Deluxe Corp. | | | 32,169 | | | | 1,037,128 | |
DigitalGlobe, Inc.* | | | 10,127 | | | | 247,504 | |
EMCOR Group, Inc. | | | 5,105 | | | | 176,684 | |
EnerSys, Inc.* | | | 41,348 | | | | 1,555,925 | |
Exponent, Inc.* | | | 9,075 | | | | 506,657 | |
Generac Holdings, Inc. | | | 27,111 | | | | 930,178 | |
Genesee & Wyoming, Inc., Class A* | | | 10,409 | | | | 791,917 | |
| | | | | | | | |
| | | Shares | | | Value | |
| | | | | | | | |
Healthcare Services Group, Inc. | | | 82,030 | | | $ | 1,905,557 | |
HEICO Corp. | | | 6,896 | | | | 308,665 | |
Hexcel Corp.* | | | 28,452 | | | | 767,066 | |
HNI Corp. | | | 14,910 | | | | 448,195 | |
Hub Group, Inc.,
Class A* | | | 26,750 | | | | 898,800 | |
Interface, Inc. | | | 25,241 | | | | 405,875 | |
Knoll, Inc. | | | 31,836 | | | | 489,001 | |
Meritor, Inc.* | | | 31,300 | | | | 148,049 | |
Middleby Corp.* | | | 6,890 | | | | 883,367 | |
Mine Safety Appliances Co. | | | 8,240 | | | | 351,930 | |
Mueller Industries, Inc. | | | 1,645 | | | | 82,299 | |
Polypore International, Inc.*,1 | | | 6,877 | | | | 319,780 | |
Portfolio Recovery Associates, Inc.* | | | 5,176 | | | | 553,107 | |
Proto Labs, Inc.* | | | 14,175 | | | | 558,779 | |
RBC Bearings, Inc.* | | | 9,012 | | | | 451,231 | |
RPX Corp.* | | | 41,000 | | | | 370,640 | |
Standex International Corp. | | | 2,295 | | | | 117,711 | |
Taser International, Inc.* | | | 36,800 | | | | 328,992 | |
Thermon Group Holdings, Inc.* | | | 12,668 | | | | 285,410 | |
Triumph Group, Inc. | | | 27,250 | | | | 1,779,425 | |
United Rentals, Inc.* | | | 21,199 | | | | 964,978 | |
United Stationers, Inc. | | | 12,071 | | | | 374,080 | |
US Ecology, Inc. | | | 8,100 | | | | 190,674 | |
USG Corp.*,1 | | | 13,423 | | | | 376,784 | |
Wabtec Corp. | | | 32,940 | | | | 2,883,568 | |
Total Industrials | | | | | | | 32,105,025 | |
Information Technology - 19.6% | | | | | | | | |
3D Systems Corp.*,1 | | | 13,711 | | | | 731,482 | |
ADTRAN, Inc.1 | | | 18,050 | | | | 352,697 | |
Amkor Technology, Inc.* | | | 8,354 | | | | 35,505 | |
Angie’s List, Inc.* | | | 44,030 | | | | 527,920 | |
Anixter International, Inc. | | | 20,881 | | | | 1,335,966 | |
Applied Micro Circuits Corp.* | | | 116,755 | | | | 980,742 | |
Arris Group, Inc.* | | | 29,320 | | | | 438,041 | |
Aruba Networks, Inc.* | | | 29,431 | | | | 610,693 | |
Aspen Technology, Inc.* | | | 20,366 | | | | 562,916 | |
AVG Technologies N.V.* | | | 69,980 | | | | 1,107,783 | |
Bankrate, Inc.*,1 | | | 27,070 | | | | 337,022 | |
CACI International, Inc., Class A* | | | 9,104 | | | | 500,993 | |
Calix, Inc.* | | | 9,500 | | | | 73,055 | |
Cavium, Inc.* | | | 22,449 | | | | 700,633 | |
Ciena Corp.* | | | 29,315 | | | | 460,245 | |
Cirrus Logic, Inc.* | | | 11,216 | | | | 324,928 | |
CommVault Systems, Inc.* | | | 9,380 | | | | 653,880 | |
Concur Technologies, Inc.* | | | 7,987 | | | | 539,282 | |
|
The accompanying notes are an integral part of these financial statements. 9 |
Managers Special Equity Fund
Schedule of Portfolio Investments (continued)
| | | | | | | | |
| | | Shares | | | Value | |
| | | | | | | | |
Information
Technology - 19.6% (continued) | | | | | |
Cornerstone OnDemand, Inc.* | | | 21,985 | | | $ | 649,217 | |
CoStar Group, Inc.* | | | 9,637 | | | | 861,259 | |
Cree, Inc.*,1 | | | 18,689 | | | | 635,052 | |
CSG Systems International, Inc.* | | | 18,700 | | | | 339,966 | |
Daktronics, Inc. | | | 36,100 | | | | 399,627 | |
Demand Media, Inc.* | | | 12,850 | | | | 119,377 | |
EPAM Systems, Inc.* | | | 21,481 | | | | 388,806 | |
Fair Isaac Corp. | | | 28,997 | | | | 1,218,744 | |
FARO Technologies, Inc.* | | | 7,319 | | | | 261,142 | |
First Solar, Inc.*,1 | | | 16,054 | | | | 495,748 | |
Fusion-io, Inc.*,1 | | | 16,913 | | | | 387,815 | |
Heartland Payment Systems, Inc. | | | 14,270 | | | | 420,965 | |
Imperva, Inc.* | | | 13,215 | | | | 416,669 | |
Infoblox, Inc.* | | | 21,454 | | | | 385,528 | |
Inphi Corp.* | | | 63,078 | | | | 604,287 | |
InvenSense, Inc.* | | | 66,546 | | | | 739,326 | |
IPG Photonics Corp. | | | 11,677 | | | | 778,272 | |
Jive Software, Inc.* | | | 25,195 | | | | 366,083 | |
LivePerson, Inc.* | | | 103,991 | | | | 1,366,442 | |
Manhattan Associates, Inc.* | | | 8,645 | | | | 521,639 | |
MAXIMUS, Inc. | | | 29,150 | | | | 1,842,863 | |
MercadoLibre, Inc. | | | 7,666 | | | | 602,317 | |
MicroStrategy, Inc., Class A* | | | 3,246 | | | | 303,111 | |
Millennial Media, Inc.*,1 | | | 36,063 | | | | 451,869 | |
MTS Systems Corp. | | | 8,630 | | | | 439,526 | |
Netscout Systems, Inc.* | | | 13,530 | | | | 351,645 | |
NetSuite, Inc.* | | | 10,221 | | | | 687,873 | |
OpenTable, Inc.* | | | 5,694 | | | | 277,867 | |
Palo Alto Networks, Inc.* | | | 4,999 | | | | 267,546 | |
Parametric Technology Corp.* | | | 38,869 | | | | 874,941 | |
Peregrine Semiconductor Corp.*,1 | | | 24,600 | | | | 376,626 | |
Plantronics, Inc. | | | 9,970 | | | | 367,594 | |
Progress Software Corp.* | | | 29,339 | | | | 615,826 | |
Qihoo 360 Technology Co., Ltd., ADR*,1 | | | 13,143 | | | | 390,216 | |
QLIK Technologies, Inc.* | | | 50,207 | | | | 1,090,496 | |
Ruckus Wireless, Inc.* | | | 2,900 | | | | 65,337 | |
ServiceNow, Inc.*,1 | | | 7,885 | | | | 236,787 | |
| | | | | | | | |
| | | Shares | | | Value | |
| | | | | | | | |
Sohu.com, Inc.* | | | 6,872 | | | $ | 325,320 | |
Sourcefire, Inc.* | | | 19,140 | | | | 903,791 | |
Splunk, Inc.* | | | 13,353 | | | | 387,504 | |
SPS Commerce, Inc.* | | | 30,673 | | | | 1,143,183 | |
Stratasys, Ltd.* | | | 9,591 | | | | 768,719 | |
Synchronoss Technologies, Inc.* | | | 78,233 | | | | 1,649,934 | |
Tangoe, Inc.* | | | 73,252 | | | | 869,501 | |
Ultimate Software Group, Inc.* | | | 5,498 | | | | 519,066 | |
Unisys Corp.* | | | 35,976 | | | | 622,385 | |
ValueClick, Inc.* | | | 14,500 | | | | 281,445 | |
Velti PLC* | | | 28,034 | | | | 126,153 | |
Websense, Inc.* | | | 23,801 | | | | 357,967 | |
Yelp, Inc.* | | | 26,901 | | | | 507,084 | |
Total Information Technology | | | | | | | 39,334,239 | |
Materials - 2.3% | | | | | | | | |
Coeur d’Alene Mines Corp.* | | | 5,940 | | | | 146,124 | |
Eagle Materials, Inc. | | | 21,099 | | | | 1,234,291 | |
Georgia Gulf Corp. | | | 10,700 | | | | 441,696 | |
Kraton Performance Polymers, Inc.* | | | 63,820 | | | | 1,533,595 | |
Minerals Technologies, Inc. | | | 11,510 | | | | 459,479 | |
Molycorp, Inc.*,1 | | | 25,631 | | | | 241,957 | |
Myers Industries, Inc. | | | 9,510 | | | | 144,076 | |
Schweitzer-Mauduit International, Inc. | | | 8,020 | | | | 313,021 | |
Total Materials | | | | | | | 4,514,239 | |
Telecommunication Services - 0.0%# | | | | | | | | |
Premiere Global Services, Inc.* | | | 8,340 | | | | 81,565 | |
Total Common Stocks
(cost $174,541,903) | | | | | | | 194,063,429 | |
Other Investment Companies - 9.6%2 | | | | | | | | |
BNY Mellon Overnight Government Fund, 0.19%3 | | | 12,675,364 | | | | 12,675,364 | |
Dreyfus Cash Management Fund, Institutional Class Shares, 0.06% | | | 6,613,816 | | | | 6,613,816 | |
Total Other Investment Companies
(cost $19,289,180) | | | | | | | 19,289,180 | |
Total Investments - 106.4%
(cost $193,831,083) | | | | 213,352,609 | |
Other Assets, less Liabilities - (6.4)% | | | | | | | (12,803,124 | ) |
Net Assets - 100.0% | | | | | | $ | 200,549,485 | |
|
The accompanying notes are an integral part of these financial statements. 10 |
Notes to Schedule of Portfolio Investments
The following footnotes and abbreviations should be read in conjunction with the Schedule of Portfolio Investments previously presented in this report.
Based on the approximate cost of investments of $196,872,505 for Federal income tax purposes at December 31, 2012, the aggregate gross unrealized appreciation and depreciation were $23,485,733 and $7,005,629, respectively, resulting in net unrealized appreciation of investments of $16,480,104.
| | * | Non-income producing security. |
| | # | Rounds to less than 0.1%. |
| | 1 | Some or all of these shares, amounting to a market value of $12,734,430, or approximately 6.3% of net assets, were out on loan to various brokers. |
| | 2 | Yield shown for each investment company represents the December 31, 2012, seven-day average yield, which refers to the sum of the previous seven days’ dividends paid, expressed as an annual percentage. |
| | 3 | Collateral received from brokers for securities lending was invested in this short-term investment. |
As of December 31, 2012, the securities in the Fund were all valued using Level 1 inputs. For a detailed break-out of the common stocks by major industry classification, please refer to the Schedule of Portfolio Investments previously presented in this report. (See Note 1(a) in the Notes to Financial Statements.)
As of December 31, 2012, the Fund had no transfers between levels from the beginning of the reporting period.
Investment Definitions and Abbreviations:
ADR: ADR after the name of a holding stands for American Depositary Receipt, representing ownership of foreign securities on deposit with a domestic custodian bank. The value of the ADR security is determined or significantly influenced by trading on exchanges not located in the United States or Canada. Sponsored ADRs are initiated by the underlying foreign company.
|
The accompanying notes are an integral part of these financial statements. 11 |
Statement of Assets and Liabilities
December 31, 2012
| | | | |
Assets: | | | | |
Investments at value* (including securities on loan valued at $12,734,430) | | $ | 213,352,609 | |
Cash | | | 6,121 | |
Receivable for investments sold | | | 1,889,950 | |
Dividends, interest and other receivables | | | 413,691 | |
Receivable for Fund shares sold | | | 108,948 | |
Receivable from affiliate | | | 26,713 | |
Prepaid expenses | | | 11,878 | |
Total assets | | | 215,809,910 | |
Liabilities: | | | | |
Payable upon return of securities loaned | | | 12,675,364 | |
Payable for investments purchased | | | 1,707,296 | |
Payable for fund shares repurchased | | | 559,785 | |
Accrued expenses: | | | | |
Investment management and advisory fees | | | 152,622 | |
Administrative fees | | | 42,395 | |
Shareholder Servicing fees - Managers Class | | | 38,984 | |
Trustee fees & expenses | | | 1,115 | |
Other | | | 82,864 | |
Total liabilities | | | 15,260,425 | |
Net Assets | | $ | 200,549,485 | |
Net Assets Represent: | | | | |
Paid-in capital | | $ | 391,663,579 | |
Undistributed net investment loss | | | (37,506 | ) |
Accumulated net realized loss from investments | | | (210,598,114 | ) |
Net unrealized appreciation of investments | | | 19,521,526 | |
Net Assets | | $ | 200,549,485 | |
Managers Shares: | | | | |
Net Assets | | $ | 184,142,372 | |
Shares outstanding | | | 3,061,803 | |
Net asset value, offering and redemption price per share | | $ | 60.14 | |
Institutional Class: | | | | |
Net Assets | | $ | 16,407,113 | |
Shares outstanding | | | 267,489 | |
Net asset value, offering and redemption price per share | | $ | 61.34 | |
* Investments at cost | | $ | 193,831,083 | |
|
The accompanying notes are an integral part of these financial statements. 12 |
Statement of Operations
For the year ended December 31, 2012
| | | | |
Investment Income: | | | | |
Dividend income | | $ | 1,917,966 | 1 |
Securities lending income | | | 336,526 | |
Interest income | | | 690 | |
Total investment income | | | 2,255,182 | |
Expenses: | | | | |
Investment management and advisory fees | | | 2,116,747 | |
Administrative fees | | | 587,987 | |
Shareholder Servicing fees - Managers Class | | | 547,646 | |
Transfer agent | | | 70,488 | |
Custodian | | | 98,236 | |
Registration fees | | | 61,200 | |
Professional fees | | | 50,935 | |
Reports to shareholders | | | 41,515 | |
Trustees fees and expenses | | | 16,010 | |
Extraordinary expense | | | 8,048 | |
Miscellaneous | | | 11,625 | |
Total expenses before offsets | | | 3,610,437 | |
Expense reimbursements | | | (444,026 | ) |
Expense reductions | | | (28,269 | ) |
Net expenses | | | 3,138,142 | |
Net investment loss | | | (882,960 | ) |
Net Realized and Unrealized Gain (Loss): | | | | |
Net realized gain on investments | | | 30,311,197 | |
Net change in unrealized appreciation (depreciation) of investments | | | (4,258,379 | ) |
Net realized and unrealized gain | | | 26,052,818 | |
Net increase in net assets resulting from operations | | $ | 25,169,858 | |
| 1 | Includes non-recurring dividends of $852,431. |
|
The accompanying notes are an integral part of these financial statements. 13 |
Statements of Changes in Net Assets
For the year ended December 31,
| | | | | | | | |
| | | 2012 | | | 2011 | |
Increase (Decrease) in Net Assets From Operations: | | | | | | | | |
Net investment loss | | $ | (882,960 | ) | | $ | (2,850,490 | ) |
Net realized gain on investments | | | 30,311,197 | | | | 42,550,826 | |
Net change in unrealized appreciation (depreciation) of investments | | | (4,258,379 | ) | | | (37,008,078 | ) |
Net increase in net assets resulting from operations | | | 25,169,858 | | | | 2,692,258 | |
Capital Share Transactions: | | | | | | | | |
Managers Class: | | | | | | | | |
Proceeds from sale of shares | | | 13,657,712 | | | | 152,829,719 | |
Cost of shares repurchased | | | (96,985,080 | ) | | | (189,754,386 | ) |
Net decrease from Managers Class share transactions | | | (83,327,368 | ) | | | (36,924,667 | ) |
Institutional Class: | | | | | | | | |
Proceeds from sale of shares | | | 4,033,024 | | | | 11,950,135 | |
Cost of shares repurchased | | | (3,145,437 | ) | | | (3,388,450 | ) |
Net increase from Institutional Class share transactions | | | 887,587 | | | | 8,561,685 | |
Net decrease from capital share transactions | | | (82,439,781 | ) | | | (28,362,982 | ) |
Total decrease in net assets | | | (57,269,923 | ) | | | (25,670,724 | ) |
Net Assets: | | | | | | | | |
Beginning of year | | | 257,819,408 | | | | 283,490,132 | |
End of year | | $ | 200,549,485 | | | $ | 257,819,408 | |
End of year undistributed net investment loss | | $ | (37,506 | ) | | $ | (53,875 | ) |
| | | | | | | | |
Share Transactions: | | | | | | | | |
Managers Class: | | | | | | | | |
Sale of shares | | | 228,746 | | | | 2,679,236 | |
Shares repurchased | | | (1,640,865 | ) | | | (3,492,876 | ) |
Net decrease in shares | | | (1,412,119 | ) | | | (813,640 | ) |
Institutional Class: | | | | | | | | |
Sale of shares | | | 67,753 | | | | 224,397 | |
Shares repurchased | | | (52,036 | ) | | | (62,207 | ) |
Net increase in shares | | | 15,717 | | | | 162,190 | |
|
The accompanying notes are an integral part of these financial statements. 14 |
Managers Special Equity Fund
Financial Highlights
For a share outstanding throughout each year
| | | | | | | | | | | | | | | | | | | | |
| | | For the year ended December 31, | |
Managers Class | | 2012 | | | 2011 | | | 2010 | | | 2009 | | | 2008 | |
Net Asset Value, Beginning of Year | | $ | 54.51 | | | $ | 52.71 | | | $ | 39.60 | | | $ | 30.28 | | | $ | 64.27 | |
Income from Investment Operations: | | | | | | | | | | | | | | | | | | | | |
Net investment loss1 | | | (0.24 | )4 | | | (0.50 | ) | | | (0.41 | ) | | | (0.34 | ) | | | (0.28 | ) |
Net realized and unrealized gain (loss) on investments1 | | | 5.87 | | | | 2.30 | | | | 13.52 | | | | 9.66 | | | | (27.93 | ) |
Total from investment operations | | | 5.63 | | | | 1.80 | | | | 13.11 | | | | 9.32 | | | | (28.21 | ) |
Less Distribution to Shareholder from: | | | | | | | | | | | | | | | | | | | | |
Net realized gain from investments | | | — | | | | — | | | | — | | | | — | | | | (5.78 | ) |
Net Asset Value, End of Year | | $ | 60.14 | | | $ | 54.51 | | | $ | 52.71 | | | $ | 39.60 | | | $ | 30.28 | |
Total Return2 | | | 10.35 | % | | | 3.41 | %5 | | | 33.11 | % | | | 30.78 | % | | | (43.49 | )% |
Ratio of net expenses to average net assets | | | 1.35 | %6 | | | 1.37 | %7 | | | 1.48 | % | | | 1.58 | % | | | 1.48 | % |
Ratio of net investment loss to average net assets2 | | | (0.40 | )%6 | | | (0.89 | )% | | | (0.95 | )% | | | (1.08 | )% | | | (0.52 | )% |
Portfolio turnover | | | 107 | % | | | 126 | % | | | 138 | % | | | 186 | % | | | 138 | % |
Net assets at end of year (000’s omitted) | | $ | 184,142 | | | $ | 243,858 | | | $ | 278,701 | | | $ | 221,159 | | | $ | 352,106 | |
| | | | | | | | | | | | | | | | | | | | |
Ratios absent expense offsets:3 | | | | | | | | | | | | | | | | | | | | |
Ratio of total expenses to average net assets | | | 1.55 | % | | | 1.54 | % | | | 1.55 | % | | | 1.61 | % | | | 1.51 | % |
Ratio of net investment loss to average net assets | | | (0.60 | )% | | | (1.06 | )% | | | (1.02 | )% | | | (1.11 | )% | | | (0.55 | )% |
| | | | | | | | | | | | | | | | | | | | |
| |
| | | For the year ended December 31, | |
Institutional Class | | 2012 | | | 2011 | | | 2010 | | | 2009 | | | 2008 | |
Net Asset Value, Beginning of Year | | $ | 55.45 | | | $ | 53.43 | | | $ | 40.04 | | | $ | 30.56 | | | $ | 64.71 | |
Income from Investment Operations: | | | | | | | | | | | | | | | | | | | | |
Net investment loss1 | | | (0.05 | )4 | | | (0.29 | ) | | | (0.30 | ) | | | (0.26 | ) | | | (0.15 | ) |
Net realized and unrealized gain (loss) on investments1 | | | 5.94 | | | | 2.31 | | | | 13.69 | | | | 9.74 | | | | (28.16 | ) |
Total from investment operations | | | 5.89 | | | | 2.02 | | | | 13.39 | | | | 9.48 | | | | (28.31 | ) |
Less Distributions to Shareholders from: | | | | | | | | | | | | | | | | | | | | |
Net realized gain from investments | | | — | | | | — | | | | — | | | | — | | | | (5.84 | ) |
Net Asset Value, End of Year | | $ | 61.34 | | | $ | 55.45 | | | $ | 53.43 | | | $ | 40.04 | | | $ | 30.56 | |
Total Return2 | | | 10.62 | % | | | 3.78 | % | | | 33.44 | %5 | | | 31.02 | %5 | | | (43.35 | )% |
Ratio of net expenses to average net assets | | | 1.10 | %6 | | | 1.12 | %7 | | | 1.23 | % | | | 1.33 | % | | | 1.23 | % |
Ratio of net investment loss to average net assets2 | | | (0.08 | )%6 | | | (0.53 | )% | | | (0.70 | )% | | | (0.83 | )% | | | (0.29 | )% |
Portfolio turnover | | | 107 | % | | | 126 | % | | | 138 | % | | | 186 | % | | | 138 | % |
Net assets at end of year (000’s omitted) | | $ | 16,407 | | | $ | 13,961 | | | $ | 4,786 | | | $ | 8,028 | | | $ | 92,439 | |
| | | | | | | | | | | | | | | | | | | | |
Ratios absent expense offsets:3 | | | | | | | | | | | | | | | | | | | | |
Ratio of total expenses to average net assets | | | 1.30 | % | | | 1.29 | % | | | 1.30 | % | | | 1.36 | % | | | 1.26 | % |
Ratio of net investment loss to average net assets | | | (0.28 | )% | | | (0.70 | )% | | | (0.77 | )% | | | (0.86 | )% | | | (0.32 | )% |
| | | | | | | | | | | | | | | | | | | | |
Notes to Financial Highlights
The following footnotes should be read in conjunction with the Financial Highlights of the Fund previously presented in this report.
| 1 | Per share numbers have been calculated using average shares. |
| 2 | Total returns and net investment income would have been lower had certain expenses not been reduced. (See Note 1(c) of Notes to Financial Statements.) |
| 3 | Excludes the impact of expense reimbursements or fee waivers and expense reductions such as brokerage credits, but includes expense repayments and non-reimbursable expenses, if any, such as interest, taxes and extraordinary expenses. (See Note 1(c) of Notes to Financial Statements.) |
| 4 | Includes non-recurring dividends. Without these dividends, net investment income per share would have been $(0.45) and $(0.27) for the Managers Class and Institutional Class, respectively. |
| 5 | The Total Return is based on the Financial Statement Net Asset Values as shown above. |
| 6 | Includes non-routine extraordinary expenses amounting to $7,399 or 0.003% and $649 or 0.004% of average net assets for the Managers Class and Institutional Class, respectively. |
| 7 | Effective July 1, 2011, as described in the current prospectus, the Fund’s expense cap was reduced to 1.11% from 1.14%. For the period April 1, 2011 through June 30, 2011, the Fund’s expense cap was 1.14%. From January 1, 2011 through March 31, 2011, the Fund’s expense cap was 1.19%. The expense ratio shown reflects the weighted average expense ratio for the full year ended December 31, 2011. |
Notes to Financial Statements
December 31, 2012
| 1. | Summary of Significant Accounting Policies |
The Managers Funds (the “Trust”) is an open-end management investment company, organized as a Massachusetts business trust, and registered under the Investment Company Act of 1940, as amended (the “1940 Act”). Currently, the Trust consists of a number of different Funds, each having distinct investment management objectives, strategies, risks and policies. Included in this report is the Managers Special Equity Fund (“Special Equity” or the “Fund”).
The Fund offers both Managers Class shares and Institutional Class shares. The Institutional Class shares, which are designed primarily for institutional investors that meet certain administrative and servicing criteria, have a minimum investment of $2,500,000. Managers Class shares are offered to all other investors. Each class represents an interest in the same assets of the Fund and the classes are identical except for class specific expenses related to shareholder activity. Each class has equal voting privileges except that each class has exclusive voting rights with respect to its services and/or distribution plan. Please refer to a current prospectus for additional information on each share class.
The Fund’s financial statements are prepared in accordance with accounting principles generally accepted in the United States of America (“U.S. GAAP”), which require management to make estimates and assumptions that affect the reported amounts of assets and liabilities and disclosure of contingent assets and liabilities at the date of the financial statements and the reported amounts of income and expenses during the reporting period. Actual results could differ from those estimates and such differences could be material. The following is a summary of significant accounting policies followed by the Fund in the preparation of its financial statements:
| a. | Valuation of Investments |
Equity securities traded on a domestic or international securities exchange are valued at the last quoted sale price, or, lacking any sales, at the last quoted bid price. Over-the-counter securities are valued at the Nasdaq Official Closing Price, if one is available. Lacking any sales, over-the-counter securities are valued at the last quoted bid price. The Fund’s investments are generally valued based on market quotations provided by third-party pricing services approved by the Board of Trustees of the Fund (the “Board”).
Short-term investments having a remaining maturity of 60 days or less are generally valued at amortized cost, which approximates market value. Investments in other open-end regulated investment companies are valued at their end of day net asset value per share.
Under certain circumstances, the value of certain Fund investments (including derivatives) may be based on an evaluation of fair value, pursuant to procedures established by and under the general supervision of the Board. The Pricing Committee is the committee formed by the Board to make fair value determinations for such investments. When determining the fair value of an investment, the Pricing Committee seeks to determine the price that the Fund might reasonably expect to receive from a current sale of that investment in an arm’s-length transaction. Fair value determinations shall be based upon consideration of all available facts and information, including, but not limited to (i) attributes specific to the investment;
(ii) fundamental analytical data and press releases relating to the investment and its issuer; (iii) the value of comparable securities or relevant financial instruments, including derivative securities, traded on other markets or among dealers; and (iv) other factors, such as future cash flows, interest rates, yield curves, volatilities, credit risks and/or default rates. The Board will be presented with a quarterly report comparing fair values determined by the Pricing Committee against subsequent market valuations for those securities. The values assigned to fair value investments are based on available information and do not necessarily represent amounts that might ultimately be realized, since such amounts depend on future developments inherent in long-term investments. Further, because of the inherent uncertainty of valuation, those estimated values may differ significantly from the values that would have been used had a ready market for the investments existed, and the differences could be material. The Fund may use the fair value of a portfolio investment to calculate its net asset value (“NAV”) when, for example, (1) market quotations are not readily available because a portfolio investment is not traded in a public market or the principal market in which the investment trades is closed, (2) trading in a portfolio investment is suspended and has not resumed before the Fund calculates its NAV, (3) a significant event affecting the value of a portfolio investment is determined to have occurred between the time of the market quotation provided for a portfolio investment and the time as of which the Fund calculates its NAV, (4) an investment’s price has remained unchanged over a period of time (often referred to as a “stale price”), or (5) Managers Investment Group LLC (the “Investment Manager”) determines that a market quotation is inaccurate. Portfolio investments that trade primarily on foreign markets are priced based upon the market quotation of such securities as of the close of their respective principal markets. Under certain circumstances, the Investment Manager may adjust such prices based on its determination of the impact of events occurring subsequent to the close of such markets but prior to the time as of which the Fund calculates its NAV. The Fund may invest in securities that may be thinly traded. The Board has adopted procedures to adjust prices of thinly traded securities that are judged to be stale so that they reflect fair value. An investment valued on the basis of its fair value may be valued at a price higher or lower than available market quotations. An investment’s valuation may differ depending on the method used and the factors considered in determining value according to the Fund’s fair value procedures.
U.S. GAAP defines fair value as the price that a Fund would receive to sell an asset or pay to transfer a liability in an orderly transaction between market participants at the measurement date. U.S. GAAP also establishes a framework for measuring fair value, and a three level hierarchy for fair value measurements based upon the transparency of inputs to the valuation of an asset or liability. Inputs may be observable or unobservable and refer broadly to the assumptions that market participants would use in pricing the asset or liability. Observable inputs reflect the assumptions market participants would use in pricing the asset or liability based on market data obtained from sources independent of the Fund. Unobservable inputs reflect the Fund’s own assumptions about the assumptions that market participants would use in pricing the asset or liability developed based on the best information available in the
Notes to Financial Statements (continued)
circumstances. Each investment is assigned a level based upon the observability of the inputs which are significant to the overall valuation.
The three-tier hierarchy of inputs is summarized below:
Level 1 – inputs are quoted prices in active markets for identical investments (e.g., equity securities, open-end investment companies)
Level 2 – other observable inputs (including, but not limited to: quoted prices for similar assets or liabilities in markets that are active, quoted prices for identical or similar assets or liabilities in markets that are not active, inputs other than quoted prices that are observable for the assets or liabilities (such as interest rates, yield curves, volatilities, prepayment speeds, loss severities, credit risks and default rates) or other market corroborated inputs) (e.g., debt securities, government securities, foreign securities utilizing international fair value pricing, broker-quoted securities, fair valued securities with observable inputs)
Level 3 – inputs are significant unobservable inputs (including the Fund’s own assumptions used to determine the fair value of investments) (e.g., fair valued securities with unobservable inputs)
Changes in inputs or methodologies used for valuing investments may result in a transfer in or out of levels within the fair value hierarchy. The inputs or methodologies used for valuing investments are not necessarily an indication of the risk associated with investing in those investments.
Security transactions are accounted for as of trade date. Realized gains and losses on securities sold are determined on the basis of identified cost.
| c. | Investment Income and Expenses |
Dividend income is recorded on the ex-dividend date. Dividend and interest income on foreign securities is recorded net of any withholding tax. Interest income, which includes amortization of premium and accretion of discount on debt securities, is accrued as earned. Non-cash dividends included in dividend income, if any, are reported at the fair market value of the securities received. Other income and expenses are recorded on an accrual basis. Expenses that cannot be directly attributed to a Fund are apportioned among the Funds in the Trust and in some cases other affiliated funds based upon their relative average net assets or number of shareholders. Investment income, realized and unrealized capital gains and losses, the common expenses of the Fund and certain Fund level expense reductions, if any, are allocated on a pro-rata basis to each class based on the relative net assets of each class to the total net assets of the Fund.
The Fund had certain portfolio trades directed to various brokers, under a brokerage recapture program, which paid a portion of the Fund’s expenses. For the year ended December 31, 2012, the amount by which the Fund’s expenses were reduced and the impact on the expense ratio if any, was: $28,207 or 0.01%.
The Fund has a “balance credit” agreement with The Bank of New York Mellon (“BNYM”), the Fund’s custodian, whereby the Fund is credited with an interest factor equal to 0.75% below the effective
90-day T-Bill rate for account balances left uninvested overnight. If the T-Bill rate falls below 0.75%, no credits will be earned. These credits serve to reduce custody expenses that otherwise would be charged to the Fund. For the year ended December 31, 2012, the custodian expense was not reduced.
Overdrafts will cause a reduction of any balance credits, computed at 2% above the Federal funds rate on the day of the overdraft. For the year ended December 31, 2012, overdraft fees equaled $2.
The Fund also has a balance credit arrangement with its Transfer Agent, BNY Mellon Investment Servicing (US) Inc., whereby balance credits are used to offset banking charges and other out-of-pocket expenses. For the year ended December 31, 2012, the transfer agent expense was reduced by $62.
Total returns and net investment income for the Fund would have been lower had certain expenses not been offset. Total expenses before offsets exclude the impact of expense reimbursements or fee waivers and expense reductions such as brokerage recapture credits, but include non-reimbursable expenses, if any, such as interest, taxes and extraordinary expenses.
| d. | Dividends and Distributions |
Dividends resulting from net investment income and distributions of capital gains, if any, normally will be declared and paid annually in December and when required for Federal excise tax purposes. Dividends and distributions to shareholders are recorded on the ex-dividend date. Income and capital gain distributions are determined in accordance with Federal income tax regulations, which may differ from U.S. GAAP. These differences are primarily due to differing treatments for losses deferred due to wash sales, equalization accounting for tax purposes and market discount transactions. Permanent book and tax basis differences, if any, relating to shareholder distributions will result in reclassifications to paid-in capital.
As of December 31, 2012, the components of distributable earnings (excluding unrealized appreciation/depreciation) on a tax basis consisted of:
| | | | |
Capital loss carryforward | | $ | 205,491,204 | |
Undistributed ordinary income | | | — | |
Undistributed short-term capital gains | | | — | |
Undistributed long-term capital gains | | | — | |
Post-October loss deferral | | | 2,079,601 | |
The Fund intends to comply with the requirements under Subchapter M of the Internal Revenue Code of 1986, as amended, to distribute substantially all of its taxable income and gains to its shareholders and to meet certain diversification and income requirements with respect to investment companies. Therefore, no provision for Federal income or excise tax is included in the accompanying financial statements.
Additionally, based on the Fund’s understanding of the tax rules and rates related to income, gains and transactions for the foreign jurisdictions in which it invests, the Fund will provide for foreign taxes, and where appropriate, deferred foreign taxes.
Notes to Financial Statements (continued)
Management has analyzed the Fund’s tax positions taken on Federal income tax returns as of December 31, 2012 and for all open tax years, and has concluded that no provision for federal income tax is required in the Fund’s financial statements. Additionally, the Fund is not aware of any tax position for which it is reasonably possible that the total amounts of unrecognized tax benefits will change materially in the next twelve months.
Under the Regulated Investment Company Modernization Act of 2010, post-enactment capital losses may be carried forward for an unlimited time period. However, any new losses incurred will be required to be utilized prior to any loss carryovers incurred in pre-enactment taxable years, which generally expire eight years following the close of the taxable year in which they were incurred. As a result of this ordering rule, pre-enactment capital loss carryovers may be more likely to expire unused. Additionally, post-enactment capital losses that are carried forward retain their tax character as either short-term or long-term capital losses rather than being considered all short-term as under previous law.
| f. | Capital Loss Carryovers and Deferrals |
As of December 31, 2012, the Fund had accumulated net realized capital loss carryovers from security transactions for Federal income tax purposes as shown in the following chart. These amounts may be used to offset realized capital gains, if any, through the expiration date listed or in the case of post-enactment losses, for an unlimited time period.
| | | | | | | | | | |
| | | Capital Loss Carryover Amounts | | | Expires |
| | | Short-Term | | | Long-Term | | | December 31, |
(Pre-Enactment) | | $ | 21,869,427 | | | | | | | 2016 |
(Pre-Enactment) | | | 183,621,777 | | | | | | | 2017 |
| | | | | | | | | | |
Total | | $ | 205,491,204 | | | | — | | | |
| | | | | | | | | | |
For the year ended December 31, 2012, the Fund utilized capital loss carryovers in the amount of $29,638,144.
The Trust’s Declaration of Trust authorizes for each series the issuance of an unlimited number of shares of beneficial interest, without par value. The Fund records sales and repurchases of its capital stock on the trade date. The cost of securities contributed to the Fund in connection with the issuance of shares is based on the valuation of those securities in accordance with the Fund’s policy on investment valuation.
At December 31, 2012, certain unaffiliated shareholders of record, specifically omnibus accounts, individually or collectively held greater than 10% of the outstanding shares of the Fund as follows: two collectively own 51%. Transactions by these shareholders may have a material impact on the Fund.
| 2. | Agreements and Transactions with Affiliates |
The Trust has entered into an Investment Management Agreement under which the Investment Manager, a subsidiary of Affiliated Managers Group, Inc. (“AMG”), serves as investment manager to the Fund and is responsible for the Fund’s overall administration and operations. The Investment Manager selects subadvisors for the
Fund (subject to Board approval) and monitors the subadvisor’s investment performance, security holdings and investment strategies. The Fund’s investment portfolio is managed by one or more portfolio managers who serves pursuant to a subadvisory agreement with the Investment Manager.
Investment management fees are paid directly by the Fund to the Investment Manager based on average daily net assets. For the year ended December 31, 2012 the investment management fee rate, as a percentage of average daily net assets, was 0.90%.
The Investment Manager has contractually agreed, until at least May 1, 2013, to waive management fees and/or reimburse Fund expenses, in order to limit total annual Fund operating expenses after fee waiver and expense reimbursements (exclusive of taxes, interest (including interest incurred in connection with bank and custody overdrafts), shareholder servicing fees, brokerage commissions and other transaction costs, acquired fund fees and expenses, and extraordinary expenses) to 1.11% of the Fund’s average daily net assets.
The Fund is obligated to repay the Investment Manager such amounts waived, paid or reimbursed in future years provided that the repayment occurs within thirty-six (36) months after the waiver or reimbursement and that such repayment would not cause the Fund’s total operating expenses in any such future year to exceed the Fund’s expense cap. For the year ended December 31, 2012, the Fund’s components of reimbursement are detailed in the following chart:
| | | | |
Reimbursement Available - 12/31/11 | | $ | 550,121 | |
Additional Reimbursements | | | 444,026 | |
Repayments | | | — | |
Expired Reimbursements | | | — | |
| | | | |
Reimbursement Available - 12/31/12 | | $ | 994,147 | |
| | | | |
The Fund has entered into an Administration and Shareholder Servicing Agreement under which the Investment Manager serves as the Fund’s administrator (the “Administrator”) and is responsible for all aspects of managing the Fund’s operations, including administration and shareholder services to the Fund, its shareholders, and certain institutions, such as bank trust departments, broker-dealers and registered investment advisers, that advise or act as an intermediary with the Fund’s shareholders. The Fund pays a fee to the Administrator at the rate of 0.25% per annum of the Fund’s average daily net assets for this service.
The aggregate annual retainer paid to each Independent Trustee of the Board is $80,000, plus $5,000 or $2,500 for each regular or special meeting attended, respectively. The Independent Chairman of the Trusts receives an additional payment of $20,000 per year. The Chairman of the Audit Committee receives an additional payment of $8,000 per year. The Trustees’ fees and expenses are allocated among all of the Funds for which the Investment Manager serves as the advisor (the “Managers Funds”) based on the relative net assets of such Funds. The “Trustees fees and expenses” shown in the financial statements represents the Fund’s allocated portion of the total fees and expenses paid by the Managers Funds.
Notes to Financial Statements (continued)
Beginning January 1, 2013, the annual retainer paid to each Independent Trustee of the Board will be $105,000, plus $6,000 or $2,500 for each regular or special meeting attended, respectively. The Independent Chairman of the Trusts will receive an additional payment of $25,000 per year. The Chairman of the Audit Committee will receive an additional payment of $10,000 per year.
The Fund is distributed by Managers Distributors, Inc. (the “Distributor” or “MDI”), a wholly-owned subsidiary of the Investment Manager. MDI serves as the distributor and underwriter for the Fund and is a registered broker-dealer and member of the Financial Industry Regulatory Authority, Inc. (“FINRA”). Shares of the Fund will be continuously offered and will be sold directly to prospective purchasers through brokers, dealers or other financial intermediaries who have executed selling agreements with MDI. Subject to the compensation arrangement discussed below, generally MDI bears all or a portion of the expenses of providing services pursuant to the distribution agreement, including the payment of the expenses relating to the distribution of prospectuses for sales purposes and any advertising or sales literature. Certain Trustees and Officers of the Fund are Officers and/or Directors of the Investment Manager, AMG and/or the Distributor.
Additional expenses to the Managers Class shares include payments to third parties who maintain omnibus accounts; these payments to third parties represent shareholder recordkeeping services and are expected not to exceed 0.25% of the Managers Class shares average daily net assets. The actual expense and the impact on the expense ratio for the year ended December 31, 2012, was $547,646, or 0.25%.
The Securities and Exchange Commission granted an exemptive order that permits the Fund to lend and borrow money for certain temporary purposes directly to and from other eligible Managers Funds. Participation in this interfund lending program is voluntary for both borrowing and lending Funds, and an interfund loan is only made if it benefits each participating fund. The Investment Manager administers the program according to procedures approved by the Board, and the Board monitors the operation of the program. An interfund loan must comply with certain conditions set out in the exemptive order, which are designed to assure fairness and protect all participating Funds. For the year ended December 31, 2012, the Fund lent to other Managers Funds varying amounts not exceeding $2,271,746 for 5 days earning interest of $575. The interest earned is included in the Statement of Operations as interest income. At December 31, 2012, the Fund had no loans outstanding.
For the year ended December 31, 2012, the Fund executed the following transactions at the closing price of the security and with no commissions under Rule 17a-7 procedures approved by the Board:
June 7, 2012 – sold 1,455 shares of Titan Machinery, Inc. at $27.97 to Lord Abbett Small Cap Fund.
June 26, 2012 – bought 2,554 shares of Portfolio Recovery Assoc. at $85.28 from Lord Abbett Small Cap Blend Fund.
July 17, 2012 –bought 300 shares of Portfolio Recovery Assoc. at $90.58 from Lord Abbett Small Cap Blend Fund.
July 18, 2012 – bought 300 shares of Texas Capital Bancshares at $43.00 from Lord Abbett Research Fund, Small-Cap Value Series.
| 3. | Purchases and Sales of Securities |
Purchases and sales of securities (excluding short-term securities and U.S. Government obligations) for the year ended December 31, 2012, were $244,279,626 and $326,848,925, respectively. There were no purchases or sales of U.S. Government Obligations for the Fund.
| 4. | Portfolio Securities Loaned |
The Fund participates in a securities lending program offered by BNYM (the “Program”), providing for the lending of securities to qualified brokers. Securities lending income include earnings of such temporary cash investments, plus or minus any rebate to a borrower. These earnings (after any rebate) are then divided between BNYM, as a fee for its services under the program, and the Fund, according to agreed-upon rates. Collateral on all securities loaned is accepted in cash and/or government securities and is maintained at a minimum level of 102% (105% in the case of certain foreign securities) of the market value, plus interest, if applicable, of investments on loan. It is the Fund’s policy to obtain additional collateral from or return excess collateral to the borrower by the end of the next business day, following the valuation date of the securities loaned. Therefore, the value of the collateral held may be temporarily less than the value of the securities on loan. Lending securities entails a risk of loss to the Fund if and to the extent that the market value of the securities loaned were to increase and the borrower did not increase the collateral accordingly, and the borrower fails to return the securities. Under the terms of the Program, the Fund is indemnified for such losses by BNYM. The Fund bears the risk of any deficiency in the amount of the collateral available for return to the borrower due to any loss on the collateral invested. Collateral received in the form of cash is invested temporarily in the BNY Mellon Overnight Government Fund, or other short-term investments as defined in the Securities Lending Agreement with BNYM. For the year ended December 31, 2012, the Fund participated in the program.
| 5. | Commitments and Contingencies |
In the normal course of business, the Fund may enter into contracts and agreements that contain a variety of representations and warranties, which provide general indemnifications. The maximum exposure to the Fund under these arrangements is unknown, as this would involve future claims that may be made against the Fund that have not yet occurred. However the Fund has had no prior claims or losses and expects the risk of loss to be remote.
| 6. | New Accounting Pronouncements |
In December 2011, the FASB issued ASU No. 2011-11, “Disclosures about Offsetting Assets and Liabilities.” ASU 2011-11 requires disclosures to make financial statements that are prepared under U.S. GAAP more comparable to those prepared under IFRS. The new disclosure requirements mandate that entities disclose both gross and net information about instruments and transactions eligible for offset in the statement of assets and liabilities as well as instruments and transactions subject to an agreement similar to a master netting arrangement. In addition, ASU 2011-11 requires disclosure of collateral received and posted in connection with
Notes to Financial Statements (continued)
master netting agreements or similar arrangements. New disclosures are required for annual reporting periods beginning on or after January 1, 2013, and interim periods within those annual periods. Management is evaluating the impact of ASU 2011-11 on the Fund’s financial statements and disclosures.
The Fund has determined that no material events or transactions occurred through the issuance date of the Fund’s financial statements, which require additional disclosure in or adjustment of the Fund’s financial statements.
Tax Information(unaudited)
Managers Special Equity hereby designates the maximum amount allowable of its net taxable income as qualified dividends as provided in the Jobs and Growth Tax Relief Reconciliation act of 2003. The 2012 Form 1099-DIV you receive for the Fund will show the tax status of all distributions paid to you during the year.
Pursuant to section 852 of the Internal Revenue Code, Managers Special Equity Fund hereby designate $0, as a capital gain distribution with respect to the taxable fiscal year ended December 31, 2012, or if subsequently determined to be different, the net capital gains of such year.
Report of Independent Registered Public Accounting Firm
To the Board of Trustees of The Managers Funds and the Shareholders of Managers Special Equity Fund:
In our opinion, the accompanying statement of assets and liabilities, including the schedule of portfolio investments, and the related statements of operations and of changes in net assets and the financial highlights present fairly, in all material respects, the financial position of Managers Special Equity Fund (the “Fund”) at December 31, 2012, and the results of its operations, the changes in its net assets and the financial highlights for each of the periods indicated, in conformity with accounting principles generally accepted in the United States of America. These financial statements and financial highlights (hereafter referred to as “financial statements”) are the responsibility of the Fund’s management. Our responsibility is to express an opinion on these financial statements based on our audits. We conducted our audits of these financial statements in accordance with the standards of the Public Company Accounting Oversight Board (United States). Those standards require that we plan and perform the audit to obtain reasonable assurance about whether the financial statements are free of material misstatement. An audit includes examining, on a test basis, evidence supporting the amounts and disclosures in the financial statements, assessing the accounting principles used and significant estimates made by management, and evaluating the overall financial statement presentation. We believe that our audits, which included confirmation of securities at December 31, 2012 by correspondence with the custodian and brokers, and the application of alternative auditing procedures where securities purchased had not been received, provide a reasonable basis for our opinion.
PricewaterhouseCoopers LLP
Boston, Massachusetts
February 27, 2013
Trustees and Officers
The Trustees and Officers of the Trust, their business addresses, principal occupations for the past five years and dates of birth are listed below. The Trustees provide broad supervision over the affairs of the Trust and the Funds. The Trustees are experienced executives who meet periodically throughout the year to oversee the Funds’ activities, review contractual arrangements with companies that provide services to the Funds, and review the Funds’ performance. Unless otherwise noted, the address of each Trustee or Officer is the address of the Trust: 800 Connecticut Avenue, Norwalk, Connecticut 06854.
There is no stated term of office for Trustees. Trustees serve until their resignation, retirement or removal in accordance with the Trust’s organizational documents and policies adopted by the Board from time to time. The Chairman of the Trustees, President, Treasurer and Secretary of the Trust are elected by the Trustees annually. Other officers hold office at the pleasure of the Trustees.
Independent Trustees
The following Trustees are not “interested persons” of the Trust within the meaning of the 1940 Act:
| | |
Name, Date of Birth, Number of Funds Overseen in Fund Complex* | | Principal Occupation(s)
During Past 5 Years
and Other Directorships
Held by Trustee |
Bruce B. Bingham, 12/01/48 • Trustee since 2012 • Oversees 37 Funds in Fund Complex | | Partner, Hamilton Partners (real estate development firm) (1987-Present). |
| |
William E. Chapman, II,
9/23/41 • Independent Chairman • Trustee since 1999 • Oversees 37 Funds in Fund Complex | | President and Owner, Longboat Retirement Planning Solutions (1998-Present); Hewitt Associates, LLC (part time) (provider of Retirement and Investment Education Seminars) (2002-2009); Trustee of Bowdoin College (2002-Present);Director of Harding, Loevner Funds, Inc. (6 portfolios); Trustee of Third Avenue Trust (5 portfolios); Trustee of Third Avenue Variable Trust (1 portfolio); Trustee of Aston Funds (26 portfolios). |
| |
Edward J. Kaier, 9/23/45 • Trustee since 1999 • Oversees 37 Funds in Fund Complex | | Attorney at Law and Partner, Teeters Harvey Gilboy & Kaier LLP (2007-Present); Attorney at Law and Partner, Hepburn Willcox Hamilton & Putnam, LLP (1977-2007); Trustee of Third Avenue Trust (5 portfolios); Trustee of Third Avenue Variable Trust (1 portfolio); Trustee of Aston Funds (26 portfolios). |
| |
Steven J. Paggioli, 4/3/50 • Trustee since 2004 • Oversees 37 Funds in Fund Complex | | Independent Consultant (2002-Present); Formerly Executive Vice President and Director, The Wadsworth Group (1986-2001); Executive Vice President, Secretary and Director, Investment Company Adminis- tration, LLC (1990-2001); Vice President, Secretary and Director, First Fund Distributors, Inc. (1991-2001); Trustee, Professionally Managed Portfolios (38 portfolios); Advisory Board Member, Sustainable Growth Advisors, LP; Independent Director, Chase Investment Counsel (2008 – Present); Trustee of Aston Funds (26 portfolios). |
| |
Eric Rakowski, 6/5/58 • Trustee since 1999 • Oversees 37 Funds in Fund Complex | | Professor, University of California at Berkeley School of Law (1990-Present); Director of Harding, Loevner Funds, Inc. (6 portfolios); Trustee of Third Avenue Trust (5 portfolios); Trustee of Third Avenue Variable Trust (1 portfolio); Trustee of Aston Funds (26 portfolios). |
| |
Thomas R. Schneeweis, 5/10/47 • Trustee since 2004 • Oversees 37 Funds in Fund Complex | | Professor of Finance, University of Massachusetts (1977-Present); Director, CISDM at the University of Massachusetts, (1996-Present); President, Alternative Investment Analytics, LLC, (formerly Schneeweis Partners, LLC) (2001-Present); Partner, S Capital Management, LLC (2007-Present); President, TRS Associates (1982-Present); Partner, White Bear Partners, LLC (2007-2010); Partner, Northampton Capital Management, LLC (2004-2010); Trustee of Aston Funds (26 portfolios). |
| * | The Fund Complex consists of Managers AMG Funds, The Managers Funds, Managers Trust I and Managers Trust II. |
Interested Trustees
Each Trustee in the following table is an “interested person” of the Trust within the meaning of the 1940 Act. Mr. Streur is an interested person of the Trust within the meaning of the 1940 Act by virtue of his positions with the Investment Manager and Managers Distributors, Inc. and because of his service as President of the Trust. Ms. Carsman is an
interested person of the Trust within the meaning of the 1940 Act by virtue of her position with, and interest in securities of, AMG, and her former position as Chief Legal Officer of the Trust.
| | |
Name, Date of Birth, Number of Funds Overseen in Fund Complex* | | Principal Occupation(s)
During Past 5 Years
and Other Directorships
Held by Trustee |
Christine C. Carsman, 4/2/52 • Trustee since 2011 • Oversees 37 Funds in Fund Complex | | Senior Vice President and Deputy General Counsel, Affiliated Managers Group, Inc. (2011-Present); Senior Vice President and Chief Regulatory Counsel, Affiliated Managers Group, Inc. (2007-2011); Vice President and Chief Regulatory Counsel, Affiliated Managers Group, Inc. (2004-2007); Secretary and Chief Legal Officer, Managers AMG Funds, The Managers Funds, Managers Trust I and Managers Trust II (2004-2011); Senior Counsel, Vice President and Director of Operational Risk Management and Compliance, Wellington Management Company, LLP (1995-2004). |
| |
Officers | | |
Name, Date of Birth,
Position(s) Held with Fund and Length of Time Served | | Principal Occupation(s)
During Past 5 Years |
Keitha L. Kinne, 5/16/58 • President since 2012 • Chief Operating Officer since 2007 | | Managing Partner and Chief Operating Officer, Managers Investment Group LLC (2007-Present); Chief Investment Officer, Managers Investment Group LLC (2008-Present); President, Managers Distributors, Inc. (2012-Present); Chief Operating Officer, The Managers Funds, Managers Trust I and Managers Trust II (2007-Present); Managing Director, Legg Mason & Co., LLC (2006-2007); Managing Director, Citigroup Asset Management (2004-2006). |
| |
Lewis Collins, 2/26/66 • Secretary since 2011 • Chief Legal Officer since 2011 | | Senior Vice President and Senior Counsel, Affiliated Managers Group, Inc. (2010-Present); Vice President and Senior Counsel, Affiliated Managers Group, Inc. (2006-2010); Senior Counsel, Affiliated Managers Group, Inc. (2002-2006); Attorney, Ropes & Gray LLP (1998-2002). |
| |
Donald S. Rumery, 5/29/58 • Chief Financial Officer since 2007 • Treasurer since 1995 | | Senior Vice President, Managers Investment Group LLC (2005-Present); Treasurer, Managers AMG Funds (1999-Present); Treasurer, Managers Trust I and Managers Trust II (2000-Present); Chief Financial Officer, Managers AMG Funds, Managers Trust I and Managers Trust II (2007-Present); Treasurer and Chief Financial Officer, Managers Distributors, Inc. (2000-2012); Vice President, The Managers Funds LLC, (1994-2004). |
| |
John J. Ferencz, 3/09/62 • Chief Compliance Officer since 2010 | | Vice President, Legal and Compliance, Managers Investment Group LLC (2010-Present); Senior Compliance Analyst, Mutual Funds and Regulatory, GE Asset Management Incorporated (2005-2010). |
| |
Michael S. Ponder, 9/12/73 • Assistant Secretary since 2011 | | Senior Vice President and Counsel, Managers Investment Group LLC (2011-Present); Attorney, DeNovo Legal (2009-2010); Vice President, Credit Suisse (2007-2009); Associate, Willkie Farr & Gallagher LLP (2006-2007). |
| |
Matthew B. Wallace, 11/24/80 • Anti-Money Laundering Compliance Officer since 2012 | | Senior Associate, Legal and Compliance, Managers Investment Group LLC (2012-Present); Associate, Legal and Compliance, Managers Investment Group LLC (2010-2012); Compliance Specialist, Calamos Advisors LLC (2007-2010). |
Investment Manager and Administrator
Managers Investment Group LLC
800 Connecticut Avenue
Norwalk, CT 06854
(800) 835-3879
Distributor
Managers Distributors, Inc.
800 Connecticut Avenue
Norwalk, CT 06854
(800) 835-3879
Custodian
The Bank of New York Mellon
2 Hanson Place
Brooklyn, NY 11217
Legal Counsel
Ropes & Gray LLP
Prudential Tower, 800 Boylston Street
Boston, MA 02199-3600
Transfer Agent
BNY Mellon Investment Servicing (US) Inc.
Attn: Managers
P.O. Box 9769
Providence, RI 02940
(800) 548-4539
For ManagersChoiceTM Only
Managers
c/o BNY Mellon Investment Servicing (US) Inc.
P.O. Box 9847
Providence, RI 02940-8047
(800) 358-7668

MANAGERSAND MANAGERS AMG FUNDS
| | | | |
EQUITY FUNDS | | BALANCED FUNDS |
CADENCE CAPITAL APPRECIATION CADENCE MID-CAP CADENCE EMERGING COMPANIES Cadence Capital Management, LLC ESSEX SMALL/MICRO CAP GROWTH Essex Investment Management Co., LLC FQ TAX-MANAGED U.S. EQUITY FQ U.S. EQUITY First Quadrant, L.P. FRONTIER SMALL CAP GROWTH Frontier Capital Management Company, LLC GW&K SMALL CAP EQUITY Gannett Welsh & Kotler, LLC MICRO-CAP Lord, Abbett & Co. LLC WEDGE Capital Management L.L.P. Next Century Growth Investors LLC RBC Global Asset Management (U.S.) Inc. REAL ESTATE SECURITIES Urdang Securities Management, Inc. RENAISSANCE LARGE CAP GROWTH Renaissance Group LLC SKYLINE SPECIAL EQUITIES PORTFOLIO Skyline Asset Management, L.P. | | SPECIAL EQUITY Ranger Investment Management, L.P. Lord, Abbett & Co. LLC Smith Asset Management Group, L.P. Federated MDTA LLC SYSTEMATIC VALUE SYSTEMATIC MID CAP VALUE Systematic Financial Management, L.P. TIMESSQUARE INTERNATIONAL SMALL CAP FUND TIMESSQUARE MID CAP GROWTH TIMESSQUARE SMALL CAP GROWTH TSCM GROWTH EQUITY TimesSquare Capital Management, LLC TRILOGY GLOBAL EQUITY TRILOGY EMERGING MARKETS EQUITY TRILOGY INTERNATIONAL SMALL CAP Trilogy Global Advisors, L.P. YACKTMAN FUND YACKTMAN FOCUSED FUND Yacktman Asset Management L.P. | | CHICAGO EQUITY PARTNERS BALANCED Chicago Equity Partners, LLC ALTERNATIVE FUNDS FQ GLOBAL ALTERNATIVES FQ GLOBAL ESSENTIALS First Quadrant, L.P. INCOME FUNDS BOND (MANAGERS) GLOBAL INCOME OPPORTUNITY Loomis, Sayles & Co., L.P. BOND (MANAGERs PIMCO) Pacific Investment Management Co. LLC CALIFORNIA INTERMEDIATE TAX-FREE Miller Tabak Asset Management LLC GW&K FIXED INCOME FUND GW&K MUNICIPAL BOND GW&K MUNICIPAL ENHANCED YIELD Gannett Welsh & Kotler, LLC HIGH YIELD J.P. Morgan Investment Management LLC INTERMEDIATE DURATION GOVERNMENT SHORT DURATION GOVERNMENT Smith Breeden Associates, Inc. |
| | |
This report is prepared for the Fund’s shareholders. It is authorized for distribution to prospective investors only when preceded or accompanied by an effective prospectus. To receive a free copy of the prospectus or Statement of Additional Information, which includes additional information about Fund Trustees, please contact us by calling 800.835.3879. Distributed by Managers Distributors, Inc., member FINRA. A description of the policies and procedures each Fund uses to vote its proxies is available: (i) without charge, upon request, by calling 800.835.3879, or (ii) on the Securities and Exchange Commission’s (SEC) Web site at www. sec.gov. For information regarding each Fund’s proxy voting record for the 12-month period ended June 30, call 800.835.3879 or visit the SEC Web site at www.sec.gov. The Fund files its complete schedule of portfolio holdings with the SEC for the first and third quarters of each fiscal year on Form N-Q. The Funds’ Forms N-Q are available on the SEC’s Web site at www.sec.gov. A Fund’s Forms N-Q may be reviewed and copied at the SEC’s Public Reference Room in Washington, DC. Information on the operation of the Public Reference Room may be obtained by calling 800.SEC.0330. To review a complete list of the Fund’s portfolio holdings, or to view the most recent quarterly holdings report, semiannual report, or annual report, please visit www.managersinvest.com. | |  |

Managers Bond Fund
Annual Report — December 31, 2012
| | | | |
TABLE OF CONTENTS | | Page | |
| |
LETTER TO SHAREHOLDERS | | | 1 | |
| |
ABOUT YOUR FUND’S EXPENSES | | | 2 | |
| |
PORTFOLIO MANAGER’S COMMENTS, FUND SNAPSHOTS, AND SCHEDULE OF PORTFOLIO INVESTMENTS | | | 3 | |
| |
NOTES TO SCHEDULE OF PORTFOLIO INVESTMENTS | | | 15 | |
| |
FINANCIAL STATEMENTS | | | | |
| |
Statement of Assets and Liabilities | | | 17 | |
Balance sheet, net asset value (NAV) per share computation and cumulative undistributed amounts | | | | |
| |
Statement of Operations | | | 18 | |
Detail of sources of income, expenses, and realized and unrealized gains (losses) during the year | | | | |
| |
Statements of Changes in Net Assets | | | 19 | |
Detail of changes in assets for the past two years | | | | |
| |
FINANCIAL HIGHLIGHTS | | | 20 | |
Historical net asset values per share, distributions, total returns, income and expense ratios, turnover ratios and net assets | | | | |
| |
NOTES TO FINANCIAL STATEMENTS | | | 21 | |
Accounting and distribution policies, details of agreements and transactions with Fund management and affiliates, and descriptions of certain investment risks | | | | |
| |
REPORT OF INDEPENDENT REGISTERED PUBLIC ACCOUNTING FIRM | | | 27 | |
| |
TRUSTEES AND OFFICERS | | | 28 | |
Nothing contained herein is to be considered an offer, sale or solicitation of an offer to buy shares of any series of the Managers Family of Funds. Such offering is made only by Prospectus, which includes details as to offering price and other material information.
Letter to Shareholders
Dear Shareholder:
Thank you for your investment in The Managers Funds. Our foremost goal at Managers Investment Group (MIG) is to provide investment products and solutions that help our shareholders and clients successfully reach their investment goals and objectives. We do this by offering a broad selection of funds managed by a collection of Affiliated Managers Group’s (AMG) Affiliate investment boutiques, along with a complementary series of open-architecture mutual funds.
The past year has been an exciting one for us at MIG. In connection with AMG’s investment in Yacktman Asset Management (“Yacktman”), MIG partnered with Yacktman in reorganizing the Yacktman Focused Fund and the Yacktman Fund into The Managers Funds. The addition of the Yacktman Funds to our platform brought our total assets under management to over $25 billion at the end of 2012.
Additionally, in an effort to better meet our shareholders’ needs as well as bring consistency across our funds, we restructured our share class offerings across many of our Funds, which included discontinuing certain share classes with sales charges (commonly called sales loads). As a result, many of our Funds now offer three No Load share classes – Investor, Service, and Institutional Share Classes. We believe this simplified structure makes it easier for our clients as well as Financial Advisors to select the appropriate share class to match their needs.
During 2012, we also executed on other changes to certain Funds, which included reducing expense ratios on several Funds to ensure that our offerings remain competitive and affordable for our clients.
As we enter into 2013, both known and unknown risks remain to the global economy and its growth prospects. Nevertheless, we remain optimistic that the collective fiscal and monetary efforts undertaken over the past several years will continue to have a positive impact on the global economy. In the meantime, we remain confident that our Funds are well positioned to weather an uncertain economic environment.
We thank you for your continued confidence and investment in The Managers Funds. You can rest assured that under all market conditions our team is focused on delivering excellent investment management services for your benefit.
Respectfully,
Keitha Kinne
President
The Managers Funds
About Your Fund’s Expenses
| | |
As a shareholder of a Fund, you may incur two types of costs: (1) transaction costs, which may include sales charges (loads) on purchase payments; redemption fees; and exchange fees; and (2) ongoing costs, including management fees; distribution
(12b-1) fees; and other Fund expenses. This example is intended to help you understand your ongoing costs (in dollars) of investing in the Fund and to compare these costs with the ongoing costs of investing in other mutual funds. The example is based on $1,000 invested at the beginning of the period and held for the entire period as indicated below. Actual Expenses The first line of the following table provides information about the actual account values and actual expenses. You may use the information in this line, together with the amount you invested, to estimate the expenses that you paid over the period. Simply divide your account value by $1,000 (for example, an $8,600 account value divided by $1,000 = 8.6), then multiply the result by the number in the first line under the heading entitled “Expenses Paid During Period” to estimate the expenses you paid on your account during this period. Hypothetical Example for Comparison Purposes The second line of the following table provides information about hypothetical account values and hypothetical expenses based on the Fund’s actual expense ratio and an assumed annual rate of return of 5% before expenses, which is not the Fund’s actual return. The hypothetical account values and expenses may not be used to estimate the actual ending account balance or expenses you paid for the period. You may use this information to compare the ongoing costs of investing in the Fund and other funds by comparing this 5% hypothetical example with the 5% hypothetical examples that appear in the shareholder reports of other funds. Please note that the expenses shown in the table are meant to highlight your ongoing costs only and do not reflect any transactional costs, such as sales charges (loads), redemption fees, or exchange fees. Therefore, the second line of the table is useful in comparing ongoing costs only, and will not help you determine the relative total costs of owning different funds. | | |
| | | | | | | | | | | | | | | | |
Six Months Ended December 31, 2012 | | Expense
Ratio for
the Period | | | Beginning
Account Value
07/01/12 | | | Ending
Account Value
12/31/12 | | | Expenses
Paid During
the Period* | |
Managers Bond Fund | | | | | | | | | | | | | | | | |
Based on Actual Fund Return | | | 0.99 | % | | $ | 1,000 | | | $ | 1,064 | | | $ | 5.14 | |
Hypothetical (5% return before expenses) | | | 0.99 | % | | $ | 1,000 | | | $ | 1,020 | | | $ | 5.03 | |
| * | Expenses are equal to the Fund’s annualized expense ratio multiplied by the average account value over the period, multiplied by the number of days in the most recent fiscal half-year (184), then divided by 366. |
2
Managers Bond Fund
Portfolio Manager’s Comments
The Year in Review
The Managers Bond Fund returned 12.04% for the year ended December 31, 2012, beating the Barclay’s U.S. Government/Credit Index, which returned 4.82%
During the year, the Fund delivered solid absolute and relative performance versus the benchmark. At the beginning of 2012, the Fund solidly outperformed its benchmark with the strong performance due to a combination of good security selection and portfolio positioning. In particular, the Fund’s underweight to U.S. Treasuries and exposure to corporates, A-rated and BBB-rated bonds, high yield, convertibles, and non-U.S. Dollar bonds helped performance. This was against the backdrop of central banks around the world sending a rush of liquidity into the global financial system with this coordinated effort helping to stem the risk of a major European credit crunch that was brewing at the close of 2011. Risk assets generally responded very well to easy money policies early in the year and the Fund’s exposure to these was rewarded with strong performance.
The second quarter was the only quarter the Fund underperformed during the year, albeit while generating a positive return. During that quarter, investors flocked to higher-quality assets in response to the mounting stress, and this drove sovereign bond yields lower in perceived safe haven countries such as the U.S., U.K., Germany, Switzerland, and Japan. Underperformance during this period was generally proportional to the quantity of out-of-benchmark allocations, with non-U.S. Dollar denominated and convertible securities having the most detractive effect on returns. The Fund’s underweight to U.S. Treasuries also hurt relative results since most spread products generated negative returns during yet another period when “risk off” returned to favor.
During the summer months, aggressive policy responses from major central banks were dominant forces as the European Central Bank, Federal Reserve (Fed), Bank of Japan, and other central banks took decisive action prompted by the escalating European sovereign debt crisis, slowing global growth, financial market volatility, and the then impending U.S. “fiscal cliff.” The policy moves helped reduce the risk that a large country like Spain or Italy would face a major sovereign debt funding squeeze and be forced out of the Euro. Against this backdrop, the Fund generated strong absolute and relative returns. Outperformance was due to a combination of strong security selection and favorable positioning. The underweight to U.S. Treasuries and overweight to U.S. corporates were the main contributors to strong relative results while high yield and non-U.S. Dollar exposure also helped returns.
The final quarter of 2012 was the icing on the cake of an exceptional year for the credit sectors. Fourth-quarter credit gains stemmed in part from uncommonly aggressive monetary policy responses in the third quarter. As economic growth continued to undershoot expectations, major central banks made clear they were dissatisfied with the status quo of tepid economic growth and high unemployment. The Fed went so far as to tie its monetary policy to the level of the unemployment rate. Financial markets seemed encouraged that risky assets would ride the tailwind of unconventional central bank policies through 2013, at least. With markets appearing to discount aggressive policy easing for some time to come, assets across the credit spectrum enjoyed very good performance during the last three months of the year. The Fund put
forth positive returns in the fourth quarter as the rally in the credit markets persisted in both October and much of December. Outperformance was driven by holdings of investment grade corporates and out-of-benchmark allocations, with high yield, non-USD denominated, and convertible securities providing the bulk of excess returns.
LOOKING FORWARD
From Treasuries to mortgages, investment grade and high yield credits, and emerging market debt, the low level of yields at once illustrates and reinforces the global thirst for yield. This thirst for yield has left many scratching their heads, pondering the hypothesis that unconventional monetary policies are, unequivocally, a recipe for runaway inflation. The only major inflation we have seen in recent years is bond price inflation.
We expect the global thirst for yield to persist in 2013; however, investors were treated to some outstanding bond returns in 2012 that are unlikely to repeat in 2013. The math of fixed income returns becomes more difficult with a steady decline in yields. Instead of high single-digit returns on investment grade corporate bonds and even double-digit returns on high yield and emerging market bonds, investors need to adjust their expectations lower. We believe bonds can still generate positive returns, but going forward, a fixed income investor’s returns should be closer to the yield a bond offers when it is purchased and should not incorporate much in the way of price appreciation.
Still, we believe some fixed income sectors could produce mid-single-digit returns in 2012, including bank loans, convertible bonds, high yield, and RMBS. We continue to like the investment grade credit markets in the U.S. and Europe but think emerging market companies that issue debt denominated in dollars and euros should perform better. Currently, there is not a lot of value in high-quality sovereign bonds such as Treasuries, bunds or gilts-unless a major economic downturn or financial accident develops; however, an event like this is not part of Loomis Sayles’ base-case outlook for 2013.
Selected sovereign bonds from Mexico, Italy, Poland, Turkey, Malaysia, Thailand, and the Philippines could produce returns competitive with corporate credit risk in 2013. The drive lower in investment grade and high yield corporate bond yields should prompt investors to scour the globe for alternatives, and local currency emerging market bonds should continue to see flows. We suggest investors do their currency research, as there were some high-profile emerging currency flops in 2012: Brazil, South Africa, and Indonesia.
This commentary reflects the viewpoints of the portfolio manager, Loomis, Sayles & Company, as of December 31, 2012 and is not intended as a forecast or guarantee of future results.
Managers Bond Fund
Portfolio Manager’s Comments (continued)
Cumulative Total Return Performance
Managers Bond Fund’s cumulative total return is based on the daily change in net asset value (NAV), and assumes that all distributions were reinvested. This chart compares a hypothetical $10,000 investment made in the Managers Bond Fund on December 31, 2002, to a $10,000 investment made in the Barclays U.S. Government/Credit Bond Index for the same time period. The chart is not intended to imply any future performance of the Fund. The graph and chart do not reflect the deduction of taxes that a shareholder would pay on a Fund distribution or redemption of shares. Total returns would have been lower had certain expenses not been reduced. Past performance is not indicative of future results.
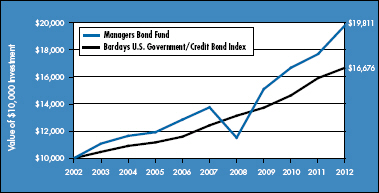
The table below shows the average annual total returns for the Managers Bond Fund and the Barclays U.S. Government/Credit Bond Index for the same time periods ended December 31, 2012.
| | | | | | | | | | | | |
| | | Average Annual Total Returns1 | |
| | | One Year | | | Five Years | | | Ten Years | |
Managers Bond Fund 2,3,4,5 | | | 12.04 | % | | | 7.57 | % | | | 7.08 | % |
Barclays U.S. Government/Credit Bond Index6 | | | 4.82 | % | | | 6.06 | % | | | 5.25 | % |
The performance data shown represents past performance. Past performance is not a guarantee of future results. Current performance may be lower or higher than the performance data quoted. The investment return and principal value of an investment will fluctuate so that an investor’s shares, when redeemed, may be worth more or less than their original cost. For performance information through the most recent month end, please call (800) 835-3879 or visit our Web site at www.managersinvest.com.
Investors should carefully consider the Fund’s investment objectives, risks, charges and expenses before investing. For this and other information, please call (800) 835-3879 or visit www.managersinvest.com for a free prospectus. Read it carefully before investing or sending money. Funds are distributed by Managers Distributors, Inc., a member of FINRA.
| | |
| | 1 Total return equals income yield plus share price change and assumes reinvestment of all dividends and capital gain distributions. Returns are net of fees and may reflect offsets of Fund expenses as described in the Prospectus. No adjustment has been made for taxes payable by shareholders on their reinvested dividends and capital gain distributions. Returns for periods greater than one year are annualized. The listed returns on the Fund are net of expenses and based on the published NAV as of December 31, 2012. All returns are in U.S. dollars($). 2 From time to time, the Fund’s advisor has waived fees and/or absorbed Fund expenses, which may have resulted in higher returns. 3 The Fund is subject to the risks associated with investments in debt securities, such as default risk and fluctuations in the perception of the debtor’s ability to pay its creditors. Changing interest rates may adversely affect the value of an investment. An increase in interest rates typically causes the value of bonds and other fixed-income securities to fall. 4 Investments in international securities are subject to certain risks of overseas investing including currency fluctuations and changes in political and economic conditions, which could result in significant market fluctuations. These risks are magnified in emerging markets. 5 High yield bonds (also known as “junk bonds”) are subject to additional risks such as the risk of default. 6 The Barclays U.S. Government/Credit Bond Index is an index of investment-grade government and corporate bonds with a maturity rate of more than one year. Unlike the Fund, the Barclays U.S. Government/ Credit Bond Index is unmanaged, is not available for investment, and does not incur expenses. Not FDIC insured, nor bank guaranteed. May lose value. |
4
Managers Bond Fund
Fund Snapshots
December 31, 2012
Portfolio Breakdown (unaudited)
| | | | |
Category | | Managers
Bond Fund** | |
Corporate Bonds and Notes | | | 63.1 | % |
U.S. Government and Agency Obligations | | | 21.5 | % |
Foreign Government and Agency Obligations | | | 5.7 | % |
Asset-Backed Securities | | | 2.2 | % |
Municipal Bonds | | | 1.1 | % |
Common Stocks | | | 0.8 | % |
Bank Loan Obligations | | | 0.5 | % |
Preferred Stocks | | | 0.5 | % |
Mortgage-Backed Securities | | | 0.2 | % |
Other Assets and Liabilities | | | 4.4 | % |
| ** | As a percentage of net assets |
| | | | |
Rating | | Managers
Bond Fund*** | |
U.S. Treasury & Agency | | | 23.0 | % |
Aaa | | | 5.2 | % |
Aa | | | 2.8 | % |
A | | | 16.7 | % |
Baa | | | 41.2 | % |
Ba & lower | | | 10.4 | % |
Not Rated | | | 0.7 | % |
| *** | As a percentage of market value of fixed income securities Chart does not include equity securities. |
Top Ten Holdings (unaudited)
| | | | |
Security Name | | % of Net
Assets | |
U.S. Treasury Note, 0.250%, 05/31/14* | | | 9.5 | % |
U.S. Treasury Note, 0.250%, 02/28/14* | | | 5.3 | |
Springleaf Finance Corp., MTN, Series J, 6.900%, 12/15/17* | | | 2.2 | |
Southwestern Electric Power Co., 6.450%, 01/15/19* | | | 2.0 | |
Kinder Morgan Energy Partners, L.P., 5.950%, 02/15/18* | | | 1.8 | |
Merrill Lynch & Co., Inc., 6.110%, 01/29/37* | | | 1.7 | |
EQT Corp., 6.500%, 04/01/18* | | | 1.7 | |
Nisource Finance Corp., 6.400%, 03/15/18* | | | 1.4 | |
DP World, Ltd., 6.850%, 07/02/37 | | | 1.4 | |
Morgan Stanley, GMTN, 5.500%, 07/24/20 | | | 1.4 | |
Top Ten as a Group | | | 28.4 | % |
| | | | |
| * | Top Ten Holding at June 30, 2012 |
Any sectors, industries, or securities discussed should not be perceived as investment recommendations. Mention of a specific security should not be considered a recommendation to buy or solicitation to sell that security. Specific securities mentioned in this report may have been sold from the Fund’s portfolio of investments by the time you receive this report.
5
Managers Bond Fund
Schedule of Portfolio Investments
December 31, 2012
| | | | | | | | | | | | |
| | | | | | Principal Amount† | | | Value | |
| | | | | | | | | | | | |
Asset-Backed Securities - 2.2% | | | | | | | | | | | | |
Chase Issuance Trust, Series 2007-B1, Class B-1, 0.459%, 04/15/19 (01/15/13)1 | | | | | | $ | 17,040,000 | | | $ | 16,952,363 | |
Marriott Vacation Club Owner Trust, Series 2009-2A, Class A, 4.809%, 07/20/31 (a) | | | | | | | 6,830,692 | | | | 7,113,045 | |
Sierra Receivables Funding Co., LLC, Series 2010-2A, Class A, 3.840%,
11/20/25 (a) | | | | | | | 7,398,372 | | | | 7,567,151 | |
Trinity Rail Leasing, L.P., | | | | | | | | | | | | |
Series 2009-1A, Class A, 6.657%, 11/16/39 (a) | | | | | | | 4,390,214 | | | | 5,180,286 | |
Series 2012-1A, Class A1, 2.266%, 01/15/43 (a) | | | | | | | 3,750,000 | | | | 3,731,441 | |
Trip Rail Master Funding LLC, Series 2011-1A, Class A1A, 4.370%, 07/15/41 (a) | | | | | | | 8,956,334 | | | | 9,556,005 | |
World Financial Network Credit Card Master Trust, Series 2010-A, 6.750%, 04/15/19 | | | | | | | 1,000,000 | | | | 1,103,051 | |
Total Asset-Backed Securities (cost $47,382,174) | | | | | | | | | | | 51,203,342 | |
Bank Loan Obligations - 0.5% | | | | | | | | | | | | |
Flying Fortress, Inc., Term Loan, 5.000%, 06/30/17 (cost $11,325,600) | | | | | | | 11,440,000 | | | | 11,525,800 | |
| | | |
| | | | | | Shares | | | | |
Common Stocks - 0.8% | | | | | | | | | | | | |
PPG Industries, Inc. (Materials) (cost $10,696,329) | | | | | | | 145,736 | | | | 19,725,368 | |
| | | |
| | | | | | Principal Amount† | | | | |
Corporate Bonds and Notes - 63.1% | | | | | | | | | | | | |
Financials - 27.1% | | | | | | | | | | | | |
Ally Financial, Inc., 8.000%, 11/01/31 | | | | | | $ | 1,267,000 | | | | 1,604,339 | |
Alta Wind Holdings LLC, 7.000%, 06/30/35 (a) | | | | | | | 7,909,037 | | | | 8,510,915 | |
American International Group, Inc., | | | | | | | | | | | | |
8.175%, 05/15/582 | | | | | | | 10,530,000 | | | | 13,715,325 | |
MTN, 5.450%, 05/18/17 | | | | | | | 485,000 | | | | 557,030 | |
MTN, Series G, 5.850%, 01/16/18 | | | | | | | 1,940,000 | | | | 2,293,462 | |
Bank of America Corp., | | | | | | | | | | | | |
7.625%, 06/01/19 | | | | | | | 2,906,000 | | | | 3,718,433 | |
MTN, 5.000%, 05/13/21 | | | | | | | 2,475,000 | | | | 2,825,589 | |
Camden Property Trust, 5.700%, 05/15/17 | | | | | | | 5,205,000 | | | | 5,990,773 | |
Cantor Fitzgerald, L.P., | | | | | | | | | | | | |
6.375%, 06/26/15 (a) | | | | | | | 8,115,000 | | | | 8,219,188 | |
7.875%, 10/15/19 (a)3 | | | | | | | 3,145,000 | | | | 3,224,345 | |
Citigroup, Inc., | | | | | | | | | | | | |
5.500%, 10/15/14 | | | | | | | 18,680,000 | | | | 20,040,670 | |
6.125%, 08/25/36 | | | | | | | 10,760,000 | | | | 11,727,077 | |
6.250%, 06/29/17 | | | NZD | | | | 37,108,000 | | | | 32,480,777 | |
Cooperatieve Centrale Raiffeisen-Boerenleenbank BA/Netherlands, | | | | | | | | | | | | |
3.375%, 01/19/17 | | | | | | | 1,930,000 | | | | 2,073,372 | |
3.875%, 02/08/22 | | | | | | | 11,250,000 | | | | 12,106,395 | |
Crown Castle Towers LLC, 6.113%, 01/15/20 (a) | | | | | | | 13,725,000 | | | | 16,531,529 | |
Duke Realty, L.P., | | | | | | | | | | | | |
5.950%, 02/15/17 | | | | | | | 2,210,000 | | | | 2,526,353 | |
6.500%, 01/15/18 | | | | | | | 5,000,000 | | | | 5,928,375 | |
Equifax, Inc., 7.000%, 07/01/37 | | | | | | | 4,421,000 | | | | 5,570,858 | |
|
The accompanying notes are an integral part of these financial statements. 6 |
Managers Bond Fund
Schedule of Portfolio Investments (continued)
| | | | | | | | | | | | |
| | | | | | Principal Amount† | | | Value | |
| | | | | | | | | | | | |
Financials - 27.1% (continued) | | | | | | | | | | | | |
Equity One, Inc., 6.000%, 09/15/17 | | | | | | $ | 5,915,000 | | | $ | 6,775,195 | |
ERP Operating, L.P., | | | | | | | | | | | | |
5.125%, 03/15/16 | | | | | | | 600,000 | | | | 669,154 | |
5.750%, 06/15/17 | | | | | | | 925,000 | | | | 1,091,178 | |
Export-Import Bank of Korea, 8.300%, 03/15/14 (a) | | | IDR | | | | 1,400,000,000 | | | | 149,057 | |
First Industrial, L.P., 5.950%, 05/15/17 | | | | | | | 15,000,000 | | | | 16,051,305 | |
General Electric Capital Corp., | | | | | | | | | | | | |
6.500%, 09/28/15 | | | NZD | | | | 15,265,000 | | | | 13,458,372 | |
6.750%, 09/26/164 | | | NZD | | | | 6,390,000 | | | | 5,776,458 | |
EMTN, 5.500%, 02/01/17 | | | NZD | | | | 6,250,000 | | | | 5,432,744 | |
GMTN, 7.625%, 12/10/14 | | | NZD | | | | 9,365,000 | | | | 8,301,716 | |
Goldman Sachs Group, Inc., The, 6.750%, 10/01/37 | | | | | | | 14,590,000 | | | | 16,535,241 | |
Hanover Insurance Group, Inc., The, 7.500%, 03/01/20 | | | | | | | 6,475,000 | | | | 7,675,905 | |
Highwoods Realty, L.P., | | | | | | | | | | | | |
5.850%, 03/15/17 | | | | | | | 3,680,000 | | | | 4,150,293 | |
7.500%, 04/15/18 | | | | | | | 2,405,000 | | | | 2,901,777 | |
ICICI Bank, Ltd., 6.375%, 04/30/22 (a)2 | | | | | | | 900,000 | | | | 907,875 | |
iStar Financial, Inc., | | | | | | | | | | | | |
5.700%, 03/01/14 | | | | | | | 15,000 | | | | 15,338 | |
5.850%, 03/15/17 | | | | | | | 325,000 | | | | 318,500 | |
5.875%, 03/15/16 | | | | | | | 1,340,000 | | | | 1,340,000 | |
6.050%, 04/15/15 | | | | | | | 620,000 | | | | 623,100 | |
JPMorgan Chase & Co., | | | | | | | | | | | | |
7.700%, 06/01/16 (a) | | | IDR | | | | 19,000,000,000 | | | | 2,097,837 | |
Series EMTN, 1.053%, 05/30/17 (01/31/13)1 | | | GBP | | | | 1,500,000 | | | | 2,278,487 | |
Lloyds TSB Bank PLC, 6.500%, 09/14/20 (a)4 | | | | | | | 17,940,000 | | | | 19,823,162 | |
Marsh & McLennan Cos., Inc., 5.875%, 08/01/33 | | | | | | | 10,360,000 | | | | 12,083,438 | |
MBIA Insurance Corp., 14.000%, 01/15/33 (a)2 | | | | | | | 525,000 | | | | 89,250 | |
Merrill Lynch & Co., Inc., | | | | | | | | | | | | |
6.050%, 05/16/16 | | | | | | | 900,000 | | | | 990,771 | |
6.110%, 01/29/37 | | | | | | | 38,050,000 | | | | 41,533,477 | |
10.710%, 03/08/17 | | | BRL | | | | 2,500,000 | | | | 1,358,364 | |
EMTN, 4.625%, 09/14/184 | | | EUR | | | | 1,750,000 | | | | 2,432,722 | |
MTN, Series C, 6.050%, 06/01/34 | | | | | | | 22,100,000 | | | | 24,133,996 | |
Morgan Stanley, | | | | | | | | | | | | |
0.820%, 10/15/15 (01/15/13)1 | | | | | | | 300,000 | | | | 290,690 | |
3.450%, 11/02/15 | | | | | | | 2,360,000 | | | | 2,458,905 | |
4.750%, 04/01/144 | | | | | | | 8,355,000 | | | | 8,651,394 | |
4.875%, 11/01/22 | | | | | | | 1,455,000 | | | | 1,506,498 | |
5.750%, 01/25/21 | | | | | | | 400,000 | | | | 456,814 | |
GMTN, 5.500%, 01/26/20 | | | | | | | 500,000 | | | | 560,897 | |
GMTN, 5.500%, 07/24/20 | | | | | | | 29,000,000 | | | | 32,625,290 | |
MTN, 0.775%, 10/18/16 (01/18/13)1 | | | | | | | 2,000,000 | | | | 1,901,270 | |
MTN, 5.625%, 09/23/19 | | | | | | | 7,500,000 | | | | 8,482,350 | |
|
The accompanying notes are an integral part of these financial statements. 7 |
Managers Bond Fund
Schedule of Portfolio Investments (continued)
| | | | | | | | | | | | |
| | | | | | Principal Amount† | | | Value | |
| | | | | | | | | | | | |
Financials - 27.1% (continued) | | | | | | | | | | | | |
Morgan Stanley, | | | | | | | | | | | | |
MTN, 6.250%, 08/09/26 | | | | | | $ | 11,000,000 | | | $ | 12,909,732 | |
MTN, 6.625%, 04/01/18 | | | | | | | 3,095,000 | | | | 3,647,690 | |
Series GMTN, 8.000%, 05/09/174 | | | AUD | | | | 8,100,000 | | | | 9,295,187 | |
Mutual of Omaha Insurance Co., 6.800%, 06/15/36 (a) | | | | | | | 13,925,000 | | | | 16,346,864 | |
National City Bank of Indiana, 4.250%, 07/01/18 | | | | | | | 6,310,000 | | | | 6,991,171 | |
National City Corp., 6.875%, 05/15/19 | | | | | | | 1,905,000 | | | | 2,376,642 | |
National Life Insurance Co., 10.500%, 09/15/39 (a) | | | | | | | 5,000,000 | | | | 6,963,935 | |
Nationwide Mutual Insurance Co., 6.600%, 04/15/34 (a) | | | | | | | 3,325,000 | | | | 3,345,881 | |
Newfield Exploration Co., 5.625%, 07/01/24 | | | | | | | 6,320,000 | | | | 6,825,600 | |
Old Republic International Corp., 3.750%, 03/15/185 | | | | | | | 15,805,000 | | | | 16,447,078 | |
Penn Mutual Life Insurance Co., The, 7.625%, 06/15/40 (a) | | | | | | | 8,885,000 | | | | 11,237,837 | |
ProLogis, L.P., | | | | | | | | | | | | |
5.625%, 11/15/15 | | | | | | | 345,000 | | | | 380,671 | |
5.750%, 04/01/16 | | | | | | | 280,000 | | | | 312,059 | |
Realty Income Corp., | | | | | | | | | | | | |
5.750%, 01/15/21 | | | | | | | 1,435,000 | | | | 1,684,750 | |
6.750%, 08/15/19 | | | | | | | 6,240,000 | | | | 7,724,571 | |
Royal Bank of Scotland Group PLC, 6.125%, 12/15/22 | | | | | | | 4,650,000 | | | | 4,907,991 | |
Santander Financial Issuances, Ltd., 7.250%, 11/01/15 | | | | | | | 500,000 | | | | 520,000 | |
Santander Issuances SAU, | | | | | | | | | | | | |
5.911%, 06/20/16 (a) | | | | | | | 1,100,000 | | | | 1,127,500 | |
6.500%, 08/11/19 (a)2 | | | | | | | 900,000 | | | | 910,337 | |
Santander US Debt SAU, 3.724%, 01/20/15 (a) | | | | | | | 2,700,000 | | | | 2,712,258 | |
Simon Property Group, L.P., 5.750%, 12/01/15 | | | | | | | 445,000 | | | | 501,268 | |
Sirius International Group Ltd., 6.375%, 03/20/17 (a) | | | | | | | 4,555,000 | | | | 4,974,789 | |
SLM Corp., | | | | | | | | | | | | |
5.000%, 04/15/15 | | | | | | | 50,000 | | | | 52,706 | |
5.375%, 05/15/14 | | | | | | | 300,000 | | | | 313,654 | |
8.450%, 06/15/18 | | | | | | | 18,665,000 | | | | 21,838,050 | |
Societe Generale SA, 5.200%, 04/15/21 (a) | | | | | | | 7,000,000 | | | | 7,758,289 | |
Springleaf Finance Corp., | | | | | | | | | | | | |
MTN, 5.400%, 12/01/15 | | | | | | | 5,000,000 | | | | 4,725,000 | |
MTN, Series J, 6.900%, 12/15/17 | | | | | | | 57,315,000 | | | | 51,296,925 | |
WEA Finance LLC / WT Finance Australia Pty., Ltd.,
6.750%, 09/02/19 (a) | | | | | | | 8,325,000 | | | | 10,313,276 | |
Willis North America, Inc., | | | | | | | | | | | | |
6.200%, 03/28/17 | | | | | | | 5,350,000 | | | | 6,090,841 | |
7.000%, 09/29/19 | | | | | | | 2,860,000 | | | | 3,370,413 | |
Total Financials | | | | | | | | | | | 643,476,590 | |
Industrials - 28.6% | | | | | | | | | | | | |
Alcatel-Lucent USA, Inc., | | | | | | | | | | | | |
6.450%, 03/15/29 | | | | | | | 4,335,000 | | | | 3,294,600 | |
6.500%, 01/15/28 | | | | | | | 305,000 | | | | 229,513 | |
America Movil SAB de CV, Series 12, 6.450%, 12/05/22 | | | MXN | | | | 169,300,000 | | | | 13,443,792 | |
|
The accompanying notes are an integral part of these financial statements. 8 |
Managers Bond Fund
Schedule of Portfolio Investments (continued)
| | | | | | | | |
| | | Principal Amount† | | | Value | |
| | | | | | | | |
Industrials - 28.6% (continued) | | | | | | | | |
APL, Ltd., 8.000%, 01/15/243 | | $ | 250,000 | | | $ | 231,250 | |
ArcelorMittal, | | | | | | | | |
6.000%, 03/01/21 (b)4 | | | 150,000 | | | | 149,570 | |
6.125%, 06/01/184 | | | 4,580,000 | | | | 4,641,830 | |
6.750%, 02/25/22 (b)4 | | | 1,600,000 | | | | 1,679,224 | |
7.250%, 03/01/41 (b) | | | 11,065,000 | | | | 10,262,787 | |
7.500%, 10/15/39 (b) | | | 6,604,000 | | | | 6,207,760 | |
AT&T, Inc., 4.350%, 06/15/45 (a) | | | 2,491,000 | | | | 2,502,200 | |
Canadian Pacific Railway Co., 5.750%, 03/15/33 | | | 195,000 | | | | 225,011 | |
CenturyLink, Inc., | | | | | | | | |
Series P, 7.600%, 09/15/39 | | | 9,335,000 | | | | 9,689,749 | |
Series S, 6.450%, 06/15/21 | | | 13,395,000 | | | | 14,801,462 | |
Chesapeake Energy Corp., | | | | | | | | |
2.500%, 05/15/374,5 | | | 3,800,000 | | | | 3,420,000 | |
2.750%, 11/15/354,5 | | | 1,560,000 | | | | 1,491,750 | |
6.625%, 08/15/20 | | | 55,000 | | | | 58,988 | |
6.875%, 11/15/20 | | | 85,000 | | | | 92,119 | |
Choice Hotels International, Inc., 5.700%, 08/28/20 | | | 11,900,000 | | | | 12,911,500 | |
Cigna Corp., 6.150%, 11/15/36 | | | 6,830,000 | | | | 8,326,494 | |
Continental Airlines, Inc., | | | | | | | | |
1999-1 Class B Pass Through Trust, Series 991B, 6.795%, 08/02/18 | | | 20,489 | | | | 21,333 | |
2000-1 Class A-1 Pass Through Trust, Series 00A1, 8.048%, 11/01/20 | | | 82,486 | | | | 93,415 | |
2007-1 Class A Pass Through Trust, Series 071A, 5.983%, 04/19/22 | | | 16,223,423 | | | | 18,068,027 | |
2007-1 Class B Pass Through Trust, Series 071B,, 6.903%, 04/19/22 | | | 5,281,760 | | | | 5,651,483 | |
Corning, Inc., | | | | | | | | |
6.850%, 03/01/29 | | | 9,142,000 | | | | 11,215,232 | |
7.250%, 08/15/36 | | | 1,185,000 | | | | 1,508,974 | |
Cummins, Inc., | | | | | | | | |
5.650%, 03/01/98 | | | 11,235,000 | | | | 11,676,007 | |
6.750%, 02/15/27 | | | 2,853,000 | | | | 3,544,057 | |
Cytec Industries, Inc., 6.000%, 10/01/15 | | | 875,000 | | | | 965,486 | |
Darden Restaurants, Inc., 6.000%, 08/15/35 | | | 2,635,000 | | | | 2,904,305 | |
Delta Air Lines, Inc., | | | | | | | | |
2007-1 Class B Pass Through Trust, Series 071B, 8.021%, 08/10/22 | | | 10,238,829 | | | | 11,198,207 | |
2010-1 Class A Pass Through Trust, Series 1A, 6.200%, 07/02/184 | | | 4,409,366 | | | | 4,971,560 | |
Dillard’s, Inc., 7.000%, 12/01/28 | | | 225,000 | | | | 226,688 | |
DP World, Ltd., 6.850%, 07/02/37 (a) | | | 28,350,000 | | | | 33,204,937 | |
Embarq Corp., 7.995%, 06/01/36 | | | 5,830,000 | | | | 6,439,357 | |
Energy Transfer Partners, L.P., | | | | | | | | |
6.125%, 02/15/17 | | | 700,000 | | | | 810,061 | |
6.625%, 10/15/36 | | | 1,805,000 | | | | 2,119,473 | |
Enterprise Products Operating LLC, 4.050%, 02/15/22 | | | 8,450,000 | | | | 9,340,317 | |
EQT Corp., 6.500%, 04/01/18 | | | 35,420,000 | | | | 41,175,892 | |
|
The accompanying notes are an integral part of these financial statements. 9 |
Managers Bond Fund
Schedule of Portfolio Investments (continued)
| | | | | | | | |
| | | Principal Amount† | | | Value | |
| | | | | | | | |
Industrials - 28.6% (continued) | | | | | | | | |
ERAC USA Finance LLC, | | | | | | | | |
6.375%, 10/15/17 (a) | | $ | 4,910,000 | | | $ | 5,938,463 | |
6.700%, 06/01/34 (a) | | | 1,250,000 | | | | 1,513,486 | |
7.000%, 10/15/37 (a) | | | 19,033,000 | | | | 24,168,655 | |
Foot Locker, Inc., 8.500%, 01/15/22 | | | 570,000 | | | | 640,081 | |
Ford Motor Co., 6.375%, 02/01/29 | | | 1,990,000 | | | | 2,225,431 | |
Georgia-Pacific LLC, 5.400%, 11/01/20 (a) | | | 5,175,000 | | | | 6,156,356 | |
HCA, Inc., 7.500%, 11/06/33 | | | 75,000 | | | | 75,375 | |
Intel Corp., | | | | | | | | |
2.950%, 12/15/355 | | | 8,030,000 | | | | 8,326,106 | |
3.250%, 08/01/395 | | | 15,000,000 | | | | 17,578,125 | |
Intuit, Inc., 5.750%, 03/15/17 | | | 3,560,000 | | | | 4,106,610 | |
Kinder Morgan Energy Partners, L.P., | | | | | | | | |
5.300%, 09/15/20 | | | 8,100,000 | | | | 9,441,060 | |
5.950%, 02/15/18 | | | 36,530,000 | | | | 43,737,844 | |
Marks & Spencer PLC, 7.125%, 12/01/37 (a) | | | 4,725,000 | | | | 5,227,972 | |
Masco Corp., | | | | | | | | |
5.850%, 03/15/17 | | | 8,150,000 | | | | 8,869,645 | |
6.500%, 08/15/32 | | | 955,000 | | | | 987,837 | |
7.125%, 03/15/204 | | | 8,815,000 | | | | 10,255,644 | |
7.750%, 08/01/29 | | | 1,070,000 | | | | 1,190,050 | |
Mead Corp., The, 7.550%, 03/01/47 | | | 970,000 | | | | 1,098,077 | |
Methanex Corp., | | | | | | | | |
5.250%, 03/01/22 | | | 350,000 | | | | 388,192 | |
6.000%, 08/15/15 | | | 3,825,000 | | | | 4,133,597 | |
Micron Technology, Inc., | | | | | | | | |
1.875%, 06/01/145 | | | 175,000 | | | | 173,469 | |
Series B, 1.875%, 08/01/315 | | | 5,000 | | | | 4,569 | |
Series C, 2.375%, 05/01/32 (a)5 | | | 20,000 | | | | 19,275 | |
Missouri Pacific Railroad Co., 5.000%, 01/01/453 | | | 825,000 | | | | 723,335 | |
New Albertsons, Inc., | | | | | | | | |
6.625%, 06/01/28 | | | 1,015,000 | | | | 540,488 | |
7.450%, 08/01/29 | | | 3,195,000 | | | | 1,789,200 | |
7.750%, 06/15/26 | | | 915,000 | | | | 514,688 | |
NGPL PipeCo LLC, 7.119%, 12/15/17 (a)4 | | | 21,980,000 | | | | 23,958,200 | |
Northwest Airlines, 2007-1 Class B Pass Through Trust, Series 41091, 8.028%, 11/01/17 | | | 4,830,029 | | | | 5,222,227 | |
Owens & Minor, Inc., 6.350%, 04/15/163 | | | 1,355,000 | | | | 1,486,237 | |
Owens Corning, | | | | | | | | |
6.500%, 12/01/16 | | | 925,000 | | | | 1,039,390 | |
7.000%, 12/01/36 | | | 9,175,000 | | | | 10,151,826 | |
Panhandle Eastern Pipe Line Co., L.P., | | | | | | | | |
6.200%, 11/01/17 | | | 5,520,000 | | | | 6,605,309 | |
7.000%, 06/15/18 | | | 26,505,000 | | | | 32,295,653 | |
|
The accompanying notes are an integral part of these financial statements. 10 |
Managers Bond Fund
Schedule of Portfolio Investments (continued)
| | | | | | | | | | | | |
| | | | | | Principal Amount† | | | Value | |
| | | | | | | | | | | | |
Industrials - 28.6% (continued) | | | | | | | | | | | | |
Plains All American Pipeline L.P./PAA Finance Corp., | | | | | | | | | | | | |
6.125%, 01/15/17 | | | | | | $ | 1,770,000 | | | $ | 2,087,239 | |
6.500%, 05/01/18 | | | | | | | 8,975,000 | | | | 11,079,772 | |
Portugal Telecom International Finance, B.V., EMTN, 4.500%, 06/16/25 | | | EUR | | | | 500,000 | | | | 596,647 | |
PulteGroup, Inc., | | | | | | | | | | | | |
6.000%, 02/15/35 | | | | | | | 11,585,000 | | | | 10,774,050 | |
6.375%, 05/15/33 | | | | | | | 5,135,000 | | | | 5,122,162 | |
Qwest Capital Funding, Inc., | | | | | | | | | | | | |
6.500%, 11/15/18 | | | | | | | 620,000 | | | | 703,213 | |
6.875%, 07/15/28 | | | | | | | 1,190,000 | | | | 1,212,871 | |
7.625%, 08/03/21 | | | | | | | 2,135,000 | | | | 2,340,045 | |
Qwest Corp., | | | | | | | | | | | | |
6.875%, 09/15/33 | | | | | | | 7,209,000 | | | | 7,245,045 | |
7.200%, 11/10/26 | | | | | | | 435,000 | | | | 437,393 | |
7.250%, 09/15/25 | | | | | | | 1,185,000 | | | | 1,373,084 | |
7.250%, 10/15/35 | | | | | | | 2,165,000 | | | | 2,289,054 | |
Reliance Holdings USA, Inc., 5.400%, 02/14/22 (a) | | | | | | | 3,250,000 | | | | 3,635,050 | |
Reynolds American, Inc., | | | | | | | | | | | | |
6.750%, 06/15/17 | | | | | | | 8,170,000 | | | | 9,866,239 | |
7.250%, 06/15/37 | | | | | | | 980,000 | | | | 1,285,104 | |
Rowan Cos., Inc., 7.875%, 08/01/19 | | | | | | | 4,710,000 | | | | 5,815,753 | |
RR Donnelley & Sons Co., 8.250%, 03/15/19 | | | | | | | 2,230,000 | | | | 2,252,300 | |
Samsung Electronics Co., Ltd., 7.700%, 10/01/27 (a) | | | | | | | 3,300,000 | | | | 4,264,491 | |
Telecom Italia Capital SA, | | | | | | | | | | | | |
6.000%, 09/30/34 | | | | | | | 5,965,000 | | | | 5,830,787 | |
6.375%, 11/15/33 | | | | | | | 4,865,000 | | | | 4,901,487 | |
Telekom Malaysia Bhd, 7.875%, 08/01/25 (a) | | | | | | | 250,000 | | | | 359,042 | |
Texas Eastern Transmission, L.P., 6.000%, 09/15/17 (a) | | | | | | | 3,000,000 | | | | 3,592,863 | |
Toro Co., The, 6.625%, 05/01/373 | | | | | | | 6,810,000 | | | | 7,149,199 | |
Transocean, Inc., 7.375%, 04/15/18 | | | | | | | 500,000 | | | | 594,913 | |
UAL, Series 2007-1, 6.636%, 07/02/22 | | | | | | | 14,130,713 | | | | 15,190,516 | |
United States Steel Corp., | | | | | | | | | | | | |
6.650%, 06/01/37 | | | | | | | 3,595,000 | | | | 3,127,650 | |
7.000%, 02/01/184 | | | | | | | 7,310,000 | | | | 7,803,425 | |
US Airways, 2011-1 Class A Pass Through Trust, Series 2011 A, 7.125%, 10/22/23 | | | | | | | 3,625,825 | | | | 4,079,053 | |
USG Corp., 6.300%, 11/15/16 | | | | | | | 1,410,000 | | | | 1,459,350 | |
Vale Overseas Ltd., 6.875%, 11/21/36 | | | | | | | 3,665,000 | | | | 4,543,061 | |
Verizon New England, Inc., 7.875%, 11/15/29 | | | | | | | 2,390,000 | | | | 3,175,082 | |
Verizon Pennsylvania, Inc., 6.000%, 12/01/28 | | | | | | | 1,335,000 | | | | 1,565,069 | |
Western Union Co., The, 6.200%, 06/21/40 | | | | | | | 130,000 | | | | 132,172 | |
Weyerhaeuser Co., | | | | | | | | | | | | |
6.875%, 12/15/33 | | | | | | | 12,890,000 | | | | 15,395,636 | |
7.375%, 10/01/19 | | | | | | | 3,915,000 | | | | 4,838,689 | |
7.375%, 03/15/32 | | | | | | | 1,930,000 | | | | 2,431,945 | |
|
The accompanying notes are an integral part of these financial statements. 11 |
Managers Bond Fund
Schedule of Portfolio Investments (continued)
| | | | | | | | | | | | |
| | | | | | Principal Amount† | | | Value | |
| | | | | | | | | | | | |
Industrials - 28.6% (continued) | | | | | | | | | | | | |
White Pine Hydro LLC, | | | | | | | | | | | | |
6.310%, 07/10/17 (a)3 | | | | | | $ | 1,700,000 | | | $ | 1,689,791 | |
6.960%, 07/10/37 (a)3 | | | | | | | 1,645,000 | | | | 1,583,191 | |
Wyndham Worldwide Corp., | | | | | | | | | | | | |
5.750%, 02/01/18 | | | | | | | 950,000 | | | | 1,061,923 | |
6.000%, 12/01/16 | | | | | | | 6,430,000 | | | | 7,272,124 | |
7.375%, 03/01/20 | | | | | | | 7,220,000 | | | | 8,690,866 | |
Total Industrials | | | | | | | | | | | 678,224,228 | |
Utilities - 7.4% | | | | | | | | | | | | |
Abu Dhabi National Energy Co., 7.250%, 08/01/18 (a) | | | | | | | 21,130,000 | | | | 26,254,025 | |
Ameren Energy Generating Co., Series H, 7.000%, 04/15/184 | | | | | | | 4,500,000 | | | | 3,262,500 | |
Bruce Mansfield Unit, 6.850%, 06/01/34 | | | | | | | 9,994,601 | | | | 10,414,375 | |
DCP Midstream LLC, 6.450%, 11/03/36 (a) | | | | | | | 870,000 | | | | 994,893 | |
EDP Finance, B.V., 4.900%, 10/01/19 (a) | | | | | | | 600,000 | | | | 594,471 | |
Endesa SA/Cayman Islands, 7.875%, 02/01/27 | | | | | | | 2,900,000 | | | | 3,531,411 | |
Enel Finance International N.V., | | | | | | | | | | | | |
5.125%, 10/07/19 (a) | | | | | | | 3,700,000 | | | | 3,910,393 | |
6.000%, 10/07/39 (a) | | | | | | | 18,382,000 | | | | 17,800,155 | |
Series EMTN, 5.750%, 09/14/40 | | | GBP | | | | 210,000 | | | | 310,638 | |
Iberdrola Finance Ireland, Ltd., 3.800%, 09/11/14 (a) | | | | | | | 975,000 | | | | 1,001,459 | |
ITC Holdings Corp., 5.875%, 09/30/16 (a) | | | | | | | 2,410,000 | | | | 2,738,811 | |
Mackinaw Power LLC, 6.296%, 10/31/23 (a)3 | | | | | | | 7,284,486 | | | | 7,693,728 | |
Nisource Finance Corp., | | | | | | | | | | | | |
6.400%, 03/15/18 | | | | | | | 27,910,000 | | | | 33,645,031 | |
6.800%, 01/15/19 | | | | | | | 11,625,000 | | | | 14,265,014 | |
Southwestern Electric Power Co., 6.450%, 01/15/19 | | | | | | | 39,195,000 | | | | 47,702,432 | |
Tenaga Nasional Bhd, 7.500%, 11/01/25 (a) | | | | | | | 2,000,000 | | | | 2,783,998 | |
Total Utilities | | | | | | | | | | | 176,903,334 | |
Total Corporate Bonds and Notes (cost $1,297,083,201) | | | | | | | | | | | 1,498,604,152 | |
Foreign Government and Agency Obligations - 5.7% | | | | | | | | | | | | |
Alberta Notes, Province of, 5.930%, 09/16/16 | | | CAD | | | | 85,757 | | | | 93,785 | |
Brazil Bonds, Republic of, 10.250%, 01/10/28 | | | BRL | | | | 5,750,000 | | | | 3,699,939 | |
Brazilian Government International Bond, 8.500%, 01/05/24 | | | BRL | | | | 6,650,000 | | | | 3,954,273 | |
Canadian Government Notes, | | | | | | | | | | | | |
1.750%, 03/01/13 | | | CAD | | | | 400,000 | | | | 402,630 | |
2.500%, 06/01/15 | | | CAD | | | | 14,775,000 | | | | 15,323,845 | |
3.000%, 12/01/15 | | | CAD | | | | 15,225,000 | | | | 16,070,357 | |
3.500%, 06/01/13 | | | CAD | | | | 5,964,000 | | | | 6,056,095 | |
European Bank for Reconstruction & Development, Series GMTN, 9.000%, 04/28/14 | | | BRL | | | | 2,000,000 | | | | 1,016,264 | |
|
The accompanying notes are an integral part of these financial statements. 12 |
Managers Bond Fund
Schedule of Portfolio Investments (continued)
| | | | | | | | | | | | |
| | | | | | Principal Amount† | | | Value | |
| | | | | | | | | | | | |
Foreign Government and Agency Obligations - 5.7% (continued) | | | | | | | | | | | | |
European Investment Bank, | | | | | | | | | | | | |
Bonds, 4.946%, 03/10/216 | | | AUD | | | | 5,000,000 | | | $ | 3,484,205 | |
Notes, 4.433%, 04/24/13 (a)6 | | | IDR | | | | 50,074,770,000 | | | | 5,111,342 | |
Notes, 11.250%, 02/14/13 | | | BRL | | | | 13,490,000 | | | | 6,620,147 | |
Iceland Government International Bonds, 5.875%, 05/11/22 | | | | | | | 5,800,000 | | | | 6,475,410 | |
Inter-American Development Bank, | | | | | | | | | | | | |
Bonds, 6.000%, 12/15/17 | | | NZD | | | | 4,215,000 | | | | 3,877,133 | |
Notes, 5.184%, 05/20/136 | | | IDR | | | | 45,580,000,000 | | | | 4,647,150 | |
Notes, EMTN, 5.387%, 09/23/136 | | | IDR | | | | 33,430,000,000 | | | | 3,346,642 | |
International Bank for Reconstruction & Development Notes, GDIF, 1.430%, 03/05/14 | | | SGD | | | | 5,800,000 | | | | 4,774,864 | |
Ireland Government Bonds, | | | | | | | | | | | | |
4.500%, 04/18/20 | | | EUR | | | | 1,655,000 | | | | 2,184,469 | |
5.000%, 10/18/20 | | | EUR | | | | 995,000 | | | | 1,346,723 | |
Manitoba Bonds, Province of, 6.375%, 09/01/15 | | | NZD | | | | 5,450,000 | | | | 4,839,698 | |
New South Wales Treasury Corp., Series 813, 5.500%, 08/01/13 | | | AUD | | | | 21,225,000 | | | | 22,368,893 | |
Norway Government Bonds, 6.500%, 05/15/13 | | | NOK | | | | 53,065,000 | | | | 9,709,900 | |
Queensland Treasury Corp. Bonds, 7.125%, 09/18/17 (a) | | | NZD | | | | 7,500,000 | | | | 7,116,667 | |
Singapore Government Bond, 1.375%, 10/01/14 | | | SGD | | | | 4,400,000 | | | | 3,671,932 | |
Total Foreign Government and Agency Obligations (cost $126,344,823) | | | | | | | | | | | 136,192,363 | |
| | | |
Mortgage-Backed Securities - 0.2% | | | | | | | | | | | | |
Community Program Loan Trust, Series 87-A, Class A5, 4.500%, 04/01/29 | | | | | | $ | 2,905,591 | | | | 2,935,576 | |
Credit Suisse Mortgage Capital Certificates, Series 2007-C5, Class A4, 5.695%, 09/15/402 | | | | | | | 1,704,000 | | | | 1,974,605 | |
JPMorgan Chase Commercial Mortgage Securities Corp., Series 2007-LD11, Class A4, 5.812%, 06/15/492 | | | | | | | 80,000 | | | | 93,292 | |
WFRBS Commercial Mortgage Trust, Series 2011-C3, Class D, 5.549%, 03/15/44 (a)2 | | | | | | | 875,000 | | | | 865,302 | |
Total Mortgage-Backed Securities (cost $4,368,488) | | | | | | | | | | | 5,868,775 | |
Municipal Bonds - 1.1% | | | | | | | | | | | | |
Buckeye Tobacco Settlement Financing Authority, Series 2007 A-2, 5.875%, 06/01/473 | | | | | | | 5,035,000 | | | | 4,503,455 | |
Chicago Illinois O’Hare International Airport Revenue Bond, Series 2008-A, 4.500%, 01/01/38 (AGM Insured)7 | | | | | | | 315,000 | | | | 333,009 | |
Illinois State General Obligation, Series 2003, 5.100%, 06/01/33 | | | | | | | 2,880,000 | | | | 2,848,781 | |
Michigan Tobacco Settlement Finance Authority, Series 2006 A, 7.309%, 06/01/343 | | | | | | | 2,950,000 | | | | 2,469,858 | |
Virginia Tobacco Settlement Financing Corp., Series 2007 A-1, 6.706%, 06/01/463 | | | | | | | 21,620,000 | | | | 15,384,143 | |
Total Municipal Bonds (cost $31,514,902) | | | | | | | | | | | 25,539,246 | |
| | | |
| | | | | | Shares | | | | |
Preferred Stocks - 0.5% | | | | | | | | | | | | |
Financials - 0.5% | | | | | | | | | | | | |
Bank of America Corp., 6.375%4 | | | | | | | 20,000 | | | | 496,600 | |
Bank of America Corp., Series L, 7.250%5 | | | | | | | 7,808 | | | | 8,862,080 | |
SLM Corp., 6.000% | | | | | | | 41,250 | | | | 989,175 | |
Total Financials | | | | | | | | | | | 10,347,855 | |
|
The accompanying notes are an integral part of these financial statements. 12 |
Managers Bond Fund
Schedule of Portfolio Investments (continued)
| | | | | | | | |
| | | Shares | | | Value | |
| | | | | | | | |
Preferred Stocks - 0.5% (continued) | | | | | | | | |
Utilities - 0.0%# | | | | | | | | |
Entergy New Orleans, Inc., 4.750% | | | 482 | | | $ | 46,995 | |
Entergy New Orleans, Inc., 5.560% | | | 100 | | | | 9,894 | |
Wisconsin Electric Power Co., 3.600% | | | 3,946 | | | | 322,467 | |
Total Utilities | | | | | | | 379,356 | |
Total Preferred Stocks (cost $8,690,119) | | | | | | | 10,727,211 | |
| | |
| | | Principal Amount† | | | | |
U.S. Government and Agency Obligations - 21.5% | | | | | | | | |
Federal Home Loan Banks - 0.7% | | | | | | | | |
FHLB, 1.875%, 06/21/13 | | $ | 16,600,000 | | | | 16,735,937 | |
Federal Home Loan Mortgage Corporation - 0.7% | | | | | | | | |
FHLMC, 1.625%, 04/15/13 | | | 16,595,000 | | | | 16,666,408 | |
FHMLC Gold, 5.000%, 12/01/31 | | | 69,418 | | | | 74,914 | |
Total Federal Home Loan Mortgage Corporation | | | | | | | 16,741,322 | |
Federal National Mortgage Association - 0.2% | | | | | | | | |
FNMA, | | | | | | | | |
3.000%, 07/01/27 | | | 4,478,566 | | | | 4,733,424 | |
4.000%, 10/01/18 | | | 929,421 | | | | 997,549 | |
6.000%, 07/01/29 | | | 5,076 | | | | 5,671 | |
Total Federal National Mortgage Association | | | | | | | 5,736,644 | |
U.S. Treasury Obligations - 19.9% | | | | | | | | |
U.S. Treasury Notes, | | | | | | | | |
0.125%, 12/31/14 | | | 29,585,000 | | | | 29,511,037 | |
0.250%, 02/28/14 to 12/15/15 | | | 411,840,000 | | | | 411,939,511 | |
0.375%, 11/15/15 | | | 30,140,000 | | | | 30,168,271 | |
Total U.S. Treasury Obligations | | | | | | | 471,618,819 | |
Total U.S. Government and Agency Obligations (cost $509,934,596) | | | | | | | 510,832,722 | |
| | |
| | | Shares | | | | |
Other Investment Companies - 5.1%8 | | | | | | | | |
BNY Mellon Overnight Government Fund, 0.19%9 | | | 39,592,759 | | | | 39,592,759 | |
Dreyfus Cash Management Fund, Institutional Class Shares, 0.06% | | | 81,294,588 | | | | 81,294,588 | |
Total Other Investment Companies (cost $120,887,347) | | | | | | | 120,887,347 | |
Total Investments - 100.7% (cost $2,168,227,579) | | | | | | | 2,391,106,326 | |
Other Assets, less Liabilities - (0.7)% | | | | | | | (17,094,118 | ) |
Net Assets - 100.0% | | | | | | $ | 2,374,012,208 | |
|
The accompanying notes are an integral part of these financial statements. 14 |
Notes to Schedule of Portfolio Investments
The following footnotes and abbreviations should be read in conjunction with the Schedule of Portfolio Investments previously presented in this report.
At December 31, 2012, the approximate cost of investments of $2,168,227,579 for Federal income tax purposes and the gross aggregate unrealized appreciation and depreciation were $241,826,823 and $18,948,076, respectively, resulting in net unrealized appreciation of investments of $222,878,747.
| | † | Principal amount stated in U.S. dollars unless otherwise stated. |
| | # | Rounds to less than 0.1%. |
| | (a) | Security exempt from registration under Rule 144A of the Securities Act of 1933. This security may be resold in transactions exempt from registration, normally to qualified buyers. At December 31, 2012, the value of these securities amounted to $353,071,268, or 14.9% of net assets. |
| | (b) | Step Bond: A debt instrument with either deferred interest payments or an interest rate that resets at specific times during its term. |
| | 1 | Floating Rate Security. The rate listed is as of December 31, 2012. Date in parentheses represents the security’s next coupon rate reset. |
| | 2 | Variable Rate Security. The rate listed is as of December 31, 2012, and is periodically reset subject to terms and conditions set forth in the debenture. |
| | 3 | Illiquid Security. A security not readily convertible into cash such as a stock, bond or commodity that is not actively traded and would be difficult to sell in a timely sale. The Fund may not invest more than 15% of its net assets in illiquid securities. All illiquid securities are valued by an independent pricing agent and are fair valued at Level 2. Illiquid securities at December 31, 2012, amounted to $46,138,532, or 1.9% of net assets. |
| | 4 | Some or all of these securities, amounting to a market value of $39,090,479, or 1.7% of net assets, were out on loan to various brokers. |
| | 5 | Convertible Security. A corporate bond or preferred stock, usually a junior debenture, that can be converted, at the option of the holder, for a specific number of shares of the company’s preferred stock or common stock. Convertible Bonds and Convertible Preferred Stocks at December 31, 2012, amounted to $47,460,372, or 2.0% of net assets, and $8,862,080, or 0.4% of net assets, respectively. |
| | 6 | Represents yield to maturity at December 31, 2012. |
| | 7 | Securities in the portfolio backed by insurance of financial institutions and financial guaranty assurance agencies amounted to $333,009, or 0.01% of net assets. |
| | 8 | Yield shown for each investment company represents the December 31, 2012, seven-day average yield, which refers to the sum of the previous seven days’ dividends paid, expressed as an annual percentage. |
| | 9 | Collateral received from brokers for securities lending was invested in this short-term investment. |
The following table summarizes the inputs used to value the Fund’s net assets by the fair value hierarchy levels as of December 31, 2012: (See Note 1(a) in the Notes to the Financial Statements.)
| | | | | | | | | | | | | | | | |
| | | Quoted Prices in Active
Markets for Identical
Investments
Level 1 | | | Significant Other
Observable Inputs
Level 2 | | | Significant Unobservable Inputs
Level 3 | | | Total | |
Managers Bond Fund | | | | | | | | | | | | | | | | |
Investments in Securities | | | | | | | | | | | | | |
Asset-Backed Securities | | | — | | | $ | 51,203,342 | | | | — | | | $ | 51,203,342 | |
Bank Loan Obligations | | | — | | | | 11,525,800 | | | | — | | | | 11,525,800 | |
Common Stocks† | | $ | 19,725,368 | | | | — | | | | — | | | | 19,725,368 | |
Corporate Bonds and Notes†† | | | — | | | | 1,498,604,152 | | | | — | | | | 1,498,604,152 | |
Foreign Government and Agency Obligations | | | — | | | | 136,192,363 | | | | — | | | | 136,192,363 | |
Mortgage-Backed Securities | | | — | | | | 5,868,775 | | | | — | | | | 5,868,775 | |
Municipal Bonds | | | — | | | | 25,539,246 | | �� | | — | | | | 25,539,246 | |
Preferred Stocks† | | | 10,727,211 | | | | — | | | | — | | | | 10,727,211 | |
U.S. Government and Agency Obligations†† | | | — | | | | 510,832,722 | | | | — | | | | 510,832,722 | |
Other Investment Companies | | | 120,887,347 | | | | — | | | | — | | | | 120,887,347 | |
| | | | | | | | | | | | | | | | |
Total Investments in Securities | | $ | 151,339,926 | | | $ | 2,239,766,400 | | | | — | | | $ | 2,391,106,326 | |
| | | | | | | | | | | | | | | | |
| | † | All common stocks and preferred stocks held in the Fund are level 1 securities. For a detailed breakout of these securities, please refer to the Schedule of Portfolio Investments. |
| | †† | All corporate bonds and notes and U.S. government and agency obligations held in the Fund are level 2 securities. For a detailed breakout of the corporate bonds and notes and U.S. government and agency obligations by major industry or agency classification, please refer to the Schedule of Portfolio Investments. |
|
The accompanying notes are an integral part of these financial statements. 15 |
Notes to Schedule of Portfolio Investments (continued)
As of December 31, 2012, the Fund had no transfers between levels from the beginning of the reporting period.
Investment Abbreviations and Definitions:
| | |
AGM: | | Assured Guaranty Municipal Corp. |
EMTN: | | European Medium-Term Note |
FHLB: | | Federal Home Loan Bank |
FHLMC: | | Federal Home Loan Mortgage Corp. |
FNMA: | | Federal National Mortgage Association |
GDIF: | | Global Debt Issuance Facility |
GMTN: | | Global Multi-Currency Notes |
MBIA: | | MBIA Insurance Corp. |
MTN: | | Medium-Term Note |
Currency abbreviations have been used throughout the portfolio to indicate amounts shown in currencies other than the U.S. dollar (USD):
| | |
AUD: | | Australian Dollar |
BRL: | | Brazilian Real |
CAD: | | Canadian Dollar |
EUR: | | Euro |
GBP: | | Great Britain Pound |
IDR: | | Indonesian Rupiah |
MXN: | | Mexican Peso |
NOK: | | Norwegian Krone |
NZD: | | New Zealand Dollar |
SGD: | | Singapore Dollar |
|
The accompanying notes are an integral part of these financial statements. 16 |
Statement of Assets and Liabilities
December 31, 2012
| | | | |
Assets: | | | | |
Investments at value* (including securities on loan valued at $39,090,479) | | $ | 2,391,106,326 | |
Foreign currency** | | | 952,208 | |
Dividends, interest and other receivables | | | 24,321,282 | |
Receivable for Fund shares sold | | | 6,445,705 | |
Receivable from affiliate | | | 109,602 | |
Prepaid expenses | | | 55,019 | |
Total assets | | | 2,422,990,142 | |
Liabilities: | | | | |
Payable upon return of securities loaned | | | 39,592,759 | |
Payable for Fund shares repurchased | | | 7,046,140 | |
Accrued expenses: | | | | |
Investment advisory and management fees | | | 1,257,230 | |
Administrative fees | | | 502,892 | |
Trustees fees and expenses | | | 4,064 | |
Other | | | 574,849 | |
Total liabilities | | | 48,977,934 | |
Net Assets | | $ | 2,374,012,208 | |
Net Assets Represent: | | | | |
Paid-in capital | | $ | 2,168,844,775 | |
Undistributed net investment income | | | 513,641 | |
Accumulated net realized loss from investments and foreign currency transactions | | | (18,212,480 | ) |
Net unrealized appreciation of investments and foreign currency translations | | | 222,866,272 | |
Net Assets | | $ | 2,374,012,208 | |
Shares outstanding | | | 84,997,164 | |
Net asset value, offering and redemption price per share | | $ | 27.93 | |
* Investments at cost | | $ | 2,168,227,579 | |
** Foreign currency at cost | | $ | 960,553 | |
|
The accompanying notes are an integral part of these financial statements. 17 |
Statement of Operations
For the year ended December 31, 2012
| | | | |
Investment Income: | | | | |
Interest income | | $ | 107,331,397 | |
Dividend income | | | 1,518,769 | |
Securities lending income | | | 546,877 | |
Foreign withholding tax | | | 9,397 | |
Total investment income | | | 109,406,440 | |
Expenses: | | | | |
Investment advisory and management fees | | | 14,290,099 | |
Administrative fees | | | 5,716,040 | |
Transfer agent | | | 2,674,108 | |
Custodian | | | 348,974 | |
Reports to shareholders | | | 299,448 | |
Professional fees | | | 232,305 | |
Registration fees | | | 162,874 | |
Trustees fees and expenses | | | 135,127 | |
Extraordinary expense | | | 95,917 | |
Miscellaneous | | | 90,690 | |
Total expenses before offsets | | | 24,045,582 | |
Expense reimbursements | | | (1,313,568 | ) |
Fee waivers | | | (23,617 | ) |
Expense reductions | | | (580 | ) |
Net expenses | | | 22,707,817 | |
Net investment income | | | 86,698,623 | |
Net Realized and Unrealized Gain (Loss): | | | | |
Net realized gain on investments | | | 49,528,069 | |
Net realized gain on foreign currency transactions | | | 1,502,062 | |
Net change in unrealized appreciation (depreciation) of investments | | | 120,430,633 | |
Net change in unrealized appreciation (depreciation) of foreign currency translations | | | (214,367 | ) |
Net realized and unrealized gain | | | 171,246,397 | |
Net increase in net assets resulting from operations | | $ | 257,945,020 | |
|
The accompanying notes are an integral part of these financial statements. 18 |
Statements of Changes in Net Assets
For the year ended December 31,
| | | | | | | | |
| | | 2012 | | | 2011 | |
Increase (Decrease) in Net Assets From Operations: | | | | | | | | |
Net investment income | | $ | 86,698,623 | | | $ | 89,187,692 | |
Net realized gain on investments and foreign currency transactions | | | 51,030,131 | | | | 24,677,946 | |
Net change in unrealized appreciation (depreciation) of investments and foreign currency translations | | | 120,216,266 | | | | 3,364,692 | |
Net increase in net assets resulting from operations | | | 257,945,020 | | | | 117,230,330 | |
Distributions to Shareholders: | | | | | | | | |
From net investment income | | | (93,830,463 | ) | | | (91,439,318 | ) |
Capital Share Transactions: | | | | | | | | |
Proceeds from sale of shares | | | 661,018,738 | | | | 675,736,563 | |
Reinvestment of dividends and distributions | | | 84,754,560 | | | | 83,384,606 | |
Cost of shares repurchased | | | (657,366,515 | ) | | | (649,797,137 | ) |
Net increase from capital share transactions | | | 88,406,783 | | | | 109,324,032 | |
Total increase in net assets | | | 252,521,340 | | | | 135,115,044 | |
Net Assets: | | | | | | | | |
Beginning of year | | | 2,121,490,868 | | | | 1,986,375,824 | |
End of year | | $ | 2,374,012,208 | | | $ | 2,121,490,868 | |
End of year undistributed net investment income | | $ | 513,641 | | | $ | 143,958 | |
| | | | | | | | |
Share Transactions: | | | | | | | | |
Sale of shares | | | 24,384,005 | | | | 25,821,719 | |
Shares issued in connection with reinvestments of dividends and distributions | | | 3,120,139 | | | | 3,201,464 | |
Shares repurchased | | | (24,211,309 | ) | | | (24,893,267 | ) |
Net increase in shares | | | 3,292,835 | | | | 4,129,916 | |
|
The accompanying notes are an integral part of these financial statements. 19 |
Managers Bond Fund
Financial Highlights
For a share outstanding throughout each year
| | | | | | | | | | | | | | | | | | | | |
| | | For the year ended December 31, | |
| | | 2012 | | | 2011 | | | 2010 | | | 2009 | | | 2008 | |
Net Asset Value, Beginning of Year | | $ | 25.97 | | | $ | 25.61 | | | $ | 24.29 | | | $ | 19.65 | | | $ | 25.34 | |
Income from Investment Operations: | | | | | | | | | | | | | | | | | | | | |
Net investment income1 | | | 1.03 | | | | 1.14 | | | | 1.16 | | | | 1.30 | | | | 1.42 | |
Net realized and unrealized gain (loss) on investments1 | | | 2.04 | | | | 0.39 | | | | 1.34 | | | | 4.62 | | | | (5.42 | ) |
Total from investment operations | | | 3.07 | | | | 1.53 | | | | 2.50 | | | | 5.92 | | | | (4.00 | ) |
Less Distributions to Shareholders from: | | | | | | | | | | | | | | | | | | | | |
Net investment income | | | (1.11 | ) | | | (1.17 | ) | | | (1.18 | ) | | | (1.28 | ) | | | (1.41 | ) |
Net realized gain on investments | | | — | | | | — | | | | — | | | | — | | | | (0.28 | ) |
Total distributions to shareholders | | | (1.11 | ) | | | (1.17 | ) | | | (1.18 | ) | | | (1.28 | ) | | | (1.69 | ) |
Net Asset Value, End of Year | | $ | 27.93 | | | $ | 25.97 | | | $ | 25.61 | | | $ | 24.29 | | | $ | 19.65 | |
Total Return2 | | | 12.04 | % | | | 6.06 | % | | | 10.47 | %4 | | | 31.12 | %4 | | | (16.31 | )% |
Ratio of net expenses to average net assets | | | 0.99 | %5 | | | 0.99 | % | | | 0.99 | % | | | 0.99 | % | | | 0.99 | % |
Ratio of net investment income to average net assets2 | | | 3.79 | % | | | 4.36 | % | | | 4.59 | % | | | 5.93 | % | | | 6.10 | % |
Portfolio turnover | | | 26 | % | | | 17 | % | | | 17 | % | | | 23 | % | | | 39 | % |
Net assets at end of year (000’s omitted) | | $ | 2,374,012 | | | $ | 2,121,491 | | | $ | 1,986,376 | | | $ | 2,193,702 | | | $ | 1,888,919 | |
| | | | | | | | | | | | | | | | | | | | |
Ratios absent expense offsets:3 | | | | | | | | | | | | | | | | | | | | |
Ratio of total expenses to average net assets | | | 1.05 | % | | | 1.05 | % | | | 1.06 | % | | | 1.10 | % | | | 1.10 | % |
Ratio of net investment income to average net assets | | | 3.73 | % | | | 4.30 | % | | | 4.52 | % | | | 5.82 | % | | | 5.99 | % |
| | | | | | | | | | | | | | | | | | | | |
Notes to Financial Highlights
The following footnotes should be read in conjunction with the Financial Highlights of the Fund previously presented in this report.
| 1 | Per share numbers have been calculated using average shares. |
| 2 | Total returns and net investment income would have been lower had certain expenses not been reduced. (See Note 1(c) of Notes to Financial Statements.) |
| 3 | Excludes the impact of expense reimbursements or fee waivers and expense reductions such as brokerage credits, but includes expense repayments and non-reimbursable expenses, if any, such as interest, taxes and extraordinary expenses. (See Note 1(c) of Notes to Financial Statements.) |
| 4 | The Total Return is based on the Financial Statement Net Asset Values as shown above. |
| 5 | Includes non-routine extraordinary expenses amounting to $95,917 or 0.004% of average net assets. |
Notes to Financial Statements
December 31, 2012
| 1. | Summary of Significant Accounting Policies |
The Managers Funds (the “Trust”) is an open-end management investment company organized as a Massachusetts business trust and registered under the Investment Company Act of 1940, as amended (the “1940 Act”). Currently, the Trust consists of a number of different Funds, each having distinct investment management objectives, strategies, risks, and policies. Included in this report is the Managers Bond Fund (the “Fund”).
The Fund’s financial statements are prepared in accordance with accounting principles generally accepted in the United States of America (“U.S. GAAP”), which require management to make estimates and assumptions that affect the reported amounts of assets and liabilities and disclosure of contingent assets and liabilities at the date of the financial statements and the reported amounts of income and expenses during the reporting period. Actual results could differ from those estimates and such differences could be material. The following is a summary of significant accounting policies followed by the Fund in the preparation of its financial statements:
| a. | Valuation of Investments |
Equity securities traded on a domestic or international securities exchange are valued at the last quoted sale price, or, lacking any sales, at the last quoted bid price. Over-the-counter securities are valued at the Nasdaq Official Closing Price, if one is available. Lacking any sales, over-the-counter securities are valued at the last quoted bid price. The Fund’s investments are generally valued based on market quotations provided by third-party pricing services approved by the Board of Trustees of the Fund (the “Board”).
Fixed-income securities are valued based on valuations furnished by independent pricing services that utilize matrix systems, which reflect such factors as security prices, yields, maturities, and ratings, and are supplemented by dealer and exchange quotations. Short-term investments having a remaining maturity of 60 days or less are generally valued at amortized cost, which approximates market value. Investments in other open-end regulated investment companies are valued at their end of day net asset value per share. Investments in certain mortgage-backed and stripped mortgage-backed securities, preferred stocks, convertible securities, derivatives and other debt securities not traded on an organized securities market are valued on the basis of valuations provided by dealers or by a pricing service which uses information with respect to transactions in such securities and various relationships between such securities and yield to maturity in determining value.
Under certain circumstances, the value of certain Fund investments (including derivatives) may be based on an evaluation of fair value, pursuant to procedures established by and under the general supervision of the Board. The Pricing Committee is the committee formed by the Board to make fair value determinations for such investments. When determining the fair value of an investment, the Pricing Committee seeks to determine the price that the Fund might reasonably expect to receive from a current sale of that investment in an arm-length transaction. Fair value determinations shall be based upon consideration of all available facts and information, including, but not limited to (i) attributes specific to the investment; (ii) fundamental analytical data and press releases relating to the
investment and its issuer; (iii) the value of comparable securities or relevant financial instruments, including derivative securities, traded on other markets or among dealers; and (iv) other factors, such as future cash flows, interest rates, yield curves, volatilities, credit risks and/or default rates. The Board will be presented with a quarterly report comparing fair values determined by the Pricing Committee against subsequent market valuations for those securities. The values assigned to fair value investments are based on available information and do not necessarily represent amounts that might ultimately be realized, since such amounts depend on future developments inherent in long-term investments. Further, because of the inherent uncertainty of valuation, those estimated values may differ significantly from the values that would have been used had a ready market for the investments existed, and the differences could be material. The Fund may use the fair value of a portfolio investment to calculate its net asset value (“NAV”) when, for example, (1) market quotations are not readily available because a portfolio investment is not traded in a public market or the principal market in which the investment trades is closed, (2) trading in a portfolio investment is suspended and has not resumed before the Fund calculates its NAV, (3) a significant event affecting the value of a portfolio investment is determined to have occurred between the time of the market quotation provided for a portfolio investment and the time as of which the Fund calculates its NAV, (4) an investment’s price has remained unchanged over a period of time (often referred to as a “stale price”), or (5) Managers Investment Group LLC (the “Investment Manager”) determines that a market quotation is inaccurate. Portfolio investments that trade primarily on foreign markets are priced based upon the market quotation of such securities as of the close of their respective principal markets. Under certain circumstances, the Investment Manager may adjust such prices based on its determination of the impact of events occurring subsequent to the close of such markets but prior to the time as of which the Fund calculates its NAV. The Fund may invest in securities that may be thinly traded. The Board has adopted procedures to adjust prices of thinly traded securities that are judged to be stale so that they reflect fair value. An investment’s valued on the basis of its fair value may be valued at a price higher or lower than available market quotations. An investment valuation may differ depending on the method used and the factors considered in determining value according to the Fund’s fair value procedures.
U.S. GAAP defines fair value as the price that a Fund would receive to sell an asset or pay to transfer a liability in an orderly transaction between market participants at the measurement date. U.S. GAAP also establishes a framework for measuring fair value, and a three-level hierarchy for fair value measurements based upon the transparency of inputs to the valuation of an asset or liability. Inputs may be observable or unobservable and refer broadly to the assumptions that market participants would use in pricing the asset or liability. Observable inputs reflect the assumptions market participants would use in pricing the asset or liability based on market data obtained from sources independent of the Fund. Unobservable inputs reflect the Fund’s own assumptions about the assumptions that market participants would use in pricing the asset or liability developed based on the best information available in the
Notes to Financial Statements (continued)
circumstances. Each investment is assigned a level based upon the observability of the inputs which are significant to the overall valuation.
The three-tier hierarchy of inputs is summarized below:
Level 1 – inputs are quoted prices in active markets for identical investments (e.g., equity securities, open-end investment companies)
Level 2 – other observable inputs (including, but not limited to: quoted prices for similar assets or liabilities in markets that are active, quoted prices for identical or similar assets or liabilities in markets that are not active, inputs other than quoted prices that are observable for the assets or liabilities (such as interest rates, yield curves, volatilities, prepayment speeds, loss severities, credit risks and default rates) or other market corroborated inputs) (e.g., debt securities, government securities, foreign currency exchange contracts, foreign securities utilizing international fair value pricing, broker-quoted securities, fair valued securities with observable inputs)
Level 3 – inputs are significant unobservable inputs (including the Fund’s own assumptions used to determine the fair value of investments) (e.g., fair valued securities with unobservable inputs)
Changes in inputs or methodologies used for valuing investments may result in a transfer in or out of levels within the fair value hierarchy. The inputs or methodologies used for valuing investments are not necessarily an indication of the risk associated with investing in those investments.
Security transactions are accounted for as of trade date. Realized gains and losses on securities sold are determined on the basis of identified cost.
| c. | Investment Income and Expenses |
Dividend income is recorded on the ex-dividend date. Dividend and interest income on foreign securities is recorded net of any withholding tax. Interest income, which includes amortization of premium and accretion of discount on debt securities, is accrued as earned. Non-cash dividends included in dividend income, if any, are reported at the fair market value of the securities received. Other income and expenses are recorded on an accrual basis. Expenses that cannot be directly attributed to a Fund are apportioned among the Funds in the Trust and in some cases other affiliated funds based upon their relative average net assets or number of shareholders.
The Fund has a “balance credit” agreement with The Bank of New York Mellon (“BNYM”), the Fund’s custodian, whereby the Fund is credited with an interest factor equal to 0.75% below the effective 90-day T-Bill rate for account balances left uninvested overnight. If the T-Bill rate falls below 0.75%, no credits will be earned. These credits serve to reduce custody expenses that would otherwise be charged to the Fund. For the year ended December 31, 2012, the custodian expense was not reduced.
Overdrafts will cause a reduction of any balance credits, computed at 2% above the Federal funds rate on the day of the overdraft. For the year endedDecember 31, 2012, the Fund had no overdraft fees.
The Fund also has a balance credit arrangement with its Transfer Agent, BNY Mellon Investment Servicing (US) Inc., whereby balance credits are used to offset banking charges and other out-of-pocket expenses. For the year ended December 31, 2012, the transfer agent expense was reduced by $580.
Total returns and net investment income for the Fund would have been lower had certain expenses not been offset. Total expenses before offsets exclude the impact of expense reimbursements or fee waivers and expense reductions such as brokerage recapture credits, but include non-reimbursable expenses, if any, such as interest, taxes and extraordinary expenses.
| d. | Dividends and Distributions |
Dividends resulting from net investment income, if any, normally will be declared daily and paid monthly. Distributions of capital gains, if any, will be made on an annual basis and when required for Federal excise tax purposes. Dividends and distributions to shareholders are recorded on the ex-dividend date. Income and capital gain distributions are determined in accordance with Federal income tax regulations, which may differ from U.S. GAAP. These differences are primarily due to differing treatments for losses deferred due to wash sales, equalization accounting for tax purposes, foreign currency, futures and market discount transactions. Permanent book and tax basis differences, if any, relating to shareholder distributions will result in reclassifications to paid-in capital.
The tax character of distributions paid during the years ended December 31, 2012 and December 31, 2011 were as follows:
| | | | | | | | |
| Distributions paid from: | | 2012 | | | 2011 | |
Ordinary income | | $ | 93,830,463 | | | $ | 91,439,318 | |
Short-term capital gains | | | — | | | | — | |
Long-term capital gains | | | — | | | | — | |
| | | | | | | | |
Total | | $ | 93,830,463 | | | $ | 91,439,318 | |
| | | | | | | | |
As of December 31, 2012, the components of distributable earnings (excluding unrealized/depreciation) on a tax basis consisted of:
| | | | |
Capital loss carryforward | | $ | 18,212,480 | |
Undistributed ordinary income | | | 505,296 | |
Undistributed short-term capital gains | | | — | |
Undistributed long-term capital gains | | | — | |
Post-October loss deferral | | | — | |
The Fund intends to comply with the requirements under Subchapter M of the Internal Revenue Code of 1986, as amended, and to distribute substantially all of its taxable income and gains to its shareholders and to meet certain diversification and income requirements with respect to investment companies. Therefore, no provision for Federal income or excise tax is included in the accompanying financial statements.
Additionally, based on the Fund’s understanding of the tax rules and rates related to income, gains and transactions for the foreign jurisdictions in which it invests, the Fund will provide for foreign taxes, and where appropriate, deferred foreign taxes.
Notes to Financial Statements (continued)
Management has analyzed the Fund’s tax positions taken on Federal income tax returns as of December 31, 2012 and for all open tax years, and has concluded that no provision for federal income tax is required in the Fund’s financial statements. Additionally, the Fund is not aware of any tax position for which it is reasonably possible that the total amounts of unrecognized tax benefits will change materially in the next twelve months.
Under the Regulated Investment Company Modernization Act of 2010, post-enactment capital losses may be carried forward for an unlimited time period. However, any new losses incurred will be required to be utilized prior to any loss carryovers incurred in pre-enactment taxable years, which generally expire eight years following the close of the taxable year in which they were incurred. As a result of this ordering rule, pre-enactment capital loss carryovers may be more likely to expire unused. Additionally, post-enactment capital losses that are carried forward retain their tax character as either short-term or long-term capital losses rather than being considered all short-term as under previous law.
| f. | Capital Loss Carryovers and Deferrals |
As of December 31, 2012, the Fund had accumulated net realized capital loss carryovers from securities transactions for Federal income tax purposes as shown in the following chart. These amounts may be used to offset future realized capital gains, if any, through the expiration dates listed or in the case of post-enactment losses, for an unlimited time period.
| | | | | | | | | | |
| | | Capital Loss Carryover Amounts | | | |
| | | |
| | | Short-Term | | | Long-Term | | | Expires
December 31, |
(Pre-Enactment) | | $ | 2,905,184 | | | | — | | | 2017 |
(Pre-Enactment) | | | 15,307,296 | | | | — | | | 2018 |
| | | | | | | | | | |
Total | | $ | 18,212,480 | | | | — | | | |
| | | | | | | | | | |
For the year ended December 31, 2012, the Fund utilized capital loss carryovers in the amount of:
| | | | | | | | |
| | | Capital Loss Carryovers Utilized | |
| | |
| | | Short-Term | | | Long-Term | |
| | $ | 43,528,608 | | | | — | |
The Trust’s Declaration of Trust authorizes for each series the issuance of an unlimited number of shares of beneficial interest, without par value. The Fund records sales and repurchases of its capital stock on the trade date. The cost of securities contributed to the Fund in connection with the issuance of shares is based on the valuation of those securities in accordance with the Fund’s policy on investment valuation.
At December 31, 2012, certain unaffiliated shareholders of record, specifically omnibus accounts, individually or collectively held greater than 10% of the outstanding shares of the Fund as follows: three collectively own 62%. Transactions by these shareholders may have a material impact on the Fund.
| h. | Foreign Currency Translation |
The books and records of the Fund are maintained in U.S. dollars. The value of investments, assets and liabilities denominated in currencies other than U.S. dollars are translated into U.S. dollars based upon current foreign exchange rates. Purchases and sales of foreign investments, income and expenses are converted into U.S. dollars based on currency exchange rates prevailing on the respective dates of such transactions. Net realized and unrealized gain (loss) on foreign currency transactions represent: (1) foreign exchange gains and losses from the sale and holdings of foreign currencies; (2) gains and losses between trade date and settlement date on investment securities transactions and forward foreign currency exchange contracts; and (3) gains and losses from the difference between amounts of interest and dividends recorded and the amounts actually received.
The Fund does not isolate the net realized and unrealized gain or loss resulting from changes in exchange rates from the fluctuations in market prices of securities held. Such fluctuations are included with the net realized and unrealized gain or loss on investments.
The Fund invests in securities of foreign entities and in instruments denominated in foreign currencies which involve risks not typically associated with investments in domestic securities. Non-domestic securities carry special risks, such as exposure to currency fluctuations, less developed or less efficient trading markets, political instability, a lack of company information, differing auditing and legal standards, and, potentially, less liquidity.
Realized gains in certain countries may be subject to foreign taxes at the Fund level, at rates ranging from approximately 10% to 15%. The Fund would pay such foreign taxes on net realized gains at the appropriate rate for each jurisdiction.
| 2. | Agreements and Transactions with Affiliates |
The Trust has entered into an Investment Management Agreement under which the Investment Manager, a subsidiary of Affiliated Managers Group, Inc. (“AMG”), serves as investment manager to the Fund and is responsible for the Fund’s overall administration and operations. The Investment Manager selects subadvisors for the Fund (subject to Board approval) and monitors each subadvisor’s investment performance, security holdings and investment strategies. The Fund’s investment portfolio is managed by Loomis, Sayles & Co., L.P. which serves pursuant to a subadvisory agreement with the Investment Manager.
Investment management fees are paid directly by the Fund to the Investment Manager based on average net assets. The annual investment management fee rate, as a percentage of average daily net assets, for the year ended December 31, 2012, was 0.625%.
The Investment Manager has contractually agreed, through at least May 1, 2013, to waive fees and pay or reimburse Fund expenses in order to limit total annual Fund operating expenses after fee waiver and expense reimbursements (exclusive of taxes, interest (including interest incurred in connection with bank and custody overdrafts), brokerage commissions and other transaction costs, acquired fund fees and expenses, and extraordinary expenses) to 0.99% of the Fund’s average daily net assets subject to later reimbursement by the Fund in certain circumstances.
Notes to Financial Statements (continued)
The Fund is obligated to repay the Investment Manager such amounts waived, paid or reimbursed in future years provided that the repayment occurs within thirty-six (36) months after the waiver or reimbursement and that such repayment would not cause the Fund’s total operating expenses in any such future year to exceed the Fund’s expense cap. For the year ended December 31, 2012, the Fund’s components of reimbursement available are detailed in the following chart:
| | | | |
Reimbursement Available - 12/31/11 | | $ | 5,150,846 | |
Additional Reimbursements | | | 1,313,568 | |
Repayments | | | — | |
Expired Reimbursements | | | (2,318,870 | ) |
| | | | |
Reimbursement Available - 12/31/12 | | $ | 4,145,544 | |
| | | | |
The Investment Manager has agreed to waive a portion of its management fee in consideration of shareholder servicing fees that it has received from JPMorgan Distribution Services, Inc., with respect to short-term cash investments the Fund may have made in JPMorgan Liquid Assets Money Market Fund, Capital Shares. For the year ended December 31, 2012, the management fee was reduced by $23,617.
The Fund has entered into an Administration and Shareholder Servicing Agreement under which the Investment Manager serves as the Fund’s administrator (the “Administrator”) and is responsible for all aspects of managing the Fund’s operations, including administration and shareholder services to the Fund, its shareholders, and certain institutions, such as bank trust departments, brokerdealers and registered investment advisers, that advise or act as an intermediary with the Fund’s shareholders. The Fund pays a fee to the Administrator at the rate of 0.25% per annum of the Fund’s average daily net assets for this service.
The aggregate annual retainer paid to each Independent Trustee of the Board is $80,000, plus $5,000 or $2,500 for each regular or special meeting attended, respectively. The Independent Chairman of the Trust receives an additional payment of $20,000 per year. The Chairman of the Audit Committee receives an additional payment of $8,000 per year. The Trustees’ fees and expenses are allocated among all of the Funds for which the Investment Manager serves as the advisor (the “Managers Funds”) based on the relative net assets of such Funds. The “Trustees fees and expenses” shown in the financial statements represents the Fund’s allocated portion of the total fees and expenses paid by the Managers Funds.
Beginning January 1, 2013, the annual retainer paid to each Independent Trustee of the Board will be $105,000, plus $6,000 or $2,500 for each regular or special meeting attended, respectively. The Independent Chairman of the Trusts will receive an additional payment of $25,000 per year. The Chairman of the Audit Committee will receive an additional payment of $10,000 per year.
The Fund is distributed by Managers Distributors, Inc. (the “Distributor” or “MDI”), a wholly-owned subsidiary of the Investment Manager. MDI serves as the distributor and underwriter
for the Fund and is a registered broker-dealer and member of the Financial Industry Regulatory Authority, Inc. (“FINRA”). Shares of the Fund will be continuously offered and will be sold directly to prospective purchasers through brokers, dealers or other financial intermediaries who have executed selling agreements with MDI. Subject to the compensation arrangement discussed below, generally MDI bears all or a portion of the expenses of providing services pursuant to the distribution agreement, including the payment of the expenses relating to the distribution of prospectuses for sales purposes and any advertising or sales literature. Certain Trustees and Officers of the Fund are Officers and/or Directors of the Investment Manager, AMG and/or the Distributor.
Additional expenses to the Fund include payments to third parties who maintain omnibus accounts; these payments to third parties represent shareholder recordkeeping services and are expected not to exceed 0.10% of the Fund’s average daily net assets. The actual expense and the impact on the expense ratio for the year ended December 31, 2012 was $2,286,400, or 0.10%.
The Securities and Exchange Commission granted an exemptive order that permits the Fund to lend and borrow money for certain temporary purposes directly to and from other eligible Managers Funds. Participation in this interfund lending program is voluntary for both borrowing and lending funds, and an interfund loan is only made if it benefits each participating fund. The Investment Manager administers the program according to procedures approved by the Board, and the Board monitors the operation of the program. An interfund loan must comply with certain conditions set out in the exemptive order, which are designed to assure fairness and protect all participating funds. For the year ended December 31, 2012, the Fund lent to other Managers Funds varying amounts not exceeding $18,086,305 for 5 days earning interest of $615. The interest earned is included in the Statement of Operations as interest income. For the same period, the Fund did not borrow from any other Managers Funds. At December 31, 2012, the Fund had no loans outstanding.
For the year ended December 31, 2012, the Fund executed the following transactions at the closing price of the security and with no commissions under Rule 17a-7 procedures approved by the Board:
November 15, 2012 - bought 600,000 shares of EDP Finance, B.V., 4.90%, 10/01/19 at $97.38 from Managers Fixed Income Fund.
November 15, 2012 - bought 75,000 shares of HCA, Inc., 7.500%, 11/06/33 at $98.50 from Managers Fixed Income Fund.
November 15, 2012 - bought 2,745,000 shares of Old Republic International Corp., 3.750%, 3/15/18 at $102.88 from Managers Fixed Income Fund.
November 15, 2012 - bought 500,000 shares of Portugal Telecom International Finance, B.V., EMTN, 4.500%, 6/16/25 at $87.00 from Managers Fixed Income Fund.
November 15, 2012 - bought 1,265,000 shares of PulteGroup, Inc., 6.000%, 2/15/35 at $94.00 from Managers Fixed Income Fund.
November 15, 2012 - bought 465,000 shares of PulteGroup, Inc. 6.375%, 5/15/33 at $97.25 from Managers Fixed Income Fund.
Notes to Financial Statements (continued)
November 15, 2012 - bought 1,080,000 shares of Telecom Italia Capital SA, 6.000%, 9/30/34 at $92.00 from Managers Fixed Income Fund.
November 15, 2012 - bought 725,000 shares of Telecom Italia Capital SA, 6.375%, 11/15/33 at $95.19 from Managers Fixed Income Fund.
| 3. | Purchases and Sales of Securities |
Purchases and sales of securities (excluding short-term securities and U.S. Government obligations) for the year ended December 31, 2012, were $258,573,687 and $458,248,814, respectively.
Purchases and sales of U.S. Government obligations for the year ended December 31, 2012, were $557,608,236 and $88,314,808, respectively.
| 4. | Portfolio Securities Loaned |
The Fund participates in a securities lending program offered by BNYM (the “Program”), providing for the lending of securities to qualified brokers. Securities lending income include earnings of such temporary cash investments, plus or minus any rebate to a borrower. These earnings (after any rebate) are then divided between BNYM, as a fee for its services under the program, and the Fund, according to agreed-upon rates. Collateral on all securities loaned is accepted in cash and/or government securities and is maintained at a minimum level of 102% (105% in the case of certain foreign securities) of the market value, plus interest, if applicable, of investments on loan. It is the Fund’s policy to obtain additional collateral from or return excess collateral to the borrower by the end of the next business day, following the valuation date of the securities loaned. Therefore, the value of the collateral held may be temporarily less than the value of the securities on loan. Lending securities entails a risk of loss to the Fund if and to the extent that the market value of the securities loaned were to increase and the borrower did not increase the collateral accordingly, and the borrower fails to return the securities. Under the terms of the Program, the Fund is indemnified for such losses by BNYM. The Fund bears the risk of any deficiency in the amount of the collateral available for return to the borrower due to any loss on the collateral invested. Collateral received in the form of cash is invested temporarily in the BNY Mellon Overnight Government Fund, or other short-term investments as defined in the Securities Lending Agreement with BNYM. For the year ended December 31, 2012, the Fund participated in the program.
| 5. | Commitments and Contingencies |
In the normal course of business, the Fund may enter into contracts and agreements that contain a variety of representations and warranties, which provide general indemnifications. The maximum exposure to the Fund under these arrangements is unknown, as this would involve future claims that may be made against the Fund that have not yet occurred. However, the Fund has had no prior claims or losses and expects the risks of loss to be remote.
| 6. | Risks Associated with High Yield Securities |
Investing in high yield securities involves greater risks and considerations not typically associated with U.S. Government and other high quality/investment grade securities. High Yield securities
are generally below investment grade securities and do not have an established retail secondary market. Economic downturns may disrupt the high yield market and impair the issuer’s ability to repay principal and interest. Also, an increase in interest rates would likely have an adverse impact on the value of such obligations and could cause the securities to become less liquid.
Certain transactions, such as futures and forward transactions, dollar roll agreements, or purchases of when-issued or delayed delivery securities may have a similar effect on the Fund net asset value as if the Fund had created a degree of leverage in its portfolio. However, if the Fund enters into such a transaction, the Fund will establish a segregated account with its custodian in which it will maintain cash, U.S. government securities or other liquid securities equal in value to its obligations in respect to such transaction. Securities and other assets held in the segregated account may not be sold while the transaction is outstanding, unless other suitable assets are substituted.
| 8. | Forward Foreign Currency Contracts |
During the year ended December 31, 2012, the Fund invested in forward foreign currency contracts to facilitate transactions in foreign securities and to hedge against foreign currency exchange rate risk on its non-U.S. dollar denominated investment securities.
A forward foreign currency contract is an agreement between a fund and another party to buy or sell a currency at a set price at a future date. The market value of the contract will fluctuate with changes in currency exchange rates. The contract is marked-to-market daily, and the change in market value is recorded as an unrealized gain or loss. Gain or loss on the purchase or sale of contracts having the same settlement date, amount and counterparty is realized on the date of offset, otherwise gain or loss is realized on the settlement date.
| 9. | New Accounting Pronouncements |
In December 2011, the FASB issued ASU No. 2011-11, “Disclosures about Offsetting Assets and Liabilities.” ASU 2011-11 requires disclosures to make financial statements that are prepared under U.S. GAAP more comparable to those prepared under IFRS. The new disclosure requirements mandate that entities disclose both gross and net information about instruments and transactions eligible for offset in the statement of assets and liabilities as well as instruments and transactions subject to an agreement similar to a master netting arrangement. In addition, ASU 2011-11 requires disclosure of collateral received and posted in connection with master netting agreements or similar arrangements. New disclosures are required for annual reporting periods beginning on or after January 1, 2013, and interim periods within those annual periods. Management is evaluating the impact of ASU 2011-11 on the Fund’s financial statements and disclosures.
The Fund has determined that no material events or transactions occurred through the issuance date of the Fund’s financial statements, which require additional disclosure in or adjustment of the Fund’s financial statements.
Notes to Financial Statements (continued)
Tax Information(unaudited)
The Managers Bond Fund hereby designates the maximum amount allowable of its net taxable income as qualified dividends as provided in the Jobs and Growth Tax Relief Reconciliation Act of 2003. The 2012 Form 1099-DIV you receive for the Fund will show the tax status of all distributions paid to you during the year.
| | | | | | | | |
| | | 2012 | | | 2011 | |
Ordinary Income - QDI | | | 1.42 | % | | | 1.60 | % |
Ordinary Income - DRD | | | 1.42 | % | | | 0.61 | % |
Pursuant to section 852 of the Internal Revenue Code, Managers Bond Fund hereby designates $0, as a capital gain distribution with respect to the taxable year ended December 31, 2012, or if subsequently determined to be different, the net capital gains of such year.
Report of Independent Registered Public Accounting Firm
To the Board of Trustees of The Managers Funds and the Shareholders of Managers Bond Fund:
In our opinion, the accompanying statement of assets and liabilities, including the schedule of portfolio investments, and the related statements of operations and of changes in net assets and the financial highlights present fairly, in all material respects, the financial position of Managers Bond Fund (the “Fund”) at December 31, 2012, and the results of its operations, the changes in its net assets and the financial highlights for each of the periods indicated, in conformity with accounting principles generally accepted in the United States of America. These financial statements and financial highlights (hereafter referred to as “financial statements”) are the responsibility of the Funds’ management. Our responsibility is to express an opinion on these financial statements based on our audits. We conducted our audits of these financial statements in accordance with the standards of the Public Company Accounting Oversight Board (United States). Those standards require that we plan and perform the audit to obtain reasonable assurance about whether the financial statements are free of material misstatement. An audit includes examining, on a test basis, evidence supporting the amounts and disclosures in the financial statements, assessing the accounting principles used and significant estimates made by management, and evaluating the overall financial statement presentation. We believe that our audits, which included confirmation of securities at December 31, 2012 by correspondence with the custodian and agent bank provide a reasonable basis for our opinion.
PricewaterhouseCoopers LLP
Boston, Massachusetts
February 27, 2013
Trustees and Officers
The Trustees and Officers of the Trust, their business addresses, principal occupations for the past five years and dates of birth are listed below. The Trustees provide broad supervision over the affairs of the Trust and the Funds. The Trustees are experienced executives who meet periodically throughout the year to oversee the Funds’ activities, review contractual arrangements with companies that provide services to the Funds, and review the Funds’ performance. Unless otherwise noted, the address of each Trustee or Officer is the address of the Trust: 800 Connecticut Avenue, Norwalk, Connecticut 06854.
There is no stated term of office for Trustees. Trustees serve until their resignation, retirement or removal in accordance with the Trust’s organizational documents and policies adopted by the Board from time to time. The Chairman of the Trustees, President, Treasurer and Secretary of the Trust are elected by the Trustees annually. Other officers hold office at the pleasure of the Trustees.
Independent Trustees
The following Trustees are not “interested persons” of the Trust within the meaning of the 1940 Act:
| | |
Name, Date of Birth, Number of Funds Overseen in Fund Complex* | | Principal Occupation(s) During Past 5 Years and Other Directorships Held by Trustee |
Bruce B. Bingham, 12/01/48 • Trustee since 2012 • Oversees 37 Funds in Fund Complex | | Partner, Hamilton Partners (real estate development firm) (1987-Present). |
| |
William E. Chapman, II, 9/23/41 • Independent Chairman • Trustee since 1999 • Oversees 37 Funds in Fund Complex | | President and Owner, Longboat Retirement Planning Solutions (1998-Present); Hewitt Associates, LLC (part time) (provider of Retirement and Investment Education Seminars) (2002-2009); Trustee of Bowdoin College (2002-Present);Director of Harding, Loevner Funds, Inc. (6 portfolios); Trustee of Third Avenue Trust (5 portfolios); Trustee of Third Avenue Variable Trust (1 portfolio); Trustee of Aston Funds (26 portfolios). |
| |
Edward J. Kaier, 9/23/45 • Trustee since 1999 • Oversees 37 Funds in Fund Complex | | Attorney at Law and Partner, Teeters Harvey Gilboy & Kaier LLP (2007-Present); Attorney at Law and Partner, Hepburn Willcox Hamilton & Putnam, LLP (1977-2007); Trustee of Third Avenue Trust (5 portfolios); Trustee of Third Avenue Variable Trust (1 portfolio); Trustee of Aston Funds (26 portfolios). |
| |
Steven J. Paggioli, 4/3/50 • Trustee since 2004 • Oversees 37 Funds in Fund Complex | | Independent Consultant (2002-Present); Formerly Executive Vice President and Director, The Wadsworth Group (1986-2001); Executive Vice President, Secretary and Director, Investment Company Adminis- tration, LLC (1990-2001); Vice President, Secretary and Director, First Fund Distributors, Inc. (1991-2001); Trustee, Professionally Managed Portfolios (38 portfolios); Advisory Board Member, Sustainable Growth Advisors, LP; Independent Director, Chase Investment Counsel (2008 – Present); Trustee of Aston Funds (26 portfolios). |
| |
Eric Rakowski, 6/5/58 • Trustee since 1999 • Oversees 37 Funds in Fund Complex | | Professor, University of California at Berkeley School of Law (1990-Present); Director of Harding, Loevner Funds, Inc. (6 portfolios); Trustee of Third Avenue Trust (5 portfolios); Trustee of Third Avenue Variable Trust (1 portfolio); Trustee of Aston Funds (26 portfolios). |
| |
Thomas R. Schneeweis, 5/10/47 • Trustee since 2004 • Oversees 37 Funds in Fund Complex | | Professor of Finance, University of Massachusetts (1977-Present); Director, CISDM at the University of Massachusetts, (1996-Present); President, Alternative Investment Analytics, LLC, (formerly Schneeweis Partners, LLC) (2001-Present); Partner, S Capital Management, LLC (2007-Present); President, TRS Associates (1982-Present); Partner, White Bear Partners, LLC (2007-2010); Partner, Northampton Capital Management, LLC (2004-2010); Trustee of Aston Funds (26 portfolios). |
| * | The Fund Complex consists of Managers AMG Funds, The Managers Funds, Managers Trust I and Managers Trust II. |
Interested Trustees
Each Trustee in the following table is an “interested person” of the Trust within the meaning of the 1940 Act. Mr. Streur is an interested person of the Trust within the meaning of the 1940 Act by virtue of his positions with the Investment Manager and Managers Distributors, Inc. and because of his service as President of the Trust. Ms. Carsman is an
interested person of the Trust within the meaning of the 1940 Act by virtue of her position with, and interest in securities of, AMG, and her former position as Chief Legal Officer of the Trust.
| | |
Name, Date of Birth, Number of Funds Overseen in Fund Complex* | | Principal Occupation(s) During Past 5 Years and Other Directorships Held by Trustee |
Christine C. Carsman, 4/2/52 • Trustee since 2011 • Oversees 37 Funds in Fund Complex | | Senior Vice President and Deputy General Counsel, Affiliated Managers Group, Inc. (2011-Present); Senior Vice President and Chief Regulatory Counsel, Affiliated Managers Group, Inc. (2007-2011); Vice President and Chief Regulatory Counsel, Affiliated Managers Group, Inc. (2004-2007); Secretary and Chief Legal Officer, Managers AMG Funds, The Managers Funds, Managers Trust I and Managers Trust II (2004-2011); Senior Counsel, Vice President and Director of Operational Risk Management and Compliance, Wellington Management Company, LLP (1995-2004). |
| |
Officers | | |
Name, Date of Birth, Position(s) Held with Fund and Length of Time Served | | Principal Occupation(s) During Past 5 Years |
Keitha L. Kinne, 5/16/58 • President since 2012 • Chief Operating Officer since 2007 | | Managing Partner and Chief Operating Officer, Managers Investment Group LLC (2007-Present); Chief Investment Officer, Managers Investment Group LLC (2008-Present); President, Managers Distributors, Inc. (2012-Present); Chief Operating Officer, The Managers Funds, Managers Trust I and Managers Trust II (2007-Present); Managing Director, Legg Mason & Co., LLC (2006-2007); Managing Director, Citigroup Asset Management (2004-2006). |
| |
Lewis Collins, 2/26/66 • Secretary since 2011 • Chief Legal Officer since 2011 | | Senior Vice President and Senior Counsel, Affiliated Managers Group, Inc. (2010-Present); Vice President and Senior Counsel, Affiliated Managers Group, Inc. (2006-2010); Senior Counsel, Affiliated Managers Group, Inc. (2002-2006); Attorney, Ropes & Gray LLP (1998-2002). |
| |
Donald S. Rumery, 5/29/58 • Chief Financial Officer since 2007 • Treasurer since 1995 | | Senior Vice President, Managers Investment Group LLC (2005-Present); Treasurer, Managers AMG Funds (1999-Present); Treasurer, Managers Trust I and Managers Trust II (2000-Present); Chief Financial Officer, Managers AMG Funds, Managers Trust I and Managers Trust II (2007-Present); Treasurer and Chief Financial Officer, Managers Distributors, Inc. (2000-2012); Vice President, The Managers Funds LLC, (1994-2004). |
| |
John J. Ferencz, 3/09/62 • Chief Compliance Officer since 2010 | | Vice President, Legal and Compliance, Managers Investment Group LLC (2010-Present); Senior Compliance Analyst, Mutual Funds and Regulatory, GE Asset Management Incorporated (2005-2010). |
| |
Michael S. Ponder, 9/12/73 • Assistant Secretary since 2011 | | Senior Vice President and Counsel, Managers Investment Group LLC (2011-Present); Attorney, DeNovo Legal (2009-2010); Vice President, Credit Suisse (2007-2009); Associate, Willkie Farr & Gallagher LLP (2006-2007). |
| |
Matthew B. Wallace, 11/24/80 • Anti-Money Laundering Compliance Officer since 2012 | | Senior Associate, Legal and Compliance, Managers Investment Group LLC (2012-Present); Associate, Legal and Compliance, Managers Investment Group LLC (2010-2012); Compliance Specialist, Calamos Advisors LLC (2007-2010). |
THIS PAGE INTENTIONALLY LEFT BLANK
THIS PAGE INTENTIONALLY LEFT BLANK
THIS PAGE INTENTIONALLY LEFT BLANK
Investment Manager and Administrator
Managers Investment Group LLC
800 Connecticut Avenue
Norwalk, CT 06854
(800) 835-3879
Distributor
Managers Distributors, Inc.
800 Connecticut Avenue
Norwalk, CT 06854
(800) 835-3879
Custodian
The Bank of New York Mellon
2 Hanson Place
Brooklyn, NY 11217
Legal Counsel
Ropes & Gray LLP
Prudential Tower, 800 Boylston Street
Boston, MA 02199-3600
Transfer Agent
BNY Mellon Investment Servicing (US) Inc.
Attn: Managers
P.O. Box 9769
Providence, RI 02940
(800) 548-4539
For ManagersChoiceTM Only
Managers
c/o BNY Mellon Investment Servicing (US) Inc.
P.O. Box 9847
Providence, RI 02940-8047
(800) 358-7668

MANAGERSAND Managers AMG FUNDS
| | | | |
EQUITY FUNDS | | BALANCED FUNDS |
CADENCE CAPITAL APPRECIATION CADENCE MID-CAP CADENCE EMERGING COMPANIES Cadence Capital Management, LLC ESSEX SMALL/MICRO CAP GROWTH Essex Investment Management Co., LLC FQ TAX-MANAGED U.S. EQUITY FQ U.S. EQUITY First Quadrant, L.P. FRONTIER SMALL CAP GROWTH Frontier Capital Management Company, LLC GW&K SMALL CAP EQUITY Gannett Welsh & Kotler, LLC MICRO-CAP Lord, Abbett & Co. LLC WEDGE Capital Management L.L.P. Next Century Growth Investors LLC RBC Global Asset Management (U.S.) Inc. REAL ESTATE SECURITIES Urdang Securities Management, Inc. RENAISSANCE LARGE CAP GROWTH Renaissance Group LLC | | SKYLINE SPECIAL EQUITIES PORTFOLIO Skyline Asset Management, L.P. SPECIAL EQUITY Ranger Investment Management, L.P. Lord, Abbett & Co. LLC Smith Asset Management Group, L.P. Federated MDTA LLC SYSTEMATIC VALUE SYSTEMATIC MID CAP VALUE Systematic Financial Management, L.P. TIMESQUARE INTERNATIONAL SMALL CAP FUND TIMESSQUARE MID CAP GROWTH TIMESSQUARE SMALL CAP GROWTH TSCM GROWTH EQUITY TimesSquare Capital Management, LLC TRILOGY GLOBAL EQUITY TRILOGY EMERGING MARKETS EQUITY TRILOGY INTERNATIONAL SMALL CAP Trilogy Global Advisors, L.P. YACKTMAN FUND YACKTMAN FOCUSED FUND Yacktman Asset Management L.P. | | CHICAGO EQUITY PARTNERS BALANCED Chicago Equity Partners, LLC ALTERNATIVE FUNDS FQ GLOBAL ALTERNATIVES FQ GLOBAL ESSENTIALS First Quadrant, L.P. INCOME FUNDS BOND (MANAGERS) GLOBAL INCOME OPPORTUNITY Loomis, Sayles & Co., L.P. BOND (MANAGERS PIMCO) Pacific Investment Management Co. LLC CALIFORNIA INTERMEDIATE TAX-FREE Miller Tabak Asset Management LLC GW&K FIXED INCOME FUND GW&K MUNICIPAL BOND GW&K MUNICIPAL ENHANCED YIELD BOND Gannett Welsh & Kotler, LLC HIGH YIELD J.P. Morgan Investment Management LLC INTERMEDIATE DURATION GOVERNMENT SHORT DURATION GOVERNMENT Smith Breeden Associates, Inc. |
| | |
This report is prepared for the Fund’s shareholders. It is authorized for distribution to prospective investors only when preceded or accompanied by an effective prospectus. To receive a free copy of the prospectus or Statement of Additional Information, which includes additional information about Fund Trustees, please contact us by calling 800.835.3879. Distributed by Managers Distributors, Inc., member FINRA. A description of the policies and procedures each Fund uses to vote its proxies is available: (i) without charge, upon request, by calling 800.835.3879, or (ii) on the Securities and Exchange Commission’s (SEC) Web site at www. sec.gov. For information regarding each Fund’s proxy voting record for the 12-month period ended June 30, call 800.835.3879 or visit the SEC Web site at www.sec.gov. The Fund files its complete schedule of portfolio holdings with the SEC for the first and third quarters of each fiscal year on Form N-Q. The Funds’ Forms N-Q are available on the SEC’s Web site at www.sec.gov. A Fund’s Forms N-Q may be reviewed and copied at the SEC’s Public Reference Room in Washington, DC. Information on the operation of the Public Reference Room may be obtained by calling 800.SEC.0330. To review a complete list of the Fund’s portfolio holdings, or to view the most recent quarterly holdings report, semiannual report, or annual report, please visit www.managersinvest.com. | | |

Managers Global Income Opportunity Fund
Annual Report — December 31, 2012
| | | | |
TABLE OF CONTENTS | | Page | |
| |
LETTER TO SHAREHOLDERS | | | 1 | |
| |
ABOUT YOUR FUND’S EXPENSES | | | 2 | |
| |
PORTFOLIO MANAGER’S COMMENTS, FUND SNAPSHOTS, AND SCHEDULE OF PORTFOLIO INVESTMENTS | | | 3 | |
| |
NOTES TO THE SCHEDULE OF PORTFOLIO INVESTMENTS | | | 11 | |
| |
FINANCIAL STATEMENTS | | | | |
| |
Statement of Assets and Liabilities | | | 15 | |
Balance sheet, net asset value (NAV) per share computation and cumulative undistributed amounts | | | | |
| |
Statement of Operations | | | 16 | |
Detail of sources of income, expenses, and realized and unrealized gains (losses) during the year | | | | |
| |
Statements of Changes in Net Assets | | | 17 | |
Detail of changes in assets for the past two years | | | | |
| |
FINANCIAL HIGHLIGHTS | | | 18 | |
Historical net asset values per share, distributions, total returns, income and expense ratios, turnover ratios and net assets | | | | |
| |
NOTES TO FINANCIAL STATEMENTS | | | 19 | |
Accounting and distribution policies, details of agreements and transactions with Fund management and affiliates, and descriptions of certain investment risks | | | | |
| |
REPORT OF INDEPENDENT REGISTERED PUBLIC ACCOUNTING FIRM | | | 25 | |
| |
TRUSTEES AND OFFICERS | | | 26 | |
Nothing contained herein is to be considered an offer, sale or solicitation of an offer to buy shares of any series of the Managers Family of Funds. Such offering is made only by Prospectus, which includes details as to offering price and other material information.
Letter to Shareholders
Dear Shareholder:
Thank you for your investment in The Managers Funds. Our foremost goal at Managers Investment Group (MIG) is to provide investment products and solutions that help our shareholders and clients successfully reach their investment goals and objectives. We do this by offering a broad selection of funds managed by a collection of Affiliated Managers Group’s (AMG) Affiliate investment boutiques, along with a complementary series of open-architecture mutual funds.
The past year has been an exciting one for us at MIG. In connection with AMG’s investment in Yacktman Asset Management (“Yacktman”), MIG partnered with Yacktman in reorganizing the Yacktman Focused Fund and the Yacktman Fund into The Managers Funds. The addition of the Yacktman Funds to our platform brought our total assets under management to over $25 billion at the end of 2012.
Additionally, in an effort to better meet our shareholders’ needs as well as bring consistency across our funds, we restructured our share class offerings across many of our Funds, which included discontinuing certain share classes with sales charges (commonly called sales loads). As a result, many of our Funds now offer three No Load share classes – Investor, Service, and Institutional Share Classes. We believe this simplified structure makes it easier for our clients as well as Financial Advisors to select the appropriate share class to match their needs.
During 2012, we also executed on other changes to certain Funds, which included reducing expense ratios on several Funds to ensure that our offerings remain competitive and affordable for our clients.
As we enter into 2013, both known and unknown risks remain to the global economy and its growth prospects. Nevertheless, we remain optimistic that the collective fiscal and monetary efforts undertaken over the past several years will continue to have a positive impact on the global economy. In the meantime, we remain confident that our Funds are well positioned to weather an uncertain economic environment.
We thank you for your continued confidence and investment in The Managers Funds. You can rest assured that under all market conditions our team is focused on delivering excellent investment management services for your benefit.
Respectfully,

Keitha Kinne
President
Managers Investment Group LLC
About Your Fund’s Expenses
| | |
As a shareholder of a Fund, you may incur two types of costs: (1) transaction costs, which may include sales charges (loads) on purchase payments; redemption fees; and exchange fees; and (2) ongoing costs, including management fees; distribution (12b-1) fees; and other Fund expenses. This example is intended to help you understand your ongoing costs (in dollars) of investing in the Fund and to compare these costs with the ongoing costs of investing in other mutual funds. The example is based on $1,000 invested at the beginning of the period and held for the entire period as indicated below. Actual Expenses The first line of the following table provides information about the actual account values and actual expenses. You may use the information in this line, together with the amount you invested, to estimate the expenses that you paid over the period. Simply divide your account value by $1,000 (for example, an $8,600 account value divided by $1,000 = 8.6), then multiply the result by the number in the first line under the heading entitled “Expenses Paid During Period” to estimate the expenses you paid on your account during this period. Hypothetical Example for Comparison Purposes The second line of the following table provides information about hypothetical account values and hypothetical expenses based on the Fund’s actual expense ratio and an assumed annual rate of return of 5% before expenses, which is not the Fund’s actual return. The hypothetical account values and expenses may not be used to estimate the actual ending account balance or expenses you paid for the period. You may use this information to compare the ongoing costs of investing in the Fund and other funds by comparing this 5% hypothetical example with the 5% hypothetical examples that appear in the shareholder reports of other funds. Please note that the expenses shown in the table are meant to highlight your ongoing costs only and do not reflect any transactional costs, such as sales charges (loads), redemption fees, or exchange fees. Therefore, the second line of the table is useful in comparing ongoing costs only, and will not help you determine the relative total costs of owning different funds. | | |
| | | | | | | | | | | | | | | | |
Six Months Ended December 31, 2012 | | Expense
Ratio for
the Period | | | Beginning
Account Value
07/01/12 | | | Ending
Account Value
12/31/12 | | | Expenses
Paid During
the Period* | |
Managers Global Income Opportunity Fund | |
Based on Actual Fund Return | | | 0.99 | % | | $ | 1,000 | | | $ | 1,064 | | | $ | 5.14 | |
Hypothetical (5% return before expenses) | | | 0.99 | % | | $ | 1,000 | | | $ | 1,020 | | | $ | 5.03 | |
| * | Expenses are equal to the Fund’s annualized expense ratio multiplied by the average account value over the period, multiplied by the number of days in the most recent half-year (184), then divided by 366. |
2
Managers Global Income Opportunity Fund
Portfolio Manager’s Comments
THE YEAR IN REVIEW
Managers Global Income Opportunity Fund returned 10.63% during the year ended December 31, 2012, outperforming the 4.32% return for the Barclay’s Global Aggregate Bond Index (the “Index”).
Early in the year, on February 1, 2012 the Fund’s investment guidelines were modified to allow Loomis Sayles & Company (“Loomis Sayles”) greater flexibility within the Fund. The key changes are highlighted within the Fund’s prospectus. Most notably, the Fund expanded its flexibility so that it can now hold up to 30% (of its assets) in high-yield bonds, up to 20% in emerging markets debt and at least 20% in U.S. Dollar exposure. As noted when those changes were made, we believe the slight modifications give Loomis Sayles greater flexibility to incorporate their best global investment ideas within the Fund.
During the year, the Fund delivered solid absolute and relative performance versus the benchmark. At the beginning of 2012, the Fund solidly outperformed its benchmark as a combination of favorable positioning and good stock selection contributed to the outperformance. “Riskier” assets performed best, as macro data looked more optimistic given better liquidity conditions and indications of modest improvements expected in global growth. The second quarter was the only quarter where the Fund underperformed during the year, albeit modestly, as the U.S. growth path downshifted, with weaker GDP revisions and payroll figures. Against this backdrop, the Fund’s security selection and sector allocation, primarily the overweight to the corporates sector, detracted from performance.
During the summer and early fall months, global risk markets advanced on a broad front gratified by the Federal Reserve’s decision to begin uncapped purchases of mortgage-backed securities as QE3 became official policy. Japan’s central bank also announced an expansion of bond purchases. Broad liquidity support for markets became the policy in all of the G-4 economies. As a result, the Fund solidly outperformed during this time with security selection the primary source of excess return. Issue selection across the U.S., U.K., and European corporate sector proved quite positive, along with favored sovereign and supranational names. Our positioning in high yield and emerging market debt also increased relative performance, given the “risk-on” tone for much of the period.
Entering the final months of the year, we saw global risk appetite waver after the U.S. election, as the fiscal cliff debate became a major focus. In Europe, we expect that the ongoing fiscal austerity and weak demand will keep EMU growth flat over the coming months. Massive ongoing dispersion across economies and peripheral recessions may persist into 2013. In China, while there are signs that the latest deceleration is ending, a strong rebound is unlikely. Despite these challenges, corporate debt and peripheral European government bonds both posted strong returns. The potential for improving growth later in 2013 should support risk assets, but may pose challenges to absolute returns for government bond markets where growth may improve, such as in the U.S. The Fund sharply outperformed the benchmark during the final quarter as security selection was a primary source of excess return. Issue selection across the U.S., U.K., and European corporate sector, once again, proved quite positive, along with select sovereign names. As credit spreads tightened, off-benchmark positioning in high yield
bonds proved favorable and aided absolute and relative performance. The performance impact attributable to high yield and emerging market positions is captured in this segment. On a quality basis, lower-rated securities performed the best as spreads rallied towards the end of the year. We are currently following a swap discipline in our credit exposures, adding select new issues to replace some issues that have rallied to ’tight’ yield levels or to a high price premium above par. Sector allocation also contributed to relative performance during the late stages of 2012 primarily due to the overweight to the corporate sector.
LOOKING FORWARD
New Year celebrations included sharp selloffs in U.S. Treasuries and the Yen. 10-year U.S. yields spiked from 1.75% to 1.92% in the first week of the year, reflecting risk-on sentiment from the resolution of the fiscal cliff tax impasse, plus a rethink in the value of the latest Fed minutes. These hinted at a shorter period of quantitative ease than had been previously expected.
The investor reaction to the Fed minutes illustrates one of our key themes: yields are far below normal valuation metrics (nominal GDP trend) and have not been kept down by monetary policy. Policy renormalization will almost certainly be accompanied by yield normalization, hence the intense focus on the QE forecast. Also, yield should now respond strongly to growth accelerations and decelerations as the end of extraordinary QE is tied to the unemployment rate. The net effect is likely to be a higher trading range for 10-year Treasuries in 2013. Our year-end forecast is now 2.50%, up from 2.00%-2.50% previously.
Separately, the decisive electoral victory of Japanese Prime Minister Shinzo Abe’s government is arguably a vote for reflation. Reflation should include Japanese QE, and hence a weaker Yen. While markets are over-positioned for this story on technical measures, there is massive potential for Japanese capital outflows, hedge reductions, foreign bond purchase by Bank of Japan etc, so we are not being contrarian. Rather we profitably increased our Yen underweight in the final quarter of 2012.
Global growth prospects have improved marginally. We have raised our U.S. forecast. The tax hikes agreed were slightly less than expected, totally about 1.0% of GDP. Employment growth has been steady at about 150,000 monthly, gasoline prices have eased, and housing has firmed. Absent new shocks, we see a gradual acceleration in GDP growth to over 2.5% per annum in the second half of 2013.
Elsewhere, we are more positive on China, but remain pessimistic on the Euro Zone. This is reflected in a maintained underweight for the Euro, and overweights in non-Japan Asian currencies. Downside risks to global growth appear diminished, so we are comfortable with our credit positions for now, despite tighter spreads.
This commentary reflects the viewpoints of the portfolio manager, Loomis, Sayles & Company, as of December 31, 2012 and is not intended as a forecast or guarantee of future results.
Managers Global Income Opportunity Fund
Portfolio Manager’s Comments (continued)
Cumulative Total Return Performance
Global Bond’s cumulative total return is based on the daily change in net asset value (NAV), and assumes that all distributions were reinvested. This graph compares a hypothetical $10,000 investment made in Global bond on December 31, 2002, to a $10,000 investment made in the Barclays Global Aggregate Bond Index for the same time period. Performance for periods longer than one year is the average annual return. The graph and table do not reflect the deduction of taxes that a shareholder would pay on a Fund distribution or redemption of shares. The listed returns for the Fund are net of expenses and the returns for the index exclude expenses. Past performance is not indicative of future results. Total returns would have been lower had certain expenses not been reduced.
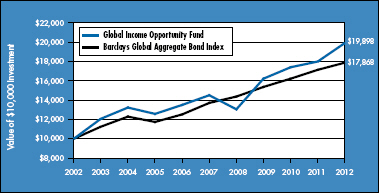
The table below shows the average annual total returns for the Managers Global Income Opportunity Fund and the Barclays Global Aggregate Bond Index for the same time periods ended December 31, 2012.
| | | | | | | | | | | | |
Average Annualized Total Returns1 | | One Year | | | Five Years | | | Ten Years | |
Managers Global Income Opportunity Fund 2,3,4,5,6,7 | | | 10.63 | % | | | 6.53 | % | | | 7.12 | % |
Barclays Global Aggregate Bond Index8 | | | 4.32 | % | | | 5.44 | % | | | 5.98 | % |
The performance data shown represents past performance. Past performance is not a guarantee of future results. Current performance may be lower or higher than the performance data quoted. The investment return and principal value of an investment will fluctuate so that an investor’s shares, when redeemed, may be worth more or less than their original cost. For performance information through the most recent month end, please call (800) 835-3879 or visit our Web site at www.managersinvest.com.
Investors should carefully consider the Fund’s investment objectives, risks, charges, and expenses before investing. For this and other information, please call (800) 835-3879 or visit www.managersinvest.com for a free prospectus. Read it carefully before investing or sending money. Funds are distributed by Managers Distributors, Inc., a member of FINRA.
|
1 Total return equals income yield plus share price change and assumes reinvestment of all dividends and capital gain distributions. Returns are net of fees and may reflect offsets of Fund expenses as described in the Prospectus. No adjustment has been made for taxes payable by shareholders on their reinvested dividends and capital gain distributions. Returns for periods greater than one year are the average annual return. The listed returns on the Fund are net of expenses and based on the published NAV as of December 31, 2012. All returns are in U.S. dollars($). 2 From time to time the Fund’s advisor has waived fees and/or absorbed Fund expenses, which may have resulted in higher returns. 3 The Fund is subject to the risks associated with investments in debt securities, such as default risk and fluctuations in the perception of the debtor’s ability to pay its creditors. 4 Changing interest rates may adversely affect the value of an investment. An increase in interest rates typically causes the value of bonds and other fixed-income securities to fall. 5 Investments in foreign securities are subject to additional risks such as changing market conditions, economic and political instability, and currency exchange rate fluctuations. 6 The Fund may invest in below investment grade debt securities and unrated securities of similar credit quality (commonly known as “junk bond” or “high yield securities”) which may be subject to greater levels of interest rate, credit and liquidity risk. 7 The Fund is subject to currency risk resulting from fluctuations in exchange rates that may affect the total loss or gain on a non-U.S. Dollar security when converted back to U.S. Dollars. 8 The Barclays Global Aggregate Bond Index provides a broad-based measure of the global investment-grade fixed income markets. The three major components of this index are the U.S. Aggregate, the Pan-European Aggregate, and the Asian-Pacific Aggregate Indices. The Index also includes Eurodollar and Euro-Yen corporate bonds, Canadian government, agency and corporate securities, and USD investment-grade 144A securities. Unlike the Fund, the Barclays Global Aggregate Bond Index is unmanaged, is not available for investment, and does not incur fees. Not FDIC insured, nor bank guaranteed. May lose value. |
4
Managers Global Income Opportunity Fund
Fund Snapshots
December 31, 2012
Portfolio Breakdown (unaudited)
| | | | |
Category | | Managers Global
Income Opportunity Fund** | |
Foreign Government and Agency Obligations | | | 43.6 | % |
Corporate Bonds and Notes | | | 38.6 | % |
U.S. Government Obligations | | | 10.8 | % |
Asset-Backed Securities | | | 2.2 | % |
Mortgage-Backed Securities | | | 1.0 | % |
Other Assets and Liabilities | | | 3.8 | % |
| ** | As a percentage of net assets. |
| | | | |
Rating | | Managers Global
Income Opportunity
Fund† | |
U.S. Treasury & Agency | | | 10.4 | % |
Aaa | | | 24.8 | % |
Aa | | | 9.3 | % |
A | | | 21.9 | % |
Baa | | | 24.5 | % |
Ba & lower | | | 5.4 | % |
Not Rated | | | 3.7 | % |
| † | As a percentage of market value of fixed income securities. Chart does not include equity securities. |
Top Ten Holdings (unaudited)
| | | | |
Security Name | | % of
Net Assets | |
U.S. Treasury Notes, 0.250%, 02/15/15* | | | 6.3 | % |
Mexican Fixed Rate Notes, Series M 10, 7.750%, 12/14/17* | | | 2.9 | |
Canadian Government Notes, 3.000%, 12/01/15* | | | 2.6 | |
Norway Government Bonds, Series 473, 4.500%, 05/22/19* | | | 2.6 | |
U.S. Treasury Notes, 0.125%, 12/31/14 | | | 2.0 | |
Canadian Government Bonds, 4.250%, 06/01/18 | | | 2.0 | |
Mexican Fixed Rate Bonds, Series M 20, 8.000%, 12/07/23* | | | 1.8 | |
International Bank for Reconstruction & Development Notes, GMTN, 2.300%, 02/26/13* | | | 1.6 | |
Italy Buoni Poliennali Del Tesoro Notes, 4.500%, 08/01/18 | | | 1.5 | |
Mexican Fixed Rate Bonds, Series M 30, 8.500%, 11/18/38 | | | 1.3 | |
| | | | |
Top Ten as a Group | | | 24.6 | % |
| | | | |
| * | Top Ten Holding at June 30, 2012 |
Any sectors, industries, or securities discussed should not be perceived as investment recommendations. Mention of a specific security should not be considered a recommendation to buy or solicitation to sell that security. Specific securities mentioned in this report may have been sold from the Fund’s portfolio of investments by the time you receive this report.
Managers Global Income Opportunity Fund
Schedule of Portfolio Investments
December 31, 2012
| | | | | | | | | | | | |
| | | | | | Principal Amount† | | | Value | |
| | | | | | | | | | | | |
Asset-Backed Securities - 2.2% | | | | | | | | | | | | |
Avis Budget Rental Car Funding AESOP LLC, Series 2009-2A, Class A, 5.680%, 02/20/14 (a) | | | | | | $ | 33,333 | | | $ | 33,498 | |
Capital One Multi-Asset Execution Trust, Series 2004-B7, Class B7, 0.699%, 08/17/17 (01/17/13)1 | | | EUR | | | | 100,000 | | | | 128,641 | |
Hertz Vehicle Financing LLC, Series 2009-2A, Class A1,
4.260%, 03/25/14 (a) | | | | | | | 50,000 | | | | 50,278 | |
Hyundai Capital Auto Funding, Ltd., Series 2010-8A, Class A, 1.209%, 09/20/16 (01/18/13) (a)1 | | | | | | | 180,834 | | | | 181,214 | |
MBNA Credit Card Master Note Trust, Series 2005-B3, Class B3, 0.509%, 03/19/18 (01/17/13)1 | | | EUR | | | | 100,000 | | | | 128,586 | |
Santander Drive Auto Receivables Trust, Series 2011-S2A, Class D, 3.350%, 06/15/17 (a) | | | | | | | 41,023 | | | | 41,244 | |
Trinity Rail Leasing, L.P., Series 2010-1A, Class A, 5.194%, 10/16/40 (a) | | | | | | | 92,502 | | | | 96,657 | |
World Financial Network Credit Card Master Trust, Series 2010-A, Class A, 3.960%, 04/15/19 | | | | | | | 95,000 | | | | 102,413 | |
Total Asset-Backed Securities (cost $724,435) | | | | | | | | | | | 762,531 | |
Corporate Bonds and Notes - 38.6% | | | | | | | | | | | | |
Financials - 19.4% | | | | | | | | | | | | |
AXA SA, 7.125%, 12/15/20 | | | GBP | | | | 50,000 | | | | 93,201 | |
Banco BTG Pactual SA, 5.750%, 09/28/22 (a) | | | | | | | 200,000 | | | | 205,000 | |
Banco Latinoamericano de Comercio Exterior SA, 3.750%, 04/04/17 (a) | | | | | | | 150,000 | | | | 153,525 | |
Banco Santander Chile, 6.500%, 09/22/20 (a) | | | CLP | | | | 100,000,000 | | | | 208,877 | |
Banco Votorantim SA, 6.250%, 05/16/16 (a) | | | BRL | | | | 300,000 | | | | 169,304 | |
Bank of America Corp., | | | | | | | | | | | | |
4.750%, 05/06/192 | | | EUR | | | | 100,000 | | | | 128,357 | |
5.700%, 01/24/22 | | | | | | | 140,000 | | | | 168,357 | |
Bank of Nova Scotia, 1.375%, 12/18/17 | | | | | | | 345,000 | | | | 345,478 | |
Barclays Bank PLC, 6.050%, 12/04/17 | | | | | | | 100,000 | | | | 110,639 | |
BBVA Bancomer SA, 6.750%, 09/30/22 (a) | | | | | | | 150,000 | | | | 168,750 | |
BNP Paribas SA, Series BKNT, 5.000%, 01/15/21 | | | | | | | 75,000 | | | | 84,236 | |
BNZ International Funding, Ltd., EMTN, 4.000%, 03/08/17 | | | EUR | | | | 100,000 | | | | 146,386 | |
Braskem Finance, Ltd., 5.750%, 04/15/21 (a) | | | | | | | 200,000 | | | | 210,500 | |
Citigroup, Inc., | | | | | | | | | | | | |
5.500%, 02/15/17 | | | | | | | 85,000 | | | | 94,225 | |
6.250%, 06/29/17 | | | NZD | | | | 200,000 | | | | 175,061 | |
Cooperatieve Centrale Raiffeisen-Boerenleenbank BA, EMTN,
4.375%, 01/22/14 | | | EUR | | | | 85,000 | | | | 116,805 | |
Crown Castle Towers LLC, 6.113%, 01/15/20 (a) | | | | | | | 100,000 | | | | 120,448 | |
Export-Import Bank of Korea, 4.000%, 11/26/15 (a) | | | PHP | | | | 5,000,000 | | | | 128,840 | |
General Electric Capital Corp., Series A, 7.125%, 12/15/492,3 | | | | | | | 200,000 | | | | 226,058 | |
HSBC Bank PLC, 4.125%, 08/12/20 (a) | | | | | | | 100,000 | | | | 111,296 | |
Hutchison Whampoa International 11, Ltd., 3.500%, 01/13/17 (a) | | | | | | | 200,000 | | | | 212,223 | |
Hyundai Capital Services, Inc., 3.500%, 09/13/17 (a) | | | | | | | 200,000 | | | | 211,202 | |
Industrial Bank of Korea, 2.375%, 07/17/17 (a) | | | | | | | 200,000 | | | | 203,099 | |
JPMorgan Chase & Co., 4.400%, 07/22/20 | | | | | | | 75,000 | | | | 84,663 | |
Lloyds TSB Bank PLC, 6.500%, 09/14/20 (a) | | | | | | | 100,000 | | | | 110,497 | |
Macquarie Bank, Ltd., 5.000%, 02/22/17 (a) | | | | | | | 300,000 | | | | 328,110 | |
Morgan Stanley, | | | | | | | | | | | | |
5.375%, 11/14/13 | | | GBP | | | | 40,000 | | | | 66,799 | |
GMTN, 5.500%, 07/24/20 | | | | | | | 100,000 | | | | 112,501 | |
MTN, 7.250%, 05/26/15 | | | AUD | | | | 200,000 | | | | 219,319 | |
|
The accompanying notes are an integral part of these financial statements. 6 |
Managers Global Income Opportunity Fund
Schedule of Portfolio Investments (continued)
| | | | | | | | | | | | |
| | | | | | Principal Amount† | | | Value | |
| | | | | | | | | | | | |
Financials - 19.4% (continued) | | | | | | | | | | | | |
National Australia Bank, Ltd., GMTN, 4.750%, 07/15/16 | | | EUR | | | | 100,000 | | | $ | 149,594 | |
Sirius International Group, Ltd., 6.375%, 03/20/17 (a) | | | | | | | 140,000 | | | | 152,902 | |
Turkiye Garanti Bankasi A.S., 4.000%, 09/13/17 (a) | | | | | | | 200,000 | | | | 206,250 | |
Turkiye Is Bankasi, 3.875%, 11/07/17 (a) | | | | | | | 200,000 | | | | 203,700 | |
VTB Bank OJSC Via VTB Capital, S.A., 6.000%, 04/12/17 (a) | | | | | | | 200,000 | | | | 216,200 | |
Wells Fargo & Co., | | | | | | | | | | | | |
1.500%, 01/16/184 | | | | | | | 350,000 | | | | 350,574 | |
4.625%, 11/02/35 | | | GBP | | | | 50,000 | | | | 88,389 | |
Westpac Banking Corp., 2.450%, 11/28/16 (a)4 | | | | | | | 200,000 | | | | 210,800 | |
Yapi ve Kredi Bankasi Via Unicredit Luxembourg SA, 5.188%, 10/13/15 (a) | | | | | | | 200,000 | | | | 208,700 | |
Zurich Finance USA, Inc., | | | | | | | | | | | | |
EMTN, 4.500%, 06/15/252 | | | EUR | | | | 100,000 | | | | 138,580 | |
EMTN, 5.750%, 10/02/232 | | | EUR | | | | 100,000 | | | | 135,940 | |
Total Financials | | | | | | | | | | | 6,775,385 | |
Industrials - 17.2% | | | | | | | | | | | | |
America Movil SAB de CV, Series 12, 6.450%, 12/05/22 | | | MXN | | | | 4,000,000 | | | | 317,633 | |
Anglo American Capital PLC, 2.625%, 09/27/17 (a) | | | | | | | 200,000 | | | | 204,105 | |
AngloGold Ashanti Holdings PLC, 5.125%, 08/01/22 | | | | | | | 155,000 | | | | 157,090 | |
Asciano Finance, Ltd., 4.625%, 09/23/20 (a) | | | | | | | 65,000 | | | | 67,446 | |
Avnet, Inc., 5.875%, 06/15/20 | | | | | | | 60,000 | | | | 65,385 | |
Bell Aliant Regional Communications LP, 5.410%, 09/26/16 | | | CAD | | | | 160,000 | | | | 175,617 | |
BRF - Brasil Foods, S.A., 5.875%, 06/06/22 (a) | | | | | | | 200,000 | | | | 220,500 | |
British Telecommunications PLC, 5.750%, 12/07/28 | | | GBP | | | | 100,000 | | | | 192,538 | |
Colombia Telecomunicaciones, S.A. ESP, 5.375%, 09/27/22 (a) | | | | | | | 200,000 | | | | 203,250 | |
CSN Resources, S.A., 6.500%, 07/21/20 (a) | | | | | | | 100,000 | | | | 108,500 | |
Desarrolladora Homex, S.A.B. de C.V., 9.750%, 03/25/20 (a) | | | | | | | 200,000 | | | | 217,000 | |
Dubai Electricity & Water Authority, 6.375%, 10/21/16 (a) | | | | | | | 200,000 | | | | 221,000 | |
Edcon Proprietary, Ltd., 3.433%, 06/15/14 (03/15/13) (a)1 | | | EUR | | | | 50,000 | | | | 63,358 | |
ERAC USA Finance LLC, 6.700%, 06/01/34 (a) | | | | | | | 120,000 | | | | 145,295 | |
Fibria Overseas Finance, Ltd., 6.750%, 03/03/21 (a) | | | | | | | 150,000 | | | | 166,125 | |
Finmeccanica S.p.A., EMTN, 4.875%, 03/24/25 | | | EUR | | | | 50,000 | | | | 64,267 | |
HCA, Inc., | | | | | | | | | | | | |
6.375%, 01/15/15 | | | | | | | 35,000 | | | | 37,844 | |
6.500%, 02/15/16 | | | | | | | 80,000 | | | | 87,000 | |
7.690%, 06/15/25 | | | | | | | 15,000 | | | | 15,338 | |
MTN, 7.580%, 09/15/25 | | | | | | | 10,000 | | | | 10,125 | |
Hyatt Hotels Corp., 5.375%, 08/15/21 | | | | | | | 90,000 | | | | 100,928 | |
International Paper Co., 6.000%, 11/15/41 | | | | | | | 50,000 | | | | 59,207 | |
Korea National Oil Corp., 3.125%, 04/03/17 (a) | | | | | | | 200,000 | | | | 209,820 | |
Lotte Shopping Co., Ltd., 3.375%, 05/09/17 (a) | | | | | | | 200,000 | | | | 207,462 | |
Methanex Corp., 3.250%, 12/15/19 | | | | | | | 345,000 | | | | 347,007 | |
Nabors Industries, Inc., 4.625%, 09/15/21 | | | | | | | 75,000 | | | | 80,718 | |
Noble Group, Ltd., 6.750%, 01/29/20 (a) | | | | | | | 200,000 | | | | 210,750 | |
|
The accompanying notes are an integral part of these financial statements. 7 |
Managers Global Income Opportunity Fund
Schedule of Portfolio Investments (continued)
| | | | | | | | | | | | |
| | | | | | Principal Amount† | | | Value | |
| | | | | | | | | | | | |
Industrials - 17.2% (continued) | | | | | | | | | | | | |
Odebrecht Drilling VIII/IX, Ltd., 6.350%, 06/30/21 (a)4 | | | | | | $ | 95,000 | | | $ | 106,638 | |
OGX Austria GmbH, 8.500%, 06/01/18 (a)4 | | | | | | | 200,000 | | | | 180,000 | |
Oi SA, 9.750%, 09/15/16 (a) | | | BRL | | | | 600,000 | | | | 307,692 | |
Reliance Holdings USA, Inc., 5.400%, 02/14/22 (a) | | | | | | | 250,000 | | | | 279,619 | |
Rowan Companies, Inc., 5.000%, 09/01/17 | | | | | | | 60,000 | | | | 66,654 | |
Telecom Italia Capital SA, | | | | | | | | | | | | |
6.375%, 11/15/33 | | | | | | | 45,000 | | | | 45,338 | |
7.200%, 07/18/36 | | | | | | | 20,000 | | | | 20,880 | |
Telefonica Emisiones, S.A.U., | | | | | | | | | | | | |
5.134%, 04/27/20 | | | | | | | 75,000 | | | | 78,844 | |
7.045%, 06/20/36 | | | | | | | 75,000 | | | | 81,000 | |
Teva Pharmaceutical Finance Co. BV, 2.950%, 12/18/22 | | | | | | | 345,000 | | | | 348,988 | |
Transportadora de Gas del Sur SA, 7.875%, 05/14/17 (a) | | | | | | | 235,000 | | | | 195,050 | |
Valeant Pharmaceuticals International, 6.750%, 08/15/21 (a) | | | | | | | 10,000 | | | | 10,725 | |
Virgin Media Finance PLC, 4.875%, 02/15/22 | | | | | | | 325,000 | | | | 332,313 | |
Total Industrials | | | | | | | | | | | 6,009,049 | |
Utilities - 2.0% | | | | | | | | | | | | |
CEZ A.S., 4.250%, 04/03/22 (a) | | | | | | | 200,000 | | | | 214,088 | |
Deutsche Telekom International Finance, B.V., EMTN, 4.875%, 04/22/25 | | | EUR | | | | 50,000 | | | | 81,039 | |
EDP Finance, B.V., EMTN, 8.625%, 01/04/24 | | | GBP | | | | 50,000 | | | | 88,777 | |
Emgesa SA ESP, 8.750%, 01/25/21 (a) | | | COP | | | | 120,000,000 | | | | 79,565 | |
Listrindo Capital, B.V., 6.950%, 02/21/19 (a) | | | | | | | 200,000 | | | | 223,086 | |
Total Utilities | | | | | | | | | | | 686,555 | |
Total Corporate Bonds and Notes (cost $12,722,100) | | | | | | | | | | | 13,470,989 | |
Foreign Government and Agency Obligations - 43.6% | | | | | | | | | | | | |
Australian Government Index Linked Bonds, Series 2009-25CI,
3.000%, 09/20/25 | | | AUD | | | | 180,000 | | | | 256,451 | |
Bundesrepublik Deutschland Bonds, | | | | | | | | | | | | |
3.000%, 07/04/20 | | | EUR | | | | 60,000 | | | | 91,375 | |
Series 05, 4.000%, 01/04/37 | | | EUR | | | | 85,000 | | | | 152,471 | |
Series 06, 3.750%, 01/04/17 | | | EUR | | | | 220,000 | | | | 331,896 | |
Canadian Government, | | | | | | | | | | | | |
Bonds, 4.000%, 06/01/16 | | | CAD | | | | 260,000 | | | | 284,826 | |
Bonds, 4.250%, 06/01/18 | | | CAD | | | | 595,000 | | | | 685,497 | |
Notes, 3.000%, 12/01/15 | | | CAD | | | | 855,000 | | | | 902,473 | |
Central American Bank for Economic Integration Notes,
3.875%, 02/09/17 (a) | | | | | | | 280,000 | | | | 297,540 | |
Corp. Andina de Fomento, Notes, 4.375%, 06/15/22 | | | | | | | 280,000 | | | | 303,174 | |
Eksportfinans ASA Notes, 2.000%, 09/15/15 | | | | | | | 120,000 | | | | 114,860 | |
Empresas Publicas de Medellin ESP Notes, 8.375%, 02/01/21 (a) | | | COP | | | | 180,000,000 | | | | 117,667 | |
European Investment Bank, | | | | | | | | | | | | |
Bonds, 2.375%, 07/10/20 | | | CHF | | | | 165,000 | | | | 201,600 | |
Notes, EMTN, 4.433%, 04/24/13 (a)5 | | | IDR | | | | 1,842,000,000 | | | | 188,021 | |
Iceland Government International Notes, 5.875%, 05/11/22 | | | | | | | 300,000 | | | | 334,935 | |
Inter-American Development Bank Notes, 5.238%, 08/20/155 | | | IDR | | | | 750,000,000 | | | | 68,521 | |
International Bank for Reconstruction & Development Notes, GMTN, 2.300%, 02/26/13 | | | KRW | | | | 600,000,000 | | | | 559,628 | |
|
The accompanying notes are an integral part of these financial statements. 8 |
Managers Global Income Opportunity Fund
Schedule of Portfolio Investments (continued)
| | | | | | | | | | | | |
| | | | | | Principal Amount† | | | Value | |
| | | | | | | | | | | | |
Foreign Government and Agency Obligations - 43.6% (continued) | | | | | | | | | | | | |
Italy Buoni Poliennali Del Tesoro, | | | | | | | | | | | | |
Bonds, 5.000%, 03/01/22 | | | EUR | | | | 125,000 | | | $ | 173,608 | |
Notes, 4.500%, 08/01/18 | | | EUR | | | | 390,000 | | | | 540,698 | |
Korea Treasury Notes, Series 1409, 5.000%, 09/10/14 | | | KRW | | | | 430,000,000 | | | | 415,941 | |
Malaysia Government, | | | | | | | | | | | | |
Bonds, Series 1/06, 4.262%, 09/15/16 | | | MYR | | | | 375,000 | | | | 127,450 | |
Notes, Series 0210, 4.012%, 09/15/17 | | | MYR | | | | 1,000,000 | | | | 337,930 | |
Mexican Fixed Rate, | | | | | | | | | | | | |
Bonds, Series M 20, 8.000%, 12/07/23 | | | MXN | | | | 6,800,000 | | | | 636,340 | |
Bonds, Series M 30, 8.500%, 11/18/38 | | | MXN | | | | 4,500,000 | | | | 439,929 | |
Notes, Series M 10, 7.750%, 12/14/17 | | | MXN | | | | 11,650,000 | | | | 1,003,198 | |
Notes, Series M 10, 8.500%, 12/13/18 | | | MXN | | | | 4,100,000 | | | | 371,141 | |
New South Wales Treasury Corp. Bonds, Series 2007 CIB1, 2.750%, 11/20/25 | | | AUD | | | | 70,000 | | | | 94,584 | |
New Zealand Government Bonds, Series 521, 6.000%, 05/15/21 | | | NZD | | | | 335,000 | | | | 329,085 | |
Norway Government Bonds, Series 473, 4.500%, 05/22/19 | | | NOK | | | | 4,270,000 | | | | 895,807 | |
Poland Government, Notes, EMTN, 3.000%, 09/23/14 | | | CHF | | | | 65,000 | | | | 74,015 | |
Province of Quebec Canada, 5.000%, 03/01/16 | | | | | | | 270,000 | | | | 306,423 | |
Republic of Argentina, | | | | | | | | | | | | |
Bonds, 7.000%, 10/03/15 | | | | | | | 215,000 | | | | 193,930 | |
Bonds, Series NY, 8.280%, 12/31/33 | | | | | | | 114,797 | | | | 82,080 | |
Republic of Costa Rica, Notes, 10.580%, 09/23/15 | | | CRC | | | | 85,000,000 | | | | 172,778 | |
Singapore Government, | | | | | | | | | | | | |
Bonds, 2.250%, 07/01/13 | | | SGD | | | | 120,000 | | | | 99,228 | |
Bonds, 2.250%, 06/01/21 | | | SGD | | | | 210,000 | | | | 186,749 | |
Bonds, 2.500%, 06/01/19 | | | SGD | | | | 200,000 | | | | 181,312 | |
Notes, 1.625%, 04/01/13 | | | SGD | | | | 535,000 | | | | 439,382 | |
Spain Government, | | | | | | | | | | | | |
Bonds, 4.200%, 01/31/37 | | | EUR | | | | 385,000 | | | | 405,517 | |
Bonds, 4.300%, 10/31/19 | | | EUR | | | | 140,000 | | | | 180,821 | |
Notes, 4.250%, 10/31/16 | | | EUR | | | | 150,000 | | | | 200,845 | |
Sweden Government Bond, | | | | | | | | | | | | |
Series 1047, 5.000%, 12/01/20 | | | SEK | | | | 1,800,000 | | | | 350,677 | |
Series 1049, 4.500%, 08/12/15 | | | SEK | | | | 2,030,000 | | | | 341,441 | |
U.K. Gilt, | | | | | | | | | | | | |
Bonds, 4.000%, 03/07/22 | | | GBP | | | | 145,000 | | | | 282,420 | |
Bonds, 4.250%, 03/07/36 | | | GBP | | | | 120,000 | | | | 238,690 | |
Bonds, 4.750%, 03/07/20 | | | GBP | | | | 90,000 | | | | 180,542 | |
Bonds, 5.000%, 03/07/25 | | | GBP | | | | 110,000 | | | | 235,869 | |
Notes, 1.750%, 01/22/17 | | | GBP | | | | 220,000 | | | | 372,605 | |
|
The accompanying notes are an integral part of these financial statements. 9 |
Managers Global Income Opportunity Fund
Schedule of Portfolio Investments (continued)
| | | | | | | | | | | | |
| | | | | | Principal Amount† | | | Value | |
| | | | | | | | | | | | |
Foreign Government and Agency Obligations - 43.6% (continued) | | | | | | | | | | | | |
Uruguay Government International Bonds, | | | | | | | | | | | | |
3.700%, 06/26/37 | | | UYU | | | | 800,000 | | | $ | 70,352 | |
4.375%, 12/15/28 | | | UYU | | | | 1,630,109 | | | | 110,727 | |
5.000%, 09/14/18 | | | UYU | | | | 3,000,000 | | | | 286,906 | |
Total Foreign Government and Agency Obligations (cost $14,075,396) | | | | | | | | | | | 15,249,955 | |
Mortgage-Backed Securities - 1.0% | | | | | | | | | | | | |
Greenwich Capital Commercial Funding Corp., Series 2007-GG11, Class A4, 5.736%, 12/10/49 | | | | | | | 75,000 | | | | 88,410 | |
GS Mortgage Securities Corp. II, Series 2007-GG10, Class A4,
5.789%, 08/10/452 | | | | | | | 91,000 | | | | 104,914 | |
Morgan Stanley Capital I, Inc., Series 2007-IQ14, Class A4,
5.692%, 04/15/492 | | | | | | | 50,000 | | | | 58,059 | |
Wachovia Bank Commercial Mortgage Trust, Series 2007-C30, Class A5, 5.342%, 12/15/43 | | | | | | | 75,000 | | | | 85,931 | |
Total Mortgage-Backed Securities (cost $308,940) | | | | | | | | | | | 337,314 | |
U.S. Government Obligations - 10.8% | | | | | | | | | | | | |
U.S. Treasury Notes, | | | | | | | | | | | | |
0.125%, 12/31/14 | | | | | | | 700,000 | | | | 698,250 | |
0.250%, 02/15/15 | | | | | | | 2,220,000 | | | | 2,218,959 | |
1.125%, 12/31/19 | | | | | | | 350,000 | | | | 349,016 | |
1.500%, 07/31/166 | | | | | | | 165,000 | | | | 171,084 | |
1.625%, 11/15/22 | | | | | | | 355,000 | | | | 351,117 | |
Total U.S. Government Obligations (cost $3,771,829) | | | | | | | | | | | 3,788,426 | |
| | | |
| | | | | | Shares | | | | |
Other Investment Companies - 3.8%7 | | | | | | | | | | | | |
BNY Mellon Overnight Government Fund, 0.19%8 | | | | | | | 836,475 | | | | 836,475 | |
Dreyfus Cash Management Fund, Institutional Class Shares, 0.06% | | | | | | | 487,737 | | | | 487,737 | |
Total Other Investment Companies (cost $1,324,212) | | | | | | | | | | | 1,324,212 | |
Total Investments - 100.0% (cost $32,926,912) | | | | | | | | | | | 34,933,427 | |
Other Assets, less Liabilities - 0.0% | | | | | | | | | | | 14,926 | |
Net Assets - 100.0% | | | | | | | | | | $ | 34,948,353 | |
|
The accompanying notes are an integral part of these financial statements. 10 |
Notes to Schedule of Portfolio Investments
The following footnotes and abbreviations should be read in conjunction with the Schedule of Portfolio Investments previously presented in this report.
Based on the approximate cost of investments of $32,927,511 for Federal income tax purposes at December 31, 2012, the aggregate gross unrealized appreciation and depreciation were $2,153,961 and $148,045, respectively, resulting in net unrealized appreciation of investments of $2,005,916.
| | † | Principal amount stated in U.S. dollars unless otherwise stated. |
| | (a) | Security exempt from registration under Rule 144A of the Securities Act of 1933. This security may be resold in transactions exempt from registration, normally to qualified buyers. At December 31, 2012, the value of these securities amounted to $8,587,416, or 24.6% of net assets. |
| | 1 | Floating Rate Security. The rate listed is as of December 31, 2012. Date in parentheses represents the security’s next coupon rate reset. |
| | 2 | Variable Rate Security. The rate listed is as of December 31, 2012, and is periodically reset subject to terms and conditions set forth in the debenture. |
| | 3 | Perpetuity Bond. The date shown is the final call date. |
| | 4 | Some or all of these securities, amounting to a market value of $810,943, or 2.3% of net assets, were out on loan to various brokers. |
| | 5 | Represents yield to maturity at December 31, 2012. |
| | 6 | Some or all of this security is held as collateral for futures contracts, amounting to a market value of $171,084, or 0.5% of net assets. |
| | 7 | Yield shown for each investment company represents the December 31, 2012, seven-day average yield, which refers to the sum of the previous seven days’ dividends paid, expressed as an annual percentage. |
| | 8 | Collateral received from brokers for securities lending was invested in this short-term investment. |
| | | | |
Country | | Global Income
Opportunity
Fund* | |
Australia | | | 1.2 | % |
Brazil | | | 0.5 | % |
Canada | | | 2.0 | % |
Cayman Islands | | | 0.2 | % |
France | | | 0.3 | % |
Ireland | | | 0.2 | % |
Luxembourg | | | 2.1 | % |
Malaysia | | | 0.1 | % |
Mexico | | | 0.6 | % |
Netherlands | | | 1.6 | % |
Norway | | | 0.4 | % |
Singapore | | | 0.2 | % |
South Korea | | | 0.2 | % |
Spain | | | 0.2 | % |
United Kingdom | | | 1.3 | % |
United States | | | 86.1 | % |
Other | | | 2.8 | % |
| | | | |
| | | 100.0 | % |
| | | | |
| * | As a percentage of total market value on December 31, 2012. |
|
The accompanying notes are an integral part of these financial statements. 11 |
Notes to Schedule of Portfolio Investments (continued)
The following tables summarize the inputs used to value the Fund’s net assets by the above fair value hierarchy levels as of December 31, 2012. (See Note 1(a) in the Notes to the Financial Statements.)
| | | | | | | | | | | | | | | | |
Investments in Securities | | Quoted Prices in Active
Markets for Identical
Investments Level 1 | | | Significant Other Observable
Inputs Level 2 | | | Significant Unobservable
Inputs Level 3 | | | Total | |
Asset-Backed Securities | | | — | | | $ | 762,531 | | | | — | | | $ | 762,531 | |
Corporate Bonds and Notes† | | | — | | | | 13,470,989 | | | | — | | | | 13,470,989 | |
Foreign Government and Agency Obligations | | | — | | | | 15,249,955 | | | | — | | | | 15,249,955 | |
Mortgage-Backed Securities | | | — | | | | 337,314 | | | | — | | | | 337,314 | |
U.S. Government Obligations† | | | — | | | | 3,788,426 | | | | — | | | | 3,788,426 | |
Other Investment Companies | | $ | 1,324,212 | | | | — | | | | — | | | | 1,324,212 | |
| | | | | | | | | | | | | | | | |
Total Investments in Securities | | $ | 1,324,212 | | | $ | 33,609,215 | | | | — | | | $ | 34,933,427 | |
| | | | | | | | | | | | | | | | |
Financial Derivative Instruments-Assets†† | | | | | | | | | | | | | | | | |
Foreign Exchange Contracts | | | — | | | $ | 12,316 | | | | — | | | $ | 12,316 | |
Interest Rate Contracts | | $ | 1,688 | | | | — | | | | — | | | | 1,688 | |
| | | | | | | | | | | | | | | | |
| | | 1,688 | | | | 12,316 | | | | — | | | | 14,004 | |
| | | | | | | | | | | | | | | | |
Financial Derivative Instruments-Liabilities†† | | | | | | | | | | | | | | | | |
Foreign Exchange Contracts | | | — | | | | (15,181 | ) | | | — | | | | (15,181 | ) |
Interest Rate Contracts | | | (4,113 | ) | | | — | | | | — | | | | (4,113 | ) |
| | | | | | | | | | | | | | | | |
| | | (4,113 | ) | | | (15,181 | ) | | | — | | | | (19,294 | ) |
| | | | | | | | | | | | | | | | |
Total Financial Derivative Instruments | | $ | (2,425 | ) | | $ | (2,865 | ) | | | — | | | $ | (5,290 | ) |
| | | | | | | | | | | | | | | | |
| † | All corporate bonds and notes and U.S. government obligations held in the Fund are level 2 securities. For a detailed breakout of the corporate bonds and notes and U.S. government obligations by major industry or agency classification, please refer to the Schedule of Portfolio Investments. |
| †† | Derivative instruments, such as futures and forwards contracts, are not reflected in the Schedule of Portfolio Investments and are valued at the unrealized appreciation/depreciation of the instrument. |
As of December 31, 2012, the Fund had no transfers between levels from the beginning of the reporting period.
The following schedule is the fair value of derivative instruments at December 31, 2012:
| | | | | | | | | | | | | | |
| | | Asset Derivatives | | | Liability Derivatives | |
Derivatives not accounted for as hedging instruments | | Statement of Assets and Liabilities
Location | | | Fair Value | | | Statement of Assets and Liabilities
Location | | Fair Value | |
| Interest rate contracts | |
| Variation margin
receivable1 |
| | $ | 516 | | | Variation margin
payable1 | | $ | 1,828 | |
| Foreign exchange contracts | |
| Unrealized
appreciation on
foreign currency
contracts |
| | | 12,316 | | | Unrealized
depreciation on
foreign currency
contracts | | | 15,181 | |
| | | | | | | | | | | | | | |
| | | Total | | | $ | 12,832 | | | | | $ | 17,009 | |
| | | | | | | | | | | | | | |
| 1 | Only current day’s variation margin is reported within the Statements of Assets and Liabilities. The variation margin is included in the open futures cumulative appreciation/ (depreciation) of $(2,425) as reported in the Notes to Schedule of Investments. |
|
The accompanying notes are an integral part of these financial statements. 12 |
Notes to Schedule of Portfolio Investments (continued)
For the year ended December 31, 2012, the effect of derivative instruments on the Statement of Operations and the amount of realized gain/(loss) on derivatives recognized in income is as follows:
| | | | | | | | | | | | |
Derivatives not accounted for as hedging instruments | | Futures | | | Forward Currency
Contracts | | | Total | |
Foreign exchange contracts | | | — | | | $ | (63,983 | ) | | | (63,983 | ) |
Interest rate contracts | | $ | (14,681 | ) | | | — | | | | (14,681 | ) |
| | | | | | | | | | | | |
Total | | $ | (14,681 | ) | | $ | (63,983 | ) | | ($ | 78,664 | ) |
| | | | | | | | | | | | |
The change in unrealized gain/(loss) on derivatives recognized in income is as follows:
| | | | | | | | | | | | |
Derivatives not accounted for as hedging instruments | | Futures | | | Forward Currency
Contracts | | | Total | |
Foreign exchange contracts | | | — | | | $ | (706 | ) | | $ | (706 | ) |
Interest rate contracts | | $ | 1,320 | | | | — | | | | 1,320 | |
| | | | | | | | | | | | |
Total | | $ | 1,320 | | | $ | (706 | ) | | $ | 614 | |
| | | | | | | | | | | | |
At December 31, 2012, the Fund had the following futures contracts:
(See Note 9 in the Notes to the Financial Statements.)
| | | | | | | | | | | | |
Type | | Number of Contracts | | Position | | Expiration Date | | | Unrealized Gain/(Loss) | |
5-Year U.S. Treasury Note | | 5 | | Short | | | 03/28/13 | | | $ | 381 | |
10-Year U.S. Treasury Note | | 3 | | Short | | | 03/19/13 | | | | 1,307 | |
U.S. Treasury Long Bond | | 2 | | Long | | | 03/19/13 | | | | (4,113 | ) |
| | | | | | | | | | | | |
| | | | | | | Total | | | $ | (2,425 | ) |
| | | | | | | | | | | | |
|
The accompanying notes are an integral part of these financial statements. 13 |
Notes to Schedule of Portfolio Investments (continued)
At December 31, 2012, the Fund had the following forward foreign currency contracts (in U.S. dollars): (See Note 8 in the Notes to Financial Statements.)
| | | | | | | | | | | | | | | | | | | | |
Foreign Currency | | Position | | Settlement Date | | Counterparty | | | Receivable
Amount | | | Payable
Amount | | | Unrealized Gain/
(Loss) | |
Brazilian Real | | Long | | 02/06/13 | | | CS | | | $ | 294,012 | | | $ | 294,368 | | | $ | (356 | ) |
Euro | | Long | | 03/12/13 | | | DUB | | | | 246,824 | | | | 244,985 | | | | 1,839 | |
Malaysian Ringgit | | Long | | 03/21/13 | | | JPM | | | | 276,417 | | | | 276,576 | | | | (159 | ) |
South Korean Won | | Long | | 03/11/13 | | | BRC | | | | 541,719 | | | | 534,481 | | | | 7,238 | |
South Korean Won | | Long | | 03/11/13 | | | CS | | | | 158,793 | | | | 156,006 | | | | 2,787 | |
Australian Dollar | | Short | | 02/28/13 | | | CS | | | | 513,802 | | | | 516,960 | | | | (3,158 | ) |
British Pound | | Short | | 03/28/13 | | | BRC | | | | 275,888 | | | | 276,080 | | | | (192 | ) |
Canadian Dollar | | Short | | 03/07/13 | | | CS | | | | 472,300 | | | | 471,848 | | | | 452 | |
New Zealand Dollar | | Short | | 01/31/13 | | | BRC | | | | 511,648 | | | | 519,556 | | | | (7,908 | ) |
Norwegian Krone | | Short | | 03/12/13 | | | DUB | | | | 244,985 | | | | 247,652 | | | | (2,667 | ) |
Swiss Franc | | Short | | 03/20/13 | | | UBS | | | | 64,955 | | | | 65,696 | | | | (741 | ) |
| | | | | | | | | | | | | | | | | | | | |
| | | | | | | Total | | | $ | 3,601,343 | | | $ | 3,604,208 | | | $ | (2,865 | ) |
| | | | | | | | | | | | | | | | | | | | |
Investments Definitions and Abbreviations:
| | |
| |
EMTN: | | European Medium-Term Notes |
GMTN: | | Global Multi-Currency Notes |
MTN: | | Medium-Term Note |
Counterparty Abbreviations:
| | |
| |
BRC: | | Barclays Bank PLC |
CS: | | Credit Suisse |
DUB: | | Deutsche Bank |
JPM: | | JPMorgan Chase & Co. |
UBS: | | UBS Warburg LLC |
Currency abbreviations have been used throughout the portfolio to indicate amounts shown in currencies other than the U.S. dollar (USD):
| | |
AUD: | | Australian Dollar |
BRL: | | Brazilian Real |
CAD: | | Canadian Dollar |
CHF: | | Swiss Franc |
CLP: | | Chilean Peso |
COP: | | Colombian Peso |
CRC: | | Costa Rican Colon |
EUR: | | Euro |
GBP: | | British Pound |
IDR: | | Indonesian Rupiah |
KRW: | | South Korean Won |
MXN: | | Mexican Peso |
MYR: | | Malaysia Ringgit |
NOK: | | Norwegian Krone |
NZD: | | New Zealand Dollar |
PHP: | | Philippine Peso |
SEK: | | Swedish Krona |
SGD: | | Singapore Dollar |
UYU: | | Uruguayan Peso |
|
The accompanying notes are an integral part of these financial statements. 14 |
Statement of Assets and Liabilities
December 31, 2012
| | | | |
Assets: | | | | |
Investments at value* (including securities on loan valued at $810,943) | | $ | 34,933,427 | |
Foreign currency** | | | 1,150,690 | |
Dividends, interest and other receivables | | | 342,838 | |
Receivable for Fund shares sold | | | 179,261 | |
Receivable from affiliate | | | 13,581 | |
Unrealized appreciation on foreign currency contracts | | | 12,316 | |
Prepaid expenses | | | 3,298 | |
Variation margin receivable | | | 516 | |
Total assets | | | 36,635,927 | |
Liabilities: | | | | |
Payable upon return of securities loaned | | | 836,475 | |
Payable for investments purchased | | | 525,641 | |
Payable for Fund shares repurchased | | | 255,088 | |
Unrealized depreciation on foreign currency contracts | | | 15,181 | |
Variation margin payable | | | 1,828 | |
Accrued expenses: | | | | |
Investment advisory and management fees | | | 20,490 | |
Administrative fees | | | 5,854 | |
Trustee fees and expenses | | | 28 | |
Other | | | 26,989 | |
Total liabilities | | | 1,687,574 | |
| |
Net Assets | | $ | 34,948,353 | |
Net Assets Represent: | | | | |
Paid-in capital | | $ | 36,147,858 | |
Undistributed net investment income | | | 75,701 | |
Accumulated net realized loss from investments, futures contracts and foreign currency transactions | | | (3,280,016 | ) |
Net unrealized appreciation of investments, futures contracts and foreign currency translations | | | 2,004,810 | |
Net Assets | | $ | 34,948,353 | |
Shares outstanding | | | 1,700,042 | |
Net asset value, offering and redemption price per share | | $ | 20.56 | |
* Investments at cost | | $ | 32,926,912 | |
** Foreign currency at cost | | $ | 1,151,901 | |
|
The accompanying notes are an integral part of these financial statements. 15 |
Statement of Operations
For the year ended December 31, 2012
| | | | |
Investment Income: | | | | |
Interest income | | $ | 1,145,462 | |
Securities lending income | | | 3,250 | |
Dividend income | | | 1,600 | |
Foreign withholding tax | | | (10,025 | ) |
Total investment income | | | 1,140,287 | |
Expenses: | | | | |
Investment advisory and management fees | | | 217,271 | |
Administrative fees | | | 62,078 | |
Custodian | | | 43,409 | |
Professional fees | | | 39,745 | |
Registration fees | | | 25,161 | |
Reports to shareholders | | | 16,895 | |
Transfer agent | | | 14,184 | |
Trustees fees and expenses | | | 1,759 | |
Extraordinary expense | | | 1,394 | |
Miscellaneous | | | 1,313 | |
Total expenses before offsets | | | 423,209 | |
Expense reimbursements | | | (98,482 | ) |
Expense reductions | | | (8 | ) |
Net expenses | | | 324,719 | |
| |
Net investment income | | | 815,568 | |
Net Realized and Unrealized Gain (Loss): | | | | |
Net realized gain on investments | | | 693,765 | |
Net realized loss on futures contracts | | | (14,681 | ) |
Net realized loss on foreign currency transactions | | | (38,678 | ) |
Net change in unrealized appreciation (depreciation) of investments | | | 1,546,559 | |
Net change in unrealized appreciation (depreciation) of futures contracts | | | 1,320 | |
Net change in unrealized appreciation (depreciation) of foreign currency translations | | | 19,961 | |
Net realized and unrealized gain | | | 2,208,246 | |
| |
Net increase in net assets resulting from operations | | $ | 3,023,814 | |
|
The accompanying notes are an integral part of these financial statements. 16 |
Statements of Changes in Net Assets
For the year ended December 31,
| | | | | | | | |
| | | 2012 | | | 2011 | |
Increase (Decrease) in Net Assets From Operations: | | | | | | | | |
Net investment income | | $ | 815,568 | | | $ | 671,037 | |
Net realized gain on investments, futures contracts and foreign currency transactions | | | 640,406 | | | | 739,119 | |
Net change in unrealized appreciation (depreciation) of investments, futures contracts and foreign currency translations | | | 1,567,840 | | | | (565,124 | ) |
Net increase in net assets resulting from operations | | | 3,023,814 | | | | 845,032 | |
Distributions to Shareholders: | | | | | | | | |
From net investment income | | | (1,300,592 | ) | | | (850,157 | ) |
Capital Share Transactions: | | | | | | | | |
Proceeds from sale of shares | | | 15,136,995 | | | | 9,189,578 | |
Reinvestment of dividends and distributions | | | 1,201,915 | | | | 751,971 | |
Cost of shares repurchased | | | (7,721,668 | ) | | | (11,050,797 | ) |
Net increase (decrease) from capital share transactions | | | 8,617,242 | | | | (1,109,248 | ) |
| | |
Total increase (decrease) in net assets | | | 10,340,464 | | | | (1,114,373 | ) |
Net Assets: | | | | | | | | |
Beginning of year | | | 24,607,889 | | | | 25,722,262 | |
End of year | | $ | 34,948,353 | | | $ | 24,607,889 | |
End of year undistributed net investment income | | $ | 75,701 | | | $ | 316,720 | |
| | | | | | | | |
Share Transactions: | | | | | | | | |
Sale of shares | | | 746,561 | | | | 459,246 | |
Reinvested shares from dividends and distributions | | | 58,601 | | | | 39,104 | |
Shares repurchased | | | (380,121 | ) | | | (554,249 | ) |
Net increase (decrease) in shares | | | 425,041 | | | | (55,899 | ) |
|
The accompanying notes are an integral part of these financial statements. 17 |
Managers Global Income Opportunity Fund
Financial Highlights
For a share outstanding throughout each year
| | | | | | | | | | | | | | | | | | | | |
| | | For the year ended December 31, | |
| | | 2012 | | | 2011 | | | 2010 | | | 2009 | | | 2008 | |
Net Asset Value, Beginning of Year | | $ | 19.30 | | | $ | 19.33 | | | $ | 18.82 | | | $ | 16.93 | | | $ | 21.31 | |
Income from Investment Operations: | | | | | | | | | | | | | | | | | | | | |
Net investment income1 | | | 0.53 | | | | 0.53 | | | | 0.50 | | | | 0.89 | | | | 0.76 | |
Net realized and unrealized gain (loss) on investments1 | | | 1.52 | | | | 0.12 | | | | 0.87 | | | | 3.22 | | | | (2.93 | ) |
Total from investment operations | | | 2.05 | | | | 0.65 | | | | 1.37 | | | | 4.11 | | | | (2.17 | ) |
Less Distributions to Shareholders from: | | | | | | | | | | | | | | | | | | | | |
Net investment income | | | (0.79 | ) | | | (0.68 | ) | | | (0.86 | ) | | | (2.22 | ) | | | (2.18 | ) |
Net realized gain on investments | | | — | | | | — | | | | — | | | | — | | | | (0.03 | ) |
Total distributions to shareholders | | | (0.79 | ) | | | (0.68 | ) | | | (0.86 | ) | | | (2.22 | ) | | | (2.21 | ) |
Net Asset Value, End of Year | | $ | 20.56 | | | $ | 19.30 | | | $ | 19.33 | | | $ | 18.82 | | | $ | 16.93 | |
Total Return2 | | | 10.63 | % | | | 3.39 | % | | | 7.27 | % | | | 24.27 | %5 | | | (10.07 | )%5 |
Ratio of net expenses to average net assets | | | 1.05 | %4 | | | 1.10 | % | | | 1.10 | % | | | 1.10 | % | | | 1.10 | % |
Ratio of net investment income to average net assets2 | | | 2.63 | %4 | | | 2.63 | % | | | 2.57 | % | | | 4.82 | % | | | 3.62 | % |
Portfolio turnover | | | 59 | % | | | 91 | % | | | 131 | % | | | 102 | % | | | 56 | % |
Net assets at end of year (000’s omitted) | | $ | 34,948 | | | $ | 24,608 | | | $ | 25,722 | | | $ | 26,146 | | | $ | 47,735 | |
| | | | | | | | | | | | | | | | | | | | |
Ratios absent expense offsets:3 | | | | | | | | | | | | | | | | | | | | |
Ratio of total expenses to average net assets | | | 1.36 | % | | | 1.39 | % | | | 1.43 | % | | | 1.32 | % | | | 1.25 | % |
Ratio of net investment income to average net assets | | | 2.32 | % | | | 2.34 | % | | | 2.24 | % | | | 4.60 | % | | | 3.47 | % |
| | | | | | | | | | | | | | | | | | | | |
Notes to Financial Highlights
The following footnotes should be read in conjunction with the Financial Highlights of the Fund previously presented in this report.
| 1 | Per share numbers have been calculated using average shares. |
| 2 | Total returns and net investment income would have been lower had certain expenses not been reduced. (See Note 1(c) of Notes to Financial Statements.) |
| 3 | Excludes the impact of expense reimbursements or fee waivers and expense reductions such as brokerage credits, but includes non-reimbursable expenses, if any, such as interest, taxes and extraordinary expenses. (See Note 1(c) of Notes to Financial Statements.) |
| 4 | Includes non-routine extraordinary expenses amounting to $1,394 and represents 0.004% of average net assets. |
| 5 | The Total Return is based on the Financial Statement Net Asset Values as shown above. |
Notes to Financial Statements
December 31, 2012
| 1. | Summary of Significant Accounting Policies |
The Managers Funds (the “Trust”) is an open-end management investment company organized as a Massachusetts business trust, and registered under the Investment Company Act of 1940, as amended (the “1940 Act”). Currently, the Trust consists of a number of different Funds, each having distinct investment management objectives, strategies, risks and policies. Included in this report is the Managers Global Income Opportunity Fund (formerly Managers Global Bond Fund) (the “Fund”). The Fund will deduct a 1.00% redemption fee from the proceeds of any redemption (including a redemption by exchange) of shares if the redemption occurs within 60 days of the purchase of those shares. For the year ended December 31, 2012, the Fund had redemption fees amounting to $874.
The Fund’s financial statements are prepared in accordance with accounting principles generally accepted in the United States of America (“U.S. GAAP”), which require management to make estimates and assumptions that affect the reported amounts of assets and liabilities and disclosure of contingent assets and liabilities at the date of the financial statements and the reported amounts of income and expenses during the reporting period. Actual results could differ from those estimates and such differences could be material. The following is a summary of significant accounting policies followed by the Fund in the preparation of its financial statements:
| a. | Valuation of Investments |
Equity securities traded on a domestic or international securities exchange are valued at the last quoted sale price, or, lacking any sales, at the last quoted bid price. Over-the-counter securities are valued at the Nasdaq Official Closing Price, if one is available. Lacking any sales, over-the-counter securities are valued at the last quoted bid price. The Fund’s investments are generally valued based on market quotations provided by third-party pricing services approved by the Board of Trustees of the Fund (the “Board”).
Fixed-income securities are valued based on valuations furnished by independent pricing services that utilize matrix systems, which reflect such factors as security prices, yields, maturities, and ratings, and are supplemented by dealer and exchange quotations. Futures contracts for which market quotations are readily available are valued at the settlement price as of the close of the futures exchange. Short-term investments having a remaining maturity of 60 days or less are generally valued at amortized cost, which approximates market value. Investments in other open-end regulated investment companies are valued at their end of day net asset value per share. Investments in certain mortgage-backed and stripped mortgage-backed securities, preferred stocks, convertible securities, derivatives and other debt securities not traded on an organized securities market are valued on the basis of valuations provided by dealers or by a pricing service which uses information with respect to transactions in suchsecurities and various relationships between such securities and yield to maturity in determining value.
Under certain circumstances, the value of certain Fund investments (including derivatives) may be based on an evaluation of fair value, pursuant to procedures established by and under the general supervision of the Board. The Pricing Committee is the committee formed by the Board to make fair value determinations for such investments. When determining the fair value of an investment, the Pricing Committee seeks to determine the price that the Fund might reasonably expect to receive from a current sale of that investment in an arm’s-length transaction. Fair value determinations shall be based upon consideration of all available facts and information, including, but not limited to (i) attributes specific to the investment; (ii) fundamental analytical data and press releases relating to the investment and its issuer; (iii) the value of comparable securities or relevant financial instruments, including derivative securities, traded on other markets or among dealers; and (iv) other factors, such as future cash flows, interest rates, yield curves, volatilities, credit risks and/or default rates. The Board will be presented with a quarterly report comparing fair values determined by the Pricing Committee against subsequent market valuations for those securities. The values assigned to fair value investments are based on available information and do not necessarily represent amounts that might ultimately be realized, since such amounts depend on future developments inherent in long-term investments. Further, because of the inherent uncertainty of valuation, those estimated values may differ significantly from the values that would have been used had a ready market for the investments existed, and the differences could be material. The Fund may use the fair value of a portfolio investment to calculate its net asset value (“NAV”) when, for example, (1) market quotations are not readily available because a portfolio investment is not traded in a public market or the principal market in which the investment trades is closed, (2) trading in a portfolio investment is suspended and has not resumed before the Fund calculates its NAV, (3) a significant event affecting the value of a portfolio investment is determined to have occurred between the time of the market quotation provided for a portfolio investment and the time as of which the Fund calculates its NAV, (4) an investment’s price has remained unchanged over a period of time (often referred to as a “stale price”), or (5) Managers Investment Group LLC (the “Investment Manager”) determines that a market quotation is inaccurate. Portfolio investments that trade primarily on foreign markets are priced based upon the market quotation of such securities as of the close of their respective principal markets. Under certain circumstances, the Investment Manager may adjust such prices based on its determination of the impact of events occurring subsequent to the close of such markets but prior to the time as of which the Fund calculates its NAV. The Fund may invest in securities that may be thinly traded. The Board has adopted procedures to adjust prices of thinly traded securities that are judged to be stale so that they reflect fair value. An investment valued on the basis of its fair value may be valued at a price higher or lower than available market quotations. An investment’s valuation may differ depending on the method used and the factors considered in determining value according to the Fund’s fair value procedures.
Notes to Financial Statements (continued)
U.S. GAAP defines fair value as the price that a Fund would receive to sell an asset or pay to transfer a liability in an orderly transaction between market participants at the measurement date. U.S. GAAP also establishes a framework for measuring fair value, and a three level hierarchy for fair value measurements based upon the transparency of inputs to the valuation of an asset or liability. Inputs may be observable or unobservable and refer broadly to the assumptions that market participants would use in pricing the asset or liability. Observable inputs reflect the assumptions market participants would use in pricing the asset or liability based on market data obtained from sources independent of the Fund. Unobservable inputs reflect the Fund’s own assumptions about the assumptions that market participants would use in pricing the asset or liability developed based on the best information available in the circumstances. Each investment is assigned a level based upon the observability of the inputs which are significant to the overall valuation.
The three-tier hierarchy of inputs is summarized below:
Level 1 – inputs are quoted prices in active markets for identical investments (e.g., equity securities, open-end investment companies, futures contracts, options contracts)
Level 2 – other observable inputs (including, but not limited to: quoted prices for similar assets or liabilities in markets that are active, quoted prices for identical or similar assets or liabilities in markets that are not active, inputs other than quoted prices that are observable for the assets or liabilities (such as interest rates, yield curves, volatilities, prepayment speeds, loss severities, credit risks and default rates) or other market corroborated inputs) (e.g., debt securities, government securities, swap contracts, foreign currency exchange contracts, foreign securities utilizing international fair value pricing, broker-quoted securities, fair valued securities with observable inputs)
Level 3 – inputs are significant unobservable inputs (including the Fund’s own assumptions used to determine the fair value of investments) (e.g., fair valued securities with unobservable inputs)
Changes in inputs or methodologies used for valuing investments may result in a transfer in or out of levels within the fair value hierarchy. The inputs or methodologies used for valuing investments are not necessarily an indication of the risk associated with investing in those investments.
Security transactions are accounted for as of trade date. Realized gains and losses on securities sold are determined on the basis of identified cost.
| c. | Investment Income and Expenses |
Dividend income is recorded on the ex-dividend date. Dividend and interest income on foreign securities is recorded net of any withholding tax. Interest income, which includes amortization of premium and accretion of discount on debt securities, is accrued as earned. Non-cash dividends included in dividend income, if any, are reported at the fair market value of the securities received. Other income and expenses are recorded on an accrual basis. Expenses that cannot be directly attributed to a Fund are apportioned among the Funds in the Trust and in some cases other affiliated funds
based upon their relative average net assets or number of shareholders.
The Fund has a “balance credit” arrangement with The Bank of New York Mellon (“BNYM”), the Fund’s custodian, whereby the Fund is credited with an interest factor equal to 0.75% below the effective 90-day T-Bill rate for account balances left uninvested overnight. If the T-Bill rate falls below 0.75%, no credits will be earned. These credits serve to reduce custody expenses that would otherwise be charged to the Fund. For the year ended December 31, 2012, the custodian expense was not reduced.
Overdrafts will cause a reduction of any balance credits, computed at 2% above the effective Federal funds rate on the day of the overdraft. For the year ended December 31, 2012, the Fund did not have any overdraft fees.
The Fund also has a balance credit arrangement with its Transfer Agent, BNY Mellon Investment Servicing (US) Inc., whereby balance credits are used to offset banking charges and other out-of-pocket expenses. For the year ended December 31, 2012, the transfer agent expense was reduced by $8.
Total returns and net investment income for the Fund would have been lower had certain expenses not been offset. Total expenses before offsets exclude the impact of expense reimbursements or fee waivers and expense reductions such as brokerage recapture credits, but include non-reimbursable expenses, if any, such as interest, taxes and extraordinary expenses.
| d. | Dividends and Distributions |
Dividends resulting from net investment income and distributions of capital gains, if any, normally will be declared and paid annually in December and when required for Federal excise tax purposes. Income and capital gain distributions are determined in accordance with Federal income tax regulations, which may differ from U.S. GAAP. These differences are primarily due to differing treatments for losses deferred due to wash sales, equalization accounting for tax purposes, foreign currency, futures and market discount transactions. Permanent book and tax basis differences, if any, relating to shareholder distributions will result in reclassifications to paid-in capital.
The tax character of distributions paid during the years ended December 31, 2012and 2011 were as follows:
| | | | | | | | |
| Distributions paid from: | | 2012 | | | 2011 | |
Ordinary income | | $ | 1,300,592 | | | $ | 850,157 | |
Short-term capital gains | | | — | | | | — | |
Long-term capital gains | | | — | | | | — | |
| | | | | | | | |
Total | | $ | 1,300,592 | | | | $850,157 | |
| | | | | | | | |
Notes to Financial Statements (continued)
As of December 31, 2012, the components of distributable earnings (excluding unrealized appreciation/depreciation) on a tax basis consisted of:
| | | | |
Capital loss carryforward | | $ | 3,261,188 | |
Undistributed ordinary income | | | 73,333 | |
Undistributed short-term capital gains | | | — | |
Undistributed long-term capital gains | | | — | |
Post-October loss deferral | | | 20,992 | |
The Fund intends to comply with the requirements under Subchapter M of the Internal Revenue Code of 1986, as amended, to distribute substantially all of its taxable income and gains to its shareholders and to meet certain diversification and income requirements with respect to investment companies. Therefore, no provision for Federal income or excise tax is included in the accompanying financial statements.
Additionally, based on the Fund’s understanding of the tax rules and rates related to income, gains and transactions for the foreign jurisdictions in which it invests, the Fund will provide for foreign taxes, and where appropriate, deferred foreign taxes.
Management has analyzed the Fund’s tax positions taken on federal income tax returns as of December 31, 2012 and for all open tax years and has concluded that no provision for federal income tax is required in the Fund’s financial statements. Additionally, the Fund is not aware of any tax position for which it is reasonably possible that the total amounts of unrecognized tax benefits will change materially in the next twelve months.
Under the Regulated Investment Company Modernization Act of 2010, post-enactment capital losses may be carried forward for an unlimited time period. However, any new losses incurred will be required to be utilized prior to any loss carryovers incurred in pre-enactment taxable years, which generally expire eight years following the close of the taxable year in which they were incurred. As a result of this ordering rule, pre-enactment capital loss carryovers may be more likely to expire unused. Additionally, post-enactment capital losses that are carried forward retain their tax character as either short-term or long-term capital losses rather than being considered all short-term as under previous law.
| f. | Capital Loss Carryovers and Deferrals |
As of December 31, 2012, the Fund had accumulated net realized capital loss carryovers from security transactions for Federal income tax purposes as shown in the following chart. These amounts may be used to offset future realized capital gains, if any, through the expiration dates listed, or in the case of post-enactment losses, for an unlimited time period.
| | | | | | | | | | |
| | | Capital Loss Carryover
Amounts | | | Expires |
| | | Short-Term | | | Long-Term | | | December 31, |
(Pre-Enactment) | | $ | 31,468 | | | | — | | | 2016 |
(Pre-Enactment) | | | 2,196,208 | | | | — | | | 2017 |
(Pre-Enactment) | | | 1,033,512 | | | | — | | | 2018 |
| | | | | | | | | | |
Total | | $ | 3,261,188 | | | | — | | | |
| | | | | | | | | | |
For the year ended December 31, 2012, the Fund utilized capital loss carryovers in the amount of $418,741.
The Trust’s Declaration of Trust authorizes for each series the issuance of an unlimited number of shares of beneficial interest, without par value. The Fund records sales and repurchases of its capital stock on the trade date. The cost of securities contributed to the Fund in connection with the issuance of shares is based on the valuation of those securities in accordance with the Fund’s policy on investment valuation.
At December 31, 2012, certain unaffiliated shareholders of record, specifically omnibus accounts, individually or collectively held greater than 10% of the outstanding shares of the Fund as follows: one owns 26.7%. Transactions by this shareholder may have a material impact on the Fund.
| h. | Foreign Currency Translation |
The books and records of the Fund are maintained in U.S. dollars. The values of investments, assets and liabilities denominated in currencies other than U.S. dollars are translated into U.S. dollars based upon current foreign exchange rates. Purchases and sales of foreign investments, income and expenses are converted into U.S. dollars based on currency exchange rates prevailing on the respective dates of such transactions. Net realized and unrealized gain (loss) on foreign currency transactions represent: (1) foreign exchange gains and losses from the sale and holdings of foreign currencies; (2) gains and losses between trade date and settlement date on investment securities transactions and forward foreign currency exchange contracts; and (3) gains and losses from the difference between amounts of interest and dividends recorded and the amounts actually received.
The Fund does not isolate the net realized and unrealized gain or loss resulting from changes in exchange rates from the fluctuations in market prices of securities held. Such fluctuations are included with the net realized and unrealized gain or loss on investments.
The Fund invests in securities of foreign entities and in instruments denominated in foreign currencies which involve risks not typically associated with investments in domestic securities. Non-domestic securities carry special risks, such as exposure to currency fluctuations, less developed or less efficient trading markets, political instability, a lack of company information, differing auditing and legal standards, and, potentially, less liquidity.
Realized gains in certain countries may be subject to foreign taxes at the Fund level, at rates ranging from approximately 10% to 15%. The Fund would pay such foreign taxes at the appropriate rate for each jurisdiction.
| 2. | Agreements and Transactions with Affiliates |
The Trust has entered into an Investment Management Agreement under which the Investment Manager, a subsidiary of Affiliated Managers Group, Inc. (“AMG”), serves as investment manager to the Fund and is responsible for the Fund’s overall administration. The Investment Manager selects subadvisors for the Fund (subject to Board approval) and monitors each subadvisor’s investment
Notes to Financial Statements (continued)
performance, security holdings and investment strategies. The Fund’s investment portfolio is managed by Loomis, Sayles & Co., L.P. which serves pursuant to a subadvisory agreement with the Investment Manager.
Investment management fees are paid directly by the Fund to the Investment Manager based on average daily net assets. For the year ended December 31, 2012, the annual investment management fee rate, as a percentage of average daily net assets, was 0.70%.
Effective July 1, 2012, Managers Investment Group LLC has contractually agreed until at least May 1, 2014, to limit the Fund’s total annual operating expenses (exclusive of taxes interest (including interest incurred in connection with bank and custody overdrafts), brokerage commissions and other transaction costs, acquired fund fees and expenses, and extraordinary expenses) to 0.99% of average daily net assets of the Fund. Immediately prior to July 1, 2012, the Fund had a contractual expense limitation of 1.10%.
The Fund is obligated to repay the Investment Manager such amounts waived, paid or reimbursed in future years provided that the repayment occurs within thirty-six (36) months after the waiver or reimbursement and that such repayment would not cause the Fund’s total operating expenses in any such future year to exceed the Fund’s expense cap. For the year ended December 31, 2012, the Fund’s components of reimbursement available are detailed in the following chart:
| | | | |
Reimbursement Available - 12/31/11 | | $ | 211,934 | |
Additional Reimbursements | | | 98,482 | |
Repayments | | | — | |
Expired Reimbursements | | | (52,656 | ) |
| | | | |
Reimbursement Available - 12/31/12 | | $ | 257,760 | |
| | | | |
The Fund has entered into an Administration and Shareholder Servicing Agreement under which the Investment Manager serves as the Fund’s administrator (the “Administrator”) and is responsible for all aspects of managing the Fund’s operations, including administration and shareholder services to the Fund, its shareholders, and certain institutions, such as bank trust departments, broker dealers and registered investment advisers, that advise or act as an intermediary with the Fund’s shareholders. The Fund pays a fee to the Administrator at the rate of 0.20% per annum of the Fund’s average daily net assets for this service.
The aggregate annual retainer paid to each Independent Trustee of the Board is $80,000, plus $5,000 or $2,500 for each regular or special meeting attended, respectively. The Independent Chairman of the Trust receives an additional payment of $20,000 per year. The Chairman of the Audit Committee receives an additional payment of $8,000 per year. The Trustees’ fees and expenses are allocated among all of the Funds for which the Investment Manager serves as the advisor (the “Managers Funds”) based on the relative net assets of such Funds. The “Trustees fees and expenses” shown in the financial statements represents the Fund’s allocated portion of the total fees and expenses paid by the Managers Funds.
Beginning January 1, 2013, the annual retainer paid to each Independent Trustee of the Board will be $105,000, plus $6,000 or $2,500 for each regular or special meeting attended, respectively. The Independent Chairman of the Trusts will receive and additional payment of $25,000 per year. The Chairman of the Audit Committee will receive an additional payment of $10,000 per year.
The Fund is distributed by Managers Distributors, Inc. (the “Distributor” or “MDI”), a wholly-owned subsidiary of the Investment Manager. MDI serves as the distributor and underwriter for the Fund and is a registered broker-dealer and member of the Financial Industry Regulatory Authority, Inc. (“FINRA”). Shares of the Fund will be continuously offered and will be sold directly to prospective purchasers through brokers, dealers or other financial intermediaries who have executed selling agreements with MDI. Subject to the compensation arrangement discussed below, generally MDI bears all or a portion of the expenses of providing services pursuant to the distribution agreement, including the payment of the expenses relating to the distribution of prospectuses for sales purposes and any advertising or sales literature. Certain Trustees and Officers of the Fund are Officers and/or Directors of the Investment Manager, AMG and/or the Distributor.
The Securities and Exchange Commission granted an exemptive order that permits the Fund to lend and borrow money for certain temporary purposes directly to and from other eligible Managers Funds. Participation in this interfund lending program is voluntary for both borrowing and lending Funds, and an interfund loan is only made if it benefits each participating Fund. The Investment Manager administers the program according to procedures approved by the Board, and the Board monitors the operation of the program. An interfund loan must comply with certain conditions set out in the exemptive order, which are designed to assure fairness and protect all participating funds. For the year ended December 31, 2012, the Fund lent to other Managers Funds varying amounts not exceeding $1,032,942, for 5 days earning interest of $211. The interest amounts are included in the Statement of Operations as interest income. For the same period, the Fund did not borrow from any other Managers Funds. At December 31, 2012 the Fund had no loans outstanding.
| 3. | Purchases and Sales of Securities |
Purchases and sales of securities (excluding short-term securities and U.S. Government obligations) for the year ended December 31, 2012, were $20,711,745 and $14,774,995, respectively. Purchases and sales of U.S. Government obligations for the year ended December 31, 2012, were $4,847,610 and $1,912,003, respectively.
| 4. | Portfolio Securities Loaned |
The Fund participates in a securities lending program offered by BNYM (the “Program”), providing for the lending of securities to qualified brokers. Securities lending income include earnings of such temporary cash investments, plus or minus any rebate to a borrower. These earnings (after any rebate) are then divided between BNYM, as a fee for its services under the program, and the Fund, according to agreed-upon rates. Collateral on all securities loaned is accepted in cash and/or government securities and is maintained at a minimum level of 102% (105% in the case of certain foreign securities) of the market value, plus interest, if applicable, of investments on loan. It is the Fund’s policy to obtain additional
Notes to Financial Statements (continued)
collateral from or return excess collateral to the borrower by the end of the next business day, following the valuation date of the securities loaned. Therefore, the value of the collateral held may be temporarily less than the value of the securities on loan. Lending securities entails a risk of loss to the Fund if and to the extent that the market value of the securities loaned were to increase and the borrower did not increase the collateral accordingly, and the borrower fails to return the securities. Under the terms of the Program, the Fund is indemnified for such losses by BNYM. The Fund bears the risk of any deficiency in the amount of the collateral available for return to the borrower due to any loss on the collateral invested. Collateral received in the form of cash is invested temporarily in the BNY Mellon Overnight Government Fund, or other short-term investments as defined in the Securities Lending Agreement with BNYM. For the year ended December 31, 2012, the Fund participated in the program.
| 5. | Commitments and Contingencies |
In the normal course of business, the Fund may enter into contracts and agreements that contain a variety of representations and warranties, which provide general indemnifications. The maximum exposure to the Fund under these arrangements is unknown, as this would involve future claims that may be made against the Fund that have not yet occurred. However, the Fund has had no prior claims or losses and expects the risk of material loss to be remote.
Certain transactions, such as futures and forward transactions, dollar roll agreements, or purchases of when-issued or delayed delivery securities may have a similar effect on the Fund’s net asset value as if the Fund had created a degree of leverage in its portfolio. However, if the Fund enters into such a transaction, the Fund will establish a segregated account with its custodian in which it will maintain cash, U.S. government securities or other liquid securities equal in value to its obligations in respect to such transaction. Securities and other assets held in the segregated account may not be sold while the transaction is outstanding, unless other suitable assets are substituted.
The following disclosures contain information on how and why the Fund uses derivative instruments, the credit risk and how derivative instruments affect the Fund’s financial position, results of operations and cash flows. The location and fair value amounts of these instruments on the Statement of Assets and Liabilities and the realized and changes in unrealized gains and losses on the Statement of Operations, each categorized by type of derivative contract, are included in a table in the Schedule of Portfolio Investments. For the year ended December 31, 2012, the average quarterly balances of outstanding derivative financial instruments were as follows:
| | | | |
| | | For the year ended
December 31, 2012 | |
Financial futures contracts: | | | | |
Average number of contracts purchased | | | 2 | |
Average number of contracts sold | | | 8 | |
Average notional value of contracts purchased | | $ | 232,785 | |
Average notional value of contracts sold | | $ | 1,014,962 | |
Foreign currency exchange contracts: | | | | |
Average US dollar amounts purchased/sold | | $ | 3,436,500 | |
| 8. | Forward Foreign Currency Contracts |
During the year ended December 31, 2012, the Fund invested in forward foreign currency contracts to facilitate transactions in foreign securities and to hedge against foreign currency exchange rate risk on its non-U.S. dollar denominated investment securities.
A forward foreign currency contract is an agreement between a fund and another party to buy or sell a currency at a set price at a future date. The market value of the contract will fluctuate with changes in currency exchange rates. The contract is marked-to-market daily, and the change in market value is recorded as an unrealized gain or loss. Gain or loss on the purchase or sale of contracts having the same settlement date, amount and counterparty is realized on the date of offset, otherwise gain or loss is realized on the settlement date. Risks may arise upon entering into these contracts from the potential inability of counterparties to meet the terms of their contracts and from unanticipated movements in the value of a foreign currency relative to the U.S. dollar.
The Fund entered into futures contracts to achieve a desired level of investment, whether to accommodate portfolio turnover or cash flows from capital shares transactions. There are certain risks associated with futures contracts. Prices may not move as expected or the Fund may not be able to close out the contract when it desires to do so, resulting in losses.
On entering into a futures contract, either cash or securities in an amount equal to a certain percentage of the contract value (initial margin) must be deposited with the futures broker. Subsequent payments (variation margin) are made or received each day. The variation margin payments equal the daily changes in the contract value and are recorded as unrealized gains or losses. For OTC futures, daily variation margin is not required. The Fund recognizes a realized gain or loss when the contract is closed or expires equal to the difference between the value of the contract at the time it was opened and the value at the time it was closed. Futures are valued at their quoted daily settlement prices. The aggregate principal amounts of the contracts are not recorded in the financial statements. Fluctuations in the value of the contracts are recorded in the Statement of Assets and Liabilities as an asset (liability) and in the Statement of Operations as unrealized appreciation (depreciation) until the contracts are closed, when they are recorded as realized gains (losses) on futures contracts.
Notes to Financial Statements (continued)
| 10. | New Accounting Pronouncements |
In December 2011, the FASB issued ASU No. 2011-11 “Disclosures about Offsetting Assets and Liabilities.” ASU 2011-11 requires disclosures to make financial statements that are prepared under U.S. GAAP more comparable to those prepared under IFRS. The new disclosure requirements mandate that entities disclose both gross and net information about instruments and transactions eligible for offset in the statement of assets and liabilities as well as instruments and transactions subject to an agreement similar to a master netting arrangement. In addition, ASU 2011-11 requires disclosure of collateral received and posted in connection with master netting agreements or similar arrangements. New disclosures are required for annual reporting periods beginning on or after January 1, 2013, and interim periods within those annual periods. Management is evaluating the impact of ASU 2011-11 on the Fund’s financial statements and disclosures.
The Fund has determined that no material events or transactions occurred through the issuance of the Fund’s financial statements,
which require additional disclosure in the Fund’s financial statements.
Tax Information(unaudited)
Managers Global Income Opportunity Fund hereby designates the maximum amount allowable of its net taxable income as qualified dividends as provided in the Jobs and Growth Tax Relief Reconciliation act of 2003. The 2012 Form 1099-DIV you receive for the Fund will show the tax status of all distributions paid to you during the year.
Pursuant to section 852 of the Internal Revenue Code, Managers Global Income Opportunity Fund hereby designates $0, as a capital gain distribution with respect to the taxable year ended December 31, 2012, or if subsequently determined to be different, the net capital gains of such fiscal year.
Report of Independent Registered Public Accounting Firm
To the Board of Trustees of The Managers Funds and the Shareholders of Managers Global Income Opportunity Fund:
In our opinion, the accompanying statement of assets and liabilities, including the schedule of portfolio investments, and the related statements of operations and of changes in net assets and the financial highlights present fairly, in all material respects, the financial position of Managers Global Income Opportunity Fund (formerly Managers Global Bond Fund) (the “Fund”) at December 31, 2012, and the results of its operations, the changes in its net assets and the financial highlights for each of the periods indicated, in conformity with accounting principles generally accepted in the United States of America. These financial statements and financial highlights (hereafter referred to as “financial statements”) are the responsibility of the Fund’s management. Our responsibility is to express an opinion on these financial statements based on our audits. We conducted our audits of these financial statements in accordance with the standards of the Public Company Accounting Oversight Board (United States). Those standards require that we plan and perform the audit to obtain reasonable assurance about whether the financial statements are free of material misstatement. An audit includes examining, on a test basis, evidence supporting the amounts and disclosures in the financial statements, assessing the accounting principles used and significant estimates made by management, and evaluating the overall financial statement presentation. We believe that our audits, which included confirmation of securities at December 31, 2012 by correspondence with the custodian and brokers, and the application of alternative auditing procedures where securities purchased had not been received, provide a reasonable basis for our opinion.
PricewaterhouseCoopers LLP
Boston, Massachusetts
February 27, 2013
Trustees and Officers
The Trustees and Officers of the Trust, their business addresses, principal occupations for the past five years and dates of birth are listed below. The Trustees provide broad supervision over the affairs of the Trust and the Funds. The Trustees are experienced executives who meet periodically throughout the year to oversee the Fund’s activities, review contractual arrangements with companies that provide services to the Fund, and review the Fund’s performance. Unless otherwise noted, the address of each Trustee or Officer is the address of the Trust: 800 Connecticut Avenue, Norwalk, Connecticut 06854.
There is no stated term of office for Trustees. Trustees serve until their resignation, retirement or removal in accordance with the Trust’s organizational documents and policies adopted by the Board from time to time. The Chairman of the Trustees, President, Treasurer and Secretary of the Trust are elected by the Trustees annually. Other officers hold office at the pleasure of the Trustees.
Independent Trustees
The following Trustees are not “interested persons” of the Trust within the meaning of the 1940 Act:
| | |
Name, Date of Birth, Number of Funds Overseen in Fund Complex* | | Principal Occupation(s) During Past 5 Years and Other Directorships Held by Trustee |
Bruce B. Bingham, 12/01/48 • Trustee since 2012 • Oversees 37 Funds in Fund Complex | | Partner, Hamilton Partners (real estate development firm) (1987-Present). |
| |
William E. Chapman, II, 9/23/41 • Independent Chairman • Trustee since 1999 • Oversees 37 Funds in Fund Complex | | President and Owner, Longboat Retirement Planning Solutions (1998-Present); Hewitt Associates, LLC (part time) (provider of Retirement and Investment Education Seminars) (2002-2009); Trustee of Bowdoin College (2002-Present);Director of Harding, Loevner Funds, Inc. (6 portfolios); Trustee of Third Avenue Trust (5 portfolios); Trustee of Third Avenue Variable Trust (1 portfolio); Trustee of Aston Funds (26 portfolios). |
| |
Edward J. Kaier, 9/23/45 • Trustee since 1999 • Oversees 37 Funds in Fund Complex | | Attorney at Law and Partner, Teeters Harvey Gilboy & Kaier LLP (2007-Present); Attorney at Law and Partner, Hepburn Willcox Hamilton & Putnam, LLP (1977-2007); Trustee of Third Avenue Trust (5 portfolios); Trustee of Third Avenue Variable Trust (1 portfolio); Trustee of Aston Funds (26 portfolios). |
| |
Steven J. Paggioli, 4/3/50 • Trustee since 1993 • Oversees 37 Funds in Fund Complex | | Consultant (2002-Present); Formerly Executive Vice President and Director, The Wadsworth Group (1986-2001); Executive Vice President, Secretary and Director, Investment Company Administration, LLC (1990-2001); Vice President, Secretary and Director, First Fund Distributors, Inc. (1991-2001); Trustee, Professionally Managed Portfolios (38 portfolios); Advisory Board Member, Sustainable Growth Advisors, LP; Independent Director, Chase Investment Counsel (2008 – Present); Trustee of Aston Funds (26 portfolios). |
| |
Eric Rakowski, 6/5/58 • Trustee since 1999 • Oversees 37 Funds in Fund Complex | | Professor, University of California at Berkeley School of Law (1990-Present); Director of Harding, Loevner Funds, Inc. (6 portfolios); Trustee of Third Avenue Trust (5 portfolios); Trustee of Third Avenue Variable Trust (1 portfolio); Trustee of Aston Funds (26 portfolios). |
| |
Thomas R. Schneeweis, 5/10/47 • Trustee since 1987 • Oversees 37 Funds in Fund Complex | | Professor of Finance, University of Massachusetts (1977-Present); Director, CISDM at the University of Massachusetts, (1996-Present); President, Alternative Investment Analytics, LLC, (formerly Schneeweis Partners, LLC) (2001-Present); Partner, S Capital Management, LLC (2007-Present); President, TRS Associates (1982-Present); Partner, White Bear Partners, LLC (2007-2010); Partner, Northampton Capital Management, LLC (2004-2010); Trustee of Aston Funds (26 portfolios). |
| * | The Fund Complex consists of Managers AMG Funds, The Managers Funds, Managers Trust I and Managers Trust II. |
Interested Trustees
Each Trustee in the following table is an “interested person” of the Trust within the meaning of the 1940 Act. Ms. Carsman is an interested person of the Trust within the meaning of the 1940 Act by virtue of her position with, and interest in securities of, AMG, and her former position as Chief Legal Officer of the Trust.
| | |
Name, Date of Birth, Number of Funds Overseen in Fund Complex* | | Principal Occupation(s) During Past 5 Years and Other Directorships Held by Trustee |
Christine C. Carsman, 4/2/52 • Trustee since 2011 • Oversees 37 Funds in Fund Complex | | Senior Vice President and Deputy General Counsel, Affiliated Managers Group, Inc. (2011-Present); Senior Vice President and Chief Regulatory Counsel, Affiliated Managers Group, Inc. (2007-2011); Vice President and Chief Regulatory Counsel, Affiliated Managers Group, Inc. (2004-2007); Secretary and Chief Legal Officer, Managers AMG Funds, The Managers Funds, Managers Trust I and Managers Trust II (2004-2011); Senior Counsel, Vice President and Director of Operational Risk Management and Compliance, Wellington Management Company, LLP (1995-2004) |
Officers
| | |
Name, Date of Birth, Position(s) Held with Fund and Length of Time Served | | Principal Occupation(s) During Past 5 Years |
Keitha L. Kinne, 5/16/58 • President since 2012 Chief Operating Officer since 2007 | | Managing Partner and Chief Operating Officer, Managers Investment Group LLC (2007-Present); Chief Investment Officer, Managers Investment Group LLC (2008-Present); President, Managers Distributors, Inc. (2012-Present); Chief Operating Officer, Managers AMG Funds, Managers Trust I and Managers Trust II (2007-Present); Managing Director, Legg Mason & Co., LLC (2006-2007); Managing Director, Citigroup Asset Management (2004-2006). |
| |
Lewis Collins, 2/22/66 • Secretary since 2011 • Chief Legal Officer since 2011 | | Senior Vice President and Senior Counsel, Affiliated Managers Group, Inc. (2010-Present); Vice President and Senior Counsel, Affiliated Managers Group, Inc. (2006-2010); Senior Counsel, Affiliated Managers Group, Inc. (2002-2006); Attorney, Ropes & Gray LLP (1998-2002). |
| |
Donald S. Rumery, 5/29/58 • Chief Financial Officer since 2007 • Treasurer since 1995 | | Senior Vice President, Managers Investment Group LLC (2005-Present); Treasurer, Managers AMG Funds (1999-Present); Treasurer, Managers Trust I and Managers Trust II (2000-Present); Chief Financial Officer, Managers AMG Funds, Managers Trust I and Managers Trust II (2007-Present); Treasurer and Chief Financial Officer, Managers Distributors, Inc. (2000-2012); Vice President, The Managers Funds, LLC, (1994-2004). |
| |
John J. Ferencz, 3/09/62 • Chief Compliance Officer since 2010 | | Vice President, Legal and Compliance, Managers Investment Group LLC (2010-Present); Senior Compliance Analyst, Mutual Funds and Regulatory, GE Asset Management Incorporated (2005-2010). |
| |
Michael S. Ponder, 9/12/73 • Assistant Secretary since 2011 | | Senior Vice President and Counsel, Managers Investment Group LLC (2011-Present); Attorney, DeNovo Legal (2009-2010); Vice President, Credit Suisse (2007-2009); Associate, Willkie Farr & Gallagher LLP (2006-2007). |
| |
Matthew B. Wallace, 11/24/80 • Anti-Money Laundering Compliance Officer since 2012 | | Senior Associate, Legal and Compliance, Managers Investment Group LLC (2012-Present); Associate, Legal and Compliance, Managers Investment Group LLC (2010-2012); Compliance Specialist, Calamos Advisors LLC (2007-2010). |
THIS PAGE INTENTIONALLY LEFT BLANK
Investment Manager and Administrator
Managers Investment Group LLC
800 Connecticut Avenue
Norwalk, CT 06854
(800) 835-3879
Distributor
Managers Distributors, Inc.
800 Connecticut Avenue
Norwalk, CT 08654
(800) 835-3879
Custodian
The Bank of New York Mellon
2 Hanson Place
Brooklyn, NY 11217
Legal Counsel
Ropes & Gray LLP
Prudential Tower, 800 Boylston Street
Boston, MA 02199-3600
Transfer Agent
BNY Mellon Investment Servicing (US) Inc.
Attn: Managers
P.O. Box 9769
Providence, RI 02940
(800) 548-4539
For ManagersChoiceTM Only
Managers
c/o BNY Mellon Investment Servicing (US) Inc.
P.O. Box 9847 Providence, RI 02940-8047
(800) 358-7668
MANAGERSAND MANAGERS AMG FUNDS
| | | | |
EQUITY FUNDS | | BALANCED FUNDS |
| | |
CADENCE CAPITAL APPRECIATION CADENCE MID-CAP CADENCE EMERGING COMPANIES Cadence Capital Management, LLC ESSEX SMALL/MICRO CAP GROWTH Essex Investment Management Co., LLC FQ TAX-MANAGED U.S. EQUITY FQ U.S. EQUITY First Quadrant, L.P. FRONTIER SMALL CAP GROWTH Frontier Capital Management Company, LLC GW&K SMALL CAP EQUITY Gannett Welsh & Kotler, LLC MICRO-CAP Lord, Abbett & Co. LLC WEDGE Capital Management L.L.P. Next Century Growth Investors LLC RBC Global Asset Management (U.S.) Inc. REAL ESTATE SECURITIES Urdang Securities Management, Inc. RENAISSANCE LARGE CAP GROWTH Renaissance Group LLC | | SKYLINE SPECIAL EQUITIES PORTFOLIO Skyline Asset Management, L.P. SPECIAL EQUITY Ranger Investment Management, L.P. Lord, Abbett & Co. LLC Smith Asset Management Group, L.P. Federated MDTA LLC SYSTEMATIC VALUE SYSTEMATIC MID CAP VALUE Systematic Financial Management, L.P. TIMESSQUARE INTERNATIONAL SMALL CAP FUND TIMESSQUARE MID CAP GROWTH TIMESSQUARE SMALL CAP GROWTH TSCM GROWTH EQUITY TimesSquare Capital Management, LLC TRILOGY GLOBAL EQUITY TRILOGY EMERGING MARKETS EQUITY TRILOGY INTERNATIONAL SMALL CAP Trilogy Global Advisors, L.P. YACKTMAN FUND YACKTMAN FOCUSED FUND Yacktman Asset Management L.P. | | CHICAGO EQUITY PARTNERS BALANCED Chicago Equity Partners, LLC ALTERNATIVE FUNDS FQ GLOBAL ALTERNATIVES FQ GLOBAL ESSENTIALS First Quadrant, L.P. INCOME FUNDS BOND (MANAGERS) GLOBAL INCOME OPPORTUNITY Loomis, Sayles & Co., L.P. BOND (MANAGERS PIMCO) Pacific Investment Management Co. LLC CALIFORNIA INTERMEDIATE TAX-FREE Miller Tabak Asset Management LLC GW&K FIXED INCOME FUND GW&K MUNICIPAL BOND GW&K MUNICIPAL ENHANCED YIELD Gannett Welsh & Kotler, LLC HIGH YIELD J.P. Morgan Investment Management LLC INTERMEDIATE DURATION GOVERNMENT SHORT DURATION GOVERNMENT Smith Breeden Associates, Inc. |
| | |
This report is prepared for the Fund’s shareholders. It is authorized for distribution to prospective investors only when preceded or accompanied by an effective prospectus. To receive a free copy of the prospectus or Statement of Additional Information, which includes additional information about Fund Trustees, please contact us by calling 800.835.3879. Distributed by Managers Distributors, Inc., member FINRA. A description of the policies and procedures each Fund uses to vote its proxies is available: (i) without charge, upon request, by calling 800.835.3879, or (ii) on the Securities and Exchange Commission’s (SEC) Web site at www.sec.gov. For information regarding each Fund’s proxy voting record for the 12-month period ended June 30, call 800.835.3879 or visit the SEC Web site at www.sec.gov. The Fund files its complete schedule of portfolio holdings with the SEC for the first and third quarters of each fiscal year on Form N-Q. The Funds’ Forms N-Q are available on the SEC’s website at www.sec.gov. A Fund’s Forms N-Q may be reviewed and copied at the SEC’s Public Reference Room in Washington, DC. Information on the operation of the Public Reference Room may be obtained by calling 800.SEC.0330. To review a complete list of the Fund’s portfolio holdings, or to view the most recent quarterly holdings report, semiannual report, or annual report, please visit www.managersinvest.com. | | |

Item 2. CODE OF ETHICS
Registrant has adopted a Code of Ethics. See attached Exhibit (a)(1).
Item 3. AUDIT COMMITTEE FINANCIAL EXPERT
Registrant’s Board of Trustees has determined that independent Trustees Mr. Jack W. Aber and Mr. Steven J. Paggioli each qualify as the Audit Committee Financial Expert. Mr. Aber and Mr. Paggioli are “independent” as such term is defined in Form N-CSR.
Item 4. PRINCIPAL ACCOUNTANT FEES AND SERVICES
The aggregate fees billed by the Funds’ independent registered public accounting firm, PricewaterhouseCoopers LLP (“PwC”), to the Funds for the Funds’ two most recent fiscal years for professional services rendered for audits of annual financial statements, or services that are normally provided in connection with statutory and regulatory filings or engagements (“Audit Fees”) were as follows:
| | | | | | | | |
Fund | | Fiscal 2012 | | | Fiscal 2011 | |
Managers Bond Fund | | $ | 63,116 | | | $ | 69,012 | |
Managers Global Income Opportunity Fund* | | $ | 28,697 | | | $ | 24,767 | |
Managers Special Equity Fund | | $ | 27,878 | | | $ | 22,782 | |
| * | Formerly known as Managers Global Bond Fund |
There were no fees billed by PwC to the Funds in its two recent fiscal years for services rendered for assurance and related services that are reasonably related to the performance of the audit or review of the Fund’s financial statements, but are not reported as Audit Fees (“Audit-Related Fees”).
For the Funds’ two most recent fiscal years, there were no Audit-Related Fees billed by PwC for engagements related directly to the operations and financial reporting of one or more Funds by a Fund Service Provider. A Fund Service Provider is (a) any investment adviser to the Fund (not including any Subadvisor whose role is primarily portfolio management and is subcontracted with or overseen by another investment adviser) or (b) any entity that provides ongoing services to the Fund and is controlling, controlled by or under common control with a Fund investment adviser described in (a).
The aggregate fees billed by PwC to the Funds for the two most recent fiscal years for professional services rendered for tax compliance, tax advice, and tax planning (“Tax Fees”) were as follows:
| | | | | | | | |
Fund | | Fiscal 2012 | | | Fiscal 2011 | |
Managers Bond Fund | | $ | 9,000 | | | $ | 9,190 | |
Managers Global Income Opportunity Fund* | | $ | 9,000 | | | $ | 10,200 | |
Managers Special Equity Fund | | $ | 7,000 | | | $ | 7,340 | |
| * | Formerly known as Managers Global Bond Fund |
For the Funds’ two most recent fiscal years, Tax Fees billed by PwC for engagements by Fund Service Providers that related directly to the operations and financial reporting of the Funds were $0 for fiscal 2012 and $0 for fiscal 2011, respectively.
The services for which Tax Fees were charged comprise all services performed by professional staff in PwC’s tax division except those services related to the audit. Typically, this category would include fees for tax compliance, tax planning, and tax advice. Tax compliance, tax advice, and tax planning services include preparation of original and amended tax returns, claims for refund and tax payment-planning services, assistance with tax audits and appeals, tax advice related to mergers and acquisitions and requests for rulings or technical advice from taxing authorities.
There were no other fees billed by PwC to the Funds for all other non-audit services (“Other Fees”) during the Funds’ two most recent fiscal years. During the same period, there were no Other Fees billed by PwC for engagements by Fund Service Providers that related directly to the operations and financial reporting of the Funds.
(e)(1) According to policies adopted by the Audit Committee, services provided by PwC to the Funds must be pre-approved by the Audit Committee. On an annual basis, the Audit Committee reviews and pre-approves various types of services that PwC may perform for the Funds without specific approval of each engagement, subject to specified budget limitations. As contemplated by the Sarbanes-Oxley Act of 2002 and related SEC rules, the Audit Committee also pre-approves non-audit services provided by PwC to any Fund Service Provider for any engagement that relates directly to the operations and financial reporting of the Funds. Any engagement that is not already pre-approved or that will exceed a pre-approved budget must be submitted to the Audit Committee for pre-approval. The Chairman of the Audit Committee is authorized on behalf of the Board of Trustees and the Audit Committee to approve the engagement of PwC to perform non-audit services subject to certain conditions, including notification to the Audit Committee of such pre-approval not later than the next meeting of the Audit Committee following the date of such pre-approval.
(g) The aggregate fees billed by PwC in 2012 and 2011 for non-audit services rendered to the Funds and Fund Service Providers were $91,000 and $90,730, respectively. For the fiscal year ended December 31, 2012, this amount reflects the amounts disclosed above in Item 4(b),(c),(d), plus $66,000 in fees billed to the Fund Service Providers for non-audit services that did not relate directly to the operations and financial reporting of the Funds. For the fiscal year ended December 31, 2011, this amount reflects the amounts disclosed above in Item 4(b),(c),(d), plus $64,000 in fees billed to the Fund Service Providers for non-audit services that did not relate directly to the operations and financial reporting of the Funds.
(h) The Trust’s Audit Committee has considered whether the provision of non-audit services by registrant’s independent registered public accounting firm to the registrant’s investment advisor, and any entity controlling, controlled, or under common control with the investment advisor that provided ongoing services to the registrant that were not pre-approved by the Committee (because such services did not relate directly to the operations and financial reporting of the registrant) was compatible with maintaining the independence of the independent registered public accounting firm.
Item 5. AUDIT COMMITTEE OF LISTED REGISTRANTS
Not applicable.
Item 6. SCHEDULE OF INVESTMENTS
Not applicable.
Item 7. DISCLOSURE OF PROXY VOTING POLICIES AND PROCEDURES FOR CLOSED-END MANAGEMENT INVESTMENT COMPANIES
Not applicable.
Item 8. PORTFOLIO MANAGERS OF CLOSED-END MANAGEMENT INVESTMENT COMPANIES
Not applicable.
Item 9. PURCHASES OF EQUITY SECURITIES BY CLOSED-END MANAGEMENT INVESTMENT COMPANIES AND AFFILIATED PURCHASERS
Not applicable.
Item 10. SUBMISSION OF MATTERS TO A VOTE OF SECURITY HOLDERS
Not applicable.
Item 11. CONTROLS AND PROCEDURES
(a) The Registrant’s principal executive and principal financial officers have concluded, based on their evaluation of the registrant’s disclosure controls and procedures as of a date within 90 days of the filing of this report, that the Registrant’s disclosure controls and procedures are reasonably designed to ensure that information required to be disclosed by the Registrant on Form N-CSR is recorded, processed, summarized and reported within the required time periods and that information required to be disclosed by the registrant
in the reports that it files or submits on Form N-CSR is accumulated and communicated to the Registrant’s management, including its principal executive and principal financial officers, as appropriate to allow timely decisions regarding required disclosure.
(b) There were no changes in the Registrant’s internal control over financial reporting during the Registrant’s fourth fiscal quarter of the period covered by this report that have materially affected, or are reasonably likely to affect, the internal control over financial reporting.
Item 12. EXHIBITS
| | |
| |
| (a)(1) | | Any Code of Ethics or amendments hereto. Filed herewith. |
| |
| (a)(2) | | Certifications pursuant to Rule 30a-2(a) under the Investment Company Act of 1940 - Filed herewith. |
| |
| (a)(3) | | Not applicable. |
| |
| (b) | | Certifications pursuant to Rule 30a-2(b) under the Investment Company Act of 1940 - Filed herewith. |
SIGNATURES
Pursuant to the requirements of the Securities Exchange Act of 1934 and the Investment Company Act of 1940, the registrant has duly caused this report to be signed on its behalf by the undersigned, thereunto duly authorized.
THE MANAGERS FUNDS
| | |
By: | | /s/ Keitha L. Kinne |
| | Keitha L. Kinne, President |
Date: March 11, 2013
Pursuant to the requirements of the Securities Exchange Act of 1934 and the Investment Company Act of 1940, this report has been signed below by the following persons on behalf of the registrant and in the capacities and on the dates indicated.
| | |
By: | | /s/ Keitha L. Kinne |
| | Keitha L. Kinne, President |
Date: March 11, 2013
| | |
By: | | /s/ Donald S. Rumery |
| | Donald S. Rumery, Chief Financial Officer |
Date: March 11, 2013