UNITED STATES
SECURITIES AND EXCHANGE COMMISSION
Washington, D.C. 20549
FORM N-CSRS
CERTIFIED SHAREHOLDER REPORT OF REGISTERED MANAGEMENT
INVESTMENT COMPANIES
Investment Company Act file number: 811-03752
THE MANAGERS FUNDS
(Exact name of registrant as specified in charter)
| 800 Connecticut Avenue, Norwalk, Connecticut | 06854 | |
| (Address of principal executive offices) | (Zip code) |
Managers Investment Group LLC
800 Connecticut Avenue, Norwalk, Connecticut 06854
(Name and address of agent for service)
Registrant’s telephone number, including area code: (203) 299-3500
| Date of fiscal year end: | DECEMBER 31 | |
Date of reporting period: | JANUARY 1, 2006 – JUNE 30, 2006 | |
| (Semi-Annual Shareholder Report) |
Item 1. Reports to Shareholders
SEMI-ANNUAL REPORT
Managers Funds
June 30, 2006
| • | Managers Value Fund |
| • | Managers Capital Appreciation Fund |
| • | Managers Small Company Fund |
| • | Managers International Equity Fund |
| • | Managers Emerging Markets Equity Fund |
| • | Managers Bond Fund |
| • | Managers Global Bond Fund |

The Managers Funds
Semi-Annual Report — June 30, 2006 (unaudited)
TABLE OF CONTENTS | Page | |
| LETTER TO SHAREHOLDERS | 1 | |
| ABOUT YOUR FUNDS’ EXPENSES | 2 | |
| FUND PERFORMANCE | 3 | |
| FUND SNAPSHOTS AND SCHEDULES OF PORTFOLIO INVESTMENTS | ||
| 4 | ||
| 7 | ||
| 9 | ||
| 13 | ||
| 18 | ||
| 22 | ||
| 28 | ||
| NOTES TO SCHEDULES OF PORTFOLIO INVESTMENTS | 34 | |
| FINANCIAL STATEMENTS: | ||
| 35 | ||
Funds’ balance sheet, net asset value (NAV) per share computation and cumulative undistributed amount | ||
| 37 | ||
Detail of sources of income, Fund expenses, and realized and unrealized gains (losses) during the fiscal period | ||
| 39 | ||
Detail of changes in Fund assets for the past two fiscal periods | ||
| FINANCIAL HIGHLIGHTS | 41 | |
Historical net asset values per share, distributions, total returns, expense ratios, turnover ratios and net assets | ||
| NOTES TO FINANCIAL STATEMENTS | 45 | |
Accounting and distribution policies, details of agreements and transactions with Fund management and affiliates, and descriptions of certain investment risks | ||
| ANNUAL RENEWAL OF INVESTMENT ADVISORY AGREEMENTS | 50 | |
Nothing contained herein is to be considered an offer, sale or solicitation of an offer to buy shares of The Managers Funds or Managers AMG Funds. Such offering is made only by Prospectus, which includes details as to offering price and other material information.
Dear Fellow Shareholder,
The first half of 2006 was characterized by increased volatility in most markets. U.S. and foreign stocks, as well as bonds were all impacted by higher oil prices, unrest in the Middle East, and uncertainty over growth rates and inflation. Times like these challenge investors to remove emotion from decisions and stay the course with their long-term investment plans.
At Managers, regardless of market conditions, we maintain a focus on providing investors with excellent, trusted, and rigorously monitored investment solutions across all major market segments and styles. We encourage our portfolio managers to take a long term view and to invest with a long term horizon. We strive to stay on course even when market volatility causes concern.
Our overriding goal is to hire fund managers that can effectively manage your assets in all types of market conditions. Toward this goal we maintain a team of skilled investment professionals focused solely on understanding the global capital markets and overseeing the managers in our Funds. We hire fund portfolio managers who excel over time, have a strong investment discipline and stick to it. Our investment team oversees the Funds’ managers and portfolios every day so you don’t have to. Once you have selected Managers Funds as part of your asset allocation, you can be assured that we are monitoring that investment every day to help ensure it is delivering on its investment mandate.
We believe we have hired some of the best managers in the market to help our investors navigate complex and volatile markets.
We believe we have hired some of the best managers in the market to help our investors navigate complex and volatile markets. An example is Dan Fuss of Loomis Sayles (Managers Bond Fund) and Bill Gross of PIMCO (Managers Fremont Bond Fund) who have both helped our investors deal with changing market conditions for years. Recently, and for differing reasons, both managers came to the conclusion that the Federal Reserve Board would stop raising short term rates and extended the maturities of their portfolio holdings. These managers made reasoned judgments on the market based on their investment philosophies and backed up by extensive research. Their well thought out and executed investment management strategies let you the investor have confidence that your assets are being managed prudently and proactively.
At Managers we appreciate the opportunity to be a part of your long term investment plan. You can rest assured that under all market conditions our team is focused on delivering you excellent investment management services.
| Respectfully, | ||||
 |  | |||
| Peter M. Lebovitz | Thomas G. Hoffman, CFA | |||
President Managers Funds | Executive Vice President Chief Investment Officer Managers Investment Group LLC |
1
About Your Fund’s Expenses (unaudited)
As a shareholder of the Fund, you may incur two types of costs: (1) transaction costs, which may include sales charges (loads) on purchase payments; redemption fees; and exchange fees; and (2) ongoing costs, including management fees; distribution (12b-1) fees; and other Fund expenses. These Funds incur only ongoing costs. This example is intended to help you understand your ongoing costs (in dollars) of investing in the Fund and to compare these costs with the ongoing costs of investing in other mutual funds. The example is based on an investment of $1,000 invested at the beginning of the period and held for the entire period as indicated below.
Actual Expenses
The first line of the table below provides information about the actual account values and actual expenses. You may use the information in this line, together with the amount you invested, to estimate the expenses that you paid over the period. Simply divide your account value by $1,000 (for example, an $8,600 account value divided by $1,000 = 8.6), then multiply the result by the number in the first line under the heading entitled “Expenses Paid During Period” to estimate the expenses you paid on your account during this period.
Hypothetical Example for Comparison Purposes
The second line of the table below provides information about hypothetical account values and hypothetical expenses based on the Fund’s actual expense ratio and an assumed annual rate of return of 5% before expenses, which is not the Fund’s actual return. The hypothetical account values and expenses may not be used to estimate the actual ending account balance or expenses you paid for the period. You may use this information to compare the ongoing costs of investing in the Fund and other funds by comparing this 5% hypothetical example with the 5% hypothetical examples that appear in the shareholder reports of other funds.
Please note that the expenses shown in the table are meant to highlight your ongoing costs only and do not reflect any transactional costs, such as sales charges (loads), redemption fees, or exchange fees. Therefore, the second line of the table is useful in comparing ongoing costs only, and will not help you determine the relative total costs of owning different funds.
Six Months Ended June 30, 2006 | Beginning Account Value 1/01/2006 | Ending Account Value 6/30/2006 | Expenses Paid During the Period* | ||||||
Managers Value Fund | |||||||||
Based on Actual Fund Return | $ | 1,000 | $ | 1,027 | $ | 5.83 | |||
Based on Hypothetical 5% Annual Return | $ | 1,000 | $ | 1,019 | $ | 5.83 | |||
Managers Capital Appreciation Fund | |||||||||
Based on Actual Fund Return | $ | 1,000 | $ | 969 | $ | 6.11 | |||
Based on Hypothetical 5% Annual Return | $ | 1,000 | $ | 1,019 | $ | 6.26 | |||
Managers Small Company Fund | |||||||||
Based on Actual Fund Return | $ | 1,000 | $ | 1,030 | $ | 7.10 | |||
Based on Hypothetical 5% Annual Return | $ | 1,000 | $ | 1,018 | $ | 7.06 | |||
Managers International Equity Fund | |||||||||
Based on Actual Fund Return | $ | 1,000 | $ | 1,108 | $ | 7.54 | |||
Based on Hypothetical 5% Annual Return | $ | 1,000 | $ | 1,018 | $ | 7.21 | |||
Managers Emerging Markets Equity Fund | |||||||||
Based on Actual Fund Return | $ | 1,000 | $ | 1,056 | $ | 8.87 | |||
Based on Hypothetical 5% Annual Return | $ | 1,000 | $ | 1,016 | $ | 8.70 | |||
Managers Bond Fund | |||||||||
Based on Actual Fund Return | $ | 1,000 | $ | 1,002 | $ | 4.91 | |||
Based on Hypothetical 5% Annual Return | $ | 1,000 | $ | 1,020 | $ | 4.96 | |||
Managers Global Bond Fund | |||||||||
Based on Actual Fund Return | $ | 1,000 | $ | 1,027 | $ | 5.98 | |||
Based on Hypothetical 5% Annual Return | $ | 1,000 | $ | 1,019 | $ | 5.96 | |||
| * | Expenses are equal to the Fund’s annualized expense ratio multiplied by the average account value over the period, multiplied by the number of days in the most recent fiscal half-year (181), then divided by 365. |
2
All periods ended June 30, 2006 (unaudited)
| Average Annual Total Returns1 | ||||||||||||||||||||
The Managers Funds | One Month | Six Months | One Year | Three Years | Five Years | Since Inception | Inception Date | |||||||||||||
Managers Value Fund 2,4 | (0.38 | )% | 2.65 | % | 5.87 | % | 12.42 | % | 3.07 | % | 11.46 | % | 10/31/84 | |||||||
S&P 500 Index | 0.14 | % | 2.71 | % | 8.63 | % | 11.22 | % | 2.49 | % | ||||||||||
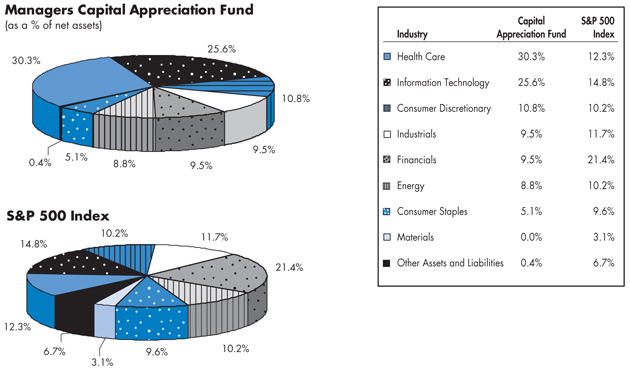
Managers Capital Appreciation Fund 2 | (1.86 | )% | (3.09 | )% | 3.89 | % | 5.92 | % | (3.16 | )% | 11.31 | % | 6/1/84 | |||||||
S&P 500 Index | 0.14 | % | 2.71 | % | 8.63 | % | 11.22 | % | 2.49 | % | ||||||||||
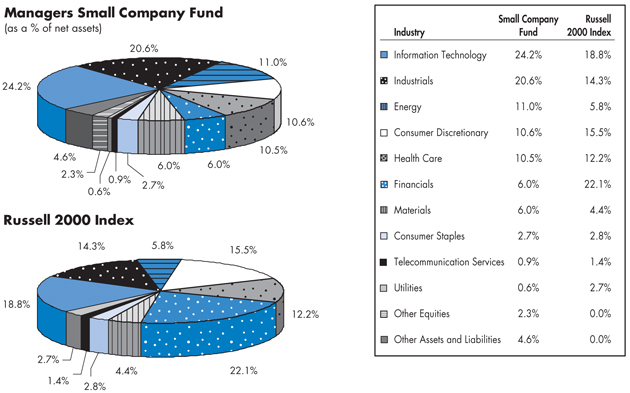
Managers Small Company Fund2,4 | (1.67 | )% | (6.45 | )% | 2.95 | % | 15.09 | % | 4.99 | % | 1.84 | % | 6/19/00 | |||||||
Russell 2000 Index | 0.64 | % | 8.21 | % | 14.58 | % | 18.70 | % | 8.50 | % | ||||||||||
Managers International Equity Fund2,5 | (0.50 | )% | 10.84 | % | 31.54 | % | 22.26 | % | 7.85 | % | 10.63 | % | 12/31/85 | |||||||
MSCI EAFE Index | (0.01 | )% | 10.16 | % | 26.56 | % | 23.94 | % | 10.02 | % | ||||||||||
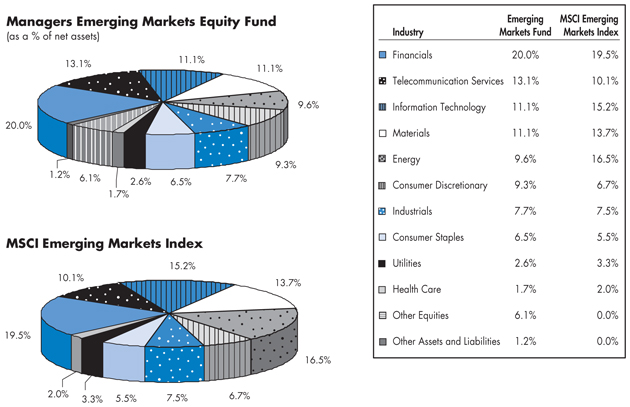
Managers Emerging Markets Equity Fund2,6 | 0.81 | % | 5.57 | % | 34.30 | % | 33.20 | % | 19.72 | % | 12.53 | % | 2/9/98 | |||||||
MSCI Emerging Markets Index | (0.21 | )% | 7.33 | % | 35.91 | % | 34.77 | % | 21.54 | % | ||||||||||
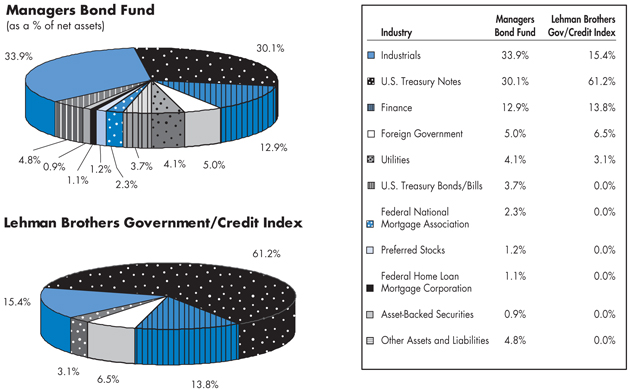
Managers Bond Fund 2,3,8 | 0.19 | % | 0.15 | % | 1.14 | % | 3.18 | % | 6.63 | % | 9.38 | % | 6/1/84 | |||||||
Lehman Brothers Government/Credit Index | 0.23 | % | (1.15 | )% | (1.52 | )% | 1.60 | % | 5.13 | % | ||||||||||
Managers Global Bond Fund 2,3,5,7 | (0.62 | )% | 2.67 | % | 0.88 | % | 4.58 | % | 9.48 | % | 5.40 | % | 3/25/94 | |||||||
Lehman Brothers Global Aggregate Index | (0.79 | )% | 2.29 | % | 0.26 | % | 4.08 | % | 7.73 | % | ||||||||||
The performance data shown represents past performance. Past performance is not a guarantee of future results. Current performance may be lower or higher than the performance data quoted. The investment return and principal value of an investment in the Fund will fluctuate so that an investor’s shares, when redeemed, may be worth more or less than their original cost. For performance information through the most recent month end, please call (800) 835-3879 or visit our website at www.managersinvest.com.
In choosing a Fund, investors should carefully consider the amount they plan to invest, their investment objectives, the Fund’s investment objectives, risks, charges and expenses before investing. For this and other information, please call 800.835.3879 or visit www.managersinvest. com for a free prospectus. Read it carefully before investing or sending money. Distributed by Managers Distributors, Inc., member NASD.
| 1 | Total return equals income yield plus share price change and assumes reinvestment of all dividends and capital gain distributions. Returns are net of fees and may reflect offsets of Fund expenses as described in the Prospectus. No adjustment has been made for taxes payable by shareholders on their reinvested dividends and capital gain distributions. Returns for periods greater than one year are annualized. The listed returns on the Fund are net of expenses. All returns are in U.S. dollars($). |
| 2 | Fund for which, from time to time, the Fund’s advisor has waived its fees and/or absorbed Fund expenses, which has resulted in higher returns. |
| 3 | Fixed-income funds are subject to the risks associated with investments in debt securities, such as default risk, fluctuations in debtor’s perceived ability to pay its creditors. Changing interest rates may adversely affect the value of an investment. An increase in interest rates typically causes the value of bonds and other fixed-income securities to fall. |
| 4 | The Fund is subject to risks associated with investments in small capitalization companies, such as erratic earnings patterns, competitive conditions, limited earnings history and a reliance on one or a limited number of products. |
| 5 | Investments in foreign securities are subject to additional risks such as changing market conditions, economic and political instability, and currency exchange rate fluctuations. |
| 6 | The Fund is subject to the risks associated with investments in emerging markets, such as erratic earnings patterns, economic and political instability, changing exchange controls, limitations on repatriation of foreign capital and changes in local governmental attitudes toward private investment, possibly leading to nationalization or confiscation of investor assets. |
| 7 | The Fund is subject to risks associated with investing in a concentrated fund, and the value of the portfolio will be greatly affected by the fluctuations in the value of a single stock. |
| 8 | Investments in international securities are subject to certain risks of overseas investing including currency fluctuations and changes in political and economic conditions, which could result in significant market fluctuations. These risks are magnified in emerging markets. |
3
Fund Snapshots
June 30, 2006 (unaudited)
Portfoilo Breakdown

Top Ten Holding
Security Name | Percentage of Net Assets | ||
Bank of America Corp. | 4.7 | % | |
Citigroup, Inc.* | 4.4 | ||
American International Group, Inc.* | 4.3 | ||
ChevronTexaco Corp.* | 3.9 | ||
Pfizer, Inc.* | 3.4 | ||
Verizon Communications, Inc.* | 3.0 | ||
ConocoPhillips Co. | 2.7 | ||
Nokia Corp., Sponsored ADR* | 2.5 | ||
Merrill Lynch & Co., Inc.* | 2.5 | ||
Dollar Tree Stores, Inc. | 2.2 | ||
Top Ten as a Group | 33.6 | % | |
| * | Top Ten Holding at December 31, 2005 |
Any sectors, industries, or securities discussed should not be perceived as investment recommendations. Mention of a specific security should not be considered a recommendation to buy or solicitation to sell that security.
4
Managers Value Fund
Schedule of Portfolio Investments
June 30, 2006 (unaudited)
| Shares | Value | |||||
Common Stocks - 99.3% | ||||||
Consumer Discretionary - 20.8% | ||||||
Comcast Corp., Special Class A* | 56,560 | 2 | $ | 1,854,036 | ||
Dollar Tree Stores, Inc.* | 70,400 | 2 | 1,865,600 | |||
Gannett Co., Inc. | 32,200 | 2 | 1 ,800,946 | |||
Gap, Inc., The | 60,800 | 1,057,920 | ||||
Jarden Corp.* | 44,900 | 2 | 1,367,205 | |||
Jones Apparel Group, Inc. | 53,500 | 1 ,700,765 | ||||
Lowe’s Co., Inc. | 14,400 | 873,648 | ||||
Mattel, Inc. | 79,400 | 1,310,894 | ||||
Office Depot, Inc.* | 21,570 | 819,660 | ||||
Pacific Sunwear of California, Inc.* | 77,800 | 1 ,394,954 | ||||
Pulte Homes, Inc. | 21,920 | 2 | 631,077 | |||
Rent-A-Center, Inc.* | 46,800 | 2 | 1,163,448 | |||
Time Warner, Inc. | 105,100 | 2 | 1,818,230 | |||
Total Consumer Discretionary | 17,658,383 | |||||
Consumer Staples - 1.6% | ||||||
CVS Corp. | 44,700 | 1,372,290 | ||||
Energy - 8.4% | ||||||
ChevronTexaco Corp. | 52,800 | 2 | 3,276,768 | |||
ConocoPhillips Co. | 35,130 | 2,302,069 | ||||
Devon Energy Corp. | 25,600 | 1 ,546,496 | ||||
Total Energy | 7,125,333 | |||||
Financials - 30.4% | ||||||
ACE, Ltd. | 33,050 | 2 | 1,672,000 | |||
Allstate Corp., The | 19,700 | 1,078,181 | ||||
American International Group, Inc. | 61,220 | 3,615,041 | ||||
Bank of America Corp. | 83,700 | 4,025,970 | ||||
Chubb Corp. | 20,460 | 1,020,954 | ||||
Citigroup, Inc. | 77,241 | 3,726,105 | ||||
Fannie Mae Co. | 35,300 | 1,697,930 | ||||
Goldman Sachs Group, Inc. | 7,100 | 1,068,053 | ||||
MBIA, Inc. | 31,000 | 2 | 1,815,050 | |||
Merrill Lynch & Co., Inc. | 30,000 | 2,086,800 | ||||
Morgan Stanley Co. | 22,820 | 1,442,452 | ||||
North Fork Bancorporation, Inc. | 30,400 | 917,168 | ||||
Washington Mutual, Inc. | 35,800 | 2 | 1,631,764 | |||
Total Financials | 25,797,468 | |||||
Health Care - 7.2% | ||||||
Abbott Laboratories Co. | 30,600 | 1,334,466 | ||||
HCA, Inc. | 24,040 | 2 | 1,037,326 | |||
Pfizer, Inc. | 123,600 | 2,900,892 | ||||
WellPoint, Inc.* | 11,390 | 828,850 | ||||
Total Health Care | 6,101,534 | |||||
Industrials - 10.3% | ||||||
Cendant Corp. | 64,210 | 1,045,981 | ||||
Emerson Electric Co. | 13,600 | 1,139,816 | ||||
Empresa Brasileira de Aeronautica, S.A. | 25,600 | 2 | 933,632 | |||
General Electric Co. | 37,175 | 1,225,288 | ||||
Honeywell International, Inc. | 21,100 | 850,330 | ||||
Pitney Bowes, Inc. | 30,900 | 1,276,170 | ||||
Tyco International, Ltd. | 40,600 | 2 | 1,116,500 | |||
United Technologies Corp. | 18,700 | 1,185,954 | ||||
Total Industrials | 8,773,671 | |||||
Information Technology - 7.8% | ||||||
Dell, Inc.* | 29,430 | 2 | 718,386 | |||
First Data Corp. | 18,690 | 841,798 | ||||
International Business Machines Corp. | 10,680 | 820,438 | ||||
Nokia Corp., Sponsored ADR | 105,700 | 2,141,482 | ||||
Symantec Corp.* | 68,100 | 2 | 1,058,274 | |||
Xerox Corp.* | 73,710 | 2 | 1,025,306 | |||
Total Information Technology | 6,605,684 | |||||
Materials - 6.5% | ||||||
Cemex SA de CV | 7,150 | 407,336 | ||||
Dow Chemical Co. | 32,000 | 2 | 1,248,960 | |||
E.I. du Pont de Nemours & Co., Inc. | 30,000 | 1,248,000 | ||||
Pactiv Corp.* | 52,300 | 1,294,425 | ||||
PPG Industries, Inc. | 19,500 | 1,287,000 | ||||
Total Materials | 5,485,721 | |||||
Telecommunication Services - 4.7% | ||||||
Embarq Corp.* | 3,451 | 141,456 | ||||
Sprint Nextel Corp. | 69,037 | 2 | 1,380,050 | |||
Verizon Communications, Inc. | 75,000 | 2 | 2,511,750 | |||
Total Telecommunication Services | 4,033,256 | |||||
Utilities - 1.6% | ||||||
Exelon Corp. | 24,600 | 1,398,018 | ||||
Total Common Stocks (cost $70,611,907) | 84,351,358 | |||||
Short-Term Investments - 29.6%1 | ||||||
Other Investment Companies - 28.1% | ||||||
Bank of New York Institutional Cash Reserves Fund, 5.22%3 | 23,088,298 | 23,088,298 | ||||
JPMorgan Prime Money Market Fund, Institutional Class Shares, 4.98% | 791,352 | 791,352 | ||||
Total Other Investment Companies | 23,879,650 | |||||
The accompanying notes are an integral part of these financial statements.
5
Managers Value Fund
Schedule of Portfolio Investments (continued)
| Principal Amount | Value | ||||||
Other Short-Term Investments - 1.5% | |||||||
Goldman Sachs Promissory Note, 5.23%, 07/21/063 | $ | 1,251,610 | $ | 1,251,610 | |||
Total Short-Term Investments | 25,131,260 | ||||||
Total Investments - 128.9% | 109,482,618 | ||||||
| Other Assets, less Liabilities - (28.9%) | (24,546,377 | ) | |||||
| Net Assets - 100.0% | $ | 84,936,241 | |||||
The accompanying notes are an integral part of these financial statements.
6
Managers Capital Appreciation Fund
Fund Snapshots
June 30, 2006 (unaudited)
Portfolio Breakdown
Top Ten Holdings
Security Name | Percentage of Net Assets | ||
Yahoo!, Inc. | 4.5 | % | |
General Electric Co.* | 4.2 | ||
Google, Inc. | 3.8 | ||
Weatherford International, Ltd. | 3.7 | ||
QUALCOMM, Inc.* | 3.5 | ||
Gilead Sciences, Inc.* | 3.5 | ||
Genentech, Inc.* | 3.2 | ||
Schlumberger, Ltd.* | 3.2 | ||
Procter & Gamble Co. | 3.1 | ||
BEA Systems, Inc. | 2.9 | ||
Top Ten as a Group | 35.6 | % | |
| * | Top Ten Holding at December 31, 2005 |
Any sectors, industries, or securities discussed should not be perceived as investment recommendations. Mention of a specific security should not be considered a recommendation to buy or solicitation to sell that security.
7
Managers Capital Appreciation Fund
Schedule of Portfolio Investments
June 30, 2006 (unaudited)
| Shares | Value | |||||||
Common Stocks - 99.6% | ||||||||
Consumer Discretionary - 10.8% | ||||||||
Comcast Corp., Class A* | 30,893 | $ | 1,011,437 | |||||
DreamWorks Animation SKG, Inc.* | 54,411 | 2 | 1,246,012 | |||||
Harrah's Entertainment, Inc. | 22,390 | 2 | 1,593,720 | |||||
Staples, Inc. | 52,588 | 1,278,940 | ||||||
Starwood Hotels & Resorts Worldwide, Inc. | 16,836 | 1,015,884 | ||||||
Station Casinos, Inc. | 13,873 | 2 | 944,474 | |||||
Total Consumer Discretionary | 7,090,467 | |||||||
Consumer Staples - 5.1% | ||||||||
PepsiCo, Inc. | 21,594 | 1,296,504 | ||||||
Procter & Gamble Co. | 36,838 | 2,048,193 | ||||||
Total Consumer Staples | 3,344,697 | |||||||
Energy - 8.8% | ||||||||
ENSCO International, Inc. | 12,910 | 2 | 594,118 | |||||
Schlumberger, Ltd. | 32,087 | 2 | 2,089,185 | |||||
Southwestern Energy Co.* | 22,613 | 704,621 | ||||||
Weatherford International, Ltd.* | 48,430 | 2,403,097 | ||||||
Total Energy | 5,791,021 | |||||||
Financials - 9.5% | ||||||||
American International Group, Inc. | 21,546 | 1,272,291 | ||||||
CB Richard Ellis Group, Inc.* | 72,375 | 1,802,138 | ||||||
Goldman Sachs Group, Inc. | 9,435 | 1,419,307 | ||||||
Merrill Lynch & Co., Inc. | 24,675 | 1,716,393 | ||||||
Total Financials | 6,210,129 | |||||||
Health Care - 30.3% | ||||||||
Amgen, Inc.* | 23,634 | 2 | 1,541,646 | |||||
Cardinal Health, Inc. | 22,428 | 2 | 1,442,793 | |||||
Caremark Rx, Inc.* | 23,441 | 1,169,003 | ||||||
Genentech, Inc.* | 25,840 | 2 | 2,113,711 | |||||
Genzyme Corp.* | 18,595 | 1,135,225 | ||||||
Gilead Sciences, Inc.* | 38,765 | 2,293,336 | ||||||
McKesson Corp. | 33,414 | 1,579,814 | ||||||
Medtronic, Inc. | 30,467 | 1,429,512 | ||||||
MGI Pharmaceuticals, Inc.* | 53,995 | 2 | 1,160,893 | |||||
Novartis AG, Sponsored ADR | 32,760 | 1,766,419 | ||||||
Sepracor, Inc.* | 16,755 | 2 | 957,381 | |||||
Shire Pharmaceuticals PLC | 37,559 | 2 | 1,661,235 | |||||
Teva Pharmaceutical Industries, Ltd., | 51,790 | 2 | 1,636,046 | |||||
Total Health Care | 19,887,014 | |||||||
Industrials - 9.5% | ||||||||
AMR Corp.* | 55,287 | 2 | 1,405,396 | |||||
General Electric Co. | 83,015 | 2,736,174 | ||||||
Laureate Education, Inc.* | 20,426 | 870,760 | ||||||
UTI Worldwide, Inc. | 48,038 | 2 | 1,211,999 | |||||
Total Industrials | 6,224,329 | |||||||
Information Technology - 25.6% | ||||||||
Applied Materials, Inc. | 58,889 | 2 | 958,713 | |||||
Autodesk, Inc.* | 37,126 | 1,279,362 | ||||||
BEA Systems, Inc.* | 144,283 | 2 | 1,888,664 | |||||
Brocade Communications Systems, Inc.* | 250,026 | 1,535,160 | ||||||
Google, Inc.* | 5,933 | 2,487,885 | ||||||
Marvell Technology Group, Ltd.* | 34,994 | 2 | 1,551,284 | |||||
Network Appliance, Inc.* | 52,745 | 2 | 1,861,899 | |||||
QUALCOMM, Inc. | 57,460 | 2,302,422 | ||||||
Yahoo!, Inc.* | 88,889 | 2 | 2,933,336 | |||||
Total Information Technology | 16,798,725 | |||||||
Total Common Stocks | 65,346,382 | |||||||
Short-Term Investments - 30.0%1 | ||||||||
Other Investment Companies - 28.1% | ||||||||
Bank of New York Institutional Cash Reserves Fund, 5.22%3 | 17,068,441 | 17,068,441 | ||||||
JPMorgan Prime Money Market Fund, Institutional Class Shares, 4.98% | 1,373,398 | 1,373,398 | ||||||
Total Other Investment Companies | 18,441,839 | |||||||
| Principal Amount | ||||||||
Other Short-Term Investments - 1.9% | ||||||||
Goldman Sachs Promissory Note, 5.23%, 07/2 1/063 | $ | 1,251,610 | 1,251,610 | |||||
Total Short-Term Investments | 19,693,449 | |||||||
Total Investments - 129.6% | 85,039,831 | |||||||
Other Assets, less Liabilities - (29.6)% | (19,441,801 | ) | ||||||
Net Assets - 100.0% | $ | 65,598,030 | ||||||
The accompanying notes are an integral part of these financial statements.
8
Fund Snapshots
June 30, 2006 (unaudited)
Portfolio Breakdown
Top Ten Holdings
Security Name | Percentage of Net Assets | ||
iShares Russell 2000 Index Fund | 2.4 | % | |
Actuant Corp., Class A | 1.6 | ||
Infocrossing, Inc. | 1.4 | ||
TODCO Class A | 1.4 | ||
Texas Regional Bancshares, Inc., Class A | 1.3 | ||
OMI Corp. | 1.2 | ||
Endo Pharmaceuticals Holdings, Inc.* | 1.2 | ||
Ultra Petroleum Corp.* | 1.2 | ||
Ventas, Inc. | 1.2 | ||
Service Corp. International | 1.2 | ||
Top Ten as a Group | 14.1 | % | |
| * | Top Ten Holding at December 31, 2005 |
Any sectors, industries, or securities discussed should not be perceived as investment recommendations. Mention of a specific security should not be considered a recommendation to buy or solicitation to sell that security.
9
Managers Small Company Fund
Schedule of Portfolio Investments
June 30, 2006 (unaudited)
| Shares | Value | |||||
Common Stocks - 95.4% | ||||||
Consumer Discretionary - 10.6% | ||||||
1-800-FLOWERS.COM, Inc.* | 6,575 | $ | 37,938 | |||
Aaron Rents, Inc. | 5,035 | 135,341 | ||||
BJ’s Restaurants, Inc.* | 4,200 | 93,828 | ||||
Carter’s, Inc.* | 6,550 | 173,117 | ||||
Coldwater Creek, Inc.* | 12,430 | 332,626 | ||||
Entravision Communications Corp* | 19,400 | 166,258 | ||||
GameStop Corp.* | 6,575 | 2 | 276,150 | |||
Insight Enterprises, Inc.* | 15,875 | 302,418 | ||||
Life Time Fitness, Inc.* | 4,275 | 197,804 | ||||
MarineMax, Inc.* | 6,350 | 2 | 166,561 | |||
Michaels Stores, Inc. | 4,625 | 2 | 190,735 | |||
O'Reilly Automotive, Inc.* | 3,725 | 116,183 | ||||
Penn National Gaming, Inc.* | 3,400 | 131,852 | ||||
Red Robin Gourmet Burgers, Inc.* | 5,850 | 2 | 248,976 | |||
Ruby Tuesday, Inc. | 6,300 | 153,783 | ||||
Service Corp. International | 52,250 | 425,314 | ||||
Toro Co. | 7,800 | 364,259 | ||||
Tractor Supply Co.* | 4,300 | 237,660 | ||||
Total Consumer Discretionary | 3,750,803 | |||||
Consumer Staples - 2.7% | ||||||
Boston Beer Co., Inc.* | 7,780 | 227,876 | ||||
Central European Distribution Corp.* | 5,551 | 2 | 139,663 | |||
Elizabeth Arden, Inc.* | 7,800 | 139,464 | ||||
Performance Food Group Co.* | 9,900 | 300,762 | ||||
Revlon, Inc., Class A* | 133,700 | 168,462 | ||||
Total Consumer Staples | 976,227 | |||||
Energy- 11.0% | ||||||
Atwood Oceanics, Inc.* | 3,600 | 2 | 178,560 | |||
Buckeye Partners LP. | 8,500 | 357,765 | ||||
Core Laboratories N.V.* | 4,650 | 283,836 | ||||
Delta Petroleum Corp.* | 6,675 | 2 | 114,343 | |||
Duvernay Oil Corp.* | 3,400 | 119,374 | ||||
Niko Resources, Ltd. | 4,700 | 265,409 | ||||
OMI Corp. | 20,500 | 2 | 443,824 | |||
Parallel Petroleum Corp.* | 13,825 | 341,616 | ||||
Seacor Holdings, Inc.* | 2,750 | 225,775 | ||||
Tidewater, Inc. | 4,025 | 2 | 198,030 | |||
TODCO Class A | 11,850 | 2 | 484,072 | |||
Ultra Petroleum Corp.* | 7,425 | 440,079 | ||||
Valero L.P. | 5,500 | 271,425 | ||||
Warren Resources, Inc.* | 13,550 | 2 | 194,578 | |||
Total Energy | 3,918,686 | |||||
Financials - 6.0% | ||||||
Boston Private Financial Holdings, Inc. | 3,275 | 91,373 | ||||
Brookline Bancorp, Inc. | 20,300 | 279,531 | ||||
First State Bancorporation | 6,860 | 163,131 | ||||
Firstcity Financial Corp.* | 6,300 | 65,835 | ||||
Hub International, Ltd. | 3,550 | 93,046 | ||||
Signature Bank* | 11,050 | 2 | 357,799 | |||
Tejon Ranch Co.* | 2,600 | 107,016 | ||||
Texas Regional Bancshares, Inc., Class A | 11,935 | 452,575 | ||||
UMB Financial Corp. | 2,550 | 85,017 | ||||
Ventas, Inc. | 12,950 | 438,745 | ||||
Total Financials | 2,134,068 | |||||
Health Care - 10.5% | ||||||
Amedisys, Inc.* | 5,500 | 2 | 208,450 | |||
America Service Group, Inc.* | 9,548 | 148,185 | ||||
Analogic Corp. | 3,600 | 167,796 | ||||
Connetics Corp.* | 10,425 | 122,598 | ||||
Cooper Companies, Inc., The | 2,675 | 2 | 118,476 | |||
Covance, Inc.* | 6,450 | 394,869 | ||||
Emageon, Inc.* | 8,650 | 126,204 | ||||
Endo Pharmaceuticals Holdings, Inc.* | 13,450 | 443,580 | ||||
Lifepoint Hospitals, Inc.* | 5,950 | 191,174 | ||||
Martek Biosciences Corp.* | 2,300 | 2 | 66,585 | |||
PSS World Medical, Inc.* | 15,025 | 2 | 265,191 | |||
Resmed, Inc.* | 6,875 | 322,781 | ||||
Respironics, Inc.* | 8,375 | 286,593 | ||||
Rural/Metro Corp.* | 45,310 | 317,170 | ||||
Sonosite, Inc.* | 7,700 | 2 | 300,608 | |||
United Surgical Partners International, Inc.* | 8,325 | 2 | 250,333 | |||
Total Health Care | 3,730,593 | |||||
Industrials - 20.6% | ||||||
Actuant Corp., Class A | 11,535 | 2 | 576,173 | |||
Aeroflex, Inc.* | 18,750 | 218,813 | ||||
Alliant Techsystems Inc* | 4,300 | 328,305 | ||||
American Ecology Corp. | 5,050 | 133,825 | ||||
Carlisle Co., Inc. | 1,875 | 148,688 | ||||
Chicago Bridge & Iron Co. N.V. | 8,025 | 2 | 193,804 | |||
ChoicePoint, Inc.* | 4,425 | 184,832 | ||||
Corrections Corp. of America* | 5,775 | 305,729 | ||||
CoStar Group, Inc.* | 3,525 | 210,901 | ||||
The accompanying notes are an integral part of these financial statements.
10
Managers Small Company Fund
Schedule of Portfolio Investments (continued)
| Shares | Value | |||||
Industrials - 20.6% (continued) | ||||||
DeVry, Inc.* | 12,100 | 2 | $ | 265,837 | ||
DRS Technologies, Inc. | 6,800 | 331,500 | ||||
Dycom Industries, Inc.* | 8,120 | 2 | 172,875 | |||
EDO Corp. | 14,350 | 349,279 | ||||
Florida East Coast Industries, Inc. | 8,030 | 420,209 | ||||
Intermagnetics General Corp.* | 9,112 | 245,842 | ||||
K&F Industries Holdings, Inc.* | 15,330 | 2 | 271,801 | |||
Laureate Education, Inc.* | 5,500 | 234,465 | ||||
Learning Tree International, Inc.* | 16,900 | 148,213 | ||||
Manitowoc Co., The | 5,700 | 253,650 | ||||
Mobile Mini, Inc.* | 10,725 | 2 | 313,814 | |||
Modtech Holdings, Inc.* | 22,910 | 2 | 155,101 | |||
MSC Industrial Direct Co., Class A | 6,900 | 328,233 | ||||
Navigant Consulting, Inc.* | 6,950 | 2 | 157,418 | |||
NCI Building Systems, Inc.* | 4,550 | 2 | 241,924 | |||
Pentair, Inc. | 5,175 | 176,933 | ||||
Si International, Inc.* | 4,550 | 139,503 | ||||
Tetra Technologies, Inc.* | 10,500 | 186,270 | ||||
UTI Worldwide, Inc. | 9,900 | 249,777 | ||||
Washington Group International, Inc.* | 7,150 | 381,381 | ||||
Total Industrials | 7,325,095 | |||||
Information Technology - 24.2% | ||||||
Actuate Corp.* | 17,780 | 71,831 | ||||
Acxiom Corp. | 10,225 | 255,625 | ||||
Alliance Data Systems Corp.* | 4,200 | 2 | 247,044 | |||
aQuantive, Inc.* | 4,125 | 104,486 | ||||
Arris Group, Inc.* | 15,090 | 197,981 | ||||
ATMI, Inc.* | 9,725 | 239,430 | ||||
Avocent Corp.* | 13,150 | 345,188 | ||||
Benchmark Electronics, Inc.* | 10,725 | 258,687 | ||||
Ceridian Corp.* | 9,375 | 229,125 | ||||
Cypress Semiconductor Corp.* | 11,160 | 2 | 162,266 | |||
Diebold, Inc. | 4,000 | 2 | 162,480 | |||
Digitas, Inc.* | 13,075 | 151,932 | ||||
Diodes, Inc.* | 2,875 | 2 | 119,140 | |||
DTS, Inc.* | 11,150 | 2 | 217,202 | |||
Fair Isaac Corp. | 9,450 | 343,130 | ||||
FEI Co.* | 5,550 | 2 | 125,874 | |||
Infocrossing, Inc.* | 43,090 | 2 | 497,689 | |||
Intermec, Inc.* | 4,100 | 2 | 94,054 | |||
International Rectifier Corp.* | 3,725 | 145,573 | ||||
Ixia, Inc.* | 10,200 | 91,800 | ||||
Macrovision Corp.* | 5,020 | 108,030 | ||||
MAXIMUS, Inc. | 6,875 | 159,156 | ||||
MRS Group, Inc.* | 10,300 | 155,118 | ||||
NCI, Inc., Class A* | 5,900 | 77,290 | ||||
NICE Systems, Ltd. * | 7,560 | 212,738 | ||||
Online Resources Corp.* | 5,925 | 61,265 | ||||
OPNET Technologies, Inc.* | 9,925 | 128,628 | ||||
Photon Dynamics, Inc.* | 6,875 | 86,075 | ||||
Polycom, Inc.* | 9,775 | 214,268 | ||||
Powerwave Technologies, Inc.* | 38,850 | 2 | 354,312 | |||
Progress Software Corp.* | 6,975 | 163,285 | ||||
Radisys Corp.* | 9,225 | 2 | 202,581 | |||
RightNow Technologies, Inc.* | 6,350 | 2 | 105,918 | |||
Rogers Corp. | 4,325 | 2 | 243,671 | |||
Sapient Corp.* | 32,250 | 170,925 | ||||
Silicon Image, Inc.* | 37,800 | 407,484 | ||||
SRA International, Inc.* | 8,310 | 2 | 221,295 | |||
Sybase, Inc.* | 16,600 | 322,040 | ||||
Symmetricom, Inc.* | 14,055 | 2 | 99,369 | |||
TALX Corp. | 3,500 | 76,545 | ||||
Tekelec* | 18,250 | 2 | 225,388 | |||
Tessera Technologies, Inc.* | 7,300 | 200,750 | ||||
THQ, Inc.* | 17,150 | 2 | 370,439 | |||
Valueclick, Inc.* | 11,450 | 2 | 175,758 | |||
Total Information Technology | 8,602,865 | |||||
Materials - 6.0% | ||||||
Albemarle Corp. | 7,125 | 341,144 | ||||
American Vanguard Corp. | 6,375 | 2 | 98,685 | |||
Brust Well Man, Inc.* | 8,750 | 182,438 | ||||
Cambrex, Corp. | 12,600 | 262,458 | ||||
Foundation Coal Holdings, Inc. | 3,710 | 174,110 | ||||
Methanex Corp. | 19,250 | 407,715 | ||||
Nalco Holding Co.* | 5,750 | 101,373 | ||||
Oregon Steel Mills, Inc.* | 5,850 | 296,361 | ||||
Tronox, Inc.* | 19,050 | 2 | 250,889 | |||
Total Materials | 2,115,173 | |||||
Other Equities - 2.3% | ||||||
iShares Russell 2000 Index Fund | 11,625 | 835,838 | ||||
Telecommunication Services - 0.9% | ||||||
Cincinnati Bell, Inc.* | 80,490 | 330,009 | ||||
Utilities - 0.6% | ||||||
Westar Energy, Inc. | 10,050 | 211,553 | ||||
Total Common Stocks | 33,930,910 | |||||
The accompanying notes are an integral part of these financial statements.
11
Managers Small Company Fund
Schedule of Portfolio Investments (continued)
| Shares | Value | |||||
Other Investment Companies - 24.6%1 | ||||||
Bank of New York Institutional Cash Reserves Fund, 5.22%3 | 7,032,010 | $ | 7,032,010 | |||
JPMorgan Prime Money Market Fund, Institutional Class Shares, 4.98% | 1,728,824 | 1,728,824 | ||||
Total Other Investment Companies | 8,760,834 | |||||
Total Investments - 120.0% | 42,691,744 | |||||
Other Assets, less Liabilities - (20.0)% | (7,134,080 | ) | ||||
Net Assets - 100.0% | $ | 35,557,664 | ||||
The accompanying notes are an integral part of these financial statements.
12
Managers International Equity Fund
Fund Snapshots
June 30, 2006 (unaudited)
Portfolio Breakdown

Top Ten Holdings
Security Name | Percentage of Net Assets | ||
Sanofi-Synthelabo SA | 2.2 | % | |
ING Groep NV* | 1.4 | ||
Sumitomo Realty & Development Co., Ltd. | 1.4 | ||
BP PLC* | 1.3 | ||
ORIX Corp.* | 1.3 | ||
Vodafone Group PLC | 1.3 | ||
Total SA | 1.3 | ||
Japan Tobacco, Inc. | 1.2 | ||
Samsung Electronics Co., Ltd. | 1.2 | ||
Renault SA | 1.2 | ||
Top Ten as a Group | 13.8 | % | |
| * | Top Ten Holding at December 31, 2005 |
Any sectors, industries, or securities discussed should not be perceived as investment recommendations. Mention of a specific security should not be considered a recommendation to buy or solicitation to sell that security.
13
Managers International Equity Fund
Fund Snapshots (continued)
Summary of Investments by Country
Country | Managers International Equity Fund* | MSCI EAFE Index | ||||
Argentina | 0.0 | % | 0.0 | % | ||
Brazil | 1.5 | % | 0.0 | % | ||
China | 0.3 | % | 0.0 | % | ||
Hungary | 0.3 | % | 0.0 | % | ||
India | 0.2 | % | 0.0 | % | ||
South Korea | 3.2 | % | 0.0 | % | ||
Malaysia | 0.0 | % | 0.0 | % | ||
Mexico | 1.1 | % | 0.0 | % | ||
South Africa | 0.9 | % | 0.0 | % | ||
Taiwan | 1.5 | % | 0.0 | % | ||
Australia | 0.0 | % | 5.3 | % | ||
Austria | 0.4 | % | 0.6 | % | ||
Belgium | 1.4 | % | 1.1 | % | ||
Denmark | 0.0 | % | 0.7 | % | ||
Finland | 0.0 | % | 1.5 | % | ||
France | 12.6 | % | 9.8 | % | ||
Germany | 6.4 | % | 7.0 | % | ||
Greece | 0.5 | % | 0.6 | % | ||
Hong Kong | 3.7 | % | 1.7 | % | ||
Ireland | 0.6 | % | 0.8 | % | ||
Italy | 1.2 | % | 3.8 | % | ||
Japan | 19.9 | % | 24.5 | % | ||
Netherlands | 5.1 | % | 3.3 | % | ||
New Zealand | 0.0 | % | 0.1 | % | ||
Norway | 0.6 | % | 0.9 | % | ||
Portugal | 0.0 | % | 0.3 | % | ||
Singapore | 1.3 | % | 0.8 | % | ||
Spain | 1.7 | % | 3.8 | % | ||
Sweden | 1.3 | % | 2.4 | % | ||
Switzerland | 4.8 | % | 6.8 | % | ||
United Kingdom | 18.6 | % | 24.2 | % | ||
Canada | 4.9 | % | 0.0 | % | ||
United States | 5.0 | % | 0.0 | % | ||
Luxembourg | 1.0 | % | 0.0 | % | ||
| 100.0 | % | 100.0 | % | |||
| * | As a percentage of total market value of common stocks on June 30, 2006 |
14
Managers International Equity Fund
Schedule of Portfolio Investments
June 30, 2006 (unaudited)
| Shares | Value | |||||
Common Stocks - 94.2% | ||||||
Consumer Discretionary - 11.0% | ||||||
Carphone Warehouse Group, The (United Kingdom) | 322,670 | $ | 1,890,328 | |||
Continental AG (Germany) | 19,300 | 1,969,426 | ||||
Daiwa House Industry Co., Ltd. (Japan) | 69,000 | 1,103,406 | ||||
Debenhams PLC (United Kingdom)* | 162,819 | 566,044 | ||||
EMI Group PLC (United Kingdom) | 284,846 | 1,596,944 | ||||
George Wimpey PLC (United Kingdom) | 89,700 | 753,277 | ||||
Grupo Televisa S. A. (Mexico) | 62,200 | 1,201,082 | ||||
Koninklijke (Royal) Phillips Electronics N.V. (Netherlands) | 42,062 | 1,310,358 | ||||
LVMH Moet Hennessy Louis Vuitton SA (France) | 11,134 | 1,103,563 | ||||
OPAP SA (Greece) | 27,168 | 987,338 | ||||
Pearson PLC (United Kingdom) | 80,853 | 1,099,490 | ||||
Peugeot SA (France) | 14,831 | 921,100 | ||||
Rakuten, Inc. (Japan) | 2,623 | 1,562,695 | ||||
Reed Elsevier PLC (United Kingdom) | 33,272 | 335,382 | ||||
Renault SA (France) | 23,200 | 2,489,522 | ||||
Shanghai Forte Land Co., Ltd. (Hong Kong) | 224,000 | 2 | 91,134 | |||
Sharp Corp. (Japan) | 18,000 | 284,559 | ||||
Swatch Group AG, The (Switzerland) | 25,166 | 877,225 | ||||
Toyota Motor Corp. (Japan) | 27,200 | 1,421,589 | ||||
Whitbread PLC (United Kingdom) | 45,681 | 984,960 | ||||
Whitbread PLC (United Kingdom) | 53,742 | 154,040 | ||||
Walters Kluwer NV (Netherlands) | 34,800 | 821,511 | ||||
Total Consumer Discretionary | 23,524,973 | |||||
Consumer Staples - 8.0% | ||||||
Boots Group PLC (United Kingdom)* | 68,387 | 972,133 | ||||
British American Tobacco PLC (United Kingdom) | 77,700 | 1,956,277 | ||||
Swedish Match AB (Sweden) | 41,000 | 660,411 | ||||
Delhaize Le Lion (Belgium) | 2,500 | 173,211 | ||||
Deutsche Lufthansa AG (Germany) | 41,400 | 761,000 | ||||
Diageo PLC (United Kingdom) | 46,646 | 783,481 | ||||
Groupe Danone (France) | 13,618 | 2 | 1,729,247 | |||
Heineken N.V. (Netherlands) | 22,146 | 938,336 | ||||
Interbrew (Belgium) | 18,155 | 889,912 | ||||
J Sainsbury PLC (United Kingdom) | 207,300 | 1,280,262 | ||||
Japan Tobacco, Inc. (Japan) | 689 | 2,516,221 | ||||
Koninklijke Ahold N.V. (Netherlands)* | 119,359 | 1,033,629 | ||||
L'Oreal SA (France) | 9,000 | 849,568 | ||||
Metro AG (Germany) | 3,800 | 215,023 | ||||
Reckitt Benckiser PLC (United Kingdom) | 19,831 | 739,962 | ||||
Seven & I Holdings Co., Ltd. (Japan) | 34,000 | 1,121,019 | ||||
Tesco PLC (United Kingdom)* | 80,103 | 494,479 | ||||
Total Consumer Staples | 17,114,171 | |||||
Energy - 8.4% | ||||||
BP PLC (United Kingdom) | 244,700 | 2,837,242 | ||||
Canadian Natural Resources, Ltd. (Canada) | 32,700 | 1,807,976 | ||||
China Petroleum and Chemical Corp., Class H (Hong Kong) | 924,000 | 529,802 | ||||
EnCana Corp. (Canada) | 22,968 | 2 | 1,209,405 | |||
Eni S.p.A. (Italy) | 53,800 | 1,580,267 | ||||
MOL Magyar Olaj-es Gazipari Rt. (Hungary) | 6,100 | 627,129 | ||||
Petroleo Brasileiro SA, Sponsored ADR (Brazil) | 22,400 | 2 | 1,788,416 | |||
Repsol YPF, S.A. (Spain) | 51,100 | 2 | 1,463,399 | |||
Statoil ASA (Norway) | 41,250 | 1,175,854 | ||||
Suncor Energy, Inc. (Canada) | 14,100 | 1,141,086 | ||||
Tenaris S.A. (Luxembourg) | 22,200 | 898,878 | ||||
Total SA (France) | 42,292 | 2,778,239 | ||||
Total Energy | 17,837,693 | |||||
Financials - 30.9% | ||||||
Allianz AG (Germany) | 4,100 | 645,563 | ||||
Assicurazioni Generali S.p.A. (Italy) | 14,600 | 530,921 | ||||
Assurances Generales de France (France) | 14,500 | 2 | 1,709,309 | |||
Aviva PLC (United Kingdom) | 126,100 | 1,784,671 | ||||
Axa Group (France) | 23,100 | 747,692 | ||||
Banco Bilbao Vizcaya Argentaria SA (Spain) | 33,881 | 697,179 | ||||
Barclays PLC (United Kingdom) | 93,700 | 1,062,213 | ||||
BNP Paribas SA (France) | 16,240 | 2 | 1,552,938 | |||
British Land CP. PLC (United Kingdom) | 28,779 | 671,231 | ||||
CapitaLand, Ltd. (Singapore) | 230,000 | 656,291 | ||||
China Overseas Land & Investment, Ltd. (Hong Kong) | 952,000 | 582,479 | ||||
Commerzbank AG (Germany) | 49,507 | 1,795,771 | ||||
Credit Agricole SA (France) | 13,600 | 516,120 | ||||
Credit Saison Co., Ltd. (Japan) | 8,700 | 412,215 | ||||
Credit Suisse Group (Switzerland) | 32,400 | 1,807,664 | ||||
Daiwa Securities Group, Inc. (Japan) | 80,000 | 953,263 | ||||
DBS Group Holdings, Ltd. (Singapore) | 122,000 | 1,393,834 | ||||
Deutsche Boerse AG (Germany) | 3,936 | 535,437 | ||||
Deutsche Postbank AG (Germany) | 7,900 | 2 | 567,288 | |||
The accompanying notes are an integral part of these financial statements.
15
Managers International Equity Fund
Schedule of Portfolio Investments (continued)
| Shares | Value | |||||
Financials - 30.9% (continued) | ||||||
Erste Bank der oesterreichischen Sparkassen AG (Austria) | 15,563 | $ | 874,916 | |||
Euronext NV (Netherlands) | 15,991 | 1,500,488 | ||||
Fortis (Belgium) | 30,000 | 1,021,409 | ||||
Friends Provident PLC (United Kingdom) | 53,100 | 175,583 | ||||
Hana Financial Group, Inc. (South Korea) | 18,640 | 874,387 | ||||
Hang Seng Bank, Ltd. (Hong Kong) | 56,300 | 2 | 712,957 | |||
HBOS PLC (United Kingdom) | 96,800 | 1,679,877 | ||||
HDFC Bank, Ltd. (India) | 15,700 | 271,964 | ||||
Henderson Land Development Co., Ltd. (Hong Kong) | 155,000 | 806,021 | ||||
Hong Kong Exchanges & Clearing, Ltd. (Hong Kong) | 184,000 | 2 | 1,184,738 | |||
ING Groep NV (Netherlands) | 76,517 | 3,003,871 | ||||
KBC Bank & Insurance Group, Inc. (Belgium) | 7,965 | 854,850 | ||||
Kennedy-Wilson Japan (Japan) | 40 | 174,207 | ||||
KK DaVinci Advisors (Japan)* | 295 | 2 | 292,040 | |||
Kookmin Bank (South Korea) | 23,974 | 1,975,268 | ||||
Leopalace21 Corp. (Japan) | 23,400 | 806,100 | ||||
Man Group PLC (United Kingdom) | 20,225 | 952,126 | ||||
Millea Holdings, Inc. (Japan) | 39 | 725,983 | ||||
Mitsubishi Estate Co., Ltd. (Japan) | 92,000 | 1,957,884 | ||||
Mitsui Fudosan Co., Ltd. (Japan) | 96,000 | 2,086,354 | ||||
Muenchener Rueckversicherungs AG (Germany) | 16,700 | 2,278,813 | ||||
Nikko Cordial Corp. (Japan) | 23,000 | 293,841 | ||||
Nomura Holdings, Inc. (Japan) | 56,000 | 1,051,707 | ||||
ORIX Corp. (Japan) | 11,470 | 2,798,815 | ||||
Royal Bank of Scotland Group PLC (United Kingdom) | 56,600 | 1,857,902 | ||||
Shinsei Bank, Ltd. (Japan) | 255,000 | 1,616,134 | ||||
Shun TAK Holdings, Ltd. (Hong Kong) | 390,000 | 2 | 510,856 | |||
Societe Generale (France) | 10,800 | 1,585,723 | ||||
Standard Chartered, PLC (United Kingdom)* | 75,831 | 1,850,277 | ||||
Sumitomo Mitsui Financial Group, Inc. (Japan) | 186 | 1,969,708 | ||||
Sumitomo Realty & Development Co., Ltd. (Japan) | 120,000 | 2,961,024 | ||||
Sun Hung Kai Properties, Ltd. (Hong Kong) | 74,000 | 755,420 | ||||
Swiss Reinsurance (Switzerland) | 16,739 | 2 | 1,167,868 | |||
T&D Holdings, Inc. (Japan) | 15,150 | 1,221,361 | ||||
UBS AG (Switzerland) | 16,350 | 1,789,756 | ||||
Unibail (France) | 5,659 | 2 | 985,943 | |||
Zurich Financial Services AG (Switzerland)* | 3,100 | 2 | 678,662 | |||
Total Financials | 65,926,912 | |||||
Health Care - 6.1% | ||||||
Actelion, Ltd. (Switzerland)* | 1,841 | 185,485 | ||||
AstraZeneca PLC (United Kingdom)* | 33,126 | 1,991,912 | ||||
Daiichi Sankyo Co., Ltd. (Japan) | 25,500 | 701,799 | ||||
Eisai Co., Ltd. (Japan) | 20,600 | 927,899 | ||||
Elan Corp., PLC -Sponsored ADR (Ireland)* | 41,100 | 2 | 686,370 | |||
Essilor International SA (France) | 8,067 | 811,401 | ||||
GlaxoSmithKline PLC (United Kingdom) | 60,200 | 1,680,014 | ||||
Roche Holding AG (Switzerland)* | 7,863 | 1,297,494 | ||||
Sanofi-Synthelabo SA (France) | 47,847 | 4,661,756 | ||||
Total Health Care | 12,944,130 | |||||
Industrials - 6.2% | ||||||
ABB, Ltd. (Switzerland) | 84,000 | 1,089,188 | ||||
BAE Systems PLC (United Kingdom) | 117,500 | 802,713 | ||||
British Airways PLC (United Kingdom)* | 101,718 | 644,383 | ||||
Buzzi Unicem S.p.A (Italy) | 16,417 | 376,242 | ||||
Dai Nippon Printing Co., Ltd. (Japan) | 42,000 | 649,402 | ||||
easyjet PLC (United Kingdom)* | 48,138 | 343,888 | ||||
European Aeronautic Defense and Space Co. (Netherlands) | 41,820 | 2 | 1,199,659 | |||
FANUC, Ltd. (Japan) | 7,300 | 655,715 | ||||
Hutchison Whampoa, Ltd. (Hong Kong) | 108,000 | 986,136 | ||||
Koyo Seiko Co., Ltd. (Japan) | 29,600 | 572,417 | ||||
MAN AG (Germany) | 12,500 | 903,752 | ||||
Mitsui O.S.K. Lines, Ltd. (Japan) | 76,000 | 517,525 | ||||
RT Group PLC (United Kingdom)* | 360,539 | 26,669 | ||||
Ryanair Holdings PLC (Ireland)* | 12,200 | 2 | 643,184 | |||
Siemens AG (Germany) | 9,000 | 781,812 | ||||
SNC-Lavalin Group, Inc. (Canada) | 25,800 | 679,033 | ||||
Sumitomo Heavy Industries, Ltd. (Japan) | 73,000 | 674,513 | ||||
Tostem Inax Holding Corp. (Japan) | 32,000 | 672,727 | ||||
Yamato Transport Co., Ltd. (Japan) | 62,000 | 1,100,174 | ||||
Total Industrials | 13,319,132 | |||||
Information Technology - 7.6% | ||||||
ARM Holdings PLC (United Kingdom) | 583,529 | 1,218,980 | ||||
ASML Holding N.V. (Netherlands)* | 49,058 | 991,986 | ||||
Canon, Inc. (Japan) | 37,050 | 1,815,795 | ||||
Compal Electronics, Inc. (Taiwan) | 155,395 | 2 | 741,529 | |||
Ericsson (LM), Class B (Sweden) | 416,000 | 1,372,871 | ||||
Flextronics International, Ltd. (Singapore)* | 64,500 | 684,990 | ||||
Logitech International S.A. (Switzerland) | 33,636 | 1,300,303 | ||||
The accompanying notes are an integral part of these financial statements.
16
Managers International Equity Fund
Schedule of Portfolio Investments (continued)
| Shares | Value | |||||||
Information Technology - 7.6% (continued) | ||||||||
Nintendo Co., Ltd. (Japan) | 8,100 | $ | 1,360,979 | |||||
Samsung Electronics Co., Ltd. (South Korea) | 3,955 | 2,510,270 | ||||||
SAP AG (Germany) | 5,058 | 1,063,419 | ||||||
Taiwan Semiconductor Manufacturing Co., Ltd., Sponsored ADR | 193,447 | 1,775,840 | ||||||
Tokyo Electron, Ltd. (Japan) | 13,000 | 908,410 | ||||||
Yokogawa Electric Corp. (Japan) | 26,500 | 378,518 | ||||||
Total Information Technology | 16,123,890 | |||||||
Materials - 10.0% | ||||||||
Air Liquide Sante International (France) | 4,401 | 856,750 | ||||||
Alcan, Inc. (Canada) | 7,504 | 351,504 | ||||||
Arcelor (Luxembourg) | 24,200 | 1,171,208 | ||||||
Arkema, Inc. (France)* | 140 | 5,463 | ||||||
Barrick Gold Corp. (Canada) | 44,0862 | 1,302,083 | ||||||
BHP Billiton PLC (United Kingdom) | 36,451 | 709,175 | ||||||
Cameco Corp. (Canada) | 21,0002 | 839,370 | ||||||
China Shenhua Energy Co., Ltd. (China) | 359,000 | 666,112 | ||||||
Compania Vale do Rio Doce - ADR (Brazil) | 54,7002 | 1,314,988 | ||||||
Gold Fields, Ltd. (South Africa) | 65,500 | 1,486,799 | ||||||
Goldcorp, Inc. (Canada) | 43,600 | 1,314,288 | ||||||
Impala Platinum Holdings, Ltd. (South Africa) | 11,2002 | 518,175 | ||||||
JFE Holdings, Inc. (Japan) | 49,100 | 2,084,668 | ||||||
JSR Corp. (Japan) | 25,600 | 648,008 | ||||||
Meridian Gold, Inc. (Canada)* | 37,700 | 1,189,460 | ||||||
Mitsui Chemicals, Inc. (Japan) | 70,000 | 457,473 | ||||||
POSCO (South Korea) | 5,300 | 1,423,250 | ||||||
Svenska Cellulosa AB (Sweden) | 19,400 | 800,945 | ||||||
Vallourec SA (France) | 1,5542 | 1,870,382 | ||||||
Xstrata PLC (United Kingdom) | 63,238 | 2,406,986 | ||||||
Total Materials | 21,417,087 | |||||||
Telecommunication Services - 2.5% | ||||||||
America Movil , S.A. de C.V. (Mexico) | 36,900 | 1,227,294 | ||||||
Bharti Tele-Ventures, Ltd. (India)* | 21,200 | 170,685 | ||||||
China Netcom Group Corp., (HK) Ltd. (Hong Kong) | 268,000 | 469,980 | ||||||
Rogers Communications, Inc. (Canada) | 15,300 | 615,536 | ||||||
Singapore Telecommunications, Inc. (Singapore)* | 26,857 | 43,137 | ||||||
Vodafone Group PLC (United Kingdom) | 1,310,399 | 2,788,995 | ||||||
Total Telecommunication Services | 5,315,627 | |||||||
Utilities - 3.5% | ||||||||
E.ON AG (Germany) | 12,800 | 1,471,371 | ||||||
Endesa, S.A. (Spain) | 45,0002 | 1,563,521 | ||||||
Hong Kong & China Gas Co., Ltd. (Hong Kong) | 527,000 | $ | 1,158,219 | |||||
National Grid PLC (United Kingdom) | 74,061 | 800,234 | ||||||
RWE AG (Germany) | 9,150 | 759,351 | ||||||
Veolia Environnement (France) | 34,165 | 1,762,820 | ||||||
Total Utilities | 7,515,516 | |||||||
Total Common Stocks | 201,039,131 | |||||||
Rights - 0.0%# | ||||||||
Axa Group (France) | 23,100 | 19,500 | ||||||
Warrants - 0.3% | ||||||||
China Overseas Land & Investment (Hong Kong) | 119,000 | 3,448 | ||||||
United Microelectronics Corp. Warrants, Exp. 12/31/06 (Taiwan) | 1,116,500 | 668,784 | ||||||
Total Warrants | 672,232 | |||||||
Short-Term Investments - 11 .8% | ||||||||
Other Investment Companies - 11.3%1 | ||||||||
Bank of New York Institutional Cash Reserves Fund, 5.22%3 | 15,874,081 | 15,874,081 | ||||||
JPMorgan Prime Money Market Fund, Institutional Class Shares, 4.98% | 7,799,262 | 7,799,262 | ||||||
streetTRACKS Gold Trust | 7,300 | 2 | 446,979 | |||||
Total Other Investment Companies | 24,120,322 | |||||||
Other Short-Term Investments - 0.5% | | Principal Amount | | |||||
Goldman Sachs Promissory Note, 5.23%, 07/21/063 | $ | 1,001,288 | 1,001,288 | |||||
Total Short-Term Investments | 25,121,610 | |||||||
Total Investments - 106.3% | 226,852,473 | |||||||
Other Assets, less Liabilities - (6.3)% | (13,557,608 | ) | ||||||
Net Assets - 100.0% | $ | 213,294,865 | ||||||
17
Managers Emerging Markets Equity Fund
Fund Snapshots
June 30, 2006 (unaudited)
Portfolio Breakdown
Top Ten Holdings
Security Name | Percentage of Net Assets | ||
TAM S.A.* | 2.2 | % | |
Telekomunikasi Indonesia Tbk P | 2.0 | ||
Anglo American PLC* | 2.0 | ||
Companhia Energetica de Minas Gerais* | 2.0 | ||
Shinhan Financial Group Co., Ltd.* | 1.9 | ||
Sberbank RF | 1.8 | ||
Shinsegae Co., Ltd. | 1.8 | ||
Cosco Pacific, Ltd. | 1.8 | ||
China Overseas Land & Investment Ltd. | 1.7 | ||
Advanced Semiconductor Engineering, Inc.* | 1.7 | ||
Top Ten as a Group | 18.9 | % | |
| * | Top Ten Holding at December 31, 2005 |
Any sectors, industries, or securities discussed should not be perceived as investment recommendations. Mention of a specific security should not be considered a recommendation to buy or solicitation to sell that security.
18
Managers Emerging Markets Equity Fund
Fund Snapshots (continued)
Summary of Investments by Country
Country | Managers Emerging Markets Equity Fund* | MSCI EM Index | ||||
Argentina | 0.0 | % | 0.8 | % | ||
Brazil | 13.4 | % | 11.0 | % | ||
Chile | 1.5 | % | 1.6 | % | ||
China | 4.2 | % | 9.4 | % | ||
Colombia | 1.0 | % | 0.3 | % | ||
Czech Republic | 1.6 | % | 0.8 | % | ||
Egypt | 0.0 | % | 0.7 | % | ||
Hungary | 1.7 | % | 1.0 | % | ||
India | 8.1 | % | 6.1 | % | ||
Indonesia | 4.6 | % | 1.5 | % | ||
Israel | 2.0 | % | 2.3 | % | ||
Jordan | 0.0 | % | 0.2 | % | ||
South Korea | 13.5 | % | 17.9 | % | ||
Malaysia | 4.6 | % | 2.7 | % | ||
Mexico | 4.4 | % | 5.7 | % | ||
Morocco | 0.0 | % | 0.3 | % | ||
Pakistan | 0.0 | % | 0.2 | % | ||
Peru | 0.0 | % | 0.5 | % | ||
Philippines | 0.3 | % | 0.4 | % | ||
Poland | 0.0 | % | 1.7 | % | ||
Russia | 10.2 | % | 8.7 | % | ||
South Africa | 4.1 | % | 8.9 | % | ||
Taiwan | 9.7 | % | 13.7 | % | ||
Thailand | 3.7 | % | 1.6 | % | ||
Turkey | 3.3 | % | 1.5 | % | ||
Hong Kong | 3.4 | % | 0.0 | % | ||
United Kingdom | 2.0 | % | 0.0 | % | ||
United States | 0.9 | % | 0.0 | % | ||
Bermuda | 1.8 | % | 0.0 | % | ||
Supranational & Other | 0.0 | % | 0.5 | % | ||
| 100.0 | % | 100.0 | % | |||
* As a percentage of total market value of common stocks on June 30, 2006
19
Managers Emerging Markets Equity Fund
Schedule of Portfolio Investments
June 30, 2006 (unanudited)
| Shares | Value | |||||
Common Stocks - 92.7% | ||||||
Consumer Discretionary - 9.3% | ||||||
Astra International Tbk PT (Indonesia) | 1,854,000 | $ | 1,955,454 | |||
Consorcio ARA, S.A. de C.V. (Mexico) | 392,200 | 1,614,967 | ||||
Cosco Pacific, Ltd. (Bermuda) | 998,0002 | 2,210,269 | ||||
Genting Berhad (Malaysia) | 292,300 | 1,884,488 | ||||
Hankook Tire Co., Ltd. (South Korea) | 82,250 | 965,202 | ||||
Hyundai Motor Co., Ltd. (South Korea) | 3,430 | 291,157 | ||||
Land and Houses PCL (Thailand) | 6,239,5002 | 1,156,741 | ||||
Maruti Udyog Ltd. (India) | 95,533 | 1,654,715 | ||||
Total Consumer Discretionary | 11,732,993 | |||||
Consumer Staples - 6.5% | ||||||
Cia Brasileira de Distribuicao Grupo Pao de Acucar (Brazil) | 56,000 | 1,743,840 | ||||
IOI Corp., Berhad (Malaysia)* | 476,000 | 1,853,529 | ||||
ITC, Ltd. (India) | 436,621 | 1,729,805 | ||||
OJSC Cherkizovo Group (a) (Russia)* | 42,118 | 581,228 | ||||
Shinsegae Co., Ltd. (South Korea) | 4,500 | 2,252,819 | ||||
Total Consumer Staples | 8,161,221 | |||||
Energy - 9.6% | ||||||
China Petroleum and Chemical Corp., Class H (Hong Kong) | 3,731,000 | 2,139,278 | ||||
LUKOIL Holdings, ADR (Russia) | 23,506 | 1,965,102 | ||||
Oil & Natural Gas Corp., Ltd. (India) | 59,702 | 1 ,437,648 | ||||
Petroleo Brasileiro S.A., Sponsored ADR (Brazil) | 20,500 | 1,830,855 | ||||
PTT Public Co., Ltd. (Thailand) | 172,600 | 959,895 | ||||
Surgutneftegaz Sponsored ADR (Russia) | 26,180 | 2 | 1,937,320 | |||
Yanzhou Coal Mining Co., Ltd. (China)* | 2,452,0002 | 1,812,563 | ||||
Total Energy | 12,082,661 | |||||
Financials - 20.0% | ||||||
Bancolombia S.A. (Colombia) | 50,001 | 1,205,024 | ||||
Bank Hapoalim, Ltd. (Israel) | 345,470 | 1,510,231 | ||||
China Overseas Land & Investment Ltd. (Hong Kong) | 3,544,000 | 2,168,390 | ||||
Chinatrust Financial Holding Co (Taiwan) | 2,569,000 | 2,130,792 | ||||
Grupo Financiero Banorte S.A. de C.V. (Mexico) | 807,476 | 1,872,511 | ||||
Haci Omer Sabanci Holding AS (Turkey) | 494,742 | 1,318,316 | ||||
Kookmin Bank, Sponsored ADR (South Korea) | 25,248 | 2,097,099 | ||||
OAO Open Investments (Russia)* | 1,168 | 189,216 | ||||
PT Bank Central Asia, Tbk (Indonesia) | 1,486,000 | 659,172 | ||||
PT Bank Rakyat Indonesia (Indonesia) | 1,424,000 | 631,320 | ||||
Samsung Fire & Marine Insurance Co., Ltd. (South Korea) | 10,900 | 1,459,401 | ||||
Sanlam, Ltd. (South Africa) | 850,883 | 1,717,333 | ||||
Sberbank RF (Russia) | 1,340 | 2,277,942 | ||||
Shinhan Financial Group Co., Ltd. (South Korea) | 51,890 | 2,444,740 | ||||
SM Investments Corp. (Philippines) | 106,080 | 427,809 | ||||
SM Prime Holdings, Inc. (Philippines) | 800 | 118 | ||||
Turkiye Is Bankasi (Isbank) (Turkey) | 218,155 | 1,058,806 | ||||
Uniao de Bancos Brasileiros SA (Brazil) | 28,620 | 2 | 1,900,082 | |||
Total Financials | 25,068,302 | |||||
Health Care- 1.7% | ||||||
Richter Gedeon Rt (Hungary) | 11,280 | 2,073,232 | ||||
Industrials - 7.7% | ||||||
Alfa, S.A. (Mexico) | 391,418 | 1,966,883 | ||||
Barloworld Ltd (South Africa) | 98,202 | 1,655,200 | ||||
China Shipping Development Co., Ltd. (China) | 2,558,000 | 1,850,413 | ||||
Daewoo Shipbuilding & Marine Engineering Co., Ltd. (South Korea) | 70,740 | 2,079,346 | ||||
EVA Airways Corp. (Taiwan) | 88,506 | 37,690 | ||||
Hyundai Development Co. (South Korea) | 39,900 | 1 ,724,647 | ||||
Sime Darby Berhad (Malaysia) | 267,200 | 399,946 | ||||
Total Industrials | 9,714,125 | |||||
Information Technology - 11.1% | ||||||
Acer, Inc. (Taiwan) | 738,000 | 1,294,244 | ||||
Advanced Semiconductor Engineering, Inc. (Taiwan)* | 2,185,728 | 2,163,435 | ||||
Compal Electronics Inc. (Taiwan) | 1,412,532 | 1,346,221 | ||||
Hon Hai Precision Industry Co., Ltd. (Taiwan) | 293,154 | 1,809,961 | ||||
Infosys Technologies Ltd. (India) | 27,966 | 1,871,210 | ||||
Samsung Electronics Co., Ltd., GDR, (a) (South Korea) | 6,670 | 2,119,748 | ||||
Taiwan Semiconductor Manufacturing Co., Ltd. (Taiwan) | 986 | 1,791 | ||||
Taiwan Semiconductor Manufacturing Co., Ltd., Sponsored ADR | 207,062 | 1,900,830 | ||||
United Microelectronics Corp. (Taiwan) | 2,395,007 | 1,422,414 | ||||
Total Information Technology | 13,929,854 | |||||
Materials- 11.1% | ||||||
Anglo American PLC (United Kingdom) | 61,123 | 2,493,688 | ||||
Compania Vale do Rio Doce - ADR (Brazil) | 80,000 | 2 | 1,923,200 | |||
Formosa Chemicals & Fibre Corp. (Taiwan) | 660 | 1,019 | ||||
GMK Norilsk Nickel, Sponsored ADR (Russia) | 14,400 | 2 | 1,872,000 | |||
The accompanying notes are an integral part of these financial statements.
20
Managers Emerging Markets Equity Fund
Schedule of Portfolio Investments (continued)
| Shares | Value | |||||
Materials - 11.1% (continued) | ||||||
Hindalco Ind., Ltd., Sponsored GDR, (a) (India) | 390,0002 | $ | 1,486,641 | |||
Novolipetsk Steel, Corp. (Russia) | 77,5852 | 1,741,783 | ||||
Polyus Gold ADR (Russia)* | 27,165 | 1,168,095 | ||||
Sappi Ltd. (South Africa) | 146,2352 | 1,801,792 | ||||
Siam Cement Public Co., Ltd., The (Thailand) | 224,900 | 1,358,667 | ||||
Tata Steel Ltd. (India) | 2,041 | 23,699 | ||||
Total Materials | 13,870,584 | |||||
Telecommunication Services - 13.1% | ||||||
Advanced Information Services PCL (Thailand) | 510,000 | 1,207,208 | ||||
Bezeq Israeli Telecommunication Corp., Ltd. (Israel) | 894,739 | 1,054,549 | ||||
Bharti Tele-Ventures Ltd. (India)* | 240,457 | 1,935,965 | ||||
Cesky Telecom a.s. (Czech Republic) | 91,953 | 1,976,370 | ||||
China Telecom Corp., Ltd., Class H (China) | 4,842,000 | 1,564,492 | ||||
Mobile Telesystems, Sponsored ADR (Russia) | 35,827 | 1,054,747 | ||||
Telekomunikasi Indonesia Tbk P (Indonesia) | 3,219,000 | 2,570,823 | ||||
Tim Participacoes S.A. (Brazil) | 76,9002 | 2,118,595 | ||||
Turkcell lletisim Hizmet AS (Turkey) | 374,000 | 1 ,732,404 | ||||
Vivo Participacoes S.A. (Brazil) | 491,1002 | 1,208,106 | ||||
Total Telecommunication Services | 16,423,259 | |||||
Utilities - 2.6% | ||||||
Empresa Nacional de Electricidad SA/Chile, ADR (Chile) | 69,8792 | 1,844,807 | ||||
Tenaga Nasional Berhad (Malaysia) | 579,750 | 1,451,545 | ||||
Total Utilities | 3,296,352 | |||||
Total Common Stocks (cost $87,889,229) | 116,352,583 | |||||
Preferred Stocks - 6.0% | ||||||
Braskem SA , Preferred A (Brazil) | 142,400 | 873,111 | ||||
Companhia Energetica de Minas Gerais, 1.58% (Brazil) | 58,304,967 | 2,481,171 | ||||
Hyundai Motor Co., Ltd., 3.92% (South Korea) | 30,560 | 1,484,955 | ||||
Tam S.A. (Brazil) | 101,183 | 2,742,251 | ||||
Total Preferred Stocks (cost $4,225,517) | 7,581,488 | |||||
Rights - 0.1% | ||||||
Hindalco Ind., Ltd., (India) (cost $53,158) | 97,500 | 53,158 | ||||
Warrants - 0.0%# | ||||||
China Overseas Land & Investment (Hong Kong) (cost $0) | 443,000 | 12,834 | ||||
| Other Investment Companies - 12.0%1,3 | ||||||
Bank of New York Institutional Cash Reserves Fund, 5.22% (cost $15,041,132) | 15,041,132 | 15,041,132 | ||||
Total Investments - 110.8% | ||||||
(cost $107,209,036) | 139,041,195 | |||||
Other Assets, less Liabilities - (10.8)% | (13,516,775 | ) | ||||
Net Assets - 100.0% | $ | 125,524,420 | ||||
The accompanying notes are an integral part of these financial statements.
21
Fund Snapshots
June 30, 2006 (unaudited)
Portfolio Breakdown
Top Ten Holdings
Security Name | Percentage of Net Assets | ||
USTN, 3.625%, 04/30/07 | 8.5 | % | |
USTN, 4.250%, 10/31/07 | 7.8 | ||
USTB, 5.375%, 02/15/31 | 3.7 | ||
USTN, 4.375%, 05/15/07 | 2.9 | ||
USTN, 2.750%, 07/31/06 | 2.5 | ||
Telefonica Emisiones SAU, 7.045%, 06/20/36 | 2.3 | ||
USTN, 3.500%, 05/31/07 | 2.3 | ||
Qantas Airways Ltd., 6.050%, 04/15/16 (a) | 2.2 | ||
Comcast Corp., 6.450%, 03/15/37 | 1.9 | ||
Verizon Global Funding Corp., 5.850%, 09/15/35 | 1.9 | ||
Top Ten as a Group | 36.0 | % | |
| * | Top Ten Holding at December 31, 2005 |
Any sectors, industries, or securities discussed should not be perceived as investment recommendations. Mention of a specific security should not be considered a recommendation to buy or solicitation to sell that security.
22
Managers Bond Fund
Schedule of Portfolio Investments
June 30, 2006 (unaudited)
Security Description | Principal Amount | Value | |||||||
Corporate Bonds - 51.8% | |||||||||
Asset-Backed Security - 0.9% | |||||||||
Bank of America-First Union National Bank Commercial Mortgage, Series 2001-3, Class A2, 5.460%, 04/11/37 | $ | 1,500,000 | $ | 1,478,591 | |||||
Community Program Loan Trust, Series 87-A, Class A4, 4.500%, 10/01/18 | 167,691 | 163,667 | |||||||
Community Program Loan Trust, Series 87-A, Class A5, 4.500%, 04/01/29 | 3,225,000 | 2,893,163 | |||||||
Total Asset-Backed Security | 4,535,421 | ||||||||
Finance - 12.9% | |||||||||
ASIF Global Financial, 2.380%, 02/26/09 (a) | SGD | 5,800,000 | 3,522,964 | ||||||
Bank of American Capital Trust, 5.625%, 03/08/35 | 3,085,000 | 2,643,696 | |||||||
Barclays Capital Corp., 4.100%, 02/22/10 (a) | THB | 109,000,000 | 2,673,616 | ||||||
Barclays Capital Corp., 4.160%, 02/22/10 (a) | THB | 25,000,000 | 615,438 | ||||||
BNP Paribas SA, 0.000%, 06/31/11 (a) | IDR | 18,710,000,0004 | 1,188,383 | ||||||
Cerro Negro Finance Ltd., 7.900%, 12/01/20 (a) | 500,000 | 447,500 | |||||||
Citibank N.A., 15.000%, 07/02/10 (a) | BRL | 2,000,000 | 948,169 | ||||||
Citigroup, Inc., 3.500%, 02/01/08 | 2,020,000 | 1,956,140 | |||||||
Colonial Realty LP, 4.800%, 04/01/11 | 3,485,000 | 3,270,028 | |||||||
Colonial Realty LP, 5.500%, 10/01/15 | 1,255,000 | 1,173,032 | |||||||
EOP Operating LP, 6.750%, 02/15/12 | 500,000 | 515,917 | |||||||
General Electric Capital Corp., 6.625%, 02/04/10 | NZD | 3,500,000 | 2,111,921 | ||||||
General Motors Acceptance Corp., 5.625%, 05/15/09 | 500,000 | 475,580 | |||||||
General Motors Acceptance Corp., 7.500%, 12/01/06 | NZD | 1,000,000 | 597,251 | ||||||
GMAC International Finance BV, 8.000%, 03/14/07 | NZD | 950,000 | 572,612 | ||||||
GMAC, 6.039%, 03/20/07 | 1,500,000 | 1,489,704 | |||||||
GMAC, 6.125%, 01/22/08 | 2,000,0002 | 1,960,550 | |||||||
GMAC, 6.875%, 09/15/11 | 250,000 | 238,540 | |||||||
Highwoods Properties, Inc., 7.500%, 04/15/18 | 2,405,000 | 2,532,814 | |||||||
Inter-American Development Bank, 0.000%, 05/11/09 | BRL | 6,500,000 | 4 | 1,974,699 | |||||
Inter-American Development Bank, 6.000%, 12/15/17 | NZD | 4,215,000 | 2,479,567 | ||||||
JPMorgan Chase & Co., 4.000%, 02/01/08 | 1,000,0002 | 975,276 | |||||||
JPMorgan Chase of London, 0.000%, 10/21/10 (a) | IDR | 16,627,462,500 | 4 | 1,137,286 | |||||
JPMorgan Chase Bank, NA, 0.000%, 05/17/10 (a) | BRL | 3,600,000 | 4 | 957,151 | |||||
Marsh & McClennan Companies, 5.875%, 08/01/33 | 2,730,000 | 2,371,038 | |||||||
Morgan Stanley & Co., Inc., 3.625%, 04/01/08 | 2,100,000 | 2,032,330 | |||||||
Mutual of Omaha Insurance Co., 6.800%, 06/15/36 (a) | 10,125,000 | 9,871,976 | |||||||
NiSource Finance Corp., 6.150%, 03/01/13 | 1,250,000 | 1,254,104 | |||||||
SLM Corp., 6.500%, 06/15/10 | NZD | 500,000 | 300,452 | ||||||
Spieker Properties, Inc., 7.350%,12/01/17 | 250,000 | 266,379 | |||||||
St. Paul Travelers Companies, Inc. 6.750%, 06/20/36 | 2,610,000 | 2,576,929 | |||||||
Time Warner, Inc., 7.700%, 05/01/32 | 365,000 | 396,701 | |||||||
Toll Brothers Finance Corp., 5.150%, 05/15/15 | 3,785,000 | 3,303,170 | |||||||
Wells Fargo Co., 4.898%, 05/01/33 | 8,390,000 | 8,379,513 | |||||||
Total Finance | 67,210,426 | ||||||||
The accompanying notes are an integral part of these financial statements.
23
Managers Bond Fund
Schedule of Portfolio Investments (continued)
Security Description | Principal Amount | Value | ||||
Industrials - 33.9% | ||||||
Abitibi-Consolidated, Inc., 7.500%, 04/01/28 | $ | 500,000 | $ | 395,000 | ||
Altria Group, Inc., 7.000%, 11/04/13 | 1,500,000 | 1,582,500 | ||||
America Movil, S.A. de C.V., 4.125%, 03/01/09 | 3,000,0002 | 2,845,244 | ||||
American President, Ltd., 8.000%, 01/15/24 | 250,0005 | 225,325 | ||||
Arrow Electronics, Inc., 6.875%, 07/01/13 | 500,000 | 511,229 | ||||
AT&T, Inc., 6.500%, 03/15/29 | 3,690,000 | 3,481,655 | ||||
AT&T, Inc., 6.150%, 09/15/34 | 1,375,000 | 1,261,908 | ||||
Avnet, Inc., 6.000%, 09/01/15 | 2,800,000 | 2,650,732 | ||||
BellSouth Corp., 6.000%,11/15/34 | 5,515,0002 | 4,900,772 | ||||
Bowater, Inc., 6.500%, 06/15/13 | 500,000 | 435,000 | ||||
Bristol-Myers Squibb, 4.829%, 09/15/23 | 6,060,000 | 6,048,668 | ||||
Centex Corp., 5.250%, 06/15/15 | 1,915,000 | 1,719,651 | ||||
Chartered Semiconductor, 6.250%, 04/04/13 | 5,600,0002 | 5,442,920 | ||||
Cia Brasileira de Bebida, 8.750%, 09/15/13 | 3,795,000 | 4,179,244 | ||||
Clear Channel Communications, 4.250%, 05/15/09 | 1 ,500,000 | 1,422,435 | ||||
Clear Channel Communications, 5.750%, 01/15/13 | 500,000 | 469,211 | ||||
Comcast Corp., 5.650%, 06/15/35 | 4,910,000 | 4,167,205 | ||||
Comcast Corp., 6.450%, 03/15/37 | 10,570,000 | 9,928,242 | ||||
Comcast Corp., 6.500%, 11/15/35 | 375,000 | 353,989 | ||||
Continental Airlines, Inc., 6.795%, 08/02/20 | 53,994 | 50,950 | ||||
Corning, Inc., 6.850%, 03/01/29 | 8,907,0002 | 9,060,521 | ||||
D.R. Horton, Inc., 5.250%, 02/15/15 | 3,245,0002 | 2,884,104 | ||||
Devon Energy Corp., 4.900%, 08/15/08 | 1,250,000 | 1,517,188 | ||||
Devon Energy Corp., 4.950%, 08/15/08 | 1,692,000 | 2,053,665 | ||||
Dillards, Inc., 7.000%, 12/01/28 | 225,000 | 199,125 | ||||
El Paso Corp., 6.950%, 06/01/28 (a) | 300,000 | 267,750 | ||||
Foot Locker, Inc., 8.500%, 01/15/22 | 570,000 | 574,988 | ||||
Ford Motor Co., 6.375%, 02/01/29 | 1 ,990,000 | 1,373,100 | ||||
Georgia-Pacific Corp., 7.250%, 06/01/28 | 500,000 | 442,500 | ||||
Georgia-Pacific Corp., 7.750%, 11/15/29 | 925,000 | 846,375 | ||||
GTE Corp., 6.940%, 04/15/28 | 130,000 | 127,003 | ||||
HCA, Inc., 6.250%, 02/15/13 | 1,940,000 | 1,811,514 | ||||
HCA, Inc., 5.750%, 03/15/14 | 2,500,000 | 2,235,475 | ||||
HCA, Inc., 7.050%, 12/01/27 | 1,600,000 | 1,401,272 | ||||
HCA, Inc., 7.580%, 09/15/25 | 125,000 | 116,422 | ||||
Hutchison Whampoa International, Ltd., 5.450%, 11/24/10 (a) | 2,225,000 | 2,177,445 | ||||
International Paper Co., 4.000%, 04/01/10 | 1,000,000 | 935,616 | ||||
International Paper Co., 4.250%, 01/15/09 | 1,000,000 | 961,040 | ||||
Kellwood Co., 7.625%, 10/15/17 | 250,000 | 225,273 | ||||
Lennar Corp., 5.600%, 05/31/15 | 2,740,000 | 2,489,015 | ||||
Lennar Corp., 6.500%, 04/15/16 (a) | 2,340,0002 | 2,267,636 | ||||
Lowe's Co., Inc., 6.875%, 02/15/28 | 500,000 | 544,474 | ||||
The accompanying notes are an integral part of these financial statements.
24
Managers Bond Fund
Schedule of Portfolio Investments (continued)
Security Description | Principal Amount | Value | ||||
Industrials - 33.9% (continued) | ||||||
Lubrizol, Corp., 6.500%, 10/01/34 | $ | 1,000,000 | $ | 956,397 | ||
MacMillan Bloedel, Ltd., 7.700%, 02/15/26 | 1,350,000 | 1,413,044 | ||||
Motorola, Inc., 7.625%, 11/15/10 | 60,000 | 64,253 | ||||
Motorola, Inc., 8.000%, 11/01/11 | 1,075,000 | 1,178,704 | ||||
New England Telephone & Telegraph Co., 7.875%, 11/15/29 | 2,390,000 | 2,474,575 | ||||
News America, Inc., 6.200%, 12/15/34 | 2,790,000 | 2,531,900 | ||||
News America, Inc., 6.400%, 12/15/35 | 5,820,000 | 5,382,947 | ||||
Owens & Minor, Inc., 6.350%, 04/15/16 | 1,000,000 | 979,235 | ||||
Pemex Project Funding Master Trust, 8.625%, 12/01/23 | 950,000 | 1,039,300 | ||||
Penney (JC), Co., 7.125%, 11/15/23 | 33,000 | 35,195 | ||||
PF Export Rec Master Trust, 6.436%, 06/01/15 (a) | 726,236 | 726,113 | ||||
Pulte Homes, Inc., 5.200%, 02/15/15 | 2,935,0002 | 2,617,339 | ||||
Pulte Home, Inc., 6.000%, 02/15/35 | 8,315,0002 | 6,941,986 | ||||
Pulte Homes, Inc., 6.375%, 05/15/33 | 3,120,000 | 2,695,639 | ||||
Qantas Airways, Ltd., 6.050%, 04/15/16 (a) | 11,800,000 | 11,427,085 | ||||
Qwest Capital Funding, Inc., 6.500%, 11/15/18 | 280,000 | 246,400 | ||||
Qwest Capital Funding, Inc., 6.875%, 07/15/28 | 90,0002 | 77,625 | ||||
Qwest Capital Funding, Inc., 7.750%, 02/15/31 | 290,000 | 271,150 | ||||
Qwest Corp., 6.875%, 09/15/33 | 535,000 | 462,775 | ||||
Raytheon Co., 7.000%, 11/01/28 | 1,500,000 | 1,615,311 | ||||
Raytheon Co., 7.200%, 08/15/27 | 800,000 | 881,114 | ||||
Samsung Electronics Co., Ltd., 7.700%, 10/01/27 (a) | 4,695,000 | 4,808,783 | ||||
Schering-Plough Corp., 5.300%, 12/01/13 | 1,500,000 | 1,454,028 | ||||
Teck Cominco Ltd., 7.000%, 09/15/12 | 1,000,000 | 1,040,025 | ||||
Telefonica Emisiones SAU, 7.045%, 06/20/36 | 12,125,000 | 12,118,392 | ||||
Telekom Malaysia Berhad, 7.875%, 08/01/25 (a) | 250,000 | 285,787 | ||||
Time Warner, Inc., 6.625%, 05/15/29 | 1,995,000 | 1,916,868 | ||||
Time Warner, Inc., 6.950%, 01/15/28 | 855,000 | 852,234 | ||||
Time Warner, Inc., 7.625%, 04/15/31 | 560,000 | 602,966 | ||||
US West Communications, Inc., 7.250%, 09/15/25 | 560,000 | 523,600 | ||||
Verizon Global Funding Corp., 5.850%, 09/15/35 | 11,400,000 | 9,917,384 | ||||
Verizon Maryland, Inc., 5.125%, 06/15/33 | 300,0002 | 229,302 | ||||
Verizon New York, Inc., 7.375%, 04/01/32 | 3,090,0002 | 3,046,066 | ||||
Viacom, Inc., 6.875%, 04/30/36 (a) | 7,175,0002 | 6,924,313 | ||||
Watson Pharmaceuticals, Inc., 1.750%, 03/15/23 | 515,0002 | 451,913 | ||||
Williams Co., Inc., Series A, 7.500%, 01/15/31 | 1,000,000 | 965,000 | ||||
XTO Energy, Inc., 6.100%, 04/01/36 | 190,000 | 171,980 | ||||
Total Industrials | 175,910,109 | |||||
Utilities - 4.1% | ||||||
Commonwealth Edison, 4.700%, 04/15/15 | 1,465,000 | 1,332,762 | ||||
Commonwealth Edison, 5.875%, 02/01/33 | 5,000,000 | 4,607,410 | ||||
Constellation Energy Group, Inc., 4.550%, 06/15/15 | 1,675,000 | 1,483,280 | ||||
Dominion Resources, Inc., 5.950%, 06/15/35 | 740,000 | 663,467 | ||||
The accompanying notes are an integral part of these financial statements.
25
Managers Bond Fund
Schedule of Portfolio Investments (continued)
Security Description | Principal Amount | Value | |||||||
Utilities - 4.1% (continued) | |||||||||
El Paso Corp., 6.750%, 05/15/09 | $ | 250,000 | $ | 246,875 | |||||
El Paso Corp., 7.000%, 05/15/11 | 500,000 | 493,125 | |||||||
Empresa Nacional de Electricidad SA, 8.625%, 08/01/15 | 300,000 | 2 | 330,207 | ||||||
Empresa Nacional de Electricidad, Yankee, 7.875%, 02/01/27 | 2,900,000 | 3,010,067 | |||||||
Enersis SA, Yankee, 7.400%, 12/01/16 | 225,000 | 228,743 | |||||||
Methanex Corp., 6.000%, 08/15/15 | 2,625,000 | 2,443,641 | |||||||
MidAmerican Energy Holdings, 5.875%, 10/01/12 | 750,000 | 743,988 | |||||||
MidAmerican Energy Holdings, 6.125%, 04/01/36 (a) | 2,305,000 | 2,154,668 | |||||||
Southern Natural Gas Co., 7.350%, 02/15/31 | 1,000,000 | 959,491 | |||||||
Tenaga Nasional Berhad, 7.500%, 11/01/25 (a) | 2,000,000 | 2,160,532 | |||||||
Transocean, Inc., 7.375%, 04/15/18 | 500,000 | 546,599 | |||||||
Total Utilities | 21,404,855 | ||||||||
Total Corporate Bonds (cost $272,517,353) | 269,060,811 | ||||||||
Foreign Government and Agency Obligations - 5.0% | |||||||||
British Columbia, Province of, 6.000%, 06/09/08 | CAD | 560,000 | 514,971 | ||||||
European Investment Bank, 0.000%, 03/10/21 | AUD | 5,000,000 | 4 | 1,572,545 | |||||
European Investment Bank, 0.000%, 09/12/08 (a) | BRL | 13,323,060 | 4 | 4,459,285 | |||||
Government of Canada., 2.750%, 12/07/07 | CAD | 5,260,000 | 4,604,420 | ||||||
Manitoba, Province of, 5.750%, 06/02/08 | CAD | 3,800,000 | 3,477,563 | ||||||
Mexican Fixed Rate Bonds, 8.000%, 12/07/23 | MXN | 56,500,000 | 4,359,087 | ||||||
Mexican Government, 9.000%, 12/20/12 | MXN | 54,500,000 | 4,854,963 | ||||||
Mexico Government, 7.500%, 01/14/12 | 1,250,000 | 1,325,000 | |||||||
Ontario Province, 5.700%, 12/01/08 | CAD | 545,000 | 500,426 | ||||||
Province of Alberta, Series CS, Sinking Fund, 5.930%, 09/16/16 | CAD | 188,675 | 179,420 | ||||||
Total Foreign Government and Agency Obligations (cost $25,012,989) | 25,847,680 | ||||||||
U.S. Government and Agency Obligations - 37.2% | |||||||||
Federal Home Loan Mortgage Corporation - 1.1% | |||||||||
FHLMC, 3.220%, 06/20/07 | SGD | 500,000 | 314,154 | ||||||
FHLMC, 5.500%, 09/15/11 | 5,090,000 | 2 | 5,089,542 | ||||||
FHLMC, Gold, 5.000%, 12/01/31 | 204,761 | 191,664 | |||||||
Total Federal Home Loan Mortgage Corporation | 5,595,360 | ||||||||
Federal National Mortgage Association - 2.3% | |||||||||
FNMA, 2.290%, 02/19/09 | SGD | 3,800,000 | 2,310,254 | ||||||
FNMA, 4.000%, 10/01/18 | 10,277,819 | 9,500,503 | |||||||
FNMA, 6.000%, 07/01/29 | 24,684 | 24,416 | |||||||
Total Federal National Mortgage Association | 11,835,173 | ||||||||
U.S. Treasury Bonds - 3.7% | |||||||||
USTB, 5.375%, 02/15/31 | 18,715,000 | 2 | 19,038,133 | ||||||
U.S. Treasury Notes - 30.1% | |||||||||
USTN, 2.375%, 08/15/06 | 985,000 | 2 | 981,999 | ||||||
USTN, 2.500%, 09/30/06 | 3,000,000 | 2 | 2,980,665 | ||||||
USTN, 2.750%, 07/31/06 | 12,785,000 | 2 | 12,764,518 | ||||||
The accompanying notes are an integral part of these financial statements.
26
Managers Bond Fund
Schedule of Portfolio Investments (continued)
Security Description | Principal Amount | Value | ||||||
U.S. Treasury Notes - 30.1% (continued) | ||||||||
USTN, 3.000%, 02/15/08 | $ | 8,000,000 | 2 | $ | 7,729,688 | |||
USTN, 3.250%, 08/15/08 | 5,000,000 | 2 | 4,810,940 | |||||
USTN, 3.375%, 02/28/07 | 7,080,000 | 6,992,328 | ||||||
USTN, 3.500%, 05/31/07 | 12,255,000 | 2 | 12,060,648 | |||||
USTN, 3.500%, 11/15/06 | 3,400,000 | 2 | 3,378,352 | |||||
USTN, 3.625%, 04/30/07 | 45,000,000 | 2 | 44,388,270 | |||||
USTN, 4.250%, 10/31/07 | 41,000,000 | 2 | 40,489,099 | |||||
USTN, 4.250%, 11/30/07 | 5,000,000 | 2 | 4,933,985 | |||||
USTN, 4.375%, 05/15/07 | 15,000,000 | 2 | 14,885,160 | |||||
Total U.S. Treasury Notes | 156,395,652 | |||||||
Total U.S. Government and Agency Obligations (cost $195,117,943) | 192,864,318 | |||||||
Municipal Bonds - 0.6% | ||||||||
MI Tobacco Settlement, 7.309%, 06/01/34 (cost $3,209,808) | 3,210,000 | 3,206,951 | ||||||
| Preferred Stocks - 1.2% | Shares | |||||||
Entergy New Orleans, Inc., 4.750% | 482 | 17,744 | ||||||
Entergy New Orleans, Inc., 5.560% | 100 | 4,134 | ||||||
Newell Financial Trust 1, 5.250% | 78,775 | 3,475,947 | ||||||
Travelers Property Casualty Corp., 4.500% | 109,275 | 2,679,423 | ||||||
Wisconsin Electric Power Co., 3.600% | 3,946 | 272,866 | ||||||
Total Preferred Stocks (cost $6,056,766) | 6,450,114 | |||||||
Short-Term Investments - 32.2%1 | ||||||||
Other Investment Companies - 28.4% | ||||||||
Bank of New York Institutional Cash Reserves Fund, 5.22%3 | 132,932,414 | 132,932,414 | ||||||
JPMorgan Prime Money Market Fund, Institutional Class Shares, 4.98% | 14,437,940 | 14,437,940 | ||||||
Total Other Investment Companies | 147,370,354 | |||||||
| Other Short-Term Investments - 0.4% | Principal Amount | |||||||
Goldman Sachs Promissory Notes, 5.23%, 07/21/063 | $ | 2,503,220 | 2,503,220 | |||||
Repurchase Agreement - 3.4% | ||||||||
UBS Securities, LLC, dated 06/30/06, due 07/06/06, 5.09%, total to be received $17,535,791 (secured by $17,539,260 U.S. Treasury Notes), at cost3 | 17,535,791 | |||||||
Total Short-Term Investments (cost $167,409,365) | 167,409,365 | |||||||
Total Investments - 128.0% (cost $669,324,224) | 664,839,239 | |||||||
Other Assets, less Liabilities - (28.0)% | (145,461,814 | ) | ||||||
Net Assets - 100.0% | $ | 519,377,425 | ||||||
The accompanying notes are an integral part of these financial statements.
27
Fund Snapshots
June 30, 2006 (unaudited)
Portfolio Breakdown
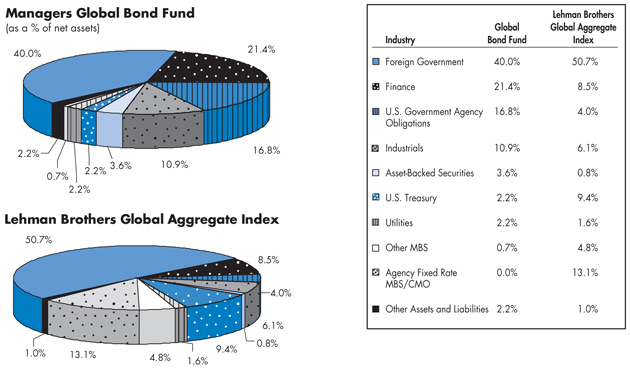
Top Ten Holdings
Security Name | Percentage of Net Assets | ||
Irish Government, 4.600%, 04/18/16 | 4.2 | % | |
Belgium Government Bond, 3.750%, 03/28/09 | 3.1 | ||
Development Bank of Japan, 1.750%, 06/21/10 | 3.1 | ||
Swedish Government, 5.250%, 03/15/11 | 2.8 | ||
KfW International Finance, Inc., 2.050%, 09/21/21 | 2.7 | ||
Depfa ACS Bank, 0.750%, 09/22/09 | 2.7 | ||
Bundes Obligation, 3.250%, 04/17/09 (a) | 2.6 | ||
Oesterreichische Kontrollbank AG, 1.800%, 03/22/10 | 2.5 | ||
FNMA, 1.750%, 03/26/08 | 2.5 | ||
FHLMC Gold Pool, 5.000%, 07/01/35 | 2.4 | ||
Top Ten as a Group | 28.6 | % | |
| * | Top Ten Holding at December 31, 2005 |
Any sectors, industries, or securities discussed should not be perceived as investment recommendations. Mention of a specific security should not be considered a recommendation to buy or solicitation to sell that security.
28
Managers Global Bond Fund
Schedule of Portfolio Investments
June 30, 2006 (unaudited)
Security Description | Principal Amount | Value | ||||||
Foreign Government and Agency Obligations - 40.0% | ||||||||
Foreign Government - 40.0% | ||||||||
Argentina, Republic of, 2.000%, 09/30/14 | ARS | 640,000 | $ | 198,200 | ||||
Bank of England Euro Note, 3.000%, 01/27/09 | EUR | 70,000 | 88,020 | |||||
Barclays Financial LLC, 4.140%, 03/23/09 (a) | KRW | 307,770,000 | 325,261 | |||||
Belgium Government Bond, 3.750%, 03/28/09 | EUR | 1,200,000 | 1,538,112 | |||||
Belgium Kingdom, 5.500%, 09/28/17 | EUR | 495,000 | 711,891 | |||||
Brazil, Republic of, 8.250%, 01/20/34 | USD | 180,000 | 189,000 | |||||
Bundes Immobil, 4.625%, 09/27/12 | EUR | 525,000 | 687,681 | |||||
Bundes Obligation, 3.250%, 04/17/09 | EUR | 1,025,000 | 1,296,173 | |||||
Colombia, Republic of, 8.125%, 05/21/24 | USD | 65,000 | 2 | 65,813 | ||||
Development Bank of Japan, 1.750%, 06/21/10 | JPY | 171,000,000 | 2 | 1,522,103 | ||||
Development Bank of Japan, 2.875%, 12/20/06 | JPY | 30,000,000 | 265,334 | |||||
Deutschland Republic, 4.000%, 01/04/37 | EUR | 495,000 | 597,485 | |||||
European Investment Bank, 0.000%, 03/10/21 | AUD | 655,000 | 4 | 206,003 | ||||
Federal Republic of Brazil, 8.750%, 02/04/25 | USD | 105,000 | 2 | 115,238 | ||||
Irish Government, 4.600%, 04/18/16 | EUR | 1,530,000 | 2,040,280 | |||||
Kingdom of Norway, 5.500%, 05/15/09 | NOK | 2,800,000 | 468,156 | |||||
Mexican Fixed Rate Bonds, 8.000%, 12/07/23 | MXN | 500,000 | 38,576 | |||||
Mexican Government, 9.000%, 12/20/12 | MXN | 8,940,000 | 796,392 | |||||
Netherlands Government SA, 5.500%, 01/15/28 | EUR | 660,000 | 982,347 | |||||
Republic of Columbia, 11.750%, 03/01/10 | COP | 136,000,000 | 55,251 | |||||
Republic of Columbia, 12.000%, 10/22/15 | COP | 401,000,000 | 168,876 | |||||
Republic of Deutschland, Series 02, 5.000%, 01/04/12 | EUR | 300,000 | 404,347 | |||||
Republic of Indonesia, 6.875%, 03/09/17 (a) | USD | 105,000 | 102,244 | |||||
Republic of Poland, 1.020%, 06/09/09 | JPY | 100,000,000 | 868,577 | |||||
Republic of South Africa, 13.000%, 08/31/10 | ZAR | 2,850,000 | 2 | 457,860 | ||||
Republic of South Africa, 5.250%, 05/16/13 | EUR | 350,000 | 453,040 | |||||
Republic of Turkey, 7.250%, 03/15/15 | USD | 60,000 | 56,325 | |||||
Singapore Government, 4.625%, 07/01/10 | SGD | 1,120,000 | 741,480 | |||||
Spain, Government of, 3.600%, 01/31/09 | EUR | 715,000 | 912,762 | |||||
Swedish Government, 5.250%, 03/15/11 | SEK | 9,300,000 | 1,370,946 | |||||
U.K. Gilts, 4.250%, 03/07/36 | GBP | 140,000 | 255,154 | |||||
U.K. Treasury, 5.000%, 03/07/12 | GBP | 175,000 | 327,431 | |||||
U.K. Treasury, 6.250%, 11/25/10 | GBP | 215,000 | 420,509 | |||||
United Mexican States, 4.250%, 06/16/15 | EUR | 250,000 | 299,202 | |||||
USTB, 5.000%, 03/07/25 | GBP | 325,000 | 635,285 | |||||
Total Foreign Government and Agency Obligations (cost $19,381,955) | 19,661,354 | |||||||
Corporate Bonds - 38.9% | ||||||||
Asset-Backed Security - 3.6% | ||||||||
Daimler Chrysler Auto Trust, Series 2004-B, Class A4, 3.710%, 10/08/09 | USD | 35,000 | 34,127 | |||||
DaimlerChrysler Auto Trust, Class A4, Series 2005-A, 3.740%, 02/08/10 | USD | 340,000 | 330,626 | |||||
The accompanying notes are an integral part of these financial statements.
29
Managers Global Bond Fund
Schedule of Portfolio Investments (continued)
Security Description | Principal Amount | Value | ||||||
Asset-Backed Security - 3.6% (continued) | ||||||||
Greenwich Capital Commericial Funding Corp., Series 2005-GG5, Class A2, 5.117%, 11/10/37 | USD | 385,000 | $ | 376,087 | ||||
Honda Auto Receivables Owner Trust, Class A4, Series 2005-1, 3.820%, 05/21/10 | USD | 330,000 | 319,233 | |||||
Honda Auto Receivables Owner Trust, 4.930%, 03/18/11 | USD | 100,000 | 98,308 | |||||
MBNA Credit Card Master Note Trust, 4.300%, 02/15/11 | USD | 410,000 | 399,908 | |||||
Merrill Lynch/Countrywide Commercial Mortgage Trust, Series 2006-1, Class A2, 5.439%, 02/12/39 | USD | 235,000 | 231,831 | |||||
Total Asset-Backed Security | 1,790,120 | |||||||
Finance - 22.2% | ||||||||
Barclays Capital Corp., 4.100%, 02/22/10 (a) | THB | 8,000,000 | 196,229 | |||||
Barclays Capital Corp., 4.160%, 02/22/10 (a) | THB | 7,000,000 | 172,323 | |||||
Barclays Financial LLC, 4.060%, 09/16/10 (a) | KRW | 220,000,000 | 226,618 | |||||
Barclays Financial LLC., 4.460%, 09/23/10 (a) | KRW | 110,000,000 | 115,028 | |||||
BSkyB Finance PLC, 5.750%, 10/20/17 | GBP | 210,000 | 377,986 | |||||
Cerro Negro Finance, Ltd., 7.900%, 12/01/20 (a) | USD | 70,000 | 62,650 | |||||
CIT Group, Inc., 5.500%, 12/01/14 | GBP | 80,000 | 145,893 | |||||
Citibank N.A., 15.000%, 07/02/10 (a) | BRL | 460,000 | 218,079 | |||||
Couche-Tard US/Finance, 7.500%, 12/15/13 | USD | 160,000 | 159,200 | |||||
Depfa ACS Bank, 0.750%, 09/22/08 | JPY | 150,000,000 | 2 | 1,307,523 | ||||
Ford Motor Credit Co., 5.700%, 01/15/10 | USD | 315,000 | 275,920 | |||||
Goldman Sachs Group, Inc., 3.246%, 05/23/16 | EUR | 350,000 | 444,215 | |||||
Hypothekenbank in Essen AG, 5.250%, 01/22/08 | EUR | 810,000 | 1,061,210 | |||||
Inter-American Development Bank, 1.900%, 07/08/09 | JPY | 60,000,000 | 536,798 | |||||
International Bank for Reconstruction & Development, 2.000%, 02/18/08 | JPY | 58,000,000 | 516,430 | |||||
Japan Bank for International Cooperation, 0.350%, 03/19/08 | JPY | 18,000,000 | 156,348 | |||||
JPMorgan Chase of London, 0.000%, 10/21/10 (a) | IDR | 2,680,548,500 | 4 | 183,344 | ||||
KfW International Finance, Inc., 1.750%, 03/23/10 | JPY | 20,000,000 | 2 | 178,039 | ||||
KfW International Finance, Inc., 2.050%, 09/21/09 | JPY | 148,000,000 | 1,329,486 | |||||
MBNA Europe Funding, PLC, 6.500%, 03/27/07 | EUR | 50,000 | 65,356 | |||||
Morgan Stanley Co., Series EMTN, 5.375%, 11/14/13 | GBP | 120,000 | 220,048 | |||||
Muenchener Hypothekenbank eG, 5.000%, 01/16/12 | EUR | 685,000 | 917,868 | |||||
Oesterreichische Kontrollbank AG, 1.800%, 03/22/10 | JPY | 140,000,000 | 1,248,493 | |||||
Permanent Financing PLC, 5.100%, 06/11/07 | EUR | 275,000 | 356,580 | |||||
Petrozuata Finance, Inc., 8.220%, 04/01/17 (a) | USD | 105,000 | 98,700 | |||||
Simon Property Group, L.P., 4.825%, 03/18/10 | USD | 180,000 | 173,610 | |||||
SLMCorp., 6.500%, 06/15/10 | NZD | 245,000 | 147,222 | |||||
Total Finance | 10,891,196 | |||||||
Industrials - 10.9% | ||||||||
Albertson's Inc., 6.625%, 06/01/28 | USD | 35,000 | 27,802 | |||||
Albertson's Inc., 7.750%, 06/15/26 | USD | 40,000 | 35,572 | |||||
Albertson's Inc., 8.000%, 05/01/31 | USD | 40,000 | 36,051 | |||||
Albertson's Inc., 8.700%, 05/01/30 | USD | 5,000 | 4,737 | |||||
The accompanying notes are an integral part of these financial statements.
30
Managers Global Bond Fund
Schedule of Portfolio Investments (continued)
Security Description | Principal Amount | Value | ||||||
Industrials - 10.9% (continued) | ||||||||
Albertson's, Inc., 7.450%, 08/01/29 | USD | 165,000 | $ | 141,722 | ||||
America Movil SA, 9.000%, 01/15/16 | MXN | 1,400,000 | 119,493 | |||||
America Movil, S.A. de C.V., 4.125%, 03/01/09 | USD | 135,000 | 2 | 128,036 | ||||
American Standard, Inc., 8.250%, 06/01/09 | GBP | 50,000 | 97,471 | |||||
American Stores Co., 8.000%, 06/01/26 | USD | 25,000 | 24,040 | |||||
ASIF Global, 2.380%, 02/26/09 (a) | SGD | 500,000 | 303,704 | |||||
Avenor lnc., 10.850%, 11/30/14 | CAD | 150,000 | 144,191 | |||||
Cia Brasileira de Bebida, 8.750%, 09/15/13 | USD | 70,000 | 77,088 | |||||
Comcast Corp., 6.450%, 03/15/37 | USD | 210,000 | 197,250 | |||||
Corning Inc., 6.750%, 09/15/13 | USD | 125,000 | 130,144 | |||||
DaimlerChrysler N.A. Holdings Corp., 4.875%, 06/15/10 | USD | 95,000 | 2 | 90,811 | ||||
Desarrolladora Homex S.A. de C.V., 7.500%, 09/28/15 | USD | 230,000 | 216,200 | |||||
Georgia-Pacific Corp., 7.250%, 06/01/28 | USD | 160,000 | 141,600 | |||||
Hanarotelecom, Inc., 7.000%, 02/01/12 (a) | USD | 50,000 | 47,250 | |||||
Harrahs Operating Co., Inc., 5.750%, 10/01/17 | USD | 110,000 | 100,208 | |||||
HCA, Inc., 5.500%, 12/01/09 | USD | 150,000 | 144,549 | |||||
LPG International, Inc., 7.250%, 12/20/15 | USD | 120,000 | 110,400 | |||||
Lucent Technologies, Inc., 6.450%, 03/15/29 | USD | 115,000 | 97,750 | |||||
News America Holdings, 8.625%, 02/07/14 | AUD | 350,000 | 5 | 269,467 | ||||
Owens & Minor, Inc., 6.350%, 04/15/16 | USD | 200,000 | 195,847 | |||||
Pemex Project Funding Master Trust, 7.875%, 02/01/09 | USD | 325,000 | 2 | 337,188 | ||||
Phillips-Van Heusen Corp., 7.250%, 02/15/11 | USD | 70,000 | 69,300 | |||||
Qwest Corp., 7.875%, 09/01/11 | USD | 75,000 | 75,938 | |||||
Qwest Capital Funding, Inc., 6.500%, 11/15/18 | USD | 35,000 | 30,800 | |||||
Qwest Capital Funding, Inc., 6.875%, 07/15/28 | USD | 15,000 | 2 | 12,938 | ||||
Qwest Capital Funding, Inc., 7.250%, 02/15/11 | USD | 75,000 | 2 | 72,938 | ||||
Qwest Capital Funding, Inc., 7.750%, 02/15/31 | USD | 50,000 | 46,750 | |||||
Qwest Corp., 6.875%, 09/15/33 | USD | 55,000 | 47,575 | |||||
Rogers Cable, Inc., 5.500%, 03/15/14 | USD | 110,000 | 97,625 | |||||
Rogers Wireless Inc., 7.625%, 12/15/11 | CAD | 55,000 | 51,487 | |||||
Shaw Communications, Inc., 6.150%, 05/09/16 | CAD | 190,000 | 160,480 | |||||
Sing Telecommunications, 6.000%, 11/21/11 | EUR | 50,000 | 69,018 | |||||
Smithfield Foods, Inc., 7.000%, 08/01/11 | USD | 145,000 | 2 | 140,288 | ||||
Stena AB, 7.000%, 12/01/16 | USD | 170,000 | 156,400 | |||||
Stena AB, 7.500%, 11/01/13 | USD | 75,000 | 72,750 | |||||
Telefonica Emisiones SAU, 6.421%, 06/20/16 | USD | 265,000 | 264,450 | |||||
Time Warner, Inc., 6.625%, 05/15/29 | USD | 310,000 | 297,859 | |||||
US West Communications, Inc., 7.250%, 09/15/25 | USD | 5,000 | 4,675 | |||||
Vale Overseas Limited., 8.250%, 01/17/34 | USD | 185,000 | 199,569 | |||||
WPP Group, PLC. 6.000%, 06/18/08 | EUR | 50,000 | 66,426 | |||||
Xerox Corp., 6.400%, 03/15/16 | USD | 216,000 | 2 | 203,850 | ||||
Total Industrials | 5,359,687 | |||||||
The accompanying notes are an integral part of these financial statements.
31
Managers Global Bond Fund
Schedule of Portfolio Investments (continued)
Security Description | Principal Amount | Value | ||||||
Utilities - 2.2% | ||||||||
Dominion Resources, Inc., 5.000%, 03/15/13 | USD | 450,000 | $ | 421,004 | ||||
Empresa Nacional de Electricidad, Yankee, 7.875%, 02/01/27 | USD | 200,000 | 207,591 | |||||
Enersis SA, Yankee, 7.400%, 12/01/16 | USD | 80,000 | 81,331 | |||||
MidAmerican Energy Holdings, 6.125%, 04/01/36 (a) | USD | 190,000 | 177,608 | |||||
Scottish Power, 6.625%, 01/14/10 | GBP | 90,000 | 173,014 | |||||
Total Utilities | 1,060,548 | |||||||
Total Corporate Bonds (cost $19,703,199) | 19,101,551 | |||||||
U.S. Government and Agency Obligations - 19.0% | ||||||||
U.S. Government Agency Obligations - 16.8% | ||||||||
Federal Farm Credit Bank, 4.125%, 04/15/09 | 965,000 | 2 | 932,806 | |||||
FHLMC Gold Pool, 4.000%, 02/01/20 | 64,555 | 59,585 | ||||||
FHLMC Gold Pool, 4.500%, 04/01/35 | 292,043 | 265,604 | ||||||
FHLMC Gold Pool, 5.000%, 04/01/20 | 212,272 | 204,373 | ||||||
FHLMC Gold Pool, 5.000%, 07/01/35 | 1,276,319 | 1,192,883 | ||||||
FHLMC Gold Pool, 6.000%, 05/01/18 | 31,281 | 31,338 | ||||||
FHLMC Gold Pool, 6.000%, 10/01/20 | 52,152 | 52,272 | ||||||
FHLMC Gold Pool, 6.500%, 08/01/35 | 35,916 | 36,134 | ||||||
FHLMC Gold Pool, 6.500%, 10/01/35 | 44,539 | 44,809 | ||||||
FNMA, 1.750%, 03/26/08 | JPY | 140,000,000 | 1,244,417 | |||||
FNMA, 2.290%, 02/19/09 | SGD | 400,000 | 243,185 | |||||
FNMA, 4.500%, 05/01/20 | 215,864 | 204,043 | ||||||
FNMA, 4.500%, 09/01/35 | 86,943 | 78,821 | ||||||
FNMA, 5.000%, 06/01/20 | 52,715 | 50,786 | ||||||
FNMA, 5.000%, 07/01/35 | 195,654 | 183,010 | ||||||
FNMA, 5.000%, 09/01/35 | 417,839 | 390,836 | ||||||
FNMA, 5.000%, 10/01/19 | 70,386 | 67,894 | ||||||
FNMA, 5.000%, 10/01/19 | 25,666 | 24,758 | ||||||
FNMA, 5.500%, 06/01/35 | 320,032 | 307,606 | ||||||
FNMA, 5.500%, 09/01/20 | 50,481 | 49,592 | ||||||
FNMA, 5.500%, 09/01/35 | 174,371 | 167,601 | ||||||
FNMA, 5.500%, 11/01/16 | 24,477 | 24,068 | ||||||
FNMA, 5.500%, 11/01/34 | 64,446 | 62,065 | ||||||
FNMA, 5.500%, 12/01/35 | 1,146,073 | 1,101,574 | ||||||
FNMA, 6.000%, 04/01/35 | 201,564 | 198,788 | ||||||
FNMA, 6.000%, 05/01/35 | 145,190 | 143,016 | ||||||
FNMA, 6.000%, 06/01/17 | 72,487 | 72,609 | ||||||
FNMA, 6.000%, 11/01/17 | 58,071 | 58,293 | ||||||
FNMA, 6.000%, 08/15/20 | 152,351 | 152,732 | ||||||
FNMA, 6.000%, 11/01/34 | 166,266 | 163,976 | ||||||
FNMA, 6.500%, 03/01/33 | 125,993 | 127,183 | ||||||
FNMA, 6.500%, 05/01/36 | 38,550 | 38,756 | ||||||
FNMA, 6.500%, 10/01/35 | 103,970 | 104,580 | ||||||
The accompanying notes are an integral part of these financial statements.
32
Managers Global Bond Fund
Schedule of Portfolio Investments (continued)
Security Description | Principal Amount | Value | ||||||
U.S. Government Agency Obligations - 16.8% (continued) | ||||||||
GNMA, 5.500%, 02/20/36 | $ | 90,207 | $ | 87,085 | ||||
GNMA, 5.500%, 11/20/34 | 33,673 | 32,530 | ||||||
GNMA, 6.000%, 10/20/35 | 41,939 | 41,507 | ||||||
Total U.S. Government Agency Obligations | 8,241,115 | |||||||
U.S. Treasury - 2.2% | ||||||||
USTB, 4.470%, 07/20/06 | 152,000 | 2 | 151,691 | |||||
USTN, 4.750%, 03/31/11 | 955,000 | 2 | 940,638 | |||||
Total U.S. Treasury | 1,092,329 | |||||||
Total U.S. Government and Agency Obligations (cost $9,266,828) | 9,333,444 | |||||||
| Other Investment Companies - 14.1%1 | Shares | |||||||
Bank of New York Institutional Cash Reserves Fund, 5.30%3 | 5,832,644 | 5,832,644 | ||||||
JPMorgan Prime Money Market Fund, Institutional Class Shares, 4.98% | 1,072,655 | 1 ,072,655 | ||||||
Total Other Investment Companies (cost $6,905,299) | 6,905,299 | |||||||
Total Investments - 112.0% (cost $55,257,281) | 55,001,648 | |||||||
Other Assets, less Liabilities - (0.12)% | (5,875,493 | ) | ||||||
Net Assets- 100.0% | $ | 49,126,155 | ||||||
The accompanying notes are an integral part of these financial statements.
33
Notes to Schedules of Portfolio Investments (unaudited)
The following footnotes and abbreviations should be read in conjunction with each of the Schedules of Portfolio Investments previously presented in this report.
At June 30, 2006, the cost of securities for Federal income tax purposes and the gross aggregate unrealized appreciation and/or depreciation based on tax cost were approximately:
Fund | Cost | Appreciation | Depreciation | Net | ||||||||||
Value | $ | 95,743,167 | $ | 15,833,221 | $ | (2,093,770 | ) | $ | 13,739,451 | |||||
Capital Appreciation | 80,398,027 | 6,594,973 | (1,953,169 | ) | 4,641,804 | |||||||||
Small Company | 39,029,839 | 5,465,286 | (1,803,381 | ) | 3,661,905 | |||||||||
International Equity | 179,342,387 | 51,319,543 | (3,809,457 | ) | 47,510,086 | |||||||||
Emerging Markets Equity | 107,209,036 | 35,700,835 | (3,868,676 | ) | 31,832,159 | |||||||||
Bond | 669,324,224 | 6,476,170 | (10,961,155 | ) | (4,484,985 | ) | ||||||||
Global Bond | 55,257,281 | 835,152 | (1,090,785 | ) | (255,633 | ) | ||||||||
| * | Non-income-producing security. |
| # | Rounds to less than 0.01% |
| (a) | Security exempt from registration under Rule 144A of the Securities Act of 1933. This security may be resold in transactions exempt from registration, normally to qualified buyers. At June 30, 2006, the value of these securities amounted to the following: |
Fund | Market Value | % of Net Assets | ||||
Emerging Markets Equity | $ | 4,187,617 | 3.3 | % | ||
Bond | 59,021,880 | 11.4 | % | |||
Global Bond | 2,229,038 | 4.5 | % | |||
| 1 | Yield shown for an investment company represents its June 30, 2006, seven-day average yield, which refers to the sum of the previous seven days’ dividends paid, expressed as an annual percentage. |
| 2 | Some or all of these shares were out on loan to various brokers as of June 30, 2006, amounting to: |
Fund | Market Value | % of Net Assets | ||||
Value | $ | 23,739,713 | 28.0 | % | ||
Capital Appreciation | 17,949,996 | 27.4 | % | |||
Small Company | 6,943,588 | 19.5 | % | |||
International Equity | 16,528,361 | 7.7 | % | |||
Emerging Markets Equity | 14,494,956 | 11.5 | % | |||
Bond | 150,046,466 | 28.9 | % | |||
Global Bond | 5,640,703 | 11.5 | % | |||
| 3 | Collateral received from brokers for securities lending was invested in these short-term investments. |
| 4 | Zero coupon security. |
| 5 | Security is illiquid. |
Investments Definitions and Abbreviations:
ADR/GDR: ADR after the name of a holding stands for American Depositary Receipt, representing ownership of foreign securities on deposit with a domestic custodian bank; a GDR (Global Depositary Receipt) is comparable, but foreign securities are held on deposit in a non-U.S. bank. The value of the ADR/GDR securities is determined or significantly influenced by trading on exchanges not located in the United States or Canada. Sponsored ADR/GDRs are initiated by the underlying foreign company.
| FHLMC: | Federal Home Loan Mortgage Corp. | |
| FNMA: | Federal National Mortgage Association | |
| GNMA: | Government National Mortgage Association | |
| USTB: | United States Treasury Bond | |
| USTN: | United States Treasury Note | |
| GMAC: | General Motors Acceptance Corp. |
Registered shares: A security whose owner has been recorded with its issuer or issuer’s registrar.
Abbreviations have been used throughout the portfolios to indicate amounts shown in currencies other than the U.S. dollar (USD):
| ARS: | Argentine Peso | |
AUD: | Australian Dollar | |
| BRL: | Brazilian Real | |
| CAD: | Canadian Dollar | |
| CHF: | Swiss Franc | |
| CZK: | Czech Koruna | |
| EUR: | Euro | |
| GBP: | British Pound | |
| HKD: | Hong Kong Dollar | |
| HUF: | Hungarian Forint | |
| IDR: | Indonesian Rupiah | |
| ILS: | Israeli Shekel | |
| JPY: | Japanese Yen | |
KRW: | South Korean Won | |
| MXN: | Mexican Peso | |
| MYR: | Malaysian Ringgit | |
NOK: | Norwegian Krone | |
NZD: | New Zealand Dollar | |
| PHP: | Philippine Peso | |
SEK: | Swedish Krona | |
| SGD: | Singapore Dollar | |
THB: | Thailand Baht | |
| TRY: | Turkish Lira | |
| TWD: | Taiwan Dollar | |
| ZAR: | South African Rand |
34
Statements of Assets and Liabilities
June 30, 2006 (unaudited)
| Managers Value Fund | Managers Capital Appreciation Fund | Managers Small Company Fund | |||||||||
Assets: | |||||||||||
Investments at value (including securities on loan valued at $23,739,713, $17,949,996, $6,943,588, $16,528,361, $14,494,956, $150,046,466, $5,640,703, respectively)* | $ | 109,482,618 | $ | 85,039,831 | $ | 42,691,744 | |||||
Cash | — | — | — | ||||||||
Foreign currency** | — | — | — | ||||||||
Receivable for investments sold | — | — | 165,156 | ||||||||
Receivable for Fund shares sold | 24,465 | 24,969 | 74,970 | ||||||||
Receivable for open forward foreign currency contracts | — | — | — | ||||||||
Receivable for variation margin on futures | — | — | — | ||||||||
Dividends, interest and other receivables | 81,214 | 35,239 | 18,087 | ||||||||
Prepaid expenses | 16,615 | 12,563 | 17,535 | ||||||||
Total assets | 109,604,912 | 85,112,602 | 42,967,492 | ||||||||
Liabilities: | |||||||||||
Payable to affiliate | — | — | 9,530 | ||||||||
Payable to Custodian | 135,539 | 30,172 | 28,463 | ||||||||
Payable for Fund shares repurchased | 82,341 | 87,175 | 82,172 | ||||||||
Payable upon return of securities loaned | 24,339,908 | 18,320,051 | 7,032,010 | ||||||||
Payable for investments purchased | — | 975,981 | 206,994 | ||||||||
Payable for open forward foreign currency contracts | — | — | — | ||||||||
Accrued expenses: | |||||||||||
Investment advisory and management fees | 48,938 | 39,036 | 25,656 | ||||||||
Administrative fees | 17,306 | 13,437 | 7,127 | ||||||||
Other | 44,639 | 48,720 | 17,876 | ||||||||
Total liabilities | 24,668,671 | 19,514,572 | 7,409,828 | ||||||||
Net Assets | $ | 84,936,241 | $ | 65,598,030 | $ | 35,557,664 | |||||
Shares outstanding | 2,957,545 | 2,435,198 | 3,187,200 | ||||||||
Net asset value, offering and redemption price per share | $ | 28.72 | $ | 26.94 | $ | 11.16 | |||||
Net Assets Represent: | |||||||||||
Paid-in capital | $ | 63,652,627 | $ | 207,643,128 | $ | 32,999,429 | |||||
Undistributed net investment income (loss) | 485,394 | (50,112 | ) | (132,517 | ) | ||||||
Accumulated net realized gain (loss) from investments, futures and foreign currency transactions | 7,058,769 | (146,636,790 | ) | (971,153 | ) | ||||||
Net unrealized appreciation (depreciation) of investments, futures and foreign currency contracts and translations | 13,739,451 | 4,641,804 | 3,661,905 | ||||||||
| Net Assets | $ | 84,936,241 | $ | 65,598,030 | $35,557,664 | ||||||
* Investments at cost | $ | 95,743,167 | $ | 80,398,027 | $ | 39,029,839 | |||||
** Foreign currency at cost | — | — | — | ||||||||
The accompanying notes are an integral part of these financial statements.
35
| Managers International Equity Fund | Managers Emerging Markets Equity Fund | Managers Bond Fund | Managers Global Bond Fund | |||||||||||
Assets: | ||||||||||||||
Investments at value (including securities on loan valued at $23,739,713, $17,949,996, $6,943,588, $16,528,361, $14,494,956, $150,046,466, $5,640,703, respectively)* | $ | 226,852,473 | $ | 139,041,195 | $ | 664,839,239 | $ | 55,001,648 | ||||||
Cash | 119,288 | — | 322,208 | — | ||||||||||
Foreign currency** | 332,747 | 1,271,280 | 553,944 | 189,779 | ||||||||||
Receivable for investments sold | 3,926,194 | 428,960 | 69,250 | 744,735 | ||||||||||
Receivable for Fund shares sold | 48,908 | 162,144 | 1,333,832 | 35,322 | ||||||||||
Receivable for open forward foreign currency contracts | 694,123 | — | — | 1,050,235 | ||||||||||
Receivable for variation margin on futures | 23,331 | — | — | — | ||||||||||
Dividends, interest and other receivables | 493,896 | 446,496 | 6,152,322 | 645,708 | ||||||||||
Prepaid expenses | 17,044 | 47,781 | 36,900 | 17,794 | ||||||||||
Total assets | 232,508,004 | 141,397,856 | 673,307,695 | 57,685,221 | ||||||||||
Liabilities: | ||||||||||||||
Payable to affiliate | — | — | — | — | ||||||||||
Payable to Custodian | — | 195,902 | — | 39,718 | ||||||||||
Payable for Fund shares repurchased | 116,272 | 132,449 | 413,384 | 71,615 | ||||||||||
Payable upon return of securities loaned | 16,875,369 | 15,041,132 | 152,971,425 | 5,832,644 | ||||||||||
Payable for investments purchased | 1,153,223 | 194,431 | 114,245 | 1,507,168 | ||||||||||
Payable for open forward foreign currency contracts | 684,658 | — | — | 1,021,268 | ||||||||||
Accrued expenses: | ||||||||||||||
Investment advisory and management fees | 152,515 | 113,457 | 255,708 | 24,716 | ||||||||||
Administrative fees | 42,365 | 24,665 | 104,352 | 8,043 | ||||||||||
Other | 188,737 | 171,400 | 71,156 | 53,894 | ||||||||||
Total liabilities | 19,213,139 | 15,873,436 | 153,930,270 | 8,559,066 | ||||||||||
Net Assets | $ | 213,294,865 | $ | 125,524,420 | $ | 519,377,425 | $ | 49,126,155 | ||||||
Shares outstanding | 3,578,885 | 5,914,167 | 21,972,002 | 2,369,348 | ||||||||||
Net asset value, offering and redemption price per share | $ | 59.60 | $ | 21.22 | $ | 23.64 | $ | 20.73 | ||||||
Net Assets Represent: | ||||||||||||||
Paid-in capital | $ | 240,437,937 | $ | 86,385,427 | $ | 524,422,760 | $ | 48,489,963 | ||||||
Undistributed net investment income (loss) | 1,248,207 | 1,055,038 | (338,927 | ) | 772,418 | |||||||||
Accumulated net realized gain (loss) from investments, futures and foreign currency transactions | (76,008,971) | 6,243,417 | (204,061 | ) | 90,430 | |||||||||
Net unrealized appreciation (depreciation) of investments, futures and foreign currency contracts and translations | 47,617,692 | 31,840,538 | (4,502,347 | ) | (226,656 | ) | ||||||||
| Net Assets | $ | 213,294,865 | $ | 125,524,420 | $ | 519,377,425 | $ | 49,126,155 | ||||||
* Investments at cost | $ | 179,342,387 | $ | 107,209,036 | $ | 669,324,224 | $ | 55,257,281 | ||||||
** Foreign currency at cost | 331,510 | 1,263,659 | 558,834 | 187,590 | ||||||||||
The accompanying notes are an integral part of these financial statements.
36
For the six months ended June 30, 2006 (unaudited)
| Managers Value Fund | Managers Capital Appreciation Fund | Managers Small Company Fund | ||||||||||
Investment Income: | ||||||||||||
Dividend income | $ | 1,101,939 | $ | 499,474 | $ | 122,206 | ||||||
Interest income | — | — | — | |||||||||
Foreign withholding tax | (7,170 | ) | (9,490 | ) | (755 | ) | ||||||
Securities lending fees | 11,832 | 8,852 | 11,656 | |||||||||
Total investment income | 1,106,601 | 498,836 | 133,107 | |||||||||
Expenses: | ||||||||||||
Investment management fees | 400,161 | 351,039 | 169,469 | |||||||||
Administrative fees | 133,387 | 109,699 | 47,075 | |||||||||
Transfer agent | 52,135 | 52,608 | 20,120 | |||||||||
Professional fees | 19,771 | 17,550 | 9,063 | |||||||||
Custodian | 17,560 | 23,333 | 11,771 | |||||||||
Registration fees | 8,154 | 7,415 | 5,415 | |||||||||
Reports to shareholders | 5,417 | 3,841 | 1,990 | |||||||||
Trustees fees and expenses | 3,080 | 2,445 | 1,187 | |||||||||
Miscellaneous | 2,221 | 283 | 1,094 | |||||||||
Total expenses before offsets | 641,886 | 568,213 | 267,184 | |||||||||
Expense (reimbursement)/recoupment | (7,164 | ) | (2,119 | ) | 5,850 | |||||||
Expense reductions | (13,515 | ) | (17,146 | ) | (7,410 | ) | ||||||
Net expenses | 621,207 | 548,948 | 265,624 | |||||||||
Net investment income (loss) | 485,394 | (50,112 | ) | (132,517 | ) | |||||||
Net Realized and Unrealized Gain (Loss): | ||||||||||||
Net realized gain on investment transactions | 6,298,281 | 9,138,425 | 5,731,617 | |||||||||
Net realized gain on futures contracts | — | — | — | |||||||||
Net realized gain (loss) on foreign currency contracts and transactions | — | — | — | |||||||||
Net unrealized appreciation (depreciation) of investments | (2,572,872 | ) | (9,293,295 | ) | (4,262,114 | ) | ||||||
Net unrealized depreciation of futures contracts | — | — | — | |||||||||
Net unrealized appreciation (depreciation) of foreign currency contracts and translations | — | — | — | |||||||||
Net realized and unrealized gain (loss) | 3,725,409 | (154,870 | ) | 1,469,503 | ||||||||
Net Increase (Decrease) in Net Assets Resulting from Operations | $ | 4,210,803 | $ | (204,982 | ) | $ | 1,336,986 | |||||
The accompanying notes are an integral part of these financial statements.
37
| Managers International Equity Fund | Managers Emerging Markets Equity Fund | Managers Bond Fund | Managers Global Bond Fund | ||||||||||||
Investment Income: | |||||||||||||||
Dividend income | $ | 3,401,374 | $ | 2,351,467 | $ | 165,065 | — | ||||||||
Interest income | — | — | 11,662,722 | $ | 896,188 | ||||||||||
Foreign withholding tax | (309,383) | (175,017 | ) | — | — | ||||||||||
Securities lending fees | 108,972 | 28,880 | 98,049 | 4,299 | |||||||||||
Total investment income | 3,200,963 | 2,205,330 | 11,925,836 | 900,487 | |||||||||||
Expenses: | |||||||||||||||
Investment management fees | 963,680 | 750,308 | 1,461,304 | 159,894 | |||||||||||
Administrative fees | 267,689 | 163,110 | 584,521 | 45,684 | |||||||||||
Transfer agent | 101,142 | 81,747 | 144,184 | 21,530 | |||||||||||
Professional fees | 22,319 | 18,481 | 37,853 | 21,396 | |||||||||||
Custodian | 179,914 | 102,210 | 46,739 | 21,986 | |||||||||||
Registration fees | 8,357 | 7,933 | 17,956 | 7,807 | |||||||||||
Reports to shareholders | 8,656 | 2,630 | 20,246 | 1,433 | |||||||||||
Trustees fees and expenses | 5,447 | 2,698 | 11,390 | 1,312 | |||||||||||
Miscellaneous | 18,666 | 5,749 | 9,942 | 1,749 | |||||||||||
Total expenses before offsets | 1,575,870 | 1,134,866 | 2,334,135 | 282,791 | |||||||||||
Expense (reimbursement)/recoupment | — | — | (19,440 | ) | (10,736 | ) | |||||||||
Expense reductions | (32,202) | — | — | (100 | ) | ||||||||||
Net expenses | 1,543,668 | 1,134,866 | 2,314,695 | 271,955 | |||||||||||
Net investment income (loss) | 1,657,295 | 1,070,464 | 9,611,141 | 628,532 | |||||||||||
Net Realized and Unrealized Gain (Loss): | |||||||||||||||
Net realized gain on investment transactions | 25,182,976 | 6,532,923 | (26,145 | ) | 104,477 | ||||||||||
Net realized gain on futures contracts | 13,876 | — | — | — | |||||||||||
Net realized gain (loss) on foreign currency contracts and transactions | (132,276) | (17,704 | ) | 10,588 | (14,047 | ) | |||||||||
Net unrealized appreciation (depreciation) of investments | (4,829,727) | (1,215,900 | ) | (9,192,117 | ) | 510,010 | |||||||||
Net unrealized depreciation of futures contracts | (13,214) | — | — | — | |||||||||||
Net unrealized appreciation (depreciation) of foreign currency contracts and translations | 63,094 | (4,752 | ) | 28,550 | (12,993 | ) | |||||||||
Net realized and unrealized gain (loss) | 20,284,729 | 5,294,567 | (9,179,124 | ) | 587,447 | ||||||||||
Net Increase (Decrease) in Net Assets Resulting irom Operations | $ | 21,942,024 | $ | 6,365,031 | $ | 432,017 | $ | 1,215,979 | |||||||
The accompanying notes are an integral part of these financial statements.
38
Statements of Changes in Net Assets
For the six months ended June 30, 2006 (unaudited) and for the fiscal year ended December 31, 2005
| Managers Value Fund | Managers Capital Appreciation Fund | Managers Small Company Fund | ||||||||||||||||||||||
| 2006 | 2005 | 2006 | 2005 | 2006 | 2005 | |||||||||||||||||||
Increase (Decrease) in Net Assets From Operations: | ||||||||||||||||||||||||
Net investment income (loss) | $ | 485,394 | $ | 873,773 | $ | (50,112 | ) | $ | (269,927 | ) | $ | (132,517 | ) | $ | (253,791 | ) | ||||||||
Net realized gain on investments, futures and foreign currency transactions | 6,298,281 | 14,156,521 | 9,138,425 | 6,056,702 | 5,731,617 | 1,316,218 | ||||||||||||||||||
Net unrealized appreciation (depreciation) of investments and foreign currency translations | (2,572,872 | ) | (7,729,948 | ) | (9,293,295 | ) | (730,839 | ) | (4,262,114 | ) | 631,127 | |||||||||||||
Net increase (decrease) in net assets resulting from operations | 4,210,803 | 7,300,346 | (204,982 | ) | 5,055,936 | 1,336,986 | 1,693,554 | |||||||||||||||||
Distributions to Shareholders: | ||||||||||||||||||||||||
From net investment income | — | (974,970 | ) | — | — | — | — | |||||||||||||||||
From net realized gain on investments | — | (12,602,042 | ) | — | — | — | — | |||||||||||||||||
Total distributions to shareholders | — | (13,577,012 | ) | — | — | — | — | |||||||||||||||||
From Capital Share Transactions: | ||||||||||||||||||||||||
Proceeds from sale of shares | 10,221,507 | 41,625,309 | 8,018,417 | 32,049,419 | 6,561,820 | 13,834,182 | ||||||||||||||||||
Reinvestment of dividends and distributions | — | 13,449,285 | — | — | — | — | ||||||||||||||||||
Cost of shares repurchased | (54,139,200 | ) | (43,702,003 | ) | (47,093,118 | ) | (30,575,012 | ) | (9,334,503 | ) | (6,163,175 | ) | ||||||||||||
Net increase (decrease) from capital share transactions | (43,917,693 | ) | 11,372,591 | (39,074,701 | ) | 1,474,407 | (2,772,683 | ) | 7,671,007 | |||||||||||||||
Total increase (decrease) in net assets | (39,706,890 | ) | 5,095,925 | (39,279,683 | ) | 6,530,343 | (1,435,697 | ) | 9,364,561 | |||||||||||||||
Net Assets: | ||||||||||||||||||||||||
Beginning of period | 124,643,131 | 119,547,206 | 104,877,713 | 98,347,370 | 36,993,361 | 27,628,800 | ||||||||||||||||||
End of period | $ | 84,936,241 | $ | 124,643,131 | $ | 65,598,030 | $ | 104,877,713 | $ | 35,557,664 | $ | 36,993,361 | ||||||||||||
End of period undistributed net investment income (loss) | $ | 485,394 | — | $ | (50,112 | ) | — | $ | (132,517 | ) | — | |||||||||||||
| �� | ||||||||||||||||||||||||
Share Transactions: | ||||||||||||||||||||||||
Sale of shares | 354,482 | 1,419,446 | 280,955 | 1,250,037 | 571,875 | 1,346,911 | ||||||||||||||||||
Reinvested shares | — | 479,168 | — | — | — | — | ||||||||||||||||||
Shares repurchased | (1,851,570 | ) | (1,465,605 | ) | (1,619,122 | ) | (1,149,831 | ) | (797,357 | ) | (599,977 | ) | ||||||||||||
Net increase (decrease) in shares | (1,497,088 | ) | 433,009 | (1,338,167 | ) | 100,206 | (225,482 | ) | 746,934 | |||||||||||||||
The accompanying notes are an integral part of these financial statements.
39
| Managers International Equity Fund | Managers Emerging Markets Equity Fund | Managers Bond Fund | Managers Global Bond Fund | ||||||||||||||||||||||||||||
| 2006 | 2005 | 2006 | 2005 | 2006 | 2005 | 2006 | 2005 | ||||||||||||||||||||||||
Increase (Decrease) in Net Assets From Operations: | |||||||||||||||||||||||||||||||
Net investment income (loss) | $ | 1,657,295 | $ | 1,606,669 | $ | 1,070,464 | $ | 483,564 | $ | 9,611,141 | $ | 11,379,121 | $ | 628,532 | $ | 924,935 | |||||||||||||||
Net realized gain on investments, futures and foreign currency transactions | 25,064,576 | 27,455,397 | 6,515,219 | 8,194,901 | (15,557 | ) | 3,310,368 | 90,430 | 783,739 | ||||||||||||||||||||||
Net unrealized appreciation (depreciation) of investments and foreign currency translations | (4,779,847) | 884,817 | (1,220,652 | ) | 17,294,853 | (9,163,567 | ) | (6,574,645 | ) | 497,017 | (3,673,290 | ) | |||||||||||||||||||
Net increase (decrease) in net assets resulting from operations | 21,942,024 | 29,946,883 | 6,365,031 | 25,973,318 | 432,017 | 8,114,844 | 1,215,979 | (1,964,616 | ) | ||||||||||||||||||||||
Distributions to Shareholders: | |||||||||||||||||||||||||||||||
From net investment income | — | (2,001,385 | ) | — | (299,119 | ) | (10,083,845 | ) | (12,451,131 | ) | — | (1,549,265 | ) | ||||||||||||||||||
From net realized gain on investments | — | — | — | (9,253,162 | ) | — | (2,620,643 | ) | — | (599,669 | ) | ||||||||||||||||||||
Total distributions to shareholders | — | (2,001,385 | ) | — | (9,552,281 | ) | (10,083,845 | ) | (15,071,774 | ) | — | (2,148,934 | ) | ||||||||||||||||||
From Capital Share Transactions: | |||||||||||||||||||||||||||||||
Proceeds from sale of shares | 22,968,188 | 36,147,458 | 22,747,094 | 51,433,377 | 166,711,932 | 255,440,152 | 10,536,744 | 17,762,867 | |||||||||||||||||||||||
Reinvestment of dividends and distributions | — | 1,625,660 | — | 8,975,928 | 9,520,104 | 14,138,984 | — | 2,136,679 | |||||||||||||||||||||||
Cost of shares repurchased | (38,008,474) | (93,386,057 | ) | (20,816,498 | ) | (23,168,214 | ) | (73,650,879 | ) | (95,384,135 | ) | (5,757,840 | ) | (9,108,361 | ) | ||||||||||||||||
Net increase (decrease) from capital share transactions | (15,040,286) | (55,612,939 | ) | 1,930,596 | 37,241,091 | 102,581,157 | 174,195,001 | 4,778,904 | 10,791,185 | ||||||||||||||||||||||
Total increase (decrease) in net assets | 6,901,738 | (27,667,441 | ) | 8,295,627 | 53,662,128 | 92,929,329 | 167,238,071 | 5,994,883 | 6,677,635 | ||||||||||||||||||||||
Net Assets: | |||||||||||||||||||||||||||||||
Beginning of period | 206,393,127 | 234,060,568 | 117,228,793 | 63,566,665 | 426,448,096 | 259,210,025 | 43,131,272 | 36,453,637 | |||||||||||||||||||||||
End of period | $ | 213,294,865 | $ | 206,393,127 | $ | 125,524,420 | $ | 117,228,793 | $ | 519,377,425 | $ | 426,448,096 | $ | 49,126,155 | $ | 43,131,272 | |||||||||||||||
End of period undistributed net investment income (loss) | $ | 1,248,207 | $ | (409,088 | ) | $ | 1,055,038 | $ | (15,426 | ) | $ | (338,927 | ) | $ | 133,777 | $ | 772,418 | $ | 143,886 | ||||||||||||
Share Transactions: | |||||||||||||||||||||||||||||||
Sale of shares | 385,370 | 754,899 | 1,036,224 | 2,819,768 | 6,961,250 | 10,471,518 | 513,983 | 820,950 | |||||||||||||||||||||||
Reinvested shares | — | 30,335 | — | 450,177 | 399,496 | 581,998 | — | 105,882 | |||||||||||||||||||||||
Shares repurchased | (645,831) | (1,920,526 | ) | (953,299 | ) | (1,291,342 | ) | (3,075,719 | ) | (3,910,052 | ) | (280,493 | ) | (419,719 | ) | ||||||||||||||||
Net increase (decrease) in shares | (260,461) | (1,135,292 | ) | 82,925 | 1,978,603 | 4,285,027 | 7,143,464 | 233,490 | 507,113 | ||||||||||||||||||||||
The accompanying notes are an integral part of these financial statements.
40
For a share outstanding throughout each period
Managers Value Fund | For the six June 30, 2006 (unaudited) | For the year ended December 31, | ||||||||||||||||||||||
| 2005 | 2004 | 2003 | 2002 | 2001 | ||||||||||||||||||||
Net Asset Value, Beginning of Period | $ | 27.98 | $ | 29.73 | $ | 26.24 | $ | 20.69 | $ | 27.45 | $ | 27.73 | ||||||||||||
Income from Investment Operations: | ||||||||||||||||||||||||
Net investment income | 0.16 | 0.23 | 0.17 | 0.11 | 0.15 | 0.09 | ||||||||||||||||||
Net realized and unrealized gain (loss) on investments | 0.58 | 1.43 | 3.47 | 5.56 | (6.65 | ) | 0.70 | |||||||||||||||||
Total from investment operations | 0.74 | 1.66 | 3.64 | 5.67 | (6.50 | ) | 0.79 | |||||||||||||||||
Less Distributions to Shareholders from: | ||||||||||||||||||||||||
Net investment income | — | (0.25 | ) | (0.15 | ) | (0.12 | ) | (0.16 | ) | (0.08 | ) | |||||||||||||
Net realized gain on investments | — | (3.16 | ) | — | — | (0.10 | ) | (0.99 | ) | |||||||||||||||
Total distributions to shareholders | — | (3.41 | ) | (0.15 | ) | (0.12 | ) | (0.26 | ) | (1.07 | ) | |||||||||||||
Net Asset Value, End of Period | $ | 28.72 | $ | 27.98 | $ | 29.73 | $ | 26.24 | $ | 20.69 | $ | 27.45 | ||||||||||||
Total Return 1 | 2.65 | %2 | 5.53 | % | 13.87 | % | 27.39 | % | (23.79 | )% | 2.92 | % | ||||||||||||
Ratio of net expenses to average net assets 1 | 1.16 | %3 | 1.18 | % | 1.22 | % | 1.27 | % | 1.28 | % | 1.25 | % | ||||||||||||
Ratio of total expenses to average net assets 1 | 1.20 | %3,5 | 1.15 | %5 | 1.38 | %5 | 1.42 | %5 | 1.35 | % | 1.35 | % | ||||||||||||
Ratio of net investment income to average net assets | 0.91 | %3 | 0.72 | % | 0.62 | % | 0.59 | % | 0.60 | % | 0.43 | % | ||||||||||||
Portfolio turnover | 13 | %2 | 54 | % | 39 | % | 40 | % | 53 | % | 147 | % | ||||||||||||
Net assets at end of period (000’s omitted) | $ | 84,936 | $ | 124,643 | $ | 119,547 | $ | 100,720 | $ | 48,001 | $ | 63,628 | ||||||||||||
Managers Capital Appreciation Fund | For the six June 30, 2006 (unaudited) | For the year ended December 31, | ||||||||||||||||||||||
| 2005 | 2004 | 2003 | 2002 | 2001 | ||||||||||||||||||||
Net Asset Value, Beginning of Period | $ | 27.79 | $ | 26.77 | $ | 25.46 | $ | 20.36 | $ | 29.29 | $ | 42.79 | ||||||||||||
Income from Investment Operations: | ||||||||||||||||||||||||
Net investment loss | (0.02 | ) | (0.07 | )6 | (0.07 | ) | (0.16 | ) | (0.28 | ) | (0.25 | ) | ||||||||||||
Net realized and unrealized gain (loss) on investments | (0.83 | ) | 1.09 | 1.38 | 5.26 | (8.65 | ) | (13.25 | ) | |||||||||||||||
Total from investment operations | (0.85 | ) | 1.02 | 1.31 | 5.10 | (8.93 | ) | (13.50 | ) | |||||||||||||||
Net Asset Value, End of Period | $ | 26.94 | $ | 27.79 | $ | 26.77 | $ | 25.46 | $ | 20.36 | $ | 29.29 | ||||||||||||
Total Return 1 | (3.09 | )%2 | 3.85 | % | 5.14 | % | 25.05 | % | (30.49 | )% | (31.55 | )% | ||||||||||||
Ratio of net expenses to average net assets 1 | 1.25 | %3 | 1.28 | % | 1.34 | % | 1.33 | % | 1.39 | % | 1.34 | % | ||||||||||||
Ratio of total expenses to average net assets 1 | 1.29 | %3,5 | 1.22 | %5 | 1.47 | %5 | 1.52 | %5 | 1.43 | % | 1.40 | % | ||||||||||||
Ratio of net investment loss to average net assets | (0.11 | )%3 | (0.27 | )% | (0.26 | )% | (0.67 | )% | (1.07 | )% | (0.75 | )% | ||||||||||||
Portfolio turnover | 256 | %2 | 97 | % | 79 | % | 109 | % | 141 | % | 265 | % | ||||||||||||
Net assets at end of period (000’s omitted) | $ | 65,598 | $ | 104,878 | $ | 98,347 | $ | 110,903 | $ | 107,545 | $ | 186,876 | ||||||||||||
41
Financial Highlights
For a share outstanding throughout each period
Managers Small Company Fund | For the six June 30, 2006 (unaudited) | For the year ended December 31, | ||||||||||||||||||||||
| 2005 | 2004 | 2003 | 2002 | 2001 | ||||||||||||||||||||
Net Asset Value, Beginning of Period | $ | 10.84 | $ | 10.36 | $ | 9.19 | $ | 6.40 | $ | 8.16 | $ | 9.29 | ||||||||||||
Income from Investment Operations: | ||||||||||||||||||||||||
Net investment loss | (0.04 | ) | (0.08 | )6 | (0.08 | ) | (0.09 | ) | (0.13 | ) | (0.07 | ) | ||||||||||||
Net realized and unrealized gain (loss) on investments | 0.36 | 0.56 | 1.25 | 2.88 | (1.63 | ) | (1.06 | ) | ||||||||||||||||
Total from investment operations | 0.32 | 0.48 | 1.17 | 2.79 | (1.76 | ) | (1.13 | ) | ||||||||||||||||
Net Asset Value, End of Period | $ | 11.16 | $ | 10.84 | $ | 10.36 | $ | 9.19 | $ | 6.40 | $ | 8.16 | ||||||||||||
Total Return1 | 2.95 | %2 | 4.63 | % | 12.73 | % | 43.59 | % | (21.57 | )% | (12.16 | )% | ||||||||||||
Ratio of net expenses to average net assets1 | 1.41 | %3 | 1 .45 | % | 1.45 | % | 1.45 | % | 1.40 | % | 1.30 | % | ||||||||||||
Ratio of total expenses to average net assets1 | 1.42 | %3,5 | 1.41 | %5 | 1.43 | %5 | 1.50 | % | 1.70 | % | 1.71 | % | ||||||||||||
Ratio of net investment loss to average net assets | (0.70 | )%3 | (0.82 | )% | (1.05 | )% | (1.20 | )% | (1.17 | )% | (0.92 | )% | ||||||||||||
Portfolio turnover | 105 | %2 | 26 | % | 18 | % | 48 | % | 134 | % | 95 | % | ||||||||||||
Net assets at end of period (000’s omitted) | $ | 35,558 | $ | 36,993 | $ | 27,629 | $ | 18,750 | $ | 12,610 | $ | 26,764 | ||||||||||||
Managers International Equity Fund | For the six June 30, 2006 (unaudited) | For the year ended December 31, | ||||||||||||||||||||||
| 2005 | 2004 | 2003 | 2002 | 2001 | ||||||||||||||||||||
Net Asset Value, Beginning of Period | $ | 53.76 | $ | 47.05 | $ | 41.13 | $ | 31.22 | $ | 37.61 | $ | 49.38 | ||||||||||||
Income from Investment Operations: | ||||||||||||||||||||||||
Net investment income | 0.46 | 0.37 | 0.27 | 0.34 | 0.19 | 0.20 | 4 | |||||||||||||||||
Net realized and unrealized gain (loss) on investments | 5.38 | 6.83 | 5.96 | 10.04 | (6.48 | ) | (11.72 | )4 | ||||||||||||||||
Total from investment operations | 5.84 | 7.20 | 6.23 | 10.38 | (6.29 | ) | (11.52 | ) | ||||||||||||||||
Less Distributions to Shareholders from: | ||||||||||||||||||||||||
Net investment income | — | (0.49 | ) | (0.31 | ) | (0.47 | ) | (0.10 | ) | (0.25 | ) | |||||||||||||
Net realized gain on investments | — | — | — | — | — | — | ||||||||||||||||||
Total distributions to shareholders | — | (0.49 | ) | (0.31 | ) | (0.47 | ) | (0.10 | ) | (0.25 | ) | |||||||||||||
Net Asset Value, End of Period | $ | 59.60 | $ | 53.76 | $ | 47.05 | $ | 41.13 | $ | 31.22 | $ | 37.61 | ||||||||||||
Total Return | 10.84 | %2 | 15.30 | % | 15.17 | % | 33.21 | % | (16.71 | )% | (23.35 | )% | ||||||||||||
Ratio of net expenses to average net assets1 | 1.44 | %3 | 1.45 | % | 1.62 | % | 1.72 | % | 1.54 | % | 1.45 | % | ||||||||||||
Ratio of total expenses to average net assets1 | 1.47 | %3,5 | 1.42 | %5 | 1.70 | %5 | 1.73 | % | 1.56 | % | 1.46 | % | ||||||||||||
Ratio of net investment income to average net assets | 1.55 | %3 | 0.75 | % | 0.57 | % | 0.70 | % | 0.54 | % | 0.46 | %4 | ||||||||||||
Portfolio turnover | 36 | %2 | 79 | % | 93 | % | 80 | % | 132 | % | 108 | % | ||||||||||||
Net assets at end of period (000’s omitted) | $ | 213,295 | $ | 206,393 | $ | 234,061 | $ | 266,611 | $ | 362,561 | $ | 560,602 | ||||||||||||
42
Financial Highlights
For a share outstanding throughout each period
| For the six | For the year ended December 31, | |||||||||||||||||||||||
Managers Emerging Markets Equity Fund | months (unaudited) | 2005 | 2004 | 2003 | 2002 | 2001 | ||||||||||||||||||
Net Asset Value, Beginning of Period | $ | 20.10 | $ | 16.50 | $ | 13.26 | $ | 8.80 | $ | 9.56 | $ | 9.63 | ||||||||||||
Income from Investment Operations: | ||||||||||||||||||||||||
Net investment income (loss) | 0.18 | 0.52 | 0.08 | 0.01 | 0.03 | (0.01 | ) | |||||||||||||||||
Net realized and unrealized gain (loss) on investments | 0.94 | 4.84 | 3.74 | 4.50 | (0.79 | ) | (0.04 | ) | ||||||||||||||||
Total from investment operations | 1.12 | 5.36 | 3.82 | 4.51 | (0.76 | ) | (0.05 | ) | ||||||||||||||||
Less Distributions to Shareholders from: | ||||||||||||||||||||||||
Net investment income | — | (0.55 | ) | (0.06 | ) | (0.05 | ) | — | — | |||||||||||||||
Net realized gain on investments | — | (1.21 | ) | (0.52 | ) | — | — | (0.02 | ) | |||||||||||||||
Total distributions to shareholders | — | (1.76 | ) | (0.58 | ) | (0.05 | ) | 0.00 | (0.02 | ) | ||||||||||||||
Net Asset Value, End of Period | $ | 21.22 | $ | 20.10 | $ | 16.50 | $ | 13.26 | $ | 8.80 | $ | 9.56 | ||||||||||||
Total Return1 | 5.57 | %2 | 32.53 | % | 28.85 | % | 51.20 | % | (7.95 | )% | (0.57 | )% | ||||||||||||
Ratio of net expenses to average net assets1 | 1.74 | %3 | 1 .50 | % | 1 .85 | % | 1.99 | % | 1.97 | % | 1.94 | % | ||||||||||||
Ratio of total expenses to average net assets1 | 1.74 | %3,5 | 1 .72 | %5 | 1 .87 | %5 | 1.97 | %5 | 2.18 | % | 2.36 | % | ||||||||||||
Ratio of net investment income (loss) to average net assets | 1.64 | %3 | 0.59 | % | 0.67 | % | 0.08 | % | 0.32 | % | (0.09 | )% | ||||||||||||
Portfolio turnover | 16 | %2 | 35 | % | 58 | % | 79 | % | 68 | % | 69 | % | ||||||||||||
Net assets at end of period (000’s omitted) | $ | 125,524 | $ | 117,229 | $ | 63,567 | $ | 36,728 | $ | 22,211 | $ | 15,202 | ||||||||||||
| For the six | For the year ended December 31, | |||||||||||||||||||||||
Managers Bond Fund | months (unaudited) | 2005 | 2004 | 2003 | 2002 | 2001 | ||||||||||||||||||
Net Asset Value, Beginning of Period | $ | 24.11 | $ | 24.58 | $ | 24.58 | $ | 23.44 | $ | 22.32 | $ | 21.75 | ||||||||||||
Income from Investment Operations: | ||||||||||||||||||||||||
Net investment income | 0.48 | 0.88 | 0.80 | 1.08 | 1.24 | 1.44 | ||||||||||||||||||
Net realized and unrealized gain (loss) on investments | (0.44 | ) | (0.32 | ) | 0.30 | 1.40 | 1.12 | 0.60 | ||||||||||||||||
Total from investment operations | 0.04 | 0.56 | 1.10 | 2.48 | 2.36 | 2.04 | ||||||||||||||||||
Less Distributions to Shareholders from: | ||||||||||||||||||||||||
Net investment income | (0.51 | ) | (0.88 | ) | (0.93 | ) | (1.11 | ) | (1.24 | ) | (1.45 | ) | ||||||||||||
Net realized gain on investments | — | (0.15 | ) | (0.17 | ) | (0.23 | ) | — | (0.02 | ) | ||||||||||||||
Total distributions to shareholders | (0.51 | ) | (1.03 | ) | (1.10 | ) | (1.34 | ) | (1.24 | ) | (1.47 | ) | ||||||||||||
Net Asset Value, End of Period | $ | 23.64 | $ | 24.11 | $ | 24.58 | $ | 24.58 | $ | 23.44 | $ | 22.32 | ||||||||||||
Total Return1 | 0.15 | %2 | 2.29 | % | 5.14 | % | 10.77 | % | 10.98 | % | 9.64 | % | ||||||||||||
Ratio of net expenses to average net assets1 | 0.99 | %3 | 0.99 | % | 0.99 | % | 0.99 | % | 1.00 | % | 1.18 | % | ||||||||||||
Ratio of total expenses to average net assets1 | 1.00 | %3,5 | 1.02 | %5 | 1 .06 | %5 | 1.09 | %5 | 1.17 | % | 1.18 | % | ||||||||||||
Ratio of net investment income to average net assets | 4.11 | %3 | 3.36 | % | 3.65 | % | 4.50 | % | 5.55 | % | 6.45 | % | ||||||||||||
Portfolio turnover | 23 | %2 | 26 | % | 16 | % | 73 | % | 24 | % | 16 | % | ||||||||||||
Net assets at end of period (000’s omitted) | $ | 519,377 | $ | 426,448 | $ | 259,210 | $ | 179,641 | $ | 128,341 | $ | 66,817 | ||||||||||||
43
Financial Highlights
For a share outstanding throughout each period
| For the six | For the year ended December 31, | |||||||||||||||||||||||
Managers Global Bond Fund | months ended (unaudited) | 2005 | 2004 | 2003 | 2002 | 2001 | ||||||||||||||||||
Net Asset Value, Beginning of Period | $ | 20.19 | $ | 22.38 | $ | 22.19 | $ | 20.58 | $ | 17.97 | $ | 18.98 | ||||||||||||
Income from Investment Operations: | ||||||||||||||||||||||||
Net investment income | 0.26 | 0.63 | 0.65 | 0.80 | 0.81 | 0.57 | 4 | |||||||||||||||||
Net realized and unrealized gain (loss) on investments | 0.28 | (1.75 | ) | 1.49 | 3.43 | 2.57 | (1.33 | )4 | ||||||||||||||||
Total from investment operations | 0.54 | (1.12 | ) | 2.14 | 4.23 | 3.38 | (0.76 | ) | ||||||||||||||||
Less Distributions to Shareholders from: | ||||||||||||||||||||||||
Net investment income | — | (0.77 | ) | (1.34 | ) | (2.09 | ) | (0.55 | ) | — | ||||||||||||||
Net realized gain on investments | — | (0.30 | ) | (0.61 | ) | (0.53 | ) | (0.22 | ) | (0.25 | ) | |||||||||||||
Total distributions to shareholders | — | (1.07 | ) | (1.95 | ) | (2.62 | ) | (0.77 | ) | (0.25 | ) | |||||||||||||
Net Asset Value, End of Period | $ | 20.73 | $ | 20.19 | $ | 22.38 | $ | 22.19 | $ | 20.58 | $ | 17.97 | ||||||||||||
Total Return1 | 2.67 | %2 | (4.94 | )% | 9.62 | % | 20.69 | % | 18.85 | % | (4.10 | )% | ||||||||||||
Ratio of net expenses to average net assets1 | 1.1 9 | %3 | 1.19 | % | 1.29 | % | 1.68 | % | 1.55 | % | 1.45 | % | ||||||||||||
Ratio of total expenses to average net assets1 | 1.24 | %3,5 | 1.26 | %5 | 1.49 | %5 | 1.68 | % | 1.56 | % | 1.46 | % | ||||||||||||
Ratio of net investment income to average net assets | 2.75 | %3 | 2.38 | % | 2.73 | % | 3.48 | % | 4.01 | % | 2.87 | %4 | ||||||||||||
Portfolio turnover | 36 | %2 | 64 | % | 130 | % | 152 | % | 220 | % | 244 | % | ||||||||||||
Net assets at end of period (000's omitted) | $ | 49,126 | $ | 43,131 | $ | 36,454 | $ | 32,307 | $ | 19,746 | $ | 19,879 | ||||||||||||
The following notes should be read in conjunction with the Financial Highlights of the Funds presented on the preceding pages.
| 1 | Total returns and net investment income would have been lower had certain expenses not been reduced. (See Note 1(c) to the Notes to Financial Statements.) |
| 2 | Not annualized. |
| 3 | Annualized. |
| 4 | Effective January 1, 2001, the Trust adopted the provisions of the AICPA Audit and Accounting Guide for Investment Companies and began amortizing premium and discount on all debt securities, as required. The effect of this change during the year ended December 31, 2001 on International Equity and Global Bond was to decrease net investment income and increase net realized and unrealized gain (loss) per share by $0.01and $0.04, respectively. The effect of this change on the other Funds was not significant. Without this change the ratio of net investment income to average net assets for the year ended December 31, 2001 for International Equity and Global Bond would have been 0.46% and 3.08%, respectively. Per share data, ratios and supplemental data for prior periods have not been restated to reflect this change. |
| 5 | Excludes the impact of expense (reimbursement)/recoupment and expense offsets such as brokerage credits, but includes non-reimbursable expenses such as interest and taxes. (See Note 1c to the Notes to Financial Statements.) |
| 6 | Per share numbers have been calculated using average shares. |
44
June 30, 2006 (unaudited)
| 1. | Summary of Significant Accounting Policies |
The Managers Funds (the “Trust”) is an open-end management investment company organized as a Massachusetts business trust and registered under the Investment Company Act of 1940, as amended (the “1940 Act”). Currently, the Trust is comprised of a number of investment series. Included in this report are the Managers Value Fund (“Value”), Managers Capital Appreciation Fund (“Capital Appreciation”), Managers Small Company Fund (“Small Company”), Managers International Equity Fund (“International Equity”), Managers Emerging Markets Equity Fund (“Emerging Markets Equity”), Managers Bond Fund (“Bond”) and Managers Global Bond Fund (“Global Bond”), collectively the “Funds.”
The Funds’ financial statements are prepared in accordance with accounting principles generally accepted in the United States of America, which require management to make estimates and assumptions that affect the reported amount of assets and liabilities and disclosure of contingent assets and liabilities at the date of the financial statements and the reported amounts of income and expenses during the reporting periods. Actual results could differ from those estimates. The following is a summary of significant accounting policies followed by the Funds in the preparation of their financial statements:
| a. | Valuation of Investments |
Equity securities traded on a domestic or international securities exchange are generally valued at the last quoted sale price, or, lacking any sales, at the last quoted bid price. Over-the-counter securities are valued at the Nasdaq Official Closing Price, if one is available. Lacking any sales, over-the-counter securities, are valued at the last quoted bid price. Under certain circumstances, the value of a Fund investment may be based on an evaluation of its fair value, pursuant to procedures established by and under the general supervision of the Board of Trustees of the Fund. A Fund may use the fair value of a portfolio security to calculate its NAV when, for example, (1) market quotations are not readily available because a portfolio security is not traded in a public market or the principal market in which the security trades is closed, (2) trading in a portfolio security is suspended and not resumed prior to the time as of which the Fund calculates its NAV, (3) where a significant event affecting the value of a portfolio security is determined to have occurred between the time of the market quotation provided for a portfolio security and the time as of which the Fund calculates its NAV, (4) a security’s price has remained unchanged over an extended period of time (often referred to as a “stale price”), or (5) the Investment Manager determines that a market quotation is inaccurate. The Investment Manager monitors intervening events that may affect the value of securities held in each Fund’s portfolio and, in accordance with procedures adopted by the Funds’ Trustees, will adjust the prices of securities traded in foreign markets, as appropriate, to reflect the impact of events occurring subsequent to the close of such markets but prior to the time each Fund’s NAV is calculated. Fixed-income securities are valued based on valuations furnished by independent pricing services that utilize matrix systems, which reflect such factors as security prices, yields, maturities and ratings, and are supplemented by dealer and exchange quotations. Short-term investments having a remaining maturity of 60 days or less are valued at amortized cost, which approximates market value. Investments in other regulated investment companies are valued at their end of day net asset value per share except iShares or other ETF’s, which are valued the same as equity securities. Securities (including derivatives) for which market quotations are not readily available are valued at fair value, as determined in good faith, and pursuant to procedures adopted by the Board of Trustees of the Trust. The values assigned to fair value investments are based on available information and do not necessarily represent amounts that might ultimately be realized, since such amounts depend on future developments inherent in long-term investments. Further, because of the inherent uncertainty of valuation, those estimated values may differ significantly from the values that would have been used had a ready market for the investments existed, and the differences could be material.
Investments in certain mortgage-backed, stripped mortgage-backed, preferred stocks, convertible securities and other debt securities not traded on an organized market, are valued on the basis of valuations provided by dealers or by a pricing service which uses information with respect to transactions in such securities, various relationships between securities and yield to maturity in determining value.
| b. | Security Transactions |
Security transactions are accounted for as of the trade date. Realized gains and losses on securities sold are determined on the basis of identified cost.
| c. | Investment Income and Expenses |
Dividend income is recorded on the ex-dividend date except certain dividends from foreign securities where the ex-dividend date may have passed. These dividends are recorded as soon as the Trust is informed of the ex-dividend date. Dividend income on foreign securities is recorded net of any withholding tax. Interest income, which includes amortization of premium and accretion of discount on debt securities, is accrued as earned. Non-cash dividends included in dividend income, if any, are reported at the fair market value of the securities received. Other income and expenses are recorded on an accrual basis. Expenses that cannot be directly attributed to a fund are apportioned among the Funds in the Trust and in some cases other affiliated funds based upon their relative average net assets or number of shareholders.
The following Funds had certain portfolio trades directed to various brokers who paid a portion of such Fund’s expenses. For the six months ended June 30, 2006, under these arrangements the amount by which the Funds’ expenses were reduced and the impact on the expense ratios were as follows: Value -$13,515 or 0.03%; Capital Appreciation -$17,146 or 0.04%; Small Company - $7,410 or 0.04% and International Equity -$31,784 or 0.03%.
In addition, each of the Funds has a “balance credit” arrangement with The Bank of New York (“BNY”), the Funds’ custodian, whereby each Fund is credited with an interest factor equal to 1% below the effective 90-day T-Bill rate for account balances left uninvested overnight. These credits serve to reduce custody expenses that would otherwise be charged to each Fund. For the six months ended June 30, 2006, the custodian expense was reduced as follows: International Equity - $418; and Global Bond - $100.
Overdrafts will cause a reduction of any earnings credits, computed at 2% above the effective Federal Funds rate on the day of the overdraft. For the six months ended June 30, 2006, overdraft fees for International Equity and Global Bond equaled $6,988 and $135, respectively. Managers Investment Group LLC (formerly The Managers Funds LLC) (the “Investment Manager”), a subsidiary of Affiliated Managers Group, Inc. (“AMG”) and the Investment
45
Notes to Financial Statements (continued)
Manager for the Funds, has contractually agreed, through at least May 1, 2007, to waive fees and pay or reimburse expenses of Small Company, Bond and Global Bond to the extent that the total annual operating expenses (exclusive of brokerage, interest, taxes and extraordinary expenses) of the Fund exceed 1.45%, 0.99% and 1.19%, respectively, of each Fund’s average daily net assets. The Investment Manager has also contractually agreed to waive fees on Value, Capital Appreciation, International Equity and Emerging Markets Equity to the extent that the total annual operating expenses (exclusive of brokerage, interest, taxes and extraordinary expenses) of the Fund exceed 1.19%, 1.29%, 1.55% and 1.79%, respectively, of each Fund’s average daily net assets, provided that the amount of fees waived, paid or reimbursed does not exceed 0.25% per annum of each Fund’s average daily net assets.
Each Fund may be obligated to repay the Investment Manager such amounts waived, paid or reimbursed in future years provided that the repayment occurs within three (3) years after the waiver or reimbursement and that such repayment would not cause the Fund’s expenses in any such year to exceed the previously stated percentages of that Fund’s average daily net assets. For the six months ended June 30, 2006, the following Funds made such repayments to the Investment Manager in the following amounts: Value - $3,048; Capital Appreciation - $2,119; Small Company - $5,850; and Emerging Markets Equity - $1,481. At June 30, 2006, the cumulative amount of reimbursement by the Manager subject to repayment by Value, Capital Appreciation, Small Company, Bond and Global Bond equaled $101,759, $42,968, $4,699, $421,314 and $103,706, respectively.
Total returns and net investment income for the Funds would have been lower had certain expenses not been offset.
| d. | Dividends and Distributions |
Dividends resulting from net investment income, if any, normally will be declared and paid annually for Global Bond and the Equity Funds. Dividends resulting from net investment income, if any, normally will be declared and paid monthly for Bond. Distributions of capital gains, if any, will be made on an annual basis and when required for Federal excise tax purposes. Income and capital gain distributions are determined in accordance with Federal income tax regulations, which may differ from generally accepted accounting principles. These differences are primarily due to differing treatments for losses deferred due to wash sales, equalization accounting for tax purposes, foreign currency and market discount transactions. Permanent book and tax basis differences, if any, relating to shareholder distributions will result in reclassifications to paid-in capital.
| e. | Federal Taxes |
Each Fund intends to comply with the requirements under Subchapter M of the Internal Revenue Code of 1986, as amended, to distribute substantially all of its taxable income and gains to its shareholders and to meet certain diversification and income requirements with respect to investment companies. Therefore, no provision for Federal income or excise tax is included in the accompanying financial statements. Additionally, based on the Fund’s understanding of the tax rules and rates related to income, gains and transactions for the foreign jurisdictions in which it invests, the Fund will provide for foreign taxes, and where appropriate, deferred foreign taxes.
| f. | Capital Loss Carryovers |
As of June 30, 2006, the following Funds had accumulated net realized capital loss carryovers from securities transactions for Federal income tax purposes as shown in the following chart. These amounts may be used to offset realized capital gains, if any, through the expiration dates listed.
Fund | Capital Loss Carryover Amount | Expires December 31, | |||
Capital Appreciation | $ | 111,767,513 | 2009 | ||
| 30,988,593 | 2010 | ||||
| 12,899,489 | 2011 | ||||
Small Company | 4,928,358 | 2009 | |||
| 1,700,278 | 2010 | ||||
International Equity | 84,638,277 | 2010 | |||
| 16,171,901 | 2011 | ||||
| g. | Capital Stock |
The Trust’s Declaration of Trust authorizes for each series the issuance of an unlimited number of shares of beneficial interest, without par value. Each Fund records sales and repurchases of its capital stock on the trade date. Dividends and distributions to shareholders are recorded on the ex-dividend date. At June 30, 2006, certain unaffiliated shareholders, specifically omnibus accounts, individually held greater than 10% of the outstanding shares of the following Funds: Value - one owns 23%; Capital Appreciation - one owns 14%; International Equity - two collectively own 42%; Emerging Markets Equity - two collectively own 55%; Bond - one owns 17%.
| h. | Repurchase Agreements |
Each Fund may enter into repurchase agreements provided that the value of the underlying collateral, including accrued interest, will be equal to or exceed the value of the repurchase agreement during the term of the agreement. The underlying collateral for all repurchase agreements is held in safekeeping by the Fund’s custodian or at the Federal Reserve Bank. If the seller defaults and the value of the collateral declines, or if bankruptcy proceedings commence with respect to the seller of the security, realization of the collateral by the Fund may be delayed or limited.
| i. | Foreign Currency Translation |
The books and records of the Funds are maintained in U.S. dollars. The value of investments, assets and liabilities denominated in currencies other than U.S. dollars are translated into U.S. dollars based upon current foreign exchange rates. Purchases and sales of foreign investments, income and expenses are converted into U.S. dollars based on currency exchange rates prevailing on the respective dates of such transactions. Net realized and unrealized gain (loss) on foreign currency transactions represent: (1) foreign exchange gains and losses from the sale and holdings of foreign currencies; (2) gains and losses between trade date and settlement date on investment securities transactions and forward foreign currency exchange contracts; and (3) gains and losses from the difference between amounts of interest and dividends recorded and the amounts actually received.
46
Notes to Financial Statements (continued)
In addition, the Funds do not isolate the net realized and unrealized gain or loss resulting from changes in exchange rates from the fluctuations resulting from changes in market prices of securities held. Such fluctuations are included with the net realized and unrealized gain or loss on investments.
| 2. | Agreements and Transactions with Affiliates |
The Trust has entered into an Investment Management Agreement under which the Investment Manager provides or oversees investment management services to the Funds. The Investment Manager selects subadvisors for each Fund (subject to Trustee approval), allocates assets among subadvisors and monitors the subadvisors’ investment programs and results. Each Fund’s investment portfolio is managed by portfolio managers who serve pursuant to Subadvisory Agreements with the Investment Manager.
Investment management fees are paid directly by each Fund to the Investment Manager based on average daily net assets. The annual investment management fee rates, as a percentage of average daily net assets for the six months ended June 30, 2006, were as follows:
Fund | Investment Management Fee | ||
Value | 0.75 | % | |
Capital Appreciation | 0.80 | % | |
Small Company | 0.90 | % | |
International Equity | 0.90 | % | |
Emerging Markets Equity | 1.15 | % | |
Bond | 0.625 | % | |
Global Bond | 0.70 | % |
The Trust has entered into an Administration and Shareholder Servicing Agreement (“Administration Agreement”) under which Managers Investment Group LLC serves as each Fund’s administrator (the “Administrator”) and is responsible for all aspects of managing the Funds’ operations, including administration and shareholder services to each Fund, its shareholders, and certain institutions, such as bank trust departments, broker-dealers and registered investment advisers, that advise or act as an intermediary with the Funds’ shareholders. Under the terms of the Administration Agreement, each of the Funds, except Global Bond, pay a fee to the Administrator at the rate of 0.25% per annum of the Fund’s average daily net assets. Global Bond pays a fee to the Administrator at the rate of 0.20% per annum of the Fund’s average daily net assets.
Prior to July 1, 2005, the aggregate annual retainer paid to each Independent Trustee was $52,000, plus $2,000 for each meeting attended. Effective July 1, 2005, the aggregate annual retainer paid to each Independent Trustee is $55,000, plus $4,000 or $2,000 for each regular or special meeting attended, respectively. The Trustees’ fees and expenses are allocated amongst all of the Funds for which Managers Investment Group LLC serves as the Investment Manager (the “Managers Funds”) based on the relative net assets of such Funds. The Independent Chairman of the Trust receives an additional payment of $10,000 per year. (Prior to July 1, 2005, the Independent Chairman was paid an additional $5,000 per year). Effective July 1, 2005, the Chairman of the Audit Committee receives an additional $2,000 per year. The “Trustee fees and expenses” shown in the financial statements represent each Fund’s allocated portion of the total fees and expenses paid by the Managers Funds.
The Funds are distributed by Managers Distributors, Inc. (the “Distributor”), a wholly-owned subsidiary of Managers Investment Group LLC. Certain Trustees and Officers of the Funds are Officers and/or Directors of the Investment Manager, AMG and/or the Distributor. The Distributor serves as the principal underwriter for each Fund. The Distributor is a registered broker-dealer and member of the National Association of Securities Dealers, Inc. (“NASD”). Shares of each Fund will be continuously offered and will be sold by brokers, dealers or other financial intermediaries who have executed selling agreements with the Distributor. The Distributor bears all the expenses of providing services pursuant to an Underwriting Agreement, including the payment of the expenses relating to the distribution of Prospectuses for sales purposes and any advertising or sales literature.
47
Notes to Financial Statements (continued)
| 3. | Purchases and Sales of Securities |
Purchases and sales of securities, excluding short-term securities, for the six months ended June 30, 2006, were as follows:
| Long-Term Securities | U.S. Government Securities | |||||||||||
Fund | Purchases | Sales | Purchases | Sales | ||||||||
Value | $ | 13,358,218 | $ | 55,402,881 | N/A | N/A | ||||||
Capital Appreciation | 125,450,157 | 162,572,719 | N/A | N/A | ||||||||
Small Company | 37,131,845 | 38,958,141 | N/A | N/A | ||||||||
International Equity | 75,406,689 | 110,385,026 | N/A | N/A | ||||||||
Emerging Markets Equity | 22,950,607 | 20,863,966 | N/A | N/A | ||||||||
Bond | 201,633,088 | 103,282,227 | $ | 30,962,213 | $ | 86,049,841 | ||||||
Global Bond | 23,160,982 | 16,036,533 | 8,014,121 | 5,627,244 | ||||||||
| 4. | Portfolio Securities Loaned |
The Funds may participate in a securities lending program offered by BNY providing for the lending of equities, corporate bonds and government securities to qualified brokers. Collateral on all securities loaned is accepted in cash and/or government securities. Collateral is maintained at a minimum level of 102% of the market value, plus interest, if applicable, of investments on loan. Collateral received in the form of cash is invested temporarily in institutional money market funds or other short-term investments by BNY. Earnings of such temporary cash investments are divided between BNY, as a fee for its services under the program, and the Fund loaning the security, according to agreed-upon rates.
| 5. | Commitments and Contingencies |
In the normal course of business, the Funds may enter into contracts and agreements that contain a variety of representations and warranties, which provide general indemnifications. The maximum exposure to the Funds under these arrangements is unknown, as this would involve future claims that may be against the Funds that have not yet occurred. However, based on experience, the Funds expect the risks of loss to be remote.
The Financial Accounting Standards Board (“FASB”) has recently issued Interpretation No. 48, “Accounting for Uncertainty in Income Taxes – an Interpretation of FASB Statement No. 109 (the “Interpretation”), which applies to all registered investment companies and clarifies the accounting for uncertain tax positions. The Interpretation is effective for financial statements for fiscal years beginning after December 15, 2006. Management has not yet completed their analysis of the Interpretation, and is not currently in a position to estimate the significance, if any, that the impact of adoption will have on the financial statements.
| 6. | Risks Associated with Collateralized Mortgage Obligations (“CMOs”) |
The net asset value of Funds may be sensitive to interest rate fluctuations because the Funds may hold several instruments, including CMOs and other derivatives, whose values can be significantly impacted by interest rate movements. CMOs are obligations collateralized by a portfolio of mortgages or mortgage-related securities. Payments of principal and interest on the mortgage are passed through to the holder of the CMOs on the same schedule as they are received, although certain classes of CMOs have priority over others with respect to the receipt of prepayments on the mortgages.
Therefore, the investment in CMOs may be subject to a greater or lesser risk of prepayment than other types of mortgage-related securities. CMOs may have a fixed or variable rate of interest.
| 7. | Forward Commitments |
Certain transactions, such as futures and forward transactions, dollar roll agreements, or purchases of when-issued or delayed delivery securities may have a similar effect on a Fund’s net asset value as if the Fund had created a degree of leverage in its portfolio. However, if a Fund enters into such a transaction, the Fund will establish a segregated account with its custodian in which it will maintain cash, U.S. Government securities or other liquid securities equal in value to its obligations in respect to such transaction. Securities and other assets held in the segregated account may not be sold while the transaction is outstanding, unless other suitable assets are substituted.
| 8. | Forward Foreign Currency Contracts |
International Equity, Emerging Markets Equity, Bond and Global Bond invest in forward foreign currency exchange contracts to manage currency exposure. These investments may involve greater market risk than the amounts disclosed in the Funds’ financial statements.
A forward foreign currency exchange contract is an agreement between a Fund and another party to buy or sell a currency at a set price at a future date. The market value of the contract will fluctuate with changes in currency exchange rates. The contract is marked-to-market daily, and the change in market value is recorded as an unrealized gain or loss. Gain or loss on the purchase or sale of contracts having the same settlement date, amount and counter party is realized on the date of offset, otherwise gain or loss is realized on settlement date.
The Funds, except Value, Capital Appreciation, and Small Company, may invest in non-U.S. dollar denominated instruments subject to limitations, and enter into forward foreign currency exchange contracts to facilitate transactions in foreign securities and to protect against a possible loss resulting from an adverse change in the relationship between the U.S. dollar and such foreign currency. Risks may arise upon entering into these contracts from the potential inability of counterparties to meet the terms of their contracts and from unanticipated movements in the value of a foreign currency relative to the U.S. dollar.
48
Notes to Financial Statements (continued)
Open forward foreign currency exchange contracts (in U.S. Dollars) at June 30, 2006 were as follows:
Foreign Currency | Position | Settlement Date | Current Value (Receivable Amount) | Contract Value (Payable Amount) | Unrealized Gain/ (Loss) | |||||||||||
Managers International Equity Fund | ||||||||||||||||
euro-dollar Contracts | Short | 7/5/06 | $ | (80,109 | ) | $ | (80,076 | ) | $ | (33 | ) | |||||
Japanese Yen | Short | 7/5/06 | (187,126 | ) | (183,564 | ) | (3,562 | ) | ||||||||
Japanese Yen | Short | 7/5/06 | (142,684 | ) | (142,772 | ) | 88 | |||||||||
euro-dollar Contracts | Long | 7/3/06 | 275,508 | 272,374 | 3,134 | |||||||||||
Pound Sterling | Long | 7/3/06 | 266,355 | 260,793 | 5,562 | |||||||||||
Pound Sterling | Long | 7/5/06 | 283,158 | 282,863 | 295 | |||||||||||
Norwegian Krone | Long | 7/3/06 | 279,021 | 275,040 | 3,981 | |||||||||||
| $ | 694,123 | $ | 684,658 | $ | 9,465 | |||||||||||
Managers Global Bond Fund | ||||||||||||||||
Australian Dollar | Short | 8/11/06 | $ | (230,228 | ) | $ | (239,320 | ) | $ | 9,092 | ||||||
Australian Dollar | Short | 8/24/06 | (271,034 | ) | (274,301 | ) | 3,267 | |||||||||
Canadian Dollar | Short | 8/21/06 | (986,964 | ) | (982,976 | ) | (3,988 | ) | ||||||||
Canadian Dollar | Short | 7/5/06 | (583,576 | ) | (579,785 | ) | (3,791 | ) | ||||||||
Canadian Dollar | Short | 7/5/06 | (14,419 | ) | (14,492 | ) | 73 | |||||||||
Mexican Peso | Short | 9/19/06 | (488,069 | ) | (484,257 | ) | (3,812 | ) | ||||||||
New Zealand Dollar | Short | 8/11/06 | (145,879 | ) | (150,067 | ) | 4,188 | |||||||||
Australian Dollar | Long | 8/11/06 | 22,280 | 22,560 | (280 | ) | ||||||||||
Canadian Dollar | Long | 8/21/06 | 583,206 | 579,317 | 3,889 | |||||||||||
Canadian Dollar | Long | 8/21/06 | 26,917 | 26,908 | 9 | |||||||||||
euro-dollar Contracts | Long | 7/5/06 | 1,066,498 | 1,046,178 | 20,320 | |||||||||||
| $ | (1,021,268 | ) | $ | (1,050,235 | ) | $ | 28,967 | |||||||||
| 9. | Futures Contracts Held or Issued for Purposes other than Trading |
International Equity uses Equity Index futures contracts to a limited extent, with the objective of maintaining exposure to equity stock markets while maintaining liquidity. The Fund may purchase or sell futures contracts to achieve a desired level of investment, whether to accommodate portfolio turnover or cash flows from capital shares transactions. There are certain risks associated with futures contracts. Prices may not move as expected or a Fund may not be able to close out the contract when it desires to do so, resulting in losses.
Futures are valued at their quoted daily settlement prices. The aggregate principal amounts of the contracts are not recorded in the financial statements. Fluctuations in the value of the contracts are recorded in the Statement of Assets as an asset (liability) and in the Statement of Operations as unrealized appreciation (depreciation) until the contracts are closed, when they are recorded as realized gains (losses) on futures or forward currency contracts. International Equity had the following open futures contracts as of June 30, 2006:
Type | Number of Contracts | Position | Expiration Month | Unrealized Gain/ (Loss) | ||||||
3-Month Japanese Yen | 6 | Short | 09/07/06 | $ | (3,984 | ) | ||||
49
Annual Renewal of Investment Advisory Agreements (unaudited)
MANAGERS VALUE FUND, MANAGERS BOND FUND,
MANAGERS EMERGING MARKETS EQUITY FUND, MANAGERS
SMALL COMPANY FUND, MANAGERS GLOBAL BOND FUND,
MANAGERS INTERNATIONAL EQUITY FUND:
On June 2, 2006, the Board of Trustees, including a majority of the Trustees who are not “interested persons” of the Trust (the “Independent Trustees”), approved the Investment Management Agreement with the Investment Manager for each of the Funds identified below and the Subadvisory Agreement for each of the Subadvisors. The Independent Trustees were separately represented by independent counsel in connection with their consideration of the approval of these agreements. In considering the Investment Management and Subadvisory Agreements, the Trustees reviewed a variety of materials relating to each Fund, the Investment Manager and each Subadvisor, including comparative performance, fee and expense information for an appropriate peer group of similar mutual funds (each, a “Peer Group”), performance information for relevant benchmark indices (each, a “Fund Benchmark”) and other information regarding the nature, extent and quality of services provided by the Investment Manager and the Subadvisors under their respective agreements. The Trustees also took into account performance, fee and expense information regarding each Fund provided to them on a quarterly basis throughout the year. Prior to voting, the Independent Trustees: (a) reviewed the foregoing information with their independent legal counsel and with management; (b) received materials from their independent legal counsel discussing the legal standards applicable to their consideration of the Investment Management Agreement and the Subadvisory Agreements; and (c) met with their independent legal counsel in private sessions at which no representatives of management were present.
Nature, extent and quality of services.
In considering the nature, extent and quality of the services provided by the Investment Manager, the Trustees reviewed information relating to the Investment Manager’s operations and personnel. Among other things, the Investment Manager provided financial information, biographical information on its supervisory and professional staff and descriptions of its organizational and management structure. The Trustees also took into account information provided periodically throughout the previous year by the Investment Manager relating to the performance of its duties with respect to the Funds and the Trustees’ familiarity with the Investment Manager’s management through Board meetings, discussions and reports. In the course of their deliberations regarding the Investment Management Agreement, the Trustees evaluated, among other things: (a) the quality of the search, selection and monitoring services performed by the Investment Manager in overseeing the portfolio management responsibilities of the Subadvisors; (b) the Investment Manager’s ability to supervise each of the Fund’s other service providers; and (c) the Investment Manager’s compliance programs. The Trustees also took into account the financial condition of the Investment Manager with respect to its ability to provide the services required under the Investment Management Agreement and to maintain contractual expense limitations for the Funds.
For each Fund, the Trustees also reviewed information relating to each Subadvisor’s operations and personnel and the investment philosophy, strategies and techniques (for each Subadvisor, its “Investment Strategy”) used in managing the Fund or the portion of the Fund for which the Subadvisor has portfolio management responsibility. Among other things, the Trustees reviewed biographical information on portfolio management and other professional staff, information regarding each Subadvisor’s organizational and management structure and each Subadvisor’s brokerage policies and practices. The Trustees considered specific information provided regarding the experience of the individual or individuals at each Subadvisor with portfolio management responsibility for the portion of the Fund managed by the Subadvisor, including the information set forth in the Fund’s prospectus and statement of additional information. With respect to those Funds managed with multiple Subadvisors, the Trustees also noted information provided by the Investment Manager regarding the manner in which each Subadvisor’s Investment Strategy complements those utilized by the Fund’s other Subadvisors. In the course of their deliberations, the Trustees evaluated, among other things: (a) the services rendered by each Subadvisor in the past; (b) the qualifications and experience of the Subadvisor’s personnel; and (c) the Subadvisor’s compliance programs. The Trustees also took into account the financial condition of the Subadvisor with respect to its ability to provide the services required under the Subadvisory Agreement.
Performance.
As noted above, the Board considered each Fund’s performance during relevant time periods as compared to the Fund’s Peer Group and noted that the Board reviews on a quarterly basis detailed information about the Fund’s performance results, portfolio composition and Investment Strategies, including with respect to the portion of the Fund managed by each Subadvisor. The Board noted the Investment Manager’s expertise and resources in monitoring the performance, investment style and risk adjusted performance of each Subadvisor. The Board also noted each Subadvisor’s performance record with respect to the Fund. The Board was mindful of the Investment Manager’s focus on each Subadvisor’s performance with respect to the Fund and the explanations of management regarding the factors that contributed to the performance of the Fund.
In connection with the Board’s consideration of the Subadvisory Agreement with Epoch Investment Partners, Inc. (“Epoch”), which became a Subadvisor to the Small Company Fund on March 8, 2006, the Trustees, at its March 3, 2006 meeting, reviewed information related to the prior investment performance of Epoch’s portfolio management team in managing client accounts with similar investment objectives as that of the Managers Small Company Fund, including information about such performance as compared to appropriate benchmarks.
Advisory Fees and Profitability.
In considering the reasonableness of the advisory fee charged by the Investment Manager for managing each Fund, the Trustees noted that the Investment Manager, and not the Fund, is responsible for paying the fees charged by the Funds’ Subadvisors and, therefore, that the fees paid to the Investment Manager cover the reasonable cost of providing portfolio management services as well as the reasonable cost of providing search, selection and monitoring services in operating a “manager-of-managers” complex of mutual funds. The Trustees concluded that, in light of the additional high quality supervisory services provided by the Investment Manager and the fact that the subadvisory fees are paid out of the advisory fee, the advisory fee payable by each Fund to the Investment Manager can reasonably be expected to exceed the median advisory fee for the Peer Group, which consists mostly of funds that do not operate with a manager-of-managers structure.
In considering the reasonableness of the advisory fee payable to the Investment Manager, the Trustees also reviewed information
50
Annual Renewal of Investment Advisory Agreements (continued)
provided by the Investment Manager setting forth all revenues and other benefits, both direct and indirect, received by the Investment Manager and its affiliates attributable to managing each Fund and all the mutual funds in the Managers Family of Funds, the cost of providing such services and the resulting profitability to the Investment Manager and its affiliates from these relationships. The Trustees also noted the current and potential asset levels of each Fund and the willingness of the Investment Manager to waive fees and pay expenses for certain of the Funds from time to time as a means of limiting the total expenses of the smaller Funds. In this regard, the Trustees noted that, unlike the typical mutual fund that is managed by a single investment adviser, the Funds operate in a manager-of-managers structure and, as a Fund grows in size, it is common practice for the Investment Manager to recommend the selection of an additional Subadvisor to manage a portion of the Fund’s portfolio. The Trustees also noted that the subadvisory fees are paid by the Investment Manager out of its advisory fee. The Trustees further noted that, because of this practice, the Investment Manager’s oversight and supervisory responsibilities with respect to the Funds can be expected to increase with the size of the Funds. On this basis, the Trustees concluded that the profitability to the Investment Manager is reasonable and that the Investment Manager is not realizing material benefits from economies of scale that would warrant adjustments to the fees for the Funds at this time. With respect to economies of scale, the Trustees also noted that as a Fund’s assets increase over time, the Fund may realize other economies of scale to the extent that the increase in assets is proportionally greater than the increase in certain other expenses.
Subadvisory Fees and Profitability.
In considering the reasonableness of the fee payable by the Investment Manager to each Subadvisor, the Trustees relied on the ability of the Investment Manager to negotiate the terms of the Subadvisory Agreement at arm’s length as part of the manager-of-managers structure, noting that the Subadvisors are not affiliated with the Investment Manager. In addition, the Trustees noted that the subadvisory fees are paid by the Investment Manager out of its advisory fee. Accordingly, the cost of services to be provided by each Subadvisor and the profitability to each Subadvisor of its relationship with the Funds were not material factors in the Trustees’ deliberations. For similar reasons, and based on the current size of the portion of the Fund managed by each Subadvisor, the Trustees concluded that any economies of scale being realized by the Subadvisors was not a material factor in the Trustees’ deliberations at this time.
In addition to the foregoing, the Trustees considered the specific factors and related conclusions set forth below with respect to each Fund.
MANAGERS VALUE FUND
Fund Performance.
Among other information relating to the Fund’s performance, the Trustees noted that the Fund’s performance for the 1-year, 3-year, 5-year and 10-year periods ended March 31, 2006 was below, above, below and below, respectively, the median performance of the Peer Group and below, above, above and below, respectively, the performance of the Fund Benchmark, which is the S&P 500 Index. The Trustees concluded that the Fund’s performance has been reasonable in light of all factors considered. The Trustees noted that the Investment Manager will continue to monitor the performance of the Subadvisor.
Advisory Fees.
The Trustees noted that the Fund’s advisory fee and total expenses (net of applicable expense waivers/reimbursements) as of March 31, 2006 were higher than the average for the Peer Group and that the Investment Manager has contractually agreed through May 1, 2007 to limit the Fund’s net annual operating expenses to 1.19%, provided that the amount waived may not exceed 0.25%. The Trustees concluded that, in light of the nature, extent and quality of the services provided by the Investment Manager and the Subadvisors, the Fund’s performance, the foregoing expense limitation and the considerations noted above with respect to the Subadvisors and the Investment Manager, the Fund’s advisory fees are reasonable.
MANAGERS BOND FUND
Fund Performance.
Among other information relating to the Fund’s performance, the Trustees noted that the Fund’s performance for the 1-year, 3-year, 5-year and 10-year periods ended March 31, 2006 was above the median performance of the Peer Group and the performance of the Fund Benchmark, which is the Lehman Brothers Government/Credit Index. The Trustees concluded that the Fund’s performance has been satisfactory.
Advisory Fees.
The Trustees noted that the Fund’s advisory fee and total expenses (net of applicable expense waivers/reimbursements) as of March 31, 2006 were higher than the average for the Peer Group and that the Investment Manager has contractually agreed through May 1, 2007 to limit the Fund’s net annual operating expenses to 0.99%. The Trustees concluded that, in light of the nature, extent and quality of the services provided by the Investment Manager and the Subadvisor, the Fund’s performance, the foregoing expense limitation and the considerations noted above with respect to the Subadvisor and the Investment Manager, the Fund’s advisory fees are reasonable.
MANAGERS EMERGING MARKETS EQUITY FUND
Fund Performance.
Among other information relating to the Fund’s performance, the Trustees noted that the Fund’s performance for the 1-year, 3-year and 5-year periods ended March 31, 2006 and for the period from inception of the Fund in February 1998 through March 31, 2006 was above, above, below and above, respectively, the median performance of the Peer Group for such periods. The Trustees also noted that the Fund’s performance for the 1-year, 3- year and 5-year periods ended March 31, 2006 and for the period from inception of the Fund through March 31, 2006 was below, below, below and above the Fund Benchmark, which is the MSCI EMF Index. The Trustees concluded that the Fund’s performance has been reasonable in light of all factors considered. The Trustees noted that the Investment Manager will continue to monitor the performance of the Subadvisor.
Advisory Fees.
The Trustees noted that the Fund’s advisory fee and total expenses (net of applicable expense waivers/reimbursements) as of March 31, 2006 were higher than the average for the Peer Group and that the Investment Manager has contractually agreed through May 1, 2007 to limit the Fund’s net annual operating expenses to 1.79%, provided that the amount waived may not exceed 0.25%. The Trustees concluded that, in light of the nature, extent and quality of the services provided by the Investment Manager and the Subadvisor, the Fund’s performance, the foregoing expense limitation and the considerations noted above with respect to the Subadvisor and the Investment Manager, the Fund’s advisory fees are reasonable.
51
Annual Renewal of Investment Advisory Agreements (continued)
MANAGERS SMALL COMPANY FUND
Fund Performance.
Among other information relating to the Fund’s performance, the Trustees noted that the Fund’s performance for the 1-year and 3-year periods ended March 31, 2006 and for the period from inception of the Fund in June 2000 through March 31, 2006 was below the median performance of the Peer Group and the performance of the Fund Benchmark, which is the Russell 2000 Index. The Trustees concluded that the Fund’s performance has been reasonable in light of all factors considered. The Trustees noted that the Investment Manager had taken action in March 2006 to add Epoch as a Subadvisor to manage a portion of the Fund.
Advisory Fees.
The Trustees noted that the Fund’s advisory fee and total expenses (net of applicable expense waivers/reimbursements) as of March 31, 2006 were higher than the average for the Peer Group and that the Investment Manager has contractually agreed through May 1, 2007 to limit the Fund’s net annual operating expenses to 1.45%. The Trustees concluded that, in light of the nature, extent and quality of the services provided by the Investment Manager and the Subadvisor, the foregoing expense limitation and the considerations noted above with respect to the Subadvisor and the Investment Manager, the Fund’s advisory fees are reasonable.
MANAGERS GLOBAL BOND FUND
Fund Performance.
Among other information relating to the Fund’s performance, the Trustees noted that the Fund’s performance for the 1-year, 3-year, 5-year and 10-year periods ended March 31, 2006 was below, above, above and below, respectively, the median performance of the Peer Group and above, above, above and below, respectively, and the performance of the Fund Benchmark, which is the Lehman Brothers Global Aggregate Index. The Trustees further noted management’s discussion of the Fund’s performance and the strong performance of new Subadvisors that were engaged in 2004 and 2005. The Trustees concluded that the Fund’s performance has been satisfactory in light of all factors considered.
Advisory Fees.
The Trustees noted that the Fund’s advisory fee and total expenses (net of applicable expense waivers/reimbursements) as of March 31, 2006 were higher than the average for the Peer Group and that the Investment Manager has contractually agreed through May 1, 2007 to limit the Fund’s net annual operating expenses to 1.19%. The Trustees concluded that, in light of the nature, extent and quality of the services provided by the Investment Manager and the Subadvisor, the Fund’s performance, the foregoing expense limitation and the considerations noted above with respect to the Subadvisor and the Investment Manager, the Fund’s advisory fees are reasonable.
MANAGERS INTERNATIONAL EQUITY FUND
Fund Performance.
Among other information relating to the Fund’s performance, the Trustees noted that the Fund’s performance for the 1-year, 3-year, 5-year and 10-year periods ended March 31, 2006 was above, below, below and below, respectively, the median performance of the Peer Group and above, below, below and above, respectively, the performance of the Fund Benchmark, which is the MSCI EAFE Index. The Trustees noted the favorable recent performance of the Fund. In addition, the Trustees noted that the Investment Manager had taken action to replace Subadvisors for the Fund in 2002, 2003 and 2004 to improve the performance of the Fund.
Advisory Fees.
The Trustees noted that the Fund’s advisory fee and total expenses (net of applicable expense waivers/reimbursements) as of March 31, 2006 were higher than the average for the Peer Group and that the Investment Manager has contractually agreed through May 1, 2007 to limit the Fund’s net annual operating expenses to 1.55%, provided that the amount waived may not exceed 0.25%. The Trustees concluded that, in light of the nature, extent and quality of the services provided by the Investment Manager and the Subadvisors, the Fund’s performance, the foregoing expense limitation and the considerations noted above with respect to the Subadvisors and the Investment Manager, the Fund’s advisory fees are reasonable.
* * * *
After consideration of the foregoing, the Trustees also reached the following conclusions regarding the Investment Management Agreement and each Subadvisory Agreement, in addition to those conclusions discussed above: (a) the Investment Manager and each Subadvisor have demonstrated that they possess the capability and resources to perform the duties required of them under the Investment Management Agreement and the applicable Subadvisory Agreements; (b) each Subadvisor’s Investment Strategy is appropriate for pursuing the applicable Fund’s investment objectives; (c) each Subadvisor is reasonably likely to execute its Investment Strategy consistently over time; and (d) the Investment Manager and each Subadvisor maintain appropriate compliance programs.
Based on all of the above-mentioned factors and related conclusions, with no single factor or conclusion being determinative and with each Trustee not necessarily attributing the same weight to each factor, the Trustees concluded that approval of each Investment Management Agreement and each Subadvisory Agreement would be in the interests of each Fund and its shareholders. Accordingly, on June 2, 2006 the Trustees, including a majority of the Independent Trustees, voted to approve the Investment Management Agreement and the Subadvisory Agreements for each of the Fund’s Subadvisors.
MANAGERS CAPITAL APPRECIATION FUND
On June 2, 2006, the Board of Trustees, including a majority of the Trustees who are not “interested persons” of the Trust (the “Independent Trustees”), approved the Investment Management Agreement with the Investment Manager for the Managers Capital Appreciation Fund (the “Fund”) and the Subadvisory Agreement with the Fund’s Subadvisor. The Independent Trustees were separately represented by independent counsel in connection with their consideration of the approval of these agreements. In considering the Investment Management and Subadvisory Agreements, the Trustees reviewed a variety of materials relating to the Fund, the Investment Manager and the Subadvisor, including comparative performance, fee and expense information for an appropriate peer group of similar mutual funds (the “Peer Group”), performance information for the relevant benchmark index (the “Fund Benchmark”) and other information regarding the nature, extent and quality of services provided by the Investment Manager and the Subadvisor under their respective agreements. The Trustees also took into account performance, fee and expense information regarding the Fund provided to them on a quarterly basis throughout the year. Prior to voting, the Independent Trustees: (a) reviewed the foregoing information with their independent legal counsel and with management; (b) received materials from their independent
52
Annual Renewal of Investment Advisory Agreements (continued)
legal counsel discussing the legal standards applicable to their consideration of the Investment Management and Subadvisory Agreements; and (c) met with their independent legal counsel in private sessions at which no representatives of management were present.
Nature, extent and quality of services.
In considering the nature, extent and quality of the services provided by the Investment Manager, the Trustees reviewed information relating to the Investment Manager’s operations and personnel. Among other things, the Investment Manager provided financial information, biographical information on its supervisory and professional staff and descriptions of its organizational and management structure. The Trustees also took into account information provided periodically throughout the previous year by the Investment Manager relating to the performance of its duties with respect to the Fund and the Trustees’ familiarity with the Investment Manager’s management through Board meetings, discussions and reports. In the course of their deliberations regarding the Investment Management Agreement, the Trustees evaluated, among other things: (a) the quality of the Investment Manager’s oversight of the performance by the Subadvisor of its portfolio management duties; (b) the Investment Manager’s ability to supervise the Fund’s other service providers; and (c) the Investment Manager’s compliance programs. The Trustees also took into account the financial condition of the Investment Manager with respect to its ability to provide the services required under the Investment Management Agreement and the Investment Manager’s undertaking to implement an expense limitation for the Fund.
The Trustees also reviewed information relating to the Subadvisor’s financial condition, operations and personnel and the investment philosophy, strategies and techniques (its “Investment Strategy”) used in managing the Fund. Among other things, the Trustees reviewed biographical information on portfolio management and other professional staff, information regarding the Subadvisor’s organizational and management structure and the Subadvisor’s brokerage policies and practices. The Trustees considered specific information provided regarding the experience of the individual at the Subadvisor with portfolio management responsibility for the Fund, including the information set forth in the Fund’s prospectus and statement of additional information. In the course of their deliberations, the Trustees evaluated, among other things: (a) the services rendered by the Subadvisor in the past; (b) the qualifications and experience of the Subadvisor’s personnel; and (c) the Subadvisor’s compliance programs. The Trustees also took into account the financial condition of the Subadvisor with respect to its ability to provide the services required under the Subadvisory Agreement.
Performance.
Among other information relating to the Fund’s performance, the Trustees noted that the Fund’s performance for the 1-year, 3-year, 5-year and 10-year periods ended March 31, 2006 was above, below, below and above, respectively, the median performance of the Peer Group and above, below, below and below, respectively, the performance of the Fund Benchmark, which is the S&P 500 Index. The Trustees took into account management’s discussion of the reasons for the Fund’s performance, including that the market environment in certain years has been particularly difficult in light of the Fund’s focus on growth companies. In addition, the Trustees noted that (1) the Fund’s recent and long-term performance has been satisfactory, (2) the Fund’s Subadvisor has recently made changes in investment personnel and approach, in an effort to enhance the Fund’s performance, and (3) the Manager in early 2006 determined not to renew the engagement of a former subadvisor to the Fund. The Trustees concluded that appropriate action is being taken to address the Fund’s performance.
As noted above, the Board considered the Fund’s performance during relevant time periods as compared to the Fund’s Peer Group and noted that the Board reviews on a quarterly basis detailed information about both the Fund’s performance results and portfolio composition as well as the Subadvisor’s Investment Strategy. The Board noted the Investment Manager’s expertise and resources in monitoring the performance, investment style and risk adjusted performance of the Subadvisor.
Advisory and Subadvisory Fees and Profitability.
In considering the reasonableness of the advisory fee payable to the Investment Manager and the subadvisory fee payable by the Investment Manager to the Subadvisor, the Trustees reviewed information provided by the Investment Manager setting forth all revenues and other benefits, both direct and indirect, received by the Investment Manager and its affiliates attributable to managing the Fund and all the mutual funds in the Managers Family of Funds, the cost of providing such services and the resulting profitability to the Investment Manager and its affiliates from these relationships. The Trustees noted that the Investment Manager and the Subadvisor are affiliated and that the Investment Manager pays the subadvisory fee out of the advisory fee that it receives from the Fund. The Trustees also noted the current asset level of the Fund and the impact on profitability of any future growth of assets of the Fund.
In considering the cost of services to be provided by the Investment Manager under the Investment Management Agreement and the profitability to the Investment Manager of its relationship with the Fund, the Trustees noted the current asset level of the Fund and the undertaking by the Investment Manager to maintain an expense limitation for the Fund. On this basis, the Trustees concluded that the profitability to the Investment Manager is reasonable and that the Investment Manager is not realizing material benefits from economies of scale that would warrant adjustments to the fees for the Fund at this time. Also with respect to economies of scale, the Trustees noted that as the Fund’s assets increase over time, the Fund may realize other economies of scale to the extent the increase in assets is proportionally greater than the increase in certain other expenses.
In considering the cost of services to be provided by the Subadvisor under the Subadvisory Agreement and the profitability to the Subadvisor of its relationship with the Fund, the Trustees noted the current asset level of the Fund and the undertaking by the Investment Manager to maintain an expense limitation for the Fund. As a consequence, the cost of services to be provided by the Subadvisor and the profitability to the Subadvisor of its relationship with the Fund were not material factors in the Trustees’ deliberations. For similar reasons, the Trustees did not consider potential economies of scale in the management of the Fund by the Subadvisor to be a material factor in their considerations at this time.
The Trustees noted that the Fund’s advisory fee and total expenses (net of applicable expense waivers/reimbursements) as of March 31, 2006 were higher than the average for the Peer Group and that the Investment Manager has contractually agreed through May 1, 2007 to limit the Fund’s net annual operating expenses to 1.29%, provided that the amount waived may not exceed 0.25%. The Trustees
53
Annual Renewal of Investment Advisory Agreements (continued)
concluded that, in light of the nature, extent and quality of the services provided by the Investment Manager and the Subadvisor, the foregoing expense limitation and the considerations noted above with respect to the Subadvisor and the Investment Manager, the Fund’s advisory fees are reasonable.
* * *
After consideration of the foregoing, the Trustees also reached the following conclusions regarding the Investment Management and Subadvisory Agreements in addition to the conclusions discussed above: (a) the Investment Manager has demonstrated that it possesses the resources and capability to perform its duties under the Investment Management Agreement; (b) the Subadvisor has the resources to perform its duties under the Subadvisory Agreement and is qualified to manage the Fund’s assets in accordance with its investment objectives and policies; and (c) the Investment Manager and Subadvisor maintain appropriate compliance programs.
Based on all of the above-mentioned factors and their related conclusions, with no single factor or conclusion being determinative and with each Trustee not necessarily attributing the same weight to each factor, the Trustees concluded that approval of the Investment Management and Subadvisory Agreements would be in the interests of the Fund and its shareholders. Accordingly, on June 2, 2006 the Trustees, including a majority of the Independent Trustees, voted to approve the Investment Management and Subadvisory Agreements for the Fund.
54
THIS PAGE INTENTIONALLY LEFT BLANK
Investment Manager and Administrator
Managers Investment Group LLC
800 Connecticut Avenue
Norwalk, Connecticut 06854
(203) 299-3500 or (800) 835-3879
Distributor
Managers Distributors, Inc.
800 Connecticut Avenue
Norwalk, Connecticut 06854
(203) 299-3500 or (800) 835-3879
Custodian
The Bank of New York
2 Hanson Place
Brooklyn, New York 11217
Legal Counsel
Ropes & Gray LLP
One International Place
Boston, Massachusetts 02110-2624
Transfer Agent
PFPC, Inc.
attn: Managers
P.O. Box 9769
Providence, Rhode Island 02940
(800) 548-4539
Trustees
Jack W. Aber
William E. Chapman, III
Edward J. Kaier
Peter M. Lebovitz
William J. Nutt
Steven J. Paggioli
Eric Rakowski
Thomas R. Schneeweis
For Managers Choice Only
Managers
c/o PFPC, Inc.
P.O. Box 61204
King of Prussia, Pennsylvania 19406-0851
(800) 358-7668

MANAGERS AND MANAGERS AMG EQUITY FUNDS
CAPITAL APPRECIATION
Essex Investment Management Co., LLC
EMERGING MARKETS EQUITY
Rexitor Capital Management Limited
ESSEX GROWTH
ESSEX SMALL/MICRO CAP GROWTH
Essex Investment Management Co., LLC
FQ TAX-MANAGED U.S. EQUITY
FQ U.S.EQUITY
First Quadrant, L.P.
INSTITUTIONAL MICRO-CAP
Kern Capital Management LLC
INTERNATIONAL EQUITY
Alliance Bernstein L.P.
Lazard Asset Management, LLC
Wellington Management Company, LLP
INTERNATIONAL GROWTH
Wellington Management Company, LLP
MICRO-CAP
Kern Capital Management LLC
MID-CAP
Chicago Equity Partners, LLC
REAL ESTATE SECURITIES
Urdang Securities Management, Inc.
RORER LARGE-CAP
Rorer Asset Management, LLC
SMALL CAP
TimesSquare Capital Management, LLC
SMALL COMPANY
Epoch Investment Partners, Inc.
Kalmar Investment Advisers, Inc.
SPECIAL EQUITY
Donald Smith & Co., Inc.
Kern Capital Management LLC
Skyline Asset Management, L.P.
Smith Asset Management Group, LP
Veredus Asset Management LLC
Westport Asset Management, Inc.
SYSTEMATIC VALUE
Systematic Financial Management, L.P.
TIMESSQUARE MID CAP GROWTH
TIMESSQUARE SMALL CAP GROWTH
TimesSquare Capital Management, LLC
VALUE
Armstrong Shaw Associates Inc.
Osprey Partners Investment Mgmt., LLC
20
Oak Associates, Ltd.
MANAGERS BALANCED FUNDS
BALANCED
Chicago Equity Partners, LLC
Loomis, Sayles & Company L.P.
GLOBAL
333 Global Advisers*
Armstrong Shaw Associates Inc.
Alliance Bernstein L.P.
First Quadrant, L.P.
Kern Capital Management LLC
Northstar Capital Management, Inc.
Wellington Management Company, LLP
ALTERNATIVE FUNDS
FQ GLOBAL ALTERNATIVES
First Quadrant, L.P.
MANAGERS FIXED INCOME FUNDS
BOND (MANAGERS)
Loomis, Sayles & Company L.P.
BOND (MANAGERS FREMONT)
Pacific Investment Management Co. LLC
CALIFORNIA INTERMEDIATE TAX-FREE
Evergreen Investment Management Co., LLC
FIXED INCOME
Loomis, Sayles & Company L.P.
GLOBAL BOND
Loomis, Sayles & Company L.P.
HIGH YIELD
J.P. Morgan Investment Management Inc.
INTERMEDIATE DURATION GOVERNMENT
Smith Breeden Associates, Inc.
MONEY MARKET (MANAGERS)
JPMorgan Investment Advisors Inc.
MONEY MARKET (FREMONT)
333 Global Advisers*
SHORT DURATION GOVERNMENT
Smith Breeden Associates, Inc.
| * | A division of Managers Investment Group LLC |
This report is prepared for the Funds’ shareholders. It is authorized for distribution to prospective investors only when preceded or accompanied by an effective prospectus. To receive a free copy of the prospectus or Statement of Additional Information, which includes additional information about Fund Trustees, please contact us by calling 800.835.3879. Distributed by Managers Distributors, Inc., member NASD.
A description of the policies and procedures each Fund uses to vote its proxies is available:
(i) without charge, upon request, by calling 800.835.3879, or (ii) on the Securities and Exchange Commission’s (SEC) Web site at www.sec.gov. For information regarding each Fund’s proxy voting record for the 12-month period ended June 30, call 800.835.3879 or visit the SEC Web site at www.sec.gov.
The Funds file their complete schedule of portfolio holdings with the SEC for the first and third quarters of each fiscal year on Form N-Q. The Funds’ Forms N-Q are available on the SEC’s website at www.sec.gov. A Funds’ Forms N-Q may be reviewed and copied at the SEC’s Public Reference Room in Washington, DC. Information on the operation of the Public Reference Room may be obtained by calling 800.SEC.0330. To review a complete list of the Funds’ portfolio holdings, or to view the most recent quarterly holdings report, semiannual report, or annual report, please visit www.managersinvest.com.
| www.managersinvest.com |  |
SEMI-ANNUAL REPORT
Managers Funds
June 30, 2006
| • | Managers Special Equity Fund |
Managers Special Equity Fund
Semi-Annual Report — June 30, 2006 (unaudited)
TABLE OF CONTENTS | Page | |
| 1 | ||
| 2 | ||
| 3 | ||
| 4 | ||
| 5 | ||
FINANCIAL STATEMENTS: | ||
| 10 | ||
Fund’s balance sheet, net asset value (NAV) per share computation and cumulative undistributed amount | ||
| 11 | ||
Detail of sources of income, Fund expenses, and realized and unrealized gains (losses) during the fiscal period | ||
| 12 | ||
Detail of changes in Fund assets for the past two fiscal periods | ||
| 13 | ||
Historical net asset values per share, distributions, total returns, expense ratios, turnover ratios and net assets | ||
| 14 | ||
Accounting and distribution policies, details of agreements and transactions with Fund management and affiliates, and descriptions of certain investment risks | ||
| 17 | ||
Nothing contained herein is to be considered an offer, sale or solicitation of an offer to buy shares of The Managers Funds or Managers AMG Funds. Such offering is made only by Prospectus, which includes details as to offering price and other material information.
Dear Fellow Shareholder,
The first half of 2006 was characterized by increased volatility in most markets. U.S. and foreign stocks, as well as bonds were all impacted by higher oil prices, unrest in the Middle East, and uncertainty over growth rates and inflation. Times like these challenge investors to remove emotion from decisions and stay the course with their long-term investment plans.
At Managers, regardless of market conditions, we maintain a focus on providing investors with excellent, trusted, and rigorously monitored investment solutions across all major market segments and styles. We encourage our portfolio managers to take a long term view and to invest with a long term horizon. We strive to stay on course even when market volatility causes concern.
Our overriding goal is to hire fund managers that can effectively manage your assets in all types of market conditions. Toward this goal we maintain a team of skilled investment professionals focused solely on understanding the global capital markets and overseeing the managers in our Funds. We hire fund portfolio managers who excel over time, have a strong investment discipline and stick to it. Our investment team oversees the Funds’ managers and portfolios every day so you don’t have to. Once you have selected Managers Funds as part of your asset allocation, you can be assured that we are monitoring that investment every day to help ensure it is delivering on its investment mandate.
We believe we have hired some of the best managers in the market to help our investors navigate complex and volatile markets.
We believe we have hired some of the best managers in the market to help our investors navigate complex and volatile markets. An example is Dan Fuss of Loomis Sayles (Managers Bond Fund) and Bill Gross of PIMCO (Managers Fremont Bond Fund) who have both helped our investors deal with changing market conditions for years. Recently, and for differing reasons, both managers came to the conclusion that the Federal Reserve Board would stop raising short term rates and extended the maturities of their portfolio holdings. These managers made reasoned judgments on the market based on their investment philosophies and backed up by extensive research. Their well thought out and executed investment management strategies let you the investor have confidence that your assets are being managed prudently and proactively.
At Managers we appreciate the opportunity to be a part of your long term investment plan. You can rest assured that under all market conditions our team is focused on delivering you excellent investment management services.
Respectfully, | ||
|
| |
Peter M. Lebovitz President Managers Funds | Thomas G. Hoffman, CFA Executive Vice President Chief Investment Officer Managers Investment Group LLC |


1
About Your Fund’s Expenses (unaudited)
As a shareholder of the Fund, you may incur two types of costs: (1) transaction costs, which may include sales charges (loads) on purchase payments; redemption fees; and exchange fees; and (2) ongoing costs, including management fees; distribution (12b-l) fees; and other Fund expenses. This Fund incurs only ongoing costs. This example is intended to help you understand your ongoing costs (in dollars) of investing in the Fund and to compare these costs with the ongoing costs of investing in other mutual funds. The example is based on an investment of $1,000 invested at the beginning of the period and held for the entire period as indicated below.
Actual Expenses
The first line of the table below provides information about the actual account values and actual expenses. You may use the information in this line, together with the amount you invested, to estimate the expenses that you paid over the period. Simply divide your account value by $1,000 (for example, an $8,600 account value divided by $1,000 = 8.6), then multiply the result by the number in the first line under the heading entitled “Expenses Paid During Period” to estimate the expenses you paid on your account during this period.
Hypothetical Example for Comparison Purposes
The second line of the table below provides information about hypothetical account values and hypothetical expenses based on the Fund’s actual expense ratio and an assumed annual rate of return of 5% before expenses, which is not the Fund’s actual return. The hypothetical account values and expenses may not be used to estimate the actual ending account balance or expenses you paid for the period. You may use this information to compare the ongoing costs of investing in the Fund and other funds by comparing this 5% hypothetical example with the 5% hypothetical examples that appear in the shareholder reports of other funds.
Please note that the expenses shown in the table are meant to highlight your ongoing costs only and do not reflect any trans-actional costs, such as sales charges (loads), redemption fees, or exchange fees. Therefore, the second line of the table is useful in comparing ongoing costs only, and will not help you determine the relative total costs of owning different funds.
Six Months Ended June 30, 2006 | Beginning Account Value 01/01/2006 | Ending Account Value 6/30/2006 | Expenses Paid During the Period* | ||||||
Managers Special Equity Fund | |||||||||
Based on Actual Fund Return | $ | 1,000 | $ | 1,051 | $ | 7.22 | |||
Based on Hypothetical 5% Annual Return | $ | 1,000 | $ | 1,018 | $ | 7.11 | |||
Managers Special Equity Fund- Institutional Shares | |||||||||
Based on Actual Fund Return | $ | 1,000 | $ | 1,053 | $ | 6.01 | |||
Based on Hypothetical 5% Annual Return | $ | 1,000 | $ | 1,019 | $ | 5.91 | |||
| * | Expenses are equal to the Fund’s annualized expense ratio multiplied by the average account value over the period, multiplied by the number of days in the most recent fiscal half-year (181), then divided by 365. |
2
Managers Special Equity Fund Performance
All periods ended June 30, 2006 (unaudited)
| Average Annual Total Returns1 | ||||||||||||||||||||
Managers Special Equity Fund2 | Six Months | One Year | Three Years | Five Years | Ten Years | Since Inception | Inception Date | |||||||||||||
Managers Class | 5.14 | % | 11.56 | % | 16.66 | % | 5.07 | % | 9.81 | % | 13.50 | % | 6/1/84 | |||||||
Institutional Class | 5.26 | % | 11.79 | % | 11.24 | % | 5/3/04 | |||||||||||||
Russell 2000 Index | 8.21 | % | 14.58 | % | 18.70 | % | 8.50 | % | 9.05 | % | ||||||||||
The performance data shown represents past performance, which is not a guarantee of future results. Current performance may be lower or higher than the performance data quoted. The investment return and principal value of an investment in the Funds will fluctuate so that an investor’s shares, when redeemed, may be worth more or less than their original cost. For performance information through the most recent month end please call (800) 835-3879 or visit our website at www.managersinvest.com.
In choosing a Fund, investors should carefully consider the amount they plan to invest, their investment objectives, the Fund’s investment objectives, risks, charges and expenses before investing. For this and other information, please call 800.835.3879 or visit www.managersinvest. com for a free prospectus. Read it carefully before investing or sending money. Distributed by Managers Distributors, Inc., member NASD.
The Fund is subject to risks associated with investments in small capitalization companies, such as erratic earnings patterns, competitive conditions, limited earnings history, and a reliance on one or a limited number of products.
| 1 | Total return equals income yield plus share price change and assumes reinvestment of all dividends and capital gain distributions. Returns are net of fees and may reflect offsets of Fund expenses as described in the Prospectus. No adjustment has been made for taxes payable by shareholders on their reinvested dividends and capital gain distributions. Returns for periods greater than one year are annualized. The listed returns on the Fund are net of expenses. All returns are in U.S. dollars($). |
| 2 | From time to time, the Fund’s advisor has waived its fees and/or absorbed Fund expenses, which has resulted in higher returns. |
3
Fund Snapshots
June 30, 2006 (unaudited)
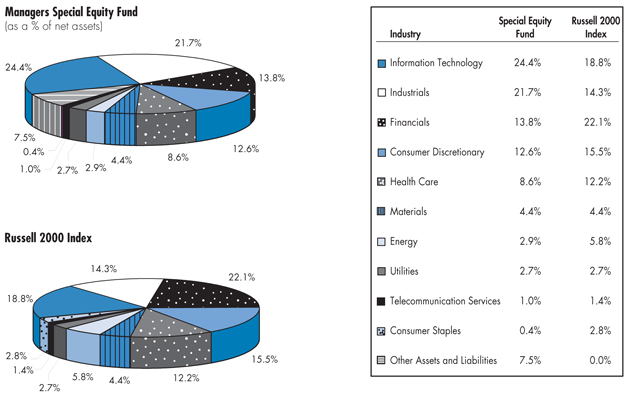
Top Ten Holdings
Security Name | Percentage of Net Assets | ||
ITT Educational Services, Inc.* | 2.2 | % | |
MI Developments, Inc., Class A* | 1.9 | ||
Reliant Resources, Inc.* | 1.7 | ||
AK Steel Holding Corp.* | 1.6 | ||
Visteon Corp.* | 1.0 | ||
aQuantive, Inc. | 1.0 | ||
Tech Data Corp. | 0.9 | ||
WebEx Communications, Inc. | 0.8 | ||
Centene Corp. | 0.8 | ||
Avista Corp. | 0.8 | ||
Top Ten as a Group | 12.7 | % | |
| * | Top Ten Holding at December 31, 2005 |
Any sectors, industries, or securities discussed should not be perceived as investment recommendations. Mention of a specific security should not be onsidered a recommendation to buy or solicitation to sell that security.
4
Schedule of Portfolio Investments
June 30, 2006 (unaudited)
| Shares | Value | |||||
Common Stocks - 92.5% | ||||||
Consumer Discretionary - 12.6% | ||||||
ADVO, Inc. | 371,333 | $ | 9,138,505 | |||
Aftermarket Technology Corp.* | 513,600 | 2 | 12,762,960 | |||
American Axle & Manufacturing | 320,600 | 2 | 5,485,466 | |||
AnnTaylor Stores Corp.* | 452,725 | 19,639,210 | ||||
Applebee’s International, Inc. | 388,125 | 7,459,763 | ||||
Beasley Broadcasting Group, Inc. | 309,462 | 2 | 2,166,234 | |||
Big 5 Sporting Goods Corp. | 413,200 | 2 | 8,057,400 | |||
Big Lots, Inc.* | 907,152 | 2 | 15,494,156 | |||
Blount International, Inc.* | 433,300 | 5,208,266 | ||||
Buckle, Inc., The | 6,300 | 263,781 | ||||
Carter’s, Inc.* | 42,600 | 1,125,918 | ||||
Charming Shoppes, Inc. * | 1,209,500 | 2 | 13,594,780 | |||
Cherokee, Inc. | 5,700 | 235,752 | ||||
Chipotle Mexican Grill, Inc.* | 140,325 | 2 | 8,552,809 | |||
Coldwater Creek, Inc.* | 460,425 | 2 | 12,320,973 | |||
Cosi, Inc.* | 686,675 | 2 | 4,277,985 | |||
COX Radio, Inc., Class A* | 368,600 | 2 | 5,315,212 | |||
Dana Corp. | 1,009,600 | 2 | 2,665,344 | |||
dELiA*s Corp.* | 348,871 | 2 | 2,818,878 | |||
Dillard’s, Inc., Class A | 519,600 | 2 | 16,549,260 | |||
Drew Industries, Inc.* | 10,400 | 336,960 | ||||
Emmis Communications Corp., Class A* | 294,524 | 2 | 4,606,355 | |||
Flowers Food’s, Inc. | 10,430 | 298,715 | ||||
Gaylord Entertainment Co., Class A* | 161,233 | 2 | 7,036,208 | |||
Genesco, Inc.* | 345,725 | 2 | 11,709,706 | |||
Group 1 Automotive, Inc. | 16,000 | 901,440 | ||||
Gymboree Corp.* | 131,500 | 4,570,940 | ||||
IMAX Corp.* | 995,000 | 2 | 9,114,200 | |||
Kerzner International, Ltd.* | 261,000 | 2 | 20,692,079 | |||
Men’s Wearhouse, Inc. | 26,700 | 809,010 | ||||
Monarch Casino & Resort, Inc.* | 14,300 | 402,116 | ||||
Morgans Hotel Group Co.* | 201,991 | 3,142,980 | ||||
Orient-Express Hotels, Ltd. | 341,900 | 2 | 13,279,396 | |||
Polaris Industries, Inc. | 168,800 | 2 | 7,309,040 | |||
Progressive Gaming International Corp.* | 1,420,500 | 2 | 11,079,900 | |||
Rare Hospitality International, Inc.* | 306,100 | 2 | 8,803,436 | |||
Ross Stores, Inc. | 930,000 | 2 | 26,086,500 | |||
Ruby Tuesday, Inc. | 510,900 | 2 | 12,471,069 | |||
Ruth’s Chris Steak House, Inc.* | 332,325 | 6,786,077 | ||||
Saks, Inc.* | 1,023,000 | 2 | 16,541,910 | |||
Scopus Video Neworks, Ltd. * 4 | 686,900 | 2 | 3,970,282 | |||
Select Comfort Corp.* | 86,100 | 2 | 1,977,717 | |||
Shuffle Master, Inc.* | 60,200 | 2 | 1,973,356 | |||
Steak n Shake Co., The* | 657,900 | 2 | 9,960,606 | |||
Steiner Leisure, Ltd. * | 11,300 | 446,689 | ||||
Stride Rite Corp., The | 20,500 | 270,395 | ||||
Talbots, Inc. | 180,400 | 3,328,380 | ||||
The Wet Seal, Inc., Class A* | 1,921,700 | 2 | 9,377,896 | |||
TJX Cos., Inc. | 160,000 | 2 | 3,657,600 | |||
Too, Inc.* | 42,500 | 1,631,575 | ||||
Toro Co. | 271,500 | 2 | 12,679,050 | |||
United Rentals, Inc.* | 300,100 | 2 | 9,597,198 | |||
VistaPrint, Ltd.* | 96,600 | 2,583,084 | ||||
Visteon Corp.* | 4,395,300 | 2 | 31,690,112 | |||
WMS Industries, Inc.* | 116,400 | 3,188,196 | ||||
Zumiez, Inc.* | 90,250 | 2 | 3,390,693 | |||
Total Consumer Discretionary | 418,833,518 | |||||
Consumer Staples - 0.4% | ||||||
Longs Drug Stores Corp. | 294,225 | 13,422,545 | ||||
NBTY, Inc.* | 29,560 | 706,780 | ||||
Total Consumer Staples | 14,129,325 | |||||
Energy - 2.9% | ||||||
Atwood Oceanics, Inc. * | 47,100 | 2,336,160 | ||||
Comstock Resources, Inc.* | 503,400 | 15,031,524 | ||||
Houston Exploration Co.* | 217,700 | 2 | 13,321,063 | |||
Key Energy Services, Inc.* | 562,300 | 8,575,075 | ||||
Newfield Exploration Co.* | 104,300 | 2 | 5,104,442 | |||
NS Group, Inc.* | 35,300 | 1,944,324 | ||||
OMI Corp. | 197,900 | 2 | 4,284,535 | |||
Overseas Shipholding Group, Inc. | 130,000 | 2 | 7,689,500 | |||
PetroQuest Energy, Inc.* | 205,950 | 2 | 2,529,066 | |||
Pioneer Drilling Co.* | 310,700 | 2 | 4,797,208 | |||
Pogo Producing Co. | 484,200 | 2 | 22,321,620 | |||
Stone Energy Corp. * | 153,200 | 2 | 7,131,460 | |||
Universal Compression Holdings, Inc.* | 22,400 | 2 | 1,410,528 | |||
W-H Energy Services, Inc.* | 21,300 | 1,082,679 | ||||
Total Energy | 97,559,184 | |||||
Financials - 13.8% | ||||||
Alabama National Bancorp | 59,530 | 2 | 4,056,970 | |||
American Financial Group, Inc. | 155,300 | 2 | 6,662,370 | |||
American National Insurance Co. | 68,950 | 2 | 8,944,194 | |||
American Physicians Capital, Inc. * | 7,200 | 378,648 | ||||
Arthur J. Gallagher & Co. | 67,800 | 2 | 1,718,052 | |||
Aspen Insurance Holdings, Ltd. | 441,800 | 2 | 10,289,522 | |||
The accompanying notes are an integral part of these financial statements.
5
Managers Special Equity Fund
Schedule of Portfolio Investments (continued)
| Shares | Value | |||||
Financials - 13.8% (continued) | ||||||
Asta Funding, Inc. | 13,700 | $ | 513,065 | |||
BankUnited Financial Corp. | 601,088 | 2 | 18,345,206 | |||
Banner Corp. | 217,740 | 2 | 8,391,700 | |||
Brown & Brown, Inc. | 530,200 | 2 | 15,492,444 | |||
Center Financial Corp. | 9,500 | 224,580 | ||||
Chittenden Corp. | 495,625 | 2 | 12,811,906 | |||
City Holding Co. | 5,800 | 209,612 | ||||
Clark, Inc. | 447,300 | 5,904,360 | ||||
Columbia Banking System, Inc. | 6,600 | 246,708 | ||||
CompuCredit Corp.* | 293,500 | 2 | 11,282,140 | |||
Conseco, Inc.* | 755,800 | 2 | 17,458,980 | |||
Corus Bankshares, Inc. | 66,400 | 2 | 1,738,352 | |||
Delphi Financial Group, Inc., Class A | 393,350 | 14,302,206 | ||||
Downey Financial Corp. | 393,380 | 2 | 26,690,832 | |||
FelCor Lodging Trust, Inc. | 750,000 | 2 | 16,305,000 | |||
Financial Federal Corp. | 13,000 | 361,530 | ||||
First Cash Financial Services, Inc.* | 28,800 | 568,800 | ||||
First Community Bancorp | 6,100 | 360,388 | ||||
First Republic Bank | 11,700 | 535,860 | ||||
FirstFed Financial Corp.* | 34,000 | 2 | 1,960,780 | |||
Greenhill & Co., Inc. | 11,125 | 675,955 | ||||
Hancock Holding Co. | 10,000 | 560,000 | ||||
Hanmi Financial Corp. | 21,300 | 414,072 | ||||
Harbor Florida Bancshares, Inc. | 11,700 | 434,538 | ||||
Hilb, Rogal & Hamilton Co. | 305,500 | 2 | 11,385,985 | |||
iStar Financial, Inc. | 437,600 | 2 | 16,519,400 | |||
Lazard, Ltd. | 351,450 | 2 | 14,198,580 | |||
MCG Capital Corp. | 779,878 | 2 | 12,400,060 | |||
Ml Developments, Inc., Class A | 1,804,700 | 61,197,376 | ||||
National Western Life Insurance Co., Class A | 12,000 | 2 | 2,875,800 | |||
Ohio Casualty Corp. | 30,900 | 918,657 | ||||
optionsXpress, Inc. | 35,700 | 832,167 | ||||
Philadelphia Consolidated Holding Co.* | 34,500 | 1,047,420 | ||||
Placer Sierra Bancshares | 328,200 | 2 | 7,610,958 | |||
PrivateBancorp, Inc. | 9,700 | 2 | 401,677 | |||
Prosperity Bancshares, Inc. | 349,300 | 2 | 11,488,477 | |||
Provident Bankshares Corp. | 234,865 | 2 | 8,546,737 | |||
RAM Holdings, Ltd.* | 601,700 | 7,563,369 | ||||
Reinsurance Group of America, Inc. | 315,900 | 2 | 15,526,485 | |||
Scottish Re Group, Ltd. | 457,300 | 2 | 7,627,764 | |||
SeaBright Insurance Holdings, Inc.* | 455,535 | 7,338,669 | ||||
Selective Insurance Group, Inc. | 12,600 | 703,962 | ||||
St. Joe Co., The | 111,500 | 2 | 5,189,210 | |||
Sterling Bancshares, Inc. | 18,700 | 350,625 | ||||
Sterling Financial Corp. | 816,005 | 2 | 24,896,312 | |||
The South Financial Group, Inc. | 45,500 | 2 | 1,201,655 | |||
TierOne Corp. | 6,400 | 216,128 | ||||
Tower Group, Inc. | 16,100 | 487,025 | ||||
TradeStation Group, Inc.* | 37,300 | 472,591 | ||||
Trammell Crow Co.* | 276,400 | 2 | 9,720,988 | |||
Triad Guaranty, Inc.* | 109,282 | 2 | 5,341,704 | |||
U.S.I. Holdings Corp.* | 736,501 | 2 | 9,876,478 | |||
United PanAm Financial Corp.* | 297,900 | 9,056,160 | ||||
Webster Financial Corp. | 279,800 | 2 | 13,273,712 | |||
Total Financials | 456,104,901 | |||||
Health Care - 8.6% | ||||||
Adams Respiratory Therapeutics, Inc.* | 326,300 | 2 | 14,559,506 | |||
Affymetrix, Inc.* | 22,000 | 563,200 | ||||
American Medical Systems Holdings, Inc.* | 52,800 | 879,120 | ||||
Amsurg Corp.* | 356,400 | 8,108,100 | ||||
AngioDynamics, Inc.* | 240,225 | 6,498,086 | ||||
Candela Corp.* | 22,800 | 361,608 | ||||
Cardica, Inc.* | 461,100 | 2 | 3,647,301 | |||
Centene Corp.* | 1,166,300 | 2 | 27,443,038 | |||
Cepheid, Inc.* | 464,700 | 4,512,237 | ||||
Charles River Laboratories International, Inc.* | 335,616 | 2 | 12,350,669 | |||
Cubist Pharmaceuticals, Inc.* | 145,900 | 3,673,762 | ||||
DexCom, Inc.* | 747,300 | 10,148,334 | ||||
Eclipsys Corp.* | 298,600 | 5,422,576 | ||||
Fisher Scientific International, Inc.* | 60,000 | 2 | 4,383,000 | |||
Gen-Probe, Inc.* | 258,800 | 13,970,024 | ||||
Haemonetics Corp.* | 21,900 | 1,018,569 | ||||
Harvard Bioscience, Inc.* | 537,600 | 2,392,320 | ||||
Hologic, Inc.* | 308,900 | 2 | 15,247,304 | |||
IMS Health, Inc. | 820,081 | 22,019,175 | ||||
Intuitive Surgical, Inc.* | 104,050 | 2 | 12,274,779 | |||
inVentiv Health, Inc.* | 44,500 | 1,280,710 | ||||
Kendle International, Inc.* | 13,200 | 484,836 | ||||
Kyphon, Inc.* | 267,350 | 2 | 10,255,546 | |||
LCA-Vision, Inc. | 61,200 | 2 | 3,238,092 | |||
LifeCell Corp.* | 465,000 | 2 | 14,377,800 | |||
Lincare Holdings, Inc.* | 212,100 | 2 | 8,025,864 | |||
Molecular Devices Corp.* | 10,700 | 326,992 | ||||
NeoPharm, Inc.* | 727,280 | 2 | 3,876,402 | |||
The accompanying notes are an integral part of these financial statements.
6
Managers Special Equity Fund
Schedule of Portfolio Investments (continued)
| Shares | Value | |||||
Health Care - 8.6% (continued) | ||||||
Neurometrix, Inc.* | 214,700 | 2 | $ | 6,539,762 | ||
NitroMed, Inc.* | 562,500 | 2 | 2,716,875 | |||
NxStage Medical, Inc.* | 343,400 | 2,997,882 | ||||
Omnicell, Inc.* | 308,900 | 4,268,998 | ||||
Owens & Minor, Inc. | 213,300 | 6,100,380 | ||||
Par Pharmaceutical Co., Inc.* | 136,900 | 2,527,174 | ||||
Parexel International Corp.* | 17,200 | 496,220 | ||||
Psychiatric Solutions, Inc.* | 86,200 | 2,470,492 | ||||
Restore Medical, Inc.* | 110,100 | 2 | 847,770 | |||
Sciele Pharma, Inc.* | 51,100 | 2 | 1,185,009 | |||
Sirona Dental Systems, Inc.* | 5,100 | 202,062 | ||||
Sonosite, Inc.* | 177,100 | 2 | 6,913,984 | |||
SurModics, Inc.* | 20,300 | 2 | 733,033 | |||
Triad Hospitals, Inc.* | 638,164 | 2 | 25,258,530 | |||
Universal Health Services, Inc., Class B | 170,000 | 8,544,200 | ||||
VCA Antech, Inc.* | 48,400 | 1,545,412 | ||||
WellCare Health Plans, Inc.* | 10,100 | 495,405 | ||||
Total Health Care | 285,182,138 | |||||
Industrials - 21.7% | ||||||
AARCorp.* | 259,200 | 2 | 5,762,016 | |||
Acuity Brands, Inc. | 248,653 | 2 | 9,675,088 | |||
Adesa, Inc. | 594,900 | 2 | 13,230,576 | |||
Air France | 948,178 | 22,196,846 | ||||
Airtran Holdings, Inc.* | 1,813,425 | 2 | 26,947,495 | |||
Alaska Airgroup, Inc.* | 615,000 | 2 | 24,243,300 | |||
American Commercial Lines, Inc.* | 172,650 | 2 | 10,402,163 | |||
American Railcar Industries, Inc. | 244,525 | 2 | 8,096,223 | |||
American Science & Engineering, Inc.* | 176,750 | 2 | 10,237,360 | |||
Applied Industrial Technologies, Inc. | 21,150 | 514,157 | ||||
Armor Holdings, Inc.* | 45,500 | 2,494,765 | ||||
Astec Industries, Inc.* | 301,700 | 10,294,004 | ||||
Axsys Technologies, Inc.* 4 | 595,550 | 8,974,939 | ||||
BE Aerospace, Inc.* | 727,600 | 16,632,936 | ||||
Bright Horizons Family Solutions, Inc.* | 16,000 | 603,040 | ||||
Carlisle Co., Inc. | 159,500 | 2 | 12,648,350 | |||
Celadon Group, Inc.* | 22,650 | 499,206 | ||||
Ceradyne, Inc.* | 54,700 | 2,707,103 | ||||
Columbus McKinnon Corp.* | 19,875 | 432,083 | ||||
Consolidated Graphics, Inc.* | 6,100 | 317,566 | ||||
Con-way, Inc. | 105,600 | 6,117,408 | ||||
CoStar Group, Inc.* | 120,330 | 7,199,344 | ||||
Crane Co. | 427,100 | 2 | 17,767,360 | |||
Curtiss-Wright Corp. | 187,900 | 2 | 5,802,352 | |||
DeVry, Inc.* | 658,200 | 2 | 14,460,654 | |||
DRS Technologies, Inc. | 28,800 | 1,404,000 | ||||
Dycom Industries, Inc.* | 674,300 | 14,355,847 | ||||
EGL, Inc.* | 263,500 | 13,227,700 | ||||
First Advantage Corp.* | 506,600 | 2 | 11,783,516 | |||
General Cable Corp.* | 231,175 | 2 | 8,091,125 | |||
Genlyte Group, Inc.* | 10,300 | 746,029 | ||||
Granite Construction, Inc. | 251,500 | 2 | 11,385,405 | |||
Greenbrier Co., Inc. | 255,725 | 2 | 8,372,437 | |||
H&E Equipment Services, Inc.* | 209,350 | 2 | 6,165,358 | |||
Heico Corp. | 17,450 | 494,708 | ||||
Heidrick & Struggles International, Inc.* | 376,900 | 2 | 12,754,296 | |||
Hub Group, Inc.* | 35,000 | 858,550 | ||||
Hudson Highland Group, Inc.* | 7,640 | 2 | 82,436 | |||
Infrasource Services, Inc.* | 493,650 | 8,989,367 | ||||
Insituform Technologies, Inc.* | 195,100 | 4,465,839 | ||||
Interpool, Inc. | 428,800 | 9,527,936 | ||||
ITT Educational Services, Inc.* | 1,106,600 | 2 | 72,825,345 | |||
JLG Industries, Inc. | 660,000 | 14,850,000 | ||||
Kaydon Corp. | 19,500 | 727,545 | ||||
Kirby Corp.* | 25,400 | 1,003,300 | ||||
Labor Ready, Inc.* | 49,000 | 1,109,850 | ||||
Laidlaw International, Inc. | 552,800 | 2 | 13,930,560 | |||
Lamson & Sessions Co. * | 71,250 | 2,020,650 | ||||
Lydall, Inc.* | 231,500 | 2,134,430 | ||||
McGrath RentCorp | 6,800 | 189,108 | ||||
Mobile Mini, Inc.* | 317,775 | 2 | 9,298,097 | |||
Moog, Inc.* | 14,500 | 496,190 | ||||
Navigant Consulting, Inc.* | 200,400 | 2 | 4,539,060 | |||
NCI Building Systems, Inc.* | 289,600 | 2 | 15,398,032 | |||
Perini Corp.* | 297,200 | 6,687,000 | ||||
Pike Electric Corp.* | 358,425 | 2 | 6,903,266 | |||
Portfolio Recovery Associates, Inc.* | 25,100 | 1,147,070 | ||||
Power-One, Inc.* | 2,189,200 | 14,448,720 | ||||
Precision Castparts Corp. | 160,200 | 2 | 9,573,552 | |||
Quanta Services, Inc.* | 524,350 | 2 | 9,086,986 | |||
Regal-Beloit Corp. | 16,400 | 724,060 | ||||
Royal Group Technologies, Ltd.* | 1,511,100 | 2 | 17,014,986 | |||
Ryder System, Inc. | 223,500 | 2 | 13,059,105 | |||
Sea Containers, Ltd., Class A | 658,900 | 2 | 3,129,775 | |||
Sequa Corp., Class A* | 99,600 | 2 | 8,117,400 | |||
Sequa Corp., Class B* | 38,300 | 3,131,025 | ||||
The accompanying notes are an integral part of these financial statements.
7
Managers Special Equity Fund
Schedule of Portfolio Investments (continued)
| Shares | Value | |||||
Industrials - 21.7% (continued) | ||||||
Shaw Group Inc., The* | 748,950 | 2 | $ | 20,820,810 | ||
Si International, Inc.* | 13,300 | 407,778 | ||||
Steelcase, Inc. | 697,300 | 2 | 11,470,585 | |||
Swift Transportation Co., Inc.* | 446,600 | 2 | 14,184,016 | |||
Tecumseh Products Co., Class B | 175,993 | 2,793,009 | ||||
Teledyne Technologies, Inc.* | 16,300 | 533,988 | ||||
Tetra Technologies, Inc.* | 478,400 | 8,486,816 | ||||
The Middleby Corp.* | 6,200 | 536,672 | ||||
Thomas & Betts Corp.* | 226,400 | 11,614,320 | ||||
Trinity Industries, Inc. | 184,125 | 2 | 7,438,650 | |||
Universal Forest Products, Inc. | 14,300 | 897,039 | ||||
URS Corp.* | 500,950 | 21,039,900 | ||||
Valmont Industries, Inc. | 6,400 | 297,536 | ||||
Wabtec Corp. | 27,000 | 1,009,800 | ||||
Walter Industries, Inc. | 164,1002 | 9,460,365 | ||||
Washington Group International, Inc.* | 208,700 | 11,132,058 | ||||
Watson Wyatt & Co. | 384,100 | 13,497,274 | ||||
Total Industrials | 718,126,611 | |||||
Information Technology - 24.4% | ||||||
Advanced Energy Industries, Inc.* | 597,100 | 7,905,604 | ||||
Airspan Networks, Inc.* | 1,720,600 | 2 | 4,301,500 | |||
Aladdin Knowledge Systems, Ltd.* | 284,400 | 5,787,540 | ||||
AMIS Holdings, Inc.* | 428,700 | 4,287,000 | ||||
Amkor Technology, Inc.* | 1,129,000 | 2 | 10,680,340 | |||
Anaren Microwave, Inc.* 4 | 731,400 | 14,986,386 | ||||
Andrew Corp. * | 2,604,800 | 2 | 23,078,528 | |||
ANSYS, Inc.* | 221,075 | 2 | 10,571,807 | |||
aQuantive, Inc. * | 1,247,400 | 2 | 31,596,642 | |||
Arris Group, Inc.* | 552,300 | 2 | 7,246,176 | |||
ASE Test Ltd* | 546,475 | 4,961,993 | ||||
ATMI, Inc.* | 1,009,100 | 24,844,042 | ||||
AudioCodes, Ltd.* | 1,308,800 | 2 | 14,265,920 | |||
Bankrate, Inc. * | 114,000 | 2 | 4,304,640 | |||
Belden CDT, Inc. | 392,700 | 2 | 12,978,735 | |||
Benchmark Electronics, Inc.* | 608,050 | 2 | 14,666,166 | |||
CalAmp Corp. * | 20,200 | 179,578 | ||||
Chartered Semiconductor Manufacturing, Ltd.* | 143,800 | 1,251,060 | ||||
CheckFree Corp.* | 80,700 | 3,999,492 | ||||
Checkpoint Systems, Inc.* | 443,300 | 2 | 9,845,693 | |||
Coherent, Inc.* | 28,100 | 947,813 | ||||
CommScope, Inc.* | 514,700 | 2 | 16,171,874 | |||
Cymer, Inc.* | 29,175 | 1,355,471 | ||||
Digital Insight Corp.* | 17,200 | $ | 589,788 | |||
Digitas, Inc.* | 75,000 | 871,500 | ||||
Diodes, Inc.* | 29,300 | 1,214,192 | ||||
DSP Group, Inc.* | 130,825 | 2 | 3,251,001 | |||
ECI Telecommunications, Ltd.* | 960,800 | 7,744,048 | ||||
eCollege.com* | 219,400 | 4,638,116 | ||||
Ectel, Ltd.* | 23,713 | 104,335 | ||||
eFunds Corp.* | 406,200 | 8,956,710 | ||||
Electronics for Imaging, Inc.* | 442,881 | 2 | 9,247,355 | |||
Equinix, Inc.* | 429,900 | 2 | 23,584,314 | |||
Euronet Worldwide, Inc.* | 40,500 | 1,553,985 | ||||
Exfo Electro-Optical Engineering, Inc.* | 1,893,100 | 11,661,496 | ||||
Fairchild Semiconductor International, Inc.* | 910,500 | 2 | 16,543,785 | |||
FEI Co.* | 569,100 | 12,907,188 | ||||
Formfactor, Inc.* | 486,300 | 21,703,569 | ||||
Hutchinson Technology, Inc.* | 701,200 | 2 | 15,166,956 | |||
Identix, Inc.* | 1,510,100 | 10,555,599 | ||||
Informatica Corp.* | 707,900 | 9,315,964 | ||||
Interwoven, Inc.* | 21,500 | 184,470 | ||||
Intevac, Inc.* | 97,925 | 2,123,014 | ||||
Itron, Inc.* | 387,875 | 2 | 22,985,472 | |||
Kanbay International, Inc.* | 505,270 | 2 | 7,346,626 | |||
Keane, Inc.* | 27,300 | 341,250 | ||||
Keithley Instruments, Inc. 4 | 838,500 | 10,674,105 | ||||
Komag, Inc.* | 46,100 | 2,128,898 | ||||
M Systems Flash Disk Pioneers, Ltd.* | 287,600 | 2 | 8,521,588 | |||
Macrovision Corp.* | 22,000 | 473,440 | ||||
MasTec, Inc.* | 571,750 | 2 | 7,552,818 | |||
Mentor Graphics Corp.* | 958,074 | 2 | 12,435,801 | |||
Microsemi Corp.* | 65,600 | 1,599,328 | ||||
MIPS Technologies, Inc.* | 40,500 | 245,835 | ||||
Multi-Fineline Electronix, Inc.* | 94,375 | 2 | 3,132,306 | |||
NDS Group, PLC* | 105,700 | 4,920,335 | ||||
Net 1 UEPS Technologies, Inc.* | 387,800 | 10,606,330 | ||||
Netgear, Inc.* | 388,200 | 2 | 8,404,530 | |||
Netlogic Microsystems, Inc.* | 324,675 | 2 | 10,470,769 | |||
Nuance Communications, Inc.* | 763,300 | 7,678,798 | ||||
Omnivision Technologies, Inc.* | 63,100 | 1,332,672 | ||||
ON Semiconductor Corp.* | 142,200 | 836,136 | ||||
Optical Communication Products, Inc.* | 2,079,700 | 4,180,197 | ||||
Packeteer, Inc.* | 33,800 | 383,292 | ||||
Parametric Technology Corp.* | 1,024,720 | 13,024,191 | ||||
Park Electrochemical Corp. | 237,400 | 6,113,050 | ||||
The accompanying notes are an integral part of these financial statements.
8
Managers Special Equity Fund
Schedule of Portfolio Investments (continued)
| Shares | Value | |||||||
Information Technology - 24.4% (continued) | ||||||||
Perot Systems Corp.* | 782,010 | 2 | $ | 11,323,505 | ||||
Power Integrations, Inc.* | 737,700 | 12,894,996 | ||||||
Progress Software Corp.* | 24,600 | 575,886 | ||||||
Rackable Systems, Inc.* | 179,025 | 2 | 7,069,698 | |||||
Radiant Systems, Inc.* | 440,475 | 2 | 4,655,821 | |||||
Reynolds & Reynolds Co., The, Class A | 115,000 | 2 | 3,527,050 | |||||
RightNow Technologies, Inc.* | 421,500 | 7,030,620 | ||||||
Rogers Corp.* | 153,400 | 2 | 8,642,556 | |||||
S1 Corp.* | 224,510 | 2 | 1,077,648 | |||||
Salesforce.com, Inc.* | 180,700 | 4,817,462 | ||||||
Smart Modular Technologies, Inc.* | 1,065,326 | 9,353,562 | ||||||
Spansion, Inc.* | 317,100 | 2 | 5,054,574 | |||||
SPSS, Inc.* | 156,875 | 5,041,963 | ||||||
SYKES Enterprises, Inc.* | 25,500 | 412,080 | ||||||
SYNNEX Corp.* | 498,200 | 2 | 9,445,872 | |||||
Synopsys, Inc.* | 356,400 | 6,689,628 | ||||||
TALX Corp. | 342,370 | 2 | 7,487,632 | |||||
Tech Data Corp.* | 815,000 | 2 | 31,222,649 | |||||
Technitrol, Inc. | 16,000 | 370,400 | ||||||
Terayon Communication Systems, Inc.* 4 | 4,758,000 | 6,566,040 | ||||||
Trident Microsystems, Inc.* | 1,078,300 | 2 | 20,466,134 | |||||
UTstarcom, Inc.* | 1,875,000 | 2 | 14,606,250 | |||||
Valueclick, Inc.* | 142,000 | 2,179,700 | ||||||
Varian Semiconductor Equipment Associates, Inc.* | 220,400 | 7,187,244 | ||||||
VeriFone Holdings, Inc.* | 210,100 | 6,403,848 | ||||||
Vishay Intertechnology, Inc.* | 713,900 | 2 | 11,229,647 | |||||
WebEx Communications, Inc.* | 778,000 | 27,650,120 | ||||||
webMethods, Inc.* | 51,100 | 504,357 | ||||||
Witness Systems, Inc.* | 864,550 | 2 | 17,437,974 | |||||
Wright Express Corp.* | 483,700 | 13,901,538 | ||||||
Xyratex, Ltd.* | 211,475 | 5,593,514 | ||||||
Total Information Technology | 807,939,120 | |||||||
Materials - 4.4% | ||||||||
AK Steel Holding Corp.* A | 3,929,400 | 2 | 54,343,601 | |||||
Albemarle Corp. | 347,400 | 2 | 16,633,512 | |||||
Arch Chemicals, Inc. | 6,795 | 244,960 | ||||||
Cytec Industries, Inc. | 376,900 | 2 | 20,224,454 | |||||
Longview Fibre Co. | 651,600 | 12,439,044 | ||||||
Lubrizol Corp. | 365,896 | 14,580,956 | ||||||
Scotts Co., The, Class A | 255,386 | 2 | 10,807,936 | |||||
Symyx Technologies, Inc.* | 738,100 | 17,825,115 | ||||||
Total Materials | 147,099,578 | |||||||
Telecommunication Services - 1 .0% | ||||||||
Cincinnati Bell, Inc.* | 2,123,119 | 8,704,788 | ||||||
General Communication, Inc., Class A* | 878,100 | 10,818,192 | ||||||
Level 3 Communications, Inc.* | 3,285,200 | 2 | 14,586,288 | |||||
Total Telecommunication Services | 34,109,268 | |||||||
Utilities - 2.7% | ||||||||
Avista Corp. | 1,188,300 | 2 | 27,128,888 | |||||
Reliant Resources, Inc.* | 4,647,500 | 2 | 55,677,050 | |||||
Sierra Pacific Resources Corp.* | 343,500 | 4,809,000 | ||||||
Total Utilities | 87,614,938 | |||||||
Total Common Stocks | 3,066,698,581 | |||||||
Warrant - 0.0%* | ||||||||
Air France, ADR (cost $1,361,928) | 861,980 | 1,137,814 | ||||||
Short-Term Investments - 31.9%1 | ||||||||
Other Investment Companies - 30.6% | ||||||||
Bank of New York Institutional Cash Reserves Fund, 5.22%3 | 792,526,709 | 792,526,709 | ||||||
JPMorgan Prime Money Market Fund, Institutional Class Shares, 4.98% | 187,456,727 | 187,456,727 | ||||||
Vanguard Prime Money Market Fund, 5.13% | 33,309,323 | 33,309,323 | ||||||
Total Other Investment Companies | 1,013,292,759 | |||||||
| Principal Amount | ||||||||
Other Short-Term Investments - 1.3%3 | ||||||||
Goldman Sachs Promissory Notes, 5.23%, 07/21/06 (cost $45,057,963) | $ | 45,057,963 | 45,057,963 | |||||
Total Short-Term Investments | 1,058,350,722 | |||||||
Total Investments - 124.4% | 4,126,187,117 | |||||||
Other Assets, less Liabilities - (24.4)% | (810,293,789 | ) | ||||||
Net Assets - 100.0% | $ | 3,315,893,328 | ||||||
Based on the approximate cost of investments of $3,524,845,788 for Federal income tax purposes at June 30, 2006, the aggregate gross unrealized appreciation and depreciation were $742,587,743 and $141,246,414, respectively, resulting in net unrealized appreciation of investments of $601,341,329.
| * | Non-income-producing securities. |
| 1 | Yield shown for an investment company represents the June 30, 2006, seven-day average yield, which refers to the sum of the previous seven days’ dividends paid, expressed as an annual percentage. |
| 2 | Some or all of these shares were out on loan to various brokers as of June 30, 2006, amounting to a market value of $818,167,487, or approximately 24.7% of net assets. |
| 3 | Collateral received from brokers for securities lending was invested in this short-term investment. |
| 4 | Affiliated Company - See Note 6 in the Notes to Financial Statements. |
| # | Rounds to less than 0.1%. |
The accompanying notes are an intergal part of these financial statements.
9
Statement of Assets and Liabilities
June 30, 2006 (unaudited)
Assets: | |||
Investments at value (including securities on loan valued at $818,167,487) | $ | 4,126,187,117 | |
Receivable for investments sold | 45,950,510 | ||
Receivable for Fund shares sold | 1,448,497 | ||
Dividends, interest and other receivables | 6,930,586 | ||
Prepaid expenses | 115,154 | ||
Total assets | 4,180,631,864 | ||
Liabilities: | |||
Payable to Custodian | 1,046,109 | ||
Payable for Fund shares repurchased | 1,798,939 | ||
Payable upon return of securities loaned | 837,584,672 | ||
Payable for investments purchased | 19,070,788 | ||
Accrued expenses: | |||
Investment advisory and management fees | 2,391,426 | ||
Administrative fees | 664,285 | ||
Other | 2,182,317 | ||
Total liabilities | 864,738,536 | ||
Net Assets | $ | 3,315,893,328 | |
Managers Shares: | |||
Net Assets | $ | 2,765,007,155 | |
Shares outstanding | 30,307,041 | ||
Net asset value, offering and redemption price per share | $ | 91.23 | |
Institutional Class Shares: | |||
Net Assets | $ | 550,886,173 | |
Shares outstanding | 6,008,577 | ||
Net asset value, offering and redemption price per share | $ | 91.68 | |
Net Assets Represent: | |||
Paid-in capital | $ | 2,375,668,293 | |
Undistributed net investment income | 292,408 | ||
Accumulated net realized gain from investments | 338,591,298 | ||
Net unrealized appreciation of investments | 601,341,329 | ||
Net Assets | $ | 3,315,893,328 | |
* Investments at cost | $ | 3,524,845,788 |
The accompanying notes are an intergal part of these financial statements.
10
Statement of Operations
For the six months ended June 30, 2006 (unaudited)
Investment Income: | ||||
Dividend income | $ | 21,353,404 | ||
Foreign withholding tax | (81,212 | ) | ||
Securities lending fees | 1,349,166 | |||
Total investment income | 22,621,358 | |||
Expenses: | ||||
Investment management fees | 15,317,714 | |||
Administrative fees | 4,254,921 | |||
Transfer agent | 3,994,577 | |||
Custodian | 300,764 | |||
Professional fees | 277,258 | |||
Trustees fees and expenses | 119,790 | |||
Reports to shareholders | 92,773 | |||
Registration fees | 39,226 | |||
Miscellaneous | 80,765 | |||
Total expenses before offsets | 24,477,788 | |||
Expense reductions | (921,245 | ) | ||
Net expenses | 23,556,543 | |||
Net investment loss | (935,185 | ) | ||
Net Realized and Unrealized Gain (Loss): | ||||
Net realized gain on investment transactions | 295,558,186 | |||
Net unrealized depreciation of investments | (118,402,488 | ) | ||
Net realized and unrealized gain | 177,155,698 | |||
Net Increase in Net Assets Resulting from Operations | $ | 176,220,513 | ||
The accompanying notes are an intergal part of these financial statements.
11
Statement of Changes in Net Assets
For the six months ended June 30, 2006 (unaudited) and for the fiscal year ended December 31, 2005
| 2006 | 2005 | |||||||
Increase (Decrease) in Net Assets From Operations: | ||||||||
Net investment loss | $ | (935,185 | ) | $ | (20,331,881 | ) | ||
Net realized gain on investments | 295,558,186 | 370,099,739 | ||||||
Net unrealized depreciation of investments | (118,402,488 | ) | (216,366,681 | ) | ||||
Net increase in net assets resulting from operations | 176,220,513 | 133,401,177 | ||||||
Distributions to Shareholders: | ||||||||
From net realized gain on investments: | ||||||||
Managers Class | — | (230,875,965 | ) | |||||
Institutional Class | — | (39,895,773 | ) | |||||
Total distributions to shareholders | — | (270,771,738 | ) | |||||
From Capital Share Transactions: | ||||||||
Managers Class: | ||||||||
Proceeds from sale of shares | 317,370,440 | 698,310,169 | ||||||
Reinvestment of dividends and distributions | — | 210,983,200 | ||||||
Cost of shares repurchased | (536,330,382 | ) | (1,368,795,175 | ) | ||||
Net decrease from capital share transactions | (218,959,942 | ) | (459,501,806 | ) | ||||
Institutional Class: | ||||||||
Proceeds from sale of shares | 86,875,177 | 318,303,171 | ||||||
Reinvestment of dividends and distributions | — | 34,758,890 | ||||||
Cost of shares repurchased | (73,097,231 | ) | (100,347,591 | ) | ||||
Net increase from capital share transactions | 13,777,946 | 252,714,470 | ||||||
Net decrease from capital share transactions | (205,181,996 | ) | (206,787,336 | ) | ||||
Total decrease in net assets | (28,961,483 | ) | (344,157,897 | ) | ||||
Net Assets: | ||||||||
Beginning of period | 3,344,854,811 | 3,689,012,708 | ||||||
End of period | $ | 3,315,893,328 | $ | 3,344,854,811 | ||||
End of period undistributed net investment income | $ | 292,408 | $ | 1,227,593 | ||||
Share Transactions: | ||||||||
Managers Class: | �� | |||||||
Sale of shares | 3,437,318 | 7,901,047 | ||||||
Reinvested shares from dividends and distribution | — | 2,423,708 | ||||||
Shares repurchased | (5,791,949 | ) | (15,430,176 | ) | ||||
Net decrease in shares | (2,354,631 | ) | (5,105,421 | ) | ||||
Institutional Class: | ||||||||
Sale of shares | 935,437 | 3,552,228 | ||||||
Reinvested shares from dividends and distribution | — | 397,790 | ||||||
Shares repurchased | (789,148 | ) | (1,113,572 | ) | ||||
Net increase in shares | 146,289 | 2,836,446 | ||||||
The accompanying notes are an intergal part of these financial statements.
12
Financial Highlights
For a share outstanding throughout each period
Managers Class: | For the six months ended June 30, 2006 | For the year ended December 31, | ||||||||||||||||||||||
| 2005 | 2004 | 2003 | 2002 | 2001 | ||||||||||||||||||||
Net Asset Value, Beginning of Period | $ | 86.78 | $ | 90.42 | $ | 78.48 | $ | 55.08 | $ | 70.59 | $ | 76.82 | ||||||||||||
Income from Investment Operations: | ||||||||||||||||||||||||
Net investment loss | (0.02 | ) | (0.54 | )5 | (0.56 | ) | (0.43 | ) | (0.34 | ) | (0.18 | ) | ||||||||||||
Net realized and unrealized gain (loss) on investments | 4.47 | 4.18 | 12.50 | 23.83 | (15.17 | ) | (6.05 | ) | ||||||||||||||||
Total from investment operations | 4.45 | 3.64 | 11.94 | 23.40 | (15.51 | ) | (6.23 | ) | ||||||||||||||||
Less Distributions to Shareholders from: | ||||||||||||||||||||||||
Net realized gain on investments | — | (7.28 | ) | — | — | — | — | |||||||||||||||||
Net Asset Value, End of Period | $ | 91.23 | $ | 86.78 | $ | 90.42 | $ | 78.48 | $ | 55.08 | $ | 70.59 | ||||||||||||
Total Return1 | 5.14 | %2 | 4.00 | % | 15.18 | % | 42.50 | % | (21.98 | )% | (8.07 | )% | ||||||||||||
Ratio of net expenses to average net assets1 | 1.40 | %3 | 1.40 | % | 1.40 | % | 1.43 | % | 1.31 | % | 1.29 | % | ||||||||||||
Ratio of total expenses to average net assets1 | 1 .43 | %3,4 | 1.45 | %4 | 1.45 | %4 | 1.46 | %4 | 1.32 | %4 | 1.30 | % | ||||||||||||
Ratio of net investment loss to average net assets | (0.10 | )%3 | (0.60 | )% | (0.69 | )% | (0.72 | )% | (0.56 | )% | (0.27 | )% | ||||||||||||
Portfolio turnover | 35 | %2 | 80 | % | 68 | % | 64 | % | 67 | % | 62 | % | ||||||||||||
Net assets at end of period (000’s omitted) | $ | 2,765,007 | $ | 2,834,314 | $ | 3,415,003 | $ | 3,279,318 | $ | 2,020,821 | $ | 2,295,234 | ||||||||||||
Institutional Class: | For the six months ended June 30, 2006 | For the year ended | For the period* ended December 31, 2004 | |||||||||||||||||||||
Net Asset Value, Beginning of Period | $ | 87.09 | $ | 90.56 | $ | 78.91 | ||||||||||||||||||
Income from Investment Operations: | ||||||||||||||||||||||||
Net investment income (loss) | 0.05 | (0.33 | )5 | (0.21 | ) | |||||||||||||||||||
Net realized and unrealized gain on investments | 4.54 | 4.14 | 11.86 | |||||||||||||||||||||
Total from investment operations | 4.59 | 3.81 | 11.65 | |||||||||||||||||||||
Less Distributions to Shareholders from: | ||||||||||||||||||||||||
| Net realized gain on investments | — | (7.28 | ) | — | ||||||||||||||||||||
Net Asset Value, End of Period | $ | 91.68 | $ | 87.09 | $ | 90.56 | ||||||||||||||||||
Total Return1 | 5.26 | %2 | 4.21 | % | 14.75 | %2 | ||||||||||||||||||
Ratio of net expenses to average net assets1 | 1.20 | %3 | 1.20 | % | 1.20 | %3 | ||||||||||||||||||
Ratio of total expenses to average net assets1 | 1.23 | %3-4 | 1.25 | %4 | 1.26 | %3-4 | ||||||||||||||||||
Ratio of net investment income (loss) to average net assets | 0.13 | %3 | (0.56 | )% | (0.49 | )%3 | ||||||||||||||||||
Portfolio turnover | 35 | %2 | 80 | % | 68 | %2 | ||||||||||||||||||
Net assets at end of period (000’s omitted) | $ | 550,886 | $ | 510,541 | $ | 274,010 | ||||||||||||||||||
| * | Commencement of operations was May 3, 2004. |
| 1 | Total returns and net investment income would have been lower had certain expenses not been reduced. (See Note 1c of Notes to Financial Statements). |
| 2 | Not annualized. |
| 3 | Annualized. |
| 4 | Excludes the impact of fee waivers and expense offsets such as brokerage credits, but includes non-reimbursable expenses such as interest and taxes. (See Note 1c to the Notes to Financial Statements.) |
| 5 | Per share numbers have been calculated using average shares. |
13
Notes to Financial Statements
June 30, 2006 (unaudited)
| 1. | Summary of Significant Accounting Policies |
The Managers Funds (the “Trust”) is an open-end management investment company organized as a Massachusetts business trust and registered under the Investment Company Act of 1940, as amended (the “1940 Act”). Currently, the Trust is comprised of a number of investment series. Included in this report is the Managers Special Equity Fund (the “Fund”).
Special Equity offers both Managers Class shares and Institutional Class shares. The Institutional Class shares, which are designed primarily for institutional investors that meet certain administrative and servicing criteria, have a minimum investment of $2,500,000. Managers Class shares are offered to all other investors. Each class represents interest in the same assets of Special Equity and the classes are identical except for class specific expenses related to shareholder activity. Investment income, realized and unrealized capital gains and losses, the common expenses of Special Equity, and certain Fund level expense reductions, if any, are allocated on a pro rata basis to each class based on the relative net assets of each class to the total net assets of Special Equity. Both classes have equal voting privileges except that each class has exclusive voting rights with respect to its services and/or distribution plan.
The Fund’s financial statements are prepared in accordance with accounting principles generally accepted in the United States of America, which require management to make estimates and assumptions that affect the reported amount of assets and liabilities and disclosure of contingent assets and liabilities at the date of the financial statements and the reported amounts of income and expenses during the reporting periods. Actual results could differ from those estimates. The following is a summary of significant accounting policies followed by the Fund in the preparation of its financial statements:
| a. | Valuation of Investments |
Equity securities traded on a domestic or international securities exchange are generally valued at the last quoted sale price, or, lacking any sales, at the last quoted bid price. Over-the-counter securities are valued at the Nasdaq Official Closing Price, if one is available. Lacking any sales, over-the-counter securities, are valued at the last quoted bid price. The Fund’s investments are generally valued based on market quotations by third-party pricing services approved by the Board of Trustees of the Fund. Under certain circumstances, the value of a Fund investment may be based on an evaluation of its fair value, pursuant to procedures established by and under the general supervision of the Board of Trustees of the Trust. The Fund may use the fair value of a portfolio security to calculate its NAV when, for example, (1) market quotations are not readily available because a portfolio security is not traded in a public market or the principal market in which the security trades is closed, (2) trading in a portfolio security is suspended and not resumed prior to the time as of which the Fund calculates its NAV, (3) where a significant event affecting the value of a portfolio security is determined to have occurred between the time of the market quotation provided for a portfolio security and the time as of which the Fund calculates its NAV, (4) a security’s price has remained unchanged over a period of time (often referred to as a “stale price”), or (5) the Investment Manager determines that a market quotation is inaccurate. The Investment Manager monitors intervening events that may affect the value of securities held in the Fund’s portfolio and, in accordance with procedures adopted by the Fund’s Trustees, will adjust the prices of securities traded in foreign markets, as appropriate, to reflect the impact of events occurring subsequent to the close of such markets but prior to the time each Fund’s NAV is calculated. Fixed-income securities are valued based on valuations furnished by independent pricing services that utilize matrix systems, which reflect such factors as security prices, yields, maturities and ratings, and are supplemented by dealer and exchange quotations. Short-term investments having a remaining maturity of 60 days or less are valued at amortized cost, which approximates market value. Investments in other regulated investment companies are valued at their end of day net asset value per share except iShares or other ETF’s, which are valued the same as equity securities. Securities (including derivatives) for which market quotations are not readily available are valued at fair value, as determined in good faith, and pursuant to procedures adopted by the Board of Trustees of the Trust.
Investments in certain securities such as preferred stocks are valued on the basis of valuations provided by dealers or by a pricing service which uses information with respect to transactions in such securities, and various relationships between securities in determining value.
The values assigned to fair value investments are based on available information and do not necessarily represent amounts that might ultimately be realized, since such amounts depend on future developments inherent in long-term investments. Further, because of the inherent uncertainty of valuation, those estimated values may differ significantly from the values that would have been used had a ready market for the investments existed, and the differences could be material.
| b. | Security Transactions |
Security transactions are accounted for as of the trade date. Realized gains and losses on securities sold are determined on the basis of identified cost.
| c. | Investment Income and Expenses |
Dividend income is recorded on the ex-dividend date except certain dividends from foreign securities where the ex-dividend date may have passed. These dividends are recorded as soon as the Trust is informed of the ex-dividend date. Dividend income on foreign securities is recorded net of any withholding tax. Interest income, which includes amortization of premium and accretion of discount on debt securities, is accrued as earned. Non-cash dividends included in dividend income, if any, are reported at the fair market value of the securities received. Other income and expenses are recorded on an accrual basis. Expenses that cannot be directly attributed to a fund are apportioned among the Funds in the Trust and in some cases other affiliated funds based upon their relative average net assets or number of shareholders.
The Fund had certain portfolio trades directed to various brokers who paid a portion of the Fund’s expenses. For the six months ended June 30, 2006, under these arrangements the amount by which the Fund’s expenses were reduced and the impact on the expense ratios was as follows: $915,070 or 0.03%.
The Fund has a “balance credit” arrangement with The Bank of New York (“BNY”), the Fund’s custodian, whereby the Fund is credited with an interest factor equal to 1% below the effective 90-
14
Managers Special Equity Fund
Notes to Financial Statements (continued)
day T-Bill rate for account balances left uninvested overnight. This credit serves to reduce the custody expense that would otherwise be charged to the Fund. For the six months ended June 30, 2006, the custodian expense was reduced $6,175 under this arrangement.
Managers Investment Group LLC (formerly The Managers Funds LLC) (the “Investment Manager”) had agreed to waive a portion of its fee or reimburse expenses of Special Equity commensurate with the reduction in the fee paid to Essex Investment Management Company LLC (“Essex”) (subadvisor to Special Equity from December 19, 2003 to January 17, 2005), which was 0.10% of the average daily net assets of the portion of the Fund managed by Essex in excess of $100 million. From January 1, 2005 to January 17, 2005 the amount waived equaled $28,665. On January 18, 2005, Essex was replaced with Veredus Asset Management, and the Investment Manager discontinued waiving a portion of its fee.
Total returns and net investment income for the Fund would have been lower had certain expenses not been offset.
| d. | Dividends and Distributions |
Dividends resulting from net investment income, if any, normally will be declared and paid annually. Distributions of capital gains, if any, will be made on an annual basis and when required for Federal excise tax purposes. Income and capital gain distributions are determined in accordance with Federal income tax regulations, which may differ from generally accepted accounting principles. These differences are primarily due to differing treatments for losses deferred due to wash sales, equalization accounting for tax purposes, foreign currency and market discount transactions. Permanent book and tax basis differences, if any, relating to shareholder distributions will result in reclassifications to paid-in capital.
| e. | Federal Taxes |
The Fund intends to comply with the requirements under Subchapter M of the Internal Revenue Code of 1986, as amended, to distribute substantially all of its taxable income and gains to its shareholders and to meet certain diversification and income requirements with respect to investment companies. Therefore, no provision for Federal income or excise tax is included in the accompanying financial statements.
| f. | Capital Loss Carryovers |
As of June 30, 2006, the Fund had no accumulated net realized capital loss carryover from securities transactions for Federal income tax purposes.
| g. | Capital Stock |
The Trust’s Declaration of Trust authorizes for each series the issuance of an unlimited number of shares of beneficial interest, without par value. The Fund records sales and repurchases of its capital stock on the trade date. Dividends and distributions to shareholders are recorded on the ex-dividend date.
At June 30, 2006, certain unaffiliated shareholders, specifically omnibus accounts, individually held greater than 10% of the outstanding shares of the Fund: Special Equity Managers Class shares – three collectively own 47%; Special Equity Institutional Class shares – three collectively own 35%.
| 2. | Agreements and Transactions with Affiliates |
The Trust has entered into an Investment Management Agreement under which the Investment Manager provides or oversees investment management services to the Fund. The Investment Manager selects subadvisors for the Fund (subject to Trustee approval), allocates assets among subadvisors and monitors the subadvisor’s investment programs and results. The Fund’s investment portfolio is managed by portfolio managers who serve pursuant to Subadvisory Agreements with the Investment Manager. Investment management fees are paid directly by the Fund to the Investment Manager at the rate of 0.90% per annum.
The Trust has entered into an Administration and Shareholder Servicing Agreement under which Managers Investment Group LLC serves as the Fund’s administrator (the “Administrator”) and is responsible for all aspects of managing the Fund’s operations, including administration and shareholder services to the Fund, its shareholders, and certain institutions, such as bank trust departments, broker-dealers and registered investment advisers, that advise or act as an intermediary with the Fund’s shareholders. The Fund pays a fee to the Administrator at the rate of 0.25% per annum of the Fund’s average daily net assets for this service.
Prior to July 1, 2005, the aggregate annual retainer paid to each Independent Trustee was $52,000, plus $2,000 for each meeting attended. Effective July 1, 2005, the aggregate annual retainer paid to each Independent Trustee is $55,000, plus $4,000 or $2,000 for each regular or special meeting attended, respectively. The Trustees’ fees and expenses are allocated amongst all of the Funds for which Managers Investment Group LLC serves as the Investment Manager based on the relative net assets of such Funds. The Independent Chairman of the Trust receives an additional payment of $10,000 per year. (Prior to July 1, 2005, the Independent Chairman was paid an additional $5,000 per year). Effective July 1, 2005, the Chairman of the Audit Committee receives an additional $2,000 per year. The “Trustee fees and expenses” shown in the financial statements represent the Fund’s allocated portion of the total fees and expenses paid by the Managers Funds.
The Fund is distributed by Managers Distributors, Inc. (“MDI”), a wholly-owned subsidiary of Managers Investment Group LLC. Certain Trustees and Officers of the Fund are Officers and/or Directors of the Investment Manager, AMG and/or MDI. Managers Distributors, Inc. (the “Distributor”) serves as the principal underwriter for the Fund. The Distributor is a registered broker-dealer and member of the National Association of Securities Dealers, Inc. (“NASD”). Shares of the Fund will be continuously offered and will be sold by brokers, dealers or other financial intermediaries who have executed selling agreements with the Distributor. The Distributor bears all the expenses of providing services pursuant to an Underwriting Agreement, including the payment of the expenses relating to the distribution of Prospectuses for sales purposes and any advertising or sales literature.
| 3. | Purchases and Sales of Securities |
Purchases and sales of securities, excluding short-term securities, for the six months ended June 30, 2006, were $1,134,345,756 and $1,472,937,764, respectively. There were no purchases or sales of U.S. Government securities.
15
Managers Special Equity Fund
Notes to Financial Statements (continued)
| 4. | Portfolio Securities Loaned |
The Fund may participate in a securities lending program offered by BNY providing for the lending of equities, corporate bonds and government securities to qualified brokers. Collateral on all securities loaned is accepted in cash and/or government securities. Collateral is maintained at a minimum level of 102% of the market value, plus interest, if applicable, of investments on loan. Collateral received in the form of cash is invested temporarily in institutional money market funds or other short-term investments by BNY. Securities lending fees include earnings of such temporary cash investments, plus or minus any rebate to a borrower. These earnings (after any rebate) are then divided between BNY, as a fee for its services under the program, and the Fund according to agreed-upon rates.
| 5. | Commitments and Contingencies |
In the normal course of business, the Fund may enter into contracts and agreements that contain a variety of representations and warranties, which provide general indemnifications. The maximum exposure to the Fund under these arrangements is unknown, as this would involve future claims that may be against the Fund that have not yet occurred. However, based on experience, the Fund expects the risks of loss to be remote.
| 6. | Transactions with Affiliated Companies |
An affiliated company is a company that is directly or indirectly controlled by a related party or a company in which a fund has ownership of at least 5% of the voting securities. Transactions during the six months ended June 30, 2006, with companies which are or were affiliates are as follows:
Affiliate | Purchase Cost | Sales Cost | Dividend Income | Market Value June 30, 2006 | % Ownership of Affiliate | |||||||||
Axsys Technologies, Inc. | — | $ | 1,473,103 | — | $ | 8,974,939 | 5.6 | % | ||||||
Keithley Instruments, Inc. | $ | 5,238,338 | 101,700 | — | 10,674,105 | 5.1 | % | |||||||
Scopus Video Networks, Ltd. | 685,906 | — | — | 3,970,282 | 5.2 | % | ||||||||
Terayon Communications Systems, Inc. | 336,583 | — | — | 6,566,040 | 6.2 | % | ||||||||
Totals | $ | 6,260,827 | $ | 1,574,803 | — | $ | 30,185,366 | 1.8 | %* | |||||
| * | As a Percentage of the entire Portfolio. |
16
Annual Renewal of Investment Advisory Agreements (unaudited)
On June 2, 2006, the Board of Trustees, including a majority of the Trustees who are not “interested persons” of the Trust (the “Independent Trustees”), approved the Investment Management Agreement with the Investment Manager for the Managers Special Equity Fund (the “Fund”) and the Subadvisory Agreement for each Subadvisor of the Fund. The Independent Trustees were separately represented by independent counsel in connection with their consideration of the approval of these agreements. In considering the Investment Management and Subadvisory Agreements, the Trustees reviewed a variety of materials relating to the Fund, the Investment Manager and each Subadvisor, including comparative performance, fee and expense information for an appropriate peer group of similar mutual funds (the “Peer Group”), performance information for the relevant benchmark index (the “Fund Benchmark”) and other information regarding the nature, extent and quality of services provided by the Investment Manager and the Subadvisors under their respective agreements. The Trustees also took into account performance, fee and expense information regarding the Fund provided to them on a quarterly basis throughout the year. Prior to voting, the Independent Trustees: (a) reviewed the foregoing information with their independent legal counsel and with management; (b) received materials from their independent legal counsel discussing the legal standards applicable to their consideration of the Investment Management Agreement and the Subadvisory Agreements; and (c) met with their independent legal counsel in private sessions at which no representatives of management were present.
Nature, extent and quality of services.
In considering the nature, extent and quality of the services provided by the Investment Manager, the Trustees reviewed information relating to the Investment Manager’s operations and personnel. Among other things, the Investment Manager provided financial information, biographical information on its supervisory and professional staff and descriptions of its organizational and management structure. The Trustees also took into account information provided periodically throughout the previous year by the Investment Manager relating to the performance of its duties with respect to the Fund and the Trustees’ familiarity with the Investment Manager’s management through Board meetings, discussions and reports. In the course of their deliberations regarding the Investment Management Agreement, the Trustees evaluated, among other things: (a) the quality of the search, selection and monitoring services performed by the Investment Manager in overseeing the portfolio management responsibilities of the Subadvisors; (b) the Investment Manager’s ability to supervise the Fund’s other service providers; and (c) the Investment Manager’s compliance programs. With respect to the Fund’s investment in exchange-traded funds as a means to equitize the cash reserves of the Fund, the Trustees noted that the Investment Manager’s cash management services are in addition to and different from the services provided by the investment advisor to the exchange-traded funds in which the Fund invests. The Trustees also took into account the financial condition of the Investment Manager with respect to its ability to provide the services required under the Investment Management Agreement.
The Trustees also reviewed information relating to each Subadvisor’s operations and personnel and the investment philosophy, strategies and techniques (for each Subadvisor, its “Investment Strategy”) used in managing the portion of the Fund for which the Subadvisor has portfolio management responsibility. Among other things, the Trustees reviewed biographical information on portfolio management and other professional staff, information regarding each Subadvisor’s organizational and management structure and each Subadvisor’s brokerage policies and practices. The Trustees considered specific information provided regarding the experience of the individual or individuals at each Subadvisor with portfolio management responsibility for the portion of the Fund managed by the Subadvisor, including the information set forth in the Fund’s prospectus and statement of additional information. The Trustees also noted information provided by the Investment Manager regarding the manner in which each Subadvisor’s Investment Strategy complements those utilized by the Fund’s other Subadvisors. In the course of their deliberations, the Trustees evaluated, among other things: (a) the services rendered by the Subadvisor in the past; (b) the qualifications and experience of the Subadvisor’s personnel; and (c) the Subadvisor’s compliance programs. The Trustees also took into account the financial condition of each Subadvisor with respect to its ability to provide the services required under its Subadvisory Agreement.
Performance.
Among other information relating to the Fund’s performance, the Trustees noted that the Fund’s performance for the 1-year, 3-year, 5-year and 10-year periods ended March 31, 2006 was below, below, below and above, respectively, the median performance of the Peer Group and the Fund Benchmark, which is the Russell 2000 Index. The Trustees also noted management’s discussion of the Fund’s growth bias and the market environment during relevant time periods. Furthermore, the Trustees noted that the Investment Manager had taken action in the first half of 2006 to allow for active management of the Fund’s cash reserves to maintain exposure to the equity markets and to facilitate the addition of a new Subadvisor. The Trustees also took into account the Investment Strategies of the Fund’s Subadvisors relative to the investment strategies of the Fund’s Peer Group. The Trustees concluded that the Fund’s performance was reasonable in light of all factors considered. The Trustees noted that the Investment Manager will continue to monitor the performance of the Subadvisors.
As noted above, the Board considered the Fund’s performance during relevant time periods as compared to the Fund’s Peer Group and noted that the Board reviews on a quarterly basis detailed information about the Fund’s performance results, portfolio composition and Investment Strategies, including with respect to the portion of the Fund managed by each Subadvisor. The Board noted the Investment Manager’s expertise and resources in monitoring the performance, investment style and risk adjusted performance of each Subadvisor. The Board also noted each Subadvisor’s performance record with respect to the Fund. The Board was mindful of the Investment Manager’s focus on each Subadvisor’s performance with respect to the Fund and the explanations of management regarding the factors that contributed to the performance of the Fund.
In the case of Smith Group Asset Management, L.P., (“Smith Group”), which became a Subadvisor to the Fund in May 2006, the Trustees, at a meeting held on May 20, 2006, reviewed Smith Group’s performance in employing its Investment Strategy by reviewing performance information for other investment accounts managed by Smith Group consistent with the Investment Strategy. In their review of this performance, the Trustees noted that the performance of a composite investment portfolio managed by Smith Group compared favorably to the Russell 2000 Index for various periods.
17
Annual Renewal of Investment Advisory Agreements (continued)
Advisory Fees and Profitability.
In considering the reasonableness of the advisory fee charged by the Investment Manager for managing the Fund, the Trustees noted that the Investment Manager, and not the Fund, is responsible for paying the fees charged by the Fund’s Subadvisors and, therefore, that the fees paid to the Investment Manager cover the reasonable cost of providing portfolio management services as well as the reasonable cost of providing search, selection and monitoring services in operating a “manager-of-managers” complex of mutual funds. The Trustees concluded that, in light of the additional high quality supervisory services provided by the Investment Manager and the fact that the subadvisory fees are paid out of the advisory fee, the advisory fee payable by the Fund to the Investment Manager can reasonably be expected to exceed the median advisory fee for the Peer Group, which consists mostly of funds that do not operate with a manager - of - managers structure. The Trustees noted that the Fund’s advisory fee and total expenses as of March 31, 2006 were higher and lower respectively, than the average, for the Fund’s Peer Group. The Trustees concluded that, in light of the nature, extent and quality of the services provided by the Investment Manager and the Subadvisors, the Fund’s performance, and the considerations noted above with respect to the Subadvisors and the Investment Manager, the Fund’s advisory fees are reasonable.
In considering the reasonableness of the advisory fee payable to the Investment Manager, the Trustees reviewed information provided by the Investment Manager setting forth all revenues and other benefits, both direct and indirect, received by the Investment Manager and its affiliates attributable to managing the Fund and all the mutual funds in the Managers Family of Funds, the cost of providing such services and the resulting profitability to the Investment Manager and its affiliates from these relationships. The Trustees also noted the current asset level of the Fund and the impact on profitability of any future growth of assets of the Fund. In this regard, the Trustees noted that the Investment Manager has recommended the appointment of additional Subadvisors in response to material increases in the assets of the Fund, that the Fund currently has six Subadvisors, each managing a portion of the Fund’s portfolio, and that the Investment Manager’s oversight and supervisory responsibilities with respect to the Fund have increased with the size of the Fund and the number of Subadvisors. The Trustees also noted that the subadvisory fees are paid by the Investment Manager out of its advisory fee. On this basis, the Trustees concluded that the profitability to the Investment Manager is reasonable and that the Investment Manager is not realizing material benefits from economies of scale that would warrant adjustments to the fees for the Fund at this time. With respect to economies of scale, the Trustees also noted that as the Fund’s assets increase over time, the Fund may realize other economies of scale to the extent that the increase in assets is proportionally greater than the increase in certain other expenses.
Subadvisory Fees and Profitability.
In considering the reasonableness of the fee payable by the Investment Manager to each Subadvisor (other than Skyline Asset Management, L.P. (“Skyline”), which is an affiliate of the Investment Manager), the Trustees relied on the ability of the Investment Manager to negotiate the terms of each Subadvisory Agreement at arm’s length as part of the manager-of-managers structure, noting that the Investment Manager is not affiliated with these Subadvisors (other than Skyline). In considering the fee payable by the Investment Manager to Smith Group, the Trustees noted that the fees payable to Smith Group are identical to those paid to other Subadvisors to the Fund. In addition, the Trustees noted that the subadvisory fees are paid by the Investment Manager out of its advisory fee. Accordingly, the cost of services to be provided by each Subadvisor and the profitability to each unaffiliated Subadvisor of its relationship with the Fund were not material factors in the Trustees’ deliberations. For similar reasons, and based on the current size of the portion of the Fund managed by each Subadvisor, the Trustees concluded that the effect of any economies of scale being realized by the Subadvisors was not a material factor in the Trustees’ deliberations at this time.
In considering the reasonableness of the fee payable by the Investment Manager to Skyline, the Trustees noted that Skyline is an affiliate of the Investment Manager and reviewed information regarding the cost to Skyline of providing subadvisory services to the Fund and the resulting profitability from such relationship. The Trustees also noted that the fee payable by the Investment Manager to Skyline under its Subadvisory Agreement is identical to the fee payable to each of the other Subadvisors of the Fund, none of which is an affiliate of the Investment Manager. The Trustees also noted that the subadvisory fee is paid by the Investment Manager out of the advisory fee. On this basis, the Trustees concluded that the profitability to Skyline is reasonable and that Skyline is not realizing material benefits from economies of scale that would warrant adjustments to the fees for the Fund at this time.
* * * * *
After consideration of the foregoing, the Trustees also reached the following conclusions regarding the Investment Management Agreement and the Subadvisory Agreements with each of the Subadvisors, in addition to those conclusions discussed above: (a) the Investment Manager and each Subadvisor have demonstrated that they possess the capability and resources to perform the duties required of them under the Investment Management Agreement and the applicable Subadvisory Agreements; (b) each Subadvisor’s Investment Strategy is appropriate for pursuing the Fund’s investment objectives; (c) each Subadvisor is reasonably likely to execute its Investment Strategy consistently over time; and (d) the Investment Manager and each Subadvisor maintain appropriate compliance programs.
Based on all of the above-mentioned factors and their related conclusions, with no single factor or conclusion being determinative and with each Trustee not necessarily attributing the same weight to each factor, the Trustees concluded that approval of the Investment Management Agreement and each Subadvisory Agreement would be in the interests of the Fund and its shareholders. Accordingly, on June 2, 2006 the Trustees, including a majority of the Independent Trustees, voted to approve the Investment Management Agreement and the Subadvisory Agreement for each of the Fund’s Subadvisors.
18
Investment Manager and Administrator
Managers Investment Group LLC
800 Connecticut Avenue
Norwalk, Connecticut 06854
(203) 299-3500 or (800) 835-3879
Distributor
Managers Distributors, Inc.
800 Connecticut Avenue
Norwalk, Connecticut 06854
(203) 299-3500 or (800) 835-3879
Custodian
The Bank of New York
2 Hanson Place
Brooklyn, New York 11217
Legal Counsel
Ropes & Gray LLP
One International Place
Boston, Massachusetts 02110-2624
Transfer Agent
PFPC, Inc.
attn: Managers
P.O. Box 9769
Providence, Rhode Island 02940
(800) 548-4539
Trustees
Jack W. Aber
William E. Chapman, III
Edward J. Kaier
Peter M. Lebovitz
William J. Nutt
Steven J. Paggioli
Eric Rakowski
Thomas R. Schneeweis
For Managers Choice Only
Managers
c/o PFPC, Inc.
P.O. Box 61204
King of Prussia, Pennsylvania 19406-0851
(800) 358-7668
MANAGERSAND MANAGERS AMG EQUITY FUNDS
CAPITAL APPRECIATION
Essex Investment Management Co., LLC
EMERGING MARKETS EQUITY
Rexiter Capital Management Limited
ESSEX GROWTH
ESSEX SMALL/MICRO CAP GROWTH
Essex Investment Management Co., LLC
FQ TAX-MANAGED U.S. EQUITY
FQ U.S. EQUITY
First Quadrant, L.P.
INSTITUTIONAL MICRO-CAP
Kern Capital Management LLC
INTERNATIONAL EQUITY
Alliance Bernstein L.P.
Lazard Asset Management, LLC
Wellington Management Company, LLP
INTERNATIONAL GROWTH
Wellington Management Company, LLP
MICRO-CAP
Kern Capital Management LLC
MID-CAP
Chicago Equity Partners, LLC
REAL ESTATE SECURITIES
Urdang Securities Management, Inc.
RORER LARGE-CAP
Rorer Asset Management, LLC
SMALL CAP
TimesSquare Capital Management, LLC
SMALL COMPANY
Epoch Investment Partners, Inc.
Kalmar Investment Advisers, Inc.
SPECIAL EQUITY
Donald Smith & Co., Inc.
Kern Capital Management LLC
Skyline Asset Management, L.P.
Smith Asset Management Group, LP
Veredus Asset Management LLC
Westport Asset Management, Inc.
SYSTEMATIC VALUE
Systematic Financial Management, L.P.
TIMESSQUARE MID CAP GROWTH
TIMESSQUARE SMALL CAP GROWTH
TimesSquare Capital Management, LLC
VALUE
Armstrong Shaw Associates Inc.
Osprey Partners Investment Mgmt., LLC
20
Oak Associates, Ltd.
MANAGERS BALANCED FUNDS
BALANCED
Chicago Equity Partners, LLC
Loomis, Sayles & Company L.P.
GLOBAL
333 Global Advisers*
Armstrong Shaw Associates Inc.
Alliance Bernstein L.P.
First Quadrant, L.P.
Kern Capital Management LLC
Northstar Capital Management, Inc.
Wellington Management Company, LLP
ALTERNATIVE FUNDS
FQ GLOBAL ALTERNATIVES
First Quadrant, L.P.
MANAGERS FIXED INCOME FUNDS
BOND (MANAGERS)
Loomis, Sayles & Company L.P.
BOND (MANAGERS FREMONT)
Pacific Investment Management Co. LLC
CALIFORNIA INTERMEDIATE TAX-FREE
Evergreen Investment Management Co., LLC
FIXED INCOME
Loomis, Sayles & Company L.P.
GLOBAL BOND
Loomis, Sayles & Company L.P.
HIGH YIELD
J.P. Morgan Investment Management Inc.
INTERMEDIATE DURATION GOVERNMENT
Smith Breeden Associates, Inc.
MONEY MARKET (MANAGERS)
JPMorgan Investment Advisors Inc.
MONEY MARKET (FREMONT)
333 Global Advisers*
SHORT DURATION GOVERNMENT
Smith Breeden Associates, Inc.
| * | A division of Managers Investment Group LLC |
This report is prepared for the Funds’ shareholders. It is authorized for distribution to prospective investors only when preceded or accompanied by an effective prospectus. To receive a free copy of the prospectus or Statement of Additional Information, which includes additional information about Fund Trustees, please contact us by calling 800.835.3879. Distributed by Managers Distributors, Inc., member NASD.
A description of the policies and procedures each Fund uses to vote its proxies is available: (i) without charge, upon request, by calling 800.835.3879, or (ii) on the Securities and Exchange Commission’s (SEC) Web site at www.sec.gov. For information regarding each Fund’s proxy voting record for the 12-month period ended June 30, call 800.835.3879 or visit the SEC Web site at www.sec.gov.
The Funds file their complete schedule of portfolio holdings with the SEC for the first and third quarters of each fiscal year on Form N-Q. The Funds’ Forms N-Q are available on the SEC’s website at www.sec.gov. A Funds’ Forms N-Q may be reviewed and copied at the SEC’s Public Reference Room in Washington, DC. Information on the operation of the Public Reference Room may be obtained by calling 800.SEC.0330. To review a complete list of the Funds’ portfolio holdings, or to view the most recent quarterly holdings report, semiannual report, or annual report, please visit www.managersinvest.com.
| www.managersinvest.com | |
Item 2. CODE OF ETHICS
Not applicable for the semi-annual shareholder report.
Item 3. AUDIT COMMITTEE FINANCIAL EXPERT
Not applicable for the semi-annual shareholder report.
Item 4. PRINCIPAL ACCOUNTANT FEES AND SERVICES
Not applicable for the semi-annual shareholder report.
Item 5. AUDIT COMMITTEE OF LISTED REGISTRANTS
Not applicable.
Item 6. SCHEDULE OF INVESTMENTS
Not applicable.
Item 7. DISCLOSURE OF PROXY VOTING POLICIES AND PROCEDURES FOR CLOSED-END MANAGEMENT INVESTMENT COMPANIES
Not applicable.
Item 8. PORTFOLIO MANAGERS OF CLOSED-END MANAGEMENT INVESTMENT COMPANIES
Not applicable.
Item 9. PURCHASES OF EQUITY SECURITIES BY CLOSED-END MANAGEMENT INVESTMENT COMPANIES AND AFFILIATED PURCHASERS
Not applicable.
Item 10. SUBMISSION OF MATTERS TO A VOTE OF SECURITY HOLDERS
Not applicable.
Item 11. CONTROLS AND PROCEDURES
| (a) | The registrant’s principal executive and principal financial officers have concluded, based on their evaluation of the registrant’s disclosure controls and procedures as of a date within 90 days of the filing date of this report, that the registrant’s disclosure controls and procedures are reasonably designed to ensure that information required to be disclosed by the registrant on Form N-CSR is recorded, processed, summarized and reported within the required time periods and that information required to be disclosed by the registrant in the reports that it files or submits on Form N-CSR is accumulated and communicated to the registrant’s management, including its principal executive and principal financial officers, as appropriate to allow timely decisions regarding required disclosure. |
| (b) | There were no changes in the registrant’s internal control over financial reporting during the registrant’s second fiscal quarter of the period covered by this report that have materially affected, or are reasonably likely to materially affect, the internal control over financial reporting. |
Item 12. EXHIBITS
| (a)(1) | Not applicable. |
| (a)(2) | Certifications pursuant to Rule 30a-2(a) under the Investment Company Act of 1940 - Filed herewith. |
| (a)(3) | Not applicable. |
| (b) | Certifications pursuant to Rule 30a-2(b) under the Investment Company Act of 1940 - Filed herewith. |
SIGNATURES
Pursuant to the requirements of the Securities Exchange Act of 1934 and the Investment Company Act of 1940, the registrant has duly caused this report to be signed on its behalf by the undersigned, thereunto duly authorized.
| THE MANAGERS FUNDS | ||
| By: | /s/ Peter M. Lebovitz | |
| Peter M. Lebovitz, President | ||
| Date: | September 7, 2006 | |
Pursuant to the requirements of the Securities Exchange Act of 1934 and the Investment Company Act of 1940, this report has been signed below by the following persons on behalf of the registrant and in the capacities and on the dates indicated.
| By: | /s/ Peter M. Lebovitz | |
| Peter M. Lebovitz, President | ||
| Date: | September 7, 2006 | |
| By: | /s/ Bruce M. Aronow | |
| Bruce M. Aronow, Chief Financial Officer | ||
| Date: | September 7, 2006 | |