Table of Contents
UNITED STATES
SECURITIES AND EXCHANGE COMMISSION
Washington, D.C. 20549
FORM N-CSRS
CERTIFIED SHAREHOLDER REPORT OF
REGISTERED MANAGEMENT INVESTMENT COMPANIES
Investment Company Act file number: 811-03752
THE MANAGERS FUNDS
| (Exact name of registrant as specified in charter) |
| 800 Connecticut Avenue, Norwalk, Connecticut | 06854 | |
| (Address of principal executive offices) | (Zip code) |
Managers Investment Group LLC
800 Connecticut Avenue, Norwalk, Connecticut 06854
| (Name and address of agent for service) |
Registrant’s telephone number, including area code: (203) 299-3500
Date of fiscal year end: DECEMBER 31
Date of reporting period: JANUARY 1, 2007 – JUNE 30, 2007 (Semi-Annual Shareholder Report)
Table of Contents
| Item 1. | Reports to Shareholders |
Table of Contents
SEMI-ANNUAL REPORT
Managers Funds
June 30, 2007
| • | Managers Special Equity Fund |

Table of Contents
Managers Special Equity Fund
Semi-Annual Report — June 30, 2007 (unaudited)
| Page | ||
| 1 | ||
| 3 | ||
| 4 | ||
| 5 | ||
Portfolio breakdown and top ten holdings at June 30, 2007 | ||
| 6 | ||
FINANCIAL STATEMENTS: | ||
| 11 | ||
Fund’s balance sheet, net asset value (NAV) per share computation and cumulative undistributed amount | ||
| 12 | ||
Detail of sources of income, Fund expenses, and realized and unrealized gains (losses) during the period | ||
| 13 | ||
Detail of changes in Fund assets for the past two periods | ||
| 14 | ||
Historical net asset values per share, distributions, total returns, expense ratios, turnover ratios and net assets | ||
| 15 | ||
Accounting and distribution policies, details of agreements and transactions with Fund management and affiliates, and descriptions of certain investment risks | ||
| 18 | ||
Nothing contained herein is to be considered an offer, sale or solicitation of an offer to buy shares of The Managers Funds or Managers AMG Funds. Such offering is made only by Prospectus, which includes details as to offering price and other material information.
Table of Contents
Dear Fellow Shareholder:
As most investors expected, the U.S. economy slowed over the course of the past six months and the rest of the world continued on a generally stable growth trajectory. Underpinned by a global economy performing generally within expectations, and, aside from a sharp and short-lived market correction beginning in late February, the domestic and foreign stock markets climbed steadily, providing strong gains for the period. For example, most domestic equity indices rose 7% or more during the period and international stocks provided stronger returns. Meanwhile, the bond market became increasingly volatile as the melt-down in the sub-prime lending sector caused a liquidity squeeze across other higher-risk sectors. This led investors to balance the perception that the growing global economy is putting pressure on inflation against the extent to which the liquidity squeeze will impede investment spending, acquisition activity and ultimately the U.S. and global economies.
Against this backdrop, your Fund produced positive results during the six-month period, as shown in the accompanying semiannual report.
While the strong equity market return may seem counterintuitive in the face of slowing earnings, a significantly deteriorating housing market and the stress fractures among the mortgage lending industry, there are several positive trends that led to these results. First, because of widespread belief that the economy would be slowing, investors’ expectations for earnings growth were relatively conservative, and most companies exceeded these modest expectations during the period. Furthermore, although the U.S. economy is slowing, we believe the global economy is healthy, and global growth is a significant contributor to U.S. companies’ earnings. Another important factor has been the relatively high amount of liquidity searching for return in a relatively low interest rate environment. A clear illustration of this is the enormous amount of money committed to private equity pools that are searching for and buying up public companies on a regular basis. Low volatility and low interest rates have encouraged investors to increase leverage, which has thus far been rewarding.
Speaking of interest rates, at the beginning of the year investors were confidently predicting and wishing that the Fed would reduce rates in the near future—consistent with the expectations for a real slowdown in the economy. Over the course of the first half of 2007, however expectations for a near-term rate cut evolved into uncertainty over the outlook for any rate cut at all, as the Fed has been satisfied to stand pat and communicate concerns balanced between too much inflation risk versus a slowing economy. Again, while the economy has slowed, we believe it does not appear to be falling into recession, and in fact improved during the second quarter. Although credit spreads remained tight into late May because of a high demand for yield and historically low default rates, spreads have widened significantly since then as the domino effect started by sub-prime lending defaults has prompted investors to rapidly reduce their risk exposure. Prices of high-yield bonds across all sectors have declined, the yield premium for credit default swaps (CDS) has expanded, and prices for investment grade corporate bonds have suffered, even without a deterioration in fundamental quality.
The extent and duration of this recent liquidity squeeze will be the key to the direction of the financial markets over the second half of the year. If this sharp sell off of risk is brief, as it was in February, and markets reach equilibrium within the third quarter, then we think the relatively sound fundamentals of the U.S. and global economies should only be mildly affected. Equity markets, which appear to us to be fairly valued under that scenario, will be free to move higher, default rates will remain low, and bond prices will recover. However, price declines in a leveraged marketplace have an ability to create a viscous cycle. If dominos continue to fall, forcing more investors to sell or hedge risky assets, even relatively liquid and high quality debt securities will trade lower. If the ample liquidity that has been driving profitability, acquisitions and the equity markets higher is restricted, the rise in cost of capital will hinder profitability, increase default rates and significantly deter investment spending which will, in our opinion, in time, weaken the U.S. economy.
Noting these risks and known stresses, we believe that the current strength of many foreign economies, the continued full U.S. employment picture, and the continued high levels of corporate free cash flow will all help to pull the U.S. economy through this technical liquidity squeeze. In addition, if the credit markets continue to deteriorate, we expect that the Fed will be inclined to add liquidity by reducing rates to mitigate the problem. Hence, we continue to believe that investors should maintain their portfolios with allocations near their long-run targets, rebalance if necessary and take full advantage of opportunities to participate in the growth of the global economy. In any event, investors will be well served by an appropriately balanced and globally diversified portfolio.
1
Table of Contents
Letter to Shareholders (continued)
One of our foremost goals at Managers Investment Group is to structure and manage mutual funds that will help our shareholders and clients become more successful in reaching their investment goals and objectives. Each of our Funds is geared to provide you with exposure to a specific asset class or segment of the market. Investors tend to use our Funds as part of their overall asset allocation in order to structure a well-diversified portfolio intended to meet individual needs. Most of our Funds are therefore designed to be building blocks.
The following report contains details for the Managers Special Equity Fund and covers the six-month period ended June 30, 2007. Should you have any questions about this report, or if you’d like to receive a Prospectus and additional information, including fees and expenses, for this or any of the other Funds in our family, please feel free to contact us at 1-800-835-3879, or visit our website at www.managersinvest.com. As always, please read the Prospectus carefully before you invest or send money.
If you are curious about how you can better diversify your investment program, visit the Knowledge Center on our Web site and view our articles in the investment strategies section. You can rest assured that under all market conditions our team is focused on delivering excellent investment management services for your benefit.
We thank you for your continued confidence and investment in The Managers Funds.
Sincerely,
|
| |||
| John Streur | Thomas G. Hoffman, CFA | |||
| Senior Managing Partner | Executive Vice President | |||
| Managers Investment Group LLC | Chief Investment Officer | |||
| Managers Investment Group LLC |


2
Table of Contents
About Your Fund’s Expenses (unaudited)
As a shareholder of the Fund, you may incur two types of costs: (1) transaction costs, which may include sales charges (loads) on purchase payments; redemption fees; and exchange fees; and (2) ongoing costs, including management fees; distribution (12b-1) fees; and other Fund expenses. This Fund incurs only ongoing costs. This example is intended to help you understand your ongoing costs (in dollars) of investing in the Fund and to compare these costs with the ongoing costs of investing in other mutual funds. The example is based on an investment of $1,000 invested at the beginning of the period and held for the entire period as indicated below.
Actual Expenses
The first line of the table below provides information about the actual account values and actual expenses. You may use the information in this line, together with the amount you invested, to estimate the expenses that you paid over the period. Simply divide your account value by $1,000 (for example, an $8,600 account value divided by $1,000 = 8.6), then multiply the result by the number in the first line under the heading entitled “Expenses Paid During Period” to estimate the expenses you paid on your account during this period.
Hypothetical Example for Comparison Purposes
The second line of the table below provides information about hypothetical account values and hypothetical expenses based on the Fund’s actual expense ratio and an assumed annual rate of return of 5% before expenses, which is not the Fund’s actual return. The hypothetical account values and expenses may not be used to estimate the actual ending account balance or expenses you paid for the period. You may use this information to compare the ongoing costs of investing in the Fund and other funds by comparing this 5% hypothetical example with the 5% hypothetical examples that appear in the shareholder reports of other funds.
Please note that the expenses shown in the table are meant to highlight your ongoing costs only and do not reflect any transactional costs, such as sales charges (loads), redemption fees, or exchange fees. Therefore, the second line of the table is useful in comparing ongoing costs only, and will not help you determine the relative total costs of owning different funds.
Six Months Ended June 30, 2007 | Beginning Account Value 1/01/2007 | Ending Account Value 6/30/2007 | Expenses Paid During the Period* | ||||||
Managers Special Equity Fund - Managers Shares | |||||||||
Based on Actual Fund Return | $ | 1,000 | $ | 1,098 | $ | 7.55 | |||
Based on Hypothetical 5% Annual Return | $ | 1,000 | $ | 1,018 | $ | 7.26 | |||
Managers Special Equity Fund - Institutional Shares | |||||||||
Based on Actual Fund Return | $ | 1,000 | $ | 1,100 | $ | 6.30 | |||
Based on Hypothetical 5% Annual Return | $ | 1,000 | $ | 1,019 | $ | 6.06 | |||
| * | Expenses are equal to the Fund’s annualized expense ratio multiplied by the average account value over the period, multiplied by the number of days in the most recent fiscal half-year (181), then divided by 365. |
3
Table of Contents
Managers Special Equity Fund Performance
All periods ended June 30, 2007 (unaudited)
| Average Annual Total Returns 1 | |||||||||||||||||
Managers Special Equity Fund 2 | Six Months | One Year | Five Years | Ten Years | Since Inception | Inception Date | |||||||||||
Managers Class | 9.84 | % | 16.24 | % | 12.42 | % | 9.81 | % | 13.61 | % | 6/1/1984 | ||||||
Institutional Class | 9.98 | % | 16.54 | % | — | — | 12.89 | % | 5/3/2004 | ||||||||
Russell 2000® Index | 6.45 | % | 16.43 | % | 13.88 | % | 9.06 | % | 11.44 | % | |||||||
The performance data shown represents past performance, which is not a guarantee of future results. Current performance may be lower or higher than the performance data quoted. The investment return and principal value of an investment in the Funds will fluctuate so that an investor’s shares, when redeemed, may be worth more or less than their original cost. For performance information through the most recent month end please call (800) 835-3879 or visit our website at www.managersinvest.com.
In choosing a Fund, investors should carefully consider the amount they plan to invest, their investment objectives, the Fund’s investment objectives, risks, charges and expenses before investing. For this and other information, please call 800.835.3879 or visit www.managersinvest. com for a free prospectus. Read it carefully before investing or sending money. Distributed by Managers Distributors, Inc., member FINRA.
The Fund is subject to risks associated with investments in small capitalization companies, such as erratic earnings patterns, competitive conditions, limited earnings history, and a reliance on one or a limited number of products.
The Russell 2000® Index measures the performance of the 2,000 smallest companies in the Russell 3000® Index, which measures the performance of the 3,000 largest U.S. companies based on total market capitalization. The Index reflects no deduction for fees, expenses, or taxes. The Russell 2000® Index is a trademark of the Frank Russell Company. Frank Russell® is a trademark of the Frank Russell Company.
1 | Total return equals income yield plus share price change and assumes reinvestment of all dividends and capital gain distributions. Returns are net of fees and may reflect offsets of Fund expenses as described in the Prospectus. No adjustment has been made for taxes payable by shareholders on their reinvested dividends and capital gain distributions. Returns for periods greater than one year are annualized. The listed returns on the Fund are net of expenses. All returns are in U.S. dollars($). |
2 | From time to time, the Fund’s advisor has waived its fees and/or absorbed Fund expenses, which has resulted in higher returns. |
4
Table of Contents
Fund Snapshots
June 30, 2007 (unaudited)
Portfolio Breakdown
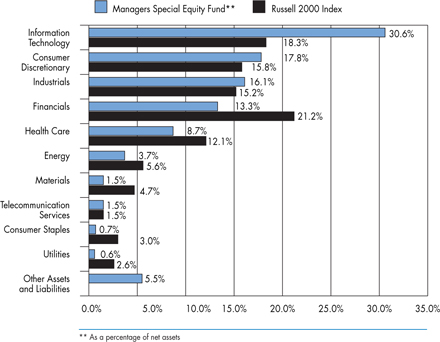 | Industry | Managers Special Equity Fund ** | Russell 2000 Index | |||||
Information Technology | 30.6 | % | 18.3 | % | ||||
Consumer Discretionary | 17.8 | % | 15.8 | % | ||||
Industrials | 16.1 | % | 15.2 | % | ||||
Financials | 13.3 | % | 21.2 | % | ||||
Health Care | 8.7 | % | 12.1 | % | ||||
Energy | 3.7 | % | 5.6 | % | ||||
Materials | 1.5 | % | 4.7 | % | ||||
Telecommunication Services | 1.5 | % | 1.5 | % | ||||
Consumer Staples | 0.7 | % | 3.0 | % | ||||
Utilities | 0.6 | % | 2.6 | % | ||||
Other Assets and Liabilities | 5.5 | % | 0.0 | % |
Top Ten Holdings
| Percentage of | |||
Security Name | Net Assets | ||
MI Developments, Inc., Class A* | 2.2 | % | |
ITT Educational Services, Inc.* | 1.9 | ||
Air France-KLM, ADR* | 1.7 | ||
Semiconductor Manufacturing International Corp.* | 1.5 | ||
Visteon Corp.* | 1.3 | ||
Dillard’s, Inc., Class A* | 1.1 | ||
DeVry, Inc. | 1.1 | ||
Ross Stores, Inc. | 1.1 | ||
Spansion, Inc., Class A* | 1.1 | ||
Arris Group, Inc. | 1.0 | ||
Top Ten as a Group | 14.0 | % | |
* | Top Ten Holding at December 31, 2006 |
Any sectors, industries, or securities discussed should not be perceived as investment recommendations. Mention of a specific security should not be considered a recommendation to buy or solicitation to sell that security.
5
Table of Contents
Schedule of Portfolio Investments
June 30, 2007 (unaudited)
| Shares | Value | |||||
Common Stocks - 94.5% | ||||||
Consumer Discretionary - 17.8% | ||||||
Aftermarket Technology Corp.* | 285,100 | $ | 8,461,768 | |||
American Axle & Manufacturing Holdings, Inc. | 265,800 | 7,872,996 | ||||
Amerigon, Inc.* | 280,525 | 5,046,645 | ||||
Applebee’s International, Inc. | 388,125 | 2 | 9,353,812 | |||
Ashbury Automotive Group, Inc. | 119,700 | 2,986,515 | ||||
Big 5 Sporting Goods Corp. | 372,600 | 9,501,300 | ||||
Big Lots, Inc.* | 907,152 | 2 | 26,688,412 | |||
Buckle, Inc., The | 33,200 | 1,308,080 | ||||
Buffalo Wild Wings, Inc.* | 110,600 | 4,599,854 | ||||
Chipotle Mexican Grill, Inc.* | 42,600 | 3,632,928 | ||||
Coldwater Creek, Inc.* | 165,050 | 3,834,112 | ||||
Crocs, Inc.* | 147,200 | 6,334,016 | ||||
Dana Corp. | 1,009,600 | 2,039,392 | ||||
Deckers Outdoor Corp.* | 62,600 | 6,316,340 | ||||
DeVry, Inc. | 853,900 | 29,049,678 | ||||
Dick’s Sporting Goods, Inc.* | 177,325 | 10,314,995 | ||||
Dillard’s, Inc., Class A | 831,200 | 29,865,016 | ||||
Gaylord Entertainment Co., Class A* | 161,233 | 8,648,538 | ||||
Guess?, Inc. | 158,625 | 7,620,345 | ||||
Gymboree Corp.* | 284,675 | 11,219,042 | ||||
IMAX Corp.* | 729,700 | 3,079,334 | ||||
ITT Educational Services, Inc.* | 429,706 | 50,438,890 | ||||
Jack in the Box, Inc.* | 124,575 | 2 | 8,837,350 | |||
Jo-Ann Stores, Inc.* | 212,525 | 6,042,086 | ||||
Jos. A. Bank Clothiers, Inc.* | 295,190 | 12,241,529 | ||||
MarineMax, Inc.* | 203,200 | 4,068,064 | ||||
McCormick & Schmick’s Seafood Restaurants, Inc.* | 25,800 | 669,252 | ||||
Men’s Wearhouse, Inc. | 75,500 | 2 | 3,855,785 | |||
Nautilus Group, Inc. | 510,900 | 6,151,236 | ||||
Orient-Express Hotels, Ltd. | 304,900 | 16,281,660 | ||||
Perry Ellis International, Inc.* | 36,800 | 1,183,856 | ||||
Priceline.com, Inc.* | 108,700 | 7,472,038 | ||||
Rare Hospitality International, Inc.* | 171,900 | 4,601,763 | ||||
Rent-A-Center, Inc.* | 117,900 | 2 | 3,092,517 | |||
Ross Stores, Inc. | 930,000 | 2 | 28,644,000 | |||
Ruby Tuesday, Inc. | 485,900 | 2 | 12,793,747 | |||
Saks, Inc. | 1,023,000 | 2 | 21,841,050 | |||
Shutterfly, Inc.* | 244,600 | 5,271,130 | ||||
Talbots, Inc. | 323,100 | 2 | 8,087,193 | |||
Texas Roadhouse, Inc., Class A* | 315,650 | 4,037,164 | ||||
Tupperware Corp. | 132,600 | 2 | 3,810,924 | |||
Universal Electronics, Inc.* | 74,575 | 2,708,564 | ||||
Visteon Corp.* | 4,395,300 | 2 | 35,601,930 | |||
Volcom, Inc.* | 66,600 | 2 | 3,338,658 | |||
Warnaco Group, Inc., The* | 500,400 | 19,685,736 | ||||
Wolverine World Wide, Inc. | 132,600 | 2 | 3,674,346 | |||
Total Consumer Discretionary | 472,203,586 | |||||
Consumer Staples - 0.7% | ||||||
B&G Foods, Inc. | 357,500 | 4,719,000 | ||||
Bare Escentuals, Inc.* | 196,875 | 6,723,281 | ||||
Inter Parfums, Inc. | 84,675 | 2,254,048 | ||||
Nash Finch Co. | 57,100 | 2,826,450 | ||||
Playtex Products, Inc.* | 90,200 | 1,335,862 | ||||
Total Consumer Staples | 17,858,641 | |||||
Energy - 3.7% | ||||||
Carrizo Oil & Gas, Inc.* | 150,850 | 6,255,750 | ||||
Comstock Resources, Inc.* | 503,400 | 2 | 15,086,898 | |||
Dawson Geophysical Co.* | 40,500 | 2,489,130 | ||||
Edge Petroleum Corp.* | 318,700 | 4,464,987 | ||||
Gulfmark Offshore, Inc.* | 49,700 | 2 | 2,545,634 | |||
Key Energy Services, Inc.* | 364,100 | 6,746,773 | ||||
Matrix Service Co.* | 95,800 | 2,380,630 | ||||
Oceaneering International, Inc.* | 95,850 | 2 | 5,045,544 | |||
Overseas Shipholding Group, Inc. | 84,768 | 6,900,115 | ||||
Parallel Petroleum Corp.* | 202,925 | 4,444,058 | ||||
Parker Drilling, Co.* | 265,200 | 2,795,208 | ||||
Petroquest Energy, Inc.* | 337,850 | 4,912,339 | ||||
Pogo Producing Co. | 484,200 | 24,592,518 | ||||
W-H Energy Services, Inc.* | 97,600 | 2 | 6,042,416 | |||
Willbros Group, Inc.* | 112,175 | 2 | 3,329,354 | |||
Total Energy | 98,031,354 | |||||
Financials - 13.3% | ||||||
American Financial Group, Inc. | 39,250 | 1,340,388 | ||||
American National Insurance Co. | 68,950 | 10,521,770 | ||||
American Physicians Capital, Inc.* | 25,750 | 1,042,875 | ||||
Argonaut Group, Inc.* | 36,800 | 1,148,528 | ||||
Aspen Insurance Holdings, Ltd. | 385,600 | 10,823,792 | ||||
Bank of the Ozarks, Inc. | 23,300 | 649,371 | ||||
BankUnited Financial Corp., Class A | 601,088 | 12,063,836 | ||||
BioMed Realty Trust, Inc. | 55,300 | 2 | 1,389,136 | |||
Brown & Brown, Inc. | 530,200 | 13,329,228 | ||||
CompuCredit Corp.* | 212,400 | 2 | 7,438,248 | |||
The accompanying notes are an integral part of these financial statements.
6
Table of Contents
Managers Special Equity Fund
Schedule of Portfolio Investments (continued)
| Shares | Value | |||||
Financials - 13.3% (continued) | ||||||
Cowen Group, Inc.* | 294,953 | $ | 5,282,608 | |||
Delphi Financial Group, Inc., Class A | 214,250 | 8,959,935 | ||||
Downey Financial Corp. | 393,380 | 25,955,212 | ||||
Entertainment Properties Trust | 23,900 | 2 | 1,285,342 | |||
Financial Federal Corp. | 34,700 | 1,034,754 | ||||
First Cash Financial Services, Inc.* | 103,100 | 2,416,664 | ||||
GFI Group, Inc.* | 180,675 | 13,095,324 | ||||
Hanover Insurance Group, Inc. | 231,900 | 11,314,401 | ||||
Harleysville Group, Inc. | 18,600 | 620,496 | ||||
Hercules Technology Growth Capital, Inc. | 276,900 | 3,740,919 | ||||
Hilb, Rogal & Hamilton Co. | 305,500 | 13,093,730 | ||||
Inland Real Estate Corp. | 81,000 | 2 | 1,375,380 | |||
iStar Financial, Inc. | 333,500 | 14,784,055 | ||||
Lazard, Ltd., Class A | 254,825 | 11,474,770 | ||||
MarketAxess Holdings, Inc.* | 257,525 | 4,632,875 | ||||
MCG Capital Corp. | 456,778 | 7,317,584 | ||||
Meadowbrook Insurance Group, Inc.* | 77,400 | 848,304 | ||||
MI Developments, Inc., Class A | 1,589,100 | 57,906,804 | ||||
National Western Life Insurance Co., Class A | 12,000 | 3,035,040 | ||||
Navigators Group, Inc.* | 12,900 | 695,310 | ||||
Philadelphia Consolidated Holding Co.* | 121,600 | 2 | 5,082,880 | |||
Phoenix Companies, Inc., The | 138,100 | 2 | 2,072,881 | |||
Portfolio Recovery Associates, Inc. | 90,200 | 5,413,804 | ||||
Preferred Bank of Los Angeles | 22,200 | 888,000 | ||||
ProAssurance Corp.* | 36,800 | 2 | 2,048,656 | |||
Prosperity Bancshares, Inc. | 263,200 | 2 | 8,622,432 | |||
Provident Bankshares Corp. | 293,265 | 2 | 9,613,227 | |||
RAM Holdings, Ltd.* | 472,600 | 7,443,450 | ||||
Reinsurance Group of America, Inc. | 242,300 | 14,596,152 | ||||
Safety Insurance Group, Inc. | 18,400 | 761,760 | ||||
SeaBright Insurance Holdings, Inc.* | 396,435 | 6,929,684 | ||||
South Financial Group, Inc., The | 225,000 | 5,094,000 | ||||
Sterling Bancshares, Inc. | 141,800 | 1,603,758 | ||||
Sterling Financial Corp. | 404,740 | 2 | 11,713,176 | |||
Sunstone Hotel Investors, Inc. | 58,900 | 2 | 1,672,171 | |||
SVB Financial Group* | 64,500 | 2 | 3,425,595 | |||
Tower Group, Inc. | 77,400 | 2,469,060 | ||||
TradeStation Group, Inc.* | 402,400 | 4,687,960 | ||||
UCBH Holdings, Inc. | 222,800 | 2 | 4,070,556 | |||
United PanAm Financial Corp.* | 226,700 | 3,232,742 | ||||
World Acceptance Corp.* | 71,800 | 3,068,014 | ||||
Total Financials | 353,126,637 | |||||
Health Care - 8.7% | ||||||
Amedisys, Inc.* | 108,700 | 3,949,071 | ||||
American Medical Systems Holdings, Inc.* | 116,400 | 2 | 2,099,856 | |||
Analogic Corp. | 31,300 | 2,300,863 | ||||
Cardica, Inc.* | 154,500 | 942,450 | ||||
Centene Corp.* | 581,000 | 12,445,020 | ||||
Cepheid, Inc.* | 521,800 | 7,618,280 | ||||
Charles River Laboratories International, Inc.* | 335,616 | 17,324,498 | ||||
Chemed Corp. | 81,000 | 2 | 5,369,490 | |||
Conceptus, Inc.* | 264,600 | 5,125,302 | ||||
Cubist Pharmaceuticals, Inc.* | 148,300 | 2,922,993 | ||||
Gen-Probe, Inc.* | 300,600 | 18,162,252 | ||||
Greatbatch, Inc.* | 45,600 | 1,477,440 | ||||
HealthExtras, Inc.* | 97,600 | 2,887,008 | ||||
Healthways, Inc.* | 99,300 | 2 | 4,703,841 | |||
Hologic, Inc.* | 289,750 | 2 | 16,026,072 | |||
Illumina, Inc.* | 358,200 | 14,539,338 | ||||
IMS Health, Inc. | 684,181 | 2 | 21,982,736 | |||
Integra LifeSciences Holdings Corp.* | 53,400 | 2 | 2,639,028 | |||
Intuitive Surgical, Inc.* | 123,875 | 2 | 17,190,134 | |||
inVentiv Health, Inc.* | 128,900 | 2 | 4,719,029 | |||
Inverness Medical Innovations, Inc.* | 193,575 | 9,876,196 | ||||
Medcath Corp.* | 44,200 | 1,405,560 | ||||
Meridian Bioscience, Inc. | 93,900 | 2,033,874 | ||||
NxStage Medical, Inc.* | 280,000 | 3,620,400 | ||||
Omnicell, Inc.* | 612,925 | 12,736,582 | ||||
Parexel International Corp.* | 60,800 | 2,557,248 | ||||
PharmaNet Development Group, Inc.* | 81,000 | 2,582,280 | ||||
Phase Forward, Inc.* | 147,800 | 2,487,474 | ||||
Sciele Pharma, Inc.* | 197,100 | 4,643,676 | ||||
Universal Health Services, Inc., Class B | 170,000 | 10,455,000 | ||||
Varian, Inc.* | 64,500 | 2 | 3,536,535 | |||
Vital Images, Inc.* | 20,200 | 548,632 | ||||
WellCare Health Plans, Inc.* | 90,200 | 8,164,002 | ||||
West Pharmaceutical Services, Inc. | 40,500 | 2 | 1,909,575 | |||
Total Health Care | 230,981,735 | |||||
Industrials - 16.1% | ||||||
AAR Corp.* | 259,200 | 2 | 8,556,192 | |||
Acco Brands Corp.* | 162,600 | 2 | 3,747,930 | |||
Advisory Board Co., The* | 36,800 | 2,044,608 | ||||
Air France-KLM, ADR | 948,178 | 44,080,795 | ||||
Airtran Holdings, Inc.* | 327,991 | 3,581,662 | ||||
The accompanying notes are an integral part of these financial statements.
7
Table of Contents
Managers Special Equity Fund
Schedule of Portfolio Investments (continued)
| Shares | Value | |||||
Industrials - 16.1% (continued) | ||||||
Alaska Airgroup, Inc.* | 615,000 | $ | 17,133,900 | |||
Allegiant Travel Co.* | 168,325 | 5,174,310 | ||||
Axsys Technologies, Inc.* | 223,150 | 4,773,178 | ||||
BE Aerospace, Inc.* | 156,250 | 6,453,125 | ||||
Bucyrus International, Inc. | 183,700 | 13,002,286 | ||||
CAI International, Inc.* | 256,500 | 3,380,670 | ||||
Carlisle Co., Inc. | 208,400 | 2 | 9,692,684 | |||
Cascade Corp. | 35,000 | 2,745,400 | ||||
CDI Corp. | 25,800 | 2 | 830,760 | |||
Ceradyne, Inc.* | 103,100 | 2 | 7,625,276 | |||
Comfort Systems USA, Inc. | 264,500 | 3,750,610 | ||||
Consolidated Graphics, Inc.* | 143,240 | 9,923,667 | ||||
Crane Co. | 231,700 | 10,530,765 | ||||
Diamond Management & Technology Consultants, Inc. | 66,300 | 2 | 875,160 | |||
DRS Technologies, Inc. | 41,700 | 2 | 2,388,159 | |||
Dynamic Materials Corp. | 38,000 | 1,425,000 | ||||
EMCOR Group, Inc.* | 172,175 | 12,551,558 | ||||
Force Protection, Inc.* | 608,725 | 12,564,084 | ||||
Fuel-Tech, Inc.* | 232,200 | 7,952,850 | ||||
Genco Shipping & Trading, Ltd. | 57,150 | 2,358,009 | ||||
Genlyte Group, Inc.* | 121,650 | 2 | 9,554,391 | |||
Heidrick & Struggles International, Inc.* | 203,300 | 10,417,092 | ||||
Houston Wire & Cable Co.* | 143,800 | 4,085,358 | ||||
Hub Group, Inc.* | 231,975 | 8,156,241 | ||||
Infrasource Services, Inc.* | 123,800 | 4,592,980 | ||||
Kaydon Corp. | 70,000 | 2 | 3,648,400 | |||
Knoll, Inc. | 123,400 | 2,764,160 | ||||
Korn/Ferry International* | 75,500 | 1,982,630 | ||||
Layne Christensen Co.* | 175,484 | 7,186,070 | ||||
Moog, Inc., Class A* | 40,500 | 2 | 1,786,455 | |||
NCI Building Systems, Inc.* | 252,700 | 12,465,691 | ||||
Perini Corp.* | 245,700 | 2 | 15,117,921 | |||
Precision Castparts Corp. | 160,200 | 2 | 19,441,872 | |||
Quanta Services, Inc.* | 374,775 | 11,494,349 | ||||
Raven Industries, Inc. | 131,700 | 4,703,007 | ||||
Regal-Beloit Corp. | 62,600 | 2 | 2,913,404 | |||
Ryder System, Inc. | 78,200 | 4,207,160 | ||||
Sequa Corp., Class A* | 99,600 | 11,155,200 | ||||
Sequa Corp., Class B* | 38,300 | 4,303,771 | ||||
Skywest, Inc. | 288,460 | 6,874,002 | ||||
Spherion Corp.* | 618,600 | 5,808,654 | ||||
Stanley, Inc.* | 176,800 | 3,115,216 | ||||
Tecumseh Products Co., Class B* | 191,688 | 2,848,484 | ||||
Teledyne Technologies, Inc.* | 64,500 | 2 | 2,963,775 | |||
Tennant Co. | 117,400 | 4,285,100 | ||||
Tetra Technologies, Inc.* | 321,900 | 2 | 6,936,945 | |||
Toro Co. | 145,700 | 2 | 8,580,273 | |||
Triumph Group, Inc. | 78,000 | 2 | 5,106,660 | |||
United Rentals, Inc.* | 259,100 | 8,431,114 | ||||
URS Corp.* | 203,150 | 9,862,932 | ||||
Valmont Industries, Inc. | 33,200 | 2 | 2,415,632 | |||
Wabtec Corp. | 99,500 | 2 | 3,634,735 | |||
Walter Industries, Inc. | 281,400 | 8,149,344 | ||||
Washington Group International, Inc.* | 69,300 | 5,544,693 | ||||
Watson Wyatt & Co. | 68,100 | 2 | 3,437,688 | |||
Total Industrials | 425,114,037 | |||||
Information Technology - 30.6% | ||||||
Acacia Research Corp.* | 157,019 | 2,537,427 | ||||
ADC Telecommunications, Inc.* | 289,200 | 2 | 5,301,036 | |||
Advanced Energy Industries, Inc.* | 90,200 | 2,043,932 | ||||
Airspan Networks, Inc.* | 1,289,619 | 4,681,317 | ||||
AMIS Holdings, Inc.* | 623,749 | 7,809,337 | ||||
Anaren Microwave, Inc.* | 209,600 | 3,691,056 | ||||
Andrew Corp.* | 794,000 | 2 | 11,465,360 | |||
ANSYS, Inc.* | 533,300 | 14,132,450 | ||||
Applied Micro Circuits Corp.* | 2,267,300 | 5,668,250 | ||||
aQuantive, Inc.* | 276,200 | 2 | 17,621,560 | |||
Arris Group, Inc.* | 1,566,725 | 27,558,693 | ||||
Aspen Technology, Inc.* | 1,086,800 | 15,215,200 | ||||
ATMI, Inc.* | 306,000 | 9,180,000 | ||||
AudioCodes, Ltd.* | 912,600 | 5,128,812 | ||||
Authorize.Net Holdings, Inc.* | 175,000 | 2 | 3,130,750 | |||
Benchmark Electronics, Inc.* | 225,350 | 5,097,417 | ||||
Borland Software Corp.* | 202,400 | 2 | 1,202,256 | |||
Bottomline Technologies, Inc.* | 64,500 | 796,575 | ||||
Brocade Communications Systems, Inc. | 582,000 | 2 | 4,551,240 | |||
CalAmp Corp.* | 200,261 | 827,078 | ||||
C-Cor, Inc.* | 609,000 | 8,562,540 | ||||
Checkpoint Systems, Inc.* | 498,600 | 12,589,650 | ||||
Ciena Corp.* | 359,900 | 2 | 13,003,187 | |||
CommScope, Inc.* | 176,500 | 10,298,775 | ||||
CommVault Systems, Inc.* | 316,303 | 5,462,553 | ||||
CyberSource Corp.* | 377,500 | 2 | 4,552,650 | |||
Daktronics, Inc. | 179,400 | 3,853,512 | ||||
Diodes, Inc.* | 103,100 | 4,306,487 | ||||
The accompanying notes are an integral part of these financial statements.
8
Table of Contents
Managers Special Equity Fund
Schedule of Portfolio Investments (continued)
| Shares | Value | |||||
Information Technology - 30.6% (continued) | ||||||
Dycom Industries, Inc.* | 512,700 | $ | 15,370,746 | |||
eCollege.com* | 515,200 | 11,463,200 | ||||
eFunds Corp* | 364,100 | 12,849,089 | ||||
Electronics for Imaging, Inc.* | 359,081 | 2 | 10,133,266 | |||
EMCORE Corp.* | 827,300 | 4,508,785 | ||||
Equinix, Inc.* | 217,600 | 19,903,872 | ||||
Exfo Electro-Optical Engineering, Inc.* | 867,938 | 6,058,207 | ||||
Fairchild Semiconductor International, Inc.* | 763,800 | 14,756,616 | ||||
FEI Co.* | 619,500 | 20,108,970 | ||||
Formfactor, Inc.* | 419,600 | 2 | 16,070,680 | |||
GigaMedia Ltd.* | 173,500 | 2,338,780 | ||||
Global Payments, Inc. | 137,000 | 2 | 5,432,050 | |||
Greenfield Online, Inc.* | 42,400 | 674,584 | ||||
Harris Stratex Networks, Inc.* | 237,122 | 4,263,454 | ||||
Himax Technologies, Inc.* | 751,900 | 4,338,463 | ||||
Hittite Microwave Corp.* | 304,625 | 13,016,626 | ||||
Hutchinson Technology, Inc.* | 459,000 | 8,633,790 | ||||
L-1 Identity Solutions, Inc.* | 700,925 | 2 | 14,333,916 | |||
Internap Network Services Corp.* | 245,300 | 3,537,226 | ||||
Interwoven, Inc.* | 75,500 | 1,060,020 | ||||
IXYS Corp.* | 382,100 | 3,190,535 | ||||
J2 Global Communications, Inc.* | 108,700 | 2 | 3,793,630 | |||
Limelight Networks, Inc.* | 264,425 | 2 | 5,230,326 | |||
Macrovision Corp.* | 109,600 | 2 | 3,294,576 | |||
Manhattan Associates, Inc.* | 60,800 | 1,696,928 | ||||
Mattson Technology, Inc.* | 334,800 | 3,247,560 | ||||
MAXIMUS, Inc. | 39,200 | 2 | 1,700,496 | |||
Net 1 UEPS Technologies, Inc.* | 614,600 | 2 | 14,842,590 | |||
Netgear, Inc.* | 138,100 | 2 | 5,006,125 | |||
NICE Systems, Ltd.* | 133,175 | 4,626,500 | ||||
Novatel Wireless, Inc.* | 180,500 | 4,696,610 | ||||
Nuance Communications, Inc.* | 1,406,600 | 2 | 23,532,418 | |||
Opnext, Inc.* | 107,800 | 1,427,272 | ||||
Opsware, Inc.* | 552,000 | 5,249,520 | ||||
Parametric Technology Corp.* | 440,080 | 2 | 9,510,129 | |||
Perficient, Inc.* | 465,800 | 9,642,060 | ||||
Perot Systems Corp.* | 820,310 | 13,978,082 | ||||
Photon Dynamics, Inc.* | 700,700 | 7,637,630 | ||||
Plexus Corp.* | 145,900 | 3,354,241 | ||||
Polycom, Inc.* | 291,575 | 9,796,920 | ||||
Power Integrations, Inc.* | 678,800 | 17,784,560 | ||||
RADVision Ltd.* | 287,400 | 6,044,022 | ||||
Rimage Corp.* | 90,300 | 2,852,577 | ||||
Rogers Corp.* | 153,400 | 5,675,800 | ||||
Rudolph Technologies, Inc.* | 462,400 | 7,680,464 | ||||
Salesforce.com, Inc.* | 74,000 | 3,171,640 | ||||
Scopus Video Neworks, Ltd.* | 688,200 | 3,441,000 | ||||
Semiconductor Manufacturing International Corp.* | 5,592,500 | 2 | 38,532,324 | |||
Semtech Corp.* | 201,300 | 2 | 3,488,529 | |||
Silicon Motion Technology Corp., ADR* | 98,450 | 2,444,514 | ||||
SkillSoft PLC* | 252,700 | 2,347,583 | ||||
Smart Modular Technologies (WWH), Inc.* | 820,301 | 11,287,342 | ||||
Solectron Corp* | 4,318,200 | 2 | 15,890,976 | |||
Spansion, Inc., Class A* | 2,571,200 | 28,540,320 | ||||
SPSS, Inc.* | 74,500 | 2 | 3,288,430 | |||
Stratasys, Inc.* | 103,750 | 4,874,175 | ||||
Super Micro Computer, Inc.* | 265,600 | 2,658,656 | ||||
Switch and Data, Inc.* | 133,325 | 2,558,507 | ||||
SYNNEX Corp.* | 393,500 | 8,110,035 | ||||
Synopsys, Inc.* | 356,400 | 9,419,652 | ||||
Tech Data Corp.* | 685,000 | 2 | 26,345,100 | |||
Terayon Communication Systems, Inc.* 4 | 5,597,600 | 9,851,776 | ||||
THQ, Inc.* | 128,600 | 2 | 3,924,872 | |||
Transaction Systems Architects, Inc.* | 123,800 | 4,167,108 | ||||
Triquint Semiconductor, Inc.* | 1,840,850 | 9,314,701 | ||||
Utstarcom, Inc.* | 400,000 | 2,244,000 | ||||
VeriFone Holdings, Inc.* | 234,200 | 2 | 8,255,550 | |||
Vishay Intertechnology, Inc.* | 713,900 | 11,293,897 | ||||
Vocus, Inc.* | 35,000 | 878,850 | ||||
Wright Express Corp.* | 439,800 | 15,071,946 | ||||
Zoran Corp* | 175,000 | 3,507,000 | ||||
Zygo Corp.* | 60,800 | 868,832 | ||||
Total Information Technology | 810,390,326 | |||||
Materials - 1.5% | ||||||
AptarGroup, Inc. | 109,400 | 2 | 3,890,264 | |||
Cytec Industries, Inc. | 221,000 | 2 | 14,093,170 | |||
Flotek Industries, Inc.* | 21,575 | 2 | 1,293,421 | |||
GrafTech International Ltd.* | 224,700 | 2 | 3,783,948 | |||
HB Fuller Co. | 197,100 | 2 | 5,891,319 | |||
Hercules, Inc.* | 184,200 | 2 | 3,619,530 | |||
Quanex Corp. | 93,900 | 2 | 4,572,930 | |||
Rock-Tenn Co. | 40,500 | 1,284,660 | ||||
Spartech Corp. | 51,600 | 1,369,980 | ||||
Total Materials | 39,799,222 | |||||
The accompanying notes are an integral part of these financial statements.
9
Table of Contents
Managers Special Equity Fund
Schedule of Portfolio Investments (continued)
| Shares | Value | ||||||
Telecommunication Services - 1.5% | |||||||
Aruba Networks, Inc.* | 174,157 | 2 | $ | 3,500,556 | |||
Cincinnati Bell, Inc.* | 1,584,019 | 9,155,630 | |||||
Cogent Communications Group, Inc.* | 180,175 | 5,381,827 | |||||
General Communication, Inc., Class A* | 878,100 | 11,248,461 | |||||
InPhonic, Inc.* | 456,906 | 2,129,182 | |||||
Premiere Global Services, Inc.* | 160,200 | 2,085,804 | |||||
Syniverse Holdings, Inc.* | 374,600 | 4,817,356 | |||||
Total Telecommunication Services | 38,318,816 | ||||||
Utilities - 0.6% | |||||||
Avista Corp. | 703,000 | 15,149,650 | |||||
Total Common Stocks | |||||||
(cost $1,898,737,783) | 2,500,974,004 | ||||||
Warrants - 0.4% | |||||||
Air France-KLM (cost $1,361,928) | 861,980 | 11,559,152 | |||||
Other Short Term Investments-18.3%1 | |||||||
Bank of New York Institutional Cash Reserves Fund, 5.33%3 | 339,175,314 | 339,175,314 | |||||
JPMorgan Prime Money Market Fund, Institutional Class Shares, 5.19% | 110,611,499 | 110,611,499 | |||||
Vanguard Prime Money Market Fund, Institutional Class Shares, 5.24% | 34,932,822 | 34,932,822 | |||||
Total Other Short Term Investments | |||||||
(cost $484,719,635) | 484,719,635 | ||||||
Total Investments - 113.2% | |||||||
(cost $2,384,819,346) | 2,997,252,791 | ||||||
Other Assets, less Liabilities - (13.2)% | (349,796,961 | ) | |||||
Net Assets - 100% | $ | 2,647,455,830 | |||||
Based on the approximate cost of investments of $2,402,806,052 for Federal income tax purposes at June 30, 2007, the aggregate gross unrealized appreciation and depreciation were $662,346,195 and $67,899,456, respectively, resulting in net unrealized appreciation of investments of $594,446,739.
| * | Non-income-producing securities. |
1 | Yield shown for an investment company represents the June 30, 2007, seven-day average yield, which refers to the sum of the previous seven days’ dividends paid, expressed as an annual percentage. |
2 | Some or all of these shares were out on loan to various brokers as of June 30, 2007, amounting to a market value of $327,528,867, or approximately 12.4 % of net assets. |
3 | Collateral received from brokers for securities lending was invested in this short-term investment. |
4 | Affiliated Company – See Note 6 in the Notes to Financial Statements. |
The accompanying notes are an integral part of these financial statements.
10
Table of Contents
Statement of Assets and Liabilities
June 30, 2007 (unaudited)
Assets: | ||||
Investments at value (including securities on loan valued at $327,528,867) | $ | 2,997,252,791 | ||
Receivable for investments sold | 16,879,344 | |||
Receivable for Fund shares sold | 3,220,928 | |||
Dividends, interest and other receivables | 1,555,934 | |||
Prepaid expenses | 101,574 | |||
Total assets | 3,019,010,571 | |||
Liabilities: | ||||
Payable to Custodian | 8,445,506 | |||
Payable for Fund shares repurchased | 4,318,584 | |||
Payable upon return of securities loaned | 339,175,314 | |||
Payable for investments purchased | 15,115,888 | |||
Accrued expenses: | ||||
Investment advisory and management fees | 2,011,924 | |||
Administrative fees | 558,868 | |||
Other | 1,928,657 | |||
Total liabilities | 371,554,741 | |||
Net Assets | $ | 2,647,455,830 | ||
Managers Shares: | ||||
Net Assets | $ | 2,259,213,098 | ||
Shares outstanding | 24,792,779 | |||
Net asset value, offering and redemption price per share | $ | 91.12 | ||
Institutional Class Shares: | ||||
Net Assets | $ | 388,242,732 | ||
Shares outstanding | 4,225,331 | |||
Net asset value, offering and redemption price per share | $ | 91.88 | ||
Net Assets Represent: | ||||
Paid-in capital | $ | 1,703,337,645 | ||
Undistributed net investment loss | (8,404,615 | ) | ||
Accumulated net realized gain from investments | 340,089,355 | |||
Net unrealized appreciation of investments | 612,433,445 | |||
Net Assets | $ | 2,647,455,830 | ||
* Investments at cost | $ | 2,384,819,346 |
The accompanying notes are an integral part of these financial statements.
11
Table of Contents
Statement of Operations
For the six months ended June 30, 2007 (unaudited)
Investment Income: | ||||
Dividend income | $ | 10,665,761 | ||
Foreign withholding tax | (71,510 | ) | ||
Securities lending fees | 484,101 | |||
Total investment income | 11,078,352 | |||
Expenses: | ||||
Investment management fees | 12,837,894 | |||
Administrative fees | 3,566,082 | |||
Transfer agent/Shareholder Servicing fees | 3,294,874 | |||
Custodian | 294,230 | |||
Professional fees | 270,800 | |||
Trustees fees and expenses | 108,007 | |||
Reports to shareholders | 84,033 | |||
Registration fees | 37,272 | |||
Miscellaneous | 75,258 | |||
Total expenses before offsets | 20,568,450 | |||
Expense reductions | (412,044 | ) | ||
Net expenses | 20,156,406 | |||
Net investment loss | (9,078,054 | ) | ||
Net Realized and Unrealized Gain (Loss): | ||||
Net realized gain on investment transactions | 282,189,085 | |||
Net unrealized depreciation of investments | (323,071 | ) | ||
Net realized and unrealized gain | 281,866,014 | |||
Net Increase in Net Assets Resulting from Operations | $ | 272,787,960 | ||
The accompanying notes are an integral part of these financial statements.
12
Table of Contents
Statement of Changes in Net Assets
For the six months ended June 30, 2007 (unaudited) and for the year ended December 31, 2006
| 2007 | 2006 | |||||||
Increase (Decrease) in Net Assets From Operations: | ||||||||
Net investment loss | $ | (9,078,054 | ) | $ | (3,566,911 | ) | ||
Net realized gain on investments | 282,189,085 | 459,675,943 | ||||||
Net unrealized depreciation of investments | (323,071 | ) | (106,987,301 | ) | ||||
Net increase in net assets resulting from operations | 272,787,960 | 349,121,731 | ||||||
Distributions to Shareholders: | ||||||||
From net realized gain on investments: | ||||||||
Managers Class | — | (365,600,521 | ) | |||||
Institutional Class | — | (80,218,690 | ) | |||||
Total distributions to shareholders | — | (445,819,211 | ) | |||||
From Capital Share Transactions: | ||||||||
Managers Class: | ||||||||
Proceeds from sale of shares | 161,154,964 | 497,790,367 | ||||||
Reinvestment of distributions | — | 333,256,656 | ||||||
Cost of shares repurchased | (682,964,885 | ) | (1,038,280,018 | ) | ||||
Net decrease from capital share transactions | (521,809,921 | ) | (207,232,995 | ) | ||||
Institutional Class: | ||||||||
Proceeds from sale of shares | 109,267,750 | 146,171,560 | ||||||
Reinvestment of distributions | — | 70,000,901 | ||||||
Cost of shares repurchased | (326,486,996 | ) | (143,399,760 | ) | ||||
Net increase (decrease) from capital share transactions | (217,219,246 | ) | 72,772,701 | |||||
Net decrease from capital share transactions | (739,029,167 | ) | (134,460,294 | ) | ||||
Total decrease in net assets | (466,241,207 | ) | (231,157,774 | ) | ||||
Net Assets: | ||||||||
Beginning of period | 3,113,697,037 | 3,344,854,811 | ||||||
End of period | $ | 2,647,455,830 | $ | 3,113,697,037 | ||||
End of period undistributed net investment income (loss) | $ | (8,404,615 | ) | $ | 673,439 | |||
Share Transactions: | ||||||||
Managers Class: | ||||||||
Sale of shares | 1,854,652 | 5,448,864 | ||||||
Reinvested shares from distributions | — | 4,027,757 | ||||||
Shares repurchased | (7,818,570 | ) | (11,381,596 | ) | ||||
Net decrease in shares | (5,963,918 | ) | (1,904,975 | ) | ||||
Institutional Class: | ||||||||
Sale of shares | 1,238,774 | 1,591,644 | ||||||
Reinvested shares from distributions | — | 840,044 | ||||||
Shares repurchased | (3,739,388 | ) | (1,568,031 | ) | ||||
Net increase (decrease) in shares | (2,500,614 | ) | 863,657 | |||||
The accompanying notes are an integral part of these financial statements.
13
Table of Contents
Financial Highlights
For a share outstanding throughout each period
| For the six months ended June 30, 2007 | For the year ended December 31, | |||||||||||||||||||||||
Managers Class: | (unaudited) | 2006 | 2005 | 2004 | 2003 | 2002 | ||||||||||||||||||
Net Asset Value, Beginning of Period | $ | 82.96 | $ | 86.78 | $ | 90.42 | $ | 78.48 | $ | 55.08 | $ | 70.59 | ||||||||||||
Income from Investment Operations: | ||||||||||||||||||||||||
Net investment loss | (0.30 | )5 | (0.14 | )5 | (0.54 | )5 | (0.56 | ) | (0.43 | ) | (0.34 | ) | ||||||||||||
Net realized and unrealized gain (loss) on investments | 8.46 | 9.88 | 4.18 | 12.50 | 23.83 | (15.17 | ) | |||||||||||||||||
Total from investment operations | 8.16 | 9.74 | 3.64 | 11.94 | 23.40 | (15.51 | ) | |||||||||||||||||
Less Distributions to Shareholders from: | ||||||||||||||||||||||||
Net realized gain on investments | — | (13.56 | ) | (7.28 | ) | — | — | — | ||||||||||||||||
Net Asset Value, End of Period | $ | 91.12 | $ | 82.96 | $ | 86.78 | $ | 90.42 | $ | 78.48 | $ | 55.08 | ||||||||||||
Total Return 1 | 9.84 | %2 | 11.28 | % | 4.00 | % | 15.18 | % | 42.50 | % | (21.98 | )% | ||||||||||||
Ratio of net expenses to average net assets 1 | 1.45 | %3 | 1.42 | % | 1.40 | % | 1.40 | % | 1.43 | % | 1.31 | % | ||||||||||||
Ratio of total expenses to average net assets 1, 4 | 1.48 | %3 | 1.47 | % | 1.45 | % | 1.45 | % | 1.46 | % | 1.32 | % | ||||||||||||
Ratio of net investment loss to average net assets | (0.67 | )%3 | (0.15 | )% | (0.60 | )% | (0.69 | )% | (0.72 | )% | (0.56 | )% | ||||||||||||
Portfolio turnover | 30 | %2 | 76 | % | 80 | % | 68 | % | 64 | % | 67 | % | ||||||||||||
Net assets at end of period (000’s omitted) | $ | 2,259,213 | $ | 2,551,703 | $ | 2,834,314 | $ | 3,415,003 | $ | 3,279,318 | $ | 2,020,821 | ||||||||||||
| For the six months ended June 30, 2007 (unaudited) | For the year ended December 31, | For the period* ended December 31, | ||||||||||||||
Institutional Class: | 2006 | 2005 | 2004 | |||||||||||||
Net Asset Value, Beginning of Period | $ | 83.56 | $ | 87.09 | $ | 90.56 | $ | 78.91 | ||||||||
Income from Investment Operations: | ||||||||||||||||
Net investment income (loss) | (0.33 | )5 | 0.10 | 5 | (0.33 | )5 | (0.21 | ) | ||||||||
Net realized and unrealized gain on investments | 8.65 | 9.93 | 4.14 | 11.86 | ||||||||||||
Total from investment operations | 8.32 | 10.03 | 3.81 | 11.65 | ||||||||||||
Less Distributions to Shareholders from: | ||||||||||||||||
Net realized gain on investments | — | (13.56 | ) | (7.28 | ) | — | ||||||||||
Net Asset Value, End of Period | $ | 91.88 | $ | 83.56 | $ | 87.09 | $ | 90.56 | ||||||||
Total Return 1 | 9.96 | %2 6 | 11.56 | %6 | 4.21 | % | 14.75 | %2 | ||||||||
Ratio of net expenses to average net assets 1 | 1.20 | %3 | 1.18 | % | 1.20 | % | 1.20 | %3 | ||||||||
Ratio of total expenses to average net assets 1, 4 | 1.23 | %3 | 1.23 | % | 1.25 | % | 1.26 | %3 | ||||||||
Ratio of net investment income (loss) to average net assets | (0.42 | )%3 | 0.09 | % | (0.56 | )% | (0.49 | )%3 | ||||||||
Portfolio turnover | 30 | %2 | 76 | % | 80 | % | 68 | %2 | ||||||||
Net assets at end of period (000’s omitted) | $ | 388,243 | $ | 561,994 | $ | 510,541 | $ | 274,010 | ||||||||
| * | Commencement of operations was May 3, 2004. |
1 | Total returns and net investment income would have been lower had certain expenses not been reduced. (See Note 1c of Notes to Financial Statements.) |
2 | Not Annualized. |
3 | Annualized. |
4 | Excludes the impact of fee waivers and expense offsets such as brokerage credits, but includes non-reimbursable expenses such as interest and taxes. (See Note 1c to the Notes to Financial Statements.) |
5 | Per share numbers have been calculated using average shares. |
6 | The Total Return is based on the Financial Statement Net Asset Values as shown above. |
14
Table of Contents
Notes to Financial Statements
June 30, 2007 (unaudited)
| 1. | Summary of Significant Accounting Policies |
The Managers Funds (the “Trust”) is an open-end management investment company organized as a Massachusetts business trust and registered under the Investment Company Act of 1940, as amended (the “1940 Act”). Currently, the Trust is comprised of a number of investment series. Included in this report is the Managers Special Equity Fund (the “Fund”).
Special Equity offers both Managers Class shares and Institutional Class shares. The Institutional Class shares, which are designed primarily for institutional investors that meet certain administrative and servicing criteria, have a minimum investment of $2,500,000. Managers Class shares are offered to all other investors. Each class represents interest in the same assets of Special Equity and the classes are identical except for class specific expenses related to different distribution and shareholder servicing arrangements, which may result in differences in the expenses borne indirectly by the shareholders of each class and the returns realized by such shareholders. Investment income, realized and unrealized capital gains and losses, the common expenses of Special Equity, and certain Fund level expense reductions, if any, are allocated on a pro rata basis to each class based on the relative net assets of each class to the total net assets of Special Equity. Both classes have equal voting privileges except that each class has exclusive voting rights with respect to its services and/or distribution plan.
The Fund’s financial statements are prepared in accordance with accounting principles generally accepted in the United States of America, which require management to make estimates and assumptions that affect the reported amount of assets and liabilities and disclosure of contingent assets and liabilities at the date of the financial statements and the reported amounts of income and expenses during the reporting period. Actual results could differ from those estimates. The following is a summary of significant accounting policies followed by the Fund in the preparation of its financial statements:
| a. | Valuation of Investments |
Equity securities traded on a domestic or international securities exchange are generally valued at the last quoted sale price, or, lacking any sales, at the last quoted bid price. Over-the-counter securities are valued at the Nasdaq Official Closing Price, if one is available. Lacking any sales, over-the-counter securities, are valued at the last quoted bid price. The Fund’s investments are generally valued based on market quotations by third-party pricing services approved by the Board of Trustees of the Fund. Under certain circumstances, the value of a Fund investment may be based on an evaluation of its fair value, pursuant to procedures established by and under the general supervision of the Board of Trustees of the Trust. The Fund may use the fair value of a portfolio security to calculate its NAV when, for example, (1) market quotations are not readily available because a portfolio security is not traded in a public market or the principal market in which the security trades is closed, (2) trading in a portfolio security is suspended and not resumed prior to the time as of which the Fund calculates its NAV, (3) where a significant event affecting the value of a portfolio security is determined to have occurred between the time of the market quotation provided for a portfolio security and the time as of which the Fund calculates its NAV, (4) a security’s price has remained unchanged over a period of time (often referred to as a “stale price”), or (5) the Investment Manager determines that a market quotation is inaccurate. The Investment Manager monitors intervening events that may affect the value of securities held in the Fund’s portfolio and, in accordance with procedures adopted by the Fund’s Trustees, will adjust the prices of securities traded in foreign markets, as appropriate, to reflect the impact of events occurring subsequent to the close of such markets but prior to the time each Fund’s NAV is calculated. Fixed-income securities are valued based on valuations furnished by independent pricing services that utilize matrix systems, which reflect such factors as security prices, yields, maturities and ratings, and are supplemented by dealer and exchange quotations. Short-term investments having a remaining maturity of 60 days or less are valued at amortized cost, which approximates market value. Investments in other regulated investment companies are valued at their end of day net asset value per share except iShares or other ETF’s, which are valued the same as equity securities. Securities (including derivatives) for which market quotations are not readily available are valued at fair value, as determined in good faith, and pursuant to procedures adopted by the Board of Trustees of the Trust.
Investments in certain securities such as preferred stocks are valued on the basis of valuations provided by dealers or by a pricing service which uses information with respect to transactions in such securities, and various relationships between securities in determining value.
The values assigned to fair value investments are based on available information and do not necessarily represent amounts that might ultimately be realized, since such amounts depend on future developments inherent in long-term investments. Further, because of the inherent uncertainty of valuation, those estimated values may differ significantly from the values that would have been used had a ready market for the investments existed, and the differences could be material.
| b. | Security Transactions |
Security transactions are accounted for as of the trade date. Realized gains and losses on securities sold are determined on the basis of identified cost.
| c. | Investment Income and Expenses |
Dividend income is recorded on the ex-dividend date except certain dividends from foreign securities where the ex-dividend date may have passed. These dividends are recorded as soon as the Trust is informed of the ex-dividend date. Dividend income on foreign securities is recorded net of any withholding tax. Interest income, which includes amortization of premium and accretion of discount on debt securities, is accrued as earned. Non-cash dividends included in dividend income, if any, are reported at the fair market value of the securities received. Other income and expenses are recorded on an accrual basis. Expenses that cannot be directly attributed to a fund are apportioned among the Funds in the Trust and in some cases other affiliated funds based upon their relative average net assets or number of shareholders.
The Fund had certain portfolio trades directed to various brokers who paid a portion of the Fund’s expenses. For the six months ended June 30, 2007, under these arrangements the amount by which the Fund’s expenses were reduced and the impact on the expense ratios was as follows: $400,288 or 0.03% annualized.
The Fund has a “balance credit” arrangement with The Bank of New York (“BNY”), the Fund’s custodian, whereby the Fund is
15
Table of Contents
Managers Special Equity Fund
Notes to Financial Statements (continued)
credited with an interest factor equal to 1% below the effective 90-day T-Bill rate for account balances left uninvested overnight. This credit serves to reduce the custody expense that would otherwise be charged to the Fund. For the six months ended June 30, 2007, the custodian expense was reduced by $2,286 under this arrangement.
The Trust also has a balance credit arrangement with its Transfer Agent, PFPC, Inc., whereby earnings credits are used to offset banking charges. For the six months ended June 30, 2007, the Fund’s portion of the transfer agent expense was reduced by $9,470 under this arrangement.
Total returns and net investment income for the Fund would have been lower had certain expenses not been offset.
| d. | Dividends and Distributions |
Dividends resulting from net investment income, if any, normally will be declared and paid annually. Distributions of capital gains, if any, will be made on an annual basis and when required for Federal excise tax purposes. Income and capital gain distributions are determined in accordance with Federal income tax regulations, which may differ from generally accepted accounting principles. These differences are primarily due to differing treatments for losses deferred due to wash sales, equalization accounting for tax purposes, foreign currency and market discount transactions. Permanent book and tax basis differences, if any, relating to shareholder distributions will result in reclassifications to paid-in capital.
| e. | Federal Taxes |
The Fund intends to comply with the requirements under Subchapter M of the Internal Revenue Code of 1986, as amended, to distribute substantially all of its taxable income and gains to its shareholders and to meet certain diversification and income requirements with respect to investment companies. Therefore, no provision for Federal income or excise tax is included in the accompanying financial statements.
| f. | Capital Loss Carryovers |
As of June 30, 2007, the Fund had no accumulated net realized capital loss carryover from securities transactions for Federal income tax purposes.
| g. | Capital Stock |
The Trust’s Declaration of Trust authorizes for each series the issuance of an unlimited number of shares of beneficial interest, without par value. The Fund records sales and repurchases of its capital stock on the trade date. Dividends and distributions to shareholders are recorded on the ex-dividend date.
At June 30, 2007 certain unaffiliated shareholders, specifically omnibus accounts, individually held greater than 10% of the outstanding shares of the Fund: Managers Class shares – two collectively own 39%; Institutional Class shares – two collectively own 37%. Transactions by these shareholders may have a material impact on the Fund or the class.
| 2. | Agreements and Transactions with Affiliates |
The Trust has entered into an Investment Management Agreement under which Managers Investment Group LLC (the “Investment Manager”), an indirect wholly-owned subsidiary of Affiliated Managers Group, Inc. (“AMG”), provides or oversees investment management services to the Fund. The Investment Manager selects subadvisors for the Fund (subject to Trustee approval), allocates assets among subadvisors and monitors the subadvisor’s investment programs and results. The Fund’s investment portfolio is managed by portfolio managers who serve pursuant to Subadvisory Agreements with the Investment Manager. Investment management fees are paid directly by the Fund to the Investment Manager at the rate of 0.90% per annum.
The Trust has entered into an Administration and Shareholder Servicing Agreement under which Managers Investment Group LLC serves as the Fund’s administrator (the “Administrator”) and is responsible for all aspects of managing the Fund’s operations, including administration and shareholder services to the Fund, its shareholders, and certain institutions, such as bank trust departments, broker-dealers and registered investment advisers, that advise or act as an intermediary with the Fund’s shareholders. The Fund pays a fee to the Administrator at the rate of 0.25% per annum of the Fund’s average daily net assets for this service.
The aggregate annual retainer paid to each Independent Trustee is $55,000, plus $4,000 or $2,000 for each regular or special meeting attended, respectively. The Trustees’ fees and expenses are allocated amongst all of the Funds for which Managers Investment Group LLC serves as the Investment Manager based on the relative net assets of such Funds. The Independent Chairman of the Trust receives an additional payment of $10,000 per year and the Chairman of the Audit Committee receives an additional $2,000 per year. The “Trustee fees and expenses” shown in the financial statements represent the Fund’s allocated portion of the total fees and expenses paid by the Managers Funds.
The Fund is distributed by Managers Distributors, Inc. (“MDI”), a wholly-owned subsidiary of Managers Investment Group LLC. Managers Distributors, Inc. (the “Distributor”) serves as the principal underwriter for the Fund. The Distributor is a registered broker-dealer and member of the Financial Industry Regulatory Authority (“FINRA”). Shares of the Fund will be continuously offered and will be sold by brokers, dealers or other financial intermediaries who have executed selling agreements with the Distributor. The Distributor bears all the expenses of providing services pursuant to an Underwriting Agreement, including the payment of the expenses relating to the distribution of Prospectuses for sales purposes and any advertising or sales literature. Certain Trustees and Officers of the Fund are Officers and/or Directors of the Investment Manager, AMG and/or MDI.
| 3. | Purchases and Sales of Securities |
Purchases and sales of securities, excluding short-term securities, for the six months ended June 30, 2007, were $808,180,857 and $1,444,003,832, respectively. There were no purchases or sales of U.S. Government securities.
| 4. | Portfolio Securities Loaned |
The Fund may participate in a securities lending program offered by BNY providing for the lending of equities, corporate bonds and government securities to qualified brokers. Collateral on all securities loaned is accepted in cash and/or government securities. Collateral is maintained at a minimum level of 102% of the market value, plus interest, if applicable, of investments on loan. Collateral received in the form of cash is invested temporarily in institutional money market funds or other short-term investments by BNY. Securities lending fees
16
Table of Contents
Managers Special Equity Fund
Notes to Financial Statements (continued)
include earnings of such temporary cash investments, plus or minus any rebate to a borrower. These earnings (after any rebate) are then divided between BNY, as a fee for its services under the program, and the Fund according to agreed-upon rates.
| 5. | Commitments and Contingencies |
In the normal course of business, the Fund may enter into contracts and agreements that contain a variety of representations and warranties, which provide general indemnifications. The maximum exposure to the Fund under these arrangements is unknown, as this would involve future claims that may be against the Fund that have not yet occurred. However, based on experience, the Fund expects the risks of loss to be remote.
| 6. | Transactions with Affiliated Companies |
An affiliated company is a company that is directly or indirectly controlled by a related party or a company in which a fund has ownership of at least 5% of the voting securities. Transactions during the six months ended June 30, 2007, with companies which are or were affiliates are as follows:
Affiliate | Purchase Cost | Sales Cost | Gain/Loss | Dividend Income | Market Value June 30, 2007 | % Ownership of Affiliate | ||||||||
Terayon Communications Systems, Inc. | — | — | — | — | $ | 9,851,776 | 7.21 | % | ||||||
| 7. | New Accounting Pronouncements |
The Financial Accounting Standards Board (“FASB”) has recently issued Interpretation No. 48, “Accounting for Uncertainty in Income Taxes – an Interpretation of FASB Statement No. 109 (the “Interpretation”), which applies to all registered investment companies and clarifies the accounting for uncertain tax positions. The Interpretation is effective for financial statements for fiscal years beginning after December 15, 2006. FIN 48 will be effective for the Fund’s fiscal year ended December 31, 2007. Based on analysis computed to date, management does not believe the adoption of FIN 48 will result in any material impact to the Fund’s financial statements.
In addition, in September 2006, Statement of Financial Accounting Standards No. 157, Fair Value Measurements (“SFAS 157”), was issued and is effective for fiscal years beginning after November 15, 2007. SFAS 157 defines fair value, establishes a framework for measuring fair value and expands disclosures about fair value measurements. Management is currently evaluating the impact, if any, the adoption of SFAS 157 will have on the Fund’s financial statements.
17
Table of Contents
Annual Renewal of Investment Advisory Agreements (unaudited)
On June 8, 2007, the Board of Trustees, including a majority of the Trustees who are not “interested persons” of the Trust (the “Independent Trustees”), approved the Investment Management Agreement with the Investment Manager for the Managers Special Equity Fund (the “Fund”) and the Subadvisory Agreement for each Subadvisor of the Fund. The Independent Trustees were separately represented by independent counsel in connection with their consideration of the approval of these agreements. In considering the Investment Management and Subadvisory Agreements, the Trustees reviewed a variety of materials relating to the Fund, the Investment Manager and each Subadvisor, including comparative performance, fee and expense information for an appropriate peer group of similar mutual funds (the “Peer Group”), performance information for the relevant benchmark index (the “Fund Benchmark”) and other information regarding the nature, extent and quality of services provided by the Investment Manager and the Subadvisors under their respective agreements. The Trustees also took into account performance, fee and expense information regarding the Fund provided to them on a quarterly basis throughout the year. Prior to voting, the Independent Trustees: (a) reviewed the foregoing information with their independent legal counsel and with management; (b) received materials from their independent legal counsel discussing the legal standards applicable to their consideration of the Investment Management Agreement and the Subadvisory Agreements; and (c) met with their independent legal counsel in private sessions at which no representatives of management were present.
Nature, extent and quality of services. In considering the nature, extent and quality of the services provided by the Investment Manager, the Trustees reviewed information relating to the Investment Manager’s operations and personnel. Among other things, the Investment Manager provided financial information, biographical information on its supervisory and professional staff and descriptions of its organizational and management structure. The Trustees also took into account information provided periodically throughout the previous year by the Investment Manager relating to the performance of its duties with respect to the Fund and the Trustees’ familiarity with the Investment Manager’s management through Board meetings, discussions and reports. In the course of their deliberations regarding the Investment Management Agreement, the Trustees evaluated, among other things: (a) the quality of the search, selection and monitoring services performed by the Investment Manager in overseeing the portfolio management responsibilities of the Subadvisors; (b) the Investment Manager’s ability to supervise the Fund’s other service providers; and (c) the Investment Manager’s compliance programs. With respect to the Fund’s investment in exchange-traded funds as a means to equitize the cash reserves segment of the Fund, the Trustees noted that the Investment Manager’s cash management services are in addition to and different from the services provided by the investment advisor to the exchange-traded funds in which the Fund invests. The Trustees also took into account the financial condition of the Investment Manager with respect to its ability to provide the services required under the Investment Management Agreement.
The Trustees also reviewed information relating to each Subadvisor’s operations and personnel and the investment philosophy, strategies and techniques (for each Subadvisor, its “Investment Strategy”) used in managing the portion of the Fund for which the Subadvisor has portfolio management responsibility. Among other things, the Trustees reviewed biographical information on portfolio management and other professional staff, information regarding each Subadvisor’s organizational and management structure and each Subadvisor’s brokerage policies and practices. The Trustees considered specific information provided regarding the experience of the individual or individuals at each Subadvisor with portfolio management responsibility for the portion of the Fund managed by the Subadvisor, including the information set forth in the Fund’s prospectus and statement of additional information. The Trustees also noted information provided by the Investment Manager regarding the manner in which each Subadvisor’s Investment Strategy complements those utilized by the Fund’s other Subadvisors. In the course of their deliberations, the Trustees evaluated, among other things: (a) the services rendered by the Subadvisor in the past; (b) the qualifications and experience of the Subadvisor’s personnel; and (c) the Subadvisor’s compliance programs. The Trustees also took into account the financial condition of each Subadvisor with respect to its ability to provide the services required under its Subadvisory Agreement.
Performance. Among other information relating to the Fund’s performance, the Trustees noted that the Fund’s performance for the 1-year, 3-year, 5-year and 10-year periods ended March 31, 2007 was above, below, below, and below, respectively, the median performance of the Peer Group and was below, below, below and above, respectively, the performance of the Fund Benchmark, which is the Russell 2000 Index. The Trustees noted management’s discussion of the Fund’s growth bias and the market environment during relevant time periods. The Trustees also took into account the Investment Strategies of the Fund’s Subadvisors relative to the investment strategies of the Fund’s Peer Group. The Trustees concluded that the Fund’s performance was satisfactory in light of all factors considered.
As noted above, the Board considered the Fund’s performance during relevant time periods as compared to the Fund’s Peer Group and noted that the Board reviews on a quarterly basis detailed information about the Fund’s performance results, portfolio composition and Investment Strategies, including with respect to the portion of the Fund managed by each Subadvisor. The Board noted the Investment Manager’s expertise and resources in monitoring the performance, investment style and risk adjusted performance of each Subadvisor. The Board also noted each Subadvisor’s performance record with respect to the Fund. The Board was mindful of the Investment Manager’s focus on each Subadvisor’s performance with respect to the Fund and the explanations of management regarding the factors that contributed to the performance of the Fund.
Advisory Fees and Profitability. In considering the reasonableness of the advisory fee charged by the Investment Manager for managing the Fund, the Trustees noted that the Investment Manager, and not the Fund, is responsible for paying the fees charged by the Fund’s Subadvisors and, therefore, that the fees paid to the Investment Manager cover the cost of providing portfolio management services as well as the cost of providing search, selection and monitoring services in operating a “manager-of-managers” complex of mutual funds. The Trustees concluded that, in light of the additional high quality supervisory services provided by the Investment Manager and the fact that the subadvisory fees are paid out of the advisory fee, the advisory fee payable by the Fund to the Investment Manager can reasonably be expected to exceed the median advisory fee for the Peer Group, which consists mostly of funds that do not operate with a manager-of-managers structure. The Trustees noted that the Fund’s advisory fee and total expenses as of December 31, 2006
18
Table of Contents
Annual Renewal of Investment Advisory Agreements (continued)
were higher and lower, respectively, than the average for the Fund’s Peer Group. The Trustees concluded that, in light of the nature, extent and quality of the services provided by the Investment Manager and the Subadvisors and the considerations noted above with respect to the Subadvisors and the Investment Manager, the Fund’s advisory fees are reasonable.
In considering the reasonableness of the advisory fee payable to the Investment Manager, the Trustees reviewed information provided by the Investment Manager setting forth all revenues and other benefits, both direct and indirect, received by the Investment Manager and its affiliates attributable to managing the Fund and all the mutual funds in the Managers Family of Funds, the cost of providing such services and the resulting profitability to the Investment Manager and its affiliates from these relationships. The Trustees also noted the current asset levels of the Fund and the impact on profitability of any future growth of assets of the Fund. In this regard, the Trustees noted that the Fund currently has six Subadvisors, each managing a portion of the Fund’s portfolio, and that the Investment Manager’s oversight and supervisory responsibilities with respect to the Fund have increased with the size of the Fund and the number of Subadvisors. The Trustees also noted that the subadvisory fees are paid by the Investment Manager out of its advisory fee. Based on the foregoing, the Trustees concluded that the profitability to the Investment Manager is reasonable and that the Investment Manager is not realizing material benefits from economies of scale that would warrant adjustments to the advisory fee at this time. With respect to economies of scale, the Trustees also noted that as the Fund’s assets increase over time, the Fund may realize other economies of scale to the extent that the increase in assets is proportionally greater than the increase in certain other expenses.
Subadvisory Fees and Profitability. In considering the reasonableness of the fee payable by the Investment Manager to each Subadvisor (other than Skyline Asset Management, L.P. (“Skyline”), which is an affiliate of the Investment Manager), the Trustees relied on the ability of the Investment Manager to negotiate the terms of each Subadvisory Agreement at arm’s length as part of the manager-of-managers structure, noting that the Investment Manager is not affiliated with these Subadvisors. In addition, the Trustees noted that the subadvisory fees are paid by the Investment Manager out of its advisory fee. Accordingly, the cost of services to be provided by each Subadvisor and the profitability to each Subadvisor of its relationship with the Fund were not material factors in the Trustees’ deliberations. For similar reasons, and based on the current size of the portion of the Fund managed by each Subadvisor, the Trustees concluded that the effect of any economies of scale being realized by the Subadvisors was not a material factor in the Trustees’ deliberations at this time.
In considering the reasonableness of the fee payable by the Investment Manager to Skyline, the Trustees noted that Skyline is an affiliate of the Investment Manager and reviewed information provided by Skyline regarding the cost to Skyline of providing subadvisory services to the Fund and the resulting profitability from such relationship. The Trustees also noted that the fee payable by the Investment Manager to Skyline under its Subadvisory Agreement is identical to the fee payable to each of the other Subadvisors of the Fund, none of which is an affiliate of the Investment Manager. The Trustees also noted that the subadvisory fee is paid by the Investment Manager out of the advisory fee. Accordingly, the cost of services to be provided by Skyline and the profitability to Skyline of its relationship with the Fund were not material factors in the Trustees’ deliberations. For similar reasons, and based on the current size of the portion of the Fund managed by each Subadvisor, the Trustees concluded that the effect of any economies of scale being realized by Skyline was not a material factor in the Trustees’ deliberations at this time.
* * * * *
After consideration of the foregoing, the Trustees also reached the following conclusions regarding the Investment Management Agreement and the Subadvisory Agreements with each of the Subadvisors, in addition to those conclusions discussed above: (a) the Investment Manager and each Subadvisor have demonstrated that they possess the capability and resources to perform the duties required of them under the Investment Management Agreement and the applicable Subadvisory Agreement; (b) each Subadvisor’s Investment Strategy is appropriate for pursuing the Fund’s investment objectives; (c) each Subadvisor is reasonably likely to execute its Investment Strategy consistently over time; and (d) the Investment Manager and each Subadvisor maintain appropriate compliance programs.
Based on all of the above-mentioned factors and their related conclusions, with no single factor or conclusion being determinative and with each Trustee not necessarily attributing the same weight to each factor, the Trustees concluded that approval of the Investment Management Agreement and each Subadvisory Agreement would be in the interests of the Fund and its shareholders. Accordingly, on June 8, 2007, the Trustees, including a majority of the Independent Trustees, voted to approve the Investment Management Agreement and the Subadvisory Agreement for each of the Fund Subadvisors.
19
Table of Contents
Investment Manager and Administrator
Managers Investment Group LLC
800 Connecticut Avenue
Norwalk, Connecticut 06854
(203) 299-3500 or (800) 835-3879
Distributor
Managers Distributors, Inc.
800 Connecticut Avenue
Norwalk, Connecticut 06854
(203) 299-3500 or (800) 835-3879
Custodian
The Bank of New York
2 Hanson Place
Brooklyn, New York 11217
Legal Counsel
Ropes & Gray LLP
One International Place
Boston, Massachusetts 02110-2624
Transfer Agent
PFPC, Inc.
attn: Managers
P.O. Box 9769
Providence, Rhode Island 02940
(800) 548-4539
Trustees
Jack W. Aber
William E. Chapman, II
Edward J. Kaier
William J. Nutt
Steven J. Paggioli
Eric Rakowski
Thomas R. Schneeweis
For Managers Choice Only
Managers
c/o PFPC, Inc.
P.O. Box 61204
King of Prussia, Pennsylvania 19406-0851
(800) 358-7668

Table of Contents
MANAGERSAND MANAGERS AMG EQUITY FUNDS | MANAGERSAND MANAGERS AMG | |||
| EMERGING MARKETS EQUITY | SMALL CAP | BALANCED FUNDS | ||
| Rexiter Capital Management Limited | TIMESSQUARE MID CAP GROWTH | CHICAGO EQUITY PARTNERS BALANCED | ||
| TIMESSQUARE SMALL CAP GROWTH | Chicago Equity Partners, LLC | |||
| ESSEX GROWTH | TimesSquare Capital Management, LLC | |||
| ESSEX LARGE CAP GROWTH | GLOBAL | |||
| ESSEX SMALL/MICRO CAP GROWTH | SMALL COMPANY | Armstrong Shaw Associates Inc. | ||
| Essex Investment Management Co., LLC | Epoch Investment Partners, Inc. | Alliance Bernstein L.P. | ||
| Kalmar Investment Advisers, Inc. | First Quadrant, L.P. | |||
| FQ TAX-MANAGED U.S. EQUITY | Kern Capital Management LLC | |||
| FQ U.S. EQUITY | SPECIAL EQUITY | Northstar Capital Management, Inc. | ||
| First Quadrant, L.P. | Donald Smith & Co., Inc. | Wellington Management Company, LLP | ||
| Kern Capital Management LLC | ||||
| INSTITUTIONAL MICRO-CAP | Skyline Asset Management, L.P. | ALTERNATIVE FUNDS | ||
| MICRO-CAP | Smith Asset Management Group, LP | FQ GLOBAL ALTERNATIVES | ||
| Kern Capital Management LLC | Veredus Asset Management LLC | First Quadrant, L.P. | ||
| Westport Asset Management, Inc. | ||||
| INTERNATIONAL EQUITY | MANAGERS | |||
| Alliance Bernstein L.P. | SYSTEMATIC VALUE | FIXED INCOME FUNDS | ||
| Lazard Asset Management, LLC | SYSTEMATIC MID CAP VALUE | BOND (MANAGERS) | ||
| Wellington Management Company, LLP | Systematic Financial Management, L.P. | FIXED INCOME | ||
| GLOBAL BOND | ||||
| CHICAGO EQUITY PARTNERS | VALUE | Loomis, Sayles & Company L.P. | ||
| MID-CAP | Armstrong Shaw Associates Inc. | |||
| Chicago Equity Partners, LLC | Osprey Partners Investment Mgmt., LLC | BOND (MANAGERS FREMONT) | ||
| Pacific Investment Management Co. LLC | ||||
| REAL ESTATE SECURITIES | ||||
| Urdang Securities Management, Inc. | CALIFORNIA INTERMEDIATE TAX-FREE | |||
| Evergreen Investment Management Co., LLC | ||||
This report is prepared for the Fund’s shareholders. It is authorized for distribution to prospective investors only when preceded or accompanied by an effective prospectus. To receive a free copy of the prospectus or Statement of Additional Information, which includes additional information about Fund Trustees, please contact us by calling 800.835.3879. Distributed by Managers Distributors, Inc., member FINRA.
A description of the policies and procedures each Fund uses to vote its proxies is available: (i) without charge, upon request, by calling 800.835.3879, or (ii) on the Securities and Exchange Commission’s (SEC) Web site at www.sec.gov. For information regarding each Fund’s proxy voting record for the 12- month period ended June 30, call 800.835.3879 or visit the SEC Web site at www.sec.gov.
The Fund files its complete schedule of portfolio holdings with the SEC for the first and third quarters of each fiscal year on Form N-Q. The Fund’s Forms N-Q are available on the SEC’s website at www.sec. gov. A Fund’s Forms N-Q may be reviewed and copied at the SEC’s Public Reference Room in Washington, DC. Information on the operation of the Public Reference Room may be obtained by calling 1-800-SEC-0330. To review a complete list of the Fund’s portfolio holdings, or to view the most recent quarterly holdings report, semiannual report, or annual report, please visit www.managersinvest.com. |
HIGH YIELD J.P. Morgan Investment Management Inc.
INTERMEDIATE DURATION GOVERNMENT SHORT DURATION GOVERNMENT Smith Breeden Associates, Inc.
MONEY MARKET JPMorgan Investment Advisors Inc. | |||
| www.managersinvest.com |  |
Table of Contents
SEMI-ANNUAL REPORT
Managers Funds
June 30, 2007
| • | Managers Value Fund |
| • | Managers AMG Essex Large Cap Growth Fund |
| • | Managers Small Company Fund |
| • | Managers International Equity Fund |
| • | Managers Emerging Markets Equity Fund |
| • | Managers Bond Fund |
| • | Managers Global Bond Fund |
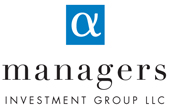
Table of Contents
The Managers Funds
Semi-Annual Report — June 30, 2007 (unaudited)
| Page | ||
| 1 | ||
| 3 | ||
| 4 | ||
FUND SNAPSHOTS AND SCHEDULES OF PORTFOLIO INVESTMENTS | ||
| 5 | ||
| 7 | ||
| 9 | ||
| 13 | ||
| 18 | ||
| 22 | ||
| 32 | ||
| 38 | ||
FINANCIAL STATEMENTS: | ||
| 39 | ||
Funds’ balance sheet, net asset value (NAV) per share computation and cumulative undistributed amount | ||
| 41 | ||
Detail of sources of income, Fund expenses, and realized and unrealized gains (losses) during the period | ||
| 43 | ||
Detail of changes in Fund assets for the past two periods | ||
| 45 | ||
Historical net asset values per share, distributions, total returns, expense ratios, turnover ratios and net assets | ||
| 49 | ||
Accounting and distribution policies, details of agreements and transactions with Fund management and affiliates, and descriptions of certain investment risks | ||
| 55 | ||
Nothing contained herein is to be considered an offer, sale or solicitation of an offer to buy shares of The Managers Funds or Managers AMG Funds. Such offering is made only by Prospectus, which includes details as to offering price and other material information.
Table of Contents
Dear Fellow Shareholder:
As most investors expected, the U.S. economy slowed over the course of the past six months and the rest of the world continued on a generally stable growth trajectory. Underpinned by a global economy performing generally within expectations, and, aside from a sharp and short-lived market correction beginning in late February, the domestic and foreign stock markets climbed steadily, providing strong gains for the period. For example, most domestic equity indices rose 7% or more during the period and international stocks provided stronger returns. Meanwhile, the bond market became increasingly volatile as the melt-down in the sub-prime lending sector caused a liquidity squeeze across other higher-risk sectors. This led investors to balance the perception that the growing global economy is putting pressure on inflation against the extent to which the liquidity squeeze will impede investment spending, acquisition activity and ultimately the U.S. and global economies.
Against this backdrop, your Funds produced positive results during the six-month period, as shown in the accompanying semiannual report.
While the strong equity market return may seem counterintuitive in the face of slowing earnings, a significantly deteriorating housing market and the stress fractures among the mortgage lending industry, there are several positive trends that led to these results. First, because of widespread belief that the economy would be slowing, investors’ expectations for earnings growth were relatively conservative, and most companies exceeded these modest expectations during the period. Furthermore, although the U.S. economy is slowing, we believe the global economy is healthy, and global growth is a significant contributor to U.S. companies’ earnings. Another important factor has been the relatively high amount of liquidity searching for return in a relatively low interest rate environment. A clear illustration of this is the enormous amount of money committed to private equity pools that are searching for and buying up public companies on a regular basis. Low volatility and low interest rates have encouraged investors to increase leverage, which has thus far been rewarding.
Speaking of interest rates, at the beginning of the year investors were confidently predicting and wishing that the Fed would reduce rates in the near future—consistent with the expectations for a real slowdown in the economy. Over the course of the first half of 2007, however expectations for a near-term rate cut evolved into uncertainty over the outlook for any rate cut at all, as the Fed has been satisfied to stand pat and communicate concerns balanced between too much inflation risk versus a slowing economy. Again, while the economy has slowed, we believe it does not appear to be falling into recession, and in fact improved during the second quarter. Although credit spreads remained tight into late May because of a high demand for yield and historically low default rates, spreads have widened significantly since then as the domino effect started by sub-prime lending defaults has prompted investors to rapidly reduce their risk exposure. Prices of high-yield bonds across all sectors have declined, the yield premium for credit default swaps (CDS) has expanded, and prices for investment grade corporate bonds have suffered, even without a deterioration in fundamental quality.
The extent and duration of this recent liquidity squeeze will be the key to the direction of the financial markets over the second half of the year. If this sharp sell off of risk is brief, as it was in February, and markets reach equilibrium within the third quarter, then we think the relatively sound fundamentals of the U.S. and global economies should only be mildly affected. Equity markets, which appear to us to be fairly valued under that scenario, will be free to move higher, default rates will remain low, and bond prices will recover. However, price declines in a leveraged marketplace have an ability to create a viscous cycle. If dominos continue to fall, forcing more investors to sell or hedge risky assets, even relatively liquid and high quality debt securities will trade lower. If the ample liquidity that has been driving profitability, acquisitions and the equity markets higher is restricted, the rise in cost of capital will hinder profitability, increase default rates and significantly deter investment spending which will, in our opinion, in time, weaken the U.S. economy.
Noting these risks and known stresses, we believe that the current strength of many foreign economies, the continued full U.S. employment picture, and the continued high levels of corporate free cash flow will all help to pull the U.S. economy through this technical liquidity squeeze. In addition, if the credit markets continue to deteriorate, we expect that the Fed will be inclined to add liquidity by reducing rates to mitigate the problem. Hence, we continue to believe that investors should maintain their portfolios with allocations near their long-run targets, rebalance if necessary and take full advantage of opportunities to participate in the growth of the global economy. In any event, investors will be well served by an appropriately balanced and globally diversified portfolio.
1
Table of Contents
Letter to Shareholders (continued)
One of our foremost goals at Managers Investment Group is to structure and manage mutual funds that will help our shareholders and clients become more successful in reaching their investment goals and objectives. Each of our Funds is geared to provide you with exposure to a specific asset class or segment of the market. Investors tend to use our Funds as part of their overall asset allocation in order to structure a well-diversified portfolio intended to meet individual needs. Most of our Funds are therefore designed to be building blocks.
The following report contains details for each of the Funds and covers the six-month period ended June 30, 2007. Should you have any questions about this report, or if you’d like to receive a Prospectus and additional information, including fees and expenses, for these or any of the other Funds in our family, please feel free to contact us at 1-800-835-3879, or visit our website at www.managersinvest.com. As always, please read the Prospectus carefully before you invest or send money.
If you are curious about how you can better diversify your investment program, visit the Knowledge Center on our Web site and view our articles in the investment strategies section. You can rest assured that under all market conditions our team is focused on delivering excellent investment management services for your benefit.
We thank you for your continued confidence and investment in The Managers Funds.
Sincerely,
 |  | |||
| John H. Streur | Tom Hoffman, CFA | |||
| Senior Managing Partner | Executive Vice President and CIO | |||
| Managers Investment Group LLC | Managers Investment Group LLC | |||
2
Table of Contents
About Your Fund’s Expenses (unaudited)
As a shareholder of the Fund, you may incur two types of costs: (1) transaction costs, which may include sales charges (loads) on purchase payments; redemption fees; and exchange fees; and (2) ongoing costs, including management fees; distribution (12b-1) fees; and other Fund expenses. This example is intended to help you understand your ongoing costs (in dollars) of investing in the Fund and to compare these costs with the ongoing costs of investing in other mutual funds. The example is based on an investment of $1,000 invested at the beginning of the period and held for the entire period as indicated below.
Actual Expenses
The first line of the table below provides information about the actual account values and actual expenses. You may use the information in this line, together with the amount you invested, to estimate the expenses that you paid over the period. Simply divide your account value by $1,000 (for example, an $8,600 account value divided by $1,000 = 8.6), then multiply the result by the number in the first line under the heading entitled “Expenses Paid During Period” to estimate the expenses you paid on your account during this period.
Hypothetical Example for Comparison Purposes
The second line of the table below provides information about hypothetical account values and hypothetical expenses based on the Fund’s actual expense ratio and an assumed annual rate of return of 5% before expenses, which is not the Fund’s actual return. The hypothetical account values and expenses may not be used to estimate the actual ending account balance or expenses you paid for the period. You may use this information to compare the ongoing costs of investing in the Fund and other funds by comparing this 5% hypothetical example with the 5% hypothetical examples that appear in the shareholder reports of other funds.
Please note that the expenses shown in the table are meant to highlight your ongoing costs only and do not reflect any transactional costs, such as sales charges (loads), redemption fees, or exchange fees. Therefore, the second line of the table is useful in comparing ongoing costs only, and will not help you determine the relative total costs of owning different funds.
Six Months Ended June 30, 2007 | Beginning Account Value 1/1/2007 | Ending Account Value 6/30/2007 | Expenses Paid During the Period* | ||||||
Managers Value Fund | |||||||||
Based on Actual Fund Return | $ | 1,000 | $ | 1,057 | $ | 5.91 | |||
Based on Hypothetical 5% Annual Return | $ | 1,000 | $ | 1,019 | $ | 5.81 | |||
AMG Essex Large Cap Growth Fund | |||||||||
Based on Actual Fund Return | $ | 1,000 | $ | 1,081 | $ | 6.50 | |||
Based on Hypothetical 5% Annual Return | $ | 1,000 | $ | 1,019 | $ | 6.31 | |||
Managers Small Company Fund | |||||||||
Based on Actual Fund Return | $ | 1,000 | $ | 1,111 | $ | 7.22 | |||
Based on Hypothetical 5% Annual Return | $ | 1,000 | $ | 1,018 | $ | 6.90 | |||
Managers International Equity Fund | |||||||||
Based on Actual Fund Return | $ | 1,000 | $ | 1,097 | $ | 7.49 | |||
Based on Hypothetical 5% Annual Return | $ | 1,000 | $ | 1,018 | $ | 7.20 | |||
Managers Emerging Markets Equity Fund | |||||||||
Based on Actual Fund Return | $ | 1,000 | $ | 1,164 | $ | 9.50 | |||
Based on Hypothetical 5% Annual Return | $ | 1,000 | $ | 1,016 | $ | 8.85 | |||
Managers Bond Fund | |||||||||
Based on Actual Fund Return | $ | 1,000 | $ | 1,009 | $ | 4.93 | |||
Based on Hypothetical 5% Annual Return | $ | 1,000 | $ | 1,020 | $ | 4.96 | |||
Managers Global Bond Fund | |||||||||
Based on Actual Fund Return | $ | 1,000 | $ | 1,003 | $ | 5.91 | |||
Based on Hypothetical 5% Annual Return | $ | 1,000 | $ | 1,019 | $ | 5.96 | |||
| * | Expenses are equal to the Fund’s annualized expense ratio multiplied by the average account value over the period, multiplied by the number of days in the most recent fiscal half-year (181), then divided by 365. |
3
Table of Contents
All periods ended June 30, 2007 (unaudited)
| Average Annual Total Returns 1 | |||||||||||||||||
The Managers Funds | Six Months | One Year | Five Years | Ten Years | Since Inception | Inception Date | |||||||||||
Managers Value Fund 2,4 | 5.65 | % | 21.53 | % | 10.31 | % | 7.78 | % | 11.88 | % | 10/31/1984 | ||||||
Russell 1000® Value Index 8 | 6.23 | % | 21.87 | % | 13.31 | % | 9.87 | % | N/A | ||||||||
S&P 500 Index 9 | 6.96 | % | 20.59 | % | 10.71 | % | 7.13 | % | 13.19 | % | |||||||
AMG Essex Large Cap Growth Fund 2 | 8.05 | % | 17.04 | % | 5.81 | % | 6.99 | % | 11.55 | % | 6/1/1984 | ||||||
Russell 1000® Growth Index 10 | 8.13 | % | 19.04 | % | 9.28 | % | 4.39 | % | N/A | ||||||||
S&P 500 Index 9 | 6.96 | % | 20.59 | % | 10.71 | % | 7.13 | % | 13.19 | % | |||||||
Managers Small Company Fund 2,4 | 11.11 | % | 19.18 | % | 12.78 | % | N/A | 4.14 | % | 6/19/2000 | |||||||
Russell 2000® Index 11 | 6.45 | % | 16.43 | % | 13.88 | % | 9.06 | % | 8.21 | % | |||||||
Managers International Equity Fund 2,5 | 9.74 | % | 26.36 | % | 15.75 | % | 7.40 | % | 11.31 | % | 12/31/1985 | ||||||
MSCI EAFE Index | 10.74 | % | 27.00 | % | 17.73 | % | 7.66 | % | 10.67 | % | |||||||
Managers Emerging Markets Equity Fund 2,6 | 16.41 | % | 48.30 | % | 29.92 | % | N/A | 15.88 | % | 2/9/1998 | |||||||
MSCI Emerging Markets Index | 17.75 | % | 45.45 | % | 30.66 | % | 9.40 | % | 13.63 | % | |||||||
Managers Bond Fund 2,3,7 | 0.88 | % | 8.63 | % | 6.62 | % | 6.98 | % | 9.35 | % | 6/1/1984 | ||||||
Lehman Brothers Government/Credit Index | 0.97 | % | 6.00 | % | 4.70 | % | 6.08 | % | N/A | ||||||||
Managers Global Bond Fund 2,3,5 | 0.28 | % | 4.85 | % | 8.29 | % | 5.20 | % | 5.36 | % | 3/25/1994 | ||||||
Lehman Brothers Global Aggregate Index | 0.39 | % | 4.67 | % | 6.28 | % | 5.56 | % | N/A | ||||||||
The performance data shown represents past performance. Past performance is not a guarantee of future results. Current performance may be lower or higher than the performance data quoted. The investment return and principal value of an investment in the Fund will fluctuate so that an investor’s shares, when redeemed, may be worth more or less than their original cost. For performance information through the most recent month end, please call (800) 835-3879 or visit our website at www.managersinvest.com.
In choosing a Fund, investors should carefully consider the amount they plan to invest, their investment objectives, the Fund’s investment objectives, risks, charges and expenses before investing. For this and other information, please call 800.835.3879 or visit www.managersinvest.com for a free prospectus. Read it carefully before investing or sending money. Distributed by Managers Distributors, Inc., member FINRA.
1 | Total return equals income yield plus share price change and assumes reinvestment of all dividends and capital gain distributions. Returns are net of fees and may reflect offsets of Fund expenses as described in the Prospectus. No adjustment has been made for taxes payable by shareholders on their reinvested dividends and capital gain distributions. Returns for periods greater than one year are annualized. The listed returns on the Fund are net of expenses. All returns are in U.S. dollars($). |
2 | Fund for which, from time to time, the Fund’s advisor has waived its fees and/or absorbed Fund expenses, which has resulted in higher returns. |
3 | Fixed-income funds are subject to the risks associated with investments in debt securities, such as default risk, fluctuations in debtor’s perceived ability to pay its creditors. Changing interest rates may adversely affect the value of an investment. An increase in interest rates typically causes the value of bonds and other fixed-income securities to fall. |
4 | The Fund is subject to risks associated with investments in small capitalization companies, such as erratic earnings patterns, competitive conditions, limited earnings history and a reliance on one or a limited number of products. |
5 | Investments in foreign securities are subject to additional risks such as changing market conditions, economic and political instability, and currency exchange rate fluctuations. |
6 | The Fund is subject to the risks associated with investments in emerging markets, such as erratic earnings patterns, economic and political instability, changing exchange controls, limitations on repatriation of foreign capital and changes in local governmental attitudes toward private investment, possibly leading to nationalization or confiscation of investor assets. |
7 | Investments in international securities are subject to certain risks of overseas investing including currency fluctuations and changes in political and economic conditions, which could result in significant market fluctuations. These risks are magnified in emerging markets. |
8 | The Russell 1000® Value is a large cap value index measuring the performance of the largest 1,000 U.S. incorporated companies with lower price-to-book ratios and lower forcasted growth values. Unlike the Fund, the Russell 1000® Value Index is unmanaged, is not available for investment, and does not incur expenses. The Russell 1000® Value Index is a trademark of the Frank Russell Company. Frank Russell® is a trademark of the Frank Russell Company. |
9 | The S&P 500 was the Fund’s prior benchmark. The Investment Manager changed the benchmark to the Russell 1000 Value for Managers Value Fund and the Russell 1000 Growth for AMG Essex Large Cap Growth Fund because it determined that each respective Index more accurately reflects the types of securities the Fund invests in. The S&P 500 Index is a market capitalization weighted index of 500 U.S. common stocks. The Index reflects no deduction of fees, expenses, or taxes. The S&P 500 Index is proprietary data of Standard & Poor’s, a division of the MacGraw-Hill Companies, Inc. All rights reserved. |
10 | Russell 1000® Growth Index measures the performance of those companies in the Russell 1000® Index with higher price-to book ratios and higher forecasted growth values. The Russell 1000® Index measures the performance of the 1,000 largest companies in the Russell 3000® Index, which measures the performance of the 3,000 largest U.S. companies based on total market capitalization. The Indexes reflect no deduction for fees, expenses, or taxes. The Russell 1000® Growth Index is a trademark of the Frank Russell Company. Frank Russell® is a trademark of the Frank Russell Company. |
11 | The Russell 2000® Index is composed of the 2,000 smallest companies of the 3,000 largest U.S. companies as measured by market capitalization and is accepted as a measure of small-cap stock performance. Unlike the Fund, the Russell 2000® Index is unmanaged, is not available for investment, and does not incur expenses. The Russell 2000® Index is a trademark of the Frank Russell Company. Frank Russell® is a trademark of the Frank Russell Company. An investment cannot be made directly into an Index. |
4
Table of Contents
Fund Snapshots
June 30, 2007 (unaudited)
Portfolio Breakdown
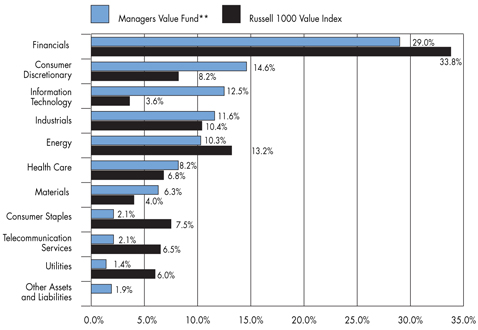
| ** | As a percentage of net assets |
Industry | Managers Value Fund** | Russell 1000 Value Index | ||||
Financials | 29.0 | % | 33.8 | % | ||
Consumer Discretionary | 14.6 | % | 8.2 | % | ||
Information Technology | 12.5 | % | 3.6 | % | ||
Industrials | 11.6 | % | 10.4 | % | ||
Energy | 10.3 | % | 13.2 | % | ||
Health Care | 8.2 | % | 6.8 | % | ||
Materials | 6.3 | % | 4.0 | % | ||
Consumer Staples | 2.1 | % | 7.5 | % | ||
Telecommunication Services | 2.1 | % | 6.5 | % | ||
Utilities | 1.4 | % | 6.0 | % | ||
Other Assets and Liabilities | 1.9 | % | 0.0 | % |
Top Ten Holdings
Security Name | Percentage of Net Assets | ||
American International Group, Inc.* | 4.5 | % | |
Bank of America Corp.* | 4.3 | ||
ChevronTexaco Corp.* | 4.1 | ||
Citigroup, Inc.* | 4.1 | ||
ConocoPhillips Co.* | 3.7 | ||
Nokia Corp., Sponsored ADR* | 3.0 | ||
Fannie Mae Co. | 2.7 | ||
Merrill Lynch & Co., Inc.* | 2.5 | ||
Ingram Micro, Inc., Class A | 2.2 | ||
CVS Corp. | 2.1 | ||
Top Ten as a Group | 33.2 | % | |
| * | Top Ten Holding at December 31, 2006 |
Any sectors, industries, or securities discussed should not be perceived as investment recommendations. Mention of a specific security should not be considered a recommendation to buy or solicitation to sell that security.
5
Table of Contents
Managers Value Fund
Schedule of Portfolio Investments
June 30, 2007 (unaudited)
| Shares | Value | ||||||
Common Stocks - 98.1% | |||||||
Consumer Discretionary - 14.6% | |||||||
Abercrombie & Fitch Co. | 21,500 | $ | 1,569,070 | ||||
Comcast Corp., Special Class A* | 62,040 | 1,734,638 | |||||
J.C. Penney Co., Inc. | 20,200 | 1,462,076 | |||||
Jarden Corp.* | 39,000 | 1,677,390 | |||||
Lowe’s Co., Inc. | 34,040 | 1,044,688 | |||||
Office Depot, Inc.* | 28,610 | 866,883 | |||||
Rent-A-Center, Inc.* | 39,500 | 1,036,085 | |||||
Time Warner Co., Inc. | 78,700 | 1,655,848 | |||||
Wyndham Worldwide Corp.* | 21,602 | 783,289 | |||||
Total Consumer Discretionary | 11,829,967 | ||||||
Consumer Staples - 2.1% | |||||||
CVS Corp. | 47,940 | 1,747,413 | |||||
Energy - 10.3% | |||||||
Baker Hughes, Inc. | 10,310 | 867,380 | |||||
ChevronTexaco Corp. | 40,000 | 3,369,600 | |||||
ConocoPhillips Co. | 38,430 | 3,016,756 | |||||
Devon Energy Corp. | 14,060 | 1,100,757 | |||||
Total Energy | 8,354,493 | ||||||
Financials - 29.0% | |||||||
ACE, Ltd. | 26,800 | 1,675,536 | |||||
American International Group, Inc. | 52,220 | 3,656,966 | |||||
Bank of America Corp. | 71,600 | 3,500,524 | |||||
Bear, Stearns & Co., Inc. | 9,600 | 2 | 1,344,000 | ||||
Capital One Financial Corp. | 18,403 | 1,443,531 | |||||
Citigroup, Inc. | 65,541 | 3,361,598 | |||||
Fannie Mae Co. | 34,100 | 2,227,753 | |||||
MBIA, Inc. | 26,300 | 1,636,386 | |||||
Merrill Lynch & Co., Inc. | 24,300 | 2,030,994 | |||||
Morgan Stanley Co. | 15,320 | 1,285,042 | |||||
Washington Mutual, Inc. | 32,400 | 1,381,536 | |||||
Total Financials | 23,543,866 | ||||||
Health Care - 8.2% | |||||||
Abbott Laboratories Co. | 18,650 | 998,708 | |||||
Boston Scientific Corp.* | 44,450 | 681,863 | |||||
GlaxoSmithKline PLC, Sponsored ADR | 31,000 | 1,623,470 | |||||
McKesson Corp. | 14,200 | 846,888 | |||||
Pfizer, Inc. | 60,300 | 1,541,870 | |||||
UnitedHealth Group, Inc. | 19,540 | 999,276 | |||||
Total Health Care | 6,692,075 | ||||||
Industrials - 11.6% | |||||||
Emerson Electric Co. | 13,600 | 636,480 | |||||
Empresa Brasileira de Aeronautica, S.A. | 34,100 | 1,643,961 | |||||
General Electric Co. | 39,075 | 1,495,791 | |||||
Ingersoll-Rand Co., Class A | 13,500 | 740,070 | |||||
Tyco International, Ltd. | 31,300 | 1,057,627 | |||||
United Parcel Service, Inc., Class B | 14,230 | 2 | 1,038,790 | ||||
United Technologies Corp. | 15,500 | 1,099,415 | |||||
Wesco International, Inc.* | 28,400 | 1,716,780 | |||||
Total Industrials | 9,428,914 | ||||||
Information Technology - 12.5% | |||||||
Cisco Systems, Inc.* | 38,800 | 1,080,580 | |||||
First Data Corp. | 40,320 | 1,317,254 | |||||
Ingram Micro, Inc., Class A* | 83,400 | 1,810,614 | |||||
International Business Machines Corp. | 7,980 | 839,895 | |||||
Nokia Corp., Sponsored ADR | 87,300 | 2,454,003 | |||||
QUALCOMM, Inc. | 19,100 | 2 | 828,749 | ||||
Symantec Corp.* | 41,630 | 2 | 840,926 | ||||
Xerox Corp.* | 55,110 | 1,018,433 | |||||
Total Information Technology | 10,190,454 | ||||||
Materials - 6.3% | |||||||
Cemex SAB de C.V. | 31,955 | 1,179,140 | |||||
Dow Chemical Co. | 31,400 | 1,388,507 | |||||
E.I. du Pont de Nemours & Co., Inc. | 25,400 | 2 | 1,291,336 | ||||
PPG Industries, Inc. | 17,100 | 2 | 1,301,481 | ||||
Total Materials | 5,160,464 | ||||||
Telecommunication Services - 2.1% | |||||||
Verizon Communications, Inc. | 41,200 | 2 | 1,696,204 | ||||
Utilities - 1.4% | |||||||
Exelon Corp. | 15,300 | 1,110,780 | |||||
Total Common Stocks | 79,754,630 | ||||||
Other Investment Companies - 8.6% 1 | |||||||
Bank of New York Institutional Cash Reserves Fund, 5.33% 3 | 5,605,658 | 5,605,658 | |||||
JPMorgan Prime Money Market Fund, Institutional Class Shares, 5.19% | 1,416,600 | 1,416,600 | |||||
Total Other Investment Companies | 7,022,258 | ||||||
Total Investments - 106.7% | 86,776,888 | ||||||
Other Assets, less Liabilities - (6.7)% | (5,481,227 | ) | |||||
Net Assets - 100% | $ | 81,295,661 | |||||
The accompanying notes are an integral part of these financial statements.
6
Table of Contents
Managers AMG Essex Large Cap Growth Fund
Fund Snapshots
June 30, 2007 (unaudited)
Portfolio Breakdown
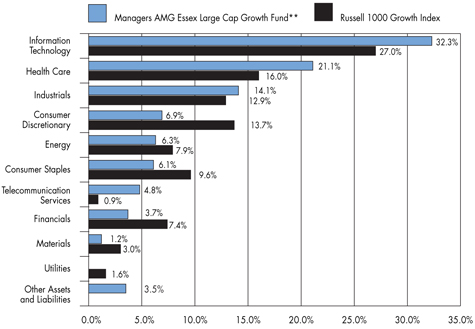
| ** | As a percentage of net assets |
Industry | Managers AMG Essex Large Cap Growth Fund** | Russell 1000 Growth Index | ||||
Information Technology | 32.3 | % | 27.0 | % | ||
Health Care | 21.1 | % | 16.0 | % | ||
Industrials | 14.1 | % | 12.9 | % | ||
Consumer Discretionary | 6.9 | % | 13.7 | % | ||
Energy | 6.3 | % | 7.9 | % | ||
Consumer Staples | 6.1 | % | 9.6 | % | ||
Telecommunication Services | 4.8 | % | 0.9 | % | ||
Financials | 3.7 | % | 7.4 | % | ||
Materials | 1.2 | % | 3.0 | % | ||
Utilities | 0.0 | % | 1.6 | % | ||
Other Assets and Liabilities | 3.5 | % | 0.0 | % |
Top Ten Holdings
Security Name | Percentage of Net Assets | ||
Google, Inc.* | 4.2 | % | |
BEA Systems, Inc. | 3.2 | ||
Deere & Co. | 3.2 | ||
Research In Motion, Ltd. | 3.2 | ||
Cisco Systems, Inc. | 3.1 | ||
General Electric Co.* | 3.0 | ||
Gilead Sciences, Inc.* | 2.7 | ||
NII Holdings, Inc., Class B | 2.7 | ||
Corning, Inc. | 2.6 | ||
Kohl’s Corp. | 2.5 | ||
Top Ten as a Group | 30.4 | % | |
| * | Top Ten Holding at December 31, 2006 |
Any sectors, industries, or securities discussed should not be perceived as investment recommendations. Mention of a specific security should not be considered a recommendation to buy or solicitation to sell that security.
7
Table of Contents
Managers AMG Essex Large Cap Growth Fund
Schedule of Portfolio Investments
June 30, 2007 (unaudited)
| Shares | Value | ||||||
Common Stocks - 96.5% | |||||||
Consumer Discretionary - 6.9% | |||||||
International Game Technology | 23,290 | 2 | $ | 924,613 | |||
Kohl’s Corp.* | 23,124 | 1,642,497 | |||||
McGraw-Hill Companies, Inc., The | 9,636 | 656,019 | |||||
News Corp., Inc., Class A | 60,246 | 1,277,818 | |||||
Total Consumer Discretionary | 4,500,947 | ||||||
Consumer Staples - 6.1% | |||||||
CVS Corp. | 43,204 | 1,574,786 | |||||
PepsiCo, Inc. | 14,708 | 953,814 | |||||
Procter & Gamble Co. | 23,511 | 1,438,638 | |||||
Total Consumer Staples | 3,967,238 | ||||||
Energy - 6.3% | |||||||
Cameco Corp. | 12,572 | 2 | 637,903 | ||||
Chesapeake Energy Corp. | 27,911 | 2 | 965,721 | ||||
Schlumberger, Ltd. | 17,138 | 1,455,702 | |||||
Southwestern Energy Co.* | 24,156 | 1,074,942 | |||||
Total Energy | 4,134,268 | ||||||
Financials - 3.7% | |||||||
CB Richard Ellis Group, Inc.* | 17,426 | 636,049 | |||||
Goldman Sachs Group, Inc. | 3,117 | 2 | 675,610 | ||||
Merrill Lynch & Co., Inc. | 12,815 | 1,071,077 | |||||
Total Financials | 2,382,736 | ||||||
Health Care - 21.1% | |||||||
Abbott Laboratories Co. | 28,439 | 1,522,908 | |||||
Alcon, Inc. | 7,001 | 944,505 | |||||
Baxter International, Inc. | 18,561 | 1,045,727 | |||||
Celgene Corp.* | 11,163 | 639,975 | |||||
Covance, Inc.* | 19,622 | 1,345,284 | |||||
Genentech, Inc.* | 21,296 | 1,611,255 | |||||
Genzyme Corp.* | 14,950 | 962,780 | |||||
Gilead Sciences, Inc.* | 45,738 | 1,773,263 | |||||
McKesson Corp. | 21,781 | 1,299,018 | |||||
Medco Health Solutions, Inc.* | 8,284 | 646,069 | |||||
Vertex Pharmaceuticals, Inc.* | 34,904 | 2 | 996,858 | ||||
Zimmer Holdings, Inc.* | 10,757 | 913,163 | |||||
Total Health Care | 13,700,805 | ||||||
Industrials - 14.1% | |||||||
AMR Corp.* | 50,675 | 1,335,286 | |||||
Boeing Co., The | 9,987 | 960,350 | |||||
Deere & Co. | 17,350 | 2,094,839 | |||||
General Cable Corp.* | 8,726 | 660,995 | |||||
General Electric Co. | 51,408 | 1,967,898 | |||||
Joy Global, Inc. | 21,501 | 2 | 1,254,153 | ||||
UTI Worldwide, Inc. | 33,167 | 888,544 | |||||
Total Industrials | 9,162,065 | ||||||
Information Technology - 32.3% | |||||||
Adobe Systems, Inc.* | 21,859 | 2 | 877,639 | ||||
BEA Systems, Inc.* | 153,904 | 2,106,946 | |||||
Broadcom Corp., Class A* | 30,730 | 898,852 | |||||
Brocade Communications Systems, Inc. | 205,911 | 1,610,224 | |||||
Cisco Systems, Inc.* | 71,236 | 1,983,923 | |||||
Corning, Inc.* | 65,632 | 1,676,898 | |||||
Google, Inc.* | 5,256 | 2,750,884 | |||||
Intel Corp. | 67,881 | 1,612,853 | |||||
MEMC Electronic Materials, Inc.* | 11,466 | 700,802 | |||||
Nvidia Corp.* | 30,836 | 2 | 1,273,835 | ||||
QUALCOMM, Inc. | 35,443 | 2 | 1,537,872 | ||||
Research In Motion, Ltd.* | 10,248 | 2,049,498 | |||||
Texas Instruments, Inc. | 26,079 | 2 | 981,353 | ||||
THQ, Inc.* | 31,229 | 2 | 953,109 | ||||
Total Information Technology | 21,014,688 | ||||||
Materials - 1.2% | |||||||
Potash Corp. of Saskatchewan | 9,690 | 2 | 755,529 | ||||
Telecommunication Services - 4.8% | |||||||
American Tower Corp., Class A* | 23,104 | 970,368 | |||||
MetroPCS Communications, Inc.* | 11,961 | 2 | 395,191 | ||||
NII Holdings, Inc., Class B* | 21,462 | 1,732,842 | |||||
Total Telecommunication Services | 3,098,401 | ||||||
Total Common Stocks (cost $53,551,119) | 62,716,677 | ||||||
Other Investment Companies - 18.0% 1 | |||||||
Bank of New York Institutional Cash Reserves Fund, 5.33% 3 | 9,599,839 | 9,599,839 | |||||
JPMorgan Prime Money Market Fund, Institutional Class Shares, 5.19% | 2,107,571 | 2,107,571 | |||||
Total Other Investment Companies | 11,707,410 | ||||||
Total Investments - 114.5% | 74,424,087 | ||||||
Other Assets, less Liabilities - (14.5)% | (9,408,294 | ) | |||||
Net Assets - 100% | $ | 65,015,793 | |||||
The accompanying notes are an integral part of these financial statements.
8
Table of Contents
Fund Snapshots
June 30, 2007 (unaudited)
Portfolio Breakdown
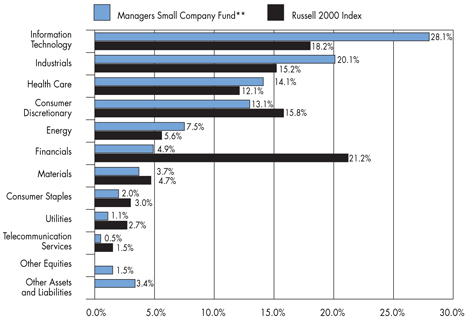
| ** | As a percentage of net assets |
Industry | Managers Small Company Fund** | Russell 2000 Index | ||||
Information Technology | 28.1 | % | 18.2 | % | ||
Industrials | 20.1 | % | 15.2 | % | ||
Health Care | 14.1 | % | 12.1 | % | ||
Consumer Discretionary | 13.1 | % | 15.8 | % | ||
Energy | 7.5 | % | 5.6 | % | ||
Financials | 4.9 | % | 21.2 | % | ||
Materials | 3.7 | % | 4.7 | % | ||
Consumer Staples | 2.0 | % | 3.0 | % | ||
Utilities | 1.1 | % | 2.7 | % | ||
Telecommunication Services | 0.5 | % | 1.5 | % | ||
Other Equities | 1.5 | % | 0.0 | % | ||
Other Assets and Liabilities | 3.4 | % | 0.0 | % |
Top Ten Holdings
Security Name | Percentage of Net Assets | ||
Service Corp. International* | 1.7 | % | |
Infocrossing, Inc.* | 1.5 | ||
iShares Russell 2000 Index Fund * | 1.5 | ||
Sonosite, Inc.* | 1.4 | ||
Kennametal, Inc. | 1.4 | ||
Florida East Coast Industries, Inc.* | 1.2 | ||
DeVry, Inc. | 1.2 | ||
EDO Corp. | 1.1 | ||
Inverness Medical Innovations, Inc. | 1.1 | ||
Toro Co. | 1.1 | ||
Top Ten as a Group | 13.2 | % | |
| * | Top Ten Holding at December 31, 2006 |
Any sectors, industries, or securities discussed should not be perceived as investment recommendations. Mention of a specific security should not be considered a recommendation to buy or solicitation to sell that security.
9
Table of Contents
Managers Small Company Fund
Schedule of Portfolio Investments
June 30, 2007 (unaudited)
| Shares | Value | |||||
Common Stocks - 95.1% | ||||||
Consumer Discretionary - 13.1% | ||||||
1-800-FLOWERS.COM, Inc.* | 32,429 | $ | 305,805 | |||
Aaron Rents, Inc. | 5,035 | 2 | 147,022 | |||
Arbitron, Inc. | 8,550 | 440,582 | ||||
BJ’s Restaurants, Inc.* | 4,200 | 82,908 | ||||
Carter’s, Inc.* | 5,050 | 130,997 | ||||
Charming Shoppes* | 18,100 | 2 | 196,023 | |||
Coldwater Creek, Inc.* | 9,070 | 210,696 | ||||
DeVry, Inc. | 14,620 | 497,372 | ||||
Fred’s, Inc. | 8,040 | 107,575 | ||||
GameStop Corp.* | 6,630 | 259,233 | ||||
Guitar Center, Inc.* | 4,350 | 260,174 | ||||
Life Time Fitness, Inc.* | 8,195 | 2 | 436,220 | |||
Luby’s, Inc.* | 9,390 | 90,707 | ||||
Multimedia Games, Inc.* | 18,620 | 237,591 | ||||
O’Reilly Automotive, Inc.* | 3,725 | 136,149 | ||||
Penn National Gaming, Inc.* | 3,400 | 204,306 | ||||
Pool Corp. | 3,800 | 2 | 148,314 | |||
Ruby Tuesday, Inc. | 6,300 | 2 | 165,879 | |||
Service Corp. International | 56,930 | 727,566 | ||||
Shuffle Master, Inc.* | 11,600 | 192,560 | ||||
Stride Rite Corp. | 9,400 | 190,444 | ||||
Tractor Supply Co.* | 6,880 | 2 | 358,104 | |||
Total Consumer Discretionary | 5,526,227 | |||||
Consumer Staples - 2.0% | ||||||
Central European Distribution Corp.* | 5,551 | 192,176 | ||||
Elizabeth Arden, Inc.* | 7,800 | 189,228 | ||||
Performance Food Group Co.* | 9,900 | 321,651 | ||||
Sunopta, Inc.* | 8,590 | 95,778 | ||||
Susser Holdings Corp.* | 2,870 | 46,523 | ||||
Total Consumer Staples | 845,356 | |||||
Energy - 7.5% | ||||||
Atwood Oceanics, Inc.* | 3,600 | 2 | 247,032 | |||
Clean Energy Fuels Corp.* | 5,830 | 73,225 | ||||
Core Laboratories N.V.* | 2,160 | 219,650 | ||||
Delta Petroleum Corp.* | 11,835 | 237,647 | ||||
Foundation Coal Holdings, Inc. | 5,470 | 222,301 | ||||
GMX Resources, Inc.* | 4,640 | 160,544 | ||||
Niko Resources, Ltd. | 4,700 | 427,980 | ||||
Oceaneering International, Inc.* | 3,800 | 200,032 | ||||
Parallel Petroleum Corp.* | 11,505 | 251,960 | ||||
Seacor Holdings, Inc.* | 2,500 | 2 | 233,400 | |||
Tidewater, Inc. | 2,895 | 205,198 | ||||
Ultra Petroleum Corp.* | 7,425 | 410,157 | ||||
Warren Resources, Inc.* | 25,070 | 292,818 | ||||
Total Energy | 3,181,944 | |||||
Financials - 4.9% | ||||||
Amcore Financial, Inc. | 6,100 | 176,839 | ||||
Boston Private Financial Holdings, Inc. | 3,275 | 87,999 | ||||
Education Realty Trust, Inc. | 11,350 | 159,240 | ||||
First Republic Bank | 2,450 | 131,467 | ||||
First State Bancorporation | 11,200 | 238,448 | ||||
National Financial Partners Corp. | 2,280 | 2 | 105,587 | |||
NorthStar Realty Finance Corp. | 28,000 | 350,281 | ||||
Signature Bank* | 11,760 | 401,016 | ||||
Tejon Ranch Co.* | 2,600 | 114,920 | ||||
UMB Financial Corp. | 7,750 | 285,742 | ||||
Total Financials | 2,051,539 | |||||
Health Care - 14.1% | ||||||
Analogic Corp. | 4,740 | 348,437 | ||||
Arrow International, Inc. | 4,400 | 168,432 | ||||
Bio-Reference Labs, Inc.* | 6,990 | 191,176 | ||||
Cambrex Corp. | 15,810 | 209,799 | ||||
Cooper Companies, Inc., The | 6,425 | 2 | 342,581 | |||
Covance, Inc.* | 4,690 | 321,546 | ||||
Endo Pharmaceuticals Holdings, Inc.* | 6,200 | 212,226 | ||||
HealthExtras, Inc.* | 6,870 | 2 | 203,215 | |||
Healthways, Inc.* | 6,660 | 315,484 | ||||
inVentiv Health, Inc.* | 7,880 | 288,487 | ||||
Inverness Medical Innovations, Inc.* | 9,050 | 461,731 | ||||
IRIS International, Inc.* | 13,300 | 223,972 | ||||
K-V Pharmaceutical Co., Class A* | 130 | 3,541 | ||||
LifeCell Corp.* | 9,070 | 276,998 | ||||
Pediatrix Medical Group, Inc.* | 4,400 | 242,660 | ||||
Phase Forward, Inc.* | 6,430 | 108,217 | ||||
PSS World Medical, Inc.* | 15,025 | 2 | 273,756 | |||
Resmed, Inc.* | 5,895 | 2 | 243,228 | |||
Respironics, Inc.* | 8,375 | 356,691 | ||||
Rural/Metro Corp.* | 39,790 | 227,201 | ||||
Sonosite, Inc.* | 19,200 | 603,456 | ||||
Sunrise Senior Living, Inc.* | 7,570 | 2 | 302,724 | |||
Total Health Care | 5,925,558 | |||||
The accompanying notes are an integral part of these financial statements.
10
Table of Contents
Managers Small Company Fund
Schedule of Portfolio Investments (continued)
| Shares | Value | |||||
Industrials - 20.1% | ||||||
Actuant Corp., Class A | 4,010 | $ | 252,871 | |||
Advisory Board Co., The* | 4,030 | 223,907 | ||||
Alliant Techsystems, Inc.* | 4,300 | 2 | 426,345 | |||
American Ecology Corp. | 16,650 | 356,643 | ||||
Beacon Roofing Supply, Inc.* | 6,110 | 2 | 103,809 | |||
Carlisle Co., Inc. | 3,750 | 174,412 | ||||
Chicago Bridge & Iron Co. N.V. | 11,325 | 427,406 | ||||
ChoicePoint, Inc.* | 4,425 | 187,841 | ||||
Corrections Corp. of America* | 5,882 | 371,213 | ||||
CoStar Group, Inc.* | 2,125 | 112,370 | ||||
DRS Technologies, Inc. | 6,800 | 2 | 389,436 | |||
EDO Corp. | 14,350 | 471,684 | ||||
Encore Wire Corp. | 7,800 | 229,645 | ||||
Florida East Coast Industries, Inc. | 6,080 | 504,518 | ||||
Goodman Global, Inc.* | 6,860 | 2 | 152,429 | |||
Healthcare Services Group | 6,800 | 200,600 | ||||
Hexcel Corp.* | 5,530 | 116,517 | ||||
ICT Group, Inc.* | 11,100 | 207,681 | ||||
IHS, Inc., Class A* | 5,280 | 242,880 | ||||
Kennametal, Inc. | 7,150 | 586,514 | ||||
Learning Tree International, Inc.* | 16,870 | 220,997 | ||||
Mobile Mini, Inc.* | 10,725 | 313,170 | ||||
MSC Industrial Direct Co., Class A | 6,900 | 379,500 | ||||
NCI Building Systems, Inc.* | 4,550 | 224,452 | ||||
Tetra Technologies, Inc.* | 10,500 | 2 | 226,275 | |||
Toro Co. | 7,800 | 2 | 459,342 | |||
UTI Worldwide, Inc. | 10,380 | 278,080 | ||||
Wabash National Corp. | 9,130 | 133,572 | ||||
Washington Group International, Inc.* | 3,350 | 268,034 | ||||
Williams Scotsman International, Inc.* | 9,180 | 218,576 | ||||
Total Industrials | 8,460,719 | |||||
Information Technology - 28.1% | ||||||
Actuate Corp.* | 35,150 | 238,668 | ||||
Acxiom Corp. | 10,225 | 270,451 | ||||
ADC Telecommunications, Inc.* | 12,550 | 230,042 | ||||
Aeroflex, Inc.* | 14,870 | 210,708 | ||||
Alliance Data Systems Corp.* | 4,200 | 324,576 | ||||
ANSYS, Inc.* | 8,040 | 213,060 | ||||
aQuantive, Inc.* | 4,125 | 2 | 263,175 | |||
Arris Group, Inc.* | 14,990 | 263,674 | ||||
ATMI, Inc.* | 9,725 | 291,750 | ||||
Avocent Corp.* | 9,600 | 2 | 278,496 | |||
Benchmark Electronics, Inc.* | 10,725 | 242,600 | ||||
Ceridian Corp.* | 9,375 | 328,125 | ||||
Concur Technologies, Inc.* | 6,320 | 144,412 | ||||
Cypress Semiconductor Corp.* | 14,450 | 336,540 | ||||
DealerTrack Holdings, Inc.* | 2,820 | 103,889 | ||||
Diebold, Inc. | 8,650 | 451,531 | ||||
Diodes, Inc.* | 2,875 | 120,089 | ||||
DTS, Inc.* | 15,810 | 344,184 | ||||
Dycom Industries, Inc.* | 7,700 | 230,846 | ||||
Fair Isaac Corp. | 11,300 | 2 | 453,356 | |||
FEI Co.* | 5,550 | 180,153 | ||||
Harmonic, Inc.* | 18,100 | 160,547 | ||||
Hypercom Corp.* | 54,750 | 323,572 | ||||
Infocrossing, Inc.* | 33,160 | 612,467 | ||||
Insight Enterprises, Inc.* | 14,805 | 334,149 | ||||
Internap Network Services Corp.* | 6,050 | 87,241 | ||||
International Rectifier Corp.* | 2,525 | 2 | 94,082 | |||
Ixia, Inc.* | 9,240 | 85,562 | ||||
Macrovision Corp.* | 7,850 | 2 | 235,971 | |||
Microsemi Corp.* | 5,510 | 2 | 131,964 | |||
MPS Group, Inc.* | 13,870 | 185,442 | ||||
NICE Systems, Ltd.* | 3,950 | 137,223 | ||||
Occam Networks, Inc.* | 6,030 | 60,179 | ||||
Online Resources Corp.* | 5,925 | 65,056 | ||||
OPNET Technologies, Inc.* | 9,925 | 114,237 | ||||
Polycom, Inc.* | 5,505 | 184,968 | ||||
Powerwave Technologies, Inc.* | 53,150 | 356,105 | ||||
Progress Software Corp.* | 6,975 | 221,735 | ||||
RightNow Technologies, Inc.* | 8,640 | 141,782 | ||||
Rogers Corp.* | 4,325 | 160,025 | ||||
Sapient Corp.* | 32,740 | 253,080 | ||||
Silicon Image, Inc.* | 47,690 | 409,180 | ||||
Sirenza Microdevices, Inc.* | 14,720 | 174,726 | ||||
Sybase, Inc.* | 16,600 | 396,574 | ||||
Symmetricom, Inc.* | 11,045 | 92,778 | ||||
Tessera Technologies, Inc.* | 7,300 | 296,015 | ||||
THQ, Inc.* | 14,800 | 2 | 451,696 | |||
Transaction Systems Architects, Inc.* | 5,910 | 198,931 | ||||
Valueclick, Inc.* | 11,450 | 337,317 | ||||
Total Information Technology | 11,822,929 | |||||
Materials - 3.7% | ||||||
Albemarle Corp. | 7,120 | 2 | 274,334 | |||
Hercules, Inc.* | 5,990 | 117,704 | ||||
The accompanying notes are an integral part of these financial statements.
11
Table of Contents
Managers Small Company Fund
Schedule of Portfolio Investments (continued)
| Shares | Value | ||||||
Materials - 3.7% (continued) | |||||||
Methanex Corp. | 10,350 | $ | 260,199 | ||||
Nalco Holding Co. | 10,010 | 274,774 | |||||
Schweitzer-Mauduit International, Inc. | 4,600 | 142,600 | |||||
Sensient Technologies Corp. | 3,720 | 94,451 | |||||
Silgan Holdings, Inc. | 7,190 | 397,463 | |||||
Total Materials | 1,561,525 | ||||||
Telecommunication Services - 0.5% | |||||||
Cbeyond, Inc.* | 3,460 | 133,245 | |||||
NTELOS Holdings Corp. | 3,380 | 93,423 | |||||
Total Telecommunication Services | 226,668 | ||||||
Utilities - 1.1% | |||||||
Vectren Corp. | 7,850 | 211,400 | |||||
Westar Energy, Inc. | 10,050 | 244,014 | |||||
Total Utilities | 455,414 | ||||||
Total Common Stocks | 40,057,879 | ||||||
Other Investment Company - 1.5% | |||||||
iShares Russell 2000 Index Fund | 7,600 | 2 | 630,496 | ||||
Short-Term Investments - 18.2% | |||||||
Other Investment Companies - 18.2% 1 | |||||||
Bank of New York Institutional Cash Reserves Fund, 5.33% 3 | 5,996,774 | 5,996,774 | |||||
JPMorgan Prime Money Market Fund, Institutional Class Shares. 5.19% | 1,675,790 | 1,675,790 | |||||
Total Short-Term Investments | 7,672,564 | ||||||
Total Investments - 114.8% | 48,360,939 | ||||||
Other Assets, less Liabilities - (14.8)% | (6,228,020 | ) | |||||
Net Assets - 100% | $ | 42,132,919 | |||||
The accompanying notes are an integral part of these financial statements.
12
Table of Contents
Managers International Equity Fund
Fund Snapshots
June 30, 2007 (unaudited)
Portfolio Breakdown
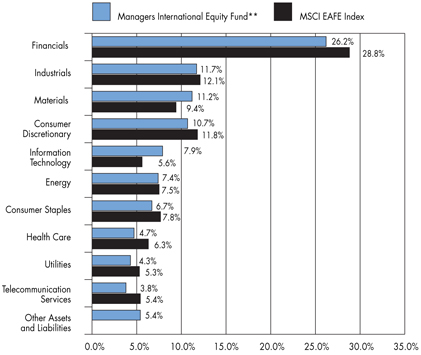
| ** | As a percentage of net assets |
Industry | Managers International Equity Fund** | MSCI EAFE Index | ||||
Financials | 26.2 | % | 28.8 | % | ||
Industrials | 11.7 | % | 12.1 | % | ||
Materials | 11.2 | % | 9.4 | % | ||
Consumer Discretionary | 10.7 | % | 11.8 | % | ||
Information Technology | 7.9 | % | 5.6 | % | ||
Energy | 7.4 | % | 7.5 | % | ||
Consumer Staples | 6.7 | % | 7.8 | % | ||
Health Care | 4.7 | % | 6.3 | % | ||
Utilities | 4.3 | % | 5.3 | % | ||
Telecommunication Services | 3.8 | % | 5.4 | % | ||
Other Assets and Liabilities | 5.4 | % | 0.0 | % |
Top Ten Holdings
Security Name | Percentage of Net Assets | ||
TOTAL SA * | 1.6 | % | |
Vodafone Group PLC* | 1.4 | ||
Siemens AG | 1.4 | ||
Renault SA | 1.3 | ||
ORIX Corp.* | 1.2 | ||
Xstrata PLC* | 1.2 | ||
BNP Paribas SA | 1.2 | ||
Veolia Environment | 1.2 | ||
ABB Ltd. | 1.1 | ||
Allianz AG | 1.1 | ||
Top Ten as a Group | 12.7 | % | |
| * | Top Ten Holding at December 31, 2006 |
Any sectors, industries, or securities discussed should not be perceived as investment recommendations. Mention of a specific security should not be considered a recommendation to buy or solicitation to sell that security.
13
Table of Contents
Managers International Equity Fund
Fund Snapshots (continued)
Summary of Investments by Country
Country | Managers International Equity Fund* | MSCI EAFE Index | ||||
Australia | 0.2 | % | 6.1 | % | ||
Austria | 0.1 | % | 0.6 | % | ||
Belgium | 1.1 | % | 1.2 | % | ||
Bermuda | 0.0 | % | 0.3 | % | ||
Brazil | 1.1 | % | 0.0 | % | ||
Canada | 4.8 | % | 0.0 | % | ||
Cayman Islands | 0.3 | % | 0.2 | % | ||
China | 1.3 | % | 0.0 | % | ||
Denmark | 0.6 | % | 0.8 | % | ||
Finland | 1.1 | % | 1.6 | % | ||
France | 10.8 | % | 9.8 | % | ||
Germany | 12.5 | % | 8.3 | % | ||
Greece | 0.2 | % | 0.7 | % | ||
Hong Kong | 4.6 | % | 1.3 | % | ||
India | 0.3 | % | 0.0 | % | ||
Ireland | 0.9 | % | 0.9 | % | ||
Italy | 1.9 | % | 3.8 | % | ||
Japan | 16.9 | % | 21.2 | % | ||
Luxembourg | 1.0 | % | 0.1 | % | ||
Mexico | 0.3 | % | 0.0 | % | ||
Netherlands | 4.5 | % | 4.1 | % | ||
New Zealand | 0.0 | % | 0.2 | % | ||
Norway | 0.4 | % | 1.0 | % | ||
Portugal | 0.0 | % | 0.4 | % | ||
Singapore | 1.1 | % | 1.1 | % | ||
South Africa | 0.8 | % | 0.0 | % | ||
South Korea | 3.6 | % | 0.0 | % | ||
Spain | 1.0 | % | 4.0 | % | ||
Sweden | 1.6 | % | 2.5 | % | ||
Switzerland | 5.4 | % | 6.5 | % | ||
Taiwan | 1.6 | % | 0.0 | % | ||
United Kingdom | 16.6 | % | 23.0 | % | ||
United States | 3.4 | % | 0.1 | % | ||
Supranational & Other | 0.0 | % | 0.2 | % | ||
| 100.0 | % | 100.0 | % | |||
| * | As a percentage of total market value of common stocks on June 30, 2007 |
14
Table of Contents
Managers International Equity Fund
Schedule of Portfolio Investments
June 30, 2007 (unaudited)
| Shares | Value | |||||
Common Stocks - 94.6% | ||||||
Consumer Discretionary - 10.7% | ||||||
Bulgari S.p.A. (Italy)* | 35,968 | $ | 576,870 | |||
Burberry Group PLC (United Kingdom) | 59,974 | 821,511 | ||||
Carphone Warehouse Group, The (United Kingdom) | 93,366 | 613,704 | ||||
China Resources Enterprises, Ltd. (Hong Kong) | 142,000 | 533,930 | ||||
Compagnie Generale des Etablissements Michelin (France) | 8,400 | 1,173,851 | ||||
Continental AG (Germany) | 12,631 | 1,783,175 | ||||
Ctrip.com International, Ltd. (China)* | 9,100 | 715,533 | ||||
DaimlerChrylser Ag (Germany) | 12,739 | 1,178,510 | ||||
Daiwa House Industry Co., Ltd. (Japan) | 69,000 | 986,215 | ||||
Focus Media Holding, Ltd. (Cayman Islands)* | 14,500 | 2 | 732,250 | |||
George Wimpey PLC (United Kingdom) | 89,700 | 897,904 | ||||
Hyundai Mobis (South Korea) | 7,700 | 730,519 | ||||
Hyundai Motor Co., Ltd. (South Korea) | 9,992 | 788,430 | ||||
KarstadtQuelle AG (Germany)* | 48,645 | 1,647,287 | ||||
Kinross Gold Corp. (Canada)* | 18,500 | 2 | 216,080 | |||
LG Electronics, Inc. (South Korea) | 19,072 | 1,574,554 | ||||
Luxottica Group S.p.A. (Italy) | 17,462 | 678,350 | ||||
Nissan Motor Co., Ltd. (Japan) | 84,100 | 900,366 | ||||
Pearson PLC (United Kingdom) | 71,053 | 1,196,905 | ||||
Pinault-Printemps-Redoute SA (France) | 3,556 | 620,292 | ||||
Renault SA (France) | 20,100 | 3,223,821 | ||||
Sharp Corp. (Japan) | 77,000 | 1,459,727 | ||||
Sony Corp (Japan) | 15,700 | 805,908 | ||||
Swatch Group AG, The (Switzerland) | 15,649 | 885,111 | ||||
Toyota Motor Corp. (Japan) | 14,300 | 901,849 | ||||
Wolters Kluwer NV (Netherlands) | 34,800 | 1,061,231 | ||||
Yamada Denki Co., Ltd. (Japan) | 5,290 | 552,473 | ||||
Total Consumer Discretionary | 27,256,356 | |||||
Consumer Staples - 6.7% | ||||||
British American Tobacco PLC (United Kingdom) | 30,000 | 1,023,164 | ||||
Cadbury Schweppes PLC (United Kingdom) | 24,383 | 330,936 | ||||
Diageo PLC (United Kingdom) | 60,912 | 1,266,051 | ||||
Heineken N.V. (Netherlands) | 22,146 | 1,298,238 | ||||
Henkel KGaA (Germany) | 9,475 | 500,060 | ||||
Interbrew (Belgium) | 18,155 | 1,437,980 | ||||
Japan Tobacco, Inc. (Japan) | 382 | 1,882,972 | ||||
Koninklijke Ahold N.V. (Netherlands)* | 119,359 | 1,497,107 | ||||
L’Oreal SA (France) | 9,000 | 1,063,806 | ||||
Metro AG (Germany) | 3,800 | 2 | 315,513 | |||
Nestle SA, Registered (Switzerland) | 2,224 | 845,061 | ||||
Reckitt Benckiser PLC (United Kingdom) | 35,399 | 1,937,937 | ||||
Seven & I Holdings Co., Ltd. (Japan) | 39,000 | 1,114,830 | ||||
Tesco PLC (United Kingdom)* | 212,419 | 1,777,246 | ||||
Unilever NV (Netherlands) | 22,467 | 697,237 | ||||
Uni-President Enterprises Corp. (Taiwan) | 231,000 | 231,270 | ||||
Total Consumer Staples | 17,219,408 | |||||
Energy - 7.4% | ||||||
BP PLC (United Kingdom) | 198,000 | 2,382,398 | ||||
Cameco Corp. (Canada) | 18,200 | 923,468 | ||||
Canadian Natural Resources, Ltd. (Canada) | 19,500 | 2 | 1,295,668 | |||
China Petroleum and Chemical Corp., Class H (Hong Kong) | 924,000 | 1,030,873 | ||||
China Shenhua Energy Co., Ltd. (China) | 359,000 | 1,252,682 | ||||
EnCana Corp. (Canada) | 22,668 | 1,394,234 | ||||
Eni S.p.A. (Italy) | 63,700 | 2,309,597 | ||||
Petroleo Brasileiro S.A. (Brazil) | 14,400 | 2 | 1,536,192 | |||
Petroplus Holdings AG (Switzerland)* | 5,782 | 590,956 | ||||
Repsol YPF, S.A. (Spain) | 23,900 | 2 | 946,166 | |||
Suncor Energy, Inc. (Canada) | 13,700 | 1,234,125 | ||||
TOTAL SA (France) | 50,452 | 4,090,559 | ||||
Total Energy | 18,986,918 | |||||
Financials - 26.2% | ||||||
Allianz AG (Germany) | 12,000 | 2,814,419 | ||||
Amvescap PLC (United Kingdom) | 151,420 | 1,951,058 | ||||
Aviva PLC (United Kingdom) | 96,100 | 1,426,578 | ||||
Bank of East Asia, Ltd. (Hong Kong) | 69,600 | 391,414 | ||||
Barclays PLC (United Kingdom) | 117,200 | 1,630,593 | ||||
BNP Paribas SA (France) | 25,440 | 3,021,855 | ||||
CapitaLand Ltd. (Singapore) | 230,000 | 1,218,557 | ||||
Cathay Financial Holding Co., Ltd. (Taiwan) | 105,000 | 250,652 | ||||
China Merchants Bank Co., Ltd. (China) | 296,500 | 2 | 902,932 | |||
China Overseas Land & Investment Ltd. (Hong Kong) | 952,000 | 1,484,421 | ||||
Chinatrust Financial Holding, Co. (Taiwan) | 281,000 | 218,881 | ||||
Credit Agricole SA (France) | 29,875 | 2 | 1,212,268 | |||
Credit Suisse Group (Switzerland) | 32,400 | 2,300,111 | ||||
Daiwa Securities Group, Inc. (Japan) | 80,000 | 850,530 | ||||
DBS Group Holdings, Ltd. (Singapore) | 81,000 | 1,206,863 | ||||
Deutsche Boerse AG (Germany) | 13,328 | 1,509,990 | ||||
Deutsche Postbank AG (Germany) | 7,900 | 2 | 692,674 | |||
Fondiaria-Sai SpA (Italy) | 19,200 | 2 | 851,873 | |||
Fortis (Belgium) | 30,000 | 1,271,515 | ||||
Friends Provident PLC (United Kingdom) | 29,900 | 107,030 | ||||
The accompanying notes are an integral part of these financial statements.
15
Table of Contents
Managers International Equity Fund
Schedule of Portfolio Investments (continued)
| Shares | Value | |||||
Financials - 26.2% (continued) | ||||||
HBOS PLC (United Kingdom) | 96,800 | $ | 1,903,990 | |||
HDFC Bank Ltd. (India) | 15,700 | 437,829 | ||||
Henderson Land Development Co., Ltd. (Hong Kong) | 155,000 | 1,056,622 | ||||
Hong Kong Exchanges & Clearing, Ltd. (Hong Kong) | 184,000 | 2,597,529 | ||||
ING Groep NV (Netherlands) | 59,617 | 2,623,972 | ||||
Julias Baer Holding, Ltd. (Switzerland) | 22,157 | 1,594,433 | ||||
Kennedy-Wilson Japan (Japan) | 80 | 148,895 | ||||
KK DaVinci Advisors (Japan)* | 295 | 257,536 | ||||
Kookmin Bank (South Korea)* | 28,565 | 2,505,399 | ||||
Leopalace21 Corp. (Japan) | 7,200 | 246,043 | ||||
Man Group PLC (United Kingdom) | 150,310 | 1,828,359 | ||||
Mitsubishi Estate Co., Ltd. (Japan) | 72,000 | 1,953,406 | ||||
Mitsui Fudosan Co., Ltd. (Japan) | 76,000 | 2,130,153 | ||||
Muenchener Rueckversicherungs AG (Germany) | 14,400 | 2,640,832 | ||||
National Bank of Greece S.A. (Greece) | 10,329 | 588,128 | ||||
Nomura Holdings, Inc. (Japan) | 56,000 | 1,087,708 | ||||
ORIX Corp. (Japan) | 11,920 | 3,141,960 | ||||
Prudential Corp. PLC (United Kingdom) | 95,903 | 1,365,112 | ||||
Royal Bank of Scotland Group PLC (United Kingdom) | 175,524 | 2,220,990 | ||||
Shanghai Forte Land Company Ltd. (Hong Kong) | 224,000 | 126,280 | ||||
Sino Land Co. (Hong Kong) | 170,300 | 354,562 | ||||
Societe Generale (France) | 11,340 | 2,101,057 | ||||
Standard Chartered, PLC. (United Kingdom)* | 41,100 | 1,340,574 | ||||
Sumitomo Mitsui Financial Group, Inc. (Japan) | 241 | 2,246,700 | ||||
Sumitomo Realty & Development Co., Ltd. (Japan) | 65,000 | 2,116,819 | ||||
Sun Hung Kai Properties, Ltd. (Hong Kong) | 74,000 | 890,416 | ||||
T&D Holdings, Inc. (Japan) | 15,150 | 1,023,139 | ||||
Zurich Financial Services AG (Switzerland) | 3,860 | 1,193,243 | ||||
Total Financials | 67,035,900 | |||||
Health Care - 4.7% | ||||||
Actelion Ltd. (Switzerland)* | 13,705 | 610,380 | ||||
AstraZeneca PLC (United Kingdom)* | 16,100 | 862,813 | ||||
Elan Corp., PLC -Sponsored ADR (Ireland)* | 88,400 | 1,938,612 | ||||
Essilor International SA (France) | 5,274 | 628,164 | ||||
Fresenius Medical Care AG (Germany) | 19,369 | 890,254 | ||||
GlaxoSmithKline PLC (United Kingdom) | 75,200 | 1,958,960 | ||||
Novartis AG (Switzerland) | 12,600 | 707,371 | ||||
Phonak Holding AG (Switzerland) | 4,326 | 387,780 | ||||
Roche Holding AG (Switzerland)* | 3,000 | 531,560 | ||||
Sanofi-Synthelabo SA (France) | 26,725 | 2,159,041 | ||||
Smith & Nephew PLC (United Kingdom) | 106,695 | 1,321,951 | ||||
Total Health Care | 11,996,886 | |||||
Industrials - 11.7% | ||||||
ABB Ltd. (Switzerland) | 127,767 | 2,884,981 | ||||
Air France-KLM (France) | 15,200 | 2 | 707,250 | |||
Alfa Laval AB (Sweden) | 8,050 | 485,015 | ||||
ALSTOM (France) | 11,385 | 2 | 1,898,480 | |||
BAE Systems PLC (United Kingdom) | 117,500 | 948,165 | ||||
Brambles, Ltd. (Australia)* | 34,285 | 353,458 | ||||
China Communications Constuction Co., Ltd. (China) | 299,000 | 535,807 | ||||
Dai Nippon Printing Co., Ltd. (Japan) | 42,000 | 626,774 | ||||
Deutsche Lufthansa AG (Germany) | 41,400 | 1,161,450 | ||||
European Aeronautic Defense and Space Co. (Netherlands) | 29,880 | 2 | 969,718 | |||
FANUC, Ltd. (Japan) | 10,800 | 1,114,704 | ||||
Far Eastern Textile Co., Ltd. (Taiwan) | 264,000 | 270,301 | ||||
Gamesa Corporacion Tecnologica, S.A. (Spain) | 25,472 | 2 | 921,473 | |||
Hutchison Whampoa, Ltd. (Hong Kong) | 108,000 | 1,072,121 | ||||
Kajima Corp. (Japan) | 113,000 | 472,290 | ||||
Komatsu Ltd. (Japan) | 29,700 | 860,798 | ||||
Mitsubishi Corp. (Japan) | 21,900 | 573,825 | ||||
Mitsubishi Heavy Inds., Ltd. (Japan) | 141,000 | 903,038 | ||||
Mitsui O.S.K. Lines, Ltd. (Japan) | 166,000 | 2,250,781 | ||||
Nippon Yusen Kabushiki Kaisha (Japan) | 73,000 | 669,513 | ||||
Renewable Energy Corp. AS (Norway)* | 28,550 | 1,105,696 | ||||
Rolls-Royce, Class B (United Kingdom)* | 6,140,757 | 12,331 | ||||
RT Group PLC (United Kingdom)* | 360,539 | 28,960 | ||||
Ryanair Holdings PLC (Ireland)* | 11,800 | 2 | 445,450 | |||
Shimizu Corp. (Japan) | 90,000 | 521,417 | ||||
Siemens AG (Germany) | 24,516 | 3,527,947 | ||||
Tostem Inax Holding Corp. (Japan) | 32,000 | 648,769 | ||||
Transurban Group (Australia) | 41,947 | 284,403 | ||||
Vestas Wind Systems A/S (Denmark)* | 24,300 | 1,594,620 | ||||
Wright Express Corp. (France) | 3,673 | 1,174,353 | ||||
Yamato Transport Co., Ltd. (Japan) | 62,000 | 876,439 | ||||
Total Industrials | 29,900,327 | |||||
Information Technology - 7.9% | ||||||
Advantest Corp. (Japan) | 9,200 | 400,568 | ||||
ARM Holdings PLC (United Kingdom) | 312,047 | 912,826 | ||||
ASML Holding N.V. (Netherlands)* | 56,684 | 1,557,413 | ||||
Au Optronics Corp., Sponsored ADR (Taiwan) | 29,760 | 511,872 | ||||
Business Objects SA (France)* | 2,900 | 113,280 | ||||
The accompanying notes are an integral part of these financial statements.
16
Table of Contents
Managers International Equity Fund
Schedule of Portfolio Investments (continued)
| Shares | Value | ||||||
Information Technology - 7.9% (continued) | |||||||
Canon, Inc. (Japan) | 13,900 | $ | 815,138 | ||||
Elpida Memory, Inc. (Japan)* | 14,200 | 623,565 | |||||
Ericsson (LM), Class B (Sweden) | 636,000 | 2,536,936 | |||||
HON HAI Precision Industry Co., Ltd. (Taiwan) | 68,594 | 1,185,462 | |||||
Hynix Semiconductor, Inc. (South Korea)* | 22,900 | 823,889 | |||||
Infineon Technologies AG (Germany)* | 72,936 | 1,211,455 | |||||
Nintendo Co., Ltd. (Japan) | 1,700 | 620,234 | |||||
Nokia Oyj (Finland) | 99,092 | 2,783,027 | |||||
Research In Motion, Ltd. (Canada)* | 8,200 | 1,639,918 | |||||
Samsung Electronics Co., Ltd. (South Korea) | 3,005 | 1,837,114 | |||||
Taiwan Semiconductor Manufacturing Co., Ltd. Sponsored ADR (Taiwan) | 99,123 | 2 | 1,103,240 | ||||
Toshiba Corp. (Japan) | 173,000 | 1,507,313 | |||||
Total Information Technology | 20,183,250 | ||||||
Materials - 11.2% | |||||||
Air Liquide SA (France) | 11,402 | 1,496,199 | |||||
Antofagasta PLC (United Kingdom) | 22,900 | 280,662 | |||||
Barrick Gold Corp. (Canada) | 48,486 | 1,410,088 | |||||
BASF AG (Germany) | 16,700 | 2,193,448 | |||||
Bayer AG (Germany) | 19,881 | 1,505,344 | |||||
Buzzi Unicem SpA (Italy)* | 16,417 | 565,276 | |||||
Compania Vale do Rio Doce - ADR (Brazil) | 26,100 | 1,162,755 | |||||
Gold Fields, Ltd. (South Africa) | 65,500 | 1,018,829 | |||||
Goldcorp, Inc. (Canada) | 43,600 | 1,035,104 | |||||
Impala Platinum Holdings, Ltd. (South Africa) | 22,400 | 686,103 | |||||
JFE Holdings, Inc. (Japan) | 37,700 | 2,343,286 | |||||
Kazakmys PLC (United Kingdom)* | 27,300 | 687,313 | |||||
Lonza Group AG (Switzerland) | 3,900 | 357,828 | |||||
Meridan Gold, Inc. (Canada)* | 37,700 | 1,031,640 | |||||
Mitsubishi Chemical Holdings Corp. (Japan) | 131,000 | 1,202,566 | |||||
Mitsui Petrochemical (Japan) | 70,000 | 531,663 | |||||
Mittal Steel Co. NV (Netherlands) | 27,609 | 1,724,287 | |||||
POSCO (South Korea) | 1,870 | 897,757 | |||||
Potash Corp. of Saskatchewan (Canada) | 7,800 | 608,166 | |||||
Salzgitter AG (Germany) | 6,755 | 1,294,600 | |||||
Svenska Cellulosa AB (SCA) (Sweden) | 58,200 | 973,276 | |||||
Syngenta AG (Switzerland) | 4,400 | 857,783 | |||||
Taiwan Fertilizer Co., Ltd. (Taiwan) | 120,000 | 251,896 | |||||
Wacker Chemie AG (Germany) | 5,411 | 1,274,421 | |||||
Xstrata PLC (United Kingdom) | 52,614 | 3,132,268 | |||||
Total Materials | 28,522,558 | ||||||
Telecommunication Services - 3.8% | |||||||
America Movil , S.A. de C.V. (Mexico) | 12,900 | 2 | 798,897 | ||||
Bharti Tele-Ventures Ltd. (India)* | 21,200 | 435,754 | |||||
BT Group PLC (United Kingdom) | 51,513 | 342,847 | |||||
Cable & Wireless PLC (United Kingdom) | 273,313 | 1,061,610 | |||||
China Netcom Group Corp Hong K (Hong Kong) | 316,000 | 872,322 | |||||
Millicom International Cellular S.A. (Luxembourg)* | 9,100 | 833,924 | |||||
Nippon Telegraph & Tel Corp. (Japan) | 149 | 659,372 | |||||
Rogers Communications, Class B (Canada) | 23,300 | 993,463 | |||||
Vodafone Group PLC (United Kingdom) | 1,094,599 | 3,667,795 | |||||
Total Telecommunication Services | 9,665,984 | ||||||
Utilities - 4.3% | |||||||
E.ON AG (Germany) | 16,500 | 2,770,486 | |||||
Hong Kong & China Gas Co., Ltd. (Hong Kong) | 579,700 | 1,221,571 | |||||
Iberdrola SA (Spain) | 14,053 | 2 | 784,671 | ||||
National Grid PLC (United Kingdom) | 65,061 | 959,995 | |||||
RWE AG (Germany) | 12,050 | 1,286,082 | |||||
Tokyo Electric Power Co., Inc., The (Japan) | 16,000 | 514,671 | |||||
Tokyo Gas Co, Ltd. (Japan) | 104,000 | 493,151 | |||||
Veolia Environment (France) | 37,966 | 2,981,887 | |||||
Total Utilities | 11,012,514 | ||||||
Total Common Stocks | 241,780,101 | ||||||
Other Investment Companies - 0.4% | |||||||
Hirco PLC (South Africa)* | 40,800 | 327,724 | |||||
StreetTRACKS Gold Trust | 11,400 | 2 | 732,678 | ||||
Total Other Investment Companies | 1,060,402 | ||||||
Warrants - 0.7% | |||||||
China Overseas Land & Investment Ltd. (Hong Kong) | 119,000 | 114,142 | |||||
Silicon Precision Industries Co., (Luxembourg) | 311,400 | 660,791 | |||||
United Microelectronics Corp. (Luxembourg) (a) | 1,717,670 | 1,046,061 | |||||
Total Warrants | 1,820,994 | ||||||
Short-Term Investments - 8.8% | |||||||
Other Investment Companies - 8.8% 1 | |||||||
Bank of New York Institutional Cash Reserves Fund, 5.33% 3 | 14,203,201 | 14,203,201 | |||||
JPMorgan Prime Money Market Fund, Institutional Class Shares, 5.19% | 8,230,640 | 8,230,640 | |||||
Total Short-Term Investments | 22,433,841 | ||||||
Total Investments - 104.5% | 267,095,338 | ||||||
Other Assets, less Liabilities - (4.5)% | (11,606,365 | ) | |||||
Net Assets - 100% | $ | 255,488,973 | |||||
The accompanying notes are an integral part of these financial statements.
17
Table of Contents
Managers Emerging Markets Equity Fund
Fund Snapshots
June 30, 2007 (unaudited)
Portfolio Breakdown
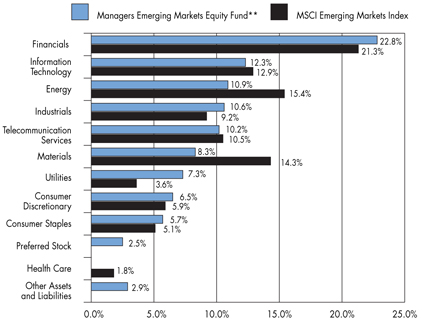
| ** | As a percentage of net assets |
Industry | Managers Emerging Markets Equity Fund** | MSCI Emerging Markets Index | ||||
Financials | 22.8 | % | 21.3 | % | ||
Information Technology | 12.3 | % | 12.9 | % | ||
Energy | 10.9 | % | 15.4 | % | ||
Industrials | 10.6 | % | 9.2 | % | ||
Telecommunication Services | 10.2 | % | 10.5 | % | ||
Materials | 8.3 | % | 14.3 | % | ||
Utilities | 7.3 | % | 3.6 | % | ||
Consumer Discretionary | 6.5 | % | 5.9 | % | ||
Consumer Staples | 5.7 | % | 5.1 | % | ||
Preferred Stock | 2.5 | % | 0.0 | % | ||
Health Care | 0.0 | % | 1.8 | % | ||
Other Assets and Liabilities | 2.9 | % | 0.0 | % |
Top Ten Holdings
Security Name | Percentage of Net Assets | ||
Daewoo Shipbuilding & Marine Engineering Co., Ltd. | 2.3 | % | |
China Petroleum and Chemical Corp., Class H* | 2.2 | ||
Yanzhou Coal Mining Co., Ltd. | 2.0 | ||
Anglo American PLC* | 1.9 | ||
IOI Corp., Berhad | 1.9 | ||
China Mobile Ltd.* | 1.9 | ||
Tam S.A. | 1.8 | ||
Hon Hai Precision Industry Co., Ltd. | 1.8 | ||
China Overseas Land & Investment Ltd.* | 1.8 | ||
Mobile Telesystems, Sponsored ADR* | 1.7 | ||
Top Ten as a Group | 19.3 | % | |
| * | Top Ten Holding at December 31, 2006 |
Any sectors, industries, or securities discussed should not be perceived as investment recommendations. Mention of a specific security should not be considered a recommendation to buy or solicitation to sell that security.
18
Table of Contents
Managers Emerging Markets Equity Fund
Fund Snapshots (continued)
Summary of Investments by Country
Country | Managers Emerging Markets Equity Fund* | MSCI EM Index | ||||
Argentina | 0.0 | % | 0.3 | % | ||
Bermuda | 1.4 | % | 0.7 | % | ||
Brazil | 13.5 | % | 11.2 | % | ||
Cayman Islands | 0.0 | % | 0.7 | % | ||
Chile | 1.6 | % | 1.6 | % | ||
China | 6.5 | % | 7.8 | % | ||
Colombia | 0.7 | % | 0.3 | % | ||
Czech Republic | 1.2 | % | 0.6 | % | ||
Egypt | 0.0 | % | 0.8 | % | ||
Hong Kong | 5.8 | % | 3.7 | % | ||
Hungary | 1.6 | % | 1.1 | % | ||
India | 6.5 | % | 6.4 | % | ||
Indonesia | 1.9 | % | 1.5 | % | ||
Israel | 1.7 | % | 2.1 | % | ||
Jordan | 0.0 | % | 0.1 | % | ||
Luxembourg | 0.0 | % | 0.4 | % | ||
Malaysia | 4.2 | % | 2.7 | % | ||
Mexico | 4.1 | % | 6.0 | % | ||
Morocco | 0.0 | % | 0.3 | % | ||
Netherlands | 0.0 | % | 0.1 | % | ||
Pakistan | 0.0 | % | 0.2 | % | ||
Peru | 0.0 | % | 0.2 | % | ||
Philippines | 0.5 | % | 0.6 | % | ||
Poland | 0.0 | % | 1.9 | % | ||
Russia | 13.4 | % | 8.6 | % | ||
South Africa | 4.4 | % | 7.5 | % | ||
South Korea | 13.2 | % | 15.7 | % | ||
Taiwan | 9.5 | % | 12.5 | % | ||
Thailand | 2.2 | % | 1.4 | % | ||
Turkey | 1.3 | % | 1.5 | % | ||
United Kingdom | 1.9 | % | 0.1 | % | ||
United States | 2.9 | % | 1.4 | % | ||
Supranational & Other | 0.0 | % | 0.0 | % | ||
| 100.0 | % | 100.0 | % | |||
| * | As a percentage of total market value of common stocks on June 30, 2007 |
19
Table of Contents
Managers Emerging Markets Equity Fund
Schedule of Portfolio Investments
June 30, 2007 (unaudited)
| Shares | Value | |||||
Common Stocks - 94.6% | ||||||
Consumer Discretionary - 6.5% | ||||||
Consorcio ARA, S.A. de C.V. (Mexico) | 1,568,800 | $ | 2,526,692 | |||
Grupo Televisa S. A. (Mexico) | 95,200 | 2,628,472 | ||||
Hyundai Motor Co., Ltd. (South Korea) | 16,381 | 1,292,562 | ||||
Lojas Renner S.A. (Brazil) | 54,800 | 1,017,024 | ||||
Net Servicos de Comunicacao SA (Brazil)* | 180,400 | 2,978,611 | ||||
Resorts World Berhad (Malaysia) | 1,949,000 | 1,955,865 | ||||
Total Consumer Discretionary | 12,399,226 | |||||
Consumer Staples - 5.7% | ||||||
IOI Corp., Berhad (Malaysia)* | 2,389,000 | 3,605,474 | ||||
ITC, Ltd. (India) | 630,056 | 2,393,205 | ||||
Natura Cosmeticos SA (Brazil) | 132,700 | 1,915,861 | ||||
OJSC Cherkizovo Group (a) (Russia)* | 42,118 | 572,805 | ||||
Shinsegae Co., Ltd. (South Korea) | 3,462 | 2,253,072 | ||||
Total Consumer Staples | 10,740,417 | |||||
Energy - 10.9% | ||||||
China Petroleum and Chemical Corp., Class H (Hong Kong) | 3,704,000 | 4,132,419 | ||||
LUKOIL Holdings, ADR (Russia) | 23,306 | 1,787,570 | ||||
OAO Rosneft Oil Co. GDR (a) (Russia) | 222,080 | 1,754,432 | ||||
PetroChina Co., Ltd. (China) | 1,710,000 | 2,539,939 | ||||
PTT Public Co., Ltd. (Thailand) | 316,200 | 2,474,753 | ||||
Sasol Ltd. (South Africa) | 75,394 | 2,830,586 | ||||
Surgutneftegaz Sponsored ADR (Russia) | 25,782 | 2 | 1,411,564 | |||
Yanzhou Coal Mining Co., Ltd. (China) | 2,438,000 | 3,711,740 | ||||
Total Energy | 20,643,003 | |||||
Financials - 22.8% | ||||||
Banco Bradesco S.A. (Brazil) | 121,140 | 2 | 2,920,685 | |||
Bancolombia S.A. (Colombia) | 43,001 | 1,411,723 | ||||
Bank Hapoalim, Ltd. (Israel) | 345,470 | 1,683,095 | ||||
Cathay Financial Holding Co., Ltd. (Taiwan) | 300,000 | 716,148 | ||||
China Merchants Bank Co., Ltd. (China) | 73,171 | 2 | 222,828 | |||
China Overseas Land & Investment Ltd. (Hong Kong) | 2,142,000 | 3,339,946 | ||||
Chinatrust Financial Holding, Co. (Taiwan) | 2,877,280 | 2,241,219 | ||||
Grupo Financiero Banorte S.A. de C.V. (Mexico) | 554,976 | 2,541,789 | ||||
Haci Omer Sabanci Holding AS (Turkey)* | 494,742 | 2,444,296 | ||||
Kookmin Bank, Sponsored ADR (South Korea) | 30,148 | 2 | 2,644,583 | |||
OAO Open Investments (Russia)* | 6,590 | 1,634,320 | ||||
OTP Bank Rt. (Hungary) | 52,735 | 3,041,456 | ||||
PT Bank Rakyat Indonesia (Indonesia) | 2,013,000 | 1,282,005 | ||||
Samsung Fire & Marine Insurance Co., Ltd. (South Korea) | 11,836 | 2,278,518 | ||||
Sanlam, Ltd. (South Africa)* | 850,883 | 2,700,654 | ||||
Savings Bank of the Russian Federation (Russia) | 823 | 3,178,567 | ||||
Siam Commercial Bank PCL (Thailand) | 791,700 | 1,672,732 | ||||
Uniao de Bancos Brasileiros SA (Brazil) | 28,420 | 2 | 3,207,765 | |||
VTB Bank OJSC (a) (Russia)* | 179,465 | 1,938,222 | ||||
Woori Investment & Securities Co., Ltd. (South Korea) | 71,280 | 2,177,056 | ||||
Total Financials | 43,277,607 | |||||
Industrials - 10.6% | ||||||
China Shipping Development Co., Ltd. (China) | 1,316,000 | 3,045,896 | ||||
Cosco Pacific Limited (Bermuda) | 1,004,000 | 2,631,870 | ||||
Daewoo Shipbuilding & Marine Engineering Co., Ltd. (South Korea) | 76,690 | 4,335,868 | ||||
Hyundai Development Co. (South Korea) | 39,900 | 2,839,041 | ||||
Larsen & Toubro Ltd. (India) | 22,769 | 1,230,287 | ||||
Localiza Rent A Car SA (Brazil) | 81,000 | 913,717 | ||||
Santos-Brasil SA (Brazil) | 57,062 | 855,190 | ||||
Siemens India, Ltd. (India) | 94,219 | 3,224,116 | ||||
SM Investments Corp. (Philippines) | 110,610 | 1,017,104 | ||||
Total Industrials | 20,093,089 | |||||
Information Technology - 12.3% | ||||||
Advanced Semiconductor Engineering, Inc. (Taiwan) | 2,200,727 | 2,993,288 | ||||
Hon Hai Precision Industry Co., Ltd. (Taiwan)* | 393,784 | 3,401,317 | ||||
Infosys Technologies (India) | 51,315 | 2,428,561 | ||||
LG.Philips LCD Co., Ltd. (South Korea)* | 62,640 | 2 | 2,780,007 | |||
Mediatek, Inc. (Taiwan)* | 203,000 | 3,158,381 | ||||
Samsung Electronics Co., Ltd. (South Korea) | 1,458 | 891,352 | ||||
Samsung Electronics Co., Ltd., GDR, (a) (South Korea) | 6,800 | 2,082,909 | ||||
Siliconware Precision Industries Co. (Taiwan) | 1,325,000 | 2,827,934 | ||||
Taiwan Semiconductor Manufacturing Co., Ltd. (Taiwan) | 991 | 2,122 | ||||
Taiwan Semiconductor Manufacturing Co., Ltd. Sponsored ADR (Taiwan) | 249,403 | 2,775,851 | ||||
Total Information Technology | 23,341,722 | |||||
Materials - 8.3% | ||||||
Anglo American PLC (United Kingdom) | 61,442 | 3,607,370 | ||||
Compania Vale do Rio Doce - ADR (Brazil) | 59,100 | 2,632,905 | ||||
Formosa Chemicals & Fibre Corp. (Taiwan) | 680 | 1,568 | ||||
The accompanying notes are an integral part of these financial statements.
20
Table of Contents
Managers Emerging Markets Equity Fund
Schedule of Portfolio Investments (continued)
| Shares | Value | ||||||
Materials - 8.3% (continued) | |||||||
GMK Norilsk Nickel, Sponsored ADR (Russia) | 14,200 | 2 | $ | 2,967,800 | |||
Magnitogorsk Iron & Steel Works (Russia)* | 76,732 | 982,170 | |||||
Novolipetsk Steel, Corp. (Russia) | 59,962 | 1,738,898 | |||||
Polyus Gold (Russia) | 7,652 | 321,997 | |||||
Polyus Gold Co. ZAO-ADR (Russia) | 16,338 | 2 | 692,731 | ||||
Sappi Ltd. (South Africa) | 154,495 | 2,810,106 | |||||
Total Materials | 15,755,545 | ||||||
Telecommunication Services - 10.2% | |||||||
Bezeq Israeli Telecommunication Corp., Ltd. (Israel) | 916,879 | 1,503,683 | |||||
Bharti Tele-Ventures Ltd. (India)* | 153,611 | 3,157,386 | |||||
China Mobile Ltd. (Hong Kong) | 332,000 | 3,571,996 | |||||
China Telecom Corp., Ltd., Class H (China) | 4,842,000 | 2,862,939 | |||||
Mobile Telesystems, Sponsored ADR (Russia) | 53,327 | 3,230,016 | |||||
Telekomunikasi Indonesia Tbk P (Indonesia) | 2,153,000 | 2,335,551 | |||||
Tim Participacoes SA-ADR (Brazil) | 78,300 | 2 | 2,699,001 | ||||
Total Telecommunication Services | 19,360,572 | ||||||
Utilities - 7.3% | |||||||
Ceske Energeticke Zavody (Czech Republic) | 44,512 | 2,288,919 | |||||
Companhia Energetica de Minas Gerais (Brazil) | 144,420 | 3,054,607 | |||||
Empresa Nacional de Electricidad SA/Chile, ADR (Chile) | 60,179 | 2 | 2,922,292 | ||||
Tenaga Nasional Berhad (Malaysia) | 756,750 | 2,503,097 | |||||
Unified Energy System (Russia) | 23,500 | 3,184,250 | |||||
Total Utilities | 13,953,165 | ||||||
Total Common Stocks | 179,564,346 | ||||||
Preferred Stocks - 2.5% | |||||||
Hyundai Motor Co., Ltd., 3.92% (South Korea) | 30,560 | 1,394,679 | |||||
Tam S.A. (Brazil) | 102,883 | 3,413,432 | |||||
Total Preferred Stocks | 4,808,111 | ||||||
Other Investment Companies - 11.6% 1 | |||||||
Bank of New York Institutional Cash Reserves Fund, 5.33% 3 | 17,731,244 | 17,731,244 | |||||
JPMorgan Prime Money Market Fund, Institutional Class Shares, 5.19% | 4,294,127 | 4,294,127 | |||||
Total Other Investment Companies | 22,025,371 | ||||||
Total Investments - 108.7% | 206,397,828 | ||||||
Other Assets, less Liabilities - (8.7)% | (16,514,034 | ) | |||||
Net Assets - 100% | $ | 189,883,794 | |||||
The accompanying notes are an integral part of these financial statements.
21
Table of Contents
Fund Snapshots
June 30, 2007 (unaudited)
Portfolio Breakdown
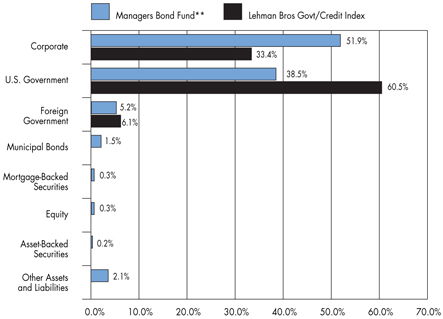
| ** | As a percentage of net assets |
Industry | Managers Bond Fund** | Lehman Bros Govt/Credit Index | ||||
Corporate | 51.9 | % | 33.4 | % | ||
U.S. Government | 38.5 | % | 60.5 | % | ||
Foreign Government | 5.2 | % | 6.1 | % | ||
Municipal Bonds | 1.5 | % | 0.0 | % | ||
Mortgage-Backed Securities | 0.3 | % | 0.0 | % | ||
Equity | 0.3 | % | 0.0 | % | ||
Asset-Backed Securities | 0.2 | % | 0.0 | % | ||
Other Assets and Liabilities | 2.1 | % | 0.0 | % |
Top Ten Holdings
Security Name | Percentage of Net Assets | ||
USTB, 5.375%, 02/15/31* | 14.4 | % | |
USTN, 4.750%, 02/15/37 | 6.1 | ||
USTB, 4.500%, 02/15/36 | 5.6 | ||
USTN, 4.625%, 11/30/08* | 5.3 | ||
USTN, 3.750%, 05/15/08* | 3.2 | ||
USTN, 4.500%, 09/30/11* | 2.7 | ||
Canada Government, 4.250%, 09/01/08* | 1.7 | ||
United Airlines, Inc., 6.636%, 07/02/22 | 1.3 | ||
Tobacco Settlement Financing Corp., 6.706%, 06/01/46 | 1.2 | ||
Nextel Communications, Inc., 5.950%, 03/15/14* | 1.2 | ||
Top Ten as a Group | 42.7 | % | |
| * | Top Ten Holding at December 31, 2006 |
Any sectors, industries, or securities discussed should not be perceived as investment recommendations. Mention of a specific security should not be considered a recommendation to buy solicitation to sell that security.
22
Table of Contents
Managers Bond Fund
Schedule of Portfolio Investments
June 30, 2007 (unaudited)
Security Description | Principal Amount | Value | ||||||
Corporate Bonds - 51.9% | ||||||||
Finance - 11.6% | ||||||||
ASIF Global Financial, 2.380%, 02/26/09 (a) | SGD | 5,800,000 | $ | 3,750,837 | ||||
Bank of America Capital Trust VI, 5.625%, 03/08/35 | 3,085,000 | 2,754,550 | ||||||
Barclays Capital Corp., | ||||||||
4.100%, 03/22/10 (a) | THB | 26,000,000 | 699,910 | |||||
4.160%, 02/22/10 (a) | THB | 25,000,000 | 736,182 | |||||
Barclays Financial LLC, 4.950%, 03/23/09, (09/23/07) (a) 6 | KRW | 160,900,000 | 174,826 | |||||
BNP Paribas SA, 12.701%, 06/13/11 (a) 4 | IDR | 19,645,500,000 | 1,546,641 | |||||
Cigna Corp., 6.150%, 11/15/36 | 6,830,000 | 6,505,930 | ||||||
Citibank N.A., 15.000%, 07/02/10 (a) | BRL | 2,000,000 | 1,209,437 | |||||
Citigroup, Inc., 3.500%, 02/01/08 | 2,020,000 | 1,999,572 | ||||||
Colonial Realty LP, | ||||||||
4.800%, 04/01/11 | 3,485,000 | 3,359,477 | ||||||
5.500%, 10/01/15 | 1,255,000 | 1,206,221 | ||||||
Equity One, Inc., 6.000%, 09/15/17 (a) | 5,915,000 | 5,785,816 | ||||||
First Industrial LP, 5.950%, 05/15/17 | 15,000,000 | 14,578,724 | ||||||
Ford Motor Credit Co., 8.000%, 12/15/16 | NZD | 3,500,000 | 3,352,468 | |||||
General Electric Capital Corp., | ||||||||
2.960%, 05/18/12 | SGD | 4,400,000 | 2,826,851 | |||||
3.485%, 03/08/12 | SGD | 16,500,000 | 10,911,817 | |||||
6.500%, 09/28/15 | NZD | 11,570,000 | 8,135,917 | |||||
6.625%, 02/04/10 | NZD | 3,500,000 | 2,595,009 | |||||
6.750%, 09/26/16 | NZD | 2,865,000 | 2,066,597 | |||||
GMAC, | ||||||||
5.625%, 05/15/09 | NZD | 500,000 | 488,866 | |||||
6.125%, 01/22/08 | BRL | 2,000,000 | 2 | 1,999,718 | ||||
6.875%, 09/15/11 | 250,000 | 245,914 | ||||||
Highwoods Properties, Inc., | ||||||||
5.850%, 03/15/17 (a) | 3,015,000 | 2,916,214 | ||||||
7.500%, 04/15/18 | 2,405,000 | 2,604,124 | ||||||
HSBC Bank USA, N.A., 3.626%, 04/18/12 (a) 4 | MYR | 11,930,000 | 2,907,776 | |||||
ICICI Bank, Ltd., 6.375%, 04/30/22 (a) 7 | 900,000 | 855,220 | ||||||
JP Morgan Chase & Co., | ||||||||
3.734%, 06/08/12 (a) 4 | MYR | 4,516,015 | 1,089,489 | |||||
4.000%, 02/01/08 | CAD | 1,000,000 | 991,511 | |||||
8.552%, 03/28/11 (a) 4 | IDR | 932,700,000 | 75,414 | |||||
8.564%, 04/12/12 (a) 4 | IDR | 40,733,437,680 | 3,018,021 | |||||
JPMorgan Chase Bank, NA, 9.996%, 05/17/10 (a) 4 | BRL | 3,600,000 | 1,408,720 | |||||
JPMorgan Chase of London, 8.370%, 10/21/10 (a) 4 | IDR | 16,627,462,500 | 1,402,147 | |||||
The accompanying notes are an integral part of these financial statements.
23
Table of Contents
Managers Bond Fund
Schedule of Portfolio Investments (continued)
Security Description | Principal Amount | Value | |||||||
Finance - 11.6% (continued) | |||||||||
Kinder Morgan Finance Co., | |||||||||
5.150%, 03/01/15 | $ | 730,000 | 2 | $ | 665,461 | ||||
5.700%, 01/05/16 | 370,000 | 341,020 | |||||||
6.400%, 01/05/36 | 2,120,000 | 1,873,486 | |||||||
Marsh & McLennan Companies, Inc., | |||||||||
5.375%, 07/15/14 | 4,390,000 | 4,107,113 | |||||||
5.750%, 09/15/15 | 3,295,000 | 3,113,561 | |||||||
5.875%, 08/01/33 | 10,185,000 | 8,575,149 | |||||||
Merrill Lynch & Co., 10.710%, 03/08/17 | 2,500,000 | 1,368,481 | |||||||
Morgan Stanley & Co., Inc., 3.625%, 04/01/08 | 2,100,000 | 2,071,293 | |||||||
Mutual of Omaha Insurance Co., 6.800%, 06/15/36 (a) | 10,125,000 | 10,477,917 | |||||||
Qwest Capital Funding, Inc., 6.875%, 07/15/28 | 1,255,000 | 1,096,556 | |||||||
SLM Corp., 6.500%, 06/15/10 | NZD | 500,000 | 350,294 | ||||||
St. Paul Travelers Companies, Inc., The, 6.750%, 06/20/36 | 2,610,000 | 2,698,085 | |||||||
Toll Brothers Finance Corp., 5.150%, 05/15/15 | 3,785,000 | 3,415,047 | |||||||
Travelers Cos, Inc., 6.250%, 06/15/37 | 15,435,000 | 14,946,559 | |||||||
Travelers Property Casualty Corp., 6.375%, 03/15/33 | 3,040,000 | 3,016,060 | |||||||
Wells Fargo Co., 5.106%, 05/01/33, (08/01/07) 6 | 8,390,000 | 2 | 8,389,161 | ||||||
Willis North America Inc., 6.200%, 03/28/17 | 5,685,000 | 5,566,724 | |||||||
Total Finance | 166,271,883 | ||||||||
Industrial - 36.8% | |||||||||
Abitibi-Consolidated, Inc., 7.500%, 04/01/28 | NZD | 500,000 | 395,000 | ||||||
Albertson’s, Inc., | |||||||||
6.625%, 06/01/28 | 1,015,000 | 914,708 | |||||||
7.450%, 08/01/29 | 3,195,000 | 3,116,176 | |||||||
7.750%, 06/15/26 | 915,000 | 922,823 | |||||||
Altria Group, Inc., 7.000%, 11/04/13 | 1,500,000 | 1,590,972 | |||||||
America Movil, S.A. de C.V., 4.125%, 03/01/09 | 3,000,000 | 2,941,869 | |||||||
American President, Ltd., 8.000%, 01/15/24 5 | 250,000 | 234,080 | |||||||
Anadarko Petroleum Corp., | |||||||||
5.950%, 09/15/06 | 4,915,000 | 4,799,119 | |||||||
6.450%, 09/15/36 | 13,415,000 | 12,902,909 | |||||||
Apache Corp., 6.000%, 01/15/37 | 12,000,000 | 11,442,756 | |||||||
Arrow Electronics, Inc., 6.875%, 07/01/13 | NZD | 500,000 | 516,908 | ||||||
AT&T Corp., | |||||||||
6.150%, 09/15/34 | 1,375,000 | 1,318,363 | |||||||
6.500%, 03/15/29 | 7,650,000 | 7,362,980 | |||||||
Avnet, Inc., | |||||||||
2.000%, 03/15/34 | 1,425,000 | 1,802,625 | |||||||
5.875%, 03/15/14 | 11,000,000 | 10,850,895 | |||||||
6.000%, 09/01/15 | 5,340,000 | 5,146,356 | |||||||
6.625%, 09/15/16 | 1,370,000 | 1,388,158 | |||||||
Bell Canada, 5.000%, 02/15/17 | CAD | 1,000,000 | 829,899 | ||||||
The accompanying notes are an integral part of these financial statements.
24
Table of Contents
Managers Bond Fund
Schedule of Portfolio Investments (continued)
Security Description | Principal Amount | Value | |||||||
Industrial - 36.8% (continued) | |||||||||
BellSouth Corp., 6.000%, 11/15/34 | $ | 9,740,000 | 2 | $ | 9,116,474 | ||||
Bowater, Inc., 6.500%, 06/15/13 | 1,675,000 | 1,455,156 | |||||||
Bristol-Myers Squibb, 4.860%, 09/15/23, (09/17/07) 6 | 6,060,000 | 6,135,750 | |||||||
Canadian Pacific Railway Co., 5.950%, 05/15/37 | 7,625,000 | 7,166,982 | |||||||
Centex Corp., 5.250%, 06/15/15 | 1,915,000 | 1,713,569 | |||||||
Chartered Semiconductor Manufacturing, 6.250%, 04/04/13 | 5,600,000 | 5,631,483 | |||||||
Cia Brasileira de Bebida, 8.750%, 09/15/13 | 3,795,000 | 4,316,812 | |||||||
Clear Channel Communications, | |||||||||
4.250%, 05/15/09 | 1,500,000 | 1,449,735 | |||||||
5.750%, 01/15/13 | NZD | 500,000 | 450,199 | ||||||
Comcast Corp., | |||||||||
5.650%, 06/15/35 | 12,425,000 | 10,809,812 | |||||||
5.983%, 04/19/22 | 7,950,000 | 7,731,375 | |||||||
6.450%, 03/15/37 | 10,570,000 | 2 | 10,186,563 | ||||||
6.500%, 11/15/35 | 375,000 | 363,506 | |||||||
6.795%, 08/02/20 | 49,114 | 47,886 | |||||||
Corn Products International, Inc., 6.625%, 04/15/37 | 4,055,000 | 3,949,140 | |||||||
Corning, Inc., | |||||||||
6.850%, 03/01/29 | 9,142,000 | 9,212,978 | |||||||
7.250%, 08/15/36 | 1,185,000 | 1,221,483 | |||||||
CSX Corp., 6.000%, 10/01/36 | 10,710,000 | 9,998,599 | |||||||
Cummins Engine Co., Inc., | |||||||||
5.650%, 03/01/98 | 11,235,000 | 8,267,252 | |||||||
6.750%, 02/15/27 | 1,853,000 | 1,803,803 | |||||||
7.125%, 03/01/28 | 50,000 | 50,507 | |||||||
D.R. Horton, Inc., 5.250%, 02/15/15 | 5,495,000 | 4,917,201 | |||||||
Desarrolladora Homex, S.A. de C.V., 7.500%, 09/28/15 | 2,725,000 | 2,820,375 | |||||||
Devon Energy Corp., | |||||||||
4.900%, 08/15/08 | 1,250,000 | 1,965,625 | |||||||
4.950%, 08/15/08 | 1,692,000 | 2,660,670 | |||||||
Dillards, Inc., 7.000%, 12/01/28 | 225,000 | 2 | 202,193 | ||||||
Duke Energy Field Services LLC, 6.450%, 11/03/36 (a) | 2,615,000 | 2,583,152 | |||||||
El Paso Corp., | |||||||||
6.750%, 05/15/09 | 250,000 | 2 | 252,182 | ||||||
6.950%, 06/01/28 | 1,030,000 | 956,984 | |||||||
7.000%, 05/15/11 | NZD | 500,000 | 2 | 509,792 | |||||
Energy Transfer Partners LP, | |||||||||
6.125%, 02/15/17 | 700,000 | 691,210 | |||||||
6.625%, 10/15/36 | 1,805,000 | 1,762,620 | |||||||
Equifax, Inc., 7.000%, 07/01/37 | 2,170,000 | 2,188,990 | |||||||
Federated Retail Holdings, 6.375%, 03/15/37 | 12,735,000 | 12,250,357 | |||||||
Foot Locker, Inc., 8.500%, 01/15/22 | 570,000 | 578,550 | |||||||
Ford Motor Co., 6.375%, 02/01/29 | 1,990,000 | 1,467,625 | |||||||
The accompanying notes are an integral part of these financial statements.
25
Table of Contents
Managers Bond Fund
Schedule of Portfolio Investments (continued)
Security Description | Principal Amount | Value | |||||||
Industrial - 36.8% (continued) | |||||||||
Georgia-Pacific Corp., | |||||||||
7.250%, 06/01/28 | $ | 1,245,000 | $ | 1,145,400 | |||||
7.750%, 11/15/29 | 1,615,000 | 1,518,100 | |||||||
8.000%, 01/15/24 | 1,695,000 | 1,644,150 | |||||||
8.875%, 05/15/31 | 2,750,000 | 2,743,125 | |||||||
GTE Corp., 6.940%, 04/15/28 | 130,000 | 133,705 | |||||||
HCA, Inc., | |||||||||
5.750%, 03/15/14 | 2,500,000 | 2,115,625 | |||||||
6.250%, 02/15/13 | 1,940,000 | 1,750,850 | |||||||
6.625%, 02/15/16 | 5,765,000 | 4,878,631 | |||||||
7.050%, 12/01/27 | 1,600,000 | 1,300,146 | |||||||
7.500%, 11/06/33 | 925,000 | 783,938 | |||||||
7.580%, 09/15/25 | 730,000 | 630,167 | |||||||
Home Depot Inc., The, 5.875%, 12/16/36 | 3,780,000 | 3,367,984 | |||||||
Hospira, Inc., 6.050%, 03/30/17 | 3,395,000 | 3,343,155 | |||||||
Hutchison Whampoa International, Ltd., 5.450%, 11/24/10 (a) | 2,225,000 | 2,210,635 | |||||||
International Paper Co., | |||||||||
4.000%, 04/01/10 | CAD | 1,000,000 | 959,842 | ||||||
4.250%, 01/15/09 | CAD | 1,000,000 | 979,950 | ||||||
Intuit, Inc., 5.750%, 03/15/17 | 3,560,000 | 3,426,635 | |||||||
JC Penney Corp., Inc., 6.375%, 10/15/36 | 6,090,000 | 5,799,550 | |||||||
Kellwood Co., 7.625%, 10/15/17 | 250,000 | 241,018 | |||||||
KN Capital Trust III, 7.630%, 04/15/28 | 75,000 | 2 | 70,520 | ||||||
Koninklijke KPN NV, 8.375%, 10/01/30 | 815,000 | 913,868 | |||||||
Kraft Foods, Inc., 6.500%, 11/01/31 | 6,100,000 | 5,897,096 | |||||||
Lennar Corp., | |||||||||
5.600%, 05/31/15 | 2,740,000 | 2,567,555 | |||||||
6.500%, 04/15/16 | 2,340,000 | 2 | 2,266,126 | ||||||
Lowe’s Co., Inc., 6.875%, 02/15/28 | NZD | 500,000 | 525,600 | ||||||
Lubrizol Corp., 6.500%, 10/01/34 | 7,825,000 | 7,553,347 | |||||||
Lucent Technologies, Inc., | |||||||||
6.450%, 03/15/29 | 4,125,000 | 3,588,750 | |||||||
6.500%, 01/15/28 | 305,000 | 265,350 | |||||||
Masco Corp., 5.850%, 03/15/17 | 8,150,000 | 7,834,660 | |||||||
Missouri Pacific Railroad, 5.000%, 01/01/45 | 300,000 | 228,753 | |||||||
Motorola, Inc., | |||||||||
6.500%, 09/01/25 | 1,145,000 | 1,095,237 | |||||||
8.000%, 11/01/11 | 1,075,000 | 1,160,312 | |||||||
New England Telephone & Telegraph Co., 7.875%, 11/15/29 | 2,390,000 | 2,614,811 | |||||||
Newmont Mining Corp., 5.875%, 04/01/35 | 720,000 | 637,275 | |||||||
The accompanying notes are an integral part of these financial statements.
26
Table of Contents
Managers Bond Fund
Schedule of Portfolio Investments (continued)
Security Description | Principal Amount | Value | |||||||
Industrial - 36.8% (continued) | |||||||||
News America, Inc., | |||||||||
6.150%, 03/01/37 (a) | $ | 6,075,000 | $ | 5,600,111 | |||||
6.200%, 12/15/34 | 3,440,000 | 3,206,734 | |||||||
6.400%, 12/15/35 | 5,820,000 | 5,542,456 | |||||||
Nextel Communications, Inc., | |||||||||
5.950%, 03/15/14 | 18,220,000 | 17,353,695 | |||||||
6.875% 10/31/13 | 20,000 | 19,851 | |||||||
ONEOK Partners, LP, 6.650%, 10/01/36 | CAD | 1,000,000 | 991,840 | ||||||
Owens & Minor, Inc., 6.350%, 04/15/16 | 1,355,000 | 1,334,296 | |||||||
Owens Corning, Inc., | |||||||||
6.500%, 12/01/16 | 1,265,000 | 1,266,657 | |||||||
7.000%, 12/01/36 | 1,895,000 | 1,846,488 | |||||||
Pemex Project Funding Master Trust, 8.625%, 12/01/23 | 950,000 | 1,157,575 | |||||||
Penney (JC), Co., 7.125%, 11/15/23 | 33,000 | 35,471 | |||||||
PF Export Rec Master Trust, 6.436%, 06/01/15 (a) | 645,545 | 667,333 | |||||||
Plains All American Pipeline LP, | |||||||||
6.125%, 01/15/17 (a) | 2,770,000 | 2,749,206 | |||||||
6.650%, 01/15/37 (a) | 5,960,000 | 5,876,310 | |||||||
Pulte Homes, Inc., | |||||||||
6.000%, 02/15/35 | 10,150,000 | 2 | 8,648,957 | ||||||
6.375%, 05/15/33 | 4,570,000 | 4,025,960 | |||||||
Series $, 5.200%, 02/15/15 | 2,935,000 | 2,637,370 | |||||||
Qantas Airways, Ltd., 6.050%, 04/15/16 (a) | 11,800,000 | 11,455,275 | |||||||
Qwest Capital Funding, Inc., | |||||||||
6.500%, 11/15/18 | 595,000 | 535,500 | |||||||
7.625%, 08/03/21 | 1,435,000 | 2 | 1,370,425 | ||||||
7.750%, 02/15/31 | 1,705,000 | 1,606,962 | |||||||
Qwest Corp., | |||||||||
6.875%, 09/15/33 | CAD | 820,000 | 768,750 | ||||||
7.250%, 09/15/25 | 560,000 | 558,600 | |||||||
Raytheon Co., | |||||||||
7.000%, 11/01/28 | 1,500,000 | 1,654,545 | |||||||
7.200%, 08/15/27 | 800,000 | 897,719 | |||||||
Reynolds American, Inc., | |||||||||
6.750%, 06/15/17 | 7,495,000 | 7,600,162 | |||||||
7.250%, 06/15/37 | BRL | 2,000,000 | 2,058,886 | ||||||
Samsung Electronics Co., Ltd., 7.700%, 10/01/27 (a) | 4,695,000 | 5,153,448 | |||||||
Schering-Plough Corp., 5.300%, 12/01/13 | 1,500,000 | 1,505,523 | |||||||
Southern Natural Gas Co., | |||||||||
5.900%, 04/01/17 (a) | 4,765,000 | 4,608,794 | |||||||
7.350%, 02/15/31 | CAD | 1,000,000 | 1,060,070 | ||||||
The accompanying notes are an integral part of these financial statements.
27
Table of Contents
Managers Bond Fund
Schedule of Portfolio Investments (continued)
Security Description | Principal Amount | Value | ||||||
Industrial - 36.8% (continued) | ||||||||
Sprint Capital Corp., 6.875%, 11/15/28 | $ | 27,000 | $ | 25,700 | ||||
Sprint Nextel Corp., 6.000%, 12/01/16 | 48,000 | 45,535 | ||||||
Talisman Energy, Inc., | ||||||||
5.850%, 02/01/37 | 1,095,000 | 966,526 | ||||||
6.250%, 02/01/38 | 3,000,000 | 2,780,259 | ||||||
Teck Cominco Ltd., 7.000%, 09/15/12 | CAD | 1,000,000 | 1,053,043 | |||||
Telecom Italia Capital, 6.000%, 09/30/34 | 1,955,000 | 1,761,306 | ||||||
Telecom Italia S.p.A., 6.375%, 11/15/33 | 3,170,000 | 2,985,978 | ||||||
Telefonica Emisiones SAU, 7.045%, 06/20/36 | 12,125,000 | 12,556,372 | ||||||
Telekom Malaysia Berhad, 7.875%, 08/01/25 (a) | 250,000 | 295,633 | ||||||
TELUS Corp., 4.950%, 03/15/17 | CAD | 7,115,000 | 6,076,587 | |||||
Tennessee Gas Pipeline Co., 7.000%, 10/15/28 | 2,395,000 | 2,466,424 | ||||||
Time Warner, Inc., | ||||||||
6.500%, 11/15/36 | 3,360,000 | 3,190,216 | ||||||
6.625%, 05/15/29 | 1,995,000 | 1,937,029 | ||||||
6.950%, 01/15/28 | 855,000 | 861,222 | ||||||
7.625%, 04/15/31 | 560,000 | 599,968 | ||||||
7.700%, 05/01/32 | 365,000 | 394,693 | ||||||
Toro Co., The, 6.625%, 05/01/37 | 6,810,000 | 6,548,564 | ||||||
Transocean, Inc., 7.375%, 04/15/18 | NZD | 500,000 | 538,049 | |||||
U.S. Steel Corp., | ||||||||
6.050%, 06/01/17 | 2,115,000 | 2,062,573 | ||||||
6.650%, 06/01/37 | 1,220,000 | 1,181,444 | ||||||
Union Pacific Corp., 5.375%, 06/01/33 | 2,525,000 | 2,201,522 | ||||||
United Airlines, Inc., 6.636%, 07/02/22 | 18,390,000 | 18,440,747 | ||||||
USG Corp, 6.300%, 11/15/16 | 1,410,000 | 1,377,784 | ||||||
Vale Overseas Ltd., 6.875%, 11/01/36 | 3,665,000 | 3,684,007 | ||||||
Verizon Global Funding Corp., 5.850%, 09/15/35 | 11,400,000 | 10,456,114 | ||||||
Verizon Maryland, Inc., 5.125%, 06/15/33 | 845,000 | 683,760 | ||||||
Verizon New York, Inc., Series B, 7.375%, 04/01/32 | 3,090,000 | 3,250,019 | ||||||
Viacom, Inc., 6.875%, 04/30/36 | 4,160,000 | 4,019,076 | ||||||
Vondafone Group PLC, 6.150%, 02/27/37 | SGD | 16,500,000 | 15,349,786 | |||||
Watson Pharmaceuticals, Inc., 1.750%, 03/15/23 | 515,000 | 498,906 | ||||||
Weatherford International, Inc., 6.500%, 08/01/36 | 1,565,000 | 1,513,414 | ||||||
Wellpoint, Inc., 6.375%, 06/15/37 | 13,650,000 | 13,478,202 | ||||||
Western Union Co., 6.200%, 11/17/36 | 12,735,000 | 12,187,701 | ||||||
White Pine Hydro LLC, | ||||||||
6.310%, 07/10/17 5 | 1,700,000 | 1,680,839 | ||||||
6.960%, 07/10/37 5 | 1,645,000 | 1,624,776 | ||||||
Williams Co., Inc., Series A, 7.500%, 01/15/31 | CAD | 1,000,000 | 1,035,000 | |||||
XTO Energy, Inc., 6.100%, 04/01/36 | 190,000 | 178,273 | ||||||
Total Industrial | 525,337,068 | |||||||
The accompanying notes are an integral part of these financial statements.
28
Table of Contents
Managers Bond Fund
Schedule of Portfolio Investments (continued)
Security Description | Principal Amount | Value | |||||||
Utilites - 3.5% | |||||||||
Cleveland Electric Illuminating Co., The, 5.950%, 12/15/36 | $ | 6,260,000 | $ | 5,769,949 | |||||
Commonwealth Edison, | |||||||||
4.700%, 04/15/15 | 1,465,000 | 1,338,069 | |||||||
5.875%, 02/01/33 | AUD | 5,000,000 | 4,622,525 | ||||||
Constellation Energy Group, Inc., 4.550%, 06/15/15 | 1,675,000 | 1,515,842 | |||||||
Dominion Resources, Inc., 5.950%, 06/15/35 | 740,000 | 693,875 | |||||||
Empresa Nacional de Electricidad SA, | |||||||||
7.875%, 02/01/27 | 2,900,000 | 3,219,922 | |||||||
8.625%, 08/01/15 | 300,000 | 2 | 344,916 | ||||||
Enersis SA, Yankee, 7.400%, 12/01/16 | 225,000 | 242,097 | |||||||
ITC Holdings Corp., | |||||||||
5.875%, 09/30/16 (a) | 2,410,000 | 2,349,502 | |||||||
6.375%, 09/30/36 (a) | 3,605,000 | 3,462,696 | |||||||
Mackinaw Power LLC, 6.296%, 10/31/23 (a) | 10,545,000 | 10,586,337 | |||||||
Methanex Corp., 6.000%, 08/15/15 | 3,825,000 | 3,681,142 | |||||||
MidAmerican Energy Holdings Co., | |||||||||
5.875%, 10/01/12 | 750,000 | 756,470 | |||||||
6.125%, 04/01/36 | 2,305,000 | 2,226,867 | |||||||
NiSource Finance Corp., 6.150%, 03/01/13 | 1,250,000 | 1,259,721 | |||||||
Oneok, Inc., 6.000%, 06/15/35 | 4,010,000 | 3,600,298 | |||||||
Tenaga Nasional Berhad, 7.500%, 11/01/25 (a) | BRL | 2,000,000 | 2,269,504 | ||||||
Toledo Edison Co., 6.150%, 05/15/37 | 2,390,000 | 2,240,522 | |||||||
Total Utilities | 50,180,254 | ||||||||
Total Corporate Bonds (cost $745,298,179) | 741,789,205 | ||||||||
Foreign Government - 5.2% | |||||||||
Alberta, Province of, Series CS, Sinking Fund, 5.930%, 09/16/16 | CAD | 175,271 | 172,092 | ||||||
Brazil, Republic of, | |||||||||
10.250%, 01/10/28 | BRL | 3,000,000 | 1,734,059 | ||||||
12.500%, 01/05/22 | BRL | 5,160,000 | 3,472,100 | ||||||
Canada Government, | |||||||||
2.750%, 12/01/07 | CAD | 3,920,000 | 3,652,546 | ||||||
4.100%, 12/15/08 | CAD | 3,340,000 | 3,108,512 | ||||||
4.250%, 09/01/08 | CAD | 25,410,000 | 23,755,279 | ||||||
4.250%, 12/01/08 | CAD | 820,000 | 765,847 | ||||||
Canadian Government Bond, 5.750%, 06/01/33 | CAD | 2,145,000 | 2,400,225 | ||||||
European Investment Bank, | |||||||||
4.600%, 01/30/37 (a) | CAD | 7,270,000 | 6,417,869 | ||||||
6.501%, 03/10/21 4 | AUD | 5,000,000 | 1,764,777 | ||||||
9.656%, 09/12/08 (a) 4 | BRL | 13,323,060 | 6,162,865 | ||||||
Inter-American Development Bank, | |||||||||
6.000%, 12/15/17 | NZD | 4,215,000 | 2,925,353 | ||||||
11.488%, 05/11/09 4 | BRL | 6,500,000 | 2,734,448 | ||||||
The accompanying notes are an integral part of these financial statements.
29
Table of Contents
Managers Bond Fund
Schedule of Portfolio Investments (continued)
Security Description | Principal Amount | Value | |||||||
Foreign Government - 5.2% (continued) | |||||||||
Mexican Fixed Rate Bonds, 8.000%, 12/07/23 | MXN | 99,070,000 | $ | 9,416,854 | |||||
Mexican Government, 9.000%, 12/20/12 | MXN | 54,500,000 | 5,336,243 | ||||||
Total Foreign Government | 73,819,069 | ||||||||
U.S. Government and Agency Obligations - 38.5% | |||||||||
Federal Home Loan Mortgage Corporation - 0.4% | |||||||||
FHLMC, 5.500%, 09/15/11 | $ | 5,090,000 | 2 | 5,135,774 | |||||
FHLMC Gold Pool, 5.000%, 12/01/31 | 195,003 | 183,763 | |||||||
Total Home Loan Mortgage Corporation | 5,319,537 | ||||||||
Federal National Mortgage Association - 0.8% | |||||||||
FNMA, 2.290%, 02/19/09 | SGD | 3,800,000 | 2,458,115 | ||||||
FNMA, 4.000%, 10/01/18 | 9,082,273 | 8,452,656 | |||||||
FNMA, 6.000%, 07/01/29 | 21,323 | 21,254 | |||||||
Total Federal National Mortgage Association | 10,932,025 | ||||||||
U.S. Treasury Bonds - 20.0% | |||||||||
USTB, 4.500%, 02/15/36 | 88,490,000 | 2 | 80,124,952 | ||||||
USTB, 5.375%, 02/15/31 | 200,405,000 | 2 | 205,790,885 | ||||||
Total U.S. Treasury Bonds | 285,915,837 | ||||||||
U.S. Treasury Notes - 17.3% | |||||||||
USTN, 3.750%, 05/15/08 | 45,790,000 | 2 | 45,289,149 | ||||||
USTN, 4.500%, 09/30/11 | 40,000,000 | 2 | 39,343,760 | ||||||
USTN, 4.625%, 11/30/08 | 76,000,000 | 2 | 75,691,288 | ||||||
USTN, 4.750%, 02/15/37 | 91,810,000 | 2 | 86,566,823 | ||||||
Total U.S. Treasury Notes | 246,891,020 | ||||||||
Total U.S. Government and Agency Obligations | 549,058,419 | ||||||||
Municipal Bonds - 1.5% | |||||||||
MI Tobacco Settlement, 7.309%, 06/01/34 | 3,210,000 | 3,272,691 | |||||||
Tobacco Settlement Financing Corp., 6.706%, 06/01/46 | 18,340,000 | 17,598,147 | |||||||
Total Municipal Bonds | 20,870,838 | ||||||||
Mortgage-Backed Securities - 0.3% | |||||||||
Bank Of America-First Union, Series 2001, 5.464%, 04/11/37 | 1,500,000 | 1,491,912 | |||||||
CS First Boston Mortgage Securities Corp., Series 2005-7, Class 3A1, 5.000%, 08/25/20 | 3,387,462 | 3,314,996 | |||||||
Total Mortgage-Backed Securities | 4,806,908 | ||||||||
Asset-Backed Securities - 0.2% | |||||||||
Community Program Loan Trust, Series 87-A, Class A4, 4.500%, 10/01/18 | 139,210 | 137,028 | |||||||
Community Program Loan Trust, Series 87-A, Class A5, 4.500%, 04/01/29 | 3,225,000 | 3,019,908 | |||||||
Total Asset-Backed Securities | 3,156,936 | ||||||||
| Shares | |||||||||
Preferred Stocks - 0.3% | |||||||||
Entergy New Orleans, Inc., 4.750% | 482 | 38,741 | |||||||
Entergy New Orleans, Inc., 5.560% | 100 | 8,612 | |||||||
Newell Financial Trust I, 5.250% | 84,628 | 4,167,929 | |||||||
Wisconsin Electric Power Co., 3.600% | 3,946 | 275,727 | |||||||
Total Preferred Stocks | 4,491,009 | ||||||||
The accompanying notes are an integral part of these financial statements.
30
Table of Contents
Managers Bond Fund
Schedule of Portfolio Investments (continued)
Security Description | Shares | Value | ||||
Other Investment Companies - 31.3% 1 | ||||||
Bank of New York Institutional Cash Reserves Fund, 5.33% 3 | 438,950,824 | $ | 438,950,824 | |||
JPMorgan Prime Money Market Fund, Institutional Class Shares, 5.19% | 7,350,048 | 7,350,048 | ||||
Total Other Investment Companies | 446,300,872 | |||||
Total Investments - 129.2% | 1,844,293,256 | |||||
Other Assets, less Liabilities - (29.2)% | (416,740,293 | ) | ||||
Net Assets - 100% | $ | 1,427,552,963 | ||||
The accompanying notes are an integral part of these financial statements.
31
Table of Contents
Fund Snapshots
June 30, 2007 (unaudited)
Portfolio Breakdown
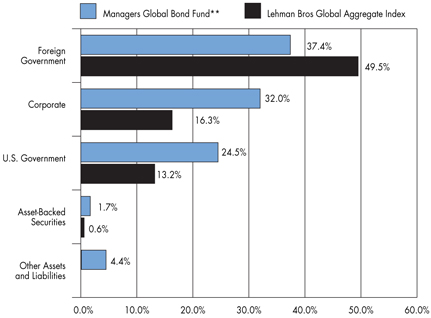
| ** | As a percentage of net assets |
Industry | Managers Global Bond Fund** | Lehman Bros Global Aggregate Index | ||||
Foreign Government | 37.4 | % | 49.5 | % | ||
Corporate | 32.0 | % | 16.3 | % | ||
U.S. Government | 24.5 | % | 13.2 | % | ||
Asset-Backed Securities | 1.7 | % | 0.6 | % | ||
Other Assets and Liabilities | 4.4 | % | 0.0 | % |
Top Ten Holdings
Security Name | Percentage of Net Assets | ||
USTN, 4.750%, 03/31/11* | 5.8 | % | |
Colombia, Republic of, 11.750%, 03/01/10 | 4.7 | ||
Belgium Kingdom, 5.500%, 09/28/17 | 3.8 | ||
Oesterreichische Kontrollbank AG, 1.800%, 03/22/10* | 3.4 | ||
FNMA, 5.500%, 04/01/36* | 2.5 | ||
Kreditanstalt fuer Wiederaufbau, 1.850%, 09/20/10 | 2.4 | ||
Swedish Government, 4.000%, 12/01/09 | 2.1 | ||
USTN, 4.500%, 02/15/16 | 2.0 | ||
U.K. Gilts, 4.750%, 03/04/20 | 1.8 | ||
Colombia, Republic of, 7.375%, 01/27/17 | 1.7 | ||
Top Ten as a Group | 30.2 | % | |
| * | Top Ten Holding at December 31, 2006 |
Any sectors, industries, or securities discussed should not be perceived as investment recommendations. Mention of a specific security should not be considered a recommendation to buy or solicitation to sell that security.
32
Table of Contents
Managers Global Bond Fund
Schedule of Portfolio Investments
June 30, 2007 (unaudited)
Security Description | Principal Amount | Value | ||||||
Foreign Government and Agency Obligations - 37.4% | ||||||||
Argentina, Republic of, 2.000%, 09/30/14 7 | ARS | 640,000 | $ | 231,824 | ||||
Asia Development Bank, 2.350%, 06/21/27 | JPY | 60,000,000 | 489,600 | |||||
Belgium Kingdom, 5.500%, 09/28/17 | EUR | 2,770,000 | 4,005,467 | |||||
Bonos Y Obligaciones Del Estado (Spain), 5.500%, 07/30/17 | EUR | 1,000,000 | 1,444,867 | |||||
Bundesrepublik Deutschland, | ||||||||
3.250%, 07/04/15 | EUR | 1,000,000 | 1,236,760 | |||||
3.750%, 01/04/17 | EUR | 1,339,000 | 1,700,241 | |||||
3.750%, 07/04/13 | EUR | 680,000 | 882,330 | |||||
4.000%, 04/13/12 | EUR | 3,820,000 | 5,053,454 | |||||
4.000%, 01/04/37 | EUR | 1,060,000 | 1,275,730 | |||||
4.500%, 07/04/09 | EUR | 275,000 | 372,271 | |||||
6.500%, 07/04/27 | EUR | 615,000 | 1,020,550 | |||||
Canadian Government, | ||||||||
4.250%, 09/01/09 | CAD | 125,000 | 116,477 | |||||
4.500%, 06/01/15 | CAD | 1,310,000 | 2 | 1,225,122 | ||||
Colombia, Republic of, | ||||||||
7.375%, 01/27/17 | USD | 100,000 | 2 | 108,400 | ||||
9.850%, 06/28/27 | COP | 245,000,000 | 124,878 | |||||
11.750%, 03/01/10 | COP | 136,000,000 | 73,038 | |||||
12.000%, 10/22/15 | COP | 422,000,000 | 2 | 248,357 | ||||
Development Bank of Japan, | ||||||||
1.400%, 06/20/12 | JPY | 228,000,000 | 1,846,988 | |||||
1.750%, 06/21/10 | JPY | 171,000,000 | 1,410,325 | |||||
European Investment Bank, 1.250%, 09/20/12 | JPY | 210,000,000 | 2 | 1,679,702 | ||||
Inter-American Development Bank, 13.000%, 06/20/08 | ISK | 16,000,000 | 256,895 | |||||
International Bank for Reconstruction & Development, 2.000%, 02/18/08 | JPY | 58,000,000 | 474,230 | |||||
Irish Government, 4.600%, 04/18/16 | EUR | 590,000 | 797,340 | |||||
Mexican Government, 9.000%, 12/20/12 | MXN | 3,790,000 | 371,089 | |||||
Netherlands Government SA, 5.500%, 01/15/28 | EUR | 190,000 | 282,304 | |||||
Norwegian Government, | ||||||||
5.000%, 05/15/15 | NOK | 6,155,000 | 1,069,304 | |||||
6.000%, 05/16/11 | NOK | 6,080,000 | 1,018,499 | |||||
Republica Orient Uruguay, 4.250%, 04/05/27 | UYU | 11,065,000 | 511,361 | |||||
Singapore Government, | ||||||||
3.625%, 07/01/14 | SGD | 2,195,000 | 1,519,387 | |||||
4.625%, 07/01/10 | SGD | 1,500,000 | 1,030,321 | |||||
South Africa, Republic of, | ||||||||
4.500%, 04/05/16 | EUR | 6,315,000 | 986,185 | |||||
13.000%, 08/31/10 | ZAR | 385,000 | 2 | 496,381 | ||||
Swedish Government, 4.000%, 12/01/09 | SEK | 15,065,000 | 2 | 2,183,139 | ||||
U.K. Gilts, | ||||||||
4.000%, 03/07/09 | GBP | 50,000 | 97,645 | |||||
4.000%, 09/07/16 | GBP | 105,000 | 188,834 | |||||
4.750%, 03/04/20 | GBP | 1,030,000 | 1,956,040 | |||||
U.K. Treasury, | ||||||||
4.250%, 03/07/36 | GBP | 250,000 | 457,122 | |||||
5.000%, 03/07/12 | GBP | 265,000 | 516,984 | |||||
5.000%, 03/07/25 | GBP | 630,000 | 1,239,830 | |||||
Total Foreign Government and Agency Obligations | 39,999,271 | |||||||
The accompanying notes are an integral part of these financial statements.
33
Table of Contents
Managers Global Bond Fund
Schedule of Portfolio Investments (continued)
Security Description | Principal Amount | Value | ||||||
Corporate Bonds - 32.0% | ||||||||
Finance - 20.9% | ||||||||
ASIF Global Financial, 2.380%, 02/26/09 (a) | USD | 500,000 | $ | 323,348 | ||||
Bank of America NA, 5.300%, 03/15/17 | USD | 1,000,000 | 954,885 | |||||
Barclays Financial LLC, | ||||||||
4.060%, 09/16/10 (a) | KRW | 220,000,000 | 232,276 | |||||
4.460%, 09/23/10 (a) | KRW | 110,000,000 | 116,471 | |||||
4.870%, 03/23/09, (9/23/07) (a) 6 | KRW | 307,770,000 | 334,408 | |||||
Bayerische Landesbank, 3.125%, 02/10/09 | CHF | 485,000 | 397,221 | |||||
BSkyB Finance PLC, 5.750%, 10/20/17 | GBP | 105,000 | 197,179 | |||||
CIT Group, Inc., 5.500%, 12/01/14 | USD | 670,000 | 1,055,961 | |||||
Cosan Finance, Ltd., 7.000%, 02/01/17 (a) | USD | 100,000 | 96,880 | |||||
Depfa ACS Bank, | ||||||||
0.750%, 09/22/08 | JPY | 150,000,000 | 1,215,840 | |||||
1.875%, 05/07/09 | CHF | 140,000 | 111,872 | |||||
General Electric Capital Corp., | ||||||||
2.250%, 02/09/09 | USD | 725,000 | 585,058 | |||||
5.250%, 04/15/13 (b) | USD | 1,000,000 | 963,277 | |||||
Goldman Sachs Group, Inc., 4.428%, 05/23/16, (8/23/07) 6 | USD | 350,000 | 472,949 | |||||
HSBC Bank USA, N.A., 3.626%, 04/18/12 (a) 4 | USD | 3,560,000 | 867,702 | |||||
HSBC Bank, | ||||||||
1.790%, 09/18/15 | USD | 100,000,000 | 785,564 | |||||
3.789%, 05/17/12 (a) 4 | USD | 3,000,000 | 723,389 | |||||
ICICI Bank, Ltd., 6.375%, 04/30/22 (a) 7 | USD | 280,000 | 266,068 | |||||
Instituto de Credito Oficial, 8.000%, 09/28/09 | JPY | 130,000,000 | 1,048,346 | |||||
ISA Capital do Brasil SA, 7.875%, 01/30/12 (a) | USD | 100,000 | 2 | 102,250 | ||||
JP Morgan Chase & Co., | ||||||||
3.734%, 06/08/12 (a) 4 | USD | 1,935,435 | 466,924 | |||||
5.125%, 09/15/14 | USD | 270,000 | 259,270 | |||||
JPMorgan Chase of London, 8.370%, 10/21/10 (a) 4 | IDR | 2,680,548,500 | 226,043 | |||||
KfW Bankengruppe, 2.050%, 02/16/26 | JPY | 120,000,000 | 944,614 | |||||
Kreditanstalt fuer Wiederaufbau, 1.850%, 09/20/10 | JPY | 315,000,000 | 2 | 2,604,434 | ||||
Morgan Stanley Co., Series EMTN, 5.375%, 11/14/13 | USD | 120,000 | 227,142 | |||||
Muenchener Hypothekenbank eG, 5.000%, 01/16/12 | EUR | 685,000 | 938,114 | |||||
Network Rail MTN Finance PLC, 4.875%, 03/06/09 | GBP | 465,000 | 917,605 | |||||
Oesterreichische Kontrollbank AG, 1.800%, 03/22/10 | JPY | 440,000,000 | 2 | 3,631,125 | ||||
Qwest Capital Funding, Inc., 6.875%, 07/15/28 | USD | 15,000 | 13,106 | |||||
Rabobank, 13.500%, 01/28/08 (a) | ISK | 50,000,000 | 800,466 | |||||
SLM Corp, 5.000%, 10/01/13 | USD | 150,000 | 127,982 | |||||
White Mountains Re Group, 6.375%, 03/20/17 (a) | USD | 285,000 | 273,821 | |||||
Total Finance | 22,281,590 | |||||||
Industrials - 9.7% | ||||||||
Albertson’s, Inc., 7.450%, 08/01/29 | USD | 165,000 | 160,929 | |||||
America Movil SA, 9.000%, 01/15/16 | MXN | 1,400,000 | 136,503 | |||||
Bell Aliant Regional Communications, 5.410%, 09/26/16 | CAD | 320,000 | 276,055 | |||||
Bell Canada, | ||||||||
5.000%, 02/15/17 | CAD | 150,000 | 124,485 | |||||
6.100%, 03/16/35 | CAD | 20,000 | 15,966 | |||||
6.550%, 05/01/29 (a) | CAD | 10,000 | 8,460 | |||||
7.300%, 02/23/32 | CAD | 25,000 | 22,754 | |||||
Bertelsmann AG, 3.625%, 10/06/15 | EUR | 180,000 | 217,879 | |||||
Bite Finance International, 7.645%, 03/15/14, (09/15/07) (a) 6 | EUR | 170,000 | 240,441 | |||||
The accompanying notes are an integral part of these financial statements.
34
Table of Contents
Managers Global Bond Fund
Schedule of Portfolio Investments (continued)
Security Description | Principal Amount | Value | ||||||
Industrials - 9.7% (continued) | ||||||||
Chesapeake Energy Corp., | ||||||||
6.500%, 08/15/17 | USD | 30,000 | $ | 28,425 | ||||
6.875%, 11/15/20 | USD | 160,000 | 153,200 | |||||
Comcast Corp., | ||||||||
6.450%, 03/15/37 | USD | 210,000 | 202,382 | |||||
4.950%, 06/15/16 | USD | 570,000 | 522,904 | |||||
Community Health Systems, 8.875%, 07/15/15 (a) | USD | 225,000 | 228,094 | |||||
Corning, Inc., 6.750%, 09/15/13 | USD | 125,000 | 131,404 | |||||
Couche-Tard US LP/Couche-Tard Finance Corp., 7.500%, 12/15/13 | USD | 160,000 | 161,200 | |||||
CSX Corp., 6.000%, 10/01/36 | USD | 505,000 | 471,456 | |||||
DaimlerChrysler N.A. Holdings Corp., 4.875%, 06/15/10 | USD | 95,000 | 93,190 | |||||
Desarrolladora Homex SAB de CV, 7.500%, 09/28/15 | USD | 380,000 | 393,300 | |||||
Edcon Proprietary Ltd., 7.395%, 06/15/14 (09/17/07) (a) 6 | EUR | 440,000 | 2 | 586,587 | ||||
France Telecom, 3.625%, 10/14/15 | EUR | 210,000 | 254,089 | |||||
Georgia-Pacific Corp., | ||||||||
7.125%, 01/15/17 (a) | USD | 105,000 | 100,800 | |||||
7.250%, 06/01/28 | USD | 160,000 | 147,200 | |||||
Grupo Televida S.A., 8.490%, 05/11/37 (a) | MXN | 5,900,000 | 552,406 | |||||
Hanaro Telecom, Inc., 7.000%, 02/01/12 (a) | USD | 50,000 | 50,125 | |||||
Hilcorp Energy I LP/Hilcorp Finance Co., 7.750%, 11/01/15 (a) | USD | 120,000 | 2 | 116,400 | ||||
Hospira, Inc., | ||||||||
5.550%, 03/30/12 | USD | 230,000 | 227,997 | |||||
6.050%, 03/30/17 | USD | 65,000 | 64,007 | |||||
Host Marriott LP, 6.750%, 06/01/16 | USD | 65,000 | 63,700 | |||||
K Hovnanian Enterprises, Inc., | ||||||||
6.250%, 01/15/16 | USD | 145,000 | 2 | 123,250 | ||||
6.375%, 12/15/14 | USD | 5,000 | 4,275 | |||||
6.500%, 01/15/14 | USD | 5,000 | 4,425 | |||||
LPG International, Inc., 7.250%, 12/20/15 | USD | 120,000 | 120,300 | |||||
Lucent Technologies, Inc., 6.450%, 03/15/29 | USD | 595,000 | 517,650 | |||||
News America, Inc., 6.150%, 03/01/37 (a) | USD | 420,000 | 387,168 | |||||
Owens & Minor, Inc., 6.350%, 04/15/16 | USD | 530,000 | 521,902 | |||||
Pemex Project Funding Master Trust, 6.625%, 04/04/10 | USD | 390,000 | 548,855 | |||||
Qwest Capital Funding, Inc., | ||||||||
6.500%, 11/15/18 | USD | 40,000 | 36,000 | |||||
7.250%, 02/15/11 | USD | 75,000 | 2 | 74,625 | ||||
7.750%, 02/15/31 | USD | 65,000 | 2 | 61,262 | ||||
Qwest Corp., | ||||||||
6.875%, 09/15/33 | USD | 75,000 | 2 | 70,312 | ||||
7.250%, 09/15/25 | USD | 5,000 | 2 | 4,988 | ||||
Shaw Communications, 5.700%, 03/02/17 | CAD | 315,000 | 279,897 | |||||
Sprint Nextel Corp., 6.000%, 12/01/16 | USD | 404,000 | 383,257 | |||||
Stena AB, 7.000%, 12/01/16 | USD | 90,000 | 90,000 | |||||
Telecom Italia Capital, 6.000%, 09/30/34 | USD | 95,000 | 85,588 | |||||
Telecom Italia SpA, 6.375%, 11/15/33 | USD | 125,000 | 117,744 | |||||
Telefonica Emisiones SAU, 6.221%, 07/03/17 | USD | 265,000 | 264,336 | |||||
Time Warner, Inc., | ||||||||
6.625%, 05/15/29 | USD | 310,000 | 300,992 | |||||
6.950%, 01/15/28 | USD | 85,000 | 85,619 | |||||
Union Pacifi c Corp., 5.375%, 06/01/33 | USD | 86,000 | 74,983 | |||||
The accompanying notes are an integral part of these financial statements.
35
Table of Contents
Managers Global Bond Fund
Schedule of Portfolio Investments (continued)
Security Description | Principal Amount | Value | ||||||
Industrials - 9.7% (continued) | ||||||||
Wendel Investissement, | ||||||||
4.375%, 08/09/17 | EUR | 200,000 | $ | 245,389 | ||||
4.875%, 05/26/16 | EUR | 200,000 | 258,198 | |||||
Total Industrials | 10,413,353 | |||||||
Utilities - 1.4% | ||||||||
Majapahit Holding BV, 7.250%, 06/28/17 (a) | USD | 200,000 | 2 | 195,250 | ||||
National Grid PLC, 6.300%, 08/01/16 | USD | 250,000 | 254,562 | |||||
Transporta De Gas Del Sur, 7.875%, 05/14/17 (a) | USD | 540,000 | 2 | 520,425 | ||||
TXU Corp., | ||||||||
6.500%, 11/15/24 | USD | 405,000 | 2 | 334,877 | ||||
6.550%, 11/15/34 | USD | 190,000 | 2 | 153,676 | ||||
Total Utilities | 1,458,790 | |||||||
Total Corporate Bonds | 34,153,733 | |||||||
U.S. Government and Agency Obligations - 24.5% | ||||||||
Federal Home Loan Mortgage Corporation - 3.5% | ||||||||
FHLMC, 5.000%, 08/01/35 | USD | 1,422,627 | 1,337,003 | |||||
FHLMC Gold Pool, 4.000%, 02/01/20 | USD | 57,497 | 53,421 | |||||
FHLMC Gold Pool, 4.500%, 04/01/35 | USD | 266,163 | 242,889 | |||||
FHLMC Gold Pool, 5.000%, 04/01/20 to 07/01/35 | USD | 1,303,851 | 1,230,359 | |||||
FHLMC Gold Pool, 5.500%, 12/01/15 | USD | 801,319 | 795,079 | |||||
FHLMC Gold Pool, 6.000%, 05/01/18 to 10/01/20 | USD | 67,594 | 67,910 | |||||
FHLMC Gold Pool, 6.500%, 08/01/35 to 10/01/35 | USD | 64,444 | 65,198 | |||||
Total Federal Home Loan Mortgage Corporation | 3,791,859 | |||||||
Federal National Mortgage Association - 9.2% | ||||||||
FNMA, 1.750%, 03/26/08 | JPY | 140,000,000 | 1,144,683 | |||||
FNMA, 2.290%, 02/19/09 | USD | 400,000 | 258,749 | |||||
FNMA, 4.500%, 05/01/20 to 09/01/35 | USD | 362,103 | 347,335 | |||||
FNMA, 5.000%, 10/01/19 to 03/01/37 | USD | 2,433,279 | 2,296,136 | |||||
FNMA, 5.500%, 11/01/16 to 04/01/36 | USD | 4,230,344 | 4,091,798 | |||||
FNMA, 6.000%, 06/01/17 to 05/01/35 | USD | 1,360,215 | 1,361,414 | |||||
FNMA, 6.500%, 10/01/35 to 05/01/36 | USD | 108,556 | 109,991 | |||||
FNMA Gold Pool, 6.000%, 10/01/20 to 04/01/35 | USD | 207,056 | 206,113 | |||||
Total Federal National Mortgage Association | 9,816,219 | |||||||
Government National Mortgage Association - 0.5% | ||||||||
GNMA, 5.500%, 11/20/34 | USD | 111,232 | 107,843 | |||||
GNMA, 6.000%, 10/20/35 | USD | 35,395 | 35,226 | |||||
GNMA, 6.500%, TBA | USD | 455,000 | 462,821 | |||||
Total Government National Mortgage Association | 605,890 | |||||||
U.S. Treasury - 11.3% | ||||||||
USTB, 2.000%, 01/15/26 | USD | 556,887 | 504,418 | |||||
USTB, 5.375%, 02/15/31 | USD | 705,000 | 2 | 723,947 | ||||
USTN, 4.500%, 02/15/16 to 02/15/36 | USD | 2,375,000 | 2 | 2,277,420 | ||||
USTN, 4.750%, 03/31/11 to 02/15/37 | USD | 7,025,000 | 2 | 6,947,360 | ||||
USTN, 4.875%, 08/15/16 | USD | 1,065,000 | 2 | 1,051,937 | ||||
USTN, 5.000%, 07/31/08 | USD | 525,000 | 524,836 | |||||
Total U.S. Treasury | 12,029,918 | |||||||
Total U.S. Government and Agency Obligations | 26,243,886 | |||||||
The accompanying notes are an integral part of these financial statements.
36
Table of Contents
Managers Global Bond Fund
Schedule of Portfolio Investments (continued)
Security Description | Principal Amount | Value | ||||||
Asset-Backed Securities - 1.7% | ||||||||
Daimler Chrysler Auto Trust, Series 2004-B, Class A4, 3.710%, 10/08/09 | USD | 35,000 | $ | 34,750 | ||||
DaimlerChrysler Auto Trust, Class A4, Series 2005-A, 3.740%, 02/08/10 | USD | 340,000 | 336,190 | |||||
Greenwich Capital Commericial Funding Corp., Series 2005-GG5, Class A2, 5.117%, 04/10/37 | USD | 385,000 | 380,725 | |||||
Honda Auto Receivables Owner Trust, 4.930%, 03/18/11 | USD | 100,000 | 99,277 | |||||
Honda Auto Receivables Owner Trust, Class A4, Series 2005-1, 3.820%, 05/21/10 | USD | 330,000 | 324,871 | |||||
MBNA Credit Card Master Note Trust, 4.300%, 02/15/11 | USD | 410,000 | 405,227 | |||||
Merrill Lynch/Countrywide Mortgage Trust, 5.439%, 02/12/39 7 | USD | 235,000 | 233,864 | |||||
Total Asset-Backed Securities | 1,814,904 | |||||||
Short-Term Investments - 24.1% | ||||||||
U.S. Government Agencies - 0.4% | ||||||||
FHLMC Discount Notes, 4.371%, 07/18/07 4 | USD | 455,000 | 453,969 | |||||
| Shares | ||||||||
Other Investment Companies - 23.7% 1 | ||||||||
Bank of New York Institutional Cash Reserves Fund, 5.33% 3 | 21,052,226 | 21,052,226 | ||||||
JPMorgan Prime Money Market Fund, Institutional Class Shares, 5.19% | 4,230,314 | 4,230,314 | ||||||
Total Other Investment Companies | 25,282,540 | |||||||
Total Short-Term Investments | 25,736,509 | |||||||
Total Investments - 119.7% | 127,948,303 | |||||||
Other Assets, less Liabilities - (19.7)% | (21,065,717 | ) | ||||||
Net Assets - 100% | $ | 106,882,586 | ||||||
The accompanying notes are an integral part of these financial statements.
37
Table of Contents
Notes to Schedules of Portfolio Investments (unaudited)
The following footnotes and abbreviations should be read in conjunction with each of the Schedules of Portfolio Investments previously presented in this report.
At June 30, 2007, the cost of securities for Federal income tax purposes and the gross aggregate unrealized appreciation and/or depreciation based on tax cost were approximately:
Fund | Cost | Appreciation | Depreciation | Net | |||||||||
Value | $ | 68,697,262 | $ | 19,592,304 | ($1,512,678 | ) | $ | 18,079,626 | |||||
Managers AMG Essex Large Cap Growth | 65,300,520 | 9,717,720 | (594,153 | ) | 9,123,567 | ||||||||
Small Company | 39,885,860 | 9,391,821 | (916,742 | ) | 8,475,079 | ||||||||
International Equity | 197,417,888 | 73,551,890 | (3,874,440 | ) | 69,677,450 | ||||||||
Emerging Markets Equity | 135,992,743 | 70,967,972 | (562,887 | ) | 70,405,085 | ||||||||
Bond | 1,841,711,140 | 23,549,734 | (20,967,618 | ) | 2,582,116 | ||||||||
Global Bond | 128,472,828 | 1,092,353 | (1,616,878 | ) | (524,525 | ) | |||||||
| * | Non-income-producing security. |
| (a) | Security exempt from registration under Rule 144A of the Securities Act of 1933. This security may be resold in transactions exempt from registration, normally to qualified buyers. At June 30, 2007, the value of these securities amounted to the following: |
Fund | Market Value | % of Net Assets | ||||
International Equity | $ | 1,046,061 | 0.4 | % | ||
Emerging Markets Equity | 6,348,368 | 3.3 | % | |||
Bond | 111,562,299 | 7.8 | % | |||
Global Bond | 8,754,317 | 8.2 | % | |||
| (b) | Step Bond. High-yield debt instrument with either deferred interest payments or an interest rate that resets at specific times during its term. |
1 | Yield shown for an investment company represents the June 30, 2007, seven-day average yield, which refers to the sum of the previous seven days’ dividends paid, expressed as an annual percentage. |
2 | Some or all of these shares were out on loan to various brokers as of June 30, 2007, amounting to: |
Fund | Market Value | % of Net Assets | ||||
Value | $ | 5,447,317 | 6.7 | % | ||
Managers AMG Essex Large Cap Growth | 9,213,490 | 14.2 | ||||
Small Company | 5,863,067 | 13.9 | ||||
International Equity | 13,729,104 | 5.4 | ||||
Emerging Markets Equity | 16,019,167 | 8.4 | ||||
Bond | 434,240,697 | 30.4 | ||||
Global Bond | 20,403,871 | 19.1 | ||||
3 | Collateral received from brokers for securities lending was invested in these short-term investments. |
4 | Represents yield to maturity at June 30, 2007. |
5 | Security is illiquid. |
6 | Floating Rate Security. The rate listed is as of June 30, 2007. Date in parenthesis represents the security’s next coupon rate reset. |
7 | Variable Rate Security. The rate listed is as of June 30, 2007 and is periodically reset subject to terms and conditions set forth in the debenture. |
Investments Definitions and Abbreviations:
ADR/GDR: ADR after the name of a holding stands for American Depositary Receipt, representing ownership of foreign securities on deposit with a domestic custodian bank; a GDR (Global Depositary Receipt) is comparable, but foreign securities are held on deposit in a non-U.S. bank. The value of the ADR/GDR securities is determined or significantly influenced by trading on exchanges not located in the United States or Canada. Sponsored ADR/GDRs are initiated by the underlying foreign company.
| FHLMC: | Federal Home Loan Mortgage Corp. | |
| FNMA: | Federal National Mortgage Association | |
| GNMA: | Government National Mortgage Association | |
| USTB: | United States Treasury Bond | |
| USTN: | United States Treasury Note | |
| GMAC: | General Motors Acceptance Corp. |
Registered shares: A security whose owner has been recorded with its issuer or issuer’s registrar.
Abbreviations have been used throughout the portfolios to indicate amounts shown in currencies other than the U.S. dollar (USD):
| ARS: | Argentine Peso | |
| AUD: | Australian Dollar | |
| BRL: | Brazilian Real | |
| CAD: | Canadian Dollar | |
| CHF: | Swiss Franc | |
| COP: | Columbian Peso | |
| EUR: | Euro | |
| GBP: | British Pound | |
| IDR: | Indonesian Rupiah | |
| ISK: | Icelandic Krona | |
| JPY: | Japanese Yen | |
| KRW: | South Korean Won | |
| MXN: | Mexican Peso | |
| MYR: | Malaysian Ringgit | |
| NOK: | Norwegian Krone | |
| NZD: | New Zealand Dollar | |
| SEK: | Swedish Krona | |
| SGD: | Singapore Dollar | |
| THB: | Thailand Baht | |
| UYU: | Uruguay Peso | |
| ZAR: | South African Rand |
38
Table of Contents
Statements of Assets and Liabilities
June 30, 2007 (unaudited)
| Managers Value Fund | Managers AMG Essex Large Cap Growth Fund | Managers Small Company Fund | ||||||||
Assets: | ||||||||||
Investments at value (including securities on loan valued at $5,447,317, $9,213,490, $5,863,067, $13,729,104, $16,019,167, $434,240,697 and $20,403,871, respectively)* | $ | 86,776,888 | $ | 74,424,087 | $ | 48,360,939 | ||||
Cash | — | 51,851 | — | |||||||
Foreign currency** | — | — | — | |||||||
Receivable for investments sold | 207,741 | 2,106,370 | — | |||||||
Receivable for Fund shares sold | 97,784 | 64,419 | 58,203 | |||||||
Unrealized gains on forward foreign currency contracts | — | — | — | |||||||
Receivable for variation margin on futures | — | — | — | |||||||
Dividends, interest and other receivables | 69,680 | 39,984 | 22,820 | |||||||
Prepaid expenses | 15,625 | 15,284 | 17,507 | |||||||
Total assets | 87,167,718 | 76,701,995 | 48,459,469 | |||||||
Liabilities: | ||||||||||
Payable to affiliate | — | 356 | — | |||||||
Payable to Custodian | 17,880 | — | 15,772 | |||||||
Payable for Fund shares repurchased | 119,877 | 49,076 | 154,566 | |||||||
Payable upon return of securities loaned | 5,605,658 | 9,599,839 | 5,996,774 | |||||||
Payable for investments purchased | — | 1,919,576 | 77,852 | |||||||
Unrealized losses on forward foreign currency contracts | — | — | — | |||||||
Other payables | — | — | — | |||||||
Accrued expenses: | ||||||||||
Investment advisory and management fees | 48,759 | 43,748 | 30,432 | |||||||
Administrative fees | 17,006 | 13,671 | 8,682 | |||||||
Other | 62,877 | 59,936 | 42,472 | |||||||
Total liabilities | 5,872,057 | 11,686,202 | 6,326,550 | |||||||
Net Assets | $ | 81,295,661 | $ | 65,015,793 | $ | 42,132,919 | ||||
Shares outstanding | 2,749,787 | 2,061,797 | 3,168,781 | |||||||
Net asset value, offering and redemption price per share | $ | 29.56 | $ | 31.53 | $ | 13.30 | ||||
Net Assets Represent: | ||||||||||
Paid-in capital | $ | 56,685,134 | $ | 196,459,649 | $ | 32,499,780 | ||||
Undistributed net investment income (loss) | 334,429 | (148,172 | ) | 30,383 | ||||||
Accumulated net realized gain (loss) from investments, futures and foreign currency transactions | 5,221,833 | (140,461,242 | ) | 1,076,522 | ||||||
Net unrealized appreciation (depreciation) of investments, futures and foreign currency contracts and translations | 19,054,265 | 9,165,558 | 8,526,234 | |||||||
Net Assets | $ | 81,295,661 | $ | 65,015,793 | $ | 42,132,919 | ||||
| $ | 67,722,623 | $ | 65,258,529 | $ | 39,834,705 | |||||
| — | — | — | ||||||||
| * | Investments at cost |
| ** | Foreign currency at cost |
The accompanying notes are an integral part of these financial statements.
39
Table of Contents
| Managers International Equity Fund | Managers Emerging Markets Equity Fund | Managers Bond Fund | Managers Global Bond Fund | ||||||||||
| $ | 267,095,338 | $ | 206,397,828 | $ | 1,844,293,256 | $ | 127,948,303 | ||||||
| — | — | 1,239,479 | — | ||||||||||
| 1,059,750 | 1,034,994 | 17,532 | 2,127,910 | ||||||||||
| 3,050,385 | 224,172 | — | 45,676 | ||||||||||
| 223,433 | 133,147 | 5,007,775 | 121,351 | ||||||||||
| 6,114 | — | — | 17,595 | ||||||||||
| 11,694 | — | — | — | ||||||||||
| 575,260 | 735,691 | 20,520,381 | 1,482,307 | ||||||||||
| 21,360 | 26,417 | 106,315 | 15,781 | ||||||||||
| 272,043,334 | 208,552,249 | 1,871,184,738 | 131,758,923 | ||||||||||
| — | — | — | 15,293 | ||||||||||
| 324,094 | 285,807 | — | 2,064,041 | ||||||||||
| 216,016 | 110,284 | 1,530,040 | 51,448 | ||||||||||
| 14,203,201 | 17,731,244 | 438,950,824 | 21,052,226 | ||||||||||
| 1,328,553 | 128,854 | 1,915,963 | 1,538,472 | ||||||||||
| 2,355 | — | — | — | ||||||||||
| 6,479 | — | 56,856 | 13,108 | ||||||||||
| 187,644 | 170,835 | 702,672 | 52,826 | ||||||||||
| 52,123 | 38,263 | 283,704 | 17,609 | ||||||||||
| 233,896 | 203,168 | 191,716 | 71,314 | ||||||||||
| 16,554,361 | 18,668,455 | 443,631,775 | 24,876,337 | ||||||||||
| $ | 255,488,973 | $ | 189,883,794 | $ | 1,427,552,963 | $ | 106,882,586 | ||||||
| 3,452,960 | 6,673,215 | 58,242,147 | 5,035,037 | ||||||||||
| $ | 73.99 | $ | 28.45 | $ | 24.51 | $ | 21.23 | ||||||
| $ | 233,037,365 | $ | 105,988,297 | $ | 1,425,605,682 | $ | 104,467,338 | ||||||
| (383,772 | ) | 679,851 | (358,072 | ) | 1,655,705 | ||||||||
| (47,491,928 | ) | 12,681,791 | (904,453 | ) | 1,234,102 | ||||||||
| 70,327,308 | 70,533,855 | 3,209,806 | (474,559 | ) | |||||||||
| $ | 255,488,973 | $ | 189,883,794 | $ | 1,427,552,963 | $ | 106,882,586 | ||||||
| $ | 196,830,226 | $ | 135,980,444 | $ | 1,841,139,532 | $ | 128,470,801 | ||||||
| $ | 1,055,684 | $ | 1,032,440 | — | $ | 2,113,466 | |||||||
The accompanying notes are an integral part of these financial statements.
40
Table of Contents
For the six months ended June 30, 2007 (unaudited)
| Managers Value Fund | Managers AMG Essex Large Cap Growth Fund | Managers Small Company Fund | ||||||||||
Investment Income: | ||||||||||||
Dividend income | $ | 805,201 | $ | 263,321 | $ | 302,075 | ||||||
Interest income | — | — | — | |||||||||
Foreign withholding tax | (7,514 | ) | (2,337 | ) | (512 | ) | ||||||
Securities lending fees | 2,013 | 3,505 | 1,983 | |||||||||
Total investment income | 799,700 | 264,489 | 303,546 | |||||||||
Expenses: | ||||||||||||
Investment management fees | 301,117 | 262,246 | 177,757 | |||||||||
Administrative fees | 100,373 | 81,952 | 49,377 | |||||||||
Transfer agent | 33,942 | 40,352 | 20,531 | |||||||||
Professional fees | 21,302 | 19,384 | 13,507 | |||||||||
Custodian | 19,671 | 9,297 | 20,558 | |||||||||
Registration fees | 7,927 | 8,334 | 6,708 | |||||||||
Reports to shareholders | 4,329 | 4,502 | 409 | |||||||||
Trustees fees and expenses | 2,689 | 2,379 | 1,506 | |||||||||
Miscellaneous | 2,137 | 973 | 1,153 | |||||||||
Total expenses before offsets | 493,487 | 429,419 | 291,506 | |||||||||
Expense (reimbursement) recoupment | (15,229 | ) | (5,715 | ) | (4,855 | ) | ||||||
Expense reductions | (12,987 | ) | (11,043 | ) | (13,488 | ) | ||||||
Net expenses | 465,271 | 412,661 | 273,163 | |||||||||
Net investment income (loss) | 334,429 | (148,172 | ) | 30,383 | ||||||||
Net Realized and Unrealized Gain (Loss): | ||||||||||||
Net realized gain (loss) on investment transactions | 3,933,414 | 4,897,079 | 1,664,232 | |||||||||
Net realized gain on futures contracts | — | — | — | |||||||||
Net realized gain (loss) on foreign currency contracts and transactions | — | — | — | |||||||||
Net unrealized appreciation (depreciation) of investments | 187,244 | 391,706 | 2,505,548 | |||||||||
Net unrealized appreciation of futures contracts | — | — | — | |||||||||
Net unrealized appreciation (depreciation) of foreign currency contracts and translations | — | — | — | |||||||||
Net realized and unrealized gain (loss) | 4,120,658 | 5,288,785 | 4,169,780 | |||||||||
Net Increase in Net Assets Resulting from Operations | $ | 4,455,087 | $ | 5,140,613 | $ | 4,200,163 | ||||||
The accompanying notes are an integral part of these financial statements.
41
Table of Contents
| Managers International Equity Fund | Managers Emerging Markets Equity Fund | Managers Bond Fund | Managers Global Bond Fund | |||||||||||
| $ | 3,699,776 | $ | 2,306,742 | $ | 1,151,156 | $ | 81,717 | |||||||
| — | — | 31,964,343 | 2,099,334 | |||||||||||
| (352,804 | ) | (184,350 | ) | — | — | |||||||||
| 66,634 | 29,249 | 254,137 | 18,761 | |||||||||||
| 3,413,606 | 2,151,641 | 33,369,636 | 2,199,812 | |||||||||||
| 1,078,011 | 958,919 | 3,678,227 | 305,078 | |||||||||||
| 299,447 | 208,460 | 1,471,291 | 101,693 | |||||||||||
| 316,688 | 112,754 | 271,923 | 32,900 | |||||||||||
| 35,007 | 24,435 | 97,819 | 24,853 | |||||||||||
| 175,316 | 173,952 | 151,025 | 31,541 | |||||||||||
| 8,918 | 9,261 | 42,074 | 6,803 | |||||||||||
| 10,590 | 7,872 | 58,068 | 4,307 | |||||||||||
| 7,875 | 5,361 | 37,793 | 3,645 | |||||||||||
| 12,483 | 7,728 | 24,172 | 1,670 | |||||||||||
| 1,944,335 | 1,508,742 | 5,832,392 | 512,490 | |||||||||||
| (210,518 | ) | (36,046 | ) | (1,527 | ) | 93,369 | ||||||||
| (3,815 | ) | (906 | ) | (4,554 | ) | (500 | ) | |||||||
| 1,730,002 | 1,471,790 | 5,826,311 | 605,359 | |||||||||||
| 1,683,604 | 679,851 | 27,543,325 | 1,594,453 | |||||||||||
| 17,899,243 | 10,316,845 | (145,277 | ) | 38,773 | ||||||||||
| 218,103 | — | — | — | |||||||||||
| 59,339 | (53,191 | ) | 1,287,515 | 1,161,896 | ||||||||||
| 2,578,225 | 15,311,688 | (21,623,282 | ) | (2,106,048 | ) | |||||||||
| 14,277 | — | — | — | |||||||||||
| (31,238 | ) | 2,367 | 274,489 | 74,133 | ||||||||||
| 20,737,949 | 25,577,709 | (20,206,555 | ) | (831,246 | ) | |||||||||
| $ | 22,421,553 | $ | 26,257,560 | $ | 7,336,770 | $ | 763,207 | |||||||
The accompanying notes are an integral part of these financial statements.
42
Table of Contents
Statements of Changes in Net Assets
For the six months ended June 30, 2007 (unaudited) and for the year ended December 31, 2006
| Managers Value Fund | Managers AMG Essex Large Cap Growth Fund | Managers Small Company Fund | ||||||||||||||||||||||
| 2007 | 2006 | 2007 | 2006 | 2007 | 2006 | |||||||||||||||||||
Increase (Decrease) in Net Assets From Operations: | ||||||||||||||||||||||||
Net investment income (loss) | $ | 334,429 | $ | 853,565 | ($148,172 | ) | ($256,524 | ) | $ | 30,383 | ($268,690 | ) | ||||||||||||
Net realized gain (loss) on investments, futures and foreign currency transactions | 3,933,414 | 12,106,593 | 4,897,079 | 10,416,894 | 1,664,232 | 6,115,060 | ||||||||||||||||||
Net unrealized appreciation (depreciation) of investments and foreign currency translations | 187,244 | 2,554,698 | 391,706 | (5,161,247 | ) | 2,505,548 | (1,903,333 | ) | ||||||||||||||||
Net increase in net assets resulting from operations | 4,455,087 | 15,514,856 | 5,140,613 | 4,999,123 | 4,200,163 | 3,943,037 | ||||||||||||||||||
Distributions to Shareholders: | ||||||||||||||||||||||||
From net investment income | — | (855,868 | ) | — | — | — | — | |||||||||||||||||
From net realized gain on investments | — | (11,576,359 | ) | — | — | — | — | |||||||||||||||||
Total distributions to shareholders | — | (12,432,227 | ) | — | — | — | — | |||||||||||||||||
From Capital Share Transactions: | ||||||||||||||||||||||||
Proceeds from sale of shares | 8,122,502 | 17,671,554 | 5,287,953 | 13,685,274 | 4,276,190 | 11,120,944 | ||||||||||||||||||
Reinvestment of dividends and distributions | — | 12,291,981 | — | — | — | — | ||||||||||||||||||
Cost of shares repurchased | (12,198,237 | ) | (76,772,986 | ) | (11,411,978 | ) | (57,562,905 | ) | (4,781,476 | ) | (13,619,300 | ) | ||||||||||||
Net increase (decrease) from capital share transactions | (4,075,735 | ) | (46,809,451 | ) | (6,124,025 | ) | (43,877,631 | ) | (505,286 | ) | (2,498,356 | ) | ||||||||||||
Total increase (decrease) in net assets | 379,352 | (43,726,822 | ) | (983,412 | ) | (38,878,508 | ) | 3,694,877 | 1,444,681 | |||||||||||||||
Net Assets: | ||||||||||||||||||||||||
Beginning of period | 80,916,309 | 124,643,131 | 65,999,205 | 104,877,713 | 38,438,042 | 36,993,361 | ||||||||||||||||||
End of period | $ | 81,295,661 | $ | 80,916,309 | $ | 65,015,793 | $ | 65,999,205 | $ | 42,132,919 | $ | 38,438,042 | ||||||||||||
End of period undistributed net investment income (loss) | $ | 334,429 | — | ($148,172 | ) | — | $ | 30,383 | — | |||||||||||||||
Share Transactions: | ||||||||||||||||||||||||
Sale of shares | 284,561 | 599,108 | 172,817 | 489,185 | 339,693 | 969,613 | ||||||||||||||||||
Reinvested shares | — | 439,628 | — | — | — | — | ||||||||||||||||||
Shares repurchased | (426,897 | ) | (2,601,246 | ) | (372,742 | ) | (2,000,828 | ) | (380,782 | ) | (1,172,425 | ) | ||||||||||||
Net increase (decrease) in shares | (142,336 | ) | (1,562,510 | ) | (199,925 | ) | (1,511,643 | ) | (41,089 | ) | (202,812 | ) | ||||||||||||
The accompanying notes are an integral part of these financial statements.
43
Table of Contents
| Managers International Equity Fund | Managers Emerging Markets Equity Fund | Managers Bond Fund | Managers Global Bond Fund | |||||||||||||||||||||||||||
| 2007 | 2006 | 2007 | 2006 | 2007 | 2006 | 2007 | 2006 | |||||||||||||||||||||||
| $ | 1,683,604 | $ | 1,524,445 | $ | 679,851 | $ | 1,168,431 | $ | 27,543,325 | $ | 26,026,961 | $ | 1,594,453 | $ | 1,395,617 | |||||||||||||||
| 18,176,685 | 36,194,122 | 10,263,654 | 15,879,607 | 1,142,238 | (941,142 | ) | 1,200,669 | (166,942 | ) | |||||||||||||||||||||
| 2,561,264 | 15,368,505 | 15,314,055 | 22,158,611 | (21,348,793 | ) | 19,897,379 | (2,031,915 | ) | 2,281,029 | |||||||||||||||||||||
| 22,421,553 | 53,087,072 | 26,257,560 | 39,206,649 | 7,336,770 | 44,983,198 | 763,207 | 3,509,704 | |||||||||||||||||||||||
| — | (4,000,641 | ) | — | (1,229,899 | ) | (27,602,114 | ) | (27,271,077 | ) | — | (1,211,010 | ) | ||||||||||||||||||
| — | — | — | (13,239,958 | ) | — | — | — | (66,866 | ) | |||||||||||||||||||||
| — | (4,000,641 | ) | — | (14,469,857 | ) | (27,602,114 | ) | (27,271,077 | ) | — | (1,277,876 | ) | ||||||||||||||||||
| 28,325,320 | 48,510,526 | 44,011,559 | 39,305,219 | 649,620,758 | 569,632,303 | 60,128,145 | 19,531,900 | |||||||||||||||||||||||
| — | 3,476,492 | — | 13,851,717 | 26,326,261 | 25,707,360 | — | 1,252,232 | |||||||||||||||||||||||
| (26,174,026 | ) | (76,550,450 | ) | (33,368,004 | ) | (42,139,842 | ) | (134,904,858 | ) | (132,723,734 | ) | (7,678,303 | ) | (12,477,695 | ) | |||||||||||||||
| 2,151,294 | (24,563,432 | ) | 10,643,555 | 11,017,094 | 541,042,161 | 462,615,929 | 52,449,842 | 8,306,437 | ||||||||||||||||||||||
| 24,572,847 | 24,522,999 | 36,901,115 | 35,753,886 | 520,776,817 | 480,328,050 | 53,213,049 | 10,538,265 | |||||||||||||||||||||||
| 230,916,126 | 206,393,127 | 152,982,679 | 117,228,793 | 906,776,146 | 426,448,096 | 53,669,537 | 43,131,272 | |||||||||||||||||||||||
| $ | 255,488,973 | $ | 230,916,126 | $ | 189,883,794 | $ | 152,982,679 | $ | 1,427,552,963 | $ | 906,776,146 | $ | 106,882,586 | $ | 53,669,537 | |||||||||||||||
| ($383,772) | ($2,067,376 | ) | $ | 679,851 | — | ($358,072 | ) | ($299,283 | ) | $ | 1,655,705 | $ | 61,252 | |||||||||||||||||
| 402,910 | 799,592 | 1,734,147 | 1,734,005 | 26,111,482 | 23,240,946 | 2,861,527 | 938,126 | |||||||||||||||||||||||
| — | 51,997 | — | 579,812 | 1,063,689 | 1,054,166 | — | 59,123 | |||||||||||||||||||||||
| (375,084 | ) | (1,265,801 | ) | (1,319,332 | ) | (1,886,659 | ) | (5,439,040 | ) | (5,476,071 | ) | (362,142 | ) | (597,455 | ) | |||||||||||||||
| 27,826 | (414,212 | ) | 414,815 | 427,158 | 21,736,131 | 18,819,041 | 2,499,385 | 399,794 | ||||||||||||||||||||||
The accompanying notes are an integral part of these financial statements.
44
Table of Contents
For a share outstanding throughout each period
For the six months ended June 30, 2007 (unaudited) | For the year ended December 31, | |||||||||||||||||||||||
Managers Value Fund | 2006 | 2005 | 2004 | 2003 | 2002 | |||||||||||||||||||
Net Asset Value, Beginning of Period | $ | 27.98 | $ | 27.98 | $ | 29.73 | $ | 26.24 | $ | 20.69 | $ | 27.45 | ||||||||||||
Income from Investment Operations: | ||||||||||||||||||||||||
Net investment income | 0.12 | 0.27 | 3 | 0.23 | 0.17 | 0.11 | 0.15 | |||||||||||||||||
Net realized and unrealized gain (loss) on investments | 1.46 | 4.79 | 1.43 | 3.47 | 5.56 | (6.65 | ) | |||||||||||||||||
Total from investment operations | 1.58 | 5.06 | 1.66 | 3.64 | 5.67 | (6.50 | ) | |||||||||||||||||
Less Distributions to Shareholders from: | ||||||||||||||||||||||||
Net investment income | — | (0.35 | ) | (0.25 | ) | (0.15 | ) | (0.12 | ) | (0.16 | ) | |||||||||||||
Net realized gain on investments | — | (4.71 | ) | (3.16 | ) | — | — | (0.10 | ) | |||||||||||||||
Total distributions to shareholders | — | (5.06 | ) | (3.41 | ) | (0.15 | ) | (0.12 | ) | (0.26 | ) | |||||||||||||
Net Asset Value, End of Period | $ | 29.56 | $ | 27.98 | $ | 27.98 | $ | 29.73 | $ | 26.24 | $ | 20.69 | ||||||||||||
Total Return 1 | 5.65 | %5 | 18.08 | % | 5.53 | % | 13.87 | % | 27.39 | % | (23.79 | )% | ||||||||||||
Ratio of net expenses to average net assets 1 | 1.16 | %6 | 1.17 | % | 1.18 | % | 1.22 | % | 1.27 | % | 1.28 | % | ||||||||||||
Ratio of total expenses to average net assets 1, 2 | 1.23 | %6 | 1.23 | % | 1.15 | % | 1.38 | % | 1.42 | % | 1.35 | % | ||||||||||||
Ratio of net investment income to average net assets | 0.83 | %6 | 0.90 | % | 0.72 | % | 0.62 | % | 0.59 | % | 0.60 | % | ||||||||||||
Portfolio turnover | 17 | %5 | 32 | % | 54 | % | 39 | % | 40 | % | 53 | % | ||||||||||||
Net assets at end of period (000’s omitted) | $ | 81,296 | $ | 80,916 | $ | 124,643 | $ | 119,547 | $ | 100,720 | $ | 48,001 | ||||||||||||
For the six months ended June 30, 2007 (unaudited) | For the year ended December 31, | |||||||||||||||||||||||
Managers AMG Essex Large Cap Growth Fund | 2006 | 2005 | 2004 | 2003 | 2002 | |||||||||||||||||||
Net Asset Value, Beginning of Period | $ | 29.18 | $ | 27.79 | $ | 26.77 | $ | 25.46 | $ | 20.36 | $ | 29.29 | ||||||||||||
Income from Investment Operations: | ||||||||||||||||||||||||
Net investment loss | (0.07 | ) | (0.09 | )3 | (0.07 | )3 | (0.07 | ) | (0.16 | ) | (0.28 | ) | ||||||||||||
Net realized and unrealized gain (loss) on investments | 2.42 | 1.48 | 1.09 | 1.38 | 5.26 | (8.65 | ) | |||||||||||||||||
Total from investment operations | 2.35 | 1.39 | 1.02 | 1.31 | 5.10 | (8.93 | ) | |||||||||||||||||
Net Asset Value, End of Period | $ | 31.53 | $ | 29.18 | $ | 27.79 | $ | 26.77 | $ | 25.46 | $ | 20.36 | ||||||||||||
Total Return 1 | 8.05 | %5 | 4.96 | % | 3.85 | % | 5.14 | % | 25.05 | % | (30.49 | )% | ||||||||||||
Ratio of net expenses to average net assets 1 | 1.26 | %6 | 1.25 | % | 1.28 | % | 1.34 | % | 1.33 | % | 1.39 | % | ||||||||||||
Ratio of total expenses to average net assets 1, 2 | 1.31 | %6 | 1.32 | % | 1.22 | % | 1.47 | % | 1.52 | % | 1.43 | % | ||||||||||||
Ratio of net investment loss to average net assets | (0.45 | )%6 | (0.33 | )% | (0.27 | )% | (0.26 | )% | (0.67 | )% | (1.07 | )% | ||||||||||||
Portfolio turnover | 49 | %5 | 200 | % | 97 | % | 79 | % | 109 | % | 141 | % | ||||||||||||
Net assets at end of period (000’s omitted) | $ | 65,016 | $ | 65,999 | $ | 104,878 | $ | 98,347 | $ | 110,903 | $ | 107,545 | ||||||||||||
45
Table of Contents
Financial Highlights
For a share outstanding throughout each period
For the six (unaudited) | For the year ended December 31, | |||||||||||||||||||||||
Managers Small Company Fund | 2006 | 2005 | 2004 | 2003 | 2002 | |||||||||||||||||||
Net Asset Value, Beginning of Period | $ | 11.97 | $ | 10.84 | $ | 10.36 | $ | 9.19 | $ | 6.40 | $ | 8.16 | ||||||||||||
Income from Investment Operations: | ||||||||||||||||||||||||
Net investment income (loss) | 0.01 | (0.08 | )3 | (0.08 | )3 | (0.08 | ) | (0.09 | ) | (0.13 | ) | |||||||||||||
Net realized and unrealized gain (loss) on investments | 1.32 | 1.21 | 0.56 | 1.25 | 2.88 | (1.63 | ) | |||||||||||||||||
Total from investment operations | 1.33 | 1.13 | 0.48 | 1.17 | 2.79 | (1.76 | ) | |||||||||||||||||
Net Asset Value, End of Period | $ | 13.30 | $ | 11.97 | $ | 10.84 | $ | 10.36 | $ | 9.19 | $ | 6.40 | ||||||||||||
Total Return 1 | 11.11 | %5 | 10.42 | % | 4.63 | % | 12.73 | % | 43.59 | % | (21.57 | )% | ||||||||||||
Ratio of net expenses to average net assets 1 | 1.38 | %6 | 1.39 | % | 1.45 | % | 1.45 | % | 1.45 | % | 1.40 | % | ||||||||||||
Ratio of total expenses to average net assets 1,2 | 1.47 | %6 | 1.54 | % | 1.41 | % | 1.43 | % | 1.50 | % | 1.70 | % | ||||||||||||
Ratio of net investment income (loss) to average net assets | 0.15 | %6 | (0.72 | )% | (0.82 | )% | (1.05 | )% | (1.20 | )% | (1.17 | )% | ||||||||||||
Portfolio turnover | 23 | %5 | 126 | % | 26 | % | 18 | % | 48 | % | 134 | % | ||||||||||||
Net assets at end of period (000’s omitted) | $ | 42,133 | $ | 38,438 | $ | 36,993 | $ | 27,629 | $ | 18,750 | $ | 12,610 | ||||||||||||
For the six (unaudited) | For the year ended December 31, | |||||||||||||||||||||||
Managers International Equity Fund | 2006 | 2005 | 2004 | 2003 | 2002 | |||||||||||||||||||
Net Asset Value, Beginning of Period | $ | 67.42 | $ | 53.76 | $ | 47.05 | $ | 41.13 | $ | 31.22 | $ | 37.61 | ||||||||||||
Income from Investment Operations: | ||||||||||||||||||||||||
Net investment income | 0.49 | 0.69 | 0.37 | 0.27 | 0.34 | 0.19 | ||||||||||||||||||
Net realized and unrealized gain (loss) on investments | 6.08 | 14.15 | 6.83 | 5.96 | 10.04 | (6.48 | ) | |||||||||||||||||
Total from investment operations | 6.57 | 14.84 | 7.20 | 6.23 | 10.38 | (6.29 | ) | |||||||||||||||||
Less Distributions to Shareholders from: | ||||||||||||||||||||||||
Net investment income | — | (1.18 | ) | (0.49 | ) | (0.31 | ) | (0.47 | ) | (0.10 | ) | |||||||||||||
Total distributions to shareholders | — | (1.18 | ) | (0.49 | ) | (0.31 | ) | (0.47 | ) | (0.10 | ) | |||||||||||||
Net Asset Value, End of Period | $ | 73.99 | $ | 67.42 | $ | 53.76 | $ | 47.05 | $ | 41.13 | $ | 31.22 | ||||||||||||
Total Return | 9.74 | %5 | 27.63 | % | 15.30 | % | 15.17 | % | 33.21 | % | (16.71 | )% | ||||||||||||
Ratio of net expenses to average net assets 1 | 1.45 | %6 | 1.45 | % | 1.45 | % | 1.62 | % | 1.72 | % | 1.54 | % | ||||||||||||
Ratio of total expenses to average net assets 1, 2 | 1.62 | %6 | 1.47 | % | 1.42 | % | 1.70 | % | 1.73 | % | 1.56 | % | ||||||||||||
Ratio of net investment income to average net assets | 1.41 | %6 | 0.70 | % | 0.75 | % | 0.57 | % | 0.70 | % | 0.54 | % | ||||||||||||
Portfolio turnover | 52 | %5 | 70 | % | 79 | % | 93 | % | 80 | % | 132 | % | ||||||||||||
Net assets at end of period (000’s omitted) | $ | 255,489 | $ | 230,916 | $ | 206,393 | $ | 234,061 | $ | 266,611 | $ | 362,561 | ||||||||||||
46
Table of Contents
Financial Highlights
For a share outstanding throughout each period
For the six months ended June 30, 2007 (unaudited) | For the year ended December 31, | |||||||||||||||||||||||
Managers Emerging Markets Equity Fund | 2006 | 2005 | 2004 | 2003 | 2002 | |||||||||||||||||||
Net Asset Value, Beginning of Period | $ | 24.44 | $ | 20.10 | $ | 16.50 | $ | 13.26 | $ | 8.80 | $ | 9.56 | ||||||||||||
Income from Investment Operations: | ||||||||||||||||||||||||
Net investment income | 0.10 | 0.22 | 0.52 | 0.08 | 0.01 | 0.03 | ||||||||||||||||||
Net realized and unrealized gain (loss) on investments | 3.91 | 6.66 | 4.84 | 3.74 | 4.50 | (0.79 | ) | |||||||||||||||||
Total from investment operations | 4.01 | 6.88 | 5.36 | 3.82 | 4.51 | (0.76 | ) | |||||||||||||||||
Less Distributions to Shareholders from: | ||||||||||||||||||||||||
Net investment income | — | (0.22 | ) | (0.55 | ) | (0.06 | ) | (0.05 | ) | — | ||||||||||||||
Net realized gain on investments | — | (2.32 | ) | (1.21 | ) | (0.52 | ) | — | — | |||||||||||||||
Total distributions to shareholders | — | (2.54 | ) | (1.76 | ) | (0.58 | ) | (0.05 | ) | — | ||||||||||||||
Net Asset Value, End of Period | $ | 28.45 | $ | 24.44 | $ | 20.10 | $ | 16.50 | $ | 13.26 | $ | 8.80 | ||||||||||||
Total Return 1 | 16.41 | %5 | 34.50 | % | 32.53 | % | 28.85 | % | 51.20 | % | (7.95 | )% | ||||||||||||
Ratio of net expenses to average net assets 1 | 1.77 | %6 | 1.76 | % | 1.75 | % | 1.85 | % | 1.99 | % | 1.97 | % | ||||||||||||
Ratio of total expenses to average net assets 1, 2 | 1.81 | %6 | 1.76 | % | 1.72 | % | 1.87 | % | 1.97 | % | 2.18 | % | ||||||||||||
Ratio of net investment income to average net assets | 0.82 | %6 | 0.89 | % | 0.59 | % | 0.67 | % | 0.08 | % | 0.32 | % | ||||||||||||
Portfolio turnover | 21 | %5 | 41 | % | 35 | % | 58 | % | 79 | % | 68 | % | ||||||||||||
Net assets at end of period (000’s omitted) | $ | 189,884 | $ | 152,983 | $ | 117,229 | $ | 63,567 | $ | 36,728 | $ | 22,211 | ||||||||||||
For the six months ended June 30, 2007 (unaudited) | For the year ended December 31, | |||||||||||||||||||||||
Managers Bond Fund | 2006 | 2005 | 2004 | 2003 | 2002 | |||||||||||||||||||
Net Asset Value, Beginning of Period | $ | 24.84 | $ | 24.11 | $ | 24.58 | $ | 24.58 | $ | 23.44 | $ | 22.32 | ||||||||||||
Income from Investment Operations: | ||||||||||||||||||||||||
Net investment income | 0.56 | 1.08 | 0.88 | 0.80 | 1.08 | 1.24 | ||||||||||||||||||
Net realized and unrealized gain (loss) on investments | (0.33 | ) | 0.75 | (0.32 | ) | 0.30 | 1.40 | 1.12 | ||||||||||||||||
Total from investment operations | 0.23 | 1.83 | 0.56 | 1.10 | 2.48 | 2.36 | ||||||||||||||||||
Less Distributions to Shareholders from: | ||||||||||||||||||||||||
Net investment income | (0.56 | ) | (1.10 | ) | (0.88 | ) | (0.93 | ) | (1.11 | ) | (1.24 | ) | ||||||||||||
Net realized gain on investments | — | — | (0.15 | ) | (0.17 | ) | (0.23 | ) | — | |||||||||||||||
Total distributions to shareholders | (0.56 | ) | (1.10 | ) | (1.03 | ) | (1.10 | ) | (1.34 | ) | (1.24 | ) | ||||||||||||
Net Asset Value, End of Period | $ | 24.51 | $ | 24.84 | $ | 24.11 | $ | 24.58 | $ | 24.58 | $ | 23.44 | ||||||||||||
Total Return 1 | 0.88 | %5 | 7.79 | %4 | 2.29 | % | 5.14 | % | 10.77 | % | 10.98 | % | ||||||||||||
Ratio of net expenses to average net assets 1 | 0.99 | %6 | 0.99 | % | 0.99 | % | 0.99 | % | 0.99 | % | 1.00 | % | ||||||||||||
Ratio of total expenses to average net assets 1, 2 | 0.99 | %6 | 1.02 | % | 1.02 | % | 1.06 | % | 1.09 | % | 1.17 | % | ||||||||||||
Ratio of net investment income to average net assets | 4.68 | %6 | 4.52 | % | 3.36 | % | 3.65 | % | 4.50 | % | 5.55 | % | ||||||||||||
Portfolio turnover | 11 | %5 | 46 | % | 26 | % | 16 | % | 73 | % | 24 | % | ||||||||||||
Net assets at end of period (000’s omitted) | $ | 1,427,553 | $ | 906,776 | $ | 426,448 | $ | 259,210 | $ | 179,641 | $ | 128,341 | ||||||||||||
47
Table of Contents
Financial Highlights
For a share outstanding throughout each period
For the six months ended June 30, 2007 (unaudited) | For the year ended December 31, | |||||||||||||||||||||||
Managers Global Bond Fund | 2006 | 2005 | 2004 | 2003 | 2002 | |||||||||||||||||||
Net Asset Value, Beginning of Period | $ | 21.17 | $ | 20.19 | $ | 22.38 | $ | 22.19 | $ | 20.58 | $ | 17.97 | ||||||||||||
Income from Investment Operations: | ||||||||||||||||||||||||
Net investment income | 0.30 | 0.45 | 0.63 | 0.65 | 0.80 | 0.81 | ||||||||||||||||||
Net realized and unrealized gain (loss) on investments | (0.24 | ) | 1.05 | (1.75 | ) | 1.49 | 3.43 | 2.57 | ||||||||||||||||
Total from investment operations | 0.06 | 1.50 | (1.12 | ) | 2.14 | 4.23 | 3.38 | |||||||||||||||||
Less Distributions to Shareholders from: | ||||||||||||||||||||||||
Net investment income | — | (0.49 | ) | (0.77 | ) | (1.34 | ) | (2.09 | ) | (0.55 | ) | |||||||||||||
Net realized gain on investments | — | (0.03 | ) | (0.30 | ) | (0.61 | ) | (0.53 | ) | (0.22 | ) | |||||||||||||
Total distributions to shareholders | — | (0.52 | ) | (1.07 | ) | (1.95 | ) | (2.62 | ) | (0.77 | ) | |||||||||||||
Net Asset Value, End of Period | $ | 21.23 | $ | 21.17 | $ | 20.19 | $ | 22.38 | $ | 22.19 | $ | 20.58 | ||||||||||||
Total Return 1 | 0.28 | %5 | 7.36 | % | (4.94 | )% | 9.62 | % | 20.69 | % | 18.85 | % | ||||||||||||
Ratio of net expenses to average net assets 1 | 1.19 | %6 | 1.19 | % | 1.19 | % | 1.29 | % | 1.68 | % | 1.55 | % | ||||||||||||
Ratio of total expenses to average net assets 1, 2 | 1.01 | %6 | 1.27 | % | 1.26 | % | 1.49 | % | 1.68 | % | 1.56 | % | ||||||||||||
Ratio of net investment income to average net assets | 3.13 | %6 | 2.86 | % | 2.38 | % | 2.73 | % | 3.48 | % | 4.01 | % | ||||||||||||
Portfolio turnover | 75 | %5 | 56 | % | 64 | % | 130 | % | 152 | % | 220 | % | ||||||||||||
Net assets at end of period (000’s omitted) | $ | 106,883 | $ | 53,670 | $ | 43,131 | $ | 36,454 | $ | 32,307 | $ | 19,746 | ||||||||||||
The following notes should be read in conjunction with the Financial Highlights of the Funds presented on the preceding pages.
1 | Total returns and net investment income would have been lower had certain expenses not been reduced. (See Note 1(c) to the Notes to Financial Statements.) |
2 | Excludes the impact of expense (reimbursement)/recoupment and expense offsets such as brokerage credits, but includes non-reimbursable expenses such as interest and taxes. (See Note 1c to the Notes to Financial Statements.) |
3 | Per share numbers have been calculated using average shares. |
4 | The Total Return is based on the Financial Statement Net Asset Values as shown above. |
5 | Not Annualized. |
6 | Annualized. |
48
Table of Contents
June 30, 2007 (unaudited)
| 1. | Summary of Significant Accounting Policies |
The Managers Funds (the “Trust”) is an open-end management investment company organized as a Massachusetts business trust and registered under the Investment Company Act of 1940, as amended (the “1940 Act”). Currently, the Trust is comprised of a number of investment series. Included in this report are the Managers Value Fund (“Value”), Managers AMG Essex Large Cap Growth Fund (formerly Managers Capital Appreciation Fund) (“Essex Large Cap Growth”), Managers Small Company Fund (“Small Company”), Managers International Equity Fund (“International Equity”), Managers Emerging Markets Equity Fund (“Emerging Markets Equity”), Managers Bond Fund (“Bond”) and Managers Global Bond Fund (“Global Bond”), collectively the “Funds.”
The Funds’ financial statements are prepared in accordance with accounting principles generally accepted in the United States of America, which require management to make estimates and assumptions that affect the reported amount of assets and liabilities and disclosure of contingent assets and liabilities at the date of the financial statements and the reported amounts of income and expenses during the reporting periods. Actual results could differ from those estimates. The following is a summary of significant accounting policies followed by the Funds in the preparation of their financial statements:
| a. | Valuation of Investments |
Equity securities traded on a domestic or international securities exchange are generally valued at the last quoted sale price, or, lacking any sales, at the last quoted bid price. Over-the-counter securities are valued at the Nasdaq Official Closing Price, if one is available. Lacking any sales, over-the-counter securities, are valued at the last quoted bid price. The Funds’ investments are generally valued based on market quotations provided by third-party pricing services approved by the Board of Trustees of the Trust. Under certain circumstances, the value of a Fund investment may be based on an evaluation of its fair value, pursuant to procedures established by and under the general supervision of the Board of Trustees of the Fund. A Fund may use the fair value of a portfolio security to calculate its NAV when, for example, (1) market quotations are not readily available because a portfolio security is not traded in a public market or the principal market in which the security trades is closed, (2) trading in a portfolio security is suspended and has not resumed prior to the time as of which the Fund calculates its NAV, (3) where a significant event affecting the value of a portfolio security is determined to have occurred between the time of the market quotation provided for a portfolio security and the time as of which the Fund calculates its NAV, (4) a security’s price has remained unchanged over a period of time (often referred to as a “stale price”), or (5) the Investment Manager determines that a market quotation is inaccurate. The Investment Manager monitors intervening events that may affect the value of securities held in each Fund’s portfolio and, in accordance with procedures adopted by the Funds’ Trustees, will adjust the prices of securities traded in foreign markets, as appropriate, to reflect the impact of events occurring subsequent to the close of such markets but prior to the time each Fund’s NAV is calculated. Fixed-income securities are valued based on valuations furnished by independent pricing services that utilize matrix systems, which reflect such factors as security prices, yields, maturities and ratings, and are supplemented by dealer and exchange quotations. Short-term investments having a remaining maturity of 60 days or less are valued at amortized cost, which approximates market value. Investments in other regulated investment companies are valued at their end of day net asset value per share except iShares or other ETF’s, which are valued the same as equity securities. Securities (including derivatives) for which market quotations are not readily available are valued at fair value, as determined in good faith, and pursuant to procedures adopted by the Board of Trustees of the Trust. The values assigned to fair value investments are based on available information and do not necessarily represent amounts that might ultimately be realized, since such amounts depend on future developments inherent in long-term investments. Further, because of the inherent uncertainty of valuation, those estimated values may differ significantly from the values that would have been used had a ready market for the investments existed, and the differences could be material.
Investments in certain mortgage-backed, stripped mortgage-backed, preferred stocks, convertible securities and other debt securities not traded on an organized market, are valued on the basis of valuations provided by dealers or by a pricing service which uses information with respect to transactions in such securities, various relationships between securities and yield to maturity in determining value.
| b. | Security Transactions |
Security transactions are accounted for as of the trade date. Realized gains and losses on securities sold are determined on the basis of identified cost.
| c. | Investment Income and Expenses |
Dividend income is recorded on the ex-dividend date except certain dividends from foreign securities where the ex-dividend date may have passed. These dividends are recorded as soon as the Trust is informed of the ex-dividend date. Dividend income on foreign securities is recorded net of any withholding tax. Interest income, which includes amortization of premium and accretion of discount on debt securities, is accrued as earned. Non-cash dividends included in dividend income, if any, are reported at the fair market value of the securities received. Other income and expenses are recorded on an accrual basis. Expenses that cannot be directly attributed to a fund are apportioned among the Funds in the Trust and in some cases other affiliated funds based upon their relative average net assets or number of shareholders.
The following Funds had certain portfolio trades directed to various brokers who paid a portion of such Fund’s expenses. For the six months ended June 30, 2007, under these arrangements the amount by which the Funds’ expenses were reduced and the impact on the expense ratios were as follows: Value - $12,539 or 0.03%: Essex Large Cap Growth - $10,683 or 0.03%,; Small Company - $13,223 or 0.07% and International Equity - $2,659 or 0.002%.
In addition, each of the Funds has a “balance credit” arrangement with The Bank of New York (“BNY”), the Funds’ custodian, whereby each Fund is credited with an interest factor equal to 1% below the effective 90-day T-Bill rate for account balances left uninvested overnight. These credits serve to reduce custody expenses that would otherwise be charged to each Fund. For the six months ended June 30, 2007, the custodian expense was reduced as follows: International Equity - $221; Emerging Markets Equity - $337; and Bond - $748.
Overdrafts will cause a reduction of any earnings credits, computed at 2% above the effective Federal Funds rate on the day of the overdraft. For the six months ended June 30, 2007, overdraft fees for Essex Large Cap Growth and Global Bond equaled $473 and $288, respectively.
49
Table of Contents
Notes to Financial Statements (continued)
The Trust also has a balance credit arrangement with its Transfer Agent, PFPC, Inc., whereby earnings credits are used to offset banking charges. For the six months ended June 30, 2007, the Funds’ portion of the transfer agent expense was reduced under this arrangement as follows: Essex Large Cap Growth - $360; Small Company - $265; Value - - $448; International Equity - $935; Emerging Markets Equity - $569; Bond - $3,806 and Global Bond - $500.
Managers Investment Group LLC (the “Investment Manager”), an indirect wholly-owned subsidiary of Affiliated Managers Group, Inc. (“AMG”) and the Investment Manager for the Funds, has contractually agreed, through at least May 1, 2008, subject to later reimbursement by the Funds in certain circumstances, that the total annual operating expenses (exclusive of taxes, interest, brokerage costs, acquired fund expenses and extraordinary expenses) will be limited to the following amounts of the Fund’s average daily net assets: Small Company - 1.45%; Bond - 0.99%; and Global Bond - 1.19%. The Investment Manager has also contractually agreed, subject to later reimbursement by the Funds in certain circumstances, that the total annual operating expenses (exclusive of taxes, interest, brokerage costs, acquired fund expenses and extraordinary expenses) will be limited to 1.19%, 1.29%, 1.55% and 1.79%, on Value, Essex Large Cap Growth, International Equity, and Emerging Markets Equity, respectively, of each Fund’s average daily net assets, provided that the amount of fees waived, paid or reimbursed does not exceed 0.25% per annum of each Fund’s average daily net assets.
In general, for a period of up to three years from the time of any waiver or payment pursuant to the Fund’s contractual expense limitation, the Investment Manager may recover from the Fund fees waived and expenses paid to the extent that the Fund’s total annual operating expenses do not exceed the contractual expense limitation amount. For the six months ended June 30, 2007, the following Funds made such repayments to the Investment Manager in the following amounts: Essex Large Cap Growth - $5,158; Bond - $12,020 and Global Bond - $78,076. At June 30, 2007, the cumulative amount of reimbursement by the Manager subject to repayment by Value, Essex Large Cap Growth, Small Company, International Equity, Emerging Markets Equity, Bond and Global Bond equaled $114,012, $42,244, $39,020, $85,518, $36,046, $362,233 and $26,782, respectively. For the six months ended June 30, 2007, the Investment Manager voluntarily waived $125,000 of expenses for International Equity which may not be recovered by the Investment Manager.
Total returns and net investment income for the Funds would have been lower had certain expenses not been offset.
| d. | Dividends and Distributions |
Dividends resulting from net investment income, if any, normally will be declared and paid annually for all Funds except Bond. Dividends resulting from net investment income, if any, normally will be declared and paid monthly for Bond. Distributions of capital gains, if any, will be made on an annual basis and when required for Federal excise tax purposes. Income and capital gain distributions are determined in accordance with Federal income tax regulations, which may differ from generally accepted accounting principles. These differences are primarily due to differing treatments for losses deferred due to wash sales, equalization accounting for tax purposes, foreign currency and market discount transactions. Permanent book and tax basis differences, if any, relating to shareholder distributions will result in reclassifications to paid-in capital.
| e. | Federal Taxes |
Each Fund intends to comply with the requirements under Subchapter M of the Internal Revenue Code of 1986, as amended, to distribute substantially all of its taxable income and gains to its shareholders and to meet certain diversification and income requirements with respect to investment companies. Therefore, no provision for Federal income or excise tax is included in the accompanying financial statements.
Additionally, based on the Fund’s understanding of the tax rules and rates related to income, gains and transactions for the foreign jurisdictions in which it invests, the Fund will provide for foreign taxes, and where appropriate, deferred foreign taxes.
| f. | Capital Loss Carryovers |
As of June 30, 2007, the following Funds had accumulated net realized capital loss carryovers from securities transactions for Federal income tax purposes as shown in the following chart. These amounts may be used to offset realized capital gains, if any, through the expiration dates listed.
Fund | Capital Loss Carryover Amount | Expires December 31, | |||
Essex Large Cap Growth | $ | 101,428,248 | 2009 | ||
| 30,988,593 | 2010 | ||||
| 12,899,489 | 2011 | ||||
Small Company | 536,555 | 2010 | |||
International Equity | 48,892,407 | 2010 | |||
| 16,171,901 | 2011 | ||||
Bond Fund | 2,046,691 | 2014 | |||
| g. | Capital Stock |
The Trust’s Declaration of Trust authorizes for each series the issuance of an unlimited number of shares of beneficial interest, without par value. Each Fund records sales and repurchases of its capital stock on the trade date. Dividends and distributions to shareholders are recorded on the ex-dividend date.
At June 30, 2007, certain unaffiliated shareholders, specifically omnibus accounts, individually held greater than 10% of the outstanding shares of the following Funds: Value - one owns 10%; Essex Large Cap Growth - one owns 13%; International Equity - two collectively own 42%; Emerging Markets Equity – two collectively own 62%; Bond - two collectively own 34%. Transactions by these shareholders may have a material impact on the Funds.
| h. | Repurchase Agreements |
Each Fund may enter into repurchase agreements provided that the value of the underlying collateral, including accrued interest, will be equal to or exceed the value of the repurchase agreement during the term of the agreement. The underlying collateral for all repurchase agreements is held in safekeeping by the Fund’s custodian or at the Federal Reserve Bank.
If the seller defaults and the value of the collateral declines, or if bankruptcy proceedings commence with respect to the seller of the security, realization of the collateral by the Fund may be delayed or limited.
50
Table of Contents
Notes to Financial Statements (continued)
| i. | Foreign Currency Translation |
The books and records of the Funds are maintained in U.S. dollars. The value of investments, assets and liabilities denominated in currencies other than U.S. dollars are translated into U.S. dollars based upon current foreign exchange rates. Purchases and sales of foreign investments, income and expenses are converted into U.S. dollars based on currency exchange rates prevailing on the respective dates of such transactions. Net realized and unrealized gain (loss) on foreign currency transactions represent: (1) foreign exchange gains and losses from the sale and holdings of foreign currencies; (2) gains and losses between trade date and settlement date on investment securities transactions and forward foreign currency exchange contracts; and (3) gains and losses from the difference between amounts of interest and dividends recorded and the amounts actually received.
In addition, the Funds do not isolate the net realized and unrealized gain or loss resulting from changes in exchange rates from the fluctuations resulting from changes in market prices of securities held. Such fluctuations are included with the net realized and unrealized gain or loss on investments.
| 2. | Agreements and Transactions with Affiliates |
The Trust has entered into an Investment Management Agreement under which the Investment Manager provides or oversees investment management services to the Funds. The Investment Manager selects subadvisors for each Fund (subject to Trustee approval), allocates assets among subadvisors and monitors the subadvisors’ investment programs and results. Each Fund’s investment portfolio is managed by portfolio managers who serve pursuant to Subadvisory Agreements with the Investment Manager.
Investment management fees are paid directly by each Fund to the Investment Manager based on average daily net assets. The annual investment management fee rates, as a percentage of average daily net assets for the six months ended June 30, 2007, were as follows:
Fund | Investment Management Fee | ||
Value | 0.75 | % | |
Essex Large Cap Growth | 0.80 | % | |
Small Company | 0.90 | % | |
International Equity | 0.90 | % | |
Emerging Markets Equity | 1.15 | % | |
Bond | 0.625 | % | |
Global Bond | 0.70 | % |
The Investment Manager of Global Bond has agreed to contractually waive a portion of its management fee for the Fund until at least March 1, 2008. For the six months ended June 30, 2007, the amount waived is $50,846 or 0.10%.
The Trust has entered into an Administration and Shareholder Servicing Agreement (“Administration Agreement”) under which Managers Investment Group LLC serves as each Fund’s administrator (the “Administrator”) and is responsible for all aspects of managing the Funds’ operations, including administration and shareholder services to each Fund, its shareholders, and certain institutions, such as bank trust departments, broker-dealers and registered investment advisers, that advise or act as an intermediary with the Funds’ shareholders. Under the terms of the Administration Agreement, each of the Funds, except Global Bond, pay a fee to the Administrator at the rate of 0.25% per annum of the Fund’s average daily net assets. Global Bond pays a fee to the Administrator at the rate of 0.20% per annum of the Fund’s average daily net assets.
The aggregate annual retainer paid to each Independent Trustee is $55,000, plus $4,000 or $2,000 for each regular or special meeting attended, respectively. The Trustees’ fees and expenses are allocated amongst all of the Funds for which Managers Investment Group LLC serves as the Investment Manager (the “Managers Funds”) based on the relative net assets of such Funds. The Independent Chairman of the Trust receives an additional payment of $10,000 per year. The Chairman of the Audit Committee receives an additional $2,000 per year. The “Trustee fees and expenses” shown in the financial statements represent each Fund’s allocated portion of the total fees and expenses paid by the Managers Funds.
The Funds are distributed by Managers Distributors, Inc. (the “Distributor”), a wholly-owned subsidiary of Managers Investment Group LLC. The Distributor serves as the principal underwriter for each Fund. The Distributor is a registered broker-dealer and member of the Financial Industry Regulatory Authority (“FINRA”). Shares of each Fund will be continuously offered and will be sold by brokers, dealers or other financial intermediaries who have executed selling agreements with the Distributor. The Distributor bears all the expenses of providing services pursuant to an Underwriting Agreement, including the payment of the expenses relating to the distribution of Prospectuses for sales purposes and any advertising or sales literature. Certain Trustees and Officers of the Funds are Officers and/or Directors of the Investment Manager, AMG and/or the Distributor.
51
Table of Contents
Notes to Financial Statements (continued)
| 3. | Purchases and Sales of Securities |
Purchases and sales of securities, excluding short-term securities, for the six months ended June 30, 2007, were as follows:
| Long-Term Securities | U.S. Government Securities | |||||||||||
Fund | Purchases | Sales | Purchases | Sales | ||||||||
Value | $ | 13,753,508 | $ | 18,440,779 | N/A | N/A | ||||||
Essex Large Cap Growth | 31,749,526 | 40,101,803 | N/A | N/A | ||||||||
Small Company | 8,988,919 | 9,732,815 | N/A | N/A | ||||||||
International Equity | 119,555,172 | 120,759,886 | N/A | N/A | ||||||||
Emerging Markets Equity | 42,180,362 | 33,897,089 | N/A | N/A | ||||||||
Bond | 677,847,658 | 125,607,795 | $ | 313,078,370 | $ | 109,103,936 | ||||||
Global Bond | 124,412,997 | 71,748,208 | 21,868,135 | 13,660,161 | ||||||||
| 4. | Portfolio Securities Loaned |
The Funds may participate in a securities lending program offered by BNY providing for the lending of equities, corporate bonds and government securities to qualified brokers. Collateral on all securities loaned is accepted in cash and/or government securities. Collateral is maintained at a minimum level of 102% of the market value, plus interest, if applicable, of investments on loan. Collateral received in the form of cash is invested temporarily in institutional money market funds or other short-term investments by BNY. Earnings of such temporary cash investments are divided between BNY, as a fee for its services under the program, and the Fund loaning the security, according to agreed-upon rates.
| 5. | Commitments and Contingencies |
In the normal course of business, the Funds may enter into contracts and agreements that contain a variety of representations and warranties, which provide general indemnifications. The maximum exposure to the Funds under these arrangements is unknown, as this would involve future claims that may be against the Funds that have not yet occurred. However, based on experience, the Funds expect the risks of loss to be remote.
| 6. | Risks Associated with Collateralized Mortgage Obligations (“CMOs”) (Bond Fund) |
The net asset value of Bond Fund may be sensitive to interest rate fluctuations because the Fund may hold several instruments, including CMOs and other derivatives, whose values can be significantly impacted by interest rate movements. CMOs are obligations collateralized by a portfolio of mortgages or mortgage-related securities. Payments of principal and interest on the mortgage are passed through to the holder of the CMOs on the same schedule as they are received, although certain classes of CMOs have priority over others with respect to the receipt of prepayments on the mortgages.
Therefore, the investment in CMOs may be subject to a greater or lesser risk of prepayment than other types of mortgage-related securities. CMOs may have a fixed or variable rate of interest.
| 7. | Forward Commitments |
Certain transactions, such as futures and forward transactions, dollar roll agreements, or purchases of when-issued or delayed delivery securities may have a similar effect on a Fund’s net asset value as if the Fund had created a degree of leverage in its portfolio. However, if a Fund enters into such a transaction, the Fund will establish a segregated account with its custodian in which it will maintain cash, U.S. Government securities or other liquid securities equal in value to its obligations in respect to such transaction. Securities and other assets held in the segregated account may not be sold while the transaction is outstanding, unless other suitable assets are substituted.
| 8. | Forward Foreign Currency Contracts |
International Equity, Emerging Markets Equity, Bond and Global Bond invest in forward foreign currency exchange contracts to manage currency exposure. These investments may involve greater market risk than the amounts disclosed in the Funds’ financial statements.
A forward foreign currency exchange contract is an agreement between a Fund and another party to buy or sell a currency at a set price at a future date. The market value of the contract will fluctuate with changes in currency exchange rates. The contract is marked-to-market daily, and the change in market value is recorded as an unrealized gain or loss. Gain or loss on the purchase or sale of contracts having the same settlement date, amount and counter party is realized on the date of offset, otherwise gain or loss is realized on settlement date.
52
Table of Contents
Notes to Financial Statements (continued)
The Funds, except Value, Essex Large Cap Growth, and Small Company, may invest in non-U.S. dollar denominated instruments subject to limitations, and enter into forward foreign currency exchange contracts to facilitate transactions in foreign securities and to protect against a possible loss resulting from an adverse change in the relationship between the U.S. dollar and such foreign currency.
Risks may arise upon entering into these contracts from the potential inability of counterparties to meet the terms of their contracts and from unanticipated movements in the value of a foreign currency relative to the U.S. dollar.
Open forward foreign currency exchange contracts (in U.S. Dollars) at June 30, 2007 were as follows:
Foreign Currency | Position | Settlement Date | Current Value (Receivable Amount) | Contract Value (Payable Amount) | Unrealized Gain/ (Loss) | |||||||||
International Equity Fund | ||||||||||||||
Canadian Dollar | Short | 7/5/07 | ($256,382 | ) | ($257,683 | ) | $ | 1,301 | ||||||
Canadian Dollar | Short | 7/5/07 | (318,429 | ) | (318,296 | ) | (133 | ) | ||||||
euro-dollar Contracts | Short | 7/3/07 | (183,119 | ) | (181,639 | ) | (1,480 | ) | ||||||
euro-dollar Contracts | Short | 7/5/07 | (105,712 | ) | (105,708 | ) | (4 | ) | ||||||
Pound Sterling | Short | 7/3/07 | (186,743 | ) | (186,118 | ) | (625 | ) | ||||||
Pound Sterling | Short | 7/5/07 | (289,533 | ) | (289,420 | ) | (113 | ) | ||||||
Japanese Yen | Short | 7/2/07 | (323,611 | ) | (325,249 | ) | 1,638 | |||||||
euro-dollar Contracts | Long | 7/2/07 | 49,099 | 48,796 | 303 | |||||||||
Pound Sterling | Long | 7/2/07 | 445,949 | 443,701 | 2,248 | |||||||||
Swedish Krona | Long | 7/3/07 | 225,315 | 224,691 | 624 | |||||||||
| 7/12/07 | ($943,166 | ) | ($946,925 | ) | $ | 3,759 | ||||||||
Foreign Currency | Position | Settlement Date | Current Value (Receivable Amount) | Contract Value (Payable Amount) | Unrealized Gain/ (Loss) | |||||||||
Global Bond Fund | ||||||||||||||
Colombian Peso | Short | 9/6/07 | ($337,996 | ) | ($355,591 | ) | $ | 17,595 | ||||||
53
Table of Contents
Notes to Financial Statements (continued)
| 9. | Futures Contracts Held |
International Equity uses Equity Index futures contracts to a limited extent, with the objective of maintaining exposure to equity stock markets while maintaining liquidity. The Fund may purchase or sell futures contracts to achieve a desired level of investment, whether to accommodate portfolio turnover or cash flows from capital shares transactions. There are certain risks associated with futures contracts. Prices may not move as expected or a Fund may not be able to close out the contract when it desires to do so, resulting in losses.
Futures are valued at their quoted daily settlement prices. The aggregate principal amounts of the contracts are not recorded in the financial statements. Fluctuations in the value of the contracts are recorded in the Statement of Assets as an asset (liability) and in the Statement of Operations as unrealized appreciation (depreciation) until the contracts are closed, when they are recorded as realized gains (losses) on futures or forward currency contracts. Cash pledged to cover margin requirements for the open futures positions at June 30, 2007, amounted to $83,200. International Equity had the following open futures contracts as of June 30, 2007:
Type | Number of Contracts | Position | Expiration Month | Unrealized Gain/(Loss) | |||||
3-Month Euro | 27 | Long | 9/21/07 | $ | 30,920 | ||||
| 10. | New Accounting Pronouncements |
The Financial Accounting Standards Board (“FASB”) has recently issued Interpretation No. 48, “Accounting for Uncertainty in Income Taxes – an Interpretation of FASB Statement No. 109) the “Interpretation”), which applies to all registered investment companies and clarifies the accounting for uncertain tax positions. The Interpretation is effective for financial statements for fiscal years beginning after December 15, 2006. FIN 48 will be effective for each Fund’s fiscal year ended December 31, 2007. Based on analysis computed to date, management does not believe the adoption of FIN 48 will result in any material impact to the Funds’ financial statements.
In addition, in September 2006, Statement of Financial Accounting Standards No. 157, Fair Value Measurements (“SFAS 157”), was issued and is effective for fiscal years beginning after November 15, 2007. SFAS 157 defines fair value, establishes a framework for measuring fair value and expands disclosures about fair value measurements. Management is currently evaluating the impact, if any, the adoption of SFAS 157 will have on the Funds’ financial statements.
54
Table of Contents
Annual Renewal of Investment Advisory Agreements (unaudited)
On June 8, 2007, the Board of Trustees, including a majority of the Trustees who are not “interested persons” of the Trust (the “Independent Trustees”), approved the Investment Management Agreement with the Investment Manager for the Managers AMG Essex Large Cap Growth Fund (the “Fund”) and the Subadvisory Agreement with the Fund’s Subadvisor. The Independent Trustees were separately represented by independent counsel in connection with their consideration of the approval of these agreements. In considering the Investment Management and Subadvisory Agreements, the Trustees reviewed a variety of materials relating to the Fund, the Investment Manager and the Subadvisor, including comparative performance, fee and expense information for an appropriate peer group of similar mutual funds (the “Peer Group”), performance information for the relevant benchmark index (the “Fund Benchmark”) and other information regarding the nature, extent and quality of services provided by the Investment Manager and the Subadvisor under their respective agreements. The Trustees also took into account performance, fee and expense information regarding the Fund provided to them on a quarterly basis throughout the year. Prior to voting, the Independent Trustees: (a) reviewed the foregoing information with their independent legal counsel and with management; (b) received materials from their independent legal counsel discussing the legal standards applicable to their consideration of the Investment Management and Subadvisory Agreements; and (c) met with their independent legal counsel in private sessions at which no representatives of management were present.
Nature, extent and quality of services. In considering the nature, extent and quality of the services provided by the Investment Manager, the Trustees reviewed information relating to the Investment Manager’s operations and personnel. Among other things, the Investment Manager provided financial information, biographical information on its supervisory and professional staff and descriptions of its organizational and management structure. The Trustees also took into account information provided periodically throughout the previous year by the Investment Manager relating to the performance of its duties with respect to the Fund and the Trustees’ familiarity with the Investment Manager’s management through Board meetings, discussions and reports. In the course of their deliberations regarding the Investment Management Agreement, the Trustees evaluated, among other things: (a) the quality of the Investment Manager’s oversight of the performance by the Subadvisor of its portfolio management duties; (b) the Investment Manager’s ability to supervise the Fund’s other service providers; and (c) the Investment Manager’s compliance programs. The Trustees also took into account the financial condition of the Investment Manager with respect to its ability to provide the services required under the Investment Management Agreement and the Investment Manager’s undertaking to implement an expense limitation for the Fund.
The Trustees also reviewed information relating to the Subadvisor’s financial condition, operations and personnel and the investment philosophy, strategies and techniques (its “Investment Strategy”) used in managing the Fund. Among other things, the Trustees reviewed biographical information on portfolio management and other professional staff, information regarding the Subadvisor’s organizational and management structure and the Subadvisor’s brokerage policies and practices. The Trustees considered specific information provided regarding the experience of the individual at the Subadvisor with portfolio management responsibility for the Fund, including the information set forth in the Fund’s prospectus and statement of additional information. In the course of their deliberations, the Trustees evaluated, among other things: (a) the services rendered by the Subadvisor in the past; (b) the qualifications and experience of the Subadvisor’s personnel; and (c) the Subadvisor’s compliance programs. The Trustees also took into account the financial condition of the Subadvisor with respect to its ability to provide the services required under the Subadvisory Agreement.
Performance. Among other information relating to the Fund’s performance, the Trustees noted that the Fund’s performance for the 1-year, 3-year, 5-year and 10-year periods ended March 31, 2007 was below, below, below and above, respectively, the median performance of the Peer Group and below the performance of the Fund Benchmark, the S&P 500 Index, for all such periods. The Trustees took into account management’s discussion of the reasons for the Fund’s performance, including that the market environment in certain years has been particularly difficult in light of the Fund’s focus on growth companies. In addition, the Trustees noted that the Fund’s year-to-date and 10-year performance has been satisfactory. The Trustees concluded that the Fund’s performance has been satisfactory in light of all factors considered.
As noted above, the Board considered the Fund’s performance during relevant time periods as compared to the Fund’s Peer Group and noted that the Board reviews on a quarterly basis detailed information about both the Fund’s performance results and portfolio composition as well as the Subadvisor’s Investment Strategy. The Board noted the Investment Manager’s expertise and resources in monitoring the performance, investment style and risk adjusted performance of the Subadvisor.
Advisory and Subadvisory Fees and Profitability. In considering the reasonableness of the advisory fee payable to the Investment Manager and the subadvisory fee payable by the Investment Manager to the Subadvisor, the Trustees reviewed information provided by the Investment Manager setting forth all revenues and other benefits, both direct and indirect, received by the Investment Manager and its affiliates attributable to managing the Fund and all the mutual funds in the Managers Family of Funds, the cost of providing such services and the resulting profitability to the Investment Manager and its affiliates from these relationships. The Trustees noted that the Investment Manager and the Subadvisor are affiliated and that the Investment Manager pays the subadvisory fee out of the advisory fee that it receives from the Fund. The Trustees also noted the current asset level of the Fund and the impact on profitability of any future growth of assets of the Fund.
In considering the cost of services to be provided by the Investment Manager under the Investment Management Agreement and the profitability to the Investment Manager of its relationship with the Fund, the Trustees noted the current asset level of the Fund and the undertaking by the Investment Manager to maintain an expense limitation for the Fund. Based on the foregoing, the Trustees concluded that the profitability to the Investment Manager is reasonable and that the Investment Manager is not realizing material benefits from economies of scale that would warrant adjustments to the advisory fee at this time. Also with respect to economies of scale, the Trustees noted that as the Fund’s assets increase over time, the Fund may realize other economies of scale to the extent the increase in assets is proportionally greater than the increase in certain other expenses.
55
Table of Contents
Annual Renewal of Investment Advisory Agreements (continued)
In considering the cost of services to be provided by the Subadvisor under the Subadvisory Agreement and the profitability to the Subadvisor of its relationship with the Fund, the Trustees noted the current asset level of the Fund and the undertaking by the Investment Manager to maintain an expense limitation for the Fund. As a consequence, the cost of services to be provided by the Subadvisor and the profitability to the Subadvisor of its relationship with the Fund were not material factors in the Trustees’ deliberations. For similar reasons, the Trustees did not consider potential economies of scale in the management of the Fund by the Subadvisor to be a material factor in their considerations at this time.
The Trustees noted that the Fund’s advisory fee and total expenses (net of applicable expense waivers/reimbursements) as of December 31, 2006 were higher than the average for the Peer Group. The Trustees took into account the fact that the Investment Manager has contractually agreed through May 1, 2008 to limit the Fund’s net annual operating expenses to 1.29%, provided that the amount waived may not exceed 0.25%. The Trustees concluded that, in light of the nature, extent and quality of the services provided by the Investment Manager and the Subadvisor, the foregoing expense limitation and the considerations noted above with respect to the Subadvisor and the Investment Manager, the Fund’s advisory fees are reasonable.
* * * *
After consideration of the foregoing, the Trustees also reached the following conclusions regarding the Investment Management and Subadvisory Agreements in addition to the conclusions discussed above: (a) the Investment Manager has demonstrated that it possesses the resources and capability to perform its duties under the Investment Management Agreement; (b) the Subadvisor has the resources to perform its duties under the Subadvisory Agreement and is qualified to manage the Fund’s assets in accordance with its investment objectives and policies; and (c) the Investment Manager and Subadvisor maintain appropriate compliance programs.
Based on all of the above-mentioned factors and their related conclusions, with no single factor or conclusion being determinative and with each Trustee not necessarily attributing the same weight to each factor, the Trustees concluded that approval of the Investment Management and Subadvisory Agreements would be in the interests of the Fund and its shareholders. Accordingly, on June 8, 2007, the Trustees, including a majority of the Independent Trustees, voted to approve the Investment Management and Subadvisory Agreements for the Fund.
MANAGERS VALUE FUND, MANAGERS BOND FUND, MANAGERS EMERGING MARKETS EQUITY FUND, MANAGERS SMALL COMPANY FUND, MANAGERS GLOBAL BOND FUND, MANAGERS INTERNATIONAL EQUITY FUND:
On June 8, 2007, the Board of Trustees, including a majority of the Trustees who are not “interested persons” of the Trust (the “Independent Trustees”), approved the Investment Management Agreement with the Investment Manager for each of the Funds identified below and the Subadvisory Agreement for each of the Subadvisors. The Independent Trustees were separately represented by independent counsel in connection with their consideration of the approval of these agreements. In considering the Investment Management and Subadvisory Agreements, the Trustees reviewed a variety of materials relating to each Fund, the Investment Manager and each Subadvisor, including comparative performance, fee and expense information for an appropriate peer group of similar mutual funds (each, a “Peer Group”), performance information for relevant benchmark indices (each, a “Fund Benchmark”) and other information regarding the nature, extent and quality of services provided by the Investment Manager and the Subadvisors under their respective agreements. The Trustees also took into account performance, fee and expense information regarding each Fund provided to them on a quarterly basis throughout the year. Prior to voting, the Independent Trustees: (a) reviewed the foregoing information with their independent legal counsel and with management; (b) received materials from their independent legal counsel discussing the legal standards applicable to their consideration of the Investment Management Agreement and the Subadvisory Agreements; and (c) met with their independent legal counsel in private sessions at which no representatives of management were present.
Nature, extent and quality of services. In considering the nature, extent and quality of the services provided by the Investment Manager, the Trustees reviewed information relating to the Investment Manager’s operations and personnel. Among other things, the Investment Manager provided financial information, biographical information on its supervisory and professional staff and descriptions of its organizational and management structure. The Trustees also took into account information provided periodically throughout the previous year by the Investment Manager relating to the performance of its duties with respect to the Funds and the Trustees’ familiarity with the Investment Manager’s management through Board meetings, discussions and reports. In the course of their deliberations regarding the Investment Management Agreement, the Trustees evaluated, among other things: (a) the quality of the search, selection and monitoring services performed by the Investment Manager in overseeing the portfolio management responsibilities of the Subadvisors; (b) the Investment Manager’s ability to supervise the Funds’ other service providers; and (c) the Investment Manager’s compliance programs. The Trustees also took into account the financial condition of the Investment Manager with respect to its ability to provide the services required under the Investment Management Agreement and to maintain contractual expense limitations for the Funds.
For each Fund, the Trustees also reviewed information relating to each Subadvisor’s operations and personnel and the investment philosophy, strategies and techniques (for each Subadvisor, its “Investment Strategy”) used in managing the Fund or the portion of the Fund for which the Subadvisor has portfolio management responsibility. Among other things, the Trustees reviewed biographical information on portfolio management and other professional staff, information regarding each Subadvisor’s organizational and management structure and each Subadvisor’s brokerage policies and practices. The Trustees considered specific information provided regarding the experience of the individual or individuals at each Subadvisor with portfolio management responsibility for the portion of the Fund managed by the Subadvisor, including the information set forth in the Fund’s prospectus and statement of additional information. With respect to those Funds managed with multiple Subadvisors, the Trustees also noted information provided by the Investment Manager regarding the manner in which each Subadvisor’s Investment Strategy complements those utilized by a Fund’s other Subadvisors. In the course of their deliberations, the Trustees evaluated, among other things: (a) the services rendered by each Subadvisor in the past; (b) the qualifications and experience of the Subadvisor’s personnel; and (c) the Subadvisor’s
56
Table of Contents
Annual Renewal of Investment Advisory Agreements (continued)
compliance programs. The Trustees also took into account the financial condition of each Subadvisor with respect to its ability to provide the services required under its Subadvisory Agreement.
Performance. As noted above, the Board considered each Fund’s performance during relevant time periods as compared to the Fund’s Peer Group and noted that the Board reviews on a quarterly basis detailed information about the Fund’s performance results, portfolio composition and Investment Strategies, including with respect to the portion of the Fund managed by each Subadvisor. The Board noted the Investment Manager’s expertise and resources in monitoring the performance, investment style and risk adjusted performance of each Subadvisor. The Board also noted each Subadvisor’s performance record with respect to the Fund. The Board was mindful of the Investment Manager’s focus on each Subadvisor’s performance with respect to the Fund and the explanations of management regarding the factors that contributed to the performance of the Fund.
Advisory Fees and Profitability. In considering the reasonableness of the advisory fee charged by the Investment Manager for managing each Fund, the Trustees noted that the Investment Manager, and not the Fund, is responsible for paying the fees charged by the Fund’s Subadvisors and, therefore, that the fees paid to the Investment Manager cover the cost of providing portfolio management services as well as the cost of providing search, selection and monitoring services in operating a “manager-of-managers” complex of mutual funds. The Trustees concluded that, in light of the additional high quality supervisory services provided by the Investment Manager and the fact that the subadvisory fees are paid out of the advisory fee, the advisory fee payable by each Fund to the Investment Manager can reasonably be expected to exceed the median advisory fee for the Peer Group, which consists mostly of funds that do not operate with a manager-of-managers structure.
In considering the reasonableness of the advisory fee payable to the Investment Manager, the Trustees also reviewed information provided by the Investment Manager setting forth all revenues and other benefits, both direct and indirect, received by the Investment Manager and its affiliates attributable to managing each Fund and all the mutual funds in the Managers Family of Funds, the cost of providing such services and the resulting profitability to the Investment Manager and its affiliates from these relationships. The Trustees also noted the current and potential asset levels of each Fund and the willingness of the Investment Manager to waive fees and pay expenses for certain of the Funds from time to time as a means of limiting the total expenses of the smaller Funds. In this regard, the Trustees noted that, unlike a mutual fund that is managed by a single investment adviser, the Funds operate in a manager-of-managers structure and, as a Fund grows in size, it is common practice for the Investment Manager to recommend the selection of an additional Subadvisor to manage a portion of the Fund’s portfolio. The Trustees also noted that the subadvisory fees are paid by the Investment Manager out of its advisory fee. The Trustees further noted that, because of this practice, the Investment Manager’s oversight and supervisory responsibilities with respect to the Funds can be expected to increase with the size of the Funds. Based on the foregoing, the Trustees concluded that the profitability to the Investment Manager is reasonable and that the Investment Manager is not realizing material benefits from economies of scale that would warrant adjustments to the advisory fees for any Fund at this time. With respect to economies of scale, the Trustees also noted that as a Fund’s assets increase over time, the Fund may realize other economies of scale to the extent that the increase in assets is proportionally greater than the increase in certain other expenses.
Subadvisory Fees and Profitability. In considering the reasonableness of the fee payable by the Investment Manager to each Subadvisor, the Trustees relied on the ability of the Investment Manager to negotiate the terms of the Subadvisory Agreement at arm’s length as part of the manager-of-managers structure, noting that the Subadvisors are not affiliated with the Investment Manager. In addition, the Trustees noted that the subadvisory fees are paid by the Investment Manager out of its advisory fee. Accordingly, the cost of services to be provided by each Subadvisor and the profitability to each Subadvisor of its relationship with a Fund were not material factors in the Trustees’ deliberations. For similar reasons, and based on the current size of the portion of the Fund managed by each Subadvisor, the Trustees concluded that any economies of scale being realized by the Subadvisors was not a material factor in the Trustees’ deliberations at this time.
In addition to the foregoing, the Trustees considered the specific factors and related conclusions set forth below with respect to each Fund.
MANAGERS VALUE FUND
Fund Performance. Among other information relating to the Fund’s performance, the Trustees noted that the Fund’s performance for the 1-year, 3-year, 5-year and 10-year periods ended March 31, 2007 was below the median performance of the Peer Group for all such periods and below, above, below and above, respectively, the performance of the Fund Benchmark, which is the S&P 500 Index. The Trustees took into account management’s discussion of the reasons for the Fund’s performance.
Advisory Fees. The Trustees noted that the Fund’s advisory fee and total expenses (net of applicable expense waivers/reimbursements) as of December 31, 2006 were higher than and equal to the average, respectively, for the Peer Group. The Trustees took into account the fact that the Investment Manager has contractually agreed through May 1, 2008 to limit the Fund’s net annual operating expenses to 1.19%, provided that the amount waived may not exceed 0.25%. The Trustees concluded that, in light of the nature, extent and quality of the services provided by the Investment Manager and the Subadvisors, the foregoing expense limitation and the considerations noted above with respect to the Subadvisors and the Investment Manager, the Fund’s advisory fees are reasonable.
MANAGERS BOND FUND
Fund Performance. Among other information relating to the Fund’s performance, the Trustees noted that the Fund’s performance for the 1-year, 3-year, 5-year and 10-year periods ended March 31, 2007 was above the median performance of the Peer Group and above the performance of the Fund Benchmark, which is the Lehman Brothers Government/Credit Index, for all such periods. The Trustees concluded that the Fund’s performance has been satisfactory.
Advisory Fees. The Trustees noted that the Fund’s advisory fee and total expenses (net of applicable expense waivers/reimbursements) as of December 31, 2006 were higher than the average for the Peer Group. The Trustees took into account the fact that the Investment Manager has contractually agreed through May 1, 2008 to limit the Fund’s net annual operating expenses to 0.99%. The Trustees concluded that, in light of the nature, extent and quality of the
57
Table of Contents
Annual Renewal of Investment Advisory Agreements (continued)
services provided by the Investment Manager and the Subadvisor, the Fund’s performance, the foregoing expense limitation and the considerations noted above with respect to the Subadvisor and the Investment Manager, the Fund’s advisory fees are reasonable.
MANAGERS EMERGING MARKETS EQUITY FUND
Fund Performance. Among other information relating to the Fund’s performance, the Trustees noted that the Fund’s performance for the 1-year, 3-year and 5-year periods ended March 31, 2007 and for the period from inception of the Fund in February 1998 through March 31, 2007 was above the median performance of the Peer Group for all such periods and above, below, below and above, respectively, the performance of the Fund Benchmark, which is the MSCI Emerging Markets Index, for such periods. The Trustees concluded that the Fund’s performance has been satisfactory.
Advisory Fees. The Trustees noted that the Fund’s advisory fee and total expenses (net of applicable expense waivers/reimbursements) as of December 31, 2006 were higher than the average for the Peer Group. The Trustees took into account the fact that the Investment Manager has contractually agreed through May 1, 2008 to limit the Fund’s net annual operating expenses to 1.79%, provided that the amount waived may not exceed 0.25%. The Trustees concluded that, in light of the nature, extent and quality of the services provided by the Investment Manager and the Subadvisor, the Fund’s performance, the foregoing expense limitation and the considerations noted above with respect to the Subadvisor and the Investment Manager, the Fund’s advisory fees are reasonable.
MANAGERS SMALL COMPANY FUND
Fund Performance. Among other information relating to the Fund’s performance, the Trustees noted that the Fund’s performance for the 1-year, 3-year and 5-year periods ended March 31, 2007 and for the period from inception of the Fund in June 2000 through March 31, 2007 was below the median performance of the Peer Group and below the performance of the Fund Benchmark, which is the Russell 2000 Index, for all such periods. The Trustees took into account management’s discussion of the reasons for the Fund’s performance.
Advisory Fees. The Trustees noted that the Fund’s advisory fee and total expenses (net of applicable expense waivers/reimbursements) as of December 31, 2006 were higher and lower, respectively, than the average for the Peer Group. The Trustees took into account the fact that the Investment Manager has contractually agreed through May 1, 2008 to limit the Fund’s net annual operating expenses to 1.45%. The Trustees concluded that, in light of the nature, extent and quality of the services provided by the Investment Manager and the Subadvisor, the foregoing expense limitation and the considerations noted above with respect to the Subadvisor and the Investment Manager, the Fund’s advisory fees are reasonable.
MANAGERS GLOBAL BOND FUND
Fund Performance. Among other information relating to the Fund’s performance, the Trustees noted that the Fund’s performance for the 1-year, 3-year, 5-year and 10-year periods ended March 31, 2007 was above the median performance of the Peer Group for all such periods and above, above, above and below, respectively, the performance of the Fund Benchmark, which is the Lehman Brothers Global Aggregate Bond Index. The Trustees concluded that the Fund’s performance has been satisfactory in light of all factors considered.
Advisory Fees. The Trustees noted that the Fund’s advisory fee and total expenses (net of applicable expense waivers/reimbursements) as of December 31, 2006 were higher than the average for the Peer Group. The Trustees took into account the fact that the Investment Manager has contractually agreed through May 1, 2008 to limit the Fund’s net annual operating expenses to 1.19%. The Trustees concluded that, in light of the nature, extent and quality of the services provided by the Investment Manager and the Subadvisor, the Fund’s performance, the foregoing expense limitation and the considerations noted above with respect to the Subadvisor and the Investment Manager, the Fund’s advisory fees are reasonable.
MANAGERS INTERNATIONAL EQUITY FUND
Fund Performance. Among other information relating to the Fund’s performance, the Trustees noted that the Fund’s performance for the 1-year, 3-year, 5-year and 10-year periods ended March 31, 2007 was below the median performance of the Peer Group and below the performance of the Fund Benchmark, the MSCI EAFE Index, for all such periods. The Trustees took into account management’s discussion of the reasons for the Fund’s performance.
Advisory Fees. The Trustees noted that the Fund’s advisory fee and total expenses (net of applicable expense waivers/reimbursements) as of December 31, 2006 were higher than the average for the Peer Group. The Trustees took into account the fact that the Investment Manager has contractually agreed through May 1, 2008 to limit the Fund’s net annual operating expenses to 1.55%, provided that the amount waived may not exceed 0.25%. The Trustees concluded that, in light of the nature, extent and quality of the services provided by the Investment Manager and the Subadvisors, the foregoing expense limitation and the considerations noted above with respect to the Subadvisors and the Investment Manager, the Fund’s advisory fees are reasonable.
* * * * *
After consideration of the foregoing, the Trustees also reached the following conclusions regarding the Investment Management Agreement and each Subadvisory Agreement, in addition to those conclusions discussed above: (a) the Investment Manager and each Subadvisor have demonstrated that they possess the capability and resources to perform the duties required of them under the Investment Management Agreement and the applicable Subadvisory Agreements; (b) each Subadvisor’s Investment Strategy is appropriate for pursuing the applicable Fund’s investment objectives; (c) each Subadvisor is reasonably likely to execute its Investment Strategy consistently over time; and (d) the Investment Manager and each Subadvisor maintain appropriate compliance programs.
Based on all of the above-mentioned factors and related conclusions, with no single factor or conclusion being determinative and with each Trustee not necessarily attributing the same weight to each factor, the Trustees concluded that approval of each Investment Management Agreement and each Subadvisory Agreement (as applicable) would be in the interests of each Fund and its shareholders. Accordingly, on June 8, 2007, the Trustees, including a majority of the Independent Trustees, voted to approve the Investment Management Agreement and the Subadvisory Agreements for each of the Fund’s Subadvisors.
58
Table of Contents
Investment Manager and Administrator
Managers Investment Group LLC
800 Connecticut Avenue
Norwalk, Connecticut 06854
(203) 299-3500 or (800) 835-3879
Distributor
Managers Distributors, Inc.
800 Connecticut Avenue
Norwalk, Connecticut 06854
(203) 299-3500 or (800) 835-3879
Custodian
The Bank of New York
2 Hanson Place
Brooklyn, New York 11217
Legal Counsel
Ropes & Gray LLP
One International Place
Boston, Massachusetts 02110-2624
Transfer Agent
PFPC, Inc.
attn: Managers
P.O. Box 9769
Providence, Rhode Island 02940
(800) 548-4539
Trustees
Jack W. Aber
William E. Chapman, II
Edward J. Kaier
William J. Nutt
Steven J. Paggioli
Eric Rakowski
Thomas R. Schneeweis
For Managers Choice Only
Managers
c/o PFPC, Inc.
P.O. Box 61204
King of Prussia, Pennsylvania 19406-0851
(800) 358-7668

Table of Contents
MANAGERSAND MANAGERS AMG EQUITY FUNDS
EMERGING MARKETS EQUITY
Rexiter Capital Management Limited
ESSEX GROWTH
ESSEX LARGE CAP GROWTH
ESSEX SMALL/MICRO CAP GROWTH
Essex Investment Management Co., LLC
FQ TAX-MANAGED U.S. EQUITY
FQ U.S. EQUITY
First Quadrant, L.P.
INSTITUTIONAL MICRO-CAP
MICRO-CAP
Kern Capital Management LLC
INTERNATIONAL EQUITY
Alliance Bernstein L.P.
Lazard Asset Management, LLC
Wellington Management Company, LLP
CHICAGO EQUITY PARTNERS
MID-CAP
Chicago Equity Partners, LLC
REAL ESTATE SECURITIES
Urdang Securities Management, Inc.
SMALL CAP
TIMESSQUARE MID CAP GROWTH
TIMESSQUARE SMALL CAP GROWTH
TimesSquare Capital Management, LLC
SMALL COMPANY
Epoch Investment Partners, Inc. Kalmar
Investment Advisers, Inc.
SPECIAL EQUITY
Donald Smith & Co., Inc.
Kern Capital Management LLC
Skyline Asset Management, L.P.
Smith Asset Management Group, LP
Veredus Asset Management LLC
Westport Asset Management, Inc.
SYSTEMATIC VALUE
SYSTEMATIC MID CAP VALUE
Systematic Financial Management, L.P.
VALUE
Armstrong Shaw Associates Inc.
Osprey Partners Investment Mgmt., LLC
MANAGERSAND MANAGERS AMG BALANCED FUNDS
CHICAGO EQUITY PARTNERS BALANCED
Chicago Equity Partners, LLC
GLOBAL
Armstrong Shaw Associates Inc.
Alliance Bernstein L.P.
First Quadrant, L.P.
Kern Capital Management LLC
Northstar Capital Management, Inc.
Wellington Management Company, LLP
ALTERNATIVE FUNDS
FQ GLOBAL ALTERNATIVES
First Quadrant, L.P.
MANAGERS FIXED INCOME FUNDS
BOND (MANAGERS)
FIXED INCOME
GLOBAL BOND
Loomis, Sayles & Company L.P.
BOND (MANAGERS FREMONT)
Pacific Investment Management Co. LLC
CALIFORNIA INTERMEDIATE TAX-FREE
Evergreen Investment Management Co., LLC
HIGH YIELD
J.P. Morgan Investment Management Inc.
INTERMEDIATE DURATION GOVERNMENT SHORT DURATION GOVERNMENT
Smith Breeden Associates, Inc.
MONEY MARKET
JPMorgan Investment Advisors Inc.
This report is prepared for the Funds’ shareholders. It is authorized for distribution to prospective investors only when preceded or accompanied by an effective prospectus. To receive a free copy of the prospectus or Statement of Additional Information, which includes additional information about Fund Trustees, please contact us by calling 800.835.3879. Distributed by Managers Distributors, Inc., member FINRA.
A description of the policies and procedures each Fund uses to vote its proxies is available: (i) without charge, upon request, by calling 800.835.3879, or (ii) on the Securities and Exchange Commission’s (SEC) Web site at www.sec.gov. For information regarding each Fund’s proxy voting record for the 12-month period ended June 30, call 800.835.3879 or visit the SEC Web site at www.sec.gov.
The Funds file their complete schedule of portfolio holdings with the SEC for the first and third quarters of each fiscal year on Form N-Q. The Funds’ Forms N-Q are available on the SEC’s website at www.sec.gov. A Fund’s Forms N-Q may be reviewed and copied at the SEC’s Public Reference Room in Washington, DC. Information on the operation of the Public Reference Room may be obtained by calling 800.SEC.0330. To review a complete list of the Funds’ portfolio holdings, or to view the most recent quarterly holdings report, semiannual report, or annual report, please visit www.managersinvest.com.
www.managersinvest.com

Table of Contents
| Item 2. | CODE OF ETHICS |
Not applicable for the semi-annual shareholder report.
| Item 3. | AUDIT COMMITTEE FINANCIAL EXPERT |
Not applicable for the semi-annual shareholder report.
| Item 4. | PRINCIPAL ACCOUNTANT FEES AND SERVICES |
Not applicable for the semi-annual shareholder report.
| Item 5. | AUDIT COMMITTEE OF LISTED REGISTRANTS |
Not applicable.
| Item 6. | SCHEDULE OF INVESTMENTS |
The schedule of investments in unaffiliated issuers as of the close of the reporting period is included as part of the shareholder report contained in Item 1 hereof.
| Item 7. | DISCLOSURE OF PROXY VOTING POLICIES AND PROCEDURES FOR CLOSED-END MANAGEMENT INVESTMENT COMPANIES |
Not applicable.
| Item 8. | PORTFOLIO MANAGERS OF CLOSED-END MANAGEMENT INVESTMENT COMPANIES |
Not applicable.
| Item 9. | PURCHASES OF EQUITY SECURITIES BY CLOSED-END MANAGEMENT INVESTMENT COMPANIES AND AFFILIATED PURCHASERS |
Not applicable.
| Item 10. | SUBMISSION OF MATTERS TO A VOTE OF SECURITY HOLDERS |
Not applicable.
Table of Contents
| Item 11. | CONTROLS AND PROCEDURES |
| (a) | The registrant’s principal executive and principal financial officers have concluded, based on their evaluation of the registrant’s disclosure controls and procedures as of a date within 90 days of the filing date of this report, that the registrant’s disclosure controls and procedures are reasonably designed to ensure that information required to be disclosed by the registrant on Form N-CSR is recorded, processed, summarized and reported within the required time periods and that information required to be disclosed by the registrant in the reports that it files or submits on Form N-CSR is accumulated and communicated to the registrant’s management, including its principal executive and principal financial officers, as appropriate to allow timely decisions regarding required disclosure. |
| (b) | There were no changes in the registrant’s internal control over financial reporting during the registrant’s second fiscal quarter of the period covered by this report that have materially affected, or are reasonably likely to materially affect, the internal control over financial reporting. |
| Item 12. | EXHIBITS |
(a)(1) | Not applicable. | |
(a)(2) | Certifications pursuant to Rule 30a-2(a) under the Investment Company Act of 1940 - Filed herewith. | |
(a)(3) | Not applicable. | |
(b) | Certifications pursuant to Rule 30a-2(b) under the Investment Company Act of 1940 - Filed herewith. | |
Table of Contents
SIGNATURES
Pursuant to the requirements of the Securities Exchange Act of 1934 and the Investment Company Act of 1940, the registrant has duly caused this report to be signed on its behalf by the undersigned, thereunto duly authorized.
| THE MANAGERS FUNDS | ||
| By: | /s/ William J. Nutt | |
| William J. Nutt, President | ||
| Date: | November 26, 2007 | |
Pursuant to the requirements of the Securities Exchange Act of 1934 and the Investment Company Act of 1940, this report has been signed below by the following persons on behalf of the registrant and in the capacities and on the dates indicated.
| By: | /s/ William J. Nutt | |
| William J. Nutt, President | ||
| Date: | November 26, 2007 | |
| By: | /s/ Bruce M. Aronow | |
| Bruce M. Aronow, Chief Financial Officer | ||
| Date: | November 26, 2007 | |