Table of Contents
UNITED STATES
SECURITIES AND EXCHANGE COMMISSION
Washington, D.C. 20549
FORM N-CSRS
CERTIFIED SHAREHOLDER REPORT OF REGISTERED
MANAGEMENT INVESTMENT COMPANIES
Investment Company Act file number: 811-03752
THE MANAGERS FUNDS
(Exact name of registrant as specified in charter)
| 800 Connecticut Avenue, Norwalk, Connecticut | 06854 | |
| (Address of principal executive offices) | (Zip code) |
Managers Investment Group LLC
800 Connecticut Avenue, Norwalk, Connecticut 06854
(Name and address of agent for service)
Registrant’s telephone number, including area code: (203) 299-3500
Date of fiscal year end: DECEMBER 31
Date of reporting period: JANUARY 1, 2008 – JUNE 30, 2008
(Semi-Annual Shareholder Report)
Table of Contents
| Item 1. | Reports to Shareholders |
Table of Contents
SEMI-ANNUAL REPORT
Managers Funds
June 30, 2008
Managers Bond Fund

Table of Contents
Semi-Annual Report — June 30, 2008 (unaudited)
TABLE OF CONTENTS | Page | |
| 1 | ||
| 3 | ||
| 4 | ||
| 5 | ||
| 20 | ||
FINANCIAL STATEMENTS: | ||
| 21 | ||
Fund’s balance sheet, net asset value (NAV) per share computation and cumulative undistributed amount | ||
| 22 | ||
Detail of sources of income, Fund expenses, and realized and unrealized gains (losses) during the period | ||
| 23 | ||
Detail of changes in Fund assets for the past two periods | ||
| 24 | ||
Historical net asset values per share, distributions, total returns, expense ratios, turnover ratios and net assets | ||
| 25 | ||
Accounting and distribution policies, details of agreements and transactions with Fund management and affiliates, and descriptions of certain investment risks | ||
| 29 | ||
Nothing contained herein is to be considered an offer, sale or solicitation of an offer to buy shares of The Managers Funds or Managers AMG Funds. Such offering is made only by Prospectus, which includes details as to offering price and other material information.
Table of Contents
Dear Shareholder:
As you are undoubtedly aware, the financial markets were under significant pressure during a majority of the six-month period ending June 30, 2008 (the “period”). The period began with the major U.S. equity markets seeing their worst returns in 5 1/2 years during the first quarter, largely driven by investor concerns over the economic impact of a decline in U.S. home values and the related devaluation of the mortgage-securities market. After the Federal Reserve’s mid-March establishment of the credit facility to extend overnight funds to primary dealers and the bail out of Bear Stearns, the second quarter started with many investors believing that the worst of the credit crunch was over, that economic growth would begin to bounce back later in the year, and that stock prices, in anticipation of future growth, would advance. The stock market roughly followed that projected course until approximately mid-to-late May. Stocks, unfortunately, then sold off during the remainder of the quarter as investors’ concerns over surging energy and food prices, continued fallout from the credit crisis, slow economic growth, and declining corporate profits took center stage. Time may tell if the concerns are completely justified. In the short term, however, the pain in the financial markets has been all too real.
The resulting impact on equities was widespread. For the period, the Russell 1000® (large cap), Russell 2000® (small cap), and the Russell 3000® (all cap) Indices returned -11.2%, -9.4% and -11.1%, respectively. Even with the benefit of currencies that were strong relative to the U.S. Dollar for the period, foreign stock markets offered little help in the way of diversification. For the period, the MSCI EAFE Index returned -11.0% (U.S. Dollars), while the MSCI Emerging Markets Index declined by 11.8%.
While many of the media headlines took a negative tone and emphasized inflation, the “housing crisis” and the losses in the stock market, various portions of the bond market provided positive returns. Interest rates fell (and bond prices rose) across the yield curve, although the interest rate declines were most pronounced on the shorter end of the curve. Meanwhile, for the period in aggregate, demand for higher-quality, lower-risk bonds like U.S. Treasuries increased, while some investors sold higher-risk, lower-quality bonds in an effort to curtail risk. For the period, the Lehman Brothers U.S. Aggregate Index and the Lehman Brothers Global Aggregate Index returned 1.1% and 3.4% (U.S. Dollars), respectively. Meanwhile, the Lehman Brothers U.S. Credit Bond Index and Lehman U.S. Corporate High Yield Index declined 0.5% and 1.3%, respectively.
Against this backdrop, the performance of the Managers Bond Fund (the “Fund”), while exceeding equity returns, was challenged, as detailed below.
Periods Ended 06/30/08 | 6 Months | 1 Year | 3 Years | 5 Years | 10 Years | Since Inception | Inception Date | |||||||||||||
Managers Bond Fund | (0.71 | )% | 5.38 | % | 5.00 | % | 4.69 | % | 6.39 | % | 9.18 | % | 6/1/1984 | |||||||
Lehman Brothers U.S. Government/Credit Index | 0.98 | % | 7.24 | % | 3.84 | % | 3.58 | % | 5.69 | % | 8.62 | % | 6/1/1984 |
Note: Returns greater than one year are annualized.
As noted above, for the six months ended June 30, 2008, the Managers Bond Fund returned -0.71%, compared to a return of 0.98% for the Lehman Brothers U.S. Government/Credit Index, the Fund’s primary benchmark. While returns for the period were disappointing, the Fund’s absolute and relative performance is significantly better over three-, five-, and ten-year and since-inception time periods. Furthermore, the Fund ranks in the top ten percent among peers over all of those time periods.
During the period, the Fund trailed the benchmark primarily due to its greater-than-benchmark allocation to corporate bonds and the related underweight to Treasuries. Much of the underperformance was concentrated during the first quarter, when corporate bonds underperformed Treasuries by nearly 500 basis points. Spreads did narrow somewhat during the second quarter, but corporate bonds still finished the period more than 260 basis points behind Treasuries. Security selection within the industrial sector also detracted from relative returns for the period, while a small allocation to non-U.S. bonds contributed positively.
1
Table of Contents
Letter to Shareholders (continued)
The widening trend in corporate bond spreads has created what Loomis, Sayles & Company (“Loomis”), the Fund’s subadvisor, deems to be attractive buying opportunities. Over the past several quarters, Loomis has been gradually decreasing the Fund’s exposure to Treasuries and using the proceeds to carefully allocate to corporate bonds. As of June 30th, nearly 80% of the Fund’s assets were in corporates, versus just over 35% for the Index. Loomis also believes that security selection will likely prove to be more critical moving forward, as Loomis expects default rates to trend upward and market conditions to remain vulnerable to the possibility of further economic deterioration. Loomis has lowered its growth forecast for the balance of 2008, due primarily to rising energy costs. Their forecast is for moderate growth in 2009, as Loomis believes that the banks could recover, the credit market may improve, and the bulk of the damage from the housing crisis may move behind us. Energy prices remain a significant risk to this forecast. In the near term, Loomis believes bond yields could move lower as the market backs off expectations of potential tightening, with a sustained move higher unlikely to occur until 2009. Assuming the economy begins to recover as they have forecast, Loomis believes rate hikes could begin in the second quarter of 2009.
The following report covers the six-month period ended June 30, 2008. Should you have any questions about this report, or if you’d like to receive a prospectus and additional information, including fees and expenses for this or any of the other Funds in our family, please feel free to contact us at 1-800-835-3879, or visit our Web site at www.managersinvest.com. As always, please read the prospectus carefully before you invest or send money.
If you are curious about how you can better diversify your investment program, visit the Knowledge Center on our Web site and view our articles in the investment strategies section. You can rest assured that under all market conditions our team is focused on delivering excellent investment management services for your benefit.
We thank you for your continued confidence and investment in The Managers Funds.
Respectfully,
/s/ John H. Streur |
| John H. Streur |
Senior Managing Partner Managers Investment Group LLC |
2
Table of Contents
About Your Fund's Expenses (unaudited)
As a shareholder of the Fund, you may incur two types of costs: (1) transaction costs, which may include sales charges (loads) on purchase payments; redemption fees; and exchange fees; and (2) ongoing costs, including management fees; distribution (12b-1) fees; and other Fund expenses. This example is intended to help you understand your ongoing costs (in dollars) of investing in the Fund and to compare these costs with the ongoing costs of investing in other mutual funds. The example is based on an investment of $1,000 invested at the beginning of the period and held for the entire period as indicated below.
Actual Expenses
The first line of the table to the right provides information about the actual account values and actual expenses. You may use the information in this line, together with the amount you invested, to estimate the expenses that you paid over the period. Simply divide your account value by $1,000 (for example, an $8,600 account value divided by $1,000 = 8.6), then multiply the result by the number in the first line under the heading entitled “Expenses Paid During Period” to estimate the expenses you paid on your account during this period.
Hypothetical Example for Comparison Purposes
The second line of the table to the right provides information about hypothetical account values and hypothetical expenses based on the Fund’s actual expense ratio and an assumed annual rate of return of 5% before expenses, which is not the Fund’s actual return. The hypothetical account values and expenses may not be used to estimate the actual ending account balance or expenses you paid for the period. You may use this information to compare the ongoing costs of investing in the Fund and other funds by comparing this 5% hypothetical example with the 5% hypothetical examples that appear in the shareholder reports of other funds.
Please note that the expenses shown in the table are meant to highlight your ongoing costs only and do not reflect any transactional costs, such as sales charges (loads), redemption fees, or exchange fees. Therefore, the second line of the table is useful in comparing ongoing costs only, and will not help you determine the relative total costs of owning different funds.
Six Months Ended June 30, 2008 | Expense Ratio for the Period | Beginning Account Value 1/1/2008 | Ending Account Value 6/30/2008 | Expenses Paid During the Period* | ||||||||
Managers Bond Fund | ||||||||||||
Based on Actual Fund Return | 0.99 | % | $ | 1,000 | $ | 993 | $ | 4.91 | ||||
Based on Hypothetical 5% Annual Return | 0.99 | % | $ | 1,000 | $ | 1,020 | $ | 4.97 | ||||
| * | Expenses are equal to the Fund’s annualized expense ratio multiplied by the average account value over the period, multiplied by the number of days in the most recent fiscal half-year (182), then divided by 366. |
3
Table of Contents
Managers Bond Fund Performance
All periods ended June 30, 2008 (unaudited)
Average Annual Total Returns1 | Six Months | One Year | Five Years | Ten Years | Inception Date | |||||||||
Managers Bond Fund 2,3,4,5 | (0.71 | )% | 5.38 | % | 4.69 | % | 6.39 | % | 6/1/1984 | |||||
Lehman Brothers U.S. Government/Credit Index | 0.98 | % | 7.24 | % | 3.58 | % | 5.69 | % | ||||||
The performance data shown represents past performance. Past performance is not a guarantee of future results. Current performance may be lower or higher than the performance data quoted. The investment return and principal value of an investment in the Fund will fluctuate so that an investor’s shares, when redeemed, may be worth more or less than their original cost. For performance information through the most recent month end, please call (800) 835-3879 or visit our Web site at www.managersinvest.com.
In choosing a Fund, investors should carefully consider the amount they plan to invest, their investment objectives, the Fund’s investment objectives, risks, charges and expenses before investing. For this and other information, please call 800.835.3879 or visit www.managersinvest.com for a free prospectus. Read it carefully before investing or sending money. Distributed by Managers Distributors, Inc., member FINRA.
1 | Total return equals income yield plus share price change and assumes reinvestment of all dividends and capital gain distributions. Returns are net of fees and may reflect offsets of Fund expenses as described in the Prospectus. No adjustment has been made for taxes payable by shareholders on their reinvested dividends and capital gain distributions. Returns for periods greater than one year are annualized. The listed returns on the Fund are net of expenses. All returns are in U.S. dollars($). |
2 | From time to time, the Fund’s advisor has waived its fees and/or absorbed Fund expenses, which has resulted in higher returns. |
3 | The Fund is subject to the risks associated with investments in debt securities, such as default risk, fluctuations in debtor’s perceived ability to pay its creditors. Changing interest rates may adversely affect the value of an investment. An increase in interest rates typically causes the value of bonds and other fixed-income securities to fall. |
4 | Investments in international securities are subject to certain risks of overseas investing including currency fluctuations and changes in political and economic conditions, which could result in significant market fluctuations. These risks are magnified in emerging markets. |
5 | High yield bonds (also known as “junk bonds”) are subject to additional risks such as the risk of default. |
The Lehman Brothers U.S. Govt./Credit Index is an index of all investment grade government and corporate bonds with a maturity between one and ten years. Unlike the Fund, the Lehman Brothers U.S. Govt./Credit Index is unmanaged, is not available for investment, and does not incur expenses.
Not FDIC insured, nor bank guaranteed. May lose value.
4
Table of Contents
Fund Snapshot
June 30, 2008 (unaudited)
Portfolio Breakdown
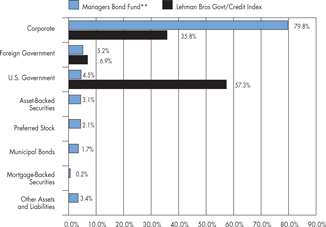
Industry | Managers Bond Fund** | Lehman Bros Govt/Credit Index | ||||
Corporate | 79.8 | % | 35.8 | % | ||
Foreign Government | 5.2 | % | 6.9 | % | ||
U.S. Government | 4.5 | % | 57.3 | % | ||
Asset-Backed Securities | 3.1 | % | 0.0 | % | ||
Preferred Stock | 2.1 | % | 0.0 | % | ||
Municipal Bonds | 1.7 | % | 0.0 | % | ||
Mortgage-Backed Securities | 0.2 | % | 0.0 | % | ||
Other Assets and Liabilities | 3.4 | % | 0.0 | % | ||
| ** | As a percentage of net assets |
Top Ten Holdings
Security Name | Percentage of Net Assets | ||
USTN, 4.625%, 11/30/08* | 2.5 | % | |
CIT Group, Inc., 7.625%, 11/30/12* | 2.3 | ||
American General Finance Corp., Series MTN, 6.900%, 12/15/17* | 2.0 | ||
Merrill Lynch & Co., Inc., 6.110%, 01/29/37 | 1.9 | ||
Kinder Morgan Finance Co., 5.950%, 02/15/18 | 1.7 | ||
Plains All American Pipeline L.P., 6.650%, 01/15/37 | 1.6 | ||
International Paper Co., 7.950%, 06/15/18 | 1.6 | ||
Southwestern Electric Power Co., 6.450%, 1/15/19 | 1.5 | ||
Equitable Resources, Inc., 6.500%, 04/01/18 | 1.4 | ||
Medco Health Solutions, Inc., 7.125%, 03/15/18 | 1.3 | ||
Top Ten as a Group | 17.8 | % | |
| * | Top Ten Holding at December 31, 2007 |
Any sectors, industries, or securities discussed should not be perceived as investment recommendations. Mention of a specific security should not be considered a recommendation to buy or solicitation to sell that security.
5
Table of Contents
Managers Bond Fund
Schedule of Portfolio Investments
June 30, 2008 (unaudited)
Security Description | Principal Amount | Value | |||||
Corporate Bonds - 79.8% | |||||||
Finance - 20.4% | |||||||
American General Finance Corp., Series MTN, 6.900%, 12/15/17 | 57,315,000 | $ | 49,953,748 | ||||
ASIF Global Financial, 2.380%, 02/26/09 | SGD | 5,800,000 | 4,258,190 | ||||
Bank of America Capital Trust VI, 5.625%, 03/08/35 | 3,085,000 | 2,512,035 | |||||
Barclays Capital Corp., 4.160%, 02/22/10 (a) | THB | 25,000,000 | 743,757 | ||||
Barclays Financial LLC, | |||||||
4.740%, 03/23/09, (09/23/08) (a) 6 | KRW | 160,900,000 | 155,324 | ||||
Series EMTN, 4.100%, 03/22/10 (a) | THB | 26,000,000 | 755,310 | ||||
Bear Stearns Companies, Inc., The, | |||||||
4.650%, 07/02/18 | 215,000 | 181,022 | |||||
5.300%, 10/30/15 | 560,000 | 524,176 | |||||
6.400%, 10/02/17 | 1,245,000 | 1,230,298 | |||||
7.250%, 02/01/18 | 9,770,000 | 10,195,630 | |||||
BNP Paribas SA DN, 12.075%, 06/13/11 (a) 4 | IDR | 19,645,500,000 | 1,506,865 | ||||
Caterpillar Financial Services Corp., 5.850%, 09/01/17 | 13,000,000 | 13,314,249 | |||||
CIGNA Corp., 6.150%, 11/15/36 | 6,830,000 | 6,016,356 | |||||
CIT Group, Inc., | |||||||
5.000%, 02/13/14 | 395,000 | 283,643 | |||||
5.125%, 09/30/14 | 680,000 | 487,049 | |||||
5.500%, 12/20/16 | GBP | 1,900,000 | 2,507,489 | ||||
7.625%, 11/30/12 | 71,175,000 | 59,159,093 | |||||
Citibank, N.A., 15.000%, 07/02/10 (a) | BRL | 2,000,000 | 1,305,857 | ||||
Colonial Realty, L.P., | |||||||
4.800%, 04/01/11 | 3,485,000 | 3,287,383 | |||||
5.500%, 10/01/15 | 1,255,000 | 1,105,240 | |||||
Duke Realty, L.P., | |||||||
5.950%, 02/15/17 | 2,210,000 | 2,041,112 | |||||
6.500%, 01/15/18 | 5,000,000 | 4,761,135 | |||||
Equity One, Inc., 6.000%, 09/15/17 | 5,915,000 | 5,197,191 | |||||
ERAC USA Finance Co., | |||||||
6.375%, 10/15/17 (a) | 4,765,000 | 4,258,004 | |||||
6.700%, 06/01/34 (a) | 1,250,000 | 1,023,726 | |||||
7.000%, 10/15/37 (a) | 18,870,000 | 15,695,707 | |||||
ERP Operating, L.P., | |||||||
5.125%, 03/15/16 | 600,000 | 541,057 | |||||
5.750%, 06/15/17 | 1,450,000 | 1,338,399 | |||||
First Industrial L.P., 5.950%, 05/15/17 | 15,000,000 | 13,179,315 | |||||
FNMA, 2.290%, 02/19/09 | SGD | 3,800,000 | 2,802,180 | ||||
Ford Motor Credit Company LLC, | |||||||
5.700%, 01/15/10 | 6,815,000 | 5,814,354 | |||||
The accompanying notes are an integral part of these financial statements.
6
Table of Contents
Managers Bond Fund
Schedule of Portfolio Investments (continued)
Security Description | Principal Amount | Value | ||||||
Finance - 20.4% (continued) | ||||||||
Ford Motor Credit Company LLC, | ||||||||
7.000%, 10/01/13 | 200,000 | $ | 147,282 | |||||
8.000%, 12/15/16 | 3,500,000 | 2 | 2,543,667 | |||||
8.625%, 11/01/10 | 195,000 | 165,419 | ||||||
9.750%, 09/15/10 | 445,000 | 387,988 | ||||||
General Electric Capital Corp., | ||||||||
3.485%, 03/08/12 | SGD | 16,500,000 | 11,835,141 | |||||
6.500%, 09/28/15 | NZD | 14,950,000 | 9,805,679 | |||||
6.625%, 02/04/10 | NZD | 3,500,000 | 2,584,024 | |||||
6.750%, 09/26/16 | NZD | 5,985,000 | 3,924,005 | |||||
2.960%, 05/18/12 | SGD | 4,400,000 | 3,097,392 | |||||
GMAC LLC, | ||||||||
5.625%, 05/15/09 | 265,000 | 2 | 245,363 | |||||
6.000%, 12/15/11 | 1,780,000 | 1,224,895 | ||||||
6.625%, 05/15/12 | 2,170,000 | 1,488,657 | ||||||
6.750%, 12/01/14 | 1,660,000 | 1,096,339 | ||||||
6.875%, 09/15/11 | 250,000 | 179,643 | ||||||
6.875%, 08/28/12 | 400,000 | 273,911 | ||||||
7.000%, 02/01/12 | 1,205,000 | 837,604 | ||||||
7.250%, 03/02/11 | 1,290,000 | 948,164 | ||||||
8.000%, 11/01/31 | 2,325,000 | 2 | 1,512,594 | |||||
Highwoods Realty, L.P., | ||||||||
5.850%, 03/15/17 | 3,680,000 | 3,178,214 | ||||||
7.500%, 04/15/18 | 2,405,000 | 2,285,125 | ||||||
HSBC Bank USA, N.A., 1.959% 04/18/12 4 | MYR | 11,930,000 | 3,390,420 | |||||
ICICI Bank, Ltd., 6.375%, 04/30/22 (a) 7 | 900,000 | 806,554 | ||||||
iStar Financial, Inc., | ||||||||
3.291%, 10/01/12 (10/01/08) 6 | 8,095,000 | 6,314,100 | ||||||
5.125%, 04/01/11 | 280,000 | 239,400 | ||||||
5.150%, 03/01/12 | 4,360,000 | 3,597,000 | ||||||
5.375%, 04/15/10 | 830,000 | 747,000 | ||||||
5.500%, 06/15/12 | 260,000 | 213,200 | ||||||
5.650%, 09/15/11 | 3,095,000 | 2,646,225 | ||||||
5.700%, 03/01/14 | 15,000 | 12,600 | ||||||
5.800%, 03/15/11 | 640,000 | 544,000 | ||||||
5.875%, 03/15/16 | 1,340,000 | 1,055,686 | ||||||
5.950%, 10/15/13 | 4,725,000 | 3,874,500 | ||||||
6.050%, 04/15/15 | 620,000 | 496,000 | ||||||
8.625%, 06/01/13 | 425,000 | 388,875 | ||||||
JPMorgan Chase & Co., | ||||||||
4.135%, 06/08/12 4 | MYR | 4,516,015 | 1,176,306 | |||||
12.034%, 03/28/11 4 | IDR | 932,700,000 | 73,422 | |||||
12.380%, 04/12/12 4 | IDR | 40,733,437,680 | 2,804,510 | |||||
The accompanying notes are an integral part of these financial statements.
7
Table of Contents
Managers Bond Fund
Schedule of Portfolio Investments (continued)
Security Description | Principal Amount | Value | ||||||
Finance - 20.4% (continued) | ||||||||
JPMorgan Chase Bank, N.A., 14.732%, 05/17/10 (a) 4 | BRL | 3,600,000 | $ | 1,718,896 | ||||
JPMorgan International, 11.870%, 10/21/10 (a) 4 | IDR | 16,627,462,500 | 1,381,955 | |||||
Kaupthing Bank, | ||||||||
3.413%, 01/15/10 (07/15/08) (a) 6 | 1,000,000 | 867,892 | ||||||
5.750%, 10/04/11 (a) | 9,800,000 | 7,933,933 | ||||||
6.125%, 10/04/16 (a) | 1,800,000 | 1,313,636 | ||||||
KfW Bankengruppe, | ||||||||
10.000%, 10/27/08 | ISK | 301,500,000 | 3,812,847 | |||||
10.750%, 02/01/10 | ISK | 20,000,000 | 258,063 | |||||
Kinder Morgan Finance Co., | ||||||||
5.150%, 03/01/15 | 730,000 | 644,225 | ||||||
5.700%, 01/05/16 | 370,000 | 329,300 | ||||||
Lehman Brothers Holdings, Inc., | ||||||||
6.000%, 05/03/32 7 | 615,000 | 470,193 | ||||||
6.875%, 07/17/37 | 14,085,000 | 12,124,340 | ||||||
Marsh & McLennan Companies, Inc., | ||||||||
5.375%, 07/15/14 | 4,390,000 | 4,261,948 | ||||||
5.750%, 09/15/15 | 11,939,000 | 11,837,005 | ||||||
5.875%, 08/01/33 | 10,360,000 | 8,692,610 | ||||||
Merrill Lynch & Co., Inc., | ||||||||
6.110%, 01/29/37 | 60,150,000 | 47,771,491 | ||||||
10.710%, 03/08/17 | BRL | 2,500,000 | 1,243,684 | |||||
Morgan Stanley & Co., Inc., 6.625%, 04/01/18 | 24,810,000 | 23,508,095 | ||||||
Mutual of Omaha Insurance Co., 6.800%, 06/15/36 (a) | 13,925,000 | 13,289,881 | ||||||
PNC Bank, N.A., 6.875%, 04/01/18 | 8,050,000 | 7,985,560 | ||||||
ProLogis Trust, | ||||||||
5.625%, 11/15/15 | 345,000 | 324,124 | ||||||
5.750%, 04/01/16 | 280,000 | 263,703 | ||||||
Qwest Capital Funding, Inc., 6.875%, 07/15/28 | 1,255,000 | 2 | 1,004,000 | |||||
Rabobank Nederland, | ||||||||
12.500%, 02/17/09 | ISK | 560,000,000 | 7,160,929 | |||||
14.000%, 01/28/09 (a) | ISK | 344,000,000 | 4,382,099 | |||||
Realty Income Corp., 6.750%, 08/15/19 | 7,675,000 | 7,228,676 | ||||||
Residential Capital LLC, | ||||||||
7.875%, 05/17/13 | GBP | 2,500,000 | 2,141,221 | |||||
8.000%, 06/01/12 | 2,715,000 | 1,058,850 | ||||||
8.375%, 06/30/15 | 1,095,000 | 2 | 427,050 | |||||
SLM Corp., | ||||||||
5.000%, 10/01/13 | 2,060,000 | 1,781,208 | ||||||
5.125%, 08/27/12 | 540,000 | 469,863 | ||||||
5.375%, 01/15/13 | 1,910,000 | 1,682,265 | ||||||
5.375%, 05/15/14 | 300,000 | 263,560 | ||||||
The accompanying notes are an integral part of these financial statements.
8
Table of Contents
Managers Bond Fund
Schedule of Portfolio Investments (continued)
Security Description | Principal Amount | Value | ||||||
Finance - 20.4% (continued) | ||||||||
SLM Corp., | ||||||||
5.400%, 10/25/11 | 520,000 | $ | 474,858 | |||||
6.500%, 06/15/10 | NZD | 500,000 | 339,318 | |||||
8.450%, 06/15/18 | 17,995,000 | 17,263,251 | ||||||
St. Paul Travelers Companies, Inc., The, 6.750%, 06/20/36 | 2,610,000 | 2,629,776 | ||||||
Toll Brothers Finance Corp., 5.150%, 05/15/15 | 3,785,000 | 3,277,825 | ||||||
Travelers Cos., Inc., 6.250%, 06/15/37 | 15,435,000 | 14,347,666 | ||||||
Travelers Property Casualty Corp., 6.375%, 03/15/33 | 3,040,000 | 2,903,495 | ||||||
White Mountains Insurance Group, Ltd., 6.375%, 03/20/17 (a) 5 | 4,555,000 | 4,075,636 | ||||||
Willis North America, Inc., 6.200%, 03/28/17 | 5,685,000 | 5,023,522 | ||||||
Total Finance | 520,244,247 | |||||||
Industrial - 51.3% | ||||||||
Abitibi-Consolidated, Inc., 7.500%, 04/01/28 | 500,000 | 185,000 | ||||||
Agilent Technologies, Inc., 6.500%, 11/01/17 | 6,945,000 | 6,764,652 | ||||||
Albertson’s, Inc., | ||||||||
6.625%, 06/01/28 | 1,015,000 | 870,505 | ||||||
7.450%, 08/01/29 | 3,195,000 | 2 | 3,022,342 | |||||
7.750%, 06/15/26 | 915,000 | 897,342 | ||||||
America Movil, S.A. de C.V., 4.125%, 03/01/09 | 3,000,000 | 3,005,010 | ||||||
American President, Ltd., 8.000%, 01/15/24 5 | 250,000 | 207,500 | ||||||
Anadarko Petroleum Corp., | ||||||||
5.950%, 09/15/16 | 4,915,000 | 4,917,639 | ||||||
6.450%, 09/15/36 | 13,875,000 | 13,695,846 | ||||||
Anheuser-Busch Companies, Inc., | ||||||||
5.950%, 01/15/33 | 6,177,000 | 5,454,316 | ||||||
6.450%, 09/01/37 | 7,900,000 | 2 | 7,550,299 | |||||
Apache Corp., 6.000%, 01/15/37 | 12,000,000 | 11,774,772 | ||||||
Arrow Electronics, Inc., 6.875%, 07/01/13 | 410,000 | 418,735 | ||||||
AstraZeneca PLC, 6.450%, 09/15/37 | 13,975,000 | 14,227,207 | ||||||
AT&T Corp., | ||||||||
6.150%, 09/15/34 | 1,375,000 | 1,284,762 | ||||||
6.500%, 03/15/29 | 7,650,000 | 7,263,644 | ||||||
6.500%, 09/01/37 | 9,605,000 | 9,295,902 | ||||||
Avnet, Inc., | ||||||||
2.000%, 03/15/34 | 1,425,000 | 1,473,094 | ||||||
5.875%, 03/15/14 | 11,000,000 | 10,592,021 | ||||||
6.000%, 09/01/15 | 5,340,000 | 5,176,665 | ||||||
6.625%, 09/15/16 | 1,370,000 | 1,369,394 | ||||||
Bell Canada, 5.000%, 02/15/17 | CAD | 1,000,000 | 796,332 | |||||
BellSouth Corp., 6.000%, 11/15/34 | 9,740,000 | 2 | 8,919,532 | |||||
Bowater, Inc., 6.500%, 06/15/13 | 1,675,000 | 1,055,250 | ||||||
The accompanying notes are an integral part of these financial statements.
9
Table of Contents
Managers Bond Fund
Schedule of Portfolio Investments (continued)
Security Description | Principal Amount | Value | ||||
Industrial - 51.3% (continued) | ||||||
Camden Property Trust, 5.700%, 05/15/17 | 5,205,000 | $ | 4,551,981 | |||
Canadian Pacific Railway Co., | ||||||
5.750%, 03/15/33 | 195,000 | 157,357 | ||||
5.950%, 05/15/37 | 9,340,000 | 7,749,772 | ||||
Centex Corp., 5.250%, 6/15/15 | 1,915,000 | 1,512,850 | ||||
Chartered Semiconductor Manufacturing, Ltd., 6.250%, 04/04/13 | 5,600,000 | 5,333,037 | ||||
Cia Brasileira de Bebida, 8.750%, 09/15/13 | 3,795,000 | 4,288,350 | ||||
Clear Channel Communications, | ||||||
4.250%, 05/15/09 | 1,500,000 | 1,447,500 | ||||
5.750%, 01/15/13 | 500,000 | 336,875 | ||||
Colonial Realty, L.P., 6.050%, 09/01/16 | 470,000 | 411,494 | ||||
Comcast Corp., | ||||||
5.650%, 06/15/35 | 13,570,000 | 11,530,918 | ||||
6.450%, 03/15/37 | 10,295,000 | 9,581,464 | ||||
6.500%, 11/15/35 | 2,320,000 | 2,205,450 | ||||
6.950%, 08/15/37 | 22,230,000 | 21,865,183 | ||||
Continental Airlines, Inc., | ||||||
5.983%, 04/19/22 | 16,735,000 | 13,848,212 | ||||
6.795%, 08/02/20 | 46,383 | 44,644 | ||||
6.903%, 04/19/22 | 5,595,000 | 2 | 4,489,988 | |||
Corn Products International, Inc., 6.625%, 04/15/37 | 4,055,000 | 4,093,636 | ||||
Corning, Inc., | ||||||
6.850%, 03/01/29 | 9,142,000 | 8,943,427 | ||||
7.250%, 08/15/36 | 1,185,000 | 1,202,027 | ||||
Covidien International Finance, S.A., | ||||||
6.000%, 10/15/17 | 6,005,000 | 6,056,703 | ||||
6.550%, 10/15/37 | 11,635,000 | 2 | 10,082,111 | |||
CSX Corp., | ||||||
6.000%, 10/01/36 | 5,965,000 | 6,037,135 | ||||
6.250%, 03/15/18 | 16,400,000 | 15,787,378 | ||||
Cummins Engine Co., Inc., | ||||||
5.650%, 03/01/98 | 11,235,000 | 7,714,120 | ||||
6.750%, 02/15/27 | 2,853,000 | 2,497,938 | ||||
7.125%, 03/01/28 | 50,000 | 2 | 47,443 | |||
D.R. Horton, Inc., 5.250%, 02/15/15 | 5,495,000 | 4,368,525 | ||||
Delta Air Lines, Inc., 8.021%, 08/10/22 | 15,467,305 | 14,075,247 | ||||
Desarrolladora Homex, S.A. de C.V., 7.500%, 09/28/15 | 2,725,000 | 2,738,625 | ||||
Devon Energy Corp., | ||||||
4.900%, 08/15/08 | 1,250,000 | 2,321,875 | ||||
4.950%, 08/15/08 | 1,692,000 | 3,142,890 | ||||
Dillards, Inc., 7.000%, 12/01/28 | 225,000 | 141,750 | ||||
DP World, Ltd., 6.850%, 07/02/37 (a) | 22,050,000 | 18,920,488 | ||||
The accompanying notes are an integral part of these financial statements.
10
Table of Contents
Managers Bond Fund
Schedule of Portfolio Investments (continued)
Security Description | Principal Amount | Value | ||||||
Industrial - 51.3% (continued) | ||||||||
Duke Energy Field Services LLC, 6.450%, 11/03/36 (a) | 2,615,000 | $ | 2,383,952 | |||||
Dun & Bradstreet Corp., The, 6.000%, 04/01/13 | 32,120,000 | 31,998,811 | ||||||
EL Paso Corp., | ||||||||
6.950%, 06/01/28 | 1,030,000 | 2 | 948,632 | |||||
7.000%, 05/15/11 | 500,000 | 501,608 | ||||||
Energy Transfer Partners, L.P., | ||||||||
6.125%, 02/15/17 | 700,000 | 677,904 | ||||||
6.625%, 10/15/36 | 1,805,000 | 1,680,089 | ||||||
Enterprise Products Operating L.P., 6.300%, 09/15/17 | 8,440,000 | 8,380,988 | ||||||
Equifax, Inc., 7.000%, 07/01/37 | 5,470,000 | 5,034,178 | ||||||
Equitable Resources, Inc., 6.500%, 04/01/18 | 35,420,000 | 35,471,076 | ||||||
Eurofima, 11.000%, 02/05/10 | ISK | 60,000,000 | 768,077 | |||||
Federated Retail Holdings, Inc., 6.375%, 03/15/37 | 14,065,000 | 10,832,610 | ||||||
Foot Locker, Inc., 8.500%, 01/15/22 | 570,000 | 532,950 | ||||||
Ford Motor Co., 6.375%, 02/01/29 | 1,990,000 | 1,044,750 | ||||||
Freescale Semiconductor, Inc., 10.125%, 12/15/16 | 1,275,000 | 2 | 972,188 | |||||
General Motors Corp., | ||||||||
7.400%, 09/01/25 | 570,000 | 293,550 | ||||||
8.250%, 07/15/23 | 3,535,000 | 2 | 2,059,138 | |||||
8.375%, 07/15/33 | 135,000 | 2 | 79,988 | |||||
Georgia-Pacific Corp., | ||||||||
7.250%, 06/01/28 | 1,245,000 | 1,039,575 | ||||||
7.750%, 11/15/29 | 1,615,000 | 1,421,200 | ||||||
8.000%, 01/15/24 | 1,695,000 | 1,567,875 | ||||||
8.875%, 05/15/31 | 2,750,000 | 2,543,750 | ||||||
GTE Corp., 6.940%, 04/15/28 | 130,000 | 128,700 | ||||||
HCA, Inc., | ||||||||
5.750%, 03/15/14 | 2,200,000 | 1,908,500 | ||||||
6.250%, 02/15/13 | 2,330,000 | 1,933,900 | ||||||
6.375%, 01/15/15 | 5,960,000 | 4,961,700 | ||||||
6.625%, 02/15/16 | 6,850,000 | 2 | 5,702,625 | |||||
6.750%, 07/15/13 | 190,000 | 166,725 | ||||||
7.050%, 12/01/27 | 1,685,000 | 1,276,037 | ||||||
7.190%, 11/15/15 | 1,090,000 | 938,889 | ||||||
7.500%, 12/15/23 | 1,172,000 | 952,975 | ||||||
7.500%, 11/06/33 | 925,000 | 712,250 | ||||||
7.580%, 09/15/25 | 1,680,000 | 1,362,641 | ||||||
7.690%, 06/15/25 | 2,589,000 | 2,117,201 | ||||||
7.750%, 07/15/36 | 330,000 | 260,976 | ||||||
8.360%, 04/15/24 | 2,105,000 | 1,791,675 | ||||||
The accompanying notes are an integral part of these financial statements.
11
Table of Contents
Managers Bond Fund
Schedule of Portfolio Investments (continued)
Security Description | Principal Amount | Value | ||||
Industrial - 51.3% (continued) | ||||||
Home Depot, Inc., The, | ||||||
5.400%, 03/01/16 | 130,000 | $ | 119,373 | |||
5.875%, 12/16/36 | 19,035,000 | 15,550,186 | ||||
Hospira, Inc., 6.050%, 03/30/17 | 3,395,000 | 3,276,402 | ||||
Hutchison Whampoa International, Ltd., 5.450%, 11/24/10 (a) | 2,225,000 | 2,243,194 | ||||
International Paper Co., | ||||||
4.000%, 04/01/10 | 1,000,000 | 968,126 | ||||
4.250%, 01/15/09 | 1,000,000 | 996,727 | ||||
5.500%, 01/15/14 | 550,000 | 505,401 | ||||
7.950%, 06/15/18 | 40,440,000 | 40,214,911 | ||||
Intuit, Inc., 5.750%, 03/15/17 | 3,560,000 | 3,343,791 | ||||
J.C. Penney Co., Inc., | ||||||
5.750%, 02/15/18 | 325,000 | 257,156 | ||||
5.850%, 03/15/17 | 12,955,000 | 2 | 10,819,938 | |||
6.375%, 10/15/36 | 4,660,000 | 2 | 4,157,759 | |||
7.125%, 11/15/23 | 18,000 | 17,801 | ||||
7.400%, 04/01/37 | 4,205,000 | 3,775,522 | ||||
7.625%, 03/01/97 | 5,035,000 | 4,114,209 | ||||
Johnson & Johnson, 5.950%, 08/15/37 | 15,020,000 | 15,593,073 | ||||
Kellwood Co., 7.625%, 10/15/17 5 | 250,000 | 161,250 | ||||
Kinder Morgan Energy Partners L.P., | ||||||
5.800%, 03/15/35 | 3,360,000 | 2,915,160 | ||||
5.950%, 02/15/18 | 44,630,000 | 43,480,911 | ||||
KLA Instruments Corp., 6.900%, 05/01/18 | 24,365,000 | 23,886,618 | ||||
Koninklijke KPN NV, 8.375%, 10/01/30 | 815,000 | 936,946 | ||||
Koninklijke Philips Electronics NV, 6.875%, 03/11/38 | 22,735,000 | 23,472,046 | ||||
Kraft Foods Inc., | ||||||
6.500%, 08/11/17 | 8,950,000 | 8,961,393 | ||||
6.500%, 11/01/31 | 13,635,000 | 12,619,929 | ||||
7.000%, 08/11/37 | 7,280,000 | 7,207,855 | ||||
Kroger Co., The, 6.400%, 08/15/17 | 3,060,000 | 3,121,068 | ||||
Lennar Corp., | ||||||
5.500%, 09/01/14 | 1,900,000 | 1,387,000 | ||||
5.600%, 05/31/15 | 2,740,000 | 2,003,625 | ||||
6.500%, 04/15/16 | 2,340,000 | 1,793,025 | ||||
Lowe’s Companies, Inc., | ||||||
6.650%, 09/15/37 | 6,595,000 | 6,428,503 | ||||
6.875%, 02/15/28 | 500,000 | 510,178 | ||||
Lubrizol Corp., 6.500%, 10/01/34 | 16,940,000 | 15,400,425 | ||||
Lucent Technologies, Inc., | ||||||
6.450%, 03/15/29 | 4,335,000 | 3,316,275 | ||||
6.500%, 01/15/28 | 305,000 | 233,325 | ||||
The accompanying notes are an integral part of these financial statements.
12
Table of Contents
Managers Bond Fund
Schedule of Portfolio Investments (continued)
Security Description | Principal Amount | Value | ||||
Industrial - 51.3% (continued) | ||||||
Macys Retail Holdings, Inc., | ||||||
6.790%, 07/15/27 | 3,105,000 | $ | 2,545,609 | |||
6.900%, 04/01/29 | 835,000 | 705,627 | ||||
Marks & Spencer Group PLC, 7.125%, 12/01/37 (a) | 4,725,000 | 4,129,302 | ||||
Masco Corp., 5.850%, 03/15/17 | 8,150,000 | 7,387,087 | ||||
Medco Health Solutions, Inc., 7.125%, 03/15/18 | 33,040,000 | 34,311,842 | ||||
Missouri Pacific Railroad Co., 5.000%, 01/01/45 | 825,000 | 511,500 | ||||
Motorola, Inc., | ||||||
5.220%, 10/01/97 | 1,890,000 | 1,486,874 | ||||
6.500%, 09/01/25 | 895,000 | 497,888 | ||||
6.500%, 11/15/28 | 1,430,000 | 1,117,063 | ||||
6.625%, 11/15/37 | 1,145,000 | 854,983 | ||||
8.000%, 11/01/11 | 1,075,000 | 1,097,785 | ||||
New England Telephone & Telegraph Co., 7.875%, 11/15/29 | 2,390,000 | 2,555,328 | ||||
Newmont Mining Corp., 5.875%, 04/01/35 | 11,660,000 | 9,979,561 | ||||
News America, Inc., | ||||||
6.150%, 03/01/37 | 6,075,000 | 5,593,331 | ||||
6.200%, 12/15/34 | 3,440,000 | 3,172,306 | ||||
6.400%, 12/15/35 | 5,820,000 | 5,507,571 | ||||
Nextel Communications, Inc., | ||||||
5.950%, 03/15/14 | 18,220,000 | 14,621,550 | ||||
6.875%, 10/31/13 | 20,000 | 16,900 | ||||
NGPL Pipeco LLC, 7.119%, 12/15/17 (a) | 21,980,000 | 22,464,901 | ||||
Northwest Airlines, Inc., 8.028%, 11/01/17 | 9,330,000 | 8,863,500 | ||||
ONEOK Partners, L.P., 6.650%, 10/01/36 | 3,500,000 | 3,335,952 | ||||
Owens & Minor, Inc., 6.350%, 04/15/16 | 1,355,000 | 1,330,865 | ||||
Owens Corning, Inc., | ||||||
6.500%, 12/01/16 | 2,655,000 | 2,417,316 | ||||
7.000%, 12/01/36 | 4,990,000 | 4,168,686 | ||||
Panhandle Eastern Pipe Line Co., L.P., | ||||||
6.200%, 11/01/17 | 5,520,000 | 5,228,483 | ||||
7.000%, 06/15/18 | 26,505,000 | 26,451,089 | ||||
PF Export Rec Master Trust, 6.436%, 06/01/15 (a) | 564,855 | 578,976 | ||||
Plains All American Pipeline L.P., | ||||||
6.125%, 01/15/17 | 2,770,000 | 2,722,204 | ||||
6.500%, 05/01/18 (a) | 5,960,000 | 5,558,213 | ||||
6.650%, 01/15/37 | 39,640,000 | 40,400,612 | ||||
PPG Industries, Inc., 6.650%, 03/15/18 | 8,975,000 | 8,941,523 | ||||
Pulte Homes, Inc., | ||||||
6.000%, 02/15/35 | 10,320,000 | 2 | 8,049,600 | |||
6.375%, 05/15/33 | 4,670,000 | 3,619,250 | ||||
Series $, 5.200%, 02/15/15 | 3,165,000 | 2,579,475 | ||||
The accompanying notes are an integral part of these financial statements.
13
Table of Contents
Managers Bond Fund
Schedule of Portfolio Investments (continued)
Security Description | Principal Amount | Value | ||||
Industrial - 51.3% (continued) | ||||||
Qantas Airways, Ltd., 6.050%, 04/15/16 (a) | 11,800,000 | $ | 10,696,794 | |||
Questar Market Resources, Inc., 6.800%, 04/01/18 | 27,465,000 | 26,835,585 | ||||
Qwest Capital Funding, Inc., | ||||||
6.500%, 11/15/18 | 620,000 | 508,400 | ||||
7.625%, 08/03/21 | 2,135,000 | 2 | 1,841,438 | |||
7.750%, 02/15/31 | 1,705,000 | 2 | 1,453,512 | |||
Qwest Corp., | ||||||
6.500%, 06/01/17 | 155,000 | 138,338 | ||||
6.875%, 09/15/33 | 4,715,000 | 2 | 3,889,875 | |||
7.200%, 11/10/26 | 435,000 | 365,400 | ||||
7.250%, 09/15/25 | 1,085,000 | $ | 960,225 | |||
7.250%, 10/15/35 | 2,165,000 | 1,818,600 | ||||
7.500%, 06/15/23 | 1,146,000 | 2 | 1,019,940 | |||
R.H. Donnelley Corp., Series A-1, 6.875%, 01/15/13 | 1,345,000 | 800,275 | ||||
R.H. Donnelley Corp., Series A-2, 6.875%, 01/15/13 | 1,060,000 | 630,700 | ||||
R.H. Donnelley Corp., | ||||||
6.875%, 01/15/13 | 430,000 | 255,850 | ||||
8.875%, 01/15/16 | 1,535,000 | 921,000 | ||||
8.875%, 10/15/17 (a) | 245,000 | 2 | 145,775 | |||
Raytheon Co., | ||||||
7.000%, 11/01/28 | 1,500,000 | 1,601,330 | ||||
7.200%, 08/15/27 | 800,000 | 880,000 | ||||
Reynolds American, Inc., | ||||||
6.750%, 06/15/17 | 8,170,000 | 8,127,426 | ||||
7.250%, 06/15/37 | 2,000,000 | 1,968,270 | ||||
Safeway, Inc., 6.350%, 08/15/17 | 8,000,000 | 8,233,352 | ||||
Samsung Electronics Co., Ltd., 7.700%, 10/01/27 (a) | 4,400,000 | 4,740,234 | ||||
Schering-Plough Corp., 5.300%, 12/01/13 | 1,500,000 | 1,509,936 | ||||
Simon Property Group, L.P., 5.750%, 12/01/15 | 445,000 | 431,881 | ||||
Southern Natural Gas Co., | ||||||
5.900%, 04/01/17 (a) | 4,765,000 | 4,552,171 | ||||
7.350%, 02/15/31 | 1,000,000 | 1,012,816 | ||||
Sprint Capital Corp., 6.875%, 11/15/28 | 27,000 | 22,478 | ||||
Sprint Nextel Corp., 6.000%, 12/01/16 | 48,000 | 41,280 | ||||
Talisman Energy, Inc., | ||||||
5.850%, 02/01/37 | 3,674,000 | 3,165,507 | ||||
6.250%, 02/01/38 | 3,635,000 | 3,341,350 | ||||
Target Corp., | ||||||
6.500%, 10/15/37 | 1,381,000 | 1,328,487 | ||||
7.000%, 01/15/38 | 25,054,000 | 25,687,716 | ||||
Teck Cominco Ltd., 7.000%, 09/15/12 | 1,000,000 | 1,067,960 | ||||
The accompanying notes are an integral part of these financial statements.
14
Table of Contents
Managers Bond Fund
Schedule of Portfolio Investments (continued)
Security Description | Principal Amount | Value | ||||||
Industrial - 51.3% (continued) | ||||||||
Telecom Italia Capital S.p.A., | ||||||||
6.000%, 09/30/34 | 3,210,000 | $ | 2,747,166 | |||||
6.375%, 11/15/33 | 3,170,000 | 2,822,153 | ||||||
Telefonica Emisiones SAU, 7.045%, 06/20/36 | 12,125,000 | 2 | 12,443,281 | |||||
Telekom Malaysia Berhad, 7.875%, 08/01/25 (a) | 250,000 | 283,645 | ||||||
TELUS Corp., 4.950%, 03/15/17 | CAD | 7,115,000 | 6,455,692 | |||||
Tennessee Gas Pipeline Co., 7.000%, 10/15/28 | 2,395,000 | 2,335,741 | ||||||
Texas Eastern Transmission, L.P., 6.000%, 09/15/17 (a) | 3,000,000 | 2,915,462 | ||||||
Time Warner Cable, Inc., | ||||||||
5.850%, 05/01/17 | 830,000 | 788,335 | ||||||
6.750%, 07/01/18 | 30,000,000 | 30,198,930 | ||||||
Time Warner, Inc., | 3,360,000 | 2,991,065 | ||||||
6.500%, 11/15/36 | ||||||||
6.625%, 05/15/29 | 1,995,000 | 1,815,402 | ||||||
6.950%, 01/15/28 | 855,000 | 820,394 | ||||||
7.625%, 04/15/31 | 560,000 | 568,538 | ||||||
7.700%, 05/01/32 | 365,000 | 373,688 | ||||||
Toro Co., The, 6.625%, 05/01/37 | 6,810,000 | 6,964,321 | ||||||
Transocean, Inc., 7.375%, 04/15/18 | 500,000 | 544,560 | ||||||
U.S. Steel Corp., | ||||||||
6.050%, 06/01/17 | 2,115,000 | 1,975,315 | ||||||
6.650%, 06/01/37 | 3,595,000 | 3,167,098 | ||||||
7.000%, 02/01/18 | 22,850,000 | 22,799,753 | ||||||
Union Pacific Corp., 5.375%, 06/01/33 | 2,525,000 | 2,164,917 | ||||||
United Airlines, Inc., 6.636%, 07/02/22 | 18,133,294 | 14,823,968 | ||||||
UnitedHealth Group, Inc., | ||||||||
5.800%, 03/15/36 | 13,506,000 | 11,178,808 | ||||||
6.500%, 06/15/37 | 310,000 | 282,689 | ||||||
6.625%, 11/15/37 | 1,540,000 | 1,418,234 | ||||||
USG Corp., 6.300%, 11/15/16 | 1,410,000 | 1,135,050 | ||||||
V.F. Corp., 6.450%, 11/01/37 | 9,334,000 | 8,829,712 | ||||||
Vale Overseas Ltd., 6.875%, 11/01/36 | 3,665,000 | 2 | 3,403,814 | |||||
Verizon Global Funding Corp., 5.850%, 09/15/35 | 11,400,000 | 10,047,789 | ||||||
Verizon Maryland, Inc., 5.125%, 06/15/33 | 1,055,000 | 814,678 | ||||||
Verizon New York, Inc., Series B, 7.375%, 04/01/32 | 3,090,000 | 3,138,930 | ||||||
Viacom, Inc., 6.875%, 04/30/36 | 4,160,000 | 3,906,602 | ||||||
Vondafone Group PLC, | ||||||||
5.000%, 09/15/15 | 4,465,000 | 4,224,613 | ||||||
6.150%, 02/27/37 | 16,500,000 | 15,089,530 | ||||||
Watson Pharmaceuticals, Inc., 1.750%, 03/15/23 | 515,000 | 490,538 | ||||||
Weatherford International, Inc., 6.500%, 08/01/36 | 1,565,000 | 1,531,323 | ||||||
The accompanying notes are an integral part of these financial statements.
15
Table of Contents
Managers Bond Fund
Schedule of Portfolio Investments (continued)
Security Description | Principal Amount | Value | ||||
Industrial - 51.3% (continued) | ||||||
Wellpoint, Inc., 6.375%, 06/15/37 | 13,650,000 | $ | 12,317,487 | |||
Western Union Co., 6.200%, 11/17/36 | 12,735,000 | 11,884,187 | ||||
Weyerhaeuser Co., 6.875%, 12/15/33 | 12,890,000 | 11,968,120 | ||||
White Pine Hydro LLC, | ||||||
6.310%, 07/10/17 5 | 1,700,000 | 1,640,500 | ||||
6.960%, 07/10/37 | 1,645,000 | 1,558,463 | ||||
Williams Co., Inc., Series A, 7.500%, 01/15/31 | 1,000,000 | 1,011,250 | ||||
XTO Energy, Inc., | ||||||
6.100%, 04/01/36 | 190,000 | 180,968 | ||||
6.750%, 08/01/37 | 2,770,000 | 2,808,819 | ||||
Total Industrial | 1,307,639,119 | |||||
Utility - 8.1% | ||||||
Ameren Energy Generating Co., 7.000%, 04/15/18 (a) | 22,700,000 | 22,731,644 | ||||
Baltimore Gas & Electric Co., 5.200%, 06/15/33 | 1,470,000 | 1,147,969 | ||||
Bruce Mansfield Unit 1 2, 6.850%, 06/01/34 | 10,805,000 | 10,935,109 | ||||
Cleveland Electric Illuminating Co., The, 5.950%, 12/15/36 | 15,645,000 | 13,253,192 | ||||
Commonwealth Edison Co., | ||||||
4.700%, 04/15/15 | 1,465,000 | 1,360,941 | ||||
5.875%, 02/01/33 | 5,000,000 | 4,520,875 | ||||
Constellation Energy Group, Inc., 4.550%, 06/15/15 | 1,675,000 | 2 | 1,492,182 | |||
Dominion Resources, Inc., 5.950%, 06/15/35 | 740,000 | 664,146 | ||||
Empresa Nacional de Electricidad SA, 8.625%, 08/01/15 | 300,000 | 2 | 341,037 | |||
Empresa Nacional de Electricidad, Yankee, 7.875%, 02/01/27 | 2,900,000 | 3,160,316 | ||||
Enersis SA, Yankee, 7.400%, 12/01/16 | 225,000 | 240,830 | ||||
Illinois Power Co., 6.250%, 04/01/18 (a) | 26,000,000 | 25,029,082 | ||||
ITC Holdings Corp., | ||||||
5.875%, 09/30/16 (a) | 2,410,000 | 2,340,443 | ||||
6.375%, 09/30/36 (a) | 3,605,000 | 3,274,331 | ||||
Mackinaw Power LLC, 6.296%, 10/31/23 (a) | 10,091,565 | 10,110,335 | ||||
Methanex Corp., 6.000%, 08/15/15 | 3,825,000 | 3,558,811 | ||||
MidAmerican Energy Holdings Co., | ||||||
5.875%, 10/01/12 | 750,000 | 771,404 | ||||
6.125%, 04/01/36 | 2,305,000 | 2,213,411 | ||||
6.500%, 09/15/37 | 6,450,000 | 2 | 6,514,319 | |||
NiSource Finance Corp., | ||||||
6.150%, 03/01/13 | 1,250,000 | 1,246,710 | ||||
6.400%, 03/15/18 | 31,155,000 | 30,068,750 | ||||
6.800%, 01/15/19 | 11,625,000 | 11,400,045 | ||||
ONEOK, Inc., 6.000%, 06/15/35 | 9,210,000 | 8,147,313 | ||||
Southwestern Electric Power Co., 6.450%, 01/15/19 | 39,195,000 | 38,963,475 | ||||
Tenaga Nasional Berhad, 7.500%, 11/01/25 (a) | 2,000,000 | 2,178,926 | ||||
The accompanying notes are an integral part of these financial statements.
16
Table of Contents
Managers Bond Fund
Schedule of Portfolio Investments (continued)
Security Description | Principal Amount | Value | |||||||
Utility - 8.1% (continued) | |||||||||
Toledo Edison Co., 6.150%, 05/15/37 | 2,390,000 | $ | 2,072,766 | ||||||
Total Utility | 207,738,362 | ||||||||
Total Corporate Bonds (cost $2,111,848,315) | 2,035,621,728 | ||||||||
Foreign Government - 5.2% | |||||||||
Alberta, Province of, Series CS, Sinking Fund, 5.930%, 09/16/16 | CAD | 161,060 | 168,697 | ||||||
Brazil, Republic of, | |||||||||
10.250%, 01/10/28 | BRL | 5,750,000 | 2 | 3,030,846 | |||||
12.500%, 01/05/22 | BRL | 5,160,000 | 3,130,248 | ||||||
Canada Government, | |||||||||
3.750%, 06/01/12 | CAD | 12,235,000 | 12,134,452 | ||||||
4.250%, 09/01/08 | CAD | 7,940,000 | 7,805,292 | ||||||
4.250%, 12/01/08 | CAD | 820,000 | 808,380 | ||||||
5.250%, 06/01/12 | CAD | 7,870,000 | 8,227,264 | ||||||
Canada Housing Trust, 4.100%, 12/15/08 | CAD | 3,340,000 | 3,290,377 | ||||||
Canadian Government Bond, 5.750%, 06/01/33 | CAD | 2,145,000 | 2,638,495 | ||||||
EUROFIMA, 10.000%, 11/03/08 | ISK | 65,900,000 | 831,140 | ||||||
European Investment Bank, | |||||||||
4.600%, 01/30/37 (a) | CAD | 7,270,000 | 6,864,543 | ||||||
6.961%, 03/10/21 4 | BRL | 5,000,000 | 2,010,909 | ||||||
11.890%, 04/24/13 (a) 4 | IDR | 50,074,770,000 | 3,113,651 | ||||||
27.699%, 09/12/08 (a) 4 | BRL | 13,323,060 | 7,863,082 | ||||||
Inter-American Development Bank, | |||||||||
6.000%, 12/15/17 | NZD | 4,215,000 | 2,955,245 | ||||||
11.619%, 05/20/13 4 | IDR | 45,580,000,000 | 2,846,031 | ||||||
12.097%, 05/11/09 4 | BRL | 6,500,000 | 3,660,533 | ||||||
International Bank for Reconstruction & Development, 9.500%, 05/27/10 | ISK | 179,000,000 | 2,285,656 | ||||||
Mexican Fixed Rate Bonds, 8.000%, 12/07/23 | MXN | 141,360,000 | 12,241,578 | ||||||
Mexican Government, 9.000%, 12/20/12 | MXN | 54,500,000 | 5,309,537 | ||||||
New South Wales Treasury Corp., | |||||||||
Series 12RG, 6.000%, 05/01/12 | AUD | 7,990,000 | 7,326,782 | ||||||
Series 10RG, 7.000%, 12/01/10 | AUD | 15,465,000 | 14,715,802 | ||||||
Nordic Investment Bank, | |||||||||
11.250%, 04/16/09 | ISK | 16,600,000 | 210,254 | ||||||
13.000%, 09/12/08 | ISK | 301,700,000 | 3,827,603 | ||||||
Queensland Treasury Corp., | |||||||||
Series 11G, 6.000%, 06/14/11 | AUD | 10,250,000 | 9,503,956 | ||||||
7.125%, 09/18/17 (a) | NZD | 7,500,000 | 5,737,945 | ||||||
Total Foreign Government (cost $124,364,872) | 132,538,298 | ||||||||
| U.S. Government and Agency Obligations - 4.5% | |||||||||
U.S. Treasury Notes - 4.2% | |||||||||
USTN, 4.250%, 11/15/17 | $ | 10,000,000 | 2 | 10,214,840 | |||||
The accompanying notes are an integral part of these financial statements.
17
Table of Contents
Managers Bond Fund
Schedule of Portfolio Investments (continued)
Security Description | Principal Amount | Value | |||||
U.S. Treasury Notes - 4.2% (continued) | |||||||
USTN, 4.500%, 09/30/11 | $ | 32,500,000 | 2 | $ | 33,967,570 | ||
USTN, 4.625%, 11/30/08 | 63,500,000 | 2 | 64,194,563 | ||||
Total U.S. Treasury Notes | 108,376,973 | ||||||
Federal Home Loan Mortgage Corporation - 0.0%# | |||||||
FHLMC, Gold, 5.000%, 12/01/31 | 183,018 | 176,699 | |||||
Federal National Mortgage Association - 0.3% | |||||||
FNMA, 4.000%, 10/01/18 | 7,762,019 | 7,379,740 | |||||
FNMA, 6.000%, 07/01/29 | 17,990 | 18,321 | |||||
Total Federal National Mortgage Association | 7,398,061 | ||||||
Total U.S. Government and Agency Obligations (cost $113,768,443) | 115,951,733 | ||||||
Municipal Bonds - 1.7% | |||||||
Alabama Public School & College Authority, Capital Improvement Bond, 4.500%, 12/01/26 | 600,000 | 580,272 | |||||
Buckeye Tobacco Settlement Financing Authority, Asset-A-2, 5.875%, 06/01/47 | 5,035,000 | 4,201,305 | |||||
Chicago Illinois Board of Education, Dedicated-Series B, 4.750%, 12/01/31 | 1,040,000 | 1,019,793 | |||||
Chicago Illinois O’Hare International Airport Revenue Bond, Series A, 4.500%, 01/01/38 | 315,000 | 282,605 | |||||
District of Columbia, Series A, 4.750%, 06/01/36 | 600,000 | 562,116 | |||||
Florida State Turnpike Authority, Revenue Bond, Department of Transportation, Series A, 3.500%, 07/01/27 | 600,000 | 484,290 | |||||
Green Bay Wisconsin, Water System Revenue Refunding Bonds, 3.500%, 11/01/26 (FSA Insured) | 410,000 | 343,272 | |||||
Green Bay Wisconsin, Water System Revenue Refunding Bonds, 3.500%, 11/01/29 (FSA Insured) | 445,000 | 358,545 | |||||
Grosse Pointe Michigan Public School System, 3.000%, 05/01/27 | 365,000 | 266,574 | |||||
Harris County Texas, Road Bonds, Series B, 4.500%, 10/01/31 | 1,715,000 | 1,620,315 | |||||
JEA Florida Water & Sewer System Revenue Bond, Series B, 4.750%, 10/01/41 | 955,000 | 894,434 | |||||
Louisianna State, Series C, 3.250%, 05/01/26 (FSA Insured) | 605,000 | 479,965 | |||||
Massachusetts State School Building Authdedicated Sales Tax Revenue Bond, Series A, 4.750%, 08/15/32 | 600,000 | 586,488 | |||||
Michigan Tobacco Settlement Financial Authority Series A, 7.309%, 06/01/34 | 3,135,000 | 2,870,343 | |||||
Omaha Public Power District, Electric System Subordinated Revenue Bonds, Series AA, 4.500%, 02/01/34 | 1,505,000 | 1,361,032 | |||||
San Diego California Unified School District, Refunding Bonds, Election 1998, Series F-1, 4.500%, 07/01/29 | 630,000 | 584,558 | |||||
San Jose California Redevelopment Agency Tax Allocation, Series C, 3.750%, 08/01/28 | 765,000 | 623,307 | |||||
San Jose Redevelopment Agency, 3.750%, 08/01/28 | 280,000 | 226,475 | |||||
State of California (AMBAC Insured), 4.500%, 08/01/27 | 950,000 | 898,700 | |||||
State of California (AMBAC Insured), 4.500%, 08/01/30 | 770,000 | 704,635 | |||||
State of California, 4.500%, 10/01/29 | 2,655,000 | 2,443,874 | |||||
State of California, 4.500%, 08/01/30 | 665,000 | 609,472 | |||||
State of California, Variable Purpose Bond, 3.250%, 12/01/27 | 495,000 | 377,853 | |||||
State of California, Variable Purpose Bond, 4.500%, 12/01/33 | 2,330,000 | 2,095,695 | |||||
Tobacco Settlement Financing Corp., 6.706%, 06/01/46 | 22,190,000 | 18,704,396 | |||||
University of California Regents Medical Center, Series A, 4.750%, 05/15/31 | 165,000 | 157,890 | |||||
The accompanying notes are an integral part of these financial statements.
18
Table of Contents
Managers Bond Fund
Schedule of Portfolio Investments (continued)
Security Description | Principal Amount | Value | |||||
Municipal Bonds - 1.7% (continued) | |||||||
Wisconsin Housing & Economic Development Authority, Revenue Bonds, Series E, 4.900%, 11/01/35 | $ | 155,000 | $ | 147,163 | |||
Total Municipal Bonds (cost $47,127,149) | 43,485,367 | ||||||
| Mortgage-Backed Securities - 0.2% | |||||||
Bank of America-First Union, Series 2001, 5.464%, 04/11/37 | 1,500,000 | 1,502,012 | |||||
CS First Boston Mortgage Securities Corp., Series 2005-7, Class 3A1, 5.000%, 08/25/20 | 2,873,197 | 2,553,554 | |||||
Total Mortgage-Backed Securities (cost $4,231,610) | 4,055,566 | ||||||
| Asset-Backed Securities - 3.1% | |||||||
ARGF, Series 2005-2A, Class A5, 2.642%, 05/20/11 (07/21/08) (a) 6 | 10,840,000 | 9,928,802 | |||||
Capital One Auto Finance Trust 2006-C A4, 2.501%, 05/15/13 (07/15/08) 6 | 14,765,000 | 13,106,600 | |||||
CCCIT, Series 2008-C6, Class C6, 6.300%, 06/20/14 | 15,450,000 | 14,774,061 | |||||
CHAIT, Series 2007-B1, Class B1, 2.721%, 04/15/19 (07/15/08) 6 | 17,040,000 | 13,604,906 | |||||
CITEC, Series 2008-VT1, Class A3, 6.590%, 12/22/14 | 7,270,000 | 7,223,108 | |||||
Community Program Loan Trust, Series 87-A, Class A4, 4.500%, 10/01/18 | 108,068 | 106,852 | |||||
Community Program Loan Trust, Series 87-A, Class A5, 4.500%, 04/01/29 | 3,225,000 | 2,882,923 | |||||
MBNA, Series 2002-C1, Class C1, 6.800%, 07/15/14 | 6,911,000 | 6,814,252 | |||||
MBNA, Series 2005-B2, Class B2, 2.651%, 12/17/12 (07/15/08) 6 | 10,405,000 | 10,020,807 | |||||
Total Asset-Backed Securities (cost $77,956,515) | 78,462,311 | ||||||
Preferred Stocks - 2.1% | Shares | ||||||
Bank of America Corp., Series L, 7.250% | 6,958 | 6,157,830 | |||||
CIT Group, Inc., The, Series C, 8.750% | 2,500 | 102,200 | |||||
Comcast Corp. Series B, 7.000% | 207,547 | 2 | 4,815,090 | ||||
Entergy New Orleans, Inc., 4.750% | 482 | 35,261 | |||||
Entergy New Orleans, Inc., 5.560% | 100 | 8,372 | |||||
FHLMC, 5.570% | 70,150 | 1,261,998 | |||||
FHLMC, 8.375% | 380,697 | 9,250,938 | |||||
FNMA, 5.125% | 17,300 | 549,275 | |||||
FNMA, 8.250% | 765,000 | 2 | 17,556,751 | ||||
Lehman Brothers Holdings Capital Trust V, Series M, 6.000% | 7,550 | 121,328 | |||||
Lehman Brothers Holdings, Inc., 6.500%, | 65,312 | 1,116,182 | |||||
Lehman Brothers Holdings, Inc., 7.950% | 26,664 | 542,612 | |||||
Lehman Brothers Holdings, Inc., 5.670% | 14,058 | 466,550 | |||||
Lehman Brothers Holdings, Inc., Series P, 7.250% | 4,265 | 3,430,894 | |||||
Lehman Brothers Holdings, Inc., Series C, 5.940% | 14,887 | 475,342 | |||||
Merrill Lynch & Co., Inc., Series 3, 6.375% | 20,000 | 337,200 | |||||
Newell Financial Trust I, 5.250% | 90,628 | 4,078,260 | |||||
SLM Corp., 6.000% | 41,250 | 721,875 | |||||
Sovereign Capital Trust IV, 4.375% | 34,236 | 1,052,757 | |||||
Wisconsin Electric Power Co., 3.600% | 3,946 | 277,823 | |||||
Total Preferred Stocks (cost $54,610,137) | 52,358,538 | ||||||
The accompanying notes are an integral part of these financial statements.
19
Table of Contents
Managers Bond Fund
Schedule of Portfolio Investments (continued)
Security Description | Shares | Value | ||||
Other Investment Companies - 7.8%1 | ||||||
Bank of New York Institutional Cash Reserves Fund, 2.62%3 | 147,706,784 | $ | 147,706,784 | |||
JPMorgan Liquid Assets Money Market Fund, Capital Shares, 2.68% | 4,048,753 | 4,048,753 | ||||
Dreyfus Cash Management Fund, Institutional Class Shares, 2.66% | 48,411,983 | 48,411,983 | ||||
Total Other Investment Companies (cost $200,167,520) | 200,167,520 | |||||
Total Investments - 104.4% (cost $2,734,074,561) | 2,662,641,061 | |||||
| Other Assets, less Liabilities - (4.4)% | (111,789,178 | ) | ||||
Net Assets - 100.0% | $ | 2,550,851,883 | ||||
The following footnotes and abbreviations should be read in conjunction with the Schedule of Portfolio Investments previously presented in this report.
Based on the cost of investments of $2,735,158,228 for Federal income tax purposes at June 30, 2008, the aggregate gross unrealized appreciation and depreciation were $37,499,450 and $110,016,617, respectively, resulting in a net unrealized depreciation of investments of $72,517,167.
| (a) | Security exempt from registration under Rule 144A of the Securities Act of 1933. This security may be resold in transactions exempt from registration, normally to qualified buyers. At June 30, 2008, the value of these securities amounted to $258,286,044 or 10.1% of net assets. |
1 | Yield shown for an investment company represents the June 30, 2008, seven-day average yield, which refers to the sum of the previous seven days’ dividends paid, expressed as an annual percentage. |
2 | Some or all of these shares were out on loan to various brokers as of June 30, 2008, amounting to $142,890,399 or 5.6% of net assets. |
3 | Collateral received from brokers for securities lending was invested in these short-term investments. |
4 | Represents yield to maturity at June 30, 2008. |
5 | Security is illiquid: A security not readily convertible into cash such as a stock, bond or commodity that is not actively traded, and would be difficult to sell in a current sale. The Fund may not invest more than 15% of its net assets in illiquid securities. All securities are valued by an independent pricing agent. |
6 | Floating Rate Security. The rate listed is as of June 30, 2008. Date in parenthesis represents the security’s next coupon rate reset. |
7 | Variable Rate Security. The rate listed is as of June 30, 2008 and is periodically reset subject to terms and conditions set forth in the debenture. |
# | Rounds to less than 0.1%. |
Investments Definitions and Abbreviations:
ADR/GDR: ADR after the name of a holding stands for American Depositary Receipt, representing ownership of foreign securities on deposit with a domestic custodian bank; a GDR (Global Depositary Receipt) is comparable, but foreign securities are held on deposit in a non-U.S. bank. The value of the ADR/GDR securities is determined or significantly influenced by trading on exchanges not located in the United States or Canada. Sponsored ADR/GDRs are initiated by the underlying foreign company.
| FHLMC: | Federal Home Loan Mortgage Corp. | |
| FNMA: | Federal National Mortgage Association | |
| USTB: | United States Treasury Bond | |
| USTN: | United States Treasury Note | |
| GMAC: | General Motors Acceptance Corp. |
Registered shares: A security whose owner has been recorded with its issuer or issuer’s registrar.
Abbreviations have been used throughout the portfolios to indicate amounts shown in currencies other than the U.S. dollar (USD):
| AUD: | Australian Dollar | |
| BRL: | Brazilian Real | |
| CAD: | Canadian Dollar | |
| GBP: | British Pound | |
| IDR: | Indonesian Rupiah | |
| ISK: | Icelandic Krona | |
| KRW: | South Korean Won | |
| MXN: | Mexican Peso | |
| MYR: | Malaysian Ringgit | |
| NZD: | New Zealand Dollar | |
| SGD: | Singapore Dollar | |
| THB: | Thailand Baht |
The accompanying notes are an integral part of these financial statements.
20
Table of Contents
Statement of Assets and Liabilities
June 30, 2008 (unaudited)
Assets: | ||||
Investments at value (including securities on loan valued at $142,890,399)* | $ | 2,662,641,061 | ||
Receivable for Fund shares sold | 7,103,381 | |||
Dividends, interest and other receivables | 38,300,107 | |||
Prepaid expenses | 212,750 | |||
Total assets | 2,708,257,299 | |||
Liabilities: | ||||
Foreign currency** | 797,657 | |||
Payable for Fund shares repurchased | 5,122,884 | |||
Payable upon return of securities loaned | 147,706,784 | |||
Payable for investments purchased | 1,751,907 | |||
Accrued expenses: | ||||
Investment advisory and management fees | 1,063,008 | |||
Administrative fees | 501,762 | |||
Other | 461,414 | |||
Total liabilities | 157,405,416 | |||
Net Assets | $ | 2,550,851,883 | ||
Shares outstanding | 104,156,860 | |||
Net asset value, offering and redemption price per share | $ | 24.49 | ||
| Net Assets Represent: | ||||
Paid-in capital | $ | 2,576,080,427 | ||
Undistributed net investment loss | (459,717 | ) | ||
Accumulated net realized gain from investments and foreign currency transactions | 46,769,162 | |||
Net unrealized depreciation of investments and foreign currency contracts and translations | (71,537,989 | ) | ||
| Net Assets | $ | 2,550,851,883 | ||
* Investments at cost | $ | 2,734,074,561 | ||
** Foreign currency at cost | $ | 797,739 |
The accompanying notes are an integral part of these financial statements.
21
Table of Contents
Statement of Operations
For the six months ended June 30, 2008 (unaudited)
Investment Income: | ||||
Interest income | $ | 70,311,830 | ||
Dividend income | 1,833,576 | |||
Securities lending fees | 818,381 | |||
Total investment income | 72,963,787 | |||
Expenses: | ||||
Investment management fees | 7,021,247 | |||
Administrative fees | 2,808,499 | |||
Transfer agent | 1,636,168 | |||
Custodian | 172,405 | |||
Professional fees | 141,894 | |||
Reports to shareholders | 125,776 | |||
Registration fees | 78,787 | |||
Trustees fees and expenses | 73,338 | |||
Miscellaneous | 39,710 | |||
Total expenses before offsets | 12,097,824 | |||
Expense waiver | (32,895 | ) | ||
Expense reimbursement | (968,470 | ) | ||
Expense reductions | (7,698 | ) | ||
Net expenses | 11,088,761 | |||
Net investment income | 61,875,026 | |||
Net Realized and Unrealized Gain (Loss): | ||||
Net realized gain on investment transactions | 46,957,457 | |||
Net realized loss on foreign currency contracts and transactions | (12,089 | ) | ||
Net unrealized depreciation of investments | (128,505,386 | ) | ||
Net unrealized depreciation of foreign currency contracts and translations | (123,947 | ) | ||
Net realized and unrealized loss | (81,683,965 | ) | ||
| Net decrease in net assets resulting from operations | $ | (19,808,939 | ) | |
The accompanying notes are an integral part of these financial statements.
22
Table of Contents
Statement of Changes in Net Assets
For the six months ended June 30, 2008 (unaudited) and for the year ended December 31, 2007
| 2008 | 2007 | |||||||
Increase (Decrease) in Net Assets From Operations: | ||||||||
Net investment income | $ | 61,875,026 | $ | 71,238,519 | ||||
Net realized gain on investments and foreign currency transactions | 46,945,368 | 4,081,419 | ||||||
Net unrealized appreciation (depreciation) of investments and foreign currency translations | (128,629,333 | ) | 32,532,745 | |||||
Net increase (decrease) in net assets resulting from operations | (19,808,939 | ) | 107,852,683 | |||||
| Distributions to Shareholders: | ||||||||
From net investment income | (61,973,746 | ) | (73,131,848 | ) | ||||
From net realized gain on investments | — | (379,319 | ) | |||||
Total distributions to shareholders | (61,973,746 | ) | (73,511,167 | ) | ||||
| From Capital Share Transactions: | ||||||||
Proceeds from sale of shares | 871,730,895 | 1,324,679,881 | ||||||
Reinvestment of dividends and distributions | 57,927,117 | 69,605,331 | ||||||
Cost of shares repurchased | (319,914,019 | ) | (312,512,299 | ) | ||||
Net increase from capital share transactions | 609,743,993 | 1,081,772,913 | ||||||
Total increase in net assets | 527,961,308 | 1,116,114,429 | ||||||
| Net Assets: | ||||||||
Beginning of period | 2,022,890,575 | 906,776,146 | ||||||
End of period | $ | 2,550,851,883 | $ | 2,022,890,575 | ||||
End of period undistributed net investment loss | $ | (459,717 | ) | $ | (360,997 | ) | ||
| Share Transactions: | ||||||||
Sale of shares | 34,758,601 | 53,069,813 | ||||||
Reinvested shares | 2,322,610 | 2,793,409 | ||||||
Shares repurchased | (12,748,712 | ) | (12,544,877 | ) | ||||
Net increase in shares | 24,332,499 | 43,318,345 | ||||||
The accompanying notes are an integral part of these financial statements.
23
Table of Contents
For a share outstanding throughout each period
| For the six months ended June 30, 2008 (unaudited) |
For the year ended December 31, | |||||||||||||||||||||||
Managers Bond Fund | 2007 | 2006 | 2005 | 2004 | 2003 | |||||||||||||||||||
| Net Asset Value, Beginning of Period | $ | 25.34 | $ | 24.84 | $ | 24.11 | $ | 24.58 | $ | 24.58 | $ | 23.44 | ||||||||||||
| Income from Investment Operations: | ||||||||||||||||||||||||
Net investment income | 0.68 | 5 | 1.22 | 5 | 1.08 | 0.88 | 0.80 | 1.08 | ||||||||||||||||
Net realized and unrealized gain (loss) on investments | (0.85 | )5 | 0.49 | 5 | 0.75 | (0.32 | ) | 0.30 | 1.40 | |||||||||||||||
Total from investment operations | (0.17 | ) | 1.71 | 1.83 | 0.56 | 1.10 | 2.48 | |||||||||||||||||
| Less Distributions to Shareholders from: | ||||||||||||||||||||||||
Net investment income | (0.68 | ) | (1.21 | ) | (1.10 | ) | (0.88 | ) | (0.93 | ) | (1.11 | ) | ||||||||||||
Net realized gain on investments | — | (0.00 | )4 | — | (0.15 | ) | (0.17 | ) | (0.23 | ) | ||||||||||||||
Total distributions to shareholders | (0.68 | ) | (1.21 | ) | (1.10 | ) | (1.03 | ) | (1.10 | ) | (1.34 | ) | ||||||||||||
Net Asset Value, End of Period | $ | 24.49 | $ | 25.34 | $ | 24.84 | $ | 24.11 | $ | 24.58 | $ | 24.58 | ||||||||||||
Total Return 1 | (0.71 | )%6 | 7.06 | % | 7.79 | %3 | 2.29 | % | 5.14 | % | 10.77 | % | ||||||||||||
Ratio of net expenses to average net assets | 0.99 | %7 | 0.99 | % | 0.99 | % | 0.99 | % | 0.99 | % | 0.99 | % | ||||||||||||
Ratio of net investment income to average net assets 1 | 5.51 | %7 | 4.91 | % | 4.52 | % | 3.36 | % | 3.65 | % | 4.50 | % | ||||||||||||
Portfolio turnover | 20 | %6 | 21 | % | 46 | % | 26 | % | 16 | % | 73 | % | ||||||||||||
Net assets at end of period (000’s omitted) | $ | 2,550,852 | $ | 2,022,891 | $ | 906,776 | $ | 426,448 | $ | 259,210 | $ | 179,641 | ||||||||||||
Ratios absent expense offsets: 2 | ||||||||||||||||||||||||
Ratio of total expenses to average net assets | 1.08 | %7 | 0.99 | % | 1.02 | % | 1.02 | % | 1.06 | % | 1.09 | % | ||||||||||||
Ratio of net investment income to average net assets | 5.42 | %7 | 4.91 | % | 4.49 | % | 3.33 | % | 3.58 | % | 4.40 | % | ||||||||||||
1 | Total returns and net investment income would have been lower had certain expenses not been reduced. (See Note 1(c) to the Notes to Financial Statements.) |
2 | Excludes the impact of expense reimbursement and expense offsets such as brokerage credits, but includes non-reimbursable expenses such as interest and taxes. (See Note 1(c) to the Notes to Financial Statements.) |
3 | The Total Return is based on the Financial Statement Net Asset Values as shown above. |
4 | Rounds to less than $0.01. |
5 | Per share numbers have been calculated using average shares. |
6 | Not Annualized. |
7 | Annualized. |
24
Table of Contents
June 30, 2008 (unaudited)
| 1. | Summary of Significant Accounting Policies |
The Managers Funds (the “Trust”) is an open-end management investment company organized as a Massachusetts business trust and registered under the Investment Company Act of 1940, as amended (the “1940 Act”). Currently, the Trust is comprised of a number of different funds, each having distinct investment management objectives, strategies, risks and policies. Included in this report is the Managers Bond Fund (“the Fund”).
The Fund’s financial statements are prepared in accordance with accounting principles generally accepted in the United States of America, which require management to make estimates and assumptions that affect the reported amount of assets and liabilities and disclosure of contingent assets and liabilities at the date of the financial statements and the reported amounts of income and expenses during the reporting periods. Actual results could differ from those estimates and such differences could be material. The following is a summary of significant accounting policies followed by the Fund in the preparation of its financial statements:
| a. | Valuation of Investments |
Equity securities traded on a domestic or international securities exchange are valued at the last quoted sale price, or, lacking any sales, at the last quoted bid price. Over-the-counter securities are valued at the Nasdaq Official Closing Price, if one is available. Lacking any sales, over-the-counter securities are valued at the last quoted bid price. The Fund’s investments are generally valued based on market quotations provided by the third party pricing services approved by the Board of Trustees of the Fund. Under certain circumstances, the value of a specific investment may be based on an evaluation of its fair value, pursuant to procedures established by and under the general supervision of the Board of Trustees of the Fund. A Fund may use the fair value of a portfolio security to calculate its NAV when, for example, (1) market quotations are not readily available because a portfolio security is not traded in a public market or the principal market in which the security trades is closed, (2) trading in a portfolio security is suspended and has not resumed before the Fund calculates its NAV, (3) where a significant event affecting the value of a portfolio security is determined to have occurred between the time of the market quotation provided for a portfolio security and the time as of which the Fund calculates its NAV, (4) a security’s price has remained unchanged over a period of time (often referred to as a “stale price”), or (5) Managers Investment Group LLC (the “Investment Manager”) determines that a market quotation is inaccurate. Portfolio investments that trade primarily on foreign markets are priced based upon the market quotation of such securities as of the close of their respective principal markets, as adjusted to reflect the Investment Manager’s determination of the impact of events occurring subsequent to the close of such markets but prior to the time as of which the Fund calculates their NAV. In accordance with procedures approved by the Board of Trustees, the Investment Manager relies upon recommendations of a third-party fair valuation service in adjusting the prices of such foreign portfolio investments. The Fund may invest in securities that may be thinly traded. The Board of Trustees has adopted procedures to adjust prices when thinly traded securities are judged to be stale so that they reflect fair value. An investment valued on the basis of its fair value may be valued at a price higher or lower than available market quotations. An investment’s valuation may differ depending on the method used and the factors considered in determining value according to the Fund’s fair value procedures.
Fixed-income securities are valued based on valuations furnished by independent pricing services that utilize matrix systems, which reflect such factors as security prices, yields, maturities, and ratings, and are supplemented by dealer and exchange quotations. Futures contracts for which market quotations are readily available are valued at the settlement price as of the close of the futures exchange. Short-term investments having a remaining maturity of 60 days or less are valued at amortized cost, which approximates market value. Investments in other regulated investment companies are valued at their end of day net asset value per share. Investments in certain mortgage-backed, stripped mortgage-backed, preferred stocks, convertible securities, derivatives and other debt securities not traded on an organized securities market are valued on the basis of valuations provided by dealers or by a pricing service which uses information with respect to transactions in such securities and various relationships between securities and yield to maturity in determining value. Securities (including derivatives) for which market quotations are not readily available are valued at fair value, as determined in good faith, and pursuant to procedures adopted by the Board of Trustees of the Trust. The values assigned to fair value investments are based on available information and do not necessarily represent amounts that might ultimately be realized, since such amounts depend on future developments inherent in long-term investments. Further, because of the inherent uncertainty of valuation, those estimated values may differ significantly from the values that would have been used had a ready market for the investments existed, and the differences could be material.
The Fund adopted Financial Accounting Standards Board Statement of Financial Accounting Standards No. 157, Fair Value Measurements (“FAS 157”), effective January 1, 2008. In accordance with FAS 157, fair value is defined as the price that a Fund would receive to sell an asset or pay to transfer a liability in an orderly transaction between market participants at the measurement date. FAS 157 also establishes a framework for measuring fair value, and a three-level hierarchy for fair value measurements based upon the transparency of inputs to the valuation of an asset or liability. Inputs may be observable or unobservable and refer broadly to the assumptions that market participants would use in pricing the asset or liability. Observable inputs reflect the assumptions market participants would use in pricing the asset or liability based on market data obtained from sources independent of the Fund. Unobservable inputs reflect the Fund’s own assumptions about the assumptions that market participants would use in pricing the asset or liability developed based on the best information available in the circumstances. Each investment is assigned a level based upon the observability of the inputs which are significant to the overall valuation. The three-tier hierarchy of inputs is summarized below:
Level 1 – quoted prices in active markets for identical investments
Level 2 – other significant observable inputs (including quoted prices for similar investments, interest rates, prepayment speeds, credit risk)
Level 3 – significant unobservable inputs (including the Fund’s own assumptions in determining the fair value of investments)
25
Table of Contents
Notes to Financial Statements (continued)
The inputs or methodologies used for valuing investments are not necessarily an indication of the risk associated with investing in those investments. The following table summarizes the valuation of the Fund’s investments by the above fair value hierarchy levels as of June 30, 2008:
Level | Investments in Securities | Other Financial Instruments* | |||
Bond Fund | |||||
Level 1 | $ | 252,526,058 | — | ||
Level 2 | 2,410,115,003 | — | |||
Level 3 | — | — | |||
Total | $ | 2,662,641,061 | — | ||
| * | Other financial instruments are derivative instruments not reflected in the Schedule of Portfolio Investments, such as futures, forwards and swap contracts, which are valued at the unrealized appreciation/depreciation of the instrument. |
| b. | Security Transactions |
Security transactions are accounted for as of the trade date. Realized gains and losses on securities sold are determined on the basis of identified cost.
| c. | Investment Income and Expenses |
Dividend income is recorded on the ex-dividend date except certain dividends from foreign securities where the ex-dividend date may have passed. These dividends are recorded as soon as the Trust is informed of the ex-dividend date. Dividend income on foreign securities is recorded net of any withholding tax. Interest income, which includes amortization of premium and accretion of discount on debt securities, is accrued as earned. Non-cash dividends included in dividend income, if any, are reported at the fair market value of the securities received. Other income and expenses are recorded on an accrual basis. Expenses that cannot be directly attributed to a fund are apportioned among the Funds in the Trust and in some cases other affiliated funds based upon their relative average net assets or number of shareholders.
The Fund has a “balance credit” arrangement with The Bank of New York Mellon (“BNYM”) (formerly the Bank of New York), the Fund’s custodian, whereby the Fund is credited with an interest factor equal to 0.75% below the effective 90-day T-Bill rate for account balances left uninvested overnight. These credits serve to reduce custody expenses that would otherwise be charged to the Fund. For the six months ended June 30, 2008, the custodian expense was reduced by $507.
Overdrafts will cause a reduction of any earnings credits, computed at 2% above the effective Federal Funds rate on the day of the overdraft. For the six months ended June 30, 2008, the Fund had no overdraft fees.
The Trust also has a balance credit arrangement with its Transfer Agent, PNC Global Investment Servicing (U.S.) Inc. (formerly PFPC Inc.), whereby earnings credits are used to offset banking charges and other out-of-pocket expenses. For the six months ended June 30, 2008, the transfer agent expense was reduced by $7,191.
The Investment Manager has agreed to waive a portion of its management fee in consideration of shareholder servicing fees that it has received from JPMorgan Distribution Services, Inc., with respect to short-term cash investments the Fund has made in the JPMorgan Liquid Assets Portfolio. For the six months ended June 30, 2008, the management fee was reduced by $32,895.
Total returns and net investment income for the Fund would have been lower had certain expenses not been offset. Total expenses before off-sets exclude the impact of expense reimbursements or fee waivers and expense offsets such as brokerage recapture credits, but include non-reimburseable expenses such as interest and taxes, if any.
| d. | Dividends and Distributions |
Dividends resulting from net investment income, if any, normally will be declared and paid monthly. Distributions of capital gains, if any, will be made annually in December and when required for Federal excise tax purposes. Income and capital gain distributions are determined in accordance with Federal income tax regulations, which may differ from generally accepted accounting principles. These differences are primarily due to differing treatments for losses deferred due to wash sales, REITS, equalization accounting for tax purposes, foreign currency, options, futures and market discount transactions. Permanent book and tax basis differences, if any, relating to shareholder distributions will result in reclassifications to paid-in capital.
| e. | Federal Taxes |
The Fund intends to comply with the requirements under Subchapter M of the Internal Revenue Code of 1986, as amended, to distribute substantially all of its taxable income and gains to its shareholders and to meet certain diversification and income requirements with respect to investment companies. Therefore, no provision for Federal income or excise tax is included in the accompanying financial statements.
Additionally, based on the Fund’s understanding of the tax rules and rates related to income, gains and transactions for the foreign jurisdictions in which it invests, the Fund will provide for foreign taxes, and where appropriate, deferred foreign taxes.
| f. | Capital Loss Carryovers |
As of June 30, 2008, the Fund had no accumulated net realized capital loss carryover from securities transactions for Federal income tax purposes.
| g. | Capital Stock |
The Trust’s Declaration of Trust authorizes for each series the issuance of an unlimited number of shares of beneficial interest, without par value. Each Fund records sales and repurchases of its capital stock on the trade date. Dividends and distributions to shareholders are recorded on the ex-dividend date.
At June 30, 2008, certain unaffiliated shareholders of record, specifically omnibus accounts, individually held greater than 10% of the outstanding shares of the Fund as follows: two collectively own 36%. Transactions by these shareholders may have a material impact on the Fund.
| h. | Foreign Currency Translation |
The books and records of the Fund are maintained in U.S. dollars. The value of investments, assets and liabilities denominated in currencies other than U.S. dollars are translated into U.S. dollars based upon current foreign exchange rates. Purchases and sales of foreign investments, income and expenses are converted into
26
Table of Contents
Notes to Financial Statements (continued)
U.S. dollars based on currency exchange rates prevailing on the respective dates of such transactions. Net realized and unrealized gain (loss) on foreign currency transactions represent: (1) foreign exchange gains and losses from the sale and holdings of foreign currencies; (2) gains and losses between trade date and settlement date on investment securities transactions and forward foreign currency exchange contracts; and (3) gains and losses from the difference between amounts of interest and dividends recorded and the amounts actually received.
In addition, the Fund does not isolate the net realized and unrealized gain or loss resulting from changes in exchange rates from the fluctuations in market prices of securities held. Such fluctuations are included with the net realized and unrealized gain or loss on investments.
| 2. | Agreements and Transactions with Affiliates |
The Trust has entered into an Investment Management Agreement under which Managers Investment Group LLC (the “Investment Manager”), an independently managed subsidiary of Affiliated Managers Group, Inc. (“AMG”), serves as investment manager to the Fund. The Investment Manager selects subadvisors for the Fund (subject to Trustee approval) and monitors each subadvisor’s investment programs and results. The Fund’s investment portfolio is managed by a portfolio manager who serves pursuant to a Subadvisory Agreement with the Investment Manager.
Investment management fees are paid directly by the Fund to the Investment Manager based on average daily net assets. For the six months ended June 30, 2008, the annual investment management fee rate, as a percentage of average daily net assets, was 0.625%.
The Trust has entered into an Administration and Shareholder Servicing Agreement under which the Investment Manager serves as the Fund’s administrator (the “Administrator”) and is responsible for all aspects of managing the Fund’s operations, including administration and shareholder services to the Fund, its shareholders, and certain institutions, such as bank trust departments, broker-dealers and registered investment advisers, that advise or act as an intermediary with the Fund’s shareholders. The Fund pays a fee to the Administrator at the rate of 0.25% per annum of the Fund’s average daily net assets for this service.
The Investment Manager has contractually agreed, through at least May 1, 2009, to waive fees and pay or reimburse expenses to the extent that the total annual operating expenses (exclusive of brokerage costs, acquired fund fees and expenses, interest, taxes and extraordinary expenses) of the Fund exceed 0.99% of the Fund’s average daily net assets.
The Fund is obligated to repay the Investment Manager such amounts waived, paid or reimbursed in future years provided that the repayment occurs within (36) months after the waiver or reimbursement and that such repayment would not cause the Fund’s total operating expenses in any such future year to exceed that Fund’s respective expense cap. For the six months ended June 30, 2008, the Fund made no such repayments to the Investment Manager. For the six months ended June 30, 2008, the cumulative amount of expense reimbursement by the Investment Manager subject to repayment by the Fund equaled $1,273,851.
Prior to July 1, 2007, the aggregate annual retainer paid to each Independent Trustee was $55,000, plus $4,000 or $2,000 for each regular or special meeting attended, respectively. Effective July 1, 2007, the aggregate annual retainer paid to each Independent Trustee is $65,000, plus $4,000 or $2,500 for each regular or special meeting attended, respectively. The Trustees’ fees and expenses are allocated amongst all of the Funds for which the Investment Manager serves as the advisor (the “Managers Funds”) based on the relative net assets of such Funds. The Independent Chairman of the Trusts receives an additional payment of $15,000 per year. (Prior to July 1, 2007, the Independent Chairman received an additional payment of $10,000 per year). The Chairman of the Audit Committee receives an additional payment of $5,000 per year. (Prior to July 1, 2007, the Chairman of the Audit Committee received an additional payment of $2,000 per year). The “Trustee fees and expenses” shown in the financial statements represents the Fund’s allocated portion of the total fees and expenses paid by the Fund and other affiliated funds in the Managers Funds.
The Fund is distributed by Managers Distributors, Inc. (the “Distributor” or “MDI”), a wholly-owned subsidiary of the Investment Manager. MDI serves as the principal underwriter for the Fund. MDI is a registered broker-dealer and member of the Financial Industry Regulatory Authority, Inc. (“FINRA”). Shares of the Fund will be continuously offered and will be sold by brokers, dealers or other financial intermediaries who have executed selling agreements with the Distributor. MDI bears all the expenses of providing services pursuant to the Underwriting Agreement, including the payment of the expenses relating to the distribution of Prospectuses for sales purposes and any advertising or sales literature. Certain Trustees and Officers of the Fund are Officers and/or Directors of the Investment Manager, AMG and/or the Distributor.
| 3. | Purchases and Sales of Securities |
Purchases and sales of securities, excluding short-term securities, for the six months ended June 30, 2008, were $948,366,390 and $44,800,747, respectively. Purchases and sales of U.S. Government securities for the six months ended June 30, 2008, were $19,754,704 and $361,532,399, respectively.
| 4. | Portfolio Securities Loaned |
The Fund may participate in a securities lending program offered by BNYM providing for the lending of equities, corporate bonds and government securities to qualified brokers. Collateral on all securities loaned is accepted in cash and/or government securities. Collateral is maintained at a minimum level of 102% (105% in the case of certain foreign securities) of the market value, plus interest, if applicable, of investments on loan. Collateral received in the form of cash is invested temporarily in institutional money market funds or other short-term investments by BNYM. Security lending fees include earnings of such temporary cash investments, plus or minus any rebate. These earnings (after any rebate) then are divided between BNYM, as a fee for its services under the program, and the Fund loaning the security, according to agreed-upon rates.
27
Table of Contents
Notes to Financial Statements (continued)
| 5. | Commitments and Contingencies |
In the normal course of business, the Fund may enter into contracts and agreements that contain a variety of representations and warranties, which provide general indemnifications. The maximum exposure to the Fund under these arrangements is unknown, as this would involve future claims that may be made against the Fund that have not yet occurred. However, based on experience, the Fund expects the risk of loss to be remote.
| 6. | Risks Associated with Collateralized Mortgage Obligations (“CMOs”) |
The net asset value of the Fund may be sensitive to interest rate fluctuations because the Fund may hold several instruments, including CMOs and other derivatives, whose values can be significantly impacted by interest rate movements. CMOs are obligations collateralized by a portfolio of mortgages or mortgage-related securities. Payments of principal and interest on the mortgage are passed through to the holder of the CMOs on the same schedule as they are received, although certain classes of CMOs have priority over others with respect to the receipt of prepayments on the mortgages.
Therefore, the investment in CMOs may be subject to a greater or lesser risk of prepayment than other types of mortgage-related securities. CMOs may have a fixed or variable rate of interest.
| 7. | Forward Commitments |
Certain transactions, such as futures and forward transactions, dollar roll agreements, or purchases of when-issued or delayed delivery securities may have a similar effect on the Fund’s net asset value as if the Fund had created a degree of leverage in its portfolio. However, if the Fund enters into such a transaction, the Fund will establish a segregated account with its custodian in which it will maintain cash, U.S. government securities or other liquid securities equal in value to its obligations in respect to such transaction. Securities and other assets held in the segregated account may not be sold while the transaction is outstanding, unless other suitable assets are substituted.
| 8. | Forward Foreign Currency Contracts |
The Fund may invest in forward foreign currency exchange contracts to manage currency exposure. These investments may involve greater market risk than the amounts disclosed in the Fund’s financial statements.
A forward foreign currency exchange contract is an agreement between a Fund and another party to buy or sell a currency at a set price at a future date. The market value of the contract will fluctuate with changes in currency exchange rates. The contract is marked-to-market daily, and the change in market value is recorded as an unrealized gain or loss. Gain or loss on the purchase or sale of contracts having the same settlement date, amount and counter party is realized on the date of offset, otherwise gain or loss is realized on the settlement date.
The Fund may invest in non-U.S. dollar denominated instruments subject to limitations, and enter into forward foreign currency exchange contracts to facilitate transactions in foreign securities and to protect against a possible loss resulting from an adverse change in the relationship between the U.S. dollar and such foreign currency. Risks may arise upon entering into these contracts from the potential inability of counterparties to meet the terms of their contracts and from unanticipated movements in the value of a foreign currency relative to the U.S. dollar.
| 9. | New Accounting Pronouncement |
In June 2006, the Financial Accounting Standards Board (“FASB”) issued Interpretation No. 48, “Accounting for Uncertainty in Income Taxes — an Interpretation of FASB Statement No. 109 (“FIN 48”).” FIN 48 applies to all registered investment companies and establishes the minimum threshold for recognizing, and a system for measuring, the benefits of tax return positions in the financial statements. FIN 48 is effective for fiscal years beginning after December 15, 2006. The Investment Manager has analyzed the Fund’s tax positions taken on federal income tax returns for all open tax years (tax years ended December 31, 2004-2007) and has concluded that as of June 30, 2008, no provision for income tax is required in the Fund’s financial statements. Additionally, the Investment Manager is not aware of any events that are reasonably possible to occur in the next twelve months that would result in the amounts of any unrecognized tax benefits significantly increasing or decreasing for the Fund. However, the Investment Manager’s conclusion regarding FIN 48 may be subject to review and adjustment at a later date based on factors including, but not limited to, further implementation guidance expected from FASB, and ongoing analysis of tax laws, regulations, and interpretations thereof.
28
Table of Contents
Annual Renewal of Investment Advisory Agreement (unaudited)
On June 6, 2008, the Board of Trustees, including a majority of the Trustees who are not “interested persons” of the Trust (the “Independent Trustees”), approved the Investment Management Agreement with the Investment Manager for the Managers Bond Fund (the “Fund”) and the Subadvisory Agreement for the Subadvisor of the Fund. The Independent Trustees were separately represented by independent counsel in connection with their consideration of the approval of these agreements. In considering the Investment Management and Subadvisory Agreements, the Trustees reviewed a variety of materials relating to the Fund, the Investment Manager and the Subadvisor, including comparative performance, fee and expense information for an appropriate peer group of similar mutual funds (the “Peer Group”), performance information for the relevant benchmark index (the “Fund Benchmark”) and other information regarding the nature, extent and quality of services provided by the Investment Manager and the Subadvisor under their respective agreements. The Trustees also took into account information on the services provided by the Investment Manager and the Subadvisor (including information provided at meetings held on May 15-16 and June 5-6, 2008), as well as performance, fee and expense information regarding the Fund provided to them on a quarterly basis throughout the year. Prior to voting, the Independent Trustees: (a) reviewed the foregoing information with their independent legal counsel and with management; (b) received materials from their independent legal counsel discussing the legal standards applicable to their consideration of the Investment Management Agreement and the Subadvisory Agreement; and (c) met with their independent legal counsel in private sessions at which no representatives of management were present.
Nature, extent and quality of services.
In considering the nature, extent and quality of the services provided by the Investment Manager, the Trustees reviewed information relating to the Investment Manager’s operations and personnel. Among other things, the Investment Manager provided financial information, biographical information on its supervisory and professional staff and descriptions of its organizational and management structure. The Trustees also took into account information provided periodically throughout the previous year by the Investment Manager relating to the performance of its duties with respect to the Fund and the Trustees’ familiarity with the Investment Manager’s management through Board meetings, discussions and reports. In the course of their deliberations regarding the Investment Management Agreement, the Trustees evaluated, among other things: (a) the extent and quality of the Investment Manager’s oversight of the operation and management of the Fund; (b) the quality of the search, selection and monitoring services performed by the Investment Manager in overseeing the portfolio management responsibilities of the Subadvisor; (c) the Investment Manager’s ability to supervise the Fund’s other service providers; and (d) the Investment Manager’s compliance programs. The Trustees also took into account the financial condition of the Investment Manager with respect to its ability to provide the services required under the Investment Management Agreement and to maintain a contractual expense limitation for the Fund.
The Trustees also reviewed information relating to the Subadvisor’s operations and personnel and the investment philosophy, strategies and techniques (the “Investment Strategy”) used in managing the Fund. Among other things, the Trustees reviewed biographical information on portfolio management and other professional staff, information regarding the Subadvisor’s organizational and management structure and the Subadvisor’s brokerage policies and practices. The Trustees considered specific information provided regarding the experience of the individual or individuals at the Subadvisor with portfolio management responsibility for the Fund, including the information set forth in the Fund’s prospectus and statement of additional information. In the course of their deliberations, the Trustees evaluated, among other things: (a) the services rendered by the Subadvisor in the past; (b) the qualifications and experience of the Subadvisor’s personnel; and (c) the Subadvisor’s compliance programs. The Trustees also took into account the financial condition of the Subadvisor with respect to its ability to provide the services required under the Subadvisory Agreement.
Performance.
Among other information relating to the Fund’s performance, the Trustees noted that the Fund’s performance for the 1-year, 3-year, 5-year and 10-year periods ended March 31, 2008 was above the median performance of the Peer Group for each period and below, above, above and above, respectively, the performance of the Fund Benchmark, the Lehman Brothers U.S. Government/Credit Index. The Trustees concluded that the Fund’s performance has been satisfactory.
As noted above, the Board considered the Fund’s performance during relevant time periods as compared to the Fund’s Peer Group and noted that the Board reviews on a quarterly basis detailed information about the Fund’s performance results, portfolio composition and Investment Strategies. The Board noted the Investment Manager’s expertise and resources in monitoring the performance, investment style and risk-adjusted performance of the Subadvisor. The Board was mindful of the Investment Manager’s attention to monitoring the Subadvisor’s performance with respect to the Fund and its discussions with management regarding the factors that contributed to the performance of the Fund.
Advisory Fees and Profitability.
In considering the reasonableness of the advisory fee charged by the Investment Manager for managing the Fund, the Trustees noted that the Investment Manager, and not the Fund, is responsible for paying the fees charged by the Fund’s Subadvisor and, therefore, that the fees paid to the Investment Manager cover the cost of providing portfolio management services as well as the cost of providing search, selection and monitoring services in operating a “manager-of-managers” complex of mutual funds. The Trustees concluded that, in light of the additional high quality supervisory services provided by the Investment Manager and the fact that the subadvisory fees are paid out of the advisory fee, the advisory fee payable by the Fund to the Investment Manager can reasonably be expected to exceed the median advisory fee for the Peer Group, which consists of many funds that do not operate with a manager-of-managers structure. In this regard, the Trustees also noted that the Investment Manager has undertaken to maintain an expense limitation for the Fund.
In considering the reasonableness of the advisory fee payable to the Investment Manager, the Trustees also reviewed information provided by the Investment Manager setting forth all revenues and other benefits, both direct and indirect, received by the Investment
29
Table of Contents
Annual Renewal of Investment Advisory Agreement (continued)
Manager and its affiliates attributable to managing the Fund and all the mutual funds in the Managers Family of Funds, the cost of providing such services and the resulting profitability to the Investment Manager and its affiliates from these relationships. The Trustees also noted the current and potential asset levels of the Fund and the willingness of the Investment Manager to waive fees and pay expenses for the Fund from time to time as a means of limiting the total expenses of the Fund. The Trustees noted that the subadvisory fees are paid by the Investment Manager out of its advisory fee. The Board took into account management’s discussion of the current advisory fee structure. In this regard, the Trustees noted that, unlike a mutual fund that is managed by a single investment adviser, the Fund operates in a manager-of-managers structure and, as the Fund grows in size, it is common practice for the Investment Manager to recommend the selection of an additional Subadvisor to manage a portion of the Fund’s portfolio. The Trustees further noted that, because of this practice, the Investment Manager’s oversight and supervisory responsibilities with respect to the Fund can be expected to increase with the size of the Fund. Based on the foregoing, the Trustees concluded that the profitability to the Investment Manager is reasonable and that the Investment Manager is not realizing material benefits from economies of scale that would warrant adjustments to the advisory fees for the Fund at this time. With respect to economies of scale, the Trustees also noted that as the Fund’s assets increase over time, the Fund may realize other economies of scale to the extent that the increase in assets is proportionally greater than the increase in certain other expenses.
The Trustees noted that the Fund’s advisory fee and total expenses (net of applicable expense waivers/reimbursements) as of March 31, 2008 were both higher than the average for the Peer Group. The Trustees took into account the fact that the Investment Manager has contractually agreed, through May 1, 2009, to limit the Fund’s net annual operating expenses to 0.99%. The Trustees concluded that, in light of the nature, extent and quality of the services provided by the Investment Manager and the Subadvisor, the Fund’s performance, the foregoing expense limitation and the considerations noted above with respect to the Subadvisor and the Investment Manager, the Fund’s advisory fees are reasonable.
Subadvisory Fees and Profitability.
In considering the reasonableness of the fee payable by the Investment Manager to the Subadvisor, the Trustees relied on the ability of the Investment Manager to negotiate the terms of the Subadvisory Agreement at arm’s length as part of the manager-of-managers structure, noting that the Subadvisor is not affiliated with the Investment Manager. In addition, the Trustees noted that the subadvisory fees are paid by the Investment Manager out of its advisory fee. Accordingly, the cost of services to be provided by the Subadvisor and the profitability to the Subadvisor of its relationship with the Fund were not material factors in the Trustees’ deliberations. For similar reasons, and based on the current size of the portion of the Fund managed by the Subadvisor, the Trustees concluded that any economies of scale being realized by the Subadvisor was not a material factor in the Trustees’ deliberations at this time.
* * * * *
After consideration of the foregoing, the Trustees also reached the following conclusions regarding the Investment Management Agreement and the Subadvisory Agreement, in addition to those conclusions discussed above: (a) the Investment Manager and the Subadvisor have demonstrated that they possess the capability and resources to perform the duties required of them under the Investment Management Agreement and the Subadvisory Agreement; (b) the Subadvisor’s Investment Strategy is appropriate for pursuing the Fund’s investment objectives; (c) the Subadvisor is reasonably likely to execute its Investment Strategy consistently over time; and (d) the Investment Manager and the Subadvisor maintain appropriate compliance programs.
Based on all of the above-mentioned factors and related conclusions, with no single factor or conclusion being determinative and with each Trustee not necessarily attributing the same weight to each factor, the Trustees concluded that approval of the Investment Management Agreement and the Subadvisory Agreement would be in the best interests of the Fund and its shareholders. Accordingly, on June 6, 2008, the Trustees, including a majority of the Independent Trustees, voted to approve the Investment Management Agreement and the Subadvisory Agreement for the Fund’s Subadvisor.
30
Table of Contents
THIS PAGE INTENTIONALLY LEFT BLANK
Table of Contents
Investment Manager and Administrator
Managers Investment Group LLC
800 Connecticut Avenue
Norwalk, Connecticut 06854
(203) 299-3500 or (800) 835-3879
Distributor
Managers Distributors, Inc.
800 Connecticut Avenue
Norwalk, Connecticut 06854
(203) 299-3500 or (800) 835-3879
Custodian
The Bank of New York Mellon
2 Hanson Place
Brooklyn, New York 11217
Legal Counsel
Ropes & Gray LLP One International Place
Boston, Massachusetts 02110-2624
Transfer Agent
PNC Global Investment Servicing (U.S.) Inc.
Attn: Managers
P.O. Box 9769
Providence, Rhode Island 02940
(800) 548-4539
Trustees
Jack W. Aber
William E. Chapman, II
Nathaniel Dalton
Edward J. Kaier
Steven J. Paggioli
Eric Rakowski
Thomas R. Schneeweis
John H. Streur
For Managers Choice Only
Managers
c/o PNC Global Investment Servicing (U.S.) Inc.
P.O. Box 61204
King of Prussia, Pennsylvania 19406-0851
(800) 358-7668

Table of Contents
MANAGERSAND MANAGERS AMG EQUITY FUNDS
EMERGING MARKETS EQUITY
Rexiter Capital Management Limited
ESSEX GROWTH
ESSEX LARGE CAP GROWTH
ESSEX SMALL/MICRO CAP GROWTH
Essex Investment Management Co., LLC
FQ TAX-MANAGED U.S. EQUITY
FQ U.S. EQUITY
First Quadrant, L.P.
INSTITUTIONAL MICRO-CAP
MICRO-CAP
Lord, Abbett & Co. LLC
WEDGE Capital Management L.L.P.
OFI Institutional Asset Management, Inc.
Next Century Growth Investors LLC
INTERNATIONAL EQUITY
AllianceBernstein L.P.
Lazard Asset Management, LLC
Wellington Management Company, LLP
CHICAGO EQUITY PARTNERS
MID-CAP
Chicago Equity Partners, LLC
REAL ESTATE SECURITIES
Urdang Securities Management, Inc.
SKYLINE SPECIAL EQUITIES
PORTFOLIO
Skyline Asset Management, L.P.
SMALL CAP
TIMESSQUARE MID CAP GROWTH
TIMESSQUARE SMALL CAP GROWTH
TimesSquare Capital Management, LLC
SMALL COMPANY
Epoch Investment Partners, Inc.
Kalmar Investment Advisers
SPECIAL EQUITY
Donald Smith & Co., Inc.
Lord, Abbett & Co. LLC
Skyline Asset Management, L.P.
Smith Asset Management Group, L.P.
Veredus Asset Management LLC
Westport Asset Management, Inc.
SYSTEMATIC VALUE
SYSTEMATIC MID CAP VALUE
Systematic Financial Management, L.P.
VALUE
Armstrong Shaw Associates Inc.
Osprey Partners Investment Management, LLC
MANAGERSAND MANAGERS AMG BALANCED FUNDS
CHICAGO EQUITY PARTNERS BALANCED
Chicago Equity Partners, LLC
GLOBAL
AllianceBernstein L.P.
First Quadrant, L.P.
Wellington Management Company, LLP
ALTERNATIVE FUNDS
FQ GLOBAL ALTERNATIVES
First Quadrant, L.P.
MANAGERS FIXED INCOME FUNDS
BOND (MANAGERS)
FIXED INCOME
GLOBAL BOND
Loomis, Sayles & Co., L.P.
BOND (MANAGERS FREMONT)
Pacific Investment Management Co. LLC
CALIFORNIA INTERMEDIATE TAX-FREE
Evergreen Investment Management Co., LLC
HIGH YIELD
J.P. Morgan Investment Management LLC
INTERMEDIATE DURATION GOVERNMENT
SHORT DURATION GOVERNMENT
Smith Breeden Associates, Inc.
MONEY MARKET
JPMorgan Investment Advisors Inc.
This report is prepared for the Fund’s shareholders. It is authorized for distribution to prospective investors only when preceded or accompanied by an effective prospectus. To receive a free copy of the prospectus or Statement of Additional Information, which includes additional information about Fund Trustees, please contact us by calling 800.835.3879. Distributed by Managers Distributors, Inc., member FINRA.
A description of the policies and procedures each Fund uses to vote its proxies is available: (i) without charge, upon request, by calling 800.835.3879, or (ii) on the Securities and Exchange Commission’s (SEC) Web site at www.sec.gov. For information regarding each Fund’s proxy voting record for the 12-month period ended June 30, call 800.835.3879 or visit the SEC Web site at www.sec.gov.
The Fund files its complete schedule of portfolio holdings with the SEC for the first and third quarters of each fiscal year on Form N-Q. The Fund’s Forms N-Q are available on the SEC’s website at www.sec.gov. A Fund’s Forms N-Q may be reviewed and copied at the SEC’s Public Reference Room in Washington, DC. Information on the operation of the Public Reference Room may be obtained by calling 1-800-SEC-0330. To review a complete list of the Fund’s portfolio holdings, or to view the most recent quarterly holdings report, semiannual report, or annual report, please visit www.managersinvest.com.
www.managersinvest.com

Table of Contents
SEMI-ANNUAL REPORT
Managers Funds
June 30, 2008
Managers Special Equity Fund

Table of Contents
Managers Special Equity Fund
Semi-Annual Report — June 30, 2008 (unaudited)
TABLE OF CONTENTS | Page | |
| LETTER TO SHAREHOLDERS | 1 | |
| ABOUT YOUR FUND’S EXPENSES | 3 | |
| FUND PERFORMANCE | 3 | |
| FUND SNAPSHOTS | 4 | |
Portfolio breakdown and top ten holdings at June 30, 2008 | ||
| SCHEDULE OF PORTFOLIO INVESTMENTS | 5 | |
| FINANCIAL STATEMENTS: | ||
| 10 | ||
Fund’s balance sheet, net asset value (NAV) per share computation and cumulative undistributed amount | ||
| 11 | ||
Detail of sources of income, Fund expenses, and realized and unrealized gains (losses) during the period | ||
| 12 | ||
Detail of changes in Fund assets for the past two periods | ||
| FINANCIAL HIGHLIGHTS | 13 | |
Historical net asset values per share, distributions, total returns, expense ratios, turnover ratios and net assets | ||
| NOTES TO FINANCIAL STATEMENTS | 14 | |
Accounting and distribution policies, details of agreements and transactions with Fund management and affiliates, and descriptions of certain investment risks | ||
| ANNUAL RENEWAL OF INVESTMENT ADVISORY AGREEMENT | 18 | |
Nothing contained herein is to be considered an offer, sale or solicitation of an offer to buy shares of The Managers Funds or Managers AMG Funds. Such offering is made only by Prospectus, which includes details as to offering price and other material information.
Table of Contents
Dear Shareholder:
As you are undoubtedly aware, the financial markets were under significant pressure during a majority of the six-month period ending June 30, 2008 (the “period”). The period began with the major U.S. equity markets seeing their worst returns in 5 1/2 years during the first quarter, largely driven by investor concerns over the economic impact of a decline in U.S. home values and the related devaluation of the mortgage-securities market. After the Federal Reserve’s mid-March establishment of the credit facility to extend overnight funds to primary dealers and the bail out of Bear Stearns, the second quarter started with many investors believing that the worst of the credit crunch was over, that economic growth would begin to bounce back later in the year, and that stock prices, in anticipation of future growth, would advance. The stock market roughly followed that projected course until approximately mid-to-late May. Stocks, unfortunately, then sold off during the remainder of the quarter as investors’ concerns over surging energy and food prices, continued fallout from the credit crisis, slow economic growth, and declining corporate profits took center stage. Time may tell if the concerns are completely justified. In the short term, however, the pain in the financial markets has been all too real.
The resulting impact on the equity markets was widespread. For the period, the Russell 1000® (large cap), Russell 2000® (small cap), and the Russell 3000® (all cap) Indices returned -11.2%, -9.4% and -11.1%, respectively. Despite underperforming during the first quarter, growth indices outperformed their value counterparts for the period (e.g., Russell 3000® Growth -9.0% versus Russell 3000® Value Index -13.3%). Within the Russell 3000® Index, all sectors except energy (+12.8%) and materials (+2.3%) were down, with financials experiencing the largest decline (-27.0%). Even with the benefit of currencies that were strong relative to the U.S. Dollar for the period, foreign stock markets offered little help in the way of diversification. For the period, the MSCI EAFE Index returned -11.0% (U.S. Dollars), while the MSCI Emerging Markets Index declined by 11.8%. Conversely, bonds generated mostly positive results as the Lehman Brothers U.S. Aggregate Index and the Lehman Brothers Global Aggregate Index returned 1.1% and 3.4% (U.S. Dollars), respectively.
Against this backdrop, the performance of the Managers Special Equity Fund (the “Fund”) discussed in this report was challenged, as detailed below.
Periods Ended 06/30/08 | 6 Months | 1 Year | 3 Years | 5 Years | 10 Years | Since Inception | Inception Date | |||||||||||||
Managers Special Equity Fund | ||||||||||||||||||||
Institutional Class | (12.78 | )% | (21.00 | )% | 0.96 | % | 3.61 | % | 5/30/2004 | |||||||||||
Managers Class | (12.88 | )% | (21.15 | )% | 0.74 | % | 7.79 | % | 5.31 | % | 11.90 | % | 6/1/1984 | |||||||
Russell 2000® Index | (9.37 | )% | (16.19 | )% | 3.79 | % | 10.29 | % | 5.53 | % | 10.12 | % | 6/1/1984 | |||||||
Note: Returns greater than one year are annualized.
As noted above, for the six months ended June 30, 2008, the Managers Special Equity Fund returned - -12.88%, compared to a return of -9.37% for the Russell 2000® Index, the Fund’s primary benchmark. The Fund did, however, outperform its benchmark during the second quarter of 2008.
For the period, the Fund’s underperformance relative to the benchmark was primarily driven by weak stock performance among holdings in the information technology, industrials, and financials sectors. Within technology, exposure to semiconductors, specifically a position in Semiconductor Manufacturing International, was the primary detractor from results, while the Fund’s difficulties in the industrial sector were caused mainly by holdings in two airlines; Air France-KLM and Alaska Air group. Both stocks have been hampered by skyrocketing fuel costs, but Donald Smith & Co., one of the Fund’s subadvisors, still has confidence in these companies going forward, and given the selloff, feels that they are now trading at particularly attractive valuations. An underweight to the financials sector did benefit the Fund. However, this was offset by disappointing stock selection within the real estate and banking areas of the sector. The Fund did benefit from strong stock selection within the health care sector, driven by biotech firm Illumina, as well as solid results within the consumer discretionary sector, coming from retailers Big Lots and Ross Stores.
As we look forward, the jury still appears to be out on the direction of the economy, and we believe that much interest will likely be shown in the Fed’s ability to handle the delicate balance between keeping inflation
1
Table of Contents
Letter to Shareholders (continued)
in check, while also trying to keep the economy out of a recession. Whether or not the economy actually falls into a recession is difficult to predict, but what we believe is more certain is the fact that the growth of the U.S economy has decelerated. In this type of declining growth environment, we feel that identifying companies with superior earnings growth – a factor emphasized by many of the Fund’s subadvisors – will likely be critical in achieving better-than-market performance. The Fund remains overweight to the consumer discretionary, industrials, and information technology sectors, while maintaining underweight positions within financials, health care, and utilities. We remain confident in the Fund’s subadvisor lineup and believe that the characteristics and positioning of the Fund relative to its index should lead to solid performance going forward.
The following report covers the six-month period ended June 30, 2008. Should you have any questions about this report, or if you’d like to receive a prospectus and additional information, including fees and expenses for this or any of the other Funds in our family, please feel free to contact us at 1-800-835-3879, or visit our Web site at www.managersinvest.com. As always, please read the prospectus carefully before you invest or send money.
If you are curious about how you can better diversify your investment program, visit the Knowledge Center on our Web site and view our articles in the investment strategies section. You can rest assured that under all market conditions our team is focused on delivering excellent investment management services for your benefit.
We thank you for your continued confidence and investment in The Managers Funds.
Respectfully,
/s/ John H. Streur |
| John H. Streur |
| Senior Managing Partner |
| Managers Investment Group LLC |
2
Table of Contents
About Your Fund’s Expenses (unaudited)
As a shareholder of the Fund, you may incur two types of costs: (1) transaction costs, which may include sales charges (loads) on purchase payments; redemption fees; and exchange fees; and (2) ongoing costs, including management fees; distribution (12b-1) fees; and other Fund expenses. This Fund incurs only ongoing costs. This example is intended to help you understand your ongoing costs (in dollars) of investing in the Fund and to compare these costs with the ongoing costs of investing in other mutual funds. The example is based on an investment of $1,000 invested at the beginning of the period and held for the entire period as indicated below.
Actual Expenses
The first line of the table to the right provides information about the actual account values and actual expenses. You may use the information in this line, together with the amount you invested, to estimate the expenses that you paid over the period. Simply divide your account value by $1,000 (for example, an $8,600 account value divided by $1,000 = 8.6), then multiply the result by the number in the first line under the heading entitled “Expenses Paid During Period” to estimate the expenses you paid on your account during this period.
Hypothetical Example for Comparison Purposes
The second line of the table to the right provides information about hypothetical account values and hypothetical expenses based on the Fund’s actual expense ratio and an assumed annual rate of return of 5% before expenses, which is not the Fund’s actual return. The hypothetical account values and expenses may not be used to estimate the actual ending account balance or expenses you paid for the period. You may use this information to compare the ongoing costs of investing in the Fund and other funds by comparing this 5% hypothetical example with the 5% hypothetical examples that appear in the shareholder reports of other funds.
Please note that the expenses shown in the table are meant to highlight your ongoing costs only and do not reflect any transactional costs, such as sales charges (loads), redemption fees, or exchange fees. Therefore, the second line of the table is useful in comparing ongoing costs only, and will not help you determine the relative total costs of owning different funds.
Six Months Ended June 30, 2008 | Expense Ratio for the Period | Beginning Account Value 1/01/2008 | Ending Account Value 6/30/2008 | Expenses Paid During the Period* | ||||||||
Managers Special Equity Fund - Managers Shares | ||||||||||||
Based on Actual Fund Return | 1.50 | % | $ | 1,000 | $ | 871 | $ | 6.98 | ||||
Based on Hypothetical 5% Annual Return | 1.50 | % | $ | 1,000 | $ | 1,017 | $ | 7.52 | ||||
Managers Special Equity Fund - Institutional Shares | ||||||||||||
Based on Actual Fund Return | 1.25 | % | $ | 1,000 | $ | 872 | $ | 5.82 | ||||
Based on Hypothetical 5% Annual Return | 1.25 | % | $ | 1,000 | $ | 1,019 | $ | 6.27 | ||||
| * | Expenses are equal to the Fund’s annualized expense ratio multiplied by the average account value over the period, multiplied by the number of days in the most recent fiscal half-year (182), then divided by 366. |
Managers Special Equity Fund Performance
All periods ended June 30, 2008 (unaudited)
| Average Annual Total Returns1 | ||||||||||||||
Managers Special Equity Fund2 | Six Months | One Year | Five Years | Ten Years | Inception Date | |||||||||
Managers Class | (12.88 | )% | (21.15 | )% | 7.79 | % | 5.31 | % | 6/1/1984 | |||||
Institutional Class | (12.78 | )% | (21.00 | )% | — | — | 5/3/2004 | |||||||
Russell 2000® Index | (9.37 | )% | (16.19 | )% | 10.29 | % | 5.53 | % | 6/1/1984 | |||||
The performance data shown represents past performance, which is not a guarantee of future results. Current performance may be lower or higher than the performance data quoted. The investment return and principal value of an investment in the Funds will fluctuate so that an investor’s shares, when redeemed, may be worth more or less than their original cost. For performance information through the most recent month end please call (800) 835-3879 or visit our Web site at www.managersinvest.com.
In choosing a Fund, investors should carefully consider the amount they plan to invest, their investment objectives, the Fund’s investment objectives, risks, charges and expenses before investing. For this and other information, please call 800.835.3879 or visit www.managersinvest.com for a free prospectus. Read it carefully before investing or sending money. Distributed by Managers Distributors, Inc., member FINRA.
The Fund is subject to risks associated with investments in small capitalization companies, such as erratic earnings patterns, competitive conditions, limited earnings history, and a reliance on one or a limited number of products.
The Russell 2000® Index is composed of the 2,000 smallest stocks in the Russell 3000® Index of the 3,000 largest U.S. companies as measured by market capitalization, and is widely regarded in the industry as the premier measure of small-cap stock performance. Unlike the Fund, the Russell 2000® Index is unmanaged, is not available for investment, and does not incur expenses.
The Russell 2000® Index is a trademark of Russell Investments. Russell® is a trademark of Russell Investments.
1 | Total return equals income yield plus share price change and assumes reinvestment of all dividends and capital gain distributions. Returns are net of fees and may reflect offsets of Fund expenses as described in the Prospectus. No adjustment has been made for taxes payable by shareholders on their reinvested dividends and capital gain distributions. Returns for periods greater than one year are annualized. The listed returns on the Fund are net of expenses. All returns are in U.S. dollars($). |
2 | From time to time, the Fund’s advisor has waived its fees and/or absorbed Fund expenses, which has resulted in higher returns. |
Not FDIC insured, nor bank guaranteed. May lose value.
3
Table of Contents
Fund Snapshots
June 30, 2008 (unaudited)
Portfolio Breakdown
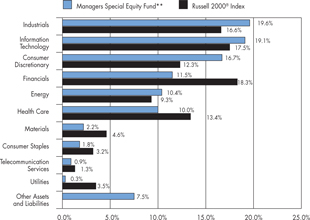
Industry | Managers Special Equity Fund ** | Russell 2000® Index | ||||
Industrials | 19.6 | % | 16.6 | % | ||
Information Technology | 19.1 | % | 17.5 | % | ||
Consumer Discretionary | 16.7 | % | 12.3 | % | ||
Financials | 11.5 | % | 18.3 | % | ||
Energy | 10.4 | % | 9.3 | % | ||
Health Care | 10.0 | % | 13.4 | % | ||
Materials | 2.2 | % | 4.6 | % | ||
Consumer Staples | 1.8 | % | 3.2 | % | ||
Telecommunication Services | 0.9 | % | 1.3 | % | ||
Utilities | 0.3 | % | 3.5 | % | ||
Other Assets and Liabilities | 7.5 | % | 0.0 | % | ||
| ** | As a percentage of net assets |
Top Ten Holdings
Security Name | Percentage of Net Assets | ||
MI Developments, Inc., Class A* | 3.1 | % | |
Air France-KLM, ADR* | 2.0 | ||
Comstock Resources, Inc. | 1.9 | ||
Plains Exploration & Production Co.* | 1.2 | ||
Semiconductor Manufacturing International Corp.* | 1.1 | ||
Deckers Outdoor Corp. | 1.1 | ||
DeVry, Inc.* | 1.1 | ||
Hilb, Rogal & Hamilton Co. | 1.0 | ||
Charles River Laboratories International, Inc.* | 1.0 | ||
Visteon Corp. | 1.0 | ||
Top Ten as a Group | 14.5 | % | |
| * | Top Ten Holding at December 31, 2007 |
Any sectors, industries, or securities discussed should not be perceived as investment recommendations. Mention of a specific security should not be considered a recommendation to buy or solicitation to sell that security.
4
Table of Contents
Schedule of Portfolio Investments
June 30, 2008 (unaudited)
| Shares | Value | |||||
Common Stocks - 92.5% | ||||||
Consumer Discretionary - 16.7% | ||||||
Aaron Rents, Inc. | 116,900 | 2 | $ | 2,610,377 | ||
American Public Education, Inc.* | 68,840 | 2,687,514 | ||||
Arbitron, Inc. | 34,200 | 2 | 1,624,500 | |||
ArvinMeritor, Inc. | 159,861 | 1,995,065 | ||||
ATC Technology Corp.* | 66,800 | 2 | 1,555,104 | |||
Bally Technologies, Inc.* | 60,800 | 2 | 2,055,040 | |||
Big 5 Sporting Goods Corp. | 243,900 | 1,846,323 | ||||
Big Lots, Inc.* | 364,102 | 11,374,546 | ||||
Buckle, Inc., The | 120,225 | 2 | 5,497,889 | |||
Buffalo Wild Wings, Inc.* | 68,352 | 2 | 1,697,180 | |||
Capella Education Co.* | 20,000 | 1,193,000 | ||||
Chipotle Mexican Grill, Inc.* | 2,700 | 2 | 223,074 | |||
Cooper Tire & Rubber Co. | 434,400 | 2 | 3,405,696 | |||
Corinthian Colleges, Inc.* | 255,400 | 2 | 2,965,194 | |||
Ctrip.com International, Ltd. | 5,294 | 2 | 242,359 | |||
Dana Holding Corp.* | 179,600 | 2 | 960,860 | |||
Deckers Outdoor Corp.* | 91,000 | 2 | 12,667,201 | |||
DeVry, Inc. | 226,523 | 12,146,164 | ||||
Dick’s Sporting Goods, Inc.* | 11,718 | 2 | 207,877 | |||
Dillard’s, Inc., Class A | 831,200 | 9,616,984 | ||||
Dress Barn, Inc., The* | 193,200 | 2 | 2,585,016 | |||
Drew Industries, Inc.* | 69,500 | 1,108,525 | ||||
DXP Enterprises, Inc.* | 28,900 | 1,203,396 | ||||
Exide Technologies, Inc.* | 190,950 | 2 | 3,200,322 | |||
Fossil, Inc.* | 4,085 | 2 | 118,751 | |||
Guess?, Inc. | 103,975 | 3,893,864 | ||||
Gymboree Corp.* | 88,300 | 3,538,181 | ||||
ITT Educational Services, Inc.* | 111,000 | 9,171,930 | ||||
J. Crew Group, Inc.* | 7,300 | 2 | 240,973 | |||
Jack in the Box, Inc.* | 104,400 | 2 | 2,339,604 | |||
Jo-Ann Stores, Inc.* | 142,147 | 3,273,645 | ||||
Jos. A. Bank Clothiers, Inc.* | 219,990 | 5,884,732 | ||||
K12, Inc.* | 128,673 | 2 | 2,757,462 | |||
Lululemon Athletica, Inc.* | 66,592 | 2 | 1,935,164 | |||
MarineMax, Inc.* | 171,600 | 1,230,372 | ||||
Marvel Entertainment, Inc.* | 83,600 | 2 | 2,686,904 | |||
McCormick & Schmick’s Seafood Restaurants, Inc.* | 230,000 | 2,217,200 | ||||
Morningstar, Inc.* | 23,400 | 2 | 1,685,502 | |||
Netflix, Inc.* | 47,300 | 2 | 1,233,111 | |||
New Oriental Education & Technology Group, Inc. - ADR* | 14,507 | 2 | 847,499 | |||
Orient-Express Hotels, Ltd. | 229,900 | 9,986,856 | ||||
Panera Bread Co., Class A* | 47,000 | 2 | 2,174,220 | |||
Polaris Industries, Inc. | 45,800 | 2 | 1,849,404 | |||
Priceline.com, Inc.* | 7,742 | 2 | 893,891 | |||
Ross Stores, Inc. | 250,341 | 8,892,112 | ||||
Saks, Inc.* | 900,000 | 9,882,000 | ||||
Strayer Education, Inc. | 19,900 | 2 | 4,160,493 | |||
True Religion Apparel, Inc.* | 97,725 | 2 | 2,604,371 | |||
Tupperware Brands Corp. | 87,600 | 2 | 2,997,672 | |||
Ulta Salon, Cosmetics & Fragrance, Inc.* | 78,654 | 2 | 884,071 | |||
Under Armour, Inc., Class A* | 3,600 | 2 | 92,304 | |||
Visteon Corp.* | 4,395,300 | 11,559,639 | ||||
Warnaco Group, Inc., The* | 162,650 | 7,167,986 | ||||
WMS Industries, Inc.* | 17,100 | 2 | 509,067 | |||
Zumiez, Inc.* | 50,908 | 844,055 | ||||
Total Consumer Discretionary | 192,222,241 | |||||
Consumer Staples - 1.8% | ||||||
B&G Foods, Inc. | 244,700 | 2,285,498 | ||||
Central European Distribution Corp.* | 72,087 | 2 | 5,345,251 | |||
Darling International, Inc.* | 169,900 | 2,806,748 | ||||
Flowers Food, Inc. | 203,700 | 2 | 5,772,858 | |||
Green Mountain Coffee Roasters, Inc.* | 42,900 | 2 | 1,611,753 | |||
Inter Parfums, Inc. | 44,900 | 2 | 673,500 | |||
Sanderson Farms, Inc. | 45,400 | 2 | 1,567,208 | |||
Zhongpin, Inc.* | 86,400 | 2 | 1,080,000 | |||
Total Consumer Staples | 21,142,816 | |||||
Energy - 10.4% | ||||||
Alpha Natural Resources, Inc.* | 17,562 | 2 | 1,831,541 | |||
Bill Barrett Corp.* | 92,500 | 2 | 5,495,425 | |||
Bristow Group, Inc.* | 49,450 | 2 | 2,447,280 | |||
Carrizo Oil & Gas, Inc.* | 87,875 | 2 | 5,983,409 | |||
Complete Production Services, Inc.* | 51,850 | 2 | 1,888,377 | |||
Comstock Resources, Inc.* | 253,500 | 21,403,006 | ||||
Dawson Geophysical Co.* | 41,300 | 2,455,698 | ||||
Dril-Quip, Inc.* | 38,100 | 2 | 2,400,300 | |||
Encore Acquisition Co.* | 27,900 | 2 | 2,097,801 | |||
Foundation Coal Holdings, Inc. | 24,914 | 2 | 2,206,882 | |||
GMX Resources, Inc.* | 58,145 | 2 | 4,308,544 | |||
The accompanying notes are an integral part of these financial statements.
5
Table of Contents
Managers Special Equity Fund
Schedule of Portfolio Investments (continued)
| Shares | Value | |||||
Energy - 10.4% (continued) | ||||||
Gulfmark Offshore, Inc.* | 86,325 | 2 | $ | 5,022,388 | ||
Hornbeck Offshore Services, Inc.* | 89,650 | 2 | 5,066,122 | |||
Key Energy Services, Inc.* | 218,700 | 4,247,154 | ||||
Mitcham Industries, Inc.* | 31,600 | 2 | 539,728 | |||
Oil States International, Inc.* | 49,700 | 2 | 3,152,968 | |||
Overseas Shipholding Group, Inc. | 84,768 | 6,740,751 | ||||
Petroquest Energy, Inc.* | 228,190 | 6,138,311 | ||||
Plains Exploration & Production Co.* | 192,508 | 2 | 14,047,338 | |||
Rex Energy Corp.* | 52,989 | 2 | 1,398,910 | |||
Stone Energy Corp.* | 77,100 | 5,081,661 | ||||
Superior Energy Services, Inc.* | 56,327 | 2 | 3,105,871 | |||
T-3 Energy Services, Inc.* | 5,100 | 405,297 | ||||
Trico Marine Services, Inc.* | 95,675 | 2 | 3,484,484 | |||
USEC, Inc.* | 450,000 | 2 | 2,736,000 | |||
Willbros Group, Inc.* | 136,650 | 5,986,636 | ||||
Total Energy | 119,671,882 | |||||
Financials - 11.5% | ||||||
American Financial Group, Inc. | 39,250 | 1,049,938 | ||||
American National Insurance Co. | 68,950 | 2 | 6,758,479 | |||
American Physicians Capital, Inc. | 18,650 | 903,406 | ||||
Aspen Insurance Holdings, Ltd. | 107,200 | 2,537,424 | ||||
BankUnited Financial Corp., Class A | 601,088 | 2 | 577,044 | |||
BioMed Realty Trust, Inc. | 52,000 | 2 | 1,275,560 | |||
Community Bank System, Inc. | 83,800 | 1,727,956 | ||||
Cowen Group, Inc.* | 192,853 | 1,488,825 | ||||
Delphi Financial Group, Inc., Class A | 139,250 | 3,222,245 | ||||
DiamondRock Hospitality Co. | 97,900 | 2 | 1,066,131 | |||
Downey Financial Corp. | 344,680 | 954,764 | ||||
eHealth, Inc.* | 10,471 | 184,918 | ||||
Entertainment Properties Trust | 24,000 | 2 | 1,186,560 | |||
FCStone Group, Inc.* | 64,685 | 2 | 1,806,652 | |||
Financial Federal Corp. | 117,200 | 2,573,712 | ||||
Hanover Insurance Group, Inc. | 117,200 | 4,981,000 | ||||
Harleysville Group, Inc. | 13,600 | 460,088 | ||||
Hilb, Rogal & Hamilton Co. | 272,500 | 11,842,850 | ||||
Inland Real Estate Corp. | 80,300 | 2 | 1,157,926 | |||
IPC Holdings, Ltd. | 369,100 | 9,799,605 | ||||
iStar Financial, Inc. | 202,700 | 2,677,667 | ||||
KBW, Inc.* | 5,400 | 111,132 | ||||
MI Developments, Inc., Class A | 1,589,100 | 35,738,859 | ||||
MSCI, Inc.* | 60,512 | 2,195,980 | ||||
National Western Life Insurance Co., Class A | 12,000 | 2,622,000 | ||||
Navigators Group, Inc.* | 9,500 | 513,475 | ||||
Penson Worldwide, Inc.* | 320,541 | 2 | 3,830,465 | |||
PrivateBancorp, Inc. | 38,474 | 1,168,840 | ||||
Prosperity Bancshares, Inc. | 104,300 | 2,787,939 | ||||
Provident Financial Services, Inc. | 68,500 | 2 | 959,685 | |||
PS Business Parks, Inc. | 22,600 | 2 | 1,166,160 | |||
RAM Holdings, Ltd.* | 304,700 | 304,700 | ||||
Reinsurance Group of America, Inc. | 118,600 | 5,161,472 | ||||
RiskMetrics Group, Inc.* | 58,774 | 2 | 1,154,321 | |||
Saul Centers, Inc. | 24,800 | 1,165,352 | ||||
SeaBright Insurance Holdings, Inc.* | 259,035 | 3,750,827 | ||||
Senior Housing Properties Trust | 52,700 | 2 | 1,029,231 | |||
South Financial Group, Inc., The | 225,000 | 2 | 882,000 | |||
SVB Financial Group* | 59,600 | 2 | 2,867,356 | |||
Texas Capital Bancshares, Inc.* | 58,500 | 2 | 936,000 | |||
Tower Group, Inc. | 56,200 | 1,190,878 | ||||
TradeStation Group, Inc.* | 263,000 | 2,669,450 | ||||
UMB Financial Corp. | 40,600 | 2 | 2,081,562 | |||
United PanAm Financial Corp.* | 110,800 | 249,300 | ||||
Total Financials | 132,769,734 | |||||
Health Care - 10.0% | ||||||
Acorda Therapeutics, Inc.* | 79,732 | 2 | 2,617,602 | |||
Alexion Pharmaceuticals, Inc.* | 62,000 | 2 | 4,495,000 | |||
Alliance Imaging, Inc.* | 377,400 | 3,272,058 | ||||
Alpharma, Inc.* | 52,200 | 2 | 1,176,066 | |||
AMAG Pharmaceuticals, Inc.* | 15,853 | 540,587 | ||||
Amedisys, Inc.* | 45,800 | 2,309,236 | ||||
Amsurg Corp.* | 41,200 | 1,003,220 | ||||
Analogic Corp. | 32,100 | 2,024,547 | ||||
athenahealth, Inc.* | 53,200 | 1,636,432 | ||||
BioMarin Pharmaceutical, Inc.* | 64,000 | 2 | 1,854,720 | |||
Bio-Reference Labs, Inc.* | 2,873 | 64,097 | ||||
Bruker BioSciences Corp.* | 83,729 | 2 | 1,075,918 | |||
CardioNet, Inc.* | 20,097 | 2 | 535,183 | |||
Cepheid, Inc.* | 73,335 | 2,062,180 | ||||
Charles River Laboratories International, Inc.* | 185,260 | 11,841,818 | ||||
Chemed Corp. | 77,700 | 2 | 2,844,597 | |||
Conmed Corp.* | 73,800 | 1,959,390 | ||||
Dionex Corp.* | 31,900 | 2 | 2,117,203 | |||
The accompanying notes are an integral part of these financial statements.
6
Table of Contents
Managers Special Equity Fund
Schedule of Portfolio Investments (continued)
| Shares | Value | |||||
Health Care - 10.0% (continued) | ||||||
eResearch Technology, Inc.* | 210,100 | $ | 3,664,144 | |||
Five Star Quality Care, Inc.* | 393,172 | 1,859,704 | ||||
Gentiva Health Services, Inc.* | 130,190 | 2,480,120 | ||||
HealthExtras, Inc.* | 76,600 | 2 | 2,308,724 | |||
Illumina, Inc.* | 92,875 | 2 | 8,090,341 | |||
Immucor, Inc.* | 4,600 | 2 | 119,048 | |||
inVentiv Health, Inc.* | 200,300 | 2 | 5,566,337 | |||
K-V Pharmaceutical Co., Class A* | 10,754 | 2 | 207,875 | |||
Martek Biosciences Corp.* | 193,225 | 2 | 6,513,615 | |||
Masimo Corp.* | 206,600 | 2 | 7,096,710 | |||
MedAssets, Inc.* | 84,580 | 1,442,089 | ||||
Meridian Bioscience, Inc. | 111,100 | 2,990,812 | ||||
Merit Medical Systems, Inc.* | 91,600 | 1,346,520 | ||||
Myriad Genetics, Inc.* | 38,275 | 2 | 1,742,278 | |||
NuVasive, Inc.* | 87,988 | 2 | 3,929,544 | |||
Onyx Pharmaceuticals, Inc.* | 39,755 | 2 | 1,415,278 | |||
OSI Pharmaceuticals, Inc.* | 52,700 | 2 | 2,177,564 | |||
Owens & Minor, Inc. | 23,200 | 2 | 1,060,008 | |||
Parexel International Corp.* | 88,400 | 2 | 2,325,804 | |||
Phase Forward, Inc.* | 127,800 | 2,296,566 | ||||
Quidel Corp.* | 106,500 | 1,759,380 | ||||
Steris Corp. | 104,900 | 2 | 3,016,924 | |||
Sun Healthcare Group, Inc.* | 97,900 | 1,310,881 | ||||
Synovis Life Technologies, Inc.* | 33,800 | 2 | 636,454 | |||
United Therapeutics Corp.* | 32,500 | 2 | 3,176,875 | |||
Vnus Medical Technologies, Inc.* | 38,600 | 2 | 772,386 | |||
Wright Medical Group, Inc.* | 82,100 | 2,332,461 | ||||
Total Health Care | 115,068,296 | |||||
Industrials - 19.6% | ||||||
AAR Corp.* | 259,200 | 3,506,976 | ||||
Acco Brands Corp.* | 219,900 | 2,469,477 | ||||
Acuity Brands, Inc. | 67,200 | 2 | 3,230,976 | |||
AeroVironment, Inc.* | 90,350 | 2,455,713 | ||||
Air France-KLM, ADR | 948,178 | 22,566,636 | ||||
Alaska Airgroup, Inc.* | 615,000 | 9,434,100 | ||||
Allegiant Travel Co.* | 23,700 | 440,583 | ||||
Altra Holdings, Inc.* | 86,600 | 2 | 1,455,746 | |||
American Superconductor Corp.* | 199,215 | 2 | 7,141,858 | |||
Axsys Technologies, Inc.* | 96,325 | 2 | 5,012,753 | |||
Baldor Electric Co. | 52,200 | 2 | 1,825,956 | |||
Brady Corp. | 94,100 | 2 | 3,249,273 | |||
Bucyrus International, Inc. | 75,750 | 2 | 5,531,265 | |||
CAI International, Inc.* | 167,600 | 2,916,240 | ||||
Carlisle Cos., Inc. | 102,500 | 2,972,500 | ||||
CBIZ, Inc.* | 629,000 | 5,000,550 | ||||
Chart Industries, Inc.* | 11,157 | 542,676 | ||||
Clean Harbors, Inc.* | 37,100 | 2 | 2,636,326 | |||
Colfax Corp.* | 124,522 | 2 | 3,124,257 | |||
Columbus McKinnon Corp.* | 36,900 | 888,552 | ||||
Comfort Systems USA, Inc. | 197,100 | 2 | 2,649,024 | |||
Consolidated Graphics, Inc.* | 75,540 | 3,721,856 | ||||
Con-Way, Inc. | 35,500 | 2 | 1,677,730 | |||
Crane Co. | 75,500 | 2,909,015 | ||||
Curtiss-Wright Corp. | 86,075 | 2 | 3,850,996 | |||
Eagle Bulk Shipping, Inc. | 62,900 | 2 | 1,859,953 | |||
EMCOR Group, Inc.* | 280,275 | 7,996,246 | ||||
Empresas ICA, S.A. de C.V.* | 69,700 | 1,731,348 | ||||
Energy Conversion Devices, Inc.* | 15,140 | 2 | 1,114,910 | |||
EnergySolutions, Inc. | 77,004 | 2 | 1,721,039 | |||
EnerNOC, Inc.* | 151,351 | 2,716,750 | ||||
EnerSys* | 64,400 | 2 | 2,204,412 | |||
Excel Maritime Carriers, Ltd. | 31,200 | 1,224,600 | ||||
Forward Air Corp. | 52,800 | 2 | 1,826,880 | |||
FTI Consulting, Inc.* | 106,475 | 2 | 7,289,278 | |||
Genesee & Wyoming, Inc., Class A* | 47,700 | 2 | 1,622,754 | |||
Geo Group, Inc., The* | 27,313 | 2 | 614,542 | |||
Gorman-Rupp Co. | 18,400 | 733,056 | ||||
GrafTech International Ltd.* | 163,300 | 2 | 4,381,339 | |||
Heidrick & Struggles International, Inc. | 113,200 | 3,128,848 | ||||
II-VI, Inc.* | 92,300 | 3,223,116 | ||||
JA Solar Holdings Co., Ltd., ADR* | 372,325 | 2 | 6,273,676 | |||
Kaydon Corp. | 47,200 | 2 | 2,426,552 | |||
Kirby Corp.* | 33,000 | 2 | 1,584,000 | |||
Layne Christensen Co.* | 71,509 | 3,131,379 | ||||
McGrath RentCorp | 32,690 | 803,847 | ||||
Middleby Corp., The* | 2,500 | 109,775 | ||||
Miller Herman, Inc. | 124,000 | 2 | 3,086,360 | |||
NCI Building Systems, Inc.* | 112,400 | 4,128,452 | ||||
Perini Corp.* | 173,475 | 5,733,349 | ||||
Polypore International, Inc.* | 64,000 | 1,621,120 | ||||
RBC Bearings, Inc.* | 48,700 | 1,622,684 | ||||
Robbins & Myers, Inc. | 127,075 | 2 | 6,337,230 | |||
Ryder System, Inc. | 22,000 | 1,515,360 | ||||
The accompanying notes are an integral part of these financial statements.
7
Table of Contents
Managers Special Equity Fund
Schedule of Portfolio Investments (continued)
| Shares | Value | |||||
Industrials - 19.6% (continued) | ||||||
Safe Bulkers, Inc.* | 81,600 | $ | 1,537,344 | |||
SkyWest, Inc. | 85,360 | 1,079,804 | ||||
Spherion Corp.* | 483,800 | 2,235,156 | ||||
Sunpower Corp., Class A* | 16,168 | 2 | 1,163,773 | |||
Tecumseh Products Co., Class B* | 191,688 | 5,560,869 | ||||
Teledyne Technologies, Inc.* | 46,800 | 2,283,372 | ||||
TeleTech Holdings, Inc.* | 67,574 | 2 | 1,348,777 | |||
Toro Co., The | 90,300 | 2 | 3,004,281 | |||
Triumph Group, Inc. | 39,400 | 1,855,740 | ||||
URS Corp.* | 55,920 | 2,346,950 | ||||
Valmont Industries, Inc. | 63,900 | 2 | 6,664,131 | |||
Wabtec Corp. | 13,100 | 2 | 636,922 | |||
Watson Wyatt & Co. | 49,500 | 2 | 2,618,055 | |||
Woodward Governor Co. | 265,825 | 2 | 9,479,320 | |||
Total Industrials | 224,788,383 | |||||
Information Technology - 19.1% | ||||||
ADC Telecommunications, Inc.* | 123,700 | 2 | 1,827,049 | |||
Advent Software, Inc.* | 56,027 | 2 | 2,021,454 | |||
Amkor Technology, Inc.* | 125,200 | 2 | 1,303,332 | |||
Anadigics, Inc.* | 156,100 | 2 | 1,537,585 | |||
Ariba, Inc.* | 128,083 | 1,884,101 | ||||
Arris Group, Inc.* | 260,400 | 2,200,380 | ||||
Aruba Networks, Inc.* | 258,597 | 1,352,462 | ||||
Aspen Technology, Inc.* | 221,200 | 2,941,960 | ||||
Atheros Communications, Inc.* | 136,122 | 2 | 4,083,660 | |||
AuthenTec, Inc.* | 220,675 | 2,299,434 | ||||
Bankrate, Inc.* | 21,490 | 839,614 | ||||
Benchmark Electronics, Inc.* | 173,750 | 2,839,075 | ||||
Brocade Communications Systems, Inc.* | 315,693 | 2 | 2,601,310 | |||
CACI International, Inc., Class A* | 44,600 | 2 | 2,041,342 | |||
Cavium Networks, Inc.* | 107,328 | 2,253,888 | ||||
Checkpoint Systems, Inc.* | 525,300 | 10,968,264 | ||||
comScore, Inc.* | 43,918 | 958,291 | ||||
Comverge, Inc.* | 106,622 | 1,490,576 | ||||
Concur Technologies, Inc.* | 204,950 | 2 | 6,810,488 | |||
CSG Systems International, Inc.* | 115,400 | 1,271,708 | ||||
CyberSource Corp.* | 85,890 | 2 | 1,436,940 | |||
Electronics for Imaging, Inc.* | 226,481 | 3,306,623 | ||||
EMS Technologies, Inc.* | 19,500 | 425,880 | ||||
Equinix, Inc.* | 41,800 | 3,729,396 | ||||
F5 Networks, Inc.* | 103,800 | 2,949,996 | ||||
Fairchild Semiconductor International, Inc.* | 172,600 | 2,024,598 | ||||
Falconstor Software, Inc.* | 303,600 | 2,149,488 | ||||
Flextronics International, Ltd.* | 268,793 | 2,526,654 | ||||
Harris Stratex Networks, Inc.* | 172,522 | 1,637,234 | ||||
Hittite Microwave Corp.* | 32,100 | 2 | 1,143,402 | |||
Infinera Corp.* | 21,205 | 2 | 187,028 | |||
Ipg Photonics Corp.* | 95,445 | 2 | 1,795,320 | |||
Itron, Inc.* | 16,100 | 2 | 1,583,435 | |||
Knot, Inc., The* | 16,600 | 162,348 | ||||
Mantech International Corp., Class A* | 48,925 | 2 | 2,354,271 | |||
Mattson Technology, Inc.* | 219,300 | 1,043,868 | ||||
MercadoLibre, Inc.* | 27,204 | 2 | 938,266 | |||
Monolithic Power Systems, Inc.* | 76,175 | 1,646,904 | ||||
Multi-Fineline Electronix, Inc.* | 115,925 | 2 | 3,207,645 | |||
Netlogic Microsystems, Inc.* | 91,196 | 3,027,707 | ||||
NetSuite, Inc.* | 92,207 | 2 | 1,887,477 | |||
Omniture, Inc.* | 148,500 | 2 | 2,757,645 | |||
ON Semiconductor Corp.* | 400,651 | 2 | 3,673,970 | |||
Parametric Technology Corp.* | 417,785 | 2 | 6,964,476 | |||
Perot Systems Corp.* | 230,710 | 3,462,957 | ||||
Polycom, Inc.* | 67,568 | 2 | 1,645,956 | |||
Power Integrations, Inc.* | 67,800 | 2,143,158 | ||||
Progress Software Corp.* | 72,900 | 2 | 1,864,053 | |||
PROS Holdings, Inc.* | 154,979 | 1,740,414 | ||||
QLogic Corp.* | 283,300 | 2 | 4,133,347 | |||
Quest Software, Inc.* | 130,500 | 1,932,705 | ||||
Rudolph Technologies, Inc.* | 126,900 | 977,130 | ||||
S1 Corp.* | 174,600 | 1,321,722 | ||||
Semiconductor Manufacturing International Corp.* | 4,462,700 | 2 | 12,986,456 | |||
Semtech Corp.* | 207,900 | 2,925,153 | ||||
Shanda Interactive Entertainment, Ltd.* | 20,238 | 549,462 | ||||
Silicon Laboratories, Inc.* | 87,300 | 2 | 3,150,657 | |||
SINA Corp.* | 98,100 | 2 | 4,174,155 | |||
Skyworks Solutions, Inc.* | 208,200 | 2 | 2,054,934 | |||
Smart Modular Technology (WWH), Inc.* | 389,626 | 1,492,268 | ||||
Sohu.com, Inc.* | 95,781 | 2 | 6,746,814 | |||
Solera Holdings, Inc.* | 199,650 | 5,522,319 | ||||
Spansion, Inc., Class A* | 2,571,200 | 5,785,200 | ||||
SRA International, Inc.* | 68 | 2 | 1,527 | |||
Starent Networks Corp.* | 372,595 | 2 | 4,687,245 | |||
Super Micro Computer, Inc.* | 215,700 | 1,591,866 | ||||
The accompanying notes are an integral part of these financial statements.
8
Table of Contents
Managers Special Equity Fund
Schedule of Portfolio Investments (continued)
| Shares | Value | ||||||
Information Technology - 19.1% (continued) | |||||||
Sybase, Inc.* | 117,100 | 2 | $ | 3,445,082 | |||
Synaptics, Inc.* | 26,085 | 984,187 | |||||
SYNNEX Corp.* | 223,200 | 2 | 5,600,088 | ||||
Synopsys, Inc.* | 181,400 | 2 | 4,337,274 | ||||
Syntel, Inc. | 88,800 | 2 | 2,994,336 | ||||
Taleo Corp.* | 116,275 | 2,277,827 | |||||
TNS, Inc.* | 251,400 | 6,023,544 | |||||
TTM Technologies, Inc.* | 232,500 | 3,071,325 | |||||
Ultratech Stepper, Inc.* | 68,200 | 2 | 1,058,464 | ||||
Veeco Instruments, Inc.* | 114,400 | 2 | 1,839,552 | ||||
Virtusa Corp.* | 143,831 | 1,457,008 | |||||
VistaPrint, Ltd.* | 4,200 | 2 | 112,392 | ||||
Vocus, Inc.* | 143,362 | 4,611,956 | |||||
Volterra Semiconductor Corp.* | 133,100 | 2 | 2,297,306 | ||||
Websense, Inc.* | 128,400 | 2,162,256 | |||||
Total Information Technology | 219,248,639 | ||||||
Materials - 2.2% | |||||||
Calgon Carbon Corp.* | 129,400 | 2,000,524 | |||||
Century Aluminum Co.* | 31,936 | 2 | 2,123,425 | ||||
Cleveland-Cliffs, Inc. | 15,300 | 1,823,607 | |||||
Cytec Industries, Inc. | 96,600 | 2 | 5,270,496 | ||||
Innophos Holdings, Inc. | 32,200 | 2 | 1,028,790 | ||||
Intrepid Potash, Inc.* | 30,400 | 2 | 1,999,712 | ||||
Koppers Holdings, Inc. | 114,550 | 4,796,208 | |||||
Olin Corp. | 115,700 | 2 | 3,029,026 | ||||
Rock-Tenn Co. | 82,200 | 2,465,178 | |||||
Zep, Inc. | 57,600 | 857,088 | |||||
Total Materials | 25,394,054 | ||||||
Telecommunication Services - 0.9% | |||||||
Cincinnati Bell, Inc.* | 1,034,819 | 4,118,580 | |||||
Premiere Global Services, Inc.* | 116,400 | 1,697,112 | |||||
Syniverse Holdings, Inc.* | 295,325 | 2 | 4,784,265 | ||||
Total Telecommunication Services | 10,599,957 | ||||||
Utilities - 0.3% | |||||||
ITC Holdings Corp. | 63,163 | 2 | 3,228,261 | ||||
Total Common Stocks (cost $1,088,979,645) | 1,064,134,263 | ||||||
Other Investment Companies - 38.6%1 | |||||||
Bank of New York Institutional Cash | 344,624,820 | 344,624,820 | |||||
JPMorgan Liquid Assets Money Market | 15,279,586 | 15,279,586 | |||||
Dreyfus Cash Management Fund, | 83,790,519 | 83,790,519 | |||||
Total Other Investment Companies (cost $443,694,925) | 443,694,925 | ||||||
Total Investments - 131.1% (cost $1,532,674,570) | 1,507,829,188 | ||||||
Other Assets, less Liabilities - (31.1)% | (357,868,831 | ) | |||||
Net Assets - 100% | $ | 1,149,960,357 | |||||
Based on the approximate cost of investments of $1,556,051,786 for Federal income tax purposes at June 30, 2008, the aggregate gross unrealized appreciation and depreciation were $170,627,411 and $218,850,009, respectively, resulting in net unrealized depreciation of investments of $48,222,598.
| * | Non income producing security. |
1 | Yield shown for an investment company represents the June 30, 2008, seven-day average yield, which refers to the sum of the previous seven days’ dividends paid, expressed as an annual percentage. |
2 | Some or all of these shares were out on loan to various brokers as of June 30, 2008, amounting to a market value of $333,493,898, or approximately 29.0% of net assets. |
3 | Collateral received from brokers for securities lending was invested in this short-term investment. |
The accompanying notes are an integral part of these financial statements.
9
Table of Contents
Statement of Assets and Liabilities
June 30, 2008 (unaudited)
Assets: | ||||
Investments at value (including securities on loan valued at $333,493,898)* | $ | 1,507,829,188 | ||
Cash | 498 | |||
Receivable for investments sold | 16,130,646 | |||
Receivable for Fund shares sold | 1,292,475 | |||
Dividends, interest and other receivables | 710,601 | |||
Prepaid expenses | 75,384 | |||
Total assets | 1,526,038,792 | |||
Liabilities: | ||||
Payable for Fund shares repurchased | 18,171,053 | |||
Payable upon return of securities loaned | 344,624,820 | |||
Payable for investments purchased | 11,516,212 | |||
Accrued expenses: | ||||
Investment advisory and management fees | 921,407 | |||
Administrative fees | 256,120 | |||
Other | 588,823 | |||
Total liabilities | 376,078,435 | |||
Net Assets | $ | 1,149,960,357 | ||
Managers Shares: | ||||
Net Assets | $ | 1,013,524,690 | ||
Shares outstanding | 18,105,779 | |||
Net asset value, offering and redemption price per share | $ | 55.98 | ||
Institutional Class Shares: | ||||
Net Assets | $ | 136,435,667 | ||
Shares outstanding | 2,417,692 | |||
Net asset value, offering and redemption price per share | $ | 56.43 | ||
Net Assets Represent: | ||||
Paid-in capital | $ | 1,120,930,289 | ||
Undistributed net investment loss | (2,867,712 | ) | ||
Accumulated net realized gain from investments | 56,743,162 | |||
Net unrealized depreciation of investments | (24,845,382 | ) | ||
Net Assets | $ | 1,149,960,357 | ||
* Investments at cost | $ | 1,532,674,570 |
The accompanying notes are an integral part of these financial statements.
10
Table of Contents
Statement of Operations
For the six months ended June 30, 2008 (unaudited)
Investment Income: | ||||
Dividend income | $ | 5,567,867 | ||
Foreign withholding tax | (71,510 | ) | ||
Securities lending fees | 1,142,301 | |||
Total investment income | 6,638,658 | |||
Expenses: | ||||
Investment management fees | 6,526,029 | |||
Administrative fees | 1,812,786 | |||
Transfer agent | 1,778,196 | |||
Custodian | 158,833 | |||
Professional fees | 141,634 | |||
Reports to shareholders | 123,108 | |||
Trustees fees and expenses | 79,559 | |||
Registration fees | 37,099 | |||
Miscellaneous | 57,189 | |||
Total expenses before offsets | 10,714,433 | |||
Expense waiver | (4,426 | ) | ||
Expense reductions | (207,164 | ) | ||
Net expenses | 10,502,843 | |||
Net investment loss | (3,864,185 | ) | ||
Net Realized and Unrealized Gain (Loss): | ||||
Net realized loss on investment transactions | (6,773,912 | ) | ||
Net unrealized depreciation of investments | (229,739,852 | ) | ||
Net realized and unrealized loss | (236,513,764 | ) | ||
Net decrease in net assets resulting from operations | $ | (240,377,949 | ) | |
The accompanying notes are an integral part of these financial statements.
11
Table of Contents
Statement of Changes in Net Assets
For the six months ended June 30, 2008 (unaudited) and for the year ended December 31, 2007
| 2008 | 2007 | |||||||
Increase (Decrease) in Net Assets From Operations: | ||||||||
Net investment loss | $ | (3,864,185 | ) | $ | (14,345,331 | ) | ||
Net realized gain (loss) on investments | (6,773,912 | ) | 468,715,374 | |||||
Net unrealized depreciation of investments | (229,739,852 | ) | (407,862,046 | ) | ||||
Net increase (decrease) in net assets resulting from operations | (240,377,949 | ) | 46,507,997 | |||||
Distributions to Shareholders: | ||||||||
From net realized gain on investments: | ||||||||
Managers Class | — | (388,900,274 | ) | |||||
Institutional Class | — | (59,529,931 | ) | |||||
Total distributions to shareholders | — | (448,430,205 | ) | |||||
From Capital Share Transactions: | ||||||||
Managers Class: | ||||||||
Proceeds from sale of shares | 139,269,634 | 299,186,761 | ||||||
Reinvestment of dividends and distributions | — | 359,741,541 | ||||||
Cost of shares repurchased | (581,215,514 | ) | (1,188,809,810 | ) | ||||
Net decrease from Managers share transactions | (441,945,880 | ) | (529,881,508 | ) | ||||
Institutional Class: | ||||||||
Proceeds from sale of shares | (3,238,458 | ) | 78,116,331 | |||||
Reinvestment of dividends and distributions | — | 53,547,184 | ||||||
Cost of shares repurchased | (79,904,826 | ) | (398,129,366 | ) | ||||
Net decrease from Institutional share transactions | (83,143,284 | ) | (266,465,851 | ) | ||||
Net decrease from capital share transactions | (525,089,164 | ) | (796,347,359 | ) | ||||
Total decrease in net assets | (765,467,113 | ) | (1,198,269,567 | ) | ||||
Net Assets: | ||||||||
Beginning of period | 1,915,427,470 | 3,113,697,037 | ||||||
End of period | $ | 1,149,960,357 | $ | 1,915,427,470 | ||||
End of period undistributed net investment income (loss) | $ | (2,867,712 | ) | $ | 996,473 | |||
Share Transactions: | ||||||||
Managers Class: | ||||||||
Sale of shares | 2,345,675 | 3,523,798 | ||||||
Reinvested shares from dividends and distribution | — | 5,443,136 | ||||||
Shares repurchased | (10,191,830 | ) | (13,771,697 | ) | ||||
Net decrease in shares | (7,846,155 | ) | (4,804,763 | ) | ||||
Institutional Class: | ||||||||
Sale of shares | 281,847 | 898,887 | ||||||
Reinvested shares from dividends and distribution | — | 804,737 | ||||||
Shares repurchased | (1,687,074 | ) | (4,606,651 | ) | ||||
Net decrease in shares | (1,405,226 | ) | (2,903,027 | ) | ||||
The accompanying notes are an integral part of these financial statements.
12
Table of Contents
Financial Highlights
For a share outstanding throughout each period
| For the six months ended June 30, 2008 | For the year ended December 31, | |||||||||||||||||||||||
Managers Class: | (unaudited) | 2007 | 2006 | 2005 | 2004 | 2003 | ||||||||||||||||||
Net Asset Value, Beginning of Period | $ | 64.27 | $ | 82.96 | $ | 86.78 | $ | 90.42 | $ | 78.48 | $ | 55.08 | ||||||||||||
Income from Investment Operations: | ||||||||||||||||||||||||
Net investment loss | (0.16 | )5 | (0.51 | )5 | (0.14 | )5 | (0.54 | )5 | (0.56 | ) | (0.43 | ) | ||||||||||||
Net realized and unrealized gain (loss) on investments | (8.13 | )5 | 0.55 | 5 | 9.88 | 5 | 4.18 | 5 | 12.50 | 23.83 | ||||||||||||||
Total from investment operations | (8.29 | ) | 0.04 | 9.74 | 3.64 | 11.94 | 23.40 | |||||||||||||||||
Less Distributions to Shareholders from: | ||||||||||||||||||||||||
Net realized gain on investments | — | (18.73 | ) | (13.56 | ) | (7.28 | ) | — | — | |||||||||||||||
Net Asset Value, End of Period | $ | 55.98 | $ | 64.27 | $ | 82.96 | $ | 86.78 | $ | 90.42 | $ | 78.48 | ||||||||||||
Total Return 1 | (12.88 | )%2 | (0.60 | )% | 11.28 | % | 4.00 | % | 15.18 | % | 42.50 | % | ||||||||||||
Ratio of net expenses to average net assets | 1.48 | %3 | 1.43 | % | 1.42 | % | 1.40 | % | 1.40 | % | 1.43 | % | ||||||||||||
Ratio of net investment loss to average net assets 1 | (0.56 | )%3 | (0.59 | )% | (0.15 | )% | (0.60 | )% | (0.69 | )% | (0.72 | )% | ||||||||||||
Portfolio turnover | 53 | %2 | 67 | % | 76 | % | 80 | % | 68 | % | 64 | % | ||||||||||||
Net assets at end of Period (000’s omitted) | $ | 1,013,525 | $ | 1,668,031 | $ | 2,551,703 | $ | 2,834,314 | $ | 3,415,003 | $ | 3,279,318 | ||||||||||||
Ratios absent expense offsets: 4 | ||||||||||||||||||||||||
Ratio of total expenses to average net assets | 1.51 | %3 | 1.46 | % | 1.47 | % | 1.45 | % | 1.45 | % | 1.46 | % | ||||||||||||
Ratio of net investment loss to average net assets | (0.59 | )%3 | (0.62 | )% | (0.20 | )% | (0.65 | )% | (0.74 | )% | (0.75 | )% | ||||||||||||
| For the six months ended June 30, 2008 | For the year ended December 31, | For the period* ended December 31, | ||||||||||||||||||
Institutional Class: | (unaudited) | 2007 | 2006 | 2005 | 2004 | |||||||||||||||
Net Asset Value, Beginning of Period | $ | 64.71 | $ | 83.56 | $ | 87.09 | $ | 90.56 | $ | 78.91 | ||||||||||
Income from Investment Operations: | ||||||||||||||||||||
Net investment income (loss) | (0.10 | )5 | (0.32 | )5 | 0.10 | 5 | (0.33 | )5 | (0.21 | ) | ||||||||||
Net realized and unrealized gain (loss) on investments | (8.18 | )5 | 0.52 | 5 | 9.93 | 5 | 4.14 | 5 | 11.86 | |||||||||||
Total from investment operations | (8.28 | ) | 0.20 | 10.03 | 3.81 | 11.65 | ||||||||||||||
Less Distributions to Shareholders from: | ||||||||||||||||||||
Net realized gain on investments | — | (19.05 | ) | (13.56 | ) | (7.28 | ) | — | ||||||||||||
Net Asset Value, End of Period | $ | 56.43 | $ | 64.71 | $ | 83.56 | $ | 87.09 | $ | 90.56 | ||||||||||
Total Return 1 | (12.78 | )%2 | (0.39 | )% | 11.56 | %6 | 4.21 | % | 14.75 | %2 | ||||||||||
Ratio of net expenses to average net assets | 1.23 | %3 | 1.20 | % | 1.18 | % | 1.20 | % | 1.20 | %3 | ||||||||||
Ratio of net investment income (loss) to average net assets 1 | (0.33 | )%3 | (0.36 | )% | 0.09 | % | (0.56 | )% | (0.49 | )%3 | ||||||||||
Portfolio turnover | 53 | %2 | 67 | % | 76 | % | 80 | % | 68 | %2 | ||||||||||
Net assets at end of period (000’s omitted) | $ | 136,435 | $ | 247,396 | $ | 561,994 | $ | 510,541 | $ | 274,010 | ||||||||||
Ratios absent expense offsets: 4 | ||||||||||||||||||||
Ratio of total expenses to average net assets | 1.26 | %3 | 1.23 | % | 1.23 | % | 1.25 | % | 1.26 | %3 | ||||||||||
Ratio of net investment loss to average net assets | (0.36 | )%3 | (0.39 | )% | 0.14 | % | 0.61 | % | 0.55 | %3 | ||||||||||
* | Commencement of operations was May 3, 2004. |
1 | Total returns and net investment income would have been lower had certain expenses not been reduced. (See Note 1(c) of Notes to Financial Statements.) |
2 | Not Annualized. (See Note 1(c) to the Notes to Financial Statements.) |
3 | Annualized. |
4 | Excludes the impact of fee waivers and expense offsets such as brokerage credits, but includes non-reimbursable expenses such as interest and taxes. (See Note 1(c) to the Notes to Financial Statements.) |
5 | Per share numbers have been calculated using average shares. |
6 | The Total Return is based on the Financial Statement Net Asset Values as shown above. |
13
Table of Contents
Notes to Financial Statements
June 30, 2008 (unaudited)
| 1. | Summary of Significant Accounting Policies |
The Managers Funds (the “Trust”) is an open-end management investment company organized as a Massachusetts business trust and registered under the Investment Company Act of 1940, as amended (the “1940 Act”). Currently, the Trust is comprised of a number of different funds, each having distinct investment management objectives, strategies, risks and policies. Included in this report is the Managers Special Equity Fund (“Special Equity” or the “Fund”).
The Fund offers both Managers Class shares and Institutional Class shares. The Institutional Class shares, which are designed primarily for institutional investors that meet certain administrative and servicing criteria, have a minimum investment of $2,500,000. Managers Class shares are offered to all other investors. Each class represents interest in the same assets of the Fund and the classes are identical except for class specific expenses related to shareholder activity. Investment income, realized and unrealized capital gains and losses, the common expenses of the Fund and certain Fund level expense reductions, if any, are allocated on a pro rata basis to each class based on the relative net assets of each class to the total net assets of the Fund. Both classes have equal voting privileges except that each class has exclusive voting rights with respect to its services and/or distribution plan.
The Fund’s financial statements are prepared in accordance with accounting principles generally accepted in the United States of America, which require management to make estimates and assumptions that affect the reported amount of assets and liabilities and disclosure of contingent assets and liabilities at the date of the financial statements and the reported amounts of income and expenses during the reporting periods. Actual results could differ from those estimates and such differences could be material. The following is a summary of significant accounting policies followed by the Fund in the preparation of its financial statements:
| a. | Valuation of Investments |
Equity securities traded on a domestic or international securities exchange are valued at the last quoted sale price, or, lacking any sales, at the last quoted bid price. Over-the-counter securities are valued at the Nasdaq Official Closing Price, if one is available. Lacking any sales, over-the-counter securities are valued at the last quoted bid price. The Fund’s investments are generally valued based on market quotations provided by the third party pricing services approved by the Board of Trustees of the Fund. Under certain circumstances, the value of a specific investment may be based on an evaluation of its fair value, pursuant to procedures established by and under the general supervision of the Board of Trustees of the Fund. A Fund may use the fair value of a portfolio security to calculate its NAV when, for example, (1) market quotations are not readily available because a portfolio security is not traded in a public market or the principal market in which the security trades is closed, (2) trading in a portfolio security is suspended and has not resumed before the Fund calculates its NAV, (3) where a significant event affecting the value of a portfolio security is determined to have occurred between the time of the market quotation provided for a portfolio security and the time as of which the Fund calculates its NAV, (4) a security’s price has remained unchanged over a period of time (often referred to as a “stale price”), or (5) Managers Investment Group LLC (the “Investment Manager”) determines that a market quotation is inaccurate. Portfolio investments that trade primarily on foreign markets are priced based upon the market quotation of such securities as of the close of their respective principal markets, as adjusted to reflect the Investment Manager’s determination of the impact of events occurring subsequent to the close of such markets but prior to the time as of which the Fund calculates their NAV. In accordance with procedures approved by the Board of Trustees, the Investment Manager relies upon recommendations of a third-party fair valuation service in adjusting the prices of such foreign portfolio investments. The Fund may invest in securities that may be thinly traded. The Board of Trustees has adopted procedures to adjust prices when thinly traded securities are judged to be stale so that they reflect fair value. An investment valued on the basis of its fair value may be valued at a price higher or lower than available market quotations. An investment’s valuation may differ depending on the method used and the factors considered in determining value according to the Fund’s fair value procedures.
Fixed-income securities are valued based on valuations furnished by independent pricing services that utilize matrix systems, which reflect such factors as security prices, yields, maturities, and ratings, and are supplemented by dealer and exchange quotations. Futures contracts for which market quotations are readily available are valued at the settlement price as of the close of the futures exchange. Short-term investments having a remaining maturity of 60 days or less are valued at amortized cost, which approximates market value. Investments in other regulated investment companies are valued at their end of day net asset value per share except iShares or other ETF’s, which are valued the same as equity securities. Investments in certain mortgage-backed, stripped mortgage-backed, preferred stocks, convertible securities, derivatives and other debt securities not traded on an organized securities market are valued on the basis of valuations provided by dealers or by a pricing service which uses information with respect to transactions in such securities and various relationships between securities and yield to maturity in determining value. Securities (including derivatives) for which market quotations are not readily available are valued at fair value, as determined in good faith, and pursuant to procedures adopted by the Board of Trustees of the Trust. The values assigned to fair value investments are based on available information and do not necessarily represent amounts that might ultimately be realized, since such amounts depend on future developments inherent in long-term investments. Further, because of the inherent uncertainty of valuation, those estimated values may differ significantly from the values that would have been used had a ready market for the investments existed, and the differences could be material.
The Fund adopted Financial Accounting Standards Board Statement of Financial Accounting Standards No. 157, Fair Value Measurements (“FAS 157”), effective January 1, 2008. In accordance with FAS 157, fair value is defined as the price that a Fund would receive to sell an asset or pay to transfer a liability in an orderly transaction between market participants at the measurement date. FAS 157 also establishes a framework for measuring fair value, and a three-level hierarchy for fair value measurements based upon the transparency of inputs to the valuation of an asset or liability. Inputs may be observable or unobservable and refer broadly to the assumptions that market participants would use in pricing the asset or liability. Observable inputs reflect the assumptions market participants would use in pricing the asset or liability based on market data obtained from sources independent of the Fund. Unobservable inputs reflect the Fund’s own assumptions about the assumptions that market
14
Table of Contents
Managers Special Equity Fund
Notes to Financial Statements (continued)
participants would use in pricing the asset or liability developed based on the best information available in the circumstances. Each investment is assigned a level based upon the observability of the inputs which are significant to the overall valuation. The three-tier hierarchy of inputs is summarized below:
Level 1 – quoted prices in active markets for identical investments
Level 2 – other significant observable inputs (including quoted prices for similar investments, interest rates, prepayment speeds, credit risk)
Level 3 – significant unobservable inputs (including the Funds’ own assumptions in determining the fair value of investments) The inputs or methodologies used for valuing investments are not necessarily an indication of the risk associated with investing in those investments. The following table summarizes the valuation of the Fund’s investments by the above fair value hierarchy levels as of June 30, 2008:
Level | Investments in Securities | Other Financial Instruments* | |||
Special Equity | |||||
Level 1 | $ | 1,507,829,188 | — | ||
Level 2 | — | — | |||
Level 3 | — | — | |||
Total | $ | 1,507,829,188 | — | ||
| * | Other financial instruments are derivative instruments not reflected in the Schedule of Portfolio Investments, such as futures, forwards and swap contracts, which are valued at the unrealized appreciation/depreciation of the instrument. |
| b. | Security Transactions |
Security transactions are accounted for as of the trade date. Realized gains and losses on securities sold are determined on the basis of identified cost.
| c. | Investment Income and Expenses |
Dividend income is recorded on the ex-dividend date except certain dividends from foreign securities where the ex-dividend date may have passed. These dividends are recorded as soon as the Trust is informed of the ex-dividend date. Dividend income on foreign securities is recorded net of any withholding tax. Interest income, which includes amortization of premium and accretion of discount on debt securities, is accrued as earned. Non-cash dividends included in dividend income, if any, are reported at the fair market value of the securities received. Other income and expenses are recorded on an accrual basis. Expenses that cannot be directly attributed to a fund are apportioned among the Funds in the Trust and in some cases other affiliated funds based upon their relative average net assets or number of shareholders.
The Fund had certain portfolio trades directed to various brokers who paid a portion of the Fund’s expenses. For the six months ended June 30, 2008, under these arrangements the amount by which the Fund’s expenses were reduced and the impact on the expense ratios was as follows: $203,107 or 0.03% annualized.
The Fund has a “balance credit” arrangement with The Bank of New York Mellon (“BNYM”) (formerly The Bank of New York), the Fund’s custodian, whereby the Fund is credited with an interest factor equal to 0.75% below the effective 90-day T-Bill rate for account balances left un-invested overnight. These credits serve to reduce custody expenses that would otherwise be charged to the Fund. For the six months ended June 30, 2008, the custodian expense was reduced by $769.
Overdrafts will cause a reduction of any earnings credits, computed at 2% above the effective Federal Funds rate on the day of the overdraft. For the six months ended June 30, 2008, the Fund had an overdraft fee of $7,546.
The Trust also has a balance credit arrangement with its Transfer Agent, PNC Global Investment Servicing (U.S.) Inc. (formerly PFPC Inc.), whereby earnings credits are used to offset banking charges and other out-of-pocket expenses. For the six months end June 30, 2008, the transfer agent expense was reduced by $3,288.
The Investment Manager has agreed to waive a portion of its management fee in consideration of shareholder servicing fees that it has received from JPMorgan Distribution Services, Inc., with respect to short-term cash investments the Fund has made in the JPMorgan Liquid Assets Portfolio. For the six months ended June 30, 2008, the management fee was reduced by $4,426.
Total returns and net investment income for the Funds would have been lower had certain expenses not been offset. Total expenses before offsets exclude the impact of expense reimbursements or fee waivers and expense offsets such as brokerage recapture credits, but include non-reimburseable expenses such as interest and taxes, if any.
| d. | Dividends and Distributions |
Dividends resulting from net investment income, if any, normally will be declared and paid. Distributions of capital gains, if any, will be made annually in December and when required for Federal excise tax purposes. Income and capital gain distributions are determined in accordance with Federal income tax regulations, which may differ from generally accepted accounting principles. These differences are primarily due to differing treatments for losses deferred due to wash sales, REITs, equalization accounting for tax purposes, foreign currency, options, futures and market discount transactions. Permanent book and tax basis differences, if any, relating to shareholder distributions will result in reclassifications to paid-in capital.
| e. | Federal Taxes |
The Fund intends to comply with the requirements under Subchapter M of the Internal Revenue Code of 1986, as amended, to distribute substantially all of its taxable income and gains to its shareholders and to meet certain diversification and income requirements with respect to investment companies. Therefore, no provision for Federal income or excise tax is included in the accompanying financial statements.
| f. | Capital Loss Carryovers |
As of June 30, 2008, the Fund had no accumulated net realized capital loss carryover from securities transactions for Federal income tax purposes.
| g. | Capital Stock |
The Trust’s Declaration of Trust authorizes for each series the issuance of an unlimited number of shares of beneficial interest, without par value, for each fund. The Fund records sales and repurchases of its capital stock on the trade date. Dividends and distributions to shareholders are recorded on the ex-dividend date.
15
Table of Contents
Managers Special Equity Fund
Notes to Financial Statements (continued)
At June 30, 2008 certain unaffiliated shareholders, specifically omnibus accounts, individually held greater than 10% of the outstanding shares of the Fund: Managers Class shares – three collectively own 54%; Institutional Class shares – three collectively own 80%. Transactions by these shareholders may have a material impact on the Fund or the class.
| 2. | Agreements and Transactions with Affiliates |
The Trust has entered into an Investment Management Agreement under which Managers Investment Group LLC (the “Investment Manager”), an independently managed subsidiary of Affiliated Managers Group, Inc. (“AMG”), serves as investment manager to the Fund. The Investment Manager selects subadvisors for the Fund (subject to Trustee approval) and monitors each subadvisor’s investment programs and results. The Fund’s investment portfolio is managed by portfolio managers who serve pursuant to a Subadvisory Agreement with the Investment Manager.
Investment management fees are paid directly by the Fund to the Investment Manager based on average daily net assets. For the six months ended June 30, 2008, the annual investment management fee rate, as a percentage of average daily net assets, was 0.90%.
The Trust has entered into an Administration and Shareholder Servicing Agreement under which the Investment Manager serves as the Fund’s administrator (the “Administrator”) and is responsible for all aspects of managing the Fund’s operations, including administration and shareholder services to the Fund, its shareholders, and certain institutions, such as bank trust departments, broker-dealers and registered investment advisers, that advise or act as an intermediary with the Fund’s shareholders. The Fund pays a fee to the Administrator at the rate of 0.25% per annum of the Fund’s average daily net assets for this service.
Prior to July 1, 2007, the aggregate annual retainer paid to each Independent Trustee was $55,000, plus $4,000 or $2,000 for each regular or special meeting attended, respectively. Effective July 1, 2007, the aggregate annual retainer paid to each Independent Trustee is $65,000, plus $4,000 or $2,500 for each regular or special meeting attended, respectively. The Trustees’ fees and expenses are allocated amongst all of the Funds for which the Investment Manager serves as the advisor (the “Managers Funds”) based on the relative net assets of such Funds. The Independent Chairman of the Trusts receives an additional payment of $15,000 per year. (Prior to July 1, 2007, the Independent Chairman received an additional payment of $10,000 per year). The Chairman of the Audit Committee receives an additional payment of $5,000 per year. (Prior to July 1, 2007, the Chairman of the Audit Committee received an additional payment of $2,000 per year). The “Trustee fees and expenses” shown in the financial statements represents the Fund’s allocated portion of the total fees and expenses paid by the Fund and other affiliated funds in the Managers Funds.
The Fund is distributed by Managers Distributors, Inc. (the “Distributor” or “MDI”), a wholly-owned subsidiary of the Investment Manager. The MDI serves as the principal underwriter for the Fund. MDI is a registered broker-dealer and member of the Financial Industry Regulatory Authority, Inc. (“FINRA”). Shares of the Fund will be continuously offered and will be sold by brokers, dealers or other financial intermediaries who have executed selling agreements with the Distributor. MDI bears all the expenses of providing services pursuant to the Underwriting Agreement, including the payment of the expenses relating to the distribution of Prospectuses for sales purposes and any advertising or sales literature. Certain Trustees and Officers of the Fund are Officers and/or Directors of the Investment Manager, AMG and/or the Distributor.
During the six months ended June 30, 2008, the Fund had the following transactions under 17a-7 procedures approved by the Board of Trustees:
January 2, 2008 – sold securities to the Skyline Opportunity Fund
Security | Shares | Cost | |||
AirTran Holdings, Inc. | 5,600 | $ | 38,808 | ||
Aspen Insurance Holdings, Ltd. | 6,500 | 184,340 | |||
Arris Group, Inc. | 6,700 | 63,181 | |||
American Axle & Manufacturing Holdings, Inc. | 3,100 | 56,265 | |||
Big 5 Sporting Goods Corp. | 6,300 | 90,216 | |||
B&G Foods, Inc. | 6,000 | 60,660 | |||
Borland Software Corp. | 6,600 | 19,140 | |||
CAI International, Inc. | 4,300 | 42,484 | |||
Cincinnati Bell, Inc. | 26,700 | 120,684 | |||
Crane Co. | 3,500 | 148,995 | |||
Carlisle Cos., Inc. | 3,100 | 116,033 | |||
Convergys Corp. | 3,600 | 57,744 | |||
Delphi Financial Group, Inc., Class A | 3,600 | 121,464 | |||
Electronics for Imaging, Inc. | 6,000 | 131,880 | |||
Fairchild Semiconductor International, Inc. | 6,400 | 89,024 | |||
Financial Federal Corp. | 3,000 | 67,200 | |||
Comfort Systems USA, Inc. | 7,300 | 89,936 | |||
Harris Stratex Networks, Inc. | 4,000 | 67,000 | |||
Hercules Technology Growth Capital, Inc. | 4,700 | 55,366 | |||
MarineMax, Inc. | 4,400 | 65,164 | |||
Key Energy Services, Inc. | 5,800 | 83,926 | |||
MCG Capital Corp. | 5,300 | 61,109 | |||
Miller Herman, Inc. | 3,200 | 103,072 | |||
Mattson Technology, Inc. | 5,700 | 47,823 | |||
Prosperity Bancshares, Inc. | 4,400 | 124,872 | |||
Ryder System, Inc. | 1,300 | 59,683 | |||
RAM Holdings, Ltd. | 8,000 | 37,760 | |||
Reinsurance Group of America, Inc. | 3,500 | 179,515 | |||
Rudolph Technologies, Inc. | 3,300 | 36,993 | |||
SeaBright Insurance Holdings, Inc. | 6,700 | 98,825 | |||
iStar Financial, Inc. | 300 | 7,725 | |||
Spherion Corp. | 12,500 | 86,875 | |||
SkyWest, Inc. | 4,900 | 130,536 | |||
Super Micro Computer, Inc. | 5,600 | 47,208 | |||
SYNNEX Corp. | 5,300 | 100,859 | |||
TNS, Inc. | 5,600 | 93,744 | |||
TradeStation Group, Inc. | 6,800 | 94,588 | |||
TTM Technologies, Inc. | 7,100 | 83,212 | |||
Total | 216,700 | $ | 3,163,909 | ||
16
Table of Contents
Managers Special Equity Fund
Notes to Financial Statements (continued)
January 15, 2008 – bought securities from the Managers Fremont Global Fund
Security | Shares | Cost | |||
Aruba Networks, Inc. | 700 | $ | 8,050 | ||
January 15, 2008 – bought securities from the Managers Fremont Micro-Cap Fund
Security | Shares | Cost | |||
Aruba Networks, Inc. | 12,443 | $ | 143,095 | ||
Calgon Carbon Corp. | 95,500 | 1,353,235 | |||
Omniture, Inc. | 56,200 | 1,511,780 | |||
Total | 164,143 | $ | 3,008,110 | ||
May 12, 2008 – sold securities to the Investment Fund for Foundations Multi-Asset Fund
Security | Shares | Cost | |||
General Communication, Inc., Class A | 230,000 | $ | 1,492,700 | ||
| 3. | Purchases and Sales of Securities |
Purchases and sales of securities, excluding short-term securities, for the six months ended June 30, 2008, were $796,887,285 and $1,297,466,547, respectively. There were no purchases or sales of U.S. Government securities.
| 4. | Portfolio Securities Loaned |
The Fund may participate in a securities lending program offered by BNYM providing for the lending of equities, corporate bonds and government securities to qualified brokers. Collateral on all securities loaned is accepted in cash and/or government securities. Collateral is maintained at a minimum level of 102% (105% in the case of certain foreign securities) of the market value, plus interest, if applicable, of investments on loan. Collateral received in the form of cash is invested temporarily in institutional money market funds or other short-term investments by BNYM. Security lending fees include earnings of such temporary cash investments, plus or minus any rebate. These earnings (after any rebate) then are divided between BNYM, as a fee for its services under the program, and the Fund loaning the security, according to agreed-upon rates.
| 5. | Commitments and Contingencies |
In the normal course of business, the Fund may enter into contracts and agreements that contain a variety of representations and warranties, which provide general indemnifications. The maximum exposure to the Fund under these arrangements is unknown, as this would involve future claims that may be made against the Fund that have not yet occurred. However, based on experience, the Fund expects the risk of loss to be remote.
| 6. | New Accounting Pronouncement |
In June 2006, the Financial Accounting Standards Board (“FASB”) issued Interpretation No. 48, “Accounting for Uncertainty in Income Taxes - an Interpretation of FASB Statement No. 109 (“FIN 48”).” FIN 48 applies to all registered investment companies and establishes the minimum threshold for recognizing, and a system for measuring, the benefits of tax return positions in the financial statements. FIN 48 is effective for fiscal years beginning after December 15, 2006. The Investment Manager has analyzed the Fund’s tax positions taken on federal income tax returns for all open tax years (tax years ended December 31, 2004-2007) and has concluded that as of June 30, 2008, no provision for income tax is required in the Fund’s financial statements. Additionally, the Investment Manager is not aware of any events that are reasonably possible to occur in the next twelve months that would result in the amounts of any unrecognized tax benefits significantly increasing or decreasing for the Fund. However, the Investment Manager’s conclusion regarding FIN 48 may be subject to review and adjustment at a later date based on factors including, but not limited to, further implementation guidance expected from FASB, and ongoing analysis of tax laws, regulations, and interpretations thereof.
17
Table of Contents
Annual Renewal of Investment Advisory Agreement (unaudited)
On June 6, 2008, the Board of Trustees, including a majority of the Trustees who are not “interested persons” of the Trust (the “Independent Trustees”), approved the Investment Management Agreement with the Investment Manager for the Managers Special Equity Fund (the “Fund”) and the Subadvisory Agreement for each Subadvisor of the Fund. The Independent Trustees were separately represented by independent counsel in connection with their consideration of the approval of these agreements. In considering the Investment Management and Subadvisory Agreements, the Trustees reviewed a variety of materials relating to the Fund, the Investment Manager and each Subadvisor, including comparative performance, fee and expense information for an appropriate peer group of similar mutual funds (the “Peer Group”), performance information for the relevant benchmark index (the “Fund Benchmark”) and other information regarding the nature, extent and quality of services provided by the Investment Manager and the Subadvisors under their respective agreements. The Trustees also took into account information on the services provided by the Investment Manager and each Subadvisor (including information provided at meetings held on May 15-16 and June 5-6, 2008), as well as performance, fee and expense information regarding the Fund provided to them on a quarterly basis throughout the year. Prior to voting, the Independent Trustees: (a) reviewed the foregoing information with their independent legal counsel and with management; (b) received materials from their independent legal counsel discussing the legal standards applicable to their consideration of the Investment Management Agreement and the Subadvisory Agreements; and (c) met with their independent legal counsel in private sessions at which no representatives of management were present.
Nature, extent and quality of services.
In considering the nature, extent and quality of the services provided by the Investment Manager, the Trustees reviewed information relating to the Investment Manager’s operations and personnel. Among other things, the Investment Manager provided financial information, biographical information on its supervisory and professional staff and descriptions of its organizational and management structure. The Trustees also took into account information provided periodically throughout the previous year by the Investment Manager relating to the performance of its duties with respect to the Fund and the Trustees’ familiarity with the Investment Manager’s management through Board meetings, discussions and reports. In the course of their deliberations regarding the Investment Management Agreement, the Trustees evaluated, among other things: (a) the extent and quality of the Investment Manager’s oversight of the operation and management of the Fund; (b) the quality of the search, selection and monitoring services performed by the Investment Manager in overseeing the portfolio management responsibilities of the Subadvisors; (c) the Investment Manager’s ability to supervise the Fund’s other service providers; and (d) the Investment Manager’s compliance programs. With respect to the Fund’s investment in exchange-traded funds as a means to equitize the cash reserves segment of the Fund, the Trustees noted that the Investment Manager’s cash management services are in addition to and different from the services provided by the investment advisor to the exchange-traded funds in which the Fund invests. The Trustees also took into account the financial condition of the Investment Manager with respect to its ability to provide the services required under the Investment Management Agreement.
The Trustees also reviewed information relating to each Subadvisor’s operations and personnel and the investment philosophy, strategies and techniques (for each Subadvisor, its “Investment Strategy”) used in managing the portion of the Fund for which the Subadvisor has portfolio management responsibility. Among other things, the Trustees reviewed biographical information on portfolio management and other professional staff, information regarding each Subadvisor’s organizational and management structure and each Subadvisor’s brokerage policies and practices. The Trustees considered specific information provided regarding the experience of the individual or individuals at each Subadvisor with portfolio management responsibility for the portion of the Fund managed by the Subadvisor, including the information set forth in the Fund’s prospectus and statement of additional information. The Trustees also noted information provided by the Investment Manager regarding the manner in which each Subadvisor’s Investment Strategy complements those utilized by the Fund’s other Subadvisors. In the course of their deliberations, the Trustees evaluated, among other things: (a) the services rendered by each Subadvisor in the past; (b) the qualifications and experience of the Subadvisor’s personnel; and (c) the Subadvisor’s compliance programs. The Trustees also took into account the financial condition of each Subadvisor with respect to its ability to provide the services required under its Subadvisory Agreement.
Performance.
Among other information relating to the Fund’s performance, the Trustees noted that the Fund’s performance for the 1-year, 3-year, 5-year and 10-year periods ended March 31, 2008 was below the median performance of the Peer Group and below the performance of the Fund Benchmark, the Russell 2000® Index, for each period. The Trustees noted management’s discussion of the Fund’s growth bias and the market environment during relevant time periods. The Trustees also took into account the Investment Strategies of the Fund’s Subadvisors relative to the investment strategies of the Fund’s Peer Group and noted that the Investment Manager replaced a Subadvisor in late 2007. The Trustees also noted that the Fund’s longer-term performance has exceeded the median of its Peer Group, which has resulted in the Fund performing within the top quartile of its Peer Group since inception of the Fund (June 1, 1984) through the period ended March 31, 2008. The Trustees concluded that management had taken appropriate steps to address the Fund’s performance.
As noted above, the Board considered the Fund’s performance during relevant time periods as compared to the Fund’s Peer Group and noted that the Board reviews on a quarterly basis detailed information about the Fund’s performance results, portfolio composition and Investment Strategies, including with respect to the portion of the Fund managed by each Subadvisor. The Board noted the Investment Manager’s expertise and resources in monitoring the performance, investment style and risk-adjusted performance of each Subadvisor. The Board also noted each Subadvisor’s performance record with respect to the Fund. The Board was mindful of the Investment Manager’s attention to monitoring each Subadvisor’s performance with respect to the Fund and its discussions with management regarding the factors that contributed to the performance of the Fund.
18
Table of Contents
Annual Renewal of Investment Advisory Agreement (continued)
Advisory Fees and Profitability.
In considering the reasonableness of the advisory fee charged by the Investment Manager for managing the Fund, the Trustees noted that the Investment Manager, and not the Fund, is responsible for paying the fees charged by the Fund’s Subadvisors and, therefore, that the fees paid to the Investment Manager cover the cost of providing portfolio management services as well as the cost of providing search, selection and monitoring services in operating a “manager-of-managers” complex of mutual funds. The Trustees concluded that, in light of the additional high quality supervisory services provided by the Investment Manager and the fact that the subadvisory fees are paid out of the advisory fee, the advisory fee payable by the Fund to the Investment Manager can reasonably be expected to exceed the median advisory fee for the Peer Group, which consists of many funds that do not operate with a manager-of-managers structure. The Trustees noted that the Fund’s advisory fee and total expenses as of March 31, 2008 were higher than and equal to, respectively, the average for the Fund’s Peer Group. The Trustees concluded that, in light of the nature, extent and quality of the services provided by the Investment Manager and the Subadvisors and the considerations noted above with respect to the Subadvisors and the Investment Manager, the Fund’s advisory fees are reasonable.
In considering the reasonableness of the advisory fee payable to the Investment Manager, the Trustees also reviewed information provided by the Investment Manager setting forth all revenues and other benefits, both direct and indirect, received by the Investment Manager and its affiliates attributable to managing the Fund and all the mutual funds in the Managers Family of Funds, the cost of providing such services and the resulting profitability to the Investment Manager and its affiliates from these relationships. The Trustees noted that the subadvisory fees are paid by the Investment Manager out of its advisory fee. The Trustees also noted the current asset levels of the Fund and the impact on profitability of any future growth of assets of the Fund. The Board took into account management’s discussion of the advisory fee structure. In this regard, the Trustees noted that the Fund currently has six Subadvisors, each managing a portion of the Fund’s portfolio, and that the Investment Manager’s oversight and supervisory responsibilities with respect to the Fund have increased with the size of the Fund and the number of Subadvisors. Based on the foregoing, the Trustees concluded that the profitability to the Investment Manager is reasonable and that the Investment Manager is not realizing material benefits from economies of scale that would warrant adjustments to the advisory fee at this time. With respect to economies of scale, the Trustees also noted that as the Fund’s assets increase over time, the Fund may realize other economies of scale to the extent that the increase in assets is proportionally greater than the increase in certain other expenses.
Subadvisory Fees and Profitability.
In considering the reasonableness of the fee payable by the Investment Manager to each Subadvisor (other than Skyline Asset Management, L.P. (“Skyline”), which is an affiliate of the Investment Manager), the Trustees relied on the ability of the Investment Manager to negotiate the terms of each Subadvisory Agreement at arm’s length as part of the manager-of-managers structure, noting that the Investment Manager is not affiliated with these Subadvisors (other than Skyline). In addition, the Trustees noted that the subadvisory fees are paid by the Investment Manager out of its advisory fee. Accordingly, the cost of services to be provided by each Subadvisor and the profitability to each Subadvisor of its relationship with the Fund were not material factors in the Trustees’ deliberations. For similar reasons, and based on the current size of the portion of the Fund managed by each Subadvisor, the Trustees concluded that the effect of any economies of scale being realized by the Subadvisors was not a material factor in the Trustees’ deliberations at this time.
In considering the reasonableness of the fee payable by the Investment Manager to Skyline, the Trustees noted that Skyline is an affiliate of the Investment Manager and reviewed information provided by Skyline regarding the cost to Skyline of providing subadvisory services to the Fund and the resulting profitability from such relationship. The Trustees also noted that the fee payable by the Investment Manager to Skyline under its Subadvisory Agreement is identical to the fee payable to each of the other Subadvisors of the Fund, none of which is an affiliate of the Investment Manager. The Trustees also noted that the subadvisory fee is paid by the Investment Manager out of the advisory fee. Accordingly, the cost of services to be provided by Skyline and the profitability to Skyline of its relationship with the Fund were not material factors in the Trustees’ deliberations. For similar reasons, and based on the current size of the portion of the Fund managed by each Subadvisor, the Trustees concluded that the effect of any economies of scale being realized by Skyline was not a material factor in the Trustees’ deliberations at this time.
* * * * *
After consideration of the foregoing, the Trustees also reached the following conclusions regarding the Investment Management Agreement and the Subadvisory Agreements with each of the Subadvisors, in addition to those conclusions discussed above: (a) the Investment Manager and each Subadvisor have demonstrated that they possess the capability and resources to perform the duties required of them under the Investment Management Agreement and the applicable Subadvisory Agreement; (b) each Subadvisor’s Investment Strategy is appropriate for pursuing the Fund’s investment objectives; (c) each Subadvisor is reasonably likely to execute its Investment Strategy consistently over time; and (d) the Investment Manager and each Subadvisor maintain appropriate compliance programs.
Based on all of the above-mentioned factors and their related conclusions, with no single factor or conclusion being determinative and with each Trustee not necessarily attributing the same weight to each factor, the Trustees concluded that approval of the Investment Management Agreement and each Subadvisory Agreement would be in the best interests of the Fund and its shareholders. Accordingly, on June 6, 2008, the Trustees, including a majority of the Independent Trustees, voted to approve the Investment Management Agreement and the Subadvisory Agreement for each of the Fund Subadvisors.
19
Table of Contents
Investment Manager and Administrator
Managers Investment Group LLC
800 Connecticut Avenue
Norwalk, Connecticut 06854
(203) 299-3500 or (800) 835-3879
Distributor
Managers Distributors, Inc.
800 Connecticut Avenue
Norwalk, Connecticut 06854
(203) 299-3500 or (800) 835-3879
Custodian
The Bank of New York Mellon
2 Hanson Place
Brooklyn, New York 11217
Legal Counsel
Ropes & Gray LLP
One International Place
Boston, Massachusetts 02110-2624
Transfer Agent
PNC Global Investment Servicing (U.S.) Inc.
Attn: Managers
P.O. Box 9769
Providence, Rhode Island 02940
(800) 548-4539
Trustees
Jack W. Aber
William E. Chapman, II
Nathaniel Dalton
Edward J. Kaier
Steven J. Paggioli
Eric Rakowski
Thomas R. Schneeweis
John H. Streur
For Managers Choice Only
Managers
c/o PNC Global Investment Servicing (U.S.) Inc.
P.O. Box 61204
King of Prussia, Pennsylvania 19406-0851
(800) 358-7668
|
Table of Contents
MANAGERSAND MANAGERS AMG EQUITY FUNDS
EMERGING MARKETS EQUITY
Rexiter Capital Management Limited
ESSEX GROWTH
ESSEX LARGE CAP GROWTH
ESSEX SMALL/MICRO CAP GROWTH
Essex Investment Management Co., LLC
FQ TAX-MANAGED U.S. EQUITY
FQ U.S. EQUITY
First Quadrant, L.P.
INSTITUTIONAL MICRO-CAP
MICRO-CAP
Lord, Abbett & Co. LLC
WEDGE Capital Management L.L.P.
OFI Institutional Asset Management, Inc.
Next Century Growth Investors LLC
INTERNATIONAL EQUITY
AllianceBernstein L.P.
Lazard Asset Management, LLC
Wellington Management Company, LLP
CHICAGO EQUITY PARTNERS
MID-CAP
Chicago Equity Partners, LLC
REAL ESTATE SECURITIES
Urdang Securities Management, Inc.
SKYLINE SPECIAL EQUITIES
PORTFOLIO
Skyline Asset Management, L.P.
SMALL CAP
TIMESSQUARE MID CAP GROWTH
TIMESSQUARE SMALL CAP GROWTH
TimesSquare Capital Management, LLC
SMALL COMPANY
Epoch Investment Partners, Inc.
Kalmar Investment Advisers
SPECIAL EQUITY
Donald Smith & Co., Inc.
Lord, Abbett & Co. LLC
Skyline Asset Management, L.P.
Smith Asset Management Group, L.P.
Veredus Asset Management LLC
Westport Asset Management, Inc.
SYSTEMATIC VALUE
SYSTEMATIC MID CAP VALUE
Systematic Financial Management, L.P.
VALUE
Armstrong Shaw Associates Inc.
Osprey Partners Investment Management, LLC
MANAGERSAND MANAGERS AMG BALANCED FUNDS
CHICAGO EQUITY PARTNERS BALANCED
Chicago Equity Partners, LLC
GLOBAL
AllianceBernstein L.P.
First Quadrant, L.P.
Wellington Management Company, LLP
ALTERNATIVE FUNDS
FQ GLOBAL ALTERNATIVES
First Quadrant, L.P.
MANAGERS FIXED INCOME FUNDS
BOND (MANAGERS)
FIXED INCOME
GLOBAL BOND
Loomis, Sayles & Co., L.P.
BOND (MANAGERS FREMONT)
Pacific Investment Management Co. LLC
CALIFORNIA INTERMEDIATE TAX-FREE
Evergreen Investment Management Co., LLC
HIGH YIELD
J.P. Morgan Investment Management LLC
INTERMEDIATE DURATION GOVERNMENT
SHORT DURATION GOVERNMENT
Smith Breeden Associates, Inc.
MONEY MARKET
JPMorgan Investment Advisors Inc.
This report is prepared for the Fund’s shareholders. It is authorized for distribution to prospective investors only when preceded or accompanied by an effective prospectus. To receive a free copy of the prospectus or Statement of Additional Information, which includes additional information about Fund Trustees, please contact us by calling 800.835.3879. Distributed by Managers Distributors, Inc., member FINRA.
A description of the policies and procedures each Fund uses to vote its proxies is available: (i) without charge, upon request, by calling 800.835.3879, or (ii) on the Securities and Exchange Commission’s (SEC) Web site at www.sec.gov. For information regarding each Fund’s proxy voting record for the 12-month period ended June 30, call 800.835.3879 or visit the SEC Web site at www.sec.gov.
The Fund files its complete schedule of portfolio holdings with the SEC for the first and third quarters of each fiscal year on Form N-Q. The Fund’s Forms N-Q are available on the SEC’s website at www.sec.gov. A Fund’s Forms N-Q may be reviewed and copied at the SEC’s Public Reference Room in Washington, DC. Information on the operation of the Public Reference Room may be obtained by calling 1-800-SEC-0330. To review a complete list of the Fund’s portfolio holdings, or to view the most recent quarterly holdings report, semiannual report, or annual report, please visit www.managersinvest.com.
www.managersinvest.com

Table of Contents
SEMI-ANNUAL REPORT
Managers Funds
June 30, 2008
Managers Value Fund
Managers AMG Essex Large Cap Growth Fund
Managers Small Company Fund
Managers International Equity Fund
Managers Emerging Markets Equity Fund
Managers Global Bond Fund
Managers Money Market Fund

SAR002-0608
Table of Contents
Semi-Annual Report — June 30, 2008 (unaudited)
TABLE OF CONTENTS | Page | |
| 1 | ||
| 4 | ||
| 5 | ||
FUND SNAPSHOTS AND SCHEDULES OF PORTFOLIO INVESTMENTS | ||
| 6 | ||
| 8 | ||
| 10 | ||
| 14 | ||
| 20 | ||
| 24 | ||
| 32 | ||
FINANCIAL STATEMENTS: | ||
| 33 | ||
Funds’ balance sheet, net asset value (NAV) per share computations and cumulative undistributed amounts | ||
| 35 | ||
Detail of sources of income, Fund expenses, and realized and unrealized gains (losses) during the period | ||
| 37 | ||
Detail of changes in Fund assets for the past two periods | ||
MANAGERS MONEY MARKET FINANCIAL STATEMENTS: | ||
| 39 | ||
Fund balance sheet, net asset value (NAV) per share computation and cumulative undistributed amount | ||
| 39 | ||
Detail of sources of income, Fund expenses, and realized and unrealized gains (losses) during the period | ||
| 40 | ||
Detail of changes in Fund assets for the past three periods | ||
| 41 | ||
Historical net asset values per share, distributions, total returns, expense ratios, turnover ratios and net assets | ||
| 44 | ||
Accounting and distribution policies, details of agreements and transactions with Fund management and affiliates, and descriptions of certain investment risks | ||
| 50 | ||
Nothing contained herein is to be considered an offer, sale or solicitation of an offer to buy shares of The Managers Funds or Managers AMG Funds. Such offering is made only by Prospectus, which includes details as to offering price and other material information.
Table of Contents
Dear Shareholder:
As you are undoubtedly aware, the financial markets were under significant pressure during a majority of the six-month period ending June 30, 2008 (the “period”). The period began with the major U.S. equity markets seeing their worst returns in 5 1/2 years during the first quarter, largely driven by investor concerns over the economic impact of a decline in U.S. home values and the related devaluation of the mortgage-securities market. After the Federal Reserve’s mid-March establishment of the credit facility to extend overnight funds to primary dealers and the bail out of Bear Stearns, the second quarter started with many investors believing that the worst of the credit crunch was over, that economic growth would begin to bounce back later in the year, and that stock prices, in anticipation of future growth, would advance. The stock market roughly followed that projected course until approximately mid-to-late May. Stocks, unfortunately, then sold off during the remainder of the quarter as investors’ concerns over surging energy and food prices, continued fallout from the credit crisis, slow economic growth, and declining corporate profits took center stage. Time may tell if the concerns are completely justified. In the short term, however, the pain in the financial markets has been all too real.
The resulting impact on the equity markets was widespread. For the period, the Russell 1000® (large cap), Russell 2000® (small cap), and the Russell 3000® (all cap) Indices returned -11.2%, -9.4% and -11.1%, respectively. Despite underperforming during the first quarter, growth indices outperformed their value counterparts for the period (e.g., Russell 3000® Growth Index -9.0% versus Russell 3000® Value Index -13.3%). Within the Russell 3000® Index, all sectors except energy and materials declined, with financials falling the hardest. Even with the benefit of currencies that were strong relative to the U.S. Dollar for the period, foreign stock markets offered little help in the way of diversification. For the period, the MSCI EAFE Index returned -11.0% (U.S. Dollars), while the MSCI Emerging Markets Index declined by 11.8%.
While many of the media headlines took a negative tone and emphasized inflation, the “housing crisis” and the losses in the stock market, various portions of the bond market provided positive returns. Interest rates fell (and bond prices rose) across the yield curve, although the interest rate declines were most pronounced on the shorter end of the curve. Meanwhile, for the period in aggregate, demand for higher-quality, lower-risk bonds like U.S. Treasuries increased, while some investors sold higher-risk, lower-quality bonds in an effort to curtail risk. For the period, the Lehman Brothers U.S. Aggregate Index and the Lehman Brothers Global Aggregate Index returned 1.1% and 3.5% (U.S. Dollars), respectively.
Against this backdrop, the Funds represented in this report have provided the following returns:
Periods Ended 06/30/08 | 6 Months | 1 Year | 3 Years | 5 Years | 10 Years | Since Inception | Inception Date | |||||||||||||
Managers Global Bond Fund | 1.92 | % | 9.18 | % | 4.92 | % | 5.54 | % | 5.66 | % | 5.62 | % | 3/25/1994 | |||||||
Lehman Brothers Global Aggregate Index | 3.53 | % | 12.90 | % | 5.81 | % | 5.90 | % | 6.10 | % | 3/25/1994 | |||||||||
Managers Small Company Fund | (8.06 | )% | (9.70 | )% | 5.46 | % | 10.41 | % | 2.31 | % | 6/19/2000 | |||||||||
Russell 2000 Index | (9.37 | )% | (16.19 | )% | 3.79 | % | 10.29 | % | 5.53 | % | 4.82 | % | 6/19/2000 | |||||||
Managers AMG Essex Large Cap Growth Fund | (6.05 | )% | (0.57 | )% | 6.53 | % | 6.70 | % | 3.16 | % | 11.02 | % | 6/1/1984 | |||||||
Russell 1000 Growth Index | (9.06 | )% | (5.96 | )% | 5.91 | % | 7.32 | % | 0.96 | % | 6/1/1984 | |||||||||
S&P 500 Index | (11.91 | )% | (13.12 | )% | 4.41 | % | 7.58 | % | 2.88 | % | 11.95 | % | 6/1/1984 | |||||||
Managers Value Fund | (17.59 | )% | (28.06 | )% | (2.54 | )% | 4.44 | % | 2.18 | % | 9.82 | % | 10/31/1984 | |||||||
Russell 1000 Value Index | (13.57 | )% | (18.78 | )% | 3.53 | % | 8.92 | % | 4.91 | % | 10/31/1984 | |||||||||
S&P 500 Index | (11.91 | )% | (13.12 | )% | 4.41 | % | 7.58 | % | 2.88 | % | 11.70 | % | 10/31/1984 | |||||||
Managers International Equity Fund | (14.02 | )% | (10.02 | )% | 14.36 | % | 15.75 | % | 4.77 | % | 10.27 | % | 12/31/1985 | |||||||
MSCI EAFE Index | (10.96 | )% | (10.61 | )% | 12.84 | % | 16.67 | % | 5.83 | % | 9.62 | % | 12/31/1985 | |||||||
Managers Emerging Markets Equity Fund | (9.70 | )% | 0.49 | % | 26.02 | % | 28.63 | % | 16.85 | % | 14.31 | % | 2/9/1998 | |||||||
MSCI EM Index (Net) | (11.76 | )% | 4.63 | % | 27.14 | % | 29.75 | % | 2/9/1998 | |||||||||||
MSCI EM Index (Gross) | (11.64 | )% | 4.89 | % | 27.52 | % | 30.15 | % | 15.51 | % | 12.76 | % | 2/9/1998 | |||||||
Money Market Fund | 1.54 | % | 4.01 | % | 4.25 | % | 3.00 | % | 3.41 | % | 4.84 | % | 6/1/1984 | |||||||
Merrill 3 Month T-Bill | 1.20 | % | 3.64 | % | 4.27 | % | 3.18 | % | 3.63 | % | 6/1/1984 | |||||||||
Note: Returns greater than one year are annualized
1
Table of Contents
Letter to Shareholders (continued)
As noted above, for the six months ended June 30, 2008, the Managers Value Fund returned -17.59%, compared with a return of -13.57% for its primary benchmark, the Russell 1000® Value Index. The Fund’s underperformance is mainly attributable to poor stock selection within the financials sector. Overall, financials was the worst performing sector within the Index, but Fund constituents declined much more than those in the Index. Similarly, relative Fund performance was hurt by poor stock selection in industrials and underweights to the utilities and energy sectors. The aforementioned detractors were partly offset by favorable stock selection within the consumer discretionary and energy sectors.
One of the Fund’s subadvisors, Osprey Partners Investment Management (“Osprey”), has been the main driver of underperformance because of their holdings in finance stocks. Osprey believes many of its holdings, which are at historically low valuations, now offer significant upside potential with limited downside risk. Meanwhile, Armstrong Shaw Associates (“Armstrong”), the Fund’s other subadvisor, outperformed the benchmark in each of the last two quarters, as a result of an underweight in financials and strong relative performance within the information technology and energy sectors. Unlike Osprey, Armstrong has avoided finance stocks because of transparency concerns and is awaiting sector stability before increasing its exposure in the sector. Overall, since each subadvisor focuses exclusively on value investing, recent multiple contraction has broadened each manager’s investable universe. In particular, both subadvisors think the technology and telecomm sectors are attractively valued after falling 24% and 21%, respectively, over the last twelve months.
As noted above, for the six-month period ended June 30, 2008, the Managers AMG Essex Large Cap Growth Fund returned -6.05%, outperforming its benchmark, the Russell 1000® Growth Index, which returned -9.06%. The Fund’s sizable outperformance was driven in part by strong stock selection and its underweight in the lagging financials sector. The Fund benefited from its stock selection within health care, as companies like Gilead Sciences, Elan Corp. and Vertex Pharmaceuticals all produced strong results during the period. The Fund’s energy holdings also contributed to the solid relative performance. Chesapeake Energy and Southwestern Energy were standout performers and benefited from investor optimism about natural gas prices. Peabody Energy was also among the top contributors in energy due to an export-driven rise in coal prices. Meanwhile, weak stock selection in the industrials sector detracted from performance, with Northwest Airlines and AMR Corp. declining substantially during the period.
Going forward, the subadvisor, Essex Investment Management Company (“Essex”), believes that stock prices will likely stay in a limited trading range; however, a break in oil prices could provide a significant boost to confidence. As far as sector positioning is concerned, the Fund remains overweight in health care and Essex is focusing on companies with unique products and services in the biotechnology, diagnostics, and medical device areas. Essex believes that these segments should be resistant to a U.S. economic slowdown and that they should be a source of positive earnings revisions for this year and next. Meanwhile, Essex remains cautions about the consumer discretionary sector as evidenced by the Fund’s underweight position relative to the benchmark.
As noted above, for the six months ended June 30, 2008, the Managers Small Company Fund returned -8.06%, compared to a return of -9.37% for its benchmark, the Russell 2000® Index. The Fund’s outperformance was mainly attributable to favorable sector allocation, although relative stock performance in specific sectors also helped. A modest overweight to energy was beneficial as the energy sector soared on rising prices and increased demand from developing nations. The Fund’s large underweight in financials was also beneficial as finance stocks continued to struggle. In addition, the Fund’s finance stocks held up better than the Index constituents, since the Fund’s subadvisors avoided some of the worst performers within the sector. The Fund’s overweight in energy was helpful, although the Fund’s 24.0% return in the sector did not keep pace with index constituents, which rose 44.8%, and thus stock performance within energy hurt relative performance. Finally, poor stock performance within the information technology, consumer discretionary, and health care sectors contributed most to the Fund’s negative absolute return during the trailing six month period.
Looking forward, Kalmar Investment Advisers (“Kalmar”), one of the Fund’s two subadvisors, believes the effect of the credit crunch, high food prices, high energy prices, and a slowing job market are likely to be in the early stages of their impact on the economy. Epoch Investment Partners (“Epoch”), the other subadvisor, agrees. Importantly, however, both Kalmar and Epoch are finding potentially attractive investment opportunities following the market declines since mid-2007. While much uncertainty remains, each investment managers’ disciplined selection process and research capabilities seem well positioned to navigate further difficulties. Lastly, while past performance is not a guarantee of future results, both subadvisors have tended to outperform in difficult markets, while exhibiting lower volatility relative to peers in all markets.
As noted above, for the six months ended June 30, 2008, the Managers International Equity Fund returned -14.02%, compared with a return of -10.96% for its benchmark, the MSCI EAFE Index. For the period, the Fund’s underperformance relative to the benchmark has been primarily driven by weak stock selection across a number of sectors, including consumer discretionary, consumer staples, and financials. Among the biggest detractors in the Fund was Nokia, which has fallen 35% after being one of the better Fund performers in 2007. However, the portfolio managers continue to retain their confidence in Nokia’s ability to potentially overcome this short-term weakness and to capitalize on its strong positioning within the markets in which it competes. On the positive side, the Fund continues to benefit from non-benchmark exposures, which include positions in Canada and several emerging market economies, including Brazil and Russia.
2
Table of Contents
Letter to Shareholders (continued)
Although performance in the global equity markets has been difficult during the period, the decline in equity prices continues to present the portfolio managers of the Fund with an increasingly attractive universe of opportunities, as valuations have become more compelling in a number of sectors and regions. For instance, many high-quality financial stocks that may not have been attractive a year ago have seen their prices decline precipitously, despite maintaining strong balance sheets. This has given the Fund’s portfolio managers a buying opportunity, the result of which is that there is now a modest overweight in the sector relative to the benchmark. Additionally, the Fund continues to maintain a modest exposure to stocks within emerging market economies, which helps to provide diversification if the economic downturn is more prolonged than anticipated in the developed equity markets.
As noted above, for the six months ended June 30, 2008, the Managers Emerging Markets Equity Fund returned -9.70%, compared to a return of -11.64% for the MSCI Emerging Markets Index (Gross), the Fund’s primary benchmark. After five consecutive calendar years of returns in excess of 25%, emerging markets finally reversed course in the first half of 2008. While the Fund was not immune to these losses, it did hold up somewhat better than its peers and outperformed the benchmark for the period. Country-allocation decisions were the primary driver of performance during the period, while strong stock selection in a handful of countries was cancelled out by underperformance in other markets. Holdings within Russia had the largest impact on performance, both on an absolute and relative return basis, thanks to an overweight position in the market combined with double-digit returns from holdings. Stock selection in Argentina and China were also favorable during the period. Offsetting these gains, however were poor stock selections in Brazil, India, and South Korea.
Looking forward, Rexiter Capital Management (“Rexiter”), the Fund’s subadvisor, believes oil and other commodity prices will continue to be an important determinant of market performance – particularly in emerging markets. Rexiter also believes inflation is another factor that will be important to watch. Specifically, Rexiter believes that the question of how much of the current inflation is due to “one-off” situations versus longer-term structural changes will be important to monitor. Many Asian markets are seeing inflation rates of 8-10%, much of which is being driven by the increase in food prices. Rexiter believes that these prices are not sustainable, and, if that is the case, Rexiter feels that growth rates for emerging markets should be able to match or exceed expectations in the coming years. The Fund remains broadly diversified across markets and sectors, with a combination of bottom-up, stock-specific stories and top-down, macro-related themes driving positioning.
As noted above, for the six months ended June 30, 2008, the Managers Global Bond Fund returned 1.92%, compared with a return of 3.53% for the Lehman Brothers Global Aggregate Index, the Fund’s primary benchmark. The Fund’s relative overweight in corporate bonds and the related underweight in Treasuries detracted from performance during the period. Security selection within South Korean corporate bonds, as well as both Indonesian and Columbian sovereign issues, also detracted from performance. On a positive note, allocations to bonds in Argentina, along with currency exposure to the Singapore Dollar, Swiss Franc, and Uruguay Peso all contributed positively to relative performance.
Loomis, Sayles & Company (“Loomis”), the Fund’s subadvisor, believes that commodity prices could be reaching a peak, and any reversal of oil prices, in particular, could be bullish for U.S. consumer sentiment, credit spreads and the U.S. Dollar. Loomis sees the value proposition for non-U.S. currencies as poor, except for non-Japan Asian currencies, which may gain strength following renewed Renminbi appreciation later this year. Loomis continues to believe that at current levels, credit spreads appear wide enough to offer value, even if the U.S. recovery is delayed. The Fund is positioned to potentially take advantage of this perceived value, with roughly 50% exposure to corporate bonds versus less than 20% for the benchmark. Finally, Loomis believes that security selection will likely prove to be more critical moving forward, as Loomis expects default rates to trend upward and market conditions to remain vulnerable to the possibility of further economic deterioration.
The following report covers the six-month period ended June 30, 2008. Should you have any questions about this report, or if you’d like to receive a prospectus and additional information, including fees and expenses for these or any of the other Funds in our family, please feel free to contact us at 1-800-835-3879, or visit our Web site at www. managersinvest.com. As always, please read the prospectus carefully before you invest or send money.
If you are curious about how you can better diversify your investment program, visit the Knowledge Center on our Web site and view our articles in the investment strategies section. You can rest assured that under all market conditions our team is focused on delivering excellent investment management services for your benefit.
We thank you for your continued confidence and investment in The Managers Funds.
| Respectfully, |
/s/ John H. Streur |
| John H. Streur |
Senior Managing Partner Managers Investment Group LLC |
3
Table of Contents
About Your Fund’s Expenses (unaudited)
As a shareholder of the Fund, you may incur two types of costs: (1) transaction costs, which may include sales charges (loads) on purchase payments; redemption fees; and exchange fees; and (2) ongoing costs, including management fees; distribution (12b-1) fees; and other Fund expenses. This example is intended to help you understand your ongoing costs (in dollars) of investing in the Fund and to compare these costs with the ongoing costs of investing in other mutual funds. The example is based on an investment of $1,000 invested at the beginning of the period and held for the entire period as indicated below.
Actual Expenses
The first line of the table to the right provides information about the actual account values and actual expenses. You may use the information in this line, together with the amount you invested, to estimate the expenses that you paid over the period. Simply divide your account value by $1,000 (for example, an $8,600 account value divided by $1,000 = 8.6), then multiply the result by the number in the first line under the heading entitled “Expenses Paid During Period” to estimate the expenses you paid on your account during this period.
Hypothetical Example for Comparison Purposes
The second line of the table to the right provides information about hypothetical account values and hypothetical expenses based on the Fund’s actual expense ratio and an assumed annual rate of return of 5% before expenses, which is not the Fund’s actual return. The hypothetical account values and expenses may not be used to estimate the actual ending account balance or expenses you paid for the period. You may use this information to compare the ongoing costs of investing in the Fund and other funds by comparing this 5% hypothetical example with the 5% hypothetical examples that appear in the shareholder reports of other funds.
Please note that the expenses shown in the table are meant to highlight your ongoing costs only and do not reflect any transactional costs, such as sales charges (loads), redemption fees, or exchange fees. Therefore, the second line of the table is useful in comparing ongoing costs only, and will not help you determine the relative total costs of owning different funds.
Six Months Ended June 30, 2008 | Expense Ratio for the Period | Beginning Account Value 1/1/2008 | Ending Account Value 6/30/2008 | Expenses Paid During the Period* | ||||||||
Managers Value Fund | ||||||||||||
Based on Actual Fund Return | 1.19 | % | $ | 1,000 | $ | 824 | $ | 5.40 | ||||
Based on Hypothetical 5% Annual Return | 1.19 | % | $ | 1,000 | $ | 1,019 | $ | 5.97 | ||||
Managers AMG Essex Large Cap Growth Fund | ||||||||||||
Based on Actual Fund Return | 1.29 | % | $ | 1,000 | $ | 940 | $ | 6.22 | ||||
Based on Hypothetical 5% Annual Return | 1.29 | % | $ | 1,000 | $ | 1,018 | $ | 6.47 | ||||
Managers Small Company Fund | ||||||||||||
Based on Actual Fund Return | 1.45 | % | $ | 1,000 | $ | 919 | $ | 6.92 | ||||
Based on Hypothetical 5% Annual Return | 1.45 | % | $ | 1,000 | $ | 1,018 | $ | 7.27 | ||||
Managers International Equity Fund | ||||||||||||
Based on Actual Fund Return | 1.48 | % | $ | 1,000 | $ | 860 | $ | 6.84 | ||||
Based on Hypothetical 5% Annual Return | 1.48 | % | $ | 1,000 | $ | 1,018 | $ | 7.42 | ||||
Managers Emerging Markets Equity Fund | ||||||||||||
Based on Actual Fund Return | 1.77 | % | $ | 1,000 | $ | 903 | $ | 8.37 | ||||
Based on Hypothetical 5% Annual Return | 1.77 | % | $ | 1,000 | $ | 1,016 | $ | 8.87 | ||||
Managers Global Bond Fund | ||||||||||||
Based on Actual Fund Return | 1.10 | % | $ | 1,000 | $ | 1,019 | $ | 5.52 | ||||
Based on Hypothetical 5% Annual Return | 1.10 | % | $ | 1,000 | $ | 1,019 | $ | 5.52 | ||||
Managers Money Market Fund | ||||||||||||
Based on Actual Fund Return | 0.27 | % | $ | 1,000 | $ | 1,015 | $ | 2.18 | ||||
Based on Hypothetical 5% Annual Return | 0.27 | % | $ | 1,000 | $ | 1,023 | $ | 2.19 | ||||
| * | Expenses are equal to the Fund’s annualized expense ratio multiplied by the average account value over the period, multiplied by the number of days in the most recent fiscal half-year (182), then divided by 366. |
4
Table of Contents
All periods ended June 30, 2008 (unaudited)
| Average Annual Total Returns 1 | |||||||||||||||||
The Managers Funds | Six Months | One Year | Five Years | Ten Years | Since Inception | Inception Date | |||||||||||
Managers Value Fund2,3 | (17.59 | )% | (28.06 | )% | 4.44 | % | 2.18 | % | 9.82 | % | 10/31/1984 | ||||||
Russell 1000® Value Index8 | (13.57 | )% | (18.78 | )% | 8.92 | % | 4.91 | % | N/A | ||||||||
AMG Essex Large Cap Growth Fund2 | (6.05 | )% | (0.57 | )% | 6.70 | % | 3.16 | % | 11.02 | % | 6/1/1984 | ||||||
Russell 1000® Growth Index9 | (9.06 | )% | (5.96 | )% | 7.32 | % | 0.96 | % | N/A | ||||||||
Managers Small Company Fund2,4 | (8.06 | )% | (9.70 | )% | 10.41 | % | — | 2.31 | % | 6/19/2000 | |||||||
Russell 2000® Index10 | (9.37 | )% | (16.19 | )% | 10.29 | % | 5.53 | % | 4.82 | % | |||||||
Managers International Equity Fund2,5 | (14.02 | )% | (10.02 | )% | 15.75 | % | 4.77 | % | 10.27 | % | 12/31/1985 | ||||||
MSCI EAFE Index®11 | (10.96 | )% | (10.61 | )% | 16.67 | % | 5.83 | % | 9.62 | % | |||||||
Managers Emerging Markets Equity Fund2,6 | (9.70 | )% | 0.49 | % | 28.63 | % | 16.85 | % | 14.31 | % | 2/9/1998 | ||||||
MSCI Emerging Markets Index13 | (11.64 | )% | 4.89 | % | 30.15 | % | 15.51 | % | 12.76 | % | |||||||
Managers Global Bond Fund2,5,7 | 1.92 | % | 9.18 | % | 5.54 | % | 5.66 | % | 5.62 | % | 3/25/1994 | ||||||
Lehman Brothers Global Aggregate Bond Index12 | 3.53 | % | 12.90 | % | 5.90 | % | 6.10 | % | N/A | ||||||||
Managers Money Market Fund2 | 1.54 | % | 4.01 | % | 3.00 | % | 3.41 | % | 4.84 | % | 6/1/1984 | ||||||
3-Month U.S. Treasury Bill14 | 1.20 | % | 3.64 | % | 3.18 | % | 3.63 | % | 5.23 | % | |||||||
The performance data shown represents past performance. Past performance is not a guarantee of future results. Current performance may be lower or higher than the performance data quoted. The investment return and principal value of an investment in the Fund will fluctuate so that an investor’s shares, when redeemed, may be worth more or less than their original cost. For performance information through the most recent month end, please call (800) 835-3879 or visit our Web site at www.managersinvest.com.
In choosing a Fund, investors should carefully consider the amount they plan to invest, their investment objectives, the Fund’s investment objectives, risks, charges and expenses before investing. For this and other information, please call 800.835.3879 or visit www.managersinvest.com for a free prospectus. Read it carefully before investing or sending money. Distributed by Managers Distributors, Inc., member FINRA.
1 | Total return equals income yield plus share price change and assumes reinvestment of all dividends and capital gain distributions. Returns are net of fees and may reflect offsets of Fund expenses as described in the Prospectus. No adjustment has been made for taxes payable by shareholders on their reinvested dividends and capital gain distributions. Returns for periods greater than one year are annualized. The listed returns on the Fund are net of expenses and based on the published NAV as of June 30, 2008. All returns are in U.S. dollars($). |
2 | Fund for which, from time to time, the Fund’s advisor has waived its fees and/or absorbed Fund expenses, which has resulted in higher returns. |
3 | Investing in value stocks contains certain risks. Value stocks may perform differently from the market as a whole and may be undervalued by the market for a long period of time. Value stocks may underperform growth stocks during given periods. |
4 | The Fund is subject to risks associated with investments in small capitalization companies, such as erratic earnings patterns, competitive conditions, limited earnings history and a reliance on one or a limited number of products. |
5 | Investments in foreign securities are subject to additional risks such as changing market conditions, economic and political instability, and currency exchange rate fluctuations. |
6 | The Fund is subject to the risks associated with investments in emerging markets, such as erratic earnings patterns, economic and political instability, changing exchange controls, limitations on repatriation of foreign capital and changes in local governmental attitudes toward private investment, possibly leading to nationalization or confiscation of investor assets. |
7 | Changing interest rates may adversely affect the value of an investment. An increase in interest rates typically causes the value of bonds and other fixed-income securities to fall. The Fund is subject to the risks associated with investments in debt securities, such as default risk and fluctuations in the perception of the debtor’s ability to pay its creditors. |
8 | The Russell 1000® Value is a large cap value index measuring the performance of the largest 1,000 U.S. incorporated companies with lower price-to-book ratios and lower forcasted growth values. Unlike the Fund, the Russell 1000® Value Index is unmanaged, is not available for investment, and does not incur expenses. The Russell 1000® Value Index is a trademark of Russell Investments. Russell® is a trademark of Russell Investments. |
9 | The Russell 1000® Growth Index is a market capitalization weighted index that measures the performance of those Russell 1000® companies with higher price-to-book ratio and higher forecasted growth values. Unlike the Fund, the Russell 1000® Growth Index is unmanaged, is not available for investment, and does not incur expenses. The Russell 1000® Growth Index is a trademark of Russell Investments. Russell® is a trademark of Russell Investments. |
10 | The Russell 2000® Index is composed of the 2,000 smallest stocks in the Russell 3000® Index, and is widely regarded in the industry as the premier measure of small cap stock performance. The Russell 3000® Index is composed of the 3,000 largest U.S. Companies as measured by market capitalization, and represents about 98% of the U.S. stock market. Unlike the Fund, the Russell 2000® Index is unmanaged, is not available for investment, and does not incur expenses. The Russell 2000® Index is a trademark of Russell Investments. Russell® is a trademark of Russell Investments. |
11 | The Morgan Stanley Capital International Europe, Australasia, and Far East (MSCI EAFE) Index® is composed of all the publicly traded stocks in developed non-U.S. Markets. Among the countries included are Australia, France, Germany, Italy, Japan, Singapore, Spain, and the United Kingdom. Unlike the Fund, the MSCI EAFE Index is unmanaged, is not available for investment, and does not incur expenses. All MSCI data is provided “as is.” The products described herein are not sponsored or endorsed and have not been reviewed or passed on by MSCI. In no event shall MSCI, its affiliates or any MSCI data provider have any liability of any kind in connection with the MSCI data or the products described herein. Copying or redistributing the MSCI data is strictly prohibited. |
12 | The Lehman Brothers Global Aggregate Index provides a broad-based measure of the global investment-grade fixed income markets. The three major components of this index are the U.S. Aggregate, the Pan-European Aggregate, and the Asian-Pacific Aggregate Indices. The Index also includes Eurodollar and Euro-Yen corporate bonds, Canadian government, agency and corporate securities, and USD investment grade 144A securities. |
13 | The MSCI Emerging Markets (MSCI EM) Index is a free float-adjusted market capitalization index designed to measure equity market performance in the global emerging markets. The MSCI EM Index consists of emerging markets country indexes, including Argentina, Brazil, Chile, Czech Republic, India, Israel, Malaysia, Mexico, the Philippines, Poland, and Thailand. Unlike the Fund, the MSCI EM Index is unmanaged, is not available for investment, and does not incur expenses. All MSCI data is provided “as is.” The products described herein are not sponsored or endorsed and have not been reviewed or passed on by MSCI. In no event shall MSCI, its affiliates, or any MSCI data provider have any liability of any kind in connection with the MSCI data or the products described herein. Copying or redistributing the MSCI data is strictly prohibited. |
14 | Since inception is as of May 31, 1984. |
Not FDIC insured, nor bank guaranteed. May lose value.
5
Table of Contents
Fund Snapshots
June 30, 2008 (unaudited)
Portfolio Breakdown
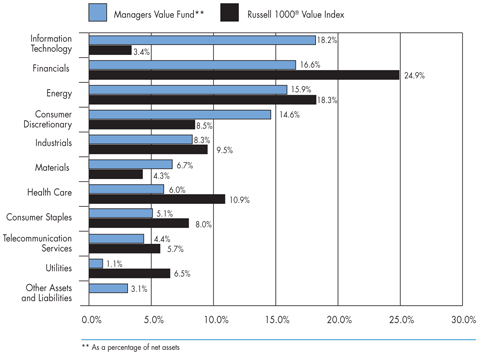
Industry | Managers Value Fund** | Russell 1000® Value Index | ||||
Information Technology | 18.2 | % | 3.4 | % | ||
Financials | 16.6 | % | 24.9 | % | ||
Energy | 15.9 | % | 18.3 | % | ||
Consumer Discretionary | 14.6 | % | 8.5 | % | ||
Industrials | 8.3 | % | 9.5 | % | ||
Materials | 6.7 | % | 4.3 | % | ||
Health Care | 6.0 | % | 10.9 | % | ||
Consumer Staples | 5.1 | % | 8.0 | % | ||
Telecommunication Services | 4.4 | % | 5.7 | % | ||
Utilities | 1.1 | % | 6.5 | % | ||
Other Assets and Liabilities | 3.1 | % | 0.0 | % | ||
Top Ten Holdings
Security Name | Percentage of Net Assets | ||
Hewlett-Packard Co. | 4.1 | % | |
J.C. Penney Co., Inc. | 3.1 | ||
Halliburton Co. | 3.0 | ||
American Express Co. | 3.0 | ||
Chesapeake Energy Corp. | 2.9 | ||
Bank of America Corp.* | 2.8 | ||
Ingram Micro, Inc., Class A | 2.8 | ||
Nokia Corp., Sponsored ADR* | 2.7 | ||
Merrill Lynch & Co., Inc. | 2.5 | ||
Verizon Communications, Inc.* | 2.5 | ||
Top Ten as a Group | 29.4 | % | |
| * | Top Ten Holding at December 31, 2007 |
Any sectors, industries, or securities discussed should not be perceived as investment recommendations. Mention of a specific security should not be considered a recommendation to buy or solicitation to sell that security.
6
Table of Contents
Managers Value Fund
Schedule of Portfolio Investments
June 30, 2008 (unaudited)
| Shares | Value | ||||||
Common Stocks - 96.9% | |||||||
Consumer Discretionary - 14.6% | |||||||
Abercrombie & Fitch Co. | 15,300 | $ | 959,004 | ||||
Comcast Corp., Special Class A | 47,240 | 886,222 | |||||
Dollar Tree, Inc.* | 29,800 | 2 | 974,162 | ||||
Home Depot, Inc., The | 23,700 | 2 | 555,054 | ||||
J.C. Penney Co., Inc. | 43,450 | 2 | 1,576,800 | ||||
Jarden Corp.* | 43,800 | 798,912 | |||||
Lowe’s Companies, Inc. | 27,240 | 565,230 | |||||
Rent-A-Center, Inc.* | 35,550 | 731,264 | |||||
Wyndham Worldwide Corp. | 19,902 | 356,445 | |||||
Total Consumer Discretionary | 7,403,093 | ||||||
Consumer Staples - 5.1% | |||||||
CVS Caremark Corp. | 22,640 | 895,865 | |||||
Kraft Foods, Inc. | 30,290 | 861,750 | |||||
Procter & Gamble Co., The | 13,900 | 845,259 | |||||
Total Consumer Staples | 2,602,874 | ||||||
Energy - 15.9% | |||||||
Baker Hughes, Inc. | 7,910 | 690,859 | |||||
Chesapeake Energy Corp. | 22,100 | 2 | 1,457,716 | ||||
Chevron Corp. | 12,900 | 1,278,777 | |||||
ConocoPhillips Co. | 11,930 | 1,126,073 | |||||
Devon Energy Corp. | 9,120 | 1,095,859 | |||||
El Paso Corp. | 43,210 | 2 | 939,385 | ||||
Halliburton Co. | 28,500 | 1,512,496 | |||||
Total Energy | 8,101,165 | ||||||
Financials - 16.6% | |||||||
American Express Co. | 40,140 | 1,512,074 | |||||
American International Group, Inc. | 46,820 | 1,238,857 | |||||
Bank of America Corp. | 60,270 | 1,438,645 | |||||
Citigroup, Inc. | 29,341 | 491,755 | |||||
Fannie Mae | 33,800 | 659,438 | |||||
JPMorgan Chase & Co. | 22,190 | 761,339 | |||||
Lehman Brothers Holdings, Inc. | 25,000 | 2 | 495,250 | ||||
Merrill Lynch & Co., Inc. | 40,640 | 2 | 1,288,694 | ||||
XL Capital, Ltd. | 26,700 | 2 | 548,952 | ||||
Total Financials | 8,435,004 | ||||||
Health Care - 6.0% | |||||||
Abbott Laboratories Co. | 14,700 | 778,659 | |||||
Covidien, Ltd. | 21,115 | 1,011,198 | |||||
Johnson & Johnson | 9,510 | 611,873 | |||||
McKesson Corp. | 11,400 | 637,374 | |||||
Total Health Care | 3,039,104 | ||||||
Industrials - 8.3% | |||||||
Empresa Brasileira de Aeronautica, S.A. | 30,050 | 2 | 796,325 | ||||
General Electric Co. | 28,175 | 751,991 | |||||
United Parcel Service, Inc., Class B | 13,530 | 2 | 831,689 | ||||
United Technologies Corp. | 15,100 | 931,670 | |||||
Wesco International, Inc.* | 23,100 | 924,924 | |||||
Total Industrials | 4,236,599 | ||||||
Information Technology - 18.2% | |||||||
Cisco Systems, Inc.* | 42,200 | 981,572 | |||||
Hewlett-Packard Co. | 47,500 | 2,099,975 | |||||
Ingram Micro, Inc., Class A* | 80,800 | 1,434,200 | |||||
International Business Machines Corp. | 9,280 | 1,099,958 | |||||
Nokia Corp., Sponsored ADR | 56,600 | 1,386,700 | |||||
Oracle Corp.* | 38,500 | 808,500 | |||||
Seagate Technology, Inc. | 39,500 | 2 | 755,635 | ||||
Xerox Corp. | 49,410 | 670,000 | |||||
Total Information Technology | 9,236,540 | ||||||
Materials - 6.7% | |||||||
Alcoa, Inc. | 25,520 | 909,022 | |||||
CEMEX, S.A.B. de C.V.* | 27,103 | 2 | 669,444 | ||||
Dow Chemical Co. | 28,000 | 977,480 | |||||
PPG Industries, Inc. | 14,700 | 843,339 | |||||
Total Materials | 3,399,285 | ||||||
Telecommunication Services - 4.4% | |||||||
Verizon Communications, Inc. | 36,200 | 2 | 1,281,480 | ||||
AT&T, Inc. | 28,200 | 950,058 | |||||
Total Telecommunication Services | 2,231,538 | ||||||
Utilities - 1.1% | |||||||
Exelon Corp. | 6,480 | 582,941 | |||||
Total Common Stocks (cost $53,486,683) | 49,268,143 | ||||||
Other Investment Companies - 20.7%1 | |||||||
Bank of New York Institutional Cash Reserves Fund, 2.62% 3 | 8,799,085 | 8,799,085 | |||||
Dreyfus Cash Management Fund, Institutional Class Shares, 2.66% | 1,740,653 | 1,740,653 | |||||
Total Other Investment Companies | 10,539,738 | ||||||
Total Investments - 117.6% | 59,807,881 | ||||||
Other Assets, less Liabilities - (17.6)% | (8,956,149 | ) | |||||
Net Assets - 100.0% | $ | 50,851,732 | |||||
The accompanying notes are an integral part of these financial statements.
7
Table of Contents
Managers AMG Essex Large Cap Growth Fund
Fund Snapshots
June 30, 2008 (unaudited)
Portfolio Breakdown

Industry | Managers AMG Essex Large Cap Growth Fund** | Russell 1000® Growth Index | ||||
Information Technology | 33.9 | % | 28.7 | % | ||
Health Care | 26.2 | % | 12.3 | % | ||
Energy | 12.3 | % | 13.3 | % | ||
Consumer Staples | 5.2 | % | 11.5 | % | ||
Consumer Discretionary | 5.1 | % | 8.7 | % | ||
Materials | 4.6 | % | 4.8 | % | ||
Industrials | 3.9 | % | 13.3 | % | ||
Telecommunication Services | 3.8 | % | 0.8 | % | ||
Financials | 1.9 | % | 4.2 | % | ||
Utilities | 0.0 | % | 2.4 | % | ||
Other Assets and Liabilities | 3.1 | % | 0.0 | % | ||
Top Ten Holdings
Security Name | Percentage of Net Assets | ||
Peabody Energy Corp.* | 4.9 | % | |
Genentech, Inc. | 3.5 | ||
Abbott Laboratories Co.* | 3.4 | ||
Gilead Sciences, Inc.* | 3.0 | ||
Oracle Corp. | 2.9 | ||
NII Holdings, Inc., Class B | 2.9 | ||
Google, Inc.* | 2.9 | ||
Research In Motion, Ltd. | 2.8 | ||
CVS Caremark Corp. | 2.8 | ||
Vertex Pharmaceuticals, Inc. | 2.7 | ||
Top Ten as a Group | 31.8 | % | |
| * | Top Ten Holding at December 31, 2007 |
Any sectors, industries, or securities discussed should not be perceived as investment recommendations. Mention of a specific security should not be considered a recommendation to buy or solicitation to sell that security.
8
Table of Contents
Managers AMG Essex Large Cap Growth Fund
Schedule of Portfolio Investments
June 30, 2008 (unaudited)
| Shares | Value | ||||||
Common Stocks - 96.9% | |||||||
Consumer Discretionary - 5.1% | |||||||
International Game Technology | 23,987 | 2 | $ | 599,195 | |||
Kohl’s Corp.* | 30,397 | 1,217,096 | |||||
Urban Outfitters, Inc.* | 16,958 | 2 | 528,920 | ||||
Total Consumer Discretionary | 2,345,211 | ||||||
Consumer Staples - 5.2% | |||||||
CVS Caremark Corp. | 33,092 | 1,309,451 | |||||
Procter & Gamble Co., The | 18,009 | 1,095,127 | |||||
Total Consumer Staples | 2,404,578 | ||||||
Energy - 12.3% | |||||||
Chesapeake Energy Corp. | 14,095 | 2 | 929,706 | ||||
Patterson-UTI Energy, Inc. | 19,414 | 2 | 699,681 | ||||
Peabody Energy Corp. | 25,763 | 2 | 2,268,432 | ||||
Petroleo Brasileiro, S.A., Sponsored ADR | 9,690 | 2 | 686,343 | ||||
Southwestern Energy Co.* | 22,804 | 1,085,698 | |||||
Total Energy | 5,669,860 | ||||||
Financials - 1.9% | |||||||
Goldman Sachs Group, Inc. | 1,312 | 229,469 | |||||
State Street Corp. | 10,275 | 657,497 | |||||
Total Financials | 886,966 | ||||||
Health Care - 26.2% | |||||||
Abbott Laboratories Co. | 29,273 | 1,550,591 | |||||
Alcon, Inc. | 5,363 | 873,043 | |||||
Baxter International, Inc. | 14,228 | 909,738 | |||||
Charles River Laboratories International, Inc.* | 10,977 | 2 | 701,650 | ||||
Elan Corp., PLC, Sponsored ADR* | 31,126 | 2 | 1,106,529 | ||||
Forest Laboratories, Inc.* | 22,241 | 772,652 | |||||
Genentech, Inc.* | 20,993 | 1,593,369 | |||||
Gilead Sciences, Inc.* | 26,526 | 1,404,552 | |||||
Intuitive Surgical, Inc.* | 1,722 | 2 | 463,907 | ||||
Medco Health Solutions, Inc.* | 12,690 | 598,968 | |||||
Thermo Fisher Scientific, Inc.* | 16,252 | 2 | 905,724 | ||||
Vertex Pharmaceuticals, Inc.* | 36,888 | 2 | 1,234,641 | ||||
Total Health Care | 12,115,364 | ||||||
Industrials - 3.9% | |||||||
ABB, Ltd.* | 14,027 | 397,245 | |||||
First Solar, Inc.* | 1,653 | 2 | 450,971 | ||||
JA Solar Holdings Co., Ltd., ADR* | 26,286 | 2 | 442,919 | ||||
Quanta Services, Inc.* | 16,226 | 2 | 539,839 | ||||
Total Industrials | 1,830,974 | ||||||
Information Technology - 33.9% | |||||||
Akamai Technologies, Inc.* | 13,758 | 478,641 | |||||
Alliance Data Systems Corp.* | 20,639 | 2 | 1,167,135 | ||||
ASML Holding, N.V., NY Regulated Shares | 22,702 | 2 | 553,929 | ||||
Broadcom Corp., Class A* | 41,338 | 2 | 1,128,114 | ||||
Brocade Communications Systems, Inc.* | 111,439 | 2 | 918,257 | ||||
EMC Corp.* | 65,796 | 966,543 | |||||
Google, Inc.* | 2,515 | 1,323,946 | |||||
Intel Corp. | 20,863 | 2 | 448,137 | ||||
International Business Machines Corp. | 9,545 | 1,131,369 | |||||
McAfee, Inc.* | 20,116 | 2 | 684,547 | ||||
Microsoft Corp. | 43,024 | 1,183,590 | |||||
Oracle Corp.* | 63,636 | 1,336,357 | |||||
QUALCOMM, Inc. | 27,148 | 1,204,557 | |||||
Research In Motion, Ltd.* | 11,213 | 1,310,800 | |||||
Salesforce.com, Inc.* | 13,691 | 2 | 934,137 | ||||
Western Union Co., The | 35,982 | 2 | 889,475 | ||||
Total Information Technology | 15,659,534 | ||||||
Materials - 4.6% | |||||||
Mosaic Co., The,* | 7,710 | 1,115,637 | |||||
Potash Corp. of Saskatchewan | 4,343 | 2 | 992,680 | ||||
Total Materials | 2,108,317 | ||||||
Telecommunication Services - 3.8% | |||||||
MetroPCS Communications, Inc.* | 23,311 | 2 | 412,838 | ||||
NII Holdings, Inc., Class B* | 28,009 | 2 | 1,330,147 | ||||
Total Telecommunication Services | 1,742,985 | ||||||
Total Common Stocks | 44,763,789 | ||||||
Other Investment Companies - 29.5%1 | |||||||
Bank of New York Institutional Cash Reserves Fund, 2.62%3 | 12,209,280 | 12,209,280 | |||||
Dreyfus Cash Management Fund, Institutional Class Shares, 2.66% | 1,418,098 | 1,418,098 | |||||
Total Other Investment Companies | 13,627,378 | ||||||
Total Investments - 126.4% | 58,391,167 | ||||||
Other Assets, less Liabilities - (26.4)% | (12,210,927 | ) | |||||
Net Assets - 100.0% | $ | 46,180,240 | |||||
The accompanying notes are an integral part of these financial statements.
9
Table of Contents
Fund Snapshots
June 30, 2008 (unaudited)
Portfolio Breakdown
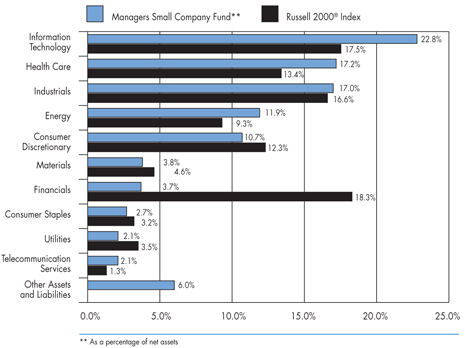
Industry | Managers Small Company Fund** | Russell 2000® Index | ||||
Information Technology | 22.8 | % | 17.5 | % | ||
Health Care | 17.2 | % | 13.4 | % | ||
Industrials | 17.0 | % | 16.6 | % | ||
Energy | 11.9 | % | 9.3 | % | ||
Consumer Discretionary | 10.7 | % | 12.3 | % | ||
Materials | 3.8 | % | 4.6 | % | ||
Financials | 3.7 | % | 18.3 | % | ||
Consumer Staples | 2.7 | % | 3.2 | % | ||
Utilities | 2.1 | % | 3.5 | % | ||
Telecommunication Services | 2.1 | % | 1.3 | % | ||
Other Assets and Liabilities | 6.0 | % | 0.0 | % | ||
Top Ten Holdings
Security Name | Percentage of Net Assets | ||
Ultra Petroleum Corp.* | 2.0 | % | |
Service Corp. International* | 1.7 | ||
Arbitron, Inc.* | 1.6 | ||
Foundation Coal Holdings, Inc. | 1.3 | ||
IHS, Inc., Class A | 1.2 | ||
Vectren Corp. | 1.2 | ||
Niko Resources, Ltd. | 1.2 | ||
Alliant Techsystems, Inc.* | 1.1 | ||
CyberSource Corp. | 1.1 | ||
Central European Distribution Corp. | 1.1 | ||
Top Ten as a Group | 13.5 | % | |
| * | Top Ten Holding at December 31, 2007 |
Any sectors, industries, or securities discussed should not be perceived as investment recommendations. Mention of a specific security should not be considered a recommendation to buy or solicitation to sell that security.
10
Table of Contents
Managers Small Company Fund
Schedule of Portfolio Investments
June 30, 2008 (unaudited)
| Shares | Value | |||||
Common Stocks - 94.0% | ||||||
Consumer Discretionary - 10.7% | ||||||
1-800-FLOWERS.COM, Inc.* | 9,095 | $ | 58,663 | |||
Arbitron, Inc. | 9,150 | 434,625 | ||||
BJ’s Restaurants, Inc.* | 3,080 | 29,968 | ||||
Charming Shoppes, Inc.* | 27,389 | 125,716 | ||||
DeVry, Inc. | 5,330 | 285,795 | ||||
Fred’s, Inc. | 5,910 | 66,428 | ||||
GameStop Corp.* | 3,410 | 137,764 | ||||
Global Traffic Network, Inc.* | 2,930 | 26,194 | ||||
LKQ Corp.* | 9,700 | 2 | 175,279 | |||
Monro Muffler Brake, Inc. | 8,386 | 2 | 129,899 | |||
Multimedia Games, Inc.* | 27,320 | 120,754 | ||||
NutriSystem, Inc.* | 5,550 | 78,477 | ||||
O’Reilly Automotive, Inc.* | 2,735 | 61,127 | ||||
Service Corp. International | 44,650 | 440,250 | ||||
Shuffle Master, Inc.* | 18,648 | 92,121 | ||||
Tractor Supply Co.* | 5,050 | 146,652 | ||||
Tupperware Brands Corp. | 4,500 | 2 | 153,990 | |||
WABCO Holdings, Inc. | 6,380 | 296,415 | ||||
Total Consumer Discretionary | 2,860,117 | |||||
Consumer Staples - 2.7% | ||||||
Central European Distribution Corp.* | 4,081 | 302,607 | ||||
Elizabeth Arden, Inc.* | 5,730 | 86,981 | ||||
Longs Drug Stores Corp. | 4,720 | 2 | 198,759 | |||
SunOpta, Inc.* | 21,900 | 113,661 | ||||
Susser Holdings Corp.* | 2,110 | 20,425 | ||||
Total Consumer Staples | 722,433 | |||||
Energy - 11.9% | ||||||
Atwood Oceanics, Inc.* | 1,670 | 2 | 207,648 | |||
Cal Dive International, Inc.* | 20,950 | 299,376 | ||||
Clean Energy Fuels Corp.* | 6,880 | 79,051 | ||||
Core Laboratories, N.V.* | 1,590 | 2 | 226,336 | |||
Delta Petroleum Corp.* | 8,885 | 226,745 | ||||
Foundation Coal Holdings, Inc. | 3,820 | 338,376 | ||||
GMX Resources, Inc.* | 3,630 | 268,983 | ||||
Kodiak Oil & Gas Corp.* | 16,120 | 73,507 | ||||
Niko Resources, Ltd. | 3,170 | 305,392 | ||||
Parallel Petroleum Corp.* | 8,455 | 170,199 | ||||
Seacor Holdings, Inc.* | 1,700 | 152,167 | ||||
Tidewater, Inc. | 2,125 | 138,189 | ||||
Ultra Petroleum Corp.* | 5,455 | 2 | 535,681 | |||
Warren Resources, Inc.* | 9,687 | 142,205 | ||||
Total Energy | 3,163,855 | |||||
Financials - 3.7% | ||||||
Education Realty Trust, Inc. | 18,100 | 210,865 | ||||
Flushing Financial Corp. | 8,340 | 158,043 | ||||
National Financial Partners Corp. | 1,670 | 33,099 | ||||
Signature Bank* | 8,910 | 229,522 | ||||
SWS Group, Inc. | 7,658 | 2 | 127,199 | |||
UMB Financial Corp. | 2,000 | 102,540 | ||||
Wilshire Bancorp, Inc. | 13,400 | 114,838 | ||||
Total Financials | 976,106 | |||||
Health Care - 17.2% | ||||||
Alkermes, Inc.* | 5,799 | 2 | 71,676 | |||
Analogic Corp. | 4,000 | 252,280 | ||||
Assisted Living Concepts, Inc. (I-A)* | 20,739 | 114,064 | ||||
Bio-Reference Labs, Inc.* | 10,990 | 245,187 | ||||
Cambrex Corp. | 20,310 | 119,220 | ||||
Cooper Companies, Inc., The | 7,140 | 2 | 265,251 | |||
Covance, Inc.* | 1,770 | 152,255 | ||||
Eclipsys Corp.* | 6,150 | 2 | 112,914 | |||
Endo Pharmaceuticals Holdings, Inc.* | 4,350 | 105,226 | ||||
eResearch Technology, Inc.* | 6,810 | 118,766 | ||||
Haemonetics Corp.* | 3,040 | 2 | 168,598 | |||
HealthExtras, Inc.* | 5,270 | 158,838 | ||||
Healthways, Inc.* | 3,810 | 2 | 112,776 | |||
Immucor, Inc.* | 3,950 | 2 | 102,226 | |||
inVentiv Health, Inc.* | 6,750 | 2 | 187,582 | |||
Inverness Medical Innovations, Inc.* | 4,690 | 155,567 | ||||
IRIS International, Inc.* | 9,600 | 150,240 | ||||
K-V Pharmaceutical Co., Class A* | 13,450 | 2 | 259,989 | |||
Landauer, Inc. | 1,700 | 95,608 | ||||
Luminex Corp.* | 4,750 | 2 | 97,612 | |||
MAKO Surgical Corp.* | 13,450 | 98,454 | ||||
Martek Biosciences Corp.* | 5,980 | 201,586 | ||||
Pediatrix Medical Group, Inc.* | 2,450 | 2 | 120,614 | |||
Phase Forward, Inc.* | 8,300 | 149,151 | ||||
PSS World Medical, Inc.* | 9,345 | 152,324 | ||||
Psychiatric Solutions, Inc.* | 4,890 | 2 | 185,038 | |||
ResMed, Inc.* | 4,325 | 2 | 154,576 | |||
SonoSite, Inc.* | 10,000 | 280,100 | ||||
The accompanying notes are an integral part of these financial statements.
11
Table of Contents
Managers Small Company Fund
Schedule of Portfolio Investments (continued)
| Shares | Value | |||||
Health Care - 17.2% (continued) | ||||||
Sunrise Senior Living, Inc.* | 8,050 | 2 | $ | 180,964 | ||
Total Health Care | 4,568,682 | |||||
Industrials - 17.0% | ||||||
Actuant Corp., Class A | 2,150 | 2 | 67,402 | |||
Advisory Board Co., The* | 2,960 | 116,417 | ||||
Alliant Techsystems, Inc.* | 3,000 | 2 | 305,040 | |||
American Ecology Corp. | 9,300 | 274,629 | ||||
Armstrong World Industries, Inc.* | 2,250 | 2 | 65,745 | |||
Barnes Group, Inc. | 3,380 | 2 | 78,044 | |||
Chicago Bridge & Iron Co., N.V. | 5,395 | 214,829 | ||||
ChoicePoint, Inc.* | 1,595 | 76,879 | ||||
Clean Harbors, Inc.* | 1,420 | 2 | 100,905 | |||
Corrections Corp. of America* | 8,644 | 237,451 | ||||
DRS Technologies, Inc. | 2,700 | 212,544 | ||||
Duff & Phelps Corp., Class A* | 14,790 | 244,922 | ||||
Dycom Industries, Inc.* | 5,450 | 79,134 | ||||
EnerSys* | 4,940 | 2 | 169,096 | |||
Healthcare Services Group, Inc. | 6,480 | 98,561 | ||||
Hexcel Corp.* | 7,380 | 2 | 142,434 | |||
IHS, Inc., Class A* | 4,730 | 329,207 | ||||
InnerWorkings, Inc.* | 6,770 | 80,969 | ||||
Kennametal, Inc. | 9,160 | 2 | 298,158 | |||
Mobile Mini, Inc.* | 7,875 | 157,500 | ||||
MPS Group, Inc.* | 10,190 | 108,320 | ||||
MSC Industrial Direct Co., Class A | 4,790 | 2 | 211,287 | |||
Polypore International, Inc.* | 10,530 | 266,725 | ||||
Teleflex, Inc. | 3,450 | 191,786 | ||||
Tetra Technologies, Inc.* | 6,530 | 147,709 | ||||
URS Corp.* | 2,039 | 85,577 | ||||
UTi Worldwide, Inc. | 7,620 | 152,019 | ||||
Total Industrials | 4,513,289 | |||||
Information Technology - 22.8% | ||||||
Actuate Corp.* | 29,950 | 117,104 | ||||
ADC Telecommunications, Inc.* | 12,560 | 185,511 | ||||
ANSYS, Inc.* | 2,280 | 107,434 | ||||
Ariba, Inc.* | 2,630 | 2 | 38,687 | |||
Arris Group, Inc.* | 21,640 | 182,858 | ||||
ATMI, Inc.* | 7,145 | 199,488 | ||||
Concur Technologies, Inc.* | 3,210 | 106,668 | ||||
Constant Contact, Inc.* | 3,710 | 69,934 | ||||
CyberSource Corp.* | 18,110 | 302,981 | ||||
DealerTrack Holdings, Inc.* | 5,840 | 82,402 | ||||
Digital River, Inc.* | 2,730 | 2 | 105,323 | |||
Diodes, Inc.* | 3,172 | 87,674 | ||||
DTS, Inc.* | 8,360 | 261,836 | ||||
Fair Isaac Corp. | 7,850 | 2 | 163,044 | |||
FEI Co.* | 5,560 | 126,657 | ||||
Harmonic, Inc.* | 12,300 | 116,973 | ||||
Heartland Payment Systems, Inc. | 2,710 | 63,956 | ||||
Hypercom Corp.* | 40,340 | 177,496 | ||||
Ixia* | 6,790 | 47,190 | ||||
Macrovision Solutions Corp.* | 18,355 | 274,591 | ||||
Microsemi Corp.* | 6,930 | 2 | 174,497 | |||
Napco Security Systems, Inc.* | 24,819 | 112,430 | ||||
NeuStar, Inc., Class A* | 10,790 | 2 | 232,632 | |||
NIC, Inc. | 9,720 | 66,388 | ||||
NICE Systems, Ltd.* | 4,700 | 138,979 | ||||
Online Resources Corp.* | 4,355 | 36,364 | ||||
OPNET Technologies, Inc.* | 3,345 | 30,105 | ||||
Polycom, Inc.* | 7,155 | 174,296 | ||||
Powerwave Technologies, Inc.* | 46,620 | 198,135 | ||||
Progress Software Corp.* | 5,125 | 131,046 | ||||
RightNow Technologies, Inc.* | 6,350 | 86,804 | ||||
Rogers Corp.* | 3,705 | 139,271 | ||||
Rubicon Technology, Inc.* | 2,790 | 2 | 56,693 | |||
Sapient Corp.* | 13,740 | 88,211 | ||||
Silicon Image, Inc.* | 30,689 | 222,495 | ||||
SkillSoft PLC* | 10,110 | 91,394 | ||||
Solera Holdings, Inc.* | 8,250 | 228,195 | ||||
Sybase, Inc.* | 10,100 | 297,143 | ||||
Symmetricom, Inc.* | 8,880 | 34,099 | ||||
Syntel, Inc. | 2,240 | 2 | 75,533 | |||
Tessera Technologies, Inc.* | 5,360 | 87,743 | ||||
THQ, Inc.* | 14,632 | 296,445 | ||||
ValueClick, Inc.* | 8,410 | 127,412 | ||||
Volterra Semiconductor Corp.* | 6,360 | 109,774 | ||||
Total Information Technology | 6,053,891 | |||||
Materials - 3.8% | ||||||
Albemarle Corp. | 5,230 | 2 | 208,728 | |||
Hercules, Inc. | 8,900 | 2 | 150,677 | |||
Methanex Corp. | 4,075 | 114,182 | ||||
Nalco Holding Co. | 5,900 | 124,785 | ||||
Schweitzer-Mauduit International, Inc. | 3,150 | 53,078 | ||||
The accompanying notes are an integral part of these financial statements.
12
Table of Contents
Managers Small Company Fund
Schedule of Portfolio Investments (continued)
| Shares | Value | ||||||
Materials - 3.8% (continued) | |||||||
Sensient Technologies Corp. | 2,770 | $ | 78,003 | ||||
Silgan Holdings, Inc. | 5,540 | 281,100 | |||||
Total Materials | 1,010,553 | ||||||
Telecommunication Services - 2.1% | |||||||
Cbeyond, Inc.* | 4,230 | 67,765 | |||||
CenturyTel, Inc. | 5,850 | 208,201 | |||||
NTELOS Holdings Corp. | 5,580 | 141,565 | |||||
Syniverse Holdings, Inc.* | 8,300 | 2 | 134,460 | ||||
Total Telecommunication Services | 551,991 | ||||||
Utilities - 2.1% | |||||||
Vectren Corp. | 10,050 | 313,661 | |||||
Westar Energy, Inc. | 11,350 | 244,138 | |||||
Total Utilities | 557,799 | ||||||
Total Common Stocks | 24,978,716 | ||||||
Other Investment Companies - 25.0%1 | |||||||
Bank of New York Institutional Cash Reserves Fund, 2.62%3 | 5,014,758 | 5,014,758 | |||||
Dreyfus Cash Management Fund, Institutional Class Shares, 2.66% | 1,627,480 | 1,627,480 | |||||
Total Other Investment Companies | 6,642,238 | ||||||
Total Investments - 119.0% | 31,620,954 | ||||||
Other Assets, less Liabilities - (19.0)% | (5,061,645 | ) | |||||
Net Assets - 100.0% | $ | 26,559,309 | |||||
The accompanying notes are an integral part of these financial statements.
13
Table of Contents
Managers International Equity Fund
Fund Snapshots
June 30, 2008 (unaudited)
Portfolio Breakdown

Industry | Managers International Equity Fund** | MSCI EAFE Index | ||||
Financials | 26.0 | % | 25.1 | % | ||
Materials | 14.5 | % | 11.8 | % | ||
Industrials | 10.8 | % | 12.0 | % | ||
Energy | 10.1 | % | 9.3 | % | ||
Information Technology | 8.7 | % | 5.2 | % | ||
Consumer Staples | 7.0 | % | 8.1 | % | ||
Health Care | 6.2 | % | 6.8 | % | ||
Consumer Discretionary | 5.2 | % | 9.7 | % | ||
Telecommunication Services | 2.8 | % | 5.6 | % | ||
Utilities | 2.8 | % | 6.4 | % | ||
Other Equities | 0.7 | % | 0.0 | % | ||
Preferred Stocks | 0.2 | % | 0.0 | % | ||
Other Assets and Liabilities | 5.0 | % | 0.0 | % | ||
Top Ten Holdings
Security Name | Percentage of Net Assets | ||
Allianz SE* | 1.5 | % | |
Royal Dutch Shell PLC, Class A | 1.5 | ||
BNP Paribas, S.A.* | 1.3 | ||
Potash Corp. of Saskatchewan, Inc. | 1.3 | ||
Vestas Wind Systems A/S | 1.3 | ||
UBS AG | 1.2 | ||
BASF SE | 1.2 | ||
Nintendo Co., Ltd. | 1.2 | ||
Syngenta AG | 1.1 | ||
Koninklijke Ahold, N.V. | 1.1 | ||
Top Ten as a Group | 12.7 | % | |
| * | Top Ten Holding at December 31, 2007 |
Any sectors, industries, or securities discussed should not be perceived as investment recommendations. Mention of a specific security should not be considered a recommendation to buy or solicitation to sell that security.
14
Table of Contents
Managers International Equity Fund
Fund Snapshots (continued)
Summary of Investments by Country
Country | Managers International Equity Fund* | MSCI EAFE Index | ||||
Australia | 0.6 | % | 6.8 | % | ||
Austria | 0.0 | % | 0.6 | % | ||
Belgium | 1.6 | % | 1.0 | % | ||
Bermuda | 0.4 | % | 0.4 | % | ||
Brazil | 1.9 | % | 0.0 | % | ||
Canada | 6.8 | % | 0.0 | % | ||
Cayman Islands | 0.0 | % | 0.1 | % | ||
China | 1.4 | % | 0.0 | % | ||
Denmark | 1.9 | % | 1.0 | % | ||
Egypt | 0.5 | % | 0.0 | % | ||
Finland | 0.7 | % | 1.6 | % | ||
France | 8.7 | % | 9.9 | % | ||
Germany | 10.3 | % | 9.1 | % | ||
Greece | 0.0 | % | 0.7 | % | ||
Hong Kong | 4.4 | % | 1.7 | % | ||
India | 0.4 | % | 0.0 | % | ||
Ireland | 1.4 | % | 0.6 | % | ||
Israel | 0.5 | % | 0.0 | % | ||
Italy | 1.1 | % | 3.8 | % | ||
Japan | 14.2 | % | 21.4 | % | ||
Jersey, Channel Islands | 0.0 | % | 0.2 | % | ||
Kazakhstan | 0.4 | % | 0.0 | % | ||
Luxembourg | 1.2 | % | 0.9 | % | ||
Netherlands | 2.8 | % | 2.7 | % | ||
New Zealand | 0.0 | % | 0.1 | % | ||
Norway | 1.2 | % | 1.0 | % | ||
Portugal | 0.0 | % | 0.3 | % | ||
Russia | 0.8 | % | 0.0 | % | ||
Singapore | 0.9 | % | 1.1 | % | ||
South Africa | 0.7 | % | 0.0 | % | ||
South Korea | 1.6 | % | 0.0 | % | ||
Spain | 0.8 | % | 4.1 | % | ||
Sweden | 0.7 | % | 2.1 | % | ||
Switzerland | 7.8 | % | 7.0 | % | ||
Taiwan | 2.1 | % | 0.0 | % | ||
United Kingdom | 16.2 | % | 21.7 | % | ||
United States | 6.0 | % | 0.1 | % | ||
| 100.0 | % | 100.0 | % | |||
| * | As a percentage of total market value on June 30, 2008 |
15
Table of Contents
Managers International Equity Fund
Schedule of Portfolio Investments
June 30, 2008 (unaudited)
| Shares | Value | |||||
Common Stocks - 94.1% | ||||||
Consumer Discretionary - 5.2% | ||||||
Arcandor AG (Germany)* | 140,437 | 2 | $ | 1,634,865 | ||
Carphone Warehouse Group PLC, The (United Kingdom) | 285,674 | 1,122,577 | ||||
Compagnie Generale des Etablissements | ||||||
Michelin SCA (France) | 8,400 | 600,652 | ||||
Compass Group PLC (United Kingdom) | 56,358 | 423,921 | ||||
Cyrela Brazil Realty, S.A. (Brazil) | 29,900 | 412,568 | ||||
Daiwa House Industry Co., Ltd. (Japan) | 69,000 | 649,548 | ||||
Hyundai Mobis Co., Ltd. (South Korea) | 10,200 | 825,654 | ||||
Lagardere (France) | 11,700 | 661,853 | ||||
New World Department Store China, Ltd. (Hong Kong)* | 90,000 | 79,407 | ||||
Nissan Motor Co., Ltd. (Japan) | 250,500 | 2,080,524 | ||||
Parkson Retail Group, Ltd. (China) | 22,500 | 164,710 | ||||
Pearson PLC (United Kingdom) | 10,838 | 132,072 | ||||
Renault, S.A. (France) | 20,100 | 1,635,873 | ||||
Sharp Corp. (Japan) | 55,000 | 896,570 | ||||
Sodexo (France) | 9,428 | 616,778 | ||||
Sony Corp. (Japan) | 9,100 | 398,886 | ||||
Taylor Wimpey PLC (United Kingdom) | 124,808 | 152,890 | ||||
Wolters Kluwer, N.V. (Netherlands) | 6,659 | 154,994 | ||||
Total Consumer Discretionary | 12,644,341 | |||||
Consumer Staples - 7.0% | ||||||
Associated British Foods PLC (United Kingdom) | 60,000 | 903,771 | ||||
British American Tobacco PLC (United Kingdom) | 30,000 | 1,034,814 | ||||
Cadbury PLC (United Kingdom) | 159,116 | 1,995,865 | ||||
Carlsberg A/S, Class B (Denmark) | 15,710 | 1,513,340 | ||||
Diageo PLC (United Kingdom) | 63,612 | 1,165,446 | ||||
Groupe Danone, S.A. (France) | 9,900 | 692,745 | ||||
InBev, N.V. (Belgium)* | 16,355 | 1,130,805 | ||||
Koninklijke Ahold, N.V. (Netherlands) | 192,418 | 2,579,486 | ||||
L’Oreal, S.A. (France) | 9,500 | 1,030,432 | ||||
Metro AG (Germany) | 11,200 | 714,502 | ||||
Nestle, S.A., Registered (Switzerland) | 41,710 | 1,879,647 | ||||
Seven & i Holdings Co., Ltd. (Japan) | 43,600 | 1,248,403 | ||||
Unilever, N.V. (Netherlands) | 23,646 | 668,677 | ||||
Uni-President Enterprises Corp. (Taiwan) | 395,860 | 474,903 | ||||
Total Consumer Staples | 17,032,836 | |||||
Energy - 10.1% | ||||||
BP PLC (United Kingdom) | 137,900 | 1,598,341 | ||||
Cameco Corp. (Canada) | 4,700 | 201,489 | ||||
Canadian Natural Resources, Ltd. (Canada) | 19,500 | 1,928,391 | ||||
China Petroleum and Chemical Corp., Class H (Hong Kong) | 1,476,000 | 1,379,646 | ||||
China Shenhua Energy Co., Ltd. (China) | 368,500 | 1,450,300 | ||||
EnCana Corp. (Canada) | 24,168 | 2,212,734 | ||||
Eni S.p.A. (Italy) | 49,700 | 1,846,376 | ||||
LUKOIL Holdings, ADR (Russia) | 11,350 | 1,114,570 | ||||
OAO Gazprom - Sponsored ADR (Russia) | 9,200 | 531,473 | ||||
Petro-Canada (Canada) | 18,000 | 1,008,120 | ||||
Petroleo Brasileiro, S.A., Sponsored ADR (Brazil) | 27,100 | 2 | 1,919,493 | |||
Petroplus Holdings AG (Switzerland)* | 10,482 | 560,989 | ||||
Royal Dutch Shell PLC, Class A (United Kingdom) | 91,500 | 3,741,710 | ||||
SeaDrill, Ltd. (Bermuda) | 33,000 | 1,009,140 | ||||
StatoilHydro ASA (Norway) | 46,050 | 1,718,114 | ||||
Total, S.A. (France) | 30,300 | 2,579,094 | ||||
Total Energy | 24,799,980 | |||||
Financials - 26.0% | ||||||
3i Group PLC (United Kingdom) | 104,164 | 1,703,921 | ||||
Allianz SE (Germany) | 21,435 | 3,770,493 | ||||
Aviva PLC (United Kingdom) | 97,743 | 969,033 | ||||
Banco do Brasil, S.A. (Brazil) | 14,500 | 235,983 | ||||
Bank of East Asia, Ltd. (Hong Kong) | 98,200 | 533,910 | ||||
Barclays PLC (United Kingdom) | 165,000 | 936,122 | ||||
BNP Paribas, S.A. (France) | 36,102 | 3,249,800 | ||||
CapitaLand, Ltd. (Singapore) | 263,000 | 1,105,149 | ||||
Cathay Financial Holding Co., Ltd. (Taiwan) | 326,000 | 708,192 | ||||
China Overseas Land & Investment, Ltd. (Hong Kong) | 1,057,000 | 1,675,406 | ||||
Chinatrust Financial Holding Co., Ltd., (Taiwan) | 623,000 | 600,959 | ||||
Commerzbank AG (Germany) | 50,906 | 1,512,310 | ||||
Credit Agricole, S.A. (France) | 71,433 | 1,450,123 | ||||
Credit Suisse Group AG (Switzerland) | 42,000 | 1,911,714 | ||||
Daiwa Securities Group, Inc. (Japan) | 80,000 | 735,664 | ||||
DBS Group Holdings, Ltd. (Singapore) | 76,000 | 1,057,386 | ||||
Deutsche Bank AG (Germany) | 22,300 | 1,925,048 | ||||
Deutsche Boerse AG (Germany) | 3,872 | 437,693 | ||||
The accompanying notes are an integral part of these financial statements.
16
Table of Contents
Managers International Equity Fund
Schedule of Portfolio Investments (continued)
| Shares | Value | |||||
Financials - 26.0% (continued) | ||||||
Deutsche Postbank AG (Germany) | 7,900 | $ | 693,401 | |||
Fondiaria-SAI S.p.A. (Italy)* | 10,000 | 329,558 | ||||
Fondiaria-SAI S.p.A., RNC (Italy) | 5,900 | 131,283 | ||||
Fortis (Belgium) | 81,100 | 1,288,231 | ||||
Hana Financial Group, Inc. (South Korea) | 9,200 | 354,013 | ||||
Hang Lung Group, Ltd. (Hong Kong) | 51,900 | 231,476 | ||||
Hang Lung Properties, Ltd. (Hong Kong) | 60,000 | 192,622 | ||||
HBOS PLC (United Kingdom) | 400,303 | 2,191,581 | ||||
HDFC Bank, Ltd. (India) | 28,500 | 667,558 | ||||
Henderson Land Development Co., Ltd. (Hong Kong) | 133,000 | 831,550 | ||||
Hong Kong Exchanges & Clearing, Ltd. (Hong Kong) | 115,000 | 1,684,602 | ||||
ING Groep, NV (Netherlands) | 67,217 | 2,125,249 | ||||
Julias Baer Holding, Ltd. (Switzerland) | 23,999 | 1,620,998 | ||||
Kookmin Bank (South Korea) | 14,374 | 844,795 | ||||
Man Group PLC (United Kingdom) | 200,358 | 2,475,086 | ||||
Mitsubishi Estate Co., Ltd. (Japan) | 54,000 | 1,236,310 | ||||
Mitsui Fudosan Co., Ltd. (Japan) | 56,000 | 1,198,567 | ||||
Mizuho Financial Group, Inc. (Japan) | 258 | 1,200,431 | ||||
Muenchener Rueckversicherungs AG (Germany) | 7,700 | 1,350,657 | ||||
Nomura Holdings, Inc. (Japan) | 80,600 | 1,193,555 | ||||
ORIX Corp. (Japan) | 11,920 | 1,707,265 | ||||
Prudential Corp. PLC (United Kingdom) | 95,903 | 1,011,559 | ||||
Royal Bank of Scotland Group PLC (United Kingdom) | 405,747 | 1,727,318 | ||||
Societe Generale (France) | 29,524 | 2,559,707 | ||||
Standard Chartered PLC (United Kingdom) | 46,700 | 1,322,517 | ||||
Sumitomo Mitsui Financial Group, Inc. (Japan) | 131 | 985,147 | ||||
Sumitomo Realty & Development Co., Ltd. (Japan) | 44,000 | 875,296 | ||||
Sun Hung Kai Properties, Ltd. (Hong Kong) | 90,000 | 1,223,466 | ||||
T&D Holdings, Inc. (Japan) | 23,150 | 1,427,905 | ||||
UBS AG (Switzerland)* | 146,364 | 3,049,968 | ||||
Unibanco-Uniao de Bancos Brasileiros, S.A. (Brazil) | 18,900 | 239,566 | ||||
Zurich Financial Services AG (Switzerland) | 4,410 | 1,123,909 | ||||
Total Financials | 63,614,052 | |||||
Health Care - 6.2% | ||||||
Actelion, Ltd. (Switzerland)* | 21,017 | 1,121,121 | ||||
Celesio AG (Germany) | 7,500 | 270,889 | ||||
CSL, Ltd. (Australia) | 44,954 | 1,538,822 | ||||
Elan Corp. PLC, Sponsored ADR (Ireland)* | 65,700 | 2 | 2,335,636 | |||
GlaxoSmithKline PLC (United Kingdom) | 98,400 | 2,175,206 | ||||
Lonza Group AG (Switzerland) | 4,630 | 639,857 | ||||
Merck KGaA (Germany) | 9,630 | 1,368,444 | ||||
Novartis AG (Switzerland) | 25,669 | 1,412,621 | ||||
Roche Holding AG (Switzerland) | 5,550 | 997,736 | ||||
Sanofi-Aventis, S.A. (France) | 28,925 | 1,922,038 | ||||
Synthes, Inc. (Switzerland) | 3,193 | 439,173 | ||||
Teva Pharmaceutical Industries, Ltd., Sponsored | ||||||
ADR (Israel) | 21,800 | 2 | 998,440 | |||
Total Health Care | 15,219,983 | |||||
Industrials - 10.8% | ||||||
ABB, Ltd. (Switzerland)* | 82,400 | 2,324,527 | ||||
Air France-KLM (France) | 15,200 | 362,563 | ||||
Alstom, S.A. (France) | 6,382 | 1,463,432 | ||||
British Airways PLC (United Kingdom) | 262,430 | 1,117,775 | ||||
Deutsche Lufthansa AG (Germany) | 41,400 | 891,998 | ||||
easyJet PLC (United Kingdom)* | 271,148 | 1,450,009 | ||||
FANUC, Ltd. (Japan) | 12,200 | 1,193,127 | ||||
Far Eastern Textile Co., Ltd. (Taiwan) | 367,920 | 478,451 | ||||
Gamesa Corporacion Tecnologica, S.A. (Spain) | 13,871 | 679,081 | ||||
Hansen Transmissions International, N.V. (Belgium)* | 214,459 | 1,143,499 | ||||
HOCHTIEF AG (Germany) | 6,700 | 679,611 | ||||
Hutchison Whampoa, Ltd. (Hong Kong) | 55,000 | 554,637 | ||||
Kajima Corp. (Japan) | 129,000 | 451,309 | ||||
Komatsu, Ltd. (Japan) | 28,400 | 793,102 | ||||
Michael Page International PLC (United | ||||||
Kingdom) | 211,492 | 979,624 | ||||
Mitsubishi Heavy Inds., Ltd. (Japan) | 232,000 | 1,108,096 | ||||
Mitsui O.S.K. Lines, Ltd. (Japan) | 67,000 | 955,552 | ||||
Renewable Energy Corp. ASA (Norway)* | 51,400 | 1,327,067 | ||||
Ryanair Holdings PLC (Ireland)* | 42,400 | 2 | 1,215,608 | |||
Shimizu Corp. (Japan) | 99,000 | 469,111 | ||||
Siemens AG (Germany) | 11,790 | 1,307,044 | ||||
Tostem Inax Holding Corp. (Japan) | 32,000 | 509,499 | ||||
Vestas Wind Systems A/S (Denmark)* | 23,650 | 3,079,157 | ||||
Wright Express Corp. (France) | 3,514 | 1,228,954 | ||||
Yamato Transport Co., Ltd. (Japan) | 40,000 | 558,357 | ||||
Total Industrials | 26,321,190 | |||||
Information Technology - 8.7% | ||||||
ARM Holdings PLC (United Kingdom) | 1,017,355 | 1,717,459 | ||||
The accompanying notes are an integral part of these financial statements.
17
Table of Contents
Managers International Equity Fund
Schedule of Portfolio Investments (continued)
| Shares | Value | |||||
Information Technology - 8.7% (continued) | ||||||
ASML Holding, N.V. (Netherlands) | 33,809 | $ | 827,522 | |||
Autonomy Corporation PLC (United Kingdom)* | 85,252 | 1,528,190 | ||||
Elpida Memory, Inc. (Japan)* | 19,200 | 615,762 | ||||
Ericsson (LM), Class B (Sweden) | 116,400 | 1,210,382 | ||||
Fujitsu, Ltd. (Japan) | 215,000 | 1,596,551 | ||||
High Tech Computer Corp. (Taiwan) | 46,000 | 1,028,096 | ||||
Hynix Semiconductor, Inc. (South Korea)* | 31,400 | 749,217 | ||||
Infineon Technologies AG (Germany)* | 51,830 | 449,862 | ||||
LDK Solar Co., Ltd. (ADR) (China)* | 47,900 | 2 | 1,814,452 | |||
Nintendo Co., Ltd. (Japan) | 5,100 | 2,892,076 | ||||
Nokia Oyj (Finland) | 50,618 | 1,237,254 | ||||
Redecard, S.A. (Brazil) | 24,500 | 452,679 | ||||
Research In Motion, Ltd. (Canada)* | 18,500 | 2,162,650 | ||||
Samsung Electronics Co., Ltd. (South Korea) | 1,380 | 824,465 | ||||
Taiwan Semiconductor Manufacturing Co., Ltd., Sponsored ADR (Taiwan)* | 106,623 | 1,163,257 | ||||
Toshiba Corp. (Japan) | 125,000 | 922,192 | ||||
Total Information Technology | 21,192,066 | |||||
Materials - 14.5% | ||||||
Air Liquide, S.A. (France) | 10,369 | 1,365,089 | ||||
Antofagasta PLC (United Kingdom) | 22,900 | 297,762 | ||||
ArcelorMittal (Luxembourg) | 19,734 | 1,948,156 | ||||
Barrick Gold Corp. (Canada) | 55,486 | 2,536,239 | ||||
BASF SE (Germany) | 43,800 | 3,018,765 | ||||
Compania Vale do Rio Doce (Brazil) | 35,000 | 1,044,400 | ||||
Compania Vale do Rio Doce - ADR (Brazil) | 8,600 | 2 | 308,052 | |||
Eurasian Natural Resources Corp. (Kazakhstan)* | 36,352 | 957,789 | ||||
Gold Fields, Ltd. (South Africa) | 67,700 | 856,499 | ||||
Goldcorp, Inc. (Canada) | 40,100 | 1,848,682 | ||||
Impala Platinum Holdings, Ltd. (South Africa) | 17,400 | 2 | 686,828 | |||
JFE Holdings, Inc. (Japan) | 36,000 | 1,815,055 | ||||
K+S AG (Germany) | 4,461 | 2,559,356 | ||||
Kazakmys PLC (United Kingdom) | 27,300 | 860,764 | ||||
Kinross Gold Corp. (Canada) | 32,700 | 2 | 772,047 | |||
Koninklijke DSM, N.V. (Netherlands) | 8,300 | 486,479 | ||||
Mitsubishi Chemical Holdings Corp. (Japan) | 160,000 | 931,681 | ||||
Mitsui Petrochemical Industries, Ltd. (Japan) | 70,000 | 345,675 | ||||
Potash Corp. of Saskatchewan, Inc. (Canada) | 14,700 | 3,356,887 | ||||
Solvay, S.A. (Belgium) | 3,200 | 416,898 | ||||
Stora Enso Oyj (Finland) | 60,700 | 565,523 | ||||
Svenska Cellulosa AB (SCA) (Sweden) | 27,200 | 382,722 | ||||
Syngenta AG (Switzerland) | 7,984 | 2,586,598 | ||||
Taiwan Fertilizer Co., Ltd. (Taiwan) | 198,000 | 742,306 | ||||
Toray Industries, Inc. (Japan) | 183,700 | 985,913 | ||||
Wacker Chemie AG (Germany) | 4,201 | 880,868 | ||||
Xstrata PLC (United Kingdom) | 20,293 | 1,616,547 | ||||
Yamana Gold, Inc. (Canada) | 84,259 | 1,401,425 | ||||
Total Materials | 35,575,005 | |||||
Telecommunication Services - 2.8% | ||||||
Bharti Tele-Ventures, Ltd. (India)* | 24,200 | 407,438 | ||||
China Netcom Group Corp. (Hong Kong) | 316,000 | 859,453 | ||||
Nippon Telegraph & Telephone Corp. (Japan) | 216 | 1,065,804 | ||||
Orascom Telecom Holding S.A.E. (Egypt) | 17,900 | 2 | 1,151,729 | |||
Telecom Italia S.p.A. (Italy) | 191,200 | 382,419 | ||||
Vimpel Communication, ADR (Russia) | 13,900 | 412,552 | ||||
Vodafone Group PLC (United Kingdom) | 859,031 | 2,530,972 | ||||
Total Telecommunication Services | 6,810,367 | |||||
Utilities - 2.8% | ||||||
E.ON AG (Germany) | 7,400 | 1,491,431 | ||||
Hong Kong & China Gas Co., Ltd. (Hong Kong) | 637,670 | 1,517,378 | ||||
Iberdrola Renovables SAU (Spain)* | 168,678 | 1,299,529 | ||||
National Grid PLC (United Kingdom) | 67,876 | 889,736 | ||||
Tokyo Electric Power Company, Inc., The (Japan) | 62,800 | 1,617,000 | ||||
Total Utilities | 6,815,074 | |||||
Total Common Stocks | 230,024,894 | |||||
Other Equities - 0.7% | ||||||
Hirco PLC (South Africa)* | 40,800 | 227,141 | ||||
SPDR Gold Shares (United States) | 16,900 | 2 | 1,544,660 | |||
Total Other Equities | 1,771,801 | |||||
Preferred Stock - 0.2% | ||||||
Samsung Electronics Co., Ltd. (South Korea) (cost $449,809) | 900 | 387,938 | ||||
Warrants - 0.4% | ||||||
ASUSTeK Computer, Inc. 01/19/17 (Luxembourg) | 151,300 | 411,687 | ||||
China Overseas Land & Investment, Ltd. (Hong Kong) | 89,250 | 12,591 | ||||
United Microelectronics Corp. (Luxembourg) (a) | 1,197,502 | 634,676 | ||||
Total Warrants | 1,058,954 | |||||
The accompanying notes are an integral part of these financial statements.
18
Table of Contents
Managers International Equity Fund
Schedule of Portfolio Investments (continued)
| Shares | Value | |||||
Rights - 0.0% | ||||||
Barclays PLC, Rights (United Kingdom) | 35,357 | $ | 6,690 | |||
HBOS PLC, Rights (United Kingdom) | 160,121 | 34,286 | ||||
Total Rights | 40,976 | |||||
Other Investment Companies - 9.1%1 | ||||||
Bank of New York Institutional Cash Reserves Fund, 2.62%3 | 12,626,427 | 12,626,427 | ||||
Dreyfus Cash Management Fund, Institutional Class Shares, 2.66% | 9,651,370 | 9,651,370 | ||||
Total Other Investment Companies | 22,277,797 | |||||
Total Investments - 104.5% | 255,562,360 | |||||
Other Assets, less Liabilities - (4.5)% | (11,035,630 | ) | ||||
Net Assets - 100.0% | $ | 244,526,730 | ||||
The accompanying notes are an integral part of these financial statements.
19
Table of Contents
Managers Emerging Markets Equity Fund
Fund Snapshots
June 30, 2008 (unaudited)
Portfolio Breakdown
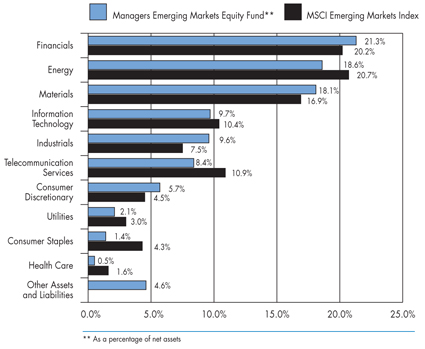
Industry | Managers Emerging Markets Equity Fund** | MSCI EM Index | ||||
Financials | 21.3 | % | 20.2 | % | ||
Energy | 18.6 | % | 20.7 | % | ||
Materials | 18.1 | % | 16.9 | % | ||
Information Technology | 9.7 | % | 10.4 | % | ||
Industrials | 9.6 | % | 7.5 | % | ||
Telecommunication Services | 8.4 | % | 10.9 | % | ||
Consumer Discretionary | 5.7 | % | 4.5 | % | ||
Utilities | 2.1 | % | 3.0 | % | ||
Consumer Staples | 1.4 | % | 4.3 | % | ||
Health Care | 0.5 | % | 1.6 | % | ||
Other Assets and Liabilities | 4.6 | % | 0.0 | % | ||
Top Ten Holdings
Security Name | Percentage of Net Assets | ||
OAO Gazprom, Sponsored ADR* | 3.8 | % | |
Compania Vale do Rio Doce, ADR* | 2.8 | ||
China Mobile Ltd.* | 2.3 | ||
Ceske Energeticke Zavody | 2.1 | ||
Petroleo Brasileiro, S.A., Sponsored ADR | 2.1 | ||
Anglo American PLC | 2.0 | ||
Tenaris S.A. | 2.0 | ||
Taiwan Semiconductor Manufacturing Co., Ltd., Sponsored ADR | 1.8 | ||
Uralkaliy OAO | 1.8 | ||
Raspadskaya | 1.6 | ||
Top Ten as a Group | 22.3 | % | |
| * | Top Ten Holding at December 31, 2007 |
Any sectors, industries, or securities discussed should not be perceived as investment recommendations. Mention of a specific security should not be considered a recommendation to buy or solicitation to sell that security.
20
Table of Contents
Managers Emerging Markets Equity Fund
Fund Snapshots (continued)
Summary of Investments by Country
Country | Managers Emerging Markets Equity Fund* | MSCI EM Index | ||||
Argentina | 0.0 | % | 0.1 | % | ||
Bermuda | 0.8 | % | 0.6 | % | ||
Brazil | 15.8 | % | 17.6 | % | ||
Cayman Islands | 0.0 | % | 1.1 | % | ||
Chile | 0.0 | % | 1.1 | % | ||
China | 7.8 | % | 8.0 | % | ||
Colombia | 0.0 | % | 0.4 | % | ||
Czech Republic | 2.1 | % | 0.8 | % | ||
Egypt | 0.0 | % | 0.7 | % | ||
Hong Kong | 3.9 | % | 4.7 | % | ||
Hungary | 1.3 | % | 0.8 | % | ||
India | 5.3 | % | 5.7 | % | ||
Indonesia | 1.5 | % | 1.6 | % | ||
Ireland | 0.0 | % | 0.0 | % | ||
Israel | 1.6 | % | 2.3 | % | ||
Jordan | 0.0 | % | 0.1 | % | ||
Luxembourg | 2.9 | % | 0.6 | % | ||
Malaysia | 1.3 | % | 2.2 | % | ||
Mexico | 5.1 | % | 4.9 | % | ||
Morocco | 0.0 | % | 0.4 | % | ||
Netherlands | 0.0 | % | 0.1 | % | ||
Pakistan | 0.0 | % | 0.2 | % | ||
Panama | 0.5 | % | 0.0 | % | ||
Peru | 0.0 | % | 0.3 | % | ||
Philippines | 0.3 | % | 0.3 | % | ||
Poland | 0.5 | % | 1.6 | % | ||
Russia | 15.0 | % | 9.9 | % | ||
South Africa | 4.3 | % | 6.6 | % | ||
South Korea | 10.1 | % | 12.6 | % | ||
Taiwan | 10.5 | % | 10.5 | % | ||
Thailand | 2.8 | % | 1.3 | % | ||
Turkey | 0.9 | % | 1.3 | % | ||
United Kingdom | 2.0 | % | 0.0 | % | ||
United States | 3.7 | % | 1.6 | % | ||
Venezuela | 0.0 | % | 0.0 | % | ||
| 100.0 | % | 100.0 | % | |||
| * | As a percentage of total market value on June 30, 2008 |
21
Table of Contents
Managers Emerging Markets Equity Fund
Schedule of Portfolio Investments
June 30, 2008 (unaudited)
| Shares | Value | |||||
Common Stocks - 95.4% | ||||||
Consumer Discretionary - 5.7% | ||||||
Consorcio ARA, S.A. de C.V. (Mexico) | 337,618 | $ | 311,654 | |||
Cyfrowy Polsat SA (Poland)* | 131,602 | 827,511 | ||||
Lojas Renner S.A. (Brazil) | 59,000 | 1,166,677 | ||||
Net Servicos de Comunicacao S.A. (Brazil)* | 188,800 | 2,357,793 | ||||
Resorts World Berhad (Malaysia) | 2,698,500 | 2,151,410 | ||||
Urbi Desarrollos Urbanos S.A. de C.V. (Mexico)* | 326,330 | 1,128,047 | ||||
Zee Entertainment Enterprises Ltd. (India) | 394,057 | 1,833,953 | ||||
Total Consumer Discretionary | 9,777,045 | |||||
Consumer Staples - 1.4% | ||||||
Shinsegae Co., Ltd. (South Korea) | 4,599 | 2,473,398 | ||||
Energy - 18.6% | ||||||
CNOOC Ltd. (Hong Kong) | 1,523,000 | 2,643,793 | ||||
LUKOIL Holdings, ADR (Russia) | 25,826 | 2,536,113 | ||||
OAO Gazprom, Sponsored ADR (Russia) | 113,650 | 6,565,429 | ||||
OAO Rosneft Oil Co. GDR (Russia) (a)* | 238,460 | 2,770,905 | ||||
OGX Petroleo e Gas Participacoes S.A. (Brazil)* | 2,400 | 1,896,810 | ||||
Petroleo Brasileiro, S.A. (Brazil) | 32,600 | 1,889,170 | ||||
Petroleo Brasileiro, S.A., Sponsored ADR (Brazil) | 50,070 | 2 | 3,546,458 | |||
PTT Public Co., Ltd. (Thailand) | 270,000 | 2,442,259 | ||||
Sasol Ltd. (South Africa) | 45,256 | 2,663,984 | ||||
Tenaris S.A. (Luxembourg) | 45,100 | 2 | 3,359,950 | |||
Yanzhou Coal Mining Co., Ltd. (China) | 848,000 | 1,580,996 | ||||
Total Energy | 31,895,867 | |||||
Financials - 21.3% | ||||||
Bank Hapoalim, Ltd. (Israel) | 210,014 | 925,800 | ||||
Bank of China, Ltd., Class H (China) | 5,276,000 | 2,349,888 | ||||
Cathay Financial Holding Co., Ltd. (Taiwan) | 998,000 | 2,168,022 | ||||
China Life Insurance Co., Ltd. (China) | 724,504 | 2,524,125 | ||||
Chinatrust Financial Holding Co., Ltd., (Taiwan) | 2,700,280 | 2,604,749 | ||||
Grupo Financiero Banorte S.A.B. de C.V. (Mexico) | 583,676 | 2,744,886 | ||||
Haci Omer Sabanci Holding AS (Turkey) | 451,486 | 1,545,847 | ||||
Industrial and Commercial Bank of China, Ltd. Class H (China) | 3,631,000 | 2,482,611 | ||||
Kookmin Bank, Sponsored ADR (South Korea) | 35,948 | 2,103,317 | ||||
OAO Open Investments (Russia)* | 674 | 248,913 | ||||
OTP Bank NyRt. (Hungary)* | 51,584 | 2,157,620 | ||||
PT Bank Rakyat Indonesia (Indonesia) | 1,706,000 | 947,739 | ||||
Samsung Fire & Marine Insurance Co., Ltd. (South Korea) | 12,226 | 2,553,506 | ||||
Sanlam, Ltd. (South Africa) | 1,081,431 | 2,286,771 | ||||
Savings Bank of the Russian | ||||||
Federation(Sberbank) (Russia) | 805,473 | 2,538,855 | ||||
Siam Commercial Bank PCL (Thailand) | 1,009,300 | 2,344,095 | ||||
Uniao de Bancos Brasileiros S.A. (Brazil) | 21,200 | 2,690,917 | ||||
Unitech Ltd. (India) | 300,000 | 1,201,465 | ||||
Total Financials | 36,419,126 | |||||
Health Care - 0.5% | ||||||
Dr. Reddy’s Laboratories Limited, ADR (India) | 60,223 | 940,440 | ||||
Industrials - 9.6% | ||||||
China Shipping Development Co., Ltd. (China) | 834,000 | 2,512,808 | ||||
Copa Holdings, S.A., Class A (Panama)* | 31,200 | 2 | 878,592 | |||
Cosco Pacific Limited (Bermuda) | 866,000 | 1,421,685 | ||||
Daewoo Shipbuilding & Marine Engineering Co., Ltd. (South Korea) | 51,175 | 1,997,885 | ||||
Hyundai Development Co. (South Korea) | 43,405 | 2,197,660 | ||||
Hyundai Heavy Industries Co., Ltd. (South Korea) | 5,285 | 1,634,190 | ||||
Larsen & Toubro Ltd. (India) | 39,843 | 2,027,417 | ||||
Localiza Rent A Car S.A. (Brazil) | 116,800 | 1,311,459 | ||||
Santos Brasil Participacoes SA (Brazil) | 64,962 | 935,670 | ||||
Siemens India, Ltd. (India) | 114,384 | 1,033,577 | ||||
SM Investments Corp. (Philippines) | 108,019 | 588,863 | ||||
Total Industrials | 16,539,806 | |||||
Information Technology - 9.7% | ||||||
Advanced Semiconductor Engineering, Inc. (Taiwan) | 2,602,285 | 2,332,739 | ||||
Delta Electronics, Inc. (Taiwan) | 40,000 | 111,123 | ||||
Hon Hai Precision Industry Co., Ltd. (Taiwan) | 480,539 | 2,363,095 | ||||
LG Display Co., Ltd. (South Korea) | 50,840 | 2 | 1,900,322 | |||
Mediatek, Inc. (Taiwan) | 218,150 | 2,511,373 | ||||
Samsung Electronics Co., Ltd. (South Korea) | 2,004 | 1,197,267 | ||||
Samsung Electronics Co., Ltd., GDR, (South Korea) (a) | 4,400 | 1,314,469 | ||||
Siliconware Precision Industries Co. (Taiwan) | 1,187,140 | 1,746,837 | ||||
Taiwan Semiconductor Manufacturing Co., Ltd. (Taiwan) | 989 | 2,101 | ||||
The accompanying notes are an integral part of these financial statements.
22
Table of Contents
Managers Emerging Markets Equity Fund
Schedule of Portfolio Investments (continued)
| Shares | Value | ||||||
Information Technology - 9.7% (continued) | |||||||
Taiwan Semiconductor Manufacturing Co., Ltd., Sponsored ADR (Taiwan)* | 282,802 | $ | 3,085,370 | ||||
Total Information Technology | 16,564,696 | ||||||
Materials - 18.1% | |||||||
Anglo American PLC (United Kingdom) | 50,000 | 3,511,684 | |||||
Anhui Conch Cement Company Ltd. (China)* | 290,936 | 2 | 1,948,877 | ||||
CEMEX, S.A.B. de C.V. (Mexico)* | 80,200 | 1,980,940 | |||||
Compania Vale do Rio Doce, ADR (Brazil) | 132,400 | 4,742,569 | |||||
Evraz Group SA GDR (Luxembourg) | 10,450 | 1,212,061 | |||||
Formosa Chemicals & Fibre Corp. (Taiwan) | 679 | 1,336 | |||||
GMK Norilsk Nickel, Sponsored ADR (Russia) | 60,016 | 2 | 1,512,403 | ||||
Harmony Gold Mining Co., Ltd. (South Africa)* | 76,995 | 937,265 | |||||
Harmony Gold Mining Co., Ltd., Sponsored ADR (United States)* | 94,100 | 2 | 1,152,725 | ||||
Mechel OAO (Russia) | 33,100 | 2 | 1,639,774 | ||||
Raspadskaya (Russia)* | 295,130 | 2,773,958 | |||||
Sappi Ltd. (South Africa) | 128,162 | 1,542,921 | |||||
Taiwan Fertilizer Co., Ltd. (Taiwan) | 272,000 | 1,019,733 | |||||
Tata Steel Ltd. (India) | 120,039 | 2,040,695 | |||||
Uralkaliy OAO (Russia) | 42,147 | 3,040,678 | |||||
Usinas Siderurgicas de Minas Gerais S.A. (Brazil) | 41,400 | 1,947,202 | |||||
Total Materials | 31,004,821 | ||||||
Telecommunication Services - 8.4% | |||||||
America Movil , SAB de C.V. (Mexico) | 48,500 | 2,558,375 | |||||
Bezeq Israeli Telecommunication Corp., Ltd. (Israel) | 941,064 | 1,853,294 | |||||
China Mobile Ltd. (Hong Kong) | 298,500 | 4,006,720 | |||||
Mobile Telesystems, Sponsored ADR (Russia) | 27,200 | 2,083,792 | |||||
Telekomunikasi Indonesia Tbk P (Indonesia) | 2,078,000 | 1,659,587 | |||||
Tim Participacoes S.A., ADR (Brazil) | 75,700 | 2 | 2,152,151 | ||||
Total Telecommunication Services | 14,313,919 | ||||||
Utility - 2.1% | |||||||
Ceske Energeticke Zavody (Czech Republic) | 40,000 | 3,552,470 | |||||
Total Common Stocks | 163,481,588 | ||||||
Preferred Stock - 1.4% | |||||||
TAM S.A. (Brazil) (cost $2,101,695) | 129,883 | 2,472,727 | |||||
Warrant - 0.0%# | |||||||
China Overseas Land & Investment Ltd. (Hong Kong) | 127,000 | 17,917 | |||||
Other Investment Companies - 11.8%1 | |||||||
Bank of New York Institutional Cash Reserves Fund, 2.62%3 | 15,900,575 | 15,900,575 | |||||
Dreyfus Cash Management Fund, Institutional Class Shares, 2.66% | 4,268,134 | 4,268,134 | |||||
Total Other Investment Companies | 20,168,709 | ||||||
Total Investments - 108.6% | 186,140,941 | ||||||
Other Assets, less Liabilities - (8.6)% | (14,799,788 | ) | |||||
Net Assets - 100.0% | $ | 171,341,153 | |||||
The accompanying notes are an integral part of these financial statements.
23
Table of Contents
Fund Snapshots
June 30, 2008 (unaudited)
Portfolio Breakdown
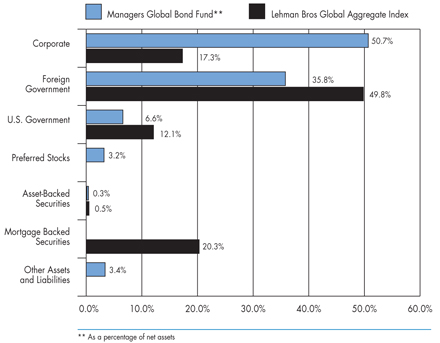
Industry | Managers Global Bond Fund** | Lehman Brothers Global Aggregate Index | ||||
Corporate | 50.7 | % | 17.3 | % | ||
Foreign Government | 35.8 | % | 49.8 | % | ||
U.S. Government | 6.6 | % | 12.1 | % | ||
Preferred Stocks | 3.2 | % | 0.0 | % | ||
Asset-Backed Securities | 0.3 | % | 0.5 | % | ||
Mortgage Backed Securities | 0.0 | % | 20.3 | % | ||
Other Assets and Liabilities | 3.4 | % | 0.0 | % | ||
Top Ten Holdings
Security Name | Percentage of Net Assets | ||
Bundesrepublik Deutschland, 3.750%, 01/04/17* | 5.2 | % | |
Belgium Kingdom, 5.500%, 09/28/17* | 4.8 | ||
Bundesrepublik Deutschland, 4.000%, 04/13/12* | 3.1 | ||
KfW Bankengruppe, 1.850%, 09/20/10* | 3.0 | ||
Deutschland, Republic of, 3.750%, 07/04/13* | 2.6 | ||
European Investment Bank, 1.250%, 09/20/12* | 2.3 | ||
U.K. Gilts, 4.750%, 03/04/20* | 1.9 | ||
Development Bank of Japan, 1.750%, 06/21/10 | 1.9 | ||
Singapore Government, 4.625%, 07/01/10 | 1.7 | ||
Japan Finance Corporation for Municipal Enterprises, 1.900%, 06/22/18 | 1.4 | ||
Top Ten as a Group | 27.9 | % | |
| * | Top Ten Holding at December 31, 2007 |
Any sectors, industries, or securities discussed should not be perceived as investment recommendations. Mention of a specific security should not be considered a recommendation to buy or solicitation to sell that security.
24
Table of Contents
Managers Global Bond Fund
Schedule of Portfolio Investments
June 30, 2008 (unaudited)
Security Description | Principal Amount | Value | ||||
Corporate Bonds - 50.7% | ||||||
Finance - 25.5% | ||||||
American Express Co., 6.150%, 08/28/17 | USD | 65,000 | $ | 63,488 | ||
ASIF Global Financial, 2.380%, 02/26/09 (a) | SGD | 500,000 | 367,085 | |||
Barclays Financial LLC, | ||||||
4.060%, 09/16/10 (a) | KRW | 220,000,000 | 211,892 | |||
4.460%, 09/23/10 (a) | KRW | 110,000,000 | 102,458 | |||
4.740%, 03/23/09 (09/23/08) (a) 5 | KRW | 307,770,000 | 297,104 | |||
BNP Paribas, 4.730%, 04/12/16 6 | EUR | 100,000 | 129,538 | |||
BSkyB Finance PLC, 5.750%, 10/20/17 | GBP | 105,000 | 181,500 | |||
Canara Bank, 6.365%, 11/28/21 6 | USD | 800,000 | 722,449 | |||
CIT Group, Inc., | ||||||
4.250%, 03/17/15 | EUR | 50,000 | 53,175 | |||
4.650%, 09/19/16 | EUR | 50,000 | 51,591 | |||
5.500%, 12/01/14 | GBP | 620,000 | 838,174 | |||
Citigroup, Inc., 5.000%, 09/15/14 | USD | 880,000 | 815,024 | |||
Depfa ACS Bank, | ||||||
1.650%, 12/20/16 | JPY | 70,000,000 | 638,915 | |||
1.875%, 05/07/09 | CHF | 140,000 | 135,420 | |||
ERAC USA Finance Co., | ||||||
6.375%, 10/15/17 (a) | USD | 220,000 | 196,592 | |||
7.000%, 10/15/37 (a) | USD | 90,000 | 74,860 | |||
Ford Motor Credit Company LLC, | ||||||
7.000%, 10/01/13 | USD | 380,000 | 279,836 | |||
8.000%, 12/15/16 | USD | 190,000 | 138,085 | |||
General Electric Capital Corp., | ||||||
2.250%, 02/09/09 | CHF | 350,000 | 340,809 | |||
3.250%, 04/15/13 (b) | USD | 1,000,000 | 1,010,663 | |||
Goldman Sachs Group, Inc., | ||||||
5.208%, 05/23/16 (08/26/08) 5 | EUR | 350,000 | 502,741 | |||
6.875%, 01/18/38 | GBP | 200,000 | 388,483 | |||
Host Hotels & Resorts, L.P., | ||||||
6.375%, 03/15/15 | USD | 35,000 | 30,975 | |||
6.875%, 11/01/14 | USD | 400,000 | 368,000 | |||
HSBC Bank USA, N.A., | ||||||
1.959%, 04/18/12 (a) 4 | MYR | 3,560,000 | 1,011,726 | |||
2.172%, 05/17/12 (a) 4 | MYR | 3,000,000 | 844,315 | |||
HSBC Finance Corp., 1.790%, 09/18/15 | JPY | 100,000,000 | 828,884 | |||
ICICI Bank, Ltd., 6.375%, 04/30/22 (a) 6 | USD | 280,000 | 250,928 | |||
ISA Capital do Brasil SA, 7.875%, 01/30/12 (a) | USD | 100,000 | 103,500 | |||
The accompanying notes are an integral part of these financial statements.
25
Table of Contents
Managers Global Bond Fund
Schedule of Portfolio Investments (continued)
Security Description | Principal Amount | Value | |||||
Finance - 25.5% (continued) | |||||||
JPMorgan Chase & Co., | |||||||
4.135%, 06/08/12 (a) 4 | MYR | 1,935,435 | $ | 504,131 | |||
7.655%, 11/01/12 (a) 4 | KRW | 641,200,000 | 442,566 | ||||
7.900%, 04/30/18 6 | USD | 485,000 | 454,755 | ||||
JPMorgan International, 11.870%, 10/21/10 (a) 4 | IDR | 2,680,548,500 | 222,788 | ||||
KfW Bankengruppe, | |||||||
1.850%, 09/20/10 | JPY | 268,000,000 | 2,564,559 | ||||
2.050%, 02/16/26 | JPY | 120,000,000 | 1,099,535 | ||||
2.600%, 06/20/37 | JPY | 68,000,000 | 656,505 | ||||
Kinder Morgan Finance Co., 5.700%, 01/05/16 | USD | 245,000 | 218,050 | ||||
Lehman Brothers Holdings, Inc., | |||||||
5.750%, 01/03/17 | USD | 195,000 | 172,081 | ||||
6.500%, 07/19/17 | USD | 595,000 | 550,446 | ||||
Lloyds TSB Bank PLC, 4.385%, 05/12/17 6 | EUR | 215,000 | 264,114 | ||||
Morgan Stanley Co., 4.750%, 04/01/14 | USD | 275,000 | 250,588 | ||||
Morgan Stanley Co., Series EMTN, 5.375%, 11/14/13 | GBP | 120,000 | 214,476 | ||||
Muenchener Hypothekenbank eG, 5.000%, 01/16/12 (a) | EUR | 685,000 | 1,071,970 | ||||
Network Rail MTN Finance PLC, 4.875%, 03/06/09 | GBP | 110,000 | 217,479 | ||||
Oesterreichische Kontrollbank AG, 2.750%, 06/14/11 | CHF | 485,000 | 466,701 | ||||
ProLogis, 6.625%, 05/15/18 | USD | 60,000 | 2 | 59,103 | |||
Qwest Capital Funding, Inc., 6.875%, 07/15/28 | USD | 15,000 | 2 | 12,000 | |||
RBS Capital Trust C, 4.243%, 01/12/16 6 | EUR | 195,000 | 229,251 | ||||
SLM Corp., | |||||||
4.000%, 01/15/10 | USD | 55,000 | 51,236 | ||||
5.000%, 10/01/13 | USD | 425,000 | 367,482 | ||||
5.375%, 05/15/14 | USD | 5,000 | 4,393 | ||||
5.400%, 10/25/11 | USD | 10,000 | 9,132 | ||||
8.450%, 06/15/18 | USD | 100,000 | 95,934 | ||||
Wells Fargo & Co., 4.625%, 11/02/35 | GBP | 350,000 | 555,601 | ||||
White Mountains Insurance Group, Ltd., 6.375%, 03/20/17 (a) | USD | 285,000 | 255,007 | ||||
Total Finance | 21,988,092 | ||||||
Industrial - 23.1% | |||||||
Ahold Finance USA, Inc., Series EMTN, 6.500%, 03/14/17 | GBP | 195,000 | 365,103 | ||||
Albertson’s, Inc., | |||||||
6.625%, 06/01/28 | USD | 65,000 | 55,747 | ||||
7.450%, 08/01/29 | USD | 295,000 | 2 | 279,058 | |||
7.750%, 06/15/26 | USD | 5,000 | 4,904 | ||||
Alltel Corp., | |||||||
6.500%, 11/01/13 | USD | 65,000 | 65,162 | ||||
6.800%, 05/01/29 | USD | 50,000 | 45,750 | ||||
7.000%, 07/01/12 | USD | 95,000 | 96,900 | ||||
7.875%, 07/01/32 | USD | 155,000 | 157,325 | ||||
The accompanying notes are an integral part of these financial statements.
26
Table of Contents
Managers Global Bond Fund
Schedule of Portfolio Investments (continued)
Security Description | Principal Amount | Value | |||||
Industrial – 23.1% (continued) | |||||||
Axtel S.A.B. de C.V., 7.625%, 02/01/17 (a) | USD | 210,000 | 2 | $ | 214,988 | ||
Bell Aliant Regional Communications, 5.410%, 09/26/16 | CAD | 320,000 | 282,671 | ||||
Bell Canada, | |||||||
5.000%, 02/15/17 | CAD | 160,000 | 127,413 | ||||
6.100%, 03/16/35 | CAD | 45,000 | 33,726 | ||||
6.550%, 05/01/29 (a) | CAD | 10,000 | 7,865 | ||||
7.300%, 02/23/32 | CAD | 25,000 | 21,294 | ||||
Bertelsmann AG, 3.625%, 10/06/15 | EUR | 380,000 | 497,715 | ||||
Biogen Idec, Inc., 6.000%, 03/01/13 | USD | 420,000 | 416,771 | ||||
Bite Finance International, 8.458%, 03/15/14 (09/15/08) (a) 5 | EUR | 170,000 | 214,126 | ||||
Bristol-Myers Squibb Co., 4.625%, 11/15/21 | EUR | 150,000 | 200,785 | ||||
British Sky Broadcasting Group PLC, 6.100%, 02/15/18 (a) | USD | 460,000 | 452,491 | ||||
Canadian Pacific Railway Co., | |||||||
5.750%, 03/15/33 | USD | 30,000 | 24,209 | ||||
5.950%, 05/15/37 | USD | 55,000 | 45,636 | ||||
Cemex Finance Europe BV, 4.750%, 03/05/14 | EUR | 350,000 | 469,105 | ||||
Chesapeake Energy Corp., | |||||||
6.250%, 01/15/17 | EUR | 100,000 | 142,488 | ||||
6.500%, 08/15/17 | USD | 115,000 | 107,525 | ||||
6.875%, 11/15/20 | USD | 170,000 | 159,800 | ||||
Citizens Communications Co., | |||||||
6.250%, 01/15/13 | USD | 125,000 | 115,938 | ||||
6.625%, 03/15/15 | USD | 115,000 | 2 | 104,362 | |||
7.125%, 03/15/19 | USD | 130,000 | 116,350 | ||||
9.000%, 08/15/31 | USD | 65,000 | 58,500 | ||||
Community Health Systems, Inc., 8.875%, 07/15/15 | USD | 225,000 | 226,406 | ||||
Couche-Tard US LP/Couche-Tard Finance Corp., 7.500%, 12/15/13 | USD | 160,000 | 158,000 | ||||
CSX Corp., | |||||||
5.600%, 05/01/17 | USD | 60,000 | 55,348 | ||||
6.000%, 10/01/36 | USD | 386,000 | 2 | 334,482 | |||
Delta Air Lines, Inc., | |||||||
6.821%, 08/10/22 | USD | 359,950 | 293,359 | ||||
8.021%, 08/10/22 | USD | 116,331 | 105,861 | ||||
Desarrolladora Homex, S.A. de C.V., 7.500%, 09/28/15 | USD | 380,000 | 381,900 | ||||
DP World, Ltd., 6.850%, 07/02/37 (a) | USD | 700,000 | 600,651 | ||||
Edcon Proprietary Ltd., 8.208%, 06/15/14 (09/15/08) (a) 5 | EUR | 510,000 | 2 | 525,947 | |||
Energy Transfer Partners, L.P., | |||||||
6.625%, 10/15/36 | USD | 425,000 | 395,589 | ||||
6.700%, 07/01/18 | USD | 90,000 | 90,585 | ||||
France Telecom, 3.625%, 10/14/15 | EUR | 210,000 | 288,288 | ||||
The accompanying notes are an integral part of these financial statements.
27
Table of Contents
Managers Global Bond Fund
Schedule of Portfolio Investments (continued)
Security Description | Principal Amount | Value | |||||
Industrial - 23.1% (continued) | |||||||
Georgia-Pacific Corp., 7.125%, 01/15/17 (a) | USD | 105,000 | 2 | $ | 98,700 | ||
Hanaro Telecom, Inc., 7.000%, 02/01/12 (a) | USD | 50,000 | 49,875 | ||||
HCA, Inc., | |||||||
6.375%, 01/15/15 | USD | 70,000 | 58,100 | ||||
6.625%, 02/15/16 | USD | 160,000 | 2 | 133,200 | |||
7.580%, 09/15/25 | USD | 20,000 | 16,222 | ||||
7.690%, 06/15/25 | USD | 25,000 | 2 | 20,444 | |||
Hilcorp Energy I LP/Hilcorp Finance Co., 7.750%, 11/01/15 | USD | 170,000 | 163,200 | ||||
Home Depot, Inc., The, 5.875%, 12/16/36 | USD | 250,000 | 204,232 | ||||
Host Hotels & Resorts, L.P., 6.750%, 06/01/16 | USD | 140,000 | 124,250 | ||||
International Paper Co., 7.950%, 06/15/18 | USD | 215,000 | 213,803 | ||||
KLA Instruments Corp., 6.900%, 05/01/18 | USD | 345,000 | 338,226 | ||||
Koninklijke KPN NV, 4.750%, 01/17/17 | EUR | 50,000 | 69,457 | ||||
Kraft Foods, Inc., 6.875%, 02/01/38 | USD | 215,000 | 209,024 | ||||
L-3 Communications Corp., | |||||||
5.875%, 01/15/15 | USD | 125,000 | 115,312 | ||||
6.125%, 07/15/13 | USD | 55,000 | 51,975 | ||||
6.125%, 01/15/14 | USD | 15,000 | 14,062 | ||||
Lafarge S.A., | |||||||
4.750%, 03/23/20 | EUR | 215,000 | 275,657 | ||||
5.375%, 06/26/17 | EUR | 150,000 | 211,195 | ||||
Level 3 Financing, Inc., 8.750%, 02/15/17 | USD | 10,000 | 8,600 | ||||
LPG International, Inc., 7.250%, 12/20/15 | USD | 120,000 | 122,850 | ||||
Lucent Technologies, Inc., 6.450%, 03/15/29 | USD | 595,000 | 455,175 | ||||
Medco Health Solutions, Inc., 7.125%, 03/15/18 | USD | 355,000 | 368,665 | ||||
Motorola, Inc., | |||||||
6.500%, 09/01/25 | USD | 215,000 | 160,543 | ||||
6.625%, 11/15/37 | USD | 240,000 | 188,809 | ||||
Nabors Industries, Inc., 6.150%, 02/15/18 (a) | USD | 245,000 | 247,637 | ||||
News America, Inc., 6.150%, 03/01/37 | USD | 420,000 | 386,699 | ||||
Nextel Communications, Inc., 7.375%, 08/01/15 | USD | 100,000 | 83,000 | ||||
Noble Group, Ltd., 8.500%, 05/30/13 (a) | USD | 210,000 | 2 | 206,850 | |||
Owens & Minor, Inc., 6.350%, 04/15/16 | USD | 530,000 | 520,560 | ||||
Owens-Brockway Glass Container, Inc., 6.750%, 12/01/14 | EUR | 50,000 | 73,999 | ||||
Pemex Project Funding Master Trust, 6.625%, 04/04/10 | EUR | 390,000 | 619,503 | ||||
PPR, 4.000%, 01/29/13 | EUR | 210,000 | 294,224 | ||||
Qwest Capital Funding, Inc., | |||||||
6.500%, 11/15/18 | USD | 40,000 | 32,800 | ||||
7.250%, 02/15/11 | USD | 75,000 | 72,750 | ||||
7.750%, 02/15/31 | USD | 65,000 | 2 | 55,412 | |||
The accompanying notes are an integral part of these financial statements.
28
Table of Contents
Managers Global Bond Fund
Schedule of Portfolio Investments (continued)
Security Description | Principal Amount | Value | |||||
Industrial - 23.1% (continued) | |||||||
Qwest Corp., | |||||||
6.500%, 06/01/17 | USD | 46,000 | $ | 41,055 | |||
6.875%, 09/15/33 | USD | 75,000 | 61,875 | ||||
7.250%, 09/15/25 | USD | 83,000 | 73,455 | ||||
7.250%, 10/15/35 | USD | 158,000 | 132,720 | ||||
R.H. Donnelley Corp., 6.875%, 01/15/13 | USD | 55,000 | 32,725 | ||||
R.H. Donnelley Corp., Series A-2, 6.875%, 01/15/13 | USD | 250,000 | 148,750 | ||||
Reynolds American, Inc., 6.750%, 06/15/17 | USD | 355,000 | 353,150 | ||||
Sappi Papier Holding AG, 7.500%, 06/15/32 (a) | USD | 370,000 | 303,979 | ||||
Shaw Communications, Inc., 5.700%, 03/02/17 | CAD | 315,000 | 291,872 | ||||
SK Telecom Co., Ltd., 6.625%, 07/20/27 (a) | USD | 725,000 | 694,180 | ||||
Sprint Nextel Corp., 6.000%, 12/01/16 | USD | 404,000 | 347,440 | ||||
Telecom Italia Capital S.p.A., | |||||||
4.950%, 09/30/14 | USD | 290,000 | 265,423 | ||||
6.375%, 11/15/33 | USD | 125,000 | 111,284 | ||||
Time Warner, Inc., | |||||||
6.625%, 05/15/29 | USD | 310,000 | 282,093 | ||||
6.950%, 01/15/28 | USD | 85,000 | 81,560 | ||||
7.300%, 07/01/38 | USD | 450,000 | 447,233 | ||||
UnitedHealth Group, Inc., | |||||||
5.800%, 03/15/36 | USD | 440,000 | 364,184 | ||||
6.000%, 02/15/18 | USD | 130,000 | 2 | 125,753 | |||
Vale Overseas Ltd., 6.875%, 11/01/36 | USD | 405,000 | 2 | 376,138 | |||
Vivendi, 3.875%, 02/15/12 | EUR | 90,000 | 129,153 | ||||
Wendel Investissement, | |||||||
4.375%, 08/09/17 | EUR | 200,000 | 204,334 | ||||
4.875%, 05/26/16 | EUR | 200,000 | 229,382 | ||||
Wolters Kluwer N.V., 5.125%, 01/27/14 | EUR | 60,000 | 89,470 | ||||
WPP Finance S.A., 5.250%, 01/30/15 | EUR | 100,000 | 140,960 | ||||
Total Industrial | 19,933,301 | ||||||
Utilities - 2.1% | |||||||
Edison Mission Energy, 7.625%, 05/15/27 | USD | 155,000 | 139,112 | ||||
Majapahit Holding BV, 7.250%, 06/28/17 (a) | USD | 200,000 | 179,000 | ||||
NiSource Finance Corp., 6.400%, 03/15/18 | USD | 365,000 | 352,274 | ||||
Transport De Gas Del Sur, 7.875%, 05/14/17 (a) | USD | 540,000 | 415,801 | ||||
TXU Corp., 6.500%, 11/15/24 | USD | 410,000 | 302,499 | ||||
Veolia Environnement, | |||||||
4.000%, 02/12/16 | EUR | 75,000 | 104,680 | ||||
5.125%, 05/24/22 | EUR | 200,000 | 279,164 | ||||
6.000%, 06/01/18 | USD | 80,000 | 79,816 | ||||
Total Utilities | 1,852,346 | ||||||
Total Corporate Bonds | 43,773,740 | ||||||
The accompanying notes are an integral part of these financial statements.
29
Table of Contents
Managers Global Bond Fund
Schedule of Portfolio Investments (continued)
Security Description | Principal Amount | Value | |||||
Foreign Government - 35.8% | |||||||
Asian Development Bank, 2.350%, 06/21/27 | JPY | 20,000,000 | $ | 192,770 | |||
Belgium Kingdom, 5.500%, 09/28/17 | EUR | 2,520,000 | 4,141,253 | ||||
Bundesrepublik Deutschland, | |||||||
3.250%, 04/17/09 | EUR | 425,000 | 662,091 | ||||
3.750%, 01/04/17 | EUR | 3,049,000 | 4,506,676 | ||||
4.000%, 04/13/12 | EUR | 1,750,000 | 2,689,336 | ||||
6.500%, 07/04/27 | EUR | 615,000 | 1,149,622 | ||||
Canadian Government, 4.250%, 09/01/09 | CAD | 125,000 | 123,967 | ||||
Colombia, Republic of, | |||||||
9.850%, 06/28/27 | COP | 245,000,000 | 99,921 | ||||
11.750%, 03/01/10 | COP | 136,000,000 | 71,074 | ||||
12.000% 10/22/15 | COP | 422,000,000 | 211,695 | ||||
Deutschland, Republic of, 3.750%, 07/04/13 | EUR | 1,480,000 | 2,238,292 | ||||
Development Bank of Japan, | |||||||
1.400%, 06/20/12 | JPY | 39,000,000 | 370,397 | ||||
1.750%, 06/21/10 | JPY | 171,000,000 | 1,632,047 | ||||
European Investment Bank, | |||||||
1.250%, 09/20/12 | JPY | 210,000,000 | 2 | 1,977,684 | |||
1.400%, 06/20/17 | JPY | 100,300,000 | 926,986 | ||||
11.890%, 04/24/13 (a) 4 | IDR | 8,021,910,000 | 498,803 | ||||
Government of France, 5.000%, 10/25/16 | EUR | 590,000 | 942,278 | ||||
Indonesia Government International Bond, 7.750%, 01/17/38 (a) | USD | 460,000 | 2 | 432,400 | |||
Inter-American Development Bank, 11.619%, 05/20/13 4 | IDR | 2,350,000,000 | 146,735 | ||||
Japan Finance Corporation for Municipal Enterprises, | |||||||
1.550%, 02/21/12 | JPY | 76,000,000 | 727,702 | ||||
1.900%, 06/22/18 | JPY | 130,000,000 | 1,234,199 | ||||
Netherlands Government SA, 5.500%, 01/15/28 | EUR | 190,000 | 316,548 | ||||
Nordic Investment Bank, (The), 1.700%, 04/27/17 | JPY | 50,000,000 | 474,193 | ||||
Republica Orient Uruguay, 4.250%, 04/05/27 | UYU | 17,730,000 | 1,048,486 | ||||
Singapore Government, | |||||||
3.625%, 07/01/11 | SGD | 595,000 | 460,211 | ||||
4.625%, 07/01/10 | SGD | 1,860,000 | 1,454,851 | ||||
South Africa, Republic of, 4.500%, 04/05/16 | EUR | 385,000 | 519,787 | ||||
U.K. Gilts, 4.750%, 03/04/20 | GBP | 875,000 | 1,677,253 | ||||
Total Foreign Government | 30,927,257 | ||||||
U.S. Government and Agency Obligations - 6.6% | |||||||
Federal Home Loan Mortgage Corporation - 1.2% | |||||||
FHLMC Gold Pool, 5.000%, 07/01/35 | USD | 997,151 | 958,843 | ||||
FHLMC Gold Pool, 6.000%, 05/01/18 to 10/01/20 | USD | 55,083 | 56,445 | ||||
FHLMC Gold Pool, 6.500%, 08/01/35 to 10/01/35 | USD | 53,879 | 55,663 | ||||
Total Federal Home Loan Mortgage Corporation | 1,070,951 | ||||||
The accompanying notes are an integral part of these financial statements.
30
Table of Contents
Managers Global Bond Fund
Schedule of Portfolio Investments (continued)
Security Description | Principal Amount | Value | ||||||
Federal National Mortgage Association - 4.1% | ||||||||
FNMA, 2.290%, 02/19/09 | SGD | 400,000 | $ | 294,966 | ||||
FNMA, 4.500%, 05/01/20 | USD | 78,682 | 81,778 | |||||
FNMA, 5.000%, 03/01/37 | USD | 862,986 | 828,031 | |||||
FNMA, 5.500%, 11/01/16 to 04/01/36 | USD | 859,811 | 850,552 | |||||
FNMA, 6.000%, 06/01/17 to 08/01/37 | USD | 1,235,438 | 1,250,493 | |||||
FNMA, 6.500%, 10/01/35 | USD | 65,831 | 68,031 | |||||
FNMA Gold Pool, 6.000%, 10/01/20 to 04/01/35 | USD | 174,771 | 177,579 | |||||
Total Federal National Mortgage Association | 3,551,430 | |||||||
Government National Mortgage Association - 1.3% | ||||||||
GNMA, 5.500%, 11/20/34 to 02/20/35 | USD | 97,033 | 96,530 | |||||
GNMA, 6.000%, 07/20/37 | USD | 630,269 | 639,827 | |||||
GNMA, 6.500%, 09/20/36 | USD | 358,655 | 370,502 | |||||
Total Government National Mortgage Association | 1,106,859 | |||||||
Total U.S. Government and Agency Obligations | 5,729,240 | |||||||
Asset Backed Security - 0.3% | ||||||||
Merrill Lynch/Countrywide Mortgage Trust, 5.439%, 02/12/396 (cost $236,256) | USD | 235,000 | 234,029 | |||||
| Shares | ||||||||
Preferred Stocks - 3.2% | ||||||||
Bank of America Corp., Series H, 8.200% | 35,950 | 2 | 891,919 | |||||
FHLMC, 8.375% | 21,825 | 530,348 | ||||||
FNMA, 8.250% | 37,350 | 857,182 | ||||||
Merrill Lynch & Co., Inc., 8.625% | 21,325 | 494,740 | ||||||
Total Preferred Stocks | 2,774,189 | |||||||
Other Investment Company - 5.3%1 | ||||||||
Bank of New York Institutional Cash Reserves Fund, 2.62%3 (cost $4,608,616) | 4,608,616 | 4,608,616 | ||||||
Total Investments - 101.9% | 88,047,071 | |||||||
Other Assets, less Liabilities - (1.9)% | (1,613,798 | ) | ||||||
Net Assets - 100.0% | $ | 86,433,273 | ||||||
The accompanying notes are an integral part of these financial statements.
31
Table of Contents
Notes to Schedules of Portfolio Investments (unaudited)
The following footnotes and abbreviations should be read in conjunction with each of the Schedules of Portfolio Investments previously presented in this report.
At June 30, 2008, the cost of securities for Federal income tax purposes and the gross aggregate unrealized appreciation and/or depreciation based on tax cost were:
Fund | Cost | Appreciation | Depreciation | Net | ||||||||||
Value | $ | 64,621,964 | $ | 6,249,865 | $ | (11,063,948 | ) | $ | (4,814,083 | ) | ||||
Managers AMG Essex Large Cap Growth | 53,079,711 | 8,452,783 | (3,141,327 | ) | 5,311,456 | |||||||||
Small Company | 30,338,061 | 4,609,238 | (3,326,345 | ) | 1,282,893 | |||||||||
International Equity | 240,505,804 | 42,492,026 | (27,435,470 | ) | 15,056,556 | |||||||||
Emerging Markets Equity | 164,927,487 | 32,166,153 | (10,952,699 | ) | 21,213,454 | |||||||||
Global Bond | 86,541,062 | 4,114,662 | (2,608,653 | ) | 1,506,009 | |||||||||
| * | Non-income-producing security. |
| (a) | Security exempt from registration under Rule 144A of the Securities Act of 1933. This security may be resold in transactions exempt from registration, normally to qualified buyers. At June 30, 2008, the value of these securities amounted to the following: |
Fund | Market Value | % of Net Assets | ||||
International Equity | $ | 634,676 | 0.3 | % | ||
Emerging Markets Equity | 4,085,374 | 2.4 | % | |||
Global Bond | 11,263,415 | 13.0 | % | |||
| (b) | Step Bond. A debt instrument with either deferred interest payments or an interest rate that resets at specific times during its term. |
1 | Yield shown for an investment company represents the June 30, 2008, seven-day average yield, which refers to the sum of the previous seven days’ dividends paid, expressed as an annual percentage. |
2 | Some or all of these shares were out on loan to various brokers as of June 30, 2008, amounting to: |
Fund | Market Value | % of Net Assets | ||||
Value | $ | 8,459,334 | 16.6 | % | ||
Managers AMG Essex Large Cap Growth | 11,933,870 | 25.8 | % | |||
Small Company | 4,860,300 | 18.3 | % | |||
International Equity | 12,264,945 | 5.0 | % | |||
Emerging Markets Equity | 15,673,841 | 9.1 | % | |||
Global Bond | 4,471,552 | 5.2 | % | |||
3 | Collateral received from brokers for securities lending was invested in these short-term investments. |
4 | Represents yield to maturity at June 30, 2008. |
5 | Floating Rate Security. The rate listed is as of June 30, 2008. Date in parenthesis represents the security’s next coupon rate reset. |
6 | Variable Rate Security. The rate listed is as of June 30, 2008 and is periodically reset subject to terms and conditions set forth in the debenture. |
# | Rounds to less than 0.1%. |
Investments Definitions and Abbreviations:
ADR/GDR: ADR after the name of a holding stands for American Depositary Receipt, representing ownership of foreign securities on deposit with a domestic custodian bank; a GDR (Global Depositary Receipt) is comparable, but foreign securities are held on deposit in a non-U.S. bank. The value of the ADR/GDR securities is determined or significantly influenced by trading on exchanges not located in the United States or Canada. Sponsored ADR/GDRs are initiated by the underlying foreign company.
FHLMC: Federal Home Loan Mortgage Corp.
FNMA: Federal National Mortgage Association
GNMA: Government National Mortgage Association
USTN: United States Treasury Note
Registered shares: A security whose owner has been recorded with its issuer or issuer’s registrar.
Abbreviations have been used throughout the portfolios to indicate amounts shown in currencies other than the U.S. dollar (USD):
ARS: | Argentine Peso | |
CAD: | Canadian Dollar | |
CHF: | Swiss Franc | |
COP: | Columbian Peso | |
EUR: | Euro | |
GBP: | British Pound | |
IDR: | Indonesian Rupiah | |
JPY: | Japanese Yen | |
KRW: | South Korean Won | |
MYR: | Malaysian Ringgit | |
SEK: | Swedish Krona | |
SGD: | Singapore Dollar | |
UYU: | Uruguay Peso |
32
Table of Contents
Statements of Assets and Liabilities
June 30, 2008 (unaudited)
| Managers Value Fund | Managers AMG Essex Large Cap Growth Fund | Managers Small Company Fund | ||||||||||
Assets: | ||||||||||||
Investments at value (including securities on loan valued at $8,459,334, $11,933,870, $4,860,300, $12,264,945, $15,673,841 and $4,471,552, respectively)* | $ | 59,807,881 | $ | 58,391,167 | $ | 31,620,954 | ||||||
Cash | — | — | — | |||||||||
Foreign currency** | — | — | — | |||||||||
Receivable for investments sold | — | 1,427,966 | 182,015 | |||||||||
Receivable for Fund shares sold | 80,590 | 33,740 | 26,432 | |||||||||
Receivable from affiliate | 5,185 | 5,497 | — | |||||||||
Unrealized gains on forward foreign currency contracts | — | — | — | |||||||||
Receivable for variation margin on futures | — | — | — | |||||||||
Dividends, interest and other receivables | 50,567 | 14,872 | 17,998 | |||||||||
Prepaid expenses | 14,606 | 11,577 | 18,516 | |||||||||
Total assets | 59,958,829 | 59,884,819 | 31,865,915 | |||||||||
Liabilities: | ||||||||||||
Payable to Custodian | 21,852 | — | — | |||||||||
Payable for Fund shares repurchased | 189,109 | 244,301 | 86,584 | |||||||||
Payable upon return of securities loaned | 8,799,085 | 12,209,280 | 5,014,758 | |||||||||
Payable for investments purchased | — | 1,161,597 | 144,800 | |||||||||
Unrealized losses on forward foreign currency contracts | — | — | — | |||||||||
Other payables | — | — | — | |||||||||
Accrued expenses: | ||||||||||||
Investment advisory and management fees | 22,435 | 21,503 | 19,769 | |||||||||
Administrative fees | 11,218 | 9,774 | 5,735 | |||||||||
Other | 63,398 | 58,124 | 34,960 | |||||||||
Total liabilities | 9,107,097 | 13,704,579 | 5,306,606 | |||||||||
Net Assets | $ | 50,851,732 | $ | 46,180,240 | $ | 26,559,309 | ||||||
Shares outstanding | 2,825,777 | 1,473,256 | 2,644,032 | |||||||||
Net asset value, offering and redemption price per share | $ | 18.00 | $ | 31.35 | $ | 10.05 | ||||||
Net Assets Represent: | ||||||||||||
Paid-in capital | $ | 56,619,028 | $ | 176,990,270 | $ | 24,801,762 | ||||||
Undistributed net investment income (loss) | 315,259 | (122,057 | ) | (54,679 | ) | |||||||
Accumulated net realized gain (loss) from investments, futures and foreign currency transactions | (1,864,015 | ) | (136,215,290 | ) | 391,600 | |||||||
Net unrealized appreciation (depreciation) of investments, futures and foreign currency contracts and translations | (4,218,540 | ) | 5,527,317 | 1,420,626 | ||||||||
Net Assets | $ | 50,851,732 | $ | 46,180,240 | $ | 26,559,309 | ||||||
| ||||||||||||
* Investments at cost | $ | 64,026,421 | $ | 52,863,850 | $ | 30,200,328 | ||||||
** Foreign currency at cost | — | — | — | |||||||||
The accompanying notes are an integral part of these financial statements.
33
Table of Contents
| Managers International Equity Fund | Managers Emerging Markets Equity Fund | Managers Global Bond Fund | ||||||||
Assets: | ||||||||||
Investments at value (including securities on loan valued at $8,459,334, $11,933,870, $4,860,300, $12,264,945, $15,673,841 and $4,471,552, respectively)* | $ | 255,562,360 | $ | 186,140,941 | $ | 88,047,071 | ||||
Cash | — | 79,658 | — | |||||||
Foreign currency** | 1,682,902 | 652,155 | 1,614,135 | |||||||
Receivable for investments sold | 4,950,288 | 545,567 | 459,741 | |||||||
Receivable for Fund shares sold | 929,114 | 378,391 | 41,805 | |||||||
Receivable from affiliate | — | — | — | |||||||
Unrealized gains on forward foreign currency contracts | 51,613 | — | 53,029 | |||||||
Receivable for variation margin on futures | 866 | — | — | |||||||
Dividends, interest and other receivables | 629,879 | 574,389 | 1,353,924 | |||||||
Prepaid expenses | 17,711 | 23,161 | 18,492 | |||||||
Total assets | 263,824,733 | 188,394,262 | 91,588,197 | |||||||
Liabilities: | ||||||||||
Payable to Custodian | 189,381 | — | 46,812 | |||||||
Payable for Fund shares repurchased | 1,425,666 | 642,046 | 132,443 | |||||||
Payable upon return of securities loaned | 12,626,427 | 15,900,575 | 4,608,616 | |||||||
Payable for investments purchased | 4,530,771 | 129,368 | 165,947 | |||||||
Unrealized losses on forward foreign currency contracts | 73,506 | — | 9,660 | |||||||
Other payables | 6,343 | — | — | |||||||
Accrued expenses: | ||||||||||
Investment advisory and management fees | 159,900 | 140,219 | 43,642 | |||||||
Administrative fees | 52,915 | 35,869 | 14,548 | |||||||
Other | 233,094 | 205,032 | 133,256 | |||||||
Total liabilities | 19,298,003 | 17,053,109 | 5,154,924 | |||||||
Net Assets | $ | 244,526,730 | $ | 171,341,153 | $ | 86,433,273 | ||||
Shares outstanding | 3,689,753 | 7,077,081 | 3,983,210 | |||||||
Net asset value, offering and redemption price per share | $ | 66.27 | $ | 24.21 | $ | 21.70 | ||||
Net Assets Represent: | ||||||||||
Paid-in capital | $ | 254,401,075 | $ | 117,573,406 | $ | 80,992,176 | ||||
Undistributed net investment income (loss) | 698,206 | 418,468 | 2,144,029 | |||||||
Accumulated net realized gain (loss) from investments, futures and foreign currency transactions | (27,065,168 | ) | 31,705,220 | 1,668,326 | ||||||
Net unrealized appreciation (depreciation) of investments, futures and foreign currency contracts and translations | 16,492,617 | 21,644,059 | 1,628,742 | |||||||
Net Assets | $ | 244,526,730 | $ | 171,341,153 | $ | 86,433,273 | ||||
| ||||||||||
* Investments at cost | $ | 239,055,111 | $ | 164,855,708 | $ | 86,521,817 | ||||
** Foreign currency at cost | $ | 1,253,004 | $ | 657,255 | $ | 1,575,895 | ||||
The accompanying notes are an integral part of these financial statements.
34
Table of Contents
For the six months ended June 30, 2008 (unaudited)
| Managers Value Fund | Managers AMG Essex Large Cap Growth Fund | Managers Small Company Fund | ||||||||||
Investment Income: | ||||||||||||
Dividend income | $ | 643,231 | $ | 149,936 | $ | 116,139 | ||||||
Interest income | — | — | — | |||||||||
Foreign withholding tax | (9,040 | ) | (5,248 | ) | (345 | ) | ||||||
Securities lending fees | 13,050 | 18,724 | 14,008 | |||||||||
Total investment income | 647,241 | 163,412 | 129,802 | |||||||||
Expenses: | ||||||||||||
Investment management fees | 211,937 | 186,444 | 120,152 | |||||||||
Administrative fees | 70,645 | 58,264 | 33,375 | |||||||||
Transfer agent | 74,178 | 68,807 | 12,118 | |||||||||
Professional fees | 19,309 | 18,977 | 12,532 | |||||||||
Registration fees | 11,055 | 13,324 | 9,377 | |||||||||
Custodian | 9,356 | 9,384 | 11,645 | |||||||||
Reports to shareholders | 5,397 | 5,370 | 2,862 | |||||||||
Trustees fees and expenses | 2,700 | 2,150 | 1,049 | |||||||||
Miscellaneous | 2,489 | 961 | 3,454 | |||||||||
Total expenses before offsets | 407,066 | 363,681 | 206,564 | |||||||||
Fee waivers | (5,185 | ) | (5,497 | ) | — | |||||||
Expense reimbursement | (65,362 | ) | (57,411 | ) | (10,580 | ) | ||||||
Expense reductions | (4,537 | ) | (15,304 | ) | (2,349 | ) | ||||||
Net expenses | 331,982 | 285,469 | 193,635 | |||||||||
Net investment income (loss) | 315,259 | (122,057 | ) | (63,833 | ) | |||||||
Net Realized and Unrealized Gain (Loss): | ||||||||||||
Net realized gain (loss) on investment transactions | (881,411 | ) | (2,938,105 | ) | 216,946 | |||||||
Net realized loss on futures contracts | — | — | — | |||||||||
Net realized gain (loss) on foreign currency contracts and transactions | — | — | — | |||||||||
Net unrealized depreciation of investments | (10,361,678 | ) | (154,323 | ) | (2,506,991 | ) | ||||||
Net unrealized appreciation of futures contracts | — | — | — | |||||||||
Net unrealized appreciation (depreciation) of foreign currency contracts and translations | — | — | — | |||||||||
Net realized and unrealized gain (loss) | (11,243,089 | ) | (3,092,428 | ) | (2,290,045 | ) | ||||||
Net increase (decrease) in net assets resulting from operations | $ | (10,927,830 | ) | $ | (3,214,485 | ) | $ | (2,353,878 | ) | |||
The accompanying notes are an integral part of these financial statements.
35
Table of Contents
| Managers International Equity Fund | Managers Emerging Markets Equity Fund | Managers Global Bond Fund | ||||||||||
Investment Income: | ||||||||||||
Dividend income | $ | 5,074,581 | $ | 2,046,057 | $ | 82,768 | ||||||
Interest income | — | — | 2,091,782 | |||||||||
Foreign withholding tax | (512,751 | ) | (149,827 | ) | — | |||||||
Securities lending fees | 52,010 | 41,581 | 16,788 | |||||||||
Total investment income | 4,613,840 | 1,937,811 | 2,191,338 | |||||||||
Expenses: | ||||||||||||
Investment management fees | 1,212,530 | 1,000,094 | 318,391 | |||||||||
Administrative fees | 336,814 | 217,412 | 90,969 | |||||||||
Transfer agent | 389,695 | 242,349 | 66,510 | |||||||||
Professional fees | 44,404 | 36,594 | 24,619 | |||||||||
Registration fees | 14,612 | 14,406 | 13,471 | |||||||||
Custodian | 156,187 | 175,434 | 37,106 | |||||||||
Reports to shareholders | 15,014 | 10,752 | 4,725 | |||||||||
Trustees fees and expenses | 13,107 | 8,243 | 3,040 | |||||||||
Miscellaneous | 8,341 | 35,773 | 2,800 | |||||||||
Total expenses before offsets | 2,190,704 | 1,741,057 | 561,631 | |||||||||
Fee waivers | — | — | (45,484 | ) | ||||||||
Expense reimbursement | (195,948 | ) | (170,309 | ) | (15,508 | ) | ||||||
Expense reductions | (2,772 | ) | (537 | ) | (305 | ) | ||||||
Net expenses | 1,991,984 | 1,570,211 | 500,334 | |||||||||
Net investment income (loss) | 2,621,856 | 367,600 | 1,691,004 | |||||||||
Net Realized and Unrealized Gain (Loss): | ||||||||||||
Net realized gain (loss) on investment transactions | 3,242,370 | 17,496,145 | 1,595,890 | |||||||||
Net realized loss on futures contracts | (124,445 | ) | — | — | ||||||||
Net realized gain (loss) on foreign currency contracts and transactions | (237,522 | ) | (33,221 | ) | 28,838 | |||||||
Net unrealized depreciation of investments | (47,042,383 | ) | (37,576,482 | ) | (1,692,953 | ) | ||||||
Net unrealized appreciation of futures contracts | 54,393 | — | — | |||||||||
Net unrealized appreciation (depreciation) of foreign currency contracts and translations | (1,314 | ) | (32,269 | ) | 69,458 | |||||||
Net realized and unrealized gain (loss) | (44,108,901 | ) | (20,145,827 | ) | 1,233 | |||||||
Net increase (decrease) in net assets resulting from operations | $ | (41,487,045 | ) | $ | (19,778,227 | ) | $ | 1,692,237 | ||||
The accompanying notes are an integral part of these financial statements.
36
Table of Contents
Statements of Changes in Net Assets
For the six months ended June 31, 2008 (unaudited) and for the year ended December 31, 2007
| Managers Value Fund | Managers AMG Essex Large Cap Growth Fund | Managers Small Company Fund | ||||||||||||||||||||||
| 2008 | 2007 | 2008 | 2007 | 2008 | 2007 | |||||||||||||||||||
Increase (Decrease) in Net Assets From Operations: | ||||||||||||||||||||||||
Net investment income (loss) | $ | 315,259 | $ | 638,193 | $ | (122,057 | ) | $ | (295,342 | ) | $ | (63,833 | ) | $ | 71,442 | |||||||||
Net realized gain (loss) on investments, futures and foreign currency transactions | (881,411 | ) | 7,066,106 | (2,938,105 | ) | 12,081,136 | 216,946 | 5,644,580 | ||||||||||||||||
Net unrealized appreciation (depreciation) of investments and foreign currency translations | (10,361,678 | ) | (12,723,883 | ) | (154,323 | ) | (3,092,212 | ) | (2,506,991 | ) | (2,093,069 | ) | ||||||||||||
Net increase (decrease) in net assets resulting from operations | (10,927,830 | ) | (5,019,584 | ) | (3,214,485 | ) | 8,693,582 | (2,353,878 | ) | 3,622,953 | ||||||||||||||
Distributions to Shareholders: | ||||||||||||||||||||||||
From net investment income | — | (644,259 | ) | — | — | — | (72,068 | ) | ||||||||||||||||
From net realized gain on investments | — | (9,340,529 | ) | — | — | — | (4,872,436 | ) | ||||||||||||||||
Total distributions to shareholders | — | (9,984,788 | ) | — | — | — | (4,944,504 | ) | ||||||||||||||||
From Capital Share Transactions: | ||||||||||||||||||||||||
Proceeds from sale of shares | 4,466,655 | 16,625,662 | 2,339,126 | 13,177,776 | 2,246,013 | 7,101,231 | ||||||||||||||||||
Reinvestment of dividends and distributions | — | 9,480,374 | — | — | — | 4,917,140 | ||||||||||||||||||
Cost of shares repurchased | (5,466,591 | ) | (29,238,475 | ) | (4,820,724 | ) | (35,994,240 | ) | (2,682,274 | ) | (19,785,414 | ) | ||||||||||||
Net increase (decrease) from capital share transactions | (999,936 | ) | (3,132,439 | ) | (2,481,598 | ) | (22,816,464 | ) | (436,261 | ) | (7,767,043 | ) | ||||||||||||
Total increase (decrease) in net assets | (11,927,766 | ) | (18,136,811 | ) | (5,696,083 | ) | (14,122,882 | ) | (2,790,139 | ) | (9,088,594 | ) | ||||||||||||
Net Assets: | ||||||||||||||||||||||||
Beginning of period | 62,779,498 | 80,916,309 | 51,876,323 | 65,999,205 | 29,349,448 | 38,438,042 | ||||||||||||||||||
End of period | $ | 50,851,732 | $ | 62,779,498 | $ | 46,180,240 | $ | 51,876,323 | $ | 26,559,309 | $ | 29,349,448 | ||||||||||||
End of period undistributed net investment income (loss) | $ | 315,259 | — | $ | (122,057 | ) | — | $ | (54,679 | ) | — | |||||||||||||
Share Transactions: | ||||||||||||||||||||||||
Sale of shares | 222,824 | 584,902 | 75,039 | 401,884 | 223,891 | 555,756 | ||||||||||||||||||
Reinvested shares | — | 425,129 | — | — | — | 439,422 | ||||||||||||||||||
Shares repurchased | (273,228 | ) | (1,025,973 | ) | (156,167 | ) | (1,109,222 | ) | (267,022 | ) | (1,517,885 | ) | ||||||||||||
Net increase (decrease) in shares | (50,404 | ) | (15,942 | ) | (81,128 | ) | (707,338 | ) | (43,131 | ) | (522,707 | ) | ||||||||||||
The accompanying notes are an integral part of these financial statements.
37
Table of Contents
| Managers International Equity Fund | Managers Emerging Markets Equity Fund | Managers Global Bond Fund | ||||||||||||||||||||||
| 2008 | 2007 | 2008 | 2007 | 2008 | 2007 | |||||||||||||||||||
Increase (Decrease) in Net Assets From Operations: | ||||||||||||||||||||||||
Net investment income (loss) | $ | 2,621,856 | $ | 1,549,035 | $ | 367,600 | $ | 244,320 | $ | 1,691,004 | $ | 3,286,666 | ||||||||||||
Net realized gain (loss) on investments, futures and foreign currency transactions | 2,880,403 | 35,687,191 | 17,462,924 | 42,821,002 | 1,624,728 | 2,942,161 | ||||||||||||||||||
Net unrealized appreciation (depreciation) of investments and foreign currency translations | (46,989,304 | ) | (4,284,123 | ) | (37,608,751 | ) | 4,033,010 | (1,623,495 | ) | 1,694,881 | ||||||||||||||
Net increase (decrease) in net assets resulting from operations | (41,487,045 | ) | 32,952,103 | (19,778,227 | ) | 47,098,332 | 1,692,237 | 7,923,708 | ||||||||||||||||
Distributions to Shareholders: | ||||||||||||||||||||||||
From net investment income | — | (1,407,436 | ) | — | — | — | (5,790,344 | ) | ||||||||||||||||
From net realized gain on investments | — | — | — | (31,190,295 | ) | — | (36,545 | ) | ||||||||||||||||
Total distributions to shareholders | — | (1,407,436 | ) | — | (31,190,295 | ) | — | (5,826,889 | ) | |||||||||||||||
From Capital Share Transactions: | ||||||||||||||||||||||||
Proceeds from sale of shares | 20,148,567 | 89,614,996 | 33,507,012 | 81,147,105 | 6,984,276 | 70,923,164 | ||||||||||||||||||
Reinvestment of dividends and distributions | — | 1,269,831 | — | 30,267,900 | — | 5,738,814 | ||||||||||||||||||
Cost of shares repurchased | (36,160,063 | ) | (51,320,349 | ) | (40,622,526 | ) | (82,070,827 | ) | (14,367,592 | ) | (40,303,982 | ) | ||||||||||||
Net increase (decrease) from capital share transactions | (16,011,496 | ) | 39,564,478 | (7,115,514 | ) | 29,344,178 | (7,383,316 | ) | 36,357,996 | |||||||||||||||
Total increase (decrease) in net assets | (57,498,541 | ) | 71,109,145 | (26,893,741 | ) | 45,252,215 | (5,691,079 | ) | 38,454,815 | |||||||||||||||
Net Assets: | ||||||||||||||||||||||||
Beginning of period | 302,025,271 | 230,916,126 | 198,234,894 | 152,982,679 | 92,124,352 | 53,669,537 | ||||||||||||||||||
End of period | $ | 244,526,730 | $ | 302,025,271 | $ | 171,341,153 | $ | 198,234,894 | $ | 86,433,273 | $ | 92,124,352 | ||||||||||||
End of period undistributed net investment income (loss) | $ | 698,206 | — | $ | 418,468 | — | $ | 2,144,029 | — | |||||||||||||||
Share Transactions: | ||||||||||||||||||||||||
Sale of shares | 284,709 | 1,182,441 | 1,319,226 | 2,961,645 | 319,082 | 3,348,376 | ||||||||||||||||||
Reinvested shares | — | 16,446 | — | 1,123,113 | — | 272,628 | ||||||||||||||||||
Shares repurchased | (510,749 | ) | (708,228 | ) | (1,638,065 | ) | (2,947,238 | ) | (659,063 | ) | (1,833,465 | ) | ||||||||||||
Net increase (decrease) in shares | (226,040 | ) | 490,659 | (318,839 | ) | 1,137,520 | (339,981 | ) | 1,787,539 | |||||||||||||||
The accompanying notes are an integral part of these financial statements.
38
Table of Contents
Statement of Assets and Liabilities
June 30, 2008 (unaudited)
Assets: | |||
Investment in JPMorgan Liquid Assets Money Market Fund, Capital Shares (cost $76,131,286) | $ | 76,131,286 | |
Receivable for Fund shares sold | 2,999 | ||
Dividends receivable | 162,148 | ||
Prepaid expenses | 16,403 | ||
Total assets | 76,312,836 | ||
Liabilities: | |||
Payable for Fund shares repurchased | 7,495 | ||
Dividends payable to shareholders | 24,621 | ||
Administration fee payable | 9,184 | ||
Other accrued expenses | 47,496 | ||
Total liabilities | 88,796 | ||
Net Assets | $ | 76,224,040 | |
Shares outstanding | 76,224,040 | ||
Net asset value, offering and redemption price per share | $ | 1.00 | |
Net Assets Represent: | |||
Paid-in capital | $ | 76,224,040 | |
Statement of Operations
| For the six months ended June 30, 2008 (unaudited) | ||||
Investment Income: | ||||
Dividend income | $ | 1,469,521 | ||
Expenses: | ||||
Administration fees | 63,768 | |||
Transfer agent | 26,968 | |||
Registration fees | 16,958 | |||
Professional fees | 15,797 | |||
Reports to shareholders | 3,136 | |||
Trustees fees and expenses | 3,130 | |||
Accounting fees | 3,000 | |||
Miscellaneous expenses | 2,310 | |||
Total expenses before offsets | 135,067 | |||
Expense reductions | (21,256 | ) | ||
Net expenses | 113,811 | |||
Net Investment Income | $ | 1,355,710 | ||
The accompanying notes are an integral part of these financial statements.
39
Table of Contents
Statement of Changes in Net Assets
| For the six months ended June 30, 2008 (unaudited) | For the one month ended December 31, 2007* | For the fiscal year ended November 30, 2007 | ||||||||||
Increase (Decrease) in Net Assets from Operations: | ||||||||||||
Net investment income | $ | 1,355,710 | $ | 360,095 | $ | 5,069,405 | ||||||
Distributions to Shareholders: | ||||||||||||
From net investment income | (1,355,710 | ) | (360,095 | ) | (5,069,405 | ) | ||||||
From Capital Share Transactions (at a constant $1.00 per share): | ||||||||||||
Proceeds from sale of shares | 69,860,855 | 9,618,816 | 215,023,349 | |||||||||
Reinvestment of dividends | 1,317,075 | 333,820 | 4,966,351 | |||||||||
Cost of shares repurchased | (86,171,817 | ) | (11,840,450 | ) | (164,722,861 | ) | ||||||
Net increase (decrease) from capital share transactions | (14,993,887 | ) | (1,887,814 | ) | 55,266,839 | |||||||
Total increase (decrease) in net assets | (14,993,887 | ) | (1,887,814 | ) | 55,266,839 | |||||||
Net Assets: | ||||||||||||
Beginning of period | 91,217,927 | 93,105,741 | 37,838,902 | |||||||||
End of period | $ | 76,224,040 | $ | 91,217,927 | $ | 93,105,741 | ||||||
| * | Effective December 1, 2007, Managers Money Market changed its fiscal year end from November 30 to December 31. |
Managers Money Market Financial Highlights
For a share outstanding throughout each period
| For the six months ended June 30, 2008 (unaudited) | For one month ended December 31, 2007*** | For the fiscal year ended November 30, | ||||||||||||||||||||||||||
| 2007 | 2006 | 2005** | 2004* | 2003 | ||||||||||||||||||||||||
Net Asset Value, Beginning of Period | $ | 1.000 | $ | 1.000 | $ | 1.000 | $ | 1.000 | $ | 1.000 | $ | 1.000 | $ | 1.000 | ||||||||||||||
Income from Investment Operations: | ||||||||||||||||||||||||||||
Net investment income | 0.016 | 0.004 | 0.049 | 0.043 | 0.026 | 0.008 | 0.007 | |||||||||||||||||||||
Less Distributions to Shareholders from: | ||||||||||||||||||||||||||||
Net investment income | (0.016 | ) | (0.004 | ) | (0.049 | ) | (0.043 | ) | (0.026 | ) | (0.008 | ) | (0.007 | ) | ||||||||||||||
Net Asset Value, End of Period | $ | 1.000 | $ | 1.000 | $ | 1.000 | $ | 1.000 | $ | 1.000 | $ | 1.000 | $ | 1.000 | ||||||||||||||
Total Return1 | 1.54 | %3 | 0.37 | %3 | 5.05 | % | 4.45 | % | 2.61 | % | 0.82 | % | 0.69 | % | ||||||||||||||
Ratio of net expenses to average net assets | 0.27 | %4 | 0.39 | %4 | 0.29 | % | 0.40 | % | 0.40 | % | 0.36 | % | 0.38 | % | ||||||||||||||
Ratio of net investment income to average net assets | 3.19 | %4 | 4.46 | %4 | 4.92 | % | 4.42 | % | 2.62 | % | 0.86 | % | 0.69 | % | ||||||||||||||
Net assets at end of year (000’s omitted) | $ | 76,224 | $ | 91,218 | $ | 93,106 | $ | 37,839 | $ | 37,896 | $ | 47,645 | $ | 33,050 | ||||||||||||||
Expense Waivers/Offsets2 | ||||||||||||||||||||||||||||
Ratio of total expenses to average net assets | 0.32 | %4 | 0.44 | %4 | 0.34 | % | 0.45 | % | 0.46 | % | 0.44 | % | 0.43 | % | ||||||||||||||
Ratio of net investment income to average net assets | 3.14 | %4 | 4.41 | %4 | 4.87 | % | 4.37 | % | 2.56 | % | 0.78 | % | 0.64 | % | ||||||||||||||
| * | Prior to May 14, 2004 the Fund invested all of its assets in the Institutional Class Shares of the JPMorgan Prime Money Market Fund. (See Notes to Financial Statements). |
| ** | Prior to February 19, 2005 the Fund invested all of its assets in the Institutional Class Shares of the JPMorgan Liquid Assets Money Market Fund. (See Notes to Financial Statements). |
| *** | Effective December 1, 2007, Managers Money Market Fund changed its fiscal year end from November 30 to December 31. (See Notes to Financial Statements.) |
1 | Total returns and net investment income would have been lower had certain expenses not been reduced. (See Note 1(c) of Notes to Financial Statements.) |
2 | Excludes the impact of expense reimbursements and expense reductions such as brokerage credits, but includes non-reimbursable expenses, if any, such as interest and taxes. (See Note 1(c) of Notes to Financial Statements.) |
3 | Not Annualized. |
4 | Annualized. |
The accompanying notes are an integral part of these financial statements.
40
Table of Contents
For a share outstanding throughout each period
Managers Value Fund | For the six months ended June 30, 2008 (unaudited) | For the year ended December 31, | ||||||||||||||||||||||
| 2007 | 2006 | 2005 | 2004 | 2003 | ||||||||||||||||||||
Net Asset Value, Beginning of Period | $ | 21.83 | $ | 27.98 | $ | 27.98 | $ | 29.73 | $ | 26.24 | $ | 20.69 | ||||||||||||
Income from Investment Operations: | ||||||||||||||||||||||||
Net investment income | 0.11 | 0.23 | 3 | 0.27 | 3 | 0.23 | 0.17 | 0.11 | ||||||||||||||||
Net realized and unrealized gain (loss) on investments | (3.94 | ) | (2.32 | )3 | 4.79 | 3 | 1.43 | 3.47 | 5.56 | |||||||||||||||
Total from investment operations | (3.83 | ) | (2.09 | ) | 5.06 | 1.66 | 3.64 | 5.67 | ||||||||||||||||
Less Distributions to Shareholders from: | ||||||||||||||||||||||||
Net investment income | — | (0.26 | ) | (0.35 | ) | (0.25 | ) | (0.15 | ) | (0.12 | ) | |||||||||||||
Net realized gain on investments | — | (3.80 | ) | (4.71 | ) | (3.16 | ) | — | — | |||||||||||||||
Total distributions to shareholders | — | (4.06 | ) | (5.06 | ) | (3.41 | ) | (0.15 | ) | (0.12 | ) | |||||||||||||
Net Asset Value, End of Period | $ | 18.00 | $ | 21.83 | $ | 27.98 | $ | 27.98 | $ | 29.73 | $ | 26.24 | ||||||||||||
Total Return1 | (17.59 | )%4,5 | (7.77 | )% | 18.08 | % | 5.53 | % | 13.87 | % | 27.39 | % | ||||||||||||
Ratio of net expenses to average net assets | 1.17 | %6 | 1.16 | % | 1.17 | % | 1.18 | % | 1.22 | % | 1.27 | % | ||||||||||||
Ratio of net investment income to average net assets1 | 1.12 | %6 | 0.83 | % | 0.90 | % | 0.72 | % | 0.62 | % | 0.59 | % | ||||||||||||
Portfolio turnover | 25 | %5 | 37 | % | 32 | % | 54 | % | 39 | % | 40 | % | ||||||||||||
Net assets at end of period (000’s omitted) | $ | 50,852 | $ | 62,779 | $ | 80,916 | $ | 124,643 | $ | 119,547 | $ | 100,720 | ||||||||||||
Ratios absent expense offsets:2 | ||||||||||||||||||||||||
Ratio of total expenses to average net assets | 1.44 | %6 | 1.20 | % | 1.23 | % | 1.15 | % | 1.38 | % | 1.42 | % | ||||||||||||
Ratio of net investment income to average net assets | 0.85 | %6 | 0.80 | % | 0.84 | % | 0.71 | % | 0.47 | % | 0.44 | % | ||||||||||||
Managers AMG Essex Large Cap Growth Fund | For the six months ended June 30, 2008 (unaudited) | For the year ended December 31, | ||||||||||||||||||||||
| 2007 | 2006 | 2005 | 2004 | 2003 | ||||||||||||||||||||
Net Asset Value, Beginning of Period | $ | 33.37 | $ | 29.18 | $ | 27.79 | $ | 26.77 | $ | 25.46 | $ | 20.36 | ||||||||||||
Income from Investment Operations: | ||||||||||||||||||||||||
Net investment loss | (0.08 | ) | (0.15 | )3 | (0.09 | )3 | (0.07 | )3 | (0.07 | ) | (0.16 | ) | ||||||||||||
Net realized and unrealized gain (loss) on investments | (1.94 | ) | 4.34 | 3 | 1.48 | 3 | 1.09 | 3 | 1.38 | 5.26 | ||||||||||||||
Total from investment operations | (2.02 | ) | 4.19 | 1.39 | 1.02 | 1.31 | 5.10 | |||||||||||||||||
Net Asset Value, End of Period | $ | 31.35 | $ | 33.37 | $ | 29.18 | $ | 27.79 | $ | 26.77 | $ | 25.46 | ||||||||||||
Total Return1 | (6.05 | )%5 | 14.36 | % | 4.96 | % | 3.85 | % | 5.14 | % | 25.05 | % | ||||||||||||
Ratio of net expenses to average net assets | 1.22 | %6 | 1.24 | % | 1.25 | % | 1.28 | % | 1.34 | % | 1.33 | % | ||||||||||||
Ratio of net investment loss to average net assets1 | (0.52 | )%6 | (0.47 | )% | (0.33 | )% | (0.27 | )% | (0.26 | )% | (0.67 | )% | ||||||||||||
Portfolio turnover | 54 | %5 | 116 | % | 200 | % | 97 | % | 79 | % | 109 | % | ||||||||||||
Net assets at end of period (000’s omitted) | $ | 46,180 | $ | 51,876 | $ | 65,999 | $ | 104,878 | $ | 98,347 | $ | 110,903 | ||||||||||||
Ratios absent expense offsets:2 | ||||||||||||||||||||||||
Ratio of total expenses to average net assets | 1.56 | %6 | 1.29 | % | 1.32 | % | 1.22 | % | 1.47 | % | 1.52 | % | ||||||||||||
Ratio of net investment loss to average net assets | (0.86 | )%6 | (0.52 | )% | (0.40 | )% | (0.21 | )% | (0.39 | )% | (0.86 | )% | ||||||||||||
41
Table of Contents
Financial Highlights
For a share outstanding throughout each period
Managers Small Company Fund | For the six months ended June 30, 2008 (unaudited) | For the year ended December 31, | ||||||||||||||||||||||
| 2007 | 2006 | 2005 | 2004 | 2003 | ||||||||||||||||||||
Net Asset Value, Beginning of Period | $ | 10.92 | $ | 11.97 | $ | 10.84 | $ | 10.36 | $ | 9.19 | $ | 6.40 | ||||||||||||
Income from Investment Operations: | ||||||||||||||||||||||||
Net investment income (loss) | (0.02 | ) | 0.02 | 3 | (0.08 | )3 | (0.08 | )3 | (0.08 | ) | (0.09 | ) | ||||||||||||
Net realized and unrealized gain (loss) on investments | (0.85 | ) | 1.12 | 3 | 1.21 | 3 | 0.56 | 3 | 1.25 | 2.88 | ||||||||||||||
Total from investment operations | (0.87 | ) | 1.14 | 1.13 | 0.48 | 1.17 | 2.79 | |||||||||||||||||
Less Distributions to Shareholders from: | ||||||||||||||||||||||||
Net investment income | — | (0.03 | ) | — | — | — | — | |||||||||||||||||
Net realized gain on investments | — | (2.16 | ) | — | — | — | — | |||||||||||||||||
Total distributions to shareholders | — | (2.19 | ) | — | — | — | — | |||||||||||||||||
Net Asset Value, End of Period | $ | 10.05 | $ | 10.92 | $ | 11.97 | $ | 10.84 | $ | 10.36 | $ | 9.19 | ||||||||||||
Total Return1 | (7.97 | )%4,5 | 9.13 | % | 10.42 | % | 4.63 | % | 12.73 | % | 43.59 | % | ||||||||||||
Ratio of net expenses to average net assets | 1.45 | %6 | 1.36 | % | 1.39 | % | 1.45 | % | 1.45 | % | 1.45 | % | ||||||||||||
Ratio of net investment income (loss) to average net assets1 | (0.48 | )%6 | 0.19 | % | (0.72 | )% | (0.82 | )% | (1.05 | )% | (1.20 | )% | ||||||||||||
Portfolio turnover | 16 | %5 | 50 | % | 126 | % | 26 | % | 18 | % | 48 | % | ||||||||||||
Net assets at end of period (000’s omitted) | $ | 26,559 | $ | 29,349 | $ | 38,438 | $ | 36,993 | $ | 27,629 | $ | 18,750 | ||||||||||||
Ratios absent expense offsets:2 | ||||||||||||||||||||||||
Ratio of total expenses to average net assets | 1.55 | %6,7 | 1.47 | % | 1.54 | % | 1.41 | % | 1.43 | % | 1.50 | % | ||||||||||||
Ratio of net investment income (loss) to average net assets | (0.58 | )%6,7 | 0.08 | % | (0.87 | )% | (0.78 | )% | (1.03 | )% | (1.25 | )% | ||||||||||||
Managers International Equity Fund | For the six months ended June 30, 2008 (unaudited) | For the year ended December 31, | ||||||||||||||||||||||
| 2007 | 2006 | 2005 | 2004 | 2003 | ||||||||||||||||||||
Net Asset Value, Beginning of Period | $ | 77.13 | $ | 67.42 | $ | 53.76 | $ | 47.05 | $ | 41.13 | $ | 31.22 | ||||||||||||
Income from Investment Operations: | ||||||||||||||||||||||||
Net investment income | 0.68 | 0.47 | 0.69 | 0.37 | 0.27 | 0.34 | ||||||||||||||||||
Net realized and unrealized gain (loss) on investments | (11.54 | ) | 9.60 | 14.15 | 6.83 | 5.96 | 10.04 | |||||||||||||||||
Total from investment operations | (10.86 | ) | 10.07 | 14.84 | 7.20 | 6.23 | 10.38 | |||||||||||||||||
Less Distributions to Shareholders from: | ||||||||||||||||||||||||
Net investment income | — | (0.36 | ) | (1.18 | ) | (0.49 | ) | (0.31 | ) | (0.47 | ) | |||||||||||||
Total distributions to shareholders | — | (0.36 | ) | (1.18 | ) | (0.49 | ) | (0.31 | ) | (0.47 | ) | |||||||||||||
Net Asset Value, End of Period | $ | 66.27 | $ | 77.13 | $ | 67.42 | $ | 53.76 | $ | 47.05 | $ | 41.13 | ||||||||||||
Total Return1 | (14.02 | )%5 | 14.94 | %4 | 27.63 | % | 15.30 | % | 15.17 | % | 33.21 | % | ||||||||||||
Ratio of net expenses to average net assets | 1.48 | %6 | 1.48 | % | 1.45 | % | 1.45 | % | 1.62 | % | 1.72 | % | ||||||||||||
Ratio of net investment income to average net assets1 | 1.95 | %6 | 0.60 | % | 0.70 | % | 0.75 | % | 0.57 | % | 0.70 | % | ||||||||||||
Portfolio turnover | 93 | %5 | 98 | % | 70 | % | 79 | % | 93 | % | 80 | % | ||||||||||||
Net assets at end of period (000’s omitted) | $ | 244,527 | $ | 302,025 | $ | 230,916 | $ | 206,393 | $ | 234,061 | $ | 266,611 | ||||||||||||
Ratios absent expense offsets:2 | ||||||||||||||||||||||||
Ratio of total expenses to average net assets | 1.63 | %6 | 1.61 | % | 1.47 | % | 1.42 | % | 1.70 | % | 1.73 | % | ||||||||||||
Ratio of net investment income to average net assets | 1.80 | %6 | 0.46 | % | 0.68 | % | 0.79 | % | 0.50 | % | 0.69 | % | ||||||||||||
42
Table of Contents
Financial Highlights
For a share outstanding throughout each period
Managers Emerging Markets Equity Fund | For the six months ended June 30, 2008 (unaudited) | For the year ended December 31, | ||||||||||||||||||||||
| 2007 | 2006 | 2005 | 2004 | 2003 | ||||||||||||||||||||
Net Asset Value, Beginning of Period | $ | 26.80 | $ | 24.44 | $ | 20.10 | $ | 16.50 | $ | 13.26 | $ | 8.80 | ||||||||||||
Income from Investment Operations: | ||||||||||||||||||||||||
Net investment income | 0.05 | 0.04 | 3 | 0.22 | 0.52 | 0.08 | 0.01 | |||||||||||||||||
Net realized and unrealized gain (loss) on investments | (2.64 | ) | 7.20 | 3 | 6.66 | 4.84 | 3.74 | 4.50 | ||||||||||||||||
Total from investment operations | (2.59 | ) | 7.24 | 6.88 | 5.36 | 3.82 | 4.51 | |||||||||||||||||
Less Distributions to Shareholders from: | ||||||||||||||||||||||||
Net investment income | — | — | (0.22 | ) | (0.55 | ) | (0.06 | ) | (0.05 | ) | ||||||||||||||
Net realized gain on investments | — | (4.88 | ) | (2.32 | ) | (1.21 | ) | (0.52 | ) | — | ||||||||||||||
Total distributions to shareholders | — | (4.88 | ) | (2.54 | ) | (1.76 | ) | (0.58 | ) | (0.05 | ) | |||||||||||||
Net Asset Value, End of Period | $ | 24.21 | $ | 26.80 | $ | 24.44 | $ | 20.10 | $ | 16.50 | $ | 13.26 | ||||||||||||
Total Return1 | (9.70 | )%5 | 29.50 | %4 | 34.50 | % | 32.53 | % | 28.85 | % | 51.20 | % | ||||||||||||
Ratio of net expenses to average net assets | 1.80 | %6 | 1.78 | % | 1.76 | % | 1.75 | % | 1.85 | % | 1.99 | % | ||||||||||||
Ratio of net investment income to average net assets1 | 0.43 | %6 | 0.13 | % | 0.89 | % | 0.59 | % | 0.67 | % | 0.08 | % | ||||||||||||
Portfolio turnover | 22 | %5 | 62 | % | 41 | % | 35 | % | 58 | % | 79 | % | ||||||||||||
Net assets at end of period (000’s omitted) | $ | 171,341 | $ | 198,235 | $ | 152,983 | $ | 117,229 | $ | 63,567 | $ | 36,728 | ||||||||||||
Ratios absent expense offsets:2 | ||||||||||||||||||||||||
Ratio of total expenses to average net assets | 2.00 | %6,7 | 1.93 | % | 1.76 | % | 1.72 | % | 1.87 | % | 1.97 | % | ||||||||||||
Ratio of net investment income to average net assets | 0.23 | %6,7 | (0.02 | )% | 0.89 | % | 0.62 | % | 0.66 | % | 0.13 | % | ||||||||||||
Managers Global Bond Fund | For the six months ended June 30, 2008 (unaudited) | For the year ended December 31, | ||||||||||||||||||||||
| 2007 | 2006 | 2005 | 2004 | 2003 | ||||||||||||||||||||
Net Asset Value, Beginning of Period | $ | 21.31 | $ | 21.17 | $ | 20.19 | $ | 22.38 | $ | 22.19 | $ | 20.58 | ||||||||||||
Income from Investment Operations: | ||||||||||||||||||||||||
Net investment income | 0.43 | 0.70 | 3 | 0.45 | 0.63 | 0.65 | 0.80 | |||||||||||||||||
Net realized and unrealized gain (loss) on investments | (0.04 | ) | 0.88 | 3 | 1.05 | (1.75 | ) | 1.49 | 3.43 | |||||||||||||||
Total from investment operations | 0.39 | 1.58 | 1.50 | (1.12 | ) | 2.14 | 4.23 | |||||||||||||||||
Less Distributions to Shareholders from: | ||||||||||||||||||||||||
Net investment income | — | (1.43 | ) | (0.49 | ) | (0.77 | ) | (1.34 | ) | (2.09 | ) | |||||||||||||
Net realized gain on investments | — | (0.01 | ) | (0.03 | ) | (0.30 | ) | (0.61 | ) | (0.53 | ) | |||||||||||||
Total distributions to shareholders | — | (1.44 | ) | (0.52 | ) | (1.07 | ) | (1.95 | ) | (2.62 | ) | |||||||||||||
Net Asset Value, End of Period | $ | 21.70 | $ | 21.31 | $ | 21.17 | $ | 20.19 | $ | 22.38 | $ | 22.19 | ||||||||||||
Total Return1 | 1.92 | %5 | 7.52 | %4 | 7.36 | % | (4.94 | )% | 9.62 | % | 20.69 | % | ||||||||||||
Ratio of net expenses to average net assets | 1.10 | %6 | 1.19 | % | 1.19 | % | 1.19 | % | 1.29 | % | 1.68 | % | ||||||||||||
Ratio of net investment income to average net assets1 | 3.72 | %6 | 3.25 | % | 2.86 | % | 2.38 | % | 2.73 | % | 3.48 | % | ||||||||||||
Portfolio turnover | 29 | %5 | 152 | % | 56 | % | 64 | % | 130 | % | 152 | % | ||||||||||||
Net assets at end of period (000’s omitted) | $ | 86,433 | $ | 92,124 | $ | 53,670 | $ | 43,131 | $ | 36,454 | $ | 32,307 | ||||||||||||
Ratios absent expense offsets:2 | ||||||||||||||||||||||||
Ratio of total expenses to average net assets | 1.23 | %6 | 1.25 | % | 1.27 | % | 1.26 | % | 1.49 | % | 1.68 | % | ||||||||||||
Ratio of net investment income to average net assets | 3.59 | %6 | 3.18 | % | 2.78 | % | 2.31 | % | 2.53 | % | 3.48 | % | ||||||||||||
The following notes should be read in conjunction with the Financial Highlights of the Funds presented on the preceding pages.
1 | Total returns and net investment income would have been lower had certain expenses not been reduced. (See Note 1(c) to the Notes to Financial Statements.) |
2 | Excludes the impact of expense (reimbursement)/recoupment and expense reductions such as brokerage credits, but includes non-reimbursable expenses, if any, such as interest and taxes. (See Note 1(c) to the Notes to Financial Statements.) |
3 | Per share numbers have been calculated using average shares. |
4 | The Total Return is based on the Financial Statement Net Asset Values as shown above. |
5 | Not Annualized. |
6 | Annualized. |
7 | Includes interest expense for the period ended June 30, 2008, of 0.02% and 0.03% for Small Company and Emerging Markets Equity, respectively. (See Note 1(c) of Notes to Financial Statements.) |
43
Table of Contents
June 30, 2008 (unaudited)
| 1. | Summary of Significant Accounting Policies |
The Managers Funds (the “Trust”) is an open-end management investment company organized as a Massachusetts business trust and registered under the Investment Company Act of 1940, as amended (the “1940 Act”). Currently, the Trust is comprised of a number of different funds. Included in this report are the Managers Value Fund (“Value”), Managers AMG Essex Large Cap Growth Fund (“Essex Large Cap Growth”), Managers Small Company Fund (“Small Company”), Managers International Equity Fund (“International Equity”), Managers Emerging Markets Equity Fund (“Emerging Markets Equity”), Managers Money Market Fund (“Money Market”) and Managers Global Bond Fund (“Global Bond”), collectively the “Funds.”
Money Market invests all of its investable assets in the Capital Shares of the JPMorgan Liquid Assets Money Market Fund (the “Portfolio”), a separate registered open-end management investment company with substantially the same investment objective and policies as the Fund. The Portfolio is a series of the JPMorgan Trust II, a business trust organized under the laws of The Commonwealth of Massachusetts. The investment manager of the Portfolio is JPMorgan Investment Advisors Inc. (“JPMIA”). The performance of the Fund is directly affected by the performance of the Portfolio.
The Funds’ financial statements are prepared in accordance with accounting principles generally accepted in the United States of America, which require management to make estimates and assumptions that affect the reported amount of assets and liabilities and disclosure of contin-gent assets and liabilities at the date of the financial statements and the reported amounts of income and expenses during the reporting periods. Actual results could differ from those estimates and such differences could be material. The following is a summary of significant accounting policies followed by the Funds in the preparation of their financial statements:
| a. | Valuation of Investments |
Equity securities traded on a domestic or international securities exchange are valued at the last quoted sale price, or, lacking any sales, at the last quoted bid price. Over-the-counter securities are valued at the Nasdaq Official Closing Price, if one is available. Lacking any sales, over-the-counter securities are valued at the last quoted bid price. The Funds’ investments are generally valued based on market quotations provided by the third party pricing services approved by the Board of Trustees of the Funds. Under certain circumstances, the value of a specific investment may be based on an evaluation of its fair value, pursuant to procedures established by and under the general supervision of the Board of Trustees of the Trust. A Fund may use the fair value of a portfolio security to calculate its NAV when, for example, (1) market quotations are not readily available because a portfolio security is not traded in a public market or the principal market in which the security trades is closed, (2) trading in a portfolio security is suspended and has not resumed before the Fund calculates its NAV, (3) where a significant event affecting the value of a portfolio security is determined to have occurred between the time of the market quotation provided for a portfolio security and the time as of which the Fund calculates its NAV, (4) a security’s price has remained unchanged over a period of time (often referred to as a “stale price”), or (5) Managers Investment Group LLC (the “Investment Manager”) determines that a market quotation is inaccurate. Portfolio investments that trade primarily on foreign markets are priced based upon the market quotation of such securities as of the close of their respective principal markets, as adjusted to reflect the Investment Manager’s determination of the impact of events occurring subsequent to the close of such markets but prior to the time as of which the Fund calculates their NAV. In accordance with procedures approved by the Board of Trustees, the Investment Manager relies upon recommendations of a third-party fair valuation service in adjusting the prices of such foreign portfolio investments. The Funds may invest in securities that may be thinly traded. The Board of Trustees has adopted procedures to adjust prices when thinly traded securities are judged to be stale so that they reflect fair value. An investment valued on the basis of its fair value may be valued at a price higher or lower than available market quotations. An investment’s valuation may differ depending on the method used and the factors considered in determining value according to the Funds fair value procedures.
Fixed-income securities are valued based on valuations furnished by independent pricing services that utilize matrix systems, which reflect such factors as security prices, yields, maturities, and ratings, and are supplemented by dealer and exchange quotations. Short-term investments having a remaining maturity of 60 days or less are valued at amortized cost, which approximates market value. Investments in other regulated investment companies are valued at their end of day net asset value per share except iShares or other ETF’s, which are valued the same as equity securities. Investments in certain mortgage-backed, stripped mortgage-backed, preferred stocks, convertible securities, derivatives and other debt securities not traded on an organized securities market are valued on the basis of valuations provided by dealers or by a pricing service which uses information with respect to transactions in such securities and various relationships between securities and yield to maturity in determining value. Securities (including derivatives) for which market quotations are not readily available are valued at fair value, as determined in good faith, and pursuant to procedures adopted by the Board of Trustees of the Trust. The values assigned to fair value investments are based on available information and do not necessarily represent amounts that might ultimately be realized, since such amounts depend on future developments inherent in long-term investments. Further, because of the inherent uncertainty of valuation, those estimated values may differ significantly from the values that would have been used had a ready market for the investments existed, and the differences could be material.
Money Market’s investment in the Portfolio is valued daily at its end of day net asset value per share. The Portfolio’s underlying investments are valued at amortized cost which approximates market value. The amortized cost method of valuation values a security at its cost at the time of purchase and thereafter assumes a constant amortization to maturity of any discount or premium, regardless of the impact of fluctuating interest rates on the market value of the instruments.
The Funds adopted Financial Accounting Standards Board Statement of Financial Accounting Standards No. 157, Fair Value Measurements (“FAS 157”), effective January 1, 2008. In accordance with FAS 157, fair value is defined as the price that a Fund would receive to sell an asset or pay to transfer a liability in an orderly transaction between market participants at the measurement date. FAS 157 also establishes a framework for measuring fair value, and a three-level hierarchy for fair value measurements based upon the transparency of inputs to the valuation of an asset or liability.
44
Table of Contents
Notes to Financial Statements (continued)
Inputs may be observable or unobservable and refer broadly to the assumptions that market participants would use in pricing the asset or liability. Observable inputs reflect the assumptions market participants would use in pricing the asset or liability based on market data obtained from sources independent of the Funds. Unobservable inputs reflect the Funds’ own assumptions about the assumptions that market participants would use in pricing the asset or liability developed based on the best information available in the circumstances. Each investment is as-signed a level based upon the observability of the inputs which are significant to the overall valuation. The three-tier hierarchy of inputs is summarized below:
Level 1 – quoted prices in active markets for identical investments
Level 2 – other significant observable inputs (including quoted prices for similar investments, interest rates, prepayment speeds, credit risk)
Level 3 – significant unobservable inputs (including the Funds’ own assumptions in determining the fair value of investments)
The inputs or methodologies used for valuing investments are not necessarily an indication of the risk associated with investing in those investments. The following table summarizes the valuation of the Fund’s investments by the above fair value hierarchy levels as of June 30, 2008:
Level | Investments in Securities | Other Financial Instruments* | ||||
Value | ||||||
Level 1 | $ | 59,807,881 | — | |||
Level 2 | — | — | ||||
Level 3 | — | — | ||||
Total | $ | 59,807,881 | — | |||
Essex Large Cap Growth | ||||||
Level 1 | $ | 58,391,067 | — | |||
Level 2 | — | — | ||||
Level 3 | — | — | ||||
Total | $ | 58,391,067 | — | |||
Small Company | ||||||
Level 1 | $ | 31,620,954 | — | |||
Level 2 | — | — | ||||
Level 3 | — | — | ||||
Total | $ | 31,620,954 | — | |||
International Equity | ||||||
Level 1 | $ | 60,064,582 | (16,701 | ) | ||
Level 2 | 195,497,778 | (21,894 | ) | |||
Level 3 | — | — | ||||
Total | $ | 255,562,360 | (38,595 | ) | ||
Emerging Markets Equity | ||||||
Level 1 | $ | 79,285,050 | — | |||
Level 2 | 106,855,891 | — | ||||
Level 3 | — | — | ||||
Total | $ | 186,140,941 | — | |||
Global Bond | ||||||
Level 1 | $ | 7,382,806 | — | |||
Level 2 | 80,664,265 | 43,368 | ||||
Level 3 | — | — | ||||
Total | $ | 88,047,071 | 43,368 | |||
Money Market | ||||||
Level 1 | $ | 76,131,286 | — | |||
Level 2 | — | — | ||||
Level 3 | — | — | ||||
Total | $ | 76,131,286 | — | |||
| * | Other financial instruments are derivative instruments not reflected in the Schedule of Portfolio Investments, such as futures, forwards and swap contracts, which are valued at the unrealized appreciation/depreciation of the instrument. |
| b. | Security Transactions |
Security transactions are accounted for as of the trade date. Realized gains and losses on securities sold are determined on the basis of identified cost.
| c. | Investment Income and Expenses |
Dividend income is recorded on the ex-dividend date except certain dividends from foreign securities where the ex-dividend date may have passed. These dividends are recorded as soon as the Trust is informed of the ex-dividend date. Dividend income on foreign securities is recorded net of any withholding tax. Interest income, which includes amortization of premium and accretion of discount on debt securities, is accrued as earned. Non-cash dividends included in dividend income, if any, are reported at the fair market value of the securities received. As a shareholder of the Portfolio, the Money Market Fund receives its proportionate share of the dividends paid by such class, which takes into consideration the Fund’s proportionate share of net investment income and expenses of such class. Other income and expenses are recorded on an accrual basis. Expenses that cannot be directly attributed to a fund are apportioned among the Funds in the Trust and in some cases other affiliated funds based upon their relative average net assets or number of shareholders.
The following Funds had certain portfolio trades directed to various brokers who paid a portion of such Fund’s expenses. For the six months ended June 30, 2008, under these arrangements the amount by which the Funds’ expenses were reduced and the impact on the expense ratios were as follows: Value - $4,393 or 0.02%; Essex Large Cap Growth - $15,173 or 0.07%; Small Company - $2,274 or 0.02% and International Equity – 1,997 or 0.001%.
45
Table of Contents
Notes to Financial Statements (continued)
The Funds have a “balance credit” arrangement with The Bank of New York Mellon (“BNYM”) (formerly The Bank of New York), the Fund’s custodian, whereby the Funds are credited with an interest factor equal to 0.75% below the effective 90-day T-Bill rate for account balances left uninvested overnight. These credits serve to reduce custody expenses that would otherwise be charged to the Funds. For the six months ended June 30, 2008, the custodian expense was reduced as follows: International Equity - $82; Emerging Markets Equity - $53 and Global Bond - $61.
Overdrafts will cause a reduction of any earnings credits, computed at 2% above the Federal funds rate on the day of the overdraft. For the six months ended June 30, 2008, overdraft fees were as follows: Small Company - $2,331 or 0.02% and Emerging Markets Equity – $30,936 or 0.03%.
The Trust also has a balance credit arrangement with its Transfer Agent, PNC Global Investment Servicing (U.S.) Inc. (formerly PFPC Inc.), whereby earnings credits are used to offset banking charges and other out-of-pocket expenses. For six months ended June, 30, 2008, the Funds’ portion of the transfer agent expense was reduced under this arrangement as follows: Value - - $144; Essex Large Cap Growth - $131; Small Company - $75; International Equity - $693; Emerging Markets Equity - $484 and Global Bond - $244.
The Investment Manager has agreed to waive a portion of its administrative fee in consideration of shareholder servicing fees that it has received from JPMorgan Distribution Services, Inc., with respect to short-term cash investments the Funds have made in the JPMorgan Liquid Assets Portfolio. For the six months ended June 30, 2008, the Money Market’s administrative fee was reduced by $21,256.
Total returns and net investment income for the Funds would have been lower had certain expenses not been offset. Total expenses before off-sets exclude the impact of expense reimbursements or fee waivers and expense offsets such as brokerage recapture credits, but include non-reimburseable expenses such as interest and taxes, if any.
| d. | Dividends and Distributions |
Dividends resulting from net investment income, if any, normally will be declared and paid annually for all Funds except Money Market. Dividends resulting from net investment income, if any, normally will be declared daily and paid monthly for Money Market. Distributions of capital gains, if any, will be made annually in December and when required for Federal excise tax purposes. Income and capital gain distributions are determined in accordance with Federal income tax regulations, which may differ from generally accepted accounting principles. These differences are primarily due to differing treatments for losses deferred due to wash sales, REITS, equalization accounting for tax purposes, foreign currency, options, futures and market discount transactions. Permanent book and tax basis differences, if any, relating to shareholder distributions will result in reclassifications to paid-in capital.
| e. | Federal Taxes |
The Funds intend to comply with the requirements under Subchapter M of the Internal Revenue Code of 1986, as amended, to distribute substantially all of its taxable income and gains to its shareholders and to meet certain diversification and income requirements with respect to investment companies. Therefore, no provision for Federal income or excise tax is included in the accompanying financial statements.
Additionally, based on the Funds’ understanding of the tax rules and rates related to income, gains and transactions for the foreign jurisdictions in which it invests, the Fund will provide for foreign taxes, and where appropriate, deferred foreign taxes.
| f. | Capital Loss Carryovers |
As of June 30, 2008, the following Funds had accumulated net realized capital loss carryovers from securities transactions for Federal income tax purposes as shown in the following chart. These amounts may be used to offset realized capital gains, if any, through the expiration dates listed.
Fund | Capital Loss Carryover Amount | Expires December 31, | |||
Essex Large Cap Growth | $ | 89,173,242 | 2009 | ||
| 30,988,593 | 2010 | ||||
| 12,899,489 | 2011 | ||||
International Equity | 13,386,880 | 2010 | |||
| 16,170,119 | 2011 | ||||
Money Market | 2,266 | 2008 | |||
| g. | Capital Stock |
The Trust’s Declaration of Trust authorizes for each series the issuance of an unlimited number of shares of beneficial interest, without par value, for each fund. Each Fund records sales and repurchases of its capital stock on the trade date. Dividends and distributions to shareholders are recorded on the ex-dividend date.
At June 30, 2008, certain unaffiliated shareholders, specifically omnibus accounts, individually held greater than 10% of the outstanding shares of the following Funds: Essex Large Cap Growth – one owns 13%; International Equity – one owns 28% and Emerging Markets Equity – two collectively own 68%. Transactions by these shareholders may have a material impact on the Funds.
| h. | Foreign Currency Translation |
The books and records of the Funds are maintained in U.S. dollars. The value of investments, assets and liabilities denominated in currencies other than U.S. dollars are translated into U.S. dollars based upon current foreign exchange rates. Purchases and sales of foreign investments, income and expenses are converted into U.S. dollars based on currency exchange rates prevailing on the respective dates of such transactions. Net realized and unrealized gain (loss) on foreign currency transactions represent: (1) foreign exchange gains and losses from the sale and holdings of foreign currencies; (2) gains and losses between trade date and settlement date on investment securities transactions and forward foreign currency exchange contracts; and (3) gains and losses from the difference between amounts of interest and dividends recorded and the amounts actually received.
46
Table of Contents
Notes to Financial Statements (continued)
In addition, the Funds do not isolate the net realized and unrealized gain or loss resulting from changes in exchange rates from the fluctuations in market prices of securities held. Such fluctuations are included with the net realized and unrealized gain or loss on investments.
| 2. | Agreements and Transactions with Affiliates |
For each of the Funds other than Money Market, the Trust has entered into an Investment Management Agreement under which Managers Investment Group LLC (the “Investment Manager”), an independently managed subsidiary of Affiliated Managers Group, Inc. (“AMG”), serves as investment manager to the Funds. The Investment Manager selects subadvisors for the Fund (subject to Trustee approval) and monitors each subadvisor’s investment programs and results. The Funds’ investment portfolio is managed by portfolio managers who serve pursuant to a Subadvisory Agreement with the Investment Manager.
Investment management fees are paid directly by the Funds to the Investment Manager based on average daily net assets. For the six months ended June 30, 2008, the annual investment management fee rate, as a percentage of average daily net assets, were as follows:
Fund | Investment Management Fee | ||
Value | 0.75 | % | |
Essex Large Cap Growth | 0.80 | % | |
Small Company | 0.90 | % | |
International Equity | 0.90 | % | |
Emerging Markets Equity | 1.15 | % | |
Global Bond | 0.70 | % |
The Investment Manager of Global Bond has agreed to contractually waive a portion of its management fee for the Fund until at least March 1, 2009. For the six months ended June 30, 2008, the amount waived was $45,484 or 0.10%.
The Trust has entered into an Administration and Shareholder Servicing Agreement under which the Investment Manager serves as each Fund’s administrator (the “Administrator”) and is responsible for all aspects of managing the Fund’s operations, including administration and shareholder services to each Fund, its shareholders, and certain institutions, such as bank trust departments, broker-dealers and registered investment advisers, that advise or act as an intermediary with the Funds’ shareholders. Under the terms of the Administration Agreement, each of the Funds, except Global Bond and Money Market, pay a fee to the Administrator at the rate of 0.25% per annum of the Fund’s average daily net assets. Global Bond and Money Market pay a fee to the Administrator at the rate of 0.20% and 0.15%, respectively, per annum of the Fund’s average daily net assets.
The Investment Manager for the Funds, has contractually agreed, through at least May 1, 2009, subject to later reimbursement by the Funds in certain circumstances, that the total annual operating expenses (exclusive of taxes, interest, brokerage costs, acquired fund expenses and extraordinary expenses) will be limited to the following amounts of the Fund’s average daily net assets: Small Company – 1.45%; International Equity – 1.48%; Emerging Markets Equity – 1.77%; and Global Bond – 1.10%. The Investment Manager has also contractually agreed, subject to later reimbursement by the Funds in certain circumstances, that the total annual operating expenses (exclusive of taxes, interest, brokerage costs, acquired fund expenses and extraordinary expenses) will be limited to 1.19% and 1.29%, on Value and Essex Large Cap Growth, respectively, of each Fund’s average daily net assets, provided that the amount of fees waived, paid or reimbursed does not exceed 0.25% per annum of each Fund’s average daily net assets. Prior to January 1, 2008, the expense limitations for International Equity, Emerging Markets Equity, and Global Bond were 1.55%, 1.79%, and 1.19%, respectively.
Each Fund is obligated to repay the Investment Manager such amounts waived, paid or reimbursed in future years provided that the repayment occurs within (36) months after the waiver or reimbursement and that such repayment would not cause the Fund’s total operating expenses in any such future year to exceed that Fund’s respective expense cap. For the six months ended June 30, 2008, the Funds made no such repayments to the Investment Manager. At June 30, 2008, the cumulative amount of reimbursement by the Manager subject to repayment by Value, Essex Large Cap, Small Company, International Equity, Emerging Markets Equity and Global Bond equaled $119,224, $99,283, $61,955, $195,948, $237,210 and $39,983, respectively. For the six months ended June 30, 2008, the Investment Manager voluntarily waived $5,185 and $5,497 of expenses for Value and Essex Large Cap which may not be recovered by the Investment Manager.
Prior to July 1, 2007, the aggregate annual retainer paid to each Independent Trustee was $55,000, plus $4,000 or $2,000 for each regular or special meeting attended, respectively. Effective July 1, 2007, the aggregate annual retainer paid to each Independent Trustee is $65,000, plus $4,000 or $2,500 for each regular or special meeting attended, respectively. The Trustees’ fees and expenses are allocated amongst all of the Funds for which the Investment Manager serves as the advisor (the “Managers Funds”) based on the relative net assets of such Funds. The Independent Chairman of the Trusts receives an additional payment of $15,000 per year. (Prior to July 1, 2007, the Independent Chairman received an additional payment of $10,000 per year). The Chairman of the Audit Committee receives an additional payment of $5,000 per year. (Prior to July 1, 2007, the Chairman of the Audit Committee received an additional payment of $2,000 per year). The “Trustee fees and expenses” shown in the financial statements represents the Fund’s allocated portion of the total fees and expenses paid by the Fund and other affiliated funds in the Managers Funds.
The Funds are distributed by Managers Distributors, Inc. (the “Distributor” or “MDI”), a wholly-owned subsidiary of the Investment Manager. The MDI serves as the principal underwriter for each Fund in the Trust. MDI is a registered broker-dealer and member of the Financial Industry Regulatory Authority, Inc. (“FINRA”). Shares of each Fund will be continuously offered and will be sold by brokers, dealers or other financial intermediaries who have executed selling agreements with the Distributor. MDI bears all the expenses of providing services pursuant to the Underwriting Agreement, including the payment of the expenses relating to the distribution of Prospectuses for sales purposes and any advertising or sales literature. Certain Trustees and Officers of the Funds are Officers and/or Directors of the Investment Manager, AMG and/or the Distributor.
47
Table of Contents
Notes to Financial Statements (continued)
| 3. | Purchases and Sales of Securities |
Purchases and sales of securities, excluding short-term securities, for the six months ended June 30, 2008, were as follows:
| Long-Term Securities | U.S. Government Securities | |||||||||||
Fund | Purchases | Sales | Purchases | Sales | ||||||||
Value | $ | 14,125,529 | $ | 15,069,373 | N/A | N/A | ||||||
Essex Large Cap Growth | 24,852,036 | 27,267,055 | N/A | N/A | ||||||||
Small Company | 4,053,870 | 4,485,618 | N/A | N/A | ||||||||
International Equity | 245,480,386 | 256,121,638 | N/A | N/A | ||||||||
Emerging Markets Equity | 38,435,926 | 53,295,468 | N/A | N/A | ||||||||
Global Bond | 23,519,861 | 22,414,707 | $ | 1,830,676 | $ | 8,345,084 | ||||||
| 4. | Portfolio Securities Loaned |
Each of the Funds other than Money Market may participate in a securities lending program offered by BNYM providing for the lending of equities, corporate bonds and government securities to qualified brokers. Collateral on all securities loaned is accepted in cash and/or government securities. Collateral is maintained at a minimum level of 102% (105% in the case of certain foreign securities) of the market value, plus interest, if applicable, of investments on loan. Collateral received in the form of cash is invested temporarily in institutional money market funds or other short-term investments by BNYM. Security lending fees include earnings of such temporary cash investments, plus or minus any rebate. These earnings (after any rebate) then are divided between BNYM, as a fee for its services under the program, and the Fund loaning the security, according to agreed-upon rates.
| 5. | Commitments and Contingencies |
In the normal course of business, the Funds may enter into contracts and agreements that contain a variety of representations and warranties, which provide general indemnifications. The maximum exposure to the Funds under these arrangements is unknown, as this would involve future claims that may be made against the Funds that have not yet occurred. However, based on experience, the Funds expects the risk of loss to be remote.
| 6. | Forward Commitments |
Certain transactions, such as futures and forward transactions, dollar roll agreements, or purchases of when-issued or delayed delivery securities may have a similar effect on the Fund’s net asset value as if the Fund had created a degree of leverage in its portfolio. However, if the Fund enters into such a transaction, the Fund will establish a segregated account with its custodian in which it will maintain cash, U.S. government securities or other liquid securities equal in value to its obligations in respect to such transaction. Securities and other assets held in the segregated account may not be sold while the transaction is outstanding, unless other suitable assets are substituted.
| 7. | Futures Contracts Held or Issued |
International Equity may purchase or sell futures contracts to achieve a desired level of investment, whether to accommodate portfolio turnover or cash flows from capital shares transactions. There are certain risks associated with futures contracts. Prices may not move as expected or the Fund may not be able to close out the contract when it desires to do so, resulting in losses.
Futures are valued at their quoted daily settlement prices. The aggregate principal amounts of the contracts are not recorded in the financial statements. Fluctuations in the value of the contracts are recorded in the Statement of Assets and Liabilities as an asset (liability) and in the Statement of Operations as unrealized appreciation (depreciation) until the contracts are closed, when they are recorded as realized gains (losses) on futures or forward currency contracts. Cash pledged to cover margin requirements for the open futures positions at June 30, 2008, amounted to $61,199. Open futures contracts (in U.S. Dollars) at June 30, 2008, were as follows:
Type | Number of Contracts | Position | Expiration Month | Unrealized Gain/(Loss) | ||||||
DJ Euro Stoxx 50 | 5 | Long | 9/08 | $ | (16,702 | ) | ||||
| 8. | Forward Foreign Currency Contracts |
During the six months ended June 30, 2008, International Equity, Emerging Markets Equity, and Global Bond invested in forward foreign currency exchange contracts to manage currency exposure. These investments may involve greater market risk than the amounts disclosed in the Fund’s financial statements.
A forward foreign currency exchange contract is an agreement between a Fund and another party to buy or sell a currency at a set price at a future date. The market value of the contract will fluctuate with changes in currency exchange rates. The contract is marked-to-market daily, and the change in market value is recorded as an unrealized gain or loss. Gain or loss on the purchase or sale of contracts having the same settlement date, amount and counter party is realized on the date of offset, otherwise gain or loss is realized on the settlement date.
The Funds, except Value, Essex Large Cap Growth, Money Market and Small Company, may invest in non-U.S. dollar denominated instruments subject to limitations, and enter into forward foreign currency exchange contracts to facilitate transactions in foreign securities and to protect against a possible loss resulting from an adverse change in the relationship between the U.S. dollar and such foreign currency. Risks may arise upon entering into these contracts from the potential inability of counterparties to meet the terms of their contracts and from unanticipated movements in the value of a foreign currency relative to the U.S. dollar.
48
Table of Contents
Notes to Financial Statements (continued)
Cash pledged to cover margin requirements for open forward positions in Global Bond at June 30, 2008 is $154,427. Open forward foreign currency exchange contracts (in U.S. Dollars) at June 30, 2008 were as follows:
Foreign Currency | Position | Settlement Date | Current Value (Receivable Amount) | Contract Value (Payable Amount) | Unrealized Gain/ (Loss) | |||||||||||
International Equity | ||||||||||||||||
euro-dollar | Short | 7/2/08 | (2,188,435 | ) | (2,189,346 | ) | 911 | |||||||||
Pound Sterling | Short | 9/5/08 | (3,369,934 | ) | (3,305,499 | ) | (64,435 | ) | ||||||||
Japanese Yen | Short | 7/3/08 | (576,148 | ) | (575,942 | ) | (206 | ) | ||||||||
South African Rand | Short | 7/2/08 | (326,597 | ) | (321,108 | ) | (5,489 | ) | ||||||||
Swiss Franc | Long | 7/3/08 | 406,889 | 407,833 | (944 | ) | ||||||||||
euro-dollar | Long | 7/3/08 | 70,505 | 70,508 | (3 | ) | ||||||||||
Pound Sterling | Long | 9/5/08 | 3,440,610 | 3,392,337 | 48,273 | |||||||||||
| $ | (2,543,110 | ) | $ | (2,521,217 | ) | $ | (21,893 | ) | ||||||||
Global Bond | ||||||||||||||||
Canadian Dollar | Short | 9/17/08 | (911,100 | ) | (906,973 | ) | (4,127 | ) | ||||||||
Colombian Peso | Short | 9/17/08 | (430,879 | ) | (483,908 | ) | 53,029 | |||||||||
Colombian Peso | Long | 9/17/08 | 430,879 | 436,412 | (5,533 | ) | ||||||||||
| $ | (911,100 | ) | $ | (954,469 | ) | $ | 43,369 | |||||||||
| 9. | New Accounting Pronouncement |
In June 2006, the Financial Accounting Standards Board (“FASB”) issued Interpretation No. 48, “Accounting for Uncertainty in Income Taxes - an Interpretation of FASB Statement No. 109 (“FIN 48”).” FIN 48 applies to all registered investment companies and establishes the minimum threshold for recognizing, and a system for measuring, the benefits of tax-return positions in the financial statements. FIN 48 is effective for fiscal years beginning after December 15, 2006. The Investment Manager has analyzed the Funds’ tax positions taken on federal income tax returns for all open tax years (tax years ended June 30, 2004-2007) and has concluded that as of June 30, 2008, no provision for income tax is required in the Funds’ financial statements. Additionally, the Investment Manager is not aware of any events that are reasonably possible to occur in the next twelve months that would result in the amounts of any unrecognized tax benefits significantly increasing or decreasing for the Funds. However, the Investment Manager’s conclusion regarding FIN 48 may be subject to review and adjustment at a later date based on factors including, but not limited to, further implementation guidance expected from FASB, and ongoing analysis of tax laws, regulations, and interpretations thereof.
49
Table of Contents
Annual Renewal of Investment Advisory Agreements (unaudited)
On June 6, 2008, the Board of Trustees, including a majority of the Trustees who are not “interested persons” of the Trust (the “Independent Trustees”), approved the Investment Management Agreement with the Investment Manager for each of the Funds identified below and the Subadvisory Agreement for each of the Subadvisors. The Independent Trustees were separately represented by independent counsel in connection with their consideration of the approval of these agreements. In considering the Investment Management and Subadvisory Agreements, the Trustees reviewed a variety of materials relating to each Fund, the Investment Manager and each Subadvisor, including comparative performance, fee and expense information for an appropriate peer group of similar mutual funds (each a “Peer Group”), performance information for relevant benchmark indices (each a “Fund Benchmark”) and other information regarding the nature, extent and quality of services provided by the Investment Manager and the Subadvisors under their respective agreements. The Trustees also took into account information on the services provided by the Investment Manager and each Subadvisor (including information provided at meetings held on May 15-16 and June 5-6, 2008), as well as performance, fee and expense information regarding each Fund provided to them on a quarterly basis throughout the year. Prior to voting, the Independent Trustees: (a) reviewed the foregoing information with their independent legal counsel and with management; (b) received materials from their independent legal counsel discussing the legal standards applicable to their consideration of the Investment Management Agreement and the Subadvisory Agreements; and (c) met with their independent legal counsel in private sessions at which no representatives of management were present.
Nature, extent and quality of services.
In considering the nature, extent and quality of the services provided by the Investment Manager, the Trustees reviewed information relating to the Investment Manager’s operations and personnel. Among other things, the Investment Manager provided financial information, biographical information on its supervisory and professional staff and descriptions of its organizational and management structure. The Trustees also took into account information provided periodically throughout the previous year by the Investment Manager relating to the performance of its duties with respect to the Funds and the Trustees’ familiarity with the Investment Manager’s management through Board meetings, discussions and reports. In the course of their deliberations regarding the Investment Management Agreement, the Trustees evaluated, among other things: (a) the extent and quality of the Investment Manager’s oversight of the operation and management of the Funds; (b) the quality of the search, selection and monitoring services performed by the Investment Manager in overseeing the portfolio management responsibilities of the Subadvisors; (c) the Investment Manager’s ability to supervise the Funds’ other service providers; and (d) the Investment Manager’s compliance programs. The Trustees also took into account the financial condition of the Investment Manager with respect to its ability to provide the services required under the Investment Management Agreement and to maintain contractual expense limitations for the Funds.
For each Fund, the Trustees also reviewed information relating to each Subadvisor’s operations and personnel and the investment philosophy, strategies and techniques (for each Subadvisor, its “Investment Strategy”) used in managing the Fund or the portion of the Fund for which the Subadvisor has portfolio management responsibility.
Among other things, the Trustees reviewed biographical information on portfolio management and other professional staff, information regarding each Subadvisor’s organizational and management structure and each Subadvisor’s brokerage policies and practices. The Trustees considered specific information provided regarding the experience of the individual or individuals at each Subadvisor with portfolio management responsibility for the portion of the Fund managed by the Subadvisor, including the information set forth in the Fund’s prospectus and statement of additional information. With respect to those Funds managed with multiple Subadvisors, the Trustees also noted information provided by the Investment Manager regarding the manner in which each Subadvisor’s Investment Strategy complements those utilized by a Fund’s other Subadvisors. In the course of their deliberations, the Trustees evaluated, among other things: (a) the services rendered by each Subadvisor in the past; (b) the qualifications and experience of the Subadvisor’s personnel; and (c) the Subadvisor’s compliance programs. The Trustees also took into account the financial condition of each Subadvisor with respect to its ability to provide the services required under its Subadvisory Agreement.
Performance.
As noted above, the Board considered each Fund’s performance during relevant time periods as compared to the Fund’s Peer Group and noted that the Board reviews on a quarterly basis detailed information about the Fund’s performance results, portfolio composition and Investment Strategies, including with respect to the portion of the Fund managed by each Subadvisor. The Board noted the Investment Manager’s expertise and resources in monitoring the performance, investment style and risk-adjusted performance of each Subadvisor. The Board also noted each Subadvisor’s performance record with respect to the Fund. The Board was mindful of the Investment Manager’s attention to monitoring each Subadvisor’s performance with respect to the Funds and its discussions with management regarding the factors that contributed to the performance of the Funds.
Advisory Fees and Profitability.
In considering the reasonableness of the advisory fee charged by the Investment Manager for managing each Fund, the Trustees noted that the Investment Manager, and not the Fund, is responsible for paying the fees charged by the Fund’s Subadvisors and, therefore, that the fees paid to the Investment Manager cover the cost of providing portfolio management services as well as the cost of providing search, selection and monitoring services in operating a “manager-of-managers” complex of mutual funds. The Trustees concluded that, in light of the additional high quality supervisory services provided by the Investment Manager and the fact that the subadvisory fees are paid out of the advisory fee, the advisory fee payable by each Fund to the Investment Manager can reasonably be expected to exceed the median advisory fee for the Peer Group, which consists of many funds that do not operate with a manager-of-managers structure. In this regard, the Trustees also noted that the Investment Manager has undertaken to maintain expense limitations for the Funds.
In considering the reasonableness of the advisory fee payable to the Investment Manager, the Trustees also reviewed information provided by the Investment Manager setting forth all revenues and other benefits, both direct and indirect, received by the Investment Manager and its affiliates attributable to managing each Fund and all the mutual funds in the Managers Family of Funds, the cost
50
Table of Contents
Annual Renewal of Investment Advisory Agreements (continued)
of providing such services and the resulting profitability to the Investment Manager and its affiliates from these relationships. The Trustees also noted the current and potential asset levels of each Fund and the willingness of the Investment Manager to waive fees and pay expenses for certain of the Funds from time to time as a means of limiting the total expenses of the smaller Funds. The Trustees noted that the subadvisory fees are paid by the Investment Manager out of its advisory fee. The Board took into account management’s discussion of the current advisory fee structure. In this regard, the Trustees noted that, unlike a mutual fund that is managed by a single investment adviser, the Funds operate in a manager-of-managers structure and, as a Fund grows in size, it is common practice for the Investment Manager to recommend the selection of an additional Subadvisor to manage a portion of the Fund’s portfolio. The Trustees further noted that, because of this practice, the Investment Manager’s oversight and supervisory responsibilities with respect to the Funds can be expected to increase with the size of the Funds. Based on the foregoing, the Trustees concluded that the profitability to the Investment Manager is reasonable and that the Investment Manager is not realizing material benefits from economies of scale that would warrant adjustments to the advisory fees for any Fund at this time. With respect to economies of scale, the Trustees also noted that as a Fund’s assets increase over time, the Fund may realize other economies of scale to the extent that the increase in assets is proportionally greater than the increase in certain other expenses.
Subadvisory Fees and Profitability.
In considering the reasonableness of the fee payable by the Investment Manager to each Subadvisor, the Trustees relied on the ability of the Investment Manager to negotiate the terms of the Subadvisory Agreement at arm’s length as part of the manager-of-managers structure, noting that the Subadvisors are not affiliated with the Investment Manager. In addition, the Trustees noted that the subadvisory fees are paid by the Investment Manager out of its advisory fee. Accordingly, the cost of services to be provided by each Subadvisor and the profitability to each Subadvisor of its relationship with a Fund were not material factors in the Trustees’ deliberations. For similar reasons, and based on the current size of the portion of the Fund managed by each Subadvisor, the Trustees concluded that any economies of scale being realized by the Subadvisors was not a material factor in the Trustees’ deliberations at this time.
In addition to the foregoing, the Trustees considered the specific factors and related conclusions set forth below with respect to each Fund.
MANAGERS VALUE FUND
Fund Performance.
Among other information relating to the Fund’s performance, the Trustees noted that the Fund’s performance for the 1-year, 3-year, 5-year and 10-year periods ended March 31, 2008 was below the median performance of the Peer Group and below the performance of the Fund Benchmark, the Russell 1000® Value Index, for each period. The Trustees took into account management’s discussion of the reasons for the Fund’s performance and its discussion regarding its review of the Subadvisors for the Fund. The Trustees concluded that management was taking steps to address the Fund’s performance.
Advisory Fees.
The Trustees noted that the Fund’s advisory fee and total expenses (net of applicable expense waivers/reimbursements) as of March 31, 2008 were both higher than the average for the Peer Group. The Trustees took into account the fact that the Investment Manager has contractually agreed, through May 1, 2009, to limit the Fund’s net annual operating expenses to 1.19%, provided that the amount waived may not exceed 0.25%. The Trustees concluded that, in light of the nature, extent and quality of the services provided by the Investment Manager and the Subadvisors, the foregoing expense limitation and the considerations noted above with respect to the Subadvisors and the Investment Manager, the Fund’s advisory fees are reasonable.
MANAGERS EMERGING MARKETS EQUITY FUND
Fund Performance.
Among other information relating to the Fund’s performance, the Trustees noted that the Fund’s performance for the 1-year, 3-year, 5-year and 10-year periods ended March 31, 2008 was below, below, below and above, respectively, the median performance of the Peer Group and below, below, below and above, respectively, the performance of the Fund Benchmark, the MSCI Emerging Markets Index. The Trustees took into account management’s discussion of the Fund’s performance. In this regard, the Trustees noted that performance has improved in 2008 and the Fund’s performance since inception (February 9, 1998) is in the top quartile of its Peer Group. The Trustees concluded that the Fund’s performance is being addressed.
Advisory Fees.
The Trustees noted that the Fund’s advisory fee and total expenses (net of applicable expense waivers/reimbursements) as of March 31, 2008 were both higher than the average for the Peer Group. The Trustees took into account the fact that the Investment Manager has contractually agreed, through May 1, 2009, to limit the Fund’s net annual operating expenses to 1.77%. The Trustees concluded that, in light of the nature, extent and quality of the services provided by the Investment Manager and the Subadvisor, the foregoing expense limitation and the considerations noted above with respect to the Subadvisor and the Investment Manager, the Fund’s advisory fees are reasonable.
MANAGERS SMALL COMPANY FUND
Fund Performance.
Among other information relating to the Fund’s performance, the Trustees noted that the Fund’s performance for the 1-year, 3-year and 5-year periods ended March 31, 2008 and for the period from inception of the Fund on June 19, 2000 through March 31, 2008 was above, above, below and below, respectively, the median performance of the Peer Group and above, below, below and below, respectively, the performance of the Fund Benchmark, the Russell 2000® Index. The Trustees also took into account management’s discussion of the Fund’s performance, including the fact that the Fund outperformed the Fund Benchmark and its Peer Group in the calendar year most recently completed. The Trustees concluded that the Fund’s performance has been satisfactory in light of all factors considered.
51
Table of Contents
Annual Renewal of Investment Advisory Agreements (continued)
Advisory Fees.
The Trustees noted that the Fund’s advisory fee and total expenses (net of applicable expense waivers/reimbursements) as of March 31, 2008 were higher and lower, respectively, than the average for the Peer Group. The Trustees took into account the fact that the Investment Manager has contractually agreed, through May 1, 2009, to limit the Fund’s net annual operating expenses to 1.45%. The Trustees concluded that, in light of the nature, extent and quality of the services provided by the Investment Manager and the Subadvisor, the foregoing expense limitation and the considerations noted above with respect to the Subadvisor and the Investment Manager, the Fund’s advisory fees are reasonable.
MANAGERS GLOBAL BOND FUND
Fund Performance.
Among other information relating to the Fund’s performance, the Trustees noted that the Fund’s performance for the 1-year, 3-year, 5-year and 10-year periods ended March 31, 2008 was below, above, above and above, respectively, the median performance of the Peer Group and below, below, above and below, respectively, the performance of the Fund Benchmark, the Lehman Brothers Global Aggregate Bond Index. The Trustees took into account management’s discussion of the Fund’s more recent performance. The Trustees concluded that the Fund’s performance has been satisfactory in light of all factors considered.
Advisory Fees.
The Trustees noted that the Fund’s advisory fee and total expenses (net of applicable expense waivers/reimbursements) as of March 31, 2008 were both higher than the average for the Peer Group. The Trustees took into account the fact that the Investment Manager has contractually agreed, through May 1, 2009, to limit the Fund’s net annual operating expenses to 1.10%. The Trustees concluded that, in light of the nature, extent and quality of the services provided by the Investment Manager and the Subadvisor, the Fund’s performance, the foregoing expense limitation and the considerations noted above with respect to the Subadvisor and the Investment Manager, the Fund’s advisory fees are reasonable.
MANAGERS INTERNATIONAL EQUITY FUND
Fund Performance.
Among other information relating to the Fund’s performance, the Trustees noted that the Fund’s performance for the 1-year, 3-year, 5-year and 10-year periods ended March 31, 2008 was above, above, below and below, respectively, the median performance of the Peer Group and above, above, below and below, respectively, the performance of the Fund Benchmark, the MSCI EAFE Index. The Trustees took into account management’s discussion of the Fund’s performance, including the fact that the Fund’s performance since inception (December 31, 1985) is in the top quartile of its Peer Group. The Trustees concluded that the Fund’s performance has been satisfactory in light of all factors considered.
Advisory Fees.
The Trustees noted that the Fund’s advisory fee and total expenses (net of applicable expense waivers/reimbursements) as of March 31, 2008 were both higher than the average for the Peer Group. The Trustees took into account the fact that the Investment Manager has contractually agreed, through May 1, 2009, to limit the Fund’s net annual operating expenses to 1.48%. The Trustees concluded that, in light of the nature, extent and quality of the services provided by the Investment Manager and the Subadvisors, the foregoing expense limitation and the considerations noted above with respect to the Subadvisors and the Investment Manager, the Fund’s advisory fees are reasonable.
* * * * *
After consideration of the foregoing, the Trustees also reached the following conclusions regarding the Investment Management Agreement and each Subadvisory Agreement, in addition to those conclusions discussed above: (a) the Investment Manager and each Subadvisor have demonstrated that they possess the capability and resources to perform the duties required of them under the Investment Management Agreement and the applicable Subadvisory Agreements; (b) each Subadvisor’s Investment Strategy is appropriate for pursuing the applicable Fund’s investment objectives; (c) each Subadvisor is reasonably likely to execute its Investment Strategy consistently over time; and (d) the Investment Manager and each Subadvisor maintain appropriate compliance programs.
Based on all of the above-mentioned factors and related conclusions, with no single factor or conclusion being determinative and with each Trustee not necessarily attributing the same weight to each factor, the Trustees concluded that approval of each Investment Management Agreement and each Subadvisory Agreement (as applicable) would be in the best interests of each Fund and its shareholders. Accordingly, on June 6, 2008, the Trustees, including a majority of the Independent Trustees, voted to approve the Investment Management Agreement and the Subadvisory Agreements (as applicable) for each Fund.
52
Table of Contents
Annual Renewal of Investment Advisory Agreements (continued)
MANAGERS AMG ESSEX LARGE CAP GROWTH FUND
On June 6, 2008, the Board of Trustees, including a majority of the Trustees who are not “interested persons” of the Trust (the “Independent Trustees”), approved the Investment Management Agreement with the Investment Manager for the Managers AMG Essex Large Cap Growth Fund (the “Fund”) and the Subadvisory Agreement with the Fund’s Subadvisor. The Independent Trustees were separately represented by independent counsel in connection with their consideration of the approval of these agreements. In considering the Investment Management and Subadvisory Agreements, the Trustees reviewed a variety of materials relating to the Fund, the Investment Manager and the Subadvisor, including comparative performance, fee and expense information for an appropriate peer group of similar mutual funds (the “Peer Group”), performance information for the relevant benchmark index (the “Fund Benchmark”) and other information regarding the nature, extent and quality of services provided by the Investment Manager and the Subadvisor under their respective agreements. The Trustees also took into account information on the services provided by the Investment Manager and the Subadvisor (including information provided at meetings held on May 15-16 and June 5-6, 2008), as well as performance, fee and expense information regarding the Fund provided to them on a quarterly basis throughout the year. Prior to voting, the Independent Trustees: (a) reviewed the foregoing information with their independent legal counsel and with management; (b) received materials from their independent legal counsel discussing the legal standards applicable to their consideration of the Investment Management and Subadvisory Agreements; and (c) met with their independent legal counsel in private sessions at which no representatives of management were present.
Nature, extent and quality of services.
In considering the nature, extent and quality of the services provided by the Investment Manager, the Trustees reviewed information relating to the Investment Manager’s operations and personnel. Among other things, the Investment Manager provided financial information, biographical information on its supervisory and professional staff and descriptions of its organizational and management structure. The Trustees also took into account information provided periodically throughout the previous year by the Investment Manager relating to the performance of its duties with respect to the Fund and the Trustees’ familiarity with the Investment Manager’s management through Board meetings, discussions and reports. In the course of their deliberations regarding the Investment Management Agreement, the Trustees evaluated, among other things: (a) the extent and quality of the Investment Manager’s oversight of the operation and management of the Fund; (b) the quality of the Investment Manager’s oversight of the performance by the Subadvisor of its portfolio management duties; (c) the Investment Manager’s ability to supervise the Fund’s other service providers; and (d) the Investment Manager’s compliance programs. The Trustees also took into account the financial condition of the Investment Manager with respect to its ability to provide the services required under the Investment Management Agreement and the Investment Manager’s undertaking to maintain a contractual expense limitation for the Fund.
The Trustees also reviewed information relating to the Subadvisor’s financial condition, operations and personnel and the investment philosophy, strategies and techniques (its “Investment Strategy”) used in managing the Fund. Among other things, the Trustees reviewed biographical information on portfolio management and other professional staff, information regarding the Subadvisor’s organizational and management structure and the Subadvisor’s brokerage policies and practices. The Trustees considered specific information provided regarding the experience of the individual at the Subadvisor with portfolio management responsibility for the Fund, including the information set forth in the Fund’s prospectus and statement of additional information. In the course of their deliberations, the Trustees evaluated, among other things: (a) the services rendered by the Subadvisor in the past; (b) the qualifications and experience of the Subadvisor’s personnel; and (c) the Subadvisor’s compliance programs. The Trustees also took into account the financial condition of the Subadvisor with respect to its ability to provide the services required under the Subadvisory Agreement.
Performance.
Among other information relating to the Fund’s performance, the Trustees noted that the Fund’s performance for the 1-year, 3-year, 5-year and 10-year periods ended March 31, 2008 was below, below, below and above, respectively, the median performance of the Peer Group and below, below, below and above, respectively, the performance of the Fund Benchmark, the Russell 1000® Growth Index. The Trustees took into account management’s discussion of the reasons for the Fund’s performance, including that the market environment in certain years has been particularly difficult in light of the Fund’s focus on growth companies. In addition, the Trustees noted that the Fund’s 10-year performance has been satisfactory. The Trustees concluded that the Fund’s performance has been satisfactory in light of all factors considered.
As noted above, the Board considered the Fund’s performance during relevant time periods as compared to the Fund’s Peer Group and noted that the Board reviews on a quarterly basis detailed information about both the Fund’s performance results and portfolio composition as well as the Subadvisor’s Investment Strategy. The Board noted the Investment Manager’s expertise and resources in monitoring the performance, investment style and risk-adjusted performance of the Subadvisor. The Board was mindful of the Investment Manager’s attention to monitoring the Subadvisor’s performance with respect to the Fund and its discussions with management regarding the factors that contributed to the performance of the Fund.
Advisory and Subadvisory Fees and Profitability.
In considering the reasonableness of the advisory fee payable to the Investment Manager and the subadvisory fee payable by the Investment Manager to the Subadvisor, the Trustees reviewed information provided by the Investment Manager setting forth all revenues and other benefits, both direct and indirect, received by the Investment Manager and its affiliates attributable to managing the Fund and all the mutual funds in the Managers Family of Funds, the cost of providing such services and the resulting profitability to the Investment Manager and its affiliates from these relationships. The Trustees noted that the Investment Manager and the Subadvisor are affiliated and that the Investment Manager pays the subadvisory fee out of the advisory fee that it receives from the Fund. The Trustees also noted the current asset level of the Fund and the impact on profitability of any future growth of assets of the Fund.
53
Table of Contents
Annual Renewal of Investment Advisory Agreements (continued)
In considering the cost of services to be provided by the Investment Manager under the Investment Management Agreement and the profitability to the Investment Manager of its relationship with the Fund, the Trustees noted the current asset level of the Fund and the undertaking by the Investment Manager to maintain an expense limitation for the Fund. The Board also took into account management’s discussion of the current advisory fee structure. Based on the foregoing, the Trustees concluded that the profitability to the Investment Manager is reasonable and that the Investment Manager is not realizing material benefits from economies of scale that would warrant adjustments to the advisory fee at this time. Also with respect to economies of scale, the Trustees noted that as the Fund’s assets increase over time, the Fund may realize other economies of scale to the extent the increase in assets is proportionally greater than the increase in certain other expenses.
In considering the cost of services to be provided by the Subadvisor under the Subadvisory Agreement and the profitability to the Subadvisor of its relationship with the Fund, the Trustees noted the current asset level of the Fund and the undertaking by the Investment Manager to maintain an expense limitation for the Fund. As a consequence, the cost of services to be provided by the Subadvisor and the profitability to the Subadvisor of its relationship with the Fund were not material factors in the Trustees’ deliberations. For similar reasons, the Trustees did not consider potential economies of scale in the management of the Fund by the Subadvisor to be a material factor in their considerations at this time.
The Trustees noted that the Fund’s advisory fee and total expenses (net of applicable expense waivers/reimbursements) as of March 31, 2008 were both higher than the average for the Peer Group. The Trustees took into account the fact that the Investment Manager has contractually agreed, through May 1, 2009, to limit the Fund’s net annual operating expenses to 1.29%, provided that the amount waived may not exceed 0.25%. The Trustees concluded that, in light of the nature, extent and quality of the services provided by the Investment Manager and the Subadvisor, the foregoing expense limitation and the considerations noted above with respect to the Subadvisor and the Investment Manager, the Fund’s advisory fees are reasonable.
* * * *
After consideration of the foregoing, the Trustees also reached the following conclusions regarding the Investment Management and Subadvisory Agreements in addition to the conclusions discussed above: (a) the Investment Manager has demonstrated that it possesses the resources and capability to perform its duties under the Investment Management Agreement; (b) the Subadvisor has the resources to perform its duties under the Subadvisory Agreement and is qualified to manage the Fund’s assets in accordance with its investment objectives and policies; and (c) the Investment Manager and Subadvisor maintain appropriate compliance programs.
Based on all of the above-mentioned factors and their related conclusions, with no single factor or conclusion being determinative and with each Trustee not necessarily attributing the same weight to each factor, the Trustees concluded that approval of the Investment Management and Subadvisory Agreements would be in the best interests of the Fund and its shareholders. Accordingly, on June 6, 2008, the Trustees, including a majority of the Independent Trustees, voted to approve the Investment Management and Subadvisory Agreements for the Fund.
54
Table of Contents
THIS PAGE INTENTIONALLY LEFT BLANK
Table of Contents
Investment Manager and Administrator
Managers Investment Group LLC
800 Connecticut Avenue
Norwalk, Connecticut 06854
(203) 299-3500 or (800) 835-3879
Distributor
Managers Distributors, Inc.
800 Connecticut Avenue
Norwalk, Connecticut 06854
(203) 299-3500 or (800) 835-3879
Custodian
The Bank of New York Mellon
2 Hanson Place
Brooklyn, New York 11217
Legal Counsel
Ropes & Gray LLP
One International Place
Boston, Massachusetts 02110-2624
Transfer Agent
PNC Global Investment Servicing (U.S.) Inc.
Attn: Managers
P.O. Box 9769
Providence, Rhode Island 02940
(800) 548-4539
Trustees
Jack W. Aber
William E. Chapman, II
Nathaniel Dalton
Edward J. Kaier
Steven J. Paggioli
Eric Rakowski
Thomas R. Schneeweis
John H. Streur
For Managers Choice Only
Managers
c/o PNC Global Investment Servicing (U.S.) Inc.
P.O. Box 61204
King of Prussia, Pennsylvania 19406-0851
(800) 358-7668

Table of Contents
MANAGERSAND MANAGERS AMG EQUITY FUNDS
EMERGING MARKETS EQUITY
Rexiter Capital Management Limited
ESSEX GROWTH
ESSEX LARGE CAP GROWTH
ESSEX SMALL/MICRO CAP GROWTH
Essex Investment Management Co., LLC
FQ TAX-MANAGED U.S. EQUITY
FQ U.S. EQUITY
First Quadrant, L.P.
INSTITUTIONAL MICRO-CAP
MICRO-CAP
Lord, Abbett & Co. LLC
WEDGE Capital Management L.L.P.
OFI Institutional Asset Management, Inc.
Next Century Growth Investors LLC
INTERNATIONAL EQUITY
AllianceBernstein L.P.
Lazard Asset Management, LLC
Wellington Management Company, LLP
CHICAGO EQUITY PARTNERS
MID-CAP
Chicago Equity Partners, LLC
REAL ESTATE SECURITIES
Urdang Securities Management, Inc.
SKYLINE SPECIAL EQUITIES
PORTFOLIO
Skyline Asset Management, L.P.
SMALL CAP
TIMESSQUARE MID CAP GROWTH
TIMESSQUARE SMALL CAP GROWTH
TimesSquare Capital Management, LLC
SMALL COMPANY
Epoch Investment Partners, Inc.
Kalmar Investment Advisers
SPECIAL EQUITY
Donald Smith & Co., Inc.
Lord, Abbett & Co. LLC
Skyline Asset Management, L.P.
Smith Asset Management Group, L.P.
Veredus Asset Management LLC
Westport Asset Management, Inc.
SYSTEMATIC VALUE
SYSTEMATIC MID CAP VALUE
Systematic Financial Management, L.P.
VALUE
Armstrong Shaw Associates Inc.
Osprey Partners Investment Management, LLC
MANAGERSAND MANAGERS AMG BALANCED FUNDS
CHICAGO EQUITY PARTNERS BALANCED
Chicago Equity Partners, LLC
GLOBAL
AllianceBernstein L.P.
First Quadrant, L.P.
Wellington Management Company, LLP
ALTERNATIVE FUNDS
FQ GLOBAL ALTERNATIVES
First Quadrant, L.P.
MANAGERS FIXED INCOME FUNDS
BOND (MANAGERS)
FIXED INCOME
GLOBAL BOND
Loomis, Sayles & Co., L.P.
BOND (MANAGERS FREMONT)
Pacific Investment Management Co. LLC
CALIFORNIA INTERMEDIATE TAX-FREE
Evergreen Investment Management Co., LLC
HIGH YIELD
J.P. Morgan Investment Management LLC
INTERMEDIATE DURATION GOVERNMENT
SHORT DURATION GOVERNMENT
Smith Breeden Associates, Inc.
MONEY MARKET
JPMorgan Investment Advisors Inc.
This report is prepared for the Funds’ shareholders. It is authorized for distribution to prospective investors only when preceded or accompanied by an effective prospectus. To receive a free copy of the prospectus or Statement of Additional Information, which includes additional information about Fund Trustees, please contact us by calling 800.835.3879. Distributed by Managers Distributors, Inc., member FINRA.
A description of the policies and procedures each Fund uses to vote its proxies is available: (i) without charge, upon request, by calling 800.835.3879, or (ii) on the Securities and Exchange Commission’s (SEC) Web site at www.sec.gov. For information regarding each Fund’s proxy voting record for the 12-month period ended June 30, call 800.835.3879 or visit the SEC Web site at www.sec.gov.
The Funds file their complete schedule of portfolio holdings with the SEC for the first and third quarters of each fiscal year on Form N-Q. The Funds’ Forms N-Q are available on the SEC’s website at www.sec.gov. A Fund’s Forms N-Q may be reviewed and copied at the SEC’s Public Reference Room in Washington, DC. Information on the operation of the Public Reference Room may be obtained by calling 800.SEC.0330. To review a complete list of the Funds’ portfolio holdings, or to view the most recent quarterly holdings report, semiannual report, or annual report, please visit www.managersinvest.com.
www.managersinvest.com


Table of Contents
| Item 2. | CODE OF ETHICS |
Not applicable for the semi-annual shareholder report.
| Item 3. | AUDIT COMMITTEE FINANCIAL EXPERT |
Not applicable for the semi-annual shareholder report.
| Item 4. | PRINCIPAL ACCOUNTANT FEES AND SERVICES |
Not applicable for the semi-annual shareholder report.
| Item 5. | AUDIT COMMITTEE OF LISTED REGISTRANTS |
Not applicable.
| Item 6. | SCHEDULE OF INVESTMENTS |
The schedule of investments in unaffiliated issuers as of the close of the reporting period is included as part of the shareholder report contained in Item 1 hereof.
| Item 7. | DISCLOSURE OF PROXY VOTING POLICIES AND PROCEDURES FOR CLOSED-END MANAGEMENT INVESTMENT COMPANIES |
Not applicable.
| Item 8. | PORTFOLIO MANAGERS OF CLOSED-END MANAGEMENT INVESTMENT COMPANIES |
Not applicable.
| Item 9. | PURCHASES OF EQUITY SECURITIES BY CLOSED-END MANAGEMENT INVESTMENT COMPANIES AND AFFILIATED PURCHASERS |
Not applicable.
| Item 10. | SUBMISSION OF MATTERS TO A VOTE OF SECURITY HOLDERS |
Not applicable.
Table of Contents
| Item 11. | CONTROLS AND PROCEDURES |
| (a) | The registrant’s principal executive and principal financial officers have concluded, based on their evaluation of the registrant’s disclosure controls and procedures as of a date within 90 days of the filing date of this report, that the registrant’s disclosure controls and procedures are reasonably designed to ensure that information required to be disclosed by the registrant on Form N-CSR is recorded, processed, summarized and reported within the required time periods and that information required to be disclosed by the registrant in the reports that it files or submits on Form N-CSR is accumulated and communicated to the registrant’s management, including its principal executive and principal financial officers, as appropriate to allow timely decisions regarding required disclosure. |
| (b) | There were no changes in the registrant’s internal control over financial reporting during the registrant’s second fiscal quarter of the period covered by this report that have materially affected, or are reasonably likely to materially affect, the internal control over financial reporting. |
| Item 12. | EXHIBITS |
(a) | (1) | Not applicable. | ||||
(a) | (2) | Certifications pursuant to Rule 30a-2(a) under the Investment Company Act of 1940 – Filed herewith. | ||||
(a) | (3) | Not applicable. | ||||
(b) | Certifications pursuant to Rule 30a-2(b) under the Investment Company Act of 1940 – Filed herewith. | |||||
Table of Contents
SIGNATURES
Pursuant to the requirements of the Securities Exchange Act of 1934 and the Investment Company Act of 1940, the registrant has duly caused this report to be signed on its behalf by the undersigned, thereunto duly authorized.
THE MANAGERS FUNDS
By: | /s/ John H. Streur | |
| John H. Streur, President |
Date: August 29, 2008
Pursuant to the requirements of the Securities Exchange Act of 1934 and the Investment Company Act of 1940, this report has been signed below by the following persons on behalf of the registrant and in the capacities and on the dates indicated.
| By: | /s/ John H. Streur | |
| John H. Streur, President |
Date: August 29, 2008
| By: | /s/ Donald S. Rumery | |
| Donald S. Rumery, Chief Financial Officer |
Date: August 29, 2008