Table of Contents
UNITED STATES
SECURITIES AND EXCHANGE COMMISSION
Washington, D.C. 20549
FORM N-CSRS
CERTIFIED SHAREHOLDER REPORT OF
REGISTERED MANAGEMENT INVESTMENT COMPANIES
Investment Company Act file number: 811-03752
THE MANAGERS FUNDS
(Exact name of registrant as specified in charter)
800 Connecticut Avenue, Norwalk, Connecticut 06854
(Address of principal executive offices) (Zip code)
Managers Investment Group LLC
800 Connecticut Avenue, Norwalk, Connecticut 06854
(Name and address of agent for service)
Registrant’s telephone number, including area code: (203) 299-3500
| Date of fiscal year end: | DECEMBER 31 | |
| Date of reporting period: | JANUARY 1, 2009 – JUNE 30, 2009 | |
| (Semi-Annual Shareholder Report) | ||
Table of Contents
Item 1. Reports to Shareholders
Table of Contents
SEMI-ANNUAL REPORT
Managers Funds
June 30, 2009
Managers AMG Essex Large Cap Growth Fund
Managers International Equity Fund
Managers Emerging Markets Equity Fund
Managers Global Bond Fund
Managers Money Market Fund

SAR002-0609
Table of Contents
The Managers Funds
Semi-Annual Report — June 30, 2009 (unaudited)
| Page | ||
| ABOUT YOUR FUND’S EXPENSES | 1 | |
| FUND PERFORMANCE | 2 | |
| FUND SNAPSHOTS AND SCHEDULES OF PORTFOLIO INVESTMENTS | ||
| 3 | ||
| 5 | ||
| 10 | ||
| 16 | ||
| NOTES TO SCHEDULES OF PORTFOLIO INVESTMENTS | 22 | |
| FINANCIAL STATEMENTS: | ||
| 23 | ||
Funds’ balance sheet, net asset value (NAV) per share computations and cumulative undistributed amounts | ||
| 24 | ||
Detail of sources of income, Fund expenses, and realized and unrealized gains (losses) during the period | ||
| 25 | ||
Detail of changes in Fund assets for the past two periods | ||
| MANAGERS MONEY MARKET FINANCIAL STATEMENTS: | ||
| 27 | ||
Fund balance sheet, net asset value (NAV) per share computation and cumulative undistributed amount | ||
| 27 | ||
Detail of sources of income, Fund expenses, and realized and unrealized gains (losses) during the period | ||
| 28 | ||
Detail of changes in Fund assets for the past three periods | ||
| FINANCIAL HIGHLIGHTS | 28 | |
Historical net asset values per share, distributions, total returns, expense ratios, turnover ratios and net assets | ||
| NOTES TO FINANCIAL STATEMENTS | 31 | |
Accounting and distribution policies, details of agreements and transactions with Fund management and affiliates, and descriptions of certain investment risks | ||
| ANNUAL RENEWAL OF INVESTMENT ADVISORY AGREEMENTS | 39 | |
Nothing contained herein is to be considered an offer, sale or solicitation of an offer to buy shares of any series of the Managers Family of Funds. Such offering is made only by Prospectus, which includes details as to offering price and other material information.
Table of Contents
About Your Fund’s Expenses (unaudited)
As a shareholder of a Fund, you may incur two types of costs: (1) transaction costs, which may include sales charges (loads) on purchase payments; redemption fees; and exchange fees; and (2) ongoing costs, including management fees; distribution (12b-1) fees; and other Fund expenses. This example is intended to help you understand your ongoing costs (in dollars) of investing in the Fund and to compare these costs with the ongoing costs of investing in other mutual funds. The example is based on $1,000 invested at the beginning of the period and held for the entire period as indicated below.
Actual Expenses
The first line of the following table provides information about the actual account values and actual expenses. You may use the information in this line, together with the amount you invested, to estimate the expenses that you paid over the period. Simply divide your account value by $1,000 (for example, an $8,600 account value divided by $1,000 = 8.6), then multiply the result by the number in the first line under the heading entitled “Expenses Paid During Period” to estimate the expenses you paid on your account during this period.
Hypothetical Example for Comparison Purposes
The second line of the following table provides information about hypothetical account values and hypothetical expenses based on the Fund’s actual expense ratio and an assumed annual rate of return of 5% before expenses, which is not the Fund’s actual return. The hypothetical account values and expenses may not be used to estimate the actual ending account balance or expenses you paid for the period. You may use this information to compare the ongoing costs of investing in the Fund and other funds by comparing this 5% hypothetical example with the 5% hypothetical examples that appear in the shareholder reports of other funds.
Please note that the expenses shown in the table are meant to highlight your ongoing costs only and do not reflect any transactional costs, such as sales charges (loads), redemption fees, or exchange fees. Therefore, the second line of the table is useful in comparing ongoing costs only, and will not help you determine the relative total costs of owning different funds.
Six Months Ended June 30, 2009 | Expense Ratio for the Period | Beginning Account Value 1/1/2009 | Ending Account Value 6/30/2009 | Expenses Paid During the Period* | ||||||||
Managers AMG Essex Large Cap Growth Fund | ||||||||||||
Based on Actual Fund Return | 1.40 | % | $ | 1,000 | $ | 1,134 | $ | 7.41 | ||||
Based on Hypothetical 5% Annual Return | 1.40 | % | $ | 1,000 | $ | 1,018 | $ | 7.00 | ||||
Managers International Equity Fund | ||||||||||||
Based on Actual Fund Return | 1.48 | % | $ | 1,000 | $ | 1,106 | $ | 7.73 | ||||
Based on Hypothetical 5% Annual Return | 1.48 | % | $ | 1,000 | $ | 1,017 | $ | 7.40 | ||||
Managers Emerging Markets Equity Fund | ||||||||||||
Based on Actual Fund Return | 1.77 | % | $ | 1,000 | $ | 1,296 | $ | 10.08 | ||||
Based on Hypothetical 5% Annual Return | 1.77 | % | $ | 1,000 | $ | 1,016 | $ | 8.85 | ||||
Managers Global Bond Fund | ||||||||||||
Based on Actual Fund Return | 1.10 | % | $ | 1,000 | $ | 1,105 | $ | 5.74 | ||||
Based on Hypothetical 5% Annual Return | 1.10 | % | $ | 1,000 | $ | 1,019 | $ | 5.51 | ||||
Managers Money Market Fund | ||||||||||||
Based on Actual Fund Return | 0.35 | % | $ | 1,000 | $ | 1,003 | $ | 2.53 | ||||
Based on Hypothetical 5% Annual Return | 0.35 | % | $ | 1,000 | $ | 1,022 | $ | 2.56 | ||||
| * | Expenses are equal to the Fund’s annualized expense ratio multiplied by the average account value over the period, multiplied by the number of days in the most recent fiscal half-year (181), then divided by 365. |
1
Table of Contents
All periods ended June 30, 2009 (unaudited)
The table below shows the average annual total returns for the Managers Funds and for each Fund’s Index from June 30, 1999 through June 30, 2009.
| Average Annual Total Returns 1 | ||||||||||||||
The Managers Funds | Six Months | One Year | Five Years | Ten Years | Inception Date | |||||||||
AMG Essex Large Cap Growth Fund2,3 | 13.37 | % | (29.67 | )% | (2.92 | )% | (4.35 | )% | 6/1/1984 | |||||
Russell 1000® Growth Index7 | 11.53 | % | (24.50 | )% | (1.83 | )% | (4.18 | )% | ||||||
Managers International Equity Fund2,4 | 10.61 | % | (34.28 | )% | 1.63 | % | 0.10 | % | 12/31/1985 | |||||
MSCI EAFE Index®8 | 7.95 | % | (31.35 | )% | 2.31 | % | 1.18 | % | ||||||
Managers Emerging Markets Equity Fund2,5 | 29.58 | % | (35.35 | )% | 11.44 | % | 9.34 | % | 2/9/1998 | |||||
MSCI Emerging Markets Index®9 | 36.01 | % | (28.07 | )% | 14.72 | % | 8.70 | % | ||||||
Managers Global Bond Fund2,4,6 | 10.45 | % | (2.49 | )% | 3.88 | % | 4.87 | % | 3/25/1994 | |||||
Barclays Capital Global Aggregate Bond Index10 | 1.52 | % | 2.76 | % | 5.53 | % | 6.05 | % | ||||||
Managers Money Market Fund2 | 0.27 | % | 1.44 | % | 3.18 | % | 3.06 | % | 6/1/1984 | |||||
Merrill Lynch 3-Month U.S. Treasury Bill | 0.10 | % | 0.95 | % | 3.17 | % | 3.23 | % | ||||||
The performance data shown represents past performance. Past performance is not a guarantee of future results. Current performance may be lower or higher than the performance data quoted. The investment return and principal value of an investment in the Fund will fluctuate so that an investor’s shares, when redeemed, may be worth more or less than their original cost. For performance information through the most recent month end, please call (800) 835-3879 or visit our Web site at www.managersinvest.com.
In choosing a Fund, investors should carefully consider the amount they plan to invest, their investment objectives, the Fund’s investment objectives, risks, charges and expenses before investing. For this and other information, please call 800.835.3879 or visit www.managersinvest. com for a free prospectus. Read it carefully before investing or sending money. Distributed by Managers Distributors, Inc., member FINRA.
| 1 | Total return equals income yield plus share price change and assumes reinvestment of all dividends and capital gain distributions. Returns are net of fees and may reflect offsets of Fund expenses as described in the Prospectus. No adjustment has been made for taxes payable by shareholders on their reinvested dividends and capital gain distributions. Returns for periods greater than one year are annualized. The listed returns on the Fund are net of expenses and based on the published NAV as of June 30, 2009. All returns are in U.S. dollars($). |
| 2 | Fund for which, from time to time, the Fund’s advisor has waived its fees and/or absorbed Fund expenses, which has resulted in higher returns. |
| 3 | The Fund invests in large-capitalization companies that may underperform other stock funds (such as funds that focus on small- and medium capitalization companies) when stocks of large capitalization companies are out of favor. The Fund invests in growth stocks, which may be more sensitive to market movements because their prices tend to reflect future investor expectations rather than just current profits. Growth stocks may underperform value stocks during given periods. |
| 4 | Investments in foreign securities are subject to additional risks such as changing market conditions, economic and political instability, and currency exchange rate fluctuations. The Fund is subject to currency risk resulting from fluctuations in exchange rates that may affect the total loss or gain on a non-U.S. Dollar security when converted back to U.S. Dollars. |
| 5 | The Fund is subject to the risks associated with investments in emerging markets, such as erratic earnings patterns, economic and political instability, changing exchange controls, limitations on repatriation of foreign capital and changes in local governmental attitudes toward private investment, possibly leading to nationalization or confiscation of investor assets. The Fund is also subject to currency risk resulting from fluctuations in exchange rates that may affect the total loss or gain on a non-U.S. Dollar security when converted back to U.S. Dollars. |
| 6 | Changing interest rates may adversely affect the value of an investment. An increase in interest rates typically causes the value of bonds and other fixed-income securities to fall. The Fund is subject to the risks associated with investments in debt securities, such as default risk and fluctuations in the perception of the debtor’s ability to pay its creditors. |
| 7 | The Russell 1000® Growth Index is a market capitalization weighted index that measures the performance of those Russell 1000® companies with higher price-to-book ratio and higher forecasted growth values. Unlike the Fund, the Russell 1000® Growth Index is unmanaged, is not available for investment, and does not incur expenses. The Russell 1000® Growth Index is a trademark of Russell Investments. Russell® is a trademark of Russell Investments. |
| 8 | The Morgan Stanley Capital International Europe, Australasia, and Far East (MSCI EAFE) Index® is composed of all the publicly traded stocks in developed non-U.S. Markets. The MSCI EAFE Index® consisted of the following 21 developed market country indices: Australia, Austria, Belgium, Denmark, Finland, France, Germany, Greece, Hong Kong, Ireland, Italy, Japan, the Netherlands, New Zealand, Norway, Portugal, Singapore, Spain, Sweden, Switzerland and the United Kingdom. Unlike the Fund, the MSCI EAFE Index® is unmanaged, is not available for investment, and does not incur expenses. All MSCI data is provided “as is.” The products described herein are not sponsored or endorsed and have not been reviewed or passed on by MSCI. In no event shall MSCI, its affiliates or any MSCI data provider have any liability of any kind in connection with the MSCI data or the products described herein. |
| 9 | The MSCI Emerging Markets Index® is a free float-adjusted market capitalization index that is designed to measure equity market performance in the global emerging markets. The MSCI Emerging Markets Index consisted of the following 22 emerging market country indices: Brazil, Chile, China, Colombia, Czech Republic, Egypt, Hungary, India, Indonesia, Israel, Korea, Malaysia, Mexico, Morocco, Peru, Philippines, Poland, Russia, South Africa, Taiwan, Thailand and Turkey. Unlike the Fund, the MSCI EM Index is unmanaged, is not available for investment, and does not incur expenses. All MSCI data is provided “as is.” The products described herein are not sponsored or endorsed and have not been reviewed or passed on by MSCI. In no event shall MSCI, its affiliates, or any MSCI data provider have any liability of any kind in connection with the MSCI data or the products described herein. |
| 10 | The Barclays Capital Global Aggregate Bond Index provides a broad-based measure of the global investment-grade fixed income markets. The three major components of this index are the U.S. Aggregate, the Pan-European Aggregate, and the Asian-Pacific Aggregate Indices. The Index also includes Eurodollar and Euro-Yen corporate bonds, Canadian government, agency and corporate securities, and USD investment grade 144A securities. Unlike the Fund, the Barclays Capital Global Aggregate Bond Index is unmanaged, is not available for investment, and does not incur fees. |
Not FDIC insured, nor bank guaranteed. May lose value.
2
Table of Contents
Managers AMG Essex Large Cap Growth Fund
Fund Snapshots
June 30, 2009 (unaudited)
Portfolio Breakdown
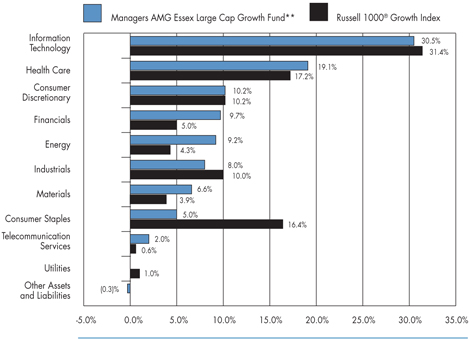
Industry | Managers AMG Essex Large Cap Growth Fund** | Russell 1000® Growth Index | ||||
Information Technology | 30.5 | % | 31.4 | % | ||
Health Care | 19.1 | % | 17.2 | % | ||
Consumer Discretionary | 10.2 | % | 10.2 | % | ||
Financials | 9.7 | % | 5.0 | % | ||
Energy | 9.2 | % | 4.3 | % | ||
Industrials | 8.0 | % | 10.0 | % | ||
Materials | 6.6 | % | 3.9 | % | ||
Consumer Staples | 5.0 | % | 16.4 | % | ||
Telecommunication Services | 2.0 | % | 0.6 | % | ||
Utilities | 0.0 | % | 1.0 | % | ||
Other Assets and Liabilities | (0.3 | )% | 0.0 | % |
| ** | As a percentage of net assets |
Top Ten Holdings
Security Name | Percentage of Net Assets | ||
Microsoft Corp. | 4.5 | % | |
Goldman Sachs Group, Inc. | 3.7 | ||
QUALCOMM, Inc.* | 3.6 | ||
Cisco Systems, Inc. | 3.6 | ||
Apollo Group, Inc., Class A* | 3.2 | ||
Google, Inc. | 3.0 | ||
Baxter International, Inc. | 2.8 | ||
URS Corp. | 2.8 | ||
Kohl’s Corp.* | 2.8 | ||
Teva Pharmaceutical Industries, Ltd., Sponsored ADR | 2.7 | ||
Top Ten as a Group | 32.7 | % | |
| * | Top Ten Holding at December 31, 2008 |
Any sectors, industries, or securities discussed should not be perceived as investment recommendations. Mention of a specific security should not be considered a recommendation to buy or solicitation to sell that security. Specific securities mentioned in this report may have been sold from the Fund’s portfolio of investments by the time you receive this report.
3
Table of Contents
Managers AMG Essex Large Cap Growth Fund
Schedule of Portfolio Investments
June 30, 2009 (unaudited)
| Shares | Value | ||||||
Common Stocks - 100.3% | |||||||
Consumer Discretionary - 10.2% | |||||||
Apollo Group, Inc., Class A* | 6,010 | $ | 427,432 | ||||
Johnson Controls, Inc. | 9,749 | 211,748 | |||||
Kohl’s Corp.* | 8,710 | 372,352 | |||||
TJX Cos., Inc., The | 11,427 | 359,493 | |||||
Total Consumer Discretionary | 1,371,025 | ||||||
Consumer Staples - 5.0% | |||||||
Colgate-Palmolive Co. | 2,754 | 194,818 | |||||
Procter & Gamble Co., The | 3,349 | 171,134 | |||||
Wal-Mart Stores, Inc. | 6,309 | 305,608 | |||||
Total Consumer Staples | 671,560 | ||||||
Energy - 9.2% | |||||||
Anadarko Petroleum Corp. | 7,157 | 324,855 | |||||
Southwestern Energy Co.* | 7,883 | 306,255 | |||||
Transocean, Ltd.* | 4,195 | 311,647 | |||||
Weatherford International, Ltd.* | 15,005 | 293,498 | |||||
Total Energy | 1,236,255 | ||||||
Financials - 9.7% | |||||||
ACE, Ltd. | 2,321 | 102,658 | |||||
Charles Schwab Corp., The | 14,027 | 246,034 | |||||
Fifth Third Bancorp | 8,768 | 62,253 | |||||
Goldman Sachs Group, Inc. | 3,387 | 499,379 | |||||
IntercontinentalExchange, Inc.* | 1,231 | 140,629 | |||||
JPMorgan Chase & Co. | 7,546 | 257,394 | |||||
Total Financials | 1,308,347 | ||||||
Health Care - 19.1% | |||||||
Abbott Laboratories Co. | 6,438 | 302,844 | |||||
Amgen, Inc.* | 1,925 | 101,910 | |||||
Baxter International, Inc. | 7,088 | 375,379 | |||||
Celgene Corp.* | 3,142 | 150,313 | |||||
Genzyme Corp.* | 2,264 | 126,037 | |||||
Gilead Sciences, Inc.* | 7,250 | 339,590 | |||||
Medco Health Solutions, Inc.* | 5,078 | 231,608 | |||||
Shire Pharmaceuticals PLC | 4,663 | 193,421 | |||||
St. Jude Medical, Inc.* | 4,897 | 201,267 | |||||
Teva Pharmaceutical Industries, Ltd., Sponsored ADR | 7,477 | 368,915 | |||||
Vertex Pharmaceuticals, Inc.* | 5,195 | 185,150 | |||||
Total Health Care | 2,576,434 | ||||||
Industrials - 8.0% | |||||||
Aecom Technology Corp.* | 7,808 | 249,856 | |||||
Delta Air Lines, Inc.* | 16,585 | 96,027 | |||||
Quanta Services, Inc.* | 15,485 | 358,168 | |||||
URS Corp.* | 7,549 | 373,827 | |||||
Total Industrials | 1,077,878 | ||||||
Information Technology - 30.5% | |||||||
Apple, Inc.* | 2,471 | 351,945 | |||||
ASML Holding, N.V. | 11,533 | 2 | 249,689 | ||||
Cisco Systems, Inc.* | 25,893 | 482,646 | |||||
EMC Corp.* | 19,261 | 252,319 | |||||
Google, Inc.* | 963 | 405,991 | |||||
International Business Machines Corp. | 2,527 | 263,869 | |||||
McAfee, Inc.* | 7,136 | 301,068 | |||||
MEMC Electronic Materials, Inc.* | 14,249 | 253,775 | |||||
Microsoft Corp. | 25,443 | 604,780 | |||||
Nvidia Corp.* | 28,336 | 319,913 | |||||
QUALCOMM, Inc. | 10,819 | 489,019 | |||||
Symantec Corp.* | 8,576 | 133,443 | |||||
Total Information Technology | 4,108,458 | ||||||
Materials - 6.6% | |||||||
Agnico-Eagle Mines, Ltd. | 2,490 | 130,675 | |||||
Freeport McMoRan Copper & Gold, Inc., Class B | 4,436 | 222,288 | |||||
Mosaic Co., The, | 6,786 | 300,620 | |||||
Potash Corp. of Saskatchewan, Inc. | 2,644 | 246,024 | |||||
Total Materials | 899,607 | ||||||
Telecommunication Services - 2.0% | |||||||
NII Holdings, Inc., Class B* | 14,232 | 271,404 | |||||
Total Common Stocks (cost $12,257,192) | 13,520,967 | ||||||
Short-Term Investments - 6.1%1 | |||||||
BNY Institutional Cash Reserves Fund, Series A, 0.06%3 | 443,006 | 443,006 | |||||
BNY Institutional Cash Reserves Fund, Series B*3,8 | 119,397 | 17,611 | |||||
Dreyfus Cash Management Fund, Institutional Class Shares, 0.44%9 | 353,221 | 353,221 | |||||
Total Short-Term Investments (cost $915,624) | 813,838 | ||||||
Total Investments - 106.4% (cost $13,172,816) | 14,334,805 | ||||||
Other Assets, less Liabilities - (6.4)% | (859,039 | ) | |||||
Net Assets - 100.0% | $ | 13,475,766 | |||||
The accompanying notes are an integral part of these financial statements.
4
Table of Contents
Managers International Equity Fund
Fund Snapshots
June 30, 2009 (unaudited)
Portfolio Breakdown
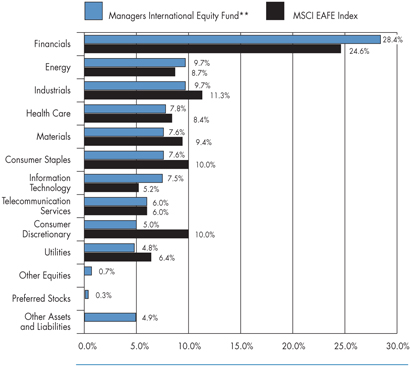
Industry | Managers International Equity Fund** | MSCI EAFE Index | ||||
Financials | 28.4 | % | 24.6 | % | ||
Energy | 9.7 | % | 8.7 | % | ||
Industrials | 9.7 | % | 11.3 | % | ||
Health Care | 7.8 | % | 8.4 | % | ||
Materials | 7.6 | % | 9.4 | % | ||
Consumer Staples | 7.6 | % | 10.0 | % | ||
Information Technology | 7.5 | % | 5.2 | % | ||
Telecommunication Services | 6.0 | % | 6.0 | % | ||
Consumer Discretionary | 5.0 | % | 10.0 | % | ||
Utilities | 4.8 | % | 6.4 | % | ||
Other Equities | 0.7 | % | 0.0 | % | ||
Preferred Stocks | 0.3 | % | 0.0 | % | ||
Other Assets and Liabilities | 4.9 | % | 0.0 | % |
| ** | As a percentage of net assets |
Top Ten Holdings
Security Name | Percentage of Net Assets | ||
BP PLC* | 1.8 | % | |
Vodafone Group PLC* | 1.6 | ||
Eni S.p.A. | 1.6 | ||
Sanofi-Aventis SA* | 1.5 | ||
GlaxoSmithKline PLC | 1.5 | ||
Societe Generale | 1.5 | ||
Allianz SE* | 1.4 | ||
Nestle SA, Registered | 1.4 | ||
Sun Hung Kai Properties, Ltd. | 1.3 | ||
E.ON AG | 1.3 | ||
Top Ten as a Group | 14.9 | % | |
| * | Top Ten Holding at December 31, 2008 |
Any sectors, industries, or securities discussed should not be perceived as investment recommendations. Mention of a specific security should not be considered a recommendation to buy or solicitation to sell that security. Specific securities mentioned in this report may have been sold from the Fund’s portfolio of investments by the time you receive this report.
5
Table of Contents
Managers International Equity Fund
Fund Snapshots (continued)
Summary of Investments by Country
Country | Managers International Equity Fund* | MSCI EAFE Index | ||||
Australia | 0.6 | % | 7.3 | % | ||
Belgium | 0.4 | % | 0.9 | % | ||
Belgium | 0.0 | % | 0.9 | % | ||
Bermuda | 0.0 | % | 0.4 | % | ||
Brazil | 2.4 | % | 0.0 | % | ||
Canada | 3.6 | % | 0.0 | % | ||
Cayman Islands | 0.5 | % | 0.0 | % | ||
China | 2.2 | % | 0.0 | % | ||
Cyprus | 0.0 | % | 0.0 | % | ||
Czech Republic | 0.9 | % | 0.0 | % | ||
Denmark | 0.3 | % | 0.9 | % | ||
Finland | 1.0 | % | 1.3 | % | ||
France | 9.0 | % | 9.8 | % | ||
Germany | 9.7 | % | 7.7 | % | ||
Greece | 0.0 | % | 0.5 | % | ||
Hong Kong | 4.4 | % | 2.1 | % | ||
India | 0.6 | % | 0.0 | % | ||
Ireland | 0.0 | % | 0.3 | % | ||
Israel | 0.6 | % | 0.0 | % | ||
Italy | 2.8 | % | 3.4 | % | ||
Japan | 13.3 | % | 24.0 | % | ||
Jersey, Channel Islands | 0.0 | % | 0.3 | % | ||
Luxembourg | 0.7 | % | 0.5 | % | ||
Netherlands | 3.6 | % | 2.5 | % | ||
New Zealand | 0.0 | % | 0.1 | % | ||
Norway | 1.0 | % | 0.6 | % | ||
Portugal | 0.0 | % | 0.3 | % | ||
Russia | 1.0 | % | 0.0 | % | ||
Singapore | 1.3 | % | 1.3 | % | ||
South Africa | 1.0 | % | 0.0 | % | ||
South Korea | 1.5 | % | 0.0 | % | ||
Spain | 2.2 | % | 4.5 | % | ||
Sweden | 2.3 | % | 2.3 | % | ||
Switzerland | 8.0 | % | 7.3 | % | ||
Taiwan | 1.9 | % | 0.0 | % | ||
Turkey | 0.2 | % | 0.0 | % | ||
United Kingdom | 14.0 | % | 20.7 | % | ||
United States | 9.0 | % | 0.1 | % | ||
| 100.0 | % | 100.0 | % | |||
| * | As a percentage of total market value on June 30, 2009 |
6
Table of Contents
Managers International Equity Fund
Schedule of Portfolio Investments
June 30, 2009 (unaudited)
| Shares | Value | ||||
Common Stocks - 94.1% | |||||
Consumer Discretionary - 5.0% | |||||
Aisin Seiki Co., Ltd. (Japan) | 19,300 | $ | 416,945 | ||
Compass Group PLC (United Kingdom) | 137,182 | 774,351 | |||
Cyrela Brazil Realty, S.A. (Brazil) | 39,100 | 293,325 | |||
Electrolux AB, Series B (Sweden)* | 18,200 | 254,611 | |||
Hennes & Mauritz AB (Sweden) | 14,242 | 711,164 | |||
Lagardere (France) | 11,700 | 390,069 | |||
New World Department Store China, Ltd. (China) | 61,000 | 45,874 | |||
Nissan Motor Co., Ltd. (Japan) | 80,700 | 489,760 | |||
Parkson Retail Group, Ltd. (China) | 83,500 | 118,933 | |||
Pearson PLC (United Kingdom) | 5,604 | 56,434 | |||
Renault SA (France)* | 12,800 | 472,916 | |||
Sekisui House, Ltd. (Japan) | 68,000 | 688,701 | |||
Toyota Motor Corp. (Japan) | 24,700 | 934,089 | |||
Wolters Kluwer, N.V. (Netherlands) | 3,531 | 61,945 | |||
Total Consumer Discretionary | 5,709,117 | ||||
Consumer Staples - 7.6% | |||||
Associated British Foods PLC (United Kingdom) | 37,600 | 473,695 | |||
British American Tobacco PLC (United Kingdom) | 14,521 | 400,840 | |||
Cadbury PLC (United Kingdom) | 36,449 | 311,555 | |||
Casino Guichard-Perrachon SA (France) | 14,413 | 976,132 | |||
Delhaize Group (Belgium) | 6,600 | 464,669 | |||
Diageo PLC (United Kingdom) | 31,476 | 452,093 | |||
Groupe Danone SA (France) | 4,802 | 238,107 | |||
Koninklijke Ahold, N.V. (Netherlands) | 97,042 | 1,118,751 | |||
L’Oreal SA (France) | 4,632 | 347,696 | |||
Metro AG (Germany) | 15,448 | 738,078 | |||
Nestle SA, Registered (Switzerland) | 42,143 | 1,591,255 | |||
Seven & i Holdings Co., Ltd. (Japan) | 21,700 | 508,921 | |||
Unilever, N.V. (Netherlands) | 35,333 | 854,570 | |||
Uni-President Enterprises Corp. (Taiwan) | 214,653 | 220,472 | |||
Total Consumer Staples | 8,696,834 | ||||
Energy - 9.7% | |||||
BP PLC (United Kingdom) | 265,247 | 2,095,930 | |||
Canadian Natural Resources, Ltd. (Canada) | 9,400 | 494,507 | |||
China Shenhua Energy Co., Ltd. (China) | 184,000 | 672,222 | |||
EnCana Corp. (Canada) | 12,068 | 598,342 | |||
Eni S.p.A. (Italy) | 76,430 | 1,812,702 | |||
INPEX Corp. (Japan) | 79 | 629,882 | |||
LUKOIL Holdings, ADR (Russia) | 16,400 | 733,080 | |||
Nexen, Inc. (Canada) | 11,000 | 238,980 | |||
Petro-Canada (Canada) | 17,800 | 687,423 | |||
Petroleo Brasileiro, S.A., ADR (Brazil) | 21,400 | 713,904 | |||
Petroleo Brasileiro, S.A., Sponsored ADR (Brazil) | 11,100 | 454,878 | |||
Petroplus Holdings AG (Switzerland)* | 4,398 | 72,927 | |||
Royal Dutch Shell PLC, Class A (Netherlands) | 52,900 | 1,325,530 | |||
StatoilHydro ASA (Norway) | 35,600 | 703,213 | |||
Total Energy | 11,233,520 | ||||
Financials - 28.4% | |||||
Allianz SE (Germany) | 18,092 | 1,668,854 | |||
Australia and New Zealand Banking Group, Ltd. (Australia) | 58,800 | 779,246 | |||
Aviva PLC (United Kingdom) | 97,743 | 550,330 | |||
Banca Intesa S.p.A. (Italy)* | 118,400 | 382,613 | |||
Banco do Brasil, S.A. (Brazil) | 54,400 | 587,170 | |||
Banco Santander Central Hispano, S.A. (Spain) | 104,462 | 1,262,757 | |||
Bank of China, Ltd., Class H (China) | 1,513,000 | 716,471 | |||
Bank of East Asia, Ltd. (Hong Kong) | 60,790 | 184,230 | |||
Bank of Yokohama, Ltd., The (Japan) | 116,000 | 620,900 | |||
Barclays PLC (United Kingdom) | 100,400 | 466,563 | |||
BNP Paribas SA (France) | 14,400 | 939,062 | |||
CapitaLand, Ltd. (Singapore) | 204,500 | 519,951 | |||
Cathay Financial Holding Co., Ltd. (Taiwan)* | 197,300 | 290,055 | |||
China Life Insurance Co., Ltd. (China) | 224,000 | 823,245 | |||
China Overseas Land & Investment, Ltd. (Hong Kong) | 547,360 | 1,263,301 | |||
Chinatrust Financial Holding Co., Ltd., (Taiwan)* | 403,109 | 242,155 | |||
Credit Agricole SA (France) | 54,009 | 677,180 | |||
Credit Suisse Group AG (Switzerland) | 27,047 | 1,239,185 | |||
Daiwa House Industry Co., Ltd. (Japan) | 34,000 | 365,603 | |||
Daiwa Securities Group, Inc. (Japan) | 40,000 | 237,688 | |||
DBS Group Holdings, Ltd. (Singapore) | 55,500 | 449,947 | |||
Deutsche Bank AG (Germany) | 16,300 | 990,893 | |||
Deutsche Boerse AG (Germany) | 2,681 | 208,649 | |||
Hang Lung Group, Ltd. (Hong Kong) | 20,900 | 97,799 | |||
Hang Lung Properties, Ltd. (Hong Kong) | 41,000 | 135,014 | |||
HDFC Bank, Ltd. (India) | 14,195 | 442,444 | |||
Henderson Land Development Co., Ltd. (Hong Kong) | 68,000 | 388,023 | |||
The accompanying notes are an integral part of these financial statements.
7
Table of Contents
Managers International Equity Fund
Schedule of Portfolio Investments (continued)
| Shares | Value | ||||
Financials - 28.4% (continued) | |||||
Hong Kong Exchanges and Clearing, Ltd. (Hong Kong) | 57,400 | $ | 887,203 | ||
HSBC Holdings PLC (United Kingdom) | 170,464 | 1,420,164 | |||
Industrial and Commercial Bank of China, Ltd. - Class H (China)* | 354,000 | 245,211 | |||
ING Groep, N.V. (Netherlands) | 56,217 | 569,539 | |||
KB Financial Group, Inc. (South Korea)* | 13,200 | 440,073 | |||
Lloyds TSB Group PLC (United Kingdom) | 343,885 | 396,427 | |||
Man Group PLC (United Kingdom) | 162,976 | 747,064 | |||
Mitsubishi Estate Co., Ltd. (Japan) | 25,000 | 415,042 | |||
Mitsui Fudosan Co., Ltd. (Japan) | 66,000 | 1,144,715 | |||
Muenchener Rueckversicherungs AG (Germany) | 6,100 | 823,630 | |||
Nomura Holdings, Inc. (Japan) | 38,900 | 328,349 | |||
Prudential Corp. PLC (United Kingdom) | 47,876 | 327,255 | |||
Societe Generale (France) | 31,324 | 1,719,400 | |||
Standard Bank Group Ltd. (South Africa) | 44,700 | 514,240 | |||
Standard Chartered PLC (United Kingdom) | 22,498 | 423,030 | |||
Storebrand ASA (Norway)* | 111,189 | 486,321 | |||
Sumitomo Mitsui Financial Group, Inc. (Japan) | 27,200 | 1,100,656 | |||
Sumitomo Realty & Development Co., Ltd. (Japan) | 22,000 | 401,691 | |||
Sun Hung Kai Properties, Ltd. (Hong Kong) | 122,000 | 1,514,971 | |||
T&D Holdings, Inc. (Japan) | 11,400 | 325,709 | |||
Turkiye Garanti Bankasi A.S. (Turkey)* | 103,200 | 274,548 | |||
United Overseas Bank, Ltd. (Singapore) | 62,000 | 625,629 | |||
Zurich Financial Services AG (Switzerland) | 6,203 | 1,096,401 | |||
Total Financials | 32,756,596 | ||||
Health Care - 7.8% | |||||
Actelion, Ltd. (Switzerland)* | 10,381 | 544,112 | |||
AstraZeneca PLC (United Kingdom) | 11,700 | 515,882 | |||
Bayer AG (Germany) | 16,400 | 881,340 | |||
GlaxoSmithKline PLC (United Kingdom) | 100,148 | 1,768,943 | |||
Lonza Group AG (Switzerland) | 2,432 | 241,930 | |||
Novartis AG (Switzerland)* | 23,268 | 947,176 | |||
Roche Holding AG (Switzerland)* | 10,904 | 1,485,694 | |||
Sanofi-Aventis SA (France) | 30,119 | 1,779,728 | |||
Teva Pharmaceutical Industries, Ltd., Sponsored ADR (Israel) | 17,100 | 843,714 | |||
Total Health Care | 9,008,519 | ||||
Industrials - 9.7% | |||||
ABB, Ltd., ADR (Switzerland)* | 40,800 | 645,442 | |||
ABB, Ltd. (Switzerland)* | 50,074 | 790,702 | |||
Adecco SA (Switzerland) | 5,700 | 238,244 | |||
Alstom SA (France)* | 8,140 | 483,327 | |||
Atlas Copco AB (Sweden) | 52,200 | 525,613 | |||
Babcock International Group PLC (United Kingdom) | 65,768 | 521,758 | |||
Deutsche Lufthansa AG (Germany) | 20,700 | 259,965 | |||
Deutsche Post AG (Germany)* | 52,050 | 679,617 | |||
East Japan Railway Co. (Japan) | 10,400 | 626,141 | |||
FANUC, Ltd. (Japan) | 6,000 | 480,818 | |||
Far Eastern Textile Co., Ltd. (Taiwan) | 225,278 | 259,495 | |||
HOCHTIEF AG (Germany) | 5,740 | 289,859 | |||
Hutchison Whampoa, Ltd. (Hong Kong) | 30,000 | 195,154 | |||
ITOCHU Corp. (Japan) | 88,000 | 610,651 | |||
Kajima Corp. (Japan) | 67,000 | 208,571 | |||
Mitsubishi Corp. (Japan) | 18,900 | 348,766 | |||
Mitsubishi Heavy Inds., Ltd. (Japan) | 113,000 | 467,629 | |||
Randstad Holding, N.V. (Netherlands)* | 15,800 | 439,088 | |||
Shimizu Corp. (Japan) | 48,000 | 208,340 | |||
Siemens AG (Germany) | 18,105 | 1,252,008 | |||
Tognum AG (Germany) | 26,513 | 348,853 | |||
Tostem Inax Holding Corp. (Japan) | 16,100 | 248,474 | |||
Vestas Wind Systems A/S (Denmark)* | 4,400 | 315,765 | |||
Wolseley PLC (United Kingdom)* | 22,400 | 428,809 | |||
Yamato Transport Co., Ltd. (Japan) | 21,000 | 279,213 | |||
Total Industrials | 11,152,302 | ||||
Information Technology - 7.5% | |||||
AU Optronics Corp., Sponsored ADR (Taiwan) | 45,100 | 436,568 | |||
Autonomy Corporation PLC (United Kingdom)* | 35,091 | 831,470 | |||
Canon, Inc. (Japan) | 22,900 | 748,006 | |||
Cia Brasileira de Meios de Pagamentos (Brazil)* | 20,700 | 178,002 | |||
Ericsson (LM), Class B (Sweden) | 99,400 | 979,232 | |||
Fujitsu, Ltd. (Japan) | 78,000 | 423,714 | |||
Gemalto NV (France)* | 19,157 | 665,802 | |||
NetEase.com, Inc., ADR (Cayman Islands)* | 16,800 | 591,024 | |||
Nokia Oyj (Finland) | 79,400 | 1,162,986 | |||
Redecard, S.A. (Brazil) | 20,200 | 309,263 | |||
Samsung Electronics Co., Ltd. (South Korea) | 1,778 | 822,084 | |||
The accompanying notes are an integral part of these financial statements.
8
Table of Contents
Managers International Equity Fund
Schedule of Portfolio Investments (continued)
| Shares | Value | ||||||
Information Technology - 7.5% (continued) | |||||||
Samsung Electronics Co., Ltd., GDR, (a) (South Korea)* | 2,287 | $ | 531,380 | ||||
Taiwan Semiconductor Manufacturing Co., Ltd., Sponsored ADR (Taiwan) | 52,061 | 489,890 | |||||
Toshiba Corp. (Japan) | 125,000 | 452,868 | |||||
Total Information Technology | 8,622,289 | ||||||
Materials - 7.6% | |||||||
Air Liquide SA (France) | 5,148 | 472,360 | |||||
ArcelorMittal (Luxembourg) | 24,428 | 808,416 | |||||
Barrick Gold Corp. (Canada) | 25,686 | 864,555 | |||||
BASF SE (Germany) | 17,300 | 689,263 | |||||
GMK Norilsk Nickel, Sponsored ADR (Russia)* | 54,724 | 2 | 497,988 | ||||
Gold Fields, Ltd. (South Africa) | 32,663 | 394,526 | |||||
Goldcorp, Inc. (Canada) | 20,000 | 695,181 | |||||
Impala Platinum Holdings, Ltd. (South Africa) | 9,800 | 216,678 | |||||
Kinross Gold Corp. (Canada) | 16,500 | 299,475 | |||||
Mitsubishi Chemical Holdings Corp. (Japan) | 72,500 | 306,657 | |||||
Rio Tinto PLC (United Kingdom) | 23,042 | 797,977 | |||||
Shin-Etsu Chemical Co., Ltd. (Japan) | 13,400 | 621,477 | |||||
Svenska Cellulosa AB (SCA) (Sweden) | 27,200 | 286,373 | |||||
Syngenta AG (Switzerland) | 2,931 | 681,944 | |||||
Taiwan Fertilizer Co., Ltd. (Taiwan) | 112,000 | 331,059 | |||||
Toray Industries, Inc. (Japan) | 88,700 | 451,496 | |||||
Yamana Gold, Inc. (Canada) | 43,259 | 384,558 | |||||
Total Materials | 8,799,983 | ||||||
Telecommunication Services - 6.0% | |||||||
Bharti Tele-Ventures, Ltd. (India)* | 13,107 | 219,102 | |||||
BT Group PLC (United Kingdom) | 236,090 | 395,568 | |||||
Deutsche Telekom AG (Germany) | 35,800 | 423,248 | |||||
France Telecom SA (France) | 48,315 | 1,099,344 | |||||
Nippon Telegraph & Telephone Corp. (Japan) | 24,700 | 1,005,918 | |||||
Telecom Italia S.p.A. (Italy) | 506,800 | 702,671 | |||||
Telecom Italia S.p.A., RSP (Italy) | 464,100 | 457,192 | |||||
Telefonica, S.A. (Spain) | 36,000 | 817,548 | |||||
Vodafone Group PLC (United Kingdom) | 947,306 | 1,842,452 | |||||
Total Telecommunication Services | 6,963,043 | ||||||
Utilities - 4.8% | |||||||
Centrica PLC (United Kingdom) | 133,900 | 492,355 | |||||
Ceske Energeticke Zavody (Czech Republic)* | 23,011 | 1,028,509 | |||||
E.ON AG (Germany) | 42,641 | 1,513,670 | |||||
Electricite de France SA (France) | 9,800 | 478,517 | |||||
Hong Kong and China Gas Co., Ltd., The (Hong Kong) | 313,670 | 658,451 | |||||
Iberdrola Renovables SAU (Spain)* | 121,205 | 555,670 | |||||
National Grid PLC (United Kingdom) | 32,230 | 290,834 | |||||
RWE AG (Germany) | 7,140 | 563,058 | |||||
Total Utilities | 5,581,064 | ||||||
Total Common Stocks (cost $109,645,720) | 108,523,267 | ||||||
Other Equities - 0.7% | |||||||
Hirco PLC (South Africa)* | 18,100 | 28,576 | |||||
SPDR Gold Shares (United States)* | 8,400 | 765,912 | |||||
Total Other Equities (cost $823,505) | 794,488 | ||||||
Preferred Stock - 0.3% | |||||||
Itau Unibanco Banco Multiplo, S.A., Preferred (Brazil) | 20,513 | 323,366 | |||||
Total Preferred Stock (cost $349,850) | 323,366 | ||||||
Short-Term Investments - 8.6%1 | |||||||
BNY Institutional Cash Reserves Fund, Series A, 0.06%3 | 399,006 | 399,006 | |||||
BNY Institutional Cash Reserves Fund, Series B*3,8 | 104,356 | 15,393 | |||||
Dreyfus Government Cash Management Fund, Institutional Class Shares, 0.44%9 | 9,476,298 | 9,476,298 | |||||
Total Short-Term Investments (cost $9,979,660) | 9,890,697 | ||||||
Total Investments - 103.7% (cost $120,798,735) | 119,531,818 | ||||||
Other Assets, less Liabilities - (3.7)% | (4,267,421 | ) | |||||
Net Assets - 100.0% | $ | 115,264,397 | |||||
The accompanying notes are an integral part of these financial statements.
9
Table of Contents
Managers Emerging Markets Equity Fund
Fund Snapshots
June 30, 2009 (unaudited)
Portfolio Breakdown

Industry | Managers Emerging Markets Equity Fund** | MSCI EM Index | ||||
Financials | 26.6 | % | 24.0 | % | ||
Energy | 15.9 | % | 16.1 | % | ||
Telecommunication Services | 11.8 | % | 10.5 | % | ||
Materials | 11.6 | % | 13.5 | % | ||
Information Technology | 10.0 | % | 12.3 | % | ||
Industrials | 7.5 | % | 7.2 | % | ||
Consumer Discretionary | 7.3 | % | 5.0 | % | ||
Consumer Staples | 2.9 | % | 5.1 | % | ||
Utilities | 2.5 | % | 3.9 | % | ||
Preferred Stocks | 1.6 | % | 0.0 | % | ||
Health Care | 1.4 | % | 2.4 | % | ||
Other Assets and Liabilities | 0.9 | % | 0.0 | % |
| ** | As a percentage of net assets |
Top Ten Holdings
Security Name | Percentage of Net Assets | ||
Petroleo Brasileiro, S.A., ADR | 2.8 | % | |
OAO Gazprom, ADR* | 2.7 | ||
China Mobile, Ltd.* | 2.2 | ||
Bank of China, Ltd., Class H | 1.9 | ||
China Construction Bank Corp. | 1.9 | ||
CNOOC, Ltd.* | 1.8 | ||
Industrial and Commercial Bank of China, Ltd. - Class H | 1.8 | ||
Samsung Electronics Co., Ltd. | 1.8 | ||
Hon Hai Precision Industry Co., Ltd. | 1.5 | ||
Banco Bradesco, S.A. | 1.5 | ||
Top Ten as a Group | 19.9 | % | |
| * | Top Ten Holding at December 31, 2008 |
Any sectors, industries, or securities discussed should not be perceived as investment recommendations. Mention of a specific security should not be considered a recommendation to buy or solicitation to sell that security. Specific securities mentioned in this report may have been sold from the Fund’s portfolio of investments by the time you receive this report.
10
Table of Contents
Managers Emerging Markets Equity Fund
Fund Snapshots (continued)
Summary of Investments by Country
Country | Managers Emerging Markets Equity Fund* | MSCI EM Index | ||||
Bermuda | 0.4 | % | 0.3 | % | ||
Brazil | 15.1 | % | 14.6 | % | ||
Cayman Islands | 0.0 | % | 2.2 | % | ||
Chile | 0.8 | % | 1.5 | % | ||
China | 12.3 | % | 11.4 | % | ||
Colombia | 0.0 | % | 0.6 | % | ||
Czech Republic | 0.4 | % | 0.5 | % | ||
Egypt | 1.3 | % | 0.6 | % | ||
Hong Kong | 6.5 | % | 5.4 | % | ||
Hungary | 0.3 | % | 0.5 | % | ||
India | 8.1 | % | 7.5 | % | ||
Indonesia | 3.1 | % | 1.7 | % | ||
Israel | 2.1 | % | 2.7 | % | ||
Luxembourg | 0.6 | % | 0.0 | % | ||
Malaysia | 1.4 | % | 2.9 | % | ||
Mexico | 3.1 | % | 4.4 | % | ||
Morocco | 0.0 | % | 0.4 | % | ||
Panama | 0.5 | % | 0.0 | % | ||
Peru | 0.7 | % | 0.0 | % | ||
Philippines | 0.9 | % | 0.4 | % | ||
Poland | 0.3 | % | 1.1 | % | ||
Russia | 8.3 | % | 5.7 | % | ||
South Africa | 5.4 | % | 7.5 | % | ||
South Korea | 10.5 | % | 12.3 | % | ||
Supranational & Other | 0.3 | % | 0.0 | % | ||
Taiwan | 8.7 | % | 11.7 | % | ||
Thailand | 2.8 | % | 1.4 | % | ||
Turkey | 3.0 | % | 1.4 | % | ||
United Kingdom | 0.7 | % | 0.0 | % | ||
United States | 2.4 | % | 1.3 | % | ||
| 100.0 | % | 100.0 | % | |||
| * | As a percentage of total market value on June 30, 2009 |
11
Table of Contents
Managers Emerging Markets Equity Fund
Schedule of Portfolio Investments
June 30, 2009 (unaudited)
| Shares | Value | |||||
Common Stocks - 97.5% | ||||||
Consumer Discretionary - 7.3% | ||||||
Astra International Tbk PT (Indonesia) | 79,000 | $ | 183,424 | |||
Cyfrowy Polsat SA (Poland)* | 43,502 | 210,333 | ||||
Desarrolladora Homex, S.A.B. de C.V. (Mexico)* | 15,578 | 2 | 434,470 | |||
Far Eastern Department Stores, Ltd. (Taiwan) | 210,000 | 205,416 | ||||
Genting Malaysia Berhad (Malaysia)* | 454,700 | 348,243 | ||||
Golden Eagle Retail Group, Ltd. (China) | 289,000 | 334,883 | ||||
Grupo Televisa SA (Mexico) | 34,300 | 583,100 | ||||
Hyundai Mobis Co., Ltd. (South Korea) | 3,224 | 280,895 | ||||
Hyundai Motor Co., Ltd. (South Korea) | 5,899 | 341,190 | ||||
Land and Houses PCL (Thailand) | 432,700 | 64,425 | ||||
LG Electronics, Inc. (South Korea) | 6,152 | 561,982 | ||||
Lojas Renner, S.A. (Brazil) | 29,000 | 321,153 | ||||
Maruti Udyog, Ltd. (India) | 5,195 | 115,523 | ||||
MegaStudy Co., Ltd. (South Korea) | 988 | 177,527 | ||||
Naspers, Ltd. (South Africa) | 12,847 | 338,343 | ||||
Net Servicos de Comunicacao, S.A. (Brazil)* | 69,010 | 672,667 | ||||
Parkson Retail Group, Ltd. (China) | 141,500 | 201,545 | ||||
Urbi Desarrollos Urbanos, SA de CV (Mexico)* | 142,030 | 215,716 | ||||
Zee Entertainment Enterprises, Ltd. (India) | 112,914 | 415,807 | ||||
Total Consumer Discretionary | 6,006,642 | |||||
Consumer Staples - 2.9% | ||||||
Anadolu Efes Biracilik ve Malt Sanayii A.S. (Turkey) | 28,191 | 253,403 | ||||
BIM Birlesik Magazalar A.S. (Turkey) | 4,824 | 168,305 | ||||
China Mengniu Dairy Co., Ltd. (Hong Kong)* | 167,000 | 387,419 | ||||
Cia Brasileira de Distribuicao Grupo Pao de Acucar (Brazil) | 6,732 | 258,913 | ||||
Cia de Bebidas das Americas, RCT (Brazil) | 8 | 520 | ||||
ITC, Ltd. (India) | 38,968 | 154,913 | ||||
KT&G Corp. (South Korea) | 2,863 | 161,551 | ||||
Kuala Lumpur Kepong Berhad (Malaysia) | 38,500 | 130,040 | ||||
Shinsegae Co., Ltd. (South Korea) | 1,717 | 678,515 | ||||
Shufersal, Ltd. (Israel) | 20,001 | 73,788 | ||||
Uni-President Enterprises Corp. (Taiwan) | 146,000 | 149,958 | ||||
Total Consumer Staples | 2,417,325 | |||||
Energy - 15.9% | ||||||
Cairn India, Ltd. (India)* | 37,427 | 181,384 | ||||
China Shenhua Energy Co., Ltd. (China) | 40,000 | 146,135 | ||||
CNOOC, Ltd. (Hong Kong) | 1,213,790 | 1,495,210 | ||||
LUKOIL Holdings, ADR (Russia) | 24,594 | 1,099,352 | ||||
NovaTek OAO, Sponsored GDR (Russia) | 2,200 | 104,833 | ||||
OAO Gazprom, ADR (Russia) | 109,559 | 2,224,735 | ||||
OAO Rosneft Oil Co., GDR (a) (Russia)* | 76,178 | 426,597 | ||||
OGX Petroleo e Gas Participacoes, S.A. (Brazil)* | 600 | 307,728 | ||||
PetroChina Co., Ltd. (China) | 332,000 | 366,880 | ||||
Petroleo Brasileiro, S.A., ADR (Brazil) | 67,842 | 2,263,209 | ||||
Petroleo Brasileiro, S.A., Sponsored ADR (Brazil) | 18,110 | 742,148 | ||||
PT Tambang Batubara Bukit Asam Tbk (Indonesia)* | 244,500 | 276,128 | ||||
PTT Exploration & Production PCL (Thailand) | 50,400 | 196,609 | ||||
PTT Public Co., Ltd. (Thailand) | 89,900 | 614,914 | ||||
Reliance Industries, Ltd. (India) | 13,265 | 558,406 | ||||
Rosneft Oil, GDR (Russia)* | 53,550 | 292,538 | ||||
Sasol, Ltd. (South Africa) | 12,741 | 445,740 | ||||
Tenaris, S.A. (Luxembourg) | 18,800 | 2 | 508,352 | |||
Tupras Turkiye Petrol Rafine (Turkey) | 64,762 | 785,860 | ||||
Total Energy | 13,036,758 | |||||
Financials - 26.6% | ||||||
ABSA Group, Ltd. (South Africa) | 25,672 | 366,329 | ||||
Banco Bradesco, S.A. (Brazil) | 85,291 | 1,259,748 | ||||
Banco Santander Chile, ADR (Chile) | 2,990 | 139,603 | ||||
Bangkok Bank Pcl (Thailand) | 66,200 | 216,644 | ||||
Bank Hapoalim, Ltd. (Israel)* | 41,988 | 111,286 | ||||
Bank of China, Ltd., Class H (China) | 3,306,000 | 1,565,533 | ||||
BM&FBOVESPA, S.A. (Brazil) | 23,300 | 139,122 | ||||
Bumiputra-Commerce Holdings Berhad (Malaysia) | 101,500 | 260,592 | ||||
Commercial Bank of Qatar (Qatar) | 70,950 | 230,588 | ||||
Cathay Financial Holding Co., Ltd. (Taiwan)* | 300,000 | 441,036 | ||||
Cathay Financial Holding Co., Ltd., GDR (Taiwan)* | 1,100 | 15,577 | ||||
China Construction Bank Corp. (China) | 1,998,000 | 1,539,544 | ||||
China Life Insurance Co., Ltd. (China) | 112,000 | 411,623 | ||||
China Overseas Land & Investment, Ltd. (Hong Kong) | 190,000 | 438,518 | ||||
Chinatrust Financial Holding Co., Ltd., (Taiwan)* | 1,584,777 | 952,005 | ||||
Commercial International Bank (Egypt) | 11,504 | 100,356 | ||||
Credicorp, Ltd. (Peru) | 10,595 | 616,629 | ||||
The accompanying notes are an integral part of these financial statements.
12
Table of Contents
Managers Emerging Markets Equity Fund
Schedule of Portfolio Investments (continued)
| Shares | Value | ||||
Financials - 26.6% (continued) | |||||
Daegu Bank, Ltd., The (South Korea) | 16,780 | $ | 153,161 | ||
EFG-Hermes (Egypt) | 37,053 | 149,738 | |||
FirstRand, Ltd. (South Africa) | 261,077 | 476,576 | |||
Franshion Properties China, Ltd. (Hong Kong) | 862,000 | 293,154 | |||
Grupo Financiero Banorte, S.A.B. de C.V. (Mexico) | 140,800 | 341,087 | |||
Guangzhou Investment Co., Inc. (Hong Kong) | 796,000 | 175,548 | |||
Hana Financial Group, Inc. (South Korea) | 4,840 | 103,110 | |||
HDFC Bank, Ltd. (India) | 10,369 | 323,191 | |||
Housing Development Finance Corp., Ltd. (India) | 19,642 | 958,801 | |||
ICICI Bank, Ltd. (India) | 17,312 | 259,571 | |||
ICICI Bank, Ltd., Sponsored ADR (India) | 2,300 | 67,850 | |||
Industrial and Commercial Bank of China, Ltd. - Class H (China)* | 2,110,958 | 1,462,233 | |||
Infrastructure Development Finance Co., Ltd. (India) | 209,348 | 590,528 | |||
Itau Unibanco Banco Multiplo, S.A., ADR (Brazil) | 56,247 | 890,390 | |||
Kasikornbank PCL (Thailand) | 173,200 | 366,535 | |||
KB Financial Group, Inc. (South Korea)* | 5,180 | 172,695 | |||
OTP Bank NyRt. (Hungary)* | 5,427 | 98,120 | |||
Ping An Insurance (Group) Co. of China, Ltd. (China) | 151,383 | 1,016,090 | |||
PT Bank Mandiri (Indonesia) | 588,500 | 182,256 | |||
PT Bank Rakyat Indonesia (Indonesia) | 902,113 | 553,102 | |||
Robinsons Land Corp. (Philippines) | 473,000 | 66,644 | |||
Samsung Fire & Marine Insurance Co., Ltd. (South Korea) | 4,024 | 591,598 | |||
Sanlam, Ltd. (South Africa) | 251,037 | 562,855 | |||
Savings Bank of the Russian Federation(Sberbank) (Russia) | 267,782 | 334,995 | |||
Sberbank, GDR (Russia) | 1,793 | 397,437 | |||
Shanghai Lujiazui Finance & Trade Zone Development Co., Ltd. (China) | 89,500 | 153,090 | |||
Shinhan Financial Group Co., Ltd. (South Korea)* | 9,670 | 243,787 | |||
Siam Commercial Bank PCL (Thailand) | 189,100 | 404,492 | |||
Siam Commercial Bank Public Company, Ltd. (Thailand) | 85,300 | 182,460 | |||
Sino-Ocean Land Holdings, Ltd. (China) | 267,500 | 303,750 | |||
Standard Bank Group, Ltd. (South Africa) | 13,800 | 158,759 | |||
Turkiye Garanti Bankasi A.S. (Turkey)* | 158,654 | 422,075 | |||
Turkiye Halk Bankasi A.S. (Turkey) | 67,173 | 263,098 | |||
Turkiye Is Banksai (Isbank) (Turkey) | 87,469 | 254,502 | |||
Total Financials | 21,778,011 | ||||
Health Care - 1.4% | |||||
Richter Gedeon Rt (Hungary) | 933 | 167,808 | |||
Teva Pharmaceutical Industries, Ltd., Sponsored ADR (Israel) | 19,572 | 965,682 | |||
Total Health Care | 1,133,490 | ||||
Industrials - 7.5% | |||||
Aveng, Ltd. (South Africa) | 31,646 | 143,657 | |||
Beijing Enterprises Holdings, Ltd. (Hong Kong) | 94,000 | 467,874 | |||
Bharat Heavy Electricals, Ltd. (India) | 9,396 | 431,276 | |||
China Communications Constuction Co., Ltd. (China) | 45,000 | 52,172 | |||
China Railway Construction Corp. (China) | 335,300 | 514,548 | |||
China Shipping Development Co., Ltd. (China) | 368,000 | 470,638 | |||
Companhia de Concessoes Rodoviarias (Brazil) | 16,308 | 257,582 | |||
Copa Holdings, S.A., Class A (Panama) | 10,100 | 412,282 | |||
COSCO Pacific, Ltd. (Bermuda) | 290,000 | 324,717 | |||
GS Engineering & Construction Corp. (South Korea) | 2,021 | 116,583 | |||
Hyundai Development Co. (South Korea) | 12,175 | 383,245 | |||
Hyundai Engineering & Construction Co. (South Korea) | 5,160 | 215,062 | |||
IJM Corp. Berhad (Malaysia) | 74,800 | 123,134 | |||
Jiangsu Expressway Co., Ltd. (China) | 376,000 | 274,866 | |||
Larsen & Toubro, Ltd. (India) | 19,483 | 636,345 | |||
Localiza Rent A Car, S.A. (Brazil) | 34,558 | 213,397 | |||
Orascom Construction Industries (Egypt) | 13,478 | 457,493 | |||
PLUS Expressways Berhad (Malaysia) | 208,000 | 189,176 | |||
Raubex Group, Ltd. (South Africa) | 60,273 | 212,874 | |||
Samsung Heavy Industries Co., Ltd. (South Korea) | 5,490 | 124,001 | |||
Santos Brasil Participacoes, S.A. (Brazil) | 17,363 | 97,470 | |||
SM Investments Corp. (Philippines) | 1 | 6 | |||
Weg, S.A. (Brazil) | 9,265 | 65,723 | |||
Total Industrials | 6,184,121 | ||||
Information Technology - 10.0% | |||||
Acer, Inc. (Taiwan) | 104,000 | 180,021 | |||
Advanced Semiconductor Engineering, Inc. (Taiwan) | 893,893 | 516,987 | |||
The accompanying notes are an integral part of these financial statements.
13
Table of Contents
Managers Emerging Markets Equity Fund
Schedule of Portfolio Investments (continued)
| Shares | Value | |||||
Information Technology - 10.0% (continued) | ||||||
Cia Brasileira de Meios de Pagamentos (Brazil)* | 13,229 | $ | 113,758 | |||
Hon Hai Precision Industry Co., Ltd. (Taiwan) | 412,611 | 1,265,364 | ||||
Hon Hai Precision Industry Co., Ltd., ADR (Taiwan) | 4,255 | 25,721 | ||||
Infosys Technologies (India) | 9,836 | 363,735 | ||||
LG Display Co., Ltd. (South Korea) | 20,910 | 521,402 | ||||
MediaTek, Inc. (Taiwan) | 57,331 | 680,659 | ||||
NHN Corp. (South Korea)* | 739 | 101,867 | ||||
Redecard, S.A. (Brazil) | 27,100 | 414,902 | ||||
Samsung Electronics Co., Ltd. (South Korea) | 3,104 | 1,435,179 | ||||
Samsung Electronics Co., Ltd., GDR, (a) (South Korea)* | 1,120 | 260,230 | ||||
Siliconware Precision Industries Co. (Taiwan) | 23,912 | 148,254 | ||||
Siliconware Precision Industries Co. (Taiwan) | 5,871 | 6,793 | ||||
Taiwan Semiconductor Manufacturing Co., Ltd. (Taiwan) | 603,993 | 991,274 | ||||
Taiwan Semiconductor Manufacturing Co., Ltd., Sponsored ADR (Taiwan) | 68,527 | 644,839 | ||||
Tata Consultancy Services, Ltd. (India) | 68,796 | 558,834 | ||||
Total Information Technology | 8,229,819 | |||||
Materials - 11.6% | ||||||
Anglo American PLC (United Kingdom) | 19,483 | 569,665 | ||||
AngloGold Ashanti, Ltd. (South Africa) | 2,138 | 78,354 | ||||
Anhui Conch Cement Co., Ltd. (China) | 82,936 | 515,856 | ||||
CEMEX, S.A.B. de C.V. (Mexico)* | 420 | 3,923 | ||||
China National Building Materials Co., Ltd. (China) | 160,000 | 307,624 | ||||
China Shanshui Cement Group, Ltd. (China) | 250,000 | 172,735 | ||||
China Steel Corp. (Taiwan) | 220,000 | 188,431 | ||||
Companhia Siderurgica Nacional, S.A., Sponsored ADR (Brazil) | 7,613 | 170,151 | ||||
Formosa Chemicals & Fibre Corp. (Taiwan)* | 679 | 1,019 | ||||
GMK Norilsk Nickel, Sponsored ADR (Russia)* | 18,826 | 2 | 171,317 | |||
Gold Fields, Ltd. (South Africa) | 39,886 | 481,770 | ||||
Hidili Industry International Development, Ltd. (China)* | 201,000 | 156,425 | ||||
Impala Platinum Holdings, Ltd. (South Africa) | 13,057 | 288,918 | ||||
Indocement Tunggal Prakarsa Tbk PT (Indonesia)* | 236,000 | 178,488 | ||||
Israel Chemicals, Ltd. (Israel) | 7,642 | 74,990 | ||||
KG Chemical Co., Ltd. (South Korea) | 2,379 | 259,266 | ||||
Makhteshim-Agan Industries, Ltd. (Israel) | 26,100 | 128,576 | ||||
MMC Norilsk Nickel, ADR (Russia)* | 15,350 | 141,488 | ||||
Novolipetsk Steel, GDR (Russia) | 3,158 | 65,024 | ||||
POSCO (South Korea) | 2,909 | 967,041 | ||||
Raspadskaya (Russia) | 116,495 | 260,353 | ||||
Sappi, Ltd. (South Africa) | 127,758 | 376,622 | ||||
Sociedad Quimica y Minera de Chile SA, ADR (Chile) | 5,430 | 196,512 | ||||
Taiwan Cement Corp. (Taiwan) | 210,000 | 200,009 | ||||
Taiwan Fertilizer Co., Ltd. (Taiwan) | 143,000 | 422,692 | ||||
Uralkaliy OAO (Russia) | 25,738 | 414,871 | ||||
Usinas Siderurgicas de Minas Gerais, S.A. ADR (Brazil) | 9,300 | 199,099 | ||||
Usinas Siderurgicas de Minas Gerais, S.A. (Brazil) | 28,200 | 592,927 | ||||
Vale, S.A., 5.500%, Preferred ADR (Brazil) | 57,299 | 879,540 | ||||
Vale, S.A., Sponsored ADR (Brazil) | 58,667 | 1,034,299 | ||||
Total Materials | 9,497,985 | |||||
Telecommunication Services - 11.8% | ||||||
Advanced Information Services PCL (Thailand) | 104,400 | 276,458 | ||||
America Movil, S.A.B. de C.V. (Mexico) | 26,466 | 1,024,763 | ||||
Bezeq Israeli Telecommunication Corp., Ltd. (Israel) | 232,356 | 428,898 | ||||
Bharti Tele-Ventures, Ltd. (India)* | 43,000 | 718,804 | ||||
China Communications Services Corp., Ltd. (China) | 456,000 | 280,390 | ||||
China Mobile, Ltd. (Hong Kong) | 183,000 | 1,832,269 | ||||
Chunghwa Telecom Co., Ltd., ADR (Taiwan) | 7,811 | 154,892 | ||||
Comstar - United Telesystems, GDR (Russia) | 58,468 | 252,642 | ||||
Indosat Tbk PT (Indonesia) | 22,000 | 10,684 | ||||
LG Telecom, Ltd. (South Korea) | 17,860 | 112,175 | ||||
Mobile Telesystems, Sponsored ADR (Russia) | 20,416 | 753,963 | ||||
MTN Group, Ltd. (South Africa) | 39,032 | 599,470 | ||||
Orascom Telecom Holding SAE (Egypt)* | 26,321 | 139,962 | ||||
Philippine Long Distance Telephone Co., ADR (Philippines) | 5,507 | 273,808 | ||||
Philippine Long Distance Telephone Co. (Philippines) | 8,420 | 417,512 | ||||
SK Telecom (South Korea) | 5,375 | 732,690 | ||||
Tele Norte Leste Participacoes, S.A. (Brazil) | 14,619 | 217,385 | ||||
Telecom Egypt Co. (Egypt) | 76,976 | 221,662 | ||||
Telekomunikasi Indonesia Tbk PT (Indonesia) | 1,164,067 | 861,757 | ||||
Turk Telekomunikasyon A.S. (Turkey)* | 78,376 | 244,098 | ||||
Turkcell Iletisim Hizmetleri A.S. (Turkey) | 14,575 | 80,581 | ||||
Total Telecommunication Services | 9,634,863 | |||||
The accompanying notes are an integral part of these financial statements.
14
Table of Contents
Managers Emerging Markets Equity Fund
Schedule of Portfolio Investments (continued)
| Shares | Value | |||||
Utilities - 2.5% | ||||||
Ceske Energeticke Zavody (Czech Republic)* | 7,329 | $ | 327,580 | |||
China Resources Power Holdings Co. (Hong Kong) | 158,000 | 349,460 | ||||
Companhia Energetica de Minas Gerais (Brazil) | 10,214 | 137,087 | ||||
Enersis SA, ADR (Chile) | 19,841 | 366,463 | ||||
PT Perusahaan Gas Negara (Persero) Tbk (Indonesia)* | 1,131,000 | 346,700 | ||||
Reliance Infrastructure, Ltd. (India) | 10,082 | 250,684 | ||||
Tata Power Co., Ltd. (India) | 7,220 | 172,730 | ||||
Tenaga Nasional Berhad (Malaysia)* | 48,600 | 105,526 | ||||
Total Utilities | 2,056,230 | |||||
Total Common Stocks (cost $82,144,473) | 79,975,244 | |||||
Preferred Stocks - 1.6% | ||||||
Bradespar, S.A., Preferred (Brazil) | 13,150 | 171,262 | ||||
Companhia de Bebidas das Americas, Preferred (Brazil) | 2,862 | 184,851 | ||||
Eletropaulo Metropolitana Sao Paulo, S.A., Preferred (Brazil) | 11,271 | 197,811 | ||||
Itau Unibanco Banco Multiplo, S.A., Preferred (Brazil) | 28,451 | 448,508 | ||||
Ultrapar Participacoes, S.A., Preferred (Brazil) | 8,807 | 277,536 | ||||
Total Preferred Stocks (cost $957,287) | 1,279,968 | |||||
Rights - 0.1% | ||||||
China Resources Power Holdings Co., Ltd., Rights (Hong Kong) | 15,800 | 6,728 | ||||
Total Rights (cost $0) | 6,728 | |||||
Short-Term Investments - 2.8%1 | ||||||
BNY Institutional Cash Reserves Fund, Series A, 0.06%3 | 1,023,015 | 1,023,015 | ||||
BNY Institutional Cash Reserves Fund, Series B*3,8 | 110,742 | 16,334 | ||||
Dreyfus Government Cash Management Fund, Institutional Class Shares, 0.44%9 | 1,300,481 | 1,300,481 | ||||
Total Short-Term Investments (cost $2,434,238) | 2,339,830 | |||||
Total Investments - 102.0% (cost $85,535,998) | 83,601,770 | |||||
Other Assets, less Liabilities - (2.0)% | (1,598,745 | ) | ||||
Net Assets - 100.0% | $ | 82,003,025 | ||||
The accompanying notes are an integral part of these financial statements.
15
Table of Contents
Fund Snapshots
June 30, 2009 (unaudited)
Portfolio Breakdown
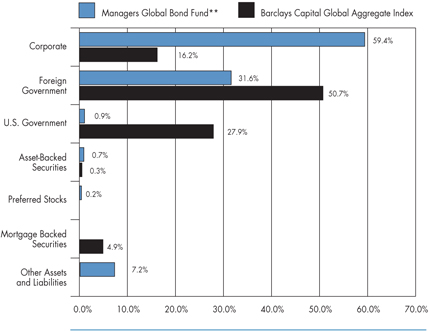
Industry | Managers Global Bond Fund** | Barclays Capital Global Aggregate Index | ||||
Corporate | 59.4 | % | 16.2 | % | ||
Foreign Government | 31.6 | % | 50.7 | % | ||
U.S. Government | 0.9 | % | 27.9 | % | ||
Asset-Backed Securities | 0.7 | % | 0.3 | % | ||
Preferred Stocks | 0.2 | % | 0.0 | % | ||
Mortgage Backed Securities | 0.0 | % | 4.9 | % | ||
Other Assets and Liabilities | 7.2 | % | 0.0 | % |
| ** | As a percentage of net assets |
Top Ten Holdings
Security Name | Percentage of Net Assets | ||
Bundesrepublik Deutschland, 3.750%, 01/04/17* | 5.1 | % | |
Belgium Kingdom, 5.500%, 09/28/17* | 5.0 | ||
Japan Finance Corporation for Municipal Enterprises, 1.550%, 02/21/12* | 2.6 | ||
Bundesrepublik Deutschland, 4.000%, 04/13/12 | 2.1 | ||
Norway Government Bond, 6.500%, 05/15/13 | 1.8 | ||
Citigroup, Inc., 5.000%, 09/15/14 | 1.7 | ||
Development Bank of Japan, 1.750%, 06/21/10* | 1.6 | ||
KfW Bankengruppe, 2.600%, 06/20/37 | 1.6 | ||
SK Telecom Co., Ltd., 6.625%, 07/20/27 | 1.5 | ||
HSBC Finance Corp., 1.790%, 09/18/15* | 1.5 | ||
Top Ten as a Group | 24.5 | % | |
| * | Top Ten Holding at December 31, 2008 |
Any sectors, industries, or securities discussed should not be perceived as investment recommendations. Mention of a specific security should not be considered a recommendation to buy or solicitation to sell that security. Specific securities mentioned in this report may have been sold from the Fund’s portfolio of investments by the time you receive this report.
16
Table of Contents
Managers Global Bond Fund
Schedule of Portfolio Investments
June 30, 2009 (unaudited)
Security Description | Principal Amount | Value | ||||||
Corporate Bonds - 59.4% | ||||||||
Finance - 19.8% | ||||||||
Abbey National Treasury Services, Series EMTN, 5.500%, 06/18/14 | GBP | 100,000 | $ | 166,022 | ||||
Bank of America Corp., 4.750%, 05/06/19 6 | EUR | 325,000 | 312,349 | |||||
Barclays Bank PLC, 6.750%, 05/22/19 | USD | 200,000 | 198,354 | |||||
BSkyB Finance PLC, 5.750%, 10/20/17 | GBP | 5,000 | 8,185 | |||||
Canara Bank, 6.365%, 11/28/21 6 | USD | 400,000 | 351,662 | |||||
Citigroup, Inc., 5.000%, 09/15/14 | USD | 880,000 | 737,720 | |||||
Credit Suisse USA, Inc., 4.875%, 01/15/15 | USD | 185,000 | 185,782 | |||||
Depfa ACS Bank, 1.650%, 12/20/16 | JPY | 70,000,000 | 479,624 | |||||
ERAC USA Finance Co., | ||||||||
6.375%, 10/15/17 (a) | USD | 220,000 | 198,640 | |||||
6.700%, 06/01/34 (a) | USD | 240,000 | 180,063 | |||||
7.000%, 10/15/37 (a) | USD | 60,000 | 47,717 | |||||
General Electric Capital Corp., 5.250%, 04/15/13 (b) | USD | 460,000 | 2 | 453,204 | ||||
Goldman Sachs Group, Inc., | ||||||||
1.609%, 05/23/16, (08/24/09) 5 | EUR | 350,000 | 405,460 | |||||
6.875%, 01/18/38 | GBP | 200,000 | 260,040 | |||||
Host Hotels & Resorts, L.P., | ||||||||
6.375%, 03/15/15 | USD | 35,000 | 30,275 | |||||
6.875%, 11/01/14 | USD | 150,000 | 135,000 | |||||
HSBC Finance Corp., 1.790%, 09/18/15 | JPY | 100,000,000 | 661,348 | |||||
ICICI Bank, Ltd., 6.375%, 04/30/22 (a) 6 | USD | 280,000 | 218,360 | |||||
ISA Capital do Brasil SA, 7.875%, 01/30/12 (a) | USD | 100,000 | 103,000 | |||||
KfW Bankengruppe, | ||||||||
2.050%, 02/16/26 | JPY | 35,000,000 | 345,280 | |||||
2.600%, 06/20/37 | JPY | 68,000,000 | 675,254 | |||||
KfW International Finance, Inc., 1.750%, 03/23/10 | JPY | 17,000,000 | 178,069 | |||||
Morgan Stanley, | ||||||||
4.750%, 04/01/14 | USD | 275,000 | 259,762 | |||||
Series EMTN, 5.375%, 11/14/13 | GBP | 120,000 | 187,675 | |||||
Muenchener Hypothekenbank eG, 5.000%, 01/16/12 (a) | EUR | 325,000 | 485,238 | |||||
Oesterreichische Kontrollbank AG, 1.800%, 03/22/10 | JPY | 34,000,000 | 354,500 | |||||
ProLogis, 6.625%, 05/15/18 | USD | 60,000 | 47,244 | |||||
Qwest Capital Funding, Inc., 6.875%, 07/15/28 | USD | 15,000 | 10,200 | |||||
SLM Corp., 5.000%, 10/01/13 | USD | 295,000 | 238,612 | |||||
Wells Fargo & Co., 4.625%, 11/02/35 | GBP | 350,000 | 452,300 | |||||
White Mountains Insurance Group, Ltd., 6.375%, 03/20/17 (a) | USD | 285,000 | 216,748 | |||||
Total Finance | 8,583,687 | |||||||
Industrial - 35.1% | ||||||||
Ahold Finance USA, Inc., Series EMTN, 6.500%, 03/14/17 | GBP | 195,000 | 317,605 | |||||
Albertson’s, Inc., | ||||||||
7.450%, 08/01/29 | USD | 295,000 | 241,900 | |||||
7.750%, 06/15/26 | USD | 5,000 | 4,262 | |||||
The accompanying notes are an integral part of these financial statements.
17
Table of Contents
Managers Global Bond Fund
Schedule of Portfolio Investments (continued)
Security Description | Principal Amount | Value | |||||
Industrial - 35.1% (continued) | |||||||
Anheuser-Busch InBev NV/SA, Series EMTN, 6.500%, 06/23/17 | GBP | 75,000 | $ | 121,995 | |||
ArcelorMittal, 9.850%, 06/01/19 | USD | 75,000 | 80,941 | ||||
Axtel S.A.B. de C.V., 7.625%, 02/01/17 (a) | USD | 210,000 | 168,000 | ||||
Bell Aliant Regional Communications, 5.410%, 09/26/16 | CAD | 320,000 | 264,897 | ||||
Bell Canada, | |||||||
5.000%, 02/15/17 (a) | CAD | 55,000 | 46,547 | ||||
6.100%, 03/16/35 (a) | CAD | 45,000 | 34,647 | ||||
6.550%, 05/01/29 (a) | CAD | 10,000 | 8,116 | ||||
7.300%, 02/23/32 (a) | CAD | 130,000 | 114,519 | ||||
Bertelsmann AG, 3.625%, 10/06/15 | EUR | 380,000 | 442,163 | ||||
Bristol-Myers Squibb Co., 4.625%, 11/15/21 | EUR | 150,000 | 202,729 | ||||
British Sky Broadcasting Group PLC, 6.100%, 02/15/18 (a) | USD | 460,000 | 459,325 | ||||
Canadian Pacific Railway Co., | |||||||
5.750%, 03/15/33 | USD | 30,000 | 24,183 | ||||
5.950%, 05/15/37 | USD | 55,000 | 45,018 | ||||
Cargill, Inc. 6.625%, 09/15/37 (a) | USD | 200,000 | 188,233 | ||||
Chesapeake Energy Corp., | |||||||
6.250%, 01/15/17 | EUR | 100,000 | 123,452 | ||||
6.500%, 08/15/17 | USD | 115,000 | 96,600 | ||||
6.875%, 11/15/20 | USD | 170,000 | 136,850 | ||||
Chevron Phillips Chemical Co. LLC, 7.000%, 06/15/14, (a) | USD | 250,000 | 255,607 | ||||
Citizens Communications Co., | |||||||
6.625%, 03/15/15 | USD | 115,000 | 101,200 | ||||
7.125%, 03/15/19 | USD | 130,000 | 110,825 | ||||
9.000%, 08/15/31 | USD | 65,000 | 53,625 | ||||
CSX Corp., | |||||||
5.600%, 05/01/17 | USD | 60,000 | 58,432 | ||||
6.000%, 10/01/36 | USD | 386,000 | 349,652 | ||||
6.250%, 03/15/18 | USD | 40,000 | 40,342 | ||||
Delta Air Lines, Inc., | |||||||
6.821%, 08/10/22 | USD | 335,797 | 278,711 | ||||
8.021%, 08/10/22 | USD | 110,251 | 71,663 | ||||
Desarrolladora Homex, S.A. de C.V., 7.500%, 09/28/15 | USD | 380,000 | 326,800 | ||||
DP World, Ltd., 6.850%, 07/02/37 (a) | USD | 900,000 | 598,500 | ||||
Edcon Proprietary Ltd., 4.527%, 06/15/14 (09/15/09) (a)5 | EUR | 310,000 | 252,234 | ||||
Embarq Corp., 7.995%, 06/01/36 | USD | 110,000 | 96,731 | ||||
Energy Transfer Partners, L.P., | |||||||
6.625%, 10/15/36 | USD | 425,000 | 415,255 | ||||
6.700%, 07/01/18 | USD | 90,000 | 92,007 | ||||
Finmeccanica SpA, 4.875, 03/24/25 | EUR | 300,000 | 342,473 | ||||
Hanaro Telecom, Inc., 7.000%, 02/01/12 (a) | USD | 50,000 | 50,125 | ||||
The accompanying notes are an integral part of these financial statements.
18
Table of Contents
Managers Global Bond Fund
Schedule of Portfolio Investments (continued)
Security Description | Principal Amount | Value | ||||||
Industrial - 35.1% (continued) | ||||||||
HCA, Inc., | ||||||||
6.375%, 01/15/15 | USD | $ | 70,000 | $ | 56,875 | |||
6.625%, 02/15/16 | USD | 160,000 | 129,200 | |||||
7.580%, 09/15/25 | USD | 20,000 | 12,315 | |||||
7.690%, 06/15/25 | USD | 25,000 | 15,353 | |||||
Hilcorp Energy I LP/Hilcorp Finance Co., 7.750%, 11/01/15 (a) | USD | 170,000 | 143,650 | |||||
Hologic, Inc., 2.000%, 12/15/37 (b) | USD | 70,000 | 49,700 | |||||
Home Depot, Inc., The, 5.875%, 12/16/36 | USD | 250,000 | 220,566 | |||||
Host Hotels & Resorts, L.P., 6.750%, 06/01/16 | USD | 140,000 | 121,450 | |||||
Imperial Tobacco Finance PLC, 4.375%, 11/22/13 | EUR | 250,000 | 337,825 | |||||
International Paper Co., 7.950%, 06/15/18 | USD | 215,000 | 207,419 | |||||
Kinder Morgan Energy Partners L.P., 5.800%, 03/15/35 | USD | 240,000 | 202,603 | |||||
KLA Instruments Corp., 6.900%, 05/01/18 | USD | 345,000 | 310,181 | |||||
Koninklijke KPN, N.V., 4.750%, 01/17/17 | EUR | 250,000 | 348,347 | |||||
Lafarge S.A., | ||||||||
4.750%, 03/23/20 | EUR | 215,000 | 243,614 | |||||
5.375%, 06/26/17 | EUR | 150,000 | 184,180 | |||||
Lucent Technologies, Inc., 6.450%, 03/15/29 | USD | 595,000 | 337,662 | |||||
Motorola, Inc., | ||||||||
6.500%, 09/01/25 | USD | 215,000 | 150,500 | |||||
6.625%, 11/15/37 | USD | 240,000 | 163,200 | |||||
Nabors Industries, Inc., 6.150%, 02/15/18 | USD | 250,000 | 239,990 | |||||
Nextel Communications, Inc., 7.375%, 08/01/15 | USD | 100,000 | 79,750 | |||||
Noble Group, Ltd., 8.500%, 05/30/13 (a) | USD | 100,000 | 95,000 | |||||
Owens & Minor, Inc., 6.350%, 04/15/16 7 | USD | 215,000 | 188,128 | |||||
Owens-Brockway Glass Container, Inc., 6.750%, 12/01/14 | EUR | 50,000 | 63,129 | |||||
Pemex Project Funding Master Trust, 6.625%, 04/04/10 | EUR | 390,000 | 560,082 | |||||
Qtel International Finance, Ltd., 7.875%, 06/10/19 (a) | USD | 200,000 | 203,475 | |||||
Qwest Capital Funding, Inc., | ||||||||
6.500%, 11/15/18 | USD | 40,000 | 30,800 | |||||
7.750%, 02/15/31 | USD | 65,000 | 46,150 | |||||
Qwest Corp., | ||||||||
6.500%, 06/01/17 | USD | 46,000 | 40,480 | |||||
6.875%, 09/15/33 | USD | 75,000 | 54,750 | |||||
7.250%, 09/15/25 | USD | 83,000 | 63,495 | |||||
7.250%, 10/15/35 | USD | 158,000 | 114,550 | |||||
Reynolds American, Inc., 6.750%, 06/15/17 | USD | 355,000 | 331,465 | |||||
Sappi Papier Holding AG, 7.500%, 06/15/32 (a) | USD | 89,000 | 37,380 | |||||
SK Telecom Co., Ltd., 6.625%, 07/20/27 (a) | USD | 725,000 | 669,984 | |||||
Sprint Nextel Corp., 6.000%, 12/01/16 | USD | 200,000 | 163,500 | |||||
Telecom Italia Capital S.p.A., | ||||||||
4.950%, 09/30/14 | USD | 290,000 | 277,623 | |||||
6.375%, 11/15/33 | USD | 125,000 | 111,094 | |||||
The accompanying notes are an integral part of these financial statements.
19
Table of Contents
Managers Global Bond Fund
Schedule of Portfolio Investments (continued)
Security Description | Principal Amount | Value | ||||||
Industrials - 35.1% (continued) | ||||||||
Telefonica Emisiones S.A.U., 4.375%, 02/02/16 | EUR | 55,000 | $ | 75,758 | ||||
Time Warner Cable, Inc. 6.550%, 05/01/37 | USD | 90,000 | 86,297 | |||||
Time Warner, Inc., | ||||||||
6.625%, 05/15/29 | USD | 310,000 | 280,317 | |||||
6.950%, 01/15/28 | USD | 85,000 | 79,850 | |||||
UnitedHealth Group, Inc., 5.800%, 03/15/36 | USD | 440,000 | 355,897 | |||||
Vale Overseas Ltd., 6.875%, 11/01/36 | USD | 278,000 | 263,962 | |||||
Vivendi, 3.875%, 02/15/12 | EUR | 90,000 | 127,416 | |||||
Wendel Investissement, | ||||||||
4.375%, 08/09/17 | EUR | 200,000 | 189,386 | |||||
4.875%, 05/26/16 | EUR | 200,000 | 192,192 | |||||
Wolters Kluwer NV, 6.375%, 04/10/18 | EUR | 150,000 | 217,032 | |||||
WPP Finance S.A., 5.250%, 01/30/15 | EUR | 100,000 | 127,945 | |||||
Total Industrials | 15,217,681 | |||||||
Utilities - 4.5% | ||||||||
Abu Dhabi National Energy Co., 7.250%, 08/01/18 (a) | USD | 500,000 | 499,272 | |||||
Edison Mission Energy, 7.625%, 05/15/27 | USD | 155,000 | 99,200 | |||||
Majapahit Holding BV, 7.250%, 06/28/17 (a) | USD | 200,000 | 170,000 | |||||
NiSource Finance Corp., 6.400%, 03/15/18 | USD | 365,000 | 334,885 | |||||
Transport De Gas Del Sur, 7.875%, 05/14/17 (a) | USD | 540,000 | 2 | 394,200 | ||||
Veolia Environnement, | ||||||||
4.000%, 02/12/16 | EUR | 75,000 | 100,204 | |||||
5.125%, 05/24/22 | EUR | 200,000 | 243,531 | |||||
6.000%, 06/01/18 | USD | 80,000 | 81,541 | |||||
Total Utilities | 1,922,833 | |||||||
Total Corporate Bonds (cost $28,283,242) | 25,724,201 | |||||||
Foreign Government Obligations - 31.6% | ||||||||
Asian Development Bank, 2.350%, 06/21/27 | JPY | 20,000,000 | 203,603 | |||||
Banco Nacional de Desenvolvimento Economico e Social, 6.500%, 06/10/19 (a) | USD | 200,000 | 200,400 | |||||
Belgium Kingdom, 5.500%, 09/28/17 | EUR | 1,365,000 | 2,149,957 | |||||
Bundesrepublik Deutschland, | ||||||||
3.750%, 01/04/17 | EUR | 1,529,000 | 2,230,470 | |||||
4.000%, 04/13/12 | EUR | 605,000 | 900,086 | |||||
Canadian Government, | ||||||||
4.250%, 09/01/09 | CAD | 315,000 | 272,539 | |||||
4.500%, 06/01/15 | CAD | 555,000 | 2 | 523,436 | ||||
Development Bank of Japan, | ||||||||
1.400%, 06/20/12 | JPY | 39,000,000 | 411,937 | |||||
1.750%, 06/21/10 | JPY | 65,000,000 | 681,892 | |||||
European Investment Bank, | ||||||||
1.250%, 09/20/12 | JPY | 16,000,000 | 167,448 | |||||
11.505%, 04/24/13 (a)4 | IDR | 4,605,000,000 | 294,368 | |||||
Export-Import Bank of Korea, 8.125%, 01/21/14 | 175,000 | 191,560 | ||||||
The accompanying notes are an integral part of these financial statements.
20
Table of Contents
Managers Global Bond Fund
Schedule of Portfolio Investments (continued)
Security Description | Principal Amount | Value | ||||||
Indonesia Government International Bond, 7.750%, 01/17/38 (a) | USD | $ | 460,000 | $ | 418,600 | |||
Japan Finance Corporation for Municipal Enterprises, 1.550%, 02/21/12 | JPY | 106,000,000 | 1,126,916 | |||||
Japan Government Ten Year Bond, 1.400%, 06/20/11 | JPY | 8,000,000 | 84,843 | |||||
Mexican Fixed Rate Bonds, 8.000%, 12/07/23 | MXN | 3,900,000 | 284,602 | |||||
New South Wales Treasury Corp., Series 10RG, 7.000%, 12/01/10 | AUD | 410,000 | 344,715 | |||||
Norway Government Bond, | ||||||||
4.250%, 05/19/17 | NOK | 970,000 | 154,412 | |||||
5.000%, 05/15/15 | NOK | 1,600,000 | 266,700 | |||||
6.000%, 05/16/11 | NOK | 1,715,000 | 286,366 | |||||
6.500%, 05/15/13 | NOK | 4,410,000 | 771,102 | |||||
Republica Oriental del Uruguay, 4.250%, 04/05/27 | UYU | 10,730,000 | 444,342 | |||||
South Africa, Republic of, 4.500%, 04/05/16 | EUR | 385,000 | 482,580 | |||||
U.K. Gilts, | ||||||||
4.250%, 06/07/32 | GBP | 110,000 | 178,510 | |||||
4.750%, 03/04/20 | GBP | 355,000 | 638,741 | |||||
Total Foreign Government Obligations (cost $13,157,982) | 13,710,125 | |||||||
U.S. Government - 0.9% | ||||||||
USTN, 1.230%, 01/15/12 (cost $403,562) | USD | 405,000 | 402,406 | |||||
Asset-Backed Securities - 0.7% | ||||||||
COMET, Series 2004-B7, Class B7, 1.905%, 08/17/17 (07/17/09)5 | EUR | 100,000 | 87,492 | |||||
Merrill Lynch/Countrywide Mortgage Trust, 5.439%, 02/12/396 | USD | 235,000 | 223,641 | |||||
Total Asset-Backed Securities (cost $318,329) | 311,133 | |||||||
| Shares | ||||||||
Preferred Stocks - 0.2% | ||||||||
FHLMC, Series Z, 8.375%* | 21,825 | 26,627 | ||||||
FNMA, Series S, 8.250%* | 37,350 | 50,049 | ||||||
Total Preferred Stocks (cost $1,510,918) | 76,676 | |||||||
Short-Term Investments - 2.9%1 | ||||||||
BNY Institutional Cash Reserves Fund, Series A, 0.06%3 | 675,010 | 675,010 | ||||||
BNY Institutional Cash Reserves Fund, Series B*3,8 | 38,044 | 5,612 | ||||||
Dreyfus Cash Management Fund, Institutional Class Shares, 0.44%9 | 565,040 | 565,040 | ||||||
Total Short-Term Investments (cost $1,278,094) | 1,245,662 | |||||||
Total Investments 95.7% (cost $44,952,127) | 41,470,203 | |||||||
Other Assets, less Liabilities - 4.3% | 1,844,408 | |||||||
Net Assets - 100.0% | $ | 43,314,611 | ||||||
The accompanying notes are an integral part of these financial statements.
21
Table of Contents
Notes to Schedules of Portfolio Investments (unaudited)
The following footnotes and abbreviations should be read in conjunction with each of the Schedules of Portfolio Investments previously presented in this report.
At June 30, 2009, the cost of securities for Federal income tax purposes and the gross aggregate unrealized appreciation and/or depreciation based on tax cost were:
Fund | Cost | Appreciation | Depreciation | Net | |||||||||
Managers AMG Essex Large Cap Growth | $ | 13,365,287 | $ | 1,885,488 | ($915,970 | ) | $ | 969,518 | |||||
International Equity | 130,753,776 | 13,776,752 | (24,998,710 | ) | (11,221,958 | ) | |||||||
Emerging Markets Equity | 87,747,504 | 8,685,791 | (12,831,525 | ) | (4,145,734 | ) | |||||||
Global Bond | 44,952,127 | 1,280,622 | (4,762,546 | ) | (3,481,924 | ) | |||||||
| * | Non-income producing security. |
| (a) | Security exempt from registration under Rule 144A of the Securities Act of 1933. This security may be resold in transactions exempt from registration, normally to qualified buyers. At June 30, 2009, the value of these securities amounted to the following: |
Fund | Market Value | % of Net Assets | ||||
International Equity | $ | 531,380 | 0.5 | % | ||
Emerging Markets Equity | 686,827 | 0.8 | % | |||
Global Bond | 6,751,948 | 15.6 | % | |||
| (b) | Step Bond. A debt instrument with either deferred interest payments or an interest rate that resets at specific times during its term. |
| 1 | Yield shown for each short term investment represents the June 30, 2009, seven-day average yield, which refers to the sum of the previous seven days’ dividends paid, expressed as an annual percentage. |
| 2 | Some or all of these shares were out on loan to various brokers as of June 30, 2009, amounting to: |
Fund | Market Value | % of Net Assets | ||||
Managers AMG Essex Large Cap Growth | $ | 249,869 | 1.9 | % | ||
International Equity | 514,672 | 0.4 | % | |||
Emerging Markets Equity | 1,110,440 | 1.4 | % | |||
Global Bond | 691,772 | 1.6 | % | |||
| 3 | Collateral received from brokers for securities lending was invested in these short-term investments. |
| 4 | Represents yield to maturity at June 30, 2009. |
| 5 | Floating Rate Security. The rate listed is as of June 30, 2009. Date in parentheses represents the security’s next coupon rate reset. |
| 6 | Variable Rate Security. The rate listed is as of June 30, 2009, and is periodically reset subject to terms and conditions set forth in the debenture. |
| 7 | Security is illiquid: A security not readily convertible into cash such as a stock, bond or commodity that is not actively traded, and would be difficult to sell in a current sale. The Fund may not invest more than 15% of its net assets in illiquid securities. All securities are valued on the basis of valuations provided by dealers or independent pricing services. Illiquid securities at June 30, 2009, for Global Bond Fund amounted to $188,128 or 0.4% of net assets. |
| 8 | On September 12, 2008, The Bank of New York Mellon (“BNYM”) established a separate sleeve of the BNY Institutional Cash Reserves Fund (“ICRF”) (Series B) to hold certain Lehman Brothers floating rate notes. The Fund’s position in Series B is being marked to market daily. |
| 9 | Each Fund’s investment in the Dreyfus Cash Management Fund is covered under the U.S. Treasury Temporary Money Market Fund Guarantee Program up to a maximum of: |
Fund | Market Value | ||
Managers AMG Essex Large Cap Growth | $ | 1,474,284 | |
International Equity | 6,597,699 | ||
Global Bond | 819,695 | ||
Investments Definitions and Abbreviations:
ADR/GDR: ADR after the name of a holding stands for American Depositary Receipt, representing ownership of foreign securities on deposit with a domestic custodian bank; a GDR (Global Depositary Receipt) is comparable, but foreign securities are held on deposit in a non-U.S. bank. The value of the ADR/GDR securities is determined or significantly influenced by trading on exchanges not located in the United States or Canada. Sponsored ADR/GDRs are initiated by the underlying foreign company.
EMTN: | European Medium Term Note | |
FHLMC: | Federal Home Loan Mortgage Corp. | |
FNMA: | Federal National Mortgage Association | |
RSP: | Risparmio shares which are saving shares traded on the Italian Stock Exchange | |
USTN: | United States Treasury Note |
Abbreviations have been used throughout the portfolios to indicate amounts shown in currencies other than the U.S. dollar (USD):
AUD: | Australian Dollar | |
CAD: | Canadian Dollar | |
EUR: | euro | |
GBP: | British Pound | |
IDR: | Indonesian Rupiah | |
JPY: | Japanese Yen | |
NOK: | Norwegian Krone | |
MXN: | Mexican Peso | |
UYU: | Uruguay Peso |
22
Table of Contents
Statements of Assets and Liabilities
June 30, 2009 (unaudited)
| Managers AMG Essex Large Cap Growth Fund | Managers International Equity Fund | Managers Emerging Markets Equity Fund | Managers Global Bond Fund | |||||||||||||
Assets: | ||||||||||||||||
Investments at value (including securities on loan valued at $249,869, $514,672, $1,110,440 and $691,772, respectively)* | $ | 14,334,805 | $ | 119,531,818 | $ | 83,601,770 | $ | 41,470,203 | ||||||||
Cash | 21,718 | 14,296 | 10,169 | 167,743 | ||||||||||||
Cash collateral for futures | — | 60,179 | — | — | ||||||||||||
Foreign currency** | — | 410,016 | 654,527 | 777,312 | ||||||||||||
Receivable for investments sold | 16,675,402 | 1,128,203 | 462,824 | 430,269 | ||||||||||||
Receivable for Fund shares sold | 10,374 | 55,946 | 140,420 | 1,389,990 | ||||||||||||
Unrealized appreciation of foreign currency contracts | — | 146,881 | — | — | ||||||||||||
Dividends, interest and other receivables | 4,232 | 622,812 | 341,060 | 654,543 | ||||||||||||
Prepaid expenses | 12,989 | 17,181 | 22,949 | 14,843 | ||||||||||||
Total assets | 31,059,520 | 121,987,332 | 85,233,719 | 44,904,903 | ||||||||||||
Liabilities: | ||||||||||||||||
Payable for Fund shares repurchased | 16,649,095 | 5,195,264 | 1,273,968 | 171,856 | ||||||||||||
Payable upon return of securities loaned | 562,403 | 503,362 | 1,133,757 | 713,054 | ||||||||||||
Payable for investments purchased | 301,559 | 492,049 | 637,150 | 608,821 | ||||||||||||
Unrealized depreciation of foreign currency contracts | — | 297,958 | — | 10,991 | ||||||||||||
Payable for variation margin on futures | — | 4,770 | — | — | ||||||||||||
Other payables | — | 4,477 | — | 5,364 | ||||||||||||
Accrued expenses: | ||||||||||||||||
Investment advisory and management fees | 13,732 | 70,041 | 68,935 | 19,427 | ||||||||||||
Administrative fees | 6,242 | 27,183 | 17,380 | 6,950 | ||||||||||||
Other | 50,723 | 127,831 | 99,504 | 53,829 | ||||||||||||
Total liabilities | 17,583,754 | 6,722,935 | 3,230,694 | 1,590,292 | ||||||||||||
Net Assets | $ | 13,475,766 | $ | 115,264,397 | $ | 82,003,025 | $ | 43,314,611 | ||||||||
Shares outstanding | 612,191 | 2,659,116 | 7,834,645 | 2,315,009 | ||||||||||||
Net asset value, offering and redemption price per share | $ | 22.01 | $ | 43.35 | $ | 10.47 | $ | 18.71 | ||||||||
Net Assets Represent: | ||||||||||||||||
Paid-in capital | $ | 158,728,738 | $ | 211,416,313 | $ | 119,024,238 | $ | 49,326,236 | ||||||||
Undistributed net investment income (loss) | (76,488 | ) | 1,700,928 | 370,865 | 1,489,943 | |||||||||||
Accumulated net realized loss from investments, futures and foreign currency transactions | (146,338,473 | ) | (96,454,339 | ) | (35,465,208 | ) | (4,024,754 | ) | ||||||||
Net unrealized appreciation (depreciation) of investments, futures and foreign currency contracts and translations | 1,161,989 | (1,398,505 | ) | (1,926,870 | ) | (3,476,814 | ) | |||||||||
Net Assets | $ | 13,475,766 | $ | 115,264,397 | $ | 82,003,025 | $ | 43,314,611 | ||||||||
* Investments at cost | $ | 13,172,816 | $ | 120,930,323 | $ | 85,528,640 | $ | 44,947,017 | ||||||||
** Foreign currency at cost | — | $ | 437,401 | $ | 655,090 | $ | 771,422 | |||||||||
The accompanying notes are an integral part of these financial statements.
23
Table of Contents
For the six months ended June 30, 2009 (unaudited)
| Managers AMG Essex Large Cap Growth Fund | Managers International Equity Fund | Managers Emerging Markets Equity Fund | Managers Global Bond Fund | |||||||||||||
Investment Income: | ||||||||||||||||
Dividend income | $ | 115,239 | $ | 2,928,508 | $ | 1,034,300 | $ | 20,427 | ||||||||
Interest income | — | — | — | 1,503,884 | ||||||||||||
Foreign withholding tax | (2,377 | ) | (334,018 | ) | (96,241 | ) | — | |||||||||
Securities lending fees | 128 | 3,323 | 1,963 | 1,769 | ||||||||||||
Total investment income | 112,990 | 2,597,813 | 940,022 | 1,526,080 | ||||||||||||
Expenses: | ||||||||||||||||
Investment management fees | 111,582 | 532,174 | 378,228 | 147,024 | ||||||||||||
Administrative fees | 34,869 | 147,826 | 82,223 | 42,007 | ||||||||||||
Transfer agent | 46,380 | 194,655 | 98,001 | 37,140 | ||||||||||||
Professional fees | 15,975 | 34,761 | 31,950 | 22,520 | ||||||||||||
Registration fees | 9,743 | 13,950 | 13,178 | 9,481 | ||||||||||||
Custodian | 5,669 | 101,038 | 31,848 | 17,577 | ||||||||||||
Reports to shareholders | 3,246 | 15,933 | 18,253 | 1,524 | ||||||||||||
Trustees fees and expenses | 1,259 | 4,356 | 2,316 | 2,476 | ||||||||||||
Miscellaneous | 927 | 3,795 | 7,678 | 1,725 | ||||||||||||
Total expenses before offsets | 229,650 | 1,048,488 | 663,675 | 281,474 | ||||||||||||
Fee waivers | — | — | — | (21,004 | ) | |||||||||||
Expense reimbursement | (34,869 | ) | (172,947 | ) | (75,657 | ) | (29,084 | ) | ||||||||
Expense reductions | (5,303 | ) | (2,214 | ) | (178 | ) | (122 | ) | ||||||||
Net expenses | 189,478 | 873,327 | 587,840 | 231,264 | ||||||||||||
Net investment income (loss) | (76,488 | ) | 1,724,486 | 352,182 | 1,294,816 | |||||||||||
Net Realized and Unrealized Gain (Loss): | ||||||||||||||||
Net realized loss on investment transactions | (1,775,733 | ) | (24,591,269 | ) | (22,585,834 | ) | (3,173,794 | ) | ||||||||
Net realized gain on futures contracts | — | 125,533 | — | — | ||||||||||||
Net realized gain (loss) on foreign currency contracts and transactions | — | (627,151 | ) | (59,074 | ) | 55,758 | ||||||||||
Net unrealized appreciation of investments | 5,269,011 | 34,949,098 | 40,307,709 | 5,680,664 | ||||||||||||
Net unrealized depreciation of futures contracts | — | (3,439 | ) | — | — | |||||||||||
Net unrealized appreciation (depreciation) of foreign currency contracts and translations | — | (107,789 | ) | 7,559 | 13,661 | |||||||||||
Net realized and unrealized gain | 3,493,278 | 9,744,983 | 17,670,360 | 2,576,289 | ||||||||||||
Net increase in net assets resulting from operations | $ | 3,416,790 | $ | 11,469,469 | $ | 18,022,542 | $ | 3,871,105 | ||||||||
The accompanying notes are an integral part of these financial statements.
24
Table of Contents
Statements of Changes in Net Assets
For the six months ended June 30, 2009 (unaudited) and for the year ended December 31, 2008
| Managers AMG Essex Large Cap Growth Fund | Managers International Equity Fund | |||||||||||||||
| 2009 | 2008 | 2009 | 2008 | |||||||||||||
Increase (Decrease) in Net Assets From Operations: | ||||||||||||||||
Net investment income (loss) | ($76,488 | ) | ($217,145 | ) | $ | 1,724,486 | $ | 2,768,049 | ||||||||
Net realized gain (loss) on investments, futures and foreign currency transactions | (1,775,733 | ) | (11,285,555 | ) | (25,092,887 | ) | (41,702,975 | ) | ||||||||
Net unrealized appreciation (depreciation) of investments and foreign currency translations | 5,269,011 | (9,788,662 | ) | 34,837,870 | (99,695,283 | ) | ||||||||||
Net increase (decrease) in net assets resulting from operations | 3,416,790 | (21,291,362 | ) | 11,469,469 | (138,630,209 | ) | ||||||||||
Distributions to Shareholders: | ||||||||||||||||
From net investment income | — | — | — | (579,286 | ) | |||||||||||
From net realized gain on investments | — | — | — | — | ||||||||||||
Total distributions to shareholders | — | — | — | (579,286 | ) | |||||||||||
From Capital Share Transactions: | ||||||||||||||||
Proceeds from sale of shares | 1,881,691 | 8,636,662 | 13,206,865 | 47,873,956 | ||||||||||||
Reinvestment of dividends and distributions | — | — | — | 525,450 | ||||||||||||
Cost of shares repurchased | (20,782,185 | ) | (10,262,153 | ) | (37,396,353 | ) | (83,230,766 | ) | ||||||||
Net increase (decrease) from capital share transactions | (18,900,494 | ) | (1,625,491 | ) | (24,189,488 | ) | (34,831,360 | ) | ||||||||
Total increase (decrease) in net assets | (15,483,704 | ) | (22,916,853 | ) | (12,720,019 | ) | (174,040,855 | ) | ||||||||
Net Assets: | ||||||||||||||||
Beginning of period | 28,959,470 | 51,876,323 | 127,984,416 | 302,025,271 | ||||||||||||
End of period | $ | 13,475,766 | $ | 28,959,470 | $ | 115,264,397 | $ | 127,984,416 | ||||||||
End of period undistributed net investment income (loss) | ($76,488 | ) | — | $ | 1,700,928 | ($23,558 | ) | |||||||||
Share Transactions: | ||||||||||||||||
Sale of shares | 94,506 | 326,270 | 360,675 | 830,645 | ||||||||||||
Reinvested shares | — | — | — | 13,882 | ||||||||||||
Shares repurchased | (971,456 | ) | (391,513 | ) | (967,451 | ) | (1,494,428 | ) | ||||||||
Net increase (decrease) in shares | (876,950 | ) | (65,243 | ) | (606,776 | ) | (649,901 | ) | ||||||||
The accompanying notes are an integral part of these financial statements.
25
Table of Contents
| Managers Emerging Markets Equity Fund | Managers Global Bond Fund | |||||||||||||
| 2009 | 2008 | 2009 | 2008 | |||||||||||
| $ | 352,182 | $ | 1,030,654 | $ | 1,294,816 | $ | 2,847,226 | |||||||
| (22,644,908 | ) | (3,403,946 | ) | (3,118,036 | ) | 1,526,739 | ||||||||
| 40,315,268 | (101,316,338 | ) | 5,694,325 | (12,423,376 | ) | |||||||||
| 18,022,542 | (103,689,630 | ) | 3,871,105 | (8,049,411 | ) | |||||||||
| — | (990,986 | ) | — | (5,511,710 | ) | |||||||||
| — | (19,178,599 | ) | — | (63,791 | ) | |||||||||
| — | (20,169,585 | ) | — | (5,575,501 | ) | |||||||||
| 20,571,562 | 53,517,690 | 2,904,775 | 9,573,497 | |||||||||||
| — | 19,578,962 | — | 5,410,372 | |||||||||||
| (16,946,350 | ) | (87,117,060 | ) | (11,195,816 | ) | (45,748,762 | ) | |||||||
| 3,625,212 | (14,020,408 | ) | (8,291,041 | ) | (30,764,893 | ) | ||||||||
| 21,647,754 | (137,879,623 | ) | (4,419,936 | ) | (44,389,805 | ) | ||||||||
| 60,355,271 | 198,234,894 | 47,734,547 | 92,124,352 | |||||||||||
| $ | 82,003,025 | $ | 60,355,271 | $ | 43,314,611 | $ | 47,734,547 | |||||||
| $ | 370,865 | $ | 18,683 | $ | 1,489,943 | $ | 201,732 | |||||||
| 2,329,241 | 2,584,081 | 158,897 | 449,639 | |||||||||||
| — | 2,523,148 | — | 322,430 | |||||||||||
| (1,958,212 | ) | (5,039,533 | ) | (663,640 | ) | (2,275,508 | ) | |||||||
| 371,029 | 67,696 | (504,743 | ) | (1,503,439 | ) | |||||||||
The accompanying notes are an integral part of these financial statements.
26
Table of Contents
Statement of Assets and Liabilities
June 30, 2009 (unaudited)
Assets: | |||
Investment in JPMorgan Liquid Assets Money Market Fund, Capital Shares (cost $78,968,222) | $ | 78,968,222 | |
Receivable for Fund shares sold | 3,263 | ||
Dividends receivable | 36,058 | ||
Prepaid expenses | 35,857 | ||
Total assets | 79,043,400 | ||
Liabilities: | |||
Payable for Fund shares repurchased | 240,413 | ||
Dividends payable to shareholders | 1,053 | ||
Administration fee payable | 10,055 | ||
Other accrued expenses | 32,884 | ||
Total liabilities | 284,405 | ||
Net Assets | $ | 78,758,995 | |
Shares outstanding | 78,758,995 | ||
Net asset value, offering and redemption price per share | $ | 1.00 | |
Net Assets Represent: | |||
Paid-in capital | $ | 78,758,995 |
Statement of Operations
| For the six months ended June 30, 2009 (unaudited) | ||||
Investment Income: | ||||
Dividend income | $ | 369,587 | ||
Expenses: | ||||
Administration fees | 62,062 | |||
Transfer agent | 43,490 | |||
Professional fees | 15,993 | |||
Registration fees | 17,135 | |||
Trustees fees and expenses | 4,323 | |||
Accounting fees | 2,976 | |||
Reports to shareholders | 1,426 | |||
Miscellaneous expenses | 17,768 | |||
Total expenses before offsets | 165,173 | |||
Fee waivers | (20,687 | ) | ||
Expense reductions | (246 | ) | ||
Net expenses | 144,240 | |||
Net Investment Income | $ | 225,347 | ||
The accompanying notes are an integral part of these financial statements.
27
Table of Contents
Statement of Changes in Net Assets
| For the six months ended June 30, 2009 (unaudited) | For the year ended December 31, 2008 | |||||||
Increase (Decrease) in Net Assets from Operations: | ||||||||
Net investment income | $ | 225,347 | $ | 2,304,236 | ||||
Distributions to Shareholders: | ||||||||
From net investment income | (225,347 | ) | (2,304,236 | ) | ||||
From Capital Share Transactions (at a constant $1.00 per share): | ||||||||
Proceeds from sale of shares | 56,743,157 | 165,086,227 | ||||||
Reinvestment of dividends | 234,036 | 2,255,961 | ||||||
Cost of shares repurchased | (58,642,406 | ) | (178,135,907 | ) | ||||
Net decrease from capital share transactions | (1,665,213 | ) | (10,793,719 | ) | ||||
Total decrease in net assets | (1,665,213 | ) | (10,793,719 | ) | ||||
Net Assets: | ||||||||
Beginning of period | 80,424,208 | 91,217,927 | ||||||
End of period | $ | 78,758,995 | $ | 80,424,208 | ||||
The accompanying notes are an integral part of these financial statements.
For a share outstanding throughout each period
| For the six months ended June 30, 2009 (unaudited) | For the year ended December 31, 2008 | For one month ended December 31, 2007*** | For the fiscal year ended November 30, | |||||||||||||||||||||||||
Managers Money Market Fund | 2007 | 2006 | 2005** | 2004* | ||||||||||||||||||||||||
Net Asset Value, Beginning of Period | $ | 1.000 | $ | 1.000 | $ | 1.000 | $ | 1.000 | $ | 1.000 | $ | 1.000 | $ | 1.000 | ||||||||||||||
Income from Investment Operations: | ||||||||||||||||||||||||||||
Net investment income | 0.003 | 0.027 | 0.004 | 0.049 | 0.043 | 0.026 | 0.008 | |||||||||||||||||||||
Less Distributions to Shareholders from: | ||||||||||||||||||||||||||||
Net investment income | (0.003 | ) | (0.027 | ) | (0.004 | ) | (0.049 | ) | (0.043 | ) | (0.026 | ) | (0.008 | ) | ||||||||||||||
Net Asset Value, End of Period | $ | 1.000 | $ | 1.000 | $ | 1.000 | $ | 1.000 | $ | 1.000 | $ | 1.000 | $ | 1.000 | ||||||||||||||
Total Return1 | 0.27 | %3 | 2.73 | % | 0.37 | %3 | 5.05 | % | 4.45 | % | 2.61 | % | 0.82 | % | ||||||||||||||
Ratio of net expenses to average net assets | 0.35 | %4 | 0.26 | % | 0.39 | %4 | 0.29 | % | 0.40 | % | 0.40 | % | 0.36 | % | ||||||||||||||
Ratio of net investment income to average net assets1 | 0.54 | %4 | 2.75 | % | 4.46 | %4 | 4.92 | % | 4.42 | % | 2.62 | % | 0.86 | % | ||||||||||||||
Net assets at end of period (000’s omitted) | $ | 78,759 | $ | 80,424 | $ | 91,218 | $ | 93,106 | $ | 37,839 | $ | 37,896 | $ | 47,645 | ||||||||||||||
Ratios absent expense offsets:2 | ||||||||||||||||||||||||||||
Ratio of total expenses to average net assets | 0.40 | %4 | 0.31 | % | 0.44 | %4 | 0.34 | % | 0.45 | % | 0.46 | % | 0.44 | % | ||||||||||||||
Ratio of net investment income to average net assets | 0.49 | %4 | 2.70 | % | 4.41 | %4 | 4.87 | % | 4.37 | % | 2.56 | % | 0.78 | % | ||||||||||||||
| * | Prior to May 14, 2004 the Fund invested all of its assets in the Institutional Class Shares of the JPMorgan Prime Money Market Fund. |
| ** | Prior to February 19, 2005 the Fund invested all of its assets in the Institutional Class Shares of the JPMorgan Liquid Assets Money Market Fund. |
| *** | Effective December 1, 2007, Managers Money Market Fund changed its fiscal year end from November 30 to December 31. |
| 1 | Total returns and net investment income would have been lower had certain expenses not been reduced. (See Note 1(c) of Notes to Financial Statements.) |
| 2 | Excludes the impact of expense reimbursements and expense reductions such as brokerage credits, but includes non-reimbursable expenses, if any, such as interest and taxes. (See Note 1(c) of Notes to Financial Statements.) |
| 3 | Not Annualized. |
| 4 | Annualized. |
28
Table of Contents
Financial Highlights
For a share outstanding throughout each period
| For the six months ended June 30, 2009 (unaudited) | For the year ended December 31, | |||||||||||||||||||||||
Managers AMG Essex Large Cap Growth Fund | 2008 | 2007 | 2006 | 2005 | 2004 | |||||||||||||||||||
Net Asset Value, Beginning of Period | $ | 19.45 | $ | 33.37 | $ | 29.18 | $ | 27.79 | $ | 26.77 | $ | 25.46 | ||||||||||||
Income from Investment Operations: | ||||||||||||||||||||||||
Net investment loss | (0.12 | ) | (0.14 | )3 | (0.15 | )3 | (0.09 | )3 | (0.07 | )3 | (0.07 | ) | ||||||||||||
Net realized and unrealized gain (loss) on investments | 2.68 | (13.78 | )3 | 4.34 | 3 | 1.48 | 3 | 1.09 | 3 | 1.38 | ||||||||||||||
Total from investment operations | 2.56 | (13.92 | ) | 4.19 | 1.39 | 1.02 | 1.31 | |||||||||||||||||
Net Asset Value, End of Period | $ | 22.01 | $ | 19.45 | $ | 33.37 | $ | 29.18 | $ | 27.79 | $ | 26.77 | ||||||||||||
Total Return1 | 13.37 | %6 | (41.71 | )% | 14.36 | % | 4.96 | % | 3.85 | % | 5.14 | % | ||||||||||||
Ratio of net expenses to average net assets | 1.36 | %7 | 1.24 | % | 1.24 | % | 1.25 | % | 1.28 | % | 1.34 | % | ||||||||||||
Ratio of net investment loss to average net assets1 | (0.55 | )%7 | (0.52 | )% | (0.47 | )% | (0.33 | )% | (0.27 | )% | (0.26 | )% | ||||||||||||
Portfolio turnover | 46 | %6 | 119 | % | 116 | % | 200 | % | 97 | % | 79 | % | ||||||||||||
Net assets at end of period (000’s omitted) | $ | 13,476 | $ | 28,959 | $ | 51,876 | $ | 65,999 | $ | 104,878 | $ | 98,347 | ||||||||||||
Ratios absent expense offsets:2 | ||||||||||||||||||||||||
Ratio of total expenses to average net assets | 1.65 | %7 | 1.61 | % | 1.29 | % | 1.32 | % | 1.22 | % | 1.47 | % | ||||||||||||
Ratio of net investment loss to average net assets | (0.84 | )%7 | (0.89 | )% | (0.52 | )% | (0.40 | )% | (0.21 | )% | (0.39 | )% | ||||||||||||
| For the six months ended June 30, 2009 (unaudited) | For the year ended December 31, | |||||||||||||||||||||||
Managers International Equity Fund | 2008 | 2007 | 2006 | 2005 | 2004 | |||||||||||||||||||
Net Asset Value, Beginning of Period | $ | 39.19 | $ | 77.13 | $ | 67.42 | $ | 53.76 | $ | 47.05 | $ | 41.13 | ||||||||||||
Income from Investment Operations: | ||||||||||||||||||||||||
Net investment income | 0.65 | 0.76 | 3 | 0.47 | 0.69 | 0.37 | 0.27 | |||||||||||||||||
Net realized and unrealized gain (loss) on investments | 3.51 | (38.52 | )3 | 9.60 | 14.15 | 6.83 | 5.96 | |||||||||||||||||
Total from investment operations | 4.16 | (37.76 | ) | 10.07 | 14.84 | 7.20 | 6.23 | |||||||||||||||||
Less Distributions to Shareholders from: | ||||||||||||||||||||||||
Net investment income | — | (0.18 | ) | �� | (0.36 | ) | (1.18 | ) | (0.49 | ) | (0.31 | ) | ||||||||||||
Total distributions to shareholders | — | (0.18 | ) | (0.36 | ) | (1.18 | ) | (0.49 | ) | (0.31 | ) | |||||||||||||
Net Asset Value, End of Period | $ | 43.35 | $ | 39.19 | $ | 77.13 | $ | 67.42 | $ | 53.76 | $ | 47.05 | ||||||||||||
Total Return1 | 10.61 | %6 | (48.92 | )% | 14.94 | %4 | 27.63 | % | 15.30 | % | 15.17 | % | ||||||||||||
Ratio of net expenses to average net assets | 1.48 | %7 | 1.48 | % | 1.48 | % | 1.45 | % | 1.45 | % | 1.62 | % | ||||||||||||
Ratio of net investment income to average net assets1 | 2.92 | %7 | 1.24 | % | 0.60 | % | 0.70 | % | 0.75 | % | 0.57 | % | ||||||||||||
Portfolio turnover | 73 | %6 | 142 | % | 98 | % | 70 | % | 79 | % | 93 | % | ||||||||||||
Net assets at end of period (000’s omitted) | $ | 115,264 | $ | 127,984 | $ | 302,025 | $ | 230,916 | $ | 206,393 | $ | 234,061 | ||||||||||||
Ratios absent expense offsets:2 | ||||||||||||||||||||||||
Ratio of total expenses to average net assets | 1.77 | %7 | 1.64 | % | 1.61 | % | 1.47 | % | 1.42 | % | 1.70 | % | ||||||||||||
Ratio of net investment income to average net assets | 2.63 | %7 | 1.08 | % | 0.46 | % | 0.68 | % | 0.79 | % | 0.50 | % | ||||||||||||
29
Table of Contents
Financial Highlights
For a share outstanding throughout each period
| For the six months ended June 30, 2009 (unaudited) | For the year ended December 31, | |||||||||||||||||||||||
Managers Emerging Markets Equity Fund | 2008 | 2007 | 2006 | 2005 | 2004 | |||||||||||||||||||
Net Asset Value, Beginning of Period | $ | 8.09 | $ | 26.80 | $ | 24.44 | $ | 20.10 | $ | 16.50 | $ | 13.26 | ||||||||||||
Income from Investment Operations: | ||||||||||||||||||||||||
Net investment income | 0.04 | 0.15 | 3 | 0.04 | 3 | 0.22 | 0.52 | 0.08 | ||||||||||||||||
Net realized and unrealized gain (loss) on investments | 2.34 | (15.02 | )3 | 7.20 | 3 | 6.66 | 4.84 | 3.74 | ||||||||||||||||
Total from investment operations | 2.38 | (14.87 | ) | 7.24 | 6.88 | 5.36 | 3.82 | |||||||||||||||||
Less Distributions to Shareholders from: | ||||||||||||||||||||||||
Net investment income | — | (0.19 | ) | — | (0.22 | ) | (0.55 | ) | (0.06 | ) | ||||||||||||||
Net realized gain on investments | — | (3.65 | ) | (4.88 | ) | (2.32 | ) | (1.21 | ) | (0.52 | ) | |||||||||||||
Total distributions to shareholders | — | (3.84 | ) | (4.88 | ) | (2.54 | ) | (1.76 | ) | (0.58 | ) | |||||||||||||
Net Asset Value, End of Period | 10.47 | $ | 8.09 | $ | 26.80 | $ | 24.44 | $ | 20.10 | $ | 16.50 | |||||||||||||
Total Return1 | 29.58 | %6 | (54.87 | )%4 | 29.50 | %4 | 34.50 | % | 32.53 | % | 28.85 | % | ||||||||||||
Ratio of net expenses to average net assets | 1.77 | %5,7 | 1.77 | %5 | 1.78 | % | 1.76 | % | 1.75 | % | 1.85 | % | ||||||||||||
Ratio of net investment income to average net assets1 | 1.09 | %5,7 | 0.76 | %5 | 0.13 | % | 0.89 | % | 0.59 | % | 0.67 | % | ||||||||||||
Portfolio turnover | 56 | %6 | 49 | % | 62 | % | 41 | % | 35 | % | 58 | % | ||||||||||||
Net assets at end of period (000’s omitted) | $ | 82,003 | $ | 60,355 | $ | 198,235 | $ | 152,983 | $ | 117,229 | $ | 63,567 | ||||||||||||
Ratios absent expense offsets:2 | ||||||||||||||||||||||||
Ratio of total expenses to average net assets | 2.02 | %7 | 2.03 | % | 1.93 | % | 1.76 | % | 1.72 | % | 1.87 | % | ||||||||||||
Ratio of net investment income (loss) to average net assets | 0.84 | %7 | 0.50 | % | (0.02 | )% | 0.89 | % | 0.62 | % | 0.66 | % | ||||||||||||
| For the six months ended June 30, 2009 (unaudited) | For the year ended December 31, | |||||||||||||||||||||||
Managers Global Bond Fund | 2008 | 2007 | 2006 | 2005 | 2004 | |||||||||||||||||||
Net Asset Value, Beginning of Period | $ | 16.93 | $ | 21.31 | $ | 21.17 | $ | 20.19 | $ | 22.38 | $ | 22.19 | ||||||||||||
Income from Investment Operations: | ||||||||||||||||||||||||
Net investment income | 0.57 | 0.76 | 3 | 0.70 | 3 | 0.45 | 0.63 | 0.65 | ||||||||||||||||
Net realized and unrealized gain (loss) on investments | 1.21 | (2.93 | )3 | 0.88 | 3 | 1.05 | (1.75 | ) | 1.49 | |||||||||||||||
Total from investment operations | 1.78 | (2.17 | ) | 1.58 | 1.50 | (1.12 | ) | 2.14 | ||||||||||||||||
Less Distributions to Shareholders from: | ||||||||||||||||||||||||
Net investment income | — | (2.18 | ) | (1.43 | ) | (0.49 | ) | (0.77 | ) | (1.34 | ) | |||||||||||||
Net realized gain on investments | — | (0.03 | ) | (0.01 | ) | (0.03 | ) | (0.30 | ) | (0.61 | ) | |||||||||||||
Total distributions to shareholders | — | (2.21 | ) | (1.44 | ) | (0.52 | ) | (1.07 | ) | (1.95 | ) | |||||||||||||
Net Asset Value, End of Period | 18.71 | $ | 16.93 | $ | 21.31 | $ | 21.17 | $ | 20.19 | $ | 22.38 | |||||||||||||
Total Return1 | 10.45 | %6 | (10.07 | )%4 | 7.52 | %4 | 7.36 | % | (4.94 | )% | 9.62 | % | ||||||||||||
Ratio of net expenses to average net assets | 1.10 | %7 | 1.10 | % | 1.19 | % | 1.19 | % | 1.19 | % | 1.29 | % | ||||||||||||
Ratio of net investment income to average net assets1 | 6.16 | %7 | 3.62 | % | 3.25 | % | 2.86 | % | 2.38 | % | 2.73 | % | ||||||||||||
Portfolio turnover | 21 | %6 | 56 | % | 152 | % | 56 | % | 64 | % | 130 | % | ||||||||||||
Net assets at end of period (000’s omitted) | $ | 43,315 | $ | 43,315 | $ | 92,124 | $ | 53,670 | $ | 43,131 | $ | 36,454 | ||||||||||||
Ratios absent expense offsets:2 | ||||||||||||||||||||||||
Ratio of total expenses to average net assets | 1.34 | %7 | 1.25 | % | 1.25 | % | 1.27 | % | 1.26 | % | 1.49 | % | ||||||||||||
Ratio of net investment income to average net assets | 5.92 | %7 | 3.47 | % | 3.18 | % | 2.78 | % | 2.31 | % | 2.53 | % | ||||||||||||
The following notes should be read in conjunction with the Financial Highlights of the Funds presented on the preceding pages.
| 1 | Total returns and net investment income would have been lower had certain expenses not been reduced. (See Note 1(c) to the Notes to Financial Statements.) |
| 2 | Excludes the impact of expense (reimbursement)/recoupment and expense reductions such as brokerage credits, but includes non-reimbursable expenses, if any, such as interest and taxes. (See Note 1(c) to the Notes to Financial Statements.) |
| 3 | Per share numbers have been calculated using average shares. |
| 4 | The Total Return is based on the Financial Statement Net Asset Values as shown above. |
| 5 | Excludes interest expense for the six months ended June 30, 2009 and the year ended December 31, 2008, of 0.02% and 0.03%, respectively, for Emerging Markets Equity. (See Note 1(c) of Notes to Financial Statements.) |
| 6 | Not Annualized. |
| 7 | Annualized. |
30
Table of Contents
June 30, 2009 (unaudited)
| 1. | Summary of Significant Accounting Policies |
The Managers Funds (the “Trust”) is an open-end management investment company organized as a Massachusetts business trust and registered under the Investment Company Act of 1940, as amended (the “1940 Act”). Currently, the Trust is comprised of a number of different funds. Included in this report are the Managers AMG Essex Large Cap Growth Fund (“Essex Large Cap Growth”), Managers International Equity Fund (“International Equity”), Managers Emerging Markets Equity Fund (“Emerging Markets Equity”), Managers Money Market Fund (“Money Market”) and Managers Global Bond Fund (“Global Bond”), collectively the “Funds.”
Money Market invests all of its investable assets in the Capital Shares of the JPMorgan Liquid Assets Money Market Fund (the “Portfolio”), a separate registered open-end management investment company with substantially the same investment objective and policies as the Fund. The Portfolio is a series of the JPMorgan Trust II, a business trust organized under the laws of The Commonwealth of Massachusetts. The investment manager of the Portfolio is JPMorgan Investment Advisors Inc. (“JPMIA”). The performance of the Fund is directly affected by the performance of the Portfolio.
The Funds’ financial statements are prepared in accordance with accounting principles generally accepted in the United States of America, which require management to make estimates and assumptions that affect the reported amounts of assets and liabilities and disclosure of contingent assets and liabilities at the date of the financial statements and the reported amounts of income and expenses during the reporting period. Actual results could differ from those estimates and such differences could be material. The following is a summary of significant accounting policies followed by the Funds in the preparation of their financial statements:
| a. | Valuation of Investments |
Equity securities traded on a domestic or international securities exchange are valued at the last quoted sale price, or, lacking any sales, at the last quoted bid price. Over-the-counter securities are valued at the Nasdaq Official Closing Price, if one is available. Lacking any sales, over-the-counter securities are valued at the last quoted bid price. The Funds’ investments are generally valued based on market quotations provided by third party pricing services approved by the Board of Trustees of the Funds. Under certain circumstances, the value of a specific investment may be based on an evaluation of its fair value, pursuant to procedures established by and under the general supervision of the Board of Trustees of the Trust. A Fund may use the fair value of a portfolio security to calculate its NAV when, for example, (1) market quotations are not readily available because a portfolio security is not traded in a public market or the principal market in which the security trades is closed, (2) trading in a portfolio security is suspended and has not resumed before the Fund calculates its NAV, (3) a significant event affecting the value of a portfolio security is determined to have occurred between the time of the market quotation provided for a portfolio security and the time as of which the Fund calculates its NAV, (4) a security’s price has remained unchanged over a period of time (often referred to as a “stale price”), or (5) Managers Investment Group LLC (the “Investment Manager”) determines that a market quotation is inaccurate. Portfolio investments that trade primarily on foreign markets are priced based upon the market quotation of such securities as of the close of their respective principal markets, as adjusted to reflect the Investment Manager’s determination of the impact of events occurring subsequent to the close of such markets but prior to the time as of which the Fund calculates its NAV. In accordance with procedures approved by the Board of Trustees, the Investment Manager relies upon recommendations of a third-party fair valuation service in adjusting the prices of such foreign portfolio investments. The Funds may invest in securities that may be thinly traded. The Board of Trustees has adopted procedures to adjust prices when thinly traded securities are judged to be stale so that they reflect fair value. An investment valued on the basis of its fair value may be valued at a price higher or lower than available market quotations. An investment’s valuation may differ depending on the method used and the factors considered in determining value according to the Fund’s fair value procedures.
Fixed-income securities are valued based on valuations furnished by independent pricing services that utilize matrix systems, which reflect such factors as security prices, yields, maturities, and ratings, and are supplemented by dealer and exchange quotations. Futures contracts for which market quotations are readily available are valued at the settlement price as of the close of the futures exchange. Short-term investments having a remaining maturity of 60 days or less are valued at amortized cost, which approximates market value. Investments in other open-end regulated investment companies are valued at their end of day net asset value per share except ishares or other ETF’s, which are valued the same as equity securities. Investments in certain mortgage-backed and stripped mortgage-backed securities, preferred stocks, convertible securities, derivatives and other debt securities not traded on an organized securities market are valued on the basis of valuations provided by dealers or by a pricing service which uses information with respect to transactions in such securities and various relationships between securities and yield to maturity in determining value. Securities (including derivatives) for which market quotations are not readily available are valued at fair value, as determined in good faith, and pursuant to procedures adopted by the Board of Trustees of the Trust. The values assigned to fair value investments are based on available information and do not necessarily represent amounts that might ultimately be realized, since such amounts depend on future developments inherent in long-term investments. Further, because of the inherent uncertainty of valuation, those estimated values may differ significantly from the values that would have been used had a ready market for the investments existed, and the differences could be material.
Money Market’s investment in the Portfolio is valued daily at its end of day net asset value per share. The Portfolio’s underlying investments are valued at amortized cost which approximates market value. The amortized cost method of valuation values a security at its cost at the time of purchase and thereafter assumes a constant amortization to maturity of any discount or premium, regardless of the impact of fluctuating interest rates on the market value of the instruments.
The Funds adopted Financial Accounting Standards Board Statement of Financial Accounting Standards No. 157, Fair Value Measurements (“FAS 157”), effective January 1, 2008. In accordance with FAS 157, fair value is defined as the price that the
31
Table of Contents
Notes to Financial Statements (continued)
Fund would receive to sell an asset or pay to transfer a liability in an orderly transaction between market participants at the measurement date. FAS 157 also establishes a framework for measuring fair value, and a three-level hierarchy for fair value measurements based upon the transparency of inputs to the valuation of an asset or liability. Inputs may be observable or unobservable and refer broadly to the assumptions that market participants would use in pricing the asset or liability. Observable inputs reflect the assumptions market participants would use in pricing the asset or liability based on market data obtained from sources independent of the Funds. Unobservable inputs reflect the Funds’ own assumptions about the assumptions that market participants would use in pricing the asset or liability developed based on the best information available in the circumstances. Each investment is assigned a level based upon the observability of the inputs which are significant to the overall valuation.
In April 2009, Statement of Financial Accounting Standards Staff Position No. 157-4, “Determining Fair Value When the Volume and Level of Activity for the Asset or Liability Have Significantly Decreased and Identifying Transactions that are not Orderly” (“FSP FAS 157-4”) was issued and is effective for interim and annual reporting periods ending after June 15, 2009. FSP FAS 157-4 provides additional guidance for estimating fair value in accordance with FAS 157 when the volume and level of activity for the asset or liability have significantly decreased. Additionally, FSP FAS 157-4 requires quantitative disclosures about fair value measurements separately for each major category of assets and liabilities.
The three-tier hierarchy of inputs is summarized below:
Level 1 – quoted prices in active markets for identical investments
Level 2 – other significant observable inputs (including quoted prices for similar investments, interest rates, prepayment speeds, credit risk)
Level 3 – significant unobservable inputs (including the Funds’ own assumptions in determining the fair value of investments)
The inputs or methodologies used for valuing investments are not necessarily an indication of the risk associated with investing in those investments. The following table summarizes the valuation of the Fund’s investments by the above fair value hierarchy levels as of June 30, 2009:
| Level 1 | Level 2 | Level 3 | Total | ||||||||
Essex Large Cap Growth | |||||||||||
Investments in Securities | |||||||||||
Common Stocks | |||||||||||
Information Technology | $ | 4,108,457 | — | — | $ | 4,108,457 | |||||
Health Care | 2,576,434 | — | — | 2,576,434 | |||||||
Consumer Discretionary | 1,371,025 | — | — | 1,371,025 | |||||||
Financials | 1,308,347 | — | — | 1,308,347 | |||||||
Energy | 1,236,255 | — | — | 1,236,255 | |||||||
Industrials | 1,077,878 | — | — | 1,077,878 | |||||||
Materials | 899,607 | — | — | 899,607 | |||||||
Consumer Staples | 671,560 | — | — | 671,560 | |||||||
Telecommunication Services | 271,404 | — | — | 271,404 | |||||||
Utilities | — | — | — | — | |||||||
Short-Term Investments | 796,227 | $ | 17,611 | — | 813,838 | ||||||
Total Investments in Securities | 14,317,194 | 17,611 | — | 14,334,805 | |||||||
Other Financial Instruments* | — | — | — | — | |||||||
Totals | $ | 14,317,194 | $ | 17,611 | — | $ | 14,334,805 | ||||
32
Table of Contents
Notes to Financial Statements (continued)
| Level 1 | Level 2 | Level 3 | Total | |||||||||||
International Equity | ||||||||||||||
Investments in Securities | ||||||||||||||
Common Stocks | ||||||||||||||
Energy | $ | 3,921,114 | $ | 7,312,406 | — | $ | 11,233,520 | |||||||
Materials | 3,756,412 | 5,043,571 | — | 8,799,983 | ||||||||||
Information Technology | 2,536,127 | 6,086,162 | — | 8,622,289 | ||||||||||
Financials | 1,029,614 | 31,726,982 | — | 32,756,596 | ||||||||||
Health Care | 843,714 | 8,164,806 | — | 9,008,520 | ||||||||||
Consumer Discretionary | 293,325 | 5,415,792 | — | 5,709,117 | ||||||||||
Industrials | — | 11,152,302 | — | 11,152,302 | ||||||||||
Consumer Staples | — | 8,696,834 | — | 8,696,834 | ||||||||||
Telecommunication Services | — | 6,963,043 | — | 6,963,043 | ||||||||||
Utilities | — | 5,581,063 | — | 5,581,063 | ||||||||||
Other Equities | 765,912 | 28,576 | — | 794,488 | ||||||||||
Preferred Stock | 323,366 | — | — | 323,366 | ||||||||||
Short-Term Investments | 9,875,304 | 15,393 | — | 9,890,697 | ||||||||||
Total Investments in Securities | 23,344,888 | 96,186,930 | — | 119,531,818 | ||||||||||
Other Financial Instruments* | (4,388 | ) | (151,077 | ) | — | (155,465 | ) | |||||||
Totals | $ | 23,340,500 | $ | 96,035,853 | — | $ | 119,376,353 | |||||||
| Level 1 | Level 2 | Level 3 | Total | |||||||||||
Emerging Markets Equity | ||||||||||||||
Investments in Securities | ||||||||||||||
Common Stocks | ||||||||||||||
Energy | $ | 5,347,386 | $ | 7,689,372 | — | $ | 13,036,758 | |||||||
Materials | 4,214,809 | 5,283,176 | — | 9,497,985 | ||||||||||
Financials | 4,008,208 | 17,769,803 | — | 21,778,011 | ||||||||||
Telecommunication Services | 2,424,811 | 7,210,052 | — | 9,634,863 | ||||||||||
Consumer Discretionary | 2,227,106 | 3,779,536 | — | 6,006,642 | ||||||||||
Information Technology | 1,607,704 | 6,622,115 | — | 8,229,819 | ||||||||||
Industrials | 1,046,454 | 5,137,667 | — | 6,184,121 | ||||||||||
Health Care | 965,682 | 167,808 | — | 1,133,490 | ||||||||||
Utilities | 503,550 | 1,552,680 | — | 2,056,230 | ||||||||||
Consumer Staples | 259,433 | 2,157,892 | — | 2,417,325 | ||||||||||
Preferred Stocks | 1,279,968 | — | — | 1,279,968 | ||||||||||
Rights | 6,728 | — | — | 6,728 | ||||||||||
Short-Term Investments | 2,323,496 | 16,334 | — | 2,339,830 | ||||||||||
Total Investments in Securities | 26,215,335 | 57,386,435 | — | 83,601,770 | ||||||||||
Other Financial Instruments* | — | — | — | — | ||||||||||
Totals | $ | 26,215,335 | $ | 57,386,435 | — | $ | 83,601,770 | |||||||
33
Table of Contents
Notes to Financial Statements (continued)
| Level 1 | Level 2 | Level 3 | Total | ||||||||||
Global Bond | |||||||||||||
Corporate Bonds | |||||||||||||
Finance | — | $ | 8,583,687 | — | $ | 8,583,687 | |||||||
Industrial | — | 15,217,681 | — | 15,217,681 | |||||||||
Utility | — | 1,922,833 | — | 1,922,833 | |||||||||
Foreign Government Obligations | — | 13,710,125 | — | 13,710,125 | |||||||||
Asset-Backed Securities | — | 311,133 | — | 311,133 | |||||||||
U.S. Government and Agency Obligations | |||||||||||||
U.S. Government | — | 402,406 | — | 402,406 | |||||||||
Preferred Stocks | $ | 76,676 | — | — | 76,676 | ||||||||
Short-Term Investments | 1,240,050 | 5,612 | — | 1,245,662 | |||||||||
Total Investments | 1,316,726 | 40,153,477 | — | 41,470,203 | |||||||||
Other Financial Instruments* | — | (10,991 | ) | — | (10,991 | ) | |||||||
Totals | $ | 1,316,726 | $ | 40,142,486 | — | $ | 41,459,212 | ||||||
| Level 1 | Level 2 | Level 3 | Total | |||||||
Money Market | ||||||||||
Investments in Securities | ||||||||||
Short-Term Investments | $ | 78,968,222 | — | — | $ | 78,968,222 | ||||
Total Investments in Securities | 78,968,222 | — | — | 78,968,222 | ||||||
Other Financial Instruments* | — | — | — | — | ||||||
Totals | $ | 78,968,222 | — | — | $ | 78,968,222 | ||||
| * | Other financial instruments are derivative instruments not reflected in the Schedule of Portfolio Investments, such as futures, forwards and swap contracts, which are valued at the unrealized appreciation/depreciation of the instrument. |
In March 2008, Statement of Financial Accounting Standards No. 161, “Disclosures about Derivative Instruments and Hedging Activities” (“SFAS 161”) was issued and is effective for fiscal years and interim periods beginning after November 15, 2008. SFAS 161 is intended to improve financial reporting for derivative instruments by requiring enhanced disclosure that enables investors to understand how and why a fund uses derivatives, how derivatives are accounted for, and how derivative instruments affect a fund’s results of operations and financial position. The fair values of derivative instruments as of June 30, 2009 for International Equity and Global Bond were as follows:
Asset Derivatives | Liability Derivatives | ||||||||||||
Fund | Derivatives not accounted for as hedging | Statement of Assets and | Fair Value | Statement of Assets and | Fair Value | ||||||||
International Equity | Equity contracts | Receivable for variation margin on futures | — | Payable for variation margin on futures | $ | 4,770 | * | ||||||
| Foreign exchange contracts | Unrealized appreciation of foreign currency contracts | $ | 146,881 | Unrealized depreciation of foreign currency contracts | $ | 297,958 | |||||||
Total | $ | 146,881 | $ | 302,728 | |||||||||
Global Bond | Foreign exchange contracts | Unrealized appreciation of foreign currency contracts | — | Unrealized depreciation of foreign currency contracts | $ | 10,991 | |||||||
| * | Includes cumulative appreciation/deprecation of futures contracts as reported in the notes to financial statements. One current day’s variation margin is reported within the statement of assets and liabilities. |
34
Table of Contents
Notes to Financial Statements (continued)
As of June 30, 2009, the effect of derivative instruments on the Statement of Operations for International Equity and Global Bond were as follows. The amount of realized gain/(loss) on derivatives recognized in income for International Equity and Global Bond were as follows:
Fund | Derivatives not accounted for as hedging | Futures | Forward Currency Contracts | Total | |||||||||
International Equity | Equity contracts | $ | 125,533 | — | $ | 125,533 | |||||||
| Foreign exchange contracts | — | ($627,151 | ) | (627,151 | ) | ||||||||
Total | $ | 125,533 | ($627,151 | ) | ($501,618 | ) | |||||||
Global Bond | Foreign exchange contracts | — | $ | 55,758 | $ | 55,758 | |||||||
The change in unrealized gain/(loss) on derivatives recognized in income for International Equity and Global Bond were as follows:
Fund | Derivatives not accounted for as hedging | Futures | Forward Currency Contracts | Total | |||||||
International Equity | �� | Equity contracts | ($3,439 | ) | — | ($3,439 | ) | ||||
Foreign exchange contracts | — | ($107,789 | ) | (107,789 | ) | ||||||
Total | ($3,439 | ) | ($107,789 | ) | ($111,228 | ) | |||||
Global Bond | Foreign exchange contracts | — | 13,661 | 13,661 | |||||||
| b. | Security Transactions |
Security transactions are accounted for as of the trade date. Realized gains and losses on securities sold are determined on the basis of identified cost.
| c. | Investment Income and Expenses |
Dividend income is recorded on the ex-dividend date except certain dividends from foreign securities where the ex-dividend date may have passed. These dividends are recorded as soon as the Trust is informed of the ex-dividend date. Dividend income on foreign securities is recorded net of any withholding tax. Interest income, which includes amortization of premium and accretion of discount on debt securities, is accrued as earned. Non-cash dividends included in dividend income, if any, are reported at the fair market value of the securities received. As a shareholder of the Portfolio, the Money Market Fund receives its proportionate share of the dividends paid by such class, which takes into consideration the Fund’s proportionate share of net investment income and expenses of such class. Other income and expenses are recorded on an accrual basis. Expenses that cannot be directly attributed to a fund are apportioned among the Funds in the Trust and in some cases other affiliated funds based upon their relative average net assets or number of shareholders.
The following Funds had certain portfolio trades directed to various brokers who paid a portion of such Fund’s expenses. For the six months ended June 30, 2009, under these arrangements the amount by which the Funds’ expenses were reduced and the impact on the expense ratios were as follows: Essex Large Cap Growth - $5,224 or 0.03% and International Equity - $1,882 or 0.00%.
The Funds have a “balance credit” arrangement with The Bank of New York Mellon (“BNYM”) (formerly The Bank of New York), the Fund’s custodian, whereby the Funds are credited with an interest factor equal to 0.75% below the effective 90-day T-Bill rate for account balances left uninvested overnight. If the T-Bill rate falls below 0.75%, no credits will be earned. These credits serve to reduce custody expenses that would otherwise be charged to the Funds. For the six months ended June 30, 2009, the custodian expense was not reduced.
The Trust also has a balance credit arrangement with its Transfer Agent, PNC Global Investment Servicing (U.S.) Inc. (formerly PFPC, Inc.), whereby earnings credits are used to offset banking charges and other out-of-pocket expenses. For the six months ended June 30, 2009, the Funds’ portion of the transfer agent expense was reduced under this arrangement as follows: Essex Large Cap Growth - $80; International Equity - $332; Emerging Markets Equity - $178; Global Bond - $122 and Money Market - $246.
Overdrafts will cause a reduction of any earnings credits, computed at 2% above the Federal funds rate on the day of the overdraft. For the six months ended June 30, 2009, overdraft fees were as follows: International Equity – $78 or 0.00%, Emerging Markets Equity - $5,775 or 0.01% and Global Bond Fund - $227 or 0.00% .
The Investment Manager has agreed to waive a portion of its management or administrative fee in consideration of shareholder servicing fees that it has received from JPMorgan Distribution Services, Inc., with respect to short-term cash investments the Funds have made in the JPMorgan Liquid Assets Money Market Fund- Capital Share Class. For the six months ended June 30, 2009, the Money Market’s administrative fee was reduced by $20,687.
Total returns and net investment income for the Funds would have been lower had certain expenses not been offset. Total expenses before offsets exclude the impact of expense reimbursements or fee waivers and expense reductions such as brokerage recapture credits but include non-reimbursable expenses, if any, such as interest and taxes.
| d. | Dividends and Distributions |
Dividends resulting from net investment income, if any, normally will be declared and paid annually for all Funds except Money Market.
35
Table of Contents
Notes to Financial Statements (continued)
Dividends resulting from net investment income, if any, normally will be declared daily and paid monthly for Money Market. Distributions of capital gains, if any, will be made annually in December and when required for Federal excise tax purposes. Income and capital gain distributions are determined in accordance with Federal income tax regulations, which may differ from generally accepted accounting principles. These differences are primarily due to differing treatments for losses deferred due to wash sales, REITS, equalization accounting for tax purposes, foreign currency, options, futures and market discount transactions. Permanent book and tax basis differences, if any, relating to shareholder distributions will result in reclassifications to paid-in capital.
| e. | Federal Taxes |
Each Fund intends to comply with the requirements under Subchapter M of the Internal Revenue Code of 1986, as amended, to distribute substantially all of their taxable income and gains to their shareholders and to meet certain diversification and income requirements with respect to investment companies. Therefore, no provision for Federal income or excise tax is included in the accompanying financial statements.
Additionally, based on each Fund’s understanding of the tax rules and rates related to income, gains and transactions for the foreign jurisdictions in which it invests, each Fund will provide for foreign taxes, and where appropriate, deferred foreign taxes.
Management has analyzed the Funds’ tax positions taken on federal income tax returns for all open tax years (tax years ended December 31, 2005-2008), and has concluded that no provision for federal income tax is required in the Funds’ financial statements. The Funds are not aware of any tax position for which it is reasonably possible that the total amounts of unrecognized tax benefits will change materially in the next twelve months.
| f. | Capital Loss Carryovers |
As of June 30, 2009, the following Funds had accumulated net realized capital loss carryovers from securities transactions for Federal income tax purposes as shown in the following chart. These amounts may be used to offset realized capital gains, if any, through the expiration dates listed.
Fund | Capital Loss Carryover Amount | Expires December 31, | |||
Essex Large Cap Growth | $ | 89,173,242 | 2009 | ||
| 30,988,593 | 2010 | ||||
| 12,899,489 | 2011 | ||||
| 7,531,988 | 2016 | ||||
Total | $ | 140,593,312 | |||
International Equity | $ | 13,386,880 | 2010 | ||
| 16,170,119 | 2011 | ||||
| 19,998,844 | 2016 | ||||
Total | $ | 49,555,843 | |||
Global Bond | $ | 906,645 | 2016 | ||
| g. | Capital Stock |
The Trust’s Declaration of Trust authorizes for each series the issuance of an unlimited number of shares of beneficial interest, without par value, for each fund. Each Fund records sales and repurchases of its capital stock on the trade date. Dividends and distributions to shareholders are recorded on the ex-dividend date.
At June 30, 2009, certain unaffiliated shareholders, specifically omnibus accounts, individually held greater than 10% of the outstanding shares of the following Funds: Essex Large Cap Growth – one owns 12%; International Equity – one owns 18% and Emerging Markets Equity – two collectively own 47%. Transactions by these shareholders may have a material impact on the Funds.
| h. | Foreign Currency Translation |
The books and records of the Funds are maintained in U.S. dollars. The value of investments, assets and liabilities denominated in currencies other than U.S. dollars are translated into U.S. dollars based upon current foreign exchange rates. Purchases and sales of foreign investments, income and expenses are converted into U.S. dollars based on currency exchange rates prevailing on the respective dates of such transactions. Net realized and unrealized gain (loss) on foreign currency transactions represent: (1) foreign exchange gains and losses from the sale and holdings of foreign currencies; (2) gains and losses between trade date and settlement date on investment securities transactions and forward foreign currency exchange contracts; and (3) gains and losses from the difference between amounts of interest and dividends recorded and the amounts actually received.
The Funds do not isolate the net realized and unrealized gain or loss resulting from changes in exchange rates from the fluctuations in market prices of securities held. Such fluctuations are included with the net realized and unrealized gain or loss on investments.
| 2. | Agreements and Transactions with Affiliates |
For each of the Funds other than Money Market, the Trust has entered into an Investment Management Agreement under which the Investment Manager, an independently managed subsidiary of Affiliated Managers Group, Inc. (“AMG”), serves as investment manager to the Funds and is responsible for the Funds’ overall administration. The Investment Manager selects subadvisors for the Funds (subject to Trustee approval) and monitors each subadvisor’s investment programs and results. The Funds’ investment portfolio is managed by portfolio managers who serve pursuant to a Subadvisory Agreement with the Investment Manager.
Investment management fees are paid directly by the Funds to the Investment Manager based on average daily net assets. For the six months ended June 30, 2009, the annual investment management fee rates, as a percentage of average daily net assets, were as follows:
Fund | Investment Management Fee | ||
Essex Large Cap Growth | 0.80 | % | |
International Equity | 0.90 | % | |
Emerging Markets Equity | 1.15 | % | |
Global Bond | 0.70 | % |
The Investment Manager of Global Bond has agreed to contractually waive a portion of its management fee for the Fund until at least March 1, 2010. For the six months ended June 30, 2009, the amount waived was $21,004 or 0.10% .
The Trust has entered into an Administration and Shareholder Servicing Agreement under which the Investment Manager serves as each Fund’s administrator (the “Administrator”) and is responsible for all
36
Table of Contents
Notes to Financial Statements (continued)
aspects of managing the Funds’ operations, including administration and shareholder services to each Fund, its shareholders, and certain institutions, such as bank trust departments, broker-dealers and registered investment advisers, that advise or act as an intermediary with the Funds’ shareholders. Under the terms of the Administration Agreement, each of the Funds, except Global Bond and Money Market, pay a fee to the Administrator at the rate of 0.25% per annum of the Funds’ average daily net assets. Global Bond and Money Market pay a fee to the Administrator at the rate of 0.20% and 0.15%, respectively, per annum of the Funds’ average daily net assets.
The Investment Manager for the Funds has contractually agreed, through at least May 1, 2010, subject to later reimbursement by the Funds in certain circumstances, that the total annual operating expenses (exclusive of taxes, interest, brokerage costs, acquired fund expenses and extraordinary expenses) will be limited to the following amounts of the Funds’ average daily net assets: International Equity – 1.48%; Emerging Markets Equity – 1.77%; and Global Bond - 1.10% . The Investment Manager has also contractually agreed, subject to later reimbursement by the Funds in certain circumstances, that the total annual operating expenses (exclusive of taxes, interest, brokerage costs, acquired fund expenses and extraordinary expenses) on Essex Large Cap Growth, will be limited to 1.29% of the Fund’s average daily net assets, provided that the amount of fees waived, paid or reimbursed does not exceed 0.25% per annum. This amount for the six months ended June 30, 2009 was $14,775 or 0.11% annualized. Prior to January 1, 2008, the expense limitations for International Equity, Emerging Markets Equity, and Global Bond were 1.55%, 1.79%, and 1.19%, respectively.
Each Fund is obligated to repay the Investment Manager such amounts waived, paid or reimbursed in future years provided that the repayment occurs within thirty-six (36) months after the waiver or reimbursement occurs and that such repayment would not cause the Funds’ total operating expenses in any such future year to exceed that Funds’ respective expense cap. For the six months ended June 30, 2009, the Funds made no such repayments to the Investment Manager. At June 30, 2009, the cumulative amount of reimbursement by the Investment Manager subject to repayment by Essex Large Cap, International Equity, Emerging Markets Equity and Global Bond equaled $170,262, $522,078, $461,743 and $67,833, respectively.
The aggregate annual retainer paid to each Independent Trustee is $65,000, plus $4,000 or $2,500 for each regular or special meeting attended, respectively. The Trustees’ fees and expenses are allocated amongst all of the Funds for which the Investment Manager serves as the advisor (the “Managers Funds”) based on the relative net assets of such Funds. The Independent Chairman of the Trusts receives an additional payment of $15,000 per year. The Chairman of the Audit Committee receives an additional payment of $5,000 per year. The “Trustee fees and expenses” shown in the financial statements represents each Fund’s allocated portion of the total fees and expenses paid by the Managers Funds.
The Funds are distributed by Managers Distributors, Inc. (the “Distributor” or “MDI”), a wholly-owned subsidiary of the Investment Manager. MDI serves as the principal underwriter for each Fund in the Trust. MDI is a registered broker-dealer and member of the Financial Industry Regulatory Authority, Inc. (“FINRA”). Shares of each Fund will be continuously offered and will be sold by brokers, dealers or other financial intermediaries who have executed selling agreements with the Distributor. MDI bears all the expenses of providing services pursuant to the Underwriting Agreement, including the payment of the expenses relating to the distribution of Prospectuses for sales purposes and any advertising or sales literature. Certain Trustees and Officers of the Funds are Officers and/or Directors of the Investment Manager, AMG and/or the Distributor.
| 3. | Purchases and Sales of Securities |
Purchases and sales of securities, excluding short-term securities, for the six months ended June 30, 2009, for Essex Large Cap Growth were $11,459,923 and $30,153,333; International Equity were $82,435,869 and $104,709,449; Emerging Markets Equity were $41,561,569 and $36,084,461; and Global Bond were $8,885,713 and $17,564,675, respectively. There were no purchases and sales of U.S. Government securities for the Funds for the six months ended June 30, 2009, except for Global Bond, which were $4,306,380 and $4,228,497, respectively.
| 4. | Portfolio Securities Loaned |
Each of the Funds other than Money Market may participate in a securities lending program offered by BNYM, providing for the lending of securities to qualified brokers. Securities lending fees include earnings of such temporary cash investments, plus or minus any rebate to a borrower. These earnings (after any rebate) are then divided between BNYM, as a fee for its services under the program, and the Fund, according to agreed-upon rates. Collateral on all securities loaned is accepted in cash and/or government securities and is maintained at a minimum level of 102% (105% in the case of certain foreign securities) of the market value, plus interest, if applicable, of investments on loan. It is the Funds’ policy to obtain additional collateral from or return excess collateral to the borrower by the end of the next business day, following the valuation date of the securities loaned. Therefore, the value of the collateral held may be temporarily less than the value of the securities on loan. Lending securities entails a risk of loss to the Funds if and to the extent that the market value of the securities loaned were to increase and the borrower did not increase the collateral accordingly, and the borrower fails to return the securities. The Funds bear the risk of any deficiency in the amount of the collateral available for return to the borrower due to any loss on the collateral invested. Collateral received in the form of cash is invested temporarily in the BNY Institutional Cash Reserves Fund (the “ICRF”), or other short-term investments as defined in the Securities Lending Agreement with BNYM.
In September of 2008, BNYM advised the Investment Manager that the ICRF had exposure to certain defaulted debt obligations, and that BNYM had established a separate sleeve of the ICRF to hold these securities. The net impact of these positions is not material to each Fund. Each Fund’s position in the separate sleeve of the ICRF Fund is included in the Schedule of Portfolio Investments and the unrealized loss on such investment is included in Net Unrealized Depreciation on the Statement of Assets and Liabilities and the Statement of Operations.
| 5. | Commitments and Contingencies |
In the normal course of business, the Funds may enter into contracts and agreements that contain a variety of representations and warranties, which provide general indemnifications. The maximum exposure to the Funds under these arrangements is unknown, as this would involve future claims that may be made against a Fund that have not yet occurred. However, based on experience, the Funds expect the risks of loss to be remote.
37
Table of Contents
Notes to Financial Statements (continued)
| 6. | Forward Commitments |
Certain transactions, such as futures and forward transactions, dollar roll agreements, or purchases of when-issued or delayed delivery securities may have a similar effect on a Fund’s net asset value as if the Fund had created a degree of leverage in its portfolio. However, if a Fund enters into such a transaction, the Fund will establish a segregated account with its custodian in which it will maintain cash, U.S. government securities or other liquid securities equal in value to its obligations in respect to such transaction. Securities and other assets held in the segregated account may not be sold while the transaction is outstanding, unless other suitable assets are substituted.
| 7. | Forward Foreign Currency Contracts |
International Equity, Emerging Markets Equity, and Global Bond may invest in forward foreign currency exchange contracts to manage currency exposure by settling planned purchases or sales of securities and hedge the currency exposure associated with some or all of a Fund’s securities or as part of an investment strategy.
A forward foreign currency exchange contract is an agreement between a Fund and another party to buy or sell a currency at a set price at a future date. The market value of the contract will fluctuate with changes in currency exchange rates. The contract is marked-to-market daily, and the change in market value is recorded as an unrealized gain or loss. Gain or loss on the purchase or sale of contracts having the same settlement date, amount and counterparty is realized on the date of offset, otherwise gain or loss is realized on the settlement date. These contracts may involve greater market risk in excess of the unrealized gain or loss reflected on the Statement of Assets and Liabilities.
The Funds, except Essex Large Cap Growth and Money Market, may invest in non-U.S. dollar denominated instruments subject to limitations, and enter into forward foreign currency exchange contracts to facilitate transactions in foreign securities and to protect against a possible loss resulting from an adverse change in the relationship between the U.S. dollar and such foreign currency. Risks may arise upon entering into these contracts from the potential inability of counterparties to meet the terms of their contracts and from unanticipated movements in the value of a foreign currency relative to the U.S. dollar.
Open forward foreign currency exchange contracts (in U.S. Dollars) at June 30, 2009 were as follows:
Foreign Currency | Position | Settlement Date | Current Value (Receivable Amount) | Contract Value (Payable Amount) | Unrealized Gain/(Loss) | ||||||||
International Equity | |||||||||||||
Pound Sterling | Short | 08/17/09 | $ | 4,474,538 | $ | 4,772,495 | ($297,957 | ) | |||||
Pound Sterling | Long | 08/17/09 | 4,772,496 | 4,625,616 | 146,880 | ||||||||
| $ | 9,247,034 | $ | 9,398,111 | ($151,077 | ) | ||||||||
Global Bond | |||||||||||||
Japanese Yen | Short | 07/15/09 | $ | 451,365 | $ | 456,821 | ($5,456 | ) | |||||
South Korean Won | Long | 07/15/09 | 487,135 | 492,670 | (5,535 | ) | |||||||
| $ | 938,500 | $ | 949,491 | ($10,991 | ) | ||||||||
| 8. | Futures Contracts Held or Issued for Purposes other than Trading |
International Equity may purchase or sell futures contracts to achieve a desired level of investment, whether to accommodate portfolio turnover or cash flows from capital shares transactions. The Fund is subject to equity price risk and foreign currency exchange risk in the normal course of pursuing its investment objectives. Prices may not move as expected or a Fund may not be able to close out the contract when it desires to do so, resulting in losses. With futures, there is minimal counterparty credit risk to the Fund since futures are exchange traded and the exchange’s clearinghouse, as counterparty to all exchange traded futures, guarantees the futures against default.
On entering into a futures contract, either cash or securities in an amount equal to a certain percentage of the contract value (initial margin) must be deposited with the futures broker. Subsequent payments (variation margin) are made or received each day. The variation margin payments equal the daily changes in the contract value and are recorded as unrealized gains or losses. The Funds recognize a realized gain or loss when the contract is closed or expires equal to the difference between the value of the contract at the time it was opened and the value at the time it was closed. Futures are valued at their quoted daily settlement prices. The aggregate principal amounts of the contracts are not recorded in the financial statements. Fluctuations in the value of the contracts are recorded in the Statement of Assets and Liabilities as an asset (liability) and in the Statement of Operations as unrealized appreciation (depreciation) until the contracts are closed, when they are recorded as realized gains (losses) on futures or forward currency contracts.
Cash pledged to cover margin requirements for the open futures positions at June 30, 2009, amounted to $60,179. Open futures contracts (in U.S. Dollars) at June 30, 2009, were as follows:
Type | Number of Contracts | Position | Expiration Date | Unrealized Gain/(Loss) | |||||
DJ Euro Stoxx 50 | 10 | Long | 09/18/09 | ($4,388 | ) |
38
Table of Contents
Annual Renewal of Investment Advisory Agreements (unaudited)
On June 4-5, 2009, the Board of Trustees, including a majority of the Trustees who are not “interested persons” of the Trust (the “Independent Trustees”), approved the Investment Management Agreement with the Investment Manager for each of the Funds identified below and the Subadvisory Agreement for each of the Subadvisors, with the exception of Schroder Investment Management North America Inc. and Martin Currie Inc. (for purposes of this section, each a “Subadvisor” and “Subadvisory Agreement” and collectively the “Subadvisors” and “Subadvisory Agreements”). The Independent Trustees were separately represented by independent counsel in connection with their consideration of the approval of these agreements. In considering the Investment Management and Subadvisory Agreements, the Trustees reviewed a variety of materials relating to each Fund, the Investment Manager and each Subadvisor, including comparative performance, fee and expense information for an appropriate peer group of similar mutual funds (each a “Peer Group”), performance information for relevant benchmark indices (each a “Fund Benchmark”) and, with respect to each Subadvisor, comparative performance information for an appropriate peer group of managed accounts, and, as to all other matters, other information provided to them on a periodic basis throughout the year, as well as information provided in connection with the meetings of June 4-5, 2009, regarding the nature, extent and quality of services provided by the Investment Manager and the Subadvisors under their respective agreements. Prior to voting, the Independent Trustees: (a) reviewed the foregoing information with their independent legal counsel and with management; (b) received materials from their independent legal counsel discussing the legal standards applicable to their consideration of the Investment Management Agreement and the Subadvisory Agreements; and (c) met with their independent legal counsel in private sessions at which no representatives of management were present.
Nature, extent and quality of services.
In considering the nature, extent and quality of the services provided by the Investment Manager, the Trustees reviewed information relating to the Investment Manager’s operations and personnel. Among other things, the Investment Manager provided financial information, biographical information on its supervisory and professional staff and descriptions of its organizational and management structure. The Trustees also took into account information provided periodically throughout the previous year by the Investment Manager relating to the performance of its duties with respect to the Funds and the Trustees’ familiarity with the Investment Manager’s management through Board meetings, discussions and reports. In the course of their deliberations regarding the Investment Management Agreement, the Trustees evaluated, among other things: (a) the extent and quality of the Investment Manager’s oversight of the operation and management of the Funds; (b) the quality of the search, selection and monitoring services performed by the Investment Manager in overseeing the portfolio management responsibilities of the Subadvisors; (c) the Investment Manager’s ability to supervise the Funds’ other service providers; and (d) the Investment Manager’s compliance programs. The Trustees also took into account the financial condition of the Investment Manager with respect to its ability to provide the services required under the Investment Management Agreement and to maintain contractual expense limitations for the Funds.
For each Fund, the Trustees also reviewed information relating to each Subadvisor’s operations and personnel and the investment philosophy, strategies and techniques (for each Subadvisor, its “Investment Strategy”) used in managing the Fund or the portion of the Fund for which the Subadvisor has portfolio management responsibility. Among other things, the Trustees reviewed biographical information on portfolio management and other professional staff, information regarding each Subadvisor’s organizational and management structure and each Subadvisor’s brokerage policies and practices. The Trustees considered specific information provided regarding the experience of the individual or individuals at each Subadvisor with portfolio management responsibility for the portion of the Fund managed by the Subadvisor, including the information set forth in the Fund’s prospectus and statement of additional information. With respect to those Funds managed with multiple Subadvisors, the Trustees also noted information provided by the Investment Manager regarding the manner in which each Subadvisor’s Investment Strategy complements those utilized by a Fund’s other Subadvisors. In the course of their deliberations, the Trustees evaluated, among other things: (a) the services rendered by each Subadvisor in the past; (b) the qualifications and experience of the Subadvisor’s personnel; and (c) the Subadvisor’s compliance programs. The Trustees also took into account the financial condition of each Subadvisor with respect to its ability to provide the services required under its Subadvisory Agreement.
Performance.
As noted above, the Board considered each Fund’s performance during relevant time periods as compared to the Fund’s Peer Group and considered each Subadvisor’s performance as compared to an appropriate peer group of managed accounts and noted that the Board reviews on a quarterly basis detailed information about the Fund’s performance results, portfolio composition and Investment Strategies, including with respect to the portion of the Fund managed by each Subadvisor. The Board noted the Investment Manager’s expertise and resources in monitoring the performance, investment style and risk-adjusted performance of each Subadvisor. The Board also noted each Subadvisor’s performance record with respect to the Fund. The Board was mindful of the Investment Manager’s attention to monitoring each Subadvisor’s performance with respect to the Funds and its discussions with management regarding the factors that contributed to the performance of the Funds.
Advisory Fees and Profitability.
In considering the reasonableness of the advisory fee charged by the Investment Manager for managing each Fund, the Trustees noted that the Investment Manager, and not the Fund, is responsible for paying the fees charged by the Fund’s Subadvisors and, therefore, that the fees paid to the Investment Manager cover the cost of providing portfolio management services as well as the cost of providing search, selection and monitoring services in operating a “manager-of-managers” complex of mutual funds. The Trustees concluded that, in light of the additional high quality supervisory services provided by the Investment Manager and the fact that the subadvisory fees are paid out of the advisory fee, the advisory fee payable by each Fund to the Investment Manager can reasonably be expected to exceed the median advisory fee for the Peer Group,
39
Table of Contents
Annual Renewal of Investment Advisory Agreements (continued)
which consists of many funds that do not operate with a manager-of-managers structure. In this regard, the Trustees also noted that the Investment Manager has undertaken to maintain expense limitations for the Funds.
In considering the reasonableness of the advisory fee payable to the Investment Manager, the Trustees also reviewed information provided by the Investment Manager setting forth all revenues and other benefits, both direct and indirect, received by the Investment Manager and its affiliates attributable to managing each Fund and all the mutual funds in the Managers Family of Funds, the cost of providing such services and the resulting profitability to the Investment Manager and its affiliates from these relationships. The Trustees also noted the current and potential asset levels of each Fund and the willingness of the Investment Manager to waive fees and pay expenses for certain of the Funds from time to time as a means of limiting total expenses. The Trustees noted that the subadvisory fees are paid by the Investment Manager out of its advisory fee. The Trustees also considered the current asset levels of the Funds, including the effect on assets attributable to the economic and market conditions over the past year, and considered the impact on profitability of the current asset levels and any future growth of assets of the Funds. The Board took into account management’s discussion of the current advisory fee structure. In this regard, the Trustees noted that, unlike a mutual fund that is managed by a single investment adviser, the Funds operate in a manager-of-managers structure. Based on the foregoing, the Trustees concluded that the profitability to the Investment Manager is reasonable and that the Investment Manager is not realizing material benefits from economies of scale that would warrant adjustments to the advisory fees for any Fund at this time. With respect to economies of scale, the Trustees also noted that as a Fund’s assets increase over time, the Fund may realize other economies of scale to the extent that the increase in assets is proportionally greater than the increase in certain other expenses.
Subadvisory Fees and Profitability.
In considering the reasonableness of the fee payable by the Investment Manager to each Subadvisor (other than Essex Investment Management Company, LLC (“Essex”), which is an affiliate of the Investment Manager), the Trustees relied on the ability of the Investment Manager to negotiate the terms of the Subadvisory Agreement at arm’s length as part of the manager-of-managers structure, noting that the Subadvisors are not affiliated with the Investment Manager (other than Essex). In addition, the Trustees noted that the subadvisory fees are paid by the Investment Manager out of its advisory fee. Accordingly, the cost of services to be provided by each Subadvisor and the profitability to each Subadvisor of its relationship with a Fund were not material factors in the Trustees’ deliberations. For similar reasons, and based on the current size of the portion of the Fund managed by each Subadvisor, the Trustees concluded that any economies of scale being realized by the Subadvisors was not a material factor in the Trustees’ deliberations at this time.
In considering the reasonableness of the fee payable by the Investment Manager to Essex, a Subadvisor to the Managers AMG Essex Large Cap Growth Fund, the Trustees noted that Essex is an affiliate of the Investment Manager and reviewed information provided by Essex regarding the cost to Essex of providing subadvisory services to the Fund and the resulting profitability from such relationship. The Trustees also noted that the subadvisory fee is paid by the Investment Manager out of the advisory fee. Based on the current size of the portion of the Fund managed by Essex, the Trustees concluded that the effect of any economies of scale being realized by Essex was not a material factor in the Trustees’ deliberations at this time.
In addition to the foregoing, the Trustees considered the specific factors and related conclusions set forth below with respect to each Fund.
MANAGERS EMERGING MARKETS EQUITY FUND
Fund Performance.
Among other information relating to the Fund’s performance, the Trustees noted that the Fund’s performance for the 1-year, 3-year, 5-year and 10-year periods ended March 31, 2009 was below, below, below and above, respectively, the median performance of the Peer Group and below, below, below and above, respectively, the performance of the Fund Benchmark, the MSCI Emerging Markets Index®. The Trustees noted that the Investment Manager recently added a new Subadvisor to the Fund, and also, at meetings held on March 5-6, 2009, the Trustees previously noted that the composite portfolio performance of the Fund’s new Subadvisor was above the Fund Benchmark for various periods. The Trustees further took into account management’s discussion of the Fund’s performance, including the fact that the Fund’s 10-year performance remains above both the Fund Benchmark and the Peer Group. The Trustees concluded that management had taken appropriate steps to address the Fund’s performance.
Advisory Fees.
The Trustees noted that the Fund’s advisory fee and total expenses (net of applicable expense waivers/reimbursements) as of March 31, 2009 were both higher than the average for the Peer Group. The Trustees took into account the fact that the Investment Manager has contractually agreed, through May 1, 2010, to limit the Fund’s net annual operating expenses to 1.77%. The Trustees concluded that, in light of the nature, extent and quality of the services provided by the Investment Manager and the Subadvisors, the foregoing expense limitation and the considerations noted above with respect to the Subadvisors and the Investment Manager, the Fund’s advisory fees are reasonable.
MANAGERS GLOBAL BOND FUND
Fund Performance.
Among other information relating to the Fund’s performance, the Trustees noted that the Fund’s performance for the 1-year, 3-year, 5-year and 10-year periods ended March 31, 2009 was below the median performance of the Peer Group and below the performance of the Fund Benchmark, the Barclays Capital Global Aggregate Index, for each period. The Trustees took into account management’s discussion of the Fund’s more recent performance, including the fact that the Fund has outperformed the Fund Benchmark year-to-date through April 2009. The Trustees noted that the Fund’s long-term performance had previously been strong and had been negatively affected by the past year’s performance. The Trustees concluded that the Fund’s performance has been satisfactory in light of all factors considered.
40
Table of Contents
Annual Renewal of Investment Advisory Agreements (continued)
Advisory Fees.
The Trustees noted that the Fund’s advisory fee and total expenses (net of applicable expense waivers/reimbursements) as of March 31, 2009 were both higher than the average for the Peer Group. The Trustees took into account the fact that the Investment Manager has contractually agreed, through May 1, 2010, to limit the Fund’s net annual operating expenses to 1.10%. The Trustees concluded that, in light of the nature, extent and quality of the services provided by the Investment Manager and the Subadvisor, the foregoing expense limitation and the considerations noted above with respect to the Subadvisor and the Investment Manager, the Fund’s advisory fees are reasonable.
MANAGERS INTERNATIONAL EQUITY FUND
Fund Performance.
Among other information relating to the Fund’s performance, the Trustees noted that the Fund’s performance for the 1-year, 3-year, 5-year and 10-year periods ended March 31, 2009 was below the median performance of the Peer Group and below the performance of the Fund Benchmark, the MSCI EAFE Index®, for each period. The Trustees noted that the Investment Manager recently replaced a Subadvisor to the Fund, and also, at meetings held on March 5-6, 2009, the Trustees previously noted that the composite portfolio performance of the Fund’s new Subadvisor was above the Fund Benchmark for various periods. The Trustees further took into account management’s discussion of the Fund’s performance, including the fact that last year was the first calendar year in four years where the Fund underperformed the Fund Benchmark. The Trustees concluded that management had taken appropriate steps to address the Fund’s performance.
Advisory Fees.
The Trustees noted that the Fund’s advisory fee and total expenses (net of applicable expense waivers/reimbursements) as of March 31, 2009 were both higher than the average for the Peer Group. The Trustees took into account the fact that the Investment Manager has contractually agreed, through May 1, 2010, to limit the Fund’s net annual operating expenses to 1.48%. The Trustees concluded that, in light of the nature, extent and quality of the services provided by the Investment Manager and the Subadvisors, the foregoing expense limitation and the considerations noted above with respect to the Subadvisors and the Investment Manager, the Fund’s advisory fees are reasonable.
MANAGERS AMG ESSEX LARGE CAP GROWTH FUND
Fund Performance.
Among other information relating to the Fund’s performance, the Trustees noted that the Fund’s performance for the 1-year, 3-year, 5-year and 10-year periods ended March 31, 2009 was above, below, below and below, respectively, the median performance of the Peer Group and below, below, below and above, respectively, the performance of the Fund Benchmark, the Russell 1000® Growth Index. The Trustees took into account management’s discussion of the reasons for the Fund’s performance, including that the market environment in certain years has been particularly difficult in light of the Fund’s growth style. In addition, the Trustees noted that the Fund has performed well during market conditions favorable to growth style funds over the long run, including the fact that the Fund’s 10-year performance has exceeded the performance of the Fund Benchmark, and that the Fund’s 1-year performance has been strong relative to the Peer Group. The Trustees concluded that the Fund’s performance has been satisfactory in light of all factors considered.
Advisory Fees.
The Trustees noted that the Fund’s advisory fee and total expenses (net of applicable expense waivers/reimbursements) as of March 31, 2009 were both higher than the average for the Peer Group. The Trustees took into account the fact that the Investment Manager has contractually agreed, through May 1, 2010, to limit the Fund’s net annual operating expenses to 1.29%, provided that the amount waived may not exceed 0.25%. The Trustees concluded that, in light of the nature, extent and quality of the services provided by the Investment Manager and the Subadvisor, the foregoing expense limitation and the considerations noted above with respect to the Subadvisor and the Investment Manager, the Fund’s advisory fees are reasonable.
* * * * *
After consideration of the foregoing, the Trustees also reached the following conclusions regarding the Investment Management Agreement and each Subadvisory Agreement, in addition to those conclusions discussed above: (a) the Investment Manager and each Subadvisor have demonstrated that they possess the capability and resources to perform the duties required of them under the Investment Management Agreement and the applicable Subadvisory Agreements; (b) each Subadvisor’s Investment Strategy is appropriate for pursuing the applicable Fund’s investment objectives; (c) each Subadvisor is reasonably likely to execute its Investment Strategy consistently over time; and (d) the Investment Manager and each Subadvisor maintain appropriate compliance programs.
Based on all of the above-mentioned factors and related conclusions, with no single factor or conclusion being determinative and with each Trustee not necessarily attributing the same weight to each factor, the Trustees concluded that approval of each Investment Management Agreement and each Subadvisory Agreement (as applicable) would be in the best interests of each Fund and its shareholders. Accordingly, on June 4-5, 2009, the Trustees, including a majority of the Independent Trustees, voted to approve the Investment Management Agreement and the Subadvisory Agreements (as applicable) for each Fund, with the exception of Schroder Investment Management North America Inc. and Martin Currie Inc. (which contracts had previously been approved at meetings held on March 5-6, 2009).
41
Table of Contents
THIS PAGE INTENTIONALLY LEFT BLANK
Table of Contents
THIS PAGE INTENTIONALLY LEFT BLANK
Table of Contents
Investment Manager and Administrator
Managers Investment Group LLC
333 W. Wacker Drive
Suite 1200
Chicago, IL 60606
(800) 835-3879
Distributor
Managers Investment Group LLC
333 W. Wacker Drive
Suite 1200
Chicago, IL 60606
(800) 835-3879
Custodian
The Bank of New York Mellon
2 Hanson Place
Brooklyn, New York 11217
Legal Counsel
Ropes & Gray LLP
One International Place
Boston, Massachusetts 02110-2624
Transfer Agent
PNC Global Investment Servicing (U.S.) Inc.
Attn: Managers
P.O. Box 9769
Providence, Rhode Island 02940
(800) 548-4539
Trustees
Jack W. Aber
William E. Chapman, II
Nathaniel Dalton
Edward J. Kaier
Steven J. Paggioli
Eric Rakowski
Thomas R. Schneeweis
John H. Streur
For Managers Choice Only
Managers
c/o PNC Global Investment Servicing (U.S.) Inc.
P.O. Box 61204
King of Prussia, Pennsylvania 19406-0851
(800) 358-7668

Table of Contents
MANAGERSAND MANAGERS AMG FUNDS
EQUITY FUNDS
EMERGING MARKETS EQUITY
Rexiter Capital Management Limited
Schroder Investment Management North America Inc.
ESSEX GROWTH
ESSEX LARGE CAP GROWTH
ESSEX SMALL/MICRO CAP GROWTH
Essex Investment Management Co., LLC
FQ TAX-MANAGED U.S. EQUITY
FQ U.S. EQUITY
First Quadrant, L.P.
GW&K SMALL CAP EQUITY
Gannett Welsh & Kotler, LLC
INSTITUTIONAL MICRO-CAP
MICRO-CAP
Lord, Abbett & Co. LLC
WEDGE Capital Management L.L.P.
OFI Institutional Asset Management, Inc.
Next Century Growth Investors LLC
INTERNATIONAL EQUITY
AllianceBernstein L.P.
Lazard Asset Management, LLC
Martin Currie Inc.
CHICAGO EQUITY PARTNERS
MID-CAP
Chicago Equity Partners, LLC
REAL ESTATE SECURITIES
Urdang Securities Management, Inc.
RENAISSANCE LARGE CAP GROWTH
Renaissance Group LLC
SKYLINE SPECIAL EQUITIES PORTFOLIO
Skyline Asset Management, L.P.
SMALL CAP
TIMESSQUARE MID CAP GROWTH
TIMESSQUARE SMALL CAP GROWTH
TimesSquare Capital Management, LLC
SPECIAL EQUITY
Ranger Investment Management, L.P.
Lord, Abbett & Co. LLC
Smith Asset Management Group, L.P.
Federated MDTA LLC
SYSTEMATIC VALUE
SYSTEMATIC MID CAP VALUE
Systematic Financial Management, L.P.
BALANCED FUNDS
CHICAGO EQUITY PARTNERS BALANCED
Chicago Equity Partners, LLC
GLOBAL
AllianceBernstein L.P.
First Quadrant, L.P.
Wellington Management Company, LLP
ALTERNATIVE FUNDS
FQ GLOBAL ALTERNATIVES
First Quadrant, L.P.
INCOME FUNDS
BOND (MANAGERS)
FIXED INCOME
GLOBAL BOND
Loomis, Sayles & Co., L.P.
BOND (MANAGERS FREMONT)
Pacific Investment Management Co. LLC
CALIFORNIA INTERMEDIATE TAX-FREE
Miller Tabak Asset Management LLC
GW&K MUNICIPAL BOND
GW&K MUNICIPAL ENHANCED YIELD
Gannett Welsh & Kotler, LLC
HIGH YIELD
J.P. Morgan Investment Management LLC
INTERMEDIATE DURATION GOVERNMENT
SHORT DURATION GOVERNMENT
Smith Breeden Associates, Inc.
MONEY MARKET
JPMorgan Investment Advisors Inc.
This report is prepared for the Funds’ shareholders. It is authorized for distribution to prospective investors only when preceded or accompanied by an effective prospectus. To receive a free copy of the prospectus or Statement of Additional Information, which includes additional information about Fund Trustees, please contact us by calling 800.835.3879. Distributed by Managers Distributors, Inc., member FINRA.
A description of the policies and procedures each Fund uses to vote its proxies is available: (i) without charge, upon request, by calling 800.835.3879, or (ii) on the Securities and Exchange Commission’s (SEC) Web site at www.sec.gov. For information regarding each Fund’s proxy voting record for the 12-month period ended June 30, call 800.835.3879 or visit the SEC Web site at www.sec.gov.
The Funds file their complete schedule of portfolio holdings with the SEC for the first and third quarters of each fiscal year on Form N-Q. The Funds’ Forms N-Q are available on the SEC’s website at www.sec.gov. A Fund’s Forms N-Q may be reviewed and copied at the SEC’s Public Reference Room in Washington, DC. Information on the operation of the Public Reference Room may be obtained by calling 800.SEC.0330. To review a complete list of the Funds’ portfolio holdings, or to view the most recent quarterly holdings report, semiannual report, or annual report, please visit www.managersinvest.com.

www.managersinvest.com

Table of Contents
SEMI-ANNUAL REPORT
Managers Funds
June 30, 2009
Managers Bond Fund
SAR017-0609
Table of Contents
Managers Bond Fund
Semi-Annual Report — June 30, 2009 (unaudited)
| Page | ||
| 1 | ||
| 2 | ||
| 3 | ||
FINANCIAL STATEMENTS: | ||
| 17 | ||
Fund’s balance sheet, net asset value (NAV) per share computation and cumulative undistributed amount | ||
| 18 | ||
Detail of sources of income, Fund expenses, and realized and unrealized gains (losses) during the period | ||
| 19 | ||
Detail of changes in Fund assets for the past two periods | ||
| 20 | ||
Historical net asset values per share, distributions, total returns, expense ratios, turnover ratios and net assets | ||
| 21 | ||
Accounting and distribution policies, details of agreements and transactions with Fund management and affiliates, and descriptions of certain investment risks | ||
| 26 | ||
Nothing contained herein is to be considered an offer, sale or solicitation of an offer to buy shares of any series of the Managers Family of Funds. Such offering is made only by Prospectus, which includes details as to offering price and other material information.
Table of Contents
About Your Fund’s Expenses (unaudited)
As a shareholder of a Fund, you may incur two types of costs: (1) transaction costs, which may include sales charges (loads) on purchase payments; redemption fees; and exchange fees; and (2) ongoing costs, including management fees; distribution (12b-1) fees; and other Fund expenses. This example is intended to help you understand your ongoing costs (in dollars) of investing in the Fund and to compare these costs with the ongoing costs of investing in other mutual funds. The example is based on $1,000 invested at the beginning of the period and held for the entire period as indicated below.
Actual Expenses
The first line of the following table provides information about the actual account values and actual expenses. You may use the information in this line, together with the amount you invested, to estimate the expenses that you paid over the period. Simply divide your account value by $1,000 (for example, an $8,600 account value divided by $1,000 = 8.6), then multiply the result by the number in the first line under the heading entitled “Expenses Paid During Period” to estimate the expenses you paid on your account during this period.
Hypothetical Example for Comparison Purposes
The second line of the following table provides information about hypothetical account values and hypothetical expenses based on the Fund’s actual expense ratio and an assumed annual rate of return of 5% before expenses, which is not the Fund’s actual return. The hypothetical account values and expenses may not be used to estimate the actual ending account balance or expenses you paid for the period. You may use this information to compare the ongoing costs of investing in the Fund and other funds by comparing this 5% hypothetical example with the 5% hypothetical examples that appear in the shareholder reports of other funds.
Please note that the expenses shown in the table are meant to highlight your ongoing costs only and do not reflect any transactional costs, such as sales charges (loads), redemption fees, or exchange fees. Therefore, the second line of the table is useful in comparing ongoing costs only, and will not help you determine the relative total costs of owning different funds.
Six Months Ended June 30, 2009 | Expense Ratio for the Period | Beginning Account Value 01/01/2009 | Ending Account Value 06/30/2009 | Expenses Paid During the Period* | ||||||||
Managers Bond Fund | ||||||||||||
Based on Actual Fund Return | 0.99 | % | $ | 1,000 | $ | 1,158 | $ | 5.30 | ||||
Based on Hypothetical 5% Annual Return | 0.99 | % | $ | 1,000 | $ | 1,020 | $ | 4.96 | ||||
| * | Expenses are equal to the Fund’s annualized expense ratio multiplied by the average account value over the period, multiplied by the number of days in the most recent fiscal half-year (181), then divided by 365. |
1
Table of Contents
Managers Bond Fund Performance
All periods ended June 30, 2009 (unaudited)
The table below shows the average annual total returns from June 30, 1999 through June 30, 2009 of the Managers Bond Fund and the Barclays Capital U.S. Government / Credit Index for the same time periods.
Average Annual Total Returns1 | Six Months | One Year | Five Years | Ten Years | Inception Date | |||||||||
Managers Bond Fund2,3,4,5 | 15.77 | % | (2.42 | )% | 3.91 | % | 5.82 | % | 6/1/1984 | |||||
Barclays Capital U.S. Government / Credit Index | 0.55 | % | 5.26 | % | 4.80 | % | 5.95 | % |
The performance data shown represents past performance. Past performance is not a guarantee of future results. Current performance may be lower or higher than the performance data quoted. The investment return and principal value of an investment in the Fund will fluctuate so that an investor’s shares, when redeemed, may be worth more or less than their original cost. For performance information through the most recent month end, please call (800) 835-3879 or visit our Web site at www.managersinvest.com.
In choosing a Fund, investors should carefully consider the amount they plan to invest, their investment objectives, the Fund’s investment objectives, risks, charges and expenses before investing. For this and other information, please call (800) 835-3879 or visit www.managersinvest.com for a free prospectus. Read it carefully before investing or sending money. Distributed by Managers Distributors, Inc., member FINRA.
| 1 | Total return equals income yield plus share price change and assumes reinvestment of all dividends and capital gain distributions. Returns are net of fees and may reflect offsets of Fund expenses as described in the Prospectus. No adjustment has been made for taxes payable by shareholders on their reinvested dividends and capital gain distributions. Returns for periods greater than one year are annualized. The listed returns on the Fund are net of expenses and based on the published NAV as of June 30, 2009. All returns are in U.S. dollars($). |
| 2 | From time to time, the Fund’s advisor has waived its fees and/or absorbed Fund expenses, which has resulted in higher returns. |
| 3 | The Fund is subject to the risks associated with investments in debt securities, such as default risk, fluctuations in debtor’s perceived ability to pay its creditors. Changing interest rates may adversely affect the value of an investment. An increase in interest rates typically causes the value of bonds and other fixed-income securities to fall. |
| 4 | Investments in international securities are subject to certain risks of overseas investing including currency fluctuations and changes in political and economic conditions, which could result in significant market fluctuations. These risks are magnified in emerging markets. |
| 5 | High yield bonds (also known as “junk bonds”) are subject to additional risks such as the risk of default. |
Barclays Capital U.S. Govt./Credit Index is an index of all investment grade government and corporate bonds with a maturity between one and ten years. Unlike the Fund, the Barclays Capital U.S. Govt./Credit Index is unmanaged, is not available for investment, and does not incur expenses.
Not FDIC insured, nor bank guaranteed. May lose value.
2
Table of Contents
Fund Snapshot
June 30, 2009 (unaudited)
Portfolio Breakdown
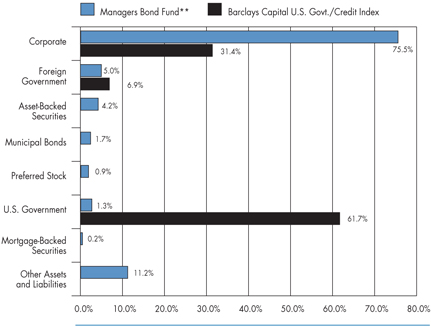
Industry | Managers Bond Fund** | Barclays Capital U.S. Govt./ Credit Index | ||||
Corporate | 75.5 | % | 31.4 | % | ||
Foreign Government | 5.0 | % | 6.9 | % | ||
Asset-Backed Securities | 4.2 | % | 0.0 | % | ||
Municipal Bonds | 1.7 | % | 0.0 | % | ||
Preferred Stock | 0.9 | % | 0.0 | % | ||
U.S. Government | 1.3 | % | 61.7 | % | ||
Mortgage-Backed Securities | 0.2 | % | 0.0 | % | ||
Other Assets and Liabilities | 11.2 | % | 0.0 | % |
| ** | As a percentage of net assets |
Top Ten Holdings
Security Name | Percentage of Net Assets | ||
Merrill Lynch & Co., Inc., 6.110%, 11/29/37 * | 2.3 | % | |
International Paper Co., 7.950%, 06/15/18 * | 2.3 | ||
Kinder Morgan Energy Partners L.P., 5.950%, 02/15/18 * | 2.1 | ||
Southwestern Electric Power Co., 4.650%, 01/15/19 * | 2.0 | ||
Equitable Resources, Inc., 6.500%, 04/01/18 * | 1.7 | ||
Dun & Bradstreet, Corp., The, 6.000%, 04/01/13* | 1.6 | ||
American General Finance Corp., MTN, Series J, 6.900%, 12/15/17 | 1.5 | ||
Panhandle Eastern Pipe Line Co., L.P., 7.000%, 6/15/18 | 1.3 | ||
Questar Market Resources, Inc., 6.800%, 04/01/18 * | 1.3 | ||
NiSource Finance Corp., 6.400%, 03/15/18 | 1.3 | ||
Top Ten as a Group | 17.4 | % | |
| * | Top Ten Holding at December 31, 2008 |
Any sectors, industries, or securities discussed should not be perceived as investment recommendations. Mention of a specific security should not be considered a recommendation to buy or solicitation to sell that security. Specific securities mentioned in this report may have been sold from the Fund’s portfolio of investments by the time you receive this report.
3
Table of Contents
Managers Bond Fund
Schedule of Portfolio Investments
June 30, 2009 (unaudited)
Security Description | Principal Amount | Value | ||||||
Corporate Bonds - 75.5% | ||||||||
Finance - 18.8% | ||||||||
American General Finance Corp., | ||||||||
5.400%, 12/01/15 | $ | 5,000,000 | $ | 2,692,850 | ||||
MTN, Series J, 6.900%, 12/15/17 | 57,315,000 | 31,035,040 | ||||||
Bank of America Capital Trust VI, 5.625%, 03/08/35 | 3,085,000 | 2,005,935 | ||||||
Barclays Capital Corp., | ||||||||
4.160%, 02/22/10 (a) | THB | 25,000,000 | 736,854 | |||||
Series EMTN, 4.100%, 03/22/10 (a) | THB | 26,000,000 | 776,719 | |||||
BNP Paribas SA DN, 14.257%, 06/13/11 (a) 4 | IDR | 19,645,500,000 | 1,470,790 | |||||
Caterpillar Financial Services Corp., 5.850%, 09/01/17 | 13,000,000 | 13,236,574 | ||||||
CIGNA Corp., 6.150%, 11/15/36 | 6,830,000 | 4,890,335 | ||||||
CIT Group, Inc., | ||||||||
5.000%, 02/13/14 | 120,000 | 71,263 | ||||||
5.125%, 09/30/14 | 206,000 | 121,423 | ||||||
5.500%, 12/20/16 | GBP | 1,900,000 | 1,562,937 | |||||
7.625%, 11/30/12 | 21,513,000 | 14,730,941 | ||||||
12.000%, 12/18/18 (a) | 33,607,000 | 15,788,602 | ||||||
15.000%, 07/02/10 (a) | BRL | 2,000,000 | 1,073,764 | |||||
Colonial Realty, L.P., | ||||||||
4.800%, 04/01/11 | 1,005,000 | 941,254 | ||||||
5.500%, 10/01/15 | 1,255,000 | 989,131 | ||||||
Duke Realty, L.P., | ||||||||
5.950%, 02/15/17 | 2,210,000 | 1,713,121 | ||||||
6.500%, 01/15/18 | 5,000,000 | 3,912,240 | ||||||
Equity One, Inc., 6.000%, 09/15/17 | 5,915,000 | 4,643,417 | ||||||
ERAC USA Finance Co., | ||||||||
6.375%, 10/15/17 (a) | 4,910,000 | 4,433,273 | ||||||
6.700%, 06/01/34 (a) | 1,250,000 | 937,829 | ||||||
7.000%, 10/15/37 (a) | 19,033,000 | 15,136,697 | ||||||
ERP Operating, L.P., | ||||||||
5.125%, 03/15/16 | 600,000 | 550,258 | ||||||
5.750%, 06/15/17 | 1,450,000 | 1,352,676 | ||||||
First Industrial L.P., 5.950%, 05/15/17 | 15,000,000 | 8,813,145 | ||||||
Ford Motor Credit Company LLC, | ||||||||
7.000%, 10/01/13 | 200,000 | 160,806 | ||||||
8.000%, 12/15/16 | 3,500,000 | 2,675,852 | ||||||
8.625%, 11/01/10 | 195,000 | 183,285 | ||||||
9.750%, 09/15/10 | 445,000 | 426,264 | ||||||
GE Capital Australia Funding Pty., Ltd., EMTN, 8.000%, 02/13/12 | AUD | 3,965,000 | 3,195,531 | |||||
The accompanying notes are an integral part of these financial statements.
4
Table of Contents
Managers Bond Fund
Schedule of Portfolio Investments (continued)
Security Description | Principal Amount | Value | ||||||
Finance - 18.8% (continued) | ||||||||
General Electric Capital Corp., | ||||||||
2.960%, 05/18/12 | SGD | 4,400,000 | $ | 2,779,230 | ||||
3.485%, 03/08/12 | SGD | 16,500,000 | 10,646,407 | |||||
6.500%, 09/28/15 | NZD | 14,950,000 | 8,395,858 | |||||
6.625%, 02/04/10 | NZD | 3,500,000 | 2,269,394 | |||||
6.750%, 09/26/16 | NZD | 6,390,000 | 3,636,904 | |||||
GMAC LLC, | ||||||||
6.000%, 12/15/11 (a) | 1,127,000 | 963,585 | ||||||
6.625%, 05/15/12 (a) | 1,374,000 | 1,147,290 | ||||||
6.750%, 12/01/14 (a) | 1,019,000 | 799,915 | ||||||
6.875%, 08/28/12 (a) | 253,000 | 2 | 211,255 | |||||
6.875%, 09/15/11 (a) | 158,000 | 138,250 | ||||||
7.000%, 02/01/12 (a) | 763,000 | 2 | 647,024 | |||||
7.250%, 03/02/11 (a) | 816,000 | 746,640 | ||||||
7.500%, 12/31/13 (a) | 584,000 | 452,600 | ||||||
8.000%, 12/31/18 (a) | 1,366,000 | 867,410 | ||||||
8.000%, 11/01/31 (a) | 1,427,000 | 998,900 | ||||||
Highwoods Realty, L.P., | ||||||||
5.850%, 03/15/17 | 3,680,000 | 2,930,715 | ||||||
7.500%, 04/15/18 | 2,405,000 | 2,081,063 | ||||||
ICICI Bank, Ltd., 6.375%, 04/30/22 (a) 7 | 900,000 | 701,870 | ||||||
International Lease Finance Corp., | ||||||||
5.000%, 04/15/10 | 1,040,000 | 952,509 | ||||||
5.550%, 09/05/12 | 345,000 | 268,034 | ||||||
6.375%, 03/25/13 | 1,730,000 | 1,316,208 | ||||||
6.625%, 12/07/09 | GBP | 9,140,000 | 14,130,377 | |||||
iStar Financial Inc., | ||||||||
1.097%, 10/01/12 (10/01/09) 6 | 8,095,000 | 3,061,529 | ||||||
5.150%, 03/01/12 | 4,360,000 | 2,201,800 | ||||||
5.125%, 04/01/11 | 280,000 | 162,400 | ||||||
5.375%, 04/15/10 | 830,000 | 2 | 705,500 | |||||
5.500%, 06/15/12 | 260,000 | 131,950 | ||||||
5.650%, 09/15/11 | 3,095,000 | 1,795,100 | ||||||
5.700%, 03/01/14 | 15,000 | 6,300 | ||||||
5.800%, 03/15/11 | 640,000 | 2 | 387,200 | |||||
5.875%, 03/15/16 | 1,340,000 | 536,000 | ||||||
5.950%, 10/15/13 | 4,725,000 | 2,079,000 | ||||||
6.050%, 04/15/15 | 620,000 | 248,000 | ||||||
8.625%, 06/01/13 | 425,000 | 221,000 | ||||||
JPMorgan Chase & Co., | ||||||||
9.683%, 05/17/10 (a) 4 | BRL | 3,600,000 | 1,690,433 | |||||
The accompanying notes are an integral part of these financial statements.
5
Table of Contents
Managers Bond Fund
Schedule of Portfolio Investments (continued)
Security Description | Principal Amount | Value | |||||
Finance - 18.8% (continued) | |||||||
JPMorgan Chase & Co., (continued) | |||||||
14.362%, 03/28/11 (a) 4 | IDR | 932,700,000 | $ | 71,738 | |||
14.588%, 04/12/12 (a) 4 | IDR | 40,733,437,680 | 2,698,802 | ||||
JPMorgan International, 13.248%, 10/21/10 (a) 4 | IDR | 16,627,462,500 | 1,377,274 | ||||
Kaupthing Bank, | |||||||
3.413%, 01/15/10 (a) 8 | 1,000,000 | 130,000 | |||||
5.750%, 10/04/11 (a) 8 | 10,000,000 | 1,300,000 | |||||
6.125%, 10/04/16 (a) 8 | 1,800,000 | 234,000 | |||||
KfW Bankengruppe, 10.750%, 02/01/10 | ISK | 20,000,000 | 160,859 | ||||
Kinder Morgan Finance Co., 5.700%, 01/05/16 | 370,000 | 317,275 | |||||
Marsh & McLennan Companies, Inc., | |||||||
5.375%, 07/15/14 | 4,390,000 | 4,273,700 | |||||
5.750%, 09/15/15 | 11,939,000 | 11,374,632 | |||||
5.875%, 08/01/33 | 10,360,000 | 8,198,521 | |||||
MBIA Insurance Corp., 14.000%, 01/15/33 (a) 7 | 525,000 | 199,500 | |||||
Merrill Lynch & Co., Inc., | |||||||
4.625%, 09/14/18 | EUR | 1,750,000 | 1,640,691 | ||||
6.110%, 01/29/37 | 60,150,000 | 46,457,152 | |||||
10.710%, 03/08/17 | BRL | 2,500,000 | 1,085,790 | ||||
Morgan Stanley, | |||||||
4.750%, 04/01/14 | 10,715,000 | 10,121,282 | |||||
5.550%, 04/27/17 | 11,000,000 | 10,239,658 | |||||
6.625%, 04/01/18 | 3,095,000 | 3,085,424 | |||||
Mutual of Omaha Insurance Co., 6.800%, 06/15/36 (a) | 13,925,000 | 9,544,808 | |||||
National City Bank of Indiana, 4.250%, 07/01/18 | 6,310,000 | 5,297,554 | |||||
National City Corp., 6.875%, 05/15/19 | 1,905,000 | 1,827,796 | |||||
ProLogis Trust, | |||||||
5.625%, 11/15/15 | 345,000 | 273,553 | |||||
5.750%, 04/01/16 | 280,000 | 220,697 | |||||
Qwest Capital Funding, Inc., 6.875%, 07/15/28 | 1,190,000 | 809,200 | |||||
Realty Income Corp., 6.750%, 08/15/19 | 7,675,000 | 6,914,415 | |||||
SLM Corp., | |||||||
5.000%, 10/01/13 | 2,060,000 | 1,666,245 | |||||
5.000%, 04/15/15 | 50,000 | 38,087 | |||||
5.125%, 08/27/12 | 540,000 | 461,894 | |||||
5.375%, 01/15/13 | 2,460,000 | 2,055,089 | |||||
5.375%, 05/15/14 | 300,000 | 241,113 | |||||
5.400%, 10/25/11 | 520,000 | 467,683 | |||||
6.500%, 06/15/10 | NZD | 500,000 | 236,356 | ||||
8.450%, 06/15/18 | 18,665,000 | 15,967,628 | |||||
St. Paul Travelers Companies, Inc., The, 6.750%, 06/20/36 | 2,610,000 | 2,829,402 | |||||
The accompanying notes are an integral part of these financial statements.
6
Table of Contents
Managers Bond Fund
Schedule of Portfolio Investments (continued)
Security Description | Principal Amount | Value | ||||
Finance - 18.8% (continued) | ||||||
Toll Brothers Finance Corp., 5.150%, 05/15/15 | $ | 3,785,000 | $ | 3,351,156 | ||
Travelers Cos., Inc., | ||||||
6.250%, 06/15/37 | 7,120,000 | 7,373,764 | ||||
6.375%, 03/15/33 | 3,040,000 | 3,187,948 | ||||
White Mountains Insurance Group, Ltd., 6.375%, 03/20/17 (a) 5 | 4,555,000 | 3,464,182 | ||||
Willis North America, Inc., 6.200%, 03/28/17 | 5,685,000 | 5,034,534 | ||||
Total Finance | 384,795,858 | |||||
Industrial - 46.2% | ||||||
Agilent Technologies, Inc., 6.500%, 11/01/17 | 6,945,000 | 6,044,991 | ||||
Albertson’s, Inc., | ||||||
6.625%, 06/01/28 | 1,015,000 | 751,100 | ||||
7.450%, 08/01/29 | 3,195,000 | 2,619,900 | ||||
7.750%, 06/15/26 | 915,000 | 780,038 | ||||
8.000%, 01/15/24 | 250,000 | 155,992 | ||||
Anadarko Petroleum Corp., | ||||||
5.950%, 09/15/16 | 4,915,000 | 4,849,257 | ||||
6.450%, 09/15/36 | 13,875,000 | 12,472,460 | ||||
Anheuser-Busch Companies, Inc., | ||||||
5.950%, 01/15/33 | 6,177,000 | 5,090,948 | ||||
6.450%, 09/01/37 | 7,900,000 | 7,358,684 | ||||
AT&T Corp., | ||||||
6.150%, 09/15/34 | 6,945,000 | 6,593,048 | ||||
6.500%, 03/15/29 | 6,415,000 | 6,131,438 | ||||
6.500%, 09/01/37 | 4,970,000 | 4,929,485 | ||||
Avnet, Inc., | ||||||
5.875%, 03/15/14 | 11,000,000 | 10,360,328 | ||||
6.000%, 09/01/15 | 5,340,000 | 4,910,514 | ||||
6.625%, 09/15/16 | 1,370,000 | 1,284,501 | ||||
BellSouth Corp., | ||||||
6.000%, 11/15/34 | 2,370,000 | 2,233,825 | ||||
6.550%, 06/15/34 | 1,800,000 | 1,764,614 | ||||
Camden Property Trust, 5.700%, 05/15/17 | 5,205,000 | 4,702,296 | ||||
Canadian Pacific Railway Co., | ||||||
5.750%, 03/15/33 | 195,000 | 157,190 | ||||
5.950%, 05/15/37 | 9,340,000 | 7,644,855 | ||||
Centex Corp., 5.250%, 06/15/15 | 1,915,000 | 1,651,688 | ||||
Chartered Semiconductor Manufacturing, Ltd., 6.250%, 04/04/13 | 5,600,000 | 5,067,849 | ||||
Colonial Realty, L.P., 6.050%, 09/01/16 | 470,000 | 370,482 | ||||
Comcast Corp., | ||||||
5.650%, 06/15/35 | 13,285,000 | 12,167,413 | ||||
6.500%, 11/15/35 | 1,320,000 | 1,334,379 | ||||
The accompanying notes are an integral part of these financial statements.
7
Table of Contents
Managers Bond Fund
Schedule of Portfolio Investments (continued)
Security Description | Principal Amount | Value | ||||||
Industrial - 46.2% (continued) | ||||||||
Comcast Corp., (continued) | ||||||||
6.950%, 08/15/37 | $ | 19,230,000 | $ | 20,050,717 | ||||
Continental Airlines, Inc., | ||||||||
5.983%, 04/19/22 | 16,735,000 | 13,806,375 | ||||||
6.795%, 08/02/20 | 43,331 | 31,632 | ||||||
Series B, 6.903%, 04/19/22 | 5,595,000 | 3,468,900 | ||||||
Corn Products International, Inc., 6.625%, 04/15/37 | 4,055,000 | 3,227,022 | ||||||
Corning, Inc., | ||||||||
6.850%, 03/01/29 | 9,142,000 | 8,481,902 | ||||||
7.250%, 08/15/36 | 1,185,000 | 1,149,400 | ||||||
CSX Corp., | ||||||||
6.000%, 10/01/36 | 11,635,000 | 10,539,390 | ||||||
6.250%, 03/15/18 | 16,400,000 | 16,540,253 | ||||||
Cummins Engine Co., Inc., | ||||||||
5.650%, 03/01/98 | 11,235,000 | 5,970,358 | ||||||
6.750%, 02/15/27 | 2,853,000 | 2,236,384 | ||||||
7.125%, 03/01/28 | 50,000 | 40,035 | ||||||
D.R. Horton, Inc., 5.250%, 02/15/15 | 5,495,000 | 4,560,850 | ||||||
Delta Air Lines, Inc., 8.021%, 08/10/22 | 14,658,976 | 9,528,334 | ||||||
Desarrolladora Homex, S.A. de C.V., 7.500%, 09/28/15 | 2,725,000 | 2,343,500 | ||||||
Dillards, Inc., 7.000%, 12/01/28 | 225,000 | 109,125 | ||||||
DP World, Ltd., 6.850%, 07/02/37 (a) | 28,350,000 | 18,852,750 | ||||||
Duke Energy Field Services LLC, 6.450%, 11/03/36 (a) | 2,615,000 | 2,091,864 | ||||||
Dun & Bradstreet Corp., The, 6.000%, 04/01/13 | 32,120,000 | 32,200,782 | ||||||
El Paso Corp., 6.950%, 06/01/28 | 1,030,000 | 774,954 | ||||||
Energy Transfer Partners, L.P., | ||||||||
6.125%, 02/15/17 | 700,000 | 695,426 | ||||||
6.625%, 10/15/36 | 1,805,000 | 1,763,611 | ||||||
Enterprise Products Operating L.P., 6.300%, 09/15/17 | 8,440,000 | 8,481,862 | ||||||
Equifax, Inc., 7.000%, 07/01/37 | 4,421,000 | 4,284,104 | ||||||
Equitable Resources, Inc., 6.500%, 04/01/18 | 35,420,000 | 34,225,071 | ||||||
Eurofima, 11.000%, 02/05/10 | ISK | 60,000,000 | 479,915 | |||||
Foot Locker, Inc., 8.500%, 01/15/22 | 570,000 | 495,900 | ||||||
Ford Motor Co., 6.375%, 02/01/29 | 1,990,000 | 1,074,600 | ||||||
Freescale Semiconductor, Inc., 10.125%, 12/15/16 | 270,000 | 91,800 | ||||||
GTE Corp., 6.940%, 04/15/28 | 130,000 | 130,347 | ||||||
HCA, Inc., | ||||||||
5.750%, 03/15/14 | 5,960,000 | 4,768,000 | ||||||
6.250%, 02/15/13 | 2,200,000 | 1,925,000 | ||||||
6.375%, 01/15/15 | 2,330,000 | 1,893,125 | ||||||
6.625%, 02/15/16 | 6,850,000 | 5,531,375 | ||||||
6.750%, 07/15/13 | 190,000 | 167,200 | ||||||
The accompanying notes are an integral part of these financial statements.
8
Table of Contents
Managers Bond Fund
Schedule of Portfolio Investments (continued)
Security Description | Principal Amount | Value | ||||
Industrial - 46.2% (continued) | ||||||
HCA, Inc., (continued) | ||||||
7.050%, 12/01/27 | $ | 1,685,000 | $ | 1,026,266 | ||
7.190%, 11/15/15 | 1,090,000 | 839,962 | ||||
7.500%, 11/06/33 | 925,000 | 527,250 | ||||
7.500%, 12/15/23 | 1,172,000 | 763,408 | ||||
7.580%, 09/15/25 | 1,680,000 | 1,034,425 | ||||
7.690%, 06/15/25 | 2,589,000 | 1,589,923 | ||||
7.750%, 07/15/36 | 330,000 | 196,170 | ||||
8.360%, 04/15/24 | 2,105,000 | 1,389,717 | ||||
Home Depot, Inc., The, | ||||||
5.400%, 03/01/16 | 93,000 | 92,835 | ||||
5.875%, 12/16/36 | 20,049,000 | 17,688,511 | ||||
Hospira, Inc., 6.050%, 03/30/17 | 3,395,000 | 3,315,543 | ||||
International Paper Co., | ||||||
5.500%, 01/15/14 | 550,000 | 505,269 | ||||
7.950%, 06/15/18 | 48,010,000 | 46,317,214 | ||||
Intuit, Inc., 5.750%, 03/15/17 | 3,560,000 | 3,382,434 | ||||
iStar Financial, Inc., 5.850%, 03/15/17 | 325,000 | 130,000 | ||||
Kinder Morgan Energy Partners L.P., | ||||||
5.800%, 03/15/35 | 3,360,000 | 2,836,448 | ||||
5.950%, 02/15/18 | 44,630,000 | 43,687,504 | ||||
KLA Instruments Corp., 6.900%, 05/01/18 | 24,365,000 | 21,905,938 | ||||
Koninklijke KPN, N.V., | ||||||
6.875%, 03/11/38 | 22,735,000 | 24,352,482 | ||||
8.375%, 10/01/30 | 815,000 | 931,575 | ||||
Kraft Foods, Inc., | ||||||
6.500%, 11/01/31 | 13,635,000 | 13,538,164 | ||||
7.000%, 08/11/37 | 7,280,000 | 7,688,022 | ||||
Lennar Corp., | ||||||
5.500%, 09/01/14 | 1,900,000 | 1,520,000 | ||||
5.600%, 05/31/15 | 2,740,000 | 2,157,750 | ||||
6.500%, 04/15/16 | 2,340,000 | 1,872,000 | ||||
Lowe’s Companies, Inc., | ||||||
5.500%, 10/15/35 | 175,000 | 160,040 | ||||
6.650%, 09/15/37 | 6,420,000 | 7,001,941 | ||||
6.875%, 02/15/28 | 500,000 | 525,428 | ||||
Lubrizol Corp., 6.500%, 10/01/34 | 16,940,000 | 15,013,736 | ||||
Lucent Technologies, Inc., | ||||||
6.450%, 03/15/29 | 4,335,000 | 2,460,112 | ||||
6.500%, 01/15/28 | 305,000 | 170,800 | ||||
The accompanying notes are an integral part of these financial statements.
9
Table of Contents
Managers Bond Fund
Schedule of Portfolio Investments (continued)
Security Description | Principal Amount | Value | |||||
Industrial - 46.2% (continued) | |||||||
Marks & Spencer Group PLC, 7.125%, 12/01/37 (a) | $ | 4,725,000 | $ | 3,497,856 | |||
Masco Corp., 5.850%, 03/15/17 | 8,150,000 | 6,510,236 | |||||
Missouri Pacific Railroad Co., 5.000%, 01/01/45 | 825,000 | 412,500 | |||||
Motorola, Inc., | |||||||
5.220%, 10/01/97 | 895,000 | 398,721 | |||||
6.500%, 09/01/25 | 1,345,000 | 941,500 | |||||
6.500%, 11/15/28 | 1,430,000 | 972,400 | |||||
8.000%, 11/01/11 | 1,075,000 | 1,082,200 | |||||
New England Telephone & Telegraph Co., 7.875%, 11/15/29 | 2,390,000 | 2,453,925 | |||||
Newmont Mining Corp., 5.875%, 04/01/35 | 11,660,000 | 10,887,642 | |||||
News America, Inc., | |||||||
6.150%, 03/01/37 | 4,075,000 | 3,456,134 | |||||
6.200%, 12/15/34 | 3,440,000 | 2,936,714 | |||||
6.400%, 12/15/35 | 5,820,000 | 5,093,868 | |||||
Nextel Communications, Inc., | |||||||
5.950%, 03/15/14 | 18,220,000 | 14,348,250 | |||||
6.875%, 10/31/13 | 20,000 | 16,550 | |||||
7.375%, 08/01/15 | 3,775,000 | 3,010,562 | |||||
NGPL Pipeco LLC, 7.119%, 12/15/17 (a) | 21,980,000 | 23,039,524 | |||||
Northwest Airlines, Inc., 8.028%, 11/01/17 | 8,777,514 | 2 | 5,617,609 | ||||
ONEOK Partners, L.P., 6.650%, 10/01/36 | 2,650,000 | 2,443,324 | |||||
Owens & Minor, Inc., 6.350%, 04/15/16 | 1,355,000 | 1,185,647 | |||||
Owens Corning, Inc., | |||||||
6.500%, 12/01/16 | 2,655,000 | 2,327,275 | |||||
7.000%, 12/01/36 | 4,990,000 | 3,536,568 | |||||
Panhandle Eastern Pipe Line Co., L.P., | |||||||
6.200%, 11/01/17 | 5,520,000 | 5,321,346 | |||||
7.000%, 06/15/18 | 26,505,000 | 26,905,596 | |||||
PF Export Rec Master Trust, 6.436%, 06/01/15 (a) | 484,164 | 489,005 | |||||
Plains All American Pipeline L.P., | |||||||
6.125%, 01/15/17 | 2,770,000 | 2,670,948 | |||||
6.500%, 05/01/18 | 8,975,000 | 9,081,910 | |||||
6.650%, 01/15/37 | 5,960,000 | 5,529,396 | |||||
Pulte Homes, Inc., | |||||||
Senior Notes, 5.200%, 02/15/15 | 3,165,000 | 2,642,775 | |||||
6.000%, 02/15/35 | 10,320,000 | 6,708,000 | |||||
6.375%, 05/15/33 | 4,670,000 | 3,082,200 | |||||
Qantas Airways, Ltd., 6.050%, 04/15/16 (a) | 11,800,000 | 10,659,565 | |||||
Questar Market Resources, Inc., 6.800%, 04/01/18 | 27,465,000 | 25,878,208 | |||||
Qwest Capital Funding, Inc., | |||||||
6.500%, 11/15/18 | 620,000 | 477,400 | |||||
7.625%, 08/03/21 | 2,135,000 | 1,633,275 | |||||
The accompanying notes are an integral part of these financial statements.
10
Table of Contents
Managers Bond Fund
Schedule of Portfolio Investments (continued)
Security Description | Principal Amount | Value | |||||||
Industrial - 46.2% (continued) | |||||||||
Qwest Corp., | |||||||||
6.500%, 06/01/17 | $ | 155,000 | $ | 136,400 | |||||
6.875%, 09/15/33 | 7,209,000 | 5,262,570 | |||||||
7.200%, 11/10/26 | 435,000 | 328,425 | |||||||
7.250%, 09/15/25 | 1,085,000 | 830,025 | |||||||
7.250%, 10/15/35 | 2,165,000 | 1,569,625 | |||||||
7.500%, 06/15/23 | 839,000 | 667,005 | |||||||
Reynolds American, Inc., | |||||||||
6.750%, 06/15/17 | 8,170,000 | 7,628,354 | |||||||
7.250%, 06/15/37 | 2,000,000 | 1,651,108 | |||||||
Samsung Electronics Co., Ltd., 7.700%, 10/01/27 (a) | 4,180,000 | 4,235,418 | |||||||
Simon Property Group, L.P., 5.750%, 12/01/15 | 445,000 | 409,837 | |||||||
Southern Natural Gas Co., 5.900%, 04/01/17 (a) | 4,765,000 | 4,614,931 | |||||||
Sprint Capital Corp., 6.875%, 11/15/28 | 27,000 | 19,170 | |||||||
Sprint Nextel Corp., 6.000%, 12/01/16 | 48,000 | 39,240 | |||||||
Talisman Energy, Inc., | |||||||||
5.850%, 02/01/37 | 3,674,000 | 3,135,899 | |||||||
6.250%, 02/01/38 | 3,635,000 | 3,273,943 | |||||||
Teck Cominco Ltd., 7.000%, 09/15/12 | 1,000,000 | 987,500 | |||||||
Telecom Italia Capital S.p.A., | |||||||||
6.000%, 09/30/34 | 3,210,000 | 2,711,188 | |||||||
6.375%, 11/15/33 | 3,170,000 | 2,817,353 | |||||||
Telekom Malaysia Berhad, 7.875%, 08/01/25 (a) | 250,000 | 274,380 | |||||||
TELUS Corp., 4.950%, 03/15/17 | CAD | 7,115,000 | 6,039,385 | ||||||
Tennessee Gas Pipeline Co., 7.000%, 10/15/28 | 1,605,000 | 1,529,427 | |||||||
Texas Eastern Transmission, L.P., 6.000%, 09/15/17 (a) | 3,000,000 | 2,995,848 | |||||||
Time Warner, Inc., 6.500%, 11/15/36 | 3,360,000 | 2,942,349 | |||||||
Toro Co., The, 6.625%, 05/01/37 | 6,810,000 | 4,949,413 | |||||||
Transocean, Inc., 7.375%, 04/15/18 | 500,000 | 552,866 | |||||||
U.S. Steel Corp., | |||||||||
6.050%, 06/01/17 | 2,115,000 | 1,803,871 | |||||||
6.650%, 06/01/37 | 3,595,000 | 2,716,116 | |||||||
7.000%, 02/01/18 | 22,850,000 | 19,850,640 | |||||||
Union Pacific Corp., 5.375%, 06/01/33 | 2,525,000 | 2,209,484 | |||||||
United Airlines, Inc., 6.636%, 07/02/22 | 17,354,410 | 2 | 13,015,807 | ||||||
UnitedHealth Group, Inc., | |||||||||
5.800%, 03/15/36 | 13,506,000 | 10,924,409 | |||||||
6.500%, 06/15/37 | 310,000 | 268,782 | |||||||
6.625%, 11/15/37 | 1,540,000 | 1,380,762 | |||||||
USG Corp., 6.300%, 11/15/16 | 1,410,000 | 1,043,400 | |||||||
V.F. Corp., 6.450%, 11/01/37 | 9,334,000 | 8,857,565 | |||||||
Vale Overseas Ltd., 6.875%, 11/01/36 | 3,665,000 | 3,479,936 | |||||||
The accompanying notes are an integral part of these financial statements.
11
Table of Contents
Managers Bond Fund
Schedule of Portfolio Investments (continued)
Security Description | Principal Amount | Value | ||||
Industrial - 46.2% (continued) | ||||||
Verizon Global Funding Corp., 5.850%, 09/15/35 | $ | 8,900,000 | $ | 8,277,881 | ||
Verizon Maryland, Inc., 5.125%, 06/15/33 | 1,055,000 | 781,632 | ||||
Verizon New York, Inc., Series B, 7.375%, 04/01/32 | 3,090,000 | 3,010,538 | ||||
Viacom, Inc., 6.875%, 04/30/36 | 4,160,000 | 3,832,645 | ||||
Vondafone Group PLC, 6.150%, 02/27/37 | 13,185,000 | 12,972,075 | ||||
Watson Pharmaceuticals, Inc., Convertible 1.750%, 03/15/23 | 515,000 | 507,919 | ||||
Weatherford International, Inc., 6.500%, 08/01/36 | 1,565,000 | 1,416,311 | ||||
Wellpoint, Inc., 6.375%, 06/15/37 | 13,650,000 | 12,515,398 | ||||
Western Union Co., 6.200%, 11/17/36 | 12,735,000 | 12,000,585 | ||||
Weyerhaeuser Co., 6.875%, 12/15/33 | 12,890,000 | 8,783,349 | ||||
White Pine Hydro LLC, | ||||||
6.310%, 07/10/17 (a) 5 | 1,700,000 | 1,442,776 | ||||
6.960%, 07/10/37 (a) | 1,645,000 | 1,169,000 | ||||
Williams Co., Inc., Series A, 7.500%, 01/15/31 | 1,000,000 | 880,000 | ||||
XTO Energy, Inc., 6.100%, 04/01/36 | 190,000 | 184,141 | ||||
Total Industrial | 946,235,315 | |||||
Utility - 10.5% | ||||||
Abu Dhabi National Energy Co., 7.250%, 08/01/18 (a) | 21,130,000 | 21,099,256 | ||||
Ameren Energy Generating Co., 7.000%, 04/15/18 | 22,700,000 | 20,462,733 | ||||
Baltimore Gas & Electric Co., 5.200%, 06/15/33 | 1,470,000 | 1,221,999 | ||||
Bruce Mansfield Unit 1 2, 6.850%, 06/01/34 | 10,675,000 | 9,399,803 | ||||
Cleveland Electric Illuminating Co., The, 5.950%, 12/15/36 | 15,645,000 | 13,630,487 | ||||
Commonwealth Edison Co., 5.875%, 02/01/33 | 5,000,000 | 4,792,035 | ||||
Constellation Energy Group, Inc., 4.550%, 06/15/15 | 1,675,000 | 1,451,803 | ||||
Dominion Resources, Inc., 5.950%, 06/15/35 | 740,000 | 705,899 | ||||
Empresa Nacional de Electricidad, 7.875%, 02/01/27 | 2,900,000 | 3,062,478 | ||||
Illinois Power Co., 6.250%, 04/01/18 | 26,000,000 | 24,622,779 | ||||
ITC Holdings Corp., | ||||||
5.875%, 09/30/16 (a) | 2,410,000 | 2,281,222 | ||||
6.375%, 09/30/36 (a) | 3,605,000 | 3,023,240 | ||||
Mackinaw Power LLC, 6.296%, 10/31/23 (a) | 9,647,621 | 7,954,560 | ||||
Methanex Corp., 6.000%, 08/15/15 | 3,825,000 | 2,944,168 | ||||
MidAmerican Energy Holdings Co., | ||||||
6.125%, 04/01/36 | 2,305,000 | 2,278,442 | ||||
6.500%, 09/15/37 | 6,450,000 | 6,694,094 | ||||
NiSource Finance Corp., | ||||||
6.150%, 03/01/13 | 1,250,000 | 1,242,536 | ||||
6.400%, 03/15/18 | 27,910,000 | 25,607,230 | ||||
6.800%, 01/15/19 | 11,625,000 | 10,893,706 | ||||
ONEOK, Inc., 6.000%, 06/15/35 | 9,210,000 | 7,719,629 | ||||
Southwestern Electric Power Co., 6.450%, 01/15/19 | 39,195,000 | 39,972,863 | ||||
The accompanying notes are an integral part of these financial statements.
12
Table of Contents
Managers Bond Fund
Schedule of Portfolio Investments (continued)
Security Description | Principal Amount | Value | |||||||
Utility - 10.5% (continued) | |||||||||
Tenaga Nasional Berhad, 7.500%, 11/01/25 (a) | $ | 2,000,000 | $ | 2,040,738 | |||||
Toledo Edison Co., 6.150%, 05/15/37 | 2,390,000 | 2,249,743 | |||||||
Total Utility | 215,351,443 | ||||||||
Total Corporate Bonds (cost $1,729,621,123) | 1,546,382,616 | ||||||||
Foreign Government Obligations - 5.0% | |||||||||
Alberta, Province of, Series CS, Sinking Fund, 5.930%, 09/16/16 | CAD | 145,994 | 138,912 | ||||||
Brazil, Republic of, | |||||||||
10.250%, 01/10/28 | BRL | 5,750,000 | 2,890,406 | ||||||
12.500%, 01/05/22 | BRL | 5,160,000 | 2 | 2,922,991 | |||||
Canadian Government, | |||||||||
2.750%, 12/01/10 | CAD | 7,940,000 | 7,014,560 | ||||||
3.750%, 09/01/11 | CAD | 4,160,000 | 3,755,248 | ||||||
3.750%, 06/01/12 | CAD | 12,235,000 | 11,084,554 | ||||||
5.250%, 06/01/12 | CAD | 7,870,000 | 7,415,114 | ||||||
5.750%, 06/01/33 | CAD | 2,145,000 | 2,344,830 | ||||||
European Investment Bank, | |||||||||
4.600%, 01/30/37 (a) | CAD | 7,270,000 | 5,492,049 | ||||||
6.507%, 03/10/21 4 | AUD | 5,000,000 | 1,905,266 | ||||||
7.000%, 01/18/12 | NZD | 4,746,000 | 3,227,467 | ||||||
11.250%, 02/14/13 | BRL | 13,490,000 | 7,161,851 | ||||||
11.505%, 04/24/13 (a) 4 | IDR | 50,074,770,000 | 3,200,959 | ||||||
Inter-American Development Bank, | |||||||||
6.000%, 12/15/17 | NZD | 4,215,000 | 2,645,683 | ||||||
11.037%, 05/20/13 4 | IDR | 45,580,000,000 | 2,940,429 | ||||||
Series EMTN, 12.542%, 09/23/13 4 | IDR | 33,430,000,000 | 2,080,307 | ||||||
International Bank for Reconstruction & Development, | |||||||||
Series GDIF, 1.430%, 03/05/14 | SGD | 5,800,000 | 3,865,085 | ||||||
9.500%, 05/27/10 | ISK | 179,000,000 | 1,408,094 | ||||||
Mexican Bonos, Series M 10, 7.250%, 12/15/16 | MXN | 31,000,000 | 2,261,747 | ||||||
Mexican Fixed Rate Bonds, 8.000%, 12/07/23 | MXN | 141,360,000 | 10,315,713 | ||||||
Mexican Government, 9.000%, 12/20/12 | MXN | 26,900,000 | 2,196,451 | ||||||
New South Wales Treasury Corp., Series 10RG, 7.000%, 12/01/10 | AUD | 10,320,000 | 8,676,717 | ||||||
Province of Manitoba Canada, 6.360%, 09/01/15 | NZD | 5,000,000 | 3,104,674 | ||||||
Queensland Treasury Corp., 7.125%, 09/18/17 (a) | NZD | 7,500,000 | 4,933,012 | ||||||
Total Foreign Government Obligations (cost $111,510,248) | 102,982,119 | ||||||||
Municipal Bonds - 1.7% | |||||||||
Alabama Public School & College Authority, Capital Improvement Bond, 4.500%, 12/01/26 | 600,000 | 575,484 | |||||||
Buckeye Tobacco Settlement Financing Authority, Asset-A-2, 5.875%, 06/01/47 | 5,035,000 | 2,842,258 | |||||||
Chicago Illinois Board of Education, Dedicated-Series B, 4.750%, 12/01/31 | 1,040,000 | 978,120 | |||||||
Chicago Illinois O’Hare International Airport Revenue Bond, Series A, 4.500%, 01/01/38 | 315,000 | 277,899 | |||||||
District of Columbia, Series A, 4.750%, 06/01/36 | 600,000 | 534,984 | |||||||
The accompanying notes are an integral part of these financial statements.
13
Table of Contents
Managers Bond Fund
Schedule of Portfolio Investments (continued)
Security Description | Principal Amount | Value | ||||
Municipal Bonds - 1.7% (continued) | ||||||
Florida State Turnpike Authority, Revenue Bond, Department of Transportation, Series A, 3.500%, 07/01/27 | $ | 600,000 | $ | 470,244 | ||
Green Bay Wisconsin, Water System Revenue Refunding Bonds, 3.500%, 11/01/26 (FSA Insured) | 410,000 | 350,808 | ||||
Green Bay Wisconsin, Water System Revenue Refunding Bonds, 3.500%, 11/01/29 (FSA Insured) | 445,000 | 360,913 | ||||
Grosse Pointe Michigan Public School System, 3.000%, 05/01/27 | 365,000 | 280,229 | ||||
Harris County Texas, Road Bonds, Series B, 4.500%, 10/01/31 | 1,715,000 | 1,645,028 | ||||
JEA Florida Water & Sewer System Revenue Bond, Series B, 4.750%, 10/01/41 | 955,000 | 853,932 | ||||
Louisianna State, Series C, 3.250%, 05/01/26 (FSA Insured) | 605,000 | 447,827 | ||||
Massachusetts State School Building Authdedicated Sales Tax Revenue Bond, Series A, 4.750%, 08/15/32 | 600,000 | 581,154 | ||||
Michigan Tobacco Settlement Financial Authority Series A, 7.309%, 06/01/34 | 3,075,000 | 2,048,965 | ||||
Omaha Public Power District (Nebraska), Electric System Subordinated Revenue Bonds, Series AA, 4.500%, 02/01/34 | 1,505,000 | 1,406,949 | ||||
San Diego California Unified School District, Refunding Bonds, Election 1998, Series F-1, 4.500%, 07/01/29 | 630,000 | 574,497 | ||||
San Jose California Redevelopment Agency Tax Allocation, Series C, 3.750%, 08/01/28 | 765,000 | 528,745 | ||||
San Jose Redevelopment Agency, 3.750%, 08/01/28 | 280,000 | 209,314 | ||||
State of California (AMBAC Insured), 4.500%, 08/01/27 | 950,000 | 768,806 | ||||
State of California (AMBAC Insured), 4.500%, 08/01/30 | 770,000 | 601,770 | ||||
State of California, 4.500%, 10/01/29 | 2,655,000 | 2,094,184 | ||||
State of California, 4.500%, 08/01/30 | 665,000 | 519,711 | ||||
State of California, Variable Purpose Bond, 3.250%, 12/01/27 | 495,000 | 318,226 | ||||
State of California, Variable Purpose Bond, 4.500%, 12/01/33 | 2,330,000 | 1,768,656 | ||||
Tobacco Settlement Financing Corp., VA, 6.706%, 06/01/46 | 21,620,000 | 13,376,944 | ||||
University of California Regents Medical Center, Series A, 4.750%, 05/15/31 | 165,000 | 157,012 | ||||
Wisconsin Housing & Economic Development Authority, Revenue Bonds, Series E, 4.900%, 11/01/35 | 155,000 | 138,657 | ||||
Total Municipal Bonds (cost $46,559,549) | 34,711,316 | |||||
Asset-Backed Securities - 4.2% | ||||||
ARG Funding Corp., Series 2005-2A, Class A5, 2.639%, 05/20/11 (07/20/09) (a) 6 | 14,830,000 | 13,867,121 | ||||
Capital One Auto Finance Trust 2006-C A4, 0.349%, 05/15/13 (07/15/09) 6 | 14,765,000 | 13,512,286 | ||||
Chase Issuance Trust, Series 2007-B1, Class B1, 0.569%, 04/15/19 (07/15/09) 6 | 17,040,000 | 11,859,077 | ||||
Chase Issuance Trust, Series 2005-C1, Class C1, 0.689%, 11/15/12 (07/15/09) 6 | 1,175,000 | 1,134,301 | ||||
CITEC, Series 2008-VT1, Class A3, 6.590%, 12/22/14 | 7,270,000 | 7,332,252 | ||||
Citibank Credit Card Issuance Trust, Series 2008-C6, Class C6, 6.300%, 06/20/14 | 15,450,000 | 14,599,756 | ||||
Community Program Loan Trust, Series 87-A, Class A4, 4.500%, 10/01/18 | 80,446 | 80,419 | ||||
Community Program Loan Trust, Series 87-A, Class A5, 4.500%, 04/01/29 | 3,225,000 | 2,864,700 | ||||
MBNA Credit Card Master Note Trust, Series 2005-B2, Class B, 0.499%, 12/17/12 (07/15/09) 6 | 10,405,000 | 10,146,247 | ||||
MBNA, Series 2002-C1, Class C1, 6.800%, 07/15/14 | 6,911,000 | 6,716,180 | ||||
Merrill Auto Trust Securitization, Series 2008-1, Class B, 6.750%, 04/15/15 | 4,035,000 | 3,454,644 | ||||
Total Asset-Backed Securities (cost $87,844,402) | 85,566,983 | |||||
The accompanying notes are an integral part of these financial statements.
14
Table of Contents
Managers Bond Fund
Schedule of Portfolio Investments (continued)
Security Description | Principal Amount | Value | |||||
U.S. Government and Agency Obligations - 1.3% | |||||||
U.S. Government - 1.0% | |||||||
USTN, 3.125%, 05/15/19 | $ | 20,000,000 | 2 | $ | 19,343,800 | ||
Federal Home Loan Mortgage Corporation - 0.0%# | |||||||
FHLMC, Gold, 5.000%, 12/01/31 | 147,608 | 151,136 | |||||
Federal National Mortgage Association - 0.3% | |||||||
FNMA, 4.000%, 10/01/18 | 3,449,134 | 3,527,099 | |||||
FNMA, 4.000%, 10/01/18 | 3,227,050 | 3,299,995 | |||||
FNMA, 6.000%, 07/01/29 | 14,522 | 15,357 | |||||
Total Federal National Mortgage Association | 6,842,451 | ||||||
Total U.S. Government and Agency Obligations (cost $25,771,780) | 26,337,387 | ||||||
Mortgage-Backed Securities - 0.2% | |||||||
Bank of America-First Union, Series 2001, 5.464%, 04/11/37 | 1,500,000 | 1,509,867 | |||||
Credit Suisse Mortgage Capital, Series 2007-C5, Class A4, 5.695%, 09/15/40 7 | 1,704,000 | 1,170,067 | |||||
CS First Boston Mortgage Securities Corp., Series 2005-7, Class 3A1, 5.000%, 08/25/20 | 2,590,719 | 2,188,348 | |||||
JP Morgan Chase Commercial Mortgage, Series 2007-LD11, Class A4, 6.007%, 06/15/49 7 | 305,000 | 232,909 | |||||
Total Mortgage-Backed Securities (cost $5,035,617) | 5,101,191 | ||||||
| Shares | |||||||
Preferred Stocks - 0.9% | |||||||
Bank of America Corp., 6.375% | 20,000 | 326,200 | |||||
Bank of America Corp., 7.250%, Series L | 7,808 | 2 | 6,527,723 | ||||
CIT Group, Inc., The, Series C, 8.750% | 2,500 | 43,650 | |||||
Comcast Corp. Series B, 7.000% | 207,547 | 2 | 4,742,449 | ||||
Entergy New Orleans, Inc., 4.750% | 482 | 33,740 | |||||
Entergy New Orleans, Inc., 5.560% | 100 | 8,075 | |||||
FHLMC, Series F, 5.000%* | 15,400 | 21,560 | |||||
FHLMC, Series K, 5.790%* | 45,200 | 56,500 | |||||
FHLMC, Series O, 5.810%* | 15,850 | 26,945 | |||||
FHLMC, Series P, 6.000%* | 19,800 | 26,532 | |||||
FHLMC, Series R, 5.700%* | 24,500 | 33,075 | |||||
FHLMC, Series T, 6.420%* | 14,300 | 22,880 | |||||
FHLMC, Series U, 5.900%* | 35,100 | 28,080 | |||||
FHLMC, Series V, 5.570%* | 307,950 | 283,314 | |||||
FHLMC, Series W, 5.660%* | 70,700 | 63,630 | |||||
FHLMC, Series Y, 6.550%* | 67,825 | 55,616 | |||||
FHLMC, Series Z, 8.375%* | 605,747 | 739,011 | |||||
FNMA, Series H, 5.810%* | 9,050 | 13,846 | |||||
FNMA, Series I, 5.375%* | 21,500 | 36,980 | |||||
FNMA, Series L, 5.125%* | 28,100 | 41,307 | |||||
FNMA, Series M, 4.750%* | 30,700 | 46,664 | |||||
FNMA, Series Q, 6.750%* | 13,950 | 16,740 | |||||
FNMA, Series S, 8.250%* | 1,125,850 | 1,508,639 | |||||
Newell Financial Trust I, 5.250% | 90,628 | 2,395,978 | |||||
The accompanying notes are an integral part of these financial statements.
15
Table of Contents
Managers Bond Fund
Schedule of Portfolio Investments (continued)
Security Description | Shares | Value | ||||
Preferred Stocks - 0.9% (continued) | ||||||
Preferred Blocker, Inc. 9.000% (a) | 1,560 | $ | 670,898 | |||
SLM Corp., 6.000% | 41,250 | 2 | 614,625 | |||
Sovereign Capital Trust IV, 4.375% | 34,236 | 714,676 | ||||
Wisconsin Electric Power Co., 3.600% | 3,946 | 232,814 | ||||
Total Preferred Stocks (cost $68,576,358) | 19,332,147 | |||||
Short-Term Investments - 9.1%1 | ||||||
BNY Institutional Cash Reserves Fund, Series A, 0.06%3 | 39,754,571 | 39,754,571 | ||||
BNY Institutional Cash Reserves Fund, Series B*3,9 | 1,652,054 | 243,678 | ||||
Dreyfus Cash Management Fund, Institutional Class Shares, 0.44%10 | 129,329,791 | 129,329,791 | ||||
JPMorgan Liquid Assets Money Market Fund, Capital Shares, 0.48%10 | 16,137,739 | 16,137,739 | ||||
Total Short-Term Investments (cost $186,874,155) | 185,465,779 | |||||
Total Investments - 97.9% (cost $2,261,793,232) | 2,005,879,538 | |||||
Other Assets, less Liabilities - 2.1% | 42,062,039 | |||||
Net Assets - 100.0% | $ | 2,047,941,577 | ||||
The following footnotes and abbreviations should be read in conjunction with the Schedule of Portfolio Investments.
Based on the cost of investments of $2,262,271,000 for Federal income tax purposes at June 30, 2009, the aggregate gross unrealized appreciation and depreciation were $19,608,477 and $275,999,939, respectively, resulting in a net unrealized depreciation of investments of $256,391,462.
| * | Non-income producing security. |
| (a) | Security exempt from registration under Rule 144A of the Securities Act of 1933. This security may be resold in transactions exempt from registration, normally to qualified buyers. At June 30, 2009, the value of these securities amounted to $206,665,976 or 10.1% of net assets. |
| 1 | Yield shown for an investment company represents the June 30, 2009, seven-day average yield, which refers to the sum of the previous seven days’ dividends paid, expressed as an annual percentage. |
| 2 | Some or all of these shares were out on loan to various brokers as of June 30, 2009, amounting to $41,321,779 or 2.0% of net assets. |
| 3 | Collateral received from brokers for securities lending was invested in these short-term investments. |
| 4 | Represents yield to maturity at June 30, 2009. |
| 5 | Security is illiquid: A security not readily convertible into cash such as a stock, bond or commodity that is not actively traded, and would be difficult to sell in a current sale. The Fund may not invest more than 15% of its net assets in illiquid securities. All securities are valued by an independent pricing agent or broker. Illiquid securities at June 30, 2009 amounted to $4,906,958 or 0.24% of net assets. |
| 6 | Floating Rate Security. The rate listed is as of June 30, 2009. Date in parentheses represents the security’s next coupon rate reset. |
| 7 | Variable Rate Security. The rate listed is as of June 30, 2009 and is periodically reset subject to terms and conditions set forth in the debenture. |
| 8 | Security is in default. Issuer has failed to make a timely payment of either principal or interest or has failed to comply with some provision of the bond indenture. |
| 9 | On September 12, 2008, The Bank of New York Mellon (“BNYM”) established a separate sleeve of the BNY Institutional Cash Reserves Fund (“ICRF”) (Series B) to hold certain Lehman Brothers floating rate notes. The Fund’s position in Series B is being marked to market daily. |
| 10 | The Fund’s investments in Dreyfus Cash Management Fund and JPMorgan Liquid Assets Money Market Fund are covered under the U.S. Treasury Temporary Money Market Fund Guarantee Program up to a maximum of $18,257,748 and $16,146,303, respectively. |
| # | Rounds to less than 0.1%. |
Investments Definitions and Abbreviations:
AMBAC: | American Municipal Bond Assurance Corp. | |
EMTN: | European Medium Term Note | |
FHLMC: | Federal Home Loan Mortgage Corp. | |
FNMA: | Federal National Mortgage Association | |
FSA: | Financial Security Assurance | |
GMAC: | General Motors Acceptance Corp. | |
MTN: | Medium Term Note | |
USTN: | United States Treasury Note |
Abbreviations have been used throughout the portfolios to indicate amounts shown in currencies other than the U.S. dollar (USD):
AUD: | Australian Dollar | |
BRL: | Brazilian Real | |
CAD: | Canadian Dollar | |
EUR: | euro | |
GBP: | British Pound | |
IDR: | Indonesian Rupiah | |
ISK: | Icelandic Krona | |
MXN: | Mexican Peso | |
NZD: | New Zealand Dollar | |
SGD: | Singapore Dollar | |
THB: | Thailand Baht |
The accompanying notes are an integral part of these financial statements.
16
Table of Contents
Statement of Assets and Liabilities
June 30, 2009 (unaudited)
Assets: | ||||
Investments at value (including securities on loan valued at $41,321,779)* | $ | 2,005,879,538 | ||
Foreign currency** | 135,596 | |||
Receivable for investments sold | 2,645,717 | |||
Receivable for Fund shares sold | 59,128,723 | |||
Dividends, interest and other receivables | 30,592,265 | |||
Prepaid expenses | 125,784 | |||
Total assets | 2,098,507,623 | |||
Liabilities: | ||||
Payable to Custodian | 489,748 | |||
Payable for Fund shares repurchased | 6,936,148 | |||
Payable upon return of securities loaned | 41,406,625 | |||
Accrued expenses: | ||||
Investment advisory and management fees | 804,306 | |||
Administrative fees | 401,708 | |||
Other | 527,511 | |||
Total liabilities | 50,566,046 | |||
Net Assets | $ | 2,047,941,577 | ||
Shares outstanding | 93,012,912 | |||
Net asset value, offering and redemption price per share | $ | 22.02 | ||
Net Assets Represent: | ||||
Paid-in capital | $ | 2,369,044,317 | ||
Undistributed net investment income | 2,502,308 | |||
Accumulated net realized loss from investments and foreign currency transactions | (67,894,745 | ) | ||
Net unrealized depreciation of investments and foreign currency contracts and translations | (255,710,303 | ) | ||
Net Assets | $ | 2,047,941,577 | ||
* Investments at cost | $ | 2,261,793,232 | ||
** Foreign currency at cost | $ | 138,385 |
The accompanying notes are an integral part of these financial statements.
17
Table of Contents
Statement of Operations
For the six months ended June 30, 2009 (unaudited)
Investment Income: | ||||
Interest income | $ | 72,976,350 | ||
Dividend income | 350,005 | |||
Securities lending fees | 17,518 | |||
Total investment income | 73,343,873 | |||
Expenses: | ||||
Investment management fees | 5,787,154 | |||
Administrative fees | 2,314,862 | |||
Transfer agent | 1,428,099 | |||
Professional fees | 248,724 | |||
Custodian | 177,986 | |||
Reports to shareholders | 170,240 | |||
Registration fees | 60,646 | |||
Trustees fees and expenses | 90,714 | |||
Miscellaneous | 60,481 | |||
Total expenses before offsets | 10,338,906 | |||
Expense waiver | (3,995 | ) | ||
Expense reimbursement | (1,166,684 | ) | ||
Expense reductions | (5,370 | ) | ||
Net expenses | 9,162,857 | |||
Net investment income | 64,181,016 | |||
Net Realized and Unrealized Gain (Loss): | ||||
Net realized loss on investment transactions | (52,612,611 | ) | ||
Net realized loss on foreign currency contracts and transactions | (1,064,961 | ) | ||
Net unrealized appreciation of investments | 249,132,529 | |||
Net unrealized appreciation of foreign currency contracts and translations | 10,557,974 | |||
Net realized and unrealized gain | 206,012,931 | |||
Net increase in net assets resulting from operations | $ | 270,193,947 |
The accompanying notes are an integral part of these financial statements.
18
Table of Contents
Statement of Changes in Net Assets
For the six months ended June 30, 2009 (unaudited) and for the year ended December 31, 2008
| 2009 | 2008 | |||||||
Increase (Decrease) in Net Assets From Operations: | ||||||||
Net investment income | $ | 64,181,016 | $ | 136,714,173 | ||||
Net realized gain (loss) on investments and foreign currency transactions | (53,677,572 | ) | 10,641,730 | |||||
Net unrealized appreciation (depreciation) of investments and foreign currency translations | 259,690,503 | (572,492,152 | ) | |||||
Net increase (decrease) in net assets resulting from operations | 270,193,947 | (425,136,249 | ) | |||||
Distributions to Shareholders: | ||||||||
From net investment income | (60,871,492 | ) | (136,203,930 | ) | ||||
From net realized gain on investments | — | (27,020,555 | ) | |||||
Total distributions to shareholders | (60,871,492 | ) | (163,224,485 | ) | ||||
From Capital Share Transactions: | ||||||||
Proceeds from sale of shares | 380,312,608 | 1,260,249,492 | ||||||
Reinvestment of dividends and distributions | 56,038,121 | 152,445,157 | ||||||
Cost of shares repurchased | (486,650,763 | ) | (958,305,334 | ) | ||||
Net increase (decrease) from capital share transactions | (50,300,034 | ) | 454,389,315 | |||||
Total increase (decrease) in net assets | 159,022,421 | (133,971,419 | ) | |||||
Net Assets: | ||||||||
Beginning of period | 1,888,919,156 | 2,022,890,575 | ||||||
End of period | $ | 2,047,941,577 | $ | 1,888,919,156 | ||||
End of period undistributed net investment income (loss) | $ | 2,502,308 | ($807,216 | ) | ||||
Share Transactions: | ||||||||
Sale of shares | 18,476,560 | 52,689,979 | ||||||
Reinvested shares | 2,776,002 | 6,912,748 | ||||||
Shares repurchased | (24,363,680 | ) | (43,303,058 | ) | ||||
Net increase (decrease) in shares | (3,111,118 | ) | 16,299,669 | |||||
The accompanying notes are an integral part of these financial statements.
19
Table of Contents
For a share outstanding throughout each period
Managers Bond Fund | For the six months ended June 30, 2009 (unaudited) | For the year ended December 31, | ||||||||||||||||||||||
| 2008 | 2007 | 2006 | 2005 | 2004 | ||||||||||||||||||||
Net Asset Value, Beginning of Period | $ | 19.65 | $ | 25.34 | $ | 24.84 | $ | 24.11 | $ | 24.58 | $ | 24.58 | ||||||||||||
Income from Investment Operations: | ||||||||||||||||||||||||
Net investment income | 0.70 | 1.42 | 5 | 1.22 | 5 | 1.08 | 0.88 | 0.80 | ||||||||||||||||
Net realized and unrealized gain (loss) on investments | 2.33 | (5.42 | )5 | 0.49 | 5 | 0.75 | (0.32 | ) | 0.30 | |||||||||||||||
Total from investment operations | 3.03 | (4.00 | ) | 1.71 | 1.83 | 0.56 | 1.10 | |||||||||||||||||
Less Distributions to Shareholders from: | ||||||||||||||||||||||||
Net investment income | (0.66 | ) | (1.41 | ) | (1.21 | ) | (1.10 | ) | (0.88 | ) | (0.93 | ) | ||||||||||||
Net realized gain on investments | — | (0.28 | ) | (0.00 | )4 | — | (0.15 | ) | (0.17 | ) | ||||||||||||||
Total distributions to shareholders | (0.66 | ) | (1.69 | ) | (1.21 | ) | (1.10 | ) | (1.03 | ) | (1.10 | ) | ||||||||||||
Net Asset Value, End of Period | $ | 22.02 | $ | 19.65 | $ | 25.34 | $ | 24.84 | $ | 24.11 | $ | 24.58 | ||||||||||||
Total Return 1 | 15.77 | %6 | (16.31 | )% | 7.06 | % | 7.79 | %3 | 2.29 | % | 5.14 | % | ||||||||||||
Ratio of net expenses to average net assets | 0.99 | %7 | 0.99 | % | 0.99 | % | 0.99 | % | 0.99 | % | 0.99 | % | ||||||||||||
Ratio of net investment income to average net assets 1 | 6.93 | %7 | 6.10 | % | 4.91 | % | 4.52 | % | 3.36 | % | 3.65 | % | ||||||||||||
Portfolio turnover | 3 | %6 | 39 | % | 21 | % | 46 | % | 26 | % | 16 | % | ||||||||||||
Net assets at end of period (000’s omitted) | $ | 2,047,942 | $ | 1,888,919 | $ | 2,022,891 | $ | 906,776 | $ | 426,448 | $ | 259,210 | ||||||||||||
Ratios absent expense offsets: 2 | ||||||||||||||||||||||||
Ratio of total expenses to average net assets | 1.12 | %7 | 1.10 | % | 0.99 | % | 1.02 | % | 1.02 | % | 1.06 | % | ||||||||||||
Ratio of net investment income to average net assets | 6.80 | %7 | 5.99 | % | 4.91 | % | 4.49 | % | 3.33 | % | 3.58 | % | ||||||||||||
| 1 | Total returns and net investment income would have been lower had certain expenses not been reduced. (See Note 1(c) to the Notes to Financial Statements.) |
| 2 | Excludes the impact of expense reimbursement and expense offsets such as brokerage credits, but includes non-reimbursable expenses, if any, such as interest and taxes. (See Note 1(c) to the Notes to Financial Statements.) |
| 3 | The Total Return is based on the Financial Statement Net Asset Values as shown above. |
| 4 | Rounds to less than $0.01. |
| 5 | Per share numbers have been calculated using average shares. |
| 6 | Not Annualized. |
| 7 | Annualized. |
20
Table of Contents
June 30, 2009 (unaudited)
| 1. | Summary of Significant Accounting Policies |
The Managers Funds (the “Trust”) is an open-end management investment company organized as a Massachusetts business trust and registered under the Investment Company Act of 1940, as amended (the “1940 Act”). Currently, the Trust is comprised of a number of different funds, each having distinct investment management objectives, strategies, risks and policies. Included in this report is the Managers Bond Fund (“the Fund”).
The Fund’s financial statements are prepared in accordance with accounting principles generally accepted in the United States of America, which require management to make estimates and assumptions that affect the reported amounts of assets and liabilities and disclosure of contingent assets and liabilities at the date of the financial statements and the reported amounts of income and expenses during the reporting periods. Actual results could differ from those estimates and such differences could be material. The following is a summary of significant accounting policies followed by the Fund in the preparation of its financial statements:
| a. | Valuation of Investments |
Equity securities traded on a domestic or international securities exchange are valued at the last quoted sale price, or, lacking any sales, at the last quoted bid price. Over-the-counter securities are valued at the Nasdaq Official Closing Price, if one is available. Lacking any sales, over-the-counter securities are valued at the last quoted bid price. The Fund’s investments are generally valued based on market quotations provided by the third party pricing services approved by the Board of Trustees of the Fund. Under certain circumstances, the value of certain Fund investments may be based on an evaluation of its fair value, pursuant to procedures established by and under the general supervision of the Board of Trustees of the Fund. The Fund may use the fair value of a portfolio security to calculate its NAV when, for example, (1) market quotations are not readily available because a portfolio security is not traded in a public market or the principal market in which the security trades is closed, (2) trading in a portfolio security is suspended and has not resumed before the Fund calculates its NAV, (3) a significant event affecting the value of a portfolio security is determined to have occurred between the time of the market quotation provided for a portfolio security and the time as of which the Fund calculates its NAV, (4) a security’s price has remained unchanged over a period of time (often referred to as a “stale price”), or (5) Managers Investment Group LLC (the “Investment Manager”) determines that a market quotation is inaccurate. Portfolio investments that trade primarily on foreign markets are priced based upon the market quotation of such securities as of the close of their respective principal markets, as adjusted to reflect the Investment Manager’s determination of the impact of events occurring subsequent to the close of such markets but prior to the time as of which the Fund calculates its NAV. In accordance with procedures approved by the Board of Trustees, the Investment Manager relies upon recommendations of a third-party fair valuation service in adjusting the prices of such foreign portfolio investments. The Fund may invest in securities that may be thinly traded. The Board of Trustees has adopted procedures to adjust prices when thinly traded securities are judged to be stale so that they reflect fair value. An investment valued on the basis of its fair value may be valued at a price higher or lower than available market quotations. An investment’s valuation may differ depending on the method used and the factors considered in determining value according to the Fund’s fair value procedures.
Fixed-income securities are valued based on valuations furnished by independent pricing services that utilize matrix systems, which reflect such factors as security prices, yields, maturities, and ratings, and are supplemented by dealer and exchange quotations. Futures contracts for which market quotations are readily available are valued at the settlement price as of the close of the futures exchange. Short-term investments having a remaining maturity of 60 days or less are valued at amortized cost, which approximates market value. Investments in other open-end regulated investment companies are valued at their end of day net asset value per share. Investments in certain mortgage-backed and stripped mortgage-backed securities, preferred stocks, convertible securities, derivatives and other debt securities not traded on an organized securities market are valued on the basis of valuations provided by dealers or by a pricing service which uses information with respect to transactions in such securities and various relationships between securities and yield to maturity in determining value. Securities (including derivatives) for which market quotations are not readily available are valued at fair value, as determined in good faith, and pursuant to procedures adopted by the Board of Trustees of the Trust. The values assigned to fair value investments are based on available information and do not necessarily represent amounts that might ultimately be realized, since such amounts depend on future developments inherent in long-term investments. Further, because of the inherent uncertainty of valuation, those estimated values may differ significantly from the values that would have been used had a ready market for the investments existed, and the differences could be material.
The Fund adopted Financial Accounting Standards Board Statement of Financial Accounting Standards No. 157, Fair Value Measurements (“FAS 157”), effective January 1, 2008. In accordance with FAS 157, fair value is defined as the price that a Fund would receive to sell an asset or pay to transfer a liability in an orderly transaction between market participants at the measurement date. FAS 157 also establishes a framework for measuring fair value, and a three-level hierarchy for fair value measurements based upon the transparency of inputs to the valuation of an asset or liability. Inputs may be observable or unobservable and refer broadly to the assumptions that market participants would use in pricing the asset or liability. Observable inputs reflect the assumptions market participants would use in pricing the asset or liability based on market data obtained from sources independent of the Fund. Unobservable inputs reflect the Fund’s own assumptions about the assumptions that market participants would use in pricing the asset or liability developed based on the best information available in the circumstances. Each investment is assigned a level based upon the observability of the inputs which are significant to the overall valuation.
21
Table of Contents
Notes to Financial Statements (continued)
In April 2009, Statement of Financial Accounting Standards Staff Position No. 157-4, “Determining Fair Value When the Volume and Level of Activity for the Asset or Liability Have Significantly Decreased and Identifying Transactions that are not Orderly” (“FSP FAS 157-4”) was issued and is effective for interim and annual reporting periods ending after June 15, 2009. FSP FAS 157-4 provides additional guidance for estimating fair value in accordance with FAS 157 when the volume and level of activity for the asset or liability have significantly decreased. Additionally, FSP FAS 157-4 requires quantitative disclosures about fair value measurements separately for each major category of assets and liabilities.
The three-tier hierarchy of inputs is summarized below:
Level 1 – quoted prices in active markets for identical investments
Level 2 – other significant observable inputs (including quoted prices for similar investments, interest rates, prepayment speeds, credit risk)
Level 3 – significant unobservable inputs (including the Fund’s own assumptions in determining the fair value of investments)
The inputs or methodologies used for valuing investments are not necessarily an indication of the risk associated with investing in those investments. The following table summarizes the valuation of the Fund’s investments by the above fair value hierarchy levels as of June 30, 2009:
| Level 1 | Level 2 | Level 3 | Total | ||||||||
Managers Bond | |||||||||||
Corporate Bonds | |||||||||||
Finance | — | $ | 384,795,858 | — | $ | 384,795,858 | |||||
Industrial | — | 946,235,315 | — | 946,235,315 | |||||||
Utility | — | 215,351,443 | — | 215,351,443 | |||||||
Foreign Government Obligations | — | 102,982,119 | — | 102,982,119 | |||||||
Municipal Bonds | — | 34,711,316 | — | 34,711,316 | |||||||
Asset-Backed Securities | — | 85,566,983 | — | 85,566,983 | |||||||
U.S. Government and Agency Obligations | |||||||||||
U.S. Government | — | 19,343,800 | — | 19,343,800 | |||||||
Federal Home Loan Mortgage Corporation | — | 151,136 | — | 151,136 | |||||||
Federal National Mortgage Association | — | 6,842,451 | — | 6,842,451 | |||||||
Mortgage-Backed Securities | — | 5,101,191 | — | 5,101,191 | |||||||
Preferred Stocks | $ | 19,332,147 | — | — | 19,332,147 | ||||||
Short-Term Investments | 145,467,530 | 39,998,249 | — | 185,465,779 | |||||||
Total Investments | 164,799,677 | 1,841,079,861 | — | 2,005,879,538 | |||||||
Other Financial Instruments* | — | — | — | — | |||||||
Totals | $ | 164,799,677 | $ | 1,841,079,861 | — | $ | 2,005,879,538 | ||||
| * | Other financial instruments are derivative instruments not reflected in the Schedule of Portfolio Investments, such as futures, forwards and swap contracts, which are valued at the unrealized appreciation/depreciation of the instrument. |
In March 2008, Statement of Financial Accounting Standards No. 161, “Disclosures about Derivative Instruments and Hedging Activities” (“SFAS 161”) was issued and is effective for fiscal years and interim periods beginning after November 15, 2008. SFAS 161 is intended to improve financial reporting for derivative instruments by requiring enhanced disclosure that enables investors to understand how and why a fund uses derivatives, how derivatives are accounted for, and how derivative instruments affect a fund’s results of operations and financial position. For the six months ended June 30, 2009, the Fund did not engage in any derivative activity. Therefore, no additional disclosure is required.
22
Table of Contents
Notes to Financial Statements (continued)
| b. | Security Transactions |
Security transactions are accounted for as of the trade date. Realized gains and losses on securities sold are determined on the basis of identified cost.
| c. | Investment Income and Expenses |
Dividend income is recorded on the ex-dividend date except certain dividends from foreign securities where the ex-dividend date may have passed. These dividends are recorded as soon as the Trust is informed of the ex-dividend date. Dividend income on foreign securities is recorded net of any withholding tax. Interest income, which includes amortization of premium and accretion of discount on debt securities, is accrued as earned. Non-cash dividends included in dividend income, if any, are reported at the fair market value of the securities received. Other income and expenses are recorded on an accrual basis. Expenses that cannot be directly attributed to a fund are apportioned among the Funds in the Trust and in some cases other affiliated funds based upon their relative average net assets or number of shareholders. Investment income, realized and unrealized capital gains and losses, the common expenses of the Fund and certain Fund level expense reductions, if any, are allocated on a pro rata basis to each class based on the relative net assets of each class to the total net assets of the Fund.
The Fund has a “balance credit” arrangement with The Bank of New York Mellon (“BNYM”), the Fund’s custodian, whereby the Fund is credited with an interest factor equal to 0.75% below the effective 90-day T-Bill rate for account balances left uninvested overnight. If the T-Bill rate falls below 0.75%, no credits will be earned. These credits serve to reduce custody expenses that would otherwise be charged to the Fund. For the six months ended June 30, 2009, the custodian expense was not reduced.
Overdrafts will cause a reduction of any earnings credits, computed at 2% above the effective Federal Funds rate on the day of the overdraft. For the six months ended June 30, 2009, the Fund had no overdraft fees.
The Trust also has a balance credit arrangement with its Transfer Agent, PNC Global Investment Servicing (U.S.) Inc., whereby earnings credits are used to offset banking charges and other out-of-pocket expenses. For the six months ended June 30, 2009, the transfer agent expense was reduced by $5,370.
The Investment Manager has agreed to waive a portion of its management fee in consideration of shareholder servicing fees that it has received from JPMorgan Distribution Services, Inc., with respect to short-term cash investments the Fund has made in the JPMorgan Liquid Assets Portfolio. For the six months ended June 30, 2009, the management fee was reduced by $3,995.
Total returns and net investment income for the Fund would have been lower had certain expenses not been offset. Total expenses before offsets exclude the impact of expense reimbursements or fee waivers and expense offsets such as brokerage recapture credits, but include non-reimburseable expenses if any, such as interest and taxes.
| d. | Dividends and Distributions |
Dividends resulting from net investment income, if any, normally will be declared and paid monthly. Distributions of capital gains, if any, will be made annually in December and when required for Federal excise tax purposes. Income and capital gain distributions are determined in accordance with Federal income tax regulations, which may differ from generally accepted accounting principles. These differences are primarily due to differing treatments for losses deferred due to wash sales, REITS, equalization accounting for tax purposes, foreign currency, options, futures and market discount transactions. Permanent book and tax basis differences, if any, relating to shareholder distributions will result in reclassifications to paid-in capital.
| e. | Federal Taxes |
The Fund intends to comply with the requirements under Subchapter M of the Internal Revenue Code of 1986, as amended, to distribute substantially all of its taxable income and gains to its shareholders and to meet certain diversification and income requirements with respect to investment companies. Therefore, no provision for Federal income or excise tax is included in the accompanying financial statements.
Additionally, based on the Fund’s understanding of the tax rules and rates related to income, gains and transactions for the foreign jurisdictions in which it invests, the Fund will provide for foreign taxes, and where appropriate, deferred foreign taxes.
Management has analyzed the Fund’s tax positions taken on federal income tax returns for all open tax years (tax years ended December 31, 2005-2008), and has concluded that no provision for federal income tax is required in the Fund’s financial statements. The Fund is not aware of any tax position for which it is reasonably possible that the total amounts of unrecognized tax benefits will change materially in the next twelve months.
| f. | Capital Loss Carryovers |
As of December 31, 2008, the Fund had no accumulated net realized capital loss carryover from securities transactions for Federal income tax purposes.
| g. | Capital Stock |
The Trust’s Declaration of Trust authorizes for each series the issuance of an unlimited number of shares of beneficial interest, without par value. Each Fund records sales and repurchases of its capital stock on the trade date. Dividends and distributions to shareholders are recorded on the ex-dividend date.
At June 30, 2009, certain unaffiliated shareholders of record, specifically omnibus accounts, individually held greater than 10% of the outstanding shares of the Fund as follows: three collectively own 47%. Transactions by these shareholders may have a material impact on the Fund.
23
Table of Contents
Notes to Financial Statements (continued)
| h. | Foreign Currency Translation |
The books and records of the Fund are maintained in U.S. dollars. The value of investments, assets and liabilities denominated in currencies other than U.S. dollars are translated into U.S. dollars based upon current foreign exchange rates. Purchases and sales of foreign investments, income and expenses are converted into U.S. dollars based on currency exchange rates prevailing on the respective dates of such transactions. Net realized and unrealized gain (loss) on foreign currency transactions represent: (1) foreign exchange gains and losses from the sale and holdings of foreign currencies; (2) gains and losses between trade date and settlement date on investment securities transactions and forward foreign currency exchange contracts; and (3) gains and losses from the difference between amounts of interest and dividends recorded and the amounts actually received.
The Fund does not isolate the net realized and unrealized gain or loss resulting from changes in exchange rates from the fluctuations in market prices of securities held. Such fluctuations are included with the net realized and unrealized gain or loss on investments.
| 2. | Agreements and Transactions with Affiliates |
The Trust has entered into an Investment Management Agreement under which the Investment Manager, an independently managed subsidiary of Affiliated Managers Group, Inc. (“AMG”), serves as investment manager to the Fund and is responsible for the Fund’s overall administration. The Investment Manager selects subadvisors for the Fund (subject to Trustee approval) and monitors each subadvisor’s investment programs and results. The Fund’s investment portfolio is managed by a portfolio manager who serves pursuant to a Subadvisory Agreement with the Investment Manager.
Investment management fees are paid directly by the Fund to the Investment Manager based on average daily net assets. For the six months ended June 30, 2009, the annual investment management fee rate, as a percentage of average daily net assets, was 0.625%.
The Trust has entered into an Administration and Shareholder Servicing Agreement under which the Investment Manager serves as the Fund’s administrator (the “Administrator”) and is responsible for all aspects of managing the Fund’s operations, including administration and shareholder services to the Fund, its shareholders, and certain institutions, such as bank trust departments, broker-dealers and registered investment advisers, that advise or act as an intermediary with the Fund’s shareholders. The Fund pays a fee to the Administrator at the rate of 0.25% per annum of the Fund’s average daily net assets for this service.
The Investment Manager has contractually agreed, through at least May 1, 2010, to waive fees and pay or reimburse expenses to the extent that the total annual operating expenses (exclusive of brokerage costs, acquired fund fees and expenses, interest, taxes and extraordinary expenses) of the Fund exceed 0.99% of the Fund’s average daily net assets.
The Fund is obligated to repay the Investment Manager such amounts waived, paid or reimbursed in future years provided that the repayment occurs within thirty-six (36) months after the waiver or reimbursement and that such repayment would not cause the Fund’s total operating expenses in any such future year to exceed that Fund’s respective expense cap. For the six months ended June 30, 2009, the Fund made no such repayments to the Investment Manager. At December 31, 2008, the cumulative amount of expense reimbursement by the Investment Manager subject to repayment by the Fund equaled $3,811,049.
The aggregate annual retainer paid to each Independent Trustee is $65,000, plus $4,000 or $2,500 for each regular or special meeting attended, respectively. The Trustees’ fees and expenses are allocated amongst all of the Funds for which the Investment Manager serves as the advisor (the “Managers Funds”) based on the relative net assets of such Funds. The Independent Chairman of the Trusts receives an additional payment of $15,000 per year. The Chairman of the Audit Committee receives an additional payment of $5,000 per year. The “Trustees fees and expenses” shown in the financial statements represents the Fund’s allocated portion of the total fees and expenses paid by the Fund and other affiliated funds in the Managers Funds.
The Fund is distributed by Managers Distributors, Inc. (the “Distributor” or “MDI”), a wholly-owned subsidiary of the Investment Manager. MDI serves as the principal underwriter for the Fund. MDI is a registered broker-dealer and member of the Financial Industry Regulatory Authority, Inc. (“FINRA”). Shares of the Fund will be continuously offered and will be sold by brokers, dealers or other financial intermediaries who have executed selling agreements with the Distributor. MDI bears all the expenses of providing services pursuant to the Underwriting Agreement, including the payment of the expenses relating to the distribution of Prospectuses for sales purposes and any advertising or sales literature. Certain Trustees and Officers of the Fund are Officers and/or Directors of the Investment Manager, AMG and/or the Distributor.
| 3. | Purchases and Sales of Securities |
Purchases and sales of securities, excluding short-term securities, for the six months ended June 30, 2009, were $50,801,927 and $241,840,115, respectively. Purchases and sales of U.S. Government securities for the six months ended June 30, 2009, were $19,064779 and $630,000, respectively.
| 4. | Portfolio Securities Loaned |
The Fund may participate in a securities lending program offered by BNYM, providing for the lending of securities to qualified brokers. Securities lending fees include earnings of such temporary cash investments, plus or minus any rebate to a borrower. These earnings (after any rebate) are then divided between BNYM, as a fee for its services under the program, and the Fund, according to agreed-upon rates. Collateral on all securities loaned is accepted in cash and/or government securities and is maintained at a minimum level of 102% (105% in the case of certain foreign securities) of the market value, plus interest, if applicable, of investments on loan. It is the Funds policy to obtain additional collateral from or return excess collateral to the borrower by the end of the next business day, following the valuation date of the securities loaned. Therefore, the value of the collateral held may be temporarily less than the value of the securities on loan. Lending securities entails a risk of loss to the Fund if and to the extent
24
Table of Contents
Notes to Financial Statements (continued)
that the market value of the securities loaned were to increase and the borrower did not increase the collateral accordingly, and the borrower fails to return the securities. The Fund bears the risk of any deficiency in the amount of the collateral available for return to the borrower due to any loss on the collateral invested. Collateral received in the form of cash is invested temporarily in the BNY Institutional Cash Reserves Fund (the “ICRF”), or other short-term investments as defined in the Securities Lending Agreement with BNYM.
In September of 2008, BNYM advised the Investment Manager that the ICRF had exposure to certain defaulted debt obligations, and that BNYM had established a separate sleeve of the ICRF to hold these securities. The net impact of this position is not material to the Fund. The Fund’s position in the separate sleeve of the ICRF Fund is included in the Schedule of Portfolio Investments and the unrealized loss on such investment is included in Net Unrealized Depreciation on the Statement of Assets and Liabilities and the Statement of Operations.
| 5. | Commitments and Contingencies |
In the normal course of business, the Fund may enter into contracts and agreements that contain a variety of representations and warranties, which provide general indemnifications. The maximum exposure to the Fund under these arrangements is unknown, as this would involve future claims that may be made against the Fund that have not yet occurred. However, based on experience, the Fund expects the risk of loss to be remote.
| 6. | Risks Associated with Collateralized Mortgage Obligations (“CMOs”) |
The net asset value of the Fund may be sensitive to interest rate fluctuations because the Fund may hold several instruments, including CMOs and other derivatives, whose values can be significantly impacted by interest rate movements. CMOs are obligations collateralized by a portfolio of mortgages or mortgage-related securities. Payments of principal and interest on the mortgage are passed through to the holder of the CMOs on the same schedule as they are received, although certain classes of CMOs have priority over others with respect to the receipt of prepayments on the mortgages.
Therefore, the investment in CMOs may be subject to a greater or lesser risk of prepayment than other types of mortgage-related securities. CMOs may have a fixed or variable rate of interest.
| 7. | Forward Commitments |
Certain transactions, such as futures and forward transactions, dollar roll agreements, or purchases of when-issued or delayed delivery securities may have a similar effect on the Fund’s net asset value as if the Fund had created a degree of leverage in its portfolio. However, if the Fund enters into such a transaction, the Fund will establish a segregated account with its custodian in which it will maintain cash, U.S. government securities or other liquid securities equal in value to its obligations in respect to such transaction. Securities and other assets held in the segregated account may not be sold while the transaction is outstanding, unless other suitable assets are substituted.
| 8. | Forward Foreign Currency Contracts |
The Fund may invest in forward foreign currency exchange contracts to manage currency exposure. These investments may involve greater market risk than the amounts disclosed in the Fund’s financial statements.
A forward foreign currency exchange contract is an agreement between a Fund and another party to buy or sell a currency at a set price at a future date. The market value of the contract will fluctuate with changes in currency exchange rates. The contract is marked-to-market daily, and the change in market value is recorded as an unrealized gain or loss. Gain or loss on the purchase or sale of contracts having the same settlement date, amount and counterparty is realized on the date of offset, otherwise gain or loss is realized on the settlement date.
The Fund may invest in non-U.S. dollar denominated instruments subject to limitations, and enter into forward foreign currency exchange contracts to facilitate transactions in foreign securities and to protect against a possible loss resulting from an adverse change in the relationship between the U.S. dollar and such foreign currency. Risks may arise upon entering into these contracts from the potential inability of counterparties to meet the terms of their contracts and from unanticipated movements in the value of a foreign currency relative to the U.S. dollar.
25
Table of Contents
Annual Renewal of Investment Advisory Agreement (unaudited)
On June 4-5, 2009, the Board of Trustees, including a majority of the Trustees who are not “interested persons” of the Trust (the “Independent Trustees”), approved the Investment Management Agreement with the Investment Manager for the Managers Bond Fund (the “Fund”) and the Subadvisory Agreement for the Subadvisor of the Fund. The Independent Trustees were separately represented by independent counsel in connection with their consideration of the approval of these agreements. In considering the Investment Management and Subadvisory Agreements, the Trustees reviewed a variety of materials relating to the Fund, the Investment Manager and the Subadvisor, including comparative performance, fee and expense information for an appropriate peer group of similar mutual funds (the “Peer Group”), performance information for the relevant benchmark index (the “Fund Benchmark”) and, with respect to the Subadvisor, comparative performance information for an appropriate peer group of managed accounts, and, as to all other matters, other information provided to them on a periodic basis throughout the year, as well as information provided in connection with the meetings of June 4-5, 2009, regarding the nature, extent and quality of services provided by the Investment Manager and the Subadvisor under their respective agreements. Prior to voting, the Independent Trustees: (a) reviewed the foregoing information with their independent legal counsel and with management; (b) received materials from their independent legal counsel discussing the legal standards applicable to their consideration of the Investment Management Agreement and the Subadvisory Agreement; and (c) met with their independent legal counsel in private sessions at which no representatives of management were present.
Nature, extent and quality of services.
In considering the nature, extent and quality of the services provided by the Investment Manager, the Trustees reviewed information relating to the Investment Manager’s operations and personnel. Among other things, the Investment Manager provided financial information, biographical information on its supervisory and professional staff and descriptions of its organizational and management structure. The Trustees also took into account information provided periodically throughout the previous year by the Investment Manager relating to the performance of its duties with respect to the Fund and the Trustees’ familiarity with the Investment Manager’s management through Board meetings, discussions and reports. In the course of their deliberations regarding the Investment Management Agreement, the Trustees evaluated, among other things: (a) the extent and quality of the Investment Manager’s oversight of the operation and management of the Fund; (b) the quality of the search, selection and monitoring services performed by the Investment Manager in overseeing the portfolio management responsibilities of the Subadvisor; (c) the Investment Manager’s ability to supervise the Fund’s other service providers; and (d) the Investment Manager’s compliance programs. The Trustees also took into account the financial condition of the Investment Manager with respect to its ability to provide the services required under the Investment Management Agreement and to maintain a contractual expense limitation for the Fund.
The Trustees also reviewed information relating to the Subadvisor’s operations and personnel and the investment philosophy, strategies and techniques (the “Investment Strategy”) used in managing the Fund. Among other things, the Trustees reviewed biographical information on portfolio management and other professional staff, information regarding the Subadvisor’s organizational and management structure and the Subadvisor’s brokerage policies and practices. The Trustees considered specific information provided regarding the experience of the individual or individuals at the Subadvisor with portfolio management responsibility for the Fund, including the information set forth in the Fund’s prospectus and statement of additional information. In the course of their deliberations, the Trustees evaluated, among other things: (a) the services rendered by the Subadvisor in the past; (b) the qualifications and experience of the Subadvisor’s personnel; and (c) the Subadvisor’s compliance programs. The Trustees also took into account the financial condition of the Subadvisor with respect to its ability to provide the services required under the Subadvisory Agreement.
Performance.
Among other information relating to the Fund’s performance, the Trustees noted that the Fund’s performance for the 1-year, 3-year, 5-year and 10-year periods ended March 31, 2009 was below, below, below and above, respectively, the median performance of the Peer Group and below the performance of the Fund Benchmark, the Barclays Capital U.S. Government/Credit Index, for each period. The Board took into account management’s discussion of the Fund’s more recent performance. In this regard, the Trustees noted that the Fund had outperformed the Fund Benchmark and ranked near the top of the Peer Group upon entering 2008 and has performed well in year-to-date 2009. The Trustees also noted that the Fund’s 10-year performance has been competitive relative to the Peer Group. The Trustees concluded that the Fund’s performance has been satisfactory in light of all factors considered.
As noted above, the Board considered the Fund’s performance during relevant time periods as compared to the Fund’s Peer Group and considered the Subadvisor’s performance as compared to an appropriate peer group of managed accounts and noted that the Board reviews on a quarterly basis detailed information about the Fund’s performance results, portfolio composition and Investment Strategies. The Board noted the Investment Manager’s expertise and resources in monitoring the performance, investment style and risk-adjusted performance of the Subadvisor. The Board was mindful of the Investment Manager’s attention to monitoring the Subadvisor’s performance with respect to the Fund and its discussions with management regarding the factors that contributed to the performance of the Fund.
Advisory Fees and Profitability.
In considering the reasonableness of the advisory fee charged by the Investment Manager for managing the Fund, the Trustees noted that the Investment Manager, and not the Fund, is responsible for paying the fees charged by the Fund’s Subadvisor and, therefore,
26
Table of Contents
Annual Renewal of Investment Advisory Agreement (continued)
that the fees paid to the Investment Manager cover the cost of providing portfolio management services as well as the cost of providing search, selection and monitoring services in operating a “manager-of-managers” complex of mutual funds. The Trustees concluded that, in light of the additional high quality supervisory services provided by the Investment Manager and the fact that the subadvisory fees are paid out of the advisory fee, the advisory fee payable by the Fund to the Investment Manager can reasonably be expected to exceed the median advisory fee for the Peer Group, which consists of many funds that do not operate with a manager-of-managers structure. In this regard, the Trustees also noted that the Investment Manager has undertaken to maintain an expense limitation for the Fund.
In considering the reasonableness of the advisory fee payable to the Investment Manager, the Trustees also reviewed information provided by the Investment Manager setting forth all revenues and other benefits, both direct and indirect, received by the Investment Manager and its affiliates attributable to managing the Fund and all the mutual funds in the Managers Family of Funds, the cost of providing such services and the resulting profitability to the Investment Manager and its affiliates from these relationships. The Trustees also noted the current and potential asset levels of the Fund and the willingness of the Investment Manager to waive fees and pay expenses for the Fund from time to time as a means of limiting the total expenses of the Fund. The Trustees also considered the current asset level of the Fund, including the effect on assets attributable to the economic and market conditions over the past year, and considered the impact on profitability of the current asset level and any future growth of assets of the Fund. The Board took into account management’s discussion of the current advisory fee structure. The Trustees also noted that the subadvisory fees are paid by the Investment Manager out of its advisory fee. Based on the foregoing, the Trustees concluded that the profitability to the Investment Manager is reasonable and that the Investment Manager is not realizing material benefits from economies of scale that would warrant adjustments to the advisory fees for the Fund at this time. With respect to economies of scale, the Trustees also noted that as the Fund’s assets increase over time, the Fund may realize other economies of scale to the extent that the increase in assets is proportionally greater than the increase in certain other expenses.
The Trustees noted that the Fund’s advisory fee and total expenses (net of applicable expense waivers/reimbursements) as of March 31, 2009 were both higher than the average for the Peer Group. The Trustees took into account the fact that the Investment Manager has contractually agreed, through May 1, 2010, to limit the Fund’s net annual operating expenses to 0.99%. The Trustees concluded that, in light of the nature, extent and quality of the services provided by the Investment Manager and the Subadvisor, the foregoing expense limitation and the considerations noted above with respect to the Subadvisor and the Investment Manager, the Fund’s advisory fees are reasonable.
Subadvisory Fees and Profitability.
In considering the reasonableness of the fee payable by the Investment Manager to the Subadvisor, the Trustees relied on the ability of the Investment Manager to negotiate the terms of the Subadvisory Agreement at arm’s length as part of the manager-of-managers structure, noting that the Subadvisor is not affiliated with the Investment Manager. In addition, the Trustees noted that the subadvisory fees are paid by the Investment Manager out of its advisory fee. Accordingly, the cost of services to be provided by the Subadvisor and the profitability to the Subadvisor of its relationship with the Fund were not material factors in the Trustees’ deliberations. For similar reasons, and based on the current size of the portion of the Fund managed by the Subadvisor, the Trustees concluded that any economies of scale being realized by the Subadvisor was not a material factor in the Trustees’ deliberations at this time.
* * * *
After consideration of the foregoing, the Trustees also reached the following conclusions regarding the Investment Management Agreement and the Subadvisory Agreement, in addition to those conclusions discussed above: (a) the Investment Manager and the Subadvisor have demonstrated that they possess the capability and resources to perform the duties required of them under the Investment Management Agreement and the Subadvisory Agreement; (b) the Subadvisor’s Investment Strategy is appropriate for pursuing the Fund’s investment objectives; (c) the Subadvisor is reasonably likely to execute its Investment Strategy consistently over time; and (d) the Investment Manager and the Subadvisor maintain appropriate compliance programs.
Based on all of the above-mentioned factors and related conclusions, with no single factor or conclusion being determinative and with each Trustee not necessarily attributing the same weight to each factor, the Trustees concluded that approval of the Investment Management Agreement and the Subadvisory Agreement would be in the best interests of the Fund and its shareholders. Accordingly, on June 4-5, 2009, the Trustees, including a majority of the Independent Trustees, voted to approve the Investment Management Agreement and the Subadvisory Agreement for the Fund’s Subadvisor.
27
Table of Contents
Investment Manager and Administrator
Managers Investment Group LLC
333 W. Wacker Drive
Suite 1200
Chicago, IL 60606
(800) 835-3879
Distributor
Managers Investment Group LLC
333 W. Wacker Drive
Suite 1200
Chicago, IL 60606
(800) 835-3879
Custodian
The Bank of New York Mellon
2 Hanson Place
Brooklyn, New York 11217
Legal Counsel
Ropes & Gray LLP
One International Place
Boston, Massachusetts 02110-2624
Transfer Agent
PNC Global Investment Servicing (U.S.) Inc.
Attn: Managers
P.O. Box 9769
Providence, Rhode Island 02940
(800) 548-4539
Trustees
Jack W. Aber
William E. Chapman, II
Nathaniel Dalton
Edward J. Kaier
Steven J. Paggioli
Eric Rakowski
Thomas R. Schneeweis
John H. Streur
For Managers Choice Only
Managers
c/o PNC Global Investment Servicing (U.S.) Inc.
P.O. Box 61204
King of Prussia, Pennsylvania 19406-0851
(800) 358-7668
Table of Contents
MANAGERSAND MANAGERS AMG FUNDS
EQUITY FUNDS
EMERGING MARKETS EQUITY
Rexiter Capital Management Limited
Schroder Investment Management North America Inc.
ESSEX GROWTH
ESSEX LARGE CAP GROWTH
ESSEX SMALL/MICRO CAP GROWTH
Essex Investment Management Co., LLC
FQ TAX-MANAGED U.S. EQUITY
FQ U.S. EQUITY
First Quadrant, L.P.
GW&K SMALL CAP EQUITY
Gannett Welsh & Kotler, LLC
INSTITUTIONAL MICRO-CAP
MICRO-CAP
Lord, Abbett & Co. LLC
WEDGE Capital Management L.L.P.
OFI Institutional Asset Management, Inc.
Next Century Growth Investors LLC
INTERNATIONAL EQUITY
AllianceBernstein L.P.
Lazard Asset Management, LLC
Martin Currie Inc.
CHICAGO EQUITY PARTNERS
MID-CAP
Chicago Equity Partners, LLC
REAL ESTATE SECURITIES
Urdang Securities Management, Inc.
RENAISSANCE LARGE CAP GROWTH
Renaissance Group LLC
SKYLINE SPECIAL EQUITIES
PORTFOLIO
Skyline Asset Management, L.P.
SMALL CAP
TIMESSQUARE MID CAP GROWTH
TIMESSQUARE SMALL CAP GROWTH
TimesSquare Capital Management, LLC
SPECIAL EQUITY
Ranger Investment Management, L.P.
Lord, Abbett & Co. LLC
Smith Asset Management Group, L.P.
Federated MDTA LLC
SYSTEMATIC VALUE
SYSTEMATIC MID CAP VALUE
Systematic Financial Management, L.P.
BALANCED FUNDS
CHICAGO EQUITY PARTNERS BALANCED
Chicago Equity Partners, LLC
GLOBAL
AllianceBernstein L.P.
First Quadrant, L.P.
Wellington Management Company, LLP
ALTERNATIVE FUNDS
FQ GLOBAL ALTERNATIVES
First Quadrant, L.P.
INCOME FUNDS
BOND (MANAGERS)
FIXED INCOME
GLOBAL BOND
Loomis, Sayles & Co., L.P.
BOND (MANAGERS FREMONT)
Pacific Investment Management Co. LLC
CALIFORNIA INTERMEDIATE TAX-FREE
Miller Tabak Asset Management LLC
GW&K MUNICIPAL BOND
GW&K MUNICIPAL ENHANCED YIELD
Gannett Welsh & Kotler, LLC
HIGH YIELD
J.P. Morgan Investment Management LLC
INTERMEDIATE DURATION GOVERNMENT
SHORT DURATION GOVERNMENT
Smith Breeden Associates, Inc.
MONEY MARKET
JPMorgan Investment Advisors Inc.
This report is prepared for the Fund’s shareholders. It is authorized for distribution to prospective investors only when preceded or accompanied by an effective prospectus. To receive a free copy of the prospectus or Statement of Additional Information, which includes additional information about Fund Trustees, please contact us by calling 800.835.3879. Distributed by Managers Distributors, Inc., member FINRA.
A description of the policies and procedures each Fund uses to vote its proxies is available: (i) without charge, upon request, by calling 800.835.3879, or (ii) on the Securities and Exchange Commission’s (SEC) Web site at www.sec.gov. For information regarding each Fund’s proxy voting record for the 12-month period ended June 30, call 800.835.3879 or visit the SEC Web site at www.sec.gov.
The Fund files its complete schedule of portfolio holdings with the SEC for the first and third quarters of each fiscal year on Form N-Q. The Fund’s Forms N-Q are available on the SEC’s website at www.sec.gov. A Fund’s Forms N-Q may be reviewed and copied at the SEC’s Public Reference Room in Washington, DC. Information on the operation of the Public Reference Room may be obtained by calling 1-800-SEC-0330. To review a complete list of the Fund’s portfolio holdings, or to view the most recent quarterly holdings report, semiannual report, or annual report, please visit www.managersinvest.com.
www.managersinvest.com

Table of Contents
SEMI-ANNUAL REPORT
Managers Funds
June 30, 2009
Managers Special Equity Fund
SAR006-0609
Table of Contents
Managers Special Equity Fund
Semi-Annual Report — June 30, 2009 (unaudited)
| Page | ||
| ABOUT YOUR FUND’S EXPENSES | 1 | |
| FUND PERFORMANCE | 2 | |
| FUND SNAPSHOTS AND SCHEDULE OF PORTFOLIO INVESTMENTS | 3 | |
| FINANCIAL STATEMENTS: | ||
| 9 | ||
Fund’s balance sheet, net asset value (NAV) per share computation and cumulative undistributed amount | ||
| 10 | ||
Detail of sources of income, Fund expenses, and realized and unrealized gains (losses) during the period | ||
| 11 | ||
Detail of changes in Fund assets for the past two periods | ||
| FINANCIAL HIGHLIGHTS | 12 | |
Historical net asset values per share, distributions, total returns, expense ratios, turnover ratios and net assets | ||
| NOTES TO FINANCIAL STATEMENTS | 13 | |
Accounting and distribution policies, details of agreements and transactions with Fund management and affiliates, and descriptions of certain investment risks | ||
| ANNUAL RENEWAL OF INVESTMENT ADVISORY AGREEMENT | 17 | |
Nothing contained herein is to be considered an offer, sale or solicitation of an offer to buy shares of any series of the Managers Family of Funds. Such offering is made only by Prospectus, which includes details as to offering price and other material information.
Table of Contents
About Your Fund’s Expenses (unaudited)
As a shareholder of a Fund, you may incur two types of costs: (1) transaction costs, which may include sales charges (loads) on purchase payments; redemption fees; and exchange fees; and (2) ongoing costs, including management fees; distribution (12b-1) fees; and other Fund expenses. This example is intended to help you understand your ongoing costs (in dollars) of investing in the Fund and to compare these costs with the ongoing costs of investing in other mutual funds. The example is based on $1,000 invested at the beginning of the period and held for the entire period as indicated below.
Actual Expenses
The first line of the following table provides information about the actual account values and actual expenses. You may use the information in this line, together with the amount you invested, to estimate the expenses that you paid over the period. Simply divide your account value by $1,000 (for example, an $8,600 account value divided by $1,000 = 8.6), then multiply the result by the number in the first line under the heading entitled “Expenses Paid During Period” to estimate the expenses you paid on your account during this period.
Hypothetical Example for Comparison Purposes
The second line of the following table provides information about hypothetical account values and hypothetical expenses based on the Fund’s actual expense ratio and an assumed annual rate of return of 5% before expenses, which is not the Fund’s actual return. The hypothetical account values and expenses may not be used to estimate the actual ending account balance or expenses you paid for the period. You may use this information to compare the ongoing costs of investing in the Fund and other funds by comparing this 5% hypothetical example with the 5% hypothetical examples that appear in the shareholder reports of other funds.
Please note that the expenses shown in the table are meant to highlight your ongoing costs only and do not reflect any transactional costs, such as sales charges (loads), redemption fees, or exchange fees. Therefore, the second line of the table is useful in comparing ongoing costs only, and will not help you determine the relative total costs of owning different funds.
Six Months Ended June 30, 2009 | Expense Ratio for the Period | Beginning Account Value 01/01/2009 | Ending Account Value 06/30/2009 | Expenses Paid During the Period* | ||||||||
Managers Special Equity Fund - Managers Shares | ||||||||||||
Based on Actual Fund Return | 1.61 | % | $ | 1,000 | $ | 1,072 | $ | 8.27 | ||||
Based on Hypothetical 5% Annual Return | 1.61 | % | $ | 1,000 | $ | 1,017 | $ | 8.05 | ||||
Managers Special Equity Fund - Institutional Shares | ||||||||||||
Based on Actual Fund Return | 1.36 | % | $ | 1,000 | $ | 1,073 | $ | 6.99 | ||||
Based on Hypothetical 5% Annual Return | 1.36 | % | $ | 1,000 | $ | 1,018 | $ | 6.80 | ||||
| * | Expenses are equal to the Fund’s annualized expense ratio multiplied by the average account value over the period, multiplied by the number of days in the most recent fiscal half-year (181), then divided by 365. |
1
Table of Contents
Managers Special Equity Fund Performance
All periods ended June 30, 2009 (unaudited)
The table below shows the average annual total returns from June 30, 1999 through June 30, 2009 of the Special Equity Fund, the Russell 2000® Index and the Russell 2000® Growth Index for the same time periods.
| Average Annual Total Returns1 | ||||||||||||||
Managers Special Equity Fund 2 | Six Months | One Year | Five Years | Ten Years | Inception Date | |||||||||
Managers Class | 7.17 | % | (30.48 | )% | (5.22 | )% | 0.97 | % | 6/1/1984 | |||||
Institutional Class | 7.30 | % | (30.31 | )% | (5.01 | )% | N/A | 5/3/2004 | ||||||
Russell 2000® Growth Index | 11.36 | % | (24.85 | )% | (1.32 | )% | (0.89 | )% | ||||||
Russell 2000® Index | 2.64 | % | (25.01 | )% | (1.71 | )% | 2.38 | % | ||||||
The performance data shown represents past performance. Past performance is not a guarantee of future results. Current performance may be lower or higher than the performance data quoted. The investment return and the principal value of an investment will fluctuate so that an investor’s shares, when redeemed, may be worth more or less than their original cost. For performance information through the most recent month end please call (800) 835-3879 or visit our Web site at www.managersinvest.com.
In choosing a Fund, investors should carefully consider the amount they plan to invest, their investment objectives, the Fund’s investment objectives, risks, charges and expenses before investing. For this and other information, please call (800) 835-3879 or visit www.managersinvest.com for a free prospectus. Read it carefully before investing or sending money. Distributed by Managers Distributors, Inc., member FINRA.
The Fund is subject to risks associated with investments in small capitalization companies, such as erratic earnings patterns, competitive conditions, limited earnings history, and a reliance on one or a limited number of products.
The Russell 2000® Index was the Fund’s prior benchmark. Effective May 26, 2009, the Investment Manager changed the benchmark to the Russell 2000® Growth Index because it determined that the Russell 2000® Growth Index more accurately reflects the Fund’s investments. The Russell 2000® Index is composed of the 2,000 smallest stocks in the Russell 3000® Index and is widely regarded in the industry as the premier measure of small-cap stock performance. The Russell 2000® Growth Index measures the performance of the Russell 2000 companies with higher price-to-book ratios and higher forecasted growth values. Unlike the Fund, the Indexes are unmanaged, are not available for investment, and reflect no deduction for fees and expenses.
The Russell 2000® Index and Russell 2000® Growth Index are trademarks of Russell Investments. Russell® is a trademark of Russell Investments.
| 1 | Total return equals income yield plus share price change and assumes reinvestment of all dividends and capital gain distributions. Returns are net of fees and may reflect offsets of Fund expenses as described in the Prospectus. No adjustment has been made for taxes payable by shareholders on their reinvested dividends and capital gain distributions. Returns for periods greater than one year are annualized. The listed returns on the Fund are net of expenses and based on the published NAV as of June 30, 2009. All returns are in U.S. dollars($). |
| 2 | From time to time, the Fund’s advisor has waived its fees and/or absorbed Fund expenses, which has resulted in higher returns. |
Not FDIC insured, nor bank guaranteed. May lose value.
2
Table of Contents
Fund Snapshots
June 30, 2009 (unaudited)
Portfolio Breakdown
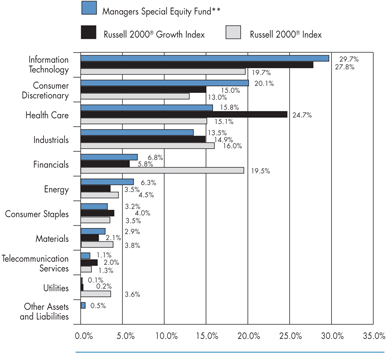
Industry | Managers Special Equity Fund ** | Russell 2000® Growth Index | Russell 2000® Index | ||||||
Information Technology | 29.7 | % | 27.8 | % | 19.7 | % | |||
Consumer Discretionary | 20.1 | % | 15.0 | % | 13.0 | % | |||
Health Care | 15.8 | % | 24.7 | % | 15.1 | % | |||
Industrials | 13.5 | % | 14.9 | % | 16.0 | % | |||
Financials | 6.8 | % | 5.8 | % | 19.5 | % | |||
Energy | 6.3 | % | 3.5 | % | 4.5 | % | |||
Consumer Staples | 3.2 | % | 4.0 | % | 3.5 | % | |||
Materials | 2.9 | % | 2.1 | % | 3.8 | % | |||
Telecommunication Services | 1.1 | % | 2.0 | % | 1.3 | % | |||
Utilities | 0.1 | % | 0.2 | % | 3.6 | % | |||
Other Assets and Liabilities | 0.5 | % | 0.0 | % | 0.0 | % |
| ** | As a percentage of net assets |
Top Ten Holdings
Security Name | Percentage of Net Assets | ||
Starent Networks Corp. | 1.5 | % | |
HMS Holdings Corp.* | 1.5 | ||
99 Cents Only Stores | 1.5 | ||
NetLogic Microsystems, Inc. | 1.4 | ||
Monolithic Power Systems, Inc. | 1.2 | ||
Concur Technologies, Inc. | 1.2 | ||
athenahealth, Inc. | 1.1 | ||
Rackspace Hosting, Inc. | 1.1 | ||
Chico’s FAS, Inc. | 1.0 | ||
Gymboree Corp. | 0.9 | ||
Top Ten as a Group | 12.4 | % | |
| * | Top Ten Holding at December 31, 2008 |
Any sectors, industries, or securities discussed should not be perceived as investment recommendations. Mention of a specific security should not be considered a recommendation to buy or solicitation to sell that security. Specific securities mentioned in this report may have been sold from the Fund’s portfolio of investments by the time you receive this report.
3
Table of Contents
Managers Special Equity Fund
Schedule of Portfolio Investments
June 30, 2009 (unaudited)
| Shares | Value | |||||
Common Stocks - 99.5% | ||||||
Consumer Discretionary - 20.1% | ||||||
99 Cents Only Stores* | 353,034 | $ | 4,794,203 | |||
Aaron Rents, Inc. | 46,394 | 2 | 1,383,469 | |||
Aeropostale, Inc.* | 38,085 | 1,305,173 | ||||
American Eagle Outfitters, Inc. | 74,500 | 1,055,665 | ||||
American Public Education, Inc.* | 20,442 | 809,708 | ||||
America’s Car-Mart, Inc.* | 41,476 | 850,258 | ||||
Ameristar Casinos, Inc. | 31,900 | 607,057 | ||||
Barnes & Noble, Inc. | 6,420 | 132,445 | ||||
BJ’s Restaurants, Inc.* | 58,840 | 992,631 | ||||
Blue Nile, Inc.* | 5,746 | 2 | 247,021 | |||
Brink’s Home Security Holdings, Inc.* | 7,691 | 217,732 | ||||
Buckle, Inc., The | 53,262 | 2 | 1,692,134 | |||
California Pizza Kitchen, Inc.* | 58,546 | 778,076 | ||||
Capella Education Co.* | 12,895 | 773,055 | ||||
Career Education Corp.* | 9,143 | 227,569 | ||||
Carter’s, Inc.* | 37,822 | 930,799 | ||||
Cato Corporation, The, Class A | 45,896 | 800,426 | ||||
CEC Entertainment, Inc.* | 15,756 | 464,487 | ||||
Cheesecake Factory, Inc., The* | 59,478 | 1,028,969 | ||||
Chico’s FAS, Inc.* | 312,789 | 3,043,438 | ||||
Children’s Place Retail Stores, Inc., The* | 24,245 | 640,795 | ||||
Chipotle Mexican Grill, Inc.* | 9,700 | 2 | 776,000 | |||
Chipotle Mexican Grill, Inc., Class B* | 8,130 | 567,393 | ||||
Citi Trends, Inc.* | 32,618 | 844,154 | ||||
Corinthian Colleges, Inc.* | 55,480 | 939,276 | ||||
Cracker Barrel Old Country Store, Inc. | 27,147 | 757,401 | ||||
Ctrip.com International, Ltd. | 30,400 | 1,407,520 | ||||
Dick’s Sporting Goods, Inc.* | 12,218 | 210,150 | ||||
DineEquity, Inc. | 17,500 | 2 | 545,825 | |||
Domino’s Pizza, Inc.* | 77,074 | 577,284 | ||||
Dress Barn, Inc., The* | 54,007 | 772,300 | ||||
Fossil, Inc.* | 57,656 | 1,388,356 | ||||
Group 1 Automotive, Inc. | 84,501 | 2,198,716 | ||||
Gymboree Corp.* | 84,901 | 3,012,288 | ||||
hhgregg, Inc.* | 33,738 | 511,468 | ||||
Hibbett Sports, Inc.* | 26,298 | 473,364 | ||||
Home Inns & Hotels Management Inc., ADR* | 39,188 | 2 | 622,697 | |||
J. Crew Group, Inc.* | 31,305 | 845,861 | ||||
Jos. A. Bank Clothiers, Inc.* | 29,335 | 2 | 1,010,884 | |||
K12, Inc.* | 37,079 | 799,052 | ||||
Lincoln Educational Services Corp.* | 21,667 | 453,490 | ||||
Lululemon Athletica, Inc.* | 70,485 | 2 | 918,420 | |||
Lumber Liquidators, Inc.* | 44,900 | 2 | 707,624 | |||
Men’s Wearhouse, Inc. | 30,300 | 581,154 | ||||
Monro Muffler Brake, Inc. | 40,670 | 1,045,626 | ||||
Netflix, Inc.* | 7,073 | 2 | 292,398 | |||
P.F. Chang’s China Bistro, Inc.* | 38,713 | 2 | 1,241,139 | |||
Panera Bread Co., Class A* | 16,640 | 829,670 | ||||
Papa John’s International, Inc.* | 42,961 | 1,065,003 | ||||
Penn National Gaming, Inc.* | 14,200 | 413,362 | ||||
PetMed Express, Inc.* | 66,036 | 992,521 | ||||
Polaris Industries, Inc. | 18,900 | 2 | 607,068 | |||
Steven Madden, Ltd.* | 101,181 | 2,575,057 | ||||
Strayer Education, Inc. | 3,729 | 2 | 813,332 | |||
Tempur-Pedic International, Inc. | 56,100 | 2 | 733,227 | |||
Texas Roadhouse, Inc., Class A* | 210,242 | 2,293,740 | ||||
Timberland Co.* | 33,724 | 447,517 | ||||
Tractor Supply Co.* | 12,500 | 516,500 | ||||
True Religion Apparel, Inc.* | 30,683 | 684,231 | ||||
Tupperware Brands Corp. | 46,092 | 1,199,314 | ||||
Under Armour, Inc., Class A* | 10,100 | 2 | 226,038 | |||
Universal Electronics, Inc.* | 28,000 | 564,760 | ||||
Warnaco Group, Inc., The* | 46,107 | 1,493,867 | ||||
Westport Innovations, Inc.* | 110,160 | 891,194 | ||||
WMS Industries, Inc.* | 37,790 | 1,190,763 | ||||
Total Consumer Discretionary | 63,812,114 | |||||
Consumer Staples - 3.2% | ||||||
American Italian Pasta Co.* | 22,400 | 2 | 652,736 | |||
Bare Escentuals, Inc.* | 50,200 | 445,274 | ||||
Calavo Growers, Inc. | 21,646 | 429,240 | ||||
Casey’s General Stores, Inc. | 36,617 | 940,691 | ||||
Diamond Foods, Inc. | 1,076 | 30,020 | ||||
Green Mountain Coffee Roasters, Inc.* | 17,241 | 2 | 1,019,288 | |||
Hansen Natural Corp.* | 3,300 | 101,706 | ||||
Lancaster Colony Corp. | 32,244 | 1,420,993 | ||||
Lance, Inc. | 35,777 | 827,522 | ||||
Nu Skin Enterprises, Inc., Class A | 64,692 | 989,788 | ||||
Prestige Brands Holdings, Inc.* | 78,500 | 482,775 | ||||
TreeHouse Foods, Inc.* | 87,640 | 2,521,403 | ||||
Zhongpin, Inc.* | 33,081 | 342,719 | ||||
Total Consumer Staples | 10,204,155 | |||||
The accompanying notes are an integral part of these financial statements.
4
Table of Contents
Managers Special Equity Fund
Schedule of Portfolio Investments (continued)
| Shares | Value | |||||
Energy - 6.3% | ||||||
Arena Resources, Inc.* | 84,490 | $ | 2,691,006 | |||
CARBO Ceramics, Inc. | 16,995 | 2 | 581,229 | |||
Clean Energy Fuels Corp.* | 107,800 | 2 | 928,158 | |||
Core Laboratories, N.V. | 30,310 | 2 | 2,641,516 | |||
Dril-Quip, Inc.* | 16,200 | 617,220 | ||||
EXCO Resources, Inc.* | 143,815 | 1,858,090 | ||||
Goodrich Petroleum Corp.* | 92,500 | 2,274,575 | ||||
Gulfport Energy Corp.* | 75,800 | 519,230 | ||||
Matrix Service Co.* | 86,900 | 997,612 | ||||
Oceaneering International, Inc.* | 46,346 | 2,094,839 | ||||
Parker Drilling, Co.* | 105,100 | 456,134 | ||||
Quicksilver Resources, Inc.* | 50,100 | 2 | 465,429 | |||
Rosetta Resources, Inc.* | 183,143 | 1,602,501 | ||||
Superior Energy Services, Inc.* | 74,344 | 1,283,921 | ||||
Willbros Group, Inc.* | 44,000 | 550,440 | ||||
World Fuel Services Corp. | 7,953 | 327,902 | ||||
Total Energy | 19,889,802 | |||||
Financials - 6.8% | ||||||
Amtrust Financial Services, Inc. | 632 | 7,205 | ||||
BOK Financial Corp. | 41,012 | 1,544,922 | ||||
Broadpoint Gleacher Securities, Inc.* | 61,900 | 345,402 | ||||
Calamos Asset Management, Inc. - A | 69,033 | 974,056 | ||||
eHealth, Inc.* | 35,516 | 627,213 | ||||
E-House China Holdings, Ltd., ADR* | 52,200 | 805,968 | ||||
First Cash Financial Services, Inc.* | 37,740 | 661,205 | ||||
GFI Group, Inc. | 135,765 | 915,056 | ||||
Greenhill & Co., Inc. | 7,170 | 2 | 517,746 | |||
Horace Mann Educators Corp. | 55,900 | 557,323 | ||||
KBW, Inc.* | 29,300 | 842,668 | ||||
Lazard, Ltd., Class A | 55,895 | 1,504,693 | ||||
Life Partners Holdings, Inc. | 18,398 | 260,884 | ||||
Pinnacle Financial Partners, Inc.* | 110,184 | 1,467,651 | ||||
PS Business Parks, Inc. | 9,300 | 450,492 | ||||
Signature Bank* | 78,950 | 2,141,124 | ||||
Stifel Financial Corp.* | 15,200 | 730,968 | ||||
SVB Financial Group* | 97,975 | 2 | 2,666,879 | |||
Texas Capital Bancshares, Inc.* | 166,565 | 2,576,760 | ||||
Tower Group, Inc. | 23,600 | 584,808 | ||||
UMB Financial Corp. | 16,700 | 634,767 | ||||
World Acceptance Corp.* | 42,107 | 2 | 838,350 | |||
Total Financials | 21,656,140 | |||||
Health Care - 15.8% | ||||||
Acorda Therapeutics, Inc.* | 47,889 | 1,349,991 | ||||
Air Methods Corp.* | 11,437 | 312,916 | ||||
Alexion Pharmaceuticals, Inc.* | 25,100 | 1,032,112 | ||||
Align Technology, Inc.* | 58,947 | 624,838 | ||||
Allos Therapeutics, Inc.* | 66,400 | 550,456 | ||||
Amedisys, Inc.* | 24,024 | 793,272 | ||||
American Medical Systems Holdings, Inc.* | 104,841 | 1,656,488 | ||||
AMERIGROUP Corp.* | 30,600 | 821,610 | ||||
AMN Healthcare Services, Inc.* | 84,900 | 541,662 | ||||
AmSurg Corp.* | 17,000 | 364,480 | ||||
athenahealth, Inc.* | 94,657 | 3,503,256 | ||||
Bruker BioSciences Corp.* | 55,479 | 513,736 | ||||
CardioNet, Inc.* | 17,587 | 287,020 | ||||
Catalyst Health Solutions, Inc.* | 31,500 | 785,610 | ||||
Chemed Corp. | 30,625 | 1,209,075 | ||||
Conceptus, Inc.* | 49,079 | 829,435 | ||||
Crucell N.V., ADR* | 27,200 | 654,432 | ||||
Cyberonics, Inc.* | 43,946 | 730,822 | ||||
DexCom, Inc.* | 145,791 | 902,446 | ||||
Eclipsys Corp.* | 34,893 | 620,398 | ||||
Emergency Medical Services Corp., Class A* | 6,935 | 255,347 | ||||
Eurand N.V.* | 82,200 | 1,068,600 | ||||
Genoptix, Inc.* | 27,506 | 879,917 | ||||
Gentiva Health Services, Inc.* | 57,397 | 944,755 | ||||
Haemonetics Corp.* | 8,646 | 492,822 | ||||
HMS Holdings Corp.* | 117,743 | 4,794,495 | ||||
ICON PLC* | 51,975 | 1,121,620 | ||||
Illumina, Inc.* | 27,361 | 2 | 1,065,437 | |||
Insulet Corp.* | 85,700 | 2 | 659,890 | |||
Kensey Nash Corp.* | 24,320 | 637,427 | ||||
LHC Group, Inc.* | 55,927 | 1,242,139 | ||||
Martek Biosciences Corp.* | 28,800 | 609,120 | ||||
Masimo Corp.* | 55,990 | 1,349,919 | ||||
Matrixx Initiatives, Inc.* | 45,334 | 253,417 | ||||
MedAssets, Inc.* | 36,103 | 702,203 | ||||
Medicis Pharmaceutical Corp. | 43,800 | 714,816 | ||||
Medidata Solutions, Inc.* | 25,900 | 424,242 | ||||
Noven Pharmaceuticals, Inc.* | 115,247 | 1,648,032 | ||||
NuVasive, Inc.* | 23,770 | 2 | 1,060,142 | |||
Odyssey HealthCare, Inc.* | 54,400 | 559,232 | ||||
Owens & Minor, Inc. | 13,300 | 582,806 | ||||
The accompanying notes are an integral part of these financial statements.
5
Table of Contents
Managers Special Equity Fund
Schedule of Portfolio Investments (continued)
| Shares | Value | |||||
Health Care - 15.8% (continued) | ||||||
PAREXEL International Corp.* | 69,117 | $ | 993,902 | |||
PDL BioPharma, Inc. | 67,200 | 530,880 | ||||
Pharmerica Corp.* | 28,045 | 550,523 | ||||
Phase Forward, Inc.* | 41,014 | 619,722 | ||||
Savient Pharmaceuticals, Inc.* | 37,900 | 2 | 525,294 | |||
Somanetics Corp.* | 60,060 | 991,591 | ||||
Steris Corp. | 17,500 | 456,400 | ||||
Sun Healthcare Group, Inc.* | 69,354 | 585,348 | ||||
SXC Health Solutions Corp.* | 81,410 | 2,069,442 | ||||
Thoratec Corp.* | 66,551 | 1,782,236 | ||||
United Therapeutics Corp.* | 5,900 | 2 | 491,647 | |||
Valeant Pharmaceuticals International* | 29,500 | 2 | 758,740 | |||
Vanda Pharmaceuticals, Inc.* | 46,596 | 2 | 548,435 | |||
Total Health Care | 50,054,593 | |||||
Industrials - 13.5% | ||||||
Acuity Brands, Inc. | 19,200 | 2 | 538,560 | |||
Allegiant Travel Co.* | 12,983 | 2 | 514,646 | |||
American Reprographics Co.* | 56,100 | 466,752 | ||||
American Science & Engineering, Inc. | 6,900 | 476,928 | ||||
American Superconductor Corp.* | 48,619 | 1,276,249 | ||||
Applied Signal Technology, Inc. | 66,298 | 1,691,262 | ||||
Badger Meter, Inc. | 20,886 | 856,326 | ||||
BE Aerospace, Inc.* | 172,592 | 2,478,421 | ||||
Beacon Roofing Supply, Inc.* | 112,297 | 1,623,815 | ||||
Bucyrus International, Inc. | 74,080 | 2,115,725 | ||||
Chart Industries, Inc.* | 32,143 | 584,360 | ||||
Colfax Corp.* | 52,634 | 406,334 | ||||
Copa Holdings, S.A., Class A | 12,700 | 518,414 | ||||
Copart, Inc.* | 42,960 | 1,489,423 | ||||
CRA International, Inc.* | 19,900 | 552,424 | ||||
Cubic Corp. | 23,487 | 840,600 | ||||
Deluxe Corp. | 45,500 | 582,855 | ||||
DigitalGlobe, Inc.* | 11,200 | 215,040 | ||||
Duoyuan Global Water, Inc., ADR* | 34,700 | 2 | 842,516 | |||
DynCorp International, Inc.* | 73,268 | 1,230,170 | ||||
EMCOR Group, Inc.* | 26,100 | 525,132 | ||||
Energy Conversion Devices, Inc.* | 11,258 | 2 | 159,301 | |||
Energy Recovery, Inc.* | 75,000 | 531,000 | ||||
EnerNOC, Inc.* | 78,089 | 1,692,189 | ||||
EnerSys* | 158,260 | 2,878,748 | ||||
Exponent, Inc.* | 18,895 | 463,116 | ||||
Force Protection, Inc.* | 19,603 | 173,291 | ||||
FTI Consulting, Inc.* | 16,300 | 826,736 | ||||
Geo Group, Inc., The* | 52,885 | 982,603 | ||||
Harbin Electric, Inc.* | 46,700 | 2 | 730,388 | |||
II-VI, Inc.* | 19,381 | 429,677 | ||||
Kforce, Inc.* | 19,946 | 164,953 | ||||
Marten Transport, Ltd.* | 27,800 | 577,128 | ||||
Michael Baker Corp.* | 15,000 | 635,400 | ||||
Middleby Corp., The* | 10,000 | 439,200 | ||||
MYR Group, Inc.* | 46,307 | 936,328 | ||||
Nordson Corp. | 34,403 | 1,330,020 | ||||
Old Dominion Freight Line, Inc.* | 26,274 | 882,018 | ||||
Orion Marine Group, Inc.* | 139,639 | 2,653,141 | ||||
Powell Industries, Inc.* | 14,985 | 555,494 | ||||
RBC Bearings, Inc.* | 13,600 | 278,120 | ||||
Resources Connection, Inc.* | 22,700 | 389,759 | ||||
Ritchie Bros. Auctioneers, Inc. | 27,790 | 651,676 | ||||
SunPower Corp., Class B* | 4,281 | 102,530 | ||||
Suntech Power Holdings Co., Ltd.* | 22,100 | 2 | 394,706 | |||
Tetra Technologies, Inc.* | 12,336 | 353,426 | ||||
Triumph Group, Inc. | 59,900 | 2,396,000 | ||||
Wabtec Corp. | 32,010 | 1,029,762 | ||||
Watson Wyatt & Co. | 10,100 | 379,053 | ||||
Total Industrials | 42,841,715 | |||||
Information Technology - 29.7% | ||||||
3PAR, Inc.* | 98,482 | 1,221,177 | ||||
ACI Worldwide, Inc.* | 54,071 | 754,831 | ||||
Acxiom Corp. | 102,223 | 902,629 | ||||
Advent Software, Inc.* | 27,242 | 893,265 | ||||
Anadigics, Inc.* | 167,800 | 703,082 | ||||
Arcsight, Inc.* | 50,276 | 893,405 | ||||
Ariba, Inc.* | 193,880 | 1,907,779 | ||||
Arris Group, Inc.* | 68,601 | 834,188 | ||||
Aruba Networks, Inc.* | 211,990 | 1,852,793 | ||||
AsiaInfo Holdings, Inc.* | 66,865 | 1,150,747 | ||||
Atheros Communications, Inc.* | 39,981 | 769,234 | ||||
Bankrate, Inc.* | 12,398 | 312,926 | ||||
Benchmark Electronics, Inc.* | 40,800 | 587,520 | ||||
Broadridge Financial Solutions, Inc. | 37,400 | 620,092 | ||||
CACI International, Inc., Class A* | 37,746 | 1,612,132 | ||||
Cavium Networks, Inc.* | 53,275 | 895,553 | ||||
Changyou.com, ADR* | 5,800 | 223,126 | ||||
Ciena Corp.* | 49,774 | 2 | 515,161 | |||
The accompanying notes are an integral part of these financial statements.
6
Table of Contents
Managers Special Equity Fund
Schedule of Portfolio Investments (continued)
| Shares | Value | |||||
Information Technology - 29.7% (continued) | ||||||
Concur Technologies, Inc.* | 119,030 | $ | 3,699,451 | |||
Constant Contact, Inc.* | 51,284 | 2 | 1,017,475 | |||
CSG Systems International, Inc.* | 89,988 | 1,191,441 | ||||
CyberSource Corp.* | 34,890 | 533,817 | ||||
DG FastChannel, Inc.* | 101,630 | 1,859,829 | ||||
Digital River, Inc.* | 18,500 | 671,920 | ||||
Diodes, Inc.* | 51,700 | 808,588 | ||||
Equinix, Inc.* | 38,010 | 2,764,847 | ||||
F5 Networks, Inc.* | 26,555 | 918,537 | ||||
Global Cash Access Holdings, Inc.* | 115,539 | 919,690 | ||||
GSI Commerce, Inc.* | 55,000 | 783,750 | ||||
Infinera Corp.* | 15,684 | 143,195 | ||||
Informatica Corp.* | 89,730 | 1,542,459 | ||||
InterDigital, Inc.* | 15,500 | 2 | 378,820 | |||
IPG Photonics Corp.* | 34,573 | 379,266 | ||||
Itron, Inc.* | 11,700 | 644,319 | ||||
J2 Global Communications, Inc.* | 56,227 | 1,268,481 | ||||
Knot, Inc., The* | 63,083 | 497,094 | ||||
Longtop Financial Technologies, Ltd. - ADR* | 27,622 | 678,396 | ||||
Macrovision Solutions Corp.* | 118,080 | 2,575,325 | ||||
ManTech International Corp., Class A* | 13,000 | 559,520 | ||||
MercadoLibre, Inc.* | 30,700 | 825,216 | ||||
Monolithic Power Systems, Inc.* | 167,195 | 3,746,839 | ||||
Multi-Fineline Electronix, Inc.* | 29,800 | 637,720 | ||||
Net 1 UEPS Technologies, Inc.* | 29,800 | 404,982 | ||||
Netezza Corp.* | 69,699 | 579,896 | ||||
NetLogic Microsystems, Inc.* | 121,298 | 4,422,524 | ||||
NetSuite, Inc.* | 56,653 | 669,072 | ||||
Neutral Tandem, Inc.* | 45,635 | 1,347,145 | ||||
NICE Systems, Ltd.* | 14,084 | 324,918 | ||||
NVE Corp.* | 8,749 | 425,201 | ||||
OpenTable, Inc.* | 26,800 | 2 | 808,556 | |||
OSI Systems, Inc.* | 44,341 | 924,510 | ||||
Palm, Inc.* | 45,300 | 2 | 750,621 | |||
Pegasystems, Inc. | 34,823 | 918,631 | ||||
PMC - Sierra, Inc.* | 91,149 | 725,546 | ||||
Power Integrations, Inc. | 8,492 | 202,025 | ||||
Rackspace Hosting, Inc.* | 241,407 | 3,345,901 | ||||
RightNow Technologies, Inc.* | 77,871 | 918,878 | ||||
Riverbed Technology, Inc.* | 80,077 | 1,856,986 | ||||
Rosetta Stone, Inc.* | 10,018 | 2 | 274,894 | |||
S1 Corp.* | 188,490 | 1,300,581 | ||||
ScanSource, Inc.* | 16,918 | 414,829 | ||||
Semtech Corp.* | 21,126 | 336,115 | ||||
Silicon Laboratories, Inc.* | 33,400 | 1,267,196 | ||||
Skyworks Solutions, Inc.* | 243,268 | 2,379,161 | ||||
Sohu.com, Inc.* | 10,500 | 659,715 | ||||
Solera Holdings, Inc.* | 87,700 | 2,227,580 | ||||
Starent Networks Corp.* | 200,181 | 2 | 4,886,417 | |||
STEC, Inc.* | 30,572 | 2 | 708,965 | |||
SuccessFactors, Inc.* | 70,200 | 2 | 644,436 | |||
Sybase, Inc.* | 24,900 | 780,366 | ||||
Synaptics, Inc.* | 48,181 | 1,862,196 | ||||
Synchronoss Technologies, Inc.* | 56,936 | 698,605 | ||||
Syntel, Inc. | 30,493 | 958,700 | ||||
Taleo Corp.* | 51,247 | 936,283 | ||||
TeleTech Holdings, Inc.* | 76,565 | 1,159,960 | ||||
Teradyne, Inc.* | 92,600 | 2 | 635,236 | |||
TNS, Inc.* | 46,510 | 872,062 | ||||
Tyler Technologies, Inc.* | 19,888 | 310,651 | ||||
ValueClick, Inc.* | 48,500 | 510,220 | ||||
VistaPrint, Ltd.* | 38,304 | 1,633,666 | ||||
Vocus, Inc.* | 93,201 | 1,841,652 | ||||
Websense, Inc.* | 59,526 | 1,061,944 | ||||
Wright Express Corp.* | 60,202 | 1,533,345 | ||||
Total Information Technology | 94,215,802 | |||||
Materials - 2.9% | ||||||
Bway Holding Co.* | 58,119 | 1,018,826 | ||||
Chemspec International, Ltd., ADR* | 71,600 | 601,440 | ||||
Commercial Metals Co. | 88,380 | 1,416,731 | ||||
Intrepid Potash, Inc.* | 37,290 | 1,047,103 | ||||
Koppers Holdings, Inc. | 26,000 | 685,620 | ||||
NewMarket Corp. | 21,698 | 1,460,926 | ||||
Rock-Tenn Co. | 14,980 | 571,637 | ||||
Schnitzer Steel Industries, Inc. | 35,440 | 1,873,359 | ||||
Scotts Co., The, Class A | 18,200 | 637,910 | ||||
Total Materials | 9,313,552 | |||||
Telecommunication Services - 1.1% | ||||||
Cbeyond, Inc.* | 26,300 | 377,405 | ||||
Cincinnati Bell, Inc.* | 26,179 | 74,348 | ||||
NTELOS Holdings Corp. | 42,244 | 778,134 | ||||
Syniverse Holdings, Inc.* | 137,371 | 2,202,058 | ||||
Total Telecommunication Services | 3,431,945 | |||||
The accompanying notes are an integral part of these financial statements.
7
Table of Contents
Managers Special Equity Fund
Schedule of Portfolio Investments (continued)
| Shares | Value | ||||||
Utilities - 0.1% | |||||||
ITC Holdings Corp. | 8,663 | 2 | $ | 392,954 | |||
Total Common Stocks (cost $280,046,254) | 315,812,772 | ||||||
Short-Term Investments - 13.9%1 | |||||||
BNY Institutional Cash Reserves Fund, Series A, 0.06%3 | 21,769,313 | 21,769,313 | |||||
BNY Institutional Cash Reserves Fund, Series B*3,4 | 2,499,559 | 368,685 | |||||
Dreyfus Cash Management Fund, Institutional Class Shares, 0.44%5 | 22,083,238 | 22,083,238 | |||||
Short-Term Investments | 44,221,236 | ||||||
Total Investments - 113.4% | 360,034,008 | ||||||
Other Assets, less Liabilities - (13.4)% | (42,447,955 | ) | |||||
Net Assets - 100.0% | $ | 317,586,053 | |||||
Based on the approximate cost of investments of $359,881,628 for Federal income tax purposes at June 30, 2009, the aggregate gross unrealized appreciation and depreciation were $46,456,789 and $46,304,409, respectively, resulting in net unrealized appreciation of investments of $152,380.
| * | Non-income producing security. |
| 1 | Yield shown for an investment company represents the June 30, 2009, seven-day average yield, which refers to the sum of the previous seven days’ dividends paid, expressed as an annual percentage. |
| 2 | Some or all of these shares were out on loan to various brokers as of June 30, 2009, amounting to a market value of $23,512,271, or approximately 7.4% of net assets. |
| 3 | Collateral received from brokers for securities lending was invested in this short-term investment. |
| 4 | On September 12, 2008, The Bank of New York Mellon (“BNYM”) established a separate sleeve of the BNY Institutional Cash Reserves Fund (“ICRF”) (Series B) to hold certain Lehman Brothers floating rate notes. The Fund’s position in Series B is being marked to market daily. |
| 5 | The Fund’s investment is covered under the U.S. Treasury Temporary Money Market Fund Guarantee Program up to a maximum of $105,626,374. |
Investments Definitions and Abbreviations:
ADR: ADR after the name of a holding stands for American Depositary Receipt, representing ownership of foreign securities on deposit with a domestic custodian bank. The value of the ADR security is determined or significantly influenced by trading on exchanges not located in the United States or Canada. Sponsored ADRs are initiated by the underlying foreign company.
The accompanying notes are an integral part of these financial statements.
8
Table of Contents
Statement of Assets and Liabilities
June 30, 2009 (unaudited)
Assets: | ||||
Investments at value (including securities on loan valued at $23,512,271)* | $ | 360,034,008 | ||
Receivable for investments sold | 19,021,441 | |||
Receivable for Fund shares sold | 3,489,844 | |||
Dividends, interest and other receivables | 73,462 | |||
Prepaid expenses | 46,770 | |||
Total assets | 382,665,525 | |||
Liabilities: | ||||
Payable for Fund shares repurchased | 31,806,022 | |||
Payable upon return of securities loaned | 24,268,872 | |||
Payable for investments purchased | 8,400,927 | |||
Accrued expenses: | ||||
Investment advisory and management fees | 260,112 | |||
Administrative fees | 72,253 | |||
Other | 271,286 | |||
Total liabilities | 65,079,472 | |||
Net Assets | $ | 317,586,053 | ||
Managers Shares: | ||||
Net Assets | $ | 257,455,407 | ||
Shares outstanding | 7,932,494 | |||
Net asset value, offering and redemption price per share | $ | 32.46 | ||
Institutional Class Shares: | ||||
Net Assets | $ | 60,130,646 | ||
Shares outstanding | 1,834,059 | |||
Net asset value, offering and redemption price per share | $ | 32.79 | ||
Net Assets Represent: | ||||
Paid-in capital | $ | 662,895,393 | ||
Undistributed net investment loss | (1,850,661 | ) | ||
Accumulated net realized loss from investments | (377,094,323 | ) | ||
Net unrealized appreciation of investments | 33,635,644 | |||
Net Assets | $ | 317,586,053 | ||
* Investments at cost | $ | 326,398,364 |
The accompanying notes are an integral part of these financial statements.
9
Table of Contents
Statement of Operations
For the six months ended June 30, 2009 (unaudited)
Investment Income: | ||||
Dividend income | $ | 718,497 | ||
Foreign withholding tax | (3,538 | ) | ||
Securities lending fees | 131,279 | |||
Total investment income | 846,238 | |||
Expenses: | ||||
Investment management fees | 1,587,139 | |||
Administrative fees | 440,872 | |||
Transfer agent | 445,734 | |||
Custodian | 90,675 | |||
Reports to shareholders | 77,611 | |||
Professional fees | 57,448 | |||
Registration fees | 22,309 | |||
Trustees fees and expenses | 8,262 | |||
Miscellaneous | 16,416 | |||
Total expenses before offsets | 2,746,466 | |||
Expense reductions | (49,567 | ) | ||
Net expenses | 2,696,899 | |||
Net investment loss | (1,850,661 | ) | ||
Net Realized and Unrealized Gain (Loss): | ||||
Net realized loss on investment transactions | (108,847,886 | ) | ||
Net unrealized appreciation of investments | 127,768,916 | |||
Net realized and unrealized gain | 18,921,030 | |||
Net increase in net assets resulting from operations | $ | 17,070,369 |
The accompanying notes are an integral part of these financial statements.
10
Table of Contents
Statement of Changes in Net Assets
For the six months ended June 30, 2009 (unaudited) and for the year ended December 31, 2008
| 2009 | 2008 | |||||||
Increase (Decrease) in Net Assets From Operations: | ||||||||
Net investment loss | ($1,850,661 | ) | ($5,943,300 | ) | ||||
Net realized loss on investments | (108,847,886 | ) | (262,909,241 | ) | ||||
Net unrealized appreciation (depreciation) of investments | 127,768,916 | (299,027,742 | ) | |||||
Net increase (decrease) in net assets resulting from operations | 17,070,369 | (567,880,283 | ) | |||||
Distributions to Shareholders: | ||||||||
From net realized gain on investments: | ||||||||
Managers Class | — | (60,482,450 | ) | |||||
Institutional Class | — | (14,942,810 | ) | |||||
Total distributions to shareholders | — | (75,425,260 | ) | |||||
From Capital Share Transactions: | ||||||||
Managers Class: | ||||||||
Proceeds from sale of shares | 24,081,425 | 187,952,090 | ||||||
Reinvestment of dividends and distributions | — | 56,640,818 | ||||||
Cost of shares repurchased | (133,522,596 | ) | (997,437,797 | ) | ||||
Net decrease from Managers Class share transactions | (109,441,171 | ) | (752,844,889 | ) | ||||
Institutional Class: | ||||||||
Proceeds from sale of shares | 9,453,313 | 116,771,071 | ||||||
Reinvestment of dividends and distributions | — | 12,946,151 | ||||||
Cost of shares repurchased | (44,041,191 | ) | (204,449,527 | ) | ||||
Net decrease from Institutional Class share transactions | (34,587,878 | ) | (74,732,305 | ) | ||||
Net decrease from capital share transactions | (144,029,049 | ) | (827,577,194 | ) | ||||
Total decrease in net assets | (126,958,680 | ) | (1,470,882,737 | ) | ||||
Net Assets: | ||||||||
Beginning of period | 444,544,733 | 1,915,427,470 | ||||||
End of period | $ | 317,586,053 | $ | 444,544,733 | ||||
End of period undistributed net investment income (loss) | ($1,850,661 | ) | — | |||||
Share Transactions: | ||||||||
Managers Class: | ||||||||
Sale of shares | 823,953 | 3,473,798 | ||||||
Reinvested shares from dividends and distribution | — | 1,951,786 | ||||||
Shares repurchased | (4,519,512 | ) | (19,749,465 | ) | ||||
Net decrease in shares | (3,695,559 | ) | (14,323,881 | ) | ||||
Institutional Class: | ||||||||
Sale of shares | 329,443 | 2,489,353 | ||||||
Reinvested shares from dividends and distribution | — | 441,999 | ||||||
Shares repurchased | (1,519,979 | ) | (3,729,675 | ) | ||||
Net decrease in shares | (1,190,536 | ) | (798,323 | ) | ||||
The accompanying notes are an integral part of these financial statements.
11
Table of Contents
Financial Highlights
For a share outstanding throughout each period
| For the six months ended June 30, 2009 | For the year ended December 31, | |||||||||||||||||||||||
| (unaudited) | 2008 | 2007 | 2006 | 2005 | 2004 | |||||||||||||||||||
Managers Class: | ||||||||||||||||||||||||
Net Asset Value, Beginning of Period | $ | 30.28 | $ | 64.27 | $ | 82.96 | $ | 86.78 | $ | 90.42 | $ | 78.48 | ||||||||||||
Income from Investment Operations: | ||||||||||||||||||||||||
Net investment loss | (0.20 | ) | (0.28 | )5 | (0.51 | )5 | (0.14 | )5 | (0.54 | )5 | (0.56 | ) | ||||||||||||
Net realized and unrealized gain (loss) on investments | 2.38 | (27.93 | )5 | 0.55 | 5 | 9.88 | 5 | 4.18 | 5 | 12.50 | ||||||||||||||
Total from investment operations | 2.18 | (28.21 | ) | 0.04 | 9.74 | 3.64 | 11.94 | |||||||||||||||||
Less Distributions to Shareholders from: | ||||||||||||||||||||||||
Net realized gain on investments | — | (5.78 | ) | (18.73 | ) | (13.56 | ) | (7.28 | ) | — | ||||||||||||||
Net Asset Value, End of Period | $ | 32.46 | $ | 30.28 | $ | 64.27 | $ | 82.96 | $ | 86.78 | $ | 90.42 | ||||||||||||
Total Return 1 | 7.20 | %2,6 | (43.49 | )% | (0.60 | )% | 11.28 | % | 4.00 | % | 15.18 | % | ||||||||||||
Ratio of net expenses to average net assets | 1.58 | %3 | 1.48 | % | 1.43 | % | 1.42 | % | 1.40 | % | 1.40 | % | ||||||||||||
Ratio of net investment loss to average net assets 1 | (1.10 | )%3 | (0.52 | )% | (0.59 | )% | (0.15 | )% | (0.60 | )% | (0.69 | )% | ||||||||||||
Portfolio turnover | 112 | %2 | 138 | % | 67 | % | 76 | % | 80 | % | 68 | % | ||||||||||||
Net assets at end of period (000’s omitted) | $ | 257,455 | $ | 352,106 | $ | 1,668,031 | $ | 2,551,703 | $ | 2,834,314 | $ | 3,415,003 | ||||||||||||
Ratios absent expense offsets: 4 | ||||||||||||||||||||||||
Ratio of total expenses to average net assets | 1.61 | %3 | 1.51 | % | 1.46 | % | 1.47 | % | 1.45 | % | 1.45 | % | ||||||||||||
Ratio of net investment loss to average net assets | (1.13 | )%3 | (0.55 | )% | (0.62 | )% | (0.20 | )% | (0.65 | )% | (0.74 | )% | ||||||||||||
| For the six months ended June 30, 2009 | For the year ended December 31, | For the period* ended December 31, 2004 | ||||||||||||||||||||||
| (unaudited) | 2008 | 2007 | 2006 | 2005 | ||||||||||||||||||||
Institutional Class: | ||||||||||||||||||||||||
Net Asset Value, Beginning of Period | $ | 30.56 | $ | 64.71 | $ | 83.56 | $ | 87.09 | $ | 90.56 | $ | 78.91 | ||||||||||||
Income from Investment Operations: | ||||||||||||||||||||||||
Net investment income (loss) | (0.16 | ) | (0.15 | )5 | (0.32 | )5 | 0.10 | 5 | (0.33 | )5 | (0.21 | ) | ||||||||||||
Net realized and unrealized gain (loss) on investments | 2.39 | (28.16 | )5 | 0.52 | 5 | 9.93 | 5 | 4.14 | 5 | 11.86 | ||||||||||||||
Total from investment operations | 2.23 | (28.31 | ) | 0.20 | 10.03 | 3.81 | 11.65 | |||||||||||||||||
Less Distributions to Shareholders from: | ||||||||||||||||||||||||
Net realized gain on investments | — | (5.84 | ) | (19.05 | ) | (13.56 | ) | (7.28 | ) | — | ||||||||||||||
Net Asset Value, End of Period | $ | 32.79 | $ | 30.56 | $ | 64.71 | $ | 83.56 | $ | 87.09 | $ | 90.56 | ||||||||||||
Total Return 1 | 7.30 | %2 | (43.35 | )% | (0.39 | )% | 11.56 | %6 | 4.21 | % | 14.75 | %2 | ||||||||||||
Ratio of net expenses to average net assets | 1.33 | %3 | 1.23 | % | 1.20 | % | 1.18 | % | 1.20 | % | 1.20 | %3 | ||||||||||||
Ratio of net investment income (loss) to average net assets 1 | (0.84 | )%3 | (0.29 | )% | (0.36 | )% | 0.09 | % | (0.56 | )% | (0.49 | )%3 | ||||||||||||
Portfolio turnover | 112 | %2 | 138 | % | 67 | % | 76 | % | 80 | % | 68 | %2 | ||||||||||||
Net assets at end of period (000’s omitted) | $ | 60,131 | $ | 92,439 | $ | 247,396 | $ | 561,994 | $ | 510,541 | $ | 274,010 | ||||||||||||
Ratios absent expense offsets: 4 | ||||||||||||||||||||||||
Ratio of total expenses to average net assets | 1.36 | %3 | 1.26 | % | 1.23 | % | 1.23 | % | 1.25 | % | 1.26 | %3 | ||||||||||||
Ratio of net investment income (loss) to average net assets | (0.87 | )%3 | (0.32 | )% | (0.39 | )% | 0.04 | % | (0.61 | )% | (0.55 | )%3 | ||||||||||||
| * | Commencement of operations was May 3, 2004. |
| 1 | Total returns and net investment income would have been lower had certain expenses not been reduced. (See Note 1(c) of Notes to Financial Statements.) |
| 2 | Not Annualized. |
| 3 | Annualized. |
| 4 | Excludes the impact of fee waivers and expense offsets such as brokerage credits, but includes non-reimbursable expenses, if any, such as interest and taxes. (See Note 1(c) to the Notes to Financial Statements.) |
| 5 | Per share numbers have been calculated using average shares. |
| 6 | The Total Return is based on the Financial Statement Net Asset Values as shown above. |
12
Table of Contents
Notes to Financial Statements
June 30, 2009 (unaudited)
| 1. | Summary of Significant Accounting Policies |
The Managers Funds (the “Trust”) is an open-end management investment company organized as a Massachusetts business trust and registered under the Investment Company Act of 1940, as amended (the “1940 Act”). Currently, the Trust is comprised of a number of different funds, each having distinct investment management objectives, strategies, risks and policies. Included in this report is the Managers Special Equity Fund (“Special Equity” or the “Fund”).
The Fund offers both Managers Class shares and Institutional Class shares. The Institutional Class shares, which are designed primarily for institutional investors that meet certain administrative and servicing criteria, have a minimum investment of $2,500,000. Managers Class shares are offered to all other investors. Each class represents interest in the same assets of the Fund and the classes are identical except for class specific expenses related to shareholder activity.
The Fund’s financial statements are prepared in accordance with accounting principles generally accepted in the United States of America, which require management to make estimates and assumptions that affect the reported amounts of assets and liabilities and disclosure of contingent assets and liabilities at the date of the financial statements and the reported amounts of income and expenses during the reporting periods. Actual results could differ from those estimates and such differences could be material. The following is a summary of significant accounting policies followed by the Fund in the preparation of its financial statements:
| a. | Valuation of Investments |
Equity securities traded on a domestic or international securities exchange are valued at the last quoted sale price, or, lacking any sales, at the last quoted bid price. Over-the-counter securities are valued at the Nasdaq Official Closing Price, if one is available. Lacking any sales, over-the-counter securities are valued at the last quoted bid price. The Fund’s investments are generally valued based on market quotations provided by third party pricing services approved by the Board of Trustees of the Fund. Under certain circumstances, the value of certain Fund investments may be based on an evaluation of fair value, pursuant to procedures established by and under the general supervision of the Board of Trustees of the Fund. The Fund may use the fair value of a portfolio security to calculate its NAV when, for example, (1) market quotations are not readily available because a portfolio security is not traded in a public market or the principal market in which the security trades is closed, (2) trading in a portfolio security is suspended and has not resumed before the Fund calculates its NAV, (3) a significant event affecting the value of a portfolio security is determined to have occurred between the time of the market quotation provided for a portfolio security and the time as of which the Fund calculates its NAV, (4) a security’s price has remained unchanged over a period of time (often referred to as a “stale price”), or (5) Managers Investment Group LLC (the “Investment Manager”) determines that a market quotation is inaccurate. Portfolio investments that trade primarily on foreign markets are priced based upon the market quotation of such securities as of the close of their respective principal markets, as adjusted to reflect the Investment Manager’s determination of the impact of events occurring subsequent to the close of such markets but prior to the time as of which the Fund calculates its NAV. In accordance with procedures approved by the Board of Trustees, the Investment Manager relies upon recommendations of a third-party fair valuation service in adjusting the prices of such foreign portfolio investments. The Fund may invest in securities that may be thinly traded. The Board of Trustees has adopted procedures to adjust prices when thinly traded securities are judged to be stale so that they reflect fair value. An investment valued on the basis of its fair value may be valued at a price higher or lower than available market quotations. An investment’s valuation may differ depending on the method used and the factors considered in determining value according to the Fund’s fair value procedures.
Fixed-income securities are valued based on valuations furnished by independent pricing services that utilize matrix systems, which reflect such factors as security prices, yields, maturities, and ratings, and are supplemented by dealer and exchange quotations. Futures contracts for which market quotations are readily available are valued at the settlement price as of the close of the futures exchange. Short-term investments having a remaining maturity of 60 days or less are valued at amortized cost, which approximates market value. Investments in other open-end regulated investment companies are valued at their end of day net asset value per share except iShares or other ETF’s, which are valued the same as equity securities. Investments in certain mortgage-backed and stripped mortgage-backed securities, preferred stocks, convertible securities, derivatives and other debt securities not traded on an organized securities market are valued on the basis of valuations provided by dealers or by a pricing service which uses information with respect to transactions in such securities and various relationships between securities and yield to maturity in determining value. Securities (including derivatives) for which market quotations are not readily available are valued at fair value, as determined in good faith, and pursuant to procedures adopted by the Board of Trustees of the Trust. The values assigned to fair value investments are based on available information and do not necessarily represent amounts that might ultimately be realized, since such amounts depend on future developments inherent in long-term investments. Further, because of the inherent uncertainty of valuation, those estimated values may differ significantly from the values that would have been used had a ready market for the investments existed, and the differences could be material.
The Fund adopted Financial Accounting Standards Board Statement of Financial Accounting Standards No. 157, Fair Value Measurements (“FAS 157”), effective January 1, 2008. In accordance with FAS 157, fair value is defined as the price that a Fund would receive to sell an asset or pay to transfer a liability in an orderly transaction between market participants at the measurement date. FAS 157 also establishes a framework for measuring fair value, and a three-level hierarchy for fair value measurements based upon the transparency of inputs to the valuation of an asset or liability. Inputs may be observable or unobservable and refer broadly to the assumptions that market participants would use in pricing the asset or liability. Observable inputs reflect the assumptions market participants would use in pricing the asset or liability based on market data obtained
13
Table of Contents
Managers Special Equity Fund
Notes to Financial Statements (continued)
from sources independent of the Fund. Unobservable inputs reflect the Fund’s own assumptions about the assumptions that market participants would use in pricing the asset or liability developed based on the best information available in the circumstances. Each investment is assigned a level based upon the observability of the inputs which are significant to the overall valuation.
In April 2009, Statement of Financial Accounting Standards Staff Position No. 157-4, “Determining Fair Value When the Volume and Level of Activity for the Asset or Liability Have Significantly Decreased and Identifying Transactions that are not Orderly” (“FSP FAS 157-4”) was issued and is effective for interim and annual reporting periods ending after June 15, 2009. FSP FAS 157-4 provides additional guidance for estimating fair value in accordance with FAS 157 when the volume and level of activity for the asset or liability have significantly decreased. Additionally, FSP FAS 157-4 requires quantitative disclosures about fair value measurements separately for each major category of assets and liabilities.
The three-tier hierarchy of inputs is summarized below:
Level 1 – quoted prices in active markets for identical investments
Level 2 – other significant observable inputs (including quoted prices for similar investments, interest rates, prepayment speeds, credit risk)
Level 3 – significant unobservable inputs (including the Funds’ own assumptions in determining the fair value of investments)
The inputs or methodologies used for valuing investments are not necessarily an indication of the risk associated with investing in those investments. The following table summarizes the valuation of the Fund’s investments by the above fair value hierarchy levels as of June 30, 2009:
| Level 1 | Level 2 | Level 3 | Total | ||||||||
Special Equity | |||||||||||
Investments in Securities | |||||||||||
Common Stocks | |||||||||||
Information Technology | $ | 94,215,802 | — | — | $ | 94,215,802 | |||||
Consumer Discretionary | 63,812,114 | — | — | 63,812,114 | |||||||
Health Care | 50,054,593 | — | — | 50,054,593 | |||||||
Industrials | 42,841,715 | — | — | 42,841,715 | |||||||
Financials | 21,656,140 | — | — | 21,656,140 | |||||||
Energy | 19,889,802 | — | — | 19,889,802 | |||||||
Consumer Staples | 10,204,155 | — | — | 10,204,155 | |||||||
Materials | 9,313,552 | — | — | 9,313,552 | |||||||
Telecommunication Services | 3,431,945 | — | — | 3,431,945 | |||||||
Utilities | 392,954 | — | — | 392,954 | |||||||
Short-Term Investments | 22,083,238 | $ | 22,137,998 | — | 44,221,236 | ||||||
Total Investments in Securities | 337,896,010 | 22,137,998 | — | 360,034,008 | |||||||
Other Financial Instruments* | — | — | — | — | |||||||
Totals | $ | 337,896,010 | $ | 22,137,998 | — | $ | 360,034,008 | ||||
| * | Other financial instruments are derivative instruments not reflected in the Schedule of Portfolio Investments, such as futures, forwards and swap contracts, which are valued at the unrealized appreciation/depreciation of the instrument. |
14
Table of Contents
Managers Special Equity Fund
Notes to Financial Statements (continued)
In March 2008, Statement of Financial Accounting Standards No. 161, “Disclosures about Derivative Instruments and Hedging Activities” (“SFAS 161”) was issued and is effective for fiscal years and interim periods beginning after November 15, 2008. SFAS 161 is intended to improve financial reporting for derivative instruments by requiring enhanced disclosure that enables investors to understand how and why a fund uses derivatives, how derivatives are accounted for, and how derivative instruments affect a fund’s results of operations and financial position. For the six months ended June 30, 2009, the Fund did not engage in any derivative activity. Therefore, no additional disclosure is required.
| b. | Security Transactions |
Security transactions are accounted for as of the trade date. Realized gains and losses on securities sold are determined on the basis of identified cost.
| c. | Investment Income and Expenses |
Dividend income is recorded on the ex-dividend date except certain dividends from foreign securities where the ex-dividend date may have passed. These dividends are recorded as soon as the Trust is informed of the ex-dividend date. Dividend income on foreign securities is recorded net of any withholding tax. Interest income, which includes amortization of premium and accretion of discount on debt securities, is accrued as earned. Non-cash dividends included in dividend income, if any, are reported at the fair market value of the securities received. Other income and expenses are recorded on an accrual basis. Expenses that cannot be directly attributed to a fund are apportioned among the Funds in the Trust and in some cases other affiliated funds based upon their relative average net assets or number of shareholders. Investment income, realized and unrealized capital gains and losses, the common expenses of the Fund and certain Fund level expense reductions, if any, are allocated on a pro rata basis to each class based on the relative net assets of each class to the total net assets of the Fund. Both classes have equal voting privileges except that each class has exclusive voting rights with respect to its services and/or distribution plan.
The Fund had certain portfolio trades directed to various brokers who paid a portion of the Fund’s expenses. For the six months ended June 30, 2009, under these arrangements the amount by which the Fund’s expenses were reduced and the impact on the expense ratios was as follows: $48,546 or 0.03% annualized.
The Fund has a “balance credit” arrangement with The Bank of New York Mellon (“BNYM”), the Fund’s custodian, whereby the Fund is credited with an interest factor equal to 0.75% below the effective 90-day T-Bill rate for account balances left un-invested overnight. If the T-Bill rate falls below 0.75%, no credits will be earned. These credits serve to reduce custody expenses that would otherwise be charged to the Fund. For the six months ended June 30, 2009, the custodian expense was not reduced.
Overdrafts will cause a reduction of any earnings credits, computed at 2% above the effective Federal Funds rate on the day of the overdraft. For the six months ended June 30, 2009, the Fund incurred overdraft fees of $1,926.
The Trust also has a balance credit arrangement with its Transfer Agent, PNC Global Investment Servicing (U.S.) Inc., whereby earnings credits are used to offset banking charges and other out-of-pocket expenses. For the six months ended June 30, 2009, the transfer agent expense was reduced by $1,021.
The Investment Manager has agreed to waive a portion of its management fee in consideration of shareholder servicing fees that it has received from JPMorgan Distribution Services, Inc., with respect to short-term cash investments the Fund has made in the JPMor-gan Liquid Assets Money Market Fund – Capital Share Class. For the six months ended June 30, 2009, the management fee was not reduced.
Total returns and net investment income for the Funds would have been lower had certain expenses not been offset. Total expenses before offsets exclude the impact of expense reimbursements or fee waivers and expense offsets such as brokerage recapture credits, but include non-reimburseable expenses, if any, such as interest and taxes.
| d. | Dividends and Distributions |
Dividends resulting from net investment income, if any, normally will be declared and paid annually. Distributions of capital gains, if any, will be made annually in December and when required for Federal excise tax purposes. Distributions are recorded on the ex-dividend date and are declared separately for each class. Income and capital gain distributions are determined in accordance with Federal income tax regulations, which may differ from generally accepted accounting principles. These differences are primarily due to differing treatments for losses deferred due to wash sales, REITs, equalization accounting for tax purposes, foreign currency, options, futures and market discount transactions. Permanent book and tax basis differences, if any, relating to shareholder distributions will result in reclassifications to paid-in capital.
| e. | Federal Taxes |
The Fund intends to comply with the requirements under Subchapter M of the Internal Revenue Code of 1986, as amended, to distribute substantially all of its taxable income and gains to its shareholders and to meet certain diversification and income requirements with respect to investment companies. Therefore, no provision for Federal income or excise tax is included in the accompanying financial statements.
Additionally, based on the Fund’s understanding of the tax rules and rates related to income, gains and transactions for the foreign jurisdictions in which it invests, the Fund will provide for foreign taxes, and where appropriate, deferred foreign taxes.
Management has analyzed the Fund’s tax positions taken on federal income tax returns for all open tax years (tax years ended December 31, 2005-2008), and has concluded that no provision for federal income tax is required in the Fund’s financial statements. The Fund is not aware of any tax position for which it is reasonably possible that the total amounts of unrecognized tax benefits will change materially in the next twelve months.
| f. | Capital Loss Carryovers |
As of December 31, 2008, the Fund had accumulated net realized capital loss carryover from securities transactions for Federal income tax purposes of $145,119,718 expiring December 31, 2016.
15
Table of Contents
Managers Special Equity Fund
Notes to Financial Statements (continued)
| g. | Capital Stock |
The Trust’s Declaration of Trust authorizes for each series the issuance of an unlimited number of shares of beneficial interest, without par value, for each fund. The Fund records sales and repurchases of its capital stock on the trade date. Dividends and distributions to shareholders are recorded on the ex-dividend date.
At June 30, 2009, certain unaffiliated shareholders, specifically omnibus accounts, individually held greater than 10% of the outstanding shares of the Fund as follows: Managers Class shares – two collectively own 44%; Institutional Class shares – three collectively own 90%. Transactions by these shareholders may have a material impact on the Fund or the class.
| 2. | Agreements and Transactions with Affiliates |
The Trust has entered into an Investment Management Agreement under which the Investment Manager, an independently managed subsidiary of Affiliated Managers Group, Inc. (“AMG”), serves as investment manager to the Fund and is responsible for the Fund’s overall administration. The Investment Manager selects subadvisors for the Fund (subject to Trustee approval) and monitors each subadvisor’s investment programs and results. The Fund’s investment portfolio is managed by portfolio managers who serve pursuant to a Subadvisory Agreement with the Investment Manager.
Investment management fees are paid directly by the Fund to the Investment Manager based on average daily net assets. The annual investment management fee rate, as a percentage of average daily net assets, is 0.90%.
The Trust has entered into an Administration and Shareholder Servicing Agreement under which the Investment Manager serves as the Fund’s administrator (the “Administrator”) and is responsible for all aspects of managing the Fund’s operations, including administration and shareholder services to the Fund, its shareholders, and certain institutions, such as bank trust departments, broker-dealers and registered investment advisers, that advise or act as an intermediary with the Fund’s shareholders. The Fund pays a fee to the Administrator at the rate of 0.25% per annum of the Fund’s average daily net assets for this service.
The aggregate annual retainer paid to each Independent Trustee is $65,000, plus $4,000 or $2,500 for each regular or special meeting attended, respectively. The Trustees’ fees and expenses are allocated amongst all of the Funds for which the Investment Manager serves as the advisor (the “Managers Funds”) based on the relative net assets of such Funds. The Independent Chairman of the Trusts receives an additional payment of $15,000 per year. The Chairman of the Audit Committee receives an additional payment of $5,000 per year. The “Trustees fees and expenses” shown in the financial statements represents the Fund’s allocated portion of the total fees and expenses paid by the Fund and other affiliated funds in the Managers Funds.
The Fund is distributed by Managers Distributors, Inc. (the “Distributor” or “MDI”), a wholly-owned subsidiary of the Investment Manager. MDI serves as the principal underwriter for the Fund. MDI is a registered broker-dealer and member of the Financial Industry Regulatory Authority, Inc. (“FINRA”). Shares of the Fund will be continuously offered and will be sold by brokers, dealers or other financial intermediaries who have executed selling agreements with the Distributor. MDI bears all the expenses of providing services pursuant to the Underwriting Agreement, including the payment of the expenses relating to the distribution of Prospectuses for sales purposes and any advertising or sales literature. Certain Trustees and Officers of the Fund are Officers and/or Directors of the Investment Manager, AMG and/or the Distributor.
| 3. | Purchases and Sales of Securities |
Purchases and sales of securities, excluding short-term securities, for the six months ended June 30, 2009, were $393,302,057 and $532,594,500, respectively. There were no purchases or sales of U.S. Government securities.
| 4. | Portfolio Securities Loaned |
The Fund may participate in a securities lending program offered by BNYM, providing for the lending of securities to qualified brokers. Securities lending fees include earnings of such temporary cash investments, plus or minus any rebate to a borrower. These earnings (after any rebate) are then divided between BNYM, as a fee for its services under the program, and the Fund, according to agreed-upon rates. Collateral on all securities loaned is accepted in cash and/or government securities and is maintained at a minimum level of 102% (105% in the case of certain foreign securities) of the market value, plus interest, if applicable, of investments on loan. It is the Funds policy to obtain additional collateral from or return excess collateral to the borrower by the end of the next business day, following the valuation date of the securities loaned. Therefore, the value of the collateral held may be temporarily less than the value of the securities on loan. Lending securities entails a risk of loss to the Fund if and to the extent that the market value of the securities loaned were to increase and the borrower did not increase the collateral accordingly, and the borrower fails to return the securities. The Fund bears the risk of any deficiency in the amount of the collateral available for return to the borrower due to any loss on the collateral invested. Collateral received in the form of cash is invested temporarily in the BNY Institutional Cash Reserves Fund (the “ICRF”), or other short-term investments as defined in the Securities Lending Agreement with BNYM.
In September of 2008, BNYM advised the Investment Manager that the ICRF had exposure to certain defaulted debt obligations, and that BNYM had established a separate sleeve of the ICRF to hold these securities. The net impact of this position is not material to the Fund. The Fund’s position in the separate sleeve of the ICRF Fund is included in the Schedule of Portfolio Investments and the unrealized loss on such investment is included in Net Unrealized Depreciation on the Statement of Assets and Liabilities and the Statement of Operations.
| 5. | Commitments and Contingencies |
In the normal course of business, the Fund may enter into contracts and agreements that contain a variety of representations and warranties, which provide general indemnifications. The maximum exposure to the Fund under these arrangements is unknown, as this would involve future claims that may be made against the Fund that have not yet occurred. However, based on experience, the Fund expects the risk of loss to be remote.
16
Table of Contents
Annual Renewal of Investment Advisory Agreement (unaudited)
On June 4-5, 2009, the Board of Trustees, including a majority of the Trustees who are not “interested persons” of the Trust (the “Independent Trustees”), approved the Investment Management Agreement with the Investment Manager for the Managers Special Equity Fund (the “Fund”) and the Subadvisory Agreement for each Subadvisor of the Fund, with the exception of Ranger Investment Management, L.P. and Federated MDTA LLC (for purposes of this section, each a “Subadvisor” and “Subadvisory Agreement” and collectively the “Subadvisors” and “Subadvisory Agreements”). The Independent Trustees were separately represented by independent counsel in connection with their consideration of the approval of these agreements. In considering the Investment Management and Subadvisory Agreements, the Trustees reviewed a variety of materials relating to the Fund, the Investment Manager and each Subadvisor, including comparative performance, fee and expense information for an appropriate peer group of similar mutual funds (the “Peer Group”), performance information for the relevant benchmark index (the “Fund Benchmark”) and, with respect to each Subadvisor, comparative performance information for an appropriate peer group of managed accounts, and, as to all other matters, other information provided to them on a periodic basis throughout the year, as well as information provided in connection with the meetings of June 4-5, 2009, regarding the nature, extent and quality of services provided by the Investment Manager and the Subadvisors under their respective agreements. Prior to voting, the Independent Trustees: (a) reviewed the foregoing information with their independent legal counsel and with management; (b) received materials from their independent legal counsel discussing the legal standards applicable to their consideration of the Investment Management Agreement and the Subadvisory Agreements; and (c) met with their independent legal counsel in private sessions at which no representatives of management were present.
Nature, extent and quality of services.
In considering the nature, extent and quality of the services provided by the Investment Manager, the Trustees reviewed information relating to the Investment Manager’s operations and personnel. Among other things, the Investment Manager provided financial information, biographical information on its supervisory and professional staff and descriptions of its organizational and management structure. The Trustees also took into account information provided periodically throughout the previous year by the Investment Manager relating to the performance of its duties with respect to the Fund and the Trustees’ familiarity with the Investment Manager’s management through Board meetings, discussions and reports. In the course of their deliberations regarding the Investment Management Agreement, the Trustees evaluated, among other things: (a) the extent and quality of the Investment Manager’s oversight of the operation and management of the Fund; (b) the quality of the search, selection and monitoring services performed by the Investment Manager in overseeing the portfolio management responsibilities of the Subadvisors; (c) the Investment Manager’s ability to supervise the Fund’s other service providers; and (d) the Investment Manager’s compliance programs. The Trustees also took into account the financial condition of the Investment Manager with respect to its ability to provide the services required under the Investment Management Agreement.
The Trustees also reviewed information relating to each Subadvisor’s operations and personnel and the investment philosophy, strategies and techniques (for each Subadvisor, its “Investment Strategy”) used in managing the portion of the Fund for which the Subadvisor has portfolio management responsibility. Among other things, the Trustees reviewed biographical information on portfolio management and other professional staff, information regarding each Subadvisor’s organizational and management structure and each Subadvisor’s brokerage policies and practices. The Trustees considered specific information provided regarding the experience of the individual or individuals at each Subadvisor with portfolio management responsibility for the portion of the Fund managed by the Subadvisor, including the information set forth in the Fund’s prospectus and statement of additional information. The Trustees also noted information provided by the Investment Manager regarding the manner in which each Subadvisor’s Investment Strategy complements those utilized by the Fund’s other Subadvisors. In the course of their deliberations, the Trustees evaluated, among other things: (a) the services rendered by each Subadvisor in the past; (b) the qualifications and experience of the Subadvisor’s personnel; and (c) the Subadvisor’s compliance programs. The Trustees also took into account the financial condition of each Subadvisor with respect to its ability to provide the services required under its Subadvisory Agreement.
Performance.
Among other information relating to the Fund’s performance, the Trustees noted that the Fund’s performance for Managers Class shares for the 1-year, 3-year, 5-year and 10-year periods ended March 31, 2009 was below the median performance of the Peer Group and below the performance of the Fund Benchmark, the Russell 2000® Index, for each period. The Trustees took into account management’s discussion of the Fund’s growth bias for the past several years and relative performance during relevant time periods, including the Fund’s strong performance in the first quarter of 2009. The Trustees also noted that the Investment Manager implemented the termination of certain Subadvisors and the hiring of others in 2007 and 2008 to address both performance challenges and transition of the Fund from a growth to a value-oriented investment style. The Trustees concluded that management had taken appropriate steps to address the Fund’s performance.
As noted above, the Board considered the Fund’s performance during relevant time periods as compared to the Fund’s Peer Group and considered each Subadvisor’s performance as compared to an appropriate peer group of managed accounts and noted that the Board reviews on a quarterly basis detailed information about the Fund’s performance results, portfolio composition and Investment Strategies, including with respect to the portion of the Fund managed by each Subadvisor. The Board noted the Investment Manager’s expertise and resources in monitoring the performance, investment style and risk-adjusted performance of each Subadvisor. The Board also noted each Subadvisor’s performance record with respect to the Fund. The Board was mindful of the Investment Manager’s attention to monitoring each Subadvisor’s performance with respect to the Fund and its discussions with management regarding the factors that contributed to the performance of the Fund.
17
Table of Contents
Annual Renewal of Investment Advisory Agreement (continued)
Advisory Fees and Profitability.
In considering the reasonableness of the advisory fee charged by the Investment Manager for managing the Fund, the Trustees noted that the Investment Manager, and not the Fund, is responsible for paying the fees charged by the Fund’s Subadvisors and, therefore, that the fees paid to the Investment Manager cover the cost of providing portfolio management services as well as the cost of providing search, selection and monitoring services in operating a “manager-of-managers” complex of mutual funds. The Trustees concluded that, in light of the additional high quality supervisory services provided by the Investment Manager and the fact that the subadvisory fees are paid out of the advisory fee, the advisory fee payable by the Fund to the Investment Manager can reasonably be expected to exceed the median advisory fee for the Peer Group, which consists of many funds that do not operate with a manager-of-managers structure. The Trustees noted that the Fund’s advisory fee and total expenses (net of applicable expense waivers/ reimbursements) as of March 31, 2009 were both higher than the average for the Fund’s Peer Group. The Trustees concluded that, in light of the nature, extent and quality of the services provided by the Investment Manager and the Subadvisors and the considerations noted above with respect to the Subadvisors and the Investment Manager, the Fund’s advisory fees are reasonable.
In considering the reasonableness of the advisory fee payable to the Investment Manager, the Trustees also reviewed information provided by the Investment Manager setting forth all revenues and other benefits, both direct and indirect, received by the Investment Manager and its affiliates attributable to managing the Fund and all the mutual funds in the Managers Family of Funds, the cost of providing such services and the resulting profitability to the Investment Manager and its affiliates from these relationships. The Trustees noted that the subadvisory fees are paid by the Investment Manager out of its advisory fee. The Trustees also noted the current asset levels of the Fund, including the effect on assets attributable to the economic and market conditions over the past year, and considered the impact on profitability of the current asset levels and any future growth of assets of the Fund. The Board took into account management’s discussion of the advisory fee structure. In this regard, the Trustees noted that the Fund currently has four Subadvisors, each managing a portion of the Fund’s portfolio. Based on the foregoing, the Trustees concluded that the profitability to the Investment Manager is reasonable and that the Investment Manager is not realizing material benefits from economies of scale that would warrant adjustments to the advisory fee at this time. With respect to economies of scale, the Trustees also noted that as the Fund’s assets increase over time, the Fund may realize other economies of scale to the extent that the increase in assets is proportionally greater than the increase in certain other expenses.
Subadvisory Fees and Profitability.
In considering the reasonableness of the fee payable by the Investment Manager to each Subadvisor, the Trustees relied on the ability of the Investment Manager to negotiate the terms of each Subadvisory Agreement at arm’s length as part of the manager-of-managers structure, noting that the Investment Manager is not affiliated with these Subadvisors. In addition, the Trustees noted that the subadvisory fees are paid by the Investment Manager out of its advisory fee. Accordingly, the cost of services to be provided by each Subadvisor and the profitability to each Subadvisor of its relationship with the Fund were not material factors in the Trustees’ deliberations. For similar reasons, and based on the current size of the portion of the Fund managed by each Subadvisor, the Trustees concluded that the effect of any economies of scale being realized by the Subadvisors was not a material factor in the Trustees’ deliberations at this time.
* * * * *
After consideration of the foregoing, the Trustees also reached the following conclusions regarding the Investment Management Agreement and the Subadvisory Agreements with each of the Subadvisors, in addition to those conclusions discussed above: (a) the Investment Manager and each Subadvisor have demonstrated that they possess the capability and resources to perform the duties required of them under the Investment Management Agreement and the applicable Subadvisory Agreement; (b) each Subadvisor’s Investment Strategy is appropriate for pursuing the Fund’s investment objectives; (c) each Subadvisor is reasonably likely to execute its Investment Strategy consistently over time; and (d) the Investment Manager and each Subadvisor maintain appropriate compliance programs.
Based on all of the above-mentioned factors and their related conclusions, with no single factor or conclusion being determinative and with each Trustee not necessarily attributing the same weight to each factor, the Trustees concluded that approval of the Investment Management Agreement and each Subadvisory Agreement would be in the best interests of the Fund and its shareholders. Accordingly, on June 4-5, 2009, the Trustees, including a majority of the Independent Trustees, voted to approve the Investment Management Agreement and the Subadvisory Agreement for each of the Fund Subadvisors, with the exception of Ranger Investment Management, L.P. and Federated MDTA LLC (which contracts had previously been approved at meetings held on September 11-12, 2008).
18
Table of Contents
THIS PAGE INTENTIONALLY LEFT BLANK
Table of Contents
Investment Manager and Administrator
Managers Investment Group LLC
333 W. Wacker Drive
Suite 1200
Chicago, IL 60606
(800) 835-3879
Distributor
Managers Investment Group LLC
333 W. Wacker Drive
Suite 1200
Chicago, IL 60606
(800) 835-3879
Custodian
The Bank of New York Mellon
2 Hanson Place
Brooklyn, New York 11217
Legal Counsel
Ropes & Gray LLP
One International Place
Boston, Massachusetts 02110-2624
Transfer Agent
PNC Global Investment Servicing (U.S.) Inc.
Attn: Managers
P.O. Box 9769
Providence, Rhode Island 02940
(800) 548-4539
Trustees
Jack W. Aber
William E. Chapman, II
Nathaniel Dalton
Edward J. Kaier
Steven J. Paggioli
Eric Rakowski
Thomas R. Schneeweis
John H. Streur
For Managers Choice Only
Managers
c/o PNC Global Investment Servicing (U.S.) Inc.
P.O. Box 61204
King of Prussia, Pennsylvania 19406-0851
(800) 358-7668
Table of Contents
MANAGERSAND MANAGERS AMG FUNDS
| EQUITY FUNDS |
EMERGING MARKETS EQUITY |
Rexiter Capital Management Limited |
Schroder Investment Management North America Inc. |
ESSEX GROWTH |
ESSEX LARGE CAP GROWTH |
ESSEX SMALL/MICRO CAP GROWTH |
Essex Investment Management Co., LLC |
FQ TAX-MANAGED U.S. EQUITY |
FQ U.S. EQUITY |
First Quadrant, L.P. |
GW&K SMALL CAP EQUITY |
Gannett Welsh & Kotler, LLC |
INSTITUTIONAL MICRO-CAP |
MICRO-CAP |
Lord, Abbett & Co. LLC |
WEDGE Capital Management L.L.P. |
OFI Institutional Asset Management, Inc. |
Next Century Growth Investors LLC |
INTERNATIONAL EQUITY |
AllianceBernstein L.P. |
Lazard Asset Management, LLC |
Martin Currie Inc. |
| CHICAGO EQUITY PARTNERS |
| MID-CAP |
| Chicago Equity Partners, LLC |
REAL ESTATE SECURITIES |
| Urdang Securities Management, Inc. |
| RENAISSANCE LARGE CAP GROWTH |
| Renaissance Group LLC |
| SKYLINE SPECIAL EQUITIES |
| PORTFOLIO |
| Skyline Asset Management, L.P. |
| SMALL CAP |
| TIMESSQUARE MID CAP GROWTH |
TIMESSQUARE SMALL CAP GROWTH TimesSquare Capital Management, LLC |
| SPECIAL EQUITY |
| Ranger Investment Management, L.P. |
| Lord, Abbett & Co. LLC |
| Smith Asset Management Group, L.P. |
| Federated MDTA LLC |
| SYSTEMATIC VALUE |
| SYSTEMATIC MID CAP VALUE |
| Systematic Financial Management, L.P. |
BALANCED FUNDS
CHICAGO EQUITY PARTNERS BALANCED
Chicago Equity Partners, LLC
GLOBAL
AllianceBernstein L.P.
First Quadrant, L.P.
Wellington Management Company, LLP
ALTERNATIVE FUNDS
FQ GLOBAL ALTERNATIVES
First Quadrant, L.P.
INCOME FUNDS
BOND (MANAGERS)
FIXED INCOME
GLOBAL BOND
Loomis, Sayles & Co., L.P.
BOND (MANAGERS FREMONT)
Pacific Investment Management Co. LLC
CALIFORNIA INTERMEDIATE TAX-FREE
Miller Tabak Asset Management LLC
GW&K MUNICIPAL BOND
GW&K MUNICIPAL ENHANCED YIELD
Gannett Welsh & Kotler, LLC
HIGH YIELD
J.P. Morgan Investment Management LLC
INTERMEDIATE DURATION GOVERNMENT
SHORT DURATION GOVERNMENT
Smith Breeden Associates, Inc.
MONEY MARKET
JPMorgan Investment Advisors Inc.
This report is prepared for the Fund’s shareholders. It is authorized for distribution to prospective investors only when preceded or accompanied by an effective prospectus. To receive a free copy of the prospectus or Statement of Additional Information, which includes additional information about Fund Trustees, please contact us by calling 800.835.3879. Distributed by Managers Distributors, Inc., member FINRA.
A description of the policies and procedures each Fund uses to vote its proxies is available: (i) without charge, upon request, by calling 800.835.3879, or (ii) on the Securities and Exchange Commission’s (SEC) Web site at www.sec.gov. For information regarding each Fund’s proxy voting record for the 12-month period ended June 30, call 800.835.3879 or visit the SEC Web site at www.sec.gov.
The Fund files its complete schedule of portfolio holdings with the SEC for the first and third quarters of each fiscal year on Form N-Q. The Fund’s Forms N-Q are available on the SEC’s website at www.sec.gov. A Fund’s Forms N-Q may be reviewed and copied at the SEC’s Public Reference Room in Washington, DC. Information on the operation of the Public Reference Room may be obtained by calling 1-800-SEC-0330. To review a complete list of the Fund’s portfolio holdings, or to view the most recent quarterly holdings report, semiannual report, or annual report, please visit www.managersinvest.com.
www.managersinvest.com

Table of Contents
| Item 2. | CODE OF ETHICS |
Not applicable for the semi-annual shareholder report.
| Item 3. | AUDIT COMMITTEE FINANCIAL EXPERT |
Not applicable for the semi-annual shareholder report.
| Item 4. | PRINCIPAL ACCOUNTANT FEES AND SERVICES |
Not applicable for the semi-annual shareholder report.
| Item 5. | AUDIT COMMITTEE OF LISTED REGISTRANTS |
Not applicable.
| Item 6. | SCHEDULE OF INVESTMENTS |
The schedule of investments in unaffiliated issuers as of the close of the reporting period is included as part of the shareholder report contained in Item 1 hereof.
| Item 7. | DISCLOSURE OF PROXY VOTING POLICIES AND PROCEDURES FOR CLOSED-END MANAGEMENT INVESTMENT COMPANIES |
Not applicable.
| Item 8. | PORTFOLIO MANAGERS OF CLOSED-END MANAGEMENT INVESTMENT COMPANIES |
Not applicable.
| Item 9. | PURCHASES OF EQUITY SECURITIES BY CLOSED-END MANAGEMENT INVESTMENT COMPANIES AND AFFILIATED PURCHASERS |
Not applicable.
| Item 10. | SUBMISSION OF MATTERS TO A VOTE OF SECURITY HOLDERS |
Not applicable.
Table of Contents
| Item 11. | CONTROLS AND PROCEDURES |
| (a) | The registrant’s principal executive and principal financial officers have concluded, based on their evaluation of the registrant’s disclosure controls and procedures as of a date within 90 days of the filing date of this report, that the registrant’s disclosure controls and procedures are reasonably designed to ensure that information required to be disclosed by the registrant on Form N-CSR is recorded, processed, summarized and reported within the required time periods and that information required to be disclosed by the registrant in the reports that it files or submits on Form N-CSR is accumulated and communicated to the registrant’s management, including its principal executive and principal financial officers, as appropriate to allow timely decisions regarding required disclosure. |
| (b) | There were no changes in the registrant’s internal control over financial reporting during the registrant’s second fiscal quarter of the period covered by this report that have materially affected, or are reasonably likely to materially affect, the internal control over financial reporting. |
| Item 12. | EXHIBITS |
(a)(1) | Not applicable. | |
(a)(2) | Certifications pursuant to Rule 30a-2(a) under the Investment Company Act of 1940 - Filed herewith. | |
(a)(3) | Not applicable. | |
(b) | Certifications pursuant to Rule 30a-2(b) under the Investment Company Act of 1940 - Filed herewith. | |
Table of Contents
SIGNATURES
Pursuant to the requirements of the Securities Exchange Act of 1934 and the Investment Company Act of 1940, the registrant has duly caused this report to be signed on its behalf by the undersigned, thereunto duly authorized.
| THE MANAGERS FUNDS | ||
| By: | /s/ John H. Streur | |
| John H. Streur, President | ||
| Date: | September 3, 2009 | |
Pursuant to the requirements of the Securities Exchange Act of 1934 and the Investment Company Act of 1940, this report has been signed below by the following persons on behalf of the registrant and in the capacities and on the dates indicated.
| By: | /s/ John H. Streur | |
| John H. Streur, President | ||
| Date: | September 3, 2009 | |
| By: | /s/ Donald S. Rumery | |
| Donald S. Rumery, Chief Financial Officer | ||
| Date: | September 3, 2009 | |