Table of Contents
UNITED STATES
SECURITIES AND EXCHANGE COMMISSION
Washington, D.C. 20549
FORM N-CSRS
CERTIFIED SHAREHOLDER REPORT OF REGISTERED
MANAGEMENT INVESTMENT COMPANIES
Investment Company Act file number: 811-03752
THE MANAGERS FUNDS
(Exact name of registrant as specified in charter)
800 Connecticut Avenue, Norwalk, Connecticut 06854
(Address of principal executive offices) (Zip code)
Managers Investment Group LLC
800 Connecticut Avenue, Norwalk, Connecticut 06854
(Name and address of agent for service)
Registrant’s telephone number, including area code: (203) 299-3500
Date of fiscal year end: | DECEMBER 31 | |
Date of reporting period: | JANUARY 1, 2010 – JUNE 30, 2010 | |
| (Semi-Annual Shareholder Report) | ||
Table of Contents
| Item 1. | Reports to Shareholders |
Table of Contents
SEMI-ANNUAL REPORT
Managers Funds
June 30, 2010
Managers AMG Essex Large Cap Growth Fund
Managers International Equity Fund
Managers Emerging Markets Equity Fund
Managers Global Bond Fund

SAR002-0610
Table of Contents
Table of Contents
Semi-Annual Report — June 30, 2010 (unaudited)
TABLE OF CONTENTS
| Page | ||
| ABOUT YOUR FUND’S EXPENSES | 1 | |
| 2 | ||
FUND SNAPSHOTS AND SCHEDULES OF PORTFOLIO INVESTMENTS | ||
| 3 | ||
| 5 | ||
| 10 | ||
| 15 | ||
| 20 | ||
FINANCIAL STATEMENTS: | ||
| 21 | ||
Funds’ balance sheet, net asset value (NAV) per share computations and cumulative undistributed amounts | ||
| 22 | ||
Detail of sources of income, Fund expenses, and realized and unrealized gains (losses) during the period | ||
| 23 | ||
Detail of changes in Fund assets for the past two periods | ||
| 25 | ||
Historical net asset values per share, distributions, total returns, expense ratios, turnover ratios and net assets | ||
| 27 | ||
Accounting and distribution policies, details of agreements and transactions with Fund management and affiliates, and descriptions of certain investment risks | ||
| 36 | ||
Nothing contained herein is to be considered an offer, sale or solicitation of an offer to buy shares of any series of the Managers Family of Funds. Such offering is made only by Prospectus, which includes details as to offering price and other material information.
Table of Contents
About Your Fund’s Expenses (unaudited)
As a shareholder of a Fund, you may incur two types of costs: (1) transaction costs, which may include sales charges (loads) on purchase payments; redemption fees; and exchange fees; and (2) ongoing costs, including management fees; distribution (12b-1) fees; and other Fund expenses. This example is intended to help you understand your ongoing costs (in dollars) of investing in the Fund and to compare these costs with the ongoing costs of investing in other mutual funds. The example is based on $1,000 invested at the beginning of the period and held for the entire period as indicated below.
Actual Expenses
The first line of the following table provides information about the actual account values and actual expenses. You may use the information in this line, together with the amount you invested, to estimate the expenses that you paid over the period. Simply divide your account value by $1,000 (for example, an $8,600 account value divided by $1,000 = 8.6), then multiply the result by the number in the first line under the heading entitled “Expenses Paid During Period” to estimate the expenses you paid on your account during this period.
Hypothetical Example for Comparison Purposes
The second line of the following table provides information about hypothetical account values and hypothetical expenses based on the Fund’s actual expense ratio and an assumed annual rate of return of 5% before expenses, which is not the Fund’s actual return. The hypothetical account values and expenses may not be used to estimate the actual ending account balance or expenses you paid for the period. You may use this information to compare the ongoing costs of investing in the Fund and other funds by comparing this 5% hypothetical example with the 5% hypothetical examples that appear in the shareholder reports of other funds.
Please note that the expenses shown in the table are meant to highlight your ongoing costs only and do not reflect any transactional costs, such as sales charges (loads), redemption fees, or exchange fees. Therefore, the second line of the table is useful in comparing ongoing costs only, and will not help you determine the relative total costs of owning different funds.
Six Months Ended June 30, 2010 | Expense Ratio for the Period | Beginning Account Value 01/01/2010 | Ending Account Value 06/30/2010 | Expenses Paid During the Period* | ||||||||
Managers AMG Essex Large Cap Growth Fund | ||||||||||||
Based on Actual Fund Return | 1.58 | % | $ | 1,000 | $ | 882 | $ | 7.37 | ||||
Based on Hypothetical 5% Annual Return | 1.58 | % | $ | 1,000 | $ | 1,017 | $ | 7.90 | ||||
Managers International Equity Fund | ||||||||||||
Based on Actual Fund Return | 1.48 | % | $ | 1,000 | $ | 851 | $ | 6.79 | ||||
Based on Hypothetical 5% Annual Return | 1.48 | % | $ | 1,000 | $ | 1,017 | $ | 7.40 | ||||
Managers Emerging Markets Equity Fund | ||||||||||||
Based on Actual Fund Return | 1.77 | % | $ | 1,000 | $ | 917 | $ | 8.41 | ||||
Based on Hypothetical 5% Annual Return | 1.77 | % | $ | 1,000 | $ | 1,016 | $ | 8.85 | ||||
Managers Global Bond Fund | ||||||||||||
Based on Actual Fund Return | 1.10 | % | $ | 1,000 | $ | 994 | $ | 5.44 | ||||
Based on Hypothetical 5% Annual Return | 1.10 | % | $ | 1,000 | $ | 1,019 | $ | 5.51 | ||||
| * | Expenses are equal to the Fund’s annualized expense ratio multiplied by the average account value over the period, multiplied by the number of days in the most recent fiscal half-year (181), then divided by 365. |
1
Table of Contents
All periods ended June 30, 2010 (unaudited)
The table below shows the average annual total returns for the periods indicated for each Fund, as well as each Fund’s relative index for the same time periods.
| Average Annual Total Returns1 | ||||||||||||||
The Managers Funds | Six Months | One Year | Five Years | Ten Years | Inception Date | |||||||||
AMG Essex Large Cap Growth Fund2,3 | (11.84 | )% | 2.95 | % | (2.63 | )% | (8.47 | )% | 6/1/1984 | |||||
Russell 1000® Growth Index7 | (7.65 | )% | 13.62 | % | 0.38 | % | (5.14 | )% | ||||||
Managers International Equity Fund2,4 | (14.87 | )% | 1.35 | % | (0.07 | )% | (1.05 | )% | 12/31/1985 | |||||
MSCI EAFE Index®8 | (13.23 | )% | 5.92 | % | 0.88 | % | 0.16 | % | ||||||
Managers Emerging Markets Equity Fund2,5 | (8.35 | )% | 18.78 | % | 8.98 | % | 8.59 | % | 2/9/1998 | |||||
MSCI Emerging Markets Index®9 | (6.17 | )% | 23.15 | % | 12.73 | % | 10.02 | % | ||||||
Managers Global Bond Fund2,4,6 | (0.64 | )% | 11.79 | % | 4.71 | % | 6.42 | % | 3/25/1994 | |||||
Barclays Capital Global Aggregate Bond Index10 | (0.31 | )% | 5.00 | % | 5.03 | % | 6.40 | % | ||||||
The performance data shown represents past performance. Past performance is not a guarantee of future results. Current performance may be lower or higher than the performance data quoted. The investment return and principal value of an investment in the Fund will fluctuate so that an investor’s shares, when redeemed, may be worth more or less than their original cost. For performance information through the most recent month end, please call (800) 835-3879 or visit our Web site at www.managersinvest.com.
In choosing a Fund, investors should carefully consider the amount they plan to invest, their investment objectives, the Fund’s investment objectives, risks, charges and expenses before investing. For this and other information, please call 800.835.3879 or visit www.managersinvest.com for a free prospectus. Read it carefully before investing or sending money. Distributed by Managers Distributors, Inc., member FINRA.
| 1 | Total return equals income yield plus share price change and assumes reinvestment of all dividends and capital gain distributions. Returns are net of fees and may reflect offsets of Fund expenses as described in the Prospectus. No adjustment has been made for taxes payable by shareholders on their reinvested dividends and capital gain distributions. Returns for periods greater than one year are annualized. The listed returns on the Fund are net of expenses and based on the published NAV as of June 30, 2010. All returns are in U.S. dollars($). |
| 2 | Fund for which, from time to time, the Fund’s advisor has waived its fees and/or absorbed Fund expenses, which has resulted in higher returns. |
| 3 | The Fund invests in large-capitalization companies that may underperform other stock funds (such as funds that focus on small- and medium- capitalization companies) when stocks of large capitalization companies are out of favor. The Fund invests in growth stocks, which may be more sensitive to market movements because their prices tend to reflect future investor expectations rather than just current profits. Growth stocks may underperform value stocks during given periods. |
| 4 | Investments in foreign securities are subject to additional risks such as changing market conditions, economic and political instability, and currency exchange rate fluctuations. The Fund is subject to currency risk resulting from fluctuations in exchange rates that may affect the total loss or gain on a non-U.S. Dollar security when converted back to U.S. Dollars. |
| 5 | The Fund is subject to the risks associated with investments in emerging markets, such as erratic earnings patterns, economic and political instability, changing exchange controls, limitations on repatriation of foreign capital and changes in local governmental attitudes toward private investment, possibly leading to nationalization or confiscation of investor assets. The Fund is also subject to currency risk resulting from fluctuations in exchange rates that may affect the total loss or gain on a non-U.S. Dollar security when converted back to U.S. Dollars. |
| 6 | Changing interest rates may adversely affect the value of an investment. An increase in interest rates typically causes the value of bonds and other fixed-income securities to fall. The Fund is subject to the risks associated with investments in debt securities, such as default risk and fluctuations in the perception of the debtor’s ability to pay its creditors. |
| 7 | The Russell 1000® Growth Index is a market capitalization weighted index that measures the performance of those Russell 1000® companies with higher price-to-book ratio and higher forecasted growth values. Unlike the Fund, the Russell 1000® Growth Index is unmanaged, is not available for investment, and does not incur expenses. The Russell 1000® Growth Index is a trademark of Russell Investments. Russell® is a trademark of Russell Investments. |
| 8 | The Morgan Stanley Capital International Europe, Australasia, and Far East (MSCI EAFE) Index® is composed of all the publicly traded stocks in developed non-U.S. Markets. The MSCI EAFE Index® consisted of the following 21 developed market country indices: Australia, Austria, Belgium, Denmark, Finland, France, Germany, Greece, Hong Kong, Ireland, Italy, Japan, the Netherlands, New Zealand, Norway, Portugal, Singapore, Spain, Sweden, Switzerland and the United Kingdom. Unlike the Fund, the MSCI EAFE Index® is unmanaged, is not available for investment, and does not incur expenses. All MSCI data is provided “as is.” The products described herein are not sponsored or endorsed and have not been reviewed or passed on by MSCI. In no event shall MSCI, its affiliates or any MSCI data provider have any liability of any kind in connection with the MSCI data or the products described herein. Copying or redistributing the MSCI data is strictly prohibited. |
| 9 | The MSCI Emerging Markets Index® is a free float-adjusted market capitalization index that is designed to measure equity market performance in the global emerging markets. The MSCI Emerging Markets Index consisted of the following 21 emerging market country indices: Brazil, Chile, China, Colombia, Czech Republic, Egypt, Hungary, India, Indonesia, Korea, Malaysia, Mexico, Morocco, Peru, Philippines, Poland, Russia, South Africa, Taiwan, Thailand and Turkey. Unlike the Fund, the MSCI EM Index is unmanaged, is not available for investment, and does not incur expenses. All MSCI data is provided “as is.” The products described herein are not sponsored or endorsed and have not been reviewed or passed on by MSCI. In no event shall MSCI, its affiliates, or any MSCI data provider have any liability of any kind in connection with the MSCI data or the products described herein. |
| 10 | The Barclays Capital Global Aggregate Bond Index provides a broad-based measure of the global investment-grade fixed income markets. The three major components of this index are the U.S. Aggregate, the Pan-European Aggregate, and the Asian-Pacific Aggregate Indices. The Index also includes Eurodollar and Euro-Yen corporate bonds, Canadian government, agency and corporate securities, and USD investment grade 144A securities. Unlike the Fund, the Barclays Capital Global Aggregate Bond Index is unmanaged, is not available for investment, and does not incur fees. |
Not FDIC insured, nor bank guaranteed. May lose value.
2
Table of Contents
Managers AMG Essex Large Cap Growth Fund
Fund Snapshots
June 30, 2010 (unaudited)
Portfolio Breakdown
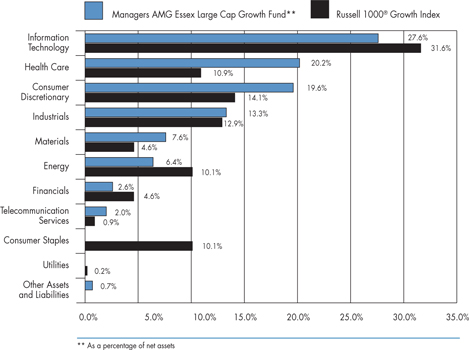
Industry | Managers AMG Essex Large Cap Growth Fund** | Russell 1000® Growth Index | ||||
Information Technology | 27.6 | % | 31.6 | % | ||
Health Care | 20.2 | % | 10.9 | % | ||
Consumer Discretionary | 19.6 | % | 14.1 | % | ||
Industrials | 13.3 | % | 12.9 | % | ||
Materials | 7.6 | % | 4.6 | % | ||
Energy | 6.4 | % | 10.1 | % | ||
Financials | 2.6 | % | 4.6 | % | ||
Telecommunication Services | 2.0 | % | 0.9 | % | ||
Consumer Staples | 0.0 | % | 10.1 | % | ||
Utilities | 0.0 | % | 0.2 | % | ||
Other Assets and Liabilities | 0.7 | % | 0.0 | % |
Top Ten Holdings
Security Name | Percentage of Net Assets | ||
Apple, Inc.* | 5.5 | % | |
Occidental Petroleum Corp. | 4.2 | ||
Goldcorp, Inc. | 4.0 | ||
Human Genome Sciences, Inc. | 4.0 | ||
Celgene Corp.* | 3.8 | ||
Salesforce.com, Inc. | 3.3 | ||
Netflix, Inc. | 3.3 | ||
Cummins, Inc. | 3.2 | ||
BE Aerospace, Inc. | 3.2 | ||
Akamai Technologies, Inc. | 3.0 | ||
Top Ten as a Group | 37.5 | % | |
| * | Top Ten Holding at December 31, 2009 |
Any sectors, industries, or securities discussed should not be perceived as investment recommendations. Mention of a specific security should not be considered a recommendation to buy or solicitation to sell that security. Specific securities mentioned in this report may have been sold from the Fund’s portfolio of investments by the time you receive this report.
3
Table of Contents
Managers AMG Essex Large Cap Growth Fund
Schedule of Portfolio Investments
June 30, 2010 (unaudited)
| Shares | Value | ||||||
Common Stocks - 99.3% | |||||||
Consumer Discretionary - 19.6% | |||||||
Amazon.com, Inc.* | 2,654 | $ | 289,976 | ||||
McDonald’s Corp. | 4,791 | 315,583 | |||||
Mohawk Industries, Inc.* | 7,117 | 325,674 | |||||
Netflix, Inc.* | 3,596 | 390,705 | |||||
Royal Caribbean Cruises, Ltd.* | 9,188 | 209,211 | |||||
Starwood Hotels & Resorts Worldwide, Inc. | 7,201 | 298,337 | |||||
TJX Cos., Inc., The | 5,861 | 245,869 | |||||
Walt Disney Co., The | 7,973 | 251,150 | |||||
Total Consumer Discretionary | 2,326,505 | ||||||
Energy - 6.4% | |||||||
Halliburton Co. | 10,616 | 260,623 | |||||
Occidental Petroleum Corp. | 6,459 | 498,312 | |||||
Total Energy | 758,935 | ||||||
Financials - 2.6% | |||||||
JPMorgan Chase & Co. | 8,415 | 308,073 | |||||
Health Care - 20.2% | |||||||
Allergan, Inc. | 5,533 | 322,353 | |||||
Celgene Corp.* | 8,838 | 449,147 | |||||
Express Scripts, Inc.* | 6,620 | 311,272 | |||||
Human Genome Sciences, Inc.* | 20,881 | 473,164 | |||||
Illumina, Inc.* | 6,338 | 275,893 | |||||
Teva Pharmaceutical Industries, Ltd., Sponsored ADR | 6,075 | 315,839 | |||||
Vertex Pharmaceuticals, Inc.* | 7,703 | 253,429 | |||||
Total Health Care | 2,401,097 | ||||||
Industrials - 13.3% | |||||||
BE Aerospace, Inc.* | 14,738 | 374,787 | |||||
Cummins, Inc. | 5,879 | 382,899 | |||||
FedEx Corp. | 3,989 | 279,669 | |||||
Parker Hannifin Corp. | 4,335 | 240,419 | |||||
Rockwell Automation, Inc. | 6,233 | 305,978 | |||||
Total Industrials | 1,583,752 | ||||||
Information Technology - 27.6% | |||||||
Akamai Technologies, Inc.* | 8,770 | 2 | 355,799 | ||||
Apple, Inc.* | 2,593 | 652,217 | |||||
Broadcom Corp., Class A | 9,654 | 318,292 | |||||
Google, Inc.* | 749 | 333,268 | |||||
JDS Uniphase Corp.* | 34,756 | 341,999 | |||||
NetApp, Inc.* | 8,670 | 323,478 | |||||
Oracle Corp. | 11,111 | 238,443 | |||||
Salesforce.com, Inc.* | 4,619 | 396,403 | |||||
VMware, Inc. Class A* | 5,020 | 314,202 | |||||
Total Information Technology | 3,274,101 | ||||||
Materials - 7.6% | |||||||
Goldcorp, Inc. | 10,821 | 474,501 | |||||
Potash Corp. of Saskatchewan, Inc. | 2,643 | 227,932 | |||||
Walter Industries, Inc. | 3,358 | 204,334 | |||||
Total Materials | 906,767 | ||||||
Telecommunication Services - 2.0% | |||||||
NII Holdings, Inc., Class B* | 7,306 | 237,591 | |||||
Total Common Stocks (cost $11,835,509) | 11,796,821 | ||||||
Short-Term Investments - 2.7% | |||||||
BNY Mellon Institutional Cash Reserves Fund, Series B*3,8 | 119,397 | 23,282 | |||||
BNY Mellon Overnight Government Fund, 0.03%3 | 91,000 | 91,000 | |||||
Dreyfus Government Cash Management Fund, Institutional Class Shares, 0.13% | 210,065 | 210,065 | |||||
Total Short-Term Investments | |||||||
(cost $420,462) | 324,347 | ||||||
Total Investments - 102.0% | |||||||
(cost $12,255,971) | 12,121,168 | ||||||
Other Assets, less Liabilities - (2.0)% | (242,434 | ) | |||||
Net Assets - 100.0% | $ | 11,878,734 | |||||
The accompanying notes are an integral part of these financial statements.
4
Table of Contents
Managers International Equity Fund
Fund Snapshots
June 30, 2010 (unaudited)
Portfolio Breakdown
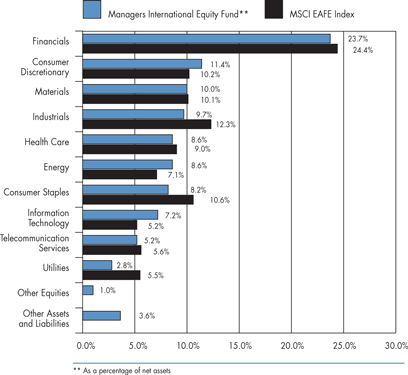
Industry | Managers International Equity Fund** | MSCI EAFE Index | ||||
Financials | 23.7 | % | 24.4 | % | ||
Consumer Discretionary | 11.4 | % | 10.2 | % | ||
Materials | 10.0 | % | 10.1 | % | ||
Industrials | 9.7 | % | 12.3 | % | ||
Health Care | 8.6 | % | 9.0 | % | ||
Energy | 8.6 | % | 7.1 | % | ||
Consumer Staples | 8.2 | % | 10.6 | % | ||
Information Technology | 7.2 | % | 5.2 | % | ||
Telecommunication Services | 5.2 | % | 5.6 | % | ||
Utilities | 2.8 | % | 5.5 | % | ||
Other Equities | 1.0 | % | 0.0 | % | ||
Other Assets and Liabilities | 3.6 | % | 0.0 | % |
Top Ten Holdings
Security Name | Percentage of Net Assets | ||
British American Tobacco PLC | 2.1 | % | |
Vodafone Group PLC* | 1.9 | ||
Sanofi-Aventis SA* | 1.8 | ||
Goldcorp, Inc. | 1.7 | ||
Roche Holding AG* | 1.5 | ||
Mitsui Fudosan Co., Ltd.* | 1.4 | ||
Royal Dutch Shell PLC, Class A* | 1.3 | ||
AstraZeneca PLC | 1.2 | ||
DBS Group Holdings, Ltd. | 1.2 | ||
Siemens AG | 1.2 | ||
Top Ten as a Group | 15.3 | % | |
| * | Top Ten Holding at December 31, 2009 |
Any sectors, industries, or securities discussed should not be perceived as investment recommendations. Mention of a specific security should not be considered a recommendation to buy or solicitation to sell that security. Specific securities mentioned in this report may have been sold from the Fund’s portfolio of investments by the time you receive this report.
5
Table of Contents
Managers International Equity Fund
Fund Snapshots (continued)
Summary of Investments by Country
Country | Managers International Equity Fund* | MSCI EAFE Index | ||||
Australia | 2.8 | % | 8.1 | % | ||
Austria | 0.0 | % | 0.3 | % | ||
Belgium | 0.0 | % | 0.9 | % | ||
Bermuda | 0.0 | % | 0.4 | % | ||
Brazil | 3.9 | % | 0.0 | % | ||
Canada | 6.2 | % | 0.0 | % | ||
Cayman Islands | 0.1 | % | 0.1 | % | ||
China | 2.7 | % | 0.0 | % | ||
Denmark | 0.4 | % | 1.0 | % | ||
Finland | 0.5 | % | 1.0 | % | ||
France | 8.0 | % | 9.3 | % | ||
Germany | 7.2 | % | 7.8 | % | ||
Greece | 0.0 | % | 0.2 | % | ||
Hong Kong | 5.7 | % | 2.1 | % | ||
India | 0.6 | % | 0.0 | % | ||
Ireland | 0.0 | % | 0.3 | % | ||
Israel | 1.1 | % | 0.8 | % | ||
Italy | 1.6 | % | 2.7 | % | ||
Japan | 17.9 | % | 23.3 | % | ||
Jersey, Channel Islands | 0.0 | % | 0.5 | % | ||
Luxembourg | 0.4 | % | 0.5 | % | ||
Netherlands | 5.1 | % | 2.9 | % | ||
New Zealand | 0.0 | % | 0.1 | % | ||
Norway | 0.7 | % | 0.7 | % | ||
Portugal | 0.0 | % | 0.3 | % | ||
Russia | 0.3 | % | 0.0 | % | ||
Singapore | 2.2 | % | 1.6 | % | ||
South Africa | 0.6 | % | 0.0 | % | ||
South Korea | 2.0 | % | 0.0 | % | ||
Spain | 0.0 | % | 3.5 | % | ||
Supranational & Other | 0.0 | % | 0.1 | % | ||
Sweden | 0.5 | % | 2.9 | % | ||
Switzerland | 6.3 | % | 8.0 | % | ||
Taiwan | 1.9 | % | 0.0 | % | ||
United Kingdom | 17.3 | % | 20.5 | % | ||
United States | 4.0 | % | 0.1 | % | ||
| 100.0 | % | 100.0 | % | |||
| * | As a percentage of total market value on June 30, 2010 |
6
Table of Contents
Managers International Equity Fund
Schedule of Portfolio Investments
June 30, 2010 (unaudited)
| Shares | Value | |||||
Common Stocks - 95.4% | ||||||
Consumer Discretionary - 11.4% | ||||||
adidas-Salomon AG (Germany) | 13,681 | $ | 662,366 | |||
Bayerische Motoren Werke AG (Germany) | 17,200 | 835,519 | ||||
Bridgestone Corp. (Japan) | 41,200 | 651,462 | ||||
Compass Group PLC (United Kingdom) | 90,399 | 687,708 | ||||
Ctrip.com International, Ltd. (China)* | 12,500 | 469,500 | ||||
Cyrela Brazil Realty, S.A. (Brazil) | 33,500 | 364,510 | ||||
Esprit Holdings, Ltd. (Hong Kong) | 61,647 | 331,128 | ||||
GOME Electrical Appliances Holdings, Ltd. (Hong Kong)* | 1,224,000 | 2 | 369,370 | |||
Inchcape PLC (United Kingdom)* | 102,398 | 374,164 | ||||
Lagardere (France) | 11,700 | 364,916 | ||||
Marks & Spencer Group PLC (United Kingdom) | 78,500 | 386,723 | ||||
Matsushita Electric Industrial Co., Ltd. (Japan) | 50,900 | 635,581 | ||||
New World Department Store China, Ltd. (China) | 29,000 | 26,221 | ||||
Nissan Motor Co., Ltd. (Japan)* | 80,700 | 562,356 | ||||
Parkson Retail Group, Ltd. (China) | 62,000 | 104,506 | ||||
PDG Realty SA Empreendimentos e Participacoes (Brazil) | 74,000 | 619,878 | ||||
Pearson PLC (United Kingdom) | 59,888 | 787,633 | ||||
Persimmon PLC (United Kingdom)* | 88,448 | 459,078 | ||||
Sekisui House, Ltd. (Japan) | 57,000 | 487,493 | ||||
SES SA (France) | 29,414 | 611,710 | ||||
Sharp Corp. (Japan) | 51,000 | 537,980 | ||||
Sony Corp. (Japan) | 16,400 | 437,437 | ||||
Vivendi Universal SA (France) | 33,820 | 687,295 | ||||
Total Consumer Discretionary | 11,454,534 | |||||
Consumer Staples - 8.2% | ||||||
British American Tobacco PLC (United Kingdom) | 67,451 | 2,140,611 | ||||
Carlsberg A/S, Class B (Denmark) | 3,775 | 287,689 | ||||
Casino Guichard-Perrachon SA (France) | 5,000 | 379,425 | ||||
Diageo PLC (United Kingdom) | 3,184 | 50,014 | ||||
Groupe Danone SA (France) | 3,752 | 201,146 | ||||
Heineken N.V. (Netherlands) | 13,803 | 585,073 | ||||
Imperial Tobacco Group PLC (United Kingdom) | 17,900 | 500,138 | ||||
Japan Tobacco, Inc. (Japan) | 221 | 687,552 | ||||
Kirin Brewery Co., Ltd. (Japan) | 54,000 | 679,838 | ||||
Metro AG (Germany) | 4,748 | 242,251 | ||||
Nestle SA, Registered (Switzerland) | 4,733 | 228,220 | ||||
SABMiller PLC (United Kingdom) | 15,322 | 429,636 | ||||
Seven & i Holdings Co., Ltd. (Japan) | 18,300 | 419,277 | ||||
Tingyi Cayman Islands Holding Corp. (Cayman Islands) | 28,000 | 68,649 | ||||
Unilever N.V. (Netherlands) | 24,451 | 667,739 | ||||
Unilever PLC (United Kingdom) | 16,700 | 446,424 | ||||
Uni-President Enterprises Corp. (Taiwan) | 179,097 | 196,811 | ||||
Total Consumer Staples | 8,210,493 | |||||
Energy - 8.6% | ||||||
BP PLC (United Kingdom) | 154,202 | 738,190 | ||||
Canadian Natural Resources, Ltd. (Canada) | 16,400 | 544,279 | ||||
Cenovus Energy, Inc. (Canada) | 10,568 | 272,005 | ||||
China Shenhua Energy Co., Ltd. (China) | 162,500 | 586,252 | ||||
CNOOC, Ltd. (Hong Kong) | 3,900 | 2 | 663,663 | |||
EnCana Corp. (Canada) | 10,168 | 307,939 | ||||
Nexen, Inc. (Canada) | 33,060 | 650,300 | ||||
OAO Gazprom, Sponsored ADR (Russia) | 28,000 | 527,192 | ||||
Penn West Energy Trust (Canada) | 28,351 | 2 | 540,628 | |||
Petrofac, Ltd. (United Kingdom) | 33,040 | 581,271 | ||||
Petroleo Brasileiro, S.A., Sponsored ADR (Brazil) | 9,600 | 329,472 | ||||
Royal Dutch Shell PLC, Class A (Netherlands) | 52,800 | 2 | 1,327,271 | |||
Straits Asia Resources, Ltd. (Singapore) | 273,000 | 385,751 | ||||
Suncor Energy, Inc. (Canada) | 19,300 | 568,004 | ||||
Technip-Coflexip, ADR (France) | 10,488 | 601,550 | ||||
Total Energy | 8,623,767 | |||||
Financials - 23.7% | ||||||
Allianz SE (Germany) | 10,100 | 999,633 | ||||
Banco do Brasil, S.A. (Brazil) | 45,800 | 634,095 | ||||
Banco Santander, S.A. (Brazil) | 32,200 | 331,812 | ||||
Bank of China, Ltd., Class H (China) | 1,351,000 | 681,583 | ||||
Bank of East Asia, Ltd. (Hong Kong) | 48,990 | 2 | 176,736 | |||
Bank of Yokohama, Ltd., The (Japan) | 110,000 | 503,191 | ||||
Barclays PLC (United Kingdom) | 264,534 | 1,055,887 | ||||
BNP Paribas SA (France) | 14,810 | 796,791 | ||||
CapitaLand, Ltd. (Singapore) | 177,500 | 452,615 | ||||
CapitaMalls Asia, Ltd. (Singapore) | 117,000 | 174,930 | ||||
Cathay Financial Holding Co., Ltd. (Taiwan) | 160,300 | 237,144 | ||||
China Life Insurance Co., Ltd. (China) | 55,000 | 240,528 | ||||
China Minsheng Banking Corp., Ltd. (China) | 75,600 | 65,731 | ||||
China Overseas Land & Investment, Ltd. (Hong Kong) | 493,360 | 919,284 | ||||
The accompanying notes are an integral part of these financial statements.
7
Table of Contents
Managers International Equity Fund
Schedule of Portfolio Investments (continued)
| Shares | Value | |||||
Financials - 23.7% (continued) | ||||||
Chinatrust Financial Holding Co., Ltd. (Taiwan) | 318,917 | $ | 174,258 | |||
Credit Suisse Group AG (Switzerland) | 16,631 | 625,280 | ||||
Dai-ichi Mutual Life Insurance Co., The (Japan) | 574 | 795,933 | ||||
Daiwa House Industry Co., Ltd. (Japan) | 28,000 | 251,892 | ||||
Daiwa Securities Group, Inc. (Japan) | 31,000 | 130,881 | ||||
Danske Bank A/S (United States) | 15,900 | 305,955 | ||||
DBS Group Holdings, Ltd. (Singapore) | 122,500 | 1,188,849 | ||||
Deutsche Bank AG (Germany) | 8,700 | 488,673 | ||||
Deutsche Boerse AG (Germany) | 4,361 | 264,947 | ||||
DnB Holding ASA (Norway) | 70,800 | 680,969 | ||||
Hana Financial Group, Inc. (South Korea) | 7,000 | 185,609 | ||||
Hang Lung Group, Ltd. (Hong Kong) | 15,900 | 85,688 | ||||
Hang Lung Properties, Ltd. (Hong Kong) | 36,000 | 137,698 | ||||
HDFC Bank, Ltd. (India) | 12,895 | 529,571 | ||||
Henderson Land Development Co., Ltd. (Hong Kong) | 61,000 | 357,281 | ||||
Hong Kong Exchanges and Clearing, Ltd. (Hong Kong) | 51,200 | 798,539 | ||||
Industrial and Commercial Bank of China, Ltd., Class H (China) | 311,000 | 226,052 | ||||
ING Groep N.V. (Netherlands)* | 68,987 | 510,540 | ||||
Itau Unibanco Banco Holding S.A. (Brazil) | 20,564 | 370,720 | ||||
KB Financial Group, Inc. (South Korea) | 12,125 | 464,761 | ||||
Klepierre (France) | 232 | 2 | 6,410 | |||
Mitsubishi Estate Co., Ltd. (Japan) | 20,000 | 278,433 | ||||
Mitsubishi Tokyo Financial Group, Inc. (Japan) | 31,500 | 143,032 | ||||
Mitsui Fudosan Co., Ltd. (Japan) | 99,000 | 1,377,929 | ||||
National Australia Bank, Ltd. (Australia) | 36,300 | 701,834 | ||||
Nomura Holdings, Inc. (Japan) | 146,000 | 797,669 | ||||
Old Mutual PLC (United Kingdom) | 291,700 | 446,606 | ||||
Prudential PLC (United Kingdom) | 67,976 | 512,716 | ||||
Standard Chartered PLC (United Kingdom) | 19,698 | 479,654 | ||||
Sumitomo Mitsui Financial Group, Inc. (Japan) | 21,200 | 600,010 | ||||
Sumitomo Realty & Development Co., Ltd. (Japan) | 18,000 | 305,855 | ||||
Sun Hung Kai Properties, Ltd. (Hong Kong) | 38,000 | 519,687 | ||||
T&D Holdings, Inc. (Japan) | 8,800 | 188,165 | ||||
UniCredito Italiano SpA (Italy) | 284,475 | 629,270 | ||||
Westpac Banking Corp. (United States) | 27,414 | 483,212 | ||||
Zurich Financial Services AG (Switzerland) | 1,858 | 409,528 | ||||
Total Financials | 23,724,066 | |||||
Health Care - 8.6% | ||||||
Actelion, Ltd. (Switzerland)* | 8,881 | 332,521 | ||||
AstraZeneca PLC (United Kingdom) | 25,700 | 1,211,647 | ||||
Bayer AG (Germany) | 16,400 | 916,457 | ||||
GlaxoSmithKline PLC (United Kingdom) | 16,199 | 275,073 | ||||
Lonza Group AG (Switzerland) | 2,622 | 174,571 | ||||
Mindray Medical International, Ltd., ADR (China) | 9,800 | 2 | 307,916 | |||
Novartis AG (Switzerland) | 23,608 | 1,144,118 | ||||
Roche Holding AG (Switzerland) | 10,633 | 1,463,544 | ||||
Sanofi-Aventis SA (France) | 29,241 | 1,761,110 | ||||
Teva Pharmaceutical Industries, Ltd., Sponsored ADR (Israel) | 20,400 | 1,060,596 | ||||
Total Health Care | 8,647,553 | |||||
Industrials - 9.7% | ||||||
ABB, Ltd. (Switzerland)* | 39,372 | 685,489 | ||||
ABB, Ltd., ADR (Switzerland)* | 35,230 | 615,732 | ||||
BAE Systems PLC (United Kingdom) | 109,800 | 511,033 | ||||
Bouygues (France) | 17,500 | 675,528 | ||||
FANUC, Ltd. (Japan) | 5,100 | 575,905 | ||||
Far Eastern New Century Corp. (Taiwan) | 179,783 | 184,891 | ||||
HOCHTIEF AG (Germany) | 4,700 | 280,617 | ||||
Kajima Corp. (Japan) | 48,000 | 108,821 | ||||
Koninklijke (Royal) Phillips Electronics N.V. (Netherlands) | 27,247 | 813,653 | ||||
Leighton Holdings, Ltd. (Australia) | 14,605 | 2 | 351,266 | |||
Mitsubishi Corp. (Japan) | 25,700 | 531,693 | ||||
Mitsubishi Heavy Inds., Ltd. (Japan) | 94,000 | 324,276 | ||||
Mitsui & Co., Ltd. (Japan) | 26,300 | 306,810 | ||||
Nippon Yusen Kabushiki Kaisha (Japan) | 158,000 | 575,795 | ||||
Randstad Holding N.V. (Netherlands)* | 15,300 | 601,218 | ||||
Rolls-Royce Group PLC (United Kingdom) | 80,400 | 671,081 | ||||
Rolls-Royce Group PLC, Class C (United Kingdom)* | 7,236,000 | 10,811 | ||||
Shimizu Corp. (Japan) | 36,000 | 123,035 | ||||
Siemens AG (Germany) | 13,288 | 1,188,477 | ||||
Tostem Inax Holding Corp. (Japan) | 13,000 | 248,142 | ||||
Vestas Wind Systems A/S (Denmark)* | 2,770 | 115,277 | ||||
Yamato Transport Co., Ltd. (Japan) | 17,000 | 225,004 | ||||
Total Industrials | 9,724,554 | |||||
The accompanying notes are an integral part of these financial statements.
8
Table of Contents
Managers International Equity Fund
Schedule of Portfolio Investments (continued)
| Shares | Value | ||||||
Information Technology - 7.2% | |||||||
AIXTRON AG (Germany) | 16,851 | 2 | $ | 398,380 | |||
ASML Holding N.V. (Netherlands) | 23,264 | 640,224 | |||||
AU Optronics Corp., Sponsored ADR (Taiwan) | 46,453 | 412,503 | |||||
Cap Gemini SA (France) | 12,100 | 531,791 | |||||
Companhia Brasileira de Meios de Pagamentos (Brazil) | 16,900 | 143,627 | |||||
Ericsson (LM), Class B (Sweden) | 48,670 | 539,859 | |||||
Gemalto NV (France)* | 14,204 | 2 | 534,552 | ||||
Murata Manufacturing Co., Ltd. (Japan) | 700 | 33,382 | |||||
Nokia Oyj (Finland) | 61,800 | 503,721 | |||||
Redecard, S.A. (Brazil) | 18,000 | 254,393 | |||||
Ricoh Co., Ltd. (Japan) | 43,000 | 548,315 | |||||
Samsung Electronics Co., Ltd. (South Korea) | 1,370 | 859,285 | |||||
SJM Holdings, Ltd. (United States) | 850,000 | 711,880 | |||||
Taiwan Semiconductor Manufacturing Co., Ltd., Sponsored ADR (Taiwan) | 45,620 | 445,250 | |||||
Toshiba Corp. (Japan)* | 143,000 | 708,361 | |||||
Total Information Technology | 7,265,523 | ||||||
Materials - 10.0% | |||||||
Air Liquide SA (France) | 4,747 | 479,384 | |||||
Barrick Gold Corp. (Canada) | 13,486 | 612,130 | |||||
First Quantum Minerals, Ltd. (Canada) | 8,300 | 417,514 | |||||
Gold Fields, Ltd. (South Africa) | 29,663 | 397,809 | |||||
Goldcorp, Inc. (Canada) | 39,000 | 1,707,567 | |||||
Impala Platinum Holdings, Ltd. (South Africa) | 8,900 | 207,548 | |||||
Incitec Pivot, Ltd. (Australia) | 220,239 | 498,088 | |||||
Kazakmys PLC (United Kingdom) | 10,400 | 152,661 | |||||
Kinross Gold Corp. (Canada) | 14,600 | 249,514 | |||||
Newcrest Mining, Ltd. (Australia) | 26,183 | 763,930 | |||||
Rio Tinto PLC (United Kingdom) | 15,900 | 698,238 | |||||
Shin-Etsu Chemical Co., Ltd. (Japan) | 15,000 | 697,428 | |||||
Syngenta AG (Switzerland) | 2,606 | 602,028 | |||||
Taiwan Fertilizer Co., Ltd. (Taiwan) | 94,000 | 245,930 | |||||
Toray Industries, Inc. (Japan) | 75,700 | 2 | 362,836 | ||||
Vale, S.A., ADR (Brazil) | 32,800 | 689,456 | |||||
Xstrata PLC (United Kingdom) | 65,400 | 856,403 | |||||
Yamana Gold, Inc. (Canada) | 39,459 | 404,765 | |||||
Total Materials | 10,043,229 | ||||||
Telecommunication Services - 5.2% | |||||||
Bharti Tele-Ventures, Ltd. (India) | 22,614 | 127,317 | |||||
KT Corp. (South Korea) | 27,200 | 521,425 | |||||
Nippon Telegraph & Telephone Corp. (Japan) | 24,700 | 1,006,176 | |||||
NTT DoCoMo, Inc. (Japan) | 427 | 646,602 | |||||
Telecom Italia S.p.A. (Italy) | 506,800 | 559,687 | |||||
Telecom Italia S.p.A., RSP (Italy) | 464,100 | 423,938 | |||||
Vodafone Group PLC (United Kingdom) | 917,896 | 1,891,315 | |||||
Total Telecommunication Services | 5,176,460 | ||||||
Utilities - 2.8% | |||||||
E.ON AG (Germany) | 27,700 | 744,805 | |||||
Electricite de France SA (France) | 11,900 | 2 | 452,756 | ||||
Hong Kong and China Gas Co., Ltd., The (Hong Kong) | 305,337 | 755,024 | |||||
National Grid PLC (United Kingdom) | 37,226 | 271,786 | |||||
Tokyo Electric Power Company, Inc., The (Japan) | 22,300 | 606,637 | |||||
Total Utilities | 2,831,008 | ||||||
Total Common Stocks (cost $104,175,458) | 95,701,187 | ||||||
Other Equities - 1.0% | |||||||
Hirco PLC (South Africa)* | 2,800 | 5,629 | |||||
SPDR Gold Shares (United States)* | 7,800 | 949,104 | |||||
Total Other Equities (cost $633,669) | 954,733 | ||||||
Warrants - 0.4% | |||||||
Henderson Land Development Co., Ltd., 06/01/11 (Hong Kong) | 12,600 | 2,136 | |||||
Hon Hai Precision Co., Ltd., 09/29/14 (United States) | 121,000 | 427,130 | |||||
Total Warrants (cost $428,461) | 429,266 | ||||||
Short-Term Investments - 5.3% | |||||||
BNY Institutional Cash Reserves Fund, Series B*3,8 | 104,356 | 20,349 | |||||
BNY Mellon Overnight Government Fund, 0.03%3 | 3,029,000 | 3,029,000 | |||||
Dreyfus Cash Management Fund, Institutional Class Shares, 0.13% | 2,300,987 | 2,300,987 | |||||
Total Short-Term Investments | |||||||
(cost $5,434,343) | 5,350,336 | ||||||
Total Investments - 102.1% | |||||||
(cost $110,671,931) | 102,435,522 | ||||||
Other Assets, less Liabilities - (2.1)% | (2,062,666 | ) | |||||
Net Assets - 100.0% | $ | 100,372,856 | |||||
The accompanying notes are an integral part of these financial statements.
9
Table of Contents
Managers Emerging Markets Equity Fund
Fund Snapshots
June 30, 2010 (unaudited)
Portfolio Breakdown
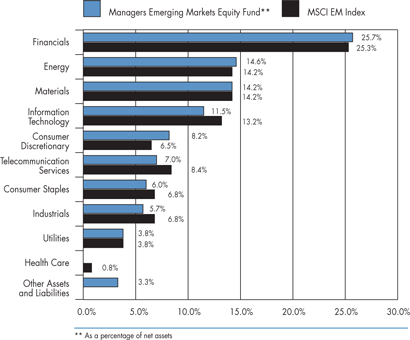
Industry | Managers Emerging Markets Equity Fund** | MSCI EM Index | ||||
Financials | 25.7 | % | 25.3 | % | ||
Energy | 14.6 | % | 14.2 | % | ||
Materials | 14.2 | % | 14.2 | % | ||
Information Technology | 11.5 | % | 13.2 | % | ||
Consumer Discretionary | 8.2 | % | 6.5 | % | ||
Telecommunication Services | 7.0 | % | 8.4 | % | ||
Consumer Staples | 6.0 | % | 6.8 | % | ||
Industrials | 5.7 | % | 6.8 | % | ||
Utilities | 3.8 | % | 3.8 | % | ||
Health Care | 0.0 | % | 0.8 | % | ||
Other Assets and Liabilities | 3.3 | % | 0.0 | % |
Top Ten Holdings
Security Name | Percentage of Net Assets | ||
Samsung Electronics Co., Ltd.* | 2.7 | % | |
America Movil, S.A.B. de C.V. | 2.1 | ||
China Construction Bank Corp.* | 2.0 | ||
OAO Gazprom, ADR* | 2.0 | ||
CNOOC, Ltd.* | 1.8 | ||
POSCO* | 1.6 | ||
China Mobile, Ltd. | 1.6 | ||
Vale, S.A., Sponsored ADR* | 1.5 | ||
Ping An Insurance (Group) Co. of China, Ltd. | 1.5 | ||
Hon Hai Precision Industry Co., Ltd.* | 1.5 | ||
Top Ten as a Group | 18.3 | % | |
| * | Top Ten Holding at December 31, 2009 |
Any sectors, industries, or securities discussed should not be perceived as investment recommendations. Mention of a specific security should not be considered a recommendation to buy or solicitation to sell that security. Specific securities mentioned in this report may have been sold from the Fund’s portfolio of investments by the time you receive this report.
10
Table of Contents
Managers Emerging Markets Equity Fund
Fund Snapshots (continued)
Summary of Investments by Country
Country | Managers Emerging Markets Equity Fund* | MSCI EM Index | ||||
Bermuda | 0.0 | % | 0.7 | % | ||
Brazil | 13.6 | % | 15.4 | % | ||
Cayman Islands | 0.0 | % | 2.8 | % | ||
Chile | 10.5 | % | 1.5 | % | ||
China | 0.0 | % | 10.7 | % | ||
Colombia | 0.0 | % | 0.8 | % | ||
Czech Republic | 0.0 | % | 0.4 | % | ||
Egypt | 0.8 | % | 0.5 | % | ||
Hong Kong | 8.0 | % | 4.9 | % | ||
Hungary | 0.2 | % | 0.4 | % | ||
India | 6.7 | % | 8.4 | % | ||
Indonesia | 3.5 | % | 2.4 | % | ||
Israel | 0.2 | % | 0.0 | % | ||
Kazakhstan | 0.2 | % | 0.0 | % | ||
Luxembourg | 1.5 | % | 0.0 | % | ||
Malaysia | 2.4 | % | 2.9 | % | ||
Mexico | 5.5 | % | 4.4 | % | ||
Morocco | 0.0 | % | 0.2 | % | ||
Panama | 0.6 | % | 0.0 | % | ||
Philippines | 0.7 | % | 0.5 | % | ||
Poland | 0.3 | % | 1.3 | % | ||
Russia | 8.8 | % | 5.9 | % | ||
South Africa | 2.8 | % | 7.2 | % | ||
South Korea | 14.2 | % | 13.6 | % | ||
Taiwan | 8.8 | % | 10.9 | % | ||
Thailand | 2.9 | % | 1.5 | % | ||
Turkey | 3.6 | % | 1.6 | % | ||
United Kingdom | 0.7 | % | 0.0 | % | ||
United States | 3.5 | % | 1.1 | % | ||
| 100.0 | % | 100.0 | % | |||
| * | As a percentage of total market value on June 30, 2010 |
11
Table of Contents
Managers Emerging Markets Equity Fund
Schedule of Portfolio Investments
June 30, 2010 (unaudited)
| Shares | Value | ||||
Common Stocks - 96.7% | |||||
Consumer Discretionary - 8.2% | |||||
Belle International Holdings, Ltd. (Hong Kong) | 721,000 | $ | 1,022,871 | ||
CTC Media, Inc. (Russia) | 1,677 | 24,216 | |||
Ctrip.com International, Ltd. (China)* | 13,200 | 495,792 | |||
Cyfrowy Polsat SA (Poland)* | 21,640 | 89,979 | |||
Estacio Participacoes, S.A., (Brazil) | 11,483 | 127,872 | |||
Genting Malaysia Berhad (Malaysia) | 76,300 | 166,899 | |||
Golden Eagle Retail Group, Ltd. (China) | 151,000 | 315,256 | |||
Grupo Televisa SA (Mexico) | 28,500 | 496,185 | |||
Hero Honda Motors, Ltd. (India) | 15,822 | 694,076 | |||
Hyundai Department Store Co., Ltd. (South Korea) | 2,723 | 260,130 | |||
Hyundai Mobis Co., Ltd. (South Korea) | 586 | 98,287 | |||
Hyundai Motor Co., Ltd. (South Korea) | 6,220 | 727,794 | |||
LG Electronics, Inc. (South Korea) | 7,863 | 597,934 | |||
Lojas Renner, S.A., (Brazil) | 25,700 | 703,511 | |||
Parkson Retail Group, Ltd. (China) | 151,500 | 255,366 | |||
Turk Sise ve Cam Fabrikalari A.S. (Turkey) | 334,541 | 365,372 | |||
Urbi Desarrollos Urbanos, S.A. de CV (Mexico)* | 155,130 | 287,876 | |||
Total Consumer Discretionary | 6,729,416 | ||||
Consumer Staples - 6.0% | |||||
Anadolu Efes Biracilik ve Malt Sanayii A.S. (Turkey) | 48,929 | 571,115 | |||
BRF - Brasil Foods S.A. (Brazil) | 27,220 | 357,705 | |||
China Mengniu Dairy Co., Ltd. (Hong Kong) | 114,000 | 369,497 | |||
Companhia Brasileira de Distribuicao Grupo Pao de Acucar (Brazil) | 5,732 | 398,489 | |||
Companhia de Bebidas das Americas, ADR (Brazil) | 1,400 | 141,414 | |||
Hengan International Group Co. (Hong Kong) | 29,500 | 238,874 | |||
ITC, Ltd. (India) | 79,422 | 518,175 | |||
Kuala Lumpur Kepong Berhad (Malaysia) | 78,200 | 395,080 | |||
LG Household & Health Care, Ltd. (South Korea) | 1,203 | 341,650 | |||
Perusahaan Perkebunan London Sumatra Indonesia Tbk PT (Indonesia)* | 169,000 | 153,319 | |||
Shinsegae Co., Ltd. (South Korea) | 2,357 | 1,018,399 | |||
Shoprite Holdings, Ltd. (South Africa) | 9,689 | 104,166 | |||
Wal-Mart de Mexico SAB de CV (Mexico) | 131,200 | 290,641 | |||
Total Consumer Staples | 4,898,524 | ||||
Energy - 14.6% | |||||
Banpu PLC, NVDR (Thailand) | 12,800 | 237,070 | |||
Cairn India, Ltd. (India)* | 31,196 | 202,004 | |||
China Shenhua Energy Co., Ltd. (China) | 110,000 | 396,848 | |||
CNOOC, Ltd. (Hong Kong) | 857,790 | 1,457,967 | |||
Integra Group Holdings, GDR (Russia)* | 45,105 | 100,137 | |||
LUKOIL Holdings, ADR (Russia) | 16,493 | 849,390 | |||
NovaTek OAO, Sponsored GDR (Russia) | 1,600 | 114,045 | |||
OAO Gazprom, ADR (Russia) | 87,969 | 1,656,306 | |||
OAO Rosneft Oil Co., GDR (Russia) (a)* | 55,966 | 341,393 | |||
OGX Petroleo e Gas Participacoes, S.A., (Brazil)* | 67,700 | 628,991 | |||
PetroChina Co., Ltd. (China) | 318,000 | 351,729 | |||
Petroleo Brasileiro, S.A., ADR (Brazil) | 27,188 | 810,202 | |||
Petroleo Brasileiro, S.A., Sponsored ADR (Brazil) | 28,460 | 976,747 | |||
PT Adaro Energy Tbk (Indonesia) | 956,000 | 207,647 | |||
PTT PLC, NVDR (Thailand) | 62,300 | 468,384 | |||
Reliance Industries, Ltd. (India) | 30,940 | 720,082 | |||
Rosneft Oil, GDR (Russia)* | 59,700 | 364,064 | |||
Sasol, Ltd. (South Africa) | 15,792 | 561,021 | |||
SK Energy Co., Ltd. (South Korea) | 2,058 | 183,040 | |||
Tenaris, S.A., (Luxembourg) | 14,000 | 484,540 | |||
Tupras Turkiye Petrol Rafine (Turkey) | 44,355 | 804,572 | |||
Total Energy | 11,916,179 | ||||
Financials - 25.7% | |||||
ABSA Group, Ltd. (South Africa) | 17,866 | 281,394 | |||
Banco Bradesco, S.A., (Brazil) | 19,287 | 305,892 | |||
Bangkok Bank PCL (Thailand) | 128,400 | 502,058 | |||
Bank of China, Ltd., Class H (China) | 1,724,000 | 869,763 | |||
BM&F Bovespa, S.A., (Brazil) | 51,300 | 332,526 | |||
BR Malls Participacoes, S.A., (Brazil) | 14,100 | 185,292 | |||
BR Properties, S.A., (Brazil) | 54,000 | 376,953 | |||
Bumiputra-Commerce Holdings Berhad (Malaysia) | 268,500 | 578,100 | |||
Cathay Financial Holding Co., Ltd. (Taiwan) | 300,000 | 443,814 | |||
China Construction Bank Corp. (China) | 2,068,000 | 1,664,767 | |||
China Life Insurance Co., Ltd. (China) | 35,000 | 153,063 | |||
China Pacific Insurance (Group) Co., Ltd. (China) | 74,800 | 295,943 | |||
Chinatrust Financial Holding Co., Ltd. (Taiwan) | 1,114,326 | 608,872 | |||
The accompanying notes are an integral part of these financial statements.
12
Table of Contents
Managers Emerging Markets Equity Fund
Schedule of Portfolio Investments (continued)
| Shares | Value | |||||
Financials - 25.7% (continued) | ||||||
Commercial International Bank (Egypt) | 27,102 | $ | 317,277 | |||
Daegu Bank, Ltd., The (South Korea) | 21,160 | 240,391 | ||||
EFG-Hermes (Egypt) | 27,306 | 137,740 | ||||
Franshion Properties China, Ltd. (Hong Kong) | 974,000 | 267,788 | ||||
Grupo Financiero Banorte, S.A.B. de C.V. (Mexico) | 286,800 | 1,086,612 | ||||
Halyk Savings Bank of Kazakhstan, GDR (Kazakhstan)* | 17,515 | 137,284 | ||||
Hana Financial Group, Inc. (South Korea) | 8,900 | 235,988 | ||||
HDFC Bank, Ltd. (India) | 17,017 | 698,853 | ||||
Industrial and Commercial Bank of China, Ltd., Class H (China) | 1,260,958 | 916,533 | ||||
Itau Unibanco Banco Holding S.A., (Brazil) | 25,696 | 463,240 | ||||
Itau Unibanco Banco Holding S.A., ADR (Brazil) | 54,854 | 987,921 | ||||
Kasikornbank PLC, NVDR (Thailand) | 142,700 | 396,409 | ||||
OTP Bank NyRt. (Hungary)* | 8,745 | 176,320 | ||||
Ping An Insurance (Group) Co. of China, Ltd. (China) | 148,883 | 1,230,351 | ||||
Poly Investments, Ltd. (Hong Kong) | 177,000 | 173,467 | ||||
Powszechny Zaklad Ubezpieczen S.A., (Poland)* | 1,406 | 145,062 | ||||
PT Bank Mandiri (Indonesia) | 1,676,000 | 1,098,229 | ||||
Public Bank Berhad (Malaysia) | 167,068 | 613,629 | ||||
Samsung Fire & Marine Insurance Co., Ltd. (South Korea) | 4,149 | 658,597 | ||||
Sberbank, GDR (Russia) | 2,556 | 637,443 | ||||
Sberbank-CLS (Russia) | 249,000 | 598,235 | ||||
Shanghai Lujiazui Finance & Trade Zone Development Co., Ltd. (China) | 2,142 | 2,808 | ||||
Shinhan Financial Group Co., Ltd. (South Korea) | 29,260 | 1,077,035 | ||||
Siam Commercial Bank Public Company, Ltd. (Thailand) | 144,900 | 360,399 | ||||
Standard Bank Group, Ltd. (South Africa) | 28,063 | 372,146 | ||||
Turkiye Garanti Bankasi A.S. (Turkey) | 89,912 | 374,181 | ||||
Turkiye Halk Bankasi A.S. (Turkey) | 42,098 | 310,790 | ||||
Turkiye Is Bankasi (Isbank) (Turkey) | 94,458 | 292,331 | ||||
VTB Bank, GDR (Russia) | 86,617 | 2 | 416,095 | |||
Total Financials | 21,021,591 | |||||
Industrials - 5.7% | ||||||
Aveng, Ltd. (South Africa) | 43,387 | 193,743 | ||||
Beijing Enterprises Holdings, Ltd. (Hong Kong) | 36,000 | 233,701 | ||||
Bharat Heavy Electricals, Ltd. (India) | 6,692 | 352,579 | ||||
China Merchants Holdings International Co., Ltd. (Hong Kong) | 98,000 | 323,523 | ||||
China Shipping Development Co., Ltd. (China) | 290,000 | 364,751 | ||||
Companhia de Concessoes Rodoviarias (Brazil) | 10,700 | 219,335 | ||||
Copa Holdings, S.A., Class A (Panama)* | 11,400 | 504,108 | ||||
COSCO Pacific, Ltd. (Hong Kong) | 222,000 | 262,008 | ||||
Far Eastern New Century Corp. (Taiwan) | 248,000 | 255,047 | ||||
GS Engineering & Construction Corp. (South Korea) | 4,467 | 270,622 | ||||
Hyundai Engineering & Construction Co. (South Korea) | 9,955 | 457,723 | ||||
Hyundai Heavy Industries Co., Ltd. (South Korea) | 605 | 115,123 | ||||
IJM Corp. Berhad (Malaysia) | 139,000 | 210,378 | ||||
Jiangsu Expressway Co., Ltd. (China) | 280,000 | 253,241 | ||||
Orascom Construction Industries (Egypt) | 3,292 | 129,601 | ||||
Raubex Group, Ltd. (South Africa) | 35,202 | 86,929 | ||||
TAV Havalimanlari Holding A.S. (Turkey)* | 31,820 | 112,802 | ||||
United Tractors Tbk PT (Indonesia) | 138,000 | 282,851 | ||||
Total Industrials | 4,628,065 | |||||
Information Technology - 11.5% | ||||||
Advanced Semiconductor Engineering, Inc. (Taiwan) | 595,893 | 469,188 | ||||
AsiaInfo Holdings, Inc. (China)* | 5,700 | 124,602 | ||||
Asustek Computer, Inc. (Taiwan) | 31,650 | 233,137 | ||||
Asustek Computer, Inc., GDR (Taiwan) | 503 | 18,592 | ||||
Catcher Technology Co., Ltd. (Taiwan) | 72,000 | 155,308 | ||||
Hon Hai Precision Industry Co., Ltd. (Taiwan) | 343,611 | 1,204,416 | ||||
Hon Hai Precision Industry Co., Ltd., ADR (Taiwan)* | 555 | 3,938 | ||||
Hynix Semiconductor, Inc. (South Korea)* | 3,320 | 67,107 | ||||
Infosys Technologies (India) | 10,225 | 610,056 | ||||
LG Display Co., Ltd. (South Korea) | 16,770 | 551,564 | ||||
MediaTek, Inc. (Taiwan) | 34,000 | 474,564 | ||||
Pegatron Corp. (Taiwan)* | 91,943 | 85,987 | ||||
Samsung Electronics Co., Ltd. (South Korea) | 3,535 | 2,217,203 | ||||
Samsung Electronics Co., Ltd., GDR, (South Korea)(a) | 1,020 | 323,037 | ||||
Siliconware Precision Industries Co. (Taiwan) | 225,871 | 243,390 | ||||
Siliconware Precision Industries Co., ADR (Taiwan) | 77,400 | 414,090 | ||||
The accompanying notes are an integral part of these financial statements.
13
Table of Contents
Managers Emerging Markets Equity Fund
Schedule of Portfolio Investments (continued)
| Shares | Value | ||||||
Information Technology - 11.5% (continued) | |||||||
Taiwan Semiconductor Manufacturing Co., Ltd. (Taiwan) | 495,584 | $ | 926,268 | ||||
Taiwan Semiconductor Manufacturing Co., Ltd., Sponsored ADR (Taiwan) | 56,035 | 546,902 | |||||
Tata Consultancy Services, Ltd. (India) | 35,984 | 577,429 | |||||
Tencent Holdings, Ltd. (China) | 12,000 | 198,807 | |||||
Total Information Technology | 9,445,585 | ||||||
Materials - 14.2% | |||||||
African Rainbow Minerals, Ltd. (South Africa) | 2,407 | 50,365 | |||||
Anglo American PLC (United Kingdom)* | 15,569 | 542,504 | |||||
AngloGold Ashanti, Ltd. (South Africa) | 4,839 | 208,846 | |||||
Anhui Conch Cement Co., Ltd. (China) | 133,872 | 2 | 389,200 | ||||
Bradespar, S.A., (Brazil) | 7,450 | 135,049 | |||||
CEMEX, S.A.,B. de C.V. (Mexico)* | 60,216 | 582,289 | |||||
China Steel Corp. (Taiwan) | 537,739 | 495,382 | |||||
Evraz Group SA, GDR (Luxembourg)* | 12,146 | 283,282 | |||||
Gerdau SA, Sponsored ADR (Brazil) | 29,900 | 394,082 | |||||
GMK Norilsk Nickel, Sponsored ADR (Russia) | 33,420 | 482,919 | |||||
Hidili Industry International Development, Ltd. (China) | 326,000 | 240,134 | |||||
Impala Platinum Holdings, Ltd. (South Africa) | 12,218 | 284,363 | |||||
Indocement Tunggal Prakarsa Tbk PT (Indonesia)* | 179,500 | 310,282 | |||||
KG Chemical Co., Ltd. (South Korea) | 2,192 | 549,733 | |||||
LSR Group OJSC, GDR (Russia)* | 26,996 | 202,950 | |||||
Mechel OAO (Russia) | 3,300 | 59,862 | |||||
MMC Norilsk Nickel, ADR (Russia) | 12,100 | 173,430 | |||||
MMX Mineracao e Metalicos S.A., (Brazil)* | 53,200 | 311,242 | |||||
POSCO (South Korea) | 3,538 | 1,340,587 | |||||
Raspadskaya (Russia)* | 79,212 | 304,348 | |||||
Severstal, GDR, Reg S (Russia)* | 14,500 | 139,724 | |||||
Southern Copper Corp. (United States) | 9,200 | 244,168 | |||||
Taiwan Fertilizer Co., Ltd. (Taiwan) | 143,000 | 374,128 | |||||
Tata Steel Ltd. (India) | 20,374 | 210,925 | |||||
Ternium SA (Luxembourg)* | 14,200 | 2 | 467,464 | ||||
Uralkaliy OAO (Russia) | 8,000 | 142,385 | |||||
Usinas Siderurgicas de Minas Gerais, S.A., (Brazil) | 20,000 | 531,967 | |||||
Usinas Siderurgicas de Minas Gerais, S.A., ADR (Brazil) | 6,100 | 163,230 | |||||
Vale, S.A., Sponsored ADR (Brazil) | 51,467 | 1,253,221 | |||||
Vale, S.A., ADR (Brazil) | 33,999 | 714,659 | |||||
Total Materials | 11,582,720 | ||||||
Telecommunication Services - 7.0% | |||||||
Advanced Info Service PCL (Thailand) | 153,700 | 409,770 | |||||
America Movil, S.A.,B. de C.V. (Mexico) | 36,800 | 1,748,000 | |||||
Bezeq Israeli Telecommunication Corp., Ltd. (Israel) | 84,167 | 183,981 | |||||
China Mobile, Ltd. (Hong Kong) | 131,000 | 1,301,858 | |||||
Chunghwa TelecomCo., Ltd., ADR (Taiwan) | 12,200 | 240,218 | |||||
LG Telecom, Ltd. (South Korea) | 41,420 | 258,290 | |||||
Mobile Telesystems, Sponsored ADR (Russia)* | 23,487 | 450,011 | |||||
MTN Group, Ltd. (South Africa) | 8,541 | 111,931 | |||||
Orascom Telecom Holding SAE (Egypt) | 39,086 | 33,621 | |||||
Philippine Long Distance Telephone Co. (Philippines) | 6,680 | 341,580 | |||||
Philippine Long Distance Telephone Co., Sponsored ADR (Philippines) | 4,407 | 224,625 | |||||
Turk Telekomunikasyon A.S. (Turkey) | 31,101 | 99,285 | |||||
Vivo Participacoes S.A., ADR (Brazil) | 11,325 | 293,544 | |||||
Total Telecommunication Services | 5,696,714 | ||||||
Utilities - 3.8% | |||||||
China Gas Holdings, Ltd. (Hong Kong) | 722,000 | 401,837 | |||||
China Resources Power Holdings Co. (Hong Kong) | 223,800 | 507,252 | |||||
Companhia Energetica de Minas Gerais (Brazil) | 7,934 | 114,729 | |||||
Companhia Energetica de Minas Gerais, Sponsored ADR (Brazil) | 16,390 | 240,441 | |||||
Gail India Ltd. (India) | 64,909 | 648,989 | |||||
Inter-Regional Distribution Network Co Center and Privolzhya OJSC (Russia)* | 21,609,907 | 129,659 | |||||
PT Perusahaan Gas Negara (Persero) Tbk (Indonesia) | 1,933,000 | 819,440 | |||||
Reliance Infrastructure, Ltd. (India) | 8,711 | 223,040 | |||||
Total Utilities | 3,085,387 | ||||||
Total Common Stocks (cost $76,190,609) | 79,004,181 | ||||||
Short-Term Investments - 3.8% | |||||||
BNY Institutional Cash Reserves Fund, Series B*3,8 | 110,742 | 21,595 | |||||
BNY Mellon Overnight Government Fund, 0.03%3 | 1,022,000 | 1,022,000 | |||||
Dreyfus Cash Management Fund, Institutional Class Shares, 0.13% | 2,032,291 | 2,032,291 | |||||
Total Short-Term Investments | |||||||
(cost $3,165,033) | 3,075,886 | ||||||
Total Investments - 100.5% | |||||||
(cost $79,355,642) | 82,080,067 | ||||||
Other Assets, less Liabilities - (0.5)% | (414,736 | ) | |||||
Net Assets - 100.0% | $ | 81,665,331 | |||||
The accompanying notes are an integral part of these financial statements.
14
Table of Contents
Fund Snapshots
June 30, 2010 (unaudited)
Portfolio Breakdown
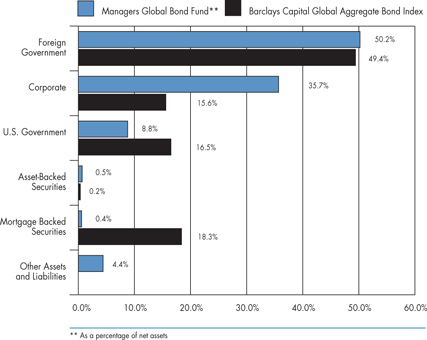
Category | Managers Global Bond Fund** | Barclays Capital Global Aggregate Bond Index | ||||
Foreign Government | 50.2 | % | 49.4 | % | ||
Corporate | 35.7 | % | 15.6 | % | ||
U.S. Government | 8.8 | % | 16.5 | % | ||
Asset-Backed Securities | 0.5 | % | 0.2 | % | ||
Mortgage Backed Securities | 0.4 | % | 18.3 | % | ||
Other Assets and Liabilities | 4.4 | % | 0.0 | % |
Top Ten Holdings
Security Name | Percentage of Net Assets | ||
USTN, 1.000%, 10/31/11* | 6.5 | % | |
Deutschland, Republic of, 3.750%, 07/04/13* | 4.4 | ||
Depfa ACS Bank, 1.650%, 12/20/16* | 2.7 | ||
Government of France, 5.000%, 10/25/16* | 2.4 | ||
U.K. Gilts, 4.750%, 03/04/20* | 2.4 | ||
Japan Finance Corporation for Municipal Enterprises, 1.550%, 02/21/12 | 2.4 | ||
USTN, 2.375%, 02/28/15 | 2.3 | ||
Bundesrepublik Deutschland, 3.750%, 01/04/17* | 2.3 | ||
Singapore, Government Of, 2.250%, 07/01/13 | 2.2 | ||
Norway Government Bond, 4.500%, 05/22/19 | 2.2 | ||
Top Ten as a Group | 29.8 | % | |
| * | Top Ten Holding at December 31, 2009 |
Any sectors, industries, or securities discussed should not be perceived as investment recommendations. Mention of a specific security should not be considered a recommendation to buy or solicitation to sell that security. Specific securities mentioned in this report may have been sold from the Fund’s portfolio of investments by the time you receive this report.
15
Table of Contents
Managers Global Bond Fund
Schedule of Portfolio Investments
June 30, 2010 (unaudited)
Security Description | Principal Amount | Value | ||||
Corporate Bonds - 35.7% | ||||||
Financials - 13.0% | ||||||
Bank of America Corp., 4.750%, 05/06/196 | EUR | 100,000 | $ | 113,376 | ||
Bank of Nova Scotia, The, 2.250%, 01/22/13 | USD | 75,000 | 76,045 | |||
BBVA Bancomer SA, Texas, 7.250%, 04/22/20(a) | USD | 100,000 | 98,658 | |||
British American Tobacco Holdings, The Netherlands, B.V., 4.000%, 07/07/20 | EUR | 50,000 | 61,262 | |||
Canara Bank, 6.365%, 11/28/216 | USD | 150,000 | 146,384 | |||
Commonwealth Bank of Australia, 3.500%, 03/19/15(a) | USD | 200,000 | 202,637 | |||
Depfa ACS Bank, 1.650%, 12/20/16 | JPY | 70,000,000 | 630,409 | |||
ICICI Bank, Ltd., 6.375%, 04/30/22(a)6 | USD | 140,000 | 128,801 | |||
KfW Bankengruppe, 2.600%, 06/20/37 | JPY | 23,000,000 | 283,578 | |||
Landesbank Baden-Wuerttemberg, Series 14, 3.750%, 02/12/14 | EUR | 120,000 | 156,892 | |||
Morgan Stanley Co., Series EMTN, 5.375%, 11/14/13 | GBP | 40,000 | 62,438 | |||
Muenchener Hypothekenbank eG, 5.000%, 01/16/12(a) | EUR | 170,000 | 219,633 | |||
Network Rail Infrastructure Finance PLC, Series EMTN, 3.500%, 06/17/13 | USD | 300,000 | 316,844 | |||
Nomura Holdings, Inc., 6.700%, 03/04/20 | USD | 70,000 | 74,056 | |||
Nordea Bank AB, 3.700%, 11/13/14(a) | USD | 100,000 | 101,871 | |||
ProLogis, 6.625%, 05/15/18 | USD | 60,000 | 57,167 | |||
SLM Corp., 5.000%, 10/01/13 | USD | 150,000 | 143,395 | |||
Wells Fargo & Co., 4.625%, 11/02/35 | GBP | 50,000 | 65,500 | |||
White Mountains Insurance Group, Ltd., 6.375%, 03/20/17(a) | USD | 140,000 | 140,149 | |||
Total Financials | 3,079,095 | |||||
Industrials - 21.4% | ||||||
Ahold Finance USA, Inc., Series EMTN, 6.500%, 03/14/17 | GBP | 100,000 | 166,501 | |||
Anheuser-Busch InBev Worldwide, Inc., 3.625%, 04/15/15(a) | USD | 150,000 | 153,530 | |||
Avnet, Inc., 5.875%, 06/15/20 | USD | 60,000 | 60,788 | |||
Axtel S.A.B. de C.V., 7.625%, 02/01/17(a) | USD | 55,000 | 48,812 | |||
Bell Aliant Regional Communications, 5.410%, 09/26/16 | CAD | 160,000 | 160,090 | |||
Bell Canada, | ||||||
6.100%, 03/16/35(a) | CAD | 45,000 | 42,180 | |||
6.550%, 05/01/29(a) | CAD | 10,000 | 9,812 | |||
7.300%, 02/23/32(a) | CAD | 130,000 | 138,840 | |||
Bertelsmann AG, 3.625%, 10/06/15 | EUR | 50,000 | 61,511 | |||
Boston Scientific Corp., 4.500%, 01/15/15 | USD | 60,000 | 58,940 | |||
Chesapeake Energy Corp., 6.875%, 11/15/20 | USD | 55,000 | 55,481 | |||
Citizens Communications Co., 6.625%, 03/15/15 | USD | 115,000 | 110,975 | |||
Corus Entertainment, Inc., 7.250%, 02/10/17(a) | CAD | 130,000 | 124,364 | |||
CSC Holdings Inc., 8.500%, 04/15/14 | USD | 100,000 | 104,250 | |||
Delta Air Lines, Inc., | ||||||
6.821%, 08/10/22 | USD | 155,899 | 153,950 | |||
8.021%, 08/10/22 | USD | 101,567 | 96,743 | |||
The accompanying notes are an integral part of these financial statements.
16
Table of Contents
Managers Global Bond Fund
Schedule of Portfolio Investments (continued)
Security Description | Principal Amount | Value | ||||
Industrials - 21.4% (continued) | ||||||
Desarrolladora Homex, S.A. de C.V., 7.500%, 09/28/15 | USD | 190,000 | $ | 186,675 | ||
DP World, Ltd., 6.850%, 07/02/37(a) | USD | 250,000 | 198,872 | |||
EchoStar DBS Corp., 6.625%, 10/01/14 | USD | 65,000 | 65,000 | |||
Edcon Proprietary Ltd., 3.969%, 06/15/14 (09/15/10)(a)5 | EUR | 150,000 | 129,317 | |||
Embarq Corp., 7.995%, 06/01/36 | USD | 110,000 | 109,167 | |||
ERAC USA Finance Co., | ||||||
6.375%, 10/15/17(a) | USD | 75,000 | 84,426 | |||
6.700%, 06/01/34(a) | USD | 120,000 | 127,911 | |||
7.000%, 10/15/37(a) | USD | 20,000 | 21,794 | |||
Finmeccanica SpA, 4.875, 03/24/25 | EUR | 100,000 | 120,022 | |||
HCA, Inc., | ||||||
6.375%, 01/15/15 | USD | 35,000 | 32,681 | |||
6.625%, 02/15/16 | USD | 80,000 | 74,600 | |||
7.580%, 09/15/25 | USD | 10,000 | 8,800 | |||
7.690%, 06/15/25 | USD | 15,000 | 13,425 | |||
Hilcorp Energy I LP/Hilcorp Finance Co., 7.750%, 11/01/15(a) | USD | 170,000 | 167,450 | |||
Hologic, Inc., 2.000%, 12/15/37(b)9 | USD | 70,000 | 59,588 | |||
Incitec Pivot Finance LLC, 6.000%, 12/10/19(a) | USD | 90,000 | 92,188 | |||
Lafarge S.A., 4.750%, 03/23/20 | EUR | 50,000 | 55,354 | |||
Mexichem SAB de CV, 8.750%, 11/06/19(a) | USD | 100,000 | 111,000 | |||
Motorola, Inc., | ||||||
6.500%, 09/01/25 | USD | 105,000 | 104,548 | |||
6.625%, 11/15/37 | USD | 120,000 | 123,233 | |||
Nabors Industries, Inc., 6.150%, 02/15/18 | USD | 125,000 | 134,027 | |||
New Albertsons, Inc., 7.250%, 05/01/13 | USD | 40,000 | 40,700 | |||
Nextel Communications, Inc., | ||||||
6.875%, 10/31/13 | USD | 84,000 | 81,375 | |||
7.375%, 08/01/15 | USD | 50,000 | 47,500 | |||
Noble Group, Ltd., 8.500%, 05/30/13(a) | USD | 100,000 | 110,250 | |||
Owens & Minor, Inc., 6.350%, 04/15/16 | USD | 105,000 | 105,744 | |||
Owens-Brockway Glass Container, Inc., 6.750%, 12/01/14 | EUR | 50,000 | 60,531 | |||
Questar Market Resources, Inc., 6.800%, 03/01/20 | USD | 20,000 | 20,786 | |||
Qwest Capital Funding, Inc., 6.500%, 11/15/18 | USD | 40,000 | 37,600 | |||
Qwest Corp., | ||||||
7.250%, 09/15/25 | USD | 83,000 | 79,680 | |||
7.250%, 10/15/35 | USD | 158,000 | 144,965 | |||
Range Resources Corp., 7.375%, 07/15/13 | USD | 50,000 | 50,500 | |||
Steel Dynamics, Inc., 7.375%, 11/01/12 | USD | 70,000 | 72,450 | |||
SUPERVALU, Inc., 7.500%, 11/15/14 | USD | 40,000 | 40,000 | |||
Transport De Gas Del Sur, 7.875%, 05/14/17(a) | USD | 270,000 | 259,200 | |||
Viacom, Inc., 6.875%, 04/30/36 | USD | 130,000 | 147,169 | |||
The accompanying notes are an integral part of these financial statements.
17
Table of Contents
Managers Global Bond Fund
Schedule of Portfolio Investments (continued)
Security Description | Principal Amount | Value | |||||
Industrials - 21.4% (continued) | |||||||
Voto-Votorantim, Ltd., 6.750%, 04/05/21(a) | USD | 100,000 | 2 | $ | 101,000 | ||
Wendel Investissement, 4.875%, 05/26/16 | EUR | 100,000 | 104,554 | ||||
Total Industrials | 5,070,849 | ||||||
Utilities - 1.3% | |||||||
Abu Dhabi National Energy Co. PJSC, 4.750%, 09/15/14 | USD | 100,000 | 100,750 | ||||
AES Corp., 8.750%, 05/15/13(a) | USD | 36,000 | 36,540 | ||||
Axtel S.A.B. de C.V.. 9.000%, 09/22/19(a) | USD | 45,000 | 40,050 | ||||
IPALCO Enterprises, Inc., 7.250%, 04/01/16(a) | USD | 30,000 | 30,675 | ||||
Majapahit Holding BV, 7.250%, 06/28/17(a) | USD | 100,000 | 106,000 | ||||
Total Utilities | 314,015 | ||||||
Total Corporate Bonds (cost $8,342,252) | 8,463,959 | ||||||
Foreign Government Obligations - 50.2% | |||||||
Banco Nacional de Desenvolvimento Economico e Social, 6.500%, 06/10/19(a) | USD | 100,000 | 107,125 | ||||
Belgium Kingdom, 5.500%, 09/28/17 | EUR | 205,000 | 291,559 | ||||
Brazil, Republic of, 10.250%, 01/10/28 | BRL | 250,000 | 139,716 | ||||
Bundesobligation, Series 153, 4.000%, 10/11/13 | EUR | 185,000 | 249,294 | ||||
Bundesrepublik Deutschland, | |||||||
3.750%, 01/04/17 | EUR | 399,000 | 540,945 | ||||
4.000%, 01/04/37 | EUR | 165,000 | 226,627 | ||||
Canadian Government, 4.500%, 06/01/15 | CAD | 310,000 | 320,667 | ||||
Denmark Government, | |||||||
4.000%, 11/15/15 | DKK | 2,500,000 | 455,275 | ||||
Series EMTN, 2.250%, 05/14/12 | USD | 250,000 | 255,230 | ||||
Deutschland, Republic of, 3.750%, 07/04/13 | EUR | 785,000 | 1,042,311 | ||||
Eksportfinans ASA, Series GMTN, 1.875%, 04/02/13 | USD | 170,000 | 171,392 | ||||
European Investment Bank, | |||||||
2.375%, 07/10/20 | CHF | 165,000 | 160,914 | ||||
6.219%, 04/24/13(a)4 | IDR | 4,605,000,000 | 427,506 | ||||
German Government 2-Year Note, Series 1, 1.250%, 09/16/11 | EUR | 100,000 | 123,396 | ||||
Government of France, 5.000%, 10/25/16 | EUR | 410,000 | 580,184 | ||||
Japan Bank for International Cooperation, 2.125%, 11/05/12 | USD | 500,000 | 509,860 | ||||
Japan Finance Corporation for Municipal Enterprises, | |||||||
1.550%, 02/21/12 | JPY | 49,000,000 | 565,105 | ||||
1.900%, 06/22/18 | JPY | 30,000,000 | 366,984 | ||||
Mexican Bonos, Series M 10, 8.500%, 02/13/18 | MXN | 3,000,000 | 257,248 | ||||
Mexican Fixed Rate Bond, | |||||||
8.000%, 12/17/15 | MXN | 1,500,000 | 124,971 | ||||
8.000%, 12/07/23 | MXN | 3,900,000 | 321,184 | ||||
New South Wales Treasury Corp., Series 10RG, 7.000%, 12/01/10 | AUD | 190,000 | 161,391 | ||||
Norway Government Bond, | |||||||
4.250%, 05/19/17 | NOK | 970,000 | 162,044 | ||||
4.500%, 05/22/19 | NOK | 3,010,000 | 511,191 | ||||
The accompanying notes are an integral part of these financial statements.
18
Table of Contents
Managers Global Bond Fund
Schedule of Portfolio Investments (continued)
Security Description | Principal Amount | Value | |||||
Foreign Government Obligations - 50.2% (continued) | |||||||
Province of British Columbia, 2.850%, Series BCUSG-4, 06/15/15 | USD | 175,000 | $ | 180,754 | |||
Province of Ontario, 2.950%, 02/05/15 | USD | 245,000 | 2 | 251,185 | |||
Province of Quebec, Series EMTN, 3.375%, 06/20/16 | EUR | 150,000 | 191,149 | ||||
Province of Saskatchewan, 7.375%, 07/15/13 | USD | 225,000 | 263,817 | ||||
Qatar Government International Bond, 4.000%, 01/20/15(a) | USD | 200,000 | 205,500 | ||||
Republic of Hungary, 6.250%, 01/29/20 | USD | 75,000 | 73,817 | ||||
Republic of Lithuania, 7.375%, 02/11/20(a) | USD | 100,000 | 105,925 | ||||
Republic of Poland, Series EMTN, 3.000%, 09/23/14 | CHF | 65,000 | 61,150 | ||||
Singapore, Government of, 2.250%, 07/01/13 | SGD | 685,000 | 514,822 | ||||
Sweden Government Bond, | |||||||
Series 1046, 5.500%, 10/08/12 | SEK | 3,520,000 | 492,159 | ||||
Series 1047, 5.000%, 12/01/20 | SEK | 1,650,000 | 255,668 | ||||
U.K. Gilts, 4.750%, 03/04/20 | GBP | 345,000 | 574,432 | ||||
U.K. Treasury, | |||||||
5.000%, 03/07/25 | GBP | 110,000 | 184,543 | ||||
5.250%, 06/07/12 | GBP | 290,000 | 469,416 | ||||
Total Foreign Government Obligations (cost $12,129,526) | 11,896,456 | ||||||
U.S. Government Obligations - 8.8% | |||||||
USTN, 1.000%, 10/31/11 | USD | 1,530,000 | 1,540,698 | ||||
USTN, 2.375%, 02/28/15 | USD | 525,000 | 541,081 | ||||
Total U.S. Government Obligations (cost $2,057,085) | 2,081,779 | ||||||
Asset-Backed Security - 0.5% | |||||||
COMET, Series 2004-B7, Class B7, 1.134%, 08/17/17 (07/19/10)5 (cost $87,723) | EUR | 100,000 | 108,602 | ||||
Mortgage-Backed Security - 0.4% | |||||||
Western Union Co., The, 6.200%, 06/21/40 (cost $99,878) | USD | 100,000 | 103,473 | ||||
| Shares | |||||||
Preferred Stock - 0.0%# | |||||||
FNMA, Series S, 8.250%* (cost $293,684) | 11,800 | 4,012 | |||||
Short-Term Investments - 2.4%1 | |||||||
BNY Institutional Cash Reserves Fund, Series B* 3,8 | 38,044 | 7,419 | |||||
BNY Mellon Overnight Government Fund, 0.03%3 | 328,000 | 328,000 | |||||
Dreyfus Cash Management Fund, Institutional Class Shares, 0.13% | 221,877 | 221,877 | |||||
Total Short-Term Investments (cost $587,921) | 557,296 | ||||||
Total Investments - 98.0% (cost $23,598,069) | 23,215,577 | ||||||
Other Assets, less Liabilities - 2.0% | 471,241 | ||||||
Net Assets - 100.0% | $ | 23,686,818 | |||||
The accompanying notes are an integral part of these financial statements.
19
Table of Contents
Notes to Schedules of Portfolio Investments (unaudited)
The following footnotes and abbreviations should be read in conjunction with each of the Schedules of Portfolio Investments previously presented in this report.
At June 30, 2010, the cost of securities for Federal income tax purposes and the gross aggregate unrealized appreciation and/or depreciation based on tax cost were approximately:
Fund | Cost | Appreciation | Depreciation | Net | ||||||||||
Managers AMG Essex Large Cap Growth | $ | 12,332,674 | $ | 677,564 | ($ | 889,070 | ) | ($ | 211,506 | ) | ||||
International Equity | 114,178,040 | 7,853,260 | (19,595,778 | ) | (11,742,518 | ) | ||||||||
Emerging Markets Equity | 81,695,960 | 9,878,452 | (9,494,345 | ) | 384,107 | |||||||||
Global Bond | 23,598,601 | 711,662 | (1,094,686 | ) | (383,024 | ) | ||||||||
| * | Non-income-producing security. |
| (a) | Security exempt from registration under Rule 144A of the Securities Act of 1933. This security may be resold in transactions exempt from registration, normally to qualified buyers. At June 30, 2010, the value of these securities amounted to the following: |
Fund | Market Value | % of Net Assets | ||||
Emerging Markets Equity | $ | 664,430 | 0.8 | % | ||
Global Bond | 3,872,016 | 16.3 | % | |||
| (b) | Step Bond. A debt instrument with either deferred interest payments or an interest rate that resets at specific times during its term. |
| # | Rounds to less than 0.1%. |
| 1 | Yield shown for each short term investment represents the June 30, 2010, seven-day average yield, which refers to the sum of the previous seven days’ dividends paid, expressed as an annual percentage. |
| 2 | Some or all of these shares were out on loan to various brokers as of June 30, 2010, amounting to: |
Fund | Market Value | % of Net Assets | ||||
Managers AMG Essex Large Cap Growth | $ | 202,850 | 1.7 | % | ||
International Equity | 2,989,315 | 3.0 | % | |||
Emerging Markets Equity | 1,055,012 | 1.3 | % | |||
Global Bond | 352,185 | 1.5 | % | |||
| 3 | Collateral received from brokers for securities lending was invested in these short-term investments. |
| 4 | Represents yield to maturity at June 30, 2010. |
| 5 | Floating Rate Security. The rate listed is as of June 30, 2010. Date in parentheses represents the security’s next coupon rate reset. |
| 6 | Variable Rate Security. The rate listed is as of June 30, 2010, and is periodically reset subject to terms and conditions set forth in the debenture. |
| 7 | Security is illiquid: A security not readily convertible into cash such as a stock, bond or commodity that is not actively traded, and would be difficult to sell in a current sale. The Fund may not invest more than 15% of its net assets in illiquid securities. All securities are valued on the basis of valuations provided by dealers or independent pricing services. Illiquid securities at June 30, 2010, for Global Bond Fund amounted to $105,744, or 0.4% of net assets. |
| 8 | On September 12, 2008, The Bank of New York Mellon established a separate sleeve of the BNY Institutional Cash Reserves Fund (Series B) to hold certain Lehman Brothers floating rate notes. The Fund’s position in Series B is being marked to market daily. (See Note 8 in the Notes to the Financial Statements.) |
| 9 | Convertible Bond: A corporate bond, usually a junior debenture, that can be converted, at the option of the holder, for a specific number of shares of the company’s preferred stock or common stock. Convertible bonds at June 30, 2010 amounted to $59,588, or 0.3% of net assets. |
Investments Definitions and Abbreviations:
ADR/GDR: ADR after the name of a holding stands for American Depositary Receipt, representing ownership of foreign securities on deposit with a domestic custodian bank; a GDR (Global Depositary Receipt) is comparable, but foreign securities are held on deposit in a non-U.S. bank. The value of the ADR/GDR securities is determined or significantly influenced by trading on exchanges not located in the United States or Canada. Sponsored ADR/GDRs are initiated by the underlying foreign company.
| EMTN: | European Medium Term Note | |
| FNMA: | Federal National Mortgage Association | |
| GMTN: | Global Multi-Currency | |
| NVDR: | Non-Voting Depository Receipt | |
| RSP: | Risparmio shares which are saving shares traded on the Italian Stock Exchange | |
| USTN: | United States Treasury Note |
Abbreviations have been used throughout the portfolios to indicate amounts shown in currencies other than the U.S. dollar (USD):
| AUD: | Australian Dollar | |
| BRL: | Brazilian Real | |
| CAD: | Canadian Dollar | |
| CHF: | Swiss Franc | |
| DKK: | Danish Krone | |
| EUR: | euro | |
| GBP: | British Pound | |
| IDR: | Indonesian Rupiah | |
| JPY: | Japanese Yen | |
| NOK: | Norwegian Krone | |
| MXN: | Mexican Peso | |
| SEK: | Swedish Krona | |
| SGD: | Singapore Dollar |
The accompanying notes are an integral part of these financial statements.
20
Table of Contents
Statements of Assets and Liabilities
June 30, 2010 (unaudited)
| Managers AMG Essex Large Cap Growth Fund | Managers International Equity Fund | Managers Emerging Markets Equity Fund | Managers Global Bond Fund | |||||||||||||
Assets: | ||||||||||||||||
Investments at value (including securities on loan valued at $202,850, $2,989,315, $1,055,012 and $352,185, respectively)* | $ | 12,121,168 | $ | 102,435,522 | $ | 82,080,067 | $ | 23,215,577 | ||||||||
Cash | 24 | 11,965 | — | — | ||||||||||||
Cash collateral for futures | — | 23,683 | — | — | ||||||||||||
Foreign currency** | — | 630,165 | 788,896 | 560,315 | ||||||||||||
Receivable for investments sold | — | 1,648,646 | 427,820 | 33,762 | ||||||||||||
Receivable for Fund shares sold | 1,323 | 61,708 | 43,894 | 65,744 | ||||||||||||
Receivable from affiliate | 2,669 | 23,099 | 18,925 | 7,277 | ||||||||||||
Unrealized appreciation of foreign currency contracts | — | 260,301 | — | 32,609 | ||||||||||||
Receivable for variation margin on futures | — | 1,101 | — | — | ||||||||||||
Dividends, interest and other receivables | 2,964 | 391,495 | 258,686 | 301,354 | ||||||||||||
Prepaid expenses | 8,043 | 10,940 | 15,751 | 11,755 | ||||||||||||
Total assets | 12,136,191 | 105,498,625 | 83,634,039 | 24,228,393 | ||||||||||||
Liabilities: | ||||||||||||||||
Payable for Fund shares repurchased | 1,655 | 148,436 | 148,363 | 44,240 | ||||||||||||
Payable upon return of securities loaned | 210,397 | 3,133,356 | 1,132,742 | 366,044 | ||||||||||||
Payable for investments purchased | — | 1,569,902 | 429,848 | 60,797 | ||||||||||||
Unrealized depreciation of foreign currency contracts | — | 24,561 | — | 12,905 | ||||||||||||
Accrued expenses: | ||||||||||||||||
Investment management and advisory fees | 8,540 | 77,372 | 79,516 | 13,547 | ||||||||||||
Administrative fees | 2,669 | 21,492 | 17,286 | 3,871 | ||||||||||||
Other | 34,196 | 150,650 | 160,953 | 40,171 | ||||||||||||
Total liabilities | 257,457 | 5,125,769 | 1,968,708 | 541,575 | ||||||||||||
Net Assets | $ | 11,878,734 | $ | 100,372,856 | $ | 81,665,331 | $ | 23,686,818 | ||||||||
Shares outstanding | 523,320 | 2,299,704 | 6,581,230 | 1,266,172 | ||||||||||||
Net asset value, offering and redemption price per share | $ | 22.70 | $ | 43.65 | $ | 12.41 | $ | 18.71 | ||||||||
Net Assets Represent: | ||||||||||||||||
Paid-in capital | $ | 67,231,926 | $ | 193,415,941 | $ | 102,472,217 | $ | 27,369,351 | ||||||||
Undistributed net investment income (loss) | (59,060 | ) | 1,117,594 | 271,741 | 737,580 | |||||||||||
Accumulated net realized loss from investments, futures and foreign currency transactions | (55,159,329 | ) | (86,165,393 | ) | (23,801,004 | ) | (4,034,447 | ) | ||||||||
Net unrealized appreciation (depreciation) of investments, futures and foreign currency translations | (134,803 | ) | (7,995,286 | ) | 2,722,377 | (385,666 | ) | |||||||||
Net Assets | $ | 11,878,734 | $ | 100,372,856 | $ | 81,665,331 | $ | 23,686,818 | ||||||||
| ||||||||||||||||
* Investments at cost | $ | 12,255,971 | $ | 110,671,931 | $ | 79,355,642 | $ | 23,598,069 | ||||||||
** Foreign currency at cost | — | $ | 655,353 | $ | 791,030 | $ | 570,396 | |||||||||
The accompanying notes are an integral part of these financial statements.
21
Table of Contents
For the six months ended June 30, 2010 (unaudited)
| Managers AMG Essex Large Cap Growth Fund | Managers International Equity Fund | Managers Emerging Markets Equity Fund | Managers Global Bond Fund | |||||||||||||
Investment Income: | ||||||||||||||||
Dividend income | $ | 46,869 | $ | 1,885,294 | $ | 1,207,676 | $ | 200 | ||||||||
Interest income | — | 51 | — | 462,905 | ||||||||||||
Foreign withholding tax | (525 | ) | (175,716 | ) | (115,353 | ) | — | |||||||||
Securities lending fees | 453 | 69,654 | 2,469 | 252 | ||||||||||||
Total investment income | 46,797 | 1,779,283 | 1,094,792 | 463,357 | ||||||||||||
Expenses: | ||||||||||||||||
Investment management and advisory fees | 56,550 | 510,090 | 526,147 | 86,982 | ||||||||||||
Administrative fees | 17,672 | 141,692 | 114,380 | 24,852 | ||||||||||||
Transfer agent | 25,169 | 178,975 | 120,547 | 25,537 | ||||||||||||
Registration fees | 10,899 | 14,400 | 17,670 | 11,705 | ||||||||||||
Professional fees | 10,251 | 37,313 | 41,135 | 19,862 | ||||||||||||
Custodian | 4,765 | 80,503 | 138,459 | 14,095 | ||||||||||||
Reports to shareholders | 2,811 | 5,964 | 16,841 | 2,191 | ||||||||||||
Trustees fees and expenses | 575 | 4,911 | 3,682 | 1,092 | ||||||||||||
Miscellaneous | 592 | 3,652 | 3,320 | 1,167 | ||||||||||||
Total expenses before offsets | 129,284 | 977,500 | 982,181 | 187,483 | ||||||||||||
Expense reimbursements | (17,672 | ) | (138,602 | ) | (171,844 | ) | (50,779 | ) | ||||||||
Expense reductions | (5,755 | ) | (441 | ) | (120 | ) | (18 | ) | ||||||||
Net expenses | 105,857 | 838,457 | 810,217 | 136,686 | ||||||||||||
Net investment income (loss) | (59,060 | ) | 940,826 | 284,575 | 326,671 | |||||||||||
Net Realized and Unrealized Gain (Loss): | ||||||||||||||||
Net realized gain (loss) on investments | 1,049,684 | 4,160,579 | 5,799,003 | (843,183 | ) | |||||||||||
Net realized loss on futures contracts | — | (26,665 | ) | — | — | |||||||||||
Net realized loss on foreign currency transactions | — | (106,737 | ) | (125,712 | ) | (87,879 | ) | |||||||||
Net unrealized appreciation (depreciation) of investments | (2,622,668 | ) | (23,011,136 | ) | (13,467,676 | ) | 469,226 | |||||||||
Net unrealized depreciation of futures contracts | — | (16,237 | ) | — | — | |||||||||||
Net unrealized appreciation (depreciation) of foreign currency translations | — | 224,229 | (8,822 | ) | 16,231 | |||||||||||
Net realized and unrealized loss | (1,572,984 | ) | (18,775,967 | ) | (7,803,207 | ) | (445,605 | ) | ||||||||
Net decrease in net assets resulting from operations | ($ | 1,632,044 | ) | ($ | 17,835,141 | ) | ($ | 7,518,632 | ) | ($ | 118,934 | ) | ||||
The accompanying notes are an integral part of these financial statements.
22
Table of Contents
Statements of Changes in Net Assets
For the six months ended June 30, 2010 (unaudited) and for the year ended December 31, 2009
| Managers AMG Essex Large Cap Growth Fund | Managers International Equity Fund | |||||||||||||||
| 2010 | 2009 | 2010 | 2009 | |||||||||||||
Increase (Decrease) in Net Assets From Operations: | ||||||||||||||||
Net investment income (loss) | ($ | 59,060 | ) | ($ | 132,822 | ) | $ | 940,826 | $ | 1,655,879 | ||||||
Net realized gain (loss) on investments, futures and foreign currency transactions | 1,049,684 | (819,515 | ) | 4,027,177 | (19,530,869 | ) | ||||||||||
Net unrealized appreciation (depreciation) of investments and foreign currency contracts and translations | (2,622,668 | ) | 6,594,887 | (22,803,144 | ) | 51,044,233 | ||||||||||
Net increase (decrease) in net assets resulting from operations | (1,632,044 | ) | 5,642,550 | (17,835,141 | ) | 33,169,243 | ||||||||||
Distributions to Shareholders: | ||||||||||||||||
From net investment income | — | — | — | (850,021 | ) | |||||||||||
From Capital Share Transactions: | ||||||||||||||||
Proceeds from sale of shares1 | 855,853 | 2,304,747 | 8,755,790 | 19,062,082 | ||||||||||||
Reinvestment of dividends and distributions | — | — | — | 770,986 | ||||||||||||
Cost of shares repurchased | (1,957,393 | ) | (22,294,449 | ) | (17,343,102 | ) | (53,341,397 | ) | ||||||||
Net decrease from capital share transactions | (1,101,540 | ) | (19,989,702 | ) | (8,587,312 | ) | (33,508,329 | ) | ||||||||
Total increase (decrease) in net assets | (2,733,584 | ) | (14,347,152 | ) | (26,422,453 | ) | (1,189,107 | ) | ||||||||
Net Assets: | ||||||||||||||||
Beginning of period | 14,612,318 | 28,959,470 | 126,795,309 | 127,984,416 | ||||||||||||
End of period | $ | 11,878,734 | $ | 14,612,318 | $ | 100,372,856 | $ | 126,795,309 | ||||||||
End of period undistributed net investment income (loss) | ($ | 59,060 | ) | — | $ | 1,117,594 | $ | 176,768 | ||||||||
Share Transactions: | ||||||||||||||||
Sale of shares | 33,036 | 112,176 | 174,093 | 478,162 | ||||||||||||
Reinvested shares | — | — | — | 14,997 | ||||||||||||
Shares repurchased | (77,126 | ) | (1,033,907 | ) | (347,898 | ) | (1,285,542 | ) | ||||||||
Net decrease in shares | (44,090 | ) | (921,731 | ) | (173,805 | ) | (792,383 | ) | ||||||||
| 1 | For the six months ended June 30, 2010, and the year ended December 31, 2009, the proceeds from the sale of shares for International Equity includes the receipt of market timing settlements of $106,327 and $94,219, respectively. |
The accompanying notes are an integral part of these financial statements.
23
Table of Contents
| Managers Emerging Markets Equity Fund | Managers Global Bond Fund | ||||||||||||
| 2010 | 2009 | 2010 | 2009 | ||||||||||
| $ | 284,575 | $ | 236,072 | $ | 326,671 | $ | 1,906,014 | ||||||
| 5,673,291 | (16,716,106 | ) | (931,062 | ) | (1,086,939 | ) | |||||||
| (13,476,498) | 58,441,013 | 485,457 | 8,300,016 | ||||||||||
| (7,518,632) | 41,960,979 | (118,934 | ) | 9,119,091 | |||||||||
| — | (209,563 | ) | — | (2,806,638 | ) | ||||||||
| 13,179,993 | 35,544,198 | 5,112,674 | 9,245,127 | ||||||||||
| — | 188,220 | — | 2,757,790 | ||||||||||
| (20,283,874) | (41,551,261 | ) | (7,453,205 | ) | (39,903,634 | ) | |||||||
| (7,103,881) | (5,818,843 | ) | (2,340,531 | ) | (27,900,717 | ) | |||||||
| (14,622,513) | 35,932,573 | (2,459,465 | ) | (21,588,264 | ) | ||||||||
| 96,287,844 | 60,355,271 | 26,146,283 | 47,734,547 | ||||||||||
| $ | 81,665,331 | $ | 96,287,844 | $ | 23,686,818 | $ | 26,146,283 | ||||||
| $ | 271,741 | ($ | 12,834 | ) | $ | 737,580 | $ | 410,909 | |||||
| 994,075 | 3,577,894 | 270,071 | 471,568 | ||||||||||
| — | 13,983 | — | 146,344 | ||||||||||
| (1,524,567) | (3,943,771 | ) | (392,950 | ) | (2,048,613 | ) | |||||||
| (530,492) | (351,894 | ) | (122,879 | ) | (1,430,701 | ) | |||||||
The accompanying notes are an integral part of these financial statements.
24
Table of Contents
For a share outstanding throughout each period
For the six June 30, 2010 | For the year ended December 31, | |||||||||||||||||||||||
Managers AMG Essex Large Cap Growth Fund | (unaudited) | 2009 | 2008 | 2007 | 2006 | 2005 | ||||||||||||||||||
Net Asset Value, Beginning of Period | $ | 25.75 | $ | 19.45 | $ | 33.37 | $ | 29.18 | $ | 27.79 | $ | 26.77 | ||||||||||||
Income from Investment Operations: | ||||||||||||||||||||||||
Net investment loss | (0.11 | ) | (0.13 | )3 | (0.14 | )3 | (0.15 | )3 | (0.09 | )3 | (0.07 | )3 | ||||||||||||
Net realized and unrealized gain (loss) on investments | (2.94 | ) | 6.43 | 3 | (13.78 | )3 | 4.34 | 3 | 1.48 | 3 | 1.09 | 3 | ||||||||||||
Total from investment operations | (3.05 | ) | 6.30 | (13.92 | ) | 4.19 | 1.39 | 1.02 | ||||||||||||||||
Net Asset Value, End of Period | $ | 22.70 | $ | 25.75 | $ | 19.45 | $ | 33.37 | $ | 29.18 | $ | 27.79 | ||||||||||||
Total Return1 | (11.84 | )%6 | 32.39 | % | (41.71 | )% | 14.36 | % | 4.96 | % | 3.85 | % | ||||||||||||
Ratio of net expenses to average net assets | 1.50 | %7 | 1.42 | % | 1.24 | % | 1.24 | % | 1.25 | % | 1.28 | % | ||||||||||||
Ratio of net investment loss to average net assets1 | (0.84 | )%7 | (0.63 | )% | (0.52 | )% | (0.47 | )% | (0.33 | )% | (0.27 | )% | ||||||||||||
Portfolio turnover | 94 | %6 | 108 | % | 119 | % | 116 | % | 200 | % | 97 | % | ||||||||||||
Net assets at end of period (000’s omitted) | $ | 11,879 | $ | 14,612 | $ | 28,959 | $ | 51,876 | $ | 65,999 | $ | 104,878 | ||||||||||||
Ratios absent expense offsets:2 | ||||||||||||||||||||||||
Ratio of total expenses to average net assets | 1.83 | %7 | 1.72 | % | 1.61 | % | 1.29 | % | 1.32 | % | 1.22 | % | ||||||||||||
Ratio of net investment loss to average net assets | (1.17 | )%7 | (0.93 | )% | (0.89 | )% | (0.52 | )% | (0.40 | )% | (0.21 | )% | ||||||||||||
For the six June 30, 2010 | For the year ended December 31, | |||||||||||||||||||||||
Managers International Equity Fund | (unaudited) | 2009 | 2008 | 2007 | 2006 | 2005 | ||||||||||||||||||
Net Asset Value, Beginning of Period | $ | 51.26 | $ | 39.19 | $ | 77.13 | $ | 67.42 | $ | 53.76 | $ | 47.05 | ||||||||||||
Income from Investment Operations: | ||||||||||||||||||||||||
Net investment income | 0.41 | 0.58 | 3 | 0.76 | 3 | 0.47 | 0.69 | 0.37 | ||||||||||||||||
Net realized and unrealized gain (loss) on investments | (8.02 | ) | 11.84 | 3 | (38.52 | )3 | 9.60 | 14.15 | 6.83 | |||||||||||||||
Total from investment operations | (7.61 | ) | 12.42 | (37.76 | ) | 10.07 | 14.84 | 7.20 | ||||||||||||||||
Less Distributions to Shareholders from: | ||||||||||||||||||||||||
Net investment income | — | (0.35 | ) | (0.18 | ) | (0.36 | ) | (1.18 | ) | (0.49 | ) | |||||||||||||
Net Asset Value, End of Period | $ | 43.65 | $ | 51.26 | $ | 39.19 | $ | 77.13 | $ | 67.42 | $ | 53.76 | ||||||||||||
Total Return1 | (14.85 | )%4,6 | 31.68 | % | (48.92 | )% | 14.94 | %4 | 27.63 | % | 15.30 | % | ||||||||||||
Ratio of net expenses to average net assets | 1.48 | %7 | 1.48 | % | 1.48 | % | 1.48 | % | 1.45 | % | 1.45 | % | ||||||||||||
Ratio of net investment income to average net assets1 | 1.66 | %7 | 1.34 | % | 1.24 | % | 0.60 | % | 0.70 | % | 0.75 | % | ||||||||||||
Portfolio turnover | 37 | %6 | 128 | % | 142 | % | 98 | % | 70 | % | 79 | % | ||||||||||||
Net assets at end of period (000’s omitted) | $ | 100,373 | $ | 126,795 | $ | 127,984 | $ | 302,025 | $ | 230,916 | $ | 206,393 | ||||||||||||
Ratios absent expense offsets:2 | ||||||||||||||||||||||||
Ratio of total expenses to average net assets | 1.72 | %7 | 1.73 | % | 1.64 | % | 1.61 | % | 1.47 | % | 1.42 | % | ||||||||||||
Ratio of net investment income to average net assets | 1.42 | %7 | 1.09 | % | 1.08 | % | 0.46 | % | 0.68 | % | 0.79 | % | ||||||||||||
25
Table of Contents
Financial Highlights
For a share outstanding throughout each period
For the six June 30, 2010 | For the year ended December 31, | |||||||||||||||||||||||
Managers Emerging Markets Equity Fund | (unaudited) | 2009 | 2008 | 2007 | 2006 | 2005 | ||||||||||||||||||
Net Asset Value, Beginning of Period | $ | 13.54 | $ | 8.09 | $ | 26.80 | $ | 24.44 | $ | 20.10 | $ | 16.50 | ||||||||||||
Income from Investment Operations: | ||||||||||||||||||||||||
Net investment income | 0.04 | 0.03 | 3 | 0.15 | 3 | 0.04 | 3 | 0.22 | 0.52 | |||||||||||||||
Net realized and unrealized gain (loss) on investments | (1.17 | ) | 5.45 | 3 | (15.02 | )3 | 7.20 | 3 | 6.66 | 4.84 | ||||||||||||||
Total from investment operations | (1.13 | ) | 5.48 | (14.87 | ) | 7.24 | 6.88 | 5.36 | ||||||||||||||||
Less Distributions to Shareholders from: | ||||||||||||||||||||||||
Net investment income | — | (0.03 | ) | (0.19 | ) | — | (0.22 | ) | (0.55 | ) | ||||||||||||||
Net realized gain on investments | — | — | (3.65 | ) | (4.88 | ) | (2.32 | ) | (1.21 | ) | ||||||||||||||
Total distributions to shareholders | — | (0.03 | ) | (3.84 | ) | (4.88 | ) | (2.54 | ) | (1.76 | ) | |||||||||||||
Net Asset Value, End of Period | 12.41 | 13.54 | $ | 8.09 | $ | 26.80 | $ | 24.44 | $ | 20.10 | ||||||||||||||
Total Return1 | (8.35 | )%6 | 67.94 | % | (54.87 | )%4 | 29.50 | %4 | 34.50 | % | 32.53 | % | ||||||||||||
Ratio of net expenses to average net assets | 1.77 | %7 | 1.77 | %5 | 1.77 | %5 | 1.78 | % | 1.76 | % | 1.75 | % | ||||||||||||
Ratio of net investment income to average net assets1 | 0.62 | %7 | 0.32 | %5 | 0.76 | %5 | 0.13 | % | 0.89 | % | 0.59 | % | ||||||||||||
Portfolio turnover | 35 | %6 | 103 | % | 49 | % | 62 | % | 41 | % | 35 | % | ||||||||||||
Net assets at end of period (000’s omitted) | $ | 81,665 | $ | 96,288 | $ | 60,355 | $ | 198,235 | $ | 152,983 | $ | 117,229 | ||||||||||||
Ratios absent expense offsets:2 | ||||||||||||||||||||||||
Ratio of total expenses to average net assets | 2.15 | %7 | 2.13 | % | 2.03 | % | 1.93 | % | 1.76 | % | 1.72 | % | ||||||||||||
Ratio of net investment income (loss) to average net assets | 0.24 | %7 | (0.04 | )% | 0.50 | % | (0.02 | )% | 0.89 | % | 0.62 | % | ||||||||||||
For the six June 30, 2010 | For the year ended December 31, | |||||||||||||||||||||||
Managers Global Bond Fund | (unaudited) | 2009 | 2008 | 2007 | 2006 | 2005 | ||||||||||||||||||
Net Asset Value, Beginning of Period | $ | 18.82 | $ | 16.93 | $ | 21.31 | $ | 21.17 | $ | 20.19 | $ | 22.38 | ||||||||||||
Income from Investment Operations: | ||||||||||||||||||||||||
Net investment income | 0.29 | 0.89 | 3 | 0.76 | 3 | 0.70 | 3 | 0.45 | 0.63 | |||||||||||||||
Net realized and unrealized gain (loss) on investments | (0.40 | ) | 3.22 | 3 | (2.93 | )3 | 0.88 | 3 | 1.05 | (1.75 | ) | |||||||||||||
Total from investment operations | (0.11 | ) | 4.11 | (2.17 | ) | 1.58 | 1.50 | (1.12 | ) | |||||||||||||||
Less Distributions to Shareholders from: | ||||||||||||||||||||||||
Net investment income | — | (2.22 | ) | (2.18 | ) | (1.43 | ) | (0.49 | ) | (0.77 | ) | |||||||||||||
Net realized gain on investments | — | — | (0.03 | ) | (0.01 | ) | (0.03 | ) | (0.30 | ) | ||||||||||||||
Total distributions to shareholders | — | (2.22 | ) | (2.21 | ) | (1.44 | ) | (0.52 | ) | (1.07 | ) | |||||||||||||
Net Asset Value, End of Period | $ | 18.71 | $ | 18.82 | $ | 16.93 | $ | 21.31 | $ | 21.17 | $ | 20.19 | ||||||||||||
Total Return1 | (0.64 | )%6 | 24.27 | %4 | (10.07 | )%4 | 7.52 | %4 | 7.36 | % | (4.94 | )% | ||||||||||||
Ratio of net expenses to average net assets | 1.10 | %7 | 1.10 | % | 1.10 | % | 1.19 | % | 1.19 | % | 1.19 | % | ||||||||||||
Ratio of net investment income to average net assets1 | 2.63 | %7 | 4.82 | % | 3.62 | % | 3.25 | % | 2.86 | % | 2.38 | % | ||||||||||||
Portfolio turnover | 68 | %6 | 102 | % | 56 | % | 152 | % | 56 | % | 64 | % | ||||||||||||
Net assets at end of period (000’s omitted) | $ | 23,687 | $ | 26,146 | $ | 47,735 | $ | 92,124 | $ | 53,670 | $ | 43,131 | ||||||||||||
Ratios absent expense offsets:2 | ||||||||||||||||||||||||
Ratio of total expenses to average net assets | 1.51 | %7 | 1.32 | % | 1.25 | % | 1.25 | % | 1.27 | % | 1.26 | % | ||||||||||||
Ratio of net investment income to average net assets | 2.22 | %7 | 4.60 | % | 3.47 | % | 3.18 | % | 2.78 | % | 2.31 | % | ||||||||||||
The following notes should be read in conjunction with the Financial Highlights of the Funds presented on the preceding pages.
| 1 | Total returns and net investment income would have been lower had certain expenses not been reduced. (See Note 1(c) to the Notes to Financial Statements.) |
| 2 | Excludes the impact of expense (reimbursement)/recoupment and expense reductions such as brokerage credits, but includes non-reimbursable expenses, if any, such as interest and taxes. (See Note 1(c) to the Notes to Financial Statements.) |
| 3 | Per share numbers have been calculated using average shares. |
| 4 | The Total Return is based on the Financial Statement Net Asset Values as shown above. |
| 5 | Excludes interest expense for the years ended December 31, 2009 and 2008, of 0.02% and 0.03%, respectively, for Emerging Markets Equity. (See Note 1(c) of Notes to Financial Statements.) |
| 6 | Not Annualized. |
| 7 | Annualized. |
26
Table of Contents
June 30, 2010 (unaudited)
1. Summary of Significant Accounting Policies
The Managers Funds (the “Trust”) is an open-end management investment company organized as a Massachusetts business trust, and registered under the Investment Company Act of 1940, as amended (the “1940 Act”). Currently, the Trust is comprised of a number of different funds, each having distinct investment management objectives, strategies, risks, and policies. Included in this report are: Managers AMG Essex Large Cap Growth Fund (“Essex Large Cap Growth”), Managers International Equity Fund (“International Equity”), Managers Emerging Markets Equity Fund (“Emerging Markets Equity”), and Managers Global Bond Fund (“Global Bond”), collectively the “Funds.”
The Funds’ financial statements are prepared in accordance with accounting principles generally accepted in the United States of America, which require management to make estimates and assumptions that affect the reported amounts of assets and liabilities and disclosure of contingent assets and liabilities at the date of the financial statements and the reported amounts of income and expenses during the reporting period. Actual results could differ from those estimates and such differences could be material. The following is a summary of significant accounting policies followed by the Funds in the preparation of their financial statements:
a. Valuation of Investments
Equity securities traded on a domestic or international securities exchange are valued at the last quoted sale price, or, lacking any sales, at the last quoted bid price. Over-the-counter securities are valued at the Nasdaq Official Closing Price, if one is available. Lacking any sales, over-the-counter securities are valued at the last quoted bid price. The Funds’ investments are generally valued based on market quotations provided by third-party pricing services approved by the Board of Trustees of the Funds. Under certain circumstances, the value of certain Fund investments may be based on an evaluation of fair value, pursuant to procedures established by and under the general supervision of the Board of Trustees of the Trust. Each Fund may use the fair value of a portfolio security to calculate its NAV when, for example, (1) market quotations are not readily available because a portfolio security is not traded in a public market or the principal market in which the security trades is closed, (2) trading in a portfolio security is suspended and has not resumed before the Fund calculates its NAV, (3) a significant event affecting the value of a portfolio security is determined to have occurred between the time of the market quotation provided for a portfolio security and the time as of which the Fund calculates its NAV, (4) a security’s price has remained unchanged over a period of time (often referred to as a “stale price”), or (5) Managers Investment Group LLC (the “Investment Manager”) determines that a market quotation is inaccurate. Portfolio investments that trade primarily on foreign markets are priced based upon the market quotation of such securities as of the close of their respective principal markets, as adjusted to reflect the Investment Manager’s determination of the impact of events occurring subsequent to the close of such markets but prior to the time as of which the Fund calculates its NAV. In accordance with procedures approved by the Board of Trustees, the Investment Manager relies upon recommendations of a third-party fair valuation service in adjusting the prices of such foreign portfolio investments. The Funds may invest in securities that may be thinly traded. The Board of Trustees has adopted procedures to adjust prices when thinly traded securities are judged to be stale so that they reflect fair value. An investment valued on the basis of its fair value may be valued at a price higher or lower than available market quotations. An investment’s valuation may differ depending on the method used and the factors considered in determining value according to the Fund’s fair value procedures.
Fixed-income securities are valued based on valuations furnished by independent pricing services that utilize matrix systems, which reflect such factors as security prices, yields, maturities, and ratings, and are supplemented by dealer and exchange quotations. Futures contracts for which market quotations are readily available are valued at the settlement price as of the close of the futures exchange. Short-term investments having a remaining maturity of 60 days or less are valued at amortized cost, which approximates market value. Investments in other open-end regulated investment companies are valued at their end of day net asset value per share except ishares or other ETF’s, which are valued the same as equity securities. Investments in certain mortgage-backed and stripped mortgage-backed securities, preferred stocks, convertible securities, derivatives and other debt securities not traded on an organized securities market are valued on the basis of valuations provided by dealers or by a pricing service which uses information with respect to transactions in such securities and various relationships between securities and yield to maturity in determining value. Securities (including derivatives) for which market quotations are not readily available are valued at fair value, as determined in good faith, and pursuant to procedures adopted by the Board of Trustees of the Trust. The values assigned to fair value investments are based on available information and do not necessarily represent amounts that might ultimately be realized, since such amounts depend on future developments inherent in long-term investments. Further, because of the inherent uncertainty of valuation, those estimated values may differ significantly from the values that would have been used had a ready market for the investments existed, and the differences could be material.
Generally Accepted Accounting Principles (GAAP) define fair value as the price that a Fund would receive to sell an asset or pay to transfer a liability in an orderly transaction between market participants at the measurement date. GAAP also establishes a framework for measuring fair value, and a three-level hierarchy for fair value measurements based upon the transparency of inputs to the valuation of an asset or liability. Inputs may be observable or unobservable and refer broadly to the assumptions that market participants would use in pricing the asset or liability. Observable inputs reflect the assumptions market participants would use in pricing the asset or liability based on market data obtained from sources independent of the Funds. Unobservable inputs reflect
27
Table of Contents
Notes to Financial Statements (continued)
the Funds’ own assumptions about the assumptions that market participants would use in pricing the asset or liability developed based on the best information available in the circumstances. Each investment is assigned a level based upon the observability of the inputs which are significant to the overall valuation.
The three-tier hierarchy of inputs is summarized below:
Level 1 – quoted prices in active markets for identical investments
Level 2 – other significant observable inputs (including quoted prices for similar investments, interest rates, prepayment speeds, credit risk)
Level 3 – significant unobservable inputs (including the Funds’ own assumptions in determining the fair value of investments)
The inputs or methodologies used for valuing investments are not necessarily an indication of the risk associated with investing in those investments. As of June 30, 2010, the Funds had no significant transfers between Level 1 and Level 2 from the beginning of the reporting period. The following table summarizes the inputs used to value the Funds’ net assets by the above fair value hierarchy levels as of June 30, 2010:
| Level 1 | Level 2 | Level 3 | Total | ||||||||
Essex Large Cap Growth | |||||||||||
Investments in Securities | |||||||||||
Common Stocks1 | $ | 11,796,821 | — | — | $ | 11,796,821 | |||||
Short-Term Investments | 301,065 | $ | 23,282 | — | 324,347 | ||||||
Total Investments in Securities | $ | 12,097,886 | $ | 23,282 | — | $ | 12,121,168 | ||||
| Level 1 | Level 2 | Level 3 | Total | ||||||||
International Equity | |||||||||||
Investments in Securities | |||||||||||
Common Stocks | |||||||||||
Materials | $ | 4,288,494 | $ | 5,754,735 | — | $ | 10,043,229 | ||||
Energy | 3,876,290 | 4,747,477 | — | 8,623,767 | |||||||
Financials | 2,132,560 | 21,591,506 | — | 23,724,066 | |||||||
Consumer Discretionary | 1,453,888 | 10,000,646 | — | 11,454,534 | |||||||
Health Care | 1,368,512 | 7,279,041 | — | 8,647,553 | |||||||
Information Technology | 1,255,773 | 6,009,750 | — | 7,265,523 | |||||||
Telecommunication Services | 521,425 | 4,655,035 | — | 5,176,460 | |||||||
Consumer Staples | — | 8,210,493 | — | 8,210,493 | |||||||
Industrials | — | 9,724,554 | — | 9,724,554 | |||||||
Utilities | — | 2,831,008 | — | 2,831,008 | |||||||
Other Equities | 951,240 | 432,759 | — | 1,383,999 | |||||||
Short-Term Investments | 5,329,987 | 20,349 | — | 5,350,336 | |||||||
Total Investments in Securities | $ | 21,178,169 | $ | 81,257,353 | — | $ | 102,435,522 | ||||
Derivatives3 | |||||||||||
Equity Contracts | $ | 6,932 | — | — | $ | 6,932 | |||||
Foreign Exchange Contracts | — | $ | 235,740 | — | 235,740 | ||||||
Total Derivatives | $ | 6,932 | $ | 235,740 | — | $ | 242,672 | ||||
28
Table of Contents
Notes to Financial Statements (continued)
| Level 1 | Level 2 | Level 3 | Total | ||||||||
Emerging Markets Equity | |||||||||||
Investments in Securities | |||||||||||
Common Stocks | |||||||||||
Materials | $ | 5,340,152 | $ | 6,242,568 | — | $ | 11,582,720 | ||||
Energy | 4,091,263 | 7,824,916 | — | 11,916,179 | |||||||
Financials | 3,883,498 | 17,138,093 | — | 21,021,591 | |||||||
Telecommunication Services | 2,956,398 | 2,740,316 | — | 5,696,714 | |||||||
Consumer Discretionary | 2,135,452 | 4,593,964 | — | 6,729,416 | |||||||
Information Technology | 1,517,148 | 7,928,437 | — | 9,445,585 | |||||||
Consumer Staples | 1,188,249 | 3,710,275 | — | 4,898,524 | |||||||
Industrials | 723,443 | 3,904,622 | — | 4,628,065 | |||||||
Utilities | 484,829 | 2,600,558 | — | 3,085,387 | |||||||
Short-Term Investments | 3,054,291 | 21,595 | — | 3,075,886 | |||||||
Total Investments in Securities | $ | 25,374,723 | $ | 56,705,344 | — | $ | 82,080,067 | ||||
| Level 1 | Level 2 | Level 3 | Total | ||||||||
Global Bond | |||||||||||
Investments in Securities | |||||||||||
Corporate Bonds2 | — | $ | 8,463,959 | — | $ | 8,463,959 | |||||
Foreign Government Obligations | — | 11,896,456 | — | 11,896,456 | |||||||
U.S. Government Obligations | — | 2,081,779 | — | 2,081,779 | |||||||
Asset-Backed Security | — | 108,602 | — | 108,602 | |||||||
Mortgage-Backed Security | — | 103,473 | — | 103,473 | |||||||
Preferred Stocks | $ | 4,012 | — | — | 4,012 | ||||||
Short-Term Investments | 549,877 | 7,419 | — | 557,296 | |||||||
Total Investments | $ | 553,889 | $ | 22,661,688 | — | $ | 23,215,577 | ||||
Derivatives3 | |||||||||||
Foreign Exchange Contracts | — | $ | 19,704 | — | $ | 19,704 | |||||
| 1 | All common stocks held in the Funds are Level 1 securities. For a detailed break-out of the common stocks by major industry classification, please refer to the Schedule of Portfolio Investments. |
| 2 | All corporate bonds held in the Funds are Level 2 securities. For a detailed break-out of the corporate bonds by major industry classification, please refer to the Schedule of Portfolio Investments. |
| 3 | Derivative instruments, such as futures, forwards and swap contracts, are not reflected in the Schedule of Portfolio Investments, and are valued at the unrealized appreciation/depreciation of the instrument. |
29
Table of Contents
Notes to Financial Statements (continued)
The fair values of derivative instruments at June 30, 2010 for International Equity and Global Bond were as follows:
Asset Derivatives | Liability Derivatives | ||||||||||||
Fund | Derivatives not accounted for as hedging | Statement of Assets and | Fair Value | Statement of Assets and | Fair Value | ||||||||
| International Equity | Equity contracts* | Receivable for variation margin on futures | $ | 1,101 | Payable for variation margin on futures | — | |||||||
| Unrealized appreciation of foreign currency contracts | 260,301 | Unrealized depreciation of foreign currency contracts | ($ | 24,561 | ) | ||||||||
Totals | $ | 261,402 | ($ | 24,561 | ) | ||||||||
| Global Bond | Foreign exchange contracts | Unrealized appreciation of foreign currency contracts | $ | 32,609 | Unrealized depreciation of foreign currency contracts | ($ | 12,905 | ) | |||||
| * | Current day variation margin is zero. Prior variation margin is included in the cash value as reflected in the Statement of Assets and Liabilities. |
As of June 30, 2010, the effect of derivative instruments on the Statement of Operations for International Equity and Global Bond and the amount of realized gain/(loss) on derivatives recognized in income were as follows:
Fund | Derivatives not accounted for as hedging | Futures | Forward Currency Contracts | Total | ||||||||||
| International Equity | Equity contracts | ($ | 26,665 | ) | — | ($ | 26,665 | ) | ||||||
| Global Bond | Foreign exchange contracts | — | ($ | 32,663 | ) | ($ | 32,663 | ) | ||||||
The change in unrealized gain/(loss) on derivatives recognized in income were as follows:
Fund | Derivatives not accounted for as hedging instruments | Futures | Forward Currency Contracts | Total | |||||||||
| International Equity | Equity contracts | ($ | 16,237 | ) | — | ($ | 16,237 | ) | |||||
| Foreign exchange contracts | — | $ | 235,740 | 235,740 | |||||||||
Totals | ($ | 16,237 | ) | $ | 235,740 | $ | 219,503 | ||||||
| Global Bond | Foreign exchange contracts | — | $ | 32,318 | $ | 32,318 | |||||||
b. Security Transactions
Security transactions are accounted for as of trade date. Realized gains and losses on securities sold are determined on the basis of identified cost.
c. Investment Income and Expenses
Dividend income is recorded on the ex-dividend date, except certain dividends from foreign securities where the ex-dividend date may have passed. These dividends are recorded as soon as the Trust is informed of the ex-dividend date. Dividend income on foreign securities is recorded net of any withholding tax. Interest income, which includes amortization of premium and accretion of discount on debt securities, is accrued as earned. Non-cash dividends included in dividend income, if any, are reported at the fair market value of the securities received. Other income and expenses are recorded on an accrual basis. Expenses that cannot be directly attributed to a fund are apportioned among the Funds in the Trust and in some cases other affiliated funds based upon their relative average net assets or number of shareholders.
The following Funds had certain portfolio trades directed to various brokers, under a brokerage recapture program, which paid a portion of the Fund’s expenses. For the six months ended June 30, 2010, under these arrangements the amount by which the Funds’ expenses were reduced and the impact on the expense ratios were as follows: Essex Large Cap Growth - $5,745 or 0.08%, International Equity - $359 or 0.00% and Emerging Markets Equity - $55 or 0.00%.
The Funds have a “balance credit” arrangement with The Bank of New York Mellon (“BNYM”), the Funds’ custodian, whereby each Fund is credited with an interest factor equal to 0.75% below the effective 90-day T-Bill rate for account balances left uninvested overnight. If the T-Bill rate falls below 0.75%, no credits will be earned. These credits serve to reduce custody expenses that would otherwise be charged to each Fund. For the six months ended June 30, 2010, the custodian expense was not reduced.
Overdrafts will cause a reduction of any earnings credits, computed at 2% above the effective Federal funds rate on the day of the overdraft. For the six months ended June 30, 2010, overdraft fees were as follows: Essex Large Cap Growth - $33; International Equity - $0, Emerging Markets Equity - $41 and Global Bond Fund - $0.
30
Table of Contents
Notes to Financial Statements (continued)
The Trust also has a balance credit arrangement with its Transfer Agent, BNY Mellon Investment Servicing (US) Inc.,(formerly PNC Global Investment Servicing (U.S.) Inc.), whereby earnings credits are used to offset banking charges and other out-of-pocket expenses. For the six months ended June 30, 2010, the transfer agent expense was reduced as follows: Essex Large Cap Growth - $10; International Equity - $82; Emerging Markets Equity - $65 and Global Bond - $18.
Total returns and net investment income for the Funds would have been lower had certain expenses not been offset. Total expenses before offsets exclude the impact of expense reimbursements or fee waivers and expense reductions such as brokerage recapture credits but include non-reimbursable expenses, if any, such as interest and taxes.
d. Dividends and Distributions
Dividends resulting from net investment income and distributions of capital gains, if any, will be made annually in December and when required for Federal excise tax purposes. Income and capital gain distributions are determined in accordance with Federal income tax regulations, which may differ from GAAP. These differences are primarily due to differing treatments for losses deferred due to wash sales, REITS, equalization accounting for tax purposes, foreign currency, options, futures and market discount transactions. Permanent book and tax basis differences, if any, relating to shareholder distributions will result in reclassifications to paid-in capital.
e. Federal Taxes
Each Fund intends to comply with the requirements under Subchapter M of the Internal Revenue Code of 1986, as amended, to distribute substantially all of their taxable income and gains to their shareholders and to meet certain diversification and income requirements with respect to investment companies. Therefore, no provision for Federal income or excise tax is included in the accompanying financial statements.
Additionally, based on each Fund’s understanding of the tax rules and rates related to income, gains and transactions for the foreign jurisdictions in which it invests, each Fund will provide for foreign taxes, and where appropriate, deferred foreign taxes.
Management has analyzed the Funds’ tax positions taken on federal income tax returns for all open tax years (tax years ended December 31, 2006-2009), and has concluded that no provision for federal income tax is required in the Funds’ financial statements. Additionally, the Funds are not aware of any tax position for which it is reasonably possible that the total amounts of unrecognized tax benefits will change materially in the next twelve months.
f. Capital Loss Carryovers
As of June 30, 2010 the following Funds had accumulated net realized capital loss carryovers from securities transactions for Federal income tax purposes as shown in the following chart. These amounts may be used to offset realized capital gains, if any, through the expiration dates listed.
Fund | Capital Loss Carryover Amount | Expires December 31, | |||
Essex Large Cap Growth | $ | 30,988,593 | 2010 | ||
| 12,899,489 | 2011 | ||||
| 7,531,988 | 2016 | ||||
| 4,712,240 | 2017 | ||||
Total | $ | 56,132,310 | |||
International Equity | $ | 13,386,880 | 2010 | ||
| 16,170,119 | 2011 | ||||
| 19,998,844 | 2016 | ||||
| 26,006,476 | 2017 | ||||
Total | $ | 75,562,319 | |||
Emerging Markets | $ | 26,786,390 | 2017 | ||
Global Bond* | $ | 906,645 | 2016 | ||
| 2,196,208 | 2017 | ||||
Total | $ | 3,102,853 | |||
| * | The Fund’s ability to utilize capital loss carryforward in the future may be limited under the Internal Revenue Code and related regulations based on results of share ownership activity. |
g. Capital Stock
The Trust’s Declaration of Trust authorizes for each series the issuance of an unlimited number of shares of beneficial interest, without par value. Each Fund records sales and repurchases of its capital stock on the trade date. The cost of securities contributed to the Funds in connection with the issuance of shares is based on the valuation of those securities in accordance with the Funds’ policy on investment valuation. Dividends and distributions to shareholders are recorded on the ex-dividend date.
At June 30, 2010, certain unaffiliated shareholders of record, specifically omnibus accounts, individually or collectively held greater than 10% of the outstanding shares of the following Funds: Essex Large Cap Growth - two collectively own 39%; International Equity - one owns 17 %; Emerging Markets Equity - one owns 36% and Global Bond - two collectively own 24%. Transactions by these shareholders may have a material impact on the Funds.
31
Table of Contents
Notes to Financial Statements (continued)
h. Foreign Currency Translation
The books and records of the Funds are maintained in U.S. dollars. The value of investments, assets and liabilities denominated in currencies other than U.S. dollars are translated into U.S. dollars based upon current foreign exchange rates. Purchases and sales of foreign investments, income and expenses are converted into U.S. dollars based on currency exchange rates prevailing on the respective dates of such transactions. Net realized and unrealized gain (loss) on foreign currency transactions represent: (1) foreign exchange gains and losses from the sale and holdings of foreign currencies; (2) gains and losses between trade date and settlement date on investment securities transactions and forward foreign currency exchange contracts; and (3) gains and losses from the difference between amounts of interest and dividends recorded and the amounts actually received.
The Funds do not isolate the net realized and unrealized gain or loss resulting from changes in exchange rates from the fluctuations in market prices of securities held. Such fluctuations are included with the net realized and unrealized gain or loss on investments.
2. Agreements and Transactions with Affiliates
For each of the Funds, the Trust has entered into an Investment Management Agreement under which the Investment Manager, an independently managed subsidiary of Affiliated Managers Group, Inc. (“AMG”), serves as investment manager to the Funds and is responsible for the Funds’ overall administration. The Investment Manager selects subadvisors for the Funds (subject to Trustee approval) and monitors each subadvisor’s investment programs and results. Each Fund’s investment portfolio is managed by one or more portfolio managers who serve pursuant to a Subadvisory Agreement with the Investment Manager.
Investment management fees are paid directly by the Funds to the Investment Manager based on average daily net assets. For the six months ended June 30, 2010, the annual investment management fee rates, as a percentage of average daily net assets, were as follows:
Fund | Investment Management Fee | ||
Essex Large Cap Growth | 0.80 | % | |
International Equity | 0.90 | % | |
Emerging Markets Equity | 1.15 | % | |
Global Bond | 0.70 | % |
The Trust has entered into an Administration and Shareholder Servicing Agreement under which the Investment Manager serves as each Fund’s administrator (the “Administrator”) and is responsible for all aspects of managing the Funds’ operations, including administration and shareholder services to each Fund, its shareholders, and certain institutions, such as bank trust departments, broker-dealers and registered investment advisers, that advise or act as an intermediary with the Funds’ shareholders. Under the terms of the Administration Agreement, each of the Funds, except Global Bond, pay a fee to the Administrator at the rate of 0.25% per annum of the Funds’ average daily net assets. Global Bond pays a fee to the Administrator at the rate of 0.20% per annum of the Fund’s average daily net assets.
The Investment Manager for the Funds has contractually agreed, through at least May 1, 2011, subject to later reimbursement by the Funds in certain circumstances, that the total annual operating expenses (exclusive of taxes, interest, brokerage costs, acquired fund expenses and extraordinary expenses) will be limited to the following amounts of the following Funds’ average daily net assets: International Equity — 1.48%; Emerging Markets Equity — 1.77%; and Global Bond—1.10%. The Investment Manager has also contractually agreed, subject to later reimbursement by the Funds in certain circumstances, that the total annual operating expenses (exclusive of taxes, interest, brokerage costs, acquired fund expenses and extraordinary expenses) on Essex Large Cap Growth, will be limited to 1.29% of the Fund’s average daily net assets, provided that the amount of fees waived, paid or reimbursed does not exceed 0.25% per annum. For the six months ended June 30, 2010, the total amount that exceeded the 0.25% maximum waiver was $20,383 or 0.29%.
Each Fund is obligated to repay the Investment Manager such amounts waived, paid or reimbursed in future years provided that the repayment occurs within thirty-six (36) months after the waiver or reimbursement occurs and that such repayment would not cause the Funds’ total operating expenses in any such future year to exceed that Funds’ respective expense cap. For the six months ended June 30, 2010, the Funds made no repayments to the Investment Manager. At June 30, 2010, the cumulative amount of reimbursement by the Investment Manager subject to repayment by Essex Large Cap, International Equity, Emerging Markets Equity and Global Bond equaled $174,280, $791,207, $820,898 and $156,119, respectively.
The aggregate annual retainer paid to each Independent Trustee is $65,000, plus $4,000 or $2,500 for each regular or special meeting attended, respectively. The Trustees’ fees and expenses are allocated amongst all of the Funds for which the Investment Manager serves as the advisor (the “Managers Funds”) based on the relative net assets of such Funds. The Independent Chairman of the Trusts receives an additional payment of $15,000 per year. The Chairman of the Audit Committee receives an additional payment of $5,000 per year. The “Trustee fees and expenses” shown in the financial statements represents each Fund’s allocated portion of the total fees and expenses paid by the Managers Funds.
32
Table of Contents
Notes to Financial Statements (continued)
The Funds are distributed by Managers Distributors, Inc. (the “Distributor” or “MDI”), a wholly-owned subsidiary of the Investment Manager. MDI serves as the principal underwriter for each Fund and is a registered broker-dealer and member of the Financial Industry Regulatory Authority, Inc. (“FINRA”). Shares of each Fund will be continuously offered and will be sold by brokers, dealers or other financial intermediaries who have executed selling agreements with the Distributor. MDI bears all the expenses of providing services pursuant to the Underwriting Agreement, including the payment of the expenses relating to the distribution of Prospectuses for sales purposes and any advertising or sales literature. Certain Trustees and Officers of the Funds are Officers and/or Directors of the Investment Manager, AMG and/or the Distributor.
On June 23, 2009, the Securities and Exchange Commission granted an exemptive order that permits the Funds to lend and borrow money for certain temporary purposes directly to and from other eligible Funds in the Managers Family of Funds (the “Fund Family”). Participation in this interfund lending program is voluntary for both borrowing and lending Funds, and an interfund loan is only made if it benefits each participating Fund. The Investment Manager administers the program according to procedures approved by the Funds’ Board of Trustees (the “Board”), and the Board monitors the operation of the program. An interfund loan must comply with certain conditions set out in the exemptive order, which are designed to assure fairness and protect all participating Funds. For the six months ended June 30, 2010, the following Funds lent to other Funds in the Fund Family: International Equity lent $506,575 for 7 days earning interest of $51. For the same period, the Funds did not borrow from other Funds in the Fund Family. The interest amounts are included in the Statement of Operations in interest income.
3. Purchases and Sales of Securities
Purchases and sales of securities (excluding short-term securities and U.S. government obligations) for the six months ended June 30, 2010, were as follows:
| Long-Term Securities | U.S. Government Obligations | |||||||||
Fund | Purchases | Sales | Purchases | Sales | ||||||
Essex Large Cap Growth | $ | 12,956,401 | $ | 14,213,426 | N/A | N/A | ||||
International Equity | 40,562,624 | 46,677,076 | N/A | N/A | ||||||
Emerging Markets Equity | 30,848,865 | 39,990,918 | N/A | N/A | ||||||
Global Bond | 9,702,092 | 10,387,395 | $6,446,904 | $7,696,566 | ||||||
4. Portfolio Securities Loaned
Each of the Funds may participate in a securities lending program offered by BNYM, providing for the lending of securities to qualified brokers. Securities lending fees include earnings of such temporary cash investments, plus or minus any rebate to a borrower. These earnings (after any rebate) are then divided between BNYM, as a fee for its services under the program, and the Fund, according to agreed-upon rates. Collateral on all securities loaned is accepted in cash and/or government securities and is maintained at a minimum level of 102% (105% in the case of certain foreign securities) of the market value, plus interest, if applicable, of investments on loan. It is the Funds’ policy to obtain additional collateral from or return excess collateral to the borrower by the end of the next business day, following the valuation date of the securities loaned. Therefore, the value of the collateral held may be temporarily less than the value of the securities on loan. Lending securities entails a risk of loss to the Funds if and to the extent that the market value of the securities loaned were to increase and the borrower did not increase the collateral accordingly, and the borrower fails to return the securities. The Funds bear the risk of any deficiency in the amount of the collateral available for return to the borrower due to any loss on the collateral invested. Collateral received in the form of cash is invested temporarily in the BNY Mellon Overnight Government Fund, formerly the BNY Institutional Cash Reserves Fund (the “ICRF”), or other short-term investments as defined in the Securities Lending Agreement with BNYM.
In September of 2008, BNYM advised the Investment Manager that the ICRF had exposure to certain defaulted debt obligations, and that BNYM had established a separate sleeve of the ICRF to hold these securities. The net impact of these positions is not material to each Fund. Each Fund’s position in the separate sleeve of the ICRF is included in the Schedule of Portfolio Investments and the unrealized loss on such investment is included in Net Unrealized Depreciation on the Statement of Assets and Liabilities and the Statement of Operations.
33
Table of Contents
Notes to Financial Statements (continued)
5. Commitments and Contingencies
In the normal course of business, the Funds may enter into contracts and agreements that contain a variety of representations and warranties, which provide general indemnifications. The maximum exposure to the Funds under these arrangements is unknown, as this would involve future claims that may be made against a Fund that have not yet occurred. However, based on experience, the Funds expect the risks of loss to be remote.
6. Forward Commitments
Certain transactions, such as futures and forward transactions, dollar roll agreements, or purchases of when-issued or delayed delivery securities may have a similar effect on a Fund’s net asset value as if the Fund had created a degree of leverage in its portfolio. However, if a Fund enters into such a transaction, the Fund will establish a segregated account with its custodian in which it will maintain cash, U.S. government securities or other liquid securities equal in value to its obligations in respect to such transaction. Securities and other assets held in the segregated account may not be sold while the transaction is outstanding, unless other suitable assets are substituted.
7. Derivative Instruments
The following disclosures contain information on how and why the Funds use derivative instruments, the credit-risk and how derivative instruments affect the Funds’ financial position, results of operations and cash flows. The location and fair value amounts of these instruments on the Statement of Assets and Liabilities and the realized and changes in unrealized gains and losses on the Statement of Operations, each categorized by type of derivative contract, are included in a table in the Notes to Financial Statements. The derivative instruments outstanding as of period end as disclosed in the Statement of Assets and Liabilities and the realized and changes in unrealized gains and losses on derivative instruments during the period as disclosed in the Statement of Operations serve as indicators of the volume of derivative activity for the Funds.
a. Forward Foreign Currency Contracts
International Equity, Emerging Markets Equity, and Global Bond may invest in forward foreign currency exchange contracts to manage currency exposure. These investments may involve greater market risk than the amounts disclosed in the Funds’ financial statements.
A forward foreign currency exchange contract is an agreement between a Fund and another party to buy or sell a currency at a set price at a future date. The market value of the contract will fluctuate with changes in currency exchange rates. The contract is marked-to-market daily, and the change in market value is recorded as an unrealized gain or loss. Gain or loss on the purchase or sale of contracts having the same settlement date, amount and counterparty is realized on the date of offset, otherwise gain or loss is realized on the settlement date.
The Funds, except Essex Large Cap Growth, may invest in non-U.S. dollar denominated instruments subject to limitations, and enter into forward foreign currency exchange contracts to facilitate transactions in foreign securities and to hedge against currency exchange rate risk on non-U.S. dollar denominated investment securities. Risks may arise upon entering into these contracts from the potential inability of counterparties to meet the terms of their contracts and from unanticipated movements in the value of a foreign currency relative to the U.S. dollar.
Open forward foreign currency exchange contracts (in U.S. dollars) at June 30, 2010 were as follows:
Foreign Currency | Position | Settlement Date | Counterparty | Current Value (Receivable Amount) | Contract Value (Payable Amount) | Unrealized Gain/(Loss) | ||||||||||
International Equity | ||||||||||||||||
Euro | Short | 8/16/10 | The Bank of New York Mellon | $ | 3,406,245 | $ | 3,145,944 | $ | 260,301 | |||||||
Euro | Long | 8/16/10 | The Bank of New York Mellon | 2,438,963 | 2,463,524 | (24,561 | ) | |||||||||
| $ | 5,845,208 | $ | 5,609,468 | $ | 235,740 | |||||||||||
Global Bond | ||||||||||||||||
Chinese Yuan Remninbi | Short | 11/16/10 | Morgan Stanley & Co., Inc. | $ | 281,837 | $ | 281,165 | $ | 672 | |||||||
Danish Krone | Short | 9/15/10 | Barclays Capital, Inc. | 439,793 | 436,789 | 3,004 | ||||||||||
Indian Rupee | Short | 9/23/10 | Warburg Dillon Read | 252,119 | 250,484 | 1,635 | ||||||||||
Chinese Yuan Remninbi | Long | 11/16/10 | Morgan Stanley & Co., Inc. | 281,164 | 288,228 | (7,064 | ) | |||||||||
Indian Rupee | Long | 9/23/10 | UBS Securities, Inc. | 250,484 | 256,326 | (5,842 | ) | |||||||||
South Korean Won | Long | 9/13/10 | UBS Securities, Inc. | 702,032 | 688,827 | 13,205 | ||||||||||
South Korean Won | Long | 9/13/11 | Credit Suisse First Boston, Inc. | 481,626 | 472,945 | 8,681 | ||||||||||
Malaysian Ringgit | Long | 9/22/10 | Barclays Capital, Inc. | 261,514 | 256,101 | 5,413 | ||||||||||
| $ | 2,950,569 | $ | 2,930,865 | $ | 19,704 | |||||||||||
34
Table of Contents
Notes to Financial Statements (continued)
b. Futures Contracts
International Equity may use futures contracts, including futures contracts on global equity and fixed-income securities, interest rate futures contracts, foreign currency futures contracts and futures contracts on security indices (including broad-based security indices), for any purpose. The Funds may purchase or sell futures contracts to achieve a desired level of investment, whether to accommodate portfolio turnover or cash flows from capital shares transactions. There are certain risks associated with futures contracts. Prices may not move as expected or a Fund may not be able to close out the contract when it desires to do so, resulting in losses.
On entering into a futures contract, either cash or securities in an amount equal to a certain percentage of the contract value (initial margin) must be deposited with the futures broker. Subsequent payments (variation margin) are made or received each day. The variation margin payments equal the daily changes in the contract value and are recorded as unrealized gains or losses. The Funds recognize a realized gain or loss when the contract is closed or expires equal to the difference between the value of the contract at the time it was opened and the value at the time it was closed. Futures are valued at their quoted daily settlement prices. The aggregate principal amounts of the contracts are not recorded in the financial statements. Fluctuations in the value of the contracts are recorded in the Statement of Assets and Liabilities as an asset (liability) and in the Statement of Operations as unrealized appreciation (depreciation) until the contracts are closed, when they are recorded as realized gains (losses) on futures or forward currency contracts.
Cash pledged to cover margin requirements for the open futures positions at June 30, 2010, amounted to $23,683. Open futures contracts (in U.S. dollars) at June 30, 2010, were as follows:
Type | Currency | Number of Contracts | Position | Expiration Date | Unrealized Gain/(Loss) | ||||||
International Equity | |||||||||||
DJ Euro Stoxx 50 | Euro | 10 | Long | 09/17/10 | $ | 6,932 | |||||
8. Subsequent Events
At a meeting held on June 10-11, 2010, the Trust’s Board of Trustees approved a new contractual expense limitation with respect to the International Equity and Emerging Markets Equity. Effective July 1, 2010, Managers has contractually agreed, until at least May 1, 2012, to limit International Equity and Emerging Markets Equity total annual operating expenses (exclusive of taxes, interest, brokerage commissions, acquired fund fees and expenses, and extraordinary items) to 1.39% and 1.74%, respectively, of each Fund’s average daily net assets. Immediately prior to July 1, 2010, the Funds had contractual expense limitations of 1.48% and 1.77%, respectively.
On July 1, 2010, paperwork was filed with the appropriate authorities in order to enact a legal entity name change for PNC Global Investment Servicing (U.S.) Inc. to BNY Mellon Investment Servicing (US) Inc., due to the acquisition of the company by The Bank of New York Mellon.
Effective August 2, 2010, the Trust, on behalf of each applicable Fund, has entered into an agreement with The Bank of New York Mellon and the Bank of New York Mellon Corporation (“BNYMC”) with respect to each Fund’s position in the BNY Institutional Cash Reserves Fund (the “ICRF”), pursuant to which (i) BNYMC will support the value of certain defaulted securities issued by Lehman Brothers Holdings, Inc. and held by ICRF, and (ii) if certain conditions are met, BNYMC will purchase the defaulted securities from each Fund in September 2011. Each applicable Fund is now fair valuing its position in the ICRF daily.
35
Table of Contents
Annual Renewal of Investment Advisory Agreements (unaudited)
On June 10-11, 2010, the Board of Trustees, including a majority of the Trustees who are not “interested persons” of the Trust (the “Independent Trustees”), approved the Investment Management Agreement with the Investment Manager for each of the Funds identified below and the Subadvisory Agreement for each of the Subadvisors. The Independent Trustees were separately represented by independent counsel in connection with their consideration of the approval of these agreements. In considering the Investment Management and Subadvisory Agreements, the Trustees reviewed a variety of materials relating to each Fund, the Investment Manager and each Subadvisor, including comparative performance, fee and expense information for an appropriate peer group of similar mutual funds (each a “Peer Group”), performance information for relevant benchmark indices (each a “Fund Benchmark”) and, with respect to each Subadvisor, comparative performance information for an appropriate peer group of managed accounts, and, as to all other matters, other information provided to them on a periodic basis throughout the year, as well as information provided in connection with the meetings of June 10-11, 2010, regarding the nature, extent and quality of services provided by the Investment Manager and the Subadvisors under their respective agreements. Prior to voting, the Independent Trustees: (a) reviewed the foregoing information with their independent legal counsel and with management; (b) received materials from their independent legal counsel discussing the legal standards applicable to their consideration of the Investment Management Agreement and the Subadvisory Agreements; and (c) met with their independent legal counsel in private sessions at which no representatives of management were present.
Nature, extent and quality of services.
In considering the nature, extent and quality of the services provided by the Investment Manager, the Trustees reviewed information relating to the Investment Manager’s operations and personnel. Among other things, the Investment Manager provided financial information, biographical information on its supervisory and professional staff and descriptions of its organizational and management structure. The Trustees also took into account information provided periodically throughout the previous year by the Investment Manager relating to the performance of its duties with respect to the Funds and the Trustees’ familiarity with the Investment Manager’s management through Board meetings, discussions and reports. In the course of their deliberations regarding the Investment Management Agreement, the Trustees evaluated, among other things: (a) the extent and quality of the Investment Manager’s oversight of the operation and management of the Funds; (b) the quality of the search, selection and monitoring services performed by the Investment Manager in overseeing the portfolio management responsibilities of the Subadvisors; (c) the Investment Manager’s ability to supervise the Funds’ other service providers; and (d) the Investment Manager’s compliance programs. The Trustees also took into account the financial condition of the Investment Manager with respect to its ability to provide the services required under the Investment Management Agreement and to maintain contractual expense limitations for the Funds.
For each Fund, the Trustees also reviewed information relating to each Subadvisor’s operations and personnel and the investment philosophy, strategies and techniques (for each Subadvisor, its “Investment Strategy”) used in managing the Fund or the portion of the Fund for which the Subadvisor has portfolio management responsibility. Among other things, the Trustees reviewed biographical information on portfolio management and other professional staff, information regarding each Subadvisor’s organizational and management structure and each Subadvisor’s brokerage policies and practices. The Trustees considered specific information provided regarding the experience of the individual or individuals at each Subadvisor with portfolio management responsibility for the portion of the Fund managed by the Subadvisor, including the information set forth in the Fund’s prospectus and statement of additional information. With respect to those Funds managed with multiple Subadvisors, the Trustees also noted information provided by the Investment Manager regarding the manner in which each Subadvisor’s Investment Strategy complements those utilized by a Fund’s other Subadvisors. In the course of their deliberations, the Trustees evaluated, among other things: (a) the services rendered by each Subadvisor in the past; (b) the qualifications and experience of the Subadvisor’s personnel; and (c) the Subadvisor’s compliance programs. The Trustees also took into account the financial condition of each Subadvisor with respect to its ability to provide the services required under its Subadvisory Agreement.
Performance.
As noted above, the Board considered each Fund’s performance during relevant time periods as compared to the Fund’s Peer Group and considered each Subadvisor’s performance as compared to an appropriate peer group of managed accounts and also considered the gross performance of the Fund or the portion of the Fund managed by each Subadvisor as compared to the Subadvisor’s relevant performance composite that utilizes the same investment strategy and approach and noted that the Board reviews on a quarterly basis detailed information about the Fund’s performance results, portfolio composition and Investment Strategies, including with respect to the portion of the Fund managed by each Subadvisor. The Board noted the Investment Manager’s expertise and resources in monitoring the performance, investment style and risk-adjusted performance of each Subadvisor. The Board also noted each Subadvisor’s performance record with respect to the Fund. The Board was mindful of the Investment Manager’s attention to monitoring each Subadvisor’s performance with respect to the Funds and its discussions with management regarding the factors that contributed to the performance of the Funds.
Advisory Fees and Profitability.
In considering the reasonableness of the advisory fee charged by the Investment Manager for managing each Fund, the Trustees noted that the Investment Manager, and not the Fund, is responsible for paying the fees charged by the Fund’s Subadvisor(s) and, therefore, that the fees paid to the Investment Manager cover the cost of providing portfolio management services as well as the cost of providing search, selection and monitoring services in operating
36
Table of Contents
Annual Renewal of Investment Advisory Agreements (continued)
a “manager-of-managers” complex of mutual funds. The Trustees concluded that, in light of the additional high quality supervisory services provided by the Investment Manager and the fact that the subadvisory fees are paid out of the advisory fee, the advisory fee payable by each Fund to the Investment Manager can reasonably be expected to exceed the median advisory fee for the Peer Group, which consists of many funds that do not operate with a manager-of-managers structure. In this regard, the Trustees also noted that the Investment Manager has undertaken to maintain expense limitations for the Funds.
In considering the reasonableness of the advisory fee payable to the Investment Manager, the Trustees also reviewed information provided by the Investment Manager setting forth all revenues and other benefits, both direct and indirect, received by the Investment Manager and its affiliates attributable to managing each Fund and all the mutual funds in the Managers Family of Funds, the cost of providing such services and the resulting profitability to the Investment Manager and its affiliates from these relationships. The Trustees also noted the current and potential asset levels of each Fund and the willingness of the Investment Manager to waive fees and pay expenses for certain of the Funds from time to time as a means of limiting total expenses. The Trustees noted that the subadvisory fees are paid by the Investment Manager out of its advisory fee. The Trustees also considered management’s discussion of the current asset levels of the Funds, including the effect on assets attributable to the economic and market conditions over the past eighteen months, and considered the impact on profitability of the current asset levels and any future growth of assets of the Funds. The Board took into account management’s discussion of the current advisory fee structure. In this regard, the Trustees noted that, unlike a mutual fund that is managed by a single investment adviser, the Funds operate in a manager-of-managers structure. Based on the foregoing, the Trustees concluded that the profitability to the Investment Manager is reasonable and that the Investment Manager is not realizing material benefits from economies of scale that would warrant adjustments to the advisory fees for any Fund at this time. With respect to economies of scale, the Trustees also noted that as a Fund’s assets increase over time, the Fund may realize other economies of scale to the extent that the increase in assets is proportionally greater than the increase in certain other expenses.
Subadvisory Fees and Profitability.
In considering the reasonableness of the fee payable by the Investment Manager to each Subadvisor (other than Essex Investment Management Company, LLC (“Essex”), which is an affiliate of the Investment Manager), the Trustees relied on the ability of the Investment Manager to negotiate the terms of the Subadvisory Agreement at arm’s length as part of the manager-of-managers structure, noting that the Subadvisors are not affiliated with the Investment Manager (other than Essex). In addition, the Trustees noted that the subadvisory fees are paid by the Investment Manager out of its advisory fee. Accordingly, the cost of services to be provided by each Subadvisor and the profitability to each Subadvisor of its relationship with a Fund were not material factors in the Trustees’ deliberations. For similar reasons, and based on the current size of the portion of the Fund managed by each Subadvisor, the Trustees concluded that any economies of scale being realized by the Subadvisors was not a material factor in the Trustees’ deliberations at this time.
In considering the reasonableness of the fee payable by the Investment Manager to Essex, a Subadvisor to the Managers AMG Essex Large Cap Growth Fund, the Trustees noted that Essex is an affiliate of the Investment Manager and reviewed information provided by Essex regarding the cost to Essex of providing subadvisory services to the Fund and the resulting profitability from such relationship. The Trustees also noted that the subadvisory fee is paid by the Investment Manager out of the advisory fee. Based on the current size of the portion of the Fund managed by Essex, the Trustees concluded that the effect of any economies of scale being realized by Essex was not a material factor in the Trustees’ deliberations at this time.
In addition to the foregoing, the Trustees considered the specific factors and related conclusions set forth below with respect to each Fund.
MANAGERS EMERGING MARKETS EQUITY FUND
Fund Performance.
Among other information relating to the Fund’s performance, the Trustees noted that the Fund’s performance for the 1-year, 3-year, 5-year and 10-year periods ended March 31, 2010 was below the median performance of the Peer Group and below the performance of the Fund Benchmark, the MSCI Emerging Markets Index, for each period. The Trustees took into account the fact that the addition of a Subadvisor to the Fund in 2009 has not yet had the anticipated positive impact on performance, but that the Manager continued to believe the hire was a positive addition to the Fund’s Subadvisor lineup. The Trustees also took into account management’s discussion of the Fund’s performance, including the impact of the Fund’s current investment strategy on performance relative to the Fund’s Peer Group. The Trustees concluded that management has taken appropriate steps to address the Fund’s performance.
Advisory Fees.
The Trustees noted that the Fund’s advisory fee and total expenses (net of applicable expense waivers/reimbursements) as of March 31, 2010 were both higher than the average for the Peer Group. The Trustees took into account the fact that the Investment Manager has contractually agreed to lower the Fund’s contractual expense limitation from 1.77% to 1.74% of the Fund’s net annual operating expenses effective July 1, 2010 through at least May 1, 2012. The Board also took into account the current size of the Fund. The Trustees concluded that, in light of the nature, extent and quality of the services provided by the Investment Manager and the Subadvisors, the foregoing expense limitation and the considerations noted above with respect to the Subadvisors and the Investment Manager, the Fund’s advisory fees are reasonable.
37
Table of Contents
Annual Renewal of Investment Advisory Agreements (continued)
MANAGERS GLOBAL BOND FUND
Fund Performance.
Among other information relating to the Fund’s performance, the Trustees noted that the Fund’s performance for the 1-year, 3-year, 5-year and 10-year periods ended March 31, 2010 was above the median performance of the Peer Group for each period and above, below, below and above, respectively, the performance of the Fund Benchmark, the Barclays Capital Global Aggregate Index. The Trustees took into account management’s discussion of the Fund’s more recent performance, including the fact that the Fund has outperformed the Fund Benchmark and was in the top quartile relative to the Peer Group over the past year. The Trustees also noted various portfolio allocations and strategies of the Fund that contributed positively to relative performance. The Trustees concluded that the Fund’s performance has been satisfactory.
Advisory Fees.
The Trustees noted that the Fund’s advisory fee and total expenses (net of applicable expense waivers/reimbursements) as of March 31, 2010 were both higher than the average for the Peer Group. The Trustees took into account the fact that the Investment Manager has contractually agreed, through April 1, 2011, to limit the Fund’s net annual operating expenses to 1.10%. The Board also took into account the current size of the Fund. The Trustees concluded that, in light of the nature, extent and quality of the services provided by the Investment Manager and the Subadvisor, the Fund’s performance, the foregoing expense limitation and the considerations noted above with respect to the Subadvisor and the Investment Manager, the Fund’s advisory fees are reasonable.
MANAGERS INTERNATIONAL EQUITY FUND
Fund Performance.
Among other information relating to the Fund’s performance, the Trustees noted that the Fund’s performance for the 1-year, 3-year, 5-year and 10-year periods ended March 31, 2010 was below the median performance of the Peer Group and below the performance of the Fund Benchmark, the MSCI EAFE Index, for each period. The Trustees took into account management’s discussion of the Fund’s performance. The Trustees also took into account the fact that the Investment Manager added a new Subadvisor to the Fund at the end of the first quarter of 2009 to address performance challenges and noted management’s belief that this was a positive addition to the Fund’s Subadvisor lineup. The Trustees concluded that management has taken appropriate steps to address the Fund’s performance.
Advisory Fees.
The Trustees noted that the Fund’s advisory fee and total expenses (net of applicable expense waivers/reimbursements) as of March 31, 2010 were both higher than the average for the Peer Group. The Trustees took into account the fact that the Investment Manager has contractually agreed to lower the Fund’s contractual expense limitation from 1.48% to 1.39% of the Fund’s net annual operating expenses effective July 1, 2010 through at least May 1, 2012. The Trustees concluded that, in light of the nature, extent and quality of the services provided by the Investment Manager and the Subadvisors, the foregoing expense limitation and the considerations noted above with respect to the Subadvisors and the Investment Manager, the Fund’s advisory fees are reasonable.
MANAGERS AMG ESSEX LARGE CAP GROWTH FUND
Fund Performance.
Among other information relating to the Fund’s performance, the Trustees noted that the Fund’s performance for the 1-year, 3-year, 5-year and 10-year periods ended March 31, 2010 was below the median performance of the Peer Group and below the performance of the Fund Benchmark, the Russell 1000 Growth Index, for each period. The Trustees took into account management’s discussion of the reasons for the Fund’s performance, including that the market environment in certain years has been particularly difficult in light of the Fund’s growth style. In addition, the Trustees noted that the Fund has generally performed well during market conditions favorable to growth style funds. The Trustees concluded that the Fund’s performance has been satisfactory in light of all factors considered.
Advisory Fees.
The Trustees noted that the Fund’s advisory fee and total expenses (net of applicable expense waivers/reimbursements) as of March 31, 2010 were both higher than the average for the Peer Group. The Trustees took into account the fact that the Investment Manager has contractually agreed, through April 1, 2011, to limit the Fund’s net annual operating expenses to 1.29%, provided that the amount waived may not exceed 0.25%. The Board also took into account the current size of the Fund. The Trustees concluded that, in light of the nature, extent and quality of the services provided by the Investment Manager and the Subadvisor, the foregoing expense limitation and the considerations noted above with respect to the Subadvisor and the Investment Manager, the Fund’s advisory fees are reasonable.
* * * * *
After consideration of the foregoing, the Trustees also reached the following conclusions regarding the Investment Management Agreement and each Subadvisory Agreement, in addition to those conclusions discussed above: (a) the Investment Manager and each Subadvisor have demonstrated that they possess the capability and resources to perform the duties required of them under the Investment Management Agreement and the applicable Subadvisory Agreements; (b) each Subadvisor’s Investment Strategy is appropriate for pursuing the applicable Fund’s investment objectives; (c) each Subadvisor is reasonably likely to execute its Investment Strategy consistently over time; and (d) the Investment Manager and each Subadvisor maintain appropriate compliance programs.
Based on all of the above-mentioned factors and related conclusions, with no single factor or conclusion being determinative and with each Trustee not necessarily attributing the same weight to each factor, the Trustees concluded that approval of each Investment Management Agreement and each Subadvisory Agreement (as applicable) would be in the best interests of each Fund and its shareholders. Accordingly, on June 10-11, 2010, the Trustees, including a majority of the Independent Trustees, voted to approve the Investment Management Agreement and the Subadvisory Agreements (as applicable) for each Fund.
38
Table of Contents
THIS PAGE INTENTIONALLY LEFT BLANK
Table of Contents
Investment Manager and Administrator
Managers Investment Group LLC
333 W. Wacker Drive
Suite 1200
Chicago, IL 60606
(800) 835-3879
Distributor
Managers Distributors, Inc.
333 W. Wacker Drive
Suite 1200
Chicago, IL 60606
(800) 835-3879
Custodian
The Bank of New York Mellon
2 Hanson Place
Brooklyn, New York 11217
Legal Counsel
Ropes & Gray LLP
One International Place
Boston, Massachusetts 02110-2624
Transfer Agent
BNY Mellon Investment Servicing (US) Inc.*
Attn: Managers
P.O. Box 9769
Providence, Rhode Island 02940
(800) 548-4539
Trustees
Jack W. Aber
William E. Chapman, II
Nathaniel Dalton
Edward J. Kaier
Steven J. Paggioli
Eric Rakowski
Thomas R. Schneeweis
John H. Streur
For Managers Choice Only
Managers
c/o BNY Mellon Investment Servicing (US) Inc.*
P.O. Box 9847
Providence, Rhode Island 02940-8047
(800) 358-7668
| * | Formerly PNC Global Investment Servicing (U.S.) Inc. |

Table of Contents
MANAGERSAND MANAGERS AMG FUNDS
EQUITY FUNDS | BALANCED FUNDS | |||
EMERGING MARKETS EQUITY Rexiter Capital Management Limited Schroder Investment Management North America Inc.
ESSEX GROWTH ESSEX LARGE CAP GROWTH ESSEX SMALL/MICRO CAP GROWTH Essex Investment Management Co., LLC
FQ TAX-MANAGED U.S. EQUITY FQ U.S. EQUITY First Quadrant, L.P.
GW&K SMALL CAP EQUITY Gannett Welsh & Kotler, LLC
INSTITUTIONAL MICRO-CAP MICRO-CAP Lord, Abbett & Co. LLC WEDGE Capital Management L.L.P. Next Century Growth Investors LLC RBC Global Asset Management (U.S.) Inc.
INTERNATIONAL EQUITY AllianceBernstein L.P. Lazard Asset Management, LLC Martin Currie Inc. | CHICAGO EQUITY PARTNERS MID-CAP Chicago Equity Partners, LLC
REAL ESTATE SECURITIES Urdang Securities Management, Inc
RENAISSANCE LARGE CAP GROWTH Renaissance Group LLC
SKYLINE SPECIAL EQUITIES PORTFOLIO Skyline Asset Management, L.P.
FRONTIER SMALL CAP GROWTH Frontier Capital Management Company, LLC
SPECIAL EQUITY Ranger Investment Management, L.P. Lord, Abbett & Co. LLC Smith Asset Management Group, L.P. Federated MDTA LLC
SYSTEMATIC VALUE SYSTEMATIC MID CAP VALUE Systematic Financial Management, L.P.
TIMESSQUARE MID CAP GROWTH TIMESSQUARE SMALL CAP GROWTH TSCM GROWTH EQUITY TimesSquare Capital Management, LLC
| CHICAGO EQUITY PARTNERS BALANCED Chicago Equity Partners, LLC
ALTERNATIVE FUNDS FQ GLOBAL ALTERNATIVES FQ GLOBAL ESSENTIALS First Quadrant, L.P.
INCOME FUNDS BOND (MANAGERS) FIXED INCOME GLOBAL BOND Loomis, Sayles & Co., L.P.
BOND (MANAGERS PIMCO) Pacific Investment Management Co. LLC
CALIFORNIA INTERMEDIATE TAX-FREE Miller Tabak Asset Management LLC
GW&K MUNICIPAL BOND GW&K MUNICIPAL ENHANCED YIELD Gannett Welsh & Kotler, LLC
HIGH YIELD J.P. Morgan Investment Management LLC
INTERMEDIATE DURATION GOVERNMENT SHORT DURATION GOVERNMENT Smith Breeden Associates, Inc.
| ||
This report is prepared for the Funds’ shareholders. It is authorized for distribution to prospective investors only when preceded or accompanied by an effective prospectus. To receive a free copy of the prospectus or Statement of Additional Information, which includes additional information about Fund Trustees, please contact us by calling 800.835.3879. Distributed by Managers Distributors, Inc., member FINRA.
A description of the policies and procedures each Fund uses to vote its proxies is available: (i) without charge, upon request, by calling 800.835.3879, or (ii) on the Securities and Exchange Commission’s (SEC) Web site at www.sec.gov. For information regarding each Fund’s proxy voting record for the 12-month period ended June 30, call 800.835.3879 or visit the SEC Web site at www.sec.gov.
The Funds file their complete schedule of portfolio holdings with the SEC for the first and third quarters of each fiscal year on Form N-Q. The Funds’ Forms N-Q are available on the SEC’s website at http://www.sec.gov. A Fund’s Forms N-Q may be reviewed and copied at the SEC’s Public Reference Room in Washington, DC. Information on the operation of the Public Reference Room may be obtained by calling 800.SEC.0330. To review a complete list of the Funds’ portfolio holdings, or to view the most recent quarterly holdings report, semiannual report, or annual report, please visit www.managersinvest.
|  | |||
| www.managersinvest.com | ||||

Table of Contents
SEMI-ANNUAL REPORT
Managers Funds
June 30, 2010
Managers Special Equity Fund

SAR006-0610
Table of Contents
Table of Contents
Semi-Annual Report — June 30, 2010 (unaudited)
TABLE OF CONTENTS
| Page | ||
| 1 | ||
| 2 | ||
| 3 | ||
FINANCIAL STATEMENTS: | ||
| 9 | ||
Fund’s balance sheet, net asset value (NAV) per share computation and cumulative undistributed amount | ||
| 10 | ||
Detail of sources of income, Fund expenses, and realized and unrealized gains (losses) during the period | ||
| 11 | ||
Detail of changes in Fund assets for the past two periods | ||
| 12 | ||
Historical net asset values per share, distributions, total returns, expense ratios, turnover ratios and net assets | ||
| 13 | ||
Accounting and distribution policies, details of agreements and transactions with Fund management and affiliates, and descriptions of certain investment risks | ||
| 18 | ||
Nothing contained herein is to be considered an offer, sale or solicitation of an offer to buy shares of any series of the Managers Family of Funds. Such offering is made only by Prospectus, which includes details as to offering price and other material information.
Table of Contents
As a shareholder of a Fund, you may incur two types of costs: (1) transaction costs, which may include sales charges (loads) on purchase payments; redemption fees; and exchange fees; and (2) ongoing costs, including management fees; distribution (12b-1) fees; and other Fund expenses. This example is intended to help you understand your ongoing costs (in dollars) of investing in the Fund and to compare these costs with the ongoing costs of investing in other mutual funds. The example is based on $1,000 invested at the beginning of the period and held for the entire period as indicated below.
Actual Expenses
The first line of the following table provides information about the actual account values and actual expenses. You may use the information in this line, together with the amount you invested, to estimate the expenses that you paid over the period. Simply divide your account value by $1,000 (for example, an $8,600 account value divided by $1,000 = 8.6), then multiply the result by the number in the first line under the heading entitled “Expenses Paid During Period” to estimate the expenses you paid on your account during this period.
Hypothetical Example for Comparison Purposes
The second line of the following table provides information about hypothetical account values and hypothetical expenses based on the Fund’s actual expense ratio and an assumed annual rate of return of 5% before expenses, which is not the Fund’s actual return. The hypothetical account values and expenses may not be used to estimate the actual ending account balance or expenses you paid for the period. You may use this information to compare the ongoing costs of investing in the Fund and other funds by comparing this 5% hypothetical example with the 5% hypothetical examples that appear in the shareholder reports of other funds.
Please note that the expenses shown in the table are meant to highlight your ongoing costs only and do not reflect any transactional costs, such as sales charges (loads), redemption fees, or exchange fees. Therefore, the second line of the table is useful in comparing ongoing costs only, and will not help you determine the relative total costs of owning different funds.
Six Months Ended June 30, 2010 | Expense Ratio for the Period | Beginning Account Value 01/01/2010 | Ending Account Value 06/30/2010 | Expenses Paid During the Period* | ||||||||
Managers Special Equity Fund - Managers Class | ||||||||||||
Based on Actual Fund Return | 1.56 | % | $ | 1,000 | $ | 976 | $ | 7.64 | ||||
Based on Hypothetical 5% Annual Return | 1.56 | % | $ | 1,000 | $ | 1,017 | $ | 7.80 | ||||
Managers Special Equity Fund - Institutional Class | ||||||||||||
Based on Actual Fund Return | 1.31 | % | $ | 1,000 | $ | 977 | $ | 6.42 | ||||
Based on Hypothetical 5% Annual Return | 1.31 | % | $ | 1,000 | $ | 1,018 | $ | 6.55 | ||||
| * | Expenses are equal to the Fund’s annualized expense ratio multiplied by the average account value over the period, multiplied by the number of days in the most recent fiscal half-year (181), then divided by 365. |
1
Table of Contents
Managers Special Equity Fund Performance
All periods ended June 30, 2010 (unaudited)
The table below shows the average annual total returns for the periods indicated for the Special Equity Fund and the Russell 2000® Growth Index.
| Average Annual Total Returns1 | ||||||||||||||
Managers Special Equity Fund 2 | Six Months | One Year | Five Years | Ten Years | Inception Date | |||||||||
Managers Class | (2.40 | )% | 19.11 | % | (3.28 | )% | (1.68 | )% | 6/1/1984 | |||||
Institutional Class | (2.30 | )% | 19.34 | % | (3.07 | )% | — | 5/3/2004 | ||||||
Russell 2000® Growth Index | (2.31 | )% | 17.96 | % | 1.14 | % | (1.72 | )% | ||||||
The performance data shown represents past performance. Past performance is not a guarantee of future results. Current performance may be lower or higher than the performance data quoted. The investment return and the principal value of an investment will fluctuate so that an investor’s shares, when redeemed, may be worth more or less than their original cost. For performance information through the most recent month end please call (800) 835-3879 or visit our Web site at www.managersinvest.com.
In choosing a Fund, investors should carefully consider the amount they plan to invest, their investment objectives, the Fund’s investment objectives, risks, charges and expenses before investing. For this and other information, please call (800) 835-3879 or visit www.managersinvest.com for a free prospectus. Read it carefully before investing or sending money. Distributed by Managers Distributors, Inc., member FINRA.
The Fund is subject to risks associated with investments in small capitalization companies, such as erratic earnings patterns, competitive conditions, limited earnings history, and a reliance on one or a limited number of products.
The Russell 2000® Growth Index measures the performance of the Russell 2000® companies with higher price-to-book ratios and higher forecasted growth values. Unlike the Fund, the Indexes are unmanaged, are not available for investment, and reflect no deduction for fees and expenses.
The Russell 2000® Growth Index and the Russell 2000® Index are trademarks of Russell Investments. Russell® is a trademark of Russell Investments.
| 1 | Total return equals income yield plus share price change and assumes reinvestment of all dividends and capital gain distributions. Returns are net of fees and may reflect offsets of Fund expenses as described in the Prospectus. No adjustment has been made for taxes payable by shareholders on their reinvested dividends and capital gain distributions. Returns for periods greater than one year are annualized. The listed returns on the Fund are net of expenses and based on the published NAV as of June 30, 2010. All returns are in U.S. dollars($). |
| 2 | From time to time, the Fund’s advisor has waived its fees and/or absorbed Fund expenses, which has resulted in higher returns. |
Not FDIC insured, nor bank guaranteed. May lose value.
2
Table of Contents
Fund Snapshots
June 30, 2010 (unaudited)
Portfolio Breakdown
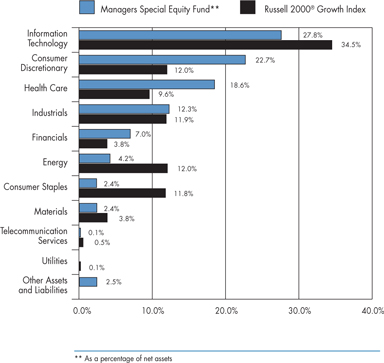
Industry | Managers Special Equity Fund ** | Russell 2000® Growth Index | ||||
Information Technology | 27.8 | % | 34.5 | % | ||
Consumer Discretionary | 22.7 | % | 12.0 | % | ||
Health Care | 18.6 | % | 9.6 | % | ||
Industrials | 12.3 | % | 11.9 | % | ||
Financials | 7.0 | % | 3.8 | % | ||
Energy | 4.2 | % | 12.0 | % | ||
Consumer Staples | 2.4 | % | 11.8 | % | ||
Materials | 2.4 | % | 3.8 | % | ||
Telecommunication Services | 0.1 | % | 0.5 | % | ||
Utilities | 0.0 | % | 0.1 | % | ||
Other Assets and Liabilities | 2.5 | % | 0.0 | % |
Top Ten Holdings
Security Name | Percentage of Net Assets | ||
Rovi Corp. | 1.8 | % | |
SXC Health Solutions Corp.* | 1.8 | ||
Steven Madden, Ltd.* | 1.6 | ||
Aruba Networks | 1.3 | ||
99 Cents Only Stores | 1.3 | ||
HMS Holdings Corp.* | 1.2 | ||
NuVasive, Inc. | 1.2 | ||
Ariba, Inc. | 1.1 | ||
Iberia Bank Corp. | 1.0 | ||
Rosetta Resources, Inc. | 1.0 | ||
Top Ten as a Group | 13.3 | % | |
| * | Top Ten Holding at December 31, 2009 |
Any sectors, industries, or securities discussed should not be perceived as investment recommendations. Mention of a specific security should not be considered a recommendation to buy or solicitation to sell that security. Specific securities mentioned in this report may have been sold from the Fund’s portfolio of investments by the time you receive this report.
3
Table of Contents
Managers Special Equity Fund
Schedule of Portfolio Investments
June 30, 2010 (unaudited)
| Shares | Value | |||||
Common Stocks - 97.5% | ||||||
Consumer Discretionary - 22.7% | ||||||
99 Cents Only Stores* | 163,369 | $ | 2,417,861 | |||
Aeropostale, Inc.* | 8,750 | 250,600 | ||||
American Greetings Corp., Class A | 9,264 | 173,793 | ||||
American Public Education, Inc.* | 10,574 | 462,084 | ||||
America’s Car-Mart, Inc.* | 82,130 | 1,858,602 | ||||
AnnTaylor Stores Corp.* | 14,205 | 231,115 | ||||
ArvinMeritor, Inc.* | 23,100 | 302,610 | ||||
BJ’s Restaurants, Inc.* | 16,663 | 393,247 | ||||
Bridgepoint Education, Inc.* | 19,910 | 2 | 314,777 | |||
Brunswick Corp. | 20,143 | 250,377 | ||||
Capella Education Co.* | 9,665 | 786,248 | ||||
Carter’s, Inc.* | 60,510 | 1,588,388 | ||||
Cheesecake Factory, Inc., The* | 44,200 | 983,892 | ||||
Chico’s FAS, Inc. | 114,164 | 1,127,940 | ||||
Children’s Place Retail Stores, Inc., The* | 30,946 | 1,362,243 | ||||
China Automotive Systems, Inc.* | 14,400 | 2 | 253,440 | |||
Chipotle Mexican Grill, Inc.* | 7,896 | 1,080,252 | ||||
Citi Trends, Inc.* | 11,080 | 2 | 364,975 | |||
Coinstar, Inc.* | 8,028 | 344,963 | ||||
Collective Brands, Inc.* | 7,936 | 125,389 | ||||
Cooper Tire & Rubber Co. | 15,400 | 300,300 | ||||
Cracker Barrel Old Country Store, Inc. | 6,100 | 284,016 | ||||
Deckers Outdoor Corp.* | 9,838 | 1,405,555 | ||||
Dick’s Sporting Goods, Inc.* | 13,776 | 342,885 | ||||
DineEquity, Inc.* | 10,693 | 298,549 | ||||
DSW, Inc.* | 2,546 | 57,183 | ||||
Fossil, Inc.* | 34,935 | 1,212,244 | ||||
Group 1 Automotive, Inc.* | 27,520 | 647,546 | ||||
Gymboree Corp.* | 19,052 | 813,711 | ||||
Hibbett Sports, Inc.* | 13,599 | 325,832 | ||||
Home Inns & Hotels Management Inc., ADR* | 9,934 | 387,823 | ||||
HSN, Inc.* | 13,141 | 315,384 | ||||
IMAX Corp.* | 31,425 | 2 | 458,805 | |||
J. Crew Group, Inc.* | 19,103 | 703,181 | ||||
Jo-Ann Stores, Inc.* | 6,500 | 243,815 | ||||
Jos. A. Bank Clothiers, Inc.* | 14,943 | 2 | 806,773 | |||
K12, Inc.* | 16,264 | 360,736 | ||||
Lululemon Athletica, Inc.* | 15,501 | 2 | 576,947 | |||
Lumber Liquidators Holdings, Inc.* | 14,109 | 329,163 | ||||
Maidenform Brands, Inc.* | 11,500 | 234,140 | ||||
Netflix, Inc.* | 6,588 | 715,786 | ||||
Overstock.com, Inc.* | 22,569 | 407,822 | ||||
Oxford Industries, Inc. | 12,200 | 255,346 | ||||
Panera Bread Co., Class A* | 10,550 | 794,310 | ||||
Polaris Industries, Inc. | 16,784 | 916,742 | ||||
Rue21, Inc.* | 13,388 | 406,192 | ||||
Sotheby’s | 28,410 | 649,737 | ||||
Steven Madden, Ltd.* | 97,091 | 3,060,307 | ||||
Strayer Education, Inc. | 1,745 | 2 | 362,768 | |||
Tempur-Pedic International, Inc.* | 48,692 | 2 | 1,497,279 | |||
Texas Roadhouse, Inc., Class A* | 81,820 | 1,032,568 | ||||
Timberland Co.* | 18,379 | 296,821 | ||||
Tractor Supply Co. | 18,197 | 1,109,471 | ||||
Tupperware Brands Corp. | 21,773 | 867,654 | ||||
Ulta Salon, Cosmetics & Fragrance, Inc.* | 42,012 | 994,004 | ||||
Under Armour, Inc., Class A* | 45,519 | 2 | 1,508,044 | |||
Universal Technical Institute, Inc.* | 9,700 | 229,308 | ||||
Vitamin Shoppe, Inc.* | 14,200 | 364,230 | ||||
Warnaco Group, Inc., The* | 9,291 | 335,777 | ||||
Westport Innovations, Inc.* | 32,462 | 509,329 | ||||
WMS Industries, Inc.* | 9,836 | 386,063 | ||||
Wolverine World Wide, Inc. | 41,230 | 1,039,821 | ||||
Zumiez, Inc.* | 12,963 | 2 | 208,834 | |||
Total Consumer Discretionary | 42,725,597 | |||||
Consumer Staples - 2.4% | ||||||
Boston Beer Co., Inc.* | 9,641 | 650,285 | ||||
Cal-Maine Foods, Inc. | 8,185 | 261,347 | ||||
Lancaster Colony Corp. | 14,123 | 753,603 | ||||
Nu Skin Enterprises, Inc., Class A | 38,202 | 952,376 | ||||
Prestige Brands Holdings, Inc.* | 29,300 | 207,444 | ||||
Sanderson Farms, Inc. | 11,450 | 580,973 | ||||
Spectrum Brands Holdings | 16,458 | 64,515 | ||||
TreeHouse Foods, Inc.* | 23,920 | 1,092,188 | ||||
Total Consumer Staples | 4,562,731 | |||||
The accompanying notes are an integral part of these financial statements.
4
Table of Contents
Managers Special Equity Fund
Schedule of Portfolio Investments (continued)
| Shares | Value | |||||
Energy - 4.2% | ||||||
CARBO Ceramics, Inc. | 6,402 | $ | 462,160 | |||
Clean Energy Fuels Corp.* | 25,770 | 2 | 385,004 | |||
Dril-Quip, Inc.* | 25,120 | 1,105,782 | ||||
EXCO Resources, Inc. | 57,261 | 836,583 | ||||
Gulfport Energy Corp.* | 28,400 | 336,824 | ||||
ION Geophysical Corp.* | 44,153 | 153,652 | ||||
Lufkin Industries, Inc. | 34,436 | 1,342,660 | ||||
OYO Geospace Corp.* | 1,547 | 74,999 | ||||
Rosetta Resources, Inc.* | 98,690 | 1,955,049 | ||||
RPC, Inc. | 21,103 | 288,056 | ||||
World Fuel Services Corp. | 37,722 | 978,509 | ||||
Total Energy | 7,919,278 | |||||
Financials - 7.0% | ||||||
Altisource Portfolio Solutions S.A.* | 19,500 | 482,430 | ||||
BOK Financial Corp. | 38,270 | 2 | 1,816,676 | |||
Calamos Asset Management, Inc., Class A | 27,996 | 259,803 | ||||
CNinsure, Inc., ADR | 11,846 | 2 | 307,285 | |||
Financial Engines, Inc.* | 42,700 | 2 | 580,720 | |||
First Cash Financial Services, Inc.* | 3,089 | 67,340 | ||||
Horace Mann Educators Corp. | 20,900 | 319,770 | ||||
Iberia Bank Corp. | 37,470 | 1,928,955 | ||||
MarketAxess Holdings, Inc. | 68,240 | 941,030 | ||||
Park National Corp. | 3,100 | 201,624 | ||||
Portfolio Recovery Associates, Inc.* | 10,302 | 687,968 | ||||
PS Business Parks, Inc. | 5,100 | 284,478 | ||||
Signature Bank* | 45,199 | 1,718,014 | ||||
SVB Financial Group* | 14,316 | 590,249 | ||||
Texas Capital Bancshares, Inc.* | 109,750 | 1,799,900 | ||||
Western Alliance Bancorp* | 56,000 | 401,520 | ||||
World Acceptance Corp.* | 19,760 | 757,006 | ||||
Total Financials | 13,144,768 | |||||
Health Care - 18.6% | ||||||
Accretive Health, Inc.* | 22,500 | 297,675 | ||||
Acorda Therapeutics, Inc.* | 20,662 | 642,795 | ||||
Align Technology, Inc.* | 31,739 | 471,959 | ||||
Allos Therapeutics, Inc.* | 16,929 | 103,775 | ||||
Almost Family, Inc.* | 6,900 | 241,017 | ||||
Amedisys, Inc.* | 33,430 | 2 | 1,469,917 | |||
American Medical Systems Holdings, Inc.* | 18,300 | 404,796 | ||||
AMERIGROUP Corp.* | 24,223 | 786,763 | ||||
AMN Healthcare Services, Inc.* | 48,700 | 364,276 | ||||
Analogic Corp. | 3,000 | 136,530 | ||||
Ariad Pharmaceuticals, Inc.* | 44,874 | 126,545 | ||||
Arqule, Inc.* | 34,900 | 150,070 | ||||
Array BioPharma, Inc.* | 38,600 | 117,730 | ||||
Auxilium Pharmaceuticals, Inc.* | 5,167 | 2 | 121,424 | |||
BioMarin Pharmaceutical, Inc.* | 8,200 | 155,472 | ||||
Bio-Reference Laboratories, Inc.* | 6,100 | 135,237 | ||||
BioScrip, Inc.* | 231,116 | 1,211,048 | ||||
Cantel Medical Corp. | 11,900 | 198,730 | ||||
Catalyst Health Solutions, Inc.* | 50,340 | 1,736,730 | ||||
Cepheid* | 28,000 | 448,560 | ||||
Chemed Corp. | 5,045 | 275,659 | ||||
DexCom, Inc.* | 61,891 | 2 | 715,460 | |||
DynaVox, Inc., Class A* | 13,300 | 2 | 212,933 | |||
Emergency Medical Services Corp., Class A* | 9,300 | 455,979 | ||||
Endologix, Inc.* | 66,792 | 302,568 | ||||
Exelixis, Inc.* | 30,600 | 106,182 | ||||
Gentiva Health Services, Inc.* | 16,684 | 450,635 | ||||
HMS Holdings Corp.* | 43,100 | 2,336,883 | ||||
Human Genome Sciences, Inc.* | 15,166 | 343,662 | ||||
ICON PLC, Sponsored ADR* | 40,190 | 1,161,089 | ||||
Impax Laboratories, Inc.* | 22,814 | 434,835 | ||||
Incyte Genomics, Inc.* | 41,381 | 2 | 458,088 | |||
Infinity Pharmaceuticals | 2,111 | 12,476 | ||||
Insulet Corp.* | 32,108 | 483,225 | ||||
Integra LifeSciences Holdings Corp.* | 9,212 | 340,844 | ||||
Invacare Corp. | 2,034 | 42,185 | ||||
IPC The Hospitalist Co., Inc.* | 36,690 | 920,919 | ||||
Kensey Nash Corp.* | 11,520 | 273,139 | ||||
Lexicon Genetics, Inc.* | 43,822 | 56,092 | ||||
LHC Group, Inc.* | 33,150 | 919,912 | ||||
MedAssets, Inc.* | 68,500 | 2 | 1,580,980 | |||
Medicis Pharmaceutical Corp., Class A | 15,800 | 345,704 | ||||
Micromet* | 18,800 | 117,312 | ||||
Nabi Biopharmaceuticals* | 25,500 | 138,720 | ||||
NuVasive, Inc.* | 62,162 | 2 | 2,204,265 | |||
NxStage Medical, Inc.* | 38,342 | 568,995 | ||||
Orexigen Therapeutics, Inc.* | 21,700 | 91,140 | ||||
The accompanying notes are an integral part of these financial statements.
5
Table of Contents
Managers Special Equity Fund
Schedule of Portfolio Investments (continued)
| Shares | Value | |||||
Health Care - 18.6% (continued) | ||||||
PAREXEL International Corp.* | 35,105 | 2 | $ | 761,076 | ||
PDL BioPharma, Inc. | 27,491 | 154,499 | ||||
Providence Service Corp.* | 15,600 | 218,400 | ||||
Regeneron Pharmaceuticals, Inc.* | 14,391 | 321,207 | ||||
RehabCare Group, Inc.* | 61,472 | 1,338,860 | ||||
Salix Pharmaceuticals, Ltd.* | 17,472 | 681,932 | ||||
Sirona Dental Systems, Inc.* | 23,107 | 805,048 | ||||
Steris Corp. | 16,656 | 517,668 | ||||
SXC Health Solutions Corp.* | 46,172 | 3,382,100 | ||||
Thoratec Corp.* | 33,077 | 1,413,380 | ||||
TomoTherapy, Inc.* | 11,230 | 35,711 | ||||
Valeant Pharmaceuticals International* | 2,792 | 2 | 145,994 | |||
Vanda Pharmaceuticals, Inc.* | 14,100 | 93,201 | ||||
Volcano Corp.* | 19,837 | 432,843 | ||||
Total Health Care | 34,972,849 | |||||
Industrials - 12.3% | ||||||
A.O. Smith Corp. | 6,602 | 318,150 | ||||
Acuity Brands, Inc. | 14,197 | 516,487 | ||||
Alaska Airgroup, Inc.* | 16,212 | 728,729 | ||||
Allegiant Travel Co.* | 6,800 | 290,292 | ||||
American Superconductor Corp.* | 17,511 | 2 | 467,369 | |||
Avis Budget Group, Inc.* | 14,152 | 2 | 138,973 | |||
Baldor Electric Co. | 14,319 | 516,630 | ||||
BE Aerospace, Inc.* | 48,530 | 1,234,118 | ||||
Beacon Roofing Supply, Inc.* | 19,204 | 346,056 | ||||
Builders FirstSource, Inc.* | 77,200 | 185,280 | ||||
Chart Industries, Inc.* | 17,914 | 279,100 | ||||
China Valves Technology, Inc.* | 43,877 | 409,372 | ||||
Clean Harbors, Inc.* | 10,202 | 677,515 | ||||
Copa Holdings, S.A., Class A* | 8,654 | 382,680 | ||||
Corporate Executive Board Co. | 21,907 | 575,497 | ||||
Cubic Corp. | 7,400 | 269,212 | ||||
Deluxe Corp. | 40,950 | 767,812 | ||||
DigitalGlobe, Inc.* | 17,110 | 449,993 | ||||
EMCOR Group, Inc.* | 9,800 | 227,066 | ||||
EnerNOC, Inc.* | 14,317 | 450,126 | ||||
EnerSys* | 51,240 | 1,094,999 | ||||
Graham Corp. | 14,000 | 209,860 | ||||
Harbin Electric, Inc.* | 34,557 | 575,374 | ||||
HEICO Corp. | 8,865 | 2 | 318,431 | |||
Hexcel Corp.* | 26,416 | 2 | 409,712 | |||
HNI Corp. | 19,695 | 543,385 | ||||
Hub Group, Inc.* | 54,460 | 2 | 1,634,345 | |||
Kforce, Inc.* | 24,962 | 318,266 | ||||
Middleby Corp., The* | 6,900 | 367,011 | ||||
NACCO Industries, Inc., Class A | 1,068 | 94,796 | ||||
Nordson Corp. | 17,805 | 998,504 | ||||
Old Dominion Freight Line, Inc.* | 2,763 | 97,092 | ||||
Orion Marine Group, Inc.* | 3,229 | 45,852 | ||||
Pacer International, Inc.* | 13,913 | 97,252 | ||||
Polypore International, Inc.* | 42,920 | 976,001 | ||||
Powell Industries, Inc.* | 5,585 | 152,694 | ||||
Quanex Building Products Corp. | 7,955 | 137,542 | ||||
RBC Bearings, Inc.* | 12,197 | 2 | 353,591 | |||
Simpson Manufacturing Co., Inc. | 16,990 | 417,104 | ||||
TAL International Group, Inc. | 10,500 | 235,935 | ||||
Tennant Co. | 8,700 | 294,234 | ||||
Textainer Group Holdings, Ltd. | 12,986 | 313,482 | ||||
Towers Watson & Co., Class A | 5,100 | 198,135 | ||||
Triumph Group, Inc. | 22,300 | 1,485,849 | ||||
UTI Worldwide, Inc.* | 102,880 | 1,273,654 | ||||
Wabtec Corp. | 30,760 | 1,227,016 | ||||
Total Industrials | 23,100,573 | |||||
Information Technology - 27.8% | ||||||
Acme Packet, Inc.* | 23,510 | 631,949 | ||||
Amkor Technology, Inc.* | 75,225 | 414,490 | ||||
Ancestry.com, Inc.* | 15,482 | 272,793 | ||||
Anixter International, Inc.* | 16,744 | 713,294 | ||||
Arcsight, Inc.* | 59,450 | 2 | 1,331,086 | |||
Ariba, Inc.* | 130,524 | 2,079,246 | ||||
Aruba Networks, Inc.* | 173,443 | 2 | 2,469,827 | |||
AsiaInfo Holdings, Inc.* | 12,100 | 264,506 | ||||
Atheros Communications, Inc.* | 39,658 | 1,092,181 | ||||
Benchmark Electronics, Inc.* | 15,806 | 250,525 | ||||
Blue Coat Systems, Inc.* | 18,595 | 379,896 | ||||
Brightpoint, Inc.* | 30,400 | 212,800 | ||||
CACI International, Inc., Class A* | 15,804 | 671,354 | ||||
Cavium Networks, Inc.* | 40,208 | 1,053,048 | ||||
Cirrus Logic, Inc.* | 24,735 | 391,060 | ||||
Concur Technologies, Inc.* | 8,780 | 374,730 | ||||
Constant Contact, Inc.* | 29,803 | 635,698 | ||||
The accompanying notes are an integral part of these financial statements.
6
Table of Contents
Managers Special Equity Fund
Schedule of Portfolio Investments (continued)
| Shares | Value | |||||
Information Technology - 27.8% (continued) | ||||||
CSG Systems International, Inc.* | 60,088 | $ | 1,101,413 | |||
CTS Corp. | 30,400 | 280,896 | ||||
DG FastChannel, Inc.* | 19,372 | 631,140 | ||||
Diodes, Inc.* | 11,800 | 187,266 | ||||
Emulex Corp.* | 22,693 | 208,322 | ||||
FARO Technologies, Inc.* | 16,106 | 301,343 | ||||
Fortinet, Inc.* | 15,044 | 2 | 247,323 | |||
Global Cash Access Holdings, Inc.* | 5,321 | 38,364 | ||||
GSI Commerce, Inc.* | 8,034 | 231,379 | ||||
Higher One Holdings, Inc.* | 23,667 | 343,171 | ||||
hiSoft Technology International, ADR* | 29,858 | 310,523 | ||||
Hittite Microwave Corp.* | 11,804 | 528,111 | ||||
Hollysys Automation Technologies, Ltd.* | 17,500 | 2 | 157,675 | |||
Informatica Corp.* | 68,070 | 1,625,512 | ||||
InterDigital, Inc.* | 20,318 | 501,651 | ||||
IPG Photonics Corp.* | 31,682 | 482,517 | ||||
Ixia* | 89,110 | 765,455 | ||||
J2 Global Communications, Inc.* | 7,585 | 165,656 | ||||
Lattice Semiconductor Corp.* | 54,600 | 236,964 | ||||
LogMeIn, Inc.* | 23,424 | 614,412 | ||||
Manhattan Associates, Inc.* | 16,181 | 445,787 | ||||
MAXIMUS, Inc. | 11,895 | 688,364 | ||||
MaxLinear, Inc., Class A* | 8,000 | 111,840 | ||||
Maxwell Technologies, Inc.* | 19,421 | 221,399 | ||||
MercadoLibre, Inc.* | 9,541 | 501,380 | ||||
MicroStrategy, Inc.* | 4,906 | 368,392 | ||||
Net 1 UEPS Technologies, Inc.* | 18,700 | 2 | 250,767 | |||
Netezza Corp.* | 63,632 | 870,486 | ||||
Netgear, Inc.* | 12,100 | 215,864 | ||||
NetLogic Microsystems, Inc.* | 59,535 | 1,619,352 | ||||
OpenTable, Inc.* | 23,200 | 962,104 | ||||
Oplink Communications, Inc.* | 18,000 | 257,940 | ||||
OSI Systems, Inc.* | 11,200 | 311,024 | ||||
Plantronics, Inc. | 37,680 | 1,077,648 | ||||
Plexus Corp.* | 17,235 | 460,864 | ||||
Power Integrations, Inc. | 13,090 | 421,433 | ||||
QLogic Corp.* | 74,862 | 1,244,206 | ||||
QuinStreet, Inc.* | 23,345 | 268,701 | ||||
Renesola, Ltd., ADR* | 63,224 | 377,447 | ||||
RF Micro Devices, Inc.* | 50,000 | 195,500 | ||||
RightNow Technologies, Inc.* | 69,780 | 1,094,848 | ||||
Riverbed Technology, Inc.* | 19,167 | 529,393 | ||||
Rovi Corp.* | 87,830 | 3,329,635 | ||||
Rubicon Technology, Inc.* | 10,626 | 2 | 316,549 | |||
Sanmina-SCI Corp.* | 23,106 | 2 | 314,473 | |||
Silicon Laboratories, Inc.* | 10,850 | 440,076 | ||||
Skyworks Solutions, Inc.* | 49,920 | 838,157 | ||||
SolarWinds, Inc.* | 40,980 | 2 | 657,319 | |||
SS&C Technologies Holdings, Inc.* | 25,500 | 408,765 | ||||
Stratasys, Inc.* | 11,588 | 284,601 | ||||
SuccessFactors, Inc.* | 41,566 | 864,157 | ||||
Synaptics, Inc.* | 4,761 | 130,928 | ||||
Synchronoss Technologies, Inc.* | 91,568 | 1,737,045 | ||||
Syntel, Inc. | 6,217 | 2 | 211,067 | |||
Taleo Corp.* | 59,823 | 1,453,101 | ||||
TIBCO Software, Inc.* | 90,185 | 1,087,631 | ||||
Trident Microsystems, Inc.* | 28,193 | 40,034 | ||||
TriQuint Semiconductor, Inc.* | 34,800 | 212,628 | ||||
VanceInfo Technologies, Inc., ADR* | 24,500 | 570,360 | ||||
Veeco Instruments, Inc.* | 31,039 | 2 | 1,064,017 | |||
VeriFone Holdings, Inc.* | 69,091 | 1,307,893 | ||||
Volterra Semiconductor Corp.* | 58,854 | 1,357,173 | ||||
Wright Express Corp.* | 27,251 | 809,355 | ||||
Zix Corp.* | 9,842 | 22,243 | ||||
Zoran Corp.* | 24,900 | 2 | 237,546 | |||
Zygo Corp.* | 2,443 | 19,813 | ||||
Total Information Technology | 52,406,881 | |||||
Materials - 2.4% | ||||||
Chemspec International, Ltd., ADR* | 20,108 | 2 | 144,979 | |||
Gulf Resources, Inc.* | 19,514 | 2 | 167,625 | |||
Kraton Performance Polymers, Inc.* | 55,550 | 1,043,785 | ||||
NewMarket Corp. | 6,685 | 583,734 | ||||
PolyOne, Corp.* | 30,000 | 252,600 | ||||
Rock-Tenn Co., Class A | 11,751 | 2 | 583,672 | |||
Rockwood Holdings, Inc.* | 28,062 | 636,727 | ||||
Silgan Holdings, Inc. | 4,044 | 114,769 | ||||
STR Holdings, Inc.* | 26,028 | 489,326 | ||||
Worthington Industries, Inc. | 39,272 | 505,038 | ||||
Total Materials | 4,522,255 | |||||
The accompanying notes are an integral part of these financial statements.
7
Table of Contents
Managers Special Equity Fund
Schedule of Portfolio Investments (continued)
| Shares | Value | |||||
Telecommunication Services - 0.1% | ||||||
Consolidated Communications Holdings, Inc. | 15,800 | $ | 268,758 | |||
Total Common Stocks (cost $162,411,897) | 183,740,457 | |||||
Short-Term Investments - 9.7%1 | ||||||
BNY Institutional Cash Reserves Fund, Series B*3,4 | 2,499,559 | 487,414 | ||||
BNY Mellon Overnight Government Fund, 0.03%3 | 9,947,000 | 9,947,000 | ||||
Dreyfus Cash Management Fund, Institutional Class Shares, 0.13% | 7,783,916 | 7,783,916 | ||||
Total Short-Term Investments | ||||||
(cost $20,230,475) | 18,218,330 | |||||
Total Investments - 107.2% | ||||||
(cost $182,642,372) | 201,958,787 | |||||
Other Assets, less Liabilities - (7.2)% | (13,484,809 | ) | ||||
Net Assets - 100.0% | $ | 188,473,978 | ||||
The following footnotes and abbreviations should be read in conjunction with the Schedule of Portfolio Investments.
Based on the cost of investments of $190,859,627 for Federal income tax purposes at June 30, 2010, the aggregate gross unrealized appreciation and depreciation were approximately $22,730,336 and $11,631,176, respectively, resulting in net unrealized appreciation of investments of $11,099,160.
| * | Non-income producing security. |
| 1 | Yield shown for an investment company represents the June 30, 2010, seven-day average yield, which refers to the sum of the previous seven days’ dividends paid, expressed as an annual percentage. |
| 2 | Some or all of these shares were out on loan to various brokers as of June 30, 2010, amounting to a market value of $11,952,699, or approximately 6.3% of net assets. |
| 3 | Collateral received from brokers for securities lending was invested in this short-term investment. |
| 4 | On September 12, 2008, The Bank of New York Mellon established a separate sleeve of the BNY Institutional Cash Reserves Fund (Series B) to hold certain Lehman Brothers floating rate notes. The Fund’s position in Series B is being marked to market daily. (See note 6 in the Notes to the Financial Statements.) |
Investments Definitions and Abbreviations:
ADR: ADR after the name of a holding stands for American Depositary Receipt, representing ownership of foreign securities on deposit with a domestic custodian bank. The value of the ADR security is determined or significantly influenced by trading on exchanges not located in the United States or Canada. Sponsored ADRs are initiated by the underlying foreign company.
The accompanying notes are an integral part of these financial statements.
8
Table of Contents
Statement of Assets and Liabilities
June 30, 2010 (unaudited)
Assets: | ||||
Investments at value (including securities on loan valued at $11,952,699)* | $ | 201,958,787 | ||
Receivable for investments sold | 3,167,484 | |||
Receivable for Fund shares sold | 47,895 | |||
Dividends, interest and other receivables | 56,090 | |||
Prepaid expenses | 22,712 | |||
Total assets | 205,252,968 | |||
Liabilities: | ||||
Payable for Fund shares repurchased | 509,020 | |||
Payable for investments purchased | 3,406,939 | |||
Payable upon return of securities loaned | 12,446,559 | |||
Accrued expenses: | ||||
Investment advisory and management fees | 148,614 | |||
Administrative fees | 41,282 | |||
Other | 226,576 | |||
Total liabilities | 16,778,990 | |||
Net Assets | $ | 188,473,978 | ||
Managers Shares: | ||||
Net Assets | $ | 183,834,314 | ||
Shares outstanding | 4,756,668 | |||
Net asset value, offering and redemption price per share | $ | 38.65 | ||
Institutional Class Shares: | ||||
Net Assets | $ | 4,639,664 | ||
Shares outstanding | 118,586 | |||
Net asset value, offering and redemption price per share | $ | 39.12 | ||
Net Assets Represent: | ||||
Paid-in capital | $ | 476,518,185 | ||
Undistributed net investment loss | (1,063,000 | ) | ||
Accumulated net realized loss from investments | (306,297,622 | ) | ||
Net unrealized appreciation of investments | 19,316,415 | |||
Net Assets | $ | 188,473,978 | ||
| ||||
* Investments at cost | $ | 182,642,372 | ||
The accompanying notes are an integral part of these financial statements.
9
Table of Contents
Statement of Operations
For the six months ended June 30, 2010 (unaudited)
Investment Income: | ||||
Dividend income | $ | 421,015 | ||
Securities lending fees | 171,207 | |||
Interest income | 67 | |||
Foreign withholding tax | (636 | ) | ||
Total investment income | 591,653 | |||
Expenses: | ||||
Investment management and advisory fees | 974,109 | |||
Administrative fees | 270,586 | |||
Transfer agent | 310,720 | |||
Custodian | 54,799 | |||
Reports to shareholders | 27,419 | |||
Registration fees | 23,537 | |||
Trustees fees and expenses | 5,645 | |||
Professional fees | 4,190 | |||
Miscellaneous | 6,991 | |||
Total expenses before offsets | 1,677,996 | |||
Expense reductions | (23,239 | ) | ||
Fee waivers | (104 | ) | ||
Net expenses | 1,654,653 | |||
Net investment loss | (1,063,000 | ) | ||
Net Realized and Unrealized Gain (Loss): | ||||
Net realized gain on investments | 30,562,519 | |||
Net unrealized depreciation of investments | (32,731,717 | ) | ||
Net realized and unrealized loss | (2,169,198 | ) | ||
Net decrease in net assets resulting from operations | ($ | 3,232,198 | ) |
The accompanying notes are an integral part of these financial statements.
10
Table of Contents
Statement of Changes in Net Assets
For the six months ended June 30, 2010 (unaudited) and for the year ended December 31, 2009
| 2010 | 2009 | |||||||
Increase (Decrease) in Net Assets From Operations: | ||||||||
Net investment loss | ($ | 1,063,000 | ) | ($ | 3,341,765 | ) | ||
Net realized gain (loss) on investments | 30,562,519 | (68,748,383 | ) | |||||
Net unrealized appreciation (depreciation) of investments | (32,731,717 | ) | 146,181,404 | |||||
Net increase (decrease) in net assets resulting from operations | (3,232,198 | ) | 74,091,256 | |||||
From Capital Share Transactions: | ||||||||
Managers Class: | ||||||||
Proceeds from sale of shares | 7,578,735 | 31,884,153 | ||||||
Cost of shares repurchased | (41,687,587 | ) | (225,493,111 | ) | ||||
Net decrease from Managers Class share transactions | (34,108,852 | ) | (193,608,958 | ) | ||||
Institutional Class: | ||||||||
Proceeds from sale of shares | 231,249 | 12,754,238 | ||||||
Cost of shares repurchased | (3,603,323 | ) | (108,594,167 | ) | ||||
Net decrease from Institutional Class share transactions | (3,372,074 | ) | (95,839,929 | ) | ||||
Net decrease from capital share transactions | (37,480,926 | ) | (289,448,887 | ) | ||||
Total decrease in net assets | (40,713,124 | ) | (215,357,631 | ) | ||||
Net Assets: | ||||||||
Beginning of period | 229,187,102 | 444,544,733 | ||||||
End of period | $ | 188,473,978 | $ | 229,187,102 | ||||
End of period undistributed net investment loss | ($ | 1,063,000 | ) | — | ||||
Share Transactions: | ||||||||
Managers Class: | ||||||||
Sale of shares | 182,488 | 1,041,783 | ||||||
Shares repurchased | (1,010,871 | ) | (7,084,785 | ) | ||||
Net decrease in shares | (828,383 | ) | (6,043,002 | ) | ||||
Institutional Class: | ||||||||
Sale of shares | 5,821 | 421,778 | ||||||
Shares repurchased | (87,742 | ) | (3,245,866 | ) | ||||
Net decrease in shares | (81,921 | ) | (2,824,088 | ) | ||||
The accompanying notes are an integral part of these financial statements.
11
Table of Contents
Financial Highlights
For a share outstanding throughout each period
Managers Class: | For the six months ended June 30, 2010 (unaudited) |
For the year ended December 31, | ||||||||||||||||||||||
| 2009 | 2008 | 2007 | 2006 | 2005 | ||||||||||||||||||||
Net Asset Value, Beginning of Period | $ | 39.60 | $ | 30.28 | $ | 64.27 | $ | 82.96 | $ | 86.78 | $ | 90.42 | ||||||||||||
Income from Investment Operations: | ||||||||||||||||||||||||
Net investment loss | (0.20 | )5 | (0.34 | )5 | (0.28 | )5 | (0.51 | )5 | (0.14 | )5 | (0.54 | )5 | ||||||||||||
Net realized and unrealized gain (loss) on investments | (0.75 | )5 | 9.66 | 5 | (27.93 | )5 | 0.55 | 5 | 9.88 | 5 | 4.18 | 5 | ||||||||||||
Total from investment operations | (0.95 | ) | 9.32 | (28.21 | ) | 0.04 | 9.74 | 3.64 | ||||||||||||||||
Less Distributions to Shareholders from: | ||||||||||||||||||||||||
Net realized gain on investments | — | — | (5.78 | ) | (18.73 | ) | (13.56 | ) | (7.28 | ) | ||||||||||||||
Net Asset Value, End of Period | $ | 38.65 | $ | 39.60 | $ | 30.28 | $ | 64.27 | $ | 82.96 | $ | 86.78 | ||||||||||||
Total Return1 | (2.40 | )%2 | 30.78 | % | (43.49 | )% | (0.60 | )% | 11.28 | % | 4.00 | % | ||||||||||||
Ratio of net expenses to average net assets | 1.54 | %3 | 1.58 | % | 1.48 | % | 1.43 | % | 1.42 | % | 1.40 | % | ||||||||||||
Ratio of net investment loss to average net assets1 | (0.99 | )%3 | (1.08 | )% | (0.52 | )% | (0.59 | )% | (0.15 | )% | (0.60 | )% | ||||||||||||
Portfolio turnover | 64 | %2 | 186 | % | 138 | % | 67 | % | 76 | % | 80 | % | ||||||||||||
Net assets at end of period (000’s omitted) | $ | 183,834 | $ | 221,159 | $ | 352,106 | $ | 1,668,031 | $ | 2,551,703 | $ | 2,834,314 | ||||||||||||
Ratios absent expense offsets:2 | ||||||||||||||||||||||||
Ratio of total expenses to average net assets | 1.56 | %3 | 1.61 | % | 1.51 | % | 1.46 | % | 1.47 | % | 1.45 | % | ||||||||||||
Ratio of net investment loss to average net assets | (1.01 | )%3 | (1.11 | )% | (0.55 | )% | (0.62 | )% | (0.20 | )% | (0.65 | )% | ||||||||||||
Institutional Class: | For the six months ended June 30, 2010 (unaudited) |
For the year ended December 31, | ||||||||||||||||||||||
| 2009 | 2008 | 2007 | 2006 | 2005 | ||||||||||||||||||||
Net Asset Value, Beginning of Period | $ | 40.04 | $ | 30.56 | $ | 64.71 | $ | 83.56 | $ | 87.09 | $ | 90.56 | ||||||||||||
Income from Investment Operations: | ||||||||||||||||||||||||
Net investment income (loss) | (0.16 | )5 | (0.26 | )5 | (0.15 | )5 | (0.32 | )5 | 0.10 | 5 | (0.33 | )5 | ||||||||||||
Net realized and unrealized gain (loss) on investments | (0.76 | )5 | 9.74 | 5 | (28.16 | )5 | 0.52 | 5 | 9.93 | 5 | 4.14 | 5 | ||||||||||||
Total from investment operations | (0.92 | ) | 9.48 | (28.31 | ) | 0.20 | 10.03 | 3.81 | ||||||||||||||||
Less Distributions to Shareholders from: | ||||||||||||||||||||||||
Net realized gain on investments | — | — | (5.84 | ) | (19.05 | ) | (13.56 | ) | (7.28 | ) | ||||||||||||||
Net Asset Value, End of Period | $ | 39.12 | $ | 40.04 | $ | 30.56 | $ | 64.71 | $ | 83.56 | $ | 87.09 | ||||||||||||
Total Return1 | (2.32 | )%2,6 | 31.02 | %6 | (43.35 | )% | (0.39 | )% | 11.56 | %6 | 4.21 | % | ||||||||||||
Ratio of net expenses to average net assets | 1.29 | %3 | 1.33 | % | 1.23 | % | 1.20 | % | 1.18 | % | 1.20 | % | ||||||||||||
Ratio of net investment income (loss) to average net assets1 | (0.74 | )%3 | (0.83 | )% | (0.29 | )% | (0.36 | )% | 0.09 | % | (0.56 | )% | ||||||||||||
Portfolio turnover | 64 | %2 | 186 | % | 138 | % | 67 | % | 76 | % | 80 | % | ||||||||||||
Net assets at end of period (000’s omitted) | $ | 4,640 | $ | 8,028 | $ | 92,439 | $ | 247,396 | $ | 561,994 | $ | 510,541 | ||||||||||||
Ratios absent expense offsets:2 | ||||||||||||||||||||||||
Ratio of total expenses to average net assets | 1.31 | %3 | 1.36 | % | 1.26 | % | 1.23 | % | 1.23 | % | 1.25 | % | ||||||||||||
Ratio of net investment income (loss) to average net assets | (0.76 | )%3 | (0.86 | )% | (0.32 | )% | (0.39 | )% | 0.04 | % | (0.61 | )% | ||||||||||||
| 1 | Total returns and net investment income would have been lower had certain expenses not been reduced. (See Note 1(c) of Notes to Financial Statements.) |
| 2 | Not Annualized. |
| 3 | Annualized. |
| 4 | Excludes the impact of fee waivers and expense offsets such as brokerage credits, but includes non-reimbursable expenses, if any, such as interest and taxes. (See Note 1(c) to the Notes to Financial Statements.) |
| 5 | Per share numbers have been calculated using average shares. |
| 6 | The Total Return is based on the Financial Statement Net Asset Values as shown above. |
12
Table of Contents
Notes to Financial Statements
June 30, 2010 (unaudited)
1. Summary of Significant Accounting Policies
The Managers Funds (the “Trust”) is an open-end management investment company organized as a Massachusetts business trust and registered under the Investment Company Act of 1940, as amended (the “1940 Act”). Currently, the Trust is comprised of a number of different funds, each having distinct investment management objectives, strategies, risks and policies. Included in this report is the Managers Special Equity Fund (“Special Equity” or the “Fund”).
The Fund offers both Managers Class shares and Institutional Class shares. The Institutional Class shares, which are designed primarily for institutional investors that meet certain administrative and servicing criteria, have a minimum investment of $2,500,000. Managers Class shares are offered to all other investors. Each class represents an interest in the same assets of the Fund and the classes are identical except for class specific expenses related to shareholder activity. Each class has equal voting privileges except that each class has exclusive voting rights with respect to its services and/or distribution plan. Please refer to a current prospectus for additional information on each share class.
The Fund’s financial statements are prepared in accordance with accounting principles generally accepted in the United States of America, which require management to make estimates and assumptions that affect the reported amounts of assets and liabilities and disclosure of contigent assets and liabilities at the date of the financial statements and the reported amounts of income and expenses during the reporting periods. Actual results could differ from those estimates and such differences could be material. The following is a summary of significant accounting policies followed by the Fund in the preparation of its financial statements:
a. Valuation of Investments
Equity securities traded on a domestic or international securities exchange are valued at the last quoted sale price, or, lacking any sales, at the last quoted bid price. Over-the-counter securities are valued at the Nasdaq Official Closing Price, if one is available. Lacking any sales, over-the-counter securities are valued at the last quoted bid price. The Fund’s investments are generally valued based on market quotations provided by third-party pricing services approved by the Board of Trustees of the Fund. Under certain circumstances, the value of certain Fund investments may be based on an evaluation of fair value, pursuant to procedures established by and under the general supervision of the Board of Trustees of the Fund. The Fund may use the fair value of a portfolio security to calculate its NAV when, for example, (1) market quotations are not readily available because a portfolio security is not traded in a public market or the principal market in which the security trades is closed, (2) trading in a portfolio security is suspended and has not resumed before the Fund calculates its NAV, (3) a significant event affecting the value of a portfolio security is determined to have occurred between the time of the market quotation provided for a portfolio security and the time as of which the Fund calculates its NAV, (4) a security’s price has remained unchanged over a period of time (often referred to as a “stale price”), or (5) Managers Investment Group LLC (the “Investment Manager”) determines that a market quotation is inaccurate. Portfolio investments that trade primarily on foreign markets are priced based upon the market quotation of such securities as of the close of their respective principal markets, as adjusted to reflect the Investment Manager’s determination of the impact of events occurring subsequent to the close of such markets but prior to the time as of which the Fund calculates its NAV. In accordance with procedures approved by the Board of Trustees, the Investment Manager relies upon recommendations of a third-party fair valuation service in adjusting the prices of such foreign portfolio investments. The Fund may invest in securities that may be thinly traded. The Board of Trustees has adopted procedures to adjust prices when thinly traded securities are judged to be stale so that they reflect fair value. An investment valued on the basis of its fair value may be valued at a price higher or lower than available market quotations. An investment’s valuation may differ depending on the method used and the factors considered in determining value according to the Fund’s fair value procedures.
Short-term investments having a remaining maturity of 60 days or less are valued at amortized cost, which approximates market value. Investments in other open-end regulated investment companies are valued at their end of day net asset value per share except iShares or other ETF’s, which are valued the same as equity securities. Investments in certain mortgage-backed and stripped mortgage-backed securities, preferred stocks, convertible securities, derivatives and other debt securities not traded on an organized securities market are valued on the basis of valuations provided by dealers or by a pricing service which uses information with respect to transactions in such securities and various relationships between securities and yield to maturity in determining value. Securities (including derivatives) for which market quotations are not readily available are valued at fair value, as determined in good faith, and pursuant to procedures adopted by the Board of Trustees of the Trust. The values assigned to fair value investments are based on available information and do not necessarily represent amounts that might ultimately be realized, since such amounts depend on future developments inherent in long-term investments. Further, because of the inherent uncertainty of valuation, those estimated values may differ significantly from the values that would have been used had a ready market for the investments existed, and the differences could be material.
13
Table of Contents
Managers Special Equity Fund
Notes to Financial Statements (continued)
Generally Accepted Accounting Principles (GAAP) define fair value as the price that a Fund would receive to sell an asset or pay to transfer a liability in an orderly transaction between market participants at the measurement date. GAAP also establishes a framework for measuring fair value, and a three-level hierarchy for fair value measurements based upon the transparency of inputs to the valuation of an asset or liability. Inputs may be observable or unobservable and refer broadly to the assumptions that market participants would use in pricing the asset or liability. Observable inputs reflect the assumptions market participants would use in pricing the asset or liability based on market data obtained from sources independent of the Fund. Unobservable inputs reflect the Fund’s own assumptions about the assumptions that market participants would use in pricing the asset or liability developed based on the best information available in the circumstances. Each investment is assigned a level based upon the observability of the inputs which are significant to the overall valuation.
The three-tier hierarchy of inputs is summarized below:
Level 1 – quoted prices in active markets for identical investments
Level 2 – other significant observable inputs (including quoted prices for similar investments, interest rates, prepayment speeds, credit risk)
Level 3 – significant unobservable inputs (including the Fund’s own assumptions in determining the fair value of investments)
The inputs or methodologies used for valuing investments are not necessarily an indication of the risk associated with investing in those investments. As of June 30, 2010, the Fund had no significant transfers between Level 1 and Level 2 from the beginning of the reporting period. The following table summarizes the inputs used to value the Fund’s net assets by the above fair value hierarchy levels as of June 30, 2010:
| Level 1 | Level 2 | Level 3 | Total | ||||||||
Special Equity | |||||||||||
Investments in Securities | |||||||||||
Common Stocks1 | $ | 183,740,457 | — | — | $ | 183,740,457 | |||||
Short-Term Investments | 17,730,916 | $ | 487,414 | — | 18,218,330 | ||||||
Total Investments in Securities | $ | 201,471,373 | $ | 487,414 | — | $ | 201,958,787 | ||||
| 1 | All common stocks held in the Fund are Level 1 securities. For a detailed break-out of the common stocks by major industry classification, please refer to the Schedule of Portfolio Investments. |
14
Table of Contents
Managers Special Equity Fund
Notes to Financial Statements (continued)
b. Security Transactions
Security transactions are accounted for as of trade date. Realized gains and losses on securities sold are determined on the basis of identified cost.
c. Investment Income and Expenses
Dividend income is recorded on the ex-dividend date except certain dividends from foreign securities where the ex-dividend date may have passed. These dividends are recorded as soon as the Trust is informed of the ex-dividend date. Dividend income on foreign securities is recorded net of any withholding tax. Interest income, which includes amortization of premium and accretion of discount on debt securities, is accrued as earned. Non-cash dividends included in dividend income, if any, are reported at the fair market value of the securities received. Other income and expenses are recorded on an accrual basis. Expenses that cannot be directly attributed to a fund are apportioned among the Funds in the Trust and in some cases other affiliated funds based upon their relative average net assets or number of shareholders. Investment income, realized and unrealized capital gains and losses, the common expenses of the Fund and certain Fund level expense reductions, if any, are allocated on a pro rata basis to each class based on the relative net assets of each class to the total net assets of the Fund.
The Fund had certain portfolio trades directed to various brokers, under a brokerage recapture program, which paid a portion of the Fund’s expenses. For the six months ended June 30, 2010, under these arrangements the amount by which the Fund’s expenses were reduced and the impact on the expense ratio was as follows: $23,083 or 0.02% annualized.
The Fund has a “balance credit” arrangement with The Bank of New York Mellon (“BNYM”), the Fund’s custodian, whereby the Fund is credited with an interest factor equal to 0.75% below the effective 90-day T-Bill rate for account balances left uninvested overnight. If the T-Bill rate falls below 0.75%, no credits will be earned. These credits serve to reduce custody expenses that would otherwise be charged to the Fund. For the six months ended June 30, 2010, the custodian expense was not reduced.
Overdrafts will cause a reduction of any earnings credits, computed at 2% above the effective Federal Funds rate on the day of the overdraft. For the six months ended June 30, 2010, the Fund incurred overdraft fees of $17.
The Trust also has a balance credit arrangement with its Transfer Agent, PNC Global Investment Servicing (U.S.) Inc., whereby earnings credits are used to offset banking charges and other out-of-pocket expenses. For the six months ended June 30, 2010, the transfer agent expense was reduced by $156.
The Investment Manager has agreed to waive a portion of its management fee in consideration of shareholder servicing fees that it has received from JPMorgan Distribution Services, Inc., with respect to short-term cash investments the Fund has made in the JPMorgan Liquid Assets Money Market Fund - Capital Shares. For the six months ended June 30, 2010, the management fee was reduced by $104.
Total returns and net investment income for the Funds would have been lower had certain expenses not been offset. Total expenses before offsets exclude the impact of expense reimbursements or fee waivers and expense offsets such as brokerage recapture credits, but include non-reimburseable expenses, if any, such as interest and taxes.
d. Dividends and Distributions
Dividends resulting from net investment income and distributions of capital gains, if any, normally will be declared and paid annually in December and when required for Federal excise tax purposes. Distributions are recorded on the ex-dividend date and are declared separately for each class. Income and capital gain distributions are determined in accordance with Federal income tax regulations, which may differ from GAAP. These differences are primarily due to differing treatments for losses deferred due to wash sales, REITs, equalization accounting for tax purposes, foreign currency, options, futures and market discount transactions. Permanent book and tax basis differences, if any, relating to shareholder distributions will result in reclassifications to paid-in capital.
e. Federal Taxes
The Fund intends to comply with the requirements under Subchapter M of the Internal Revenue Code of 1986, as amended, to distribute substantially all of its taxable income and gains to its shareholders and to meet certain diversification and income requirements with respect to investment companies. Therefore, no provision for Federal income or excise tax is included in the accompanying financial statements.
Additionally, based on the Fund’s understanding of the tax rules and rates related to income, gains and transactions for the foreign jurisdictions in which it invests, the Fund will provide for foreign taxes, and where appropriate, deferred foreign taxes.
Management has analyzed the Fund’s tax positions taken on federal income tax returns for all open tax years (tax years ended December 31, 2006-2009), and has concluded that no provision for federal income tax is required in the Fund’s financial statements. Additionally, the Fund is not aware of any tax position for which it is reasonably possible that the total amounts of unrecognized tax benefits will change materially in the next twelve months.
15
Table of Contents
Managers Special Equity Fund
Notes to Financial Statements (continued)
f. Capital Loss Carryovers
As of June 30, 2010, the Fund had accumulated net realized capital loss carryover from securities transactions for Federal income tax purposes as shown in the following chart. These amounts may be used to offset realized capital gains, if any, through the expiration dates listed.
Fund | Capital Loss Carryover Amount | Expires December 31, | |||
Special Equity | $ | 145,021,109 | 2016 | ||
| 183,621,777 | 2017 | ||||
Total | $ | 328,642,886 | |||
g. Capital Stock
The Trust’s Declaration of Trust authorizes for each series the issuance of an unlimited number of shares of beneficial interest, without par value. The Fund records sales and repurchases of its capital stock on the trade date. The cost of securities contributed to the Fund in connection with the issuance of shares is based on the valuation of those securities in accordance with the Fund’s policy on investment valuation. Dividends and distributions to shareholders are recorded on the ex-dividend date.
At June 30, 2010, certain unaffiliated shareholders of record, specifically omnibus accounts, individually or collectively held greater than 10% of the outstanding shares of the Fund as follows: two collectively own 54%. Transactions by these shareholders may have a material impact on the Fund.
2. Agreements and Transactions with Affiliates
The Trust has entered into an Investment Management Agreement under which the Investment Manager, an independently managed subsidiary of Affiliated Managers Group, Inc. (“AMG”), serves as investment manager to the Fund and is responsible for the Fund’s overall administration. The Investment Manager selects subadvisors for the Fund (subject to Trustee approval) and monitors each subadvisor’s investment programs and results. The Fund’s investment portfolio is managed by portfolio managers who serve pursuant to a Subadvisory Agreement with the Investment Manager.
Investment management fees are paid directly by the Fund to the Investment Manager based on average daily net assets. The annual investment management fee rate, as a percentage of average daily net assets, is 0.90%.
The Trust has entered into an Administration and Shareholder Servicing Agreement under which the Investment Manager serves as the Fund’s administrator (the “Administrator”) and is responsible for all aspects of managing the Fund’s operations, including administration and shareholder services to the Fund, its shareholders, and certain institutions, such as bank trust departments, broker-dealers and registered investment advisers, that advise or act as an intermediary with the Fund’s shareholders. The Fund pays a fee to the Administrator at the rate of 0.25% per annum of the Fund’s average daily net assets for this service.
The aggregate annual retainer paid to each Independent Trustee is $65,000, plus $4,000 or $2,500 for each regular or special meeting attended, respectively. The Trustees’ fees and expenses are allocated amongst all of the Funds for which the Investment Manager serves as the advisor (the “Managers Funds”) based on the relative net assets of such Funds. The Independent Chairman of the Trusts receives an additional payment of $15,000 per year. The Chairman of the Audit Committee receives an additional payment of $5,000 per year. The “Trustees fees and expenses” shown in the financial statements represents the Fund’s allocated portion of the total fees and expenses paid by the Managers Funds.
The Fund is distributed by Managers Distributors, Inc. (the “Distributor” or “MDI”), a wholly-owned subsidiary of the Investment Manager. MDI serves as the principal underwriter for the Fund and is a registered broker-dealer and member of the Financial Industry Regulatory Authority, Inc. (“FINRA”). Shares of the Fund will be continuously offered and will be sold by brokers, dealers or other financial intermediaries who have executed selling agreements with MDI. MDI bears all the expenses of providing services pursuant to the Underwriting Agreement, including the payment of the expenses relating to the distribution of Prospectuses for sales purposes and any advertising or sales literature. Certain Trustees and Officers of the Fund are Officers and/or Directors of the Investment Manager, AMG and/or the Distributor.
On June 23, 2009, the Securities and Exchange Commission granted an exemptive order that permits the Funds to lend and borrow money for certain temporary purposes directly to and from other eligible Funds in the Managers Family of Funds (the “Fund Family”). Participation in this interfund lending program is voluntary for both borrowing and lending Funds, and an interfund loan is only made if it benefits each participating Fund. The Investment Manager administers the program according to procedures approved by the Funds’ Board of Trustees (the
16
Table of Contents
Managers Special Equity Fund
Notes to Financial Statements (continued)
“Board”), and the Board monitors the operation of the program. An interfund loan must comply with certain conditions set out in the exemptive order, which are designed to assure fairness and protect all participating Funds. For the six months ended June 30, 2010, the Fund lent to other Funds in the Fund Family varying amounts up to $1,409,226 over 3 days earning interest of $67. The interest amounts are presented in the Statement of Operations in interest income. For the same period, the Fund did not borrow from any Fund in the Fund Family.
3. Purchases and Sales of Securities
Purchases and sales of securities, excluding short-term securities and U.S. government obligations, for the six months ended June 30, 2010, were $133,724,183 and $164,024,880, respectively. There were no purchases or sales of U.S. government obligations.
4. Portfolio Securities Loaned
The Fund may participate in a securities lending program offered by BNYM, providing for the lending of securities to qualified brokers. Securities lending fees include earnings of such temporary cash investments, plus or minus any rebate to a borrower. These earnings (after any rebate) are then divided between BNYM, as a fee for its services under the program, and the Fund, according to agreed-upon rates. Collateral on all securities loaned is accepted in cash and/or government securities and is maintained at a minimum level of 102% (105% in the case of certain foreign securities) of the market value, plus interest, if applicable, of investments on loan. It is the Fund’s policy to obtain additional collateral from or return excess collateral to the borrower by the end of the next business day, following the valuation date of the securities loaned. Therefore, the value of the collateral held may be temporarily less than the value of the securities on loan. Lending securities entails a risk of loss to the Fund if and to the extent that the market value of the securities loaned were to increase and the borrower did not increase the collateral accordingly, and the borrower fails to return the securities. The Fund bears the risk of any deficiency in the amount of the collateral available for return to the borrower due to any loss on the collateral invested. Collateral received in the form of cash is invested temporarily in the BNY Mellon Overnight Government Fund, formerly the BNY Institutional Cash Reserves Fund (the “ICRF”), or other short-term investments as defined in the Securities Lending Agreement with BNYM.
In September of 2008, BNYM advised the Investment Manager that the ICRF had exposure to certain defaulted debt obligations, and that BNYM had established a separate sleeve of the ICRF to hold these securities. The net impact of this position is not material to the Fund. The Fund’s position in the separate sleeve of the ICRF Fund is included in the Schedule of Portfolio Investments and the unrealized loss on such investment is included in Net Unrealized Depreciation on the Statement of Assets and Liabilities and the Statement of Operations.
5. Commitments and Contingencies
In the normal course of business, the Fund may enter into contracts and agreements that contain a variety of representations and warranties, which provide general indemnifications. The maximum exposure to the Fund under these arrangements is unknown, as this would involve future claims that may be made against the Fund that have not yet occurred. However, based on experience, the Fund expects the risk of loss to be remote.
6. Subsequent Events
At a meeting held on June 10-11, 2010, the Trust’s Board of Trustees established a contractual expense limitation with respect to the Fund. Effective July 1, 2010, Managers has contractually agreed, until at least May 1, 2012, to limit the Fund’s total annual operating expenses (exclusive of taxes, interest, shareholder servicing fees, brokerage commissions, acquired fund fees and expenses, and extraordinary items) to 1.19% of average daily net assets of the Fund. Prior to July 1, 2010, the Fund did not have a contractual expense limitation.
On July 1, 2010, paperwork was filed with the appropriate authorities in order to enact a legal entity name change for PNC Global Investment Servicing (U.S.) Inc. to BNY Mellon Investment Servicing (US) Inc., due to the acquisition of the company by The Bank of New York Mellon.
Effective August 2, 2010, the Trust, on behalf of each applicable Fund, has entered into an agreement with The Bank of New York Mellon and the Bank of New York Mellon Corporation (“BNYMC”) with respect to each Fund’s position in the BNY Institutional Cash Reserves Fund (the “ICRF”), pursuant to which (i) BNYMC will support the value of certain defaulted securities issued by Lehman Brothers Holdings, Inc. and held by ICRF, and (ii) if certain conditions are met, BNYMC will purchase the defaulted securities from each Fund in September 2011. Each applicable Fund is now fair valuing its position in the ICRF daily.
17
Table of Contents
Annual Renewal of Investment Advisory Agreement (unaudited)
On June 10-11, 2010, the Board of Trustees, including a majority of the Trustees who are not “interested persons” of the Trust (the “Independent Trustees”), approved the Investment Management Agreement with the Investment Manager for the Managers Special Equity Fund (the “Fund”) and the Subadvisory Agreement for each Subadvisor of the Fund. The Independent Trustees were separately represented by independent counsel in connection with their consideration of the approval of these agreements. In considering the Investment Management and Subadvisory Agreements, the Trustees reviewed a variety of materials relating to the Fund, the Investment Manager and each Subadvisor, including comparative performance, fee and expense information for an appropriate peer group of similar mutual funds (the “Peer Group”), performance information for the relevant benchmark index (the “Fund Benchmark”) and, with respect to each Subadvisor, comparative performance information for an appropriate peer group of managed accounts, and, as to all other matters, other information provided to them on a periodic basis throughout the year, as well as information provided in connection with the meetings of June 10-11, 2010, regarding the nature, extent and quality of services provided by the Investment Manager and the Subadvisors under their respective agreements. Prior to voting, the Independent Trustees: (a) reviewed the foregoing information with their independent legal counsel and with management; (b) received materials from their independent legal counsel discussing the legal standards applicable to their consideration of the Investment Management Agreement and the Subadvisory Agreements; and (c) met with their independent legal counsel in private sessions at which no representatives of management were present.
Nature, extent and quality of services.
In considering the nature, extent and quality of the services provided by the Investment Manager, the Trustees reviewed information relating to the Investment Manager’s operations and personnel. Among other things, the Investment Manager provided financial information, biographical information on its supervisory and professional staff and descriptions of its organizational and management structure. The Trustees also took into account information provided periodically throughout the previous year by the Investment Manager relating to the performance of its duties with respect to the Fund and the Trustees’ familiarity with the Investment Manager’s management through Board meetings, discussions and reports. In the course of their deliberations regarding the Investment Management Agreement, the Trustees evaluated, among other things: (a) the extent and quality of the Investment Manager’s oversight of the operation and management of the Fund; (b) the quality of the search, selection and monitoring services performed by the Investment Manager in overseeing the portfolio management responsibilities of the Subadvisors; (c) the Investment Manager’s ability to supervise the Fund’s other service providers; and (d) the Investment Manager’s compliance programs. The Trustees also took into account the financial condition of the Investment Manager with respect to its ability to provide the services required under the Investment Management Agreement and the Manager’s undertaking to implement a contractual expense limitation for the Fund effective July 1, 2010.
The Trustees also reviewed information relating to each Subadvisor’s operations and personnel and the investment philosophy, strategies and techniques (for each Subadvisor, its “Investment Strategy”) used in managing the portion of the Fund for which the Subadvisor has portfolio management responsibility. Among other things, the Trustees reviewed biographical information on portfolio management and other professional staff, information regarding each Subadvisor’s organizational and management structure and each Subadvisor’s brokerage policies and practices. The Trustees considered specific information provided regarding the experience of the individual or individuals at each Subadvisor with portfolio management responsibility for the portion of the Fund managed by the Subadvisor, including the information set forth in the Fund’s prospectus and statement of additional information. The Trustees also noted information provided by the Investment Manager regarding the manner in which each Subadvisor’s Investment Strategy complements those utilized by the Fund’s other Subadvisors. In the course of their deliberations, the Trustees evaluated, among other things: (a) the services rendered by each Subadvisor in the past; (b) the qualifications and experience of the Subadvisor’s personnel; and (c) the Subadvisor’s compliance programs. The Trustees also took into account the financial condition of each Subadvisor with respect to its ability to provide the services required under its Subadvisory Agreement.
Performance.
Among other information relating to the Fund’s performance, the Trustees noted that the Fund’s performance for Managers Class shares for the 1-year, 3-year, 5-year and 10-year periods ended March 31, 2010 was below the median performance of the Peer Group for each period and below, below, below and above, respectively, the performance of the Fund Benchmark, the Russell 2000 Growth Index. The Trustees noted that the Fund’s performance challenges over the previous twelve months were concentrated in the second and third quarters of 2009, when low-quality stocks outperformed higher-quality stocks, and the performance challenges during the second quarter of 2009 were caused in part by the value bias of certain Subadvisors who were replaced by new Subadvisors in May 2009. The Trustees also took into account management’s discussion of the Fund’s more recent performance, noting that the Fund has outperformed the Fund Benchmark in the fourth quarter of 2009 and first quarter of 2010. The Trustees concluded that management has taken appropriate steps to address the Fund’s performance.
As noted above, the Board considered the Fund’s performance during relevant time periods as compared to the Fund’s Peer Group and considered each Subadvisor’s performance as compared to an appropriate peer group of managed accounts and also considered the gross performance of the portion of the Fund managed by each Subadvisor as compared to the Subadvisor’s relevant performance composite that utilizes the same investment strategy and approach and noted that the Board reviews on a quarterly basis detailed information about the Fund’s performance results, portfolio composition and Investment Strategies, including with respect to the portion of the Fund managed by each Subadvisor. The Board noted
18
Table of Contents
Annual Renewal of Investment Advisory Agreement (continued)
the Investment Manager’s expertise and resources in monitoring the performance, investment style and risk-adjusted performance of each Subadvisor. The Board also noted each Subadvisor’s performance record with respect to the Fund. The Board was mindful of the Investment Manager’s attention to monitoring each Subadvisor’s performance with respect to the Fund and its discussions with management regarding the factors that contributed to the performance of the Fund.
Advisory Fees and Profitability.
In considering the reasonableness of the advisory fee charged by the Investment Manager for managing the Fund, the Trustees noted that the Investment Manager, and not the Fund, is responsible for paying the fees charged by the Fund’s Subadvisors and, therefore, that the fees paid to the Investment Manager cover the cost of providing portfolio management services as well as the cost of providing search, selection and monitoring services in operating a “manager-of-managers” complex of mutual funds. The Trustees concluded that, in light of the additional high quality supervisory services provided by the Investment Manager and the fact that the subadvisory fees are paid out of the advisory fee, the advisory fee payable by the Fund to the Investment Manager can reasonably be expected to exceed the median advisory fee for the Peer Group, which consists of many funds that do not operate with a manager-of-managers structure. In this regard, the Trustees also noted that the Investment Manager has undertaken to implement an expense limitation for the Fund effective July 1, 2010.
In considering the reasonableness of the advisory fee payable to the Investment Manager, the Trustees also reviewed information provided by the Investment Manager setting forth all revenues and other benefits, both direct and indirect, received by the Investment Manager and its affiliates attributable to managing the Fund and all the mutual funds in the Managers Family of Funds, the cost of providing such services and the resulting profitability to the Investment Manager and its affiliates from these relationships. The Trustees noted that the subadvisory fees are paid by the Investment Manager out of its advisory fee. The Trustees also noted the current and potential asset levels of the Fund and the willingness of the Investment Manager to waive fees and pay expenses for the Fund from time to time as a means of limiting the total expenses of the Fund. The Trustees also considered management’s discussion of the current asset levels of the Fund, including the effect on assets attributable to the economic and market conditions over the past eighteen months, and considered the impact on profitability of the current asset levels and any future growth of assets of the Fund. The Board took into account management’s discussion of the advisory fee structure. In this regard, the Trustees noted that the Fund currently has four Subadvisors, each managing a portion of the Fund’s portfolio. Based on the foregoing, the Trustees concluded that the profitability to the Investment Manager is reasonable and that the Investment Manager is not realizing material benefits from economies of scale that would warrant adjustments to the advisory fee at this time. With respect to economies of scale, the Trustees also noted that as the Fund’s assets increase over time, the Fund may realize other economies of scale to the extent that the increase in assets is proportionally greater than the increase in certain other expenses.
The Trustees noted that the Fund’s advisory fee and total expenses (net of applicable expense waivers/reimbursements) as of March 31, 2010 were both higher than the average for the Fund’s Peer Group. The Trustees took into account the fact that the Investment Manager has contractually agreed, effective July 1, 2010 and through at least May 1, 2012, to limit the Fund’s net annual operating expenses to 1.19%. The Trustees concluded that, in light of the nature, extent and quality of the services provided by the Investment Manager and the Subadvisors, the foregoing expense limitation and the considerations noted above with respect to the Subadvisors and the Investment Manager, the Fund’s advisory fees are reasonable.
Subadvisory Fees and Profitability.
In considering the reasonableness of the fee payable by the Investment Manager to each Subadvisor, the Trustees relied on the ability of the Investment Manager to negotiate the terms of each Subadvisory Agreement at arm’s length as part of the manager-of-managers structure, noting that the Investment Manager is not affiliated with these Subadvisors. In addition, the Trustees noted that the subadvisory fees are paid by the Investment Manager out of its advisory fee. Accordingly, the cost of services to be provided by each Subadvisor and the profitability to each Subadvisor of its relationship with the Fund were not material factors in the Trustees’ deliberations. For similar reasons, and based on the current size of the portion of the Fund managed by each Subadvisor, the Trustees concluded that the effect of any economies of scale being realized by the Subadvisors was not a material factor in the Trustees’ deliberations at this time.
* * * * *
After consideration of the foregoing, the Trustees also reached the following conclusions regarding the Investment Management Agreement and the Subadvisory Agreements with each of the Subadvisors, in addition to those conclusions discussed above: (a) the Investment Manager and each Subadvisor have demonstrated that they possess the capability and resources to perform the duties required of them under the Investment Management Agreement and the applicable Subadvisory Agreement; (b) each Subadvisor’s Investment Strategy is appropriate for pursuing the Fund’s investment objectives; (c) each Subadvisor is reasonably likely to execute its Investment Strategy consistently over time; and (d) the Investment Manager and each Subadvisor maintain appropriate compliance programs.
Based on all of the above-mentioned factors and their related conclusions, with no single factor or conclusion being determinative and with each Trustee not necessarily attributing the same weight to each factor, the Trustees concluded that approval of the Investment Management Agreement and each Subadvisory Agreement would be in the best interests of the Fund and its shareholders. Accordingly, on June 10-11, 2010, the Trustees, including a majority of the Independent Trustees, voted to approve the Investment Management Agreement and the Subadvisory Agreement for each of the Fund Subadvisors.
19
Table of Contents
Investment Manager and Administrator
Managers Investment Group LLC
333 W. Wacker Drive
Suite 1200
Chicago, IL 60606
(800) 835-3879
Distributor
Managers Distributors, Inc.
333 W. Wacker Drive
Suite 1200
Chicago, IL 60606
(800) 835-3879
Custodian
The Bank of New York Mellon
2 Hanson Place
Brooklyn, New York 11217
Legal Counsel
Ropes & Gray LLP
One International Place
Boston, Massachusetts 02110-2624
Transfer Agent
BNY Mellon Investment Servicing (US) Inc.*
Attn: Managers
P.O. Box 9769
Providence, Rhode Island 02940
(800) 548-4539
Trustees
Jack W. Aber
William E. Chapman, II
Nathaniel Dalton
Edward J. Kaier
Steven J. Paggioli
Eric Rakowski
Thomas R. Schneeweis
John H. Streur
For Managers Choice Only
Managers
c/o BNY Mellon Investment Servicing (US) Inc.*
P.O. Box 9847
Providence, Rhode Island 02940-8047
(800) 358-7668
| * | Formerly PNC Global Investment Servicing (U.S.) Inc. |

Table of Contents
MANAGERSAND MANAGERS AMG FUNDS
EQUITY FUNDS | BALANCED FUNDS | |||
EMERGING MARKETS EQUITY Rexiter Capital Management Limited Schroder Investment Management North America Inc.
ESSEX GROWTH ESSEX LARGE CAP GROWTH ESSEX SMALL/MICRO CAP GROWTH Essex Investment Management Co., LLC
FQ TAX-MANAGED U.S. EQUITY FQ U.S. EQUITY First Quadrant, L.P.
GW&K SMALL CAP EQUITY Gannett Welsh & Kotler, LLC
INSTITUTIONAL MICRO-CAP MICRO-CAP Lord, Abbett & Co. LLC WEDGE Capital Management L.L.P. Next Century Growth Investors LLC RBC Global Asset Management (U.S.) Inc.
INTERNATIONAL EQUITY AllianceBernstein L.P. Lazard Asset Management, LLC Martin Currie Inc. | CHICAGO EQUITY PARTNERS MID-CAP Chicago Equity Partners, LLC
REAL ESTATE SECURITIES Urdang Securities Management, Inc.
RENAISSANCE LARGE CAP GROWTH Renaissance Group LLC
SKYLINE SPECIAL EQUITIES PORTFOLIO Skyline Asset Management, L.P.
FRONTIER SMALL CAP GROWTH Frontier Capital Management Company, LLC
SPECIAL EQUITY Ranger Investment Management, L.P. Lord, Abbett & Co. LLC Smith Asset Management Group, L.P. Federated MDTA LLC
SYSTEMATIC VALUE SYSTEMATIC MID CAP VALUE Systematic Financial Management, L.P.
TIMESSQUARE MID CAP GROWTH TIMESSQUARE SMALL CAP GROWTH TSCM GROWTH EQUITY TimesSquare Capital Management, LLC
| CHICAGO EQUITY PARTNERS BALANCED Chicago Equity Partners, LLC | ||
ALTERNATIVE FUNDS | ||||
FQ GLOBAL ALTERNATIVES FQ GLOBAL ESSENTIALS First Quadrant, L.P. | ||||
INCOME FUNDS | ||||
BOND (MANAGERS) FIXED INCOME GLOBAL BOND Loomis, Sayles & Co., L.P.
BOND (MANAGERS PIMCO) Pacific Investment Management Co. LLC
CALIFORNIA INTERMEDIATE TAX-FREE Miller Tabak Asset Management LLC
GW&K MUNICIPAL BOND GW&K MUNICIPAL ENHANCED YIELD Gannett Welsh & Kotler, LLC
HIGH YIELD J.P. Morgan Investment Management LLC
INTERMEDIATE DURATION GOVERNMENT SHORT DURATION GOVERNMENT Smith Breeden Associates, Inc.
| ||||
This report is prepared for the Fund’s shareholders. It is authorized for distribution to prospective investors only when preceded or accompanied by an effective prospectus. To receive a free copy of the prospectus or Statement of Additional Information, which includes additional information about Fund Trustees, please contact us by calling 800.835.3879. Distributed by Managers Distributors, Inc., member FINRA.
A description of the policies and procedures each Fund uses to vote its proxies is available: (i) without charge, upon request, by calling 800.835.3879, or (ii) on the Securities and Exchange Commission’s (SEC) Web site at www.sec.gov. For information regarding each Fund’s proxy voting record for the 12-month period ended June 30, call 800.835.3879 or visit the SEC Web site at www.sec.gov.
The Fund files its complete schedule of portfolio holdings with the SEC for the first and third quarters of each fiscal year on Form N-Q. The Fund’s Forms N-Q are available on the SEC’s website at www.sec.gov. A Fund’s Forms N-Q may be reviewed and copied at the SEC’s Public Reference Room in Washington, DC. Information on the operation of the Public Reference Room may be obtained by calling 1-800-SEC-0330. To review a complete list of the Fund’s portfolio holdings, or to view the most recent quarterly holdings report, semiannual report, or annual report, please visit www.managersinvest.com.
|  | |||
| www.managersinvest.com | ||||
| ||||

Table of Contents
SEMI-ANNUAL REPORT
Managers Funds
June 30, 2010
Managers Bond Fund

SAR017-0610
Table of Contents
Table of Contents
Managers Bond Fund
Semi-Annual Report — June 30, 2010 (unaudited)
TABLE OF CONTENTS
| Page | ||
| ABOUT YOUR FUND’S EXPENSES | 1 | |
| FUND PERFORMANCE | 2 | |
| FUND SNAPSHOT AND SCHEDULE OF PORTFOLIO INVESTMENTS | 3 | |
| FINANCIAL STATEMENTS: | ||
| 15 | ||
Fund’s balance sheet, net asset value (NAV) per share computation and cumulative undistributed amount | ||
| 16 | ||
Detail of sources of income, Fund expenses, and realized and unrealized gains (losses) during the period | ||
| 17 | ||
Detail of changes in Fund assets for the past two periods | ||
| FINANCIAL HIGHLIGHTS | 18 | |
Historical net asset values per share, distributions, total returns, expense ratios, turnover ratios and net assets | ||
| NOTES TO FINANCIAL STATEMENTS | 19 | |
Accounting and distribution policies, details of agreements and transactions with Fund management and affiliates, and descriptions of certain investment risks | ||
| ANNUAL RENEWAL OF INVESTMENT ADVISORY AGREEMENT | 25 | |
Nothing contained herein is to be considered an offer, sale or solicitation of an offer to buy shares of any series of the Managers Family of Funds. Such offering is made only by Prospectus, which includes details as to offering price and other material information.
Table of Contents
About Your Fund’s Expenses (unaudited)
As a shareholder of a Fund, you may incur two types of costs: (1) transaction costs, which may include sales charges (loads) on purchase payments; redemption fees; and exchange fees; and (2) ongoing costs, including management fees; distribution (12b-1) fees; and other Fund expenses. This example is intended to help you understand your ongoing costs (in dollars) of investing in the Fund and to compare these costs with the ongoing costs of investing in other mutual funds. The example is based on $1,000 invested at the beginning of the period and held for the entire period as indicated below.
Actual Expenses
The first line of the following table provides information about the actual account values and actual expenses. You may use the information in this line, together with the amount you invested, to estimate the expenses that you paid over the period. Simply divide your account value by $1,000 (for example, an $8,600 account value divided by $1,000 = 8.6), then multiply the result by the number in the first line under the heading entitled “Expenses Paid During Period” to estimate the expenses you paid on your account during this period.
Hypothetical Example for Comparison Purposes
The second line of the following table provides information about hypothetical account values and hypothetical expenses based on the Fund’s actual expense ratio and an assumed annual rate of return of 5% before expenses, which is not the Fund’s actual return. The hypothetical account values and expenses may not be used to estimate the actual ending account balance or expenses you paid for the period. You may use this information to compare the ongoing costs of investing in the Fund and other funds by comparing this 5% hypothetical example with the 5% hypothetical examples that appear in the shareholder reports of other funds.
Please note that the expenses shown in the table are meant to highlight your ongoing costs only and do not reflect any transactional costs, such as sales charges (loads), redemption fees, or exchange fees. Therefore, the second line of the table is useful in comparing ongoing costs only, and will not help you determine the relative total costs of owning different funds.
Six Months Ended June 30, 2010 | Expense Ratio for the Period | Beginning Account Value 01/01/2010 | Ending Account Value 06/30/2010 | Expenses Paid During the Period* | ||||||||
Managers Bond Fund | ||||||||||||
Based on Actual Fund Return | 0.99 | % | $ | 1,000 | $ | 1,058 | $ | 5.05 | ||||
Based on Hypothetical 5% Annual Return | 0.99 | % | $ | 1,000 | $ | 1,020 | $ | 4.96 | ||||
| * | Expenses are equal to the Fund’s annualized expense ratio multiplied by the average account value over the period, multiplied by the number of days in the most recent fiscal half-year (181), then divided by 365. |
1
Table of Contents
Managers Bond Fund Performance
All periods ended June 30, 2010 (unaudited)
The table below shows the average annual total returns for the periods indicated for the Managers Bond Fund and the Barclays Capital U.S. Government / Credit Bond Index.
Average Annual Total Returns1 | Six Months | One Year | Five Years | Ten Years | Inception Date | |||||||||
Managers Bond Fund2,3,4,5 | 5.76 | % | 19.82 | % | 6.24 | % | 7.31 | % | 6/1/1984 | |||||
Barclays Capital U.S. Government/Credit Bond Index6 | 5.49 | % | 9.65 | % | 5.26 | % | 6.48 | % |
The performance data shown represents past performance. Past performance is not a guarantee of future results. Current performance may be lower or higher than the performance data quoted. The investment return and principal value of an investment in the Fund will fluctuate so that an investor’s shares, when redeemed, may be worth more or less than their original cost. For performance information through the most recent month end, please call (800) 835-3879 or visit our Web site at www.managersinvest.com.
In choosing a Fund, investors should carefully consider the amount they plan to invest, their investment objectives, the Fund’s investment objectives, risks, charges and expenses before investing. For this and other information, please call (800) 835-3879 or visit www.managersinvest.com for a free prospectus. Read it carefully before investing or sending money. Distributed by Managers Distributors, Inc., member FINRA.
| 1 | Total return equals income yield plus share price change and assumes reinvestment of all dividends and capital gain distributions. Returns are net of fees and may reflect offsets of Fund expenses as described in the Prospectus. No adjustment has been made for taxes payable by shareholders on their reinvested dividends and capital gain distributions. Returns for periods greater than one year are annualized. The listed returns on the Fund are net of expenses and based on the published NAV as of June 30, 2010. All returns are in U.S. dollars($). |
| 2 | From time to time, the Fund’s advisor has waived its fees and/or absorbed Fund expenses, which has resulted in higher returns. |
| 3 | The Fund is subject to the risks associated with investments in debt securities, such as default risk, fluctuations in debtor’s perceived ability to pay its creditors. Changing interest rates may adversely affect the value of an investment. An increase in interest rates typically causes the value of bonds and other fixed-income securities to fall. |
| 4 | Investments in international securities are subject to certain risks of overseas investing including currency fluctuations and changes in political and economic conditions, which could result in significant market fluctuations. These risks are magnified in emerging markets. |
| 5 | High yield bonds (also known as “junk bonds”) are subject to additional risks such as the risk of default. |
| 6 | The Barclays Capital U.S. Government/Credit Bond Index is an index of investment-grade government and corporate bonds with a maturity rate of more than one year. Unlike the Fund, the Barclays Capital U.S. Government/Credit Bond Index is unmanaged, is not available for investment, and does not incur expenses. |
Not FDIC insured, nor bank guaranteed. May lose value.
2
Table of Contents
Fund Snapshot
June 30, 2010 (unaudited)
Portfolio Breakdown
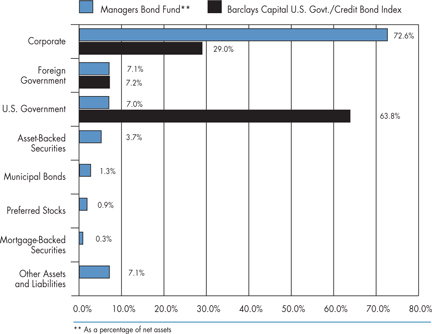
Category | Managers Bond Fund** | Barclays Capital U.S. Govt./ Credit Bond Index | ||||
Corporate | 72.6 | % | 29.0 | % | ||
Foreign Government | 7.1 | % | 7.2 | % | ||
U.S. Government | 7.0 | % | 63.8 | % | ||
Asset-Backed Securities | 3.7 | % | 0.0 | % | ||
Municipal Bonds | 1.3 | % | 0.0 | % | ||
Preferred Stocks | 0.9 | % | 0.0 | % | ||
Mortgage-Backed Securities | 0.3 | % | 0.0 | % | ||
Other Assets and Liabilities | 7.1 | % | 0.0 | % |
Top Ten Holdings
Security Name | Percentage of Net Assets | ||
International Paper Co., 7.950%, 06/15/18* | 2.4 | % | |
Kinder Morgan Energy Partners L.P., 5.950%, 02/15/18* | 2.2 | ||
American General Finance Corp., MTN, Series J, 6.900%, 12/15/17* | 2.1 | ||
USTN, 1.000%, 08/31/11* | 2.0 | ||
Southwestern Electric Power Co., 6.450%, 01/15/19* | 2.0 | ||
Canadian Government, 2.000%, 09/01/12* | 1.8 | ||
Equitable Resources, Inc., 6.500%, 04/01/18* | 1.8 | ||
Dun & Bradstreet Corp., The, 6.000%, 04/01/13* | 1.6 | ||
Merrill Lynch & Co., Inc., 6.110%, 01/29/37* | 1.6 | ||
FNMA, 1.375%, 04/28/11* | 1.5 | ||
Top Ten as a Group | 19.0 | % | |
| * | Top Ten Holding at December 31, 2009 |
Any sectors, industries, or securities discussed should not be perceived as investment recommendations. Mention of a specific security should not be considered a recommendation to buy or solicitation to sell that security. Specific securities mentioned in this report may have been sold from the Fund’s portfolio of investments by the time you receive this report.
3
Table of Contents
Managers Bond Fund
Schedule of Portfolio Investments
June 30, 2010 (unaudited)
Security Description | Principal Amount† | Value | |||||
Corporate Bonds - 72.6% | |||||||
Financials - 21.2% | |||||||
American General Finance Corp., | |||||||
5.400%, 12/01/15 | $ | 5,000,000 | $ | 3,887,500 | |||
MTN, Series J, 6.900%, 12/15/17 | 57,315,000 | 45,637,069 | |||||
American International Group, Inc., | |||||||
MTN, Series G, 5.850%, 01/16/18 | 1,940,000 | 1,733,875 | |||||
MTN, Series MP, 5.450%, 05/18/17 | 485,000 | 430,438 | |||||
Bank of America Capital Trust VI, 5.625%, 03/08/35 | 3,085,000 | 2,599,134 | |||||
BNP Paribas SA DN, 7.400%, 06/13/11(a)4 | IDR | 19,645,500,000 | 2,021,980 | ||||
Camden Property Trust, 5.700%, 05/15/17 | 5,205,000 | 5,420,909 | |||||
Cantor Fitzgerald L.P., | |||||||
6.375%, 06/26/15(a) | 13,710,000 | 13,759,959 | |||||
7.875%, 10/15/19(a) | 10,805,000 | 11,179,988 | |||||
CIT Group, Inc., | |||||||
7.000%, 05/01/13 | 106,487 | 101,961 | |||||
7.000%, 05/01/14 | 509,731 | 2 | 480,421 | ||||
7.000%, 05/01/15 | 509,731 | 2 | 470,227 | ||||
7.000%, 05/01/16 | 516,223 | 471,053 | |||||
7.000%, 05/01/17 | 822,711 | 740,440 | |||||
Citibank, NA, 15.000%, 07/02/10(a) | BRL | 2,000,000 | 1,108,033 | ||||
Citigroup, Inc., | |||||||
5.500%, 10/15/14 | 21,385,000 | 21,986,239 | |||||
6.125%, 08/25/36 | 10,760,000 | 9,779,656 | |||||
Colonial Realty, L.P., 4.800%, 04/01/11 | 1,005,000 | 990,956 | |||||
Crown Castle Towers LLC, 6.113%, 01/15/20(a) | 13,725,000 | 15,063,929 | |||||
Duke Realty, L.P., | |||||||
5.950%, 02/15/17 | 2,210,000 | 2,255,975 | |||||
6.500%, 01/15/18 | 5,000,000 | 5,319,010 | |||||
Equity One, Inc., 6.000%, 09/15/17 | 5,915,000 | 6,018,264 | |||||
ERP Operating, L.P., | |||||||
5.125%, 03/15/16 | 600,000 | 631,588 | |||||
5.750%, 06/15/17 | 1,450,000 | 1,562,382 | |||||
First Industrial L.P., 5.950%, 05/15/17 | 15,000,000 | 14,030,160 | |||||
GE Capital Australia Funding Pty., Ltd., Series EMTN, 8.000%, 02/13/12 | AUD | 3,965,000 | 3,454,209 | ||||
GE Capital Corp., | |||||||
Series EMTN, 9.000%, 01/04/11 | NZD | 765,000 | 535,054 | ||||
Series GMTN, 7.625%, 12/10/14 | NZD | 9,365,000 | 6,770,390 | ||||
The accompanying notes are an integral part of these financial statements.
4
Table of Contents
Managers Bond Fund
Schedule of Portfolio Investments (continued)
Security Description | Principal Amount† | Value | |||||
Financials - 21.2% (continued) | |||||||
General Electric Capital Corp., | |||||||
2.960%, 05/18/12 | SGD | 4,400,000 | $ | 3,173,295 | |||
3.485%, 03/08/12 | SGD | 16,500,000 | 11,992,468 | ||||
6.500%, 09/28/15 | NZD | 14,950,000 | 10,344,534 | ||||
6.750%, 09/26/16 | NZD | 6,390,000 | 4,473,863 | ||||
GMAC, Inc. | |||||||
6.000%, 12/15/11 | $ | 1,127,000 | 1,127,000 | ||||
6.625%, 05/15/12 | 1,374,000 | 1,374,000 | |||||
6.750%, 12/01/14 | 1,019,000 | 985,882 | |||||
6.875%, 09/15/11 | 158,000 | 160,172 | |||||
6.875%, 08/28/12 | 253,000 | 253,632 | |||||
7.000%, 02/01/12 | 763,000 | 2 | 767,769 | ||||
7.250%, 03/02/11 | 816,000 | 829,260 | |||||
7.500%, 12/31/13 | 584,000 | 582,540 | |||||
8.000%, 12/31/18 | 1,366,000 | 1,256,720 | |||||
8.000%, 11/01/31 | 1,427,000 | 1,316,408 | |||||
Hanover Insurance Group, Inc., The, 7.500%, 03/01/20 | 6,475,000 | 2 | 6,994,308 | ||||
Highwoods Realty, L.P., | |||||||
5.850%, 03/15/17 | 3,680,000 | 3,671,459 | |||||
7.500%, 04/15/18 | 2,405,000 | 2,585,512 | |||||
ICICI Bank, Ltd., 6.375%, 04/30/22(a)7 | 900,000 | 828,009 | |||||
International Lease Finance Corp., | |||||||
5.125%, 11/01/10 | 720,000 | 713,700 | |||||
5.550%, 09/05/12 | 345,000 | 324,300 | |||||
6.375%, 03/25/13 | 1,730,000 | 1,621,875 | |||||
iStar Financial, Inc., | |||||||
5.125%, 04/01/11 | 280,000 | 2 | 257,600 | ||||
5.150%, 03/01/12 | 4,360,000 | 3,575,200 | |||||
5.500%, 06/15/12 | 260,000 | 2 | 213,200 | ||||
5.650%, 09/15/11 | 3,095,000 | 2 | 2,785,500 | ||||
5.700%, 03/01/14 | 15,000 | 11,062 | |||||
5.743%, 10/01/12 (10/01/10)6,9 | 8,095,000 | 5,828,400 | |||||
5.800%, 03/15/11 | 640,000 | 2 | 595,200 | ||||
5.850%, 03/15/17 | 325,000 | 227,500 | |||||
5.875%, 03/15/16 | 1,340,000 | 2 | 938,000 | ||||
5.950%, 10/15/13 | 4,725,000 | 3,732,750 | |||||
6.050%, 04/15/15 | 620,000 | 446,400 | |||||
8.625%, 06/01/13 | 425,000 | 344,250 | |||||
JPMorgan Chase & Co., | |||||||
7.064%, 03/28/11(a)4 | IDR | 932,700,000 | 97,663 | ||||
8.179%, 04/12/12(a)4 | IDR | 40,733,437,680 | 3,894,952 | ||||
The accompanying notes are an integral part of these financial statements.
5
Table of Contents
Managers Bond Fund
Schedule of Portfolio Investments (continued)
Security Description | Principal Amount† | Value | |||||
Financials - 21.2% (continued) | |||||||
JPMorgan International, 7.455%, 10/21/10(a)4 | IDR | 16,627,462,500 | $ | 1,792,281 | |||
Marsh & McLennan Companies, Inc., | |||||||
5.375%, 07/15/14 | $ | 4,390,000 | 4,640,730 | ||||
5.750%, 09/15/15 | 11,939,000 | 12,769,560 | |||||
5.875%, 08/01/33 | 10,360,000 | 9,661,114 | |||||
MBIA Insurance Corp., 14.000%, 01/15/33(a)7 | 525,000 | 2 | 236,250 | ||||
Merrill Lynch & Co., Inc., | |||||||
4.625%, 09/14/18 | EUR | 1,750,000 | 1,942,512 | ||||
6.110%, 01/29/37 | 38,050,000 | 34,556,097 | |||||
10.710%, 03/08/17 | BRL | 2,500,000 | 1,329,640 | ||||
MTN, Series C, 6.050%, 06/01/34 | 22,100,000 | 22,045,258 | |||||
Morgan Stanley, | |||||||
4.750%, 04/01/14 | 10,715,000 | 10,733,387 | |||||
5.550%, 04/27/17 | 11,000,000 | 10,910,614 | |||||
6.625%, 04/01/18 | 3,095,000 | 3,243,975 | |||||
GMTN, Series F, 5.625%, 09/23/19 | 6,700,000 | 6,481,667 | |||||
Mutual of Omaha Insurance Co., 6.800%, 06/15/36(a) | 13,925,000 | 13,740,549 | |||||
National City Bank of Indiana, 4.250%, 07/01/18 | 6,310,000 | 6,143,082 | |||||
National City Corp., 6.875%, 05/15/19 | 1,905,000 | 2,138,399 | |||||
National Life Insurance Co., 10.500%, 09/15/39(a) | 5,000,000 | 5,908,100 | |||||
PF Export Rec Master Trust, 6.436%, 06/01/15(a) | 403,473 | 423,235 | |||||
ProLogis Trust, | |||||||
5.625%, 11/15/15 | 345,000 | 330,855 | |||||
5.750%, 04/01/16 | 280,000 | 266,511 | |||||
Realty Income Corp., 6.750%, 08/15/19 | 7,675,000 | 8,470,276 | |||||
Simon Property Group, L.P., 5.750%, 12/01/15 | 445,000 | 489,214 | |||||
SLM Corp., | |||||||
5.000%, 10/01/13 | 2,060,000 | 1,969,290 | |||||
5.000%, 04/15/15 | 50,000 | 43,003 | |||||
5.125%, 08/27/12 | 540,000 | 531,962 | |||||
5.375%, 01/15/13 | 2,460,000 | 2,385,482 | |||||
5.375%, 05/15/14 | 300,000 | 274,308 | |||||
5.400%, 10/25/11 | 520,000 | 516,922 | |||||
8.450%, 06/15/18 | 18,665,000 | 17,224,267 | |||||
WEA Finance LLC / WT Finance Australia, 6.750%, 09/02/19(a) | 8,325,000 | 9,252,863 | |||||
White Mountains Insurance Group, Ltd., 6.375%, 03/20/17(a) | 4,555,000 | 4,559,851 | |||||
Willis North America, Inc., | |||||||
6.200%, 03/28/17 | 5,685,000 | 5,917,670 | |||||
7.000%, 09/29/19 | 2,860,000 | 3,070,659 | |||||
Total Financials | 460,764,765 | ||||||
The accompanying notes are an integral part of these financial statements.
6
Table of Contents
Managers Bond Fund
Schedule of Portfolio Investments (continued)
Security Description | Principal Amount† | Value | ||||
Industrials - 41.7% | ||||||
Agilent Technologies, Inc., 6.500%, 11/01/17 | $ | 6,945,000 | $ | 7,670,433 | ||
Albertson’s, Inc., | ||||||
6.625%, 06/01/28 | 1,015,000 | 740,950 | ||||
7.450%, 08/01/29 | 3,195,000 | 2,651,850 | ||||
7.750%, 06/15/26 | 915,000 | 759,450 | ||||
American President, Ltd., 8.000%, 01/15/24 | 250,000 | 162,500 | ||||
Anadarko Petroleum Corp., 6.450%, 09/15/36 | 13,875,000 | 11,037,271 | ||||
Anheuser-Busch Companies, Inc., 5.950%, 01/15/33 | 6,177,000 | 6,508,717 | ||||
AT&T Corp., | ||||||
6.500%, 03/15/29 | 6,415,000 | 6,873,846 | ||||
6.500%, 09/01/37 | 140,000 | 155,281 | ||||
Avnet, Inc., | ||||||
5.875%, 03/15/14 | 11,000,000 | 11,918,830 | ||||
6.000%, 09/01/15 | 5,340,000 | 5,786,419 | ||||
6.625%, 09/15/16 | 1,370,000 | 1,525,402 | ||||
Bell Atlantic Pennsylvania, Inc., 6.000%, 12/01/28 | 1,335,000 | 1,321,136 | ||||
BellSouth Corp., 6.000%, 11/15/34 | 2,370,000 | 2,448,833 | ||||
Canadian Pacific Railway Co., 5.750%, 03/15/33 | 195,000 | 195,868 | ||||
CenturyTel, Series P, 7.600%, 09/15/39 | 9,335,000 | 8,849,645 | ||||
CIGNA Corp., 6.150%, 11/15/36 | 6,830,000 | 7,024,956 | ||||
Comcast Corp., | ||||||
5.650%, 06/15/35 | 8,370,000 | 8,244,232 | ||||
6.500%, 11/15/35 | 740,000 | 804,754 | ||||
6.950%, 08/15/37 | 19,230,000 | 21,874,625 | ||||
Continental Airlines, Inc., | ||||||
5.983%, 04/19/22 | 17,813,836 | 17,475,373 | ||||
6.795%, 08/02/20 | 36,045 | 33,162 | ||||
Series 00A1, 8.048%, 11/01/20 | 85,803 | 88,162 | ||||
Series B, 6.903%, 04/19/22 | 5,546,329 | 5,102,623 | ||||
Corn Products International, Inc., 6.625%, 04/15/37 | 4,055,000 | 4,234,709 | ||||
Corning, Inc., | ||||||
6.850%, 03/01/29 | 9,142,000 | 10,248,749 | ||||
7.250%, 08/15/36 | 1,185,000 | 1,326,549 | ||||
CSX Corp., 6.000%, 10/01/36 | 7,909,000 | 8,476,993 | ||||
Cummins Engine Co., Inc., | ||||||
5.650%, 03/01/98 | 11,235,000 | 9,607,655 | ||||
6.750%, 02/15/27 | 2,853,000 | 3,057,081 | ||||
7.125%, 03/01/28 | 50,000 | 55,603 | ||||
Cytec Industries, Inc., 6.000%, 10/01/15 | 875,000 | 961,801 | ||||
Darden Restaurants, Inc., 6.000%, 08/15/35 | 2,635,000 | 2,672,559 | ||||
The accompanying notes are an integral part of these financial statements.
7
Table of Contents
Managers Bond Fund
Schedule of Portfolio Investments (continued)
Security Description | Principal Amount† | Value | |||||
Industrials - 41.7% (continued) | |||||||
Delta Air Lines, Inc., | |||||||
8.021%, 08/10/22 | $ | 13,504,343 | $ | 12,862,887 | |||
Pass Through Certificate, Series 2010-1A, 6.200%, 07/02/18 | 5,175,000 | 5,278,500 | |||||
Dillards, Inc., 7.000%, 12/01/28 | 225,000 | 184,500 | |||||
DP World, Ltd., 6.850%, 07/02/37(a) | 28,350,000 | 22,552,056 | |||||
Duke Energy Field Services LLC, 6.450%, 11/03/36(a) | 2,615,000 | 2,660,064 | |||||
Dun & Bradstreet Corp., The, 6.000%, 04/01/13 | 32,120,000 | 35,067,588 | |||||
El Paso Corp., 6.950%, 06/01/28 | 1,030,000 | 922,155 | |||||
Energy Transfer Partners, L.P., | |||||||
6.125%, 02/15/17 | 700,000 | 727,872 | |||||
6.625%, 10/15/36 | 1,805,000 | 1,732,264 | |||||
Enterprise Products Operating L.P., 6.300%, 09/15/17 | 8,440,000 | 9,441,187 | |||||
Equifax, Inc., 7.000%, 07/01/37 | 4,421,000 | 4,875,333 | |||||
Equitable Resources, Inc., 6.500%, 04/01/18 | 35,420,000 | 38,546,665 | |||||
ERAC USA Finance Co., | |||||||
6.375%, 10/15/17(a) | 4,910,000 | 5,527,084 | |||||
6.700%, 06/01/34(a) | 1,250,000 | 1,332,410 | |||||
7.000%, 10/15/37(a) | 19,033,000 | 20,740,241 | |||||
Foot Locker, Inc., 8.500%, 01/15/22 | 570,000 | 535,800 | |||||
Ford Motor Co., 6.375%, 02/01/29 | 1,990,000 | 1,522,350 | |||||
Freescale Semiconductor, Inc., 10.125%, 12/15/16 | 270,000 | 2 | 216,000 | ||||
GATX Corp., 4.750%, 10/01/12 | 8,965,000 | 9,437,778 | |||||
GTE Corp., 6.940%, 04/15/28 | 130,000 | 143,018 | |||||
Intel Corp., | |||||||
2.950%, 12/15/359 | 6,230,000 | 5,918,500 | |||||
3.250%, 08/01/39(a)9 | 15,000,000 | 16,893,750 | |||||
International Paper Co., | |||||||
7.500%, 08/15/21 | 1,000,000 | 1,170,895 | |||||
7.950%, 06/15/18 | 44,098,000 | 52,502,683 | |||||
Intuit, Inc., 5.750%, 03/15/17 | 3,560,000 | 3,910,902 | |||||
Kinder Morgan Energy Partners L.P., | |||||||
5.800%, 03/15/35 | 3,360,000 | 3,170,657 | |||||
5.950%, 02/15/18 | 44,630,000 | 48,202,096 | |||||
KLA Instruments Corp., 6.900%, 05/01/18 | 15,425,000 | 17,255,870 | |||||
Lowe’s Companies, Inc., 6.875%, 02/15/28 | 500,000 | 602,216 | |||||
Lucent Technologies, Inc., | |||||||
6.450%, 03/15/29 | 4,335,000 | 2,861,100 | |||||
6.500%, 01/15/28 | 305,000 | 201,300 | |||||
Marks & Spencer Group PLC, 7.125%, 12/01/37(a) | 4,725,000 | 4,954,238 | |||||
The accompanying notes are an integral part of these financial statements.
8
Table of Contents
Managers Bond Fund
Schedule of Portfolio Investments (continued)
Security Description | Principal Amount† | Value | ||||
Industrials - 41.7% (continued) | ||||||
Masco Corp., | ||||||
5.850%, 03/15/17 | $ | 8,150,000 | $ | 7,950,366 | ||
6.500%, 08/15/32 | 955,000 | 807,335 | ||||
7.125%, 03/15/20 | 9,065,000 | 8,801,988 | ||||
7.750%, 08/01/29 | 820,000 | 790,614 | ||||
Methanex Corp., 6.000%, 08/15/15 | 3,825,000 | 3,719,277 | ||||
Missouri Pacific Railroad Co., 5.000%, 01/01/45 | 825,000 | 606,548 | ||||
Motorola, Inc., | ||||||
6.500%, 09/01/25 | 1,345,000 | 1,339,215 | ||||
6.500%, 11/15/28 | 1,430,000 | 1,443,009 | ||||
8.000%, 11/01/11 | 1,075,000 | 1,153,823 | ||||
New England Telephone & Telegraph Co., 7.875%, 11/15/29 | 2,390,000 | 2,788,411 | ||||
News America, Inc., | ||||||
6.150%, 03/01/37 | 4,075,000 | 4,249,936 | ||||
6.200%, 12/15/34 | 2,675,000 | 2,817,358 | ||||
6.400%, 12/15/35 | 5,300,000 | 5,768,191 | ||||
NGPL Pipeco LLC, 7.119%, 12/15/17(a) | 21,980,000 | 20,963,535 | ||||
Northwest Airlines, Inc., 8.028%, 11/01/17 | 7,293,735 | 6,783,174 | ||||
ONEOK Partners, L.P., | ||||||
6.000%, 06/15/35 | 9,210,000 | 8,683,695 | ||||
6.650%, 10/01/36 | 2,650,000 | 2,718,322 | ||||
Owens & Minor, Inc., 6.350%, 04/15/16 | 1,355,000 | 1,364,597 | ||||
Owens Corning, Inc., | ||||||
6.500%, 12/01/16 | 4,560,000 | 4,851,790 | ||||
7.000%, 12/01/36 | 9,175,000 | 9,130,391 | ||||
Panhandle Eastern Pipe Line Co., L.P., | ||||||
6.200%, 11/01/17 | 5,520,000 | 5,681,753 | ||||
7.000%, 06/15/18 | 26,505,000 | 28,412,724 | ||||
Penn Mutual Life Insurance Co., The, 7.625%, 06/15/40(a) | 8,885,000 | 8,706,163 | ||||
Plains All American Pipeline L.P., | ||||||
6.125%, 01/15/17 | 2,770,000 | 3,006,746 | ||||
6.500%, 05/01/18 | 8,975,000 | 9,877,661 | ||||
6.650%, 01/15/37 | 5,960,000 | 5,952,473 | ||||
Pulte Homes, Inc., | ||||||
6.000%, 02/15/35 | 10,320,000 | 7,533,600 | ||||
6.375%, 05/15/33 | 4,670,000 | 3,595,900 | ||||
Qantas Airways, Ltd., 6.050%, 04/15/16(a) | 11,800,000 | 12,228,446 | ||||
Questar Market Resources, Inc., 6.800%, 04/01/18 | 27,465,000 | 28,746,544 | ||||
Qwest Capital Funding, Inc., | ||||||
6.500%, 11/15/18 | 620,000 | 582,800 | ||||
6.875%, 07/15/28 | 1,190,000 | 1,005,550 | ||||
7.625%, 08/03/21 | 2,135,000 | 2,006,900 | ||||
The accompanying notes are an integral part of these financial statements.
9
Table of Contents
Managers Bond Fund
Schedule of Portfolio Investments (continued)
Security Description | Principal Amount† | Value | ||||
Industrials - 41.7% (continued) | ||||||
Qwest Corp., | ||||||
6.500%, 06/01/17 | $ | 155,000 | $ | 156,162 | ||
6.875%, 09/15/33 | 7,209,000 | 6,614,258 | ||||
7.200%, 11/10/26 | 435,000 | 406,725 | ||||
7.250%, 09/15/25 | 1,185,000 | 1,137,600 | ||||
7.250%, 10/15/35 | 2,165,000 | 1,986,388 | ||||
7.500%, 06/15/23 | 739,000 | 707,592 | ||||
Reynolds American, Inc., | ||||||
6.750%, 06/15/17 | 8,170,000 | 8,851,280 | ||||
7.250%, 06/15/37 | 2,000,000 | 2,057,646 | ||||
Rowan Cos., Inc., 7.875%, 08/01/19 | 4,710,000 | 5,188,918 | ||||
Samsung Electronics Co., Ltd., 7.700%, 10/01/27(a) | 3,960,000 | 4,599,647 | ||||
Southern Natural Gas Co., 5.900%, 04/01/17(a) | 4,765,000 | 5,048,341 | ||||
Talisman Energy, Inc., | ||||||
5.850%, 02/01/37 | 2,650,000 | 2,754,394 | ||||
6.250%, 02/01/38 | 3,140,000 | 3,349,319 | ||||
Telecom Italia Capital S.p.A., | ||||||
6.000%, 09/30/34 | 3,210,000 | 2,750,119 | ||||
6.375%, 11/15/33 | 3,170,000 | 2,838,662 | ||||
Telekom Malaysia Berhad, 7.875%, 08/01/25(a) | 250,000 | 314,636 | ||||
Texas Eastern Transmission, L.P., 6.000%, 09/15/17(a) | 3,000,000 | 3,430,101 | ||||
Toll Brothers Finance Corp., 5.150%, 05/15/15 | 3,785,000 | 3,710,004 | ||||
Toro Co., The, 6.625%, 05/01/37 | 6,810,000 | 6,907,887 | ||||
Transocean, Inc., 7.375%, 04/15/18 | 500,000 | 474,348 | ||||
U.S. Steel Corp., | ||||||
6.650%, 06/01/37 | 3,595,000 | 3,091,700 | ||||
7.000%, 02/01/18 | 7,310,000 | 7,227,762 | ||||
United Airlines, Inc., 6.636%, 07/02/22 | 16,580,715 | 15,254,258 | ||||
UnitedHealth Group, Inc., | ||||||
5.800%, 03/15/36 | 13,506,000 | 13,576,677 | ||||
6.500%, 06/15/37 | 310,000 | 334,489 | ||||
6.625%, 11/15/37 | 1,540,000 | 1,692,760 | ||||
USG Corp., 6.300%, 11/15/16 | 1,410,000 | 1,216,125 | ||||
V.F. Corp., 6.450%, 11/01/37 | 9,334,000 | 10,521,714 | ||||
Vale Overseas Ltd., 6.875%, 11/01/36 | 3,665,000 | 3,820,803 | ||||
Verizon Global Funding Corp., 5.850%, 09/15/35 | 2,285,000 | 2,357,025 | ||||
Verizon Maryland, Inc., 5.125%, 06/15/33 | 1,055,000 | 933,084 | ||||
Verizon New York, Inc., Series B, 7.375%, 04/01/32 | 1,755,000 | 1,984,572 | ||||
Viacom, Inc., 6.875%, 04/30/36 | 20,000 | 22,641 | ||||
Weatherford International, Inc., 6.500%, 08/01/36 | 1,565,000 | 1,418,159 | ||||
The accompanying notes are an integral part of these financial statements.
10
Table of Contents
Managers Bond Fund
Schedule of Portfolio Investments (continued)
Security Description | Principal Amount† | Value | ||||
Industrials - 41.7% (continued) | ||||||
Wellpoint, Inc., 6.375%, 06/15/37 | $ | 12,195,000 | $ | 13,161,832 | ||
Western Union Co., 6.200%, 11/17/36 | 12,735,000 | 13,579,038 | ||||
Weyerhaeuser Co., | ||||||
6.875%, 12/15/33 | 12,890,000 | 12,067,193 | ||||
7.375%, 10/01/19 | 3,915,000 | 4,136,988 | ||||
7.375%, 03/15/32 | 1,930,000 | 1,906,664 | ||||
White Pine Hydro LLC, | ||||||
6.310%, 07/10/17(a) | 1,700,000 | 1,735,632 | ||||
6.960%, 07/10/37(a) | 1,645,000 | 1,613,597 | ||||
Williams Cos., Inc., Series A, 7.500%, 01/15/31 | 741,000 | 788,218 | ||||
Wyndham Worldwide Corp., | ||||||
6.000%, 12/01/16 | 6,430,000 | 6,238,193 | ||||
7.375%, 03/01/20 | 7,220,000 | 7,406,637 | ||||
Total Industrials | 905,284,599 | |||||
Utilities - 9.7% | ||||||
Abu Dhabi National Energy Co., 7.250%, 08/01/18(a) | 21,130,000 | 22,752,573 | ||||
Ameren Energy Generating Co., 7.000%, 04/15/18 | 22,700,000 | 24,159,315 | ||||
Baltimore Gas & Electric Co., 5.200%, 06/15/33 | 1,470,000 | 1,428,902 | ||||
Bruce Mansfield Unit 1 2, 6.850%, 06/01/34 | 10,600,854 | 11,074,273 | ||||
Cleveland Electric Illuminating Co., The, 5.950%, 12/15/36 | 15,155,000 | 15,026,698 | ||||
Empresa Nacional de Electricidad, 7.875%, 02/01/27 | 2,900,000 | 3,230,252 | ||||
Illinois Power Co., 6.250%, 04/01/18 | 26,000,000 | 28,758,470 | ||||
ITC Holdings Corp., | ||||||
5.875%, 09/30/16(a) | 2,410,000 | 2,628,777 | ||||
6.375%, 09/30/36(a) | 3,605,000 | 3,726,759 | ||||
Mackinaw Power LLC, 6.296%, 10/31/23(a) | 9,200,513 | 9,427,581 | ||||
Nisource Finance Corp., | ||||||
6.400%, 03/15/18 | 27,910,000 | 30,710,378 | ||||
6.800%, 01/15/19 | 11,625,000 | 12,941,822 | ||||
Southwestern Electric Power Co., 6.450%, 01/15/19 | 39,195,000 | 43,091,414 | ||||
Tenaga Nasional Berhad, 7.500%, 11/01/25(a) | 2,000,000 | 2,433,006 | ||||
Total Utilities | 211,390,220 | |||||
Total Corporate Bonds (cost $1,499,001,527) | 1,577,439,584 | |||||
Foreign Government Obligations - 7.1% | ||||||
Alberta, Province of, 5.930%, 09/16/16 | CAD | 130,022 | 135,049 | |||
Brazil, Republic of, | ||||||
10.250%, 01/10/28 | BRL | 5,750,000 | 3,213,470 | |||
12.500%, 01/05/22 | BRL | 5,160,000 | 3,237,507 | |||
The accompanying notes are an integral part of these financial statements.
11
Table of Contents
Managers Bond Fund
Schedule of Portfolio Investments (continued)
Security Description | Principal Amount† | Value | |||||
Foreign Government Obligations - 7.1% (continued) | |||||||
Canadian Government, | |||||||
1.000%, 09/01/11 | CAD | 2,660,000 | $ | 2,496,684 | |||
1.250%, 12/01/11 | CAD | 400,000 | 376,163 | ||||
2.000%, 09/01/12 | CAD | 41,000,000 | 38,886,356 | ||||
2.750%, 12/01/10 | CAD | 7,940,000 | 7,520,904 | ||||
3.500%, 06/01/13 | CAD | 5,964,000 | 5,863,886 | ||||
3.750%, 09/01/11 | CAD | 4,160,000 | 4,028,113 | ||||
3.750%, 06/01/12 | CAD | 12,235,000 | 12,003,069 | ||||
European Investment Bank, | |||||||
6.219%, 04/24/13(a)4 | IDR | 50,074,770,000 | 4,648,695 | ||||
6.588%, 03/10/214 | AUD | 5,000,000 | 2,104,285 | ||||
7.000%, 01/18/12 | NZD | 5,508,000 | 3,932,912 | ||||
11.250%, 02/14/13 | BRL | 13,490,000 | 7,748,791 | ||||
Inter-American Development Bank, | |||||||
6.000%, 12/15/17 | NZD | 4,215,000 | 2,984,340 | ||||
8.347%, 05/20/134 | IDR | 45,580,000,000 | 3,970,212 | ||||
Series EMTN, 9.990%, 09/23/134 | IDR | 33,430,000,000 | 2,825,969 | ||||
International Bank for Reconstruction & Development, Series GDIF, 1.430%, 03/05/14 | SGD | 5,800,000 | 4,159,710 | ||||
Mexican Government, | |||||||
8.000%, 12/07/23 | MXN | 141,360,000 | 11,641,688 | ||||
9.000%, 12/20/12 | MXN | 26,900,000 | 2,253,202 | ||||
Series M 10, 7.250%, 12/15/16 | MXN | 31,000,000 | 2,482,531 | ||||
New South Wales Treasury Corp., Series 10RG, 7.000%, 12/01/10 | AUD | 10,320,000 | 8,766,084 | ||||
New Zealand Government Bond, Series 413, 6.500%, 04/15/13 | NZD | 11,870,000 | 8,632,809 | ||||
Province of Manitoba Canada, 6.360%, 09/01/15 | NZD | 5,000,000 | 3,581,769 | ||||
Queensland Treasury Corp., 7.125%, 09/18/17(a) | NZD | 7,500,000 | 5,596,444 | ||||
Total Foreign Government Obligations (cost $148,820,398) | 153,090,641 | ||||||
U.S. Government and Agency Obligations - 7.0% | |||||||
Federal Home Loan Mortgage Corporation - 2.7% | |||||||
FHLMC, 1.625%, 09/26/12 | $ | 16,600,000 | 2 | 16,878,017 | |||
FHLMC, 1.625%, 04/15/13 | 16,595,000 | 16,845,900 | |||||
FHLMC, 2.125%, 09/21/12 | 24,895,000 | 25,596,890 | |||||
FHLMC, Gold, 5.000%, 12/01/31 | 138,351 | 147,266 | |||||
Total Federal Home Loan Mortgage Corporation | 59,468,073 | ||||||
Federal National Mortgage Association - 2.3% | |||||||
FNMA, 1.375%, 04/28/11 | 33,195,000 | 33,458,933 | |||||
FNMA, 1.875%, 04/20/12 | 10,325,000 | 2 | 10,541,102 | ||||
FNMA, 4.000%, 10/01/18 | 5,287,593 | 5,591,526 | |||||
FNMA, 6.000%, 07/01/29 | 11,138 | 12,338 | |||||
Total Federal National Mortgage Corporation | 49,603,899 | ||||||
The accompanying notes are an integral part of these financial statements.
12
Table of Contents
Managers Bond Fund
Schedule of Portfolio Investments (continued)
Security Description | Principal Amount† | Value | ||||
U.S. Treasury Notes - 2.0% | ||||||
USTN, 1.000%, 08/31/11 | $ | 43,530,000 | $ | 43,812,249 | ||
Total U.S. Government and Agency Obligations (cost $150,792,101) | 152,884,221 | |||||
Municipal Bonds - 1.3% | ||||||
Buckeye Tobacco Settlement Financing Authority, Series 2007 A-2, 5.875%, 06/01/47 | 5,035,000 | 3,602,190 | ||||
California State, 4.500%, 08/01/27 (AMBAC Insured) | 950,000 | 873,278 | ||||
California State, 4.500%, 10/01/29 | 2,655,000 | 2,370,331 | ||||
California State, 4.500%, 08/01/30 | 665,000 | 591,690 | ||||
California State, 4.500%, 08/01/30 (AMBAC Insured) | 770,000 | 685,115 | ||||
California State, Variable Purpose, 3.250%, 12/01/27 (NATL-RE Insured) | 495,000 | 385,783 | ||||
California State, Variable Purpose, 4.500%, 12/01/33 (AMBAC Insured) | 2,330,000 | 2,017,873 | ||||
Chicago Illinois O’Hare International Airport Revenue, Series 2008 A, 4.500%, 01/01/38 (AGM Insured) | 315,000 | 296,081 | ||||
Michigan Tobacco Settlement Financial Authority, Series 2006 A, 7.309%, 06/01/34 | 3,025,000 | 2,315,940 | ||||
San Jose California Redevelopment Agency Tax Allocation, Series 2006 C, 3.750%, 08/01/28 (NATL-RE Insured) | 765,000 | 608,290 | ||||
San Jose Redevelopment Agency, 3.750%, 08/01/28 (MBIA Insured) | 280,000 | 235,970 | ||||
Tobacco Settlement Financing Corp., VA, 6.706%, 06/01/46 | 21,620,000 | 14,592,419 | ||||
Total Municipal Bonds (cost $37,341,902) | 28,574,961 | |||||
Asset-Backed Securities - 3.7% | ||||||
Chase Issuance Trust, Series 2007-B1, Class B1, 2.721%, 04/15/19 (07/15/10)6 | 17,040,000 | 16,322,556 | ||||
Chrysler Financial Lease Trust, Series 2010-A, Class B, 3.460%, 09/16/13(a) | 10,010,000 | 9,997,228 | ||||
CIT Equipment Collateral, Series 2008-VT1, Class A3, 6.590%, 12/22/14 | 5,539,409 | 5,727,628 | ||||
Citibank Credit Card Issuance Trust, Series 2008-C6, Class C6, 6.300%, 06/20/14 | 15,450,000 | 16,508,364 | ||||
Marriott Vacation Club Owner Trust, Series 2009-2A, Class A, 4.809%, 07/20/31(a) | 15,344,076 | 15,542,337 | ||||
MBNA, Series 2002-C1, Class C1, 6.800%, 07/15/14 | 6,911,000 | 7,370,790 | ||||
Merrill Auto Trust Securitization, Series 2008-1, Class B, 6.750%, 04/15/15 | 4,035,000 | 4,229,079 | ||||
Trinity Rail Leasing LP, Series 2009-1A, Class A, 6.657%, 11/16/39(a) | 4,901,213 | 5,096,977 | ||||
Total Asset-Backed Securities (cost $75,600,558) | 80,794,959 | |||||
Mortgage-Backed Securities - 0.3% | ||||||
Bank of America-First Union, Series 2001, 5.464%, 04/11/37 | 1,449,630 | 1,491,634 | ||||
Community Program Loan Trust, Series 87-A, Class A5, 4.500%, 04/01/29 | 3,225,000 | 3,027,604 | ||||
Credit Suisse Mortgage Capital, Series 2007-C5, Class A4, 5.695%, 09/15/407 | 1,704,000 | 1,617,942 | ||||
JP Morgan Chase Commercial Mortgage Securities Corp., Series 2007-LD11, Class A4, 5.983%, 06/15/497 | 305,000 | 298,402 | ||||
Total Mortgage-Backed Securities (cost $5,269,627) | 6,435,582 | |||||
| Shares | ||||||
Preferred Stocks - 0.9% | ||||||
Bank of America Corp., 6.375% | 20,000 | 385,000 | ||||
Bank of America Corp., Series L, 7.250%9 | 7,808 | 7,089,664 | ||||
Comcast Corp. Series B, 7.000% | 207,547 | 5,267,543 | ||||
Entergy New Orleans, Inc., 4.750% | 482 | 38,048 | ||||
Entergy New Orleans, Inc., 5.560% | 100 | 9,241 | ||||
FNMA, Series S, 8.250%* | 355,700 | 120,938 | ||||
The accompanying notes are an integral part of these financial statements.
13
Table of Contents
Managers Bond Fund
Schedule of Portfolio Investments (continued)
Security Description | Shares | Value | ||||
Preferred Stocks - 0.9% (continued) | ||||||
GMAC Preferred, 9.000%,(a) | 1,560 | $ | 1,212,559 | |||
Newell Financial Trust I, 5.250%9 | 90,628 | 3,171,980 | ||||
SLM Corp., 6.000% | 41,250 | 694,650 | ||||
Sovereign Capital Trust IV, 4.375%9 | 34,236 | 1,082,713 | ||||
Wisconsin Electric Power Co., 3.600% | 3,946 | 287,811 | ||||
Total Preferred Stocks (cost $24,590,368) | 19,360,147 | |||||
Short-Term Investments - 7.6%1 | ||||||
BNY Institutional Cash Reserves Fund, Series B*3,8 | 1,652,054 | 322,151 | ||||
BNY Mellon Overnight Government Fund, 0.03%3 | 16,555,000 | 16,555,000 | ||||
Dreyfus Cash Management Fund, Institutional Class Shares, 0.13% | 83,047,931 | 83,047,931 | ||||
JPMorgan Liquid Assets Money Market Fund, Capital Shares, 0.21% | 66,176,253 | 66,176,253 | ||||
Total Short-Term Investments (cost $167,431,238) | 166,101,335 | |||||
Total Investments - 100.5% (cost $2,108,847,719) | 2,184,681,430 | |||||
Other Assets, less Liabilities - (0.5)% | (1 1,282,183 | ) | ||||
Net Assets - 100.0% | $ | 2,173,399,247 | ||||
The following footnotes and abbreviations should be read in conjunction with the Schedule of Portfolio Investments.
Based on the approximate cost of investments of $2,109,589,740 for Federal income tax purposes at June 30, 2010, the aggregate gross unrealized appreciation and depreciation were $126,993,919 and $51,902,229, respectively, resulting in a net unrealized appreciation of investments of $75,091,690.
| * | Non-income-producing security. |
| † | Principal Amount stated in U.S. dollars unless otherwise noted. |
| (a) | Security exempt from registration under Rule 144A of the Securities Act of 1933. This security may be resold in transactions exempt from registration, normally to qualified buyers. At June 30, 2010, the value of these securities amounted to $300,230,519 or 13.8% of net assets. |
| 1 | Yield shown for an investment company represents the June 30, 2010, seven-day average yield, which refers to the sum of the previous seven days’ dividends paid, expressed as an annual percentage. |
| 2 | Some or all of these shares were out on loan to various brokers as of June 30, 2010, amounting to $17,635,521 or 0.8% of net assets. |
| 3 | Collateral received from brokers for securities lending was invested in these short-term investments. |
| 4 | Represents yield to maturity at June 30, 2010. |
| 5 | Security is illiquid: A security not readily convertible into cash such as a stock, bond or commodity that is not actively traded, and would be difficult to sell in a current sale. The Fund may not invest more than 15% of its net assets in illiquid securities. All securities are valued by an independent pricing agent or broker. Illiquid securities at June 30, 2010 amounted to $59,043,071 or 2.7% of net assets. |
| 6 | Floating Rate Security. The rate listed is as of June 30, 2010. Date in parentheses represents the security’s next coupon rate reset. |
| 7 | Variable Rate Security. The rate listed is as of June 30, 2010 and is periodically reset subject to terms and conditions set forth in the debenture. |
| 8 | On September 12, 2008, The Bank of New York Mellon established a separate sleeve of the BNY Institutional Cash Reserves Fund (Series B) to hold certain Lehman Brothers floating rate notes. The Fund’s position in Series B is being marked to market daily. (See note 9 in the Notes to the Financial Statements.) |
| 9 | Convertible Security. A corporate bond or preferred stock, usually a junior debenture, that can be converted, at the option of the holder, for a specific number of shares of the company’s preferred stock or common stock. Convertible Bonds and Convertible Preferred Stocks at June 30, 2010 amounted to $28,640,650 or 1.3% of net assets and $11,344,357 or 0.5% of net assets, respectively. |
Investments Definitions and Abbreviations:
| AGM: | Assured Guaranty Municipal Corp. | |
| AMBAC: | American Municipal Bond Assurance Corp. | |
| EMTN: | European Medium Term Note | |
| FHLMC: | Federal Home Loan Mortgage Corp. | |
| FNMA: | Federal National Mortgage Association | |
| GDIF: | Global Debt Insurance Facility | |
| GMAC: | General Motors Acceptance Corp. | |
| GMTN: | Global Multi-Currency Notes | |
| MBIA: | MBIA Insurance Corp. | |
| MTN: | Medium Term Note | |
| NATL-RE: | National Public Finance Guarantee Corporation | |
| USTN: | United States Treasury Notes |
Abbreviations have been used throughout the portfolios to indicate amounts shown in currencies other than the U.S. dollar (USD):
| AUD: | Australian Dollar | |
| BRL: | Brazilian Real | |
| CAD: | Canadian Dollar | |
| EUR: | euro | |
| IDR: | Indonesian Rupiah | |
| MXN: | Mexican Peso | |
| NZD: | New Zealand Dollar | |
| SGD: | Singapore Dollar |
The accompanying notes are an integral part of these financial statements.
14
Table of Contents
Managers Bond Fund
Statement of Assets and Liabilities
June 30, 2010 (unaudited]
Assets: |
| |||
Investments at value (including securities on loan valued at $17,635,521)* | $ | 2,184,681,430 | ||
Foreign currency** | 2,460 | |||
Receivable for investments sold | 2,312,065 | |||
Receivable for Fund shares sold | 4,472,185 | |||
Receivable from affiliate | 141,237 | |||
Dividends, interest and other receivables | 26,269,968 | |||
Prepaid expenses | 96,339 | |||
Total assets | 2,217,975,684 | |||
Liabilities: | ||||
Payable for Fund shares repurchased | 3,828,870 | |||
Payable upon return of securities loaned | 18,207,054 | |||
Payable for investments purchased | 20,151,759 | |||
Other payables | 103,641 | |||
Accrued expenses: | ||||
Investment advisory and management fees | 1,106,323 | |||
Administrative fees | 442,529 | |||
Other | 736,261 | |||
Total liabilities | 44,576,437 | |||
Net Assets | $ | 2,173,399,247 | ||
Shares outstanding | 86,467,836 | |||
Net asset value, offering and redemption price per share | $ | 25.14 | ||
Net Assets Represent: | ||||
Paid-in capital | $ | 2,200,509,207 | ||
Undistributed net investment income | 366,693 | |||
Accumulated net realized loss from investments and foreign currency transactions | (103,259,917 | ) | ||
Net unrealized appreciation of investments and foreign currency translations | 75,783,264 | |||
Net Assets | $ | 2,173,399,247 | ||
| ||||
* Investments at cost | $ | 2,108,847,719 | ||
** Foreign currency at cost | $ | 2,499 | ||
The accompanying notes are an integral part of these financial statements.
15
Table of Contents
Managers Bond Fund
For the six months ended June 30, 2010 (unaudited]
Investment Income: | ||||
Interest income | $ | 60,158,844 | ||
Dividend income | 799,527 | |||
Securities lending fees | 13,043 | |||
Total investment income | 60,971,414 | |||
Expenses: | ||||
Investment management and advisory fees | 6,763,376 | |||
Administrative fees | 2,705,350 | |||
Transfer agent | 1,319,032 | |||
Professional fees | 233,438 | |||
Custodian | 190,649 | |||
Reports to shareholders | 144,495 | |||
Trustees fees and expenses | 91,446 | |||
Registration fees | 49,113 | |||
Miscellaneous | 65,182 | |||
Total expenses before offsets | 11,562,081 | |||
Expense reimbursements | (847,348 | ) | ||
Fee waivers | (5,305 | ) | ||
Expense reductions | (1,546 | ) | ||
Net expenses | 10,707,882 | |||
Net investment income | 50,263,532 | |||
Net Realized and Unrealized Gain (Loss): | ||||
Net realized loss on investments | (31,715,705 | ) | ||
Net realized loss on foreign currency transactions | (837,367 | ) | ||
Net unrealized appreciation of investments | 105,355,194 | |||
Net unrealized depreciation of foreign currency translations | (228,581 | ) | ||
Net realized and unrealized gain | 72,573,541 | |||
Net increase in net assets resulting from operations | $ | 122,837,073 |
The accompanying notes are an integral part of these financial statements.
16
Table of Contents
Managers Bond Fund
Statement of Changes in Net Assets
For the six months ended June 30, 2010 (unaudited) and for the year ended December 31, 2009
| 2010 | 2009 | |||||||
Increase (Decrease) in Net Assets From Operations: | ||||||||
Net investment income | $ | 50,263,532 | $ | 120,096,032 | ||||
Net realized loss on investments and foreign currency transactions | (32,553,072 | ) | (59,485,276 | ) | ||||
Net unrealized appreciation of investments and foreign currency translations | 105,126,613 | 486,057,459 | ||||||
Net increase in net assets resulting from operations | 122,837,073 | 546,668,215 | ||||||
Distributions to Shareholders: | ||||||||
From net investment income | (47,881,008 | ) | (118,309,043 | ) | ||||
From Capital Share Transactions: | ||||||||
Proceeds from sale of shares | 283,268,554 | 684,473,826 | ||||||
Reinvestment of dividends and distributions | 44,564,769 | 108,826,420 | ||||||
Cost of shares repurchased | (423,091,838 | ) | (916,876,877 | ) | ||||
Net decrease from capital share transactions | (95,258,515 | ) | (123,576,631 | ) | ||||
Total increase (decrease) in net assets | (20,302,450 | ) | 304,782,541 | |||||
Net Assets: | ||||||||
Beginning of period | 2,193,701,697 | 1,888,919,156 | ||||||
End of period | $ | 2,173,399,247 | $ | 2,193,701,697 | ||||
End of period undistributed net investment income (loss) | $ | 366,693 | ($ | 2,015,831 | ) | |||
Share Transactions: | ||||||||
Sale of shares | 11,350,077 | 31,756,529 | ||||||
Reinvested shares | 1,787,567 | 5,009,261 | ||||||
Shares repurchased | (16,966,003 | ) | (42,593,625 | ) | ||||
Net decrease in shares | (3,828,359 | ) | (5,827,835 | ) | ||||
The accompanying notes are an integral part of these financial statements.
17
Table of Contents
For a share outstanding throughout each period
| For the six months ended June 30, 2010 (unaudited) |
For the year ended December 31, | |||||||||||||||||||||||
Managers Bond Fund | 2009 | 2008 | 2007 | 2006 | 2005 | |||||||||||||||||||
Net Asset Value, Beginning of Period | $ | 24.29 | $ | 19.65 | $ | 25.34 | $ | 24.84 | $ | 24.11 | $ | 24.58 | ||||||||||||
Income from Investment Operations: | ||||||||||||||||||||||||
Net investment income | 0.57 | 5 | 1.30 | 5 | 1.42 | 5 | 1.22 | 5 | 1.08 | 0.88 | ||||||||||||||
Net realized and unrealized gain (loss) on investments | 0.83 | 5 | 4.62 | 5 | (5.42 | )5 | 0.49 | 5 | 0.75 | (0.32 | ) | |||||||||||||
Total from investment operations | 1.40 | 5.92 | (4.00 | ) | 1.71 | 1.83 | 0.56 | |||||||||||||||||
Less Distributions to Shareholders from: | ||||||||||||||||||||||||
Net investment income | (0.55 | ) | (1.28 | ) | (1.41 | ) | (1.21 | ) | (1.10 | ) | (0.88 | ) | ||||||||||||
Net realized gain on investments | — | — | (0.28 | ) | (0.00 | )4 | — | (0.15 | ) | |||||||||||||||
Total distributions to shareholders | (0.55 | ) | (1.28 | ) | (1.69 | ) | (1.21 | ) | (1.10 | ) | (1.03 | ) | ||||||||||||
Net Asset Value, End of Period | $ | 25.14 | $ | 24.29 | $ | 19.65 | $ | 25.34 | $ | 24.84 | $ | 24.11 | ||||||||||||
Total Return1 | 5.80 | %3,6 | 31.12 | %3 | (16.31 | )% | 7.06 | % | 7.79 | %3 | 2.29 | % | ||||||||||||
Ratio of net expenses to average net assets | 0.99 | %7 | 0.99 | % | 0.99 | % | 0.99 | % | 0.99 | % | 0.99 | % | ||||||||||||
Ratio of net investment income to average net assets1 | 4.65 | %7 | 5.93 | % | 6.10 | % | 4.91 | % | 4.52 | % | 3.36 | % | ||||||||||||
Portfolio turnover | 8 | %6 | 23 | % | 39 | % | 21 | % | 46 | % | 26 | % | ||||||||||||
Net assets at end of period (000’s omitted) | $ | 2,173,399 | $ | 2,193,702 | $ | 1,888,919 | $ | 2,022,891 | $ | 906,776 | $ | 426,448 | ||||||||||||
Ratios absent expense offsets:2 | ||||||||||||||||||||||||
Ratio of total expenses to average net assets | 1.07 | %7 | 1.10 | % | 1.10 | % | 0.99 | % | 1.02 | % | 1.02 | % | ||||||||||||
Ratio of net investment income to average net assets | 4.57 | %7 | 5.82 | % | 5.99 | % | 4.91 | % | 4.49 | % | 3.33 | % | ||||||||||||
| 1 | Total returns and net investment income would have been lower had certain expenses not been reduced. (See Note 1(c) to the Notes to Financial Statements.) |
| 2 | Excludes the impact of expense reimbursement and expense offsets such as brokerage credits, but includes non-reimbursable expenses, if any, such as interest and taxes. (See Note 1(c) to the Notes to Financial Statements.) |
| 3 | The Total Return is based on the Financial Statement Net Asset Values as shown above. |
| 4 | Rounds to less than $0.01. |
| 5 | Per share numbers have been calculated using average shares. |
| 6 | Not Annualized. |
| 7 | Annualized. |
18
Table of Contents
June 30, 2010 (unaudited)
1. Summary of Significant Accounting Policies
The Managers Funds (the “Trust”) is an open-end management investment company organized as a Massachusetts business trust and registered under the Investment Company Act of 1940, as amended (the “1940 Act”). Currently, the Trust is comprised of a number of different funds, each having distinct investment management objectives, strategies, risks and policies. Included in this report is the Managers Bond Fund (“the Fund”).
The Fund’s financial statements are prepared in accordance with accounting principles generally accepted in the United States of America, which require management to make estimates and assumptions that affect the reported amounts of assets and liabilities and disclosure of contingent assets and liabilities at the date of the financial statements and the reported amounts of income and expenses during the reporting periods. Actual results could differ from those estimates and such differences could be material. The following is a summary of significant accounting policies followed by the Fund in the preparation of its financial statements:
a. Valuation of Investments
Equity securities traded on a domestic or international securities exchange are valued at the last quoted sale price, or, lacking any sales, at the last quoted bid price. Over-the-counter securities are valued at the Nasdaq Official Closing Price, if one is available. Lacking any sales, over-the-counter securities are valued at the last quoted bid price. The Fund’s investments are generally valued based on market quotations provided by third-party pricing services approved by the Board of Trustees of the Fund. Under certain circumstances, the value of certain Fund investments may be based on an evaluation of its fair value, pursuant to procedures established by and under the general supervision of the Board of Trustees of the Fund. The Fund may use the fair value of a portfolio security to calculate its NAV when, for example, (1) market quotations are not readily available because a portfolio security is not traded in a public market or the principal market in which the security trades is closed, (2) trading in a portfolio security is suspended and has not resumed before the Fund calculates its NAV, (3) a significant event affecting the value of a portfolio security is determined to have occurred between the time of the market quotation provided for a portfolio security and the time as of which the Fund calculates its NAV, (4) a security’s price has remained unchanged over a period of time (often referred to as a “stale price”), or (5) Managers Investment Group LLC (the “Investment Manager”) determines that a market quotation is inaccurate. Portfolio investments that trade primarily on foreign markets are priced based upon the market quotation of such securities as of the close of their respective principal markets, as adjusted to reflect the Investment Manager’s determination of the impact of events occurring subsequent to the close of such markets but prior to the time as of which the Fund calculates its NAV. In accordance with procedures approved by the Board of Trustees, the Investment Manager relies upon recommendations of a third-party fair valuation service in adjusting the prices of such foreign portfolio investments. The Fund may invest in securities that may be thinly traded. The Board of Trustees has adopted procedures to adjust prices when thinly traded securities are judged to be stale so that they reflect fair value. An investment valued on the basis of its fair value may be valued at a price higher or lower than available market quotations. An investment’s valuation may differ depending on the method used and the factors considered in determining value according to the Fund’s fair value procedures.
Fixed-income securities are valued based on valuations furnished by independent pricing services that utilize matrix systems, which reflect such factors as security prices, yields, maturities, and ratings, and are supplemented by dealer and exchange quotations. Futures contracts for which market quotations are readily available are valued at the settlement price as of the close of the futures exchange. Short-term investments having a remaining maturity of 60 days or less are valued at amortized cost, which approximates market value. Investments in other open-end regulated investment companies are valued at their end of day net asset value per share. Investments in certain mortgage-backed and stripped mortgage-backed securities, preferred stocks, convertible securities, derivatives and other debt securities not traded on an organized securities market are valued on the basis of valuations provided by dealers or by a pricing service which uses information with respect to transactions in such securities and various relationships between securities and yield to maturity in determining value. Securities (including derivatives) for which market quotations are not readily available are valued at fair value, as determined in good faith, and pursuant to procedures adopted by the Board of Trustees of the Trust. The values assigned to fair value investments are based on available information and do not necessarily represent amounts that might ultimately be realized, since such amounts depend on future developments inherent in long-term investments. Further, because of the inherent uncertainty of valuation, those estimated values may differ significantly from the values that would have been used had a ready market for the investments existed, and the differences could be material.
Generally Accepted Accounting Principles (GAAP) define fair value as the price that a Fund would receive to sell an asset or pay to transfer a liability in an orderly transaction between market participants at the measurement date. GAAP also establishes a framework for measuring fair value, and a three-level hierarchy for fair value measurements based upon the transparency of inputs to the valuation of an asset or liability. Inputs may be observable or unobservable and refer broadly to the assumptions that market participants would use in pricing the asset or liability. Observable inputs reflect the assumptions market participants would use in pricing the asset or liability based on market data obtained from sources independent of the Fund. Unobservable inputs reflect the Fund’s own assumptions about the assumptions that market participants would use in pricing the asset or liability developed based on the best information available in the circumstances. Each investment is assigned a level based upon the observability of the inputs which are significant to the overall valuation.
19
Table of Contents
Notes to Financial Statements (continued)
The three-tier hierarchy of inputs is summarized below:
Level 1 – quoted prices in active markets for identical investments
Level 2 – other significant observable inputs (including quoted prices for similar investments, interest rates, prepayment speeds, credit risk)
Level 3 – significant unobservable inputs (including the Fund’s own assumptions in determining the fair value of investments)
The inputs or methodologies used for valuing investments are not necessarily an indication of the risk associated with investing in those investments. As of June 30, 2010, the Fund had no significant transfers between Level 1 and Level 2 from the beginning of the reporting period. The following table summarizes the inputs used to value the Fund’s net assets by the above fair value hierarchy levels as of June 30, 2010:
| Level 1 | Level 2 | Level 3 | Total | ||||||||
Managers Bond | |||||||||||
Investments in Securities | |||||||||||
Corporate Bonds1 | — | $ | 1,577,439,584 | — | $ | 1,577,439,584 | |||||
Foreign Government Obligations | — | 153,090,641 | — | 153,090,641 | |||||||
Municipal Bonds | — | 28,574,961 | — | 28,574,961 | |||||||
Asset-Backed Securities | — | 80,794,959 | — | 80,794,959 | |||||||
U.S. Government and Agency Obligations2 | — | 152,884,221 | — | 152,884,221 | |||||||
Mortgage-Backed Securities | — | 6,435,582 | — | 6,435,582 | |||||||
Preferred Stocks | $ | 19,360,147 | — | — | 19,360,147 | ||||||
Short-Term Investments | 165,779,184 | 322,151 | — | 166,101,335 | |||||||
Total Investments | $ | 185,139,331 | $ | 1,999,542,099 | — | $ | 2,184,681,430 | ||||
| 1 | All corporate bonds held in the Fund are Level 2 securities. For a detailed break-out of the corporate bonds by major industry classification, please refer to the Schedule of Portfolio Investments. |
| 2 | All U.S. Government and Agency Obligations held in the Funds are Level 2 securities. For a detailed break-out of these securities, please refer to the Schedule of Portfolio Investments. |
20
Table of Contents
Notes to Financial Statements (continued)
b. Security Transactions
Security transactions are accounted for as of trade date. Realized gains and losses on securities sold are determined on the basis of identified cost.
c. Investment Income and Expenses
Dividend income is recorded on the ex-dividend date except certain dividends from foreign securities where the ex-dividend date may have passed. These dividends are recorded as soon as the Trust is informed of the ex-dividend date. Dividend income on foreign securities is recorded net of any withholding tax. Interest income, which includes amortization of premium and accretion of discount on debt securities, is accrued as earned. Non-cash dividends included in dividend income, if any, are reported at the fair market value of the securities received. Other income and expenses are recorded on an accrual basis. Expenses that cannot be directly attributed to a fund are apportioned among the Funds in the Trust and in some cases other affiliated funds based upon their relative average net assets or number of shareholders.
The Fund has a “balance credit” arrangement with The Bank of New York Mellon (“BNYM”), the Fund’s custodian, whereby the Fund is credited with an interest factor equal to 0.75% below the effective 90-day T-Bill rate for account balances left uninvested overnight. If the T-Bill rate falls below 0.75%, no credits will be earned. These credits serve to reduce custody expenses that would otherwise be charged to the Fund. For the six months ended June 30, 2010, the custodian expense was not reduced.
Overdrafts will cause a reduction of any earnings credits, computed at 2% above the effective Federal Funds rate on the day of the overdraft. For the six months ended June 30, 2010, the Fund had no overdraft fees.
The Trust also has a balance credit arrangement with its Transfer Agent, PNC Global Investment Servicing (U.S.) Inc., whereby earnings credits are used to offset banking charges and other out-of-pocket expenses. For the six months ended June 30, 2010, the transfer agent expense was reduced by $1,546.
The Investment Manager has agreed to waive a portion of its management fee in consideration of shareholder servicing fees that it has received from JPMorgan Distribution Services, Inc., with respect to short-term cash investments the Fund has made in JPMorgan Liquid Assets Money Market Fund, Capital Shares. For the six months ended June 30, 2010, the management fee was reduced by $5,305.
Total returns and net investment income for the Fund would have been lower had certain expenses not been offset. Total expenses before offsets exclude the impact of expense reimbursements or fee waivers and expense offsets such as brokerage recapture credits, but include non-reimbursable expenses if any, such as interest and taxes.
d. Dividends and Distributions
Dividends resulting from net investment income, if any, normally will be declared and paid monthly. Distributions of capital gains, if any, will be made annually in December and when required for Federal excise tax purposes. Income and capital gain distributions are determined in accordance with Federal income tax regulations, which may differ from GAAP. These differences are primarily due to differing treatments for losses deferred due to wash sales, REITS, equalization accounting for tax purposes, foreign currency, options, futures and market discount transactions. Permanent book and tax basis differences, if any, relating to shareholder distributions will result in reclassifications to paid-in capital.
e. Federal Taxes
The Fund intends to comply with the requirements under Subchapter M of the Internal Revenue Code of 1986, as amended, to distribute substantially all of its taxable income and gains to its shareholders and to meet certain diversification and income requirements with respect to investment companies. Therefore, no provision for Federal income or excise tax is included in the accompanying financial statements.
Additionally, based on the Fund’s understanding of the tax rules and rates related to income, gains and transactions for the foreign jurisdictions in which it invests, the Fund will provide for foreign taxes, and where appropriate, deferred foreign taxes.
Management has analyzed the Fund’s tax positions taken on federal income tax returns for all open tax years (tax years ended December 31, 2006-2009), and has concluded that no provision for federal income tax is required in the Fund’s financial statements. Additionally, the Fund is not aware of any tax position for which it is reasonably possible that the total amounts of unrecognized tax benefits will change materially in the next twelve months.
f. Capital Loss Carryovers
As of June 30, 2010, the Fund had $69,964,824 in accumulated net realized capital loss carryover from securities transactions for Federal income tax purposes. This amount may be used to offset realized capital gains, if any, through December 31, 2017.
21
Table of Contents
Notes to Financial Statements (continued)
g. Capital Stock
The Trust’s Declaration of Trust authorizes for each series the issuance of an unlimited number of shares of beneficial interest, without par value. The Fund records sales and repurchases of its capital stock on the trade date. The cost of securities contributed to the Fund in connection with the issuance of shares is based on the valuation of those securities in accordance with the Fund’s policy on investment valuation. Dividends and distributions to shareholders are recorded on the ex-dividend date.
At June 30, 2010, certain unaffiliated shareholders of record, specifically omnibus accounts, individually held greater than 10% of the outstanding shares of the Fund as follows: two collectively own 39%. Transactions by these shareholders may have a material impact on the Fund.
h. Foreign Currency Translation
The books and records of the Fund are maintained in U.S. dollars. The value of investments, assets and liabilities denominated in currencies other than U.S. dollars are translated into U.S. dollars based upon current foreign exchange rates. Purchases and sales of foreign investments, income and expenses are converted into U.S. dollars based on currency exchange rates prevailing on the respective dates of such transactions. Net realized and unrealized gain (loss) on foreign currency transactions represent: (1) foreign exchange gains and losses from the sale and holdings of foreign currencies; (2) gains and losses between trade date and settlement date on investment securities transactions and forward foreign currency exchange contracts; and (3) gains and losses from the difference between amounts of interest and dividends recorded and the amounts actually received.
The Fund does not isolate the net realized and unrealized gain or loss resulting from changes in exchange rates from the fluctuations in market prices of securities held. Such fluctuations are included with the net realized and unrealized gain or loss on investments.
2. Agreements and Transactions with Affiliates
The Trust has entered into an Investment Management Agreement under which the Investment Manager, an independently managed subsidiary of Affiliated Managers Group, Inc. (“AMG”), serves as investment manager to the Fund and is responsible for the Fund’s overall administration. The Investment Manager selects subadvisors for the Fund (subject to Trustee approval) and monitors each subadvisor’s investment programs and results. The Fund’s investment portfolio is managed by a portfolio manager who serves pursuant to a Subadvisory Agreement with the Investment Manager.
Investment management fees are paid directly by the Fund to the Investment Manager based on average daily net assets. For the six months ended June 30, 2010, the annual investment management fee rate, as a percentage of average daily net assets, was 0.625%.
The Trust has entered into an Administration and Shareholder Servicing Agreement under which the Investment Manager serves as the Fund’s administrator (the “Administrator”) and is responsible for all aspects of managing the Fund’s operations, including administration and shareholder services to the Fund, its shareholders, and certain institutions, such as bank trust departments, broker-dealers and registered investment advisers, that advise or act as an intermediary with the Fund’s shareholders. The Fund pays a fee to the Administrator at the rate of 0.25% per annum of the Fund’s average daily net assets for this service.
The Investment Manager has contractually agreed, through at least May 1, 2011, to waive fees and pay or reimburse expenses to the extent that the total annual operating expenses (exclusive of taxes, interest, brokerage costs, acquired fund expenses, and extraordinary expenses) of the Fund exceed 0.99% of the Fund’s average daily net assets.
The Fund is obligated to repay the Investment Manager such amounts waived, paid or reimbursed in future years provided that the repayment occurs within thirty-six (36) months after the waiver or reimbursement and that such repayment would not cause the Fund’s total operating expenses in any such future year to exceed that Fund’s respective expense cap. For the six months ended June 30, 2010, the Fund made no such repayments to the Investment Manager. At June 30, 2010, the cumulative amount of expense reimbursement by the Investment Manager subject to repayment by the Fund equaled $5,661,222.
The aggregate annual retainer paid to each Independent Trustee is $65,000, plus $4,000 or $2,500 for each regular or special meeting attended, respectively. The Trustees’ fees and expenses are allocated amongst all of the Funds for which the Investment Manager serves as the advisor (the “Managers Funds”) based on the relative net assets of such Funds. The Independent Chairman of the Trusts receives an additional payment of $15,000 per year. The Chairman of the Audit Committee receives an additional payment of $5,000 per year. The “Trustees fees and expenses” shown in the financial statements represents the Fund’s allocated portion of the total fees and expenses paid by the Managers Funds.
The Fund is distributed by Managers Distributors, Inc. (the “Distributor” or “MDI”), a wholly-owned subsidiary of the Investment Manager. MDI serves as the principal underwriter for the Fund and is a registered broker-dealer and member of the Financial Industry Regulatory Authority, Inc. (“FINRA”). Shares of the Fund will be
22
Table of Contents
Notes to Financial Statements (continued)
continuously offered and will be sold by brokers, dealers or other financial intermediaries who have executed selling agreements with the Distributor. MDI bears all the expenses of providing services pursuant to the Underwriting Agreement, including the payment of the expenses relating to the distribution of Prospectuses for sales purposes and any advertising or sales literature. Certain Trustees and Officers of the Fund are Officers and/or Directors of the Investment Manager, AMG and/or the Distributor.
On June 23, 2009, the Securities and Exchange Commission granted an exemptive order that permits the Fund to lend and borrow money for certain temporary purposes directly to and from other eligible Funds in the Managers Family of Funds (the “Fund Family”). Participation in this interfund lending program is voluntary for both borrowing and lending Funds, and an interfund loan is only made if it benefits each participating Fund. The Investment Manager administers the program according to procedures approved by the Funds’ Board of Trustees (the “Board”), and the Board monitors the operation of the program. An interfund loan must comply with certain conditions set out in the exemptive order, which are designed to assure fairness and protect all participating Funds. For the six months ended June 30, 2010, the Fund lent to other Funds in the Fund Family varying amounts up to $2,081,733 for 7 days earning interest of $159. The interest amounts are included in the Statement of Operations in interest income. For the same period, the Fund did not borrow from any Fund in the Fund Family.
3. Purchases and Sales of Securities
Purchases and sales of securities (excluding short-term securities and U.S. government obligations) for the six months ended June 30, 2010, were $133,765,378 and $180,758,012, respectively. Purchases and sales of U.S. government obligations for the six months ended June 30, 2010, were $38,206,937 and $89,622,857, respectively.
4. Portfolio Securities Loaned
The Fund may participate in a securities lending program offered by BNYM, providing for the lending of securities to qualified brokers. Securities lending fees include earnings of such temporary cash investments, plus or minus any rebate to a borrower. These earnings (after any rebate) are then divided between BNYM, as a fee for its services under the program, and the Fund, according to agreed-upon rates. Collateral on all securities loaned is accepted in cash and/or government securities and is maintained at a minimum level of 102% (105% in the case of certain foreign securities) of the market value, plus interest, if applicable, of investments on loan. It is the Fund’s policy to obtain additional collateral from or return excess collateral to the borrower by the end of the next business day, following the valuation date of the securities loaned. Therefore, the value of the collateral held may be temporarily less than the value of the securities on loan. Lending securities entails a risk of loss to the Fund if and to the extent that the market value of the securities loaned were to increase and the borrower did not increase the collateral accordingly, and the borrower fails to return the securities. The Fund bears the risk of any deficiency in the amount of the collateral available for return to the borrower due to any loss on the collateral invested. Collateral received in the form of cash is invested temporarily in the BNY Mellon Overnight Government Fund, formerly the BNY Institutional Cash Reserves Fund (the “ICRF”), or other short-term investments as defined in the Securities Lending Agreement with BNYM.
In September of 2008, BNYM advised the Investment Manager that the ICRF had exposure to certain defaulted debt obligations, and that BNYM had established a separate sleeve of the ICRF to hold these securities. The net impact of these positions is not material to each Fund. Each Fund’s position in the separate sleeve of the ICRF is included in the Schedule of Portfolio Investments and the unrealized loss on such investment is included in Net Unrealized Depreciation on the Statement of Assets and Liabilities and the Statement of Operations.
5. Commitments and Contingencies
In the normal course of business, the Fund may enter into contracts and agreements that contain a variety of representations and warranties, which provide general indemnifications. The maximum exposure to the Fund under these arrangements is unknown, as this would involve future claims that may be made against the Fund that have not yet occurred. However, based on experience, the Fund expects the risk of loss to be remote.
6. Risks Associated with High Yield Securities (High Yield)
Investing in high yield securities involves greater risks and considerations not typically associated with U.S. Government and other high quality/investment grade securities. High Yield securities are generally below investment grade securities and do not have an established retail secondary market. Economic downturns may disrupt the high yield market and impair the issuer’s ability to repay principal and interest. Also, an increase in interest rates would likely have an adverse impact on the value of such obligations and could cause the securities to become less liquid.
23
Table of Contents
Notes to Financial Statements (continued)
7. Forward Commitments
Certain transactions, such as futures and forward transactions, dollar roll agreements, or purchases of when-issued or delayed delivery securities may have a similar effect on the Fund’s net asset value as if the Fund had created a degree of leverage in its portfolio. However, if the Fund enters into such a transaction, the Fund will establish a segregated account with its custodian in which it will maintain cash, U.S. government securities or other liquid securities equal in value to its obligations in respect to such transaction. Securities and other assets held in the segregated account may not be sold while the transaction is outstanding, unless other suitable assets are substituted.
8. Forward Foreign Currency Contracts
The Fund may invest in forward foreign currency exchange contracts to manage currency exposure. These investments may involve greater market risk than the amounts disclosed in the Fund’s financial statements.
A forward foreign currency exchange contract is an agreement between a Fund and another party to buy or sell a currency at a set price at a future date. The market value of the contract will fluctuate with changes in currency exchange rates. The contract is marked-to-market daily, and the change in market value is recorded as an unrealized gain or loss. Gain or loss on the purchase or sale of contracts having the same settlement date, amount and counterparty is realized on the date of offset, otherwise gain or loss is realized on the settlement date. There were no forward currency contracts held during the year.
The Fund may invest in non-U.S. dollar denominated instruments subject to limitations, and enter into forward foreign currency exchange contracts to facilitate transactions in foreign securities and to hedge foreign currency exchange rate risk on its non-U. S. Dollar denominated investment securities. Risks may arise upon entering into these contracts from the potential inability of counterparties to meet the terms of their contracts and from unanticipated movements in the value of a foreign currency relative to the U. S. dollar.
9. Subsequent Events
On July 1, 2010, paperwork was filed with the appropriate authorities in order to enact a legal entity name change for PNC Global Investment Servicing (U.S.) Inc. to BNY Mellon Investment Servicing (US) Inc., due to the acquisition of the company by The Bank of New York Mellon.
Effective August 2, 2010, the Trust, on behalf of each applicable Fund, has entered into an agreement with The Bank of New York Mellon and the Bank of New York Mellon Corporation (“BNYMC”) with respect to each Fund’s position in the BNY Institutional Cash Reserves Fund (the “ICRF”), pursuant to which (i) BNYMC will support the value of certain defaulted securities issued by Lehman Brothers Holdings, Inc. and held by ICRF, and (ii) if certain conditions are met, BNYMC will purchase the defaulted securities from each Fund in September 2011. Each applicable Fund is now fair valuing its position in the ICRF daily.
24
Table of Contents
Annual Renewal of Investment Advisory Agreement (unaudited)
On June 10-11, 2010, the Board of Trustees, including a majority of the Trustees who are not “interested persons” of the Trust (the “Independent Trustees”), approved the Investment Management Agreement with the Investment Manager for the Managers Bond Fund (the “Fund”) and the Subadvisory Agreement for the Subadvisor of the Fund. The Independent Trustees were separately represented by independent counsel in connection with their consideration of the approval of these agreements. In considering the Investment Management and Subadvisory Agreements, the Trustees reviewed a variety of materials relating to the Fund, the Investment Manager and the Subadvisor, including comparative performance, fee and expense information for an appropriate peer group of similar mutual funds (the “Peer Group”), performance information for the relevant benchmark index (the “Fund Benchmark”) and, with respect to the Subadvisor, comparative performance information for an appropriate peer group of managed accounts, and, as to all other matters, other information provided to them on a periodic basis throughout the year, as well as information provided in connection with the meetings of June 10-11, 2010, regarding the nature, extent and quality of services provided by the Investment Manager and the Subadvisor under their respective agreements. Prior to voting, the Independent Trustees: (a) reviewed the foregoing information with their independent legal counsel and with management; (b) received materials from their independent legal counsel discussing the legal standards applicable to their consideration of the Investment Management Agreement and the Subadvisory Agreement; and (c) met with their independent legal counsel in private sessions at which no representatives of management were present.
Nature, extent and quality of services.
In considering the nature, extent and quality of the services provided by the Investment Manager, the Trustees reviewed information relating to the Investment Manager’s operations and personnel. Among other things, the Investment Manager provided financial information, biographical information on its supervisory and professional staff and descriptions of its organizational and management structure. The Trustees also took into account information provided periodically throughout the previous year by the Investment Manager relating to the performance of its duties with respect to the Fund and the Trustees’ familiarity with the Investment Manager’s management through Board meetings, discussions and reports. In the course of their deliberations regarding the Investment Management Agreement, the Trustees evaluated, among other things: (a) the extent and quality of the Investment Manager’s oversight of the operation and management of the Fund; (b) the quality of the search, selection and monitoring services performed by the Investment Manager in overseeing the portfolio management responsibilities of the Subadvisor; (c) the Investment Manager’s ability to supervise the Fund’s other service providers; and (d) the Investment Manager’s compliance programs. The Trustees also took into account the financial condition of the Investment Manager with respect to its ability to provide the services required under the Investment Management Agreement and to maintain a contractual expense limitation for the Fund.
The Trustees also reviewed information relating to the Subadvisor’s operations and personnel and the investment philosophy, strategies and techniques (the “Investment Strategy”) used in managing the Fund. Among other things, the Trustees reviewed biographical information on portfolio management and other professional staff, information regarding the Subadvisor’s organizational and management structure and the Subadvisor’s brokerage policies and practices. The Trustees considered specific information provided regarding the experience of the individual or individuals at the Subadvisor with portfolio management responsibility for the Fund, including the information set forth in the Fund’s prospectus and statement of additional information. In the course of their deliberations, the Trustees evaluated, among other things: (a) the services rendered by the Subadvisor in the past; (b) the qualifications and experience of the Subadvisor’s personnel; and (c) the Subadvisor’s compliance programs. The Trustees also took into account the financial condition of the Subadvisor with respect to its ability to provide the services required under the Subadvisory Agreement.
Performance.
Among other information relating to the Fund’s performance, the Trustees noted that the Fund’s performance for the 1-year, 3-year, 5-year and 10-year periods ended March 31, 2010 was above the median performance of the Peer Group and above the performance of the Fund Benchmark, the Barclays Capital U.S. Government/Credit Index, for each period. The Board took into account management’s discussion of the Fund’s performance, including the fact that over the previous year the Fund has outperformed the Fund Benchmark by a wide margin and exceeded nearly all of the mutual funds in the Peer Group. The Trustees concluded that the Fund’s performance has been satisfactory.
As noted above, the Board considered the Fund’s performance during relevant time periods as compared to the Fund’s Peer Group and considered the Subadvisor’s performance as compared to an appropriate peer group of managed accounts and also considered the gross performance of the Fund as compared to the Subadvisor’s relevant performance composite that utilizes the same investment strategy and approach and noted that the Board reviews on a quarterly basis detailed information about the Fund’s performance results, portfolio composition and Investment Strategies. The Board noted the Investment Manager’s expertise and resources in monitoring the performance, investment style and risk-adjusted performance of the Subadvisor. The Board was mindful of the Investment Manager’s attention to monitoring the Subadvisor’s performance with respect to the Fund and its discussions with management regarding the factors that contributed to the performance of the Fund.
Advisory Fees and Profitability.
In considering the reasonableness of the advisory fee charged by the Investment Manager for managing the Fund, the Trustees noted that the Investment Manager, and not the Fund, is responsible for paying the fees charged by the Fund’s Subadvisor and, therefore, that the fees paid to the Investment Manager cover the cost of
25
Table of Contents
Annual Renewal of Investment Advisory Agreement (continued)
providing portfolio management services as well as the cost of providing search, selection and monitoring services in operating a “manager-of-managers” complex of mutual funds. The Trustees concluded that, in light of the additional high quality supervisory services provided by the Investment Manager and the fact that the subadvisory fees are paid out of the advisory fee, the advisory fee payable by the Fund to the Investment Manager can reasonably be expected to exceed the median advisory fee for the Peer Group, which consists of many funds that do not operate with a manager-of-managers structure. In this regard, the Trustees also noted that the Investment Manager has undertaken to maintain an expense limitation for the Fund.
In considering the reasonableness of the advisory fee payable to the Investment Manager, the Trustees also reviewed information provided by the Investment Manager setting forth all revenues and other benefits, both direct and indirect, received by the Investment Manager and its affiliates attributable to managing the Fund and all the mutual funds in the Managers Family of Funds, the cost of providing such services and the resulting profitability to the Investment Manager and its affiliates from these relationships. The Trustees also noted the current and potential asset levels of the Fund and the willingness of the Investment Manager to waive fees and pay expenses for the Fund from time to time as a means of limiting the total expenses of the Fund. The Trustees also considered management’s discussion of the current asset level of the Fund, including the effect on assets attributable to the economic and market conditions over the past eighteen months, and considered the impact on profitability of the current asset level and any future growth of assets of the Fund. The Board took into account management’s discussion of the current advisory fee structure. The Trustees also noted that the subadvisory fees are paid by the Investment Manager out of its advisory fee. Based on the foregoing, the Trustees concluded that the profitability to the Investment Manager is reasonable and that the Investment Manager is not realizing material benefits from economies of scale that would warrant adjustments to the advisory fees for the Fund at this time. With respect to economies of scale, the Trustees also noted that as the Fund’s assets increase over time, the Fund may realize other economies of scale to the extent that the increase in assets is proportionally greater than the increase in certain other expenses.
The Trustees noted that the Fund’s advisory fee and total expenses (net of applicable expense waivers/reimbursements) as of March 31, 2010 were both higher than the average for the Peer Group. The Trustees took into account the fact that the Investment Manager has contractually agreed, through April 1, 2011, to limit the Fund’s net annual operating expenses to 0.99%. The Trustees concluded that, in light of the nature, extent and quality of the services provided by the Investment Manager and the Subadvisor, the Fund’s performance, the foregoing expense limitation and the considerations noted above with respect to the Subadvisor and the Investment Manager, the Fund’s advisory fees are reasonable.
Subadvisory Fees and Profitability.
In considering the reasonableness of the fee payable by the Investment Manager to the Subadvisor, the Trustees relied on the ability of the Investment Manager to negotiate the terms of the Subadvisory Agreement at arm’s length as part of the manager-of-managers structure, noting that the Subadvisor is not affiliated with the Investment Manager. In addition, the Trustees noted that the subadvisory fees are paid by the Investment Manager out of its advisory fee. Accordingly, the cost of services to be provided by the Subadvisor and the profitability to the Subadvisor of its relationship with the Fund were not material factors in the Trustees’ deliberations. For similar reasons, and based on the current size of the portion of the Fund managed by the Subadvisor, the Trustees concluded that any economies of scale being realized by the Subadvisor was not a material factor in the Trustees’ deliberations at this time.
* * * *
After consideration of the foregoing, the Trustees also reached the following conclusions regarding the Investment Management Agreement and the Subadvisory Agreement, in addition to those conclusions discussed above: (a) the Investment Manager and the Subadvisor have demonstrated that they possess the capability and resources to perform the duties required of them under the Investment Management Agreement and the Subadvisory Agreement; (b) the Subadvisor’s Investment Strategy is appropriate for pursuing the Fund’s investment objectives; (c) the Subadvisor is reasonably likely to execute its Investment Strategy consistently over time; and (d) the Investment Manager and the Subadvisor maintain appropriate compliance programs.
Based on all of the above-mentioned factors and related conclusions, with no single factor or conclusion being determinative and with each Trustee not necessarily attributing the same weight to each factor, the Trustees concluded that approval of the Investment Management Agreement and the Subadvisory Agreement would be in the best interests of the Fund and its shareholders. Accordingly, on June 10-11, 2010, the Trustees, including a majority of the Independent Trustees, voted to approve the Investment Management Agreement and the Subadvisory Agreement for the Fund’s Subadvisor.
26
Table of Contents
THIS PAGE INTENTIONALLY LEFT BLANK
Table of Contents
Investment Manager and Administrator
Managers Investment Group LLC
333 W. Wacker Drive
Suite 1200
Chicago, IL 60606
(800) 835-3879
Distributor
Managers Distributors, Inc.
333 W. Wacker Drive
Suite 1200
Chicago, IL 60606
(800) 835-3879
Custodian
The Bank of New York Mellon
2 Hanson Place
Brooklyn, New York 11217
Legal Counsel
Ropes & Gray LLP
One International Place
Boston, Massachusetts 02110-2624
Transfer Agent
BNY Mellon Investment Servicing (US) Inc.*
Attn: Managers
P.O. Box 9769
Providence, Rhode Island 02940
(800) 548-4539
Trustees
Jack W. Aber
William E. Chapman, II
Nathaniel Dalton
Edward J. Kaier
Steven J. Paggioli
Eric Rakowski
Thomas R. Schneeweis
John H. Streur
For Managers Choice Only
Managers
c/o BNY Mellon Investment Servicing (US) Inc.*
P.O. Box 9847
Providence, Rhode Island 02940-8047
(800) 358-7668
| * | Formerly PNC Global Investment Servicing (U.S.) Inc. |

Table of Contents
MANAGERSAND MANAGERS AMG FUNDS
EQUITY FUNDS | BALANCED FUNDS | |||
EMERGING MARKETS EQUITY Rexiter Capital Management Limited Schroder Investment Management North America Inc.
ESSEX GROWTH ESSEX LARGE CAP GROWTH ESSEX SMALL/MICRO CAP GROWTH Essex Investment Management Co., LLC
FQ TAX-MANAGED U.S. EQUITY FQ U.S. EQUITY First Quadrant, L.P.
GW&K SMALL CAP EQUITY Gannett Welsh & Kotler, LLC
INSTITUTIONAL MICRO-CAP MICRO-CAP Lord, Abbett & Co. LLC WEDGE Capital Management L.L.P. Next Century Growth Investors LLC RBC Global Asset Management (U.S.) Inc.
INTERNATIONAL EQUITY AllianceBernstein L.P. Lazard Asset Management, LLC Martin Currie Inc. | CHICAGO EQUITY PARTNERS MID-CAP Chicago Equity Partners, LLC
REAL ESTATE SECURITIES Urdang Securities Management, Inc.
RENAISSANCE LARGE CAP GROWTH Renaissance Group LLC
SKYLINE SPECIAL EQUITIES PORTFOLIO Skyline Asset Management, L.P.
FRONTIER SMALL CAP GROWTH Frontier Capital Management Company, LLC
SPECIAL EQUITY Ranger Investment Management, L.P. Lord, Abbett & Co. LLC Smith Asset Management Group, L.P. Federated MDTA LLC
SYSTEMATIC VALUE SYSTEMATIC MID CAP VALUE Systematic Financial Management, L.P.
TIMESSQUARE MID CAP GROWTH TIMESSQUARE SMALL CAP GROWTH TSCM GROWTH EQUITY TimesSquare Capital Management, LLC
| CHICAGO EQUITY PARTNERS BALANCED Chicago Equity Partners, LLC
ALTERNATIVE FUNDS FQ GLOBAL ALTERNATIVES FQ GLOBAL ESSENTIALS First Quadrant, L.P.
INCOME FUNDS BOND (MANAGERS) FIXED INCOME GLOBAL BOND Loomis, Sayles & Co., L.P.
BOND (MANAGERS PIMCO) Pacific Investment Management Co. LLC
CALIFORNIA INTERMEDIATE TAX-FREE Miller Tabak Asset Management LLC
GW&K MUNICIPAL BOND GW&K MUNICIPAL ENHANCED YIELD Gannett Welsh & Kotler, LLC
HIGH YIELD J.P. Morgan Investment Management LLC
INTERMEDIATE DURATION GOVERNMENT SHORT DURATION GOVERNMENT Smith Breeden Associates, Inc. | ||
This report is prepared for the Fund’s shareholders. It is authorized for distribution to prospective investors only when preceded or accompanied by an effective prospectus. To receive a free copy of the prospectus or Statement of Additional Information, which includes additional information about Fund Trustees, please contact us by calling 800.835.3879. Distributed by Managers Distributors, Inc., member FINRA.
A description of the policies and procedures each Fund uses to vote its proxies is available: (i) without charge, upon request, by calling 800.835.3879, or (ii) on the Securities and Exchange Commission’s (SEC) Web site at www.sec.gov. For information regarding each Fund’s proxy voting record for the 12-month period ended June 30, call 800.835.3879 or visit the SEC Web site at www.sec.gov.
The Fund files its complete schedule of portfolio holdings with the SEC for the first and third quarters of each fiscal year on Form N-Q. The Fund’s Forms N-Q are available on the SEC’s website at www.sec.gov. A Fund’s Forms N-Q may be reviewed and copied at the SEC’s Public Reference Room in Washington, DC. Information on the operation of the Public Reference Room may be obtained by calling 1-800-SEC-0330. To review a complete list of the Fund’s portfolio holdings, or to view the most recent quarterly holdings report, semiannual report, or annual report, please visit www.managersinvest.com.
|  | |||
| www.managersinvest.com | ||||
 | ||||
Table of Contents
| Item 2. | CODE OF ETHICS |
Not applicable for the semi-annual shareholder report.
| Item 3. | AUDIT COMMITTEE FINANCIAL EXPERT |
Not applicable for the semi-annual shareholder report.
| Item 4. | PRINCIPAL ACCOUNTANT FEES AND SERVICES |
Not applicable for the semi-annual shareholder report.
| Item 5. | AUDIT COMMITTEE OF LISTED REGISTRANTS |
Not applicable.
| Item 6. | SCHEDULE OF INVESTMENTS |
The schedule of investments in unaffiliated issuers as of the close of the reporting period is included as part of the shareholder report contained in Item 1 hereof.
| Item 7. | DISCLOSURE OF PROXY VOTING POLICIES AND PROCEDURES FOR CLOSED-END MANAGEMENT INVESTMENT COMPANIES |
Not applicable.
| Item 8. | PORTFOLIO MANAGERS OF CLOSED-END MANAGEMENT INVESTMENT COMPANIES |
Not applicable.
| Item 9. | PURCHASES OF EQUITY SECURITIES BY CLOSED-END MANAGEMENT INVESTMENT COMPANIES AND AFFILIATED PURCHASERS |
Not applicable.
| Item 10. | SUBMISSION OF MATTERS TO A VOTE OF SECURITY HOLDERS |
Not applicable.
Table of Contents
| Item 11. | CONTROLS AND PROCEDURES |
| (a) | The registrant’s principal executive and principal financial officers have concluded, based on their evaluation of the registrant’s disclosure controls and procedures as of a date within 90 days of the filing date of this report, that the registrant’s disclosure controls and procedures are reasonably designed to ensure that information required to be disclosed by the registrant on Form N-CSR is recorded, processed, summarized and reported within the required time periods and that information required to be disclosed by the registrant in the reports that it files or submits on Form N-CSR is accumulated and communicated to the registrant’s management, including its principal executive and principal financial officers, as appropriate to allow timely decisions regarding required disclosure. |
| (b) | There were no changes in the registrant’s internal control over financial reporting during the registrant’s second fiscal quarter of the period covered by this report that have materially affected, or are reasonably likely to materially affect, the internal control over financial reporting. |
| Item 12. | EXHIBITS |
| (a) (1) | Not applicable. | |
| (a) (2) | Certifications pursuant to Rule 30a-2(a) under the Investment Company Act of 1940 - Filed herewith. | |
| (a) (3) | Not applicable. | |
| (b) | Certifications pursuant to Rule 30a-2(b) under the Investment Company Act of 1940 - Filed herewith. | |
Table of Contents
SIGNATURES
Pursuant to the requirements of the Securities Exchange Act of 1934 and the Investment Company Act of 1940, the registrant has duly caused this report to be signed on its behalf by the undersigned, thereunto duly authorized.
| THE MANAGERS FUNDS | ||
| By: | /S/ JOHN H. STREUR | |
| John H. Streur, President | ||
Date: September 8, 2010
Pursuant to the requirements of the Securities Exchange Act of 1934 and the Investment Company Act of 1940, this report has been signed below by the following persons on behalf of the registrant and in the capacities and on the dates indicated.
| By: | /S/ JOHN H. STREUR | |
| John H. Streur, President |
Date: September 8, 2010
| By: | /S/ DONALD S. RUMERY | |
| Donald S. Rumery, Chief Financial Officer |
Date: September 8, 2010