UNITED STATES
SECURITIES AND EXCHANGE COMMISSION
Washington, D.C. 20549
FORM N-CSR
CERTIFIED SHAREHOLDER REPORT OF
REGISTERED MANAGEMENT INVESTMENT COMPANIES
Investment Company Act file number: 811-03752
AMG Funds III
(Exact name of registrant as specified in charter)
800 Connecticut Avenue, Norwalk, Connecticut 06854
(Address of principal executive offices) (Zip code)
AMG Funds LLC
800 Connecticut Avenue, Norwalk, Connecticut 06854
(Name and address of agent for service)
Registrant’s telephone number, including area code: (203) 299-3500
Date of fiscal year end: May 31
Date of reporting period: June 1, 2014 – May 31, 2015
(Annual Shareholder Report)
Item 1. Reports to Shareholders
| | | | |
 | | ANNUAL REPORT | | |
| | | | | | |
| | |
| | | AMG Funds |
| | | May 31, 2015 | | | | |
| | | AMG Managers Cadence Capital Appreciation Fund |
| | | Investor Class: MPAFX | | | Service Class: MCFYX | | | Institutional Class: MPCIX |
| | | AMG Managers Cadence Mid Cap Fund |
| | | Investor Class: MCMAX | | | Service Class: MCMYX | | | Institutional Class: MCMFX |
| | | AMG Managers Cadence Emerging Companies Fund |
| | | | | | Service Class: MECAX | | | Institutional Class:MECIX |
| | |
| | |
| | | |
| www.amgfunds.com | | AR065-0515 |
| | | | |
| | | | | |
| | | AMG Funds | | |
| | | Annual Report—May 31, 2015 | | |
| | | | | | |
| | | TABLE OF CONTENTS | | PAGE | |
| | | | |
| | | LETTER TO SHAREHOLDERS | | | 2 | |
| | | |
| | | ABOUT YOUR FUND’S EXPENSES | | | 3 | |
| | | |
| | | PORTFOLIO MANAGER’S COMMENTS, FUND SNAPSHOTS, AND SCHEDULES OF PORTFOLIO INVESTMENTS | | | | |
| | | |
| | | AMG Managers Cadence Capital Appreciation Fund | | | 4 | |
| | | AMG Managers Cadence Mid Cap Fund | | | 10 | |
| | | AMG Managers Cadence Emerging Companies Fund | | | 16 | |
| | | |
| | | NOTES TO SCHEDULES OF PORTFOLIO INVESTMENTS | | | 22 | |
| | | |
| | | FINANCIAL STATEMENTS | | | | |
| | | |
| | | Statement of Assets and Liabilities | | | 24 | |
| | | Balance sheets, net asset value (NAV) per share computations and cumulative undistributed amounts | | | | |
| | | |
| | | Statement of Operations | | | 26 | |
| | | Detail of sources of income, expenses, and realized and unrealized gains (losses) during the fiscal year | | | | |
| | | |
| | | Statements of Changes in Net Assets | | | 27 | |
| | | Detail of changes in assets for the past two fiscal years | | | | |
| | | |
| | | Financial Highlights | | | 28 | |
| | | Historical net asset values per share, distributions, total returns, income and expense ratios, turnover ratios and net assets | | | | |
| | | |
| | | Notes to Financial Highlights | | | 33 | |
| | | |
| | | Notes to Financial Statements | | | 34 | |
| | | Accounting and distribution policies, details of agreements and transactions with Fund management and affiliates, and descriptions of certain investment risks | | | | |
| | | |
| | | REPORT OF INDEPENDENT REGISTERED PUBLIC ACCOUNTING FIRM | | | 42 | |
| | | |
| | | TRUSTEES AND OFFICERS | | | 43 | |
|
Nothing contained herein is to be considered an offer, sale or solicitation of an offer to buy shares of any series of the AMG Family of Funds. Such offering is made only by prospectus, which includes details as to offering price and other material information. |
| |
|
| | | | |
| | | | |
| | Letter to Shareholders | | |
| | | | |
DEAR SHAREHOLDER:
Overall, U.S. equity investors were rewarded with another strong period of returns for the fiscal year ended May 31, 2015. Despite the collapse of oil prices and its negative effects on energy stocks, the S&P 500 Index, a widely followed barometer of the U.S. equity market, rose nearly 12% during the past twelve months. Nine out of ten sectors of the S&P 500 were positive over the prior twelve months, led by health care. International stocks, by comparison, fell 1%, as measured by the MSCI ACWI ex USA Index (in U.S. Dollar terms). International investment returns in U.S. Dollar terms were impacted by the strengthening U.S. Dollar. The first quarter of 2015 also marked the six-year anniversary of the equity bull market. The first quarter of 2015 also marked 9 consecutive quarters of positive performance for the S&P 500. Continuing the trend from 2014, equity funds, particularly international funds, saw strong inflows in 2015.
The Barclays U.S. Aggregate Bond Index, a broad U.S. bond market benchmark, returned 3.0% for the fiscal year ended May 31, 2015. Interest rates fell throughout much of 2014, lending positive support to bond prices. However, interest rates have increased more recently, putting pressure on bond prices, driven by a combination of the strengthening U.S. economy along with market expectation of an eventual end, in the coming months, to the Federal Reserve’s zero interest rate policy.
Our foremost goal at AMG Funds is to provide investment solutions that help our shareholders successfully reach their long-term investment goals. By partnering with AMG’s affiliated investment boutiques, AMG Funds provide access to a distinctive array of actively managed, return oriented investment strategies. Additionally, we oversee and distribute a number of complementary open-architecture mutual funds subadvised by unaffiliated investment managers. We thank you for your continued confidence and investment in AMG Funds. You can rest assured that under all market conditions our team is focused on delivering excellent investment management services for your benefit.
Respectfully,

Jeffery Cerutti
President
AMG Funds
| | | | | | | | |
| Average Annual Total Returns | | Periods ended May 31, 2015 |
| Stocks: | | | | 1 Year | | 3 Years | | 5 Years |
| Large Caps | | (S&P 500 Index) | | 11.81% | | 19.67% | | 16.54% |
| | | | |
| Small Caps | | (Russell 2000® Index) | | 11.32% | | 19.45% | | 15.04% |
| | | | |
| International | | (MSCI All Country World Index ex USA Index) | | (0.90)% | | 12.61% | | 8.09% |
| Bonds: | | | | | | | | |
| Investment Grade | | (Barclays U.S. Aggregate Bond Index) | | 3.03% | | 2.21% | | 3.90% |
| | | | |
| High Yield | | (Barclays U.S. High Yield Bond Index) | | 1.95% | | 8.10% | | 9.21% |
| | | | |
| Tax-exempt | | (Barclays Municipal Bond Index) | | 3.18% | | 3.09% | | 4.53% |
| | | | |
| Treasury Bills | | (BofA Merrill Lynch 6-month U.S. Treasury Bill) | | 0.15% | | 0.17% | | 0.21% |
| | | | |
| | | | | |
| | | About Your Fund’s Expenses | | |
| | | | | |
|
As a shareholder of a Fund, you may incur two types of costs: (1) transaction costs, which may include sales charges (loads) on purchase payments; redemption fees; and exchange fees; and (2) ongoing costs, including management fees; distribution (12b-1) fees; and other Fund expenses. This example is intended to help you understand your ongoing costs (in dollars) of investing in the Fund and to compare these costs with the ongoing costs of investing in other mutual funds. The example is based on $1,000 invested at the beginning of the period and held for the entire period as indicated below. ACTUAL EXPENSES The first line of the following table provides information about the actual account values and actual expenses. You may use the information in this line, together with the amount you invested, to estimate the expenses that you paid over the period. Simply divide your account value by $1,000 (for example, an $8,600 account value divided by $1,000 = 8.6), then multiply the result by the number in the first line under the heading entitled “Expenses Paid During Period” to estimate the expenses you paid on your account during this period. HYPOTHETICAL EXAMPLE FOR COMPARISON PURPOSES The second line of the following table provides information about hypothetical account values and hypothetical expenses based on the Fund’s actual expense ratio and an assumed annual rate of return of 5% before expenses, which is not the Fund’s actual return. The hypothetical account values and expenses may not be used to estimate the actual ending account balance or expenses you paid for the period. You may use this information to compare the ongoing costs of investing in the Fund and other funds by comparing this 5% hypothetical example with the 5% hypothetical examples that appear in the shareholder reports of other funds. Please note that the expenses shown in the table are meant to highlight your ongoing costs only and do not reflect any transactional costs, such as sales charges (loads), redemption fees, or exchange fees. Therefore, the second line of the table is useful in comparing ongoing costs only, and will not help you determine the relative total costs of owning different funds. |
| | | | | | | | |
| Six Months Ended May 31, 2015 | | Expense
Ratio for
the Period | | Beginning
Account Value
12/01/14 | | Ending
Account Value
05/31/15 | | Expenses
Paid During
the Period* |
| AMG Managers Cadence Capital Appreciation Fund |
| Investor Class | | | | | | | | |
| Based on Actual Fund Return | | 1.12% | | $1,000 | | $1,056 | | $5.74 |
| Hypothetical (5% return before expenses) | | 1.12% | | $1,000 | | $1,019 | | $5.64 |
| Service Class | | | | | | | | |
| Based on Actual Fund Return | | 0.97% | | $1,000 | | $1,057 | | $4.97 |
| Hypothetical (5% return before expenses) | | 0.97% | | $1,000 | | $1,020 | | $4.89 |
| Institutional Class | | | | | | | | |
| Based on Actual Fund Return | | 0.72% | | $1,000 | | $1,058 | | $3.69 |
| Hypothetical (5% return before expenses) | | 0.72% | | $1,000 | | $1,021 | | $3.63 |
| AMG Managers Cadence Mid Cap Fund |
| Investor Class | | | | | | | | |
| Based on Actual Fund Return | | 1.12% | | $1,000 | | $1,054 | | $5.73 |
| Hypothetical (5% return before expenses) | | 1.12% | | $1,000 | | $1,019 | | $5.64 |
| Service Class | | | | | | | | |
| Based on Actual Fund Return | | 0.97% | | $1,000 | | $1,055 | | $4.97 |
| Hypothetical (5% return before expenses) | | 0.97% | | $1,000 | | $1,020 | | $4.89 |
| Institutional Class | | | | | | | | |
| Based on Actual Fund Return | | 0.72% | | $1,000 | | $1,056 | | $3.69 |
| Hypothetical (5% return before expenses) | | 0.72% | | $1,000 | | $1,021 | | $3.63 |
| AMG Managers Cadence Emerging Companies Fund |
| Service Class | | | | | | | | |
| Based on Actual Fund Return | | 1.67% | | $1,000 | | $1,117 | | $8.81 |
| Hypothetical (5% return before expenses) | | 1.67% | | $1,000 | | $1,017 | | $8.40 |
| Institutional Class | | |
| Based on Actual Fund Return | | 1.42% | | $1,000 | | $1,119 | | $7.50 |
| Hypothetical (5% return before expenses) | | 1.42% | | $1,000 | | $1,018 | | $7.14 |
| * | Expenses are equal to the Fund’s annualized expense ratio multiplied by the average account value over the period, multiplied by the number of days in the most recent fiscal half-year (182), then divided by 365. |
| | | | |
| | | | | |
| | | AMG Managers Cadence Capital Appreciation Fund | | |
| | | Portfolio Manager’s Comments | | |
| | | | | | | | |
For the fiscal year ended May 31, 2015, the AMG Managers Cadence Capital Appreciation Fund (Institutional Class) (the “Fund”) returned 13.6%, lagging its benchmark, the Russell 1000® Growth Index, which returned 14.7%. U.S. stocks continued their ascent during the fiscal year ended May 31, 2015, with the broad S&P 500 Index returning 11.8%. This performance followed the S&P’s strong gain of 20.5% for the prior 12 months ended May 31, 2014, challenging many strategists who argued that rising stock prices in the face of slowing global economic growth were a recipe for investment disappointment. Despite the economic and market cross currents, the Fund posted a positive return, but modestly underperformed the Russell 1000 Growth Index. The Fund performed well for the fiscal year in the consumer staples, financials, materials and industrials sectors, adding value versus the Russell 1000 Growth Index through a combination of stock selection and sector allocation. In contrast, the Fund underperformed the benchmark in health care, information technology, consumer discretionary and energy. Health care has been among the market’s best performing sectors since 2011, powered by increased utilization, innovation in new drugs and medical devices, a powerful IPO market and a robust M&A environment. The Fund benefitted from these tailwinds with portfolio gains exceeding 30% in the fiscal year. Conversely, energy was the weakest sector over the last year, as crude oil prices collapsed by over 50%. Energy stocks in the Russell 1000 Growth Index declined by nearly 16%, and Fund holdings experienced declines that averaged nearly 27%. To emphasize the rotational nature of the equity market, energy was the Russell 1000 Growth’s strongest performing sector in the fiscal year ended May 31, 2014, returning over 35%. | | | | THE YEAR IN REVIEW The fiscal year started on a strong note, with the S&P 500 hitting eight new all-time highs in June, 2014. The employment picture and consumer spending, while far from robust, suggested the economic recovery, which started in June 2009 (essentially six years ago), was still intact, although growing at a slower pace than normal. The U.S. Federal Reserve (the “Fed”) maintained an accommodative monetary stance, fearful of policy mistakes at this stage of the recovery. However, talk of economic decoupling became increasingly loud during the summer months. While the U.S. continued to recover, Europe and the developing markets began to show signs of economic deceleration. China, which had been the primary economic engine of both the developed and the developing markets, showed clear signs of slowing, with some expressing fears of a hard landing. Copper and iron ore prices, as well as other industrial metals, all of which were closely linked with China’s growth, started to collapse. Crude oil prices peaked in late June and by the end of 2014 had fallen by over 50%. As the summer continued, economists described the Euro Zone as increasingly fragile and the foreign backdrop as the biggest threat to the U.S. economy. Economic weakness and declining commodity prices awakened fears of deflation. Central banks around the globe embarked on monetary easing programs to fuel growth and halt the spread of deflationary forces. Interest rates fell to historically low levels – including negative rates in some cases. As 2014 came to a close, the U.S. was the symbol of strength and stability, and the U.S. Dollar started one of its sharpest rises of the recent past. Dollar strength, however, posed a dual threat – U.S. exports became increasingly expensive relative to other countries, and currency translation impacted the reported sales and earnings of U.S. multinational companies. On top | | | | of these macroeconomic headwinds, the West Coast dock strike, bitter temperatures and historic snowfalls paralyzed parts of the country. Despite the many negative macroeconomic and geopolitical worries, stocks managed to look through the current fog and discount an improved future. OUTLOOK To quote John Kenneth Galbraith, “The only function of economic forecasting is to make astrology look respectable.” While this tongue-in-cheek statement could be applied to all types of forecasts, equity portfolio management demands an opinion or expectation about the future. Absent an unexpected geopolitical event or policy mistake, we continue to believe that U.S. and international economic recovery will continue, given that economies respond with a lag to economic stimulus. For example, it may take from six months to a year for the effects of central bank accommodation to work its way through the global economy. This is stimulus that, along with lower energy prices, improving labor conditions, increased household formation and improved consumer confidence, can propel the economy for years. The Fed will ultimately move off its zero interest rate policy. The only unknown variables are the timing of the initial rate increase, and the rate of further increases. The Fed has maintained that its actions will be data-dependent, which is interpreted to mean measured and gradual. (As this is being written, the timing for the initial rate increase is as early as September, and possibly December.) We know that most financial assets are not cheap by historical standards, with bonds being among the most richly valued alternatives. Stock and bond |
| | | | |
| | | | | |
| | | AMG Managers Cadence Capital Appreciation Fund | | |
| | | Portfolio Manager’s Comments (continued) | | |
| | | | | | | | |
valuations are influenced by inflationary expectations and interest rate policy. We know that U.S. investors have been divesting their domestic mutual fund holdings for five or more years, seeking higher return or less risky or less correlated alternatives. The bull market that started in March, 2009, has been the least respected advance in memory. While select health care and biotechnology stocks, and some individual themes in information technology, have evidence of froth, it is hard to make the case of the market being as overvalued as last seen in March 2000. Given the above, we believe that stocks still offer the most attractive combination of risk and prospective return. Benign inflation benefits stocks over bonds, as businesses have greater flexibility navigating modestly higher costs. Bull markets never die of old age, as the old adage goes. They end when central bankers and policy makers raise interest rates to reduce the threat of rising inflationary expectations. When the yield curve inverts and short-term rates exceed long-term rates, it is only a matter of time before the bull market ends. This | | | | is not to say that the road ahead will be forever smooth – stocks reflect the fear and greed of investors with varied investment styles and objectives. Price volatility is an expression of investor sentiment that frequently arises at times when least expected. Cadence seeks to avoid these traps by following our time-tested investment approach. We seek growing, profitable companies selling at prices that make sense. Our research identifies stocks with improving sales and earnings, upward estimate revisions, and attractive relative valuations. We structure diversified portfolios, mindful that even the best managed businesses hit a pot hole on occasion. Thank you for your investment in the AMG Managers Cadence Capital Appreciation Fund. We appreciate your trust and look forward to rewarding your continued confidence in the year ahead. This commentary reflects the viewpoints of the Cadence Capital Management, LLC. as of May 31, | | | | 2015 and is not intended as a forecast or guarantee of future results. CUMULATIVE TOTAL RETURN PERFORMANCE AMG Managers Cadence Capital Appreciation Fund’s cumulative total return is based on the daily change in net asset value (NAV), and assumes that all dividends and distributions were reinvested. This graph compares a hypothetical $10,000 investment made in AMG Managers Cadence Capital Appreciation Fund’s Institutional Class on May 31, 2005, compared to a $10,000 investment made in the Russell 1000® Growth Index for the same time period. The graph and table do not reflect the deduction of taxes that a shareholder would pay on a Fund distribution or redemption of shares. The listed returns for the Fund are net of expenses and the returns for the index exclude expenses. Total returns would have been lower had certain expenses not been reduced. |
| | | | |
| | | | | |
| | | AMG Managers Cadence Capital Appreciation Fund | | |
| | | Portfolio Manager’s Comments (continued) | | |
CUMULATIVE TOTAL RETURN PERFORMANCE (continued)
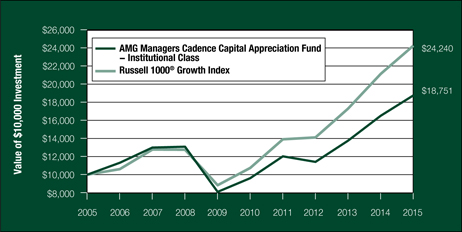
The table below shows the average annual total returns for the AMG Managers Cadence Capital Appreciation Fund and the Russell 1000® Growth Index for the same time periods ended May 31, 2015.
| | | | | | | | | | | | |
| Average Annual Total Returns1 | | One
Year | | | Five
Years | | | Ten
Years | |
AMG Managers Cadence Capital Appreciation Fund 2,3,4,5 | | | | | | | | | | | | |
Investor Class | | | 13.16 | % | | | 13.85 | % | | | 6.07 | % |
Service Class | | | 13.41 | % | | | 14.03 | % | | | 6.23 | % |
Institutional Class | | | 13.62 | % | | | 14.29 | % | | | 6.49 | % |
Russell 1000® Growth Index 6 | | | 14.73 | % | | | 17.67 | % | | | 9.26 | % |
The performance data shown represents past performance. Past performance is not a guarantee of future results. Current performance may be lower or higher than the performance data quoted. The investment return and principal value of an investment in the Fund will fluctuate so that an investor’s shares, when redeemed, may be worth more or less than their original cost.
Investors should carefully consider the Fund’s investment objectives, risks, charges, and expenses before investing. For performance information through the most recent month end, current net asset values per share for the Fund and other information, please call (800) 835-3879 or visit our website at www.amgfunds.com for a free prospectus. Read it carefully before investing or sending money.
Distributed by AMG Distributors, Inc., member FINRA/SIPC.
| 1 | Total return equals income yield plus share price change and assumes reinvestment of all dividends and capital gain distributions. Returns are net of fees and may reflect offsets of Fund expenses as described in the prospectus. No adjustment has been made for taxes payable by shareholders on their reinvested dividends and capital gain distributions. Returns for periods greater than one year are annualized. The listed returns on the Fund are net of expenses and based on the published NAV as of May 31, 2015. All returns are in U.S. dollars ($). |
|
2 From time to time, the Fund’s advisor has waived its fees and/or absorbed Fund expenses, which has resulted in higher returns. 3 The Fund invests in growth stocks, which may be more sensitive to market movements because their prices tend to reflect future investor expectations rather than just current profits. Growth stocks may underperform value stocks during given periods. 4 The Fund invests in large-capitalization companies that may underperform other stock funds (such as funds that focus on small- and medium-capitalization companies) when stocks of large-capitalization companies are out of favor. 5 The Fund is subject to special risk considerations similar to those associated with the direct ownership of real estate. Real estate valuations may be subject to factors such as changing general and local economic, financial, competitive, and environmental conditions. 6 The Russell 1000® Growth Index is a market capitalization weighted index that measures the performance of those Russell 1000 companies with higher price-to-book ratios and higher forecasted growth values. Unlike the Fund, the Russell 1000® Growth Index is unmanaged, is not available for investment and does not incur expenses. The Russell 1000® Growth Index is a registered trademark of Russell Investments. Russell® is a trademark of Russell Investments. Not FDIC insured, nor bank guaranteed. May lose value. |
| | | | |
| | | AMG Managers Cadence Capital Appreciation Fund | | |
| | | Fund Snapshots (unaudited) | | |
| | | May 31, 2015 | | |
PORTFOLIO BREAKDOWN
| | | | | | | | | | | | | | |
| | | Sector | | AMG Managers
Cadence Capital
Appreciation Fund** | | Russell 1000®
Growth Index | | |
| | | Information Technology | | | | 27.0 | % | | | | 29.1 | % | | |
| | | Consumer Discretionary | | | | 22.2 | % | | | | 18.8 | % | | |
| | | Health Care | | | | 16.9 | % | | | | 14.4 | % | | |
| | | Industrials | | | | 11.6 | % | | | | 11.4 | % | | |
| | | Consumer Staples | | | | 7.3 | % | | | | 10.4 | % | | |
| | | Financials | | | | 6.8 | % | | | | 5.1 | % | | |
| | | Energy | | | | 5.3 | % | | | | 4.6 | % | | |
| | | Materials | | | | 2.3 | % | | | | 4.0 | % | | |
| | | Utilities | | | | 0.7 | % | | | | 0.1 | % | | |
| | | Telecommunication Services | | | | 0.0 | % | | | | 2.1 | % | | |
| | | Other Assets and Liabilities | | | | (0.1 | )% | | | | 0.0 | % | | |
| | | ** As a percentage of net assets. | | | |
TOP TEN HOLDINGS
| | | | |
| Security Name | | | | % of Net Assets |
Apple, Inc.* | | | | 6.2% |
Microsoft Corp.* | | | | 3.3 |
Gilead Sciences, Inc.* | | | | 2.9 |
The Walt Disney Co.* | | | | 2.4 |
Facebook, Inc., Class A* | | | | 2.4 |
Visa, Inc., Class A | | | | 2.4 |
Google, Inc., Class A* | | | | 2.0 |
Biogen, Inc. | | | | 2.0 |
The Boeing Co.* | | | | 1.9 |
Hanesbrands, Inc. | | | | 1.8 |
| | | | |
Top Ten as a Group | | | | 27.3% |
| | | | |
* Top Ten Holding as of November 30, 2014. |
Because a fund’s strategy may result in multiple investments in particular sectors of the economy, its performance may depend on the performance of those sectors and may fluctuate more widely than investments diversified across more sectors. For additional information on these and other risk considerations, please see the Fund’s prospectus.
Any sectors, industries, or securities discussed should not be perceived as investment recommendations. Mention of a specific security should not be considered a recommendation to buy or solicitation to sell that security. Specific securities mentioned in this report may have been sold from the Fund’s portfolio of investments by the time you receive this report.
| | | | |
| | | AMG Managers Cadence Capital Appreciation Fund | | |
| | | Schedule of Portfolio Investments | | |
| | | May 31, 2015 | | |
| | | | | | | | |
| | | | Shares | | | | Value | |
Common Stocks - 100.1% | | | | | | | | |
Consumer Discretionary - 22.2% | | | | | | | | |
Aramark | | | 43,411 | | | | $1,360,935 | |
Delphi Automotive PLC | | | 20,067 | | | | 1,745,428 | |
Foot Locker, Inc. | | | 26,910 | | | | 1,700,712 | |
Genuine Parts Co. | | | 13,876 | | | | 1,255,362 | |
Hanesbrands, Inc. | | | 74,420 | | | | 2,371,021 | |
Harman International Industries, Inc. | | | 13,295 | | | | 1,602,313 | |
Hilton Worldwide Holdings, Inc.* | | | 49,572 | | | | 1,435,605 | |
Macy’s, Inc. | | | 28,885 | | | | 1,933,851 | |
Nordstrom, Inc. | | | 15,310 | | | | 1,112,118 | |
Omnicom Group, Inc.1 | | | 20,334 | | | | 1,515,493 | |
O’Reilly Automotive, Inc.* | | | 9,362 | | | | 2,055,240 | |
The Priceline Group, Inc.* | | | 1,522 | | | | 1,783,845 | |
Scripps Networks Interactive, Inc., Class A | | | 17,448 | | | | 1,169,191 | |
Starbucks Corp. | | | 42,000 | | | | 2,182,320 | |
The TJX Cos., Inc. | | | 25,058 | | | | 1,613,234 | |
VF Corp. | | | 18,586 | | | | 1,309,012 | |
The Walt Disney Co. | | | 28,447 | | | | 3,139,695 | |
Total Consumer Discretionary | | | | | | | 29,285,375 | |
Consumer Staples - 7.3% | | | | | | | | |
The Clorox Co. | | | 10,030 | | | | 1,079,830 | |
Colgate-Palmolive Co. | | | 22,648 | | | | 1,512,660 | |
Constellation Brands, Inc., Class A | | | 13,903 | | | | 1,639,025 | |
CVS Health Corp. | | | 21,519 | | | | 2,203,115 | |
Mondelez International, Inc., Class A | | | 29,991 | | | | 1,247,326 | |
Philip Morris International, Inc. | | | 24,202 | | | | 2,010,460 | |
Total Consumer Staples | | | | | | | 9,692,416 | |
Energy - 5.3% | | | | | | | | |
Anadarko Petroleum Corp. | | | 11,910 | | | | 995,795 | |
EOG Resources, Inc. | | | 18,687 | | | | 1,657,350 | |
Halliburton Co. | | | 34,208 | | | | 1,553,043 | |
Kinder Morgan, Inc. | | | 37,983 | | | | 1,575,915 | |
National Oilwell Varco, Inc. | | | 13,082 | | | | 643,504 | |
Whiting Petroleum Corp.* | | | 17,373 | | | | 573,135 | |
Total Energy | | | | | | | 6,998,742 | |
Financials - 6.8% | | | | | | | | |
American Tower Corp. | | | 21,095 | | | | 1,957,405 | |
JPMorgan Chase & Co. | | | 29,126 | | | | 1,915,908 | |
Marsh & McLennan Cos., Inc. | | | 28,059 | | | | 1,633,876 | |
| | | | | | | | |
| | | | Shares | | | | Value | |
T. Rowe Price Group, Inc. | | | 17,380 | | | | $1,402,392 | |
Wells Fargo & Co. | | | 36,463 | | | | 2,040,469 | |
Total Financials | | | | | | | 8,950,050 | |
Health Care - 16.9% | | | | | | | | |
Abbott Laboratories | | | 40,267 | | | | 1,956,976 | |
Aetna, Inc. | | | 10,956 | | | | 1,292,479 | |
Biogen, Inc.* | | | 6,571 | | | | 2,608,621 | |
Cardinal Health, Inc. | | | 18,150 | | | | 1,600,286 | |
Gilead Sciences, Inc.* | | | 33,763 | | | | 3,790,572 | |
Johnson & Johnson | | | 17,863 | | | | 1,788,801 | |
Mallinckrodt PLC* | | | 15,800 | | | | 2,045,152 | |
Medtronic PLC | | | 24,601 | | | | 1,877,548 | |
Mylan N.V.* | | | 27,325 | | | | 1,984,615 | |
Stryker Corp. | | | 19,586 | | | | 1,882,802 | |
Zoetis, Inc. | | | 29,660 | | | | 1,476,178 | |
Total Health Care | | | | | | | 22,304,030 | |
Industrials - 11.6% | | | | | | | | |
Alaska Air Group, Inc. | | | 23,882 | | | | 1,543,732 | |
American Airlines Group, Inc. | | | 29,648 | | | | 1,256,186 | |
The Boeing Co. | | | 17,934 | | | | 2,520,086 | |
Honeywell International, Inc. | | | 22,122 | | | | 2,305,112 | |
Illinois Tool Works, Inc. | | | 16,924 | | | | 1,587,979 | |
Ingersoll-Rand PLC | | | 22,134 | | | | 1,522,377 | |
Rockwell Automation, Inc. | | | 11,696 | | | | 1,437,321 | |
United Parcel Service, Inc.,
Class B | | | 18,238 | | | | 1,809,574 | |
WABCO Holdings, Inc.* | | | 11,010 | | | | 1,391,884 | |
Total Industrials | | | | | | | 15,374,251 | |
Information Technology - 27.0% | | | | | | | | |
Accenture PLC, Class A | | | 22,238 | | | | 2,135,738 | |
Adobe Systems, Inc.* | | | 16,497 | | | | 1,304,748 | |
Apple, Inc. | | | 62,392 | | | | 8,128,430 | |
Avago Technologies, Ltd. | | | 12,960 | | | | 1,918,987 | |
Facebook, Inc., Class A* | | | 39,593 | | | | 3,135,370 | |
Google, Inc., Class A* | | | 4,906 | | | | 2,675,340 | |
Google, Inc., Class C* | | | 4,117 | | | | 2,190,697 | |
Intuit, Inc. | | | 16,870 | | | | 1,757,011 | |
MasterCard, Inc., Class A | | | 25,316 | | | | 2,335,654 | |
Microsoft Corp. | | | 91,781 | | | | 4,300,858 | |
Red Hat, Inc.* | | | 20,582 | | | | 1,590,371 | |
Splunk, Inc.* | | | 14,782 | | | | 999,559 | |
|
|
| The accompanying notes are an integral part of these financial statements. |
| 8 |
| | | | |
| | | | | |
| | | AMG Managers Cadence Capital Appreciation Fund | | |
| | | Schedule of Portfolio Investments (continued) | | |
| | | | | | | | |
| | | Shares | | | Value | |
Information Technology - 27.0% (continued) | | | | | |
Visa, Inc., Class A | | | 45,536 | | | | $3,127,412 | |
Total Information Technology | | | | | | | 35,600,175 | |
Materials - 2.3% | | | | | | | | |
CF Industries Holdings, Inc. | | | 3,487 | | | | 1,101,474 | |
Sealed Air Corp. | | | 39,849 | | | | 1,940,646 | |
Total Materials | | | | | | | 3,042,120 | |
Utilities - 0.7% | | | | | | | | |
ITC Holdings Corp. | | | 25,391 | | | | 896,048 | |
Total Common Stocks
(cost $101,740,084) | | | | | | | 132,143,207 | |
| | | | | | | | |
| | | | | | | | |
| | | Principal Amount | | | Value | |
Short-Term Investments - 0.9% | | | | | |
Repurchase Agreements - 0.9%2 | | | | | |
Cantor Fitzgerald Securities, Inc., dated 05/29/15, due 06/01/15, 0.110%, total to be received $1,000,009 (collateralized by various U.S. Government Agency Obligations, 0.000% - 8.000%, 07/15/15 - 04/20/65, totaling $1,020,000) | | | $1,000,000 | | | | $1,000,000 | |
Nomura Securities International, Inc., dated 05/29/15, due 06/01/15, 0.110%, total to be received $174,254 (collateralized by various U.S. Government Agency Obligations, 0.000% - 9.500%, 06/15/15 - 04/20/65, totaling $177,737) | | | 174,252 | | | | 174,252 | |
Total Repurchase Agreements | | | | 1,174,252 | |
Total Short-Term Investments
(cost $1,174,252) | | | | 1,174,252 | |
Total Investments - 101.0%
(cost $102,914,336) | | | | 133,317,459 | |
Other Assets, less Liabilities - (1.0)% | | | | (1,347,990 | ) |
Net Assets - 100.0% | | | | | | | $131,969,469 | |
| | | | | | | | |
|
|
| The accompanying notes are an integral part of these financial statements. |
| 9 |
| | | | |
| | | | | |
| | | AMG Managers Cadence Mid Cap Fund | | |
| | | Portfolio Manager’s Comments | | |
| | | | | | | | |
For the fiscal year ended May 31, 2015, the AMG Managers Cadence Mid Cap Fund (Institutional Class) (the “Fund”) returned 15.6%, outperforming its benchmark, the Russell Midcap® Growth Index, which returned 14.7%. U.S. stocks continued their ascent during the fiscal year ended May 31, 2015, with the broad S&P 500 Index returning 11.8% and the Russell Midcap Growth Index returning 14.7%. This performance followed the S&P’s strong gain of 20.5% for the prior 12 months ended May 31, 2014, challenging many strategists who argued that rising stock prices in the face of slowing global economic growth were a recipe for investment disappointment. Despite the economic and market cross currents, the Fund posted a strong positive return and modestly outperformed the benchmark. The Fund performed well for the fiscal year in information technology, consumer staples, financials and materials, adding value versus the Russell Midcap Growth Index through a combination of stock selection and sector allocation. Fund holdings had average returns that ranged from 21.4% for financials to 37.1% for information technology, outperforming both the Index and the corresponding sectors of the Index. In contrast, the Fund underperformed the benchmark in consumer discretionary, with average gains of 2.6% compared with the sector’s gains of 14.5%. Health care has been among the market’s best performing sectors since 2011, powered by increased utilization, innovation in new drugs and medical devices, a powerful IPO market and a robust M&A environment. The Fund benefitted from these tailwinds with portfolio gains exceeding 42% in the fiscal year. Conversely, energy was the Fund’s weakest sector in absolute terms over the last year, as crude oil prices collapsed by over 50%. While our holdings lagged the Index’s energy stocks, the Fund’s underweight position in the sector added value relative to the benchmark. To emphasize the rotational nature of | | | | the equity market, energy was among the Russell Midcap Growth’s strongest performing sectors in the fiscal year ended May 31, 2014, returning over 26%. THE YEAR IN REVIEW The fiscal year started on a strong note, with the S&P 500 hitting eight new all-time highs in June, 2014. The employment picture and consumer spending, while far from robust, suggested the economic recovery, which started in June 2009 (essentially six years ago), was still intact, although growing at a slower pace than normal. The U.S. Federal Reserve (the “Fed”) maintained an accommodative monetary stance, fearful of policy mistakes at this stage of the recovery. However, talk of economic decoupling became increasingly loud during the summer months. While the U.S. continued to recover, Europe and the developing markets began to show signs of economic deceleration. China, which had been the primary economic engine of both the developed and the developing markets, showed clear signs of slowing, with some expressing fears of a hard landing. Copper and iron ore prices, as well as other industrial metals, all of which were closely linked with China’s growth, started to collapse. Crude oil prices peaked in late June and by the end of 2014 had fallen by over 50%. As the summer continued, economists described the Euro Zone as increasingly fragile and the foreign backdrop as the biggest threat to the U.S. economy. Economic weakness and declining commodity prices awakened fears of deflation. Central banks around the globe embarked on monetary easing programs to fuel growth and halt the spread of deflationary forces. Interest rates fell to historically low levels – including negative rates in some cases. As 2014 came to a close, the U.S. was the symbol of strength and stability, and the U.S. Dollar started one of its sharpest rises of the recent past. Dollar strength, however, posed a dual threat – U.S. exports became increasingly expensive relative to other countries, and currency | | | | translation impacted the reported sales and earnings of U.S. multinational companies. On top of these macroeconomic headwinds, the West Coast dock strike, bitter temperatures and historic snowfalls paralyzed parts of the country. Despite the many negative macroeconomic and geopolitical worries, stocks managed to look through the current fog and discount an improved future. OUTLOOK To quote John Kenneth Galbraith, “The only function of economic forecasting is to make astrology look respectable.” While this tongue-in-cheek statement could be applied to all types of forecasts, equity portfolio management demands an opinion or expectation about the future. Absent an unexpected geopolitical event or policy mistake, we continue to believe that U.S. and international economic recovery will continue, given that economies respond with a lag to economic stimulus. For example, it may take from six months to a year for the effects of central bank accommodation to work its way through the global economy. This is stimulus that, along with lower energy prices, improving labor conditions, increased household formation and improved consumer confidence, can propel the economy for years. The Fed will ultimately move off its zero-interest rate policy. The only unknown variables are the timing of the initial rate increase, and the rate of further increases. The Fed has maintained that its actions will be data-dependent, which is interpreted to mean measured and gradual. (As this is being written, the timing for the initial rate increase is as early as September, and possibly December.) We know that most financial assets are not cheap by historical standards, with bonds being among the most richly valued alternatives. Stock and bond valuations are influenced by inflationary |
| | | | |
| | | | | |
| | | AMG Managers Cadence Mid Cap Fund | | |
| | | Portfolio Manager’s Comments (continued) | | |
| | | | | | | | |
expectations and interest rate policy. We know that U.S. investors have been divesting their domestic mutual fund holdings for five or more years, seeking higher return or less risky or less correlated alternatives. The bull market that started in March, 2009, has been the least respected advance in memory. While select health care and biotechnology stocks, and some individual themes in information technology, have evidence of froth, it is hard to make the case of the market being as overvalued as last seen in March 2000. Given the above, we believe that stocks still offer the most attractive combination of risk and prospective return. Benign inflation benefits stocks over bonds, as businesses have greater flexibility navigating modestly higher costs. Bull markets never die of old age, as the old adage goes. They end when central bankers and policy makers raise interest rates to reduce the threat of rising inflationary expectations. When the yield curve inverts and short-term rates exceed long-term rates, it is only a matter of time before the bull market ends. This | | | | is not to say that the road ahead will be forever smooth – stocks reflect the fear and greed of investors with varied investment styles and objectives. Price volatility is an expression of investor sentiment that frequently arises at times when least expected. Cadence seeks to avoid these traps by following our time-tested investment approach. We seek growing, profitable companies selling at prices that make sense. Our research identifies stocks with improving sales and earnings, upward estimate revisions and attractive relative valuations. We structure diversified portfolios, mindful that even the best managed businesses hit a pot hole on occasion. Thank you for your investment in the AMG Managers Cadence Mid Cap Fund. We appreciate your trust and look forward to rewarding your continued confidence in the year ahead. This commentary reflects the viewpoints of the Cadence Capital Management, LLC. as of May 31, | | | | 2015 and is not intended as a forecast or guarantee of future results. CUMULATIVE TOTAL RETURN PERFORMANCE AMG Managers Cadence Mid Cap Fund’s cumulative total return is based on the daily change in net asset value (NAV), and assumes that all dividends and distributions were reinvested. This graph compares a hypothetical $10,000 investment made in AMG Managers Cadence Mid Cap Fund’s Institutional Class on May 31, 2005, compared to a $10,000 investment made in the Russell Midcap® Growth Index for the same time period. The graph and table do not reflect the deduction of taxes that a shareholder would pay on a Fund distribution or redemption of shares. The listed returns for the Fund are net of expenses and the returns for the index exclude expenses. Total returns would have been lower had certain expenses not been reduced. |
| | | | |
| | | | | |
| | | AMG Managers Cadence Mid Cap Fund | | |
| | | Portfolio Manager’s Comments (continued) | | |
CUMULATIVE TOTAL RETURN PERFORMANCE (continued)

The table below shows the average annual total returns for the AMG Managers Cadence Mid Cap Fund and the Russell Midcap® Growth Index for the same time periods ended May 31, 2015.
| | | | | | | | | | | | |
| Average Annual Total Returns 1 | | One
Year | | | Five
Years | | | Ten
Years | |
AMG Managers Cadence Mid Cap Fund 2,3,4,5 | | | | | | | | | | | | |
Investor Class | | | 15.14 | % | | | 15.11 | % | | | 7.42 | % |
Service Class | | | 15.34 | % | | | 15.29 | % | | | 7.59 | % |
Institutional Class | | | 15.62 | % | | | 15.58 | % | | | 7.85 | % |
Russell Midcap® Growth Index 6 | | | 14.72 | % | | | 17.52 | % | | | 10.07 | % |
The performance data shown represents past performance. Past performance is not a guarantee of future results. Current performance may be lower or higher than the performance data quoted. The investment return and principal value of an investment in the Fund will fluctuate so that an investor’s shares, when redeemed, may be worth more or less than their original cost.
Investors should carefully consider the Fund’s investment objectives, risks, charges and expenses before investing. For performance information through the most recent month end, current net asset values per share for the Fund and other information, please call (800) 835-3879 or visit our website at www.amgfunds.com for a free prospectus. Read it carefully before investing or sending money.
Distributed by AMG Distributors, Inc., member FINRA/SIPC.
| 1 | Total return equals income yield plus share price change and assumes reinvestment of all dividends and capital gain distributions. Returns are net of fees and may reflect offsets of Fund expenses as described in the prospectus. No adjustment has been made for taxes payable by shareholders on their reinvested dividends and capital gain distributions. Returns for periods greater than one year are annualized. The listed returns on the Fund are net of expenses and based on the published NAV as of May 31, 2015. All returns are in U.S. dollars ($). |
| | |
| | | 2 From time to time, the Fund’s advisor has waived its fees and/or absorbed Fund expenses, which has resulted in higher returns. 3 The Fund invests in growth stocks, which may be more sensitive to market movements because their prices tend to reflect future investor expectations rather than just current profits. Growth stocks may underperform value stocks during given periods. 4 The Fund is subject to risks associated with investments in mid-capitalization companies such as erratic earnings patterns, competitive conditions, limited earnings history, and a reliance on one or a limited number of products. 5 The Fund is subject to special risk considerations similar to those associated with the direct ownership of real estate. Real estate valuations may be subject to factors such as changing general and local economic, financial, competitive, and environmental conditions. 6 The Russell Midcap® Growth Index measures the performance of the Russell Midcap companies with higher price-to-book ratios and higher forecasted growth values. The stocks are also members of the Russell 1000® Growth Index. Unlike the Fund, the Index is unmanaged, is not available for investment, and does not incur expenses. The Russell Midcap® Growth Index is a registered trademark of Russell Investments. Russell® is a trademark of Russell Investments. Not FDIC insured, nor bank guaranteed. May lose value. |
| | | | |
| | | AMG Managers Cadence Mid Cap Fund | | |
| | | Fund Snapshots (unaudited) | | |
| | | May 31, 2015 | | |
PORTFOLIO BREAKDOWN
| | | | | | | | | | | | | | |
| | | Sector | | AMG Managers
Cadence Mid
Cap Fund** | | Russell Midcap®
Growth Index | | |
| | | Consumer Discretionary | | | | 20.5 | % | | | | 22.9 | % | | |
| | | Information Technology | | | | 20.2 | % | | | | 18.7 | % | | |
| | | Health Care | | | | 17.8 | % | | | | 14.3 | % | | |
| | | Consumer Staples | | | | 15.4 | % | | | | 8.0 | % | | |
| | | Industrials | | | | 9.3 | % | | | | 15.5 | % | | |
| | | Financials | | | | 7.9 | % | | | | 9.6 | % | | |
| | | Energy | | | | 4.7 | % | | | | 5.1 | % | | |
| | | Materials | | | | 3.9 | % | | | | 4.8 | % | | |
| | | Telecommunication Services | | | | 0.0 | % | | | | 0.9 | % | | |
| | | Utilities | | | | 0.0 | % | | | | 0.2 | % | | |
| | | Other Assets and Liabilities | | | | 0.3 | % | | | | 0.0 | % | | |
| | | ** As a percentage of net assets. | | | |
TOP TEN HOLDINGS
| | | | |
| Security Name | | | | % of Net Assets |
The WhiteWave Foods Co. | | | | 2.6% |
Constellation Brands, Inc., Class A | | | | 2.4 |
Skyworks Solutions, Inc.* | | | | 2.2 |
Moody’s Corp.* | | | | 2.2 |
Sealed Air Corp.* | | | | 2.1 |
Mallinckrodt PLC | | | | 2.1 |
Avago Technologies, Ltd. | | | | 2.1 |
Tableau Software, Inc., Class A | | | | 2.1 |
Zoetis, Inc. | | | | 2.1 |
Hanesbrands, Inc.* | | | | 2.0 |
| | | | |
Top Ten as a Group | | | | 21.9% |
| | | | |
* Top Ten Holding as of November 30, 2014. |
Because a fund’s strategy may result in multiple investments in particular sectors of the economy, its performance may depend on the performance of those sectors and may fluctuate more widely than investments diversified across more sectors. For additional information on these and other risk considerations, please see the Fund’s prospectus.
Any sectors, industries, or securities discussed should not be perceived as investment recommendations. Mention of a specific security should not be considered a recommendation to buy or solicitation to sell that security. Specific securities mentioned in this report may have been sold from the Fund’s portfolio of investments by the time you receive this report.
| | | | |
| | | AMG Managers Cadence Mid Cap Fund | | |
| | | Schedule of Portfolio Investments | | |
| | | May 31, 2015 | | |
| | | | | | | | |
| | | | Shares | | | | Value | |
Common Stocks - 99.7% | | | | | | | | |
Consumer Discretionary - 20.5% | | | | | | | | |
Aramark | | | 86,790 | | | | $2,720,867 | |
Dillard’s, Inc., Class A | | | 14,470 | | | | 1,678,665 | |
DISH Network Corp., Class A* | | | 11,780 | | | | 833,906 | |
Domino’s Pizza, Inc. | | | 11,210 | | | | 1,218,079 | |
Foot Locker, Inc. | | | 44,110 | | | | 2,787,752 | |
Hanesbrands, Inc. | | | 102,440 | | | | 3,263,738 | |
Harman International Industries, Inc. | | | 19,350 | | | | 2,332,062 | |
Hilton Worldwide Holdings, Inc.* | | | 94,730 | | | | 2,743,381 | |
Leggett & Platt, Inc. | | | 44,420 | | | | 2,100,178 | |
Macy’s, Inc. | | | 26,350 | | | | 1,764,133 | |
Restaurant Brands International, Inc.1 | | | 76,745 | | | | 2,967,729 | |
Six Flags Entertainment Corp. | | | 34,610 | | | | 1,691,045 | |
Ulta Salon Cosmetics & Fragrance, Inc.* | | | 20,780 | | | | 3,171,444 | |
Under Armour, Inc., Class A*,1 | | | 38,310 | | | | 3,003,887 | |
VF Corp. | | | 22,880 | | | | 1,611,438 | |
Total Consumer Discretionary | | | | | | | 33,888,304 | |
Consumer Staples - 15.4% | | | | | | | | |
Church & Dwight Co., Inc. | | | 24,660 | | | | 2,070,700 | |
Constellation Brands, Inc., Class A | | | 33,710 | | | | 3,974,072 | |
Dr. Pepper Snapple Group, Inc. | | | 39,130 | | | | 2,998,923 | |
The Hain Celestial Group, Inc.* | | | 46,300 | | | | 2,929,401 | |
The Kroger Co. | | | 29,120 | | | | 2,119,936 | |
Mead Johnson Nutrition Co. | | | 16,800 | | | | 1,634,640 | |
Molson Coors Brewing Co., Class B | | | 40,370 | | | | 2,962,351 | |
Monster Beverage Corp.* | | | 18,530 | | | | 2,358,498 | |
The WhiteWave Foods Co.* | | | 89,820 | | | | 4,314,055 | |
Total Consumer Staples | | | | | | | 25,362,576 | |
Energy - 4.7% | | | | | | | | |
Cabot Oil & Gas Corp. | | | 49,360 | | | | 1,676,266 | |
Cameron International Corp.* | | | 28,160 | | | | 1,445,453 | |
Helmerich & Payne, Inc.1 | | | 8,890 | | | | 648,881 | |
Western Refining, Inc. | | | 55,550 | | | | 2,443,089 | |
Whiting Petroleum Corp.* | | | 45,817 | | | | 1,511,503 | |
Total Energy | | | | | | | 7,725,192 | |
Financials - 7.9% | | | | | | | | |
Extra Space Storage, Inc. | | | 41,510 | | | | 2,906,945 | |
Marsh & McLennan Cos., Inc. | | | 42,480 | | | | 2,473,610 | |
McGraw Hill Financial, Inc. | | | 22,280 | | | | 2,311,550 | |
| | | | | | | | |
| | | | Shares | | | | Value | |
Moody’s Corp. | | | 33,060 | | | | $3,573,786 | |
Sovran Self Storage, Inc. | | | 19,930 | | | | 1,817,815 | |
Total Financials | | | | | | | 13,083,706 | |
Health Care - 17.8% | | | | | | | | |
Agios Pharmaceuticals, Inc.*,1 | | | 13,260 | | | | 1,617,985 | |
Alkermes PLC* | | | 49,120 | | | | 3,001,232 | |
AmerisourceBergen Corp. | | | 24,900 | | | | 2,802,744 | |
Cardinal Health, Inc. | | | 33,590 | | | | 2,961,630 | |
Centene Corp.* | | | 31,400 | | | | 2,365,676 | |
HCA Holdings, Inc.* | | | 18,170 | | | | 1,486,851 | |
Laboratory Corp. of America Holdings* | | | 13,640 | | | | 1,608,838 | |
Mallinckrodt PLC* | | | 26,880 | | | | 3,479,347 | |
Mettler-Toledo International, Inc.* | | | 7,490 | | | | 2,431,853 | |
Mylan N.V.* | | | 33,540 | | | | 2,436,010 | |
Vertex Pharmaceuticals, Inc.* | | | 13,570 | | | | 1,740,895 | |
Zoetis, Inc. | | | 68,620 | | | | 3,415,217 | |
Total Health Care | | | | | | | 29,348,278 | |
Industrials - 9.3% | | | | | | | | |
AerCap Holdings N.V.* | | | 34,260 | | | | 1,652,702 | |
Alaska Air Group, Inc. | | | 46,090 | | | | 2,979,258 | |
Cintas Corp. | | | 24,670 | | | | 2,123,840 | |
The Dun & Bradstreet Corp. | | | 13,000 | | | | 1,663,090 | |
The Middleby Corp.* | | | 16,080 | | | | 1,747,896 | |
RR Donnelley & Sons Co. | | | 85,400 | | | | 1,637,972 | |
Snap-on,, Inc. | | | 11,590 | | | | 1,801,086 | |
Verisk Analytics, Inc.* | | | 23,720 | | | | 1,721,598 | |
Total Industrials | | | | | | | 15,327,442 | |
Information Technology - 20.2% | | | | | | | | |
Akamai Technologies, Inc.* | | | 34,920 | | | | 2,663,348 | |
Avago Technologies, Ltd. | | | 23,200 | | | | 3,435,224 | |
Check Point Software Technologies, Ltd.* | | | 32,310 | | | | 2,737,303 | |
Equinix, Inc. | | | 10,540 | | | | 2,825,458 | |
FireEye, Inc.*,1 | | | 66,840 | | | | 3,112,739 | |
IPG Photonics Corp.*,1 | | | 17,940 | | | | 1,701,430 | |
NVIDIA Corp. | | | 75,470 | | | | 1,670,151 | |
NXP Semiconductors N.V.* | | | 18,030 | | | | 2,023,868 | |
Sabre Corp. | | | 112,570 | | | | 2,936,951 | |
Skyworks Solutions, Inc. | | | 32,740 | | | | 3,580,446 | |
SolarWinds, Inc.* | | | 38,660 | | | | 1,834,417 | |
Splunk, Inc.* | | | 22,212 | | | | 1,501,975 | |
|
|
| The accompanying notes are an integral part of these financial statements. |
| 14 |
| | | | |
| | | | | |
| | | AMG Managers Cadence Mid Cap Fund | | |
| | | Schedule of Portfolio Investments (continued) | | |
| | | | | | | | |
| | | Shares | | | Value | |
Information Technology - 20.2% (continued) | | | | | |
Tableau Software, Inc., Class A* | | | 30,300 | | | | $3,430,263 | |
Total Information Technology | | | | | | | 33,453,573 | |
Materials - 3.9% | | | | | | | | |
Axalta Coating Systems , Ltd.* | | | 39,630 | | | | 1,357,328 | |
International Paper Co. | | | 30,760 | | | | 1,594,291 | |
Sealed Air Corp. | | | 72,020 | | | | 3,507,374 | |
Total Materials | | | | | | | 6,458,993 | |
Total Common Stocks
(cost $137,221,706) | | | | | | | 164,648,064 | |
| | |
| | | Principal
Amount | | | | |
Short-Term Investments - 4.2% | | | | | |
Repurchase Agreements - 4.0%2 | | | | | |
Cantor Fitzgerald Securities, Inc., dated 05/29/15, due 06/01/15, 0.110%, total to be received $1,592,796 (collateralized by various U.S. Government Agency Obligations, 0.000% - 8.000%, 07/15/15 - 04/20/65, totaling $1,624,637) | | | $1,592,781 | | | | 1,592,781 | |
Citigroup Global Markets, Inc., dated 05/29/15, due 06/01/15, 0.100%, total to be received $335,312 (collateralized by various U.S. Government Agency Obligations, 0.084% - 4.375%, 04/30/16 - 11/15/39, totaling $342,015) | | | 335,309 | | | | 335,309 | |
Daiwa Capital Markets America, dated 05/29/15, due 06/01/15, 0.140%, total to be received $1,592,800 (collateralized by various U.S. Government Agency Obligations, 0.000% - 8.000%, 08/19/15 - 03/01/48, totaling $1,624,637) | | | 1,592,781 | | | | 1,592,781 | |
| | | | | | | | |
| | | Principal Amount | | | Value | |
HSBC Securities USA, Inc., dated 05/29/15, due 06/01/15, 0.080%, total to be received $1,592,792 (collateralized by various U.S. Government Agency Obligations, 0.000% - 9.375%, 07/15/15 - 07/15/32, totaling $1,624,643) | | | $1,592,781 | | | | $1,592,781 | |
Nomura Securities International, Inc., dated 05/29/15, due 06/01/15, 0.110%, total to be received $1,592,796 (collateralized by various U.S. Government Agency Obligations, 0.000% - 9.500%, 06/15/15 - 04/20/65 totaling $1,624,637) | | | 1,592,781 | | | | 1,592,781 | |
Total Repurchase Agreements | | | | 6,706,433 | |
| | |
| | | Shares | | | | |
Other Investment Companies - 0.2%3 | | | | | |
Dreyfus Institutional Cash Advantage Fund, Institutional Class Shares, 0.08% | | | 282,994 | | | | 282,994 | |
Total Short-Term Investments
(cost $6,989,427) | | | | 6,989,427 | |
Total Investments - 103.9%
(cost $144,211,133) | | | | 171,637,491 | |
Other Assets, less Liabilities - (3.9)% | | | | (6,470,357 | ) |
Net Assets - 100.0% | | | | | | | $165,167,134 | |
|
|
| The accompanying notes are an integral part of these financial statements. |
| 15 |
| | | | |
| | | | | |
| | | AMG Managers Cadence Emerging Companies Fund | | |
| | | Portfolio Manager’s Comments | | |
| | | | | | | | |
For the fiscal year ended May 31, 2015, the AMG Managers Cadence Emerging Companies Fund (Institutional Class) (the “Fund”) returned 15.3%, lagging its benchmark, the Russell Microcap® Growth Index, which returned 18.5%. U.S. stocks continued their ascent during the fiscal year ended May 31, 2015, with the broad S&P 500 Index returning 11.8%, the Russell 2000® Index returning 11.3% and the Russell Microcap Growth Index gaining 18.5%. This performance followed the S&P’s strong gain of 20.5% for the prior 12 months ended May 31, 2014, challenging many strategists who argued that rising stock prices in the face of slowing global economic growth were a recipe for investment disappointment. Despite the economic and market cross currents, the Fund posted a positive return, but underperformed the Index, largely attributable to underweighting the top-performing biotechnology industry. The Fund performed well for the fiscal year in consumer discretionary, consumer staples and materials, adding value versus the Russell Microcap Growth Index through a combination of stock selection and sector allocation. In contrast, the Fund underperformed the benchmark in health care, information technology and industrials. Health care has been among the market’s best performing sectors since 2011, powered by increased utilization, innovation in new drugs and medical devices, a powerful IPO market and a robust M&A environment. The sector, which represented an average of 40.4% of the Index, accounted for most of the Index’s total return for the fiscal year, with average gains of 40.8%. Within health care, micro-cap biotechnology stocks powered the sector, with average returns of 55.6%. This performance, coupled with the industry’s 20.7% average weighting in the Index, contributed over half of the Index’s total return for the full fiscal year. The Fund benefitted from these tailwinds with portfolio gains exceeding 40% in the sector and average returns of nearly 85% for the biotechnology holdings. The Fund has historically underweighted the biotechnology industry due to | | | | many companies’ loss-making financial profile and risky business models dependent on scientific advancement, regulatory uncertainty and narrow product profiles. Conversely, energy was the market’s and the Fund’s weakest sector on an absolute basis over the last year, as crude oil prices collapsed by over 50%. The Fund’s holdings essentially matched the weighting and the performance of the Index, which resulted in minimal impact on relative performance. To emphasize the rotational nature of the equity market, energy was the Russell Microcap Growth’s strongest performing sector in the year ended May 31, 2014, returning nearly 44%. THE YEAR IN REVIEW The fiscal year started on a strong note, with the S&P 500 hitting eight new all-time highs in June, 2014. The employment picture and consumer spending, while far from robust, suggested the economic recovery, which started in June 2009 (essentially six years ago), was still intact, although growing at a slower pace than normal. The U.S. Federal Reserve (the “Fed”) maintained an accommodative monetary stance, fearful of policy mistakes at this stage of the recovery. However, talk of economic decoupling became increasingly loud during the summer months. While the U.S. continued to recover, Europe and the developing markets began to show signs of economic deceleration. China, which had been the primary economic engine of both the developed and the developing markets, showed clear signs of slowing, with some expressing fears of a hard landing. Copper and iron ore prices, as well as other industrial metals, all of which were closely linked with China’s growth, started to collapse. Crude oil prices peaked in late June and by the end of 2014 had fallen by over 50%. As the summer continued, economists described the Euro Zone as increasingly fragile and the foreign backdrop as the biggest threat to the U.S. economy. Economic weakness and declining commodity prices awakened fears of deflation. Central banks around the globe embarked on | | | | monetary easing programs to fuel growth and halt the spread of deflationary forces. Interest rates fell to historically low levels – including negative rates in some cases. As 2014 came to a close, the U.S. was the symbol of strength and stability, and the U.S Dollar started one of its sharpest rises of the recent past. Dollar strength, however, posed a dual threat – U.S. exports became increasingly expensive relative to other countries, and currency translation impacted the reported sales and earnings of U.S. multinational companies. On top of these macroeconomic headwinds, the West Coast dock strike, bitter temperatures and historic snowfalls paralyzed parts of the country. Despite the many negative macroeconomic and geopolitical worries, stocks managed to look through the current fog and discount an improved future. OUTLOOK To quote John Kenneth Galbraith, “The only function of economic forecasting is to make astrology look respectable.” While this tongue-in-cheek statement could be applied to all types of forecasts, equity portfolio management demands an opinion or expectation about the future. Absent an unexpected geopolitical event or policy mistake, we continue to believe that U.S. and international economic recovery will continue, given that economies respond with a lag to economic stimulus. For example, it may take from six months to a year for the effects of central bank accommodation to work its way through the global economy. This is stimulus that, along with lower energy prices, improving labor conditions, increased household formation and improved consumer confidence, can propel the economy for years. The Fed will ultimately move off its zero interest rate policy. The only unknown variables are the timing of the initial rate increase, and the rate of further increases. The Fed has maintained that its actions will be data-dependent, which is interpreted to mean measured and gradual. (As this is being written, the timing for the initial rate ncrease is as early as September, and possibly December.) |
| | | | |
| | | | | |
| | | AMG Managers Cadence Emerging Companies Fund | | |
| | | Portfolio Manager’s Comments (continued) | | |
| | | | | | | | |
We know that most financial assets are not cheap by historical standards, with bonds being among the most richly valued alternatives. Stock and bond valuations are influenced by inflationary expectations and interest rate policy. We know that U.S. investors have been divesting their domestic mutual fund holdings for five or more years, seeking higher return or less risky or less correlated alternatives. The bull market that started in March, 2009, has been the least respected advance in memory. While select health care and biotechnology stocks, and some individual themes in information technology, have evidence of froth, it is hard to make the case of the market being as overvalued as last seen in March 2000. Given the above, we believe that stocks still offer the most attractive combination of risk and prospective return. Benign inflation benefits stocks over bonds, as businesses have greater flexibility navigating modestly higher costs. Bull markets never die of old age, as the old adage goes. They end when central bankers and policy makers raise interest rates to reduce the threat of rising inflationary | | | | expectations. When the yield curve inverts and short-term rates exceed long-term rates, it is only a matter of time before the bull market ends. This is not to say that the road ahead will be forever smooth – stocks reflect the fear and greed of investors with varied investment styles and objectives. Price volatility is an expression of investor sentiment that frequently arises at times when least expected. Cadence seeks to avoid these traps by following our time-tested investment approach. We seek growing, profitable companies selling at prices that make sense. Our research identifies stocks with improving sales and earnings, upward estimate revisions and attractive relative valuations. We structure diversified portfolios, mindful that even the best managed businesses hit a pot hole on occasion. Thank you for your investment in the AMG Managers Cadence Emerging Companies Fund. We appreciate your trust and look forward to rewarding your continued confidence in the year ahead. This commentary reflects the viewpoints of the Cadence Capital Management, LLC as of May 31, | | | | 2015 and is not intended as a forecast or guarantee of future results. CUMULATIVE TOTAL RETURN PERFORMANCE AMG Managers Cadence Emerging Companies Fund’s cumulative total return is based on the daily change in net asset value (NAV), and assumes that all dividends and distributions were reinvested. This graph compares a hypothetical $10,000 investment made in AMG Managers Cadence Emerging Companies Fund’s Institutional Class on May 31, 2005, to a $10,000 investment made in the Russell Microcap® Growth Index and the Russell 2000® Growth Index for the same time period. The graph and table do not reflect the deduction of taxes that a shareholder would pay on a Fund distribution or redemption of shares. The listed returns for the Fund are net of expenses and the returns for the index exclude expenses. Total returns would have been lower had certain expenses not been reduced. |
| | | | |
| | | | | |
| | | AMG Managers Cadence Emerging Companies Fund | | |
| | | Portfolio Manager’s Comments (continued) | | |
CUMULATIVE TOTAL RETURN PERFORMANCE (continued)
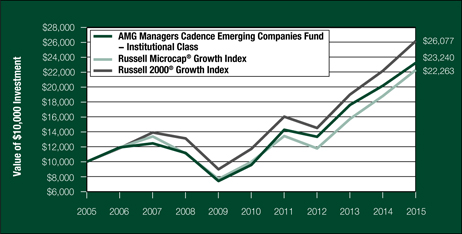
The table below shows the average annual total returns for the AMG Managers Cadence Emerging Companies Fund and the Russell Microcap® Growth Index and the Russell 2000® Growth Index for the same time periods ended May 31, 2015.
| | | | | | | | | | | | |
| | | One | | | Five | | | Ten | |
| Average Annual Total Returns1 | | Year | | | Years | | | Years | |
AMG Managers Cadence Emerging Companies Fund 2,3,4,5,6 | | | | | | | | | | | | |
Service Class | | | 14.95% | | | | 19.14% | | | | 8.53% | |
Institutional Class | | | 15.27% | | | | 19.44% | | | | 8.80% | |
| |
Russell Microcap® Growth Index7 | | | 18.51% | | | | 17.43% | | | | 8.33% | |
Russell 2000® Growth Index8 | | | 17.73% | | | | 17.37% | | | | 10.06% | |
|
| |
The performance data shown represents past performance. Past performance is not a guarantee of future results. Current performance may be lower or higher than the performance data quoted. The investment return and principal value of an investment in the Fund will fluctuate so that an investor’s shares, when redeemed, may be worth more or less than their original cost.
Investors should carefully consider the Fund’s investment objectives, risks, charges and expenses before investing. For performance information through the most recent month end, current net asset values per share for the Fund and other information, please call (800) 835-3879 or visit our website at www.amgfunds.com for a free prospectus. Read it carefully before investing or sending money.
Distributed by AMG Distributors, Inc., member FINRA/SIPC.
| 1 | Total return equals income yield plus share price change and assumes reinvestment of all dividends and capital gain distributions. Returns are net of fees and may reflect offsets of Fund expenses as described in the prospectus. No adjustment has been made for taxes payable by shareholders on their reinvested dividends and capital gain distributions. Returns for periods greater than one year are annualized. The listed returns on the Fund are net of expenses and based on the published NAV as of May 31, 2015. All returns are in U.S. dollars ($). |
| | |
| | | 2 From time to time, the Fund’s advisor has waived its fees and/or absorbed Fund expenses, which has resulted in higher returns. 3 The Fundinvests in growth stocks, which may be more sensitive to market movements because their prices tend to reflect future investor expectations rather than just current profits. Growth stocks may underperform value stocks during given periods. 4 The Fund is subject to risks associated with investments in small-capitalization companies such as erratic earnings patterns, competitive conditions, limited earnings history, and a reliance on one or a limited number of products. 5 The Fund is subject to special risk considerations similar to those associated with the direct ownership of real estate. Real estate valuations may be subject to factors such as changing general and local economic, financial, competitive, and environmental conditions. 6 The Fund is subject to the special risks associated with investments in micro-cap companies, such as relatively short earnings history, competitive conditions, less publicly available corporate information and reliance on a limited number of products. 7 The Russell Microcap® Growth Index measures the performance of the micro-cap growth segment of the U.S. equity market. It includes those Russell Microcap Index companies with higher price-to-book ratios and higher forecasted growth values. Unlike the Fund, the Index is unmanaged, is not available for investment, and does not incur expenses. 8 The Russell 2000® Growth Index measures the performance of the Russell 2000 companies with higher price-to-book ratios and higher forecasted growth values. Unlike the Fund, the Index is unmanaged, is not available for investment, and does not incur expenses. The Russell Microcap® Growth Index and Russell 2000® Growth Index are registered trademarks of Russell Investments. Russell® is a trademark of Russell Investments. Not FDIC insured, nor bank guaranteed. May lose value. |
| | | | |
| | | AMG Managers Cadence Emerging Companies Fund | | |
| | | Fund Snapshots (unaudited) | | |
| | | May 31, 2015 | | |
PORTFOLIO BREAKDOWN
| | | | | | | | | | | | | | | | | |
| | | Sector | | AMG Managers Cadence Emerging
Companies Fund* | | Russell
Microcap®
Growth Index | | Russell
2000®
Growth
Index |
| | | Health Care | | | | 33.1 | % | | | | 45.4 | % | | | | 25.7 | % |
| | | Information Technology | | | | 19.2 | % | | | | 17.8 | % | | | | 26.0 | % |
| | | Consumer Discretionary | | | | 19.1 | % | | | | 10.9 | % | | | | 15.3 | % |
| | | Industrials | | | | 8.5 | % | | | | 10.2 | % | | | | 13.7 | % |
| | | Financials | | | | 7.9 | % | | | | 5.4 | % | | | | 7.5 | % |
| | | Consumer Staples | | | | 3.0 | % | | | | 2.4 | % | | | | 3.5 | % |
| | | Energy | | | | 2.3 | % | | | | 2.4 | % | | | | 3.1 | % |
| | | Telecommunication Services | | | | 1.9 | % | | | | 2.5 | % | | | | 0.7 | % |
| | | Materials | | | | 1.0 | % | | | | 2.6 | % | | | | 4.2 | % |
| | | Utilities | | | | 0.0 | % | | | | 0.4 | % | | | | 0.3 | % |
| | | Other Assets and Liabilities | | | | 4.0 | % | | | | 0.0 | % | | | | 0.0 | % |
| | | * As a percentage of net assets. | |
TOP TEN HOLDINGS
| | | | | | | | | | | | |
| | | | | | | |
| | | | | | | |
| | | Security Name | | | | % of Net Assets |
| | | Bluebird Bio, Inc. | | | | | | 2.0% | |
| | | Receptos, Inc. | | | | | | 1.7 | |
| | | Chimerix, Inc. | | | | | | 1.6 | |
| | | Alliance Fiber Optic Products, Inc. | | | | | | 1.4 | |
| | | LSI Industries, Inc. | | | | | | 1.4 | |
| | | AtriCure, Inc. | | | | | | 1.4 | |
| | | AMAG Pharmaceuticals, Inc. | | | | | | 1.4 | |
| | | RealD, Inc. | | | | | | 1.3 | |
| | | Capital Senior Living Corp. | | | | | | 1.3 | |
| | | Cascade Microtech, Inc. | | | | | | 1.3 | |
| | | | | | | | | | | |
| | | Top Ten as a Group | | | | | | 14.8% | |
| | | | | | | | | | | |
Because a fund’s strategy may result in multiple investments in particular sectors of the economy, its performance may depend on the performance of those sectors and may fluctuate more widely than investments diversified across more sectors. For additional information on these and other risk considerations, please see the Fund’s prospectus.
Any sectors, industries, or securities discussed should not be perceived as investment recommendations. Mention of a specific security should not be considered a recommendation to buy or solicitation to sell that security. Specific securities mentioned in this report may have been sold from the Fund’s portfolio of investments by the time you receive this report.
| | | | |
| | | AMG Managers Cadence Emerging Companies Fund | | |
| | | Schedule of Portfolio Investments | | |
| | | May 31, 2015 | | |
| | | | | | | | |
| | | | Shares | | | | Value | |
Common Stocks - 96.0% | | | | | | | | |
Consumer Discretionary - 19.1% | | | | | | | | |
Bassett Furniture Industries, Inc. | | | 12,345 | | | | $350,104 | |
Carmike Cinemas, Inc.* | | | 14,730 | | | | 409,936 | |
Carriage Services, Inc.1 | | | 18,680 | | | | 464,758 | |
Cavco Industries, Inc.* | | | 5,870 | | | | 425,751 | |
Cherokee, Inc. | | | 9,980 | | | | 238,522 | |
Escalade, Inc. | | | 21,930 | | | | 400,880 | |
Good Times Restaurants, Inc.* | | | 24,407 | | | | 224,056 | |
Haverty Furniture Cos., Inc. | | | 16,950 | | | | 356,120 | |
Installed Building Products, Inc.* | | | 19,240 | | | | 412,506 | |
Kona Grill, Inc.* | | | 14,340 | | | | 291,389 | |
Malibu Boats, Inc., Class A* | | | 19,400 | | | | 406,818 | |
Martha Stewart Living Omnimedia, Inc., Class A* | | | 68,320 | | | | 355,264 | |
Nautilus, Inc.* | | | 17,696 | | | | 373,740 | |
Nutrisystem, Inc. | | | 16,660 | | | | 379,182 | |
Overstock.com, Inc.*,1 | | | 16,660 | | | | 360,356 | |
Papa Murphy’s Holdings, Inc.* | | | 9,903 | | | | 170,134 | |
Stoneridge, Inc.* | | | 29,740 | | | | 354,798 | |
Superior Uniform Group, Inc. | | | 24,270 | | | | 458,703 | |
Tower International, Inc.* | | | 13,020 | | | | 358,180 | |
Winnebago Industries, Inc.1 | | | 9,270 | | | | 201,437 | |
Zoe’s Kitchen, Inc.*,1 | | | 5,990 | | | | 189,763 | |
Total Consumer Discretionary | | | | | | | 7,182,397 | |
Consumer Staples - 3.0% | | | | | | | | |
Calavo Growers, Inc. | | | 8,030 | | | | 405,114 | |
Lifeway Foods, Inc.* | | | 15,791 | | | | 282,027 | |
Primo Water Corp.*,1 | | | 70,095 | | | | 442,299 | |
Total Consumer Staples | | | | | | | 1,129,440 | |
Energy - 2.3% | | | | | | | | |
Abraxas Petroleum Corp.* | | | 119,090 | | | | 348,934 | |
Penn Virginia Corp.* | | | 49,240 | | | | 228,966 | |
Synergy Resources Corp.* | | | 25,320 | | | | 291,433 | |
Total Energy | | | | | | | 869,333 | |
Financials - 7.9% | | | | | | | | |
Atlas Financial Holdings, Inc.* | | | 22,790 | | | | 428,680 | |
Bryn Mawr Bank Corp. | | | 13,910 | | | | 401,721 | |
Eagle Bancorp, Inc.* | | | 9,590 | | | | 381,586 | |
Heritage Insurance Holdings, Inc.* | | | 16,880 | | | | 354,480 | |
Preferred Bank | | | 13,280 | | | | 366,262 | |
| | | | | | | | |
| | | | Shares | | | | Value | |
QTS Realty Trust, Inc., Class A | | | 10,150 | | | | $377,884 | |
Silvercrest Asset Management Group, Inc., Class A | | | 30,369 | | | | 394,797 | |
UMH Properties, Inc. | | | 29,080 | | | | 287,020 | |
Total Financials | | | | | | | 2,992,430 | |
Health Care - 33.1% | | | | | | | | |
Addus HomeCare Corp.* | | | 13,708 | | | | 383,961 | |
Albany Molecular Research, Inc.*,1 | | | 22,590 | | | | 455,189 | |
AMAG Pharmaceuticals, Inc.*,1 | | | 7,340 | | | | 510,717 | |
ANI Pharmaceuticals, Inc.*,1 | | | 3,390 | | | | 170,788 | |
AtriCure, Inc.* | | | 22,310 | | | | 511,791 | |
BioSpecifics Technologies Corp.* | | | 2,457 | | | | 117,051 | |
BioTelemetry, Inc.* | | | 42,468 | | | | 409,816 | |
Bluebird Bio, Inc.* | | | 3,920 | | | | 761,460 | |
Cambrex Corp.* | | | 10,390 | | | | 415,808 | |
Capital Senior Living Corp.* | | | 18,710 | | | | 481,970 | |
Cardiovascular Systems, Inc.* | | | 10,000 | | | | 279,800 | |
Chimerix, Inc.* | | | 14,570 | | | | 609,755 | |
Cross Country Healthcare, Inc.* | | | 19,460 | | | | 206,665 | |
Emergent Biosolutions, Inc.* | | | 13,909 | | | | 443,141 | |
Enanta Pharmaceuticals, Inc.*,1 | | | 5,220 | | | | 213,394 | |
Harvard Bioscience, Inc.* | | | 67,930 | | | | 380,408 | |
Heska Corp.* | | | 12,385 | | | | 392,604 | |
Icad, Inc.* | | | 37,486 | | | | 165,313 | |
Inogen, Inc.* | | | 11,160 | | | | 417,161 | |
Insys Therapeutics, Inc.*,1 | | | 6,210 | | | | 370,116 | |
Juniper Pharmaceuticals, Inc.* | | | 24,810 | | | | 199,224 | |
Ligand Pharmaceuticals, Inc.* | | | 4,450 | | | | 392,089 | |
MacroGenics, Inc.* | | | 7,430 | | | | 240,360 | |
Misonix, Inc.* | | | 28,932 | | | | 315,359 | |
POZEN, Inc.* | | | 53,850 | | | | 347,332 | |
The Providence Service Corp.* | | | 3,880 | | | | 186,473 | |
Psychemedics Corp. | | | 8,150 | | | | 120,131 | |
PTC Therapeutics, Inc.* | | | 4,190 | | | | 243,397 | |
Receptos, Inc.* | | | 3,825 | | | | 630,704 | |
Sangamo BioSciences, Inc.* | | | 28,220 | | | | 345,695 | |
SciClone Pharmaceuticals, Inc.* | | | 40,295 | | | | 373,132 | |
Sharps Compliance Corp.* | | | 60,235 | | | | 339,123 | |
Simulations Plus, Inc. | | | 55,937 | | | | 330,028 | |
SurModics, Inc.* | | | 14,360 | | | | 354,405 | |
|
|
| The accompanying notes are an integral part of these financial statements. |
| 20 |
| | | | |
| | | | | |
| | | AMG Managers Cadence Emerging Companies Fund | | |
| | | Schedule of Portfolio Investments (continued) | | |
| | | | | | | | |
| | | | Shares | | | | Value | |
Health Care - 33.1% (continued) | | | | | | | | |
U.S. Physical Therapy, Inc. | | | 7,580 | | | | $377,939 | |
Total Health Care | | | | | | | 12,492,299 | |
Industrials - 8.5% | | | | | |
Argan, Inc. | | | 10,540 | | | | 377,121 | |
CRA International, Inc.* | | | 10,751 | | | | 297,050 | |
Hawaiian Holdings, Inc.* | | | 18,730 | | | | 453,641 | |
Hill International, Inc.* | | | 87,799 | | | | 465,335 | |
Insteel Industries, Inc. | | | 17,000 | | | | 337,450 | |
LSI Industries, Inc. | | | 54,860 | | | | 519,524 | |
PGT, Inc.* | | | 39,535 | | | | 472,839 | |
Radiant Logistics, Inc.* | | | 49,560 | | | | 284,970 | |
Total Industrials | | | | | | | 3,207,930 | |
Information Technology - 19.2% | | | | | |
Alliance Fiber Optic Products, Inc. | | | 28,102 | | | | 544,055 | |
American Software, Inc., Class A | | | 40,115 | | | | 352,611 | |
Autobytel, Inc.* | | | 11,994 | | | | 201,019 | |
Cascade Microtech, Inc.* | | | 30,000 | | | | 480,300 | |
CEVA, Inc.* | | | 17,390 | | | | 357,191 | |
DSP Group, Inc.* | | | 35,940 | | | | 401,809 | |
DTS, Inc.* | | | 10,656 | | | | 338,115 | |
Edgewater Technology, Inc.* | | | 42,007 | | | | 298,670 | |
Gigamon, Inc.* | | | 11,670 | | | | 358,969 | |
Information Services Group, Inc. | | | 47,637 | | | | 181,973 | |
Inphi Corp.* | | | 15,565 | | | | 372,626 | |
Numerex Corp., Class A* | | | 32,553 | | | | 278,654 | |
NVE Corp. | | | 6,520 | | | | 468,332 | |
Qualys, Inc.* | | | 10,220 | | | | 416,158 | |
RealD, Inc.* | | | 38,850 | | | | 490,287 | |
Reis, Inc. | | | 20,210 | | | | 438,961 | |
Sapiens International Corp. N.V. | | | 27,065 | | | | 244,938 | |
ShoreTel, Inc.* | | | 38,970 | | | | 268,114 | |
SPS Commerce, Inc.* | | | 5,460 | | | | 355,009 | |
| | | | | | | | |
| | | Shares | | | | | Value | |
United Online, Inc.* | | 22,640 | | | | | $391,446 | |
Total Information Technology | | | | | | | 7,239,237 | |
Materials - 1.0% | | | | | | | | |
AEP Industries, Inc.* | | 7,350 | | | | | 367,721 | |
Telecommunication Services - 1.9% | | | | | | |
8x8, Inc.* | | 42,220 | | | | | 352,115 | |
Vonage Holdings Corp.* | | 79,440 | | | | | 370,190 | |
Total Telecommunication Services | | | | | 722,305 | |
Total Common Stocks | | | | | | | | |
(cost $32,000,886) | | | | | | | 36,203,092 | |
| | | |
| | | Principal
Amount | | | | | |
| | |
Short-Term Investments - 5.9% | | | | | | |
Repurchase Agreements - 4.4%2 | | | | | | |
Cantor Fitzgerald Securities, Inc., dated 05/29/15, due 06/01/15, 0.110%, total to be received $1,000,009 (collateralized by various U.S. Government Agency Obligations, 0.000% - 8.000%, 07/15/15 - 04/20/65,totaling $1,020,000) | | $1,000,000 | | | | | 1,000,000 | |
Nomura Securities International, Inc., dated 05/29/15, due 06/01/15, 0.110%, total to be received $655,571 (collateralized by various U.S. Government Agency Obligations, 0.000% - 9.500%, 06/15/15 - 04/20/65 totaling $668,676) | | 655,565 | | | | | 655,565 | |
Total Repurchase Agreements | | | | | | | 1,655,565 | |
| | | |
| | | Shares | | | | | |
| | |
Other Investment Companies - 1.5%3 | | | | | | |
Dreyfus Institutional Cash Advantage Fund, Institutional Class Shares, 0.08% | | 565,722 | | | | | 565,722 | |
Total Short-Term Investments | | | | | | | | |
(cost $2,221,287) | | | | | | | 2,221,287 | |
Total Investments - 101.9%
(cost $34,222,173) | | | | | | | 38,424,379 | |
Other Assets, less Liabilities - (1.9)% | | | | | (715,506 | ) |
Net Assets - 100.0% | | | | | | | $37,708,873 | |
|
|
| The accompanying notes are an integral part of these financial statements. |
| 21 |
| | | | |
| | | | | |
| | | | | |
| | | Notes to Schedules of Portfolio Investments | | |
The following footnotes should be read in conjunction with each of the Schedules of Portfolio Investments previously presented in this report.
At May 31, 2015, the approximate cost of investments for federal income tax purposes and the aggregate gross unrealized appreciation and/or depreciation based on tax cost were as follows:
| | | | | | | | | | | | | | | | |
| Fund | | Cost | | | Appreciation | | | Depreciation | | | Net | |
AMG Managers Cadence Capital Appreciation Fund | | | $104,192,391 | | | | $31,951,120 | | | | $(2,826,052 | ) | | | $29,125,068 | |
AMG Managers Cadence Mid Cap Fund | | | 144,647,355 | | | | 28,435,530 | | | | (1,445,394 | ) | | | 26,990,136 | |
AMG Managers Cadence Emerging Companies Fund | | | 34,242,967 | | | | 5,774,391 | | | | (1,592,979 | ) | | | 4,181,412 | |
| * | Non-income producing security. |
| 1 | Some or all of these securities were out on loan to various brokers as of May 31, 2015, amounting to the following: |
| | | | | | | | |
| Fund | | Market Value | | | % of Net Assets | |
AMG Managers Cadence Capital Appreciation Fund | | | $1,136,583 | | | | 0.9% | |
AMG Managers Cadence Mid Cap Fund | | | $6,554,338 | | | | 4.0% | |
AMG Managers Cadence Emerging Companies Fund | | | $1,620,675 | | | | 4.3% | |
| 2 | Collateral received from brokers for securities lending was invested in these short-term investments. |
| 3 | Yield shown represents the May 31, 2015, seven-day average yield, which refers to the sum of the previous seven days’ dividends paid, expressed as an annual percentage. |
The following tables summarize the inputs used to value the Funds’ net assets by the fair value hierarchy levels as of May 31, 2015: (See Note 1(a) in the Notes to Financial Statements.)
| | | | | | | | | | | | | | | | |
| | | Quoted Prices in Active
Markets for Identical
Investments Level 1 | | | Significant Other
Observable Inputs Level 2 | | | Significant Unobservable
Inputs Level 3 | | | Total | |
| AMG Managers Cadence Capital Appreciation Fund | | | | | | | | | | | | |
Investments in Securities | | | | | | | | | | | | | | | | |
Common Stocks† | | | $132,143,207 | | | | — | | | | — | | | | $132,143,207 | |
Short-Term Investments | | | | | | | | | | | | | | | | |
Repurchase Agreements | | | — | | | | $1,174,252 | | | | — | | | | 1,174,252 | |
| | | | | | | | | | | | | | | | |
Total Investments in Securities | | | $132,143,207 | | | | $1,174,252 | | | | — | | | | $133,317,459 | |
| | | | | | | | | | | | | | | | |
| | | | |
| | | Quoted Prices in Active
Markets for Identical
Investments Level 1 | | | Significant Other
Observable Inputs
Level 2 | | | Significant Unobservable
Inputs Level 3 | | | Total | |
| AMG Managers Cadence Mid Cap Fund | | | | | | | | | | | | |
Investments in Securities | | | | | | | | | | | | | | | | |
Common Stocks† | | | $164,648,064 | | | | — | | | | — | | | | $164,648,064 | |
Short-Term Investments | | | | | | | | | | | | | | | | |
Repurchase Agreements | | | — | | | | $6,706,433 | | | | — | | | | 6,706,433 | |
Other Investment Companies | | | 282,994 | | | | — | | | | — | | | | 282,994 | |
| | | | | | | | | | | | | | | | |
Total Investments in Securities | | | $164,931,058 | | | | $6,706,433 | | | | — | | | | $171,637,491 | |
| | | | | | | | | | | | | | | | |
|
|
| The accompanying notes are an integral part of these financial statements. |
| 22 |
| | | | |
| | | | | |
| | | | | |
| | | Notes to Schedules of Portfolio Investments (continued) | | |
| | | | | | | | | | | | | | | | |
| | | Quoted Prices in Active
Markets for Identical
Investments Level 1 | | | Significant Other Observable Inputs
Level 2 | | | Significant Unobservable
Inputs Level 3 | | | Total | |
| AMG Managers Cadence Emerging Companies Fund | | | | | | | | | | | | |
Investments in Securities | | | | | | | | | | | | | | | | |
Common Stocks† | | | $36,203,092 | | | | — | | | | — | | | | $36,203,092 | |
Short-Term Investments | | | | | | | | | | | | | | | | |
Repurchase Agreements | | | — | | | | $1,655,565 | | | | — | | | | 1,655,565 | |
Other Investment Companies | | | 565,722 | | | | — | | | | — | | | | 565,722 | |
| | | | | | | | | | | | | | | | |
Total Investments in Securities | | | $36,768,814 | | | | $1,655,565 | | | | — | | | | $38,424,379 | |
| | | | | | | | | | | | | | | | |
| † | All common stocks held in the Funds are level 1 securities. For a detailed break-out of the common stocks by major industry classification, please refer to the respective Schedule of Portfolio Investments. |
As of May 31, 2015, the Funds had no transfers between levels from the beginning of the reporting period.
|
|
| The accompanying notes are an integral part of these financial statements. |
| 23 |
| | | | |
| | | | | |
| | | Statement of Assets and Liabilities | | |
| | | May 31, 2015 | | |
| | | | | | | | | | | | |
| | | AMG Managers
Cadence
Capital
Appreciation
Fund | | | AMG Managers
Cadence Mid Cap Fund | | | AMG Managers
Cadence
Emerging
Companies
Fund | |
Assets: | | | | | | | | | | | | |
Investments at value* (including securities on loan valued at $1,136,583, $6,554,338, and $1,620,675, respectively) | | | $133,317,459 | | | | $171,637,491 | | | | $38,424,379 | |
Receivable for investments sold | | | — | | | | 4,551,459 | | | | 696,099 | |
Dividends, interest and other receivables | | | 147,199 | | | | 189,729 | | | | 16,789 | |
Receivable from affiliate | | | 10,928 | | | | — | | | | 10,231 | |
Receivable for Fund shares sold | | | 4,842 | | | | 21,633 | | | | 493,943 | |
Prepaid expenses | | | 13,175 | | | | 10,276 | | | | 7,753 | |
Total assets | | | 133,493,603 | | | | 176,410,588 | | | | 39,649,194 | |
Liabilities: | | | | | | | | | | | | |
Payable to Custodian | | | 90,796 | | | | — | | | | — | |
Payable upon return of securities loaned | | | 1,174,252 | | | | 6,706,433 | | | | 1,655,565 | |
Payable for Fund shares repurchased | | | 106,542 | | | | 200,256 | | | | 1,450 | |
Payable for investments purchased | | | — | | | | 4,140,842 | | | | 215,567 | |
Payable to affiliate | | | — | | | | 2,390 | | | | — | |
Accrued expenses: | | | | | | | | | | | | |
Investment advisory and management fees | | | 50,779 | | | | 62,881 | | | | 40,070 | |
Administrative fees | | | 28,211 | | | | 34,934 | | | | 8,014 | |
Distribution fees - Investor Class | | | 16,189 | | | | 24,690 | | | | — | |
Shareholder servicing fees - Investor Class | | | 9,713 | | | | 14,814 | | | | — | |
Shareholder servicing fees - Service Class | | | 2,192 | | | | 3,128 | | | | 669 | |
Trustees fees and expenses | | | 1,414 | | | | 3,654 | | | | 436 | |
Other | | | 44,046 | | | | 49,432 | | | | 18,550 | |
Total liabilities | | | 1,524,134 | | | | 11,243,454 | | | | 1,940,321 | |
| | | | | | | | | | | | |
Net Assets | | | $131,969,469 | | | | $165,167,134 | | | | $37,708,873 | |
Net Assets Represent: | | | | | | | | | | | | |
Paid-in capital | | | $167,761,201 | | | | $125,272,781 | | | | $56,110,741 | |
Undistributed (accumulated) net investment income (loss) | | | 238,577 | | | | 25,370 | | | | (111,235 | ) |
Accumulated net realized gain (loss) from investments | | | (66,433,432 | ) | | | 12,442,625 | | | | (22,492,839 | ) |
Net unrealized appreciation (depreciation) of investments | | | 30,403,123 | | | | 27,426,358 | | | | 4,202,206 | |
Net Assets | | | $131,969,469 | | | | $165,167,134 | | | | $37,708,873 | |
* Investments at cost | | | $102,914,336 | | | | $144,211,133 | | | | $34,222,173 | |
|
|
| The accompanying notes are an integral part of these financial statements. |
| 24 |
| | | | |
| | | | | |
| | | | | |
| | | Statement of Assets and Liabilities (continued) | | |
| | | | | | | | | | | | |
| | | AMG Managers
Cadence
Capital
Appreciation
Fund | | | AMG Managers
Cadence Mid Cap Fund | | | AMG Managers
Cadence
Emerging
Companies
Fund | |
Investor Class: | | | | | | | | | | | | |
Net Assets | | | $75,755,446 | | | | $116,665,652 | | | | n/a | |
Shares outstanding | | | 2,859,382 | | | | 3,628,593 | | | | n/a | |
Net asset value, offering and redemption price per share | | | $26.49 | | | | $32.15 | | | | n/a | |
Service Class: | | | | | | | | | | | | |
Net Assets | | | $10,286,610 | | | | $14,808,563 | | | | $3,143,300 | |
Shares outstanding | | | 382,737 | | | | 447,835 | | | | 89,062 | |
Net asset value, offering and redemption price per share | | | $26.88 | | | | $33.07 | | | | $35.29 | |
Institutional Class: | | | | | | | | | | | | |
Net Assets | | | $45,927,413 | | | | $33,692,919 | | | | $34,565,573 | |
Shares outstanding | | | 1,669,800 | | | | 978,098 | | | | 908,713 | |
Net asset value, offering and redemption price per share | | | $27.50 | | | | $34.45 | | | | $38.04 | |
|
|
| The accompanying notes are an integral part of these financial statements. |
| 25 |
| | | | |
| | | | | |
| | | Statement of Operations | | |
| | | For the fiscal year ended May 31, 2015 | | |
| | | | | | | | | | | | |
| | | AMG Managers
Cadence
Capital
Appreciation
Fund | | | AMG Managers
Cadence Mid Cap Fund | | | AMG Managers
Cadence
Emerging
Companies
Fund | |
Investment Income: | | | | | | | | | | | | |
Dividend income | | | $1,974,003 | | | | $1,980,133 | | | | $234,940 | 1 |
Securities lending income | | | 637 | | | | 57,658 | | | | 20,495 | |
Foreign withholding tax | | | — | | | | (3,746 | ) | | | (446 | ) |
Total investment income | | | 1,974,640 | | | | 2,034,045 | | | | 254,989 | |
Expenses: | | | | | | | | | | | | |
Investment advisory and management fees | | | 625,882 | | | | 961,377 | | | | 464,925 | |
Administrative fees | | | 347,712 | | | | 534,099 | | | | 92,985 | |
Distribution fees - Investor Class | | | 193,889 | | | | 299,467 | | | | — | |
Shareholder servicing fees - Investor Class | | | 116,334 | | | | 179,680 | | | | — | |
Shareholder servicing fees - Service Class | | | 38,643 | | | | 37,530 | | | | 7,669 | |
Registration fees | | | 48,615 | | | | 45,041 | | | | 32,989 | |
Professional fees | | | 34,304 | | | | 38,458 | | | | 25,214 | |
Transfer agent | | | 33,402 | | | | 31,115 | | | | 1,456 | |
Reports to shareholders | | | 25,330 | | | | 36,566 | | | | 6,621 | |
Custodian | | | 14,694 | | | | 17,412 | | | | 9,603 | |
Trustees fees and expenses | | | 5,426 | | | | 10,797 | | | | 1,632 | |
Miscellaneous | | | 5,814 | | | | 13,343 | | | | 1,915 | |
Total expenses before offsets/reductions | | | 1,490,045 | | | | 2,204,885 | | | | 645,009 | |
Expense reimbursements | | | (138,134 | ) | | | (142,818 | ) | | | (108,830 | ) |
Expense reductions | | | (6,804 | ) | | | (14,135 | ) | | | (2,793 | ) |
Net expenses | | | 1,345,107 | | | | 2,047,932 | | | | 533,386 | |
| | | | | | | | | | | | |
Net investment income (loss) | | | 629,533 | | | | (13,887 | ) | | | (278,397 | ) |
Net Realized and Unrealized Gain (Loss): | | | | | | | | | | | | |
Net realized gain on investments | | | 17,201,283 | | | | 34,018,847 | | | | 5,090,199 | |
Net change in unrealized appreciation (depreciation) of investments | | | (407,439 | ) | | | (3,481,338 | ) | | | 584,905 | |
Net realized and unrealized gain | | | 16,793,844 | | | | 30,537,509 | | | | 5,675,104 | |
| | | | | | | | | | | | |
Net increase in net assets resulting from operations | | | $17,423,377 | | | | $30,523,622 | | | | $5,396,707 | |
1 Includes non-recurring dividends of $15,252.
|
|
| The accompanying notes are an integral part of these financial statements. |
| 26 |
| | | | |
| | | | | |
| | | Statements of Changes in Net Assets | | |
| | | For the fiscal year ended May 31, | | |
| | | | | | | | | | | | | | | | | | | | | | | | |
| | | AMG Managers Cadence Capital Appreciation Fund | | | AMG Managers Cadence Mid Cap Fund | | | AMG Managers Cadence Emerging Companies Fund | |
| | | 2015 | | | 2014 | | | 2015 | | | 2014 | | | 2015 | | | 2014 | |
Increase (Decrease) in Net
Assets From Operations: | | | | | | | | | | | | | | | | | | | | | | | | |
Net investment income (loss) | | | $629,533 | | | | $1,305,944 | | | | $(13,887 | ) | | | $644,787 | | | | $(278,397 | ) | | | $(329,021 | ) |
Net realized gain on investments | | | 17,201,283 | | | | 17,677,791 | | | | 34,018,847 | | | | 61,304,157 | | | | 5,090,199 | | | | 7,950,821 | |
Net change in unrealized appreciation (depreciation) of investments | | | (407,439 | ) | | | 13,567,273 | | | | (3,481,338 | ) | | | 4,098,746 | | | | 584,905 | | | | (1,795,923 | ) |
Net increase in net assets resulting from operations | | | 17,423,377 | | | | 32,551,008 | | | | 30,523,622 | | | | 66,047,690 | | | | 5,396,707 | | | | 5,825,877 | |
Distributions to Shareholders: | | | | | | | | | | | | | | | | | | | | | | | | |
From net investment income: | | | | | | | | | | | | | | | | | | | | | | | | |
Investor Class | | | (430,064 | ) | | | (383,057 | ) | | | — | | | | — | | | | — | | | | — | |
Service Class | | | (17,436 | ) | | | (461,023 | ) | | | — | | | | — | | | | — | | | | — | |
Institutional Class | | | (447,908 | ) | | | (368,513 | ) | | | — | | | | (450,094 | ) | | | — | | | | — | |
From net realized gain on investments: | | | | | | | | | | | | | | | | | | | | | | | | |
Investor Class | | | — | | | | — | | | | (22,396,748 | ) | | | — | | | | — | | | | — | |
Service Class | | | — | | | | — | | | | (2,704,133 | ) | | | — | | | | — | | | | — | |
Institutional Class | | | — | | | | — | | | | (13,096,718 | ) | | | — | | | | — | | | | — | |
Total distributions to shareholders | | | (895,408 | ) | | | (1,212,593 | ) | | | (38,197,599 | ) | | | (450,094 | ) | | | — | | | | — | |
Capital Share Transactions:1 | | | | | | | | | | | | | | | | | | | | | | | | |
Net decrease from capital share transactions | | | (54,464,464 | ) | | | (42,122,270 | ) | | | (153,790,230 | ) | | | (162,202,847 | ) | | | (10,690,675 | ) | | | (2,129,263 | ) |
| | | | | | | | | | | | | | | | | | | | | | | | |
Total increase (decrease) in net assets | | | (37,936,495 | ) | | | (10,783,855 | ) | | | (161,464,207 | ) | | | (96,605,251 | ) | | | (5,293,968 | ) | | | 3,696,614 | |
Net Assets: | | | | | | | | | | | | | | | | | | | | | | | | |
Beginning of year | | | 169,905,964 | | | | 180,689,819 | | | | 326,631,341 | | | | 423,236,592 | | | | 43,002,841 | | | | 39,306,227 | |
End of year | | | $131,969,469 | | | | $169,905,964 | | | | $165,167,134 | | | | $326,631,341 | | | | $37,708,873 | | | | $43,002,841 | |
End of year undistributed (accumulated) net investment income (loss) | | | $238,577 | | | | $486,418 | | | | $25,370 | | | | $12,618 | | | | $(111,235 | ) | | | $(79,021 | ) |
| | | | | | | | | | | | | | | | | | | | | | | | |
1 See Note 1(g) of the Notes to Financial Statements.
|
|
| The accompanying notes are an integral part of these financial statements. |
| 27 |
| | | | |
| | | | | |
| | | AMG Managers Cadence Capital Appreciation Fund Financial Highlights | | |
| | | For a share outstanding throughout each fiscal period | | |
| | | | | | | | | | | | | | | | | | | | | | | | |
| | | | | | | | | | | | | | | For the | | | For the | |
| | | | | | | | | | | | | | | period from | | | fiscal year | |
| | | For the fiscal years ended May 31, | | | July 1, 2010, to | | | ended June 30, | |
| Investor Class | | 2015 | | | 2014 | | | 2013 | | | 2012 | | | May 31, 2011 | | | 2010 | |
Net Asset Value, Beginning of Period | | | $23.54 | | | | $19.78 | | | | $16.59 | | | | $17.57 | | | | $13.34 | | | | $11.91 | |
Income from Investment Operations: | | | | | | | | | | | | | | | | | | | | | | | | |
Net investment income1,2 | | | 0.08 | | | | 0.13 | 4 | | | 0.15 | 6 | | | 0.04 | | | | 0.04 | | | | 0.03 | |
Net realized and unrealized gain (loss) on investments | | | 3.01 | | | | 3.73 | | | | 3.17 | | | | (1.01 | ) | | | 4.26 | | | | 1.43 | |
Total from investment operations | | | 3.09 | | | | 3.86 | | | | 3.32 | | | | (0.97 | ) | | | 4.30 | | | | 1.46 | |
Less Distributions to Shareholders from: | | | | | | | | | | | | | | | | | | | | | | | | |
Net investment income | | | (0.14 | ) | | | (0.10 | ) | | | (0.13 | ) | | | (0.01 | ) | | | (0.07 | ) | | | (0.03 | ) |
Net Asset Value, End of Period | | | $26.49 | | | | $23.54 | | | | $19.78 | | | | $16.59 | | | | $17.57 | | | | $13.34 | |
Total Return2 | | | 13.16 | % | | | 19.53 | % | | | 20.12 | % | | | (5.50 | )% | | | 32.23 | %8,15 | | | 12.23 | % |
Ratio of net expenses to average net assets (with offsets/reductions) | | | 1.12 | % | | | 1.09 | %5 | | | 1.12 | %7 | | | 1.11 | % | | | 1.10 | %16 | | | 1.11 | % |
Ratio of expenses to average net assets (with offsets) | | | 1.13 | % | | | 1.13 | %5 | | | 1.14 | %7 | | | 1.12 | % | | | 1.11 | %16 | | | 1.11 | % |
Ratio of total expenses to average net assets (without offsets/reductions)3 | | | 1.22 | % | | | 1.23 | %5 | | | 1.23 | %7 | | | 1.21 | % | | | 1.16 | %16 | | | 1.11 | % |
Ratio of net investment income to average net assets2 | | | 0.30 | % | | | 0.59 | %5 | | | 0.81 | %7 | | | 0.21 | % | | | 0.30 | %16 | | | 0.24 | % |
Portfolio turnover | | | 41 | % | | | 52 | % | | | 79 | % | | | 163 | % | | | 75 | %8,15 | | | 103 | % |
Net assets at end of period (000’s omitted) | | | $75,755 | | | | $81,866 | | | | $87,419 | | | | $68,310 | | | | $110,903 | | | | $108,395 | |
| |
| | | | | | |
| | | | | | | | | | | | | | | For the | | | For the | |
| | | | | | | | | | | | | | | period from | | | fiscal year | |
| | | For the fiscal years ended May 31, | | | July 1, 2010, to | | | ended June 30, | |
| Service Class | | 2015 | | | 2014 | | | 2013 | | | 2012 | | | May 31, 2011 | | | 2010 | |
Net Asset Value, Beginning of Period | | | $23.74 | | | | $19.99 | | | | $16.71 | | | | $17.67 | | | | $13.40 | | | | $11.98 | |
Income from Investment Operations: | | | | | | | | | | | | | | | | | | | | | | | | |
Net investment income1,2 | | | 0.12 | | | | 0.16 | 4 | | | 0.14 | 6 | | | 0.06 | | | | 0.06 | | | | 0.05 | |
Net realized and unrealized gain (loss) on investments | | | 3.06 | | | | 3.76 | | | | 3.24 | | | | (1.01 | ) | | | 4.29 | | | | 1.43 | |
Total from investment operations | | | 3.18 | | | | 3.92 | | | | 3.38 | | | | (0.95 | ) | | | 4.35 | | | | 1.48 | |
Less Distributions to Shareholders from: | | | | | | | | | | | | | | | | | | | | | | | | |
Net investment income | | | (0.04 | ) | | | (0.17 | ) | | | (0.10 | ) | | | (0.01 | ) | | | (0.08 | ) | | | (0.06 | ) |
Net Asset Value, End of Period | | | $26.88 | | | | $23.74 | | | | $19.99 | | | | $16.71 | | | | $17.67 | | | | $13.40 | |
Total Return2 | | | 13.41 | % | | | 19.63 | %9 | | | 20.31 | %9 | | | (5.38 | )% | | | 32.47 | %8,15 | | | 12.43 | % |
Ratio of net expenses to average net assets (with offsets/reductions) | | | 0.97 | % | | | 0.94 | %5 | | | 0.95 | %7 | | | 0.96 | % | | | 0.96 | %16 | | | 0.96 | % |
Ratio of expenses to average net assets (with offsets) | | | 0.98 | % | | | 0.98 | %5 | | | 0.97 | %7 | | | 0.97 | % | | | 0.96 | %16 | | | 0.96 | % |
Ratio of total expenses to average net assets (without offsets/reductions)3 | | | 1.07 | % | | | 1.08 | %5 | | | 1.06 | %7 | | | 1.06 | % | | | 1.02 | %16 | | | 0.99 | % |
Ratio of net investment income to average net assets2 | | | 0.45 | % | | | 0.74 | %5 | | | 0.76 | %7 | | | 0.34 | % | | | 0.43 | %16 | | | 0.39 | % |
Portfolio turnover | | | 41 | % | | | 52 | % | | | 79 | % | | | 163 | % | | | 75 | %8,15 | | | 103 | % |
Net assets at end of period (000’s omitted) | | | $10,287 | | | | $42,245 | | | | $55,735 | | | | $67,536 | | | | $143,233 | | | | $199,889 | |
| |
| | | | |
| | | AMG Managers Cadence Capital Appreciation Fund Financial Highlights | | |
| | | For a share outstanding throughout each fiscal period | | |
| | | | | | | | | | | | | | | | | | | | | | | | | | | | | | |
| | | | | | | | | | | For the | | For the |
| | | | | | | | | | | period from | | fiscal year |
| | | For the fiscal years ended May 31, | | July 1, 2010, to | | ended June 30, |
| Institutional Class | | 2015 | | 2014 | | 2013 | | 2012 | | May 31, 2011 | | 2010 |
Net Asset Value, Beginning of Period | | | | $24.44 | | | | | $20.57 | | | | | $17.21 | | | | | $18.24 | | | | | $13.84 | | | | | $12.36 | |
| | | | | | |
Income from Investment Operations: | | | | | | | | | | | | | | | | | | | | | | | | | | | | | | |
| | | | | | |
Net investment income1,2 | | | | 0.18 | | | | | 0.22 | 4 | | | | 0.18 | 6 | | | | 0.10 | | | | | 0.10 | | | | | 0.09 | |
| | | | | | |
Net realized and unrealized gain (loss) on investments | | | | 3.14 | | | | | 3.88 | | | | | 3.34 | | | | | (1.03 | ) | | | | 4.42 | | | | | 1.48 | |
| | | | | | |
Total from investment operations | | | | 3.32 | | | | | 4.10 | | | | | 3.52 | | | | | (0.93 | ) | | | | 4.52 | | | | | 1.57 | |
| | | | | | |
Less Distributions to Shareholders from: | | | | | | | | | | | | | | | | | | | | | | | | | | | | | | |
| | | | | | |
Net investment income | | | | (0.26 | ) | | | | (0.23 | ) | | | | (0.16 | ) | | | | (0.10 | ) | | | | (0.12 | ) | | | | (0.09 | ) |
| | | | | | |
Net Asset Value, End of Period | | | | $27.50 | | | | | $24.44 | | | | | $20.57 | | | | | $17.21 | | | | | $18.24 | | | | | $13.84 | |
| | | | | | |
Total Return2 | | | | 13.62 | % | | | | 19.96 | % | | | | 20.57 | % | | | | (5.10 | )% | | | | 32.73 | %8,15 | | | | 12.67 | % |
| | | | | | |
Ratio of net expenses to average net assets (with offsets/reductions) | | | | 0.72 | % | | | | 0.69 | %5 | | | | 0.70 | %7 | | | | 0.71 | % | | | | 0.71 | %16 | | | | 0.71 | % |
| | | | | | |
Ratio of expenses to average net assets (with offsets) | | | | 0.73 | % | | | | 0.73 | %5 | | | | 0.72 | %7 | | | | 0.72 | % | | | | 0.71 | %16 | | | | 0.71 | % |
| | | | | | |
Ratio of total expenses to average net assets (without offsets/reductions)3 | | | | 0.82 | % | | | | 0.83 | %5 | | | | 0.81 | %7 | | | | 0.81 | % | | | | 0.77 | %16 | | | | 0.71 | % |
| | | | | | |
Ratio of net investment income to average net assets2 | | | | 0.70 | % | | | | 1.00 | %5 | | | | 1.00 | %7 | | | | 0.58 | % | | | | 0.69 | %16 | | | | 0.62 | % |
| | | | | | |
Portfolio turnover | | | | 41 | % | | | | 52 | % | | | | 79 | % | | | | 163 | % | | | | 75 | %8,15 | | | | 103 | % |
| | | | | | |
Net assets at end of period (000’s omitted) | | | | $45,927 | | | | | $45,795 | | | | | $37,536 | | | | | $85,338 | | | | | $178,990 | | | | | $187,350 | |
| | | | |
| | | AMG Managers Cadence Mid Cap Fund Financial Highlights | | |
| | | For a share outstanding throughout each fiscal period | | |
| | | | | | | | | | | | | | | | | | | | | | | | | | | | | | |
| | | | | | | | | | | For the | | For the |
| | | | | | | | | | | period from | | fiscal year |
| | | For the fiscal years ended May 31, | | July 1, 2010, to | | ended June 30, |
| Investor Class | | 2015 | | 2014 | | 2013 | | 2012 | | May 31, 2011 | | 2010 |
Net Asset Value, Beginning of Period | | | | $34.15 | | | | | $28.32 | | | | | $24.10 | | | | | $26.29 | | | | | $18.23 | | | | | $15.57 | |
| | | | | | |
Income from Investment Operations: | | | | | | | | | | | | | | | | | | | | | | | | | | | | | | |
| | | | | | |
Net investment income (loss)1,2 | | | | (0.06 | ) | | | | (0.02 | )4 | | | | 0.03 | 6 | | | | (0.06 | ) | | | | (0.01 | ) | | | | (0.03 | ) |
| | | | | | |
Net realized and unrealized gain (loss) on investments | | | | 4.88 | | | | | 5.85 | | | | | 4.23 | | | | | (2.13 | ) | | | | 8.10 | | | | | 2.69 | |
| | | | | | |
Total from investment operations | | | | 4.82 | | | | | 5.83 | | | | | 4.26 | | | | | (2.19 | ) | | | | 8.09 | | | | | 2.66 | |
| | | | | | |
Less Distributions to Shareholders from: | | | | | | | | | | | | | | | | | | | | | | | | | | | | | | |
| | | | | | |
Net investment income | | | | — | | | | | — | | | | | (0.04 | ) | | | | — | | | | | (0.03 | ) | | | | — | |
| | | | | | |
Net realized gain on investments | | | | (6.82 | ) | | | | — | | | | | — | | | | | — | | | | | — | | | | | — | |
| | | | | | |
Total distributions to shareholders | | | | (6.82 | ) | | | | — | | | | | (0.04 | ) | | | | — | | | | | (0.03 | ) | | | | — | |
| | | | | | |
Net Asset Value, End of Period | | | | $32.15 | | | | | $34.15 | | | | | $28.32 | | | | | $24.10 | | | | | $26.29 | | | | | $18.23 | |
| | | | | | |
Total Return2 | | | | 15.14 | % | | | | 20.59 | % | | | | 17.70 | % | | | | (8.33 | )% | | | | 44.38 | %8,15 | | | | 17.08 | % |
| | | | | | |
Ratio of net expenses to average net assets (with offsets/reductions) | | | | 1.12 | % | | | | 1.11 | %10 | | | | 1.13 | %11 | | | | 1.11 | % | | | | 1.10 | %16 | | | | 1.11 | % |
| | | | | | |
Ratio of expenses to average net assets (with offsets) | | | | 1.13 | % | | | | 1.13 | %10 | | | | 1.14 | %11 | | | | 1.12 | % | | | | 1.11 | %16 | | | | 1.11 | % |
| | | | | | |
Ratio of total expenses to average net assets (without offsets/reductions)3 | | | | 1.19 | % | | | | 1.18 | %10 | | | | 1.21 | %11 | | | | 1.20 | % | | | | 1.18 | %16 | | | | 1.11 | % |
| | | | | | |
Ratio of net investment income (loss) to average net assets2 | | | | (0.16 | )% | | | | (0.05 | )%10 | | | | 0.13 | %11 | | | | (0.25 | )% | | | | (0.05 | )%16 | | | | (0.14 | )% |
| | | | | | |
Portfolio turnover | | | | 130 | % | | | | 203 | % | | | | 121 | % | | | | 127 | % | | | | 85 | %8,15 | | | | 107 | % |
| | | | | | |
Net assets at end of period (000’s omitted) | | | | $116,666 | | | | | $122,497 | | | | | $163,088 | | | | | $138,115 | | | | | $174,948 | | | | | $155,574 | |
| | | | | | | | | | | | | | | | | | | | | | | | | | | | | | |
| | | | | | | | | | | For the | | For the |
| | | | | | | | | | | period from | | fiscal years |
| | | For the fiscal years ended May 31, | | July 1, 2010, to | | ended June 30, |
| Service Class | | 2015 | | 2014 | | 2013 | | 2012 | | May 31, 2011 | | 2010 |
Net Asset Value, Beginning of Period | | | | $35.04 | | | | | $29.02 | | | | | $24.67 | | | | | $26.87 | | | | | $18.61 | | | | | $15.88 | |
| | | | | | |
Income from Investment Operations: | | | | | | | | | | | | | | | | | | | | | | | | | | | | | | |
| | | | | | |
Net investment income (loss)1,2 | | | | (0.01 | ) | | | | 0.05 | 4 | | | | 0.08 | 6 | | | | (0.02 | ) | | | | 0.02 | | | | | 0.00 | # |
| | | | | | |
Net realized and unrealized gain (loss) on investments | | | | 5.02 | | | | | 5.97 | | | | | 4.32 | | | | | (2.18 | ) | | | | 8.28 | | | | | 2.73 | |
Total from investment operations | | | | 5.01 | | | | | 6.02 | | | | | 4.40 | | | | | (2.20 | ) | | | | 8.30 | | | | | 2.73 | |
Less Distributions to Shareholders from: | | | | | | | | | | | | | | | | | | | | | | | | | | | | | | |
| | | | | | |
Net investment income | | | | — | | | | | — | | | | | (0.05 | ) | | | | — | | | | | (0.04 | ) | | | | — | |
| | | | | | |
Net realized gain on investments | | | | (6.98 | ) | | | | — | | | | | — | | | | | — | | | | | — | | | | | — | |
| | | | | | |
Total distributions to shareholders | | | | (6.98 | ) | | | | — | | | | | (0.05 | ) | | | | — | | | | | (0.04 | ) | | | | — | |
| | | | | | |
Net Asset Value, End of Period | | | | $33.07 | | | | | $35.04 | | | | | $29.02 | | | | | $24.67 | | | | | $26.87 | | | | | $18.61 | |
| | | | | | |
Total Return2 | | | | 15.34 | % | | | | 20.74 | % | | | | 17.88 | % | | | | (8.19 | )% | | | | 44.60 | %8,15 | | | | 17.19 | % |
| | | | | | |
Ratio of net expenses to average net assets (with offsets/reductions) | | | | 0.97 | % | | | | 0.96 | %10 | | | | 0.98 | %11 | | | | 0.96 | % | | | | 0.94 | %16 | | | | 0.96 | % |
| | | | | | |
Ratio of expenses to average net assets (with offsets) | | | | 0.98 | % | | | | 0.98 | %10 | | | | 0.99 | %11 | | | | 0.97 | % | | | | 0.96 | %16 | | | | 0.96 | % |
| | | | | | |
Ratio of total expenses to average net assets (without offsets/reductions)3 | | | | 1.04 | % | | | | 1.03 | %10 | | | | 1.06 | %11 | | | | 1.05 | % | | | | 1.02 | %16 | | | | 0.99 | % |
| | | | | | |
Ratio of net investment income (loss) to average net assets2 | | | | (0.01 | )% | | | | 0.15 | %10 | | | | 0.32 | %11 | | | | (0.09 | )% | | | | 0.11 | %16 | | | | 0.01 | % |
| | | | | | |
Portfolio turnover | | | | 130 | % | | | | 203 | % | | | | 121 | % | | | | 127 | % | | | | 85 | %8,15 | | | | 107 | % |
| | | | | | |
Net assets at end of period (000’s omitted) | | | | $14,809 | | | | | $33,215 | | | | | $65,393 | | | | | $92,851 | | | | | $129,964 | | | | | $130,157 | |
| | | | |
| | | AMG Managers Cadence Mid Cap Fund Financial Highlights | | |
| | | For a share outstanding throughout each fiscal period | | |
| | | | | | | | | | | | | | | | | | | | | | | | | | | | | | |
| | | | | | | | | | | For the | | For the |
| | | | | | | | | | | period from | | fiscal years |
| | | For the fiscal years ended May 31, | | July 1, 2010, to | | ended June 30, |
| Institutional Class | | 2015 | | 2014 | | 2013 | | 2012 | | May 31, 2011 | | 2010 |
Net Asset Value, Beginning of Period | | | | $36.44 | | | | | $30.18 | | | | | $25.66 | | | | | $27.88 | | | | | $19.32 | | | | | $16.44 | |
| | | | | | |
Income from Investment Operations: | | | | | | | | | | | | | | | | | | | | | | | | | | | | | | |
| | | | | | |
Net investment income1,2 | | | | 0.09 | | | | | 0.12 | 4 | | | | 0.15 | 6 | | | | 0.04 | | | | | 0.08 | | | | | 0.05 | |
| | | | | | |
Net realized and unrealized gain (loss) on investments | | | | 5.21 | | | | | 6.23 | | | | | 4.50 | | | | | (2.26 | ) | | | | 8.58 | | | | | 2.83 | |
| | | | | | |
Total from investment operations | | | | 5.30 | | | | | 6.35 | | | | | 4.65 | | | | | (2.22 | ) | | | | 8.66 | | | | | 2.88 | |
| | | | | | |
Less Distributions to Shareholders from: | | | | | | | | | | | | | | | | | | | | | | | | | | | | | | |
| | | | | | |
Net investment income | | | | — | | | | | (0.09 | ) | | | | (0.13 | ) | | | | — | | | | | (0.10 | ) | | | | — | |
| | | | | | |
Net realized gain on investments | | | | (7.29 | ) | | | | — | | | | | — | | | | | — | | | | | — | | | | | — | |
| | | | | | |
Total distributions to shareholders | | | | (7.29 | ) | | | | (0.09 | ) | | | | (0.13 | ) | | | | — | | | | | (0.10 | ) | | | | — | |
| | | | | | |
Net Asset Value, End of Period | | | | $34.45 | | | | | $36.44 | | | | | $30.18 | | | | | $25.66 | | | | | $27.88 | | | | | $19.32 | |
| | | | | | |
Total Return2 | | | | 15.62 | % | | | | 21.04 | % | | | | 18.20 | % | | | | (7.96 | )% | | | | 44.87 | %8,15 | | | | 17.52 | % |
| | | | | | |
Ratio of net expenses to average net assets (with offsets/reductions) | | | | 0.72 | % | | | | 0.71 | %10 | | | | 0.73 | %11 | | | | 0.71 | % | | | | 0.70 | %16 | | | | 0.71 | % |
| | | | | | |
Ratio of expenses to average net assets (with offsets) | | | | 0.73 | % | | | | 0.73 | %10 | | | | 0.74 | %11 | | | | 0.72 | % | | | | 0.71 | %16 | | | | 0.71 | % |
| | | | | | |
Ratio of total expenses to average net assets (without offsets/reductions)3 | | | | 0.79 | % | | | | 0.78 | %10 | | | | 0.81 | %11 | | | | 0.80 | % | | | | 0.78 | %16 | | | | 0.74 | % |
| | | | | | |
Ratio of net investment income to average net assets2 | | | | 0.24 | % | | | | 0.35 | %10 | | | | 0.56 | %11 | | | | 0.15 | % | | | | 0.36 | %16 | | | | 0.26 | % |
| | | | | | |
Portfolio turnover | | | | 130 | % | | | | 203 | % | | | | 121 | % | | | | 127 | % | | | | 85 | %8,15 | | | | 107 | % |
| | | | | | |
Net assets at end of period (000’s omitted) | | | | $33,693 | | | | | $170,920 | | | | | $194,755 | | | | | $234,346 | | | | | $299,909 | | | | | $292,232 | |
| | | | |
| | | AMG Managers Cadence Emerging Companies Fund Financial Highlights | | |
| | | For a share outstanding throughout each fiscal period | | |
| | | | | | | | | | | | | | | | | | | | | | | | | | | | | | |
| | | | | | | | | | | For the | | For the |
| | | | | | | | | | | period from | | fiscal year |
| | | For the fiscal years ended May 31, | | July 1, 2010, to | | ended June 30, |
| Service Class | | 2015 | | 2014 | | 2013 | | 2012 | | May 31, 2011 | | 2010 |
Net Asset Value, Beginning of Period | | | | $30.70 | | | | | $26.84 | | | | | $20.39 | | | | | $21.88 | | | | | $13.73 | | | | | $11.72 | |
| | | | | | |
Income from Investment Operations: | | | | | | | | | | | | | | | | | | | | | | | | | | | | | | |
| | | | | | |
Net investment loss1,2 | | | | (0.32 | )12 | | | | (0.29 | )4 | | | | (0.07 | )6 | | | | (0.24 | ) | | | | (0.12 | ) | | | | (0.12 | ) |
| | | | | | |
Net realized and unrealized gain (loss) on investments | | | | 4.91 | | | | | 4.15 | | | | | 6.52 | | | | | (1.25 | ) | | | | 8.27 | | | | | 2.13 | |
| | | | | | |
Total from investment operations | | | | 4.59 | | | | | 3.86 | | | | | 6.45 | | | | | (1.49 | ) | | | | 8.15 | | | | | 2.01 | |
| | | | | | |
Net Asset Value, End of Period | | | | $35.29 | | | | | $30.70 | | | | | $26.84 | | | | | $20.39 | | | | | $21.88 | | | | | $13.73 | |
| | | | | | |
Total Return2 | | | | 14.95 | % | | | | 14.38 | % | | | | 31.63 | % | | | | (6.81 | )% | | | | 59.36 | %8,15 | | | | 17.15 | % |
| | | | | | |
Ratio of net expenses to average net assets (with offsets/reductions) | | | | 1.66 | % | | | | 1.61 | %13 | | | | 1.63 | %14 | | | | 1.60 | % | | | | 1.66 | %16 | | | | 1.67 | % |
| | | | | | |
Ratio of expenses to average net assets (with offsets) | | | | 1.67 | % | | | | 1.66 | %13 | | | | 1.68 | %14 | | | | 1.66 | % | | | | 1.67 | %16 | | | | 1.67 | % |
| | | | | | |
Ratio of total expenses to average net assets (without offsets/reductions)3 | | | | 1.96 | % | | | | 1.90 | %13 | | | | 1.99 | %14 | | | | 1.98 | % | | | | 1.92 | %16 | | | | 1.80 | % |
| | | | | | |
Ratio of net investment loss to average net assets2 | | | | (0.98 | )% | | | | (0.94 | )%13 | | | | (0.31 | )%14 | | | | (1.16 | )% | | | | (0.71 | )%16 | | | | (0.90 | )% |
| | | | | | |
Portfolio turnover | | | | 146 | % | | | | 127 | % | | | | 101 | % | | | | 120 | % | | | | 93 | %8,15 | | | | 129 | % |
| | | | | | |
Net assets at end of period (000’s omitted) | | | | $3,143 | | | | | $3,540 | | | | | $3,184 | | | | | $2,505 | | | | | $4,706 | | | | | $1,830 | |
| | | | | | | | | | | | | | | | | | | | | | | | | | | | | | |
| | | | | | | | | | | For the | | For the |
| | | | | | | | | | | period from | | fiscal year |
| | | For the fiscal years ended May 31, | | July 1, 2010, to | | ended June 30, |
| Institutional Class | | 2015 | | 2014 | | 2013 | | 2012 | | May 31, 2011 | | 2010 |
Net Asset Value, Beginning of Period | | | | $33.00 | | | | | $28.80 | | | | | $21.81 | | | | | $23.35 | | | | | $14.62 | | | | | $12.44 | |
| | | | | | |
Income from Investment Operations: | | | | | | | | | | | | | | | | | | | | | | | | | | | | | | |
| | | | | | |
Net investment loss1,2 | | | | (0.25 | )12 | | | | (0.23 | )4 | | | | (0.01 | )6 | | | | (0.20 | ) | | | | (0.04 | ) | | | | (0.11 | ) |
| | | | | | |
Net realized and unrealized gain (loss) on investments | | | | 5.29 | | | | | 4.43 | | | | | 7.00 | | | | | (1.34 | ) | | | | 8.77 | | | | | 2.29 | |
| | | | | | |
Total from investment operations | | | | 5.04 | | | | | 4.20 | | | | | 6.99 | | | | | (1.54 | ) | | | | 8.73 | | | | | 2.18 | |
| | | | | | |
Net Asset Value, End of Period | | | | $38.04 | | | | | $33.00 | | | | | $28.80 | | | | | $21.81 | | | | | $23.35 | | | | | $14.62 | |
| | | | | | |
Total Return2 | | | | 15.27 | % | | | | 14.58 | %9 | | | | 32.05 | %9 | | | | (6.60 | )% | | | | 59.71 | %8,15 | | | | 17.52 | % |
| | | | | | |
Ratio of net expenses to average net assets (with offsets/reductions) | | | | 1.41 | % | | | | 1.38 | %13 | | | | 1.38 | %14 | | | | 1.37 | % | | | | 1.41 | %16 | | | | 1.42 | % |
| | | | | | |
Ratio of expenses to average net assets (with offsets) | | | | 1.42 | % | | | | 1.43 | %13 | | | | 1.43 | %14 | | | | 1.43 | % | | | | 1.42 | %16 | | | | 1.42 | % |
| | | | | | |
Ratio of total expenses to average net assets (without offsets/reductions)3 | | | | 1.71 | % | | | | 1.67 | %13 | | | | 1.74 | %14 | | | | 1.73 | % | | | | 1.67 | %16 | | | | 1.55 | % |
| | | | | | |
Ratio of net investment loss to average net assets2 | | | | (0.73 | )% | | | | (0.71 | )%13 | | | | (0.05 | )%14 | | | | (0.94 | )% | | | | (0.24 | )%16 | | | | (0.73 | )% |
| | | | | | |
Portfolio turnover | | | | 146 | % | | | | 127 | % | | | | 101 | % | | | | 120 | % | | | | 93 | %8,15 | | | | 129 | % |
| | | | | | |
Net assets at end of period (000’s omitted) | | | | $34,566 | | | | | $39,463 | | | | | $36,123 | | | | | $34,883 | | | | | $65,222 | | | | | $55,166 | |
| | | | |
| | | | | |
| | | | | |
| | | Notes to Financial Highlights | | |
The following should be read in conjunction with the Financial Highlights of the Funds previously presented in this report.
# Rounds to less than $0.01 per share or 0.01%.
| 1 | Per share numbers have been calculated using average shares. |
| 2 | Total returns and net investment income would have been lower had certain expenses not been offset. |
| 3 | Excludes the impact of expense reimbursements or fee waivers and expense reductions such as brokerage credits, but includes expense repayments and non-reimbursable expenses, if any, such as interest, taxes and extraordinary expenses. (See Note 1(c) in the Notes to Financial Statements.) |
| 4 | Includes non-recurring dividends. Without these dividends, net investment income per share would have been $0.12, $0.15, and $0.21 for AMG Managers Cadence Capital Appreciation Fund’s Investor Class, Service Class, and Institutional Class, respectively, $(0.03), $0.04, and $0.11 for AMG Managers Cadence Mid Cap Fund’s Investor Class, Service Class, and Institutional Class, respectively and $(0.32) and $(0.26) for AMG Managers Cadence Emerging Companies Fund’s Service Class and Institutional Class, respectively. |
| 5 | Includes non-routine extraordinary expenses amounting to 0.007%, 0.007%, and 0.007% of average net assets for the Investor Class, Service Class and Institutional Class, respectively. |
| 6 | Includes non-recurring dividends. Without these dividends, net investment income per share would have been $0.09, $0.08, and $0.13 for AMG Managers Cadence Capital Appreciation Fund’s Investor Class, Service Class, and Institutional Class, respectively, $(0.11), $(0.06), and $0.01 for AMG Managers Cadence Mid Cap Fund’s Investor Class, Service Class, and Institutional Class, respectively, and $(0.31) and $(0.25) for AMG Managers Cadence Emerging Companies Fund’s Service Class and Institutional Class, respectively. |
| 7 | Includes non-routine extraordinary expenses amounting to 0.022%, 0.004%, and 0.003% of average net assets for the Investor Class, Service Class and Institutional Class, respectively. |
| 8 | Reflects the 11 month period from July 1, 2010 to May 31, 2011. |
| 9 | The Total Return is based on the Financial Statement Net Asset Values as shown above. |
| 10 | Includes non-routine extraordinary expenses amounting to 0.008%, 0.007%, and 0.008% of average net assets for the Investor Class, Service Class and Institutional Class, respectively. |
| 11 | Includes non-routine extraordinary expenses amounting to 0.018%, 0.015%, and 0.016% of average net assets for the Investor Class, Service Class and Institutional Class, respectively. |
| 12 | Includes non-recurring dividends. Without these dividends, net investment income per share would have been $(0.33) and $(0.27) for the Service Class and Institutional Class, respectively. |
| 13 | Includes non-routine extraordinary expenses amounting to 0.009% and 0.009% of average net assets for the Institutional Class and Service Class, respectively. |
| 14 | Includes non-routine extraordinary expenses amounting to 0.014% and 0.014% of average net assets for the Institutional Class and Service Class, respectively. |
| | | | |
| | | | | |
| | | Notes to Financial Statements | | |
| | | May 31, 2015 | | |
1. SUMMARY OF SIGNIFICANT ACCOUNTING POLICIES
AMG Funds III (the “Trust”) is an open-end management investment company, organized as a Massachusetts business trust and registered under the Investment Company Act of 1940, as amended (the “1940 Act”). Currently, the Trust consists of a number of different funds, each having distinct investment management objectives, strategies, risks, and policies. Included in this report are: AMG Managers Cadence Capital Appreciation Fund (“Capital Appreciation”), AMG Managers Cadence Mid Cap Fund (“Mid Cap”) and AMG Managers Cadence Emerging Companies Fund (“Emerging Companies”), each a “Fund” and collectively the “Funds”.
Capital Appreciation and Mid Cap offer Investor Class shares, Service Class shares and Institutional Class shares. Emerging Companies offers Service Class shares and Institutional Class shares. Each class represents an interest in the same assets of the Fund. Although all share classes generally have identical voting rights, each share class votes separately when required by law. Different share classes may pay different distribution amounts to the extent the net asset value per share and/or the expenses of such share classes differ. Each share class has its own expense structure. Please refer to a current prospectus for additional information on each share class.
The Funds’ financial statements are prepared in accordance with accounting principles generally accepted in the United States of America (“U.S. GAAP”), which require management to make estimates and assumptions that affect the reported amounts of assets and liabilities and disclosure of contingent assets and liabilities at the date of the financial statements and the reported amounts of income and expenses during the reporting period. Actual results could differ from those estimates and such differences could be material. The following is a summary of significant accounting policies followed by the Funds in the preparation of their financial statements:
a. VALUATION OF INVESTMENTS
Equity securities traded on a domestic or international securities exchange are valued at the last quoted sale price, or, lacking any sales, at the last quoted bid price. Equity securities traded on an international securities exchange and equity securities traded on NASDAQ or in a U.S. or non-U.S. over-the-counter market are valued at the market’s official closing price, or, if there are no trades on the applicable date, at the last quoted bid price. In addition, if the applicable market does not offer an official closing price or if the official closing price is not representative of the overall market, equity securities traded on an international securities exchange and equity securities traded in a non-U.S. over-the-counter market are valued at the last quoted sales price. The Funds’ investments are generally valued based on independent market quotations or prices or, if none, “evaluative” or other market based valuations provided by third-party pricing services approved by the Board of Trustees of the Funds (the “Board”).
Short-term debt obligations (debt obligations with maturities of one year or less at the time of issuance) that have 60 days or less remaining until maturity will be valued at amortized cost. Investments in other open-end regulated investment companies are valued at their end of day net asset value per share.
Under certain circumstances, the value of certain Fund investments (including derivatives) may be based on an evaluation of fair value, pursuant to procedures established by and under the general supervision of the Board. The Pricing
Committee is the committee formed by the Board to make fair value determinations for such investments. Each Fund may use the fair value of a portfolio investment to calculate its net asset value (“NAV”) in the event that the market quotation, price or market based valuation for the portfolio investment is not deemed to be readily available or otherwise not determinable pursuant to the Board’s valuation procedures, if AMG Funds LLC (the “Investment Manager”) believes the quotation, price or market based valuation to be unreliable, or in certain other circumstances. When determining the fair value of an investment, the Pricing Committee seeks to determine the price that the Fund might reasonably expect to receive from a current sale of that investment in an arms-length transaction. Fair value determinations shall be based upon consideration of all available facts and information, including, but not limited to (i) attributes specific to the investment; (ii) fundamental analytical data and press releases relating to the investment and its issuer; and (iii) the value of other comparable securities or relevant financial instruments, including derivative securities, traded on other markets or among dealers.
The values assigned to fair value investments are based on available information and do not necessarily represent amounts that might ultimately be realized in the future, since such amounts depend on future developments inherent in long-term investments. Because of the inherent uncertainty of valuation, those estimated values may differ significantly from the values that would have been used had a ready market for the investments existed, and the differences could be material. The Board will be presented with a quarterly report showing, as of the most recent quarter end, all outstanding securities fair valued by the Pricing Committee, including a comparison with the prior quarter end and the percentage of the Fund that the security represents at each quarter end.
Portfolio investments that trade on foreign markets are priced based upon the market quotation of such securities as of the close of their respective principal markets. Under certain circumstances, on behalf of a fund that invests in international securities, the Investment Manager or applicable subadvisor may recommend an adjustment of such prices based on its determination of the impact of events occurring subsequent to the close of such markets but prior to the time as of which each Fund calculates its NAV. The Board has also adopted a policy that securities held in a fund that invests in international securities and certain foreign debt obligations held by a fund, in each case, that can be fair valued by the applicable fair value pricing service are fair valued on each business day without regard to a “trigger” (e.g., without regard to invoking fair value based upon a change in a U.S. equity securities index exceeding a pre-determined level). The Funds may invest in securities that may be thinly traded. The Board has adopted procedures to adjust prices of securities that are judged to be stale so that they reflect fair value. An investment valued on the basis of its fair value may be valued at a price higher or lower than available market quotations.
U.S. GAAP defines fair value as the price that a fund would receive to sell an asset or pay to transfer a liability in an orderly transaction between market participants at the measurement date. U.S. GAAP also establishes a framework for measuring fair value, and a three-level hierarchy for fair value measurements based upon the transparency of inputs to the valuation of an asset or liability. Inputs may be observable or unobservable and refer broadly to the assumptions that market participants would use in pricing the asset or
| | | | |
| | | | | |
| | | | | |
| | | Notes to Financial Statements (continued) | | |
liability. Observable inputs reflect the assumptions market participants would use in pricing the asset or liability based on market data obtained from sources independent of the Funds. Unobservable inputs reflect the Funds’ own assumptions about the assumptions that market participants would use in pricing the asset or liability developed based on the best information available in the circumstances. Each investment is assigned a level based upon the observability of the inputs which are significant to the overall valuation.
The three-tier hierarchy of inputs is summarized below:
Level 1 – inputs are quoted prices in active markets for identical investments (e.g., equity securities, open-end investment companies)
Level 2 – other observable inputs (including, but not limited to: quoted prices for similar assets or liabilities in markets that are active, quoted prices for identical or similar assets or liabilities in markets that are not active, inputs other than quoted prices that are observable for the assets or liabilities (such as interest rates, yield curves, volatilities, prepayment speeds, loss severities, credit risks and default rates) or other market corroborated inputs) (e.g., debt securities, government securities, foreign currency exchange contracts, foreign securities utilizing international fair value pricing, broker-quoted securities, fair valued securities with observable inputs)
Level 3 – inputs are significant unobservable inputs (including the Fund’s own assumptions used to determine the fair value of investments) (e.g., fair valued securities with unobservable inputs)
Changes in inputs or methodologies used for valuing investments may result in a transfer in or out of levels within the fair value hierarchy. The inputs or methodologies used for valuing investments may not necessarily be an indication of the risk associated with investing in those investments. Transfers between different levels of the fair value disclosure hierarchy are deemed to have occurred as of the beginning of the reporting period.
b. SECURITY TRANSACTIONS
Security transactions are accounted for as of trade date. Realized gains and losses on securities sold are determined on the basis of identified cost.
c. INVESTMENT INCOME AND EXPENSES
Dividend income is recorded on the ex-dividend date. Dividend and interest income on foreign securities is recorded gross of any withholding tax. Interest income, which includes amortization of premium and accretion of discount on debt securities, is accrued as earned. Non-cash dividends included in dividend income, if any, are reported at the fair market value of the securities received. Distributions received in excess of income from return of capital including real estate investment trusts (REITs) are recorded as a reduction of the cost of the related investment and/or as a realized gain. If the Funds no longer own the applicable securities, any distributions received in excess of income are recorded as an adjustment to realized gain. Other income and expenses are recorded on an accrual basis. Expenses that cannot be directly attributed to a Fund are apportioned among the Funds in the Trust and in some cases other affiliated funds based upon their relative average net assets or number of shareholders. Investment income, realized and unrealized capital gains and losses, the common expenses of each Fund, and certain Fund level expense
reductions, if any, are allocated on a pro-rata basis to each class based on the relative net assets of each class to the total net assets of each Fund.
The following Funds had certain portfolio trades directed to various brokers, under a brokerage recapture program, which paid a portion of such Fund’s expenses. For the fiscal year ended May 31, 2015, the amount by which the Funds’ expenses were reduced and the impact on the expense ratios, if any, were as follows: Capital Appreciation - $6,804 or 0.005%, Mid Cap - $14,135 or 0.007% and Emerging Companies - $2,793 or 0.007%.
The Funds have a “balance credit” arrangement with The Bank of New York Mellon (“BNYM”), the Funds’ custodian, whereby each Fund is credited with an interest factor equal to 0.75% below the effective 90-day T-Bill rate for account balances left uninvested overnight. If the T-Bill rate falls below 0.75%, no credits will be earned. These credits serve to reduce custodian expenses that would otherwise be charged to each Fund. For the fiscal year ended May 31, 2015, the Funds’ custodian expense was not reduced.
Overdraft fees are computed at 1% above the effective Federal Funds rate on the day of the overdraft. For the fiscal year ended May 31, 2015, overdraft fees for Capital Appreciation, Mid Cap and Emerging Companies equaled $343, $205 and $138, respectively.
d. DIVIDEND AND DISTRIBUTIONS
Fund distributions resulting from either net investment income or realized net capital gains, if any, will normally be declared and paid at least annually in December, as described in the Funds’ prospectus. Distributions to shareholders are recorded on the ex-dividend date. Distributions are determined in accordance with federal income tax regulations, which may differ from net investment income and net realized capital gains for financial statement purposes (U.S. GAAP). Differences may be permanent or temporary. Permanent differences are reclassified among capital accounts in the financial statements to reflect their tax character. Permanent book and tax basis differences, if any, relating to shareholder distributions will result in reclassifications to paid-in capital. Temporary differences arise when certain items of income, expense and gain or loss are recognized in different periods for financial statement and tax purposes; these differences will reverse at some time in the future. The permanent differences are primarily due to a net operating loss and tax equalization. The temporary differences are due to differing treatments for losses deferred due to excise tax regulations and wash sales.
| | | | |
| | | | | |
| | | | | |
| | | Notes to Financial Statements (continued) | | |
The tax character of distributions paid during the fiscal years ended May 31, 2015 and May 31, 2014 were as follows:
| | | �� | | | | | | | | | | | | | | | | | | | | | |
| | | Capital Appreciation | | | Mid Cap | | | Emerging Companies | |
| Distributions paid from: | | 2015 | | | 2014 | | | 2015 | | | 2014 | | | 2015 | | | 2014 | |
Ordinary income | | | $895,408 | | | | $1,212,593 | | | | $12,618 | | | | $450,094 | | | | — | | | | — | |
Short-term capital gains | | | — | | | | — | | | | 14,271,502 | | | | — | | | | — | | | | — | |
Long-term capital gains | | | — | | | | — | | | | 23,913,479 | | | | — | | | | — | | | | — | |
Return of capital | | | — | | | | — | | | | — | | | | — | | | | — | | | | — | |
| | | | | | | | | | | | | | | | | | | | | | | | |
Totals | | | $895,408 | | | | $1,212,593 | | | | $38,197,599 | | | | $450,094 | | | | — | | | | — | |
| | | | | | | | | | | | | | | | | | | | | | | | |
As of May 31, 2015, the components of distributable earnings (excluding unrealized appreciation/depreciation) on a tax basis consisted of:
| | | | | | | | | | | | |
| | | Capital
Appreciation | | | Mid Cap | | | Emerging
Companies | |
Capital loss carryforward | | | $(64,905,691 | ) | | | — | | | | $(22,472,045 | ) |
Undistributed ordinary income | | | 237,563 | | | | $25,370 | | | | — | |
Undistributed short-term capital gains | | | — | | | | 4,872,791 | | | | — | |
Undistributed long-term capital gains | | | — | | | | 8,006,056 | | | | — | |
Late year loss deferral | | | (248,672 | ) | | | — | | | | (111,235 | ) |
e. FEDERAL TAXES
Each Fund intends to comply with the requirements under Subchapter M of the Internal Revenue Code of 1986, as amended, and to distribute substantially all of its taxable income and gains to its shareholders and to meet certain diversification and income requirements with respect to investment companies. Therefore, no provision for federal income or excise tax is included in the accompanying financial statements.
Additionally, based on each Fund’s understanding of the tax rules and rates related to income, gains and transactions for the foreign jurisdictions in which it invests, each Fund will provide for foreign taxes, and where appropriate, deferred foreign taxes.
Management has analyzed the Funds’ tax positions taken on federal income tax returns as of May 31, 2015 and for all open tax years (generally, the three prior taxable years), and has concluded that no provision for federal income tax is required in the Funds’ financial statements. Additionally, the Funds are not aware of any tax position for which it is reasonably possible that the total amounts of unrecognized tax benefits will change materially in the next twelve months.
Net capital losses incurred in taxable years beginning after the enactment of the Regulated Investment Company Modernization Act of 2010, may be carried forward for an unlimited time period. Such losses will be required to be utilized prior to any loss carryovers incurred in pre-enactment taxable years, which generally expire eight years following the close of the taxable year in which they were incurred. As a result of this ordering rule, pre-enactment capital loss carryovers may be more likely to expire unused. Additionally, post-enactment capital losses that are carried forward retain their tax character as either short-
term or long-term capital losses, unlike pre-enactment losses which are considered all short-term.
f. CAPITAL LOSS CARRYOVERS AND DEFERRALS
As of May 31, 2015, the following Funds had accumulated net realized capital loss carryovers from securities transactions for federal income tax purposes as shown in the following chart. These amounts may be used to offset future realized capital gains, if any, through the expiration dates listed or in the case of post-enactment losses, for an unlimited time period.
| | | | | | | | | | | | |
| | | Capital Loss | | | | |
| | | Carryover Amounts | | | | |
| | | | | | | | | Expires | |
| Fund | | Short-Term | | | Long-Term | | | May 31, | |
Capital Appreciation | | | | | | | | | | | | |
(Pre-Enactment) | | $ | 64,905,691 | | | | — | | | | 2018 | |
Mid Cap | | | | | | | | | | | | |
(Pre-Enactment) | | | — | | | | — | | | | — | |
Emerging Companies | | | | | | | | | | | | |
(Pre-Enactment) | | $ | 2,560,058 | | | | — | | | | 2017 | |
(Pre-Enactment) | | | 19,911,987 | | | | — | | | | 2018 | |
| | | | | | | | | | | | |
| | $ | 22,472,045 | | | | — | | | | | |
| | | | | | | | | | | | |
For the fiscal year ended May 31, 2015, the following Funds utilized capital loss carryovers in the amount of:
| | | | | | | | |
| | | Capital Loss Carryovers Utilized | |
| | |
| | | Short-Term | | | Long-Term | |
Capital Appreciation | | | $16,909,685 | | | | — | |
Mid Cap | | | — | | | | — | |
Emerging Companies | | | 4,278,789 | | | | — | |
g. CAPITAL STOCK
The Trust’s Declaration of Trust authorizes for each Fund the issuance of an unlimited number of shares of beneficial interest, without par value. Each Fund records sales and repurchases of its capital stock on the trade date. The cost of securities contributed to the Funds in connection with the issuance of shares is based on the valuation of those securities in accordance with the Funds’ policy on investment valuation.
| | | | |
| | | | | |
| | | Notes to Financial Statements (continued) | | |
| | | | | |
For the fiscal years ended May 31, 2015 and May 31, 2014, the capital stock transactions by class for Capital Appreciation, Mid Cap and Emerging Companies were as follows:
| | | | | | | | | | | | | | | | |
| | | Capital Appreciation | |
| | | May 31, 2015 | | | May 31, 2014 | |
| | | Shares | | | Amount | | | Shares | | | Amount | |
Investor Class: | | | | | | | | | | | | | | | | |
Proceeds from sale of shares | | | 59,873 | | | | $1,481,224 | | | | 78,726 | | | | $1,709,686 | |
Reinvestment of distributions | | | 14,114 | | | | 357,803 | | | | 14,195 | | | | 321,647 | |
Cost of shares repurchased | | | (692,331) | | | | (17,079,885) | | | | (1,033,787) | | | | (22,309,535) | |
| | | | | | | | | | | | | | | | |
Net decrease | | | (618,344) | | | | $(15,240,858) | | | | (940,866) | | | | $(20,278,202) | |
| | | | | | | | | | | | | | | | |
Service Class: | | | | | | | | | | | | | | | | |
Proceeds from sale of shares | | | 72,208 | | | | $1,772,208 | | | | 448,633 | | | | $9,304,338 | |
Reinvestment of distributions | | | 678 | | | | 17,413 | | | | 20,181 | | | | 460,933 | |
Cost of shares repurchased | | | (1,469,452) | | | | (35,749,664) | | | | (1,478,167) | | | | (33,228,382) | |
| | | | | | | | | | | | | | | | |
Net decrease | | | (1,396,566) | | | | $(33,960,043) | | | | (1,009,353) | | | | $(23,463,111) | |
| | | | | | | | | | | | | | | | |
Institutional Class: | | | | | | | | | | | | | | | | |
Proceeds from sale of shares | | | 194,715 | | | | $4,967,777 | | | | 429,372 | | | | $10,045,479 | |
Reinvestment of distributions | | | 16,609 | | | | 436,318 | | | | 15,092 | | | | 354,508 | |
Cost of shares repurchased | | | (415,104) | | | | (10,667,658) | | | | (395,507) | | | | (8,780,944) | |
| | | | | | | | | | | | | | | | |
Net increase (decrease) | | | (203,780) | | | | $(5,263,563) | | | | 48,957 | | | | $1,619,043 | |
| | | | | | | | | | | | | | | | |
| |
| | | Mid Cap | |
| | | May 31, 2015 | | | May 31, 2014 | |
| | | Shares | | | Amount | | | Shares | | | Amount | |
Investor Class: | | | | | | | | | | | | | | | | |
Proceeds from sale of shares | | | 195,258 | | | | $6,377,413 | | | | 236,681 | | | | $7,300,483 | |
Reinvestment of distributions | | | 657,238 | | | | 20,098,353 | | | | — | | | | — | |
Cost of shares repurchased | | | (810,820) | | | | (26,759,793) | | | | (2,407,596) | | | | (71,749,648) | |
| | | | | | | | | | | | | | | | |
Net increase (decrease) | | | 41,676 | | | | $(284,027) | | | | (2,170,915) | | | | $(64,449,165) | |
| | | | | | | | | | | | | | | | |
Service Class: | | | | | | | | | | | | | | | | |
Proceeds from sale of shares | | | 65,637 | | | | $2,282,045 | | | | 120,226 | | | | $3,916,062 | |
Reinvestment of distributions | | | 85,370 | | | | 2,683,174 | | | | — | | | | — | |
Cost of shares repurchased | | | (650,986) | | | | (22,775,066) | | | | (1,425,608) | | | | (43,567,127) | |
| | | | | | | | | | | | | | | | |
Net decrease | | | (499,979) | | | | $(17,809,847) | | | | (1,305,382) | | | | $(39,651,065) | |
| | | | | | | | | | | | | | | | |
Institutional Class: | | | | | | | | | | | | | | | | |
Proceeds from sale of shares | | | 218,489 | | | | $7,866,084 | | | | 504,283 | | | | $16,929,733 | |
Reinvestment of distributions | | | 363,321 | | | | 11,884,230 | | | | 12,334 | | | | 432,785 | |
Cost of shares repurchased | | | (4,293,880) | | | | (155,446,670) | | | | (2,279,921) | | | | (75,465,135) | |
| | | | | | | | | | | | | | | | |
Net decrease | | | (3,712,070) | | | | $(135,696,356) | | | | (1,763,304) | | | | $(58,102,617) | |
| | | | | | | | | | | | | | | | |
| | | | |
| | | | | |
| | | Notes to Financial Statements (continued) | | |
| | | | | |
| | | | | | | | | | | | | | | | |
| | | Emerging Companies | |
| | | May 31, 2015 | | | May 31, 2014 | |
| | | Shares | | | Amount | | | Shares | | | Amount | |
Service Class: | | | | | | | | | | | | | | | | |
Proceeds from sale of shares | | | 20,070 | | | | $659,133 | | | | 33,735 | | | | $1,027,708 | |
Cost of shares repurchased | | | (46,316) | | | | (1,474,031) | | | | (37,019) | | | | (1,132,294) | |
| | | | | | | | | | | | | | | | |
Net decrease | | | (26,246) | | | | $(814,898) | | | | (3,284) | | | | $(104,586) | |
| | | | | | | | | | | | | | | | |
Institutional Class: | | | | | | | | | | | | | | | | |
Proceeds from sale of shares | | | 107,635 | | | | $3,880,982 | | | | 194,513 | | | | $6,357,928 | |
Cost of shares repurchased | | | (394,697) | | | | (13,756,759) | | | | (253,214) | | | | (8,382,605) | |
| | | | | | | | | | | | | | | | |
Net decrease | | | (287,062) | | | | $(9,875,777) | | | | (58,701) | | | | $(2,024,677) | |
| | | | | | | | | | | | | | | | |
At May 31, 2015, certain unaffiliated shareholders of record, specifically omnibus accounts, individually or collectively held greater than 10% of the net assets of the Funds as follows: Capital Appreciation – one collectively owns 27%; Mid Cap – one collectively owns 11% and Emerging Companies – two collectively own 45%. Transactions by these shareholders may have a material impact on their respective Funds.
h. REPURCHASE AGREEMENTS
The Funds may enter into repurchase agreements provided that the value of the underlying collateral, including accrued interest, will equal or exceed the value of the repurchase agreement during the term of the agreement. The underlying collateral for all repurchase agreements is held in safekeeping by the Funds’ custodian or at the Federal Reserve Bank. If the seller defaults and the value of the collateral declines, or if bankruptcy proceedings commence with respect to the seller of the security, realization of the collateral by the Funds may be delayed or limited. At May 31, 2015, the market value of repurchase agreements for Capital Appreciation, Mid Cap and Emerging Companies was $1,174,252, $6,706,433 and $1,655,565, respectively.
2. AGREEMENTS AND TRANSACTIONS WITH AFFILIATES
For each of the Funds, the Trust has entered into an investment advisory agreement under which the Investment Manager, a subsidiary and the U.S. retail distribution arm of Affiliated Managers Group, Inc. (“AMG”), serves as Investment Manager to the Funds and is responsible for the Funds’ overall administration and operations. The Investment Manager selects one or more subadvisors for the Funds (subject to Board approval) and monitors each subadvisor’s investment performance, security holdings and investment strategies. Each Fund’s investment portfolio is managed by one or more portfolio managers who serve pursuant to a subadvisory agreement with the Investment Manager.
Investment management fees are paid directly by the Funds to the Investment Manager based on average daily net assets. For the fiscal year ended May 31, 2015, the Funds’ investment management fees were paid at the following annual rate of each Fund’s average daily net assets:
| | | | |
Capital Appreciation | | | 0.45% | |
Mid Cap | | | 0.45% | |
Emerging Companies | | | 1.25% | |
The Investment Manager has contractually agreed, through at least October 1, 2015, to waive management fees (but not below zero) and/or reimburse Fund expenses in order to limit total annual Fund operating expenses after fee waiver and expense reimbursements (exclusive of taxes, interest (including interest incurred in connection with bank and custody overdrafts), shareholder servicing fees, distribution and service (12b-1) fees, brokerage commissions and other transaction costs, acquired fund fees and expenses and extraordinary expenses) of Capital Appreciation, Mid Cap and Emerging Companies to 0.72%, 0.72% and 1.42%, respectively, of each Fund’s average daily net assets subject to later reimbursement by the Funds in certain circumstances. The contractual expense limitation may only be terminated in the event the Investment Manager or a successor ceases to be the investment manager of the Fund or a successor fund, by mutual agreement of the Investment Manager and the AMG Funds’ Board of Trustees, or in the event of the Fund’s liquidation unless the Fund is reorganized or is a party to a merger in which the surviving entity is successor to the accounting and performance information of the Fund.
| | | | |
| | | | | |
| | | Notes to Financial Statements (continued) | | |
| | | | | |
Each Fund is obligated to repay the Investment Manager such amounts waived, paid, or reimbursed in future years provided that the repayment occurs within thirty-six (36) months after the waiver or reimbursement and that such repayment would not cause the Fund’s total annual operating expenses after fee waiver and expense reimbursements in any such future year to exceed that Fund’s contractual expense limitation amount. For the fiscal year ended May 31, 2015, each Fund’s components of reimbursement are detailed in the following chart:
| | | | | | | | | | | | |
| | | Capital | | | | | | Emerging | |
| | | Appreciation | | | Mid Cap | | | Companies | |
Reimbursement Available -
5/31/14 | | $ | 1,212,989 | | | $ | 1,039,278 | | | $ | 385,869 | |
Additional Reimbursements | | | 138,134 | | | | 142,818 | | | | 108,830 | |
Expired
Reimbursements | | | (649,797) | | | | (478,853) | | | | (169,375) | |
| | | | | | | | | | | | |
Reimbursement Available -
5/31/15 | | | $701,326 | | | | $703,243 | | | | $325,324 | |
| | | | | | | | | | | | |
Effective January 1, 2015, the Board provides supervision of the affairs of the Trust, other trusts within the AMG Funds family of mutual funds (collectively the “AMG Funds family”) and other affiliated funds. Previously, the Board provided supervision to only the Trust and other trusts within the AMG Funds family.
Beginning January 1, 2015, the aggregate annual retainer paid to each Independent Trustee of the Board is $200,000, plus $16,000, $4,000 or $2,000 for each regular, in-person special or telephonic special meeting attended, respectively. The Independent Chairman of the Trusts receives an additional payment of $55,000 per year. The Chairman of the Audit Committee receives an additional payment of $25,000 per year.
Prior to January 1, 2015, the aggregate annual retainer paid to each Independent Trustee of the Board was $130,000, plus $7,000 or $2,500 for each regular or special meeting attended, respectively. The Independent Chairman of the Trusts formerly received an additional payment of $35,000 per year. The Chairman of the Audit Committee formerly received an additional payment of $15,000 per year.
Prior to January 1, 2014, the aggregate annual retainer paid to each Independent Trustee of the Board was $105,000, plus $6,000 or $2,500 for each regular or special meeting attended, respectively. The Independent Chairman of the Trusts formerly received an additional payment of $25,000 per year. The Chairman of the Audit Committee formerly received an additional payment of $10,000 per year.
Effective January 1, 2015, the Trustees’ fees and expenses are generally allocated among all of the Funds in the Trust, other trusts within the AMG Funds family and other affiliated funds based on the relative net assets of such funds. Before January 1, 2015, the Trustees’ fees and expenses were generally allocated among all of the funds in the Trust and other trusts within the AMG Funds family. The “Trustees fees and expenses” shown in the financial statements represents each Fund’s allocated portion of the total fees and expenses paid to the Independent Trustee of the Board.
The Funds are distributed by AMG Distributors, Inc. (the “Distributor”), a wholly-owned subsidiary of the Investment Manager. The Distributor serves as the distributor and underwriter for each Fund and is a registered broker-dealer and member of the Financial Industry Regulatory Authority, Inc. (“FINRA”). Shares of each Fund will be continuously offered and will be sold directly to prospective purchasers and through brokers, dealers or other financial intermediaries who have executed selling agreements with the Distributor. Subject to the compensation arrangement discussed below, generally the Distributor bears all or a portion of the expenses of providing services pursuant to the distribution agreement, including the payment of the expenses relating to the distribution of prospectuses for sales purposes and any advertising or sales literature. Certain Trustees and Officers of the Funds are Officers and/or Directors of the Investment Manager, AMG and/or the Distributor.
The Trust has adopted a distribution and service plan (the “Plan”) with respect to the Investor Class shares, in accordance with the requirements of Rule 12b-1 under the 1940 Act and the requirements of the applicable rules of the FINRA regarding asset-based sales charges. Pursuant to the Plan, each Fund may make payments to the Distributor for its expenditures in financing any activity primarily intended to result in the sale of each such class of the Fund’s shares and for maintenance and personal service provided to existing shareholders of that class. The Plan authorizes payments to the Distributor up to 0.25% annually of each Fund’s daily net assets attributable to the Investor Class shares.
For each of the Investor and Service Classes, the Board has approved reimbursement payments to the Investment Manager for shareholder servicing expenses (“shareholder servicing fees”) incurred. Shareholder servicing fees include payments to third parties such as a bank, broker-dealer, trust company or other financial intermediaries who provide shareholder recordkeeping, account servicing and other services. The Investor and Service Class may reimburse the Investment Manager for the actual amount incurred up to a maximum annual rate of each Class’s average daily net assets as shown in the table below.
The impact on the annualized expense ratios for the fiscal year ended May 31, 2015, were as follows:
| | | | |
| | | Maximum | | Actual |
| Fund | | Amount Allowed | | Amount Incurred |
Capital Appreciation | | | | |
Investor Class | | 0.15% | | 0.15% |
Service Class | | 0.25% | | 0.25% |
Mid Cap | | | | |
Investor Class | | 0.15% | | 0.15% |
Service Class | | 0.25% | | 0.25% |
Emerging Companies | | | | |
Service Class | | 0.25% | | 0.25% |
|
| | | | |
| | | | | |
| | | Notes to Financial Statements (continued) | | |
| | | | | |
During the fiscal year ended May 31, 2014, the Investor Class of Capital Appreciation recorded a capital contribution by the Investment Manager of $15,885. The contribution represented a payment in connection with the reallocation of certain shareholder servicing expenses for which the Class had reimbursed the Investment Managers in prior periods, plus interest.
The Securities and Exchange Commission has granted an exemptive order that permits the Funds to lend and borrow money for certain temporary purposes directly to and from other eligible Funds in the AMG Funds family. Participation in this interfund lending program is voluntary for both the borrowing and lending funds, and an interfund loan is only made if it benefits each participating Fund. The Investment Manager administers the program according to procedures approved by the Board, and the Board monitors the operation of the program. An interfund loan must comply with certain conditions set out in the exemptive order, which are designed to assure fairness and protect all participating Funds. For the fiscal year ended May 31, 2015, the following Funds borrowed from other Funds in the AMG Funds family: Capital Appreciation borrowed varying amounts not exceeding $27,661,045 for 12 days paying interest of $1,255, Mid Cap borrowed varying amounts not exceeding $77,962,211 for 29 days paying interest of $6,900 and Emerging Companies borrowed varying amounts not exceeding $1,150,349 for 12 days paying interest of $210. The interest amount is included in the Statement of Operations as miscellaneous expense. At May 31, 2015, the Funds had no interfund loans outstanding. The Funds did not lend to other Funds in the AMG Funds Family during the fiscal year ended May 31, 2015.
3. PURCHASES AND SALES OF SECURITIES
Purchases and sales of securities (excluding short-term securities and U.S. Government obligations) for the fiscal year ended May 31, 2015, were as follows:
| | | | | | | | |
| Fund | | Purchases | | | Sales | |
Capital Appreciation | | | $56,806,045 | | | | $109,554,736 | |
Mid Cap | | | 274,085,995 | | | | 462,271,507 | |
Emerging Companies | | | 52,909,713 | | | | 64,815,017 | |
The Funds had no purchases or sales of U.S. Government obligations during the fiscal year ended May 31, 2015.
4. PORTFOLIO SECURITIES LOANED
The Funds participate in a securities lending program offered by BNYM (the “Program”), providing for the lending of securities to qualified brokers. Securities lending income include earnings of such temporary cash investments, plus or minus any rebate to a borrower. These earnings (after any rebate) are then divided between BNYM, as a fee for its services under the program, and the Funds, according to agreed-upon rates. Collateral on all securities loaned is accepted in cash and is maintained at a minimum level of 102% (105% in the case of certain foreign securities) of the market value, plus interest, if applicable, of investments on loan. It is the Funds’ policy to obtain additional collateral from or return excess collateral to the borrower by the end of the next business day, following the valuation date of the securities loaned. Therefore, the value of the collateral held may be temporarily less than the value of the securities on loan. Lending securities entails a risk of loss to the Funds if and to the extent that the market value of the securities loaned were to
increase and the borrower did not increase the collateral accordingly, and the borrower fails to return the securities. Under the terms of the Program, the Funds are indemnified for such losses by BNYM. Cash collateral is held in a separate account managed by BNYM, who is authorized to exclusively enter into overnight government repurchase agreements. BNYM bears the risk of any deficiency in the amount of the cash collateral available for return to the borrower due to any loss on the collateral invested.
At May 31, 2015, the value of the securities loaned and cash collateral received, were as follows.
| | | | | | | | |
| | | Securities | | | Cash Collateral | |
| Fund | | Loaned | | | Received | |
Capital Appreciation | | $ | 1,136,583 | | | | $1,174,252 | |
Mid Cap | | | 6,554,338 | | | | 6,706,433 | |
Emerging Companies | | | 1,620,675 | | | | 1,655,565 | |
5. COMMITMENTS AND CONTINGENCIES
Under the Trust’s organizational documents, its trustees and officers are indemnified against certain liabilities arising out of the performance of their duties to the Trust. In addition, in the normal course of business, the Funds may enter into contracts and agreements that contain a variety of representations and warranties, which provide general indemnifications. The maximum exposure to the Funds under these arrangements is unknown, as this would involve future claims that may be made against a Fund that have not yet occurred. However, based on experience, the Funds had no prior claims or losses and expect the risks of loss to be remote.
6. MASTER NETTING AGREEMENTS
The Funds may enter into master netting agreements with their counterparties for the securities lending program and repurchase agreements, which provide the right, in the event of default (including bankruptcy or insolvency) for the non-defaulting party to liquidate the collateral and calculate net exposure to the defaulting party or request additional collateral. For financial reporting purposes, the Funds do not offset financial assets and financial liabilities that are subject to master netting agreements in the Statement of Assets and Liabilities. For securities lending transactions, see Note 4.
| | | | |
| | | | | |
| | | Notes to Financial Statements (continued) | | |
| | | | | |
The following table is a summary of the Funds’ open repurchase agreements that are subject to a master netting agreement as of May 31, 2015:
| | | | | | | | | | | | | | | | |
| | | | | | Gross Amount Not Offset in the
Statement of Assets and Liabilities | | | | |
| Fund | | Net Amounts of Assets
Presented in the Statement
of Assets and Liabilities | | | Financial Instruments Collateral | | | Cash Collateral Received | | | Net Amount | |
Capital Appreciation | | | | | | | | | | | | | | | | |
Cantor Fitzgerald Securities, Inc. | | | $1,000,000 | | | | $1,000,000 | | | | — | | | | — | |
Nomura Securities International, Inc. | | | 174,252 | | | | 174,252 | | | | — | | | | — | |
| | | | | | | | | | | | | | | | |
Total | | | $1,174,252 | | | | $1,174,252 | | | | — | | | | — | |
| | | | | | | | | | | | | | | | |
Mid Cap | | | | | | | | | | | | | | | | |
Cantor Fitzgerald Securities, Inc. | | | $1,592,781 | | | | $1,592,781 | | | | — | | | | — | |
Citigroup Global Markets, Inc. | | | 335,309 | | | | 335,309 | | | | — | | | | — | |
Daiwa Capital Markets America | | | 1,592,781 | | | | 1,592,781 | | | | — | | | | — | |
HSBC Securities USA, Inc. | | | 1,592,781 | | | | 1,592,781 | | | | — | | | | — | |
Nomura Securities International, Inc. | | | 1,592,781 | | | | 1,592,781 | | | | — | | | | — | |
| | | | | | | | | | | | | | | | |
Total | | | $6,706,433 | | | | $6,706,433 | | | | — | | | | — | |
| | | | | | | | | | | | | | | | |
Emerging Companies | | | | | | | | | | | | | | | | |
Cantor Fitzgerald Securities, Inc. | | | $1,000,000 | | | | $1,000,000 | | | | — | | | | — | |
Nomura Securities International, Inc. | | | 655,565 | | | | 655,565 | | | | — | | | | — | |
| | | | | | | | | | | | | | | | |
Total | | | $1,655,565 | | | | $1,655,565 | | | | — | | | | — | |
| | | | | | | | | | | | | | | | |
7. SUBSEQUENT EVENTS
Each Fund has determined that no material events or transactions occurred through the issuance date of the Funds’ financial statements which require additional disclosure in or adjustment of the Funds’ financial statements.
TAX INFORMATION (unaudited)
The AMG Managers Cadence Capital Appreciation Fund, AMG Managers Cadence Mid Cap Fund and AMG Managers Cadence Emerging Companies Fund each hereby designates the maximum amount allowable of its net taxable income as qualified dividends as provided in the Jobs and Growth Tax Relief Reconciliation Act of 2003. The 2014/2015 Form 1099-DIV you receive for each Fund shows the tax status of all distributions paid to you during the year.
Pursuant to section 852 of the Internal Revenue Code, AMG Managers Cadence Capital Appreciation Fund, AMG Managers Cadence Mid Cap Fund and AMG Managers Cadence Emerging Companies Fund each hereby designates $0, $25,822,859 and $0, respectively, as a capital gain distribution with respect to the taxable fiscal year ended May 31, 2015, or if subsequently determined to be different, the net capital gains of such year.
| | | | |
| | | | | |
| | | Report of Independent Registered Public Accounting Firm | | |
| | | | | |
TO THE BOARD OF TRUSTEES OF AMG FUNDS III AND THE SHAREHOLDERS OF THE AMG MANAGERS CADENCE CAPITAL APPRECIATION FUND, AMG MANAGERS CADENCE MID CAP FUND AND AMG MANAGERS CADENCE EMERGING COMPANIES FUND:
In our opinion, the accompanying statements of assets and liabilities, including the schedules of portfolio investments, and the related statements of operations and of changes in net assets and the financial highlights present fairly, in all material respects, the financial positions of AMG Managers Cadence Capital Appreciation Fund, AMG Managers Cadence Mid Cap Fund, and AMG Managers Cadence Emerging Companies Fund (the “Funds”) at May 31, 2015, and the results of each of their operations, the changes in each of their net assets and the financial highlights for each of the periods indicated, in conformity with accounting principles generally accepted in the United States of America. These financial statements and financial highlights (hereafter referred to as “financial statements”) are the responsibility of the Funds’ management. Our responsibility is to express an opinion on these financial statements based on our audits. We conducted our audits of these financial statements in accordance with the standards of the Public Company Accounting Oversight Board (United States). Those standards require that we plan and perform the audit to obtain reasonable assurance about whether the financial statements are free of material misstatement. An audit includes examining, on a test basis, evidence supporting the amounts and disclosures in the financial statements, assessing the accounting principles used and significant estimates made by management, and evaluating the overall financial statement presentation. We believe that our audits, which included confirmation of securities at May 31, 2015 by correspondence with the custodian and brokers, and the application of alternative auditing procedures where securities purchased had not been received, provide a reasonable basis for our opinion.
PricewaterhouseCoopers LLP
Boston, Massachusetts
July 21, 2015
| | | | |
| | | | | |
| | | AMG Funds | | |
| | | Trustees and Officers | | |
| | | | | | | | |
| The Trustees and Officers of the Trust, their business addresses, principal occupations for the past five years and dates of birth are listed below. The Trustees provide broad supervision over the affairs of the Trust and the Funds. The Trustees are experienced executives who meet periodically throughout the year to oversee the Funds’ activities, review contractual arrangements with | | | | companies that provide services to the Funds, and review the Funds’ performance. Unless otherwise noted, the address of each Trustee or Officer is the address of the Trust: 800 Connecticut Avenue, Norwalk, Connecticut 06854. There is no stated term of office for Trustees. Trustees serve until their resignation, retirement or removal in accordance with the Trust’s | | | | organizational documents and policies adopted by the Board from time to time. The Chairman of the Trustees, President, Treasurer and Secretary of the Trust are elected by the Trustees annually. Other officers hold office at the pleasure of the Trustees. |
Independent Trustees
The following Trustees are not “interested persons” of the Trust within the meaning of the 1940 Act:
| | |
Number of Funds Overseen in Fund Complex | | Name, Date of Birth, Principal Occupation(s) During Past 5 Years and Other Directorships Held by Trustee |
• Trustee since 2012 • Oversees 46 Funds in Fund Complex | | Bruce B. Bingham, 12/1/48 Partner, Hamilton Partners (real estate development firm) (1987-Present); Trustee of Aston Funds (27 portfolios) (2014-Present); Director of the Yacktman Funds (2000-2012). |
• Independent Chairman • Trustee since 1999 • Oversees 46 Funds in Fund Complex | | William E. Chapman, II, 9/23/41 President and Owner, Longboat Retirement Planning Solutions (1998-Present); Hewitt Associates, LLC (part time) (provider of Retirement and Investment Education Seminars) (2002-2009); Trustee Emeritus of Bowdoin College (2013-Present); Trustee of Bowdoin College (2002-2013); Director of Harding, Loevner Funds, Inc. (6 portfolios); Trustee of Third Avenue Trust (5 portfolios); Trustee of Third Avenue Variable Trust (1 portfolio); Trustee of Aston Funds (27 portfolios) (2010-Present). |
• Trustee since 1999 • Oversees 46 Funds in Fund Complex | | Edward J. Kaier, 9/23/45 Attorney at Law and Partner, Teeters Harvey Marrone & Kaier LLP (2007-Present); Attorney at Law and Partner, Hepburn Willcox Hamilton & Putnam, LLP (1977-2007); Trustee of Third Avenue Trust (5 portfolios); Trustee of Third Avenue Variable Trust (1 portfolio); Trustee of Aston Funds (27 portfolios) (2010-Present). |
• Trustee since 2013 • Oversees 48 Funds in Fund Complex | | Kurt A. Keilhacker, 10/5/63 Managing Member, TechFund Capital (1997-Present); Managing Member, TechFund Europe (2000-Present); Trustee, Gordon College (2001-Present); Board Member, 6wind SA, (2002-Present); Managing Member, Elementum Ventures (2013-Present); Trustee of Aston Funds (27 portfolios) ( 2014-Present). |
• Trustee since 1993 • Oversees 46 Funds in Fund Complex | | Steven J. Paggioli, 4/3/50 Independent Consultant (2002-Present); Formerly Executive Vice President and Director, The Wadsworth Group (1986-2001); Executive Vice President, Secretary and Director, Investment Company Administration, LLC (1990-2001); Vice President, Secretary and Director, First Fund Distributors, Inc. (1991-2001); Trustee, Professionally Managed Portfolios (43 portfolios); Advisory Board Member, Sustainable Growth Advisors, LP; Independent Director, Chase Investment Counsel (2008 – Present); Trustee of Aston Funds (27 portfolios) (2010-Present). |
• Trustee since 2013 • Oversees 46 Funds in Fund Complex | | Richard F. Powers III, 2/2/46 Adjunct Professor, Boston College (2011-Present); Trustee of Aston Funds (27 portfolios) (2014-Present); President and CEO of Van Kampen Investments Inc. (1998-2003). |
• Trustee since 1999 • Oversees 48 Funds in Fund Complex | | Eric Rakowski, 6/5/58 Professor, University of California at Berkeley School of Law (1990-Present); Director of Harding, Loevner Funds, Inc. (6 portfolios); Trustee of Third Avenue Trust (5 portfolios); Trustee of Third Avenue Variable Trust (1 portfolio); Trustee of Aston Funds (27 portfolios) (2010-Present). |
• Trustee since 2013 • Oversees 48 Funds in Fund Complex | | Victoria L. Sassine, 8/11/65 Lecturer, Babson College (2007 – Present); Trustee of Aston Funds (25 portfolios) (2014-Present). |
• Trustee since 1987 • Oversees 46 Funds in Fund Complex | | Thomas R. Schneeweis, 5/10/47 Professor Emeritus, University of Massachusetts (2013 - Present); Partner, S Capital Management, LLC (2007-Present); President, TRS Associates (1982-Present); Director, CISDM at the University of Massachusetts, (1996-2013); President, Alternative Investment Analytics, LLC, (formerly Schneeweis Partners, LLC) (2001-2013); Professor of Finance, University of Massachusetts (1977-2013); Partner, White Bear Partners, LLC (2007-2010); Partner, Northampton Capital Management, LLC (2004-2010); Trustee of Aston Funds (27 portfolios) (2010-Present). |
| | | | |
| | | | | |
| | | AMG Funds | | |
| | | Trustees and Officers (continued) | | |
Interested Trustees
Each Trustee in the following table is an “interested person” of the Trust within the meaning of the 1940 Act. Ms. Carsman is an interested person of the Trust within the meaning of the 1940 Act by virtue of her position with, and interest in securities of, AMG, and her former position as Chief Legal Officer of the Trust.
| | |
Number of Funds Overseen in Fund Complex | | Name, Date of Birth, Principal Occupation(s) During Past 5 Years and Other Directorships Held by Trustee |
• Trustee since 2011 • Oversees 48 Funds in Fund Complex | | Christine C. Carsman, 4/2/52 Senior Vice President and Deputy General Counsel, Affiliated Managers Group, Inc. (2011-Present); Trustee of Aston Funds (27 portfolios) (2014-Present); Senior Vice President and Chief Regulatory Counsel, Affiliated Managers Group, Inc. (2007-2011); Vice President and Chief Regulatory Counsel, Affiliated Managers Group, Inc. (2004-2007); Secretary and Chief Legal Officer, AMG Funds, AMG Funds I, AMG Funds II and AMG Funds III (2004-2011); Senior Counsel, Vice President and Director of Operational Risk Management and Compliance, Wellington Management Company, LLP (1995-2004). |
Officers | | |
Position(s) Held with Fund and Length of Time Served | | Name, Date of Birth, Principal Occupation(s) During Past 5 Years |
• President since 2014 • Principal Executive Officer since 2014 | | Jeffrey T. Cerutti, 2/07/68 Chief Executive Officer, AMG Funds LLC (2014-Present); Director, President and Principal, AMG Distributors, Inc. (2014-Present); President, VP Distributors, (2011-2014); Executive Vice President, Head of Distribution, Virtus Investment Partners, Inc. (2010-2014); Managing Director, Head of Sales, UBS Global Asset Management (2001-2010). |
• Chief Operating Officer since 2007 | | Keitha L. Kinne, 5/16/58 Chief Operating Officer, AMG Funds LLC (2007-Present); Chief Investment Officer, AMG Funds LLC (2008-Present); Chief Operating Officer, AMG Distributors, Inc. (2007-Present); Managing Partner, AMG Funds LLC (2007-2014); President, AMG Funds (2012-2014); President, AMG Distributors, Inc. (2012-2014); Managing Director, Legg Mason & Co., LLC (2006-2007); Managing Director, Citigroup Asset Management (2004-2006). |
• Secretary since 2015 • Chief Legal Officer since 2015 | | Mark J. Duggan, 2/20/65 Senior Vice President and Senior Counsel, AMG Funds LLC (2015-Present); Secretary and Chief Legal Officer, AMG Funds, AMG Funds I, AMG Funds II and AMG Funds III (2015-Present); Attorney, K&L Gates, LLP (2009-2015). |
• Chief Financial Officer since 2007 • Treasurer since 1995 • Principal Financial Officer since 2008 | | Donald S. Rumery, 5/29/58 Senior Vice President, Director of Mutual Funds Services, AMG Funds LLC (2005-Present); Treasurer, AMG Funds (1999-Present); Treasurer, AMG Funds I and AMG Funds II (2000-Present); Chief Financial Officer, AMG Funds, AMG Funds I and AMG Funds II (2007-Present); Treasurer and Chief Financial Officer, AMG Distributors, Inc. (2000-2012); Vice President, AMG Funds LLC, (1994-2004). |
• Assistant Treasurer since 2014 | | John C. Ball, 1/09/76 Vice President, Assistant Treasurer, AMG Funds LLC (2014-Present); Vice President, State Street Corp. (2010-2014); Vice President, State Street International (Ireland) Limited (2007-2010). |
• Chief Compliance Officer since 2010 | | John J. Ferencz, 3/09/62 Vice President, Chief Compliance Officer - AMG Family of Funds, AMG Funds LLC (2010-Present); Code of Ethics Reporting Officer and Sarbanes Oxley Code of Ethics Compliance Officer, AMG Funds, AMG Funds I, AMG Funds II and AMG Funds III (2010-Present); Senior Compliance Analyst, Mutual Funds and Regulatory, GE Asset Management Incorporated (2005-2010). |
• Anti-Money Laundering Compliance Officer since 2014 | | Patrick J. Spellman, 3/15/74 Senior Vice President, Chief Compliance Officer, AMG Funds LLC (2011-Present); Chief Compliance Officer, AMG Distributors, Inc., (2010-Present); Compliance Manager, Legal and Compliance, Affiliated Managers Group, Inc. (2005-2011). |
| | | | | | |
| | | INVESTMENT MANAGER AND ADMINISTRATOR AMG Funds LLC 800 Connecticut Avenue Norwalk, CT 06854 (800) 835-3879 DISTRIBUTOR AMG Distributors, Inc. 800 Connecticut Avenue Norwalk, CT 06854 (800) 835-3879 SUBADVISOR Cadence Capital Management, LLC 265 Franklin Street, 11th Floor Boston, MA 02110 CUSTODIAN The Bank of New York Mellon 2 Hanson Place Brooklyn, NY 11217 LEGAL COUNSEL Ropes & Gray LLP Prudential Tower, 800 Boylston Street Boston, MA 02199-3600 | | TRANSFER AGENT BNY Mellon Investment Servicing (US) Inc. Attn: AMG P.O. Box 9769 Providence, RI 02940 (800) 548-4539 | | This report is prepared for the Funds’ shareholders. It is authorized for distribution to prospective investors only when preceded or accompanied by an effective prospectus. To receive a free copy of the prospectus or Statement of Additional Information, which includes additional information about Fund Trustees, please contact us by calling 800.835.3879. Distributed by AMG Distributors, Inc., member FINRA/SIPC. Current net asset values per share for each Fund are available on the Funds’ website at www.amgfunds.com. A description of the policies and procedures each Fund uses to vote its proxies is available: (i) without charge, upon request, by calling 800.835.3879, or (ii) on the Securities and Exchange Commission’s (SEC) website at www.sec.gov. For information regarding each Fund’s proxy voting record for the 12-month period ended June 30, call 800.835.3879 or visit the SEC website at www.sec.gov. Each Fund files its complete schedule of portfolio holdings with the SEC for the first and third quarters of each fiscal year on Form N-Q. The Funds’ Forms N-Q are available on the SEC’s website at www.sec.gov. A Fund’s Forms N-Q may be reviewed and copied at the SEC’s Public Reference Room in Washington, DC. Information on the operation of the Public Reference Room may be obtained by calling 1-800-SEC-0330. To review a complete list of the Funds’ portfolio holdings, or to view the most recent quarterly holdings report, semiannual report, or annual report, please visit www.amgfunds.com. |
| | | | | |
| | | | | |
| | | | | |
| | | | | |
| | | | | |
| | | | | |
| | | | | |
| | | | | |
| | | | | |
| | | | | |
| | | | | |
| | | | | |
| | | | | |
| | | | | |
| | | | | |
| | | | | |
| | | | | |
| | | | | |
| | | | | |
| | | | | |
| | | | | |
| | | | | |
| | | | | |
| | | | | |
| | | | | |
| | | | | |
| | | | | |
| | | | | |
| | | | | |
| | | | | | |
| | | | |
| | | | |
www.amgfunds.com |
| | | | | | | | | | |
| | AFFILIATE SUBADVISED FUNDS |
| | | | | | | | | | |
| | | BALANCED FUNDS AMG Chicago Equity Partners Balanced Chicago Equity Partners, LLC AMG FQ Global Risk-Balanced First Quadrant, L.P. EQUITY FUNDS AMG Chicago Equity Partners Small Cap Value Chicago Equity Partners, LLC AMG FQ Tax-Managed U.S. Equity AMG FQ U.S. Equity First Quadrant, L.P. AMG Frontier Small Cap Growth Frontier Capital Management Company, LLC AMG GW&K Small Cap Core AMG GW&K Small Cap Growth GW&K Investment Management, LLC | | | | AMG Renaissance International Equity AMG Renaissance Large Cap Growth The Renaissance Group LLC AMG SouthernSun Small Cap AMG SouthernSun U.S. Equity SouthernSun Asset Management, LLC AMG Systematic Large Cap Value AMG Systematic Mid Cap Value Systematic Financial Management, L.P. AMG TimesSquare All Cap Growth AMG TimesSquare International Small Cap AMG TimesSquare Mid Cap Growth AMG TimesSquare Small Cap Growth TimesSquare Capital Management, LLC | | | | AMG Trilogy Emerging Markets Equity AMG Trilogy Emerging Wealth Equity AMG Trilogy Global Equity AMG Trilogy International Small Cap Trilogy Global Advisors, L.P. AMG Yacktman Focused AMG Yacktman AMG Yacktman Special Opportunities Yacktman Asset Management LP FIXED INCOME FUNDS AMG GW&K Enhanced Core Bond AMG GW&K Core Bond (formerly AMG Managers Total Return Bond) AMG GW&K Municipal Bond AMG GW&K Municipal Enhanced Yield GW&K Investment Management, LLC |
| | | | | |
| | | | | | | | | | |
| | OPEN-ARCHITECTURE FUNDS |
| | | | | | | | | | |
| | | EQUITY FUNDS AMG Managers Brandywine Advisors Mid Cap Growth AMG Managers Brandywine Blue AMG Managers Brandywine Friess Associates, LLC AMG Managers Cadence Capital Appreciation AMG Managers Cadence Emerging Companies AMG Managers Cadence Mid Cap Cadence Capital Management, LLC AMG Managers Emerging Opportunities Lord, Abbett & Co. LLC WEDGE Capital Management L.L.P. Next Century Growth Investors LLC RBC Global Asset Management (U.S.) Inc. | | | | AMG Managers Essex Small/Micro Cap Growth Essex Investment Management Co., LLC AMG Managers Real Estate Securities CenterSquare Investment Management, Inc. AMG Managers Skyline Special Equities Skyline Asset Management, L.P. AMG Managers Special Equity Ranger Investment Management, L.P. Lord, Abbett & Co. LLC Smith Asset Management Group, L.P. Federated MDTA LLC | | | | FIXED INCOME FUNDS AMG Managers Bond AMG Managers Global Income Opportunity Loomis, Sayles & Co., L.P. AMG Managers High Yield J.P. Morgan Investment Management Inc. AMG Managers Intermediate Duration Government AMG Managers Short Duration Government Amundi Smith Breeden LLC |
| | | | |

AR065-0515 | | | | | www.amgfunds.com |
Item 2. CODE OF ETHICS
Registrant has adopted a Code of Ethics. See attached Exhibit (a)(1).
Item 3. AUDIT COMMITTEE FINANCIAL EXPERT
Registrant’s Board of Trustees has determined that independent Trustee Mr. Steven J. Paggioli qualifies as the Audit Committee Financial expert. Mr. Paggioli is “independent” as such term is defined in Form N-CSR.
Item 4. PRINCIPAL ACCOUNTANT FEES AND SERVICES
(a) Audit Fees
The aggregate fees billed by the Funds’ independent registered public accounting firm, PricewaterhouseCoopers LLP (“PwC”), to the Funds for the Funds’ two most recent fiscal years for professional services rendered for audits of annual financial statements, or services that are normally provided in connection with statutory and regulatory filings or engagements (“Audit Fees”) were as follows:
| | | | |
| | | Fiscal 2015 | | Fiscal 2014 |
AMG Managers Cadence Capital Appreciation Fund | | $22,770 | | $27,107 |
AMG Managers Cadence Mid-Cap Fund | | $24,265 | | $27,581 |
AMG Managers Cadence Emerging Companies Fund | | $17,407 | | $11,724 |
(b) Audit-Related Fees
There were no fees billed by PwC to the Funds in its two recent fiscal years for services rendered for assurance and related services that are reasonably related to the performance of the audit or review of the Fund’s financial statements, but are not reported as Audit Fees (“Audit-Related Fees”).
For the Funds’ two most recent fiscal years, there were no Audit-Related Fees billed by PwC for engagements related directly to the operations and financial reporting of one or more Funds by a Fund Service Provider. A Fund Service Provider is (a) any investment adviser to the Fund (not including any Subadvisor whose role is primarily portfolio management and is subcontracted with or overseen by another investment adviser) or (b) any entity that provides ongoing services to the Fund and is controlling, controlled by or under common control with a Fund investment adviser described in (a).
(c) Tax Fees
The aggregate fees billed by PwC to the Funds for the two most recent fiscal years for professional services rendered for tax compliance, tax advice, and tax planning (“Tax Fees”) were as follows:
| | | | |
| | | Fiscal 2015 | | Fiscal 2014 |
AMG Managers Cadence Capital Appreciation Fund | | $6,985 | | $6,885 |
AMG Managers Cadence Mid Cap Fund | | $6,985 | | $6,885 |
AMG Managers Cadence Emerging Companies Fund | | $6,985 | | $6,885 |
For the Funds’ two most recent fiscal years, Tax Fees billed by PwC for engagements by Fund Service Providers that related directly to the operations and financial reporting of the Funds were $0 for fiscal 2014 and $0 for fiscal 2013, respectively.
The services for which Tax Fees were charged comprise all services performed by professional staff in PwC’s tax division except those services related to the audit. Typically, this category would include fees for tax compliance, tax planning, and tax advice. Tax compliance, tax advice, and tax planning services include preparation of original and amended tax returns, claims for refund and tax payment-planning services, assistance with tax audits and appeals, tax advice related to mergers and acquisitions and requests for rulings or technical advice from taxing authorities.
(d) All Other Fees
There were no other fees billed by PwC to the Funds for all other non-audit services (“Other Fees”) during the Funds’ two most recent fiscal years. During the same period, there were no Other Fees billed by PwC for engagements by Fund Service Providers that related directly to the operations and financial reporting of the Funds.
(e)(1) According to policies adopted by the Audit Committee, services provided by PwC to the Funds must be pre-approved by the Audit Committee. On an annual basis, the Audit Committee reviews and pre-approves various types of services that PwC may perform for the Funds without specific approval of each engagement, subject to specified budget limitations. As contemplated by the Sarbanes-Oxley Act of 2002 and related SEC rules, the Audit Committee also pre-approves non-audit services provided by PwC to any Fund Service Provider for any engagement that relates directly to the operations and financial reporting of the Funds. Any engagement that is not already pre-approved or that will exceed a pre-approved budget must be submitted to the Audit Committee for pre-approval. The Chairman of the Audit Committee is authorized on behalf of the Board of Trustees and the Audit Committee to approve the engagement of PwC to perform non-audit services subject to certain conditions, including notification to the Audit Committee of such pre-approval not later than the next meeting of the Audit Committee following the date of such pre-approval.
(e)(2) None.
(f) Not applicable.
(g) The aggregate fees billed by PwC in 2015 and 2014 for non-audit services rendered to the Funds and Fund Service Providers were $116,523 and $89,955, respectively. For the fiscal year ended May 31, 2015, this amount reflects the amounts disclosed above in Item 4(b),(c),(d), plus $95,568 in fees billed to the Fund Service Providers for non-audit services that did not relate directly to the operations and financial reporting of the Funds. For the fiscal year ended May 31, 2014, this amount reflects the amounts disclosed above in Item 4(b),(c),(d), plus $69,300 in fees billed to the Fund Service Providers for non-audit services that did not relate directly to the operations and financial reporting of the Funds.
(h) The Trust’s Audit Committee has considered whether the provision of non-audit services by registrant’s independent registered public accounting firm to the registrant’s investment advisor, and any entity controlling, controlled, or under common control with the investment advisor that provided ongoing services to the registrant that were not pre-approved by the Committee (because such services did not relate directly to the operations and financial reporting of the registrant) was compatible with maintaining the independence of the independent registered public accounting firm.
Item 5. AUDIT COMMITTEE OF LISTED REGISTRANTS
Not applicable.
Item 6. SCHEDULE OF INVESTMENTS
The schedule of investments in unaffiliated issuers as of the close of the reporting period is included as part of the shareholder report contained in Item 1 hereof.
Item 7. DISCLOSURE OF PROXY VOTING POLICIES AND PROCEDURES FOR CLOSED-END MANAGEMENT INVESTMENT COMPANIES
Not applicable.
Item 8. PORTFOLIO MANAGERS OF CLOSED-END MANAGEMENT INVESTMENT COMPANIES
Not applicable.
Item 9. PURCHASES OF EQUITY SECURITIES BY CLOSED-END MANAGEMENT INVESTMENT COMPANIES AND AFFILIATED PURCHASERS
Not applicable.
Item 10. SUBMISSION OF MATTERS TO A VOTE OF SECURITY HOLDERS
Not applicable.
Item 11. CONTROLS AND PROCEDURES
(a) The Registrant’s principal executive and principal financial officers have concluded, based on their evaluation of the registrant’s disclosure controls and procedures as of a date within 90 days of the filing of this report, that the Registrant’s disclosure controls and procedures are reasonably designed to ensure that information required to be disclosed by the Registrant on Form N-CSR is recorded, processed, summarized and reported within the required time periods and that information required to be disclosed by the registrant in the reports that it files or submits on Form N-CSR is accumulated and communicated to the Registrant’s management, including its principal executive and principal financial officers, as appropriate to allow timely decisions regarding required disclosure.
(b) There were no changes in the Registrant’s internal control over financial reporting during the Registrant’s fourth fiscal quarter of the period covered by this report that have materially affected, or are reasonably likely to affect, the internal control over financial reporting.
Item 12. EXHIBITS
| | |
| (a)(1) | | Any Code of Ethics or amendments hereto. Filed herewith. |
| |
| (a)(2) | | Certifications pursuant to Rule 30a-2(a) under the Investment Company Act of 1940—Filed herewith. |
| |
| (a)(3) | | Not applicable. |
| |
| (b) | | Certifications pursuant to Rule 30a-2(b) under the Investment Company Act of 1940—Filed herewith. |
SIGNATURES
Pursuant to the requirements of the Securities Exchange Act of 1934 and the Investment Company Act of 1940, the registrant has duly caused this report to be signed on its behalf by the undersigned, thereunto duly authorized.
AMG FUNDS III
| | |
| By: | | /s/ Jeffrey T. Cerutti |
| | Jeffrey T. Cerutti, Principal Executive Officer |
| |
| Date: | | July 31, 2015 |
Pursuant to the requirements of the Securities Exchange Act of 1934 and the Investment Company Act of 1940, this report has been signed below by the following persons on behalf of the registrant and in the capacities and on the dates indicated.
| | |
| By: | | /s/ Jeffrey T. Cerutti |
| | Jeffrey T. Cerutti, Principal Executive Officer |
| |
| Date: | | July 31, 2014 |
| | |
| By: | | /s/ Donald S. Rumery |
| | Donald S. Rumery, Principal Financial Officer |
| |
| Date: | | July 31, 2015 |