UNITED STATES
SECURITIES AND EXCHANGE COMMISSION
Washington, D.C. 20549
FORM N-CSR
CERTIFIED SHAREHOLDER REPORT OF
REGISTERED MANAGEMENT INVESTMENT COMPANIES
Investment Company Act file number: 811-03752
AMG FUNDS III
(Exact name of registrant as specified in charter)
680 Washington Boulevard,
Suite 500, Stamford, Connecticut 06901
(Address of principal executive offices) (Zip code)
AMG Funds LLC
680 Washington Boulevard,
Suite 500, Stamford, Connecticut 06901
(Name and address of agent for service)
Registrant’s telephone number, including area code: (203) 299-3500
Date of fiscal year end: DECEMBER 31
Date of reporting period: JANUARY 1, 2021 – DECEMBER 31, 2021 (Annual Shareholder Report)
| Item 1. | Reports to Shareholders |
| | | | | | |
| | | AMG Funds |
| | | | |
| | | December 31, 2021 | | | | |
| | |
| | | Veritas — Asset Management |
| | |
| | | AMG Veritas Asia Pacific Fund |
| | | (formerly AMG Managers Special Equity Fund) |
| | | |
| | | Class N: MGSEX | | Class I: MSEIX |
| | | | |
| | | | | | | |
| | | | |
| | | | | |
| | | |
| amgfunds.com | | 123121 | | AR078 |
| | |
| | AMG Funds Annual Report — December 31, 2021 |
| | | | |
| | | TABLE OF CONTENTS | | PAGE |
| | | |
| | | LETTER TO SHAREHOLDERS | | 2 |
| | | |
| | | ABOUT YOUR FUND’S EXPENSES | | 3 |
| | | |
| | | PORTFOLIO MANAGER’S COMMENTS, FUND SNAPSHOTS AND SCHEDULE OF PORTFOLIO INVESTMENTS | | 4 |
| | | |
| | | FINANCIAL STATEMENTS | | |
| | | |
| | | Statement of Assets and Liabilities | | 13 |
| | | |
| | | Balance sheet, net asset value (NAV) per share computations and cumulative distributable earnings (loss) | | |
| | | |
| | | Statement of Operations | | 15 |
| | | |
| | | Detail of sources of income, expenses, and realized and unrealized gains (losses) during the fiscal year | | |
| | | |
| | | Statements of Changes in Net Assets | | 16 |
| | | |
| | | Detail of changes in assets for the past two fiscal years | | |
| | | |
| | | Financial Highlights | | 17 |
| | | |
| | | Historical net asset values per share, distributions, total returns, income and expense ratios, turnover ratios and net assets | | |
| | | |
| | | Notes to Financial Statements | | 19 |
| | | |
| | | Accounting and distribution policies, details of agreements and transactions with Fund management and affiliates, and descriptions of certain investment risks | | |
| | | |
| | | REPORT OF INDEPENDENT REGISTERED PUBLIC ACCOUNTING FIRM | | 25 |
| | | |
| | | OTHER INFORMATION | | 26 |
| | | |
| | | TRUSTEES AND OFFICERS | | 27 |
Nothing contained herein is to be considered an offer, sale or solicitation of an offer to buy shares of any series of the AMG Funds Family of Funds. Such offering is made only by prospectus, which includes details as to offering price and other material information.
| | | | |
| |  | | Letter to Shareholders |
Dear Shareholder:
The fiscal year ended December 31, 2021, was marked by the continued extraordinary recovery amid an unprecedented global effort to stop the COVID-19 pandemic. Equities rallied to new record highs amid better-than-expected corporate earnings, colossal fiscal and monetary stimulus programs, and an improving economic backdrop. Since the market bottom on March 23, 2020, the S&P 500® Index has gained over 119%. Businesses and consumers contended with disrupted supply chains and rising prices on a wide range of goods such as lumber and gasoline, and outbreaks of coronavirus variants kept the world on edge. Volatility increased in September as investors grew more concerned about rising inflation and more hawkish global central bank policies, but equities were resilient and finished the fiscal year with a strong rally.
The S&P 500® gained 28.71% during the year and all sectors produced double-digit returns, but there was very wide dispersion in performance. Energy and real estate led the market with returns of 54.72% and 46.20%, respectively. On the other hand, utilities and consumer staples lagged with returns of 17.63% and 18.63%, respectively. Growth stocks edged out Value stocks as the Russell 1000® Growth Index returned 27.60% compared to the 25.16% return for the Russell 1000® Value Index. Small cap stocks underperformed as the Russell 2000® Index returned 14.82%. Within small caps, the Value-Growth disparity was much more pronounced as the Russell 2000® Value Index returned 28.27% compared to 2.83% for the Russell 2000® Growth Index. Outside the U.S., foreign developed markets lagged their U.S. counterparts with an 11.26% return for the MSCI EAFE Index. A major regulatory crackdown in China shook investor confidence in Chinese equities and caused emerging markets to underperform with a (2.54)% return for the MSCI Emerging Markets Index.
Interest rates lifted off from near-historic lows as the vaccine rollout initiated a return to normalcy and the economic outlook improved. The 10-year Treasury yield rose 59 basis points to 1.52% and ended the year slightly shy of its post-pandemic high. The Bloomberg U.S. Aggregate Bond Index, a broad measure of U.S. bond market performance, lost (1.54)% over the period. While risk appetite was strong, rising rates still hurt returns for investment-grade corporate bonds, which lost (1.04)% during the year. The global search for yield helped high-yield bonds outperform the investment-grade market with a 5.28% return as measured by the return of the Bloomberg U.S. Corporate High Yield Bond Index. Municipal bonds benefited from a strong technical backdrop, which drove a 1.52% return for the Bloomberg Municipal Bond Index.
AMG Funds appreciates the privilege of providing investment tools to you and your clients. Our foremost goal is to provide investment solutions that help our shareholders successfully reach their long-term investment goals. AMG Funds provides access to a distinctive array of actively managed return-oriented investment strategies. We thank you for your continued confidence and investment in AMG Funds. You can rest assured that under all market conditions our team is focused on delivering excellent investment management services for your benefit.
Respectfully,

Keitha Kinne
President
AMG Funds
| | | | | | | | | | | | | | |
| Average Annual Total Returns | | Periods ended December 31, 2021* | |
| | | | |
| Stocks: | | | | 1 Year | | | 3 Years | | | 5 Years | |
| | | | |
Large Cap | | (S&P 500® Index) | | | 28.71 | % | | | 26.07 | % | | | 18.47 | % |
| | | | |
Small Cap | | (Russell 2000® Index) | | | 14.82 | % | | | 20.02 | % | | | 12.02 | % |
| | | | |
International | | (MSCI ACWI ex USA) | | | 7.82 | % | | | 13.18 | % | | | 9.61 | % |
| Bonds: | | | | | | | | | | | |
| | | | |
Investment Grade | | (Bloomberg U.S. Aggregate Bond Index) | | | (1.54 | )% | | | 4.79 | % | | | 3.57 | % |
| | | | |
High Yield | | (Bloomberg U.S. Corporate High Yield Bond Index) | | | 5.28 | % | | | 8.83 | % | | | 6.30 | % |
| | | | |
Tax-exempt | | (Bloomberg Municipal Bond Index) | | | 1.52 | % | | | 4.73 | % | | | 4.17 | % |
| | | | |
Treasury Bills | | (ICE BofAML U.S. 6-Month Treasury Bill Index) | | | 0.09 | % | | | 1.23 | % | | | 1.31 | % |
*Source: FactSet. Past performance is no guarantee of future results.
2
| | |
| | About Your Fund’s Expenses |
| | | | | | | | |
As a shareholder of a Fund, you may incur two types of costs: (1) transaction costs, which may include sales charges (loads) on purchase payments; redemption fees; and exchange fees; and (2) ongoing costs, including management fees; distribution (12b-1) fees; and other Fund expenses. This example is intended to help you understand your ongoing costs (in dollars) of investing in the Fund and to compare these costs with the ongoing costs of investing in other mutual funds. The example is based on $1,000 invested at the beginning of the period and held for the entire period as indicated below. ACTUAL EXPENSES The first line of the following table provides information about the actual account values and | | | | actual expenses. You may use the information in this line, together with the amount you invested, to estimate the expenses that you paid over the period. Simply divide your account value by $1,000 (for example, an $8,600 account value divided by $1,000 = 8.6), then multiply the result by the number in the first line under the heading entitled “Expenses Paid During Period” to estimate the expenses you paid on your account during this period. HYPOTHETICAL EXAMPLE FOR COMPARISON PURPOSES The second line of the following table provides information about hypothetical account values and hypothetical expenses based on the Fund’s actual expense ratio and an assumed annual rate of return of 5% before expenses, which is not the Fund’s | | | | actual return. The hypothetical account values and expenses may not be used to estimate the actual ending account balance or expenses you paid for the period. You may use this information to compare the ongoing costs of investing in the Fund and other funds by comparing this 5% hypothetical example with the 5% hypothetical examples that appear in the shareholder reports of other funds. Please note that the expenses shown in the table are meant to highlight your ongoing costs only and do not reflect any transactional costs, such as sales charges (loads), redemption fees, or exchange fees. Therefore, the second line of the table is useful in comparing ongoing costs only, and will not help you determine the relative total costs of owning different funds. |
| | | | | | | | |
| | | | | | | | |
| | | | | | | | |
| | | | | | | |
| | | | | | | | | | |
Six Months Ended
December 31, 2021 | | Expense
Ratio for
the Period | | Beginning
Account
Value
07/01/21 | | Ending
Account
Value
12/31/21 | | Expenses
Paid
During
the Period* |
|
AMG Veritas Asia Pacific Fund | |
| |
Based on Actual Fund Return | | | | |
| | | | |
Class N | | 1.18% | | $1,000 | | $915 | | | $5.70 | |
| | | | |
Class I | | 0.93% | | $1,000 | | $916 | | | $4.49 | |
| | |
Based on Hypothetical 5% Annual Return | | | | |
| | | | |
Class N | | 1.18% | | $1,000 | | $1,019 | | | $6.01 | |
| | | | |
Class I | | 0.93% | | $1,000 | | $1,021 | | | $4.74 | |
| * | Expenses are equal to the Fund’s annualized expense ratio multiplied by the average account value over the period, multiplied by the number of days in the most recent fiscal half-year (184), then divided by 365. |
3
| | |
| | AMG Veritas Asia Pacific Fund Portfolio Manager’s Comments (unaudited) |
| | | | | | | | |
For the 12 months ended December 31, 2021, AMG Veritas Asia Pacific Fund (formerly AMG Managers Special Equity Fund) (the “Fund”) Class N shares returned 3.16%, compared with the (2.90)% return for the MSCI AC Asia Pacific ex Japan Index, the Fund’s current benchmark, and the 2.83% return for the Russell 2000® Growth Index, the Fund’s former benchmark. On March 17-18, 2021, the Fund’s Board of Trustees approved the appointment of Veritas Asset Management LLP (“Veritas”) as interim subadviser to the Fund effective March 19, 2021. On May 24, the Fund’s principal investment strategies changed from primarily investing in U.S small-cap equity securities to investing in a relatively select group of companies within the Asia Pacific region. On June 18, 2021, the Fund’s shareholders approved the appointment of Veritas as the subadviser to the Fund, the change in the Fund’s name, and its benchmark. Also approved was a change to the Fund’s sub-classification from “diversified” to “non-diversified.” ASIA MARKET OVERVIEW As a brief recap, 2021 started with markets picking up where they had left off in 2020 earning material gains. This continued until the market peaked on February 17, 2021, when the prospect of rising inflation leading to higher bond yields and higher interest rates overcame markets. The key 10-year U.S. Treasury yield rose from 95 basis points to over 170 basis points in short order. The impact on the share price of many high quality, fast growing companies was material, as the implication of using a higher discount rate to value future cash flows meant these cash flows could be worth significantly less, leading to some dramatic falls of between (25)% and (40)% in the share price of a number of businesses owned by the Fund over a three to four week period. This resulted in a market rotation into “value” and share prices of businesses that had been so unloved for so long rose rapidly at the expense of some high quality businesses which were continuing to deliver superb operational performance. The rotation proved to be short lived (it often is in Asia) as markets’ fear of higher inflation subsided, yields fell, and the operational performance of many of the high quality businesses the Fund owns came through in their quarterly and half yearly results as they “proved up.” The impact on the Fund was a performance boost versus the Fund’s current index. During Q3 things started to get really intense as Chinese authorities moved to turn the huge “for-profit” out-of-school education sector into a | | | | not-for-profit industry, resulting in billions of dollars being wiped off the value of companies such as New Oriental and TAL Education that were held and eventually sold during the period. The market was awash with rumors about “who’s next to be regulated out of existence?” Would it be e-commerce companies? Would it be healthcare? Many investors took fright at what they saw as the specter of an Orwellian, authoritarian, anti-business government clamping down and retrenching into its communist origins. From then on, every announcement or piece of regulation or law passed was seen through a negative lens in the West, and this intensified as the common prosperity narrative was, in our view, misinterpreted by many. Then, to add fuel to the fire, came the Evergrande issue. The prospect of the world’s most indebted property company no longer being in a position to service its $300 billion+ of debts and defaulting led to a frenzy of speculation. It’s no wonder some investors were asking themselves if China was still investable. Given the selling pressure that built up during Q4 some have clearly decided it is not, or at least not for now. PERFORMANCE REVIEW For the first three months of the period under the management of the Fund’s prior subadvisers, the Fund underperformed its former benchmark. The Fund’s relative performance benefited from strong stock selection within the health care and industrials sectors, combined with an underweight to the poor performing health care sector. This was more than offset by negative stock selection results within the information technology, consumer discretionary, and materials sectors. For the remainder of the period, the Fund outperformed its current benchmark. During this period, stock selection in China, and the Fund’s near double weighting in India, added the most to the relative outperformance. At the sector level, health care and industrials added most to relative performance, with Indian private hospital group Apollo Hospitals +68% standing out in health care and the solar inverter company Sungrow Power Supply +66% standing out in industrials. The only sector to cause a significant lag was materials—with the Korean battery company LG Chem (29)% accounting for most of the Fund’s exposure to the sector. OUTLOOK Our view has not changed. We categorically believe that China continues to represent a highly attractive opportunity set to deploy capital into some | | | | wonderful businesses that have the tailwind of one or more structural growth drivers, as well as having the capital and management ability to take advantage of the opportunities this presents. One such area on which we are focused is “Made in Asia—part 2.” This is related to companies that benefit from the opportunities by the world’s move to decarbonize—solar and wind—and the supply chain that feeds the industry, i.e. the upgrading of high spec, high tech manufacturing. Asia is home to many of the world’s leading businesses in their respective areas of the renewable energy industry, whether that be a leading inverter manufacturer such as Sungrow Power Supply, or a global leader in photovoltaic film used in solar panels such as Hangzhou First Applied Material, or a global leader in machinery used to manufacture lithium-ion batteries such as WuXi Lead Intelligent Equipment, or indeed the lithium-ion battery manufacturers themselves, Samsung SDI and LG Chem, which among them have over 60% global market share. The point common to all is that we believe they benefit from a multi-year (and potentially multi-decade) structural tailwind, have scale and years of knowhow, are industry leaders, are well run by talented aligned management teams, and are based in Asia. It is entirely possible we could see a reversal of past decades where Asia has imported expertise and machinery to a time where Asia is the exporter of expertise and high spec machinery. Yet it is these types of companies that have suffered in recent weeks leading to the Fund coming back toward the market return for the year. Where-to from here? We believe parts of the Chinese equity market have the potential to be an outstanding place to deploy capital over the coming quarters. In essence, the team believes there are parallels between where we are today and the end of 2015/early 2016 with monetary policy of the U.S. Federal Reserve (the “Fed”) and the People’s Bank of China (“PBOC”) moving in opposite directions—the Fed tightening and PBOC loosening, but in a very targeted way to support stated policy goals. Indeed, this loosening may well have already started following the Politburo meeting in early December and the subsequent Central Economic Work Conference (“CEWC”) on December 10. The Politburo meeting gave the clearest signal yet that China is moving to an easier policy stance. During the meeting it affirmed its pro-growth stance |
| | | | |
| | | | |
4
| | |
| | AMG Veritas Asia Pacific Fund Portfolio Manager’s Comments (continued) |
| | | | | | | | |
and housing policy easing, while calling for “keeping economic growth in a reasonable range and maintaining social stability in 2022 ahead of the 20th Party Congress.” In particular, three policy options stood out; • Cyclical policy would promote consumption and expand effective investment. • The meeting set goals to accelerate affordable housing construction to better meet the reasonable demands of home buyers and promote “virtuous circulation” in the sector. • On social welfare, new fertility policies, a coordinated national pension system and improving the provision of basic public services based on residence. This is part of the common prosperity narrative being put into action—housing for living, not speculation, more affordable housing, seeking to address the needs and improve the lives of the 800 million people who still live on $140 or less per month. | | | | One other important point to mention from the meeting is the wording on “anti-trust” and “disorderly expansion of capital” being dropped. This suggests the regulatory tightening seen in 2021 may be entering a phase focused more on implementation rather than introducing new measures—there may be tweaks but we feel it is unlikely there will be new large scale aggressive policy moves. The subsequent CEWC set out an action plan for growth in 2022. In fact, stabilizing growth was set as the top priority as it pledged to “mobilize all departments and local government with front-loaded infrastructure capex, tax cuts, and a green investment push.” The CEWC is China’s most important and powerful economic execution body and is clearly setting out policy to meet Politburo objectives by, among other things, front loading countercyclical easing, particularly in infrastructure. | | | | The CEWC also emphasized the importance of environmental policy and decarbonization as it pledged “investment before de-investment” in order to boost investment in renewable energy with greater incentives. While 2021 proved to be somewhat disappointing, we move into 2022 with optimism that we may have seen (or at least we started to see) some capitulation in Asian markets, which is starting to present a material valuation gap between markets such as the U.S. and Asia. At the same time, policy in China is moving to support key areas of growth that will benefit not just Chinese business but businesses across Asia involved in supplying industries such as renewable energy. The views expressed represent the opinions of Veritas Asset Management LLP and are not intended as a forecast or guarantee of future results, and are subject to change without notice. |
| | | | |
| | | | |
5
| | |
| | AMG Veritas Asia Pacific Fund Portfolio Manager’s Comments (continued) |
CUMULATIVE TOTAL RETURN PERFORMANCE
AMG Veritas Asia Pacific Fund’s cumulative total return is based on the daily change in net asset value (NAV), and assumes that all dividends and distributions were reinvested. The graph compares a hypothetical $10,000 investment made in the AMG Veritas Asia Pacific Fund’s Class N shares on December 31, 2011, to a $10,000 investment made in the MSCI AC Asia Pacific ex Japan Index and the Russell 2000® Growth Index for the same time period. The graph and table do not reflect the deduction of taxes that a shareholder would pay on a Fund distribution or redemption of shares. The listed returns for the Fund are net expenses and the returns for the index exclude expenses. Total returns would have been lower had certain expenses not been reduced.
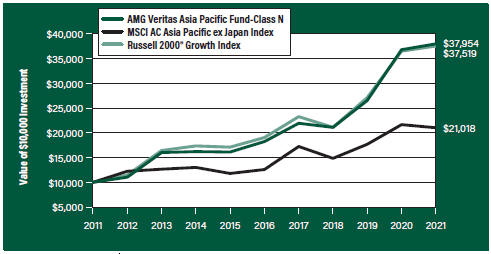
The table below shows the average annual total returns for the AMG Veritas Asia Pacific Fund, MSCI AC Asia Pacific ex Japan Index and the Russell 2000® Growth Index for the same time periods ended December 31, 2021.
| | | | | | | | | | | | |
Average Annual Total Returns1 | | One
Year | | | Five
Years | | | Ten
Years | |
AMG Veritas Asia Pacific Fund2, 3, 4, 5, 6, 7, 8, 9, 10, 11, 12, 13, 14, 15, 16, 17, 18, 19 | |
| | | |
Class N | | | 3.16 | % | | | 15.79% | | | | 14.27% | |
| | | |
Class I | | | 3.43 | % | | | 16.09% | | | | 14.51% | |
MSCI AC Asia Pacific ex Japan Index20 | | | (2.90 | %) | | | 10.81% | | | | 7.71% | |
| | | |
Russell 2000® Growth Index21 | | | 2.83 | % | | | 14.53% | | | | 14.14% | |
The performance data shown represents past performance. Past performance is not a guarantee of future results. Current performance may be lower or higher than the performance data quoted. The investment return and principal value of an investment will fluctuate so that an investor’s shares, when redeemed, may be worth more or less than their original cost.
Investors should carefully consider the Fund’s investment objectives, risks, charges and expenses before investing. For performance information through the most recent month end, current net asset values per share for the Fund and other information, please call 800.548.4539 or visit our website at amgfunds.com for a free prospectus. Read it carefully before investing or sending money.
Distributed by AMG Distributors, Inc., member FINRA/SIPC.
| 1 | Total return equals income yield plus share price change and assumes reinvestment of all dividends and capital gain distributions. Returns are net of fees and may reflect offsets of Fund expenses as described in the prospectus. No adjustment has been made for taxes payable by shareholders on their reinvested dividends and capital gain distributions. Returns for periods greater than one year are annualized. The listed returns on the Fund are net of expenses and based on the published NAV as of December 31, 2021. All returns are in U.S. dollars ($). |
|
2 Performance shown for periods prior to March 19, 2021, reflects the performance and investment strategies of the Fund’s previous subadvisers, Federated MDTA LLC, Lord, Abbett & Co. LLC, Ranger Investment Management L.P. and Smith Asset Management Group, L.P. 3 From time to time, the Fund’s advisor has waived its fees and/or absorbed Fund expenses, which has resulted in higher returns. 4 The Fund is subject to risks associated with investments in small-capitalization companies, such as erratic earnings patterns, competitive conditions, limited earnings history and a reliance on one or a limited number of products. 5 The Fund is subject to risks associated with investments in mid-capitalization companies such as greater price volatility, lower trading volume, and less liquidity than the stocks of larger, more established companies. 6 Investments in international securities are subject to certain risks of overseas investing including currency fluctuations and changes in political and economic conditions, which could result in significant market fluctuations. These risks are magnified in emerging markets. 7 Market prices of investments held by the Fund may fall rapidly or unpredictably due to a variety of economic or political factors, market conditions, disasters or public health issues, or in response to events that affect particular industries or companies. |
|
8 The Fund is subject to currency risk resulting from fluctuations in exchange rates that may affect the total loss or gain on a non-U.S. Dollar investment when converted back to U.S. Dollars. |
|
9 To the extent the Fund focuses its investments in a particular country, group of countries or geographic region, the Fund is particularly susceptible to economic, political, regulatory or other events or conditions affecting such countries or region, and the Fund’s NAV may be more volatile than the NAV of a more geographically diversified fund and may result in losses. |
10 When the Fund has a significant cash balance for a sustained period, the benefit to the Fund of any market upswing may likely be reduced, and the performance may be adversely affected. 11 An investment in participatory notes is subject to market risk. The performance results of participatory notes may not exactly replicate the performance of the underlying securities. An investment in participatory notes is also subject to counterparty risk, relating to the non-U.S. bank or broker-dealer that issues the participatory notes, and maybe subject to liquidity risk. 12 Changes in the general political and social |
6
| | |
| | AMG Veritas Asia Pacific Fund Portfolio Manager’s Comments (continued) |
| | | | | | | | |
environment of a country can have substantial effects on the value of investments exposed to that country. 13 The application of the tax laws and regulations of the People’s Republic of China to income, including capital gains, derived from certain investments of the Fund remains unclear, and may well continue to evolve, possibly with retroactive effect. Any taxes imposed on the investments of the Fund pursuant to such laws and regulations will reduce the Fund’s overall returns. 14 Trading in China A-Shares through Stock Connect is subject to sudden changes in quota limitations, application of trading suspensions, differences in trading days between the People’s Republic of China and Stock Connect, operational risk, clearing and settlement risk and regulatory and taxation risk. 15 The Fund may not be able to value its investments in a manner that accurately reflects their market values, and the Fund may not be able to sell an investment at a price equal to the valuation ascribed to that investment by the Fund. 16 The Fund is subject to the risks associated with investments in emerging markets, such as erratic | | | | earnings patterns, economic and political instability, changing exchange controls, limitations on repatriation of foreign capital and changes in local governmental attitudes toward private investment, possibly leading to nationalization or confiscation of investor assets. 17 A greater percentage of the Fund’s holdings may be focused in a smaller number of securities which may place the Fund at greater risk than a more diversified fund. 18 The Fund invests in large-capitalization companies that may underperform other stock funds (such as funds that focus on small-and medium-capitalization companies) when stocks of large-capitalization companies are out of favor. 19 The Fund invests in value stocks, which may perform differently from the market as a whole and maybe undervalued by the market for a long period of time. 20 On March 19, 2021, the benchmark changed from the Russell 2000® Growth Index to the MSCI AC Asia Pacific ex Japan Index. The MSCI AC Asia Pacific ex Japan Index captures large and mid cap representation across certain Developed and Emerging Market countries in the Asia Pacific | | | | region (excluding Japan). Unlike the Fund, the MSCI AC Asia Pacific ex Japan Index is unmanaged, is not available for investment and does not incur expenses. 21 The Russell 2000® Growth Index measures the performance of the Russell 2000® companies with higher price-to-book ratios and higher forecasted growth values. Unlike the Fund, the Russell 2000® Growth Index is unmanaged, is not available for investment and does not incur expenses. The All MSCI data is provided “as is.” The products described herein are not sponsored or endorsed and have not been reviewed or passed on by MSCI. In no event shall MSCI, its affiliates, or any MSCI data provider have any liability of any kind in connection with the MSCI data or the products described herein. Copying or redistributing the MSCI data is strictly prohibited. The Russell Indices are trademarks of the London Stock Exchange Group companies. Not FDIC insured, nor bank guaranteed. May lose value. |
| | | | | | | | |
| | | | | | | | |
| | | | | | | | |
7
| | |
| | AMG Veritas Asia Pacific Fund Fund Snapshots (unaudited) December 31, 2021 |
PORTFOLIO BREAKDOWN
| | |
Sector | | % of Net Assets |
| | |
Information Technology | | 33.5 |
| | |
Industrials | | 11.0 |
| | |
Health Care | | 10.8 |
| | |
Consumer Staples | | 8.8 |
| | |
Communication Services | | 7.4 |
| | |
Consumer Discretionary | | 7.1 |
| | |
Financials | | 6.8 |
| | |
Materials | | 6.5 |
| | |
Real Estate | | 4.3 |
| | |
Energy | | 3.2 |
| | |
Short-Term Investments | | 0.7 |
| | |
Other Assets Less Liabilities | | (0.1) |
TOP TEN HOLDINGS
| | |
Security Name | | % of
Net Assets |
| | |
Taiwan Semiconductor Manufacturing Co., Ltd. (Taiwan) | | 8.2 |
| | |
Samsung Electronics Co., Ltd. (South Korea) | | 8.0 |
| | |
Sungrow Power Supply Co., Ltd., Class A (China) | | 4.8 |
| | |
HDFC Bank, Ltd., ADR (India) | | 4.4 |
| | |
Wuxi Lead Intelligent Equipment Co., Ltd., Class A (China) | | 4.3 |
| | |
Apollo Hospitals Enterprise, Ltd. (CLSA Ltd.) (India) | | 4.2 |
| | |
Sea, Ltd., ADR (Singapore) | | 3.9 |
| | |
Kweichow Moutai Co., Ltd., Class A (China) | | 3.8 |
| | |
Shenzhen Inovance Technology Co., Ltd., Class A (China) | | 3.8 |
| | |
Samsung SDI Co., Ltd. (South Korea) | | 3.6 |
| | |
| | | |
| | |
Top Ten as a Group | | 49.0 |
| | |
Because a fund’s strategy may result in multiple investments in particular sectors of the economy, its performance may depend on the performance of those sectors and may fluctuate more widely than investments diversified across more sectors. For additional information on these and other risk considerations, please see the Fund’s prospectus.
Any sectors, industries, or securities discussed should not be perceived as investment recommendations. Mention of a specific security should not be considered a recommendation to buy or solicitation to sell that security. Specific securities mentioned in this report may have been sold from the Fund’s portfolio of investments by the time you receive this report.
8
| | |
| | AMG Veritas Asia Pacific Fund Schedule of Portfolio Investments December 31, 2021 |
| | | | | | | | |
| | | Shares | | | Value | |
| |
Common Stocks - 74.1% | | | | | |
| |
Communication Services - 7.4% | | | | | |
| | |
Kakao Corp. (South Korea)* | | | 12,000 | | | | $1,133,188 | |
| | |
Sea, Ltd., ADR (Singapore)* | | | 33,136 | | | | 7,412,854 | |
| | |
Tencent Holdings, Ltd. (China) | | | 92,239 | | | | 5,382,249 | |
| |
Total Communication Services | | | | 13,928,291 | |
| |
Consumer Discretionary - 3.3% | | | | | |
| | |
Alibaba Group Holding, Ltd. (China)* | | | 91,350 | | | | 1,342,442 | |
| | |
Coupang, Inc. (South Korea)* | | | 60,000 | | | | 1,762,800 | |
| | |
Midea Group Co., Ltd., Class A (China) | | | 270,697 | | | | 3,134,824 | |
| |
Total Consumer Discretionary | | | | 6,240,066 | |
| |
Consumer Staples - 3.8% | | | | | |
| | |
Kweichow Moutai Co., Ltd., Class A (China) | | | 22,100 | | | | 7,102,014 | |
| |
Financials - 4.4% | | | | | |
| | |
HDFC Bank, Ltd., ADR (India) | | | 126,816 | | | | 8,251,917 | |
| |
Health Care - 5.4% | | | | | |
| | |
Adeptus Health, Inc. (United States)1,2 | | | 24,574 | | | | 0 | |
| | |
Cochlear, Ltd. (Australia) | | | 15,918 | | | | 2,498,338 | |
| | |
CSL, Ltd. (Australia) | | | 20,974 | | | | 4,436,009 | |
| | |
Guangzhou Kingmed Diagnostics Group Co., Ltd., Class A (China) | | | 169,900 | | | | 2,963,093 | |
| | |
JW Cayman Therapeutics Co., Ltd. (China)*,3 | | | 199,500 | | | | 344,656 | |
| |
Total Health Care | | | | 10,242,096 | |
| |
Industrials - 11.0% | | | | | |
| | |
Centre Testing International Group Co., Ltd., Class A (China) | | | 544,800 | | | | 2,296,081 | |
| | |
Contemporary Amperex Technology Co., Ltd., Class A (China) | | | 24,700 | | | | 2,275,233 | |
| | |
Shenzhen Inovance Technology Co., Ltd., Class A (China) | | | 655,297 | | | | 7,060,501 | |
| | |
Sungrow Power Supply Co., Ltd., Class A (China) | | | 394,700 | | | | 9,032,754 | |
| |
Total Industrials | | | | 20,664,569 | |
| |
Information Technology - 29.9% | | | | | |
| | |
Afterpay, Ltd. (Australia)* | | | 81,597 | | | | 4,925,784 | |
| | |
Hangzhou First Applied Material Co., Ltd., Class A (China) | | | 119,960 | | | | 2,454,573 | |
| | |
Kakao Pay Corp. (South Korea)* | | | 6,970 | | | | 1,023,146 | |
| | |
LONGi Green Energy Technology Co., Ltd., Class A (China) | | | 93,760 | | | | 1,268,582 | |
| | |
MediaTek, Inc. (Taiwan) | | | 25,000 | | | | 1,072,738 | |
| | |
Samsung Electronics Co., Ltd. (South Korea) | | | 229,650 | | | | 15,082,257 | |
| | |
Samsung SDI Co., Ltd. (South Korea)* | | | 12,400 | | | | 6,819,654 | |
| | |
Taiwan Semiconductor Manufacturing Co., Ltd. (Taiwan) | | | 701,400 | | | | 15,515,669 | |
| | | | | | | | |
| | | Shares | | | Value | |
| | |
Wuxi Lead Intelligent Equipment Co., Ltd., Class A (China) | | | 689,998 | | | | $8,047,901 | |
| |
Total Information Technology | | | | 56,210,304 | |
| |
Materials - 4.6% | | | | | |
| | |
LG Chem, Ltd. (South Korea) | | | 13,040 | | | | 6,741,186 | |
| | |
Yunnan Energy New Material Co., Ltd., Class A (China) | | | 48,000 | | | | 1,883,698 | |
| |
Total Materials | | | | 8,624,884 | |
| |
Real Estate - 4.3% | | | | | |
| | |
Country Garden Services Holdings Co., Ltd. (China) | | | 399,958 | | | | 2,401,314 | |
| | |
Goodman Group, REIT (Australia) | | | 300,346 | | | | 5,789,717 | |
| |
Total Real Estate | | | | 8,191,031 | |
| | |
Total Common Stocks | | | | | | | | |
(Cost $145,024,046) | | | | | | | 139,455,172 | |
| | |
Participation Notes - 25.3% | | | | | | | | |
| |
Consumer Discretionary - 3.8% | | | | | |
| | |
Titan Co., Ltd. (CLSA Ltd.), 01/09/23 (India) | | | 100,000 | | | | 3,382,897 | |
| | |
Zomato, Ltd. (CLSA Ltd.), 07/22/26 (India) | | | 2,000,000 | | | | 3,696,746 | |
| |
Total Consumer Discretionary | | | | 7,079,643 | |
| |
Consumer Staples - 5.0% | | | | | |
| | |
Hindustan Unilever, Ltd. (CLSA Ltd.), 06/30/25 (India) | | | 194,500 | | | | 6,156,998 | |
| | |
Nestle India, Ltd. (CLSA Ltd.), 02/19/25 (India) | | | 12,300 | | | | 3,255,452 | |
| |
Total Consumer Staples | | | | 9,412,450 | |
| |
Energy - 3.2% | | | | | |
| | |
Reliance Industries Ltd. (CLSA Ltd.), 06/30/25 (India) | | | 84,000 | | | | 2,668,394 | |
| | |
Sungrow Power Supply Co., Ltd. (UBS Securities LLC), 04/21/22 (China) | | | 146,494 | | | | 3,352,532 | |
| |
Total Energy | | | | 6,020,926 | |
| |
Financials - 2.4% | | | | | |
| | |
Kotak Mahindra Bank, Ltd. (CLSA Ltd.), 06/02/25 (India) | | | 187,500 | | | | 4,513,281 | |
| |
Health Care - 5.4% | | | | | |
| | |
Apollo Hospitals Enterprise, Ltd. (CLSA Ltd.), 05/23/22 (India) | | | 118,000 | | | | 7,942,854 | |
| | |
Max Healthcare Institute, Ltd. (CLSA Ltd.), 04/06/26 (India) | | | 378,000 | | | | 2,246,823 | |
| |
Total Health Care | | | | 10,189,677 | |
| |
Information Technology - 3.6% | | | | | |
| | |
Info Edge India, Ltd. (CLSA Ltd.), 12/31/24 (India) | | | 10,000 | | | | 748,406 | |
| | |
Tata Consultancy Services, Ltd. (CLSA Ltd.), 02/25/25 (India) | | | 120,731 | | | | 6,055,329 | |
| |
Total Information Technology | | | | 6,803,735 | |
The accompanying notes are an integral part of these financial statements.
9
| | |
| | AMG Veritas Asia Pacific Fund Schedule of Portfolio Investments (continued) |
| | | | | | | | |
| | | Shares | | | Value | |
| |
Materials - 1.9% | | | | | |
| | |
Asian Paints, Ltd. (CLSA Ltd.), 06/30/25 (India) | | | 78,500 | | | | $3,567,020 | |
| | |
Total Participation Notes | | | | | | | | |
(Cost $39,656,555) | | | | | | | 47,586,732 | |
| | |
Short-Term Investments - 0.7% | | | | | | | | |
|
Other Investment Companies - 0.7% | |
| | |
Dreyfus Government Cash Management Fund, Institutional Shares, 0.03%4 | | | 454,273 | | | | 454,273 | |
| | |
Dreyfus Institutional Preferred Government Money Market Fund, Institutional Shares, 0.01%4 | | | 454,273 | | | | 454,273 | |
| | | | | | | | |
| | | Shares | | | Value | |
| | |
JPMorgan U.S. Government Money Market Fund, IM Shares, 0.03%4 | | | 468,038 | | | | $468,038 | |
| | |
Total Short-Term Investments | | | | | | | | |
(Cost $1,376,584) | | | | | | | 1,376,584 | |
| | |
Total Investments - 100.1% | | | | | | | | |
(Cost $186,057,185) | | | | | | | 188,418,488 | |
| | |
Other Assets, less Liabilities - (0.1)% | | | | | | | (184,572 | ) |
| | |
Net Assets - 100.0% | | | | | | $ | 188,233,916 | |
| * | Non-income producing security. |
| 2 | Security’s value was determined by using significant unobservable inputs. |
| 3 | Security exempt from registration under Rule 144A of the Securities Act of 1933. This security may be resold in transactions exempt from registration, normally to qualified institutional buyers. At December 31, 2021, the value of these securities amounted to $344,656 or 0.2% of net assets. |
| 4 | Yield shown represents the December 31, 2021, seven day average yield, which refers to the sum of the previous seven days’ dividends paid, expressed as an annual percentage. |
ADR American Depositary Receipt
REIT Real Estate Investment Trust
The accompanying notes are an integral part of these financial statements.
10
| | |
| | AMG Veritas Asia Pacific Fund Schedule of Portfolio Investments (continued) |
The following table summarizes the inputs used to value the Fund’s investments by the fair value hierarchy levels as of December 31, 2021:
| | | | | | | | | | | | | | | | |
| | | Level 1 | | | Level 21 | | | Level 3 | | | Total | |
Investments in Securities | | | | | | | | | | | | | | | | |
| | | | |
Common Stocks | | | | | | | | | | | | | | | | |
| | | | |
Information Technology | | | $1,023,146 | | | | $55,187,158 | | | | – | | | $ | 56,210,304 | |
| | | | |
Industrials | | | – | | | | 20,664,569 | | | | – | | | | 20,664,569 | |
| | | | |
Communication Services | | | 7,412,854 | | | | 6,515,437 | | | | – | | | | 13,928,291 | |
| | | | |
Health Care | | | – | | | | 10,242,096 | | | | $0 | | | | 10,242,096 | |
| | | | |
Materials | | | – | | | | 8,624,884 | | | | – | | | | 8,624,884 | |
| | | | |
Financials | | | 8,251,917 | | | | – | | | | – | | | | 8,251,917 | |
| | | | |
Real Estate | | | – | | | | 8,191,031 | | | | – | | | | 8,191,031 | |
| | | | |
Consumer Staples | | | – | | | | 7,102,014 | | | | – | | | | 7,102,014 | |
| | | | |
Consumer Discretionary | | | 1,762,800 | | | | 4,477,266 | | | | – | | | | 6,240,066 | |
| | | | |
Participation Notes | | | | | | | | | | | | | | | | |
| | | | |
Health Care | | | – | | | | 10,189,677 | | | | – | | | | 10,189,677 | |
| | | | |
Consumer Staples | | | – | | | | 9,412,450 | | | | – | | | | 9,412,450 | |
| | | | |
Consumer Discretionary | | | – | | | | 7,079,643 | | | | – | | | | 7,079,643 | |
| | | | |
Information Technology | | | – | | | | 6,803,735 | | | | – | | | | 6,803,735 | |
| | | | |
Energy | | | – | | | | 6,020,926 | | | | – | | | | 6,020,926 | |
| | | | |
Financials | | | – | | | | 4,513,281 | | | | – | | | | 4,513,281 | |
| | | | |
Materials | | | – | | | | 3,567,020 | | | | – | | | | 3,567,020 | |
| | | | |
Short-Term Investments | | | | | | | | | | | | | | | | |
| | | | |
Other Investment Companies | | | 1,376,584 | | | | – | | | | – | | | | 1,376,584 | |
| | | | | | | | | | | | | | | | |
| | | | |
Total Investments in Securities | | $ | 19,827,301 | | | | $168,591,187 | | | | $0 | | | $ | 188,418,488 | |
| | | | | | | | | | | | | | | | |
| 1 | An external pricing service is used to reflect any impact on security value due to market movements between the time the Fund valued such foreign securities and the earlier closing of foreign markets. |
For the fiscal year ended December 31, 2021 there were no transfers in or out of Level 3.
| | | | |
| | | Common
Stock |
| |
Balance as of December 31, 2020 | | | $68,811 | |
| |
Accrued discounts (premiums) | | | – | |
| |
Realized gain (loss) | | | (107,072 | ) |
| |
Change in unrealized appreciation/depreciation | | | 119,593 | |
| |
Purchases | | | – | |
| |
Sales | | | (81,332 | ) |
| |
Transfers in to Level 3 | �� | | – | |
| |
Transfers out of Level 3 | | | | |
| |
Balance as of December 31, 2021 | | | $0 | |
| |
| | | | |
| |
Net change in unrealized appreciation/depreciation on investments still held at December 31, 2021 | | | $0 | |
The accompanying notes are an integral part of these financial statements.
11
| | |
| | AMG Veritas Asia Pacific Fund Schedule of Portfolio Investments (continued) |
The country allocation in the Schedule of Portfolio Investments at December 31, 2021, was as follows:
| | |
| Country | | % of Long-Term
Investments |
| |
Australia | | 9.4 |
| |
China | | 32.3 |
| |
India | | 28.0 |
| |
Singapore | | 4.0 |
| |
South Korea | | 17.4 |
| |
Taiwan | | 8.9 |
| |
United States | | 0.0 |
| | |
| |
| | 100.0 |
| | |
The accompanying notes are an integral part of these financial statements.
12
| | |
| | Statement of Assets and Liabilities December 31, 2021 |
| | | | |
| | | AMG Veritas
Asia
Pacific Fund |
| |
Assets: | | | | |
| |
Investments at value1 | | | $188,418,488 | |
| |
Dividend and interest receivables | | | 246,667 | |
| |
Receivable for Fund shares sold | | | 56,762 | |
| |
Receivable from affiliate | | | 20,448 | |
| |
Prepaid expenses and other assets | | | 11,208 | |
| |
Total assets | | | 188,753,573 | |
| |
Liabilities: | | | | |
| |
Payable for Fund shares repurchased | | | 220,756 | |
| |
Accrued expenses: | | | | |
| |
Investment advisory and management fees | | | 115,276 | |
| |
Administrative fees | | | 24,354 | |
| |
Shareholder service fees | | | 35,879 | |
| |
Other | | | 123,392 | |
| |
Total liabilities | | | 519,657 | |
| |
| | | | |
| |
Net Assets | | | $188,233,916 | |
| |
1 Investments at cost | | | $186,057,185 | |
The accompanying notes are an integral part of these financial statements.
13
| | |
| | Statement of Assets and Liabilities (continued) |
| | | | |
| | | AMG Veritas
Asia
Pacific Fund | |
| |
Net Assets Represent: | | | | |
Paid-in capital | | | $186,175,597 | |
| |
Total distributable earnings | | | 2,058,319 | |
| |
Net Assets | | | $188,233,916 | |
| |
Class N: | | | | |
| |
Net Assets | | | $166,168,062 | |
| |
Shares outstanding | | | 2,016,038 | |
| |
Net asset value, offering and redemption price per share | | | $82.42 | |
| |
Class I: | | | | |
| |
Net Assets | | | $22,065,854 | |
| |
Shares outstanding | | | 244,766 | |
| |
Net asset value, offering and redemption price per share | | | $90.15 | |
The accompanying notes are an integral part of these financial statements.
14
| | |
| | Statement of Operations For the fiscal year ended December 31, 2021 |
| | | | |
| | | AMG Veritas | |
| | | Asia | |
| | | Pacific Fund | |
| |
Investment Income: | | | | |
| |
Dividend income | | | $1,516,303 | |
| |
Interest income | | | 387 | |
| |
Securities lending income | | | 44,863 | |
| |
Foreign withholding tax | | | (218,287 | ) |
| |
Total investment income | | | 1,343,266 | |
| |
Expenses: | | | | |
| |
Investment advisory and management fees | | | 1,857,412 | |
| |
Administrative fees | | | 345,461 | |
| |
Shareholder servicing fees - Class N | | | 487,717 | |
| |
Custodian fees | | | 81,591 | |
| |
Professional fees | | | 47,757 | |
| |
Reports to shareholders | | | 35,456 | |
| |
Registration fees | | | 32,331 | |
| |
Transfer agent fees | | | 23,182 | |
| |
Trustee fees and expenses | | | 15,914 | |
| |
Interest expense | | | 207 | |
| |
Miscellaneous | | | 8,894 | |
| |
Total expenses before offsets | | | 2,935,922 | |
| |
Expense reimbursements | | | (95,606 | ) |
| |
Expense reductions | | | (695 | ) |
| |
Net expenses | | | 2,839,621 | |
| |
| | | | |
| |
Net investment loss | | | (1,496,355 | ) |
| |
Net Realized and Unrealized Gain: | | | | |
| |
Net realized gain on investments | | | 90,927,326 | |
| |
Net realized loss on foreign currency transactions | | | (123,767 | ) |
| |
Net change in unrealized appreciation/depreciation on investments | | | (79,240,814 | ) |
| |
Net change in unrealized appreciation/depreciation on foreign currency translations | | | 103 | |
| |
Net realized and unrealized gain | | | 11,562,848 | |
| |
| | | | |
| |
Net increase in net assets resulting from operations | | | $10,066,493 | |
The accompanying notes are an integral part of these financial statements.
15
| | |
| | Statements of Changes in Net Assets For the fiscal years ended December 31, |
| | | | | | | | |
| | | AMG Veritas
Asia Pacific Fund | |
| | |
| | | 2021 | | | 2020 | |
| | |
Increase in Net Assets Resulting From Operations: | | | | | | | | |
| | |
Net investment loss | | | $(1,496,355 | ) | | | $(1,688,073 | ) |
| | |
Net realized gain on investments | | | 90,803,559 | | | | 17,151,747 | |
| | |
Net change in unrealized appreciation/depreciation on investments | | | (79,240,711 | ) | | | 54,091,097 | |
| | |
Net increase in net assets resulting from operations | | | 10,066,493 | | | | 69,554,771 | |
| | |
Distributions to Shareholders: | | | | | | | | |
| | |
From net investment income and/or realized gain on investments: | | | | | | | | |
| | |
Class N | | | (78,253,343 | ) | | | (8,646,696 | ) |
| | |
Class I | | | (14,229,481 | ) | | | (1,785,052 | ) |
| | |
From paid-in capital: | | | | | | | | |
| | |
Class N | | | (16,749,799 | ) | | | — | |
| | |
Class I | | | (3,045,760 | ) | | | — | |
| | |
Total distributions to shareholders | | | (112,278,383 | ) | | | (10,431,748 | ) |
| | |
Capital Share Transactions:1 | | | | | | | | |
| | |
Net increase (decrease) from capital share transactions | | | 41,059,273 | | | | (19,630,632 | ) |
| | | | | | | | |
| | |
Total increase (decrease) in net assets | | | (61,152,617 | ) | | | 39,492,391 | |
| | |
Net Assets: | | | | | | | | |
| | |
Beginning of year | | | 249,386,533 | | | | 209,894,142 | |
| | |
End of year | | | $188,233,916 | | | | $249,386,533 | |
| | | | | | | |
1 See Note 1(g) of the Notes to Financial Statements.
The accompanying notes are an integral part of these financial statements.
16
| | |
| | | AMG Veritas Asia Pacific Fund |
| | | Financial Highlights |
| | | For a share outstanding throughout each fiscal year |
| | | | | | | | | | | | | | | | | | | | |
| | | For the fiscal years ended December 31, | |
| | | | | |
| Class N | | 2021 | | | 2020 | | | 2019 | | | 2018 | | | 20171 | |
| | | | | |
Net Asset Value, Beginning of Year | | | $147.58 | | | | $111.15 | | | | $114.95 | | | | $119.45 | | | | $99.33 | |
| | | | | |
Income (loss) from Investment Operations: | | | | | | | | | | | | | | | | | | | | |
| | | | | |
Net investment loss2,3 | | | (0.67 | ) | | | (1.03 | ) | | | (1.03 | ) | | | (0.91 | ) | | | (0.79 | )4 |
| | | | | |
Net realized and unrealized gain (loss) on investments | | | 4.55 | | | | 43.88 | | | | 30.19 | | | | (3.59 | ) | | | 20.91 | |
| | | | | |
Total income (loss) from investment operations | | | 3.88 | | | | 42.85 | | | | 29.16 | | | | (4.50 | ) | | | 20.12 | |
| | | | | |
Less Distributions to Shareholders from: | | | | | | | | | | | | | | | | | | | | |
| | | | | |
Net realized gain on investments | | | (56.87 | ) | | | (6.42 | ) | | | (32.96 | ) | | | — | | | | — | |
| | | | | |
Paid in capital | | | (12.17 | ) | | | — | | | | — | | | | — | | | | — | |
| | | | | |
Total distributions to shareholders | | | (69.04 | ) | | | (6.42 | ) | | | (32.96 | ) | | | — | | | | — | |
| | | | | |
Net Asset Value, End of Year | | | $82.42 | | | | $147.58 | | | | $111.15 | | | | $114.95 | | | | $119.45 | |
| | | | | |
Total Return3,5 | | | 3.16 | % | | | 38.74 | % | | | 25.69 | % | | | (3.76 | )% | | | 20.25 | % |
| | | | | |
Ratio of net expenses to average net assets6 | | | 1.27 | % | | | 1.36 | % | | | 1.36 | % | | | 1.36 | % | | | 1.36 | % |
| | | | | |
Ratio of gross expenses to average net assets7 | | | 1.31 | % | | | 1.42 | % | | | 1.42 | % | | | 1.38 | % | | | 1.41 | % |
| | | | | |
Ratio of net investment loss to average net assets3 | | | (0.69 | )% | | | (0.89 | )% | | | (0.76 | )% | | | (0.69 | )% | | | (0.73 | )% |
| | | | | |
Portfolio turnover | | | 222 | % | | | 100 | % | | | 96 | % | | | 113 | % | | | 81 | % |
| | | | | |
Net assets end of year (000’s) omitted | | | $166,168 | | | | $204,794 | | | | $171,801 | | | | $170,744 | | | | $173,607 | |
| | | | | | | | | | | | | | | | | | | | | |
17
| | |
| | | AMG Veritas Asia Pacific Fund |
| | | Financial Highlights |
| | | For a share outstanding throughout each fiscal year |
| | | | | | | | | | | | | | | | | | | | |
| | | For the fiscal years ended December 31, | |
| | | | | |
| Class I | | 2021 | | | 2020 | | | 2019 | | | 2018 | | | 2017 | |
| | | | | |
Net Asset Value, Beginning of Year | | | $154.81 | | | | $116.08 | | | | $118.57 | | | | $122.90 | | | | $101.95 | |
| | | | | |
Income (loss) from Investment Operations: | | | | | | | | | | | | | | | | | | | | |
| | | | | |
Net investment loss2,3 | | | (0.48 | ) | | | (0.77 | ) | | | (0.72 | ) | | | (0.60 | ) | | | (0.54 | )4 |
| | | | | |
Net realized and unrealized gain (loss) on investments | | | 4.86 | | | | 45.92 | | | | 31.19 | | | | (3.73 | ) | | | 21.49 | |
| | | | | |
Total income (loss) from investment operations | | | 4.38 | | | | 45.15 | | | | 30.47 | | | | (4.33 | ) | | | 20.95 | |
| | | | | |
Less Distributions to Shareholders from: | | | | | | | | | | | | | | | | | | | | |
| | | | | |
Net realized gain on investments | | | (56.87 | ) | | | (6.42 | ) | | | (32.96 | ) | | | — | | | | — | |
| | | | | |
Paid in capital | | | (12.17 | ) | | | — | | | | — | | | | — | | | | — | |
| | | | | |
Total distributions to shareholders | | | (69.04 | ) | | | (6.42 | ) | | | (32.96 | ) | | | — | | | | — | |
| | | | | |
Net Asset Value, End of Year | | | $90.15 | | | | $154.81 | | | | $116.08 | | | | $118.57 | | | | $122.90 | |
| | | | | |
Total Return3,5 | | | 3.43 | % | | | 39.08 | % | | | 26.02 | % | | | (3.52 | )% | | | 20.55 | % |
| | | | | |
Ratio of net expenses to average net assets6 | | | 1.02 | % | | | 1.11 | % | | | 1.11 | % | | | 1.11 | % | | | 1.11 | % |
| | | | | |
Ratio of gross expenses to average net assets7 | | | 1.06 | % | | | 1.17 | % | | | 1.17 | % | | | 1.13 | % | | | 1.16 | % |
| | | | | |
Ratio of net investment loss to average net assets3 | | | (0.44 | )% | | | (0.64 | )% | | | (0.51 | )% | | | (0.44 | )% | | | (0.48 | )% |
| | | | | |
Portfolio turnover | | | 222 | % | | | 100 | % | | | 96 | % | | | 113 | % | | | 81 | % |
| | | | | |
Net assets end of year (000’s) omitted | | | $22,066 | | | | $44,593 | | | | $38,093 | | | | $31,253 | | | | $26,865 | |
| | | | | | | | | | | | | | | | | | | | | |
| 1 | Effective February 27, 2017, Class S shares were renamed Class N shares. |
| 2 | Per share numbers have been calculated using average shares. |
| 3 | Total returns and net investment loss would have been lower had certain expenses not been offset. |
| 4 | Includes non-recurring dividends. Without these dividends, net investment loss per share would have been $(0.84) and $(0.59) for Class N and Class I, respectively. |
| 5 | The total return is calculated using the published Net Asset Value as of fiscal year end. |
| 6 | Includes reduction from broker recapture amounting to less than 0.01% for the fiscal years ended 2021, 2020, 2019, 2018 and 2017, respectively. |
| 7 | Excludes the impact of expense reimbursement or fee waivers and expense reductions such as brokerage credits, but includes expense repayments and non-reimbursable expenses, if any, such as interest, taxes, and extraordinary expenses. (See Note 1(c) and 2 in the Notes to Financial Statements.) |
18
| | |
| | Notes to Financial Statements December 31, 2021 |
1. ORGANIZATION AND SUMMARY OF SIGNIFICANT ACCOUNTING POLICIES
AMG Funds III (the “Trust”) is an open-end management investment company, organized as a Massachusetts business trust, and registered under the Investment Company Act of 1940, as amended (the “1940 Act”). Currently, the Trust consists of a number of different funds, each having distinct investment management objectives, strategies, risks, and policies. Included in this report is AMG Veritas Asia Pacific Fund (formerly AMG Managers Special Equity Fund) (the “Fund”).
The Fund offers Class N and Class I shares. Each class represents an interest in the same assets of the Fund. Although all share classes generally have identical voting rights, each share class votes separately when required by law. Different share classes may have different net asset values per share to the extent the share classes pay different distribution amounts and/or the expenses of such share classes differ. Each share class has its own expense structure. Please refer to a current prospectus for additional information on each share class.
On March 17-18, 2021, the Board of Trustees of AMG Funds III, (the “Board”) approved Veritas Asset Management LLP (“Veritas”) as the subadviser to the Fund to replace Federated MDTA LLC (“Federated Hermes”), Lord, Abbett & Co. LLC (“Lord Abbett”), Ranger Investment Management L.P. (“Ranger Investment Management”) and Smith Asset Management Group, L.P. (“Smith Asset Management”) effective March 19, 2021, which was subsequently approved by the shareholders of the Fund on June 18, 2021. In conjunction with the subadviser change, the Fund seeks to achieve its investment objective by investing in equity securities listed or traded on exchanges in the Asia Pacific region (excluding Japan). In conjunction with the respective changes in investment strategy, the Fund sold substantially all open positions around the date of the subadviser change that increased the Fund’s portfolio turnover. The Fund also declared a special capital gain distribution on March 24, 2021. In addition, the Board also approved expense changes (See Note 2).
Effective June 18, 2021, the Fund became a non-diversified fund. A greater percentage of the Fund’s holdings may be focused in a smaller number of securities which may place the Fund at greater risk than a more diversified fund.
Market disruptions associated with the COVID-19 pandemic have had a global impact, and uncertainty exists as to the long-term implications. Such disruptions can adversely affect assets of the Fund and thus Fund performance.
The Fund’s financial statements are prepared in accordance with accounting principles generally accepted in the United States of America (“U.S. GAAP”), including accounting and reporting guidance pursuant to Accounting Standards Codification Topic 946 applicable to investment companies. U.S. GAAP requires management to make estimates and assumptions that affect the reported amounts of assets and liabilities and disclosure of contingent assets and liabilities at the date of the financial statements and the reported amounts of income and expenses during the reporting period. Actual results could differ from those estimates and such differences could be material. The following is a summary of significant accounting policies followed by the Fund in the preparation of its financial statements:
a. VALUATION OF INVESTMENTS
Equity securities traded on a national securities exchange or reported on the NASDAQ national market system (“NMS”) are valued at the last quoted sales price on the primary exchange or, if applicable, the NASDAQ official closing price or the official closing price of the relevant exchange or, lacking any sales, at the last
quoted bid price. Equity securities traded in the over-the-counter market (other than NMS securities) are valued at the bid price. Foreign equity securities (securities principally traded in markets other than U.S. markets) are valued at the official closing price on the primary exchange or, for markets that either do not offer an official closing price or where the official closing price may not be representative of the overall market, the last quoted sale price.
Fixed income securities purchased with a remaining maturity of 60 days or less are valued at amortized cost, provided that the amortized cost value is approximately the same as the fair value of the security valued without the use of amortized cost. Investments in other open-end registered investment companies are valued at their end of day net asset value per share.
Participation notes (“P-Notes”) are valued using the underlying equity security’s official closing price on the primary exchange or, for markets that either do not offer an official closing price or where the official closing price may not be representative of the overall market, the last quoted sale price.
The Fund’s portfolio investments are generally valued based on independent market quotations or prices or, if none, “evaluative” or other market based valuations provided by third party pricing services approved by the Board. Under certain circumstances, the value of certain Fund portfolio investments may be based on an evaluation of fair value, pursuant to procedures established by and under the general supervision of the Board. The Valuation Committee, which is comprised of the Independent Trustees of the Board, and the Pricing Committee, which is comprised of representatives from AMG Funds LLC (the “Investment Manager”) are the committees appointed by the Board to make fair value determinations. The Fund may use the fair value of a portfolio investment to calculate its net asset value (“NAV”) in the event that the market quotation, price or market based valuation for the portfolio investment is not readily available or otherwise not determinable pursuant to the Board’s valuation procedures, if the Investment Manager or the Pricing Committee believes the quotation, price or market based valuation to be unreliable, or in certain other circumstances. When determining the fair value of an investment, the Pricing Committee and, if required under the Trust’s securities valuation procedures, the Valuation Committee, seeks to determine the price that the Fund might reasonably expect to receive from current sale of that portfolio investment in an arms-length transaction. Fair value determinations shall be based upon consideration of all available facts and information, including, but not limited to (i) attributes specific to the investment; (ii) fundamental and analytical data relating to the investment; and (iii) the value of other comparable securities or relevant financial instruments, including derivative securities, traded on other markets or among dealers.
The values assigned to fair value portfolio investments are based on available information and do not necessarily represent amounts that might ultimately be realized in the future, since such amounts depend on future developments inherent in long-term investments. Because of the inherent uncertainty of valuation, those estimated values may differ significantly from the values that would have been used had a ready market for the investments existed, and the differences could be material. The Board will be presented with a quarterly report showing as of the most recent quarter end, all outstanding securities fair valued by the Fund, including a comparison with the prior quarter end and the percentage of the Fund that the security represents at each quarter end.
With respect to foreign equity securities and certain foreign fixed income securities, the Board has adopted a policy that securities held in the Fund that can be fair valued by the applicable fair value pricing service are fair valued on each
19
| | |
| | Notes to Financial Statements (continued) |
business day provided that each individual price exceeds a pre-established confidence level.
U.S. GAAP defines fair value as the price that a fund would receive to sell an asset or pay to transfer a liability in an orderly transaction between market participants at the measurement date. U.S. GAAP also establishes a framework for measuring fair value, and a three level hierarchy for fair value measurements based upon the transparency of inputs to the valuation of an asset or liability. Inputs may be observable or unobservable and refer broadly to the assumptions that market participants would use in pricing the asset or liability. Observable inputs reflect the assumptions market participants would use in pricing the asset or liability based on market data obtained from sources independent of the Fund.
Unobservable inputs reflect the Fund’s own assumptions about the assumptions that market participants would use in pricing the asset or liability developed based on the best information available in the circumstances. Each investment is assigned a level based upon the observability of the inputs which are significant to the overall valuation.
The three-tier hierarchy of inputs is summarized below:
Level 1 – inputs are quoted prices in active markets for identical investments (e.g., equity securities, open-end investment companies)
Level 2 – other observable inputs (including, but not limited to: quoted prices for similar assets or liabilities in markets that are active, quoted prices for identical or similar assets or liabilities in markets that are not active, inputs other than quoted prices that are observable for the assets or liabilities (such as interest rates, yield curves, volatilities, prepayment speeds, loss severities, credit risks and default rates) or other market corroborated inputs) (e.g., debt securities, government securities, foreign currency exchange contracts, swaps, P-Notes, foreign securities utilizing international fair value pricing, fair valued securities with observable inputs)
Level 3 – inputs are significant unobservable inputs (including the Fund’s own assumptions used to determine the fair value of investments) (e.g., fair valued securities with unobservable inputs)
Changes in inputs or methodologies used for valuing investments may result in a transfer in or out of levels within the fair value hierarchy. The inputs or methodologies used for valuing investments may not necessarily be an indication of the risk associated with investing in those investments.
b. SECURITY TRANSACTIONS
Security transactions are accounted for as of trade date. Realized gains and losses on securities sold are determined on the basis of identified cost.
c. INVESTMENT INCOME AND EXPENSES
Dividend income is recorded on the ex-dividend date. Dividends from foreign securities are recorded on the ex-dividend date, and if after the fact, as soon as the Fund becomes aware of the ex-dividend date, except for Korean securities where dividends are recorded on confirmation date. Interest income, which includes amortization of premium and accretion of discount on debt securities, is accrued as earned. Dividend and interest income on foreign securities is recorded gross of any withholding tax. Non-cash dividends included in dividend income, if any, are reported at the fair market value of the securities received. Other income and expenses are recorded on an accrual basis. Expenses that cannot be directly attributed to a Fund are apportioned among the funds in the Trust and other trusts
or funds within the AMG Funds Family of Funds (collectively the “AMG Funds Family”) based upon their relative average net assets or number of shareholders. Investment income, realized and unrealized capital gains and losses, the common expenses of the Fund, and certain fund level expense reductions, if any, are allocated on a pro-rata basis to each class based on the relative net assets of each class to the total net assets of the Fund.
The Fund had certain portfolio trades directed to various brokers under a brokerage recapture program. Credits received from the brokerage recapture program are earned and paid on a monthly basis, and are recorded as expense offsets, which serve to reduce the Fund’s overall expense ratio. For the fiscal year ended December 31, 2021, the impact on the expenses and expense ratios was $695 or less than 0.01%.
d. DIVIDENDS AND DISTRIBUTIONS
Fund distributions resulting from either net investment income or realized net capital gains, if any, will normally be declared and paid at least annually in December. Distributions to shareholders are recorded on the ex-dividend date. Distributions are determined in accordance with federal income tax regulations, which may differ from net investment income and net realized capital gains for financial statement purposes (U.S. GAAP). Differences may be permanent or temporary. Permanent differences are reclassified among capital accounts in the financial statements to reflect their tax character. Permanent book and tax basis differences, if any, relating to shareholder distributions will result in reclassifications to paid-in capital. Temporary differences arise when certain items of income, expense and gain or loss are recognized in different periods for financial statement and tax purposes; these differences will reverse at some time in the future. There were no permanent differences during the year. Temporary differences are due to wash sale loss deferrals and the deferral of qualified late year losses.
The tax character of distributions paid during the fiscal years ended December 31, 2021 and December 31, 2020 were as follows:
| | | | | | | | |
| | |
| Distributions paid from: | | 2021 | | | 2020 | |
Ordinary income * | | | $37,755,763 | | | | — | |
Long-term capital gains | | | 54,727,061 | | | | $10,431,748 | |
Paid-in capital | | | 19,795,559 | | | | — | |
| | | | | | | | |
| | | $112,278,383 | | | | $10,431,748 | |
| | | | | | | | |
| * | For tax purposes, short-term capital gain distributions, if any, are considered ordinary income distributions. |
As of December 31, 2021, the components of distributable earnings (excluding unrealized appreciation/depreciation) on a tax basis consisted of:
| | |
| |
Late-year loss deferral | | $109,128 |
At December 31, 2021, the cost of investments and the aggregate gross unrealized appreciation and depreciation for federal income tax purposes were as follows:
| | | | | | | | | | | | |
| Cost | | Appreciation | | | Depreciation | | | Net Appreciation | |
| $186,251,144 | | | $18,567,993 | | | | $(16,400,546) | | | | $2,167,447 | |
20
| | |
| | Notes to Financial Statements (continued) |
e. FEDERAL TAXES
The Fund currently qualifies as an investment company and intends to comply with the requirements under Subchapter M of the Internal Revenue Code of 1986, as amended, and to distribute substantially all of its taxable income and gains to its shareholders and to meet certain diversification and income requirements with respect to investment companies. Therefore, no provision for federal income or excise tax is included in the accompanying financial statements.
Additionally, based on the Fund’s understanding of the tax rules and rates related to income, gains and transactions for the foreign jurisdictions in which it invests, the Fund will provide for foreign taxes, and where appropriate, deferred foreign taxes.
Management has analyzed the Fund’s tax positions taken on federal income tax returns as of December 31, 2021, and for all open tax years (generally, the three
prior taxable years), and has concluded that no provision for federal income tax is required in the Fund’s financial statements. Additionally, Management is not aware of any tax position for which it is reasonably possible that the total amounts of unrecognized tax benefits will change materially in the next twelve months.
f. CAPITAL LOSS CARRYOVERS AND DEFERRALS
As of December 31, 2021, the Fund had no capital loss carryovers for federal income tax purposes. Should the Fund incur net capital losses for the fiscal year ended December 31, 2022, such amounts may be used to offset future realized capital gains indefinitely, and retain their character as short-term and/or long-term.
g. CAPITAL STOCK
The Trust’s Declaration of Trust authorizes for the Fund the issuance of an unlimited number of shares of beneficial interest, without par value. The Fund records sales and repurchases of its capital stock on the trade date.
For the fiscal years ended December 31, 2021 and December 31, 2020, the capital stock transactions by class for the Fund were as follows:
| | | | | | | | | | | | | | | | |
| | | December 31, 2021 | | | December 31, 2020 | |
| | | Shares | | | Amount | | | Shares | | | Amount | |
| | | | |
Class N: | | | | | | | | | | | | | | | | |
| | | | |
Proceeds from sale of shares | | | 55,947 | | | | $5,742,835 | | | | 32,466 | | | | $3,813,396 | |
| | | | |
Reinvestment of distributions | | | 1,128,609 | | | | 91,981,675 | | | | 58,454 | | | | 8,351,282 | |
| | | | |
Cost of shares repurchased | | | (556,214) | | | | (49,186,622) | | | | (248,844) | | | | (27,811,616) | |
| | | | | | | | | | | | | | | | |
| | | | |
Net increase (decrease) | | | 628,342 | | | | $48,537,888 | | | | (157,924) | | | | $(15,646,938) | |
| | | | | | | | | | | | | | | | |
| | | | |
Class I: | | | | | | | | | | | | | | | | |
| | | | |
Proceeds from sale of shares | | | 63,510 | | | | $7,190,492 | | | | 53,503 | | | | $6,681,747 | |
| | | | |
Reinvestment of distributions | | | 192,066 | | | | 17,088,128 | | | | 11,788 | | | | 1,766,664 | |
| | | | |
Cost of shares repurchased | | | (298,858) | | | | (31,757,235) | | | | (105,414) | | | | (12,432,105) | |
| | | | | | | | | | | | | | | | |
| | | | |
Net decrease | | | (43,282) | | | | $(7,478,615) | | | | (40,123) | | | | $(3,983,694) | |
| | | | | | | | | | | | | | | | |
h. REPURCHASE AGREEMENTS AND JOINT REPURCHASE AGREEMENTS
The Fund may enter into third-party repurchase agreements for temporary cash management purposes and third-party or bilateral joint repurchase agreements for reinvestment of cash collateral on securities lending transactions under the securities lending program offered by The Bank of New York Mellon (“BNYM”) (the “Program”) (collectively, “Repurchase Agreements”). The value of the underlying collateral, including accrued interest, must equal or exceed the value of the Repurchase Agreements during the term of the agreement. For joint repurchase agreements, the Fund participates on a pro rata basis with other clients of BNYM in its share of the underlying collateral under such joint repurchase agreements and in its share of proceeds from any repurchase or other disposition of the underlying collateral. The underlying collateral for all Repurchase Agreements is held in safekeeping by the Fund’s custodian or at the Federal Reserve Bank. If the seller defaults and the value of the collateral declines, or if bankruptcy
proceedings commence with respect to the seller of the security, realization of the collateral by the Fund may be delayed or limited. Pursuant to the Program, the Fund is indemnified for such losses by BNYM on joint repurchase agreements.
At December 31, 2021, there are no outstanding Repurchase Agreements for the Fund.
i. FOREIGN CURRENCY TRANSLATION
The books and records of the Fund are maintained in U.S. dollars. The value of investments, assets and liabilities denominated in currencies other than U.S. dollars are translated into U.S. dollars based upon current foreign exchange rates. Purchases and sales of foreign investments, income and expenses are converted into U.S. dollars based on currency exchange rates prevailing on the respective dates of such transactions. Net realized and unrealized gain (loss) on foreign currency transactions represent: (1) foreign exchange gains and losses from the
21
| | |
| | Notes to Financial Statements (continued) |
sale and holdings of foreign currencies; (2) gains and losses between trade date and settlement date on investment securities transactions and foreign currency exchange contracts; and (3) gains and losses from the difference between amounts of interest and dividends recorded and the amounts actually received.
The Fund does not isolate the net realized and unrealized gain or loss resulting from changes in exchange rates from the fluctuations in market prices of securities held. Such fluctuations are included with the net realized and unrealized gain or loss on investments.
2. AGREEMENTS AND TRANSACTIONS WITH AFFILIATES
The Trust has entered into an investment advisory agreement under which the Investment Manager, a subsidiary and the U.S. retail distribution arm of Affiliated Managers Group, Inc. (“AMG”), serves as investment manager to the Fund and is responsible for the Fund’s overall administration and operations. The Investment Manager selects one or more subadvisers for the Fund (subject to Board approval) and monitors each subadviser’s investment performance, security holdings and investment strategies. The Fund’s investment portfolio is managed by Veritas Asset Management LLP (“Veritas”) who serves pursuant to a subadvisory agreement with the Investment Manager. AMG indirectly owns a majority interest in Veritas. Prior to March 19, 2021, the Fund’s investment portfolio was managed by Federated Hermes, Lord Abbett, Ranger Investment Management and Smith Asset Management.
Investment management fees are paid directly by the Fund to the Investment Manager based on average daily net assets. For the fiscal year ended December 31, 2021, the Fund paid an investment management fee at the annual rate of 0.71% of the average daily net assets of the Fund. Prior to June 18, 2021, the Fund paid an investment management fee at the annual rate of 0.90% of the average daily net assets of the Fund.
The Investment Manager has contractually agreed, through at least May 1, 2023, to waive management fees and/or pay or reimburse fund expenses in order to limit total annual Fund operating expenses after fee waiver and expense reimbursements (exclusive of taxes, interest (including interest incurred in connection with bank and custody overdrafts, and in connection with securities sold short), shareholder servicing fees, distribution and service (12b-1) fees, brokerage commissions and other transaction costs, dividends payable with respect to securities sold short, acquired fund fees and expenses and extraordinary expenses) to the annual rate of 0.93% of the Fund’s average daily net assets (this annual rate or such other annual rate that may be in effect from time to time, the “Expense Cap”), subject to later reimbursement by the Fund in certain circumstances. Prior to June 18, 2021, the total annual Fund operating expense limitation was 1.11% of average daily net assets.
In general, for a period of up to 36 months after the date any amounts are paid, waived or reimbursed by the Investment Manager, the Investment Manager may recover such amounts from the Fund, provided that such repayment would not cause the Fund’s total annual operating expenses after fee waiver and expense reimbursements (exclusive of the items noted in the parenthetical above) to exceed either (i) the Expense Cap in effect at the time such amounts were paid, waived or reimbursed, or (ii) the Expense Cap in effect at the time of such repayment by the Fund.
The contractual expense limitation may only be terminated in the event the Investment Manager or a successor ceases to be the investment manager of the Fund or a successor fund, by mutual agreement between the Investment Manager
and the Board, or in the event of the Fund’s liquidation unless the Fund is reorganized or is a party to a merger in which the surviving entity is successor to the accounting and performance information of the Fund.
At December 31, 2021, the Fund’s expiration of reimbursements subject to recoupment is as follows:
| | | | |
Expiration Period | | | |
| |
Less than 1 year | | | $121,521 | |
| |
1-2 years | | | 120,416 | |
| |
2-3 years | | | 95,606 | |
| | | | |
| |
Total | | | $337,543 | |
| | | | |
The Trust, on behalf of the Fund, has entered into an amended and restated Administration Agreement under which the Investment Manager serves as the Fund’s administrator (the “Administrator”) and is responsible for all non-portfolio management aspects of managing the Fund’s operations, including administration and shareholder services to the Fund. The Fund pays a fee to the Administrator at the rate of 0.15% per annum of the Fund’s average daily net assets for this service.
The Fund is distributed by AMG Distributors, Inc. (the “Distributor”), a wholly-owned subsidiary of the Investment Manager. The Distributor serves as the distributor and underwriter for the Fund and is a registered broker-dealer and member of the Financial Industry Regulatory Authority, Inc. (“FINRA”). Shares of the Fund will be continuously offered and will be sold directly to prospective purchasers and through brokers, dealers or other financial intermediaries who have executed selling agreements with the Distributor. Generally the Distributor bears all or a portion of the expenses of providing services pursuant to the distribution agreement, including the payment of the expenses relating to the distribution of prospectuses for sales purposes and any advertising or sales literature.
For Class N shares, the Board has approved reimbursement payments to the Investment Manager for shareholder servicing expenses (“shareholder servicing fees”) incurred. Shareholder servicing fees include payments to financial intermediaries, such as broker-dealers (including fund supermarket platforms), banks, and trust companies who provide shareholder recordkeeping, account servicing and other services. The Class N shares may reimburse the Investment Manager for the actual amount incurred up to a maximum annual rate of the Class’s average daily net assets as shown in the table below.
The impact on the annualized expense ratios for the fiscal year ended December 31, 2021, were as follows:
| | | | | | | | |
| | | Maximum Annual | | | Actual | |
| | | Amount | | | Amount | |
| | | Approved | | | Incurred | |
| | |
Class N | | | 0.25% | | | | 0.25% | |
The Board provides supervision of the affairs of the Trust and other trusts within the AMG Funds Family. The Trustees of the Trust who are not affiliated with the Investment Manager receive an annual retainer and per meeting fees for regular, special and telephonic meetings, and they are reimbursed for out-of-pocket expenses incurred while carrying out their duties as Board members. The Chairman of the Board and the Audit Committee Chair receive additional annual retainers. Certain Trustees and Officers of the Fund are Officers and/or Directors of the Investment Manager, AMG and/or the Distributor.
22
| | |
| | Notes to Financial Statements (continued) |
The Securities and Exchange Commission (the “SEC”) granted an exemptive order that permits certain eligible funds in the AMG Funds Family to lend and borrow money for certain temporary purposes directly to and from other eligible funds in the AMG Funds Family. Participation in this interfund lending program is voluntary for both the borrowing and lending funds, and an interfund loan is only made if it benefits each participating fund. The Administrator manages the program according to procedures approved by the Board, and the Board monitors the operation of the program. An interfund loan must comply with certain conditions set out in the exemptive order, which are designed to assure fairness and protect all participating funds. The interest earned and interest paid on interfund loans are included on the Statement of Operations as interest income and interest expense, respectively. At December 31, 2021, the Fund had no interfund loans outstanding.
The Fund utilized the interfund loan program during the fiscal year ended December 31, 2021 as follows:
| | | | | | | | | | | | |
| Average | | | Number | | | Interest | | | Average |
| Lent | | | of Days | | | Earned | | | Interest Rate |
| | $1,875,729 | | | | 8 | | | | $387 | | | 0.941% |
| | | |
| Average | | | Number | | | Interest | | | Average |
| Borrowed | | | of Days | | | Paid | | | Interest Rate |
| | $1,187,913 | | | | 7 | | | | $207 | | | 0.909% |
For the fiscal year ended December 31, 2021, the Fund executed security transactions with other funds affiliated with Lord Abbett. Each of the transactions were executed at the closing price of the security transacted and with no commissions under Rule 17a-7 procedures approved by the Board. The amounts purchased and sold during the fiscal year ended December 31, 2021, are reflected in the following chart:
| | | | | | |
| | | Number of | | Total | | |
| | | Transactions | | Quantity | | Cost/Proceeds |
| Purchases | | 7 | | 4,057 | | $176,269 |
| Sales* | | 1 | | 2,940 | | 482,160 |
| * | Realized gain was $305,582. |
3. PURCHASES AND SALES OF SECURITIES
Purchases and sales of securities (excluding short-term securities and U.S. Government Obligations) for the fiscal year ended December 31, 2021, were $482,624,151 and $552,232,866, respectively.
The Fund had no purchases or sales of U.S. Government Obligations during the fiscal year ended December 31, 2021.
4. PORTFOLIO SECURITIES LOANED
The Fund participates in the Program providing for the lending of securities to qualified borrowers. Securities lending income includes earnings of such temporary cash investments, plus or minus any rebate to a borrower. These earnings (after any rebate) are then divided between BNYM, as a fee for its services under the Program, and the Fund, according to agreed-upon rates. Collateral on all securities loaned is accepted in cash, U.S. Treasury Obligations or U.S. Government Agency Obligations. Collateral is maintained at a minimum level of 102% (105% in the case of certain foreign securities) of the market value, plus interest, if applicable, of investments on loan. It is the Fund’s policy to obtain
additional collateral from or return excess collateral to the borrower by the end of the next business day, following the valuation date of the securities loaned. Therefore, the value of the collateral held may be temporarily less than the value of the securities on loan. Lending securities entails a risk of loss to the Fund if and to the extent that the market value of the securities loaned were to increase and the borrower did not increase the collateral accordingly, and the borrower fails to return the securities. Under the terms of the Program, the Fund is indemnified for such losses by BNYM. Cash collateral is held in separate omnibus accounts managed by BNYM, who is authorized to exclusively enter into joint repurchase agreements for that cash collateral. Securities collateral is held in separate omnibus accounts managed by BNYM and cannot be sold or pledged. BNYM bears the risk of any deficiency in the amount of the cash collateral available for return to the borrower due to any loss on the collateral invested. Loans of securities are terminable at any time and the borrower, after notice, is required to return borrowed securities as soon as practical, which is normally within three business days. At December 31, 2021, the Fund had no securities on loan.
5. FOREIGN SECURITIES
The Fund invests in securities of foreign entities and in instruments denominated in foreign currencies which involve risks not typically associated with investments in domestic securities. Non-domestic securities carry special risks, such as exposure to currency fluctuations, less developed or less efficient trading markets, political instability, a lack of company information, differing auditing and legal standards, and, potentially, less liquidity. Emerging market countries generally have economic structures that are less diverse and mature, and political systems that are less stable, than those of developed countries. Realized gains in certain countries may be subject to foreign taxes at the Fund level and the Fund would pay such foreign taxes at the appropriate rate for each jurisdiction.
6. GEOGRAPHICAL FOCUS RISK
The Fund is particularly susceptible to risks in the Greater China region and India. Economies in the Greater China region are dependent on the economies of other countries and can be significantly affected by currency fluctuations and increasing competition from other emerging economies in Asia with lower costs. Adverse events in any one country within the region may impact the other countries in the region or Asia as a whole. Markets in the Greater China region can experience significant volatility due to social, economic, regulatory and political uncertainties. Significant portions of the Chinese securities markets may become rapidly illiquid, as Chinese issuers have the ability to suspend the trading of their equity securities, and have shown a willingness to exercise that option in response to market volatility and other events. U.S. or foreign government restrictions or intervention could negatively affect the implementation of the Fund’s investment strategies, for example by precluding the Fund from making certain investments or causing the Fund to sell investments at disadvantageous times. China has yet to develop comprehensive securities, corporate, or commercial laws, its market is relatively new and less developed, and its economy may be adversely impacted by a slowdown in export growth.
The Indian government has exercised and continues to exercise significant influence over many aspects of the economy. Government actions, bureaucratic obstacles and inconsistent economic reform within the Indian government have had a significant effect on its economy and could adversely affect market conditions, economic growth and the profitability of private enterprises in India. Global factors and foreign actions may inhibit the flow of foreign capital on which India is dependent to sustain its growth. Large portions of many Indian companies
23
| | |
| | Notes to Financial Statements (continued) |
remain in the hands of their founders (including members of their families). Corporate governance standards of family-controlled companies may be weaker and less transparent, which increases the potential for loss and unequal treatment of investors. India experiences many of the risks associated with developing economies, including relatively low levels of liquidity, which may result in extreme volatility in the prices of Indian securities. Religious, cultural and military disputes persist in India, and between India and Pakistan (as well as sectarian groups within each country). The Fund’s NAV may be more volatile than the NAV of a more geographically diversified fund and may result in losses.
7. PARTICIPATION NOTES
The Fund invests in P-Notes to gain exposure to issuers in certain countries. P-Notes are a type of equity-linked derivative that generally are traded in the over-the-counter market and constitute general unsecured contractual obligations of the banks or broker-dealers that issue them. Generally, banks and broker-dealers associated with non-U.S.-based brokerage firms buy securities listed on certain foreign exchanges and then issue P-Notes which are designed to replicate the performance of certain issuers and markets. The performance results of P-Notes will not replicate exactly the performance of the issuers or markets that the notes seek to replicate due to transaction costs and other expenses. The return on a P-Note that is linked to a particular underlying security generally is increased to the extent of any dividends paid in connection with the underlying security. However, the holder of a P-Note typically does not receive voting or other rights as it would if it directly owned the underlying security, and P-Notes present similar risks to investing directly in the underlying security. Additionally, P-Notes entail the risks that the counterparty or issuer of the P-Note may not be able to fulfill its obligations, that the holder and counterparty or issuer may disagree as to the meaning or application of contractual terms, or that the instrument may not perform as expected. Additionally, while P-Notes may be listed on an exchange, there is no guarantee that a liquid market will exist or that the counterparty or issuer of a P-Note will be willing to repurchase such instrument when a Fund wishes to sell it.
8. COMMITMENTS AND CONTINGENCIES
Under the Trust’s organizational documents, its trustees and officers are indemnified against certain liabilities arising out of the performance of their duties to the Trust. In addition, in the normal course of business, the Fund may enter into contracts and agreements that contain a variety of representations and warranties, which provide general indemnifications. The maximum exposure to the Fund under these arrangements is unknown, as this would involve future claims that may be made against the Fund that have not yet occurred. However, based on experience, the Fund had no prior claims or
losses and expects the risks of loss to be remote.
9. MASTER NETTING AGREEMENTS
The Fund may enter into master netting agreements with its counterparties for the securities lending program and Repurchase Agreements, which provide the right, in the event of default (including bankruptcy or insolvency) for the non-defaulting party to liquidate the collateral and calculate net exposure to the defaulting party or request additional collateral. For financial reporting purposes, the Fund does not offset financial assets and financial liabilities that are subject to master netting agreements in the Statement of Assets and Liabilities. For securities lending transactions, see Note 4. At December 31, 2021, the Fund had no Repurchase Agreements outstanding.
10. SUBSEQUENT EVENTS
The Fund has determined that no material events or transactions occurred through the issuance date of the Fund’s financial statements which require an additional disclosure in or adjustment of the Fund’s financial statements.
24
| | |
| | Report of Independent Registered Public Accounting Firm |
| | |
TO THE BOARD OF TRUSTEES OF AMG FUNDS III AND SHAREHOLDERS OF AMG VERITAS ASIA PACIFIC FUND Opinions on the Financial Statements We have audited the accompanying statement of assets and liabilities, including the schedule of portfolio investments, of AMG Veritas Asia Pacific Fund (formerly AMG Managers Special Equity Fund) (one of the funds constituting AMG Funds III, referred to hereafter as the “Fund”) as of December 31, 2021, the related statement of operations for the year ended December 31, 2021, the statements of changes in net assets for each of the two years in the period ended December 31, 2021, including the related notes, and the financial highlights for each of five years in the period ended December 31, 2021 (collectively referred to as the “financial statements”). In our opinion, the financial statements present fairly, in all material respects, the financial position of the Fund as of December 31, 2021, the results of its operations for the year then ended, the changes in its net assets for each of the two years in the period ended December 31, 2021 and the financial highlights for each of five years in the period ended December 31, 2021 in conformity with accounting principles generally accepted in the United States of America. Basis for Opinions These financial statements are the responsibility of the Fund’s management. Our responsibility is to express an opinion on the Fund’s financial statements based on our audit. We are a public accounting firm registered with the Public Company Accounting Oversight Board (United States) (PCAOB) and are required to be independent with respect to the Fund in accordance with the U.S. federal securities laws and the applicable rules and regulations of the Securities and Exchange Commission and the PCAOB. We conducted our audit of these financial statements in accordance with the standards of the PCAOB. Those standards require that we plan and perform the audit to obtain reasonable assurance about whether the financial statements are free of material misstatement, whether due to error or fraud. Our audit included performing procedures to assess the risks of material misstatement of the financial statements, whether due to error or fraud, and performing procedures that respond to those risks. Such procedures included examining, on a test basis, evidence regarding the amounts and disclosures in the financial statements. Our audit also included evaluating the accounting principles used and significant estimates made by management, as well as evaluating the overall presentation of the financial statements. Our procedures included confirmation of securities owned as of December 31, 2021 by correspondence with the custodian, transfer agent and brokers; when replies were not received from brokers, we performed other auditing procedures. We believe that our audit provides a reasonable basis for our opinion. PricewaterhouseCoopers LLP Boston, Massachusetts February 24, 2022 We have served as the auditor of one or more investment companies in AMG Funds Family since 1993. | | |
25
| | |
| | Other Information (unaudited) |
TAX INFORMATION
AMG Veritas Asia Pacific Fund hereby designates the maximum amount allowable of its net taxable income as qualified dividends as provided in the Jobs and Growth Tax Relief Reconciliation Act of 2003. The 2021 Form 1099-DIV you receive for the Fund will show the tax status of all distributions paid to you during the year.
In accordance with federal tax law, AMG Veritas Asia Pacific Fund elected to provide foreign taxes paid and the income sourced from foreign countries. Accordingly, AMG Veritas Asia Pacific Fund hereby makes the following designations regarding its period ended December 31, 2021:
u The total amount of taxes paid and income sourced from foreign countries was $216,196 and $1,423,322, respectively.
Pursuant to section 852 of the Internal Revenue Code, AMG Veritas Asia Pacific Fund hereby designates $54,727,061 as a capital gain distribution with respect to the taxable year ended December 31, 2021, or if subsequently determined to be different, the net capital gains of such fiscal year.
26
| | |
| | AMG Funds Trustees and Officers |
| | | | | | | | |
| The Trustees and Officers of the Trust, their business addresses, principal occupations for the past five years and ages are listed below. The Trustees provide broad supervision over the affairs of the Trust and the Fund. The Trustees are experienced executives who meet periodically throughout the year to oversee the Fund’s activities, review contractual arrangements with companies that provide services to the Fund, and | | | | review the Fund’s performance. Unless otherwise noted, the address of each Trustee or Officer is the address of the Trust: 680 Washington Blvd., Suite 500, Stamford, CT. 06901. There is no stated term of office for Trustees. Trustees serve until their resignation, retirement or removal in | | | | accordance with the Trust’s organizational documents and policies adopted by the Board from time to time. The Chairman of the Trustees, President, Treasurer and Secretary of the Trust are elected by the Trustees annually. Other officers hold office at the pleasure of the Trustees. |
| | | | |
| | | | |
Independent Trustees
The following Trustees are not “interested persons” of the Trust within the meaning of the 1940 Act:
| | |
Number of Funds Overseen in
Fund Complex | | Name, Age, Principal Occupation(s) During Past 5 Years and Other Directorships Held by Trustee |
| | |
• Trustee since 2012 • Oversees 42 Funds in Fund Complex | | Bruce B. Bingham, 73 Partner, Hamilton Partners (real estate development firm) (1987-Current); Director of The Yacktman Funds (2 portfolios) (2000-2012). |
| | |
• Trustee since 2013 • Oversees 46 Funds in Fund Complex | | Kurt A. Keilhacker, 58 Managing Partner, TechFund Europe (2000-Present); Managing Partner, TechFund Capital (1997-Present); Managing Partner, Elementum Ventures (2013-Present); Director, MetricStory, Inc. (2017-Present); Trustee, Wheaton College (2018-Present); Trustee, Gordon College (2001-2016); Board Member, 6wind SA (2002-2019). |
| | |
• Trustee since 2000 • Oversees 42 Funds in Fund Complex | | Steven J. Paggioli, 71 Independent Consultant (2002-Present); Trustee, Professionally Managed Portfolios (28 portfolios); Advisory Board Member, Sustainable Growth Advisors, LP; Independent Director, Muzinich BDC, Inc. (business development company) (2019-Present); Director, The Wadsworth Group; Independent Director, Chase Investment Counsel (2008–2019); Executive Vice President, Secretary and Director, Investment Company Administration, LLC and First Fund Distributors, INC. (1990-2001). |
| | |
• Independent Chairman • Trustee since 2000 • Oversees 46 Funds in Fund Complex | | Eric Rakowski, 63 Professor of Law, University of California at Berkeley School of Law (1990-Present); Tax Attorney at Davis Polk & Wardwell and clerked for Judge Harry T. Edwards of the U.S. Court of Appeals for the District of Columbia Circuit and for Justice William J. Brennan Jr. of the U.S. Supreme Court; Director of Harding, Loevner Funds, Inc. (10 portfolios); Trustee of Third Avenue Trust (3 portfolios) (2002-2019); Trustee of Third Avenue Variable Trust (1 portfolio) (2002-2019). |
| | |
• Trustee since 2013 • Oversees 46 Funds in Fund Complex | | Victoria L. Sassine, 56 Adjunct Professor, Babson College (2007–Present); Director, Board of Directors, PRG Group (2017-Present); CEO, Founder, Scale Smarter Partners, LLC (2018-Present); Adviser, EVOFEM Biosciences (2019-Present); Chairperson of the Board of Directors of Business Management Associates (2018 to 2019). |
| | |
• Trustee since 1987 • Oversees 42 Funds in Fund Complex | | Thomas R. Schneeweis, 74 Professor Emeritus, University of Massachusetts (2013-Present); President, TRS Associates (1982-Present); Board Member, Chartered Alternative Investment Association (“CAIA”) (2002-Present); Co-Founder and Director, Institute for Global Asset and Risk Management (Education) (2010-Present); Co-Owner, Quantitative Investment Technologies (2014-Present); Co-Owner, Yes Wealth Management (2018-Present); Director, CAIA Foundation (2010-2019); Partner, S Capital Wealth Advisors (2015-2018); Partner, S Capital Management, LLC (2007-2015); President, Alternative Investment Analytics, LLC (formerly Schneeweis Partners, LLC) (2001-2013). |
Interested Trustees
Each Trustee in the following table is an “interested person” of the Trust within the meaning of the 1940 Act. Ms. Carsman is an interested person of the Trust within the meaning of the 1940 Act by virtue of her position with, and interest in securities of, AMG.
| | |
Number of Funds Overseen in Fund Complex | | Name, Age, Principal Occupation(s) During Past 5 Years and Other Directorships Held by Trustee |
| | |
• Trustee since 2011 • Oversees 46 Funds in Fund Complex | | Christine C. Carsman, 69 Affiliated Managers Group, Inc. (2004-Present): Senior Policy Advisor (2019-Present), Executive Vice President, Deputy General Counsel and Chief Regulatory Counsel (2017-2018), Senior Vice President and Deputy General Counsel (2011-2016), Senior Vice President and Chief Regulatory Counsel (2007-2011), Vice President and Chief Regulatory Counsel (2004-2007); Chair of the Board of Directors, AMG Funds plc (2015-2018); Director, AMG Funds plc (2010-2018); Secretary and Chief Legal Officer, AMG Funds, AMG Funds I, AMG Funds II and AMG Funds III (2004-2011); Senior Counsel, Vice President and Director of Operational Risk Management and Compliance, Wellington Management Company, LLP (1995-2004); Director Emeritus of Harding, Loevner Funds, Inc. (0 Portfolios) (2021- Present); Director of Harding, Loevner Funds, Inc. (9 portfolios) (2017-2020). |
27
| | |
| | AMG Funds Trustees and Officers (continued) |
| | |
Number of Funds Overseen in Fund Complex | | Name, Age, Principal Occupation(s) During Past 5 Years and Other Directorships Held by Trustee |
| | |
• Trustee since 2021 • Oversees 46 Funds in Fund Complex | | Garret W. Weston, 40 Affiliated Managers Group, Inc. (2008-Present): Managing Director, Co-Head of Affiliate Engagement (2021-Present), Senior Vice President, Affiliate Development (2016-2021), Vice President, Office of the CEO (2015-2016), Vice President, New Investments (2012-2015), Senior Associate, New Investments (2008-2012); Associate, Madison Dearborn Partners (2006-2008); Analyst, Merrill Lynch (2004-2006). |
| |
| Officers | | |
Position(s) Held with Fund
and Length of Time Served | | Name, Age, Principal Occupation(s) During Past 5 Years |
| | |
• President since 2018 • Principal Executive Officer since 2018 • Chief Executive Officer since 2018 • Chief Operating Officer since 2007 | | Keitha L. Kinne, 63 Chief Operating Officer, AMG Funds LLC (2007-Present); Chief Investment Officer, AMG Funds LLC (2008-Present); President and Principal, AMG Distributors, Inc. (2018-Present); Chief Operating Officer, AMG Distributors, Inc. (2007-Present); President, Chief Executive Officer and Principal Executive Officer, AMG Funds, AMG Funds I, AMG Funds II, AMG Funds III and AMG Funds IV (2018-Present); Chief Operating Officer, AMG Funds, AMG Funds I, AMG Funds II, and AMG Funds III (2007-Present); Chief Operating Officer, AMG Funds IV (2016-Present); Chief Operating Officer and Chief Investment Officer, Aston Asset Management, LLC (2016); President and Principal Executive Officer, AMG Funds, AMG Funds I, AMG Funds II and AMG Funds III (2012-2014); Managing Partner, AMG Funds LLC (2007-2014); President and Principal, AMG Distributors, Inc. (2012-2014); Managing Director, Legg Mason & Co., LLC (2006-2007); Managing Director, Citigroup Asset Management (2004-2006). |
| | |
• Secretary since 2015 • Chief Legal Officer since 2015 | | Mark J. Duggan, 56 Managing Director and Senior Counsel, AMG Funds LLC (2021-Present); Senior Vice President and Senior Counsel, AMG Funds LLC (2015-2021); Secretary and Chief Legal Officer, AMG Funds, AMG Funds I, AMG Funds II, AMG Funds III and AMG Funds IV (2015-Present); Attorney, K&L Gates, LLP (2009-2015). |
| | |
• Chief Financial Officer since 2017 • Treasurer since 2017 • Principal Financial Officer since 2017 • Principal Accounting Officer since 2017 | | Thomas G. Disbrow, 55 Vice President, Mutual Fund Treasurer & CFO, AMG Funds, AMG Funds LLC (2017-Present); Chief Financial Officer, Principal Financial Officer, Treasurer and Principal Accounting Officer, AMG Funds, AMG Funds I, AMG Funds II, AMG Funds III and AMG Funds IV (2017-Present); Managing Director - Global Head of Traditional Funds Product Control, UBS Asset Management (Americas), Inc. (2015-2017); Managing Director - Head of North American Funds Treasury, UBS Asset Management (Americas), Inc. (2011-2015). |
| | |
• Deputy Treasurer since 2017 | | John A. Starace, 51 Vice President, Mutual Fund Accounting, AMG Funds LLC (2021-Present); Director, Mutual Fund Accounting, AMG Funds LLC (2017-2021); Vice President, Deputy Treasurer of Mutual Funds Services, AMG Funds LLC (2014-2017); Deputy Treasurer, AMG Funds, AMG Funds I, AMG Funds II, AMG Funds III and AMG Funds IV (2017-Present); Vice President, Citi Hedge Fund Services (2010-2014); Audit Senior Manager (2005-2010) and Audit Manager (2001-2005), Deloitte & Touche LLP. |
| | |
• Chief Compliance Officer and Sarbanes-Oxley Code of Ethics since 2019 | | Patrick J. Spellman, 47 Vice President, Chief Compliance Officer, AMG Funds LLC (2017-Present); Chief Compliance Officer, AMG Distributors, Inc. (2010-Present); Chief Compliance Officer and Sarbanes-Oxley Code of Ethics Compliance Officer, AMG Funds, AMG Funds I, AMG Funds II, AMG Funds III and AMG Funds IV (2019-Present); Senior Vice President, Chief Compliance Officer, AMG Funds LLC (2011-2017); Anti-Money Laundering Compliance Officer, AMG Funds, AMG Funds I, AMG Funds II, and AMG Funds III (2014-2019); Anti-Money Laundering Officer, AMG Funds IV (2016-2019); Compliance Manager, Legal and Compliance, Affiliated Managers Group, Inc. (2005-2011). |
| | |
• Assistant Secretary since 2016 | | Maureen A. Meredith, 36 Vice President, Senior Counsel, AMG Funds LLC (2021-Present); Vice President, Counsel, AMG Funds LLC (2019-2021); Director, Counsel, AMG Funds LLC (2017-2018); Vice President, Counsel, AMG Funds LLC (2015-2017); Assistant Secretary, AMG Funds, AMG Funds I, AMG Funds II, AMG Funds III and AMG Funds IV (2016-Present); Associate, Ropes & Gray LLP (2011-2015); Law Fellow, Massachusetts Appleseed Center for Law and Justice (2010-2011). |
| | |
• Anti-Money Laundering Compliance Officer since 2019 | | Hector D. Roman, 44 Director, Legal and Compliance, AMG Funds LLC (2020-Present); Anti-Money Laundering Compliance Officer, AMG Funds, AMG Funds I, AMG Funds II, AMG Funds III and AMG Funds IV (2019-Present); Manager, Legal and Compliance, AMG Funds LLC (2017-2019); Director of Compliance, Morgan Stanley Investment Management (2015-2017); Senior Advisory, PricewaterhouseCoopers LLP (2014-2015); Risk Manager, Barclays Investment Bank (2008-2014). |
28
| | | | |
INVESTMENT MANAGER AND ADMINISTRATOR AMG Funds LLC 680 Washington Blvd., Suite 500 Stamford, CT 06901 800.548.4539 DISTRIBUTOR AMG Distributors, Inc. 680 Washington Blvd., Suite 500 Stamford, CT 06901 800.548.4539 SUBADVISER Veritas Asset Management LLP 1 Smart’s Place London, WC2B 5LW CUSTODIAN The Bank of New York Mellon Mutual Funds Custody 6023 Airport Road Oriskany, NY 13424 | | LEGAL COUNSEL Ropes & Gray LLP Prudential Tower, 800 Boylston Street Boston, MA 02199-3600 TRANSFER AGENT BNY Mellon Investment Servicing (US) Inc. Attn: AMG Funds 4400 Computer Drive Westborough, MA 01581 800.548.4539 | | This report is prepared for the Fund’s shareholders. It is authorized for distribution to prospective investors only when preceded or accompanied by an effective prospectus. To receive a free copy of the prospectus or Statement of Additional Information, which includes additional information about Fund Trustees, please contact us by calling 800.548.4539. Distributed by AMG Distributors, Inc., member FINRA/SIPC. Current net asset values per share for the Fund are available on the Fund’s website at amgfunds.com. A description of the policies and procedures the Fund uses to vote its proxies is available: (i) without charge, upon request, by calling 800.548.4539, or (ii) on the Securities and Exchange Commission’s (SEC) website at sec.gov. For information regarding the Fund’s proxy voting record for the 12-month period ended June 30, call 800.548.4539 or visit the SEC website at sec.gov. The Fund files its complete schedule of portfolio holdings with the SEC for the first and third quarters of each fiscal year as an exhibit to their reports on Form N-PORT. The Fund’s portfolio holdings on Form N-PORT are available on the SEC’s website at sec.gov and the Fund’s website at amgfunds.com. To review a complete list of the Fund’s portfolio holdings, or to view the most recent semiannual report or annual report, please visit amgfunds.com. |
| | | | | | | | |
BALANCED FUNDS AMG GW&K Global Allocation GW&K Investment Management, LLC AMG FQ Global Risk-Balanced First Quadrant, L.P. EQUITY FUNDS AMG Beutel Goodman International Equity Beutel, Goodman & Company Ltd. AMG Boston Common Global Impact Boston Common Asset Management, LLC AMG Managers CenterSquare Real Estate CenterSquare Investment Management LLC AMG Frontier Small Cap Growth Frontier Capital Management Co., LLC AMG GW&K Small Cap Core AMG GW&K Small Cap Value AMG GW&K Small/Mid Cap AMG GW&K Small/Mid Cap Growth AMG GW&K Emerging Markets Equity AMG GW&K Emerging Wealth Equity AMG GW&K International Small Cap GW&K Investment Management, LLC AMG Montrusco Bolton Large Cap Growth Montrusco Bolton Investments, Inc. | | | | AMG Renaissance Large Cap Growth The Renaissance Group LLC AMG River Road Dividend All Cap Value AMG River Road Focused Absolute Value AMG River Road International Value Equity AMG River Road Large Cap Value Select AMG River Road Mid Cap Value AMG River Road Small-Mid Cap Value AMG River Road Small Cap Value River Road Asset Management, LLC AMG TimesSquare Emerging Markets Small Cap AMG TimesSquare Global Small Cap AMG TimesSquare International Small Cap AMG TimesSquare Mid Cap Growth AMG TimesSquare Small Cap Growth TimesSquare Capital Management, LLC AMG Veritas Asia Pacific AMG Veritas China AMG Veritas Global Focus AMG Veritas Global Real Return Veritas Asset Management LLP AMG Yacktman AMG Yacktman Focused AMG Yacktman Global AMG Yacktman Special Opportunities Yacktman Asset Management LP | | FIXED INCOME FUNDS AMG Beutel Goodman Core Plus Bond Beutel, Goodman & Company Ltd. AMG GW&K Core Bond ESG AMG GW&K Enhanced Core Bond ESG AMG GW&K ESG Bond AMG GW&K High Income AMG GW&K Municipal Bond AMG GW&K Municipal Enhanced Yield GW&K Investment Management, LLC | | |
| | |
| amgfunds.com | | | 123121 AR078 |
| | |
 | | ANNUAL REPORT |
| | | | |
| | | AMG Funds |
| | | |
| | | December 31, 2021 | | |
| | |  |
| | |
| | | AMG GW&K ESG Bond Fund |
| | | (formerly AMG Managers Loomis Sayles Bond Fund) |
| | |
| | | Class N: MGFIX | Class I: MGBIX |
| | |
| | | AMG GW&K Enhanced Core Bond ESG Fund |
| | |
| | | Class N: MFDAX | Class I: MFDSX | Class Z: MFDYX |
| | |
| | | AMG GW&K High Income Fund |
| | |
| | | Class N: MGGBX | Class I: GWHIX |
| | |
| | | AMG GW&K Municipal Bond Fund |
| | |
| | | Class N: GWMTX | Class I: GWMIX |
| | |
| | | AMG GW&K Municipal Enhanced Yield Fund |
| | |
| | | Class N: GWMNX | Class I: GWMEX | Class Z: GWMZX |
| | |
| | | |
| | | | |
amgfunds.com | | | 123121 | | AR088 |
| | |
| | AMG Funds Annual Report – December 31, 2021 |
| | | | |
| | | TABLE OF CONTENTS | | PAGE |
| | | |
| | | LETTER TO SHAREHOLDERS | | 2 |
| | | |
| | | ABOUT YOUR FUND’S EXPENSES | | 3 |
| | | |
| | | PORTFOLIO MANAGER’S COMMENTS, FUND SNAPSHOTS AND SCHEDULES OF PORTFOLIO INVESTMENTS | | |
| | | |
| | | AMG GW&K ESG Bond Fund | | 4 |
| | | |
| | | AMG GW&K Enhanced Core Bond ESG Fund | | 15 |
| | | |
| | | AMG GW&K High Income Fund | | 24 |
| | | |
| | | AMG GW&K Municipal Bond Fund | | 32 |
| | | |
| | | AMG GW&K Municipal Enhanced Yield Fund | | 42 |
| | | |
| | | FINANCIAL STATEMENTS | | |
| | | |
| | | Statement of Assets and Liabilities | | 50 |
| | | Balance sheets, net asset value (NAV) per share computations
and cumulative distributable earnings (loss) | | |
| | | |
| | | Statement of Operations | | 52 |
| | | Detail of sources of income, expenses, and realized and
unrealized gains (losses) during the fiscal year | | |
| | | |
| | | Statements of Changes in Net Assets | | 53 |
| | | Detail of changes in assets for the past two fiscal years | | |
| | | |
| | | Financial Highlights | | 55 |
| | | Historical net asset values per share, distributions, total returns, income
and expense ratios, turnover ratios and net assets | | |
| | | |
| | | Notes to Financial Statements | | 67 |
| | | Accounting and distribution policies, details of agreements and
transactions with Fund management and affiliates, and descriptions of
certain investment risks | | |
| | | |
| | | REPORT OF INDEPENDENT REGISTERED PUBLIC ACCOUNTING FIRM | | 77 |
| | | |
| | | OTHER INFORMATION | | 78 |
| | | |
| | | TRUSTEES AND OFFICERS | | 79 |
Nothing contained herein is to be considered an offer, sale or solicitation of an offer to buy shares of any series of the AMG Funds Family of Funds. Such offering is made only by prospectus, which includes details as to offering price and other material information.
| | | | |
| | | | Letter to Shareholders |
Dear Shareholder:
The fiscal year ended December 31, 2021, was marked by the continued extraordinary recovery amid an unprecedented global effort to stop the COVID-19 pandemic. Equities rallied to new record highs amid better-than-expected corporate earnings, colossal fiscal and monetary stimulus programs, and an improving economic backdrop. Since the market bottom on March 23, 2020, the S&P 500® Index has gained over 119%. Businesses and consumers contended with disrupted supply chains and rising prices on a wide range of goods such as lumber and gasoline, and outbreaks of coronavirus variants kept the world on edge. Volatility increased in September as investors grew more concerned about rising inflation and more hawkish global central bank policies, but equities were resilient and finished the fiscal year with a strong rally.
The S&P 500® gained 28.71% during the year and all sectors produced double-digit returns, but there was very wide dispersion in performance. Energy and real estate led the market with returns of 54.72% and 46.20%, respectively. On the other hand, utilities and consumer staples lagged with returns of 17.63% and 18.63%, respectively. Growth stocks edged out Value stocks as the Russell 1000® Growth Index returned 27.60% compared to the 25.16% return for the Russell 1000® Value Index. Small cap stocks underperformed as the Russell 2000® Index returned 14.82%. Within small caps, the Value-Growth disparity was much more pronounced as the Russell 2000® Value Index returned 28.27% compared to 2.83% for the Russell 2000® Growth Index. Outside the U.S., foreign developed markets lagged their U.S. counterparts with an 11.26% return for the MSCI EAFE Index. A major regulatory crackdown in China shook investor confidence in Chinese equities and caused emerging markets to underperform with a (2.54)% return for the MSCI Emerging Markets Index.
Interest rates lifted off from near-historic lows as the vaccine rollout initiated a return to normalcy and the economic outlook improved. The 10-year Treasury yield rose 59 basis points to 1.52% and ended the year slightly shy of its post-pandemic high. The Bloomberg U.S. Aggregate Bond Index, a broad measure of U.S. bond market performance, lost (1.54)% over the period. While risk appetite was strong, rising rates still hurt returns for investment-grade corporate bonds, which lost (1.04)% during the year. The global search for yield helped high-yield bonds outperform the investment-grade market with a 5.28% return as measured by the return of the Bloomberg U.S. Corporate High Yield Bond Index. Municipal bonds benefited from a strong technical backdrop, which drove a 1.52% return for the Bloomberg Municipal Bond Index.
AMG Funds appreciates the privilege of providing investment tools to you and your clients. Our foremost goal is to provide investment solutions that help our shareholders successfully reach their long-term investment goals. AMG Funds provides access to a distinctive array of actively managed return-oriented investment strategies. We thank you for your continued confidence and investment in AMG Funds. You can rest assured that under all market conditions our team is focused on delivering excellent investment management services for your benefit.
Respectfully,

Keitha Kinne
President
AMG Funds
| | | | | | | | | | | | | | |
| Average Annual Total Returns | | Periods ended
December 31, 2021* | |
| | | | |
| Stocks: | | | | 1 Year | | | 3 Years | | | 5 Years | |
| | | | |
Large Cap | | (S&P 500® Index) | | | 28.71 | % | | | 26.07 | % | | | 18.47 | % |
| | | | |
Small Cap | | (Russell 2000® Index) | | | 14.82 | % | | | 20.02 | % | | | 12.02 | % |
| | | | |
International | | (MSCI ACWI ex USA) | | | 7.82 | % | | | 13.18 | % | | | 9.61 | % |
| Bonds: | | | | | | | | | | | |
| | | | |
Investment Grade | | (Bloomberg U.S. Aggregate Bond Index) | | | (1.54 | )% | | | 4.79 | % | | | 3.57 | % |
| | | | |
High Yield | | (Bloomberg U.S. Corporate High Yield Bond Index) | | | 5.28 | % | | | 8.83 | % | | | 6.30 | % |
| | | | |
Tax-exempt | | (Bloomberg Municipal Bond Index) | | | 1.52 | % | | | 4.73 | % | | | 4.17 | % |
| | | | |
Treasury Bills | | (ICE BofAML U.S. 6-Month Treasury Bill Index) | | | 0.09 | % | | | 1.23 | % | | | 1.31 | % |
*Source: FactSet. Past performance is no guarantee of future results.
2
| | |
| | About Your Fund’s Expenses |
| | | | | | |
As a shareholder of a Fund, you may incur two types of costs: (1) transaction costs, which may include sales charges (loads) on purchase payments; redemption fees; and exchange fees; and (2) ongoing costs, including management fees; distribution (12b-1) fees; and other Fund expenses. This example is intended to help you understand your ongoing costs (in dollars) of investing in the Fund and to compare these costs with the ongoing costs of investing in other mutual funds. The example is based on $1,000 invested at the beginning of the period and held for the entire period as indicated below. ACTUAL EXPENSES The first line of the following table provides information about the actual account values and | | actual expenses. You may use the information in this line, together with the amount you invested, to estimate the expenses that you paid over the period. Simply divide your account value by $1,000 (for example, an $8,600 account value divided by $1,000 = 8.6), then multiply the result by the number in the first line under the heading entitled “Expenses Paid During Period” to estimate the expenses you paid on your account during this period. HYPOTHETICAL EXAMPLE FOR COMPARISON PURPOSES The second line of the following table provides information about hypothetical account values and hypothetical expenses based on the Fund’s actual expense ratio and an assumed annual rate of return of 5% before expenses, which is not the Fund’s | | | | actual return. The hypothetical account values and expenses may not be used to estimate the actual ending account balance or expenses you paid for the period. You may use this information to compare the ongoing costs of investing in the Fund and other funds by comparing this 5% hypothetical example with the 5% hypothetical examples that appear in the shareholder reports of other funds. Please note that the expenses shown in the table are meant to highlight your ongoing costs only and do not reflect any transactional costs, such as sales charges (loads), redemption fees, or exchange fees. Therefore, the second line of the table is useful in comparing ongoing costs only, and will not help you determine the relative total costs of owning different funds. |
| | | | | | | |
| | | | | | | | | | |
Six Months Ended December 31, 2021 | | Expense Ratio for the Period | | Beginning Account Value 07/01/21 | | Ending Account Value 12/31/21 | | Expenses Paid During the Period* | |
|
AMG GW&K ESG Bond Fund | |
| |
Based on Actual Fund Return | | | | |
| | | | |
Class N | | 0.68% | | $1,000 | | $999 | | | $3.43 | |
| | | | |
Class I | | 0.48% | | $1,000 | | $1,000 | | | $2.42 | |
| | |
Based on Hypothetical 5% Annual Return | | | | |
| | | | |
Class N | | 0.68% | | $1,000 | | $1,022 | | | $3.47 | |
| | | | |
Class I | | 0.48% | | $1,000 | | $1,023 | | | $2.45 | |
| | | | |
| | | | | | | | | | |
AMG GW&K Enhanced Core Bond ESG Fund | |
| |
Based on Actual Fund Return | | | | |
| | | | |
Class N | | 0.73% | | $1,000 | | $996 | | | $3.67 | |
| | | | |
Class I | | 0.57% | | $1,000 | | $997 | | | $2.87 | |
| | | | |
Class Z | | 0.48% | | $1,000 | | $997 | | | $2.42 | |
| | |
Based on Hypothetical 5% Annual Return | | | | |
| | | | |
Class N | | 0.73% | | $1,000 | | $1,022 | | | $3.72 | |
| | | | |
Class I | | 0.57% | | $1,000 | | $1,022 | | | $2.91 | |
| | | | |
Class Z | | 0.48% | | $1,000 | | $1,023 | | | $2.45 | |
| | | | |
| | | | | | | | | | |
AMG GW&K High Income Fund | |
| |
Based on Actual Fund Return | | | | |
| | | | |
Class N | | 0.84% | | $1,000 | | $1,008 | | | $4.25 | |
| | | | |
Class I | | 0.65% | | $1,000 | | $1,009 | | | $3.29 | |
| | |
Based on Hypothetical 5% Annual Return | | | | |
| | | | |
Class N | | 0.84% | | $1,000 | | $1,021 | | | $4.28 | |
| | | | |
Class I | | 0.65% | | $1,000 | | $1,022 | | | $3.31 | |
| | | | | | | | | | |
Six Months Ended December 31, 2021 | | Expense Ratio for the Period | | Beginning Account Value 07/01/21 | | Ending Account Value 12/31/21 | | Expenses Paid During the Period* | |
|
AMG GW&K Municipal Bond Fund | |
| |
Based on Actual Fund Return | | | | |
| | | | |
Class N | | 0.72% | | $1,000 | | $999 | | | $3.63 | |
| | | | |
Class I | | 0.39% | | $1,000 | | $1,001 | | | $1.97 | |
| | |
Based on Hypothetical 5% Annual Return | | | | |
| | | | |
Class N | | 0.72% | | $1,000 | | $1,022 | | | $3.67 | |
| | | | |
Class I | | 0.39% | | $1,000 | | $1,023 | | | $1.99 | |
| | | | |
| | | | | | | | | | |
AMG GW&K Municipal Enhanced Yield Fund | |
| |
Based on Actual Fund Return | | | | |
| | | | |
Class N | | 0.99% | | $1,000 | | $1,002 | | | $5.00 | |
| | | | |
Class I | | 0.64% | | $1,000 | | $1,004 | | | $3.23 | |
| | | | |
Class Z | | 0.59% | | $1,000 | | $1,004 | | | $2.98 | |
| | |
Based on Hypothetical 5% Annual Return | | | | |
| | | | |
Class N | | 0.99% | | $1,000 | | $1,020 | | | $5.04 | |
| | | | |
Class I | | 0.64% | | $1,000 | | $1,022 | | | $3.26 | |
| | | | |
Class Z | | 0.59% | | $1,000 | | $1,022 | | | $3.01 | |
| * | Expenses are equal to the Fund’s annualized expense ratio multiplied by the average account value over the period, multiplied by the number of days in the most recent fiscal half-year (184), then divided by 365. |
3
| | |
| | AMG GW&K ESG Bond Fund Portfolio Manager’s Comments (unaudited) |
| | | | | | |
THE YEAR IN REVIEW AMG GW&K ESG Bond Fund Class N (the “Fund”) shares returned (1.29%) for the year ended December 31, 2021, compared with the (1.54%) return for its current benchmark, the Bloomberg U.S. Aggregate Bond Index. The Fund’s prior benchmark, the Bloomberg Barclays U.S. Government/Credit Bond Index, returned (1.75%). Effective March 19, 2021, the subadviser of the Fund changed from Loomis, Sayles & Company, L.P. to GW&K Investment Management, LLC (“GW&K”). Also effective March 19, 2021, the Fund changed its name to AMG GW&K ESG Bond Fund and changed its principal investment strategies, benchmark, and principal risks. On June 11, 2021, the Fund’s shareholders approved the appointment of GW&K as the subadviser to the Fund and the change in the Fund’s name. MARKET OVERVIEW In the first quarter of 2021, fixed income markets posted their worst returns since 1981 amid a sharp rebound in growth expectations and burgeoning fears of higher inflation. The success of the nationwide vaccine rollout, a rapidly healing labor market, and swelling consumer confidence continued to drive the reflation narrative. Further support came in the form of a $1.9 trillion fiscal stimulus package on top of a commitment to ultra-loose monetary policy from the U.S. Federal Reserve (the “Fed”). And beyond that, investors were confronted with the possibility of yet more fiscal support with a proposal of more than $2 trillion of infrastructure spending. This combination of factors amounted to nothing less than a wholesale regime shift for a bond market that until just a few months ago struggled with an anemic growth outlook and fears of deflation. Nevertheless, worries over new variants, challenged vaccine rollouts, and isolated instances of supply constraints might present challenges in the months ahead. Fixed income markets rebounded solidly in the second quarter following their worst selloff in decades. The most prominent catalyst behind the first quarter rout–the threat of sharply faster economic growth and elevated inflation–proved far less menacing in light of lackluster data and a less dovish Fed. In addition to the overhang of COVID-19, including fears of new variants and the elusiveness of herd immunity, signs began to emerge that the pace of the recovery had peaked. Nonfarm payrolls posted successive disappointments, the | | manufacturing resurgence stalled, and retail sales slipped. Some of the more sensational commodity price spikes began to roll over as well, casting further doubt over the persistence of recent inflationary pressures. None of this suggested that the recovery is off track, but the bond market’s stubborn resilience points to a marked revision of the timeframe for normalization. Fixed income markets were essentially unchanged in the third quarter despite a steady succession of headlines related to COVID-19, geopolitics, and price increases. Bond investors’ largely sanguine response to these challenges suggested they have been able to look beyond near-term headwinds toward the next stage of the recovery. The delta variant drove a massive surge in cases across much of the U.S., even as new prevention and treatment options continued to emerge and data suggest cases have crested. Chinese authorities enacted assertive regulatory changes and pursued efforts to reduce systemic leverage, while nevertheless framing both as necessary to achieve long-term stability and prosperity. Supply-chain constraints, energy shortages, and limited labor availability threatened to weigh on growth around the world, but there have been few indications that these market failures reflect any weakness in aggregate demand. On balance, these various obstacles seem to have been relegated to the category of one-time items, and the bond market has demonstrated little concern that they represent a meaningful threat to the current trading regime. Fixed income markets were effectively flat in the fourth quarter, despite major narrative shifts with respect to inflation, monetary policy, and COVID-19. Signs of easing supply-chain pressures and continued labor market normalization were not enough to quell concerns about rising inflation, which printed at its highest level in almost 40 years. The Fed executed a “hawkish pivot” in acknowledging more persistent inflationary forces and signaled their intention to respond accordingly. The extremely contagious omicron variant rapidly established itself as the dominant strain around the globe, forcing a reappraisal of reopening timelines and reviving the specter of lockdowns and healthcare rationing. Ironically, the combined effect of these various forces essentially netted to zero; solid economic data and a broadly constructive outlook from the Fed were met with the prospect of tightening financial conditions and growth fears | | | | posed by omicron. But trading overall was orderly, and after the last two years’ investors seemed well practiced at looking past near-term volatility toward the next stage of a return to normalcy. FUND REVIEW The Fund outperformed during its fiscal year, helped by its overweight to spread product. For the period prior to the Fund’s transition to GW&K, January 1, 2021 to March 18, 2021, the Fund outperformed the legacy Bloomberg Barclays U.S. Government/Credit Bond Index. An overweight allocation to corporate bonds, including out-of-benchmark high yield allocation, were primary drivers of excess return. Following the transition of the Fund to GW&K, the Fund modestly trailed its current benchmark. High yield corporates notably outperformed the broad investment grade market, as they were less sensitive to the upward shift in rates and experienced 77 basis points in spread tightening. Thus, the Fund’s out-of-benchmark allocation to high yield corporates contributed to returns. An overweight to taxable municipals was a modest tailwind. Security selection was the main contributor to performance. Selection within banking, due to an inclusion of out-of-benchmark preferred stock, was a key positive. Also helping was selection in the investment grade corporate technology, consumer cyclicals, and consumer non-cyclicals sectors. Selection within agency MBS was a drag on returns. The biggest detractor from relative performance was yield curve positioning. The Fund benefited from having an overall duration shorter than its benchmark as yields rose. However, this effect was more than offset by the negative impact of our underweight to the long end amid the sharp flattening of the curve. ESG continues to be a growing area of focus for the corporate bond market. The range of companies publishing sustainability reports and setting related goals and targets increased significantly this year. Large companies in even some of the highest emitting industries, like autos, oil & gas, and steel, set long-term reduction targets and committed to significant sustainability investments. Following this trend, 2021 was another record-shattering year for ESG-labeled bond issuance, with green bonds dominating the market as investors clamor for ESG-related investments. While we continue to selectively add ESG-labeled bonds, we remain focused on avoiding corporate issuers with weaker ESG-related practices |
4
| | |
| | AMG GW&K ESG Bond Fund Portfolio Manager’s Comments (continued) |
| | | | | | |
OUTLOOK The meaningful shift in the Fed’s reaction function–in addition to potentially elevated inflation pressure in the near term–suggests front-end maturities could face a challenging 2022. Farther out the curve, however, the outlook is less clear. With the Fed projecting a terminal rate near 2.5% and the market pricing in a ceiling closer to 1.75%, any fluctuation in this differential is likely to impact longer maturities most acutely as investors weigh the potential for a policy error. In light of these various moving pieces and projections, we believe the bias in rates is to the upside and consequently we are broadly shorter than our benchmark. With respect to curve positioning, we think risks are fairly balanced. We have only a small underweight to long | | maturities because we see a more appealing risk profile in intermediates, which offer attractive carry and roll with less exposure to potential volatility as rates move higher. In light of our constructive fundamental outlook for the credit market and still-supportive market technicals, we believe the corporate credit space offers attractive value. Additionally, with Treasury rates at historically low levels, corporates offer a competitive yield and the potential for spread compression in a rising-rate environment. While we are on guard against the potential for elevated M&A and an increased focus on shareholder returns, we see value in credit improvement stories within the investment grade space. In high yield, we favor crossover stories trading wide of investment grade | | | | peers while avoiding some of the more cyclical industries where we think good news is already reflected in spreads. We remain neutral on mortgages heading into the taper, though higher mortgage rates could improve our outlook for prepayment speeds. We also maintain our preference for higher-coupon, seasoned pools given our expectation of higher rates, as they are less exposed to extension risk. �� The views expressed represent the opinions of GW&K Investment Management, LLC and are not intended as a forecast or guarantee of future results, and are subject to change without notice. |
5
| | |
| | AMG GW&K ESG Bond Fund Portfolio Manager’s Comments (continued) |
CUMULATIVE TOTAL RETURN PERFORMANCE
AMG GW&K ESG Bond Fund’s cumulative total return is based on the daily change in net asset value (NAV), and assumes that all dividends and distributions were reinvested. The graph compares a hypothetical $10,000 investment made in the AMG GW&K ESG Bond Fund’s Class N shares on December 31, 2011, to a $10,000 investment made in the Bloomberg U.S. Aggregate Bond Index and Bloomberg U.S. Government/Credit Bond Index for the same time period. The graph and table do not reflect the deduction of taxes that a shareholder would pay on a Fund distribution or redemption of shares. The listed returns for the Fund are net of expenses and the returns for the indexes exclude expenses. Total returns would have been lower had certain expenses not been reduced.
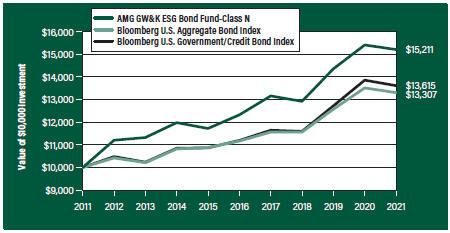
The table below shows the average annual total returns for the AMG GW&K ESG Bond Fund and the Bloomberg U.S. Aggregate Bond Index and Bloomberg U.S. Government/Credit Bond Index for the same time periods ended December 31, 2021.
| | | | | | | | | | | | | | | | | | | | |
Average Annual Total Returns1 | | One Year | | | Five Years | | | Ten Years | | | Since Inception | | | Inception Date | |
AMG GW&K ESG Bond Fund2, 3, 4, 5, 6, 7, 8, 9, 10, 11, 12, 13, 14, 15 | | | | | | | | | |
| | | | | |
Class N | | | (1.29 | %) | | | 4.30% | | | | 4.28% | | | | 7.71% | | | | 06/01/84 | |
| | | | | |
Class I | | | (1.05 | %) | | | 4.47% | | | | — | | | | 3.51% | | | | 04/01/13 | |
Bloomberg U.S. Aggregate Bond Index16 | | | (1.54 | %) | | | 3.57% | | | | 2.90% | | | | 6.97% | | | | 06/01/84† | |
| | | | | |
Bloomberg U.S. Government/Credit Bond Index17 | | | (1.75 | %) | | | 3.99% | | | | 3.13% | | | | 6.99% | | | | 06/01/84† | |
The performance data shown represents past performance. Past performance is not a guarantee of future results. Current performance may be lower or higher than the performance data quoted. The investment return and principal value of an investment will fluctuate so that an investor’s shares, when redeemed, may be worth more or less than their original cost.
Investors should carefully consider the Fund’s investment objectives, risks, charges and expenses before investing. For performance information through the most recent month end, current net asset values per share for the Fund and other information, please call 800.548.4539 or visit our website at amgfunds.com for a free prospectus. Read it carefully before investing or sending money.
Distributed by AMG Distributors, Inc., member FINRA/SIPC.
| † | Date reflects inception date of the Fund, not the index. |
1 Total return equals income yield plus share price change and assumes reinvestment of all dividends and capital
|
gain distributions. Returns are net of fees and may reflect offsets of Fund expenses as described in the prospectus. No adjustment has been made for taxes payable by shareholders on their reinvested dividends and capital gain distributions. Returns for periods greater than one year are annualized. The listed returns on the Fund are net of expenses and based on the published NAV as of December 31, 2021. All returns are in U.S. dollars($). 2 As of March 19, 2021, the Fund’s subadvisor was changed to GW&K Investment Management, LLC. Prior to March 19, 2021, the Fund was known as the AMG Managers Loomis Sayles Bond Fund and had different principal investment strategies and corresponding risks. Performance shown for periods prior to March 19, 2021 reflects the performance and investment strategies of the Fund’s previous subadvisor, Loomis, Sayles & Company, L.P. The Fund’s past performance would have been different if the Fund were managed by the current subadvisor and strategy, and the Fund’s prior performance record might be less pertinent for investors considering whether to purchase shares of the Fund. 3 From time to time, the Fund’s advisor has waived fees and/or absorbed Fund expenses, which has resulted in higher returns. 4 The Fund is subject to the risks associated with investments in debt securities, such as default risk and fluctuations in the perception of the debtor’s ability to pay its creditors. Changing interest rates may adversely affect the value of an investment. An increase in interest rates typically causes the value of bonds and other fixed income securities to fall. 5 To the extent that the Fund invests in asset-backed or mortgage-backed securities, its exposure to prepayment and extension risks may be greater than investments in other fixed income securities. 6 The Fund may invest in derivatives such as options and futures; the complexity and rapidly changing structure of derivatives markets may increase the possibility of market losses. 7 High-yield bonds (also known as “junk bonds”) may be subject to greater levels of interest rate, credit, and liquidity risk than investments in higher rated securities. These securities are considered predominantly speculative with respect to the issuer’s continuing ability to make principal and interest payments. The issuers of the Fund’s holdings may be involved in bankruptcy proceedings, reorganizations, or financial restructurings, and are not as strong financially as higher-rated issuers. 8 Market prices of investments held by the Fund may fall rapidly or unpredictably due to a variety of economic or political factors, market conditions, disasters or public health issues, or in response to |
6
| | |
| | AMG GW&K ESG Bond Fund Portfolio Manager’s Comments (continued) |
| | | | | | | | |
events that affect particular industries or companies. 9 Investments in international securities are subject to certain risks of overseas investing including currency fluctuations and changes in political and economic conditions, which could result in significant market fluctuations. These risks are magnified in emerging markets. 10 The Fund is subject to currency risk resulting from fluctuations in exchange rates that may affect the total loss or gain on a non-U.S. Dollar investment when converted back to U.S. Dollars. 11 Applying the Fund’s ESG investment criteria may result in the selection or exclusion of securities of certain issuers for reasons other than performance, and the Fund may underperform funds that do not utilize an ESG investment strategy. The application of this strategy may affect the Fund’s exposure to certain companies, sectors, regions, countries or types of investments, which could negatively impact the Fund’s performance depending on whether such investments are in or out of favor. Applying ESG criteria to investment decisions is qualitative and subjective by nature, and there is no guarantee that the criteria utilized by the Subadviser or any judgment exercised by the Subadviser will reflect the beliefs or values of any particular investor | | | | 12 Because exchange-traded funds (ETFs) incur their own costs, investing in them could result in a higher cost to the investor. Additionally, the Fund will be indirectly exposed to all the risks of securities held by the ETFs. 13 Factors unique to the municipal bond market may negatively affect the value in municipal bonds. 14 The Fund is subject to the risks associated with investments in emerging markets, such as erratic earnings patterns, economic and political instability, changing exchange controls, limitations on repatriation of foreign capital and changes in local governmental attitudes toward private investment, possibly leading to nationalization or confiscation of investor assets. 15 Obligations of certain government agencies are not backed by the full faith and credit of the U.S. government. If one of these agencies defaulted on a loan, there is no guarantee that the U.S. government would provide financial support. Additionally, debt securities of the U.S. government may be affected by changing interest rates and subject to prepayment risk. 16 On March 19, 2021, the primary benchmark changed from the Bloomberg U.S. Government/Credit Bond Index to the Bloomberg U.S. Aggregate Bond Index. The Bloomberg U.S. Aggregate Bond Index is an index of the U.S. investment-grade fixed-rate bond | | | | market, including both government and corporate bonds. Unlike the Fund, the Bloomberg U.S. Aggregate Bond Index is unmanaged, is not available for investment and does not incur expenses. 17 The Bloomberg U.S. Government/Credit Bond Index is an index of investment grade government and corporate bonds with a maturity date of more than one year. Unlike the Fund, the Bloomberg U.S. Government/Credit Bond Index is unmanaged, is not available for investment and does not incur expenses. “Bloomberg®” and any Bloomberg index described herein are service marks of Bloomberg Finance L.P. and its affiliates, including Bloomberg Index Services Limited (“BISL”), the administrator of the index (collectively, “Bloomberg”) and have been licensed for use for certain purposes by AMG Funds LLC. Bloomberg is not affiliated with AMG Funds LLC, and Bloomberg does not approve, endorse, review, or recommend the fund described herein. Bloomberg does not guarantee the timeliness, accurateness, or completeness of any data or information relating to such fund. Not FDIC insured, nor bank guaranteed. May lose value. |
7
| | |
| | AMG GW&K ESG Bond Fund Fund Snapshots (unaudited) December 31, 2021 |
PORTFOLIO BREAKDOWN
| | |
Category | | % of Net Assets |
| | |
Corporate Bonds and Notes | | 52.8 |
| | |
U.S. Government and Agency Obligations | | 40.1 |
| | |
Municipal Bonds | | 4.1 |
| | |
Foreign Government Obligations | | 0.6 |
| | |
Asset-Backed Securities | | 0.3 |
| | |
Short-Term Investments | | 2.6 |
| | |
Other Assets Less Liabilities | | (0.5) |
| | |
| |
Rating | | % of Market Value1 |
| | |
U.S. Government and Agency Obligations | | 41.0 |
| | |
Aaa/AAA | | 1.4 |
| | |
Aa/AA | | 7.4 |
| | |
A | | 5.1 |
| | |
Baa/BBB | | 20.3 |
| | |
Ba/BB | | 21.3 |
| | |
B | | 3.5 |
TOP TEN HOLDINGS
| | |
Security Name | | % of
Net Assets |
| | |
U.S. Treasury Bonds, 2.250%, 05/15/41 | | 2.9 |
| | |
FHLMC, 3.000%, 04/01/51 | | 2.8 |
| | |
FHLMC, 2.000%, 03/01/36 | | 2.6 |
| | |
U.S. Treasury Bonds, 1.875%, 02/15/51 | | 2.3 |
| | |
FNMA, 2.000%, 04/01/51 | | 2.2 |
| | |
FNMA, 3.500%, 08/01/49 | | 2.2 |
| | |
FNMA, 3.500%, 02/01/35 | | 2.1 |
| | |
U.S. Treasury Bonds, 3.500%, 02/15/39 | | 2.0 |
| | |
FHLMC, 3.500%, 02/01/50 | | 1.8 |
| | |
FHLMC, 4.500%, 12/01/48 | | 1.8 |
| | |
| | | |
Top Ten as a Group | | 22.7 |
| | |
| 1 | Includes market value of long-term fixed-income securities only. |
Credit quality ratings shown above reflect the highest rating assigned by either Standard & Poor’s (“S&P”), Moody’s Investors Service, Inc. (“Moody’s”) or Fitch. These rating agencies are independent, nationally recognized statistical rating organizations and are widely used. Investment grade ratings are credit ratings of BBB/Baa or higher. Below investment grade ratings are credit ratings of BB/Ba or lower. Investments designated N/R are not rated by any of the rating agencies. Unrated investments do not necessarily indicate low credit quality. Credit quality ratings are subject to change.
Because a fund’s strategy may result in multiple investments in particular sectors of the economy, its performance may depend on the performance of those sectors and may fluctuate more widely than investments diversified across more sectors. For additional information on these and other risk considerations, please see the Fund’s prospectus.
Any sectors, industries, or securities discussed should not be perceived as investment recommendations. Mention of a specific security should not be considered a recommendation to buy or solicitation to sell that security. Specific securities mentioned in this report may have been sold from the Fund’s portfolio of investments by the time you receive this report.
8
| | |
| | AMG GW&K ESG Bond Fund Schedule of Portfolio Investments December 31, 2021 |
| | | | | | | | |
| | |
| | | Principal
Amount | | | Value | |
| | |
Corporate Bonds and Notes - 52.8% | | | | | | | | |
| |
Financials - 12.7% | | | | | |
| | |
AerCap Ireland Capital DAC/AerCap Global Aviation Trust (Ireland) 1.650%, 10/29/24 | | | $5,850,000 | | | | $5,839,389 | |
| | |
Aircastle, Ltd. (Bermuda) | | | | | | | | |
5.250%, 08/11/251 | | | 2,582,000 | | | | 2,839,181 | |
| | |
Ally Financial, Inc. | | | | | | | | |
Series B, (4.700% to 05/15/26 then U.S. Treasury Yield Curve CMT 5 year + 3.868%), 4.700%, 05/15/262,3,4,5 | | | 3,010,000 | | | | 3,122,875 | |
8.000%, 11/01/31 | | | 3,100,000 | | | | 4,388,265 | |
| | |
American Express Co. | | | | | | | | |
(3.550% to 09/15/26 then U.S. Treasury Yield Curve CMT 5 year + 2.854%), 3.550%, 09/15/262,3,5 | | | 1,195,000 | | | | 1,197,091 | |
| | |
American Tower Corp. | | | | | | | | |
4.400%, 02/15/26 | | | 2,300,000 | | | | 2,510,009 | |
| | |
Bank of America Corp. | | | | | | | | |
MTN, (4.330% to 03/15/49 then 3 month LIBOR + 1.520%), 4.330%, 03/15/502,5 | | | 6,175,000 | | | | 7,639,152 | |
| | |
The Bank of New York Mellon Corp. | | | | | | | | |
Series G, (4.700% to 09/20/25 then U.S. Treasury Yield Curve CMT 5 year + 4.358%), 4.700%, 09/20/252,3,5 | | | 4,850,000 | | | | 5,173,737 | |
| | |
The Bank of Nova Scotia (Canada) | | | | | | | | |
(SOFR + 0.610%), 0.660%, 09/15/265 | | | 4,788,000 | | | | 4,788,000 | |
| | |
The Charles Schwab Corp. | | | | | | | | |
Series I, (4.000% to 06/01/26 then U.S. Treasury Yield Curve CMT 5 year + 3.168%), 4.000%, 06/01/262,3,5 | | | 4,900,000 | | | | 4,998,000 | |
| | |
CIT Group, Inc. | | | | | | | | |
6.125%, 03/09/284 | | | 2,975,000 | | | | 3,592,313 | |
| | |
Crown Castle International Corp. | | | | | | | | |
4.000%, 03/01/27 | | | 2,300,000 | | | | 2,499,700 | |
| | |
GLP Capital LP/GLP Financing II, Inc. | | | | | | | | |
4.000%, 01/15/31 | | | 1,700,000 | | | | 1,813,883 | |
| | |
The Goldman Sachs Group, Inc. | | | | | | | | |
(SOFR + 0.920%), 0.969%, 10/21/275 | | | 3,150,000 | | | | 3,164,876 | |
6.750%, 10/01/37 | | | 2,200,000 | | | | 3,119,377 | |
| | |
Iron Mountain, Inc. | | | | | | | | |
4.500%, 02/15/311 | | | 3,850,000 | | | | 3,891,156 | |
| | |
JPMorgan Chase & Co. | | | | | | | | |
(SOFR + 0.580%), 0.630%, 03/16/245 | | | 4,000,000 | | | | 4,007,559 | |
4.125%, 12/15/26 | | | 2,700,000 | | | | 2,978,022 | |
| | |
Morgan Stanley | | | | | | | | |
3.950%, 04/23/27 | | | 2,200,000 | | | | 2,421,937 | |
| | |
OneMain Finance Corp. | | | | | | | | |
8.250%, 10/01/23 | | | 3,450,000 | | | | 3,799,312 | |
| | |
Owl Rock Capital Corp. | | | | | | | | |
4.250%, 01/15/26 | | | 2,300,000 | | | | 2,418,612 | |
| | | | | | | | |
| | |
| | | Principal
Amount | | | Value | |
| | |
SBA Communications Corp. | | | | | | | | |
3.875%, 02/15/27 | | $ | 3,850,000 | | | | $3,965,500 | |
| | |
SLM Corp. | | | | | | | | |
3.125%, 11/02/264 | | | 3,365,000 | | | | 3,331,350 | |
4.200%, 10/29/25 | | | 838,000 | | | | 875,710 | |
| | |
Starwood Property Trust, Inc. | | | | | | | | |
4.750%, 03/15/254 | | | 1,700,000 | | | | 1,768,000 | |
| | |
Truist Financial Corp. | | | | | | | | |
Series P, (4.950% to 12/01/25 then U.S. Treasury Yield Curve CMT 5 year + 4.605%), 4.950%, 09/01/252,3,5 | | | 4,050,000 | | | | 4,345,212 | |
| | |
VICI Properties LP/VICI Note Co., Inc. | | | | | | | | |
3.500%, 02/15/251,4 | | | 1,900,000 | | | | 1,928,500 | |
| | |
Weyerhaeuser Co. | | | | | | | | |
6.875%, 12/15/33 | | | 2,600,000 | | | | 3,550,116 | |
| | |
Total Financials | | | | | | | 95,966,834 | |
| |
Industrials - 38.3% | | | | | |
| | |
ACCO Brands Corp. | | | | | | | | |
4.250%, 03/15/291 | | | 4,100,000 | | | | 4,069,250 | |
| | |
Advocate Health & Hospitals Corp. | | | | | | | | |
4.272%, 08/15/48 | | | 2,200,000 | | | | 2,721,217 | |
| | |
AECOM | | | | | | | | |
5.125%, 03/15/27 | | | 2,100,000 | | | | 2,287,625 | |
| | |
Air Products and Chemicals, Inc. | | | | | | | | |
2.700%, 05/15/40 | | | 2,700,000 | | | | 2,722,720 | |
| | |
Alcoa Nederland Holding, B.V. (Netherlands) | | | | | | | | |
4.125%, 03/31/291 | | | 3,800,000 | | | | 3,914,000 | |
| | |
Anheuser-Busch InBev Worldwide, Inc. | | | | | | | | |
4.375%, 04/15/38 | | | 2,200,000 | | | | 2,576,323 | |
| | |
Aramark Services, Inc. | | | | | | | | |
5.000%, 02/01/281,4 | | | 3,620,000 | | | | 3,742,175 | |
| | |
ArcelorMittal, S.A. (Luxembourg) | | | | | | | | |
4.250%, 07/16/294 | | | 3,550,000 | | | | 3,887,007 | |
| | |
Ardagh Metal Packaging Finance USA LLC/Ardagh Metal Packaging Finance PLC
3.250%, 09/01/281 | | | 3,500,000 | | | | 3,460,713 | |
| | |
Ashtead Capital, Inc. | | | | | | | | |
1.500%, 08/12/261,4 | | | 3,536,000 | | | | 3,471,110 | |
| | |
AT&T, Inc.
(3 month LIBOR + 1.180%), 1.381%, 06/12/245
4.300%, 02/15/30 | |
| 3,900,000
2,200,000 |
| |
| 3,952,494
2,476,078 |
|
| | |
Ball Corp. | | | | | | | | |
2.875%, 08/15/30 | | | 4,075,000 | | | | 3,952,750 | |
| | |
Block, Inc. | | | | | | | | |
2.750%, 06/01/261 | | | 2,130,000 | | | | 2,132,535 | |
| | |
Broadcom Corp./Broadcom Cayman Finance, Ltd. | | | | | | | | |
3.875%, 01/15/27 | | | 3,419,000 | | | | 3,707,193 | |
| | |
Caesars Entertainment, Inc. | | | | | | | | |
6.250%, 07/01/251 | | | 3,675,000 | | | | 3,857,372 | |
The accompanying notes are an integral part of these financial statements.
9
| | |
| | AMG GW&K ESG Bond Fund Schedule of Portfolio Investments (continued) |
| | | | | | | | |
| | |
| | | Principal Amount | | | Value | |
| | |
Industrials - 38.3% (continued) | | | | | | | | |
| | |
Centene Corp. | | | | | | | | |
3.375%, 02/15/30 | | $ | 3,850,000 | | | $ | 3,920,801 | |
| | |
Central Garden & Pet Co. | | | | | | | | |
4.125%, 10/15/304 | | | 1,800,000 | | | | 1,815,750 | |
| | |
Cisco Systems, Inc. | | | | | | | | |
5.500%, 01/15/40 | | | 1,900,000 | | | | 2,645,541 | |
| | |
Clearwater Paper Corp. | | | | | | | | |
4.750%, 08/15/281 | | | 2,150,000 | | | | 2,187,625 | |
| | |
The Coca-Cola Co. | | | | | | | | |
2.500%, 06/01/40 | | | 2,600,000 | | | | 2,609,785 | |
| | |
Cogent Communications Group, Inc. | | | | | | | | |
3.500%, 05/01/261 | | | 3,565,000 | | | | 3,620,899 | |
| | |
CommonSpirit Health | | | | | | | | |
3.347%, 10/01/29 | | | 2,300,000 | | | | 2,445,775 | |
| | |
Crown Americas LLC/Crown Americas Capital Corp. V | | | | | | | | |
4.250%, 09/30/26 | | | 3,700,000 | | | | 3,949,750 | |
| | |
CVS Health Corp. | | | | | | | | |
5.125%, 07/20/45 | | | 2,100,000 | | | | 2,729,715 | |
| | |
Dana, Inc. | | | | | | | | |
4.250%, 09/01/30 | | | 1,000,000 | | | | 1,013,750 | |
5.375%, 11/15/274 | | | 3,700,000 | | | | 3,880,171 | |
| | |
Dell International LLC/EMC Corp. | | | | | | | | |
8.100%, 07/15/36 | | | 972,000 | | | | 1,478,995 | |
| | |
Dell, Inc. | | | | | | | | |
7.100%, 04/15/284 | | | 3,100,000 | | | | 3,883,783 | |
| | |
Delta Air Lines, Inc. | | | | | | | | |
7.375%, 01/15/264 | | | 3,350,000 | | | | 3,943,945 | |
| | |
Discovery Communications LLC | | | | | | | | |
3.950%, 03/20/28 | | | 2,247,000 | | | | 2,442,023 | |
| | |
Elanco Animal Health, Inc. | | | | | | | | |
5.900%, 08/28/286 | | | 3,400,000 | | | | 3,944,000 | |
| | |
Encompass Health Corp. | | | | | | | | |
4.750%, 02/01/30 | | | 3,400,000 | | | | 3,502,000 | |
| | |
Fiserv, Inc. | | | | | | | | |
4.200%, 10/01/28 | | | 2,200,000 | | | | 2,466,255 | |
| | |
FMG Resources August 2006 Pty, Ltd. (Australia) | | | | | | | | |
4.500%, 09/15/271 | | | 3,700,000 | | | | 3,940,500 | |
| | |
The Ford Foundation | | | | | | | | |
Series 2020, 2.415%, 06/01/50 | | | 2,900,000 | | | | 2,739,925 | |
| | |
G-III Apparel Group, Ltd. | | | | | | | | |
7.875%, 08/15/251 | | | 3,440,000 | | | | 3,660,143 | |
| | |
GLP Capital LP/GLP Financing II Inc. | | | | | | | | |
5.750%, 06/01/28 | | | 1,500,000 | | | | 1,731,960 | |
| | |
The Goodyear Tire & Rubber Co. | | | | | | | | |
4.875%, 03/15/27 | | | 3,475,000 | | | | 3,679,156 | |
| | |
Graphic Packaging International LLC | | | | | | | | |
3.500%, 03/01/291 | | | 3,150,000 | | | | 3,126,375 | |
| | |
Hanesbrands, Inc. | | | | | | | | |
4.875%, 05/15/261 | | | 3,650,000 | | | | 3,900,937 | |
| | | | | | | | |
| | |
| | | Principal Amount | | | Value | |
| | |
Hasbro, Inc. | | | | | | | | |
3.900%, 11/19/294 | | $ | 3,925,000 | | | $ | 4,327,454 | |
| | |
HB Fuller Co. | | | | | | | | |
4.250%, 10/15/28 | | | 3,900,000 | | | | 4,017,000 | |
| | |
HCA, Inc. | | | | | | | | |
3.500%, 09/01/30 | | | 3,600,000 | | | | 3,804,750 | |
| | |
Hilton Domestic Operating Co., Inc. | | | | | | | | |
4.875%, 01/15/30 | | | 3,750,000 | | | | 4,007,812 | |
| | |
The Home Depot, Inc. | | | | | | | | |
5.875%, 12/16/36 | | | 1,700,000 | | | | 2,407,895 | |
| | |
IEA Energy Services LLC | | | | | | | | |
6.625%, 08/15/291 | | | 1,855,000 | | | | 1,832,276 | |
| | |
KB Home | | | | | | | | |
4.800%, 11/15/294 | | | 1,347,000 | | | | 1,470,251 | |
6.875%, 06/15/27 | | | 1,751,000 | | | | 2,053,048 | |
| | |
Klabin Finance, S.A. (Luxembourg) | | | | | | | | |
4.875%, 09/19/271 | | | 3,700,000 | | | | 3,931,250 | |
| | |
Kraft Heinz Foods Co. | | | | | | | | |
4.375%, 06/01/46 | | | 5,800,000 | | | | 6,791,802 | |
| | |
Lamar Media Corp. | | | | | | | | |
4.875%, 01/15/29 | | | 3,650,000 | | | | 3,809,688 | |
| | |
Lumen Technologies Inc | | | | | | | | |
5.625%, 04/01/25 | | | 1,900,000 | | | | 2,009,668 | |
| | |
Macy’s Retail Holdings, LLC | | | | | | | | |
4.500%, 12/15/34 | | | 4,100,000 | | | | 4,048,750 | |
| | |
MercadoLibre, Inc. | | | | | | | | |
2.375%, 01/14/26 | | | 4,000,000 | | | | 3,890,040 | |
| | |
Merck & Co.,Inc. | | | | | | | | |
1.900%, 12/10/284 | | | 7,460,000 | | | | 7,495,118 | |
| | |
Methanex Corp. (Canada) | | | | | | | | |
5.125%, 10/15/27 | | | 1,800,000 | | | | 1,890,000 | |
| | |
MGM Resorts International | | | | | | | | |
5.750%, 06/15/25 | | | 3,550,000 | | | | 3,820,688 | |
| | |
Microsoft Corp. | | | | | | | | |
2.525%, 06/01/50 | | | 2,700,000 | | | | 2,633,007 | |
| | |
MSCI, Inc. | | | | | | | | |
3.250%, 08/15/331 | | | 2,015,000 | | | | 2,037,669 | |
| | |
Murphy Oil USA, Inc. | | | | | | | | |
4.750%, 09/15/29 | | | 3,700,000 | | | | 3,894,250 | |
| | |
Newell Brands, Inc. | | | | | | | | |
4.700%, 04/01/266 | | | 3,600,000 | | | | 3,924,918 | |
| | |
Nordstrom, Inc. | | | | | | | | |
4.000%, 03/15/274 | | | 3,900,000 | | | | 3,919,500 | |
| | |
Northrop Grumman Corp. | | | | | | | | |
3.200%, 02/01/27 | | | 2,200,000 | | | | 2,334,922 | |
| | |
Novelis Corp. | | | | | | | | |
3.250%, 11/15/261 | | | 3,775,000 | | | | 3,808,031 | |
| | |
Owens Corning | | | | | | | | |
7.000%, 12/01/36 | | | 1,800,000 | | | | 2,541,702 | |
| | |
Parker-Hannifin Corp. | | | | | | | | |
3.250%, 06/14/29 | | | 2,200,000 | | | | 2,331,511 | |
The accompanying notes are an integral part of these financial statements.
10
| | |
| | AMG GW&K ESG Bond Fund Schedule of Portfolio Investments (continued) |
| | | | | | | | |
| | |
| | | Principal Amount | | | Value | |
| | |
Industrials - 38.3% (continued) | | | | | | | | |
| | |
Penn National Gaming, Inc. | | | | | | | | |
5.625%, 01/15/271,4 | | | $3,400,000 | | | | $3,468,000 | |
| | |
Prime Security Services Borrower LLC/Prime Finance, Inc. | | | | | | | | |
5.750%, 04/15/261 | | | 3,650,000 | | | | 3,918,895 | |
| | |
PulteGroup, Inc. | | | | | | | | |
6.000%, 02/15/35 | | | 4,050,000 | | | | 5,208,420 | |
| | |
Royal Caribbean Cruises, Ltd. (Liberia) | | | | | | | | |
5.500%, 04/01/281,4 | | | 3,475,000 | | | | 3,515,171 | |
| | |
Sally Holdings LLC/Sally Capital, Inc. | | | | | | | | |
8.750%, 04/30/251 | | | 2,000,000 | | | | 2,130,000 | |
| | |
SK Hynix, Inc. (South Korea) | | | | | | | | |
2.375%, 01/19/311 | | | 3,000,000 | | | | 2,887,091 | |
| | |
Sysco Corp. | | | | | | | | |
2.400%, 02/15/30 | | | 4,900,000 | | | | 4,914,371 | |
| | |
Teleflex, Inc. | | | | | | | | |
4.250%, 06/01/281 | | | 3,900,000 | | | | 4,017,741 | |
| | |
Tenet Healthcare Corp. | | | | | | | | |
4.875%, 01/01/261 | | | 3,750,000 | | | | 3,851,737 | |
| | |
Travel + Leisure Co. | | | | | | | | |
5.650%, 04/01/246 | | | 2,900,000 | | | | 3,081,250 | |
| | |
Twilio, Inc. | | | | | | | | |
3.625%, 03/15/29 | | | 600,000 | | | | 605,298 | |
3.875%, 03/15/31 | | | 2,819,000 | | | | 2,846,344 | |
| | |
United Parcel Service, Inc. | | | | | | | | |
6.200%, 01/15/38 | | | 1,700,000 | | | | 2,453,164 | |
| | |
United Rentals North America, Inc. | | | | | | | | |
3.875%, 02/15/31 | | | 3,850,000 | | | | 3,907,750 | |
| | |
Valvoline, Inc. | | | | | | | | |
4.250%, 02/15/301 | | | 3,600,000 | | | | 3,672,792 | |
| | |
Verizon Communications, Inc. | | | | | | | | |
3.875%, 02/08/294 | | | 3,860,000 | | | | 4,277,550 | |
| | |
VF Corp. | | | | | | | | |
2.950%, 04/23/30 | | | 2,400,000 | | | | 2,489,401 | |
| | |
Walgreens Boots Alliance, Inc. | | | | | | | | |
4.800%, 11/18/44 | | | 3,120,000 | | | | 3,751,999 | |
| | |
Walmart, Inc. | | | | | | | | |
4.050%, 06/29/48 | | | 2,100,000 | | | | 2,668,884 | |
| | |
WESCO Distribution, Inc. | | | | | | | | |
7.125%, 06/15/251 | | | 1,600,000 | | | | 1,696,000 | |
| | |
Western Digital Corp. | | | | | | | | |
4.750%, 02/15/26 | | | 2,066,000 | | | | 2,259,047 | |
| | |
Yum! Brands, Inc. | | | | | | | | |
3.625%, 03/15/31 | | | 3,950,000 | | | | 3,935,187 | |
| | |
Total Industrials | | | | | | | 288,779,213 | |
| | |
Utilities - 1.8% | | | | | | | | |
| | |
Dominion Energy, Inc. | | | | | | | | |
Series B, (4.650% to 12/15/24 then U.S. Treasury Yield Curve CMT 5 year + 2.993%), 4.650%, 12/15/242,3,5 | | | 4,450,000 | | | | 4,639,125 | |
| | | | | | | | |
| | |
| | | Principal Amount | | | Value | |
| | |
National Rural Utilities Cooperative Finance Corp. | | | | | | | | |
1.350%, 03/15/31 | | | $5,100,000 | | | | $4,686,458 | |
| | |
Northern States Power Co. | | | | | | | | |
2.900%, 03/01/50 | | | 4,200,000 | | | | 4,240,203 | |
| | |
Total Utilities | | | | | | | 13,565,786 | |
| | |
Total Corporate Bonds and Notes | | | | | | | | |
(Cost $389,051,017) | | | | | | | 398,311,833 | |
| |
Asset-Backed Securities - 0.3% | | | | | |
| | |
FAN Engine Securitization, Ltd. (Ireland) | | | | | | | | |
Series 2013-1A, Class 1A 4.625%, 10/15/43 (Cost $7,109,736)1,7 | | | 7,176,547 | | | | 2,475,909 | |
| |
Municipal Bonds - 4.1% | | | | | |
| | |
California State General Obligation, School Improvements
7.550%, 04/01/39 | | | 2,900,000 | | | | 4,839,679 | |
| | |
JobsOhio Beverage System, Series A
2.833%, 01/01/38 | | | 4,000,000 | | | | 4,123,719 | |
| | |
Los Angeles Unified School District, School Improvements
5.750%, 07/01/34 | | | 3,725,000 | | | | 4,848,629 | |
| | |
Massachusetts School Building Authority Series B, 1.753%, 08/15/30 | | | 4,850,000 | | | | 4,796,170 | |
| | |
New Jersey Economic Development Authority, Pension Funding, Series A (National Insured)
7.425%, 02/15/29 | | | 3,900,000 | | | | 4,901,645 | |
| | |
Port Authority of New York & New Jersey | | | | | | | | |
6.040%, 12/01/29 | | | 2,150,000 | | | | 2,789,364 | |
| | |
University of California | | | | | | | | |
1.697%, 05/15/29 | | | 4,370,000 | | | | 4,302,439 | |
| | |
Total Municipal Bonds | | | | | | | | |
(Cost $30,539,769) | | | | | | | 30,601,645 | |
| |
| U.S. Government and Agency Obligations - 40.1% | | | | | |
| | |
Fannie Mae - 13.4% | | | | | | | | |
| | |
FNMA | | | | | | | | |
2.000%, 04/01/51 | | | 16,409,567 | | | | 16,373,579 | |
2.500%, 11/01/50 | | | 5,917,701 | | | | 6,043,218 | |
3.500%, 02/01/35 to 08/01/49 | | | 32,000,239 | | | | 33,880,883 | |
4.000%, 06/01/48 to 01/01/51 | | | 24,331,566 | | | | 25,931,739 | |
5.000%, 05/01/50 | | | 4,328,171 | | | | 4,804,358 | |
| | |
FNMA Pool | | | | | | | | |
3.500%, 02/01/51 | | | 6,011,309 | | | | 6,467,641 | |
4.000%, 07/01/44 | | | 7,387,565 | | | | 8,098,067 | |
| | |
Total Fannie Mae | | | | | | | 101,599,485 | |
| | |
Freddie Mac - 9.0% | | | | | | | | |
| | |
FHLMC | | | | | | | | |
2.000%, 03/01/36 | | | 18,816,097 | | | | 19,300,901 | |
3.000%, 04/01/51 | | | 20,334,540 | | | | 21,072,492 | |
3.500%, 02/01/50 | | | 13,134,900 | | | | 13,823,343 | |
The accompanying notes are an integral part of these financial statements.
11
| | |
| | AMG GW&K ESG Bond Fund Schedule of Portfolio Investments (continued) |
| | | | | | | | |
| | |
| | | Principal
Amount | | | Value | |
| | |
Freddie Mac - 9.0% (continued) | | | | | | | | |
| | |
FHLMC | | | | | | | | |
4.500%, 12/01/48 | | | $12,600,668 | | | | $13,524,568 | |
| | |
Total Freddie Mac | | | | | | | 67,721,304 | |
| |
U.S. Treasury Obligations - 17.7% | | | | | |
| | |
U.S. Treasury Bonds | | | | | | | | |
1.250%, 05/15/50 | | | 6,850,000 | | | | 5,816,881 | |
1.875%, 02/15/51 | | | 17,501,000 | | | | 17,315,052 | |
2.250%, 05/15/41 | | | 20,772,000 | | | | 21,817,091 | |
2.500%, 02/15/46 | | | 3,396,000 | | | | 3,751,386 | |
3.125%, 05/15/48 | | | 6,521,000 | | | | 8,149,722 | |
3.500%, 02/15/39 | | | 12,306,000 | | | | 15,438,262 | |
5.000%, 05/15/37 | | | 5,325,000 | | | | 7,750,995 | |
6.750%, 08/15/26 | | | 3,474,000 | | | | 4,329,744 | |
| | |
U.S. Treasury Notes | | | | | | | | |
0.125%, 03/31/23 to 02/15/24 | | | 25,713,000 | | | | 25,489,854 | |
0.250%, 03/15/24 | | | 7,718,000 | | | | 7,625,746 | |
0.500%, 02/28/26 | | | 8,870,000 | | | | 8,618,106 | |
0.875%, 03/31/26 | | | 3,800,000 | | | | 3,727,859 | |
2.500%, 01/31/25 | | | 3,650,000 | | | | 3,816,103 | |
| | |
Total U.S. Treasury Obligations | | | | | | | 133,646,801 | |
| | |
Total U.S. Government and Agency Obligations | | | | | | | | |
(Cost $301,875,763) | | | | | | | 302,967,590 | |
| |
Foreign Government Obligation - 0.6% | | | | | |
The Korea Development Bank (South Korea) | | | | | | | | |
0.500%, 10/27/23
(Cost $4,806,814) | | | 4,800,000 | | | | 4,757,313 | |
Short-Term Investments - 2.6% | | | | | |
| |
Joint Repurchase Agreements - 2.6%8 | | | | | |
| | |
Cantor Fitzgerald Securities, Inc., dated 12/31/21,due 01/03/22, 0.050% total to be received $4,688,720 (collateralized by various U.S. Government Agency Obligations, 0.000% - 9.000%, 02/01/22 - 07/20/71, totaling $4,782,474) | | | 4,688,700 | | | | 4,688,700 | |
| | | | | | | | |
| | |
| | | Principal
Amount | | | Value | |
| | |
Citadel Securities LLC, dated 12/31/21, due 01/03/22, 0.070% total to be received $3,954,575 (collateralized by various U.S. Treasuries, 0.000% - 7.250%, 01/04/22 - 11/15/51, totaling $4,033,667) | | | $3,954,552 | | | | $3,954,552 | |
| | |
HSBC Securities USA, Inc., dated 12/31/21, due 01/03/22, 0.040% total to be received $116,285 (collateralized by various U.S. Treasuries, 0.125% - 3.875%, 05/15/23 - 08/15/47, totaling $118,611) | | | 116,285 | | | | 116,285 | |
| | |
Mirae Asset Securities USA, Inc., dated 12/31/21,due 01/03/22, 0.060% total to be received $2,196,474 (collateralized by various U.S. Government Agency Obligations, 0.550% - 7.500%, 01/01/23 - 10/20/71, totaling $2,240,404) | | | 2,196,463 | | | | 2,196,463 | |
| | |
RBC Dominion Securities, Inc., dated 12/31/21, due 01/03/22, 0.050% total to be received $4,688,716 (collateralized by various U.S. Government Agency Obligations and U.S. Treasuries, 0.000% - 6.500%, 05/15/22 - 12/01/51, totaling $4,782,470) | | | 4,688,696 | | | | 4,688,696 | |
| | |
State of Wisconsin Investment Board, dated 12/31/21, due 01/03/22, 0.070% total to be received $4,097,172 (collateralized by various U.S. Treasuries, 0.125% - 3.875%, 07/15/23 - 02/15/48, totaling $4,179,112) | | | 4,097,148 | | | | 4,097,148 | |
| | |
Total Joint Repurchase Agreements | | | | | | | 19,741,844 | |
| | |
Total Short-Term Investments | | | | | | | | |
(Cost $19,741,844) | | | | | | | 19,741,844 | |
| | |
Total Investments - 100.5% | | | | | | | | |
(Cost $753,124,943) | | | | | | | 758,856,134 | |
| |
Other Assets, less Liabilities - (0.5)% | | | | (3,917,812 | ) |
| | |
Net Assets - 100.0% | | | | | | | $754,938,322 | |
| 1 | Security exempt from registration under Rule 144A of the Securities Act of 1933. This security may be resold in transactions exempt from registration, normally to qualified institutional buyers. At December 31, 2021, the value of these securities amounted to $96,985,033 or 12.8% of net assets. |
| 2 | Fixed to variable rate investment. The rate shown reflects the fixed rate in effect at December 31, 2021. Rate will reset at a future date. |
| 3 | Perpetuity Bond. The date shown represents the next call date. |
| 4 | Some of these securities, amounting to $39,839,239 or 5.3% of net assets, were out on loan to various borrowers and are collateralized by cash and various U.S. Treasury Obligations. See Note 4 of Notes to Financial Statements. |
| 5 | Variable rate security. The rate shown is based on the latest available information as of December 31, 2021. Certain variable rate securities are not based on a published reference rate and spread but are determined by the issuer or agent and are based on current market conditions. These securities do not indicate a reference rate and spread in their description above. |
| 6 | Step Bond: A debt instrument with either deferred interest payments or an interest rate that resets at specific times during its term. |
| 7 | Security’s value was determined by using significant unobservable inputs. |
| 8 | Cash collateral received for securities lending activity was invested in these joint repurchase agreements. |
| | |
| CMT | | Constant Maturity Treasury |
| FHLMC | | Freddie Mac |
| FNMA | | Fannie Mae |
| LIBOR | | London Interbank Offered Rate |
| MTN | | Medium-Term Note |
| National Insured | | National Public Finance Guarantee Corp. |
| SOFR | | Secured Overnight Financing Rate |
The accompanying notes are an integral part of these financial statements.
12
| | |
| | AMG GW&K ESG Bond Fund Schedule of Portfolio Investments (continued) |
The following table summarizes the inputs used to value the Fund’s investments by the fair value hierarchy levels as of December 31, 2021:
| | | | | | | | | | | | | | | | |
| | | Level 1 | | | Level 2 | | | Level 3 | | | Total | |
| | | | |
Investments in Securities | | | | | | | | | | | | | | | | |
| | | | |
Corporate Bonds and Notes† | | | – | | | $ | 398,311,833 | | | | – | | | $ | 398,311,833 | |
| | | | |
Asset-Backed Securities | | | – | | | | – | | | $ | 2,475,909 | | | | 2,475,909 | |
| | | | |
Municipal Bonds† | | | – | | | | 30,601,645 | | | | – | | | | 30,601,645 | |
| | | | |
U.S. Government and Agency Obligations† | | | – | | | | 302,967,590 | | | | – | | | | 302,967,590 | |
| | | | |
Foreign Government Obligation | | | – | | | | 4,757,313 | | | | – | | | | 4,757,313 | |
| | | | |
Short-Term Investments | | | | | | | | | | | | | | | | |
| | | | |
Joint Repurchase Agreements | | | – | | | | 19,741,844 | | | | – | | | | 19,741,844 | |
| | | | |
| | | | | | | | | | | | | | | | |
| | | | |
Total Investments in Securities | | | – | | | $ | 756,380,225 | | | $ | 2,475,909 | | | $ | 758,856,134 | |
| | | | | | | | | | | | | | | | |
| † | All corporate bonds and notes, municipal bonds, and U.S. government and agency obligations held in the Fund are Level 2 securities. For a detailed breakout of corporate bonds and notes, municipal bonds, and U.S. government and agency obligations by major industry or agency classification, please refer to the Fund’s Schedule of Portfolio Investments. |
The following table below is a reconciliation of investments in which significant unobservable inputs (Level 3) were used in determining fair value at December 31, 2021:
| | | | | |
| | | Asset-Backed
Securities |
Balance as of December 31, 2020 | | | $ | 5,105,499 | |
Accrued discounts (premiums) | | | | 5,414 | |
Realized gain (loss) | | | | 11,419 | |
Change in unrealized appreciation/depreciation | | | | (1,471,536 | ) |
Purchases | | | | – | |
Sales | | | | – | |
Paydowns | | | | (1,174,887 | ) |
Transfers in to Level 3 | | | | – | |
Transfers out of Level 3 | | | | – | |
Balance as of December 31, 2021 | | | $ | 2,475,909 | |
| | | | | |
Net change in unrealized appreciation/depreciation on investments still held at December 31, 2021 | | | $ | (1,911,114 | ) |
The following table summarizes the quantitative inputs and assumptions used for investments categorized in Level 3 of the fair value hierarchy as of December 31, 2021. The table below is not intended to be all-inclusive, but rather provides information on the significant Level 3 inputs as they relate to the Fund’s fair value measurements:
Quantitative Information about Level 3 Fair Value Measurements
| | | | | | | | | | | | |
| | | Fair Value as of | | Valuation | | Unobservable | | | | | | Impact to Valuation from |
| | | December 31, 2021 | | Technique(s) | | Inputs(s) | | Range | | Median | | an Increase in Input(a) |
| | | | | | Broker Quote weighted 25% | | 55 | | N/A | | Increase |
| Asset-Backed Securities | | $2,475,909 | | Market Approach | | Discount Rate | | 3.83% | | N/A | | Decrease |
| | | | | | Indicative Bid Price weighted 75% | | 29.5 | | N/A | | Increase |
| (a) | Represents the directional change in the fair value of the Level 3 investments that could have resulted from an increase in the corresponding input as of period end. A decrease to the unobservable input would have had the opposite effect. Significant changes in these inputs may have resulted in a significantly higher or lower fair value measurement at period end. |
The accompanying notes are an integral part of these financial statements.
13
| | |
| | AMG GW&K ESG Bond Fund Schedule of Portfolio Investments (continued) |
For the fiscal year ended December 31, 2021, the effect of derivative instruments on the Statement of Operations for the Fund and the amount of realized gain/loss and unrealized appreciation/depreciation on derivatives recognized in income was as follows:
| | | | | | | | | | |
| | | Realized Gain/(Loss) | | Change in Unrealized Appreciation/Depreciation | |
Derivatives not accounted
for as hedging instruments | | Statement of Operations
Location | | Realized Gain/(Loss) | | Statement of Operations
Location | | Change in
Unrealized
Appreciation/
Depreciation | |
Interest rate futures contracts | | Net realized gain on futures contracts | | $267,476 | | Net change in unrealized appreciation/ depreciation on futures contracts | | | – | |
The accompanying notes are an integral part of these financial statements.
14
| | |
| | AMG GW&K Enhanced Core Bond ESG Fund Portfolio Manager’s Comments (unaudited) |
| | | | | | |
THE YEAR IN REVIEW AMG GW&K Enhanced Core Bond ESG Fund (the “Fund”) Class N shares returned (1.26%) for the year ended December 31, 2021, compared to the return of (1.54%) for Fund’s benchmark, the Bloomberg Barclays U.S. Aggregate Bond Index. MARKET OVERVIEW In the first quarter of 2021, fixed income markets posted their worst returns since 1981 amid a sharp rebound in growth expectations and burgeoning fears of higher inflation. The success of the nationwide vaccine rollout, a rapidly healing labor market, and swelling consumer confidence continued to drive the reflation narrative. Further support came in the form of a $1.9 trillion fiscal stimulus package on top of a commitment to ultra-loose monetary policy from the U.S. Federal Reserve (the “Fed”). And beyond that, investors were confronted with the possibility of yet more fiscal support with a proposal of more than $2 trillion of infrastructure spending. This combination of factors amounted to nothing less than a wholesale regime shift for a bond market that until just a few months ago struggled with an anemic growth outlook and fears of deflation. Nevertheless, worries over new variants, challenged vaccine rollouts, and isolated instances of supply constraints might present challenges in the months ahead. Fixed income markets rebounded solidly in the second quarter following their worst selloff in decades. The most prominent catalyst behind the first quarter rout—the threat of sharply faster economic growth and elevated inflation—proved far less menacing in light of lackluster data and a less dovish Fed. In addition to the overhang of COVID-19, including fears of new variants and the elusiveness of herd immunity, signs began to emerge that the pace of the recovery had peaked. Nonfarm payrolls posted successive disappointments, the manufacturing resurgence stalled, and retail sales slipped. Some of the more sensational commodity price spikes began to roll over as well, casting further doubt over the persistence of recent inflationary pressures. None of this suggested that the recovery is off track, but the bond market’s stubborn resilience points to a marked revision of the timeframe for normalization. Fixed income markets were essentially unchanged in the third quarter despite a steady succession of headlines related to COVID-19, geopolitics, and price increases. Bond investors’ largely sanguine response to these challenges suggested they have been able | | to look beyond near-term headwinds toward the next stage of the recovery. The delta variant drove a massive surge in cases across much of the U.S., even as new prevention and treatment options continued to emerge and data suggest cases have crested. Chinese authorities enacted assertive regulatory changes and pursued efforts to reduce systemic leverage, while nevertheless framing both as necessary to achieve long-term stability and prosperity. Supply-chain constraints, energy shortages, and limited labor availability threatened to weigh on growth around the world, but there have been few indications that these market failures reflect any weakness in aggregate demand. On balance, these various obstacles seem to have been relegated to the category of one-time items, and the bond market has demonstrated little concern that they represent a meaningful threat to the current trading regime. Fixed income markets were effectively flat in the fourth quarter, despite major narrative shifts with respect to inflation, monetary policy, and COVID-19. Signs of easing supply-chain pressures and continued labor market normalization were not enough to quell concerns about rising inflation, which is at its highest level in almost 40 years. The Fed executed a “hawkish pivot” in acknowledging more persistent inflationary forces and signaled their intention to respond accordingly. The extremely contagious omicron variant rapidly established itself as the dominant strain around the globe, forcing a reappraisal of reopening timelines and reviving the specter of lockdowns and healthcare rationing. Ironically, the combined effect of these various forces essentially netted to zero; solid economic data and a broadly constructive outlook from the Fed were met with the prospect of tightening financial conditions and growth fears posed by omicron. But trading overall was orderly, and after the last two years’ investors seemed well practiced at looking past near-term volatility toward the next stage of a return to normalcy. FUND REVIEW The Fund outperformed its benchmark during the fiscal year, helped by its overweight to spread product. Investment grade corporates outperformed due to modest spread contraction and their higher carry. Additionally, high yield corporates notably outperformed the broad investment grade market, as they were less sensitive to the upward shift in rates and experienced 77 basis points in spread tightening. Thus, the Fund’s above-benchmark allocation to investment grade corporate bonds and the Fund’s | | | | out-of-benchmark allocation to high yield corporates contributed to returns. An overweight to taxable municipals was an additional tailwind. Security selection was the main contributor to performance. Selection within banking, due to an inclusion of out-of-benchmark preferreds, was a key positive. Also helping was selection in the investment grade corporate consumer cyclicals and consumer non-cyclicals sectors as well as in taxable municipals and agency MBS. Selection was negative in the communications and capital goods sectors. The Fund benefited from having an overall duration shorter than its benchmark as yields rose across the curve. However, our preference for intermediate maturities and underweight to the long end weighed on performance amid the sharp flattening of the yield curve. ESG continues to be a growing area of focus for the corporate bond market. The range of companies publishing sustainability reports and setting related goals and targets increased significantly this year. Large companies in even some of the highest emitting industries, like autos, oil & gas, and steel, set long-term reduction targets and committed to significant sustainability investments. Following this trend, 2021 was another record-shattering year for ESG-labeled bond issuance, with green bonds dominating the market as investors clamor for ESG-related investments. While we continue to selectively add ESG-labeled bonds, we remain focused on avoiding corporate issuers with weaker ESG-related practices. OUTLOOK The meaningful shift in the Fed reaction function—in addition to potentially elevated inflation pressure in the near term—suggests front-end maturities could face a challenging 2022. Farther out the curve, however, the outlook is less clear. With the Fed projecting a terminal rate near 2.5% and the market pricing in a ceiling closer to 1.75%, any fluctuation in this differential is likely to impact longer maturities most acutely as investors weigh the potential for a policy error. In light of these various moving pieces and projections, we believe the bias in rates is to the upside and consequently we are broadly shorter than our benchmark. With respect to curve positioning, we think risks are fairly balanced. We have only a small underweight to long maturities because we see a more appealing risk profile in intermediates, which offer attractive carry and roll with less exposure to potential volatility as rates move higher. |
15
| | |
| | AMG GW&K Enhanced Core Bond ESG Fund Portfolio Manager’s Comments (continued) |
| | | | | | |
In light of our constructive fundamental outlook for the credit market and still-supportive market technicals, we believe the corporate credit space offers attractive value. Additionally, with Treasury rates at historically low levels, corporates offer a competitive yield and the potential for spread compression in a rising-rate environment. While we are on guard against the potential for elevated M&A and an increased focus on shareholder returns, we | | see value in credit improvement stories within the investment grade space. In high yield, we favor crossover stories trading wide of investment grade peers while avoiding some of the more cyclical industries where we think good news is already reflected in spreads. We remain neutral on mortgages heading into the taper, though higher mortgage rates could improve our outlook for prepayment speeds. We also maintain our | | | | preference for higher-coupon, seasoned pools given our expectation of higher rates, as they are less exposed to extension risk. The views expressed represent the opinions of GW&K Investment Management, LLC and are not intended as a forecast or guarantee of future results, and are subject to change without notice. |
16
| | |
| | AMG GW&K Enhanced Core Bond ESG Fund Portfolio Manager’s Comments (continued) |
CUMULATIVE TOTAL RETURN PERFORMANCE
AMG GW&K Enhanced Core Bond ESG Fund’s cumulative total return is based on the daily change in net asset value (NAV), and assumes that all dividends and distributions were reinvested. The graph compares a hypothetical $10,000 investment made in the AMG GW&K Enhanced Core Bond ESG Fund’s Class N shares on December 31, 2011, to a $10,000 investment made in the Bloomberg U.S. Aggregate Bond Index for the same time period. The graph and table do not reflect the deduction of taxes that a shareholder would pay on a Fund distribution or redemption of shares. The listed returns for the Fund are net of expenses and the returns for the index exclude expenses. Total returns would have been lower had certain expenses not been reduced.
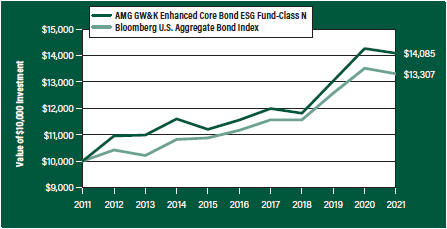
The table below shows the average annual total returns for the AMG GW&K Enhanced Core Bond ESG Fund and the Bloomberg U.S. Aggregate Bond Index for the same time periods ended December 31, 2021.
| | | | | | | | | | | | | | | | | | | | |
| | | One | | | Five | | | Ten | | | Since | | | Inception | |
| Average Annual Total Returns1 | | Year | | | Years | | | Years | | | Inception | | | Date | |
AMG GW&K Enhanced Core Bond ESG Fund2, 3, 4, 5, 6, 7, 8, 9 | | | | | |
Class N | | | (1.26 | %) | | | 4.04 | % | | | 3.48 | % | | | 5.20 | % | | | 01/02/97 | |
| | | | | |
Class I | | | (1.07 | %) | | | 4.23 | % | | | | – | | | 3.01 | % | | | 11/30/12 | |
| | | | | |
Class Z | | | (0.92 | %) | | | 4.30 | % | | | 3.75 | % | | | 5.57 | % | | | 01/02/97 | |
| | | | | |
Bloomberg U.S. Aggregate Bond Index10 | | | (1.54 | %) | | | 3.57 | % | | | 2.90 | % | | | 4.96 | % | | | 01/02/97 | † |
The performance data shown represents past performance. Past performance is not a guarantee of future results. Current performance may be lower or higher than the performance data quoted. The investment return and principal value of an investment will fluctuate so that an investor’s shares, when redeemed, may be worth more or less than their original cost.
Investors should carefully consider the Fund’s investment objectives, risks, charges and expenses before investing. For performance information through the most recent month end, current net asset values per share for the Fund and other information, please call 800.548.4539 or visit our website at amgfunds.com for a free prospectus. Read it carefully before investing or sending money.
Distributed by AMG Distributors, Inc., member FINRA/SIPC.
| † | Date reflects the inception date of the Fund, not the index. |
| 1 | Total return equals income yield plus share price change and assumes reinvestment of all dividends and capital gain distributions. Returns are net of fees and may reflect offsets of Fund expenses as described in the prospectus. No adjustment has been made for taxes payable by shareholders on their reinvested dividends and |
|
capital gain distributions. Returns for periods greater than one year are annualized. The listed returns on the Fund are net of expenses and based on the published NAV as of December 31, 2021. All returns are in U.S. dollars ($). 2 From time to time, the Fund’s advisor has waived its fees and/or absorbed Fund expenses, which has resulted in higher returns. |
3 The Fund is subject to the risks associated with investments in debt securities, such as default risk and fluctuations in the perception of the debtor’s ability to pay its creditors. Changing interest rates may adversely affect the value of an investment. An increase in interest rates typically causes the value of bonds and other fixed income securities to fall. 4 To the extent that the Fund invests in asset-backed or mortgage-backed securities, its exposure to prepayment and extension risks may be greater than investments in other fixed income securities. 5 High-yield bonds (also known as “junk bonds”) may be subject to greater levels of interest rate, credit, and liquidity risk than investments in higher rated securities. These securities are considered predominantly speculative with respect to the issuer’s continuing ability to make principal and interest payments. The issuers of the Fund’s holdings may be involved in bankruptcy proceedings, reorganizations, or financial restructurings, and are not as strong financially as higher-rated issuers. 6 Investments in international securities are subject to certain risks of overseas investing including currency fluctuations and changes in political and economic conditions, which could result in significant market fluctuations. These risks are magnified in emerging markets. 7 Market prices of investments held by the Fund may fall rapidly or unpredictably due to a variety of economic or political factors, market conditions, disasters or public health issues, or in response to events that affect particular industries or companies. 8 Obligations of certain government agencies are not backed by the full faith and credit of the U.S. government. If one of these agencies defaulted on a loan, there is no guarantee that the U.S. government would provide financial support. Additionally, debt securities of the U.S. government may be affected by changing interest rates and subject to prepayment risk. |
17
| | |
| | AMG GW&K Enhanced Core Bond ESG Fund Portfolio Manager’s Comments (continued) |
| | | | |
9 Applying the Fund’s ESG investment criteria may result in the selection or exclusion of securities of certain issuers for reasons other than performance, and the Fund may underperform funds that do not utilize an ESG investment strategy. The application of this strategy may affect the Fund’s exposure to certain companies, sectors, regions, countries or types of investments, which could negatively impact the Fund’s performance depending on whether such investments are in or out of favor. Applying ESG criteria to investment decisions is qualitative and subjective by nature, and there is no guarantee that the criteria utilized by the Subadviser or any judgment exercised by the Subadviser will reflect the beliefs or values of any particular investor. | | 10 The Bloomberg U.S. Aggregate Bond Index is an index of the U.S. investment-grade fixed-rate bond market, including both government and corporate bonds. Unlike the Fund, the Bloomberg U.S. Aggregate Bond Index is unmanaged, is not available for investment and does not incur expenses. “Bloomberg®” and any Bloomberg index described herein are service marks of Bloomberg Finance L.P. and its affiliates, including Bloomberg Index Services Limited (“BISL”), the administrator of the index (collectively, “Bloomberg”) and have been licensed for use for certain purposes by AMG Funds LLC. | | Bloomberg is not affiliated with AMG Funds LLC, and Bloomberg does not approve, endorse, review, or recommend the fund described herein. Bloomberg does not guarantee the timeliness, accurateness, or completeness of any data or information relating to such fund. Not FDIC insured, nor bank guaranteed. May lose value. |
18
| | |
| | AMG GW&K Enhanced Core Bond ESG Fund Fund Snapshots (unaudited) December 31, 2021 |
PORTFOLIO BREAKDOWN
| | | | | |
Category | | % of Net Assets |
| | |
Corporate Bonds and Notes | | | | 44.3 | |
| | |
U.S. Government and Agency Obligations | | | | 44.1 | |
| | |
Municipal Bonds | | | | 5.8 | |
| | |
Foreign Government Obligations | | | | 0.6 | |
| | |
Short-Term Investments | | | | 2.4 | |
| | |
Other Assets Less Liabilities | | | | 2.8 | |
| |
| Rating | | % of Market Value1 |
| | |
U.S. Government and Agency Obligations | | | | 46.5 | |
| | |
Aaa/AAA | | | | 2.8 | |
| | |
Aa/AA | | | | 8.6 | |
| | |
A | | | | 7.3 | |
| | |
Baa/BBB | | | | 20.1 | |
| | |
Ba/BB | | | | 13.2 | |
| | |
B | | | | 1.5 | |
TOP TEN HOLDINGS
| | | | | |
| Security Name | | % of
Net Assets |
| | |
U.S. Treasury Bonds, 6.750%, 08/15/26 | | | | 3.9 | |
| | |
U.S. Treasury Bonds, 2.250%, 05/15/41 | | | | 3.0 | |
| | |
FNMA, 4.000%, 10/01/43 | | | | 2.0 | |
| | |
U.S. Treasury Bonds, 5.000%, 05/15/37 | | | | 2.0 | |
| | |
U.S. Treasury Bonds, 1.875%, 02/15/51 | | | | 1.9 | |
| | |
California State General Obligation,
School Improvements, 7.550%, 04/01/39 | | | | 1.8 | |
| | |
FNMA, 4.500%, 09/01/46 | | | | 1.7 | |
| | |
FHLMC, 3.000%, 03/01/51 | | | | 1.5 | |
| | |
U.S. Treasury Notes, 1.625%, 02/15/26 | | | | 1.3 | |
| | |
Los Angeles Unified School District, School
Improvements, General Obligation, 5.750%, 07/01/34 | | | | 1.2 | |
| | |
| | | | | |
| | |
Top Ten as a Group | | | | 20.3 | |
| | | | | |
| | | | | |
| 1 | Includes market value of long-term fixed-income securities only. |
Credit quality ratings shown above reflect the highest rating assigned by either Standard & Poor’s (“S&P”), Moody’s Investors Service, Inc. (“Moody’s”) or Fitch. These rating agencies are independent, nationally recognized statistical rating organizations and are widely used. Investment grade ratings are credit ratings of BBB/Baa or higher. Below investment grade ratings are credit ratings of BB/Ba or lower. Investments designated N/R are not rated by any of the rating agencies. Unrated investments do not necessarily indicate low credit quality. Credit quality ratings are subject to change.
Because a fund’s strategy may result in multiple investments in particular sectors of the economy, its performance may depend on the performance of those sectors and may fluctuate more widely than investments diversified across more sectors. For additional information on these and other risk considerations, please see the Fund’s prospectus.
Any sectors, industries, or securities discussed should not be perceived as investment recommendations. Mention of a specific security should not be considered a recommendation to buy or solicitation to sell that security. Specific securities mentioned in this report may have been sold from the Fund’s portfolio of investments by the time you receive this report.
19
| | |
| | AMG GW&K Enhanced Core Bond ESG Fund Schedule of Portfolio Investments December 31, 2021 |
| | | | | | | | |
| | |
| | | Principal
Amount | | | Value | |
| |
Corporate Bonds and Notes - 44.3% | | | | | |
| |
Financials - 13.4% | | | | | |
| | |
AerCap Ireland Capital DAC/AerCap Global Aviation Trust (Ireland) 1.650%, 10/29/24 | | $ | 450,000 | | | | $449,184 | |
| | |
Ally Financial, Inc.
8.000%, 11/01/31 | | | 409,000 | | | | 578,968 | |
| | |
American Express Co. | | | | | | | | |
(3.550% to 09/15/26 then U.S. Treasury Yield Curve CMT 5 year + 2.854%), 3.550%, 09/15/261,2,3 | | | 595,000 | | | | 596,041 | |
| | |
American Tower Corp. | | | | | | | | |
2.950%, 01/15/51 | | | 591,000 | | | | 559,803 | |
| | |
Bank of America Corp. | | | | | | | | |
MTN, (4.330% to 03/15/49 then 3 month LIBOR + 1.520%), 4.330%, 03/15/501,3 | | | 484,000 | | | | 598,761 | |
| | |
The Bank of New York Mellon Corp. | | | | | | | | |
Series G, (4.700% to 09/20/25 then U.S. Treasury Yield Curve CMT 5 year + 4.358%), 4.700%, 09/20/251,2,3 | | | 234,000 | | | | 249,620 | |
| | |
The Bank of Nova Scotia (Canada) | | | | | | | | |
(SOFR + 0.610%), 0.660%, 09/15/263 | | | 600,000 | | | | 600,000 | |
| | |
Boston Properties, LP | | | | | | | | |
3.400%, 06/21/29 | | | 542,000 | | | | 575,276 | |
| | |
CIT Group, Inc. | | | | | | | | |
6.125%, 03/09/284 | | | 421,000 | | | | 508,357 | |
| | |
Crown Castle International Corp. | | | | | | | | |
4.300%, 02/15/29 | | | 392,000 | | | | 437,587 | |
| | |
The Goldman Sachs Group, Inc. | | | | | | | | |
Series U, (3.650% to 08/10/26 then U.S. Treasury Yield Curve CMT 5 year + 2.915%), 3.650%, 08/10/261,2,3 | | | 15,000 | | | | 14,850 | |
Series S, (4.400% to 02/10/25 then U.S. Treasury Yield Curve CMT 5 year + 2.850%), 4.400%, 02/10/251,2,3 | | | 343,000 | | | | 345,230 | |
| | |
Iron Mountain, Inc. | | | | | | | | |
4.500%, 02/15/315 | | | 270,000 | | | | 272,886 | |
| | |
JPMorgan Chase & Co. | | | | | | | | |
(3.157% to 04/22/41 then SOFR + 1.460%), 3.157%, 04/22/421,3 | | | 578,000 | | | | 603,363 | |
| | |
Morgan Stanley | | | | | | | | |
(3 month LIBOR + 1.220%), 1.364%, 05/08/241,3 | | | 595,000 | | | | 602,271 | |
| | |
SLM Corp. | | | | | | | | |
3.125%, 11/02/264 | | | 300,000 | | | | 297,000 | |
| | |
Starwood Property Trust, Inc. | | | | | | | | |
5.500%, 11/01/235 | | | 238,000 | | | | 246,330 | |
| | |
The Toronto-Dominion Bank (Canada) | | | | | | | | |
(SOFR + 0.355%), 0.405%, 03/04/243 | | | 592,000 | | | | 592,323 | |
| | |
Total Financials | | | | | | | 8,127,850 | |
| | |
Industrials - 29.5% | | | | | | | | |
| | |
AECOM | | | | | | | | |
5.125%, 03/15/27 | | | 235,000 | | | | 255,996 | |
| | | | | | | | |
| | |
| | | Principal
Amount | | | Value | |
| | |
Alcoa Nederland Holding, B.V. (Netherlands) | | | | | | | | |
4.125%, 03/31/295 | | $ | 230,000 | | | $ | 236,900 | |
| | |
Aramark Services, Inc. | | | | | | | | |
5.000%, 02/01/284,5 | | | 284,000 | | | | 293,585 | |
| | |
Ardagh Metal Packaging
Finance USA LLC/Ardagh Metal Packaging
Finance PLC
3.250%, 09/01/284,5 | | | 400,000 | | | | 395,510 | |
| | |
Ashtead Capital, Inc. | | | | | | | | |
1.500%, 08/12/264,5 | | | 278,000 | | | | 272,898 | |
| | |
AT&T, Inc. | | | | | | | | |
(3 month LIBOR + 1.180%), 1.381%, 06/12/243 | | | 729,000 | | | | 738,812 | |
| | |
Berry Global, Inc. | | | | | | | | |
5.625%, 07/15/275 | | | 252,000 | | | | 263,655 | |
| | |
Block Financial LLC | | | | | | | | |
3.875%, 08/15/30 | | | 124,000 | | | | 132,670 | |
| | |
Block, Inc. | | | | | | | | |
2.750%, 06/01/265 | | | 160,000 | | | | 160,190 | |
| | |
Broadcom, Inc. | | | | | | | | |
1.950%, 02/15/285 | | | 568,000 | | | | 561,546 | |
| | |
Centene Corp. | | | | | | | | |
2.500%, 03/01/31 | | | 294,000 | | | | 286,213 | |
| | |
Central Garden & Pet Co. | | | | | | | | |
4.125%, 10/15/304 | | | 130,000 | | | | 131,138 | |
| | |
Charter Communications Operating LLC/Charter Communications Operating Capital | | | | | | | | |
4.908%, 07/23/25 | | | 541,000 | | | | 595,700 | |
| | |
Clearwater Paper Corp. | | | | | | | | |
4.750%, 08/15/285 | | | 240,000 | | | | 244,200 | |
| | |
The Coca-Cola Co. | | | | | | | | |
2.500%, 06/01/40 | | | 140,000 | | | | 140,527 | |
| | |
Cogent Communications Group, Inc. | | | | | | | | |
3.500%, 05/01/265 | | | 235,000 | | | | 238,685 | |
| | |
Comcast Corp. | | | | | | | | |
4.150%, 10/15/28 | | | 514,000 | | | | 583,509 | |
| | |
CommonSpirit Health | | | | | | | | |
3.347%, 10/01/29 | | | 541,000 | | | | 575,289 | |
| | |
CVS Health Corp. | | | | | | | | |
5.125%, 07/20/45 | | | 490,000 | | | | 636,933 | |
| | |
Dana, Inc. | | | | | | | | |
4.250%, 09/01/30 | | | 35,000 | | | | 35,481 | |
5.625%, 06/15/284 | | | 377,000 | | | | 400,563 | |
| | |
Dell, Inc. | | | | | | | | |
7.100%, 04/15/284 | | | 235,000 | | | | 294,416 | |
| | |
Discovery Communications LLC | | | | | | | | |
3.950%, 03/20/28 | | | 260,000 | | | | 282,566 | |
| | |
Elanco Animal Health, Inc. | | | | | | | | |
5.900%, 08/28/286 | | | 361,000 | | | | 418,760 | |
| | |
Fiserv, Inc. | | | | | | | | |
4.200%, 10/01/28 | | | 516,000 | | | | 578,449 | |
The accompanying notes are an integral part of these financial statements.
20
| | |
| | AMG GW&K Enhanced Core Bond ESG Fund Schedule of Portfolio Investments (continued) |
| | | | | | | | |
| | | Principal
Amount | | | Value | |
| |
Industrials - 29.5% (continued) | | | | | |
| | |
The Ford Foundation | | | | | | | | |
Series 2020, 2.415%, 06/01/50 | | $ | 548,000 | | | $ | 517,751 | |
| | |
G-III Apparel Group, Ltd. | | | | | | | | |
7.875%, 08/15/255 | | | 220,000 | | | | 234,079 | |
| | |
GLP Capital LP/GLP Financing II Inc. | | | | | | | | |
5.750%, 06/01/28 | | | 115,000 | | | | 132,784 | |
| | |
Hilton Domestic Operating Co., Inc. | | | | | | | | |
4.875%, 01/15/30 | | | 218,000 | | | | 232,988 | |
| | |
Hudbay Minerals, Inc. (Canada) | | | | | | | | |
4.500%, 04/01/264,5 | | | 135,000 | | | | 135,000 | |
| | |
KB Home | | | | | | | | |
4.800%, 11/15/294 | | | 415,000 | | | | 452,972 | |
| | |
Kraft Heinz Foods Co. | | | | | | | | |
4.250%, 03/01/31 | | | 510,000 | | | | 579,931 | |
| | |
Lumen Technologies Inc | | | | | | | | |
5.625%, 04/01/25 | | | 246,000 | | | | 260,199 | |
| | |
Macy’s Retail Holdings, LLC | | | | | | | | |
4.500%, 12/15/34 | | | 518,000 | | | | 511,525 | |
| | |
Merck & Co., Inc. | | | | | | | | |
1.900%, 12/10/284 | | | 598,000 | | | | 600,815 | |
| | |
MGM Resorts International | | | | | | | | |
5.750%, 06/15/254 | | | 365,000 | | | | 392,831 | |
| | |
Microsoft Corp. | | | | | | | | |
2.525%, 06/01/50 | | | 589,000 | | | | 574,386 | |
| | |
MSCI, Inc. | | | | | | | | |
3.250%, 08/15/335 | | | 135,000 | | | | 136,519 | |
| | |
Murphy Oil USA, Inc. | | | | | | | | |
4.750%, 09/15/29 | | | 22,000 | | | | 23,155 | |
5.625%, 05/01/27 | | | 257,000 | | | | 267,280 | |
| | |
Newell Brands, Inc. | | | | | | | | |
4.700%, 04/01/266 | | | 245,000 | | | | 267,112 | |
| | |
Nordstrom, Inc. | | | | | | | | |
4.375%, 04/01/304 | | | 581,000 | | | | 586,104 | |
| | |
Penn National Gaming, Inc. | | | | | | | | |
5.625%, 01/15/275 | | | 125,000 | | | | 127,500 | |
| | |
PulteGroup, Inc. | | | | | | | | |
5.000%, 01/15/274 | | | 424,000 | | | | 481,579 | |
5.500%, 03/01/26 | | | 85,000 | | | | 96,647 | |
| | |
Royal Caribbean Cruises, Ltd. (Liberia) | | | | | | | | |
7.500%, 10/15/274 | | | 253,000 | | | | 292,595 | |
| | |
Sysco Corp. | | | | | | | | |
2.400%, 02/15/30 | | | 563,000 | | | | 564,651 | |
| | |
Travel + Leisure Co. | | | | | | | | |
5.650%, 04/01/246 | | | 412,000 | | | | 437,750 | |
| | |
United Rentals North America, Inc. | | | | | | | | |
3.875%, 02/15/31 | | | 289,000 | | | | 293,335 | |
| | |
Verizon Communications, Inc. | | | | | | | | |
3.875%, 02/08/294 | | | 526,000 | | | | 582,899 | |
| | | | | | | | |
| | | Principal
Amount | | | Value | |
| | |
Walgreens Boots Alliance, Inc. | | | | | | | | |
4.800%, 11/18/44 | | | $364,000 | | | | $437,733 | |
| | |
Total Industrials | | | | | | | 17,974,311 | |
| | |
Utilities - 1.4% | | | | | | | | |
| | |
Dominion Energy, Inc. | | | | | | | | |
Series B, (4.650% to 12/15/24 then
U.S. Treasury Yield Curve CMT 5 year + 2.993%), 4.650%, 12/15/241,2,3 | | | 456,000 | | | | 475,380 | |
| | |
National Rural Utilities Cooperative Finance Corp. | | | | | | | | |
1.350%, 03/15/31 | | | 438,000 | | | | 402,484 | |
| | |
Total Utilities | | | | | | | 877,864 | |
| | |
Total Corporate Bonds and Notes
(Cost $26,648,969) | | | | | | | 26,980,025 | |
| |
Municipal Bonds - 5.8% | | | | | |
| | |
California State General Obligation, | | | | | | | | |
School Improvements | | | | | | | | |
7.550%, 04/01/39 | | | 650,000 | | | | 1,084,756 | |
| | |
County of Miami-Dade FL Aviation | | | | | | | | |
Revenue, Series C | | | | | | | | |
4.280%, 10/01/41 | | | 675,000 | | | | 740,284 | |
| | |
Los Angeles Unified School District, | | | | | | | | |
School Improvements | | | | | | | | |
5.750%, 07/01/34 | | | 570,000 | | | | 741,938 | |
| | |
Massachusetts School Building Authority | | | | | | | | |
Series B, 1.753%, 08/15/30 | | | 518,000 | | | | 512,250 | |
| | |
University of California, University & College Improvements Series BD, 3.349%, 07/01/29 | | | 380,000 | | | | 417,496 | |
| | |
Total Municipal Bonds
(Cost $3,320,286) | | | | | | | 3,496,724 | |
| |
U.S. Government and Agency Obligations - 44.1% | | | | | |
| | |
Fannie Mae - 19.9% | | | | | | | | |
| | |
FNMA | | | | | | | | |
2.000%, 08/01/50 to 09/01/50 | | | 562,136 | | | | 561,420 | |
2.500%, 07/01/33 to 05/01/50 | | | 577,257 | | | | 596,834 | |
3.000%, 08/01/50 | | | 217,168 | | | | 227,203 | |
3.500%, 02/01/33 to 07/01/50 | | | 4,277,168 | | | | 4,583,345 | |
4.000%, 12/01/33 to 01/01/51 | | | 2,902,510 | | | | 3,159,301 | |
4.500%, 04/01/39 to 08/01/50 | | | 1,770,720 | | | | 1,941,053 | |
5.000%, 07/01/47 to 08/01/50 | | | 952,483 | | | | 1,063,412 | |
| | |
Total Fannie Mae | | | | | | | 12,132,568 | |
| | |
Freddie Mac - 8.4% | | | | | | | | |
| | |
FHLMC | | | | | | | | |
2.000%, 08/01/50 | | | 169,342 | | | | 169,456 | |
2.500%, 10/01/34 to 08/01/50 | | | 1,152,720 | | | | 1,191,307 | |
3.000%, 03/01/50 to 03/01/51 | | | 1,475,843 | | | | 1,543,488 | |
4.000%, 07/01/48 to 09/01/50 | | | 490,905 | | | | 532,304 | |
4.500%, 10/01/41 | | | 593,596 | | | | 653,435 | |
| | |
FHLMC Gold Pool | | | | | | | | |
3.500%, 02/01/30 to 04/01/46 | | | 918,454 | | | | 985,706 | |
| | |
Total Freddie Mac | | | | | | | 5,075,696 | |
The accompanying notes are an integral part of these financial statements.
21
| | |
| | AMG GW&K Enhanced Core Bond ESG Fund Schedule of Portfolio Investments (continued) |
| | | | | | | | |
| | | Principal
Amount | | | Value | |
| |
U.S. Treasury Obligations - 15.8% | | | | | |
| | |
U.S. Treasury Bonds | | | | | | | | |
1.875%, 02/15/51 | | $ | 1,173,000 | | | | $1,160,537 | |
2.250%, 05/15/41 | | | 1,732,000 | | | | 1,819,141 | |
2.500%, 02/15/46 | | | 540,000 | | | | 596,510 | |
3.125%, 05/15/48 | | | 476,000 | | | | 594,888 | |
5.000%, 05/15/37 | | | 821,000 | | | | 1,195,036 | |
6.750%, 08/15/26 | | | 1,929,000 | | | | 2,404,167 | |
| | |
U.S. Treasury Notes | | | | | | | | |
1.625%, 02/15/26 | | | 813,000 | | | | 826,974 | |
2.125%, 09/30/24 | | | 558,000 | | | | 576,222 | |
2.875%, 05/15/28 | | | 426,000 | | | | 464,124 | |
| | |
Total U.S. Treasury Obligations | | | | | | | 9,637,599 | |
| |
Total U.S. Government and Agency Obligations
(Cost $26,873,703) | | | | 26,845,863 | |
| |
Foreign Government Obligation - 0.6% | | | | | |
| | |
The Korea Development Bank (South Korea) | | | | | | | | |
0.500%, 10/27/23 | | | | | | | | |
(Cost $345,470) | | | 346,000 | | | | 342,923 | |
| | |
Short-Term Investments - 2.4% | | | | | | | | |
| |
Joint Repurchase Agreements - 2.4%7 | | | | | |
| | |
Citigroup Global Markets, Inc., dated 12/31/21, due 01/03/22, 0.060% total to be received $481,524 (collateralized by various U.S. Government Agency Obligations and U.S. Treasuries, 0.000% - 3.500%, 02/15/22 - 12/20/51, totaling $491,152) | | | 481,522 | | | | 481,522 | |
| | | | | | | | |
| | | Principal
Amount | | | Value | |
| | |
RBC Dominion Securities, Inc., dated 12/31/21, due 01/03/22, 0.050% total to be received $1,000,004 (collateralized by various U.S. Government Agency Obligations and U.S. Treasuries, 0.000% - 6.500%, 05/15/22 - 12/01/51, totaling $1,020,000) | | $ | 1,000,000 | | | | $1,000,000 | |
| |
Total Joint Repurchase Agreements | | | | 1,481,522 | |
| | |
Total Short-Term Investments
(Cost $1,481,522) | | | | | | | 1,481,522 | |
| | |
Total Investments - 97.2%
(Cost $58,669,950) | | | | | | | 59,147,057 | |
| |
Other Assets, less Liabilities - 2.8% | | | | 1,702,877 | |
| | |
Net Assets - 100.0% | | | | | | $ | 60,849,934 | |
| 1 | Fixed to variable rate investment. The rate shown reflects the fixed rate in effect at December 31, 2021. Rate will reset at a future date. |
| 2 | Perpetuity Bond. The date shown represents the next call date. |
| 3 | Variable rate security. The rate shown is based on the latest available information as of December 31, 2021. Certain variable rate securities are not based on a published reference rate and spread but are determined by the issuer or agent and are based on current market conditions. These securities do not indicate a reference rate and spread in their description above. |
| 4 | Some of these securities, amounting to $5,203,772 or 8.6% of net assets, were out on loan to various borrowers and are collateralized by cash and various U.S. Treasury Obligations. See Note 4 of Notes to Financial Statements. |
| 5 | Security exempt from registration under Rule 144A of the Securities Act of 1933. This security may be resold in transactions exempt from registration, normally to qualified institutional buyers. At December 31, 2021, the value of these securities amounted to $3,819,483 or 6.3% of net assets. |
| 6 | Step Bond: A debt instrument with either deferred interest payments or an interest rate that resets at specific times during its term. |
| 7 | Cash collateral received for securities lending activity was invested in these joint repurchase agreements. |
CMT Constant Maturity Treasury
FHLMC Freddie Mac
FNMA Fannie Mae
LIBOR London Interbank Offered Rate
MTN Medium-Term Note
SOFR Secured Overnight Financing Rate
The accompanying notes are an integral part of these financial statements.
22
| | |
| | AMG GW&K Enhanced Core Bond ESG Fund Schedule of Portfolio Investments (continued) |
The following table summarizes the inputs used to value the Fund’s investments by the fair value hierarchy levels as of December 31, 2021:
| | | | | | | | | | | | | | | | |
| | | Level 1 | | | Level 2 | | | Level 3 | | | Total | |
| | | | |
Investments in Securities | | | | | | | | | | | | | | | | |
| | | | |
Corporate Bonds and Notes† | | | – | | | $ | 26,980,025 | | | | – | | | $ | 26,980,025 | |
| | | | |
Municipal Bonds† | | | – | | | | 3,496,724 | | | | – | | | | 3,496,724 | |
| | | | |
U.S. Government and Agency Obligations† | | | – | | | | 26,845,863 | | | | – | | | | 26,845,863 | |
| | | | |
Foreign Government Obligation | | | – | | | | 342,923 | | | | – | | | | 342,923 | |
| | | | |
Short-Term Investments | | | | | | | | | | | | | | | | |
| | | | |
Joint Repurchase Agreements | | | – | | | | 1,481,522 | | | | – | | | | 1,481,522 | |
| | | | |
| | | | | | | | | | | | | | | | |
| | | | |
Total Investments in Securities | | | – | | | $ | 59,147,057 | | | | – | | | $ | 59,147,057 | |
| | | | | | | | | | | | | | | | |
| † | All corporate bonds and notes, municipal bonds, and U.S. government and agency obligations held in the Fund are Level 2 securities. For a detailed breakout of corporate bonds and notes, municipal bonds, and U.S. government and agency obligations by major industry or agency classification, please refer to the Fund’s Schedule of Portfolio Investments. |
For the fiscal year ended December 31, 2021, there were no transfers in or out of Level 3.
The accompanying notes are an integral part of these financial statements.
23
| | |
| | AMG GW&K High Income Fund Portfolio Manager’s Comments (unaudited) |
| | | | | | | | |
THE YEAR IN REVIEW AMG GW&K High Income Fund (the “Fund”) Class N shares returned 3.67% during the year ended December 31, 2021, compared to the 4.11% return for the Bloomberg Barclays U.S. High Yield 1–5 Year Ba Index. MARKET OVERVIEW In the first quarter of 2021, fixed income markets posted their worst returns since 1981 amid a sharp rebound in growth expectations and burgeoning fears of higher inflation. The success of the nationwide vaccine rollout, a rapidly healing labor market, and swelling consumer confidence continued to drive the reflation narrative. Further support came in the form of a $1.9 trillion fiscal stimulus package on top of a commitment to ultra-loose monetary policy from the U.S. Federal Reserve (the “Fed”). And beyond that, investors were confronted with the possibility of yet more fiscal support with a proposal of more than $2 trillion of infrastructure spending. This combination of factors amounted to nothing less than a wholesale regime shift for a bond market that until just a few months ago struggled with an anemic growth outlook and fears of deflation. Nevertheless, worries over new variants, challenged vaccine rollouts, and isolated instances of supply constraints might present challenges in the months ahead. Fixed income markets rebounded solidly in the second quarter following their worst selloff in decades. The most prominent catalyst behind the first quarter rout—the threat of sharply faster economic growth and elevated inflation—proved far less menacing in light of lackluster data and a less dovish Fed. In addition to the overhang of COVID-19, including fears of new variants and the elusiveness of herd immunity, signs began to emerge that the pace of the recovery had peaked. Nonfarm payrolls posted successive disappointments, the manufacturing resurgence stalled, and retail sales slipped. Some of the more sensational commodity price spikes began to roll over as well, casting further doubt over the persistence of recent inflationary pressures. None of this suggested that the recovery is off track, but the bond market’s stubborn resilience points to a marked revision of the timeframe for normalization. Fixed income markets were essentially unchanged in the third quarter despite a steady succession of headlines related to COVID-19, geopolitics, and price increases. Bond investors’ largely sanguine response | | | | to these challenges suggested they have been able to look beyond near-term headwinds toward the next stage of the recovery. The delta variant drove a massive surge in cases across much of the U.S., even as new prevention and treatment options continued to emerge and data suggest cases have crested. Chinese authorities enacted assertive regulatory changes and pursued efforts to reduce systemic leverage, while nevertheless framing both as necessary to achieve long-term stability and prosperity. Supply-chain constraints, energy shortages, and limited labor availability threatened to weigh on growth around the world, but there have been few indications that these market failures reflect any weakness in aggregate demand. On balance, these various obstacles seem to have been relegated to the category of one-time items, and the bond market has demonstrated little concern that they represent a meaningful threat to the current trading regime. Fixed income markets were effectively flat in the fourth quarter, despite major narrative shifts with respect to inflation, monetary policy, and COVID-19. Signs of easing supply-chain pressures and continued labor market normalization were not enough to quell concerns about rising inflation, which is at its highest level in almost 40 years. The Fed executed a “hawkish pivot” in acknowledging more persistent inflationary forces and signaled its intention to respond accordingly. The extremely contagious omicron variant rapidly established itself as the dominant strain around the globe, forcing a reappraisal of reopening timelines and reviving the specter of lockdowns and healthcare rationing. Ironically, the combined effect of these various forces essentially netted to zero; solid economic data and a broadly constructive outlook from the Fed were met with the prospect of tightening financial conditions and growth fears posed by omicron. But trading overall was orderly, and after the last two years investors seemed well practiced at looking past near-term volatility toward the next stage of a return to normalcy. FUND REVIEW The Fund underperformed during its fiscal year mainly because of its duration and curve positioning. The Fund’s duration was longer than that of the benchmark, which detracted from returns in the rising rate environment. In addition, an overweight to the 3- to 5-year part of the curve served as a drag on performance as longer tenors endured the worst returns. The Fund’s overweight to this segment was due to more attractive yield and bond roll versus | | | | shorter segments. The overall allocation effect was a modest negative, but this was mostly due to a small amount of cash being a drag in an upward market. However, the decisions to have a moderate out-of-benchmark allocation to investment grade corporates and B-rated bonds were additive. Security selection was the main contributor to performance and came from a range of areas. Inclusion of out-of-benchmark preferreds was a positive, as was selection in energy, basic industry, consumer cyclicals, and transportation. Selection in real estate investment trusts and communications lagged. OUTLOOK The meaningful shift in the Fed’s reaction function–in addition to potentially elevated inflation pressure in the near term—suggest front-end maturities could face a challenging 2022. Farther out the curve, however, the outlook is less clear. With the Fed projecting a terminal rate near 2.5% and the market pricing in a ceiling closer to 1.75%, any fluctuation in this differential is likely to impact longer maturities most acutely as investors weigh the potential for a policy error. In light of these various moving pieces and projections, we believe the bias in rates is to the upside and consequently we are broadly shorter than our benchmark. With respect to curve positioning, we think risks are fairly balanced. We have only a small underweight to long maturities because we see a more appealing risk profile in intermediates, which offer attractive carry and roll with less exposure to potential volatility as rates move higher. In light of our constructive fundamental outlook for the credit market and still-supportive market technicals, we believe the corporate credit space offers attractive value. Additionally, with Treasury rates at historically low levels, corporates offer a competitive yield and the potential for spread compression in a rising-rate environment. While we are on guard against the potential for elevated M&A and an increased focus on shareholder returns, we see value in credit improvement stories within the investment grade space. In high yield, we favor crossover stories trading wide of investment grade peers while avoiding some of the more cyclical industries where we think good news is already reflected in spreads. The views expressed represent the opinions of GW&K Investment Management, LLC and are not intended as a forecast or guarantee of future results, and are subject to change without notice. |
24
| | |
| | AMG GW&K High Income Fund Portfolio Manager’s Comments (continued) |
CUMULATIVE TOTAL RETURN PERFORMANCE
AMG GW&K High Income Fund’s cumulative total return is based on the daily change in net asset value (NAV), and assumes that all dividends and distributions were reinvested. The graph compares a hypothetical $10,000 investment made in the AMG GW&K High Income Fund’s Class N shares on December 31, 2011, to a $10,000 investment made in the Bloomberg U.S. High Yield 1-5 Year Ba Index for the same time period. The graph and table do not reflect the deduction of taxes that a shareholder would pay on a Fund distribution or redemption of shares. The listed returns for the Fund are net of expenses and the returns for the index exclude expenses. Total returns would have been lower had certain expenses not been reduced.
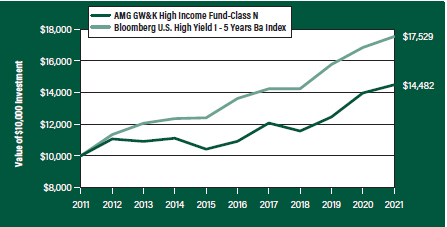
The table below shows the average annual total returns for the AMG GW&K High Income Fund and the Bloomberg U.S. High Yield 1-5 Year Ba Index for the same time periods ended December 31, 2021.
| | | | | | | | | | | | | | | | | | | | |
| Average Annual Total Returns1 | | One
Year | | | Five
Years | | | Ten
Years | | | Since
Inception | | | Inception
Date | |
AMG GW&K High Income Fund2, 3, 4, 5, 6, 7 | | | | | |
Class N | | | 3.67 | % | | | 5.81 | % | | | 3.77 | % | | | 4.97 | % | | | 03/25/94 | |
| | | | | |
Class I | | | | – | | | | – | | | | – | | | 3.68 | % | | | 03/15/21 | |
Bloomberg U.S. High Yield 1-5 Year Ba Index8 | | | 4.11 | % | | | 5.17 | % | | | 5.77 | % | | | | – | | | 03/ 25/94 | † |
The performance data shown represents past performance. Past performance is not a guarantee of future results. Current performance may be lower or higher than the performance data quoted. The investment return and principal value of an investment will fluctuate so that an investor’s shares, when redeemed, may be worth more or less than their original cost.
Investors should carefully consider the Fund’s investment objectives, risks, charges and expenses before investing. For performance information through the most recent month end, current net asset values per share for the Fund and other information, please call 800.548.4539 or visit our website at amgfunds.com for a free prospectus. Read it carefully before investing or sending money.
Distributed by AMG Distributors, Inc., member FINRA/SIPC.
† Date reflects the inception date of the Fund, not the index.
| 1 | Total return equals income yield plus share price change and assumes reinvestment of all dividends and capital gain distributions. Returns are net of fees and may reflect offsets of Fund expenses as described in the prospectus. No adjustment has been made for taxes payable by shareholders on their reinvested dividends and capital gain distributions. Returns for periods greater than one year are annualized. The listed returns on the Fund are net of expenses and based on the published NAV as of December 31, 2021. All returns are in U.S. dollars($). |
|
2 From time to time the Fund’s advisor has waived it’s fees and/or absorbed Fund expenses, which has resulted in higher returns. |
| |
3 As of December 4, 2020, the Fund’s subadvisor was changed to GW&K Investment Management, LLC. Prior to December 4, 2020, the Fund was known as the AMG Managers Global Income Opportunity Fund, and had different principal investment strategies and corresponding risks. Performance shown for periods prior to December 4, 2020 reflects the performance and investment strategies of the Fund’s previous subadvisor, Loomis, Sayles & Company, L.P. The Fund’s past performance would have been different if the Fund were managed by the current subadvisor and strategy, and the Fund’s prior performance record might be less pertinent for investors considering whether to purchase shares of the Fund. |
| |
4 The Fund is subject to the risks associated with investments in debt securities, such as default risk and fluctuations in the perception of the debtor’s ability to pay its creditors. Changing interest rates may adversely affect the value of an investment. An increase in interest rates typically causes the value of bonds and other fixed income securities to fall. |
| |
5 Market prices of investments held by the Fund may fall rapidly or unpredictably due to a variety of economic or political factors, market conditions, disasters or public health issues, or in response to events that affect particular industries or companies. |
| |
6 High-yield bonds (also known as “junk bonds”) may be subject to greater levels of interest rate, credit, and liquidity risk than investments in higher rated securities. These securities are considered predominantly speculative with respect to the issuer’s continuing ability to make principal and interest payments. The issuers of the Fund’s holdings may be involved in bankruptcy proceedings, reorganizations, or financial restructurings, and are not as strong financially as higher-rated issuers. |
| |
7 The issuer of the bonds may not be able to meet interest or principal payments when the bonds come due. |
| |
8 The Bloomberg U.S. High Yield Ba 1-5 Year Index, a subset of the Bloomberg High Yield Index, is an unmanaged index comprised of fixed rate, publicly issued, non-investment grade debt registered with the Securities and Exchange Commission (SEC) where the middle rating of Moody’s, S&P and Fitch is BB and maturities range from 1 to 5 years. Unlike the Fund, the Bloomberg U.S. High Yield Ba 1-5 Year Index is unmanaged, is not available for investment and does not incur expenses. |
| |
25
| | |
| | AMG GW&K High Income Fund Portfolio Manager’s Comments (continued) |
| | | | |
“Bloomberg®” and any Bloomberg index described herein are service marks of Bloomberg Finance L.P. and its affiliates, including Bloomberg Index Services Limited (“BISL”), the administrator of the index (collectively, “Bloomberg”) and have been licensed | | for use for certain purposes by AMG Funds LLC. Bloomberg is not affiliated with AMG Funds LLC, and Bloomberg does not approve, endorse, review, or recommend the fund described herein. Bloomberg does not guarantee the timeliness, accurateness, or | | completeness of any data or information relating to such fund. Not FDIC insured, nor bank guaranteed. May lose value |
26
| | |
| | AMG GW&K High Income Fund Fund Snapshots (unaudited) December 31, 2021 |
PORTFOLIO BREAKDOWN
| | | | | |
| Category | | % of
Net Assets |
| | |
Corporate Bonds and Notes | | | | 96.8 | |
| | |
Short-Term Investments1 | | | | 11.0 | |
| | |
Other Assets Less Liabilities2 | | | | (7.8 | ) |
| 1 | Includes reinvestment of cash collateral into joint repurchase agreements on security lending transactions. |
| 2 | Includes repayment of cash collateral on security lending transactions. |
| | | | | |
| Rating | | % of Market Value1 |
| | |
Baa/BBB | | | | 19.3 | |
| | |
Ba/BB | | | | 66.0 | |
| | |
B | | | | 14.7 | |
| 1 | Includes market value of long-term fixed-income securities only. |
TOP TEN HOLDINGS
| | | | | |
| Security Name | | % of
Net Assets |
| | |
Starwood Property Trust, Inc., 4.750%, 03/15/25 | | | | 2.2 | |
| | |
Telecom Italia S.P.A., 5.303%, 05/30/24 (Italy) | | | | 2.0 | |
| | |
Ford Motor Co., 4.346%, 12/08/26 | | | | 1.9 | |
| | |
Ovintiv Exploration Inc, 5.625%, 07/01/24 | | | | 1.8 | |
| | |
Service Properties Trust, 7.500%, 09/15/25 | | | | 1.8 | |
| | |
Apache Corp., 4.625%, 11/15/25 | | | | 1.8 | |
| | |
OneMain Finance Corp., 7.125%, 03/15/26 | | | | 1.5 | |
| | |
Ball Corp., 5.250%, 07/01/25 | | | | 1.5 | |
| | |
Citigroup, Inc., 3.875%, 02/18/26 | | | | 1.5 | |
| | |
DCP Midstream Operating LP, 5.375%, 07/15/25 | | | | 1.4 | |
| | |
| | | | | | |
| | |
Top Ten as a Group | | | | 17.4 | |
| | | | | | |
| | | | | | |
Credit quality ratings shown above reflect the highest rating assigned by either Standard & Poor’s (“S&P”), Moody’s Investors Service, Inc. (“Moody’s”) or Fitch. These rating agencies are independent, nationally recognized statistical rating organizations and are widely used. Investment grade ratings are credit ratings of BBB/Baa or higher. Below investment grade ratings are credit ratings of BB/Ba or lower. Investments designated N/R are not rated by any of the rating agencies. Unrated investments do not necessarily indicate low credit quality. Credit quality ratings are subject to change.
Because a fund’s strategy may result in multiple investments in particular sectors of the economy, its performance may depend on the performance of those sectors and may fluctuate more widely than investments diversified across more sectors. For additional information on these and other risk considerations, please see the Fund’s prospectus.
Any sectors, industries, or securities discussed should not be perceived as investment recommendations. Mention of a specific security should not be considered a recommendation to buy or solicitation to sell that security. Specific securities mentioned in this report may have been sold from the Fund’s portfolio of investments by the time you receive this report.
27
| | |
| | AMG GW&K High Income Fund Schedule of Portfolio Investments December 31, 2021 |
| | | | | | | | |
| | | Principal
Amount | | | Value | |
| |
Corporate Bonds and Notes - 96.8% | | | | | |
| |
Financials - 17.8% | | | | | |
| | |
AerCap Ireland Capital DAC/AerCap Global Aviation Trust (Ireland)
1.650%, 10/29/24 | | $ | 150,000 | | | | $149,728 | |
| | |
Ally Financial, Inc. | | | | | | | | |
Series B (4.700% to 05/15/26 then U.S. Treasury Yield Curve CMT 5 year + 3.868%), 4.700%, 05/15/261,2,3 | | | 190,000 | | | | 197,125 | |
| | |
American Express Co. | | | | | | | | |
(3.550% to 09/15/26 then U.S. Treasury Yield Curve CMT 5 year + 2.854%), 3.550%, 09/15/261,2,3 | | | 205,000 | | | | 205,359 | |
| | |
The Charles Schwab Corp. | | | | | | | | |
Series I (4.000% to 06/01/26 then U.S. Treasury Yield Curve CMT 5 year + 3.168%), 4.000%, 06/01/261,2,3 | | | 241,000 | | | | 245,820 | |
| | |
Citigroup, Inc. | | | | | | | | |
(3.875% to 02/18/26 then U.S. Treasury Yield Curve CMT 5 year + 3.417%), 3.875%, 02/18/261,2,3 | | | 310,000 | | | | 310,000 | |
| | |
MetLife, Inc. | | | | | | | | |
Series G (3.850% to 09/15/25 then U.S. Treasury Yield Curve CMT 5 year + 3.576%), 3.850%, 09/15/251,2,3,4 | | | 189,000 | | | | 192,780 | |
| | |
Morgan Stanley | | | | | | | | |
Series M (5.875% to 09/15/26 then 3 month LIBOR + 4.435%), 5.875%, 09/15/261,2,3,4 | | | 210,000 | | | | 236,638 | |
| | |
Navient Corp. | | | | | | | | |
6.125%, 03/25/24 | | | 193,000 | | | | 205,786 | |
| | |
OneMain Finance Corp. | | | | | | | | |
7.125%, 03/15/26 | | | 275,000 | | | | 313,500 | |
| | |
SBA Communications Corp. | | | | | | | | |
3.875%, 02/15/27 | | | 180,000 | | | | 185,400 | |
| | |
Service Properties Trust | | | | | | | | |
7.500%, 09/15/25 | | | 360,000 | | | | 390,037 | |
| | |
SLM Corp. | | | | | | | | |
4.200%, 10/29/25 | | | 286,000 | | | | 298,870 | |
| | |
Starwood Property Trust, Inc. | | | | | | | | |
4.750%, 03/15/25 | | | 446,000 | | | | 463,840 | |
| | |
VICI Properties LP/VICI Note Co., Inc. | | | | | | | | |
3.500%, 02/15/254,5 | | | 120,000 | | | | 121,800 | |
4.250%, 12/01/265 | | | 85,000 | | | | 88,525 | |
| | |
Wynn Las Vegas LLC/Wynn Las Vegas Capital Corp. | | | | | | | | |
5.500%, 03/01/255 | | | 185,000 | | | | 190,550 | |
| | |
Total Financials | | | | | | | 3,795,758 | |
| | | | | | | | |
| | | Principal
Amount | | | Value | |
Industrials - 77.0% | | | | | | | | |
| | |
AECOM | | | | | | | | |
5.125%, 03/15/27 | | $ | 184,000 | | | $ | 200,439 | |
| | |
Alcoa Nederland Holding BV (Netherlands) | | | | | | | | |
6.125%, 05/15/285 | | | 200,000 | | | | 215,250 | |
| | |
Allegheny Technologies, Inc. | | | | | | | | |
4.875%, 10/01/29 | | | 156,000 | | | | 156,156 | |
| | |
American Airlines Inc/AAdvantage Loyalty IP, Ltd. | | | | | | | | |
5.500%, 04/20/265 | | | 235,000 | | | | 244,371 | |
| | |
American Axle & Manufacturing, Inc. | | | | | | | | |
6.250%, 03/15/26 | | | 164,000 | | | | 167,485 | |
| | |
Apache Corp. | | | | | | | | |
4.625%, 11/15/25 | | | 351,000 | | | | 376,886 | |
| | |
Aramark Services, Inc. | | | | | | | | |
5.000%, 02/01/284,5 | | | 100,000 | | | | 103,375 | |
| | |
ArcelorMittal, S.A. (Luxembourg) | | | | | | | | |
4.250%, 07/16/294 | | | 181,000 | | | | 198,183 | |
| | |
Avient Corp. | | | | | | | | |
5.750%, 05/15/255 | | | 140,000 | | | | 145,950 | |
| | |
Ball Corp. | | | | | | | | |
5.250%, 07/01/25 | | | 283,000 | | | | 312,007 | |
| | |
Bath & Body Works, Inc. | | | | | | | | |
6.694%, 01/15/27 | | | 135,000 | | | | 155,250 | |
| | |
Block, Inc. | | | | | | | | |
2.750%, 06/01/265 | | | 210,000 | | | | 210,250 | |
| | |
Caesars Entertainment, Inc. | | | | | | | | |
6.250%, 07/01/255 | | | 185,000 | | | | 194,181 | |
| | |
CDW LLC/CDW Finance Corp. | | | | | | | | |
5.500%, 12/01/24 | | | 145,000 | | | | 158,890 | |
| | |
Clearwater Paper Corp. | | | | | | | | |
5.375%, 02/01/255 | | | 255,000 | | | | 275,400 | |
| | |
Cogent Communications Group, Inc. | | | | | | | | |
3.500%, 05/01/265 | | | 200,000 | | | | 203,136 | |
| | |
Continental Resources, Inc. | | | | | | | | |
4.375%, 01/15/28 | | | 138,000 | | | | 149,185 | |
| | |
Crown Cork & Seal Co., Inc. | | | | | | | | |
7.375%, 12/15/26 | | | 205,000 | | | | 247,281 | |
| | |
CSC Holdings LLC | | | | | | | | |
5.250%, 06/01/24 | | | 167,000 | | | | 173,680 | |
| | |
Dana, Inc. | | | | | | | | |
5.625%, 06/15/28 | | | 100,000 | | | | 106,250 | |
| | |
DCP Midstream Operating LP | | | | | | | | |
5.375%, 07/15/25 | | | 276,000 | | | | 301,530 | |
| | |
Delta Air Lines, Inc. | | | | | | | | |
7.375%, 01/15/264 | | | 251,000 | | | | 295,502 | |
| | |
DISH DBS Corp. | | | | | | | | |
7.750%, 07/01/26 | | | 175,000 | | | | 184,625 | |
| | |
Embraer Netherlands Finance BV (Netherlands) | | | | | | | | |
5.050%, 06/15/25 | | | 220,000 | | | | 227,425 | |
The accompanying notes are an integral part of these financial statements.
28
| | |
| | AMG GW&K High Income Fund Schedule of Portfolio Investments (continued) |
| | | | | | | | |
| | | Principal
Amount | | | Value | |
Industrials - 77.0% (continued) | | | | | | | | |
| | |
Encompass Health Corp. | | | | | | | | |
4.500%, 02/01/28 | | $ | 191,000 | | | $ | 196,491 | |
| | |
FMG Resources August 2006 Pty, Ltd. (Australia) | | | | | | | | |
5.125%, 05/15/245 | | | 135,000 | | | | 143,100 | |
| | |
Ford Motor Co. | | | | | | | | |
4.346%, 12/08/26 | | | 364,000 | | | | 397,033 | |
5.291%, 12/08/46 | | | 88,000 | | | | 103,422 | |
| | |
Fortress Transportation and Infrastructure Investors LLC | | | | | | | | |
6.500%, 10/01/255 | | | 175,000 | | | | 180,906 | |
| | |
G-III Apparel Group, Ltd. | | | | | | | | |
7.875%, 08/15/255 | | | 180,000 | | | | 191,519 | |
| | |
The Goodyear Tire & Rubber Co. | | | | | | | | |
4.875%, 03/15/27 | | | 283,000 | | | | 299,626 | |
| | |
Griffon Corp. | | | | | | | | |
5.750%, 03/01/28 | | | 100,000 | | | | 103,883 | |
| | |
Hanesbrands, Inc. | | | | | | | | |
4.875%, 05/15/265 | | | 170,000 | | | | 181,687 | |
| | |
HCA, Inc. | | | | | | | | |
5.375%, 02/01/25 | | | 192,000 | | | | 211,008 | |
| | |
Hexcel Corp. | | | | | | | | |
4.950%, 08/15/256 | | | 168,000 | | | | 183,211 | |
| | |
Hilton Domestic Operating Co., Inc. | | | | | | | | |
4.875%, 01/15/30 | | | 98,000 | | | | 104,738 | |
| | |
Howmet Aerospace, Inc. | | | | | | | | |
6.875%, 05/01/25 | | | 212,000 | | | | 243,739 | |
| | |
Hudbay Minerals, Inc. (Canada) | | | | | | | | |
4.500%, 04/01/265 | | | 300,000 | | | | 300,000 | |
| | |
IEA Energy Services LLC | | | | | | | | |
6.625%, 08/15/295 | | | 45,000 | | | | 44,449 | |
| | |
KB Home | | | | | | | | |
4.000%, 06/15/31 | | | 95,000 | | | | 98,563 | |
| | |
Kraft Heinz Foods Co. | | | | | | | | |
4.375%, 06/01/46 | | | 86,000 | | | | 100,706 | |
| | |
Lumen Technologies Inc | | | | | | | | |
5.625%, 04/01/25 | | | 279,000 | | | | 295,104 | |
| | |
Macy’s Retail Holdings, LLC | | | | | | | | |
3.625%, 06/01/244 | | | 139,000 | | | | 142,127 | |
4.500%, 12/15/34 | | | 107,000 | | | | 105,663 | |
| | |
Matador Resources Co. | | | | | | | | |
5.875%, 09/15/26 | | | 250,000 | | | | 257,500 | |
| | |
Mattel, Inc. | | | | | | | | |
3.375%, 04/01/265 | | | 240,000 | | | | 246,125 | |
| | |
MercadoLibre, Inc. | | | | | | | | |
2.375%, 01/14/26 | | | 200,000 | | | | 194,502 | |
| | |
Meritage Homes Corp. | | | | | | | | |
6.000%, 06/01/25 | | | 163,000 | | | | 181,745 | |
| | |
Meritor, Inc. | | | | | | | | |
6.250%, 06/01/255 | | | 260,000 | | | | 271,050 | |
| | | | | | | | |
| | | Principal
Amount | | | Value | |
| | |
Methanex Corp. (Canada) | | | | | | | | |
5.125%, 10/15/27 | | $ | 200,000 | | | $ | 210,000 | |
| | |
MGM Resorts International | | | | | | | | |
5.750%, 06/15/254 | | | 233,000 | | | | 250,766 | |
| | |
Mueller Water Products, Inc. | | | | | | | | |
4.000%, 06/15/295 | | | 200,000 | | | | 202,000 | |
| | |
Newell Brands, Inc. | | | | | | | | |
4.875%, 06/01/25 | | | 180,000 | | | | 196,200 | |
| | |
Nordstrom, Inc. | | | | | | | | |
4.000%, 03/15/274 | | | 282,000 | | | | 283,410 | |
| | |
Novelis Corp. | | | | | | | | |
3.250%, 11/15/265 | | | 210,000 | | | | 211,837 | |
| | |
NuStar Logistics LP | | | | | | | | |
5.625%, 04/28/27 | | | 113,000 | | | | 119,497 | |
5.750%, 10/01/25 | | | 115,000 | | | | 123,754 | |
| | |
Occidental Petroleum Corp. | | | | | | | | |
3.400%, 04/15/26 | | | 205,000 | | | | 210,264 | |
| | |
Ovintiv Exploration Inc | | | | | | | | |
5.625%, 07/01/24 | | | 356,000 | | | | 391,878 | |
| | |
Owens-Brockway Glass Container, Inc. | | | | | | | | |
6.375%, 08/15/254,5 | | | 220,000 | | | | 237,050 | |
| | |
Penn National Gaming, Inc. | | | | | | | | |
4.125%, 07/01/294,5 | | | 200,000 | | | | 194,000 | |
| | |
Penske Automotive Group, Inc. | | | | | | | | |
3.500%, 09/01/254 | | | 192,000 | | | | 196,320 | |
| | |
Prime Security Services Borrower LLC/Prime Finance, Inc. | | | | | | | | |
5.750%, 04/15/265 | | | 250,000 | | | | 268,417 | |
| | |
PTC, Inc. | | | | | | | | |
3.625%, 02/15/255 | | | 295,000 | | | | 299,056 | |
| | |
QVC, Inc. | | | | | | | | |
4.750%, 02/15/27 | | | 204,000 | | | | 209,765 | |
| | |
Royal Caribbean Cruises, Ltd. (Liberia) | | | | | | | | |
7.500%, 10/15/274 | | | 181,000 | | | | 209,326 | |
| | |
Sally Holdings LLC/Sally Capital, Inc. | | | | | | | | |
8.750%, 04/30/255 | | | 130,000 | | | | 138,450 | |
| | |
Sealed Air Corp. | | | | | | | | |
5.500%, 09/15/255 | | | 200,000 | | | | 221,250 | |
| | |
Silgan Holdings, Inc. | | | | | | | | |
4.125%, 02/01/28 | | | 153,000 | | | | 156,251 | |
| | |
Southwestern Energy Co. | | | | | | | | |
6.450%, 01/23/25 | | | 47,000 | | | | 51,653 | |
| | |
Sprint Corp. | | | | | | | | |
7.125%, 06/15/24 | | | 169,000 | | | | 189,729 | |
| | |
Telecom Italia S.P.A. (Italy) | | | | | | | | |
5.303%, 05/30/245 | | | 400,000 | | | | 420,984 | |
| | |
Tenet Healthcare Corp. | | | | | | | | |
4.875%, 01/01/265 | | | 190,000 | | | | 195,155 | |
The accompanying notes are an integral part of these financial statements.
29
| | |
| | AMG GW&K High Income Fund Schedule of Portfolio Investments (continued) |
| | | | | | | | |
| | | Principal
Amount | | | Value | |
Industrials - 77.0% (continued) | | | | | | | | |
| | |
Teva Pharmaceutical Finance Netherlands III (Netherlands) | | | | | | | | |
2.800%, 07/21/23 | | $ | 200,000 | | | | $200,693 | |
| | |
TransDigm, Inc. | | | | | | | | |
6.250%, 03/15/265 | | | 190,000 | | | | 197,481 | |
| | |
Travel + Leisure Co. | | | | | | | | |
5.650%, 04/01/246 | | | 181,000 | | | | 192,312 | |
| | |
United Airlines Holdings, Inc. | | | | | | | | |
5.000%, 02/01/24 | | | 290,000 | | | | 300,150 | |
| | |
United States Steel Corp. | | | | | | | | |
6.875%, 03/01/294 | | | 94,000 | | | | 101,168 | |
| | |
Wabash National Corp. | | | | | | | | |
4.500%, 10/15/285 | | | 155,000 | | | | 156,550 | |
| | |
WESCO Distribution, Inc. | | | | | | | | |
7.250%, 06/15/285 | | | 100,000 | | | | 109,625 | |
| | |
Western Midstream Operating LP | | | | | | | | |
4.650%, 07/01/26 | | | 184,000 | | | | 200,265 | |
| | |
Total Industrials | | | | | | | 16,425,840 | |
| | |
Utilities - 2.0% | | | | | | | | |
| | |
NRG Energy, Inc. | | | | | | | | |
5.250%, 06/15/295 | | | 185,000 | | | | 198,206 | |
| | |
SM Energy Co. | | | | | | | | |
5.625%, 06/01/25 | | | 217,000 | | | | 218,628 | |
| | |
Total Utilities | | | | | | | 416,834 | |
| | |
Total Corporate Bonds and Notes | | | | | | | | |
(Cost $20,559,924) | | | | | | | 20,638,432 | |
| | | | | | | | |
| | | Principal
Amount | | | Value | |
Short-Term Investments - 11.0% | | | | | |
| |
Joint Repurchase Agreements - 11.0%7 | | | | | |
| | |
Bank of America Securities, Inc., dated 12/31/21,due 01/03/22, 0.050% total to be received $1,000,004 (collateralized by various U.S. Government Agency Obligations, 1.000% - 5.000%, 09/01/28 - 01/01/61, totaling $1,020,000) | | $ | 1,000,000 | | | | $1,000,000 | |
| | |
Morgan, Stanley & Co. LLC, dated 12/31/21, due 01/03/22, 0.050% total to be received $340,363 (collateralized by various U.S. Government Agency Obligations, 2.000% - 8.000%, 11/01/22 - 01/01/52, totaling $347,169) | | | 340,362 | | | | 340,362 | |
| | |
RBC Dominion Securities, Inc., dated 12/31/21, due 01/03/22, 0.050% total to be received $1,000,004 (collateralized by various U.S. Government Agency Obligations and U.S. Treasuries, 0.000% - 6.500%, 05/15/22 - 12/01/51, totaling $1,020,000) | | | 1,000,000 | | | | 1,000,000 | |
| | |
Total Joint Repurchase Agreements | | | | | | | 2,340,362 | |
| | |
Total Short-Term Investments | | | | | | | | |
(Cost $2,340,362) | | | | | | | 2,340,362 | |
| | |
Total Investments - 107.8% | | | | | | | | |
(Cost $22,900,286) | | | | | | | 22,978,794 | |
| |
Other Assets, less Liabilities - (7.8)% | | | | (1,655,082 | ) |
| | |
Net Assets - 100.0% | | | | | | $ | 21,323,712 | |
| 1 | Fixed to variable rate investment. The rate shown reflects the fixed rate in effect at December 31, 2021. Rate will reset at a future date. |
| 2 | Perpetuity Bond. The date shown represents the next call date. |
| 3 | Variable rate security. The rate shown is based on the latest available information as of December 31, 2021. Certain variable rate securities are not based on a published reference rate and spread but are determined by the issuer or agent and are based on current market conditions. These securities do not indicate a reference rate and spread in their description above. |
| 4 | Some of these securities, amounting to $2,660,400 or 12.5% of net assets, were out on loan to various borrowers and are collateralized by cash and various U.S. Treasury Obligations. See Note 4 of Notes to Financial Statements. |
| 5 | Security exempt from registration under Rule 144A of the Securities Act of 1933. This security may be resold in transactions exempt from registration, normally to qualified institutional buyers. At December 31, 2021, the value of these securities amounted to $6,601,685 or 31.0% of net assets. |
| 6 | Step Bond: A debt instrument with either deferred interest payments or an interest rate that resets at specific times during its term. |
| 7 | Cash collateral received for securities lending activity was invested in these joint repurchase agreements. |
| | |
| CMT | | Constant Maturity Treasury |
| LIBOR | | London Interbank Offered Rate |
The accompanying notes are an integral part of these financial statements.
30
| | |
| | AMG GW&K High Income Fund Schedule of Portfolio Investments (continued) |
The following table summarizes the inputs used to value the Fund’s investments by the fair value hierarchy levels as of December 31, 2021:
| | | | | | | | | | | | | | | | |
| | | Level 1 | | | Level 2 | | | Level 3 | | | Total | |
| | | | |
Investments in Securities | | | | | | | | | | | | | | | | |
| | | | |
Corporate Bonds and Notes† | | | – | | | $ | 20,638,432 | | | | – | | | $ | 20,638,432 | |
| | | | |
Short-Term Investments | | | | | | | | | | | | | | | | |
| | | | |
Joint Repurchase Agreements | | | – | | | | 2,340,362 | | | | – | | | | 2,340,362 | |
| | | | | | | | | | | | | | | | |
| | | | |
Total Investments in Securities | | | – | | | $ | 22,978,794 | | | | – | | | $ | 22,978,794 | |
| | | | | | | | | | | | | | | | |
| † | All corporate bonds and notes held in the Fund are level 2 securities. For a detailed breakout of corporate bonds and notes by major industry classification, please refer to the Fund’s Schedule of Portfolio Investments. |
For the fiscal year ended December 31, 2021, there were no transfers in or out of Level 3.
The accompanying notes are an integral part of these financial statements.
31
| | |
| | AMG GW&K Municipal Bond Fund Portfolio Manager’s Comments (unaudited) |
| | | | |
THE YEAR IN REVIEW For the year ended December 31, 2021, AMG GW&K Municipal Bond Fund (the “Fund”) Class N shares returned 0.10%, compared to the 0.96% return for its benchmark, the Bloomberg 10-Year Municipal Bond Index (the “Index”). Municipal bonds fared better than most fixed income alternatives in the first quarter, but ultimately could not escape the gravitational pull of a bond market selloff that saw Treasury yields surge to their highest levels of the pandemic era. The major catalyst came in January, when the Democrats unexpectedly secured control of the U.S. Senate, clearing the way to add a $1.9 trillion fiscal stimulus package to an economy already buoyed by the momentum of a successful vaccine rollout. Investors responded quickly, repositioning for a sharp acceleration in growth and a revival of long-dormant inflationary pressures. The yield on the 10-year U.S. Treasury shot up 82 basis points over the first quarter and the curve steepened significantly, as the futures market pulled forward by a year; the date of a first rate hike. But the U.S. Federal Reserve (the “Fed”) pledged patience and dismissed pricing pressures as temporary. While inflation expectations had pushed to decade-highs, policymakers emphasized that over half of the increase in nominal yields was driven by a surge in real rates, a welcome reflection of investor confidence in the recovery. That followed with solid gains from municipal bonds in the second quarter, riding the coattails of a Treasury rally that reversed much of the first quarter selloff in bonds. In many ways, the rebound in the broader market went against the grain of events. After all, during the quarter, unprecedented fiscal stimulus made its way through the economy, with the White House pushing aggressively for even more. A vaccine-led recovery across the U.S. unleashed a mountain of pent-up savings amid easing lockdowns, fueling an acceleration in growth. Inflation readings jumped to levels not seen in two decades, as job openings surged to record highs and supply chain disruptions caused widespread shortages. And yet, Treasury yields declined anyway. Disappointing employment data and a deceleration in retail sales and manufacturing activity called into question the strength of the recovery. Fiscal spending initiatives met stiff resistance in Congress. And the Fed surprised investors by easing off its ultra-accommodative stance on rates and asset purchases, signaling two quarter point hikes in 2023 | | and setting the stage for a future discussion on tapering. This combination of less-robust growth and a more vigilant Fed led to a significant flattening of the yield curve. Modest losses for municipal bonds followed in the third quarter, driven by a late-September selloff in Treasuries. For most of the summer, broader rates remained low and traded within a narrow range, despite solid economic data and rising inflation prints. The market, it appeared, was more focused on the longer term, taking supply-chain disruptions in stride and buying into the Fed’s argument that price increases would ultimately prove “transitory.” The spread of the delta variant also helped to keep a lid on rates, as concerns about delayed reopenings dialed back expectations over the pace for global growth. But the markets received a jolt from the September FOMC meeting when a less dovish Fed indicated that the tapering program was likely to begin in November and finish next summer. Further, the accompanying dot plot reflected a more aggressive path for rate hikes, with liftoff potentially beginning next year, followed by three more hikes in both 2023 and 2024. The yield on the 10-year Treasury reacted with the single largest one-day jump since February. Meanwhile, Congress found it increasingly difficult to reach consensus on the infrastructure deal, which has been put on hold pending the outcome of a more contentious $3.5 trillion social policy bill. A debt ceiling debate and threats of a government shutdown only added to the apprehension and uncertainty. Over the final eight days of September, the 10-year Treasury yield rose nearly 20 basis points to finish roughly unchanged for the third quarter. Municipal bonds posted mixed returns in the fourth quarter; short maturities barely broke even, held back by the potential for an accelerated rate-hike cycle, while the long end rallied on declining growth expectations. Municipal bonds outperformed Treasuries across the entire curve, buoyed by a strong technical environment that had been in place all year. The broader market, meanwhile, experienced its second major selloff of 2021, though most of the losses were likewise concentrated at the short end, while the long end saw solid gains. Back in the first quarter, the long end had led the slide, as investors repositioned during the so-called “reflation trade.” This time around, the results reflected a market trying to juggle elevated growth and inflation against tighter monetary policy, less fiscal stimulus and the damping effects of the omicron variant. With | | inflation topping 40-year highs, the Fed executed a well-telegraphed hawkish pivot, doubling the pace of its expected taper and signaling as many as six quarter-point rate hikes over the next two years. The “transitory” moniker was also dropped from the policy statement, a nod to the reality that the spike in price increases is expected to linger far longer than originally anticipated. While two-year rates jumped 45 basis points over the quarter in reaction to the new messaging, 10-year rates were essentially unchanged. Whereas the 30-year rallied 14 basis points, an indication that investors believe the Fed will either succeed in keeping inflation at bay or damage the economy in trying. Municipals charted their own path through the end of the year, largely ignoring the volatility in the Treasury market. After a brief hiccup in October, the market regained its footing in November and December. The catalyst was a seasonal boost in reinvestment flows against a backdrop of stable to falling issuance. In Washington, the House passed a version of the Build Back Better legislation, but left out key provisions that the municipal bond market lobbied hard for, including one that would have restored tax-exempt advanced refunding transactions. With that provision off the table, it seemed clear that the scarcity premium enjoyed by tax-exempt paper would persist further, an impression reinforced by the subsequent rally in municipals even while the Treasury market was in the midst of a pre-Thanksgiving Day slide. Meanwhile, the fundamental momentum remained intact. In November, Congress finally passed the bipartisan infrastructure bill, shoring up existing funding commitments and adding new federal grants to be used by all levels of government. Tax receipts continued to pour into state and local coffers, while outsized stock market gains helped bolster the funded status of pension systems across the board. Through the end of the year, the municipal curve mimicked the flattening of the Treasury curve, though short tax-exempt rates were up far less than their taxable counterparts, while longer-term yields fell by more. Those dynamics capped a year of outperformance that enabled municipal bonds to stand as one of the few investment-grade fixed income sectors to post positive returns for 2021. Amid this backdrop, the Fund underperformed the Index for the year. The Fund’s higher quality bias was a negative as credit spreads tightened, particularly for BBB-rated securities. An overweight to the |
32
| | |
| | AMG GW&K Municipal Bond Fund Portfolio Manager’s Comments (continued) |
| | | | |
transportation sector and shift in yield curve positioning in February were positive contributors for the year. From both a technical and fundamental perspective, the municipal bond market enters 2022 on a solid footing. The biggest questions moving forward involve valuation and the pace of improvement from here. After a year that saw a record $100 billion pour into industry mutual funds, it’s hard to envision a material increase in retail demand. The same can be said for credit spreads, which blew out dramatically during the early days of the lockdown but have since rallied back to post-2007 tights. Even nominal rates, | | though well above the historical lows reached in the summer of 2020, begin the year at levels that would have been all-time lows before the onset of the pandemic. The resilience of municipal bonds in the face of broader weakness has left relative value ratios nearly two standard deviations rich to their long-term averages. And yet the case for municipals remains compelling when you consider where we are in the market cycle. With asset valuations at record highs, investors would be well advised to remember the low correlation of municipal bonds with riskier securities, like equities, commodities, real estate and high yield. Backed by unprecedented federal support, conservative budgeting and its | | status as one of the few high-quality tax shelters, municipal bonds are in good shape to weather any repricing in the broader markets. To be sure, investors are currently paying a meaningful premium for such an attractive and reliable haven, but with few things as valuable as sleeping well at night, that shouldn’t come as much of a surprise. The views expressed represent the opinions of GW&K Investment Management, LLC and are not intended as a forecast or guarantee of future results, and are subject to change without notice. |
33
| | |
| | AMG GW&K Municipal Bond Fund Portfolio Manager’s Comments (continued) |
CUMULATIVE TOTAL RETURN PERFORMANCE
AMG GW&K Municipal Bond Fund’s cumulative total return is based on the daily change in net asset value (NAV), and assumes that all dividends and distributions were reinvested. The graph compares a hypothetical $10,000 investment made in the AMG GW&K Municipal Bond Fund’s Class N shares on December 31, 2011, to a $10,000 investment made in the Bloomberg 10-Year Municipal Bond Index for the same time period. The graph and table do not reflect the deduction of taxes that a shareholder would pay on a Fund distribution or redemption of shares. The listed returns for the Fund are net of expenses and the returns for the index exclude expenses. Total returns would have been lower had certain expenses not been reduced.
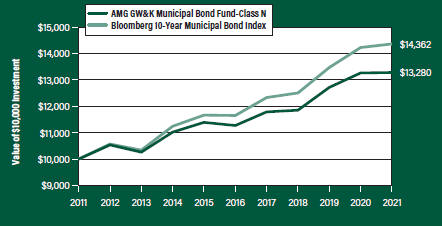
The table below shows the average annual total returns for the AMG GW&K Municipal Bond Fund and the Bloomberg 10-Year Municipal Bond Index for the same time periods ended December 31, 2021.
| | | | | | | | | | | | |
| Average Annual Total Returns1 | | One
Year | | | Five
Years | | | Ten
Years | |
| |
AMG GW&K Municipal Bond Fund2, 3, 4, 5, 6, 7 | | | | | |
| | | |
Class N | | | 0.10 | % | | | 3.33 | % | | | 2.88 | % |
| | | |
Class I | | | 0.43 | % | | | 3.66 | % | | | 3.27 | % |
| | | |
Bloomberg 10-Year Municipal Bond Index8 | | | 0.96 | % | | | 4.27 | % | | | 3.69 | % |
The performance data shown represents past performance. Past performance is not a guarantee of future results. Current performance may be lower or higher than the performance data quoted. The investment return and principal value of an investment will fluctuate so that an investor’s shares, when redeemed, may be worth more or less than their original cost.
Investors should carefully consider the Fund’s investment objectives, risks, charges and expenses before investing. For performance information through the most recent month end, current net asset values per share for the Fund and other information, please call 800.548.4539 or visit our website at amgfunds.com for a free prospectus. Read it carefully before investing or sending money.
Distributed by AMG Distributors, Inc., member FINRA/SIPC.
| 1 | Total return equals income yield plus share price change and assumes reinvestment of all dividends and capital gain distributions. Returns are net of fees and may reflect offsets of Fund expenses as described in the prospectus. No adjustment has been made for taxes payable by shareholders on their reinvested dividends and capital gain distributions. Returns for periods greater than one year are annualized. The listed returns on the Fund are net of expenses and based on the published NAV as of December 31, 2021. All returns are in U.S. dollars ($). |
| 2 | From time to time, the Fund’s advisor has waived its fees and/or absorbed Fund expenses, which has resulted in higher returns. |
| 3 | The Fund is subject to the risks associated with investments in debt securities, such as default risk and |
|
fluctuations in the perception of the debtor’s ability to pay its creditors. Changing interest rates may adversely affect the value of an investment. An increase in interest rates typically causes the value of bonds and other fixed income securities to fall. An increase in interest rates typically cause the value of bonds and other fixed securities to fall. 4 Factors unique to the municipal bond market may negatively affect the value of municipal bonds. 5 Investment income may be subject to certain state and local taxes, and depending on your tax status, the federal alternative minimum tax. Capital gains are not exempt from federal income tax. 6 Market prices of investments held by the Fund may fall rapidly or unpredictably due to a variety of economic or political factors, market conditions, disasters or public health issues, or in response to events that affect particular industries or companies. 7 Companies that are in similar industry sectors may be similarly affected by particular economic or market events; to the extent the Fund has substantial holdings within a particular sector, the risks associated with that sector increase. 8 The Bloomberg 10-Year Municipal Bond Index is the 10 Year (8-12) component of the Municipal Bond index. It is a rules-based, market-value-weighted index engineered for the tax-exempt bond market. The Index tracks general obligation bonds, revenue bonds, insured bonds, and prerefunded bonds rated Baa3/BBB- or higher by at least two of the ratings agencies: Moody’s, S&P, Fitch. Unlike the Fund, the Bloomberg 10-Year Municipal Bond Index is unmanaged, is not available for investment and does not incur expenses. “Bloomberg®” and any Bloomberg index described herein are service marks of Bloomberg Finance L.P. and its affiliates, including Bloomberg Index Services Limited (“BISL”), the administrator of the index (collectively, “Bloomberg”) and have been licensed for use for certain purposes by AMG Funds LLC. Bloomberg is not affiliated with AMG Funds LLC, and Bloomberg does not approve, endorse, review, or recommend the fund described herein. Bloomberg does not guarantee the timeliness, accurateness, or completeness of any data or information relating to such fund. Not FDIC insured, nor bank guaranteed. May lose value. |
34
| | |
| | AMG GW&K Municipal Bond Fund Fund Snapshots (unaudited) December 31, 2021 |
PORTFOLIO BREAKDOWN
| | | | | |
Category | | % of Net Assets |
| | |
Transportation | | | | 29.6 | |
| | |
Utilities | | | | 26.8 | |
| | |
General Obligation | | | | 19.7 | |
| | |
Medical | | | | 9.2 | |
| | |
Water | | | | 5.8 | |
| | |
Education | | | | 4.6 | |
| | |
Power | | | | 1.5 | |
| | |
Tobacco Settlement | | | | 0.7 | |
| | |
Industrial Development | | | | 0.7 | |
| | |
Short-Term Investments | | | | 4.4 | |
| | |
Other Assets Less Liabilities | | | | (3.0 | ) |
| |
Rating | | % of Market Value1 |
| | |
Aaa/AAA | | | | 29.5 | |
| | |
Aa/AA | | | | 43.8 | |
| | |
A | | | | 21.0 | |
| | |
Baa/BBB | | | | 5.7 | |
| 1 | Includes market value of long-term fixed-income securities only. |
TOP TEN HOLDINGS
| | | | | |
| Security Name | | % of
Net Assets |
| | |
Hampton Roads Transportation Accountability Commission, Series A, Series A, Revenue, 5.000%, 07/01/26 | | | | 2.4 | |
| | |
Wisconsin State Revenue, Department of Transportation, Series 2, Series 2, 5.000%, 07/01/29 | | | | 1.9 | |
| | |
North Carolina State Limited Obligation, Series B, Series B, 5.000%, 05/01/28 | | | | 1.4 | |
| | |
Iowa Finance Authority, State Revolving Fund Green Bond, 5.000%, 08/01/30 | | | | 1.4 | |
| | |
Metropolitan Transportation Authority, Transit Revenue, Green Bond, Series B, Series B, 5.000%, 11/15/27 | | | | 1.3 | |
| | |
State of California, General Obligation, 5.000%, 11/01/30 | | | | 1.1 | |
| | |
State of Maryland, Department of Transportation, 5.000%, 09/01/29 | | | | 1.1 | |
| | |
State of Maryland, Department of Transportation, 5.000%, 10/01/28 | | | | 1.1 | |
| | |
State of New Jersey, Series A, 5.000%, 06/01/29 | | | | 1.1 | |
| | |
New York City Transitional Finance Authority Building Aid Revenue, Series S, Series 1A, Revenue, 5.000%, 07/15/32 | | | | 1.1 | |
| | |
| | | | | | |
| | |
Top Ten as a Group | | | | 13.9 | |
| | | | | | |
| | | | | | |
Credit quality ratings shown above reflect the highest rating assigned by either Standard & Poor’s (“S&P”), Moody’s Investors Service, Inc. (“Moody’s”) or Fitch. These rating agencies are independent, nationally recognized statistical rating organizations and are widely used. Investment grade ratings are credit ratings of BBB/Baa or higher. Below investment grade ratings are credit ratings of BB/Ba or lower. Investments designated N/R are not rated by any of the rating agencies. Unrated investments do not necessarily indicate low credit quality. Credit quality ratings are subject to change.
Because a fund’s strategy may result in multiple investments in particular sectors of the economy, its performance may depend on the performance of those sectors and may fluctuate more widely than investments diversified across more sectors. For additional information on these and other risk considerations, please see the Fund’s prospectus.
Any sectors, industries, or securities discussed should not be perceived as investment recommendations. Mention of a specific security should not be considered a recommendation to buy or solicitation to sell that security. Specific securities mentioned in this report may have been sold from the Fund’s portfolio of investments by the time you receive this report.
35
| | |
| | AMG GW&K Municipal Bond Fund Schedule of Portfolio Investments December 31, 2021 |
| | | | | | | | |
| | |
| | | Principal
Amount | | | Value | |
| | |
Municipal Bonds - 98.6% | | | | | | | | |
| |
Alabama - 0.7% | | | | | |
| | |
Alabama Public School and College Authority, Series A | | | | | | | | |
5.000%, 11/01/34 | | | $7,500,000 | | | | $9,861,164 | |
| | |
Arizona - 2.7% | | | | | | | | |
| | |
Arizona Department of Transportation State Highway Fund Revenue | | | | | | | | |
5.000%, 07/01/28 | | | 5,040,000 | | | | 5,991,516 | |
| | |
Arizona Industrial Development Authority | | | | | | | | |
5.000%, 02/01/32 | | | 1,450,000 | | | | 1,946,108 | |
5.000%, 02/01/35 | | | 1,700,000 | | | | 2,256,052 | |
5.000%, 02/01/36 | | | 1,800,000 | | | | 2,381,927 | |
5.000%, 02/01/37 | | | 1,905,000 | | | | 2,514,710 | |
| | |
Arizona Water Infrastructure Finance Authority, Water Quality Revenue, Series A 5.000%, 10/01/26 | | | 10,000,000 | | | | 11,241,938 | |
| | |
Salt River Project Agricultural Improvement & Power District | | | | | | | | |
5.000%, 01/01/27 | | | 3,000,000 | | | | 3,640,618 | |
5.000%, 01/01/28 | | | 2,625,000 | | | | 3,269,607 | |
5.000%, 01/01/29 | | | 2,500,000 | | | | 3,193,543 | |
| | |
Total Arizona | | | | | | | 36,436,019 | |
| |
California - 11.2% | | | | | |
| | |
California Municipal Finance Authority, Community Medical Centers, Series A | | | | | | | | |
5.000%, 02/01/27 | | | 950,000 | | | | 1,150,857 | |
5.000%, 02/01/30 | | | 1,630,000 | | | | 1,957,709 | |
5.000%, 02/01/31 | | | 900,000 | | | | 1,080,005 | |
5.000%, 02/01/32 | | | 1,855,000 | | | | 2,222,756 | |
| | |
California State Public Works Board | | | | | | | | |
5.000%, 02/01/31 | | | 3,500,000 | | | | 4,663,931 | |
| | |
California State Public Works Board, Series A | | | | | | | | |
5.000%, 02/01/30 | | | 3,500,000 | | | | 4,563,105 | |
5.000%, 02/01/32 | | | 3,500,000 | | | | 4,756,455 | |
5.000%, 08/01/33 1 | | | 5,000,000 | | | | 6,574,537 | |
5.000%, 08/01/34 1 | | | 2,750,000 | | | | 3,608,764 | |
5.000%, 08/01/35 1 | | | 2,500,000 | | | | 3,275,189 | |
| | |
California State Public Works Board, Series C | | | | | | | | |
5.000%, 08/01/30 1 | | | 2,785,000 | | | | 3,484,573 | |
5.000%, 08/01/31 1 | | | 2,560,000 | | | | 3,263,788 | |
5.000%, 08/01/32 1 | | | 2,750,000 | | | | 3,492,133 | |
5.000%, 08/01/33 1 | | | 3,000,000 | | | | 3,802,919 | |
| | |
City of Los Angeles Department of Airports, Series C | | | | | | | | |
5.000%, 05/15/30 | | | 10,515,000 | | | | 13,583,803 | |
| | |
Los Angeles County Public Works Financing Authority, Series G | | | | | | | | |
5.000%, 12/01/30 1 | | | 1,750,000 | | | | 2,237,923 | |
5.000%, 12/01/31 1 | | | 1,500,000 | | | | 1,953,916 | |
5.000%, 12/01/32 1 | | | 1,875,000 | | | | 2,435,082 | |
| | |
Los Angeles Unified School District, Series A | | | | | | | | |
5.000%, 07/01/28 | | | 5,000,000 | | | | 6,309,182 | |
| | | | | | | | |
| | |
| | | Principal
Amount | | | Value | |
| | |
San Francisco City & County Airport Commission, San Francisco International Airport, Series A | | | | | | | | |
5.000%, 05/01/34 | | | $5,010,000 | | | | $6,249,182 | |
5.000%, 05/01/35 | | | 5,800,000 | | | | 7,223,399 | |
| | |
San Francisco City & County Airport Comm-San Francisco International Airport, Series A | | | | | | | | |
5.000%, 05/01/32 | | | 3,000,000 | | | | 3,931,202 | |
| | |
State of California | | | | | | | | |
5.000%, 08/01/29 | | | 7,235,000 | | | | 8,622,509 | |
5.000%, 09/01/29 | | | 5,075,000 | | | | 6,063,321 | |
5.000%, 11/01/30 | | | 11,575,000 | | | | 15,421,184 | |
5.000%, 09/01/31 | | | 8,000,000 | | | | 10,878,690 | |
5.000%, 04/01/32 | | | 5,000,000 | | | | 6,866,463 | |
| | |
University of California, Series S | | | | | | | | |
5.000%, 05/15/36 1 | | | 3,000,000 | | | | 4,022,462 | |
5.000%, 05/15/37 1 | | | 3,000,000 | | | | 4,005,723 | |
5.000%, 05/15/38 1 | | | 3,000,000 | | | | 3,994,483 | |
| | |
Total California | | | | | | | 151,695,245 | |
| |
Colorado - 1.0% | | | | | |
| | |
Colorado Health Facilities Authority, Series A | | | | | | | | |
5.000%, 01/01/28 | | | 2,545,000 | | | | 3,148,121 | |
5.000%, 01/01/29 | | | 4,175,000 | | | | 5,281,497 | |
5.000%, 08/01/33 | | | 4,260,000 | | | | 5,364,673 | |
| | |
Total Colorado | | | | | | | 13,794,291 | |
| |
Connecticut - 4.3% | | | | | |
| | |
Connecticut State Health & Educational Facilities Authority | | | | | | | | |
5.000%, 07/01/31 1 | | | 6,205,000 | | | | 7,923,461 | |
5.000%, 07/01/33 1 | | | 2,750,000 | | | | 3,539,557 | |
5.000%, 07/01/34 1 | | | 3,100,000 | | | | 3,981,706 | |
| | |
State of Connecticut Special Tax Revenue | | | | | | | | |
5.000%, 05/01/28 | | | 3,000,000 | | | | 3,752,640 | |
| | |
State of Connecticut Special Tax Revenue, Transportation Infrastructure | | | | | | | | |
5.000%, 01/01/30 | | | 10,180,000 | | | | 12,570,139 | |
| | |
State of Connecticut Special Tax Revenue, Series B | | | | | | | | |
5.000%, 10/01/35 | | | 7,500,000 | | | | 9,405,236 | |
| | |
State of Connecticut Special Tax Revenue, Series C | | | | | | | | |
5.000%, 01/01/28 | | | 1,000,000 | | | | 1,240,275 | |
5.000%, 01/01/29 | | | 1,000,000 | | | | 1,268,113 | |
5.000%, 01/01/30 | | | 1,000,000 | | | | 1,295,951 | |
5.000%, 01/01/31 | | | 1,000,000 | | | | 1,324,002 | |
5.000%, 01/01/32 | | | 1,000,000 | | | | 1,347,516 | |
| | |
State of Connecticut, Series A | | | | | | | | |
5.000%, 01/15/31 | | | 7,650,000 | | | | 9,881,686 | |
| | |
Total Connecticut | | | | | | | 57,530,282 | |
| |
Delaware - 0.3% | | | | | |
| | |
Delaware River & Bay Authority | | | | | | | | |
5.000%, 01/01/31 1 | | | 1,000,000 | | | | 1,254,446 | |
5.000%, 01/01/32 1 | | | 1,040,000 | | | | 1,326,839 | |
5.000%, 01/01/33 1 | | | 1,100,000 | | | | 1,399,437 | |
| | |
Total Delaware | | | | | | | 3,980,722 | |
The accompanying notes are an integral part of these financial statements.
36
| | |
| | AMG GW&K Municipal Bond Fund Schedule of Portfolio Investments (continued) |
| | | | | | | | |
| | |
| | | Principal Amount | | | Value | |
| |
District of Columbia - 2.6% | | | | | |
| | |
District of Columbia, Series A | | | | | | | | |
5.000%, 06/01/30 | | | $6,020,000 | | | | $7,129,746 | |
| | |
District of Columbia, Series B | | | | | | | | |
5.000%, 10/01/28 | | | 7,100,000 | | | | 9,025,537 | |
5.000%, 06/01/31 | | | 10,080,000 | | | | 12,578,199 | |
| | |
Washington Convention & Sports Authority, Series A | | | | | | | | |
5.000%, 10/01/27 | | | 5,475,000 | | | | 6,710,152 | |
| | |
Total District of Columbia | | | | | | | 35,443,634 | |
| |
Florida - 4.2% | | | | | |
| | |
Central Florida Expressway Authority | | | | | | | | |
5.000%, 07/01/28 | | | 4,460,000 | | | | 5,618,156 | |
| | |
Escambia County Health Facilities Authority | | | | | | | | |
5.000%, 08/15/37 | | | 6,000,000 | | | | 7,471,287 | |
| | |
Florida Development Finance Corp. | | | | | | | | |
4.000%, 11/15/33 | | | 10,000,000 | | | | 12,193,287 | |
| | |
Florida’s Turnpike Enterprise, | | | | | | | | |
Department of Transportation, Series C | | | | | | | | |
5.000%, 07/01/28 | | | 7,075,000 | | | | 8,448,783 | |
| | |
Lee Memorial Health System, Series A | | | | | | | | |
5.000%, 04/01/34 | | | 5,645,000 | | | | 7,044,799 | |
| | |
Orange County Health Facilities Authority, Series A | | | | | | | | |
5.000%, 10/01/31 | | | 4,525,000 | | | | 5,375,361 | |
| | |
State of Florida, Capital Outlay, Series B | | | | | | | | |
5.000%, 06/01/27 | | | 9,045,000 | | | | 10,034,391 | |
| | |
Total Florida | | | | | | | 56,186,064 | |
| |
Georgia - 1.4% | | | | | |
| | |
Georgia State University & College | | | | | | | | |
Improvements, Series A | | | | | | | | |
5.000%, 07/01/27 | | | 4,600,000 | | | | 4,709,270 | |
| | |
Private Colleges & Universities Authority, Series B | | | | | | | | |
5.000%, 09/01/30 | | | 10,365,000 | | | | 13,688,570 | |
| | |
Total Georgia | | | | | | | 18,397,840 | |
| |
Illinois - 6.7% | | | | | |
| | |
Chicago O’Hare International Airport, Series A | | | | | | | | |
5.000%, 01/01/35 | | | 5,010,000 | | | | 6,351,893 | |
| | |
Chicago O’Hare International Airport, Series B | | | | | | | | |
5.000%, 01/01/28 | | | 5,670,000 | | | | 6,396,162 | |
| | |
Chicago O’Hare International Airport, | | | | | | | | |
Senior Lien, Series A | | | | | | | | |
5.000%, 01/01/36 | | | 10,000,000 | | | | 12,228,819 | |
5.000%, 01/01/38 | | | 5,500,000 | | | | 6,704,337 | |
| | |
Illinois Finance Authority | | | | | | | | |
5.000%, 01/01/29 | | | 2,310,000 | | | | 2,941,857 | |
5.000%, 07/01/29 | | | 8,755,000 | | | | 11,274,443 | |
| | |
Illinois Finance Authority, Series A | | | | | | | | |
4.000%, 08/15/37 | | | 5,910,000 | | | | 7,119,323 | |
| | | | | | | | |
| | |
| | | Principal Amount | | | Value | |
| | |
Illinois State Finance Authority Revenue, Clean Water Initiative Revenue | | | | | | | | |
5.000%, 07/01/27 | | | $11,000,000 | | | | $12,851,202 | |
| | |
Illinois State Toll Highway Authority, Series A | | | | | | | | |
5.000%, 12/01/31 | | | 9,735,000 | | | | 11,319,006 | |
| | |
Illinois State Toll Highway Authority, | | | | | | | | |
Senior Revenue Bonds, Series A | | | | | | | | |
5.000%, 01/01/30 | | | 10,110,000 | | | | 12,765,369 | |
| | |
Total Illinois | | | | | | | 89,952,411 | |
| |
Indiana - 0.9% | | | | | |
| | |
Indiana Finance Authority, Series S | | | | | | | | |
5.000%, 10/01/28 | | | 1,000,000 | | | | 1,264,465 | |
5.000%, 10/01/29 | | | 3,555,000 | | | | 4,596,174 | |
| | |
Indiana Finance Authority, Series C | | | | | | | | |
5.000%, 06/01/29 | | | 4,800,000 | | | | 6,189,925 | |
| | |
Total Indiana | | | | | | | 12,050,564 | |
| |
Iowa - 1.4% | | | | | |
| | |
Iowa Finance Authority, State Revolving Fund Green Bond | | | | | | | | |
5.000%, 08/01/30 | | | 15,025,000 | | | | 18,385,413 | |
| |
Kentucky - 0.5% | | | | | |
| | |
Louisville/Jefferson County Metropolitan Government, Norton Healthcare Inc., Series A | | | | | | | | |
5.000%, 10/01/29 | | | 5,505,000 | | | | 6,536,712 | |
| |
Maine - 0.7% | | | | | |
| | |
Maine Turnpike Authority | | | | | | | | |
5.000%, 07/01/28 1 | | | 1,955,000 | | | | 2,412,650 | |
5.000%, 07/01/29 1 | | | 1,600,000 | | | | 2,018,668 | |
5.000%, 07/01/30 1 | | | 1,390,000 | | | | 1,790,045 | |
5.000%, 07/01/31 1 | | | 1,500,000 | | | | 1,972,281 | |
5.000%, 07/01/32 1 | | | 1,390,000 | | | | 1,864,736 | |
| | |
Total Maine | | | | | | | 10,058,380 | |
| |
Maryland - 6.9% | | | | | |
| | |
Maryland State Transportation Authority | | | | | | | | |
5.000%, 07/01/33 | | | 6,350,000 | | | | 8,304,142 | |
| | |
State of Maryland Department of Transportation, Series 2022B | | | | | | | | |
5.000%, 12/01/27 1 | | | 2,500,000 | | | | 2,953,843 | |
5.000%, 12/01/28 1 | | | 2,305,000 | | | | 2,782,517 | |
5.000%, 12/01/29 1 | | | 2,250,000 | | | | 2,766,847 | |
| | |
State of Maryland, Department of Transportation | | | | | | | | |
5.000%, 10/01/28 | | | 12,365,000 | | | | 14,871,215 | |
5.000%, 09/01/29 | | | 12,205,000 | | | | 14,958,232 | |
| | |
State of Maryland, Series C | | | | | | | | |
4.000%, 03/01/28 1 | | | 9,500,000 | | | | 11,136,303 | |
4.000%, 03/01/29 1 | | | 9,245,000 | | | | 11,035,552 | |
| | |
State of Maryland, Series D | | | | | | | | |
4.000%, 08/01/28 1 | | | 8,000,000 | | | | 9,457,322 | |
4.000%, 08/01/29 1 | | | 6,500,000 | | | | 7,812,916 | |
The accompanying notes are an integral part of these financial statements.
37
| | |
| | AMG GW&K Municipal Bond Fund Schedule of Portfolio Investments (continued) |
| | | | | | | | |
| | |
| | | Principal
Amount | | | Value | |
| |
Maryland - 6.9% (continued) | | | | | |
| | |
State of Maryland, State & Local Facilities Loan of 2019, 1st Series | | | | | | | | |
5.000%, 03/15/30 | | | $6,000,000 | | | | $7,684,976 | |
| | |
Total Maryland | | | | | | | 93,763,865 | |
| |
Massachusetts - 1.7% | | | | | |
| | |
Commonwealth of Massachusetts, Series F | | | | | | | | |
5.000%, 11/01/26 | | | 5,000,000 | | | | 5,199,473 | |
| | |
Massachusetts Bay Transportation Authority | | | | | | | | |
5.000%, 07/01/22 | | | 10,020,000 | | | | 10,260,035 | |
| | |
Massachusetts Water Resources Authority, Series C | | | | | | | | |
5.000%, 08/01/31 | | | 6,080,000 | | | | 7,294,591 | |
| | |
Total Massachusetts | | | | | | | 22,754,099 | |
| |
Michigan - 2.9% | | | | | |
| | |
Michigan Finance Authority, | | | | | | | | |
Henry Ford Health System | | | | | | | | |
5.000%, 11/15/29 | | | 11,450,000 | | | | 13,671,804 | |
| | |
Michigan State Building Authority Revenue, Series I | | | | | | | | |
5.000%, 04/15/27 | | | 5,700,000 | | | | 6,630,600 | |
| | |
State of Michigan | | | | | | | | |
5.000%, 03/15/27 | | | 10,000,000 | | | | 12,177,869 | |
| | |
Wayne County Airport Authority, Series A | | | | | | | | |
5.000%, 12/01/37 | | | 2,285,000 | | | | 3,002,682 | |
5.000%, 12/01/38 | | | 1,405,000 | | | | 1,842,763 | |
5.000%, 12/01/39 | | | 1,800,000 | | | | 2,353,900 | |
| | |
Total Michigan | | | | | | | 39,679,618 | |
| |
Minnesota - 1.5% | | | | | |
| | |
City of Minneapolis MN, Fairview Health Services, Series A | | | | | | | | |
5.000%, 11/15/35 | | | 3,165,000 | | | | 3,930,513 | |
| | |
State of Minnesota, Series A | | | | | | | | |
5.000%, 08/01/22 | | | 7,500,000 | | | | 7,710,715 | |
5.000%, 09/01/22 | | | 8,090,000 | | | | 8,349,873 | |
| | |
Total Minnesota | | | | | | | 19,991,101 | |
| |
Missouri - 1.4% | | | | | |
| | |
University of Missouri, Series A | | | | | | | | |
5.000%, 11/01/26 | | | 5,520,000 | | | | 6,229,634 | |
| | |
University of Missouri, Series B | | | | | | | | |
5.000%, 11/01/30 | | | 10,010,000 | | | | 13,207,690 | |
| | |
Total Missouri | | | | | | | 19,437,324 | |
| |
New Jersey - 4.7% | | | | | |
| | |
New Jersey State Turnpike Authority Revenue, Series B | | | | | | | | |
5.000%, 01/01/28 | | | 4,010,000 | | | | 4,970,860 | |
| | |
New Jersey State Turnpike Authority Revenue, Series D | | | | | | | | |
5.000%, 01/01/28 | | | 5,000,000 | | | | 5,889,726 | |
| | | | | | | | |
| | |
| | | Principal
Amount | | | Value | |
| | |
New Jersey Transportation Trust Fund Authority, Series S | | | | | | | | |
5.000%, 06/15/30 | | | $6,255,000 | | | | $8,020,522 | |
5.000%, 06/15/31 | | | 7,615,000 | | | | 9,952,421 | |
5.000%, 06/15/32 | | | 5,750,000 | | | | 7,492,255 | |
5.000%, 06/15/33 | | | 6,000,000 | | | | 7,790,786 | |
| | |
State of New Jersey | | | | | | | | |
5.000%, 06/01/25 | | | 4,335,000 | | | | 4,969,055 | |
5.000%, 06/01/29 | | | 11,500,000 | | | | 14,603,887 | |
| | |
Total New Jersey | | | | | | | 63,689,512 | |
| |
New Mexico - 1.4% | | | | | |
| | |
New Mexico Finance Authority | | | | | | | | |
5.000%, 06/01/22 | | | 2,845,000 | | | | 2,901,628 | |
| | |
New Mexico Finance Authority, Series A | | | | | | | | |
5.000%, 06/15/28 | | | 4,470,000 | | | | 5,617,990 | |
5.000%, 06/15/30 | | | 7,500,000 | | | | 9,838,336 | |
| | |
Total New Mexico | | | | | | | 18,357,954 | |
| | |
New York - 13.6% | | | | | | | | |
| | |
City of New York | | | | | | | | |
5.000%, 08/01/34 | | | 3,250,000 | | | | 4,223,327 | |
| | |
City of New York, Series C | | | | | | | | |
5.000%, 08/01/33 | | | 1,500,000 | | | | 1,954,271 | |
| | |
City of New York, Series L | | | | | | | | |
5.000%, 04/01/33 | | | 6,500,000 | | | | 8,564,462 | |
| | |
Long Island Power Authority | | | | | | | | |
5.000%, 09/01/35 | | | 5,030,000 | | | | 6,340,963 | |
| | |
Long Island Power Authority, Series A | | | | | | | | |
5.000%, 09/01/30 | | | 2,275,000 | | | | 2,991,314 | |
5.000%, 09/01/31 | | | 3,935,000 | | | | 5,265,641 | |
| | |
Metropolitan Transportation Authority, | | | | | | | | |
| | |
Transit Revenue, Green Bond, Series B | | | | | | | | |
5.000%, 11/15/27 | | | 14,225,000 | | | | 17,309,614 | |
| | |
Metropolitan Transportation Authority, | | | | | | | | |
Transit Revenue, Series F | | | | | | | | |
5.000%, 11/15/24 | | | 4,950,000 | | | | 5,144,954 | |
5.000%, 11/15/27 | | | 5,000,000 | | | | 5,191,592 | |
5.000%, 11/15/28 | | | 4,760,000 | | | | 5,485,830 | |
| | |
New York City Transitional Finance Authority | | | | | | | | |
Building Aid Revenue, Series S | | | | | | | | |
5.000%, 07/15/32 | | | 10,835,000 | | | | 14,489,198 | |
| | |
New York City Transitional Finance Authority | | | | | | | | |
Building Aid Revenue, | | | | | | | | |
Series S-3, Sub-Series S-3A | | | | | | | | |
5.000%, 07/15/31 | | | 5,080,000 | | | | 6,360,327 | |
| | |
New York City Transitional Finance Authority | | | | | | | | |
Future Tax Secured Revenue | | | | | | | | |
5.000%, 11/01/31 | | | 2,500,000 | | | | 3,334,165 | |
5.000%, 11/01/32 | | | 4,000,000 | | | | 5,318,281 | |
| | |
New York City Transitional Finance Authority | | | | | | | | |
Future Tax Secured Revenue, Series E | | | | | | | | |
5.000%, 02/01/37 | | | 7,000,000 | | | | 9,109,032 | |
The accompanying notes are an integral part of these financial statements.
38
| | |
| | AMG GW&K Municipal Bond Fund Schedule of Portfolio Investments (continued) |
| | | | | | | | |
| | |
| | | Principal
Amount | | | Value | |
| |
New York - 13.6% (continued) | | | | | |
| | |
New York City Transitional Finance Authority, Future Tax Secured Revenue, Series C | | | | | | | | |
5.000%, 11/01/26 | | | $9,585,000 | | | | $11,000,479 | |
| | |
New York State Dormitory Authority, Series A | | | | | | | | |
5.000%, 12/15/27 | | | 5,640,000 | | | | 5,893,409 | |
5.000%, 03/15/31 | | | 7,670,000 | | | | 9,675,904 | |
5.000%, 03/15/32 | | | 8,000,000 | | | | 10,624,312 | |
| | |
New York State Dormitory Authority, Series D | | | | | | | | |
5.000%, 02/15/27 | | | 5,355,000 | | | | 5,384,483 | |
| | |
New York State Dormitory Authority, Series E | | | | | | | | |
5.000%, 03/15/32 | | | 8,410,000 | | | | 9,739,322 | |
| | |
New York Transportation Development Corp. | | | | | | | | |
4.000%, 10/31/41 | | | 1,250,000 | | | | 1,456,625 | |
4.000%, 10/31/46 | | | 1,500,000 | | | | 1,727,498 | |
5.000%, 12/01/30 | | | 1,000,000 | | | | 1,287,564 | |
5.000%, 12/01/31 | | | 1,100,000 | | | | 1,407,301 | |
5.000%, 12/01/32 | | | 1,450,000 | | | | 1,856,728 | |
5.000%, 12/01/33 | | | 1,000,000 | | | | 1,276,498 | |
| | |
Port Authority of New York & New Jersey | | | | | | | | |
5.000%, 07/15/31 | | | 10,000,000 | | | | 12,872,920 | |
5.000%, 07/15/32 | | | 6,545,000 | | | | 8,392,418 | |
| | |
Total New York | | | | | | | 183,678,432 | |
| |
North Carolina - 1.4% | | | | | |
| | |
North Carolina State Limited Obligation, Series B | | | | | | | | |
5.000%, 05/01/28 | | | 15,300,000 | | | | 18,661,878 | |
| |
Ohio - 0.4% | | | | | |
| | |
Ohio State General Obligation, Series T | | | | | | | | |
5.000%, 05/01/30 | | | 5,000,000 | | | | 6,089,003 | |
| |
Oregon - 2.1% | | | | | |
| | |
Oregon State Lottery, Series C | | | | | | | | |
5.000%, 04/01/27 | | | 10,000,000 | | | | 11,415,342 | |
| | |
Oregon State Lottery, Series D | | | | | | | | |
5.000%, 04/01/28 | | | 9,225,000 | | | | 10,524,251 | |
| | |
State of Oregon | | | | | | | | |
5.000%, 05/01/27 | | | 5,000,000 | | | | 6,125,074 | |
| | |
Total Oregon | | | | | | | 28,064,667 | |
| |
Pennsylvania - 1.6% | | | | | |
| | |
Allegheny County Airport Authority, Series A | | | | | | | | |
5.000%, 01/01/31 | | | 1,350,000 | | | | 1,754,003 | |
5.000%, 01/01/32 | | | 2,215,000 | | | | 2,864,172 | |
| | |
Allegheny County Hospital Development Authority, University Pittsburgh Medical Center | | | | | | | | |
5.000%, 07/15/31 | | | 5,530,000 | | | | 7,005,417 | |
| | |
Commonwealth Financing Authority, Pennsylvania Tobacco | | | | | | | | |
5.000%, 06/01/32 | | | 7,910,000 | | | | 9,663,441 | |
| | |
Total Pennsylvania | | | | | | | 21,287,033 | |
| | | | | | | | |
| | |
| | | Principal
Amount | | | Value | |
| |
Texas - 8.1% | | | | | |
| | |
Central Texas Turnpike System Transportation Commission, Series C | | | | | | | | |
5.000%, 08/15/31 | | | $11,175,000 | | | | $12,464,719 | |
| | |
Central Texas Turnpike System, Series A | | | | | | | | |
5.000%, 08/15/39 | | | 8,000,000 | | | | 10,162,101 | |
| | |
City of Corpus Christi TX Utility System Revenue, Junior Lien | | | | | | | | |
5.000%, 07/15/29 | | | 3,125,000 | | | | 3,934,141 | |
| | |
City of Houston TX Airport System Revenue, Series A | | | | | | | | |
4.000%, 07/01/35 | | | 1,100,000 | | | | 1,316,834 | |
4.000%, 07/01/36 | | | 1,100,000 | | | | 1,311,777 | |
5.000%, 07/01/34 | | | 2,835,000 | | | | 3,684,838 | |
| | |
City of San Antonio TX Electric & Gas Systems Revenue, Series A | | | | | | | | |
5.000%, 02/01/37 | | | 3,010,000 | | | | 3,925,818 | |
5.000%, 02/01/38 | | | 2,985,000 | | | | 3,883,347 | |
| | |
Dallas Area Rapid Transit, Senior Lien | | | | | | | | |
5.250%, 12/01/28 | | | 8,865,000 | | | | 11,401,847 | |
| | |
Dallas Fort Worth International Airport, Series A | | | | | | | | |
5.000%, 11/01/30 | | | 2,000,000 | | | | 2,619,351 | |
5.000%, 11/01/31 | | | 3,265,000 | | | | 4,260,882 | |
| | |
Lower Colorado River Authority, | | | | | | | | |
LCRA Transmission Services Corporation | | | | | | | | |
5.000%, 05/15/29 | | | 3,815,000 | | | | 4,216,399 | |
| | |
North Texas Municipal Water District | | | | | | | | |
Water System Revenue, | | | | | | | | |
Refunding and Improvement | | | | | | | | |
5.000%, 09/01/29 | | | 7,350,000 | | | | 8,781,362 | |
| | |
North Texas Tollway Authority, 2nd Tier, Series B | | | | | | | | |
5.000%, 01/01/31 | | | 2,000,000 | | | | 2,319,964 | |
5.000%, 01/01/32 | | | 3,010,000 | | | | 3,602,428 | |
| | |
North Texas Tollway Authority, Series A | | | | | | | | |
5.000%, 01/01/26 | | | 7,795,000 | | | | 8,496,759 | |
| | |
Texas Private Activity Bond Surface Transportation Corp. | | | | | | | | |
4.000%, 12/31/37 | | | 5,000,000 | | | | 5,817,229 | |
4.000%, 12/31/38 | | | 3,735,000 | | | | 4,335,393 | |
| | |
Texas Transportation Commission Fund, Series A | | | | | | | | |
5.000%, 04/01/27 | | | 12,550,000 | | | | 12,697,609 | |
| | |
Total Texas | | | | | | | 109,232,798 | |
| |
Utah - 1.5% | | | | | |
| | |
Salt Lake City Corp. Airport Revenue, Series A | | | | | | | | |
5.000%, 07/01/29 | | | 3,450,000 | | | | 4,246,290 | |
5.000%, 07/01/30 | | | 6,585,000 | | | | 8,062,991 | |
| | |
State of Utah, Series B | | | | | | | | |
5.000%, 07/01/22 | | | 7,515,000 | | | | 7,695,405 | |
| | |
Total Utah | | | | | | | 20,004,686 | |
| |
Virginia - 3.0% | | | | | |
| | |
Hampton Roads Transportation Accountability Commission, Series A | | | | | | | | |
5.000%, 07/01/26 | | | 27,350,000 | | | | 32,633,848 | |
The accompanying notes are an integral part of these financial statements.
39
| | |
| | AMG GW&K Municipal Bond Fund Schedule of Portfolio Investments (continued) |
| | | | | | | | |
| | |
| | | Principal
Amount | | | Value | |
| | |
Virginia - 3.0% (continued) | | | | | | | | |
| | |
Virginia College Building Authority, Series P | | | | | | | | |
4.000%, 02/01/30 | | | $8,000,000 | | | | $8,023,255 | |
| | |
Total Virginia | | | | | | | 40,657,103 | |
| |
Washington - 3.9% | | | | | |
| | |
Central Puget Sound Regional Transit Authority, Series S | | | | | | | | |
5.000%, 11/01/29 | | | 5,700,000 | | | | 7,421,841 | |
| | |
Energy Northwest | | | | | | | | |
5.000%, 07/01/22 | | | 6,000,000 | | | | 6,143,432 | |
| | |
Port of Seattle | | | | | | | | |
5.000%, 08/01/31 | | | 5,000,000 | | | | 6,589,281 | |
| | |
State of Washington School Improvements, Series C | | | | | | | | |
5.000%, 02/01/28 | | | 7,370,000 | | | | 8,658,793 | |
| | |
State of Washington, Series R-2015C | | | | | | | | |
5.000%, 07/01/28 | | | 10,280,000 | | | | 11,616,198 | |
| | |
University of Washington, University & College Improvements Revenue, Series C | | | | | | | | |
5.000%, 07/01/27 | | | 7,270,000 | | | | 7,607,974 | |
| | |
Washington Health Care Facilities Authority, Series A | | | | | | | | |
5.000%, 08/01/38 | | | 3,270,000 | | | | 4,068,372 | |
| | |
Total Washington | | | | | | | 52,105,891 | |
| |
West Virginia - 1.2% | | | | | |
| | |
West Virginia Hospital Finance Authority, Cabell Huntington Hospital Obligation | | | | | | | | |
5.000%, 01/01/35 | | | 3,745,000 | | | | 4,578,572 | |
| | |
West Virginia Parkways Authority | | | | | | | | |
5.000%, 06/01/37 | | | 1,750,000 | | | | 2,304,346 | |
5.000%, 06/01/38 | | | 2,000,000 | | | | 2,624,600 | |
5.000%, 06/01/39 | | | 5,150,000 | | | | 6,734,028 | |
| | |
Total West Virginia | | | | | | | 16,241,546 | |
| 1 | All or part of a security is delayed delivery transaction. The market value for delayed delivery securities at December 31, 2021, amounted to $123,580,618, or 9.2% of net assets. |
| | | | | | | | |
| | |
| | | Principal
Amount | | | Value | |
| |
Wisconsin - 2.7% | | | | | |
| | |
State of Wisconsin | | | | | | | | |
5.000%, 05/01/29 | | | $3,500,000 | | | | $4,499,390 | |
5.000%, 05/01/30 | | | 2,390,000 | | | | 3,142,360 | |
5.000%, 05/01/31 | | | 2,700,000 | | | | 3,554,485 | |
| | |
Wisconsin State Revenue, Department of Transportation, Series 2 | | | | | | | | |
5.000%, 07/01/29 | | | 20,405,000 | | | | 25,009,123 | |
| | |
Total Wisconsin | | | | | | | 36,205,358 | |
| | |
Total Municipal Bonds
(Cost $1,277,111,978) | | | | | | | 1,330,210,609 | |
| |
Short-Term Investments - 4.4% | | | | | |
| |
Municipal Bonds - 4.4% | | | | | |
| |
California - 3.2% | | | | | |
| | |
City of Los Angeles | | | | | | | | |
4.000%, 06/23/22 | | | 41,525,000 | | | | 42,290,543 | |
| |
Colorado - 1.2% | | | | | |
| | |
Colorado State Education Loan Program, Series A | | | | | | | | |
4.000%, 06/29/22 | | | 16,250,000 | | | | 16,558,511 | |
| | |
Total Municipal Bonds | | | | | | | | |
(Cost $58,856,766) | | | | | | | 58,849,054 | |
| | |
Total Short-Term Investments | | | | | | | | |
(Cost $58,856,766) | | | | | | | 58,849,054 | |
| | |
Total Investments - 103.0% | | | | | | | | |
(Cost $1,335,968,744) | | | | | | | 1,389,059,663 | |
| |
Other Assets, less Liabilities - (3.0)% | | | | (39,989,524 | ) |
| | |
Net Assets - 100.0% | | | | | | | $1,349,070,139 | |
The accompanying notes are an integral part of these financial statements.
40
| | |
| | AMG GW&K Municipal Bond Fund Schedule of Portfolio Investments (continued) |
The following table summarizes the inputs used to value the Fund’s investments by the fair value hierarchy levels as of December 31, 2021:
| | | | | | | | | | | | | | | | |
| | | Level 1 | | | Level 2 | | | Level 3 | | | Total | |
| | | | | | | | | | | | | | | | |
| | | | |
Investments in Securities | | | | | | | | | | | | | | | | |
| | | | |
Municipal Bonds† | | | – | | | | $1,330,210,609 | | | | – | | | | $1,330,210,609 | |
| | | | |
Short-Term Investments | | | | | | | | | | | | | | | | |
| | | | |
Municipal Bonds† | | | – | | | | 58,849,054 | | | | – | | | | 58,849,054 | |
| | | | | | | | | | | | | | | | |
| | | | |
Total Investments in Securities | | | – | | | | $1,389,059,663 | | | | – | | | | $1,389,059,663 | |
| | | | | | | | | | | | | | | | |
| † | All municipal bonds held in the Fund are Level 2 securities. For a detailed breakout of municipal bonds by major classification, please refer to the Fund’s Schedule of Portfolio Investments. |
For the fiscal year ended December 31, 2021, there were no transfers in or out of Level 3.
The accompanying notes are an integral part of these financial statements.
41
| | |
| | AMG GW&K Municipal Enhanced Yield Fund Portfolio Manager’s Comments (unaudited) |
| | | | | | | | |
THE YEAR IN REVIEW For the year ended December 31, 2021, AMG GW&K Municipal Enhanced Yield Fund’s (the “Fund”) Class N shares returned 3.59%, compared to the Bloomberg U.S. Municipal Bond BAA Index (the “Bloomberg BAA Index”), which returned 4.85%. Municipal bonds fared better than most fixed income alternatives in the first quarter, but ultimately could not escape the gravitational pull of a bond market selloff that saw Treasury yields surge to their highest levels of the pandemic era. The major catalyst came in January, when the Democrats unexpectedly secured control of the U.S. Senate, clearing the way to add a $1.9 trillion fiscal stimulus package to an economy already buoyed by the momentum of a successful vaccine rollout. Investors responded quickly, repositioning for a sharp acceleration in growth and a revival of long-dormant inflationary pressures. The yield on the 10-year U.S. Treasury shot up 82 basis points over the first quarter and the curve steepened significantly as the futures market pulled forward by a year; the date of a first rate hike. But the U. S. Federal Reserve (the “Fed”) pledged patience and dismissed pricing pressures as temporary. While inflation expectations had pushed to decade-highs, policymakers emphasized that over half of the increase in nominal yields was driven by a surge in real rates, a welcome reflection of investor confidence in the recovery. That followed with solid gains from municipal bonds in the second quarter, riding the coattails of a Treasury rally that reversed much of the first quarter selloff in bonds. In many ways, the rebound in the broader market went against the grain of events. After all, during the quarter, unprecedented fiscal stimulus made its way through the economy, with the White House pushing aggressively for even more. A vaccine-led recovery across the U.S. unleashed a mountain of pent-up savings amid easing lockdowns, fueling an acceleration in growth. Inflation readings jumped to levels not seen in two decades, as job openings surged to record highs and supply chain disruptions caused widespread shortages. And yet, Treasury yields declined anyway. Disappointing employment data and a deceleration in retail sales and manufacturing activity called into question the strength of the recovery. Fiscal spending initiatives met stiff resistance in Congress. And the Fed surprised investors by easing off its ultra-accommodative stance on rates and asset purchases, signaling two quarter-point hikes in 2023 | | | | and setting the stage for a future discussion on tapering. This combination of less-robust growth and a more vigilant Fed led to a significant flattening of the yield curve. Modest losses for municipal bonds followed in the third quarter, driven by a late-September selloff in Treasuries. For most of the summer, broader rates remained low and traded within a narrow range, despite solid economic data and rising inflation prints. The market, it appeared, was more focused on the longer term, taking supply-chain disruptions in stride and buying into the Fed’s argument that price increases would ultimately prove “transitory.” The spread of the delta variant also helped to keep a lid on rates, as concerns about delayed reopenings dialed back expectations over the pace for global growth. But the markets received a jolt from the September FOMC meeting when a less dovish Fed indicated that the tapering program was likely to begin in November and finish next summer. Further, the accompanying dot plot reflected a more aggressive path for rate hikes, with liftoff potentially beginning next year, followed by three more hikes in both 2023 and 2024. The yield on the 10-year Treasury reacted with the single largest one-day jump since February. Meanwhile, Congress found it increasingly difficult to reach consensus on the infrastructure deal, which has been put on hold pending the outcome of a more contentious $3.5 trillion social policy bill. A debt ceiling debate and threats of a government shutdown only added to the apprehension and uncertainty. Over the final eight days of September, the 10-year Treasury yield rose nearly 20 basis points to finish roughly unchanged for the third quarter. Municipal bonds posted mixed returns in the fourth quarter – short maturities barely broke even, held back by the potential for an accelerated rate-hike cycle, while the long end rallied on declining growth expectations. Municipal bonds outperformed Treasuries across the entire curve, buoyed by a strong technical environment that had been in place all year. The broader market, meanwhile, experienced its second major selloff of 2021, though most of the losses were likewise concentrated at the short end, while the long end saw solid gains. Back in the first quarter, the long end had led the slide, as investors repositioned during the so-called “reflation trade.” This time around, the results reflected a market trying to juggle elevated growth and inflation against tighter monetary policy, less fiscal stimulus, and the damping effects of the omicron variant. With | | | | inflation topping 30-year highs, the Fed executed a well-telegraphed hawkish pivot, doubling the pace of its expected taper and signaling as many as six quarter-point rate hikes over the next two years. The “transitory” moniker was also dropped from the policy statement, a nod to the reality that the spike in price increases is expected to linger far longer than originally anticipated. While two-year rates jumped 45 basis points over the quarter in reaction to the new messaging, 10-year rates were essentially unchanged. Whereas the 30-year rallied 14 basis points, an indication that investors believe the Fed will either succeed in keeping inflation at bay or damage the economy in trying. Municipals charted their own path through the end of the year, largely ignoring the volatility in the Treasury market. After a brief hiccup in October, the market regained its footing in November and December. The catalyst was a seasonal boost in reinvestment flows against a backdrop of stable to falling issuance. In Washington, the House passed a version of the Build Back Better legislation, but left out key provisions that the municipal bond market lobbied hard for, including one that would have restored tax-exempt advanced refunding transactions. With that provision off the table, it seemed clear that the scarcity premium enjoyed by tax-exempt paper would persist further, an impression reinforced by the subsequent rally in municipals even while the Treasury market was in the midst of a pre-Thanksgiving Day slide. Meanwhile, the fundamental momentum remained intact. In November, Congress finally passed the bipartisan infrastructure bill, shoring up existing funding commitments and adding new federal grants to be used by all levels of government. Tax receipts continued to pour into state and local coffers, while outsized stock market gains helped bolster the funded status of pension systems across the board. Through the end of the year, the municipal curve mimicked the flattening of the Treasury curve, though short tax-exempt rates were up far less than their taxable counterparts, while longer-term yields fell by more. Those dynamics capped a year of outperformance that enabled municipal bonds to stand as one of the few investment-grade fixed income sectors to post positive returns for 2021. Amid this backdrop, the Fund underperformed the Bloomberg BAA Index for the year due to its higher quality bias as credit spreads tightened. The Fund has over 50% of its holdings in credits rated A or |
42
| | |
| | AMG GW&K Municipal Enhanced Yield Fund Portfolio Manager’s Comments (continued) |
| | | | | | | | |
higher versus the BBB-rated bonds in the Index. Overweights in the health care and transportation sectors were positive contributors for the year. From both a technical and fundamental perspective, the municipal bond market enters 2022 on a solid footing. The biggest questions moving forward involve valuation and the pace of improvement from here. After a year that saw a record $100 billion pour into industry mutual funds, it’s hard to envision a material increase in retail demand. The same can be said for credit spreads, which blew out dramatically during the early days of the lockdown but have since rallied back to post-2007 tights. Even nominal rates, | | | | though well above the historical lows reached in the summer of 2020, begin the year at levels that would have been all-time lows before the onset of the pandemic. The resilience of municipal bonds in the face of broader weakness has left relative value ratios nearly two standard deviations rich to their long-term averages. And yet the case for municipals remains compelling when you consider where we are in the market cycle. With asset valuations at record highs, investors would be well advised to remember the low correlation of municipal bonds with riskier securities, like equities, commodities, real estate and high yield. Backed by unprecedented federal support, conservative budgeting and its | | | | status as one of the few high-quality tax shelters, municipal bonds are in good shape to weather any repricing in the broader markets. To be sure, investors are currently paying a meaningful premium for such an attractive and reliable haven, but with few things as valuable as sleeping well at night, that shouldn’t come as much of a surprise. The views expressed represent the opinions of GW&K Investment Management, LLC and are not intended as a forecast or guarantee of future results, and are subject to change without notice. |
43
| | |
| | AMG GW&K Municipal Enhanced Yield Fund Portfolio Manager’s Comments (continued) |
CUMULATIVE TOTAL RETURN PERFORMANCE
AMG GW&K Municipal Enhanced Yield Fund’s cumulative total return is based on the daily change in net asset value (NAV), and assumes that all dividends and distributions were reinvested. The graph compares a hypothetical $10,000 investment made in the AMG GW&K Municipal Enhanced Yield Fund’s Class N shares on December 31, 2011, to a $10,000 investment made in the Bloomberg U.S. Municipal Bond BAA Index for the same time period. The graph and table do not reflect the deduction of taxes that a shareholder would pay on a Fund distribution or redemption of shares. The listed returns for the Fund are net of expenses and the returns for the index exclude expenses. Total returns would have been lower had certain expenses not been reduced.
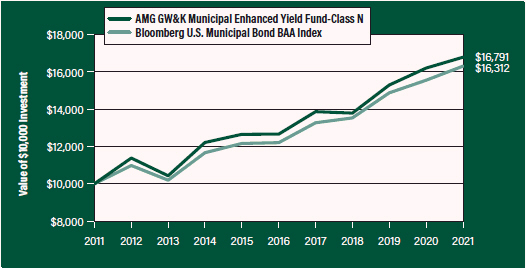
The table below shows the average annual total returns for the AMG GW&K Municipal Enhanced Yield Fund and the Bloomberg U.S. Municipal Bond BAA Index for the same time periods ended December 31, 2021.
| | | | | | | | | | | | | | | | | | | | |
| Average Annual Total Returns1 | | One
Year | | | Five
Years | | | Ten
Years | | | Since
Inception | | | Inception
Date | |
| |
AMG GW&K Municipal Enhanced Yield Fund2, 3, 4, 5, 6, 7, 8, 9, 10 | | | | | |
| | | | | |
Class N | | | 3.59 | % | | | 5.80 | % | | | 5.32 | % | | | 6.42 | % | | | 07/27/09 | |
| | | | | |
Class I | | | 3.94 | % | | | 6.17 | % | | | 5.75 | % | | | 5.04 | % | | | 12/30/05 | |
| | | | | |
Class Z | | | 3.99 | % | | | | – | | | | – | | | 6.11 | % | | | 02/24/17 | |
| | | | | |
Bloomberg U.S. Municipal Bond BAA Index11 | | | 4.85 | % | | | 5.97 | % | | | 5.01 | % | | | 5.93 | % | | | 07/27/09 | † |
The performance data shown represents past performance. Past performance is not a guarantee of future results. Current performance may be lower or higher than the performance data quoted. The investment return and principal value of an investment will fluctuate so that an investor’s shares, when redeemed, may be worth more or less than their original cost.
Investors should carefully consider the Fund’s investment objectives, risks, charges and expenses before investing. For performance information through the most recent month end, current net asset values per share for the Fund and other information, please call 800.548.4539 or visit our website at amgfunds.com for a free prospectus. Read it carefully before investing or sending money.
Distributed by AMG Distributors, Inc., member FINRA/SIPC.
| † | Date reflects the inception date of the Fund, not the index. |
| 1 | Total return equals income yield plus share price change and assumes reinvestment of all dividends and capital gain distributions. Returns are net of fees and may reflect offsets of Fund expenses as described in the prospectus. No adjustment has been made for taxes payable by shareholders on their reinvested dividends and |
|
capital gain distributions. Returns for periods greater than one year are annualized. The listed returns on the Fund are net of expenses and based on the published NAV as of December 31, 2021. All returns are in U.S. dollars ($). 2 From time to time, the Fund’s advisor has waived its fees and/or absorbed Fund expenses, which has resulted in higher returns. 3 The Fund is subject to the risks associated with investments in debt securities, such as default risk and fluctuations in the perception of the debtor’s ability to pay its creditors. Changing interest rates may adversely affect the value of an investment. An increase in interest rates typically causes the value of bonds and other fixed income securities to fall. 4 Companies that are in similar industry sectors may be similarly affected by particular economic or market events; to the extent the Fund has substantial holdings within a particular sector, the risks associated with that sector increase. 5 The Fund may invest in derivatives such as options and futures; the complexity and rapidly changing structure of derivatives markets may increase the possibility of market losses. 6 High-yield bonds (also known as “junk bonds”) may be subject to greater levels of interest rate, credit, and liquidity risk than investments in higher rated securities. These securities are considered predominantly speculative with respect to the issuer’s continuing ability to make principal and interest payments. The issuers of the Fund’s holdings may be involved in bankruptcy proceedings, reorganizations, or financial restructurings, and are not as strong financially as higher-rated issuers. |
7 The use of leverage in a Fund’s strategy, such as futures and forward commitment transactions, can magnify relatively small market movements into relatively larger losses for the Fund. 8 Factors unique to the municipal bond market may negatively affect the value of municipal bonds. 9 Investment income may be subject to certain state and local taxes, and depending on your tax status, the federal alternative minimum tax. Capital gains are not exempt from federal income tax. 10 Market prices of investments held by the Fund may fall rapidly or unpredictably due to a variety of economic or political factors, market conditions, disasters or public health issues, or in response to events that affect particular industries or companies. |
44
| | |
| | AMG GW&K Municipal Enhanced Yield Fund Portfolio Manager’s Comments (continued) |
| | | | |
11 The Bloomberg U.S. Municipal Bond BAA Index is a subset of the Bloomberg U.S. Municipal Bond Index with an index rating of Baa1, Baa2, or Baa3. The Bloomberg U.S. Municipal Bond Index is a rules-based, market-value-weighted index engineered for the long-term, tax-exempt bond market. Unlike the Fund, the Bloomberg U.S. Municipal Bond BAA Index is unmanaged, is not available for investment and does not incur expenses. | | “Bloomberg®” and any Bloomberg index described herein are service marks of Bloomberg Finance L.P. and its affiliates, including Bloomberg Index Services Limited (“BISL”), the administrator of the index (collectively, “Bloomberg”) and have been licensed for use for certain purposes by AMG Funds LLC. Bloomberg is not affiliated with AMG Funds LLC, and Bloomberg does not approve, endorse, review, or recommend the fund described herein. Bloomberg | | does not guarantee the timeliness, accurateness, or completeness of any data or information relating to such fund. Not FDIC insured, nor bank guaranteed. May lose value. |
45
| | |
| | AMG GW&K Municipal Enhanced Yield Fund Fund Snapshots (unaudited) December 31, 2021 |
PORTFOLIO BREAKDOWN
| | | | | |
| Category | | % of Net Assets |
| | |
Transportation | | | | 33.8 | |
| | |
Medical | | | | 30.3 | |
| | |
Utilities | | | | 12.4 | |
| | |
General Obligation | | | | 8.0 | |
| | |
Tobacco Settlement | | | | 4.0 | |
| | |
Education | | | | 3.9 | |
| | |
Industrial Development | | | | 3.2 | |
| | |
Housing | | | | 2.4 | |
| | |
Water | | | | 1.2 | |
| | |
Other Assets Less Liabilities | | | | 0.8 | |
| |
Rating | | % of Market Value1 |
Aa/AA | | | | 17.2 | |
| | |
A | | | | 40.1 | |
| | |
Baa/BBB | | | | 42.1 | |
| | |
Ba/BB | | | | 0.6 | |
| 1 | Includes market value of long-term fixed-income securities only. |
TOP TEN HOLDINGS
| | |
| Security Name | | % of
Net Assets |
| | |
Texas Private Activity Bond Surface Transportation Corp., 5.000%, 06/30/58 | | 2.9 |
| | |
West Virginia Hospital Finance Authority,Cabell Huntington Hospital Obligation, 5.000%, 01/01/43 | | 2.5 |
| | |
Colorado Health Facilities Authority, Series A, Series A, 5.000%, 08/01/44 | | 2.3 |
| | |
Central Plains Energy Project Project #3, Series A, Series A, 5.000%, 09/01/42 | | 2.1 |
| | |
Chicago O’Hare International Airport, Senior Lien, Series A, Series A, 5.000%, 01/01/48 | | 2.1 |
| | |
New York Transportation Development Corp., Revenue, 4.000%, 04/30/53 | | 2.1 |
| | |
Central Texas Regional Mobility Authority, Series B, Series B, 5.000%, 01/01/45 | | 2.0 |
| | |
City of Minneapolis MN, Fairview Health Services, Series A, Series A, Revenue, 5.000%, 11/15/49 | | 1.9 |
| | |
Public Authority for Colorado Energy Natural Gas Purchase Revenue, Series 2008, Revenue, 6.500%, 11/15/38 | | 1.8 |
| | |
New Orleans Aviation Board, General Airport North Terminal, Series B, Series B, Revenue, 5.000%, 01/01/48 | | 1.8 |
| | |
| | | |
| | |
Top Ten as a Group | | 21.5 |
| | | |
| | | |
Credit quality ratings shown above reflect the highest rating assigned by either Standard & Poor’s (“S&P”), Moody’s Investors Service, Inc. (“Moody’s”) or Fitch. These rating agencies are independent, nationally recognized statistical rating organizations and are widely used. Investment grade ratings are credit ratings of BBB/Baa or higher. Below investment grade ratings are credit ratings of BB/Ba or lower. Investments designated N/R are not rated by any of the rating agencies. Unrated investments do not necessarily indicate low credit quality. Credit quality ratings are subject to change.
Because a fund’s strategy may result in multiple investments in particular sectors of the economy, its performance may depend on the performance of those sectors and may fluctuate more widely than investments diversified across more sectors. For additional information on these and other risk considerations, please see the Fund’s prospectus.
Any sectors, industries, or securities discussed should not be perceived as investment recommendations. Mention of a specific security should not be considered a recommendation to buy or solicitation to sell that security. Specific securities mentioned in this report may have been sold from the Fund’s portfolio of investments by the time you receive this report.
46
| | |
| | AMG GW&K Municipal Enhanced Yield Fund Schedule of Portfolio Investments December 31, 2021 |
| | | | | | | | |
| | | Principal | | | | |
| | | Amount | | | Value | |
| | |
Municipal Bonds - 99.2% | | | | | | | | |
| |
Arizona - 1.3% | | | | | |
| | |
Arizona Industrial Development Authority | | | | | | | | |
4.000%, 02/01/50 | | | $2,000,000 | | | | $2,305,341 | |
| | |
The Industrial Development Authority of the County of Pima | | | | | | | | |
4.000%, 04/01/46 | | | 2,405,000 | | | | 2,820,285 | |
| | |
Total Arizona | | | | | | | 5,125,626 | |
| |
California - 6.4% | | | | | |
| | |
California Health Facilities Financing Authority | | | | | | | | |
4.000%, 04/01/49 | | | 1,000,000 | | | | 1,149,970 | |
| | |
California Municipal Finance Authority, Series A | | | | | | | | |
4.000%, 02/01/51 | | | 2,000,000 | | | | 2,343,517 | |
| | |
California Municipal Finance Authority, Series I | | | | | | | | |
5.000%, 05/15/43 | | | 3,000,000 | | | | 3,576,595 | |
5.000%, 05/15/48 | | | 4,600,000 | | | | 5,451,688 | |
| | |
California State Public Works Board, Series B | | | | | | | | |
4.000%, 05/01/46 | | | 2,500,000 | | | | 2,963,341 | |
| | |
Riverside County Transportation Commission | | | | | | | | |
4.000%, 06/01/46 | | | 2,500,000 | | | | 2,943,513 | |
4.000%, 06/01/47 | | | 3,425,000 | | | | 3,996,212 | |
| | |
San Diego County Regional Airport Authority, Series B | | | | | | | | |
4.000%, 07/01/51 | | | 2,000,000 | | | | 2,318,098 | |
| | |
Total California | | | | | | | 24,742,934 | |
| |
Colorado - 4.1% | | | | | |
| | |
Colorado Health Facilities Authority, Series A | | | | | | | | |
5.000%, 08/01/44 | | | 7,215,000 | | | | 8,859,952 | |
| | |
Public Authority for Colorado Energy Natural Gas Purchase Revenue, Series 2008 | | | | | | | | |
6.500%, 11/15/38 | | | 4,445,000 | | | | 6,912,350 | |
| | |
Total Colorado | | | | | | | 15,772,302 | |
| |
Connecticut - 4.6% | | | | | |
| | |
Connecticut State Health & Educational Facilities Authority | | | | | | | | |
4.000%, 07/01/39 1 | | | 3,500,000 | | | | 4,069,473 | |
4.000%, 07/01/40 1 | | | 3,400,000 | | | | 3,945,787 | |
4.000%, 07/01/42 1 | | | 1,750,000 | | | | 2,020,157 | |
| | |
State of Connecticut Special Tax Revenue | | | | | | | | |
4.000%, 05/01/39 | | | 1,000,000 | | | | 1,192,807 | |
| | |
State of Connecticut Special Tax Revenue, Transportation Infrastructure | | | | | | | | |
5.000%, 01/01/38 | | | 5,165,000 | | | | 6,316,896 | |
| | |
Total Connecticut | | | | | | | 17,545,120 | |
| |
Florida - 8.8% | | | | | |
| | |
City of Tampa, Series H | | | | | | | | |
4.000%, 07/01/45 | | | 2,775,000 | | | | 3,194,146 | |
5.000%, 07/01/50 | | | 2,250,000 | | | | 2,791,122 | |
| | |
County of Miami-Dade FL Water & Sewer System Revenue | | | | | | | | |
4.000%, 10/01/46 | | | 4,000,000 | | | | 4,750,212 | |
| | | | | | | | |
| | | Principal | | | | |
| | | Amount | | | Value | |
| | |
County of Miami-Dade Seaport Department, Series A | | | | | | | | |
4.000%, 10/01/45 | | | $5,000,000 | | | | $5,894,291 | |
| | |
Escambia County Health Facilities Authority | | | | | | | | |
4.000%, 08/15/50 | | | 6,050,000 | | | | 6,765,643 | |
| | |
Hillsborough County Industrial Development Authority | | | | | | | | |
4.000%, 08/01/50 | | | 5,000,000 | | | | 5,773,374 | |
| | |
Miami Beach Health Facilities Authority | | | | | | | | |
4.000%, 11/15/51 | | | 4,000,000 | | | | 4,635,409 | |
| | |
Total Florida | | | | | | | 33,804,197 | |
| |
Georgia - 1.5% | | | | | |
| | |
Gainesville & Hall County Hospital Authority | | | | | | | | |
4.000%, 02/15/51 | | | 5,000,000 | | | | 5,779,922 | |
| |
Illinois - 8.6% | | | | | |
| | |
Chicago O’Hare International Airport, Senior Lien, Series A | | | | | | | | |
5.000%, 01/01/48 | | | 6,750,000 | | | | 8,093,001 | |
| | |
Metropolitan Pier & Exposition Authority | | | | | | | | |
4.000%, 12/15/42 1 | | | 2,000,000 | | | | 2,299,207 | |
4.000%, 06/15/52 1 | | | 3,000,000 | | | | 3,403,750 | |
5.000%, 06/15/50 1 | | | 5,000,000 | | | | 6,000,142 | |
| | |
State of Illinois | | | | | | | | |
5.500%, 05/01/39 | | | 4,000,000 | | | | 5,110,836 | |
5.750%, 05/01/45 | | | 3,000,000 | | | | 3,842,859 | |
| | |
State of Illinois, Series A | | | | | | | | |
4.000%, 03/01/40 | | | 1,500,000 | | | | 1,741,714 | |
5.000%, 03/01/46 | | | 2,225,000 | | | | 2,762,794 | |
| | |
Total Illinois | | | | | | | 33,254,303 | |
| |
Louisiana - 3.3% | | | | | |
| | |
Louisiana Public Facilities Authority | | | | | | | | |
4.000%, 05/15/49 | | | 5,000,000 | | | | 5,764,251 | |
| | |
New Orleans Aviation Board, General Airport North Terminal, Series B | | | | | | | | |
5.000%, 01/01/48 | | | 5,845,000 | | | | 6,839,810 | |
| | |
Total Louisiana | | | | | | | 12,604,061 | |
| |
Maine - 1.1% | | | | | |
| | |
Maine Health & Higher Educational Facilities Authority, Series A | | | | | | | | |
4.000%, 07/01/45 | | | 1,500,000 | | | | 1,744,333 | |
4.000%, 07/01/50 | | | 2,000,000 | | | | 2,304,644 | |
| | |
Total Maine | | | | | | | 4,048,977 | |
| |
Massachusetts - 1.5% | | | | | |
| | |
Massachusetts Development Finance Agency | | | | | | | | |
4.000%, 07/01/51 | | | 5,110,000 | | | | 5,899,008 | |
| |
Minnesota - 3.1% | | | | | |
| | |
City of Minneapolis MN, Fairview Health Services, Series A | | | | | | | | |
5.000%, 11/15/49 | | | 5,910,000 | | | | 7,153,206 | |
The accompanying notes are an integral part of these financial statements.
47
| | |
| | AMG GW&K Municipal Enhanced Yield Fund Schedule of Portfolio Investments (continued) |
| | | | | | | | |
| | |
| | | Principal
Amount | | | Value | |
| |
Minnesota - 3.1% (continued) | | | | | |
| | |
Duluth Economic Development Authority, Essentia Health Obligated Group | | | | | | | | |
5.000%, 02/15/48 | | $ | 4,050,000 | | | | $4,796,333 | |
| | |
Total Minnesota | | | | | | | 11,949,539 | |
| |
Nebraska - 2.1% | | | | | |
| | |
Central Plains Energy Project Project #3, Series A | | | | | | | | |
5.000%, 09/01/42 | | | 5,560,000 | | | | 8,134,377 | |
| |
New Jersey - 9.3% | | | | | |
| | |
New Jersey Economic Development Authority | | | | | | | | |
5.000%, 11/01/44 | | | 3,000,000 | | | | 3,660,483 | |
| | |
New Jersey Economic Development Authority, Series DDD | | | | | | | | |
5.000%, 06/15/42 | | | 2,865,000 | | | | 3,366,281 | |
| | |
New Jersey Economic Development Authority, Series S | | | | | | | | |
4.000%, 06/15/46 | | | 1,500,000 | | | | 1,719,552 | |
4.000%, 06/15/50 | | | 1,500,000 | | | | 1,712,960 | |
| | |
New Jersey Transportation Trust Fund Authority | | | | | | | | |
4.000%, 06/15/45 | | | 2,000,000 | | | | 2,295,774 | |
4.000%, 06/15/50 | | | 2,000,000 | | | | 2,283,947 | |
5.000%, 06/15/45 | | | 1,000,000 | | | | 1,241,859 | |
5.000%, 06/15/50 | | | 2,000,000 | | | | 2,471,828 | |
| | |
New Jersey Transportation Trust Fund Authority, Series BB | | | | | | | | |
5.000%, 06/15/44 | | | 2,250,000 | | | | 2,714,571 | |
| | |
New Jersey Turnpike Authority, Series A | | | | | | | | |
4.000%, 01/01/42 | | | 2,000,000 | | | | 2,378,577 | |
4.000%, 01/01/51 | | | 2,280,000 | | | | 2,678,256 | |
| | |
Tobacco Settlement Financing Corp. Series A | | | | | | | | |
5.000%, 06/01/46 | | | 2,500,000 | | | | 2,935,807 | |
5.250%, 06/01/46 | | | 3,285,000 | | | | 3,924,086 | |
| | |
Tobacco Settlement Financing Corp. Series B | | | | | | | | |
5.000%, 06/01/46 | | | 2,050,000 | | | | 2,387,302 | |
| | |
Total New Jersey | | | | | | | 35,771,283 | |
| |
New York - 14.9% | | | | | |
| | |
City of New York, Series A | | | | | | | | |
5.000%, 08/01/45 | | | 4,405,000 | | | | 5,450,749 | |
| | |
City of New York, Series D | | | | | | | | |
5.000%, 03/01/43 | | | 5,360,000 | | | | 6,761,161 | |
| | |
City of New York, Series F | | | | | | | | |
5.000%, 03/01/42 | | | 4,000,000 | | | | 5,142,834 | |
| | |
Metropolitan Transportation Authority, Series C | | | | | | | | |
4.750%, 11/15/45 | | | 3,175,000 | | | | 3,804,034 | |
5.000%, 11/15/50 | | | 2,335,000 | | | | 2,833,909 | |
5.250%, 11/15/55 | | | 3,020,000 | | | | 3,725,279 | |
| | |
Monroe County Industrial Development Corp., Series A | | | | | | | | |
4.000%, 07/01/50 | | | 5,000,000 | | | | 5,799,651 | |
| | | | | | | | |
| | |
| | | Principal
Amount | | | Value | |
| | |
New York State Thruway Authority, Series B | | | | | | | | |
4.000%, 01/01/45 | | $ | 5,000,000 | | | | $5,770,047 | |
| | |
New York Transportation Development Corp. | | | | | | | | |
4.000%, 12/01/39 | | | 1,825,000 | | | | 2,122,287 | |
4.000%, 12/01/40 | | | 2,020,000 | | | | 2,345,127 | |
4.000%, 04/30/53 | | | 6,915,000 | | | | 7,904,436 | |
| | |
New York Transportation Development Corp., Laguardia Airport Terminal B | | | | | | | | |
5.000%, 07/01/46 | | | 5,000,000 | | | | 5,488,504 | |
| | |
Total New York | | | | | | | 57,148,018 | |
| |
Oklahoma - 3.8% | | | | | |
| | |
Norman Regional Hospital Authority | | | | | | | | |
5.000%, 09/01/45 | | | 4,335,000 | | | | 5,318,749 | |
| | |
Oklahoma Development Finance Authority, Health Ou Medicine Project, Series B | | | | | | | | |
5.250%, 08/15/48 | | | 2,975,000 | | | | 3,636,553 | |
5.500%, 08/15/52 | | | 4,500,000 | | | | 5,559,163 | |
| | |
Total Oklahoma | | | | | | | 14,514,465 | |
| |
Pennsylvania - 4.8% | | | | | |
| | |
Allegheny County Airport Authority, Series A | | | | | | | | |
5.000%, 01/01/51 | | | 5,000,000 | | | | 6,215,100 | |
| | |
Geisinger Authority, Series G | | | | | | | | |
4.000%, 04/01/50 | | | 3,510,000 | | | | 4,018,644 | |
| | |
Pennsylvania Turnpike Commission, Series B | | | | | | | | |
4.000%, 12/01/46 | | | 3,500,000 | | | | 4,099,233 | |
4.000%, 12/01/51 | | | 3,550,000 | | | | 4,129,954 | |
| | |
Total Pennsylvania | | | | | | | 18,462,931 | |
| |
Rhode Island - 1.5% | | | | | |
| | |
Tobacco Settlement Financing Corp. Series A | | | | | | | | |
5.000%, 06/01/35 | | | 2,000,000 | | | | 2,240,216 | |
5.000%, 06/01/40 | | | 3,285,000 | | | | 3,645,106 | |
| | |
Total Rhode Island | | | | | | | 5,885,322 | |
| |
South Carolina - 1.1% | | | | | |
| | |
South Carolina Jobs-Economic Development Authority, Series I | | | | | | | | |
5.000%, 12/01/46 | | | 3,325,000 | | | | 4,143,253 | |
| |
Texas - 10.6% | | | | | |
| | |
Central Texas Regional Mobility Authority, Series B | | | | | | | | |
4.000%, 01/01/51 | | | 2,000,000 | | | | 2,311,745 | |
5.000%, 01/01/45 | | | 6,405,000 | | | | 7,901,383 | |
5.000%, 01/01/46 | | | 2,050,000 | | | | 2,571,284 | |
| | |
City of Houston TX Airport System Revenue, Series A | | | | | | | | |
4.000%, 07/01/46 | | | 1,500,000 | | | | 1,744,255 | |
| | |
Texas Private Activity Bond Surface Transportation Corp. | | | | | | | | |
5.000%, 06/30/58 | | | 9,320,000 | | | | 11,148,249 | |
The accompanying notes are an integral part of these financial statements.
48
| | |
| | AMG GW&K Municipal Enhanced Yield Fund Schedule of Portfolio Investments (continued) |
| | | | | | | | |
| | |
| | | Principal
Amount | | | Value | |
| | |
Texas - 10.6% (continued) | | | | | | | | |
| | |
Texas Private Activity Bond Surface Transportation Corp., Senior Lien-Blueridge Transport | | | | | | | | |
5.000%, 12/31/40 | | | $3,955,000 | | | | $4,442,497 | |
5.000%, 12/31/45 | | | 3,880,000 | | | | 4,335,081 | |
| | |
Texas Private Activity Bond Surface Transportation Corp., Series A | | | | | | | | |
4.000%, 12/31/39 | | | 5,500,000 | | | | 6,372,567 | |
| | |
Total Texas | | | | | | | 40,827,061 | |
| |
Virginia - 2.2% | | | | | |
| | |
Lynchburg Economic Development Authority | | | | | | | | |
4.000%, 01/01/55 | | | 1,500,000 | | | | 1,748,386 | |
| | |
Virginia Small Business Financing Authority, Transform 66 P3 Project | | | | | | | | |
5.000%, 12/31/49 | | | 2,500,000 | | | | 2,967,514 | |
5.000%, 12/31/52 | | | 3,170,000 | | | | 3,748,828 | |
| | |
Total Virginia | | | | | | | 8,464,728 | |
| |
Washington - 2.1% | | | | | |
| | |
Port of Seattle | | | | | | | | |
5.000%, 08/01/46 | | | 3,000,000 | | | | 3,801,941 | |
| | | | | | | | |
| | |
| | | Principal
Amount | | | Value | |
| | |
Washington Health Care Facilities Authority | | | | | | | | |
4.000%, 09/01/45 | | | $1,000,000 | | | | $1,160,617 | |
5.000%, 09/01/45 | | | 2,465,000 | | | | 3,103,144 | |
| | |
Total Washington | | | | | | | 8,065,702 | |
| |
West Virginia - 2.5% | | | | | |
| | |
West Virginia Hospital Finance Authority, Cabell Huntington Hospital Obligation | | | | | | | | |
5.000%, 01/01/43 | | | 8,000,000 | | | | 9,655,511 | |
| | |
Total Municipal Bonds | | | | | | | | |
(Cost $356,383,477) | | | | | | | 381,598,640 | |
| | |
Total Investments - 99.2% | | | | | | | | |
(Cost $356,383,477) | | | | | | | 381,598,640 | |
| |
Other Assets, less Liabilities - 0.8% | | | | 2,931,822 | |
| | |
Net Assets - 100.0% | | | | | | | $384,530,462 | |
| | 1 | All or part of a security is delayed delivery transaction. The market value for delayed delivery securities at December 31, 2021, amounted to $16,887,977, or 4.4% of net assets. | |
The following table summarizes the inputs used to value the Fund’s investments by the fair value hierarchy levels as of December 31, 2021:
| | | | | | | | | | | | | | | | |
| | | Level 1 | | | Level 2 | | | Level 3 | | | Total | |
Investments in Securities | | | | | | | | | | | | | | | | |
| | | | |
Municipal Bonds† | | | – | | | | $381,598,640 | | | | – | | | | $381,598,640 | |
| | | | | | | | | | | | | | | | |
| | | | |
Total Investments in Securities | | | – | | | | $381,598,640 | | | | – | | | | $381,598,640 | |
| | | | | | | | | | | | | | | | |
| † | All municipal bonds held in the Fund are Level 2 securities. For a detailed breakout of municipal bonds by major classification, please refer to the Fund’s Schedule of Portfolio Investments. |
For the fiscal year ended December 31, 2021, there were no transfers in or out of Level 3.
The accompanying notes are an integral part of these financial statements.
49
| | |
| | Statement of Assets and Liabilities December 31, 2021 |
| | | | | | | | | | | | | | | | | | | | | | | | | |
| | | AMG GW&K
ESG
Bond Fund | | AMG
GW&K Enhanced
Core Bond
ESG Fund | | AMG
GW&K High
Income Fund | | AMG
GW&K Municipal
Bond Fund | | AMG
GW&K Municipal
Enhanced
Yield Fund |
Assets: | | | | | | | | | | | | | | | | | | | | | | | | | |
| | | | | |
Investments at value1 (including securities on loan valued at $39,839,239, $5,203,772, $2,660,400, $0,and $0, respectively) | | | $ | 739,114,290 | | | | $ | 57,665,535 | | | | $ | 20,638,432 | | | | $ | 1,389,059,663 | | | | $ | 381,598,640 | |
| | | | | |
Repurchase Agreements at value2 | | | | 19,741,844 | | | | | 1,481,522 | | | | | 2,340,362 | | | | | – | | | | | – | |
| | | | | |
Cash | | | | 13,886,502 | | | | | 2,253,640 | | | | | 472,173 | | | | | 66,610,198 | | | | | 15,191,181 | |
| | | | | |
Receivable for investments sold | | | | – | | | | | – | | | | | – | | | | | – | | | | | 1,158,020 | |
| | | | | |
Dividend and interest receivables | | | | 5,806,394 | | | | | 422,786 | | | | | 266,344 | | | | | 15,675,503 | | | | | 3,762,955 | |
| | | | | |
Securities lending income receivable | | | | 5,142 | | | | | 1,659 | | | | | 852 | | | | | – | | | | | – | |
| | | | | |
Receivable for Fund shares sold | | | | 159,105 | | | | | 607,385 | | | | | 78 | | | | | 1,505,622 | | | | | 886 | |
| | | | | |
Receivable from affiliate | | | | – | | | | | 6,907 | | | | | 6,591 | | | | | 75,701 | | | | | 20,189 | |
| | | | | |
Prepaid expenses and other assets | | | | 18,354 | | | | | 15,633 | | | | | 9,808 | | | | | 31,347 | | | | | 21,926 | |
| | | | | |
Total assets | | | | 778,731,631 | | | | | 62,455,067 | | | | | 23,734,640 | | | | | 1,472,958,034 | | | | | 401,753,797 | |
| | | | | |
Liabilities: | | | | | | | | | | | | | | | | | | | | | | | | | |
| | | | | |
Payable upon return of securities loaned | | | | 19,741,844 | | | | | 1,481,522 | | | | | 2,340,362 | | | | | – | | | | | – | |
| | | | | |
Payable for delayed delivery investments purchased | | | | – | | | | | – | | | | | – | | | | | 122,197,545 | | | | | 16,906,193 | |
| | | | | |
Payable for Fund shares repurchased | | | | 3,475,445 | | | | | 23,077 | | | | | 128 | | | | | 1,011,022 | | | | | 10,430 | |
| | | | | |
Accrued expenses: | | | | | | | | | | | | | | | | | | | | | | | | | |
| | | | | |
Investment advisory and management fees | | | | 157,052 | | | | | 15,376 | | | | | 6,858 | | | | | 237,004 | | | | | 146,296 | |
| | | | | |
Administrative fees | | | | 98,735 | | | | | 7,688 | | | | | 2,638 | | | | | 172,180 | | | | | 48,765 | |
| | | | | |
Distribution fees | | | | – | | | | | 2,914 | | | | | – | | | | | 3,752 | | | | | 3,051 | |
| | | | | |
Shareholder service fees | | | | 106,660 | | | | | 4,300 | | | | | 3,089 | | | | | 59,162 | | | | | 17,470 | |
| | | | | |
Other | | | | 213,573 | | | | | 70,256 | | | | | 57,853 | | | | | 207,230 | | | | | 91,130 | |
| | | | | |
Total liabilities | | | | 23,793,309 | | | | | 1,605,133 | | | | | 2,410,928 | | | | | 123,887,895 | | | | | 17,223,335 | |
| | | | | | | | | | | | | | | | | | | | | | | | | |
| | | | | |
Net Assets | | | $ | 754,938,322 | | | | $ | 60,849,934 | | | | $ | 21,323,712 | | | | $ | 1,349,070,139 | | | | $ | 384,530,462 | |
| | | | | |
1 Investments at cost | | | $ | 733,383,099 | | | | $ | 57,188,428 | | | | $ | 20,559,924 | | | | $ | 1,335,968,744 | | | | $ | 356,383,477 | |
| | | | | |
2 Repurchase agreements at cost | | | $ | 19,741,844 | | | | $ | 1,481,522 | | | | $ | 2,340,362 | | | | | – | | | | | – | |
The accompanying notes are an integral part of these financial statements.
50
| | |
| | Statement of Assets and Liabilities (continued) |
| | | | | | | | | | | | | | | | | | | | | | | | | |
| | | AMG GW&K
ESG
Bond Fund | | AMG
GW&K Enhanced
Core Bond
ESG Fund | | AMG
GW&K High
Income Fund | | AMG
GW&K Municipal
Bond Fund | | AMG
GW&K Municipal
Enhanced
Yield Fund |
Net Assets Represent: | | | | | | | | | | | | | | | | | | | | | | | | | |
| | | | | |
Paid-in capital | | | | $748,864,334 | | | | | $62,931,551 | | | | | $21,254,259 | | | | | $1,294,126,043 | | | | | $358,388,877 | |
| | | | | |
Total distributable earnings (loss) | | | | 6,073,988 | | | | | (2,081,617 | ) | | | | 69,453 | | | | | 54,944,096 | | | | | 26,141,585 | |
| | | | | |
Net Assets | | | | $754,938,322 | | | | | $60,849,934 | | | | | $21,323,712 | | | | | $1,349,070,139 | | | | | $384,530,462 | |
| | | | | |
Class N: | | | | | | | | | | | | | | | | | | | | | | | | | |
| | | | | |
Net Assets | | | | $427,817,558 | | | | | $13,736,494 | | | | | $8,157,438 | | | | | $17,111,901 | | | | | $14,922,798 | |
| | | | | |
Shares outstanding | | | | 17,192,762 | | | | | 1,294,290 | | | | | 363,154 | | | | | 1,398,394 | | | | | 1,389,806 | |
| | | | | |
Net asset value, offering and redemption price per share | | | | $24.88 | | | | | $10.61 | | | | | $22.46 | | | | | $12.24 | | | | | $10.74 | |
| | | | | |
Class I: | | | | | | | | | | | | | | | | | | | | | | | | | |
| | | | | |
Net Assets | | | | $327,120,764 | | | | | $33,401,854 | | | | | $13,166,274 | | | | | $1,331,958,238 | | | | | $369,472,801 | |
| | | | | |
Shares outstanding | | | | 13,144,313 | | | | | 3,135,727 | | | | | 586,516 | | | | | 108,224,961 | | | | | 35,421,872 | |
| | | | | |
Net asset value, offering and redemption price per share | | | | $24.89 | | | | | $10.65 | | | | | $22.45 | | | | | $12.31 | | | | | $10.43 | |
| | | | | |
Class Z: | | | | | | | | | | | | | | | | | | | | | | | | | |
| | | | | |
Net Assets | | | | – | | | | | $13,711,586 | | | | | – | | | | | – | | | | | $134,863 | |
| | | | | |
Shares outstanding | | | | – | | | | | 1,287,794 | | | | | – | | | | | – | | | | | 12,932 | |
| | | | | |
Net asset value, offering and redemption price per share | | | | – | | | | | $10.65 | | | | | – | | | | | – | | | | | $10.43 | |
The accompanying notes are an integral part of these financial statements.
51
| | |
| | Statement of Operations For the fiscal year ended December 31, 2021 |
| | | | | | | | | | | | | | | | | | | | |
| | | | | | AMG | | | | | | | | | AMG | |
| | | AMG GW&K | | | GW&K Enhanced | | | AMG | | | AMG | | | GW&K Municipal | |
| | | ESG | | | Core Bond | | | GW&K High | | | GW&K Municipal | | | Enhanced | |
| | | Bond Fund | | | ESG Fund | | | Income Fund | | | Bond Fund | | | Yield Fund | |
| | | | | |
Investment Income: | | | | | | | | | | | | | | | | | | | | |
| | | | | |
Dividend income | | | $445,841 | | | | – | | | | – | | | | – | | | | – | |
| | | | | |
Interest income | | | 22,089,992 | | | | $1,123,756 | | | | $556,462 | | | | $22,997,646 | | | | $10,468,547 | |
| | | | | |
Securities lending income | | | 60,664 | | | | 16,985 | | | | 14,023 | | | | – | | | | – | |
| | | | | |
Foreign withholding tax | | | (151,783 | ) | | | – | | | | (87 | ) | | | – | | | | – | |
| | | | | |
Total investment income | | | 22,444,714 | | | | 1,140,741 | | | | 570,398 | | | | 22,997,646 | | | | 10,468,547 | |
| | | | | |
Expenses: | | | | | | | | | | | | | | | | | | | | |
| | | | | |
Investment advisory and management fees | | | 2,288,065 | | | | 166,870 | | | | 69,762 | | | | 2,756,098 | | | | 1,657,448 | |
| | | | | |
Administrative fees | | | 1,402,709 | | | | 83,435 | | | | 26,831 | | | | 2,001,448 | | | | 552,482 | |
| | | | | |
Distribution fees - Class N | | | – | | | | 39,632 | | | | – | | | | 44,601 | | | | 26,063 | |
| | | | | |
Shareholder servicing fees - Class N | | | 1,213,393 | | | | – | | | | 23,614 | | | | 22,127 | | | | 15,638 | |
| | | | | |
Shareholder servicing fees - Class I | | | 202,209 | | | | 21,385 | | | | 4,208 | | | | 658,229 | | | | 178,882 | |
| | | | | |
Custodian fees | | | 104,038 | | | | 21,168 | | | | 15,706 | | | | 98,391 | | | | 35,989 | |
| | | | | |
Professional fees | | | 86,761 | | | | 52,856 | | | | 45,209 | | | | 82,290 | | | | 51,537 | |
| | | | | |
Reports to shareholders | | | 77,877 | | | | 5,209 | | | | 17,978 | | | | 41,773 | | | | 9,828 | |
| | | | | |
Registration fees | | | 71,825 | | | | 39,060 | | | | 19,843 | | | | 93,383 | | | | 48,915 | |
| | | | | |
Trustee fees and expenses | | | 61,515 | | | | 3,728 | | | | 1,184 | | | | 88,777 | | | | 24,696 | |
| | | | | |
Transfer agent fees | | | 48,997 | | | | 3,794 | | | | 1,220 | | | | 40,071 | | | | 10,806 | |
| | | | | |
Interest expense | | | 1,051 | | | | 111 | | | | – | | | | – | | | | 487 | |
| | | | | |
Miscellaneous | | | 33,435 | | | | 4,215 | | | | 2,303 | | | | 40,400 | | | | 11,839 | |
| | | | | |
Repayment of prior reimbursements | | | 2,766 | | | | – | | | | – | | | | – | | | | – | |
| | | | | |
Total expenses before offsets | | | 5,594,641 | | | | 441,463 | | | | 227,858 | | | | 5,967,588 | | | | 2,624,610 | |
| | | | | |
Expense reimbursements | | | (19,644 | ) | | | (113,335 | ) | | | (94,499 | ) | | | (706,015 | ) | | | (230,390 | ) |
| | | | | |
Net expenses | | | 5,574,997 | | | | 328,128 | | | | 133,359 | | | | 5,261,573 | | | | 2,394,220 | |
| | | | | | | | | | | | | | | | | | | | |
| | | | | |
Net investment income | | | 16,869,717 | | | | 812,613 | | | | 437,039 | | | | 17,736,073 | | | | 8,074,327 | |
| | | | | |
Net Realized and Unrealized Gain (Loss): | | | | | | | | | | | | | | | | | | | | |
| | | | | |
Net realized gain on investments | | | 110,502,541 | | | | 874,010 | | | | 151,347 | | | | 11,510,796 | | | | 5,033,099 | |
| | | | | |
Net realized gain on futures contracts | | | 267,476 | | | | – | | | | – | | | | – | | | | – | |
| | | | | |
Net realized loss on foreign currency transactions | | | (29,405,029 | ) | | | – | | | | – | | | | – | | | | – | |
| | | | | |
Net change in unrealized appreciation/depreciation on investments | | | (112,038,141 | ) | | | (2,321,289 | ) | | | 89,236 | | | | (24,090,355 | ) | | | 727,146 | |
| | | | | |
Net change in unrealized appreciation/depreciation on foreign currency translations | | | (6,994 | ) | | | – | | | | – | | | | – | | | | – | |
| | | | | |
Net realized and unrealized gain (loss) | | | (30,680,147 | ) | | | (1,447,279 | ) | | | 240,583 | | | | (12,579,559 | ) | | | 5,760,245 | |
| | | | | | | | | | | | | | | | | | | | |
Net increase (decrease) in net assets resulting from operations | | | $(13,810,430 | ) | | | $(634,666 | ) | | | $677,622 | | | | $5,156,514 | | | | $13,834,572 | |
The accompanying notes are an integral part of these financial statements.
52
| | |
| | Statements of Changes in Net Assets For the fiscal years ended December 31, |
| | | | | | | | | | | | | | | | | | | | | | | | |
| | | | | | | | | AMG | | | AMG | |
| | | AMG GW&K | | | GW&K Enhanced | | | GW&K High | |
| | | ESG Bond Fund | | | Core Bond ESG Fund | | | Income Fund | |
| | | | | | |
| | | 2021 | | | 2020 | | | 2021 | | | 2020 | | | 2021 | | | 2020 | |
| | | | | | |
Increase (Decrease) in Net Assets Resulting From Operations: | | | | | | | | | | | | | | | | | | | | | | | | |
| | | | | | |
Net investment income | | | $16,869,717 | | | | $38,906,482 | | | | $812,613 | | | | $827,348 | | | | $437,039 | | | | $211,227 | |
| | | | | | |
Net realized gain (loss) on investments | | | 81,364,988 | | | | (1,563,017 | ) | | | 874,010 | | | | 851,301 | | | | 151,347 | | | | 995,238 | |
| | | | | | |
Net change in unrealized appreciation/depreciation on investments | | | (112,045,135 | ) | | | 36,446,570 | | | | (2,321,289 | ) | | | 1,758,021 | | | | 89,236 | | | | (169,694 | ) |
| | | | | | |
Net increase (decrease) in net assets resulting from operations | | | (13,810,430 | ) | | | 73,790,035 | | | | (634,666 | ) | | | 3,436,670 | | | | 677,622 | | | | 1,036,771 | |
| | | | | | |
Distributions to Shareholders: | | | | | | | | | | | | | | | | | | | | | | | | |
| | | | | | |
From net investment income and/or realized gain on investments: | | | | | | | | | | | | | | | | | | | | | | | | |
| | | | | | |
Class N | | | (53,132,625 | ) | | | (19,831,473 | ) | | | (211,642 | ) | | | (270,732 | ) | | | (232,178 | ) | | | (825,025 | ) |
| | | | | | |
Class I | | | (51,380,355 | ) | | | (20,896,667 | ) | | | (426,487 | ) | | | (319,421 | ) | | | (312,124 | ) | | | – | |
| | | | | | |
Class Z | | | – | | | | – | | | | (186,240 | ) | | | (225,439 | ) | | | – | | | | – | |
| | | | | | |
From paid-in capital: | | | | | | | | | | | | | | | | | | | | | | | | |
| | | | | | |
Class N | | | – | | | | – | | | | (12,304 | ) | | | – | | | | – | | | | – | |
| | | | | | |
Class I | | | – | | | | – | | | | (24,795 | ) | | | – | | | | – | | | | – | |
| | | | | | |
Class Z | | | – | | | | – | | | | (10,828 | ) | | | – | | | | – | | | | – | |
| | | | | | |
Total distributions to shareholders | | | (104,512,980 | ) | | | (40,728,140 | ) | | | (872,296 | ) | | | (815,592 | ) | | | (544,302 | ) | | | (825,025 | ) |
| | | | | | |
Capital Share Transactions:1 | | | | | | | | | | | | | | | | | | | | | | | | |
| | | | | | |
Net increase (decrease) from capital share transactions | | | (228,559,947 | ) | | | (154,973,478 | ) | | | 7,211,314 | | | | 19,163,432 | | | | 10,888,534 | | | | 452,271 | |
| | | | | | | | | | | | | | | | | | | | | | | | |
| | | | | | |
Total increase (decrease) in net assets | | | (346,883,357 | ) | | | (121,911,583 | ) | | | 5,704,352 | | | | 21,784,510 | | | | 11,021,854 | | | | 664,017 | |
| | | | | | |
Net Assets: | | | | | | | | | | | | | | | | | | | | | | | | |
| | | | | | |
Beginning of year | | | 1,101,821,679 | | | | 1,223,733,262 | | | | 55,145,582 | | | | 33,361,072 | | | | 10,301,858 | | | | 9,637,841 | |
| | | | | | |
End of year | | | $754,938,322 | | | | $1,101,821,679 | | | | $60,849,934 | | | | $55,145,582 | | | | $21,323,712 | | | | $10,301,858 | |
| | |
| 1 See Note 1(g) of the Notes to Financial Statements. | | | | | | | |
The accompanying notes are an integral part of these financial statements.
53
| | |
| | Statements of Changes in Net Assets (continued) For the fiscal years ended December 31, |
| | | | | | | | | | | | | | | | |
| | | AMG | | | AMG | |
| | | GW&K Municipal | | | GW&K Municipal | |
| | | Bond Fund | | | Enhanced Yield Fund | |
| | | | |
| | | 2021 | | | 2020 | | | 2021 | | | 2020 | |
| | | | |
Increase in Net Assets Resulting From Operations: | | | | | | | | | | | | | | | | |
| | | | |
Net investment income | | | $17,736,073 | | | | $18,149,308 | | | | $8,074,327 | | | | $7,592,341 | |
| | | | |
Net realized gain on investments | | | 11,510,796 | | | | 4,459,854 | | | | 5,033,099 | | | | 3,972,374 | |
| | | | |
Net change in unrealized appreciation/depreciation on investments | | | (24,090,355 | ) | | | 30,387,730 | | | | 727,146 | | | | 8,743,902 | |
| | | | |
Net increase in net assets resulting from operations | | | 5,156,514 | | | | 52,996,892 | | | | 13,834,572 | | | | 20,308,617 | |
| | | | |
Distributions to Shareholders: | | | | | | | | | | | | | | | | |
| | | | |
Class N | | | (320,461 | ) | | | (291,376 | ) | | | (239,124 | ) | | | (230,199 | ) |
| | | | |
Class I | | | (27,948,470 | ) | | | (21,463,147 | ) | | | (12,853,713 | ) | | | (11,227,601 | ) |
| | | | |
Class Z | | | – | | | | – | | | | (4,817 | ) | | | (4,636 | ) |
| | | | |
Total distributions to shareholders | | | (28,268,931 | ) | | | (21,754,523 | ) | | | (13,097,654 | ) | | | (11,462,436 | ) |
| | | | |
Capital Share Transactions:1 | | | | | | | | | | | | | | | | |
| | | | |
Net increase from capital share transactions | | | 66,362,378 | | | | 241,352,504 | | | | 55,209,790 | | | | 40,667,096 | |
| | | | |
| | | | | | | | | | | | | | | | |
| | | | |
Total increase in net assets | | | 43,249,961 | | | | 272,594,873 | | | | 55,946,708 | | | | 49,513,277 | |
| | | | |
Net Assets: | | | | | | | | | | | | | | | | |
| | | | |
Beginning of year | | | 1,305,820,178 | | | | 1,033,225,305 | | | | 328,583,754 | | | | 279,070,477 | |
| | | | |
End of year | | | $1,349,070,139 | | | | $1,305,820,178 | | | | $384,530,462 | | | | $328,583,754 | |
| | | | |
| 1 See Note 1(g) of the Notes to Financial Statements. | | | | | | | | | | | | |
The accompanying notes are an integral part of these financial statements.
54
| | |
| | AMG GW&K ESG Bond Fund Financial Highlights For a share outstanding throughout each fiscal year |
| | | | | | | | | | | | | | | | | | | | |
| | | For the fiscal years ended December 31, | |
| | | | | |
| Class N | | 2021 | | | 2020 | | | 2019 | | | 2018 | | | 20171 | |
| | | | | |
Net Asset Value, Beginning of Year | | | $28.12 | | | | $27.14 | | | | $25.49 | | | | $26.97 | | | | $26.24 | |
| | | | | |
Income (loss) from Investment Operations: | | | | | | | | | | | | | | | | | | | | |
| | | | | |
Net investment income2,3 | | | 0.44 | | | | 0.90 | | | | 0.94 | | | | 0.84 | | | | 0.91 | |
| | | | | |
Net realized and unrealized gain (loss) on investments | | | (0.83 | ) | | | 1.03 | | | | 1.85 | | | | (1.33 | ) | | | 0.85 | |
| | | | | |
Total income (loss) from investment operations | | | (0.39 | ) | | | 1.93 | | | | 2.79 | | | | (0.49 | ) | | | 1.76 | |
| | | | | |
Less Distributions to Shareholders from: | | | | | | | | | | | | | | | | | | | | |
| | | | | |
Net investment income | | | (0.47 | ) | | | (0.88 | ) | | | (0.98 | ) | | | (0.80 | ) | | | (0.87 | ) |
| | | | | |
Net realized gain on investments | | | (2.38 | ) | | | (0.07 | ) | | | (0.16 | ) | | | (0.19 | ) | | | (0.16 | ) |
| | | | | |
Total distributions to shareholders | | | (2.85 | ) | | | (0.95 | ) | | | (1.14 | ) | | | (0.99 | ) | | | (1.03 | ) |
| | | | | |
Net Asset Value, End of Year | | | $24.88 | | | | $28.12 | | | | $27.14 | | | | $25.49 | | | | $26.97 | |
| | | | | |
Total Return3,4 | | | (1.29 | )% | | | 7.34 | % | | | 11.10 | % | | | (1.82 | )% | | | 6.77 | % |
| | | | | |
Ratio of net expenses to average net assets | | | 0.69 | %5 | | | 0.71 | % | | | 0.72 | %6 | | | 0.98 | %5 | | | 0.99 | %5 |
| | | | | |
Ratio of gross expenses to average net assets7 | | | 0.69 | %5 | | | 0.72 | % | | | 0.73 | %6 | | | 0.98 | %5 | | | 0.99 | %5 |
| | | | | |
Ratio of net investment income to average net assets3 | | | 1.71 | % | | | 3.31 | % | | | 3.53 | % | | | 3.19 | % | | | 3.38 | % |
| | | | | |
Portfolio turnover | | | 186 | % | | | 25 | % | | | 20 | % | | | 9 | % | | | 4 | % |
| | | | | |
Net assets end of year (000’s) omitted | | | $427,818 | | | | $555,124 | | | | $618,381 | | | | $715,468 | | | | $971,359 | |
| | | | | | | | | | | | | | | | | | | | | |
55
| | |
| | AMG GW&K ESG Bond Fund Financial Highlights For a share outstanding throughout each fiscal year |
| | | | | | | | | | | | | | | | | | | | |
| | | For the fiscal years ended December 31, | |
| | | | | | |
| Class I | | 2021 | | | 2020 | | | 2019 | | | 2018 | | | 2017 | |
| | | | | | |
Net Asset Value, Beginning of Year | | | $28.13 | | | | $27.14 | | | | $25.49 | | | | $26.97 | | | | $26.24 | |
| | | | | | |
Income (loss) from Investment Operations: | | | | | | | | | | | | | | | | | | | | |
| | | | | | |
Net investment income2,3 | | | 0.50 | | | | 0.95 | | | | 0.99 | | | | 0.86 | | | | 0.94 | |
| | | | | | |
Net realized and unrealized gain (loss) on investments | | | (0.83 | ) | | | 1.05 | | | | 1.85 | | | | (1.32 | ) | | | 0.85 | |
| | | | | | |
Total income (loss) from investment operations | | | (0.33 | ) | | | 2.00 | | | | 2.84 | | | | (0.46 | ) | | | 1.79 | |
| | | | | | |
Less Distributions to Shareholders from: | | | | | | | | | | | | | | | | | | | | |
| | | | | | |
Net investment income | | | (0.53 | ) | | | (0.94 | ) | | | (1.03 | ) | | | (0.83 | ) | | | (0.90 | ) |
| | | | | | |
Net realized gain on investments | | | (2.38 | ) | | | (0.07 | ) | | | (0.16 | ) | | | (0.19 | ) | | | (0.16 | ) |
| | | | | | |
Total distributions to shareholders | | | (2.91 | ) | | | (1.01 | ) | | | (1.19 | ) | | | (1.02 | ) | | | (1.06 | ) |
| | | | | | |
Net Asset Value, End of Year | | | $24.89 | | | | $28.13 | | | | $27.14 | | | | $25.49 | | | | $26.97 | |
| | | | | | |
Total Return3,4 | | | (1.05 | )% | | | 7.57 | % | | | 11.32 | % | | | (1.72 | )% | | | 6.87 | % |
| | | | | | |
Ratio of net expenses to average net assets | | | 0.49 | %5 | | | 0.50 | % | | | 0.52 | %6 | | | 0.88 | %5 | | | 0.89 | %5 |
| | | | | | |
Ratio of gross expenses to average net assets7 | | | 0.49 | %5 | | | 0.51 | % | | | 0.53 | %6 | | | 0.88 | %5 | | | 0.89 | %5 |
| | | | | | |
Ratio of net investment income to average net assets3 | | | 1.91 | % | | | 3.52 | % | | | 3.73 | % | | | 3.29 | % | | | 3.48 | % |
| | | | | | |
Portfolio turnover | | | 186 | % | | | 25 | % | | | 20 | % | | | 9 | % | | | 4 | % |
| | | | | | |
Net assets end of year (000’s) omitted | | | $327,121 | | | | $546,698 | | | | $605,353 | | | | $1,094,820 | | | | $1,027,477 | |
| | | | | | | | | | | | | | | | | | | | | |
| 1 | Effective February 27, 2017, Class S shares were renamed Class N shares. |
| 2 | Per share numbers have been calculated using average shares. |
| 3 | Total returns and net investment income would have been lower had certain expenses not been offset. |
| 4 | The total return is calculated using the published Net Asset Value as of fiscal year end. |
| 5 | Ratio includes recapture of reimbursed fees from prior years amounting to less than 0.01%, 0.04% and 0.07% for the fiscal year ended December 31, 2021, December 31, 2018 and December 31, 2017, respectively |
| 6 | Includes 0.01% of extraordinary expense related to legal expense in support of an investment held in the portfolio. |
| 7 | Excludes the impact of expense reimbursement or fee waivers and expense reductions such as brokerage credits, but includes expense repayments and non-reimbursable expenses, if any, such as interest, taxes, and extraordinary expenses. (See Note 1(c) and 2 in the Notes to Financial Statements.) |
56
| | |
| | AMG GW&K Enhanced Core Bond ESG Fund Financial Highlights For a share outstanding throughout each fiscal year |
| | | | | | | | | | | | | | | | | | | | |
| | | For the fiscal years ended December 31, | |
| | | | | | |
| Class N | | 2021 | | | 2020 | | | 2019 | | | 2018 | | | 2017 | |
| | | | | | |
Net Asset Value, Beginning of Year | | | $10.90 | | | | $10.15 | | | | $9.43 | | | | $9.81 | | | | $9.67 | |
| | | | | | |
Income (loss) from Investment Operations: | | | | | | | | | | | | | | | | | | | | |
| | | | | | |
Net investment income1,2 | | | 0.14 | | | | 0.20 | | | | 0.24 | | | | 0.23 | | | | 0.21 | |
| | | | | | |
Net realized and unrealized gain (loss) on investments | | | (0.28 | ) | | | 0.75 | | | | 0.73 | | | | (0.38 | ) | | | 0.15 | |
| | | | | | |
Total income (loss) from investment operations | | | (0.14 | ) | | | 0.95 | | | | 0.97 | | | | (0.15 | ) | | | 0.36 | |
| | | | | | |
Less Distributions to Shareholders from: | | | | | | | | | | | | | | | | | | | | |
| | | | | | |
Net investment income | | | (0.14 | ) | | | (0.20 | ) | | | (0.25 | ) | | | (0.23 | ) | | | (0.22 | ) |
| | | | | | |
Paid in capital | | | (0.01 | ) | | | – | | | | – | | | | – | | | | – | |
| | | | | | |
Total distributions to shareholders | | | (0.15 | ) | | | (0.20 | ) | | | (0.25 | ) | | | (0.23 | ) | | | (0.22 | ) |
| | | | | | |
Net Asset Value, End of Year | | | $10.61 | | | | $10.90 | | | | $10.15 | | | | $9.43 | | | | $9.81 | |
| | | | | | |
Total Return2,3 | | | (1.26 | )% | | | 9.41 | % | | | 10.35 | % | | | (1.48 | )% | | | 3.76 | % |
| | | | | | |
Ratio of net expenses to average net assets | | | 0.73 | % | | | 0.73 | % | | | 0.73 | % | | | 0.73 | % | | | 0.75 | % |
| | | | | | |
Ratio of gross expenses to average net assets4 | | | 0.93 | % | | | 1.06 | % | | | 1.16 | % | | | 0.99 | % | | | 1.04 | % |
| | | | | | |
Ratio of net investment income to average net assets2 | | | 1.32 | % | | | 1.86 | % | | | 2.43 | % | | | 2.45 | % | | | 2.19 | % |
| | | | | | |
Portfolio turnover | | | 86 | % | | | 101 | % | | | 71 | % | | | 26 | % | | | 39 | % |
| | | | | | |
Net assets end of year (000’s) omitted | | | $13,736 | | | | $15,794 | | | | $14,779 | | | | $12,884 | | | | $16,027 | |
| | | | | | | | | | | | | | | | | | | | | |
57
| | |
| | AMG GW&K Enhanced Core Bond ESG Fund Financial Highlights For a share outstanding throughout each fiscal year |
| | | | | | | | | | | | | | | | | | | | |
| | | For the fiscal years ended December 31, | |
| | | | | | |
| Class I | | 2021 | | | 2020 | | | 2019 | | | 2018 | | | 20175 | |
| | | | | | |
Net Asset Value, Beginning of Year | | | $10.94 | | | | $10.19 | | | | $9.47 | | | | $9.85 | | | | $9.70 | |
| | | | | | |
Income (loss) from Investment Operations: | | | | | | | | | | | | | | | | | | | | |
| | | | | | |
Net investment income1,2 | | | 0.16 | | | | 0.22 | | | | 0.26 | | | | 0.25 | | | | 0.23 | |
| | | | | | |
Net realized and unrealized gain (loss) on investments | | | (0.28 | ) | | | 0.75 | | | | 0.73 | | | | (0.38 | ) | | | 0.16 | |
| | | | | | |
Total income (loss) from investment operations | | | (0.12 | ) | | | 0.97 | | | | 0.99 | | | | (0.13 | ) | | | 0.39 | |
| | | | | | |
Less Distributions to Shareholders from: | | | | | | | | | | | | | | | | | | | | |
| | | | | | |
Net investment income | | | (0.16 | ) | | | (0.22 | ) | | | (0.27 | ) | | | (0.25 | ) | | | (0.24 | ) |
| | | | | | |
Paid in capital | | | (0.01 | ) | | | – | | | | – | | | | – | | | | – | |
| | | | | | |
Total distributions to shareholders | | | (0.17 | ) | | | (0.22 | ) | | | (0.27 | ) | | | (0.25 | ) | | | (0.24 | ) |
| | | | | | |
Net Asset Value, End of Year | | | $10.65 | | | | $10.94 | | | | $10.19 | | | | $9.47 | | | | $9.85 | |
| | | | | | |
Total Return2,3 | | | (1.07 | )% | | | 9.57 | % | | | 10.51 | % | | | (1.27 | )% | | | 4.03 | % |
| | | | | | |
Ratio of net expenses to average net assets | | | 0.56 | % | | | 0.55 | % | | | 0.55 | % | | | 0.54 | % | | | 0.61 | % |
| | | | | | |
Ratio of gross expenses to average net assets4 | | | 0.76 | % | | | 0.88 | % | | | 0.98 | % | | | 0.80 | % | | | 0.90 | % |
| | | | | | |
Ratio of net investment income to average net assets2 | | | 1.49 | % | | | 2.04 | % | | | 2.62 | % | | | 2.64 | % | | | 2.32 | % |
| | | | | | |
Portfolio turnover | | | 86 | % | | | 101 | % | | | 71 | % | | | 26 | % | | | 39 | % |
| | | | | | |
Net assets end of year (000’s) omitted | | | $33,402 | | | | $27,800 | | | | $8,502 | | | | $5,967 | | | | $6,864 | |
| | | | | | | | | | | | | | | | | | | | | |
58
| | |
| | AMG GW&K Enhanced Core Bond ESG Fund Financial Highlights For a share outstanding throughout each fiscal year |
| | | | | | | | | | | | | | | | | | | | |
| | | For the fiscal years ended December 31, | |
| | | | | | |
| Class Z | | 2021 | | | 2020 | | | 2019 | | | 2018 | | | 20175 | |
| | | | | | |
Net Asset Value, Beginning of Year | | | $10.93 | | | | $10.18 | | | | $9.46 | | | | $9.84 | | | | $9.70 | |
| | | | | | |
Income (loss) from Investment Operations: | | | | | | | | | | | | | | | | | | | | |
| | | | | | |
Net investment income1,2 | | | 0.17 | | | | 0.22 | | | | 0.27 | | | | 0.26 | | | | 0.24 | |
| | | | | | |
Net realized and unrealized gain (loss) on investments | | | (0.27 | ) | | | 0.75 | | | | 0.72 | | | | (0.38 | ) | | | 0.15 | |
| | | | | | |
Total income (loss) from investment operations | | | (0.10 | ) | | | 0.97 | | | | 0.99 | | | | (0.12 | ) | | | 0.39 | |
| | | | | | |
Less Distributions to Shareholders from: | | | | | | | | | | | | | | | | | | | | |
| | | | | | |
Net investment income | | | (0.17 | ) | | | (0.22 | ) | | | (0.27 | ) | | | (0.26 | ) | | | (0.25 | ) |
| | | | | | |
Paid in capital | | | (0.01 | ) | | | – | | | | – | | | | – | | | | – | |
| | | | | | |
Total distributions to shareholders | | | (0.18 | ) | | | (0.22 | ) | | | (0.27 | ) | | | (0.26 | ) | | | (0.25 | ) |
| | | | | | |
Net Asset Value, End of Year | | | $10.65 | | | | $10.93 | | | | $10.18 | | | | $9.46 | | | | $9.84 | |
| | | | | | |
Total Return2,3 | | | (0.92 | )% | | | 9.65 | % | | | 10.59 | % | | | (1.23 | )% | | | 4.01 | % |
| | | | | | |
Ratio of net expenses to average net assets | | | 0.48 | % | | | 0.48 | % | | | 0.48 | % | | | 0.48 | % | | | 0.50 | % |
| | | | | | |
Ratio of gross expenses to average net assets4 | | | 0.68 | % | | | 0.81 | % | | | 0.91 | % | | | 0.74 | % | | | 0.79 | % |
| | | | | | |
Ratio of net investment income to average net assets2 | | | 1.57 | % | | | 2.11 | % | | | 2.72 | % | | | 2.70 | % | | | 2.43 | % |
| | | | | | |
Portfolio turnover | | | 86 | % | | | 101 | % | | | 71 | % | | | 26 | % | | | 39 | % |
| | | | | | |
Net assets end of year (000’s) omitted | | | $13,712 | | | | $11,552 | | | | $10,080 | | | | $15,254 | | | | $21,271 | |
| | | | | | | | | | | | | | | | | | | | | |
| 1 | Per share numbers have been calculated using average shares. |
| 2 | Total returns and net investment income would have been lower had certain expenses not been offset. |
| 3 | The total return is calculated using the published Net Asset Value as of fiscal year end. |
| 4 | Excludes the impact of expense reimbursement or fee waivers and expense reductions such as brokerage credits, but includes expense repayments and non-reimbursable expenses, if any, such as interest, taxes, and extraordinary expenses. (See Note 1(c) and 2 in the Notes to Financial Statements.) |
| 5 | Effective February 27, 2017, Class I shares were renamed Class Z and Class S shares were renamed Class I. |
59
| | |
| | AMG GW&K High Income Fund Financial Highlights For a share outstanding throughout each fiscal year |
| | | | | | | | | | | | | | | | | | | | |
| | | For the fiscal years ended December 31, | |
| | | | | | |
| Class N | | 2021 | | | 2020 | | | 2019 | | | 2018 | | | 20171 | |
| | | | | | |
Net Asset Value, Beginning of Year | | | $22.23 | | | | $21.52 | | | | $20.04 | | | | $21.06 | | | | $19.05 | |
| | | | | | |
Income (loss) from Investment Operations: | | | | | | | | | | | | | | | | | | | | |
| | | | | | |
Net investment income2,3 | | | 0.53 | | | | 0.51 | | | | 0.57 | | | | 0.69 | | | | 0.75 | |
| | | | | | |
Net realized and unrealized gain (loss) on investments | | | 0.28 | | | | 2.09 | | | | 0.98 | | | | (1.57 | ) | | | 1.26 | |
| | | | | | |
Total income (loss) from investment operations | | | 0.81 | | | | 2.60 | | | | 1.55 | | | | (0.88 | ) | | | 2.01 | |
| | | | | | |
Less Distributions to Shareholders from: | | | | | | | | | | | | | | | | | | | | |
| | | | | | |
Net investment income | | | (0.53 | ) | | | (0.48 | ) | | | (0.07 | ) | | | (0.14 | ) | | | – | |
| | | | | | |
Net realized gain on investments | | | (0.05 | ) | | | (1.41 | ) | | | – | | | | – | | | | – | |
| | | | | | |
Total distributions to shareholders | | | (0.58 | ) | | | (1.89 | ) | | | (0.07 | ) | | | (0.14 | ) | | | – | |
| | | | | | |
Net Asset Value, End of Year | | | $22.46 | | | | $22.23 | | | | $21.52 | | | | $20.04 | | | | $21.06 | |
| | | | | | |
Total Return3,4 | | | 3.67 | % | | | 12.16 | % | | | 7.67 | % | | | (4.18 | )% | | | 10.55 | % |
| | | | | | |
Ratio of net expenses to average net assets | | | 0.84 | % | | | 0.89 | % | | | 0.89 | % | | | 0.89 | % | | | 0.89 | % |
| | | | | | |
Ratio of gross expenses to average net assets5 | | | 1.37 | % | | | 1.70 | % | | | 1.87 | % | | | 1.52 | % | | | 1.39 | % |
| | | | | | |
Ratio of net investment income to average net assets3 | | | 2.36 | % | | | 2.28 | % | | | 2.70 | % | | | 3.34 | % | | | 3.71 | % |
| | | | | | |
Portfolio turnover | | | 97 | % | | | 157 | % | | | 52 | % | | | 60 | % | | | 55 | % |
| | | | | | |
Net assets end of year (000’s) omitted | | | $8,157 | | | | $10,302 | | | | $9,638 | | | | $10,365 | | | | $14,074 | |
| | | | | | | | | | | | | | | | | | | | | |
60
| | |
| | AMG GW&K High Income Fund Financial Highlights For a share outstanding throughout each fiscal period |
| | | | | |
| | | For the fiscal |
| Class I | | period ended
December 31, 20216 |
| |
Net Asset Value, Beginning of Period | | | | $22.27 | |
| |
Income from Investment Operations: | | | | | |
| |
Net investment income2,3 | | | | 0.46 | |
| |
Net realized and unrealized gain on investments | | | | 0.35 | |
| |
Total income from investment operations | | | | 0.81 | |
| |
Less Distributions to Shareholders from: | | | | | |
| |
Net investment income | | | | (0.58 | ) |
| |
Net realized gain on investments | | | | (0.05 | ) |
| |
Total distributions to shareholders | | | | (0.63 | ) |
| |
��Net Asset Value, End of Period | | | | $22.45 | |
| |
Total Return3,4 | | | | 3.68 | %7 |
| |
Ratio of net expenses to average net assets | | | | 0.64 | %8 |
| |
Ratio of gross expenses to average net assets5 | | | | 1.17 | %8 |
| |
Ratio of net investment income to average net assets3 | | | | 2.56 | %8 |
| |
Portfolio turnover | | | | 97 | % |
| |
Net assets end of period (000’s) omitted | | | | $13,166 | |
| | | | | | |
| 1 | Effective February 27, 2017, Class S was renamed Class N. |
| 2 | Per share numbers have been calculated using average shares. |
| 3 | Total returns and net investment income would have been lower had certain expenses not been offset. |
| 4 | The total return is calculated using the published Net Asset Value as of fiscal year end. |
| 5 | Excludes the impact of expense reimbursement or fee waivers and expense reductions such as brokerage credits, but includes expense repayments and non-reimbursable expenses, if any, such as interest, taxes, and extraordinary expenses. (See Note 1(c) and 2 in the Notes to Financial Statements.) |
| 6 | Commencement of operations was on March 15, 2021. |
61
| | |
| | AMG GW&K Municipal Bond Fund Financial Highlights For a share outstanding throughout each fiscal year |
| | | | | | | | | | | | | | | | | | | | |
| | | For the fiscal years ended December 31, | |
| | | | | | |
| Class N | | 2021 | | | 2020 | | | 2019 | | | 2018 | | | 2017 | |
| | | | | | |
Net Asset Value, Beginning of Year | | | $12.45 | | | | $12.12 | | | | $11.48 | | | | $11.60 | | | | $11.25 | |
| | | | | | |
Income (loss) from Investment Operations: | | | | | | | | | | | | | | | | | | | | |
| | | | | | |
Net investment income1,2 | | | 0.13 | | | | 0.15 | | | | 0.19 | | | | 0.17 | | | | 0.15 | |
| | | | | | |
Net realized and unrealized gain (loss) on investments | | | (0.11 | ) | | | 0.33 | | | | 0.64 | | | | (0.11 | ) | | | 0.36 | |
| | | | | | |
Total income from investment operations | | | 0.02 | | | | 0.48 | | | | 0.83 | | | | 0.06 | | | | 0.51 | |
| | | | | | |
Less Distributions to Shareholders from: | | | | | | | | | | | | | | | | | | | | |
| | | | | | |
Net investment income | | | (0.13 | ) | | | (0.15 | ) | | | (0.19 | ) | | | (0.18 | ) | | | (0.15 | ) |
| | | | | | |
Net realized gain on investments | | | (0.10 | ) | | | – | | | | – | | | | (0.00 | )3 | | | (0.01 | ) |
| | | | | | |
Total distributions to shareholders | | | (0.23 | ) | | | (0.15 | ) | | | (0.19 | ) | | | (0.18 | ) | | | (0.16 | ) |
| | | | | | |
Net Asset Value, End of Year | | | $12.24 | | | | $12.45 | | | | $12.12 | | | | $11.48 | | | | $11.60 | |
| | | | | | |
Total Return2,4 | | | 0.10 | % | | | 4.31 | % | | | 7.29 | % | | | 0.54 | % | | | 4.58 | % |
| | | | | | |
Ratio of net expenses to average net assets | | | 0.71 | % | | | 0.71 | % | | | 0.71 | % | | | 0.71 | % | | | 0.71 | % |
| | | | | | |
Ratio of gross expenses to average net assets5 | | | 0.76 | % | | | 0.77 | % | | | 0.78 | % | | | 0.77 | % | | | 0.78 | % |
| | | | | | |
Ratio of net investment income to average net assets2 | | | 1.01 | % | | | 1.25 | % | | | 1.59 | % | | | 1.53 | % | | | 1.31 | % |
| | | | | | |
Portfolio turnover | | | 24 | % | | | 17 | % | | | 18 | % | | | 35 | % | | | 27 | % |
| | | | | | |
Net assets end of year (000’s) omitted | | | $17,112 | | | | $18,153 | | | | $18,711 | | | | $17,445 | | | | $29,513 | |
| | | | | | | | | | | | | | | | | | | | | |
62
| | |
| | AMG GW&K Municipal Bond Fund Financial Highlights For a share outstanding throughout each fiscal year |
| | | | | | | | | | | | | | | | | | | | |
| | | For the fiscal years ended December 31, | |
| | | | | | |
| Class I | | 2021 | | | 2020 | | | 2019 | | | 2018 | | | 20176 | |
| | | | | | |
Net Asset Value, Beginning of Year | | | $12.52 | | | | $12.18 | | | | $11.54 | | | | $11.66 | | | | $11.31 | |
| | | | | | |
Income (loss) from Investment Operations: | | | | | | | | | | | | | | | | | | | | |
| | | | | | |
Net investment income1,2 | | | 0.17 | | | | 0.19 | | | | 0.23 | | | | 0.21 | | | | 0.19 | |
| | | | | | |
Net realized and unrealized gain (loss) on investments | | | (0.11 | ) | | | 0.34 | | | | 0.64 | | | | (0.12 | ) | | | 0.36 | |
| | | | | | |
Total income from investment operations | | | 0.06 | | | | 0.53 | | | | 0.87 | | | | 0.09 | | | | 0.55 | |
| | | | | | |
Less Distributions to Shareholders from: | | | | | | | | | | | | | | | | | | | | |
| | | | | | |
Net investment income | | | (0.17 | ) | | | (0.19 | ) | | | (0.23 | ) | | | (0.21 | ) | | | (0.19 | ) |
| | | | | | |
Net realized gain on investments | | | (0.10 | ) | | | – | | | | – | | | | (0.00 | )3 | | | (0.01 | ) |
| | | | | | |
Total distributions to shareholders | | | (0.27 | ) | | | (0.19 | ) | | | (0.23 | ) | | | (0.21 | ) | | | (0.20 | ) |
| | | | | | |
Net Asset Value, End of Year | | | $12.31 | | | | $12.52 | | | | $12.18 | | | | $11.54 | | | | $11.66 | |
| | | | | | |
Total Return2,4 | | | 0.43 | % | | | 4.70 | % | | | 7.58 | % | | | 0.87 | % | | | 4.90 | % |
| | | | | | |
Ratio of net expenses to average net assets | | | 0.39 | % | | | 0.39 | % | | | 0.39 | % | | | 0.39 | % | | | 0.37 | % |
| | | | | | |
Ratio of gross expenses to average net assets5 | | | 0.44 | % | | | 0.45 | % | | | 0.46 | % | | | 0.45 | % | | | 0.45 | % |
| | | | | | |
Ratio of net investment income to average net assets2 | | | 1.33 | % | | | 1.57 | % | | | 1.91 | % | | | 1.85 | % | | | 1.64 | % |
| | | | | | |
Portfolio turnover | | | 24 | % | | | 17 | % | | | 18 | % | | | 35 | % | | | 27 | % |
| | | | | | |
Net assets end of year (000’s) omitted | | | $1,331,958 | | | | $1,287,667 | | | | $1,014,514 | | | | $940,553 | | | | $1,045,399 | |
| | | | | | | | | | | | | | | | | | | | | |
| 1 | Per share numbers have been calculated using average shares. |
| 2 | Total returns and net investment income would have been lower had certain expenses not been offset. |
| 3 | Less than $(0.005) per share. |
| 4 | The total return is calculated using the published Net Asset Value as of fiscal year end. |
| 5 | Excludes the impact of expense reimbursement or fee waivers and expense reductions such as brokerage credits, but includes expense repayments and non-reimbursable expenses, if any, such as interest, taxes, and extraordinary expenses. (See Note 1(c) and 2 in the Notes to Financial Statements.) |
| 6 | Effective June 23, 2017, Class S shares were converted to Class I shares. |
63
| | |
| | AMG GW&K Municipal Enhanced Yield Fund Financial Highlights For a share outstanding throughout each fiscal year |
| | | | | | | | | | | | | | | | | | | | |
| | | For the fiscal years ended December 31, | |
| | | | | | |
| Class N | | 2021 | | | 2020 | | | 2019 | | | 2018 | | | 2017 | |
| | | | | | |
Net Asset Value, Beginning of Year | | | $10.69 | | | | $10.42 | | | | $9.69 | | | | $10.02 | | | | $9.40 | |
| | | | | | |
Income (loss) from Investment Operations: | | | | | | | | | | | | | | | | | | | | |
| | | | | | |
Net investment income1,2 | | | 0.20 | | | | 0.23 | | | | 0.26 | | | | 0.27 | | | | 0.26 | |
| | | | | | |
Net realized and unrealized gain (loss) on investments | | | 0.18 | | | | 0.37 | | | | 0.78 | | | | (0.33 | ) | | | 0.62 | |
| | | | | | |
Total income (loss) from investment operations | | | 0.38 | | | | 0.60 | | | | 1.04 | | | | (0.06 | ) | | | 0.88 | |
| | | | | | |
Less Distributions to Shareholders from: | | | | | | | | | | | | | | | | | | | | |
| | | | | | |
Net investment income | | | (0.19 | ) | | | (0.21 | ) | | | (0.25 | ) | | | (0.15 | ) | | | (0.26 | ) |
| | | | | | |
Net realized gain on investments | | | (0.14 | ) | | | (0.12 | ) | | | (0.06 | ) | | | – | | | | – | |
| | | | | | |
Paid in capital | | | – | | | | – | | | | – | | | | (0.12 | ) | | | – | |
| | | | | | |
Total distributions to shareholders | | | (0.33 | ) | | | (0.33 | ) | | | (0.31 | ) | | | (0.27 | ) | | | (0.26 | ) |
| | | | | | |
Net Asset Value, End of Year | | | $10.74 | | | | $10.69 | | | | $10.42 | | | | $9.69 | | | | $10.02 | |
| | | | | | |
Total Return2,3 | | | 3.59 | % | | | 5.95 | % | | | 10.92 | % | | | (0.55 | )% | | | 9.51 | % |
| | | | | | |
Ratio of net expenses to average net assets | | | 0.99 | % | | | 0.99 | % | | | 0.99 | % | | | 0.99 | % | | | 1.01 | % |
| | | | | | |
Ratio of gross expenses to average net assets4 | | | 1.05 | % | | | 1.07 | % | | | 1.08 | % | | | 1.08 | % | | | 1.11 | % |
| | | | | | |
Ratio of net investment income to average net assets2 | | | 1.85 | % | | | 2.17 | % | | | 2.56 | % | | | 2.79 | % | | | 2.67 | % |
| | | | | | |
Portfolio turnover | | | 61 | % | | | 81 | % | | | 40 | % | | | 89 | % | | | 67 | % |
| | | | | | |
Net assets end of year (000’s) omitted | | | $14,923 | | | | $5,015 | | | | $5,722 | | | | $7,283 | | | | $8,828 | |
| | | | | | | | | | | | | | | | | | | | | |
64
| | |
| | AMG GW&K Municipal Enhanced Yield Fund Financial Highlights For a share outstanding throughout each fiscal year |
| | | | | | | | | | | | | | | | | | | | |
| | | For the fiscal years ended December 31, | |
| | | | | | |
| Class I | | 2021 | | | 2020 | | | 2019 | | | 2018 | | | 20175 | |
| | | | | | |
Net Asset Value, Beginning of Year | | | $10.40 | | | | $10.15 | | | | $9.45 | | | | $10.01 | | | | $9.40 | |
| | | | | | |
Income (loss) from Investment Operations: | | | | | | | | | | | | | | | | | | | | |
| | | | | | |
Net investment income1,2 | | | 0.23 | | | | 0.25 | | | | 0.29 | | | | 0.31 | | | | 0.30 | |
| | | | | | |
Net realized and unrealized gain (loss) on investments | | | 0.17 | | | | 0.37 | | | | 0.76 | | | | (0.32 | ) | | | 0.61 | |
| | | | | | |
Total income (loss) from investment operations | | | 0.40 | | | | 0.62 | | | | 1.05 | | | | (0.01 | ) | | | 0.91 | |
| | | | | | |
Less Distributions to Shareholders from: | | | | | | | | | | | | | | | | | | | | |
| | | | | | |
Net investment income | | | (0.23 | ) | | | (0.25 | ) | | | (0.29 | ) | | | (0.31 | ) | | | (0.30 | ) |
| | | | | | |
Net realized gain on investments | | | (0.14 | ) | | | (0.12 | ) | | | (0.06 | ) | | | – | | | | – | |
| | | | | | |
Paid in capital | | | – | | | | – | | | | – | | | | (0.24 | ) | | | – | |
| | | | | | |
Total distributions to shareholders | | | (0.37 | ) | | | (0.37 | ) | | | (0.35 | ) | | | (0.55 | ) | | | (0.30 | ) |
| | | | | | |
Net Asset Value, End of Year | | | $10.43 | | | | $10.40 | | | | $10.15 | | | | $9.45 | | | | $10.01 | |
| | | | | | |
Total Return2,3 | | | 3.94 | % | | | 6.31 | % | | | 11.28 | % | | | (0.07 | )% | | | 9.79 | % |
| | | | | | |
Ratio of net expenses to average net assets | | | 0.64 | % | | | 0.64 | % | | | 0.64 | % | | | 0.64 | % | | | 0.64 | % |
| | | | | | |
Ratio of gross expenses to average net assets4 | | | 0.70 | % | | | 0.72 | % | | | 0.73 | % | | | 0.73 | % | | | 0.74 | % |
| | | | | | |
Ratio of net investment income to average net assets2 | | | 2.20 | % | | | 2.52 | % | | | 2.91 | % | | | 3.14 | % | | | 3.05 | % |
| | | | | | |
Portfolio turnover | | | 61 | % | | | 81 | % | | | 40 | % | | | 89 | % | | | 67 | % |
| | | | | | |
Net assets end of year (000’s) omitted | | | $369,473 | | | | $323,439 | | | | $273,228 | | | | $203,867 | | | | $226,638 | |
| | | | | | | | | | | | | | | | | | | | | |
65
| | |
| | AMG GW&K Municipal Enhanced Yield Fund Financial Highlights For a share outstanding throughout each fiscal period |
| | | | | | | | | | | | | | | | | | | | |
| | | For the fiscal years ended December 31, | | | For the fiscal
period ended
December 31, | |
| | | | | | |
| Class Z | | 2021 | | | 2020 | | | 2019 | | | 2018 | | | 20176 | |
| | | | | | |
Net Asset Value, Beginning of Period | | | $10.40 | | | | $10.15 | | | | $9.44 | | | | $10.01 | | | | $9.49 | |
| | | | | | |
Income (loss) from Investment Operations: | | | | | | | | | | | | | | | | | | | | |
| | | | | | |
Net investment income1,2 | | | 0.24 | | | | 0.26 | | | | 0.30 | | | | 0.31 | | | | 0.25 | |
| | | | | | |
Net realized and unrealized gain (loss) on investments | | | 0.17 | | | | 0.37 | | | | 0.76 | | | | (0.32 | ) | | | 0.52 | |
| | | | | | |
Total income (loss) from investment operations | | | 0.41 | | | | 0.63 | | | | 1.06 | | | | (0.01 | ) | | | 0.77 | |
| | | | | | |
Less Distributions to Shareholders from: | | | | | | | | | | | | | | | | | | | | |
| | | | | | |
Net investment income | | | (0.24 | ) | | | (0.26 | ) | | | (0.29 | ) | | | (0.32 | ) | | | (0.25 | ) |
| | | | | | |
Net realized gain on investments | | | (0.14 | ) | | | (0.12 | ) | | | (0.06 | ) | | | – | | | | – | |
| | | | | | |
Paid in capital | | | – | | | | – | | | | – | | | | (0.24 | ) | | | – | |
| | | | | | |
Total distributions to shareholders | | | (0.38 | ) | | | (0.38 | ) | | | (0.35 | ) | | | (0.56 | ) | | | (0.25 | ) |
| | | | | | |
Net Asset Value, End of Period | | | $10.43 | | | | $10.40 | | | | $10.15 | | | | $9.44 | | | | $10.01 | |
| | | | | | |
Total Return2,3 | | | 3.99 | % | | | 6.37 | % | | | 11.45 | % | | | (0.09 | )% | | | 8.23 | %7 |
| | | | | | |
Ratio of net expenses to average net assets | | | 0.59 | % | | | 0.59 | % | | | 0.59 | % | | | 0.59 | % | | | 0.59 | %8 |
| | | | | | |
Ratio of gross expenses to average net assets4 | | | 0.65 | % | | | 0.67 | % | | | 0.68 | % | | | 0.68 | % | | | 0.69 | %8 |
| | | | | | |
Ratio of net investment income to average net assets2 | | | 2.25 | % | | | 2.57 | % | | | 2.96 | % | | | 3.19 | % | | | 3.07 | %8 |
| | | | | | |
Portfolio turnover | | | 61 | % | | | 81 | % | | | 40 | % | | | 89 | % | | | 67 | % |
| | | | | | |
Net assets end of period (000’s) omitted | | | $135 | | | | $130 | | | | $120 | | | | $108 | | | | $108 | |
| | | | | | | | | | | | | | | | | | | | | |
| 1 | Per share numbers have been calculated using average shares. |
| 2 | Total returns and net investment income would have been lower had certain expenses not been offset. |
| 3 | The total return is calculated using the published Net Asset Value as of fiscal year end. |
| 4 | Excludes the impact of expense reimbursement or fee waivers and expense reductions such as brokerage credits, but includes expense repayments and non-reimbursable expenses, if any, such as interest, taxes, and extraordinary expenses. (See Note 1(c) and 2 in the Notes to Financial Statements.) |
| 5 | Effective June 23, 2017, Class S shares were converted to Class I shares. |
| 6 | Commencement of operations was February 27, 2017. |
66
| | |
| | Notes to Financial Statements December 31, 2021 |
1. ORGANIZATION AND SUMMARY OF SIGNIFICANT ACCOUNTING POLICIES
AMG Funds, AMG Funds II and AMG Funds III (the “Trusts”) are open-end management investment companies, organized as Massachusetts business trusts, and registered under the Investment Company Act of 1940, as amended (the “1940 Act”). Currently, the Trusts consist of a number of different funds, each having distinct investment management objectives, strategies, risks, and policies. Included in this report are AMG Funds: AMG GW&K Municipal Bond Fund (“Municipal Bond”), AMG GW&K Municipal Enhanced Yield Fund (“Municipal Enhanced”), AMG Funds II: AMG GW&K Enhanced Core Bond ESG Fund (“Enhanced Core Bond ESG”) and AMG Funds III: AMG GW&K ESG Bond Fund (formerly AMG Managers Loomis Sayles Bond Fund) (“ESG Bond”), and AMG GW&K High Income Fund (“High Income”), each a “Fund” and collectively, the “Funds”.
Each Fund offers different classes of shares. All Funds offer Class N shares and Class I shares; and Municipal Enhanced and Enhanced Core Bond ESG offer Class Z shares. High Income Class I shares commenced operations on March 15, 2021. Each class represents an interest in the same assets of the respective Fund. Although all share classes generally have identical voting rights, each share class votes separately when required by law. Different share classes may have different net asset values per share to the extent the share classes pay different distribution amounts and/or the expenses of such share classes differ. Each share class has its own expense structure. Please refer to a current prospectus for additional information on each share class.
On March 17-18, 2021, the Board of Trustees of AMG Fund III (the “Board” and together with the Board of Trustees of AMG Funds and AMG Funds II, the “Boards”) approved GW&K Investment Management, LLC (“GW&K”) as the subadviser to ESG Bond on an interim basis to replace Loomis, Sayles & Company, L.P. (“Loomis”) effective March 19, 2021, which was subsequently approved by the shareholders of ESG Bond on June 11, 2021. After the subadviser change, ESG Bond seeks to achieve it’s investment objective by investing in a diversified portfolio of fixed income securities. In conjunction with the respective changes in investment strategy for ESG Bond, the Fund sold substantially all open positions around the date of the subadviser change that increased the Fund’s portfolio turnover. Also, during the transition of ESG Bond, the Fund invested in futures contracts to manage exposure to security markets. ESG Bond also declared a special capital gain distribution on March 29, 2021. In addition, the Board also approved expense changes (See Note 2).
Market disruptions associated with the COVID-19 pandemic have had a global impact, and uncertainty exists as to the long-term implications. Such disruptions can adversely affect assets of the Funds and thus Fund performance.
The Funds’ financial statements are prepared in accordance with accounting principles generally accepted in the United States of America (“U.S. GAAP”), including accounting and reporting guidance pursuant to Accounting Standards Codification Topic 946 applicable to investment companies. U.S. GAAP requires management to make estimates and assumptions that affect the reported amounts of assets and liabilities and disclosure of contingent assets and liabilities at the date of the financial statements and the reported amounts of income and expenses during the reporting period. Actual results could differ from those estimates and such differences could be material. The following is a summary of significant accounting policies followed by the Funds in the preparation of their financial statements:
a. VALUATION OF INVESTMENTS
For the Funds, equity securities traded on a national securities exchange or reported on the NASDAQ national market system (“NMS”) are valued at the last quoted sales price on the primary exchange or, if applicable, the NASDAQ official closing price or the official closing price of the relevant exchange or, lacking any sales, at the last quoted bid price for ESG Bond and High Income or the mean between the last quoted bid and ask prices (the “mean price”) for Enhanced Core Bond ESG, Municipal Bond and Municipal Enhanced. Equity securities held by the Funds that are traded in the over-the-counter market (other than NMS securities) are valued at the mean price. Foreign equity securities (securities principally traded in markets other than U.S. markets) are valued at the official closing price on the primary exchange or, for markets that either do not offer an official closing price or where the official closing price may not be representative of the overall market, the last quoted sale price. Effective October 1, 2021, equity securities lacking any sales in Enhanced Core Bond ESG, Municipal Bond and Municipal Enhanced are valued at the last quoted bid price and equity securities traded in the over-the-counter market (other than NMS securities) in each Fund are valued at the bid price. As of October 1, 2021, there was no impact to the Funds due to the changes in valuation policy.
Fixed income securities purchased with a remaining maturity exceeding 60 days are valued at the evaluated mean price provided by an authorized pricing service or, if an evaluated price is not available, by reference to other securities which are considered comparable in credit rating, interest rate, due date and other features (generally referred to as “matrix pricing”) or other similar pricing methodologies. Investments in certain mortgage-backed and stripped mortgage-backed securities, preferred stocks, convertible securities, derivatives and other debt securities not traded on an organized securities market are valued on the basis of valuations provided by dealers or by a pricing service which uses information with respect to transactions in such securities and various relationships between such securities and yield to maturity in determining value. Effective October 1, 2021, fixed income securities purchased with a remaining maturity exceeding 60 days are valued at the evaluated bid price provided by an authorized pricing service. As of October 1, 2021, the impact of the change in valuation policy to Unrealized Appreciation/Depreciation and Net Asset Value Per Share for ESG Bond, Enhanced Core Bond ESG, High Income, Municipal Bond and Municipal Enhanced was $(133,118), $48,641, $(1,571), $768,188 and $373,784, respectively, and less than $(0.01), $0.01, less than $(0.01), $0.01 and $0.01, respectively.
Fixed income securities purchased with a remaining maturity of 60 days or less are valued at amortized cost, provided that the amortized cost value is approximately the same as the fair value of the security valued without the use of amortized cost. Investments in other open-end registered investment companies are valued at their end of day net asset value per share.
Futures contracts for which market quotations are readily available are valued at the settlement price as of the close of the futures exchange.
The Funds’ portfolio investments are generally valued based on independent market quotations or prices or, if none, “evaluative” or other market based valuations provided by third party pricing services approved by the Boards. Under certain circumstances, the value of certain Fund portfolio investments may be based on an evaluation of fair value, pursuant to procedures established by and under the general supervision of the Boards. The Valuation Committee, which is comprised of the Independent Trustees of the Boards, and the Pricing Committee, which is comprised of representatives from AMG Funds LLC (the “Investment Manager”) are the committees appointed by the Boards to make fair value
67
| | |
| | Notes to Financial Statements (continued) |
determinations. Each Fund may use the fair value of a portfolio investment to calculate its net asset value (“NAV”) in the event that the market quotation, price or market based valuation for the portfolio investment is not readily available or otherwise not determinable pursuant to the Boards’ valuation procedures, if the Investment Manager or the Pricing Committee believes the quotation, price or market based valuation to be unreliable, or in certain other circumstances. When determining the fair value of an investment, the Pricing Committee and, if required under the Trusts’ securities valuation procedures, the Valuation Committee, seeks to determine the price that a Fund might reasonably expect to receive from current sale of that portfolio investment in an arms-length transaction. Fair value determinations shall be based upon consideration of all available facts and information, including, but not limited to (i) attributes specific to the investment; (ii) fundamental and analytical data relating to the investment; and (iii) the value of other comparable securities or relevant financial instruments, including derivative securities, traded on other markets or among dealers.
The values assigned to fair value portfolio investments are based on available information and do not necessarily represent amounts that might ultimately be realized in the future, since such amounts depend on future developments inherent in long-term investments. Because of the inherent uncertainty of valuation, those estimated values may differ significantly from the values that would have been used had a ready market for the investments existed, and the differences could be material. The Boards will be presented with a quarterly report showing as of the most recent quarter end, all outstanding securities fair valued by the Funds, including a comparison with the prior quarter end and the percentage of the Funds that the security represents at each quarter end.
With respect to foreign equity securities and certain foreign fixed income securities, the Boards have adopted a policy that securities held in the Funds that can be fair valued by the applicable fair value pricing service are fair valued on each business day provided that each individual price exceeds a pre-established confidence level.
U.S. GAAP defines fair value as the price that a fund would receive to sell an asset or pay to transfer a liability in an orderly transaction between market participants at the measurement date. U.S. GAAP also establishes a framework for measuring fair value, and a three level hierarchy for fair value measurements based upon the transparency of inputs to the valuation of an asset or liability. Inputs may be observable or unobservable and refer broadly to the assumptions that market participants would use in pricing the asset or liability. Observable inputs reflect the assumptions market participants would use in pricing the asset or liability based on market data obtained from sources independent of the Funds. Unobservable inputs reflect the Funds’ own assumptions about the assumptions that market participants would use in pricing the asset or liability developed based on the best information available in the circumstances. Each investment is assigned a level based upon the observability of the inputs which are significant to the overall valuation.
The three-tier hierarchy of inputs is summarized below:
Level 1 – inputs are quoted prices in active markets for identical investments (e.g., equity securities, open-end investment companies)
Level 2 – other observable inputs (including, but not limited to: quoted prices for similar assets or liabilities in markets that are active, quoted prices for identical or similar assets or liabilities in markets that are not active, inputs other than quoted
prices that are observable for the assets or liabilities (such as interest rates, yield curves, volatilities, prepayment speeds, loss severities, credit risks and default rates) or other market corroborated inputs) (e.g., debt securities, government securities, foreign currency exchange contracts, swaps, foreign securities utilizing international fair value pricing, fair valued securities with observable inputs)
Level 3 – inputs are significant unobservable inputs (including the Fund’s own assumptions used to determine the fair value of investments) (e.g., fair valued securities with unobservable inputs)
Changes in inputs or methodologies used for valuing investments may result in a transfer in or out of levels within the fair value hierarchy. The inputs or methodologies used for valuing investments may not necessarily be an indication of the risk associated with investing in those investments.
b. SECURITY TRANSACTIONS
Security transactions are accounted for as of trade date. Realized gains and losses on securities sold are determined on the basis of identified cost.
c. INVESTMENT INCOME AND EXPENSES
Dividend income is recorded on the ex-dividend date. Dividends from foreign securities are recorded on the ex-dividend date, and if after the fact, as soon as the Funds become aware of the ex-dividend date. Interest income, which includes amortization of premium and accretion of discount on debt securities, is accrued as earned. Dividend and interest income on foreign securities is recorded gross of any withholding tax. Expenses that cannot be directly attributed to a Fund are apportioned among the funds in the Trusts and other trusts or funds within the AMG Funds Family of Funds (collectively the “AMG Funds Family”) based upon their relative average net assets or number of shareholders. Investment income, realized and unrealized capital gains and losses, the common expenses of each Fund, and certain fund level expense reductions, if any, are allocated on a pro-rata basis to each class based on the relative net assets of each class to the total net assets of each Fund.
d. DIVIDENDS AND DISTRIBUTIONS
Fund distributions resulting from net investment income, if any, will normally be declared and paid monthly by the Funds. High Income commenced monthly net investment income distributions on March 29, 2021. Fund distributions resulting from realized net capital gains, if any, will normally be declared and paid at least annually in December. Distributions to shareholders are recorded on the ex-dividend date. Distributions are determined in accordance with federal income tax regulations, which may differ from net investment income and net realized capital gains for financial statement purposes (U.S. GAAP). Differences may be permanent or temporary. Permanent differences are reclassified among capital accounts in the financial statements to reflect their tax character. Permanent book and tax basis differences, if any, relating to shareholder distributions will result in reclassifications to paid-in capital. Temporary differences arise when certain items of income, expense and gain or loss are recognized in different periods for financial statement and tax purposes; these differences will reverse at some time in the future. Permanent differences are primarily due to the equalization utilized and net operating losses. Temporary differences are primarily due to wash sales loss deferrals and premium amortization on callable bonds.
68
| | |
| | Notes to Financial Statements (continued) |
The tax character of distributions paid during the fiscal years ended December 31, 2021 and December 31, 2020 were as follows:
| | | | | | | | | | | | | | | | | | | | | | | | |
| | | ESG Bond | | | Enhanced Core Bond ESG | | | High Income | |
| | | | | | |
Distributions paid from: | | | 2021 | | | | 2020 | | | | 2021 | | | | 2020 | | | | 2021 | | | | 2020 | |
| | | | | | |
Ordinary income * | | | $200,763 | | | | $38,079,582 | | | | $824,369 | | | | $815,592 | | | | $543,755 | | | | $364,445 | |
| | | | | | |
Tax-exempt income | | | – | | | | – | | | | – | | | | – | | | | – | | | | – | |
| | | | | | |
Long-term capital gains | | | 104,312,217 | | | | 2,648,558 | | | | – | | | | – | | | | 547 | | | | 460,580 | |
| | | | | | |
Paid-in capital | | | – | | | | – | | | | 47,927 | | | | – | | | | – | | | | – | |
| | | | | | | | | | | | | | | | | | | | | | | | |
| | | | | | |
| | | $104,512,980 | | | | $40,728,140 | | | | $872,296 | | | | $815,592 | | | | $544,302 | | | | $825,025 | |
| | | | | | | | | | | | | | | | | | | | | | | | |
| | | | |
| | | | | | | | | Municipal Bond | | | Municipal Enhanced | |
| | | | | | |
Distributions paid from: | | | | | | | | | | | 2021 | | | | 2020 | | | | 2021 | | | | 2020 | |
| | | | | | |
Ordinary income * | | | | | | | | | | | $808,177 | | | | $154,232 | | | | $1,453,156 | | | | $1,182,108 | |
| | | | | | |
Tax-exempt income | | | | | | | | | | | 17,729,864 | | | | 18,075,720 | | | | 8,070,665 | | | | 7,549,526 | |
| | | | | | |
Long-term capital gains | | | | | | | | | | | 9,730,890 | | | | 3,524,571 | | | | 3,573,833 | | | | 2,730,802 | |
| | | | | | |
Paid-in capital | | | | | | | | | | | – | | | | – | | | | – | | | | – | |
| | | | | | | | | | | | | | | | | | | | | | | | |
| | | | | | |
| | | | | | | | | | | $28,268,931 | | | | $21,754,523 | | | | $13,097,654 | | | | $11,462,436 | |
| | | | | | | | | | | | | | | | | | | | | | | | |
| * | For tax purposes, short-term capital gain distributions, if any, are considered ordinary income distributions. |
As of December 31, 2021, the components of distributable earnings (excluding unrealized appreciation/depreciation) on a tax basis consisted of:
| | | | | | | | | | | | | | | | | | | | |
| | | ESG Bond | | | Enhanced Core Bond ESG | | | High Income | | | Municipal Bond | | | Municipal Enhanced | |
| | | | | |
Capital loss carryforward | | | – | | | | $2,528,660 | | | | – | | | | – | | | | – | |
| | | | | |
Undistributed ordinary income | | | – | | | | – | | | | $24,685 | | | | $87,872 | | | | $117,246 | |
| | | | | |
Undistributed tax-exempt income | | | – | | | | – | | | | – | | | | 31,461 | | | | 8,924 | |
| | | | | |
Undistributed long-term capital gains | | | $963,551 | | | | – | | | | 2,954 | | | | 1,733,844 | | | | 814,678 | |
At December 31, 2021, the cost of investments and the aggregate gross unrealized appreciation and depreciation for federal income tax purposes were as follows:
| | | | | | | | |
| Fund | | Cost | | Appreciation | | Depreciation | | Net Appreciation |
| | | | |
ESG Bond | | $753,745,709 | | $13,194,540 | | $(8,084,103) | | $5,110,437 |
| | | | |
Enhanced Core Bond ESG | | 58,700,014 | | 880,542 | | (433,499) | | 447,043 |
| | | | |
High Income | | 22,936,479 | | 160,912 | | (119,098) | | 41,814 |
| | | | |
Municipal Bond | | 1,335,968,744 | | 55,012,705 | | (1,921,786) | | 53,090,919 |
| | | | |
Municipal Enhanced | | 356,397,903 | | 25,418,003 | | (217,266) | | 25,200,737 |
e. FEDERAL TAXES
Each Fund currently qualifies as an investment company and intends to comply with the requirements under Subchapter M of the Internal Revenue Code of 1986, as amended, and to distribute substantially all of its taxable income and gains to its shareholders and to meet certain diversification and income requirements with respect to investment companies. Therefore, no provision for federal income or excise tax is included in the accompanying financial statements.
Additionally, based on each Fund’s understanding of the tax rules and rates related to income, gains and transactions for the foreign jurisdictions in which it invests, each Fund will provide for foreign taxes, and where appropriate, deferred foreign taxes.
Management has analyzed the Funds’ tax positions taken on federal income tax returns as of December 31, 2021, and for all open tax years (generally, the three prior taxable years), and has concluded that no provision for federal income tax is required in the Funds’ financial statements. Additionally, Management is not aware of any tax position for which it is reasonably possible that the total amounts of unrecognized tax benefits will change materially in the next twelve months.
f. CAPITAL LOSS CARRYOVERS AND DEFERRALS
As of December 31, 2021, Enhanced Core Bond ESG had capital loss carryovers for federal income tax purposes as shown in the following chart. These amounts may
69
| | |
| | Notes to Financial Statements (continued) |
be used to offset future realized capital gains indefinitely, and retain their character as short-term and/or long-term.
| | | | | | | | | | | | |
| Fund | | Short-Term | | | Long-Term | | | Total | |
| | | |
Enhanced Core Bond ESG | | | $1,145,095 | | | | $1,383,565 | | | | $2,528,660 | |
As of December 31, 2021, ESG Bond, High Income, Municipal Bond and Municipal Enhanced had no accumulated net realized capital loss carryovers from securities transactions for federal income tax purposes. Should the Funds incur net capital
losses for the year ending December 31, 2022, such amounts may be used to offset future realized capital gains, for an unlimited time period.
For the fiscal year ended December 31, 2021, the following Fund utilized capital loss carryovers in the amount of:
| | | | |
| Fund | | Short-Term | | Long-Term |
| | |
Enhanced Core Bond ESG | | $22,458 | | $876,687 |
g. CAPITAL STOCK
The Trust’s Declaration of Trust authorizes for each Fund the issuance of an unlimited number of shares of beneficial interest, without par value. Each Fund records sales and repurchases of its capital stock on the trade date.
For the fiscal years ended December 31, 2021 and December 31, 2020, the capital stock transactions by class for the Funds were as follows:
| | | | | | | | | | | | | | | | | | | | | | | | | | | | | | | | |
| | | ESG Bond | | Enhanced Core Bond ESG |
| | | | | |
| | | December 31, 2021 | | December 31, 2020 | | December 31, 2021 | | December 31, 2020 |
| | | | | | | | | |
| | | Shares | | Amount | | Shares | | Amount | | Shares | | Amount | | Shares | | Amount |
| | | | | | | | | |
Class N: | | | | | | | | | | | | | | | | | | | | | | | | | | | | | | | | |
| | | | | | | | | |
Proceeds from sale of shares | | | 1,452,937 | | | | $38,053,195 | | | | 2,974,694 | | | | $80,948,805 | | | | 286,260 | | | | $3,068,578 | | | | 325,128 | | | | $3,475,322 | |
| | | | | | | | | |
Reinvestment of distributions | | | 2,051,404 | | | | 51,918,933 | | | | 712,467 | | | | 19,290,277 | | | | 17,561 | | | | 187,784 | | | | 20,814 | | | | 219,293 | |
| | | | | | | | | |
Cost of shares repurchased | | | (6,049,606 | ) | | | (156,764,465 | ) | | | (6,734,473 | ) | | | (180,090,308 | ) | | | (459,141 | ) | | | (4,905,575 | ) | | | (352,412 | ) | | | (3,703,576 | ) |
| | | | | | | | | | | | | | | | | | | | | | | | | | | | | | | | | |
| | | | | | | | | |
Net decrease | | | (2,545,265 | ) | | | $(66,792,337 | ) | | | (3,047,312 | ) | | | $(79,851,226 | ) | | | (155,320 | ) | | | $(1,649,213 | ) | | | (6,470 | ) | | | $(8,961 | ) |
| | | | | | | | | | | | | | | | | | | | | | | | | | | | | | | | | |
| | | | | | | | | |
Class I: | | | | | | | | | | | | | | | | | | | | | | | | | | | | | | | | |
| | | | | | | | | |
Proceeds from sale of shares | | | 3,132,524 | | | | $82,409,399 | | | | 5,277,165 | | | | $142,427,000 | | | | 1,729,710 | | | | $18,560,256 | | | | 1,930,056 | | | | $20,740,872 | |
| | | | | | | | | |
Reinvestment of distributions | | | 1,959,229 | | | | 49,642,039 | | | | 741,223 | | | | 20,066,494 | | | | 40,944 | | | | 439,321 | | | | 28,452 | | | | 303,557 | |
| | | | | | | | | |
Cost of shares repurchased | | | (11,383,287 | ) | | | (293,819,048 | ) | | | (8,884,854 | ) | | | (237,615,746 | ) | | | (1,177,158 | ) | | | (12,618,347 | ) | | | (250,872 | ) | | | (2,616,750 | ) |
| | | | | | | | | | | | | | | | | | | | | | | | | | | | | | | | | |
| | | | | | | | | |
Net increase (decrease) | | | (6,291,534 | ) | | | $(161,767,610 | ) | | | (2,866,466 | ) | | | $(75,122,252 | ) | | | 593,496 | | | | $6,381,230 | | | | 1,707,636 | | | | $18,427,679 | |
| | | | | | | | | | | | | | | | | | | | | | | | | | | | | | | | | |
| | | | | | | | | |
Class Z: | | | | | | | | | | | | | | | | | | | | | | | | | | | | | | | | |
| | | | | | | | | |
Proceeds from sale of shares | | | – | | | | – | | | | – | | | | – | | | | 442,744 | | | | $4,753,770 | | | | 325,068 | | | | $3,463,674 | |
| | | | | | | | | |
Reinvestment of distributions | | | – | | | | – | | | | – | | | | – | | | | 17,832 | | | | 191,235 | | | | 20,445 | | | | 216,232 | |
| | | | | | | | | |
Cost of shares repurchased | | | – | | | | – | | | | – | | | | – | | | | (229,602 | ) | | | (2,465,708 | ) | | | (278,702 | ) | | | (2,935,192 | ) |
| | | | | | | | | | | | | | | | | | | | | | | | | | | | | | | | | |
| | | | | | | | | |
Net increase | | | – | | | | – | | | | – | | | | – | | | | 230,974 | | | | $2,479,297 | | | | 66,811 | | | | $744,714 | |
| | | | | | | | | | | | | | | | | | | | | | | | | | | | | | | | | |
| | | |
| | | High Income | | Municipal Bond |
| | | | | |
| | | December 31, 2021 | | December 31, 2020 | | December 31, 2021 | | December 31, 2020 |
| | | | | | | | | |
| | | Shares | | Amount | | Shares | | Amount | | Shares | | Amount | | Shares | | Amount |
| | | | | | | | | |
Class N: | | | | | | | | | | | | | | | | | | | | | | | | | | | | | | | | |
| | | | | | | | | |
Proceeds from sale of shares | | | 111,205 | | | | $2,494,229 | | | | 122,058 | | | | $2,754,401 | | | | 698,892 | | | | $8,650,727 | | | | 841,918 | | | | $10,312,713 | |
| | | | | | | | | |
Reinvestment of distributions | | | 9,973 | | | | 224,451 | | | | 36,046 | | | | 798,071 | | | | 23,744 | | | | 292,232 | | | | 22,319 | | | | 274,465 | |
| | | | | | | | | |
Cost of shares repurchased | | | (221,405 | ) | | | (4,977,229 | ) | | | (142,591 | ) | | | (3,100,201 | ) | | | (782,262 | ) | | | (9,674,017 | ) | | | (950,262 | ) | | | (11,578,005 | ) |
| | | | | | | | | | | | | | | | | | | | | | | | | | | | | | | | | |
| | | | | | | | | |
Net increase (decrease) | | | (100,227 | ) | | | $(2,258,549 | ) | | | 15,513 | | | | $452,271 | | | | (59,626 | ) | | | $(731,058 | ) | | | (86,025 | ) | | | $(990,827 | ) |
| | | | | | | | | | | | | | | | | | | | | | | | | | | | | | | | | |
70
| | |
| | Notes to Financial Statements (continued) |
| | | | | | | | | | | | | | | | | | | | | | | | | | | | | | | | |
| | | High Income | | Municipal Bond |
| | | | | |
| | | December 31, 2021 | | December 31, 2020 | | December 31, 2021 | | December 31, 2020 |
| | | | | | | | | |
| | | Shares | | Amount | | Shares | | Amount | | Shares | | Amount | | Shares | | Amount |
| | | | | | | | | |
Class I:1 | | | | | | | | | | | | | | | | | | | | | | | | | | | | | | | | |
| | | | | | | | | |
Proceeds from sale of shares | | | 605,743 | | | | $13,584,553 | | | | – | | | | – | | | | 33,594,124 | | | | $418,621,329 | | | | 50,063,425 | | | | $614,578,625 | |
| | | | | | | | | |
Reinvestment of distributions | | | 13,885 | | | | 312,124 | | | | – | | | | – | | | | 1,809,529 | | | | 22,408,701 | | | | 1,402,065 | | | | 17,349,323 | |
| | | | | | | | | |
Cost of shares repurchased | | | (33,112 | ) | | | (749,594 | ) | | | – | | | | – | | | | (30,023,803 | ) | | | (373,936,594 | ) | | | (31,883,833 | ) | | | (389,584,617 | ) |
| | | | | | | | | | | | | | | | | | | | | | | | | | | | | | | | | |
| | | | | | | | | |
Net increase | | | 586,516 | | | | $13,147,083 | | | | – | | | | – | | | | 5,379,850 | | | | $67,093,436 | | | | 19,581,657 | | | | $242,343,331 | |
| | | | | | | | | | | | | | | | | | | | | | | | | | | | | | | | | |
| | | | | | |
| | | Municipal Enhanced | | | | | | | | |
| | | | | | | |
| | | December 31, 2021 | | December 31, 2020 | | | | | | | | |
| | | | | | | | | |
| | | Shares | | Amount | | Shares | | Amount | | | | | | | | |
| | | | | | | | | |
Class N: | | | | | | | | | | | | | | | | | | | | | | | | | | | | | | | | |
| | | | | | | | | |
Proceeds from sale of shares | | | 3,442,311 | | | | $37,047,081 | | | | 1,891,900 | | | | $19,211,900 | | | | | | | | | | | | | | | | | |
| | | | | | | | | |
Reinvestment of distributions | | | 15,958 | | | | 172,953 | | | | 17,895 | | | | 186,782 | | | | | | | | | | | | | | | | | |
| | | | | | | | | |
Cost of shares repurchased | | | (2,537,721 | ) | | | (27,497,613 | ) | | | (1,989,572 | ) | | | (20,374,161 | ) | | | | | | | | | | | | | | | | |
| | | | | | | | | | | | | | | | | | | | | | | | | | | | | | | | | |
| | | | | | | | | |
Net increase (decrease) | | | 920,548 | | | | $9,722,421 | | | | (79,777 | ) | | | $(975,479 | ) | | | | | | | | | | | | | | | | |
| | | | | | | | | | | | | | | | | | | | | | | | | | | | | | | | | |
| | | | | | | | | |
Class I: | | | | | | | | | | | | | | | | | | | | | | | | | | | | | | | | |
| | | | | | | | | |
Proceeds from sale of shares | | | 10,001,279 | | | | $105,402,142 | | | | 11,477,762 | | | | $114,640,533 | | | | | | | | | | | | | | | | | |
| | | | | | | | | |
Reinvestment of distributions | | | 631,256 | | | | 6,610,515 | | | | 570,856 | | | | 5,821,974 | | | | | | | | | | | | | | | | | |
| | | | | | | | | |
Cost of shares repurchased | | | (6,312,309 | ) | | | (66,530,105 | ) | | | (7,868,907 | ) | | | (78,826,067 | ) | | | | | | | | | | | | | | | | |
| | | | | | | | | | | | | | | | | | | | | | | | | | | | | | | | | |
| | | | | | | | | |
Net increase | | | 4,320,226 | | | | $45,482,552 | | | | 4,179,711 | | | | $41,636,440 | | | | | | | | | | | | | | | | | |
| | | | | | | | | | | | | | | | | | | | | | | | | | | | | | | | | |
| | | | | | | | | |
Class Z: | | | | | | | | | | | | | | | | | | | | | | | | | | | | | | | | |
| | | | | | | | | |
Proceeds from sale of shares | | | — | | | | — | | | | 146 | | | | $1,500 | | | | | | | | | | | | | | | | | |
| | | | | | | | | |
Reinvestment of distributions | | | 461 | | | | $4,817 | | | | 455 | | | | 4,635 | | | | | | | | | | | | | | | | | |
| | | | | | | | | | | | | | | | | | | | | | | | | | | | | | | | | |
| | | | | | | | | |
Net increase | | | 461 | | | | $4,817 | | | | 601 | | | | $6,135 | | | | | | | | | | | | | | | | | |
| | | | | | | | | | | | | | | | | | | | | | | | | | | | | | | | | |
| 1 | Commencement of operations was March 15, 2021 for Class I of High Income. |
h. REPURCHASE AGREEMENTS AND JOINT REPURCHASE AGREEMENTS
The Funds may enter into third-party repurchase agreements for temporary cash management purposes and third-party or bilateral joint repurchase agreements for reinvestment of cash collateral on securities lending transactions under the securities lending program offered by The Bank of New York Mellon (“BNYM”) (the “Program”) (collectively, “Repurchase Agreements”). The value of the underlying collateral, including accrued interest, must equal or exceed the value of the Repurchase Agreements during the term of the agreement. For joint repurchase agreements, the Funds participate on a pro rata basis with other clients of BNYM in its share of the underlying collateral under such joint repurchase agreements and in its share of proceeds from any repurchase or other disposition of the underlying collateral. The underlying collateral for all Repurchase Agreements is held in safekeeping by the Funds’ custodian or at the Federal Reserve Bank. If the seller defaults and the value of the collateral declines, or if bankruptcy proceedings commence with respect to the seller of the security, realization of the
collateral by the Funds may be delayed or limited. Pursuant to the Program, the Funds are indemnified for such losses by BNYM on joint repurchase agreements.
At December 31, 2021, the market value of Repurchase Agreements outstanding for ESG Bond, Enhanced Core Bond ESG and High Income were $19,741,844, $1,481,522, and $2,340,362, respectively.
i. FOREIGN CURRENCY TRANSLATION
The books and records of the Funds are maintained in U.S. dollars. The value of investments, assets and liabilities denominated in currencies other than U.S. dollars are translated into U.S. dollars based upon current foreign exchange rates. Purchases and sales of foreign investments, income and expenses are converted into U.S. dollars based on currency exchange rates prevailing on the respective dates of such transactions. Net realized and unrealized gain (loss) on foreign currency transactions represent: (1) foreign exchange gains and losses from the
71
| | |
| | Notes to Financial Statements (continued) |
sale and holdings of foreign currencies; (2) gains and losses between trade date and settlement date on investment securities transactions and foreign currency exchange contracts; and (3) gains and losses from the difference between amounts of interest and dividends recorded and the amounts actually received.
The Funds do not isolate the net realized and unrealized gain or loss resulting from changes in exchange rates from the fluctuations in market prices of securities held. Such fluctuations are included with the net realized and unrealized gain or loss on investments.
j. SECURITIES TRANSACTED ON A WHEN ISSUED BASIS
The Funds may enter into To-Be-Announced (“TBA”) sale commitments to hedge their portfolio positions or to sell mortgage-backed securities they own under delayed delivery arrangements. Proceeds of TBA sale commitments are not received until the contractual settlement date. During the time a TBA sale commitment is outstanding, equivalent deliverable securities, with the same counterparty, or an offsetting TBA purchase commitment deliverable on or before the sale commitment date, are held as “cover” for the transaction. Unsettled TBA sale commitments are valued at the current market value of the underlying securities according to the procedures described under “Valuation of Investments,” in Footnote 1a.
Each TBA contract is marked-to-market daily and the change in market value is recorded by the Fund as an unrealized gain or loss. If the TBA sale commitment is closed through the acquisition of an offsetting purchase commitment with the same broker, the Fund realizes a gain or loss. If the Fund delivers securities under the commitment, the Fund realizes a gain or a loss from the sale of the securities based upon the unit price established at the date the commitment was entered into.
k. DELAYED DELIVERY TRANSACTIONS AND WHEN-ISSUED SECURITIES
The Funds may enter into securities transactions on a delayed delivery or when issued basis. Payment and delivery may take place after the customary settlement period for that security. The price of the underlying securities and the date when the securities will be delivered and paid for are fixed at the time the transaction is negotiated. During the time a delayed delivery sell is outstanding, the contract is marked to market daily and equivalent deliverable securities are held for the transaction. The value of the securities purchased on a delayed delivery or when-issued basis are identified as such in each Fund’s Schedule of Portfolio Investments. With respect to purchase commitments, the Fund’s identify securities as segregated in its records with a value at least equal to the amount of the commitment. Delayed delivery or when-issued securities that have been purchased from and sold to different brokers are reflected as an investment in securities and a forward sale commitment in the Fund’s Statement of Assets and Liabilities. For financial reporting purposes, the Fund does offset the receivable and payable for delayed delivery investments purchased and sold on TBA commitments. Losses may arise due to changes in the value of the underlying securities or if the counterparty does not perform under the contract, or if the issuer does not issue the securities due to political, economic, or other factors.
2. AGREEMENTS AND TRANSACTIONS WITH AFFILIATES
For each of the Funds, the Trusts have entered into an investment advisory agreement under which the Investment Manager, a subsidiary and the U.S. retail distribution arm of Affiliated Managers Group, Inc. (“AMG”), serves as investment manager to the Funds and is responsible for the Funds’ overall administration and
operations. The Investment Manager selects one or more subadvisers for the Funds (subject to the Boards approval) and monitors each subadviser’s investment performance, security holdings and investment strategies. Each Fund’s investment portfolio is managed by GW&K who serves pursuant to a subadvisory agreement with the Investment Manager. AMG indirectly owns a majority interest in GW&K. Prior to March 19, 2021, ESG Bond’s investment portfolio was managed by Loomis, who served pursuant to subadvisory agreements with the Investment Manager.
Investment management fees are paid directly by the Funds to the Investment Manager based on average daily net assets. For the fiscal year ended December 31, 2021, the Funds’ investment management fees were paid at the following annual rates of each Fund’s respective average daily net assets:
| | | | |
| |
ESG Bond | | | 0.23%1 | |
| |
Enhanced Core Bond ESG | | | 0.30% | |
| |
High Income | | | 0.39%2 | |
| |
Municipal Bond | | | | |
| |
on first $25 million | | | 0.35% | |
| |
on next $25 million | | | 0.30% | |
| |
on next $50 million | | | 0.25% | |
| |
on balance over $100 million | | | 0.20% | |
| |
Municipal Enhanced | | | 0.45% | |
| 1 | Prior to June 12, 2021, the annual rate for the investment management fees for ESG Bond was 0.26% of the Fund’s average daily net assets. |
| 2 | Prior to December 4, 2020, the annual rate for the investment management fees for High Income was 0.55% of the Fund’s average daily net assets. |
The Investment Manager has contractually agreed, through at least May 1, 2023 for ESG Bond and through at least May 1, 2022 for Enhanced Core Bond ESG, High Income, Municipal Bond, and Municipal Enhanced, to waive management fees and/or pay or reimburse fund expenses in order to limit total annual Fund operating expenses after fee waiver and expense reimbursements (exclusive of taxes, interest (including interest incurred in connection with bank and custody overdrafts, and in connection with securities sold short), shareholder servicing fees, distribution and service (12b-1) fees, brokerage commissions and other transaction costs, dividends payable with respect to securities sold short, acquired fund fees and expenses and extraordinary expenses) of ESG Bond, Enhanced Core Bond ESG, High Income, Municipal Bond, and Municipal Enhanced to the annual rate of 0.43%, 0.48%. 0.59%, 0.34%, and 0.59%, respectively, of each Fund’s average daily net assets (this annual rate or such other annual rate that may be in effect from time to time, the “Expense Cap”), subject to later reimbursement by the Funds in certain circumstances. Prior to June 12, 2021, ESG Bond expense limitation was 0.46%, and prior to December 4, 2020, the expense limitation was 0.89% for High Income.
In general, for a period of up to 36 months after the date any amounts are paid, waived or reimbursed by the Investment Manager, the Investment Manager may recover such amounts from a Fund, provided that such repayment would not cause the Fund’s total annual operating expenses after fee waiver and expense reimbursements (exclusive of the items noted in the parenthetical above) to exceed either (i) the Expense Cap in effect at the time such amounts were paid,
72
| | |
| | Notes to Financial Statements (continued) |
waived or reimbursed, or (ii) the Expense Cap in effect at the time of such repayment by the Fund.
The contractual expense limitation may only be terminated in the event the Investment Manager or a successor ceases to be the investment manager of a Fund or a successor fund, by mutual agreement between the Investment Manager and the Boards, or in the event of a Fund’s liquidation unless the Fund is reorganized or is a party to a merger in which the surviving entity is successor to the accounting and performance information of a Fund.
At December 31, 2021, the Funds’ expiration of reimbursements subject to recoupment is as follows:
| | | | | | | | | | | | |
Expiration Period | | ESG Bond | | | Enhanced Core Bond ESG | | | High Income | |
| | | |
Less than 1 year | | | $64,494 | | | | $153,359 | | | | $94,471 | |
| | | |
1-2 years | | | 51,532 | | | | 135,792 | | | | 75,430 | |
| | | |
2-3 years | | | 19,644 | | | | 113,335 | | | | 94,499 | |
| | | | | | | | | | | | |
| | | |
Total | | | $135,670 | | | | $402,486 | | | | $264,400 | |
| | | | | | | | | | | | |
| | | | | | | | | | | | |
Expiration Period | | | | | Municipal Bond | | | Municipal Enhanced | |
| | | |
Less than 1 year | | | | | | | $651,229 | | | | $220,347 | |
| | | |
1-2 years | | | | | | | 704,935 | | | | 242,883 | |
| | | |
2-3 years | | | | | | | 706,015 | | | | 230,390 | |
| | | | | | | | | | | | |
| | | |
Total | | | | | | | $2,062,179 | | | | $693,620 | |
| | | | | | | | | | | | |
The Trusts, on behalf of the Funds, have entered into an amended and restated Administration Agreement under which the Investment Manager serves as the Funds’ administrator (the “Administrator”) and is responsible for all non-portfolio management aspects of managing the Funds’ operations, including administration and shareholder services to each Fund. Each Fund pays a fee to the Administrator at the rate of 0.15% per annum of the Fund’s average daily net assets for this service.
The Funds are distributed by AMG Distributors, Inc. (the “Distributor”), a wholly-owned subsidiary of the Investment Manager. The Distributor serves as the distributor and underwriter for each Fund and is a registered broker-dealer and member of the Financial Industry Regulatory Authority, Inc. (“FINRA”). Shares of each Fund will be continuously offered and will be sold directly to prospective purchasers and through brokers, dealers or other financial intermediaries who have executed selling agreements with the Distributor. Generally the Distributor bears all or a portion of the expenses of providing services pursuant to the distribution agreement, including the payment of the expenses relating to the distribution of prospectuses for sales purposes and any advertising or sales literature.
The Trusts have adopted a distribution and service plan (the “Plan”) with respect to the Class N shares, in accordance with the requirements of Rule 12b-1 under the 1940 Act and the requirements of the applicable rules of FINRA regarding asset-based sales charges. Pursuant to the Plan, Enhanced Core Bond ESG, Municipal Bond and Municipal Enhanced may make payments to the Distributor for its expenditures in financing any activity primarily intended to result in the sale of each Fund’s Class N shares and for maintenance and personal service provided to existing shareholders of that class. The Plan authorized payments to the
Distributor up to 0.25% annually of Enhanced Core Bond ESG, Municipal Bond and Municipal Enhanced average daily net assets attributable to the Class N shares. The portion of payments made under the plan by Class N shares of Enhanced Core Bond ESG, Municipal Bond and Municipal Enhanced for shareholder servicing may not exceed an annual rate of 0.25% of the average daily net asset value of each Fund’s shares of that class owned by clients of such broker, dealer or financial intermediary.
For each of Class N shares and Class I shares of ESG Bond, High Income, Municipal Bond, Municipal Enhanced, and for Enhanced Core Bond ESG’s Class I shares, the Boards have approved reimbursement payments to the Investment Manager for shareholder servicing expenses (“shareholder servicing fees”) incurred. Shareholder servicing fees include payments to financial intermediaries, such as broker-dealers (including fund supermarket platforms), banks, and trust companies who provide shareholder recordkeeping, account servicing and other services. The Class N and Class I shares may reimburse the Investment Manager for the actual amount incurred up to a maximum annual rate of each Class’s average daily net assets as shown in the table below.
The impact on the annualized expense ratios for the fiscal year ended December 31, 2021, were as follows:
| | | | | | | | |
| Fund | | Maximum Annual
Amount
Approved | | | Actual
Amount
Incurred |
| | |
ESG Bond | | | | | | | | |
| | |
Class N | | | 0.25% | | | | 0.25 | % |
| | |
Class I | | | 0.05% | | | | 0.05 | % |
| | |
Enhanced Core Bond ESG | | | | | | | | |
| | |
Class I | | | 0.10% | | | | 0.08 | % |
| | |
High Income | | | | | | | | |
| | |
Class N | | | 0.25% | | | | 0.25 | % |
| | |
Class I | | | 0.05% | | | | 0.05 | % |
| | |
Municipal Bond | | | | | | | | |
| | |
Class N | | | 0.15% | | | | 0.12 | % |
| | |
Class I | | | 0.05% | | | | 0.05 | % |
| | |
Municipal Enhanced | | | | | | | | |
| | |
Class N | | | 0.15% | | | | 0.15 | % |
| | |
Class I | | | 0.05% | | | | 0.05 | % |
The Boards provide supervision of the affairs of the Trusts and other trusts within the AMG Funds Family. The Trustees of the Trusts who are not affiliated with the Investment Manager receive an annual retainer and per meeting fees for regular, special and telephonic meetings, and they are reimbursed for out-of-pocket expenses incurred while carrying out their duties as Board members. The Chairman of the Boards and the Audit Committee Chair receive additional annual retainers. Certain Trustees and Officers of the Funds are Officers and/or Directors of the Investment Manager, AMG and/or the Distributor.
The Securities and Exchange Commission (the “SEC”) granted an exemptive order that permits certain eligible funds in the AMG Funds Family to lend and borrow money for certain temporary purposes directly to and from other eligible funds in the AMG Funds Family. Participation in this interfund lending program is voluntary
73
| | |
| | Notes to Financial Statements (continued) |
for both the borrowing and lending funds, and an interfund loan is only made if it benefits each participating fund. The Administrator manages the program according to procedures approved by the Boards, and the Boards monitor the operation of the program. An interfund loan must comply with certain conditions set out in the exemptive order, which are designed to assure fairness and protect all participating funds. The interest earned and interest paid on interfund loans are included on the Statement of Operations as interest income and interest expense, respectively. At December 31, 2021, the Funds had no interfund loans outstanding.
The following Funds utilized the interfund loan program during the fiscal year ended December 31, 2021 as follows:
| | | | | | | | | | | | | | | | |
| Fund | | Average
Lent | | | Number
of Days | | | Interest
Earned | | | Average
Interest Rate | |
| | | | |
ESG Bond | | | $3,192,280 | | | | 7 | | | | $578 | | | | 0.944% | |
| | | | |
Enhanced Core Bond ESG | | | 1,676,031 | | | | 6 | | | | 252 | | | | 0.914% | |
| | | | |
Municipal Bond | | | 2,642,739 | | | | 18 | | | | 1,198 | | | | 0.920% | |
| | | | |
Municipal Enhanced | | | 1,529,151 | | | | 9 | | | | 349 | | | | 0.926% | |
| | | | |
| Fund | | Average
Borrowed | | | Number
of Days | | | Interest
Paid | | | Average
Interest Rate | |
| | | | |
ESG Bond | | | $2,049,436 | | | | 20 | | | | $1,051 | | | | 0.936% | |
| | | | |
Enhanced Core Bond ESG | | | 2,212,964 | | | | 2 | | | | 111 | | | | 0.913% | |
| | | | |
Municipal Enhanced | | | 4,733,326 | | | | 4 | | | | 487 | | | | 0.938% | |
3. PURCHASES AND SALES OF SECURITIES
Purchases and sales of securities (excluding short-term securities and U.S. Government Obligations) for the fiscal year ended December 31, 2021, were as follows:
| | | | | | | | |
| | | Long Term Securities | |
| | |
| Fund | | Purchases | | | Sales | |
| | |
ESG Bond | | | $968,244,555 | | | | $1,361,615,133 | |
| | |
Enhanced Core Bond ESG | | | 29,584,559 | | | | 32,258,220 | |
| | |
High Income | | | 27,950,119 | | | | 16,972,674 | |
| | |
Municipal Bond | | | 436,576,718 | | | | 301,391,624 | |
| | |
Municipal Enhanced | | | 276,847,399 | | | | 220,346,399 | |
Purchases and sales of U.S. Government Obligations for the fiscal year ended December 31, 2021 were as follows:
| | | | | | | | |
| | | U.S. Government Obligations | |
| | |
| Fund | | Purchases | | | Sales | |
| | |
ESG Bond | | | $676,248,854 | | | | $509,070,884 | |
| | |
Enhanced Core Bond ESG | | | 22,888,664 | | | | 14,065,357 | |
4. PORTFOLIO SECURITIES LOANED
The Funds participate in the Program providing for the lending of securities to qualified borrowers. Securities lending income includes earnings of such temporary cash investments, plus or minus any rebate to a borrower. These earnings (after any rebate) are then divided between BNYM, as a fee for its
services under the Program, and the Funds, according to agreed-upon rates. Collateral on all securities loaned is accepted in cash, U.S. Treasury Obligations or U.S. Government Agency Obligations. Collateral is maintained at a minimum level of 102% (105% in the case of certain foreign securities) of the market value, plus interest, if applicable, of investments on loan. It is the Funds’ policy to obtain additional collateral from or return excess collateral to the borrower by the end of the next business day, following the valuation date of the securities loaned. Therefore, the value of the collateral held may be temporarily less than the value of the securities on loan. Lending securities entails a risk of loss to the Funds if and to the extent that the market value of the securities loaned were to increase and the borrower did not increase the collateral accordingly, and the borrower fails to return the securities. Under the terms of the Program, the Funds are indemnified for such losses by BNYM. Cash collateral is held in separate omnibus accounts managed by BNYM, who is authorized to exclusively enter into joint repurchase agreements for that cash collateral. Securities collateral is held in separate omnibus accounts managed by BNYM and cannot be sold or pledged. BNYM bears the risk of any deficiency in the amount of the cash collateral available for return to the borrower due to any loss on the collateral invested. Loans of securities are terminable at any time and the borrower, after notice, is required to return borrowed securities as soon as practical, which is normally within three business days.
The value of securities loaned on positions held, cash collateral and securities collateral received at December 31, 2021, were as follows:
| | | | | | | | | | | | | | | | |
Fund | | Securities Loaned | | | Cash Collateral Received | | | Securities Collateral Received | | | Total Collateral Received |
| | | | |
ESG Bond | | $ | 39,839,239 | | | $ | 19,741,844 | | | $ | 21,586,934 | | | $ | 41,328,778 | |
| | | | |
Enhanced Core Bond ESG | | | 5,203,772 | | | | 1,481,522 | | | | 3,886,928 | | | | 5,368,450 | |
| | | | |
High Income | | | 2,660,400 | | | | 2,340,362 | | | | 427,388 | | | | 2,767,750 | |
The following table summarizes the securities received as collateral for securities lending at December 31, 2021:
| | | | | | |
| | | Collateral | | Coupon | | Maturity |
| Fund | | Type | | Range | | Date Range |
| | | |
ESG Bond | | U.S. Treasury Obligations | | 0.000%-4.375% | | 02/03/22-11/15/49 |
| | | |
Enhanced Core Bond ESG | | U.S. Treasury Obligations | | 0.000%-4.625% | | 01/31/22-08/15/50 |
| | | |
High Income | | U.S. Treasury Obligations | | 0.000%-3.875% | | 02/03/22-02/15/49 |
5. FOREIGN SECURITIES
Certain Funds invest in securities of foreign entities and in instruments denominated in foreign currencies which involve risks not typically associated with investments in domestic securities. Non-domestic securities carry special risks, such as exposure to currency fluctuations, less developed or less efficient trading markets, political instability, a lack of company information, differing auditing and legal standards, and, potentially, less liquidity. Realized gains in certain countries may be subject to foreign taxes at the Fund level and the Fund would pay such foreign taxes at the appropriate rate for each jurisdiction.
6. COMMITMENTS AND CONTINGENCIES
Under the Trusts’ organizational documents, its trustees and officers are indemnified against certain liabilities arising out of the performance of their duties
74
| | |
| | Notes to Financial Statements (continued) |
to the Trusts. In addition, in the normal course of business, the Funds may enter into contracts and agreements that contain a variety of representations and warranties, which provide general indemnifications. The maximum exposure to the Funds under these arrangements is unknown, as this would involve future claims that may be made against a Fund that have not yet occurred. However, based on experience, the Funds had no prior claims or losses and expect the risks of loss to be remote.
7. RISKS ASSOCIATED WITH HIGH YIELD SECURITIES
Investing in high yield securities involves greater risks and considerations not typically associated with U.S. Government and other high quality/investment grade securities. High yield securities are generally below investment grade securities and do not have an established retail secondary market. Economic downturns may disrupt the high yield market and impair the issuer’s ability to repay principal and interest. Also, an increase in interest rates would likely have an adverse impact on the value of such obligations and could cause the securities to become less liquid.
8. FORWARD COMMITMENTS
Certain transactions, such as futures and forward transactions, or delayed delivery securities may have a similar effect on a Fund’s net asset value as if a Fund had created a degree of leverage in its portfolio. However, if a Fund enters into such a transaction, a Fund will establish a segregated account with its custodian in which it will maintain cash, U.S. government securities or other liquid securities equal in value to its obligations in respect to such transaction. Securities and other assets held in the segregated account may not be sold while the transaction is outstanding, unless other suitable assets are substituted.
9. DERIVATIVE INSTRUMENTS
The following disclosures contain information on how and why ESG Bond used derivative instruments, the credit risk and how derivative instruments affect the Fund’s financial position, and results of operations. The location and fair value amounts of these instruments on the Statement of Assets and Liabilities, and the realized gains and losses and changes in unrealized appreciation and depreciation on the Statement of Operations, each categorized by type of derivative contract, are included in a table at the end of ESG Bond’s Schedule of Portfolio Investments.
For ESG Bond, from March 9, 2021 to March 18, 2021, Loomis used futures contracts to adjust the Fund’s duration and from March 31, 2021 to April 4, 2021, the transition managers used futures contracts to realign the Fund’s portfolio. The daily average for ESG Bond of financial instruments outstanding were as follows:
| | | | |
| | | ESG Bond | |
| |
Financial Futures Contracts | | | | |
| |
Average number of contracts purchased | | | 8 | |
| |
Average number of contracts sold | | | 9 | |
| |
Average notional value of contracts purchased | | | $1,162,930 | |
| |
Average notional value of contracts sold | | | $1,324,812 | |
10. FUTURES CONTRACTS
Before March 19, 2021, ESG Bond used futures contracts to adjust the Fund’s duration, and during the transition of the portfolio for ESG Bond, the transition manager purchased and sold futures contracts to achieve desired levels of investment. There are certain risks associated with futures contracts. Prices may not move as expected or the Fund may not be able to close out the contract when it desires to do so, resulting in losses.
On entering into a futures contract, either cash or securities in an amount equal to a certain percentage of the contract value (initial margin) must be deposited with the futures broker. Subsequent payments (variation margin) are made or received each day.
Variation margin on futures contracts is recorded as unrealized appreciation or depreciation until the futures contract is closed or expired. The Funds recognize a realized gain or loss when the contract is closed or expires equal to the difference between the value of the contract at the time it was opened and the value at the time it was closed. Fluctuations in the value of the contracts are recorded in the Statement of Assets and Liabilities as an asset (liability), and in the Statement of Operations as unrealized appreciation (depreciation) until the contracts are closed, when they are recorded as realized gain or loss on futures contracts.
At December 31, 2021, there were no open futures contracts.
11. MASTER NETTING AGREEMENTS
The Funds may enter into master netting agreements with their counterparties for the securities lending program, Repurchase Agreements and derivatives, which provide the right, in the event of default (including bankruptcy or insolvency) for the non-defaulting party to liquidate the collateral and calculate net exposure to the defaulting party or request additional collateral. For financial reporting purposes, the Funds do not offset financial assets and financial liabilities that are subject to master netting agreements in the Statement of Assets and Liabilities. For securities lending transactions, see Note 4. At December 31, 2021, the Funds had no outstanding derivatives outstanding.
75
| | |
| | Notes to Financial Statements (continued) |
The following table is a summary of the Funds’ open Repurchase Agreements that are subject to a master netting agreement as of December 31, 2021:
| | | | | | | | | | | | | | | | | | | | |
| | | | | Gross Amount Not Offset in the
Statement of Assets and Liabilities | | | | |
| | | | | |
Fund | | Gross Amounts of Assets Presented in the Statement of Assets and Liabilities | | Offset Amount | | Net Asset Balance | | Collateral Received | | Net Amount |
| | | | | | | | | | | | | | | | | | | | |
| | | | | |
ESG Bond | | | | | | | | | | | | | | | | | | | | |
| | | | | |
Cantor Fitzgerald Securities, Inc. | | | $4,688,700 | | | | – | | | | $4,688,700 | | | | $4,688,700 | | | | – | |
| | | | | |
Citadel Securities LLC | | | 3,954,552 | | |
| –
|
| | | 3,954,552 | | | | 3,954,552 | | | | – | |
| | | | | |
HSBC Securities USA, Inc. | | | 116,285 | | | | – | | | | 116,285 | | | | 116,285 | | |
| –
|
|
| | | | | |
Mirae Asset Securities USA, Inc. | | | 2,196,463 | | | | – | | | | 2,196,463 | | | | 2,196,463 | | | | – | |
| | | | | |
RBC Dominion Securities, Inc. | | | 4,688,696 | | | | – | | | | 4,688,696 | | | | 4,688,696 | | | | – | |
| | | | | |
State of Wisconsin Investment Board | | | 4,097,148 | | | | – | | | | 4,097,148 | | | | 4,097,148 | | | | – | |
| | | | | | | | | | | | | | | | | | | | |
| | | | | |
Total | | | $19,741,844 | | | | – | | | | $19,741,844 | | | | $19,741,844 | | | | – | |
| | | | | | | | | | | | | | | | | | | | |
| | | | | |
Enhanced Core Bond ESG | | | | | | | | | | | | | | | | | | | | |
| | | | | |
Citigroup Global Markets, Inc. | | | $481,522 | | | | – | | | | $481,522 | | | | $481,522 | | | | – | |
| | | | | |
RBC Dominion Securities, Inc. | | | 1,000,000 | | | | – | | | | 1,000,000 | | | | 1,000,000 | | | | – | |
| | | | | | | | | | | | | | | | | | | | |
| | | | | |
Total | | | $1,481,522 | | | | – | | | | $1,481,522 | | | | $1,481,522 | | | | – | |
| | | | | | | | | | | | | | | | | | | | |
| | | | | |
High Income | | | | | | | | | | | | | | | | | | | | |
| | | | | |
Bank of America Securities, Inc. | | | $1,000,000 | | | | – | | | | $1,000,000 | | | | $1,000,000 | | | | – | |
| | | | | |
Morgan, Stanley & Co. LLC | | | 340,362 | | | | – | | | | 340,362 | | | | 340,362 | | | | – | |
| | | | | |
RBC Dominion Securities, Inc. | | | 1,000,000 | | | | – | | | | 1,000,000 | | | | 1,000,000 | | | | – | |
| | | | | | | | | | | | | | | | | | | | |
| | | | | |
Total | | | $2,340,362 | | | | – | | | | $2,340,362 | | | | $2,340,362 | | | | – | |
| | | | | | | | | | | | | | | | | | | | |
12. SUBSEQUENT EVENTS
The Funds have determined that no material events or transactions occurred through the issuance date of the Funds’ financial statements which require an additional disclosure in or adjustment of the Funds’ financial statements.
76
| | |
| | Report of Independent Registered Public Accounting Firm |
TO THE BOARD OF TRUSTEES OF AMG FUNDS, AMG FUNDS II, AND AMG FUNDS III AND SHAREHOLDERS OF AMG GW&K MUNICIPAL BOND FUND, AMG GW&K MUNICIPAL ENHANCED YIELD FUND, AMG GW&K ENHANCED CORE BOND ESG FUND, AMG GW&K ESG BOND FUND, AND AMG GW&K HIGH INCOME FUND
Opinions on the Financial Statements
We have audited the accompanying statements of assets and liabilities, including the schedules of portfolio investments, of AMG GW&K Municipal Bond Fund, AMG GW&K Municipal Enhanced Yield Fund (two of the funds constituting AMG Funds), AMG GW&K Enhanced Core Bond ESG Fund (one of the funds constituting AMG Funds II), AMG GW&K ESG Bond Fund (formerly AMG Managers Loomis Sayles Bond Fund), and AMG GW&K High Income Fund, (two of the funds constituting AMG Funds III) (hereafter collectively referred to as the “Funds”) as of December 31, 2021, the related statements of operations for the year ended December 31, 2021, the statements of changes in net assets for each of the two years in the period ended December 31, 2021, including the related notes, and the financial highlights for each of the periods indicated therein (collectively referred to as the “financial statements”). In our opinion, the financial statements present fairly, in all material respects, the financial position of the Funds as of December 31, 2021, the results of each of their operations for the year then ended, the changes in each of their net assets for each of the two years in the period ended December 31, 2021 and each of the financial highlights for each of the periods indicated therein in conformity with accounting principles generally accepted in the United States of America.
Basis for Opinions
These financial statements are the responsibility of the Funds’ management. Our responsibility is to express an opinion on the Funds’ financial statements based on our audits. We are a public accounting firm registered with the Public Company Accounting Oversight Board (United States) (PCAOB) and are required to be independent with respect to the Funds in accordance with the U.S. federal securities laws and the applicable rules and regulations of the Securities and Exchange Commission and the PCAOB.
We conducted our audits of these financial statements in accordance with the standards of the PCAOB. Those standards require that we plan and perform the audit to obtain reasonable assurance about whether the financial statements are free of material misstatement, whether due to error or fraud.
Our audits included performing procedures to assess the risks of material misstatement of the financial statements, whether due to error or fraud, and performing procedures that respond to those risks. Such procedures included examining, on a test basis, evidence regarding the amounts and disclosures in the financial statements. Our audits also included evaluating the accounting principles used and significant estimates made by management, as well as evaluating the overall presentation of the financial statements. Our procedures included confirmation of securities owned as of December 31, 2021 by correspondence with the custodian, transfer agent and brokers; when replies were not received from brokers, we performed other auditing procedures. We believe that our audits provide a reasonable basis for our opinions.
PricewaterhouseCoopers LLP
Boston, Massachusetts
March 1, 2022
We have served as the auditor of one or more investment companies in AMG Funds Family since 1993.
77
| | |
| | Other Information (unaudited) |
TAX INFORMATION
AMG GW&K ESG Bond Fund, AMG GW&K Enhanced Core Bond ESG Fund, AMG GW&K High Income Fund, AMG GW&K Municipal Bond Fund, and AMG GW&K Municipal Enhanced Yield Fund each hereby designates the maximum amount allowable of its net taxable income as qualified dividends as provided in the Jobs and Growth Tax Relief Reconciliation Act of 2003. The 2021 Form 1099-DIV you receive for each Fund will show the tax status of all distributions paid to you during the year.
Pursuant to section 852 of the Internal Revenue Code, AMG GW&K ESG Bond Fund, AMG GW&K Enhanced Core Bond ESG Fund, AMG GW&K High Income Fund, AMG GW&K Municipal Bond Fund, and AMG GW&K Municipal Enhanced Yield Fund each hereby designates $105,416,331, $0, $547, $9,730,890, and $3,573,833, respectively, as a capital gain distribution with respect to the taxable year ended December 31, 2021, or if subsequently determined to be different, the net capital gains of such fiscal year.
78
| | |
| | AMG Funds Trustees and Officers |
| | | | | | | | |
The Trustees and Officers of the Trust, their business addresses, principal occupations for the past five years and ages are listed below. The Trustees provide broad supervision over the affairs of the Trust and the Funds. The Trustees are experienced executives who meet periodically throughout the year to oversee the Funds’ activities, review contractual arrangements with companies that provide services to the Funds, and | | | | review the Funds’ performance. Unless otherwise noted, the address of each Trustee or Officer is the address of the Trust: 680 Washington Blvd., Suite 500, Stamford, CT. 06901. There is no stated term of office for Trustees. Trustees serve until their resignation, retirement or removal in | | | | accordance with the Trust’s organizational documents and policies adopted by the Board from time to time. The Chairman of the Trustees, President, Treasurer and Secretary of the Trust are elected by the Trustees annually. Other officers hold office at the pleasure of the Trustees. |
Independent Trustees
The following Trustees are not “interested persons” of the Trust within the meaning of the 1940 Act:
| | |
Number of Funds Overseen in Fund Complex | | Name, Age, Principal Occupation(s) During Past 5 Years and Other Directorships Held by Trustee |
• Trustee since 2012 - AMG Funds • Trustee since 2012 - AMG Funds II • Trustee since 2012 - AMG Funds III • Oversees 42 Funds in Fund Complex | | Bruce B. Bingham, 73 Partner, Hamilton Partners (real estate development firm) (1987-Current); Director of The Yacktman Funds (2 portfolios) (2000-2012). |
• Trustee since 2013 - AMG Funds • Trustee since 2013 - AMG Funds II • Trustee since 2013 - AMG Funds III • Oversees 46 Funds in Fund Complex | | Kurt A. Keilhacker, 58 Managing Partner, TechFund Europe (2000-Present); Managing Partner, TechFund Capital (1997-Present); Managing Partner, Elementum Ventures (2013-Present); Director, MetricStory, Inc. (2017-Present); Trustee, Wheaton College (2018-Present); Trustee, Gordon College (2001-2016); Board Member, 6wind SA (2002-2019). |
• Trustee since 2000 - AMG Funds • Trustee since 2000 - AMG Funds II • Trustee since 2000 - AMG Funds III • Oversees 42 Funds in Fund Complex | | Steven J. Paggioli, 71 Independent Consultant (2002-Present); Trustee, Professionally Managed Portfolios (28 portfolios); Advisory Board Member, Sustainable Growth Advisors, LP; Independent Director, Muzinich BDC, Inc. (business development company) (2019-Present); Director, The Wadsworth Group; Independent Director, Chase Investment Counsel (2008–2019); Executive Vice President, Secretary and Director, Investment Company Administration, LLC and First Fund Distributors, INC. (1990-2001). |
• Independent Chairman • Trustee since 2000 - AMG Funds • Trustee since 2000 - AMG Funds II • Trustee since 2000 - AMG Funds III • Oversees 46 Funds in Fund Complex | | Eric Rakowski, 63 Professor of Law, University of California at Berkeley School of Law (1990-Present); Tax Attorney at Davis Polk & Wardwell and clerked for Judge Harry T. Edwards of the U.S. Court of Appeals for the District of Columbia Circuit and for Justice William J. Brennan Jr. of the U.S. Supreme Court; Director of Harding, Loevner Funds, Inc. (10 portfolios); Trustee of Third Avenue Trust (3 portfolios) (2002-2019); Trustee of Third Avenue Variable Trust (1 portfolio) (2002-2019). |
• Trustee since 2013 - AMG Funds • Trustee since 2013 - AMG Funds II • Trustee since 2013 - AMG Funds III • Oversees 46 Funds in Fund Complex | | Victoria L. Sassine, 56 Adjunct Professor, Babson College (2007–Present); Director, Board of Directors, PRG Group (2017-Present); CEO, Founder, Scale Smarter Partners, LLC (2018-Present); Adviser, EVOFEM Biosciences (2019-Present); Chairperson of the Board of Directors of Business Management Associates (2018 to 2019). |
79
| | |
| | AMG Funds Trustees and Officers (continued) |
| | |
Number of Funds Overseen in Fund Complex | | Name, Age, Principal Occupation(s) During Past 5 Years and Other Directorships Held by Trustee |
• Trustee since 2000 - AMG Funds II • Trustee since 2004 - AMG Funds • Trustee since 1987 - AMG Funds III • Oversees 42 Funds in Fund Complex | | Thomas R. Schneeweis, 74 Professor Emeritus, University of Massachusetts (2013-Present); President, TRS Associates (1982-Present); Board Member, Chartered Alternative Investment Association (“CAIA”) (2002-Present); Co-Founder and Director, Institute for Global Asset and Risk Management (Education) (2010-Present); Co-Owner, Quantitative Investment Technologies (2014-Present); Co-Owner, Yes Wealth Management (2018-Present); Director, CAIA Foundation (2010-2019); Partner, S Capital Wealth Advisors (2015-2018); Partner, S Capital Management, LLC (2007-2015); President, Alternative Investment Analytics, LLC (formerly Schneeweis Partners, LLC) (2001-2013). |
| |
| Interested Trustees | | |
|
Each Trustee in the following table is an “interested person” of the Trust within the meaning of the 1940 Act. Ms. Carsman is an interested person of the Trust within the meaning of the 1940 Act by virtue of her position with, and interest in securities of, AMG. |
| Number of Funds Overseen in Fund Complex | | Name, Age, Principal Occupation(s) During Past 5 Years and Other Directorships Held by Trustee |
• Trustee since 2011 • Oversees 46 Funds in Fund Complex | | Christine C. Carsman, 69 Affiliated Managers Group, Inc. (2004-Present): Senior Policy Advisor (2019-Present), Executive Vice President, Deputy General Counsel and Chief Regulatory Counsel (2017-2018), Senior Vice President and Deputy General Counsel (2011-2016), Senior Vice President and Chief Regulatory Counsel (2007-2011), Vice President and Chief Regulatory Counsel (2004-2007); Chair of the Board of Directors, AMG Funds plc (2015-2018); Director, AMG Funds plc (2010-2018); Secretary and Chief Legal Officer, AMG Funds, AMG Funds I, AMG Funds II and AMG Funds III (2004-2011); Senior Counsel, Vice President and Director of Operational Risk Management and Compliance, Wellington Management Company, LLP (1995-2004); Director Emeritus of Harding, Loevner Funds, Inc. (0 Portfolios) (2021- Present); Director of Harding, Loevner Funds, Inc. (9 portfolios) (2017-2020). |
• Trustee since 2021 • Oversees 46 Funds in Fund Complex | | Garret W. Weston, 40 Affiliated Managers Group, Inc. (2008-Present): Managing Director, Co-Head of Affiliate Engagement (2021-Present), Senior Vice President, Affiliate Development (2016-2021), Vice President, Office of the CEO (2015-2016), Vice President, New Investments (2012-2015), Senior Associate, New Investments (2008-2012); Associate, Madison Dearborn Partners (2006-2008); Analyst, Merrill Lynch (2004-2006). |
| |
| Officers | | |
Position(s) Held with Fund and Length of Time Served | | Name, Age, Principal Occupation(s) During Past 5 Years |
• President since 2018 • Principal Executive Officer since 2018 • Chief Executive Officer since 2018 • Chief Operating Officer since 2007 | | Keitha L. Kinne, 63 Chief Operating Officer, AMG Funds LLC (2007-Present); Chief Investment Officer, AMG Funds LLC (2008-Present); President and Principal, AMG Distributors, Inc. (2018-Present); Chief Operating Officer, AMG Distributors, Inc. (2007-Present); President, Chief Executive Officer and Principal Executive Officer, AMG Funds, AMG Funds I, AMG Funds II, AMG Funds III and AMG Funds IV (2018-Present); Chief Operating Officer, AMG Funds, AMG Funds I, AMG Funds II, and AMG Funds III (2007-Present); Chief Operating Officer, AMG Funds IV (2016-Present); Chief Operating Officer and Chief Investment Officer, Aston Asset Management, LLC (2016); President and Principal Executive Officer, AMG Funds, AMG Funds I, AMG Funds II and AMG Funds III (2012-2014); Managing Partner, AMG Funds LLC (2007-2014); President and Principal, AMG Distributors, Inc. (2012-2014); Managing Director, Legg Mason & Co., LLC (2006-2007); Managing Director, Citigroup Asset Management (2004-2006). |
• Secretary since 2015 • Chief Legal Officer since 2015 | | Mark J. Duggan, 56 Managing Director and Senior Counsel, AMG Funds LLC (2021-Present); Senior Vice President and Senior Counsel, AMG Funds LLC (2015-2021); Secretary and Chief Legal Officer, AMG Funds, AMG Funds I, AMG Funds II, AMG Funds III and AMG Funds IV (2015-Present); Attorney, K&L Gates, LLP (2009-2015). |
• Chief Financial Officer since 2017 • Treasurer since 2017 • Principal Financial Officer since 2017 • Principal Accounting Officer since 2017 | | Thomas G. Disbrow, 55 Vice President, Mutual Fund Treasurer & CFO, AMG Funds, AMG Funds LLC (2017-Present); Chief Financial Officer, Principal Financial Officer, Treasurer and Principal Accounting Officer, AMG Funds, AMG Funds I, AMG Funds II, AMG Funds III and AMG Funds IV (2017-Present); Managing Director - Global Head of Traditional Funds Product Control, UBS Asset Management (Americas), Inc. (2015-2017); Managing Director - Head of North American Funds Treasury, UBS Asset Management (Americas), Inc. (2011-2015). |
80
| | |
| | AMG Funds Trustees and Officers (continued) |
| | |
Position(s) Held with Fund and Length of Time Served | | Name, Age, Principal Occupation(s) During Past 5 Years |
• Deputy Treasurer since 2017 | | John A. Starace, 51 Vice President, Mutual Fund Accounting, AMG Funds LLC (2021-Present); Director, Mutual Fund Accounting, AMG Funds LLC (2017-2021); Vice President, Deputy Treasurer of Mutual Funds Services, AMG Funds LLC (2014-2017); Deputy Treasurer, AMG Funds, AMG Funds I, AMG Funds II, AMG Funds III and AMG Funds IV (2017-Present); Vice President, Citi Hedge Fund Services (2010-2014); Audit Senior Manager (2005-2010) and Audit Manager (2001-2005), Deloitte & Touche LLP. |
• Chief Compliance Officer and Sarbanes-Oxley Code of Ethics since 2019 | | Patrick J. Spellman, 47 Vice President, Chief Compliance Officer, AMG Funds LLC (2017-Present); Chief Compliance Officer, AMG Distributors, Inc. (2010-Present); Chief Compliance Officer and Sarbanes-Oxley Code of Ethics Compliance Officer, AMG Funds, AMG Funds I, AMG Funds II, AMG Funds III and AMG Funds IV (2019-Present); Senior Vice President, Chief Compliance Officer, AMG Funds LLC (2011-2017); Anti-Money Laundering Compliance Officer, AMG Funds, AMG Funds I, AMG Funds II, and AMG Funds III (2014-2019); Anti-Money Laundering Officer, AMG Funds IV (2016-2019); Compliance Manager, Legal and Compliance, Affiliated Managers Group, Inc. (2005-2011). |
• Assistant Secretary since 2016 | | Maureen A. Meredith, 36 Vice President, Senior Counsel, AMG Funds LLC (2021-Present); Vice President, Counsel, AMG Funds LLC (2019-2021); Director, Counsel, AMG Funds LLC (2017-2018); Vice President, Counsel, AMG Funds LLC (2015-2017); Assistant Secretary, AMG Funds, AMG Funds I, AMG Funds II, AMG Funds III and AMG Funds IV (2016-Present); Associate, Ropes & Gray LLP (2011-2015); Law Fellow, Massachusetts Appleseed Center for Law and Justice (2010-2011). |
• Anti-Money Laundering Compliance Officer since 2019 | | Hector D. Roman, 44 Director, Legal and Compliance, AMG Funds LLC (2020-Present); Anti-Money Laundering Compliance Officer, AMG Funds, AMG Funds I, AMG Funds II, AMG Funds III and AMG Funds IV (2019-Present); Manager, Legal and Compliance, AMG Funds LLC (2017-2019); Director of Compliance, Morgan Stanley Investment Management (2015-2017); Senior Advisory, PricewaterhouseCoopers LLP (2014-2015); Risk Manager, Barclays Investment Bank (2008-2014). |
81
THIS PAGE INTENTIONALLY LEFT BLANK
THIS PAGE INTENTIONALLY LEFT BLANK
THIS PAGE INTENTIONALLY LEFT BLANK
| | | | |
INVESTMENT MANAGER AND ADMINISTRATOR AMG Funds LLC 680 Washington Blvd., Suite 500 Stamford, CT 06901 800.548.4539 DISTRIBUTOR AMG Distributors, Inc. 680 Washington Blvd., Suite 500 Stamford, CT 06901 800.548.4539 SUBADVISER GW&K Investment Management, LLC 222 Berkeley St. Boston, MA 02116 | | CUSTODIAN The Bank of New York Mellon Mutual Funds Custody 6023 Airport Road Oriskany, NY 13424 LEGAL COUNSEL Ropes & Gray LLP Prudential Tower, 800 Boylston Street Boston, MA 02199-3600 TRANSFER AGENT BNY Mellon Investment Servicing (US) Inc. Attn: AMG Funds 4400 Computer Drive Westborough, MA 01581 800.548.4539 | | This report is prepared for the Funds’ shareholders. It is authorized for distribution to prospective investors only when preceded or accompanied by an effective prospectus. To receive a free copy of the prospectus or Statement of Additional Information, which includes additional information about Fund Trustees, please contact us by calling 800.548.4539. Distributed by AMG Distributors, Inc., member FINRA/SIPC. Current net asset values per share for each Fund are available on the Funds’ website at amgfunds.com. A description of the policies and procedures each Fund uses to vote its proxies is available: (i) without charge, upon request, by calling 800.548.4539, or (ii) on the Securities and Exchange Commission’s (SEC) website at sec.gov. For information regarding each Fund’s proxy voting record for the 12-month period ended June 30, call 800.548.4539 or visit the SEC website at sec.gov. The Funds file their complete schedule of portfolio holdings with the SEC for the first and third quarters of each fiscal year as an exhibit to their reports on Form N-PORT. The Funds’ portfolio holdings on Form N-PORT are available on the SEC’s website at sec.gov and the Funds’ website at amgfunds.com. To review a complete list of the Funds’ portfolio holdings, or to view the most recent semiannual report or annual report, please visit amgfunds.com. |
| | | | | | | | |
BALANCED FUNDS AMG GW&K Global Allocation GW&K Investment Management, LLC AMG FQ Global Risk-Balanced First Quadrant, L.P. EQUITY FUNDS AMG Beutel Goodman International Equity Beutel, Goodman & Company Ltd. AMG Boston Common Global Impact Boston Common Asset Management, LLC AMG Managers CenterSquare Real Estate CenterSquare Investment Management LLC AMG Frontier Small Cap Growth Frontier Capital Management Co., LLC AMG GW&K Small Cap Core AMG GW&K Small Cap Value AMG GW&K Small/Mid Cap AMG GW&K Small/Mid Cap Growth AMG GW&K Emerging Markets Equity AMG GW&K Emerging Wealth Equity AMG GW&K International Small Cap GW&K Investment Management, LLC AMG Montrusco Bolton Large Cap Growth Montrusco Bolton Investments, Inc. | | | | AMG Renaissance Large Cap Growth The Renaissance Group LLC AMG River Road Dividend All Cap Value AMG River Road Focused Absolute Value AMG River Road International Value Equity AMG River Road Large Cap Value Select AMG River Road Mid Cap Value AMG River Road Small-Mid Cap Value AMG River Road Small Cap Value River Road Asset Management, LLC AMG TimesSquare Emerging Markets Small Cap AMG TimesSquare Global Small Cap AMG TimesSquare International Small Cap AMG TimesSquare Mid Cap Growth AMG TimesSquare Small Cap Growth TimesSquare Capital Management, LLC AMG Veritas Asia Pacific AMG Veritas China AMG Veritas Global Focus AMG Veritas Global Real Return Veritas Asset Management LLP AMG Yacktman AMG Yacktman Focused AMG Yacktman Global AMG Yacktman Special Opportunities Yacktman Asset Management LP | | FIXED INCOME FUNDS AMG Beutel Goodman Core Plus Bond Beutel, Goodman & Company Ltd. AMG GW&K Core Bond ESG AMG GW&K Enhanced Core Bond ESG AMG GW&K ESG Bond AMG GW&K High Income AMG GW&K Municipal Bond AMG GW&K Municipal Enhanced Yield GW&K Investment Management, LLC | | |
| | |
| amgfunds.com | | | 123121 AR088 |
Registrant has adopted a Code of Ethics. See attached Exhibit (a)(1).
| Item 3. | AUDIT COMMITTEE FINANCIAL EXPERT |
Registrant’s Board of Trustees has determined that independent Trustee Mr. Steven J. Paggioli qualifies as an Audit Committee Financial Expert. Mr. Paggioli is “independent” as such term is defined in Form N-CSR.
| Item 4. | PRINCIPAL ACCOUNTANT FEES AND SERVICES |
(a) Audit Fees
The aggregate fees billed by the Funds’ independent registered public accounting firm, PricewaterhouseCoopers LLP (“PwC”), to the Funds for the Funds’ two most recent fiscal years for professional services rendered for audits of annual financial statements, or services that are normally provided in connection with statutory and regulatory filings or engagements (“Audit Fees”) were as follows:
| | | | | | | | |
Fund - AMG Funds III | | Fiscal 2021 | | | Fiscal 2020 | |
AMG Veritas Asia Pacific Fund | | $ | 33,151 | | | $ | 25,105 | |
AMG GW&K ESG Bond Fund | | $ | 53,962 | | | $ | 54,098 | |
AMG GW&K High Income Fund | | $ | 36,216 | | | $ | 35,892 | |
(b) Audit-Related Fees
There were no fees billed by PwC to the Funds in their two most recent fiscal years for services rendered for assurance and related services that are reasonably related to the performance of the audit or review of the Funds’ financial statements, but are not reported as Audit Fees (“Audit-Related Fees”).
For the Funds’ two most recent fiscal years, there were no Audit-Related Fees billed by PwC for engagements related directly to the operations and financial reporting of one or more Funds by a Fund Service Provider. A Fund Service Provider is (a) any investment adviser to the Fund (not including any Subadvisor whose role is primarily portfolio management and is subcontracted with or overseen by another investment adviser) or (b) any entity that provides ongoing services to the Fund and is controlling, controlled by or under common control with a Fund investment adviser described in (a).
(c) Tax Fees
The aggregate fees billed by PwC to the Funds for the two most recent fiscal years for professional services rendered for tax compliance, tax advice, and tax planning (“Tax Fees”) were as follows:
| | | | | | | | |
Fund - AMG Funds III | | Fiscal 2021 | | | Fiscal 2020 | |
AMG Veritas Asia Pacific Fund | | $ | 6,250 | | | $ | 6,250 | |
AMG GW&K ESG Bond Fund | | $ | 8,400 | | | $ | 8,400 | |
AMG GW&K High Income Fund | | $ | 8,400 | | | $ | 8,400 | |
For the Funds’ two most recent fiscal years, Tax Fees billed by PwC for engagements by Fund Service Providers that related directly to the operations and financial reporting of the Funds were $0 for fiscal 2021 and $0 for fiscal 2020, respectively.
The services for which Tax Fees were charged comprise all services performed by professional staff in PwC’s tax division except those services related to the audit. Typically, this category would include fees for tax compliance, tax planning, and tax advice. Tax compliance, tax advice, and tax planning services include preparation of original and amended tax returns, claims for refund and tax payment-planning services, assistance with tax audits and appeals, tax advice related to mergers and acquisitions and requests for rulings or technical advice from taxing authorities.
(d) All Other Fees
There were no other fees billed by PwC to the Funds for all other non-audit services (“Other Fees”) during the Funds’ two most recent fiscal years. During the same period, there were no Other Fees billed by PwC for engagements by Fund Service Providers that related directly to the operations and financial reporting of the Funds.
(e)(1)According to policies adopted by the Audit Committee, services provided by PwC to the Funds must be pre-approved by the Audit Committee. On an annual basis, the Audit Committee reviews and pre-approves various types of services that PwC may perform for the Funds without specific approval of each engagement, subject to specified budget limitations. As contemplated by the Sarbanes-Oxley Act of 2002 and related SEC rules, the Audit Committee also pre-approves non-audit services provided by PwC to any Fund Service Provider for any engagement that relates directly to the operations and financial reporting of the Funds. Any engagement that is not already pre-approved or that will exceed a pre-approved budget must be submitted to the Audit Committee for pre-approval. The Chairman of the Audit Committee is authorized on behalf of the Board of Trustees and the Audit Committee to approve the engagement of PwC to perform non-audit services subject to certain conditions, including notification to the Audit Committee of such pre-approval not later than the next meeting of the Audit Committee following the date of such pre-approval.
(e)(2) None.
(f) Not applicable.
(g) The aggregate fees billed by PwC in 2021 and 2020 for non-audit services rendered to the Funds and Fund Service Providers were $69,550 and $72,550, respectively. For the fiscal year ended December 31, 2021, this amount reflects the amounts disclosed above in Item 4(b),(c),(d), plus $46,500 in fees billed to the Fund Service Providers for non-audit services that did not relate directly to the operations and financial reporting of the Funds. For the fiscal year ended December 31, 2020, this amount reflects the amounts disclosed above in Item 4(b),(c),(d), plus $49,500 in fees billed to the Fund Service Providers for non-audit services that did not relate directly to the operations and financial reporting of the Funds.
(h) The Trust’s Audit Committee has considered whether the provision of non-audit services by registrant’s independent registered public accounting firm to the registrant’s investment adviser, and any entity controlling, controlled by, or under common control with the investment adviser that provided ongoing services to the registrant that were not pre-approved by the Committee (because such services did not relate directly to the operations and financial reporting of the registrant) was compatible with maintaining the independence of the independent registered public accounting firm.
| Item 5. | AUDIT COMMITTEE OF LISTED REGISTRANTS |
Not applicable.
| Item 6. | SCHEDULE OF INVESTMENTS |
The schedule of investments in securities of unaffiliated issuers as of the close of the reporting period is included as part of the report to shareholders filed under Item 1 of this form.
| Item 7. | DISCLOSURE OF PROXY VOTING POLICIES AND PROCEDURES FOR CLOSED-END MANAGEMENT INVESTMENT COMPANIES |
Not applicable.
| Item 8. | PORTFOLIO MANAGERS OF CLOSED-END MANAGEMENT INVESTMENT COMPANIES |
Not applicable.
| Item 9. | PURCHASES OF EQUITY SECURITIES BY CLOSED-END MANAGEMENT INVESTMENT COMPANIES AND AFFILIATED PURCHASERS |
Not applicable.
| Item 10. | SUBMISSION OF MATTERS TO A VOTE OF SECURITY HOLDERS |
Not applicable.
| Item 11. | CONTROLS AND PROCEDURES |
(a) The Registrant’s principal executive and principal financial officers have concluded, based on their evaluation of the registrant’s disclosure controls and procedures as of a date within 90 days of the filing of this report, that the Registrant’s disclosure controls and procedures are reasonably designed to ensure that
information required to be disclosed by the Registrant on Form N-CSR is recorded, processed, summarized and reported within the required time periods and that information required to be disclosed by the registrant in the reports that it files or submits on Form N-CSR is accumulated and communicated to the Registrant’s management, including its principal executive and principal financial officers, as appropriate to allow timely decisions regarding required disclosure.
(b) There were no changes in the Registrant’s internal control over financial reporting during the period covered by this report that have materially affected, or are reasonably likely to materially affect, the internal control over financial reporting.
| Item 12. | DISCLOSURE OF SECURITIES LENDING ACTIVITIES FOR CLOSED-END MANAGEMENT INVESTMENT COMPANIES |
Not applicable.
SIGNATURES
Pursuant to the requirements of the Securities Exchange Act of 1934 and the Investment Company Act of 1940, the registrant has duly caused this report to be signed on its behalf by the undersigned, thereunto duly authorized.
AMG FUNDS III
| | |
| By: | | /s/ Keitha L. Kinne |
| | Keitha L. Kinne, Principal Executive Officer |
| |
| Date: | | March 7, 2022 |
Pursuant to the requirements of the Securities Exchange Act of 1934 and the Investment Company Act of 1940, this report has been signed below by the following persons on behalf of the registrant and in the capacities and on the dates indicated.
| | |
| By: | | /s/ Keitha L. Kinne |
| | Keitha L. Kinne, Principal Executive Officer |
| |
| Date: | | March 7, 2022 |
| |
| By: | | /s/ Thomas Disbrow |
| | Thomas Disbrow, Principal Financial Officer |
| |
| Date: | | March 7, 2022 |