UNITED STATES
SECURITIES AND EXCHANGE COMMISSION
Washington, D.C. 20549
FORM N-CSR
CERTIFIED SHAREHOLDER REPORT OF REGISTERED
MANAGEMENT INVESTMENT COMPANIES
Investment Company Act file number: 811-03752
AMG FUNDS III
(Exact name of registrant as specified in charter)
680 Washington Boulevard, Suite 500, Stamford, Connecticut 06901
(Address of principal executive offices) (Zip code)
AMG Funds LLC
680 Washington Boulevard, Suite 500, Stamford, Connecticut 06901
(Name and address of agent for service)
Registrant’s telephone number, including area code: (203) 299-3500
Date of fiscal year end: DECEMBER 31
Date of reporting period: JANUARY 1, 2022 – DECEMBER 31, 2022
(Annual Shareholder Report)
| Item 1. | Reports to Shareholders |
| | |
 | | ANNUAL REPORT |
| | |
| | | AMG Funds December 31, 2022 |
| | |
| | | 
|
| | |
| | | AMG Veritas Asia Pacific Fund |
| | |
| | | Class N: MGSEX | Class I: MSEIX |
| | |
| | | |
| | |
| | | |
| | |
| | | |
| | |
| | | |
amgfunds.com | | 123122 AR078 |
| | |
| | |
| | | AMG Funds Annual Report — December 31, 2022 |
| | | |
| | | |
| | | |
| | | | | | |
| | | |
| | | | | | | |
| | | TABLE OF CONTENTS | | PAGE | |
| | |
| | | | |
| | | |
| | | LETTER TO SHAREHOLDERS | | | 2 | |
| | | |
| | | ABOUT YOUR FUND’S EXPENSES | | | 3 | |
| | | |
| | | PORTFOLIO MANAGER’S COMMENTS, FUND SNAPSHOTS AND SCHEDULE OF PORTFOLIO INVESTMENTS | | | 4 | |
| | | |
| | | FINANCIAL STATEMENTS | | | | |
| | | |
| | | Statement of Assets and Liabilities | | | 11 | |
| | | |
| | | Balance sheet, net asset value (NAV) per share computations
and cumulative distributable earnings (loss) | | | | |
| | | |
| | | Statement of Operations | | | 13 | |
| | | |
| | | Detail of sources of income, expenses, and realized and
unrealized gains (losses) during the fiscal year | | | | |
| | | |
| | | Statements of Changes in Net Assets | | | 14 | |
| | | |
| | | Detail of changes in assets for the past two fiscal years | | | | |
| | | |
| | | Financial Highlights | | | 15 | |
| | | |
| | | Historical net asset values per share, distributions, total returns, income
and expense ratios, turnover ratios and net assets | | | | |
| | | |
| | | Notes to Financial Statements | | | 17 | |
| | | |
| | | Accounting and distribution policies, details of agreements and
transactions with Fund management and affiliates, and descriptions of
certain investment risks | | | | |
| | | |
| | | REPORT OF INDEPENDENT REGISTERED PUBLIC ACCOUNTING FIRM | | | 23 | |
| | | |
| | | OTHER INFORMATION | | | 24 | |
| | | |
| | | TRUSTEES AND OFFICERS | | | 25 | |
| | | | | | | |
Nothing contained herein is to be considered an offer, sale or solicitation of an offer to buy shares of any series of the AMG Funds Family of Funds. Such offering is made only by prospectus, which includes details as to offering price and other material information.
| | |
| |
| | Letter to Shareholders |
| | | |
| | | |
| | | |
Dear Shareholder:
We are pleased to provide this annual report for your investment with AMG Funds. Our foremost goal is to provide investment solutions that help our shareholders successfully achieve their long-term investment goals. We appreciate the privilege of providing you with investment tools.
The past year was a challenging period for investors, as uncertainties about high inflation, tighter financial conditions, and the Russian invasion of Ukraine led to significant volatility. Global equity and bond markets fell in tandem amid sharply higher interest rates and eroding investor confidence as worries of an impending recession lingered most of the year. A global commodity shock caused by the war in Ukraine only made matters worse. The S&P 500® Index slipped into a bear market with the Index falling more than (24)% from its peak earlier in the year. The abrupt shift in markets this year has reset expectations around future growth, as the U.S. Federal Reserve (the Fed) and other global central banks have taken aggressive policy action to bring down inflation. While the outlook is uncertain given recent negative returns across many asset classes, global stock and bond valuations are now far more attractive entering 2023 compared to a year ago.
There was very wide dispersion in S&P 500® Index sector performance. Energy significantly outperformed all other sectors with a gain of 65.72% as the price of oil surged during the period. The defensive-oriented sectors also outperformed, although utilities was the only other sector with a positive return, gaining 1.54%. Consumer staples and health care were slightly negative with returns of (0.62)% and (1.95)%, respectively. High-growth technology and mega cap internet-related companies underperformed during the period, and real estate was impacted by higher interest rates. Communications services fell the most with a (39.93)% return during the year, followed by declines of (37.03)% for consumer discretionary, (28.14)% for information technology and (26.13)% for real estate. Value stocks held up much better than growth stocks as the Russell 1000® Value Index returned (7.54)% compared to the (29.14)% return for the Russell 1000® Growth Index. Small cap stocks struggled as the Russell 2000® Index lost (20.44)%. Outside the U.S., foreign developed markets were negative with a (14.45)% return for the MSCI EAFE Index, however a very strong fourth quarter rally drove international equity returns ahead of their U.S. counterparts for the year.
The 10-year Treasury yield more than doubled during the year, surging to the highest levels since before the Great Financial Crisis. Rapidly rising rates from a very low base led to historic negative performance for bonds as the Bloomberg U.S. Aggregate Bond Index, a broad measure of U.S. bond market performance, lost (13.01)% over the period. Investment-grade corporate bonds underperformed, returning (15.76)% for the year. High yield bonds held up better with a (11.19)% return as measured by the return of the Bloomberg U.S. Corporate High Yield Bond
Index. Municipal bonds were also negative, but outperformed the broader market with a (8.53)% return for the Bloomberg Municipal Bond Index.
AMG Funds provides access to a distinctive array of actively managed return-oriented investment strategies. You can rest assured that under all market conditions our team is focused on delivering excellent investment management services for your benefit. For more information about AMG Funds’ wide range of products and resources, please visit www.amgfunds.com. We thank you for your investment and continued trust in AMG Funds.
Respectfully,

Keitha Kinne
President
AMG Funds
| | | | | | | | | | | | | | |
| | | | | Periods ended | |
| Average Annual Total Returns | | December 31, 2022* | |
| | | | |
| Stocks: | | | | 1 Year | | | 3 Years | | | 5 Years | |
| | | | |
| Large Cap | | (S&P 500® Index) | | | (18.11)% | | | | 7.66% | | | | 9.42% | |
| | | | |
| Small Cap | | (Russell 2000® Index) | | | (20.44)% | | | | 3.10% | | | | 4.13% | |
| | | | |
| International | | (MSCI ACWI ex USA) | | | (16.00)% | | | | 0.07% | | | | 0.88% | |
| | | | |
| Bonds: | | | | | | | | | | | | | | |
| | | | |
| Investment Grade | | (Bloomberg U.S. Aggregate Bond Index) | | | (13.01)% | | | | (2.71)% | | | | 0.02% | |
| | | | |
| High Yield | | (Bloomberg U.S. Corporate High Yield Bond Index) | | | (11.19)% | | | | 0.05% | | | | 2.31% | |
| | | | |
| Tax-exempt | | (Bloomberg Municipal Bond Index) | | | (8.53)% | | | | (0.77)% | | | | 1.25% | |
| | | | |
| Treasury Bills | | (ICE BofAML U.S. 6-Month Treasury Bill Index) | | | 1.34% | | | | 0.82% | | | | 1.39% | |
*Source: FactSet. Past performance is no guarantee of future results.
2
| | |
| | |
| | | About Your Fund’s Expenses |
| | | |
| | | |
| | | |
| | | | | | | | |
As a shareholder of a Fund, you may incur two types of costs: (1) transaction costs, which may include sales charges (loads) on purchase payments; redemption fees; and exchange fees; and (2) ongoing costs, including management fees; distribution (12b-1) fees; and other Fund expenses. This example is intended to help you understand your ongoing costs (in dollars) of investing in the Fund and to compare these costs with the ongoing costs of investing in other mutual funds. The example is based on $1,000 invested at the beginning of the period and held for the entire period as indicated below. ACTUAL EXPENSES The first line of the following table provides information about the actual account values and | | | | actual expenses. You may use the information in this line, together with the amount you invested, to estimate the expenses that you paid over the period. Simply divide your account value by $1,000 (for example, an $8,600 account value divided by $1,000 = 8.6), then multiply the result by the number in the first line under the heading entitled “Expenses Paid During the Period” to estimate the expenses you paid on your account during this period. HYPOTHETICAL EXAMPLE FOR COMPARISON PURPOSES The second line of the following table provides information about hypothetical account values and hypothetical expenses based on the Fund’s actual expense ratio and an assumed annual rate of return of 5% before expenses, which is not the Fund’s | | | | actual return. The hypothetical account values and expenses may not be used to estimate the actual ending account balance or expenses you paid for the period. You may use this information to compare the ongoing costs of investing in the Fund and other funds by comparing this 5% hypothetical example with the 5% hypothetical examples that appear in the shareholder reports of other funds. Please note that the expenses shown in the table are meant to highlight your ongoing costs only and do not reflect any transactional costs, such as sales charges (loads), redemption fees, or exchange fees. Therefore, the second line of the table is useful in comparing ongoing costs only, and will not help you determine the relative total costs of owning different funds. |
| | | | | | | | |
| | | | | | | | |
Six Months Ended December 31, 2022 | | Expense
Ratio for
the Period | | Beginning
Account
Value
07/01/22 | | Ending
Account
Value
12/31/22 | | Expenses
Paid
During
the Period* |
|
AMG Veritas Asia Pacific Fund |
|
Based on Actual Fund Return |
Class N | | 1.18% | | $1,000 | | $957 | | $5.82 |
Class I | | 0.93% | | $1,000 | | $959 | | $4.59 |
|
Based on Hypothetical 5% Annual Return |
Class N | | 1.18% | | $1,000 | | $1,019 | | $6.01 |
Class I | | 0.93% | | $1,000 | | $1,021 | | $4.74 |
| * | Expenses are equal to the Fund’s annualized expense ratio multiplied by the average account value over the period, multiplied by the number of days in the most recent fiscal half-year (184), then divided by 365. |
3
| | |
| | |
| | | AMG Veritas Asia Pacific Fund Portfolio Manager’s Comments (unaudited) |
| | | |
| | | |
| | | |
| | | | |
For the 12 months ended December 31, 2022, AMG Veritas Asia Pacific Fund (the “Fund”) Class N shares returned (27.91)%, compared with the (17.48)% return for the MSCI AC Asia Pacific ex Japan Index, the Fund’s benchmark. ASIA MARKET OVERVIEW Investors in Asian strategies have had a wild ride over the last few years with macroeconomic and political factors driving significant volatility in markets. The Chinese market is no stranger to excessive euphoria and extreme gloom. Over the last 30 years, the Chinese market has swung from maximum bullishness to total desperation, and each time the Chinese market bounced back. We have great conviction that the quality of Chinese companies has improved tremendously over the years and that China continues to have highly attractive businesses, with several long-term structural growth drivers. Many of these companies also have the capital and management ability to take advantage of the opportunities presented to them. One of the most attractive areas in our view is the renewable energy industry and its supply chain. Companies operating in these industries are likely to benefit from a multi-year (and potentially multi-decade) structural tailwind, have scale and years of know-how, are industry leaders, and are well run by talented management teams. However, in 2022 these industries experienced a near perfect storm, particularly in Solar & Battery. Within this industry are a number of high growth companies and therefore the prospect of higher yields impacted the valuation assigned to future cash flows. Add to this the rising cost of polysilicon and other input costs, COVID-19 disruption, speculation over who is next to be added to the U.S. Unverified List and intensified geopolitical risk meant that operational performance of these businesses had been set aside. The team believes that these challenges are transitory rather than structural. China is home to many of the world’s leading businesses in their respective areas of the renewable energy industry, whether that be a leading invertor manufacturer such as Sungrow Power (which was recently sold from the Fund), or a global leader in machinery used to manufacture lithium-ion batteries such as WuXi Lead Intelligent Equipment. While investing in this area has been a volatile ride recently, the structural multi-decade growth drivers remain intact as the world not only needs to decarbonize but to diversify its energy sources. | | Another structural long-term theme is in the import substitution sector. In fact, this is a new high conviction investment theme, named Self-Reliant Asia, and introduced by the team in 2022 to sit alongside our five long-term investment themes of Green Asia, Aspirational Asia, Efficient Asia, Connected Asia and Health Asia. China has been excelling in low-end appliance manufacturing for some time but is now also gradually moving up the value chain in terms of advanced engineering manufacturing to compete with the industrial giants of Germany and Japan. Even before the U.S. sanctions to cut off Russia from key technology, import substitution was already gathering pace in the key sectors of semiconductors, software, automation and internet, and we expect the momentum will accelerate due to the political tension. Outside of China, we believe the Indian market offers ample opportunities and our exposure to that market has increased. The team has invested in several Indian private lenders predicated on them being quality companies in what we view as a challenging industry, often overcome by external factors. The Indian private lenders display many quality characteristics we seek, such as: ◾ Financial strength – some of the highest Tier 1 ratios of any banks in the world ◾ Strong balance sheets with no known past excesses to pay for ◾ Good management teams that are alert to opportunities and threats ◾ Benefits from structural growth drivers ◾ Ownership of a scarce asset – access to capital in India is still a scarce asset Indian private banks have a proven track record of good capital deployment of that asset and as a private lender, they have the freedom to choose who they do and do not lend money to. This allows them to take advantage of the opportunities India presents as it continues along its journey of growing affluence, while maintaining lending discipline to deliver low levels of non-performing loans and, therefore, attractive rates of return on assets. Few if | | any banks anywhere in the world have this combination of financial strength, opportunity set, and scarce asset owner status. PERFORMANCE REVIEW The Fund generated negative returns and underperformed its benchmark during the period. Negative performance over the period was a result of both regional and stock specific factors. China’s weakness weighed heavily on the Fund’s performance, as did the performance of Sea Ltd., the largest regional player in Southeast Asia in both e-commerce and gaming. The company has a significant exposure to the region’s high growth e-commerce market and is uniquely positioned to subsidize its investments in e-commerce with gaming business revenues. At the time, it had strong content support from Tencent (30% stakeholder at the time) to spur growth in Southeast Asia and Taiwan. As the global recession and regulations impacted the gaming industry, so did the ability to fund their e-commerce expansion. The company reported weak earnings in the early part of the year and was punished significantly as investors moved away from high growth companies in a rising interest rate environment. The share price was further hampered by Tencent’s sale of a portion of its stake. After reducing the position materially throughout the year, we exited fully in October 2022. OUTLOOK Our highly experienced team has substantial knowledge navigating the turbulence of Asian markets with a philosophy based on seeking to preserve and grow clients’ capital in real terms. We believe this is achieved by investing in high quality companies with strong growth potential at the right price with a strict price discipline. The ability to hold cash affords the ability to navigate around the volatility. Our view is that quality companies will always shine through in the longer run, and the best time to buy quality companies is in times like this when investors are despondent and fearful. The views expressed represent the opinions of Veritas Asset Management, LLP and are not intended as a forecast or guarantee of future results, and are subject to change without notice. |
| | | | |
| | | | |
4
| | |
| | |
| | | AMG Veritas Asia Pacific Fund Portfolio Manager’s Comments (continued) |
| | | |
| | | |
| | | |
CUMULATIVE TOTAL RETURN PERFORMANCE
AMG Veritas Asia Pacific Fund’s cumulative total return is based on the daily change in net asset value (NAV), and assumes that all dividends and distributions were reinvested. The graph compares a hypothetical $10,000 investment made in the AMG Veritas Asia Pacific Fund’s Class N shares on December 31, 2012, to a $10,000 investment made in the MSCI AC Asia Pacific ex Japan Index for the same time period. The graph and table do not reflect the deduction of taxes that a shareholder would pay on a Fund distribution or redemption of shares. The listed returns for the Fund are net expenses and the returns for the index exclude expenses. Total returns would have been lower had certain expenses not been reduced.
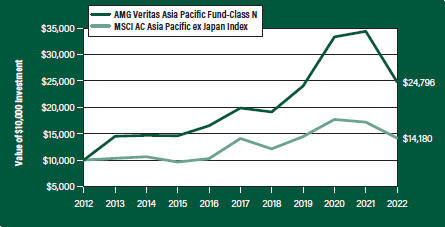
The table below shows the average annual total returns for the AMG Veritas Asia Pacific Fund and MSCI AC Asia Pacific ex Japan Index for the same time periods ended December 31, 2022.
| | | | | | | | | | | | |
| Average Annual Total Returns1 | | One Year | | | Five Years | | | Ten Years | |
|
AMG Veritas Asia Pacific Fund2, 3, 4, 5, 6, 7, 8, 9, 10, 11, 12, 13, 14, 15, 16, 17, 18, 19 | |
| | | |
Class N | | | (27.91% | ) | | | 4.53% | | | | 9.50% | |
| | | |
Class I | | | (27.73% | ) | | | 4.79% | | | | 9.74% | |
| | | |
MSCI AC Asia Pacific ex Japan Index20 | | | (17.48% | ) | | | 0.13% | | | | 3.55% | |
The performance data shown represents past performance. Past performance is not a guarantee of future results. Current performance may be lower or higher than the performance data quoted. The investment return and principal value of an investment will fluctuate so that an investor’s shares, when redeemed, may be worth more or less than their original cost.
Investors should carefully consider the Fund’s investment objectives, risks, charges and expenses before investing. For performance information through the most recent month end, current net asset values per share for the Fund and other information, please call 800.548.4539 or visit our website at amgfunds.com for a free prospectus. Read it carefully before investing or sending money.
Distributed by AMG Distributors, Inc., member FINRA/SIPC.
| 1 | Total return equals income yield plus share price change and assumes reinvestment of all dividends and capital gain distributions. Returns are net of fees and may reflect offsets of Fund expenses as described in the prospectus. No adjustment has been made for taxes payable by shareholders on their reinvested dividends and capital gain distributions. Returns for periods greater than one year are annualized. The listed returns on the Fund are net of expenses and based on the published NAV as of December 31, 2022. All returns are in U.S. Dollars ($). |
| 2 | As of March 19, 2021, the Fund’s Subadviser was changed to Veritas Asset Management LLP. Prior to March 19, |
|
2021, the Fund was known as the AMG Managers Special Equity Fund, and had different principal investment strategies and corresponding risks. Performance shown for periods prior to March 19, 2021, reflects the performance and investment strategies of the Fund’s previous subadvisers, Federated MDTA LLC, Lord, Abbett & Co. LLC, Ranger Investment Management L.P. and Smith Asset Management Group, L.P. The Fund’s past performance would have been different if the Fund were managed by the current Subadviser and strategy, and the Fund’s prior performance record might be less pertinent for investors considering whether to purchase shares of the Fund. 3 From time to time, the Fund’s investment manager has waived its fees and/or absorbed Fund expenses, which has resulted in higher returns. 4 Investments in international securities are subject to certain risks of overseas investing including currency fluctuations and changes in political and economic conditions, which could result in significant market fluctuations. These risks are magnified in emerging markets. 5 The Fund is subject to the risks associated with investments in emerging markets, such as erratic earnings patterns, economic and political instability, changing exchange controls, limitations on repatriation of foreign capital and changes in local governmental attitudes toward private investment, possibly leading to nationalization or confiscation of investor assets. 6 The Fund is subject to risks associated with investments in mid-capitalization companies such as greater price volatility, lower trading volume, and less liquidity than the stocks of larger, more established companies. 7 The Fund is subject to risks associated with investments in small-capitalization companies, such as erratic earnings patterns, competitive conditions, limited earnings history and a reliance on one or a limited number of products. 8 Market prices of investments held by the Fund may fall rapidly or unpredictably due to a variety of economic or political factors, market conditions, disasters or public health issues, or in response to events that affect particular industries or companies. 9 The Fund is subject to currency risk resulting from fluctuations in exchange rates that may affect the total loss or gain on a non-U.S. Dollar investment when converted back to U.S. Dollars. 10 To the extent the Fund focuses its investments in a particular country, group of countries or geographic region, the Fund is particularly susceptible to economic, political, regulatory or other events or conditions affecting such countries or region, and the Fund’s NAV may be more volatile than the NAV |
| |
5
| | |
| | |
| | | AMG Veritas Asia Pacific Fund Portfolio Manager’s Comments (continued) |
| | | |
| | | |
| | | |
| | | | |
of a more geographically diversified fund and may result in losses. 11 When the Fund has a significant cash balance for a sustained period, the benefit to the Fund of any market upswing may likely be reduced, and the performance may be adversely affected. 12 An investment in participatory notes is subject to market risk. The performance results of participatory notes may not exactly replicate the performance of the underlying securities. An investment in participatory notes is also subject to counterparty risk, relating to the non-U.S. bank or broker-dealer that issues the participatory notes, and maybe subject to liquidity risk. 13 Changes in the general political and social environment of a country can have substantial effects on the value of investments exposed to that country. 14 The application of the tax laws and regulations of the People’s Republic of China (“PRC”) to income, including capital gains, derived from certain investments of the Fund remains unclear, and may well continue to evolve, possibly with retroactive | | effect. Any taxes imposed on the investments of the Fund pursuant to such laws and regulations will reduce the Fund’s overall returns. 15 Trading in China A-Shares through Stock Connect is subject to sudden changes in quota limitations, application of trading suspensions, differences in trading days between the PRC and Stock Connect, operational risk, clearing and settlement risk and regulatory and taxation risk. 16 The Fund may not be able to value its investments in a manner that accurately reflects their market values, and the Fund may not be able to sell an investment at a price equal to the valuation ascribed to that investment by the Fund. 17 A greater percentage of the Fund’s holdings may be focused in a smaller number of securities which may place the Fund at greater risk than a more diversified fund. 18 The Fund invests in large-capitalization companies that may underperform other stock funds (such as funds that focus on small-and medium-capitalization companies) when stocks of large-capitalization companies are out of favor. | | 19 The Fund invests in value stocks, which may perform differently from the market as a whole and maybe undervalued by the market for a long period of time. 20 The MSCI AC Asia Pacific ex-Japan Index captures large and mid cap representation across certain Developed and Emerging Market countries in the Asia Pacific region (excluding Japan). Unlike the Fund, the MSCI AC Asia Pacific ex-Japan Index is unmanaged, is not available for investment and does not incur expenses. The All MSCI data is provided “as is.” The products described herein are not sponsored or endorsed and have not been reviewed or passed on by MSCI. In no event shall MSCI, its affiliates, or any MSCI data provider have any liability of any kind in connection with the MSCI data or the products described herein. Copying or redistributing the MSCI data is strictly prohibited. Not FDIC insured, nor bank guaranteed. May lose value. |
| | | | |
6
| | |
| | |
| | | AMG Veritas Asia Pacific Fund Fund Snapshots (unaudited) December 31, 2022 |
| | | |
| | | |
| | | |
PORTFOLIO BREAKDOWN
| | |
| Sector | | % of Net Assets |
| | |
Consumer Discretionary | | 18.7 |
| | |
Financials | | 15.5 |
| | |
Consumer Staples | | 15.5 |
| | |
Health Care | | 12.5 |
| | |
Information Technology | | 11.9 |
| | |
Industrials | | 7.0 |
| | |
Communication Services | | 6.9 |
| | |
Materials | | 6.0 |
| | |
Real Estate | | 3.3 |
| | |
Energy | | 2.3 |
| | |
Short-Term Investments | | 2.4 |
| | |
Other Assets, less Liabilities | | (2.0) |
TOP TEN HOLDINGS
| | | | |
| Security Name | | | | % of Net Assets |
| | | |
Kweichow Moutai Co., Ltd., Class A (China) | | | | 8.6 |
| | | |
CSL, Ltd. (Australia) | | | | 8.0 |
| | | |
Meituan, Class B (China) | | | | 5.4 |
| | | |
HDFC Bank, Ltd., ADR (India) | | | | 4.6 |
| | | |
Tencent Holdings, Ltd. (China) | | | | 4.3 |
| | | |
Taiwan Semiconductor Manufacturing Co., Ltd. (Taiwan) | | | | 4.1 |
| | | |
Alibaba Group Holding, Ltd. (China) | | | | 3.8 |
| | | |
Hindustan Unilever, Ltd. (CLSA Ltd.) (India) | | | | 3.7 |
| | | |
Kotak Mahindra Bank, Ltd. (CLSA Ltd.) (India) | | | | 3.7 |
| | | |
LG Chem, Ltd. (South Korea) | | | | 3.4 |
| | | |
Top Ten as a Group | | | | 49.6 |
| | | | |
Because a fund’s strategy may result in multiple investments in particular sectors of the economy, its performance may depend on the performance of those sectors and may fluctuate more widely than investments diversified across more sectors. For additional information on these and other risk considerations, please see the Fund’s prospectus.
Any sectors, industries, or securities discussed should not be perceived as investment recommendations. Mention of a specific security should not be considered a recommendation to buy or solicitation to sell that security. Specific securities mentioned in this report may have been sold from the Fund’s portfolio of investments by the time you receive this report.
7
| | |
| | |
| | | AMG Veritas Asia Pacific Fund Schedule of Portfolio Investments December 31, 2022 |
| | | |
| | | |
| | | |
| | | | | | | | |
| | | Shares | | | Value | |
| |
Common Stocks - 77.2% | | | | | |
| |
Communication Services - 6.9% | | | | | |
| | |
NetEase, Inc. (China) | | | 100,000 | | | | $1,450,402 | |
| | |
REA Group, Ltd. (Australia) | | | 20,000 | | | | 1,504,131 | |
| | |
Tencent Holdings, Ltd. (China) | | | 114,239 | | | | 4,843,775 | |
| | |
Total Communication Services | | | | | | | 7,798,308 | |
| |
Consumer Discretionary - 16.0% | | | | | |
| | |
Alibaba Group Holding, Ltd. (China)* | | | 391,350 | | | | 4,294,249 | |
| | |
JD.com, Inc., Class A (China) | | | 99,392 | | | | 2,774,691 | |
| | |
Meituan, Class B (China)*,1 | | | 275,000 | | | | 6,092,855 | |
| | |
Pinduoduo, Inc., ADR (China)* | | | 40,000 | | | | 3,262,000 | |
| | |
Sands China, Ltd. (Macau)* | | | 500,000 | | | | 1,640,114 | |
| | |
Total Consumer Discretionary | | | | | | | 18,063,909 | |
| |
Consumer Staples - 10.5% | | | | | |
| | |
Kweichow Moutai Co., Ltd., Class A (China) | | | 39,300 | | | | 9,721,882 | |
| | |
Luzhou Laojiao Co., Ltd., Class A (China) | | | 20,000 | | | | 642,688 | |
| | |
Woolworths Group, Ltd. (Australia) | | | 65,000 | | | | 1,484,303 | |
| | |
Total Consumer Staples | | | | | | | 11,848,873 | |
| |
Financials - 11.9% | | | | | |
| | |
ASX, Ltd. (Australia) | | | 50,000 | | | | 2,302,810 | |
| | |
HDFC Bank, Ltd., ADR (India) | | | 76,816 | | | | 5,254,983 | |
| | |
Hong Kong Exchanges & Clearing, Ltd. (Hong Kong) | | | 86,800 | | | | 3,729,818 | |
| | |
ICICI Bank, Ltd., Sponsored ADR (India) | | | 100,000 | | | | 2,189,000 | |
| | |
Total Financials | | | | | | | 13,476,611 | |
| |
Health Care - 8.8% | | | | | |
| | |
CSL, Ltd. (Australia) | | | 46,574 | | | | 9,081,655 | |
| | |
ResMed, Inc. (United States) | | | 40,000 | | | | 840,744 | |
| | |
Total Health Care | | | | | | | 9,922,399 | |
| |
Industrials - 7.0% | | | | | |
| | |
Centre Testing International Group Co., Ltd., Class A (China) | | | 544,800 | | | | 1,745,067 | |
| | |
NARI Technology Co., Ltd. (China) | | | 399,998 | | | | 1,397,908 | |
| | |
Shenzhen Inovance Technology Co., Ltd., Class A (China) | | | 286,297 | | | | 2,856,630 | |
| | |
Wuxi Lead Intelligent Equipment Co., Ltd., Class A (China) | | | 323,998 | | | | 1,869,164 | |
| | |
Total Industrials | | | | | | | 7,868,769 | |
| |
Information Technology - 9.4% | | | | | |
| | |
Infosys, Ltd., Sponsored ADR (India) | | | 120,000 | | | | 2,161,200 | |
| | |
Samsung Electronics Co., Ltd. (South Korea) | | | 87,650 | | | | 3,847,243 | |
| | |
Taiwan Semiconductor Manufacturing Co., Ltd. (Taiwan) | | | 320,400 | | | | 4,653,318 | |
| | |
Total Information Technology | | | | | | | 10,661,761 | |
| | | | | | | | |
| | | | | | | | |
| | | Shares | | | Value | |
| |
Materials - 3.4% | | | | | |
| | |
LG Chem, Ltd. (South Korea) | | | 8,090 | | | | $3,863,212 | |
| |
Real Estate - 3.3% | | | | | |
| | |
Goodman Group, REIT (Australia) | | | 317,346 | | | | 3,732,101 | |
| |
Total Common Stocks
(Cost $103,869,771) | | | | 87,235,943 | |
| |
| Participation Notes - 22.4% | | | | | |
| |
Consumer Discretionary - 2.7% | | | | | |
| | |
Titan Co., Ltd. (CLSA Ltd.), 06/30/28 (India) | | | 50,000 | | | | 1,568,815 | |
| | |
Zomato, Ltd. (CLSA Ltd.), 07/22/26 (India) | | | 2,000,000 | | | | 1,433,760 | |
| | |
Total Consumer Discretionary | | | | | | | 3,002,575 | |
| |
Consumer Staples - 5.0% | | | | | |
| | |
Hindustan Unilever, Ltd. (CLSA Ltd.), 06/30/25 (India) | | | 134,500 | | | | 4,155,169 | |
| | |
Nestle India, Ltd. (CLSA Ltd.), 02/19/25 (India) | | | 6,300 | | | | 1,490,305 | |
| | |
Total Consumer Staples | | | | | | | 5,645,474 | |
| |
Energy - 2.3% | | | | | |
| | |
Reliance Industries Ltd. (CLSA Ltd.), 06/30/25 (India) | | | 84,000 | | | | 2,578,852 | |
| |
Financials - 3.6% | | | | | |
| | |
Kotak Mahindra Bank, Ltd. (CLSA Ltd.), 06/02/25 (India) | | | 187,500 | | | | 4,125,244 | |
| |
Health Care - 3.7% | | | | | |
| | |
Apollo Hospitals Enterprise, Ltd. (CLSA Ltd.), 06/30/27 (India) | | | 58,000 | | | | 3,134,212 | |
| | |
Max Healthcare Institute, Ltd. (CLSA Ltd.), 04/06/26 (India) | | | 198,000 | | | | 1,049,909 | |
| | |
Total Health Care | | | | | | | 4,184,121 | |
| |
Information Technology - 2.5% | | | | | |
| | |
Info Edge India, Ltd. (CLSA Ltd.), 12/31/24 (India) | | | 10,000 | | | | 474,817 | |
| | |
Tata Consultancy Services, Ltd. (CLSA Ltd.), 02/25/25 (India) | | | 60,731 | | | | 2,388,375 | |
| | |
Total Information Technology | | | | | | | 2,863,192 | |
| |
Materials - 2.6% | | | | | |
| | |
Asian Paints, Ltd. (CLSA Ltd.), 06/30/25 (India) | | | 78,500 | | | | 2,918,330 | |
| |
Total Participation Notes
(Cost $26,839,552) | | | | 25,317,788 | |
| |
| Short-Term Investments - 2.4% | | | | | |
| |
Other Investment Companies - 2.4% | | | | | |
| | |
Dreyfus Government Cash Management Fund, Institutional Shares, 4.19%2 | | | 1,079,141 | | | | 1,079,141 | |
| | |
Dreyfus Institutional Preferred Government Money Market Fund, Institutional Shares, 4.27%2 | | | 1,615,816 | | | | 1,615,816 | |
| |
Total Short-Term Investments
(Cost $2,694,957) | | | | 2,694,957 | |
| | | | | | | | |
The accompanying notes are an integral part of these financial statements.
8
| | |
| | |
| | | AMG Veritas Asia Pacific Fund Schedule of Portfolio Investments (continued) |
| | | |
| | | |
| | | |
| | | | | | | | |
| | | | | | Value | |
| |
Total Investments - 102.0%
(Cost $133,404,280) | | | | $115,248,688 | |
| | |
Other Assets, less Liabilities - (2.0)% | | | | | | | (2,231,122 | ) |
| | |
Net Assets - 100.0% | | | | | | | $113,017,566 | |
| | | | | | | | |
| * | Non-income producing security. |
| 1 | Security exempt from registration under Rule 144A of the Securities Act of 1933. This security may be resold in transactions exempt from registration, normally to qualified institutional buyers. At December 31, 2022, the value of this security amounted to $6,092,855 or 5.4% of net assets. |
| 2 | Yield shown represents the December 31, 2022, seven day average yield, which refers to the sum of the previous seven days’ dividends paid, expressed as an annual percentage. |
| | |
| ADR | | American Depositary Receipt |
| |
| REIT | | Real Estate Investment Trust |
The following table summarizes the inputs used to value the Fund’s investments by the fair value hierarchy levels as of December 31, 2022:
| | | | | | | | | | | | | | | | |
| | | Level 1 | | | Level 21 | | | Level 3 | | | Total | |
| | | | |
Investments in Securities | | | | | | | | | | | | | | | | |
| | | | |
Common Stocks | | | | | | | | | | | | | | | | |
| | | | |
Consumer Discretionary | | | $3,262,000 | | | | $14,801,909 | | | | — | | | | $18,063,909 | |
| | | | |
Financials | | | 7,443,983 | | | | 6,032,628 | | | | — | | | | 13,476,611 | |
| | | | |
Consumer Staples | | | — | | | | 11,848,873 | | | | — | | | | 11,848,873 | |
| | | | |
Information Technology | | | 2,161,200 | | | | 8,500,561 | | | | — | | | | 10,661,761 | |
| | | | |
Health Care | | | — | | | | 9,922,399 | | | | — | | | | 9,922,399 | |
| | | | |
Industrials | | | — | | | | 7,868,769 | | | | — | | | | 7,868,769 | |
| | | | |
Communication Services | | | — | | | | 7,798,308 | | | | — | | | | 7,798,308 | |
| | | | |
Materials | | | — | | | | 3,863,212 | | | | — | | | | 3,863,212 | |
| | | | |
Real Estate | | | — | | | | 3,732,101 | | | | — | | | | 3,732,101 | |
| | | | |
Participation Notes† | | | — | | | | 25,317,788 | | | | — | | | | 25,317,788 | |
| | | | |
Short-Term Investments | | | | | | | | | | | | | | | | |
| | | | |
Other Investment Companies | | | 2,694,957 | | | | — | | | | — | | | | 2,694,957 | |
| | | | | | | | | | | | | | | | |
| | | | |
Total Investments in Securities | | | $15,562,140 | | | | $99,686,548 | | | | — | | | | $115,248,688 | |
| | | | | | | | | | | | | | | | |
| † | All participation notes held in the Fund are Level 2 securities. For a detailed breakout of participation notes by major industry classification, please refer to the Fund’s Schedule of Portfolio Investments. |
| 1 | An external pricing service is used to reflect any impact on security value due to market movements between the time the Fund valued such foreign securities and the earlier closing of foreign markets. |
For the fiscal year ended December 31, 2022, there were no transfers in or out of Level 3. The Fund sold a Level 3 common stock that was received as a result of a corporate action. Proceeds from the sale was $3,445, and the Fund realized a loss of $(197,251).
The accompanying notes are an integral part of these financial statements.
9
| | |
| | |
| | | AMG Veritas Asia Pacific Fund Schedule of Portfolio Investments (continued) |
| | | |
| | | |
| | | |
The country allocation in the Schedule of Portfolio Investments at December 31, 2022, was as follows:
| | | | |
| Country | | % of Long-Term
Investments |
| |
| Australia | | | 16.1 | |
| |
| China | | | 36.4 | |
| |
| Hong Kong | | | 3.3 | |
| |
| India | | | 31.0 | |
| |
| Macau | | | 1.5 | |
| |
| South Korea | | | 6.9 | |
| |
| Taiwan | | | 4.1 | |
| |
| United States | | | 0.7 | |
| | | | |
| | | 100.0 | |
| | | | |
The accompanying notes are an integral part of these financial statements.
10
| | |
| | |
| | | Statement of Assets and Liabilities December 31, 2022 |
| | | |
| | | |
| | | |
| | | | | |
| | | AMG Veritas
Asia
Pacific Fund |
| |
Assets: | | | | | |
| |
Investments at value1 | | | | $115,248,688 | |
| |
Dividend and interest receivables | | | | 155,224 | |
| |
Receivable for Fund shares sold | | | | 12,866 | |
| |
Receivable from affiliate | | | | 13,910 | |
| |
Prepaid expenses and other assets | | | | 10,892 | |
| |
Total assets | | | | 115,441,580 | |
| |
Liabilities: | | | | | |
| |
Payable for investments purchased | | | | 2,066,976 | |
| |
Payable for Fund shares repurchased | | | | 136,538 | |
| |
Accrued expenses: | | | | | |
| |
Investment advisory and management fees | | | | 70,458 | |
| |
Administrative fees | | | | 14,885 | |
| |
Shareholder service fees | | | | 22,129 | |
| |
Other | | | | 113,028 | |
| |
Total liabilities | | | | 2,424,014 | |
| | | | | |
| |
Net Assets | | | | $113,017,566 | |
| |
1 Investments at cost | | | | $133,404,280 | |
The accompanying notes are an integral part of these financial statements.
11
| | |
| | |
| | | Statement of Assets and Liabilities (continued) |
| | | |
| | | |
| | | |
| | | | | |
| | | AMG Veritas
Asia
Pacific Fund |
| |
Net Assets Represent: | | | | | |
| |
Paid-in capital | | | | $160,864,624 | |
| |
Total distributable loss | | | | (47,847,058 | ) |
| |
Net Assets | | | | $113,017,566 | |
| |
Class N: | | | | | |
| |
Net Assets | | | | $100,678,535 | |
| |
Shares outstanding | | | | 1,694,539 | |
| |
Net asset value, offering and redemption price per share | | | | $59.41 | |
| |
Class I: | | | | | |
| |
Net Assets | | | | $12,339,031 | |
| |
Shares outstanding | | | | 189,405 | |
| |
Net asset value, offering and redemption price per share | | | | $65.15 | |
The accompanying notes are an integral part of these financial statements.
14
| | |
| | |
| | | Statement of Operations For the fiscal year ended December 31, 2022 |
| | | |
| | | |
| | | |
| | | | | |
| | | AMG Veritas
Asia
Pacific Fund |
| |
Investment Income: | | | | | |
| |
Dividend income | | | | $1,719,593 | |
| |
Interest income | | | | 2,629 | |
| |
Securities lending income | | | | 18 | |
| |
Foreign withholding tax | | | | (230,324 | ) |
| |
Total investment income | | | | 1,491,916 | |
| |
Expenses: | | | | | |
| |
Investment advisory and management fees | | | | 956,383 | |
| |
Administrative fees | | | | 202,053 | |
| |
Shareholder servicing fees - Class N | | | | 301,215 | |
| |
Custodian fees | | | | 103,839 | |
| |
Professional fees | | | | 48,520 | |
| |
Registration fees | | | | 30,566 | |
| |
Reports to shareholders | | | | 20,417 | |
| |
Transfer agent fees | | | | 18,160 | |
| |
Trustee fees and expenses | | | | 9,276 | |
| |
Miscellaneous | | | | 7,400 | |
| |
Total expenses before offsets | | | | 1,697,829 | |
| |
Expense reimbursements | | | | (143,886 | ) |
| |
Net expenses | | | | 1,553,943 | |
| | | | | |
| |
Net investment loss | | | | (62,027 | ) |
| |
Net Realized and Unrealized Loss: | | | | | |
| |
Net realized loss on investments | | | | (29,413,760 | ) |
| |
Net realized loss on foreign currency transactions | | | | (39,858 | ) |
| |
Net change in unrealized appreciation/depreciation on investments | | | | (20,516,895 | ) |
| |
Net change in unrealized appreciation/depreciation on foreign currency translations | | | | 2,351 | |
| |
Net realized and unrealized loss | | | | (49,968,162 | ) |
| | | | | |
| |
Net decrease in net assets resulting from operations | | | | $(50,030,189) | |
The accompanying notes are an integral part of these financial statements.
13
| | |
| | |
| | | Statements of Changes in Net Assets For the fiscal years ended December 31, |
| | | |
| | | |
| | | |
| | | | | | | | | | | | |
| | | AMG Veritas
Asia Pacific Fund | |
| | | |
| | | 2022 | | | | | | 2021 | |
| | | |
Increase (Decrease) in Net Assets Resulting From Operations: | | | | | | | | | | | | |
| | | |
Net investment loss | | | $(62,027 | ) | | | | | | | $(1,496,355 | ) |
| | | |
Net realized gain (loss) on investments | | | (29,453,618 | ) | | | | | | | 90,803,559 | |
| | | |
Net change in unrealized appreciation/depreciation on investments | | | (20,514,544 | ) | | | | | | | (79,240,711 | ) |
| | | |
Net increase (decrease) in net assets resulting from operations | | | (50,030,189 | ) | | | | | | | 10,066,493 | |
| | | |
Distributions to Shareholders: | | | | | | | | | | | | |
| | | |
From net investment income and/or realized gain on investments: | | | | | | | | | | | | |
| | | |
Class N | | | — | | | | | | | | (78,253,343 | ) |
| | | |
Class I | | | — | | | | | | | | (14,229,481 | ) |
| | | |
From paid-in capital: | | | | | | | | | | | | |
| | | |
Class N | | | — | | | | | | | | (16,749,799 | ) |
| | | |
Class I | | | — | | | | | | | | (3,045,760 | ) |
| | | |
Total distributions to shareholders | | | — | | | | | | | | (112,278,383 | ) |
| | | |
Capital Share Transactions:1 | | | | | | | | | | | | |
| | | |
Net increase (decrease) from capital share transactions | | | (25,186,161 | ) | | | | | | | 41,059,273 | |
| | | | | | | | | | | | |
| | | |
Total decrease in net assets | | | (75,216,350 | ) | | | | | | | (61,152,617 | ) |
| | | |
Net Assets: | | | | | | | | | | | | |
| | | |
Beginning of year | | | 188,233,916 | | | | | | | | 249,386,533 | |
| | | |
End of year | | | $113,017,566 | | | | | | | | $188,233,916 | |
1 See Note 1(g) of the Notes to Financial Statements.
The accompanying notes are an integral part of these financial statements.
14
| | |
| | |
| | | AMG Veritas Asia Pacific Fund Financial Highlights For a share outstanding throughout each fiscal year |
| | | |
| | | |
| | | |
| | | | | | | | | | | | | | | | | | | | |
| | | For the fiscal years ended December 31, |
| | | | | |
| Class N | | 2022 | | 2021 | | 2020 | | 2019 | | 2018 |
| | | | | |
Net Asset Value, Beginning of Year | | | $82.42 | | | | $147.58 | | | | $111.15 | | | | $114.95 | | | | $119.45 | |
| | | | | |
Income (loss) from Investment Operations: | | | | | | | | | | | | | | | | | | | | |
| | | | | |
Net investment loss1,2 | | | (0.05 | ) | | | (0.67 | ) | | | (1.03 | ) | | | (1.03 | ) | | | (0.91 | ) |
| | | | | |
Net realized and unrealized gain (loss) on investments | | | (22.96 | ) | | | 4.55 | | | | 43.88 | | | | 30.19 | | | | (3.59 | ) |
| | | | | |
Total income (loss) from investment operations | | | (23.01 | ) | | | 3.88 | | | | 42.85 | | | | 29.16 | | | | (4.50 | ) |
| | | | | |
Less Distributions to Shareholders from: | | | | | | | | | | | | | | | | | | | | |
| | | | | |
Net realized gain on investments | | | — | | | | (56.87 | ) | | | (6.42 | ) | | | (32.96 | ) | | | — | |
| | | | | |
Paid in capital | | | — | | | | (12.17 | ) | | | — | | | | — | | | | — | |
| | | | | |
Total distributions to shareholders | | | — | | | | (69.04 | ) | | | (6.42 | ) | | | (32.96 | ) | | | — | |
| | | | | |
Net Asset Value, End of Year | | | $59.41 | | | | $82.42 | | | | $147.58 | | | | $111.15 | | | | $114.95 | |
| | | | | |
Total Return2,3 | | | (27.91 | )% | | | 3.16 | % | | | 38.74 | % | | | 25.69 | % | | | (3.76 | )% |
| | | | | |
Ratio of net expenses to average net assets | | | 1.18 | % | | | 1.27 | %4 | | | 1.36 | %4 | | | 1.36 | %4 | | | 1.36 | %4 |
| | | | | |
Ratio of gross expenses to average net assets5 | | | 1.29 | % | | | 1.31 | % | | | 1.42 | % | | | 1.42 | % | | | 1.38 | % |
| | | | | |
Ratio of net investment loss to average net assets2 | | | (0.07 | )% | | | (0.69 | )% | | | (0.89 | )% | | | (0.76 | )% | | | (0.69 | )% |
| | | | | |
Portfolio turnover | | | 54 | % | | | 222 | % | | | 100 | % | | | 96 | % | | | 113 | % |
| | | | | |
Net assets end of year (000’s) omitted | | | $100,679 | | | | $166,168 | | | | $204,794 | | | | $171,801 | | | | $170,744 | |
| | | | | |
| | | | | | | | | | | | | | | | | | | | | |
15
| | |
| | |
| | | AMG Veritas Asia Pacific Fund Financial Highlights For a share outstanding throughout each fiscal year |
| | | |
| | | |
| | | |
| | | | | | | | | | | | | | | | | | | | |
| | | For the fiscal years ended December 31, |
| | | | | |
| Class I | | 2022 | | 2021 | | 2020 | | 2019 | | 2018 |
| | | | | |
Net Asset Value, Beginning of Year | | | $90.15 | | | | $154.81 | | | | $116.08 | | | | $118.57 | | | | $122.90 | |
| | | | | |
Income (loss) from Investment Operations: | | | | | | | | | | | | | | | | | | | | |
| | | | | |
Net investment income (loss)1,2 | | | 0.13 | | | | (0.48 | ) | | | (0.77 | ) | | | (0.72 | ) | | | (0.60 | ) |
| | | | | |
Net realized and unrealized gain (loss) on investments | | | (25.13 | ) | | | 4.86 | | | | 45.92 | | | | 31.19 | | | | (3.73 | ) |
| | | | | |
Total income (loss) from investment operations | | | (25.00 | ) | | | 4.38 | | | | 45.15 | | | | 30.47 | | | | (4.33 | ) |
| | | | | |
Less Distributions to Shareholders from: | | | | | | | | | | | | | | | | | | | | |
| | | | | |
Net realized gain on investments | | | — | | | | (56.87 | ) | | | (6.42 | ) | | | (32.96 | ) | | | — | |
| | | | | |
Paid in capital | | | — | | | | (12.17 | ) | | | — | | | | — | | | | — | |
| | | | | |
Total distributions to shareholders | | | — | | | | (69.04 | ) | | | (6.42 | ) | | | (32.96 | ) | | | — | |
| | | | | |
Net Asset Value, End of Year | | | $65.15 | | | | $90.15 | | | | $154.81 | | | | $116.08 | | | | $118.57 | |
| | | | | |
Total Return2,3 | | | (27.73 | )% | | | 3.43 | % | | | 39.08 | % | | | 26.02 | % | | | (3.52 | )% |
| | | | | |
Ratio of net expenses to average net assets | | | 0.93 | % | | | 1.02 | %4 | | | 1.11 | %4 | | | 1.11 | %4 | | | 1.11 | %4 |
| | | | | |
Ratio of gross expenses to average net assets5 | | | 1.04 | % | | | 1.06 | % | | | 1.17 | % | | | 1.17 | % | | | 1.13 | % |
| | | | | |
Ratio of net investment income (loss) to average net assets2 | | | 0.18 | % | | | (0.44 | )% | | | (0.64 | )% | | | (0.51 | )% | | | (0.44 | )% |
| | | | | |
Portfolio turnover | | | 54 | % | | | 222 | % | | | 100 | % | | | 96 | % | | | 113 | % |
| | | | | |
Net assets end of year (000’s) omitted | | | $12,339 | | | | $22,066 | | | | $44,593 | | | | $38,093 | | | | $31,253 | |
| | | | | |
| | | | | | | | | | | | | | | | | | | | | |
| 1 | Per share numbers have been calculated using average shares. |
| 2 | Total returns and net investment income (loss) would have been lower had certain expenses not been offset. |
| 3 | The total return is calculated using the published Net Asset Value as of fiscal year end. |
| 4 | Includes reduction from broker recapture amounting to less than 0.01% for the fiscal years ended December 31, 2021, 2020, 2019 and 2018, respectively. |
| 5 | Excludes the impact of expense reimbursement or fee waivers and expense reductions such as brokerage credits, but includes expense repayments and non-reimbursable expenses, if any, such as interest, taxes, and extraordinary expenses. (See Note 1(c) and 2 in the Notes to Financial Statements.) |
16
| | |
| | |
| | | Notes to Financial Statements December 31, 2022 |
| | | |
| | | |
| | | |
1. ORGANIZATION AND SUMMARY OF SIGNIFICANT ACCOUNTING POLICIES
AMG Funds III (the “Trust”) is an open-end management investment company, organized as a Massachusetts business trust, and registered under the Investment Company Act of 1940, as amended (the “1940 Act”). Currently, the Trust consists of a number of different funds, each having distinct investment management objectives, strategies, risks, and policies. Included in this report is AMG Veritas Asia Pacific Fund (the “Fund”).
The Fund offers Class N and Class I shares. Each class represents an interest in the same assets of the Fund. Although all share classes generally have identical voting rights, each share class votes separately when required by law. Different share classes may have different net asset values per share to the extent the share classes pay different distribution amounts and/or the expenses of such share classes differ. Each share class has its own expense structure. Please refer to a current prospectus for additional information on each share class.
The Fund is non-diversified. A greater percentage of the Fund’s holdings may be focused in a smaller number of securities which may place the Fund at greater risk than a more diversified fund.
Market prices of investments held by the Fund may fall rapidly or unpredictably due to a variety of economic or political factors, market conditions, disasters or public health issues, or in response to events that affect particular industries or companies.
The Fund’s financial statements are prepared in accordance with accounting principles generally accepted in the United States of America (“U.S. GAAP”), including accounting and reporting guidance pursuant to Accounting Standards Codification Topic 946 applicable to investment companies. U.S. GAAP requires management to make estimates and assumptions that affect the reported amounts of assets and liabilities and disclosure of contingent assets and liabilities at the date of the financial statements and the reported amounts of income and expenses during the reporting period. Actual results could differ from those estimates and such differences could be material. The following is a summary of significant accounting policies followed by the Fund in the preparation of its financial statements:
a. VALUATION OF INVESTMENTS
Equity securities traded on a national securities exchange or reported on the NASDAQ national market system (“NMS”) are valued at the last quoted sales price on the primary exchange or, if applicable, the NASDAQ official closing price or the official closing price of the relevant exchange or, lacking any sales, at the last quoted bid price. Equity securities held by the Fund that are traded in the over-the-counter market (other than NMS securities) are valued at the bid price. Foreign equity securities (securities principally traded in markets other than U.S. markets) held by the Fund are valued at the official closing price on the primary exchange or, for markets that either do not offer an official closing price or where the official closing price may not be representative of the overall market, the last quoted sale price.
Fixed income securities purchased with a remaining maturity of 60 days or less are valued at amortized cost, provided that the amortized cost value is approximately the same as the fair value of the security valued without the use of amortized cost. Investments in other open-end registered investment companies are valued at their end of day net asset value per share.
Participation notes (“P-Notes”) are valued using the underlying equity security’s official closing price on the primary exchange or, for markets that either do not offer an official closing price or where the official closing price may not be representative of the overall market, the last quoted sale price.
The Fund’s portfolio investments are generally valued based on independent market quotations or prices or, if none, “evaluative” or other market based valuations provided by third party pricing services approved by the Board of Trustees of the Trust (the “Board”). Under certain circumstances, the value of certain Fund portfolio investments may be based on an evaluation of fair value, pursuant to procedures established by and under the general supervision of the Board. The Valuation Committee, which is comprised of the Independent Trustees of the Board, and the Pricing Committee, which is comprised of representatives from AMG Funds LLC (the “Investment Manager”) are the committees appointed by the Board to make fair value determinations. The Fund may use the fair value of a portfolio investment to calculate its net asset value (“NAV”) in the event that the market quotation, price or market based valuation for the portfolio investment is not readily available or otherwise not determinable pursuant to the Board’s valuation procedures, if the Investment Manager or the Pricing Committee believes the quotation, price or market based valuation to be unreliable, or in certain other circumstances. When determining the fair value of an investment, the Pricing Committee and, if required under the Trust’s securities valuation procedures, the Valuation Committee, seeks to determine the price that the Fund might reasonably expect to receive from current sale of that portfolio investment in an arms-length transaction. Fair value determinations shall be based upon consideration of all available facts and information, including, but not limited to (i) attributes specific to the investment; (ii) fundamental and analytical data relating to the investment; and (iii) the value of other comparable securities or relevant financial instruments, including derivative securities, traded on other markets or among dealers.
The values assigned to fair value portfolio investments are based on available information and do not necessarily represent amounts that might ultimately be realized in the future, since such amounts depend on future developments inherent in long-term investments. Because of the inherent uncertainty of valuation, those estimated values may differ significantly from the values that would have been used had a ready market for the investments existed, and the differences could be material. The Board will be presented with a quarterly report showing as of the most recent quarter end, all outstanding securities fair valued by the Fund, including a comparison with the prior quarter end and the percentage of the Fund that the security represents at each quarter end.
With respect to foreign equity securities and certain foreign fixed income securities, the Board has adopted a policy that securities held in the Fund that can be fair valued by the applicable fair value pricing service are fair valued on each business day provided that each individual price exceeds a pre-established confidence level.
Effective September 8, 2022, the Fund adopted the requirements of Rule 2a-5 under the 1940 Act (“Rule 2a-5”), which the Fund’s Board designated the Fund’s Investment Manager as the Fund’s Valuation Designee to perform the Fund’s fair value determinations. Such determinations are subject to Board oversight and certain reporting and other requirements intended to ensure that the Board receives the information it needs to oversee the Investment Manager’s fair value determinations. Other than the designation of the Investment Manager as the Valuation Designee, the Fund’s adoption of Rule 2-a5 did not impact how the Fund determines fair value or the carrying amount of investments held in the Fund.
| | |
| | |
| | | Notes to Financial Statements (continued) |
| | | |
| | | |
| | | |
U.S. GAAP defines fair value as the price that a fund would receive to sell an asset or pay to transfer a liability in an orderly transaction between market participants at the measurement date. U.S. GAAP also establishes a framework for measuring fair value, and a three level hierarchy for fair value measurements based upon the transparency of inputs to the valuation of an asset or liability. Inputs may be observable or unobservable and refer broadly to the assumptions that market participants would use in pricing the asset or liability. Observable inputs reflect the assumptions market participants would use in pricing the asset or liability based on market data obtained from sources independent of the Fund. Unobservable inputs reflect the Fund’s own assumptions about the assumptions that market participants would use in pricing the asset or liability developed based on the best information available in the circumstances. Each investment is assigned a level based upon the observability of the inputs which are significant to the overall valuation.
The three-tier hierarchy of inputs is summarized below:
Level 1 – inputs are quoted prices in active markets for identical investments (e.g., equity securities, open-end investment companies)
Level 2 – other observable inputs (including, but not limited to: quoted prices for similar assets or liabilities in markets that are active, quoted prices for identical or similar assets or liabilities in markets that are not active, inputs other than quoted prices that are observable for the assets or liabilities (such as interest rates, yield curves, volatilities, prepayment speeds, loss severities, credit risks and default rates) or other market corroborated inputs) (e.g., debt securities, government securities, foreign currency exchange contracts, P-Notes, foreign securities utilizing international fair value pricing, fair valued securities with observable inputs)
Level 3 – inputs are significant unobservable inputs (including the Fund’s own assumptions used to determine the fair value of investments) (e.g., fair valued securities with unobservable inputs)
Changes in inputs or methodologies used for valuing investments may result in a transfer in or out of levels within the fair value hierarchy. The inputs or methodologies used for valuing investments may not necessarily be an indication of the risk associated with investing in those investments.
b. SECURITY TRANSACTIONS
Security transactions are accounted for as of trade date. Realized gains and losses on securities sold are determined on the basis of identified cost.
c. INVESTMENT INCOME AND EXPENSES
Dividend income is recorded on the ex-dividend date. Dividends from foreign securities are recorded on the ex-dividend date, and if after the fact, as soon as the Fund becomes aware of the ex-dividend date, except for Korean securities where dividends are recorded on confirmation date. Interest income, which includes amortization of premium and accretion of discount on debt securities, is accrued as earned. Dividend and interest income on foreign securities is recorded gross of any withholding tax. Non-cash dividends included in dividend income, if any, are reported at the fair market value of the securities received. Other income and expenses are recorded on an accrual basis. Expenses that cannot be directly attributed to a Fund are apportioned among the funds in the Trust and other trusts or funds within the AMG Funds Family of Funds (collectively the “AMG Funds Family”) based upon their relative average net assets or number of shareholders. Investment income, realized and unrealized capital gains and losses, the common expenses of the Fund, and certain fund level expense reductions, if any, are allocated on a pro-rata basis to each class based on the relative net assets of each class to the total net assets of the Fund.
d. DIVIDENDS AND DISTRIBUTIONS
Fund distributions resulting from either net investment income or realized net capital gains, if any, will normally be declared and paid at least annually in December. Distributions to shareholders are recorded on the ex-dividend date. Distributions are determined in accordance with federal income tax regulations, which may differ from net investment income and net realized capital gains for financial statement purposes (U.S. GAAP). Differences may be permanent or temporary. Permanent differences are reclassified among capital accounts in the financial statements to reflect their tax character. Permanent book and tax basis differences, if any, relating to shareholder distributions will result in reclassifications to paid-in capital. Temporary differences arise when certain items of income, expense and gain or loss are recognized in different periods for financial statement and tax purposes; these differences will reverse at some time in the future. Permanent differences are primarily due to adjustments related to net operating losses. Temporary differences are primarily due to wash sale loss deferrals and the deferral of qualified late year ordinary losses.
The tax character of distributions paid during the fiscal years ended December 31, 2022 and December 31, 2021 were as follows:
| | | | | | | | |
| | |
| Distributions paid from: | | 2022 | | | 2021 | |
| | |
Ordinary income * | | | — | | | | $37,755,763 | |
| | |
Long-term capital gains | | | — | | | | 54,727,061 | |
| | |
Paid-in capital | | | — | | | | 19,795,559 | |
| | | | | | | | |
| | |
| | | — | | | | $112,278,383 | |
| | | | | | | | |
* For tax purposes, short-term capital gain distributions, if any, are considered ordinary income distributions.
18
| | |
| | |
| | | Notes to Financial Statements (continued) |
| | | |
| | | |
| | | |
As of December 31, 2022, the components of distributable earnings (excluding unrealized appreciation/depreciation) on a tax basis consisted of:
| | | | |
| |
Capital loss carryforward | | | $28,957,249 | |
| |
Late-year ordinary loss deferral | | | 101,565 | |
At December 31, 2022, the cost of investments and the aggregate gross unrealized appreciation and depreciation for federal income tax purposes were as follows:
| | | | | | | | | | | | |
| | | |
| Cost | | Appreciation | | | Depreciation | | | Net Depreciation | |
| | | |
$134,039,386 | | | $3,204,196 | | | | $(21,992,440 | ) | | | $(18,788,244 | ) |
e. FEDERAL TAXES
The Fund currently qualifies as an investment company and intends to comply with the requirements under Subchapter M of the Internal Revenue Code of 1986, as amended, and to distribute substantially all of its taxable income and gains to its shareholders and to meet certain diversification and income requirements with respect to investment companies. Therefore, no provision for federal income or excise tax is included in the accompanying financial statements.
Additionally, based on the Fund’s understanding of the tax rules and rates related to income, gains and transactions for the foreign jurisdictions in which it invests, the Fund will provide for foreign taxes, and where appropriate, deferred foreign taxes.
Management has analyzed the Fund’s tax positions taken on federal income tax returns as of December 31, 2022, and for all open tax years (generally, the three prior taxable years), and has concluded that no provision for federal income tax is required in the Fund’s financial statements. Additionally, Management is not aware of any tax position for which it is reasonably possible that the total amounts of unrecognized tax benefits will change materially in the next twelve months.
f. CAPITAL LOSS CARRYOVERS AND DEFERRALS
As of December 31, 2022, the Fund had capital loss carryovers for federal income tax purposes as shown in the following chart. These amounts may be used to offset future realized capital gains indefinitely, and retain their character as short-term and/or long-term.
| | | | | | | | | | |
| | |
| Short-Term | | | Long-Term | | | Total | |
| | |
| | $14,242,658 | | | | $14,714,591 | | | | $28,957,249 | |
g. CAPITAL STOCK
The Trust’s Declaration of Trust authorizes for the Fund the issuance of an unlimited number of shares of beneficial interest, without par value. The Fund records sales and repurchases of its capital stock on the trade date.
For the fiscal years ended December 31, 2022 and December 31, 2021, the capital stock transactions by class for the Fund were as follows:
| | | | | | | | | | | | | | | | |
| | | December 31, 2022 | | | December 31, 2021 | |
| | | Shares | | | Amount | | | Shares | | | Amount | |
| | | | |
Class N: | | | | | | | | | | | | | | | | |
| | | | |
Shares sold | | | 20,954 | | | | $1,393,716 | | | | 55,947 | | | | $5,742,835 | |
| | | | |
Shares issued in reinvestment of distributions | | | — | | | | — | | | | 1,128,609 | | | | 91,981,675 | |
| | | | |
Shares redeemed | | | (342,453) | | | | (22,253,505) | | | | (556,214) | | | | (49,186,622) | |
| | | | | | | | | | | | | | | | |
| | | | |
Net increase (decrease) | | | (321,499) | | | | $(20,859,789) | | | | 628,342 | | | | $48,537,888 | |
| | | | | | | | | | | | | | | | |
| | | | |
Class I: | | | | | | | | | | | | | | | | |
| | | | |
Shares sold | | | 58,053 | | | | $4,112,834 | | | | 63,510 | | | | $7,190,492 | |
| | | | |
Shares issued in reinvestment of distributions | | | — | | | | — | | | | 192,066 | | | | 17,088,128 | |
| | | | |
Shares redeemed | | | (113,414) | | | | (8,439,206) | | | | (298,858) | | | | (31,757,235) | |
| | | | | | | | | | | | | | | | |
| | | | |
Net decrease | | | (55,361) | | | | $(4,326,372) | | | | (43,282) | | | | $(7,478,615) | |
| | | | | | | | | | | | | | | | |
19
| | |
| | |
| | | Notes to Financial Statements (continued) |
| | | |
| | | |
| | | |
h. REPURCHASE AGREEMENTS AND JOINT REPURCHASE AGREEMENTS
The Fund may enter into third-party and bilateral repurchase agreements for temporary cash management purposes and third-party or bilateral joint repurchase agreements for reinvestment of cash collateral on securities lending transactions under the securities lending program offered by The Bank of New York Mellon (“BNYM”) (the “Program”) (collectively, “Repurchase Agreements”). The value of the underlying collateral, including accrued interest, must equal or exceed the value of the Repurchase Agreements during the term of the agreement. For joint repurchase agreements, the Fund participates on a pro rata basis with other clients of BNYM in its share of the underlying collateral under such joint repurchase agreements and in its share of proceeds from any repurchase or other disposition of the underlying collateral. The underlying collateral for all Repurchase Agreements is held in safekeeping by the Fund’s custodian or at the Federal Reserve Bank. If the seller defaults and the value of the collateral declines, or if bankruptcy proceedings commence with respect to the seller of the security, realization of the collateral by the Fund may be delayed or limited. Pursuant to the Program, the Fund is indemnified for such losses by BNYM on joint repurchase agreements.
At December 31, 2022, there are no outstanding Repurchase Agreements for the Fund.
i. FOREIGN CURRENCY TRANSLATION
The books and records of the Fund are maintained in U.S. Dollars. The value of investments, assets and liabilities denominated in currencies other than U.S. Dollars are translated into U.S. Dollars based upon current foreign exchange rates. Purchases and sales of foreign investments, income and expenses are converted into U.S. Dollars based on currency exchange rates prevailing on the respective dates of such transactions. Net realized and unrealized gain (loss) on foreign currency transactions represent: (1) foreign exchange gains and losses from the sale and holdings of foreign currencies; (2) gains and losses between trade date and settlement date on investment securities transactions and foreign currency exchange contracts; and (3) gains and losses from the difference between amounts of interest and dividends recorded and the amounts actually received.
The Fund does not isolate the net realized and unrealized gain or loss resulting from changes in exchange rates from the fluctuations in market prices of securities held. Such fluctuations are included with the net realized and unrealized gain or loss on investments.
2. AGREEMENTS AND TRANSACTIONS WITH AFFILIATES
The Trust has entered into an investment advisory agreement under which the Investment Manager, a subsidiary and the U.S. retail distribution arm of Affiliated Managers Group, Inc. (“AMG”), serves as investment manager to the Fund and is responsible for the Fund’s overall administration and operations. The Investment Manager selects one or more subadvisers for the Fund (subject to Board approval) and monitors each subadviser’s investment performance, security holdings and investment strategies. The Fund’s investment portfolio is managed by Veritas Asset Management LLP (“Veritas”) who serves pursuant to a subadvisory agreement with the Investment Manager. AMG indirectly owns a majority interest in Veritas.
Investment management fees are paid directly by the Fund to the Investment Manager based on average daily net assets. For the fiscal year ended December 31, 2022, the Fund paid an investment management fee at the annual
rate of 0.71% of the average daily net assets of the Fund. Prior to June 18, 2021, the Fund paid an investment management fee at the annual rate of 0.90% of the average daily net assets of the Fund.
The fee paid to Veritas for its services as subadviser is paid out of the fee the Investment Manager receives from the Fund and does not increase the expenses of the Fund.
The Investment Manager has contractually agreed, through at least May 1, 2023, to waive management fees and/or pay or reimburse fund expenses in order to limit total annual Fund operating expenses after fee waiver and expense reimbursements (exclusive of taxes, interest (including interest incurred in connection with bank and custody overdrafts, and in connection with securities sold short), shareholder servicing fees, distribution and service (12b-1) fees, brokerage commissions and other transaction costs, dividends payable with respect to securities sold short, acquired fund fees and expenses and extraordinary expenses) to the annual rate of 0.93% of the Fund’s average daily net assets (this annual rate or such other annual rate that may be in effect from time to time, the “Expense Cap”), subject to later reimbursement by the Fund in certain circumstances. Prior to June 18, 2021, the total annual Fund operating expense limitation was 1.11% of average daily net assets.
In general, for a period of up to 36 months after the date any amounts are paid, waived or reimbursed by the Investment Manager, the Investment Manager may recover such amounts from the Fund, provided that such repayment would not cause the Fund’s total annual operating expenses after fee waiver and expense reimbursements (exclusive of the items noted in the parenthetical above) to exceed either (i) the Expense Cap in effect at the time such amounts were paid, waived or reimbursed, or (ii) the Expense Cap in effect at the time of such repayment by the Fund.
The contractual expense limitation may only be terminated in the event the Investment Manager or a successor ceases to be the investment manager of the Fund or a successor fund, by mutual agreement between the Investment Manager and the Board, or in the event of the Fund’s liquidation unless the Fund is reorganized or is a party to a merger in which the surviving entity is successor to the accounting and performance information of the Fund.
At December 31, 2022, the Fund’s expiration of reimbursements subject to recoupment is as follows:
| | |
Expiration Period | | |
| |
Less than 1 year | | $120,416 |
| |
1-2 years | | 95,606 |
| |
2-3 years | | 143,886 |
| | |
| |
Total | | $359,908 |
| | |
The Trust, on behalf of the Fund, has entered into an amended and restated Administration Agreement under which the Investment Manager serves as the Fund’s administrator (the “Administrator”) and is responsible for all non-portfolio management aspects of managing the Fund’s operations, including administration and shareholder services to the Fund. The Fund pays a fee to the Administrator at the rate of 0.15% per annum of the Fund’s average daily net assets for this service.
The Fund is distributed by AMG Distributors, Inc. (the “Distributor”), a wholly-owned subsidiary of the Investment Manager. The Distributor serves as the distributor and
20
| | |
| | |
| | | Notes to Financial Statements (continued) |
| | | |
| | | |
| | | |
underwriter for the Fund and is a registered broker-dealer and member of the Financial Industry Regulatory Authority, Inc. (“FINRA”). Shares of the Fund will be continuously offered and will be sold directly to prospective purchasers and through brokers, dealers or other financial intermediaries who have executed selling agreements with the Distributor. Generally the Distributor bears all or a portion of the expenses of providing services pursuant to the distribution agreement, including the payment of the expenses relating to the distribution of prospectuses for sales purposes and any advertising or sales literature.
For Class N shares, the Board has approved reimbursement payments to the Investment Manager for shareholder servicing expenses (“shareholder servicing fees”) incurred. Shareholder servicing fees include payments to financial intermediaries, such as broker-dealers (including fund supermarket platforms), banks, and trust companies who provide shareholder recordkeeping, account servicing and other services. The Class N shares may reimburse the Investment Manager for the actual amount incurred up to a maximum annual rate of the Class’s average daily net assets as shown in the table below.
The impact on the annualized expense ratios for the fiscal year ended December 31, 2022, were as follows:
| | | | | | | | |
| | | Maximum Annual Amount Approved | | | Actual Amount Incurred | |
| | |
Class N | | | 0.25% | | | | 0.25% | |
The Board provides supervision of the affairs of the Trust and other trusts within the AMG Funds Family. The Trustees of the Trust who are not affiliated with the Investment Manager receive an annual retainer and per meeting fees for regular, special and telephonic meetings, and they are reimbursed for out-of-pocket expenses incurred while carrying out their duties as Board members. The Chairman of the Board and the Audit Committee Chair receive additional annual retainers. Certain Trustees and Officers of the Fund are Officers and/or Directors of the Investment Manager, AMG and/or the Distributor.
The Securities and Exchange Commission (the “SEC”) granted an exemptive order that permits certain eligible funds in the AMG Funds Family to lend and borrow money for certain temporary purposes directly to and from other eligible funds in the AMG Funds Family. Participation in this interfund lending program is voluntary for both the borrowing and lending funds, and an interfund loan is only made if it benefits each participating fund. The Administrator manages the program according to procedures approved by the Board, and the Board monitors the operation of the program. An interfund loan must comply with certain conditions set out in the exemptive order, which are designed to assure fairness and protect all participating funds. The interest earned and interest paid on interfund loans are included on the Statement of Operations as interest income and interest expense, respectively. At December 31, 2022, the Fund had no interfund loans outstanding.
The Fund utilized the interfund loan program during the fiscal year ended December 31, 2022 as follows:
| | | | | | | | | | | | | | |
Average
Lent | | | Number
of Days | | | Interest
Earned | | | Average
Interest Rate | |
| | | |
| | $1,592,157 | | | | 25 | | | | $2,629 | | | | 2.411% | |
3. PURCHASES AND SALES OF SECURITIES
Purchases and sales of securities (excluding short-term securities and U.S. Government Obligations) for the fiscal year ended December 31, 2022, were $70,211,735 and $94,859,818, respectively.
The Fund had no purchases or sales of U.S. Government Obligations during the fiscal year ended December 31, 2022.
4. PORTFOLIO SECURITIES LOANED
The Fund participates in the Program providing for the lending of securities to qualified borrowers. Securities lending income includes earnings of such temporary cash investments, plus or minus any rebate to a borrower. These earnings (after any rebate) are then divided between BNYM, as a fee for its services under the Program, and the Fund, according to agreed-upon rates. Collateral on all securities loaned is accepted in cash, U.S. Treasury Obligations or U.S. Government Agency Obligations. Collateral is maintained at a minimum level of 102% (105% in the case of certain foreign securities) of the market value, plus interest, if applicable, of investments on loan. It is the Fund’s policy to obtain additional collateral from or return excess collateral to the borrower by the end of the next business day, following the valuation date of the securities loaned. Therefore, the value of the collateral held may be temporarily less than the value of the securities on loan. Lending securities entails a risk of loss to the Fund if and to the extent that the market value of the securities loaned were to increase and the borrower did not increase the collateral accordingly, and the borrower fails to return the securities. Under the terms of the Program, the Fund is indemnified for such losses by BNYM. Cash collateral is held in separate omnibus accounts managed by BNYM, who is authorized to exclusively enter into joint repurchase agreements for that cash collateral. Securities collateral is held in separate omnibus accounts managed by BNYM and cannot be sold or pledged. BNYM bears the risk of any deficiency in the amount of the cash collateral available for return to the borrower due to any loss on the collateral invested. Loans of securities are terminable at any time and the borrower, after notice, is required to return borrowed securities as soon as practical, which is normally within three business days.
The Fund did not have any securities on loan at December 31, 2022.
5. FOREIGN SECURITIES
The Fund invests in securities of foreign entities and in instruments denominated in foreign currencies which involve risks not typically associated with investments in domestic securities. Non-domestic securities carry special risks, such as exposure to currency fluctuations, less developed or less efficient trading markets, political instability, a lack of company information, differing auditing and legal standards, and, potentially, less liquidity. A Fund’s investments in emerging market countries are exposed to additional risks. A Fund’s performance will be influenced by political, social and economic factors affecting companies in emerging market countries. Emerging market countries generally have economic structures that are less diverse and mature, and political systems that are less stable, than those of developed countries. Realized gains in certain countries may be subject to foreign taxes at the Fund level and the Fund would pay such foreign taxes at the appropriate rate for each jurisdiction.
21
| | |
| | |
| | | Notes to Financial Statements (continued) |
| | | |
| | | |
| | | |
6. GEOGRAPHICAL FOCUS RISK
As the Fund invests a significant portion of its net assets in India and the Greater China region, which consists of the People’s Republic of China (“PRC”), Hong Kong, Taiwan, among other countries, the Fund is particularly susceptible to economic, political, regulatory or other events or conditions of those countries. Therefore, the Fund’s NAV may be more volatile than the NAV of a more geographically diversified fund and may result in losses.
The Indian government has exercised and continues to exercise significant influence over many aspects of the economy. Government actions, bureaucratic obstacles and inconsistent economic reform within the Indian government have had a significant effect on its economy and could adversely affect market conditions, economic growth and the profitability of private enterprises in India. Global factors and foreign actions may inhibit the flow of foreign capital on which India is dependent to sustain its growth. Large portions of many Indian companies remain in the hands of their founders (including members of their families). Corporate governance standards of family-controlled companies may be weaker and less transparent, which increases the potential for loss and unequal treatment of investors. India experiences many of the risks associated with developing economies, including relatively low levels of liquidity, which may result in extreme volatility in the prices of Indian securities. Religious, cultural and military disputes persist in India, and between India and Pakistan (as well as sectarian groups within each country).
Economies in the Greater China region are dependent on the economies of other countries and can be significantly affected by currency fluctuations and increasing competition from other emerging economies in Asia with lower costs. Adverse events in any one country within the region may impact the other countries in the region or Asia as a whole. Markets in the Greater China region can experience significant volatility due to social, economic, regulatory and political uncertainties. Significant portions of the Chinese securities markets may become rapidly illiquid, as Chinese issuers have the ability to suspend the trading of their equity securities and have shown a willingness to exercise that option in response to market volatility and other events. U.S. or foreign government restrictions or intervention could negatively affect the implementation of the Fund’s investment strategies, for example by precluding the Fund from making certain investments or causing the Fund to sell investments at disadvantageous times. China has yet to develop comprehensive securities, corporate, or commercial laws, its market is relatively new and less developed, and its economy may be adversely impacted by a slowdown in export growth. Additionally, the Fund invests in China A-Shares through Stock Connect and is subject to sudden changes in quota limitations, application of trading suspensions, differences in trading days between the PRC and Stock Connect, operational risk, clearing and settlement risk, and regulatory and taxation risk.
7. PARTICIPATION NOTES
The Fund invests in P-Notes to gain exposure to issuers in India. P-Notes are a type of equity-linked derivative that are traded in the over-the-counter market and
constitute general unsecured contractual obligations of the banks or broker-dealers that issue them. Generally, banks and broker-dealers associated with non-U.S.-based brokerage firms buy securities listed on certain foreign exchanges and then issue P-Notes which are designed to replicate the performance of those underlying foreign securities. The performance results of P-Notes will not replicate exactly the performance of the issuers or markets that the P-Notes seek to replicate due to dividends paid in connection with the underlying security, transaction costs and other expenses. The Fund’s investment in P-Notes is susceptible to similar risks of the underlying security, but typically the Fund does not receive voting or other rights as it would if the Fund directly owned the underlying security. Additionally, P-Notes entail the risks that the counterparties or issuers of the P-Notes may not be able to fulfill their obligations, that the Fund and counterparties or issuers may disagree as to the meaning or application of contractual terms, and/or that the P-Notes may not perform as expected. Although P-Notes may be listed on an exchange, there is no guarantee that a liquid market will exist or that the counterparties or issuers of P-Notes will be willing to repurchase such instrument when the Fund wishes to sell it.
8. COMMITMENTS AND CONTINGENCIES
Under the Trust’s organizational documents, its Trustees and Officers are indemnified against certain liabilities arising out of the performance of their duties to the Trust. In addition, in the normal course of business, the Fund may enter into contracts and agreements that contain a variety of representations and warranties, which provide general indemnifications. The maximum exposure to the Fund under these arrangements is unknown, as this would involve future claims that may be made against the Fund that have not yet occurred. However, based on experience, the Fund had no prior claims or losses and expects the risks of loss to be remote.
9. MASTER NETTING AGREEMENTS
The Fund may enter into master netting agreements with its counterparties for the Program and Repurchase Agreements, which provide the right, in the event of default (including bankruptcy or insolvency) for the non-defaulting party to liquidate the collateral and calculate net exposure to the defaulting party or request additional collateral. For financial reporting purposes, the Fund does not offset financial assets and financial liabilities that are subject to master netting agreements in the Statement of Assets and Liabilities. For securities lending transactions, see Note 4. At December 31, 2022, the Fund had no Repurchase Agreements outstanding.
10. SUBSEQUENT EVENTS
The Fund has determined that no material events or transactions occurred through the issuance date of the Fund’s financial statements which require an additional disclosure in or adjustment of the Fund’s financial statements.
22
| | |
| | |
| | | Report of Independent Registered Public Accounting Firm |
| | | |
| | | |
| | | |
To the Board of Trustees of AMG Funds III and Shareholders of AMG Veritas Asia Pacific Fund
Opinion on the Financial Statements
We have audited the accompanying statement of assets and liabilities, including the schedule of portfolio investments, of AMG Veritas Asia Pacific Fund (one of the funds constituting AMG Funds III, referred to hereafter as the “Fund”) as of December 31, 2022, the related statement of operations for the year ended December 31, 2022, the statements of changes in net assets for each of the two years in the period ended December 31, 2022, including the related notes, and the financial highlights for each of the five years in the period ended December 31, 2022 (collectively referred to as the “financial statements”). In our opinion, the financial statements present fairly, in all material respects, the financial position of the Fund as of December 31, 2022, the results of its operations for the year then ended, the changes in its net assets for each of the two years in the period ended December 31, 2022 and the financial highlights for each of the five years in the period ended December 31, 2022 in conformity with accounting principles generally accepted in the United States of America.
Basis for Opinion
These financial statements are the responsibility of the Fund’s management. Our responsibility is to express an opinion on the Fund’s financial statements based on our audits. We are a public accounting firm registered with the Public Company Accounting Oversight Board (United States) (PCAOB) and are required to be independent with respect to the Fund in accordance with the U.S. federal securities laws and the applicable rules and regulations of the Securities and Exchange Commission and the PCAOB.
We conducted our audits of these financial statements in accordance with the standards of the PCAOB. Those standards require that we plan and perform the audit to obtain reasonable assurance about whether the financial statements are free of material misstatement, whether due to error or fraud.
Our audits included performing procedures to assess the risks of material misstatement of the financial statements, whether due to error or fraud, and performing procedures that respond to those risks. Such procedures included examining, on a test basis, evidence regarding the amounts and disclosures in the financial statements. Our audits also included evaluating the accounting principles used and significant estimates made by management, as well as evaluating the overall presentation of the financial statements. Our procedures included confirmation of securities owned as of December 31, 2022 by correspondence with the custodian and brokers; when replies were not received from brokers, we performed other auditing procedures. We believe that our audits provide a reasonable basis for our opinion.
/s/ PricewaterhouseCoopers LLP
Boston, Massachusetts
February 24, 2023
We have served as the auditor of one or more investment companies in the AMG Funds Family since 1993.
23
| | |
| | |
| | | Other Information (unaudited) |
| | | |
| | | |
| | | |
TAX INFORMATION
AMG Veritas Asia Pacific Fund hereby designates the maximum amount allowable of its net taxable income as qualified dividends as provided in the Jobs and Growth Tax Relief Reconciliation Act of 2003. The 2022 Form 1099-DIV you receive for the Fund will show the tax status of all distributions paid to you during the year.
Accordingly, AMG Veritas Asia Pacific Fund hereby makes the following designations regarding its period ended December 31, 2022:
Pursuant to section 852 of the Internal Revenue Code, AMG Veritas Asia Pacific Fund hereby designate $0 as a capital gain distribution with respect to the taxable year ended December 31, 2022, or if subsequently determined to be different, the net capital gains of such fiscal year.
24
| | |
| | |
| | | AMG Funds Trustees and Officers |
| | | |
| | | |
| | | |
| | | | |
| The Trustees and Officers of the Trust, their business addresses, principal occupations for the past five years and ages are listed below. The Trustees provide broad supervision over the affairs of the Trust and the Funds. The Trustees are experienced executives who meet periodically throughout the year to oversee the Funds’ activities, review contractual arrangements with companies that provide services to the Funds, and | | review the Funds’ performance. Unless otherwise noted, the address of each Trustee or Officer is the address of the Trust: 680 Washington Blvd., Suite 500, Stamford, CT. 06901. There is no stated term of office for Trustees. Trustees serve until their resignation, retirement or removal in | | accordance with the Trust’s organizational documents and policies adopted by the Board from time to time. The Chairman of the Trustees, President, Treasurer and Secretary of the Trust are elected by the Trustees annually. Other officers hold office at the pleasure of the Trustees. |
Independent Trustees
The following Trustees are not “interested persons” of the Trust within the meaning of the 1940 Act:
| | |
Number of Funds Overseen in
Fund Complex | | Name, Age, Principal Occupation(s) During Past 5 Years and Other Directorships Held by Trustee |
| | |
• Trustee since 2012 • Oversees 40 Funds in Fund Complex | | Bruce B. Bingham, 74 Partner, Hamilton Partners (real estate development firm) (1987-Present); Director of The Yacktman Funds, Inc. (2 portfolios) (2000-2012). |
| | |
• Trustee since 2013 • Chairman of the Audit Committee since 2021 • Oversees 44 Funds in Fund Complex | | Kurt A. Keilhacker, 59 Managing Partner, TechFund Europe (2000-Present); Managing Partner, TechFund Capital (1997-Present); Managing Partner, Elementum Ventures (2013-Present); Director, MetricStory, Inc. (2017-Present); Trustee, Wheaton College (2018-Present); Trustee, Gordon College (2001-2016); Board Member, 6wind SA (2002-2019). |
| | |
• Trustee since 1993 • Oversees 40 Funds in Fund Complex | | Steven J. Paggioli, 72 Independent Consultant (2002-Present); Trustee, Professionally Managed Portfolios (28 portfolios); Advisory Board Member, Sustainable Growth Advisors, LP; Independent Director, Muzinich BDC, Inc. (business development company) (2019-Present); Director, The Wadsworth Group; Independent Director, Chase Investment Counsel (2008–2019); Executive Vice President, Secretary and Director, Investment Company Administration, LLC and First Fund Distributors, INC. (1990-2001). |
| | |
• Independent Chairman of the Board of Trustees since 2017 • Chairman of the Governance Committee since 2017 • Trustee since 1999 • Oversees 44 Funds in Fund Complex | | Eric Rakowski, 64 Professor of Law, University of California at Berkeley School of Law (1990-Present); Tax Attorney at Davis Polk & Wardwell and clerked for Judge Harry T. Edwards of the U.S. Court of Appeals for the District of Columbia Circuit and for Justice William J. Brennan Jr. of the U.S. Supreme Court; Trustee of Parnassus Funds (3 portfolios) (2021-Present); Trustee of Parnassus Income Funds (2 portfolios) (2021-Present); Director of Harding, Loevner Funds, Inc. (10 portfolios); Trustee of Third Avenue Trust (3 portfolios) (2002-2019); Trustee of Third Avenue Variable Trust (1 portfolio) (2002-2019). |
| | |
• Trustee since 2013 • Oversees 44 Funds in Fund Complex | | Victoria L. Sassine, 57 Adjunct Professor, Babson College (2007–Present); Director, Board of Directors, PRG Group (2017-Present); CEO, Founder, Scale Smarter Partners, LLC (2018-Present); Adviser, EVOFEM Biosciences (2019-Present); Chairperson of the Board of Directors, Business Management Associates (2018-2019). |
| | |
• Trustee since 1987 • Oversees 40 Funds in Fund Complex | | Thomas R. Schneeweis, 75* Professor Emeritus, University of Massachusetts (2013-Present); President, TRS Associates (1982-Present); Board Member, Chartered Alternative Investment Association (“CAIA”) (2002-Present); Co-Founder and Director, Institute for Global Asset and Risk Management (Education) (2010-Present); Co-Owner, Quantitative Investment Technologies (2014-Present); Co-Owner, Yes Wealth Management (2018-Present); Director, CAIA Foundation (2010-2019); Partner, S Capital Wealth Advisors (2015-2018); Partner, S Capital Management, LLC (2007-2015); President, Alternative Investment Analytics, LLC (formerly Schneeweis Partners, LLC) (2001-2013). |
*Mr. Schneeweis retired from the Board of Trustees of AMG Funds III as of December 31, 2022.
25
| | |
| | |
| | | AMG Funds Trustees and Officers (continued) |
| | | |
| | | |
| | | |
Interested Trustee
The Trustee in the following table is an “interested person” of the Trust within the meaning of the 1940 Act.
| | |
Number of Funds Overseen in Fund Complex | | Name, Age, Principal Occupation(s) During Past 5 Years and Other Directorships Held by Trustee |
| | |
• Trustee since 2021 • Oversees 44 Funds in Fund Complex | | Garret W. Weston, 41 Affiliated Managers Group, Inc. (2008-Present): Managing Director, Co-Head of Affiliate Engagement (2021-Present), Senior Vice President, Affiliate Development (2016-2021), Vice President, Office of the CEO (2015-2016), Vice President, New Investments (2012-2015), Senior Associate, New Investments (2008-2012); Associate, Madison Dearborn Partners (2006-2008); Analyst, Merrill Lynch (2004-2006). |
Officers | | |
Position(s) Held with Fund and Length of Time Served | | Name, Age, Principal Occupation(s) During Past 5 Years |
| | |
• President since 2018 • Principal Executive Officer since 2018 • Chief Executive Officer since 2018 • Chief Operating Officer since 2007 | | Keitha L. Kinne, 64 Chief Operating Officer, AMG Funds LLC (2007-Present); Chief Investment Officer, AMG Funds LLC (2008-Present); President and Principal, AMG Distributors, Inc. (2018-Present); Chief Operating Officer, AMG Distributors, Inc. (2007-Present); President, Chief Executive Officer and Principal Executive Officer, AMG Funds, AMG Funds I, AMG Funds II, AMG Funds III and AMG Funds IV (2018-Present); Chief Operating Officer, AMG Funds, AMG Funds I, AMG Funds II, and AMG Funds III (2007-Present); Chief Operating Officer, AMG Funds IV (2016-Present); Chief Operating Officer and Chief Investment Officer, Aston Asset Management, LLC (2016); President and Principal Executive Officer, AMG Funds, AMG Funds I, AMG Funds II and AMG Funds III (2012-2014); Managing Partner, AMG Funds LLC (2007-2014); President and Principal, AMG Distributors, Inc. (2012-2014); Managing Director, Legg Mason & Co., LLC (2006-2007); Managing Director, Citigroup Asset Management (2004-2006). |
| | |
• Secretary since 2015 • Chief Legal Officer since 2015 | | Mark J. Duggan, 57 Managing Director and Senior Counsel, AMG Funds LLC (2021-Present); Senior Vice President and Senior Counsel, AMG Funds LLC (2015-2021); Secretary and Chief Legal Officer, AMG Funds, AMG Funds I, AMG Funds II, AMG Funds III and AMG Funds IV (2015-Present); Attorney, K&L Gates, LLP (2009-2015). |
| | |
• Chief Financial Officer since 2017 • Treasurer since 2017 • Principal Financial Officer since 2017 • Principal Accounting Officer since 2017 | | Thomas G. Disbrow, 56 Vice President, Mutual Fund Treasurer & CFO, AMG Funds, AMG Funds LLC (2017-Present); Chief Financial Officer, Principal Financial Officer, Treasurer and Principal Accounting Officer, AMG Funds, AMG Funds I, AMG Funds II, AMG Funds III and AMG Funds IV (2017-Present); Managing Director - Global Head of Traditional Funds Product Control, UBS Asset Management (Americas), Inc. (2015-2017); Managing Director - Head of North American Funds Treasury, UBS Asset Management (Americas), Inc. (2011-2015). |
| | |
• Deputy Treasurer since 2017 | | John A. Starace, 52 Vice President, Mutual Fund Accounting, AMG Funds LLC (2021-Present); Director, Mutual Fund Accounting, AMG Funds LLC (2017-2021); Vice President, Deputy Treasurer of Mutual Funds Services, AMG Funds LLC (2014-2017); Deputy Treasurer, AMG Funds, AMG Funds I, AMG Funds II, AMG Funds III and AMG Funds IV (2017-Present); Vice President, Citi Hedge Fund Services (2010-2014); Audit Senior Manager (2005-2010) and Audit Manager (2001-2005), Deloitte & Touche LLP. |
| | |
• Chief Compliance Officer and Sarbanes-Oxley Code of Ethics Compliance Officer since 2019 • Anti-Money Laundering Compliance Officer since 2022 | | Patrick J. Spellman, 48 Vice President, Chief Compliance Officer, AMG Funds LLC (2017-Present); Chief Compliance Officer, AMG Distributors, Inc. (2010-Present); Chief Compliance Officer and Sarbanes-Oxley Code of Ethics Compliance Officer, AMG Funds, AMG Funds I, AMG Funds II, AMG Funds III and AMG Funds IV (2019-Present); Anti-Money Laundering Compliance Officer, AMG Funds, AMG Funds I, AMG Funds II, and AMG Funds III (2014-2019; 2022-Present); Anti-Money Laundering Compliance Officer, AMG Funds IV (2016-2019; 2022-Present); Senior Vice President, Chief Compliance Officer, AMG Funds LLC (2011-2017); Compliance Manager, Legal and Compliance, Affiliated Managers Group, Inc. (2005-2011). |
| | |
• Assistant Secretary since 2016 | | Maureen M. Kerrigan, 37 Vice President, Senior Counsel, AMG Funds LLC (2021-Present); Vice President, Counsel, AMG Funds LLC (2019-2021); Director, Counsel, AMG Funds LLC (2017-2018); Vice President, Counsel, AMG Funds LLC (2015-2017); Assistant Secretary, AMG Funds, AMG Funds I, AMG Funds II, AMG Funds III and AMG Funds IV (2016-Present); Associate, Ropes & Gray LLP (2011-2015); Law Fellow, Massachusetts Appleseed Center for Law and Justice (2010-2011). |
26
THIS PAGE INTENTIONALLY LEFT BLANK
THIS PAGE INTENTIONALLY LEFT BLANK
|
|
| | | | | | | | |
INVESTMENT MANAGER AND ADMINISTRATOR AMG Funds LLC 680 Washington Blvd., Suite 500 Stamford, CT 06901 800.548.4539 DISTRIBUTOR AMG Distributors, Inc. 680 Washington Blvd., Suite 500 Stamford, CT 06901 800.548.4539 SUBADVISER Veritas Asset Management LLP 1 Smart’s Place London, WC2B 5LW CUSTODIAN The Bank of New York Mellon Mutual Funds Custody 6023 Airport Road Oriskany, NY 13424 | | | | LEGAL COUNSEL Ropes & Gray LLP Prudential Tower, 800 Boylston Street Boston, MA 02199-3600 TRANSFER AGENT BNY Mellon Investment Servicing (US) Inc. Attn: AMG Funds 4400 Computer Drive Westborough, MA 01581 800.548.4539 Effective March 9, 2023, the Transfer Agent’s mailing address will change to the following: BNY Mellon Investment Servicing (US) Inc. AMG Funds Attn: 534426 AIM 154-0520 500 Ross Street Pittsburgh, PA 15262 800.548.4539 | | | | This report is prepared for the Fund’s shareholders. It is authorized for distribution to prospective investors only when preceded or accompanied by an effective prospectus. To receive a free copy of the prospectus or Statement of Additional Information, which includes additional information about Fund Trustees, please contact us by calling 800.548.4539. Distributed by AMG Distributors, Inc., member FINRA/SIPC. Current net asset values per share for the Fund are available on the Fund’s website at amgfunds.com. A description of the policies and procedures the Fund uses to vote its proxies is available: (i) without charge, upon request, by calling 800.548.4539, or (ii) on the Securities and Exchange Commission’s (SEC) website at sec.gov. For information regarding the Fund’s proxy voting record for the 12-month period ended June 30, call 800.548.4539 or visit the SEC website at sec.gov. The Fund files its complete schedule of portfolio holdings with the SEC for the first and third quarters of each fiscal year as an exhibit to their reports on Form N-PORT. The Fund’s portfolio holdings on Form N-PORT are available on the SEC’s website at sec.gov and the Fund’s website at amgfunds.com. To review a complete list of the Fund’s portfolio holdings, or to view the most recent semiannual report or annual report, please visit amgfunds.com. |
| | | | | | | | | |
|
|
| | | | | | | | |
BALANCED FUNDS AMG GW&K Global Allocation GW&K Investment Management, LLC EQUITY FUNDS AMG Beutel Goodman International Equity Beutel, Goodman & Company Ltd. AMG Boston Common Global Impact Boston Common Asset Management, LLC AMG Frontier Small Cap Growth Frontier Capital Management Co., LLC AMG GW&K Small Cap Core AMG GW&K Small Cap Value AMG GW&K Small/Mid Cap AMG GW&K Small/Mid Cap Growth AMG GW&K Emerging Markets Equity AMG GW&K Emerging Wealth Equity AMG GW&K International Small Cap GW&K Investment Management, LLC AMG Montrusco Bolton Large Cap Growth Montrusco Bolton Investments, Inc. AMG Renaissance Large Cap Growth The Renaissance Group LLC | | | | AMG River Road Dividend All Cap Value AMG River Road Focused Absolute Value AMG River Road International Value Equity AMG River Road Large Cap Value Select AMG River Road Mid Cap Value AMG River Road Small-Mid Cap Value AMG River Road Small Cap Value River Road Asset Management, LLC AMG TimesSquare Emerging Markets Small Cap AMG TimesSquare Global Small Cap AMG TimesSquare International Small Cap AMG TimesSquare Mid Cap Growth AMG TimesSquare Small Cap Growth TimesSquare Capital Management, LLC AMG Veritas Asia Pacific AMG Veritas China AMG Veritas Global Focus AMG Veritas Global Real Return Veritas Asset Management LLP AMG Yacktman AMG Yacktman Focused AMG Yacktman Global AMG Yacktman Special Opportunities Yacktman Asset Management LP | | | | FIXED INCOME FUNDS AMG Beutel Goodman Core Plus Bond Beutel, Goodman & Company Ltd. AMG GW&K Core Bond ESG AMG GW&K Enhanced Core Bond ESG AMG GW&K ESG Bond AMG GW&K High Income AMG GW&K Municipal Bond AMG GW&K Municipal Enhanced Yield GW&K Investment Management, LLC |
| | | | | | | | | |
| | | | | | | | | |
| | | | | | | | | |
| | | | | | | | | |
| | | | | | | | | |
| | | | | | | | | |
| | | | | | | | | |
| | | | | | | | | |
| | | | | | | | | |
| | | | |
| | | | |
| | | |
| amgfunds.com | | | | 123122 AR078 |
| | |
| | ANNUAL REPORT |
| | |
| | | AMG Funds December 31, 2022 |
| | |
| | | 
|
| | |
| | | AMG GW&K ESG Bond Fund |
| | |
| | | Class N: MGFIX | Class I: MGBIX |
| | |
| | | AMG GW&K Enhanced Core Bond ESG Fund |
| | |
| | | Class N: MFDAX | Class I: MFDSX | Class Z: MFDYX |
| | |
| | | AMG GW&K High Income Fund |
| | |
| | | Class N: MGGBX | Class I: GWHIX |
| | |
| | | AMG GW&K Municipal Bond Fund |
| | |
| | | Class N: GWMTX | Class I: GWMIX |
| | |
| | | AMG GW&K Municipal Enhanced Yield Fund |
| | |
| | | Class N: GWMNX | Class I: GWMEX | Class Z: GWMZX |
| | |
| | | |
| | |
| | | |
| | | | |
| amgfunds.com | | | | 123122 AR088 |
| | |
| | | AMG Funds Annual Report — December 31, 2022 |
| | | | | | |
| | | |
| | | | | | | |
| | | TABLE OF CONTENTS | | PAGE | |
| | | | |
| | | LETTER TO SHAREHOLDERS | | | 2 | |
| | | |
| | | ABOUT YOUR FUND’S EXPENSES | | | 3 | |
| | | |
| | | PORTFOLIO MANAGER’S COMMENTS, FUND SNAPSHOTS AND SCHEDULES OF PORTFOLIO INVESTMENTS | | | | |
| | | |
| | | AMG GW&K ESG Bond Fund | | | 4 | |
| | | |
| | | AMG GW&K Enhanced Core Bond ESG Fund | | | 14 | |
| | | |
| | | AMG GW&K High Income Fund | | | 23 | |
| | | |
| | | AMG GW&K Municipal Bond Fund | | | 31 | |
| | | |
| | | AMG GW&K Municipal Enhanced Yield Fund | | | 40 | |
| | | |
| | | FINANCIAL STATEMENTS | | | | |
| | | |
| | | Statement of Assets and Liabilities | | | 48 | |
| | | |
| | | Balance sheets, net asset value (NAV) per share computations
and cumulative distributable earnings (loss) | | | | |
| | | |
| | | Statement of Operations | | | 50 | |
| | | |
| | | Detail of sources of income, expenses, and realized and
unrealized gains (losses) during the fiscal year | | | | |
| | | |
| | | Statements of Changes in Net Assets | | | 51 | |
| | | |
| | | Detail of changes in assets for the past two fiscal years | | | | |
| | | |
| | | Financial Highlights | | | 53 | |
| | | |
| | | Historical net asset values per share, distributions, total returns, income
and expense ratios, turnover ratios and net assets | | | | |
| | | |
| | | Notes to Financial Statements | | | 65 | |
| | | |
| | | Accounting and distribution policies, details of agreements and
transactions with Fund management and affiliates, and descriptions of
certain investment risks | | | | |
| | | |
| | | REPORT OF INDEPENDENT REGISTERED PUBLIC ACCOUNTING FIRM | | | 74 | |
| | | |
| | | OTHER INFORMATION | | | 75 | |
| | | |
| | | TRUSTEES AND OFFICERS | | | 76 | |
| | | | | | | |
|
Nothing contained herein is to be considered an offer, sale or solicitation of an offer to buy shares of any series of the AMG Funds Family of Funds. Such offering is made only by prospectus, which includes details as to offering price and other material information. | |
| | |
| |
| | Letter to Shareholders |
| | | |
| | | |
| | | |
Dear Shareholder:
We are pleased to provide this annual report for your investment with AMG Funds. Our foremost goal is to provide investment solutions that help our shareholders successfully achieve their long-term investment goals. We appreciate the privilege of providing you with investment tools.
The past year was a challenging period for investors, as uncertainties about high inflation, tighter financial conditions, and the Russian invasion of Ukraine led to significant volatility. Global equity and bond markets fell in tandem amid sharply higher interest rates and eroding investor confidence as worries of an impending recession lingered most of the year. A global commodity shock caused by the war in Ukraine only made matters worse. The S&P 500® Index slipped into a bear market with the Index falling more than (24)% from its peak earlier in the year. The abrupt shift in markets this year has reset expectations around future growth, as the U.S. Federal Reserve (the Fed) and other global central banks have taken aggressive policy action to bring down inflation. While the outlook is uncertain given recent negative returns across many asset classes, global stock and bond valuations are now far more attractive entering 2023 compared to a year ago.
There was very wide dispersion in S&P 500® Index sector performance. Energy significantly outperformed all other sectors with a gain of 65.72% as the price of oil surged during the period. The defensive-oriented sectors also outperformed, although utilities was the only other sector with a positive return, gaining 1.54%. Consumer staples and health care were slightly negative with returns of (0.62)% and (1.95)%, respectively. High-growth technology and mega cap internet-related companies underperformed during the period, and real estate was impacted by higher interest rates. Communications services fell the most with a (39.93)% return during the year, followed by declines of (37.03)% for consumer discretionary, (28.14)% for information technology and (26.13)% for real estate. Value stocks held up much better than growth stocks as the Russell 1000® Value Index returned (7.54)% compared to the (29.14)% return for the Russell 1000® Growth Index. Small cap stocks struggled as the Russell 2000® Index lost (20.44)%. Outside the U.S., foreign developed markets were negative with a (14.45)% return for the MSCI EAFE Index, however a very strong fourth quarter rally drove international equity returns ahead of their U.S. counterparts for the year.
The 10-year Treasury yield more than doubled during the year, surging to the highest levels since before the Great Financial Crisis. Rapidly rising rates from a very low base led to historic negative performance for bonds as the Bloomberg U.S. Aggregate Bond Index, a broad measure of U.S. bond market performance, lost (13.01)% over the period. Investment-grade corporate bonds underperformed, returning (15.76)% for the year. High yield bonds held up better with a (11.19)% return as measured by the return of the Bloomberg U.S. Corporate High Yield Bond
Index. Municipal bonds were also negative, but outperformed the broader market with a (8.53)% return for the Bloomberg Municipal Bond Index.
AMG Funds provides access to a distinctive array of actively managed return-oriented investment strategies. You can rest assured that under all market conditions our team is focused on delivering excellent investment management services for your benefit. For more information about AMG Funds’ wide range of products and resources, please visit www.amgfunds.com. We thank you for your investment and continued trust in AMG Funds.
Respectfully,
Keitha Kinne
President
AMG Funds
| | | | | | | | | | | | | | |
| | | | | Periods ended | |
| Average Annual Total Returns | | December 31, 2022* | |
| | | | |
| Stocks: | | | | 1 Year | | | 3 Years | | | 5 Years | |
| | | | |
Large Cap | | (S&P 500® Index) | | | (18.11 | )% | | | 7.66 | % | | | 9.42 | % |
| | | | |
Small Cap | | (Russell 2000® Index) | | | (20.44 | )% | | | 3.10 | % | | | 4.13 | % |
| | | | |
International | | (MSCI ACWI ex USA) | | | (16.00 | )% | | | 0.07 | % | | | 0.88 | % |
| | | | |
Bonds: | | | | | | | | | | | | | | |
| | | | |
Investment Grade | | (Bloomberg U.S. Aggregate Bond Index) | | | (13.01 | )% | | | (2.71 | )% | | | 0.02 | % |
| | | | |
High Yield | | (Bloomberg U.S. Corporate High Yield Bond Index) | | | (11.19 | )% | | | 0.05 | % | | | 2.31 | % |
| | | | |
Tax-exempt | | (Bloomberg Municipal Bond Index) | | | (8.53 | )% | | | (0.77 | )% | | | 1.25 | % |
| | | | |
Treasury Bills | | (ICE BofAML U.S. 6-Month Treasury Bill Index) | | | 1.34 | % | | | 0.82 | % | | | 1.39 | % |
*Source: FactSet. Past performance is no guarantee of future results.
2
| | |
| | |
| | | About Your Fund’s Expenses |
| | | |
| | | |
| | | |
| | | | | | | | |
As a shareholder of a Fund, you may incur two types of costs: (1) transaction costs, which may include sales charges (loads) on purchase payments; redemption fees; and exchange fees; and (2) ongoing costs, including management fees; distribution (12b-1) fees; and other Fund expenses. This example is intended to help you understand your ongoing costs (in dollars) of investing in the Fund and to compare these costs with the ongoing costs of investing in other mutual funds. The example is based on $1,000 invested at the beginning of the period and held for the entire period as indicated below. ACTUAL EXPENSES The first line of the following table provides information about the actual account values and | | | | actual expenses. You may use the information in this line, together with the amount you invested, to estimate the expenses that you paid over the period. Simply divide your account value by $1,000 (for example, an $8,600 account value divided by $1,000 = 8.6), then multiply the result by the number in the first line under the heading entitled “Expenses Paid During the Period” to estimate the expenses you paid on your account during this period. HYPOTHETICAL EXAMPLE FOR COMPARISON PURPOSES The second line of the following table provides information about hypothetical account values and hypothetical expenses based on the Fund’s actual expense ratio and an assumed annual rate of return of 5% before expenses, which is not the Fund’s | | | | actual return. The hypothetical account values and expenses may not be used to estimate the actual ending account balance or expenses you paid for the period. You may use this information to compare the ongoing costs of investing in the Fund and other funds by comparing this 5% hypothetical example with the 5% hypothetical examples that appear in the shareholder reports of other funds. Please note that the expenses shown in the table are meant to highlight your ongoing costs only and do not reflect any transactional costs, such as sales charges (loads), redemption fees, or exchange fees. Therefore, the second line of the table is useful in comparing ongoing costs only, and will not help you determine the relative total costs of owning different funds. |
| | | | | | | | |
| | | | | | | | | | |
Six Months Ended December 31, 2022 | | Expense
Ratio for
the Period | | Beginning
Account
Value
07/01/22 | | Ending
Account
Value
12/31/22 | | | Expenses
Paid
During
the Period* |
|
AMG GW&K ESG Bond Fund |
|
Based on Actual Fund Return |
Class N | | 0.68% | | $1,000 | | | $981 | | | $3.40 |
Class I | | 0.48% | | $1,000 | | | $982 | | | $2.40 |
|
Based on Hypothetical 5% Annual Return |
Class N | | 0.68% | | $1,000 | | | $1,022 | | | $3.47 |
Class I | | 0.48% | | $1,000 | | | $1,023 | | | $2.45 |
|
AMG GW&K Enhanced Core Bond ESG Fund |
|
Based on Actual Fund Return |
Class N | | 0.73% | | $1,000 | | | $971 | | | $3.63 |
Class I | | 0.56% | | $1,000 | | | $970 | | | $2.78 |
Class Z | | 0.48% | | $1,000 | | | $972 | | | $2.39 |
|
Based on Hypothetical 5% Annual Return |
Class N | | 0.73% | | $1,000 | | | $1,022 | | | $3.72 |
Class I | | 0.56% | | $1,000 | | | $1,022 | | | $2.85 |
Class Z | | 0.48% | | $1,000 | | | $1,023 | | | $2.45 |
|
AMG GW&K High Income Fund |
|
Based on Actual Fund Return |
Class N | | 0.87% | | $1,000 | | | $1,040 | | | $4.47 |
Class I | | 0.67% | | $1,000 | | | $1,041 | | | $3.45 |
|
Based on Hypothetical 5% Annual Return |
Class N | | 0.87% | | $1,000 | | | $1,021 | | | $4.43 |
Class I | | 0.67% | | $1,000 | | | $1,022 | | | $3.41 |
| | | | | | | | | | |
Six Months Ended December 31, 2022 | | Expense
Ratio for
the Period | | Beginning
Account
Value
07/01/22 | | Ending
Account
Value
12/31/22 | | | Expenses
Paid
During
the Period* |
|
AMG GW&K Municipal Bond Fund |
|
Based on Actual Fund Return |
Class N | | 0.73% | | $1,000 | | | $1,016 | | | $3.71 |
Class I | | 0.39% | | $1,000 | | | $1,019 | | | $1.98 |
|
Based on Hypothetical 5% Annual Return |
Class N | | 0.73% | | $1,000 | | | $1,022 | | | $3.72 |
Class I | | 0.39% | | $1,000 | | | $1,023 | | | $1.99 |
|
AMG GW&K Municipal Enhanced Yield Fund |
|
Based on Actual Fund Return |
Class N | | 0.99% | | $1,000 | | | $984 | | | $4.95 |
Class I | | 0.64% | | $1,000 | | | $985 | | | $3.20 |
Class Z | | 0.59% | | $1,000 | | | $985 | | | $2.95 |
|
Based on Hypothetical 5% Annual Return |
Class N | | 0.99% | | $1,000 | | | $1,020 | | | $5.04 |
Class I | | 0.64% | | $1,000 | | | $1,022 | | | $3.26 |
Class Z | | 0.59% | | $1,000 | | | $1,022 | | | $3.01 |
| * | Expenses are equal to the Fund’s annualized expense ratio multiplied by the average account value over the period, multiplied by the number of days in the most recent fiscal half-year (184), then divided by 365. |
3
| | |
| | |
| | | AMG GW&K ESG Bond Fund Portfolio Manager’s Comments (unaudited) |
| | | |
| | | |
| | | |
| | | | | | | | |
THE YEAR IN REVIEW AMG GW&K ESG Bond Fund Class N (the “Fund”) shares returned (13.17)% for the year ended December 31, 2022, compared with the (13.01)% return for its current benchmark, the Bloomberg U.S. Aggregate Bond Index (the “Index”). MARKET OVERVIEW In the first quarter of 2022, fixed income markets experienced their worst quarter in more than four decades amid an extraordinary confluence of economic and geopolitical shocks. Core inflation jumped to 5.4%, its highest level since 1983, on a broad-based rise in consumer prices. The U.S. Federal Reserve (the Fed) responded in kind, intensifying its hawkish rhetoric and laying out an aggressive course of hikes to bring inflation back to target. And in addition to exacting a tragic human toll, Russia’s invasion of Ukraine exacerbated already strained supply chains and commodity markets, threatening acute and prolonged shortages of materials vital to the basic functioning of the global economy. But for all this uncertainty and turmoil, there was a notable divergence between the performance of rates and credit; the former extended a historically severe downdraft, while the latter continued to enjoy a remarkably benign trading environment. How this disconnect eventually would resolve itself was a central question before investors, though policy uncertainty and heightened tensions seemed unlikely to subside anytime soon. More volatility followed in the second quarter, as bonds traded in a wide range and struggled to commit to a consistent narrative. The central question revolved around how persistent inflation would be and what policy measures would be necessary to quell it. A natural deceleration would allow the Fed to pursue less aggressive policy and possibly achieve a soft landing; more recalcitrant price pressure would require the Fed to mount a harsher response and invite a potential recession. The implications of these two different paths were at odds, leading to a broad lack of conviction with no clear market direction. Similarly, puzzling was a consumer with a strong proclivity to spend but a deeply pessimistic outlook and a corporate sector earning solid profits but starting to announce layoffs. Additionally, China offered a potential bright spot as it emerged from recent shutdowns, but the Ukraine conflict lingered as a major threat to global energy and commodity markets. An imminent resolution to any of these tensions seemed unlikely, so disciplined risk management and careful analysis of relative value were of particular importance for the months ahead. | | | | Fixed income markets were under extraordinary pressure in the third quarter as investors continued to adapt to restrictive monetary policy after more than a decade of accommodation. Stubbornly rising prices, hawkish central banks, and various geopolitical forces combined to tighten financial conditions and raise the cost of borrowing around the world. Defying expectations that it had peaked, inflation remained elevated and manifested across a broader and more entrenched collection of goods and services. The Fed also confounded expectations, projecting a more cautious outlook and a more aggressive path of hikes than most economists had anticipated. International pressures escalated as well, as currency market dislocations, political leadership changes in Europe and Asia, and multiple energy crises collectively drove a heightened sense of uncertainty. The variety and momentum of these forces suggested no near-term end to volatility, especially against a backdrop of increasingly expensive capital. Bonds rebounded in the fourth quarter amid growing confidence that central banks have succeeded in slowing inflation and will soon be able to pursue less restrictive policy. This modest rally nevertheless ended up being too little, too late to help the bond market avoid its worst annual performance on record and an unprecedented second consecutive year of losses. Sentiment among both investors and consumers may have reached an inflection point, but data continue to justify some measure of caution: inflation is still stubbornly above the Fed’s target, the labor market shows few signs of loosening and corporations have yet to see a meaningful deterioration in earnings. Only the rate-sensitive housing market really stands out as a casualty of the Fed’s tightening campaign to this point. Whether the end of the cycle is imminent is likely to remain an open question, especially as investors await the realization of the “long and variable lag” that has yet to be fully reflected across so many segments of the economy. FUND REVIEW The Fund slightly underperformed the Index during the fiscal year. Yield curve positioning was a relative positive, given the Fund’s shorter relative duration in a period of rising rates. Our overweight allocation to corporates had a negative impact to performance amid the heightened spread volatility. Our preference for lower-rated securities within the investment grade corporate space also had a negative effect. On | | | | the positive side, being slightly underweight mortgage-backed securities (MBS) within Securitized and our bias to higher coupon mortgages were helpful to relative performance. Our out-of-benchmark allocation to high yield had little incremental impact on relative performance. ESG (Environmental, Social, and Governance) remained an important area of focus for the corporate bond market in what could be viewed as a transition year in 2022. A growing list of companies have moved beyond publishing sustainability reports to set emissions reduction and net zero targets over the past year. Investors shook off an overall difficult market environment, from geopolitical turmoil to interest rate volatility, to demonstrate continued strong interest in ESG. This was also a landmark year for global sustainability regulation, with regulators across Europe, North America, and Asia introducing new rules and proposals related to reporting for both corporations and investors. In the U.S., the Inflation Reduction Act is poised to provide policy support for many companies of interest to ESG investors. We continue to integrate ESG as a core part of our fundamental investment process, while monitoring regulatory and policy actions that could influence the ESG investing landscape in the coming years. OUTLOOK The disconnect between the Fed’s projections and market pricing has widened following the most recent Summary of Economic Projections (SEP). The median estimate of Federal Open Market Committee (FOMC) participants for the overnight rate at the end of 2023 is 5.125%, up from 4.625% in September; the Fed Funds futures market sees a terminal rate of nearly 5.0% in June of 2023, and then two cuts by year end. There has also been a small but not insignificant chorus of economists calling for the FOMC to raise its target inflation to 3.0% from 2.0%, prompting objections that this would undermine the Fed’s hard-earned credibility. These are just two sources of tension in the rates market, and their resolution could have significant implications for both the level and the shape of the yield curve. We don’t believe investors are being sufficiently compensated for these risks, so duration and curve positioning is positioned relatively neutral to the benchmark. Our fundamental view of credit is broadly constructive, and we believe balance sheets in general are sound and liquidity is sufficient. But we recognize the potential for macroeconomic forces to |
4
| | |
| | |
| | | AMG GW&K ESG Bond Fund Portfolio Manager’s Comments (continued) |
| | | |
| | | |
| | | |
| | | | | | | | |
| alter this landscape and we don’t believe all these risks are adequately reflected in valuations. Consequently, our allocation to corporate credit is at the lower end of its historical range. Within the space, we see the best value at the front end, where higher quality credits in less rate-sensitive sectors offer attractive yields and compelling breakevens. | | | | We have also been able to identify names that we believe can improve their credit profiles independently of a challenging macro backdrop. Our exposure to mortgages is neutral, as we believe the benefits of lower originations and potentially lower rate volatility are offset by event risks surrounding quantitative tightening and middling spread levels. | | | | The views expressed represent the opinions of GW&K Investment Management, LLC as of December 31, 2022, and are not intended as a forecast or guarantee of future results, and are subject to change without notice. |
5
| | |
| | |
| | | AMG GW&K ESG Bond Fund Portfolio Manager’s Comments (continued) |
| | | |
| | | |
| | | |
CUMULATIVE TOTAL RETURN PERFORMANCE
AMG GW&K ESG Bond Fund’s cumulative total return is based on the daily change in net asset value (NAV), and assumes that all dividends and distributions were reinvested. The graph compares a hypothetical $10,000 investment made in the AMG GW&K ESG Bond Fund’s Class N shares on December 31, 2012, to a $10,000 investment made in the Bloomberg U.S. Aggregate Bond Index for the same time period. The graph and table do not reflect the deduction of taxes that a shareholder would pay on a Fund distribution or redemption of shares. The listed returns for the Fund are net of expenses and the returns for the index exclude expenses. Total returns would have been lower had certain expenses not been reduced.
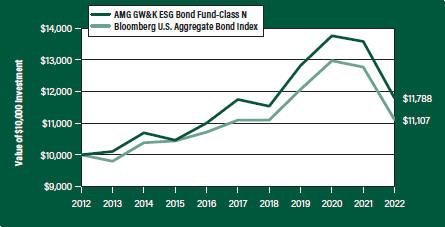
The table below shows the average annual total returns for the AMG GW&K ESG Bond Fund and the Bloomberg U.S. Aggregate Bond Index for the same time periods ended December 31, 2022.
| | | | | | | | | | | | | | | | | | | | |
| | | One | | | Five | | | Ten | | | Since | | | Inception | |
| Average Annual Total Returns1 | | Year | | | Years | | | Years | | | Inception | | | Date | |
|
AMG GW&K ESG Bond Fund2, 3, 4, 5, 6, 7, 8, 9, 10, 11, 12 | |
| | | | | |
Class N | | | (13.17%) | | | | 0.07% | | | | 1.66% | | | | 7.11% | | | | 06/01/84 | |
| | | | | |
Class I | | | (12.99%) | | | | 0.26% | | | | — | | | | 1.68% | | | | 04/01/13 | |
| | | | | |
Bloomberg U.S. Aggregate Bond Index13 | | | (13.01%) | | | | 0.02% | | | | 1.06% | | | | 6.40% | | | | 06/01/84 | † |
The performance data shown represents past performance. Past performance is not a guarantee of future results. Current performance may be lower or higher than the performance data quoted. The investment return and principal value of an investment will fluctuate so that an investor’s shares, when redeemed, may be worth more or less than their original cost.
Investors should carefully consider the Fund’s investment objectives, risks, charges and expenses before investing. For performance information through the most recent month end, current net asset values per share for the Fund and other information, please call 800.548.4539 or visit our website at amgfunds.com for a free prospectus. Read it carefully before investing or sending money.
Distributed by AMG Distributors, Inc., member FINRA/SIPC.
| † | Date reflects inception date of the Fund, not the index. |
| 1 | Total return equals income yield plus share price change and assumes reinvestment of all dividends and capital gain distributions. Returns are net of fees and may reflect offsets of Fund expenses as described in the prospectus. No adjustment has been made for taxes payable by shareholders on their reinvested dividends and capital gain distributions. Returns for periods greater than one year are annualized. The listed returns on the Fund are net of expenses and based on the published NAV as of December 31, 2022. All returns are in U.S. Dollars($). |
|
2 As of March 19, 2021, the Fund’s subadvisor was changed to GW&K Investment Management, LLC. Prior to March 19, 2021, the Fund was known as the AMG Managers Loomis Sayles Bond Fund and had different principal investment strategies and corresponding risks. Performance shown for periods prior to March 19, 2021, reflects the performance and investment strategies of the Fund’s previous subadvisor, Loomis, Sayles & Company, L.P. The Fund’s past performance would have been different if the Fund were managed by the current subadvisor and strategy, and the Fund’s prior performance record might be less pertinent for investors considering whether to purchase shares of the Fund. 3 From time to time, the Fund’s investment manager has waived fees and/or absorbed Fund expenses, which has resulted in higher returns. 4 The Fund is subject to the risks associated with investments in debt securities, such as default risk and fluctuations in the perception of the debtor’s ability to pay its creditors. Changing interest rates may adversely affect the value of an investment. An increase in interest rates typically causes the value of bonds and other fixed income securities to fall. 5 To the extent that the Fund invests in asset-backed or mortgage-backed securities, its exposure to prepayment and extension risks may be greater than investments in other fixed income securities. 6 High-yield bonds (also known as “junk bonds”) may be subject to greater levels of interest rate, credit, and liquidity risk than investments in higher rated securities. These securities are considered predominantly speculative with respect to the issuer’s continuing ability to make principal and interest payments. The issuers of the Fund’s holdings may be involved in bankruptcy proceedings, reorganizations, or financial restructurings, and are not as strong financially as higher-rated issuers. 7 Obligations of certain government agencies are not backed by the full faith and credit of the U.S. government. If one of these agencies defaulted on a loan, there is no guarantee that the U.S. government would provide financial support. Additionally, debt securities of the U.S. government may be affected by changing interest rates and subject to prepayment risk. 8 Market prices of investments held by the Fund may fall rapidly or unpredictably due to a variety of economic or political factors, market conditions, disasters or public health issues, or in response to events that affect particular industries or companies. 9 Investments in international securities are subject to certain risks of overseas investing including currency fluctuations and changes in political and economic conditions, which could result in |
6
| | |
| | |
| | | AMG GW&K ESG Bond Fund Portfolio Manager’s Comments (continued) |
| | | |
| | | |
| | | |
| | | | |
significant market fluctuations. These risks are magnified in emerging markets. 10 Applying the Fund’s ESG investment criteria may result in the selection or exclusion of securities of certain issuers for reasons other than performance, and the Fund may underperform funds that do not utilize an ESG investment strategy. The application of his strategy may affect the Fund’s exposure to certain companies, sectors, regions, countries or types of investments, which could negatively impact the Fund’s performance depending on whether such investments are in or out of favor. Applying ESG criteria to investment decisions is qualitative and subjective by nature, and there is no guarantee that the criteria utilized by the subadviser or any judgment exercised by the | | subadviser will reflect the beliefs or values of any particular investor. 11 Because exchange-traded funds (ETFs) incur their own costs, investing in them could result in a higher cost to the investor. Additionally, the fund will be indirectly exposed to all the risks of securities held by the ETFs. 12 Factors unique to the municipal bond market may negatively affect the value in municipal bonds. 13 The Bloomberg U.S. Aggregate Bond Index an index of the U.S. investment-grade fixed-rate bond market, including both government and corporate bonds. Unlike the Fund, the Bloomberg U.S. Aggregate Bond Index is unmanaged, is not available for investment and does not incur expenses. | | “Bloomberg®” and any Bloomberg index described herein are service marks of Bloomberg Finance L.P. and its affiliates, including Bloomberg Index Services Limited (“BISL”), the administrator of the index (collectively, “Bloomberg”) and have been licensed for use for certain purposes by AMG Funds LLC. Bloomberg is not affiliated with AMG Funds LLC, and Bloomberg does not approve, endorse, review, or recommend the fund described herein. Bloomberg does not guarantee the timeliness, accurateness, or completeness of any data or information relating to such fund. Not FDIC insured, nor bank guaranteed. May lose value. |
7
| | |
| | |
| | | AMG GW&K ESG Bond Fund Fund Snapshots (unaudited) December 31, 2022 |
| | | |
| | | |
| | | |
PORTFOLIO BREAKDOWN
| | |
| Category | | % of Net Assets |
| | |
Corporate Bonds and Notes | | 51.4 |
| | |
U.S. Government and Agency Obligations | | 40.5 |
| | |
Municipal Bonds | | 5.9 |
| | |
Foreign Government Obligations | | 0.9 |
| | |
Short-Term Investments | | 2.1 |
| | |
Other Assets, less Liabilities | | (0.8) |
| | |
| Rating | | % of Market Value1 |
| | |
U.S. Government and Agency Obligations | | 41.0 |
| | |
Aaa/AAA | | 2.2 |
| | |
Aa/AA | | 8.6 |
| | |
A | | 7.0 |
| | |
Baa/BBB | | 23.7 |
| | |
Ba/BB | | 16.4 |
| | |
B | | 1.1 |
| 1 | Includes market value of long-term fixed-income securities only. |
TOP TEN HOLDINGS
| | |
| Security Name | | % of Net Assets |
| | |
U.S. Treasury Bonds, 2.250%, 05/15/41 | | 3.0 |
| | |
FHLMC, 3.000%, 04/01/51 | | 3.0 |
| | |
FNMA, 3.500%, 02/01/35 | | 2.2 |
| | |
FNMA, 3.500%, 08/01/49 | | 2.1 |
| | |
FNMA, 2.000%, 04/01/51 | | 2.1 |
| | |
U.S. Treasury Bonds, 1.875%, 02/15/51 | | 2.1 |
| | |
FNMA, 3.500%, 02/01/47 | | 2.0 |
| | |
U.S. Treasury Bonds, 3.125%, 05/15/48 | | 1.9 |
| | |
FHLMC, 3.500%, 02/01/50 | | 1.8 |
| | |
U.S. Treasury Bonds, 5.000%, 05/15/37 | | 1.8 |
| | | |
| | |
Top Ten as a Group | | 22.0 |
| | |
Credit quality ratings shown above reflect the highest rating assigned by either Standard & Poor’s (“S&P”), Moody’s Investors Service, Inc. (“Moody’s”) or Fitch. These rating agencies are independent, nationally recognized statistical rating organizations and are widely used. Investment grade ratings are credit ratings of BBB- or higher. Below investment grade ratings are credit ratings of BB+ or lower. Investments designated N/R are not rated by any of the rating agencies. Unrated investments do not necessarily indicate low credit quality. Credit quality ratings are subject to change.
Because a fund’s strategy may result in multiple investments in particular sectors of the economy, its performance may depend on the performance of those sectors and may fluctuate more widely than investments diversified across more sectors. For additional information on these and other risk considerations, please see the Fund’s prospectus.
Any sectors, industries, or securities discussed should not be perceived as investment recommendations. Mention of a specific security should not be considered a recommendation to buy or solicitation to sell that security. Specific securities mentioned in this report may have been sold from the Fund’s portfolio of investments by the time you receive this report.
8
| | |
| | |
| | | AMG GW&K ESG Bond Fund Schedule of Portfolio Investments December 31, 2022 |
| | | |
| | | |
| | | |
| | | | | | | | |
| | | Principal Amount | | | Value | |
| |
Corporate Bonds and Notes - 51.4% | | | | | |
| |
Financials - 12.2% | | | | | |
| | |
AerCap Ireland Capital DAC/AerCap Global Aviation Trust (Ireland) | | | | | | | | |
1.650%, 10/29/24 | | | $5,450,000 | | | | $5,027,082 | |
| | |
Aircastle, Ltd. (Bermuda) | | | | | | | | |
5.250%, 08/11/251 | | | 2,282,000 | | | | 2,194,686 | |
| | |
American Express Co. | | | | | | | | |
(3.550% to 09/15/26 then U.S. Treasury Yield Curve CMT 5 year + 2.854%), 3.550%, 09/15/262,3,4 | | | 1,195,000 | | | | 981,693 | |
| | |
American Tower Corp. | | | | | | | | |
4.400%, 02/15/265 | | | 1,900,000 | | | | 1,851,418 | |
| | |
Bank of America Corp. | | | | | | | | |
(3.559% to 04/23/26 then 3 month LIBOR + 1.060%), 3.559%, 04/23/272,4 | | | 2,850,000 | | | | 2,670,080 | |
MTN, (4.330% to 03/15/49 then 3 month LIBOR + 1.520%), 4.330%, 03/15/502,4 | | | 2,775,000 | | | | 2,276,024 | |
| | |
The Bank of New York Mellon Corp. | | | | | | | | |
Series G, (4.700% to 09/20/25 then U.S. Treasury Yield Curve CMT 5 year + 4.358%), 4.700%, 09/20/252,3,4 | | | 4,300,000 | | | | 4,128,559 | |
| | |
The Charles Schwab Corp. | | | | | | | | |
Series I, (4.000% to 06/01/26 then U.S. Treasury Yield Curve CMT 5 year + 3.168%), 4.000%, 06/01/262,3,4 | | | 4,400,000 | | | | 3,817,000 | |
| | |
Crown Castle, Inc. | | | | | | | | |
4.000%, 03/01/27 | | | 2,300,000 | | | | 2,193,392 | |
| | |
First-Citizens Bank & Trust Co. | | | | | | | | |
6.125%, 03/09/28 | | | 2,825,000 | | | | 2,870,967 | |
| | |
The Goldman Sachs Group, Inc. | | | | | | | | |
6.750%, 10/01/37 | | | 1,850,000 | | | | 1,973,993 | |
| | |
JPMorgan Chase & Co. | | | | | | | | |
(1.470% to 09/22/26 then SOFR + 0.765%), 1.470%, 09/22/272,4 | | | 3,104,000 | | | | 2,687,328 | |
| | |
Morgan Stanley | | | | | | | | |
3.950%, 04/23/27 | | | 2,200,000 | | | | 2,077,664 | |
(4.431% to 01/23/29 then 3 month LIBOR + 1.628%), 4.431%, 01/23/302,4 | | | 2,948,000 | | | | 2,743,714 | |
| | |
Owl Rock Capital Corp. | | | | | | | | |
4.250%, 01/15/26 | | | 2,300,000 | | | | 2,111,443 | |
| | |
SBA Communications Corp. | | | | | | | | |
3.875%, 02/15/27 | | | 3,700,000 | | | | 3,343,000 | |
| | |
SLM Corp. | | | | | | | | |
3.125%, 11/02/26 | | | 3,365,000 | | | | 2,861,764 | |
4.200%, 10/29/25 | | | 838,000 | | | | 766,733 | |
| | |
Starwood Property Trust, Inc. | | | | | | | | |
4.750%, 03/15/25 | | | 1,700,000 | | | | 1,622,224 | |
| | |
Truist Financial Corp. | | | | | | | | |
Series P, (4.950% to 12/01/25 then U.S. Treasury Yield Curve CMT 5 year + 4.605%), 4.950%, 09/01/252,3,4 | | | 3,400,000 | | | | 3,250,740 | |
| | | | | | | | |
| | | Principal Amount | | | Value | |
| | |
VICI Properties LP/VICI Note Co., Inc. | | | | | | | | |
3.500%, 02/15/251 | | | $1,900,000 | | | | $1,791,377 | |
| | |
Wells Fargo & Co., MTN | | | | | | | | |
(2.879% to 10/30/29 then 3 Month Term SOFR + 1.432%), 2.879%, 10/30/302,4 | | | 3,435,000 | | | | 2,917,705 | |
| | |
Weyerhaeuser Co. | | | | | | | | |
6.875%, 12/15/33 | | | 2,600,000 | | | | 2,788,953 | |
| | |
Wynn Las Vegas LLC/Wynn Las Vegas Capital Corp. | | | | | | | | |
5.500%, 03/01/251 | | | 1,250,000 | | | | 1,186,682 | |
| | |
Total Financials | | | | | | | 60,134,221 | |
| |
Industrials - 37.2% | | | | | |
| | |
Advocate Health & Hospitals Corp. | | | | | | | | |
4.272%, 08/15/48 | | | 1,700,000 | | | | 1,443,252 | |
| | |
AECOM | | | | | | | | |
5.125%, 03/15/27 | | | 1,650,000 | | | | 1,588,125 | |
| | |
Air Products and Chemicals, Inc. | | | | | | | | |
2.700%, 05/15/40 | | | 2,450,000 | | | | 1,822,883 | |
| | |
Alcoa Nederland Holding, B.V. (Netherlands) | | | | | | | | |
4.125%, 03/31/291 | | | 5,750,000 | | | | 5,101,162 | |
| | |
Amazon.com, Inc. | | | | | | | | |
4.600%, 12/01/255 | | | 5,053,000 | | | | 5,040,560 | |
| | |
Anglo American Capital PLC (United Kingdom) | | | | | | | | |
2.875%, 03/17/311,5 | | | 3,554,000 | | | | 2,901,876 | |
| | |
Anheuser-Busch InBev Worldwide, Inc. | | | | | | | | |
4.375%, 04/15/38 | | | 2,200,000 | | | | 1,966,603 | |
| | |
Aramark Services, Inc. | | | | | | | | |
5.000%, 02/01/281,5 | | | 3,220,000 | | | | 3,004,051 | |
| | |
Ardagh Metal Packaging Finance USA LLC/Ardagh Metal Packaging Finance PLC | | | | | | | | |
3.250%, 09/01/281 | | | 3,500,000 | | | | 2,973,058 | |
| | |
Ashtead Capital, Inc. | | | | | | | | |
1.500%, 08/12/261 | | | 3,536,000 | | | | 3,017,590 | |
| | |
AT&T, Inc. | | | | | | | | |
4.300%, 02/15/30 | | | 2,200,000 | | | | 2,071,513 | |
| | |
Ball Corp. | | | | | | | | |
2.875%, 08/15/30 | | | 3,875,000 | | | | 3,092,715 | |
| | |
Broadcom Corp./Broadcom Cayman Finance, Ltd. | | | | | | | | |
3.875%, 01/15/27 | | | 3,019,000 | | | | 2,855,642 | |
| | |
CCO Holdings LLC/CCO Holdings Capital Corp. | | | | | | | | |
5.500%, 05/01/261 | | | 2,000,000 | | | | 1,936,201 | |
| | |
Celanese US Holdings LLC | | | | | | | | |
6.050%, 03/15/25 | | | 5,085,000 | | | | 5,065,216 | |
| | |
Centene Corp. | | | | | | | | |
3.375%, 02/15/305 | | | 3,650,000 | | | | 3,085,601 | |
| | |
Cisco Systems, Inc. | | | | | | | | |
5.500%, 01/15/40 | | | 1,650,000 | | | | 1,716,999 | |
| | |
Clearwater Paper Corp. | | | | | | | | |
4.750%, 08/15/281 | | | 1,950,000 | | | | 1,713,418 | |
The accompanying notes are an integral part of these financial statements.
9
| | |
| | |
| | | AMG GW&K ESG Bond Fund Schedule of Portfolio Investments (continued) |
| | | |
| | | |
| | | |
| | | | | | | | |
| | | Principal Amount | | | Value | |
| | |
Industrials - 37.2% (continued) | | | | | | | | |
| | |
The Coca-Cola Co. | | | | | | | | |
2.500%, 06/01/40 | | | $2,400,000 | | | | $1,748,822 | |
| | |
Cogent Communications Group, Inc. | | | | | | | | |
3.500%, 05/01/261 | | | 3,365,000 | | | | 3,056,909 | |
| | |
CommonSpirit Health | | | | | | | | |
3.347%, 10/01/29 | | | 1,950,000 | | | | 1,696,984 | |
| | |
Crown Americas LLC/Crown Americas Capital Corp. V | | | | | | | | |
4.250%, 09/30/265 | | | 3,350,000 | | | | 3,194,493 | |
| | |
Dell International LLC/EMC Corp. | | | | | | | | |
8.100%, 07/15/36 | | | 972,000 | | | | 1,089,241 | |
| | |
Dell, Inc. | | | | | | | | |
7.100%, 04/15/28 | | | 2,950,000 | | | | 3,145,746 | |
| | |
Delta Air Lines, Inc. | | | | | | | | |
7.375%, 01/15/265 | | | 3,100,000 | | | | 3,167,394 | |
| | |
Discovery Communications LLC | | | | | | | | |
3.950%, 03/20/285 | | | 2,047,000 | | | | 1,816,889 | |
| | |
FMG Resources August 2006 Pty, Ltd. (Australia) | | | | | | | | |
4.500%, 09/15/271 | | | 3,000,000 | | | | 2,767,500 | |
| | |
The Ford Foundation | | | | | | | | |
Series 2020, 2.415%, 06/01/50 | | | 2,725,000 | | | | 1,714,252 | |
| | |
Freeport-McMoRan, Inc. | | | | | | | | |
4.625%, 08/01/305 | | | 2,961,000 | | | | 2,757,859 | |
| | |
The Goodyear Tire & Rubber Co. | | | | | | | | |
4.875%, 03/15/275 | | | 500,000 | | | | 457,365 | |
| | |
Graphic Packaging International LLC | | | | | | | | |
3.500%, 03/01/291 | | | 2,850,000 | | | | 2,428,279 | |
| | |
Hanesbrands, Inc. | | | | | | | | |
4.875%, 05/15/261,5 | | | 3,250,000 | | | | 2,904,106 | |
| | |
Hasbro, Inc. | | | | | | | | |
3.900%, 11/19/29 | | | 3,425,000 | | | | 3,043,744 | |
| | |
HB Fuller Co. | | | | | | | | |
4.250%, 10/15/28 | | | 3,400,000 | | | | 3,009,000 | |
| | |
HCA, Inc. | | | | | | | | |
3.500%, 09/01/30 | | | 3,050,000 | | | | 2,630,553 | |
| | |
Hilton Domestic Operating Co., Inc. | | | | | | | | |
4.875%, 01/15/30 | | | 3,600,000 | | | | 3,262,356 | |
| | |
The Home Depot, Inc. | | | | | | | | |
5.875%, 12/16/36 | | | 1,600,000 | | | | 1,711,065 | |
| | |
Howmet Aerospace, Inc. | | | | | | | | |
6.875%, 05/01/25 | | | 2,000,000 | | | | 2,052,340 | |
| | |
KB Home | | | | | | | | |
4.800%, 11/15/29 | | | 1,222,000 | | | | 1,062,639 | |
6.875%, 06/15/275 | | | 1,751,000 | | | | 1,761,418 | |
| | |
Lamar Media Corp. | | | | | | | | |
4.875%, 01/15/295 | | | 3,250,000 | | | | 2,984,075 | |
| | |
Merck & Co., Inc. | | | | | | | | |
1.900%, 12/10/28 | | | 7,010,000 | | | | 6,018,509 | |
| | |
Meritage Homes Corp. | | | | | | | | |
6.000%, 06/01/25 | | | 485,000 | | | | 482,666 | |
| | | | | | | | |
| | | | | | | | |
| | | Principal Amount | | | Value | |
| | |
MGM Resorts International | | | | | | | | |
5.750%, 06/15/25 | | | $1,175,000 | | | | $1,141,954 | |
| | |
Microsoft Corp. | | | | | | | | |
2.525%, 06/01/50 | | | 2,450,000 | | | | 1,612,220 | |
| | |
MSCI, Inc. | | | | | | | | |
3.250%, 08/15/331 | | | 2,015,000 | | | | 1,556,101 | |
| | |
Mueller Water Products, Inc. | | | | | | | | |
4.000%, 06/15/291 | | | 3,000,000 | | | | 2,636,250 | |
| | |
Murphy Oil USA, Inc. | �� | | | | | | | |
4.750%, 09/15/29 | | | 3,250,000 | | | | 2,973,848 | |
| | |
Newell Brands, Inc. | | | | | | | | |
4.450%, 04/01/266 | | | 3,400,000 | | | | 3,198,704 | |
| | |
Novelis Corp. | | | | | | | | |
3.250%, 11/15/261 | | | 3,175,000 | | | | 2,846,419 | |
| | |
Owens Corning | | | | | | | | |
7.000%, 12/01/36 | | | 1,800,000 | | | | 1,904,913 | |
| | |
Parker-Hannifin Corp. | | | | | | | | |
3.250%, 06/14/29 | | | 1,900,000 | | | | 1,696,696 | |
| | |
Penske Automotive Group, Inc. | | | | | | | | |
3.500%, 09/01/255 | | | 2,000,000 | | | | 1,856,119 | |
| | |
Prime Security Services Borrower LLC/Prime Finance, Inc. | | | | | | | | |
5.750%, 04/15/261 | | | 3,250,000 | | | | 3,128,125 | |
| | |
PulteGroup, Inc. | | | | | | | | |
6.000%, 02/15/35 | | | 2,050,000 | | | | 1,960,131 | |
| | |
SK Hynix, Inc. (South Korea) | | | | | | | | |
2.375%, 01/19/311 | | | 3,000,000 | | | | 2,199,494 | |
| | |
Sonoco Products Co. | | | | | | | | |
2.850%, 02/01/32 | | | 3,682,000 | | | | 2,992,949 | |
| | |
Sysco Corp. | | | | | | | | |
2.400%, 02/15/30 | | | 4,475,000 | | | | 3,719,568 | |
| | |
Teleflex, Inc. | | | | | | | | |
4.250%, 06/01/281 | | | 3,350,000 | | | | 3,058,081 | |
| | |
Tenet Healthcare Corp. | | | | | | | | |
4.875%, 01/01/261 | | | 3,350,000 | | | | 3,167,903 | |
| | |
Toll Brothers Finance Corp. | | | | | | | | |
4.875%, 03/15/27 | | | 3,250,000 | | | | 3,103,212 | |
| | |
Travel + Leisure Co. | | | | | | | | |
5.650%, 04/01/246 | | | 2,700,000 | | | | 2,659,368 | |
| | |
Twilio, Inc. | | | | | | | | |
3.625%, 03/15/29 | | | 600,000 | | | | 487,440 | |
3.875%, 03/15/315 | | | 2,694,000 | | | | 2,137,298 | |
| | |
United Parcel Service, Inc. | | | | | | | | |
6.200%, 01/15/38 | | | 1,500,000 | | | | 1,658,363 | |
| | |
United Rentals North America, Inc. | | | | | | | | |
3.875%, 02/15/31 | | | 3,650,000 | | | | 3,059,759 | |
| | |
Verizon Communications, Inc. | | | | | | | | |
3.875%, 02/08/295 | | | 3,460,000 | | | | 3,246,398 | |
| | |
VF Corp. | | | | | | | | |
2.950%, 04/23/305 | | | 2,100,000 | | | | 1,744,175 | |
| | | | | | | | |
The accompanying notes are an integral part of these financial statements.
10
| | |
| | |
| | | AMG GW&K ESG Bond Fund Schedule of Portfolio Investments (continued) |
| | | |
| | | |
| | | |
| | | | | | | | |
| | | Principal Amount | | | Value | |
| | |
Industrials - 37.2% (continued) | | | | | | | | |
| | |
VMware, Inc. | | | | | | | | |
3.900%, 08/21/27 | | | $3,400,000 | | | | $3,173,153 | |
| | |
Walgreens Boots Alliance, Inc. | | | | | | | | |
4.800%, 11/18/44 | | | 2,520,000 | | | | 2,109,022 | |
| | |
Walmart, Inc. | | | | | | | | |
4.050%, 06/29/48 | | | 1,850,000 | | | | 1,641,798 | |
| | |
WESCO Distribution, Inc. | | | | | | | | |
7.125%, 06/15/251 | | | 1,600,000 | | | | 1,620,019 | |
| | |
Western Digital Corp. | | | | | | | | |
4.750%, 02/15/26 | | | 1,916,000 | | | | 1,804,336 | |
| | |
Yum! Brands, Inc. | | | | | | | | |
3.625%, 03/15/31 | | | 3,550,000 | | | | 2,976,675 | |
| | |
Total Industrials | | | | | | | 183,431,160 | |
| |
Utilities - 2.0% | | | | | |
| | |
Dominion Energy, Inc. | | | | | | | | |
Series B, (4.650% to 12/15/24 then U.S. Treasury Yield Curve CMT 5 year + 2.993%), 4.650%, 12/15/242,3,4 | | | 3,950,000 | | | | 3,456,250 | |
| | |
National Rural Utilities Cooperative Finance Corp. | | | | | | | | |
1.350%, 03/15/31 | | | 4,750,000 | | | | 3,509,956 | |
| | |
Northern States Power Co. | | | | | | | | |
2.900%, 03/01/50 | | | 3,800,000 | | | | 2,599,065 | |
| | |
Total Utilities | | | | | | | 9,565,271 | |
| |
Total Corporate Bonds and Notes | | | | | |
(Cost $288,413,877) | | | | | | | 253,130,652 | |
| | |
Municipal Bonds - 5.9% | | | | | | | | |
| | |
California Health Facilities Financing Authority | | | | | | | | |
4.190%, 06/01/37 | | | 3,500,000 | | | | 3,126,553 | |
| | |
California State General Obligation, School Improvements Build America Bonds, 7.550%, 04/01/39 | | | 2,300,000 | | | | 2,878,754 | |
| | |
Commonwealth of Massachusetts | | | | | | | | |
Series B, 4.110%, 07/15/31 | | | 3,660,000 | | | | 3,533,621 | |
| | |
Dallas Fort Worth International Airport, Series A | | | | | | | | |
4.507%, 11/01/51 | | | 1,000,000 | | | | 898,819 | |
| | |
JobsOhio Beverage System,
Series A | | | | | | | | |
2.833%, 01/01/38 | | | 3,700,000 | | | | 2,890,756 | |
| | |
Los Angeles Unified School District, School Improvements
5.750%, 07/01/34 | | | 3,225,000 | | | | 3,368,776 | |
| | |
Massachusetts School Building Authority | | | | | | | | |
Series B, 1.753%, 08/15/30 | | | 4,500,000 | | | | 3,673,920 | |
| | |
New Jersey Economic Development Authority, Pension Funding, Series A (National Insured) | | | | | | | | |
7.425%, 02/15/29 | | | 3,550,000 | | | | 3,821,584 | |
| | |
Port Authority of New York & New Jersey | | | | | | | | |
6.040%, 12/01/29 | | | 2,000,000 | | | | 2,109,782 | |
| | | | | | | | |
| | | | | | | | |
| | | Principal Amount | | | Value | |
| | |
University of California, Series BI | | | | | | | | |
1.697%, 05/15/29 | | | $3,650,000 | | | | $2,996,395 | |
| | |
Total Municipal Bonds | | | | | | | | |
(Cost $34,814,883) | | | | | | | 29,298,960 | |
| |
U.S. Government and Agency
Obligations - 40.5% | | | | | |
| | |
Fannie Mae - 17.2% | | | | | | | | |
| | |
FNMA | | | | | | | | |
2.000%, 04/01/51 | | | 12,427,952 | | | | 10,147,515 | |
2.500%, 11/01/50 | | | 5,079,053 | | | | 4,326,132 | |
3.500%, 02/01/35 to 02/01/51 | | | 39,894,854 | | | | 37,465,019 | |
4.000%, 07/01/44 to 01/01/51 | | | 24,014,213 | | | | 22,930,759 | |
4.500%, 05/01/48 to 06/01/49 | | | 6,969,461 | | | | 6,872,502 | |
5.000%, 05/01/50 | | | 3,240,435 | | | | 3,248,364 | |
| | |
Total Fannie Mae | | | | | | | 84,990,291 | |
| | |
Freddie Mac - 8.4% | | | | | | | | |
| | |
FHLMC | | | | | | | | |
2.000%, 03/01/36 | | | 8,784,509 | | | | 7,835,185 | |
3.000%, 04/01/51 | | | 16,670,090 | | | | 14,676,474 | |
3.500%, 02/01/50 | | | 9,647,506 | | | | 8,898,566 | |
4.500%, 10/01/48 to 12/01/48 | | | 10,081,490 | | | | 9,887,915 | |
| | |
Total Freddie Mac | | | | | | | 41,298,140 | |
| | |
U.S. Treasury Obligations - 14.9% | | | | | | | | |
| | |
U.S. Treasury Bonds | | | | | | | | |
1.250%, 05/15/50 | | | 4,625,000 | | | | 2,489,009 | |
1.875%, 02/15/51 | | | 15,912,000 | | | | 10,112,822 | |
2.250%, 05/15/41 | | | 19,759,000 | | | | 14,853,982 | |
2.500%, 02/15/46 | | | 2,096,000 | | | | 1,568,234 | |
3.125%, 05/15/48 | | | 11,143,000 | | | | 9,364,908 | |
3.500%, 02/15/39 | | | 7,852,000 | | | | 7,375,052 | |
5.000%, 05/15/37 | | | 7,846,000 | | | | 8,762,388 | |
6.750%, 08/15/26 | | | 2,579,000 | | | | 2,800,431 | |
| | |
U.S. Treasury Notes | | | | | | | | |
0.250%, 03/15/24 | | | 5,868,000 | | | | 5,562,910 | |
0.500%, 02/28/26 | | | 3,270,000 | | | | 2,913,749 | |
2.500%, 01/31/25 | | | 3,450,000 | | | | 3,319,008 | |
2.625%, 02/15/29 | | | 4,763,000 | | | | 4,402,054 | |
| | |
Total U.S. Treasury Obligations | | | | | | | 73,524,547 | |
| | |
Total U.S. Government and Agency Obligations | | | | | | | | |
(Cost $237,183,222) | | | | | | | 199,812,978 | |
| |
Foreign Government Obligation - 0.9% | | | | | |
| | |
The Korea Development Bank (South Korea)
0.500%, 10/27/23
(Cost $4,552,913) | | | 4,550,000 | | | | 4,394,653 | |
| |
Short-Term Investments - 2.1% | | | | | |
| |
Joint Repurchase Agreements - 1.5%7 | | | | | |
| | |
Bank of America Securities, Inc., dated 12/30/22,due 01/03/23, 4.300% total to be received $1,761,488 (collateralized by various U.S. Government Agency Obligations, 1.500% - 6.500%, 05/01/37 - 05/01/58, totaling $1,795,860) | | | 1,760,647 | | | | 1,760,647 | |
| | | | | | | | |
The accompanying notes are an integral part of these financial statements.
11
| | |
| | |
| | | AMG GW&K ESG Bond Fund Schedule of Portfolio Investments (continued) |
| | | |
| | | |
| | | |
| | | | | | | | |
| | | Principal Amount | | | Value | |
| |
Joint Repurchase Agreements - 1.5%7 | | | | | |
(continued) | | | | | | | | |
| | |
Citigroup Global Markets, Inc., dated 12/30/22, due 01/03/23, 4.250% total to be received $369,995 (collateralized by various U.S. Treasuries, 0.000% - 4.500%, 04/11/23 - 10/31/29, totaling $377,216) | | | $369,820 | | | | $369,820 | |
| | |
MUFG Securities America, Inc., dated 12/30/22, due 01/03/23, 4.300% total to be received $1,761,488 (collateralized by various U.S. Government Agency Obligations, 2.000% - 5.500%, 08/01/24 - 01/01/53, totaling $1,795,860) | | | 1,760,647 | | | | 1,760,647 | |
| | |
National Bank Financial, dated 12/30/22, due 01/03/23, 4.340% total to be received $1,761,496 (collateralized by various U.S. Treasuries, 0.000% - 4.435%, 01/03/23 - 09/09/49, totaling $1,795,860) | | | 1,760,647 | | | | 1,760,647 | |
| | |
RBC Dominion Securities, Inc., dated 12/30/22, due 01/03/23, 4.300% total to be received $1,761,488 (collateralized by various U.S. Government Agency Obligations, 2.000% - 6.000%, 09/01/24 - 10/20/52, totaling $1,795,860) | | | 1,760,647 | | | | 1,760,647 | |
| | |
Total Joint Repurchase Agreements | | | | | | | 7,412,408 | |
| | | | | | | | |
| | | | | | | | |
| | | Principal Amount | | | Value | |
| | |
Repurchase Agreements - 0.6% | | | | | | | | |
| | |
Fixed Income Clearing Corp., dated 12/30/22 due 01/03/23, 4.150% total to be received $3,071,416 (collateralized by a U.S. Treasury, 0.125%, 01/15/32, totaling $3,131,490) | | | $3,070,000 | | | | $3,070,000 | |
| |
Total Short-Term Investments | | | | | |
(Cost $10,482,408) | | | | 10,482,408 | |
| |
Total Investments - 100.8% | | | | | |
(Cost $575,447,303) | | | | 497,119,651 | |
| |
Other Assets, less Liabilities - (0.8)% | | | | (4,113,005 | ) |
| |
Net Assets - 100.0% | | | | $493,006,646 | |
| | | | | |
| 1 | Security exempt from registration under Rule 144A of the Securities Act of 1933. This security may be resold in transactions exempt from registration, normally to qualified institutional buyers. At December 31, 2022, the value of these securities amounted to $57,189,287 or 11.6% of net assets. |
| 2 | Fixed to variable rate investment. The rate shown reflects the fixed rate in effect at December 31, 2022. Rate will reset at a future date. |
| 3 | Perpetuity Bond. The date shown represents the next call date. |
| 4 | Variable rate security. The rate shown is based on the latest available information as of December 31, 2022. Certain variable rate securities are not based on a published reference rate and spread but are determined by the issuer or agent and are based on current market conditions. These securities do not indicate a reference rate and spread in their description above. |
| 5 | Some of these securities, amounting to $25,458,950 or 5.2% of net assets, were out on loan to various borrowers and are collateralized by cash and various U.S. Treasury Obligations. See Note 4 of Notes to Financial Statements. |
| 6 | Step Bond: A debt instrument with either deferred interest payments or an interest rate that resets at specific times during its term. |
| 7 | Cash collateral received for securities lending activity was invested in these joint repurchase agreements. |
| | |
| CMT | | Constant Maturity Treasury |
| FHLMC | | Freddie Mac |
| FNMA | | Fannie Mae |
| LIBOR | | London Interbank Offered Rate |
| MTN | | Medium-Term Note |
| National Insured | | National Public Finance Guarantee Corp. |
| SOFR | | Secured Overnight Financing Rate |
The accompanying notes are an integral part of these financial statements.
12
| | |
| | |
| | | AMG GW&K ESG Bond Fund Schedule of Portfolio Investments (continued) |
| | | |
| | | |
| | | |
The following table summarizes the inputs used to value the Fund’s investments by the fair value hierarchy levels as of December 31, 2022:
| | | | | | | | | | | | | | | | |
| | | Level 1 | | | Level 2 | | | Level 3 | | | Total | |
| | | | |
Investments in Securities | | | | | | | | | | | | | | | | |
| | | | |
Corporate Bonds and Notes† | | | — | | | | $253,130,652 | | | | — | | | | $253,130,652 | |
| | | | |
Municipal Bonds† | | | — | | | | 29,298,960 | | | | — | | | | 29,298,960 | |
| | | | |
U.S. Government and Agency Obligations† | | | — | | | | 199,812,978 | | | | — | | | | 199,812,978 | |
| | | | |
Foreign Government Obligation† | | | — | | | | 4,394,653 | | | | — | | | | 4,394,653 | |
| | | | |
Short-Term Investments | | | | | | | | | | | | | | | | |
| | | | |
Joint Repurchase Agreements | | | — | | | | 7,412,408 | | | | — | | | | 7,412,408 | |
| | | | |
Repurchase Agreements | | | — | | | | 3,070,000 | | | | — | | | | 3,070,000 | |
| | | | | | | | | | | | | | | | |
| | | | |
Total Investments in Securities | | | — | | | | $497,119,651 | | | | — | | | | $497,119,651 | |
| | | | | | | | | | | | | | | | |
| † | All corporate bonds and notes, municipal bonds, U.S. government and agency obligations and foreign government obligations held in the Fund are Level 2 securities. For a detailed breakout of corporate bonds and notes, municipal bonds, U.S. government and agency obligations and foreign government obligations by major industry or agency classification, please refer to the Fund’s Schedule of Portfolio Investments. |
The following table below is a reconciliation of investments in which significant unobservable inputs (Level 3) were used in determining fair value at December 31, 2022:
| | | | |
| | | Asset-Backed Securities | |
| |
Balance as of December 31, 2021 | | | $2,475,909 | |
| |
Accrued discounts (premiums) | | | 2,490 | |
| |
Realized gain (loss) | | | (207,677 | ) |
| |
Change in unrealized appreciation/depreciation | | | 4,633,827 | |
| |
Sales | | | (1,670,846 | ) |
| |
Paydown | | | (5,233,703 | ) |
| |
Transfers in to Level 3 | | | — | |
| |
Transfers out of Level 3 | | | — | |
| |
Balance as of December 31, 2022 | | | $0 | |
| |
| | | | |
| |
Net change in unrealized appreciation/depreciation on investments still held at December 31, 2022 | | | — | |
The accompanying notes are an integral part of these financial statements.
13
| | |
| | |
| | | AMG GW&K Enhanced Core Bond ESG Fund Portfolio Manager’s Comments (unaudited) |
| | | |
| | | |
| | | |
| | | | |
THE YEAR IN REVIEW AMG GW&K Enhanced Core Bond ESG Fund (the “Fund”) Class N shares returned (14.17)% for the year ended December 31, 2022, compared to the return of (13.01)% for the Fund’s benchmark, the Bloomberg U.S. Aggregate Bond Index. MARKET OVERVIEW In the first quarter of 2022 fixed income markets experienced their worst quarter in more than four decades amid an extraordinary confluence of economic and geopolitical shocks. Core inflation jumped to 5.4%, its highest level since 1983, on a broad-based rise in consumer prices. The U.S. Federal Reserve (the Fed) responded in kind, intensifying their hawkish rhetoric and laying out an aggressive course of hikes to bring inflation back to target. And—in addition to exacting a tragic human toll—Russia’s invasion of Ukraine exacerbated already strained supply chains and commodity markets, threatening acute and prolonged shortages of materials vital to the basic functioning of the global economy. But for all this uncertainty and turmoil, there was a notable divergence between the performance of rates and credit; the former extended a historically severe downdraft, while the latter continued to enjoy a remarkably benign trading environment. How this disconnect eventually would resolve itself was a central question before investors, though policy uncertainty and heightened tensions seemed unlikely to subside anytime soon. More volatility followed in the second quarter, as bonds traded in a wide range and struggled to commit to a consistent narrative. The central question revolved around how persistent inflation would be and what policy measures would be necessary to quell it. A natural deceleration would allow the Fed to pursue less aggressive policy and possibly achieve a soft landing; more recalcitrant price pressure would require the Fed to mount a harsher response and invite a potential recession. The implications of these two different paths were at odds, leading to a broad lack of conviction with no clear market direction. Similarly, puzzling was a consumer with a strong proclivity to spend but a deeply pessimistic outlook and a corporate sector earning solid profits but starting to announce layoffs. Additionally, China offered a potential bright spot as it emerged from recent shutdowns, but the Ukraine conflict lingered as a major threat to global energy and commodity markets. An imminent resolution to any of these tensions seemed unlikely, so disciplined risk management and careful analysis of relative value were of particular importance for the months ahead. | | Fixed income markets were under extraordinary pressure in the third quarter as investors continued to adapt to restrictive monetary policy after more than a decade of accommodation. Stubbornly rising prices, hawkish central banks, and various geopolitical forces combined to tighten financial conditions and raise the cost of borrowing around the world. Defying expectations that it had peaked, inflation remained elevated and manifested across a broader and more entrenched collection of goods and services. The Fed also confounded expectations, projecting a more cautious outlook and a more aggressive path of hikes than most economists had anticipated. International pressures escalated as well, as currency market dislocations, political leadership changes in Europe and Asia, and multiple energy crises collectively drove a heightened sense of uncertainty. The variety and momentum of these forces suggested no near-term end to volatility, especially against a backdrop of increasingly expensive capital. Bonds rebounded in the fourth quarter amid growing confidence that central banks have succeeded in slowing inflation and will soon be able to pursue less restrictive policy. This modest rally nevertheless ended up being too little, too late to help the bond market avoid its worst annual performance on record and an unprecedented second consecutive year of losses. Sentiment among both investors and consumers may have reached an inflection point, but data continue to justify some measure of caution: inflation is still stubbornly above the Fed’s target, the labor market shows few signs of loosening, and corporations have yet to see a meaningful deterioration in earnings. Only the rate-sensitive housing market really stands out as a casualty of the Fed’s tightening campaign to this point. Whether the end of the cycle is imminent is likely to remain an open question, especially as investors await the realization of the “long and variable lag” that has yet to be fully reflected across so many segments of the economy. FUND REVIEW The Fund underperformed the Index during the fiscal year. Yield curve positioning was a relative positive, given the Fund’s shorter relative duration in a period of rising rates. Our overweight allocation to corporates had a negative impact on performance amid the heightened spread volatility. Our preference for lower-rated securities within the investment grade corporate space also had a negative effect. On | | the positive side, our bias to higher coupon mortgages was helpful to relative performance. Our out-of-benchmark allocation to high yield had an incrementally positive influence on overall corporate security selection. ESG (Environmental, Social, and Governance) remained an important area of focus for the corporate bond market in what could be viewed as a transition year in 2022. A growing list of companies have moved beyond publishing sustainability reports to set emissions reduction and net zero targets over the past year. Investors shook off an overall difficult market environment, from geopolitical turmoil to interest rate volatility, to demonstrate continued strong interest in ESG. This was also a landmark year for global sustainability regulation, with regulators across Europe, North America, and Asia introducing new rules and proposals related to reporting for both corporations and investors. In the U.S., the Inflation Reduction Act is poised to provide policy support for many companies of interest to ESG investors. We continue to integrate ESG as a core part of our fundamental investment process, while monitoring regulatory and policy actions that could influence the ESG investing landscape in the coming years. OUTLOOK The disconnect between the Fed’s projections and market pricing has widened following the most recent Summary of Economic Projections (SEP). The median estimate of Federal Open Market Committee (FOMC) participants for the overnight rate at the end of 2023 is 5.125%, up from 4.625% in September; the Fed Funds futures market sees a terminal rate of nearly 5% in June of 2023, and then two cuts by year end. There has also been a small but not insignificant chorus of economists calling for the FOMC to raise its target inflation to 3.0% from 2.0%, prompting objections that this would undermine the Fed’s hard-earned credibility. These are just two sources of tension in the rates market, and their resolution could have significant implications for both the level and the shape of the yield curve. We don’t believe investors are being sufficiently compensated for these risks, so duration and curve positioning is relatively neutral relative to its benchmark. Our fundamental view of credit is broadly constructive, and we believe balance sheets in general are sound and liquidity is sufficient. But we recognize the potential for macroeconomic forces to alter this landscape and we don’t believe all these |
| | | | |
14
| | |
| | |
| | | AMG GW&K Enhanced Core Bond ESG Fund Portfolio Manager’s Comments (continued) |
| | | |
| | | |
| | | |
| | | | |
risks are adequately reflected in valuations. Consequently, our allocation to corporate credit is at the lower end of its historical range. Within the space, we see the best value at the front end, where higher quality credits in less rate-sensitive sectors offer attractive yields and compelling breakevens. We have also been able to identify names that we | | believe can improve their credit profiles independently of a challenging macro backdrop. Our exposure to mortgages is neutral, as we believe the benefits of lower originations and potentially lower rate volatility are offset by event risks surrounding quantitative tightening and middling spread levels. | | The views expressed represent the opinions of GW&K Investment Management, LLC as of December 31, 2022, and are not intended as a forecast or guarantee of future results, and are subject to change without notice. |
| | | | |
15
| | |
| | |
| | | AMG GW&K Enhanced Core Bond ESG Fund Portfolio Manager’s Comments (continued) |
| | | |
| | | |
| | | |
CUMULATIVE TOTAL RETURN PERFORMANCE
AMG GW&K Enhanced Core Bond ESG Fund’s cumulative total return is based on the daily change in net asset value (NAV), and assumes that all dividends and distributions were reinvested. The graph compares a hypothetical $10,000 investment made in the AMG GW&K Enhanced Core Bond ESG Fund’s Class N shares on December 31, 2012, to a $10,000 investment made in the Bloomberg U.S. Aggregate Bond Index for the same time period. The graph and table do not reflect the deduction of taxes that a shareholder would pay on a Fund distribution or redemption of shares. The listed returns for the Fund are net of expenses and the returns for the index exclude expenses. Total returns would have been lower had certain expenses not been reduced.
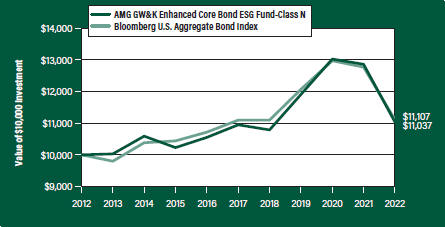
The table below shows the average annual total returns for the AMG GW&K Enhanced Core Bond ESG Fund and the Bloomberg U.S. Aggregate Bond Index for the same time periods ended December 31, 2022.
| | | | | | | | | | | | |
| Average Annual Total Returns1 | | One Year | | | Five Years | | | Ten Years | |
|
AMG GW&K Enhanced Core Bond ESG Fund2, 3, 4, 5, 6, 7, 8, 9 | |
| | | |
Class N | | | (14.17% | ) | | | 0.16% | | | | 0.99% | |
| | | |
Class I | | | (14.07% | ) | | | 0.32% | | | | 1.16% | |
| | | |
Class Z | | | (14.00% | ) | | | 0.41% | | | | 1.24% | |
| | | |
Bloomberg U.S. Aggregate Bond Index10 | | | (13.01% | ) | | | 0.02% | | | | 1.06% | |
The performance data shown represents past performance. Past performance is not a guarantee of future results. Current performance may be lower or higher than the performance data quoted. The investment return and principal value of an investment will fluctuate so that an investor’s shares, when redeemed, may be worth more or less than their original cost.
Investors should carefully consider the Fund’s investment objectives, risks, charges and expenses before investing. For performance information through the most recent month end, current net asset values per share for the Fund and other information, please call 800.548.4539 or visit our website at amgfunds.com for a free prospectus. Read it carefully before investing or sending money.
Distributed by AMG Distributors, Inc., member FINRA/SIPC.
| 1 | Total return equals income yield plus share price change and assumes reinvestment of all dividends and capital gain distributions. Returns are net of fees and may reflect offsets of Fund expenses as described in the prospectus. No adjustment has been made for taxes payable by shareholders on their reinvested dividends and capital gain distributions. Returns for periods greater than one year are annualized. The listed returns on the Fund are net of expenses and based on the published NAV as of December 31, 2022. All returns are in U.S. Dollars ($). |
|
2 From time to time, the Fund’s investment manager has waived its fees and/or absorbed Fund expenses, which has resulted in higher returns. 3 The Fund is subject to the risks associated with investments in debt securities, such as default risk and fluctuations in the perception of the debtor’s ability to pay its creditors. Changing interest rates may adversely affect the value of an investment. An increase in interest rates typically causes the value of bonds and other fixed income securities to fall. 4 To the extent that the Fund invests in asset-backed or mortgage-backed securities, its exposure to prepayment and extension risks may be greater than investments in other fixed income securities. 5 High-yield bonds (also known as “junk bonds”) may be subject to greater levels of interest rate, credit, and liquidity risk than investments in higher rated securities. These securities are considered predominantly speculative with respect to the issuer’s continuing ability to make principal and interest payments. The issuers of the Fund’s holdings may be involved in bankruptcy proceedings, reorganizations, or financial restructurings, and are not as strong financially as higher-rated issuers. 6 Investments in international securities are subject to certain risks of overseas investing including currency fluctuations and changes in political and economic conditions, which could result in significant market fluctuations. These risks are magnified in emerging markets. 7 Market prices of investments held by the Fund may fall rapidly or unpredictably due to a variety of economic or political factors, market conditions, disasters or public health issues, or in response to events that affect particular industries or companies. 8 Obligations of certain government agencies are not backed by the full faith and credit of the U.S. government. If one of these agencies defaulted on a loan, there is no guarantee that the U.S. government would provide financial support. Additionally, debt securities of the U.S. government may be affected by changing interest rates and subject to prepayment risk. 9 Applying the Fund’s ESG investment criteria may result in the selection or exclusion of securities of certain issuers for reasons other than performance, and the Fund may underperform funds that do not utilize an ESG investment strategy. The application of this strategy may affect the Fund’s exposure to certain companies, sectors, regions, countries or types of investments, which could negatively impact the Fund’s performance depending on whether such investments are in or out of favor. Applying ESG criteria to investment decisions is qualitative and subjective by nature, and there is no guarantee that the criteria utilized by the |
| |
16
| | |
| | |
| | | AMG GW&K Enhanced Core Bond ESG Fund Portfolio Manager’s Comments (continued) |
| | | |
| | | |
| | | |
| | | | |
Subadviser or any judgment exercised by the Subadviser will reflect the beliefs or values of any particular investor. 10 The Bloomberg U.S. Aggregate Bond Index is an index of the U.S. investment-grade fixed-rate bond market, including both government and corporate bonds. Unlike the Fund, the Bloomberg U.S. Aggregate Bond Index is unmanaged, is not available for investment and does not incur expenses. | | “Bloomberg®” and any Bloomberg index described herein are service marks of Bloomberg Finance L.P. and its affiliates, including Bloomberg Index Services Limited (“BISL”), the administrator of the index (collectively, “Bloomberg”) and have been licensed for use for certain purposes by AMG Funds LLC. Bloomberg is not affiliated with AMG Funds LLC, and Bloomberg does not approve, endorse, review, or recommend the fund described herein. Bloomberg | | does not guarantee the timeliness, accurateness, or completeness of any data or information relating to such fund. Not FDIC insured, nor bank guaranteed. May lose value. |
| | | | |
17
| | |
| | |
| | | AMG GW&K Enhanced Core Bond ESG Fund Fund Snapshots (unaudited) December 31, 2022 |
| | | |
| | | |
| | | |
PORTFOLIO BREAKDOWN
| | |
| Category | | % of Net Assets |
| | |
U.S. Government and Agency Obligations | | 48.3 |
| | |
Corporate Bonds and Notes | | 42.5 |
| | |
Municipal Bonds | | 6.4 |
| | |
Foreign Government Obligations | | 0.8 |
| | |
Short-Term Investments | | 3.7 |
| | |
Other Assets, less Liabilities | | (1.7) |
| | |
| Rating | | % of Market Value1 |
| | |
U.S. Government and Agency Obligations | | 49.2 |
| | |
Aaa/AAA | | 3.3 |
| | |
Aa/AA | | 7.0 |
| | |
A | | 8.1 |
| | |
Baa/BBB | | 22.6 |
| | |
Ba/BB | | 9.3 |
| | |
B | | 0.5 |
| 1 | Includes market value of long-term fixed-income securities only. |
TOP TEN HOLDINGS
| | | | |
| Security Name | | | | % of Net Assets |
| | | |
U.S. Treasury Bonds, 3.500%, 02/15/39 | | | | 3.5 |
| | | |
FNMA, 4.000%, 10/01/43 | | | | 2.2 |
| | | |
U.S. Treasury Bonds, 1.875%, 02/15/51 | | | | 2.0 |
| | | |
FNMA, 4.500%, 09/01/46 | | | | 2.0 |
| | | |
U.S. Treasury Bonds, 2.250%, 05/15/41 | | | | 2.0 |
| | | |
FNMA, 3.500%, 02/01/47 | | | | 1.9 |
| | | |
FHLMC, 3.000%, 03/01/51 | | | | 1.7 |
| | | |
U.S. Treasury Bonds, 3.125%, 05/15/48 | | | | 1.7 |
| | | |
California State General Obligation, School Improvements, , 7.550%, 04/01/39 | | | | 1.6 |
| | | |
FNMA, 3.500%, 07/01/50 | | | | 1.6 |
| | | |
Top Ten as a Group | | | | 20.2 |
| | | | |
Credit quality ratings shown above reflect the highest rating assigned by either Standard & Poor’s (“S&P”), Moody’s Investors Service, Inc. (“Moody’s”) or Fitch. These rating agencies are independent, nationally recognized statistical rating organizations and are widely used. Investment grade ratings are credit ratings of BBB- or higher. Below investment grade ratings are credit ratings of BB+ or lower. Investments designated N/R are not rated by any of the rating agencies. Unrated investments do not necessarily indicate low credit quality. Credit quality ratings are subject to change.
Because a fund’s strategy may result in multiple investments in particular sectors of the economy, its performance may depend on the performance of those sectors and may fluctuate more widely than investments diversified across more sectors. For additional information on these and other risk considerations, please see the Fund’s prospectus.
Any sectors, industries, or securities discussed should not be perceived as investment recommendations. Mention of a specific security should not be considered a recommendation to buy or solicitation to sell that security. Specific securities mentioned in this report may have been sold from the Fund’s portfolio of investments by the time you receive this report.
18
| | |
| | |
| | | AMG GW&K Enhanced Core Bond ESG Fund Schedule of Portfolio Investments December 31, 2022 |
| | | |
| | | |
| | | |
| | | | | | | | |
| | | Principal Amount | | | Value | |
| |
Corporate Bonds and Notes - 42.5% | | | | | |
| |
Financials - 12.0% | | | | | |
| | |
AerCap Ireland Capital DAC/AerCap Global Aviation Trust (Ireland) 1.650%, 10/29/24 | | | $450,000 | | | | $415,080 | |
| | |
Air Lease Corp.
2.875%, 01/15/26 | | | 248,000 | | | | 229,463 | |
| |
American Express Co. | | | | | |
(3.550% to 09/15/26 then U.S. Treasury Yield Curve CMT 5 year + 2.854%), 3.550%, 09/15/261,2,3 | | | 505,000 | | | | 414,858 | |
| |
American Tower Corp. | | | | | |
2.950%, 01/15/51 | | | 265,000 | | | | 164,065 | |
| |
Bank of America Corp. | | | | | |
MTN, (4.330% to 03/15/49 then 3 month LIBOR + 1.520%), 4.330%, 03/15/501,3 | | | 373,000 | | | | 305,931 | |
| |
The Bank of New York Mellon Corp. | | | | | |
Series G, (4.700% to 09/20/25 then U.S. Treasury Yield Curve CMT 5 year + 4.358%), 4.700%, 09/20/251,2,3 | | | 221,000 | | | | 212,189 | |
| |
Boston Properties, LP | | | | | |
3.400%, 06/21/29 | | | 473,000 | | | | 407,352 | |
| |
Crown Castle, Inc. | | | | | |
4.300%, 02/15/294 | | | 325,000 | | | | 306,910 | |
| |
First-Citizens Bank & Trust Co. | | | | | |
6.125%, 03/09/28 | | | 355,000 | | | | 360,776 | |
| |
The Goldman Sachs Group, Inc. | | | | | |
3.500%, 04/01/25 | | | 211,000 | | | | 202,907 | |
Series O, (5.300% to 11/10/26 then 3 month LIBOR + 3.834%), 5.300%, 11/10/261,2,3 | | | 243,000 | | | | 230,604 | |
| |
JPMorgan Chase & Co. | | | | | |
(1.470% to 09/22/26 then SOFR + 0.765%), 1.470%, 09/22/271,3 | | | 250,000 | | | | 216,441 | |
| |
Morgan Stanley | | | | | |
(4.431% to 01/23/29 then 3 month LIBOR + 1.628%), 4.431%, 01/23/301,3 | | | 435,000 | | | | 404,856 | |
| |
SBA Communications Corp. | | | | | |
3.875%, 02/15/27 | | | 205,000 | | | | 185,220 | |
| |
SLM Corp. | | | | | |
3.125%, 11/02/26 | | | 260,000 | | | | 221,117 | |
| |
Starwood Property Trust, Inc. | | | | | |
5.500%, 11/01/235 | | | 161,000 | | | | 159,598 | |
| |
Wells Fargo & Co., MTN | | | | | |
(2.879% to 10/30/29 then 3 month Term + 1.432%), 2.879%, 10/30/301,3 | | | 475,000 | | | | 403,467 | |
| | |
Total Financials | | | | | | | 4,840,834 | |
| |
Industrials - 29.8% | | | | | |
| |
AECOM | | | | | |
5.125%, 03/15/27 | | | 204,000 | | | | 196,350 | |
| | |
Alcoa Nederland Holding, B.V. (Netherlands) | | | | | | | | |
4.125%, 03/31/295 | | | 480,000 | | | | 425,836 | |
| | | | | | | | |
| | | | | | | | |
| | | Principal Amount | | | Value | |
| |
Amazon.com, Inc. | | | | | |
4.600%, 12/01/254 | | | $389,000 | | | | $388,042 | |
| | |
Anglo American Capital PLC (United Kingdom) | | | | | | | | |
2.875%, 03/17/315 | | | 277,000 | | | | 226,173 | |
| |
Aramark Services, Inc. | | | | | |
5.000%, 02/01/284,5 | | | 212,000 | | | | 197,782 | |
| | |
Ardagh Metal Packaging Finance USA LLC/Ardagh Metal Packaging Finance PLC | | | | | | | | |
3.250%, 09/01/284,5 | | | 400,000 | | | | 339,778 | |
| |
Ashtead Capital, Inc. | | | | | |
1.500%, 08/12/265 | | | 508,000 | | | | 433,523 | |
| |
Ball Corp. | | | | | |
2.875%, 08/15/304 | | | 203,000 | | | | 162,018 | |
| |
Block Financial LLC | | | | | |
3.875%, 08/15/30 | | | 142,000 | | | | 124,236 | |
| |
Celanese US Holdings LLC | | | | | |
6.050%, 03/15/25 | | | 411,000 | | | | 409,401 | |
| |
Centene Corp. | | | | | |
2.500%, 03/01/31 | | | 328,000 | | | | 256,651 | |
| | |
Charter Communications Operating LLC/Charter Communications Operating Capital | | | | | | | | |
4.908%, 07/23/25 | | | 427,000 | | | | 418,503 | |
| |
Clearwater Paper Corp. | | | | | |
4.750%, 08/15/285 | | | 242,000 | | | | 212,640 | |
| |
The Coca-Cola Co. | | | | | |
2.500%, 06/01/40 | | | 110,000 | | | | 80,154 | |
| |
Cogent Communications Group, Inc. | | | | | |
3.500%, 05/01/265 | | | 312,000 | | | | 283,434 | |
| |
Comcast Corp. | | | | | |
4.150%, 10/15/28 | | | 234,000 | | | | 224,394 | |
| |
CommonSpirit Health | | | | | |
3.347%, 10/01/29 | | | 458,000 | | | | 398,574 | |
| | |
Crown Americas LLC/Crown Americas Capital Corp. V | | | | | | | | |
4.250%, 09/30/264 | | | 275,000 | | | | 262,235 | |
| |
Dell, Inc. | | | | | |
7.100%, 04/15/284 | | | 379,000 | | | | 404,148 | |
| |
Discovery Communications LLC | | | | | |
3.950%, 03/20/28 | | | 483,000 | | | | 428,704 | |
| |
Fiserv, Inc. | | | | | |
4.200%, 10/01/28 | | | 423,000 | | | | 400,137 | |
| |
The Ford Foundation | | | | | |
Series 2020, 2.415%, 06/01/50 | | | 508,000 | | | | 319,574 | |
| |
Freeport-McMoRan, Inc. | | | | | |
4.625%, 08/01/304 | | | 176,000 | | | | 163,925 | |
| |
HCA, Inc. | | | | | |
3.500%, 09/01/30 | | | 207,000 | | | | 178,533 | |
| |
Hilton Domestic Operating Co., Inc. | | | | | |
4.875%, 01/15/30 | | | 220,000 | | | | 199,366 | |
| | | | | | | | |
The accompanying notes are an integral part of these financial statements.
19
| | |
| | |
| | | AMG GW&K Enhanced Core Bond ESG Fund Schedule of Portfolio Investments (continued) |
| | | |
| | | |
| | | |
| | | | | | | | |
| | | Principal Amount | | | Value | |
| |
Industrials - 29.8% (continued) | | | | | |
| |
Howmet Aerospace, Inc. | | | | | |
5.900%, 02/01/27 | | | $161,000 | | | | $160,095 | |
| |
KB Home | | | | | |
4.800%, 11/15/29 | | | 231,000 | | | | 200,875 | |
| |
Kraft Heinz Foods Co. | | | | | |
4.250%, 03/01/31 | | | 366,000 | | | | 342,157 | |
| |
Merck & Co., Inc. | | | | | |
1.900%, 12/10/28 | | | 479,000 | | | | 411,250 | |
| |
Microsoft Corp. | | | | | |
2.525%, 06/01/50 | | | 486,000 | | | | 319,812 | |
| |
MSCI, Inc. | | | | | |
3.250%, 08/15/335 | | | 218,000 | | | | 168,352 | |
| |
Murphy Oil USA, Inc. | | | | | |
4.750%, 09/15/29 | | | 60,000 | | | | 54,902 | |
5.625%, 05/01/27 | | | 165,000 | | | | 160,217 | |
| |
Newell Brands, Inc. | | | | | |
4.450%, 04/01/266 | | | 221,000 | | | | 207,916 | |
| |
Novelis Corp. | | | | | |
3.250%, 11/15/265 | | | 210,000 | | | | 188,267 | |
| | |
Prime Security Services Borrower LLC/Prime Finance, Inc. | | | | | | | | |
5.750%, 04/15/265 | | | 189,000 | | | | 181,913 | |
| |
PulteGroup, Inc. | | | | | |
5.000%, 01/15/274 | | | 407,000 | | | | 402,322 | |
| |
Sonoco Products Co. | | | | | |
2.850%, 02/01/32 | | | 501,000 | | | | 407,243 | |
| |
Sysco Corp. | | | | | |
2.400%, 02/15/30 | | | 463,000 | | | | 384,840 | |
| |
Tenet Healthcare Corp. | | | | | |
4.875%, 01/01/265 | | | 185,000 | | | | 174,944 | |
| |
Travel + Leisure Co. | | | | | |
5.650%, 04/01/246 | | | 167,000 | | | | 164,487 | |
| |
United Rentals North America, Inc. | | | | | |
3.875%, 02/15/31 | | | 195,000 | | | | 163,467 | |
| |
Verizon Communications, Inc. | | | | | |
3.875%, 02/08/294 | | | 419,000 | | | | 393,133 | |
| |
Walgreens Boots Alliance, Inc. | | | | | |
4.800%, 11/18/44 | | | 325,000 | | | | 271,997 | |
| |
WESCO Distribution, Inc. | | | | | |
7.250%, 06/15/285 | | | 175,000 | | | | 177,270 | |
| | |
Total Industrials | | | | | | | 12,069,570 | |
| |
Utilities - 0.7% | | | | | |
| | |
National Rural Utilities Cooperative Finance Corp. | | | | | | | | |
1.350%, 03/15/31 | | | 377,000 | | | | 278,580 | |
| |
Total Corporate Bonds and Notes
(Cost $19,554,986) | | | | 17,188,984 | |
| | | | | |
| | | | | | | | |
| | | Principal Amount | | | Value | |
| |
Municipal Bonds - 6.4% | | | | | |
| | |
California Health Facilities Financing Authority | | | | | | | | |
4.190%, 06/01/37 | | | $225,000 | | | | $200,993 | |
| | |
California State General Obligation, School Improvements Build America Bonds, 7.550%, 04/01/39 | | | 525,000 | | | | 657,107 | |
| | |
Commonwealth of Massachusetts Series B, 4.110%, 07/15/31 | | | 300,000 | | | | 289,641 | |
| | |
County of Miami-Dade FL Aviation Revenue, Series C | | | | | | | | |
4.280%, 10/01/41 | | | 455,000 | | | | 401,833 | |
| | |
Los Angeles Unified School District, School Improvements | | | | | | | | |
5.750%, 07/01/34 | | | 390,000 | | | | 407,387 | |
| | |
Massachusetts School Building Authority | | | | | | | | |
Series B, 1.753%, 08/15/30 | | | 448,000 | | | | 365,759 | |
| | |
University of California, University & College Improvements | | | | | | | | |
Series BD, 3.349%, 07/01/29 | | | 300,000 | | | | 274,097 | |
| |
Total Municipal Bonds
(Cost $2,962,506) | | | | 2,596,817 | |
| |
| U.S. Government and Agency Obligations - 48.3% | | | | | |
| |
Fannie Mae - 26.6% | | | | | |
| | |
FNMA | | | | | | | | |
3.000%, 06/01/38 | | | 527,353 | | | | 494,509 | |
3.500%, 02/01/33 to 07/01/50 | | | 4,241,273 | | | | 3,969,806 | |
4.000%, 10/01/43 to 03/01/50 | | | 1,850,393 | | | | 1,771,372 | |
4.500%, 04/01/39 to 08/01/50 | | | 1,517,009 | | | | 1,495,390 | |
5.000%, 07/01/47 to 08/01/50 | | | 837,562 | | | | 850,127 | |
| | |
FNMA Pool | | | | | | | | |
3.000%, 06/01/33 to 05/01/50 | | | 880,831 | | | | 804,077 | |
3.500%, 01/01/36 | | | 177,615 | | | | 170,131 | |
4.000%, 05/01/47 to 06/01/49 | | | 739,997 | | | | 709,513 | |
4.500%, 01/01/44 to 05/01/48 | | | 506,713 | | | | 502,011 | |
| | |
Total Fannie Mae | | | | | | | 10,766,936 | |
| |
Freddie Mac - 6.5% | | | | | |
| | |
FHLMC | | | | | | | | |
3.000%, 03/01/50 to 03/01/51 | | | 1,309,573 | | | | 1,157,644 | |
4.000%, 07/01/48 to 09/01/50 | | | 382,919 | | | | 365,536 | |
4.500%, 10/01/41 | | | 478,743 | | | | 474,593 | |
| | |
FHLMC Gold Pool | | | | | | | | |
3.500%, 02/01/30 to 04/01/46 | | | 661,039 | | | | 627,804 | |
| | |
Total Freddie Mac | | | | | | | 2,625,577 | |
| |
U.S. Treasury Obligations - 15.2% | | | | | |
| | |
U.S. Treasury Bonds | | | | | | | | |
1.875%, 02/15/51 | | | 1,290,000 | | | | 819,855 | |
2.250%, 05/15/41 | | | 1,057,000 | | | | 794,608 | |
2.500%, 02/15/46 | | | 318,000 | | | | 237,929 | |
3.125%, 05/15/48 | | | 816,000 | | | | 685,791 | |
3.500%, 02/15/39 | | | 1,503,000 | | | | 1,411,704 | |
5.000%, 05/15/37 | | | 523,000 | | | | 584,085 | |
| | | | | | | | |
The accompanying notes are an integral part of these financial statements.
20
| | |
| | |
| | | AMG GW&K Enhanced Core Bond ESG Fund Schedule of Portfolio Investments (continued) |
| | | |
| | | |
| | | |
| | | | | | | | |
| | | Principal Amount | | | Value | |
| |
U.S. Treasury Obligations - 15.2% (continued) | | | | | |
| | |
U.S. Treasury Bonds | | | | | | | | |
6.750%, 08/15/26 | | | $544,000 | | | | $590,708 | |
| | |
U.S. Treasury Notes | | | | | | | | |
1.625%, 02/15/26 | | | 573,000 | | | | 529,935 | |
1.875%, 02/15/32 | | | 297,000 | | | | 251,951 | |
2.125%, 09/30/24 | | | 236,000 | | | | 226,477 | |
| | |
Total U.S. Treasury Obligations | | | | | | | 6,133,043 | |
| |
Total U.S. Government and Agency Obligations
(Cost $22,257,041) | | | | 19,525,556 | |
| |
| Foreign Government Obligation - 0.8% | | | | | |
| |
The Korea Development Bank (South Korea) | | | | | |
0.500%, 10/27/23
(Cost $345,761) | | | 346,000 | | | | 334,187 | |
| |
| Short-Term Investments - 3.7% | | | | | |
| |
Joint Repurchase Agreements - 3.1%7 | | | | | |
| | |
Citigroup Global Markets, Inc., dated 12/30/22, due 01/03/23, 4.250% total to be received $242,930 (collateralized by various U.S. Treasuries, 0.000% - 4.500%, 04/11/23 - 10/31/29, totaling $247,671) | | | 242,815 | | | | 242,815 | |
| | | | | | | | |
| | | | | | | | |
| | | Principal Amount | | | Value | |
| | |
National Bank Financial, dated 12/30/22, due 01/03/23, 4.340% total to be received $1,000,482 (collateralized by various U.S. Treasuries, 0.000% - 4.435%, 01/03/23 - 09/09/49, totaling $1,020,000) | | | $1,000,000 | | | | $1,000,000 | |
| |
Total Joint Repurchase Agreements | | | | 1,242,815 | |
| |
Repurchase Agreements - 0.6% | | | | | |
| | |
Fixed Income Clearing Corp., dated 12/30/22 due 01/03/23, 4.150% total to be received $230,106 (collateralized by a U.S. Treasury, 0.125%, 01/15/32, totaling $234,600) | | | 230,000 | | | | 230,000 | |
| |
Total Short-Term Investments
(Cost $1,472,815) | | | | 1,472,815 | |
| |
Total Investments - 101.7%
(Cost $46,593,109) | | | | 41,118,359 | |
| | |
Other Assets, less Liabilities - (1.7)% | | | | | | | (671,486 | ) |
| | |
Net Assets - 100.0% | | | | | | | $40,446,873 | |
| | | | | | | | |
| 1 | Fixed to variable rate investment. The rate shown reflects the fixed rate in effect at December 31, 2022. Rate will reset at a future date. |
| 2 | Perpetuity Bond. The date shown represents the next call date. |
| 3 | Variable rate security. The rate shown is based on the latest available information as of December 31, 2022. Certain variable rate securities are not based on a published reference rate and spread but are determined by the issuer or agent and are based on current market conditions. These securities do not indicate a reference rate and spread in their description above. |
| 4 | Some of these securities, amounting to $2,393,361 or 5.9% of net assets, were out on loan to various borrowers and are collateralized by cash and various U.S. Treasury Obligations. See Note 4 of Notes to Financial Statements. |
| 5 | Security exempt from registration under Rule 144A of the Securities Act of 1933. This security may be resold in transactions exempt from registration, normally to qualified institutional buyers. At December 31, 2022, the value of these securities amounted to $3,169,510 or 7.8% of net assets. |
| 6 | Step Bond: A debt instrument with either deferred interest payments or an interest rate that resets at specific times during its term. |
| 7 | Cash collateral received for securities lending activity was invested in these joint repurchase agreements. |
| | |
| CMT | | Constant Maturity Treasury |
| |
| FHLMC | | Freddie Mac |
| |
| FNMA | | Fannie Mae |
| |
| LIBOR | | London Interbank Offered Rate |
| |
| MTN | | Medium-Term Note |
| |
| SOFR | | Secured Overnight Financing Rate |
The accompanying notes are an integral part of these financial statements.
21
| | |
| | |
| | | AMG GW&K Enhanced Core Bond ESG Fund Schedule of Portfolio Investments (continued) |
| | | |
| | | |
| | | |
The following table summarizes the inputs used to value the Fund’s investments by the fair value hierarchy levels as of December 31, 2022:
| | | | | | | | | | | | | | | | |
| | | Level 1 | | | Level 2 | | | Level 3 | | | Total | |
| | | | |
Investments in Securities | | | | | | | | | | | | | | | | |
| | | | |
Corporate Bonds and Notes† | | | — | | | | $17,188,984 | | | | — | | | | $17,188,984 | |
| | | | |
Municipal Bonds† | | | — | | | | 2,596,817 | | | | — | | | | 2,596,817 | |
| | | | |
U.S. Government and Agency Obligations† | | | — | | | | 19,525,556 | | | | — | | | | 19,525,556 | |
| | | | |
Foreign Government Obligation† | | | — | | | | 334,187 | | | | — | | | | 334,187 | |
| | | | |
Short-Term Investments | | | | | | | | | | | | | | | | |
| | | | |
Joint Repurchase Agreements | | | — | | | | 1,242,815 | | | | — | | | | 1,242,815 | |
| | | | |
Repurchase Agreements | | | — | | | | 230,000 | | | | — | | | | 230,000 | |
| | | | | | | | | | | | | | | | |
| | | | |
Total Investments in Securities | | | — | | | | $41,118,359 | | | | — | | | | $41,118,359 | |
| | | | | | | | | | | | | | | | |
| † | All corporate bonds and notes, municipal bonds, U.S. government and agency obligations and foreign government obligation held in the Fund are Level 2 securities. For a detailed breakout of corporate bonds and notes, municipal bonds, U.S. government and agency obligations and foreign government obligation by major industry or agency classification, please refer to the Fund’s Schedule of Portfolio Investments. |
For the fiscal year ended December 31, 2022, there were no transfers in or out of Level 3.
The accompanying notes are an integral part of these financial statements.
22
| | |
| | |
| | | AMG GW&K High Income Fund Portfolio Manager’s Comments (unaudited) |
| | | |
| | | |
| | | |
| | | | | | | | |
THE YEAR IN REVIEW AMG GW&K High Income Fund (the “Fund”) Class N shares returned (6.80)% during the year ended December 31, 2022, compared to the (5.30)% return for the Bloomberg U.S. High Yield 1–5 Year Ba Index (the “Index”). MARKET OVERVIEW In the first quarter of 2022, fixed income markets experienced their worst quarter in more than four decades amid an extraordinary confluence of economic and geopolitical shocks. Core inflation jumped to 5.4%, its highest level since 1983, on a broad-based rise in consumer prices. The U.S. Federal Reserve (the Fed) responded in kind, intensifying its hawkish rhetoric and laying out an aggressive course of hikes to bring inflation back to target. And—in addition to exacting a tragic human toll—Russia’s invasion of Ukraine exacerbated already strained supply chains and commodity markets, threatening acute and prolonged shortages of materials vital to the basic functioning of the global economy. But for all this uncertainty and turmoil, there was a notable divergence between the performance of rates and credit; the former extended a historically severe downdraft, while the latter continued to enjoy a remarkably benign trading environment. How this disconnect eventually would resolve itself was a central question before investors, though policy uncertainty and heightened tensions seemed unlikely to subside anytime soon. More volatility followed in the second quarter as bonds traded in a wide range and struggled to commit to a consistent narrative. The central question revolved around how persistent inflation would be and what policy measures would be necessary to quell it. A natural deceleration would allow the Fed to pursue less aggressive policy and possibly achieve a soft landing; more recalcitrant price pressure would require the Fed to mount a harsher response and invite a potential recession. The implications of these two different paths were at odds, leading to a broad lack of conviction with no clear market direction. Similarly, puzzling was a consumer with a strong proclivity to spend but a deeply pessimistic outlook and a corporate sector earning solid profits but starting to announce layoffs. | | | | Additionally, China offered a potential bright spot as it emerged from recent shutdowns, but the Ukraine conflict lingered as a major threat to global energy and commodity markets. An imminent resolution to any of these tensions seemed unlikely, so disciplined risk management and careful analysis of relative value were of particular importance for the months ahead. Fixed income markets were under extraordinary pressure in the third quarter as investors continued to adapt to restrictive monetary policy after more than a decade of accommodation. Stubbornly rising prices, hawkish central banks, and various geopolitical forces combined to tighten financial conditions and raise the cost of borrowing around the world. Defying expectations that it had peaked, inflation remained elevated and manifested across a broader and more entrenched collection of goods and services. The Fed also confounded expectations, projecting a more cautious outlook and a more aggressive path of hikes than most economists had anticipated. International pressures escalated as well, as currency market dislocations, political leadership changes in Europe and Asia, and multiple energy crises collectively drove a heightened sense of uncertainty. The variety and momentum of these forces suggested no near-term end to volatility, especially against a backdrop of increasingly expensive capital. Bonds rebounded in the fourth quarter amid growing confidence that central banks have succeeded in slowing inflation and will soon be able to pursue less restrictive policy. This modest rally nevertheless ended up being too little, too late to help the bond market avoid its worst annual performance on record and an unprecedented second consecutive year of losses. Sentiment among both investors and consumers may have reached an inflection point, but data continue to justify some measure of caution: inflation is still stubbornly above the Fed’s target, the labor market shows few signs of loosening, and corporations have yet to see a meaningful deterioration in earnings. Only the rate-sensitive housing market really stands out as a casualty of the Fed’s tightening campaign to this point. Whether the end of the cycle is imminent is likely to remain an open question, especially as | | | | investors await the realization of the “long and variable lag” that has yet to be fully reflected across so many segments of the economy. FUND REVIEW The Fund underperformed the Index during the fiscal year mainly because of its longer duration in the rising rate environment. Security selection was mixed overall but our out-of-benchmark allocation to preferreds had a notable negative effect. OUTLOOK The disconnect between the Fed’s projections and market pricing has widened following the most recent Summary of Economic Projections (SEP). The median estimate of Federal Open Market Committee (FOMC) participants for the overnight rate at the end of 2023 is 5.125%, up from 4.625% in September; the Federal Funds futures market sees a terminal rate of nearly 5.0% in June of 2023 and then two cuts by year end. There has also been a small but not insignificant chorus of economists calling for the FOMC to raise its target inflation to 3.0% from 2.0%, prompting objections that this would undermine the Fed’s hard-earned credibility. These are just two sources of tension in the rates market, and their resolution could have significant implications for both the level and the shape of the yield curve. We don’t believe investors are being sufficiently compensated for these risks. Our fundamental view of credit is broadly constructive, and we believe balance sheets in general are sound and liquidity is sufficient. But we recognize the potential for macroeconomic forces to alter this landscape and we don’t believe all these risks are adequately reflected in valuations. Within the space, we see value at the front end, where quality credits offer attractive yields and compelling breakevens. We have also been able to identify names that we believe can improve their credit profiles independently of a challenging macro backdrop. The views expressed represent the opinions of GW&K Investment Management, LLC as of December 31, 2022, and are not intended as a forecast or guarantee of future results, and are subject to change without notice. |
23
| | |
| | |
| | | AMG GW&K High Income Fund Portfolio Manager’s Comments (continued) |
| | | |
| | | |
| | | |
CUMULATIVE TOTAL RETURN PERFORMANCE
AMG GW&K High Income Fund’s cumulative total return is based on the daily change in net asset value (NAV), and assumes that all dividends and distributions were reinvested. The graph compares a hypothetical $10,000 investment made in the AMG GW&K High Income Fund’s Class N shares on December 31, 2012, to a $10,000 investment made in the Bloomberg U.S. High Yield 1-5 Year Ba Index for the same time period. The graph and table do not reflect the deduction of taxes that a shareholder would pay on a Fund distribution or redemption of shares. The listed returns for the Fund are net of expenses and the returns for the index exclude expenses. Total returns would have been lower had certain expenses not been reduced.
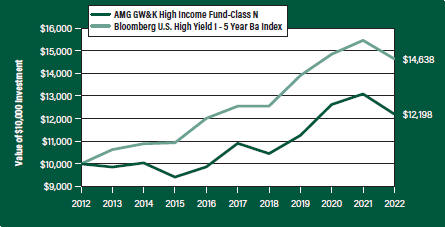
The table below shows the average annual total returns for the AMG GW&K High Income Fund and the Bloomberg U.S. High Yield 1-5 Year Ba Index for the same time periods ended December 31, 2022.
| | | | | | | | | | | | | | | | | | | | |
| | | One Year | | | Five Years | | | Ten Years | | | Since Inception | | | Inception Date | |
| Average Annual Total Returns1 |
|
AMG GW&K High Income Fund2, 3, 4, 5, 6, 7 | |
| | | | | |
Class N | | | (6.80%) | | | | 2.26% | | | | 2.01% | | | | 4.54% | | | | 03/25/94 | |
| | | | | |
Class I | | | (6.63%) | | | | — | | | | — | | | | (1.79%) | | | | 03/15/21 | |
| | | | | |
Bloomberg U.S. High Yield 1-5 Year Ba Index8 | | | (5.30%) | | | | 3.13% | | | | 3.88% | | | | — | | | | 03/25/94 | † |
The performance data shown represents past performance. Past performance is not a guarantee of future results. Current performance may be lower or higher than the performance data quoted. The investment return and principal value of an investment will fluctuate so that an investor’s shares, when redeemed, may be worth more or less than their original cost.
Investors should carefully consider the Fund’s investment objectives, risks, charges and expenses before investing. For performance information through the most recent month end, current net asset values per share for the Fund and other information, please call 800.548.4539 or visit our website at amgfunds.com for a free prospectus. Read it carefully before investing or sending money.
Distributed by AMG Distributors, Inc., member FINRA/SIPC.
| † | Date reflects the inception date of the Fund, not the index. |
| 1 | Total return equals income yield plus share price change and assumes reinvestment of all dividends and capital gain distributions. Returns are net of fees and may reflect offsets of Fund expenses as described in the prospectus. No adjustment has been made for taxes payable by shareholders on their reinvested dividends and capital gain distributions. Returns for periods greater than one year are annualized. The listed returns on the Fund are net of expenses and based on the published NAV as of December 31, 2022. All returns are in U.S. Dollars($). |
|
2 From time to time the Fund’s investment manager has waived it’s fees and/or absorbed Fund expenses, which has resulted in higher returns. 3 As of December 4, 2020, the Fund’s subadvisor was changed to GW&K Investment Management, LLC. Prior to December 4, 2020, the Fund was known as the AMG Managers Global Income Opportunity Fund, and had different principal investment strategies and corresponding risks. Performance shown for periods prior to December 4, 2020 reflects the performance and investment strategies of the Fund’s previous subadvisor, Loomis, Sayles & Company, L.P. The Fund’s past performance would have been different if the Fund were managed by the current subadvisor and strategy, and the Fund’s prior performance record might be less pertinent for investors considering whether to purchase shares of the Fund. 4 The Fund is subject to the risks associated with investments in debt securities, such as default risk and fluctuations in the perception of the debtor’s ability to pay its creditors. Changing interest rates may adversely affect the value of an investment. An increase in interest rates typically causes the value of bonds and other fixed income securities to fall. 5 Market prices of investments held by the Fund may fall rapidly or unpredictably due to a variety of economic or political factors, market conditions, disasters or public health issues, or in response to events that affect particular industries or companies. 6 High-yield bonds (also known as “junk bonds”) may be subject to greater levels of interest rate, credit, and liquidity risk than investments in higher rated securities. These securities are considered predominantly speculative with respect to the issuer’s continuing ability to make principal and interest payments. The issuers of the Fund’s holdings may be involved in bankruptcy proceedings, reorganizations, or financial restructurings, and are not as strong financially as higher-rated issuers. 7 The issuer of the bonds may not be able to meet interest or principal payments when the bonds come due. 8 The Bloomberg U.S. High Yield 1-5 Year Ba Index, a subset of the Bloomberg High Yield Index, is an unmanaged index comprised of fixed rate, publicly issued, non-investment grade debt registered with the Securities and Exchange Commission (SEC) where the middle rating of Moody’s, S&P and Fitch is BB and maturities range from 1 to 5 years. Unlike the Fund, the Bloomberg U.S. High Yield 1-5 Year Ba Index is unmanaged, is not available for investment and does not incur expenses. |
| |
24
| | |
| | |
| | | AMG GW&K High Income Fund Portfolio Manager’s Comments (continued) |
| | | |
| | | |
| | | |
| | | | | | | | |
| “Bloomberg®” and any Bloomberg index described herein are service marks of Bloomberg Finance L.P. and its affiliates, including Bloomberg Index Services Limited (“BISL”), the administrator of the index (collectively, “Bloomberg”) and have been licensed | | | | for use for certain purposes by AMG Funds LLC. Bloomberg is not affiliated with AMG Funds LLC, and Bloomberg does not approve, endorse, review, or recommend the fund described herein. Bloomberg does not guarantee the timeliness, accurateness, or | | | | completeness of any data or information relating to such fund. Not FDIC insured, nor bank guaranteed. May lose value |
25
| | |
| | |
| | | AMG GW&K High Income Fund Fund Snapshots (unaudited) December 31, 2022 |
| | | |
| | | |
| | | |
PORTFOLIO BREAKDOWN
| | |
| Category | | % of
Net Assets |
| | |
Corporate Bonds and Notes | | 97.6 |
| | |
Short-Term Investments1 | | 8.7 |
| | |
Other Assets, less Liabilities1 | | (6.3) |
| 1 | Includes reinvestment of cash collateral into joint repurchase agreements on security lending transactions. |
| | |
| Rating | | % of Market Value1 |
| | |
Baa/BBB | | 28.3 |
| | |
Ba/BB | | 61.1 |
| | |
B | | 10.6 |
| 1 | Includes market value of long-term fixed-income securities only. |
TOP TEN HOLDINGS
| | |
| Security Name | | % of Net Assets |
| | |
Ford Motor Co., 4.346%, 12/08/26 | | 1.8 |
| | |
Matador Resources Co., 5.875%, 09/15/26 | | 1.6 |
| | |
SM Energy Co., 5.625%, 06/01/25 | | 1.6 |
| | |
Southwestern Energy Co., 8.375%, 09/15/28 | | 1.6 |
| | |
Aircastle, Ltd., 4.250%, 06/15/26 (Bermuda) | | 1.5 |
| | |
Ball Corp., 5.250%, 07/01/25 | | 1.5 |
| | |
NuStar Logistics LP, 5.625%, 04/28/27 | | 1.5 |
| | |
Western Midstream Operating LP, 4.650%, 07/01/26 | | 1.5 |
| | |
DCP Midstream Operating LP, 5.375%, 07/15/25 | | 1.4 |
| | |
Starwood Property Trust, Inc., 4.750%, 03/15/25 | | 1.4 |
| | | |
| | |
Top Ten as a Group | | 15.4 |
| | |
Credit quality ratings shown above reflect the highest rating assigned by either Standard & Poor’s (“S&P”), Moody’s Investors Service, Inc. (“Moody’s”) or Fitch. These rating agencies are independent, nationally recognized statistical rating organizations and are widely used. Investment grade ratings are credit ratings of BBB- or higher. Below investment grade ratings are credit ratings of BB+ or lower. Investments designated N/R are not rated by any of the rating agencies. Unrated investments do not necessarily indicate low credit quality. Credit quality ratings are subject to change.
Because a fund’s strategy may result in multiple investments in particular sectors of the economy, its performance may depend on the performance of those sectors and may fluctuate more widely than investments diversified across more sectors. For additional information on these and other risk considerations, please see the Fund’s prospectus.
Any sectors, industries, or securities discussed should not be perceived as investment recommendations. Mention of a specific security should not be considered a recommendation to buy or solicitation to sell that security. Specific securities mentioned in this report may have been sold from the Fund’s portfolio of investments by the time you receive this report.
26
| | |
| | |
| | | AMG GW&K High Income Fund Schedule of Portfolio Investments December 31, 2022 |
| | | |
| | | |
| | | |
| | | | | | | | |
| | | Principal Amount | | | Value | |
| |
Corporate Bonds and Notes - 97.6% | | | | | |
| |
Financials - 15.1% | | | | | |
| |
Aircastle, Ltd. (Bermuda) | | | | | |
4.250%, 06/15/26 | | | $278,000 | | | | $261,439 | |
| |
Ally Financial, Inc. | | | | | |
Series B | | | | | | | | |
(4.700% to 05/15/26 then U.S. Treasury Yield | | | | | | | | |
Curve CMT 5 year + 3.868%), 4.700%, 05/15/261,2,3,4 | | | 187,000 | | | | 125,056 | |
| |
American Express Co. | | | | | |
(3.550% to 09/15/26 then U.S. Treasury Yield | | | | | | | | |
Curve CMT 5 year + 2.854%), 3.550%, 09/15/261,2,4 | | | 186,000 | | | | 152,799 | |
| |
The Charles Schwab Corp. | | | | | |
Series I | | | | | | | | |
(4.000% to 06/01/26 then U.S. Treasury Yield | | | | | | | | |
Curve CMT 5 year + 3.168%), 4.000%, 06/01/261,2,4 | | | 131,000 | | | | 113,643 | |
| |
Citigroup, Inc. | | | | | |
(3.875% to 02/18/26 then U.S. Treasury Yield | | | | | | | | |
Curve CMT 5 year + 3.417%), 3.875%, 02/18/261,2,4 | | | 276,000 | | | | 235,290 | |
| |
The Goldman Sachs Group, Inc. | | | | | |
Series U | | | | | | | | |
(3.650% to 08/10/26 then U.S. Treasury Yield | | | | | | | | |
Curve CMT 5 year + 2.915%), 3.650%, 08/10/261,2,3,4 | | | 155,000 | | | | 125,163 | |
| |
JPMorgan Chase & Co. | | | | | |
Series HH | | | | | | | | |
(4.600% to 02/01/25 then SOFR + 3.125%), | | | | | | | | |
4.600%, 02/01/251,2,4 | | | 99,000 | | | | 87,244 | |
| |
MetLife, Inc. | | | | | |
Series G | | | | | | | | |
(3.850% to 09/15/25 then U.S. Treasury Yield | | | | | | | | |
Curve CMT 5 year + 3.576%), 3.850%, 09/15/251,2,3,4 | | | 136,000 | | | | 126,310 | |
| |
Morgan Stanley | | | | | |
Series M | | | | | | | | |
(5.875% to 09/15/26 then 3 month LIBOR + | | | | | | | | |
4.435%), 5.875%, 09/15/261,2,3,4 | | | 194,000 | | | | 189,631 | |
| |
Navient Corp. | | | | | |
6.125%, 03/25/24 | | | 180,000 | | | | 176,331 | |
| |
SBA Communications Corp. | | | | | |
3.875%, 02/15/27 | | | 225,000 | | | | 203,291 | |
| |
SLM Corp. | | | | | |
4.200%, 10/29/25 | | | 259,000 | | | | 236,974 | |
| |
Starwood Property Trust, Inc. | | | | | |
4.750%, 03/15/25 | | | 250,000 | | | | 238,562 | |
| |
VICI Properties LP/VICI Note Co., Inc. | | | | | |
3.500%, 02/15/255 | | | 27,000 | | | | 25,456 | |
4.250%, 12/01/265 | | | 165,000 | | | | 153,932 | |
| | | | | | | | |
| | | | | | | | |
| | | Principal Amount | | | Value | |
| | |
Wynn Las Vegas LLC/Wynn Las Vegas Capital Corp. | | | | | | | | |
5.500%, 03/01/255 | | | $170,000 | | | | $161,389 | |
| | |
Total Financials | | | | | | | 2,612,510 | |
| |
Industrials - 79.9% | | | | | |
| |
AECOM | | | | | |
5.125%, 03/15/27 | | | 169,000 | | | | 162,663 | |
| | |
Alcoa Nederland Holding BV (Netherlands) | | | | | | | | |
6.125%, 05/15/285 | | | 200,000 | | | | 197,024 | |
| | |
American Airlines Inc/AAdvantage Loyalty IP, Ltd. | | | | | | | | |
5.500%, 04/20/265 | | | 211,000 | | | | 202,907 | |
| | |
American Axle & Manufacturing, Inc. | | | | | | | | |
6.250%, 03/15/26 | | | 206,000 | | | | 192,355 | |
| |
Aramark Services, Inc. | | | | | |
5.000%, 02/01/285 | | | 138,000 | | | | 128,745 | |
| |
ATI, Inc. | | | | | |
4.875%, 10/01/29 | | | 139,000 | | | | 122,838 | |
| |
Avient Corp. | | | | | |
5.750%, 05/15/255 | | | 135,000 | | | | 131,625 | |
| |
Ball Corp. | | | | | |
5.250%, 07/01/25 | | | 262,000 | | | | 258,580 | |
| |
Bath & Body Works, Inc. | | | | | |
6.694%, 01/15/27 | | | 123,000 | | | | 122,116 | |
| |
Caesars Entertainment, Inc. | | | | | |
6.250%, 07/01/255 | | | 170,000 | | | | 165,185 | |
| |
Callon Petroleum Co. | | | | | |
6.375%, 07/01/26 | | | 185,000 | | | | 172,428 | |
| | |
CCO Holdings LLC/CCO Holdings Capital Corp. | | | | | | | | |
5.500%, 05/01/265 | | | 179,000 | | | | 173,290 | |
| |
CDW LLC/CDW Finance Corp. | | | | | |
5.500%, 12/01/24 | | | 133,000 | | | | 132,992 | |
| |
Centene Corp. | | | | | |
4.250%, 12/15/27 | | | 231,000 | | | | 216,646 | |
| |
Cheniere Energy Partners LP | | | | | |
4.500%, 10/01/29 | | | 155,000 | | | | 139,379 | |
| |
Chord Energy Corp. | | | | | |
6.375%, 06/01/265 | | | 177,000 | | | | 172,386 | |
| |
Clearwater Paper Corp. | | | | | |
5.375%, 02/01/255 | | | 230,000 | | | | 223,478 | |
| |
Cleveland-Cliffs, Inc. | | | | | |
5.875%, 06/01/273 | | | 174,000 | | | | 166,226 | |
| | |
Cogent Communications Group, Inc. | | | | | | | | |
3.500%, 05/01/265 | | | 188,000 | | | | 170,787 | |
| |
Crown Cork & Seal Co., Inc. | | | | | |
7.375%, 12/15/26 | | | 185,000 | | | | 190,459 | |
| |
Dana, Inc. | | | | | |
5.625%, 06/15/28 | | | 123,000 | | | | 111,889 | |
| |
DCP Midstream Operating LP | | | | | |
5.375%, 07/15/25 | | | 249,000 | | | | 246,684 | |
| | | | | | | | |
The accompanying notes are an integral part of these financial statements.
27
| | |
| | |
| | | AMG GW&K High Income Fund Schedule of Portfolio Investments (continued) |
| | | |
| | | |
| | | |
| | | | | | | | |
| | | Principal Amount | | | Value | |
| |
Industrials - 79.9% (continued) | | | | | |
| |
Delta Air Lines, Inc. | | | | | |
7.375%, 01/15/263 | | | $225,000 | | | | $229,891 | |
| |
Elanco Animal Health, Inc. | | | | | |
6.400%, 08/28/28 | | | 126,000 | | | | 119,890 | |
| | |
Embraer Netherlands Finance BV (Netherlands) | | | | | | | | |
5.050%, 06/15/25 | | | 198,000 | | | | 192,161 | |
| |
Encompass Health Corp. | | | | | |
4.500%, 02/01/28 | | | 178,000 | | | | 161,695 | |
| |
Energy Transfer LP | | | | | |
5.250%, 04/15/29 | | | 180,000 | | | | 174,052 | |
| |
EQT Corp. | | | | | |
5.700%, 04/01/28 | | | 183,000 | | | | 182,017 | |
| | |
FMG Resources August 2006 Pty, Ltd. (Australia) | | | | | | | | |
4.500%, 09/15/275 | | | 94,000 | | | | 86,715 | |
| |
Ford Motor Co. | | | | | |
4.346%, 12/08/263 | | | 326,000 | | | | 309,159 | |
5.291%, 12/08/46 | | | 77,000 | | | | 58,675 | |
| | |
Fortress Transportation and Infrastructure Investors LLC | | | | | | | | |
6.500%, 10/01/255 | | | 179,000 | | | | 168,296 | |
| |
General Motors Co. | | | | | |
6.800%, 10/01/273 | | | 161,000 | | | | 167,115 | |
| |
The Goodyear Tire & Rubber Co. | | | | | |
4.875%, 03/15/273 | | | 258,000 | | | | 236,000 | |
| |
Hanesbrands, Inc. | | | | | |
4.875%, 05/15/265 | | | 157,000 | | | | 140,291 | |
| |
HB Fuller Co. | | | | | |
4.250%, 10/15/28 | | | 146,000 | | | | 129,210 | |
| |
HCA, Inc. | | | | | |
5.375%, 02/01/25 | | | 139,000 | | | | 138,832 | |
| |
Hillenbrand, Inc. | | | | | |
5.000%, 09/15/266 | | | 126,000 | | | | 121,628 | |
| |
Howmet Aerospace, Inc. | | | | | |
5.900%, 02/01/27 | | | 80,000 | | | | 79,550 | |
6.875%, 05/01/253 | | | 114,000 | | | | 116,983 | |
| |
Hudbay Minerals, Inc. (Canada) | | | | | |
4.500%, 04/01/265 | | | 97,000 | | | | 88,109 | |
| |
KB Home | | | | | |
4.000%, 06/15/31 | | | 85,000 | | | | 68,327 | |
| |
Kraft Heinz Foods Co. | | | | | |
4.375%, 06/01/46 | | | 76,000 | | | | 61,758 | |
| |
Lamar Media Corp. | | | | | |
4.875%, 01/15/293 | | | 175,000 | | | | 160,681 | |
| |
Matador Resources Co. | | | | | |
5.875%, 09/15/263 | | | 283,000 | | | | 272,093 | |
| |
Mattel, Inc. | | | | | |
3.375%, 04/01/265 | | | 218,000 | | | | 200,430 | |
| |
MEG Energy Corp. (Canada) | | | | | |
5.875%, 02/01/295 | | | 175,000 | | | | 165,029 | |
| | | | | | | | |
| | | | | | | | |
| | | Principal Amount | | | Value | |
| |
Meritage Homes Corp. | | | | | |
6.000%, 06/01/25 | | | $148,000 | | | | $147,288 | |
| |
Methanex Corp. (Canada) | | | | | |
5.125%, 10/15/27 | | | 183,000 | | | | 169,733 | |
| |
MGM Resorts International | | | | | |
5.750%, 06/15/253 | | | 210,000 | | | | 204,094 | |
| |
Mueller Water Products, Inc. | | | | | |
4.000%, 06/15/295 | | | 183,000 | | | | 160,811 | |
| |
Murphy Oil Corp. | | | | | |
6.375%, 07/15/28 | | | 170,000 | | | | 163,633 | |
| |
Murphy Oil USA, Inc. | | | | | |
5.625%, 05/01/27 | | | 180,000 | | | | 174,782 | |
| |
Newell Brands, Inc. | | | | | |
4.450%, 04/01/266 | | | 181,000 | | | | 170,284 | |
| |
Novelis Corp. | | | | | |
3.250%, 11/15/265 | | | 189,000 | | | | 169,440 | |
| |
NuStar Logistics LP | | | | | |
5.625%, 04/28/27 | | | 276,000 | | | | 258,076 | |
| |
Occidental Petroleum Corp. | | | | | |
7.875%, 09/15/31 | | | 151,000 | | | | 166,704 | |
| |
Olin Corp. | | | | | |
5.125%, 09/15/27 | | | 204,000 | | | | 192,780 | |
| |
Owens-Brockway Glass Container, Inc. | | | | | |
6.375%, 08/15/255 | | | 198,000 | | | | 194,018 | |
| |
Penn Entertainment, Inc. | | | | | |
4.125%, 07/01/295 | | | 183,000 | | | | 144,571 | |
| |
Penske Automotive Group, Inc. | | | | | |
3.500%, 09/01/25 | | | 174,000 | | | | 161,482 | |
| |
Permian Resources Operating LLC | | | | | |
5.375%, 01/15/265 | | | 190,000 | | | | 172,954 | |
| | |
Prime Security Services Borrower LLC/Prime | | | | | | | | |
Finance, Inc. | | | | | | | | |
5.750%, 04/15/265 | | | 225,000 | | | | 216,562 | |
| |
PTC, Inc. | | | | | |
3.625%, 02/15/255 | | | 218,000 | | | | 207,630 | |
| |
Sealed Air Corp. | | | | | |
5.500%, 09/15/255 | | | 182,000 | | | | 179,386 | |
| |
Silgan Holdings, Inc. | | | | | |
4.125%, 02/01/28 | | | 137,000 | | | | 126,747 | |
| |
Southwestern Energy Co. | | | | | |
8.375%, 09/15/28 | | | 260,000 | | | | 268,045 | |
| |
Sprint LLC | | | | | |
7.125%, 06/15/24 | | | 213,000 | | | | 217,162 | |
| |
Tenet Healthcare Corp. | | | | | |
4.875%, 01/01/265 | | | 177,000 | | | | 167,379 | |
| | |
Teva Pharmaceutical Finance Netherlands III, B.V. | | | | | | | | |
(Netherlands) | | | | | | | | |
3.150%, 10/01/26 | | | 201,000 | | | | 175,775 | |
| |
Toll Brothers Finance Corp. | | | | | |
4.350%, 02/15/28 | | | 190,000 | | | | 172,627 | |
| | | | | | | | |
The accompanying notes are an integral part of these financial statements.
28
| | |
| | |
| | | AMG GW&K High Income Fund Schedule of Portfolio Investments (continued) |
| | | |
| | | |
| | | |
| | | | | | | | |
| | | Principal Amount | | | Value | |
| |
Industrials - 79.9% (continued) | | | | | |
| |
TransDigm, Inc. | | | | | |
6.250%, 03/15/265 | | | $172,000 | | | | $169,625 | |
| |
Travel + Leisure Co. | | | | | |
5.650%, 04/01/246 | | | 97,000 | | | | 95,540 | |
6.600%, 10/01/256 | | | 75,000 | | | | 73,691 | |
| |
Trinity Industries, Inc. | | | | | |
4.550%, 10/01/24 | | | 182,000 | | | | 176,602 | |
| |
United Airlines Holdings, Inc. | | | | | |
4.875%, 01/15/253 | | | 110,000 | | | | 105,050 | |
5.000%, 02/01/243 | | | 157,000 | | | | 154,253 | |
| |
United Rentals North America, Inc. | | | | | |
4.875%, 01/15/28 | | | 183,000 | | | | 173,420 | |
| |
United States Steel Corp. | | | | | |
6.875%, 03/01/293 | | | 133,000 | | | | 129,096 | |
| |
Wabash National Corp. | | | | | |
4.500%, 10/15/285 | | | 153,000 | | | | 130,293 | |
| |
WESCO Distribution, Inc. | | | | | |
7.250%, 06/15/285 | | | 118,000 | | | | 119,531 | |
| |
Western Digital Corp. | | | | | |
4.750%, 02/15/26 | | | 137,000 | | | | 129,016 | |
| |
Western Midstream Operating LP | | | | | |
4.650%, 07/01/26 | | | 269,000 | | | | 255,297 | |
| |
Westlake Corp. | | | | | |
0.875%, 08/15/24 | | | 73,000 | | | | 67,782 | |
| | |
Total Industrials | | | | | | | 13,790,428 | |
| |
Utilities - 2.6% | | | | | |
| | |
NRG Energy, Inc. | | | | | | | | |
5.250%, 06/15/295 | | | 195,000 | | | | 172,134 | |
| |
SM Energy Co. | | | | | |
5.625%, 06/01/25 | | | 283,000 | | | | 271,677 | |
Total Utilities | | | | | | | 443,811 | |
| |
Total Corporate Bonds and Notes | | | | | |
(Cost $17,730,127) | | | | 16,846,749 | |
| | | | | |
| | | | | | | | |
| | | Principal Amount | | | Value | |
| |
Short-Term Investments - 8.7% | | | | | |
| |
Joint Repurchase Agreements - 7.3%7 | | | | | |
| | |
Citigroup Global Markets, Inc., dated 12/30/22, due 01/03/23, 4.250% total to be received $253,367 (collateralized by various U.S. Treasuries, 0.000% - 4.500%, 04/11/23 - 10/31/29, totaling $258,312) | | | $253,247 | | | | $253,247 | |
| | |
National Bank Financial, dated 12/30/22, due 01/03/23, 4.340% total to be received $1,000,482 (collateralized by various U.S. Treasuries, 0.000% - 4.435%, 01/03/23 - 09/09/49, totaling $1,020,000) | | | 1,000,000 | | | | 1,000,000 | |
| | |
Total Joint Repurchase Agreements | | | | | | | 1,253,247 | |
| |
Repurchase Agreements - 1.4% | | | | | |
| | |
Fixed Income Clearing Corp., dated 12/30/22 due 01/03/23, 4.150% total to be received $248,114 (collateralized by a U.S. Treasury, 0.125%, 01/15/32, totaling $252,973) | | | 248,000 | | | | 248,000 | |
| |
Total Short-Term Investments | | | | | |
(Cost $1,501,247) | | | | | | | 1,501,247 | |
| |
Total Investments - 106.3% | | | | | |
(Cost $19,231,374) | | | | | | | 18,347,996 | |
| |
Other Assets, less Liabilities - (6.3)% | | | | (1,079,447 | ) |
| |
Net Assets - 100.0% | | | | $17,268,549 | |
| | | | | |
| 1 | Fixed to variable rate investment. The rate shown reflects the fixed rate in effect at December 31, 2022. Rate will reset at a future date. |
| 2 | Perpetuity Bond. The date shown represents the next call date. |
| 3 | Some of these securities, amounting to $1,415,713 or 8.2% of net assets, were out on loan to various borrowers and are collateralized by cash and various U.S. Treasury Obligations. See Note 4 of Notes to Financial Statements. |
| 4 | Variable rate security. The rate shown is based on the latest available information as of December 31, 2022. Certain variable rate securities are not based on a published reference rate and spread but are determined by the issuer or agent and are based on current market conditions. These securities do not indicate a reference rate and spread in their description above. |
| 5 | Security exempt from registration under Rule 144A of the Securities Act of 1933. This security may be resold in transactions exempt from registration, normally to qualified institutional buyers. At December 31, 2022, the value of these securities amounted to $4,959,408 or 28.7% of net assets. |
| 6 | Step Bond: A debt instrument with either deferred interest payments or an interest rate that resets at specific times during its term. |
| 7 | Cash collateral received for securities lending activity was invested in these joint repurchase agreements. |
| | |
| CMT | | Constant Maturity Treasury |
| |
| LIBOR | | London Interbank Offered Rate |
| |
| SOFR | | Secured Overnight Financing Rate |
The accompanying notes are an integral part of these financial statements.
29
| | |
| | |
| | | AMG GW&K High Income Fund Schedule of Portfolio Investments (continued) |
| | | |
| | | |
| | | |
The following table summarizes the inputs used to value the Fund’s investments by the fair value hierarchy levels as of December 31, 2022:
| | | | | | | | | | | | | | | | |
| | | Level 1 | | | Level 2 | | | Level 3 | | | Total | |
| | | | |
Investments in Securities | | | | | | | | | | | | | | | | |
| | | | |
Corporate Bonds and Notes† | | | — | | | | $16,846,749 | | | | — | | | | $16,846,749 | |
| | | | |
Short-Term Investments | | | | | | | | | | | | | | | | |
| | | | |
Joint Repurchase Agreements | | | — | | | | 1,253,247 | | | | — | | | | 1,253,247 | |
| | | | |
Repurchase Agreements | | | — | | | | 248,000 | | | | — | | | | 248,000 | |
| | | | | | | | | | | | | | | | |
| | | | |
Total Investments in Securities | | | — | | | | $18,347,996 | | | | — | | | | $18,347,996 | |
| | | | | | | | | | | | | | | | |
| † | All corporate bonds and notes held in the Fund are level 2 securities. For a detailed breakout of corporate bonds and notes by major industry classification, please refer to the Fund’s Schedule of Portfolio Investments. |
For the fiscal year ended December 31, 2022, there were no transfers in or out of Level 3.
The accompanying notes are an integral part of these financial statements.
30
| | |
| | | AMG GW&K Municipal Bond Fund Portfolio Manager’s Comments (unaudited) |
| | | |
| | | |
| | | |
| | | | | | | | |
THE YEAR IN REVIEW For the year ended December 31, 2022, AMG GW&K Municipal Bond Fund (the “Fund”) Class N shares returned (7.80)%, compared to the (6.57)% return for its benchmark, the Bloomberg 10-Year Municipal Bond Index (the “Index”). In the first quarter of 2022, municipal bonds suffered their worst quarter of performance in 40 years, getting caught in a Treasury market rout that stemmed from the mounting determination of central banks to combat sustained inflationary pressure. Coming into 2022, the U.S. Federal Reserve (the Fed) had been projecting only three quarter-point rate hikes for the calendar year, an outlook that was also reflected in the futures market. But as the quarter progressed, labor markets began to overheat and core inflation surged to a four-decade high. Russia’s invasion of Ukraine sent energy and grain prices soaring amid a humanitarian crisis with no clear endgame. In response to these developments, the Fed rhetoric grew more hawkish and policy projections turned more aggressive. At the March Federal Open Market Committee (FOMC) meeting, after lifting rates for the first time since 2018, committee members raised their forecast to seven total hikes for 2022 and by quarter-end, the futures market was pricing in nine. Short Treasury yields surged, mirroring the faster pace of hikes, while those out longer increased less, reflecting the possible damage to growth. The combination of those two dynamics led to inversions at key segments of the curve, which raised questions as to whether monetary policy can successfully tame inflation without tipping the economy into recession. Going into the second quarter, municipal bonds posted more losses, adding to their worst start to any year on record. The selloff was driven by the Fed’s aggressive tightening campaign, as successive 40-year highs in the Consumer Price Index (CPI) put to rest any lingering convictions that inflation would prove “transitory.” Officials raised rates twice during the quarter, first by half a point in May and then by three-quarters of a point in June, the latter the largest such move since 1994. Interest rates responded by climbing to multi-year highs. Fed Chair Jerome Powell stepped up his hawkish rhetoric, emphasizing the tightness of the labor force and the mounting risks from continued supply chain disruptions, the war in Ukraine and China’s zero-COVID policy. The implication was clear: the long-term damage from entrenched inflation must be prioritized above all else, even at the risk of | | | | slowing economic growth. Investors got the message, becoming less concerned about a price spiral and more worried about the possibility of a recession. Inflation breakeven measures plunged over the final three weeks of June while futures markets pared bets on the peak Fed Funds rate and even priced in cuts by the middle of next year. Interest rates finished well below their mid-June cyclical highs, but were still up meaningfully for the quarter. Municipal bonds again posted heavy losses in the third quarter as hopes faded that the Fed would soon pull back on its aggressive tightening program. After an impressive rally in July, when it still seemed possible that a lowercase “R” recession might usher in an early-spring easing, bond yields soared over the following two months. The two major culprits were the labor market, which stayed extremely tight, and inflation, which remained broad-based and hovered near 40-year highs. Fed officials cited the data as evidence that more needed to be done, lest elevated inflation expectations become entrenched. The FOMC followed through by raising rates 150 basis points (“bps”) during the quarter, doubling the magnitude of hikes from the first half of the year. As importantly, committee members signaled more to come, forecasting a steeper policy path and higher terminal rate than traders had expected. Sentiment was also weighed down by geopolitical crosscurrents, including the ongoing war in Ukraine, COVID lockdowns in China, and a brief but dramatic crash in UK government debt, which necessitated an intervention from the Bank of England. In late September, the yield on the 10-year Treasury touched 4.00% for the first time since 2008, before declining slightly to end the quarter at 3.83%. As we ended the year, municipal bonds posted their strongest quarterly performance in over a decade, partially erasing what still amounted to the worst annual loss in 40 years. With a struggling Treasury market providing little direction, returns were instead powered by a combination of scant supply and building demand. New issue volume for the fourth quarter declined 40% on a year-over-year basis, creating a scarcity premium that was turbo-charged by the need for investors to reinvest seasonally high coupon and maturity redemptions. Although mutual funds continued to experience significant outflows, likely exacerbated by year-end tax-loss selling, the bid-side remained strong and picked up steam as the quarter progressed. In fact, after a modest selloff in October, tax-exempt yields staged a breathtaking turnaround, plummeting 70-90 bps through | | | | mid-December. Even with that rally, however, rates were still up 1.60% to 2.30% from January’s historically low starting point, leaving no escape from the sharply negative annual performance that materialized across the entire curve. Although municipal bonds outperformed Treasuries in the fourth quarter, they were still directionally influenced by the underlying forces driving the broader market. Early in the quarter, interest rates shot up due to still-elevated inflation, tight labor markets, and hawkish saber rattling from central banks. By October 28, 2022, the yield on the 10-year Treasury had risen 40 bps for the month to close at 4.24%, its highest level since 2008. From there, however, sentiment turned as the lagged effects of contractionary policy seemed to take hold. Key prints on inflation decelerated from their peaks, creating a sense that the worst may be over. A pullback in manufacturing and a softening in unit labor costs were also contributing factors. And while the Fed continued to talk tough on keeping policy restrictive, a downshift to a 50 bp hike in December after four consecutive 75 bp increases lent further credibility to the slowdown narrative. The futures market even started pricing in a couple of rate cuts for the back half of 2023. From its October high, the 10-year Treasury yield dropped 36 bps the rest of the way, ending December more than 50 bps below the yield on the two-year, the steepest inversion of that segment of the curve since the early 1980s. Amid this backdrop, the Fund underperformed the Index for the year. The Fund’s overall longer duration and overweight to longer maturities were the biggest negatives as interest rates rose. The Fund’s overweight to higher coupon structures, allocation to shorter maturities and overall security selection benefited performance. OUTLOOK Don’t be fooled by all the hand-wringing over what a terrible year 2022 was for bonds. In fact, long-term investors should be grateful for what transpired. Make no mistake, ultra-low interest rates are a threat to savers, especially those artificially manufactured by well-intentioned governments. It was critical to break out of that destabilizing cycle and mark-to-market losses were a small price to pay to get there. We believe municipal bonds enter 2023 in much better shape. Yields that began the year at 1.00% are now far more attractive, in many instances topping 5.00% on a tax-equivalent basis. The technical backdrop should continue strong, with issuance remaining low due to a decline in |
31
| | |
| | | AMG GW&K Municipal Bond Fund Portfolio Manager’s Comments (continued) |
| | | |
| | | |
| | | |
| | | | | | | | |
| refunding opportunities. The outflow cycle that plagued 2022 will likely lose steam in the face of better yields and less tax-loss selling. States are better positioned to withstand the effects of a potential recession, having made prudent use of windfall tax collections to build record reserves. To be sure, challenges still exist. More economically | | | | sensitive sectors will need closer scrutiny and a historically flat yield curve alters the risk/return calculus. But these issues are considerably less difficult to navigate than central banks pinning rates near zero. And we look forward to taking advantage of the gift handed to us by the 2022 market. | | | | The views expressed represent the opinions of GW&K Investment Management, LLC as of December 31, 2022, and are not intended as a forecast or guarantee of future results, and are subject to change without notice. |
32
| | |
| | |
| | | AMG GW&K Municipal Bond Fund Portfolio Manager’s Comments (continued) |
| | | |
| | | |
| | | |
CUMULATIVE TOTAL RETURN PERFORMANCE
AMG GW&K Municipal Bond Fund’s cumulative total return is based on the daily change in net asset value (NAV), and assumes that all dividends and distributions were reinvested. The graph compares a hypothetical $10,000 investment made in the AMG GW&K Municipal Bond Fund’s Class N shares on December 31, 2012, to a $10,000 investment made in the Bloomberg 10-Year Municipal Bond Index for the same time period. The graph and table do not reflect the deduction of taxes that a shareholder would pay on a Fund distribution or redemption of shares. The listed returns for the Fund are net of expenses and the returns for the index exclude expenses. Total returns would have been lower had certain expenses not been reduced.
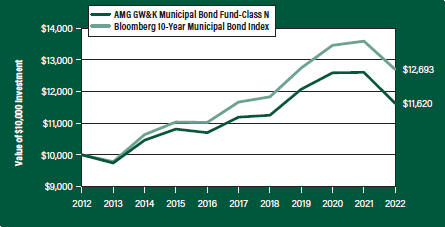
The table below shows the average annual total returns for the AMG GW&K Municipal Bond Fund and the Bloomberg 10-Year Municipal Bond Index for the same time periods ended December 31, 2022.
| | | | | | | | | | | | |
| Average Annual Total Returns1 | | One Year | | | Five Years | | | Ten Years | |
|
AMG GW&K Municipal Bond Fund2, 3, 4, 5, 6, 7 | |
| | | |
Class N | | | (7.80% | ) | | | 0.76% | | | | 1.51% | |
| | | |
Class I | | | (7.45% | ) | | | 1.09% | | | | 1.90% | |
| | | |
Bloomberg 10-Year Municipal Bond Index8 | | | (6.57% | ) | | | 1.70% | | | | 2.41% | |
The performance data shown represents past performance. Past performance is not a guarantee of future results. Current performance may be lower or higher than the performance data quoted. The investment return and principal value of an investment will fluctuate so that an investor’s shares, when redeemed, may be worth more or less than their original cost.
Investors should carefully consider the Fund’s investment objectives, risks, charges and expenses before investing. For performance information through the most recent month end, current net asset values per share for the Fund and other information, please call 800.548.4539 or visit our website at amgfunds.com for a free prospectus. Read it carefully before investing or sending money.
Distributed by AMG Distributors, Inc., member FINRA/SIPC.
| 1 | Total return equals income yield plus share price change and assumes reinvestment of all dividends and capital gain distributions. Returns are net of fees and may reflect offsets of Fund expenses as described in the prospectus. No adjustment has been made for taxes payable by shareholders on their reinvested dividends and capital gain distributions. Returns for periods greater than one year are annualized. The listed returns on the Fund are net of expenses and based on the published NAV as of December 31, 2022. All returns are in U.S. Dollars ($). |
| 2 | From time to time, the Fund’s investment manager has waived its fees and/or absorbed Fund expenses, which has resulted in higher returns. |
| 3 | The Fund is subject to the risks associated with investments in debt securities, such as default risk and |
|
fluctuations in the perception of the debtor’s ability to pay its creditors. Changing interest rates may adversely affect the value of an investment. An increase in interest rates typically causes the value of bonds and other fixed income securities to fall. 4 Factors unique to the municipal bond market may negatively affect the value of municipal bonds. 5 Investment income may be subject to certain state and local taxes, and depending on your tax status, the federal alternative minimum tax. Capital gains are not exempt from federal income tax. 6 Market prices of investments held by the Fund may fall rapidly or unpredictably due to a variety of economic or political factors, market conditions, disasters or public health issues, or in response to events that affect particular industries or companies. 7 Companies that are in similar industry sectors may be similarly affected by particular economic or market events; to the extent the Fund has substantial holdings within a particular sector, the risks associated with that sector increase. 8 The Bloomberg 10-Year Municipal Bond Index is the 10 Year (8-12) component of the Municipal Bond index. It is a rules-based, market-value-weighted index engineered for the tax-exempt bond market. The Index tracks general obligation bonds, revenue bonds, insured bonds, and prerefunded bonds rated Baa3/BBB- or higher by at least two of the ratings agencies: Moody’s, S&P, Fitch. Unlike the Fund, the Bloomberg 10-Year Municipal Bond Index is unmanaged, is not available for investment and does not incur expenses. “Bloomberg®” and any Bloomberg index described herein are service marks of Bloomberg Finance L.P. and its affiliates, including Bloomberg Index Services Limited (“BISL”), the administrator of the index (collectively, “Bloomberg”) and have been licensed for use for certain purposes by AMG Funds LLC. Bloomberg is not affiliated with AMG Funds LLC, and Bloomberg does not approve, endorse, review, or recommend the fund described herein. Bloomberg does not guarantee the timeliness, accurateness, or completeness of any data or information relating to such fund. Not FDIC insured, nor bank guaranteed. May lose value. |
33
| | |
| | | AMG GW&K Municipal Bond Fund Fund Snapshots (unaudited) December 31, 2022 |
| | | |
| | | |
PORTFOLIO BREAKDOWN
| | |
| Category | | % of
Net Assets |
| | |
| General Obligation | | 41.4 |
| | |
| Transportation | | 34.0 |
| | |
| Medical | | 9.0 |
| | |
| Water | | 6.2 |
| | |
| Education | | 4.2 |
| | |
| Utilities | | 2.1 |
| | |
| Power | | 1.7 |
| | |
| Tobacco Settlement | | 0.8 |
| | |
| Industrial Development | | 0.7 |
| | |
| Short-term | | 0.1 |
| | |
| Other Assets, less Liabilities | | (0.2) |
| | |
| Rating | | % of Market Value1 |
| | |
| Aaa/AAA | | 25.3 |
| | |
| Aa/AA | | 46.0 |
| | |
| A | | 22.2 |
| | |
| Baa/BBB | | 6.5 |
| 1 | Includes market value of long-term fixed-income securities only. |
TOP TEN HOLDINGS
| | | | | | | | |
| Security Name | | | | | % of
Net Assets | |
| | | |
Wisconsin State Revenue, Department of Transportation, Series 2, 5.000%, 07/01/29 | | | | | | | 2.1 | |
| | | |
Iowa Finance Authority, State Revolving Fund Green Bond, 5.000%, 08/01/30 | | | | | | | 1.5 | |
| | | |
Metropolitan Transportation Authority, Transit Revenue, Green Bond, Series B, 5.000%, 11/15/27 | | | | | | | 1.4 | |
| | | |
New York State Urban Development Corp., 5.000%, 03/15/32 | | | | | | | 1.3 | |
| | | |
State of California, General Obligation, 5.000%, 11/01/30 | | | | | | | 1.3 | |
| | | |
State of Maryland, Department of Transportation, 5.000%, 09/01/29 | | | | | | | 1.2 | |
| | | |
State of Maryland, Department of Transportation, 5.000%, 10/01/28 | | | | | | | 1.2 | |
| | | |
State of New Jersey, Series A, 5.000%, 06/01/29 | | | | | | | 1.2 | |
| | | |
New York City Transitional Finance Authority Building Aid Revenue, Series 1A, 5.000%, 07/15/32 | | | | | | | 1.2 | |
| | | |
Michigan Finance Authority, Henry Ford Health System, 5.000%, 11/15/29 | | | | | | | 1.1 | |
| | | |
Top Ten as a Group | | | | | | | 13.5 | |
| | | | | | | | | |
Credit quality ratings shown above reflect the highest rating assigned by either Standard & Poor’s (“S&P”), Moody’s Investors Service, Inc. (“Moody’s”) or Fitch. These rating agencies are independent, nationally recognized statistical rating organizations and are widely used. Investment grade ratings are credit ratings of BBB- or higher. Below investment grade ratings are credit ratings of BB+ or lower. Investments designated N/R are not rated by any of the rating agencies. Unrated investments do not necessarily indicate low credit quality. Credit quality ratings are subject to change.
Because a fund’s strategy may result in multiple investments in particular sectors of the economy, its performance may depend on the performance of those sectors and may fluctuate more widely than investments diversified across more sectors. For additional information on these and other risk considerations, please see the Fund’s prospectus.
Any sectors, industries, or securities discussed should not be perceived as investment recommendations. Mention of a specific security should not be considered a recommendation to buy or solicitation to sell that security. Specific securities mentioned in this report may have been sold from the Fund’s portfolio of investments by the time you receive this report.
34
| | |
| | |
| | | AMG GW&K Municipal Bond Fund Schedule of Portfolio Investments December 31, 2022 |
| | | |
| | | |
| | | |
| | | | | | | | |
| | | Principal
Amount | | | Value | |
| |
Municipal Bonds - 100.1% | | | | | |
| | |
Alabama - 0.8% | | | | | | | | |
| | |
Alabama Public School and College Authority, Series A | | | | | | | | |
5.000%, 11/01/34 | | | $7,500,000 | | | | $8,573,619 | |
| | |
Arizona - 1.2% | | | | | | | | |
| | |
Arizona Department of Transportation State Highway Fund Revenue | | | | | | | | |
5.000%, 07/01/28 | | | 5,040,000 | | | | 5,433,712 | |
| | |
Arizona Industrial Development Authority | | | | | | | | |
5.000%, 02/01/32 | | | 1,450,000 | | | | 1,677,374 | |
5.000%, 02/01/35 | | | 1,700,000 | | | | 1,928,284 | |
5.000%, 02/01/36 | | | 1,800,000 | | | | 2,010,638 | |
5.000%, 02/01/37 | | | 1,905,000 | | | | 2,100,342 | |
| | |
Total Arizona | | | | | | | 13,150,350 | |
| | |
California - 11.6% | | | | | | | | |
| | |
California Municipal Finance Authority, Community Medical Centers, Series A | | | | | | | | |
5.000%, 02/01/27 | | | 950,000 | | | | 1,007,489 | |
5.000%, 02/01/30 | | | 1,630,000 | | | | 1,720,520 | |
5.000%, 02/01/31 | | | 900,000 | | | | 949,687 | |
5.000%, 02/01/32 | | | 1,855,000 | | | | 1,953,142 | |
| | |
California State Public Works Board, Series A | | | | | | | | |
5.000%, 02/01/30 | | | 2,500,000 | | | | 2,893,407 | |
5.000%, 02/01/31 | | | 3,500,000 | | | | 4,101,895 | |
5.000%, 02/01/32 | | | 3,500,000 | | | | 4,155,800 | |
5.000%, 08/01/33 | | | 5,000,000 | | | | 5,863,122 | |
5.000%, 08/01/34 | | | 2,750,000 | | | | 3,194,881 | |
5.000%, 08/01/35 | | | 2,500,000 | | | | 2,868,944 | |
| | |
California State Public Works Board, Series C | | | | | | | | |
5.000%, 08/01/30 | | | 2,785,000 | | | | 3,250,783 | |
5.000%, 08/01/31 | | | 2,560,000 | | | | 3,020,342 | |
5.000%, 08/01/32 | | | 2,750,000 | | | | 3,235,555 | |
5.000%, 08/01/33 | | | 3,000,000 | | | | 3,517,873 | |
| | |
City of Los Angeles Department of Airports, Series C | | | | | | | | |
5.000%, 05/15/30 | | | 10,515,000 | | | | 11,590,975 | |
| | |
San Francisco City & County Airport Commission, San Francisco International Airport, Series A | | | | | | | | |
5.000%, 05/01/32 | | | 3,000,000 | | | | 3,270,007 | |
5.000%, 05/01/34 | | | 5,010,000 | | | | 5,318,966 | |
5.000%, 05/01/35 | | | 5,800,000 | | | | 6,119,436 | |
State of California | | | | | | | | |
5.000%, 09/01/29 | | | 4,075,000 | | | | 4,410,914 | |
5.000%, 11/01/29 | | | 5,000,000 | | | | 5,751,735 | |
5.000%, 11/01/30 | | | 11,575,000 | | | | 13,540,401 | |
5.000%, 09/01/31 | | | 8,000,000 | | | | 9,455,470 | |
5.000%, 04/01/32 | | | 5,000,000 | | | | 5,953,574 | |
| | |
University of California, Series BM | | | | | | | | |
5.000%, 05/15/31 1 | | | 2,000,000 | | | | 2,362,596 | |
5.000%, 05/15/32 1 | | | 5,000,000 | | | | 5,977,539 | |
| | | | | | | | |
| | | Principal
Amount | | | Value | |
| | |
University of California, Series S | | | | | | | | |
5.000%, 05/15/36 | | | $3,000,000 | | | | $3,453,213 | |
5.000%, 05/15/37 | | | 3,000,000 | | | | 3,425,656 | |
5.000%, 05/15/38 | | | 3,000,000 | | | | 3,410,677 | |
| | |
Total California | | | | | | | 125,774,599 | |
| | |
Colorado - 0.4% | | | | | | | | |
| | |
Colorado Health Facilities Authority, Series A | | | | | | | | |
5.000%, 08/01/33 | | | 4,260,000 | | | | 4,514,562 | |
| | |
Connecticut - 4.7% | | | | | | | | |
| | |
Connecticut State Health & Educational Facilities Authority | | | | | | | | |
5.000%, 07/01/31 | | | 6,205,000 | | | | 6,812,342 | |
5.000%, 07/01/33 | | | 2,750,000 | | | | 2,980,361 | |
5.000%, 07/01/34 | | | 3,100,000 | | | | 3,350,647 | |
| | |
State of Connecticut Special Tax Revenue, Series A | | | | | | | | |
5.000%, 05/01/28 | | | 3,000,000 | | | | 3,345,715 | |
| | |
State of Connecticut Special Tax Revenue, Transportation Infrastructure, Series A | | | | | | | | |
5.000%, 01/01/30 | | | 10,180,000 | | | | 11,219,614 | |
| | |
State of Connecticut Special Tax Revenue, Series B | | | | | | | | |
5.000%, 10/01/35 | | | 7,500,000 | | | | 8,218,798 | |
| | |
State of Connecticut Special Tax Revenue, Series C | | | | | | | | |
5.000%, 01/01/28 | | | 1,000,000 | | | | 1,108,578 | |
5.000%, 01/01/29 | | | 1,000,000 | | | | 1,121,404 | |
5.000%, 01/01/30 | | | 1,000,000 | | | | 1,139,234 | |
5.000%, 01/01/31 | | | 1,000,000 | | | | 1,156,600 | |
5.000%, 01/01/32 | | | 1,000,000 | | | | 1,162,692 | |
| | |
State of Connecticut, Series A | | | | | | | | |
5.000%, 01/15/31 | | | 7,650,000 | | | | 8,659,339 | |
| | |
Total Connecticut | | | | | | | 50,275,324 | |
| | |
Delaware - 0.3% | | | | | | | | |
| | |
Delaware River & Bay Authority | | | | | | | | |
5.000%, 01/01/31 | | | 1,000,000 | | | | 1,162,820 | |
5.000%, 01/01/32 | | | 1,040,000 | | | | 1,223,585 | |
5.000%, 01/01/33 | | | 1,100,000 | | | | 1,282,892 | |
| | |
Total Delaware | | | | | | | 3,669,297 | |
| | |
District of Columbia - 3.4% | | | | | | | | |
| | |
District of Columbia, Series A | | | | | | | | |
5.000%, 06/01/30 | | | 6,020,000 | | | | 6,479,505 | |
| | |
District of Columbia, Series B | | | | | | | | |
5.000%, 06/01/31 | | | 10,080,000 | | | | 11,322,300 | |
| | |
District of Columbia, Series C | | | | | | | | |
5.000%, 12/01/33 | | | 5,000,000 | | | | 5,867,415 | |
5.000%, 12/01/34 | | | 6,000,000 | | | | 6,961,513 | |
| | |
Washington DC Convention & Sports Authority, Series A | | | | | | | | |
5.000%, 10/01/27 | | | 5,475,000 | | | | 6,026,340 | |
| | |
Total District of Columbia | | | | | | | 36,657,073 | |
The accompanying notes are an integral part of these financial statements.
35
| | |
| | |
| | | AMG GW&K Municipal Bond Fund Schedule of Portfolio Investments (continued) |
| | | |
| �� | | |
| | | |
| | | | | | | | |
| | | Principal
Amount | | | Value | |
| | |
Florida - 4.3% | | | | | | | | |
| | |
Central Florida Expressway Authority | | | | | | | | |
5.000%, 07/01/28 | | | $4,460,000 | | | | $4,967,235 | |
| | |
Escambia County Health Facilities Authority | | | | | | | | |
5.000%, 08/15/37 | | | 6,000,000 | | | | 6,165,401 | |
| | |
Florida Development Finance Corp. | | | | | | | | |
4.000%, 11/15/33 | | | 10,000,000 | | | | 10,123,488 | |
| | |
Florida’s Turnpike Enterprise, Department of Transportation, Series C | | | | | | | | |
5.000%, 07/01/28 | | | 7,075,000 | | | | 7,630,134 | |
| | |
Lee Memorial Health System, Series A1 | | | | | | | | |
5.000%, 04/01/34 | | | 5,645,000 | | | | 6,034,130 | |
| | |
Orange County Health Facilities Authority, Series A | | | | | | | | |
5.000%, 10/01/31 | | | 4,525,000 | | | | 4,759,415 | |
| | |
State of Florida, Series C | | | | | | | | |
5.000%, 06/01/31 | | | 5,375,000 | | | | 6,323,204 | |
| | |
Total Florida | | | | | | | 46,003,007 | |
| | |
Georgia - 1.7% | | | | | | | | |
| | |
Private Colleges & Universities Authority, Series A | | | | | | | | |
5.000%, 09/01/32 | | | 5,000,000 | | | | 5,979,124 | |
| | |
Private Colleges & Universities Authority, Series B | | | | | | | | |
5.000%, 09/01/30 | | | 10,365,000 | | | | 12,068,283 | |
| | |
Total Georgia | | | | | | | 18,047,407 | |
| | |
Illinois - 8.1% | | | | | | | | |
| | |
Chicago O’Hare International Airport, Series A | | | | | | | | |
5.000%, 01/01/35 | | | 5,010,000 | | | | 5,479,704 | |
| | |
Chicago O’Hare International Airport, Series B | | | | | | | | |
5.000%, 01/01/28 | | | 5,670,000 | | | | 5,891,816 | |
| | |
Chicago O’Hare International Airport, Senior Lien, Series A | | | | | | | | |
5.000%, 01/01/36 | | | 10,035,000 | | | | 10,500,574 | |
5.000%, 01/01/38 | | | 5,500,000 | | | | 5,698,790 | |
| | |
Illinois Finance Authority | | | | | | | | |
5.000%, 01/01/29 | | | 2,310,000 | | | | 2,610,849 | |
5.000%, 07/01/29 | | | 8,755,000 | | | | 9,952,332 | |
| | |
Illinois Finance Authority, Series A | | | | | | | | |
4.000%, 08/15/37 | | | 5,910,000 | | | | 5,699,355 | |
| | |
Illinois State Finance Authority Revenue, Clean Water Initiative Revenue | | | | | | | | |
5.000%, 07/01/27 | | | 11,000,000 | | | | 11,712,580 | |
| | |
Illinois State Toll Highway Authority, Series A | | | | | | | | |
5.000%, 12/01/31 | | | 9,735,000 | | | | 10,289,406 | |
| | |
Illinois State Toll Highway Authority, Senior Revenue Bonds, Series A | | | | | | | | |
5.000%, 01/01/30 | | | 10,110,000 | | | | 11,320,825 | |
| | |
State of Illinois, Series A | | | | | | | | |
5.250%, 03/01/37 | | | 8,500,000 | | | | 8,685,368 | |
| | |
Total Illinois | | | | | | | 87,841,599 | |
| | | | | | | | |
| | | Principal
Amount | | | Value | |
| | |
Indiana - 2.2% | | | | | | | | |
| | |
Indiana Finance Authority, Series 1 | | | | | | | | |
5.000%, 10/01/28 | | | $1,000,000 | | | | $1,120,682 | |
5.000%, 10/01/29 | | | 3,555,000 | | | | 4,048,261 | |
| | |
Indiana Finance Authority, Series A | | | | | | | | |
5.000%, 02/01/32 | | | 5,000,000 | | | | 5,809,909 | |
| | |
Indiana Finance Authority, Series B | | | | | | | | |
5.000%, 02/01/34 | | | 5,815,000 | | | | 6,798,044 | |
| | |
Indiana Finance Authority, Series C | | | | | | | | |
5.000%, 06/01/29 | | | 4,800,000 | | | | 5,476,113 | |
| | |
Total Indiana | | | | | | | 23,253,009 | |
| | |
Iowa - 1.5% | | | | | | | | |
| | |
Iowa Finance Authority, State Revolving Fund Green Bond | | | | | | | | |
5.000%, 08/01/30 | | | 15,025,000 | | | | 16,484,229 | |
| | |
Kentucky - 0.5% | | | | | | | | |
| | |
Louisville/Jefferson County Metropolitan Government, Norton Healthcare Inc., Series A | | | | | | | | |
5.000%, 10/01/29 | | | 5,505,000 | | | | 5,777,778 | |
| | |
Maine - 0.8% | | | | | | | | |
| | |
Maine Turnpike Authority | | | | | | | | |
5.000%, 07/01/28 | | | 1,955,000 | | | | 2,181,564 | |
5.000%, 07/01/29 | | | 1,600,000 | | | | 1,810,671 | |
5.000%, 07/01/30 | | | 1,390,000 | | | | 1,597,740 | |
5.000%, 07/01/31 | | | 1,500,000 | | | | 1,747,975 | |
5.000%, 07/01/32 | | | 1,390,000 | | | | 1,638,519 | |
| | |
Total Maine | | | | | | | 8,976,469 | |
| | |
Maryland - 7.1% | | | | | | | | |
| | |
Maryland State Transportation Authority | | | | | | | | |
5.000%, 07/01/33 | | | 6,350,000 | | | | 7,291,035 | |
| | |
State of Maryland, Department of Transportation | | | | | | | | |
5.000%, 10/01/28 | | | 12,365,000 | | | | 13,413,762 | |
5.000%, 09/01/29 | | | 12,205,000 | | | | 13,475,583 | |
| | |
State of Maryland, Series C | | | | | | | | |
4.000%, 03/01/28 | | | 9,500,000 | | | | 10,136,426 | |
4.000%, 03/01/29 | | | 9,245,000 | | | | 9,972,956 | |
| | |
State of Maryland, Series D | | | | | | | | |
4.000%, 08/01/28 | | | 8,000,000 | | | | 8,575,709 | |
4.000%, 08/01/29 | | | 6,500,000 | | | | 7,042,308 | |
| | |
State of Maryland, State & Local Facilities Loan of 2019, 1st Series | | | | | | | | |
5.000%, 03/15/30 | | | 6,000,000 | | | | 6,828,295 | |
| | |
Total Maryland | | | | | | | 76,736,074 | |
| | |
Michigan - 2.2% | | | | | | | | |
| | |
Michigan Finance Authority, Henry Ford Health System | | | | | | | | |
5.000%, 11/15/29 | | | 11,450,000 | | | | 12,102,170 | |
| | |
Michigan State Building Authority Revenue, Series I | | | | | | | | |
5.000%, 04/15/27 | | | 5,700,000 | | | | 6,033,296 | |
The accompanying notes are an integral part of these financial statements.
36
| | |
| | |
| | | AMG GW&K Municipal Bond Fund Schedule of Portfolio Investments (continued) |
| | | |
| | | |
| | | |
| | | | | | | | |
| | | Principal
Amount | | | Value | |
| | |
Michigan - 2.2% (continued) | | | | | | | | |
| | |
Wayne County Airport Authority, Series A | | | | | | | | |
5.000%, 12/01/37 | | | $2,285,000 | | | | $2,504,730 | |
5.000%, 12/01/38 | | | 1,405,000 | | | | 1,528,144 | |
5.000%, 12/01/39 | | | 1,800,000 | | | | 1,948,293 | |
| | |
Total Michigan | | | | | | | 24,116,633 | |
| | |
New Jersey - 6.1% | | | | | | | | |
| | |
New Jersey Economic Development Authority, Series A | | | | | | | | |
5.250%, 11/01/40 | | | 7,000,000 | | | | 7,472,576 | |
| | |
New Jersey State Turnpike Authority Revenue, Series B | | | | | | | | |
5.000%, 01/01/28 | | | 4,010,000 | | | | 4,427,633 | |
| | |
New Jersey State Turnpike Authority Revenue, Series D | | | | | | | | |
5.000%, 01/01/28 | | | 6,000,000 | | | | 6,449,725 | |
| | |
New Jersey Transportation Trust Fund Authority, Series B | | | | | | | | |
5.000%, 06/15/30 | | | 6,255,000 | | | | 6,892,723 | |
5.000%, 06/15/31 | | | 7,615,000 | | | | 8,427,835 | |
5.000%, 06/15/32 | | | 5,750,000 | | | | 6,337,748 | |
5.000%, 06/15/33 | | | 6,000,000 | | | | 6,565,123 | |
| | |
New Jersey Transportation Trust Fund Authority, Series BB | | | | | | | | |
4.000%, 06/15/37 | | | 3,000,000 | | | | 2,847,361 | |
| | |
South Jersey Transportation Authority | | | | | | | | |
5.000%, 11/01/39 | | | 1,150,000 | | | | 1,169,028 | |
5.000%, 11/01/41 | | | 2,500,000 | | | | 2,528,542 | |
| | |
State of New Jersey, Series A | | | | | | | | |
5.000%, 06/01/29 | | | 11,500,000 | | | | 12,996,644 | |
| | |
Total New Jersey | | | | | | | 66,114,938 | |
| | |
New Mexico - 1.3% | | | | | | | | |
| | |
New Mexico Finance Authority, Series A | | | | | | | | |
5.000%, 06/15/28 | | | 4,470,000 | | | | 4,984,108 | |
5.000%, 06/15/30 | | | 7,500,000 | | | | 8,625,814 | |
| | |
Total New Mexico | | | | | | | 13,609,922 | |
| | |
New York - 19.0% | | | | | | | | |
| | |
City of New York, Series B-1 | | | | | | | | |
5.000%, 08/01/32 | | | 3,000,000 | | | | 3,539,534 | |
| | |
City of New York, Series C | | | | | | | | |
5.000%, 08/01/33 | | | 1,500,000 | | | | 1,705,347 | |
5.000%, 08/01/34 | | | 3,250,000 | | | | 3,661,864 | |
| | |
City of New York, Series L-5 | | | | | | | | |
5.000%, 04/01/33 | | | 6,500,000 | | | | 7,468,024 | |
| | |
Long Island Power Authority | | | | | | | | |
5.000%, 09/01/35 | | | 5,030,000 | | | | 5,464,745 | |
| | |
Long Island Power Authority, Series A | | | | | | | | |
5.000%, 09/01/30 | | | 2,275,000 | | | | 2,623,262 | |
5.000%, 09/01/31 | | | 3,935,000 | | | | 4,594,517 | |
| | | | | | | | |
| | | Principal
Amount | | | Value | |
| | |
Metropolitan Transportation Authority, Transit Revenue, Green Bond, Series B | | | | | | | | |
5.000%, 11/15/27 | | | $14,225,000 | | | | $14,936,243 | |
| | |
Metropolitan Transportation Authority, Transit Revenue, Series F | | | | | | | | |
5.000%, 11/15/28 | | | 4,760,000 | | | | 4,858,174 | |
| | |
New York City Transitional Finance Authority Building Aid Revenue, Series 1A | | | | | | | | |
5.000%, 07/15/32 | | | 10,835,000 | | | | 12,552,836 | |
| | |
New York City Transitional Finance Authority Building Aid Revenue, Series S-3 | | | | | | | | |
5.000%, 07/15/31 | | | 5,080,000 | | | | 5,659,719 | |
| | |
New York City Transitional Finance Authority Future Tax Secured Revenue | | | | | | | | |
5.000%, 11/01/31 | | | 2,500,000 | | | | 2,919,509 | |
5.000%, 11/01/32 | | | 4,000,000 | | | | 4,655,501 | |
| | |
New York City Transitional Finance Authority Future Tax Secured Revenue, Series 1 | | | | | | | | |
5.000%, 02/01/36 | | | 1,000,000 | | | | 1,127,805 | |
5.000%, 02/01/37 | | | 7,000,000 | | | | 7,732,156 | |
5.000%, 02/01/39 | | | 4,000,000 | | | | 4,392,443 | |
| | |
New York State Dormitory Authority, Series A | | | | | | | | |
5.000%, 03/15/31 | | | 7,670,000 | | | | 8,592,230 | |
5.000%, 03/15/32 | | | 8,000,000 | | | | 9,270,206 | |
5.000%, 03/15/33 | | | 3,200,000 | | | | 3,747,904 | |
| | |
New York State Dormitory Authority, Series E | | | | | | | | |
5.000%, 03/15/32 | | | 8,410,000 | | | | 8,875,596 | |
| | |
New York State Dormitory Authority, Series S | | | | | | | | |
4.000%, 05/01/39 | | | 2,000,000 | | | | 1,930,935 | |
| | |
New York State Urban Development Corp. | | | | | | | | |
5.000%, 03/15/32 | | | 12,000,000 | | | | 13,837,038 | |
| | |
New York Transportation Development Corp. | | | | | | | | |
4.000%, 10/31/41 | | | 1,250,000 | | | | 1,096,980 | |
4.000%, 10/31/46 | | | 1,500,000 | | | | 1,262,920 | |
5.000%, 12/01/30 | | | 1,000,000 | | | | 1,078,518 | |
5.000%, 12/01/31 | | | 1,100,000 | | | | 1,183,524 | |
5.000%, 12/01/32 | | | 1,450,000 | | | | 1,558,211 | |
5.000%, 12/01/33 | | | 1,000,000 | | | | 1,069,563 | |
| | |
New York Transportation Development Corp., Series P | | | | | | | | |
5.000%, 12/01/36 | | | 10,000,000 | | | | 10,341,972 | |
| | |
Port Authority of New York & New Jersey, Series 221 | | | | | | | | |
5.000%, 07/15/32 | | | 6,545,000 | | | | 7,117,845 | |
| | |
Triborough Bridge & Tunnel Authority | | | | | | | | |
5.000%, 05/15/30 | | | 10,000,000 | | | | 11,522,063 | |
5.000%, 05/15/31 | | | 10,000,000 | | | | 11,683,516 | |
5.000%, 05/15/32 | | | 5,000,000 | | | | 5,908,015 | |
| | |
Triborough Bridge & Tunnel Authority, Series 2 | | | | | | | | |
5.000%, 11/15/32 | | | 8,000,000 | | | | 9,453,366 | |
| | |
Utility Debt Securitization Authority, Series TE | | | | | | | | |
5.000%, 06/15/31 | | | 6,800,000 | | | | 7,763,986 | |
Total New York | | | | | | | 205,186,067 | |
The accompanying notes are an integral part of these financial statements.
37
| | |
| | |
| | | AMG GW&K Municipal Bond Fund Schedule of Portfolio Investments (continued) |
| | | |
| | | |
| | | |
| | | | | | | | |
| | | Principal
Amount | | | Value | |
| | |
North Carolina - 1.0% | | | | | | | | |
| | |
North Carolina State Limited Obligation, Series B | | | | | | | | |
5.000%, 05/01/28 | | | $10,000,000 | | | | $10,960,963 | |
| | |
Ohio - 0.9% | | | | | | | | |
| | |
Ohio State General Obligation, Series T | | | | | | | | |
5.000%, 05/01/30 | | | 5,000,000 | | | | 5,466,663 | |
| | |
State of Ohio, Series C | | | | | | | | |
5.000%, 09/01/30 | | | 3,910,000 | | | | 4,549,584 | |
| | |
Total Ohio | | | | | | | 10,016,247 | |
| | |
Oregon - 1.9% | | | | | | | | |
| | |
Oregon State Lottery, Series C | | | | | | | | |
5.000%, 04/01/27 | | | 10,000,000 | | | | 10,495,567 | |
Oregon State Lottery, Series D | | | | | | | | |
5.000%, 04/01/28 | | | 9,225,000 | | | | 9,682,161 | |
| | |
Total Oregon | | | | | | | 20,177,728 | |
| | |
Pennsylvania - 3.4% | | | | | | | | |
| | |
Allegheny County Airport Authority, Series A | | | | | | | | |
5.000%, 01/01/31 | | | 1,350,000 | | | | 1,467,595 | |
5.000%, 01/01/32 | | | 2,215,000 | | | | 2,393,738 | |
| | |
Allegheny County Hospital Development Authority, University Pittsburgh Medical Center | | | | | | | | |
5.000%, 07/15/31 | | | 5,530,000 | | | | 6,095,018 | |
| | |
Commonwealth Financing Authority, Pennsylvania Tobacco | | | | | | | | |
5.000%, 06/01/32 | | | 7,910,000 | | | | 8,577,054 | |
| | |
Hospitals & Higher Education Facilities Authority of Philadelphia | | | | | | | | |
4.000%, 07/01/38 | | | 2,500,000 | | | | 2,418,821 | |
4.000%, 07/01/39 | | | 2,000,000 | | | | 1,925,957 | |
| | |
Pennsylvania Economic Development Financing Authority | | | | | | | | |
5.250%, 06/30/35 | | | 3,000,000 | | | | 3,189,392 | |
5.750%, 06/30/48 | | | 5,000,000 | | | | 5,206,001 | |
| | |
Pennsylvania Turnpike Commission, Series A | | | | | | | | |
5.000%, 12/01/33 | | | 5,000,000 | | | | 5,792,940 | |
| | |
Total Pennsylvania | | | | | | | 37,066,516 | |
| | |
Texas - 6.8% | | | | | | | | |
| | |
City of Corpus Christi TX Utility System Revenue, Junior Lien | | | | | | | | |
5.000%, 07/15/29 | | | 3,125,000 | | | | 3,456,364 | |
| | |
City of Houston TX Airport System Revenue, Series A | | | | | | | | |
4.000%, 07/01/35 | | | 1,100,000 | | | | 1,064,938 | |
4.000%, 07/01/36 | | | 1,100,000 | | | | 1,052,830 | |
5.000%, 07/01/34 | | | 2,835,000 | | | | 3,056,614 | |
| | |
City of San Antonio TX Electric & Gas Systems Revenue, Series A | | | | | | | | |
5.000%, 02/01/37 | | | 3,010,000 | | | | 3,307,056 | |
5.000%, 02/01/38 | | | 2,985,000 | | | | 3,266,956 | |
| | |
Dallas Area Rapid Transit, Senior Lien | | | | | | | | |
5.250%, 12/01/28 | | | 8,865,000 | | | | 10,114,763 | |
| | | | | | | | |
| | | Principal
Amount | | | Value | |
| | |
Dallas Fort Worth International Airport, Series A | | | | | | | | |
5.000%, 11/01/30 | | | $2,000,000 | | | | $2,307,434 | |
5.000%, 11/01/31 | | | 3,265,000 | | | | 3,751,104 | |
| | |
Lower Colorado River Authority, LCRA Transmission Services Corporation | | | | | | | | |
5.000%, 05/15/29 | | | 3,815,000 | | | | 3,908,514 | |
| | |
North Texas Municipal Water District Water System Revenue, Refunding and Improvement | | | | | | | | |
5.000%, 09/01/29 | | | 7,350,000 | | | | 7,925,795 | |
| | |
North Texas Tollway Authority, 2nd Tier, Series B | | | | | | | | |
5.000%, 01/01/31 | | | 2,000,000 | | | | 2,099,042 | |
5.000%, 01/01/32 | | | 3,010,000 | | | | 3,201,201 | |
| | |
North Texas Tollway Authority, Series A | | | | | | | | |
5.250%, 01/01/38 | | | 4,500,000 | | | | 5,000,636 | |
| | |
State of Texas, Series A | | | | | | | | |
5.000%, 10/01/29 | | | 5,000,000 | | | | 5,303,339 | |
| | |
Texas Private Activity Bond Surface Transportation Corp., Series A | | | | | | | | |
4.000%, 12/31/37 | | | 5,000,000 | | | | 4,605,433 | |
4.000%, 12/31/38 | | | 3,735,000 | | | | 3,404,415 | |
| | |
Texas Water Development Board | | | | | | | | |
5.000%, 08/01/38 | | | 5,860,000 | | | | 6,610,933 | |
| | |
Total Texas | | | | | | | 73,437,367 | |
| | |
Utah - 2.1% | | | | | | | | |
| | |
Intermountain Power Agency, Series A | | | | | | | | |
5.000%, 07/01/34 | | | 5,250,000 | | | | 6,023,794 | |
| | |
Salt Lake City Corp. Airport Revenue, Series A | | | | | | | | |
5.000%, 07/01/29 | | | 3,450,000 | | | | 3,667,536 | |
5.000%, 07/01/30 | | | 6,585,000 | | | | 6,997,951 | |
| | |
University of Utah/The, Series B | | | | | | | | |
5.000%, 08/01/37 | | | 5,000,000 | | | | 5,670,287 | |
| | |
Total Utah | | | | | | | 22,359,568 | |
| | |
Virginia - 0.5% | | | | | | | | |
| | |
Virginia Small Business Financing Authority | | | | | | | | |
4.000%, 01/01/37 | | | 3,000,000 | | | | 2,812,422 | |
4.000%, 01/01/38 | | | 3,000,000 | | | | 2,782,255 | |
| | |
Total Virginia | | | | | | | 5,594,677 | |
| | |
Washington - 2.5% | | | | | | | | |
| | |
Port of Seattle, Series C | | | | | | | | |
5.000%, 08/01/31 | | | 5,000,000 | | | | 5,492,102 | |
| | |
State of Washington School Improvements, Series C | | | | | | | | |
5.000%, 02/01/28 | | | 7,370,000 | | | | 7,864,426 | |
| | |
State of Washington, Series C | | | | | | | | |
5.000%, 07/01/28 | | | 10,280,000 | | | | 10,728,741 | |
| | |
Washington Health Care Facilities Authority, Series A | | | | | | | | |
5.000%, 08/01/38 | | | 3,270,000 | | | | 3,381,039 | |
| | |
Total Washington | | | | | | | 27,466,308 | |
The accompanying notes are an integral part of these financial statements.
38
| | |
| | |
| | | AMG GW&K Municipal Bond Fund Schedule of Portfolio Investments (continued) |
| | | |
| | | |
| | | |
| | | | | | | | |
| | | Principal
Amount | | | Value | |
| | |
West Virginia - 0.9% | | | | | | | | |
| | |
West Virginia Parkways Authority | | | | | | | | |
5.000%, 06/01/37 | | | $1,750,000 | | | | $1,951,686 | |
5.000%, 06/01/38 | | | 2,000,000 | | | | 2,215,442 | |
5.000%, 06/01/39 | | | 5,150,000 | | | | 5,670,468 | |
| | |
Total West Virginia | | | | | | | 9,837,596 | |
| | |
Wisconsin - 2.9% | | | | | | | | |
| | |
State of Wisconsin, Series 1 | | | | | | | | |
5.000%, 05/01/31 | | | 2,700,000 | | | | 3,121,279 | |
| | |
State of Wisconsin, Series A | | | | | | | | |
5.000%, 05/01/31 | | | 5,000,000 | | | | 5,258,596 | |
| | |
Wisconsin State Revenue, Department of Transportation, Series 2 | | | | | | | | |
5.000%, 07/01/29 | | | 20,405,000 | | | | 22,486,722 | |
| | |
Total Wisconsin | | | | | | | 30,866,597 | |
| | |
Total Municipal Bonds
(Cost $1,142,894,341) | | | | | | | 1,082,545,523 | |
| 1 | All or part of a security is delayed delivery transaction. The market value for delayed delivery securities at December 31, 2022, amounted to $8,340,135, or 0.8% of net assets. |
| | | | | | | | |
| | | Principal
Amount | | | Value | |
| | |
Short-Term Investments - 0.1% | | | | | | | | |
| |
Repurchase Agreements - 0.1% | | | | | |
| | |
Fixed Income Clearing Corp., dated 12/30/22 due 01/03/23, 4.150% total to be received $668,308 (collateralized by a U.S. Treasury, 0.125%, 01/15/32, totaling $681,377) | | | $668,000 | | | | $668,000 | |
| | |
Total Short-Term Investments
(Cost $668,000) | | | | | | | 668,000 | |
| | |
Total Investments - 100.2%
(Cost $1,143,562,341) | | | | | | | 1,083,213,523 | |
| | |
Other Assets, less Liabilities - (0.2)% | | | | | | | (1,951,011 | ) |
| | |
Net Assets - 100.0% | | | | | | | $1,081,262,512 | |
The following table summarizes the inputs used to value the Fund’s investments by the fair value hierarchy levels as of December 31, 2022:
| | | | | | | | | | | | | | | | |
| | | Level 1 | | | Level 2 | | | Level 3 | | | Total | |
Investments in Securities | | | | | | | | | | | | | | | | |
| | | | |
Municipal Bonds† | | | — | | | $ | 1,082,545,523 | | | | — | | | $ | 1,082,545,523 | |
| | | | |
Short-Term Investments | | | | | | | | | | | | | | | | |
| | | | |
Repurchase Agreements | | | — | | | | 668,000 | | | | — | | | | 668,000 | |
| | | | | | | | | | | | | | | | |
Total Investments in Securities | | | — | | | $ | 1,083,213,523 | | | | — | | | $ | 1,083,213,523 | |
| | | | | | | | | | | | | | | | |
| † | All municipal bonds held in the Fund are Level 2 securities. For a detailed breakout of municipal bonds by major classification, please refer to the Fund’s Schedule of Portfolio Investments. |
For the fiscal year ended December 31, 2022, there were no transfers in or out of Level 3.
The accompanying notes are an integral part of these financial statements.
39
| | |
| | | AMG GW&K Municipal Enhanced Yield Fund Portfolio Manager’s Comments (unaudited) |
| | | |
| | | |
| | | |
| | | | | | | | |
THE YEAR IN REVIEW For the year ended December 31, 2022, AMG GW&K Municipal Enhanced Yield Fund’s (the “Fund”) Class N shares returned (18.19)%, compared to the Bloomberg U.S. Municipal Bond BAA Index (the “Index”), which returned (11.63)%. In the first quarter of 2022, Municipal bonds suffered their worst quarter of performance in 40 years, getting caught in a Treasury market rout that stemmed from the mounting determination of central banks to combat sustained inflationary pressure. Coming into 2022, the U.S. Federal Reserve (the Fed) had been projecting only three quarter-point rate hikes for the calendar year, an outlook that was also reflected in the futures market. But as the quarter progressed, labor markets began to overheat and core inflation surged to a four-decade high. Russia’s invasion of Ukraine sent energy and grain prices soaring amid a humanitarian crisis with no clear endgame. In response to these developments, the Fed rhetoric grew more hawkish and policy projections turned more aggressive. At the March Federal Open Market Committee (FOMC) meeting, after lifting rates for the first time since 2018, committee members raised their forecast to seven total hikes for 2022 and by quarter-end, the futures market was pricing in nine. Short Treasury yields surged, mirroring the faster pace of hikes, while those out longer increased less, reflecting the possible damage to growth. The combination of those two dynamics led to inversions at key segments of the curve, which raised questions as to whether monetary policy can successfully tame inflation without tipping the economy into recession. Going into the second quarter, municipal bonds posted more losses, adding to their worst start to any year on record. The selloff was driven by the Fed’s aggressive tightening campaign, as successive 40-year highs in the Consumer Price Index (CPI) put to rest any lingering convictions that inflation would prove “transitory.” Officials raised rates twice during the quarter, first by half a point in May and then by three-quarters of a point in June, the latter the largest such move since 1994. Interest rates responded by climbing to multi-year highs. Fed Chair Jerome Powell stepped up his hawkish rhetoric, emphasizing the tightness of the labor force and the mounting risks from continued supply chain disruptions, the war in Ukraine and China’s zero-COVID policy. The implication was clear: the long-term damage from entrenched inflation must be prioritized above all else, even at the risk of | | | | slowing economic growth. Investors got the message, becoming less concerned about a price spiral and more worried about the possibility of a recession. Inflation breakeven measures plunged over the final three weeks of June while futures markets pared bets on the peak Fed Funds rate and even priced in cuts by the middle of next year. Interest rates finished well below their mid-June cyclical highs, but were still up meaningfully for the quarter. Municipal bonds again posted heavy losses in the third quarter as hopes faded that the Fed would soon pull back on its aggressive tightening program. After an impressive rally in July, when it still seemed possible that a lowercase “R” recession might usher in an early-summer easing, bond yields soared over the following two months. The two major culprits were the labor market, which stayed extremely tight, and inflation, which remained broad-based and hovered near 40-year highs. The Fed officials cited the data as evidence that more needed to be done, lest elevated inflation expectations become entrenched. The FOMC followed through by raising rates 150 basis points (bps) during the quarter, doubling the magnitude of hikes from the first half of the year. As importantly, committee members signaled more to come, forecasting a steeper policy path and higher terminal rate than traders had expected. Sentiment was also weighed down by geopolitical crosscurrents, including the ongoing war in Ukraine, COVID lockdowns in China and a brief but dramatic crash in UK government debt, which necessitated an intervention from the Bank of England. In late September the yield on the 10-year Treasury touched 4.00% for the first time since 2008, before declining slightly to end the quarter at 3.83%. As we ended the year, municipal bonds posted their strongest quarterly performance in over a decade, partially erasing what still amounted to the worst annual loss in 40 years. With a struggling Treasury market providing little direction, returns were instead powered by a combination of scant supply and building demand. New issue volume for the fourth quarter declined 40% on a year-over-year basis, creating a scarcity premium that was turbo-charged by the need for investors to reinvest seasonally high coupon and maturity redemptions. Although mutual funds continued to experience significant outflows, likely exacerbated by year-end tax-loss selling, the bid-side remained strong and picked up steam as the quarter progressed. In fact, after a modest selloff in October, tax-exempt yields staged a breathtaking turnaround, plummeting 70-90 bps through | | | | mid-December. Even with that rally, however, rates were still up 1.60% to 2.30% from January’s historically low starting point, leaving no escape from the sharply negative annual performance that materialized across the entire curve. Although municipal bonds outperformed Treasuries over the quarter, they were still directionally influenced by the underlying forces driving the broader market. Early in the quarter, interest rates shot up due to still-elevated inflation, tight labor markets, and hawkish saber rattling from central banks. By October 28, 2022, the yield on the 10-year Treasury had risen 40 bps for the month to close at 4.24%, its highest level since 2008. From there, however, sentiment turned as the lagged effects of contractionary policy seemed to take hold. Key prints on inflation decelerated from their peaks, creating a sense that the worst may be over. A pullback in manufacturing and a softening in unit labor costs were also contributing factors. And while the Fed continued to talk tough on keeping policy restrictive, a downshift to a 50 bp hike in December after four consecutive 75 bp increases lent further credibility to the slowdown narrative. The futures market even started pricing in a couple of rate cuts for the back half of 2023. From its October high, the 10-year Treasury yield dropped 36 bps the rest of the way, ending December more than 50 bps below the yield on the two-year, the steepest inversion of that segment of the curve since the early 1980s. Amid this backdrop, the Fund materially underperformed the Index for the full year. The Fund’s longer duration was the biggest negative as interest rates rose. Positively contributing to performance for the year was the Fund’s higher-quality bias and its overweight to higher coupon bonds. OUTLOOK Don’t be fooled by all the hand-wringing over what a terrible year 2022 was for bonds. In fact, long-term investors should be grateful for what transpired. Make no mistake, ultra-low interest rates are a threat to savers, especially those artificially manufactured by well-intentioned governments. It was critical to break out of that destabilizing cycle and mark-to-market losses were a small price to pay to get there. We believe municipal bonds enter 2023 in much better shape. Yields that began the year at 1% are now far more attractive, in many instances topping 5% on a tax-equivalent basis. The technical backdrop should continue strong, with issuance remaining low due to a decline in refunding |
40
| | |
| | | AMG GW&K Municipal Enhanced Yield Fund Portfolio Manager’s Comments (continued) |
| | | |
| | | |
| | | |
| | | | | | | | |
| opportunities. The outflow cycle that plagued 2022 will likely lose steam in the face of better yields and less tax-loss selling. States are better positioned to withstand the effects of a potential recession, having made prudent use of windfall tax collections to build record reserves. To be sure, challenges still exist. More economically sensitive sectors will need closer | | | | scrutiny and a historically flat yield curve alters the risk/return calculus. But these issues are considerably less difficult to navigate than central banks pinning rates near zero. And we look forward to taking advantage of the gift handed to us by the 2022 market. | | | | The views expressed represent the opinions of GW&K Investment Management, LLC as of December 31, 2022, and are not intended as a forecast or guarantee of future results, and are subject to change without notice. |
41
| | |
| | |
| | | AMG GW&K Municipal Enhanced Yield Fund Portfolio Manager’s Comments (continued) |
| | | |
| | | |
| | | |
CUMULATIVE TOTAL RETURN PERFORMANCE
AMG GW&K Municipal Enhanced Yield Fund’s cumulative total return is based on the daily change in net asset value (NAV), and assumes that all dividends and distributions were reinvested. The graph compares a hypothetical $10,000 investment made in the AMG GW&K Municipal Enhanced Yield Fund’s Class N shares on December 31, 2012, to a $10,000 investment made in the Bloomberg U.S. Municipal Bond BAA Index for the same time period. The graph and table do not reflect the deduction of taxes that a shareholder would pay on a Fund distribution or redemption of shares. The listed returns for the Fund are net of expenses and the returns for the index exclude expenses. Total returns would have been lower had certain expenses not been reduced.
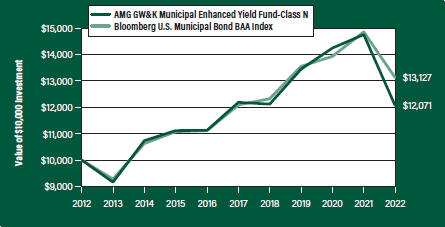
The table below shows the average annual total returns for the AMG GW&K Municipal Enhanced Yield Fund and the Bloomberg U.S. Municipal Bond BAA Index for the same time periods ended December 31, 2022.
| | | | | | | | | | | | | | | | | | |
| | | One | | Five | | | Ten | | | Since | | | Inception | |
| Average Annual Total Returns1 | | Year | | Years | | | Years | | | Inception | | | Date | |
|
AMG GW&K Municipal Enhanced Yield Fund2, 3, 4, 5, 6, 7, 8, 9, 10 | |
| | | | | |
Class N | | (18.19%) | | | (0.19%) | | | | 1.90% | | | | 4.35% | | | | 07/27/09 | |
| | | | | |
Class I | | (17.86%) | | | 0.19% | | | | 2.33% | | | | 3.53% | | | | 12/30/05 | |
| | | | | |
Class Z | | (17.82%) | | | 0.24% | | | | — | | | | 1.57% | | | | 02/24/17 | |
| | | | | |
Bloomberg U.S. Municipal Bond BAA Index11 | | (11.63%) | | | 1.66% | | | | 2.76% | | | | 4.51% | | | | 07/27/09† | |
The performance data shown represents past performance. Past performance is not a guarantee of future results. Current performance may be lower or higher than the performance data quoted. The investment return and principal value of an investment will fluctuate so that an investor’s shares, when redeemed, may be worth more or less than their original cost.
Investors should carefully consider the Fund’s investment objectives, risks, charges and expenses before investing. For performance information through the most recent month end, current net asset values per share for the Fund and other information, please call 800.548.4539 or visit our website at amgfunds.com for a free prospectus. Read it carefully before investing or sending money.
Distributed by AMG Distributors, Inc., member FINRA/SIPC.
| † | Date reflects the inception date of the Fund, not the index. |
| 1 | Total return equals income yield plus share price change and assumes reinvestment of all dividends and capital gain distributions. Returns are net of fees and may reflect offsets of Fund expenses as described in the prospectus. No adjustment has been made for taxes payable by shareholders on their reinvested dividends and |
|
capital gain distributions. Returns for periods greater than one year are annualized. The listed returns on the Fund are net of expenses and based on the published NAV as of December 31, 2022. All returns are in U.S. Dollars ($). 2 From time to time, the Fund’s investment manager has waived its fees and/or absorbed Fund expenses, which has resulted in higher returns. 3 The Fund is subject to the risks associated with investments in debt securities, such as default risk and fluctuations in the perception of the debtor’s ability to pay its creditors. Changing interest rates may adversely affect the value of an investment. An increase in interest rates typically causes the value of bonds and other fixed income securities to fall. 4 Companies that are in similar industry sectors may be similarly affected by particular economic or market events; to the extent the Fund has substantial holdings within a particular sector, the risks associated with that sector increase. 5 The Fund may invest in derivatives such as options and futures; the complexity and rapidly changing structure of derivatives markets may increase the possibility of market losses. 6 High-yield bonds (also known as “junk bonds”) may be subject to greater levels of interest rate, credit, and liquidity risk than investments in higher rated securities. These securities are considered predominantly speculative with respect to the issuer’s continuing ability to make principal and interest payments. The issuers of the Fund’s holdings may be involved in bankruptcy proceedings, reorganizations, or financial restructurings, and are not as strong financially as higher-rated issuers. 7 The use of leverage in a Fund’s strategy, such as futures and forward commitment transactions, can magnify relatively small market movements into relatively larger losses for the Fund. 8 Factors unique to the municipal bond market may negatively affect the value of municipal bonds. 9 Investment income may be subject to certain state and local taxes, and depending on your tax status, the federal alternative minimum tax. Capital gains are not exempt from federal income tax. 10 Market prices of investments held by the Fund may fall rapidly or unpredictably due to a variety of economic or political factors, market conditions, disasters or public health issues, or in response to events that affect particular industries or companies. |
42
| | |
| | |
| | | AMG GW&K Municipal Enhanced Yield Fund Portfolio Manager’s Comments (continued) |
| | | |
| | | |
| | | |
| | | | |
11 The Bloomberg U.S. Municipal Bond BAA Index is a subset of the Bloomberg U.S. Municipal Bond Index with an index rating of Baa1, Baa2, or Baa3. The Bloomberg U.S. Municipal Bond Index is a rules-based, market-value-weighted index engineered for the long-term, tax-exempt bond market. Unlike the Fund, the Bloomberg U.S. Municipal Bond BAA Index is unmanaged, is not available for investment and does not incur expenses. | | “Bloomberg®” and any Bloomberg index described herein are service marks of Bloomberg Finance L.P. and its affiliates, including Bloomberg Index Services Limited (“BISL”), the administrator of the index (collectively, “Bloomberg”) and have been licensed for use for certain purposes by AMG Funds LLC. Bloomberg is not affiliated with AMG Funds LLC, and Bloomberg does not approve, endorse, review, or recommend the fund described herein. Bloomberg | | does not guarantee the timeliness, accurateness, or completeness of any data or information relating to such fund. Not FDIC insured, nor bank guaranteed. May lose value. |
43
| | |
| | |
| | | AMG GW&K Municipal Enhanced Yield Fund Fund Snapshots (unaudited) December 31, 2022 |
| | | |
| | | |
| | | |
PORTFOLIO BREAKDOWN
| | |
| Category | | % of
Net Assets |
| | |
| Transportation | | 38.8 |
| | |
| Medical | | 22.6 |
| | |
| General Obligation | | 22.5 |
| | |
| Industrial Development | | 5.1 |
| | |
| Education | | 4.8 |
| | |
| Tobacco Settlement | | 4.2 |
| | |
| Short-Term Investments | | 0.4 |
| | |
| Other Assets, less Liabilities | | 1.6 |
| | |
| Rating | | % of Market Value1 |
| | |
| Aaa/AAA | | 0.9 |
| | |
| Aa/AA | | 6.2 |
| | |
| A | | 44.8 |
| | |
| Baa/BBB | | 48.1 |
| 1 | Includes market value of long-term fixed-income securities only. |
TOP TEN HOLDINGS
| | | | |
| Security Name | | % of
Net Assets | |
| | |
Texas Private Activity Bond Surface Transportation Corp., 5.000%, 06/30/58 | | | 3.4 | |
| | |
Chicago O’Hare International Airport, Senior Lien, Series A, 5.000%, 01/01/48 | | | 2.6 | |
| | |
Brevard County Health Facilities Authority, Series A, 5.000%, 04/01/47 | | | 2.4 | |
| | |
Pennsylvania Economic Development Financing Authority, 5.250%, 06/30/53 | | | 2.3 | |
| | |
New York Transportation Development Corp., Revenue, 4.000%, 04/30/53 | | | 2.2 | |
| | |
Central Plains Energy Project #3, Series A, 5.000%, 09/01/42 | | | 2.1 | |
| | |
Pennsylvania Turnpike Commission, Series A, 4.000%, 12/01/50 | | | 2.1 | |
| | |
Public Authority for Colorado Energy Natural Gas Purchase Revenue, 6.500%, 11/15/38 | | | 2.0 | |
| | |
Escambia County Health Facilities Authority, 4.000%, 08/15/50 | | | 2.0 | |
| | |
New York Transportation Development Corp., 5.000%, 12/01/40 | | | 2.0 | |
| | | | | |
| | |
Top Ten as a Group | | | 23.1 | |
| | | | |
Credit quality ratings shown above reflect the highest rating assigned by either Standard & Poor’s (“S&P”), Moody’s Investors Service, Inc. (“Moody’s”) or Fitch. These rating agencies are independent, nationally recognized statistical rating organizations and are widely used. Investment grade ratings are credit ratings of BBB- or higher. Below investment grade ratings are credit ratings of BB+ or lower. Investments designated N/R are not rated by any of the rating agencies. Unrated investments do not necessarily indicate low credit quality. Credit quality ratings are subject to change.
Because a fund’s strategy may result in multiple investments in particular sectors of the economy, its performance may depend on the performance of those sectors and may fluctuate more widely than investments diversified across more sectors. For additional information on these and other risk considerations, please see the Fund’s prospectus.
Any sectors, industries, or securities discussed should not be perceived as investment recommendations. Mention of a specific security should not be considered a recommendation to buy or solicitation to sell that security. Specific securities mentioned in this report may have been sold from the Fund’s portfolio of investments by the time you receive this report.
44
| | |
| | |
| | | AMG GW&K Municipal Enhanced Yield Fund Schedule of Portfolio Investments December 31, 2022 |
| | | |
| | | |
| | | |
| | | | | | | | |
| | |
| | | Principal
Amount | | | Value | |
| |
Municipal Bonds - 98.0% | | | | | |
| |
California - 6.2% | | | | | |
| | |
California Municipal Finance Authority | | | | | | | | |
5.000%, 05/15/43 | | | $3,000,000 | | | | $3,007,373 | |
5.000%, 05/15/48 | | | 4,600,000 | | | | 4,547,569 | |
| | |
California Municipal Finance Authority, Series A | | | | | | | | |
4.000%, 02/01/51 | | | 1,500,000 | | | | 1,344,180 | |
| | |
Riverside County Transportation Commission, Series B1 | | | | | | | | |
4.000%, 06/01/46 | | | 2,500,000 | | | | 2,313,403 | |
| | |
Riverside County Transportation Commission, Series C | | | | | | | | |
4.000%, 06/01/47 | | | 3,425,000 | | | | 3,146,980 | |
| | |
San Diego County Regional Airport Authority, Series B | | | | | | | | |
4.000%, 07/01/51 | | | 2,000,000 | | | | 1,728,578 | |
| | |
Total California | | | | | | | 16,088,083 | |
| | |
Colorado - 3.9% | | | | | | | | |
| | |
Colorado Health Facilities Authority, Series A | | | | | | | | |
5.000%, 08/01/44 | | | 5,000,000 | | | | 5,008,861 | |
| | |
Public Authority for Colorado Energy Natural Gas Purchase Revenue | | | | | | | | |
6.500%, 11/15/38 | | | 4,445,000 | | | | 5,207,013 | |
| | |
Total Colorado | | | | | | | 10,215,874 | |
| | |
Connecticut - 2.9% | | | | | | | | |
| | |
Connecticut State Health & Educational Facilities Authority | | | | | | | | |
4.000%, 07/01/39 | | | 3,000,000 | | | | 2,768,631 | |
4.000%, 07/01/40 | | | 3,400,000 | | | | 3,097,196 | |
4.000%, 07/01/42 | | | 1,750,000 | | | | 1,547,461 | |
| | |
Total Connecticut | | | | | | | 7,413,288 | |
| | |
Florida - 11.9% | | | | | | | | |
| | |
Brevard County Health Facilities Authority | | | | | | | | |
5.000%, 04/01/47 | | | 6,000,000 | | | | 6,181,279 | |
| | |
City of Tampa, Series B | | | | | | | | |
5.000%, 07/01/50 | | | 2,460,000 | | | | 2,482,795 | |
| | |
County of Miami-Dade Seaport Department,
Series A | | | | | | | | |
4.000%, 10/01/45 | | | 4,750,000 | | | | 4,290,215 | |
| | |
Escambia County Health Facilities Authority | | | | | | | | |
4.000%, 08/15/50 | | | 6,050,000 | | | | 5,138,584 | |
| | |
Florida Development Finance Corp. | | | | | | | | |
4.000%, 02/01/52 | | | 3,000,000 | | | | 2,317,606 | |
5.000%, 02/01/52 | | | 2,000,000 | | | | 1,814,238 | |
| | |
Hillsborough County Industrial Development Authority | | | | | | | | |
4.000%, 08/01/50 | | | 5,000,000 | | | | 4,225,508 | |
| | |
Miami Beach Health Facilities Authority | | | | | | | | |
4.000%, 11/15/46 | | | 5,000,000 | | | | 4,321,604 | |
| | |
Total Florida | | | | | | | 30,771,829 | |
| | | | | | | | |
| | |
| | | Principal
Amount | | | Value | |
| | |
Illinois - 10.3% | | | | | | | | |
| | |
Chicago O’Hare International Airport, Senior Lien, Series A | | | | | | | | |
5.000%, 01/01/48 | | | $6,750,000 | | | | $6,839,776 | |
| | |
Metropolitan Pier & Exposition Authority | | | | | | | | |
4.000%, 12/15/42 | | | 2,000,000 | | | | 1,740,270 | |
4.000%, 06/15/52 | | | 3,000,000 | | | | 2,428,314 | |
5.000%, 06/15/50 | | | 5,000,000 | | | | 4,870,522 | |
| | |
State of Illinois | | | | | | | | |
5.500%, 05/01/39 | | | 4,000,000 | | | | 4,128,331 | |
5.750%, 05/01/45 | | | 3,000,000 | | | | 3,115,852 | |
| | |
State of Illinois, Series A | | | | | | | | |
4.000%, 03/01/40 | | | 1,500,000 | | | | 1,303,398 | |
5.000%, 03/01/46 | | | 2,225,000 | | | | 2,162,415 | |
| | |
Total Illinois | | | | | | | 26,588,878 | |
| | |
Massachusetts - 1.6% | | | | | | | | |
| | |
Massachusetts Development Finance Agency | | | | | | | | |
4.000%, 07/01/51 | | | 5,180,000 | | | | 4,190,784 | |
| | |
Minnesota - 0.9% | | | | | | | | |
| | |
Duluth Economic Development Authority, Essentia Health Obligated Group, Series A | | | | | | | | |
5.000%, 02/15/48 | | | 2,550,000 | | | | 2,477,997 | |
| | |
Nebraska - 2.1% | | | | | | | | |
| | |
Central Plains Energy Project #3, Series A | | | | | | | | |
5.000%, 09/01/42 | | | 5,560,000 | | | | 5,579,807 | |
| | |
New Jersey - 12.2% | | | | | | | | |
| | |
New Jersey Economic Development Authority | | | | | | | | |
5.000%, 11/01/44 | | | 2,500,000 | | | | 2,547,965 | |
| | |
New Jersey Economic Development Authority, Series QQQ | | | | | | | | |
4.000%, 06/15/46 | | | 1,500,000 | | | | 1,300,037 | |
4.000%, 06/15/50 | | | 1,500,000 | | | | 1,261,590 | |
| | |
New Jersey Transportation Trust Fund Authority, Series AA | | | | | | | | |
4.000%, 06/15/45 | | | 2,000,000 | | | | 1,746,511 | |
4.000%, 06/15/50 | | | 2,000,000 | | | | 1,682,120 | |
5.000%, 06/15/45 | | | 1,000,000 | | | | 1,019,723 | |
5.000%, 06/15/50 | | | 1,500,000 | | | | 1,517,519 | |
| | |
New Jersey Transportation Trust Fund Authority, Series B | | | | | | | | |
5.250%, 06/15/46 | | | 2,000,000 | | | | 2,106,085 | |
5.500%, 06/15/50 | | | 1,000,000 | | | | 1,069,443 | |
| | |
New Jersey Transportation Trust Fund Authority, Series BB | | | | | | | | |
5.000%, 06/15/44 | | | 1,750,000 | | | | 1,779,880 | |
| | |
South Jersey Transportation Authority | | | | | | | | |
4.625%, 11/01/47 | | | 3,500,000 | | | | 3,298,105 | |
5.250%, 11/01/52 | | | 4,500,000 | | | | 4,567,224 | |
| | |
Tobacco Settlement Financing Corp.
Series A | | | | | | | | |
5.000%, 06/01/46 | | | 2,500,000 | | | | 2,449,212 | |
5.250%, 06/01/46 | | | 3,285,000 | | | | 3,295,562 | |
The accompanying notes are an integral part of these financial statements.
45
| | |
| | |
| | | AMG GW&K Municipal Enhanced Yield Fund Schedule of Portfolio Investments (continued) |
| | | |
| | | |
| | | |
| | | | | | | | |
| | |
| | | Principal
Amount | | | Value | |
| |
New Jersey - 12.2% (continued) | | | | | |
| | |
Tobacco Settlement Financing Corp. Series B | | | | | | | | |
5.000%, 06/01/46 | | | $2,050,000 | | | | $1,957,389 | |
| | |
Total New Jersey | | | | | | | 31,598,365 | |
| | |
New York - 15.6% | | | | | | | | |
| | |
City of New York, Series B-1 | | | | | | | | |
5.250%, 10/01/47 | | | 2,000,000 | | | | 2,199,235 | |
| | |
Metropolitan Transportation Authority, Series C | | | | | | | | |
4.750%, 11/15/45 | | | 3,175,000 | | | | 2,968,898 | |
5.000%, 11/15/50 | | | 2,335,000 | | | | 2,243,298 | |
5.250%, 11/15/55 | | | 3,020,000 | | | | 3,019,797 | |
| | |
New York City Transitional Finance Authority Future Tax Secured Revenue, Series D-1 | | | | | | | | |
5.500%, 11/01/45 | | | 2,000,000 | | | | 2,250,411 | |
| | |
New York State Dormitory Authority | | | | | | | | |
5.000%, 05/01/52 | | | 3,000,000 | | | | 3,059,347 | |
| | |
New York State Dormitory Authority, Series A | | | | | | | | |
4.000%, 07/01/47 | | | 2,000,000 | | | | 1,736,163 | |
4.000%, 07/01/52 | | | 2,115,000 | | | | 1,791,547 | |
| | |
New York State Thruway Authority, Series B | | | | | | | | |
4.000%, 01/01/45 | | | 2,000,000 | | | | 1,858,731 | |
| | |
New York Transportation Development Corp. | | | | | | | | |
4.000%, 12/01/39 | | | 1,825,000 | | | | 1,714,401 | |
4.000%, 12/01/41 | | | 1,900,000 | | | | 1,740,849 | |
4.000%, 04/30/53 | | | 6,915,000 | | | | 5,615,382 | |
5.000%, 12/01/40 | | | 5,000,000 | | | | 5,071,748 | |
5.000%, 12/01/41 | | | 5,000,000 | | | | 5,045,825 | |
| | |
Total New York | | | | | | | 40,315,632 | |
| | |
Pennsylvania - 11.5% | | | | | | | | |
| | |
Allegheny County Airport Authority, Series A | | | | | | | | |
5.000%, 01/01/51 | | | 5,000,000 | | | | 5,050,008 | |
| | |
Geisinger Authority | | | | | | | | |
4.000%, 04/01/50 | | | 3,200,000 | | | | 2,869,903 | |
| | |
Montgomery County Higher Education and Health Authority, Series B | | | | | | | | |
5.000%, 05/01/52 | | | 4,750,000 | | | | 4,604,557 | |
| | |
Pennsylvania Economic Development Financing Authority | | | | | | | | |
5.000%, 12/31/57 | | | 1,250,000 | | | | 1,239,779 | |
5.250%, 06/30/53 | | | 6,000,000 | | | | 5,874,902 | |
| | |
Pennsylvania Turnpike Commission, Series A | | | | | | | | |
4.000%, 12/01/50 | | | 6,050,000 | | | | 5,401,398 | |
| | |
Philadelphia Authority for Industrial Development | | | | | | | | |
5.250%, 11/01/52 | | | 4,615,000 | | | | 4,829,516 | |
| | |
Total Pennsylvania | | | | | | | 29,870,063 | |
| | |
Rhode Island - 1.3% | | | | | | | | |
| | |
Tobacco Settlement Financing Corp. Series A | | | | | | | | |
5.000%, 06/01/40 | | | 3,285,000 | | | | 3,304,675 | |
| | | | | | | | |
| | |
| | | Principal
Amount | | | Value | |
| | |
Texas - 10.3% | | | | | | | | |
| | |
Central Texas Regional Mobility Authority, Series B | | | | | | | | |
4.000%, 01/01/51 | | | $2,030,000 | | | | $1,790,598 | |
5.000%, 01/01/45 | | | 1,930,000 | | | | 1,990,915 | |
| | |
City of Houston Airport System Revenue, Series A | | | | | | | | |
4.000%, 07/01/48 | | | 1,500,000 | | | | 1,306,209 | |
| | |
Texas Private Activity Bond Surface Transportation Corp. | | | | | | | | |
5.000%, 06/30/58 | | | 9,320,000 | | | | 8,889,107 | |
| | |
Texas Private Activity Bond Surface Transportation Corp., Senior Lien-Blueridge Transport | | | | | | | | |
5.000%, 12/31/40 | | | 3,955,000 | | | | 3,960,894 | |
5.000%, 12/31/45 | | | 3,880,000 | | | | 3,828,155 | |
| | |
Texas Private Activity Bond Surface Transportation Corp., Series A | | | | | | | | |
4.000%, 12/31/39 | | | 5,500,000 | | | | 4,953,546 | |
| | |
Total Texas | | | | | | | 26,719,424 | |
| | |
Virginia - 5.7% | | | | | | | | |
| | |
Lynchburg Economic Development Authority | | | | | | | | |
4.000%, 01/01/55 | | | 1,500,000 | | | | 1,309,025 | |
| | |
Virginia Small Business Financing Authority | | | | | | | | |
4.000%, 01/01/39 | | | 3,000,000 | | | | 2,744,828 | |
4.000%, 01/01/40 | | | 3,000,000 | | | | 2,718,243 | |
5.000%, 12/31/47 | | | 2,555,000 | | | | 2,570,139 | |
| | |
Virginia Small Business Financing Authority, Transform 66 P3 Project | | | | | | | | |
5.000%, 12/31/49 | | | 2,500,000 | | | | 2,376,794 | |
5.000%, 12/31/52 | | | 3,170,000 | | | | 2,987,148 | |
| | |
Total Virginia | | | | | | | 14,706,177 | |
| | |
West Virginia - 1.6% | | | | | | | | |
| | |
West Virginia Hospital Finance Authority, Cabell Huntington Hospital Obligation | | | | | | | | |
5.000%, 01/01/43 | | | 4,000,000 | | | | 4,033,344 | |
| | |
Total Municipal Bonds | | | | | | | | |
(Cost $289,251,690) | | | | | | | 253,874,220 | |
| | |
Short-Term Investments - 0.4% | | | | | | | | |
| | |
Repurchase Agreements - 0.4% | | | | | | | | |
| | |
Fixed Income Clearing Corp., dated 12/30/22 due 01/03/23, 4.150% total to be received $926,427 (collateralized by a U.S. Treasury, 0.125%, 01/15/32, totaling $944,525) | | | 926,000 | | | | 926,000 | |
| | |
Total Short-Term Investments | | | | | | | | |
(Cost $926,000) | | | | | | | 926,000 | |
| | |
Total Investments - 98.4% | | | | | | | | |
(Cost $290,177,690) | | | | | | | 254,800,220 | |
| | |
Other Assets, less Liabilities - 1.6% | | | | | | | 4,193,826 | |
| | |
Net Assets - 100.0% | | | | | | | $258,994,046 | |
The accompanying notes are an integral part of these financial statements.
46
| | |
| | |
| | | AMG GW&K Municipal Enhanced Yield Fund Schedule of Portfolio Investments (continued) |
| | | |
| | | |
| | | |
The following table summarizes the inputs used to value the Fund’s investments by the fair value hierarchy levels as of December 31, 2022:
| | | | | | | | | | | | | | | | |
| | | Level 1 | | | Level 2 | | | Level 3 | | | Total | |
Investments in Securities | | | | | | | | | | | | | | | | |
| | | | |
Municipal Bonds† | | | — | | | $ | 253,874,220 | | | | — | | | $ | 253,874,220 | |
| | | | |
Short-Term Investments | | | | | | | | | | | | | | | | |
| | | | |
Repurchase Agreements | | | — | | | | 926,000 | | | | — | | | | 926,000 | |
| | | | | | | | | | | | | | | | |
| | | | |
Total Investments in Securities | | | — | | | $ | 254,800,220 | | | | — | | | $ | 254,800,220 | |
| | | | | | | | | | | | | | | | |
| † | All municipal bonds held in the Fund are Level 2 securities. For a detailed breakout of municipal bonds by major classification, please refer to the Fund’s Schedule of Portfolio Investments. |
For the fiscal year ended December 31, 2022, there were no transfers in or out of Level 3.
The accompanying notes are an integral part of these financial statements.
47
| | |
| | |
| | | Statement of Assets and Liabilities December 31, 2022 |
| | | |
| | | |
| | | |
| | | | | | | | | | | | | | | | | | | | | | | | | | | | | | | | | |
| | | AMG GW&K
ESG
Bond Fund | | | | AMG
GW&K Enhanced
Core Bond
ESG Fund | | | | AMG
GW&K High
Income Fund | | | | AMG
GW&K Municipal
Bond Fund | | | | AMG
GW&K Municipal
Enhanced
Yield Fund |
| | | | | | | | | |
Assets: | | | | | | | | | | | | | | | | | | | | | | | | | | | | | | | | | |
| | | | | | | | | |
Investments at value1 (including securities on loan valued at $25,458,950, $2,393,361, $1,415,713, $0,and $0, respectively) | | | | $497,119,651 | | | | | | | $41,118,359 | | | | | | | $18,347,996 | | | | | | | $1,083,213,523 | | | | | | | $254,800,220 | |
| | | | | | | | | |
Cash | | | | 651 | | | | | | | 331,228 | | | | | | | 890,771 | | | | | | | 548 | | | | | | | 599 | |
| | | | | | | | | |
Dividend and interest receivables | | | | 4,534,690 | | | | | | | 348,725 | | | | | | | 246,128 | | | | | | | 14,156,329 | | | | | | | 3,402,657 | |
| | | | | | | | | |
Securities lending income receivable | | | | 2,735 | | | | | | | 645 | | | | | | | 1,737 | | | | | | | — | | | | | | | — | |
| | | | | | | | | |
Receivable for Fund shares sold | | | | 24,758 | | | | | | | 4,267 | | | | | | | 1,404 | | | | | | | 2,553,483 | | | | | | | 2,793,369 | |
| | | | | | | | | |
Receivable from affiliate | | | | — | | | | | | | 13,761 | | | | | | | 9,005 | | | | | | | 67,793 | | | | | | | 20,258 | |
| | | | | | | | | |
Prepaid expenses and other assets | | | | 16,467 | | | | | | | 12,312 | | | | | | | 9,884 | | | | | | | 48,865 | | | | | | | 22,853 | |
| | | | | | | | | |
Total assets | | | | 501,698,952 | | | | | | | 41,829,297 | | | | | | | 19,506,925 | | | | | | | 1,100,040,541 | | | | | | | 261,039,956 | |
| | | | | | | | | |
Liabilities: | | | | | | | | | | | | | | | | | | | | | | | | | | | | | | | | | |
| | | | | | | | | |
Payable upon return of securities loaned | | | | 7,412,408 | | | | | | | 1,242,815 | | | | | | | 1,253,247 | | | | | | | — | | | | | | | — | |
| | | | | | | | | |
Payable for investments purchased | | | | — | | | | | | | — | | | | | | | 923,211 | | | | | | | — | | | | | | | 985,164 | |
| | | | | | | | | |
Payable for delayed delivery investments purchased | | | | — | | | | | | | — | | | | | | | — | | | | | | | 8,158,150 | | | | | | | — | |
| | | | | | | | | |
Payable for Fund shares repurchased | | | | 885,796 | | | | | | | 51,790 | | | | | | | 137 | | | | | | | 10,068,969 | | | | | | | 834,552 | |
| | | | | | | | | |
Accrued expenses: | | | | | | | | | | | | | | | | | | | | | | | | | | | | | | | | | |
| | | | | | | | | |
Investment advisory and management fees | | | | 109,998 | | | | | | | 10,581 | | | | | | | 3,768 | | | | | | | 195,849 | | | | | | | 101,123 | |
| | | | | | | | | |
Administrative fees | | | | 64,826 | | | | | | | 5,291 | | | | | | | 1,449 | | | | | | | 141,313 | | | | | | | 33,708 | |
| | | | | | | | | |
Distribution fees | | | | — | | | | | | | 2,293 | | | | | | | — | | | | | | | 2,700 | | | | | | | 632 | |
| | | | | | | | | |
Shareholder service fees | | | | 74,128 | | | | | | | 1,166 | | | | | | | 1,613 | | | | | | | 48,470 | | | | | | | 11,484 | |
| | | | | | | | | |
Other | | | | 145,150 | | | | | | | 68,488 | | | | | | | 54,951 | | | | | | | 162,578 | | | | | | | 79,247 | |
| | | | | | | | | |
Total liabilities | | | | 8,692,306 | | | | | | | 1,382,424 | | | | | | | 2,238,376 | | | | | | | 18,778,029 | | | | | | | 2,045,910 | |
| | | | | | | | | | | | | | | | | | | | | | | | | | | | | | | | | |
| | | | | | | | | |
Net Assets | | | | $493,006,646 | | | | | | | $40,446,873 | | | | | | | $17,268,549 | | | | | | | $1,081,262,512 | | | | | | | $258,994,046 | |
| | | | | | | | | |
1 Investments at cost | | | | $575,447,303 | | | | | | | $46,593,109 | | | | | | | $19,231,374 | | | | | | | $1,143,562,341 | | | | | | | $290,177,690 | |
The accompanying notes are an integral part of these financial statements.
48
| | |
| | |
| | | Statement of Assets and Liabilities (continued) |
| | | |
| | | |
| | | |
| | | | | | | | | | | | | | | | | | | | | | | | | |
| | | AMG GW&K
ESG
Bond Fund | | AMG
GW&K Enhanced
Core Bond
ESG Fund | | AMG
GW&K High
Income Fund | | AMG
GW&K Municipal
Bond Fund | | AMG
GW&K Municipal
Enhanced
Yield Fund |
| | | | | |
Net Assets Represent: | | | | | | | | | | | | | | | | | | | | | | | | | |
| | | | | |
Paid-in capital | | | | $591,675,117 | | | | | $51,134,647 | | | | | $19,378,717 | | | | | $1,151,923,012 | | | | | $305,163,279 | |
| | | | | |
Total distributable loss | | | | (98,668,471 | ) | | | | (10,687,774 | ) | | | | (2,110,168 | ) | | | | (70,660,500 | ) | | | | (46,169,233 | ) |
| | | | | |
Net Assets | | | | $493,006,646 | | | | | $40,446,873 | | | | | $17,268,549 | | | | | $1,081,262,512 | | | | | $258,994,046 | |
| | | | | |
Class N: | | | | | | | | | | | | | | | | | | | | | | | | | |
| | | | | |
Net Assets | | | | $301,027,605 | | | | | $10,680,376 | | | | | $6,528,383 | | | | | $12,972,392 | | | | | $2,955,237 | |
| | | | | |
Shares outstanding | | | | 14,256,971 | | | | | 1,197,222 | | | | | 324,636 | | | | | 1,167,150 | | | | | 345,097 | |
| | | | | |
Net asset value, offering and redemption price per share | | | | $21.11 | | | | | $8.92 | | | | | $20.11 | | | | | $11.11 | | | | | $8.56 | |
| | | | | |
Class I: | | | | | | | | | | | | | | | | | | | | | | | | | |
| | | | | |
Net Assets | | | | $191,979,041 | | | | | $19,889,744 | | | | | $10,740,166 | | | | | $1,068,290,120 | | | | | $255,927,964 | |
| | | | | |
Shares outstanding | | | | 9,091,124 | | | | | 2,221,529 | | | | | 534,326 | | | | | 95,562,700 | | | | | 30,828,135 | |
| | | | | |
Net asset value, offering and redemption price per share | | | | $21.12 | | | | | $8.95 | | | | | $20.10 | | | | | $11.18 | | | | | $8.30 | |
| | | | | |
Class Z: | | | | | | | | | | | | | | | | | | | | | | | | | |
| | | | | |
Net Assets | | | | — | | | | | $9,876,753 | | | | | — | | | | | — | | | | | $110,845 | |
| | | | | |
Shares outstanding | | | | — | | | | | 1,103,437 | | | | | — | | | | | — | | | | | 13,355 | |
| | | | | |
Net asset value, offering and redemption price per share | | | | — | | | | | $8.95 | | | | | — | | | | | — | | | | | $8.30 | |
The accompanying notes are an integral part of these financial statements.
49
| | |
| | |
| | | Statement of Operations For the fiscal year ended December 31, 2022 |
| | | |
| | | |
| | | |
| | | | | | | | | | | | | | | | | | | | | | | | | | | | | | | | | | | | | | | | | | | | | | | | | | |
| | | AMG GW&K
ESG
Bond Fund | | | | AMG
GW&K Enhanced
Core Bond
ESG Fund | | | | AMG
GW&K High
Income Fund | | | | AMG
GW&K Municipal
Bond Fund | | | | AMG
GW&K Municipal
Enhanced
Yield Fund | | |
| | | | | | | | | | |
Investment Income: | | | | | | | | | | | | | | | | | | | | | | | | | | | | | | | | | | | | | | | | | | | | | | | | | | |
| | | | | | | | | | |
Interest income | | | | $15,673,594 | | | | | | | | | | $1,317,282 | | | | | | | | | | $732,593 | | | | | | | | | | $24,322,772 | | | | | | | | | | $9,942,590 | | | | | | |
| | | | | | | | | | |
Securities lending income | | | | 91,026 | | | | | | | | | | 9,143 | | | | | | | | | | 21,484 | | | | | | | | | | — | | | | | | | | | | — | | | | | | |
| | | | | | | | | | |
Foreign withholding tax | | | | (4,703 | ) | | | | | | | | | — | | | | | | | | | | — | | | | | | | | | | — | | | | | | | | | | — | | | | | | |
| | | | | | | | | | |
Total investment income | | | | 15,759,917 | | | | | | | | | | 1,326,425 | | | | | | | | | | 754,077 | | | | | | | | | | 24,322,772 | | | | | | | | | | 9,942,590 | | | | | | |
| | | | | | | | | | |
Expenses: | | | | | | | | | | | | | | | | | | | | | | | | | | | | | | | | | | | | | | | | | | | | | | | | | | |
| | | | | | | | | | |
Investment advisory and management fees | | | | 1,363,391 | | | | | | | | | | 146,227 | | | | | | | | | | 72,096 | | | | | | | | | | 2,430,930 | | | | | | | | | | 1,325,322 | | | | | | |
| | | | | | | | | | |
Administrative fees | | | | 889,168 | | | | | | | | | | 73,114 | | | | | | | | | | 27,729 | | | | | | | | | | 1,757,573 | | | | | | | | | | 441,774 | | | | | | |
| | | | | | | | | | |
Distribution fees - Class N | | | | — | | | | | | | | | | 29,255 | | | | | | | | | | — | | | | | | | | | | 35,742 | | | | | | | | | | 10,133 | | | | | | |
| | | | | | | | | | |
Shareholder servicing fees -Class N | | | | 865,479 | | | | | | | | | | — | | | | | | | | | | 17,627 | | | | | | | | | | 18,880 | | | | | | | | | | 6,080 | | | | | | |
| | | | | | | | | | |
Shareholder servicing fees -Class I | | | | 123,293 | | | | | | | | | | 20,774 | | | | | | | | | | 5,718 | | | | | | | | | | 578,709 | | | | | | | | | | 145,173 | | | | | | |
| | | | | | | | | | |
Professional fees | | | | 105,299 | | | | | | | | | | 61,295 | | | | | | | | | | 44,119 | | | | | | | | | | 97,306 | | | | | | | | | | 52,581 | | | | | | |
| | | | | | | | | | |
Registration fees | | | | 60,338 | | | | | | | | | | 39,079 | | | | | | | | | | 27,739 | | | | | | | | | | 116,005 | | | | | | | | | | 46,918 | | | | | | |
| | | | | | | | | | |
Reports to shareholders | | | | 58,040 | | | | | | | | | | 9,094 | | | | | | | | | | 3,334 | | | | | | | | | | 49,662 | | | | | | | | | | 12,357 | | | | | | |
| | | | | | | | | | |
Custodian fees | | | | 50,336 | | | | | | | | | | 23,888 | | | | | | | | | | 17,097 | | | | | | | | | | 97,442 | | | | | | | | | | 40,199 | | | | | | |
| | | | | | | | | | |
Trustee fees and expenses | | | | 41,125 | | | | | | | | | | 3,413 | | | | | | | | | | 1,341 | | | | | | | | | | 84,573 | | | | | | | | | | 20,683 | | | | | | |
| | | | | | | | | | |
Transfer agent fees | | | | 29,706 | | | | | | | | | | 3,321 | | | | | | | | | | 1,253 | | | | | | | | | | 35,800 | | | | | | | | | | 9,340 | | | | | | |
| | | | | | | | | | |
Interest expense | | | | — | | | | | | | | | | 1,340 | | | | | | | | | | 3,009 | | | | | | | | | | 352 | | | | | | | | | | 164 | | | | | | |
| | | | | | | | | | |
Miscellaneous | | | | 24,388 | | | | | | | | | | 4,740 | | | | | | | | | | 2,410 | | | | | | | | | | 40,727 | | | | | | | | | | 13,587 | | | | | | |
| | | | | | | | | | |
Total expenses before offsets | | | | 3,610,563 | | | | | | | | | | 415,540 | | | | | | | | | | 223,472 | | | | | | | | | | 5,343,701 | | | | | | | | | | 2,124,311 | | | | | | |
| | | | | | | | | | |
Expense reimbursements | | | | (72,842 | ) | | | | | | | | | (130,195 | ) | | | | | | | | | (88,045 | ) | | | | | | | | | (726,185 | ) | | | | | | | | | (225,094 | ) | | | | | |
| | | | | | | | | | |
Net expenses | | | | 3,537,721 | | | | | | | | | | 285,345 | | | | | | | | | | 135,427 | | | | | | | | | | 4,617,516 | | | | | | | | | | 1,899,217 | | | | | | |
| | | | | | | | | | | | | | | | | | | | | | | | | | | | | | | | | | | | | | | | | | | | | | | | | | |
| | | | | | | | | | |
Net investment income | | | | 12,222,196 | | | | | | | | | | 1,041,080 | | | | | | | | | | 618,650 | | | | | | | | | | 19,705,256 | | | | | | | | | | 8,043,373 | | | | | | |
| | | | | | | | | | |
Net Realized and Unrealized Loss: | | | | | | | | | | | | | | | | | | | | | | | | | | | | | | | | | | | | | | | | | | | | | | | | | | |
| | | | | | | | | | |
Net realized loss on investments | | | | (19,299,747 | ) | | | | | | | | | (2,654,300 | ) | | | | | | | | | (1,149,384 | ) | | | | | | | | | (10,312,359 | ) | | | | | | | | | (10,807,395 | ) | | | | | |
| | | | | | | | | | |
Net change in unrealized appreciation/depreciation on investments | | | | (84,052,548 | ) | | | | | | | | | (5,951,857 | ) | | | | | | | | | (961,928 | ) | | | | | | | | | (113,439,737 | ) | | | | | | | | | (60,592,633 | ) | | | | | |
| | | | | | | | | | |
Net realized and unrealized loss | | | | (103,352,295 | ) | | | | | | | | | (8,606,157 | ) | | | | | | | | | (2,111,312 | ) | | | | | | | | | (123,752,096 | ) | | | | | | | | | (71,400,028 | ) | | | | | |
| | | | | | | | | | | | | | | | | | | | | | | | | | | | | | | | | | | | | | | | | | | | | | | | | | |
| | | | | | | | | | |
Net decrease in net assets resulting from operations | | | | $(91,130,099) | | | | | | | | | | $(7,565,077) | | | | | | | | | | $(1,492,662) | | | | | | | | | | $(104,046,840) | | | | | | | | | | $(63,356,655) | | | | | | |
The accompanying notes are an integral part of these financial statements.
50
| | |
| | |
| | | Statements of Changes in Net Assets For the fiscal years ended December 31, |
| | | |
| | | |
| | | |
| | | | | | | | | | | | | | | | | | | | | | | | |
| | | AMG GW&K
ESG Bond Fund | | | AMG
GW&K Enhanced
Core Bond ESG Fund | | | AMG
GW&K High
Income Fund | |
| | | | | | |
| | | 2022 | | | 2021 | | | 2022 | | | 2021 | | | 2022 | | | 2021 | |
| | | | | | |
Increase (Decrease) in Net Assets Resulting From Operations: | | | | | | | | | | | | | | | | | | | | | | | | |
| | | | | | |
Net investment income | | | $12,222,196 | | | | $16,869,717 | | | | $1,041,080 | | | | $812,613 | | | | $618,650 | | | | $437,039 | |
| | | | | | |
Net realized gain (loss) on investments | | | (19,299,747 | ) | | | 81,364,988 | | | | (2,654,300 | ) | | | 874,010 | | | | (1,149,384 | ) | | | 151,347 | |
| | | | | | |
Net change in unrealized appreciation/depreciation on investments | | | (84,052,548 | ) | | | (112,045,135 | ) | | | (5,951,857 | ) | | | (2,321,289 | ) | | | (961,928 | ) | | | 89,236 | |
| | | | | | | | | | | | | | | | | | | | | | | | |
| | | | | | |
Net increase (decrease) in net assets resulting from operations | | | (91,130,099 | ) | | | (13,810,430 | ) | | | (7,565,077 | ) | | | (634,666 | ) | | | (1,492,662 | ) | | | 677,622 | |
| | | | | | |
Distributions to Shareholders: | | | | | | | | | | | | | | | | | | | | | | | | |
| | | | | | |
From net investment income and/or realized gain on investments: | | | | | | | | | | | | | | | | | | | | | | | | |
| | | | | | |
Class N | | | (7,736,535 | ) | | | (53,132,625 | ) | | | (235,849 | ) | | | (211,642 | ) | | | (277,251 | ) | | | (232,178 | ) |
| | | | | | |
Class I | | | (5,885,301 | ) | | | (51,380,355 | ) | | | (537,618 | ) | | | (426,487 | ) | | | (410,014 | ) | | | (312,124 | ) |
| | | | | | |
Class Z | | | — | | | | — | | | | (268,295 | ) | | | (186,240 | ) | | | — | | | | — | |
| | | | | | |
From paid-in capital: | | | | | | | | | | | | | | | | | | | | | | | | |
| | | | | | |
Class N | | | — | | | | — | | | | — | | | | (12,304 | ) | | | — | | | | — | |
| | | | | | |
Class I | | | — | | | | — | | | | — | | | | (24,795 | ) | | | — | | | | — | |
| | | | | | |
Class Z | | | — | | | | — | | | | — | | | | (10,828 | ) | | | — | | | | — | |
| | | | | | |
Total distributions to shareholders | | | (13,621,836 | ) | | | (104,512,980 | ) | | | (1,041,762 | ) | | | (872,296 | ) | | | (687,265 | ) | | | (544,302 | ) |
| | | | | | |
Capital Share Transactions:1 | | | | | | | | | | | | | | | | | | | | | | | | |
| | | | | | |
Net increase (decrease) from capital share transactions | | | (157,179,741 | ) | | | (228,559,947 | ) | | | (11,796,222 | ) | | | 7,211,314 | | | | (1,875,236 | ) | | | 10,888,534 | |
| | | | | | | | | | | | | | | | | | | | | | | | |
| | | | | | |
Total increase (decrease) in net assets | | | (261,931,676 | ) | | | (346,883,357 | ) | | | (20,403,061 | ) | | | 5,704,352 | | | | (4,055,163 | ) | | | 11,021,854 | |
| | | | | | |
Net Assets: | | | | | | | | | | | | | | | | | | | | | | | | |
| | | | | | |
Beginning of year | | | 754,938,322 | | | | 1,101,821,679 | | | | 60,849,934 | | | | 55,145,582 | | | | 21,323,712 | | | | 10,301,858 | |
| | | | | | | | | | | | | | | | | | | | | | | | |
| | | | | | |
End of year | | | $493,006,646 | | | | $754,938,322 | | | | $40,446,873 | | | | $60,849,934 | | | | $17,268,549 | | | | $21,323,712 | |
1 See Note 1(g) of the Notes to Financial Statements.
The accompanying notes are an integral part of these financial statements.
51
| | |
| | |
| | | Statements of Changes in Net Assets (continued) For the fiscal years ended December 31, |
| | | |
| | | |
| | | |
| | | | | | | | | | | | | | | | |
| | | AMG
GW&K Municipal
Bond Fund | | AMG GW&K
Municipal Enhanced
Yield Fund |
| | | | |
| | | 2022 | | 2021 | | 2022 | | 2021 |
| | | | |
Increase (Decrease) in Net Assets Resulting From Operations: | | | | | | | | | | | | | | | | |
| | | | |
Net investment income | | | $19,705,256 | | | | $17,736,073 | | | | $8,043,373 | | | | $8,074,327 | |
| | | | |
Net realized gain (loss) on investments | | | (10,312,359 | ) | | | 11,510,796 | | | | (10,807,395 | ) | | | 5,033,099 | |
| | | | |
Net change in unrealized appreciation/depreciation on investments | | | (113,439,737 | ) | | | (24,090,355 | ) | | | (60,592,633 | ) | | | 727,146 | |
| | | | | | | | | | | | | | | | |
| | | | |
Net increase (decrease) in net assets resulting from operations | | | (104,046,840 | ) | | | 5,156,514 | | | | (63,356,655 | ) | | | 13,834,572 | |
| | | | |
Distributions to Shareholders: | | | | | | | | | | | | | | | | |
| | | | |
Class N | | | (212,610 | ) | | | (320,461 | ) | | | (79,222 | ) | | | (239,124 | ) |
| | | | |
Class I | | | (21,345,146 | ) | | | (27,948,470 | ) | | | (8,871,256 | ) | | | (12,853,713 | ) |
| | | | |
Class Z | | | — | | | | — | | | | (3,685 | ) | | | (4,817 | ) |
| | | | |
Total distributions to shareholders | | | (21,557,756 | ) | | | (28,268,931 | ) | | | (8,954,163 | ) | | | (13,097,654 | ) |
| | | | |
Capital Share Transactions:1 | | | | | | | | | | | | | | | | |
| | | | |
Net increase (decrease) from capital share transactions | | | (142,203,031 | ) | | | 66,362,378 | | | | (53,225,598 | ) | | | 55,209,790 | |
| | | | | | | | | | | | | | | | |
| | | | |
Total increase (decrease) in net assets | | | (267,807,627 | ) | | | 43,249,961 | | | | (125,536,416 | ) | | | 55,946,708 | |
| | | | |
Net Assets: | | | | | | | | | | | | | | | | |
| | | | |
Beginning of year | | | 1,349,070,139 | | | | 1,305,820,178 | | | | 384,530,462 | | | | 328,583,754 | |
| | | | | | | | | | | | | | | | |
| | | | |
End of year | | | $1,081,262,512 | | | | $1,349,070,139 | | | | $258,994,046 | | | | $384,530,462 | |
1 See Note 1(g) of the Notes to Financial Statements.
The accompanying notes are an integral part of these financial statements.
52
| | |
| | |
| | | AMG GW&K ESG Bond Fund Financial Highlights For a share outstanding throughout each fiscal year |
| | | |
| | | |
| | | |
| | | | | | | | | | | | | | | | | | | | |
| | | For the fiscal years ended December 31, |
| | | | | |
| Class N | | 2022 | | 2021 | | 2020 | | 2019 | | 2018 |
| | | | | |
Net Asset Value, Beginning of Year | | | $24.88 | | | | $28.12 | | | | $27.14 | | | | $25.49 | | | | $26.97 | |
| | | | | |
Income (loss) from Investment Operations: | | | | | | | | | | | | | | | | | | | | |
| | | | | |
Net investment income1,2 | | | 0.44 | | | | 0.44 | | | | 0.90 | | | | 0.94 | | | | 0.84 | |
| | | | | |
Net realized and unrealized gain (loss) on investments | | | (3.70 | ) | | | (0.83 | ) | | | 1.03 | | | | 1.85 | | | | (1.33 | ) |
| | | | | | | | | | | | | | | | | | | | |
| | | | | |
Total income (loss) from investment operations | | | (3.26 | ) | | | (0.39 | ) | | | 1.93 | | | | 2.79 | | | | (0.49 | ) |
| | | | | |
Less Distributions to Shareholders from: | | | | | | | | | | | | | | | | | | | | |
| | | | | |
Net investment income | | | (0.47 | ) | | | (0.47 | ) | | | (0.88 | ) | | | (0.98 | ) | | | (0.80 | ) |
| | | | | |
Net realized gain on investments | | | (0.04 | ) | | | (2.38 | ) | | | (0.07 | ) | | | (0.16 | ) | | | (0.19 | ) |
| | | | | | | | | | | | | | | | | | | | |
| | | | | |
Total distributions to shareholders | | | (0.51 | ) | | | (2.85 | ) | | | (0.95 | ) | | | (1.14 | ) | | | (0.99 | ) |
| | | | | |
Net Asset Value, End of Year | | | $21.11 | | | | $24.88 | | | | $28.12 | | | | $27.14 | | | | $25.49 | |
| | | | | | | | | | | | | | | | | | | | |
| | | | | |
Total Return2,3 | | | (13.17 | )% | | | (1.29 | )% | | | 7.34 | % | | | 11.10 | % | | | (1.82 | )% |
| | | | | |
Ratio of net expenses to average net assets | | | 0.68 | % | | | 0.69 | %4 | | | 0.71 | % | | | 0.72 | %5 | | | 0.98 | %4 |
| | | | | |
Ratio of gross expenses to average net assets6 | | | 0.69 | % | | | 0.69 | %4 | | | 0.72 | % | | | 0.73 | %5 | | | 0.98 | %4 |
| | | | | |
Ratio of net investment income to average net assets2 | | | 1.98 | % | | | 1.71 | % | | | 3.31 | % | | | 3.53 | % | | | 3.19 | % |
| | | | | |
Portfolio turnover | | | 23 | % | | | 186 | % | | | 25 | % | | | 20 | % | | | 9 | % |
| | | | | |
Net assets end of year (000’s) omitted | | | $301,028 | | | | $427,818 | | | | $555,124 | | | | $618,381 | | | | $715,468 | |
| | | | | |
| | | | | | | | | | | | | | | | | | | | | |
53
| | |
| | |
| | | AMG GW&K ESG Bond Fund Financial Highlights For a share outstanding throughout each fiscal year |
| | | |
| | | |
| | | |
| | | | | | | | | | | | | | | | | | | | |
| | | For the fiscal years ended December 31, |
| | | | | |
| Class I | | 2022 | | 2021 | | 2020 | | 2019 | | 2018 |
| | | | | |
Net Asset Value, Beginning of Year | | | $24.89 | | | | $28.13 | | | | $27.14 | | | | $25.49 | | | | $26.97 | |
| | | | | |
Income (loss) from Investment Operations: | | | | | | | | | | | | | | | | | | | | |
| | | | | |
Net investment income1,2 | | | 0.49 | | | | 0.50 | | | | 0.95 | | | | 0.99 | | | | 0.86 | |
| | | | | |
Net realized and unrealized gain (loss) on investments | | | (3.71 | ) | | | (0.83 | ) | | | 1.05 | | | | 1.85 | | | | (1.32 | ) |
| | | | | | | | | | | | | | | | | | | | |
| | | | | |
Total income (loss) from investment operations | | | (3.22 | ) | | | (0.33 | ) | | | 2.00 | | | | 2.84 | | | | (0.46 | ) |
| | | | | |
Less Distributions to Shareholders from: | | | | | | | | | | | | | | | | | | | | |
| | | | | |
Net investment income | | | (0.51 | ) | | | (0.53 | ) | | | (0.94 | ) | | | (1.03 | ) | | | (0.83 | ) |
| | | | | |
Net realized gain on investments | | | (0.04 | ) | | | (2.38 | ) | | | (0.07 | ) | | | (0.16 | ) | | | (0.19 | ) |
| | | | | | | | | | | | | | | | | | | | |
| | | | | |
Total distributions to shareholders | | | (0.55 | ) | | | (2.91 | ) | | | (1.01 | ) | | | (1.19 | ) | | | (1.02 | ) |
| | | | | |
Net Asset Value, End of Year | | | $21.12 | | | | $24.89 | | | | $28.13 | | | | $27.14 | | | | $25.49 | |
| | | | | | | | | | | | | | | | | | | | |
| | | | | |
Total Return2,3 | | | (12.99 | )% | | | (1.05 | )% | | | 7.57 | % | | | 11.32 | % | | | (1.72 | )% |
| | | | | |
Ratio of net expenses to average net assets | | | 0.48 | % | | | 0.49 | %4 | | | 0.50 | % | | | 0.52 | %5 | | | 0.88 | %4 |
| | | | | |
Ratio of gross expenses to average net assets6 | | | 0.49 | % | | | 0.49 | %4 | | | 0.51 | % | | | 0.53 | %5 | | | 0.88 | %4 |
| | | | | |
Ratio of net investment income to average net assets2 | | | 2.18 | % | | | 1.91 | % | | | 3.52 | % | | | 3.73 | % | | | 3.29 | % |
| | | | | |
Portfolio turnover | | | 23 | % | | | 186 | % | | | 25 | % | | | 20 | % | | | 9 | % |
| | | | | |
Net assets end of year (000’s) omitted | | | $191,979 | | | | $327,121 | | | | $546,698 | | | | $605,353 | | | | $1,094,820 | |
| | | | | |
| | | | | | | | | | | | | | | | | | | | | |
| 1 | Per share numbers have been calculated using average shares. |
| 2 | Total returns and net investment income would have been lower had certain expenses not been offset. |
| 3 | The total return is calculated using the published Net Asset Value as of fiscal year end. |
| 4 | Ratio includes recapture of reimbursed fees from prior years amounting to less than 0.01% and 0.04% for the fiscal year ended December 31, 2021 and December 31, 2018, respectively. |
| 5 | Includes 0.01% of extraordinary expense related to legal expense in support of an investment held in the portfolio. |
| 6 | Excludes the impact of expense reimbursement or fee waivers and expense reductions such as brokerage credits, but includes expense repayments and non-reimbursable expenses, if any, such as interest, taxes, and extraordinary expenses. (See Note 1(c) and 2 in the Notes to Financial Statements.) |
54
| | |
| | |
| | | AMG GW&K Enhanced Core Bond ESG Fund Financial Highlights For a share outstanding throughout each fiscal year |
| | | |
| | | |
| | | |
| | | | | | | | | | | | | | | | | | | | |
| | | For the fiscal years ended December 31, |
| | | | | |
| Class N | | 2022 | | 2021 | | 2020 | | 2019 | | 2018 |
| | | | | |
Net Asset Value, Beginning of Year | | | $10.61 | | | | $10.90 | | | | $10.15 | | | | $9.43 | | | | $9.81 | |
| | | | | |
Income (loss) from Investment Operations: | | | | | | | | | | | | | | | | | | | | |
| | | | | |
Net investment income1,2 | | | 0.19 | | | | 0.14 | | | | 0.20 | | | | 0.24 | | | | 0.23 | |
| | | | | |
Net realized and unrealized gain (loss) on investments | | | (1.69 | ) | | | (0.28 | ) | | | 0.75 | | | | 0.73 | | | | (0.38 | ) |
| | | | | | | | | | | | | | | | | | | | |
| | | | | |
Total income (loss) from investment operations | | | (1.50 | ) | | | (0.14 | ) | | | 0.95 | | | | 0.97 | | | | (0.15 | ) |
| | | | | |
Less Distributions to Shareholders from: | | | | | | | | | | | | | | | | | | | | |
| | | | | |
Net investment income | | | (0.19 | ) | | | (0.14 | ) | | | (0.20 | ) | | | (0.25 | ) | | | (0.23 | ) |
| | | | | |
Paid in capital | | | — | | | | (0.01 | ) | | | — | | | | — | | | | — | |
| | | | | | | | | | | | | | | | | | | | |
| | | | | |
Total distributions to shareholders | | | (0.19 | ) | | | (0.15 | ) | | | (0.20 | ) | | | (0.25 | ) | | | (0.23 | ) |
| | | | | |
Net Asset Value, End of Year | | | $8.92 | | | | $10.61 | | | | $10.90 | | | | $10.15 | | | | $9.43 | |
| | | | | | | | | | | | | | | | | | | | |
| | | | | |
Total Return2,3 | | | (14.17 | )% | | | (1.26 | )% | | | 9.41 | % | | | 10.35 | % | | | (1.48 | )% |
| | | | | |
Ratio of net expenses to average net assets | | | 0.73 | % | | | 0.73 | % | | | 0.73 | % | | | 0.73 | % | | | 0.73 | % |
| | | | | |
Ratio of gross expenses to average net assets4 | | | 1.00 | % | | | 0.93 | % | | | 1.06 | % | | | 1.16 | % | | | 0.99 | % |
| | | | | |
Ratio of net investment income to average net assets2 | | | 1.99 | % | | | 1.32 | % | | | 1.86 | % | | | 2.43 | % | | | 2.45 | % |
| | | | | |
Portfolio turnover | | | 54 | % | | | 86 | % | | | 101 | % | | | 71 | % | | | 26 | % |
| | | | | |
Net assets end of year (000’s) omitted | | | $10,680 | | | | $13,736 | | | | $15,794 | | | | $14,779 | | | | $12,884 | |
| | | | | |
| | | | | | | | | | | | | | | | | | | | | |
55
| | |
| | |
| | | AMG GW&K Enhanced Core Bond ESG Fund Financial Highlights For a share outstanding throughout each fiscal year |
| | | |
| | | |
| | | |
| | | | | | | | | | | | | | | | | | | | |
| | | For the fiscal years ended December 31, |
| | | | | |
| Class I | | 2022 | | 2021 | | 2020 | | 2019 | | 2018 |
| | | | | |
Net Asset Value, Beginning of Year | | | $10.65 | | | | $10.94 | | | | $10.19 | | | | $9.47 | | | | $9.85 | |
| | | | | |
Income (loss) from Investment Operations: | | | | | | | | | | | | | | | | | | | | |
| | | | | |
Net investment income1,2 | | | 0.21 | | | | 0.16 | | | | 0.22 | | | | 0.26 | | | | 0.25 | |
| | | | | |
Net realized and unrealized gain (loss) on investments | | | (1.70 | ) | | | (0.28 | ) | | | 0.75 | | | | 0.73 | | | | (0.38 | ) |
| | | | | | | | | | | | | | | | | | | | |
| | | | | |
Total income (loss) from investment operations | | | (1.49 | ) | | | (0.12 | ) | | | 0.97 | | | | 0.99 | | | | (0.13 | ) |
| | | | | |
Less Distributions to Shareholders from: | | | | | | | | | | | | | | | | | | | | |
| | | | | |
Net investment income | | | (0.21 | ) | | | (0.16 | ) | | | (0.22 | ) | | | (0.27 | ) | | | (0.25 | ) |
| | | | | |
Paid in capital | | | — | | | | (0.01 | ) | | | — | | | | — | | | | — | |
| | | | | | | | | | | | | | | | | | | | |
| | | | | |
Total distributions to shareholders | | | (0.21 | ) | | | (0.17 | ) | | | (0.22 | ) | | | (0.27 | ) | | | (0.25 | ) |
| | | | | |
Net Asset Value, End of Year | | | $8.95 | | | | $10.65 | | | | $10.94 | | | | $10.19 | | | | $9.47 | |
| | | | | | | | | | | | | | | | | | | | |
| | | | | |
Total Return2,3 | | | (14.07 | )% | | | (1.07 | )% | | | 9.57 | % | | | 10.51 | % | | | (1.27 | )% |
| | | | | |
Ratio of net expenses to average net assets | | | 0.56 | % | | | 0.56 | % | | | 0.55 | % | | | 0.55 | % | | | 0.54 | % |
| | | | | |
Ratio of gross expenses to average net assets4 | | | 0.83 | % | | | 0.76 | % | | | 0.88 | % | | | 0.98 | % | | | 0.80 | % |
| | | | | |
Ratio of net investment income to average net assets2 | | | 2.16 | % | | | 1.49 | % | | | 2.04 | % | | | 2.62 | % | | | 2.64 | % |
| | | | | |
Portfolio turnover | | | 54 | % | | | 86 | % | | | 101 | % | | | 71 | % | | | 26 | % |
| | | | | |
Net assets end of year (000’s) omitted | | | $19,890 | | | | $33,402 | | | | $27,800 | | | | $8,502 | | | | $5,967 | |
| | | | | |
| | | | | | | | | | | | | | | | | | | | | |
56
| | |
| | |
| | | AMG GW&K Enhanced Core Bond ESG Fund Financial Highlights For a share outstanding throughout each fiscal year |
| | | |
| | | |
| | | |
| | | | | | | | | | | | | | | | | | | | |
| | | For the fiscal years ended December 31, |
| | | | | |
| Class Z | | 2022 | | 2021 | | 2020 | | 2019 | | 2018 |
| | | | | |
Net Asset Value, Beginning of Year | | | $10.65 | | | | $10.93 | | | | $10.18 | | | | $9.46 | | | | $9.84 | |
| | | | | |
Income (loss) from Investment Operations: | | | | | | | | | | | | | | | | | | | | |
| | | | | |
Net investment income1,2 | | | 0.21 | | | | 0.17 | | | | 0.22 | | | | 0.27 | | | | 0.26 | |
| | | | | |
Net realized and unrealized gain (loss) on investments | | | (1.69 | ) | | | (0.27 | ) | | | 0.75 | | | | 0.72 | | | | (0.38 | ) |
| | | | | | | | | | | | | | | | | | | | |
| | | | | |
Total income (loss) from investment operations | | | (1.48 | ) | | | (0.10 | ) | | | 0.97 | | | | 0.99 | | | | (0.12 | ) |
| | | | | |
Less Distributions to Shareholders from: | | | | | | | | | | | | | | | | | | | | |
| | | | | |
Net investment income | | | (0.22 | ) | | | (0.17 | ) | | | (0.22 | ) | | | (0.27 | ) | | | (0.26 | ) |
| | | | | |
Paid in capital | | | — | | | | (0.01 | ) | | | — | | | | — | | | | — | |
| | | | | | | | | | | | | | | | | | | | |
| | | | | |
Total distributions to shareholders | | | (0.22 | ) | | | (0.18 | ) | | | (0.22 | ) | | | (0.27 | ) | | | (0.26 | ) |
| | | | | |
Net Asset Value, End of Year | | | $8.95 | | | | $10.65 | | | | $10.93 | | | | $10.18 | | | | $9.46 | |
| | | | | | | | | | | | | | | | | | | | |
| | | | | |
Total Return2,3 | | | (14.00 | )% | | | (0.92 | )% | | | 9.65 | % | | | 10.59 | % | | | (1.23 | )% |
| | | | | |
Ratio of net expenses to average net assets | | | 0.48 | % | | | 0.48 | % | | | 0.48 | % | | | 0.48 | % | | | 0.48 | % |
| | | | | |
Ratio of gross expenses to average net assets4 | | | 0.75 | % | | | 0.68 | % | | | 0.81 | % | | | 0.91 | % | | | 0.74 | % |
| | | | | |
Ratio of net investment income to average net assets2 | | | 2.24 | % | | | 1.57 | % | | | 2.11 | % | | | 2.72 | % | | | 2.70 | % |
| | | | | |
Portfolio turnover | | | 54 | % | | | 86 | % | | | 101 | % | | | 71 | % | | | 26 | % |
| | | | | |
Net assets end of year (000’s) omitted | | | $9,877 | | | | $13,712 | | | | $11,552 | | | | $10,080 | | | | $15,254 | |
| | | | | |
| | | | | | | | | | | | | | | | | | | | | |
| 1 | Per share numbers have been calculated using average shares. |
| 2 | Total returns and net investment income would have been lower had certain expenses not been offset. |
| 3 | The total return is calculated using the published Net Asset Value as of fiscal year end. |
| 4 | Excludes the impact of expense reimbursement or fee waivers and expense reductions such as brokerage credits, but includes expense repayments and non-reimbursable expenses, if any, such as interest, taxes, and extraordinary expenses. (See Note 1(c) and 2 in the Notes to Financial Statements.) |
57
| | |
| | |
| | | AMG GW&K High Income Fund Financial Highlights For a share outstanding throughout each fiscal year |
| | | |
| | | |
| | | |
| | | | | | | | | | | | | | | | | | | | |
| | | For the fiscal years ended December 31, |
| | | | | |
| Class N | | 2022 | | 2021 | | 2020 | | 2019 | | 2018 |
| | | | | |
Net Asset Value, Beginning of Year | | | $22.46 | | | | $22.23 | | | | $21.52 | | | | $20.04 | | | | $21.06 | |
| | | | | |
Income (loss) from Investment Operations: | | | | | | | | | | | | | | | | | | | | |
| | | | | |
Net investment income1,2 | | | 0.67 | | | | 0.53 | | | | 0.51 | | | | 0.57 | | | | 0.69 | |
| | | | | |
Net realized and unrealized gain (loss) on investments | | | (2.20 | ) | | | 0.28 | | | | 2.09 | | | | 0.98 | | | | (1.57 | ) |
| | | | | | | | | | | | | | | | | | | | |
| | | | | |
Total income (loss) from investment operations | | | (1.53 | ) | | | 0.81 | | | | 2.60 | | | | 1.55 | | | | (0.88 | ) |
| | | | | |
Less Distributions to Shareholders from: | | | | | | | | | | | | | | | | | | | | |
| | | | | |
Net investment income | | | (0.77 | ) | | | (0.53 | ) | | | (0.48 | ) | | | (0.07 | ) | | | (0.14 | ) |
| | | | | |
Net realized gain on investments | | | (0.05 | ) | | | (0.05 | ) | | | (1.41 | ) | | | — | | | | — | |
| | | | | | | | | | | | | | | | | | | | |
| | | | | |
Total distributions to shareholders | | | (0.82 | ) | | | (0.58 | ) | | | (1.89 | ) | | | (0.07 | ) | | | (0.14 | ) |
| | | | | |
Net Asset Value, End of Year | | | $20.11 | | | | $22.46 | | | | $22.23 | | | | $21.52 | | | | $20.04 | |
| | | | | | | | | | | | | | | | | | | | |
| | | | | |
Total Return2,3 | | | (6.80 | )% | | | 3.67 | % | | | 12.16 | % | | | 7.67 | % | | | (4.18 | )% |
| | | | | |
Ratio of net expenses to average net assets | | | 0.86 | %4 | | | 0.84 | % | | | 0.89 | % | | | 0.89 | % | | | 0.89 | % |
| | | | | |
Ratio of gross expenses to average net assets5 | | | 1.32 | % | | | 1.37 | % | | | 1.70 | % | | | 1.87 | % | | | 1.52 | % |
| | | | | |
Ratio of net investment income to average net assets2 | | | 3.22 | % | | | 2.36 | % | | | 2.28 | % | | | 2.70 | % | | | 3.34 | % |
| | | | | |
Portfolio turnover | | | 74 | % | | | 97 | % | | | 157 | % | | | 52 | % | | | 60 | % |
| | | | | |
Net assets end of year (000’s) omitted | | | $6,528 | | | | $8,157 | | | | $10,302 | | | | $9,638 | | | | $10,365 | |
| | | | | |
| | | | | | | | | | | | | | | | | | | | | |
58
| | |
| | |
| | | AMG GW&K High Income Fund Financial Highlights For a share outstanding throughout each fiscal period |
| | | |
| | | |
| | | |
| | | | | | | | | | |
| | | For the fiscal year ended December 31, | | For the fiscal
period ended
December 31, |
| | |
| Class I | | 2022 | | 20216 |
| | |
Net Asset Value, Beginning of Period | | | | $22.45 | | | | | $22.27 | |
| | |
Income (loss) from Investment Operations: | | | | | | | | | | |
| | |
Net investment income1,2 | | | | 0.71 | | | | | 0.46 | |
| | |
Net realized and unrealized gain (loss) on investments | | | | (2.20 | ) | | | | 0.35 | |
| | | | | | | | | | |
| | |
Total income (loss) from investment operations | | | | (1.49 | ) | | | | 0.81 | |
| | |
Less Distributions to Shareholders from: | | | | | | | | | | |
| | |
Net investment income | | | | (0.81 | ) | | | | (0.58 | ) |
| | |
Net realized gain on investments | | | | (0.05 | ) | | | | (0.05 | ) |
| | | | | | | | | | |
| | |
Total distributions to shareholders | | | | (0.86 | ) | | | | (0.63 | ) |
| | |
Net Asset Value, End of Period | | | | $20.10 | | | | | $22.45 | |
| | | | | | | | | | |
| | |
Total Return2,3 | | | | (6.63 | )% | | | | 3.68 | %7 |
| | |
Ratio of net expenses to average net assets | | | | 0.66 | %4 | | | | 0.64 | %8 |
| | |
Ratio of gross expenses to average net assets5 | | | | 1.12 | % | | | | 1.17 | %8 |
| | |
Ratio of net investment income to average net assets2 | | | | 3.42 | % | | | | 2.56 | %8 |
| | |
Portfolio turnover | | | | 74 | % | | | | 97 | % |
| | |
Net assets end of period (000’s) omitted | | | | $10,740 | | | | | $13,166 | |
| | | | | | | | | | | |
| 1 | Per share numbers have been calculated using average shares. |
| 2 | Total returns and net investment income would have been lower had certain expenses not been offset. |
| 3 | The total return is calculated using the published Net Asset Value as of fiscal year end. |
| 4 | Includes interest expense totaling 0.02% related to participation in the interfund lending program. |
| 5 | Excludes the impact of expense reimbursement or fee waivers and expense reductions such as brokerage credits, but includes expense repayments and non-reimbursable expenses, if any, such as interest, taxes, and extraordinary expenses. (See Note 1(c) and 2 in the Notes to Financial Statements.) |
| 6 | Commencement of operations was on March 15, 2021. |
59
| | |
| | |
| | | AMG GW&K Municipal Bond Fund Financial Highlights For a share outstanding throughout each fiscal year |
| | | |
| | | |
| | | |
| | | | | | | | | | | | | | | | | | | | |
| | | For the fiscal years ended December 31, |
| | | | | |
| Class N | | 2022 | | 2021 | | 2020 | | 2019 | | 2018 |
| | | | | |
Net Asset Value, Beginning of Year | | | $12.24 | | | | $12.45 | | | | $12.12 | | | | $11.48 | | | | $11.60 | |
| | | | | |
Income (loss) from Investment Operations: | | | | | | | | | | | | | | | | | | | | |
| | | | | |
Net investment income1,2 | | | 0.15 | | | | 0.13 | | | | 0.15 | | | | 0.19 | | | | 0.17 | |
| | | | | |
Net realized and unrealized gain (loss) on investments | | | (1.10 | ) | | | (0.11 | ) | | | 0.33 | | | | 0.64 | | | | (0.11 | ) |
| | | | | | | | | | | | | | | | | | | | |
| | | | | |
Total income (loss) from investment operations | | | (0.95 | ) | | | 0.02 | | | | 0.48 | | | | 0.83 | | | | 0.06 | |
| | | | | |
Less Distributions to Shareholders from: | | | | | | | | | | | | | | | | | | | | |
| | | | | |
Net investment income | | | (0.16 | ) | | | (0.13 | ) | | | (0.15 | ) | | | (0.19 | ) | | | (0.18 | ) |
| | | | | |
Net realized gain on investments | | | (0.02 | ) | | | (0.10 | ) | | | — | | | | — | | | | (0.00 | )3 |
| | | | | | | | | | | | | | | | | | | | |
| | | | | |
Total distributions to shareholders | | | (0.18 | ) | | | (0.23 | ) | | | (0.15 | ) | | | (0.19 | ) | | | (0.18 | ) |
| | | | | |
Net Asset Value, End of Year | | | $11.11 | | | | $12.24 | | | | $12.45 | | | | $12.12 | | | | $11.48 | |
| | | | | | | | | | | | | | | | | | | | |
| | | | | |
Total Return2,4 | | | (7.80 | )% | | | 0.10 | % | | | 4.31 | % | | | 7.29 | % | | | 0.54 | % |
| | | | | |
Ratio of net expenses to average net assets | | | 0.72 | % | | | 0.71 | % | | | 0.71 | % | | | 0.71 | % | | | 0.71 | % |
| | | | | |
Ratio of gross expenses to average net assets5 | | | 0.78 | % | | | 0.76 | % | | | 0.77 | % | | | 0.78 | % | | | 0.77 | % |
| | | | | |
Ratio of net investment income to average net assets2 | | | 1.35 | % | | | 1.01 | % | | | 1.25 | % | | | 1.59 | % | | | 1.53 | % |
| | | | | |
Portfolio turnover | | | 20 | % | | | 24 | % | | | 17 | % | | | 18 | % | | | 35 | % |
| | | | | |
Net assets end of year (000’s) omitted | | | $12,972 | | | | $17,112 | | | | $18,153 | | | | $18,711 | | | | $17,445 | |
| | | | | |
| | | | | | | | | | | | | | | | | | | | | |
60
| | |
| | |
| | | AMG GW&K Municipal Bond Fund Financial Highlights For a share outstanding throughout each fiscal year |
| | | |
| | | |
| | | |
| | | | | | | | | | | | | | | | | | | | |
| | | For the fiscal years ended December 31, |
| | | | | |
| Class I | | 2022 | | 2021 | | 2020 | | 2019 | | 2018 |
| | | | | |
Net Asset Value, Beginning of Year | | | $12.31 | | | | $12.52 | | | | $12.18 | | | | $11.54 | | | | $11.66 | |
| | | | | |
Income (loss) from Investment Operations: | | | | | | | | | | | | | | | | | | | | |
| | | | | |
Net investment income1,2 | | | 0.19 | | | | 0.17 | | | | 0.19 | | | | 0.23 | | | | 0.21 | |
| | | | | |
Net realized and unrealized gain (loss) on investments | | | (1.11 | ) | | | (0.11 | ) | | | 0.34 | | | | 0.64 | | | | (0.12 | ) |
| | | | | | | | | | | | | | | | | | | | |
| | | | | |
Total income (loss) from investment operations | | | (0.92 | ) | | | 0.06 | | | | 0.53 | | | | 0.87 | | | | 0.09 | |
| | | | | |
Less Distributions to Shareholders from: | | | | | | | | | | | | | | | | | | | | |
| | | | | |
Net investment income | | | (0.19 | ) | | | (0.17 | ) | | | (0.19 | ) | | | (0.23 | ) | | | (0.21 | ) |
| | | | | |
Net realized gain on investments | | | (0.02 | ) | | | (0.10 | ) | | | — | | | | — | | | | (0.00 | )3 |
| | | | | | | | | | | | | | | | | | | | |
| | | | | |
Total distributions to shareholders | | | (0.21 | ) | | | (0.27 | ) | | | (0.19 | ) | | | (0.23 | ) | | | (0.21 | ) |
| | | | | |
Net Asset Value, End of Year | | | $11.18 | | | | $12.31 | | | | $12.52 | | | | $12.18 | | | | $11.54 | |
| | | | | | | | | | | | | | | | | | | | |
| | | | | |
Total Return2,4 | | | (7.45 | )% | | | 0.43 | % | | | 4.70 | % | | | 7.58 | % | | | 0.87 | % |
| | | | | |
Ratio of net expenses to average net assets | | | 0.39 | % | | | 0.39 | % | | | 0.39 | % | | | 0.39 | % | | | 0.39 | % |
| | | | | |
Ratio of gross expenses to average net assets5 | | | 0.45 | % | | | 0.44 | % | | | 0.45 | % | | | 0.46 | % | | | 0.45 | % |
| | | | | |
Ratio of net investment income to average net assets2 | | | 1.68 | % | | | 1.33 | % | | | 1.57 | % | | | 1.91 | % | | | 1.85 | % |
| | | | | |
Portfolio turnover | | | 20 | % | | | 24 | % | | | 17 | % | | | 18 | % | | | 35 | % |
| | | | | |
Net assets end of year (000’s) omitted | | | $1,068,290 | | | | $1,331,958 | | | | $1,287,667 | | | | $1,014,514 | | | | $940,553 | |
| | | | | |
| | | | | | | | | | | | | | | | | | | | | |
| 1 | Per share numbers have been calculated using average shares. |
| 2 | Total returns and net investment income would have been lower had certain expenses not been offset. |
| 3 | Less than $(0.005) per share. |
| 4 | The total return is calculated using the published Net Asset Value as of fiscal year end. |
| 5 | Excludes the impact of expense reimbursement or fee waivers and expense reductions such as brokerage credits, but includes expense repayments and non-reimbursable expenses, if any, such as interest, taxes, and extraordinary expenses. (See Note 1(c) and 2 in the Notes to Financial Statements.) |
61
| | |
| | |
| | | AMG GW&K Municipal Enhanced Yield Fund Financial Highlights For a share outstanding throughout each fiscal year |
| | | |
| | | |
| | | |
| | | | | | | | | | | | | | | | | | | | |
| | | For the fiscal years ended December 31, |
| | | | | |
| Class N | | 2022 | | 2021 | | 2020 | | 2019 | | 2018 |
| | | | | |
Net Asset Value, Beginning of Year | | | $10.74 | | | | $10.69 | | | | $10.42 | | | | $9.69 | | | | $10.02 | |
| | | | | |
Income (loss) from Investment Operations: | | | | | | | | | | | | | | | | | | | | |
| | | | | |
Net investment income1,2 | | | 0.22 | | | | 0.20 | | | | 0.23 | | | | 0.26 | | | | 0.27 | |
| | | | | |
Net realized and unrealized gain (loss) on investments | | | (2.17 | ) | | | 0.18 | | | | 0.37 | | | | 0.78 | | | | (0.33 | ) |
| | | | | | | | | | | | | | | | | | | | |
| | | | | |
Total income (loss) from investment operations | | | (1.95 | ) | | | 0.38 | | | | 0.60 | | | | 1.04 | | | | (0.06 | ) |
| | | | | |
Less Distributions to Shareholders from: | | | | | | | | | | | | | | | | | | | | |
| | | | | |
Net investment income | | | (0.20 | ) | | | (0.19 | ) | | | (0.21 | ) | | | (0.25 | ) | | | (0.15 | ) |
| | | | | |
Net realized gain on investments | | | (0.03 | ) | | | (0.14 | ) | | | (0.12 | ) | | | (0.06 | ) | | | — | |
| | | | | |
Paid in capital | | | — | | | | — | | | | — | | | | — | | | | (0.12 | ) |
| | | | | | | | | | | | | | | | | | | | |
| | | | | |
Total distributions to shareholders | | | (0.23 | ) | | | (0.33 | ) | | | (0.33 | ) | | | (0.31 | ) | | | (0.27 | ) |
| | | | | |
Net Asset Value, End of Year | | | $8.56 | | | | $10.74 | | | | $10.69 | | | | $10.42 | | | | $9.69 | |
| | | | | | | | | | | | | | | | | | | | |
| | | | | |
Total Return2,3 | | | (18.19 | )% | | | 3.59 | % | | | 5.95 | % | | | 10.92 | % | | | (0.55 | )% |
| | | | | |
Ratio of net expenses to average net assets | | | 0.99 | % | | | 0.99 | % | | | 0.99 | % | | | 0.99 | % | | | 0.99 | % |
| | | | | |
Ratio of gross expenses to average net assets4 | | | 1.07 | % | | | 1.05 | % | | | 1.07 | % | | | 1.08 | % | | | 1.08 | % |
| | | | | |
Ratio of net investment income to average net assets2 | | | 2.39 | % | | | 1.85 | % | | | 2.17 | % | | | 2.56 | % | | | 2.79 | % |
| | | | | |
Portfolio turnover | | | 45 | % | | | 61 | % | | | 81 | % | | | 40 | % | | | 89 | % |
| | | | | |
Net assets end of year (000’s) omitted | | | $2,955 | | | | $14,923 | | | | $5,015 | | | | $5,722 | | | | $7,283 | |
| | | | | |
| | | | | | | | | | | | | | | | | | | | | |
62
| | |
| | |
| | | AMG GW&K Municipal Enhanced Yield Fund Financial Highlights For a share outstanding throughout each fiscal year |
| | | |
| | | |
| | | |
| | | | | | | | | | | | | | | | | | | | |
| | | For the fiscal years ended December 31, |
| | | | | |
| Class I | | 2022 | | 2021 | | 2020 | | 2019 | | 2018 |
| | | | | |
Net Asset Value, Beginning of Year | | | $10.43 | | | | $10.40 | | | | $10.15 | | | | $9.45 | | | | $10.01 | |
| | | | | |
Income (loss) from Investment Operations: | | | | | | | | | | | | | | | | | | | | |
| | | | | |
Net investment income1,2 | | | 0.24 | | | | 0.23 | | | | 0.25 | | | | 0.29 | | | | 0.31 | |
| | | | | |
Net realized and unrealized gain (loss) on investments | | | (2.09 | ) | | | 0.17 | | | | 0.37 | | | | 0.76 | | | | (0.32 | ) |
| | | | | | | | | | | | | | | | | | | | |
| | | | | |
Total income (loss) from investment operations | | | (1.85 | ) | | | 0.40 | | | | 0.62 | | | | 1.05 | | | | (0.01 | ) |
| | | | | |
Less Distributions to Shareholders from: | | | | | | | | | | | | | | | | | | | | |
| | | | | |
Net investment income | | | (0.25 | ) | | | (0.23 | ) | | | (0.25 | ) | | | (0.29 | ) | | | (0.31 | ) |
| | | | | |
Net realized gain on investments | | | (0.03 | ) | | | (0.14 | ) | | | (0.12 | ) | | | (0.06 | ) | | | — | |
| | | | | |
Paid in capital | | | — | | | | — | | | | — | | | | — | | | | (0.24 | ) |
| | | | | | | | | | | | | | | | | | | | |
| | | | | |
Total distributions to shareholders | | | (0.28 | ) | | | (0.37 | ) | | | (0.37 | ) | | | (0.35 | ) | | | (0.55 | ) |
| | | | | |
Net Asset Value, End of Year | | | $8.30 | | | | $10.43 | | | | $10.40 | | | | $10.15 | | | | $9.45 | |
| | | | | | | | | | | | | | | | | | | | |
| | | | | |
Total Return2,3 | | | (17.86 | )% | | | 3.94 | % | | | 6.31 | % | | | 11.28 | % | | | (0.07 | )% |
| | | | | |
Ratio of net expenses to average net assets | | | 0.64 | % | | | 0.64 | % | | | 0.64 | % | | | 0.64 | % | | | 0.64 | % |
| | | | | |
Ratio of gross expenses to average net assets4 | | | 0.72 | % | | | 0.70 | % | | | 0.72 | % | | | 0.73 | % | | | 0.73 | % |
| | | | | |
Ratio of net investment income to average net assets2 | | | 2.74 | % | | | 2.20 | % | | | 2.52 | % | | | 2.91 | % | | | 3.14 | % |
| | | | | |
Portfolio turnover | | | 45 | % | | | 61 | % | | | 81 | % | | | 40 | % | | | 89 | % |
| | | | | |
Net assets end of year (000’s) omitted | | | $255,928 | | | | $369,473 | | | | $323,439 | | | | $273,228 | | | | $203,867 | |
| | | | | |
| | | | | | | | | | | | | | | | | | | | | |
63
| | |
| | |
| | | AMG GW&K Municipal Enhanced Yield Fund Financial Highlights For a share outstanding throughout each fiscal year |
| | | |
| | | |
| | | |
| | | | | | | | | | | | | | | | | | | | |
| | | For the fiscal years ended December 31, |
| | | | | |
| Class Z | | 2022 | | 2021 | | 2020 | | 2019 | | 2018 |
| | | | | |
Net Asset Value, Beginning of Year | | | $10.43 | | | | $10.40 | | | | $10.15 | | | | $9.44 | | | | $10.01 | |
| | | | | |
Income (loss) from Investment Operations: | | | | | | | | | | | | | | | | | | | | |
| | | | | |
Net investment income1,2 | | | 0.25 | | | | 0.24 | | | | 0.26 | | | | 0.30 | | | | 0.31 | |
| | | | | |
Net realized and unrealized gain (loss) on investments | | | (2.10 | ) | | | 0.17 | | | | 0.37 | | | | 0.76 | | | | (0.32 | ) |
| | | | | | | | | | | | | | | | | | | | |
| | | | | |
Total income (loss) from investment operations | | | (1.85 | ) | | | 0.41 | | | | 0.63 | | | | 1.06 | | | | (0.01 | ) |
| | | | | |
Less Distributions to Shareholders from: | | | | | | | | | | | | | | | | | | | | |
| | | | | |
Net investment income | | | (0.25 | ) | | | (0.24 | ) | | | (0.26 | ) | | | (0.29 | ) | | | (0.32 | ) |
| | | | | |
Net realized gain on investments | | | (0.03 | ) | | | (0.14 | ) | | | (0.12 | ) | | | (0.06 | ) | | | — | |
| | | | | |
Paid in capital | | | — | | | | — | | | | — | | | | — | | | | (0.24 | ) |
| | | | | | | | | | | | | | | | | | | | |
| | | | | |
Total distributions to shareholders | | | (0.28 | ) | | | (0.38 | ) | | | (0.38 | ) | | | (0.35 | ) | | | (0.56 | ) |
| | | | | |
Net Asset Value, End of Year | | | $8.30 | | | | $10.43 | | | | $10.40 | | | | $10.15 | | | | $9.44 | |
| | | | | | | | | | | | | | | | | | | | |
| | | | | |
Total Return2,3 | | | (17.82 | )% | | | 3.99 | % | | | 6.37 | % | | | 11.45 | % | | | (0.09 | )% |
| | | | | |
Ratio of net expenses to average net assets | | | 0.59 | % | | | 0.59 | % | | | 0.59 | % | | | 0.59 | % | | | 0.59 | % |
| | | | | |
Ratio of gross expenses to average net assets4 | | | 0.67 | % | | | 0.65 | % | | | 0.67 | % | | | 0.68 | % | | | 0.68 | % |
| | | | | |
Ratio of net investment income to average net assets2 | | | 2.79 | % | | | 2.25 | % | | | 2.57 | % | | | 2.96 | % | | | 3.19 | % |
| | | | | |
Portfolio turnover | | | 45 | % | | | 61 | % | | | 81 | % | | | 40 | % | | | 89 | % |
| | | | | |
Net assets end of year (000’s) omitted | | | $111 | | | | $135 | | | | $130 | | | | $120 | | | | $108 | |
| | | | | |
| | | | | | | | | | | | | | | | | | | | | |
| 1 | Per share numbers have been calculated using average shares. |
| 2 | Total returns and net investment income would have been lower had certain expenses not been offset. |
| 3 | The total return is calculated using the published Net Asset Value as of fiscal year end. |
| 4 | Excludes the impact of expense reimbursement or fee waivers and expense reductions such as brokerage credits, but includes expense repayments and non-reimbursable expenses, if any, such as interest, taxes, and extraordinary expenses. (See Note 1(c) and 2 in the Notes to Financial Statements.) |
64
| | |
| | |
| | | Notes to Financial Statements December 31, 2022 |
| | | |
| | | |
| | | |
1. ORGANIZATION AND SUMMARY OF SIGNIFICANT ACCOUNTING POLICIES
AMG Funds, AMG Funds II and AMG Funds III (the “Trusts”) are open-end management investment companies, organized as Massachusetts business trusts, and registered under the Investment Company Act of 1940, as amended (the “1940 Act”). Currently, the Trusts consist of a number of different funds, each having distinct investment management objectives, strategies, risks, and policies. Included in this report are AMG Funds: AMG GW&K Municipal Bond Fund (“Municipal Bond”), AMG GW&K Municipal Enhanced Yield Fund (“Municipal Enhanced”), AMG Funds II: AMG GW&K Enhanced Core Bond ESG Fund (“Enhanced Core Bond ESG”) and AMG Funds III: AMG GW&K ESG Bond Fund (“ESG Bond”) and AMG GW&K High Income Fund (“High Income”), each a “Fund” and collectively, the “Funds”.
Each Fund offers different classes of shares. All Funds offer Class N shares and Class I shares; and Enhanced Core Bond ESG and Municipal Enhanced offer Class Z shares. Each class represents an interest in the same assets of the respective Fund. Although all share classes generally have identical voting rights, each share class votes separately when required by law. Different share classes may have different net asset values per share to the extent the share classes pay different distribution amounts and/or the expenses of such share classes differ. Each share class has its own expense structure. Please refer to a current prospectus for additional information on each share class.
Market prices of investments held by the Funds may fall rapidly or unpredictably due to a variety of economic or political factors, market conditions, disasters or public health issues, or in response to events that affect particular industries or companies.
The Funds’ financial statements are prepared in accordance with accounting principles generally accepted in the United States of America (“U.S. GAAP”), including accounting and reporting guidance pursuant to Accounting Standards Codification Topic 946 applicable to investment companies. U.S. GAAP requires management to make estimates and assumptions that affect the reported amounts of assets and liabilities and disclosure of contingent assets and liabilities at the date of the financial statements and the reported amounts of income and expenses during the reporting period. Actual results could differ from those estimates and such differences could be material. The following is a summary of significant accounting policies followed by the Funds in the preparation of their financial statements:
a. VALUATION OF INVESTMENTS
Fixed income securities purchased with a remaining maturity exceeding 60 days are valued at the evaluated bid price provided by an authorized pricing service or, if an evaluated price is not available, by reference to other securities which are considered comparable in credit rating, interest rate, due date and other features (generally referred to as “matrix pricing”) or other similar pricing methodologies. Investments in certain mortgage-backed and stripped mortgage-backed securities, convertible securities, derivatives and other debt securities not traded on an organized securities market are valued on the basis of valuations provided by dealers or by a pricing service which uses information with respect to transactions in such securities and various relationships between such securities and yield to maturity in determining value.
Fixed income securities purchased with a remaining maturity of 60 days or less are valued at amortized cost, provided that the amortized cost value is
approximately the same as the fair value of the security valued without the use of amortized cost. Investments in other open-end registered investment companies are valued at their end of day net asset value per share.
The Funds’ portfolio investments are generally valued based on independent market quotations or prices or, if none, “evaluative” or other market based valuations provided by third party pricing services approved by the Boards of Trustees of the Trusts (the “Boards”). Under certain circumstances, the value of certain Fund portfolio investments may be based on an evaluation of fair value, pursuant to procedures established by and under the general supervision of the Boards. The Valuation Committee, which is comprised of the Independent Trustees of the Boards, and the Pricing Committee, which is comprised of representatives from AMG Funds LLC (the “Investment Manager”) are the committees appointed by the Boards to make fair value determinations. Each Fund may use the fair value of a portfolio investment to calculate its net asset value (“NAV”) in the event that the market quotation, price or market based valuation for the portfolio investment is not readily available or otherwise not determinable pursuant to the Boards’ valuation procedures, if the Investment Manager or the Pricing Committee believes the quotation, price or market based valuation to be unreliable, or in certain other circumstances. When determining the fair value of an investment, the Pricing Committee and, if required under the Trusts’ securities valuation procedures, the Valuation Committee, seeks to determine the price that a Fund might reasonably expect to receive from current sale of that portfolio investment in an arms-length transaction. Fair value determinations shall be based upon consideration of all available facts and information, including, but not limited to (i) attributes specific to the investment; (ii) fundamental and analytical data relating to the investment; and (iii) the value of other comparable securities or relevant financial instruments, including derivative securities, traded on other markets or among dealers.
The values assigned to fair value portfolio investments are based on available information and do not necessarily represent amounts that might ultimately be realized in the future, since such amounts depend on future developments inherent in long-term investments. Because of the inherent uncertainty of valuation, those estimated values may differ significantly from the values that would have been used had a ready market for the investments existed, and the differences could be material. The Boards will be presented with a quarterly report showing as of the most recent quarter end, all outstanding securities fair valued by the Funds, including a comparison with the prior quarter end and the percentage of the Funds that the security represents at each quarter end.
With respect to foreign equity securities and certain foreign fixed income securities, the Boards have adopted a policy that securities held in the Funds that can be fair valued by the applicable fair value pricing service are fair valued on each business day provided that each individual price exceeds a pre-established confidence level.
Effective September 8, 2022, the Funds adopted the requirements of Rule 2a-5 under the 1940 Act (“Rule 2a-5”), which the Funds’ Board designated the Funds’ Investment Manager as the Funds’ Valuation Designee to perform the Funds’ fair value determinations. Such determinations are subject to Board oversight and certain reporting and other requirements intended to ensure that the Board receives the information it needs to oversee the Investment Manager’s fair value determinations. Other than the designation of the Investment Manager as the Valuation Designee, the Funds’ adoption of Rule 2-a5 did not impact how the Funds determine fair value or the carrying amount of investments held in the Funds.
| | |
| | |
| | | Notes to Financial Statements (continued) |
| | | |
| | | |
| | | |
U.S. GAAP defines fair value as the price that a fund would receive to sell an asset or pay to transfer a liability in an orderly transaction between market participants at the measurement date. U.S. GAAP also establishes a framework for measuring fair value, and a three level hierarchy for fair value measurements based upon the transparency of inputs to the valuation of an asset or liability. Inputs may be observable or unobservable and refer broadly to the assumptions that market participants would use in pricing the asset or liability. Observable inputs reflect the assumptions market participants would use in pricing the asset or liability based on market data obtained from sources independent of the Funds. Unobservable inputs reflect the Funds’ own assumptions about the assumptions that market participants would use in pricing the asset or liability developed based on the best information available in the circumstances. Each investment is assigned a level based upon the observability of the inputs which are significant to the overall valuation.
The three-tier hierarchy of inputs is summarized below:
Level 1 – inputs are quoted prices in active markets for identical investments (e.g., equity securities, open-end investment companies)
Level 2 – other observable inputs (including, but not limited to: quoted prices for similar assets or liabilities in markets that are active, quoted prices for identical or similar assets or liabilities in markets that are not active, inputs other than quoted prices that are observable for the assets or liabilities (such as interest rates, yield curves, volatilities, prepayment speeds, loss severities, credit risks and default rates) or other market corroborated inputs) (e.g., debt securities, government securities, foreign currency exchange contracts, foreign securities utilizing international fair value pricing, fair valued securities with observable inputs)
Level 3 – inputs are significant unobservable inputs (including the Fund’s own assumptions used to determine the fair value of investments) (e.g., fair valued securities with unobservable inputs)
Changes in inputs or methodologies used for valuing investments may result in a transfer in or out of levels within the fair value hierarchy. The inputs or methodologies used for valuing investments may not necessarily be an indication of the risk associated with investing in those investments.
b. SECURITY TRANSACTIONS
Security transactions are accounted for as of trade date. Realized gains and losses on securities sold are determined on the basis of identified cost.
c. INVESTMENT INCOME AND EXPENSES
Interest income, which includes amortization of premium and accretion of discount on debt securities, is accrued as earned. Interest income on foreign securities is recorded gross of any withholding tax. Expenses that cannot be directly attributed to a Fund are apportioned among the funds in the Trusts and other trusts or funds within the AMG Funds Family of Funds (collectively the “AMG Funds Family”) based upon their relative average net assets or number of shareholders. Investment income, realized and unrealized capital gains and losses, the common expenses of each Fund, and certain fund level expense reductions, if any, are allocated on a pro-rata basis to each class based on the relative net assets of each class to the total net assets of each Fund.
d. DIVIDENDS AND DISTRIBUTIONS
Fund distributions resulting from net investment income, if any, will normally be declared and paid monthly by the Funds. Fund distributions resulting from realized net capital gains, if any, will normally be declared and paid at least annually in December. Distributions to shareholders are recorded on the ex-dividend date. Distributions are determined in accordance with federal income tax regulations, which may differ from net investment income and net realized capital gains for financial statement purposes (U.S. GAAP). Differences may be permanent or temporary. Permanent differences are reclassified among capital accounts in the financial statements to reflect their tax character. Permanent book and tax basis differences, if any, relating to shareholder distributions will result in reclassifications to paid-in capital. Temporary differences arise when certain items of income, expense and gain or loss are recognized in different periods for financial statement and tax purposes; these differences will reverse at some time in the future. There are no permanent differences during the year. Temporary differences are primarily due to; for ESG Bond, Enhanced Core Bond ESG, High Income and Municipal Enhanced Yield wash sale loss deferrals, for ESG Bond and High Income, premium amortization on callable bonds.
The tax character of distributions paid during the fiscal years ended December 31, 2022 and December 31, 2021 were as follows:
| | | | | | | | | | | | | | | | | | | | | | | | |
| | | ESG Bond | | | Enhanced Core Bond ESG | | | High Income | |
| | | | | | |
| Distributions paid from: | | 2022 | | | 2021 | | | 2022 | | | 2021 | | | 2022 | | | 2021 | |
| | | | | | |
Ordinary income * | | | $12,655,107 | | | | $200,763 | | | | $1,041,762 | | | | $824,369 | | | | $684,311 | | | | $543,755 | |
| | | | | | |
Tax-exempt income | | | — | | | | — | | | | — | | | | — | | | | — | | | | — | |
| | | | | | |
Long-term capital gains | | | 966,729 | | | | 104,312,217 | | | | — | | | | — | | | | 2,954 | | | | 547 | |
| | | | | | |
Paid-in capital | | | — | | | | — | | | | — | | | | 47,927 | | | | — | | | | — | |
| | | | | | |
| | | | | | | | | | | | | | | | | | | | | | | | |
| | | | | | |
| | | $13,621,836 | | | | $104,512,980 | | | | $1,041,762 | | | | $872,296 | | | | $687,265 | | | | $544,302 | |
| | | | | | | | | | | | | | | | | | | | | | | | |
66
| | |
| | |
| | | Notes to Financial Statements (continued) |
| | | |
| | | |
| | | |
| | | | | | | | | | | | | | | | |
| | |
| | | Municipal Bond | | | Municipal Enhanced | |
| | | | |
Distributions paid from: | | | 2022 | | | | 2021 | | | | 2022 | | | | 2021 | |
| | | | |
Ordinary income * | | | $551,119 | | | | $808,177 | | | | $207,654 | | | | $1,453,156 | |
| | | | |
Tax-exempt income | | | 19,272,793 | | | | 17,729,864 | | | | 7,931,831 | | | | 8,070,665 | |
| | | | |
Long-term capital gains | | | 1,733,844 | | | | 9,730,890 | | | | 814,678 | | | | 3,573,833 | |
| | | | | | | | | | | | | | | | |
| | | | |
| | | $21,557,756 | | | | $28,268,931 | | | | $8,954,163 | | | | $13,097,654 | |
| | | | | | | | | | | | | | | | |
* For tax purposes, short-term capital gain distributions, if any, are considered ordinary income distributions.
As of December 31, 2022, the components of distributable earnings (excluding unrealized appreciation/depreciation) on a tax basis consisted of:
| | | | | | | | | | | | | | | | | | | | |
| | | | | |
| | | ESG Bond | | | Enhanced Core Bond ESG | | | High Income | | | Municipal Bond | | | Municipal Enhanced | |
| | | | | |
Capital loss carryforward | | | $19,613,061 | | | | $4,956,739 | | | | $1,188,227 | | | | $10,312,359 | | | | $10,809,353 | |
| | | | | |
Undistributed ordinary income | | | 31,878 | | | | — | | | | 4,287 | | | | — | | | | — | |
| | | | | |
Undistributed tax-exempt income | | | — | | | | — | | | | — | | | | 677 | | | | 30,058 | |
At December 31, 2022, the cost of investments and the aggregate gross unrealized appreciation and depreciation for federal income tax purposes were as follows:
| | | | | | | | | | | | | | | | |
| | | | |
| Fund | | Cost | | | Appreciation | | | Depreciation | | | Net Depreciation | |
| | | | |
ESG Bond | | | $576,213,247 | | | | $926,487 | | | | $(80,013,775 | ) | | | $(79,087,288 | ) |
| | | | |
Enhanced Core Bond ESG | | | 46,849,394 | | | | 10,494 | | | | (5,741,529 | ) | | | (5,731,035 | ) |
| | | | |
High Income | | | 19,273,681 | | | | 35,883 | | | | (962,111 | ) | | | (926,228 | ) |
| | | | |
Municipal Bond | | | 1,143,562,341 | | | | 2,993,902 | | | | (63,342,720 | ) | | | (60,348,818 | ) |
| | | | |
Municipal Enhanced | | | 290,190,158 | | | | 829,496 | | | | (36,219,434 | ) | | | (35,389,938 | ) |
e. FEDERAL TAXES
Each Fund currently qualifies as an investment company and intends to comply with the requirements under Subchapter M of the Internal Revenue Code of 1986, as amended, and to distribute substantially all of its taxable income and gains to its shareholders and to meet certain diversification and income requirements with respect to investment companies. Therefore, no provision for federal income or excise tax is included in the accompanying financial statements.
Additionally, based on each Fund’s understanding of the tax rules and rates related to income, gains and transactions for the foreign jurisdictions in which it invests, each Fund will provide for foreign taxes, and where appropriate, deferred foreign taxes.
Management has analyzed the Funds’ tax positions taken on federal income tax returns as of December 31, 2022, and for all open tax years (generally, the three prior taxable years), and has concluded that no provision for federal income tax is required in the Funds’ financial statements. Additionally, Management is not aware of any tax position for which it is reasonably possible that the total amounts of unrecognized tax benefits will change materially in the next twelve months.
f. CAPITAL LOSS CARRYOVERS AND DEFERRALS
As of December 31, 2022, the Funds had capital loss carryovers for federal income tax purposes as shown in the following chart. These amounts may be used to offset future realized capital gains indefinitely, and retain their character as short-term and/or long-term.
| | | | | | | | | | | | |
| | | |
| Fund | | Short-Term | | | Long-Term | | | Total | |
| | | |
ESG Bond | | | $7,220,366 | | | | $12,392,695 | | | | $19,613,061 | |
| | | |
Enhanced Core Bond ESG | | | 2,475,319 | | | | 2,481,420 | | | | 4,956,739 | |
| | | |
High Income | | | 397,484 | | | | 790,743 | | | | 1,188,227 | |
| | | |
Municipal Bond | | | 2,786,859 | | | | 7,525,500 | | | | 10,312,359 | |
| | | |
Municipal Enhanced | | | 3,966,598 | | | | 6,842,755 | | | | 10,809,353 | |
For the fiscal year ended December 31, 2022, the Funds did not utilize capital loss carryovers.
67
| | |
| | |
| | | Notes to Financial Statements (continued) |
| | | |
| | | |
| | | |
g. CAPITAL STOCK
The Trust’s Declaration of Trust authorizes for each Fund the issuance of an unlimited number of shares of beneficial interest, without par value. Each Fund records sales and repurchases of its capital stock on the trade date.
For the fiscal years ended December 31, 2022 and December 31, 2021, the capital stock transactions by class for the Funds were as follows:
| | | | | | | | | | | | | | | | | | | | | | | | | | | | | | | | |
| | | ESG Bond | | | Enhanced Core Bond ESG | |
| | | December 31, 2022 | | | December 31, 2021 | | | December 31, 2022 | | | December 31, 2021 | |
| | | Shares | | | Amount | | | Shares | | | Amount | | | Shares | | | Amount | | | Shares | | | Amount | |
| | | | | | | | |
Class N: | | | | | | | | | | | | | | | | | | | | | | | | | | | | | | | | |
| | | | | | | | |
Shares sold | | | 434,859 | | | | $9,802,580 | | | | 1,452,937 | | | | $38,053,195 | | | | 151,245 | | | | $1,447,268 | | | | 286,260 | | | | $3,068,578 | |
| | | | | | | | |
Shares issued in reinvestment of distributions | | | 345,800 | | | | 7,627,326 | | | | 2,051,404 | | | | 51,918,933 | | | | 20,650 | | | | 192,586 | | | | 17,561 | | | | 187,784 | |
| | | | | | | | |
Shares redeemed | | | (3,716,450) | | | | (83,888,821) | | | | (6,049,606) | | | | (156,764,465) | | | | (268,963) | | | | (2,557,723) | | | | (459,141) | | | | (4,905,575) | |
| | | | | | | | | | | | | | | | | | | | | | | | | | | | | | | | |
| | | | | | | | |
Net decrease | | | (2,935,791) | | | | $(66,458,915) | | | | (2,545,265) | | | | $(66,792,337) | | | | (97,068) | | | | $(917,869) | | | | (155,320) | | | | $(1,649,213) | |
| | | | | | | | | | | | | | | | | | | | | | | | | | | | | | | | |
| | | | | | | | |
Class I: | | | | | | | | | | | | | | | | | | | | | | | | | | | | | | | | |
| | | | | | | | |
Shares sold | | | 1,292,769 | | | | $29,148,121 | | | | 3,132,524 | | | | $82,409,399 | | | | 1,447,204 | | | | $13,969,790 | | | | 1,729,710 | | | | $18,560,256 | |
| | | | | | | | |
Shares issued in reinvestment of distributions | | | 256,042 | | | | 5,663,172 | | | | 1,959,229 | | | | 49,642,039 | | | | 55,346 | | | | 519,860 | | | | 40,944 | | | | 439,321 | |
| | | | | | | | |
Shares redeemed | | | (5,602,000) | | | | (125,532,119) | | | | (11,383,287) | | | | (293,819,048) | | | | (2,416,748) | | | | (23,744,821) | | | | (1,177,158) | | | | (12,618,347) | |
| | | | | | | | | | | | | | | | | | | | | | | | | | | | | | | | |
| | | | | | | | |
Net increase (decrease) | | | (4,053,189) | | | | $(90,720,826) | | | | (6,291,534) | | | | $(161,767,610) | | | | (914,198) | | | | $(9,255,171) | | | | 593,496 | | | | $6,381,230 | |
| | | | | | | | | | | | | | | | | | | | | | | | | | | | | | | | |
| | | | | | | | |
Class Z: | | | | | | | | | | | | | | | | | | | | | | | | | | | | | | | | |
| | | | | | | | |
Shares sold | | | — | | | | — | | | | — | | | | — | | | | 147,673 | | | | $1,476,721 | | | | 442,744 | | | | $4,753,770 | |
| | | | | | | | |
Shares issued in reinvestment of distributions | | | — | | | | — | | | | — | | | | — | | | | 27,916 | | | | 261,662 | | | | 17,832 | | | | 191,235 | |
| | | | | | | | |
Shares redeemed | | | — | | | | — | | | | — | | | | — | | | | (359,946) | | | | (3,361,565) | | | | (229,602) | | | | (2,465,708) | |
| | | | | | | | | | | | | | | | | | | | | | | | | | | | | | | | |
| | | | | | | | |
Net increase (decrease) | | | — | | | | — | | | | — | | | | — | | | | (184,357) | | | | $(1,623,182) | | | | 230,974 | | | | $2,479,297 | |
| | | | | | | | | | | | | | | | | | | | | | | | | | | | | | | | |
| | |
| | | High Income | | | Municipal Bond | |
| | | | |
| | | December 31, 2022 | | | December 31, 2021 | | | December 31, 2022 | | | December 31, 2021 | |
| | | Shares | | | Amount | | | Shares | | | Amount | | | Shares | | | Amount | | | Shares | | | Amount | |
| | | | | | | | |
Class N: | | | | | | | | | | | | | | | | | | | | | | | | | | | | | | | | |
| | | | | | | | |
Shares sold | | | 18,712 | | | | $389,945 | | | | 111,205 | | | | $2,494,229 | | | | 647,098 | | | | $7,349,629 | | | | 698,892 | | | | $8,650,727 | |
| | | | | | | | |
Shares issued in reinvestment of distributions | | | 13,040 | | | | 267,721 | | | | 9,973 | | | | 224,451 | | | | 16,904 | | | | 188,374 | | | | 23,744 | | | | 292,232 | |
| | | | | | | | |
Shares redeemed | | | (70,270) | | | | (1,469,556) | | | | (221,405) | | | | (4,977,229) | | | | (895,246) | | | | (10,012,745) | | | | (782,262) | | | | (9,674,017) | |
| | | | | | | | | | | | | | | | | | | | | | | | | | | | | | | | |
| | | | | | | | |
Net decrease | | | (38,518) | | | | $(811,890) | | | | (100,227) | | | | $(2,258,549) | | | | (231,244) | | | | $(2,474,742) | | | | (59,626) | | | | $(731,058) | |
| | | | | | | | | | | | | | | | | | | | | | | | | | | | | | | | |
| | | | | | | | |
Class I: | | | | | | | | | | | | | | | | | | | | | | | | | | | | | | | | |
| | | | | | | | |
Shares sold | | | 484,312 | | | | $9,834,594 | | | | 605,743 | | | | $13,584,553 | | | | 81,732,933 | | | | $917,700,640 | | | | 33,594,124 | | | | $418,621,329 | |
| | | | | | | | |
Shares issued in reinvestment of distributions | | | 19,941 | | | | 410,014 | | | | 13,885 | | | | 312,124 | | | | 1,484,035 | | | | 16,631,130 | | | | 1,809,529 | | | | 22,408,701 | |
| | | | | | | | |
Shares redeemed | | | (556,443) | | | | (11,307,954) | | | | (33,112) | | | | (749,594) | | | | (95,879,229) | | | | (1,074,060,059) | | | | (30,023,803) | | | | (373,936,594) | |
| | | | | | | | | | | | | | | | | | | | | | | | | | | | | | | | |
| | | | | | | | |
Net increase (decrease) | | | (52,190) | | | | $(1,063,346) | | | | 586,516 | | | | $13,147,083 | | | | (12,662,261) | | | | $(139,728,289) | | | | 5,379,850 | | | | $67,093,436 | |
| | | | | | | | | | | | | | | | | | | | | | | | | | | | | | | | |
68
| | |
| | |
| | | Notes to Financial Statements (continued) |
| | | |
| | | |
| | | |
| | | | | | | | | | | | | | | | |
| | | Municipal Enhanced | |
| | | December 31, 2022 | | | December 31, 2021 | |
| | | Shares | | | Amount | | | Shares | | | Amount | |
| | | | |
Class N: | | | | | | | | | | | | | | | | |
| | | | |
Shares sold | | | 616,950 | | | | $5,797,292 | | | | 3,442,311 | | | | $37,047,081 | |
| | | | |
Shares issued in reinvestment of distributions | | | 5,976 | | | | 53,425 | | | | 15,958 | | | | 172,953 | |
| | | | |
Shares redeemed | | | (1,667,635 | ) | | | (16,584,715 | ) | | | (2,537,721 | ) | | | (27,497,613 | ) |
| | | | | | | | | | | | | | | | |
| | | | |
Net increase (decrease) | | | (1,044,709 | ) | | | $(10,733,998 | ) | | | 920,548 | | | | $9,722,421 | |
| | | | | | | | | | | | | | | | |
| | | | |
Class I: | | | | | | | | | | | | | | | | |
| | | | |
Shares sold | | | 12,933,675 | | | | $112,341,447 | | | | 10,001,279 | | | | $105,402,142 | |
| | | | |
Shares issued in reinvestment of distributions | | | 534,430 | | | | 4,664,114 | | | | 631,256 | | | | 6,610,515 | |
| | | | |
Shares redeemed | | | (18,061,842 | ) | | | (159,500,846 | ) | | | (6,312,309 | ) | | | (66,530,105 | ) |
| | | | | | | | | | | | | | | | |
| | | | |
Net increase (decrease) | | | (4,593,737 | ) | | | $(42,495,285 | ) | | | 4,320,226 | | | | $45,482,552 | |
| | | | | | | | | | | | | | | | |
| | | | |
Class Z: | | | | | | | | | | | | | | | | |
| | | | |
Shares issued in reinvestment of distributions | | | 423 | | | | $3,685 | | | | 461 | | | | $4,817 | |
| | | | | | | | | | | | | | | | |
| | | | |
Net increase | | | 423 | | | | $3,685 | | | | 461 | | | | $4,817 | |
| | | | | | | | | | | | | | | | |
h. REPURCHASE AGREEMENTS AND JOINT REPURCHASE AGREEMENTS
The Funds may enter into third-party and bilateral repurchase agreements for temporary cash management purposes and third-party or bilateral joint repurchase agreements for reinvestment of cash collateral on securities lending transactions under the securities lending program offered by The Bank of New York Mellon (“BNYM”) (the “Program”) (collectively, “Repurchase Agreements”). The value of the underlying collateral, including accrued interest, must equal or exceed the value of the Repurchase Agreements during the term of the agreement. For joint repurchase agreements, the Funds participate on a pro rata basis with other clients of BNYM in its share of the underlying collateral under such joint repurchase agreements and in its share of proceeds from any repurchase or other disposition of the underlying collateral. The underlying collateral for all Repurchase Agreements is held in safekeeping by the Funds’ custodian or at the Federal Reserve Bank. If the seller defaults and the value of the collateral declines, or if bankruptcy proceedings commence with respect to the seller of the security, realization of the collateral by the Funds may be delayed or limited. Pursuant to the Program, the Funds are indemnified for such losses by BNYM on joint repurchase agreements.
At December 31, 2022, the market value of Repurchase Agreements outstanding for ESG Bond, Enhanced Core Bond ESG, High Income, Municipal Bond Fund and Municipal Enhanced Yield were $10,482,408, $1,472,815, $1,501,247, $668,000 and $926,000, respectively.
i. SECURITIES TRANSACTED ON A WHEN ISSUED BASIS
The Funds may enter into To-Be-Announced (“TBA”) sale commitments to hedge their portfolio positions or to sell mortgage-backed securities they own under delayed delivery arrangements. Proceeds of TBA sale commitments are not received until the contractual settlement date. During the time a TBA sale commitment is outstanding, equivalent deliverable securities, with the same counterparty, or an offsetting TBA purchase commitment deliverable on or before
the sale commitment date, are held as “cover” for the transaction. Unsettled TBA sale commitments are valued at the current market value of the underlying securities according to the procedures described under “Valuation of Investments,” in Footnote 1a above.
Each TBA contract is marked-to-market daily and the change in market value is recorded by the Fund as an unrealized gain or loss. If the TBA sale commitment is closed through the acquisition of an offsetting purchase commitment with the same broker, the Fund realizes a gain or loss. If the Fund delivers securities under the commitment, the Fund realizes a gain or a loss from the sale of the securities based upon the unit price established at the date the commitment was entered into.
j. DELAYED DELIVERY TRANSACTIONS AND WHEN-ISSUED SECURITIES
The Funds may enter into securities transactions on a delayed delivery or when issued basis. Payment and delivery may take place after the customary settlement period for that security. The price of the underlying securities and the date when the securities will be delivered and paid for are fixed at the time the transaction is negotiated. During the time a delayed delivery sell is outstanding, the contract is marked to market daily and equivalent deliverable securities are held for the transaction. The value of the securities purchased on a delayed delivery or when-issued basis are identified as such in each Fund’s Schedule of Portfolio Investments. With respect to purchase commitments, the Fund’s identify securities as segregated in its records with a value at least equal to the amount of the commitment. Delayed delivery or when-issued securities that have been purchased from and sold to different brokers are reflected as an investment in securities and a forward sale commitment in the Fund’s Statement of Assets and Liabilities. For financial reporting purposes, the Fund does offset the receivable and payable for delayed delivery investments purchased and sold on TBA commitments. Losses may arise due to changes in the value of the underlying
69
| | |
| | |
| | | Notes to Financial Statements (continued) |
| | | |
| | | |
| | | |
securities or if the counterparty does not perform under the contract, or if the issuer does not issue the securities due to political, economic, or other factors.
2. AGREEMENTS AND TRANSACTIONS WITH AFFILIATES
For each of the Funds, the Trusts have entered into an investment advisory agreement under which the Investment Manager, a subsidiary and the U.S. retail distribution arm of Affiliated Managers Group, Inc. (“AMG”), serves as investment manager to the Funds and is responsible for the Funds’ overall administration and operations. The Investment Manager selects one or more subadvisers for the Funds (subject to the Boards approval) and monitors each subadviser’s investment performance, security holdings and investment strategies. Each Fund’s investment portfolio is managed by GW&K who serves pursuant to a subadvisory agreement with the Investment Manager. AMG indirectly owns a majority interest in GW&K. Prior to March 19, 2021, ESG Bond’s investment portfolio was managed by Loomis, Sayles & Company, L.P.
Investment management fees are paid directly by the Funds to the Investment Manager based on average daily net assets. For the fiscal year ended December 31, 2022, the Funds’ investment management fees were paid at the following annual rates of each Fund’s respective average daily net assets:
| | | | |
| |
ESG Bond | | | 0.23%1 | |
| |
Enhanced Core Bond ESG | | | 0.30% | |
| |
High Income | | | 0.39% | |
| |
Municipal Bond on first $25 million | | | 0.35% | |
| |
on next $25 million | | | 0.30% | |
| |
on next $50 million | | | 0.25% | |
| |
on balance over $100 million | | | 0.20% | |
| |
Municipal Enhanced | | | 0.45% | |
| 1 | Prior to June 12, 2021, the annual rate for the investment management fees for ESG Bond was 0.26% of the Fund’s average daily net assets. |
The fee paid to GW&K for its services as subadviser is paid out of the fee the Investment Manager receives from each Fund and does not increase the expenses of each Fund.
The Investment Manager has contractually agreed, through at least May 1, 2023, to waive management fees and/or pay or reimburse fund expenses in order to limit total annual Fund operating expenses after fee waiver and expense reimbursements (exclusive of taxes, interest (including interest incurred in connection with bank and custody overdrafts, and in connection with securities sold short), shareholder servicing fees, distribution and service (12b-1) fees, brokerage commissions and other transaction costs, dividends payable with respect to securities sold short, acquired fund fees and expenses and extraordinary expenses) of ESG Bond, Enhanced Core Bond ESG, High Income, Municipal Bond, and Municipal Enhanced to the annual rate of 0.43%, 0.48%. 0.59%, 0.34%, and 0.59%, respectively, of each Fund’s average daily net assets (this annual rate or such other annual rate that may be in effect from time to time, the “Expense Cap”), subject to later reimbursement by the Funds in certain circumstances. Prior to June 12, 2021, ESG Bond expense limitation was 0.46%.
In general, for a period of up to 36 months after the date any amounts are paid, waived or reimbursed by the Investment Manager, the Investment Manager may recover such amounts from a Fund, provided that such repayment would not cause the Fund’s total annual operating expenses after fee waiver and expense reimbursements (exclusive of the items noted in the parenthetical above) to exceed either (i) the Expense Cap in effect at the time such amounts were paid, waived or reimbursed, or (ii) the Expense Cap in effect at the time of such repayment by the Fund.
The contractual expense limitation may only be terminated in the event the Investment Manager or a successor ceases to be the investment manager of a Fund or a successor fund, by mutual agreement between the Investment Manager and the Boards, or in the event of a Fund’s liquidation unless the Fund is reorganized or is a party to a merger in which the surviving entity is successor to the accounting and performance information of a Fund.
At December 31, 2022, the Funds’ expiration of reimbursements subject to recoupment is as follows:
| | | | | | | | | | | | |
| Expiration Period | | ESG Bond | | | Enhanced Core
Bond ESG | | | High Income | |
| | | |
Less than 1 year | | | $51,532 | | | | $135,792 | | | | $75,430 | |
| | | |
1-2 years | | | 19,644 | | | | 113,335 | | | | 94,499 | |
| | | |
2-3 years | | | 72,842 | | | | 130,195 | | | | 88,045 | |
| | | | | | | | | | | | |
| | | |
Total | | | $144,018 | | | | $379,322 | | | | $257,974 | |
| | | | | | | | | | | | |
| | | | | | | | |
| Expiration Period | | Municipal Bond | | | Municipal Enhanced | |
| | |
Less than 1 year | | | $704,935 | | | | $242,883 | |
| | |
1-2 years | | | 706,015 | | | | 230,390 | |
| | |
2-3 years | | | 726,185 | | | | 225,094 | |
| | | | | | | | |
| | |
Total | | | $2,137,135 | | | | $698,367 | |
| | | | | | | | |
The Trusts, on behalf of the Funds, have entered into an amended and restated Administration Agreement under which the Investment Manager serves as the Funds’ administrator (the “Administrator”) and is responsible for all non-portfolio management aspects of managing the Funds’ operations, including administration and shareholder services to each Fund. Each Fund pays a fee to the Administrator at the rate of 0.15% per annum of the Fund’s average daily net assets for this service.
The Funds are distributed by AMG Distributors, Inc. (the “Distributor”), a wholly-owned subsidiary of the Investment Manager. The Distributor serves as the distributor and underwriter for each Fund and is a registered broker-dealer and member of the Financial Industry Regulatory Authority, Inc. (“FINRA”). Shares of each Fund will be continuously offered and will be sold directly to prospective purchasers and through brokers, dealers or other financial intermediaries who have executed selling agreements with the Distributor. Generally the Distributor bears all or a portion of the expenses of providing services pursuant to the distribution agreement, including the payment of the expenses relating to the distribution of prospectuses for sales purposes and any advertising or sales literature.
The Trusts have adopted a distribution and service plan (the “Plan”) with respect to the Class N shares, in accordance with the requirements of Rule 12b-1 under the
| | |
| | |
| | | Notes to Financial Statements (continued) |
| | | |
| | | |
| | | |
1940 Act and the requirements of the applicable rules of FINRA regarding asset-based sales charges. Pursuant to the Plan, Enhanced Core Bond ESG, Municipal Bond and Municipal Enhanced may make payments to the Distributor for its expenditures in financing any activity primarily intended to result in the sale of each Fund’s Class N shares and for maintenance and personal service provided to existing shareholders of that class. The Plan authorized payments to the Distributor up to 0.25% annually of Enhanced Core Bond ESG, Municipal Bond and Municipal Enhanced average daily net assets attributable to the Class N shares. The portion of payments made under the plan by Class N shares of Enhanced Core Bond ESG, Municipal Bond and Municipal Enhanced for shareholder servicing may not exceed an annual rate of 0.25% of the average daily net asset value of each Fund’s shares of that class owned by clients of such broker, dealer or financial intermediary.
For each of Class N and Class I shares of ESG Bond, High Income, Municipal Bond, Municipal Enhanced, and for Enhanced Core Bond ESG’s Class I shares, the Boards have approved reimbursement payments to the Investment Manager for shareholder servicing expenses (“shareholder servicing fees”) incurred. Shareholder servicing fees include payments to financial intermediaries, such as broker-dealers (including fund supermarket platforms), banks, and trust companies who provide shareholder recordkeeping, account servicing and other services. The Class N and Class I shares may reimburse the Investment Manager for the actual amount incurred up to a maximum annual rate of each Class’s average daily net assets as shown in the table below.
The impact on the annualized expense ratios for the fiscal year ended December 31, 2022, were as follows:
| | | | | | |
| | | Maximum Annual | | | Actual |
| | | Amount | | | Amount |
Fund | | Approved | | | Incurred |
|
ESG Bond |
| | |
Class N | | | 0.25% | | | 0.25% |
| | |
Class I | | | 0.05% | | | 0.05% |
|
Enhanced Core Bond ESG |
| | |
Class I | | | 0.10% | | | 0.08% |
|
High Income |
| | |
Class N | | | 0.25% | | | 0.25% |
| | |
Class I | | | 0.05% | | | 0.05% |
|
Municipal Bond |
| | |
Class N | | | 0.15% | | | 0.13% |
| | |
Class I | | | 0.05% | | | 0.05% |
|
Municipal Enhanced |
| | |
Class N | | | 0.15% | | | 0.15% |
| | |
Class I | | | 0.05% | | | 0.05% |
The Boards provide supervision of the affairs of the Trusts and other trusts within the AMG Funds Family. The Trustees of the Trusts who are not affiliated with the Investment Manager receive an annual retainer and per meeting fees for regular, special and telephonic meetings, and they are reimbursed for out-of-pocket expenses incurred while carrying out their duties as Board members. The Chairman of the Boards and the Audit Committee Chair receive additional annual
retainers. Certain Trustees and Officers of the Funds are Officers and/or Directors of the Investment Manager, AMG and/or the Distributor.
The Securities and Exchange Commission (the “SEC”) granted an exemptive order that permits certain eligible funds in the AMG Funds Family to lend and borrow money for certain temporary purposes directly to and from other eligible funds in the AMG Funds Family. Participation in this interfund lending program is voluntary for both the borrowing and lending funds, and an interfund loan is only made if it benefits each participating fund. The Administrator manages the program according to procedures approved by the Boards, and the Boards monitor the operation of the program. An interfund loan must comply with certain conditions set out in the exemptive order, which are designed to assure fairness and protect all participating funds. The interest earned and interest paid on interfund loans are included on the Statement of Operations as interest income and interest expense, respectively. At December 31, 2022, the Funds had no interfund loans outstanding.
The following Funds utilized the interfund loan program during the fiscal year ended December 31, 2022 as follows:
| | | | | | | | | | | | | | | | |
Fund | | Average
Lent | | | Number
of Days | | | Interest
Earned | | | Average
Interest Rate | |
| | | | |
ESG Bond | | | $4,329,671 | | | | 4 | | | | $1,148 | | | | 2.419 | % |
| | | | |
Enhanced Core Bond ESG | | | 486,039 | | | | 14 | | | | 389 | | | | 2.089 | % |
| | | | |
High Income | | | 489,086 | | | | 7 | | | | 370 | | | | 3.945 | % |
| | | | |
Municipal Bond | | | 8,854,595 | | | | 18 | | | | 9,801 | | | | 2.245 | % |
| | | | |
Municipal Enhanced | | | 3,158,274 | | | | 12 | | | | 1,532 | | | | 1.475 | % |
| | | | |
| Fund | | Average
Borrowed | | | Number
of Days | | | Interest
Paid | | | Average
Interest Rate | |
| | | | |
Enhanced Core Bond ESG | | | $3,368,341 | | | | 8 | | | | $1,340 | | | | 1.815 | % |
| | | | |
High Income | | | 4,673,444 | | | | 5 | | | | 3,009 | | | | 4.700 | % |
| | | | |
Municipal Bond | | | 2,734,196 | | | | 1 | | | | 352 | | | | 4.700 | % |
| | | | |
Municipal Enhanced | | | 1,149,132 | | | | 1 | | | | 164 | | | | 5.210 | % |
3. PURCHASES AND SALES OF SECURITIES
Purchases and sales of securities (excluding short-term securities and U.S. Government Obligations) for the fiscal year ended December 31, 2022, were as follows:
| | | | | | | | |
| | | Long Term Securities | |
| | |
Fund | | Purchases | | | Sales | |
| | |
ESG Bond | | | $65,298,623 | | | | $153,695,147 | |
| | |
Enhanced Core Bond ESG | | | 12,514,020 | | | | 18,382,332 | |
| | |
High Income | | | 13,256,982 | | | | 14,699,126 | |
| | |
Municipal Bond | | | 233,624,424 | | | | 311,059,127 | |
| | |
Municipal Enhanced | | | 130,975,152 | | | | 184,265,445 | |
| | |
| | |
| | | Notes to Financial Statements (continued) |
| | | |
| | | |
| | | |
Purchases and sales of U.S. Government Obligations for the fiscal year ended December 31, 2022 were as follows:
| | | | | | | | |
| | | U.S. Government Obligations | |
Fund | | Purchases | | | Sales | |
| | |
ESG Bond | | | $65,991,278 | | | | $120,991,689 | |
| | |
Enhanced Core Bond ESG | | | 13,127,041 | | | | 16,165,260 | |
4. PORTFOLIO SECURITIES LOANED
The Funds participate in the Program providing for the lending of securities to qualified borrowers. Securities lending income includes earnings of such temporary cash investments, plus or minus any rebate to a borrower. These earnings (after any rebate) are then divided between BNYM, as a fee for its services under the Program, and the Funds, according to agreed-upon rates. Collateral on all securities loaned is accepted in cash, U.S. Treasury Obligations or U.S. Government Agency Obligations. Collateral is maintained at a minimum level of 102% (105% in the case of certain foreign securities) of the market value, plus interest, if applicable, of investments on loan. It is the Funds’ policy to obtain additional collateral from or return excess collateral to the borrower by the end of the next business day, following the valuation date of the securities loaned. Therefore, the value of the collateral held may be temporarily less than the value of the securities on loan. Lending securities entails a risk of loss to the Funds if and to the extent that the market value of the securities loaned were to increase and the borrower did not increase the collateral accordingly, and the borrower fails to return the securities. Under the terms of the Program, the Funds are indemnified for such losses by BNYM. Cash collateral is held in separate omnibus accounts managed by BNYM, who is authorized to exclusively enter into joint repurchase agreements for that cash collateral. Securities collateral is held in separate omnibus accounts managed by BNYM and cannot be sold or pledged. BNYM bears the risk of any deficiency in the amount of the cash collateral available for return to the borrower due to any loss on the collateral invested. Loans of securities are terminable at any time and the borrower, after notice, is required to return borrowed securities as soon as practical, which is normally within three business days.
The value of securities loaned on positions held, cash collateral and securities collateral received at December 31, 2022, were as follows:
| | | | | | | | |
| Fund | | Securities Loaned | | Cash Collateral Received | | Securities Collateral Received | | Total Collateral Received |
| | | | |
ESG Bond | | $25,458,950 | | $7,412,408 | | $19,038,641 | | $26,451,049 |
| | | | |
Enhanced Core Bond ESG | | 2,393,361 | | 1,242,815 | | 1,247,494 | | 2,490,309 |
| | | | |
High Income | | 1,415,713 | | 1,253,247 | | 226,879 | | 1,480,126 |
The following table summarizes the securities received as collateral for securities lending at December 31, 2022:
| | | | | | |
| Fund | | Collateral Type | | Coupon Range | | Maturity
Date Range |
| | | |
ESG Bond | | U.S. Treasury Obligations | | 0.125%-4.750% | | 04/15/23-11/15/51 |
| | | |
Enhanced Core Bond ESG | | U.S. Treasury Obligations | | 0.125%-4.750% | | 01/31/24-11/15/51 |
| | | |
High Income | | U.S. Treasury Obligations | | 0.125%-3.875% | | 04/15/23-11/15/50 |
5. FOREIGN SECURITIES
Certain Funds invest in securities of foreign entities and in instruments denominated in foreign currencies which involve risks not typically associated with investments in domestic securities. Non-domestic securities carry special risks, such as exposure to currency fluctuations, less developed or less efficient trading markets, political instability, a lack of company information, differing auditing and legal standards, and, potentially, less liquidity. Realized gains in certain countries may be subject to foreign taxes at the Fund level and the Fund would pay such foreign taxes at the appropriate rate for each jurisdiction.
6. COMMITMENTS AND CONTINGENCIES
Under the Trusts’ organizational documents, its Trustees and Officers are indemnified against certain liabilities arising out of the performance of their duties to the Trusts. In addition, in the normal course of business, the Funds may enter into contracts and agreements that contain a variety of representations and warranties, which provide general indemnifications. The maximum exposure to the Funds under these arrangements is unknown, as this would involve future claims that may be made against a Fund that have not yet occurred. However, based on experience, the Funds had no prior claims or losses and expect the risks of loss to be remote.
7. RISKS ASSOCIATED WITH HIGH YIELD SECURITIES
Investing in high yield securities involves greater risks and considerations not typically associated with U.S. Government and other high quality/investment grade securities. High yield securities are generally below investment grade securities and do not have an established retail secondary market. Economic downturns may disrupt the high yield market and impair the issuer’s ability to repay principal and interest. Also, an increase in interest rates would likely have an adverse impact on the value of such obligations and could cause the securities to become less liquid.
8. MASTER NETTING AGREEMENTS
The Funds may enter into master netting agreements with their counterparties for the Program and Repurchase Agreements, which provide the right, in the event of default (including bankruptcy or insolvency) for the non-defaulting party to liquidate the collateral and calculate net exposure to the defaulting party or request additional collateral. For financial reporting purposes, the Funds do not offset financial assets and financial liabilities that are subject to master netting agreements in the Statement of Assets and Liabilities. For securities lending transactions, see Note 4.
72
| | |
| | |
| | | Notes to Financial Statements (continued) |
| | | |
| | | |
| | | |
The following table is a summary of the Funds’ open Repurchase Agreements that are subject to a master netting agreement as of December 31, 2022:
| | | | | | | | | | | | | | | | | | | | | | | | | |
| | | | | Gross Amount Not Offset in the | | | | |
| | | | | Statement of Assets and Liabilities | | | | |
| Fund | | Gross Amounts of
Assets Presented in
the Statement of
Assets and Liabilities | | Offset Amount | | Net Asset Balance | | Collateral Received | | Net Amount |
| | | | | |
ESG Bond | | | | | | | | | | | | | | | | | | | | | | | | | |
| | | | | |
Bank of America Securities, Inc. | | | | $1,760,647 | | | | | — | | | | | $1,760,647 | | | | | $1,760,647 | | | | | — | |
| | | | | |
Citigroup Global Markets, Inc. | | | | 369,820 | | | | | — | | | | | 369,820 | | | | | 369,820 | | | | | — | |
| | | | | |
MUFG Securities America, Inc. | | | | 1,760,647 | | | | | — | | | | | 1,760,647 | | | | | 1,760,647 | | | | | — | |
| | | | | |
National Bank Financial | | | | 1,760,647 | | | | | — | | | | | 1,760,647 | | | | | 1,760,647 | | | | | — | |
| | | | | |
RBC Dominion Securities, Inc. | | | | 1,760,647 | | | | | — | | | | | 1,760,647 | | | | | 1,760,647 | | | | | — | |
| | | | | |
Fixed Income Clearing Corp. | | | | 3,070,000 | | | | | — | | | | | 3,070,000 | | | | | 3,070,000 | | | | | — | |
| | | | | | | | | | | | | | | | | | | | | | | | | |
Total | | | | $10,482,408 | | | | | — | | | | | $10,482,408 | | | | | $10,482,408 | | | | | — | |
| | | | | | | | | | | | | | | | | | | | | | | | | |
| | | | | |
Enhanced Core Bond ESG | | | | | | | | | | | | | | | | | | | | | | | | | |
Citigroup Global Markets, Inc. | | | | $242,815 | | | | | — | | | | | $242,815 | | | | | $242,815 | | | | | — | |
National Bank Financial | | | | 1,000,000 | | | | | — | | | | | 1,000,000 | | | | | 1,000,000 | | | | | — | |
Fixed Income Clearing Corp. | | | | 230,000 | | | | | — | | | | | 230,000 | | | | | 230,000 | | | | | — | |
| | | | | | | | | | | | | | | | | | | | | | | | | |
| | | | | |
Total | | | | $1,472,815 | | | | | — | | | | | $1,472,815 | | | | | $1,472,815 | | | | | — | |
| | | | | | | | | | | | | | | | | | | | | | | | | |
| | | | | |
High Income | | | | | | | | | | | | | | | | | | | | | | | | | |
| | | | | |
Citigroup Global Markets, Inc. | | | | $253,247 | | | | | — | | | | | $253,247 | | | | | $253,247 | | | | | — | |
| | | | | |
National Bank Financial | | | | 1,000,000 | | | | | — | | | | | 1,000,000 | | | | | 1,000,000 | | | | | — | |
| | | | | |
Fixed Income Clearing Corp. | | | | 248,000 | | | | | — | | | | | 248,000 | | | | | 248,000 | | | | | — | |
| | | | | | | | | | | | | | | | | | | | | | | | | |
| | | | | |
Total | | | | $1,501,247 | | | | | — | | | | | $1,501,247 | | | | | $1,501,247 | | | | | — | |
| | | | | | | | | | | | | | | | | | | | | | | | | |
| | | | | |
Municipal Bond | | | | | | | | | | | | | | | | | | | | | | | | | |
| | | | | |
Fixed Income Clearing Corp. | | | | $668,000 | | | | | — | | | | | $668,000 | | | | | $668,000 | | | | | — | |
| | | | | |
Municipal Enhanced | | | | | | | | | | | | | | | | | | | | | | | | | |
| | | | | |
Fixed Income Clearing Corp. | | | | $926,000 | | | | | — | | | | | $926,000 | | | | | $926,000 | | | | | — | |
9. SUBSEQUENT EVENTS
The Funds have determined that no material events or transactions occurred through the issuance date of the Funds’ financial statements which require an additional disclosure in or adjustment of the Funds’ financial statements.
73
| | |
| | |
| | | Report of Independent Registered Public Accounting Firm |
| | | |
| | | |
| | | |
To the Board of Trustees of AMG Funds, AMG Funds II, and AMG Funds III and Shareholders of AMG GW&K Municipal Bond Fund, AMG GW&K Municipal Enhanced Yield Fund, AMG GW&K Enhanced Core Bond ESG Fund, AMG GW&K ESG Bond Fund, and AMG GW&K High Income Fund
Opinions on the Financial Statements
We have audited the accompanying statements of assets and liabilities, including the schedules of portfolio investments, of AMG GW&K Municipal Bond Fund, AMG GW&K Municipal Enhanced Yield Fund (two of the funds constituting AMG Funds), AMG GW&K Enhanced Core Bond ESG Fund (one of the funds constituting AMG Funds II), AMG GW&K ESG Bond Fund, and AMG GW&K High Income Fund (two of the funds constituting AMG Funds III) (hereafter collectively referred to as the “Funds”) as of December 31, 2022, the related statements of operations for the year ended December 31, 2022, the statements of changes in net assets for each of the two years in the period ended December 31, 2022, including the related notes, and the financial highlights for each of the periods indicated therein (collectively referred to as the “financial statements”). In our opinion, the financial statements present fairly, in all material respects, the financial position of each of the Funds as of December 31, 2022, the results of each of their operations for the year then ended, the changes in each of their net assets for each of the two years in the period ended December 31, 2022 and each of the financial highlights for each of the periods indicated therein in conformity with accounting principles generally accepted in the United States of America.
Basis for Opinions
These financial statements are the responsibility of the Funds’ management. Our responsibility is to express an opinion on the Funds’ financial statements based on our audits. We are a public accounting firm registered with the Public Company Accounting Oversight Board (United States) (PCAOB) and are required to be independent with respect to the Funds in accordance with the U.S. federal securities laws and the applicable rules and regulations of the Securities and Exchange Commission and the PCAOB.
We conducted our audits of these financial statements in accordance with the standards of the PCAOB. Those standards require that we plan and perform the audit to obtain reasonable assurance about whether the financial statements are free of material misstatement, whether due to error or fraud.
Our audits included performing procedures to assess the risks of material misstatement of the financial statements, whether due to error or fraud, and performing procedures that respond to those risks. Such procedures included examining, on a test basis, evidence regarding the amounts and disclosures in the financial statements. Our audits also included evaluating the accounting principles used and significant estimates made by management, as well as evaluating the overall presentation of the financial statements. Our procedures included confirmation of securities owned as of December 31, 2022 by correspondence with the custodian and brokers; when replies were not received from brokers, we performed other auditing procedures. We believe that our audits provide a reasonable basis for our opinions.
/s/ PricewaterhouseCoopers LLP
Boston, Massachusetts
February 24, 2023
We have served as the auditor of one or more investment companies in the AMG Funds Family since 1993.
74
| | |
| | |
| | | Other Information (unaudited) |
| | | |
| | | |
| | | |
TAX INFORMATION
AMG GW&K ESG Bond Fund, AMG GW&K Enhanced Core Bond ESG Fund, AMG GW&K High Income Fund, AMG GW&K Municipal Bond Fund, and AMG GW&K Municipal Enhanced Yield Fund each hereby designates the maximum amount allowable of its net taxable income as qualified dividends as provided in the Jobs and Growth Tax Relief Reconciliation Act of 2003. The 2022 Form 1099-DIV you receive for each Fund will show the tax status of all distributions paid to you during the year.
Pursuant to section 852 of the Internal Revenue Code, AMG GW&K ESG Bond Fund, AMG GW&K Enhanced Core Bond ESG Fund, AMG GW&K High Income Fund, AMG GW&K Municipal Bond Fund, and AMG GW&K Municipal Enhanced Yield Fund each hereby designates $966,729, $0, $2,954, $1,733,844, and $814,678, respectively, as a capital gain distribution with respect to the taxable year ended December 31, 2022, or if subsequently determined to be different, the net capital gains of such fiscal year.
75
| | |
| | |
| | | AMG Funds Trustees and Officers |
| | | |
| | | |
| | | |
| | | | |
| The Trustees and Officers of the Trust, their business addresses, principal occupations for the past five years and ages are listed below. The Trustees provide broad supervision over the affairs of the Trust and the Funds. The Trustees are experienced executives who meet periodically throughout the year to oversee the Funds’ activities, review contractual arrangements with companies that provide services to the Funds, and | | review the Funds’ performance. Unless otherwise noted, the address of each Trustee or Officer is the address of the Trust: 680 Washington Blvd., Suite 500, Stamford, CT. 06901. There is no stated term of office for Trustees. Trustees serve until their resignation, retirement or removal in | | accordance with the Trust’s organizational documents and policies adopted by the Board from time to time. The Chairman of the Trustees, President, Treasurer and Secretary of the Trust are elected by the Trustees annually. Other officers hold office at the pleasure of the Trustees. |
Independent Trustees
The following Trustees are not “interested persons” of the Trust within the meaning of the 1940 Act:
| | |
Number of Funds Overseen in
Fund Complex | | Name, Age, Principal Occupation(s) During Past 5 Years and Other Directorships Held by Trustee |
| | |
• Trustee since 2012- AMG Funds • Trustee since 2012- AMG Funds II • Trustee since 2012- AMG Funds III • Oversees 40 Funds in Fund Complex | | Bruce B. Bingham, 74 Partner, Hamilton Partners (real estate development firm) (1987-Present); Director of The Yacktman Funds, Inc. (2 portfolios) (2000-2012). |
| | |
• Chairman of the Audit Committee since 2021 • Trustee since 2013- AMG Funds • Trustee since 2013- AMG Funds II • Trustee since 2013- AMG Funds III • Oversees 44 Funds in Fund Complex | | Kurt A. Keilhacker, 59 Managing Partner, TechFund Europe (2000-Present); Managing Partner, TechFund Capital (1997-Present); Managing Partner, Elementum Ventures (2013-Present); Director, MetricStory, Inc. (2017-Present); Trustee, Wheaton College (2018-Present); Trustee, Gordon College (2001-2016); Board Member, 6wind SA (2002-2019). |
| | |
• Trustee since 2004 - AMG Funds • Trustee since 2000 - AMG Funds II • Trustee since 1993 - AMG Funds III • Oversees 40 Funds in Fund Complex | | Steven J. Paggioli, 72 Independent Consultant (2002-Present); Trustee, Professionally Managed Portfolios (28 portfolios); Advisory Board Member, Sustainable Growth Advisors, LP; Independent Director, Muzinich BDC, Inc. (business development company) (2019-Present); Director, The Wadsworth Group; Independent Director, Chase Investment Counsel (2008–2019); Executive Vice President, Secretary and Director, Investment Company Administration, LLC and First Fund Distributors, INC. (1990-2001). |
| | |
• Independent Chairman of the Board of Trustees since 2017 • Chairman of the Governance Committee since 2017 • Trustee since 1999- AMG Funds • Trustee since 2000- AMG Funds II • Trustee since 1999- AMG Funds III • Oversees 44 Funds in Fund Complex | | Eric Rakowski, 64 Professor of Law, University of California at Berkeley School of Law (1990-Present); Tax Attorney at Davis Polk & Wardwell and clerked for Judge Harry T. Edwards of the U.S. Court of Appeals for the District of Columbia Circuit and for Justice William J. Brennan Jr. of the U.S. Supreme Court; Trustee of Parnassus Funds (3 portfolios) (2021-Present); Trustee of Parnassus Income Funds (2 portfolios) (2021-Present); Director of Harding, Loevner Funds, Inc. (10 portfolios); Trustee of Third Avenue Trust (3 portfolios) (2002-2019); Trustee of Third Avenue Variable Trust (1 portfolio) (2002-2019). |
| | |
• Trustee since 2013- AMG Funds • Trustee since 2013- AMG Funds II • Trustee since 2013- AMG Funds III • Oversees 44 Funds in Fund Complex | | Victoria L. Sassine, 57 Adjunct Professor, Babson College (2007–Present); Director, Board of Directors, PRG Group (2017-Present); CEO, Founder, Scale Smarter Partners, LLC (2018-Present); Adviser, EVOFEM Biosciences (2019-Present); Chairperson of the Board of Directors, Business Management Associates (2018-2019). |
76
| | |
| | |
| | | AMG Funds Trustees and Officers (continued) |
| | | |
| | | |
| | | |
| | |
Number of Funds Overseen in
Fund Complex | | Name, Age, Principal Occupation(s) During Past 5 Years and Other Directorships Held by Trustee |
| | |
• Trustee since 2000-AMG Funds II • Trustee since 2004-AMG Funds • Trustee since 1987-AMG Funds III • Oversees 40 Funds in Fund Complex | | Thomas R. Schneeweis, 75* Professor Emeritus, University of Massachusetts (2013-Present); President, TRS Associates (1982-Present); Board Member, Chartered Alternative Investment Association (“CAIA”) (2002-Present); Co-Founder and Director, Institute for Global Asset and Risk Management (Education) (2010-Present); Co-Owner, Quantitative Investment Technologies (2014-Present); Co-Owner, Yes Wealth Management (2018-Present); Director, CAIA Foundation (2010-2019); Partner, S Capital Wealth Advisors (2015-2018); Partner, S Capital Management, LLC (2007-2015); President, Alternative Investment Analytics, LLC (formerly Schneeweis Partners, LLC) (2001-2013). |
*Mr. Schneeweis retired from the Board of Trustees of AMG Funds, AMG Funds II and AMG Funds III as of December 31, 2022.
Interested Trustee
The Trustee in the following table is an “interested person” of the Trust within the meaning of the 1940 Act.
| | |
Number of Funds Overseen in
Fund Complex | | Name, Age, Principal Occupation(s) During Past 5 Years and Other Directorships Held by Trustee |
| | |
• Trustee since 2021 • Oversees 44 Funds in Fund Complex | | Garret W. Weston, 41 Affiliated Managers Group, Inc. (2008-Present): Managing Director, Co-Head of Affiliate Engagement (2021-Present), Senior Vice President, Affiliate Development (2016-2021), Vice President, Office of the CEO (2015-2016), Vice President, New Investments (2012-2015), Senior Associate, New Investments (2008-2012); Associate, Madison Dearborn Partners (2006-2008); Analyst, Merrill Lynch (2004-2006). |
Officers
| | |
Position(s) Held with Fund and Length of Time Served | | Name, Age, Principal Occupation(s) During Past 5 Years |
| | |
• President since 2018 • Principal Executive Officer since 2018 • Chief Executive Officer since 2018 • Chief Operating Officer since 2007 | | Keitha L. Kinne, 64 Chief Operating Officer, AMG Funds LLC (2007-Present); Chief Investment Officer, AMG Funds LLC (2008-Present); President and Principal, AMG Distributors, Inc. (2018-Present); Chief Operating Officer, AMG Distributors, Inc. (2007-Present); President, Chief Executive Officer and Principal Executive Officer, AMG Funds, AMG Funds I, AMG Funds II, AMG Funds III and AMG Funds IV (2018-Present); Chief Operating Officer, AMG Funds, AMG Funds I, AMG Funds II, and AMG Funds III (2007-Present); Chief Operating Officer, AMG Funds IV (2016-Present); Chief Operating Officer and Chief Investment Officer, Aston Asset Management, LLC (2016); President and Principal Executive Officer, AMG Funds, AMG Funds I, AMG Funds II and AMG Funds III (2012-2014); Managing Partner, AMG Funds LLC (2007-2014); President and Principal, AMG Distributors, Inc. (2012-2014); Managing Director, Legg Mason & Co., LLC (2006-2007); Managing Director, Citigroup Asset Management (2004-2006). |
| | |
• Secretary since 2015 • Chief Legal Officer since 2015 | | Mark J. Duggan, 57 Managing Director and Senior Counsel, AMG Funds LLC (2021-Present); Senior Vice President and Senior Counsel, AMG Funds LLC (2015-2021); Secretary and Chief Legal Officer, AMG Funds, AMG Funds I, AMG Funds II, AMG Funds III and AMG Funds IV (2015-Present); Attorney, K&L Gates, LLP (2009-2015). |
| | |
• Chief Financial Officer since 2017 • Treasurer since 2017 • Principal Financial Officer since 2017 • Principal Accounting Officer since 2017 | | Thomas G. Disbrow, 56 Vice President, Mutual Fund Treasurer & CFO, AMG Funds, AMG Funds LLC (2017-Present); Chief Financial Officer, Principal Financial Officer, Treasurer and Principal Accounting Officer, AMG Funds, AMG Funds I, AMG Funds II, AMG Funds III and AMG Funds IV (2017-Present); Managing Director - Global Head of Traditional Funds Product Control, UBS Asset Management (Americas), Inc. (2015-2017); Managing Director - Head of North American Funds Treasury, UBS Asset Management (Americas), Inc. (2011-2015). |
| | |
• Deputy Treasurer since 2017 | | John A. Starace, 52 Vice President, Mutual Fund Accounting, AMG Funds LLC (2021-Present); Director, Mutual Fund Accounting, AMG Funds LLC (2017-2021); Vice President, Deputy Treasurer of Mutual Funds Services, AMG Funds LLC (2014-2017); Deputy Treasurer, AMG Funds, AMG Funds I, AMG Funds II, AMG Funds III and AMG Funds IV (2017-Present); Vice President, Citi Hedge Fund Services (2010-2014); Audit Senior Manager (2005-2010) and Audit Manager (2001-2005), Deloitte & Touche LLP. |
| | |
• Chief Compliance Officer and Sarbanes-Oxley Code of Ethics Compliance Officer since 2019 • Anti-Money Laundering Compliance Officer since 2022 | | Patrick J. Spellman, 48 Vice President, Chief Compliance Officer, AMG Funds LLC (2017-Present); Chief Compliance Officer, AMG Distributors, Inc. (2010-Present); Chief Compliance Officer and Sarbanes-Oxley Code of Ethics Compliance Officer, AMG Funds, AMG Funds I, AMG Funds II, AMG Funds III and AMG Funds IV (2019-Present); Anti-Money Laundering Compliance Officer, AMG Funds, AMG Funds I, AMG Funds II, and AMG Funds III (2014-2019; 2022-Present); Anti-Money Laundering Compliance Officer, AMG Funds IV (2016-2019; 2022-Present); Senior Vice President, Chief Compliance Officer, AMG Funds LLC (2011-2017); Compliance Manager, Legal and Compliance, Affiliated Managers Group, Inc. (2005-2011). |
77
| | |
| | |
| | | AMG Funds Trustees and Officers (continued) |
| | | |
| | | |
| | | |
| | |
Position(s) Held with Fund and Length of Time Served | | Name, Age, Principal Occupation(s) During Past 5 Years |
| | |
• Assistant Secretary since 2016 | | Maureen M. Kerrigan, 37 Vice President, Senior Counsel, AMG Funds LLC (2021-Present); Vice President, Counsel, AMG Funds LLC (2019-2021); Director, Counsel, AMG Funds LLC (2017-2018); Vice President, Counsel, AMG Funds LLC (2015-2017); Assistant Secretary, AMG Funds, AMG Funds I, AMG Funds II, AMG Funds III and AMG Funds IV (2016-Present); Associate, Ropes & Gray LLP (2011-2015); Law Fellow, Massachusetts Appleseed Center for Law and Justice (2010-2011). |
78
|
|
| | | | | | | | |
INVESTMENT MANAGER AND ADMINISTRATOR AMG Funds LLC 680 Washington Blvd., Suite 500 Stamford, CT 06901 800.548.4539 DISTRIBUTOR AMG Distributors, Inc. 680 Washington Blvd., Suite 500 Stamford, CT 06901 800.548.4539 SUBADVISER GW&K Investment Management, LLC 222 Berkeley St. Boston, MA 02116 CUSTODIAN The Bank of New York Mellon Mutual Funds Custody 6023 Airport Road Oriskany, NY 13424 | | | | LEGAL COUNSEL Ropes & Gray LLP Prudential Tower, 800 Boylston Street Boston, MA 02199-3600 TRANSFER AGENT BNY Mellon Investment Servicing (US) Inc. Attn: AMG Funds 4400 Computer Drive Westborough, MA 01581 800.548.4539 Effective March 9, 2023, the Transfer Agent’s mailing address will change to the following: BNY Mellon Investment Servicing (US) Inc. AMG Funds Attn: 534426 AIM 154-0520 500 Ross Street Pittsburgh, PA 15262 800.548.4539 | | | | This report is prepared for the Funds’ shareholders. It is authorized for distribution to prospective investors only when preceded or accompanied by an effective prospectus. To receive a free copy of the prospectus or Statement of Additional Information, which includes additional information about Fund Trustees, please contact us by calling 800.548.4539. Distributed by AMG Distributors, Inc., member FINRA/SIPC. Current net asset values per share for each Fund are available on the Funds’ website at amgfunds.com. A description of the policies and procedures each Fund uses to vote its proxies is available: (i) without charge, upon request, by calling 800.548.4539, or (ii) on the Securities and Exchange Commission’s (SEC) website at sec.gov. For information regarding each Fund’s proxy voting record for the 12-month period ended June 30, call 800.548.4539 or visit the SEC website at sec.gov. The Funds file their complete schedule of portfolio holdings with the SEC for the first and third quarters of each fiscal year as an exhibit to their reports on Form N-PORT. The Funds’ portfolio holdings on Form N-PORT are available on the SEC’s website at sec.gov and the Funds’ website at amgfunds.com. To review a complete list of the Funds’ portfolio holdings, or to view the most recent semiannual report or annual report, please visit amgfunds.com. |
| | | | | | | | | |
|
|
| | | | | | | | |
BALANCED FUNDS AMG GW&K Global Allocation GW&K Investment Management, LLC EQUITY FUNDS AMG Beutel Goodman International Equity Beutel, Goodman & Company Ltd. AMG Boston Common Global Impact Boston Common Asset Management, LLC AMG Frontier Small Cap Growth Frontier Capital Management Co., LLC AMG GW&K Small Cap Core AMG GW&K Small Cap Value AMG GW&K Small/Mid Cap AMG GW&K Small/Mid Cap Growth AMG GW&K Emerging Markets Equity AMG GW&K Emerging Wealth Equity AMG GW&K International Small Cap GW&K Investment Management, LLC AMG Montrusco Bolton Large Cap Growth Montrusco Bolton Investments, Inc. AMG Renaissance Large Cap Growth The Renaissance Group LLC | | | | AMG River Road Dividend All Cap Value AMG River Road Focused Absolute Value AMG River Road International Value Equity AMG River Road Large Cap Value Select AMG River Road Mid Cap Value AMG River Road Small-Mid Cap Value AMG River Road Small Cap Value River Road Asset Management, LLC AMG TimesSquare Emerging Markets Small Cap AMG TimesSquare Global Small Cap AMG TimesSquare International Small Cap AMG TimesSquare Mid Cap Growth AMG TimesSquare Small Cap Growth TimesSquare Capital Management, LLC AMG Veritas Asia Pacific AMG Veritas China AMG Veritas Global Focus AMG Veritas Global Real Return Veritas Asset Management LLP AMG Yacktman AMG Yacktman Focused AMG Yacktman Global AMG Yacktman Special Opportunities Yacktman Asset Management LP | | | | FIXED INCOME FUNDS AMG Beutel Goodman Core Plus Bond Beutel, Goodman & Company Ltd. AMG GW&K Core Bond ESG AMG GW&K Enhanced Core Bond ESG AMG GW&K ESG Bond AMG GW&K High Income AMG GW&K Municipal Bond AMG GW&K Municipal Enhanced Yield GW&K Investment Management, LLC |
| | | | | | | | | |
| | | | | | | | | |
| | | | | | | | | |
| | | | | | | | | |
| | | | | | | | | |
| | | | | | | | | |
| | | | | | | | | |
| | | | | | | | | |
| | | | | | | | | |
| | | | |
| | | | |
| amgfunds.com | | | | 123122 AR088 |
Registrant has adopted a Code of Ethics. See attached Exhibit (a)(1).
| Item 3. | AUDIT COMMITTEE FINANCIAL EXPERT |
Registrant’s Board of Trustees has determined that independent Trustee Mr. Steven J. Paggioli qualifies as an Audit Committee Financial Expert. Mr. Paggioli is “independent” as such term is defined in Form N-CSR.
| Item 4. | PRINCIPAL ACCOUNTANT FEES AND SERVICES |
The aggregate fees billed by the Funds’ independent registered public accounting firm, PricewaterhouseCoopers LLP (“PwC”), to the Funds for the Funds’ two most recent fiscal years for professional services rendered for audits of annual financial statements, or services that are normally provided in connection with statutory and regulatory filings or engagements (“Audit Fees”) were as follows:
| | | | | | | | |
Fund - AMG Funds III | | Fiscal
2022 | | | Fiscal
2021 | |
AMG Veritas Asia Pacific Fund | | $ | 35,291 | | | $ | 33,151 | |
AMG GW&K ESG Bond Fund | | $ | 59,514 | | | $ | 53,962 | |
AMG GW&K High Income Fund | | $ | 35,394 | | | $ | 36,216 | |
There were no fees billed by PwC to the Funds in their two most recent fiscal years for services rendered for assurance and related services that are reasonably related to the performance of the audit or review of the Funds’ financial statements, but are not reported as Audit Fees (“Audit-Related Fees”).
For the Funds’ two most recent fiscal years, there were no Audit-Related Fees billed by PwC for engagements related directly to the operations and financial reporting of one or more Funds by a Fund Service Provider. A Fund Service Provider is (a) any investment adviser to the Fund (not including any Subadvisor whose role is primarily portfolio management and is subcontracted with or overseen by another investment adviser) or (b) any entity that provides ongoing services to the Fund and is controlling, controlled by or under common control with a Fund investment adviser described in (a).
The aggregate fees billed by PwC to the Funds for the two most recent fiscal years for professional services rendered for tax compliance, tax advice, and tax planning (“Tax Fees”) were as follows:
| | | | | | | | |
Fund - AMG Funds III | | Fiscal
2022 | | | Fiscal
2021 | |
AMG Veritas Asia Pacific Fund | | $ | 8,050 | | | $ | 6,250 | |
AMG GW&K ESG Bond Fund | | $ | 9,085 | | | $ | 8,400 | |
AMG GW&K High Income Fund | | $ | 8,050 | | | $ | 8,400 | |
For the Funds’ two most recent fiscal years, Tax Fees billed by PwC for engagements by Fund Service Providers that related directly to the operations and financial reporting of the Funds were $0 for fiscal 2022 and $0 for fiscal 2021, respectively.
The services for which Tax Fees were charged comprise all services performed by professional staff in PwC’s tax division except those services related to the audit. Typically, this category would include fees for tax compliance, tax planning, and tax advice. Tax compliance, tax advice, and tax planning services include preparation of original and amended tax returns, claims for refund and tax payment-planning services, assistance with tax audits and appeals, tax advice related to mergers and acquisitions and requests for rulings or technical advice from taxing authorities.
There were no other fees billed by PwC to the Funds for all other non-audit services (“Other Fees”) during the Funds’ two most recent fiscal years. During the same period, there were no Other Fees billed by PwC for engagements by Fund Service Providers that related directly to the operations and financial reporting of the Funds.
(e) (1) According to policies adopted by the Audit Committee, services provided by PwC to the Funds must be pre-approved by the Audit Committee. On an annual basis, the Audit Committee reviews and pre-approves various types of services that PwC may perform for the Funds without specific approval of each engagement, subject to specified budget limitations. As contemplated by the Sarbanes-Oxley Act of 2002 and related SEC rules, the Audit Committee also pre-approves non-audit services provided by PwC to any Fund Service Provider for any engagement that relates directly to the operations and financial reporting of the Funds. Any engagement that is not already pre-approved or that will exceed a pre-approved budget must be submitted to the Audit Committee for pre-approval. The Chairman of the Audit Committee is authorized on behalf of the Board of Trustees and the Audit Committee to approve the engagement of PwC to perform non-audit services subject to certain conditions, including notification to the Audit Committee of such pre-approval not later than the next meeting of the Audit Committee following the date of such pre-approval.
(e) (2) None.
(f) Not applicable.
(g) The aggregate fees billed by PwC in 2022 and 2021 for non-audit services rendered to the Funds and Fund Service Providers were $61,185 and $69,550, respectively. For the fiscal year ended December 31, 2022, this amount reflects the amounts disclosed above in Item 4(b),(c),(d), plus $36,000 in fees billed to the Fund Service Providers for non-audit services that did not relate directly to the operations and financial reporting of the Funds. For the fiscal year ended December 31, 2021, this amount reflects the amounts disclosed above in Item 4(b),(c),(d), plus $46,500 in fees billed to the Fund Service Providers for non-audit services that did not relate directly to the operations and financial reporting of the Funds.
(h) The Trust’s Audit Committee has considered whether the provision of non-audit services by registrant’s independent registered public accounting firm to the registrant’s investment adviser, and any entity controlling, controlled by, or under common control with the investment adviser that provided ongoing services to the registrant that were not pre-approved by the Committee (because such services did not relate directly to the operations and financial reporting of the registrant) was compatible with maintaining the independence of the independent registered public accounting firm.
| Item 5. | AUDIT COMMITTEE OF LISTED REGISTRANTS |
Not applicable.
| Item 6. | SCHEDULE OF INVESTMENTS |
The schedule of investments in securities of unaffiliated issuers as of the close of the reporting period is included as part of the report to shareholders filed under Item 1 of this form.
| Item 7. | DISCLOSURE OF PROXY VOTING POLICIES AND PROCEDURES FOR CLOSED-END MANAGEMENT INVESTMENT COMPANIES |
Not applicable.
| Item 8. | PORTFOLIO MANAGERS OF CLOSED-END MANAGEMENT INVESTMENT COMPANIES |
Not applicable.
| Item 9. | PURCHASES OF EQUITY SECURITIES BY CLOSED-END MANAGEMENT INVESTMENT COMPANIES AND AFFILIATED PURCHASERS |
Not applicable.
| Item 10. | SUBMISSION OF MATTERS TO A VOTE OF SECURITY HOLDERS |
Not applicable.
| Item 11. | CONTROLS AND PROCEDURES |
(a) The Registrant’s principal executive and principal financial officers have concluded, based on their evaluation of the registrant’s disclosure controls and procedures as of a date within 90 days of the filing of this report, that the Registrant’s disclosure controls and procedures are reasonably designed to ensure that
information required to be disclosed by the Registrant on Form N-CSR is recorded, processed, summarized and reported within the required time periods and that information required to be disclosed by the registrant in the reports that it files or submits on Form N-CSR is accumulated and communicated to the Registrant’s management, including its principal executive and principal financial officers, as appropriate to allow timely decisions regarding required disclosure.
(b) There were no changes in the Registrant’s internal control over financial reporting during the period covered by this report that have materially affected, or are reasonably likely to materially affect, the internal control over financial reporting.
| Item 12. | DISCLOSURE OF SECURITIES LENDING ACTIVITIES FOR CLOSED-END MANAGEMENT INVESTMENT COMPANIES |
Not applicable.
SIGNATURES
Pursuant to the requirements of the Securities Exchange Act of 1934 and the Investment Company Act of 1940, the registrant has duly caused this report to be signed on its behalf by the undersigned, thereunto duly authorized.
| | |
| AMG FUNDS III |
| |
| By: | | /s/ Keitha L. Kinne |
| | Keitha L. Kinne, Principal Executive Officer |
| |
| Date: | | March 6, 2023 |
Pursuant to the requirements of the Securities Exchange Act of 1934 and the Investment Company Act of 1940, this report has been signed below by the following persons on behalf of the registrant and in the capacities and on the dates indicated.
| | |
| By: | | /s/ Keitha L. Kinne |
| | Keitha L. Kinne, Principal Executive Officer |
| |
| Date: | | March 6, 2023 |
| |
| By: | | /s/ Thomas Disbrow |
| | Thomas Disbrow, Principal Financial Officer |
| |
| Date: | | March 6, 2023 |