UNITED STATES
SECURITIES AND EXCHANGE COMMISSION
Washington, D.C. 20549
FORM N-CSR
CERTIFIED SHAREHOLDER REPORT OF REGISTERED MANAGEMENT INVESTMENT COMPANIES
Investment Company Act file number
(Exact name of registrant as specified in charter)
680 Washington Boulevard, Suite 500, Stamford, Connecticut 06901
Registrant's telephone number, including area code:
Date of reporting period:
Item 1. Report to Stockholders.
(a) The registrant’s annual report transmitted to shareholders pursuant to Rule 30e-1 under the Investment Company Act of 1940 is as follows:
AMG GW&K International Small Cap Fund
Class N/MECAX
ANNUAL SHAREHOLDER REPORT | May 31, 2024
This annual shareholder report contains important information about AMG GW&K International Small Cap Fund (the “Fund”) for the period of June 1, 2023 to May 31, 2024. You can find additional information about the Fund at https://wealth.amg.com/resources/order-literature. You can also request this information by contacting us at 800-548-4539.
Fund Expenses
What were the Fund costs for the last year?
(Based on a hypothetical $10,000 investment)
| Fund (Class) | Costs of a $10,000 investment | Costs paid as a percentage of a $10,000 investment |
AMG GW&K International Small Cap Fund
(Class N/MECAX) | $120 | 1.14% |
Management's Discussion of Fund Performance
Performance Overview
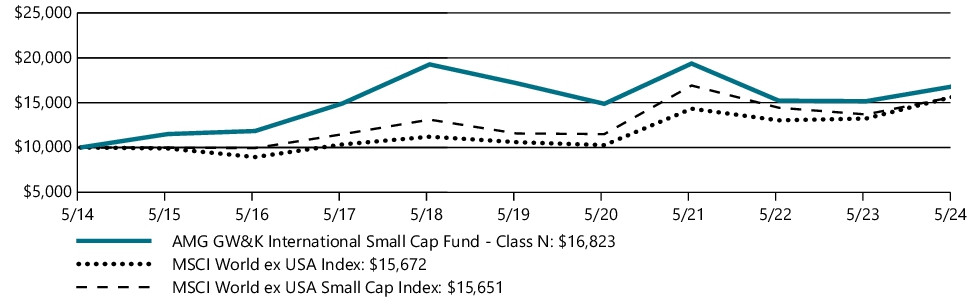
• The Fund's Class N shares advanced 10.99% for the fiscal year ended May 31, 2024, led by strong performance in Europe.
• The Fund’s results in Asia trailed Europe as the Japanese yen weakened considerably against the U.S. dollar.
Relative Performance
• The Fund underperformed the MSCI World ex USA Index, which gained 18.48% (net of source taxes), as the Fund’s focus on small cap stocks led to underperformance. The benchmark is heavily weighted in large cap stocks, which outperformed small cap stocks during the year.
Top Contributors and Detractors
• The Fund’s holdings in Canada, Germany, and the United Kingdom were the largest relative contributors on a geographic level, while positions in Japan, Sweden, and Australia detracted.
• Health care and consumer staples were the Fund’s top performing sectors on a relative basis, while financials and information technology were the main detractors.
Positioning Update
• Geographically, the Fund’s largest exposure remains Japan, followed by the United Kingdom, where the Fund has added new positions.
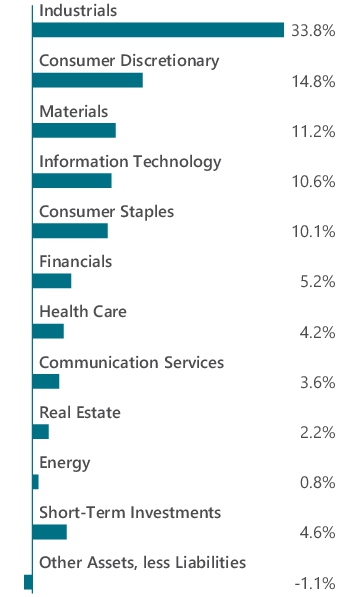
• Industrials, consumer discretionary, materials, and information technology are the Fund’s largest sectors. The Fund has no exposure to utilities.
Fund Performance
The performance line graph below shows the performance of a hypothetical $10,000 investment in the class of shares noted over a ten year period, as compared to the performance of (i) a broad based index and (ii) an additional index reflecting the market segment(s) in which the Fund invests. The performance table below shows the average annual total returns of the class of shares noted for the past one-, five-, and ten-year periods ended as of May 31, 2024. It also shows the average total returns of (i) a broad based index and (ii) an additional index reflecting the market segment(s) in which the Fund invests over the same periods.
Performance for other share classes will vary. The Fund’s past performance is not a good predictor of the Fund’s future performance.
The graph and table do not reflect the deduction of taxes that a shareholder would pay on fund distributions or redemption of fund shares.
GROWTH OF $10,000
| AVERAGE ANNUAL TOTAL RETURNS | 1 Year | 5 Years | 10 Years |
| Class N | 10.99% | (0.39%) | 5.34% |
| MSCI World ex USA Index | 18.48% | 8.15% | 4.59% |
| MSCI World ex USA Small Cap Index | 14.36% | 6.25% | 4.58% |
Effective May 31, 2024, the MSCI World ex USA Index was added as a broad measure of market performance in accordance with recent changes to regulatory disclosure requirements. The Fund continues to use the MSCI World ex USA Small Cap Index, its legacy primary benchmark, as an additional benchmark that reflects the market segment(s) in which the Fund invests.
As of October 8, 2020, the Fund's Subadviser was changed to GW&K Investment Management, LLC. Prior to October 8, 2020, the Fund had different principal investment strategies and corresponding risks. The Fund's performance before October 8, 2020, might be less pertinent for investors considering whether to purchase shares of the Fund.
All MSCI data is provided "as is". The products described herein are not sponsored or endorsed and have not been reviewed or passed on by MSCI. In no event shall MSCI, its affiliates or any MSCI data provider have any liability of any kind in connection with the MSCI data or the products described herein. Copying or redistributing the MSCI data is strictly prohibited.
For updated Fund performance information, please visit: https://wealth.amg.com/.
Key Fund Statistics (as of May 31, 2024)
| Fund net assets | $40,201,503% |
| Total number of portfolio holdings | $75% |
| Total advisory fees paid | $114,252% |
| Portfolio turnover rate as of the end of the reporting period | $27% |
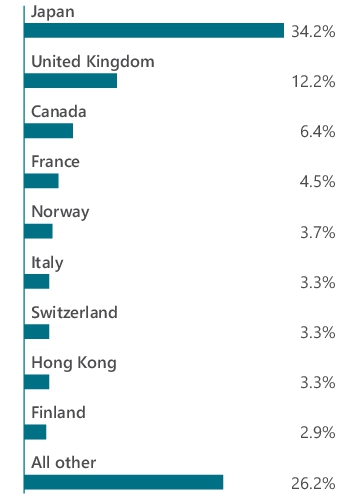
Graphical Representation of Holdings (as of May 31, 2024)
Top ten holdings and portfolio breakdown are shown as a percentage of net assets of the Fund and country allocation is shown as a percentage of total long-term investments of the Fund.
| Senshu Electric Co., Ltd. (Japan) | 2.9% |
| DMG Mori Co., Ltd. (Japan) | 2.9% |
| Vidrala, S.A. (Spain) | 2.3% |
| Gift Holdings, Inc. (Japan) | 2.1% |
| Hill & Smith PLC (United Kingdom) | 2.1% |
| Rheinmetall AG (Germany) | 2.1% |
| Howden Joinery Group PLC (United Kingdom) | 2.0% |
| Kitron A.S.A. (Norway) | 2.0% |
| ADENTRA, Inc. (Canada) | 1.9% |
| Sarantis, S.A. (Greece) | 1.8% |
| Top Ten as a Group | 22.1% |
Availability of Additional Information
You can find additional information about the Fund such as the prospectus, financial information, fund holdings and proxy voting information at https://wealth.amg.com/resources/order-literature. You can also request this information by contacting us at 800.548.4539.
Householding
In order to reduce expenses, we will deliver a single copy of prospectuses, proxies, financial reports and other communication to shareholders with the same residential address, provided they have the same last name or we reasonably believe them to be members of the same family. Unless we are notified otherwise, we will continue to send recipients only one copy of these materials for as long as they remain a shareholder of the Fund. If you would like to receive individual mailings, please call 800.548.4539 and we will begin sending you separate copies of these materials within 30 days after receiving your request.
For additional information, please navigate to the additional material at https://wealth.amg.com/resources/order-literature.
AMG GW&K International Small Cap Fund
Class I/MECIX
ANNUAL SHAREHOLDER REPORT | May 31, 2024
This annual shareholder report contains important information about AMG GW&K International Small Cap Fund (the “Fund”) for the period of June 1, 2023 to May 31, 2024. You can find additional information about the Fund at https://wealth.amg.com/resources/order-literature. You can also request this information by contacting us at 800-548-4539.
Fund Expenses
What were the Fund costs for the last year?
(Based on a hypothetical $10,000 investment)
| Fund (Class) | Costs of a $10,000 investment | Costs paid as a percentage of a $10,000 investment |
AMG GW&K International Small Cap Fund
(Class I/MECIX) | $105 | 0.99% |
Management's Discussion of Fund Performance
Performance Overview
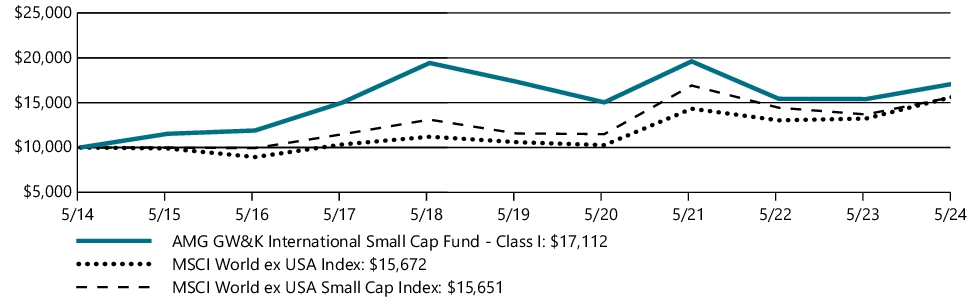
• The Fund's Class I shares advanced 11.15% for the fiscal year ended May 31, 2024, led by strong performance in Europe.
• The Fund’s results in Asia trailed Europe as the Japanese yen weakened considerably against the U.S. dollar.
Relative Performance
• The Fund underperformed the MSCI World ex USA Index, which gained 18.48% (net of source taxes), as the Fund’s focus on small cap stocks led to underperformance. The benchmark is heavily weighted in large cap stocks, which outperformed small cap stocks during the year.
Top Contributors and Detractors
• The Fund’s holdings in Canada, Germany, and the United Kingdom were the largest relative contributors on a geographic level, while positions in Japan, Sweden, and Australia detracted.
• Health care and consumer staples were the Fund’s top performing sectors on a relative basis, while financials and information technology were the main detractors.
Positioning Update
• Geographically, the Fund’s largest exposure remains Japan, followed by the United Kingdom, where the Fund has added new positions.
• Industrials, consumer discretionary, materials, and information technology are the Fund’s largest sectors. The Fund has no exposure to utilities.
Fund Performance
The performance line graph below shows the performance of a hypothetical $10,000 investment in the class of shares noted over a ten year period, as compared to the performance of (i) a broad based index and (ii) an additional index reflecting the market segment(s) in which the Fund invests. The performance table below shows the average annual total returns of the class of shares noted for the past one-, five-, and ten-year periods ended as of May 31, 2024. It also shows the average total returns of (i) a broad based index and (ii) an additional index reflecting the market segment(s) in which the Fund invests over the same periods.
Performance for other share classes will vary. The Fund’s past performance is not a good predictor of the Fund’s future performance.
The graph and table do not reflect the deduction of taxes that a shareholder would pay on fund distributions or redemption of fund shares.
GROWTH OF $10,000
| AVERAGE ANNUAL TOTAL RETURNS | 1 Year | 5 Years | 10 Years |
| Class I | 11.15% | (0.24%) | 5.52% |
| MSCI World ex USA Index | 18.48% | 8.15% | 4.59% |
| MSCI World ex USA Small Cap Index | 14.36% | 6.25% | 4.58% |
Effective May 31, 2024, the MSCI World ex USA Index was added as a broad measure of market performance in accordance with recent changes to regulatory disclosure requirements. The Fund continues to use the MSCI World ex USA Small Cap Index, its legacy primary benchmark, as an additional benchmark that reflects the market segment(s) in which the Fund invests.
As of October 8, 2020, the Fund's Subadviser was changed to GW&K Investment Management, LLC. Prior to October 8, 2020, the Fund had different principal investment strategies and corresponding risks. The Fund's performance before October 8, 2020, might be less pertinent for investors considering whether to purchase shares of the Fund.
All MSCI data is provided "as is". The products described herein are not sponsored or endorsed and have not been reviewed or passed on by MSCI. In no event shall MSCI, its affiliates or any MSCI data provider have any liability of any kind in connection with the MSCI data or the products described herein. Copying or redistributing the MSCI data is strictly prohibited.
For updated Fund performance information, please visit: https://wealth.amg.com/.
Key Fund Statistics (as of May 31, 2024)
| Fund net assets | $40,201,503% |
| Total number of portfolio holdings | $75% |
| Total advisory fees paid | $114,252% |
| Portfolio turnover rate as of the end of the reporting period | $27% |
Graphical Representation of Holdings (as of May 31, 2024)
Top ten holdings and portfolio breakdown are shown as a percentage of net assets of the Fund and country allocation is shown as a percentage of total long-term investments of the Fund.
| Senshu Electric Co., Ltd. (Japan) | 2.9% |
| DMG Mori Co., Ltd. (Japan) | 2.9% |
| Vidrala, S.A. (Spain) | 2.3% |
| Gift Holdings, Inc. (Japan) | 2.1% |
| Hill & Smith PLC (United Kingdom) | 2.1% |
| Rheinmetall AG (Germany) | 2.1% |
| Howden Joinery Group PLC (United Kingdom) | 2.0% |
| Kitron A.S.A. (Norway) | 2.0% |
| ADENTRA, Inc. (Canada) | 1.9% |
| Sarantis, S.A. (Greece) | 1.8% |
| Top Ten as a Group | 22.1% |
Availability of Additional Information
You can find additional information about the Fund such as the prospectus, financial information, fund holdings and proxy voting information at https://wealth.amg.com/resources/order-literature. You can also request this information by contacting us at 800.548.4539.
Householding
In order to reduce expenses, we will deliver a single copy of prospectuses, proxies, financial reports and other communication to shareholders with the same residential address, provided they have the same last name or we reasonably believe them to be members of the same family. Unless we are notified otherwise, we will continue to send recipients only one copy of these materials for as long as they remain a shareholder of the Fund. If you would like to receive individual mailings, please call 800.548.4539 and we will begin sending you separate copies of these materials within 30 days after receiving your request.
For additional information, please navigate to the additional material at https://wealth.amg.com/resources/order-literature.
AMG GW&K International Small Cap Fund
Class Z/MECZX
ANNUAL SHAREHOLDER REPORT | May 31, 2024
This annual shareholder report contains important information about AMG GW&K International Small Cap Fund (the “Fund”) for the period of June 1, 2023 to May 31, 2024. You can find additional information about the Fund at https://wealth.amg.com/resources/order-literature. You can also request this information by contacting us at 800-548-4539.
Fund Expenses
What were the Fund costs for the last year?
(Based on a hypothetical $10,000 investment)
| Fund (Class) | Costs of a $10,000 investment | Costs paid as a percentage of a $10,000 investment |
AMG GW&K International Small Cap Fund
(Class Z/MECZX) | $94 | 0.89% |
Management's Discussion of Fund Performance
Performance Overview
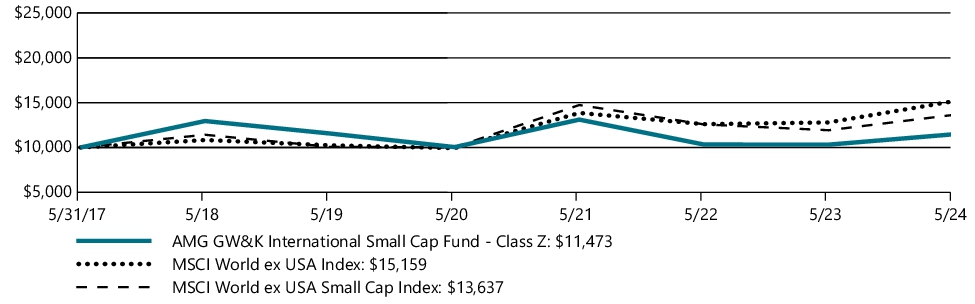
• The Fund's Class Z shares advanced 11.27% for the fiscal year ended May 31, 2024, led by strong performance in Europe.
• The Fund’s results in Asia trailed Europe as the Japanese yen weakened considerably against the U.S. dollar.
Relative Performance
• The Fund underperformed the MSCI World ex USA Index, which gained 18.48% (net of source taxes), as the Fund’s focus on small cap stocks led to underperformance. The benchmark is heavily weighted in large cap stocks, which outperformed small cap stocks during the year.
Top Contributors and Detractors
• The Fund’s holdings in Canada, Germany, and the United Kingdom were the largest relative contributors on a geographic level, while positions in Japan, Sweden, and Australia detracted.
• Health care and consumer staples were the Fund’s top performing sectors on a relative basis, while financials and information technology were the main detractors.
Positioning Update
• Geographically, the Fund’s largest exposure remains Japan, followed by the United Kingdom, where the Fund has added new positions.
• Industrials, consumer discretionary, materials, and information technology are the Fund’s largest sectors. The Fund has no exposure to utilities.
Fund Performance
The performance line graph below shows the performance of a hypothetical $10,000 investment since inception in the class of shares noted, as compared to the performance of (i) a broad based index and (ii) an additional index reflecting the market segment(s) in which the Fund invests. The performance table below shows the average annual total returns of the class of shares noted for the past one-, five-, and since inception periods ended as of May 31, 2024. It also shows the average total returns of (i) a broad based index and (ii) an additional index reflecting the market segment(s) in which the Fund invests over the same periods.
Performance for other share classes will vary. The Fund’s past performance is not a good predictor of the Fund’s future performance.
The graph and table do not reflect the deduction of taxes that a shareholder would pay on fund distributions or redemption of fund shares.
GROWTH OF $10,000
| AVERAGE ANNUAL TOTAL RETURNS | 1 Year | 5 Years | Since Inception |
| Class Z | 11.27% | (0.15%) | 1.99% |
| MSCI World ex USA Index | 18.48% | 8.15% | 6.12% |
| MSCI World ex USA Small Cap Index | 14.36% | 6.25% | 4.53% |
Effective May 31, 2024, the MSCI World ex USA Index was added as a broad measure of market performance in accordance with recent changes to regulatory disclosure requirements. The Fund continues to use the MSCI World ex USA Small Cap Index, its legacy primary benchmark, as an additional benchmark that reflects the market segment(s) in which the Fund invests.
As of October 8, 2020, the Fund's Subadviser was changed to GW&K Investment Management, LLC. Prior to October 8, 2020, the Fund had different principal investment strategies and corresponding risks. The Fund's performance before October 8, 2020, might be less pertinent for investors considering whether to purchase shares of the Fund.
All MSCI data is provided "as is". The products described herein are not sponsored or endorsed and have not been reviewed or passed on by MSCI. In no event shall MSCI, its affiliates or any MSCI data provider have any liability of any kind in connection with the MSCI data or the products described herein. Copying or redistributing the MSCI data is strictly prohibited.
For updated Fund performance information, please visit: https://wealth.amg.com/.
Key Fund Statistics (as of May 31, 2024)
| Fund net assets | $40,201,503% |
| Total number of portfolio holdings | $75% |
| Total advisory fees paid | $114,252% |
| Portfolio turnover rate as of the end of the reporting period | $27% |
Graphical Representation of Holdings (as of May 31, 2024)
Top ten holdings and portfolio breakdown are shown as a percentage of net assets of the Fund and country allocation is shown as a percentage of total long-term investments of the Fund.
| Senshu Electric Co., Ltd. (Japan) | 2.9% |
| DMG Mori Co., Ltd. (Japan) | 2.9% |
| Vidrala, S.A. (Spain) | 2.3% |
| Gift Holdings, Inc. (Japan) | 2.1% |
| Hill & Smith PLC (United Kingdom) | 2.1% |
| Rheinmetall AG (Germany) | 2.1% |
| Howden Joinery Group PLC (United Kingdom) | 2.0% |
| Kitron A.S.A. (Norway) | 2.0% |
| ADENTRA, Inc. (Canada) | 1.9% |
| Sarantis, S.A. (Greece) | 1.8% |
| Top Ten as a Group | 22.1% |
Availability of Additional Information
You can find additional information about the Fund such as the prospectus, financial information, fund holdings and proxy voting information at https://wealth.amg.com/resources/order-literature. You can also request this information by contacting us at 800.548.4539.
Householding
In order to reduce expenses, we will deliver a single copy of prospectuses, proxies, financial reports and other communication to shareholders with the same residential address, provided they have the same last name or we reasonably believe them to be members of the same family. Unless we are notified otherwise, we will continue to send recipients only one copy of these materials for as long as they remain a shareholder of the Fund. If you would like to receive individual mailings, please call 800.548.4539 and we will begin sending you separate copies of these materials within 30 days after receiving your request.
For additional information, please navigate to the additional material at https://wealth.amg.com/resources/order-literature.
(b) Not applicable.
Item 2. CODE OF ETHICS
Registrant has adopted a code of ethics (the “Code of Ethics”) that applies to the Registrant’s principal executive officer, principal financial officer, principal accounting officer or controller, or persons performing similar functions, regardless of whether these individuals are employed by the registrant or a third party. During the period covered by this report, there were not any amendments to a provision of the Code of Ethics that relates to any element of the code of ethics definition enumerated in paragraph (c) of Item 2 of Form N-CSR. During the period covered by this report, there were no waivers, including any implicit waivers, from a provision of the Code that relates to one or more of the items set forth in paragraph (d) of Item 2 of Form N-CSR. See attached Exhibit (a)(1).
Item 3. AUDIT COMMITTEE FINANCIAL EXPERT
Registrant’s Board of Trustees (the “Board”) has determined that the Registrant has at least one Audit Committee Financial Expert serving on its audit committee. The Board has determined that independent Trustee Mr. Steven J. Paggioli qualifies as the Audit Committee Financial Expert. Mr. Paggioli is “independent” as such term is defined in paragraph (a)(2) of Item 3 of Form N-CSR.
Item 4. PRINCIPAL ACCOUNTANT FEES AND SERVICES
The aggregate fees billed by the Fund’s independent registered public accounting firm, PricewaterhouseCoopers LLP (“PwC”), to the Fund for the Fund’s two most recent fiscal years for professional services rendered for audits of annual financial statements, or services that are normally provided in connection with statutory and regulatory filings or engagements (“Audit Fees”) were as follows:
| | | | | | | | |
| | | Fiscal 2024 | | | Fiscal 2023 | |
AMG GW&K International Small Cap Fund | | $ | 24,305 | | | $ | 23,559 | |
There were no fees billed by PwC to the Fund in its two recent fiscal years for services rendered for assurance and related services that are reasonably related to the performance of the audit or review of the Fund’s financial statements, but are not reported as Audit Fees (“Audit-Related Fees”).
For the Fund’s two most recent fiscal years, there were no Audit-Related Fees billed by PwC for engagements related directly to the operations and financial reporting of the Fund by a Fund Service Provider. A Fund Service Provider is (a) any investment adviser to the Fund (not including any Subadviser whose role is primarily portfolio management and is subcontracted with or overseen by another investment adviser) or (b) any entity that provides ongoing services to the Fund and is controlling, controlled by or under common control with a Fund investment adviser described in (a).
The aggregate fees billed by PwC to the Fund for the two most recent fiscal years for professional services rendered for tax compliance, tax advice, and tax planning (“Tax Fees”) were as follows:
| | | | | | | | |
| | | Fiscal 2024 | | | Fiscal 2023 | |
AMG GW&K International Small Cap Fund | | $ | 8,370 | | | $ | 8,050 | |
For the Fund’s two most recent fiscal years, Tax Fees billed by PwC for engagements by Fund Service Providers that related directly to the operations and financial reporting of the Fund were $0 for fiscal 2024 and $0 for fiscal 2023, respectively.
The services for which Tax Fees were charged comprise all services performed by professional staff in PwC’s tax division except those services related to the audit. Typically, this category would include fees for tax compliance, tax planning, and tax advice. Tax compliance, tax advice, and tax planning services include preparation of original and amended tax returns, claims for refund and tax payment-planning services, assistance with tax audits and appeals, tax advice related to mergers and acquisitions and requests for rulings or technical advice from taxing authorities.
There were no other fees billed by PwC to the Fund for all other non-audit services (“Other Fees”) during the Fund’s two most recent fiscal years. During the same period, there were no Other Fees billed by PwC for engagements by Fund Service Providers that related directly to the operations and financial reporting of the Fund.
(e)(1) According to policies adopted by the Audit Committee, services provided by PwC to the Fund must be pre-approved by the Audit Committee. On an annual basis, the Audit Committee reviews and pre-approves various types of services that PwC may perform for the Fund without specific approval of each engagement, subject to specified budget limitations. As contemplated by the Sarbanes-Oxley Act of 2002 and related SEC rules, the Audit Committee also pre-approves non-audit services provided by PwC to any Fund Service Provider for any engagement that relates directly to the operations and financial reporting of the Fund. Any engagement that is not already pre-approved or that will exceed a pre-approved budget must be submitted to the Audit Committee for pre-approval. The Chairman of the Audit Committee is authorized on behalf of the Board of Trustees and the Audit Committee to approve the engagement of PwC to perform non-audit services subject to certain conditions, including notification to the Audit Committee of such pre-approval not later than the next meeting of the Audit Committee following the date of such pre-approval.
(e)(2) None.
(f) Not applicable.
(g) The aggregate fees billed by PwC in 2024 and 2023 for non-audit services rendered to the Fund and Fund Service Providers were $50,037 and $44,050, respectively. For the fiscal year ended May 31, 2024, this amount reflects the amounts disclosed above in Item 4(b),(c),(d), plus $41,667 in fees billed to the Fund Service Providers for non-audit services that did not relate directly to the operations and financial reporting of the Fund. For the fiscal year ended May 31, 2023, this amount reflects the amounts disclosed above in Item 4(b),(c),(d), plus $36,000 in fees billed to the Fund Service Providers for non-audit services that did not relate directly to the operations and financial reporting of the Fund.
(h) The Trust’s Audit Committee has considered whether the provision of non-audit services by registrant’s independent registered public accounting firm to the registrant’s investment adviser, and any entity controlling, controlled, or under common control with the investment adviser that provided ongoing services to the registrant that were not pre-approved by the Committee (because such services did not relate directly to the operations and financial reporting of the registrant) was compatible with maintaining the independence of the independent registered public accounting firm.
Item 5. AUDIT COMMITTEE OF LISTED REGISTRANTS
Not applicable.
Item 6. INVESTMENTS
The schedule of investments in securities of unaffiliated issuers as of the close of the reporting period is included in the financial statements filed under Item 7 hereof.
Item 7. FINANCIAL STATEMENTS AND FINANCIAL HIGHLIGHTS FOR OPEN-END MANAGEMENT INVESTMENT COMPANIES.
| | |
 | | ANNUAL REPORT |
| | | | | | |
| | | | AMG Funds May 31, 2024 
AMG GW&K International Small Cap Fund |
| | | |
| | | | | Class N: MECAX | Class I: MECIX | Class Z: MECZX |
| | | | |
| | | | | | | |
| | | | |
| | |
| wealth.amg.com | | | | 053124 AR065 |
| | |
| | | AMG Funds Annual Report — May 31, 2024 |
Nothing contained herein is to be considered an offer, sale or solicitation of an offer to buy shares of any series of the AMG Funds Family of Funds. Such offering is made only by prospectus, which includes details as to offering price and other material information.
|
AMG GW&K International Small Cap Fund Schedule of Portfolio Investments May 31, 2024 |
| | | | | | | | |
| | | Shares | | | Value | |
| | |
Common Stocks - 96.5% | | | | | | | | |
| | |
Communication Services - 3.6% | | | | | | | | |
| | |
Enad Global 7 AB (Sweden) | | | 130,928 | | | | $161,359 | |
| | |
IPSOS S.A. (France) | | | 8,710 | | | | 635,335 | |
| | |
Nihon Falcom Corp. (Japan) | | | 44,025 | | | | 321,507 | |
| | |
Paradox Interactive AB (Sweden) | | | 24,181 | | | | 343,908 | |
| | |
Total Communication Services | | | | | | | 1,462,109 | |
| | |
Consumer Discretionary - 14.8% | | | | | | | | |
| | |
Cairn Homes PLC (Ireland) | | | 302,693 | | | | 561,589 | |
| | |
Garrett Motion, Inc. (Switzerland)* | | | 76,565 | | | | 695,210 | |
| | |
Gift Holdings, Inc. (Japan)1 | | | 46,474 | | | | 861,391 | |
| | |
Hamee Corp. (Japan) | | | 57,808 | | | | 483,537 | |
| | |
Max Stock, Ltd. (Israel) | | | 183,667 | | | | 483,268 | |
| | |
Mazda Motor Corp. (Japan) | | | 56,255 | | | | 593,083 | |
| | |
MIPS AB (Sweden)1 | | | 5,215 | | | | 212,613 | |
| | |
Niterra Co., Ltd. (Japan) | | | 16,300 | | | | 491,257 | |
| | |
Samsonite International, S.A.
(United States)*,2 | | | 133,200 | | | | 423,348 | |
| | |
Vistry Group PLC (United Kingdom)* | | | 32,200 | | | | 533,486 | |
| | |
Yossix Holdings Co., Ltd. (Japan) | | | 33,404 | | | | 594,194 | |
| | |
Total Consumer Discretionary | | | | | | | 5,932,976 | |
| | |
Consumer Staples - 10.1% | | | | | | | | |
| | |
Becle SAB de CV (Mexico) | | | 243,350 | | | | 447,788 | |
| | |
First Pacific Co., Ltd. (Hong Kong) | | | 1,370,332 | | | | 658,633 | |
| | |
Grupo Herdez SAB de CV (Mexico) | | | 177,131 | | | | 534,843 | |
| | |
Hilton Food Group PLC
(United Kingdom) | | | 41,790 | | | | 476,063 | |
| | |
Kusuri no Aoki Holdings Co., Ltd. (Japan) | | | 25,625 | | | | 520,455 | |
| | |
Nissin Foods Co. Ltd. (Hong Kong) | | | 397,821 | | | | 245,832 | |
| | |
Royal Unibrew A/S (Denmark)*,1 | | | 5,746 | | | | 472,271 | |
| | |
Sarantis, S.A. (Greece) | | | 60,113 | | | | 716,177 | |
| | |
Total Consumer Staples | | | | | | | 4,072,062 | |
| | |
Energy - 0.8% | | | | | | | | |
| | |
Diversified Energy Co. PLC
(United States)1 | | | 21,432 | | | | 324,159 | |
| | |
Financials - 5.2% | | | | | | | | |
| | |
BFF Bank S.P.A. (Italy)2 | | | 49,734 | | | | 496,208 | |
| | |
Coface, S.A. (France) | | | 31,750 | | | | 488,898 | |
| | |
Integral Corp. (Japan)* | | | 12,300 | | | | 310,690 | |
| | |
Omni Bridgeway, Ltd. (Australia)* | | | 376,444 | | | | 211,329 | |
| | |
Tel Aviv Stock Exchange, Ltd. (Israel) | | | 83,637 | | | | 575,678 | |
| | |
Total Financials | | | | | | | 2,082,803 | |
| | |
Health Care - 4.2% | | | | | | | | |
| | |
Haw Par Corp., Ltd. (Singapore) | | | 65,100 | | | | 471,184 | |
| | |
Riverstone Holdings, Ltd. (Singapore) | | | 917,400 | | | | 619,041 | |
| | | | | | | | |
| | | Shares | | | Value | |
| | |
Siegfried Holding AG (Switzerland) | | | 577 | | | | $577,577 | |
| | |
Total Health Care | | | | | | | 1,667,802 | |
| | |
Industrials - 33.8% | | | | | | | | |
| | |
ADENTRA, Inc. (Canada) | | | 26,549 | | | | 753,061 | |
| | |
Alliance Global Group, Inc. (Philippines) | | | 3,733,616 | | | | 591,432 | |
| | |
Calian Group, Ltd. (Canada) | | | 6,282 | | | | 254,193 | |
| | |
Clarkson PLC (United Kingdom) | | | 13,436 | | | | 704,522 | |
| | |
Creek & River Co., Ltd. (Japan) | | | 42,700 | | | | 459,103 | |
| | |
Delta Plus Group (France) | | | 6,709 | | | | 608,575 | |
| | |
DMG Mori Co., Ltd. (Japan) | | | 40,200 | | | | 1,144,366 | |
| | |
GVS S.P.A. (Italy)*,1,2 | | | 75,619 | | | | 543,813 | |
| | |
Hammond Power Solutions, Inc. (Canada) | | | 4,434 | | | | 361,662 | |
| | |
Hosokawa Micron Corp. (Japan) | | | 18,150 | | | | 497,933 | |
| | |
Howden Joinery Group PLC (United Kingdom) | | | 70,070 | | | | 817,213 | |
| | |
Inabata & Co., Ltd. (Japan) | | | 29,000 | | | | 618,226 | |
| | |
NFI Group, Inc. (Canada)* | | | 51,519 | | | | 585,138 | |
| | |
Nippon Concept Corp. (Japan) | | | 21,421 | | | | 252,920 | |
| | |
Nippon Parking Development Co., Ltd. (Japan) | | | 435,475 | | | | 529,555 | |
| | |
Nisso Holdings Co., Ltd. (Japan) | | | 85,100 | | | | 462,180 | |
| | |
Rheinmetall AG (Germany) | | | 1,447 | | | | 834,080 | |
| | |
Richelieu Hardware, Ltd. (Canada) | | | 19,350 | | | | 540,059 | |
| | |
RS GROUP PLC (United Kingdom) | | | 37,200 | | | | 337,152 | |
| | |
Senshu Electric Co., Ltd. (Japan) | | | 34,140 | | | | 1,181,441 | |
| | |
Shinnihon Corp. (Japan) | | | 58,100 | | | | 561,928 | |
| | |
Ten Pao Group Holdings, Ltd. (China) | | | 2,237,700 | | | | 351,948 | |
| | |
UT Group Co., Ltd. (Japan) | | | 31,900 | | | | 610,571 | |
| | |
Total Industrials | | | | | | | 13,601,071 | |
| | |
Information Technology - 10.6% | | | | | | | | |
| | |
Ai Holdings Corp. (Japan) | | | 34,150 | | | | 538,387 | |
| | |
Argo Graphics, Inc. (Japan) | | | 19,925 | | | | 531,716 | |
| | |
Digital Hearts Holdings Co., Ltd. (Japan)1 | | | 56,575 | | | | 350,607 | |
| | |
Digital Information Technologies Corp. (Japan) | | | 55,746 | | | | 600,843 | |
| | |
Esprinet S.P.A. (Italy)* | | | 46,124 | | | | 248,032 | |
| | |
Incap Oyj (Finland)* | | | 32,877 | | | | 424,154 | |
| | |
Kaga Electronics Co., Ltd. (Japan) | | | 10,600 | | | | 387,286 | |
| | |
Kitron A.S.A. (Norway) | | | 246,615 | | | | 791,318 | |
| | |
Macnica Holdings, Inc. (Japan) | | | 8,900 | | | | 366,069 | |
| | |
Total Information Technology | | | | | | | 4,238,412 | |
| | |
Materials - 11.2% | | | | | | | | |
| | |
Corticeira Amorim SGPS, S.A. (Portugal) | | | 54,248 | | | | 563,896 | |
| | |
Elopak A.S.A. (Norway) | | | 191,751 | | | | 656,750 | |
| | |
Hill & Smith PLC (United Kingdom) | | | 32,091 | | | | 841,257 | |
| | |
Huhtamaki Oyj (Finland) | | | 17,116 | | | | 689,753 | |
The accompanying notes are an integral part of these financial statements.
2
| | |
| | | AMG GW&K International Small Cap Fund Schedule of Portfolio Investments (continued) |
| | | |
| | | |
| | | | | | | | |
| | | Shares | | | Value | |
| | |
Materials - 11.2% (continued) | | | | | | | | |
| | |
Marshalls PLC (United Kingdom) | | | 121,020 | | | | $490,613 | |
| | |
Mayr Melnhof Karton AG (Austria) | | | 2,824 | | | | 351,285 | |
| | |
Vidrala, S.A. (Spain) | | | 7,567 | | | | 924,975 | |
| | |
Total Materials | | | | | | | 4,518,529 | |
| | |
Real Estate - 2.2% | | | | | | | | |
| | |
Far East Consortium International, Ltd. (Hong Kong) | | | 2,444,714 | | | | 360,059 | |
| | |
Safestore Holdings PLC, REIT
(United Kingdom) | | | 46,285 | | | | 534,964 | |
| | |
Total Real Estate | | | | | | | 895,023 | |
| | |
Total Common Stocks
(Cost $40,147,287) | | | | | | | 38,794,946 | |
| | |
| | | Principal
Amount | | | | |
Short-Term Investments - 4.6% | | | | | | | | |
| |
Joint Repurchase Agreements - 1.7%3 | | | | | |
| | |
Daiwa Capital Markets America, dated 05/31/24, due 06/03/24, 5.360% total to be received $674,006 (collateralized by various U.S. Government Agency Obligations and U.S. Treasuries, 0.000% - 7.500%, 11/08/24 - 06/01/54, totaling $687,179) | | | $673,705 | | | | 673,705 | |
| | | | | | | | |
| | | Principal
Amount | | | Value | |
| |
Repurchase Agreements - 2.9% | | | | | |
| | |
Fixed Income Clearing Corp., dated 05/31/24, due 06/03/24, 5.150% total to be received $1,186,509 (collateralized by a U.S. Treasury Bond, 4.625%, 05/15/54, totaling $1,209,741) | | | $1,186,000 | | | | $1,186,000 | |
| | |
Total Short-Term Investments
(Cost $1,859,705) | | | | | | | 1,859,705 | |
| | |
Total Investments - 101.1%
(Cost $42,006,992) | | | | | | | 40,654,651 | |
| | |
Other Assets, less Liabilities - (1.1)% | | | | | | | (453,148 | ) |
| | |
Net Assets - 100.0% | | | | | | | $40,201,503 | |
| | | | | | | | |
| * | Non-income producing security. |
| 1 | Some of these securities, amounting to $1,355,681 or 3.4% of net assets, were out on loan to various borrowers and are collateralized by cash and various U.S. Treasury Obligations. See Note 4 of Notes to Financial Statements. |
| 2 | Security exempt from registration under Rule 144A of the Securities Act of 1933. These securities may be resold in transactions exempt from registration, normally to qualified institutional buyers. At May 31, 2024, the value of these securities amounted to $1,463,369 or 3.6% of net assets. |
| 3 | Cash collateral received for securities lending activity was invested in these joint repurchase agreements. |
REIT Real Estate Investment Trust
The accompanying notes are an integral part of these financial statements.
3
| | |
| | | AMG GW&K International Small Cap Fund Schedule of Portfolio Investments (continued) |
| | | |
| | | |
The following table summarizes the inputs used to value the Fund’s investments by the fair value hierarchy levels as of May 31, 2024:
| | | | | | | | | | | | | | | | |
| | | Level 1 | | | Level 21 | | | Level 3 | | | Total | |
Investments in Securities | | | | | | | | | | | | | | | | |
| | | | |
Common Stocks | | | | | | | | | | | | | | | | |
| | | | |
Industrials | | | $4,750,590 | | | | $8,850,481 | | | | – | | | | $13,601,071 | |
| | | | |
Consumer Discretionary | | | 1,740,067 | | | | 4,192,909 | | | | – | | | | 5,932,976 | |
| | | | |
Materials | | | 1,910,399 | | | | 2,608,130 | | | | – | | | | 4,518,529 | |
| | | | |
Information Technology | | | 672,186 | | | | 3,566,226 | | | | – | | | | 4,238,412 | |
| | | | |
Consumer Staples | | | 2,174,871 | | | | 1,897,191 | | | | – | | | | 4,072,062 | |
| | | | |
Financials | | | 575,678 | | | | 1,507,125 | | | | – | | | | 2,082,803 | |
| | | | |
Health Care | | | – | | | | 1,667,802 | | | | – | | | | 1,667,802 | |
| | | | |
Communication Services | | | 161,359 | | | | 1,300,750 | | | | – | | | | 1,462,109 | |
| | | | |
Real Estate | | | – | | | | 895,023 | | | | – | | | | 895,023 | |
| | | | |
Energy | | | – | | | | 324,159 | | | | – | | | | 324,159 | |
| | | | |
Short-Term Investments | | | | | | | | | | | | | | | | |
| | | | |
Joint Repurchase Agreements | | | – | | | | 673,705 | | | | – | | | | 673,705 | |
| | | | |
Repurchase Agreements | | | – | | | | 1,186,000 | | | | – | | | | 1,186,000 | |
| | | | | | | | | | | | | | | | |
| | | | |
Total Investments in Securities | | | $11,985,150 | | | | $28,669,501 | | | | – | | | | $40,654,651 | |
| | | | | | | | | | | | | | | | |
| 1 | An external pricing service is used to reflect any impact on security value due to market movements between the time the Fund valued such foreign securities and the earlier closing of foreign markets. |
For the fiscal year ended May 31, 2024, there were no transfers in or out of Level 3.
The accompanying notes are an integral part of these financial statements.
4
| | |
| | | Statement of Assets and Liabilities May 31, 2024 |
| | | |
| | | |
| | | | |
| | | AMG GW&K
International Small
Cap Fund |
| |
Assets: | | | | |
| |
Investments at value1 (including securities on loan valued at $1,355,681) | | | $40,654,651 | |
| |
Cash | | | 921 | |
| |
Foreign currency2 | | | 41,464 | |
| |
Receivable for investments sold | | | 42,321 | |
| |
Dividend and interest receivables | | | 211,619 | |
| |
Securities lending income receivable | | | 135 | |
| |
Receivable for Fund shares sold | | | 1,728 | |
| |
Receivable from affiliate | | | 11,274 | |
| |
Prepaid expenses and other assets | | | 22,797 | |
| |
Total assets | | | 40,986,910 | |
| |
Liabilities: | | | | |
| |
Payable upon return of securities loaned | | | 673,705 | |
| |
Payable for investments purchased | | | 19,828 | |
| |
Accrued expenses: | | | | |
| |
Investment advisory and management fees | | | 23,358 | |
| |
Administrative fees | | | 5,078 | |
| |
Shareholder service fees | | | 3,509 | |
| |
Other | | | 59,929 | |
| |
Total liabilities | | | 785,407 | |
| |
Commitments and Contingencies
(Notes 2 & 6) | | | | |
| |
Net Assets | | | $40,201,503 | |
| |
1 Investments at cost | | | $42,006,992 | |
| |
2 Foreign currency at cost | | | $41,379 | |
The accompanying notes are an integral part of these financial statements.
5
|
Statement of Assets and Liabilities (continued) |
| | | | | |
| | | AMG GW&K
International Small
Cap Fund |
| |
Net Assets Represent: | | | | | |
| |
Paid-in capital | | | | $53,275,992 | |
| |
Total distributable loss | | | | (13,074,489 | ) |
| |
Net Assets | | | | $40,201,503 | |
| |
Class N: | | | | | |
| |
Net Assets | | | | $3,960,123 | |
| |
Shares outstanding | | | | 87,242 | |
| |
Net asset value, offering and redemption price per share | | | | $45.39 | |
| |
Class I: | | | | | |
| |
Net Assets | | | | $32,045,858 | |
| |
Shares outstanding | | | | 642,939 | |
| |
Net asset value, offering and redemption price per share | | | | $49.84 | |
| |
Class Z: | | | | | |
| |
Net Assets | | | | $4,195,522 | |
| |
Shares outstanding | | | | 83,899 | |
| |
Net asset value, offering and redemption price per share | | | | $50.01 | |
The accompanying notes are an integral part of these financial statements.
6
|
Statement of Operations For the fiscal year ended May 31, 2024 |
| | | | | |
| | | AMG GW&K
International Small
Cap Fund |
| |
Investment Income: | | | | | |
| |
Dividend income | | | | $1,099,721 | |
| |
Interest income | | | | 47,149 | |
| |
Securities lending income | | | | 16,930 | |
| |
Foreign withholding tax | | | | (116,564 | ) |
| |
Total investment income | | | | 1,047,236 | |
| |
Expenses: | | | | | |
| |
Investment advisory and management fees | | | | 256,537 | |
| |
Administrative fees | | | | 55,769 | |
| |
Shareholder servicing fees - Class N | | | | 10,095 | |
| |
Shareholder servicing fees - Class I | | | | 29,085 | |
| |
Custodian fees | | | | 48,304 | |
| |
Registration fees | | | | 39,807 | |
| |
Professional fees | | | | 38,282 | |
| |
Reports to shareholders | | | | 24,552 | |
| |
Trustee fees and expenses | | | | 2,728 | |
| |
Transfer agent fees | | | | 2,485 | |
| |
Miscellaneous | | | | 4,882 | |
| |
Total expenses before offsets | | | | 512,526 | |
| |
Expense reimbursements | | | | (142,285 | ) |
| |
Net expenses | | | | 370,241 | |
| | | | | |
| |
Net investment income | | | | 676,995 | |
| |
Net Realized and Unrealized Gain: | | | | | |
| |
Net realized loss on investments | | | | (583,378 | ) |
| |
Net realized loss on foreign currency transactions | | | | (21,451 | ) |
| |
Net change in unrealized appreciation/depreciation on investments | | | | 3,952,229 | |
| |
Net change in unrealized appreciation/depreciation on foreign currency translations | | | | 4,854 | |
| |
Net realized and unrealized gain | | | | 3,352,254 | |
| | | | | |
| |
Net increase in net assets resulting from operations | | | | $4,029,249 | |
The accompanying notes are an integral part of these financial statements.
7
|
Statements of Changes in Net Assets For the fiscal years ended May 31, |
| | | | | | | | |
| | | AMG GW&K
International Small Cap Fund |
| | |
| | | 2024 | | 2023 |
| | |
Increase (Decrease) in Net Assets Resulting From Operations: | | | | | | | | |
| | |
Net investment income | | | $676,995 | | | | $594,002 | |
| | |
Net realized loss on investments | | | (604,829 | ) | | | (2,731,166 | ) |
| | |
Net change in unrealized appreciation/depreciation on investments | | | 3,957,083 | | | | 1,654,798 | |
| | | | | | | | |
| | |
Net increase (decrease) in net assets resulting from operations | | | 4,029,249 | | | | (482,366 | ) |
| | |
Distributions to Shareholders: | | | | | | | | |
| | |
Class N | | | (60,993 | ) | | | (56,696 | ) |
| | |
Class I | | | (445,036 | ) | | | (328,079 | ) |
| | |
Class Z | | | (57,903 | ) | | | (39,970 | ) |
| | |
Total distributions to shareholders | | | (563,932 | ) | | | (424,745 | ) |
| | |
Capital Share Transactions:1 | | | | | | | | |
| | |
Net increase from capital share transactions | | | 972,723 | | | | 1,796,425 | |
| | | | | | | | |
| | |
Total increase in net assets | | | 4,438,040 | | | | 889,314 | |
| | |
Net Assets: | | | | | | | | |
| | |
Beginning of year | | | 35,763,463 | | | | 34,874,149 | |
| | | | | | | | |
| | |
End of year | | | $40,201,503 | | | | $35,763,463 | |
1 See Note 1(g) of the Notes to Financial Statements.
The accompanying notes are an integral part of these financial statements.
8
|
AMG GW&K International Small Cap Fund Financial Highlights For a share outstanding throughout each fiscal year |
| | | | | | | | | | | | | | | | | | | | |
| | | For the fiscal years ended May 31, |
| | | | | |
| Class N | | 2024 | | 2023 | | 2022 | | 2021 | | 2020 |
| | | | | |
Net Asset Value, Beginning of Year | | | $41.54 | | | | $42.25 | | | | $53.97 | | | | $41.45 | | | | $47.84 | |
| | | | | |
Income (loss) from Investment Operations: | | | | | | | | | | | | | | | | | | | | |
| | | | | |
Net investment income (loss)1,2 | | | 0.71 | | | | 0.67 | | | | 0.54 | | | | (0.12 | ) | | | (0.11 | ) |
| | | | | |
Net realized and unrealized gain (loss) on investments | | | 3.78 | | | | (0.84 | ) | | | (12.07 | ) | | | 12.64 | | | | (6.27 | ) |
| | | | | | | | | | | | | | | | | | | | |
| | | | | |
Total income (loss) from investment operations | | | 4.49 | | | | (0.17 | ) | | | (11.53 | ) | | | 12.52 | | | | (6.38 | ) |
| | | | | |
Less Distributions to Shareholders from: | | | | | | | | | | | | | | | | | | | | |
| | | | | |
Net investment income | | | (0.64 | ) | | | (0.54 | ) | | | (0.19 | ) | | | – | | | | – | |
| | | | | |
Net realized gain on investments | | | – | | | | – | | | | – | | | | – | | | | (0.01 | ) |
| | | | | | | | | | | | | | | | | | | | |
| | | | | |
Total distributions to shareholders | | | (0.64 | ) | | | (0.54 | ) | | | (0.19 | ) | | | – | | | | (0.01 | ) |
| | | | | |
Net Asset Value, End of Year | | | $45.39 | | | | $41.54 | | | | $42.25 | | | | $53.97 | | | | $41.45 | |
| | | | | | | | | | | | | | | | | | | | |
| | | | | |
Total Return2,3 | | | 10.99 | % | | | (0.36 | )% | | | (21.41 | )% | | | 30.20 | % | | | (13.35 | )% |
| | | | | |
Ratio of net expenses to average net assets | | | 1.14 | % | | | 1.14 | % | | | 1.14 | % | | | 1.14 | % | | | 1.13 | % |
| | | | | |
Ratio of gross expenses to average net assets4 | | | 1.52 | % | | | 1.54 | % | | | 1.45 | % | | | 1.31 | % | | | 1.22 | % |
| | | | | |
Ratio of net investment income (loss) to average net assets2 | | | 1.68 | % | | | 1.66 | % | | | 1.09 | % | | | (0.26 | )% | | | (0.24 | )% |
| | | | | |
Portfolio turnover | | | 27 | % | | | 25 | % | | | 26 | % | | | 236 | % | | | 96 | % |
| | | | | |
Net assets end of year (000’s) omitted | | | $3,960 | | | | $4,268 | | | | $4,704 | | | | $8,198 | | | | $11,651 | |
| | | | | |
| | | | | | | | | | | | | | | | | | | | | |
9
|
AMG GW&K International Small Cap Fund Financial Highlights For a share outstanding throughout each fiscal year |
| | | | | | | | | | | | | | | | | | | | |
| | | For the fiscal years ended May 31, |
| | | | | |
| Class I | | 2024 | | 2023 | | 2022 | | 2021 | | 2020 |
| | | | | |
Net Asset Value, Beginning of Year | | | $45.55 | | | | $46.26 | | | | $59.20 | | | | $45.40 | | | | $52.32 | |
| | | | | |
Income (loss) from Investment Operations: | | | | | | | | | | | | | | | | | | | | |
| | | | | |
Net investment income (loss)1,2 | | | 0.85 | | | | 0.80 | | | | 0.68 | | | | (0.05 | ) | | | (0.05 | ) |
| | | | | |
Net realized and unrealized gain (loss) on investments | | | 4.15 | | | | (0.91 | ) | | | (13.23 | ) | | | 13.85 | | | | (6.86 | ) |
| | | | | | | | | | | | | | | | | | | | |
| | | | | |
Total income (loss) from investment operations | | | 5.00 | | | | (0.11 | ) | | | (12.55 | ) | | | 13.80 | | | | (6.91 | ) |
| | | | | |
Less Distributions to Shareholders from: | | | | | | | | | | | | | | | | | | | | |
| | | | | |
Net investment income | | | (0.71 | ) | | | (0.60 | ) | | | (0.39 | ) | | | – | | | | – | |
| | | | | |
Net realized gain on investments | | | – | | | | – | | | | – | | | | – | | | | (0.01 | ) |
| | | | | | | | | | | | | | | | | | | | |
| | | | | |
Total distributions to shareholders | | | (0.71 | ) | | | (0.60 | ) | | | (0.39 | ) | | | – | | | | (0.01 | ) |
| | | | | |
Net Asset Value, End of Year | | | $49.84 | | | | $45.55 | | | | $46.26 | | | | $59.20 | | | | $45.40 | |
| | | | | | | | | | | | | | | | | | | | |
| | | | | |
Total Return2,3 | | | 11.15 | % | | | (0.20 | )% | | | (21.31 | )% | | | 30.39 | % | | | (13.22 | )% |
| | | | | |
Ratio of net expenses to average net assets | | | 0.99 | % | | | 0.99 | % | | | 0.99 | % | | | 0.98 | % | | | 0.99 | % |
| | | | | |
Ratio of gross expenses to average net assets4 | | | 1.37 | % | | | 1.39 | % | | | 1.30 | % | | | 1.15 | % | | | 1.08 | % |
| | | | | |
Ratio of net investment income (loss) to average net assets2 | | | 1.83 | % | | | 1.81 | % | | | 1.24 | % | | | (0.10 | )% | | | (0.10 | )% |
| | | | | |
Portfolio turnover | | | 27 | % | | | 25 | % | | | 26 | % | | | 236 | % | | | 96 | % |
| | | | | |
Net assets end of year (000’s) omitted | | | $32,046 | | | | $27,889 | | | | $27,489 | | | | $36,476 | | | | $60,267 | |
| | | | | | | | | | | | | | | | | | | | | |
10
|
AMG GW&K International Small Cap Fund Financial Highlights For a share outstanding throughout each fiscal year |
| | | | | | | | | | | | | | | | | | | | |
| | | For the fiscal years ended May 31, |
| | | | | |
| Class Z | | 2024 | | 2023 | | 2022 | | 2021 | | 2020 |
| | | | | |
Net Asset Value, Beginning of Year | | | $45.69 | | | | $46.41 | | | | $59.44 | | | | $45.54 | | | | $52.43 | |
| | | | | |
Income (loss) from Investment Operations: | | | | | | | | | | | | | | | | | | | | |
| | | | | |
Net investment income (loss)1,2 | | | 0.90 | | | | 0.85 | | | | 0.73 | | | | (0.00 | )5 | | | 0.00 | 5 |
| | | | | |
Net realized and unrealized gain (loss) on investments | | | 4.17 | | | | (0.92 | ) | | | (13.27 | ) | | | 13.90 | | | | (6.88 | ) |
| | | | | | | | | | | | | | | | | | | | |
| | | | | |
Total income (loss) from investment operations | | | 5.07 | | | | (0.07 | ) | | | (12.54 | ) | | | 13.90 | | | | (6.88 | ) |
| | | | | |
Less Distributions to Shareholders from: | | | | | | | | | | | | | | | | | | | | |
| | | | | |
Net investment income | | | (0.75 | ) | | | (0.65 | ) | | | (0.49 | ) | | | – | | | | – | |
| | | | | |
Net realized gain on investments | | | – | | | | – | | | | – | | | | – | | | | (0.01 | ) |
| | | | | | | | | | | | | | | | | | | | |
| | | | | |
Total distributions to shareholders | | | (0.75 | ) | | | (0.65 | ) | | | (0.49 | ) | | | – | | | | (0.01 | ) |
| | | | | |
Net Asset Value, End of Year | | | $50.01 | | | | $45.69 | | | | $46.41 | | | | $59.44 | | | | $45.54 | |
| | | | | | | | | | | | | | | | | | | | |
| | | | | |
Total Return2,3 | | | 11.27 | % | | | (0.13 | )% | | | (21.22 | )% | | | 30.52 | % | | | (13.13 | )% |
| | | | | |
Ratio of net expenses to average net assets | | | 0.89 | % | | | 0.89 | % | | | 0.89 | % | | | 0.89 | % | | | 0.89 | % |
| | | | | |
Ratio of gross expenses to average net assets4 | | | 1.27 | % | | | 1.29 | % | | | 1.20 | % | | | 1.06 | % | | | 0.98 | % |
| | | | | |
Ratio of net investment income (loss) to average net assets2 | | | 1.93 | % | | | 1.91 | % | | | 1.34 | % | | | (0.01 | )% | | | 0.00 | %6 |
| | | | | |
Portfolio turnover | | | 27 | % | | | 25 | % | | | 26 | % | | | 236 | % | | | 96 | % |
| | | | | |
Net assets end of year (000’s) omitted | | | $4,196 | | | | $3,606 | | | | $2,682 | | | | $4,256 | | | | $23,477 | |
| | | | | | | | | | | | | | | | | | | | | |
| 1 | Per share numbers have been calculated using average shares. |
| 2 | Total returns and net investment income (loss) would have been lower had certain expenses not been offset. |
| 3 | The total return is calculated using the published Net Asset Value as of fiscal year end. |
| 4 | Excludes the impact of expense reimbursement or fee waivers and expense reductions such as brokerage credits, but includes expense repayments and non-reimbursable expenses, if any, such as interest, taxes, and extraordinary expenses. (See Note 1(c) and 2 in the Notes to Financial Statements.) |
| 5 | Less than $0.005 or $(0.005) per share. |
11
| | |
| | | Notes to Financial Statements May 31, 2024 |
| | | |
| | | |
1. ORGANIZATION AND SUMMARY OF SIGNIFICANT ACCOUNTING POLICIES
AMG Funds III (the “Trust”) is an open-end management investment company, organized as a Massachusetts business trust, and registered under the Investment Company Act of 1940, as amended (the “1940 Act”). Currently, the Trust consists of a number of different funds, each having distinct investment management objectives, strategies, risks, and policies. Included in this report is AMG GW&K International Small Cap Fund (the “Fund”).
The Fund offers Class N, Class I and Class Z shares. Each class represents an interest in the same assets of the Fund. Although all share classes generally have identical voting rights, each share class votes separately when required by law. Different share classes may have different net asset values per share to the extent the share classes pay different distribution amounts and/or the expenses of such share classes differ. Each share class has its own expense structure. Please refer to a current prospectus for additional information on each share class.
The Fund’s financial statements are prepared in accordance with accounting principles generally accepted in the United States of America (“U.S. GAAP”), including accounting and reporting guidance pursuant to Accounting Standards Codification Topic 946 applicable to investment companies. U.S. GAAP requires management to make estimates and assumptions that affect the reported amounts of assets and liabilities and disclosure of contingent assets and liabilities at the date of the financial statements and the reported amounts of income and expenses during the reporting period. Actual results could differ from those estimates and such differences could be material. The following is a summary of significant accounting policies followed by the Fund in the preparation of its financial statements:
a. VALUATION OF INVESTMENTS
Equity securities traded on a national securities exchange or reported on the NASDAQ national market system (“NMS”) are valued at the last quoted sales price on the primary exchange or, if applicable, the NASDAQ official closing price or the official closing price of the relevant exchange or, lacking any sales, at the last quoted bid price. Equity securities held by the Fund that are traded in the over-the-counter market (other than NMS securities) are valued at the bid price. Foreign equity securities (securities principally traded in markets other than U.S. markets) held by the Fund are valued at the official closing price on the primary exchange or, for markets that either do not offer an official closing price or where the official closing price may not be representative of the overall market, the last quoted sale price.
Fixed income securities purchased with a remaining maturity of 60 days or less are valued at amortized cost, provided that the amortized cost value is approximately the same as the fair value of the security valued without the use of amortized cost. Investments in other open-end registered investment companies are valued at their end of day net asset value per share.
The Fund’s portfolio investments are generally valued based on independent market quotations or prices or, if none, “evaluative” or other market based valuations provided by third party pricing services. Pursuant to Rule 2a-5 under the 1940 Act, the Fund’s Board of Trustees (the “Board”) designated AMG Funds LLC (the “Investment Manager”) as the Fund’s Valuation Designee to perform the Fund’s fair value determinations. Such determinations are subject to Board oversight and certain reporting and other requirements intended to ensure that
the Board receives the information it needs to oversee the Investment Manager’s fair value determinations.
Under certain circumstances, the value of certain Fund portfolio investments may be based on an evaluation of fair value, pursuant to procedures established by the Investment Manager and under the general supervision of the Board. The Fund may use the fair value of a portfolio investment to calculate its net asset value (“NAV”) in the event that the market quotation, price or market based valuation for the portfolio investment is not readily available or otherwise not determinable pursuant to the Fund’s valuation procedures, if the Investment Manager believes the quotation, price or market based valuation to be unreliable, or in certain other circumstances. When determining the fair value of an investment, the Investment Manager seeks to determine the price that the Fund might reasonably expect to receive from current sale of that portfolio investment in an arms-length transaction. Fair value determinations shall be based upon consideration of all available facts and information, including, but not limited to (i) attributes specific to the investment; (ii) fundamental and analytical data relating to the investment; and (iii) the value of other comparable securities or relevant financial instruments, including derivative securities, traded on other markets or among dealers.
The values assigned to fair value portfolio investments are based on available information and do not necessarily represent amounts that might ultimately be realized in the future, since such amounts depend on future developments inherent in long-term investments. Because of the inherent uncertainty of valuation, those estimated values may differ significantly from the values that would have been used had a ready market for the investments existed, and the differences could be material. The Board will be presented with quarterly reports, as of the most recent quarter end, summarizing all fair value activity, material fair value matters that occurred during the quarter, and all outstanding securities fair valued by the Fund. Additionally, the Board will be presented with an annual report that assesses the adequacy and effectiveness of the Investment Manager’s process for determining the fair value of the Fund’s investments.
With respect to foreign equity securities and certain foreign fixed income securities, securities held in the Fund that can be fair valued by the applicable fair value pricing service are fair valued on each business day provided that each individual price exceeds a pre-established confidence level.
U.S. GAAP defines fair value as the price that a fund would receive to sell an asset or pay to transfer a liability in an orderly transaction between market participants at the measurement date. U.S. GAAP also establishes a framework for measuring fair value, and a three level hierarchy for fair value measurements based upon the transparency of inputs to the valuation of an asset or liability. Inputs may be observable or unobservable and refer broadly to the assumptions that market participants would use in pricing the asset or liability. Observable inputs reflect the assumptions market participants would use in pricing the asset or liability based on market data obtained from sources independent of the Fund. Unobservable inputs reflect the Fund’s own assumptions about the assumptions that market participants would use in pricing the asset or liability developed based on the best information available in the circumstances. Each investment is assigned a level based upon the observability of the inputs which are significant to the overall valuation.
The three-tier hierarchy of inputs is summarized below:
Level 1 – inputs are quoted prices in active markets for identical investments (e.g., equity securities, open-end investment companies)
12
| | |
| | | Notes to Financial Statements (continued) |
| | | |
| | | |
Level 2 – other observable inputs (including, but not limited to: quoted prices for similar assets or liabilities in markets that are active, quoted prices for identical or similar assets or liabilities in markets that are not active, inputs other than quoted prices that are observable for the assets or liabilities (such as interest rates, yield curves, volatilities, prepayment speeds, loss severities, credit risks and default rates) or other market corroborated inputs) (e.g., debt securities, government securities, foreign currency exchange contracts, foreign securities utilizing international fair value pricing, fair valued securities with observable inputs)
Level 3 – inputs are significant unobservable inputs (including the Fund’s own assumptions used to determine the fair value of investments) (e.g., fair valued securities with unobservable inputs)
Changes in inputs or methodologies used for valuing investments may result in a transfer in or out of levels within the fair value hierarchy. The inputs or methodologies used for valuing investments may not necessarily be an indication of the risk associated with investing in those investments.
b. SECURITY TRANSACTIONS
Security transactions are accounted for as of trade date. Realized gains and losses on securities sold are determined on the basis of identified cost.
c. INVESTMENT INCOME AND EXPENSES
Dividend income is recorded on the ex-dividend date. Dividends from foreign securities are recorded on the ex-dividend date, and if after the fact, as soon as the Fund becomes aware of the ex-dividend date. Interest income, which includes amortization of premium and accretion of discount on debt securities, is accrued as earned. Dividend and interest income on foreign securities is recorded gross of any withholding tax. Non-cash dividends included in dividend income, if any, are reported at the fair market value of the securities received. Other income and expenses are recorded on an accrual basis. Expenses that cannot be directly attributed to the Fund are apportioned among the funds in the Trust and other trusts or funds within the AMG Funds Family of Funds (collectively, the “AMG Funds Family”) based upon their relative average net assets or number of shareholders. Investment income, realized and unrealized capital gains and losses, the common expenses of the Fund, and certain fund level expense reductions, if any, are allocated on a pro-rata basis to each class based on the relative net assets of each class to the total net assets of the Fund.
d. DIVIDENDS AND DISTRIBUTIONS
Fund distributions resulting from either net investment income or realized net capital gains, if any, will normally be declared and paid at least annually in December. Distributions to shareholders are recorded on the ex-dividend date. Distributions are determined in accordance with federal income tax regulations, which may differ from net investment income and net realized capital gains for financial statement purposes (U.S. GAAP). Differences may be permanent or temporary. Permanent differences are reclassified among capital accounts in the financial statements to reflect their tax character. Permanent book and tax basis differences, if any, relating to shareholder distributions will result in reclassifications to paid-in capital. Temporary differences arise when certain items of income, expense and gain or loss are recognized in different periods for financial statement and tax purposes; these differences will reverse at some time in the future. There were no permanent differences during the year. Temporary differences are due to the mark-to-market treatment of passive foreign investment companies and wash sales deferrals.
The tax character of distributions paid during the fiscal years ended May 31, 2024 and May 31, 2023 was as follows:
| | | | | | | | |
| | |
Distributions paid from: | | 2024 | | | 2023 | |
| | |
Ordinary income * | | | $563,932 | | | | $424,745 | |
| * | For tax purposes, short-term capital gain distributions, if any, are considered ordinary income distributions. |
As of May 31, 2024, the components of distributable earnings (excluding unrealized appreciation/depreciation) on a tax basis consisted of:
| | | | |
| |
Capital loss carryforward | | $ | 11,711,903 | |
| |
Undistributed ordinary income | | | 396,572 | |
At May 31, 2024, the cost of investments and the aggregate gross unrealized appreciation and depreciation for federal income tax purposes were as follows:
| | | | | | | | | | | | |
| Cost | | Appreciation | | | Depreciation | | | Net Depreciation | |
| | | |
| $42,408,282 | | | $5,600,725 | | | | $(7,359,883 | ) | | | $(1,759,158 | ) |
e. FEDERAL TAXES
The Fund currently qualifies as an investment company and intends to comply with the requirements under Subchapter M of the Internal Revenue Code of 1986, as amended, and to distribute substantially all of its taxable income and gains to its shareholders and to meet certain diversification and income requirements with respect to investment companies. The Investment Manager has analyzed the Fund’s tax positions taken on federal income tax returns as of May 31, 2024, and for all open tax years (generally, the three prior taxable years), and has concluded that no provision for federal income tax is required in the Fund’s financial statements. Additionally, the Investment Manager is not aware of any tax position for which it is reasonably possible that the total amounts of unrecognized tax benefit/detriment will change materially in the next twelve months.
Furthermore, based on the Fund’s understanding of the tax rules and rates related to income, gains and transactions for the foreign jurisdictions in which it invests, the Fund will provide for foreign taxes, and where appropriate, deferred foreign taxes.
f. CAPITAL LOSS CARRYOVERS AND DEFERRALS
As of May 31, 2024, the Fund had capital loss carryovers for federal income tax purposes as shown in the following chart. These amounts may be used to offset future realized capital gains indefinitely, and retain their character as short-term and/or long-term.
| | | | | | | | | | |
Short-Term | | | | Long-Term | | | | | Total |
| | | | |
$8,573,346 | | | | | $3,138,557 | | | | | $11,711,903 |
For the fiscal year ended May 31, 2024, the Fund did not utilize capital loss carryovers.
13
| | |
| | | Notes to Financial Statements (continued) |
| | | |
| | | |
g. CAPITAL STOCK
The Trust’s Declaration of Trust authorizes for the Fund the issuance of an unlimited number of shares of beneficial interest, without par value. The Fund records sales and repurchases of its capital stock on the trade date.
For the fiscal years ended May 31, 2024 and May 31, 2023, the capital stock transactions by class for the Fund were as follows:
| | | | | | | | | | | | | | | | |
| | | May 31, 2024 | | | May 31, 2023 | |
| | | | |
| | | Shares | | | Amount | | | Shares | | | Amount | |
| | | | |
Class N: | | | | | | | | | | | | | | | | |
| | | | |
Shares sold | | | 4,562 | | | | $193,136 | | | | 7,448 | | | | $306,243 | |
| | | | |
Shares issued in reinvestment of distributions | | | 1,443 | | | | 59,448 | | | | 1,377 | | | | 55,377 | |
| | | | |
Shares redeemed | | | (21,513) | | | | (916,440) | | | | (17,421) | | | | (699,428) | |
| | | | | | | | | | | | | | | | |
| | | | |
Net decrease | | | (15,508) | | | | $(663,856) | | | | (8,596) | | | | $(337,808) | |
| | | | | | | | | | | | | | | | |
| | | | |
Class I: | | | | | | | | | | | | | | | | |
| | | | |
Shares sold | | | 106,144 | | | | $4,901,192 | | | | 184,151 | | | | $8,362,308 | |
| | | | |
Shares issued in reinvestment of distributions | | | 9,193 | | | | 415,725 | | | | 7,442 | | | | 327,991 | |
| | | | |
Shares redeemed | | | (84,685) | | | | (3,904,853) | | | | (173,482) | | | | (7,524,051) | |
| | | | | | | | | | | | | | | | |
| | | | |
Net increase | | | 30,652 | | | | $1,412,064 | | | | 18,111 | | | | $1,166,248 | |
| | | | | | | | | | | | | | | | |
| | | | |
Class Z: | | | | | | | | | | | | | | | | |
| | | | |
Shares sold | | | 27,251 | | | | $1,266,352 | | | | 22,384 | | | | $1,019,345 | |
| | | | |
Shares issued in reinvestment of distributions | | | 402 | | | | 18,223 | | | | 58 | | | | 2,579 | |
| | | | |
Shares redeemed | | | (22,666) | | | | (1,060,060) | | | | (1,304) | | | | (53,939) | |
| | | | | | | | | | | | | | | | |
| | | | |
Net increase | | | 4,987 | | | | $224,515 | | | | 21,138 | | | | $967,985 | |
| | | | | | | | | | | | | | | | |
h. REPURCHASE AGREEMENTS AND JOINT REPURCHASE AGREEMENTS
The Fund may enter into third-party and bilateral repurchase agreements for temporary cash management purposes and for reinvestment of cash collateral on securities lending transactions under the securities lending program offered by The Bank of New York Mellon (“BNYM”) (the “Securities Lending Program”) (collectively, “Repurchase Agreements”). The value of the underlying collateral, including accrued interest, must equal or exceed the value of the Repurchase Agreements during the term of the agreement. For joint repurchase agreements, the Fund participates on a pro rata basis with other clients of BNYM in its share of the underlying collateral under such joint repurchase agreements and in its share of proceeds from any repurchase or other disposition of the underlying collateral. The underlying collateral for all Repurchase Agreements is held by the Fund’s custodian or at the Federal Reserve Bank. If the seller defaults and the value of the collateral declines, or if bankruptcy proceedings commence with respect to the seller of the security, realization of the collateral by the Fund may be delayed or limited. Pursuant to the Securities Lending Program, the Fund is indemnified for such losses by BNYM on joint repurchase agreements.
At May 31, 2024, the market value of Repurchase Agreements outstanding was $1,859,705.
i. FOREIGN CURRENCY TRANSLATION
The books and records of the Fund are maintained in U.S. Dollars. The value of investments, assets and liabilities denominated in currencies other than U.S. Dollars are translated into U.S. Dollars based upon current foreign exchange rates. Purchases and sales of foreign investments, income and expenses are converted into U.S. Dollars based on currency exchange rates prevailing on the respective dates of such transactions. Net realized and unrealized gain (loss) on foreign currency transactions represent: (1) foreign exchange gains and losses from the sale and holdings of foreign currencies; (2) gains and losses between trade date and settlement date on investment securities transactions and foreign currency exchange contracts; and (3) gains and losses from the difference between amounts of interest and dividends recorded and the amounts actually received.
The Fund does not isolate the net realized and unrealized gain or loss resulting from changes in exchange rates from the fluctuations in market prices of securities held. Such fluctuations are included with the net realized and unrealized gain or loss on investments.
2. AGREEMENTS AND TRANSACTIONS WITH AFFILIATES
The Trust has entered into an investment advisory agreement under which the Investment Manager, a subsidiary and the U.S. wealth platform of Affiliated Managers Group, Inc. (“AMG”), serves as investment manager to the Fund and is
14
| | |
| | | Notes to Financial Statements (continued) |
| | | |
| | | |
responsible for the Fund’s overall administration and operations. The Investment Manager selects and recommends, subject to the approval of the Board and, in certain circumstances, shareholders, the subadviser for the Fund and monitors the subadviser’s investment performance, security holdings and investment strategies. The Fund’s investment portfolio is managed by GW&K Investment Management, LLC (“GW&K”), who serves pursuant to a subadvisory agreement with the Investment Manager. AMG indirectly owns a majority interest in GW&K.
Investment management fees are paid directly by the Fund to the Investment Manager based on average daily net assets. For the fiscal year ended May 31, 2024, the Fund paid an investment management fee at the annual rate of 0.69% of the average daily net assets of the Fund. The fee paid to GW&K for its services as subadviser is paid out of the fee the Investment Manager receives from the Fund and does not increase the expenses of the Fund.
The Investment Manager has contractually agreed, through at least October 1, 2024, to waive management fees and/or pay or reimburse fund expenses in order to limit total annual Fund operating expenses after fee waiver and expense reimbursements (exclusive of taxes, interest (including interest incurred in connection with bank and custody overdrafts, and in connection with securities sold short), shareholder servicing fees, distribution and service (12b-1) fees, brokerage commissions and other transaction costs, dividends payable with respect to securities sold short, acquired fund fees and expenses and extraordinary expenses) to 0.89% of the Fund’s average daily net assets (this annual rate or such other annual rate that may be in effect from time to time, the “Expense Cap”), subject to later reimbursement by the Fund in certain circumstances.
In general, for a period of up to 36 months after the date any amounts are paid, waived or reimbursed by the Investment Manager, the Investment Manager may recover such amounts from the Fund, provided that such repayment would not cause the Fund’s total annual operating expenses after fee waiver and expense reimbursements (exclusive of the items noted in the parenthetical above) to exceed either (i) the Expense Cap in effect at the time such amounts were paid, waived or reimbursed, or (ii) the Expense Cap in effect at the time of such repayment by the Fund.
The contractual expense limitation may only be terminated in the event the Investment Manager or a successor ceases to be the investment manager of the Fund or a successor fund, by mutual agreement between the Investment Manager and the Board, or in the event of the Fund’s liquidation unless the Fund is reorganized or is a party to a merger in which the surviving entity is successor to the accounting and performance information of the Fund.
For the fiscal year ended May 31, 2024, the Investment Manager reimbursed the Fund $142,285, and did not recoup any previously reimbursed expenses. At May 31, 2024, the Fund’s expiration of reimbursements subject to recoupment is as follows:
| | | | |
Expiration Period | | | |
| |
Less than 1 year | | $ | 138,682 | |
| |
1-2 years | | | 131,768 | |
| |
2-3 years | | | 142,285 | |
| | | | |
| |
Total | | $ | 412,735 | |
| | | | |
The Trust, on behalf of the Fund, has entered into an amended and restated Administration Agreement under which the Investment Manager serves as the
Fund’s administrator (the “Administrator”) and is responsible for certain aspects of managing the Fund’s operations, including administration and shareholder services to the Fund. The Fund pays a fee to the Administrator at the rate of 0.15% per annum of the Fund’s average daily net assets for this service.
The Fund is distributed by AMG Distributors, Inc. (the “Distributor”), a wholly-owned subsidiary of the Investment Manager. The Distributor serves as the distributor and underwriter for the Fund and is a registered broker-dealer and member of the Financial Industry Regulatory Authority, Inc. (“FINRA”). Shares of the Fund will be continuously offered and will be sold directly to prospective purchasers and through brokers, dealers or other financial intermediaries who have executed selling agreements with the Distributor. Generally, the Distributor bears all or a portion of the expenses of providing services pursuant to the distribution agreement, including the payment of the expenses relating to the distribution of prospectuses for sales purposes and any advertising or sales literature.
For each of the Class N and Class I shares, the Board has approved reimbursement payments to the Investment Manager for shareholder servicing expenses (“shareholder servicing fees”) incurred. Shareholder servicing fees include payments to financial intermediaries, such as broker-dealers (including fund supermarket platforms), banks, and trust companies who provide shareholder recordkeeping, account servicing and other services. The Class N and Class I shares may reimburse the Investment Manager for the actual amount incurred up to a maximum annual rate of each Class’s average daily net assets as shown in the table below.
The impact on the annualized expense ratios for the fiscal year ended May 31, 2024, was as follows:
| | | | | | | | |
| | | Maximum Annual
Amount
Approved | | | Actual Amount Incurred | |
| | |
Class N | | | 0.25% | | | | 0.25% | |
| | |
Class I | | | 0.10% | | | | 0.10% | |
The Board provides supervision of the affairs of the Trust and other trusts within the AMG Funds Family. The Trustees of the Trust who are not affiliated with the Investment Manager receive an annual retainer and per meeting fees for regular, special and telephonic meetings, and they are reimbursed for out-of-pocket expenses incurred while carrying out their duties as Board members. The Chairman of the Board and the Audit Committee Chair receive additional annual retainers. Certain Trustees and Officers of the Fund are Officers and/or Directors of the Investment Manager, AMG and/or the Distributor.
The Securities and Exchange Commission (the “SEC”) granted an exemptive order that permits certain eligible funds in the AMG Funds Family to lend and borrow money for certain temporary purposes directly to and from other eligible funds in the AMG Funds Family. Participation in this interfund lending program is voluntary for both the borrowing and lending funds, and an interfund loan is only made if it benefits each participating fund. The Administrator manages the program according to procedures approved by the Board, and the Board monitors the operation of the program. An interfund loan must comply with certain conditions set out in the exemptive order, which are designed to assure fairness and protect all participating funds. The interest earned and interest paid on interfund loans are included on the Statement of Operations as interest income and interest expense, respectively. At May 31, 2024, the Fund had no interfund loans outstanding. The Fund did not borrow during the fiscal year ended May 31, 2024.
15
| | |
| | | Notes to Financial Statements (continued) |
| | | |
| | | |
The Fund utilized the interfund loan program during the fiscal year ended May 31, 2024 as follows:
| | | | | | | | | | |
Average
Lent | | Number
of Days | | Interest
Earned | | | Average
Interest Rate | |
| | | |
$1,150,943 | | 1 | | | $199 | | | | 6.220% | |
3. PURCHASES AND SALES OF SECURITIES
Purchases and sales of securities (excluding short-term securities and U.S. Government Obligations) for the fiscal year ended May 31, 2024, were $9,717,594 and $9,646,924, respectively.
The Fund had no purchases or sales of U.S. Government Obligations during the fiscal year ended May 31, 2024.
4. PORTFOLIO SECURITIES LOANED
The Fund participates in the Securities Lending Program providing for the lending of securities to qualified borrowers. Securities lending income includes earnings of such temporary cash investments, plus or minus any rebate to a borrower. These earnings (after any rebate) are then divided between BNYM, as a fee for its services under the Securities Lending Program, and the Fund, according to agreed-upon rates. Collateral on all securities loaned is accepted in cash, U.S. Treasury Obligations or U.S. Government Agency Obligations. Collateral is maintained at a minimum level of 102% (105% in the case of certain foreign securities) of the market value, plus interest, if applicable, of investments on loan. It is the Fund’s policy to obtain additional collateral from or return excess collateral to the borrower by the end of the next business day, following the valuation date of the securities loaned. Therefore, the value of the collateral held may be temporarily less than the value of the securities on loan. Lending securities entails a risk of loss to the Fund if and to the extent that the market value of the securities loaned were to increase and the borrower did not increase the collateral accordingly, and the borrower fails to return the securities. Under the terms of the Securities Lending Program, the Fund is indemnified for such losses by BNYM. Cash collateral is held in separate omnibus accounts managed by BNYM, who is authorized to exclusively enter into joint repurchase agreements for that cash collateral. Securities collateral is held in separate omnibus accounts managed by BNYM and cannot be sold or pledged. BNYM bears the risk of any deficiency in the amount of the cash collateral available for return to the borrower due to any loss on the collateral invested. Loans of securities are terminable at any time and the borrower, after notice, is required to return borrowed securities as soon as practical, which is normally within three business days.
The value of securities loaned on positions held, cash collateral and securities collateral received at May 31, 2024, was as follows:
| | | | | | | | |
Securities Loaned | | Cash Collateral Received | | Securities Collateral Received | | | Total Collateral Received |
| | | |
$1,355,681 | | $673,705 | | | $754,688 | | | $1,428,393 |
The following table summarizes the securities received as collateral for securities lending at May 31, 2024:
| | | | | | |
Collateral Type | | Coupon
Range | | Maturity Date Range | |
| | |
U.S. Treasury Obligations | | 0.000%-5.000% | | | 06/30/24-02/15/54 | |
5. FUND RISKS
In the normal course of business, the Fund invests in securities or other instruments and may enter into certain transactions, and such activities subject the Fund to various risks. The value of securities or other instruments may also be affected by various factors, including, without limitation: (i) the general economy; (ii) the overall market as well as local, regional or global political and/or social instability; or (iii) currency and price fluctuations. Please refer to the Fund’s current prospectus for additional information about the Fund’s principal risks.
Market Risk: Market prices of investments held by the Fund may fall rapidly or unpredictably due to a variety of factors, including economic, political, or market conditions, or other factors including terrorism, war, natural disasters and the spread of infectious illness or other public health issues, including epidemics or pandemics, or in response to events that affect particular industries or companies.
Small-Capitalization Stock Risk: The stocks of small-capitalization companies often have greater price volatility, lower trading volume, and less liquidity than the stocks of larger, more established companies.
Growth Stock Risk: The prices of equity securities of companies that are expected to experience relatively rapid earnings growth, or “growth stocks,” may be more sensitive to market movements because the prices tend to reflect future investor expectations rather than just current profits.
Management Risk: Because the Fund is an actively managed investment portfolio, security selection or focus on securities in a particular style, market sector or group of companies may cause the Fund to incur losses or underperform relative to its benchmarks or other funds with a similar investment objective.
Sector Risk: Issuers and companies that are in similar industry sectors may be similarly affected by particular economic or market events; to the extent the Fund has substantial holdings within a particular sector, the risks associated with that sector increase.
Liquidity Risk: The Fund may not be able to dispose of particular investments, such as illiquid securities, readily at favorable times or prices or the Fund may have to sell them at a loss.
Foreign Securities: The Fund invests in securities of foreign entities and in instruments denominated in foreign currencies which involve risks not typically associated with investments in domestic securities, such as exposure to currency fluctuations, less developed or less efficient trading markets, political instability, a lack of company information, differing auditing and legal standards, and, potentially, less liquidity. The Fund’s performance will be influenced by political, social and economic factors affecting companies in emerging market countries. Emerging market countries generally have economic structures that are less diverse and mature, and political systems that are less stable, than those of developed countries. Realized gains in certain countries may be subject to foreign taxes at the Fund level and the Fund would pay such foreign taxes at the appropriate rate for each jurisdiction.
Geographic Focus Risk: To the extent the Fund focuses its investments in a particular country, group of countries or geographic region, the Fund is particularly susceptible to economic, political, regulatory or other events or conditions affecting such countries or region, and the Fund’s NAV may be more volatile than the NAV of a more geographically diversified fund and may result in losses.
16
| | |
| | | Notes to Financial Statements (continued) |
| | | |
| | | |
Risks Associated with Investment in Japan: The Fund is highly susceptible to the social, political, economic, regulatory and other conditions or events that may affect Japan’s economy. The Japanese economy is heavily dependent upon international trade, and, therefore, is particularly exposed to the risks of currency fluctuation, foreign trade policy and regional and global economic disruption, including the risk of increased tariffs, embargoes, and other trade limitations or factors. The Japanese economy, at times, has been impacted by government regulation, intervention, and protectionism; cross-ownership among major corporations; an aging demographic; and a declining population. The potential for natural disasters, such as earthquakes, volcanic eruptions, typhoons and tsunamis, could also have significant negative effects on Japan’s economy.
6. COMMITMENTS AND CONTINGENCIES
Under the Trust’s organizational documents, its Trustees and Officers are indemnified against certain liabilities arising out of the performance of their duties to the Trust. In addition, in the normal course of business, the Fund may enter into contracts and agreements that contain a variety of representations and warranties, which provide general indemnifications. The maximum exposure to the Fund under these arrangements is unknown, as this would involve future claims that may be made against the Fund that have not yet occurred. However, based on experience, the Fund had no prior claims or losses and expects the risks of loss to be remote.
7. MASTER NETTING AGREEMENTS
The Fund may enter into master netting agreements with its counterparties for the Securities Lending Program and Repurchase Agreements, which provide the right, in the event of default (including bankruptcy or insolvency) for the non-defaulting party to liquidate the collateral and calculate net exposure to the defaulting party or request additional collateral. For financial reporting purposes, the Fund does not offset financial assets and financial liabilities that are subject to master netting agreements in the Statement of Assets and Liabilities. For securities lending transactions, see Note 4.
The following table is a summary of the Fund’s open Repurchase Agreements that are subject to a master netting agreement as of May 31, 2024:
| | | | | | | | | | | | | | | | | | | | |
| | | | | | Gross Amount Not Offset in the | | | | | | | |
| | | | | | Statement of Assets and Liabilities | | | | | | | |
| | | | | |
| | | Gross Amounts of
Assets Presented in
the Statement of
Assets and Liabilities | | | Offset Amount | | | Net Asset Balance | | | Collateral Received | | | Net Amount | |
| | | | | |
| | | | | | | | | | | | | | | | | | | | |
| | | | | |
| | | | | | | | | | | | | | | | | | | | |
| | | | | |
Daiwa Capital Markets America | | | $673,705 | | | | – | | | | $673,705 | | | | $673,705 | | | | – | |
| | | | | |
Fixed Income Clearing Corp. | | | 1,186,000 | | | | – | | | | 1,186,000 | | | | 1,186,000 | | | | – | |
| | | | | | | | | | | | | | | | | | | | |
| | | | | |
Total | | | $1,859,705 | | | | – | | | | $1,859,705 | | | | $1,859,705 | | | | – | |
| | | | | | | | | | | | | | | | | | | | |
8. SUBSEQUENT EVENTS
The Fund has determined that no material events or transactions occurred through the issuance date of the Fund’s financial statements which require an additional disclosure in or adjustment of the Fund’s financial statements.
17
|
Report of Independent Registered Public Accounting Firm |
To the Board of Trustees of AMG Funds III and Shareholders of AMG GW&K International Small Cap Fund
Opinion on the Financial Statements
We have audited the accompanying statement of assets and liabilities, including the schedule of portfolio investments, of AMG GW&K International Small Cap Fund (one of the funds constituting AMG Funds III, referred to hereafter as the “Fund”) as of May 31, 2024, the related statement of operations for the year ended May 31, 2024, the statements of changes in net assets for each of the two years in the period ended May 31, 2024, including the related notes, and the financial highlights for each of the five years in the period ended May 31, 2024 (collectively referred to as the “financial statements”). In our opinion, the financial statements present fairly, in all material respects, the financial position of the Fund as of May 31, 2024, the results of its operations for the year then ended, the changes in its net assets for each of the two years in the period ended May 31, 2024 and the financial highlights for each of the five years in the period ended May 31, 2024 in conformity with accounting principles generally accepted in the United States of America.
Basis for Opinion
These financial statements are the responsibility of the Fund’s management. Our responsibility is to express an opinion on the Fund’s financial statements based on our audits. We are a public accounting firm registered with the Public Company Accounting Oversight Board (United States) (PCAOB) and are required to be independent with respect to the Fund in accordance with the U.S. federal securities laws and the applicable rules and regulations of the Securities and Exchange Commission and the PCAOB.
We conducted our audits of these financial statements in accordance with the standards of the PCAOB. Those standards require that we plan and perform the audit to obtain reasonable assurance about whether the financial statements are free of material misstatement, whether due to error or fraud.
Our audits included performing procedures to assess the risks of material misstatement of the financial statements, whether due to error or fraud, and performing procedures that respond to those risks. Such procedures included examining, on a test basis, evidence regarding the amounts and disclosures in the financial statements. Our audits also included evaluating the accounting principles used and significant estimates made by management, as well as evaluating the overall presentation of the financial statements. Our procedures included confirmation of securities owned as of May 31, 2024 by correspondence with the custodian and broker. We believe that our audits provide a reasonable basis for our opinion.
/s/ PricewaterhouseCoopers LLP
Boston, Massachusetts
July 24, 2024
We have served as the auditor of one or more investment companies in the AMG Funds Family since 1993.
18
| | |
| | | Other Information (unaudited) |
| | | |
| | | |
TAX INFORMATION
AMG GW&K International Small Cap Fund hereby designates the maximum amount allowable of its net taxable income as qualified dividends as provided in the Jobs and Growth Tax Relief Reconciliation Act of 2003. The 2024 Form 1099-DIV you receive for the Fund will show the tax status of all distributions paid to you during the year.
Pursuant to section 852 of the Internal Revenue Code, AMG GW&K International Small Cap Fund hereby designates $0 as a capital gain distribution with respect to the taxable year ended May 31, 2024, or if subsequently determined to be different, the net capital gains of such fiscal year.
In accordance with federal tax law, AMG GW&K International Small Cap Fund elected to provide foreign taxes paid and the income sourced from foreign countries. Accordingly, AMG GW&K International Small Cap Fund hereby makes the following designations regarding its period ended May 31, 2024:
The total amount of taxes paid and income sourced from foreign countries was $100,215 and $1,098,741, respectively.
ITEM 8. CHANGES IN AND DISAGREEMENTS WITH ACCOUNTANTS FOR OPEN-END MANAGEMENT INVESTMENT COMPANIES
During the fiscal year ended May 31, 2024, there were no changes in and/or disagreements with accountants.
ITEM 9. PROXY DISCLOSURES FOR OPEN-END MANAGEMENT INVESTMENT COMPANIES
Not applicable.
ITEM 10. REMUNERATION PAID TO DIRECTORS, OFFICERS, AND OTHERS OF OPEN-END MANAGEMENT INVESTMENT COMPANIES
The remuneration paid to the Trustees during the fiscal year ended May 31, 2024, was $2,728, which is reflected as “Trustee fees and expenses” on the Statement of Operations. There was no remuneration paid to any Fund officer or to any affiliated person of any Fund Trustee or officer during the fiscal year ended May 31, 2024.
ITEM 11. STATEMENT REGARDING BASIS FOR APPROVAL OF INVESTMENT ADVISORY CONTRACT
Not applicable.
19
THIS PAGE INTENTIONALLY LEFT BLANK
|
|
| | | | | | | | |
INVESTMENT MANAGER AND ADMINISTRATOR AMG Funds LLC 680 Washington Blvd., Suite 500 Stamford, CT 06901 800.548.4539 DISTRIBUTOR AMG Distributors, Inc. 680 Washington Blvd., Suite 500 Stamford, CT 06901 800.548.4539 SUBADVISER GW&K Investment Management, LLC 222 Berkeley St. Boston, MA 02116 CUSTODIAN The Bank of New York Mellon Mutual Funds Custody 240 Greenwich Street New York, NY 10286 | | | | LEGAL COUNSEL Ropes & Gray LLP Prudential Tower, 800 Boylston Street Boston, MA 02199-3600 TRANSFER AGENT BNY Mellon Investment Servicing (US) Inc. AMG Funds Attn: 534426 AIM 154-0520 500 Ross Street Pittsburgh, PA 15262 800.548.4539 | | | | This report is prepared for the Fund’s shareholders. It is authorized for distribution to prospective investors only when preceded or accompanied by an effective prospectus. To receive a free copy of the prospectus or Statement of Additional Information, which includes additional information about Fund Trustees, please contact us by calling 800.548.4539. Distributed by AMG Distributors, Inc., member FINRA/SIPC. Current net asset values per share for the Fund are available on the Fund’s website at wealth.amg.com. A description of the policies and procedures the Fund uses to vote its proxies is available: (i) without charge, upon request, by calling 800.548.4539, or (ii) on the Securities and Exchange Commission’s (SEC) website at sec.gov. For information regarding the Fund’s proxy voting record for the 12-month period ended June 30, call 800.548.4539 or visit the SEC website at sec.gov. The Fund files its complete schedule of portfolio holdings with the SEC for the first and third quarters of each fiscal year as an exhibit to its reports on Form N-PORT. The Fund’s portfolio holdings on Form N-PORT are available on the SEC’s website at sec.gov and the Fund’s website at wealth.amg.com. To review a complete list of the Fund’s portfolio holdings, or to view the most recent semi-annual report or annual report, please visit wealth.amg.com. |
| | | | | | | | | |
|
|
| | | | | | | | |
EQUITY FUNDS AMG Boston Common Global Impact Boston Common Asset Management, LLC AMG Frontier Small Cap Growth Frontier Capital Management Co., LLC AMG GW&K Small Cap Core AMG GW&K Small Cap Value AMG GW&K Small/Mid Cap Core AMG GW&K Small/Mid Cap Growth AMG GW&K International Small Cap GW&K Investment Management, LLC AMG Montrusco Bolton Large Cap Growth Montrusco Bolton Investments, Inc. AMG Renaissance Large Cap Growth The Renaissance Group LLC | | | | AMG River Road Dividend All Cap Value AMG River Road Focused Absolute Value AMG River Road Large Cap Value Select AMG River Road Mid Cap Value AMG River Road Small-Mid Cap Value AMG River Road Small Cap Value River Road Asset Management, LLC AMG TimesSquare Emerging Markets Small Cap AMG TimesSquare Global Small Cap AMG TimesSquare International Small Cap AMG TimesSquare Mid Cap Growth AMG TimesSquare Small Cap Growth TimesSquare Capital Management, LLC AMG Veritas Asia Pacific AMG Veritas China AMG Veritas Global Focus AMG Veritas Global Real Return Veritas Asset Management LLP AMG Yacktman AMG Yacktman Focused AMG Yacktman Global AMG Yacktman Special Opportunities Yacktman Asset Management LP | | | | FIXED INCOME FUNDS AMG Beutel Goodman Core Plus Bond Beutel, Goodman & Company Ltd. AMG GW&K Core Bond ESG AMG GW&K ESG Bond AMG GW&K Municipal Bond AMG GW&K Municipal Enhanced Yield GW&K Investment Management, LLC ALTERNATIVE FUNDS AMG Systematica Managed Futures Strategy Systematica Investments Limited, acting as general partner of Systematica Investments LP |
| | | | |
| | | |
| wealth.amg.com | | | | 053124 AR065 |
Item 12. DISCLOSURE OF PROXY VOTING POLICIES AND PROCEDURES FOR CLOSED-END MANAGEMENT INVESTMENT COMPANIES.
Not applicable.
Item 13. PORTFOLIO MANAGERS OF CLOSED-END MANAGEMENT INVESTMENT COMPANIES.
Not applicable.
Item 14. PURCHASES OF EQUITY SECURITIES BY CLOSED-END MANAGEMENT INVESTMENT COMPANIES AND AFFILIATED PURCHASERS.
Not applicable.
Item 15. SUBMISSION OF MATTERS TO A VOTE OF SECURITY HOLDERS.
Not applicable.
Item 16. CONTROLS AND PROCEDURES.
(a) The Registrant’s principal executive and principal financial officers have concluded, based on their evaluation of the registrant’s disclosure controls and procedures as of a date within 90 days of the filing of this report, that the Registrant’s disclosure controls and procedures are reasonably designed to ensure that information required to be disclosed by the Registrant on Form N-CSR is recorded, processed, summarized and reported within the required time periods and that information required to be disclosed by the registrant in the reports that it files or submits on Form N-CSR is accumulated and communicated to the Registrant’s management, including its principal executive and principal financial officers, as appropriate to allow timely decisions regarding required disclosure.
(b) There were no changes in the Registrant’s internal control over financial reporting during the period covered by this report that have materially affected, or are reasonably likely to materially affect, the internal control over financial reporting.
Item 17. DISCLOSURE OF SECURITIES LENDING ACTIVITIES FOR CLOSED-END MANAGEMENT INVESTMENT COMPANIES.
Not applicable.
Item 18. RECOVERY OF ERRONEOUSLY AWARDED COMPENSATION.
Not applicable.
Item 19. EXHIBITS
SIGNATURES
Pursuant to the requirements of the Securities Exchange Act of 1934 and the Investment Company Act of 1940, the registrant has duly caused this report to be signed on its behalf by the undersigned, thereunto duly authorized.
AMG FUNDS III
| | |
By: | | /s/ Keitha L. Kinne |
| | Keitha L. Kinne, Principal Executive Officer |
| |
| Date: | | August 8, 2024 |
Pursuant to the requirements of the Securities Exchange Act of 1934 and the Investment Company Act of 1940, this report has been signed below by the following persons on behalf of the registrant and in the capacities and on the dates indicated.
| | |
By: | | /s/ Keitha L. Kinne |
| | Keitha L. Kinne, Principal Executive Officer |
| |
| Date: | | August 8, 2024 |
| | |
By: | | /s/ Thomas Disbrow |
| | Thomas Disbrow, Principal Financial Officer |
| |
| Date: | | August 8, 2024 |