As filed with the Securities and Exchange Commission on September 5, 2014
UNITED STATES
SECURITIES AND EXCHANGE COMMISSION
Washington, D.C. 20549
FORM N-CSR
CERTIFIED SHAREHOLDER REPORT OF REGISTERED
MANAGEMENT INVESTMENT COMPANIES
Investment Company Act file number 811-03758
MATRIX ADVISORS VALUE FUND, INC.
(Exact name of registrant as specified in charter)
747 Third Avenue, 31st Floor, New York, NY 10017
(Address of principal executive offices) (Zip code)
David A. Katz
747 Third Avenue, 31st Floor
New York, NY 10017
(Name and address of agent for service)
1(800) 366-6223
Registrant's telephone number, including area code
Copies to:
Carol Gehl
Godfrey & Kahn, S.C.
780 N. Water Street
Milwaukee, WI 53202
Date of fiscal year end: June 30
Date of reporting period: June 30, 2014
Item 1. Reports to Stockholders.
MATRIX ADVISORS VALUE FUND, INC. |
August 12, 2014
Dear Fellow Shareholder,
The Fund had another favorable quarter ending June 30, 2014, finishing its fiscal year with strong absolute and relative performance. For the quarter, the Fund was up +6.12% versus a gain of +5.23% for the S&P 500 Index and for the first six months of 2014 the Fund increased +10.80% versus a gain of +7.13% for the S&P 500. For the fiscal year ending June 30, 2014, the Fund had a gain of +29.20% compared with a rise of +24.61% in the S&P 500 Index. As of June 30, 2014 the Fund’s Net Asset Value was $63.32.
| Disclosure Note: For your information, for the period ended June 30, 2014, the Fund’s average annual total returns for the one-year, five-years, ten-years and for the period from July 1, 1996, the inception of Matrix Asset Advisors’ involvement with the Fund, were 29.20%, 15.74%, 5.38% and 8.33%, respectively. For the same periods the returns for the S&P 500 Index were 24.61%, 18.83%, 7.78% and 8.07%. | ||||||
| Gross Expense Ratio: | 1.18% | �� | ||||
| Net Expense Ratio: | 0.99%** | |||||
** The Advisor has contractually agreed to reduce fees through 10/31/14. Performance data quoted represents past performance; past performance does not guarantee future results. The investment return and principal value of an investment will fluctuate so that an investor’s shares, when redeemed, may be worth more or less than their original cost. Current performance of the Fund may be lower or higher than the performance quoted. Performance data current to the most recent month end may be obtained by calling 800-366-6223 or by visiting www.matrixadvisorsvaluefund.com. The Fund imposes a 1.00% redemption fee on shares held for 60 days or less. Performance data does not reflect the redemption fee. If reflected, total returns would be reduced. Investment performance reflects fee waivers in effect. In the absence of such waivers, total return would be reduced. Matrix Asset Advisors became the sub-advisor on July 1, 1996 and Advisor to the Fund on May 11, 1997. Prior to those dates, the Fund was managed by another advisor. | ||||||
As we will discuss in the Commentary that follows, we are impressed with the market’s first half performance when considering the mixed economic data and global strife in the Middle East and the Ukraine which were prevalent over the first six months of the year. We continue to believe that there may be further gains in the market for the balance of the year, though we foresee intermittent pull-backs as well as a slow down in the pace of gains from earlier in the year.
We believe that the rest of the year should see accelerating economic growth and eventual higher interest rates due to the improved employment data and consumer confidence. We also think there will be a continuation of corporate earnings and dividend increases as the year progresses. In this environment, we believe the Fund should be well positioned to continue to deliver additional gains for the balance of the year.
1
MATRIX ADVISORS VALUE FUND, INC. |
We have been happy that the Fund has been listed several times this year in the The Wall Street Journal’s Category Kings Listing.
As we have pointed out a number of times over the years, we have a significant amount of our investable assets alongside our fellow shareholders in the Fund. So needless to say, for a wealth of reasons, we at Matrix continue to be pleased with the Fund’s solid absolute and relative performance in the first half of 2014, as well as during the past fiscal year.
We thank you for your patience and trust in the Fund.
Best regards.
Sincerely,

David A. Katz, CFA
Fund Manager
Past performance is not a guarantee of future results.
Please refer to the Schedule of Investments in this report for details on fund holdings. Fund holdings are subject to change at any time and are not recommendations to buy or sell any security.
The information provided herein represents the opinion of the Matrix Advisors Value Fund management and is not intended to be a forecast of future events, a guarantee of future results, nor investment advice.
The S&P 500 Index is a broad based unmanaged index of 500 stocks, which is widely recognized as representative of the equity market in general.
The Dow Jones Industrial Average (DJIA) is an unmanaged index of common stocks comprised of major industrial companies and assumes reinvestment of dividends.
The Dow Jones-UBS Commodity Index DJ-UBSCI, was renamed on July 1, 2014 to the Bloomberg Commodity Index, BCOM. The Bloomberg Commodity Index is a broadly diversified index that allows investors to track commodity futures through a single, simple measure.
The MSCI World is a stock market index of 1,612 ‘world’ stocks. It is maintained by MSCI Inc., formerly Morgan Stanley Capital International, and is often used as a common benchmark for ‘world’ or ‘global’ stock funds.
The MSCI Emerging Markets Index is a free float-adjusted market capitalization index that is designed to measure equity market performance in the global emerging markets.
It is not possible to invest directly in an index.
Must be preceded or accompanied by a prospectus.
Mutual fund investing involves risk. Principal loss is possible. The stock of value companies can continue to be undervalued for long periods of time and not realize its expected value. The value of the Fund may decrease in response to the activities and financial prospects of an individual company.
The Matrix Advisors Value Fund is distributed by Quasar Distributors, LLC.
2
MATRIX ADVISORS VALUE FUND, INC. |
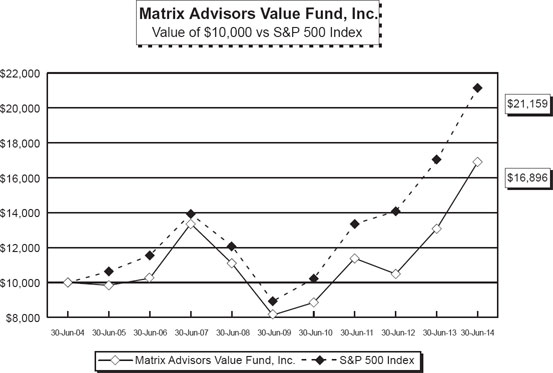
Average Annualized Total Return Periods Ended June 30, 2014 | ||||||||||||
| One Year | Five Years | Ten Years | ||||||||||
| Matrix Advisors Value Fund, Inc. | 29.20 | % | 15.74 | % | 5.38 | % | ||||||
| S&P 500 Index* | 24.61 | % | 18.83 | % | 7.78 | % | ||||||
The graph above illustrates the performance of a hypothetical $10,000 investment made in the Fund and the S&P 500 Index ten years ago. All returns in the graph and table above reflect the reinvestment of dividends and distributions, but do not reflect the deduction of taxes that an investor would pay on distributions or redemptions. The graph and table above do not imply any future performance.
Performance data quoted represents past performance and does not guarantee future results. The investment return and principal value of an investment will fluctuate so that an investor’s shares, when redeemed, may be worth more or less than their original cost. Current performance of the Fund may be lower or higher than the performance quoted. Performance data current to the most recent month end may be obtained by visiting www.matrixadvisorsvaluefund.com. The Fund imposes a redemption fee of 1.00% on shares held for 60 days or less. The performance cited above does not reflect this redemption fee; if deducted the total returns would be reduced. Performance figures reflect fee waivers in effect and in the absence of fee waivers, total returns would be lower.
* The S&P 500 is an unmanaged index which is widely regarded as the standard for measuring large-cap U.S. stock market performance. The index does not incur expenses and is not available for investment.
3
MATRIX ADVISORS VALUE FUND, INC. |
Matrix Advisors Value Fund
Capital Markets Commentary and
2014 Annual Report:
The stock market continued its record setting advance in the second quarter with the S&P 500 Index rising +5.23%, bringing the year-to-date gain for the first six months of 2014 to +7.13%.
The Fund had another strong quarter, both relatively and absolutely, building on our first quarter gains, and resulting in solid outperformance over the benchmark for the first six months of the year. For the quarter ending June 30th, the Fund was up +6.12% versus a gain of +5.23% for the S&P 500 Index and for the first six months of 2014 the Fund increased +10.80% versus a gain of +7.13% for the S&P 500.
At the beginning of the year, we thought that a high single-digit or low double-digit gain in 2014 was achievable for equities because valuations were very reasonable, the economy had positive momentum and interest rates remained at historically low levels. We are, nevertheless, impressed by the magnitude of the stock market’s first half advance as it powered through some mixed economic data and continued global strife in the Middle East and the Ukraine, with no signs of near term resolution in either area. And while we continue to expect further gains this year, we would not be surprised if the pace of the advance moderates or if there were intermittent market pull-backs.
Annual Review
The Fund posted strong absolute and relative performance for its fiscal year (6/30/13 - 6/30/14) due to an improving economic environment that boosted the Fund and the market over the same period.
For the fiscal year ending June 30, 2014, the Fund posted a return of +29.20% compared with a return of the S&P 500 over the same period of +24.61%. These results improved on what was a very strong 2013 fiscal year for both the S&P 500 and the Fund.
The Fund began its fiscal year slightly underperforming the S&P 500 Index as the market was hit with concerns surrounding the direction of interest rates and the Federal Reserve’s posture on tapering its easing program. During the 4th Quarter of 2013, the market had digested this news and returned to the more fundamental focus on individual companies, which was prevalent during the first six months of 2013. In this fundamentally focused market environment the Fund has benefited from our stock selection which has driven our outperformance.
In addition to this fundamental focus, the biggest drivers of our favorable returns over the past fiscal year has been a significant pick up in mergers and acquisitions activity, corporate activism and more aggressive capital programs by corporate boards which positively impacted a number of our holdings. From a sector perspective the Fund’s returns were driven by strong gains in Consumer Discretionary, Energy, Healthcare, Producer Durables and Technology.
4
MATRIX ADVISORS VALUE FUND, INC. |
Quarterly Commentary
On balance, the economic data in the second quarter was positive, but there were puts and takes that both Bulls and Bears could use to support their economic arguments. On the negative side, the biggest surprise was the downward revision to the first quarter Gross Domestic Product (GDP) from plus +0.1% to minus -2.9%, the largest decline in U.S. GDP since 2009. Though much of the first quarter decline is an aberration attributable to the severe winter, there is also some evidence that consumer spending was below expectations (particularly on healthcare as the Affordable Care Act rolled out) and new home sales have been disappointing. It is not clear yet if the lower than expected home sales were due to the lack of affordability, tightened lending standards, the impact of student debt or a generational shift on the desire to own versus rent after the real estate meltdown in the last recession.
On the other hand, employment data has continued to improve, consumer confidence is at a seven year high, small business optimism is up, service sector activity is at a four year high and corporate profits and dividends are on track for another positive year. We think the more optimistic outlook for the economy should prove correct and gain traction as the year progresses.
Stocks are not the only asset class to advance this year. As the Wall Street Journal reported in the June 28-29 weekend edition, six major world stock, bond and commodity indexes1 are all up together for the year to date through June 27th period. This is an extremely rare occurrence, happening last in June 1993. Normally, stocks and commodities gain when economic growth is positive, and bonds and gold benefit from economic weakness and market stress. The synchronized gains this year reflect the unusual confluence of modest global economic growth and the public commitment by central banks around the world to keep interest rates low. In our opinion, something has to give. Either growth will lead to higher stock prices and higher interest rates with lower bond prices or stock prices will fall on evidence that growth is faltering and corporate profits are unsustainably high. We believe it should ultimately be the former with accelerating economic growth and eventually higher interest rates. In that environment, the Fund should be well positioned to continue to deliver solid gains.
Fund Performance
All portfolio sectors showed gains during the second quarter with the exception of Materials & Processing whose one holding, DuPont, showed a modest loss after company management lowered earnings guidance late in the quarter, due in large part to lower than expected results in its agriculture segment.
The top performing sector in the quarter was Energy, up in the mid-teens, led by Conoco, Devon and Schlumberger. Schlumberger’s advance was propelled by a two day investor meeting in late June where the company gave a very positive outlook for the next three years.
After Energy, the strongest gains were in the Producer Durables sector (Caterpillar and Eaton) and Health Care, led by the recent purchase, Hologic, and Zimmer, which agreed to acquire rival orthopedic device maker Biomet during the quarter.
1 The six major world stock, bond and commodity indexes are: 10 Year Treasury Note, DJ UBS Commodity Index, Gold, DJIA, MSCI World (developed) Index, MSCI Emerging Markets Index.
5
MATRIX ADVISORS VALUE FUND, INC. |
We had solid gains in the Consumer Discretionary and Consumer Staples sectors, with Kellogg (sold after reaching our price target) and Coca-Cola leading the way.
Two lagging sectors in the quarter, in addition to Materials & Processing, were Financials and Technology. Financials, as a group, were depressed by lower interest rates in the quarter, though Wells Fargo made a notable new all-time stock price high. Our Technology stocks took a breather after their very strong gains in the first quarter and during 2013. In fact, even with the modest 2nd quarter, Technology continues to be one of our top sectors this year with returns in the mid-teens.
We made three new purchases in the quarter, two in Technology, Symantec and Teradata, and one in Health Care, the Biotechnology company, Gilead.
Symantec has a strong franchise in data security as well as data storage and back up. Teradata is a leading company in the growing field of analyzing the enormous amount of data being collected, and Gilead is a preeminent Biotech company with life-saving drug therapies for HIV and Hepatitis C.
We sold our positions in Corning (which we began exiting last quarter) as it reached its fair value, and Kellogg to take advantage of more compelling investment opportunities.
In addition to the new purchases noted previously, where cash was available and where positions were underweighted, we added to holdings in Capital One Financial, Eaton Corp., J.P. Morgan Chase and Johnson Controls.
As we wrap up the mid-point of the year, we are pleased with how the portfolio is positioned and encouraged by our ability to continue to uncover new investment opportunities in what we view as high quality businesses. This allows us to reinvest the profits realized from earlier investments that have reached and we believe may reach our target prices.
Equity Outlook
While we look for the pace of gains to slow down, and are expecting more volatility and market pullbacks as the year progresses, we do believe stocks should end the year at higher levels than where they are today. We believe the market should continue to have a fundamental focus, and that corporate earnings that are at or above expectations, coupled with healthy levels of M&A activity, corporate activism and managements that are more focused on shareholder oriented capital allocation plans, should give the market an upside bias.
We believe the Fund should continue to make solid progress in the upcoming environment.
* * *
We hope that everyone has a relaxing and enjoyable summer. Thank you for your continued confidence and trust in Matrix. If you have any questions on the enclosed, or if we can do anything for you, please don’t hesitate to call us at 800 366 6223 or 212 486 2004.
Best regards.
6
MATRIX ADVISORS
VALUE FUND, INC.
| Expense Example (Unaudited) |
As a shareholder of the Fund, you incur two types of costs: (1) transaction costs, including redemption fees; and (2) ongoing costs, including management fees and other Fund expenses. This Example is intended to help you understand your ongoing costs (in dollars) of investing in the Fund and to compare these costs with the ongoing costs of investing in other mutual funds.
The Example is based on an investment of $1,000 invested at the beginning of the period indicated and held for the entire period from January 1, 2014 to June 30, 2014.
Actual Expenses
The information in the table under the heading “Actual Performance” provides information about actual account values and actual expenses. You may use the information in these columns together with the amount you invested, to estimate the expenses that you paid over the period. Simply divide your account value by $1,000 (for example, an $8,600 account value divided by $1,000 = 8.6), then multiply the result by the number in the row entitled “Expenses Paid During Period” to estimate the expenses you paid on your account during this period.
Hypothetical Example for Comparison Purposes
The information in the table under the heading “Hypothetical Performance (5% return before expenses)” provides information about hypothetical account values and hypothetical expenses based on the Fund’s actual expense ratio and an assumed rate of return of 5% per year before expenses, which is not the Fund’s actual return. The hypothetical account values and expenses may not be used to estimate the actual ending account balance or expenses you paid for the period. You may use this information to compare the ongoing costs of investing in the Fund and other funds. To do so, compare this 5% hypothetical example with the 5% hypothetical examples that appear in the shareholder reports of the other funds.
Please note that the expenses shown in the table are meant to highlight your ongoing costs only and do not reflect any transaction costs, such as redemption fees. Therefore, the information under the heading “Hypothetical Performance (5% return before expenses)” is useful in comparing ongoing costs only, and will not help you determine the relative total costs of owning different funds. In addition, if these transactional costs were included, your costs would have been higher.
| ACTUAL | HYPOTHETICAL PERFORMANCE | ||||||||
| EXPENSE EXAMPLE | PERFORMANCE | (5% RETURN BEFORE EXPENSES) | |||||||
| Beginning Account Value (1/1/14) | $ | 1,000.00 | $ | 1,000.00 | |||||
| Ending Account Value (6/30/14) | $ | 1,108.00 | $ | 1,019.89 | |||||
Expenses Paid During Period1 | $ | 5.17 | $ | 4.96 | |||||
| 1 | Expenses are equal to the Fund’s annualized expense ratio of 0.99% multiplied by the average account value over the period, multiplied by 181/365 (to reflect the one-half year period). |
7
MATRIX ADVISORS
VALUE FUND, INC.
| SECTOR BREAKDOWN | ||||
| Financials | 27.2 | % | ||
| Information Technology | 17.4 | % | ||
| Energy | 16.9 | % | ||
| Health Care | 15.2 | % | ||
| Consumer Staples | 9.2 | % | ||
| Industrials | 6.0 | % | ||
| Consumer Discretionary | 5.4 | % | ||
| Materials | 2.6 | % | ||
| 99.9 | % | |||
| Cash | 0.1 | % | ||
| Total Investments | 100.0 | % | ||
| The table above lists sector allocations as a percentage of the Fund’s total investments as of June 30, 2014. | ||||
8
MATRIX ADVISORS
VALUE FUND, INC.
Schedule of Investments
June 30, 2014
| SHARES | VALUE | |||||
| COMMON STOCKS – 100.0% | ||||||
| BANK (MONEY CENTER): 3.8% | ||||||
| 54,100 | JPMorgan Chase & Co. | $ | 3,117,242 | |||
| BANK (PROCESSING): 3.4% | ||||||
| 40,900 | State Street Corp. | 2,750,934 | ||||
| BANK (REGIONAL): 3.3% | ||||||
| 67,000 | BB&T Corp. | 2,641,810 | ||||
| BANK (SUPER REGIONAL): 3.8% | ||||||
| 58,500 | Wells Fargo & Co. | 3,074,760 | ||||
| BEVERAGES: 3.9% | ||||||
| 18,000 | PepsiCo, Inc. | 1,608,120 | ||||
| 36,200 | The Coca-Cola Co. | 1,533,432 | ||||
| 3,141,552 | ||||||
| CHEMICALS: 2.6% | ||||||
| 32,200 | EI du Pont de Nemours & Co. | 2,107,168 | ||||
| COMPUTER AND PERIPHERALS: 2.8% | ||||||
| 67,500 | Hewlett-Packard Co. | 2,273,400 | ||||
| COMPUTER SOFTWARE AND SERVICES: 4.8% | ||||||
| 64,300 | Microsoft Corp. | 2,681,310 | ||||
| 29,000 | Symantec Corp. | 664,100 | ||||
| 14,000 | Teradata Corp. * | 562,800 | ||||
| 3,908,210 | ||||||
| DIVERSIFIED OPERATIONS: 3.0% | ||||||
| 48,000 | Johnson Controls, Inc. | 2,396,640 | ||||
| DRUG (GENERIC): 2.6% | ||||||
| 40,000 | Teva Pharmaceutical Industries, Ltd. - ADR | 2,096,800 | ||||
| DRUG STORE: 2.3% | ||||||
| 24,700 | CVS Caremark Corp. | 1,861,639 | ||||
| ELECTRICAL COMPONENT: 3.3% | ||||||
| 43,000 | TE Connectivity Ltd. | 2,659,120 | ||||
The accompanying notes to the financial statements are an integral part of this schedule.
9
MATRIX ADVISORS
VALUE FUND, INC.
Schedule of Investments
June 30, 2014 – Continued
| SHARES | VALUE | |||||
| FINANCIAL SERVICES: 4.7% | ||||||
| 12,100 | American Express Co. | $ | 1,147,927 | |||
| 32,600 | Capital One Financial Corp. | 2,692,760 | ||||
| 3,840,687 | ||||||
| HOUSEHOLD PRODUCTS: 3.1% | ||||||
| 31,600 | The Procter & Gamble Co. | 2,483,444 | ||||
| INSURANCE (DIVERSIFIED): 3.7% | ||||||
| 54,000 | MetLife, Inc. | 3,000,240 | ||||
| MACHINERY: 2.6% | ||||||
| 19,600 | Caterpillar, Inc. | 2,129,932 | ||||
| MACHINERY - MISCELLANEOUS: 3.4% | ||||||
| 35,500 | Eaton Corp Plc | 2,739,890 | ||||
| MEDICAL SUPPLIES: 9.7% | ||||||
| 110,000 | Hologic, Inc. * | 2,788,500 | ||||
| 23,600 | Johnson & Johnson | 2,469,032 | ||||
| 24,800 | Zimmer Holdings, Inc. | 2,575,728 | ||||
| 7,833,260 | ||||||
| OIL & GAS SERVICES: 3.9% | ||||||
| 26,500 | Schlumberger Ltd. | 3,125,675 | ||||
| OIL/GAS (DOMESTIC): 3.7% | ||||||
| 37,900 | Devon Energy Corp. | 3,009,260 | ||||
| PETROLEUM (INTEGRATED): 3.0% | ||||||
| 18,500 | Chevron Corp. | 2,415,175 | ||||
| PETROLEUM (PRODUCING): 6.4% | ||||||
| 27,600 | ConocoPhillips | 2,366,148 | ||||
| 27,400 | Occidental Petroleum Corp. | 2,812,062 | ||||
| 5,178,210 | ||||||
| PHARMACEUTICAL AND MEDICINE MANUFACTURING: 0.5% | ||||||
| 5,000 | Gilead Sciences, Inc. * | 414,550 | ||||
The accompanying notes to the financial statements are an integral part of this schedule.
10
MATRIX ADVISORS
VALUE FUND, INC.
Schedule of Investments
June 30, 2014 – Continued
| SHARES | VALUE | |||||
| PRECISION INSTRUMENTS: 2.4% | ||||||
| 16,500 | Thermo Fisher Scientific, Inc. | $ | 1,947,000 | |||
| RESTAURANTS: 2.5% | ||||||
| 19,900 | McDonald’s Corp. | 2,004,726 | ||||
| SECURITIES BROKERAGE: 4.4% | ||||||
| 74,500 | Morgan Stanley | 2,408,585 | ||||
| 43,800 | The Charles Schwab Corp. | 1,179,534 | ||||
| 3,588,119 | ||||||
| SEMICONDUCTORS: 3.2% | ||||||
| 33,100 | QUALCOMM, Inc. | 2,621,520 | ||||
| TELECOMMUNICATIONS (EQUIPMENT): 3.2% | ||||||
| 105,200 | Cisco Systems, Inc. | 2,614,220 | ||||
TOTAL COMMON STOCKS (Cost $54,538,265) | $ | 80,975,183 | ||||
| SHORT TERM INVESTMENTS: 0.1% | ||||||
| 83,946 | Fidelity Institutional Money Market Portfolio | 83,946 | ||||
TOTAL SHORT TERM INVESTMENTS (Cost $83,946) | $ | 83,946 | ||||
TOTAL INVESTMENTS (Cost $54,622,211): 100.1% | 81,059,129 | |||||
LIABILITIES IN EXCESS OF OTHER ASSETS: (0.1)% | (56,218 | ) | ||||
TOTAL NET ASSETS: 100.0% | $ | 81,002,911 | ||||
* Non-Income Producing.
ADR – American Depository Receipt.
The accompanying notes to the financial statements are an integral part of this schedule.
11
MATRIX ADVISORS VALUE FUND, INC. |
| Statement of Assets and Liabilities At June 30, 2014 |
| ASSETS: | ||||
| Investments in securities, at value (cost $54,622,211) | $ | 81,059,129 | ||
| Receivables: | ||||
| Fund shares sold | 34,871 | |||
| Dividends and Interest | 84,148 | |||
| Prepaid expenses | 15,576 | |||
Total assets | 81,193,724 | |||
| LIABILITIES: | ||||
| Payables: | ||||
| Fund shares repurchased | 89,126 | |||
| Due to Advisor | 42,080 | |||
| Accrued expenses: | ||||
| Professional fees | 18,529 | |||
| Other expenses | 41,078 | |||
| Total liabilities | 190,813 | |||
NET ASSETS | $ | 81,002,911 | ||
Number of shares, $0.01 par value, issued and outstanding (unlimited shares authorized) | 1,279,290 | |||
Net Asset Value, Offering Price and Redemption Price Per Share | $ | 63.32 | ||
| COMPOSITION OF NET ASSETS: | ||||
| Paid-in capital | 63,801,840 | |||
| Undistributed net investment income | 487,003 | |||
| Accumulated net realized loss on investment | (9,722,850 | ) | ||
| Net unrealized appreciation on investments | 26,436,918 | |||
Net Assets | $ | 81,002,911 | ||
The accompanying notes to the financial statements are an integral part of this statement.
12
MATRIX ADVISORS VALUE FUND, INC. |
Statement of Operations For the Year Ended June 30, 2014 |
| INVESTMENT INCOME |
| INCOME | ||||
| Dividend income (net of foreign taxes withheld of $9,500) | $ | 1,685,449 | ||
| Interest income | 72 | |||
| Total income | 1,685,521 | |||
| EXPENSES | ||||
| Advisory fees | 572,791 | |||
| Administration fees | 95,762 | |||
| Shareholder servicing and accounting fees | 60,043 | |||
| Professional fees | 51,296 | |||
| Federal and State registration fees | 27,783 | |||
| Custodian fees | 21,616 | |||
| Reports to shareholders | 16,211 | |||
| Directors’ fees and expenses | 10,014 | |||
| Other expenses | 19,764 | |||
| Interest expense | 129 | |||
| Total operating expenses | 875,409 | |||
| Less: Expense reimbursement by Advisor | (119,325 | ) | ||
| Net expenses | 756,084 | |||
| Net investment income | 929,437 | |||
| REALIZED AND UNREALIZED GAIN (LOSS) ON INVESTMENTS | ||||
| Net realized gain on investments | 6,790,693 | |||
| Net change in net unrealized appreciation/depreciation on investments | 11,501,729 | |||
| Net realized and unrealized gain on investments | 18,292,422 | |||
| NET INCREASE IN NET ASSETS RESULTING FROM OPERATIONS | $ | 19,221,859 | ||
The accompanying notes to the financial statements are an integral part of this statement.
13
MATRIX ADVISORS VALUE FUND, INC. |
| YEAR | YEAR | |||||||
| ENDED | ENDED | |||||||
| Statement of Changes in Net Assets | JUNE 30, 2014 | JUNE 30, 2013 | ||||||
| INCREASE (DECREASE) IN NET ASSETS | ||||||||
| OPERATIONS: | ||||||||
| Net investment income | $ | 929,437 | $ | 807,493 | ||||
| Net realized gain (loss) on investments | 6,790,693 | (5,981,711 | ) | |||||
| Net change in net unrealized appreciation/depreciation on investments | 11,501,729 | 17,645,936 | ||||||
| Net increase in net assets resulting from operations | 19,221,859 | 12,471,718 | ||||||
| DISTRIBUTIONS TO SHAREHOLDERS: | ||||||||
| Net investment income | (840,548 | ) | (916,430 | ) | ||||
| Total distributions to shareholders | (840,548 | ) | (916,430 | ) | ||||
| CAPITAL SHARE TRANSACTIONS: | ||||||||
| Proceeds from shares sold | 25,727,247 | 3,375,846 | ||||||
| Proceeds from reinvestment of distributions | 749,306 | 882,922 | ||||||
| Cost of shares redeemed | (24,516,774 | ) | (30,733,833 | ) | ||||
| Redemption fees | 1,170 | 212 | ||||||
| Net increase (decrease) from capital share transactions | 1,960,949 | (26,474,853 | ) | |||||
| Total increase (decrease) in net assets | 20,342,260 | (14,919,565 | ) | |||||
| NET ASSETS | ||||||||
| Beginning of year | 60,660,651 | 75,580,216 | ||||||
| End of year | $ | 81,002,911 | $ | 60,660,651 | ||||
| Undistributed net investment income | $ | 487,003 | $ | 398,114 | ||||
| CHANGE IN SHARES | ||||||||
| Shares outstanding, beginning of year | 1,223,871 | 1,868,981 | ||||||
| Shares sold | 465,730 | 74,662 | ||||||
| Shares issued on reinvestment of distributions | 13,402 | 21,102 | ||||||
| Shares redeemed | (423,713 | ) | (740,874 | ) | ||||
| Shares outstanding, end of year | 1,279,290 | 1,223,871 | ||||||
The accompanying notes to the financial statements are an integral part of this statement.
14
MATRIX ADVISORS VALUE FUND, INC. |
Financial Highlights For a capital share outstanding throughout each year |
| YEARS ENDED JUNE 30, | ||||||||||||||||||||
| 2014 | 2013 | 2012 | 2011 | 2010 | ||||||||||||||||
| Net asset value, beginning of year | $ | 49.56 | $ | 40.44 | $ | 44.29 | $ | 34.64 | $ | 32.04 | ||||||||||
| Income (loss) from investment operations: | ||||||||||||||||||||
| Net investment income | 0.68 | (a) | 0.59 | (a) | 0.48 | 0.26 | 0.18 | |||||||||||||
Net realized and unrealized gain (loss) on investments | 13.71 | 9.26 | (3.99 | ) | 9.62 | 2.69 | ||||||||||||||
| Total from investment operations | 14.39 | 9.85 | (3.51 | ) | 9.88 | 2.87 | ||||||||||||||
| Less distributions: | ||||||||||||||||||||
| Dividends from net investment income | (0.63 | ) | (0.73 | ) | (0.34 | ) | (0.23 | ) | (0.27 | ) | ||||||||||
| Total distributions | (0.63 | ) | (0.73 | ) | (0.34 | ) | (0.23 | ) | (0.27 | ) | ||||||||||
| Paid-in capital from redemption fees (Note 2) | 0.00 | (b) | 0.00 | (b) | 0.00 | (b) | 0.00 | (b) | 0.00 | (b) | ||||||||||
| Net asset value, end of year | $ | 63.32 | $ | 49.56 | $ | 40.44 | $ | 44.29 | $ | 34.64 | ||||||||||
| Total return | 29.20 | % | 24.69 | % | (7.88 | )% | 28.55 | % | 8.87 | % | ||||||||||
| Ratios/supplemental data: | ||||||||||||||||||||
| Net assets, end of year (millions) | $ | 81.0 | $ | 60.7 | $ | 75.6 | $ | 97.4 | $ | 82.8 | ||||||||||
| Ratio of operating expenses to average net assets: | ||||||||||||||||||||
| Before expense reimbursement | 1.15 | % | 1.18 | % | 1.15 | % | 1.16 | % | 1.38 | % | ||||||||||
| After expense reimbursement | 0.99 | % | 0.99 | % | 0.99 | % | 0.99 | % | 0.99 | % | ||||||||||
| Interest expense | 0.00 | %(c) | — | — | — | — | ||||||||||||||
Ratio of net investment income to average net assets: | ||||||||||||||||||||
| Before expense reimbursement | 1.06 | % | 1.18 | % | 0.98 | % | 0.42 | % | 0.07 | % | ||||||||||
| After expense reimbursement | 1.22 | % | 1.37 | % | 1.14 | % | 0.59 | % | 0.46 | % | ||||||||||
| Portfolio turnover rate | 41 | % | 15 | % | 19 | % | 25 | % | 20 | % | ||||||||||
(a) Calculated using the average shares method.
(b) Less than $0.01.
(c) Interest expense was less than 0.01%.
The accompanying notes to the financial statements are an integral part of this statement.
15
MATRIX ADVISORS
VALUE FUND, INC.
| Notes to the Financial Statements |
NOTE 1 – ORGANIZATION |
Matrix Advisors Value Fund, Inc. (the “Fund”) is a Maryland corporation registered under the Investment Company Act of 1940 (the “1940 Act”) as a diversified, open-end management investment company. The Fund commenced operations September 16, 1983. The objective of the Fund is to achieve a total rate of return composed of capital appreciation and current income.
NOTE 2 – SIGNIFICANT ACCOUNTING POLICIES
The Fund consistently follows the accounting policies set forth below which are in conformity with accounting principles generally accepted in the United States of America.
| A. | Security Valuation. |
| Securities traded on a national securities exchange are valued at the last reported sales price at the close of regular trading on each day the exchanges are open for trading. Securities traded on NASDAQ are valued at the NASDAQ Official Closing Price, which may not necessarily represent the last sale price. Quotations of foreign securities in a foreign currency shall be valued daily in U.S. dollars on the basis of the foreign currency exchange rates prevailing at the time such valuation is determined. Foreign currency exchange rates generally shall be determined prior to the close of the New York Stock Exchange (the “NYSE”). Securities traded on an exchange for which there have been no sales are valued at the mean between the bid and asked price. | |
| Securities for which quotations are not readily available are stated at their respective fair values as determined in good faith by a valuation committee of Matrix Asset Advisors, Inc. (the “Advisor” or “Matrix”) in accordance with procedures approved by the Board of Directors of the Fund. In determining fair value, the Fund takes into account all relevant factors and available information. Consequently, the price of the security used by the Fund to calculate its net asset value (“NAV”) per share may differ from quoted or published prices for the same security. Fair value pricing involves subjective judgments and there is no single standard for determining a security’s fair value. As a result, different mutual funds could reasonably arrive at a different fair value for the same security. It is possible that the fair value determined for a security is materially different from the value that could be realized upon the sale of that security or from the values that other mutual funds may determine. | |
| Investments in other funds are valued at their respective net asset values as determined by those funds, in accordance with the 1940 Act. | |
| Foreign securities are recorded in the financial statements after translation to U.S. dollars based on the applicable exchange rate at the end of the period. The Fund does not isolate that portion of the results of operations arising as a result of changes in the currency exchange rate from the fluctuations arising as a result of changes in the market prices of investments during the period. | |
| B. | Shares Valuation. |
| The NAV per share of the Fund is calculated by dividing the sum of the value of the securities held by the Fund, plus cash or other assets, minus all liabilities (including estimated accrued expenses), by the total |
16
MATRIX ADVISORS
VALUE FUND, INC.
| Notes to the Financial Statements Continued | |
| number of shares outstanding of the Fund, rounded to the nearest cent. The Fund’s shares will not be priced on the days on which the NYSE is closed for trading. The offering and redemption price per share of the Fund is equal to the Fund’s NAV per share. The Fund will assess a 1.00% fee on redemptions of Fund shares purchased and held for 60 days or less. These fees are deducted from the redemptions proceeds otherwise payable to the shareholder. The Fund will retain the fee charged as paid-in capital and such fees become part of that Fund’s daily NAV calculation. | |
| C. | Federal Income Taxes. |
| The Fund has elected to be treated as a “regulated investment company” under Subchapter M of the Internal Revenue Code of 1986, as amended. The Fund intends to distribute substantially all of its taxable income and any capital gains less any applicable capital loss carryforwards. Accordingly, no provision for Federal income taxes has been made in the accompanying financial statements. | |
| The Fund recognizes the tax benefits of uncertain tax positions only where the position is “more likely than not” to be sustained assuming examination by tax authorities. Management has analyzed the Fund’s tax positions, and has concluded that no liability for unrecognized tax benefits should be recorded related to uncertain tax positions taken on returns filed for open tax years (2011 – 2013), or expected to be taken in the Fund’s 2014 tax returns. The Fund identifies its major tax jurisdictions as U.S. Federal, New York State and New York City. The Fund is not aware of any tax positions for which it is reasonably possible that the total amounts of unrecognized tax benefits will change materially in the next twelve months. | |
| D. | Use of Estimates. |
| The preparation of financial statements in conformity with accounting principles generally accepted in the United States of America requires management to make estimates and assumptions that affect the reported amounts of assets and liabilities and disclosure of contingent assets and liabilities at the date of the financial statements and the reported amounts of revenues and expenses during the reporting period. Actual results could differ from these estimates. | |
| E. | Reclassification of Capital Accounts. |
| United States Generally Accepted Accounting Principles (“U.S. GAAP”) requires that certain components of net assets relating to permanent differences be reclassified between financial and tax reporting. These reclassifications have no effect on net assets or net asset value per share. For the year ended June 30, 2014, the Fund has no permanent book-to-tax differences. | |
| F. | Security Transactions, Investment Income, and Distributions. |
| Security transactions are accounted for on the trade date. Dividend income and distributions to shareholders are recorded on the ex-dividend date, and interest income is recognized on the accrual basis. Realized gains and losses are evaluated on the basis of identified costs. Premiums and discounts on the purchase of securities are amortized/accreted using the effective interest method. U.S. GAAP requires that permanent financial reporting and tax differences be reclassified in the capital accounts. | |
17
MATRIX ADVISORS
VALUE FUND, INC.
| Notes to the Financial Statements Continued |
| G. | Indemnification Obligations. |
| Under the Fund’s organizational documents, its current and former Officers and Directors are indemnified against certain liabilities arising out of the performance of their duties to the Fund. In addition, in the normal course of business, the Fund enters into contracts that contain a variety of representations and warranties that provide general indemnifications. The Fund’s maximum exposure under these arrangements is unknown as this would involve future claims that may be made against the Fund that have not yet occurred or that would be covered by other parties. | |
| H. | Line of Credit. |
The Fund has a Loan Agreement with U.S. Bank N.A. Under the terms of the Loan Agreement, the Fund’s borrowings cannot exceed the lesser of $3,400,000, 5% of the gross market value of the Fund, or 331/3% of the net asset market value of the unencumbered assets of the Fund. | |
| The interest rate on the Loan equals the prime rate minus one percent per annum, payable monthly. Borrowing activity under the Loan Agreement for the year ended June 30, 2014, was as follows: |
| Maximum | Amount | Average Daily | ||||||
| Amount | Interest | Outstanding at | Amount | Average | ||||
| Outstanding | Expense | June 30, 2014 | Outstanding | Interest Rate | ||||
| $1,593,000 | $129 | $0 | $5,674 | 2.25% |
| I. | Subsequent Events. |
| In preparing these financial statements, the Fund has evaluated events and transactions for potential recognition or disclosure through the date the financial statements were issued and determined that no events have occured that require disclosure. |
NOTE 3 – INVESTMENT ADVISORY AND OTHER AGREEMENTS
The Fund has a management agreement with the Advisor to serve as investment advisor. Certain Officers of the Advisor are also Officers of the Fund. Under the terms of the agreement, the Fund has agreed to pay the Advisor as compensation for all services rendered, staff and facilities provided and expenses paid or assumed, an annual advisory fee, accrued daily, paid monthly, of 0.75% of the Fund’s average daily net assets.
The Advisor has contractually agreed to reduce its advisory fees and/or pay expenses of the Fund to ensure that the Fund’s total annual operating expenses (excluding aquired fund fees and expenses, leverage interest, taxes, brokerage commissions and extraordinary expenses) will not exceed 0.99% of the Fund’s average daily net assets. In connection with this expense limitation, the Advisor is eligible to recover expenses waived after August 31, 2011, for three fiscal years following the fiscal year in which the expenses were originally waived.
18
MATRIX ADVISORS
VALUE FUND, INC.
| Notes to the Financial Statements Continued |
The Advisor will only be able to recover previously waived expenses if the Fund’s then current expense ratio is below the 0.99% expense cap. The Board of Directors of the Fund approved these changes at a meeting held on August 24, 2010. For the year ended June 30, 2014, Matrix waived $119,325. Any reduction in advisory fees or payment of expenses made by the Advisor may be reimbursed by the Fund if the Advisor requests reimbursement in subsequent fiscal years.
This reimbursement may be requested if the aggregate amount actually paid by the Fund toward operating expenses for such fiscal year (taking into account the reimbursement) does not exceed the applicable limitation on Fund expenses. The Advisor is permitted to be reimbursed for fee reductions and/or expense payments made in the prior three fiscal years. Any such reimbursement will be reviewed by the Fund’s Board of Directors. The Fund must pay its current ordinary operating expenses before the Advisor is entitled to any reimbursement of fees and/or expenses.
At June 30, 2014, the cumulative amount available for reimbursement that has been paid and/or waived is $367,587. Currently, the Advisor has agreed not to seek reimbursement of such fee reductions and/or expense payments. The advisor may recapture a portion of this amount no later than the dates stated below:
| June 30, | ||||
| 2015 | 2016 | 2017 | ||
| $135,059 | $113,203 | $119,325 | ||
U.S. Bancorp Fund Services, LLC (the “Administrator”) acts as the Fund’s Administrator under an Administration Agreement. The Administrator prepares various federal and state regulatory filings, reports and returns for the Fund; prepares reports and materials to be supplied to the Directors; monitors the activities of the Fund’s custodian, transfer agent and accountants; coordinates the preparation and payment of Fund expenses and reviews the Fund’s expense accruals. For the year ended June 30, 2014, U.S. Bancorp Fund Services, LLC was paid $95,762, in its capacity as Fund Administrator. U.S. Bancorp Fund Services, LLC also serves as the Fund Accountant and Transfer Agent. U.S. Bank, N.A. serves as the Fund’s Custodian. Quasar Distributors, LLC, an affiliate of U.S. Bancorp Fund Services, LLC and U.S. Bank, N.A., serves as the Fund’s principal underwriter.
The Chief Compliance Officer (“CCO”) receives no compensation from the Fund for her services; however, the Administrator was paid $10,000 for the year ended June 30, 2014 for CCO support services.
NOTE 4 – INVESTMENT TRANSACTIONS
The cost of purchases and the proceeds from sales of securities, other than short-term obligations and U.S. Government securities, for the year ended June 30, 2014, are as follows:
| Purchases | Sales | |||
| Common Stock | $ 33,950,122 | $ 31,222,323 |
19
MATRIX ADVISORS
VALUE FUND, INC.
| Notes to the Financial Statements Continued |
NOTE 5 – DISTRIBUTIONS TO SHAREHOLDERS
As of June 30, 2014, the components of distributable earnings on a tax basis were as follows:
| Cost of investments for tax purposes | $ | 54,716,980 | ||||
| Gross tax unrealized appreciation | 26,592,476 | |||||
| Gross tax unrealized depreciation | (250,327 | ) | ||||
| Net tax unrealized appreciation on investments | 26,342,149 | |||||
| Undistributed ordinary income | 487,003 | |||||
| Undistributed long-term capital gains | — | |||||
| Total Distributable Earnings | 487,003 | |||||
| Other accumulated losses | (9,628,081 | ) | ||||
| Total Accumulated Earnings/Losses | $ | 17,201,071 |
The difference between book basis and tax basis unrealized depreciation is attributable primarily to the tax deferral of losses on wash sales adjustments.
At June 30, 2014, the Fund has $9,628,081 of capital loss carryover, of which $8,130,057 expires June 30, 2018 and $1,498,024 expires June 30, 2017.
The tax character of distributions paid during fiscal year ended June 30, 2014 and fiscal year ended June 30, 2013 were as follows:
| June 30, 2014 | June 30, 2013 | |||||||||
| Distributions Paid From: | ||||||||||
| Ordinary Income* | $ | 840,548 | $ | 916,430 | ||||||
| Long-Term Capital Gain | $ | — | $ | — | ||||||
| $ | 840,548 | $ | 916,430 | |||||||
* For tax purposes, short-term capital gains are considered ordinary income.
The Fund may use earnings and profits distributed to shareholders on redemption of shares as part of the dividends paid deduction.
20
MATRIX ADVISORS
VALUE FUND, INC.
| Notes to the Financial Statements Continued |
NOTE 6 – FAIR VALUE
The Fund has adopted fair valuation accounting standards which establish an authoritative definition of fair value and set forth a hierarchy for measuring fair value. These standards require additional disclosure about the various inputs and valuation techniques used to develop the measurements of fair value and a discussion of changes in valuation techniques and related inputs during the period. These standards define fair value as the price that would be received in the sale of an asset or paid to transfer a liability in an orderly transaction between market participants on the measurement date. The fair value hierarchy is organized into three levels based upon the assumptions (referred to as “inputs”) used to value the asset or liability. These standards state that “observable inputs” reflect the assumptions that market participants would use in valuing an asset or liability based on market data obtained from independent sources. “Unobservable inputs” reflect the Fund’s own assumptions about the inputs market participants would use to value the asset or liability.
The Fund follows a fair value hierarchy that distinguishes between market data obtained from independent sources (observable inputs) and the Fund’s own market assumptions (unobservable inputs). These inputs are used in determining the value of the Fund’s investments and are summarized in the following fair value hierarchy:
Level 1 – | Unadjusted quoted prices in active markets for identical assets or liabilities that the company has the ability to access. | |
Level 2 – | Observable inputs other than quoted prices included in Level 1 that are observable for the asset or liability, either directly or indirectly. These inputs may include quoted prices for the identical instrument on an inactive market, prices for similar instruments, interest rates, prepayments speeds, credit risk, yield curves, default rates and similar data. | |
Level 3 – | Unobservable inputs for the asset or liability, to the extent relevant observable inputs are not available, representing the company’s own assumptions about the assumptions a market participant would use in valuing the asset or liability, and would be based on the best information available. |
The inputs or methodology used for valuing securities are not an indication of the risk associated with investing in those securities.
21
MATRIX ADVISORS
VALUE FUND, INC.
| Notes to the Financial Statements Continued |
The following is a summary of the inputs used to value the Fund’s net assets as of June 30, 2014. There were no transfers into or out of Level 1, Level 2 or Level 3 during the reporting period. Transfers between levels are recognized at June 30, 2014, the end of the reporting period.
| Quoted prices | Significant | |||||||||||||||
| in active | other | Significant | ||||||||||||||
| markets for | observable | unobservable | ||||||||||||||
| identical assets | inputs | inputs | ||||||||||||||
| Description | (Level 1) | (Level 2) | (Level 3) | Total | ||||||||||||
| Equity | ||||||||||||||||
| Common Stock* | $ | 80,975,183 | $ | — | $ | — | $ | 80,975,183 | ||||||||
| Total Equity | $ | 80,975,183 | $ | — | $ | — | $ | 80,975,183 | ||||||||
| Short-Term Investments | $ | 83,946 | $ | — | $ | — | $ | 83,946 | ||||||||
| Total Investments in Securities | $ | 81,059,129 | $ | — | $ | — | $ | 81,059,129 | ||||||||
* Please refer to the Schedule of Investments for a breakout of common stocks by industry classification.
22
MATRIX ADVISORS
VALUE FUND, INC.
VALUE FUND, INC.
REPORT OF INDEPENDENT REGISTERED PUBLIC ACCOUNTING FIRM
To the Board of Directors and
Shareholders of Matrix Advisors Value Fund, Inc.
New York, New York
New York, New York
We have audited the accompanying statement of assets and liabilities, including the schedule of investments, of Matrix Advisors Value Fund, Inc. as of June 30, 2014 and the related statement of operations for the year then ended, the statements of changes in net assets for each of the two years in the period then ended and the financial highlights for each of the five years in the period then ended. These financial statements and financial highlights are the responsibility of the Fund’s management. Our responsibility is to express an opinion on these financial statements and financial highlights based on our audits.
We conducted our audits in accordance with the standards of the Public Company Accounting Oversight Board (United States). Those standards require that we plan and perform the audit to obtain reasonable assurance about whether the financial statements and financial highlights are free of material misstatement. The Fund is not required to have, nor were we engaged to perform, an audit of its internal control over financial reporting. Our audits included consideration of internal control over financial reporting as a basis for designing audit procedures that are appropriate in the circumstances, but not for the purpose of expressing an opinion on the effectiveness of the Fund’s internal control over financial reporting. Accordingly, we express no such opinion. An audit includes examining, on a test basis, evidence supporting the amounts and disclosures in the financial statements and financial highlights, assessing the accounting principles used and significant estimates made by management, as well as evaluating the overall financial statement presentation. Our procedures included confirmation of securities owned as of June 30, 2014, by correspondence with the custodian. We believe that our audits provide a reasonable basis for our opinion.
In our opinion, the financial statements and financial highlights referred to above present fairly, in all material respects, the financial position of Matrix Advisors Value Fund, Inc. as of June 30, 2014, the results of its operations for the year then ended, the changes in its net assets for each of the two years in the period then ended and the financial highlights for each of the five years in the period then ended in conformity with auditing standards generally accepted in the United States of America.
TAIT WELLER & BAKER LLP
Philadelphia, Pennsylvania
August 27, 2014
August 27, 2014
23
MATRIX ADVISORS
VALUE FUND, INC.
VALUE FUND, INC.
Additional Information (Unaudited) |
PROXY VOTING INFORMATION
The Advisor votes proxies relating to portfolio securities in accordance with procedures that have been approved by the Board of Directors of the Fund. You may obtain a description of these procedures and how the Fund voted proxies relating to the portfolio securities during the most recent 12-month period ended June 30, free of charge, by calling toll-free 1-800-366-6223. This information is also available through the Securities and Exchange Commission’s website at http://www.sec.gov.
FORM N-Q DISCLOSURE
The Fund files its complete schedule of portfolio holdings with the Securities and Exchange Commission for the first and third quarters of each fiscal year on Form N-Q. The Fund’s Form N-Q is available on the Securities and Exchange Commission’s website at http://www.sec.gov. The Fund’s Form N-Q may be reviewed and copied at the Commission’s Public Reference Room in Washington, DC, and information on the operation of the Public Reference Room may be obtained by calling 1-800-SEC-0330. This information is also available, without charge, by calling toll-free, 1-800-366-6223.
TAX NOTICE (UNAUDITED) | ||
The percentage of dividend income distributed for the year ended June 30, 2014, which is designated as qualified dividend income under the Jobs and Growth Tax Relief Reconciliation Act of 2003, is 100.00%. For the year ended June 30, 2014, the percentage of ordinary income distributions that qualify for the dividend received deduction available to corporate shareholders is 100.00%. Additional Information Applicable to Foreign Shareholders only: The Fund hereby designates 0.02% of its ordinary income distributions for the fiscal year as interest-related dividends under Internal Revenue Code Section 871(k)(1)(c). |
24
MATRIX ADVISORS
VALUE FUND, INC.
VALUE FUND, INC.
Additional Information (Unaudited), Continued |
DIRECTOR AND OFFICER INFORMATION
The Board of Directors is responsible for the overall management of the Fund’s business. The Board approves all significant agreements between the Fund and persons or companies furnishing services to it, including the agreements with the Advisor, Administrator, Custodian and Transfer Agent. The Board of Directors delegates the day-to-day operations of the Fund to its Officers, subject to the Fund’s investment objective and policies and to general supervision by the Board. The Statement of Additional Information includes additional information about the Fund’s Directors and is available, without charge, by calling 1-800-366-6223.
The Directors and Officers of the Fund, their business addresses and principal occupations during the past five years are:
| Number | ||||||||||
| of Portfolios | ||||||||||
| Principal | In Fund | Other | ||||||||
| Name, | Position(s) | Occupation(s) | Complex | Directorships | ||||||
| Address, | Held with | Date | During the | Overseen by | Held by | |||||
| and Year of Birth | the Fund | Elected† | Past 5 Years | Director | Director | |||||
David A. Katz, CFA 747 Third Avenue New York, NY 10017 (Born 1962) | Director, President and Treasurer | Since 1997 | Chief Investment Officer (1986 to present) and President (1990 to present) of Matrix Asset Advisors, the Fund’s Advisor, and portfolio manager of the Fund (1996 to present). | 1 | None | |||||
Robert M. Rosencrans * 747 Third Avenue New York, NY 10017 (Born 1927) | Director | Since 1985 | Retired; formerly, President of Columbia International, Inc. (cable television developer and operator) (1984 to 2005). | 1 | None | |||||
T. Michael Tucker * 747 Third Avenue New York, NY 10017 (Born 1942) | Director and Chairman | Since 1997 | Owner of T. Michael Tucker, a certified public accounting firm (1977 to 2005 and 2011 to present); formerly, Consultant, Carr Riggs & Ingram, LLP, a certified public accounting firm (2005 to 2011). | 1 | None | |||||
Larry D. Kieszek * 747 Third Avenue New York, NY 10017 (Born 1950) | Director | Since 1997 | Partner of Purvis, Gray & Company, a certified public accounting firm (1974 to present). | 1 | None |
25
MATRIX ADVISORS
VALUE FUND, INC.
VALUE FUND, INC.
Additional Information (Unaudited), Continued |
| Number | ||||||||||
| of Portfolios | ||||||||||
| Principal | In Fund | Other | ||||||||
| Name, | Position(s) | Occupation(s) | Complex | Directorships | ||||||
| Address, | Held with | Date | During the | Overseen by | Held by | |||||
| and Year of Birth | the Fund | Elected† | Past 5 Years | Director | Director | |||||
Lon F. Birnholz 747 Third Avenue New York, NY 10017 (Born 1960) | Executive Vice President and Secretary | Since 2006 | Senior Managing Director of Matrix Asset Advisors, the Fund’s Advisor (1999 to present). | N/A | N/A | |||||
Steven G. Roukis, CFA 747 Third Avenue New York, NY 10017 (Born 1967) | Senior Vice President | Since 2000 | Managing Director of Matrix Asset Advisors, the Fund’s Advisor (2005 to present); formerly, Director of Research, Senior Vice President-Equity Research of Matrix Asset Advisors and various other positions within research (1994 – 2005). | N/A | N/A | |||||
Jordan F. Posner 747 Third Avenue New York, NY 10017 (Born 1957) | Senior Vice President | Since 2006 | Managing Director of Matrix Asset Advisors, the Fund’s Advisor (2005 to present); formerly, Partner of David J. Greene & Co., an investment firm (1993 – 2005). | N/A | N/A |
26
MATRIX ADVISORS
VALUE FUND, INC.
VALUE FUND, INC.
Additional Information (Unaudited), Continued |
| Number | ||||||||||
| of Portfolios | ||||||||||
| Principal | In Fund | Other | ||||||||
| Name, | Position(s) | Occupation(s) | Complex | Directorships | ||||||
| Address, | Held with | Date | During the | Overseen by | Held by | |||||
| and Year of Birth | the Fund | Elected† | Past 5 Years | Director | Director | |||||
Steven Pisarkiewicz 747 Third Avenue New York, NY 10017 (Born 1948) | Senior Vice President | Since 2010 | Senior Managing Director and Senior Portfolio Manager of Matrix Asset Advisors, the Fund’s Advisor (2009-present); formerly, National Managing Director for Bernstein Global Wealth Management (2007-2009); Executive Vice President of The Bank of New York and head of BNY Asset Management (2003-2007). | N/A | N/A | |||||
Stephan J. Weinberger, CFA 747 Third Avenue New York, NY 10017 (Born 1955) | Senior Vice President | Since 2010 | Managing Director and Senior Portfolio Manager of Matrix Asset Advisors, the Fund’s Advisor (2010 to present); formerly, Partner at Armstrong Shaw Associates (1996-2010). | N/A | N/A | |||||
Laurie S. Gaeta 747 Third Avenue New York, NY 10017 (Born 1960) | Senior Vice President, Chief Compliance Officer, AML Compliance Officer | Since 2008 | Managing Director of Matrix Asset Advisors, (2010-present); Director of Operations and Chief Compliance Officer, Matrix Asset Advisors, the Fund’s Advisor (2002 to present). | N/A | N/A | |||||
Conall Duffin 747 Third Avenue New York, NY 10017 (Born 1975) | Vice President and Assistant Secretary | Since 2002 | Vice President Marketing and Mutual Fund Servces, Matrix Asset Advisors, the Fund’s Advisor (2010 to present); Marketing Associate (2001- 2010). | N/A | N/A |
| * | Not an “interested person”, as that is defined by the 1940 Act. |
| † | Directors and Officers of the Fund serve until their resignation, removal or retirement. |
27
| Board of Directors | ||
| David A. Katz, CFA | ||
| Larry D. Kieszek | Annual Report | |
| Robert M. Rosencrans | ||
| T. Michael Tucker | ||
| ● | ||
| Investment Advisor | ||
| Matrix Asset Advisors, Inc. | ||
| 747 Third Avenue, 31st Floor | ||
| New York, NY 10017 | ||
| (800) 366-6223 | ||
| ● | ||
| Custodian | ||
| U.S. Bank, N.A. | ||
| 1555 N. River Center Drive, Ste. 302 | ||
| Milwaukee, WI 53212 | MATRIX ADVISORS VALUE FUND, INC. | |
| ● | ||
| Transfer Agent | ||
| U.S. Bancorp Fund Services, LLC | ||
| 615 East Michigan Street | ||
| Milwaukee, WI 53202 | ||
| ● | ||
| Administrator | ||
| U.S. Bancorp Fund Services, LLC | ||
| 333 Thornall Street, 5C | ||
| Edison, NJ 08837 | ||
| ● | ||
| Independent Registered Public | ||
| Accounting Firm | June 30, 2014 | |
| Tait, Weller & Baker, LLP | ||
| 1818 Market Street, Ste. 2400 | ||
| Philadelphia, PA 19103 | ||
| ● | ||
| Distributor | ||
| Quasar Distributors, LLC | ||
| 615 East Michigan Street | ||
| Milwaukee, WI 53202-5207 | 747 Third Avenue, 31st Floor | |
| New York, NY 10017 | ||
This report is intended for shareholders of the Fund and may not be used as sales literature unless preceded or accompanied by a current prospectus. | ||
Past performance results shown in this report should not be considered a representation of future performance. Share price and returns will fluctuate so that shares, when redeemed, may be worth more or less than their original cost. Statements and other information herein are dated and are subject to change. | ||
| Ticker Symbol: MAVFX | ||
| Cusip: 57681T102 | ||
Item 2. Code of Ethics.
The registrant has adopted a code of ethics that applies to the registrant’s principal executive officer and principal financial officer. The registrant has not made any amendments to its code of ethics during the period covered by this report. The registrant has not granted any waivers from any provisions of the code of ethics during the period covered by this report.
The registrant undertakes to provide to any person without charge, upon request, a copy of its code of ethics by mail when they call the registrant at 1-800-366-6223.
Item 3. Audit Committee Financial Expert.
The registrant’s board of directors has determined that there is at least one audit committee financial expert serving on its audit committee. Messrs. Kieszek and Tucker are “audit committee financial expert(s)” and are considered to be “independent” as each term is defined in Item 3 of Form N-CSR.
Item 4. Principal Accountant Fees and Services.
The registrant has engaged its principal accountant to perform audit services, audit-related services, tax services and other services during the past two fiscal years. “Audit services” refer to performing an audit of the registrant's annual financial statements or services that are normally provided by the accountant in connection with statutory and regulatory filings or engagements for those fiscal years. “Audit-related services” refer to the assurance and related services by the principal accountant that are reasonably related to the performance of the audit. “Tax services” refer to professional services rendered by the principal accountant for tax compliance, tax advice, and tax planning. There were no “Other services” provided by the principal accountant. The following table details the aggregate fees billed or expected to be billed for each of the last two fiscal years for audit fees, audit-related fees, tax fees and other fees by the principal accountant.
| FYE 6/30/2014 | FYE 6/30/2013 | |
| Audit Fees | $18,000 | $18,000 |
| Audit-Related Fees | $0 | $0 |
| Tax Fees | $2,800 | $2,800 |
| All Other Fees | $0 | $0 |
The audit committee has adopted pre-approval policies and procedures that require the audit committee to pre-approve all audit and non-audit services of the registrant, including services provided to any entity affiliated with the registrant.
The percentage of fees billed by Tait, Weller & Baker LLP applicable to non-audit services pursuant to waiver of pre-approval requirement were as follows:
| FYE 6/30/2014 | FYE 6/30/2013 | |
| Audit-Related Fees | 0% | 0% |
| Tax Fees | 0% | 0% |
| All Other Fees | 0% | 0% |
All of the principal accountant’s hours spent on auditing the registrant’s financial statements were attributed to work performed by full-time permanent employees of the principal accountant.
The following table indicates the non-audit fees billed or expected to be billed by the registrant’s accountant for services to the registrant and to the registrant’s investment adviser (and any other controlling entity, etc.—not sub-adviser) for the last two years. The audit committee of the board of trustees/directors has considered whether the provision of non-audit services that were rendered to the registrant's investment adviser is compatible with maintaining the principal accountant's independence and has concluded that the provision of such non-audit services by the accountant has not compromised the accountant’s independence.
| Non-Audit Related Fees | FYE 6/30/2014 | FYE 6/30/2013 |
| Registrant | $0 | $0 |
| Registrant’s Investment Adviser | $0 | $0 |
Item 5. Audit Committee of Listed Registrants.
Not applicable to registrants who are not listed issuers (as defined in Rule 10A-3 under the Securities Exchange Act of 1934).
Item 6. Investments.
| (a) | Schedule of Investments is included as part of the report to shareholders filed under Item 1 of this Form. |
| (b) | Not Applicable. |
Item 7. Disclosure of Proxy Voting Policies and Procedures for Closed-End Management Investment Companies.
Not applicable to open-end investment companies.
Item 8. Portfolio Managers of Closed-End Management Investment Companies.
Not applicable to open-end investment companies.
Item 9. Purchases of Equity Securities by Closed-End Management Investment Company and Affiliated Purchasers.
Not applicable to open-end investment companies.
Item 10. Submission of Matters to a Vote of Security Holders.
There have been no material changes to the procedures by which shareholders may recommend nominees to the registrant’s board of directors.
Item 11. Controls and Procedures.
| (a) | The Registrant’s President/Chief Executive Officer and Treasurer/Chief Financial Officer have reviewed the Registrant's disclosure controls and procedures (as defined in Rule 30a-3(c) under the Investment Company Act of 1940 (the “Act”)) as of a date within 90 days of the filing of this report, as required by Rule 30a-3(b) under the Act and Rules 13a-15(b) or 15d-15(b) under the Securities Exchange Act of 1934. Based on their review, such officers have concluded that the disclosure controls and procedures are effective in ensuring that information required to be disclosed in this report is appropriately recorded, processed, summarized and reported and made known to them by others within the Registrant and by the Registrant’s service provider. |
| (b) | There were no changes in the Registrant's internal control over financial reporting (as defined in Rule 30a-3(d) under the Act) that occurred during the second fiscal quarter of the period covered by this report that has materially affected, or is reasonably likely to materially affect, the Registrant's internal control over financial reporting. |
Item 12. Exhibits.
| (a) | (1) Any code of ethics or amendment thereto, that is the subject of the disclosure required by Item 2, to the extent that the registrant intends to satisfy Item 2 requirements through filing an exhibit. Incorporated by reference to the Registrant’s Form N-CSR filed September 2, 2004. |
(2) A separate certification for each principal executive and principal financial officer pursuant to Section 302 of the Sarbanes-Oxley Act of 2002. Filed herewith.
(3) Any written solicitation to purchase securities under Rule 23c-1 under the Act sent or given during the period covered by the report by or on behalf of the registrant to 10 or more persons. Not applicable to open-end investment companies.
| (b) | Certifications pursuant to Section 906 of the Sarbanes-Oxley Act of 2002. Furnished herewith. |
SIGNATURES
Pursuant to the requirements of the Securities Exchange Act of 1934 and the Investment Company Act of 1940, the registrant has duly caused this report to be signed on its behalf by the undersigned, thereunto duly authorized.
Matrix Advisors Value Fund, Inc.
By /s/ David A. Katz
David A. Katz, President
Date 9/2/2014
Pursuant to the requirements of the Securities Exchange Act of 1934 and the Investment Company Act of 1940, this report has been signed below by the following persons on behalf of the registrant and in the capacities and on the dates indicated.
By /s/ David A. Katz
David A. Katz, President
Date 9/2/2014