As filed with the Securities and Exchange Commission on September 7, 2016
UNITED STATES
SECURITIES AND EXCHANGE COMMISSION
Washington, D.C. 20549
SECURITIES AND EXCHANGE COMMISSION
Washington, D.C. 20549
FORM N-CSR
CERTIFIED SHAREHOLDER REPORT OF REGISTERED
MANAGEMENT INVESTMENT COMPANIES
Investment Company Act file number 811-03758
MATRIX ADVISORS VALUE FUND, INC.
(Exact name of registrant as specified in charter)
747 Third Avenue, 31st Floor, New York, NY 10017
(Address of principal executive offices) (Zip code)
David A. Katz
747 Third Avenue, 31st Floor
New York, NY 10017
(Name and address of agent for service)
1(800) 366-6223
Registrant's telephone number, including area code
Copies to:
Carol Gehl
Godfrey & Kahn, S.C.
780 N. Water Street
Milwaukee, WI 53202
Date of fiscal year end: June 30
Date of reporting period: June 30, 2016
Item 1. Reports to Stockholders.
| MATRIX ADVISORS | ||
| VALUE FUND, INC. |
August 15, 2016
Dear Fellow Shareholder:
The Fund modestly trailed the S&P 500 Index in the 2nd quarter increasing +1.76% compared to a gain of +2.46% for the Index. It trails the benchmark for the first six months of 2016 with a +1.05% gain compared to a +3.84% increase in the Index. The slow start to the calendar year, following a poor back half of 2015, left the Fund lagging the S&P 500 for the Fund’s fiscal year ending June 30, with the Fund decreasing -6.66% vs. a gain of +3.99% for the S&P 500. This lagging performance for the 2nd quarter was caused by weakness in our Financial sector stocks. As we discuss in the enclosed commentary, we think the group should move higher from here even if interest rates stay abnormally low. As of June 30, 2016 the Fund’s Net Asset Value was $57.89.
Disclosure Note: | |||
| For your information, for the period ended June 30, 2016, the Fund’s average annual total returns for the one-year, five-years, ten-years and for the period from July 1, 1996, the inception of Matrix Asset Advisors’ involvement with the Fund were -6.66%, 6.90%, 4.49% and 7.14%, respectively. For the same periods the returns for the S&P 500 Index were 3.99%, 12.10%, 7.42% and 7.83%. | |||
| Gross Expense Ratio: | 1.12% | ||
| Net Expense Ratio: | 0.99%** | ||
| Performance data quoted represents past performance; past performance does not guarantee future results. The investment return and principal value of an investment will fluctuate so that an investor’s shares, when redeemed, may be worth more or less than their original cost. Current performance of the Fund may be lower or higher than the performance quoted. Performance data current to the most recent month end may be obtained by calling 800-366-6223 or by visiting www.matrixadvisorsvaluefund.com. The Fund imposes a 1.00% redemption fee on shares held for 60 days or less. Performance data does not reflect the redemption fee. If reflected, total returns would be reduced. | |||
| **The Advisor has contractually agreed to reduce fees through 10/31/16. | |||
| Investment performance reflects fee waivers in effect. In the absence of such waivers, total return would be reduced. Matrix Asset Advisors became the sub-advisor on July 1, 1996 and Advisor to the Fund on May 11, 1997. Prior to those dates, the Fund was managed by another advisor. | |||
The U.S. economy and the stock market have been stuck in a period of low growth, low interest rates, and little forward visibility, further constrained by general economic lethargy worldwide. This environment provided a headwind for our financial and energy stocks that impeded the Fund’s performance for the fiscal year. We believe this relative weakness coupled with the favorable fundamentals of the portfolio and its depressed valuation, leaves us upbeat about upcoming periods.
After a number of difficult years for Value Investing, we think the pendulum is poised to swing back to value and feel this could provide a healthy tail wind looking forward.
1
| MATRIX ADVISORS | ||
| VALUE FUND, INC. |
Our outlook for the Fund in the coming year is positive, supported by the low interest rate environment, satisfactory economic growth, a solid employment picture, and good corporate operating performance, especially for the companies in our portfolio. Our emphasis on high quality companies in good businesses that are priced at attractive valuations should be favorable in the environment we envision. We also believe the portfolio is advantageously positioned to benefit from positive developments in its companies and the economy in the periods ahead.
As you know, Matrix partners and associates are significant shareholders in the Fund along with all of you. We have high confidence that the Fund will be a successful investment choice in the future. Most importantly, we appreciate your trust in us and for investing alongside us in the Fund.
Best regards.
Sincerely,

David A. Katz, CFA
Fund Manager
Fund Manager
Past performance is not a guarantee of future results.
Diversification does not guarantee a profit or protect from loss in a declining market.
Please refer to the Schedule of Investments in this report for details on Fund holdings. Fund holdings are subject to change at any time and are not recommendations to buy or sell any security.
The information provided herein represents the opinion of the Matrix Advisors Value Fund management and is not intended to be a forecast of future events, a guarantee of future results, nor investment advice.
The S&P 500 Index is a broad based unmanaged index of 500 stocks, which is widely recognized as representative of the equity market in general.
It is not possible to invest directly in an index.
Must be preceded or accompanied by a prospectus.
Mutual fund investing involves risk. Principal loss is possible. The stock of value companies can continue to be undervalued for long periods of time and not realize its expected value. The value of the Fund may decrease in response to the activities and financial prospects of an individual company.
The Matrix Advisors Value Fund is distributed by Quasar Distributors, LLC.
2
| MATRIX ADVISORS | ||
| VALUE FUND, INC. |
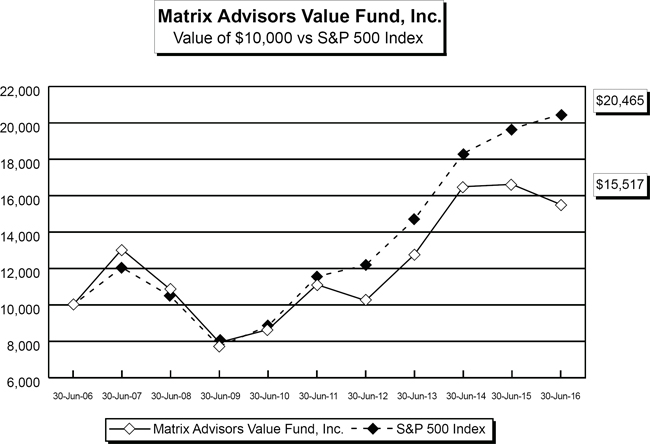
Average Annualized Total Return Periods Ended June 30, 2016 | |||||
| One Year | Five Years | Ten Years | |||
| Matrix Advisors Value Fund, Inc. | -6.66% | 6.90% | 4.49% | ||
| S&P 500 Index* | 3.99% | 12.10% | 7.42% | ||
The graph above illustrates the performance of a hypothetical $10,000 investment made in the Fund and the S&P 500 Index ten years ago. All returns in the graph and table above reflect the reinvestment of dividends and distributions, but do not reflect the deduction of taxes that an investor would pay on distributions or redemptions. The graph and table above do not imply any future performance.
Performance data quoted represents past performance and does not guarantee future results. The investment return and principal value of an investment will fluctuate so that an investor’s shares, when redeemed, may be worth more or less than their original cost. Current performance of the Fund may be lower or higher than the performance quoted. Performance data current to the most recent month end may be obtained by visiting www.matrixadvisorsvaluefund.com. The Fund imposes a redemption fee of 1.00% on shares held for 60 days or less. The performance cited above does not reflect this redemption fee; if deducted the total returns would be reduced. Performance figures reflect fee waivers in effect and in the absence of fee waivers, total returns would be lower.
| * | The S&P 500 Index is an unmanaged index which is widely regarded as the standard for measuring large-cap U.S. stock market performance. The index does not incur expenses and is not available for investment. |
3
| MATRIX ADVISORS | ||
| VALUE FUND, INC. |
Matrix Advisors Value Fund
Capital Markets Commentary and
2016 Annual Review
Capital Markets Commentary and
2016 Annual Review
The S&P 500 rose +2.46% in the second quarter, adding to its gains for the year. For 2016 to date through June 30, the S&P 500 was up +3.84%.
Until the last week of June, when Britain unexpectedly voted to leave the EU (the “Brexit vote”), it was a relatively uneventful quarter with the market rising modestly in April and May against a backdrop of steadily improving economic data and expectations for improving corporate profits.
In the two trading days following the Brexit vote on June 23rd, the S&P 500 dropped by 5.7% peak to trough. Then over the next three days it recovered much of the decline, as central banks reiterated their commitments to lower interest rates. With a slight lag in timing that spilled over into July, the Fund has also recovered the ground lost over this two day post-Brexit period. For the month of June, the S&P 500 eked out a small gain, extending the string of consecutive positive monthly returns to four.
The major consequences of the Brexit vote so far have been the decline in the British currency, which sold off sharply and now trades at its lowest level versus the dollar since 1985, and an almost certain slowdown in the already tenuous economic growth in Britain and Europe.
Annual Review
The last two fiscal years have been difficult for the Fund. In the most recent period ending 6/30/2016, the Fund was down -6.66% while the S&P 500 was up +3.99%. Most of this lag was generated in the latter half of calendar 2015 and early 2016, as crude oil prices collapsed and interest rates moved lower. Even though the Federal Reserve increased interest rates 0.25% in December, further expectations for a steady climb in interest rates were dashed as U.S. economic growth sputtered in early 2016. The Fund’s largest sector exposure was in Financials, which underperformed as mid- and long-term interest rates actually declined markedly, thus impinging on the ability of those companies to generate higher investment income. Our Energy stocks suffered, especially as OPEC (Organization of the Petroleum Exporting Countries) continued to flood the market in a bid to maintain share and relevance. Crude oil prices came down drastically, until many non-OPEC companies capitulated in February by cutting back current production and future investment. The performance of these two sectors alone were responsible for virtually the Fund’s entire decline for the year.
Consumer Staples had the most positive impact on the portfolio, as steady performers and healthy dividend payers were most favored by the market during the year’s volatility. Some other individual stocks that were notable contributors included McDonalds, DuPont and Microsoft, but Gilead was a prominent disappointment. In aggregate, investments in sectors other than Financials and Energy were about a wash.
Looking forward, we believe that the portfolio should perform well in the investment environment we envision, where areas related to economic growth should perform better than defensive sectors. Our investments in
4
| MATRIX ADVISORS | ||
| VALUE FUND, INC. |
Technology, Consumer Cyclicals, Producer Durables, Financials, and Energy are all in strong, high quality companies with compelling valuations. Positions in other sectors will help with portfolio diversification and the inevitable volatility sure to come around the election, but are positioned to contribute meaningfully to the portfolio’s return in their own right.
Quarterly Commentary
The U.S. economy showed steady improvement from the slower than expected growth in the first quarter of 2016. This has been the case for the past several years. It’s not clear if the improvement is weather related or a statistical measurement problem. After Q1 GDP growth of +1.1%, the economy is expected to show GDP growth of 2.9% in Q2, and the consensus estimate among economists is for +1.9% GDP growth for the full year.
Employment growth has slowed modestly this year, not surprising in the eighth year of the economic expansion, but remains solid, adding an average of 172,000 jobs per month for the last six months with the unemployment rate below 5%. The June employment number, reporting the addition of 287,000 workers, was the strongest month of hiring since last October. The trend has continued into July.
The best performing sectors in the stock market in the second quarter were Energy, Telecommunications, Utilities and Healthcare. For the first six months of the year, the best performing sectors were Telecommunications, Utilities, Energy and Consumer Staples. Except for Energy, these are traditionally considered more conservative sectors in times of market stress.
The worst performing sectors in the second quarter were Technology, Consumer Discretionary (both negative) and Industrials. For the first six months of 2016, the worst performing sectors were Financials, Technology (both negative) and Consumer Discretionary.
Stock prices in the Financial sector have been hurt by increasing capital requirements demanded by the industry’s regulators and the perception that lower interest rates are here forever, permanently depressing profits. The reality is that many of the individual companies we own have been performing quite well under the circumstances, showing increasing profits and raising their dividends. We think Financials represent the single best sector investment opportunity in the market and is the subject of this quarter’s Ideas About Investing.
Consumer Discretionary includes a lot of retailers, a business that is undergoing significant competitive transformation due to the internet and changing shopping habits. Technology has pulled back after last year’s strong performance, difficult earnings comparisons, and concerns about slower capital spending.
During the quarter, U.S. Treasury note yields reached near record lows despite signs of an improving economy and a pick-up in inflation. The 10-year Treasury yield ended the quarter at 1.47%, down from 1.77% at March 31 and 2.27% at the end of last year. U.S. Treasury notes look very attractive relative to the rest of the world where the 10-year British gilt yielded +0.87%, the 10-year Japanese note yielded minus -0.23% and the German 10-year Bund has a negative -0.13% yield! According to the WSJ Weekend Edition (7/9/2016), “Roughly one third of all government bonds globally carry negative yields…”. Compared to much of the world, U.S. Treasuries look attractive.
5
| MATRIX ADVISORS | ||
| VALUE FUND, INC. |
Oil continued its rebound from its lows earlier this year. U.S. oil prices rose 26% in the second quarter and finished at $48.33 a barrel on signs of supply and demand coming into balance. From its low of near $26 a barrel in February, oil is up more than 80%.
Gold was also a strong performer, up 7.2% during the quarter and 24.6% from the start of the year, the best two quarters of performance for gold since the end of 2007, according to the WSJ.
Fund Performance
The Fund showed positive performance in the quarter and was modestly ahead of the benchmark in the days just before the Brexit vote in the last week of the quarter. After the vote, economically sensitive names, including Energy, Industrials and Financials, where the Fund’s portfolio has weightings higher than the market, were disproportionately weak performers. As a result of this poor last week of the period, the Fund underperformed the benchmark for the quarter and lagged for the first six months of 2016. As noted earlier, since the end of the second quarter the Fund has regained all the ground lost after the Brexit vote.
As was the case in the first quarter, the greatest sector detractor from performance this quarter was Financials. We remain confident that our patience with investments in this sector should be rewarded. We have been wrong in thinking that rates would have begun to normalize and move higher by now, but expect that to start to happen between now and year end. In the meantime, business fundamentals for our investments in the Financial sector continue to improve with rising earnings and dividends. While a rise in interest rates might jump-start their lagging stock prices, we think the group should move higher from here even if interest rates stay abnormally low. The Financials sector is much too cheap even if low rates persist. After Financials, the next largest detractors from relative performance were Healthcare and Consumer Staples.
In Healthcare, Gilead and Teva were notable underperformers. Investors in Gilead are waiting to see how the company adds to its drug product line-up as its hepatitis drug portfolio reaches maturity. Similarly, Teva investors are waiting for the completion of its deal to buy a portfolio of generic drugs from Allergan to balance its dependence on the multiple sclerosis treatment drug Copaxone.
In Consumer Staples, CVS was a notable laggard though it continues to show strong results and is benefiting from its leading market positions in the retail pharmacy and prescription plan benefits businesses. CVS is a great example of the importance of a longer-term investing mindset. While the stock has been taking a breather in the past few months, it is up over 200% from our initial purchase five years ago. Going forward, we expect it to continue to move higher.
Turning to the positives in the quarter, the largest sector contributor to relative performance was Consumer Discretionary, led by Johnson Controls. Energy was the largest contributor to overall results, up double digits in the quarter with strong returns from all of our holdings.
There were two new purchases in the quarter: AbbVie (ABBV) and Google (GOOG).
AbbVie is a global pharmaceutical company whose best-selling drug, Humira, is the leading treatment for rheumatoid arthritis. The company has good earnings prospects and a 3.7% dividend yield but sells at a discount to the drug group because Humira represents over 60% of AbbVie’s revenues. The company is diversifying
6
| MATRIX ADVISORS | ||
| VALUE FUND, INC. |
from its dependence on Humira through acquisitions and new product development. Last year, ABBV bought Pharmacyclics, whose main product Imbruvica has the potential to become a best-selling cancer therapy. Additionally, the company has a broad pipeline of drugs that should make a more meaningful contribution to sales and profits as the contribution from Humira levels off. ABBV sells for just 13x 2016 estimated earnings. Our 12-18 month target price is $75.
Google has a dominant market share in internet searches and the associated advertising dollars. The company is making significant inroads into mobile search and video, games and applications via its YouTube, Android and Google Play marketplaces. These businesses have re-accelerated the company’s growth rate to over 20%. Out target price is $860.
During the quarter we added to existing positions in Apple, Gilead, Harley Davidson, Procter & Gamble and Schwab.
During the quarter we sold our position in Johnson & Johnson (JNJ) which reached our price target.
For the first six months of 2016, the best performing sectors in the Fund were Producer Durables and Energy, both showing double digit returns. The greatest detractors from performance have been Financials and Healthcare.
At June 30, the Fund traded at a substantial discount to the S&P 500 with an estimated price/earnings ratio of 13.9 versus 17.3.
Outlook
The Fund’s portfolio trades at a deeper-than-average discount to our estimates of fair value, and we believe the Fund is well positioned for the environment we foresee in the next twelve months. We continue to believe that 2016 should be another year of moderate economic growth, with accelerating corporate profit growth as the year unfolds.
We believe the biggest risks to the global economy and our stock market remain outside the U.S. China continues to transition to a consumer economy and though its progress is coming in fits and starts, the trajectory remains positive. The Brexit vote in Britain is a reminder of how unexpected developments overseas can rattle global markets, including the U.S. stock market.
There is great uncertainty about how Britain will leave the EU, including how much the process will impact Europe’s economy and whether Britain’s vote to leave will cause other EU members to follow their lead. Leaving the EU will be a complicated process that is expected to take several years to unfold. Britain and the EU are very significant trading partners with each other, and it is in both their interests to find solutions that cause the least disruption to their economies. The fact that Britain has its own currency makes the situation less complicated than it would be for other EU members using the Euro. While there are a number of concerns and negatives associated with the Brexit decision, we don’t expect the worst case scenarios to play out.
A very positive factor for U.S. market stability and our economy are the recently released results of the Federal Reserve stress tests for financial institutions. All major U.S. banks and other large financial firms passed the test, confirming the robust health of our financial system and its ability to withstand a serious recession and unexpected financial shocks.
As noted last quarter, we think the overall market is fairly valued at roughly 17 times estimated 2016 earnings, but that significant opportunities exist in a number of high quality stocks and sectors.
7
| MATRIX ADVISORS | ||
| VALUE FUND, INC. |
* * *
We wish you all a happy and healthy summer and thank you for your confidence and trust. Please contact any of us with any questions at (800) 366-6223 or (212) 486-2004.
Best regards.
8
| MATRIX ADVISORS | ||
| VALUE FUND, INC. |
Ideas About Investing
A Quest for Investment Enlightenment
June 30, 2016
Financials: The Best Opportunity in the Market
A Quest for Investment Enlightenment
June 30, 2016
Financials: The Best Opportunity in the Market
We continue to believe that high quality Financials offer the highest potential return of any sector in the market. Current valuations in the sector are depressed due to increasing capital requirements imposed by regulators, sluggish global economic growth, and the related perception that interest rates will remain at historically low levels for the foreseeable future, thereby depressing the profits generated by their basic lending business.
The reality is that high quality Financials are gaining market share, increasing profits, and raising dividends. We think Financial stocks should outperform even if rates stay low, which we think is unlikely. The record low U.S. Treasury interest rates reflect global stresses rather than the healthier U.S. economy. In our opinion, this is a short-term issue. As the near-crisis atmosphere in Europe and Japan abates and negative rates become positive, there is likely to be a dramatic reversal towards higher rates that could magnify the profits in the Financials sector and also result in more normal price/earnings and price/book valuations. This should drive significant sector outperformance.
Remarkably, despite having the best capital ratios and loan credit quality in decades, the U.S. banks trade for an average of about 10 times estimated 2016 earnings, just 60% of the S&P 500’s P/E, below the historical average of 75%, according to Barron’s (7/2/2016). The relative price/book value ratio is trading near the low reached at the depths of the financial crisis, according to data provided by Morgan Stanley (see chart on the next page).
We think the combination of improving business fundamentals and low absolute and historic relative valuations make high quality Financials the most attractive sector in the market today.
9
| MATRIX ADVISORS | ||
| VALUE FUND, INC. |
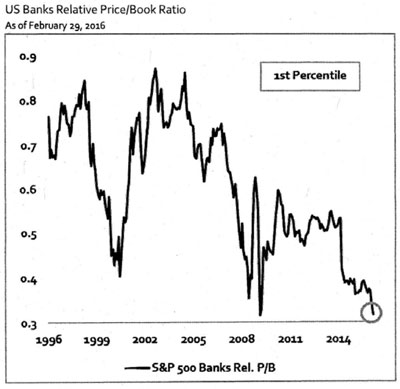 As of 6/30/16 the U.S. Banks Relative Price/Book ratio is 0.32. Source: Bloomberg, Morgan Stanley Wealth Management GIC. Past performance is not a guarantee of future results. |
Price to earnings (P/E) ratio is a common tool for comparing the prices of different common stocks and is calculated by dividing the current market price of a stock by the earnings per share.
Price to book (P/B) ratio is a common tool for comparing the prices of different common stocks and is calculated by dividing the current market price of a stock by the common equity per share, also known as the book value.
Capital ratios as it pertains to a bank, are an array of metrics set by the Federal Reserve Board that demonstrate how much equity and reserves have been provided for future loan or market losses, as compared to the total amount of loans outstanding. Thus higher capital ratios indicate a bank is stronger, and can sustain higher potential losses without impairing its business viability.
Dividend yield is a financial ratio that indicates how much a company pays out in dividends each year relative to its share price.
10
| MATRIX ADVISORS | ||
| VALUE FUND, INC. |
Expense Example (Unaudited)
As a shareholder of the Fund, you incur two types of costs: (1) transaction costs, including redemption fees; and (2) ongoing costs, including advisory fees and other Fund expenses. This Example is intended to help you understand your ongoing costs (in dollars) of investing in the Fund and to compare these costs with the ongoing costs of investing in other mutual funds.
The Example is based on an investment of $1,000 invested at the beginning of the period indicated and held for the entire period from January 1, 2016 to June 30, 2016.
Actual Expenses
The information in the table under the heading “Actual Performance” provides information about actual account values and actual expenses. You may use the information in these columns together with the amount you invested, to estimate the expenses that you paid over the period. Simply divide your account value by $1,000 (for example, an $8,600 account value divided by $1,000 = 8.6), then multiply the result by the number in the row entitled “Expenses Paid During Period” to estimate the expenses you paid on your account during this period.
Hypothetical Example for Comparison Purposes
The information in the table under the heading “Hypothetical Performance (5% return before expenses)” provides information about hypothetical account values and hypothetical expenses based on the Fund’s actual expense ratio and an assumed rate of return of 5% per year before expenses, which is not the Fund’s actual return. The hypothetical account values and expenses may not be used to estimate the actual ending account balance or expenses you paid for the period. You may use this information to compare the ongoing costs of investing in the Fund and other funds. To do so, compare this 5% hypothetical example with the 5% hypothetical examples that appear in the shareholder reports of the other funds.
Please note that the expenses shown in the table are meant to highlight your ongoing costs only and do not reflect any transaction costs, such as redemption fees. Therefore, the information under the heading “Hypothetical Performance (5% return before expenses)” is useful in comparing ongoing costs only, and will not help you determine the relative total costs of owning different funds. In addition, if these transactional costs were included, your costs would have been higher.
| EXPENSE EXAMPLE | ACTUAL PERFORMANCE | HYPOTHETICAL PERFORMANCE (5% RETURN BEFORE EXPENSES) | ||||||||||
| Beginning Account Value (1/1/16) | $ | 1,000.00 | $ | 1,000.00 | ||||||||
| Ending Account Value (6/30/16) | $ | 1,010.50 | $ | 1,019.94 | ||||||||
Expenses Paid During Period1 | $ | 4.95 | $ | 4.97 | ||||||||
1 | Expenses are equal to the Fund’s annualized expense ratio of 0.99% multiplied by the average account value over the period, multiplied by 182/366 (to reflect the one-half year period). |
11
| MATRIX ADVISORS | ||
| VALUE FUND, INC. |
| SECTOR BREAKDOWN | ||||
| Financials | 27.8 | % | ||
| Information Technology | 20.1 | % | ||
| Energy | 14.6 | % | ||
| Health Care | 13.2 | % | ||
| Industrials | 9.4 | % | ||
| Consumer Discretionary | 7.8 | % | ||
| Consumer Staples | 7.0 | % | ||
| Total Investments | 99.9 | % | ||
| Other Assets in Excess of Liabilities | 0.1 | % | ||
| Total Net Assets | 100.0 | % | ||
| The table above lists sector allocations as a percentage of the Fund’s total investments as of June 30, 2106. | ||||
12
| MATRIX ADVISORS | ||
| VALUE FUND, INC. |
| Schedule of Investments | |||||||
| June 30, 2016 | |||||||
| SHARES | VALUE | ||||||
| COMMON STOCKS - 99.8% | |||||||
| BANK (MONEY CENTER): 4.0% | |||||||
| 35,800 | JPMorgan Chase & Co. | $ | 2,224,612 | ||||
| BANK (PROCESSING): 2.6% | |||||||
| 26,700 | State Street Corp. | 1,439,664 | |||||
| BANK (REGIONAL): 1.7% | |||||||
| 26,500 | BB&T Corp. | 943,665 | |||||
| BANK (SUPER REGIONAL): 3.8% | |||||||
| 44,900 | Wells Fargo & Co. | 2,125,117 | |||||
| BEVERAGES: 2.0% | |||||||
| 10,600 | PepsiCo, Inc. | 1,122,964 | |||||
| BIOTECHNOLOGY: 4.1% | |||||||
| 6,200 | AbbVie, Inc. | 383,842 | |||||
| 22,200 | Gilead Sciences, Inc. | 1,851,924 | |||||
| 2,235,766 | |||||||
| BROADCASTING/CABLE TELEVISION: 2.7% | |||||||
| 35,500 | Viacom, Inc. | 1,472,185 | |||||
| COMPUTER AND PERIPHERALS: 3.4% | |||||||
| 3,500 | Apple, Inc. | 334,600 | |||||
| 44,000 | Hewlett Packard Enterprise Co. | 803,880 | |||||
| 57,000 | HP, Inc. | 715,350 | |||||
| 1,853,830 | |||||||
| COMPUTER SOFTWARE AND SERVICES: 6.0% | |||||||
| 38,800 | Microsoft Corp. | 1,985,396 | |||||
| 65,500 | Symantec Corp. | 1,345,370 | |||||
| 3,330,766 | |||||||
| DIVERSIFED OPERATIONS: 6.7% | |||||||
| 42,800 | Johnson Controls, Inc. | 1,894,328 | |||||
| 17,400 | United Technologies Corp. | 1,784,370 | |||||
| 3,678,698 | |||||||
The accompanying notes to the financial statements are an integral part of this schedule.
13
| MATRIX ADVISORS | ||
| VALUE FUND, INC. |
| Schedule of Investments | |||||||
| June 30, 2016 – Continued | |||||||
| SHARES | VALUE | ||||||
| DRUG (GENERIC): 3.0% | |||||||
| 33,500 | Teva Pharmaceutical Industries, Ltd. - ADR | $ | 1,682,705 | ||||
| DRUG STORE: 2.0% | |||||||
| 11,400 | CVS Health | 1,091,436 | |||||
| ELECTRICAL COMPONENT: 3.4% | |||||||
| 32,600 | TE Connectivity Ltd. | 1,861,786 | |||||
| FINANCIAL SERVICES: 5.0% | |||||||
| 19,200 | American Express Co. | 1,166,592 | |||||
| 25,200 | Capital One Financial Corp. | 1,600,452 | |||||
| 2,767,044 | |||||||
| HOUSEHOLD PRODUCTS: 2.9% | |||||||
| 19,000 | The Procter & Gamble Co. | 1,608,730 | |||||
| INSURANCE (DIVERSIFIED): 5.0% | |||||||
| 7,000 | Chubb Limited | 914,970 | |||||
| 45,900 | MetLife, Inc. | 1,828,197 | |||||
| 2,743,167 | |||||||
| INTERNET SOFTWARE & SERVICES: 0.2% | |||||||
| 200 | Alphabet, Inc. * | 138,420 | |||||
| MACHINERY: 2.7% | |||||||
| 19,500 | Caterpillar, Inc. | 1,478,295 | |||||
| MANUFACTURING - MISCELLANEOUS: 3.5% | |||||||
| 32,000 | Eaton Corp Plc | 1,911,360 | |||||
| MEDICAL SUPPLIES: 3.4% | |||||||
| 15,600 | Zimmer Biomet Holdings, Inc. | 1,877,928 | |||||
| MOTORCYCLES/MOTOR SCOOTER: 1.7% | |||||||
| 20,400 | Harley-Davidson, Inc. | 924,120 | |||||
| OIL & GAS SERVICES: 3.1% | |||||||
| 21,700 | Schlumberger Ltd. | 1,716,036 | |||||
The accompanying notes to the financial statements are an integral part of this schedule.
14
| MATRIX ADVISORS | ||
| VALUE FUND, INC. |
| Schedule of Investments | |||||||
| June 30, 2016 – Continued | |||||||
| SHARES | VALUE | ||||||
| OIL/GAS (DOMESTIC): 3.0% | |||||||
| 220 | California Resources Corp. | $ | 2,684 | ||||
| 45,500 | Devon Energy Corp. | 1,649,375 | |||||
| 1,652,059 | |||||||
| PETROLEUM (INTEGRATED): 3.1% | |||||||
| 16,400 | Chevron Corp. | 1,719,212 | |||||
| PETROLEUM (PRODUCING): 5.4% | |||||||
| 28,700 | ConocoPhillips | 1,251,320 | |||||
| 22,700 | Occidental Petroleum Corp. | 1,715,212 | |||||
| 2,966,532 | |||||||
| PRECISION INSTRUMENTS: 2.7% | |||||||
| 10,000 | Thermo Fisher Scientific, Inc. | 1,477,600 | |||||
| SECURITIES BROKERAGE: 5.6% | |||||||
| 59,000 | Morgan Stanley | 1,532,820 | |||||
| 61,300 | The Charles Schwab Corp. | 1,551,503 | |||||
| 3,084,323 | |||||||
| TELECOMMUNICATIONS (EQUIPMENT): 7.1% | |||||||
| 69,500 | Cisco Systems, Inc. | 1,993,955 | |||||
| 36,000 | QUALCOMM, Inc. | 1,928,520 | |||||
| 3,922,475 | |||||||
TOTAL COMMON STOCKS (Cost $44,560,950) | $ | 55,050,495 | |||||
| SHORT-TERM INVESTMENTS - 0.1% | |||||||
| 39,974 | Fidelity Institutional Money Market Portfolio | 39,974 | |||||
TOTAL SHORT-TERM INVESTMENTS (Cost $39,974) | $ | 39,974 | |||||
TOTAL INVESTMENTS (Cost $44,600,924): 99.9% | 55,090,469 | ||||||
OTHER ASSETS IN EXCESS OF LIABILITIES: 0.1% | 41,612 | ||||||
TOTAL NET ASSETS: 100.0% | $ | 55,132,081 | |||||
| * | Non-Income Producing |
| ADR - American Depositary Receipt | |
The accompanying notes to the financial statements are an integral part of this schedule.
15
| MATRIX ADVISORS | ||
| VALUE FUND, INC. |
| Statement of Assets and Liabilities | |||
| At June 30, 2016 |
| ASSETS: | ||||
| Investments in securities, at value (cost $44,600,924) | $ | 55,090,469 | ||
| Receivables: | ||||
| Fund shares sold | 18,732 | |||
| Investments sold | 236,974 | |||
| Dividends and Interest | 91,456 | |||
| Prepaid expenses | 12,668 | |||
| Total assets | 55,450,299 | |||
| LIABILITIES: | ||||
| Payables: | ||||
| Custodian | 750 | |||
| Fund shares repurchased | 7,621 | |||
| Investments purchased | 216,513 | |||
| Due to Advisor | 23,229 | |||
| Accrued expenses: | ||||
| Fund administration and accounting fees | 25,927 | |||
| Professional fees | 23,425 | |||
| Other expenses | 20,753 | |||
| Total liabilities | 318,218 | |||
| NET ASSETS | $ | 55,132,081 | ||
| Number of shares, $0.01 par value, issued and outstanding (unlimited shares authorized) | 952,259 | |||
| Net Asset Value, Offering Price and Redemption Price Per Share | $ | 57.90 | ||
| COMPONENTS OF NET ASSETS: | ||||
| Paid in capital | 45,607,178 | |||
| Undistributed net investment income | 824,053 | |||
| Accumulated net realized loss on investments | (1,788,695 | ) | ||
| Net unrealized appreciation on investments | 10,489,545 | |||
| Net Assets | $ | 55,132,081 | ||
The accompanying notes to the financial statements are an integral part of this statement.
16
| MATRIX ADVISORS | ||
| VALUE FUND, INC. |
| Statement of Operations | |||
| For the Year Ended June 30, 2016 |
| INVESTMENT INCOME | ||||
| INCOME | ||||
| Dividend income (net of foreign taxes withheld of $7,242) | $ | 2,043,851 | ||
| Interest income | 369 | |||
| Total income | 2,044,220 | |||
| EXPENSES | ||||
| Advisory fees | 480,281 | |||
| Administration fees | 81,052 | |||
| Shareholder servicing and accounting fees | 52,674 | |||
| Professional fees | 47,455 | |||
| Federal and State registration fees | 27,608 | |||
| Custodian fees | 16,355 | |||
| Reports to shareholders | 7,677 | |||
| Directors’ fees and expenses | 6,706 | |||
| Other expenses | 21,043 | |||
| Total operating expenses | 740,851 | |||
| Less: Expense reimbursement by Advisor | (106,880 | ) | ||
| Net expenses | 633,971 | |||
| Net investment income | 1,410,249 | |||
| REALIZED AND UNREALIZED GAIN (LOSS) ON INVESTMENTS | ||||
| Net realized gain on investments | 2,987,005 | |||
| Net change in unrealized appreciation/depreciation on investments | (10,625,706 | ) | ||
| Net realized and unrealized loss on investments | (7,638,701 | ) | ||
| NET DECREASE IN NET ASSETS RESULTING FROM OPERATIONS | $ | (6,228,452 | ) | |
The accompanying notes to the financial statements are an integral part of this statement.
17
| MATRIX ADVISORS | ||
| VALUE FUND, INC. |
| Statement of Changes in Net Assets | YEAR ENDED JUNE 30, 2016 | YEAR ENDED JUNE 30, 2015 | ||||||
| INCREASE (DECREASE) IN NET ASSETS | ||||||||
| OPERATIONS: | ||||||||
| Net investment income | $ | 1,410,249 | $ | 925,121 | ||||
| Net realized gain on investments | 2,987,005 | 4,947,150 | ||||||
| Net change in net unrealized appreciation/depreciation on investments | (10,625,706 | ) | (5,321,667 | ) | ||||
| Net increase (decrease) in net assets resulting from operations | (6,228,452 | ) | 550,604 | |||||
| DISTRIBUTIONS TO SHAREHOLDERS | ||||||||
| From net investment income | (1,070,965 | ) | (927,355 | ) | ||||
| CAPITAL SHARE TRANSACTIONS: | ||||||||
| Proceeds from shares sold | 4,647,398 | 7,778,938 | ||||||
| Proceeds from reinvestment of distributions | 859,502 | 809,531 | ||||||
| Cost of shares redeemed | (16,890,713 | ) | (15,400,304 | ) | ||||
| Redemption fees | 616 | 370 | ||||||
| Net decrease from capital share transactions | (11,383,197 | ) | (6,811,465 | ) | ||||
| Total decrease in net assets | (18,682,614 | ) | (7,188,216 | ) | ||||
| NET ASSETS | ||||||||
| Beginning of year | 73,814,695 | 81,002,911 | ||||||
| End of year | $ | 55,132,081 | $ | 73,814,695 | ||||
| Undistributed net investment income | $ | 824,053 | $ | 484,769 | ||||
| CHANGE IN SHARES | ||||||||
| Shares outstanding, beginning of year | 1,171,235 | 1,279,290 | ||||||
| Shares sold | 81,076 | 123,194 | ||||||
| Shares issued on reinvestment of distributions | 15,403 | 12,787 | ||||||
| Shares redeemed | (315,455 | ) | (244,036 | ) | ||||
| Shares outstanding, end of year | 952,259 | 1,171,235 | ||||||
The accompanying notes to the financial statements are an integral part of this statement.
18
| MATRIX ADVISORS | ||
| VALUE FUND, INC. |
| Financial Highlights | |
| For a capital share outstanding throughout each year |
| YEARS ENDED JUNE 30, | ||||||||||||||||||||
| 2016 | 2015 | 2014 | 2013 | 2012 | ||||||||||||||||
| Net asset value, beginning of the year | $ | 63.02 | $ | 63.32 | $ | 49.56 | $ | 40.44 | $ | 44.29 | ||||||||||
| Income (loss) from investment operations: | ||||||||||||||||||||
| Net investment income | 1.27 | (a) | 0.77 | (a) | 0.68 | (a) | 0.59 | (a) | 0.48 | |||||||||||
| Net realized and unrealized gain (loss) on investments | (5.49 | ) | (0.28 | ) | 13.71 | 9.26 | (3.99 | ) | ||||||||||||
| Total from investment operations | (4.22 | ) | 0.49 | 14.39 | 9.85 | (3.51 | ) | |||||||||||||
| Less distributions: | ||||||||||||||||||||
| Dividends from net investment income | (0.90 | ) | (0.79 | ) | (0.63 | ) | (0.73 | ) | (0.34 | ) | ||||||||||
| Paid-in capital from redemption fees (Note 2) | 0.00 | (b) | 0.00 | (b) | 0.00 | (b) | 0.00 | (b) | 0.00 | (b) | ||||||||||
| Net asset value, end of year | $ | 57.90 | $ | 63.02 | $ | 63.32 | $ | 49.56 | $ | 40.44 | ||||||||||
| Total return | (6.66 | )% | 0.77 | % | 29.20 | % | 24.69 | % | (7.88 | )% | ||||||||||
| Ratios/supplemental data: | ||||||||||||||||||||
| Net assets, end of year (millions) | $ | 55.10 | $ | 73.80 | $ | 81.00 | $ | 60.70 | $ | 75.60 | ||||||||||
| Ratio of operating expenses to average net assets: | ||||||||||||||||||||
| Before expense reimbursement | 1.16 | % | 1.12 | % | 1.15 | % | 1.18 | % | 1.15 | % | ||||||||||
| After expense reimbursement | 0.99 | % | 0.99 | % | 0.99 | % | 0.99 | % | 0.99 | % | ||||||||||
| Interest Expense | — | — | 0.00 | %(c) | — | — | ||||||||||||||
| Ratio of net investment income to average net assets: | ||||||||||||||||||||
| Before expense reimbursement | 2.03 | % | 1.09 | % | 1.06 | % | 1.18 | % | 0.98 | % | ||||||||||
| After expense reimbursement | 2.20 | % | 1.22 | % | 1.22 | % | 1.37 | % | 1.14 | % | ||||||||||
| Portfolio turnover rate | 15 | % | 12 | % | 41 | % | 15 | % | 19 | % | ||||||||||
| (a) | Calculated using the average shares method. |
| (b) | Less than $0.01. |
| (c) | Interest expense was less than 0.01%. |
The accompanying notes to the financial statements are an integral part of this schedule.
19
MATRIX ADVISORS VALUE FUND, INC. |
Notes to the Financial Statements (Unaudited) | |
| NOTE 1 – ORGANIZATION | |
| Matrix Advisors Value Fund, Inc. (the “Fund”) is a Maryland corporation registered under the Investment Company Act of 1940 (the “1940 Act”) as a diversified, open-end management investment company and accordingly follows the investment company accounting and reporting guidance of the Financial Accounting Standards Board (the “FASB”) Accounting Standard Codification Topic 946 “Financial Services – Investment Companies”. The Fund commenced operations September 16, 1983. The objective of the Fund is to achieve a total rate of return which is comprised of capital appreciation and current income. | |
| NOTE 2 – SIGNIFICANT ACCOUNTING POLICIES | |
| The Fund consistently follows the accounting policies set forth below which are in conformity with accounting principles generally accepted in the United States of America (“U.S. GAAP”). | |
| A. | Security Valuation. Securities traded on a national securities exchange are valued at the last reported sales price at the close of regular trading on each day the exchanges are open for trading. Securities traded on the NASDAQ Stock Market, LLC (“NASDAQ”) are valued at the NASDAQ Official Closing Price, which may not necessarily represent the last sale price. Quotations of foreign securities in a foreign currency shall be valued daily in U.S. dollars on the basis of the foreign currency exchange rates prevailing at the time such valuation is determined. Foreign currency exchange rates generally shall be determined prior to the close of the New York Stock Exchange (the “NYSE”). Securities traded on an exchange for which there have been no sales are valued at the mean between the bid and asked price. Securities for which quotations are not readily available are stated at their respective fair values as determined in good faith by a valuation committee of Matrix Asset Advisors, Inc. (the “Advisor” or “Matrix”) in accordance with procedures approved by the Board of Directors of the Fund. In determining fair value, the Fund takes into account all relevant factors and available information. Consequently, the price of the security used by the Fund to calculate its net asset value (“NAV”) per share may differ from quoted or published prices for the same security. Fair value pricing involves subjective judgments and there is no single standard for determining a security’s fair value. As a result, different mutual funds could reasonably arrive at a different fair value for the same security. It is possible that the fair value determined for a security is materially different from the value that could be realized upon the sale of that security or from the values that other mutual funds may determine. |
Investments in other funds are valued at their respective net asset values as determined by those funds, in accordance with the 1940 Act. Foreign securities are recorded in the financial statements after translation to U.S. dollars based on the applicable exchange rate at the end of the period. The Fund does not isolate that portion of the results of operations arising as a result of changes in the currency exchange rate from the fluctuations arising as a result of changes in the market prices of investments during the period. | |
20
MATRIX ADVISORS VALUE FUND, INC. |
| Notes to the Financial Statements (Unaudited), Continued |
| B. | Shares Valuation. |
The NAV per share of the Fund is calculated by dividing the sum of the value of the securities held by the Fund, plus cash or other assets, minus all liabilities (including estimated accrued expenses), by the total number of shares outstanding of the Fund, rounded to the nearest cent. The Fund’s shares will not be priced on the days on which the NYSE is closed for trading. The offering and redemption price per share of the Fund is equal to the Fund’s NAV per share. The Fund will assess a 1.00% fee on redemptions of Fund shares purchased and held for 60 days or less. These fees are deducted from the redemptions proceeds otherwise payable to the shareholder. The Fund will retain the fee charged as paid-in capital and such fees become part of that Fund’s daily NAV calculation. | |
| C. | Federal Income Taxes. |
| The Fund has elected to be treated as a “regulated investment company” under Subchapter M of the Internal Revenue Code of 1986, as amended. The Fund intends to distribute substantially all of its taxable income and any capital gains less any applicable capital loss carryforwards. Accordingly, no provision for Federal income taxes has been made in the accompanying financial statements. | |
| The Fund recognizes the tax benefits of uncertain tax positions only where the position is “more likely than not” to be sustained assuming examination by tax authorities. Management has analyzed the Fund’s tax positions, and has concluded that no liability for unrecognized tax benefits should be recorded related to uncertain tax positions taken on returns filed for open tax years (2013 – 2015), or expected to be taken in the Fund’s 2016 tax returns. The Fund identifies its major tax jurisdictions as U.S. Federal, New York State and New York City. The Fund is not aware of any tax positions for which it is reasonably possible that the total amounts of unrecognized tax benefits will change materially in the next twelve months. | |
| D. | Use of Estimates. |
| The preparation of financial statements in conformity with U.S. GAAP requires management to make estimates and assumptions that affect the reported amounts of assets and liabilities and disclosure of contingent assets and liabilities at the date of the financial statements and the reported amounts of revenues and expenses during the reporting period. Actual results could differ from these estimates. | |
| E. | Reclassification of Capital Accounts. |
| U.S. GAAP requires that certain components of net assets relating to permanent differences be reclassified between financial and tax reporting. These reclassifications have no effect on net assets or net asset value per share. For the year ended June 30, 2016, the Fund had no permanent book-to-tax differences. | |
| F. | Security Transactions, Investment Income, and Distributions. |
| Security transactions are accounted for on the trade date. Dividend income and distributions to shareholders are recorded on the ex-dividend date, and interest income is recognized on the accrual basis. Realized gains and losses are evaluated on the basis of identified costs. Premiums and discounts on the purchase of securities are amortized/accreted using the effective interest method. U.S. GAAP requires that permanent financial reporting and tax differences be reclassified in the capital accounts. |
21
MATRIX ADVISORS VALUE FUND, INC. |
Notes to the Financial Statements (Unaudited), Continued | |
| G. | Indemnification Obligations. |
| Under the Fund’s organizational documents, its current and former Officers and Directors are indemnified against certain liabilities arising out of the performance of their duties to the Fund. In addition, in the normal course of business, the Fund enters into contracts that contain a variety of representations and warranties that provide general indemnifications. The Fund’s maximum exposure under these arrangements is unknown as this would involve future claims that may be made against the Fund that have not yet occurred or that would be covered by other parties. | |
| H. | Line of Credit. |
| The Fund has a Loan Agreement with U.S. Bank, N.A. Under the terms of the Loan Agreement, the Fund’s borrowings cannot exceed the lesser of $3,400,000, 5% of the gross market value of the Fund, or 33 ⅓% of the net asset market value of the unencumbered assets of the Fund. | |
| The interest rate on the loan equals the prime rate minus one percent per annum, payable monthly. For the year ended June 30, 2016, the Fund did not borrow under the line of credit. | |
| I. | Subsequent Events. |
| In preparing these financial statements, the Fund has evaluated events and transactions for potential recognition or disclosure through the date the financial statements were issued and determined that no events have occurred that require disclosure. | |
| NOTE 3 – INVESTMENT ADVISORY AND OTHER AGREEMENTS | |
The Fund has an investment advisory agreement with the Advisor to serve as investment advisor. Certain Officers of the Advisor are also Officers of the Fund. Under the terms of the agreement, the Fund has agreed to pay the Advisor as compensation for all services rendered, staff and facilities provided and expenses paid or assumed, an annual advisory fee, accrued daily, paid monthly, of 0.75% of the Fund’s average daily net assets. For the year ended June 30, 2016 the Fund accrued $480,281 in advisory fees. The Advisor has contractually agreed to reduce its advisory fees and/or pay expenses of the Fund to ensure that the Fund’s total annual operating expenses (excluding acquired fund fees and expenses, leverage interest, taxes, brokerage commissions and extraordinary expenses) will not exceed 0.99% of the Fund’s average daily net assets. In connection with this expense limitation, the Advisor is eligible to recover expenses waived for three fiscal years following the fiscal year in which the expenses were originally waived. | |
22
MATRIX ADVISORS VALUE FUND, INC. |
Notes to the Financial Statements (Unaudited), Continued | ||||
| The Advisor will only be able to recover previously waived expenses if the Fund’s then current expense ratio is below the 0.99% expense cap. The Board of Directors of the Fund approved these changes at a meeting held on August 24, 2010. For the year ended June 30, 2016, Matrix waived $106,880. Any reduction in advisory fees or payment of expenses made by the Advisor may be reimbursed by the Fund if the Advisor requests reimbursement in subsequent fiscal years. | ||||
| This reimbursement may be requested if the aggregate amount actually paid by the Fund toward operating expenses for such fiscal year (taking into account the reimbursement) does not exceed the applicable limitation on Fund expenses. The Advisor is permitted to be reimbursed for fee reductions and/or expense payments made in the prior three fiscal years. Any such reimbursement will be reviewed by the Fund’s Board of Directors. The Fund must pay its current ordinary operating expenses before the Advisor is entitled to any reimbursement of fees and/or expenses. | ||||
At June 30, 2016, the cumulative amount available for reimbursement that has been paid and/or waived is $324,994. Currently, the Advisor has agreed not to seek reimbursement of such fee reductions and/or expense payments. The Advisor may recapture a portion of this amount no later than the dates stated below: | ||||
| June 30, | ||||
| 2017 | 2018 | 2019 | ||
| $119,325 | $98,789 | $106,880 | ||
U.S. Bancorp Fund Services, LLC (“USBFS”) acts as the Fund’s administrator (the “Administrator”) under an Administration Agreement. The Administrator prepares various federal and state regulatory filings, reports and returns for the Fund; prepares reports and materials to be supplied to the Directors; monitors the activities of the Fund’s custodian, transfer agent and accountants; coordinates the preparation and payment of Fund expenses and reviews the Fund’s expense accruals. For the year ended June 30, 2016, USBFS was paid $81,052, in its capacity as Fund Administrator. USBFS also serves as the Fund’s Accountant and Transfer Agent. U.S. Bank, N.A. serves as the Fund’s Custodian. See the statement of operations for the fees accrued. Quasar Distributors, LLC, an affiliate of USBFS and U.S. Bank, N.A., serves as the Fund’s principal underwriter. | ||||
| The Chief Compliance Officer (“CCO”) receives no compensation from the Fund for her services; however, the Administrator was paid $10,000 for the year ended June 30, 2016 for CCO support services. | ||||
| NOTE 4 – INVESTMENT TRANSACTIONS | ||||
| The cost of purchases and the proceeds from sales of securities, other than short-term obligations and U.S. Government securities, for the year ended June 30, 2016, are as follows: | ||||
| Purchases | Sales | |||
| Common Stock | $9,779,458 | $20,754,147 | ||
23
| MATRIX ADVISORS | ||
| VALUE FUND, INC. |
Notes to the Financial Statements (Unaudited), Continued |
| NOTE 5 – DISTRIBUTIONS TO SHAREHOLDERS |
As of June 30, 2016, the components of distributable earnings on a tax basis were as follows:
| Cost of investments for tax purposes | $ | 44,679,218 | ||
| Gross tax unrealized appreciation | 13,650,499 | |||
| Gross tax unrealized depreciation | (3,239,248 | ) | ||
| Net tax unrealized appreciation on investments | 10,411,251 | |||
| Undistributed ordinary income | 824,053 | |||
| Undistributed long-term capital gains | — | |||
| Total Distributable Earnings | 824,053 | |||
| Other accumulated losses | (1,710,401 | ) | ||
| Total Accumulated Earnings/Losses | $ | 9,524,903 | ||
The difference between book basis and tax basis unrealized depreciation is attributable primarily to the tax deferral of losses on wash sales adjustments.
At June 30, 2016, the Fund has $1,710,401 of capital loss carryover, of which $1,710,401 expires June 30, 2018.
At June 30, 2016, the Fund had no post-October losses.
The tax character of distributions paid during the years ended June 30, 2016 and June 30, 2015 were as follows:
| June 30, 2016 | June 30, 2015 | |||||||||||
| Distributions Paid From: | ||||||||||||
| Ordinary Income* | $ | 1,070,965 | $ | 927,355 | ||||||||
| Long-Term Capital Gain | $ | — | $ | — | ||||||||
| $ | 1,070,965 | $ | 927,355 | |||||||||
| * | For tax purposes, short-term capital gains are considered ordinary income. |
The Fund may use earnings and profits distributed to shareholders on redemption of shares as part of the dividends paid deduction.
24
| MATRIX ADVISORS | ||
| VALUE FUND, INC. |
Notes to the Financial Statements (Unaudited), Continued |
| NOTE 6 – FAIR VALUE |
The Fund has adopted fair valuation accounting standards which establish an authoritative definition of fair value and set forth a hierarchy for measuring fair value. These standards require additional disclosure about the various inputs and valuation techniques used to develop the measurements of fair value and a discussion of changes in valuation techniques and related inputs during the period. These standards define fair value as the price that would be received in the sale of an asset or paid to transfer a liability in an orderly transaction between market participants on the measurement date. The fair value hierarchy is organized into three levels based upon the assumptions (referred to as “inputs”) used to value the asset or liability. These standards state that “observable inputs” reflect the assumptions that market participants would use in valuing an asset or liability based on market data obtained from independent sources. “Unobservable inputs” reflect the Fund’s own assumptions about the inputs market participants would use to value the asset or liability.
The Fund follows a fair value hierarchy that distinguishes between market data obtained from independent sources (observable inputs) and the Fund’s own market assumptions (unobservable inputs). These inputs are used in determining the value of the Fund’s investments and are summarized in the following fair value hierarchy:
| Level 1 | – | Unadjusted quoted prices in active markets for identical assets or liabilities that the company has the ability to access. | |
| Level 2 | – | Observable inputs other than quoted prices included in Level 1 that are observable for the asset or liability, either directly or indirectly. These inputs may include quoted prices for the identical instrument on an inactive market, prices for similar instruments, interest rates, prepayments speeds, credit risk, yield curves, default rates and similar data. | |
| Level 3 | – | Unobservable inputs for the asset or liability, to the extent relevant observable inputs are not available, representing the company’s own assumptions about the assumptions a market participant would use in valuing the asset or liability, and would be based on the best information available. |
The inputs or methodology used for valuing securities are not an indication of the risk associated with investing in those securities.
25
| MATRIX ADVISORS | ||
| VALUE FUND, INC. |
Notes to the Financial Statements (Unaudited), Continued |
The following is a summary of the inputs used to value the Fund’s net assets as of June 30, 2016. There were no transfers into or out of Level 1, Level 2 or Level 3 during the reporting period. Transfers between levels are recognized at June 30, 2016, the end of the reporting period.
| Description | Quoted prices in active markets for identical assets (Level 1) | Significant other observable inputs (Level 2) | Significant unobservable inputs (Level 3) | Total | ||||||||||||
| Equity | ||||||||||||||||
| Common Stock* | $ | 55,050,495 | $ | — | $ | — | $ | 55,050,495 | ||||||||
| Total Equity | $ | 55,050,495 | $ | — | $ | — | $ | 55,050,495 | ||||||||
| Short-Term Investments | $ | 39,974 | $ | — | $ | — | $ | 39,974 | ||||||||
| Total Investments in Securities | $ | 55,090,469 | $ | — | $ | — | $ | 55,090,469 | ||||||||
| * | Please refer to the Schedule of Investments for a breakout of common stocks by industry classification. |
26
| MATRIX ADVISORS | ||
| VALUE FUND, INC. |
REPORT OF INDEPENDENT REGISTERED PUBLIC ACCOUNTING FIRM
To the Board of Directors and
Shareholders of Matrix Advisors Value Fund, Inc.
New York, New York
Shareholders of Matrix Advisors Value Fund, Inc.
New York, New York
We have audited the accompanying statement of assets and liabilities, including the schedule of investments, of Matrix Advisors Value Fund, Inc. as of June 30, 2016 and the related statement of operations for the year then ended, the statements of changes in net assets for each of the two years in the period then ended and the financial highlights for each of the five years in the period then ended. These financial statements and financial highlights are the responsibility of the Fund’s management. Our responsibility is to express an opinion on these financial statements and financial highlights based on our audits.
We conducted our audits in accordance with the standards of the Public Company Accounting Oversight Board (United States). Those standards require that we plan and perform the audit to obtain reasonable assurance about whether the financial statements and financial highlights are free of material misstatement. The Fund is not required to have, nor were we engaged to perform, an audit of its internal control over financial reporting. Our audits included consideration of internal control over financial reporting as a basis for designing audit procedures that are appropriate in the circumstances, but not for the purpose of expressing an opinion on the effectiveness of the Fund’s internal control over financial reporting. Accordingly, we express no such opinion. An audit includes examining, on a test basis, evidence supporting the amounts and disclosures in the financial statements and financial highlights, assessing the accounting principles used and significant estimates made by management, as well as evaluating the overall financial statement presentation. Our procedures included confirmation of securities owned as of June 30, 2016, by correspondence with the custodian. We believe that our audits provide a reasonable basis for our opinion.
In our opinion, the financial statements and financial highlights referred to above present fairly, in all material respects, the financial position of Matrix Advisors Value Fund, Inc. as of June 30, 2016, the results of its operations for the year then ended, the changes in its net assets for each of the two years in the period then ended and the financial highlights for each of the five years in the period then ended in conformity with accounting principles generally accepted in the United States of America.
TAIT WELLER & BAKER LLP
Philadelphia, Pennsylvania
August 24, 2016
August 24, 2016
27
| MATRIX ADVISORS | ||
| VALUE FUND, INC. |
Additional Information (Unaudited) |
| PROXY VOTING INFORMATION |
The Advisor votes proxies relating to portfolio securities in accordance with procedures that have been approved by the Board of Directors of the Fund. You may obtain a description of these procedures and how the Fund voted proxies relating to the portfolio securities during the most recent 12-month period ended June 30, free of charge, by calling toll-free 1-800-366-6223. This information is also available through the Securities and Exchange Commission’s website at http://www.sec.gov.
FORM N-Q DISCLOSURE
The Fund files its complete schedule of portfolio holdings with the Securities and Exchange Commission for the first and third quarters of each fiscal year on Form N-Q. The Fund’s Form N-Q is available on the Securities and Exchange Commission’s website at http://www.sec.gov. The Fund’s Form N-Q may be reviewed and copied at the Commission’s Public Reference Room in Washington, DC, and information on the operation of the Public Reference Room may be obtained by calling 1-800-SEC-0330. This information is also available, without charge, by calling toll-free, 1-800-366-6223.
| TAX NOTICE (UNAUDITED) |
| The percentage of dividend income distributed for the year ended June 30, 2016, which is designated as qualified dividend income under the Jobs and Growth Tax Relief Reconciliation Act of 2003, is 100.00%. |
| For the year ended June 30, 2016, the percentage of ordinary income distributions that qualify for the dividend received deduction available to corporate shareholders is 100.00%. |
| Additional Information Applicable to Foreign Shareholders only: |
| The Fund hereby designates 0.01% of its ordinary income distributions for the fiscal year as interest-related dividends under Internal Revenue Code Section 871(k)(1)(c). |
28
| MATRIX ADVISORS | ||
| VALUE FUND, INC. |
Additional Information (Unaudited), Continued
DIRECTOR AND OFFICER INFORMATION
The Board of Directors is responsible for the overall management of the Fund’s business. The Board approves all significant agreements between the Fund and persons or companies furnishing services to it, including the agreements with the Advisor, Administrator, Custodian and Transfer Agent. The Board of Directors delegates the day-to-day operations of the Fund to its Officers, subject to the Fund’s investment objective and policies and to general supervision by the Board. The Statement of Additional Information includes additional information about the Fund’s Directors and is available, without charge, by calling 1-800-366-6223.
The Directors and Officers of the Fund, their business addresses and principal occupations during the past five years are:
| Interested Director | ||||||||||
Name, Address, and Year of Birth | Position(s) Held with the Fund | Date Elected† | Principal Occupation(s) During the Past 5 Years | Number of Portfolios In Fund Complex Overseen by Director | Other Directorships Held by Director | |||||
David A. Katz, CFA 747 Third Avenue New York, NY 10017 (Born 1962) | Director, President and Treasurer | Since 1997 | Chief Investment Officer (1986 to present) and President (1990 to present) of Matrix Asset Advisors, the Fund’s Advisor, and portfolio manager of the Fund (1996 to present). | 1 | None | |||||
| Independent Directors | ||||||||||
T. Michael Tucker * 747 Third Avenue New York, NY 10017 (Born 1942) | Director | Since 1997 | Owner of T. Michael Tucker, a certified public accounting firm (1977 to 2005 and 2011 to present); formerly, Consultant, Carr Riggs & Ingram, LLP, a certified public accounting firm (2005 to 2011). | 1 | None | |||||
Larry D. Kieszek * 747 Third Avenue New York, NY 10017 (Born 1950) | Director and Chairman | Since 1997 | Retired; formerly, Partner of Purvis, Gray & Company, a certified public accounting firm (1974 to 2015). | 1 | None | |||||
29
| MATRIX ADVISORS | ||
| VALUE FUND, INC. |
Additional Information (Unaudited), Continued
| Independent Director | ||||||||||
Name, Address, and Year of Birth | Position(s) Held with the Fund | Date Elected† | Principal Occupation(s) During the Past 5 Years | Number of Portfolios In Fund Complex Overseen by Director | Other Directorships Held by Director | |||||
David S. Wyler 747 Third Avenue New York, NY 10017 1969 | Director | Since 2016 | Vice President of Business Development, Resonate (marketing intelligence firm) (2014 to present); Vice President of Business Development, Experian (information services firm) (2013 to 2014) and 41st Parameter (fraud prevention firm) (2012 to 2013); Senior Vice President and General Manager, The Nielsen Company (2008 to 2011) and IAG Research (2004 to 2008). | 1 | None | |||||
| Officers of the Fund | ||||||||||
Lon F. Birnholz 747 Third Avenue New York, NY 10017 (Born 1960) | Executive Vice President and Secretary | Since 2006 | Senior Managing Director of Matrix Asset Advisors, the Fund’s Advisor (1999 to present). | N/A | N/A | |||||
Steven G. Roukis, CFA 747 Third Avenue New York, NY 10017 (Born 1967) | Senior Vice President | Since 2000 | Managing Director of Matrix Asset Advisors, the Fund’s Advisor (2005 to present); formerly, Director of Research, Senior Vice President-Equity Research of Matrix Asset Advisors and various other positions within research (1994 to 2005). | N/A | N/A | |||||
Jordan F. Posner 747 Third Avenue New York, NY 10017 (Born 1957) | Senior Vice President | Since 2006 | Managing Director of Matrix Asset Advisors, the Fund’s Advisor (2005 to present); formerly, Partner of David J. Greene & Co., an investment firm (1993 to 2005). | N/A | N/A | |||||
30
| MATRIX ADVISORS | ||
| VALUE FUND, INC. |
Additional Information (Unaudited), Continued
Name, Address, and Year of Birth | Position(s) Held with the Fund | Date Elected† | Principal Occupation(s) During the Past 5 Years | Number of Portfolios In Fund Complex Overseen by Director | Other Directorships Held by Director | |||||
Steven Pisarkiewicz 747 Third Avenue New York, NY 10017 (Born 1948) | Senior Vice President | Since 2010 | Senior Managing Director and Senior Portfolio Manager of Matrix Asset Advisors, the Fund’s Advisor (2009 to present); formerly, National Managing Director for Bernstein Global Wealth Management (2007 to 2009); Executive Vice President of The Bank of New York and head of BNY Asset Management (2003 to 2007). | N/A | N/A | |||||
Stephan J. Weinberger, CFA 747 Third Avenue New York, NY 10017 (Born 1955) | Senior Vice President | Since 2010 | Managing Director and Senior Portfolio Manager of Matrix Asset Advisors, the Fund’s Advisor (2010 to present); formerly, Partner at Armstrong Shaw Associates (1996 to 2010). | N/A | N/A | |||||
Laurie S. Gaeta c/o Ascendant Compliance Management, Inc. 546 Fifth Avenue 18th Floor New York, NY 10036 (Born 1960) | Chief Compliance Officer, AML Compliance Officer | Since 2008 | Compliance Services Consultant, Ascendant Compliance Management, Inc. (2015 to present); Managing Director of Matrix Asset Advisors, the Fund’s Advisor, (2010 to 2015). | N/A | N/A | |||||
Conall Duffin 747 Third Avenue New York, NY 10017 (Born 1975) | Vice President and Assistant Secretary | Since 2002 | Vice President Marketing and Mutual Fund Services, Matrix Asset Advisors, the Fund’s Advisor (2010 to present); Marketing Associate (2001 to 2010). | N/A | N/A |
31
| MATRIX ADVISORS | ||
| VALUE FUND, INC. |
Additional Information (Unaudited), Continued
Name, Address, and Year of Birth | Position(s) Held with the Fund | Date Elected† | Principal Occupation(s) During the Past 5 Years | Number of Portfolios In Fund Complex Overseen by Director | Other Directorships Held by Director | |||||
Jonathan Tom 747 Third Avenue New York, NY 10017 (Born 1983) | Vice President | Since 2016 | Chief Operating Officer of Matrix Asset Advisors, the Fund’s Advisor (2015 to present); Head Fixed Income Trader (2011 to present); Equity Research Analyst (2005 to present). | N/A | N/A | |||||
| * | Not an “interested person”, as that term is defined by the 1940 Act. |
| † | Directors and Officers of the Fund serve until their resignation, removal or retirement. |
32
| MATRIX ADVISORS | ||
| VALUE FUND, INC. |
PRIVACY NOTICE
The Fund collects non-public information about you from the following sources:
| ● | Information we receive about you on applications or other forms; |
| ● | Information you give us orally; and |
| ● | Information about your transactions with us or others. |
We do not disclose any non-public personal information about our shareholders or former shareholders without the shareholder’s authorization, except as required or permitted by law or in response to inquiries from governmental authorities. We restrict access to your personal and account information to those employees who need to know that information to provide products and services to you. We may disclose that information to unaffiliated third parties (such as to brokers or custodians) only as permitted by law and only as needed for us to provide agreed services to you. We maintain physical, electronic and procedural safeguards to guard your nonpublic personal information.
If you hold shares of the Fund through a financial intermediary, including, but not limited to, a broker-dealer, bank, or trust company, the privacy policy of your financial intermediary would govern how your nonpublic personal information would be shared by those entities with nonaffiliated third parties.
33
| Board of Directors |
| David A. Katz, CFA |
| Larry D. Kieszek |
| T. Michael Tucker |
| David S. Wyler |
| ● |
| Investment Advisor |
| Matrix Asset Advisors, Inc. |
| 747 Third Avenue, 31st Floor |
| New York, NY 10017 |
| (800) 366-6223 |
| ● |
| Custodian |
| U.S. Bank, N.A. |
| 1555 N. River Center Drive, Ste. 302 |
| Milwaukee, WI 53212 |
| ● |
| Transfer Agent |
| U.S. Bancorp Fund Services, LLC |
| 615 East Michigan Street |
| Milwaukee, WI 53202 |
| ● |
| Administrator |
| U.S. Bancorp Fund Services, LLC |
| 333 Thornall Street, 5C |
| Edison, NJ 08837 |
| ● |
| Independent Registered Public |
| Accounting Firm |
| Tait, Weller & Baker, LLP |
| 1818 Market Street, Ste. 2400 |
| Philadelphia, PA 19103 |
| ● |
| Distributor |
| Quasar Distributors, LLC |
| 615 East Michigan Street |
| Milwaukee, WI 53202-5207 |
| This report is intended for shareholders of the Fund and may not be used as sales literature unless preceded or accompanied by a current prospectus. |
Past performance results shown in this report should not be considered a representation of future performance. Share price and returns will fluctuate so that shares, when redeemed, may be worth more or less than their original cost. Statements and other information herein are dated and are subject to change. |
| Annual Report |
| MATRIX |
| ADVISORS |
| VALUE FUND, INC. |
| June 30, 2016 |
| 747 Third Avenue, 31st Floor |
| New York, NY 10017 |
| Ticker Symbol: MAVFX |
| Cusip: 57681T102 |
Item 2. Code of Ethics.
The registrant has adopted a code of ethics that applies to the registrant’s principal executive officer and principal financial officer. The registrant has not made any amendments to its code of ethics during the period covered by this report. The registrant has not granted any waivers from any provisions of the code of ethics during the period covered by this report.
The registrant undertakes to provide to any person without charge, upon request, a copy of its code of ethics by mail when they call the registrant at 1-800-366-6223.
Item 3. Audit Committee Financial Expert.
The registrant’s board of directors has determined that there is at least one audit committee financial expert serving on its audit committee. Messrs. Kieszek and Tucker are “audit committee financial expert(s)” and are considered to be “independent” as each term is defined in Item 3 of Form N‑CSR.
Item 4. Principal Accountant Fees and Services.
The registrant has engaged its principal accountant to perform audit services, audit-related services, tax services and other services during the past two fiscal years. “Audit services” refer to performing an audit of the registrant's annual financial statements or services that are normally provided by the accountant in connection with statutory and regulatory filings or engagements for those fiscal years. “Audit-related services” refer to the assurance and related services by the principal accountant that are reasonably related to the performance of the audit. “Tax services” refer to professional services rendered by the principal accountant for tax compliance, tax advice, and tax planning. There were no “Other services” provided by the principal accountant. The following table details the aggregate fees billed or expected to be billed for each of the last two fiscal years for audit fees, audit-related fees, tax fees and other fees by the principal accountant.
| FYE 6/30/2016 | FYE 6/30/2015 | |
| Audit Fees | $18,000 | $18,000 |
| Audit-Related Fees | $0 | $0 |
| Tax Fees | $2,800 | $2,800 |
| All Other Fees | $0 | $0 |
The audit committee has adopted pre-approval policies and procedures that require the audit committee to pre‑approve all audit and non‑audit services of the registrant, including services provided to any entity affiliated with the registrant.
The percentage of fees billed by Tait, Weller & Baker LLP applicable to non-audit services pursuant to waiver of pre-approval requirement were as follows:
| FYE 6/30/2016 | FYE 6/30/2015 | |
| Audit-Related Fees | 0% | 0% |
| Tax Fees | 0% | 0% |
| All Other Fees | 0% | 0% |
All of the principal accountant’s hours spent on auditing the registrant’s financial statements were attributed to work performed by full‑time permanent employees of the principal accountant.
The following table indicates the non-audit fees billed or expected to be billed by the registrant’s accountant for services to the registrant and to the registrant’s investment adviser (and any other controlling entity, etc.—not sub-adviser) for the last two years. The audit committee of the board of trustees/directors has considered whether the provision of non-audit services that were rendered to the registrant's investment adviser is compatible with maintaining the principal accountant's independence and has concluded that the provision of such non-audit services by the accountant has not compromised the accountant’s independence.
| Non-Audit Related Fees | FYE 6/30/2016 | FYE 6/30/2015 |
| Registrant | $0 | $0 |
| Registrant’s Investment Adviser | $0 | $0 |
Item 5. Audit Committee of Listed Registrants.
Not applicable to registrants who are not listed issuers (as defined in Rule 10A-3 under the Securities Exchange Act of 1934).
Item 6. Investments.
| (a) | Schedule of Investments is included as part of the report to shareholders filed under Item 1 of this Form. |
| (b) | Not Applicable. |
Item 7. Disclosure of Proxy Voting Policies and Procedures for Closed-End Management Investment Companies.
Not applicable to open-end investment companies.
Item 8. Portfolio Managers of Closed-End Management Investment Companies.
Not applicable to open-end investment companies.
Item 9. Purchases of Equity Securities by Closed‑End Management Investment Company and Affiliated Purchasers.
Not applicable to open-end investment companies.
Item 10. Submission of Matters to a Vote of Security Holders.
There have been no material changes to the procedures by which shareholders may recommend nominees to the registrant’s board of directors.
Item 11. Controls and Procedures.
| (a) | The Registrant’s President/Chief Executive Officer and Treasurer/Chief Financial Officer have reviewed the Registrant's disclosure controls and procedures (as defined in Rule 30a-3(c) under the Investment Company Act of 1940 (the “Act”)) as of a date within 90 days of the filing of this report, as required by Rule 30a-3(b) under the Act and Rules 13a-15(b) or 15d‑15(b) under the Securities Exchange Act of 1934. Based on their review, such officers have concluded that the disclosure controls and procedures are effective in ensuring that information required to be disclosed in this report is appropriately recorded, processed, summarized and reported and made known to them by others within the Registrant and by the Registrant’s service provider. |
| (b) | There were no changes in the Registrant's internal control over financial reporting (as defined in Rule 30a-3(d) under the Act) that occurred during the second fiscal quarter of the period covered by this report that has materially affected, or is reasonably likely to materially affect, the Registrant's internal control over financial reporting. |
Item 12. Exhibits.
| (a) | (1) Any code of ethics or amendment thereto, that is the subject of the disclosure required by Item 2, to the extent that the registrant intends to satisfy Item 2 requirements through filing an exhibit. Incorporated by reference to the Registrant’s Form N-CSR filed September 2, 2004. |
(2) A separate certification for each principal executive and principal financial officer pursuant to Section 302 of the Sarbanes-Oxley Act of 2002. Filed herewith.
(3) Any written solicitation to purchase securities under Rule 23c‑1 under the Act sent or given during the period covered by the report by or on behalf of the registrant to 10 or more persons. Not applicable to open-end investment companies.
| (b) | Certifications pursuant to Section 906 of the Sarbanes‑Oxley Act of 2002. Furnished herewith. |
SIGNATURES
Pursuant to the requirements of the Securities Exchange Act of 1934 and the Investment Company Act of 1940, the registrant has duly caused this report to be signed on its behalf by the undersigned, thereunto duly authorized.
Matrix Advisors Value Fund, Inc.
By /s/ David A. Katz
David A. Katz, President
Date September 6, 2016
Pursuant to the requirements of the Securities Exchange Act of 1934 and the Investment Company Act of 1940, this report has been signed below by the following persons on behalf of the registrant and in the capacities and on the dates indicated.
By /s/ David A. Katz
David A. Katz, President
Date September 6, 2016