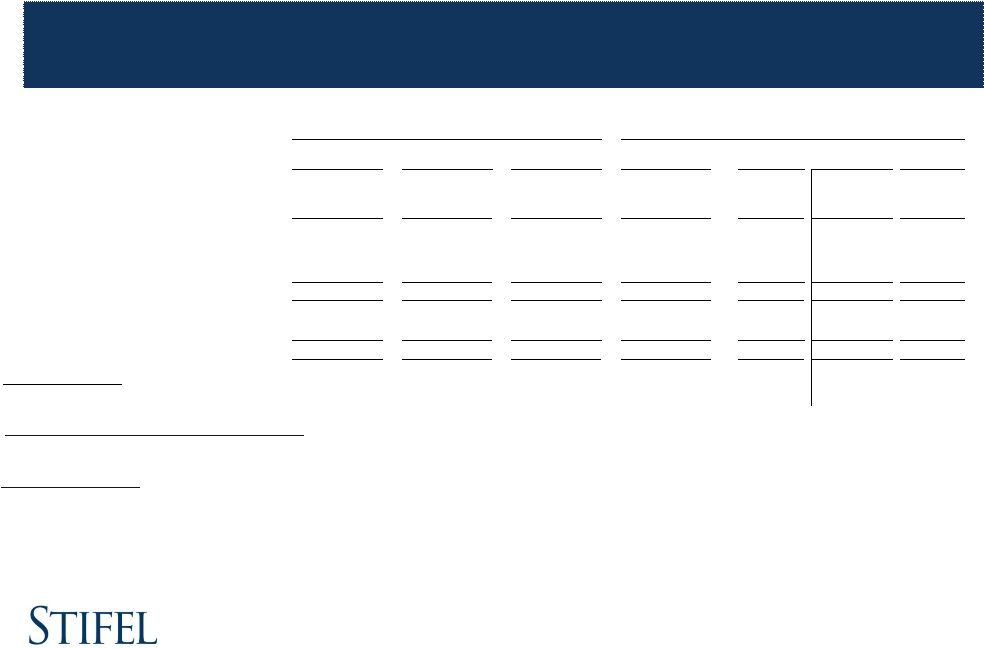
Stifel Financial Corp. Results Three months ended June 30, 2013 5 ($ in thousands, except per share amounts) GAAP Non-Core Non-GAAP 6/30/12 % Change 3/31/13 % Change Total revenues 511,421 $ 1,736 $ 513,157 $ 384,264 $ 33.5% 453,240 $ 13.2% Interest expense 12,685 - 12,685 9,857 28.7% 11,460 10.7% Net revenues 498,736 1,736 500,472 374,407 33.7% 441,780 $ 13.3% Compensation and benefits 321,331 (6,018) 315,313 239,374 31.7% 281,941 11.8% Non-comp operating expenses 126,207 (14,974) 111,233 91,159 22.0% 96,155 15.7% Total non-interest expenses 447,538 (20,992) 426,546 330,533 29.0% 378,096 12.8% Income before income taxes 51,198 22,728 73,926 43,874 68.5% 63,684 16.1% Provision for income taxes 21,763 7,807 29,570 17,738 66.7% 23,808 24.2% Net income 29,435 $ 14,921 $ 44,356 $ 26,136 $ 69.7% 39,876 $ 11.2% Earnings per share: Diluted 0.40 $ 0.60 $ 0.42 $ 42.9% 0.58 $ 3.4% Weighted average number of shares outstanding: Diluted 74,090 74,090 62,678 18.2% 69,189 7.1% Ratios to net revenues: Compensation and benefits 64.4% 63.0% 63.9% 63.8% Non-comp operating expenses 25.3% 22.2% 24.4% 21.8% Income before income taxes 10.3% 14.8% 11.7% 14.4% Three Months Ended June 30, 2013 Three Months Ended (1) Non-core adjustments consist of merger-related revenues and expenses associated with our acquisitions of KBW, the Knight Capital Fixed Income business and Miller Buckfire. _________________________________________________________ (1) |