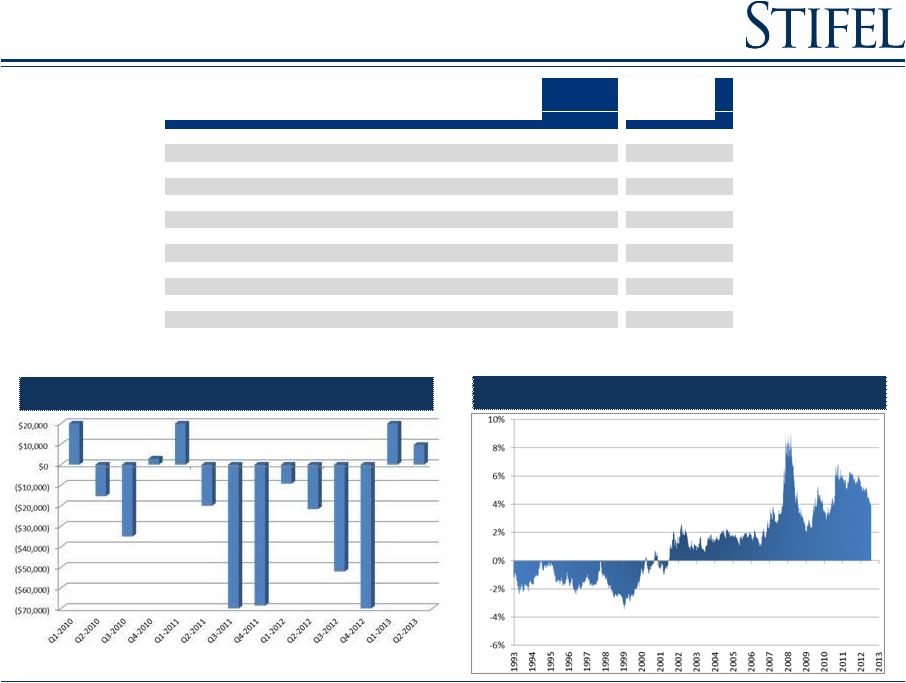
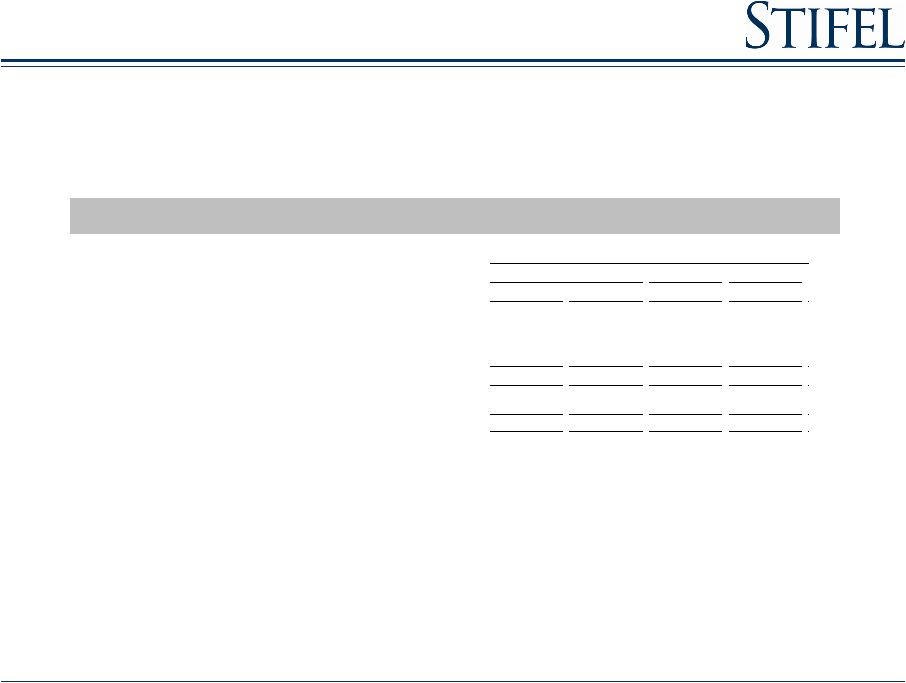
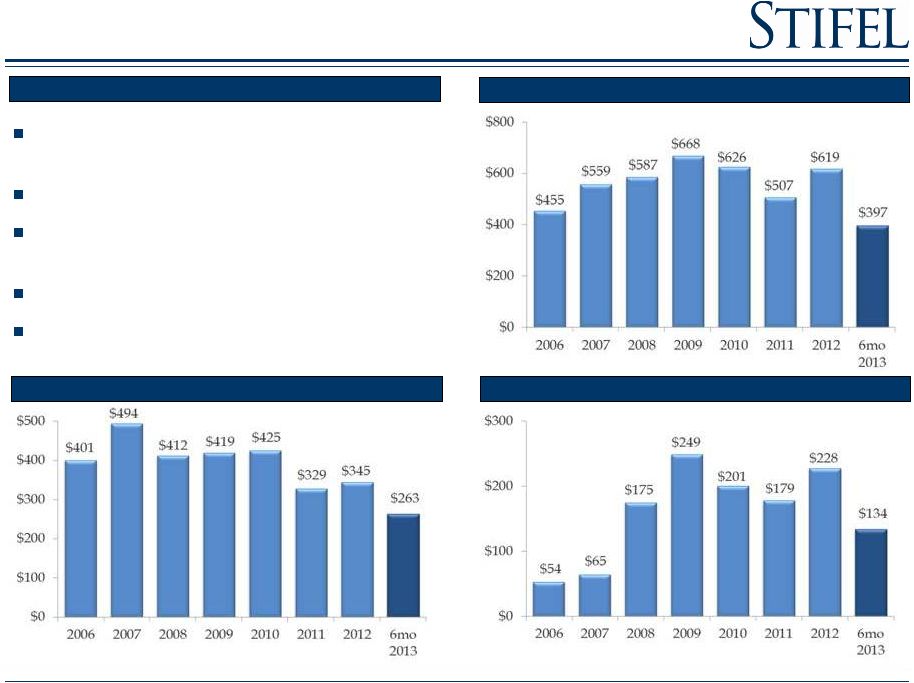
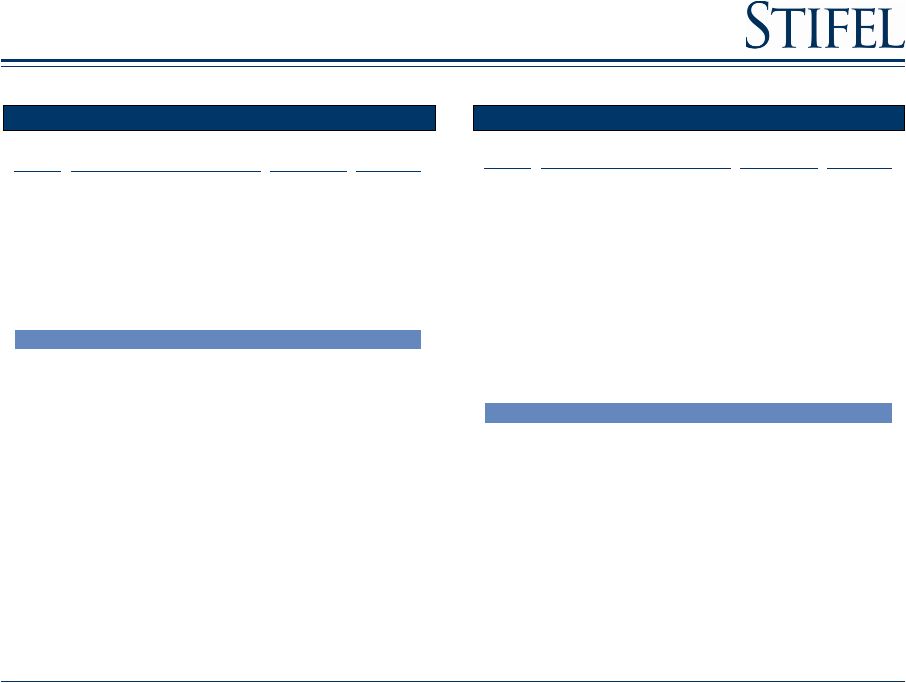
31 Sources of Revenues (1) Results for the three months ended March 31, 2013 and December 31, 2012 included realized and unrealized gains on the Company’s investment in Knight Capital Group, Inc. of $2.2 million and $13.4 million, respectively. ($ in thousands) 6/30/13 6/30/12 % Change 3/31/13 % Change 6/30/13 6/30/12 % Change Commissions 157,168 $ 127,427 $ 23.3% 148,648 $ 5.7% 305,816 $ 250,730 $ 22.0% Principal transactions 111,448 91,564 21.7% 107,244 3.9% 218,692 207,797 5.2% Brokerage revenues 268,616 218,991 22.7% 255,892 5.0% 524,508 458,527 14.4% Capital raising 74,146 40,733 82.0% 51,199 44.8% 125,345 95,566 31.2% Advisory 47,968 26,630 80.1% 27,180 76.5% 75,148 42,235 77.9% Investment banking 122,114 67,363 81.3% 78,379 55.8% 200,493 137,801 45.5% Asset mgt and service fees 76,088 65,311 16.5% 68,912 10.4% 145,000 126,129 15.0% Other 11,670 5,418 115.4% 20,212 (42.3%) 31,882 18,712 70.4% Total operating revenues 478,488 357,083 34.0% 423,395 13.0% 901,883 741,169 21.7% Interest revenue 32,933 27,181 21.2% 29,845 10.3% 62,778 52,438 19.7% Total revenues 511,421 384,264 33.1% 453,240 12.8% 964,661 793,607 21.6% Interest expense 12,685 9,857 28.7% 11,460 10.7% 24,145 18,867 28.0% Net revenues 498,736 $ 374,407 $ 33.2% 441,780 $ 12.9% 940,516 $ 774,740 $ 21.4% Three Months Ended Six Months Ended |


