Free signup for more
- Track your favorite companies
- Receive email alerts for new filings
- Personalized dashboard of news and more
- Access all data and search results
Filing tables
SF similar filings
- 19 Mar 14 Regulation FD Disclosure
- 24 Feb 14 Stifel Reports Fourth Quarter and Full-year 2013 Financial Results
- 21 Nov 13 Regulation FD Disclosure
- 19 Nov 13 Regulation FD Disclosure
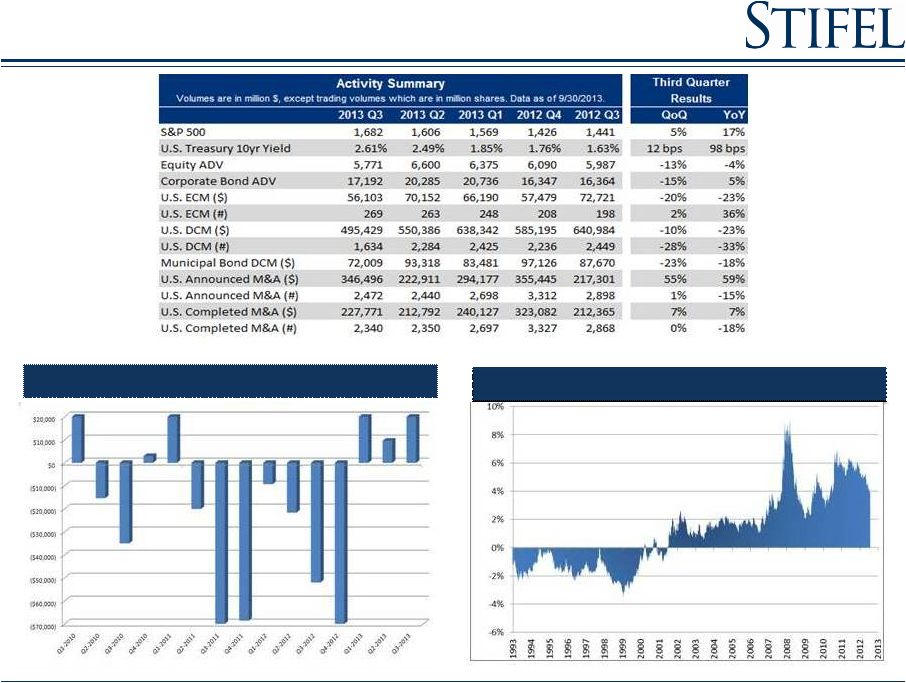
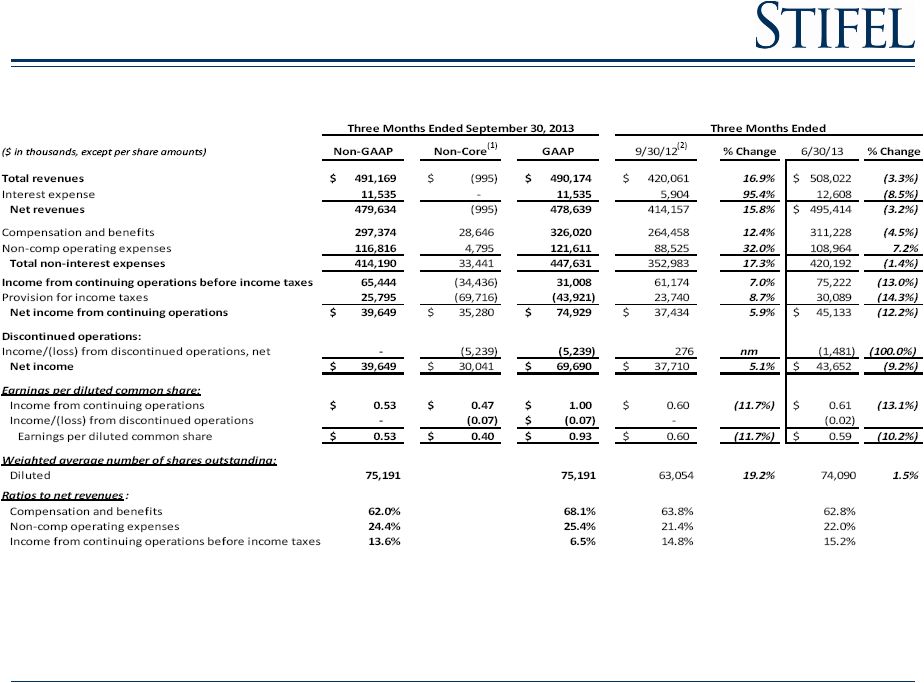
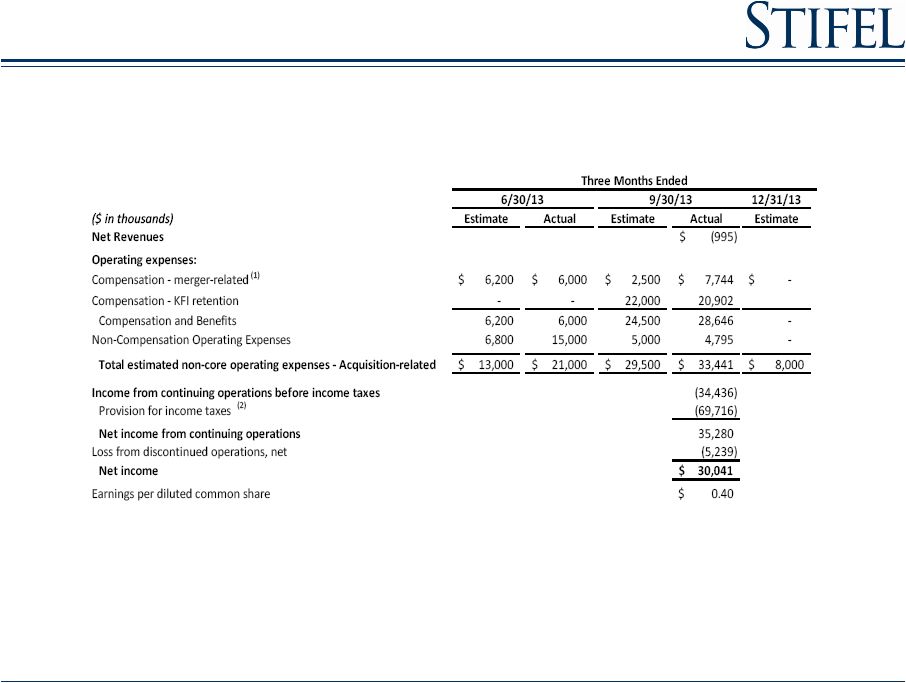
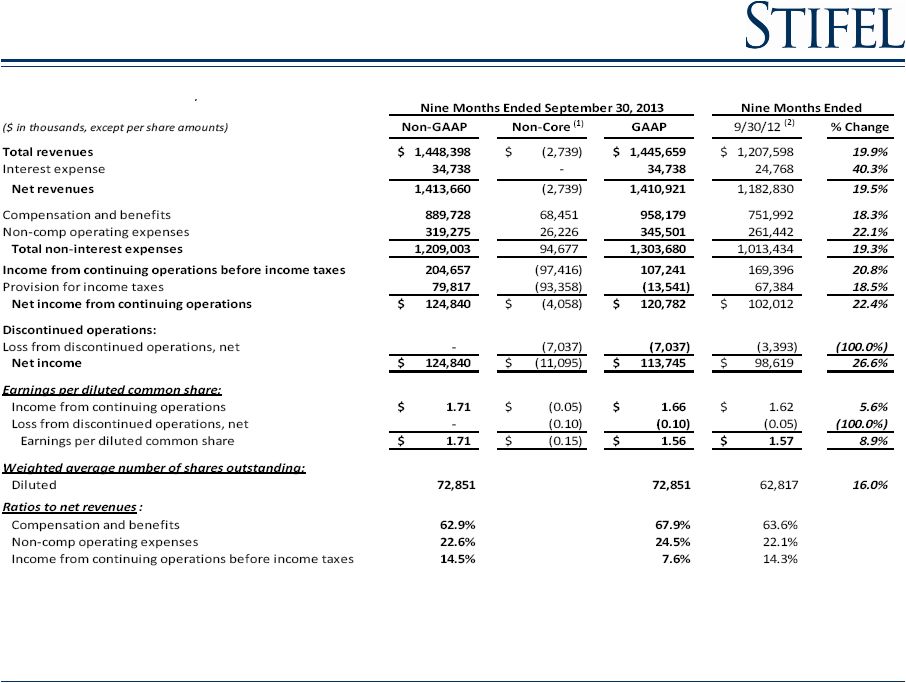
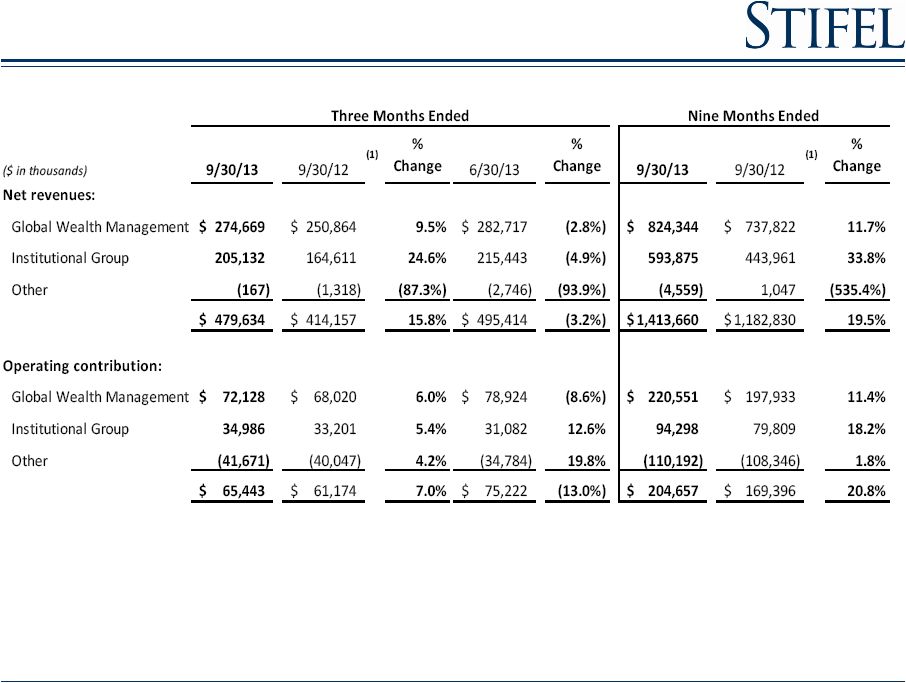
- 7 Nov 13 Stifel Reports Third Quarter 2013 Financial Results
- 1 Oct 13 Regulation FD Disclosure
- 18 Sep 13 Regulation FD Disclosure
Filing view
External links