 1 Quarter 2015 Financial Results Presentation May 11, 2015 st Exhibit 99.1 |
 1 Disclaimer Forward-Looking Statements Use of Non-GAAP Financial Measures This presentation may contain “forward-looking statements” within the meaning of the Private Securities Litigation Reform Act of 1995 that involve significant risks, assumptions, and uncertainties, including statements relating to the market opportunity and future business prospects of Stifel Financial Corp., as well as Stifel, Nicolaus & Company, Incorporated and its subsidiaries (collectively, “SF” or the “Company”). These statements can be identified by the use of the words “may,” “will,” “should,” “could,” “would,” “plan,” “potential,” “estimate,” “project,” “believe,” “intend,” “anticipate,” “expect,” and similar expressions. In particular, these statements may refer to our goals, intentions, and expectations, our business plans and growth strategies, our ability to integrate and manage our acquired businesses, estimates of our risks and future costs and benefits, and forecasted demographic and economic trends relating to our industry. You should not place undue reliance on any forward-looking statements, which speak only as of the date they were made. We will not update these forward-looking statements, even though our situation may change in the future, unless we are obligated to do so under federal securities laws. Actual results may differ materially and reported results should not be considered as an indication of future performance. Factors that could cause actual results to differ are included in the Company’s annual and quarterly reports and from time to time in other reports filed by the Company with the Securities and Exchange Commission and include, among other things, changes in general economic and business conditions, actions of competitors, regulatory and legal actions, changes in legislation, and technology changes. The Company utilized non-GAAP calculations of presented net revenues, compensation and benefits, non-compensation operating expenses, income from continuing operations before income taxes, provision for income taxes, net income from continuing operations, net income, compensation and non-compensation operating expense ratios, pre-tax margin and diluted earnings per share as an additional measure to aid in understanding and analyzing the Company’s financial results for the three months ended March 31, 2015. Specifically, the Company believes that the non-GAAP measures provide useful information by excluding certain items that may not be indicative of the Company’s core operating results and business outlook. The Company believes that these non-GAAP measures will allow for a better evaluation of the operating performance of the business and facilitate a meaningful comparison of the Company’s results in the current period to those in prior periods and future periods. Reference to these non-GAAP measures should not be considered as a substitute for results that are presented in a manner consistent with GAAP. These non-GAAP measures are provided to enhance investors' overall understanding of the Company’s financial performance. |
 2 Chairman’s Comments “We are pleased with our first quarter results, which represent our third best revenue quarter. That said, while investment banking was a good quarter, results can and will be lumpy, especially as we continue to build-out our capabilities. Looking forward, we are optimistic about the continued growth in our business. In today’s environment, we see ample opportunities to continue to build the premier investment banking and wealth management firm.” |
 Market Overview 3 Note: Volumes are in million $, except trading volumes which are in million shares. Source: Dealogic, SIFMA, Bloomberg, Strategic Insight Simfund and KBW Research. Active Domestic Passive Domestic Total Domestic Active International Passive International Total International Cumulative Total 2015 Q1 (37,765) 35,078 (2,687) 18,090 11,231 29,321 26,634 2014 Q4 (44,054) 19,660 (24,394) (10,151) 13,982 3,831 (20,563) 2014 Q1 (754) 21,072 20,318 32,938 8,406 41,345 61,663 Active Domestic Passive Domestic Total Domestic Active International Passive International Total International Cumulative Total 2015 Q1 (37,694) 56,696 19,002 18,121 48,403 66,524 85,526 2014 Q4 (44,014) 63,658 19,644 (10,065) 16,780 6,715 26,359 2014 Q1 (695) 29,723 29,028 32,946 9,637 42,584 71,611 Net Flows - Mutual Funds ($ millions) Net Flows - Mutual Funds + ETFs ($ millions) Rates S&P 500 Dow U.S. 10yr Yield VIX Equity ADV Corporate Bond ADV U.S. ECM ($) U.S. DCM ($) Municipal Bond DCM ($) U.S. Announced M&A ($) U.S. Completed M&A ($) 2015 Q1 2,068 17,776 1.92% 15.3 6,916 24,777 89,751 599,168 105,903 393,899 405,581 2014 Q4 2,059 17,823 2.17% 15.7 7,004 20,489 62,086 487,339 102,942 384,614 392,033 2014 Q1 1,872 16,458 2.72% 13.9 6,944 21,854 60,285 548,025 64,331 314,454 353,662 1Q/4Q 0% 0% -25 bps -3% -1% 21% 45% 23% 3% 2% 3% 1Q/1Q 10% 8% -79 bps 10% 0% 13% 49% 9% 65% 25% 15% Underwriting Volumes and M&A Volatility / Volumes Market Valuations |
 Financial Results |
 Stifel Financial Corp. Results Three months ended March 31, 2015 5 ($ in thousands, except per share amounts) Non-GAAP Non-Core GAAP 3/31/14 % Change 12/31/14 % Change Total revenues 574,001 $ - $ 574,001 $ 557,342 $ 3.0% 590,673 $ (2.8%) Interest expense 10,307 2,712 13,019 8,897 15.8% 12,604 (18.2%) Net revenues 563,694 (2,712) 560,982 548,445 2.8% 578,069 (2.5%) Compensation and benefits 352,283 3,410 355,693 344,705 2.2% 355,584 (0.9%) Non-comp operating expenses 130,602 4,621 135,223 119,867 9.0% 133,052 (1.8%) Total non-interest expenses 482,885 8,031 490,916 464,572 3.9% 488,636 (1.2%) Income before income taxes 80,809 (10,743) 70,066 83,873 (3.7%) 89,433 (9.6%) Provision for income taxes 30,869 (3,900) 26,969 32,436 (4.8%) 31,299 (1.4%) Net income 49,940 $ (6,843) $ 43,097 $ 51,437 $ (2.9%) 58,134 $ (14.1%) Earnings per diluted common share 0.65 $ (0.09) $ 0.56 $ 0.68 $ (4.4%) 0.75 $ (13.3%) Weighted average number of shares outstanding: Diluted 77,359 75,691 2.2% 77,540 (0.2%) Ratios to net revenues : Compensation and benefits 62.5% 63.4% 62.9% 61.5% Non-comp operating expenses 23.2% 24.1% 21.9% 23.0% Income before income taxes 14.3% 12.5% 15.2% 15.5% Three Months Ended March 31, 2015 Three Months Ended (1) Non-core adjustments consist of merger-related revenues and expenses associated with our acquisitions. and the write-off of debt issuance costs as a result of the redemption of our 6.70% senior notes in January 2015. (2) Results for the three months ended March 31, 2014 and December 31, 2014 are Core (non-GAAP). _________________________________________________________ (1) (2) (2) |
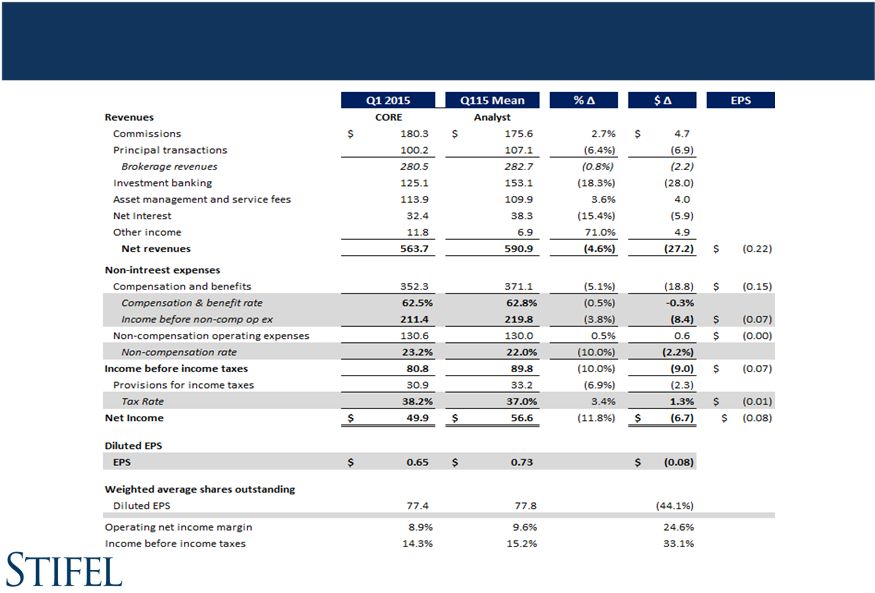 6 Q1 2015 Core Results vs. Estimates |
 Source of Revenues 7 ($ in thousands) 3/31/15 3/31/14 % Change 12/31/14 % Change Commissions 180,302 $ 172,243 $ 4.7% 174,990 $ 3.0% Principal transactions 100,205 110,360 (9.2%) 94,109 6.5% Brokerage revenues 280,507 282,603 (0.7%) 269,099 4.2% Capital raising 75,646 76,811 (1.5%) 71,175 6.3% Advisory 49,443 58,773 (15.9%) 103,423 (52.2%) Investment banking 125,089 135,584 (7.7%) 174,598 (28.4%) Asset mgt and service fees 113,869 89,170 27.7% 105,962 7.5% Other 11,800 5,238 125.3% (3,960) 398.0% Total operating revenues 531,265 512,595 3.6% 545,699 (2.6%) Interest revenue 42,736 42,836 (0.2%) 44,935 (4.9%) Total revenues 574,001 555,431 3.3% 590,634 (2.8%) Interest expense 13,019 8,675 50.1% 12,604 3.3% Net revenues 560,982 $ 546,756 $ 2.6% 578,030 $ (2.9%) Three Months Ended |
 Brokerage & Investment Banking Revenues ($ in thousands) 3/31/15 3/31/14 % Change 12/31/14 % Change Global Wealth Management 157,995 $ 160,151 $ (1.3%) 160,022 $ (1.3%) Institutional Group Equity brokerage 61,803 64,456 (4.1%) 67,273 (8.1%) Fixed income brokerage 60,709 57,995 4.7% 41,804 45.2% Total Institutional Group 122,512 122,451 0.0% 109,077 12.3% Total brokerage revenues 280,507 282,602 (0.7%) 269,099 4.2% Investment Banking: Capital raising Equity 48,931 60,429 (19.0%) 49,863 (1.9%) Fixed income 26,715 16,382 63.1% 21,312 25.4% Total capital raising 75,646 76,811 (1.5%) 71,175 6.3% Advisory fees 49,443 58,773 (15.9%) 103,423 (52.2%) Total Investment banking 125,089 $ 135,584 $ (7.7%) 174,598 $ (28.4%) Three Months Ended 8 |
 Core Non-Interest Expenses Three months ended March 31, 2015 ($ in thousands) 3/31/15 (1) 3/31/14 % Change 12/31/14 % Change 3/31/15 (1) 3/31/14 12/31/14 Net revenues 563,694 $ 548,445 $ 2.8% 578,069 $ (2.5%) 100.0% 100.0% 100.0% Compensation and benefits 329,228 321,253 2.5% 332,364 (0.9%) 58.4% 58.6% 57.5% Transition pay (2) 23,055 23,452 (1.7%) 23,220 (0.7%) 4.1% 4.3% 4.0% Total compensation and benefits 352,283 344,705 2.2% 355,584 (0.9%) 62.5% 62.9% 61.5% Occupancy and equipment rental 43,158 39,820 8.4% 42,798 0.8% 7.7% 7.3% 7.4% Communication and office supplies 28,755 24,821 15.8% 28,450 1.1% 5.1% 4.5% 4.9% Commissions and floor brokerage 9,800 9,029 8.5% 8,308 18.0% 1.7% 1.6% 1.4% Other operating expenses 48,889 46,197 5.8% 53,496 (8.6%) 8.7% 8.4% 9.3% Total non-comp operating expenses 130,602 119,867 9.0% 133,052 (1.8%) 23.2% 21.9% 23.0% Total non-interest expense 482,885 464,572 3.9% 488,636 (1.2%) 85.7% 84.7% 84.5% Income before income taxes 80,809 83,873 (3.7%) 89,433 (9.6%) 14.3% 15.3% 15.5% Provision for income taxes 30,869 32,436 (4.8%) 31,299 (1.4%) 5.5% 5.9% 5.4% Non-GAAP net income 49,940 $ 51,437 $ (2.9%) 58,134 $ (14.1%) 8.9% 9.4% 10.1% Non-core expenses (after-tax) (6,843) (4,055) (12,952) GAAP net income 43,097 $ 47,382 $ 45,182 $ Three Months Ended % of Net revenues 9 _________________________________________________________ (1) Excludes non-core adjustments consisting of merger-related revenues and expenses associated with our acquisitions and the write-off of debt issuance costs as a result of the redemption of our 6.70% senior notes in January 2015. (2) Transition pay includes amortization of retention awards, signing bonuses, and upfront notes. |
 Segment Comparison - Core 10 (1) Excludes the Other segment. _________________________________________________________ ($ in thousands) 3/31/15 3/31/14 % Change 12/31/14 % Change Net revenues: Global Wealth Management 329,410 $ 297,183 $ 10.8% 310,980 $ 5.9% Institutional Group 238,607 249,987 (4.6%) 272,686 (12.5%) Other (4,323) 1,275 nm (5,597) (22.8%) 563,694 $ 548,445 $ 2.8% 578,069 $ (2.5%) Operating contribution: Global Wealth Management 98,847 $ 79,676 $ 24.1% 84,178 $ 17.4% Institutional Group 32,331 44,923 (28.0%) 34,787 (7.1%) Other (50,369) (40,726) 23.7% (29,532) 70.6% 80,809 $ 83,873 $ (3.7%) 89,433 $ (9.6%) Operating contribution Global Wealth Management 30.0 26.8 27.1 Institutional Group 13.6 18.0 12.8 14.3 15.2 15.5 As a percentage of net revenues: Three Months Ended (1) |
 Global Wealth Management ($ in thousands) 3/31/15 3/31/14 % Change 12/31/14 % Change Commissions 116,214 $ 112,997 $ 2.8% 115,351 $ 0.7% Principal transactions 41,781 47,154 (11.4%) 44,671 (6.5%) Asset management & service fees 113,666 89,130 27.5% 105,511 7.7% Net interest 37,924 35,262 7.5% 40,236 (5.7%) Investment banking 10,326 11,280 (8.5%) 9,811 5.2% Other income 9,499 1,360 598.3% (4,600) nm Net revenues 329,410 297,183 10.8% 310,980 5.9% Compensation and benefits 183,243 174,168 5.2% 180,491 1.5% Non-comp operating expenses 47,320 43,339 9.2% 46,311 2.2% Total non-interest expenses 230,563 217,507 6.0% 226,802 1.7% Income before income taxes 98,847 $ 79,676 $ 24.1% 84,178 $ 17.4% Ratios to net revenues : Compensation and benefits 55.6% 58.6% 58.0% Non-comp operating expenses 14.4% 14.6% 14.9% Income before income taxes 30.0% 26.8% 27.1% Three Months Ended 11 |
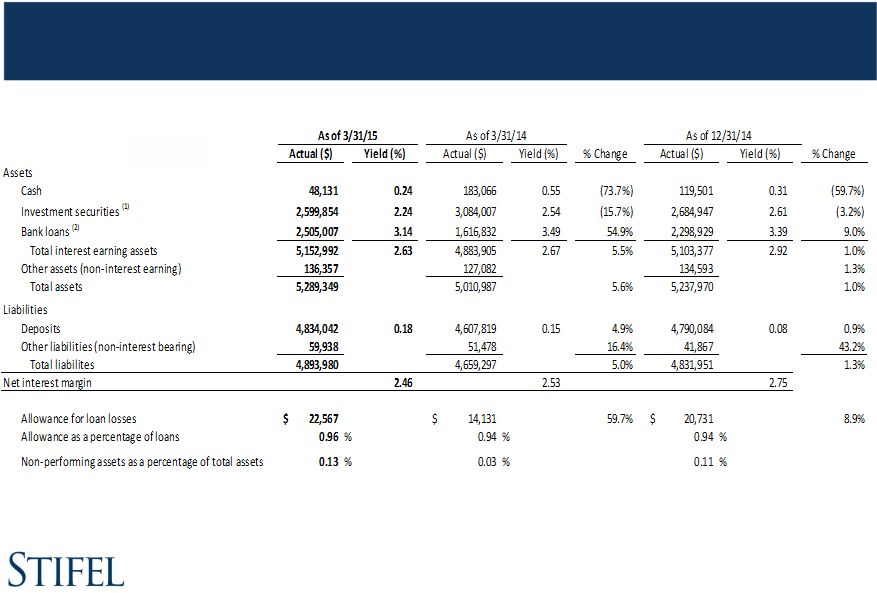 Stifel Bank & Trust (an operating unit of GWM) 12 Note: Actual amounts presented above are as of period-end and yields are based off of quarter-to-date averages. (1) Investment securities includes available-for-sale and held-to-maturity securities. (2) Includes loans held for sale. _________________________________________________________ |
 Institutional Group ($ in thousands) 3/31/15 3/31/14 % Change 12/31/14 % Change Net revenues 238,607 $ 249,987 $ (4.6%) 272,686 $ (12.5%) Compensation and benefits 149,411 154,234 (3.1%) 176,897 (15.5%) Non-comp operating expenses 56,865 50,830 11.9% 61,002 (6.8%) Total non-interest expenses 206,276 205,064 0.6% 237,899 (13.3%) Income before income taxes 32,331 $ 44,923 $ (28.0%) 34,787 $ (7.1%) Ratios to net revenues : Compensation and benefits 62.6% 61.7% 64.9% Non-comp operating expenses 23.8% 20.3% 22.3% Income before income taxes 13.6% 18.0% 12.8% Three Months Ended 13 |
 Financial Condition |
 Capital Structure (in thousands, except ratios) 15 _________________________________________________________ As of ($ in thousands) 3/31/15 3/31/14 12/31/14 Total Assets 9,373,137 $ 9,387,814 $ 9,518,151 $ Stockholders' Equity 2,363,244 2,100,140 2,322,038 4.250% senior notes, due 2024 300,000 $ - $ 300,000 $ 5.375% senior notes, due 2022 150,000 150,000 150,000 4.250% senior notes, due 2024 - 175,000 175,000 Debentures to Stifel Financial Capital Trusts II, III, & IV 82,500 82,500 82,500 Total Capitalization 2,895,744 $ 2,507,640 $ 3,029,538 $ Ratios: Debt to Equity (1) 22.5% 19.4% 30.5% Tier 1 Leverage Ratio 17.5% 15.1% 16.5% Tier 1 Risk Based Capital Ratio 29.9% 25.7% 25.0% As of (1) Debt to equity ratio includes the debentures to Stifel Financial Capital Trusts and Senior Notes divided by stockholders’equity. |
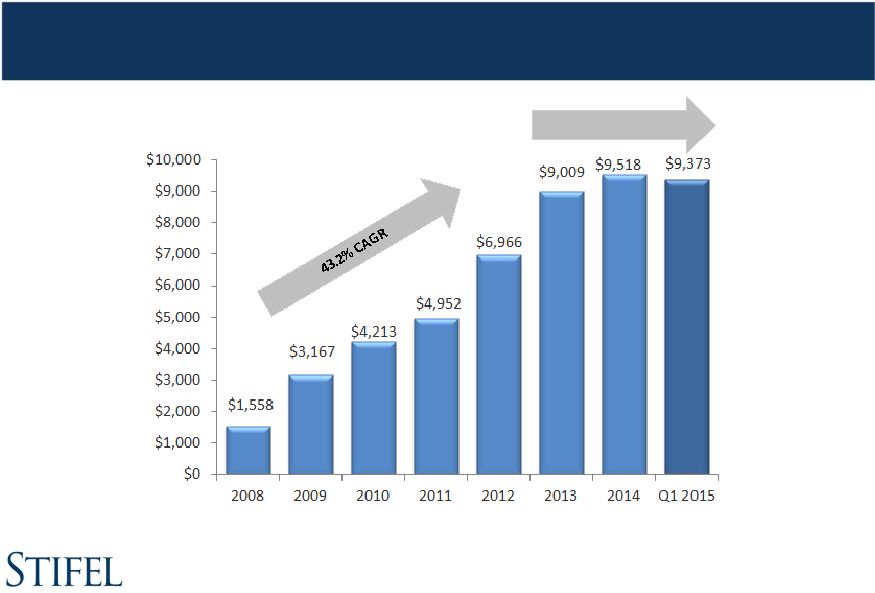 Historical Asset Balances (in thousands) 16 |
 As of 3/31/15 3/31/14 % Change 12/31/14 % Change Total assets (000s): Stifel Nicolaus & Stifel Financial 4,083,788 $ 4,376,827 $ (6.7%) 4,280,181 $ (4.6%) Stifel Bank 5,289,349 5,010,987 5.6% 5,237,970 1.0% Total assets 9,373,137 9,387,814 $ (0.2%) 9,518,151 (1.5%) Total shareholders' equity (000s): Stifel Nicolaus & Stifel Financial 1,967,874 $ 1,748,450 $ 12.5% 1,916,019 $ 2.7% Stifel Bank 395,370 351,690 12.4% 406,019 (2.6%) Total shareholders' equity 2,363,244 2,100,140 $ 12.5% 2,322,038 1.8% Leverage ratio: Stifel Nicolaus & Stifel Financial 1.6 2.0 (20.3%) 1.6 (1.3%) Stifel Bank 13.4 14.2 (6.1%) 12.9 4.0% Total leverage ratio 3.2 3.7 (14.3%) 3.1 2.1% Book value per share 34.83 $ 32.09 $ 8.5% 35.00 $ (0.5%) Financial advisors (1) 2,097 2,081 0.8% 2,103 (0.3%) Full-time associates 6,274 5,831 7.6% 6,223 0.8% Locations 368 359 2.5% 367 0.3% Total client assets (000s) 188,616,000 $ 168,899,000 $ 11.7% 186,558,000 $ 1.1% As of 17 Other Financial Data (1) Includes 134, 141, and 138 independent contractors as of March 31, 2015, March 31, 2014, and December 31, 2014. _________________________________________________________ |
 Acquisition Updates |
 To build the premier investment banking and wealth management firm Over 2,800 financial advisors in 353 branches with $200 billion in client assets¹ Private Client Asset Management Bank $20B in total assets managed through various strategies Equities Sales + Trading $5.3B in assets funded by client deposits Global Wealth Management Institutional Fixed Income Sales + Trading Investment Banking Research Experienced sales force with extensive distribution capabilities Comprehensive platform including research, strategy and DCM teams Over 350 professionals with extensive experience across all products and industry verticals Largest research platform with over 1,400 U.S. and 120 European stocks covered Strategic Vision ¹Includes pro forma for Sterne Agee. |
   20 Organic vs. Acquisition Growth Organic growth has accounted for approximately 45% and acquisitions have accounted for approximately 55% of Stifel’s growth since 2004 Outlook on acquisitions: Position Stifel to take advantage of opportunities Revenues Total Private Client Asset Mgmt Bank Equities Sales + Trading Fixed Income Sales + Trading Investment Banking 2004 $247 191 $9 $7 $40 Acquisitions $1,445 $470 $80 $20 $235 $265 $375 % of Growth 55% 40% 89% 15% 89% 80% 60% Organic $1,170 $700 $10 $110 $30 $65 $255 % of Growth 45% 60% 11% 85% 11% 20% 40% Pro Forma $2,615 $1,170 $90 $130 $265 $330 $630 Acquisitions include: Legg Mason (2005), Ryan Beck (2007), First Service/Stifel Bank (2007), Butler Wick (2008), 56 UBS branches (2009), Thomas Weisel Partners (2010), Stone & Youngberg (2011), Miller Buckfire (2012), KBW (2013), Knight (2013), Ziegler (2013), Acacia (2013), De La Rosa (2014), Oriel (2014), 1919 Investment Counsel (2014), Merchant (2015), Sterne Agee (2015). Estimated acquired revenues expected to be realized at date of acquisition. |
 21 Sterne Agee Acquisition Update Expected to close on or around the end of May 2015 100% retention of Sterne Agee’s traditional financial advisors Stifel and Sterne Agee sold Sterne Agee’s Institutional Equities business, including Equity Sales, Trading and Research to CRT Capital Group Accomplished our goal of keeping approximately 170 professionals together so they can continue their careers as a team Stifel, Sterne Agee and Stephens reached an agreement whereby five Managing Directors in the Depository Investment Banking Group of Sterne Agee will join Stephens Stifel and Sterne Agee have agreed with the founders of the FBC Mortgage business to sell the business back to them. Acquired business lines (Private Client, Independent Advisors, Fixed Income, Trust and Clearing) are expected to add $300 - $325 million in annual gross revenues |
 22 ($ in thousands) Actual Estimate 6/30/15 9/30/15 12/31/15 3/31/16 6/30/16 Existing acquisitions Duplicative operating expenses: Acacia Federal Savings Bank - - - - - - - De La Rosa & Co., Inc. 86 120 120 120 - - - Keefe, Bruyette & Woods, Inc. - - - - - - - Knight Fixed Income 1,903 2,600 2,600 2,600 2,600 2,600 - 1919 Investment Counsel 848 300 300 200 200 - - Miller Buckfire & Co., LLC 1,056 1,400 1,400 - - - - Oriel Securities Holding Limited 1,596 1,000 1,000 500 - - - Ziegler Capital Management - - - - - - - Merchant Capital 62 - - - - - - Debt issuance cost write-off 2,711 - - - - - - Intangible amortization 2,260 1,600 2,200 2,200 2,200 2,200 2,200 Sterne Agee Signing and recruiting 221 - Stock-based compensation - - 32,000 - - - - Duplicative operating expenses - - 20,000 18,700 15,200 11,700 8,200 Total Deal Costs (pre-tax) 10,743 7,020 59,620 24,320 20,200 16,500 10,400 Total Deal Costs (after-tax) (1) 6,843 $ 4,212 $ 35,772 $ 14,592 $ 12,120 $ 9,900 $ 6,240 $ Three months ended Estimate 3/31/15 Non-Core Deal Costs _________________________________________________________ (1) Assumes an effective income tax rate of 40.0%. |
 Q&A |