Stifel Financial Corp. December 2015 Exhibit 99.1
Disclaimer Forward-Looking Statements This presentation may contain “forward-looking statements” within the meaning of the Private Securities Litigation Reform Act of 1995 that involve significant risks, assumptions, and uncertainties, including statements relating to the market opportunity and future business prospects of Stifel Financial Corp., as well as Stifel, Nicolaus & Company, Incorporated and its subsidiaries (collectively, “SF” or the “Company”). These statements can be identified by the use of the words “may,” “will,” “should,” “could,” “would,” “plan,” “potential,” “estimate,” “project,” “believe,” “intend,” “anticipate,” “expect,” and similar expressions. In particular, these statements may refer to our goals, intentions, and expectations, our business plans and growth strategies, our ability to integrate and manage our acquired businesses, estimates of our risks and future costs and benefits, and forecasted demographic and economic trends relating to our industry. You should not place undue reliance on any forward-looking statements, which speak only as of the date they were made. We will not update these forward-looking statements, even though our situation may change in the future, unless we are obligated to do so under federal securities laws. Actual results may differ materially and reported results should not be considered as an indication of future performance. Factors that could cause actual results to differ are included in the Company’s annual and quarterly reports and from time to time in other reports filed by the Company with the Securities and Exchange Commission and include, among other things, changes in general economic and business conditions, actions of competitors, regulatory and legal actions, changes in legislation, and technology changes. Use of Non-GAAP Financial Measures The Company utilized non-GAAP calculations of presented net revenues, compensation and benefits, non-compensation operating expenses, income before income taxes, provision for income taxes, net income, compensation and non-compensation operating expense ratios, pre-tax margin and diluted earnings per share as an additional measure to aid in understanding and analyzing the Company’s financial results for the three and nine months ended September 30, 2015. Specifically, the Company believes that the non-GAAP measures provide useful information by excluding certain items that may not be indicative of the Company’s operating results and business outlook. The Company believes that these non-GAAP measures will allow for a better evaluation of the operating performance of the business and facilitate a meaningful comparison of the Company’s results in the current period to those in prior periods and future periods. Reference to these non-GAAP measures should not be considered as a substitute for results that are presented in a manner consistent with GAAP. These non-GAAP measures are provided to enhance investors' overall understanding of the Company’s financial performance.
Stifel Overview
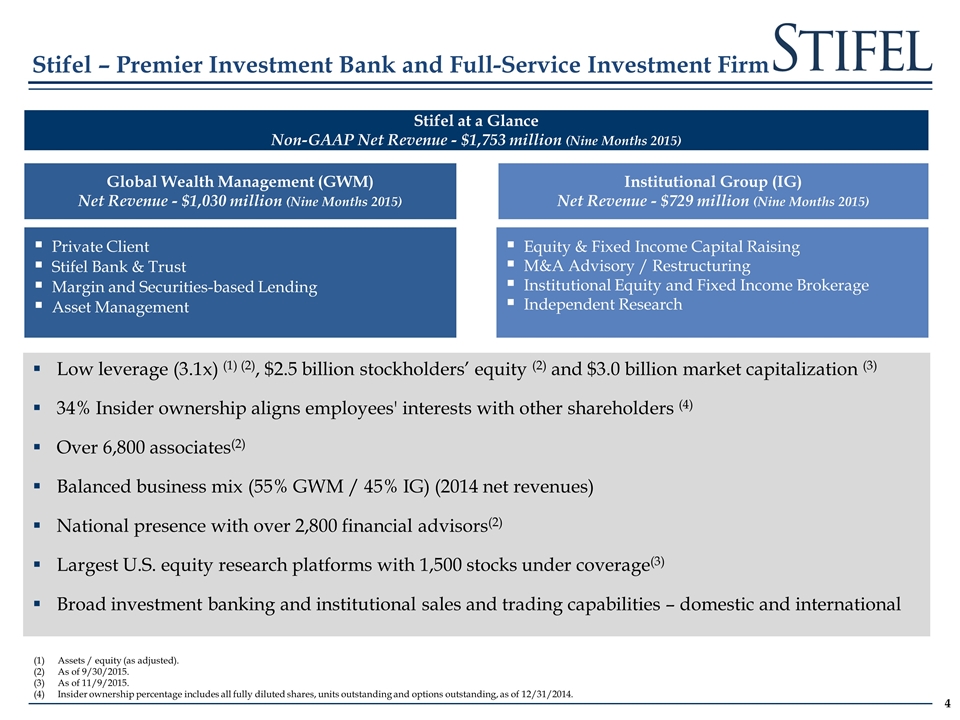
Stifel – Premier Investment Bank and Full-Service Investment Firm Largest U.S. equity research platform Broad product portfolio & industry expertise Stifel at a Glance Non-GAAP Net Revenue - $1,753 million (Nine Months 2015) Global Wealth Management (GWM) Net Revenue - $1,030 million (Nine Months 2015) Private Client Stifel Bank & Trust Margin and Securities-based Lending Asset Management Institutional Group (IG) Net Revenue - $729 million (Nine Months 2015) Equity & Fixed Income Capital Raising M&A Advisory / Restructuring Institutional Equity and Fixed Income Brokerage Independent Research Low leverage (3.1x) (1) (2), $2.5 billion stockholders’ equity (2) and $3.0 billion market capitalization (3) 34% Insider ownership aligns employees' interests with other shareholders (4) Over 6,800 associates(2) Balanced business mix (55% GWM / 45% IG) (2014 net revenues) National presence with over 2,800 financial advisors(2) Largest U.S. equity research platforms with 1,500 stocks under coverage(3) Broad investment banking and institutional sales and trading capabilities – domestic and international Assets / equity (as adjusted). As of 9/30/2015. As of 11/9/2015. Insider ownership percentage includes all fully diluted shares, units outstanding and options outstanding, as of 12/31/2014.

Bulge Bracket Boutique Leading broker-dealer providing wealth management and institutional services to consumers and companies Stifel’s Differentiated Value Proposition: Growth, Scale and Stability Institutional Wealth Management #6 Largest Retail Brokerage Network(2) Size / scale Large distribution Trading Retail Issues Lack of focus Banker turnover Lack of commitment Research indifference Lack of growth investors Firm focus Good research Growth investor access Issues Financial / firm stability Trading support Few with retail Size / scale Firm focus Stability (financial & personnel) Large distribution Trading Outstanding research Retail LARGEST provider of U.S. equity research 2nd LARGEST Equity trading platform in the U.S. outside of the Bulge Bracket firms(1) FULL SERVICE investment banking with expertise across products and industry sectors ACCESS TO top ten private client platform Based on 2014 U.S. trading volume per Bloomberg. Source: SIFMA and publicly available information for U.S. brokerage networks. Note: Includes investment banks only. Bold font indicates middle-market firms. (3) Represents Wealth Management Americas segment only (4) Includes 3,685 independent contractors. (5) Includes combined wealth management platforms post closing the Barclays acquisition. Rank Firm Brokers 1 Morgan Stanley Wealth Management 16,134 2 Bank of America Merrill Lynch 16,000 3 Wells Fargo Securities 15,187 4 UBS(3) 6,997 5 Raymond James(4) 6,265 6 Stifel + Barclays(5) 2,946 7 RBC Capital Markets 2,000 8 Oppenheimer & Co 1,390 9 JPMorgan 800 10 Deutsche Bank 772
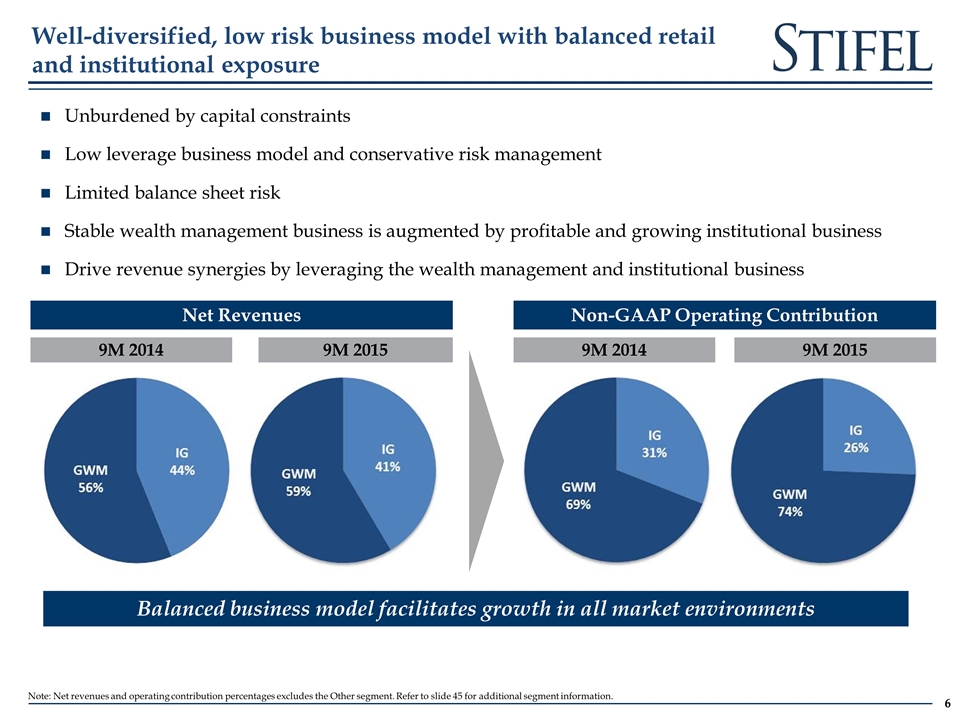
Well-diversified, low risk business model with balanced retail and institutional exposure Unburdened by capital constraints Low leverage business model and conservative risk management Limited balance sheet risk Stable wealth management business is augmented by profitable and growing institutional business Drive revenue synergies by leveraging the wealth management and institutional business Net Revenues 9M 2014 9M 2015 Non-GAAP Operating Contribution 9M 2014 9M 2015 Balanced business model facilitates growth in all market environments Note: Net revenues and operating contribution percentages excludes the Other segment. Refer to slide 45 for additional segment information.
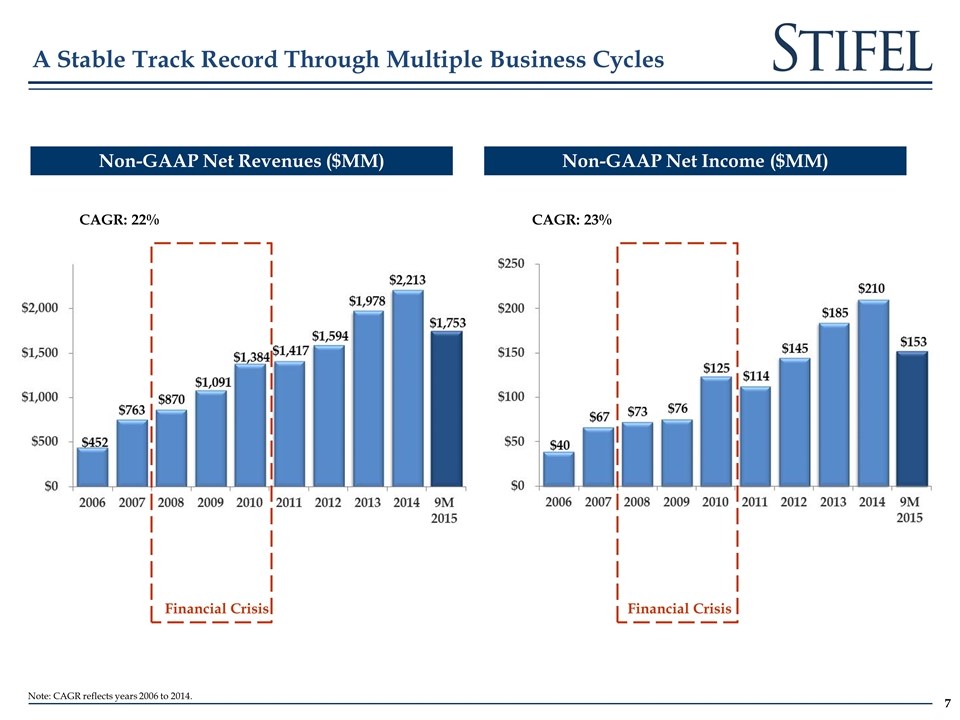
CAGR: 22% Non-GAAP Net Revenues ($MM) Non-GAAP Net Income ($MM) Financial Crisis Financial Crisis CAGR: 23% A Stable Track Record Through Multiple Business Cycles Note: CAGR reflects years 2006 to 2014.
Our Strategy
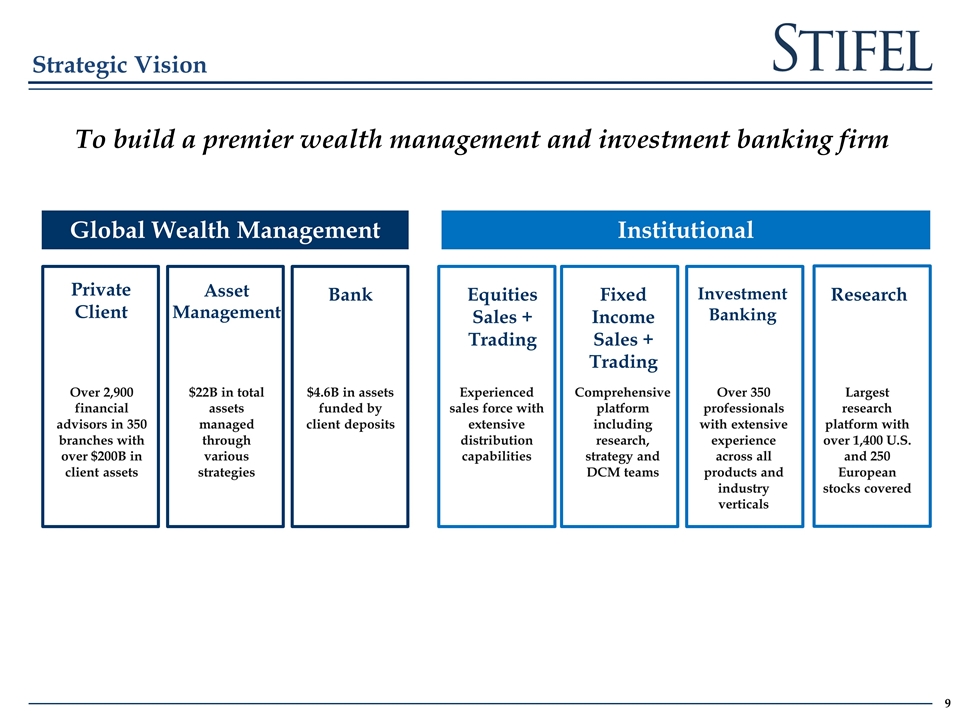
Strategic Vision To build a premier wealth management and investment banking firm Over 2,900 financial advisors in 350 branches with over $200B in client assets Private Client Asset Management Bank $22B in total assets managed through various strategies Equities Sales + Trading $4.6B in assets funded by client deposits Global Wealth Management Institutional Fixed Income Sales + Trading Investment Banking Research Experienced sales force with extensive distribution capabilities Comprehensive platform including research, strategy and DCM teams Over 350 professionals with extensive experience across all products and industry verticals Largest research platform with over 1,400 U.S. and 250 European stocks covered
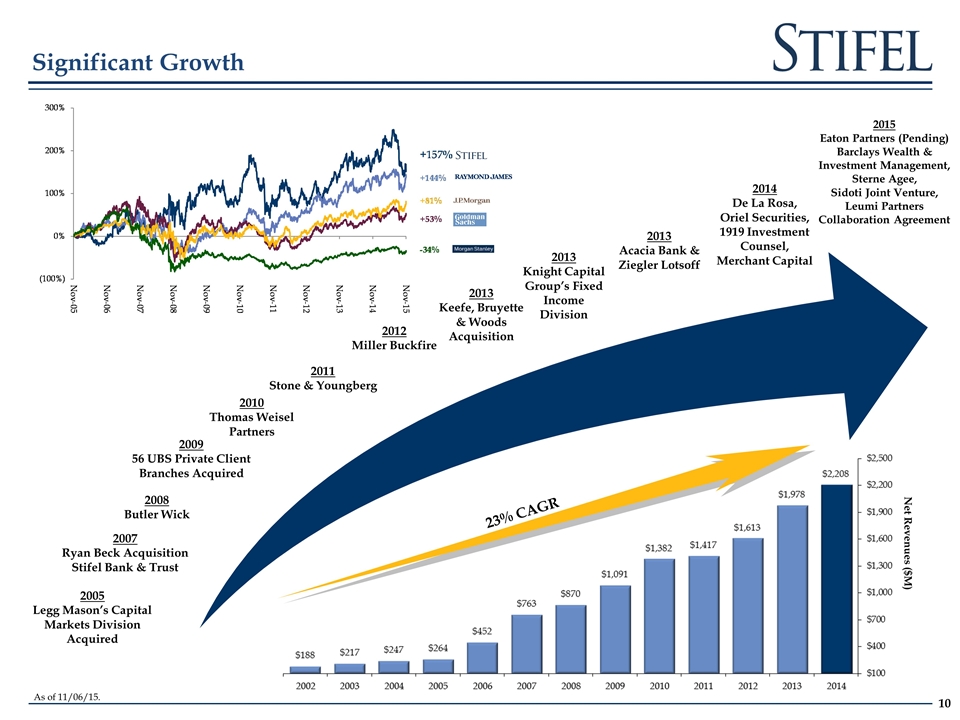
Net Revenues ($M) Significant Growth 2005 Legg Mason’s Capital Markets Division Acquired 2008 Butler Wick 2009 56 UBS Private Client Branches Acquired 2010 Thomas Weisel Partners 2007 Ryan Beck Acquisition Stifel Bank & Trust 2011 Stone & Youngberg 23% CAGR 2012 Miller Buckfire 2013 Knight Capital Group’s Fixed Income Division 2014 De La Rosa, Oriel Securities, 1919 Investment Counsel, Merchant Capital 2013 Keefe, Bruyette & Woods Acquisition 2013 Acacia Bank & Ziegler Lotsoff 2015 Eaton Partners (Pending) Barclays Wealth & Investment Management, Sterne Agee, Sidoti Joint Venture, Leumi Partners Collaboration Agreement As of 11/06/15.
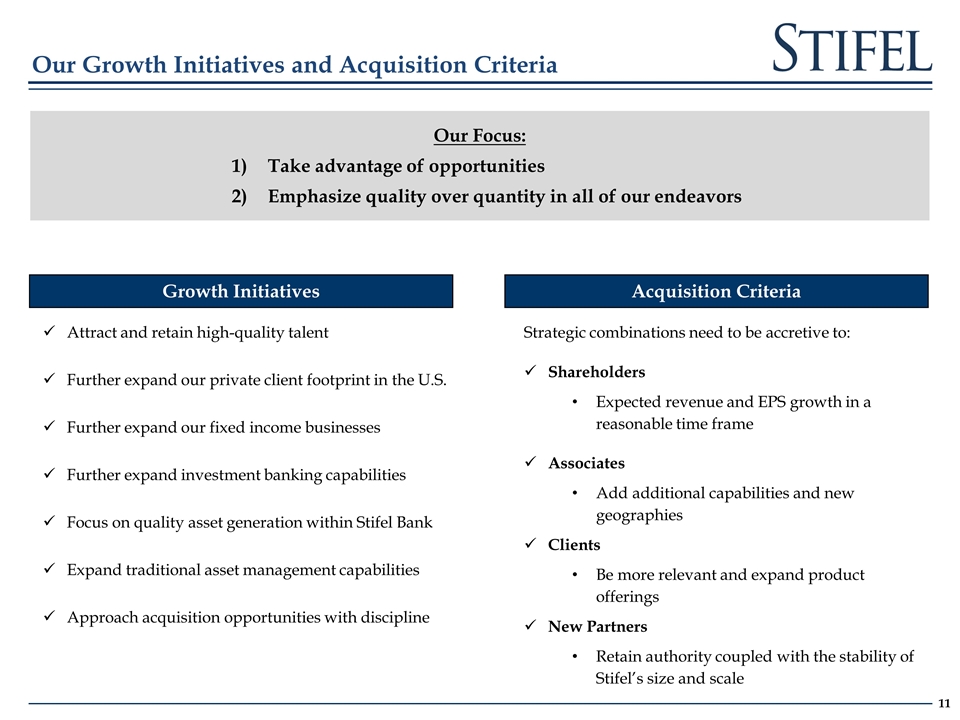
Attract and retain high-quality talent Further expand our private client footprint in the U.S. Further expand our fixed income businesses Further expand investment banking capabilities Focus on quality asset generation within Stifel Bank Expand traditional asset management capabilities Approach acquisition opportunities with discipline Growth Initiatives Our Focus: Take advantage of opportunities Emphasize quality over quantity in all of our endeavors Acquisition Criteria Strategic combinations need to be accretive to: Shareholders Expected revenue and EPS growth in a reasonable time frame Associates Add additional capabilities and new geographies Clients Be more relevant and expand product offerings New Partners Retain authority coupled with the stability of Stifel’s size and scale Our Growth Initiatives and Acquisition Criteria
Acquisition Updates
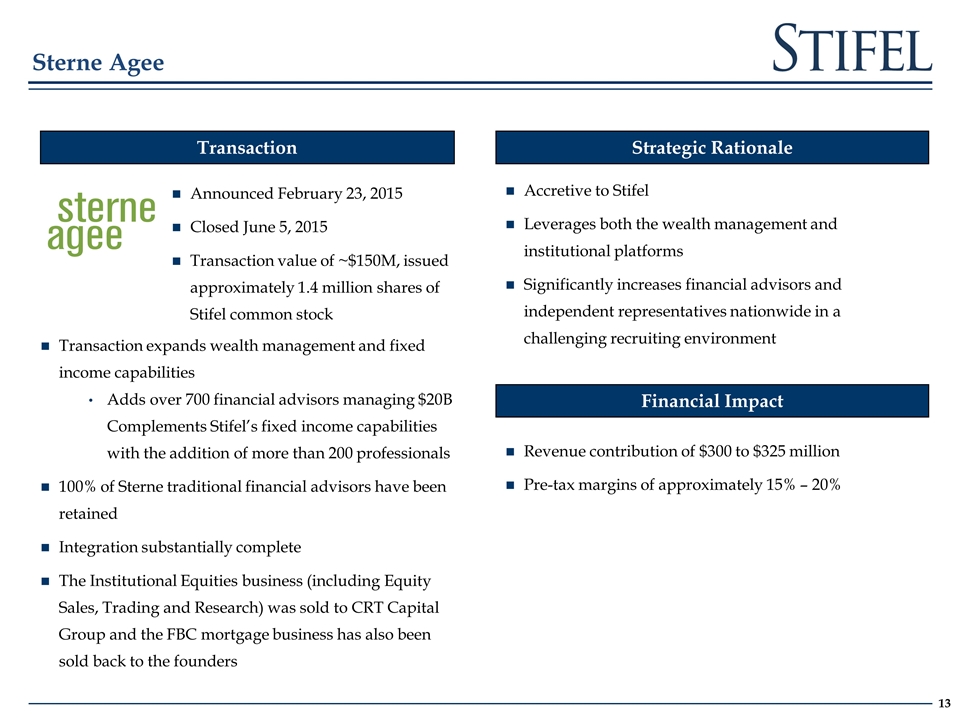
Announced February 23, 2015 Closed June 5, 2015 Transaction value of ~$150M, issued approximately 1.4 million shares of Stifel common stock Sterne Agee Transaction Financial Impact Strategic Rationale Transaction expands wealth management and fixed income capabilities Adds over 700 financial advisors managing $20B Complements Stifel’s fixed income capabilities with the addition of more than 200 professionals 100% of Sterne traditional financial advisors have been retained Integration substantially complete The Institutional Equities business (including Equity Sales, Trading and Research) was sold to CRT Capital Group and the FBC mortgage business has also been sold back to the founders Revenue contribution of $300 to $325 million Pre-tax margins of approximately 15% – 20% Accretive to Stifel Leverages both the wealth management and institutional platforms Significantly increases financial advisors and independent representatives nationwide in a challenging recruiting environment

Announced June 8, 2015 Closed Dec. 4, 2015 Investment will match the business and professionals who join Stifel Transaction Financial Impact Strategic Rationale Transaction significantly expands Stifel’s high net worth advisory business. Expected contribution: Approximately 100 financial advisors Approximately $20 billion in client assets 12 offices located in major wealth centers throughout the U.S. (HQ in NYC) Barclays’ franchise is a high touch, high service business for sophisticated clients Barclays’ Wealth & Investment Management, Americas Accretive to Stifel Combination of breadth and depth Barclays brings a highly focused organization with deep, high-conviction investment capabilities Stifel brings significant breadth of products and services complementary to Barclays Revenue contribution of $210 – $230 million Anticipated pre-tax margins of 20% – 25%, after amortization of retention On balance sheet assets of approximately $1.2 billion, plus an additional $900 million of loans held off balance sheet ($2.1 billion total) Shares issued of approximately 1.3 million (net of taxes)
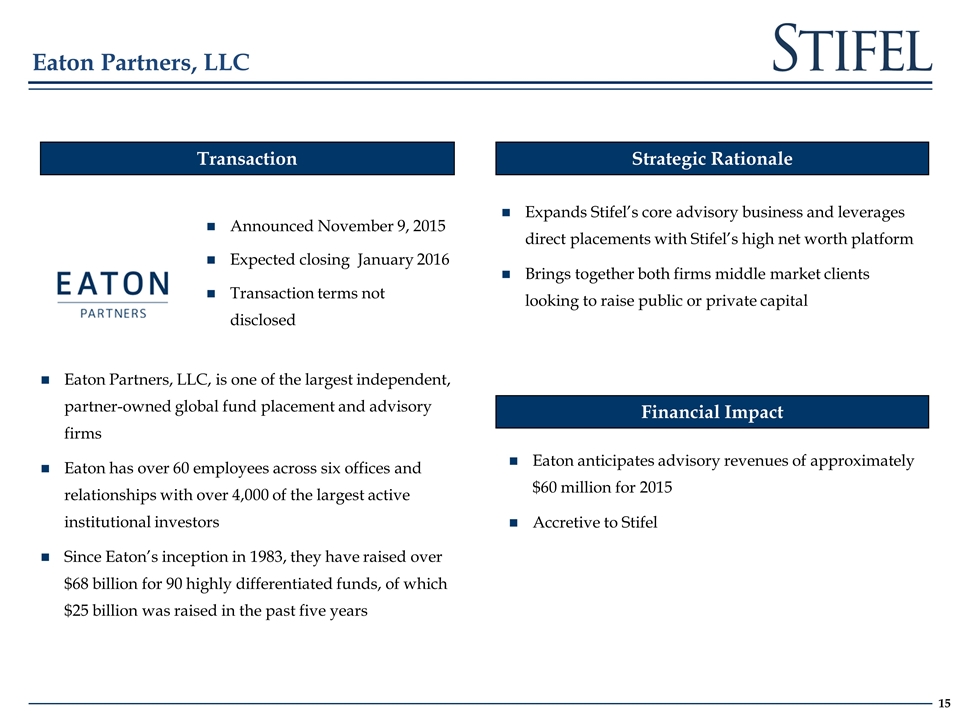
Eaton Partners, LLC Transaction Financial Impact Strategic Rationale Eaton Partners, LLC, is one of the largest independent, partner-owned global fund placement and advisory firms Eaton has over 60 employees across six offices and relationships with over 4,000 of the largest active institutional investors Since Eaton’s inception in 1983, they have raised over $68 billion for 90 highly differentiated funds, of which $25 billion was raised in the past five years Expands Stifel’s core advisory business and leverages direct placements with Stifel’s high net worth platform Brings together both firms middle market clients looking to raise public or private capital Eaton anticipates advisory revenues of approximately $60 million for 2015 Accretive to Stifel Announced November 9, 2015 Expected closing January 2016 Transaction terms not disclosed
Financial Performance Trends and Growth Drivers
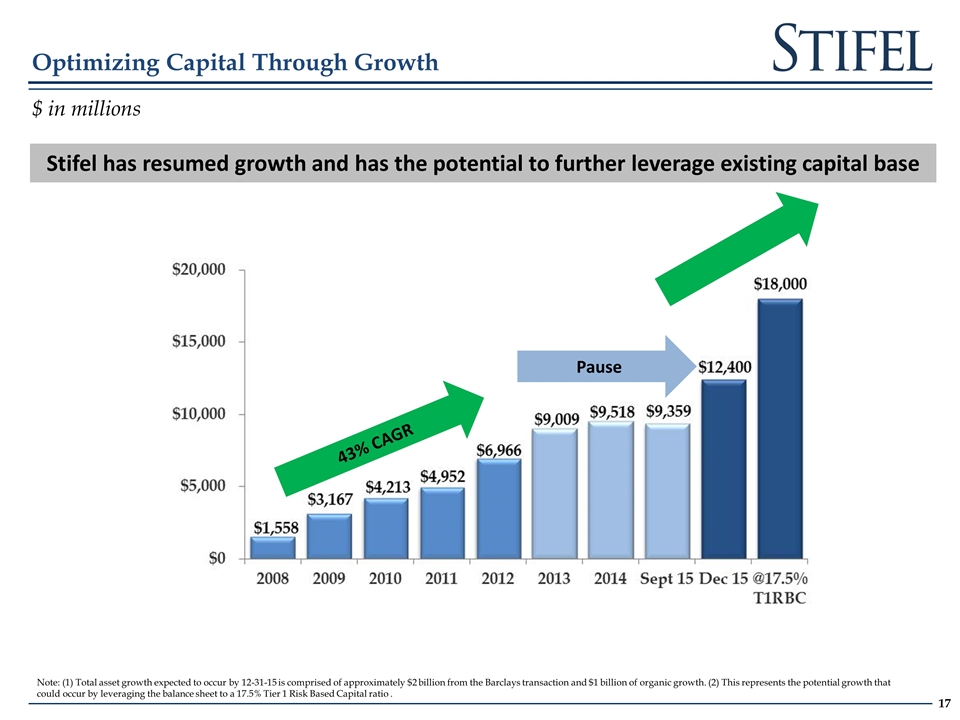
Optimizing Capital Through Growth $ in millions Stifel has resumed growth and has the potential to further leverage existing capital base Pause 43% CAGR Note: (1) Total asset growth expected to occur by 12-31-15 is comprised of approximately $2 billion from the Barclays transaction and $1 billion of organic growth. (2) This represents the potential growth that could occur by leveraging the balance sheet to a 17.5% Tier 1 Risk Based Capital ratio .
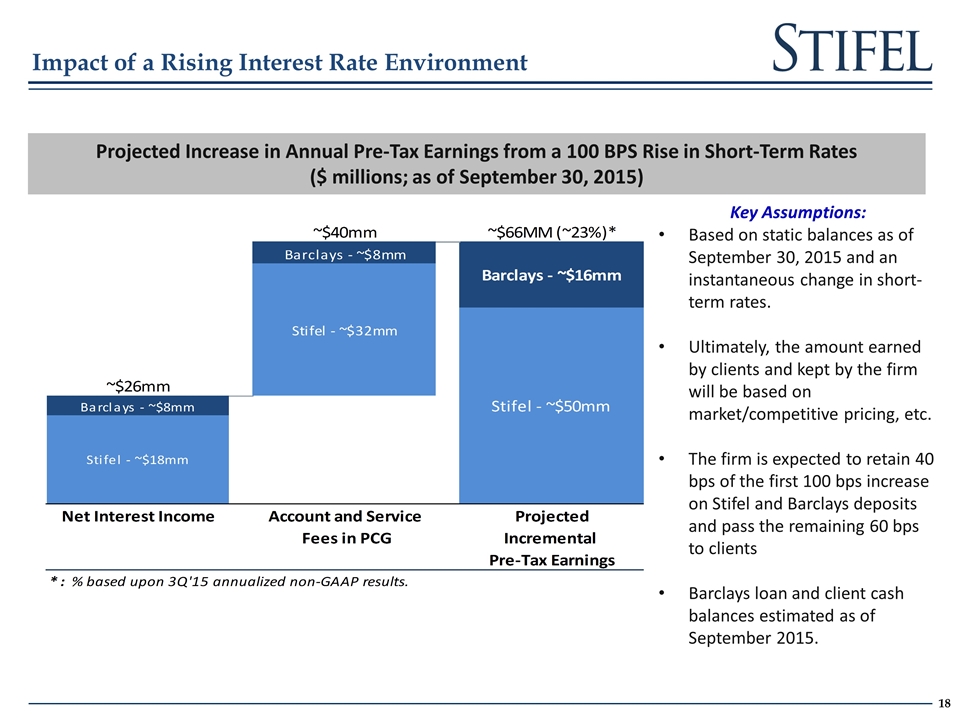
Impact of a Rising Interest Rate Environment Projected Increase in Annual Pre-Tax Earnings from a 100 BPS Rise in Short-Term Rates ($ millions; as of September 30, 2015) Key Assumptions: Based on static balances as of September 30, 2015 and an instantaneous change in short-term rates. Ultimately, the amount earned by clients and kept by the firm will be based on market/competitive pricing, etc. The firm is expected to retain 40 bps of the first 100 bps increase on Stifel and Barclays deposits and pass the remaining 60 bps to clients Barclays loan and client cash balances estimated as of September 2015.
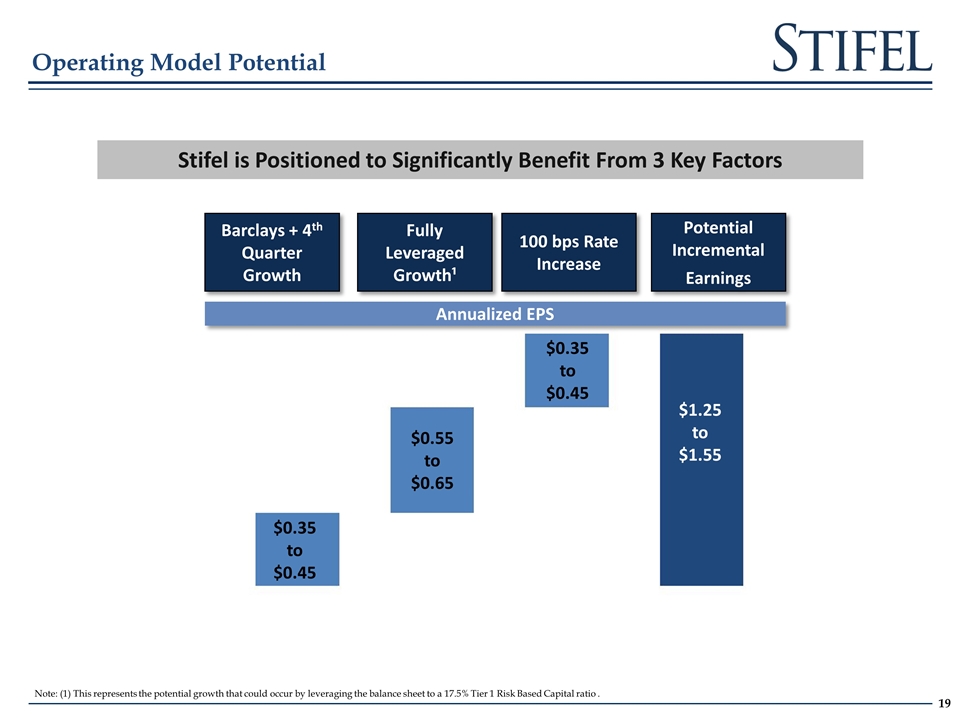
Operating Model Potential Stifel is Positioned to Significantly Benefit From 3 Key Factors Barclays + 4th Quarter Growth Fully Leveraged Growth¹ 100 bps Rate Increase Potential Incremental Earnings Annualized EPS $1.25 to $1.55 $0.35 to $0.45 $0.55 to $0.65 $0.35 to $0.45 Note: (1) This represents the potential growth that could occur by leveraging the balance sheet to a 17.5% Tier 1 Risk Based Capital ratio .
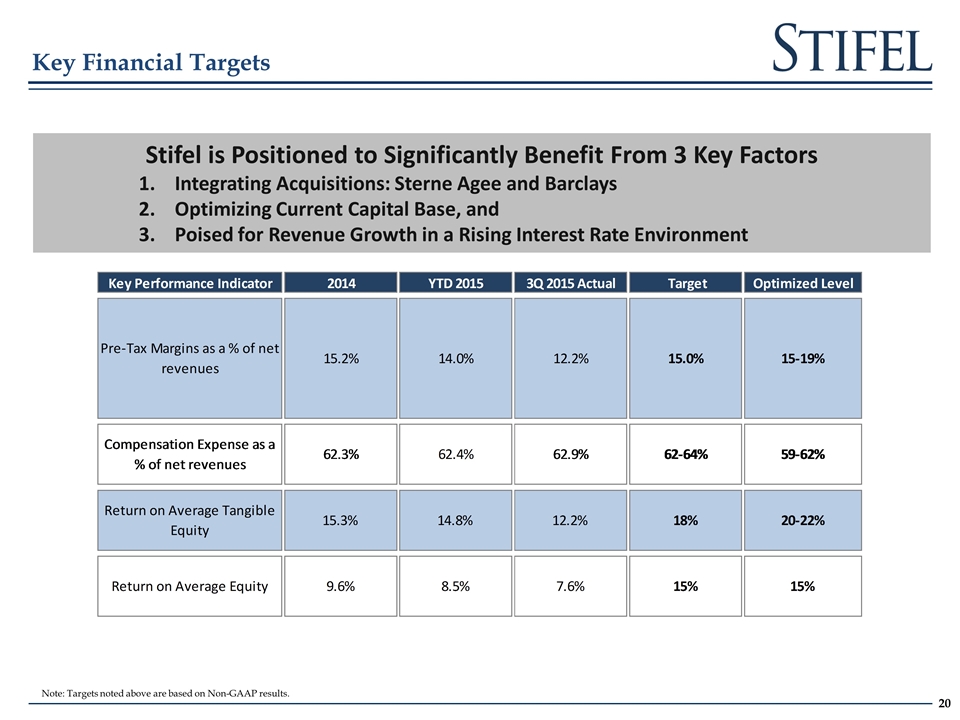
Key Financial Targets Stifel is Positioned to Significantly Benefit From 3 Key Factors Integrating Acquisitions: Sterne Agee and Barclays Optimizing Current Capital Base, and Poised for Revenue Growth in a Rising Interest Rate Environment Note: Targets noted above are based on Non-GAAP results.
Financial Overview
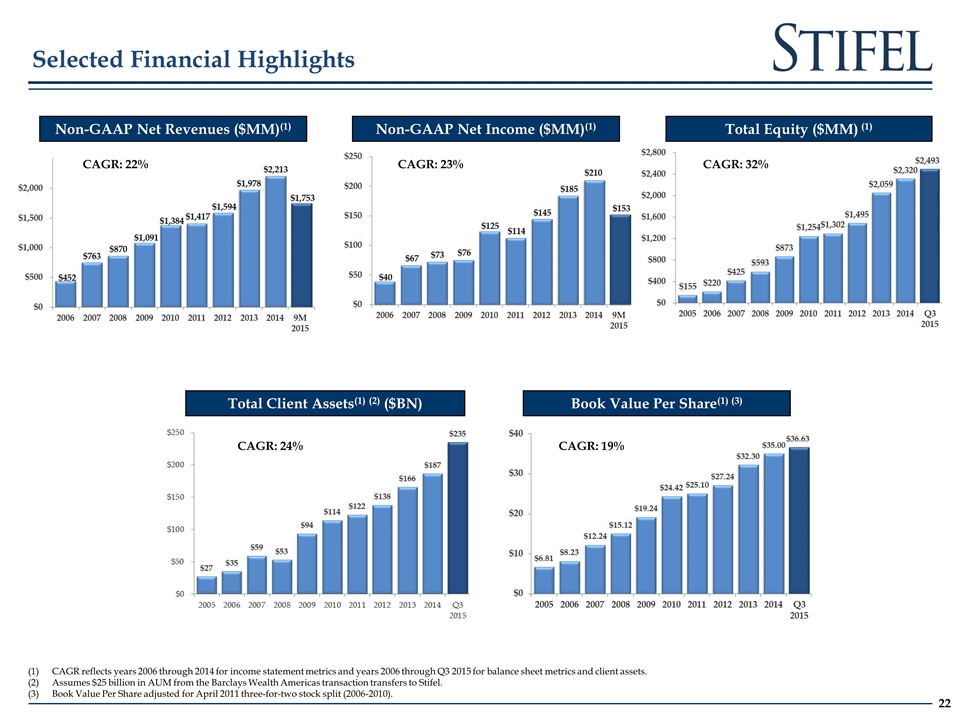
CAGR reflects years 2006 through 2014 for income statement metrics and years 2006 through Q3 2015 for balance sheet metrics and client assets. Assumes $25 billion in AUM from the Barclays Wealth Americas transaction transfers to Stifel. Book Value Per Share adjusted for April 2011 three-for-two stock split (2006-2010). Selected Financial Highlights CAGR: 19% CAGR: 24% Non-GAAP Net Revenues ($MM)(1) Non-GAAP Net Income ($MM)(1) Total Equity ($MM) (1) Total Client Assets(1) (2) ($BN) Book Value Per Share(1) (3) CAGR: 22% CAGR: 23% CAGR: 32%
Appendix
Global Wealth Management
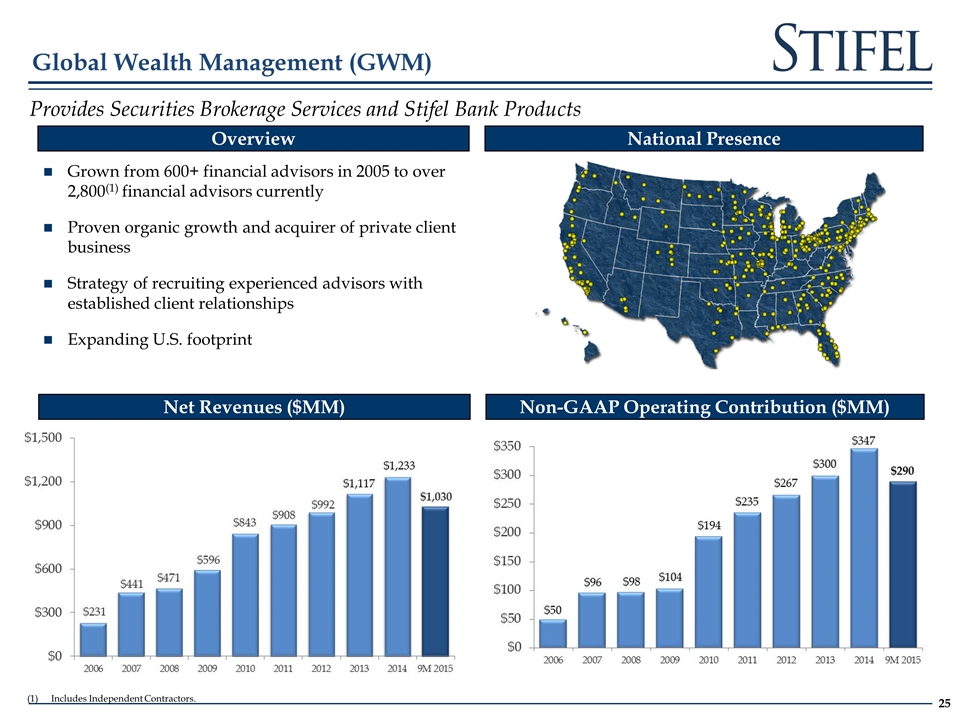
Includes Independent Contractors. Global Wealth Management (GWM) Provides Securities Brokerage Services and Stifel Bank Products Net Revenues ($MM) Non-GAAP Operating Contribution ($MM) Overview National Presence Grown from 600+ financial advisors in 2005 to over 2,800(1) financial advisors currently Proven organic growth and acquirer of private client business Strategy of recruiting experienced advisors with established client relationships Expanding U.S. footprint
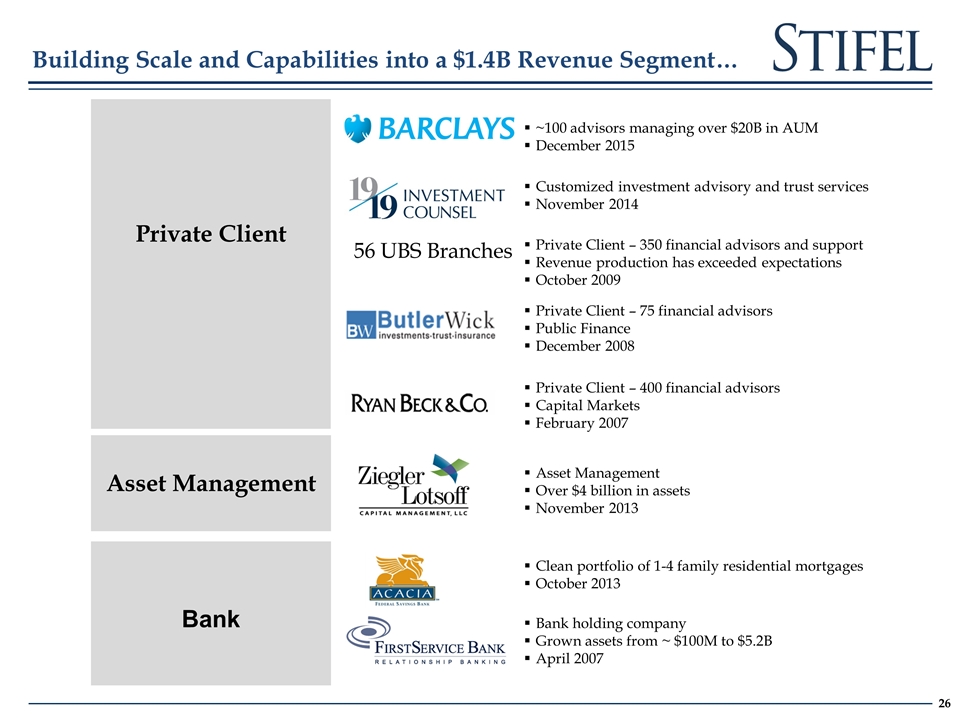
Building Scale and Capabilities into a $1.4B Revenue Segment… Private Client – 350 financial advisors and support Revenue production has exceeded expectations October 2009 Bank holding company Grown assets from ~ $100M to $5.2B April 2007 Private Client – 75 financial advisors Public Finance December 2008 56 UBS Branches Private Client – 400 financial advisors Capital Markets February 2007 Asset Management Over $4 billion in assets November 2013 Clean portfolio of 1-4 family residential mortgages October 2013 Customized investment advisory and trust services November 2014 Private Client Asset Management Bank ~100 advisors managing over $20B in AUM December 2015
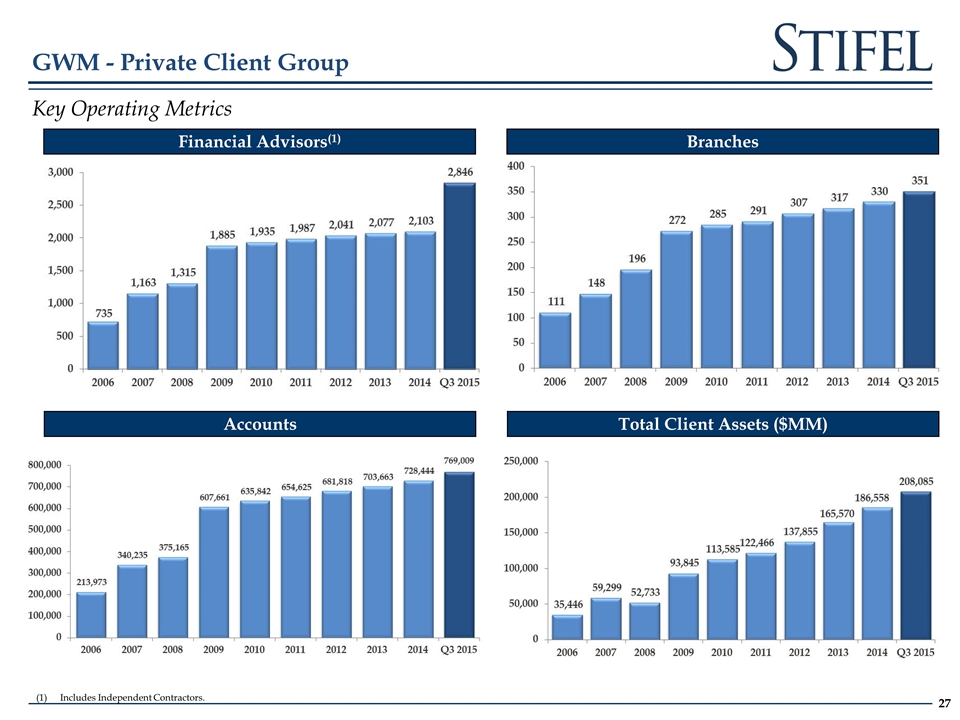
Includes Independent Contractors. Key Operating Metrics Accounts Financial Advisors(1) Total Client Assets ($MM) Branches GWM - Private Client Group
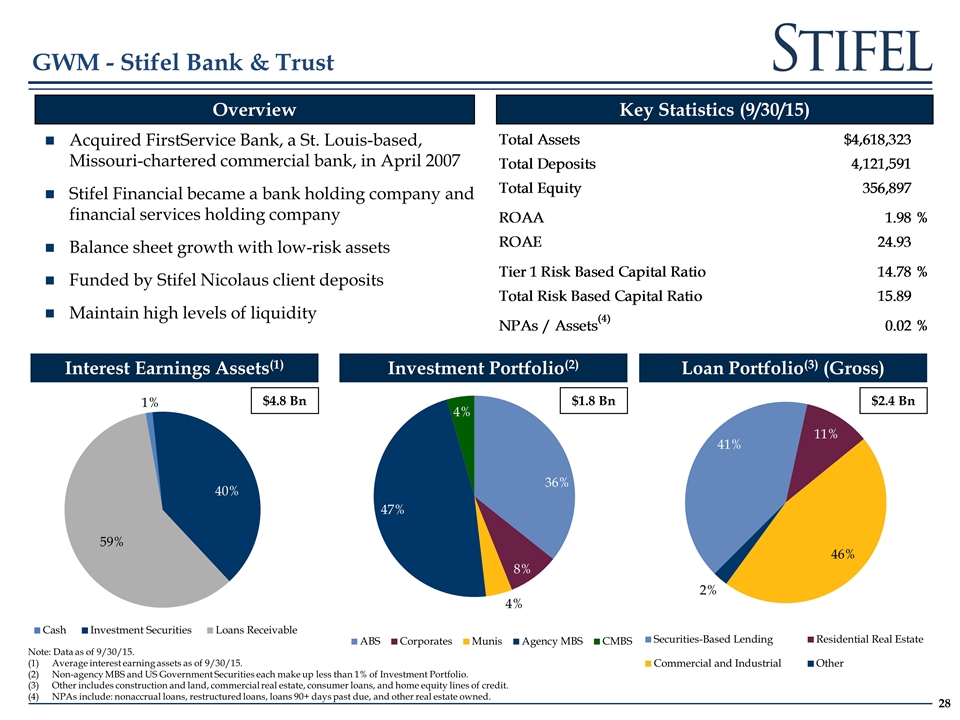
GWM - Stifel Bank & Trust Investment Portfolio(2) Loan Portfolio(3) (Gross) Acquired FirstService Bank, a St. Louis-based, Missouri-chartered commercial bank, in April 2007 Stifel Financial became a bank holding company and financial services holding company Balance sheet growth with low-risk assets Funded by Stifel Nicolaus client deposits Maintain high levels of liquidity Overview Key Statistics (9/30/15) Interest Earnings Assets(1) Note: Data as of 9/30/15. Average interest earning assets as of 9/30/15. Non-agency MBS and US Government Securities each make up less than 1% of Investment Portfolio. Other includes construction and land, commercial real estate, consumer loans, and home equity lines of credit. NPAs include: nonaccrual loans, restructured loans, loans 90+ days past due, and other real estate owned. $4.8 Bn $1.8 Bn $2.4 Bn
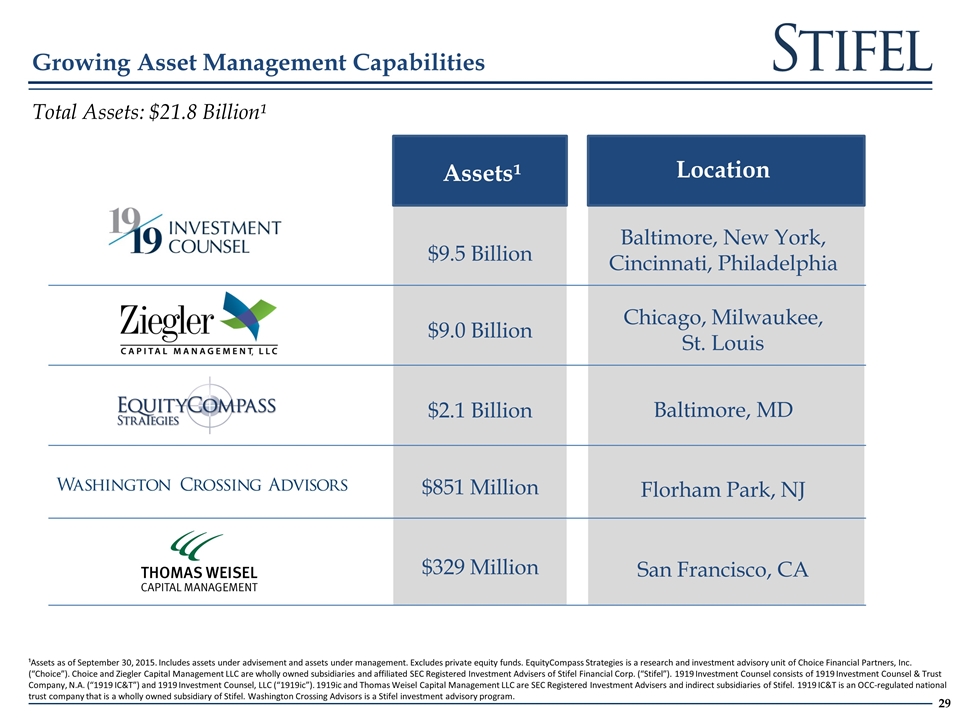
$9.5 Billion $9.0 Billion $2.1 Billion $851 Million $329 Million Assets¹ Location Growing Asset Management Capabilities ¹Assets as of September 30, 2015. Includes assets under advisement and assets under management. Excludes private equity funds. EquityCompass Strategies is a research and investment advisory unit of Choice Financial Partners, Inc. (“Choice”). Choice and Ziegler Capital Management LLC are wholly owned subsidiaries and affiliated SEC Registered Investment Advisers of Stifel Financial Corp. (“Stifel”). 1919 Investment Counsel consists of 1919 Investment Counsel & Trust Company, N.A. (“1919 IC&T”) and 1919 Investment Counsel, LLC (“1919ic”). 1919ic and Thomas Weisel Capital Management LLC are SEC Registered Investment Advisers and indirect subsidiaries of Stifel. 1919 IC&T is an OCC-regulated national trust company that is a wholly owned subsidiary of Stifel. Washington Crossing Advisors is a Stifel investment advisory program. Total Assets: $21.8 Billion¹ Baltimore, New York, Cincinnati, Philadelphia Chicago, Milwaukee, St. Louis Baltimore, MD Florham Park, NJ San Francisco, CA
Institutional Group
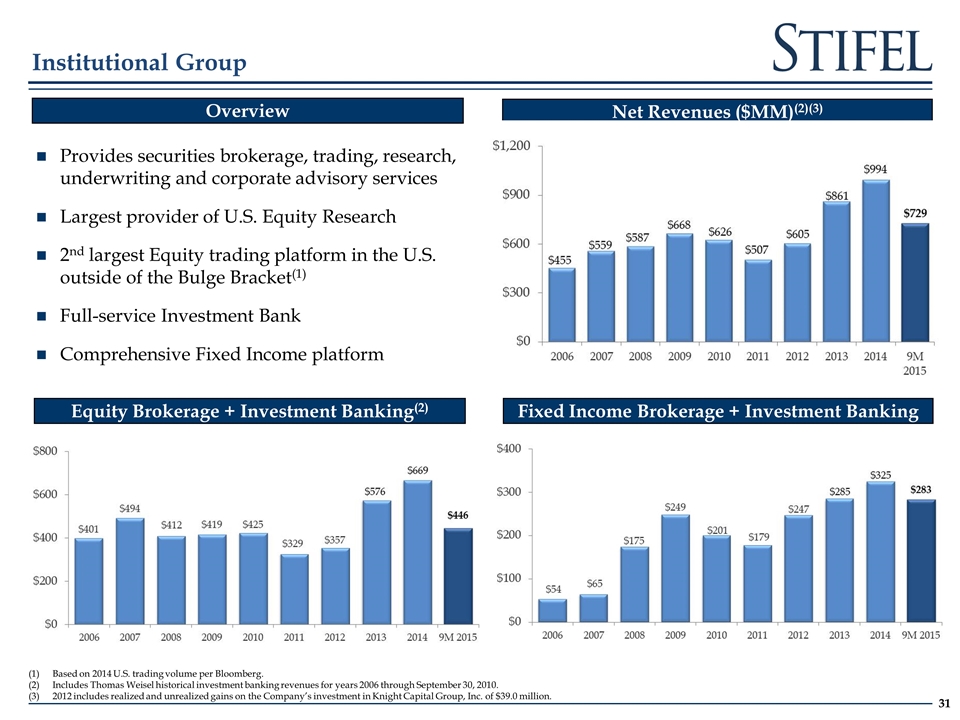
Based on 2014 U.S. trading volume per Bloomberg. Includes Thomas Weisel historical investment banking revenues for years 2006 through September 30, 2010. 2012 includes realized and unrealized gains on the Company’s investment in Knight Capital Group, Inc. of $39.0 million. Institutional Group Net Revenues ($MM)(2)(3) Fixed Income Brokerage + Investment Banking Overview Provides securities brokerage, trading, research, underwriting and corporate advisory services Largest provider of U.S. Equity Research 2nd largest Equity trading platform in the U.S. outside of the Bulge Bracket(1) Full-service Investment Bank Comprehensive Fixed Income platform Equity Brokerage + Investment Banking(2)
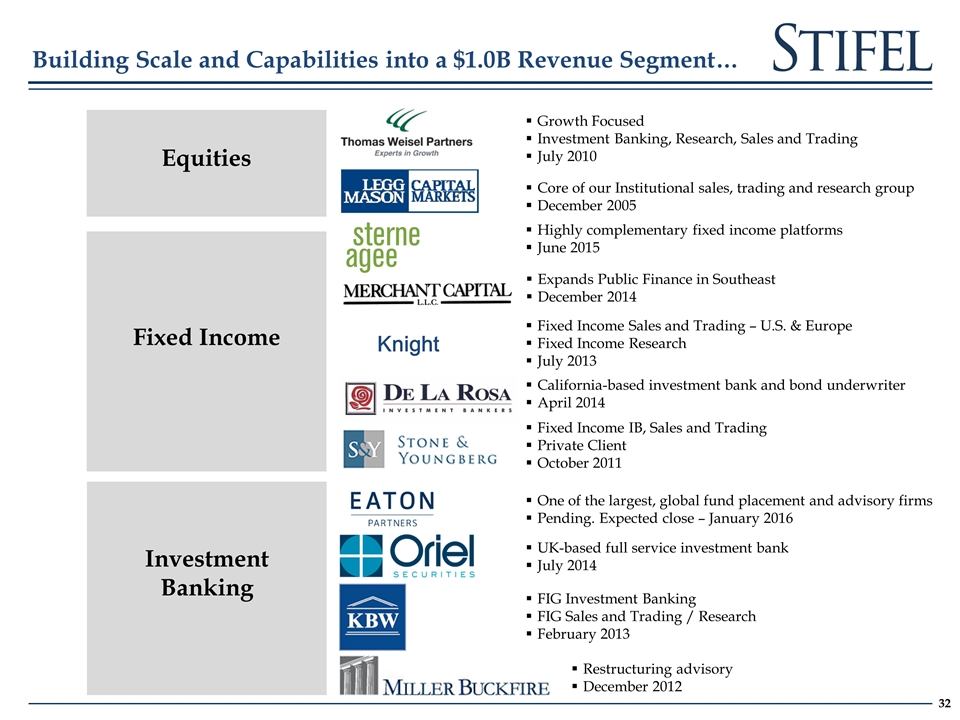
Building Scale and Capabilities into a $1.0B Revenue Segment… Growth Focused Investment Banking, Research, Sales and Trading July 2010 Core of our Institutional sales, trading and research group December 2005 Fixed Income IB, Sales and Trading Private Client October 2011 FIG Investment Banking FIG Sales and Trading / Research February 2013 Restructuring advisory December 2012 Knight Fixed Income Sales and Trading – U.S. & Europe Fixed Income Research July 2013 California-based investment bank and bond underwriter April 2014 UK-based full service investment bank July 2014 Expands Public Finance in Southeast December 2014 Equities Fixed Income Investment Banking Highly complementary fixed income platforms June 2015 One of the largest, global fund placement and advisory firms Pending. Expected close – January 2016
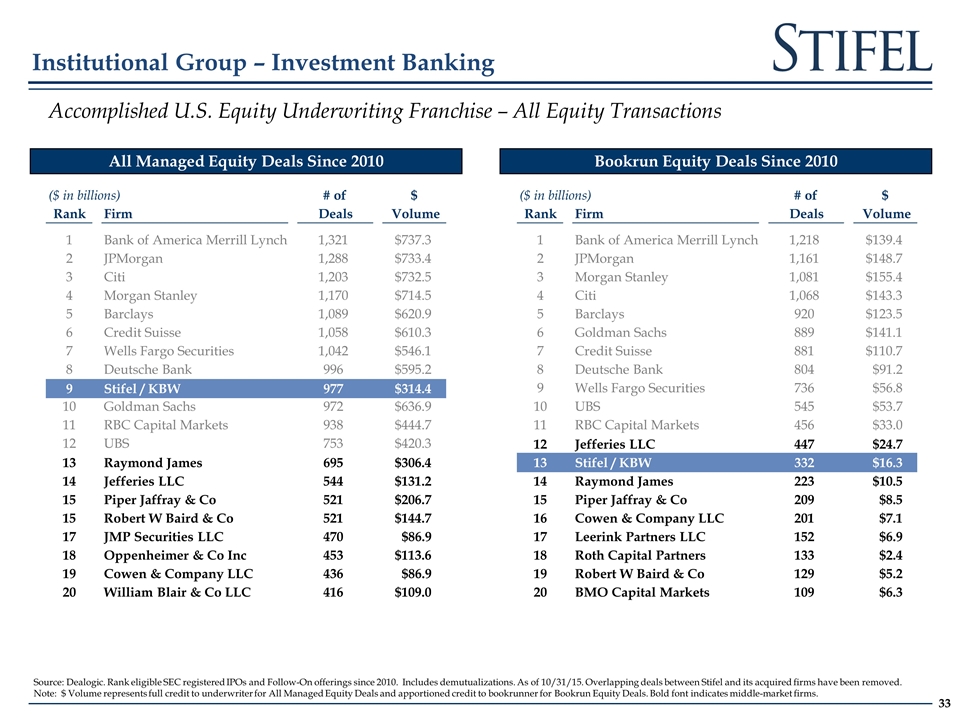
Institutional Group – Investment Banking Accomplished U.S. Equity Underwriting Franchise – All Equity Transactions Bookrun Equity Deals Since 2010 All Managed Equity Deals Since 2010 ($ in billions) # of $ Rank Firm Deals Volume 1 Bank of America Merrill Lynch 1,321 $737.3 2 JPMorgan 1,288 $733.4 3 Citi 1,203 $732.5 4 Morgan Stanley 1,170 $714.5 5 Barclays 1,089 $620.9 6 Credit Suisse 1,058 $610.3 7 Wells Fargo Securities 1,042 $546.1 8 Deutsche Bank 996 $595.2 9 Stifel / KBW 977 $314.4 10 Goldman Sachs 972 $636.9 11 RBC Capital Markets 938 $444.7 12 UBS 753 $420.3 13 Raymond James 695 $306.4 14 Jefferies LLC 544 $131.2 15 Piper Jaffray & Co 521 $206.7 15 Robert W Baird & Co 521 $144.7 17 JMP Securities LLC 470 $86.9 18 Oppenheimer & Co Inc 453 $113.6 19 Cowen & Company LLC 436 $86.9 20 William Blair & Co LLC 416 $109.0 ($ in billions) # of $ Rank Firm Deals Volume 1 Bank of America Merrill Lynch 1,218 $139.4 2 JPMorgan 1,161 $148.7 3 Morgan Stanley 1,081 $155.4 4 Citi 1,068 $143.3 5 Barclays 920 $123.5 6 Goldman Sachs 889 $141.1 7 Credit Suisse 881 $110.7 8 Deutsche Bank 804 $91.2 9 Wells Fargo Securities 736 $56.8 10 UBS 545 $53.7 11 RBC Capital Markets 456 $33.0 12 Jefferies LLC 447 $24.7 13 Stifel / KBW 332 $16.3 14 Raymond James 223 $10.5 15 Piper Jaffray & Co 209 $8.5 16 Cowen & Company LLC 201 $7.1 17 Leerink Partners LLC 152 $6.9 18 Roth Capital Partners 133 $2.4 19 Robert W Baird & Co 129 $5.2 20 BMO Capital Markets 109 $6.3 Source: Dealogic. Rank eligible SEC registered IPOs and Follow-On offerings since 2010. Includes demutualizations. As of 10/31/15. Overlapping deals between Stifel and its acquired firms have been removed. Note: $ Volume represents full credit to underwriter for All Managed Equity Deals and apportioned credit to bookrunner for Bookrun Equity Deals. Bold font indicates middle-market firms.
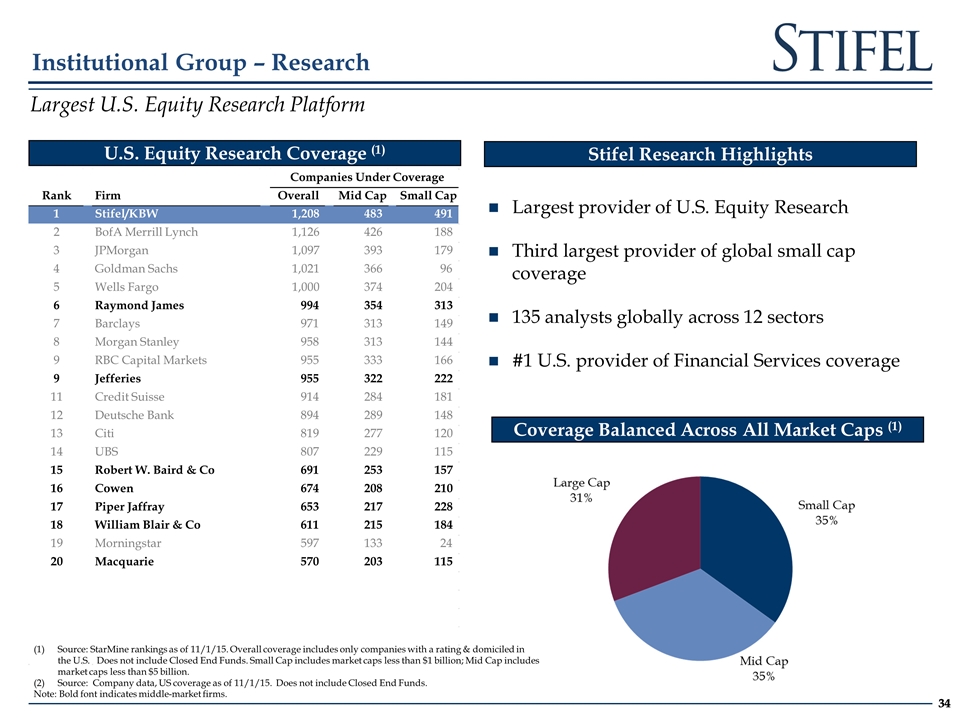
U.S. Equity Research Coverage (1) Coverage Balanced Across All Market Caps (1) Institutional Group – Research Stifel Research Highlights Largest U.S. Equity Research Platform Largest provider of U.S. Equity Research Third largest provider of global small cap coverage 135 analysts globally across 12 sectors #1 U.S. provider of Financial Services coverage Companies Under Coverage Rank Firm Overall Mid Cap Small Cap 1 Stifel/KBW 1,208 483 491 2 BofA Merrill Lynch 1,126 426 188 3 JPMorgan 1,097 393 179 4 Goldman Sachs 1,021 366 96 5 Wells Fargo 1,000 374 204 6 Raymond James 994 354 313 7 Barclays 971 313 149 8 Morgan Stanley 958 313 144 9 RBC Capital Markets 955 333 166 9 Jefferies 955 322 222 11 Credit Suisse 914 284 181 12 Deutsche Bank 894 289 148 13 Citi 819 277 120 14 UBS 807 229 115 15 Robert W. Baird & Co 691 253 157 16 Cowen 674 208 210 17 Piper Jaffray 653 217 228 18 William Blair & Co 611 215 184 19 Morningstar 597 133 24 20 Macquarie 570 203 115 Source: StarMine rankings as of 11/1/15. Overall coverage includes only companies with a rating & domiciled in the U.S. Does not include Closed End Funds. Small Cap includes market caps less than $1 billion; Mid Cap includes market caps less than $5 billion. (2) Source: Company data, US coverage as of 11/1/15. Does not include Closed End Funds. Note: Bold font indicates middle-market firms.
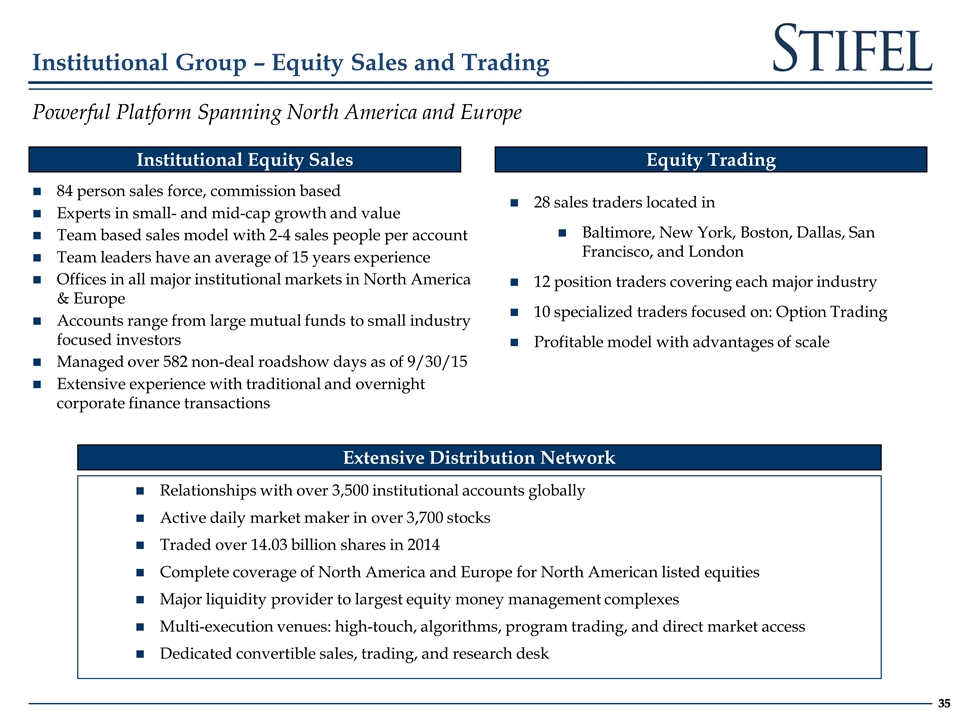
Institutional Equity Sales Equity Trading Institutional Group – Equity Sales and Trading Extensive Distribution Network Powerful Platform Spanning North America and Europe 84 person sales force, commission based Experts in small- and mid-cap growth and value Team based sales model with 2-4 sales people per account Team leaders have an average of 15 years experience Offices in all major institutional markets in North America & Europe Accounts range from large mutual funds to small industry focused investors Managed over 582 non-deal roadshow days as of 9/30/15 Extensive experience with traditional and overnight corporate finance transactions Relationships with over 3,500 institutional accounts globally Active daily market maker in over 3,700 stocks Traded over 14.03 billion shares in 2014 Complete coverage of North America and Europe for North American listed equities Major liquidity provider to largest equity money management complexes Multi-execution venues: high-touch, algorithms, program trading, and direct market access Dedicated convertible sales, trading, and research desk 28 sales traders located in Baltimore, New York, Boston, Dallas, San Francisco, and London 12 position traders covering each major industry 10 specialized traders focused on: Option Trading Profitable model with advantages of scale
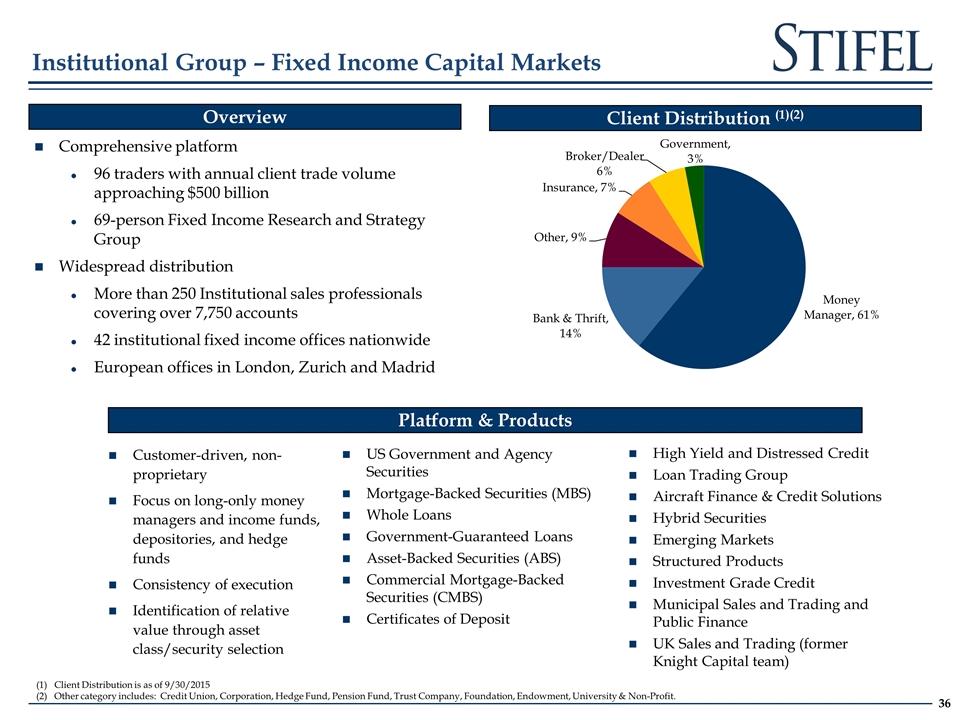
Overview Institutional Group – Fixed Income Capital Markets Client Distribution (1)(2) Platform & Products Comprehensive platform 96 traders with annual client trade volume approaching $500 billion 69-person Fixed Income Research and Strategy Group Widespread distribution More than 250 Institutional sales professionals covering over 7,750 accounts 42 institutional fixed income offices nationwide European offices in London, Zurich and Madrid Customer-driven, non-proprietary Focus on long-only money managers and income funds, depositories, and hedge funds Consistency of execution Identification of relative value through asset class/security selection US Government and Agency Securities Mortgage-Backed Securities (MBS) Whole Loans Government-Guaranteed Loans Asset-Backed Securities (ABS) Commercial Mortgage-Backed Securities (CMBS) Certificates of Deposit High Yield and Distressed Credit Loan Trading Group Aircraft Finance & Credit Solutions Hybrid Securities Emerging Markets Structured Products Investment Grade Credit Municipal Sales and Trading and Public Finance UK Sales and Trading (former Knight Capital team) Client Distribution is as of 9/30/2015 Other category includes: Credit Union, Corporation, Hedge Fund, Pension Fund, Trust Company, Foundation, Endowment, University & Non-Profit.
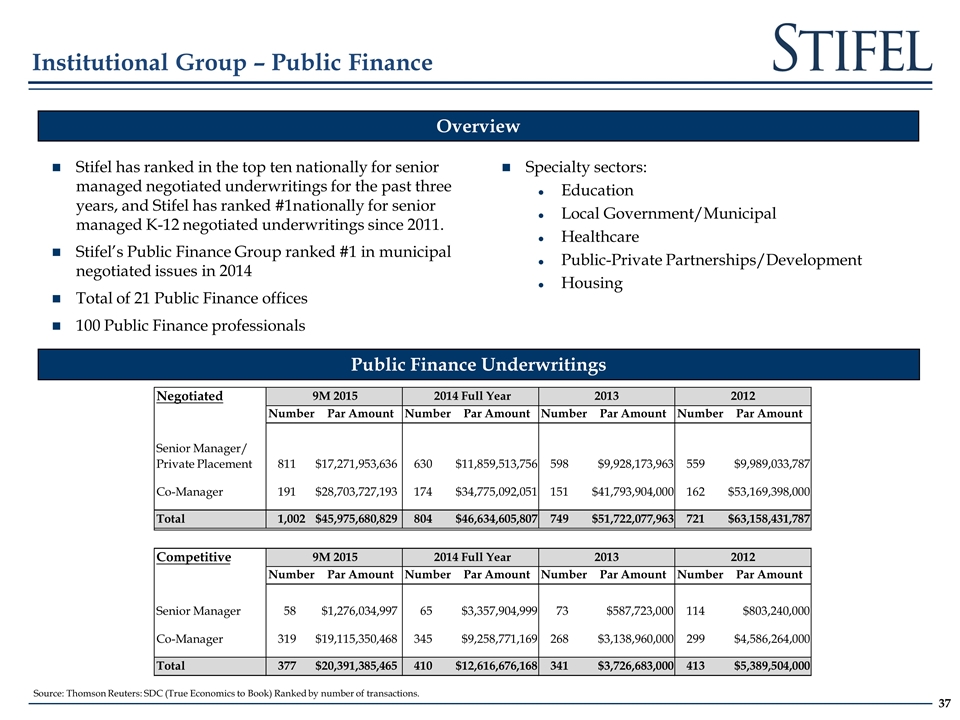
Overview Institutional Group – Public Finance Stifel has ranked in the top ten nationally for senior managed negotiated underwritings for the past three years, and Stifel has ranked #1nationally for senior managed K-12 negotiated underwritings since 2011. Stifel’s Public Finance Group ranked #1 in municipal negotiated issues in 2014 Total of 21 Public Finance offices 100 Public Finance professionals Public Finance Underwritings Specialty sectors: Education Local Government/Municipal Healthcare Public-Private Partnerships/Development Housing Negotiated Number Par Amount Number Par Amount Number Par Amount Number Par Amount Senior Manager/ Private Placement 811 $17,271,953,636 630 $11,859,513,756 598 $9,928,173,963 559 $9,989,033,787 Co-Manager 191 $28,703,727,193 174 $34,775,092,051 151 $41,793,904,000 162 $53,169,398,000 Total 1,002 $45,975,680,829 804 $46,634,605,807 749 $51,722,077,963 721 $63,158,431,787 Competitive Number Par Amount Number Par Amount Number Par Amount Number Par Amount Senior Manager 58 $1,276,034,997 65 $3,357,904,999 73 $587,723,000 114 $803,240,000 Co-Manager 319 $19,115,350,468 345 $9,258,771,169 268 $3,138,960,000 299 $4,586,264,000 Total 377 $20,391,385,465 410 $12,616,676,168 341 $3,726,683,000 413 $5,389,504,000 9M 2015 2014 Full Year 2013 2012 9M 2015 2014 Full Year 2013 2012 Source: Thomson Reuters: SDC (True Economics to Book) Ranked by number of transactions.
Financial Information
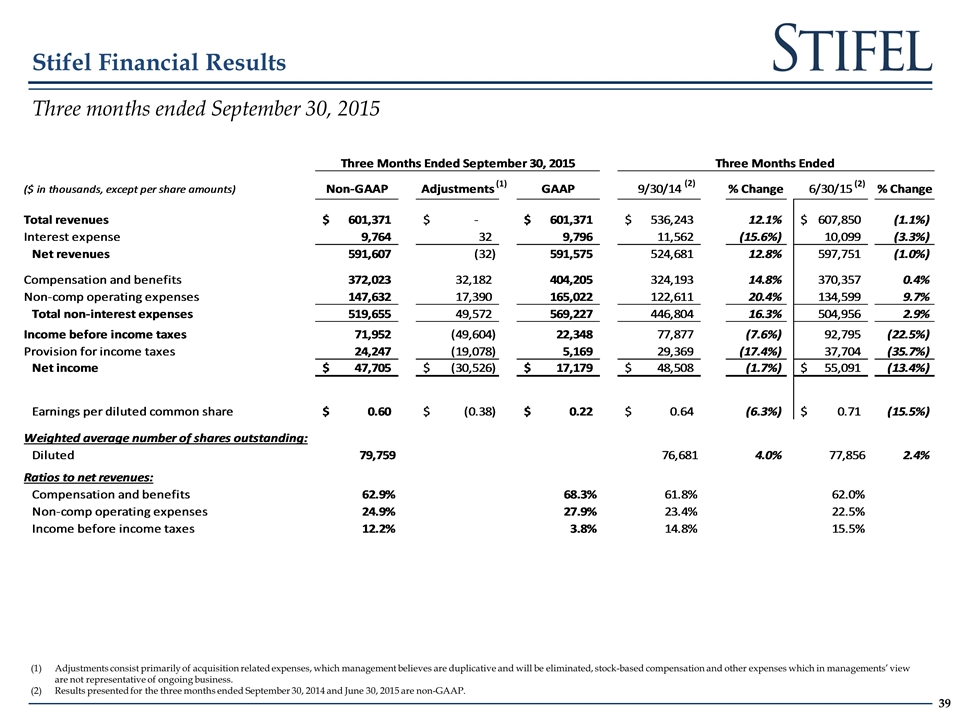
Stifel Financial Results Three months ended September 30, 2015 Adjustments consist primarily of acquisition related expenses, which management believes are duplicative and will be eliminated, stock-based compensation and other expenses which in managements’ view are not representative of ongoing business. Results presented for the three months ended September 30, 2014 and June 30, 2015 are non-GAAP. (1) (2) (2)
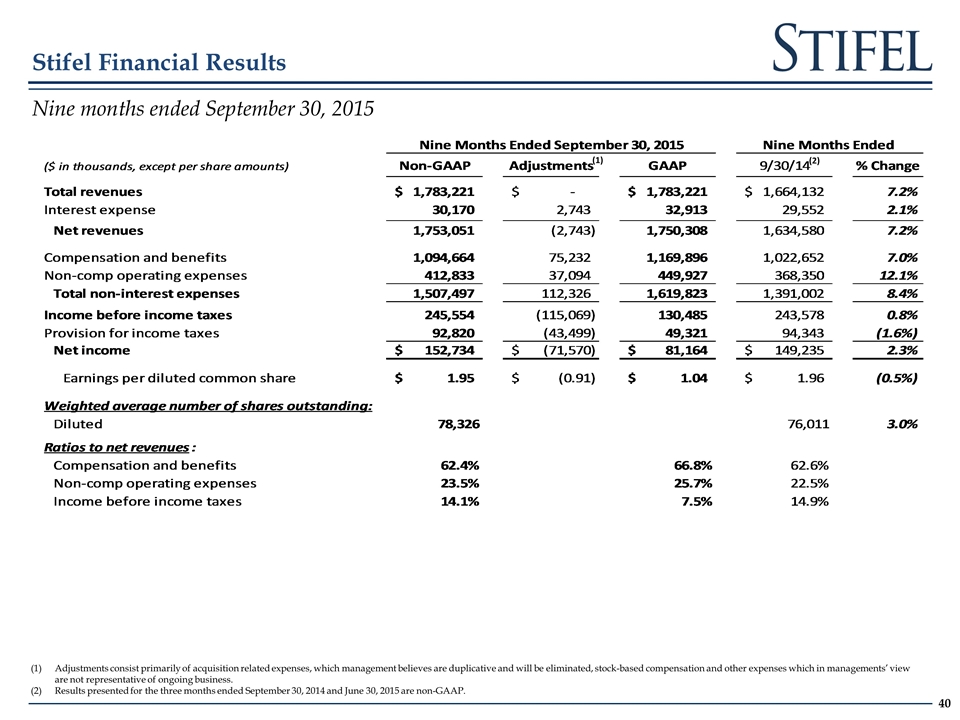
Stifel Financial Results Nine months ended September 30, 2015 Adjustments consist primarily of acquisition related expenses, which management believes are duplicative and will be eliminated, stock-based compensation and other expenses which in managements’ view are not representative of ongoing business. Results presented for the three months ended September 30, 2014 and June 30, 2015 are non-GAAP. (1) (2)
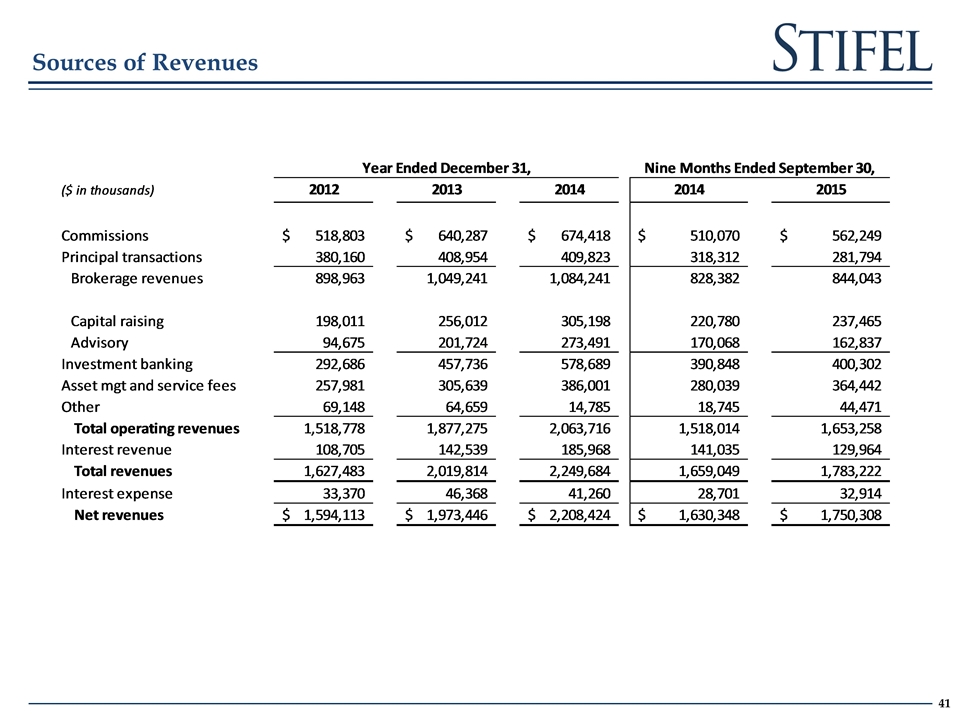
Sources of Revenues
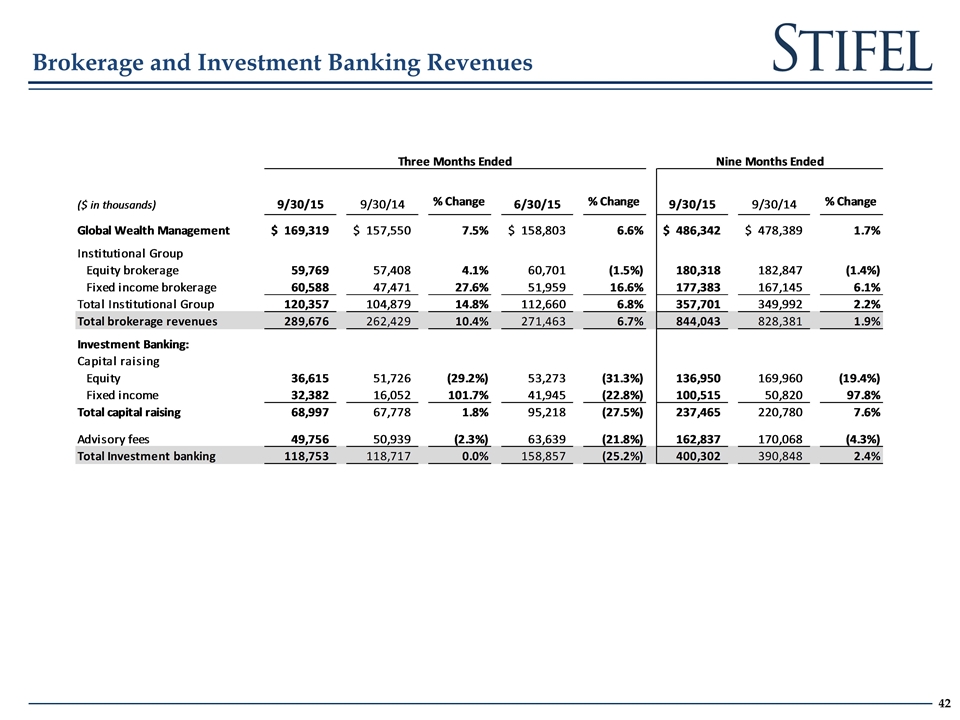
Brokerage and Investment Banking Revenues
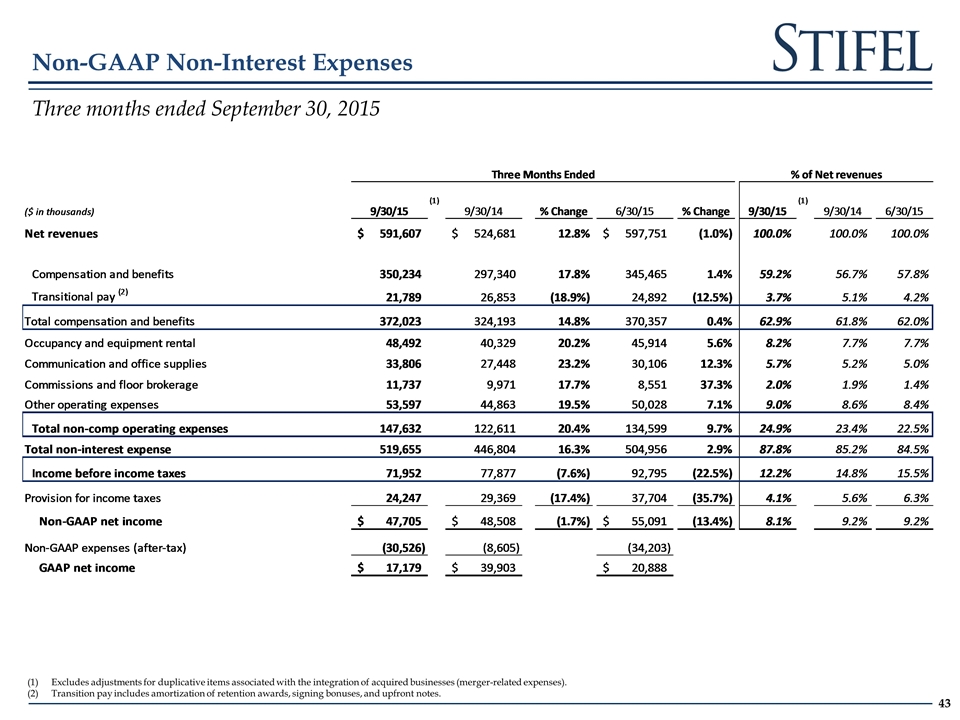
Non-GAAP Non-Interest Expenses Excludes adjustments for duplicative items associated with the integration of acquired businesses (merger-related expenses). Transition pay includes amortization of retention awards, signing bonuses, and upfront notes. Three months ended September 30, 2015
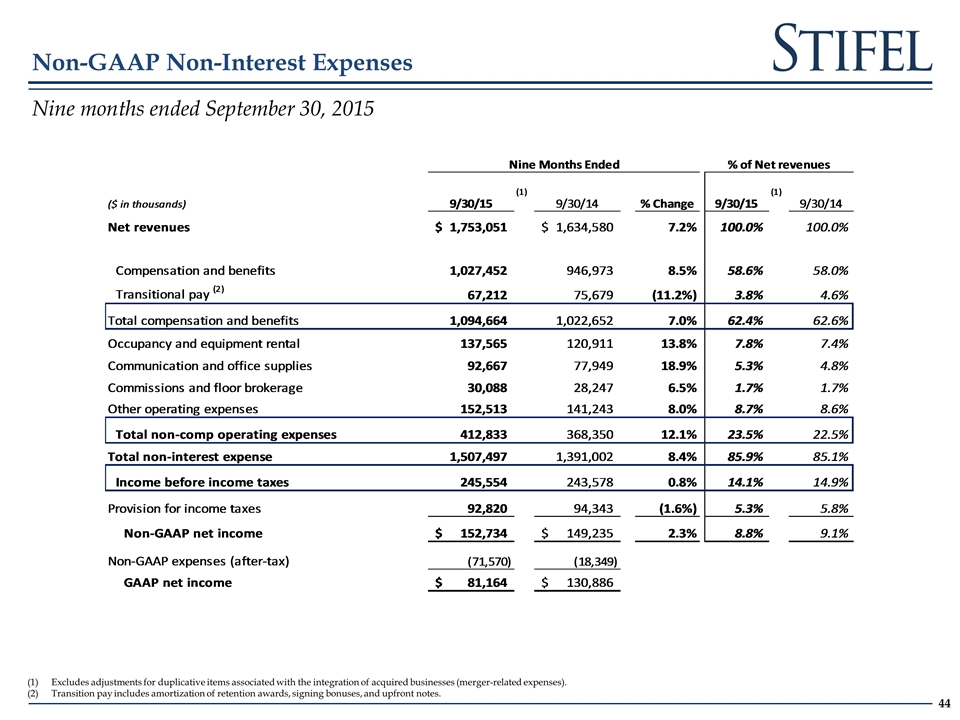
Non-GAAP Non-Interest Expenses Excludes adjustments for duplicative items associated with the integration of acquired businesses (merger-related expenses). Transition pay includes amortization of retention awards, signing bonuses, and upfront notes. Nine months ended September 30, 2015
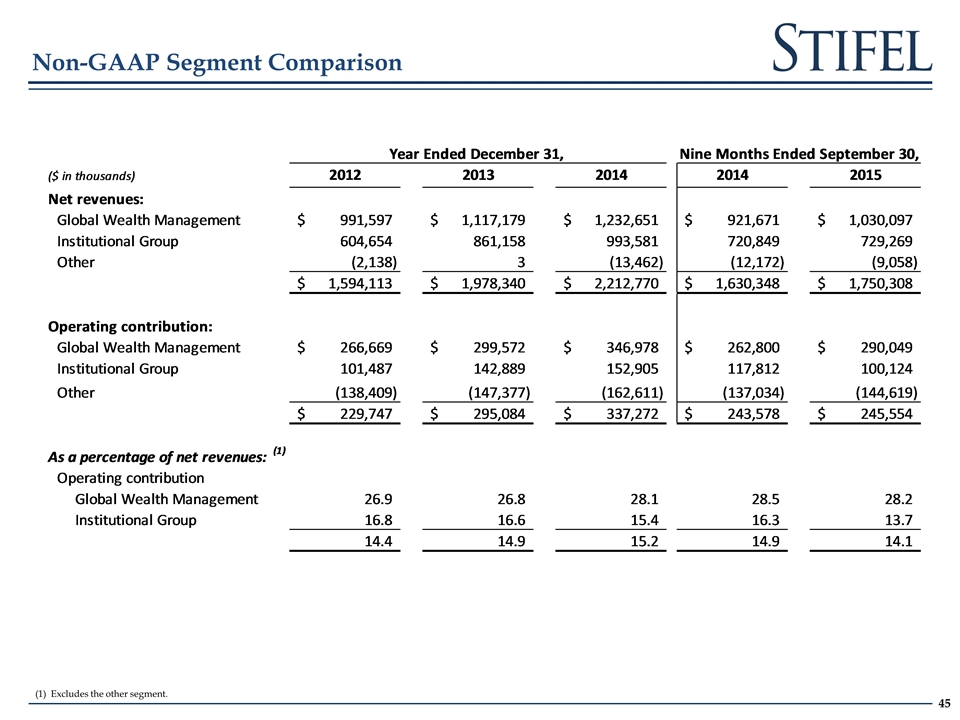
Non-GAAP Segment Comparison Excludes the other segment.
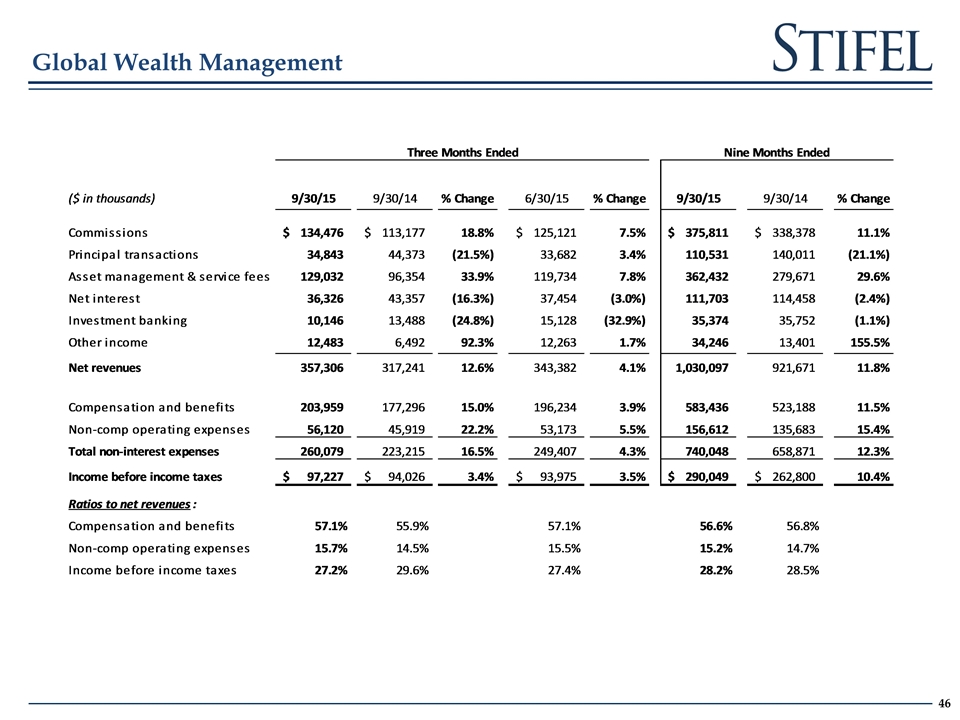
Global Wealth Management
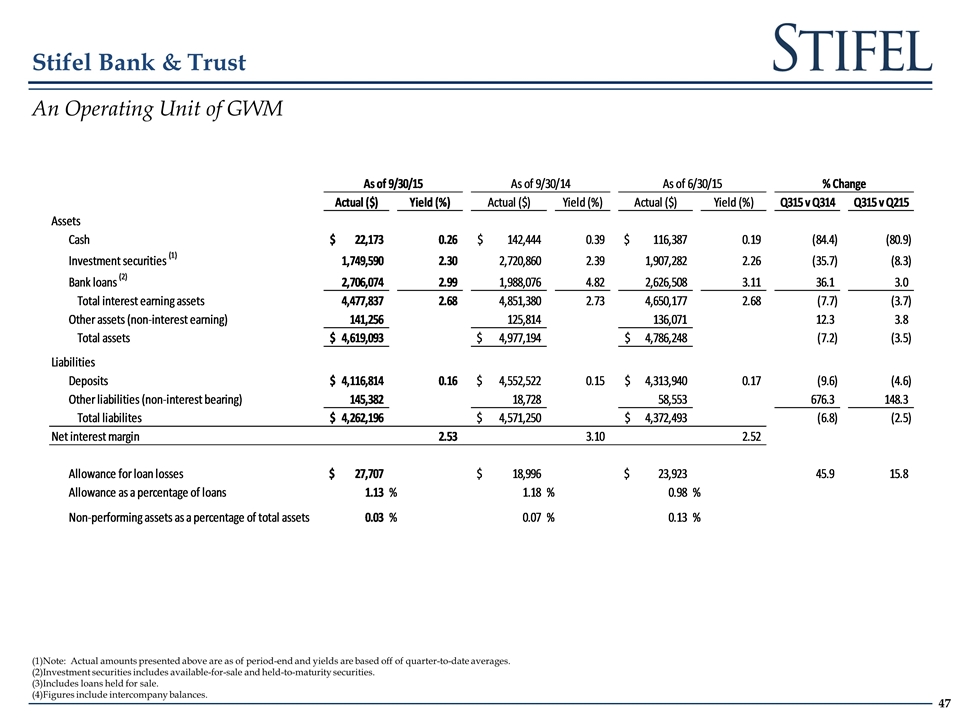
Stifel Bank & Trust Note: Actual amounts presented above are as of period-end and yields are based off of quarter-to-date averages. Investment securities includes available-for-sale and held-to-maturity securities. Includes loans held for sale. Figures include intercompany balances. An Operating Unit of GWM Stifel Bank & Trust (Unaudited) Key Statistical Information Three Months Ended 3/31/13 % Change % Change (in 000s, except percentages) Net revenues $ 23,879 16,018 49.076039455612438 22,551 5.8888741075783777 Income before income taxes 17,236 11,403 51.153205296851702 15,977 7.8800776115666267 As of 9/30/15 As of 9/30/14 As of 6/30/15 % Change Actual ($) Yield (%) Actual ($) Yield (%) Actual ($) Yield (%) Q315 v Q314 Q315 v Q215 Assets Cash $22,173 0.26 $,142,444 0.39 $,116,387 0.19 -84.433882789025859 -80.948903228023752 Investment securities (1) 1,749,590 2.2999999999999998 2,720,860 2.39 1,907,282 2.2599999999999998 -35.697169277360835 -8.2678911665920403 Bank loans (2) 2,706,074 2.99 1,988,076 4.82 2,626,508 3.11 36.115218935292212 3.0293454274649081 Total interest earning assets 4,477,837 2.68 4,851,380 2.73 4,650,177 2.68 -7.6997266757087681 -3.7060954884082906 Other assets (non-interest earning) ,141,256 ,125,814 ,136,071 12.273673835980098 3.8105106892725122 Total assets $4,619,093 $4,977,194 $4,786,248 -7.1948370909391919 -3.4924015638136594 Liabilities Deposits $4,116,814 0.16 $4,552,522 0.15 $4,313,940 0.17 -9.5706951004300471 -4.5695118615465216 Other liabilities (non-interest bearing) ,145,382 18,728 58,553 676.28150363092686 148.29129165029974 Total liabilites $4,262,196 $4,571,250 $4,372,493 -6.760820344544709 -2.5225197616096815 Net interest margin 2.5299999999999998 3.1 2.52 Allowance for loan losses $27,707 $18,996 $23,923 45.857022531059172 15.817414203904193 Allowance as a percentage of loans 1.1299999999999999 % 1.18 % 0.98 % Non-performing loans $3,907 $1,042 274.95201535508636 $1,042 274.95201535508636 Other non-performing assets 0 173 -,100 173 0 Non-performing assets $3,907 $1,215 221.56378600823047 $1,215 221.56378600823047 Non-performing assets as a percentage of total assets 0.03 % 7.0000000000000007E-2 % 0.13 % Stifel Bank & Trust (Unaudited) Key Statistical Information Three Months Ended 3/31/13 % Change % Change (in 000s, except percentages) Net revenues $ 23,879 16,018 49.076039455612438 22,551 5.8888741075783777 Income before income taxes 17,236 11,403 51.153205296851702 15,977 7.8800776115666267 As of 9/30/15 As of 9/30/14 As of 6/30/15 % Change Actual ($) Yield (%) Actual ($) Yield (%) Actual ($) Yield (%) Q315 v Q314 Q315 v Q215 Assets Cash $22,173 0.26 $,142,444 0.39 $,116,387 0.19 -84.433882789025859 -80.948903228023752 Investment securities (1) 1,749,590 2.2999999999999998 2,720,860 2.39 1,907,282 2.2599999999999998 -35.697169277360835 -8.2678911665920403 Bank loans (2) 2,706,074 2.99 1,988,076 4.82 2,626,508 3.11 36.115218935292212 3.0293454274649081 Total interest earning assets 4,477,837 2.68 4,851,380 2.73 4,650,177 2.68 -7.6997266757087681 -3.7060954884082906 Other assets (non-interest earning) ,141,256 ,125,814 ,136,071 12.273673835980098 3.8105106892725122 Total assets $4,619,093 $4,977,194 $4,786,248 -7.1948370909391919 -3.4924015638136594 Liabilities Deposits $4,116,814 0.16 $4,552,522 0.15 $4,313,940 0.17 -9.5706951004300471 -4.5695118615465216 Other liabilities (non-interest bearing) ,145,382 18,728 58,553 676.28150363092686 148.29129165029974 Total liabilites $4,262,196 $4,571,250 $4,372,493 -6.760820344544709 -2.5225197616096815 Net interest margin 2.5299999999999998 3.1 2.52 Allowance for loan losses $27,707 $18,996 $23,923 45.857022531059172 15.817414203904193 Allowance as a percentage of loans 1.1299999999999999 % 1.18 % 0.98 % Non-performing loans $3,907 $1,042 274.95201535508636 $1,042 274.95201535508636 Other non-performing assets 0 173 -,100 173 0 Non-performing assets $3,907 $1,215 221.56378600823047 $1,215 221.56378600823047 Non-performing assets as a percentage of total assets 0.03 % 7.0000000000000007E-2 % 0.13 %
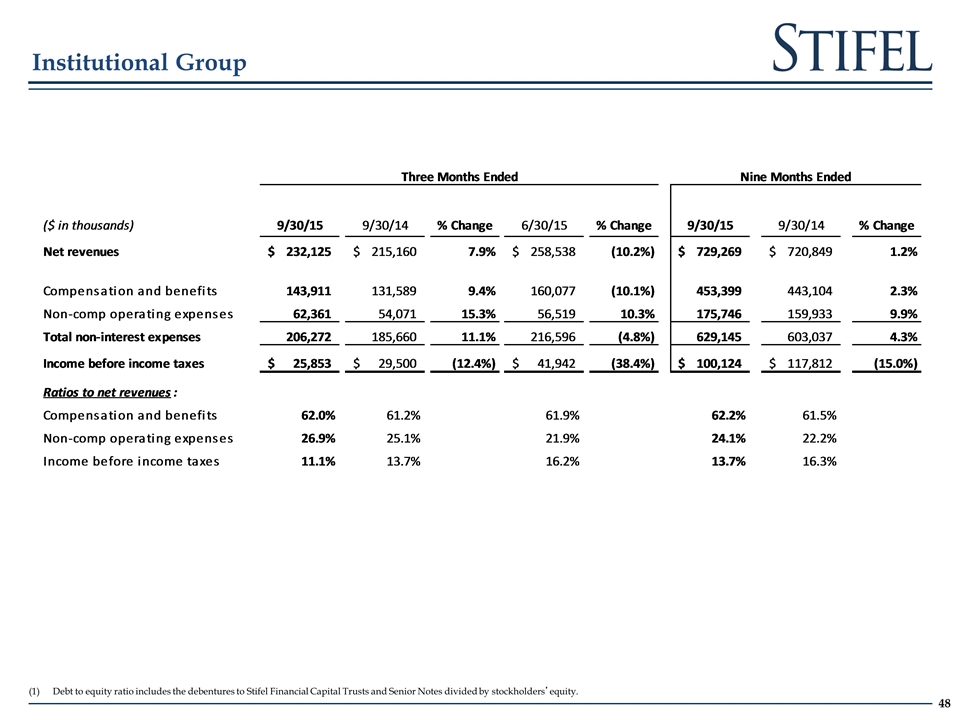
Debt to equity ratio includes the debentures to Stifel Financial Capital Trusts and Senior Notes divided by stockholders’equity. Institutional Group
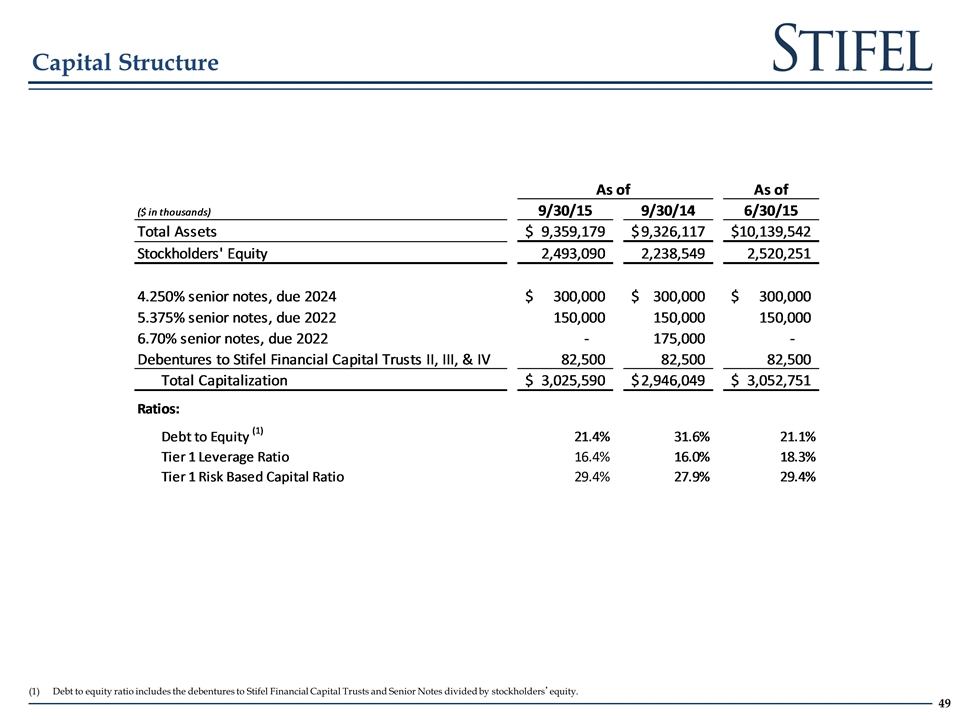
Debt to equity ratio includes the debentures to Stifel Financial Capital Trusts and Senior Notes divided by stockholders’equity. Capital Structure
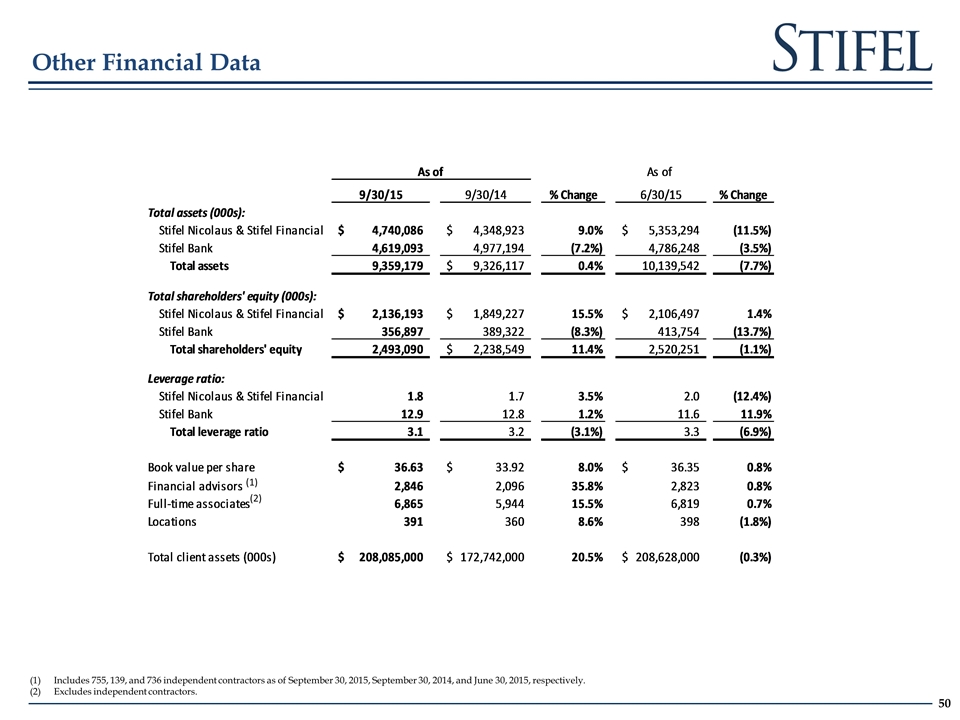
Includes 755, 139, and 736 independent contractors as of September 30, 2015, September 30, 2014, and June 30, 2015, respectively. Excludes independent contractors. Other Financial Data (1) (2)
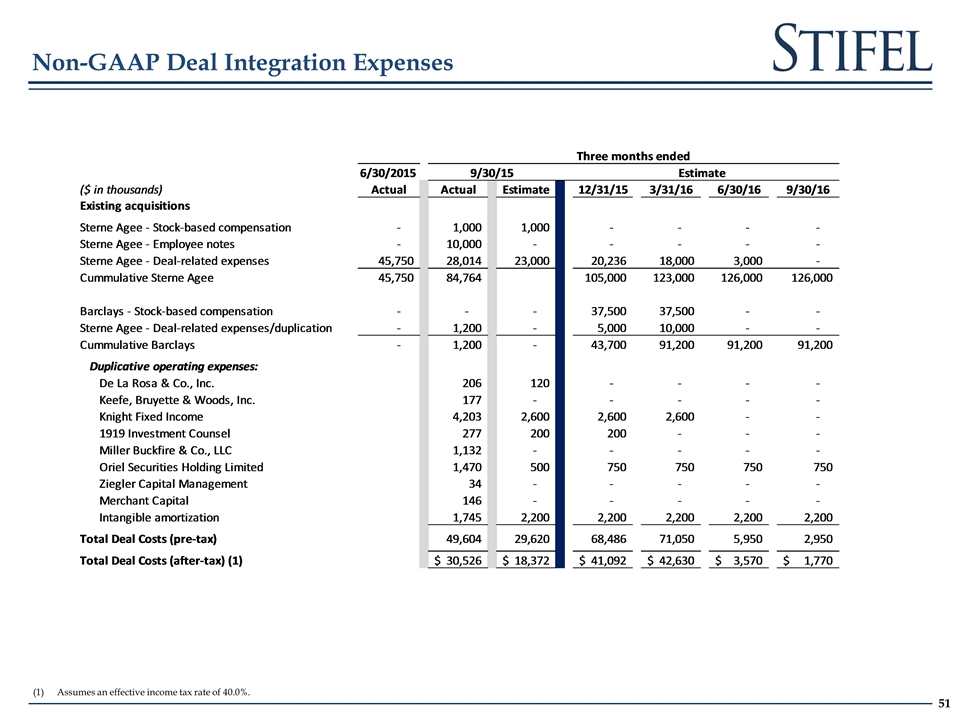
Non-GAAP Deal Integration Expenses Assumes an effective income tax rate of 40.0%.


