FORM 6-K
SECURITIES AND EXCHANGE COMMISSION
Washington, D.C. 20549
Report of Foreign Private Issuer
Pursuant to Rule 13a-16 or 15d-16 under
the Securities Exchange Act of 1934
For the month of July, 2006
Commission File Number: 000-12713
NEC CORPORATION
(Translation of registrant’s name into English)
7-1, Shiba 5-chome, Minato-ku, Tokyo, Japan
(Address of principal executive offices)
Indicate by check mark whether the registrant files or will file annual reports under cover Form 20-F or Form 40-F.
Form 20-F x Form 40-F ¨
Indicate by check mark whether the registrant by furnishing the information contained in this Form is also thereby furnishing the information to the Commission pursuant to Rule 12g3-2(b) under the Securities Exchange Act of 1934.
Yes ¨ No x
SIGNATURE
Pursuant to the requirements of the Securities Exchange Act of 1934, the registrant has duly caused this report to be signed on its behalf by the undersigned, thereunto duly authorized.
| NEC Corporation | ||
| (Registrant) | ||
| By | /S/ FUJIO OKADA | |
| Fujio Okada | ||
| Associate Senior Vice President | ||
Date: July 14, 2006
(Translation)
July 14, 2006
NEC Corporation
Kaoru Yano, President
(Tokyo Stock Exchange, 1st Section;
Code Number 6701)
Contact: Diane Foley
Corporate Communications Division
+81-3-3798-6511
NEC to Revise its Business Segments
NEC Corporation announced a shift to a new organization structure effective as of April 1, 2006. This change is aimed at the acceleration of NEC’s growth strategy by strengthening its responsiveness to next generation network (NGN) business opportunities such as the construction of NGNs for telecommunications/service providers and platform systems for new services arising from the convergence of telecommunications and finance/broadcasting.
In line with these structural changes, NEC’s business segments will be revised as of its consolidated financial results for the first quarter of the fiscal year ending March 31, 2007, being announced on July 27, 2006, in accordance with U.S. GAAP (note 1*).
Please refer to the below attachments for the following:
Attachment 1:
New Business Segment Breakdown, Correlation Chart of New & Old Segments
Attachment 2:
Organization Structure as of April 2006
Attachment 3:
Net Sales/Profit by New Segment (For fiscal years ended March 31, 2005 and 2006)
Attachment 4:
Net Sales/Profit by New Segment (Quarterly breakdown for fiscal year ended March 31, 2006)
Attachment 5:
Net Sales by Products and Services for New & Old Segments (For fiscal years ended March 31, 2005 and 2006)
Attachment 6:
Net Sales by Products and Services for New & Old Segments (Quarterly breakdown for fiscal year ended March 31, 2006)
Segments before Change | New Segments | |
IT Solutions Business | IT/Network Solutions Business | |
Network Solutions Business | Mobile/Personal Solutions Business | |
Electron Devices Business | Electron Devices Business | |
Others | Others |
Notes*
| (1) | NEC segment information is disclosed in accordance with the Statement of Financial Accounting Standards No. 131,Disclosures about Segments of an Enterprise and Related Information. |
| (2) | The segment information disclosed in this document is unaudited. |
Attachment 1
New Business Segment Breakdown
Business Segment Breakdown
Main Products/Solutions | Organization | |||
IT/Network Solutions Business | ||||
IT Services/System Integration | System Construction, Consulting, Outsourcing, Support (Maintenance) | Domestic Sales Enterprise Solutions Government, Community, Financial and Carrier Solutions IT Platform NES Solutions Group NE Software Development Group Carrier Network Social Infrastructure Solutions etc. | ||
IT Platforms |
Servers, Storage products, Professional workstations, Business PCs, Computer software | |||
Network Systems |
Enterprise network systems Network systems for telecommunications carriers | |||
Social Infrastructure |
Broadcast video systems, Control systems, Aerospace/Defense systems | |||
Mobile/Personal Solutions Business | ||||
Mobile Terminals | Mobile handsets | Mobile Terminals | ||
Personal Solutions | Personal computers, Personal communication devices, BIGLOBE | Personal Solutions | ||
Electron Devices Business | ||||
Semiconductors | System LSI and other semiconductors | NEC Electronics | ||
Electronic Components and Others | Electronic components, LCD modules etc | NEC Tokin NEC LCD Technologies etc. | ||
Correlation Chart of New & Old Segments
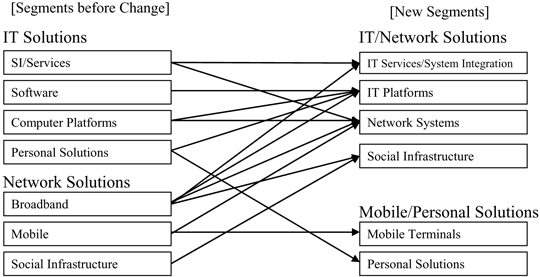
In addition to the above change, there will be other effects arising from the revision of segments such as changes in business responsibility within divisions, changes in consolidated divisions of subsidiaries, and increase or decrease of inter-segment sales volume.
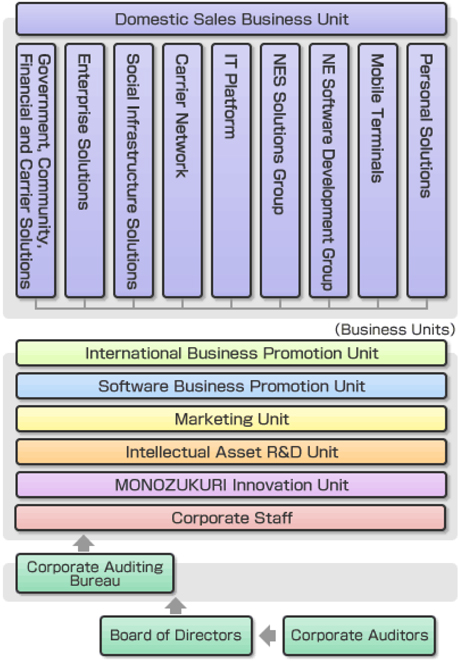
Attachment 2
Organization Structure as of April 2006
Attachment 3
Net Sales/Profit by New Segment
(1) Net Sales (Including internal sales to other segments) (Approximate figures) | (In billions of yen | ) |
Fiscal Year Segment | Fiscal Year Ended 31-Mar-06 | Fiscal Year Ended 31-Mar-05 | ||
IT/Network Solutions Business | 2,749.5 | 2,662.9 | ||
Mobile/Personal Solutions Business | 1,219.1 | 1,359.6 | ||
Electron Devices Business | 808.4 | 869.1 | ||
Others | 536.7 | 478.7 | ||
Segment Eliminations | -488.8 | -568.6 | ||
Total | 4,824.9 | 4,801.7 | ||
(2) Segment Profit/Loss (Approximate figures) | (In billions of yen | ) |
Fiscal year Segment | Fiscal Year Ended 31-Mar-06 | Fiscal Year Ended 31-Mar-05 | ||
IT/Network Solutions Business | 177.3 | 171.0 | ||
Mobile/Personal Solutions Business | -29.1 | -25.1 | ||
Electron Devices Business | -25.5 | 33.4 | ||
Others | 9.2 | 2.9 | ||
Segment Eliminations | 11.6 | 1.5 | ||
Unallocated Corporate Expenses | -48.1 | -41.8 | ||
Total | 95.4 | 141.9 | ||
Attachment 4
Net Sales/Profit by New Segment
(1) Net Sales (Including internal sales to other segments) (Approximate figures) | (In billions of yen | ) |
Fiscal Year Segment | Fiscal Year Ended March 31, 2006 | |||||||
| First Quarter | Second Quarter | Third Quarter | Fourth Quarter | |||||
IT/Network Solutions Business | 518.1 | 718.1 | 589.9 | 923.4 | ||||
Mobile/Personal Solutions Business | 280.8 | 285.4 | 331.7 | 321.2 | ||||
Electron Devices Business | 181.6 | 212.1 | 206.5 | 208.2 | ||||
Others | 117.0 | 134.2 | 133.6 | 151.9 | ||||
Segment Eliminations | -104.7 | -129.8 | -103.1 | -151.2 | ||||
Total | 992.8 | 1,220.0 | 1,158.6 | 1,453.5 | ||||
(2) Segment Profit/Loss (Approximate figures) | (In billions of yen | ) |
Fiscal year Segment | Fiscal Year Ended March 31, 2006 | |||||||
| First Quarter | Second Quarter | Third Quarter | Fourth Quarter | |||||
IT/Network Solutions Business | 7.6 | 49.0 | 44.4 | 76.3 | ||||
Mobile/Personal Solutions Business | 4.3 | -10.0 | -11.1 | -12.3 | ||||
Electron Devices Business | -9.7 | 0.2 | -2.7 | -13.3 | ||||
Others | -3.5 | 7.0 | 5.3 | 0.4 | ||||
Segment Eliminations | -0.8 | 3.9 | 0.0 | 8.5 | ||||
Unallocated Corporate Expenses | -7.8 | -17.1 | -10.5 | -12.7 | ||||
Total | -9.9 | 33.0 | 25.4 | 46.9 | ||||
Attachment 5
Net Sales by Products and Services (Including internal sales to other segments)
New Segments (Approximate Figures) | (In billions of yen) |
Fiscal Year Segment | Fiscal Year Ended 31-Mar-06 | Fiscal Year Ended 31-Mar-05 | ||
IT/Network Solutions Business | 2,749.5 | 2,662.9 | ||
IT Services/System Integration | 769.4 | 750.2 | ||
IT Platforms | 672.7 | 701.1 | ||
Network Systems | 993.1 | 916.9 | ||
Social Infrastructure | 314.3 | 294.7 | ||
Mobile/Personal Solutions Business | 1,219.1 | 1,359.6 | ||
Mobile Terminals | 453.9 | 634.0 | ||
Personal Solutions | 765.2 | 725.6 | ||
Electron Devices Business | 808.4 | 869.1 | ||
Semiconductors | 646.0 | 708.0 | ||
Electronic Components and Others | 162.4 | 161.1 |
Segments before Change | (In billions of yen) |
Fiscal Year Segment | Fiscal Year Ended 31-Mar-06 | Fiscal Year Ended 31-Mar-05 | ||
IT Solutions Business | 2,174.6 | 2,167.8 | ||
SI/Services | 832.4 | 836.9 | ||
Software | 102.8 | 106.9 | ||
Computers/Platforms | 489.9 | 500.1 | ||
Personal Solutions | 749.5 | 723.9 | ||
Network Solutions Business | 1,786.2 | 1,875.3 | ||
Broadband | 592.2 | 614.5 | ||
Mobile | 916.1 | 1,005.4 | ||
Social Infrastructure | 277.9 | 255.4 | ||
Electron Devices Business | 808.4 | 869.1 | ||
Semiconductors | 646.0 | 708.0 | ||
Displays | 64.6 | 68.9 | ||
Electronic Components and Others | 97.8 | 92.2 |
Attachment 6
Net Sales by Products and Services (Including internal sales to other segments)
New Segments (Approximate figures) | (In billions of yen) |
Fiscal Year Segments | Fiscal Year Ended March 31, 2006 | |||||||
| First Quarter | Second Quarter | Third Quarter | Fourth Quarter | |||||
IT/Network Solutions Business | 518.1 | 718.1 | 589.9 | 923.4 | ||||
IT Services/System Integration | 141.2 | 205.1 | 162.0 | 261.1 | ||||
IT Platforms | 122.7 | 188.5 | 145.8 | 215.7 | ||||
Network Systems | 207.9 | 252.2 | 218.8 | 314.2 | ||||
Social Infrastructure | 46.3 | 72.3 | 63.3 | 132.4 | ||||
Mobile/Personal Solutions Business | 280.8 | 285.4 | 331.7 | 321.2 | ||||
Mobile Terminals | 113.9 | 93.2 | 124.7 | 122.1 | ||||
Personal Solutions | 166.9 | 192.2 | 207.0 | 199.1 | ||||
Electron Devices Business | 181.6 | 212.1 | 206.5 | 208.2 | ||||
Semiconductors | 146.1 | 166.8 | 162.7 | 170.4 | ||||
Electronic Components and Others | 35.5 | 45.3 | 43.8 | 37.8 | ||||
Segments before Change | (In billions of yen) |
Fiscal Year Segment | Fiscal Year Ended March 31, 2006 | |||||||
| First Quarter | Second Quarter | Third Quarter | Fourth Quarter | |||||
IT Solutions Business | 425.8 | 576.5 | 519.0 | 653.3 | ||||
SI/Services | 152.0 | 221.2 | 172.0 | 287.2 | ||||
Software | 18.1 | 29.6 | 21.5 | 33.6 | ||||
Computer Platforms | 91.5 | 137.1 | 117.1 | 144.2 | ||||
Personal Solutions | 164.2 | 188.6 | 208.4 | 188.3 | ||||
Network Solutions Business | 371.8 | 426.6 | 413.4 | 574.4 | ||||
Broadband | 118.6 | 161.0 | 117.3 | 195.3 | ||||
Mobile | 207.9 | 200.7 | 237.5 | 270.0 | ||||
Social Infrastructure | 45.3 | 64.9 | 58.6 | 109.1 | ||||
Electron Devices Business | 181.6 | 211.1 | 207.5 | 208.2 | ||||
Semiconductors | 146.1 | 166.8 | 162.7 | 170.4 | ||||
Displays | 15.1 | 17.9 | 17.8 | 13.8 | ||||
Electronic Components and Others | 20.4 | 26.4 | 27.0 | 24.0 | ||||
CAUTIONARY STATEMENTS:
This material contains forward-looking statements pertaining to strategies, financial targets, technology, products and services, and business performance of NEC Corporation and its consolidated subsidiaries (collectively “NEC”). Written forward-looking statements may appear in other documents that NEC files with stock exchanges or regulatory authorities, such as the U.S. Securities and Exchange Commission, and in reports to shareholders and other communications. The U.S. Private Securities Litigation Reform Act of 1995 contains, and other applicable laws may contain, a safe-harbor for forward-looking statements, on which NEC relies in making these disclosures. Some of the forward-looking statements can be identified by the use of forward-looking words such as “believes,” “expects,” “may,” “will,” “should,” “seeks,” “intends,” “plans,” “estimates,” “aims,” or “anticipates,” or the negative of those words, or other comparable words or phrases. You can also identify forward-looking statements by discussions of strategy, beliefs, plans, targets, or intentions. Forward-looking statements necessarily depend on currently available assumptions, data, or methods that may be incorrect or imprecise and NEC may not be able to realize the results expected by them. You should not place undue reliance on forward-looking statements, which reflect NEC’s analysis and expectations only. Forward-looking statements are not guarantees of future performance and involve inherent risks and uncertainties. A number of important factors could cause actual results to differ materially from those in the forward-looking statements. Among the factors that could cause actual results to differ materially from such statements include (i) global economic conditions and general economic conditions in NEC’s markets, (ii) fluctuating demand for, and competitive pricing pressure on, NEC’s products and services, (iii) NEC’s ability to continue to win acceptance of NEC’s products and services in highly competitive markets, (iv) NEC’s ability to expand into foreign markets, such as China, (v) regulatory change and uncertainty and potential legal liability relating to NEC’s business and operations, (vi) NEC’s ability to restructure, or otherwise adjust, its operations to reflect changing market conditions, and (vii) movement of currency exchange rates, particularly the rate between the yen and the U.S. dollar. Any forward-looking statements speak only as of the date on which they are made. New risks and uncertainties come up from time to time, and it is impossible for NEC to predict these events or how they may affect NEC. NEC does not undertake any obligation to update or revise any of the forward-looking statements, whether as a result of new information, future events, or otherwise.
The management targets included in this material are not projections, and do not represent management’s current estimates of future performance. Rather, they represent targets that management will strive to achieve through the successful implementation of NEC’s business strategies.
Finally, NEC cautions you that the statements made in this material are not an offer of securities for sale. The securities may not be offered or sold in any jurisdiction in which registration is required absent registration or an exemption from registration under the applicable securities laws. For example, any public offering of securities to be made in the United States must be registered under the U.S. Securities Act of 1933 and made by means of an English language prospectus that contains detailed information about NEC and management, as well as NEC’s financial statements.
***