Table of Contents
FORM 6-K
SECURITIES AND EXCHANGE COMMISSION
Washington, D.C. 20549
Report of Foreign Private Issuer
Pursuant to Rule 13a-16 or 15d-16 under
the Securities Exchange Act of 1934
For the month of July, 2006
Commission File Number: 000-12713
NEC CORPORATION
(Translation of registrant’s name into English)
7-1, Shiba 5-chome, Minato-ku, Tokyo, Japan
(Address of principal executive offices)
Indicate by check mark whether the registrant files or will file annual reports under cover Form 20-F or Form 40-F.
Form 20-F x Form 40-F ¨
Indicate by check mark whether the registrant by furnishing the information contained in this Form is also thereby furnishing the information to the Commission pursuant to Rule 12g3-2(b) under the Securities Exchange Act of 1934.
Yes ¨ No x
Table of Contents
SIGNATURE
Pursuant to the requirements of the Securities Exchange Act of 1934, the registrant has duly caused this report to be signed on its behalf by the undersigned, thereunto duly authorized.
| NEC Corporation | ||
| (Registrant) | ||
| By | /S/ FUJIO OKADA | |
| Fujio Okada | ||
| Associate Senior Vice President | ||
Date: July 27, 2006
Table of Contents
1.Consolidated Financial Results for the first Quarter of the Fiscal Year Ending March 31, 2007
3.NEC, Matsushita and Panasonic Sign Agreement to Establish New Joint Venture for Mobile Handset
Table of Contents
Consolidated Financial Results for the First Quarter of the
Fiscal Year Ending March 31, 2007
I. Consolidated Financial Results
| Three months ended June 30, 2006 | Three months (Restated) | Change | |||||
| In billions of yen | In billions of yen | % | |||||
Net sales | 1,018.4 | 992.8 | +2.6 | ||||
Operating income (loss) | 14.7 | (9.9 | ) | — | |||
Income (loss) from continuing operations before income taxes | 12.9 | (15.8 | ) | — | |||
Net income (loss) | 11.5 | (5.3 | ) | — | |||
| Yen | Yen | Yen | |||||
Net income (loss) per share: | |||||||
Basic | 5.47 | (2.74 | ) | — | |||
Diluted | 5.12 | (2.74 | ) | — | |||
| As of June 30, 2006 | As of March 31, 2006 | Change | |||||
| In billions of yen | In billions of yen | % | |||||
Total assets | 3,725.3 | 3,895.8 | -4.4 | ||||
Shareholders’ equity | 905.9 | 890.9 | +1.7 | ||||
(Notes)
| 1. | The consolidated financial statements of NEC are prepared in accordance with accounting principles generally accepted in the United States, or U.S. GAAP. |
| 2. | “Operating income (loss)” set forth above is a measure commonly used by other Japanese companies that report their financial results in accordance with generally accepted accounting financial reporting practices in Japan. “Operating income (loss)” is calculated by deducting cost of sales and selling, general and administrative expenses from net sales. Management believes this measure is useful to investors in comparing NEC’s results of operations to those of other Japanese companies. This measure, however, should not be construed as an alternative to “income (loss) before income taxes” or “net income (loss)” as determined in accordance with U.S. GAAP. Please refer to the condensed consolidated statement of operations for the calculation of operating income (loss). |
| 3. | The number of consolidated subsidiaries and affiliated companies accounted for by the equity method is as follows: |
| As of June 30, 2006 | As of March 31, 2006 | As of June 30, 2005 (Restated) | ||||
Consolidated subsidiaries | 372 | 356 | 318 | |||
Affiliated companies accounted for by the equity method | 69 | 68 | 68 |
| 4. | In accordance with U.S. GAAP, a part of the consolidated financial information for the three months ended June 30, 2005 related to certain operations that were discontinued during the fiscal year ended March 31, 2006 has been reclassified. |
| 5. | The consolidated financial results for the three months ended June 30, 2005 have been revised from those already announced, and restated based on U.S. GAAP. |
| 6. | NEC changed its business segments from the three months ended June 30, 2006 in accordance with the reorganization of the company structure that became effective on April 1, 2006. The consolidated financial results for the three months ended June 30, 2005 have been reclassified in accordance with the new business segments. |
Table of Contents
II. Business Results
<1>Overview of the first quarter of the fiscal year ending March 31, 2007 (three months ended June 30, 2006)
There was stable growth in the global economy during the three months ended June 30, 2006, mainly due to an increase in capital expenditures in the U.S., amid sustained continuous high growth in China, in addition to continuous economic expansion in Asia and Europe. There was also steady growth in the Japanese economy due to continuous steady growth in domestic consumption, amid firm growth in exports, mostly due to an increase in capital expenditures against the background of an improvement in business results and a moderate recovery in personal consumption arising from an improvement in personal income and employment environments.
Amid this business environment, the consolidated net sales for the three months ended June 30, 2006 were 1,018.4 billion yen, an increase of 25.5 billion yen (2.6%) as compared with the corresponding period of the previous fiscal year. This was due to an increase in sales in semiconductors, digital terrestrial broadcasting systems in Japan and network systems for communication service providers, despite a decrease in sales of mobile handsets.
Operating income was 14.7 billion yen, an improvement of 24.6 billion yen as compared with the corresponding period of the previous fiscal year. This was due to an increase in sales and an improvement in the ratio of cost of sales, despite an increase in selling, general and administrative expenses owing to an increase in research and development costs.
Income from continuing operations before income taxes (note*) amounted to 12.9 billion yen, an improvement of 28.7 billion yen as compared with the corresponding period of the previous fiscal year. This was due to an improvement in operating income in addition to gain on transfer of marketable securities to the pension trust recognized in the corresponding period of the previous fiscal year.
Net income for the three months ended June 30, 2006 was 11.5 billion yen, an improvement of 16.8 billion yen as compared with the corresponding period of the previous fiscal year. This was due to an improvement in income from continuing operations before income taxes in addition to an improvement in equity in earnings (losses) of affiliated companies.
Note*
In accordance with U.S. GAAP, NEC has stated net income from continued operations before income taxes for the three months ended June 30, 2005 separately from consolidated net income from discontinued operations, in order to reflect the transfer of shares of NEC Machinery Corporation and Anelva Corporation that took place during the fiscal year ended March 31, 2006 and to make a net income comparison with the three months ended June 30, 2006 on an equivalent basis.
Table of Contents
<2>Results by business segments (including inter-segment transactions and profit/loss figures)
Sales and segment profit of NEC’s main segments were as follows (figures in brackets denote increases or decreases as compared with the corresponding period of the previous fiscal year):
IT/Network Solutions Business
| Sales: | 556.9 billion yen (+7.5%) | |
| Segment profit: | 27.6 billion yen (+20.0 billion yen) |
Sales for the IT/Network Solutions Business for the three months ended June 30, 2006 amounted to 556.9 billion yen, an increase of 7.5% as compared with the corresponding period of the previous fiscal year. This was due to steady sales in the area of Network Systems and Social Infrastructure.
Net sales by products and services were as follows:
In the area of IT Services/System Integration, sales amounted to 146.2 billion yen, an increase of 3.5% as compared with the corresponding period of the previous fiscal year owing to the influence of a recovery trend in domestic IT investment. In the area of IT Platforms, sales were in line with those of the corresponding period of the previous fiscal year and amounted to 122.8 billion yen. In the area of Network Systems, sales amounted to 229.3 billion yen, an increase of 10.3% as compared with the corresponding period of the previous fiscal year. This was due to an increase in sales to communication service providers such as overseas wireless systems. In the area of Social Infrastructure, sales rose by 26.6% as compared with the corresponding period of the previous fiscal year, amounting to 58.6 billion yen, owing mainly to steady sales in digital terrestrial broadcasting systems in the Japanese market.
Regarding profitability, segment profit was 27.6 billion yen, an increase of 20.0 billion yen as compared with the corresponding period of the previous fiscal year. This was mainly due to increased sales in the area of Network Systems.
Mobile/Personal Solutions Business
| Sales: | 238.3 billion yen (-15.1%) | |
| Segment loss: | 10.1 billion yen (a worsening of 14.4 billion yen) |
Sales for the Mobile/Personal Solutions business for the three months ended June 30, 2006 were 238.3 billion yen, a decrease of 15.1% as compared with the corresponding period of the previous fiscal year.
Net sales by products and services were as follows:
In the area of Mobile Terminals, sales amounted to 79.1 billion yen, a decrease of 30.6% as compared with the corresponding period of the previous fiscal year. This was due to a decrease in sales in the domestic market and shrinking of overseas business. In the area of Personal Solutions, sales amounted to 159.2 billion yen, a decrease of 4.6% as compared with the corresponding period of the previous fiscal year. This was due to stagnant growth in the consumer personal computers market in Japan.
Segment loss amounted to 10.1 billion yen, a worsening of 14.4 billion yen as compared with the corresponding period of the previous fiscal year. This was principally due to the effect of a decrease in sales of mobile handsets in the domestic market.
Electron Devices Business
| Sales: | 204.0 billion yen (+12.4%) | |
| Segment loss: | 2.4 billion yen (an improvement of 7.3 billion yen) |
Sales for the Electron Devices business for the three months ended June 30, 2006 were 204.0 billion yen, an increase of 12.4% as compared with the corresponding period of the previous fiscal year.
Net sales by products and services were as follows:
In the area of Semiconductors, sales were 165.2 billion yen, an increase of 13.1% as compared with the corresponding period of the previous fiscal year. This was due to an increase in sales in many product areas, including liquid crystal display (“LCD”) driver integrated circuits (“ICs”) and microcontrollers that are used in a diverse range of products, owing to expansion in the semiconductor market. In the area of Electronic Components and Others, due to expansion in the electronic components market, sales amounted to 38.8 billion yen, an increase of 9.3% as compared with the corresponding period of the previous fiscal year.
Segment loss was 2.4 billion yen, an improvement of 7.3 billion yen as compared with the corresponding period of the previous fiscal year. This was due to an increase in sales of semiconductors and electronic components.
Table of Contents
<3>Cash flows
Net cash used in operating activities during the three months ended June 30, 2006 was 27.1 billion yen, an improvement of 42.4 billion yen as compared with the corresponding period of the previous fiscal year. This was mainly due to an increase in cash inflows from notes and accounts receivable as compared with the corresponding period of the previous fiscal year.
Net cash used in investment activities was 42.1 billion yen, an improvement of 7.4 billion yen as compared with the corresponding period of the previous fiscal year. This was mainly due to an increase in gain on the sales of fixed assets as compared with the corresponding period of the previous fiscal year. As a result, free cash flows (the total of cash flows from operating activities and cash flows from investing activities) were cash outflows of 69.1 billion yen, an improvement of 49.7 billion yen as compared with the corresponding period of the previous fiscal year.
Net cash provided by financing activities, despite the dividend payment, amounted to 30.4 billion yen due to the issuance of commercial paper. As a result, cash and cash equivalents amounted to 417.6 billion yen, a decrease of 38.4 billion yen as compared with the end of the previous fiscal year ended March 31, 2006.
The balance of interest-bearing debt amounted to 1,005.8 billion yen, a decrease of 212.6 billion yen as compared with the end of the corresponding period of the previous fiscal year.
Debt-equity ratio was 1.11 (an improvement of 0.44 points as compared with the end of the corresponding period of the previous fiscal year).
The balance of interest-bearing debt (net), obtained by offsetting the balance of interest bearing debt with the balance of cash and cash equivalents, amounted to 588.2 billion yen, a decrease of 210.1 billion yen as compared with the end of the corresponding period of the previous fiscal year. Net debt-equity ratio was 0.65 (an improvement of 0.37 points as compared with the end of the corresponding period of the previous fiscal year).
<4>Financial forecast
Regarding the financial forecast for the fiscal year ending March 31, 2007, there is no change from the forecast announced on May 11, 2006.
***
Table of Contents
CONDENSED CONSOLIDATED STATEMENTS OF OPERATIONS (UNAUDITED)
(In millions of yen, millions of U.S. dollars)
Three months ended June 30 | 2006 | (% of net sales) | 2005 | (% of net sales) | Increase (Decrease) | 2006 | ||||||||||||||||
Net sales | JPY | 1,018,374 | (100.0 | ) | JPY | 992,847 | (100.0 | ) | JPY | 25,527 | $ | 8,855 | ||||||||||
Cost of sales | 721,114 | (70.8 | ) | 725,841 | (73.1 | ) | (4,727 | ) | 6,270 | |||||||||||||
Selling, general and administrative expenses | 282,561 | (27.8 | ) | 276,877 | (27.9 | ) | 5,684 | 2,457 | ||||||||||||||
Operating income (loss) | 14,699 | (1.4 | ) | (9,871 | ) | (-1.0 | ) | 24,570 | 128 | |||||||||||||
Non-operating income | 9,972 | (1.0 | ) | 4,696 | (0.5 | ) | 5,276 | 87 | ||||||||||||||
Interest and dividends | 3,204 | 2,431 | 773 | 28 | ||||||||||||||||||
Other | 6,768 | 2,265 | 4,503 | 59 | ||||||||||||||||||
Non-operating expenses | 11,738 | (1.1 | ) | 10,610 | (1.1 | ) | 1,128 | 103 | ||||||||||||||
Interest | 3,921 | 4,175 | (254 | ) | 34 | |||||||||||||||||
Other | 7,817 | 6,435 | 1,382 | 69 | ||||||||||||||||||
Income (loss) from continuing operations before income taxes | 12,933 | (1.3 | ) | (15,785 | ) | (-1.6 | ) | 28,718 | 112 | |||||||||||||
Provision for income taxes | 7,113 | (0.7 | ) | (8,445 | ) | (-0.8 | ) | 15,558 | 61 | |||||||||||||
Minority interest in income (loss) of consolidated subsidiaries | (198 | ) | (0.0 | ) | (1,133 | ) | (-0.1 | ) | 935 | (2 | ) | |||||||||||
Equity in earnings (losses) of affiliated companies | 5,439 | (0.5 | ) | 562 | (0.1 | ) | 4,877 | 47 | ||||||||||||||
Income (loss) from continuing operations | 11,457 | (1.1 | ) | (5,645 | ) | (-0.6 | ) | 17,102 | 100 | |||||||||||||
Income from discontinued operations, net of tax | — | — | 323 | (0.1 | ) | (323 | ) | — | ||||||||||||||
Net income (loss) | JPY | 11,457 | (1.1 | ) | JPY | ( 5,322 | ) | (-0.5 | ) | JPY | 16,779 | $ | 100 | |||||||||
(Notes)
| * | US dollar amounts are translated from yen, for convenience only, at the rate of US$1 = 115 yen. |
| * | Comprehensive income (loss), adds net income to change in accumulated other comprehensive income (loss), were 8,308 million yen (loss) and 1,744 million yen (income) for the three months ended June 30, 2006 and 2005, respectively. Accumulated other comprehensive income (loss) includes foreign currency translation adjustments, minimum pension liability adjustment, unrealized gains (losses) on marketable securities and unrealized gains (losses) on derivative financial instruments. |
| * | In accordance with U.S. GAAP, a part of the consolidated financial information for the three months ended June 30, 2005 related to certain operations that were discontinued during the fiscal year ended March 31, 2006 has been reclassified. |
| * | The consolidated financial results for the three months ended June 30, 2005 have been revised from those already announced, and restated based on U.S. GAAP. |
Table of Contents
CONDENSED CONSOLIDATED BALANCE SHEETS
(In millions of yen, millions of U.S.dollars)
June 30, 2006 (Unaudited) | June 30, 2005 (Unaudited) | Increase (Decrease) | March 31, 2006 | Increase (Decrease) | June 30, 2006 (Unaudited) | |||||||||||||||||||
Current assets | JPY | 1,926,208 | JPY | 1,934,589 | JPY | (8,381 | ) | JPY | 2,106,753 | JPY | (180,545 | ) | $ | 16,750 | ||||||||||
Cash and cash equivalents | 417,574 | 420,041 | (2,467 | ) | 455,932 | (38,358 | ) | 3,631 | ||||||||||||||||
Notes and accounts receivable, trade | 773,842 | 757,408 | 16,434 | 997,050 | (223,208 | ) | 6,729 | |||||||||||||||||
Inventories | 518,776 | 553,453 | (34,677 | ) | 461,095 | 57,681 | 4,511 | |||||||||||||||||
Other current assets | 216,016 | 203,687 | 12,329 | 192,676 | 23,340 | 1,879 | ||||||||||||||||||
Long-term assets | 1,799,052 | 1,917,651 | (118,599 | ) | 1,789,029 | 10,023 | 15,644 | |||||||||||||||||
Long-term receivables, trade | 13,349 | 11,591 | 1,758 | 11,633 | 1,716 | 116 | ||||||||||||||||||
Investments and advances | 437,411 | 416,570 | 20,841 | 453,459 | (16,048 | ) | 3,804 | |||||||||||||||||
Property, plant and equipment | 698,724 | 731,764 | (33,040 | ) | 691,779 | 6,945 | 6,076 | |||||||||||||||||
Other assets | 649,568 | 757,726 | (108,158 | ) | 632,158 | 17,410 | 5,648 | |||||||||||||||||
Total assets | JPY | 3,725,260 | JPY | 3,852,240 | JPY | (126,980 | ) | JPY | 3,895,782 | JPY | (170,522 | ) | $ | 32,394 | ||||||||||
Current liabilities | JPY | 1,598,913 | JPY | 1,583,177 | JPY | 15,736 | JPY | 1,721,250 | JPY | (122,337 | ) | $ | 13,903 | |||||||||||
Short-term borrowings and current portion of long-term debt | 415,505 | 423,533 | (8,028 | ) | 322,380 | 93,125 | 3,613 | |||||||||||||||||
Notes and accounts payable, trade | 718,190 | 709,017 | 9,173 | 865,573 | (147,383 | ) | 6,245 | |||||||||||||||||
Other current liabilities | 465,218 | 450,627 | 14,591 | 533,297 | (68,079 | ) | 4,045 | |||||||||||||||||
Long-term liabilities | 1,022,078 | 1,277,087 | (255,009 | ) | 1,082,460 | (60,382 | ) | 8,888 | ||||||||||||||||
Long-term debt | 590,284 | 794,854 | (204,570 | ) | 644,151 | (53,867 | ) | 5,133 | ||||||||||||||||
Accrued pension and severance costs | 365,745 | 438,084 | (72,339 | ) | 368,109 | (2,364 | ) | 3,180 | ||||||||||||||||
Other | 66,049 | 44,149 | 21,900 | 70,200 | (4,151 | ) | 575 | |||||||||||||||||
Minority shareholders’ equity in consolidated subsidiaries | 198,325 | 207,867 | (9,542 | ) | 201,192 | (2,867 | ) | 1,725 | ||||||||||||||||
Total shareholders’ equity | 905,944 | 784,109 | 121,835 | 890,880 | 15,064 | 7,878 | ||||||||||||||||||
Common stock | 337,821 | 337,820 | 1 | 337,821 | — | 2,938 | ||||||||||||||||||
Additional paid-in capital | 524,800 | 501,124 | 23,676 | 500,819 | 23,981 | 4,563 | ||||||||||||||||||
Retained earnings | 85,994 | 69,035 | 16,959 | 74,537 | 11,457 | 748 | ||||||||||||||||||
Accumulated other comprehensive income (loss) | (39,193 | ) | (120,801 | ) | 81,608 | (19,428 | ) | (19,765 | ) | (341 | ) | |||||||||||||
Treasury stock | (3,478 | ) | (3,069 | ) | (409 | ) | (2,869 | ) | (609 | ) | (30 | ) | ||||||||||||
Total liabilities and shareholders’ equity | JPY | 3,725,260 | JPY | 3,852,240 | JPY | (126,980 | ) | JPY | 3,895,782 | JPY | (170,522 | ) | $ | 32,394 | ||||||||||
Interest-bearing debt (*1) | JPY | 1,005,789 | JPY | 1,218,387 | JPY | (212,598 | ) | JPY | 966,531 | JPY | 39,258 | $ | 8,746 | |||||||||||
Net interest-bearing debt (*2) | 588,215 | 798,346 | (210,131 | ) | 510,599 | 77,616 | 5,115 | |||||||||||||||||
Shareholders’ equity ratio (%) (*3) | 24.3 | 20.4 | 3.9 | 22.9 | 1.4 | |||||||||||||||||||
Debt-equity ratio (times) (*4) | 1.11 | 1.55 | (0.44 | ) | 1.08 | 0.03 | ||||||||||||||||||
Net debt-equity ratio (times) (*4) | 0.65 | 1.02 | (0.37 | ) | 0.57 | 0.08 | ||||||||||||||||||
Accumulated other comprehensive income (loss) breakdown: | ||||||||||||||||||||||||
Foreign currency translation adjustments | JPY | (6,160 | ) | JPY | (11,074 | ) | JPY | 4,914 | JPY | 1,567 | JPY | ( 7,727 | ) | $ | (54 | ) | ||||||||
Minimum pension liability adjustment | (91,695 | ) | (137,212 | ) | 45,517 | (90,581 | ) | (1,114 | ) | (797 | ) | |||||||||||||
Unrealized gains (losses) on marketable securities | 59,679 | 29,011 | 30,668 | 70,676 | (10,997 | ) | 519 | |||||||||||||||||
Unrealized gains (losses) on derivative financial instruments | (1,017 | ) | (1,526 | ) | 509 | (1,090 | ) | 73 | (9 | ) | ||||||||||||||
Total accumulated other comprehensive income (loss) | JPY | (39,193 | ) | JPY | (120,801 | ) | JPY | 81,608 | JPY | (19,428 | ) | JPY | (19,765 | ) | $ | (341 | ) | |||||||
(Notes)
| *1 | Interest-bearing debt is the sum of short-term borrowings, current portion of long-term debt and long-term debt. |
| *2 | Net interest-bearing debt is interest-bearing debt less cash and cash equivalents. |
| *3 | Shareholders’ equity ratio is shareholders’ equity divided by total assets. |
| *4 | Debt-equity ratio and net debt-equity ratio are interest-bearing debt and net interest-bearing debt divided by shareholders’ equity, respectively. |
| * | The consolidated financial results for the three months ended June 30, 2005 have been revised from those already announced, and restated based on U.S. GAAP. |
Table of Contents
CONDENSED CONSOLIDATED STATEMENTS OF CASH FLOWS(UNAUDITED)
(In millions of yen, millions of U.S. dollars)
Three months ended June 30 | 2006 | 2005 | Increase (Decrease) | 2006 | ||||||||||||
I. Cash flows from operating activities: | ||||||||||||||||
Net income (loss) | JPY | 11,457 | JPY | (5,322 | ) | JPY | 16,779 | $ | 100 | |||||||
Adjustments to reconcile net income to net cash provided by operating activities: | ||||||||||||||||
Depreciation and amortization | 59,318 | 68,353 | (9,035 | ) | 516 | |||||||||||
Equity in earnings of affiliated companies, net of dividends | (4,621 | ) | (69 | ) | (4,552 | ) | (40 | ) | ||||||||
Decrease in notes and accounts receivable | 226,257 | 160,338 | 65,919 | 1,967 | ||||||||||||
Increase in inventories | (58,205 | ) | (64,155 | ) | 5,950 | (506 | ) | |||||||||
Decrease in notes and accounts payable | (158,201 | ) | (131,475 | ) | (26,726 | ) | (1,376 | ) | ||||||||
Other, net | (103,078 | ) | (97,108 | ) | (5,970 | ) | (896 | ) | ||||||||
Net cash used by operating activities | (27,073 | ) | (69,438 | ) | 42,365 | (235 | ) | |||||||||
II. Cash flows from investing activities: | ||||||||||||||||
Proceeds from sales of fixed assets | 20,384 | 13,648 | 6,736 | 177 | ||||||||||||
Additions to fixed assets | (56,039 | ) | (53,304 | ) | (2,735 | ) | (487 | ) | ||||||||
Proceeds from sales of marketable securities | 1,761 | 228 | 1,533 | 15 | ||||||||||||
Purchase of marketable securities | (964 | ) | (38 | ) | (926 | ) | (8 | ) | ||||||||
Other, net | (7,216 | ) | (9,988 | ) | 2,772 | (63 | ) | |||||||||
Net cash used in investing activities | (42,074 | ) | (49,454 | ) | 7,380 | (366 | ) | |||||||||
Free cash flows (1+II) | (69,147 | ) | (118,892 | ) | 49,745 | (601 | ) | |||||||||
III. Cash flows from financing activities: | ||||||||||||||||
Net proceeds of bonds and borrowings | 34,221 | 40,775 | (6,554 | ) | 298 | |||||||||||
Proceeds from stock issuances by subsidiaries | 1,686 | — | 1,686 | 15 | ||||||||||||
Dividends paid | (5,493 | ) | (5,324 | ) | (169 | ) | (48 | ) | ||||||||
Other, net | (62 | ) | (34 | ) | (28 | ) | (1 | ) | ||||||||
Net cash provided in financing activities | 30,352 | 35,417 | (5,065 | ) | 264 | |||||||||||
Effect of exchange rate changes on cash and cash equivalents | 437 | 887 | (450 | ) | 3 | |||||||||||
Net decrease in cash and cash equivalents | (38,358 | ) | (82,588 | ) | 44,230 | (334 | ) | |||||||||
Cash and cash equivalents at beginning of period | 455,932 | 502,629 | (46,697 | ) | 3,965 | |||||||||||
Cash and cash equivalents at end of period | JPY | 417,574 | JPY | 420,041 | JPY | (2,467 | ) | $ | 3,631 | |||||||
| (Note) |
| * | The consolidated financial results for the three months ended June 30, 2005 have been revised from those already announced, and restated based on U.S. GAAP. |
Table of Contents
SEGMENT INFORMATION (UNAUDITED)
Business Segment Information
(1) Net Sales (Including internal sales to other segments)
(In millions of yen, millions of U.S. dollars)
Three months ended June 30 | 2006 | (% of total) | % change | 2005 | (% of total) | 2006 | ||||||||||||||
IT/Network Solutions Business | JPY | 556,854 | (54.7 | ) | +7.5 | JPY | 518,102 | (52.2 | ) | $ | 4,842 | |||||||||
Mobile/Personal Solutions Business | 238,312 | (23.4 | ) | -15.1 | 280,773 | (28.3 | ) | 2,072 | ||||||||||||
Electron Devices Business | 204,027 | (20.0 | ) | +12.4 | 181,570 | (18.3 | ) | 1,774 | ||||||||||||
Others | 124,852 | (12.3 | ) | +6.7 | 117,015 | (11.8 | ) | 1,086 | ||||||||||||
Eliminations | (105,671 | ) | (-10.4 | ) | — | (104,613 | ) | (-10.6 | ) | (919 | ) | |||||||||
Consolidated total | JPY | 1,018,374 | (100.0 | ) | +2.6 | JPY | 992,847 | (100.0 | ) | $ | 8,855 | |||||||||
(2) Segment Profit or Loss
(In millions of yen, millions of U.S. dollars)
Three months ended June 30 | 2006 | (% of profit on sales) | Increase (Decrease) | 2005 | (% of profit on sales) | 2006 | ||||||||||||||||
IT/Network Solutions Business | JPY | 27,602 | (5.0 | ) | JPY | 19,977 | JPY | 7,625 | (1.5 | ) | $ | 240 | ||||||||||
Mobile/Personal Solutions Business | (10,090 | ) | (-4.2 | ) | (14,409 | ) | 4,319 | (1.5 | ) | (88 | ) | |||||||||||
Electron Devices Business | (2,374 | ) | (-1.2 | ) | 7,347 | (9,721 | ) | (-5.4 | ) | (21 | ) | |||||||||||
Others | 9,998 | (8.0 | ) | 13,517 | (3,519 | ) | (-3.0 | ) | 87 | |||||||||||||
Eliminations | (1,715 | ) | — | (870 | ) | (845 | ) | — | (15 | ) | ||||||||||||
Unallocated corporate expenses* | (8,722 | ) | — | (992 | ) | (7,730 | ) | — | (75 | ) | ||||||||||||
| 14,699 | (1.4 | ) | 24,570 | (9,871 | ) | (-1.0 | ) | 128 | ||||||||||||||
Other income | 9,972 | 5,276 | 4,696 | 87 | ||||||||||||||||||
Other expenses | (11,738 | ) | (1,128 | ) | (10,610 | ) | (103 | ) | ||||||||||||||
Consolidated income from continuing operations before income taxes | JPY | 12,933 | JPY | 28,718 | JPY | (15,785 | ) | $ | 112 | |||||||||||||
(Notes)
| * | Unallocated corporate expenses include general corporate expenses and research and development expenses at NEC Corporation which are not allocated to any business segment. |
| * | In accordance with U.S. GAAP, a part of the consolidated financial information for the three months ended June 30, 2005 related to certain operations that were discontinued during the fiscal year ended March 31, 2006 has been reclassified. |
| * | The consolidated financial results for the three months ended June 30, 2005 have been revised from those already announced, and restated based on U.S. GAAP. |
| * | NEC changed its business segments as of the consolidated financial results for the three months ended June 30, 2006 in accordance with the reorganization of the company structure that became effective on April 1, 2006. The consolidated financial results for the first quarter of the fiscal year ended March 31, 2006 have been revised and reclassified in accordance with the new business segments. |
Table of Contents
(3) Net Sales to External Customers
(In billions of yen, millions of U.S. dollars)
Three months ended June 30 | 2006 | 2005 | % change | 2006 | |||||||
IT/Network Solutions Business | JPY | 537.9 | JPY | 499.4 | +7.7 | $ | 4,677 | ||||
Domestic | 424.3 | 399.9 | +6.1 | 3,690 | |||||||
Overseas | 113.6 | 99.5 | +14.2 | 987 | |||||||
Mobile/Personal Solutions Business | 200.1 | 243.9 | -18.0 | 1,740 | |||||||
Domestic | 150.0 | 192.6 | -22.1 | 1,305 | |||||||
Overseas | 50.1 | 51.3 | -2.6 | 435 | |||||||
Electron Devices Business | 197.2 | 170.6 | +15.6 | 1,715 | |||||||
Domestic | 96.8 | 89.3 | +8.4 | 842 | |||||||
Overseas | 100.4 | 81.3 | +23.6 | 873 | |||||||
Others | 83.2 | 78.9 | +5.4 | 723 | |||||||
Domestic | 41.2 | 39.4 | +4.2 | 357 | |||||||
Overseas | 42.0 | 39.5 | +6.5 | 366 | |||||||
Consolidated total | JPY | 1,018.4 | JPY | 992.8 | +2.6 | $ | 8,855 | ||||
Domestic | 712.3 | 721.2 | -1.2 | 6,194 | |||||||
Overseas | 306.1 | 271.6 | +12.7 | 2,661 | |||||||
(4) Net Sales by Products and Services (Including internal sales to other segments)
(In billions of yen, millions of U.S. dollars)
Three months ended June 30 | 2006 | 2005 | % change | 2006 | |||||||
IT/Network Solutions Business | JPY | 556.9 | JPY | 518.1 | +7.5 | $ | 4,842 | ||||
IT Services/System Integration | 146.2 | 141.2 | +3.5 | 1,271 | |||||||
IT Platforms | 122.8 | 122.7 | +0.1 | 1,068 | |||||||
Network Systems | 229.3 | 207.9 | +10.3 | 1,994 | |||||||
Social Infrastructure | 58.6 | 46.3 | +26.6 | 509 | |||||||
Mobile/Personal Solutions Business | JPY | 238.3 | JPY | 280.8 | -15.1 | $ | 2,072 | ||||
Mobile Terminals | 79.1 | 113.9 | -30.6 | 688 | |||||||
Personal Solutions | 159.2 | 166.9 | -4.6 | 1,384 | |||||||
Electron Devices Business | JPY | 204.0 | JPY | 181.6 | +12.4 | $ | 1,774 | ||||
Semiconductors | 165.2 | 146.1 | +13.1 | 1,437 | |||||||
Electronic Components and Others | 38.8 | 35.5 | +9.3 | 337 | |||||||
(Notes)
| * | In accordance with U.S. GAAP, a part of the consolidated financial information for the three months ended June 30, 2005 related to certain operations that were discontinued during the fiscal year ended March 31, 2006 has been reclassified. |
| * | The consolidated financial results for the three months ended June 30, 2005 have been revised from those already announced, and restated based on U.S. GAAP. |
| * | NEC changed its business segments as of the consolidated financial results for the three months ended June 30, 2006 in accordance with the reorganization of the company structure that became effective on April 1, 2006. The consolidated financial results for the first quarter of the fiscal year ended March 31, 2006 have been revised and reclassified in accordance with the new business segments. |
Table of Contents
(Note)
“Operating income (loss)” set forth above is a measure commonly used by other Japanese companies that report their financial results in accordance with generally accepted accounting financial reporting practices in Japan. “Operating income (loss)” is calculated by deducting cost of sales and selling, general and administrative expenses from net sales. Management believes this measure is useful to investors in comparing NEC’s results of operations to other Japanese companies. This measure, however, should not be construed as an alternative to “income before income (loss) taxes” or “net income (loss)” as determined in accordance with U.S. GAAP. Please refer to the condensed consolidated statement of operations for the calculation of operating income (loss).
CAUTIONARY STATEMENTS:
This material contains forward-looking statements pertaining to strategies, financial targets, technology, products and services, and business performance of NEC Corporation and its consolidated subsidiaries (collectively “NEC”). Written forward-looking statements may appear in other documents that NEC files with stock exchanges or regulatory authorities, such as the U.S. Securities and Exchange Commission, and in reports to shareholders and other communications. The U.S. Private Securities Litigation Reform Act of 1995 contains, and other applicable laws may contain, a safe-harbor for forward-looking statements, on which NEC relies in making these disclosures. Some of the forward-looking statements can be identified by the use of forward-looking words such as “believes,” “expects,” “may,” “will,” “should,” “seeks,” “intends,” “plans,” “estimates,” “aims,” or “anticipates,” or the negative of those words, or other comparable words or phrases. You can also identify forward-looking statements by discussions of strategy, beliefs, plans, targets, or intentions. Forward-looking statements necessarily depend on currently available assumptions, data, or methods that may be incorrect or imprecise and NEC may not be able to realize the results expected by them. You should not place undue reliance on forward-looking statements, which reflect NEC’s analysis and expectations only. Forward-looking statements are not guarantees of future performance and involve inherent risks and uncertainties. A number of important factors could cause actual results to differ materially from those in the forward-looking statements. Among the factors that could cause actual results to differ materially from such statements include (i) global economic conditions and general economic conditions in NEC’s markets, (ii) fluctuating demand for, and competitive pricing pressure on, NEC’s products and services, (iii) NEC’s ability to continue to win acceptance of NEC’s products and services in highly competitive markets, (iv) NEC’s ability to expand into foreign markets, such as China, (v) regulatory change and uncertainty and potential legal liability relating to NEC’s business and operations, (vi) NEC’s ability to restructure, or otherwise adjust, its operations to reflect changing market conditions, and (vii) movement of currency exchange rates, particularly the rate between the yen and the U.S. dollar. Any forward-looking statements speak only as of the date on which they are made. New risks and uncertainties come up from time to time, and it is impossible for NEC to predict these events or how they may affect NEC. NEC does not undertake any obligation to update or revise any of the forward-looking statements, whether as a result of new information, future events, or otherwise.
The management targets included in this material are not projections, and do not represent management’s current estimates of future performance. Rather, they represent targets that management will strive to achieve through the successful implementation of NEC’s business strategies.
Finally, NEC cautions you that the statements made in this material are not an offer of securities for sale. The securities may not be offered or sold in any jurisdiction in which registration is required absent registration or an exemption from registration under the applicable securities laws. For example, any public offering of securities to be made in the United States must be registered under the U.S. Securities Act of 1933 and made by means of an English language prospectus that contains detailed information about NEC and management, as well as NEC’s financial statements.
***
Contacts: Diane Foley/Makoto Miyakawa
Corporate Communication Division
NEC Corporation
+81-3-3798-6511
Table of Contents
July 27, 2006
NEC Corporation
Kaoru Yano, President
(Tokyo Stock Exchange, 1st Section;
Code Number 6701)
Contact: Ken Fukuchi
Corporate Communications Division
+81-3-3798-6511
NEC, NEC Electronics, Matsushita, Panasonic Mobile and Texas Instruments
Establish New Joint Venture to Develop Communications Platform for Mobile
Handsets for the 3rd Generation (3G/3.5G) and Beyond
Development, Design, and Technology Licensing for Global Markets
TOKYO, July 27, 2006 —NEC Corporation (“NEC”), NEC Electronics Corporation (“NEC Electronics”), Matsushita Electric Industrial Co. Ltd. (“Matsushita”), Panasonic Mobile Communications Co. Ltd. (“Panasonic Mobile”) and Texas Instruments Incorporated (“Texas Instruments”) today announced that the five companies have signed an agreement to establish a new joint venture company. The company will conduct global development, design, and technology licensing for a hardware and software communications platform (*1) to manage the core communications functions for mobile handsets for the third generation (3G/3.5G) and beyond.
The new company, Adcore-Tech Co., Ltd (“Adcore-Tech”), is scheduled to be established in August, 2006 at the Yokosuka Research Park in Yokosuka, Japan, with approximately 180 employees. The five companies will jointly invest 12.0 billion yen in the new joint venture, with approximately 44 percent held jointly by NEC and NEC Electronics, approximately 44 percent held jointly by Matsushita and Panasonic Mobile, and approximately 12 percent held by Texas Instruments.
As mobile phones become increasingly sophisticated and improved with the integration of music, video, broadcasting and other new technologies for internet and high-speed, high-volume communications, an extraordinary amount of resources are required for their development.
Through this joint venture, NEC and Panasonic Mobile, which have played crucial roles in leading the industry in developing and implementing 3G/3.5G (W-CDMA/HSDPA) technology handsets, will team with communications chip(chipset) manufacturers Matsushita, NEC Electronics and Texas Instruments. This aims at concentration of the technologies and development resources of all five companies, thereby facilitating speedy and efficient development of the increasingly sophisticated communications technology for mobile handsets at 3G/3.5G and beyond, and contributing to the advancement of the 3G/3.5G and beyond mobile handset industry at large.
As a result, NEC and Panasonic Mobile will be able to continue delivering attractive products to mobile operators and users, which stay abreast of advances in communications technologies, and help improve the foundation of the companies’ mobile handset businesses.
Mobile handsets based on the new communications platform to be developed by the joint venture company are expected to become available in the fall of 2007.
The investment and operations of the new company will be established as follows:
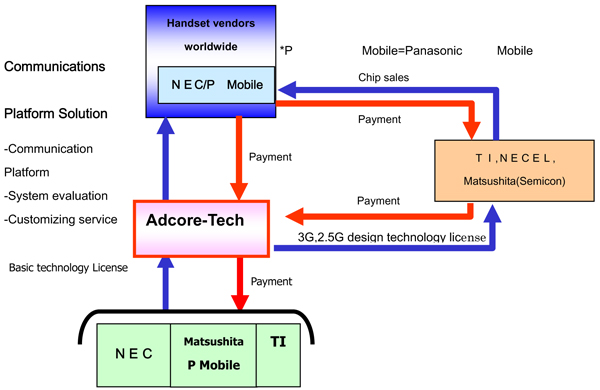
| 1. | In addition to investing in the new company, NEC, NEC Electronics, Matsushita, Panasonic Mobile, and Texas Instruments will license communications technology to the new company for 2.5G/3G/3.5G. Based on the technologies licensed, the new company will develop a competitive communications platform for 3G/3.5G and beyond. |
| 2. | The new company will license communications chip technology to NEC Electronics, Matsushita’s Semiconductor Company, and Texas Instruments. NEC and Panasonic Mobile will incorporate chips manufactured based on this technology into their mobile handsets. |
| 3. | NEC Electronics, Matsushita’s Semiconductor Company and Texas Instruments will also sell these chips to mobile handset manufacturers in Japan and worldwide. |
| 4. | The new company will license comprehensive solutions, including communications platform and necessary software, system evaluation, and customizing services to mobile handset manufacturers. |
| (*1) | Communication Platform |
All hardware and software covering (1) Basic circuit design for LSIs (2) Software to control basic circuit (3) Communication core to operate on (1) and (2), (4) Software operating as modem to coordinate (1) to (3).
Outline of the New Company (Tentative)
| Company name: | Adcore-Tech Co., Ltd | |
| Headquarters: | Yokosuka Research Park, Yokosuka City, Kanagawa Prefecture | |
| Date of establishment: | August, 2006 | |
| Business: | Development, licensing, maintenance service, and system evaluation of communications platform for mobile phones | |
| Capital: | 12.0 billion yen (6.0 billion yen capital; 6.0 billion yen capital reserves) | |
| Controlling stakes: | NEC / NEC Electronics: approximately 44% (5.3 billion yen) | |
| Matsushita / Panasonic Mobile: approximately 44% (5.3 billion yen) | ||
| Texas Instruments: approximately 12% (1.4 billion yen) | ||
| Employees: | Approximately 180 | |
| Management structure: | To be decided (President, Vice president, and 2 board members) | |
| At the time of establishment, the president will be appointed from Panasonic Mobile and the vice president from NEC. | ||
# # #
Table of Contents
CAUTIONARY STATEMENTS:
This material contains forward-looking statements pertaining to strategies, financial targets, technology, products and services, and business performance of NEC Corporation and its consolidated subsidiaries (collectively “NEC”). Written forward-looking statements may appear in other documents that NEC files with stock exchanges or regulatory authorities, such as the U.S. Securities and Exchange Commission, and in reports to shareholders and other communications. The U.S. Private Securities Litigation Reform Act of 1995 contains, and other applicable laws may contain, a safe-harbor for forward-looking statements, on which NEC relies in making these disclosures. Some of the forward-looking statements can be identified by the use of forward-looking words such as “believes,” “expects,” “may,” “will,” “should,” “seeks,” “intends,” “plans,” “estimates,” “aims,” or “anticipates,” or the negative of those words, or other comparable words or phrases. You can also identify forward-looking statements by discussions of strategy, beliefs, plans, targets, or intentions. Forward-looking statements necessarily depend on currently available assumptions, data, or methods that may be incorrect or imprecise and NEC may not be able to realize the results expected by them. You should not place undue reliance on forward-looking statements, which reflect NEC’s analysis and expectations only. Forward-looking statements are not guarantees of future performance and involve inherent risks and uncertainties. A number of important factors could cause actual results to differ materially from those in the forward-looking statements. Among the factors that could cause actual results to differ materially from such statements include (i) global economic conditions and general economic conditions in NEC’s markets, (ii) fluctuating demand for, and competitive pricing pressure on, NEC’s products and services, (iii) NEC’s ability to continue to win acceptance of NEC’s products and services in highly competitive markets, (iv) NEC’s ability to expand into foreign markets, such as China, (v) regulatory change and uncertainty and potential legal liability relating to NEC’s business and operations, (vi) NEC’s ability to restructure, or otherwise adjust, its operations to reflect changing market conditions, and (vii) movement of currency exchange rates, particularly the rate between the yen and the U.S. dollar. Any forward-looking statements speak only as of the date on which they are made. New risks and uncertainties come up from time to time, and it is impossible for NEC to predict these events or how they may affect NEC. NEC does not undertake any obligation to update or revise any of the forward-looking statements, whether as a result of new information, future events, or otherwise.
The management targets included in this material are not projections, and do not represent management’s current estimates of future performance. Rather, they represent targets that management will strive to achieve through the successful implementation of NEC’s business strategies.
Finally, NEC cautions you that the statements made in this material are not an offer of securities for sale. The securities may not be offered or sold in any jurisdiction in which registration is required absent registration or an exemption from registration under the applicable securities laws. For example, any public offering of securities to be made in the United States must be registered under the U.S. Securities Act of 1933 and made by means of an English language prospectus that contains detailed information about NEC and management, as well as NEC’s financial statements.
Table of Contents
July 27, 2006
NEC Corporation
Kaoru Yano, President
(Tokyo Stock Exchange, 1st Section;
Code Number 6701)
Contact: Ken Fukuchi
Corporate Communications Division
+81-3-3798-6511
NEC, Matsushita and Panasonic Sign Agreement to Establish
New Joint Venture for Mobile Handsets
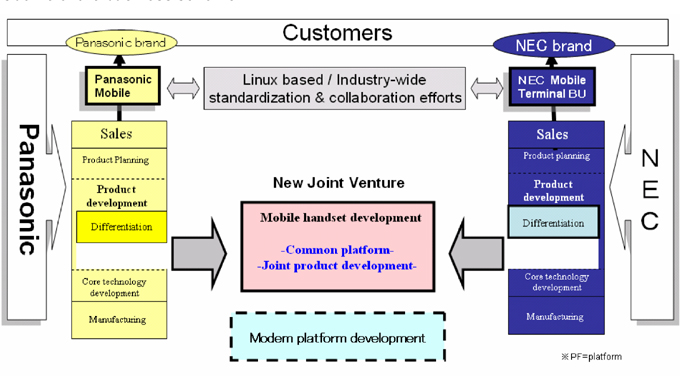
Tokyo, July 27, 2006 – NEC Corporation (“NEC”), Matsushita Electric Industrial Co., Ltd. (“Matsushita”) and Panasonic Mobile Communications Co., Ltd. (“Panasonic Mobile”) announced today the signing of a memorandum of understanding on the establishment of a development company for mobile handsets. The new company will contract development of mobile handsets and a common software and hardware platform.
Through this joint venture, the three companies intend to reinforce existing collaboration between NEC and Panasonic Mobile. The development of common middleware, applications, and hardware platform will enable the companies to avoid duplication of development efforts, leading to greater efficiency and enhanced development capabilities, and a reduction in both fixed and variable costs. This will equip NEC and Panasonic Mobile with a solid technology platform to stay at the top of innovation in functionality and communication speed as the industry moves to 3.5G and 3.9G technologies towards 2010, while simultaneously focusing resources on differentiation.
The three companies intend to establish this joint venture early October, 2006. The company will be capitalized at 100 million yen with an equal ownership between NEC and Panasonic Mobile.
The following are its main business.
| • | Planning and development of a common software platform |
| • | Planning and development of a common hardware platform |
| Ø | Design and evaluation of a common application CPU and integrated system LSI |
| Ø | Sourcing, design and evaluation of key devices |
| Ø | Design and manufacturing of an evaluation board |
| • | Joint development of mobile handsets (based on the above platform) |
Through this joint venture, NEC and Panasonic Mobile expect to create synergies by combining NEC’s expertise in communications and computer technologies and Panasonic Group’s strength in consumer electronics and audio visual products.
NEC and Panasonic Mobile will respectively handle product planning, product development, procurement and manufacturing, as well as sales of handsets bearing their respective brand names “NEC” and “Panasonic”.
NEC, Matsushita and Panasonic Mobile started collaboration on the development of mobile phones in August 2001. This effort has led to the successful shipment of NTT Docomo’s FOMA®mobile phones in November 2004, which incorporates a LinuxTM based middleware platform jointly developed by NTT Docomo, NEC, and Panasonic Mobile.
Outline of the business scheme
Outline of the New Company (Tentative)
| Company name: | To be decided | |
| Headquarters: | Tsuzuki ku, Yokohama City, Kanagawa Prefecture | |
| Date of establishment: | Early October, 2006 | |
| Main Business: | Development of a common hardware and a software platform for mobile handsets and joint development of mobile handsets | |
| Capital: | 100.0 million yen | |
| Ownership: | NEC Corporation (50%) | |
| Panasonic Mobile Communications Co., Ltd. (50%) | ||
| Employees: | Approximately 140 | |
| Management structure: | To be decided (President, Vice president, and 2 board members) | |
| At the time of establishment, the president will be appointed from NEC and the vice president from Panasonic Mobile. | ||
Linux is a registered trademark or a trademark of Linus Torvalds in the U.S. and other countries.
“FOMA” is a registered trademark of NTT DoCoMo Inc.
# # #
Table of Contents
CAUTIONARY STATEMENTS:
This material contains forward-looking statements pertaining to strategies, financial targets, technology, products and services, and business performance of NEC Corporation and its consolidated subsidiaries (collectively “NEC”). Written forward-looking statements may appear in other documents that NEC files with stock exchanges or regulatory authorities, such as the U.S. Securities and Exchange Commission, and in reports to shareholders and other communications. The U.S. Private Securities Litigation Reform Act of 1995 contains, and other applicable laws may contain, a safe-harbor for forward-looking statements, on which NEC relies in making these disclosures. Some of the forward-looking statements can be identified by the use of forward-looking words such as “believes,” “expects,” “may,” “will,” “should,” “seeks,” “intends,” “plans,” “estimates,” “aims,” or “anticipates,” or the negative of those words, or other comparable words or phrases. You can also identify forward-looking statements by discussions of strategy, beliefs, plans, targets, or intentions. Forward-looking statements necessarily depend on currently available assumptions, data, or methods that may be incorrect or imprecise and NEC may not be able to realize the results expected by them. You should not place undue reliance on forward-looking statements, which reflect NEC’s analysis and expectations only. Forward-looking statements are not guarantees of future performance and involve inherent risks and uncertainties. A number of important factors could cause actual results to differ materially from those in the forward-looking statements. Among the factors that could cause actual results to differ materially from such statements include (i) global economic conditions and general economic conditions in NEC’s markets, (ii) fluctuating demand for, and competitive pricing pressure on, NEC’s products and services, (iii) NEC’s ability to continue to win acceptance of NEC’s products and services in highly competitive markets, (iv) NEC’s ability to expand into foreign markets, such as China, (v) regulatory change and uncertainty and potential legal liability relating to NEC’s business and operations, (vi) NEC’s ability to restructure, or otherwise adjust, its operations to reflect changing market conditions, and (vii) movement of currency exchange rates, particularly the rate between the yen and the U.S. dollar. Any forward-looking statements speak only as of the date on which they are made. New risks and uncertainties come up from time to time, and it is impossible for NEC to predict these events or how they may affect NEC. NEC does not undertake any obligation to update or revise any of the forward-looking statements, whether as a result of new information, future events, or otherwise.
The management targets included in this material are not projections, and do not represent management’s current estimates of future performance. Rather, they represent targets that management will strive to achieve through the successful implementation of NEC’s business strategies.
Finally, NEC cautions you that the statements made in this material are not an offer of securities for sale. The securities may not be offered or sold in any jurisdiction in which registration is required absent registration or an exemption from registration under the applicable securities laws. For example, any public offering of securities to be made in the United States must be registered under the U.S. Securities Act of 1933 and made by means of an English language prospectus that contains detailed information about NEC and management, as well as NEC’s financial statements.