 © 2012 Total System Services, Inc. .® Proprietary. All rights reserved worldwide. 2011 Fourth Quarter and YTD Results January 24, 2012 Exhibit 99.2 |
 Forward-Looking Statements This presentation and comments made by management contain forward-looking statements including, among others, statements regarding the expected future operating results of TSYS. These statements are based on management’s current expectations and assumptions and are subject to risks, uncertainties and changes in circumstances. Forward-looking statements include all statements that are not historical facts and can be identified by the use of forward- looking terminology such as the words “believe,” “expect,” “anticipate,” “intend,” “plan,” “estimate” or similar expressions. Actual results may differ materially from those set forth in the forward-looking statements due to a variety of factors. More information about these risks, uncertainties and factors may be found in TSYS’ 2010 Annual Report on Form 10-K, Quarterly Reports on Form 10-Q and Current Reports on Form 8-K. TSYS does not assume any obligation to update any forward-looking statements as a result of new information, future developments or otherwise. 2 © 2012 Total System Services, Inc.® Proprietary. All rights reserved worldwide. |
 Use of Non-GAAP Financial Measures This slide presentation contains certain non-GAAP financial measures determined by methods other than in accordance with generally accepted accounting principles. Such non-GAAP financial measures include the following: revenues before reimbursable items; operating margin excluding reimbursable items; revenues measured on a constant currency basis; free cash flow; and EBITDA. The most comparable GAAP measures to these measures are revenues; operating margin; revenues; cash flows from operating activities; and net income, respectively. Management uses these non-GAAP financial measures to assess the performance of TSYS’ core business. TSYS believes that these non-GAAP financial measures provide meaningful additional information about TSYS to assist investors in evaluating TSYS’ operating results. These non-GAAP financial measures should not be considered as a substitute for operating results determined in accordance with GAAP and may not be comparable to other similarly titled measures of other companies. The computations of the non-GAAP financial measures used in this slide presentation are set forth in the Appendix to this slide presentation. 3 © 2012 Total System Services, Inc.® Proprietary. All rights reserved worldwide. |
 © 2012 Total System Services, Inc. .® Proprietary. All rights reserved worldwide. Phil Tomlinson Chairman and Chief Executive Officer |
 © 2012 Total System Services, Inc. .® Proprietary. All rights reserved worldwide. Jim Lipham Chief Financial Officer |
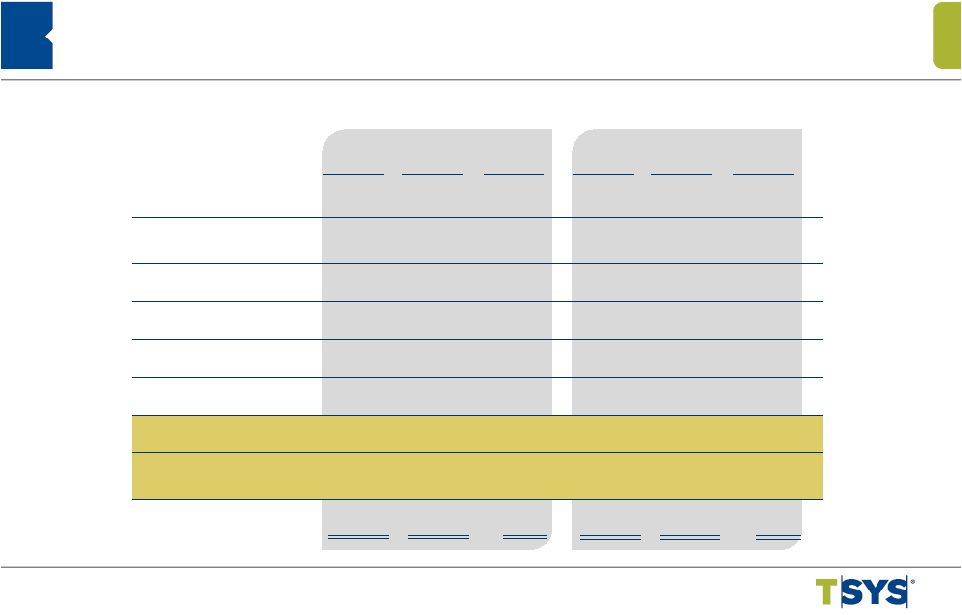
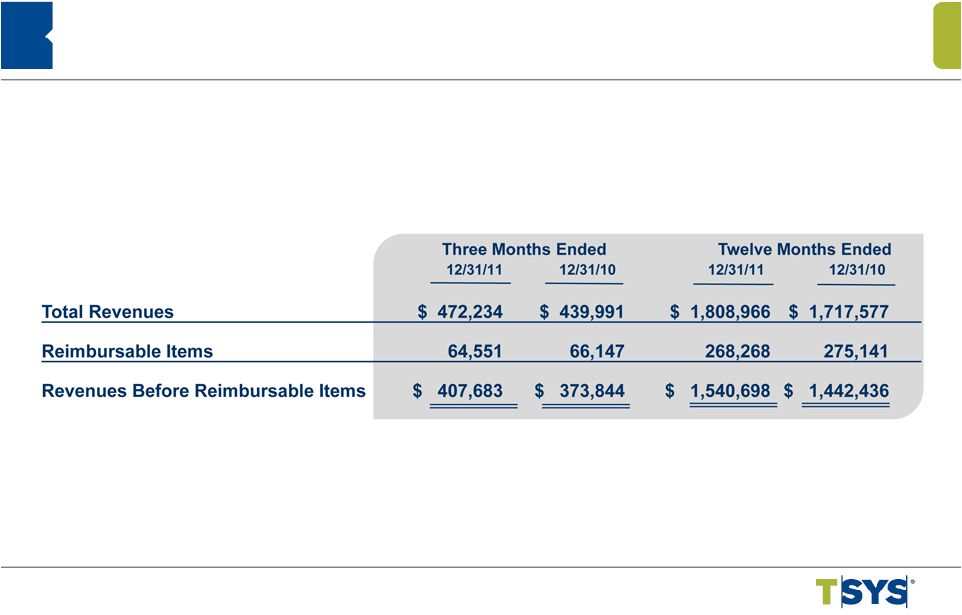
 Consolidated Selected Financial Highlights 6 © 2012 Total System Services, Inc.® Proprietary. All rights reserved worldwide. $ 472,234 $ 439,991 7.3% Total Revenues $ 1,808,966 $ 1,717,577 5.3% 407,683 373,844 9.1 Revenues Before Reimbursable Items 1,540,698 1,442,436 6.8 89,718 70,974 26.4 Operating Income 322,456 309,429 4.2 59,874 47,255 26.7 Income from Continuing Operations to TSYS Common Shareholders 220,559 197,192 11.8 59,874 47,173 26.9 Net Income Attributable to TSYS Common Shareholders 220,559 193,947 13.7 2,366.0 2,088.2 13.3 Total Cardholder Transactions (in millions) 8,687.8 7,670.4 13.3 $0.31 $0.24 29.4 Earnings Per Share from Continuing Operations Attributable to TSYS Common Shareholders $1.15 $1.00 14.4 YTD 2011 YTD 2010 Percent Change (in thousands, except per share data) 4th Qtr 2011 4th Qtr 2010 Percent Change |
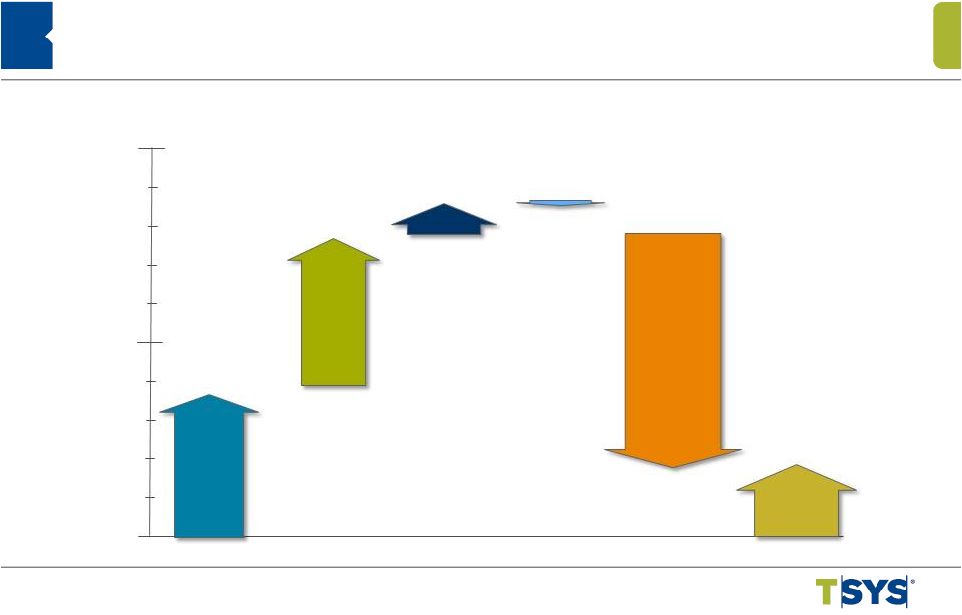
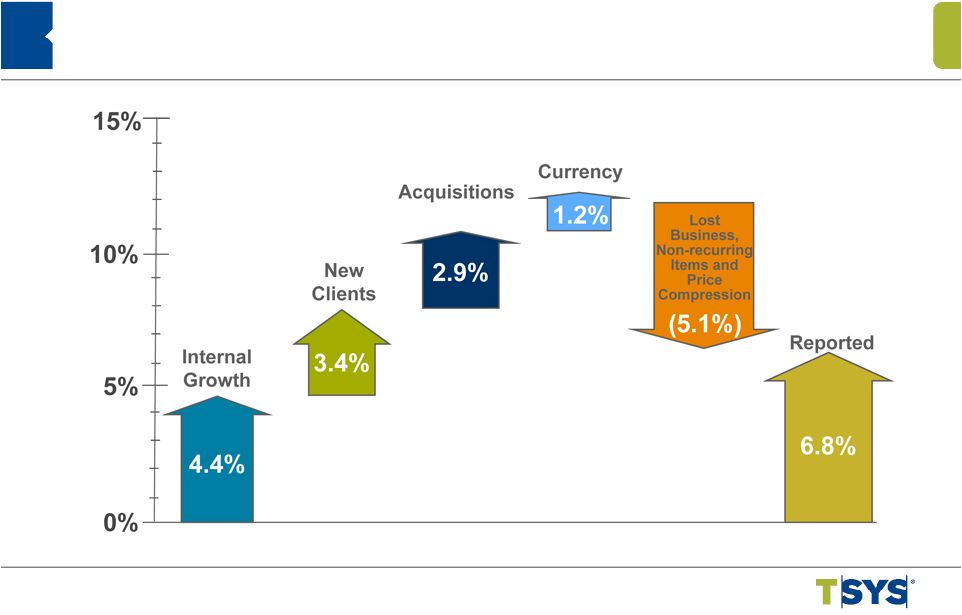 2011 YTD Revenue Change Revenues Before Reimbursable Items 7 © 2012 Total System Services, Inc.® Proprietary. All rights reserved worldwide. |
 Consolidated Accounts on File Portfolio Summary Consumer Credit 195.0 179.4 8.7 195.0 194.2 0.4 Government Services 29.7 28.1 5.7 29.7 32.6 (8.9) Retail 24.6 24.2 1.4 24.6 23.2 6.0 Total Consumer 249.3 231.7 7.6 249.3 250.0 (0.3) Commercial 61.9 49.7 24.4 61.9 59.6 3.9 Other 7.9 6.2 28.3 7.9 7.0 12.9 Subtotal 319.1 287.6 10.9 319.1 316.6 0.8 Prepaid / Stored Value 85.1 55.3 53.9 85.1 75.8 12.3 Total AOF 404.2 342.9 17.9 404.2 392.4 3.0 (in millions) Dec 2011 Dec 2010 % Change Dec 2011 Sep 2011 % Change 8 © 2012 Total System Services, Inc.® Proprietary. All rights reserved worldwide. |
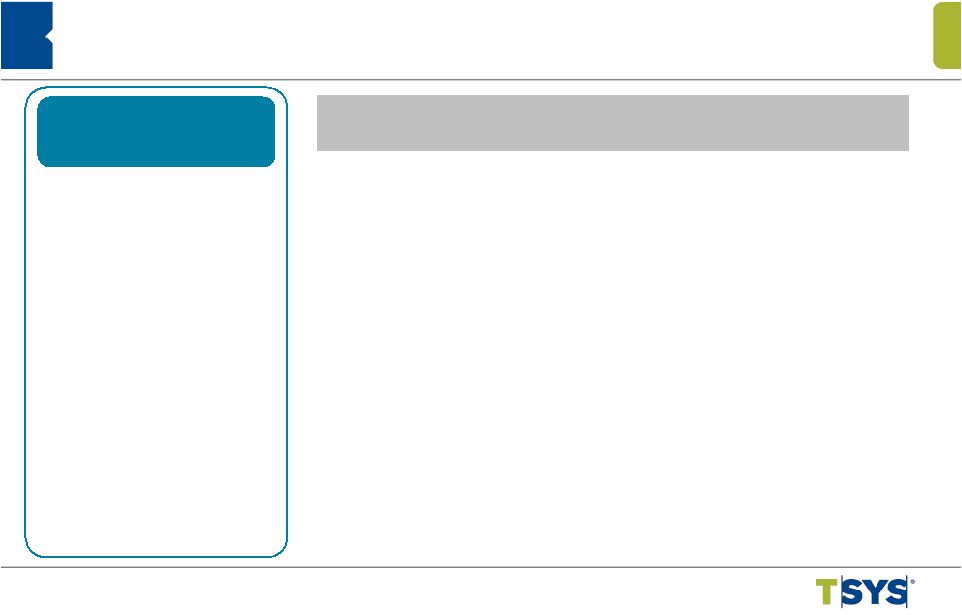 Key Drivers 4Q 2011 Year Over Year Segment Financial Highlights • Strong organic growth • Increased volumes • Volumes – Accounts on file were 351.4 million – Total cardholder transactions were 1,966.5 million, an increase of 13.6% Revenues $246.2 million Excluding Reimbursables $209.6 million Operating Income $66.6 million Operating Margin 27.0% Excluding Reimbursables 31.8% Same Client Transactions 1,954.8 million Increase of 13.0% North America Services 9 © 2012 Total System Services, Inc.® Proprietary. All rights reserved worldwide. |
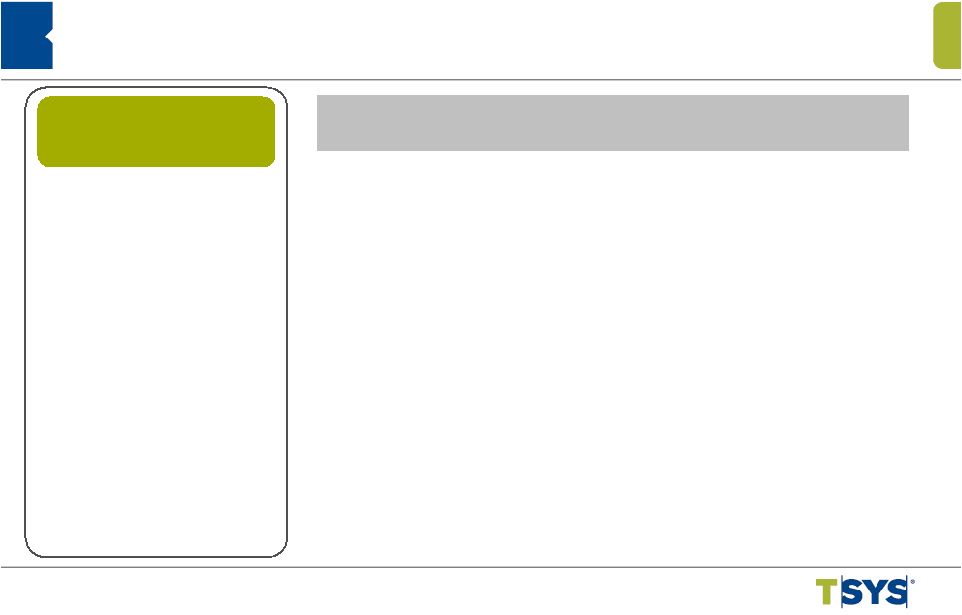 Key Drivers 4Q 2011 Year Over Year Segment Financial Highlights • Strong organic growth • Conversion of new clients • Volumes – Accounts on file were 52.8 million – Total cardholder transactions were 399.5 million, an increase of 11.7% 10 © 2012 Total System Services, Inc.® Proprietary. All rights reserved worldwide. Revenues $106.6 million Constant currency basis $106.5 million Operating Income $12.0 million Operating Margin 11.2% Excluding Reimbursables 11.7% Same Client Transactions 370.7 million Increase of 3.9% International Services |
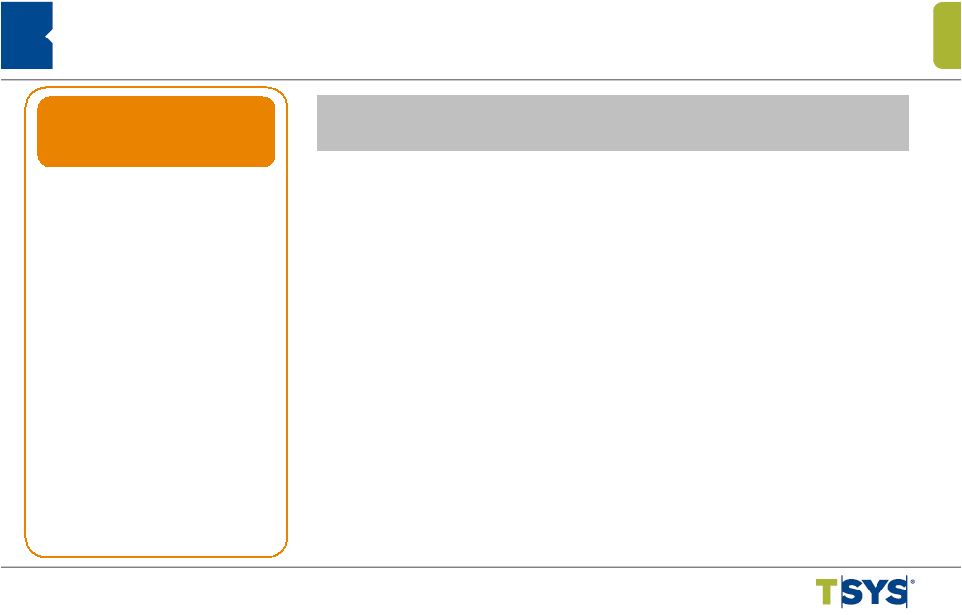 Key Drivers 4Q 2011 Year Over Year Segment Financial Highlights • Acquisition of TermNet • Decline in revenues associated with deconverted clients • Volumes – Point-of-Sale Transactions were 1,216.4 million, a decrease of 1.6% – Excluding deconverted clients, Point-of-Sale Transactions increased 6.6% 11 © 2012 Total System Services, Inc.® Proprietary. All rights reserved worldwide. Revenues $126.2 million Excluding Reimbursables $100.4 million Operating Income $33.0 million Operating Margin 26.1% Excluding Reimbursables 32.8% Merchant Services |
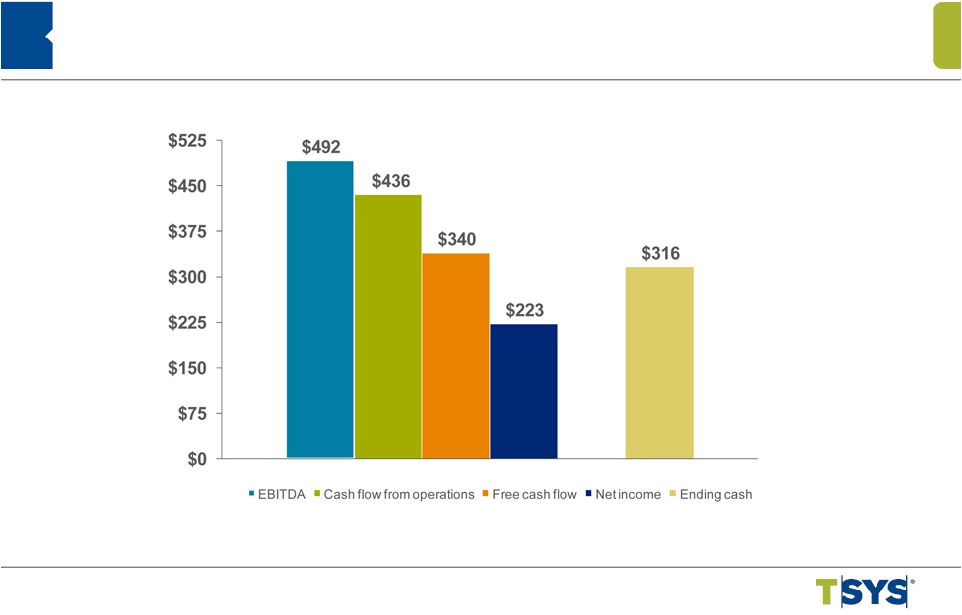 Cash Flow Strength: 2011 Consolidated Financial Highlights (in millions) 12 © 2012 Total System Services, Inc.® Proprietary. All rights reserved worldwide. |
 2012 Guidance ©2012 Total System Services, Inc.® Proprietary. All rights reserved worldwide. 13 Total Revenues $1,809 to $1,845 0 % to 2 % Revenues Before Reimbursable Items 1,569 to 1,624 2 to 5 Income from Continuing Operations Available to TSYS Common Shareholders 238 to 243 8 10 Earnings per Share from Continuing Operations $1.26 to $1.28 10 to 12 (in millions, except per share data) Range Change Range Percent Change |
 2012 Guidance Revenue Change Revenues Before Reimbursable Items 14 ©2012 Total System Services, Inc.® Proprietary. All rights reserved worldwide. 10% 5% 0% Internal Growth New Clients Acquisitions Lost Business, Non-recurring Items and Price Compression (5-6%) Guidance Currency 3-5% 1% 0% 2-5% 3-5% |
 © 2012 Total System Services, Inc. .® Proprietary. All rights reserved worldwide. Appendix |
 Appendix Non-GAAP Reconciliation – Revenues Before Reimbursable Items (in thousands) 16 © 2012 Total System Services, Inc.® Proprietary. All rights reserved worldwide. |
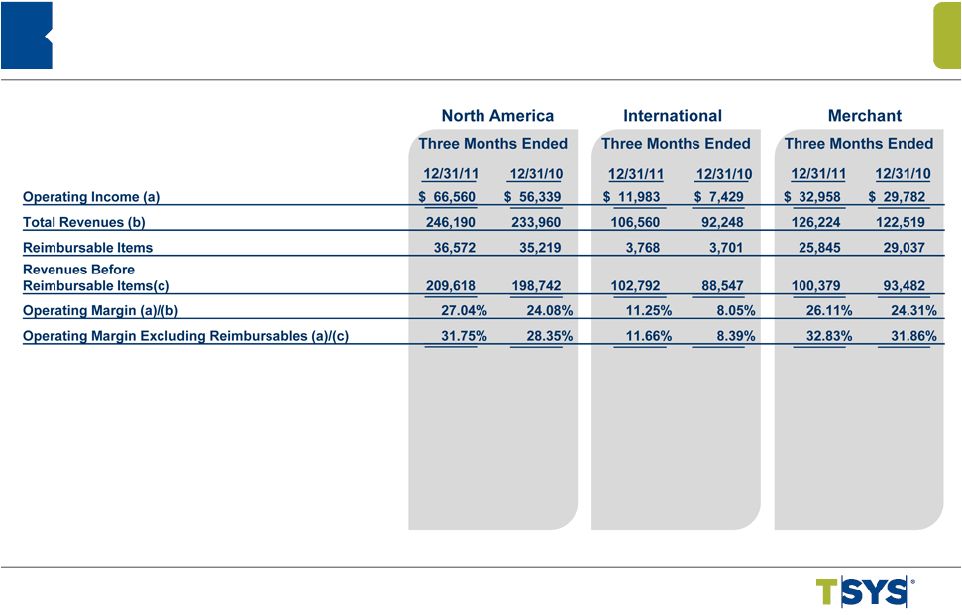 Appendix Non-GAAP Reconciliation – Segment Operating Margin Excluding Reimbursable Items (in thousands) 17 © 2012 Total System Services, Inc.® Proprietary. All rights reserved worldwide. |
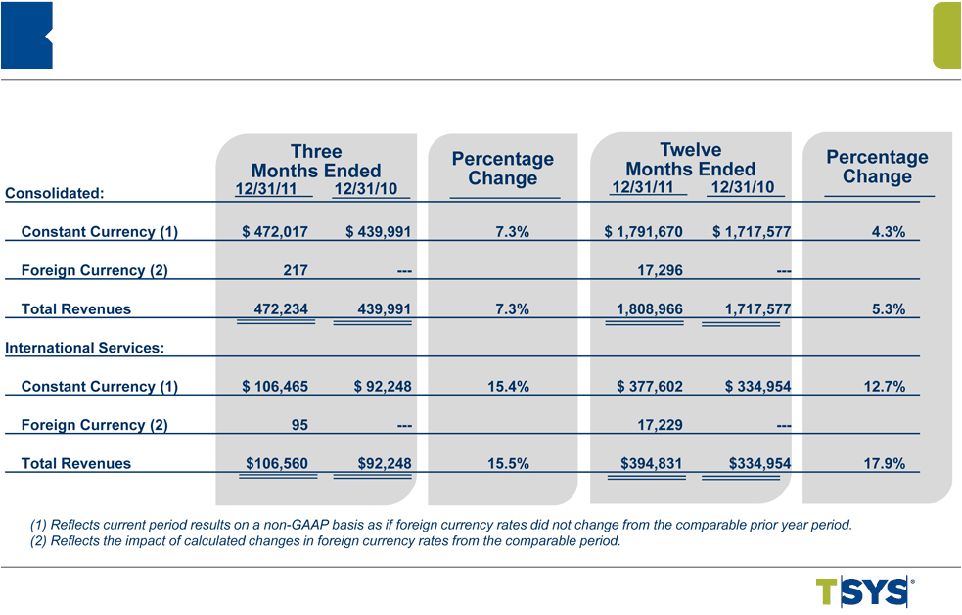 Appendix Non-GAAP Reconciliation – Constant Currency (in thousands) 18 © 2012 Total System Services, Inc.® Proprietary. All rights reserved worldwide. |
 Appendix Non-GAAP Reconciliation – EBITDA Twelve Months Ended 12/31/2011 Net Income $ 222,662 Adjusted for: Deduct: Equity in Income of Equity Investments (8,708) Add: Income Taxes 102,597 Add: Nonoperating expense 5,904 Add: Depreciation and Amortization 169,165 EBITDA $ 491,620 (in thousands) 19 © 2012 Total System Services, Inc.® Proprietary. All rights reserved worldwide. |
 Appendix Non-GAAP Reconciliation – Free Cash Flow Twelve Months Ended 12/31/2011 Cash Flows from Operating Activities $ 435,773 Less: Purchase of Property and Equipment (26,938) Additions to Licensed Computer Software from Vendors (19,502) Additions to Internally Developed Computer Software (17,882) Additions to Contract Acquisition Costs (31,622) Free Cash Flow $ 339,829 (in thousands) 20 © 2012 Total System Services, Inc.® Proprietary. All rights reserved worldwide. |