 2013 Fourth Quarter and YTD Results January 28, 2014 ©2014 Total System Services, Inc.® Proprietary. All rights reserved worldwide. Exhibit 99.2 |
 Forward-Looking Statements 2 This presentation and comments made by management contain forward- looking statements including, among others, statements regarding the expected future operating results of TSYS. These statements are based on management’s current expectations and assumptions and are subject to risks, uncertainties and changes in circumstances. Forward-looking statements include all statements that are not historical facts and can be identified by the use of forward-looking terminology such as the words “believe,” “expect,” “anticipate,” “intend,” “plan,” “potential”, “estimate” or similar expressions. Actual results may differ materially from those set forth in the forward-looking statements due to a variety of factors. More information about these risks, uncertainties and factors may be found in TSYS’ filings with the Securities and Exchange Commission, including its 2012 Annual Report on Form 10-K, Quarterly Reports on Form 10-Q and Current Reports on Form 8-K. TSYS does not assume any obligation to update any forward-looking statements as a result of new information, future developments or otherwise. ©2014 Total System Services, Inc.® Proprietary. All rights reserved worldwide. |
 Use of Non-GAAP Financial Measures 3 ©2014 Total System Services, Inc.® Proprietary. All rights reserved worldwide. This slide presentation contains certain non-GAAP financial measures determined by methods other than in accordance with generally accepted accounting principles. Such non-GAAP financial measures include the following: revenues before reimbursable items; operating margin excluding reimbursable items; revenues measured on a constant currency basis; free cash flow; EBITDA, adjusted EBITDA , adjusted cash earnings per share, adjusted segment operating income and adjusted segment operating margin. The most comparable GAAP measures to these measures are revenues; operating margin; revenues; cash flows from operating activities; net income; net income; earnings per share, operating income and operating margin, respectively. Management uses these non-GAAP financial measures to assess the performance of TSYS’ core business. TSYS believes that these non-GAAP financial measures provide meaningful additional information about TSYS to assist investors in evaluating TSYS’ operating results. These non-GAAP financial measures should not be considered as a substitute for operating results determined in accordance with GAAP and may not be comparable to other similarly titled measures of other companies. The computations of the non-GAAP financial measures used in this slide presentation are set forth in the Appendix to this slide presentation. |
 Phil Tomlinson Chairman and Chief Executive Officer ©2014 Total System Services, Inc.® Proprietary. All rights reserved worldwide. |
 Troy Woods President & Chief Operating Officer ©2014 Total System Services, Inc.® Proprietary. All rights reserved worldwide. |
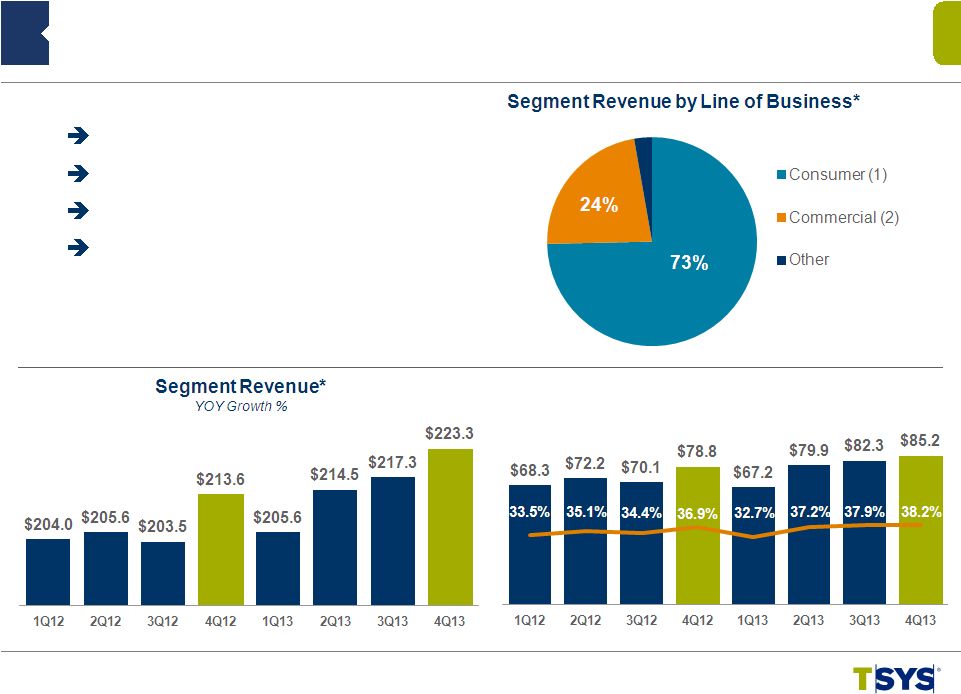 Improving Revenue Growth Annual Total Revenues Exceeded $1.0B Operating Income Up 8.1% Margin Expansion: Up 126 BPS Over 4Q12 4Q 2013 North America Segment Highlights 6 ©2014 Total System Services, Inc.® Proprietary. All rights reserved worldwide. ($ in millions) (*) Revenues Before Reimbursable Items ($ in millions) 4.9% 3.4% (1.3%) 1.9% 0.8% 4.4% 4.5% 6.8% Adjusted Segment Operating Income Operating Margin* 3% (1) Includes Credit, Debit, Retail, Prepaid & Loyalty (2) Includes Healthcare |
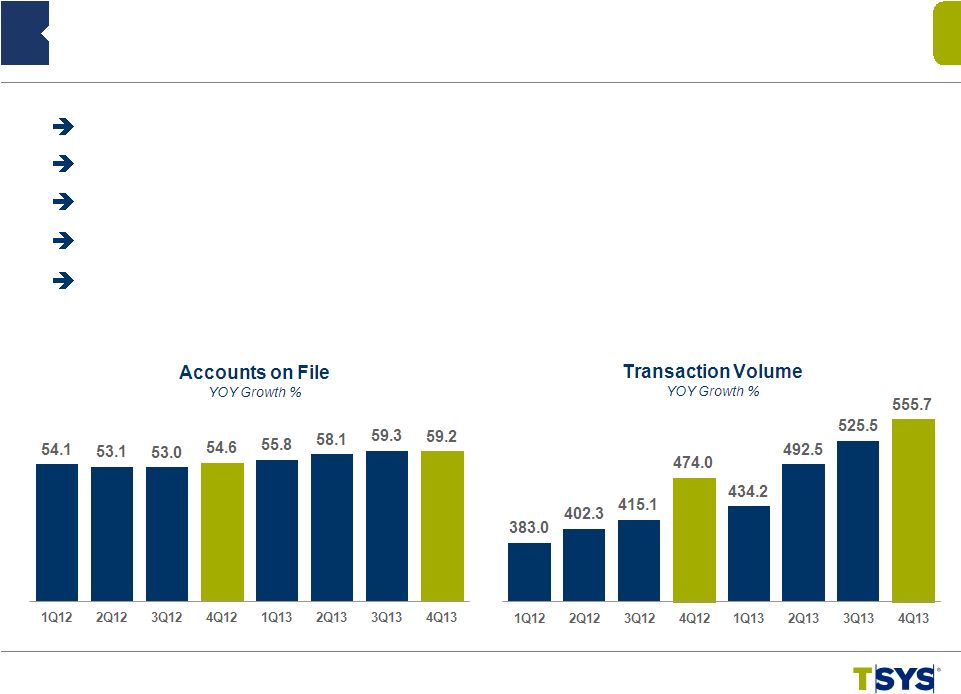
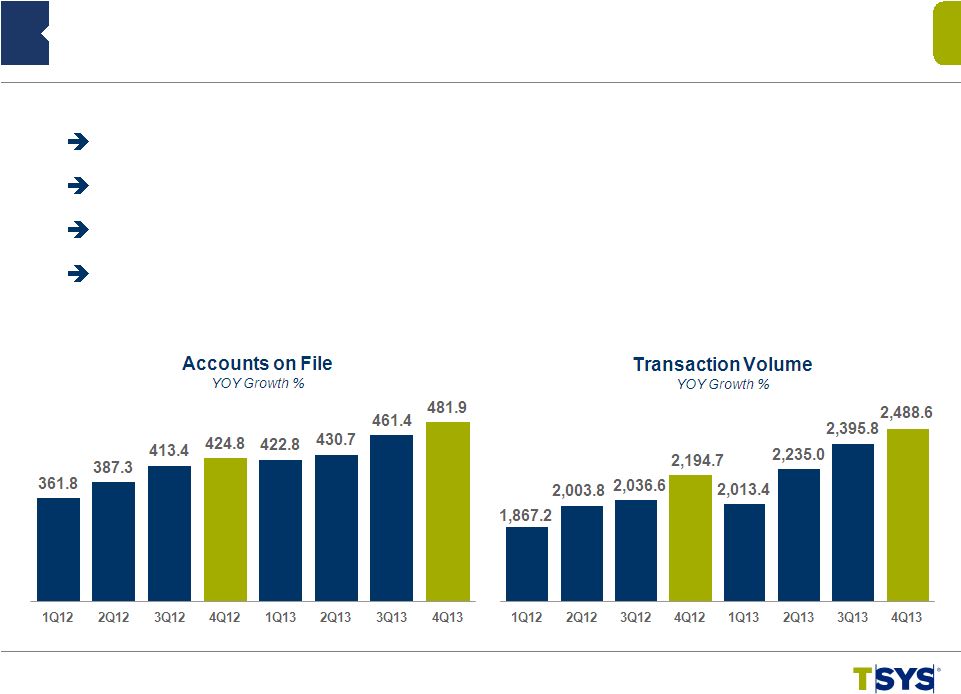 Twelfth Straight Quarter of Account On File YOY Growth Fifteenth Straight Quarter of Transaction YOY Growth Third Largest Quarter of Transaction Volume Same Client Transactions Up 10.6%: Seventeenth Straight Quarter of YOY Growth 4Q 2013 North America Segment Highlights 7 ©2014 Total System Services, Inc.® Proprietary. All rights reserved worldwide. (*) Growth Excluding Prepaid, Government Services and Single Use Accounts * (in millions) (in millions) 16.9% 7.2% 7.2% 3.4% 5.5% 5.2% 6.3% 16.2% 16.5% 18.0% 20.9% 20.9% 16.9% 11.2% 11.6% 13.4% 15.0% 12.1% 9.5% 12.7% 7.8% 11.5% 17.6% 13.4% |
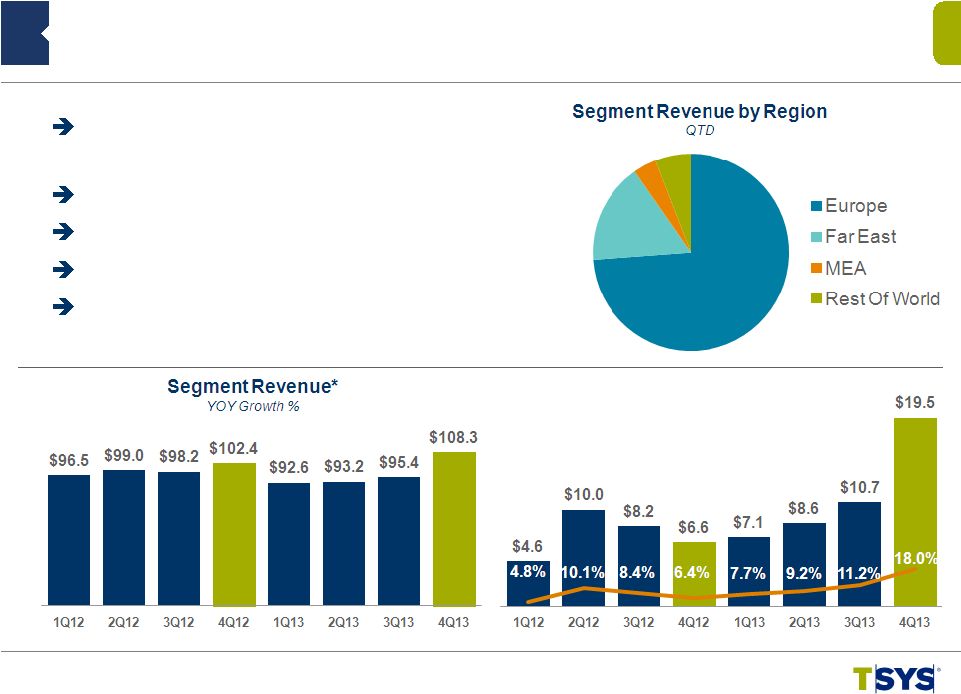 Revenue $108.3M* – Up 5.8% – Up 9.6% on Constant Currency Currency Headwinds Slowed: Q4 $4.0M* YTD $20.6M* Continued Focus on Margin Improvement Plans in Place to Accelerate Growth Expansion of Debit Opportunities 4Q 2013 International Segment Highlights 8 ©2014 Total System Services, Inc.® Proprietary. All rights reserved worldwide. ($ in millions) Reported Constant Currency (*) Revenues Before Reimbursable Items ($ in millions) Adjusted Segment Operating Income Operating Margin* 10.4% 5.6% 2.1% (0.4%) (4.0%) (5.9%) (2.8%) 11.6% 8.4% 4.7% (0.3%) 0.1% 0.4% 3.7% 5.8% 9.6% 74% 16% 4% 6% |
 4Q 2013 International Segment Highlights 9 ©2014 Total System Services, Inc.® Proprietary. All rights reserved worldwide. Strong AOF Growth, Despite Some Client Purging in Q4 2013 Irish Debit AOF Grew By 109.3% Double-digit Transaction Growth of 17.2% Same Client Transaction Growth 8.0% Debit Transactions More Than Doubled (in millions) (in millions) 14.7% 11.1% 4.9% 3.5% 3.2% 9.5% 12.0% 8.5% 17.5% 18.1% 15.1% 18.6% 13.3% 22.4% 26.6% 17.2% |
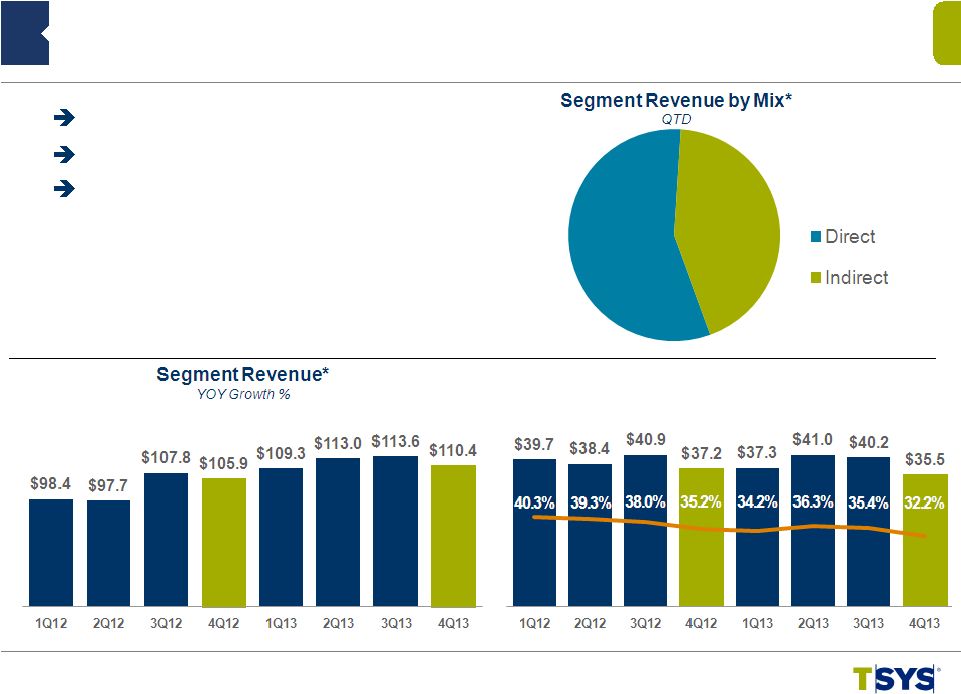 4Q 2013 Merchant Segment Highlights ©2014 Total System Services, Inc.® Proprietary. All rights reserved worldwide. 10 (*) Revenues Before Reimbursable Items ($ in millions) 13.7% 5.0% 15.6% 5.5% 11.1% 15.6% 5.4% 4.3% Adjusted Segment Operating Income Operating Margin* ($ in millions) 43% 57% Acquisitions Performing Well Sales Productivity Continues to Improve Expect Improved Operating Margins in 2H 2014 |
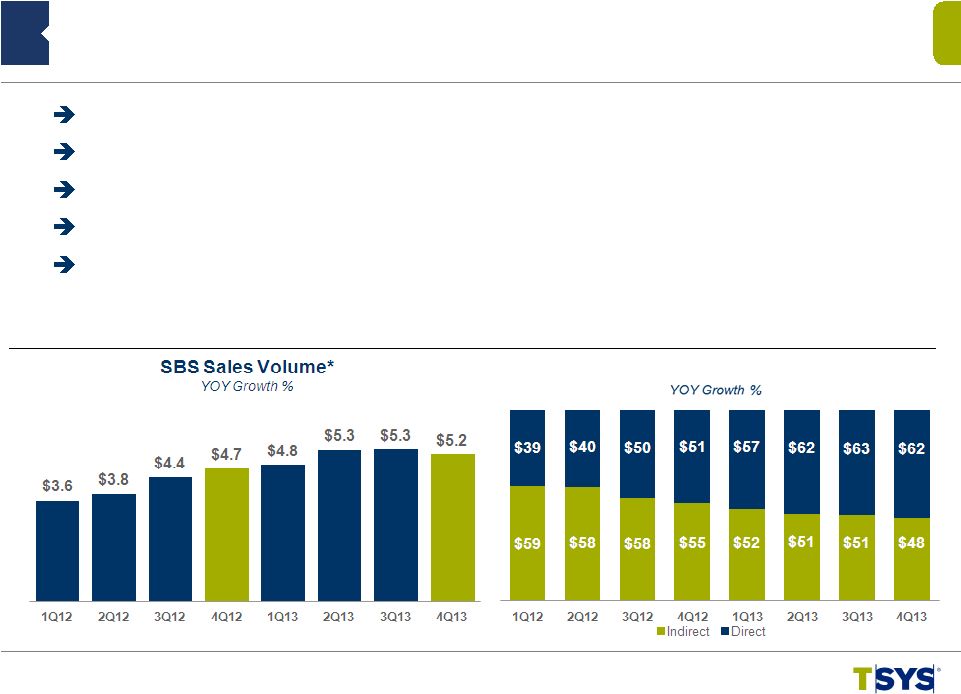 ©2014 Total System Services, Inc.® Proprietary. All rights reserved worldwide. 11 4Q 2013 Merchant Segment Highlights (*) Excludes Managed Accounts Segment Revenue by LOB ($ in billions) 30.0% 12.3% 23.0% 32.2% 35.3% 40.6% 22.0% 11.1% Direct Revenues Up 21.8% Indirect Revenues Down 12.2% Significant Milestone Achieved on Journey to Transform Merchant Segment POS Transactions Increased 3.8%, Excluding Deconverted Accounts Double-digit Small Business Sales Volume Growth (12%) 45% 55% 26% 22% (11%) (12%) (12%) ($ in millions) |
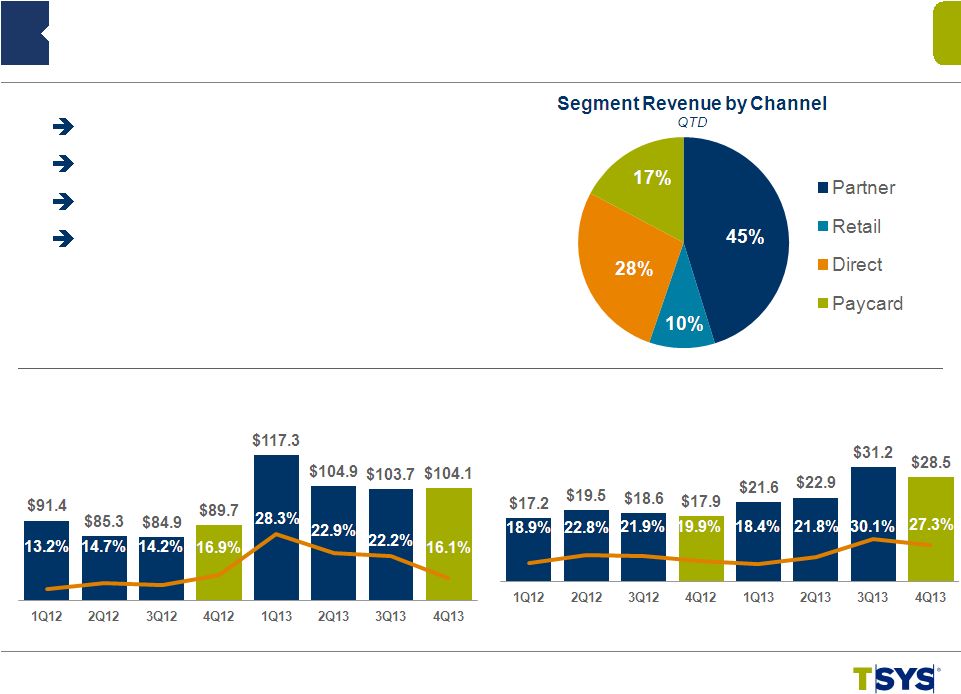 Adjusted Segment Operating Income Operating Margin* Segment Revenue YOY Growth % 4Q 2013 NetSpend Segment Highlights 12 ©2014 Total System Services, Inc.® Proprietary. All rights reserved worldwide. ($ in millions) Revenue $104.1M – up 16.1% Significant Year over Year Margin Expansion Added 4k Retail Locations Added 80+ New PayCard Clients ($ in millions) (*) Operating Income Excluding Amortization of Acquisition Intangibles, M&A Costs and Non-recurring Items, and beginning in 3Q13 also excludes corporate administrative expenses 3Q13 and 4Q13 Adjusted Operating Income represents NetSpend Segment Op.Inc |
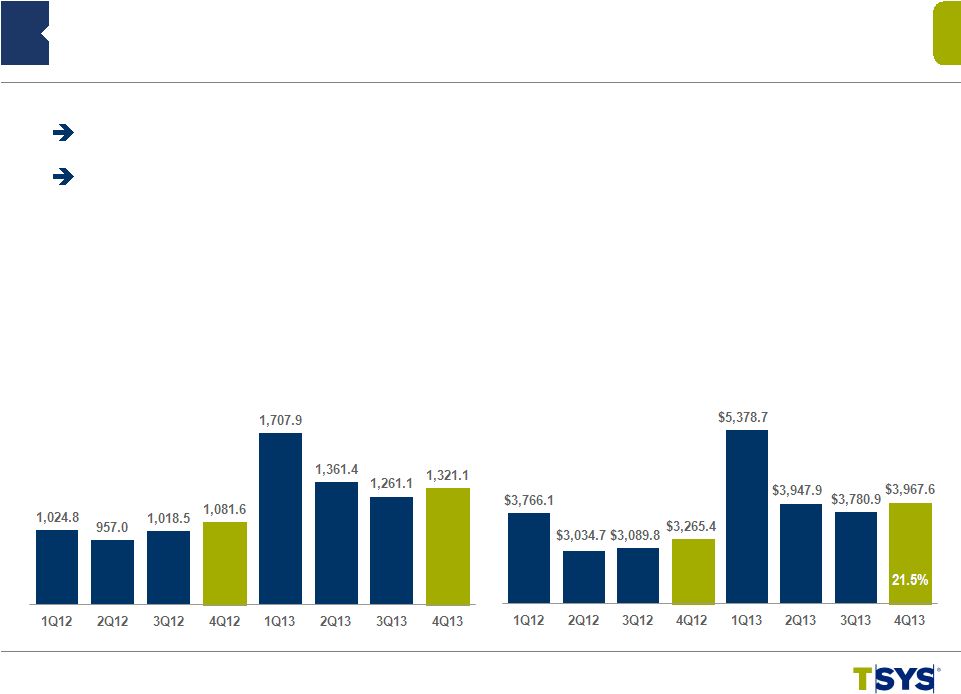 4Q 2013 NetSpend Segment Highlights 13 ©2014 Total System Services, Inc.® Proprietary. All rights reserved worldwide. Direct Deposit Active Cards YOY Growth % Direct Deposit Active Cards up 22.1% Gross Dollar Volume (GDV) up 21.5% (in thousands) ($ in millions) 22.9% 24.2% 24.8% 25.1% 66.7% 42.3% 23.8% 22.1% 17.1% 17.9% 18.2% 42.8% 30.1% 22.4% 18.4% Gross Dollar Volume YOY Growth % |
 Jim Lipham Chief Financial Officer ©2014 Total System Services, Inc.® Proprietary. All rights reserved worldwide. |
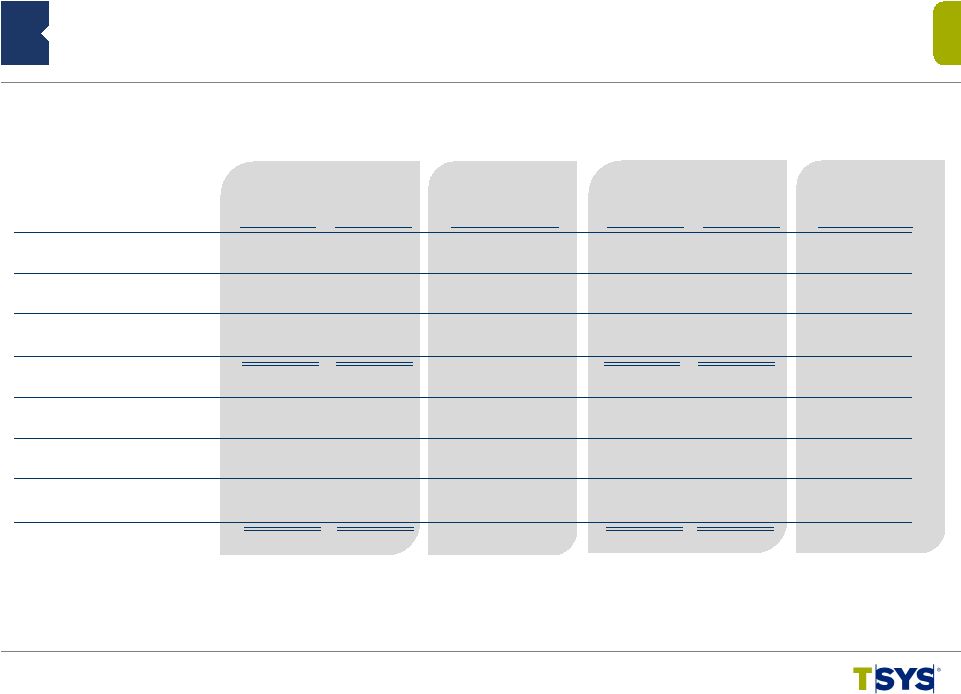
 Consolidated Selected Financial Highlights 15 ©2014 Total System Services, Inc.® Proprietary. All rights reserved worldwide. $600,840 $ 479,100 25.4% Total Revenues $2,132,353 $ 1,870,972 14.0% 542,996 418,569 29.7 Revenues Before Reimbursable Items 1,891,755 1,618,491 16.9 110,402 89,831 22.9 Operating Income 386,247 357,652 8.0 65,655 60,862 7.9 Net Income Attributable to TSYS Common Shareholders 244,750 244,280 0.2 Basic Earnings Per Share (EPS) Attributable to TSYS Common Shareholders: $0.35 $0.33 6.2 As Reported (GAAP) $1.30 $1.30 0.0 $0.48 $0.37 26.9 Adjusted Cash EPS* $1.72 $1.46 17.8 $184,234 $139,385 32.2 Adjusted EBITDA* $634,165 $546,883 16.0 YTD 2013 YTD 2012 Percent Change (in thousands, except per share data) 4 th Qtr 2013 4 th Qtr 2012 Change (*) Adjusted Cash EPS and Adjusted EBITDA definitions are contained in Appendix |
 2013 YTD Revenue Change Revenues Before Reimbursable Items 16 ©2014 Total System Services, Inc.® Proprietary. All rights reserved worldwide. 15% 20% 5% 0% 5.8% Internal Growth New Clients 3.5% Acquisitions Lost Business (5.3%) Non-recurring Items (0.6%) Price Compression (1.9%) (7.8%) Reported 16.9% Currency (1.3%) 16.7% 10% |
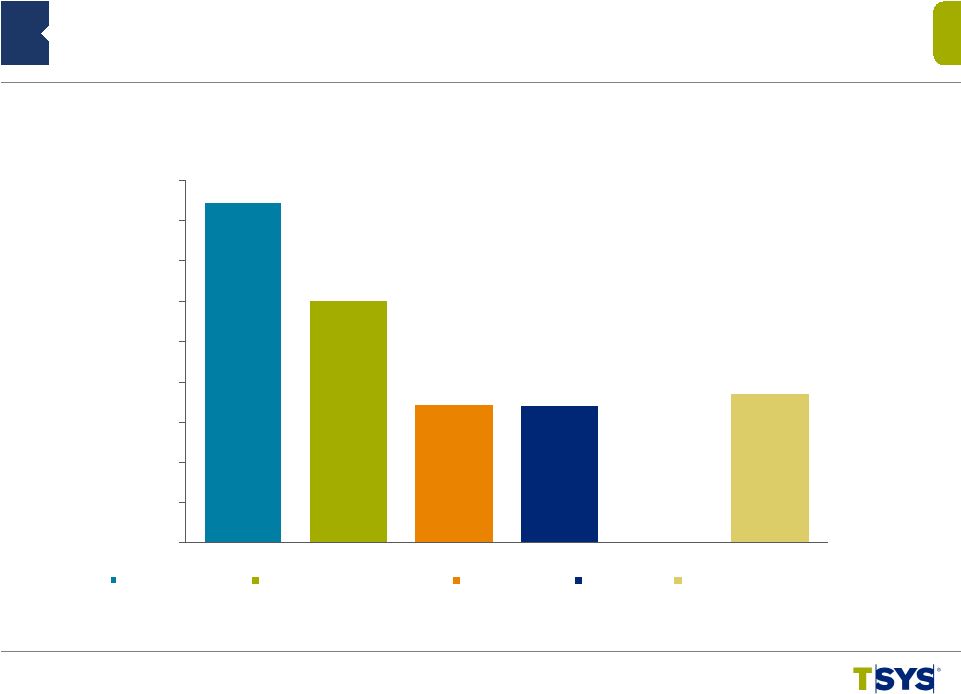
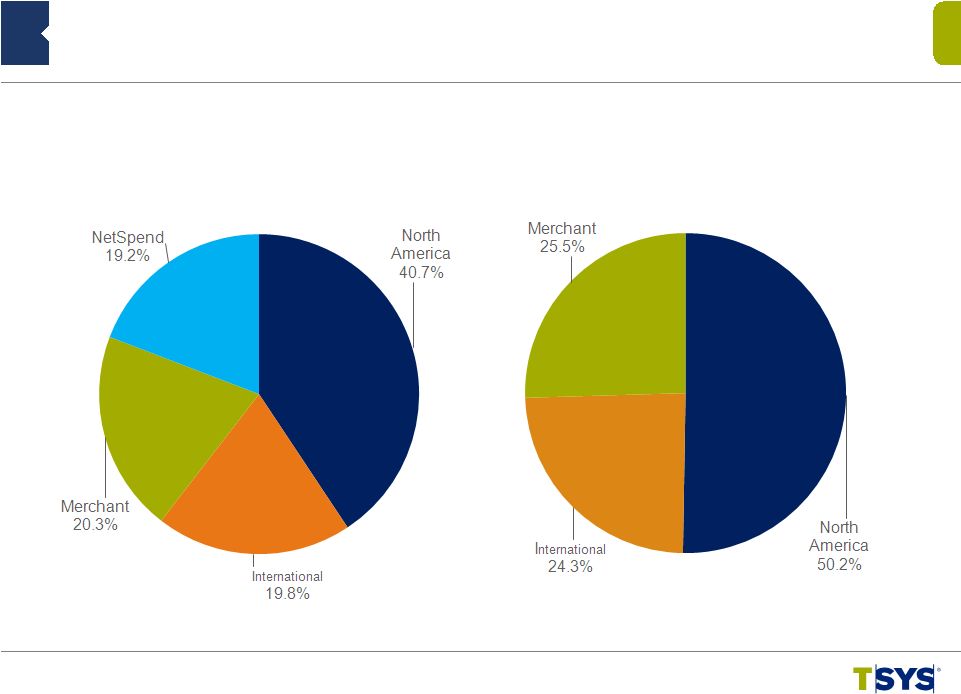 External Revenue Composition – Revenues before Reimbursable Items 4 th Qtr. 2013 ©2014 Total System Services, Inc.® Proprietary. All rights reserved worldwide. 4 th Qtr. 2012 17 |
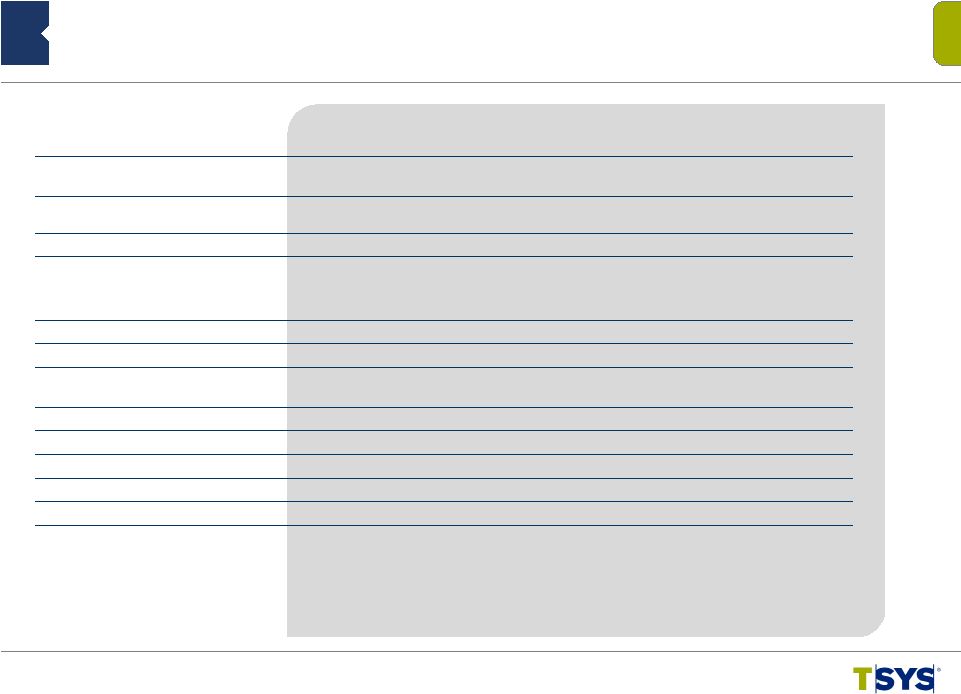
 Revenues before Reimbursable Items Adjusted Operating Margin Adjusted Segment Operating Income North America $85,205 $223,266 38.2% International 19,463 108,332 18.0% Merchant 35,526 110,375 32.2% NetSpend 28,470 104,144 27.3% Eliminations -- (3,121) Total Segments $168,664 $542,996 31.1% Amortization of acquisition intangibles (24,751) -- M&A expenses (2,211) -- Corporate administration (31,300) -- Consolidated $110,402 $542,996 20.3% Reconciliation of Segment Operating Margin to Consolidated Operating Margin (in thousands) 18 ©2014 Total System Services, Inc.® Proprietary. All rights reserved worldwide. Three Months Ended December 31, 2013 |
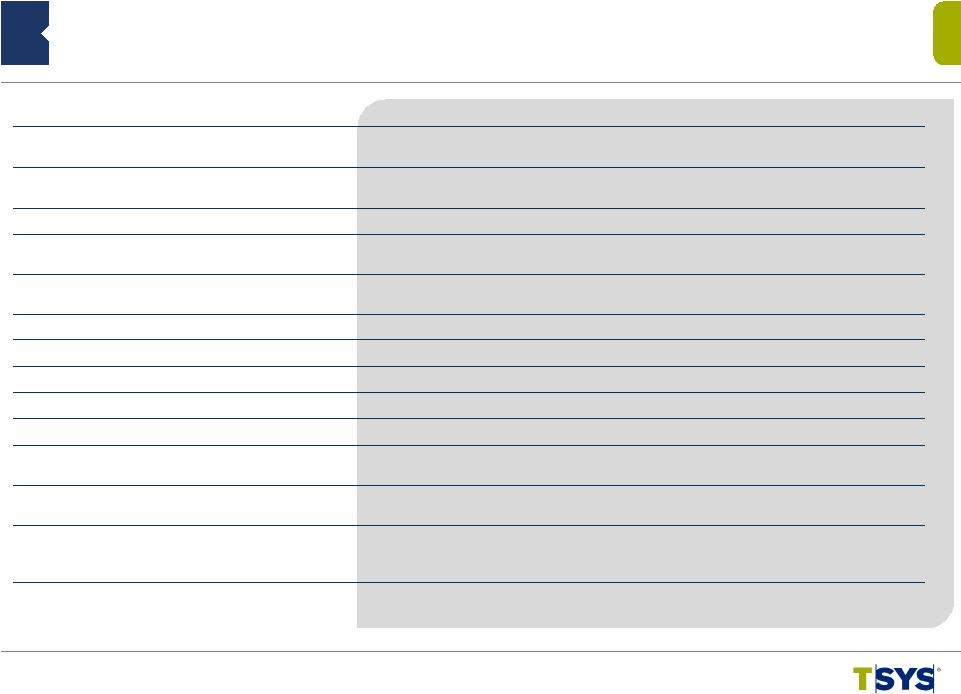
 Revenues before Reimbursable Items Adjusted Operating Margin Adjusted Segment Operating Income North America $314,577 $860,645 36.6% International 45,911 389,532 11.8% Merchant 154,047 446,277 34.5% NetSpend 59,717 207,851 28.7% Eliminations -- (12,550) Total Segments $574,252 $1,891,755 30.4% Amortization of acquisition intangibles (65,893) -- M&A expenses (14,220) -- Corporate administration (107,892) -- Consolidated $386,247 $1,891,755 20.4% Reconciliation of Segment Operating Margin to Consolidated Operating Margin (in thousands) 19 ©2014 Total System Services, Inc.® Proprietary. All rights reserved worldwide. Twelve Months Ended December 31, 2013 |
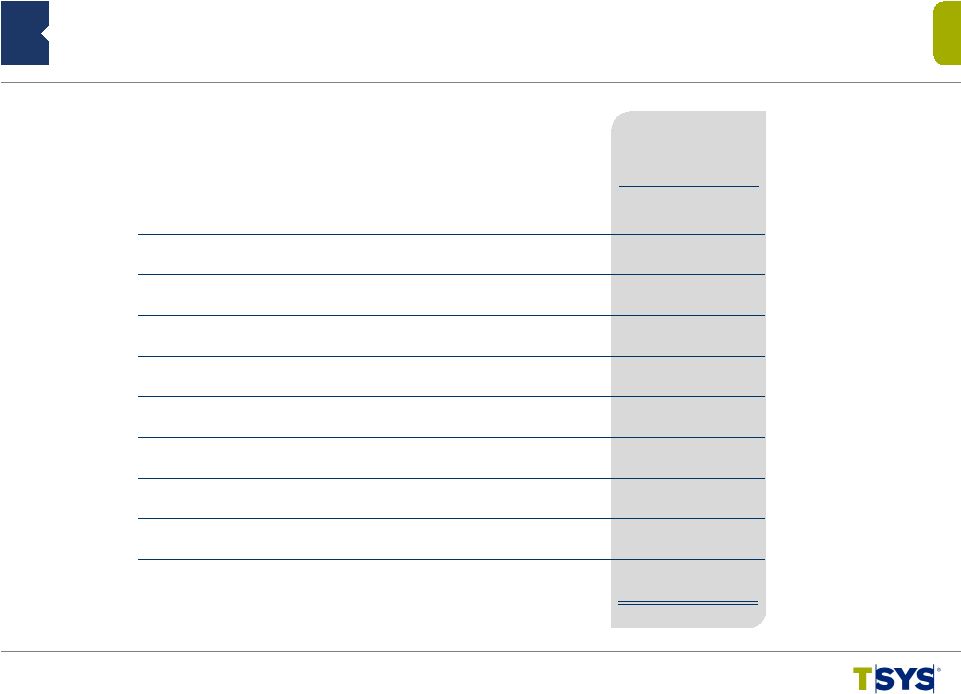
 Consumer Credit 229.0 200.5 14.2 229.0 224.2 2.2 Retail 27.8 25.0 11.0 27.8 26.8 3.6 Total Consumer 256.8 225.5 13.9 256.8 251.0 2.3 Commercial 39.9 37.1 7.6 39.9 38.9 2.7 Other 18.9 12.8 47.6 18.9 16.9 11.6 Subtotal 315.6 275.4 14.6 315.6 306.7 2.9 Prepaid */ Stored Value 118.0 115.9 1.8 118.0 110.7 6.6 Government Services 62.2 57.0 9.2 62.2 61.6 1.0 Commercial Card Single Use 45.3 31.1 45.4 45.3 41.6 8.8 Total AOF 541.1 479.4 12.9 541.1 520.7 3.9 Consolidated Accounts on File Portfolio Summary (in millions) Dec 2013 Dec 2012 % Change Dec 2013 Sep 2013 % Change 20 ©2014 Total System Services, Inc.® Proprietary. All rights reserved worldwide. (* - Prepaid does not include NetSpend accounts) |
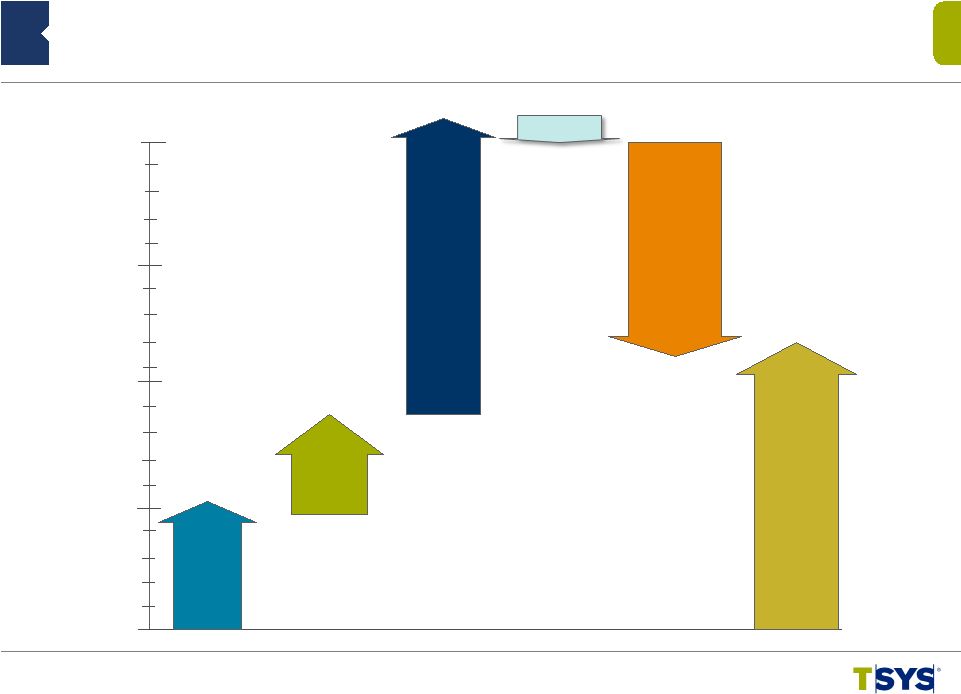
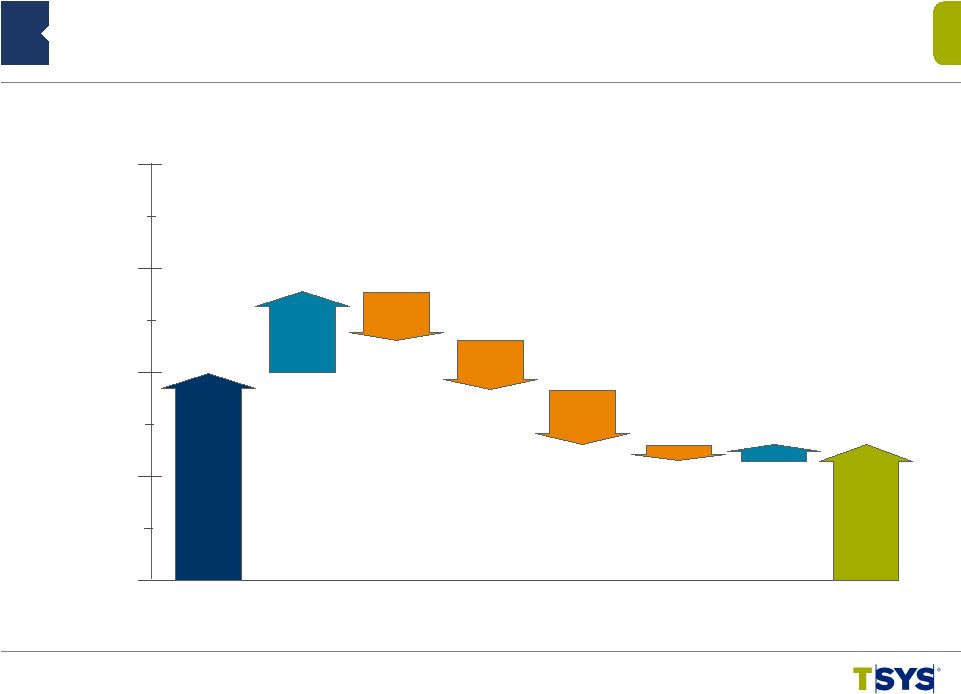 ©2014 Total System Services, Inc.® Proprietary. All rights reserved worldwide. Rollforward of Quarterly Cash Balance $400 $800 $200 $0 $600 Beginning Balance $397 Operating Activities $145 Cap Ex ($75) Debt Pmts ($84) Dividends ($19) Share Repurchase ($98) Other $12 Ending Balance $278 (in millions) 09/30/2013 12/31/2013 21 |
 Cash Flow Strength: 2013 Consolidated Financial Highlights 22 ©2014 Total System Services, Inc.® Proprietary. All rights reserved worldwide. (in millions) $634 $452 $259 $257 $278 $0 $75 $150 $225 $300 $375 $450 $525 $600 $675 Adjusted EBITDA Cash flow from operations Free cash flow Net income Ending cash |
 Debt to EBITDA Ratio ©2014 Total System Services, Inc.® Proprietary. All rights reserved worldwide. 23 7/1/2013* 12/31/2013 DEBT $1,618 $1,493 EBITDA (ex. 1-times) 618 656 EBITDA Multiple 2.62x 2.27x (in millions) * June 30, 2013 plus $300M draw Trailing Twelve Months (TSYS + NetSpend) |
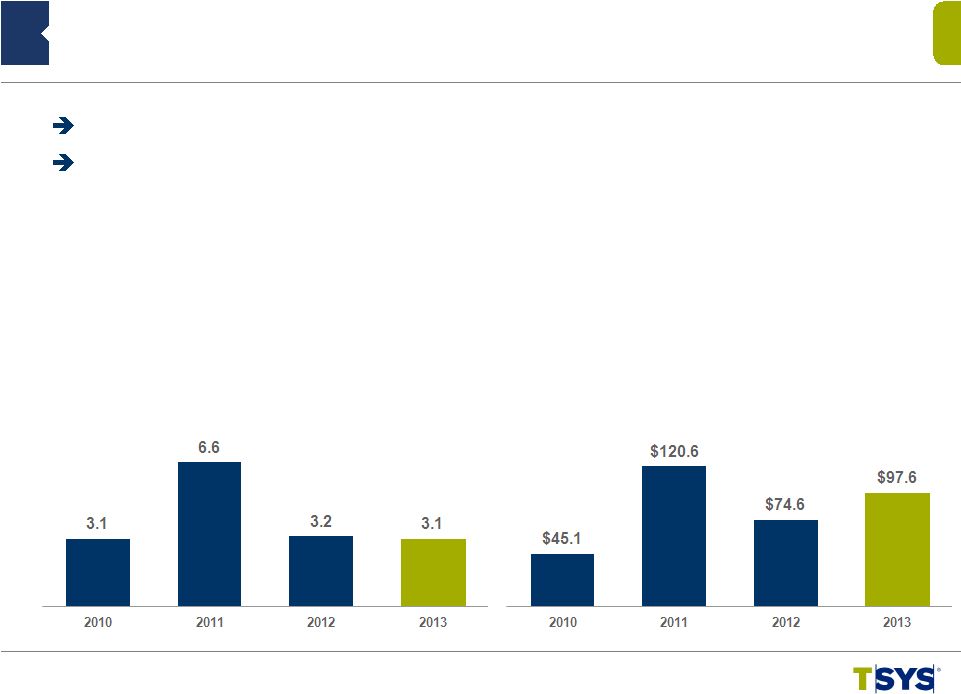 Share Repurchase Plan ©2014 Total System Services, Inc.® Proprietary. All rights reserved worldwide. 24 ($ in millions) Capital Deployed (in millions) Number of Shares Repurchased Current Plan – Up to 28M with 12M Remaining Expires April 2015 |
 2014 Guidance* Range Range Percent Change Total Revenues $2,491 to $2,542 17% to 19% Revenues Before Reimbursable Items $2,252 to $2,297 19% to 21% Adjusted EBITDA $744 to $759 17% to 20% Adjusted Cash EPS $1.90 to $1.93 11% to 13% Average Basic Weighted Shares 188.4 (in millions, except per share data) 25 (*) See Appendix for guidance assumptions ©2014 Total System Services, Inc.® Proprietary. All rights reserved worldwide. |
 Q&A ©2014 Total System Services, Inc.® Proprietary. All rights reserved worldwide. |
 Appendix ©2014 Total System Services, Inc.® Proprietary. All rights reserved worldwide. |
 Appendix: Non-GAAP Items – Adjusted EBITDA and Adjusted Cash EPS • Adjusted EBITDA is net income excluding equity in income of equity investments, nonoperating income/(expense), taxes, depreciation, amortization and stock-based compensation expenses and other non-recurring items. • Adjusted cash EPS is adjusted cash earnings divided by weighted average shares outstanding used for basic EPS calculations. Adjusted cash earnings is net income excluding the after-tax impact of stock-based compensation expenses, amortization of acquisition intangibles, and other non-recurring items. • Adjusted segment operating income is operating income at the segment level adjusted for acquisition intangible amortization. • Adjusted segment operating margin is adjusted segment operating income divided by segment revenues before reimbursable items. • The Company believes that these non-GAAP financial measures it presents are useful to investors in evaluating the Company’s operating performance for the following reasons: – adjusted EBITDA and adjusted cash EPS are widely used by investors to measure a company’s operating performance without regard to items, such as interest expense, income tax expense, depreciation and amortization, merger and acquisition expenses and employee stock-based compensation expense that can vary substantially from company to company depending upon their respective financing structures and accounting policies, the book values of their assets, their capital structures and the methods by which their assets were acquired; and – securities analysts use adjusted EBITDA and adjusted cash EPS as supplemental measures to evaluate the overall operating performance of companies. • By comparing the Company’s adjusted EBITDA and adjusted cash EPS in different historical periods, investors can evaluate the Company’s operating results without the additional variations caused by employee stock-based compensation expense, which may not be comparable from period to period due to changes in the fair market value of the Company’s common stock (which is influenced by external factors like the volatility of public markets and the financial performance of the Company’s peers) and is not a key measure of the Company’s operations. • The Company’s management uses the non-GAAP financial measures: – as measures of operating performance, because they exclude the impact of items not directly resulting from the Company’s core operations; – for planning purposes, including the preparation of the Company’s annual operating budget; – to allocate resources to enhance the financial performance of the Company’s business; – to evaluate the effectiveness of the Company’s business strategies; and – in communications with the Company’s board of directors concerning the Company’s financial performance. ©2014 Total System Services, Inc.® Proprietary. All rights reserved worldwide. 28 |
 Appendix: Non-GAAP Reconciliation – Revenues Before Reimbursable Items Three Months Ended Twelve Months Ended 12/31/13 12/31/12 12/31/13 12/31/12 Total Revenues $600,840 $479,100 $2,132,353 $1,870,972 Reimbursable Items 57,844 60,531 240,598 252,481 Revenues Before Reimbursable Items $542,996 $418,569 $1,891,755 $1,618,491 (in thousands) 29 ©2014 Total System Services, Inc.® Proprietary. All rights reserved worldwide. |
 Appendix: Non-GAAP Reconciliation – Adjusted Segment Operating Income and Operating Margin Three Months Ended Twelve Months Ended 12/31/13 12/31/12 12/31/13 12/31/12 Operating income $110,402 $89,831 $386,247 $357,652 Add: Acquisition intangible amort 24,751 7,340 65,893 26,264 Add: Corporate admin and other 33,511 25,495 122,112 91,287 Total segment adjusted operating income $168,664 $122,666 $574,252 $475,203 By segment: North America services (a) $85,205 $78,834 $314,577 $289,492 International services (b) $19,463 $6,584 $45,911 $29,427 Merchant services (c) $35,526 $37,248 $154,047 $156,284 NetSpend (d) $28,470 $ -- $59,717 $ -- Total revenues $600,840 $479,100 $2,132,353 $1,870,972 Reimbursable items (57,844) (60,531) (240,598) (252,481) Total segment revenues before reimbursable items $542,996 $418,569 $1,891,755 $1,618,491 Intersegment revenues 3,121 3,352 12,550 14,106 By segment: North America services (e) $223,266 $213,639 $860,645 $826,750 International services (f) $108,332 $102,427 $389,532 $396,149 Merchant services (g) $110,375 $105,855 $446,277 $409,698 NetSpend (h) $104,144 $ -- $207,851 $ -- Adjusted segment operating margin: North America services (a) / (e) 38.16% 36.90% 36.55% 35.02% International services (b) / (f) 17.97% 6.43% 11.79% 7.43% Merchant services (c) / (g) 32.19% 35.19% 34.52% 38.15% NetSpend (d) / (h) 27.34% na 28.73% na (in thousands) 30 ©2014 Total System Services, Inc.® Proprietary. All rights reserved worldwide. |
 Twelve Months Ended 12/31/13 12/31/12 Percentage Change Three Months Ended 12/31/13 12/31/12 Percentage Change Appendix: Non-GAAP Reconciliation – Constant Currency (1) Reflects current period results on a non-GAAP basis as if foreign currency rates did not change from the comparable prior year period. (2) Reflects the impact of calculated changes in foreign currency rates from the comparable period. (in thousands) Consolidated: Constant Currency (1) $604,665 $479,100 26.2% $2,152,961 $1,870,972 15.1% Foreign Currency (2) (3,825) --- (20,608) --- Total Revenues $600,840 $479,100 25.4% $2,132,353 $1,870,972 14.0% International Services: Constant Currency (1) $117,806 $107,000 10.1% $430,521 $413,467 4.1% Foreign Currency (2) (3,940) --- (20,924) --- Total Revenues $113,866 $107,000 6.4% $409,597 $413,467 (0.9%) 31 ©2014 Total System Services, Inc.® Proprietary. All rights reserved worldwide. |
 Twelve Months Ended 12/31/13 12/31/12 Percentage Change Three Months Ended 12/31/13 12/31/12 Percentage Change Appendix: Non-GAAP Reconciliation – Constant Currency (1) Reflects current period results on a non-GAAP basis as if foreign currency rates did not change from the comparable prior year period. (2) Reflects the impact of calculated changes in foreign currency rates from the comparable period. (in thousands) 32 ©2014 Total System Services, Inc.® Proprietary. All rights reserved worldwide. Consolidated: Constant Currency (1) $546,849 $418,569 30.6% $1,912,063 $1,618,491 18.1% Foreign Currency (2) (3,853) --- (20,308) --- Revenues before reimbursable items $542,996 $418,569 29.7% $1,891,755 $1,618,491 16.9% International Services: Constant Currency (1) $112,299 $102,427 9.6% $410,156 $396,149 3.5% Foreign Currency (2) (3,967) --- (20,624) --- Revenues before reimbursable items $108,332 $102,427 5.8% $389,532 $396,149 (1.7%) |
 Appendix: Non-GAAP Reconciliation – EBITDA and Adjusted EBITDA (in thousands) 33 ©2014 Total System Services, Inc.® Proprietary. All rights reserved worldwide. Three Months Ended Twelve Months Ended Dec 2013 Dec 2012 Dec 2013 Dec 2012 Net income : As reported (GAAP) (a) $69,393 $62,257 $256,597 $249,923 Adjusted for: Deduct: Equity in Income of Equity Investments (3,691) (3,188) (13,047) (10,171) Add: Income Taxes 33,985 30,767 112,369 115,102 Add: Nonoperating expenses 10,715 (5) 30,328 2,798 Add: Depreciation and amortization 62,862 43,281 205,352 170,610 EBITDA $173,264 $133,112 $591,599 $528,262 Adjust for: Add: Share-based compensation 9,345 6,273 28,933 18,621 Add: NetSpend M&A expenses 1,625 -- 13,633 -- Adjusted EBITDA $184,234 $139,385 $634,165 $546,883 |
 Appendix: Non-GAAP Reconciliation – Adjusted Cash EPS (in thousands) 34 ©2014 Total System Services, Inc.® Proprietary. All rights reserved worldwide. Three Months Ended Twelve Months Ended Dec 2013 Dec 2012 Dec 2013 Dec 2012 Net income Available to TSYS Common Shareholders: As reported (GAAP) (a) $65,655 $60,862 $244,750 $244,280 Adjusted for amounts attributable to TSYS common shareholders (net of taxes): Acquisition intangible amortization 16,615 4,640 43,759 17,282 Share-based compensation 6,408 4,272 19,838 12,683 Cash earnings $88,678 $69,774 $308,347 $274,245 NetSpend M&A expenses (nonrecurring) 1,317 -- 15,251 -- Adjusted cash earnings (b) $89,995 $69,774 $323,598 $274,245 Average common shares outstanding and participating securities (c) 189,446 186,471 188,391 188,030 Basic EPS Available to TSYS Common Shareholders (a) / (c) $0.35 $0.33 $1.30 $1.30 Adjusted cash EPS Available to TSYS Common Shareholders (b) / (c) $0.48 $0.37 $1.72 $1.46 |
 Appendix: Non-GAAP Reconciliation – EBITDA and Adjusted EBITDA Twelve Months Ended 12/31/2013 Net Income $256,597 Adjusted for: Deduct: Equity in Income of Equity Investments (13,047) Add: Income Taxes 112,369 Add: Nonoperating expense 30,328 Add: Depreciation and Amortization 205,352 EBITDA $591,599 Adjust for: Share-based compensation 28,933 NetSpend M&A Operating Expenses* 13,634 Adjusted EBITDA $634,165 (in thousands) 35 ©2014 Total System Services, Inc.® Proprietary. All rights reserved worldwide. * Excludes share-based compensation |
 Appendix: Non-GAAP Reconciliation – Free Cash Flow Twelve Months Ended 12/31/2013 Cash Flows from Operating Activities $452,399 Less: Purchase of Property and Equipment (40,598) Additions to Licensed Computer Software from Vendors (64,729) Additions to Internally Developed Computer Software (32,506) Additions to Contract Acquisition Costs (55,965) Free Cash Flow $258,601 (in thousands) 36 ©2014 Total System Services, Inc.® Proprietary. All rights reserved worldwide. |
 Mar 31, 2013 Dec 31, 2012 Jun 30, 2012 Jun 30, 2013 Sep 30, 2012 Appendix: Non-GAAP Reconciliation – NetSpend Adjusted Operating Income Mar 31, 2012 Operating income (loss) (GAAP) ($8,964) $17,430 $7,869 $17,594 $18,332 $15,799 Adjusted for: Add: Amortization of acquisition intangibles 881 534 446 434 590 431 Add: Settlement (gains) and other losses 25,315 1,533 10,300 (160) 48 3,423 Add: M&A expenses -- -- -- -- 2,656 3,219 Adjusted operating income $17,232 $19,497 $18,615 $17,868 $21,626 $22,872 (in thousands) 37 ©2014 Total System Services, Inc.® Proprietary. All rights reserved worldwide. Three Months Ended |
 Appendix: 2014 Guidance Assumptions The guidance assumes: • No significant movement in foreign exchange rates; and • Minimal synergies from the NetSpend acquisition for 2014. 38 ©2014 Total System Services, Inc.® Proprietary. All rights reserved worldwide. |