UNITED STATES
SECURITIES AND EXCHANGE COMMISSION
Washington, D.C. 20549
FORM N-CSR
CERTIFIED SHAREHOLDER REPORT OF REGISTERED
MANAGEMENT INVESTMENT COMPANIES
Investment Company Act file number 811-3785
Fidelity Advisor Series I
(Exact name of registrant as specified in charter)
245 Summer St., Boston, Massachusetts 02210
(Address of principal executive offices) (Zip code)
Scott C. Goebel, Secretary
245 Summer St.
Boston, Massachusetts 02210
(Name and address of agent for service)
Registrant's telephone number, including area code: 617-563-7000
Date of fiscal year end: | November 30 |
|
|
Date of reporting period: | November 30, 2014 |
This report on Form N-CSR relates solely to the Registrant's Fidelity Real Estate High Income Fund series (the "Fund").
Item 1. Reports to Stockholders
Fidelity®
Real Estate High Income
Fund
Annual Report
November 30, 2014
(Fidelity Cover Art)
Contents
Performance | How the fund has done over time. | |
Management's Discussion of Fund Performance | The Portfolio Managers' review of fund performance and strategy. | |
Shareholder Expense Example | An example of shareholder expenses. | |
Investment Changes | A summary of major shifts in the fund's investments over the past six months. | |
Investments | A complete list of the fund's investments. | |
Financial Statements | Statements of assets and liabilities, operations, and changes in net assets and cash flows as well as financial highlights. | |
Notes | Notes to the financial statements. | |
Report of Independent Registered Public Accounting Firm |
| |
Trustees and Officers |
| |
Distributions |
| |
Board Approval of Investment Advisory Contracts and Management Fees |
|
To view a fund's proxy voting guidelines and proxy voting record for the 12-month period ended June 30, visit http://www.fidelity.com/proxyvotingresults or visit the Securities and Exchange Commission's (SEC) web site at http://www.sec.gov. You may also call (collect) 1-401-292-6402 to request a free copy of the proxy voting guidelines.
Standard & Poor's, S&P and S&P 500 are registered service marks of The McGraw-Hill Companies, Inc. and have been licensed for use by Fidelity Distributors Corporation.
Other third-party marks appearing herein are the property of their respective owners.
All other marks appearing herein are registered or unregistered trademarks or service marks of FMR LLC or an affiliated company. © 2015 FMR LLC. All rights reserved.
Annual Report
This report and the financial statements contained herein are submitted for the general information of the shareholders of the fund. This report is not authorized for distribution to prospective investors in the fund unless preceded or accompanied by an effective prospectus.
A fund files its complete schedule of portfolio holdings with the SEC for the first and third quarters of each fiscal year on Form N-Q. Forms N-Q are available on the SEC's web site at http://www.sec.gov. A fund's Forms N-Q may be reviewed and copied at the SEC's Public Reference Room in Washington, DC. Information regarding the operation of the SEC's Public Reference Room may be obtained by calling 1-800-SEC-0330. For a complete list of a fund's portfolio holdings, view the most recent holdings listing, semiannual report, or annual report on Fidelity's web site at http://www.fidelity.com, http://www.advisor.fidelity.com, or http://www.401k.com, as applicable.
NOT FDIC INSURED • MAY LOSE VALUE • NO BANK GUARANTEE
Neither the fund nor Fidelity Distributors Corporation is a bank.
Annual Report
Performance: The Bottom Line
Average annual total return reflects the change in the value of an investment, assuming reinvestment of the fund's distributions from dividend income and capital gains (the profits earned upon the sale of securities that have grown in value, if any) and assuming a constant rate of performance each year. The $1,000,000 table and the fund's returns do not reflect the deduction of taxes that a shareholder would pay on fund distributions or the redemption of fund shares. During periods of reimbursement by Fidelity, a fund's total return will be greater than it would be had the reimbursement not occurred. How a fund did yesterday is no guarantee of how it will do tomorrow.
Average Annual Total Returns
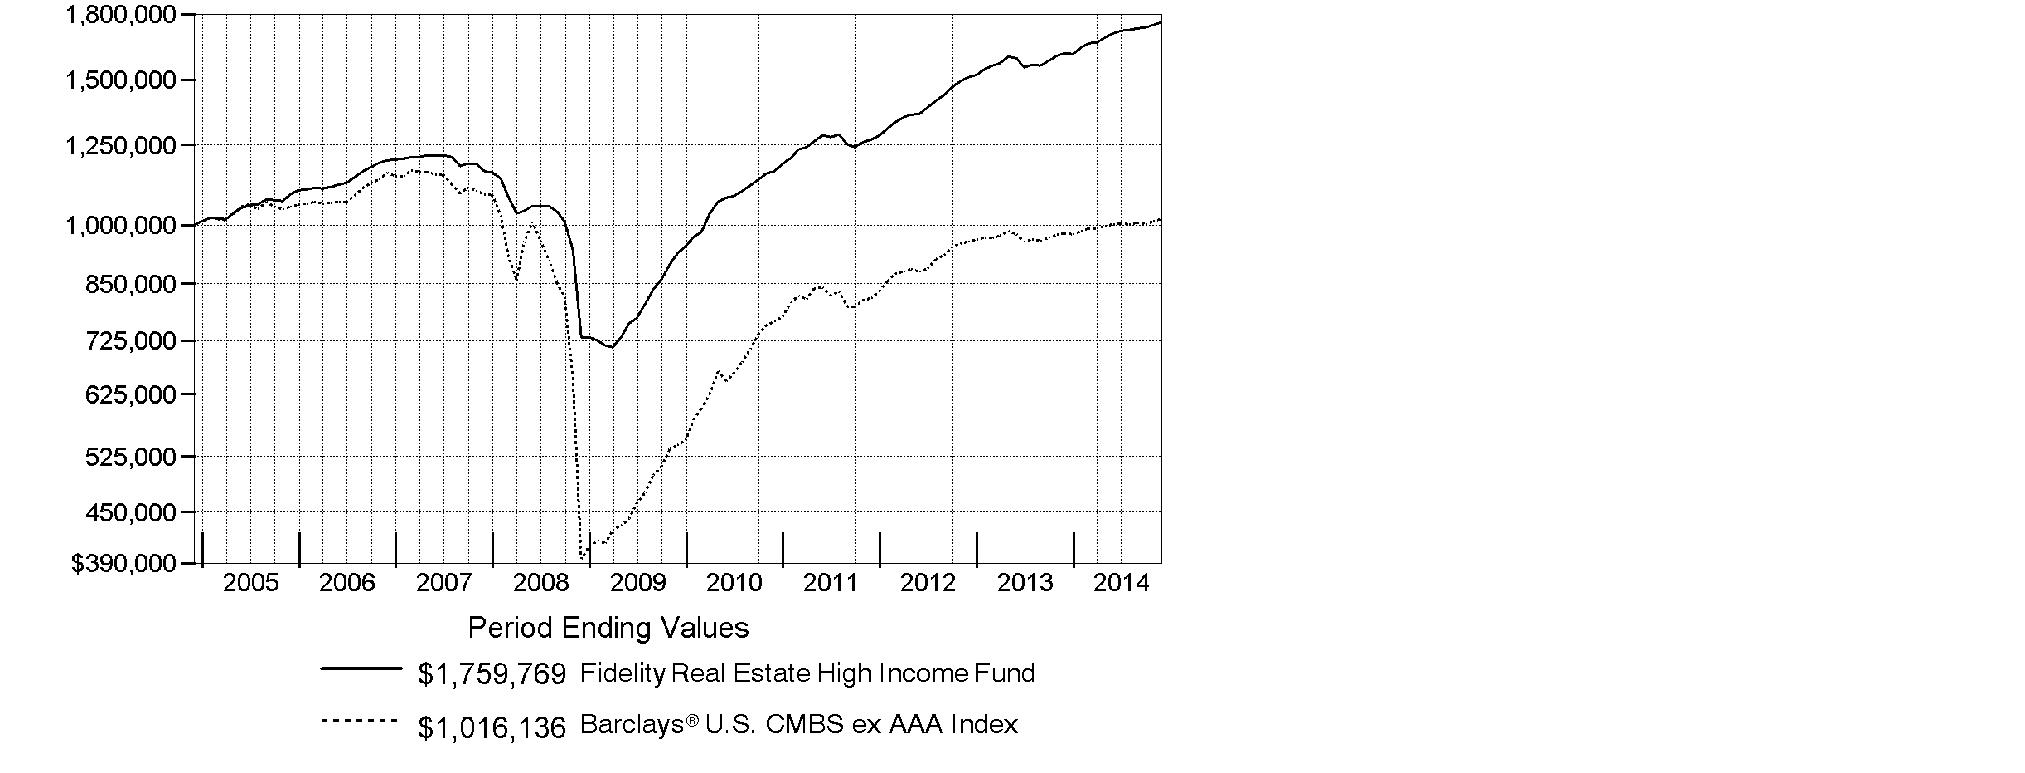
Periods ended November 30, 2014 | Past 1 | Past 5 | Past 10 |
Fidelity® Real Estate High Income Fund | 8.98% | 13.75% | 5.81% |
$1,000,000 Over 10 Years
Let's say hypothetically that $1,000,000 was invested in Fidelity® Real Estate High Income Fund on November 30, 2004. The chart shows how the value of your investment would have changed, and also shows how the Barclays® U.S. CMBS ex AAA Index performed over the same period.
Annual Report
Management's Discussion of Fund Performance
Market Recap: Commercial real estate securities finished in the black for the 12 months ending November 30, 2014, as measured by the 4.02% gain of the Barclays® U.S. CMBS ex AAA Index. Falling yields in longer-maturity U.S. Treasuries provided a favorable backdrop for the group, as did narrowing spreads, or differences, between the yields of commercial mortgage-backed securities (CMBS) and those of Treasuries. Despite concerns that Treasury yields might rise when the U.S. Federal Reserve began scaling back its quantitative easing (QE) program, yields actually declined when the tapering began in January 2014. New Fed Chair Janet Yellen took over from Ben Bernanke early in 2014 and continued to reduce QE, which ended in October 2014, while keeping short-term interest rates near zero. Inexpensive credit supported an ongoing but uneven recovery in the commercial real estate market, as reflected in rents, vacancies, defaults and other yardsticks. Issuance of CMBS securities was lower than anticipated early on, but picked up as the year progressed. Meanwhile, demand remained firm, as investors continued to reach for high yields. Underwriting standards loosened further in response to improving fundamentals and falling loan delinquencies, continuing a trend since the CMBS market restarted in 2010, following the Great Recession of 2007-2009.
Comments from Stephen Rosen and David Bagnani, Lead Portfolio Manager and Co-Portfolio Manager, respectively, of Fidelity® Real Estate High Income Fund: For the year, the fund returned 8.98%, well ahead of the Barclays index. Versus the index, the fund was aided by favorable security selection and exposure to the higher-yielding segments of the CMBS market, where our holdings delivered better returns than the benchmark's investment-grade debt. The fund's top contributor on an absolute basis was a commercial real estate collateralized debt obligation (CDO): CRSTC 2002-1A D. This position benefited when the tranche above it paid off completely, leaving the D tranche in senior position, meaning it had the strongest credit protection. Also bolstering fund performance was JPMCC 2009-IWST D, which was one of the very first CMBS issued when this market restarted in 2009. GMACC 1999-C-21 K was another older-vintage security of the CMBS variety that aided performance. Conversely, the fund's largest absolute detractor, CSMC 2007-TFL 1 L, was a relatively small CMBS position backed by only one loan during the period. CRESTC 02-1 PS is a preferred share that had lost most of its value in a prior period and continued to erode during the year. Both of these detractors had only a small negative impact on fund performance.
The views expressed above reflect those of the portfolio manager(s) only through the end of the period as stated on the cover of this report and do not necessarily represent the views of Fidelity or any other person in the Fidelity organization. Any such views are subject to change at any time based upon market or other conditions and Fidelity disclaims any responsibility to update such views. These views may not be relied on as investment advice and, because investment decisions for a Fidelity fund are based on numerous factors, may not be relied on as an indication of trading intent on behalf of any Fidelity fund.
Annual Report
Shareholder Expense Example
As a shareholder of the Fund, you incur two types of costs: (1) transaction costs, and (2) ongoing costs, including management fees and other Fund expenses. This Example is intended to help you understand your ongoing costs (in dollars) of investing in the Fund and to compare these costs with the ongoing costs of investing in other mutual funds.
The Example is based on an investment of $1,000 invested at the beginning of the period and held for the entire period (June 1, 2014 to November 30, 2014).
Actual Expenses
The first line of the accompanying table provides information about actual account values and actual expenses. You may use the information in this line, together with the amount you invested, to estimate the expenses that you paid over the period. Simply divide your account value by $1,000.00 (for example, an $8,600 account value divided by $1,000.00 = 8.6), then multiply the result by the number in the first line under the heading entitled "Expenses Paid During Period" to estimate the expenses you paid on your account during this period. In addition, the Fund, as a shareholder in the underlying Fidelity Central Funds, will indirectly bear its pro-rata share of the fees and expenses incurred by the underlying Fidelity Central Funds. These fees and expenses are not included in the Fund's annualized expense ratio used to calculate the expense estimate in the table below.
Hypothetical Example for Comparison Purposes
The second line of the accompanying table provides information about hypothetical account values and hypothetical expenses based on the Fund's actual expense ratio and an assumed rate of return of 5% per year before expenses, which is not the Fund's actual return. The hypothetical account values and expenses may not be used to estimate the actual ending account balance or expenses you paid for the period. You may use this information to compare the ongoing costs of investing in the Fund and other funds. To do so, compare this 5% hypothetical example with the 5% hypothetical examples that appear in the shareholder reports of the other funds. In addition, the Fund, as a shareholder in the underlying Fidelity Central Funds, will indirectly bear its pro-rata share of the fees and expenses incurred by the underlying Fidelity Central Funds. These fees and expenses are not included in the Fund's annualized expense ratio used to calculate the expense estimate in the table below.
Please note that the expenses shown in the table are meant to highlight your ongoing costs only and do not reflect any transaction costs. Therefore, the second line of the table is useful in comparing ongoing costs only, and will not help you determine the relative total costs of owning different funds.
Annual Report
Shareholder Expense Example - continued
| Annualized | Beginning | Ending | Expenses Paid |
Actual | .81% | $ 1,000.00 | $ 1,031.60 | $ 4.13 |
Hypothetical A |
| $ 1,000.00 | $ 1,021.01 | $ 4.10 |
A 5% return per year before expenses
B Annualized expense ratio reflects expenses net of applicable fee waivers.
* Expenses are equal to the Fund's annualized expense ratio, multiplied by the average account value over the period, multiplied by 183/365 (to reflect the one-half year period).
Annual Report
Investment Changes (Unaudited)
Quality Diversification (% of fund's net assets) | |||||||
As of November 30, 2014 | As of May 31, 2014 | ||||||
 | AAA,AA,A 22.4% |
| | AAA,AA,A 23.1% |
| ||
 | BBB 29.2% |
| | BBB 30.0% |
| ||
 | BB 16.5% |
| | BB 15.2% |
| ||
 | B 8.0% |
| | B 5.9% |
| ||
 | CCC,CC,C 5.0% |
| | CCC,CC,C 5.8% |
| ||
 | D 1.0% |
| | D 1.0% |
| ||
 | Not Rated 6.9% |
| | Not Rated 6.3% |
| ||
 | Equities 6.2% |
| | Equities 5.8% |
| ||
 | Short-Term |
| | Short-Term |
| ||

We have used ratings from Moody's Investors Service, Inc. Where Moody's® ratings are not available, we have used S&P® ratings. Where neither Moody's nor S&P ratings are not available, we have used Fitch® ratings. All ratings are as of the date indicated and do not reflect subsequent changes. |
Asset Allocation (% of fund's net assets) | |||||||
As of November 30, 2014 | As of May 31, 2014 | ||||||
| CMOs and Other |
| | CMOs and Other |
| ||
 | Asset-Backed |
| | Asset-Backed |
| ||
| Nonconvertible |
| | Nonconvertible |
| ||
| Convertible Bonds, |
| | Convertible Bonds, |
| ||
| Bank Loan |
| | Bank Loan |
| ||
 | Other Investments 0.2% |
| | Other Investments 0.2% |
| ||
| Short-Term |
| | Short-Term |
| ||

Annual Report
Investments November 30, 2014
Showing Percentage of Net Assets
Nonconvertible Bonds - 5.1% | ||||
| Principal Amount (d) | Value | ||
Healthcare - 1.5% | ||||
Aviv Healthcare Properties LP/Aviv Healthcare Capital Corp.: | ||||
6% 10/15/21 | $ 2,080,000 | $ 2,215,200 | ||
7.75% 2/15/19 | 2,725,000 | 2,861,250 | ||
Omega Healthcare Investors, Inc.: | ||||
4.95% 4/1/24 | 311,000 | 318,620 | ||
5.875% 3/15/24 | 1,790,000 | 1,915,300 | ||
6.75% 10/15/22 | 1,230,000 | 1,306,875 | ||
Sabra Health Care LP/Sabra Capital Corp. 5.375% 6/1/23 | 2,000,000 | 2,040,000 | ||
Senior Housing Properties Trust 6.75% 4/15/20 | 3,000,000 | 3,433,167 | ||
| 14,090,412 | |||
Homebuilders/Real Estate - 2.1% | ||||
CBRE Group, Inc. 5% 3/15/23 | 2,325,000 | 2,380,800 | ||
DDR Corp.: | ||||
4.625% 7/15/22 | 288,000 | 308,228 | ||
7.5% 4/1/17 | 214,000 | 241,771 | ||
7.875% 9/1/20 | 2,437,000 | 3,030,102 | ||
HCP, Inc. 3.75% 2/1/16 | 1,000,000 | 1,032,920 | ||
Highwoods/Forsyth LP 5.85% 3/15/17 | 1,000,000 | 1,094,126 | ||
Howard Hughes Corp. 6.875% 10/1/21 (f) | 1,715,000 | 1,809,325 | ||
Hunt Companies, Inc. 9.625% 3/1/21 (f) | 4,235,000 | 4,277,350 | ||
Nationwide Health Properties, Inc. 6% 5/20/15 | 1,000,000 | 1,024,783 | ||
Realogy Group LLC/Realogy Co.-Issuer Corp. 4.5% 4/15/19 (f) | 1,170,000 | 1,167,075 | ||
Reckson Operating Partnership LP/SL Green Realty Corp./SL Green Operating Partnership LP 7.75% 3/15/20 | 925,000 | 1,115,953 | ||
Standard Pacific Corp. 8.375% 5/15/18 | 1,000,000 | 1,138,750 | ||
Ventas Realty LP/Ventas Capital Corp. 4.25% 3/1/22 | 1,000,000 | 1,050,362 | ||
Wrightwood Capital LLC 1.9% 4/20/20 (c) | 20,775 | 119,251 | ||
| 19,790,796 | |||
Hotels - 1.5% | ||||
FelCor Lodging LP: | ||||
5.625% 3/1/23 | 755,000 | 753,113 | ||
6.75% 6/1/19 | 3,000,000 | 3,120,000 | ||
Host Hotels & Resorts LP: | ||||
4.75% 3/1/23 | 890,000 | 946,310 | ||
5.875% 6/15/19 | 450,000 | 473,620 | ||
Nonconvertible Bonds - continued | ||||
| Principal Amount (d) | Value | ||
Hotels - continued | ||||
Host Hotels & Resorts LP: - continued | ||||
6% 11/1/20 | $ 805,000 | $ 857,056 | ||
Times Square Hotel Trust 8.528% 8/1/26 (f) | 6,739,519 | 8,766,493 | ||
| 14,916,592 | |||
TOTAL NONCONVERTIBLE BONDS (Cost $44,461,687) |
| |||
Asset-Backed Securities - 3.1% | ||||
| ||||
American Homes 4 Rent: | ||||
Series 2014-SFR2 Class E, 6.231% 10/17/36 (f) | 672,000 | 669,045 | ||
Series 2014-SFR3 Class E, 6.418% 12/17/36 (f) | 1,864,000 | 1,882,262 | ||
Argent Securities, Inc. pass-thru certificates Series 2004-W9 Class M7, 4.352% 6/26/34 (f)(g) | 73,793 | 13,110 | ||
Capital Trust RE CDO Ltd.: | ||||
Series 2005-1A: | ||||
Class D, 1.655% 3/20/50 (f)(g) | 750,000 | 75 | ||
Class E, 2.255% 3/20/50 (f)(g) | 3,000,000 | 300 | ||
Series 2005-3A Class B, 5.267% 6/25/35 (f) | 1,357,849 | 1,362,602 | ||
Crest Clarendon Street Ltd./Crest Clarendon Corp. Series 2002-1A Class D, 9% 12/28/35 (f) | 5,592,890 | 5,457,542 | ||
Crest Ltd.: | ||||
Series 2000-1A Class D, 10% 8/31/36 (f) | 589,486 | 1,474 | ||
Series 2004-1A Class H1, 3.9231% 1/28/40 (f)(g) | 2,580,670 | 258 | ||
Fairfield Street Solar Corp. Series 2004-1A: | ||||
Class E1, 3.6006% 11/28/39 (f)(g) | 1,128,918 | 113 | ||
Class F, 5.1006% 11/28/39 (f)(g) | 1,228,753 | 123 | ||
GSR Mortgage Loan Trust Series 2005-HE3 Class B3, 3.9053% 6/25/35 (g)(i) | 5,597 | 21 | ||
Guggenheim Structured Real Estate Funding Ltd. Series 2006-3 Class E, 1.8053% 9/25/46 (f)(g) | 1,580,000 | 1,508,900 | ||
Invitation Homes Trust: | ||||
Series 2013-SFR1 Class F, 3.9% 12/17/30 (f)(g) | 600,000 | 568,732 | ||
Series 2014-SFR1 Class E, 3.404% 6/17/31 (f)(g) | 2,500,000 | 2,343,628 | ||
Series 2014-SFR3 Class E, 4.653% 12/17/31 (f)(g) | 943,000 | 926,417 | ||
Merit Securities Corp. Series 13 Class M1, 7.8497% 12/28/33 (g) | 1,665,000 | 1,765,251 | ||
Mesa West Capital CDO Ltd. Series 2007-1A: | ||||
Class A2, 0.4453% 2/25/47 (f)(g) | 1,939,055 | 1,882,241 | ||
Class H, 1.6253% 2/25/47 (f)(g) | 1,005,000 | 856,763 | ||
Asset-Backed Securities - continued | ||||
| Principal Amount (d) | Value | ||
Residential Asset Securities Corp. Series 2003-KS10 Class MI3, 6.41% 12/25/33 | $ 258,036 | $ 169,499 | ||
Resource Real Estate Funding CDO Series 2007-1A Class J, 3.1053% 9/25/46 (f)(g) | 1,190,000 | 300,475 | ||
Taberna Preferred Funding III Ltd. Series 2005-3A: | ||||
Class D, 2.8824% 2/5/36 (f)(g) | 2,521,271 | 252 | ||
Class E, 4.7324% 2/5/36 (f)(g) | 755,773 | 76 | ||
Taberna Preferred Funding VI Ltd. Series 2006-6A Class F1, 4.7324% 12/5/36 (f)(g) | 4,471,592 | 447 | ||
Wachovia Ltd./Wachovia LLC: | ||||
Series 2006-1 Class 1ML, 5.7341% 9/25/26 (f)(g) | 4,815,000 | 3,529,395 | ||
Series 2006-1A: | ||||
Class D, 0.8641% 9/25/26 (f)(g) | 868,196 | 860,121 | ||
Class E, 0.9641% 9/25/26 (f)(g) | 1,320,000 | 1,280,796 | ||
Class F, 1.3841% 9/25/26 (f)(g) | 1,601,000 | 1,524,953 | ||
Class G, 1.5841% 9/25/26 (f)(g) | 576,000 | 544,723 | ||
Class J, 2.9841% 9/25/26 (f)(g) | 500,000 | 468,500 | ||
Class K, 3.4841% 9/25/26 (f)(g) | 805,000 | 749,697 | ||
Class L, 4.2341% 9/25/26 (f)(g) | 500,000 | 465,500 | ||
Wrightwood Capital Real Estate CDO Ltd. Series 2005-1A Class A1, 0.5511% 11/21/40 (f)(g) | 862,803 | 847,703 | ||
TOTAL ASSET-BACKED SECURITIES (Cost $42,010,014) |
| |||
Collateralized Mortgage Obligations - 1.6% | ||||
| ||||
Private Sponsor - 1.5% | ||||
Countrywide Home Loans, Inc.: | ||||
Series 2002-R1: | ||||
Class B3, 6.61% 7/25/32 (f)(g) | 472,899 | 57,629 | ||
Class B4, 6.61% 7/25/32 (f)(g) | 56,877 | 740 | ||
Series 2002-R2 Class 2B4, 3.64% 7/25/33 (f)(g) | 91,382 | 11,859 | ||
Series 2002-R3 Class B3, 5.75% 8/25/43 (f) | 249,987 | 692 | ||
Series 2003-R1: | ||||
Class 2B4, 3.1568% 2/25/43 (f)(g) | 66,075 | 24,572 | ||
Class 2B5, 3.1568% 2/25/43 (f)(g) | 179,599 | 16,026 | ||
Series 2004-R1 Class 1B3, 3.7251% 11/25/34 (f)(g) | 31,009 | 927 | ||
Credit Suisse First Boston Mortgage Acceptance Corp. Series 2004-6 Class B4, 4.7505% 9/25/19 (f)(g) | 20,087 | 144 | ||
Collateralized Mortgage Obligations - continued | ||||
| Principal Amount (d) | Value | ||
Private Sponsor - continued | ||||
Credit Suisse First Boston Mortgage Securities Corp. Series 2002-26 Class 4B3, 7% 10/25/17 | $ 89,219 | $ 70,579 | ||
FREMF Mortgage Trust: | ||||
Series 2010-K6 Class B, 5.3577% 12/25/46 (f)(g) | 6,045,000 | 6,729,929 | ||
Series 2010-K7 Class B, 5.4347% 4/25/20 (f)(g) | 5,000,000 | 5,599,870 | ||
Merrill Lynch Mortgage Investors Trust Series 1998-C3 Class F, 6% 12/15/30 (f) | 1,283,194 | 1,334,965 | ||
Nomura Asset Acceptance Corp. Series 2001-R1A Class B1, 6.8866% 2/19/30 (f)(g) | 138,914 | 21,909 | ||
RESI Finance LP/RESI Finance DE Corp. floater Series 2003-B Class B9, 12.1055% 6/10/35 (f)(g) | 247,724 | 263,035 | ||
RESIX Finance Ltd. floater: | ||||
Series 2003-D Class B9, 11.6555% 12/10/35 (f)(g) | 105,012 | 27,396 | ||
Series 2004-A: | ||||
Class B7, 4.4043% 2/10/36 (f)(g) | 116,935 | 39,054 | ||
Class B9, 9.1543% 2/10/36 (f)(g) | 190,370 | 44,141 | ||
Series 2004-B: | ||||
Class B8, 4.9055% 2/10/36 (f)(g) | 101,953 | 46,436 | ||
Class B9, 8.4055% 2/10/36 (f)(g) | 173,026 | 59,574 | ||
Series 2004-C: | ||||
Class B7, 3.6555% 9/10/36 (f)(g) | 636,809 | 168,369 | ||
Class B8, 4.4055% 9/10/36 (f)(g) | 531,098 | 77,682 | ||
TOTAL PRIVATE SPONSOR | 14,595,528 | |||
U.S. Government Agency - 0.1% | ||||
Fannie Mae REMIC Trust: | ||||
Series 2001-W3 subordinate REMIC pass thru certificates: | ||||
Class B3, 7% 9/25/41 (i) | 305,013 | 93,257 | ||
Class B4, 6.9757% 9/25/41 (i) | 134,728 | 16,001 | ||
Series 2002-W1 subordinate REMIC pass thru certificates: | ||||
Class 3B3, 3.1417% 2/25/42 (f)(g) | 78,843 | 45,398 | ||
Class 3B5, 3.1417% 2/25/42 (f)(g) | 61,803 | 5,584 | ||
Series 2002-W6 subordinate REMIC pass thru certificates, Class 3B4, 3.1929% 1/25/42 (f)(g) | 66,107 | 26,714 | ||
Series 2003-W1 subordinate REMIC pass thru certificates, Class B3, 4.4843% 12/25/42 (g)(i) | 1,238,169 | 174,355 | ||
Collateralized Mortgage Obligations - continued | ||||
| Principal Amount (d) | Value | ||
U.S. Government Agency - continued | ||||
Fannie Mae REMIC Trust: - continued | ||||
Series 2003-W10 subordinate REMIC pass thru certificates: | ||||
Class 2B4, 3.0753% 6/25/43 (g)(i) | $ 238,797 | $ 76,858 | ||
Class 2B5, 3.0753% 6/25/43 (g)(i) | 168,760 | 23,250 | ||
TOTAL U.S. GOVERNMENT AGENCY | 461,417 | |||
TOTAL COLLATERALIZED MORTGAGE OBLIGATIONS (Cost $15,444,568) |
| |||
Commercial Mortgage Securities - 75.8% | ||||
| ||||
Americold LLC Trust Series 2010-ARTA Class D, 7.443% 1/14/29 (f) | 1,230,000 | 1,417,603 | ||
Asset Securitization Corp. Series 1997-D4 Class B5, 7.525% 4/14/29 | 4,476,925 | 4,395,731 | ||
Aventura Mall Trust Series 2013-AVM Class E, 3.7427% 12/5/32 (f)(g) | 5,000,000 | 4,902,425 | ||
Banc of America Commercial Mortgage Trust: | ||||
sequential payer: | ||||
Series 2005-4 Class AJ, 5.038% 7/10/45 (g) | 3,070,000 | 3,118,399 | ||
Series 2006-4 Class AM, 5.675% 7/10/46 | 4,000,000 | 4,287,008 | ||
Series 2005-1 Class CJ, 5.281% 11/10/42 (g) | 4,020,000 | 4,050,013 | ||
Series 2005-5 Class D, 5.2141% 10/10/45 (g) | 2,250,000 | 2,270,212 | ||
Series 2005-6 Class AJ, 5.1764% 9/10/47 (g) | 2,000,000 | 2,074,094 | ||
Series 2008-1 Class D, 6.2875% 2/10/51 (f)(g) | 1,970,000 | 1,596,918 | ||
Banc of America Large Loan, Inc. floater Series 2005-MIB1 Class K, 2.1547% 3/15/22 (f)(g) | 860,989 | 861,986 | ||
Bear Stearns Commercial Mortgage Securities, Inc. Series 2006-PW11 Class AJ, 5.4349% 3/11/39 (g) | 3,175,000 | 3,279,415 | ||
Bear Stearns Commercial Mortgage Securities Trust: | ||||
sequential payer Series 2006-T22 Class AJ, 5.5572% 4/12/38 (g) | 2,007,000 | 2,105,273 | ||
Series 1999-C1 Class I, 5.64% 2/14/31 (f) | 2,169,622 | 2,150,878 | ||
Series 2006-T22 Class B, 5.5572% 4/12/38 (f)(g) | 1,370,000 | 1,456,244 | ||
Series 2007-BBA8: | ||||
Class K, 1.3547% 3/15/22 (f)(g) | 1,720,000 | 1,652,984 | ||
Class L, 2.0547% 3/15/22 (f)(g) | 3,980,125 | 3,657,471 | ||
Beckman Coulter, Inc. sequential payer Series 2000-A Class A, 7.4975% 12/15/18 (f) | 5,124,554 | 5,450,989 | ||
Commercial Mortgage Securities - continued | ||||
| Principal Amount (d) | Value | ||
Berkeley Federal Bank & Trust FSB Series 1994-1 Class B, 0% 8/1/24 (f)(g) | $ 47,821 | $ 31,739 | ||
BKB Commercial Mortgage Trust Series 1997-C1 Class H, 0.4045% 10/25/22 (f)(g) | 32,065 | 26,758 | ||
BLCP Hotel Trust: | ||||
floater Series 2014-CLRN Class F, 3.1886% 8/15/29 (f)(g) | 1,000,000 | 945,127 | ||
Series 2014-CLMZ Class M, 5.8825% 8/15/29 (f)(g) | 5,912,000 | 5,885,658 | ||
Boca Hotel Portfolio Trust Series 2013-BOCA Class E, 3.9047% 8/15/26 (f)(g) | 1,750,000 | 1,752,175 | ||
Carefree Portfolio Trust floater Series 2014-CMZA Class MZA, 6.1295% 11/15/29 (f)(g) | 1,000,000 | 1,000,038 | ||
Carefree Portfolio Trust 2014-Car floater Series 2014-CMZB Class MZB, 7.8759% 11/15/29 (e)(f) | 2,000,000 | 1,990,069 | ||
CFCRE Commercial Mortgage Trust Series 2011-C2 Class B, 5.5589% 12/15/47 (f)(g) | 2,200,000 | 2,523,752 | ||
CG-CCRE Commercial Mortgage Trust: | ||||
Series 2014-FL1: | ||||
Class YTC2, 2.6437% 6/15/31 (f)(g) | 2,431,000 | 2,306,290 | ||
Class YTC3, 2.6437% 6/15/31 (f)(g) | 874,000 | 812,296 | ||
Series 2014-FL1, 2.6437% 6/15/31 (f)(g) | 2,431,000 | 2,348,103 | ||
Chase Commercial Mortgage Securities Corp.: | ||||
Series 1998-1 Class H, 6.34% 5/18/30 (f) | 3,300,000 | 3,539,309 | ||
Series 1998-2 Class J, 6.39% 11/18/30 (f) | 3,329,253 | 2,668,609 | ||
Citigroup Commercial Mortgage Trust Series 2013-GC15: | ||||
Class C, 5.1063% 9/10/46 (g) | 2,000,000 | 2,184,468 | ||
Class D, 5.1063% 9/10/46 (f)(g) | 4,860,000 | 4,832,415 | ||
COMM Mortgage Trust: | ||||
floater Series 2014-PAT Class E, 3.3033% 8/13/27 (f)(g) | 3,339,000 | 3,309,901 | ||
sequential payer Series 2013-LC6 Class E, 3.5% 1/10/46 (f) | 5,250,000 | 4,205,854 | ||
Series 2012-CR5 Class D, 4.3354% 12/10/45 (f)(g) | 1,550,000 | 1,597,698 | ||
Series 2013-CR10: | ||||
Class C, 4.958% 8/10/46 (f)(g) | 1,310,000 | 1,392,937 | ||
Class D, 4.958% 8/10/46 (f)(g) | 3,910,000 | 3,816,065 | ||
Series 2013-CR12 Class D, 5.0855% 10/10/46 (f)(g) | 5,576,000 | 5,496,057 | ||
Series 2013-CR9 Class D, 4.2596% 7/10/45 (f)(g) | 3,596,000 | 3,406,556 | ||
Series 2013-LC6 Class D, 4.2882% 1/10/46 (f)(g) | 5,429,000 | 5,202,448 | ||
Series 2014-CR15 Class D, 4.7677% 2/10/47 (f)(g) | 1,273,000 | 1,250,949 | ||
Series 2014-CR17 Class D, 4.7998% 5/10/47 (f)(g) | 2,720,000 | 2,626,486 | ||
Series 2014-UBS2 Class D, 5.0157% 3/10/47 (f)(g) | 4,146,000 | 3,990,023 | ||
Commercial Mortgage Securities - continued | ||||
| Principal Amount (d) | Value | ||
COMM Mortgage Trust pass-thru certificates Series 2001-J2A Class F, 7.142% 7/16/34 (f)(g) | $ 1,583,000 | $ 1,749,935 | ||
Commercial Mortgage Acceptance Corp. Series 1998-C2 Class J, 5.44% 9/15/30 (f) | 8,102,756 | 7,787,600 | ||
Commercial Mortgage Asset Trust Series 1999-C2: | ||||
Class G, 6% 11/17/32 | 4,575,000 | 5,100,109 | ||
Class H, 6% 11/17/32 | 3,001,037 | 3,212,753 | ||
Commercial Mortgage Trust pass-thru certificates: | ||||
Series 2005 C6 Class B, 5.246% 6/10/44 (g) | 5,875,000 | 5,946,246 | ||
Series 2005-C6 Class AJ, 5.209% 6/10/44 (g) | 4,500,000 | 4,608,477 | ||
Series 2012-CR1: | ||||
Class C, 5.36% 5/15/45 (g) | 2,060,000 | 2,284,381 | ||
Class D, 5.36% 5/15/45 (f)(g) | 6,334,000 | 6,648,622 | ||
Series 2012-CR2: | ||||
Class E, 4.8575% 8/15/45 (f)(g) | 6,370,000 | 6,497,922 | ||
Class F, 4.25% 8/15/45 (f) | 7,900,000 | 6,891,794 | ||
Series 2012-LC4: | ||||
Class C, 5.647% 12/10/44 (g) | 1,534,000 | 1,727,497 | ||
Class D, 5.647% 12/10/44 (f)(g) | 5,406,000 | 5,769,029 | ||
Series 2014-CR2 Class G, 4.25% 8/15/45 (f) | 1,500,000 | 1,131,548 | ||
Credit Suisse First Boston Mortgage Securities Corp.: | ||||
Series 1998-C1: | ||||
Class F, 6% 5/17/40 (f) | 7,515,149 | 8,146,963 | ||
Class H, 6% 5/17/40 (f) | 2,501,055 | 2,051,883 | ||
Series 1998-C2: | ||||
Class F, 6.75% 11/15/30 (f) | 5,002,535 | 5,185,183 | ||
Class G, 6.75% 11/15/30 (f) | 1,065,000 | 1,156,382 | ||
Series 2001-CK6 Class NW, 6.08% 8/15/36 (i) | 2,539 | 2,529 | ||
Series 2002-CKP1 Class KZ, 6.294% 12/15/35 (f)(g) | 2,340,643 | 2,361,285 | ||
Credit Suisse Mortgage Capital Certificates floater Series 2007-TFL1 Class L, 2.0547% 2/15/22 (f)(g) | 2,369,829 | 451,480 | ||
DBUBS Mortgage Trust Series 2011-LC1A: | ||||
Class D, 5.5573% 11/10/46 (f)(g) | 1,000,000 | 1,118,937 | ||
Class E, 5.5573% 11/10/46 (f)(g) | 4,940,000 | 5,387,287 | ||
Class F, 5.5573% 11/10/46 (f)(g) | 7,130,000 | 6,944,456 | ||
Class G, 4.652% 11/10/46 (f) | 8,160,000 | 7,093,521 | ||
Deutsche Mortgage & Asset Receiving Corp. Series 1998-C1 Class J, 6.22% 6/15/31 | 101,320 | 101,251 | ||
First Union-Lehman Brothers-Bank of America Commercial Mortgage Trust sequential payer Series 1998-C2 Class G, 7% 11/18/35 (f)(g) | 2,228,021 | 2,248,891 | ||
Four Times Square Trust sequential payer Series 2006-4TS Class A, 5.401% 12/13/28 (f) | 1,600,000 | 1,835,960 | ||
Commercial Mortgage Securities - continued | ||||
| Principal Amount (d) | Value | ||
Freddie Mac: | ||||
pass-thru certificates Series K013 Class X3, 2.7904% 1/25/43 (g)(h) | $ 5,370,000 | $ 792,231 | ||
Series KAIV Class X2, 3.6147% 6/25/46 (g)(h) | 2,780,000 | 524,640 | ||
FREMF Mortgage Trust: | ||||
Series 2010-K9 Class B, 5.1934% 9/25/45 (f)(g) | 2,300,000 | 2,550,992 | ||
Series 2011-K10 Class B, 4.6154% 11/25/49 (f)(g) | 1,650,000 | 1,779,890 | ||
Series 2011-K11 Class B, 4.4208% 12/25/48 (f)(g) | 3,190,000 | 3,407,338 | ||
GCCFC Commercial Mortgage Trust Series 2005-GG3: | ||||
Class B, 4.894% 8/10/42 (g) | 1,090,000 | 1,094,036 | ||
Class J, 4.685% 8/10/42 (f)(g) | 900,000 | 6,539 | ||
Class K, 4.685% 8/10/42 (f)(g) | 743,888 | 1,401 | ||
GE Capital Commercial Mortgage Corp. Series 2005-C3 Class J, 5.1579% 7/10/45 (f)(g) | 2,277,000 | 1,663,199 | ||
GMAC Commercial Mortgage Securities, Inc.: | ||||
Series 1997-C1 Class H, 6.6% 7/15/29 | 2,632,264 | 2,170,665 | ||
Series 1997-C2: | ||||
Class G, 6.75% 4/15/29 (g) | 2,185,938 | 2,357,470 | ||
Class H, 6.75% 4/15/29 (g) | 6,130,384 | 3,959,754 | ||
Series 1999-C2I Class K, 6.481% 9/15/33 | 7,875,000 | 6,268,043 | ||
Series 1999-C3 Class K, 6.974% 8/15/36 (f) | 72,368 | 70,846 | ||
Series 2000-C1 Class K, 7% 3/15/33 | 12,247 | 12,285 | ||
GP Portfolio Trust Series 2014-GPP: | ||||
Class D, 2.9033% 2/15/27 (f)(g) | 1,441,000 | 1,442,376 | ||
Class E, 4.0033% 2/15/27 (f)(g) | 705,000 | 705,672 | ||
GS Mortgage Securities Corp. II: | ||||
Series 2004-GG2: | ||||
Class J, 5.067% 8/10/38 (f)(g) | 420,000 | 73,332 | ||
Class K, 5.067% 8/10/38 (f)(g) | 369,522 | 31,764 | ||
Series 2010-C1: | ||||
Class D, 6.023% 8/10/43 (f)(g) | 4,985,000 | 5,497,737 | ||
Class E, 4% 8/10/43 (f) | 5,951,000 | 5,402,544 | ||
GS Mortgage Securities Trust: | ||||
Series 2010-C2 Class D, 5.2229% 12/10/43 (f)(g) | 4,100,000 | 4,335,074 | ||
Series 2011-GC5: | ||||
Class C, 5.3068% 8/10/44 (f)(g) | 7,010,000 | 7,836,956 | ||
Class D, 5.3068% 8/10/44 (f)(g) | 2,720,000 | 2,893,261 | ||
Class E, 5.3068% 8/10/44 (f)(g) | 966,000 | 913,001 | ||
Class F, 4.5% 8/10/44 (f) | 3,340,000 | 2,704,732 | ||
Series 2012-GC6 Class D, 5.6379% 1/10/45 (f)(g) | 945,000 | 1,001,895 | ||
Series 2012-GC6I Class F, 5% 1/10/45 (g) | 1,810,000 | 1,454,697 | ||
Series 2012-GCJ7: | ||||
Class C, 5.7228% 5/10/45 (g) | 5,830,000 | 6,580,716 | ||
Commercial Mortgage Securities - continued | ||||
| Principal Amount (d) | Value | ||
GS Mortgage Securities Trust: - continued | ||||
Series 2012-GCJ7: - continued | ||||
Class D, 5.7228% 5/10/45 (f)(g) | $ 6,042,000 | $ 6,385,395 | ||
Class E, 5% 5/10/45 (f) | 6,263,000 | 5,799,383 | ||
Series 2012-GCJ9 Class D, 4.858% 11/10/45 (f)(g) | 1,389,000 | 1,406,061 | ||
Series 2013-GC12 Class D, 4.4784% 6/10/46 (f)(g) | 1,043,000 | 998,703 | ||
Series 2013-GC13 Class D, 4.0711% 7/10/46 (f)(g) | 5,214,000 | 4,834,838 | ||
Series 2013-GC16: | ||||
Class D, 5.323% 11/10/46 (f)(g) | 4,541,000 | 4,557,030 | ||
Class F, 3.5% 11/10/46 (f) | 2,037,000 | 1,528,300 | ||
Hilton U.S.A. Trust: | ||||
floater Series 2014-ORL Class E, 3.4033% 7/15/29 (f)(g) | 2,884,000 | 2,877,344 | ||
Series 2013-HLT Class EFX, 5.2216% 11/5/30 (f)(g) | 8,062,000 | 8,290,005 | ||
JPMBB Commercial Mortgage Securities Trust Series 2014-C22 Class D, 4.7138% 9/15/47 (f) | 2,472,000 | 2,272,470 | ||
JPMorgan Chase Commercial Mortgage Securities Corp.: | ||||
floater Series 2011-CCHP Class E, 5.15% 7/15/28 (f)(g) | 2,000,000 | 1,997,950 | ||
sequential payer Series 2010-CNTR Class A2, 4.311% 8/5/32 (f) | 2,110,000 | 2,315,472 | ||
Series 2003-C1: | ||||
Class D, 5.192% 1/12/37 | 358,095 | 358,591 | ||
Class F, 5.6559% 1/12/37 (f)(g) | 805,000 | 809,595 | ||
Series 2009-IWST: | ||||
Class C, 7.4453% 12/5/27 (f)(g) | 2,260,000 | 2,768,030 | ||
Class D, 7.4453% 12/5/27 (f)(g) | 10,670,000 | 12,915,769 | ||
Series 2010-CNTM Class MZ, 8.5% 8/5/20 (f) | 3,590,000 | 3,770,863 | ||
Series 2010-CNTR Class D, 6.1838% 8/5/32 (f)(g) | 4,170,000 | 4,791,680 | ||
Series 2012-CBX: | ||||
Class C, 5.2406% 6/15/45 (g) | 1,480,000 | 1,626,680 | ||
Class D, 5.2406% 6/16/45 (f)(g) | 4,050,000 | 4,350,582 | ||
Class E, 5.2406% 6/15/45 (f)(g) | 1,795,000 | 1,859,058 | ||
Class F, 4% 6/15/45 (f) | 3,759,000 | 3,287,433 | ||
Class G 4% 6/15/45 (f) | 4,957,000 | 3,752,960 | ||
JPMorgan Chase Commercial Mortgage Securities Trust: | ||||
floater: | ||||
Series 2013-JWMZ Class M, 6.1547% 4/15/18 (f)(g) | 836,012 | 836,983 | ||
Series 2013-JWRZ Class E, 3.8947% 4/15/30 (f)(g) | 2,430,000 | 2,435,574 | ||
Series 2014-FBLU Class E, 3.655% 12/15/28 (f)(g) | 5,103,000 | 5,093,600 | ||
Commercial Mortgage Securities - continued | ||||
| Principal Amount (d) | Value | ||
JPMorgan Chase Commercial Mortgage Securities Trust: - continued | ||||
Series 2014-INN: | ||||
Class E, 3.755% 6/15/29 (f)(g) | $ 3,082,000 | $ 3,059,686 | ||
Class F, 4.155% 6/15/29 (f)(g) | 4,791,000 | 4,747,541 | ||
Series 2004-CBX Class D, 5.097% 1/12/37 (g) | 1,215,000 | 1,229,183 | ||
Series 2005-LDP2 Class C, 4.911% 7/15/42 (g) | 3,275,000 | 3,292,400 | ||
Series 2005-LDP5: | ||||
Class AJ, 5.3574% 12/15/44 (g) | 2,020,000 | 2,085,412 | ||
Class B, 5.3914% 12/15/44 (g) | 1,500,000 | 1,544,806 | ||
Series 2005-PRKS Class A, 9.7495% 1/15/15 (f)(g) | 2,342,014 | 2,346,698 | ||
Series 2011-C4: | ||||
Class E, 5.3967% 7/15/46 (f)(g) | 6,160,000 | 6,722,845 | ||
Class F, 3.873% 7/15/46 (f) | 555,000 | 504,938 | ||
Class H, 3.873% 7/15/46 (f) | 3,221,000 | 2,279,616 | ||
Class TAC2, 7.99% 7/15/46 (f) | 3,196,000 | 3,439,633 | ||
Series 2011-C5: | ||||
Class C, 5.3229% 8/15/46 (f)(g) | 5,803,234 | 6,485,387 | ||
Class D, 5.3229% 8/15/46 (f)(g) | 2,000,000 | 2,132,592 | ||
Series 2014-DSTY Class E, 3.8046% 6/10/27 (f)(g) | 4,116,000 | 3,792,536 | ||
JPMorgan Commercial Mortgage Finance Corp. Series 1999-C8 Class H, 6% 7/15/31 (f) | 1,018,735 | 942,647 | ||
LB Commercial Conduit Mortgage Trust Series 1998-C1 Class K, 6.3% 2/18/30 (f) | 1,648,977 | 1,259,986 | ||
LB Multi-family Mortgage Trust Series 1991-4 Class A1, 7.125% 4/25/21 (g) | 14,540 | 13,432 | ||
LB-UBS Commercial Mortgage Trust: | ||||
sequential payer: | ||||
Series 2005-C3 Class AJ, 4.843% 7/15/40 | 7,880,000 | 7,972,228 | ||
Series 2005-C7: | ||||
Class AJ, 5.323% 11/15/40 (g) | 8,400,000 | 8,649,505 | ||
Class AM, 5.263% 11/15/40 (g) | 938,000 | 971,508 | ||
Series 2006-C6: | ||||
Class A4, 5.372% 9/15/39 | 3,000,000 | 3,188,853 | ||
Class AM, 5.413% 9/15/39 | 5,000,000 | 5,341,120 | ||
Series 2006-C7 Class AM, 5.378% 11/15/38 | 1,160,000 | 1,237,445 | ||
Series 2005-C1 Class E, 4.924% 2/15/40 | 4,636,000 | 4,645,703 | ||
Series 2005-C2 Class AJ, 5.205% 4/15/30 (g) | 5,260,000 | 5,314,956 | ||
Series 2005-C7 Class C, 5.35% 11/15/40 (g) | 1,900,000 | 1,948,765 | ||
Series 2006-C4: | ||||
Class AJ, 5.8532% 6/15/38 (g) | 6,665,000 | 6,979,508 | ||
Class AM, 5.8532% 6/15/38 (g) | 3,840,000 | 4,098,321 | ||
Commercial Mortgage Securities - continued | ||||
| Principal Amount (d) | Value | ||
LSTAR Commercial Mortgage Trust: | ||||
Series 2011-1 Class D, 5.3134% 6/25/43 (f)(g) | $ 2,059,000 | $ 2,090,700 | ||
Series 2014-2: | ||||
Class D, 5.1836% 1/20/41 (f)(g) | 1,228,000 | 1,153,650 | ||
Class E, 5.1836% 1/20/41 (f)(g) | 1,913,000 | 1,549,249 | ||
Mach One Trust LLC Series 2004-1A: | ||||
Class H, 6.2445% 5/28/40 (f)(g) | 1,320,000 | 1,353,000 | ||
Class L, 5.45% 5/28/40 (f)(g) | 1,393,000 | 1,201,463 | ||
Class M, 5.45% 5/28/40 (f)(g) | 1,533,000 | 1,222,874 | ||
Merrill Lynch Financial Asset, Inc.: | ||||
Series 2005-CA16: | ||||
Class F, 4.384% 7/12/37 | CAD | 551,000 | 474,400 | |
Class G, 4.384% 7/12/37 | CAD | 275,000 | 235,399 | |
Class H, 4.384% 7/12/37 | CAD | 184,000 | 156,596 | |
Class J, 4.384% 7/12/37 | CAD | 275,000 | 232,700 | |
Class K, 4.384% 7/12/37 | CAD | 275,000 | 231,372 | |
Class L, 4.384% 7/12/37 | CAD | 184,000 | 153,929 | |
Class M, 4.384% 7/12/37 | CAD | 772,000 | 623,992 | |
Series 2005-CA17: | ||||
Class F, 4.525% 11/12/37 (g) | CAD | 812,000 | 684,117 | |
Class G, 4.525% 11/12/37 (g) | CAD | 846,000 | 703,224 | |
Class H, 4.525% 11/12/37 (g) | CAD | 235,000 | 190,582 | |
Class J, 4.525% 11/12/37 (g) | CAD | 248,000 | 194,904 | |
Class K, 4.525% 11/12/37 (g) | CAD | 261,000 | 201,388 | |
Class L, 4.525% 11/12/37 (g) | CAD | 248,000 | 187,892 | |
Class M, 4.525% 11/12/37 (g) | CAD | 2,006,355 | 1,357,933 | |
Merrill Lynch Mortgage Investors Trust: | ||||
Series 1997-C2 Class F, 6.25% 12/10/29 (g) | 2,447,944 | 2,450,265 | ||
Series 1999-C1 Class G, 6.71% 11/15/31 (f) | 276,352 | 221,082 | ||
Merrill Lynch Mortgage Trust: | ||||
Series 05-LC1 Class AJ, 5.3595% 1/12/44 (g) | 1,440,000 | 1,490,416 | ||
Series 2002-MW1 Class H, 5.695% 7/12/34 (f) | 211,101 | 212,063 | ||
Series 2006-C1: | ||||
Class AJ, 5.6732% 5/12/39 (g) | 3,440,000 | 3,461,882 | ||
Class AM, 5.6732% 5/12/39 (g) | 700,000 | 737,760 | ||
Mezz Capital Commercial Mortgage Trust: | ||||
sequential payer: | ||||
Series 2004-C1 Class A, 4.836% 1/15/37 (f) | 1,999 | 1,994 | ||
Series 2004-C2 Class A, 5.318% 10/15/40 (f) | 46,505 | 46,491 | ||
Series 2004-C1 Class IO, 8.72% 1/15/37 (f)(g)(h) | 54,333 | 1,619 | ||
Series 2004-C2: | ||||
Class D, 7.347% 10/15/40 (f) | 1,074,000 | 107 | ||
Class E, 8.309% 10/15/40 (f) | 145,517 | 15 | ||
Commercial Mortgage Securities - continued | ||||
| Principal Amount (d) | Value | ||
Morgan Stanley BAML Trust: | ||||
Series 2012-C6 Class D, 4.662% 11/15/45 (f)(g) | $ 4,361,000 | $ 4,506,766 | ||
Series 2013-C12 Class D, 4.769% 10/15/46 (f)(g) | 4,000,000 | 3,936,204 | ||
Series 2013-C13 Class D, 4.8956% 11/15/46 (f)(g) | 3,975,000 | 3,944,464 | ||
Series 2013-C7: | ||||
Class D, 4.3021% 2/15/46 (f)(g) | 4,540,000 | 4,341,230 | ||
Class E, 4.3021% 2/15/46 (f)(g) | 1,580,000 | 1,377,569 | ||
Series 2013-C8 Class D, 4.1712% 12/15/48 (f)(g) | 2,260,000 | 2,168,025 | ||
Series 2013-C9: | ||||
Class C, 4.0712% 5/15/46 (g) | 3,070,000 | 3,114,822 | ||
Class D, 4.1592% 5/15/46��(f)(g) | 5,300,000 | 5,003,534 | ||
Morgan Stanley Capital I Trust: | ||||
floater Series 2006-XLF Class J, 0.585% 7/15/19 (f)(g) | 2,609,698 | 2,579,872 | ||
sequential payer: | ||||
Series 2006-HQ10 Class AM, 5.36% 11/12/41 | 4,640,000 | 4,968,480 | ||
Series 2006-HQ9 Class AM, 5.773% 7/12/44 | 1,098,000 | 1,169,027 | ||
Series 2012-C4 Class E, 5.5251% 3/15/45 (f)(g) | 3,800,000 | 4,006,834 | ||
Series 1997-RR: | ||||
Class F, 7.4325% 4/30/39 (f)(g) | 468,988 | 470,161 | ||
Class G1, 7.4325% 4/30/39 (f)(g) | 887,484 | 100,108 | ||
Series 1998-CF1: | ||||
Class F, 7.35% 7/15/32 (f) | 277,316 | 283,303 | ||
Class G, 7.35% 7/15/32 (f) | 1,483,300 | 1,446,634 | ||
Series 1999-CAM1: | ||||
Class M, 6.54% 3/15/32 (f) | 2,262,373 | 1,862,514 | ||
Class N, 6.54% 3/15/32 (f) | 305,233 | 51,829 | ||
Series 1999-WF1: | ||||
Class L, 5.91% 11/15/31 (f) | 498,284 | 504,339 | ||
Class N, 5.91% 11/15/31 (f) | 1,600,000 | 1,606,733 | ||
Class O, 5.91% 11/15/31 (f) | 1,343,575 | 507,342 | ||
Series 2004-IQ7 Class G, 5.192% 6/15/38 (f)(g) | 1,140,000 | 1,205,630 | ||
Series 2005-HQ5 Class B, 5.272% 1/14/42 | 6,890,000 | 6,907,852 | ||
Series 2006-IQ12 Class AMFX, 5.37% 12/15/43 | 5,000,000 | 5,316,120 | ||
Series 2011-C1: | ||||
Class C, 5.2513% 9/15/47 (f)(g) | 2,050,000 | 2,288,541 | ||
Class D, 5.2513% 9/15/47 (f)(g) | 10,522,000 | 11,540,310 | ||
Class E, 5.2513% 9/15/47 (f)(g) | 1,500,000 | 1,597,997 | ||
Series 2011-C2: | ||||
Class D, 5.3043% 6/15/44 (f)(g) | 3,830,000 | 4,172,413 | ||
Class E, 5.3043% 6/15/44 (f)(g) | 4,900,000 | 5,194,372 | ||
Class F, 5.3043% 6/15/44 (f)(g) | 3,620,000 | 3,480,644 | ||
Commercial Mortgage Securities - continued | ||||
| Principal Amount (d) | Value | ||
Morgan Stanley Capital I Trust: - continued | ||||
Series 2011-C3: | ||||
Class C, 5.1828% 7/15/49 (f)(g) | $ 1,920,000 | $ 2,100,215 | ||
Class D, 5.1828% 7/15/49 (f)(g) | 7,530,000 | 8,108,025 | ||
Class E, 5.1828% 7/15/49 (f)(g) | 2,630,000 | 2,802,628 | ||
Series 2012-C4 Class D, 5.5251% 3/15/45 (f)(g) | 1,950,000 | 2,130,917 | ||
Morgan Stanley Dean Witter Capital I Trust: | ||||
Series 2001-TOP3 Class E, 7.5043% 7/15/33 (f)(g) | 1,130,000 | 1,298,447 | ||
Series 2003-TOP9 Class E, 5.4301% 11/13/36 (f)(g) | 630,000 | 629,066 | ||
Motel 6 Trust Series 2012-MTL6 Class D, 3.7812% 10/5/25 (f) | 2,000,000 | 1,986,838 | ||
NationsLink Funding Corp. Series 1999-LTL1: | ||||
Class C, 7.399% 1/22/26 (f) | 1,378,000 | 1,503,900 | ||
Class D, 6.45% 1/22/26 (f) | 3,660,000 | 4,016,894 | ||
Providence Place Group Ltd. Partnership Series 2000-C1 Class A2, 7.75% 7/20/28 (f) | 2,544,028 | 3,261,953 | ||
RBSCF Trust Series 2010-MB1 Class D, 4.8471% 4/15/24 (f)(g) | 5,717,000 | 5,763,073 | ||
Real Estate Asset Liquidity Trust: | ||||
Series 2006-2: | ||||
Class F, 4.456% 9/12/38 (f) | CAD | 1,170,000 | 1,011,572 | |
Class G, 4.456% 9/12/38 (f) | CAD | 585,000 | 497,560 | |
Class H, 4.456% 9/12/38 (f) | CAD | 390,000 | 326,335 | |
Class J, 4.456% 9/12/38 (f) | CAD | 390,000 | 313,726 | |
Class K, 4.456% 9/12/38 (f) | CAD | 195,000 | 150,942 | |
Class L, 4.456% 9/12/38 (f) | CAD | 281,000 | 201,991 | |
Class M, 4.456% 9/12/38 (f) | CAD | 1,134,647 | 666,798 | |
Series 2007-1: | ||||
Class F, 4.57% 4/12/23 | CAD | 1,515,000 | 1,272,587 | |
Class G, 4.57% 4/12/23 | CAD | 505,000 | 419,625 | |
Class H, 4.57% 4/12/23 | CAD | 505,000 | 415,111 | |
Class J, 4.57% 4/12/23 | CAD | 505,000 | 406,270 | |
Class K, 4.57% 4/12/23 | CAD | 253,000 | 199,225 | |
Class L, 4.57% 4/12/23 | CAD | 757,000 | 577,392 | |
Class M, 4.57% 4/12/23 | CAD | 1,864,935 | 1,313,658 | |
SCG Trust Series 2013-SRP1 Class D, 3.497% 11/15/26 (f)(g) | 4,190,000 | 4,090,240 | ||
Starwood Retail Property Trust Series 2014-STAR Class D, 3.4055% 11/15/27 (f)(g) | 1,000,000 | 1,004,339 | ||
TIAA Seasoned Commercial Mortgage Trust: | ||||
sequential payer Series 2007-C4 Class AJ, 5.5631% 8/15/39 (g) | 3,150,000 | 3,247,729 | ||
Series 2007-C4 Class F, 5.5631% 8/15/39 (g) | 5,345,000 | 4,309,657 | ||
Commercial Mortgage Securities - continued | ||||
| Principal Amount (d) | Value | ||
TimberStar Trust I Series 2006-1 Class F, 7.5296% 10/15/36 (f) | $ 1,530,000 | $ 1,604,658 | ||
UBS Commercial Mortgage Trust Series 2012-C1 Class D, 5.5348% 5/10/45 (f)(g) | 3,338,000 | 3,508,612 | ||
UBS-BAMLL Trust: | ||||
Series 12-WRM Class D, 4.238% 6/10/30 (f)(g) | 1,550,000 | 1,519,910 | ||
Series 2012-WRM Class C, 4.238% 6/10/30 (f)(g) | 1,000,000 | 1,011,404 | ||
UBS-Citigroup Commercial Mortgage Trust Series 2011-C1 Class B, 5.8747% 1/10/45 (f)(g) | 1,794,000 | 2,101,122 | ||
Vornado DP LLC Series 2010-VNO Class D, 6.3555% 9/13/28 (f) | 1,330,000 | 1,545,346 | ||
Wachovia Bank Commercial Mortgage Trust: | ||||
Series 2004-C11: | ||||
Class D, 5.1379% 1/15/41 (g) | 2,720,000 | 2,781,023 | ||
Class E, 5.1879% 1/15/41 (g) | 2,465,000 | 2,528,212 | ||
Series 2004-C12 Class D, 5.4297% 7/15/41 (g) | 746,127 | 747,286 | ||
Wells Fargo Commercial Mortgage Trust: | ||||
Series 2010-C1 Class XB, 0.5767% 11/15/43 (f)(g)(h) | 26,055,541 | 792,010 | ||
Series 2012-LC5 Class D, 4.778% 10/15/45 (f)(g) | 6,749,000 | 6,822,537 | ||
WF-RBS Commercial Mortgage Trust: | ||||
sequential payer Series 2011-C4I Class G, 5% 6/15/44 (f) | 1,502,600 | 1,220,863 | ||
Series 2011-C3: | ||||
Class C, 5.335% 3/15/44 (f) | 2,240,000 | 2,456,268 | ||
Class D, 5.5497% 3/15/44 (f)(g) | 3,984,000 | 4,252,561 | ||
Class E, 5% 3/15/44 (f) | 1,510,000 | 1,409,582 | ||
Series 2011-C4: | ||||
Class D, 5.2453% 6/15/44 (f)(g) | 1,940,000 | 2,117,621 | ||
Class E, 5.2453% 6/15/44 (f)(g) | 2,050,000 | 2,162,065 | ||
Series 2011-C5: | ||||
Class C, 5.635% 11/15/44 (f)(g) | 1,670,000 | 1,881,649 | ||
Class D, 5.635% 11/15/44 (f)(g) | 3,575,000 | 3,987,051 | ||
Class E, 5.635% 11/15/44 (f)(g) | 1,243,000 | 1,349,922 | ||
Class F, 5.25% 11/15/44 (f)(g) | 4,587,000 | 4,264,694 | ||
Class G, 5.25% 11/15/44 (f)(g) | 1,507,150 | 1,301,273 | ||
Series 2012-C10: | ||||
Class D, 4.4585% 12/15/45 (f)(g) | 2,130,000 | 2,079,922 | ||
Class E, 4.4585% 12/15/45 (f)(g) | 5,765,000 | 4,987,763 | ||
Series 2012-C6 Class D, 5.5619% 4/15/45 (f)(g) | 3,250,000 | 3,482,482 | ||
Series 2012-C7: | ||||
Class C, 4.8456% 6/15/45 (g) | 3,793,000 | 4,064,856 | ||
Class F, 4.5% 6/15/45 (f) | 1,765,000 | 1,541,664 | ||
Commercial Mortgage Securities - continued | ||||
| Principal Amount (d) | Value | ||
WF-RBS Commercial Mortgage Trust: - continued | ||||
Series 2012-C7: - continued | ||||
Class G, 4.5% 6/15/45 (f) | $ 3,450,000 | $ 2,575,039 | ||
Series 2012-C8 Class D, 4.8766% 8/15/45 (f)(g) | 1,000,000 | 1,063,909 | ||
Series 2013-C11: | ||||
Class D, 4.1823% 3/15/45 (f)(g) | 2,000,000 | 1,924,762 | ||
Class E, 4.1823% 3/15/45 (f)(g) | 6,000,000 | 5,092,584 | ||
Series 2013-C13 Class D, 4.2791% 5/15/45 (f)(g) | 1,800,000 | 1,705,788 | ||
TOTAL COMMERCIAL MORTGAGE SECURITIES (Cost $664,267,772) |
| |||
Preferred Stocks - 6.2% | |||
Shares |
| ||
Convertible Preferred Stocks - 0.4% | |||
Homebuilders/Real Estate - 0.2% | |||
Alexandria Real Estate Equities, Inc. Series D 7.00% | 64,000 | 1,779,002 | |
Hotels - 0.2% | |||
FelCor Lodging Trust, Inc. Series A, 1.95% | 85,000 | 2,261,000 | |
TOTAL CONVERTIBLE PREFERRED STOCKS | 4,040,002 | ||
Nonconvertible Preferred Stocks - 5.8% | |||
Homebuilders/Real Estate - 5.6% | |||
Alexandria Real Estate Equities, Inc. Series E, 6.45% | 79,400 | 2,042,962 | |
Annaly Capital Management, Inc.: | |||
Series A, 7.875% | 108,781 | 2,776,091 | |
Series C, 7.625% | 48,000 | 1,194,720 | |
Series D, 7.50% | 34,028 | 843,214 | |
CBL & Associates Properties, Inc.: | |||
Series D, 7.375% | 129,000 | 3,324,330 | |
Series E, 6.625% | 110,000 | 2,800,600 | |
Cedar Shopping Centers, Inc. Series B, 7.25% | 30,000 | 775,200 | |
CenterPoint Properties Trust Series D, 5.377% | 1,934 | 1,934,000 | |
Corporate Office Properties Trust Series L, 7.375% | 71,383 | 1,875,231 | |
CYS Investments, Inc. Series B, 7.50% | 102,500 | 2,466,150 | |
DDR Corp. Series K, 6.25% | 90,662 | 2,297,375 | |
Digital Realty Trust, Inc. Series E, 7.00% | 60,000 | 1,555,200 | |
Equity Lifestyle Properties, Inc. Series C, 6.75% | 69,828 | 1,833,683 | |
Essex Property Trust, Inc. Series H, 7.125% | 61,727 | 1,639,469 | |
First Potomac Realty Trust 7.75% | 80,000 | 2,052,000 | |
Hersha Hospitality Trust Series B, 8.00% | 80,827 | 2,081,295 | |
Preferred Stocks - continued | |||
Shares | Value | ||
Nonconvertible Preferred Stocks - continued | |||
Homebuilders/Real Estate - continued | |||
PS Business Parks, Inc.: | |||
Series R, 6.875% | 34,911 | $ 906,988 | |
Series S, 6.45% | 152,000 | 3,952,000 | |
Public Storage: | |||
Series P, 6.50% | 72,680 | 1,918,752 | |
Series R, 6.35% | 47,500 | 1,265,875 | |
Series S, 5.90% | 50,000 | 1,280,500 | |
Realty Income Corp. Series F, 6.625% | 80,000 | 2,139,200 | |
Regency Centers Corp. Series 6, 6.625% | 34,710 | 905,237 | |
Retail Properties America, Inc. 7.00% | 135,649 | 3,490,249 | |
Stag Industrial, Inc. Series A, 9.00% | 60,000 | 1,653,600 | |
Sun Communities, Inc. Series A, 7.125% | 91,635 | 2,357,769 | |
Taubman Centers, Inc. Series J, 6.50% | 66,277 | 1,749,050 | |
| 53,110,740 | ||
Hotels - 0.2% | |||
Hospitality Properties Trust Series D, 7.125% | 70,000 | 1,844,500 | |
TOTAL NONCONVERTIBLE PREFERRED STOCKS | 54,955,240 | ||
TOTAL PREFERRED STOCKS (Cost $55,804,330) |
| ||
Bank Loan Obligations - 3.2% | ||||
| Principal Amount (d) |
| ||
Diversified Financial Services - 0.2% | ||||
Blackstone 9.98% 10/1/17 | $ 2,199,254 | 2,199,254 | ||
Ocwen Loan Servicing, LLC Tranche B, term loan 5% 2/15/18 (g) | 251,175 | 239,872 | ||
| 2,439,126 | |||
Healthcare - 1.0% | ||||
Drumm Investors LLC Tranche B, term loan 6.75% 5/4/18 (g) | 3,019,630 | 3,034,728 | ||
ESH Hospitality, Inc. Tranche B, term loan 5% 6/24/19 (g) | 6,030,000 | 6,082,763 | ||
| 9,117,491 | |||
Homebuilders/Real Estate - 0.6% | ||||
CBRE Group, Inc. Tranche B, term loan 2.9067% 3/28/21 (g) | 2,402,803 | 2,366,761 | ||
Bank Loan Obligations - continued | ||||
| Principal Amount (d) | Value | ||
Homebuilders/Real Estate - continued | ||||
CityCenter 8.74% 7/10/15 (g) | $ 413,418 | $ 413,418 | ||
Realogy Group LLC Tranche B, term loan 3.75% 3/5/20 (g) | 2,572,043 | 2,559,182 | ||
| 5,339,361 | |||
Hotels - 1.2% | ||||
Hilton Worldwide Finance, LLC Tranche B, term loan 3.5% 10/25/20 (g) | 6,039,474 | 5,994,178 | ||
La Quinta Intermediate Holdings LLC Tranche B LN, Tranche B, term loan 4% 4/14/21 (g) | 5,257,169 | 5,230,883 | ||
Ryman Hospitality Properties, Inc. Tranche B, term loan 3.75% 1/15/21 (g) | 64,838 | 65,000 | ||
| 11,290,061 | |||
Super Retail - 0.2% | ||||
JC Penney Corp., Inc. Tranche B, term loan 6% 5/22/18 (g) | 2,355,000 | 2,310,844 | ||
TOTAL BANK LOAN OBLIGATIONS (Cost $30,587,058) |
| |||
Preferred Securities - 0.2% | ||||
| ||||
Homebuilders/Real Estate - 0.2% | ||||
Crest Clarendon Street 2002-1 Ltd. Series 2002-1A Class PS, 12/28/35 (f) | 3,000,000 | 1,500 | ||
Crest Dartmouth Street 2003 1 Ltd. Series 2003-1A Class PS, 6/28/38 (f) | 3,100,000 | 1,565,190 | ||
TOTAL PREFERRED SECURITIES (Cost $6,004,704) |
| |||
Money Market Funds - 4.2% | |||
Shares |
| ||
Fidelity Cash Central Fund, 0.11% (b) | 39,845,531 |
| |
TOTAL INVESTMENT PORTFOLIO - 99.4% (Cost $898,425,664) | 948,119,992 | ||
NET OTHER ASSETS (LIABILITIES) - 0.6% | 5,694,281 | ||
NET ASSETS - 100% | $ 953,814,273 | ||
Currency Abbreviations | ||
CAD | - | Canadian dollar |
Legend |
(a) Non-income producing |
(b) Affiliated fund that is generally available only to investment companies and other accounts managed by Fidelity Investments. The rate quoted is the annualized seven-day yield of the fund at period end. A complete unaudited listing of the fund's holdings as of its most recent quarter end is available upon request. In addition, each Fidelity Central Fund's financial statements, which are not covered by the Fund's Report of Independent Registered Public Accounting Firm, are available on the SEC's website or upon request. |
(c) Non-income producing - Security is in default. |
(d) Amount is stated in United States dollars unless otherwise noted. |
(e) Security initially issued at one coupon which converts to a higher coupon at a specified date. The rate shown is the rate at period end. |
(f) Security exempt from registration under Rule 144A of the Securities Act of 1933. These securities may be resold in transactions exempt from registration, normally to qualified institutional buyers. At the end of the period, the value of these securities amounted to $589,627,216 or 61.8% of net assets. |
(g) Coupon rates for floating and adjustable rate securities reflect the rates in effect at period end. |
(h) Security represents right to receive monthly interest payments on an underlying pool of mortgages or assets. Principal shown is the outstanding par amount of the pool as of the end of the period. |
(i) Restricted securities - Investment in securities not registered under the Securities Act of 1933 (excluding 144A issues). At the end of the period, the value of restricted securities (excluding 144A issues) amounted to $386,271 or 0.0% of net assets. |
Additional information on each restricted holding is as follows: |
Security | Acquisition Date | Acquisition Cost |
Credit Suisse First Boston Mortgage Securities Corp. Series 2001-CK6 Class NW, 6.08% 8/15/36 | 7/1/02 | $ 1,298 |
Fannie Mae REMIC Trust Series 2001-W3 subordinate REMIC pass thru certificates: |
| |
Class B3, 7% 9/25/41 | 5/21/03 | $ 264,312 |
Class B4, 6.9757% 9/25/41 | 11/2/01 | $ 3,189 |
Security | Acquisition Date | Acquisition Cost |
Fannie Mae REMIC Trust Series 2003-W1 subordinate REMIC pass thru certificates, Class B3, 4.4843% 12/25/42 | 3/25/03 | $ 711,433 |
Fannie Mae REMIC Trust Series 2003-W10 subordinate REMIC pass thru certificates: |
| |
Class 2B4, 3.0753% 6/25/43 | 9/29/03 | $ 96,974 |
Class 2B5, 3.0753% 6/25/43 | 9/29/03 | $ 23,035 |
GSR Mortgage Loan Trust Series 2005-HE3 Class B3, 3.9053% 6/25/35 | 6/3/05 | $ 4,938 |
Affiliated Central Funds |
Information regarding fiscal year to date income earned by the Fund from investments in Fidelity Central Funds is as follows: |
Fund | Income earned |
Fidelity Cash Central Fund | $ 70,191 |
Other Information |
The following is a summary of the inputs used, as of November 30, 2014, involving the Fund's assets and liabilities carried at fair value. The inputs or methodology used for valuing securities may not be an indication of the risk associated with investing in those securities. For more information on valuation inputs, and their aggregation into the levels used in the tables below, please refer to the Investment Valuation section in the accompanying Notes to Financial Statements. |
Valuation Inputs at Reporting Date: | ||||
Description | Total | Level 1 | Level 2 | Level 3 |
Investments in Securities: | ||||
Equities: | ||||
Financials | $ 58,995,242 | $ 57,216,240 | $ 1,779,002 | $ - |
Corporate Bonds | 48,797,800 | - | 48,678,549 | 119,251 |
Asset-Backed Securities | 29,980,994 | - | 21,006,472 | 8,974,522 |
Collateralized Mortgage Obligations | 15,056,945 | - | 13,686,673 | 1,370,272 |
Commercial Mortgage Securities | 723,379,907 | - | 706,988,771 | 16,391,136 |
Bank Loan Obligations | 30,496,883 | - | 30,083,465 | 413,418 |
Preferred Securities | 1,566,690 | - | - | 1,566,690 |
Money Market Funds | 39,845,531 | 39,845,531 | - | - |
Total Investments in Securities: | $ 948,119,992 | $ 97,061,771 | $ 822,222,932 | $ 28,835,289 |
Percentage of Market Value: | 100% | 10.3% | 86.7% | 3.0% |
Valuation Inputs at Reporting Date: |
The following is a reconciliation of Investments in Securities for which Level 3 inputs were used in determining value: |
Investments in Securities: | |
Asset-Backed Securities | |
Beginning Balance | $ 15,768,515 |
Net Realized Gain (Loss) on Investment Securities | (121,300) |
Net Unrealized Gain (Loss) on Investment Securities | 1,180,075 |
Cost of Purchases | 186,485 |
Proceeds of Sales | (9,514,000) |
Amortization/Accretion | 1,457,144 |
Transfers into Level 3 | 17,603 |
Transfers out of Level 3 | - |
Ending Balance | $ 8,974,522 |
The change in unrealized gain (loss) for the period attributable to Level 3 securities held at November 30, 2014 | $ 2,002,269 |
Investments in Securities: - continued | |
Commercial Mortgage Securities | |
Beginning Balance | $ 30,038,162 |
Net Realized Gain (Loss) on Investment Securities | (3,151,646) |
Net Unrealized Gain (Loss) on Investment Securities | 3,315,426 |
Cost of Purchases | 3,974 |
Proceeds of Sales | (2,545,190) |
Amortization/Accretion | 889,222 |
Transfers into Level 3 | - |
Transfers out of Level 3 | (12,158,812) |
Ending Balance | $ 16,391,136 |
The change in unrealized gain (loss) for the period attributable to Level 3 securities held at November 30, 2014 | $ (570,714) |
Bank Loan Obligations | |
Beginning Balance | $ 20,753,378 |
Net Realized Gain (Loss) on Investment Securities | 87,778 |
Net Unrealized Gain (Loss) on Investment Securities | (328,591) |
Cost of Purchases | - |
Proceeds of Sales | (17,879,727) |
Amortization/Accretion | 43,868 |
Transfers into Level 3 | - |
Transfers out of Level 3 | (2,263,288) |
Ending Balance | $ 413,418 |
The change in unrealized gain (loss) for the period attributable to Level 3 securities held at November 30, 2014 | $ (639) |
Investments in Securities: - continued | |
Other Investments in Securities | |
Beginning Balance | $ 6,917,145 |
Net Realized Gain (Loss) on Investment Securities | (1,774,089) |
Net Unrealized Gain (Loss) on Investment Securities | 1,292,354 |
Cost of Purchases | - |
Proceeds of Sales | (2,463,059) |
Amortization/Accretion | 340,962 |
Transfers into Level 3 | - |
Transfers out of Level 3 | (1,257,100) |
Ending Balance | $ 3,056,213 |
The change in unrealized gain (loss) for the period attributable to Level 3 securities held at November 30, 2014 | $ (598,869) |
The information used in the above reconciliations represents fiscal year to date activity for any Investments in Securities identified as using Level 3 inputs at either the beginning or the end of the current fiscal period. Transfers into Level 3 were attributable to a lack of observable market data resulting from decreases in market activity, decreases in liquidity, security restructurings or corporate actions. Transfers out of Level 3 were attributable to observable market data becoming available for those securities. Transfers in or out of Level 3 represent the beginning value of any Security or Instrument where a change in the pricing level occurred from the beginning to the end of the period. The cost of purchases and the proceeds of sales may include securities received or delivered through corporate actions or exchanges. Realized and unrealized gains (losses) disclosed in the reconciliations are included in Net Gain (Loss) on the Fund's Statement of Operations. |
See accompanying notes which are an integral part of the financial statements.
Annual Report
Financial Statements
Statement of Assets and Liabilities
| November 30, 2014 | |
Assets | ||
Investment in securities, at value - See accompanying schedule: Unaffiliated issuers (cost $858,580,133) | $ 908,274,461 |
|
Fidelity Central Funds (cost $39,845,531) | 39,845,531 |
|
Total Investments (cost $898,425,664) |
| $ 948,119,992 |
Cash |
| 910,120 |
Receivable for investments sold | 1,545,721 | |
Receivable for fund shares sold | 159 | |
Dividends receivable | 103,377 | |
Interest receivable | 4,277,658 | |
Distributions receivable from Fidelity Central Funds | 4,091 | |
Prepaid expenses | 2,252 | |
Total assets | 954,963,370 | |
|
|
|
Liabilities | ||
Payable for investments purchased | $ 10,880 | |
Distributions payable | 329,272 | |
Accrued management fee | 560,998 | |
Other affiliated payables | 45,459 | |
Other payables and accrued expenses | 202,488 | |
Total liabilities | 1,149,097 | |
|
|
|
Net Assets | $ 953,814,273 | |
Net Assets consist of: |
| |
Paid in capital | $ 950,530,149 | |
Distributions in excess of net investment income | (5,873,090) | |
Accumulated undistributed net realized gain (loss) on investments and foreign currency transactions | (40,536,434) | |
Net unrealized appreciation (depreciation) on investments and assets and liabilities in foreign currencies | 49,693,648 | |
Net Assets, for 106,091,672 shares outstanding | $ 953,814,273 | |
Net Asset Value, offering price and redemption price per share ($953,814,273 ÷ 106,091,672 shares) | $ 8.99 | |
See accompanying notes which are an integral part of the financial statements.
Annual Report
Statement of Operations
| Year ended November 30, 2014 | |
Investment Income |
|
|
Dividends |
| $ 4,276,311 |
Interest |
| 62,354,475 |
Income from Fidelity Central Funds |
| 70,191 |
Total income |
| 66,700,977 |
|
|
|
Expenses | ||
Management fee | $ 6,659,675 | |
Transfer agent fees | 146,575 | |
Accounting fees and expenses | 399,980 | |
Custodian fees and expenses | 17,927 | |
Independent trustees' compensation | 3,849 | |
Audit | 368,072 | |
Legal | 2,601 | |
Miscellaneous | 7,328 | |
Total expenses before reductions | 7,606,007 | |
Expense reductions | (163) | 7,605,844 |
Net investment income (loss) | 59,095,133 | |
Realized and Unrealized Gain (Loss) Net realized gain (loss) on: | ||
Investment securities: |
|
|
Unaffiliated issuers | (3,773,211) | |
Foreign currency transactions | 4,203 | |
Total net realized gain (loss) |
| (3,769,008) |
Change in net unrealized appreciation (depreciation) on: Investment securities | 25,792,337 | |
Assets and liabilities in foreign currencies | (8,957) | |
Total change in net unrealized appreciation (depreciation) |
| 25,783,380 |
Net gain (loss) | 22,014,372 | |
Net increase (decrease) in net assets resulting from operations | $ 81,109,505 | |
See accompanying notes which are an integral part of the financial statements.
Annual Report
Financial Statements - continued
Statement of Changes in Net Assets
| Year ended | Year ended |
Increase (Decrease) in Net Assets |
|
|
Operations |
|
|
Net investment income (loss) | $ 59,095,133 | $ 54,645,345 |
Net realized gain (loss) | (3,769,008) | (9,052,349) |
Change in net unrealized appreciation (depreciation) | 25,783,380 | 14,702,973 |
Net increase (decrease) in net assets resulting | 81,109,505 | 60,295,969 |
Distributions to shareholders from net investment income | (52,105,480) | (50,904,289) |
Distributions to shareholders from net realized gain | (5,097,366) | (3,629,909) |
Total distributions | (57,202,846) | (54,534,198) |
Share transactions | 78,985,900 | 47,275,500 |
Reinvestment of distributions | 53,153,117 | 50,746,165 |
Cost of shares redeemed | (79,690,629) | (129,037,820) |
Net increase (decrease) in net assets resulting from share transactions | 52,448,388 | (31,016,155) |
Total increase (decrease) in net assets | 76,355,047 | (25,254,384) |
|
|
|
Net Assets | ||
Beginning of period | 877,459,226 | 902,713,610 |
End of period (including distributions in excess of net investment income of $5,873,090 and distributions in excess of net investment income of $6,213,207, respectively) | $ 953,814,273 | $ 877,459,226 |
Other Information Shares | ||
Sold | 8,973,317 | 5,388,745 |
Issued in reinvestment of distributions | 5,993,334 | 5,793,530 |
Redeemed | (8,947,291) | (14,659,534) |
Net increase (decrease) | 6,019,360 | (3,477,259) |
See accompanying notes which are an integral part of the financial statements.
Annual Report
Statement of Cash Flows
Year ended November 30, 2014 | |
Cash flows from operating activities: | |
Net increase in net assets resulting from operations | $ 81,109,505 |
Adjustments to reconcile net increase in net assets resulting from operations to net cash provided by (used in) operating activities: |
|
Change in receivable for investments sold | 699,774 |
Change in dividend receivable | (441) |
Change in interest receivable | 1,850,402 |
Change in prepaid expenses | 189 |
Change in other assets | - |
Change in payable for investments purchased | (4,981,906) |
Change in other payables and accrued expenses | 40,232 |
Purchases of long-term investments | (221,328,310) |
Proceeds from sales of long-term investments | 177,844,876 |
Purchases of and proceeds from maturities/sales of short-term investments - net | 3,297,229 |
Net cash from return of capital distributions | - |
Net amortization/accretion of premium/discount | (10,933,501) |
Net realized gain on investment securities and foreign currency transactions | 3,769,008 |
Change in net unrealized (appreciation) depreciation on investment securities and assets and liabilities in foreign currencies | (25,783,380) |
Net cash provided by operating activities | 5,583,677 |
Cash flows from financing activities: | |
Proceeds from sales of shares | 78,985,741 |
Distribtions to shareholders net of reinvestments | (4,013,880) |
Cost of shares redeemed | (79,690,629) |
Change in payable to Custodian Bank | - |
Net cash used in financing activities | (4,718,768) |
Net increase in cash and cash equivalents | 864,909 |
Cash, beginning of year | 45,211 |
Cash, end of year | $ 910,120 |
See accompanying notes which are an integral part of the financial statements.
Annual Report
Financial Highlights
Years ended November 30, | 2014 | 2013 | 2012 | 2011 | 2010 |
Selected Per-Share Data |
|
|
|
|
|
Net asset value, beginning of period | $ 8.77 | $ 8.72 | $ 7.87 | $ 7.83 | $ 6.85 |
Income from Investment Operations |
|
|
|
|
|
Net investment income (loss) B | .560 | .542 | .537 | .546 | .567 |
Net realized and unrealized gain (loss) | .205 | .048 | .898 | .167 | 1.096 |
Total from investment operations | .765 | .590 | 1.435 | .713 | 1.663 |
Distributions from net investment income | (.495) | (.505) | (.574) | (.673) | (.683) |
Distributions from net realized gain | (.050) | (.035) | (.011) | - | - |
Total distributions | (.545) | (.540) | (.585) | (.673) | (.683) |
Net asset value, end of period | $ 8.99 | $ 8.77 | $ 8.72 | $ 7.87 | $ 7.83 |
Total Return A | 8.98% | 6.96% | 18.94% | 9.34% | 25.65% |
Ratios to Average Net Assets C, E |
|
|
|
|
|
Expenses before reductions | .81% | .83% | .81% | .82% | .83% |
Expenses net of fee waivers, if any | .81% | .83% | .81% | .82% | .83% |
Expenses net of all reductions | .81% | .83% | .81% | .82% | .83% |
Net investment income (loss) | 6.31% | 6.18% | 6.52% | 6.86% | 7.67% |
Supplemental Data |
|
|
|
|
|
Net assets, end of period (000 omitted) | $ 953,814 | $ 877,459 | $ 902,714 | $ 717,528 | $ 585,270 |
Portfolio turnover rate D | 20% | 22% | 21% | 20% | 17% |
A Total returns would have been lower if certain expenses had not been reduced during the applicable periods shown.
B Calculated based on average shares outstanding during the period.
C Fees and expenses of any underlying Fidelity Central Funds are not included in the Fund's expense ratio. The Fund indirectly bears its proportionate share of the expenses of any underlying Fidelity Central Funds.
D Amount does not include the portfolio activity of any underlying Fidelity Central Funds.
E Expense ratios reflect operating expenses of the Fund. Expenses before reductions do not reflect amounts reimbursed by the investment adviser or reductions from brokerage service arrangements or reductions from other expense offset arrangements and do not represent the amount paid by the Fund during periods when reimbursements or reductions occur. Expenses net of fee waivers reflect expenses after reimbursement by the investment adviser but prior to reductions from brokerage service arrangements or other expense offset arrangements. Expenses net of all reductions represent the net expenses paid by the Fund.
See accompanying notes which are an integral part of the financial statements.
Annual Report
Notes to Financial Statements
For the period ended November 30, 2014
1. Organization.
Fidelity Real Estate High Income Fund (the Fund) is a fund of Fidelity Advisor Series I (the Trust) and is authorized to issue an unlimited number of shares. The Trust is registered under the Investment Company Act of 1940, as amended (the 1940 Act), as an open-end management investment company organized as a Massachusetts business trust.
2. Investments in Fidelity Central Funds.
The Fund invests in Fidelity Central Funds, which are open-end investment companies generally available only to other investment companies and accounts managed by the investment adviser and its affiliates. The Fund's Schedule of Investments lists each of the Fidelity Central Funds held as of period end, if any, as an investment of the Fund, but does not include the underlying holdings of each Fidelity Central Fund. As an Investing Fund, the Fund indirectly bears its proportionate share of the expenses of the underlying Fidelity Central Funds.
The Money Market Central Funds seek preservation of capital and current income and are managed by Fidelity Investments Money Management, Inc. (FIMM), an affiliate of the investment adviser. Annualized expenses of the Money Market Central Funds as of their most recent shareholder report date are less than .01%.
A complete unaudited list of holdings for each Fidelity Central Fund is available upon request or at the Securities and Exchange Commission (the SEC) website at www.sec.gov. In addition, the financial statements of the Fidelity Central Funds, which are not covered by the Fund's Report of Independent Registered Public Accounting Firm, are available on the SEC website or upon request.
3. Significant Accounting Policies.
The financial statements have been prepared in conformity with accounting principles generally accepted in the United States of America (GAAP), which require management to make certain estimates and assumptions at the date of the financial statements. Actual results could differ from those estimates. Subsequent events, if any, through the date that the financial statements were issued have been evaluated in the preparation of the financial statements. The following summarizes the significant accounting policies of the Fund:
Investment Valuation. Investments are valued as of 4:00 p.m. Eastern time on the last calendar day of the period. In accordance with valuation policies and procedures approved by the Board of Trustees (the Board), the Fund attempts to obtain prices from one or more third party pricing vendors or brokers to value its investments. When current market prices, quotations or currency exchange rates are not readily available or
Annual Report
3. Significant Accounting Policies - continued
Investment Valuation - continued
reliable, investments will be fair valued in good faith by the Fidelity Management & Research Company (FMR) Fair Value Committee (the Committee), in accordance with procedures adopted by the Board. Factors used in determining fair value vary by investment type and may include market or investment specific events, changes in interest rates and credit quality. The frequency with which these procedures are used cannot be predicted and they may be utilized to a significant extent. The Committee oversees the Fund's valuation policies and procedures and is responsible for approving and reporting to the Board all fair value determinations.
The Fund categorizes the inputs to valuation techniques used to value its investments into a disclosure hierarchy consisting of three levels as shown below:
Level 1 - quoted prices in active markets for identical investments
Level 2 - other significant observable inputs (including quoted prices for similar investments, interest rates, prepayment speeds, etc.)
Level 3 - unobservable inputs (including the Fund's own assumptions based on the best information available)
Valuation techniques used to value the Fund's investments by major category are as follows:
Debt securities, including restricted securities, are valued based on evaluated prices received from third party pricing vendors or from brokers who make markets in such securities. Corporate bonds, bank loan obligations and preferred securities are valued by pricing vendors who utilize matrix pricing which considers yield or price of bonds of comparable quality, coupon, maturity and type or by broker-supplied prices. Asset backed securities, collateralized mortgage obligations and commercial mortgage securities are valued by pricing vendors who utilize matrix pricing which considers prepayment speed assumptions, attributes of the collateral, yield or price of bonds of comparable quality, coupon, maturity and type or by broker-supplied prices. Independent prices obtained from a single source or broker are evaluated by management and may be categorized as Level 3 in the hierarchy. When independent prices are unavailable or unreliable, debt securities may be valued utilizing pricing methodologies which consider similar factors that would be used by third party pricing vendors. Debt securities are generally categorized as Level 2 in the hierarchy but may be Level 3 depending on the circumstances. The Fund invests a significant portion of its assets in below investment grade securities. The value of these securities can be more volatile due to changes in the credit quality of the issuer and is sensitive to changes in economic, market and regulatory conditions.
Annual Report
Notes to Financial Statements - continued
3. Significant Accounting Policies - continued
Investment Valuation - continued
Equity securities, including restricted securities, for which market quotations are readily available, are valued at the last reported sale price or official closing price as reported by a third party pricing vendor on the primary market or exchange on which they are traded and are categorized as Level 1 in the hierarchy. In the event there were no sales during the day or closing prices are not available, securities are valued at the last quoted bid price or may be valued using the last available price and are generally categorized as Level 2 in the hierarchy. Utilizing these techniques may result in transfers between Level 1 and Level 2. For equity securities, including restricted securities, where observable inputs are limited, assumptions about market activity and risk are used and these securities may be categorized as Level 3 in the hierarchy.
The Fund attempts to obtain prices from one or more third party pricing vendors or brokers. For certain securities, independent prices may be unavailable, unreliable or limited to a single third party pricing vendor or broker. As of November 30, 2014, 12% of the securities held by the Fund were either valued based on a price provided by a single third party pricing vendor or broker or were fair valued. Actual prices may differ from the values that would be realized if the securities were sold, and the differences could be material.
Investments in open-end mutual funds, including the Fidelity Central Funds, are valued at their closing net asset value (NAV) each business day and are categorized as Level 1 in the hierarchy.
The following provides information on Level 3 securities held by the Fund that were valued at period end based on unobservable inputs. These amounts exclude valuations provided by a broker.
Asset Type | Fair Value at | Valuation | Unobservable | Amount or | Impact to |
Asset-Backed Securities | $ 8,974,522 | Discounted cash flow | Yield | 4.5% - 121.2% / 12.9% | Decrease |
|
| Expected distribution | Recovery rate | 0.0% - 0.5% / 0.0% | Increase |
|
| Market comparable | Spread | 95.9% | Decrease |
Bank Loan Obligations | $ 413,418 | Discounted cash flow | Yield | 8.8% | Decrease |
Collateralized Mortgage Obligations | $ 1,370,272 | Discounted cash flow | Yield | 0.0% - 26.0% / 9.3% | Decrease |
Annual Report
3. Significant Accounting Policies - continued
Investment Valuation - continued
Asset Type | Fair Value at | Valuation | Unobservable | Amount or | Impact to |
Commercial Mortgage Securities | $ 2,989,915 | Discounted cash flow | Discount rate | 20.0% | Decrease |
|
|
| Yield | 10.0% - 110.6% / 28.1% | Decrease |
|
|
| Quoted price | $16.98 | Increase |
|
| Expected distribution | Recovery rate | 0.0% | Increase |
|
| Market comparable | Spread | 0.6% | Decrease |
Corporate Bonds | $ 119,251 | Discounted cash flow | Discount rate | 20.0% | Decrease |
Preferred Securities | $ 1,566,690 | Discounted cash flow | Yield | 12.0% | Decrease |
|
| Expected distribution | Recovery rate | 0.1% | Increase |
* Represents the expected directional change in the fair value of the Level 3 investments that would result from an increase in the corresponding
input. A decrease to the unobservable input would have the opposite effect. Significant changes in these inputs could result in significantly higher or
lower fair value measurements.
Changes in valuation techniques may result in transfers in or out of an assigned level within the disclosure hierarchy. The aggregate value of investments by input level, as of November 30, 2014, as well as a roll forward of Level 3 investments, is included at the end of the Fund's Schedule of Investments.
Foreign Currency. The Fund may use foreign currency contracts to facilitate transactions in foreign-denominated securities. Gains and losses from these transactions may arise from changes in the value of the foreign currency or if the counterparties do not perform under the contracts' terms.
Foreign-denominated assets, including investment securities, and liabilities are translated into U.S. dollars at the exchange rates at period end. Purchases and sales of investment securities, income and dividends received and expenses denominated in foreign currencies are translated into U.S. dollars at the exchange rate in effect on the transaction date.
Annual Report
Notes to Financial Statements - continued
3. Significant Accounting Policies - continued
Foreign Currency - continued
The effects of exchange rate fluctuations on investments are included with the net realized and unrealized gain (loss) on investment securities. Other foreign currency transactions resulting in realized and unrealized gain (loss) are disclosed separately.
Investment Transactions and Income. For financial reporting purposes, the Fund's investment holdings and NAV include trades executed through the end of the last business day of the period. The NAV per share for processing shareholder transactions is calculated as of the close of business of the New York Stock Exchange (NYSE), normally 4:00 p.m. Eastern time and includes trades executed through the end of the prior business day. Gains and losses on securities sold are determined on the basis of identified cost. Dividend income is recorded on the ex-dividend date, except for certain dividends from foreign securities where the ex-dividend date may have passed, which are recorded as soon as the Fund is informed of the ex-dividend date. Non-cash dividends included in dividend income, if any, are recorded at the fair market value of the securities received. Income and capital gain distributions from Fidelity Central Funds, if any, are recorded on the ex-dividend date. Distributions received on securities that represent a return of capital or capital gain are recorded as a reduction of cost of investments and/or as a realized gain. Subsequent to ex-dividend date the Fund determines the components of these distributions, based upon receipt of tax filings or other correspondence relating to the underlying investment. Interest income is accrued as earned and includes coupon interest and amortization of premium and accretion of discount on debt securities as applicable. For certain lower credit quality securitized assets that have contractual cash flows (for example, asset backed securities, collateralized mortgage obligations and commercial mortgage-backed securities), changes in estimated cash flows are periodically evaluated and the estimated yield is adjusted on a prospective basis, resulting in increases or decreases to Interest Income in the accompanying Statement of Operations. Investment income is recorded net of foreign taxes withheld where recovery of such taxes is uncertain. Debt obligations may be placed on non-accrual status and related interest income may be reduced by ceasing current accruals and writing off interest receivables when the collection of all or a portion of interest has become doubtful based on consistently applied procedures. A debt obligation is removed from non-accrual status when the issuer resumes interest payments or when collectability of interest is reasonably assured.
Expenses. Expenses directly attributable to a fund are charged to that fund. Expenses attributable to more than one fund are allocated among the respective funds on the basis of relative net assets or other appropriate methods. Expense estimates are accrued in the period to which they relate and adjustments are made when actual amounts are known.
Annual Report
3. Significant Accounting Policies - continued
Income Tax Information and Distributions to Shareholders. Each year, the Fund intends to qualify as a regulated investment company under Subchapter M of the Internal Revenue Code, including distributing substantially all of its taxable income and realized gains. As a result, no provision for U.S. Federal income taxes is required. As of November 30, 2014, the Fund did not have any unrecognized tax benefits in the financial statements; nor is the Fund aware of any tax positions for which it is reasonably possible that the total amounts of unrecognized tax benefits will significantly change in the next twelve months. The Fund files a U.S. federal tax return, in addition to state and local tax returns as required. The Fund's federal income tax returns are subject to examination by the Internal Revenue Service (IRS) for a period of three fiscal years after they are filed. State and local tax returns may be subject to examination for an additional fiscal year depending on the jurisdiction. Foreign taxes are provided for based on the Fund's understanding of the tax rules and rates that exist in the foreign markets in which it invests.
Dividends are declared and recorded daily and paid monthly from net investment income. Distributions from realized gains, if any, are declared and recorded on the ex-dividend date. Income and capital gain distributions are determined in accordance with income tax regulations, which may differ from GAAP.
Capital accounts within the financial statements are adjusted for permanent book-tax differences. These adjustments have no impact on net assets or the results of operations. Capital accounts are not adjusted for temporary book-tax differences which will reverse in a subsequent period.
Book-tax differences are primarily due to foreign currency transactions, passive foreign investment companies (PFIC), market discount, capital loss carryforwards and losses deferred due to wash sales and excise tax regulations.
The federal tax cost of investment securities and unrealized appreciation (depreciation) as of period end were as follows:
Gross unrealized appreciation | $ 76,812,282 |
Gross unrealized depreciation | (31,377,253) |
Net unrealized appreciation (depreciation) on securities | $ 45,435,029 |
|
|
Tax Cost | $ 902,684,963 |
The tax-based components of distributable earnings as of period end were as follows:
Capital loss carryforward | $ (41,065,598) |
Net unrealized appreciation (depreciation) on securities and other investments | $ 45,434,349 |
Annual Report
Notes to Financial Statements - continued
3. Significant Accounting Policies - continued
Income Tax Information and Distributions to Shareholders - continued
Capital loss carryforwards are only available to offset future capital gains of the Fund to the extent provided by regulations and may be limited. Under the Regulated Investment Company Modernization Act of 2010 (the Act), the Fund is permitted to carry forward capital losses incurred in taxable years beginning after December 22, 2010 for an unlimited period and such capital losses are required to be used prior to any losses that expire. The capital loss carryforward information presented below, including any applicable limitation, is estimated as of fiscal period end and is subject to adjustment.
Fiscal year of expiration |
|
2016 | $ (5,138,254) |
2017 | (12,497,160) |
2019 | (15,362,164) |
Total with expiration | $ (32,997,578) |
No expiration |
|
Short-term | $ (394,308) |
Long-term | (7,673,712) |
Total no expiration | (8,068,020) |
Total capital loss carryforward | $ (41,065,598) |
The tax character of distributions paid was as follows:
| November 30, 2014 | November 30, 2013 |
Ordinary Income | $ 57,202,846 | $ 54,534,198 |
Restricted Securities. The Fund may invest in securities that are subject to legal or contractual restrictions on resale. These securities generally may be resold in transactions exempt from registration or to the public if the securities are registered. Disposal of these securities may involve time-consuming negotiations and expense, and prompt sale at an acceptable price may be difficult. Information regarding restricted securities is included at the end of the Fund's Schedule of Investments.
Loans and Other Direct Debt Instruments. The Fund invests in direct debt instruments which are interests in amounts owed to lenders by corporate or other borrowers. These instruments may be in the form of loans, trade claims or other receivables and may include standby financing commitments such as revolving credit facilities that obligate the Fund to supply additional cash to the borrower on demand. Loans may be acquired through assignment or participation. The Fund did not have any unfunded loan commitments, which are contractual obligations for future funding, at period end.
Annual Report
3. Significant Accounting Policies - continued
New Accounting Pronouncement. In June 2014, the Financial Accounting Standards Board issued Accounting Standard Update No. 2014-11, Repurchase-to-Maturity Transactions, Repurchase Financings, and Disclosures. The Update amends the accounting for certain repurchase agreements and expands disclosure requirements for reverse repurchase agreements, securities lending and other similar transactions. The disclosure requirements are effective for annual and interim reporting periods beginning after December 15, 2014. Management is currently evaluating the impact of the Update on the Fund's financial statements and related disclosures.
4. Purchases and Sales of Investments.
Purchases and sales of securities, other than short-term securities and U.S. government securities, aggregated $221,328,310 and $177,456,633, respectively.
5. Fees and Other Transactions with Affiliates.
Management Fee. Fidelity Management & Research Company (the investment adviser) and its affiliates provide the Fund with investment management related services for which the Fund pays a monthly management fee. The management fee is the sum of an individual fund fee rate that is based on an annual rate of .60% of the Fund's average net assets and an annualized group fee rate that averaged .11% during the period. The group fee rate is based upon the average net assets of all the mutual funds advised by the investment adviser, including any mutual funds previously advised by the investment adviser that are currently advised by Fidelity SelectCo, LLC, an affiliate of the investment adviser. The group fee rate decreases as assets under management increase and increases as assets under management decrease. For the reporting period, the total annual management fee rate was .71% of the Fund's average net assets.
Transfer Agent Fees. Fidelity Investments Institutional Operations Company, Inc. (FIIOC), an affiliate of the investment adviser, is the Fund's transfer, dividend disbursing and shareholder servicing agent. FIIOC receives an asset-based fee of .02% of the Fund's average net assets. FIIOC pays for typesetting, printing and mailing of shareholder reports, except proxy statements.
Accounting Fees. Fidelity Service Company, Inc. (FSC), an affiliate of the investment adviser, maintains the Fund's accounting records. The fee is based on the level of average net assets for each month.
Annual Report
Notes to Financial Statements - continued
6. Committed Line of Credit.
The Fund participates with other funds managed by the investment adviser or an affiliate in a $4.25 billion credit facility (the "line of credit") to be utilized for temporary or emergency purposes to fund shareholder redemptions or for other short-term liquidity purposes. The Fund has agreed to pay commitment fees on its pro-rata portion of the line of credit, which amounted to $1,486 and is reflected in Miscellaneous expenses on the Statement of Operations. During the period, the Fund did not borrow on this line of credit.
7. Expense Reductions.
Through arrangements with the Fund's custodian, credits realized as a result of uninvested cash balances were used to reduce the Fund's expenses. During the period, these credits reduced the Fund's custody expenses by $163.
8. Other.
The Fund's organizational documents provide former and current trustees and officers with a limited indemnification against liabilities arising in connection with the performance of their duties to the Fund. In the normal course of business, the Fund may also enter into contracts that provide general indemnifications. The Fund's maximum exposure under these arrangements is unknown as this would be dependent on future claims that may be made against the Fund. The risk of material loss from such claims is considered remote.
At the end of the period, one otherwise unaffiliated shareholder was the owner of record of approximately 12% of the total outstanding shares of the fund.
9. Credit and Liquidity Risk.
The Fund invests a significant portion of its assets in below investment grade securities with contractual cash flows, such as asset backed securities, collateralized mortgage obligations and commercial mortgage backed securities. As these securities have a higher degree of sensitivity to changes in economic conditions, including real estate values, the risk of default is higher, and the liquidity and/or value of such securities may be adversely affected.
Annual Report
Report of Independent Registered Public Accounting Firm
To the Trustees of Fidelity Advisor Series I and the Shareholders of Fidelity Real Estate High Income Fund:
In our opinion, the accompanying statement of assets and liabilities, including the schedule of investments, and the related statements of operations, of changes in net assets, and of cash flows and the financial highlights present fairly, in all material respects, the financial position of Fidelity Real Estate High Income Fund (a fund of Fidelity Advisor Series I) at November 30, 2014, the results of its operations for the year then ended, the changes in its net assets for each of the two years in the period then ended, the cash flows for the year then ended and the financial highlights for each of the five years in the period then ended, in conformity with accounting principles generally accepted in the United States of America. These financial statements and financial highlights (hereafter referred to as "financial statements") are the responsibility of the Fidelity Real Estate High Income Fund's management. Our responsibility is to express an opinion on these financial statements based on our audits. We conducted our audits of these financial statements in accordance with the standards of the Public Company Accounting Oversight Board (United States). Those standards require that we plan and perform the audit to obtain reasonable assurance about whether the financial statements are free of material misstatement. An audit includes examining, on a test basis, evidence supporting the amounts and disclosures in the financial statements, assessing the accounting principles used and significant estimates made by management, and evaluating the overall financial statement presentation. We believe that our audits, which included confirmation of securities at November 30, 2014 by correspondence with the custodian, agent banks and brokers, provide a reasonable basis for our opinion.
PricewaterhouseCoopers LLP
Boston, Massachusetts
January 27, 2015
Annual Report
Trustees and Officers
The Trustees, Member of the Advisory Board, and officers of the trust and fund, as applicable, are listed below. The Board of Trustees governs the fund and is responsible for protecting the interests of shareholders. The Trustees are experienced executives who meet periodically throughout the year to oversee the fund's activities, review contractual arrangements with companies that provide services to the fund, oversee management of the risks associated with such activities and contractual arrangements, and review the fund's performance. Except for James C. Curvey, each of the Trustees oversees 174 funds. Mr. Curvey oversees 407 funds.
The Trustees hold office without limit in time except that (a) any Trustee may resign; (b) any Trustee may be removed by written instrument, signed by at least two-thirds of the number of Trustees prior to such removal; (c) any Trustee who requests to be retired or who has become incapacitated by illness or injury may be retired by written instrument signed by a majority of the other Trustees; and (d) any Trustee may be removed at any special meeting of shareholders by a two-thirds vote of the outstanding voting securities of the trust. Each Trustee who is not an interested person (as defined in the 1940 Act) of the trust and the fund (Independent Trustee), shall retire not later than the last day of the calendar year in which his or her 75th birthday occurs. The Independent Trustees may waive this mandatory retirement age policy with respect to individual Trustees. The officers and Advisory Board Member hold office without limit in time, except that any officer and Advisory Board Member may resign or may be removed by a vote of a majority of the Trustees at any regular meeting or any special meeting of the Trustees. Except as indicated, each individual has held the office shown or other offices in the same company for the past five years.
Experience, Skills, Attributes, and Qualifications of the Fund's Trustees. The Governance and Nominating Committee has adopted a statement of policy that describes the experience, qualifications, attributes, and skills that are necessary and desirable for potential Independent Trustee candidates (Statement of Policy). The Board believes that each Trustee satisfied at the time he or she was initially elected or appointed a Trustee, and continues to satisfy, the standards contemplated by the Statement of Policy. The Governance and Nominating Committee also engages professional search firms to help identify potential Independent Trustee candidates who have the experience, qualifications, attributes, and skills consistent with the Statement of Policy. From time to time, additional criteria based on the composition and skills of the current Independent Trustees, as well as experience or skills that may be appropriate in light of future changes to board composition, business conditions, and regulatory or other developments, have also been considered by the professional search firms and the Governance and Nominating Committee. In addition, the Board takes into account the Trustees' commitment and participation in Board and committee meetings, as well as their leadership of standing and ad hoc committees throughout their tenure.
In determining that a particular Trustee was and continues to be qualified to serve as a Trustee, the Board has considered a variety of criteria, none of which, in isolation, was controlling. The Board believes that, collectively, the Trustees have balanced and diverse experience, qualifications, attributes, and skills, which allow the Board to operate effectively in governing the fund and protecting the interests of shareholders. Information about the specific experience, skills, attributes, and qualifications of each Trustee, which in each case led to the Board's conclusion that the Trustee should serve (or continue to serve) as a trustee of the fund, is provided below.
Annual Report
Board Structure and Oversight Function. James C. Curvey is an interested person (as defined in the 1940 Act) and currently serves as Chairman. The Trustees have determined that an interested Chairman is appropriate and benefits shareholders because an interested Chairman has a personal and professional stake in the quality and continuity of services provided to the fund. Independent Trustees exercise their informed business judgment to appoint an individual of their choosing to serve as Chairman, regardless of whether the Trustee happens to be independent or a member of management. The Independent Trustees have determined that they can act independently and effectively without having an Independent Trustee serve as Chairman and that a key structural component for assuring that they are in a position to do so is for the Independent Trustees to constitute a substantial majority for the Board. The Independent Trustees also regularly meet in executive session. Ned C. Lautenbach serves as Chairman of the Independent Trustees and as such (i) acts as a liaison between the Independent Trustees and management with respect to matters important to the Independent Trustees and (ii) with management prepares agendas for Board meetings.
Fidelity funds are overseen by different Boards of Trustees. The fund's Board oversees Fidelity's equity and high income funds and another Board oversees Fidelity's investment-grade bond, money market, and asset allocation funds. The asset allocation funds may invest in Fidelity funds overseen by the fund's Board. The use of separate Boards, each with its own committee structure, allows the Trustees of each group of Fidelity funds to focus on the unique issues of the funds they oversee, including common research, investment, and operational issues. On occasion, the separate Boards establish joint committees to address issues of overlapping consequences for the Fidelity funds overseen by each Board.
The Trustees operate using a system of committees to facilitate the timely and efficient consideration of all matters of importance to the Trustees, the fund, and fund shareholders and to facilitate compliance with legal and regulatory requirements and oversight of the fund's activities and associated risks. The Board, acting through its committees, has charged FMR and its affiliates with (i) identifying events or circumstances the occurrence of which could have demonstrably adverse effects on the fund's business and/or reputation; (ii) implementing processes and controls to lessen the possibility that such events or circumstances occur or to mitigate the effects of such events or circumstances if they do occur; and (iii) creating and maintaining a system designed to evaluate continuously business and market conditions in order to facilitate the identification and implementation processes described in (i) and (ii) above. Because the day-to-day operations and activities of the fund are carried out by or through FMR, its affiliates and other service providers, the fund's exposure to risks is mitigated but not eliminated by the processes overseen by the Trustees. While each of the Board's committees has responsibility for overseeing different aspects of the fund's activities, oversight is exercised primarily through the Operations, Audit, and Compliance Committees. In addition, the Independent Trustees have worked with FMR to enhance the Board's oversight of investment and financial risks, legal and regulatory risks, technology risks, and operational risks, including the development of additional risk reporting to the Board. For example, a working group comprised of Independent Trustees and FMR has worked and continues to work to review the Fidelity funds' valuation-related activities, reporting and risk management. Appropriate personnel, including but not limited to the fund's Chief Compliance Officer (CCO), FMR's internal auditor, the independent accountants, the fund's Treasurer and portfolio management personnel, make periodic reports to the Board's committees, as appropriate, including an annual review of FMR's risk management program for the Fidelity funds. The responsibilities of each standing committee, including their oversight responsibilities, are described further under "Standing Committees of the Fund's Trustees."
Annual Report
Trustees and Officers - continued
The fund's Statement of Additional Information (SAI) includes more information about the Trustees. To request a free copy, call Fidelity at 1-401-292-6402.
Interested Trustees*:
Correspondence intended for each Trustee who is an interested person may be sent to Fidelity Investments, 245 Summer Street, Boston, Massachusetts 02210.
Name, Year of Birth; Principal Occupations and Other Relevant Experience+ | |
James C. Curvey (1935) | |
Year of Election or Appointment: 2007 Trustee Chairman of the Board of Trustees | |
| Mr. Curvey also serves as Trustee of other Fidelity funds. Mr. Curvey is a Director of Fidelity Research & Analysis Co. (2009-present), and Vice Chairman (2007-present) and Director of FMR LLC. In addition, Mr. Curvey serves as an Overseer for the Boston Symphony Orchestra and a member of the board of Artis-Naples, Naples, Florida, and as a Trustee for Brewster Academy, Wolfeboro, New Hampshire. Previously, Mr. Curvey served as a Director of Fidelity Investments Money Management, Inc. (2009-2014), a Director of FMR (2007-2014), and a Director of FMR Co., Inc. (2007-2014). |
Charles S. Morrison (1960) | |
Year of Election or Appointment: 2014 Trustee | |
| Mr. Morrison also serves as Trustee of other funds. He serves as a Director of Fidelity Investments Money Management, Inc. (FIMM) (2014-present), Director of Fidelity SelectCo, LLC (2014-present), President, Asset Management (2014-present), and is an employee of Fidelity Investments. Previously, Mr. Morrison served as Vice President of Fidelity's Fixed Income and Asset Allocation Funds (2012-2014), President, Fixed Income (2011-2014), Vice President of Fidelity's Money Market Funds (2005-2009), President, Money Market Group Leader of FMR (2009), and Senior Vice President, Money Market Group of FMR (2004-2009). Mr. Morrison also served as Vice President of Fidelity's Bond Funds (2002-2005), certain Balanced Funds (2002-2005), and certain Asset Allocation Funds (2002-2007), and as Senior Vice President (2002-2005) of Fidelity's Bond Division. |
* Trustees have been determined to be "Interested Trustees" by virtue of, among other things, their affiliation with the trust or various entities under common control with FMR.
+ The information above includes each Trustee's principal occupation during the last five years and other information relating to the experience, attributes, and skills relevant to each Trustee's qualifications to serve as a Trustee, which led to the conclusion that each Trustee should serve as a Trustee for the fund.
Annual Report
Trustees and Officers - continued
Independent Trustees:
Correspondence intended for each Independent Trustee (that is, the Trustees other than the Interested Trustees) may be sent to Fidelity Investments, P.O. Box 55235, Boston, Massachusetts 02205-5235.
Name, Year of Birth; Principal Occupations and Other Relevant Experience+ | |
Dennis J. Dirks (1948) | |
Year of Election or Appointment: 2005 Trustee | |
| Mr. Dirks also serves as Trustee of other Fidelity funds. Prior to his retirement in May 2003, Mr. Dirks was Chief Operating Officer and a member of the Board of The Depository Trust & Clearing Corporation (DTCC). He also served as President, Chief Operating Officer, and Board member of The Depository Trust Company (DTC) and President and Board member of the National Securities Clearing Corporation (NSCC). In addition, Mr. Dirks served as Chief Executive Officer and Board member of the Government Securities Clearing Corporation, Chief Executive Officer and Board member of the Mortgage-Backed Securities Clearing Corporation, as a Trustee and a member of the Finance Committee of Manhattan College (2005-2008), and as a Trustee and a member of the Finance Committee of AHRC of Nassau County (2006-2008). Mr. Dirks is a member of the Independent Directors Council (IDC) Governing Council (2010-present) and Board of Directors for The Brookville Center for Children's Services, Inc. (2009-present). |
Alan J. Lacy (1953) | |
Year of Election or Appointment: 2008 Trustee | |
| Mr. Lacy also serves as Trustee of other Fidelity funds. Mr. Lacy serves as a member of the Board of Directors of Dave & Buster's Entertainment, Inc. (restaurant and entertainment complexes, 2010-present and Bristol-Myers Squibb Company (global pharmaceuticals, 2008-present). In addition, Mr. Lacy served as Senior Adviser (2007-2014) of Oak Hill Capital Partners, L.P. (private equity) and also served as Chief Executive Officer (2000-2005) and Vice Chairman (2005-2006) of Sears Holdings Corporation and Sears, Roebuck and Co. (retail). Mr. Lacy is a member of the Board of Trustees of The National Parks Conservation Association (2006-present). Previously, Mr. Lacy served as Chairman of the Board of Trustees of the National Parks Conservation Association (2008-2011) and as a member of the Board of Directors for The Western Union Company (global money transfer, 2006-2011), The Hillman Companies, Inc. (hardware wholesalers, 2010-2014), and Earth Fare, Inc. (retail grocery, 2010-2014). |
Ned C. Lautenbach (1944) | |
Year of Election or Appointment: 2000 Trustee Chairman of the Independent Trustees | |
| Mr. Lautenbach also serves as Trustee of other Fidelity funds. Mr. Lautenbach currently serves as the Lead Director of the Eaton Corporation Board of Directors (diversified industrial, 1997-present). Mr. Lautenbach is Chairman of the Board of Directors of Artis-Naples in Naples, Florida (2012-present), a member of the Council on Foreign Relations (1994-present), and a member of the Board of Governors, State University System of Florida (2013-present). Previously, Mr. Lautenbach was a Partner/Advisory Partner at Clayton, Dubilier & Rice, LLC (private equity investment, 1998-2010), as well as a Director of Sony Corporation (2006-2007). |
Joseph Mauriello (1944) | |
Year of Election or Appointment: 2008 Trustee | |
| Mr. Mauriello also serves as Trustee of other Fidelity funds. Prior to his retirement in January 2006, Mr. Mauriello served in numerous senior management positions including Deputy Chairman and Chief Operating Officer (2004-2005), and Vice Chairman of Financial Services (2002-2004) of KPMG LLP US (professional services, 1965-2005). Mr. Mauriello currently serves as a member of the Board of Directors of XL Group plc. (global insurance and re-insurance, 2006-present). Previously, Mr. Mauriello served as a Director of the Hamilton Funds of the Bank of New York (2006-2007) and of Arcadia Resources Inc. (health care services and products, 2007-2012). |
Robert W. Selander (1950) | |
Year of Election or Appointment: 2011 Trustee | |
| Mr. Selander also serves as Trustee of other Fidelity funds. Mr. Selander serves as a Director of The Western Union Company (global money transfer, 2014-present). Previously, Mr. Selander served as a Member of the Advisory Board of other Fidelity funds (2011), and Executive Vice Chairman (2010), Chief Executive Officer (2009-2010), and President and Chief Executive Officer (1997-2009) of Mastercard, Inc. |
Cornelia M. Small (1944) | |
Year of Election or Appointment: 2005 Trustee | |
| Ms. Small also serves as Trustee of other Fidelity funds. Ms. Small is a member of the Board of Directors (2009-present) and Chair of the Investment Committee (2010-present) of the Teagle Foundation. Ms. Small also serves on the Investment Committee of the Berkshire Taconic Community Foundation (2008-present). Previously, Ms. Small served as Chairperson (2002-2008) and a member of the Investment Committee and Chairperson (2008-2012) and a member of the Board of Trustees of Smith College. In addition, Ms. Small served as Chief Investment Officer, Director of Global Equity Investments, and a member of the Board of Directors of Scudder, Stevens & Clark and Scudder Kemper Investments. |
William S. Stavropoulos (1939) | |
Year of Election or Appointment: 2002 Trustee Vice Chairman of the Independent Trustees | |
| Mr. Stavropoulos also serves as Trustee of other Fidelity funds. Mr. Stavropoulos serves as President and Founder of the Michigan Baseball Foundation, the Great Lakes Loons (2007-present). Mr. Stavropoulos is Chairman Emeritus of the Board of Directors of The Dow Chemical Company, where he previously served in numerous senior management positions, including President, CEO (1995-2000; 2002-2004), Chairman of the Executive Committee (2000-2006), and as a member of the Board of Directors (1990-2006). Currently, Mr. Stavropoulos is Chairman of the Board of Directors of Univar Inc. (global distributor of commodity and specialty chemicals), a Director of Teradata Corporation (data warehousing and technology solutions), and Maersk Inc. (industrial conglomerate), and a member of the Advisory Board for Metalmark Capital LLC (private equity investment, 2005-present). Mr. Stavropoulos is an operating advisor to Clayton, Dubilier & Rice, LLC (private equity investment). In addition, Mr. Stavropoulos is a member of the University of Notre Dame Advisory Council for the College of Science, a Trustee of the Rollin L. Gerstacker Foundation, and a Director of the Naples Philharmonic Center for the Arts. Previously, Mr. Stavropoulos served as a Director of Chemical Financial Corporation (bank holding company, 1993-2012) and Tyco International, Ltd. (multinational manufacturing and services, 2007-2012). |
David M. Thomas (1949) | |
Year of Election or Appointment: 2008 Trustee | |
| Mr. Thomas also serves as Trustee of other Fidelity funds. Mr. Thomas serves as Non-Executive Chairman of the Board of Directors of Fortune Brands Home and Security (home and security products, 2011-present), as a member of the Board of Directors (2004-present and Presiding Director (2013-present) of Interpublic Group of Companies, Inc. (marketing communication), and as a member of the Board of Trustees of the University of Florida (2013-present). Previously, Mr. Thomas served as Executive Chairman (2005-2006) and Chairman and Chief Executive Officer (2000-2005) of IMS Health, Inc. (pharmaceutical and healthcare information solutions), and a Director of Fortune Brands, Inc. (consumer products, 2000-2011). |
+ The information above includes each Trustee's principal occupation during the last five years and other information relating to the experience, attributes, and skills relevant to each Trustee's qualifications to serve as a Trustee, which led to the conclusion that each Trustee should serve as a Trustee for the fund.
Advisory Board Member and Officers:
Correspondence intended for each officer and Peter S. Lynch may be sent to Fidelity Investments, 245 Summer Street, Boston, Massachusetts 02210. Officers appear below in alphabetical order.
Name, Year of Birth; Principal Occupation | |
Peter S. Lynch (1944) | |
Year of Election or Appointment: 2003 Member of the Advisory Board | |
| Mr. Lynch also serves as Member of the Advisory Board of other Fidelity funds. Mr. Lynch is Vice Chairman and a Director of FMR and FMR Co., Inc. In addition, Mr. Lynch serves as a Trustee of Boston College and as the Chairman of the Inner-City Scholarship Fund. Previously, Mr. Lynch served on the Special Olympics International Board of Directors (1997-2006). |
Elizabeth Paige Baumann (1968) | |
Year of Election or Appointment: 2012 Anti-Money Laundering (AML) Officer | |
| Ms. Baumann also serves as AML Officer of other funds. She is Chief AML Officer of FMR LLC (2012-present) and is an employee of Fidelity Investments. Previously, Ms. Baumann served as Vice President and Deputy Anti-Money Laundering Officer (2007-2012). |
William C. Coffey (1969) | |
Year of Election or Appointment: 2009 Assistant Secretary | |
| Mr. Coffey also serves as Assistant Secretary of other funds. He is Senior Vice President and Deputy General Counsel of FMR LLC (2010-present), and is an employee of Fidelity Investments. Previously, Mr. Coffey served as Vice President and Associate General Counsel of FMR LLC (2005-2009). |
Jonathan Davis (1968) | |
Year of Election or Appointment: 2010 Assistant Treasurer | |
| Mr. Davis also serves as Assistant Treasurer of other funds. Mr. Davis is an employee of Fidelity Investments. Previously, Mr. Davis served as Vice President and Associate General Counsel of FMR LLC (2003-2010). |
Adrien E. Deberghes (1967) | |
Year of Election or Appointment: 2008 Deputy Treasurer | |
| Mr. Deberghes also serves as an officer of other funds. He is an employee of Fidelity Investments (2008-present). Prior to joining Fidelity Investments, Mr. Deberghes was Senior Vice President of Mutual Fund Administration at State Street Corporation (2007-2008), Senior Director of Mutual Fund Administration at Investors Bank & Trust (2005-2007), and Director of Finance for Dunkin' Brands (2000-2005). |
Stephanie J. Dorsey (1969) | |
Year of Election or Appointment: 2010 Assistant Treasurer | |
| Ms. Dorsey also serves as an officer of other funds. She is an employee of Fidelity Investments (2008-present) and has served in other fund officer roles. Prior to joining Fidelity Investments, Ms. Dorsey served as Treasurer (2004-2008) of the JPMorgan Mutual Funds and Vice President (2004-2008) of JPMorgan Chase Bank. |
Howard J. Galligan III (1966) | |
Year of Election or Appointment: 2014 Chief Financial Officer | |
| Mr. Galligan also serves as Chief Financial Officer of other funds. Mr. Galligan serves as President of Fidelity Pricing and Cash Management Services (FPCMS) (2014-present) and as a Director of Strategic Advisers, Inc. (2008-present). Previously, Mr. Galligan served as Chief Administrative Officer of Asset Management (2011-2014) and Chief Operating Officer and Senior Vice President of Investment Support for Strategic Advisers, Inc. (2003-2011). |
Scott C. Goebel (1968) | |
Year of Election or Appointment: 2008 Secretary and Chief Legal Officer (CLO) | |
| Mr. Goebel serves as Secretary and CLO of other funds. Mr. Goebel also serves as Secretary of Fidelity SelectCo, LLC (2013-present), Fidelity Investments Money Management, Inc. (FIMM) (2010-present) and Fidelity Research and Analysis Company (FRAC) (2010-present); General Counsel, Secretary, and Senior Vice President of FMR (2008-present) and FMR Co., Inc. (2008-present); Chief Legal Officer of Fidelity Management & Research (Hong Kong) Limited (2008-present); and Assistant Secretary of Fidelity Management & Research (Japan) Limited (2008-present) and Fidelity Management & Research (U.K.) Inc. (2008-present). Previously, Mr. Goebel served as Secretary and CLO of other Fidelity funds (2008-2013), Assistant Secretary of FIMM (2008-2010), FRAC (2008-2010), and certain funds (2007-2008); and as Vice President and Secretary of Fidelity Distributors Corporation (FDC) (2005-2007). Mr. Goebel has been employed by FMR LLC or an affiliate since 2001. |
Thomas C. Hense (1964) | |
Year of Election or Appointment: 2008/2010 Vice President | |
| Mr. Hense also serves as Vice President of other funds (High Income (2008), Small Cap (2008), and Value (2010) funds). Previously, Mr. Hense served as a portfolio manager for Fidelity's Institutional Money Management Group (Pyramis) (2003-2008). |
Brian B. Hogan (1964) | |
Year of Election or Appointment: 2009 Vice President | |
| Mr. Hogan also serves as Trustee or Vice President of other funds. Mr. Hogan serves as a Director of Fidelity SelectCo, LLC (2014-present) and President of FMR's Equity Division (2009-present). Previously, Mr. Hogan served as Senior Vice President, Equity Research of FMR (2006-2009) and as a portfolio manager. |
Chris Maher (1972) | |
Year of Election or Appointment: 2013 Assistant Treasurer | |
| Mr. Maher serves as Assistant Treasurer of other funds. Mr. Maher is Vice President of Valuation Oversight and is an employee of Fidelity Investments. Previously, Mr. Maher served as Vice President of Asset Management Compliance (2013), Vice President of FMR's Program Management Group (2010-2013), and Vice President of Valuation Oversight (2008-2010). |
Kenneth B. Robins (1969) | |
Year of Election or Appointment: 2008 President and Treasurer | |
| Mr. Robins also serves as an officer of other funds. Mr. Robins serves as Executive Vice President of Fidelity Investments Money Management, Inc. (FIMM) (2013-present) and is an employee of Fidelity Investments (2004-present). Previously, Mr. Robins served in other fund officer roles. |
Stephen Sadoski (1971) | |
Year of Election or Appointment: 2012 Deputy Treasurer | |
| Mr. Sadoski also serves as Deputy Treasurer of other funds. He is an employee of Fidelity Investments (2012-present) and has served in another fund officer role. Prior to joining Fidelity Investments, Mr. Sadoski served as an assistant chief accountant in the Division of Investment Management of the Securities and Exchange Commission (SEC) (2009-2012) and as a senior manager at Deloitte & Touche LLP (1997-2009). |
Stacie M. Smith (1974) | |
Year of Election or Appointment: 2013 Deputy Treasurer | |
| Ms. Smith also serves as an officer of other funds. She is an employee of Fidelity Investments (2009-present) and has served in other fund officer roles. Prior to joining Fidelity Investments, Ms. Smith served as Senior Audit Manager of Ernst & Young LLP (1996-2009). |
Renee Stagnone (1975) | |
Year of Election or Appointment: 2013 Deputy Treasurer | |
| Ms. Stagnone also serves as Deputy Treasurer of other funds. Ms. Stagnone is an employee of Fidelity Investments. |
Linda J. Wondrack (1964) | |
Year of Election or Appointment: 2014 Chief Compliance Officer | |
| Ms. Wondrack also serves as Chief Compliance Officer of other funds. Ms. Wondrack is Executive Vice President and head of the Ethics Office and Asset Management Compliance for Fidelity Investments (2012-present). Ms. Wondrack also serves as Chief Compliance Officer of Fidelity SelectCo, LLC (2014-present); Chief Compliance Officer of Impresa Management LLC (2013-present); and Chief Compliance Officer of FMR Co., Inc., Fidelity Investments Money Management, Inc., Fidelity Management & Research (Japan) Limited, Fidelity Management & Research (U.K.) Inc., Fidelity Management & Research (Hong Kong), Fidelity Management & Research Company, Pyramis Global Advisors, LLC, and Strategic Advisers, Inc., Ballyrock Investment Advisors LLC, and Northern Neck Investors LLC (2012-present). Previously, Ms. Wondrack served as Senior Vice President and Chief Compliance Officer for Columbia Management Investment Advisers, LLC (2005-2012); Chief Compliance Officer for certain funds within the Columbia Family of Funds (2007-2012); and Senior Vice President of Compliance Risk Management at Bank of America (2005-2010). |
Joseph F. Zambello (1957) | |
Year of Election or Appointment: 2011 Deputy Treasurer | |
| Mr. Zambello also serves as Deputy Treasurer of other funds. Mr. Zambello is an employee of Fidelity Investments. Previously, Mr. Zambello served as Vice President of FMR's Program Management Group (2009-2011) and Vice President of the Transfer Agent Oversight Group (2005-2009). |
Annual Report
Distributions (Unaudited)
The Board of Trustees of Fidelity Real Estate High Income Fund voted to pay on December 30, 2014, to shareholders of record at the opening of business on December 29, 2014, a distribution of $0.05 per share derived from capital gains realized from sales of portfolio securities.
A total of 0.03% of the dividends distributed during the fiscal year was derived from interest on U.S. Government securities which is generally exempt from state income tax.
The fund designates $34,999,748 of distributions paid during the period January 1, 2014 to November 30, 2014 as qualifying to be taxed as interest-related dividends for nonresident alien shareholders.
The fund will notify shareholders in January 2015 of amounts for use in preparing 2014 income tax returns.
Annual Report
Board Approval of Investment Advisory Contracts and Management Fees
Fidelity Real Estate High Income Fund
Each year, the Board of Trustees, including the Independent Trustees (together, the Board), votes on the renewal of the management contract with Fidelity Management & Research Company (FMR) and the sub-advisory agreements (together, the Advisory Contracts) for the fund. The Board, assisted by the advice of fund counsel and Independent Trustees' counsel, requests and considers a broad range of information relevant to the renewal of the Advisory Contracts throughout the year.
The Board meets regularly and, at each of its meetings, covers an extensive agenda of topics and materials and considers factors that are relevant to its annual consideration of the renewal of the fund's Advisory Contracts, including the services and support provided to the fund and its shareholders. The Board has established various standing committees (Committees), each composed of and chaired by Independent Trustees with varying backgrounds, to which the Board has assigned specific subject matter responsibilities in order to enhance effective decision-making by the Board. The Board, acting directly and through its Committees, requests and receives information concerning the annual consideration of the renewal of the fund's Advisory Contracts. The Board also meets as needed to consider matters specifically related to the Board's annual consideration of the renewal of the Advisory Contracts. Members of the Board may also meet with trustees of other Fidelity funds through ad hoc joint committees to discuss certain matters relevant to the Fidelity funds.
At its July 2014 meeting, the Board, including the Independent Trustees, unanimously determined to renew the fund's Advisory Contracts. In reaching its determination, the Board considered all factors it believed relevant, including (i) the nature, extent, and quality of the services to be provided to the fund and its shareholders (including the investment performance of the fund); (ii) the competitiveness of the fund's management fee and total expense ratio relative to peer funds; (iii) the total costs of the services to be provided by and the profits to be realized by Fidelity from its relationship with the fund; (iv) the extent to which economies of scale exist and would be realized as the fund grows; and (v) whether fee levels reflect these economies of scale, if any, for the benefit of fund shareholders. In connection with separate internal corporate reorganizations involving Fidelity Management & Research (U.K.) Inc. (FMR U.K.) and Fidelity Management & Research (Japan) Inc. (FMR Japan), the Board approved certain non-material amendments to the fund's sub-advisory agreements with FMR U.K. and FMR Japan to reflect that, after these reorganizations, FMR Investment Management (UK) Limited and Fidelity Management & Research (Japan) Limited will carry on the business of FMR U.K. and FMR Japan, respectively. The Board noted that no changes to the portfolio managers or to the foreign research or investment advisory services provided to the fund were expected in connection with either reorganization and that the same personnel and resources would continue to be available to the fund at the new entities.
Annual Report
In considering whether to renew the Advisory Contracts for the fund, the Board reached a determination, with the assistance of fund counsel and Independent Trustees' counsel and through the exercise of its business judgment, that the renewal of the Advisory Contracts was in the best interests of the fund and its shareholders and that the compensation payable under the Advisory Contracts was fair and reasonable. The Board's decision to renew the Advisory Contracts was not based on any single factor, but rather was based on a comprehensive consideration of all the information provided to the Board at its meetings throughout the year. The Board, in reaching its determination to renew the Advisory Contracts, was aware that shareholders of the fund have a broad range of investment choices available to them, including a wide choice among funds offered by Fidelity's competitors, and that the fund's shareholders, who have the opportunity to review and weigh the disclosure provided by the fund in its prospectus and other public disclosures, have chosen to invest in this fund, which is part of the Fidelity family of funds.
Nature, Extent, and Quality of Services Provided. The Board considered Fidelity's staffing as it relates to the fund, including the backgrounds of investment personnel of FMR and the sub-advisers (together, the Investment Advisers), and also considered the fund's investment objective, strategies, and related investment philosophy. The Independent Trustees also had discussions with senior management of Fidelity's investment operations and investment groups. The Board considered the structure of the portfolio manager compensation program and whether this structure provides appropriate incentives to act in the best interests of the fund. Additionally, the Board considered the portfolio managers' investments, if any, in the funds that they manage.
Resources Dedicated to Investment Management and Support Services. The Board and the Fund Oversight and Research Committees reviewed the general qualifications and capabilities of Fidelity's investment staff, including its size, education, experience, and resources, as well as Fidelity's approach to recruiting, training, managing, and compensating investment personnel. The Board noted that Fidelity has continued to increase the resources devoted to non-U.S. offices, including expansion of Fidelity's global investment organization. The Board also noted that Fidelity's analysts have extensive resources, tools and capabilities that allow them to conduct sophisticated quantitative and fundamental analysis, as well as credit analysis of issuers, counterparties and guarantors. Further, the Board believes that Fidelity's investment professionals have sufficient access to global information and data so as to provide competitive investment results over time, and that those professionals also have access to sophisticated tools that permit them to assess portfolio construction and risk and performance attribution characteristics continuously, as well as to transmit new information and research conclusions rapidly around the world. Additionally, in its deliberations, the Board considered Fidelity's trading and risk management capabilities and resources and global compliance infrastructure, which are an integral part of the investment management process.
Annual Report
Board Approval of Investment Advisory Contracts and
Management Fees - continued
Shareholder and Administrative Services. The Board considered (i) the nature, extent, quality, and cost of advisory, administrative, and shareholder services performed by the Investment Advisers and their affiliates under the Advisory Contracts and under separate agreements covering transfer agency, pricing and bookkeeping, and securities lending services for the fund; (ii) the nature and extent of the supervision of third party service providers, principally custodians and subcustodians; and (iii) the resources devoted to, and the record of compliance with, the fund's compliance policies and procedures. The Board also reviewed the allocation of fund brokerage, including allocations to brokers affiliated with the Investment Advisers, the use of brokerage commissions to pay fund expenses, and the use of "soft" commission dollars to pay for research services.
The Board noted that the growth of fund assets over time across the complex allows Fidelity to reinvest in the development of services designed to enhance the value or convenience of the Fidelity funds as investment vehicles. These services include 24-hour access to account information and market information through telephone representatives and over the Internet, investor education materials and asset allocation tools, and the expanded availability of Fidelity Investor Centers.
In 2014, the Board formed an ad hoc Committee on Transfer Agency Fees to review the variety of transfer agency fee structures throughout the industry and Fidelity's competitive positioning with respect to industry participants.
Investment in a Large Fund Family. The Board considered the benefits to shareholders of investing in a Fidelity fund, including the benefits of investing in a fund that is part of a large family of funds offering a variety of investment disciplines and providing a large variety of mutual fund investor services. The Board noted that Fidelity had taken, or had made recommendations that resulted in the Fidelity funds taking, a number of actions over the previous year that benefited particular funds, including (i) continuing to dedicate additional resources to investment research and to the support of the senior management team that oversees asset management; (ii) persisting in efforts to enhance Fidelity's global research capabilities; (iii) launching new funds and making other enhancements to meet client needs for income-oriented solutions; (iv) reducing fund expenses for certain index funds; (v) continuing to launch dedicated lower cost underlying funds to meet portfolio construction needs related to expanding underlying fund options for Fidelity funds of funds, specifically for the Freedom Fund product lines; (vi) rationalizing product lines and gaining increased efficiencies through fund mergers; (vii) launching sector-based exchange-traded funds and establishing a new Fidelity adviser to manage sector-based funds and products; (viii) continuing to develop and implement technology to improve security and increase efficiency; (ix) modifying the eligibility criteria for certain share classes to increase their marketability to a portion of the defined contribution plan market; (x) waiving redemption fees for certain qualified fund-of-fund and wrap programs and certain retirement plan transactions; and (xi) launching new Institutional Class shares of certain money market funds to attract and retain assets and to fill a gap in the money market fund lineup.
Annual Report
Investment Performance. The Board considered whether the fund has operated in accordance with its investment objective, as well as its record of compliance with its investment restrictions and its performance history.
The Board took into account discussions with the Investment Advisers about fund investment performance that occur at Board meetings throughout the year. In this regard the Board noted that as part of regularly scheduled fund reviews and other reports to the Board on fund performance, the Board periodically considers annualized return information for the fund, for different time periods, measured against a securities market index ("benchmark index") and a peer group of funds with similar objectives ("peer group"). In its evaluation of fund investment performance, the Board gave particular attention to information indicating changes in performance of certain Fidelity funds for specific time periods and the Investment Advisers' explanations for any overperformance or underperformance.
In addition to reviewing absolute and relative fund performance, the Independent Trustees periodically consider the appropriateness of fund performance metrics in evaluating the results achieved. In general, the Independent Trustees believe that fund performance should be evaluated based on net performance (after fees and expenses) of both the highest performing and lowest performing classes, where applicable, compared to appropriate benchmark indices, over appropriate time periods which may include full market cycles, and compared to peer groups, as applicable, over the same periods, taking into account relevant factors including the following: general market conditions; issuer-specific information; tactical opportunities for investment; and fund cash flows and other factors.
The Independent Trustees recognize that shareholders evaluate performance on a net basis over their own holding periods, for which one-, three-, and five-year periods are often used as a proxy. For this reason, the performance information reviewed by the Board also included net cumulative calendar year total return information for the fund and an appropriate benchmark index and peer group for the most recent one-, three-, and five-year periods, as shown below. Returns are shown compared to the 25th percentile (top of box, 75% beaten) and 75th percentile (bottom of box, 25% beaten) of the peer universe.
Annual Report
Board Approval of Investment Advisory Contracts and
Management Fees - continued
Fidelity Real Estate High Income Fund
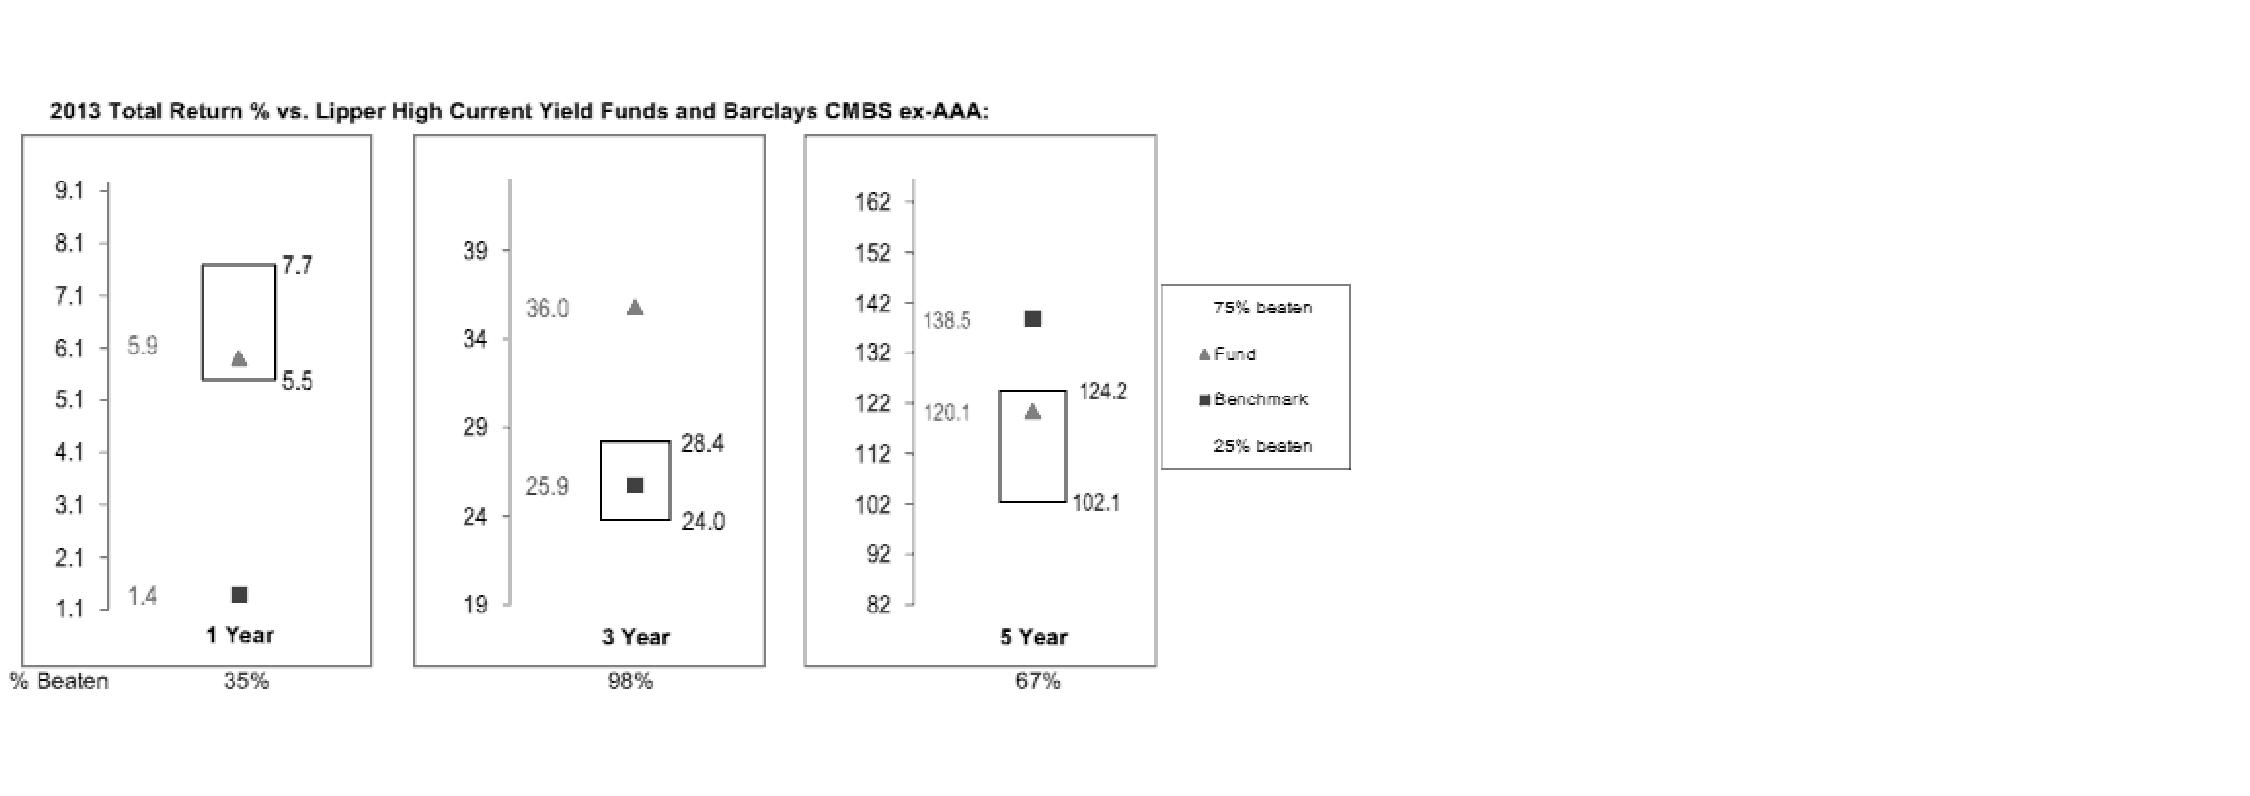
Based on its review, the Board concluded that the nature, extent, and quality of services provided to the fund under the Advisory Contracts should benefit the fund's shareholders.
Competitiveness of Management Fee and Total Expense Ratio. The Board considered the fund's management fee and total expense ratio compared to "mapped groups" of competitive funds and classes. Fidelity creates "mapped groups" by combining similar Lipper investment objective categories that have comparable investment mandates. Combining Lipper investment objective categories aids the Board's management fee and total expense ratio comparisons by broadening the competitive group used for comparison and by reducing the number of universes to which various Fidelity funds are compared.
Management Fee. The Board considered two proprietary management fee comparisons for the 12-month periods shown in the chart below. The group of Lipper funds used by the Board for management fee comparisons is referred to below as the "Total Mapped Group." The Total Mapped Group is broader than the Lipper peer group used by the Board for performance comparisons because the Total Mapped Group combines several Lipper investment objective categories while the Lipper peer group does not. The Total Mapped Group comparison focuses on a fund's standing in terms of gross management fees before expense reimbursements or caps relative to the total universe of funds with comparable investment mandates, regardless of whether their management fee structures also are comparable. Funds with comparable investment mandates offer exposure to similar types of securities. Funds with comparable management fee structures have similar management fee contractual arrangements (e.g., flat rate charged for advisory services, all-inclusive fee rate, etc.). "TMG %" represents the percentage of funds in the Total Mapped Group that had management fees that were lower than the fund's. For example, a hypothetical TMG % of 20% would mean that 80% of the funds in the Total Mapped Group had higher, and 20% had lower, management fees than the fund. The fund's actual TMG %s are in the chart below. The "Asset-Size Peer Group" (ASPG) comparison focuses on a fund's standing relative to a subset of non-Fidelity funds within the Total Mapped Group that are similar in size and management fee structure. For example, if a fund is in the first quartile of the ASPG, the fund's management fee ranks in the least expensive or lowest 25% of funds in the ASPG. The ASPG represents at least 15% of the funds in the Total Mapped Group with comparable asset size and management fee structures, subject to a minimum of 50 funds (or all funds in the Total Mapped Group if fewer than 50). Additional information, such as the ASPG quartile in which the fund's management fee rate ranked, is also included in the chart and considered by the Board.
Annual Report
Fidelity Real Estate High Income Fund
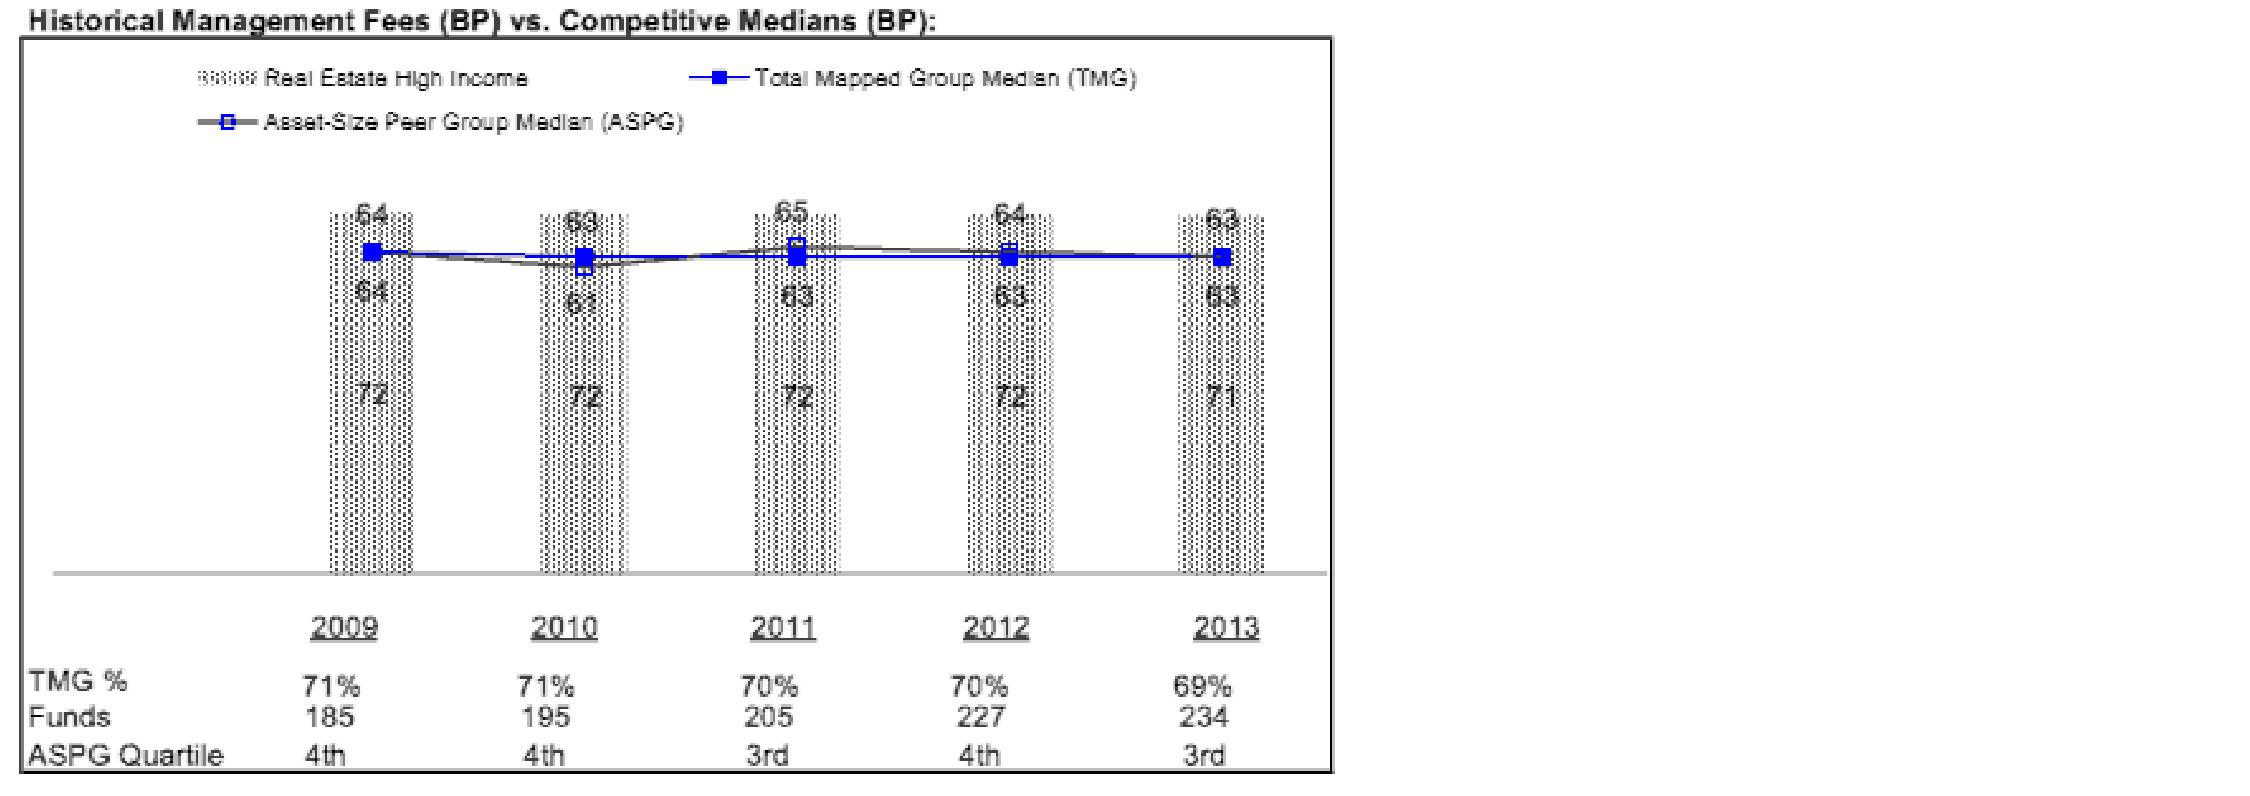
The Board noted that the fund's management fee rate ranked above the median of its Total Mapped Group and above the median of its ASPG for 2013. The Board considered that the fund is a specialized institutional product that, unlike the majority of funds in its peer group, primarily invests in lower quality commercial mortgage-backed securities and other real estate-related investments. FMR has not identified any other similar, publicly-available open-end funds.
The Board also noted that, in August 2013, the ad hoc Committee on Management Fees was formed to conduct an in-depth review of the management fee rates of Fidelity's active equity mutual funds. The Committee focused on the following areas: (i) standard fee structures; (ii) research consumption and trading evolution; (iii) management fee competitiveness/profitability by category; and (iv) factors that drive institutional pricing.
Annual Report
Board Approval of Investment Advisory Contracts and
Management Fees - continued
Based on its review, the Board concluded that the fund's management fee is fair and reasonable in light of the services that the fund receives and the other factors considered.
Total Expense Ratio. In its review of the fund's total expense ratio, the Board considered the fund's management fee as well as other fund expenses, such as transfer agent fees, pricing and bookkeeping fees, and custodial, legal, and audit fees. The Board also noted the effects of any waivers and reimbursements on fees and expenses. As part of its review, the Board also considered the current and historical total expense ratios of the fund compared to competitive fund median expenses. The fund is compared to those funds and classes in the Total Mapped Group (used by the Board for management fee comparisons) that have a similar sales load structure.
The Board noted that the fund's total expense ratio ranked above its competitive median for 2013. The Board considered that, in general, various factors can affect total expense ratios.
Fees Charged to Other Fidelity Clients. The Board also considered Fidelity fee structures and other information with respect to clients of Fidelity, such as other funds advised or subadvised by Fidelity, pension plan clients, and other institutional clients. The Board noted the findings of the 2013 ad hoc joint committee (created with the board of other Fidelity funds), which reviewed and compared Fidelity's institutional investment advisory business with its business of providing services to the Fidelity funds, including the differences in services provided, fees charged, and costs incurred, as well as competition in their respective marketplaces.
Based on its review of total expense ratios and fees charged to other Fidelity clients, the Board concluded that the fund's total expense ratio was reasonable, although above the median of the universe presented for comparison, in light of the services that the fund and its shareholders receive and the other factors considered.
Costs of the Services and Profitability. The Board considered the revenues earned and the expenses incurred by Fidelity in conducting the business of developing, marketing, distributing, managing, administering and servicing the fund and servicing the fund's shareholders. The Board also considered the level of Fidelity's profits in respect of all the Fidelity funds.
On an annual basis, Fidelity presents to the Board Fidelity's profitability for the fund. Fidelity calculates the profitability for each fund, as well as aggregate profitability for groups of Fidelity funds and all Fidelity funds, using a series of detailed revenue and cost allocation methodologies which originate with the books and records of Fidelity on which Fidelity's audited financial statements are based. The Audit Committee of the Board reviews any significant changes from the prior year's methodologies.
Annual Report
PricewaterhouseCoopers LLP (PwC), independent registered public accounting firm and auditor to Fidelity and certain Fidelity funds, has been engaged annually by the Board as part of the Board's assessment of Fidelity's profitability analysis. PwC's engagement includes the review and assessment of the methodologies used by Fidelity in determining the revenues and expenses attributable to Fidelity's mutual fund business, and completion of agreed-upon procedures in respect of the mathematical accuracy of fund profitability and its conformity to established allocation methodologies. After considering PwC's reports issued under the engagement and information provided by Fidelity, the Board concluded that while other allocation methods may also be reasonable, Fidelity's profitability methodologies are reasonable in all material respects.
The Board also reviewed Fidelity's non-fund businesses and fall-out benefits related to the mutual fund business as well as cases where Fidelity's affiliates may benefit from or be related to the fund's business.
The Board considered the costs of the services provided by and the profits realized by Fidelity in connection with the operation of the fund and was satisfied that the profitability was not excessive in the circumstances.
Economies of Scale. The Board considered whether there have been economies of scale in respect of the management of the Fidelity funds, whether the Fidelity funds (including the fund) have appropriately benefited from any such economies of scale, and whether there is potential for realization of any further economies of scale. The Board considered the extent to which the fund will benefit from economies of scale through increased services to the fund, through waivers or reimbursements, or through fee or expense ratio reductions. The Board also noted that in 2013, it and the boards of other Fidelity funds created an ad hoc committee (the Economies of Scale Committee) to analyze whether Fidelity attains economies of scale in respect of the management and servicing of the Fidelity funds, whether the Fidelity funds have appropriately benefited from such economies of scale, and whether there is potential for realization of any further economies of scale.
The Board recognized that the fund's management contract incorporates a "group fee" structure, which provides for lower group fee rates as total group assets increase, and for higher group fee rates as total group assets decrease (with "group assets" defined to include fund assets under FMR's management plus sector fund assets previously under FMR's management and currently managed by Fidelity SelectCo, LLC). FMR calculates the group fee rates based on a tiered asset "breakpoint" schedule that varies based on asset class. The Board considered that the group fee is designed to deliver the benefits of economies of scale to fund shareholders when total Fidelity fund assets increase, even if assets of any particular fund are unchanged or have declined, because some portion of Fidelity's costs are attributable to services provided to all Fidelity funds, and all funds benefit if those costs can be allocated among more assets. The Board concluded that, given the group fee structure, fund shareholders will benefit from lower management fees as group assets increase at the fund complex level, regardless of whether Fidelity achieves any such economies of scale.
Annual Report
Board Approval of Investment Advisory Contracts and
Management Fees - continued
The Board concluded, taking into account the analysis of the Economies of Scale Committee, that economies of scale, if any, are being appropriately shared between fund shareholders and Fidelity.
Additional Information Requested by the Board. In order to develop fully the factual basis for consideration of the Fidelity funds' Advisory Contracts, the Board requested and received additional information on certain topics, including: (i) fund performance trends and Fidelity's long-term strategies for certain funds; (ii) Fidelity's strategic marketing and product lineup goals; (iii) the methodology with respect to competitive fund data and peer group classifications; (iv) the arrangements with, and performance of, certain sub-advisers on behalf of the Fidelity funds, as well as certain proposed participating affiliate arrangements; (v) the realization of fall-out benefits in certain Fidelity business units; (vi) Fidelity's group fee structures, including the rationale for the individual fee rates of certain categories of funds and the definition of group assets; (vii) trends regarding industry use of performance fee structures and the performance adjustment methodologies applicable to the Fidelity funds; (viii) additional competitive analysis regarding the total expenses for certain classes; (ix) fund profitability methodology, including Fidelity's cost allocation methodology, and the impact of certain factors on fund profitability results; and (x) the process by which Fidelity determines sub-advisory fees for funds it advises.
Based on its evaluation of all of the conclusions noted above, and after considering all factors it believed relevant, the Board ultimately concluded that the advisory fee structures are fair and reasonable, and that the fund's Advisory Contracts should be renewed.
Annual Report
Investment Adviser
Fidelity Management &
Research Company
Boston, MA
Investment Sub-Advisers
FMR Co., Inc.
Fidelity Management & Research
(U.K.) Inc.
Fidelity Management & Research
(Hong Kong) Limited
Fidelity Management & Research
(Japan) Limited
General Distributor
Fidelity Distributors Corporation
Smithfield, RI
Transfer and Service Agents
Fidelity Investments Institutional
Operations Company, Inc.
Boston, MA
Fidelity Service Company, Inc.
Boston, MA
Custodian
The Bank of New York Mellon
New York, NY
(Fidelity Investment logo)(registered trademark)
Corporate Headquarters
245 Summer St., Boston, MA 02210
www.fidelity.com
REHI-UANN-0115
1.786712.111
Item 2. Code of Ethics
As of the end of the period, November 30, 2014, Fidelity Advisor Series I (the trust) has adopted a code of ethics, as defined in Item 2 of Form N-CSR, that applies to its President and Treasurer and its Chief Financial Officer. A copy of the code of ethics is filed as an exhibit to this Form N-CSR.
Item 3. Audit Committee Financial Expert
The Board of Trustees of the trust has determined that Joseph Mauriello is an audit committee financial expert, as defined in Item 3 of Form N-CSR. Mr. Mauriello is independent for purposes of Item 3 of Form N-CSR.
Item 4. Principal Accountant Fees and Services
Fees and Services
The following table presents fees billed by PricewaterhouseCoopers LLP ("PwC") in each of the last two fiscal years for services rendered to Fidelity Real Estate High Income Fund (the "Fund"):
Services Billed by PwC
November 30, 2014 FeesA
| Audit Fees | Audit-Related Fees | Tax Fees | All Other Fees |
Fidelity Real Estate High Income Fund | $350,000 | $- | $6,900 | $2,000 |
November 30, 2013 FeesA
| Audit Fees | Audit-Related Fees | Tax Fees | All Other Fees |
Fidelity Real Estate High Income Fund | $490,000 | $- | $5,600 | $1,800 |
A Amounts may reflect rounding.
The following table presents fees billed by PwC that were required to be approved by the Audit Committee for services that relate directly to the operations and financial reporting of the Fund and that are rendered on behalf of Fidelity Management & Research Company ("FMR") and entities controlling, controlled by, or under common control with FMR (not including any sub-adviser whose role is primarily portfolio management and is subcontracted with or overseen by another investment adviser) that provide ongoing services to the Fund ("Fund Service Providers"):
Services Billed by PwC
| November 30, 2014A | November 30, 2013A |
Audit-Related Fees | $5,185,000 | $4,860,000 |
Tax Fees | $- | $- |
All Other Fees | $- | $50,000 |
A Amounts may reflect rounding.
"Audit-Related Fees" represent fees billed for assurance and related services that are reasonably related to the performance of the fund audit or the review of the fund's financial statements and that are not reported under Audit Fees.
"Tax Fees" represent fees billed for tax compliance, tax advice or tax planning that relate directly to the operations and financial reporting of the fund.
"All Other Fees" represent fees billed for services provided to the fund or Fund Service Provider, a significant portion of which are assurance related, that relate directly to the operations and financial reporting of the fund, excluding those services that are reported under Audit Fees, Audit-Related Fees or Tax Fees.
Assurance services must be performed by an independent public accountant.
* * *
The aggregate non-audit fees billed by PwC for services rendered to the Fund, FMR (not including any sub-adviser whose role is primarily portfolio management and is subcontracted with or overseen by another investment adviser), and any Fund Service Provider for each of the last two fiscal years of the Fund are as follows:
Billed By | November 30, 2014 A | November 30, 2013 A |
PwC | $6,490,000 | $5,445,000 |
A Amounts may reflect rounding.
The trust's Audit Committee has considered non-audit services that were not pre-approved that were provided by PwC to Fund Service Providers to be compatible with maintaining the independence of PwC in its audit of the Fund, taking into account representations from PwC, in accordance with Public Company Accounting Oversight Board rules, regarding its independence from the Fund and its related entities and FMR's review of the appropriateness and permissibility under applicable law of such non-audit services prior to their provision to the Fund Service Providers.
Audit Committee Pre-Approval Policies and Procedures
The trust's Audit Committee must pre-approve all audit and non-audit services provided by a fund's independent registered public accounting firm relating to the operations or financial reporting of the fund. Prior to the commencement of any audit or non-audit services to a fund, the Audit Committee reviews the services to determine whether they are appropriate and permissible under applicable law.
The Audit Committee has adopted policies and procedures to, among other purposes, provide a framework for the Committee's consideration of non-audit services by the audit firms that audit the Fidelity funds. The policies and procedures require that any non-audit service provided by a fund audit firm to a Fidelity fund and any non-audit service provided by a fund auditor to a Fund Service Provider that relates directly to the operations and financial reporting of a Fidelity fund ("Covered Service") are subject to approval by the Audit Committee before such service is provided.
All Covered Services must be approved in advance of provision of the service either: (i) by formal resolution of the Audit Committee, or (ii) by oral or written approval of the service by the Chair of the Audit Committee (or if the Chair is unavailable, such other member of the Audit Committee as may be designated by the Chair to act in the Chair's absence). The approval contemplated by (ii) above is permitted where the Treasurer determines that action on such an engagement is necessary before the next meeting of the Audit Committee.
Non-audit services provided by a fund audit firm to a Fund Service Provider that do not relate directly to the operations and financial reporting of a Fidelity fund are reported to the Audit Committee on a periodic basis.
Non-Audit Services Approved Pursuant to Rule 2-01(c)(7)(i)(C) and (ii) of Regulation S-X ("De Minimis Exception")
There were no non-audit services approved or required to be approved by the Audit Committee pursuant to the De Minimis Exception during the Fund's last two fiscal years relating to services provided to (i) the Fund or (ii) any Fund Service Provider that relate directly to the operations and financial reporting of the Fund.
Item 5. Audit Committee of Listed Registrants
Not applicable.
Item 6. Investments
(a) Not applicable.
(b) Not applicable
Item 7. Disclosure of Proxy Voting Policies and Procedures for Closed-End Management Investment Companies
Not applicable.
Item 8. Portfolio Managers of Closed-End Management Investment Companies
Not applicable.
Item 9. Purchase of Equity Securities by Closed-End Management Investment Company and Affiliated Purchasers
Not applicable.
Item 10. Submission of Matters to a Vote of Security Holders
There were no material changes to the procedures by which shareholders may recommend nominees to the trust's Board of Trustees.
Item 11. Controls and Procedures
(a)(i) The President and Treasurer and the Chief Financial Officer have concluded that the disclosure controls and procedures (as defined in Rule 30a-3(c) under the Investment Company Act) for the Fund provide reasonable assurances that material information relating to the Fund is made known to them by the appropriate persons, based on their evaluation of these controls and procedures as of a date within 90 days of the filing date of this report.
(a)(ii) There was no change in the Fund's internal control over financial reporting (as defined in Rule 30a-3(d) under the Investment Company Act) that occurred during the second fiscal quarter of the period covered by this report that has materially affected, or is reasonably likely to materially affect, the Fund's internal control over financial reporting.
Item 12. Exhibits
(a) | (1) | Code of Ethics pursuant to Item 2 of Form N-CSR is filed and attached hereto as EX-99.CODE ETH. |
(a) | (2) | Certification pursuant to Rule 30a-2(a) under the Investment Company Act of 1940 (17 CFR 270.30a-2(a)) is filed and attached hereto as Exhibit 99.CERT. |
(a) | (3) | Not applicable. |
(b) |
| Certification pursuant to Rule 30a-2(b) under the Investment Company Act of 1940 (17 CFR 270.30a-2(b)) is furnished and attached hereto as Exhibit 99.906CERT. |
SIGNATURES
Pursuant to the requirements of the Securities Exchange Act of 1934 and the Investment Company Act of 1940, the registrant has duly caused this report to be signed on its behalf by the undersigned, thereunto duly authorized.
Fidelity Advisor Series I
By: | /s/Kenneth B. Robins |
| Kenneth B. Robins |
| President and Treasurer |
|
|
Date: | January 28, 2015 |
Pursuant to the requirements of the Securities Exchange Act of 1934 and the Investment Company Act of 1940, this report has been signed below by the following persons on behalf of the registrant and in the capacities and on the dates indicated.
By: | /s/Kenneth B. Robins |
| Kenneth B. Robins |
| President and Treasurer |
|
|
Date: | January 28, 2015 |
By: | /s/Howard J. Galligan III |
| Howard J. Galligan III |
| Chief Financial Officer |
|
|
Date: | January 28, 2015 |