UNITED STATES
SECURITIES AND EXCHANGE COMMISSION
Washington, D.C. 20549
FORM N-CSR
CERTIFIED SHAREHOLDER REPORT OF REGISTERED
MANAGEMENT INVESTMENT COMPANIES
Investment Company Act file number 811-3785
Fidelity Advisor Series I
(Exact name of registrant as specified in charter)
245 Summer St., Boston, Massachusetts 02210
(Address of principal executive offices) (Zip code)
Scott C. Goebel, Secretary
245 Summer St.
Boston, Massachusetts 02210
(Name and address of agent for service)
Registrant's telephone number, including area code: 617-563-7000
Date of fiscal year end: | October 31 |
|
|
Date of reporting period: | October 31, 2014 |
Item 1. Reports to Stockholders
(Fidelity Investment logo)(registered trademark)
Fidelity Advisor®
Value
Fund - Institutional Class
Annual Report
October 31, 2014
(Fidelity Cover Art)
Contents
Performance | How the fund has done over time. | |
Management's Discussion of Fund Performance | The Portfolio Manager's review of fund performance and strategy. | |
Shareholder Expense Example | An example of shareholder expenses. | |
Investment Changes | A summary of major shifts in the fund's investments over the past six months. | |
Investments | A complete list of the fund's investments with their market values. | |
Financial Statements | Statements of assets and liabilities, operations, and changes in net assets, as well as financial highlights. | |
Notes | Notes to the financial statements. | |
Report of Independent Registered Public Accounting Firm |
| |
Trustees and Officers |
| |
Distributions |
| |
Board Approval of Investment Advisory Contracts and Management Fees |
|
To view a fund's proxy voting guidelines and proxy voting record for the 12-month period ended June 30, visit http://www.fidelity.com/proxyvotingresults or visit the Securities and Exchange Commission's (SEC) web site at http://www.sec.gov. You may also call 1-877-208-0098 to request a free copy of the proxy voting guidelines.
Standard & Poor's, S&P and S&P 500 are registered service marks of The McGraw-Hill Companies, Inc. and have been licensed for use by Fidelity Distributors Corporation.
Other third-party marks appearing herein are the property of their respective owners.
All other marks appearing herein are registered or unregistered trademarks or service marks of FMR LLC or an affiliated company. © 2014 FMR LLC. All rights reserved.
Annual Report
This report and the financial statements contained herein are submitted for the general information of the shareholders of the fund. This report is not authorized for distribution to prospective investors in the fund unless preceded or accompanied by an effective prospectus.
A fund files its complete schedule of portfolio holdings with the SEC for the first and third quarters of each fiscal year on Form N-Q. Forms N-Q are available on the SEC's web site at http://www.sec.gov. A fund's Forms N-Q may be reviewed and copied at the SEC's Public Reference Room in Washington, DC. Information regarding the operation of the SEC's Public Reference Room may be obtained by calling 1-800-SEC-0330. For a complete list of a fund's portfolio holdings, view the most recent holdings listing, semiannual report, or annual report on Fidelity's web site at http://www.fidelity.com, http://www.advisor.fidelity.com, or http://www.401k.com, as applicable.
NOT FDIC INSURED • MAY LOSE VALUE • NO BANK GUARANTEE
Neither the fund nor Fidelity Distributors Corporation is a bank.
Annual Report
Performance: The Bottom Line
Average annual total return reflects the change in the value of an investment, assuming reinvestment of the class' distributions from dividend income and capital gains (the profits earned upon the sale of securities that have grown in value, if any) and assuming a constant rate of performance each year. The $10,000 table and the fund's returns do not reflect the deduction of taxes that a shareholder would pay on fund distributions or the redemption of fund shares. During periods of reimbursement by Fidelity, a fund's total return will be greater than it would be had the reimbursement not occurred. How a fund did yesterday is no guarantee of how it will do tomorrow.
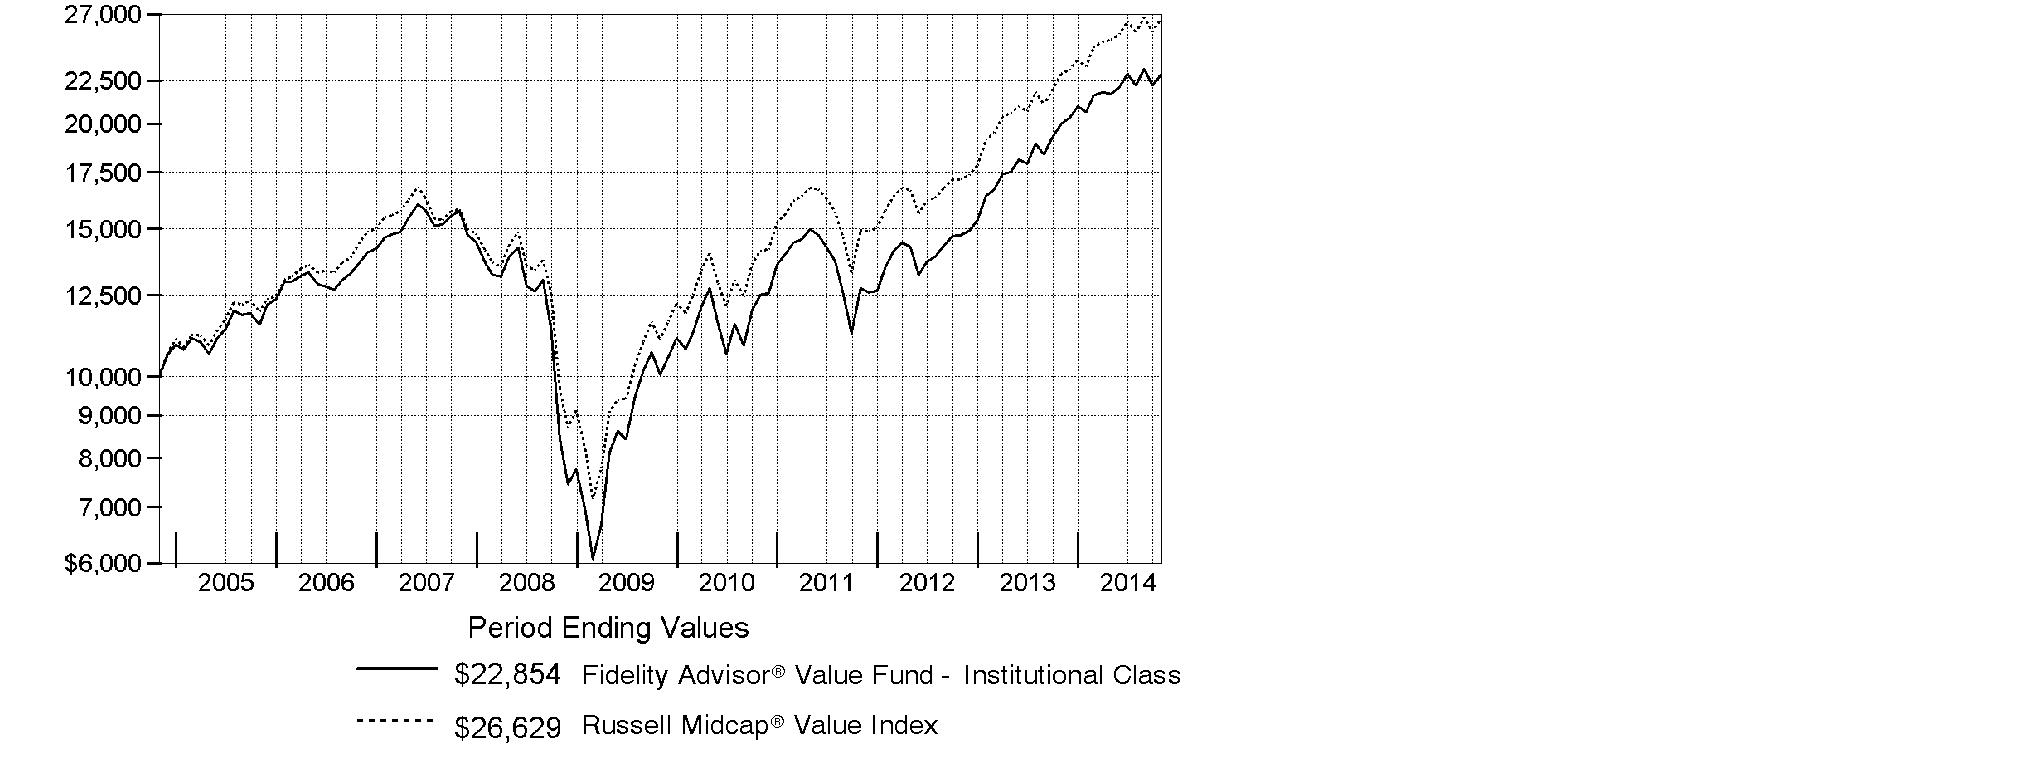
Average Annual Total Returns
Periods ended October 31, 2014 | Past 1 | Past 5 | Past 10 |
Institutional Class | 14.46% | 17.86% | 8.62% |
$10,000 Over 10 Years
Let's say hypothetically that $10,000 was invested in Fidelity Advisor® Value Fund - Institutional Class on October 31, 2004. The chart shows how the value of your investment would have changed, and also shows how the Russell Midcap® Value Index performed over the same period.
Annual Report
Management's Discussion of Fund Performance
Market Recap: The U.S. market nearly closed at an all-time high for the 12 months ending October 31, 2014, supported by low interest rates and strong corporate profits. The large-cap S&P 500® Index gained 17.27%, clawing back from an October sell-off fueled by fears of a new global economic slump. Growth stocks in the index outperformed value-oriented names. The tech-heavy Nasdaq Composite Index® advanced 19.58%, while the small-cap Russell 2000® Index returned a relatively lackluster 8.06% amid growth and valuation worries. Health care (+30%) was the top sector in the S&P 500®, spurred partly by the pharmaceuticals, biotechnology & life sciences industry. Information technology (+26%) also outperformed. Conversely, energy (+4%) lagged the index, reflecting a sharp drop in crude prices beginning in June, attributed to weaker demand and a U.S. shale-drilling supply boom. Industrials (+15%) and consumer discretionary (+9%) - sectors that tend to rise and fall with economic expectations - also trailed the broader market. Volatility was tame for much of the period but spiked to a three-year high in October amid growth concerns, Ebola fears and continued unrest in Syria, Iraq and Ukraine. Stocks finished the period strongly, however, bolstered by the relative economic strength of the U.S., which marked a six-year low in its unemployment rate.
Comments from Matthew Friedman, Co-Portfolio Manager of Fidelity Advisor® Value Fund: For the year, the fund's Institutional Class shares advanced 14.46%, underperforming the 16.18% gain of the Russell Midcap® Value Index. It was a tough environment for our bottom-up strategy, and certain stock-specific choices in various sectors and industries didn't pan out this period, leading the fund to underperform. The biggest relative detractor this period was Micron Technology, a global manufacturer and marketer of semiconductor devices. We chose to avoid this big index component because we thought the improved industry structure was already reflected in the stock's valuation. Unfortunately for us, the stock rose 87% for the year. Consecutive quarters of solid sales and better-than-expected financial results appealed to investors, who were more focused on the company's profitability than its quality. Conversely, an overweighting in Broadcom, a provider of semiconductor solutions for wired and wireless communications, was the fund's biggest contributor. The stock moved sharply higher in early June after the company announced it was evaluating plans for its cellular baseband business, including a potential sale or shutdown of the division. In October, the stock benefited from the firm's announcement of better-than-expected third-quarter financial results.
The views expressed above reflect those of the portfolio manager(s) only through the end of the period as stated on the cover of this report and do not necessarily represent the views of Fidelity or any other person in the Fidelity organization. Any such views are subject to change at any time based upon market or other conditions and Fidelity disclaims any responsibility to update such views. These views may not be relied on as investment advice and, because investment decisions for a Fidelity fund are based on numerous factors, may not be relied on as an indication of trading intent on behalf of any Fidelity fund.
Annual Report
Shareholder Expense Example
As a shareholder of the Fund, you incur two types of costs: (1) transaction costs, including sales charges (loads) on purchase payments or redemption proceeds, and (2) ongoing costs, including management fees, distribution and/or service (12b-1) fees and other Fund expenses. This Example is intended to help you understand your ongoing costs (in dollars) of investing in the Fund and to compare these costs with the ongoing costs of investing in other mutual funds.
The Example is based on an investment of $1,000 invested at the beginning of the period and held for the entire period (May 1, 2014 to October 31, 2014).
Actual Expenses
The first line of the accompanying table for each class of the Fund provides information about actual account values and actual expenses. You may use the information in this line, together with the amount you invested, to estimate the expenses that you paid over the period. Simply divide your account value by $1,000.00 (for example, an $8,600 account value divided by $1,000.00 = 8.6), then multiply the result by the number in the first line for a class of the Fund under the heading entitled "Expenses Paid During Period" to estimate the expenses you paid on your account during this period. In addition, the Fund, as a shareholder in the underlying Fidelity Central Funds, will indirectly bear its pro-rata share of the fees and expenses incurred by the underlying Fidelity Central Funds. These fees and expenses are not included in the Fund's annualized expense ratio used to calculate the expense estimate in the table below.
Hypothetical Example for Comparison Purposes
The second line of the accompanying table for each class of the Fund provides information about hypothetical account values and hypothetical expenses based on a Class' actual expense ratio and an assumed rate of return of 5% per year before expenses, which is not the Class' actual return. The hypothetical account values and expenses may not be used to estimate the actual ending account balance or expenses you paid for the period. You may use this information to compare the ongoing costs of investing in the Fund and other funds. To do so, compare this 5% hypothetical example with the 5% hypothetical examples that appear in the shareholder reports of the other funds. In addition, the Fund, as a shareholder in the underlying Fidelity Central Funds, will indirectly bear its pro-rata share of the fees and expenses incurred by the underlying Fidelity Central Funds. These fees and expenses are not included in the Fund's annualized expense ratio used to calculate the expense estimate in the table below.
Please note that the expenses shown in the table are meant to highlight your ongoing costs only and do not reflect any transaction costs. Therefore, the second line of the table is useful in comparing ongoing costs only, and will not help you determine the relative total costs of owning different funds. In addition, if these transactional costs were included, your costs would have been higher.
Annual Report
Shareholder Expense Example - continued
| Annualized | Beginning | Ending | Expenses Paid |
Class A | 1.25% |
|
|
|
Actual |
| $ 1,000.00 | $ 1,052.40 | $ 6.47 |
HypotheticalA |
| $ 1,000.00 | $ 1,018.90 | $ 6.36 |
Class T | 1.50% |
|
|
|
Actual |
| $ 1,000.00 | $ 1,051.40 | $ 7.76 |
HypotheticalA |
| $ 1,000.00 | $ 1,017.64 | $ 7.63 |
Class B | 2.00% |
|
|
|
Actual |
| $ 1,000.00 | $ 1,048.30 | $ 10.33 |
HypotheticalA |
| $ 1,000.00 | $ 1,015.12 | $ 10.16 |
Class C | 2.00% |
|
|
|
Actual |
| $ 1,000.00 | $ 1,048.50 | $ 10.33 |
HypotheticalA |
| $ 1,000.00 | $ 1,015.12 | $ 10.16 |
Institutional Class | .96% |
|
|
|
Actual |
| $ 1,000.00 | $ 1,053.90 | $ 4.97 |
HypotheticalA |
| $ 1,000.00 | $ 1,020.37 | $ 4.89 |
A 5% return per year before expenses
B Annualized expense ratio reflects expenses net of applicable fee waivers.
* Expenses are equal to each Class' annualized expense ratio, multiplied by the average account value over the period, multiplied by 184/365 (to reflect the one-half year period).
Annual Report
Investment Changes (Unaudited)
Top Ten Stocks as of October 31, 2014 | ||
| % of fund's | % of fund's net assets |
Sempra Energy | 1.6 | 1.8 |
Edison International | 1.5 | 1.7 |
AECOM Technology Corp. | 1.4 | 0.9 |
PPL Corp. | 1.3 | 0.0 |
NiSource, Inc. | 1.3 | 1.3 |
Broadcom Corp. Class A | 1.2 | 0.9 |
Berkshire Hathaway, Inc. Class B | 1.0 | 1.1 |
Whirlpool Corp. | 1.0 | 0.0 |
Invesco Ltd. | 0.9 | 0.8 |
Jazz Pharmaceuticals PLC | 0.9 | 0.2 |
| 12.1 | |
Top Five Market Sectors as of October 31, 2014 | ||
| % of fund's | % of fund's net assets |
Financials | 28.8 | 28.2 |
Information Technology | 12.6 | 11.8 |
Consumer Discretionary | 12.0 | 11.8 |
Industrials | 10.0 | 9.5 |
Utilities | 9.8 | 10.0 |
Asset Allocation (% of fund's net assets) | |||||||
As of October 31, 2014* | As of April 30, 2014** | ||||||
 | Stocks and |
| | Stocks and |
| ||
 | Other Investments 0.2% |
| | Other Investments 0.2% |
| ||
 | Short-Term |
| | Short-Term |
| ||
* Foreign investments | 18.8% |
| ** Foreign investments | 17.9% |
| ||

Annual Report
Investments October 31, 2014
Showing Percentage of Net Assets
Common Stocks - 96.9% | |||
Shares | Value | ||
CONSUMER DISCRETIONARY - 12.0% | |||
Auto Components - 1.5% | |||
Delphi Automotive PLC | 4,213 | $ 290,613 | |
Tenneco, Inc. (a) | 3,100 | 162,316 | |
The Goodyear Tire & Rubber Co. | 24,061 | 582,998 | |
Visteon Corp. (a) | 3,373 | 316,725 | |
| 1,352,652 | ||
Automobiles - 0.2% | |||
Harley-Davidson, Inc. | 3,200 | 210,240 | |
Diversified Consumer Services - 1.5% | |||
H&R Block, Inc. | 7,812 | 252,406 | |
Houghton Mifflin Harcourt Co. | 35,847 | 717,298 | |
Kroton Educacional SA | 30,392 | 216,604 | |
Service Corp. International | 7,428 | 162,450 | |
| 1,348,758 | ||
Household Durables - 2.3% | |||
Helen of Troy Ltd. (a) | 3,075 | 190,189 | |
Jarden Corp. (a) | 7,829 | 509,590 | |
KB Home (e) | 36,434 | 573,471 | |
Whirlpool Corp. | 5,310 | 913,586 | |
| 2,186,836 | ||
Leisure Products - 0.2% | |||
Brunswick Corp. | 4,893 | 228,992 | |
Media - 2.7% | |||
CBS Corp. Class B | 4,046 | 219,374 | |
Lamar Advertising Co. Class A | 8,646 | 446,566 | |
Liberty Media Corp. Class C (a) | 12,056 | 577,844 | |
Live Nation Entertainment, Inc. (a) | 26,923 | 699,998 | |
Omnicom Group, Inc. | 4,300 | 308,998 | |
Sinclair Broadcast Group, Inc. Class A (e) | 7,730 | 224,557 | |
| 2,477,337 | ||
Multiline Retail - 0.7% | |||
Dillard's, Inc. Class A | 1,826 | 193,118 | |
Kohl's Corp. | 8,375 | 454,093 | |
| 647,211 | ||
Specialty Retail - 2.2% | |||
Advance Auto Parts, Inc. | 1,992 | 292,744 | |
AutoZone, Inc. (a) | 526 | 291,152 | |
Chico's FAS, Inc. | 32,323 | 487,431 | |
Office Depot, Inc. (a) | 47,838 | 249,714 | |
Rent-A-Center, Inc. | 7,730 | 239,398 | |
Common Stocks - continued | |||
Shares | Value | ||
CONSUMER DISCRETIONARY - continued | |||
Specialty Retail - continued | |||
Staples, Inc. | 14,828 | $ 188,019 | |
The Men's Wearhouse, Inc. | 5,686 | 267,413 | |
| 2,015,871 | ||
Textiles, Apparel & Luxury Goods - 0.7% | |||
Fossil Group, Inc. (a) | 2,826 | 287,291 | |
Gildan Activewear, Inc. | 3,700 | 220,414 | |
Iconix Brand Group, Inc. (a) | 4,600 | 184,046 | |
| 691,751 | ||
TOTAL CONSUMER DISCRETIONARY | 11,159,648 | ||
CONSUMER STAPLES - 3.7% | |||
Beverages - 0.6% | |||
C&C Group PLC | 30,381 | 135,308 | |
Cott Corp. | 22,646 | 137,236 | |
Molson Coors Brewing Co. Class B | 3,520 | 261,818 | |
| 534,362 | ||
Food & Staples Retailing - 0.2% | |||
Safeway, Inc. | 5,326 | 185,664 | |
Food Products - 2.2% | |||
Bunge Ltd. | 9,230 | 818,240 | |
Dean Foods Co. (e) | 31,182 | 458,687 | |
Greencore Group PLC | 40,182 | 168,668 | |
Ingredion, Inc. | 2,763 | 213,442 | |
The J.M. Smucker Co. | 3,840 | 399,360 | |
| 2,058,397 | ||
Household Products - 0.1% | |||
Svenska Cellulosa AB (SCA) (B Shares) | 6,400 | 143,096 | |
Personal Products - 0.4% | |||
Coty, Inc. Class A | 21,254 | 352,816 | |
Tobacco - 0.2% | |||
Japan Tobacco, Inc. | 4,300 | 146,712 | |
TOTAL CONSUMER STAPLES | 3,421,047 | ||
ENERGY - 5.7% | |||
Energy Equipment & Services - 1.3% | |||
BW Offshore Ltd. | 82,345 | 100,963 | |
Cameron International Corp. (a) | 3,497 | 208,246 | |
Common Stocks - continued | |||
Shares | Value | ||
ENERGY - continued | |||
Energy Equipment & Services - continued | |||
Halliburton Co. | 7,769 | $ 428,383 | |
National Oilwell Varco, Inc. | 3,271 | 237,605 | |
Odfjell Drilling A/S | 27,718 | 81,778 | |
Rowan Companies PLC | 6,313 | 153,217 | |
| 1,210,192 | ||
Oil, Gas & Consumable Fuels - 4.4% | |||
Anadarko Petroleum Corp. | 2,600 | 238,628 | |
BPZ Energy, Inc. (a) | 68,450 | 84,878 | |
Energen Corp. | 5,752 | 389,410 | |
Energy XXI (Bermuda) Ltd. | 18,400 | 141,496 | |
Imperial Oil Ltd. | 4,000 | 192,467 | |
Kinder Morgan Holding Co. LLC | 5,300 | 205,110 | |
Marathon Petroleum Corp. | 5,057 | 459,681 | |
Markwest Energy Partners LP | 2,200 | 154,110 | |
Newfield Exploration Co. (a) | 8,887 | 289,805 | |
Noble Energy, Inc. | 3,028 | 174,504 | |
Northern Oil & Gas, Inc. (a) | 12,009 | 135,702 | |
Ophir Energy PLC (a) | 32,500 | 96,338 | |
Scorpio Tankers, Inc. | 12,555 | 109,605 | |
Stone Energy Corp. (a) | 14,090 | 345,205 | |
Tesoro Corp. | 6,608 | 471,877 | |
Ultra Petroleum Corp. (a)(e) | 6,266 | 142,865 | |
Whiting Petroleum Corp. (a) | 7,548 | 462,240 | |
| 4,093,921 | ||
TOTAL ENERGY | 5,304,113 | ||
FINANCIALS - 28.5% | |||
Banks - 5.3% | |||
Bank of Ireland (a) | 212,097 | 83,857 | |
Barclays PLC sponsored ADR | 15,018 | 231,277 | |
CIT Group, Inc. | 11,744 | 574,634 | |
Citigroup, Inc. | 6,212 | 332,528 | |
EFG Eurobank Ergasias SA (a) | 290,300 | 100,770 | |
First Citizen Bancshares, Inc. | 2,737 | 687,562 | |
Investors Bancorp, Inc. | 22,300 | 239,725 | |
JPMorgan Chase & Co. | 8,969 | 542,445 | |
M&T Bank Corp. | 2,679 | 327,320 | |
PNC Financial Services Group, Inc. | 5,041 | 435,492 | |
Common Stocks - continued | |||
Shares | Value | ||
FINANCIALS - continued | |||
Banks - continued | |||
Prosperity Bancshares, Inc. | 4,100 | $ 247,599 | |
TSB Banking Group PLC | 24,500 | 105,899 | |
U.S. Bancorp | 17,519 | 746,309 | |
Wells Fargo & Co. | 5,649 | 299,905 | |
| 4,955,322 | ||
Capital Markets - 4.4% | |||
American Capital Ltd. (a) | 6,900 | 102,327 | |
Ameriprise Financial, Inc. | 3,772 | 475,913 | |
Apollo Global Management LLC Class A | 8,518 | 193,785 | |
Ares Capital Corp. | 16,957 | 271,142 | |
Artisan Partners Asset Management, Inc. | 3,000 | 145,440 | |
Carlyle Group LP | 8,860 | 245,954 | |
E*TRADE Financial Corp. (a) | 16,759 | 373,726 | |
Fortress Investment Group LLC | 29,972 | 225,389 | |
Invesco Ltd. | 21,970 | 889,126 | |
Julius Baer Group Ltd. | 2,630 | 115,024 | |
KKR & Co. LP | 16,212 | 349,531 | |
NorthStar Asset Management Group, Inc. | 10,605 | 192,163 | |
The Blackstone Group LP | 10,414 | 313,670 | |
UBS AG | 13,828 | 240,443 | |
| 4,133,633 | ||
Consumer Finance - 2.0% | |||
Capital One Financial Corp. | 8,986 | 743,771 | |
Navient Corp. | 33,807 | 668,702 | |
SLM Corp. | 9,080 | 86,714 | |
Springleaf Holdings, Inc. | 8,790 | 328,922 | |
| 1,828,109 | ||
Diversified Financial Services - 1.3% | |||
Berkshire Hathaway, Inc. Class B (a) | 6,708 | 940,193 | |
The NASDAQ OMX Group, Inc. | 5,622 | 243,208 | |
| 1,183,401 | ||
Insurance - 6.9% | |||
ACE Ltd. | 4,300 | 469,990 | |
AFLAC, Inc. | 4,768 | 284,793 | |
Allied World Assurance Co. | 7,021 | 266,798 | |
Allstate Corp. | 5,558 | 360,436 | |
AMBAC Financial Group, Inc. (a) | 20,101 | 459,911 | |
Brown & Brown, Inc. | 9,700 | 309,042 | |
Fairfax Financial Holdings Ltd. (sub. vtg.) | 1,220 | 557,397 | |
Common Stocks - continued | |||
Shares | Value | ||
FINANCIALS - continued | |||
Insurance - continued | |||
FNF Group | 15,157 | $ 452,285 | |
FNFV Group (a) | 1,399 | 18,803 | |
Genworth Financial, Inc. Class A (a) | 9,633 | 134,766 | |
Greenlight Capital Re, Ltd. (a) | 5,127 | 166,371 | |
Hilltop Holdings, Inc. (a) | 9,574 | 210,915 | |
Intact Financial Corp. | 4,134 | 277,189 | |
Old Republic International Corp. | 20,111 | 297,039 | |
ProAssurance Corp. | 4,943 | 231,234 | |
Progressive Corp. | 4,170 | 110,130 | |
Prudential PLC | 13,586 | 314,598 | |
Reinsurance Group of America, Inc. | 5,447 | 458,910 | |
StanCorp Financial Group, Inc. | 3,868 | 269,058 | |
Third Point Reinsurance Ltd. (a) | 7,708 | 117,932 | |
Torchmark Corp. | 6,998 | 370,614 | |
Validus Holdings Ltd. | 8,346 | 332,004 | |
| 6,470,215 | ||
Real Estate Investment Trusts - 6.4% | |||
Alexandria Real Estate Equities, Inc. | 4,631 | 384,373 | |
American Capital Agency Corp. | 20,736 | 471,537 | |
American Realty Capital Properties, Inc. | 2,500 | 22,175 | |
American Tower Corp. | 5,236 | 510,510 | |
Brandywine Realty Trust (SBI) | 11,300 | 174,359 | |
Digital Realty Trust, Inc. | 5,558 | 383,446 | |
Equity Lifestyle Properties, Inc. | 13,752 | 675,223 | |
Eurobank Properties Real Estate Investment Co. | 50,742 | 548,123 | |
Extra Space Storage, Inc. | 7,991 | 464,757 | |
General Growth Properties, Inc. | 4,289 | 111,128 | |
Iron Mountain, Inc. | 9,393 | 338,806 | |
iStar Financial, Inc. (a)(e) | 14,465 | 205,258 | |
MFA Financial, Inc. | 22,010 | 184,444 | |
NorthStar Realty Finance Corp. | 19,705 | 366,119 | |
Piedmont Office Realty Trust, Inc. Class A | 17,622 | 342,748 | |
Sun Communities, Inc. | 4,813 | 279,010 | |
Washington Prime Group, Inc. | 28,000 | 493,640 | |
| 5,955,656 | ||
Real Estate Management & Development - 1.7% | |||
Brookfield Asset Management, Inc. Class A | 2,500 | 122,377 | |
Forest City Enterprises, Inc. Class A (a) | 26,845 | 560,792 | |
Kennedy Wilson Europe Real Estate PLC | 12,391 | 206,148 | |
Common Stocks - continued | |||
Shares | Value | ||
FINANCIALS - continued | |||
Real Estate Management & Development - continued | |||
Kennedy-Wilson Holdings, Inc. (a) | 20,786 | $ 563,093 | |
Realogy Holdings Corp. (a) | 3,000 | 123,030 | |
| 1,575,440 | ||
Thrifts & Mortgage Finance - 0.5% | |||
Ocwen Financial Corp. (a) | 7,024 | 165,485 | |
TFS Financial Corp. | 17,100 | 255,474 | |
| 420,959 | ||
TOTAL FINANCIALS | 26,522,735 | ||
HEALTH CARE - 8.0% | |||
Biotechnology - 0.8% | |||
Aegerion Pharmaceuticals, Inc. (a)(e) | 2,272 | 45,872 | |
Amgen, Inc. | 1,287 | 208,726 | |
Cubist Pharmaceuticals, Inc. (a) | 3,289 | 237,762 | |
United Therapeutics Corp. (a) | 2,356 | 308,565 | |
| 800,925 | ||
Health Care Equipment & Supplies - 1.2% | |||
Boston Scientific Corp. (a) | 29,162 | 387,271 | |
Covidien PLC | 3,592 | 332,044 | |
DENTSPLY International, Inc. | 3,556 | 180,538 | |
The Cooper Companies, Inc. | 200 | 32,780 | |
Zimmer Holdings, Inc. | 1,800 | 200,232 | |
| 1,132,865 | ||
Health Care Providers & Services - 2.5% | |||
Accretive Health, Inc. (a) | 10,427 | 75,074 | |
Cardinal Health, Inc. | 7,888 | 619,050 | |
Catamaran Corp. (United States) (a) | 1,473 | 70,218 | |
Community Health Systems, Inc. (a) | 10,448 | 574,327 | |
HCA Holdings, Inc. (a) | 8,034 | 562,782 | |
Humana, Inc. | 2,500 | 347,125 | |
Omnicare, Inc. | 1,500 | 99,885 | |
| 2,348,461 | ||
Health Care Technology - 0.3% | |||
CompuGroup Medical AG | 11,205 | 256,960 | |
Life Sciences Tools & Services - 0.4% | |||
Agilent Technologies, Inc. | 6,845 | 378,392 | |
Pharmaceuticals - 2.8% | |||
Actavis PLC (a) | 1,476 | 358,284 | |
Common Stocks - continued | |||
Shares | Value | ||
HEALTH CARE - continued | |||
Pharmaceuticals - continued | |||
Cardiome Pharma Corp. (a) | 11,071 | $ 87,682 | |
Impax Laboratories, Inc. (a) | 8,228 | 238,365 | |
Jazz Pharmaceuticals PLC (a) | 5,033 | 849,772 | |
Perrigo Co. PLC | 1,400 | 226,030 | |
Teva Pharmaceutical Industries Ltd. sponsored ADR | 4,683 | 264,449 | |
The Medicines Company (a) | 13,276 | 336,148 | |
Theravance, Inc. | 14,170 | 227,003 | |
| 2,587,733 | ||
TOTAL HEALTH CARE | 7,505,336 | ||
INDUSTRIALS - 10.0% | |||
Aerospace & Defense - 1.9% | |||
Alliant Techsystems, Inc. | 1,600 | 187,136 | |
Curtiss-Wright Corp. | 8,875 | 614,239 | |
Finmeccanica SpA (a) | 17,632 | 158,867 | |
GenCorp, Inc. (non-vtg.) (a) | 4,300 | 72,928 | |
L-3 Communications Holdings, Inc. | 2,000 | 242,920 | |
Textron, Inc. | 8,297 | 344,574 | |
Triumph Group, Inc. | 2,683 | 186,817 | |
| 1,807,481 | ||
Air Freight & Logistics - 0.7% | |||
FedEx Corp. | 1,494 | 250,096 | |
Hub Group, Inc. Class A (a) | 6,300 | 228,627 | |
UTi Worldwide, Inc. (a) | 15,629 | 170,825 | |
| 649,548 | ||
Airlines - 0.3% | |||
JetBlue Airways Corp. (a)(e) | 23,811 | 274,779 | |
Building Products - 0.2% | |||
Allegion PLC | 4,400 | 233,596 | |
Commercial Services & Supplies - 1.2% | |||
ADT Corp. (e) | 9,749 | 349,404 | |
Progressive Waste Solution Ltd. (Canada) | 11,738 | 342,855 | |
Regus PLC | 47,400 | 149,604 | |
West Corp. | 7,558 | 241,856 | |
| 1,083,719 | ||
Common Stocks - continued | |||
Shares | Value | ||
INDUSTRIALS - continued | |||
Construction & Engineering - 1.8% | |||
AECOM Technology Corp. (a) | 39,882 | $ 1,298,149 | |
Jacobs Engineering Group, Inc. (a) | 7,200 | 341,640 | |
| 1,639,789 | ||
Electrical Equipment - 1.0% | |||
Babcock & Wilcox Co. | 7,561 | 216,245 | |
Generac Holdings, Inc. (a) | 4,300 | 194,962 | |
OSRAM Licht AG (a) | 5,651 | 198,000 | |
Regal-Beloit Corp. | 4,000 | 283,880 | |
| 893,087 | ||
Machinery - 1.1% | |||
Allison Transmission Holdings, Inc. | 5,702 | 185,201 | |
Deere & Co. | 2,544 | 217,614 | |
Manitowoc Co., Inc. | 9,513 | 198,251 | |
TriMas Corp. (a) | 5,000 | 158,300 | |
Valmet Corp. | 400 | 4,226 | |
Valmont Industries, Inc. | 1,892 | 257,634 | |
| 1,021,226 | ||
Marine - 0.1% | |||
Ultrapetrol (Bahamas) Ltd. (a) | 37,800 | 113,778 | |
Professional Services - 0.4% | |||
Dun & Bradstreet Corp. | 2,792 | 342,886 | |
Road & Rail - 0.3% | |||
CSX Corp. | 4,981 | 177,473 | |
TransForce, Inc. | 5,464 | 133,612 | |
| 311,085 | ||
Trading Companies & Distributors - 1.0% | |||
AerCap Holdings NV (a) | 12,170 | 527,448 | |
Noble Group Ltd. | 192,000 | 178,725 | |
WESCO International, Inc. (a) | 2,706 | 223,001 | |
| 929,174 | ||
TOTAL INDUSTRIALS | 9,300,148 | ||
INFORMATION TECHNOLOGY - 12.6% | |||
Communications Equipment - 1.0% | |||
Juniper Networks, Inc. | 17,856 | 376,226 | |
Plantronics, Inc. | 4,475 | 232,118 | |
QUALCOMM, Inc. | 3,805 | 298,731 | |
| 907,075 | ||
Common Stocks - continued | |||
Shares | Value | ||
INFORMATION TECHNOLOGY - continued | |||
Electronic Equipment & Components - 1.5% | |||
Ingram Micro, Inc. Class A (a) | 11,503 | $ 308,741 | |
Jabil Circuit, Inc. | 13,495 | 282,720 | |
Knowles Corp. (a) | 12,500 | 243,250 | |
TE Connectivity Ltd. | 4,765 | 291,284 | |
TTM Technologies, Inc. (a) | 33,081 | 228,590 | |
| 1,354,585 | ||
IT Services - 3.1% | |||
Amdocs Ltd. | 6,018 | 286,096 | |
CGI Group, Inc. Class A (sub. vtg.) (a) | 6,831 | 234,498 | |
Computer Sciences Corp. | 5,674 | 342,710 | |
Global Payments, Inc. | 4,041 | 325,301 | |
Leidos Holdings, Inc. | 4,400 | 160,908 | |
Quindell PLC | 30,699 | 65,806 | |
Sapient Corp. (a) | 23,600 | 408,752 | |
Total System Services, Inc. | 23,724 | 801,634 | |
Unisys Corp. (a) | 10,785 | 276,527 | |
| 2,902,232 | ||
Semiconductors & Semiconductor Equipment - 2.2% | |||
Broadcom Corp. Class A | 27,532 | 1,153,040 | |
Freescale Semiconductor, Inc. (a) | 32,773 | 651,855 | |
MagnaChip Semiconductor Corp. (a) | 8,100 | 90,153 | |
PMC-Sierra, Inc. (a) | 22,973 | 178,960 | |
| 2,074,008 | ||
Software - 3.3% | |||
Activision Blizzard, Inc. | 13,872 | 276,746 | |
Cadence Design Systems, Inc. (a) | 16,800 | 301,560 | |
Comverse, Inc. (a) | 10,763 | 234,633 | |
Constellation Software, Inc. | 809 | 227,902 | |
Interactive Intelligence Group, Inc. (a) | 4,200 | 202,692 | |
King Digital Entertainment PLC (e) | 6,600 | 75,240 | |
MicroStrategy, Inc. Class A (a) | 858 | 138,035 | |
Oracle Corp. | 16,689 | 651,705 | |
Rovi Corp. (a) | 9,200 | 192,096 | |
Symantec Corp. | 21,035 | 522,089 | |
Synopsys, Inc. (a) | 6,900 | 282,762 | |
| 3,105,460 | ||
Technology Hardware, Storage & Peripherals - 1.5% | |||
EMC Corp. | 9,166 | 263,339 | |
Common Stocks - continued | |||
Shares | Value | ||
INFORMATION TECHNOLOGY - continued | |||
Technology Hardware, Storage & Peripherals - continued | |||
NCR Corp. (a) | 20,003 | $ 553,483 | |
Samsung Electronics Co. Ltd. | 535 | 619,427 | |
| 1,436,249 | ||
TOTAL INFORMATION TECHNOLOGY | 11,779,609 | ||
MATERIALS - 6.5% | |||
Chemicals - 4.1% | |||
Agrium, Inc. | 6,062 | 593,103 | |
Airgas, Inc. | 2,043 | 227,876 | |
Ashland, Inc. | 2,586 | 279,469 | |
Axiall Corp. | 5,506 | 221,892 | |
Cabot Corp. | 4,250 | 197,328 | |
Celanese Corp. Class A | 5,736 | 336,875 | |
CF Industries Holdings, Inc. | 1,400 | 364,000 | |
Cytec Industries, Inc. | 5,796 | 270,267 | |
Eastman Chemical Co. | 3,624 | 292,747 | |
LyondellBasell Industries NV Class A | 1,920 | 175,930 | |
Methanex Corp. | 11,154 | 662,876 | |
Tronox Ltd. Class A | 7,600 | 183,768 | |
| 3,806,131 | ||
Containers & Packaging - 1.0% | |||
Rock-Tenn Co. Class A | 12,580 | 643,467 | |
Sonoco Products Co. | 6,711 | 274,279 | |
| 917,746 | ||
Metals & Mining - 1.4% | |||
Compass Minerals International, Inc. | 2,800 | 239,904 | |
Constellium NV (a) | 5,624 | 113,886 | |
Freeport-McMoRan, Inc. | 9,730 | 277,305 | |
Gem Diamonds Ltd. (a) | 11,399 | 28,310 | |
Royal Gold, Inc. | 1,595 | 91,154 | |
Steel Dynamics, Inc. | 12,900 | 296,829 | |
SunCoke Energy, Inc. | 12,176 | 291,006 | |
| 1,338,394 | ||
TOTAL MATERIALS | 6,062,271 | ||
Common Stocks - continued | |||
Shares | Value | ||
TELECOMMUNICATION SERVICES - 0.1% | |||
Diversified Telecommunication Services - 0.1% | |||
CenturyLink, Inc. | 627 | $ 26,008 | |
Frontier Communications Corp. (e) | 13,280 | 86,851 | |
| 112,859 | ||
Wireless Telecommunication Services - 0.0% | |||
T-Mobile U.S., Inc. (a) | 602 | 17,572 | |
TOTAL TELECOMMUNICATION SERVICES | 130,431 | ||
UTILITIES - 9.8% | |||
Electric Utilities - 4.8% | |||
Edison International | 22,407 | 1,402,230 | |
Exelon Corp. | 10,299 | 376,840 | |
ITC Holdings Corp. | 21,228 | 840,841 | |
NextEra Energy, Inc. | 6,586 | 660,049 | |
PPL Corp. | 35,063 | 1,226,854 | |
| 4,506,814 | ||
Gas Utilities - 1.3% | |||
Atmos Energy Corp. | 6,826 | 361,778 | |
National Fuel Gas Co. | 11,888 | 823,006 | |
| 1,184,784 | ||
Independent Power and Renewable Electricity Producers - 0.1% | |||
NextEra Energy Partners LP | 2,000 | 73,120 | |
Independent Power Producers & Energy Traders - 0.4% | |||
Dynegy, Inc. (a) | 11,115 | 339,008 | |
Multi-Utilities - 3.2% | |||
DTE Energy Co. | 3,158 | 259,461 | |
NiSource, Inc. | 28,709 | 1,207,501 | |
Sempra Energy | 13,942 | 1,533,619 | |
| 3,000,581 | ||
TOTAL UTILITIES | 9,104,307 | ||
TOTAL COMMON STOCKS (Cost $80,096,795) |
| ||
Nonconvertible Preferred Stocks - 0.1% | |||
Shares | Value | ||
FINANCIALS - 0.1% | |||
Banks - 0.1% | |||
Itau Unibanco Holding SA sponsored ADR (Cost $164,643) | 9,317 |
| $ 137,519 |
U.S. Treasury Obligations - 0.2% | ||||
| Principal Amount (d) |
| ||
U.S. Treasury Bills, yield at date of purchase 0.01% to 0.01% 11/20/14 to 1/2/15 (h) | $ 170,000 |
| ||
Preferred Securities - 0.2% | ||||
| ||||
FINANCIALS - 0.2% | ||||
Diversified Financial Services - 0.2% | ||||
Baggot Securities Ltd. 10.24% (f)(g) (Cost $153,576) | EUR | 100,000 |
| |
Money Market Funds - 4.4% | |||
Shares |
| ||
Fidelity Cash Central Fund, 0.11% (b) | 2,958,966 | 2,958,966 | |
Fidelity Securities Lending Cash Central Fund, 0.11% (b)(c) | 1,135,575 | 1,135,575 | |
TOTAL MONEY MARKET FUNDS (Cost $4,094,541) |
| ||
TOTAL INVESTMENT PORTFOLIO - 101.8% (Cost $84,679,552) | 94,833,342 | ||
NET OTHER ASSETS (LIABILITIES) - (1.8)% | (1,697,455) | ||
NET ASSETS - 100% | $ 93,135,887 | ||
Futures Contracts | |||||
Expiration Date | Underlying | Unrealized | |||
Purchased | |||||
Equity Index Contracts | |||||
2 CME E-mini S&P Midcap 400 Index Contracts (United States) | Dec. 2014 | $ 283,080 | $ (688) | ||
|
The face value of futures purchased as a percentage of net assets is 0.3% |
Currency Abbreviations | ||
EUR | - | European Monetary Unit |
Legend |
(a) Non-income producing |
(b) Affiliated fund that is generally available only to investment companies and other accounts managed by Fidelity Investments. The rate quoted is the annualized seven-day yield of the fund at period end. A complete unaudited listing of the fund's holdings as of its most recent quarter end is available upon request. In addition, each Fidelity Central Fund's financial statements, which are not covered by the Fund's Report of Independent Registered Public Accounting Firm, are available on the SEC's website or upon request. |
(c) Investment made with cash collateral received from securities on loan. |
(d) Amount is stated in United States dollars unless otherwise noted. |
(e) Security or a portion of the security is on loan at period end. |
(f) Security exempt from registration under Rule 144A of the Securities Act of 1933. These securities may be resold in transactions exempt from registration, normally to qualified institutional buyers. At the end of the period, the value of these securities amounted to $141,639 or 0.2% of net assets. |
(g) Security is perpetual in nature with no stated maturity date. |
(h) Security or a portion of the security was pledged to cover margin requirements for futures contracts. At period end, the value of securities pledged amounted to $30,000. |
Affiliated Central Funds |
Information regarding fiscal year to date income earned by the Fund from investments in Fidelity Central Funds is as follows: |
Fund | Income earned |
Fidelity Cash Central Fund | $ 3,157 |
Fidelity Securities Lending Cash Central Fund | 10,960 |
Total | $ 14,117 |
Other Information |
The following is a summary of the inputs used, as of October 31, 2014, involving the Fund's assets and liabilities carried at fair value. The inputs or methodology used for valuing securities may not be an indication of the risk associated with investing in those securities. For more information on valuation inputs, and their aggregation into the levels used in the table below, please refer to the Investment Valuation section in the accompanying Notes to Financial Statements. |
Valuation Inputs at Reporting Date: | ||||
Description | Total | Level 1 | Level 2 | Level 3 |
Investments in Securities: | ||||
Equities: | ||||
Consumer Discretionary | $ 11,159,648 | $ 11,159,648 | $ - | $ - |
Consumer Staples | 3,421,047 | 3,274,335 | 146,712 | - |
Energy | 5,304,113 | 5,304,113 | - | - |
Financials | 26,660,254 | 26,021,356 | 638,898 | - |
Health Care | 7,505,336 | 7,505,336 | - | - |
Industrials | 9,300,148 | 9,121,423 | 178,725 | - |
Information Technology | 11,779,609 | 11,779,609 | - | - |
Materials | 6,062,271 | 6,062,271 | - | - |
Telecommunication Services | 130,431 | 130,431 | - | - |
Utilities | 9,104,307 | 9,104,307 | - | - |
U.S. Government and Government Agency Obligations | 169,998 | - | 169,998 | - |
Preferred Securities | 141,639 | - | 141,639 | - |
Money Market Funds | 4,094,541 | 4,094,541 | - | - |
Total Investments in Securities: | $ 94,833,342 | $ 93,557,370 | $ 1,275,972 | $ - |
Derivative Instruments: | ||||
Liabilities | ||||
Futures Contracts | $ (688) | $ (688) | $ - | $ - |
Value of Derivative Instruments |
The following table is a summary of the Fund's value of derivative instruments by primary risk exposure as of October 31, 2014. For additional information on derivative instruments, please refer to the Derivative Instruments section in the accompanying Notes to Financial Statements. |
Primary Risk Exposure / | Value | |
| Asset | Liability |
Equity Risk | ||
Futures Contracts (a) | $ - | $ (688) |
Total Value of Derivatives | $ - | $ (688) |
(a) Reflects gross cumulative appreciation (depreciation) on futures contracts as presented in the Schedule of Investments. Only the period end receivable or payable for daily variation margin and net unrealized appreciation (depreciation) are presented in the Statement of Assets and Liabilities. |
Other Information |
Distribution of investments by country or territory of incorporation, as a percentage of total net assets, is as follows (Unaudited): |
United States of America | 81.2% |
Canada | 4.2% |
Bermuda | 3.7% |
Ireland | 2.8% |
Switzerland | 1.5% |
United Kingdom | 1.0% |
Others (Individually Less Than 1%) | 5.6% |
| 100.0% |
See accompanying notes which are an integral part of the financial statements.
Annual Report
Financial Statements
Statement of Assets and Liabilities
| October 31, 2014 | |
|
|
|
Assets | ||
Investment in securities, at value (including securities loaned of $1,117,149) - See accompanying schedule: Unaffiliated issuers (cost $80,585,011) | $ 90,738,801 |
|
Fidelity Central Funds (cost $4,094,541) | 4,094,541 |
|
Total Investments (cost $84,679,552) |
| $ 94,833,342 |
Receivable for investments sold | 633,582 | |
Receivable for fund shares sold | 58,030 | |
Dividends receivable | 81,964 | |
Distributions receivable from Fidelity Central Funds | 1,609 | |
Receivable for daily variation margin for derivative instruments | 2,518 | |
Prepaid expenses | 285 | |
Receivable from investment adviser for expense reductions | 5,575 | |
Other receivables | 1,604 | |
Total assets | 95,618,509 | |
|
|
|
Liabilities | ||
Payable to custodian bank | $ 238,660 | |
Payable for investments purchased | 823,773 | |
Payable for fund shares redeemed | 127,513 | |
Accrued management fee | 42,565 | |
Distribution and service plan fees payable | 32,076 | |
Other affiliated payables | 20,491 | |
Other payables and accrued expenses | 61,969 | |
Collateral on securities loaned, at value | 1,135,575 | |
Total liabilities | 2,482,622 | |
|
|
|
Net Assets | $ 93,135,887 | |
Net Assets consist of: |
| |
Paid in capital | $ 93,062,105 | |
Undistributed net investment income | 65,041 | |
Accumulated undistributed net realized gain (loss) on investments and foreign currency transactions | (10,143,638) | |
Net unrealized appreciation (depreciation) on investments and assets and liabilities in foreign currencies | 10,152,379 | |
Net Assets | $ 93,135,887 | |
See accompanying notes which are an integral part of the financial statements.
Annual Report
Statement of Assets and Liabilities - continued
| October 31, 2014 | |
|
|
|
Calculation of Maximum Offering Price Class A: | $ 21.48 | |
|
|
|
Maximum offering price per share (100/94.25 of $21.48) | $ 22.79 | |
Class T: | $ 21.27 | |
|
|
|
Maximum offering price per share (100/96.50 of $21.27) | $ 22.04 | |
Class B: | $ 20.60 | |
|
|
|
Class C: | $ 20.54 | |
|
|
|
Institutional Class: | $ 21.70 | |
A Redemption price per share is equal to net asset value less any applicable contingent deferred sales charge.
See accompanying notes which are an integral part of the financial statements.
Annual Report
Financial Statements - continued
Statement of Operations
| Year ended October 31, 2014 | |
|
|
|
Investment Income |
|
|
Dividends |
| $ 1,429,351 |
Interest |
| 661 |
Income from Fidelity Central Funds |
| 14,117 |
Total income |
| 1,444,129 |
|
|
|
Expenses | ||
Management fee | $ 477,097 | |
Performance adjustment | (17,834) | |
Transfer agent fees | 204,431 | |
Distribution and service plan fees | 383,942 | |
Accounting and security lending fees | 33,868 | |
Custodian fees and expenses | 77,543 | |
Independent trustees' compensation | 351 | |
Registration fees | 70,132 | |
Audit | 60,750 | |
Legal | 299 | |
Miscellaneous | 844 | |
Total expenses before reductions | 1,291,423 | |
Expense reductions | (44,209) | 1,247,214 |
Net investment income (loss) | 196,915 | |
Realized and Unrealized Gain (Loss) Net realized gain (loss) on: | ||
Investment securities: |
|
|
Unaffiliated issuers | 13,235,314 | |
Foreign currency transactions | (2,546) | |
Futures contracts | (75,121) | |
Total net realized gain (loss) |
| 13,157,647 |
Change in net unrealized appreciation (depreciation) on: Investment securities | (2,457,686) | |
Assets and liabilities in foreign currencies | (747) | |
Futures contracts | (24,736) | |
Total change in net unrealized appreciation (depreciation) |
| (2,483,169) |
Net gain (loss) | 10,674,478 | |
Net increase (decrease) in net assets resulting from operations | $ 10,871,393 | |
See accompanying notes which are an integral part of the financial statements.
Annual Report
Statement of Changes in Net Assets
| Year ended | Year ended |
Increase (Decrease) in Net Assets |
|
|
Operations |
|
|
Net investment income (loss) | $ 196,915 | $ 337,465 |
Net realized gain (loss) | 13,157,647 | 7,180,472 |
Change in net unrealized appreciation (depreciation) | (2,483,169) | 12,345,975 |
Net increase (decrease) in net assets resulting from operations | 10,871,393 | 19,863,912 |
Distributions to shareholders from net investment income | (112,252) | (345,665) |
Distributions to shareholders from net realized gain | (142,925) | - |
Total distributions | (255,177) | (345,665) |
Share transactions - net increase (decrease) | 3,929,186 | 2,685,061 |
Total increase (decrease) in net assets | 14,545,402 | 22,203,308 |
|
|
|
Net Assets | ||
Beginning of period | 78,590,485 | 56,387,177 |
End of period (including undistributed net investment income of $65,041 and undistributed net investment income of $61,673, respectively) | $ 93,135,887 | $ 78,590,485 |
See accompanying notes which are an integral part of the financial statements.
Annual Report
Financial Highlights - Class A
Years ended October 31, | 2014 | 2013 | 2012 | 2011 | 2010 |
Selected Per-Share Data |
|
|
|
|
|
Net asset value, beginning of period | $ 18.90 | $ 14.08 | $ 12.25 | $ 12.12 | $ 9.81 |
Income from Investment Operations |
|
|
|
|
|
Net investment income (loss) C | .09 | .11 | .07 | .03 | .06 F |
Net realized and unrealized gain (loss) | 2.58 | 4.82 | 1.79 | .17 | 2.29 |
Total from investment operations | 2.67 | 4.93 | 1.86 | .20 | 2.35 |
Distributions from net investment income | (.04) | (.11) | (.03) | (.06) | (.03) |
Distributions from net realized gain | (.04) | - | - | (.01) | (.01) |
Total distributions | (.09) H | (.11) | (.03) | (.07) | (.04) |
Net asset value, end of period | $ 21.48 | $ 18.90 | $ 14.08 | $ 12.25 | $ 12.12 |
Total Return A, B | 14.15% | 35.30% | 15.22% | 1.65% | 23.99% |
Ratios to Average Net Assets D, G |
|
|
|
|
|
Expenses before reductions | 1.29% | 1.31% | 1.35% | 1.29% | 1.33% |
Expenses net of fee waivers, if any | 1.25% | 1.25% | 1.25% | 1.25% | 1.25% |
Expenses net of all reductions | 1.25% | 1.23% | 1.25% | 1.24% | 1.24% |
Net investment income (loss) | .42% | .69% | .51% | .21% | .51% F |
Supplemental Data |
|
|
|
|
|
Net assets, end of period (000 omitted) | $ 45,759 | $ 38,397 | $ 27,817 | $ 29,635 | $ 37,972 |
Portfolio turnover rate E | 78% | 103% | 77% | 96% | 152% |
A Total returns would have been lower if certain expenses had not been reduced during the applicable periods shown.
B Total returns do not include the effect of the sales charges.
C Calculated based on average shares outstanding during the period.
D Fees and expenses of any underlying Fidelity Central Funds are not included in the Fund's expense ratio. The Fund indirectly bears its proportionate share of the expenses of any underlying Fidelity Central Funds.
E Amount does not include the portfolio activity of any underlying Fidelity Central Funds.
F Investment income per share reflects a large, non-recurring dividend which amounted to $.04 per share. Excluding this non-recurring dividend, the ratio of net investment income (loss) to average net assets would have been .13%.
G Expense ratios reflect operating expenses of the class. Expenses before reductions do not reflect amounts reimbursed by the investment adviser or reductions from brokerage service arrangements or reductions from other expense offset arrangements and do not represent the amount paid by the class during periods when reimbursements or reductions occur. Expenses net of fee waivers reflect expenses after reimbursement by the investment adviser but prior to reductions from brokerage service arrangements or other expense offset arrangements. Expenses net of all reductions represent the net expenses paid by the class.
H Total distributions of $.09 per share is comprised of distributions from net investment income of $.041 and distributions from net realized gain of $.044 per share.
See accompanying notes which are an integral part of the financial statements.
Annual Report
Financial Highlights - Class T
Years ended October 31, | 2014 | 2013 | 2012 | 2011 | 2010 |
Selected Per-Share Data |
|
|
|
|
|
Net asset value, beginning of period | $ 18.72 | $ 13.95 | $ 12.15 | $ 12.03 | $ 9.74 |
Income from Investment Operations |
|
|
|
|
|
Net investment income (loss) C | .03 | .07 | .03 | (.01) | .03 F |
Net realized and unrealized gain (loss) | 2.56 | 4.78 | 1.80 | .17 | 2.27 |
Total from investment operations | 2.59 | 4.85 | 1.83 | .16 | 2.30 |
Distributions from net investment income | - | (.08) | (.03) | (.04) | (.01) |
Distributions from net realized gain | (.04) | - | - | (.01) | (.01) |
Total distributions | (.04) | (.08) | (.03) | (.04) I | (.01) H |
Net asset value, end of period | $ 21.27 | $ 18.72 | $ 13.95 | $ 12.15 | $ 12.03 |
Total Return A, B | 13.88% | 34.94% | 15.05% | 1.35% | 23.66% |
Ratios to Average Net Assets D, G |
|
|
|
|
|
Expenses before reductions | 1.57% | 1.58% | 1.61% | 1.56% | 1.59% |
Expenses net of fee waivers, if any | 1.50% | 1.50% | 1.50% | 1.50% | 1.50% |
Expenses net of all reductions | 1.50% | 1.48% | 1.50% | 1.49% | 1.49% |
Net investment income (loss) | .17% | .44% | .26% | (.04)% | .26% F |
Supplemental Data |
|
|
|
|
|
Net assets, end of period (000 omitted) | $ 18,558 | $ 17,319 | $ 12,727 | $ 12,866 | $ 17,908 |
Portfolio turnover rate E | 78% | 103% | 77% | 96% | 152% |
A Total returns would have been lower if certain expenses had not been reduced during the applicable periods shown.
B Total returns do not include the effect of the sales charges.
C Calculated based on average shares outstanding during the period.
D Fees and expenses of any underlying Fidelity Central Funds are not included in the Fund's expense ratio. The Fund indirectly bears its proportionate share of the expenses of any underlying Fidelity Central Funds.
E Amount does not include the portfolio activity of any underlying Fidelity Central Funds.
F Investment income per share reflects a large, non-recurring dividend which amounted to $.04 per share. Excluding this non-recurring dividend, the ratio of net investment income (loss) to average net assets would have been (.12)%.
G Expense ratios reflect operating expenses of the class. Expenses before reductions do not reflect amounts reimbursed by the investment adviser or reductions from brokerage service arrangements or reductions from other expense offset arrangements and do not represent the amount paid by the class during periods when reimbursements or reductions occur. Expenses net of fee waivers reflect expenses after reimbursement by the investment adviser but prior to reductions from brokerage service arrangements or other expense offset arrangements. Expenses net of all reductions represent the net expenses paid by the class.
H Total distributions of $.01 per share is comprised of distributions from net investment income of $.008 and distributions from net realized gain of $.005 per share.
I Total distributions of $.04 per share is comprised of distributions from net investment income of $.035 and distributions from net realized gain of $.009 per share.
See accompanying notes which are an integral part of the financial statements.
Annual Report
Financial Highlights - Class B
Years ended October 31, | 2014 | 2013 | 2012 | 2011 | 2010 |
Selected Per-Share Data |
|
|
|
|
|
Net asset value, beginning of period | $ 18.18 | $ 13.54 | $ 11.85 | $ 11.75 | $ 9.54 |
Income from Investment Operations |
|
|
|
|
|
Net investment income (loss) C | (.07) | (.01) | (.03) | (.07) | (.03) F |
Net realized and unrealized gain (loss) | 2.49 | 4.65 | 1.74 | .17 | 2.24 |
Total from investment operations | 2.42 | 4.64 | 1.71 | .10 | 2.21 |
Distributions from net investment income | - | - | (.02) | - | - |
Net asset value, end of period | $ 20.60 | $ 18.18 | $ 13.54 | $ 11.85 | $ 11.75 |
Total Return A, B | 13.31% | 34.27% | 14.41% | .85% | 23.17% |
Ratios to Average Net Assets D, G |
|
|
|
|
|
Expenses before reductions | 2.13% | 2.11% | 2.13% | 2.05% | 2.08% |
Expenses net of fee waivers, if any | 2.00% | 2.00% | 2.00% | 2.00% | 2.00% |
Expenses net of all reductions | 2.00% | 1.98% | 2.00% | 1.99% | 1.99% |
Net investment income (loss) | (.33)% | (.06)% | (.24)% | (.54)% | (.24)% F |
Supplemental Data |
|
|
|
|
|
Net assets, end of period (000 omitted) | $ 1,417 | $ 2,116 | $ 2,480 | $ 3,482 | $ 4,937 |
Portfolio turnover rate E | 78% | 103% | 77% | 96% | 152% |
A Total returns would have been lower if certain expenses had not been reduced during the applicable periods shown.
B Total returns do not include the effect of the contingent deferred sales charge.
C Calculated based on average shares outstanding during the period.
D Fees and expenses of any underlying Fidelity Central Funds are not included in the Fund's expense ratio. The Fund indirectly bears its proportionate share of the expenses of any underlying Fidelity Central Funds.
E Amount does not include the portfolio activity of any underlying Fidelity Central Funds.
F Investment income per share reflects a large, non-recurring dividend which amounted to $.04 per share. Excluding this non-recurring dividend, the ratio of net investment income (loss) to average net assets would have been (.62)%.
G Expense ratios reflect operating expenses of the class. Expenses before reductions do not reflect amounts reimbursed by the investment adviser or reductions from brokerage service arrangements or reductions from other expense offset arrangements and do not represent the amount paid by the class during periods when reimbursements or reductions occur. Expenses net of fee waivers reflect expenses after reimbursement by the investment adviser but prior to reductions from brokerage service arrangements or other expense offset arrangements. Expenses net of all reductions represent the net expenses paid by the class.
See accompanying notes which are an integral part of the financial statements.
Annual Report
Financial Highlights - Class C
Years ended October 31, | 2014 | 2013 | 2012 | 2011 | 2010 |
Selected Per-Share Data |
|
|
|
|
|
Net asset value, beginning of period | $ 18.13 | $ 13.51 | $ 11.83 | $ 11.73 | $ 9.53 |
Income from Investment Operations |
|
|
|
|
|
Net investment income (loss) C | (.07) | (.01) | (.03) | (.07) | (.03) F |
Net realized and unrealized gain (loss) | 2.48 | 4.64 | 1.73 | .17 | 2.23 |
Total from investment operations | 2.41 | 4.63 | 1.70 | .10 | 2.20 |
Distributions from net investment income | - | (.01) | (.02) | - | - |
Net asset value, end of period | $ 20.54 | $ 18.13 | $ 13.51 | $ 11.83 | $ 11.73 |
Total Return A, B | 13.29% | 34.32% | 14.36% | .85% | 23.08% |
Ratios to Average Net Assets D, G |
|
|
|
|
|
Expenses before reductions | 2.06% | 2.08% | 2.10% | 2.04% | 2.08% |
Expenses net of fee waivers, if any | 2.00% | 2.00% | 2.00% | 2.00% | 2.00% |
Expenses net of all reductions | 2.00% | 1.98% | 1.99% | 1.99% | 1.99% |
Net investment income (loss) | (.33)% | (.06)% | (.24)% | (.54)% | (.24)% F |
Supplemental Data |
|
|
|
|
|
Net assets, end of period (000 omitted) | $ 17,390 | $ 14,354 | $ 9,283 | $ 8,976 | $ 9,497 |
Portfolio turnover rate E | 78% | 103% | 77% | 96% | 152% |
A Total returns would have been lower if certain expenses had not been reduced during the applicable periods shown.
B Total returns do not include the effect of the contingent deferred sales charge.
C Calculated based on average shares outstanding during the period.
D Fees and expenses of any underlying Fidelity Central Funds are not included in the Fund's expense ratio. The Fund indirectly bears its proportionate share of the expenses of any underlying Fidelity Central Funds.
E Amount does not include the portfolio activity of any underlying Fidelity Central Funds.
F Investment income per share reflects a large, non-recurring dividend which amounted to $.04 per share. Excluding this non-recurring dividend, the ratio of net investment income (loss) to average net assets would have been (.62)%.
G Expense ratios reflect operating expenses of the class. Expenses before reductions do not reflect amounts reimbursed by the investment adviser or reductions from brokerage service arrangements or reductions from other expense offset arrangements and do not represent the amount paid by the class during periods when reimbursements or reductions occur. Expenses net of fee waivers reflect expenses after reimbursement by the investment adviser but prior to reductions from brokerage service arrangements or other expense offset arrangements. Expenses net of all reductions represent the net expenses paid by the class.
See accompanying notes which are an integral part of the financial statements.
Annual Report
Financial Highlights - Institutional Class
Years ended October 31, | 2014 | 2013 | 2012 | 2011 | 2010 |
Selected Per-Share Data |
|
|
|
|
|
Net asset value, beginning of period | $ 19.09 | $ 14.22 | $ 12.34 | $ 12.21 | $ 9.88 |
Income from Investment Operations |
|
|
|
|
|
Net investment income (loss) B | .14 | .16 | .10 | .06 | .09 E |
Net realized and unrealized gain (loss) | 2.60 | 4.86 | 1.81 | .18 | 2.31 |
Total from investment operations | 2.74 | 5.02 | 1.91 | .24 | 2.40 |
Distributions from net investment income | (.09) | (.15) | (.03) | (.10) | (.06) |
Distributions from net realized gain | (.04) | - | - | (.01) | (.01) |
Total distributions | (.13) | (.15) | (.03) | (.11) | (.07) |
Net asset value, end of period | $ 21.70 | $ 19.09 | $ 14.22 | $ 12.34 | $ 12.21 |
Total Return A | 14.46% | 35.65% | 15.56% | 1.93% | 24.36% |
Ratios to Average Net Assets C, F |
|
|
|
|
|
Expenses before reductions | .97% | .96% | .99% | .97% | 1.03% |
Expenses net of fee waivers, if any | .97% | .96% | .99% | .97% | 1.00% |
Expenses net of all reductions | .97% | .94% | .99% | .96% | .99% |
Net investment income (loss) | .69% | .98% | .76% | .49% | .76% E |
Supplemental Data |
|
|
|
|
|
Net assets, end of period (000 omitted) | $ 10,011 | $ 6,405 | $ 4,080 | $ 4,869 | $ 5,894 |
Portfolio turnover rate D | 78% | 103% | 77% | 96% | 152% |
A Total returns would have been lower if certain expenses had not been reduced during the applicable periods shown.
B Calculated based on average shares outstanding during the period.
C Fees and expenses of any underlying Fidelity Central Funds are not included in the Fund's expense ratio. The Fund indirectly bears its proportionate share of the expenses of any underlying Fidelity Central Funds.
D Amount does not include the portfolio activity of any underlying Fidelity Central Funds.
E Investment income per share reflects a large, non-recurring dividend which amounted to $.04 per share. Excluding this non-recurring dividend, the ratio of net investment income (loss) to average net assets would have been .38%.
F Expense ratios reflect operating expenses of the class. Expenses before reductions do not reflect amounts reimbursed by the investment adviser or reductions from brokerage service arrangements or reductions from other expense offset arrangements and do not represent the amount paid by the class during periods when reimbursements or reductions occur. Expenses net of fee waivers reflect expenses after reimbursement by the investment adviser but prior to reductions from brokerage service arrangements or other expense offset arrangements. Expenses net of all reductions represent the net expenses paid by the class.
See accompanying notes which are an integral part of the financial statements.
Annual Report
Notes to Financial Statements
For the period ended October 31, 2014
1. Organization.
Fidelity Advisor Value Fund (the Fund) is a fund of Fidelity Advisor Series I (the Trust) and is authorized to issue an unlimited number of shares. The Trust is registered under the Investment Company Act of 1940, as amended (the 1940 Act), as an open-end management investment company organized as a Massachusetts business trust. The Fund offers Class A, Class T, Class C and Institutional Class shares, each of which, along with Class B shares, has equal rights as to assets and voting privileges. Class B shares are closed to new accounts and additional purchases, except for exchanges and reinvestments. Each class has exclusive voting rights with respect to matters that affect that class. Class B shares will automatically convert to Class A shares after a holding period of seven years from the initial date of purchase.
2. Investments in Fidelity Central Funds.
The Fund invests in Fidelity Central Funds, which are open-end investment companies generally available only to other investment companies and accounts managed by the investment adviser and its affiliates. The Fund's Schedule of Investments lists each of the Fidelity Central Funds held as of period end, if any, as an investment of the Fund, but does not include the underlying holdings of each Fidelity Central Fund. As an Investing Fund, the Fund indirectly bears its proportionate share of the expenses of the underlying Fidelity Central Funds.
The Money Market Central Funds seek preservation of capital and current income and are managed by Fidelity Investments Money Management, Inc. (FIMM), an affiliate of the investment adviser. Annualized expenses of the Money Market Central Funds as of their most recent shareholder report date are less than .01%.
A complete unaudited list of holdings for each Fidelity Central Fund is available upon request or at the Securities and Exchange Commission (the SEC) website at www.sec.gov. In addition, the financial statements of the Fidelity Central Funds, which are not covered by the Fund's Report of Independent Registered Public Accounting Firm, are available on the SEC website or upon request.
3. Significant Accounting Policies.
The financial statements have been prepared in conformity with accounting principles generally accepted in the United States of America (GAAP), which require management to make certain estimates and assumptions at the date of the financial statements. Actual results could differ from those estimates. Subsequent events, if any, through the date that the financial statements were issued have been evaluated in the preparation of
Annual Report
3. Significant Accounting Policies - continued
the financial statements. The following summarizes the significant accounting policies of the Fund:
Investment Valuation. Investments are valued as of 4:00 p.m. Eastern time on the last calendar day of the period. In accordance with valuation policies and procedures approved by the Board of Trustees (the Board), the Fund attempts to obtain prices from one or more third party pricing vendors or brokers to value its investments. When current market prices, quotations or currency exchange rates are not readily available or reliable, investments will be fair valued in good faith by the Fidelity Management & Research Company (FMR) Fair Value Committee (the Committee), in accordance with procedures adopted by the Board. Factors used in determining fair value vary by investment type and may include market or investment specific events, changes in interest rates and credit quality. The frequency with which these procedures are used cannot be predicted and they may be utilized to a significant extent. The Committee oversees the Fund's valuation policies and procedures and is responsible for approving and reporting to the Board all fair value determinations.
The Fund categorizes the inputs to valuation techniques used to value its investments into a disclosure hierarchy consisting of three levels as shown below:
Level 1 - quoted prices in active markets for identical investments
Level 2 - other significant observable inputs (including quoted prices for similar investments, interest rates, prepayment speeds, etc.)
Level 3 - unobservable inputs (including the Fund's own assumptions based on the best information available)
Valuation techniques used to value the Fund's investments by major category are as follows:
Equity securities, including restricted securities, for which market quotations are readily available, are valued at the last reported sale price or official closing price as reported by a third party pricing vendor on the primary market or exchange on which they are traded and are categorized as Level 1 in the hierarchy. In the event there were no sales during the day or closing prices are not available, securities are valued at the last quoted bid price or may be valued using the last available price and are generally categorized as Level 2 in the hierarchy. For foreign equity securities, when market or security specific events arise, comparisons to the valuation of American Depositary Receipts (ADRs), futures contracts, Exchange-Traded Funds (ETFs) and certain indexes as well as quoted prices for similar securities may be used and would be categorized as Level 2 in the hierarchy. Utilizing these techniques may result in transfers between Level 1 and Level 2. For equity securities, including restricted securities, where observable inputs are
Annual Report
Notes to Financial Statements - continued
3. Significant Accounting Policies - continued
Investment Valuation - continued
limited, assumptions about market activity and risk are used and these securities may be categorized as Level 3 in the hierarchy.
Debt securities, including restricted securities, are valued based on evaluated prices received from third party pricing vendors or from brokers who make markets in such securities. Preferred securities and U.S. government and government agency obligations are valued by pricing vendors who utilize matrix pricing which considers yield or price of bonds of comparable quality, coupon, maturity and type or by broker-supplied prices. When independent prices are unavailable or unreliable, debt securities may be valued utilizing pricing methodologies which consider similar factors that would be used by third party pricing vendors. Debt securities are generally categorized as Level 2 in the hierarchy but may be Level 3 depending on the circumstances.
Futures contracts are valued at the settlement price established each day by the board of trade or exchange on which they are traded and are categorized as Level 1 in the hierarchy. Investments in open-end mutual funds, including the Fidelity Central Funds, are valued at their closing net asset value (NAV) each business day and are categorized as Level 1 in the hierarchy.
Changes in valuation techniques may result in transfers in or out of an assigned level within the disclosure hierarchy. The aggregate value of investments by input level, as of October 31, 2014, is included at the end of the Fund's Schedule of Investments.
Foreign Currency. The Fund may use foreign currency contracts to facilitate transactions in foreign-denominated securities. Gains and losses from these transactions may arise from changes in the value of the foreign currency or if the counterparties do not perform under the contracts' terms.
Foreign-denominated assets, including investment securities, and liabilities are translated into U.S. dollars at the exchange rates at period end. Purchases and sales of investment securities, income and dividends received and expenses denominated in foreign currencies are translated into U.S. dollars at the exchange rate in effect on the transaction date.
The effects of exchange rate fluctuations on investments are included with the net realized and unrealized gain (loss) on investment securities. Other foreign currency transactions resulting in realized and unrealized gain (loss) are disclosed separately.
Investment Transactions and Income. For financial reporting purposes, the Fund's investment holdings and NAV include trades executed through the end of the last business day of the period. The NAV per share for processing shareholder transactions is calculated as of the close of business of the New York Stock Exchange (NYSE), normally
Annual Report
3. Significant Accounting Policies - continued
Investment Transactions and Income - continued
4:00 p.m. Eastern time and includes trades executed through the end of the prior business day. Gains and losses on securities sold are determined on the basis of identified cost and may include proceeds received from litigation. Dividend income is recorded on the ex-dividend date, except for certain dividends from foreign securities where the ex-dividend date may have passed, which are recorded as soon as the Fund is informed of the ex-dividend date. Non-cash dividends included in dividend income, if any, are recorded at the fair market value of the securities received. Income and capital gain distributions from Fidelity Central Funds, if any, are recorded on the ex-dividend date. Distributions received on securities that represent a return of capital or capital gain are recorded as a reduction of cost of investments and/or as a realized gain. Subsequent to ex-dividend date the Fund determines the components of these distributions, based upon receipt of tax filings or other correspondence relating to the underlying investment. Interest income is accrued as earned and includes coupon interest and amortization of premium and accretion of discount on debt securities as applicable. Investment income is recorded net of foreign taxes withheld where recovery of such taxes is uncertain.
Class Allocations and Expenses. Investment income, realized and unrealized capital gains and losses, common expenses of the Fund, and certain fund-level expense reductions, if any, are allocated daily on a pro-rata basis to each class based on the relative net assets of each class to the total net assets of the Fund. Each class differs with respect to transfer agent and distribution and service plan fees incurred. Certain expense reductions may also differ by class. For the reporting period, the allocated portion of income and expenses to each class as a percent of its average net assets may vary due to the timing of recording these transactions in relation to fluctuating net assets of the classes. Expenses directly attributable to a fund are charged to that fund. Expenses attributable to more than one fund are allocated among the respective funds on the basis of relative net assets or other appropriate methods. Expense estimates are accrued in the period to which they relate and adjustments are made when actual amounts are known.
Income Tax Information and Distributions to Shareholders. Each year, the Fund intends to qualify as a regulated investment company under Subchapter M of the Internal Revenue Code, including distributing substantially all of its taxable income and realized gains. As a result, no provision for U.S. Federal income taxes is required. As of October 31, 2014, the Fund did not have any unrecognized tax benefits in the financial statements; nor is the Fund aware of any tax positions for which it is reasonably possible that the total amounts of unrecognized tax benefits will significantly change in the next twelve months. The Fund files a U.S. federal tax return, in addition to state and local tax returns as required. The Fund's federal income tax returns are subject to examination by the Internal Revenue Service (IRS) for a period of three fiscal years after they are filed.
Annual Report
Notes to Financial Statements - continued
3. Significant Accounting Policies - continued
Income Tax Information and Distributions to Shareholders - continued
State and local tax returns may be subject to examination for an additional fiscal year depending on the jurisdiction. Foreign taxes are provided for based on the Fund's understanding of the tax rules and rates that exist in the foreign markets in which it invests.
Distributions are declared and recorded on the ex-dividend date. Income dividends and capital gain distributions are declared separately for each class. Income and capital gain distributions are determined in accordance with income tax regulations, which may differ from GAAP.
Capital accounts within the financial statements are adjusted for permanent book-tax differences. These adjustments have no impact on net assets or the results of operations. Capital accounts are not adjusted for temporary book-tax differences which will reverse in a subsequent period.
Book-tax differences are primarily due to futures contracts, foreign currency transactions, passive foreign investment companies (PFIC), partnerships, capital loss carryforwards and losses deferred due to wash sales.
The federal tax cost of investment securities and unrealized appreciation (depreciation) as of period end were as follows:
Gross unrealized appreciation | $ 13,345,781 |
Gross unrealized depreciation | (3,439,414) |
Net unrealized appreciation (depreciation) on securities | $ 9,906,367 |
|
|
Tax Cost | $ 84,926,975 |
The tax-based components of distributable earnings as of period end were as follows:
Undistributed ordinary income | $ 65,041 |
Capital loss carryforward | $ (9,896,903) |
Net unrealized appreciation (depreciation) on securities and other investments | $ 9,905,269 |
Capital loss carryforwards are only available to offset future capital gains of the Fund to the extent provided by regulations and may be limited. Under the Regulated Investment Company Modernization Act of 2010 (the Act), the Fund is permitted to carry forward capital losses incurred in taxable years beginning after December 22, 2010 for an unlimited period and such capital losses are required to be used prior to any losses that expire.
Annual Report
3. Significant Accounting Policies - continued
Income Tax Information and Distributions to Shareholders - continued
The capital loss carryforward information presented below, including any applicable limitation, is estimated as of fiscal period end and is subject to adjustment.
Fiscal year of expiration |
|
2017 | $ (9,896,903) |
The tax character of distributions paid was as follows:
| October 31, 2014 | October 31, 2013 |
Ordinary Income | $ 255,177 | $ 345,665 |
Restricted Securities. The Fund may invest in securities that are subject to legal or contractual restrictions on resale. These securities generally may be resold in transactions exempt from registration or to the public if the securities are registered. Disposal of these securities may involve time-consuming negotiations and expense, and prompt sale at an acceptable price may be difficult. Information regarding restricted securities is included at the end of the Fund's Schedule of Investments.
New Accounting Pronouncement. In June 2014, the Financial Accounting Standards Board issued Accounting Standard Update No. 2014-11, Repurchase-to-Maturity Transactions, Repurchase Financings, and Disclosures. The update amends the accounting for certain repurchase agreements and expands disclosure requirements for reverse repurchase agreements, securities lending and other similar transactions. The disclosure requirements are effective for annual and interim reporting periods beginning after December 15, 2014. Management is currently evaluating the impact of the Update on the Fund's financial statements and related disclosures.
4. Derivative Instruments.
Risk Exposures and the Use of Derivative Instruments. The Fund's investment objective allows the Fund to enter into various types of derivative contracts, including futures contracts. Derivatives are investments whose value is primarily derived from underlying assets, indices or reference rates and may be transacted on an exchange or over-the-counter (OTC). Derivatives may involve a future commitment to buy or sell a specified asset based on specified terms, to exchange future cash flows at periodic intervals based on a notional principal amount, or for one party to make one or more payments upon the occurrence of specified events in exchange for periodic payments from the other party.
The Fund used derivatives to increase returns and to manage exposure to certain risks as defined below. The success of any strategy involving derivatives depends on analysis of
Annual Report
Notes to Financial Statements - continued
4. Derivative Instruments - continued
Risk Exposures and the Use of Derivative Instruments - continued
numerous economic factors, and if the strategies for investment do not work as intended, the Fund may not achieve its objectives.
The Fund's use of derivatives increased or decreased its exposure to the following risk:
Equity Risk | Equity risk relates to the fluctuations in the value of financial instruments as a result of changes in market prices (other than those arising from interest rate risk or foreign exchange risk), whether caused by factors specific to an individual investment, its issuer, or all factors affecting all instruments traded in a market or market segment. |
The Fund is also exposed to additional risks from investing in derivatives, such as liquidity risk and counterparty credit risk. Liquidity risk is the risk that the Fund will be unable to close out the derivative in the open market in a timely manner. Counterparty credit risk is the risk that the counterparty will not be able to fulfill its obligation to the Fund. Counterparty credit risk related to exchange-traded futures contracts may be mitigated by the protection provided by the exchange on which they trade.
Investing in derivatives may involve greater risks than investing in the underlying assets directly and, to varying degrees, may involve risk of loss in excess of any initial investment and collateral received and amounts recognized in the Statement of Assets and Liabilities. In addition, there may be the risk that the change in value of the derivative contract does not correspond to the change in value of the underlying instrument.
Futures Contracts. A futures contract is an agreement between two parties to buy or sell a specified underlying instrument for a fixed price at a specified future date. The Fund used futures contracts to manage its exposure to the stock market.
Upon entering into a futures contract, a fund is required to deposit either cash or securities (initial margin) with a clearing broker in an amount equal to a certain percentage of the face value of the contract. Futures contracts are marked-to-market daily and subsequent daily payments (variation margin) are made or received by a fund depending on the daily fluctuations in the value of the futures contracts and are recorded as unrealized appreciation or (depreciation). This receivable and/or payable, if any, is included in daily variation margin for derivative instruments in the Statement of Assets and Liabilities. Realized gain or (loss) is recorded upon the expiration or closing of a futures contract.
Any open futures contracts at period end are presented in the Schedule of Investments under the caption "Futures Contracts." The underlying face amount at value reflects each contract's exposure to the underlying instrument or index at period end and is representative of volume of activity during the period. Securities deposited to meet initial margin requirements are identified in the Schedule of Investments.
Annual Report
4. Derivative Instruments - continued
Futures Contracts - continued
During the period the Fund recognized net realized gain (loss) of $(75,121) and a change in net unrealized appreciation (depreciation) of $(24,736) related to its investment in futures contracts. These amounts are included in the Statement of Operations.
5. Purchases and Sales of Investments.
Purchases and sales of securities, other than short-term securities, aggregated $69,973,672 and $65,695,686, respectively.
6. Fees and Other Transactions with Affiliates.
Management Fee. Fidelity Management & Research Company (the investment adviser) and its affiliates provide the Fund with investment management related services for which the Fund pays a monthly management fee. The management fee is the sum of an individual fund fee rate that is based on an annual rate of .30% of the Fund's average net assets and an annualized group fee rate that averaged .25% during the period. The group fee rate is based upon the average net assets of all the mutual funds advised by the investment adviser, including any mutual funds previously advised by the investment adviser that are currently advised by Fidelity SelectCo, LLC, an affiliate of the investment adviser. The group fee rate decreases as assets under management increase and increases as assets under management decrease. In addition, the management fee is subject to a performance adjustment (up to a maximum of ± .20% of the Fund's average net assets over a 36 month performance period). The upward or downward adjustment to the management fee is based on the relative investment performance of the Institutional Class of the Fund as compared to its benchmark index, the Russell Midcap Value Index, over the same 36 month performance period. For the reporting period, the total annual management fee rate, including the performance adjustment, was .53% of the Fund's average net assets. The performance adjustment included in the management fee rate may be higher or lower than the maximum performance adjustment rate due to the difference between the average net assets for the reporting and performance periods.
Distribution and Service Plan Fees. In accordance with Rule 12b-1 of the 1940 Act, the Fund has adopted separate Distribution and Service Plans for each class of shares. Certain classes pay Fidelity Distributors Corporation (FDC), an affiliate of the investment adviser, separate Distribution and Service Fees, each of which is based on an annual percentage of each class' average net assets. In addition, FDC may pay financial intermediaries for selling shares of the Fund and providing shareholder support services.
Annual Report
Notes to Financial Statements - continued
6. Fees and Other Transactions with Affiliates - continued
Distribution and Service Plan Fees - continued
For the period, the Distribution and Service Fee rates, total fees and amounts retained by FDC were as follows:
| Distribution | Service | Total Fees | Retained |
Class A | -% | .25% | $ 105,951 | $ 1,752 |
Class T | .25% | .25% | 91,376 | 247 |
Class B | .75% | .25% | 18,043 | 13,716 |
Class C | .75% | .25% | 168,572 | 29,286 |
|
|
| $ 383,942 | $ 45,001 |
Sales Load. FDC may receive a front-end sales charge of up to 5.75% for selling Class A shares and 3.50% for selling Class T shares, some of which is paid to financial intermediaries for selling shares of the Fund. Depending on the holding period, FDC may receive contingent deferred sales charges levied on Class A, Class T, Class B, and Class C redemptions. The deferred sales charges range from 5.00% to 1.00% for Class B shares, 1.00% for Class C shares, 1.00% for certain purchases of Class A shares and .25% for certain purchases of Class T shares.
For the period, sales charge amounts retained by FDC were as follows:
| Retained |
Class A | $ 14,231 |
Class T | 3,718 |
Class B* | 1,208 |
Class C* | 2,114 |
| $ 21,271 |
* When Class B and Class C shares are initially sold, FDC pays commissions from its own resources to financial intermediaries through which the sales are made.
Transfer Agent Fees. Fidelity Investments Institutional Operations Company, Inc., (FIIOC), an affiliate of the investment adviser, is the transfer, dividend disbursing and shareholder servicing agent for each class of the Fund. FIIOC receives account fees and asset-based fees that vary according to the account size and type of account of the shareholders of the respective classes of the Fund. FIIOC pays for typesetting, printing and mailing of shareholder reports, except proxy statements.
Annual Report
6. Fees and Other Transactions with Affiliates - continued
Transfer Agent Fees - continued
For the period, transfer agent fees for each class were as follows:
| Amount | % of |
Class A | $ 96,564 | .23 |
Class T | 46,937 | .26 |
Class B | 5,460 | .30 |
Class C | 43,003 | .25 |
Institutional Class | 12,467 | .17 |
| $ 204,431 |
|
Accounting and Security Lending Fees. Fidelity Service Company, Inc. (FSC), an affiliate of the investment adviser, maintains the Fund's accounting records. The accounting fee is based on the level of average net assets for each month. Under a separate contract, FSC administers the security lending program. The security lending fee is based on the number and duration of lending transactions.
Brokerage Commissions. The Fund placed a portion of its portfolio transactions with brokerage firms which are affiliates of the investment adviser. Brokerage commissions are included in net realized gain (loss) and change in net unrealized appreciation (depreciation) in the Statement of Operations. The commissions paid to these affiliated firms were $1,811 for the period.
Other. During the period, the investment adviser reimbursed the Fund for certain losses in the amount of $3,208.
7. Committed Line of Credit.
The Fund participates with other funds managed by the investment adviser or an affiliate in a $4.25 billion credit facility (the "line of credit") to be utilized for temporary or emergency purposes to fund shareholder redemptions or for other short-term liquidity purposes. The Fund has agreed to pay commitment fees on its pro-rata portion of the line of credit, which amounted to $137 and is reflected in Miscellaneous expenses on the Statement of Operations. During the period, the Fund did not borrow on this line of credit.
8. Security Lending.
The Fund lends portfolio securities through a lending agent from time to time in order to earn additional income. For equity securities, a lending agent is used and may loan securities to certain qualified borrowers, including Fidelity Capital Markets (FCM), a
Annual Report
Notes to Financial Statements - continued
8. Security Lending - continued
broker-dealer affiliated with the Fund. On the settlement date of the loan, the Fund receives collateral (in the form of U.S. Treasury obligations, letters of credit and/or cash) against the loaned securities and maintains collateral in an amount not less than 100% of the market value of the loaned securities during the period of the loan. The market value of the loaned securities is determined at the close of business of the Fund and any additional required collateral is delivered to the Fund on the next business day. If the borrower defaults on its obligation to return the securities loaned because of insolvency or other reasons, the Fund may apply collateral received from the borrower against the obligation. The Fund may experience delays and costs in recovering the securities loaned. Any cash collateral received is invested in the Fidelity Securities Lending Cash Central Fund. The value of loaned securities and cash collateral at period end are disclosed on the Fund's Statement of Assets and Liabilities. At period end, there were no security loans outstanding with FCM. Security lending income represents the income earned on investing cash collateral, less rebates paid to borrowers and any lending agent fees associated with the loan, plus any premium payments received for lending certain types of securities. Security lending income is presented in the Statement of Operations as a component of income from Fidelity Central Funds. Total security lending income during the period amounted to $10,960, including $106 from securities loaned to FCM.
9. Expense Reductions.
The investment adviser voluntarily agreed to reimburse each class to the extent annual operating expenses exceeded certain levels of average net assets as noted in the table below. Some expenses, for example interest expense, including commitment fees, are excluded from this reimbursement.
The following classes were in reimbursement during the period:
| Expense | Reimbursement |
Class A | 1.25% | $ 15,952 |
Class T | 1.50% | 12,616 |
Class B | 2.00% | 2,366 |
Class C | 2.00% | 10,070 |
|
| $ 41,004 |
Commissions paid to certain brokers with whom the investment adviser, or its affiliates, places trades on behalf of the Fund include an amount in addition to trade execution, which may be rebated back to the Fund to offset certain expenses. This amount totaled $3,180 for the period. In addition, through arrangements with the Fund's custodian, credits realized as a result of uninvested cash balances were used to reduce the Fund's expenses. During the period, these credits reduced the Fund's custody expenses by $25.
Annual Report
10. Distributions to Shareholders.
Distributions to shareholders of each class were as follows:
Years ended October 31, | 2014 | 2013 |
From net investment income |
|
|
Class A | $ 83,047 | $ 223,873 |
Class T | - | 71,100 |
Class C | - | 8,906 |
Institutional Class | 29,205 | 41,786 |
Total | $ 112,252 | $ 345,665 |
From net realized gain |
|
|
Class A | $ 89,124 | $ - |
Class T | 39,363 | - |
Institutional Class | 14,438 | - |
Total | $ 142,925 | $ - |
11. Share Transactions.
Share transactions for each class were as follows and may contain automatic conversions between classes or exchanges between funds:
| Shares | Dollars | ||
Years ended October 31, | 2014 | 2013 | 2014 | 2013 |
Class A |
|
|
|
|
Shares sold | 645,072 | 661,325 | $ 13,268,279 | $ 11,066,745 |
Reinvestment of distributions | 8,091 | 14,139 | 155,015 | 202,243 |
Shares redeemed | (554,574) | (619,275) | (11,319,595) | (10,353,339) |
Net increase (decrease) | 98,589 | 56,189 | $ 2,103,699 | $ 915,649 |
Class T |
|
|
|
|
Shares sold | 161,059 | 183,578 | $ 3,267,392 | $ 3,054,837 |
Reinvestment of distributions | 2,020 | 4,868 | 38,408 | 69,164 |
Shares redeemed | (215,769) | (175,709) | (4,328,239) | (2,895,363) |
Net increase (decrease) | (52,690) | 12,737 | $ (1,022,439) | $ 228,638 |
Class B |
|
|
|
|
Shares sold | 2,813 | 16,969 | $ 54,581 | $ 251,841 |
Shares redeemed | (50,387) | (83,730) | (990,350) | (1,299,094) |
Net increase (decrease) | (47,574) | (66,761) | $ (935,769) | $ (1,047,253) |
Class C |
|
|
|
|
Shares sold | 339,964 | 286,749 | $ 6,682,150 | $ 4,683,936 |
Reinvestment of distributions | - | 588 | - | 8,189 |
Shares redeemed | (285,178) | (182,473) | (5,539,053) | (2,936,174) |
Net increase (decrease) | 54,786 | 104,864 | $ 1,143,097 | $ 1,755,951 |
Annual Report
Notes to Financial Statements - continued
11. Share Transactions - continued
| Shares | Dollars | ||
Years ended October 31, | 2014 | 2013 | 2014 | 2013 |
Institutional Class |
|
|
|
|
Shares sold | 305,064 | 121,561 | $ 6,333,952 | $ 2,027,800 |
Reinvestment of distributions | 1,763 | 2,173 | 34,039 | 31,289 |
Shares redeemed | (181,045) | (75,216) | (3,727,393) | (1,227,013) |
Net increase (decrease) | 125,782 | 48,518 | $ 2,640,598 | $ 832,076 |
12. Other.
The Fund's organizational documents provide former and current trustees and officers with a limited indemnification against liabilities arising in connection with the performance of their duties to the Fund. In the normal course of business, the Fund may also enter into contracts that provide general indemnifications. The Fund's maximum exposure under these arrangements is unknown as this would be dependent on future claims that may be made against the Fund. The risk of material loss from such claims is considered remote.
Annual Report
Report of Independent Registered Public Accounting Firm
To the Trustees of Fidelity Advisor Series I and Shareholders of Fidelity Advisor Value Fund:
We have audited the accompanying statement of assets and liabilities of Fidelity Advisor Value Fund (the Fund), a fund of Fidelity Advisor Series I, including the schedule of investments, as of October 31, 2014, and the related statement of operations for the year then ended, the statement of changes in net assets for each of the two years in the period then ended, and the financial highlights for each of the five years in the period then ended. These financial statements and financial highlights are the responsibility of the Fund's management. Our responsibility is to express an opinion on these financial statements and financial highlights based on our audits.
We conducted our audits in accordance with the standards of the Public Company Accounting Oversight Board (United States). Those standards require that we plan and perform the audit to obtain reasonable assurance about whether the financial statements and financial highlights are free of material misstatement. The Fund is not required to have, nor were we engaged to perform, an audit of its internal control over financial reporting. Our audits included consideration of internal control over financial reporting as a basis for designing audit procedures that are appropriate in the circumstances, but not for the purpose of expressing an opinion on the effectiveness of the Fund's internal control over financial reporting. Accordingly, we express no such opinion. An audit also includes examining, on a test basis, evidence supporting the amounts and disclosures in the financial statements, assessing the accounting principles used and significant estimates made by management, as well as evaluating the overall financial statement presentation. Our procedures included confirmation of securities owned as of October 31, 2014, by correspondence with the custodians and brokers; where replies were not received from brokers, we performed other auditing procedures. We believe that our audits provide a reasonable basis for our opinion.
In our opinion, the financial statements and financial highlights referred to above present fairly, in all material respects, the financial position of Fidelity Advisor Value Fund as of October 31, 2014, the results of its operations for the year then ended, the changes in its net assets for each of the two years in the period then ended, and the financial highlights for each of the five years in the period then ended, in conformity with accounting principles generally accepted in the United States of America.
DELOITTE & TOUCHE LLP
Boston, Massachusetts
December 16, 2014
Annual Report
Trustees and Officers
The Trustees, Member of the Advisory Board, and officers of the trust and fund, as applicable, are listed below. The Board of Trustees governs the fund and is responsible for protecting the interests of shareholders. The Trustees are experienced executives who meet periodically throughout the year to oversee the fund's activities, review contractual arrangements with companies that provide services to the fund, oversee management of the risks associated with such activities and contractual arrangements, and review the fund's performance. Except for James C. Curvey, each of the Trustees oversees 174 funds. Mr. Curvey oversees 407 funds.
The Trustees hold office without limit in time except that (a) any Trustee may resign; (b) any Trustee may be removed by written instrument, signed by at least two-thirds of the number of Trustees prior to such removal; (c) any Trustee who requests to be retired or who has become incapacitated by illness or injury may be retired by written instrument signed by a majority of the other Trustees; and (d) any Trustee may be removed at any special meeting of shareholders by a two-thirds vote of the outstanding voting securities of the trust. Each Trustee who is not an interested person (as defined in the 1940 Act) of the trust and the fund (Independent Trustee), shall retire not later than the last day of the calendar year in which his or her 75th birthday occurs. The Independent Trustees may waive this mandatory retirement age policy with respect to individual Trustees. The officers and Advisory Board Member hold office without limit in time, except that any officer and Advisory Board Member may resign or may be removed by a vote of a majority of the Trustees at any regular meeting or any special meeting of the Trustees. Except as indicated, each individual has held the office shown or other offices in the same company for the past five years.
Experience, Skills, Attributes, and Qualifications of the Fund's Trustees. The Governance and Nominating Committee has adopted a statement of policy that describes the experience, qualifications, attributes, and skills that are necessary and desirable for potential Independent Trustee candidates (Statement of Policy). The Board believes that each Trustee satisfied at the time he or she was initially elected or appointed a Trustee, and continues to satisfy, the standards contemplated by the Statement of Policy. The Governance and Nominating Committee also engages professional search firms to help identify potential Independent Trustee candidates who have the experience, qualifications, attributes, and skills consistent with the Statement of Policy. From time to time, additional criteria based on the composition and skills of the current Independent Trustees, as well as experience or skills that may be appropriate in light of future changes to board composition, business conditions, and regulatory or other developments, have also been considered by the professional search firms and the Governance and Nominating Committee. In addition, the Board takes into account the Trustees' commitment and participation in Board and committee meetings, as well as their leadership of standing and ad hoc committees throughout their tenure.
In determining that a particular Trustee was and continues to be qualified to serve as a Trustee, the Board has considered a variety of criteria, none of which, in isolation, was controlling. The Board believes that, collectively, the Trustees have balanced and diverse experience, qualifications, attributes, and skills, which allow the Board to operate effectively in governing the fund and protecting the interests of shareholders. Information about the specific experience, skills, attributes, and qualifications of each Trustee, which in each case led to the Board's conclusion that the Trustee should serve (or continue to serve) as a trustee of the fund, is provided below.
Annual Report
Trustees and Officers - continued
Board Structure and Oversight Function. James C. Curvey is an interested person (as defined in the 1940 Act) and currently serves as Chairman. The Trustees have determined that an interested Chairman is appropriate and benefits shareholders because an interested Chairman has a personal and professional stake in the quality and continuity of services provided to the fund. Independent Trustees exercise their informed business judgment to appoint an individual of their choosing to serve as Chairman, regardless of whether the Trustee happens to be independent or a member of management. The Independent Trustees have determined that they can act independently and effectively without having an Independent Trustee serve as Chairman and that a key structural component for assuring that they are in a position to do so is for the Independent Trustees to constitute a substantial majority for the Board. The Independent Trustees also regularly meet in executive session. Ned C. Lautenbach serves as Chairman of the Independent Trustees and as such (i) acts as a liaison between the Independent Trustees and management with respect to matters important to the Independent Trustees and (ii) with management prepares agendas for Board meetings.
Fidelity funds are overseen by different Boards of Trustees. The fund's Board oversees Fidelity's equity and high income funds and another Board oversees Fidelity's investment-grade bond, money market, and asset allocation funds. The asset allocation funds may invest in Fidelity funds overseen by the fund's Board. The use of separate Boards, each with its own committee structure, allows the Trustees of each group of Fidelity funds to focus on the unique issues of the funds they oversee, including common research, investment, and operational issues. On occasion, the separate Boards establish joint committees to address issues of overlapping consequences for the Fidelity funds overseen by each Board.
The Trustees operate using a system of committees to facilitate the timely and efficient consideration of all matters of importance to the Trustees, the fund, and fund shareholders and to facilitate compliance with legal and regulatory requirements and oversight of the fund's activities and associated risks. The Board, acting through its committees, has charged FMR and its affiliates with (i) identifying events or circumstances the occurrence of which could have demonstrably adverse effects on the fund's business and/or reputation; (ii) implementing processes and controls to lessen the possibility that such events or circumstances occur or to mitigate the effects of such events or circumstances if they do occur; and (iii) creating and maintaining a system designed to evaluate continuously business and market conditions in order to facilitate the identification and implementation processes described in (i) and (ii) above. Because the day-to-day operations and activities of the fund are carried out by or through FMR, its affiliates and other service providers, the fund's exposure to risks is mitigated but not eliminated by the processes overseen by the Trustees. While each of the Board's committees has responsibility for overseeing different aspects of the fund's activities, oversight is exercised primarily through the Operations, Audit, and Compliance Committees. In addition, the Independent Trustees have worked with FMR to enhance the Board's oversight of investment and financial risks, legal and regulatory risks, technology risks, and operational risks, including the development of additional risk reporting to the Board. For example, a working group comprised of Independent Trustees and FMR has worked and continues to work to review the Fidelity funds' valuation-related activities, reporting and risk management. Appropriate personnel, including but not limited to the fund's Chief Compliance Officer (CCO), FMR's internal auditor, the independent accountants, the fund's Treasurer and portfolio management personnel, make periodic reports to the Board's committees, as appropriate, including an annual review of FMR's risk management program for the Fidelity funds. The responsibilities of each standing committee, including their oversight responsibilities, are described further under "Standing Committees of the Fund's Trustees."
Annual Report
The fund's Statement of Additional Information (SAI) includes more information about the Trustees. To request a free copy, call Fidelity at 1-877-208-0098.
Interested Trustees*:
Correspondence intended for each Trustee who is an interested person may be sent to Fidelity Investments, 245 Summer Street, Boston, Massachusetts 02210.
Name, Year of Birth; Principal Occupations and Other Relevant Experience+ | |
James C. Curvey (1935) | |
Year of Election or Appointment: 2007 Trustee Chairman of the Board of Trustees | |
| Mr. Curvey also serves as Trustee of other Fidelity funds. Mr. Curvey is a Director of Fidelity Research & Analysis Co. (2009-present), and Vice Chairman (2007-present) and Director of FMR LLC. In addition, Mr. Curvey serves as an Overseer for the Boston Symphony Orchestra and a member of the board of Artis-Naples, Naples, Florida, and as a Trustee for Brewster Academy, Wolfeboro, New Hampshire. Previously, Mr. Curvey served as a Director of Fidelity Investments Money Management, Inc. (2009-2014), a Director of FMR (2007-2014), and a Director of FMR Co., Inc. (2007-2014). |
Charles S. Morrison (1960) | |
Year of Election or Appointment: 2014 Trustee | |
| Mr. Morrison also serves as Trustee of other funds. He serves as a Director of Fidelity Investments Money Management, Inc. (FIMM) (2014-present), Director of Fidelity SelectCo, LLC (2014-present), President, Asset Management (2014-present), and is an employee of Fidelity Investments. Previously, Mr. Morrison served as Vice President of Fidelity's Fixed Income and Asset Allocation Funds (2012-2014), President, Fixed Income (2011-2014), Vice President of Fidelity's Money Market Funds (2005-2009), President, Money Market Group Leader of FMR (2009), and Senior Vice President, Money Market Group of FMR (2004-2009). Mr. Morrison also served as Vice President of Fidelity's Bond Funds (2002-2005), certain Balanced Funds (2002-2005), and certain Asset Allocation Funds (2002-2007), and as Senior Vice President (2002-2005) of Fidelity's Bond Division. |
* Trustees have been determined to be "Interested Trustees" by virtue of, among other things, their affiliation with the trust or various entities under common control with FMR.
+ The information above includes each Trustee's principal occupation during the last five years and other information relating to the experience, attributes, and skills relevant to each Trustee's qualifications to serve as a Trustee, which led to the conclusion that each Trustee should serve as a Trustee for the fund.
Annual Report
Independent Trustees:
Correspondence intended for each Independent Trustee (that is, the Trustees other than the Interested Trustees) may be sent to Fidelity Investments, P.O. Box 55235, Boston, Massachusetts 02205-5235.
Name, Year of Birth; Principal Occupations and Other Relevant Experience+ | |
Dennis J. Dirks (1948) | |
Year of Election or Appointment: 2005 Trustee | |
| Mr. Dirks also serves as Trustee of other Fidelity funds. Prior to his retirement in May 2003, Mr. Dirks was Chief Operating Officer and a member of the Board of The Depository Trust & Clearing Corporation (DTCC). He also served as President, Chief Operating Officer, and Board member of The Depository Trust Company (DTC) and President and Board member of the National Securities Clearing Corporation (NSCC). In addition, Mr. Dirks served as Chief Executive Officer and Board member of the Government Securities Clearing Corporation, Chief Executive Officer and Board member of the Mortgage-Backed Securities Clearing Corporation, as a Trustee and a member of the Finance Committee of Manhattan College (2005-2008), and as a Trustee and a member of the Finance Committee of AHRC of Nassau County (2006-2008). Mr. Dirks is a member of the Independent Directors Council (IDC) Governing Council (2010-present) and Board of Directors for The Brookville Center for Children's Services, Inc. (2009-present). |
Alan J. Lacy (1953) | |
Year of Election or Appointment: 2008 Trustee | |
| Mr. Lacy also serves as Trustee of other Fidelity funds. Mr. Lacy serves as Senior Adviser (2007-present) of Oak Hill Capital Partners, L.P. (private equity). Mr. Lacy also served as Chief Executive Officer (2000-2005) and Vice Chairman (2005-2006) of Sears Holdings Corporation and Sears, Roebuck and Co. (retail). In addition, Mr. Lacy serves as a member of the Board of Directors of Dave & Buster's Entertainment, Inc. (restaurant and entertainment complexes, 2010-present), Earth Fare, Inc. (retail grocery, 2012-present), The Hillman Companies, Inc. (hardware wholesalers, 2010-present), and Bristol-Myers Squibb Company (global pharmaceuticals, 2008-present). Mr. Lacy is a member of the Board of Trustees of The National Parks Conservation Association (2006-present). Previously, Mr. Lacy served as Chairman of the Board of Trustees of the National Parks Conservation Association (2008-2011) and as a member of the Board of Directors for the Western Union Company (global money transfer, 2006-2011). |
Ned C. Lautenbach (1944) | |
Year of Election or Appointment: 2000 Trustee Chairman of the Independent Trustees | |
| Mr. Lautenbach also serves as Trustee of other Fidelity funds. Mr. Lautenbach currently serves as the Lead Director of the Eaton Corporation Board of Directors (diversified industrial, 1997-present). Mr. Lautenbach is Chairman of the Board of Directors of the Philharmonic Center for the Arts in Naples, Florida (2012-present) and a member of the Council on Foreign Relations (1994-present). Previously, Mr. Lautenbach was a Partner/Advisory Partner at Clayton, Dubilier & Rice, LLC (private equity investment, 1998-2010), as well as a Director of Sony Corporation (2006-2007). |
Joseph Mauriello (1944) | |
Year of Election or Appointment: 2008 Trustee | |
| Mr. Mauriello also serves as Trustee of other Fidelity funds. Prior to his retirement in January 2006, Mr. Mauriello served in numerous senior management positions including Deputy Chairman and Chief Operating Officer (2004-2005), and Vice Chairman of Financial Services (2002-2004) of KPMG LLP US (professional services, 1965-2005). Mr. Mauriello currently serves as a member of the Board of Directors of XL Group plc. (global insurance and re-insurance, 2006-present). Previously, Mr. Mauriello served as a Director of the Hamilton Funds of the Bank of New York (2006-2007) and of Arcadia Resources Inc. (health care services and products, 2007-2012). |
Robert W. Selander (1950) | |
Year of Election or Appointment: 2011 Trustee | |
| Mr. Selander also serves as Trustee of other Fidelity funds. Previously, Mr. Selander served as a Member of the Advisory Board of other Fidelity funds (2011), and Executive Vice Chairman (2010), Chief Executive Officer (2009-2010), and President and Chief Executive Officer (1997-2009) of Mastercard, Inc. |
Cornelia M. Small (1944) | |
Year of Election or Appointment: 2005 Trustee | |
| Ms. Small also serves as Trustee of other Fidelity funds. Ms. Small is a member of the Board of Directors (2009-present) and Chair of the Investment Committee (2010-present) of the Teagle Foundation. Ms. Small also serves on the Investment Committee of the Berkshire Taconic Community Foundation (2008-present). Previously, Ms. Small served as Chairperson (2002-2008) and a member of the Investment Committee and Chairperson (2008-2012) and a member of the Board of Trustees of Smith College. In addition, Ms. Small served as Chief Investment Officer, Director of Global Equity Investments, and a member of the Board of Directors of Scudder, Stevens & Clark and Scudder Kemper Investments. |
William S. Stavropoulos (1939) | |
Year of Election or Appointment: 2002 Trustee Vice Chairman of the Independent Trustees | |
| Mr. Stavropoulos also serves as Trustee of other Fidelity funds. Mr. Stavropoulos serves as President and Founder of the Michigan Baseball Foundation, the Great Lakes Loons (2007-present). Mr. Stavropoulos is Chairman Emeritus of the Board of Directors of The Dow Chemical Company, where he previously served in numerous senior management positions, including President, CEO (1995-2000; 2002-2004), Chairman of the Executive Committee (2000-2006), and as a member of the Board of Directors (1990-2006). Currently, Mr. Stavropoulos is Chairman of the Board of Directors of Univar Inc. (global distributor of commodity and specialty chemicals), a Director of Teradata Corporation (data warehousing and technology solutions), and Maersk Inc. (industrial conglomerate), and a member of the Advisory Board for Metalmark Capital LLC (private equity investment, 2005-present). Mr. Stavropoulos is an operating advisor to Clayton, Dubilier & Rice, LLC (private equity investment). In addition, Mr. Stavropoulos is a member of the University of Notre Dame Advisory Council for the College of Science, a Trustee of the Rollin L. Gerstacker Foundation, and a Director of the Naples Philharmonic Center for the Arts. Previously, Mr. Stavropoulos served as a Director of Chemical Financial Corporation (bank holding company, 1993-2012) and Tyco International, Ltd. (multinational manufacturing and services, 2007-2012). |
David M. Thomas (1949) | |
Year of Election or Appointment: 2008 Trustee | |
| Mr. Thomas also serves as Trustee of other Fidelity funds. Mr. Thomas serves as Non-Executive Chairman of the Board of Directors of Fortune Brands Home and Security (home and security products, 2011-present), and as a member of the Board of Directors of Interpublic Group of Companies, Inc. (marketing communication, 2004-present). Previously, Mr. Thomas served as Executive Chairman (2005-2006) and Chairman and Chief Executive Officer (2000-2005) of IMS Health, Inc. (pharmaceutical and healthcare information solutions), and a Director of Fortune Brands, Inc. (consumer products, 2000-2011). |
+ The information above includes each Trustee's principal occupation during the last five years and other information relating to the experience, attributes, and skills relevant to each Trustee's qualifications to serve as a Trustee, which led to the conclusion that each Trustee should serve as a Trustee for the fund.
Advisory Board Member and Officers:
Correspondence intended for each officer and Peter S. Lynch may be sent to Fidelity Investments, 245 Summer Street, Boston, Massachusetts 02210. Officers appear below in alphabetical order.
Name, Year of Birth; Principal Occupation | |
Peter S. Lynch (1944) | |
Year of Election or Appointment: 2003 Member of the Advisory Board | |
| Mr. Lynch also serves as Member of the Advisory Board of other Fidelity funds. Mr. Lynch is Vice Chairman and a Director of FMR and FMR Co., Inc. In addition, Mr. Lynch serves as a Trustee of Boston College and as the Chairman of the Inner-City Scholarship Fund. Previously, Mr. Lynch served on the Special Olympics International Board of Directors (1997-2006). |
Elizabeth Paige Baumann (1968) | |
Year of Election or Appointment: 2012 Anti-Money Laundering (AML) Officer | |
| Ms. Baumann also serves as AML Officer of other funds. She is Chief AML Officer of FMR LLC (2012-present) and is an employee of Fidelity Investments. Previously, Ms. Baumann served as Vice President and Deputy Anti-Money Laundering Officer (2007-2012). |
William C. Coffey (1969) | |
Year of Election or Appointment: 2009 Assistant Secretary | |
| Mr. Coffey also serves as Assistant Secretary of other funds. He is Senior Vice President and Deputy General Counsel of FMR LLC (2010-present), and is an employee of Fidelity Investments. Previously, Mr. Coffey served as Vice President and Associate General Counsel of FMR LLC (2005-2009). |
Jonathan Davis (1968) | |
Year of Election or Appointment: 2010 Assistant Treasurer | |
| Mr. Davis also serves as Assistant Treasurer of other funds. Mr. Davis is an employee of Fidelity Investments. Previously, Mr. Davis served as Vice President and Associate General Counsel of FMR LLC (2003-2010). |
Adrien E. Deberghes (1967) | |
Year of Election or Appointment: 2008 Deputy Treasurer | |
| Mr. Deberghes also serves as an officer of other funds. He is an employee of Fidelity Investments (2008-present). Prior to joining Fidelity Investments, Mr. Deberghes was Senior Vice President of Mutual Fund Administration at State Street Corporation (2007-2008), Senior Director of Mutual Fund Administration at Investors Bank & Trust (2005-2007), and Director of Finance for Dunkin' Brands (2000-2005). |
Stephanie J. Dorsey (1969) | |
Year of Election or Appointment: 2010 Assistant Treasurer | |
| Ms. Dorsey also serves as an officer of other funds. She is an employee of Fidelity Investments (2008-present) and has served in other fund officer roles. Prior to joining Fidelity Investments, Ms. Dorsey served as Treasurer (2004-2008) of the JPMorgan Mutual Funds and Vice President (2004-2008) of JPMorgan Chase Bank. |
Howard J. Galligan III (1966) | |
Year of Election or Appointment: 2014 Chief Financial Officer | |
| Mr. Galligan also serves as Chief Financial Officer of other funds. Mr. Galligan serves as President of Fidelity Pricing and Cash Management Services (FPCMS) (2014-present) and as a Director of Strategic Advisers, Inc. (2008-present). Previously, Mr. Galligan served as Chief Administrative Officer of Asset Management (2011-2014) and Chief Operating Officer and Senior Vice President of Investment Support for Strategic Advisers, Inc. (2003-2011). |
Scott C. Goebel (1968) | |
Year of Election or Appointment: 2008 Secretary and Chief Legal Officer (CLO) | |
| Mr. Goebel serves as Secretary and CLO of other funds. Mr. Goebel also serves as Secretary of Fidelity SelectCo, LLC (2013-present), Fidelity Investments Money Management, Inc. (FIMM) (2010-present) and Fidelity Research and Analysis Company (FRAC) (2010-present); General Counsel, Secretary, and Senior Vice President of FMR (2008-present) and FMR Co., Inc. (2008-present); Chief Legal Officer of Fidelity Management & Research (Hong Kong) Limited (2008-present); and Assistant Secretary of Fidelity Management & Research (Japan) Limited (2008-present) and Fidelity Management & Research (U.K.) Inc. (2008-present). Previously, Mr. Goebel served as Secretary and CLO of other Fidelity funds (2008-2013), Assistant Secretary of FIMM (2008-2010), FRAC (2008-2010), and certain funds (2007-2008); and as Vice President and Secretary of Fidelity Distributors Corporation (FDC) (2005-2007). Mr. Goebel has been employed by FMR LLC or an affiliate since 2001. |
Thomas C. Hense (1964) | |
Year of Election or Appointment: 2008/2010 Vice President | |
| Mr. Hense also serves as Vice President of other funds (High Income (2008), Small Cap (2008), and Value (2010) funds). Previously, Mr. Hense served as a portfolio manager for Fidelity's Institutional Money Management Group (Pyramis) (2003-2008). |
Brian B. Hogan (1964) | |
Year of Election or Appointment: 2009 Vice President | |
| Mr. Hogan also serves as Trustee or Vice President of other funds. Mr. Hogan serves as a Director of Fidelity SelectCo, LLC (2014-present) and President of FMR's Equity Division (2009-present). Previously, Mr. Hogan served as Senior Vice President, Equity Research of FMR (2006-2009) and as a portfolio manager. |
Chris Maher (1972) | |
Year of Election or Appointment: 2013 Assistant Treasurer | |
| Mr. Maher serves as Assistant Treasurer of other funds. Mr. Maher is Vice President of Valuation Oversight and is an employee of Fidelity Investments. Previously, Mr. Maher served as Vice President of Asset Management Compliance (2013), Vice President of FMR's Program Management Group (2010-2013), and Vice President of Valuation Oversight (2008-2010). |
Kenneth B. Robins (1969) | |
Year of Election or Appointment: 2008 President and Treasurer | |
| Mr. Robins also serves as an officer of other funds. Mr. Robins serves as Executive Vice President of Fidelity Investments Money Management, Inc. (FIMM) (2013-present) and is an employee of Fidelity Investments (2004-present). Previously, Mr. Robins served in other fund officer roles. |
Stephen Sadoski (1971) | |
Year of Election or Appointment: 2012 Deputy Treasurer | |
| Mr. Sadoski also serves as Deputy Treasurer of other funds. He is an employee of Fidelity Investments (2012-present) and has served in another fund officer role. Prior to joining Fidelity Investments, Mr. Sadoski served as an assistant chief accountant in the Division of Investment Management of the Securities and Exchange Commission (SEC) (2009-2012) and as a senior manager at Deloitte & Touche LLP (1997-2009). |
Stacie M. Smith (1974) | |
Year of Election or Appointment: 2013 Deputy Treasurer | |
| Ms. Smith also serves as an officer of other funds. She is an employee of Fidelity Investments (2009-present) and has served in other fund officer roles. Prior to joining Fidelity Investments, Ms. Smith served as Senior Audit Manager of Ernst & Young LLP (1996-2009). |
Renee Stagnone (1975) | |
Year of Election or Appointment: 2013 Deputy Treasurer | |
| Ms. Stagnone also serves as Deputy Treasurer of other funds. Ms. Stagnone is an employee of Fidelity Investments. |
Linda J. Wondrack (1964) | |
Year of Election or Appointment: 2014 Chief Compliance Officer | |
| Ms. Wondrack also serves as Chief Compliance Officer of other funds. Ms. Wondrack is Executive Vice President and head of the Ethics Office and Asset Management Compliance for Fidelity Investments (2012-present). Ms. Wondrack also serves as Chief Compliance Officer of Fidelity SelectCo, LLC (2014-present); Chief Compliance Officer of Impresa Management LLC (2013-present); and Chief Compliance Officer of FMR Co., Inc., Fidelity Investments Money Management, Inc., Fidelity Management & Research (Japan) Limited, Fidelity Management & Research (U.K.) Inc., Fidelity Management & Research (Hong Kong), Fidelity Management & Research Company, Pyramis Global Advisors, LLC, and Strategic Advisers, Inc., Ballyrock Investment Advisors LLC, and Northern Neck Investors LLC (2012-present). Previously, Ms. Wondrack served as Senior Vice President and Chief Compliance Officer for Columbia Management Investment Advisers, LLC (2005-2012); Chief Compliance Officer for certain funds within the Columbia Family of Funds (2007-2012); and Senior Vice President of Compliance Risk Management at Bank of America (2005-2010). |
Joseph F. Zambello (1957) | |
Year of Election or Appointment: 2011 Deputy Treasurer | |
| Mr. Zambello also serves as Deputy Treasurer of other funds. Mr. Zambello is an employee of Fidelity Investments. Previously, Mr. Zambello served as Vice President of FMR's Program Management Group (2009-2011) and Vice President of the Transfer Agent Oversight Group (2005-2009). |
Annual Report
Distributions (Unaudited)
The Board of Trustees of Advisor Value Fund voted to pay to shareholders of record at the opening of business on record date, the following distributions per share derived from capital gains realized from sales of portfolio securities, and dividends derived from net investment income:
| Pay Date | Record Date | Dividends | Capital Gains |
Institutional Class | 12/08/14 | 12/05/14 | $0.112 | $0.011 |
Institutional Class designates 100% of the dividends distributed during the fiscal year as qualifying for the dividends-received deduction for corporate shareholders.
Institutional Class designates 100% of the dividends distributed during the fiscal year as amounts which may be taken into account as a dividend for the purposes of the maximum rate under section 1(h)(11) of the Internal Revenue Code.
The fund will notify shareholders in January 2015 of amounts for use in preparing 2014 income tax returns.
Annual Report
Board Approval of Investment Advisory Contracts and Management Fees
Fidelity Advisor Value Fund
Each year, the Board of Trustees, including the Independent Trustees (together, the Board), votes on the renewal of the management contract with Fidelity Management & Research Company (FMR) and the sub-advisory agreements (together, the Advisory Contracts) for the fund. The Board, assisted by the advice of fund counsel and Independent Trustees' counsel, requests and considers a broad range of information relevant to the renewal of the Advisory Contracts throughout the year.
The Board meets regularly and, at each of its meetings, covers an extensive agenda of topics and materials and considers factors that are relevant to its annual consideration of the renewal of the fund's Advisory Contracts, including the services and support provided to the fund and its shareholders. The Board has established various standing committees (Committees), each composed of and chaired by Independent Trustees with varying backgrounds, to which the Board has assigned specific subject matter responsibilities in order to enhance effective decision-making by the Board. The Board, acting directly and through its Committees, requests and receives information concerning the annual consideration of the renewal of the fund's Advisory Contracts. The Board also meets as needed to consider matters specifically related to the Board's annual consideration of the renewal of the Advisory Contracts. Members of the Board may also meet with trustees of other Fidelity funds through ad hoc joint committees to discuss certain matters relevant to the Fidelity funds.
At its July 2014 meeting, the Board, including the Independent Trustees, unanimously determined to renew the fund's Advisory Contracts. In reaching its determination, the Board considered all factors it believed relevant, including (i) the nature, extent, and quality of the services to be provided to the fund and its shareholders (including the investment performance of the fund); (ii) the competitiveness of the fund's management fee and total expense ratio relative to peer funds; (iii) the total costs of the services to be provided by and the profits to be realized by Fidelity from its relationship with the fund; (iv) the extent to which economies of scale exist and would be realized as the fund grows; and (v) whether fee levels reflect these economies of scale, if any, for the benefit of fund shareholders. In connection with separate internal corporate reorganizations involving Fidelity Management & Research (U.K.) Inc. (FMR U.K.) and Fidelity Management & Research (Japan) Inc. (FMR Japan), the Board approved certain non-material amendments to the fund's sub-advisory agreements with FMR U.K. and FMR Japan to reflect that, after these reorganizations, FMR Investment Management (UK) Limited and Fidelity Management & Research (Japan) Limited will carry on the business of FMR U.K. and FMR Japan, respectively. The Board noted that no changes to the portfolio managers or to the foreign research or investment advisory services provided to the fund were expected in connection with either reorganization and that the same personnel and resources would continue to be available to the fund at the new entities.
Annual Report
Board Approval of Investment Advisory Contracts and
Management Fees - continued
In considering whether to renew the Advisory Contracts for the fund, the Board reached a determination, with the assistance of fund counsel and Independent Trustees' counsel and through the exercise of its business judgment, that the renewal of the Advisory Contracts was in the best interests of the fund and its shareholders and that the compensation payable under the Advisory Contracts was fair and reasonable. The Board's decision to renew the Advisory Contracts was not based on any single factor, but rather was based on a comprehensive consideration of all the information provided to the Board at its meetings throughout the year. The Board, in reaching its determination to renew the Advisory Contracts, was aware that shareholders of the fund have a broad range of investment choices available to them, including a wide choice among funds offered by Fidelity's competitors, and that the fund's shareholders, who have the opportunity to review and weigh the disclosure provided by the fund in its prospectus and other public disclosures, have chosen to invest in this fund, which is part of the Fidelity family of funds.
Nature, Extent, and Quality of Services Provided. The Board considered Fidelity's staffing as it relates to the fund, including the backgrounds of investment personnel of FMR and the sub-advisers (together, the Investment Advisers), and also considered the fund's investment objective, strategies, and related investment philosophy. The Independent Trustees also had discussions with senior management of Fidelity's investment operations and investment groups. The Board considered the structure of the portfolio manager compensation program and whether this structure provides appropriate incentives to act in the best interests of the fund. Additionally, the Board considered the portfolio managers' investments, if any, in the funds that they manage.
Resources Dedicated to Investment Management and Support Services. The Board and the Fund Oversight and Research Committees reviewed the general qualifications and capabilities of Fidelity's investment staff, including its size, education, experience, and resources, as well as Fidelity's approach to recruiting, training, managing, and compensating investment personnel. The Board noted that Fidelity has continued to increase the resources devoted to non-U.S. offices, including expansion of Fidelity's global investment organization. The Board also noted that Fidelity's analysts have extensive resources, tools and capabilities that allow them to conduct sophisticated quantitative and fundamental analysis, as well as credit analysis of issuers, counterparties and guarantors. Further, the Board believes that Fidelity's investment professionals have sufficient access to global information and data so as to provide competitive investment results over time, and that those professionals also have access to sophisticated tools that permit them to assess portfolio construction and risk and performance attribution characteristics continuously, as well as to transmit new information and research conclusions rapidly around the world. Additionally, in its deliberations, the Board considered Fidelity's trading and risk management capabilities and resources and global compliance infrastructure, which are an integral part of the investment management process.
Annual Report
Shareholder and Administrative Services. The Board considered (i) the nature, extent, quality, and cost of advisory, administrative, and shareholder services performed by the Investment Advisers and their affiliates under the Advisory Contracts and under separate agreements covering transfer agency, pricing and bookkeeping, and securities lending services for the fund; (ii) the nature and extent of the supervision of third party service providers, principally custodians and subcustodians; and (iii) the resources devoted to, and the record of compliance with, the fund's compliance policies and procedures. The Board also reviewed the allocation of fund brokerage, including allocations to brokers affiliated with the Investment Advisers, the use of brokerage commissions to pay fund expenses, and the use of "soft" commission dollars to pay for research services.
The Board noted that the growth of fund assets over time across the complex allows Fidelity to reinvest in the development of services designed to enhance the value or convenience of the Fidelity funds as investment vehicles. These services include 24-hour access to account information and market information through telephone representatives and over the Internet, investor education materials and asset allocation tools, and the expanded availability of Fidelity Investor Centers.
In 2014, the Board formed an ad hoc Committee on Transfer Agency Fees to review the variety of transfer agency fee structures throughout the industry and Fidelity's competitive positioning with respect to industry participants.
Investment in a Large Fund Family. The Board considered the benefits to shareholders of investing in a Fidelity fund, including the benefits of investing in a fund that is part of a large family of funds offering a variety of investment disciplines and providing a large variety of mutual fund investor services. The Board noted that Fidelity had taken, or had made recommendations that resulted in the Fidelity funds taking, a number of actions over the previous year that benefited particular funds, including (i) continuing to dedicate additional resources to investment research and to the support of the senior management team that oversees asset management; (ii) persisting in efforts to enhance Fidelity's global research capabilities; (iii) launching new funds and making other enhancements to meet client needs for income-oriented solutions; (iv) reducing fund expenses for certain index funds; (v) continuing to launch dedicated lower cost underlying funds to meet portfolio construction needs related to expanding underlying fund options for Fidelity funds of funds, specifically for the Freedom Fund product lines; (vi) rationalizing product lines and gaining increased efficiencies through fund mergers; (vii) launching sector-based exchange-traded funds and establishing a new Fidelity adviser to manage sector-based funds and products; (viii) continuing to develop and implement technology to improve security and increase efficiency; (ix) modifying the eligibility criteria for certain share classes to increase their marketability to a portion of the defined contribution plan market; (x) waiving redemption fees for certain qualified fund-of-fund and wrap programs and certain retirement plan transactions; and (xi) launching new Institutional Class shares of certain money market funds to attract and retain assets and to fill a gap in the money market fund lineup.
Annual Report
Board Approval of Investment Advisory Contracts and
Management Fees - continued
Investment Performance. The Board considered whether the fund has operated in accordance with its investment objective, as well as its record of compliance with its investment restrictions and its performance history. The Board noted that there was a portfolio management change for a sleeve of the fund in January 2014.
The Board took into account discussions with the Investment Advisers about fund investment performance that occur at Board meetings throughout the year. In this regard the Board noted that as part of regularly scheduled fund reviews and other reports to the Board on fund performance, the Board periodically considers annualized return information for the fund, for different time periods, measured against a securities market index ("benchmark index") and a peer group of funds with similar objectives ("peer group"). In its evaluation of fund investment performance, the Board gave particular attention to information indicating changes in performance of certain Fidelity funds for specific time periods and the Investment Advisers' explanations for any overperformance or underperformance.
In addition to reviewing absolute and relative fund performance, the Independent Trustees periodically consider the appropriateness of fund performance metrics in evaluating the results achieved. In general, the Independent Trustees believe that fund performance should be evaluated based on net performance (after fees and expenses) of both the highest performing and lowest performing classes, where applicable, compared to appropriate benchmark indices, over appropriate time periods which may include full market cycles, and compared to peer groups, as applicable, over the same periods, taking into account relevant factors including the following: general market conditions; issuer-specific information; tactical opportunities for investment; and fund cash flows and other factors.
The Independent Trustees recognize that shareholders evaluate performance on a net basis over their own holding periods, for which one-, three-, and five-year periods are often used as a proxy. For this reason, the performance information reviewed by the Board also included net cumulative calendar year total return information for the fund and an appropriate benchmark index and peer group for the most recent one-, three-, and five-year periods, as shown below. Returns are shown compared to the 25th percentile (top of box, 75% beaten) and 75th percentile (bottom of box, 25% beaten) of the peer universe.
Annual Report
Fidelity Advisor Value Fund
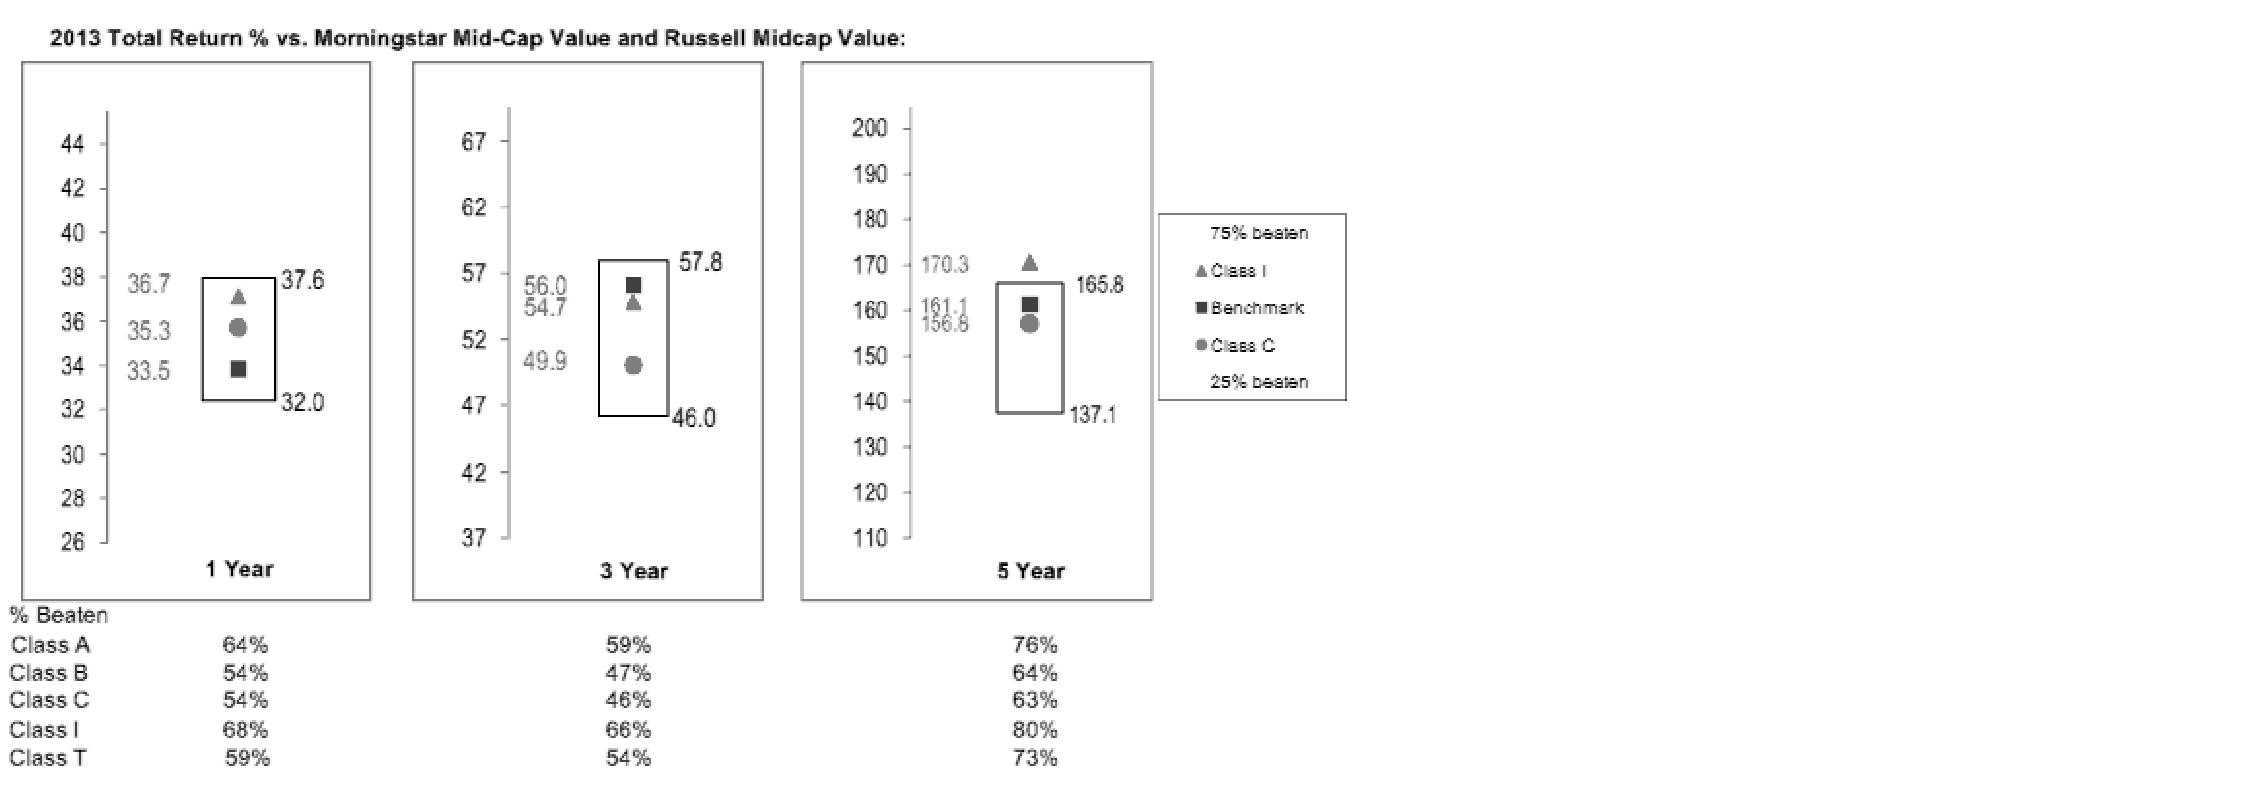
The Board also considered that the fund's management fee is subject to upward or downward adjustment depending upon whether, and to what extent, the fund's investment performance for the performance period exceeds, or is exceeded by, a securities index, thus leading to a performance adjustment for the same period. The Board noted that the performance adjustment provides FMR with a strong economic incentive to seek to achieve superior performance for the fund's shareholders and helps to more closely align the interests of FMR and the fund's shareholders.
Based on its review, the Board concluded that the nature, extent, and quality of services provided to the fund under the Advisory Contracts should benefit the fund's shareholders.
Competitiveness of Management Fee and Total Expense Ratio. The Board considered the fund's management fee and total expense ratio compared to "mapped groups" of competitive funds and classes. Fidelity creates "mapped groups" by combining similar Lipper investment objective categories that have comparable investment mandates. Combining Lipper investment objective categories aids the Board's management fee and total expense ratio comparisons by broadening the competitive group used for comparison and by reducing the number of universes to which various Fidelity funds are compared.
Management Fee. The Board considered two proprietary management fee comparisons for the 12-month periods shown in the chart below. The group of Lipper funds used by the Board for management fee comparisons is referred to below as the "Total Mapped Group." The Total Mapped Group comparison focuses on a fund's standing in terms of gross management fees before expense reimbursements or caps, and without giving effect to the fund's performance adjustment, relative to the total universe of funds with comparable investment mandates, regardless of whether their management fee structures also are comparable. Funds with comparable investment mandates offer exposure to similar types of securities. Funds with comparable management fee structures have similar management fee contractual arrangements (e.g., flat rate charged for advisory services, all-inclusive fee rate, etc.). "TMG %" represents the percentage of funds in the Total Mapped Group that had management fees that were lower than the fund's. For example, a hypothetical TMG % of 20% would mean that 80% of the funds in the Total Mapped Group had higher, and 20% had lower, management fees than the fund. The fund's actual TMG %s are in the chart below. The "Asset-Size Peer Group" (ASPG) comparison focuses on a fund's standing relative to a subset of non-Fidelity funds within the Total Mapped Group that are similar in size and management fee structure. For example, if a fund is in the first quartile of the ASPG, the fund's management fee ranks in the least expensive or lowest 25% of funds in the ASPG. The ASPG represents at least 15% of the funds in the Total Mapped Group with comparable asset size and management fee structures, subject to a minimum of 50 funds (or all funds in the Total Mapped Group if fewer than 50). Additional information, such as the ASPG quartile in which the fund's management fee rate ranked and the impact of the fund's performance adjustment, is also included in the chart and considered by the Board.
Annual Report
Board Approval of Investment Advisory Contracts and
Management Fees - continued
Fidelity Advisor Value Fund

The Board noted that the fund's management fee rate ranked below the median of its Total Mapped Group and below the median of its ASPG for 2013. The Board also noted the effect of the fund's negative performance adjustment on the fund's management fee ranking.
Annual Report
The Board also noted that, in August 2013, the ad hoc Committee on Management Fees was formed to conduct an in-depth review of the management fee rates of Fidelity's active equity mutual funds. The Committee focused on the following areas: (i) standard fee structures; (ii) research consumption and trading evolution; (iii) management fee competitiveness/profitability by category; and (iv) factors that drive institutional pricing.
Based on its review, the Board concluded that the fund's management fee is fair and reasonable in light of the services that the fund receives and the other factors considered.
Total Expense Ratio. In its review of each class's total expense ratio, the Board considered the fund's management fee as well as other fund or class expenses, as applicable, such as transfer agent fees, pricing and bookkeeping fees, fund-paid 12b-1 fees, and custodial, legal, and audit fees. The Board also noted the effects of any waivers and reimbursements on fees and expenses, as well as the impact of the fund's performance adjustment. As part of its review, the Board also considered the current and historical total expense ratios of each class of the fund compared to competitive fund median expenses. Each class of the fund is compared to those funds and classes in the Total Mapped Group (used by the Board for management fee comparisons) that have a similar sales load structure.
The Board noted that the total expense ratio of Class A ranked equal to its competitive median for 2013 and the total expense ratio of each of Class T, Class B, Class C, and Institutional Class ranked above its competitive median for 2013. The Board considered that, in general, various factors can affect total expense ratios. The Board noted that the total expense ratio of Class T was above the competitive median primarily because of higher 12b-1 fees on Class T as compared to most competitor funds. Class T has a higher 12b-1 fee, but a lower front-end sales charge, than traditionally priced front-end sales charge classes. The Board considered that Class T is primarily sold load-waived in the retirement plan market where its 0.50% 12b-1 fee is comparable to competing no-load, higher 12b-1 fee classes designed specifically for retirement plans. The Board noted that the fund offers multiple classes, each of which has a different sales load and 12b-1 fee structure, and that the multiple structures are intended to offer a range of pricing options for the intermediary market. The Board also noted that the total expense ratios of the classes vary primarily by the level of their 12b-1 fees, although differences in transfer agent fees may also cause expenses to vary from class to class.
Fees Charged to Other Fidelity Clients. The Board also considered Fidelity fee structures and other information with respect to clients of Fidelity, such as other funds advised or subadvised by Fidelity, pension plan clients, and other institutional clients. The Board noted the findings of the 2013 ad hoc joint committee (created with the board of other Fidelity funds), which reviewed and compared Fidelity's institutional investment advisory business with its business of providing services to the Fidelity funds, including the differences in services provided, fees charged, and costs incurred, as well as competition in their respective marketplaces.
Annual Report
Board Approval of Investment Advisory Contracts and
Management Fees - continued
Based on its review of total expense ratios and fees charged to other Fidelity clients, the Board concluded that the total expense ratio of each class of the fund was reasonable, although in some cases above the median of the universe presented for comparison, in light of the services that the fund and its shareholders receive and the other factors considered.
Costs of the Services and Profitability. The Board considered the revenues earned and the expenses incurred by Fidelity in conducting the business of developing, marketing, distributing, managing, administering and servicing the fund and servicing the fund's shareholders. The Board also considered the level of Fidelity's profits in respect of all the Fidelity funds.
On an annual basis, Fidelity presents to the Board Fidelity's profitability for the fund. Fidelity calculates the profitability for each fund, as well as aggregate profitability for groups of Fidelity funds and all Fidelity funds, using a series of detailed revenue and cost allocation methodologies which originate with the books and records of Fidelity on which Fidelity's audited financial statements are based. The Audit Committee of the Board reviews any significant changes from the prior year's methodologies.
PricewaterhouseCoopers LLP (PwC), independent registered public accounting firm and auditor to Fidelity and certain Fidelity funds, has been engaged annually by the Board as part of the Board's assessment of Fidelity's profitability analysis. PwC's engagement includes the review and assessment of the methodologies used by Fidelity in determining the revenues and expenses attributable to Fidelity's mutual fund business, and completion of agreed-upon procedures in respect of the mathematical accuracy of fund profitability and its conformity to established allocation methodologies. After considering PwC's reports issued under the engagement and information provided by Fidelity, the Board concluded that while other allocation methods may also be reasonable, Fidelity's profitability methodologies are reasonable in all material respects.
The Board also reviewed Fidelity's non-fund businesses and fall-out benefits related to the mutual fund business as well as cases where Fidelity's affiliates may benefit from or be related to the fund's business.
The Board considered the costs of the services provided by and the profits realized by Fidelity in connection with the operation of the fund and was satisfied that the profitability was not excessive in the circumstances.
Economies of Scale. The Board considered whether there have been economies of scale in respect of the management of the Fidelity funds, whether the Fidelity funds (including the fund) have appropriately benefited from any such economies of scale, and whether there is potential for realization of any further economies of scale. The Board considered the extent to which the fund will benefit from economies of scale through increased services to the fund, through waivers or reimbursements, or through fee or expense ratio reductions. The Board also noted that in 2013, it and the boards of other Fidelity funds created an ad hoc committee (the Economies of Scale Committee) to analyze whether Fidelity attains economies of scale in respect of the management and servicing of the Fidelity funds, whether the Fidelity funds have appropriately benefited from such economies of scale, and whether there is potential for realization of any further economies of scale.
Annual Report
The Board recognized that the fund's management contract incorporates a "group fee" structure, which provides for lower group fee rates as total group assets increase, and for higher group fee rates as total group assets decrease (with "group assets" defined to include fund assets under FMR's management plus sector fund assets previously under FMR's management and currently managed by Fidelity SelectCo, LLC). FMR calculates the group fee rates based on a tiered asset "breakpoint" schedule that varies based on asset class. The Board considered that the group fee is designed to deliver the benefits of economies of scale to fund shareholders when total Fidelity fund assets increase, even if assets of any particular fund are unchanged or have declined, because some portion of Fidelity's costs are attributable to services provided to all Fidelity funds, and all funds benefit if those costs can be allocated among more assets. The Board concluded that, given the group fee structure, fund shareholders will benefit from lower management fees as group assets increase at the fund complex level, regardless of whether Fidelity achieves any such economies of scale.
The Board concluded, taking into account the analysis of the Economies of Scale Committee, that economies of scale, if any, are being appropriately shared between fund shareholders and Fidelity.
Additional Information Requested by the Board. In order to develop fully the factual basis for consideration of the Fidelity funds' Advisory Contracts, the Board requested and received additional information on certain topics, including: (i) fund performance trends and Fidelity's long-term strategies for certain funds; (ii) Fidelity's strategic marketing and product lineup goals; (iii) the methodology with respect to competitive fund data and peer group classifications; (iv) the arrangements with, and performance of, certain sub-advisers on behalf of the Fidelity funds, as well as certain proposed participating affiliate arrangements; (v) the realization of fall-out benefits in certain Fidelity business units; (vi) Fidelity's group fee structures, including the rationale for the individual fee rates of certain categories of funds and the definition of group assets; (vii) trends regarding industry use of performance fee structures and the performance adjustment methodologies applicable to the Fidelity funds; (viii) additional competitive analysis regarding the total expenses for certain classes; (ix) fund profitability methodology, including Fidelity's cost allocation methodology, and the impact of certain factors on fund profitability results; and (x) the process by which Fidelity determines sub-advisory fees for funds it advises.
Annual Report
Board Approval of Investment Advisory Contracts and
Management Fees - continued
Based on its evaluation of all of the conclusions noted above, and after considering all factors it believed relevant, the Board ultimately concluded that the advisory fee structures are fair and reasonable, and that the fund's Advisory Contracts should be renewed.
Annual Report
Investment Adviser
Fidelity Management & Research Company
Boston, MA
Investment Sub-Advisers
FMR Co., Inc.
Fidelity Management & Research
(U.K.) Inc.
Fidelity Management & Research
(Hong Kong) Limited
Fidelity Management & Research
(Japan) Limited
General Distributor
Fidelity Distributors Corporation
Smithfield, RI
Transfer and Service Agents
Fidelity Investments Institutional Operations Company, Inc.
Boston, MA
Fidelity Service Company, Inc.
Boston, MA
Custodian
The Bank of New York Mellon
New York, NY
(Fidelity Investment logo)(registered trademark)
FAVI-UANN-1214
1.809013.110
(Fidelity Investment logo)(registered trademark)
Fidelity Advisor®
Value
Fund - Class A, Class T, Class B
and Class C
Annual Report
October 31, 2014
(Fidelity Cover Art)
Contents
Performance | How the fund has done over time. | |
Management's Discussion of Fund Performance | The Portfolio Manager's review of fund performance and strategy. | |
Shareholder Expense Example | An example of shareholder expenses. | |
Investment Changes | A summary of major shifts in the fund's investments over the past six months. | |
Investments | A complete list of the fund's investments with their market values. | |
Financial Statements | Statements of assets and liabilities, operations, and changes in net assets, as well as financial highlights. | |
Notes | Notes to the financial statements. | |
Report of Independent Registered Public Accounting Firm |
| |
Trustees and Officers |
| |
Distributions |
| |
Board Approval of Investment Advisory Contracts and Management Fees |
|
To view a fund's proxy voting guidelines and proxy voting record for the 12-month period ended June 30, visit http://www.fidelity.com/proxyvotingresults or visit the Securities and Exchange Commission's (SEC) web site at http://www.sec.gov. You may also call 1-877-208-0098 to request a free copy of the proxy voting guidelines.
Standard & Poor's, S&P and S&P 500 are registered service marks of The McGraw-Hill Companies, Inc. and have been licensed for use by Fidelity Distributors Corporation.
Other third-party marks appearing herein are the property of their respective owners.
All other marks appearing herein are registered or unregistered trademarks or service marks of FMR LLC or an affiliated company. © 2014 FMR LLC. All rights reserved.
Annual Report
This report and the financial statements contained herein are submitted for the general information of the shareholders of the fund. This report is not authorized for distribution to prospective investors in the fund unless preceded or accompanied by an effective prospectus.
A fund files its complete schedule of portfolio holdings with the SEC for the first and third quarters of each fiscal year on Form N-Q. Forms N-Q are available on the SEC's web site at http://www.sec.gov. A fund's Forms N-Q may be reviewed and copied at the SEC's Public Reference Room in Washington, DC. Information regarding the operation of the SEC's Public Reference Room may be obtained by calling 1-800-SEC-0330. For a complete list of a fund's portfolio holdings, view the most recent holdings listing, semiannual report, or annual report on Fidelity's web site at http://www.fidelity.com, http://www.advisor.fidelity.com, or http://www.401k.com, as applicable.
NOT FDIC INSURED • MAY LOSE VALUE • NO BANK GUARANTEE
Neither the fund nor Fidelity Distributors Corporation is a bank.
Annual Report
Performance: The Bottom Line
Average annual total return reflects the change in the value of an investment, assuming reinvestment of the class' distributions from dividend income and capital gains (the profits earned upon the sale of securities that have grown in value, if any) and assuming a constant rate of performance each year. The $10,000 table and the fund's returns do not reflect the deduction of taxes that a shareholder would pay on fund distributions or the redemption of fund shares. During periods of reimbursement by Fidelity, a fund's total return will be greater than it would be had the reimbursement not occurred. How a fund did yesterday is no guarantee of how it will do tomorrow. Returns reflect the conversion of Class B shares to Class A shares after a maximum of seven years.
Average Annual Total Returns
Periods ended October 31, 2014 | Past 1 | Past 5 | Past 10 |
Class A (incl. 5.75% sales charge) | 7.59% | 16.15% | 7.70% |
Class T (incl. 3.50% sales charge) | 9.89% | 16.42% | 7.68% |
Class B (incl. contingent deferred sales charge)A | 8.31% | 16.46% | 7.77% |
Class C (incl. c ontingent deferred sales charge)B | 12.29% | 16.65% | 7.53% |
A Class B shares' contingent deferred sales charges included in the past one year, past five years, and past ten years total return figures are 5%, 2%, and 0%, respectively.
B Class C shares' contingent deferred sales charges included in the past one year, past five years, and past ten years total return figures are 1%, 0%, and 0%, respectively.
Annual Report
$10,000 Over 10 Years
Let's say hypothetically that $10,000 was invested in Fidelity Advisor® Value Fund - Class A on October 31, 2004, and the current 5.75% sales charge was paid. The chart shows how the value of your investment would have changed, and also shows how the Russell Midcap® Value Index performed over the same period.
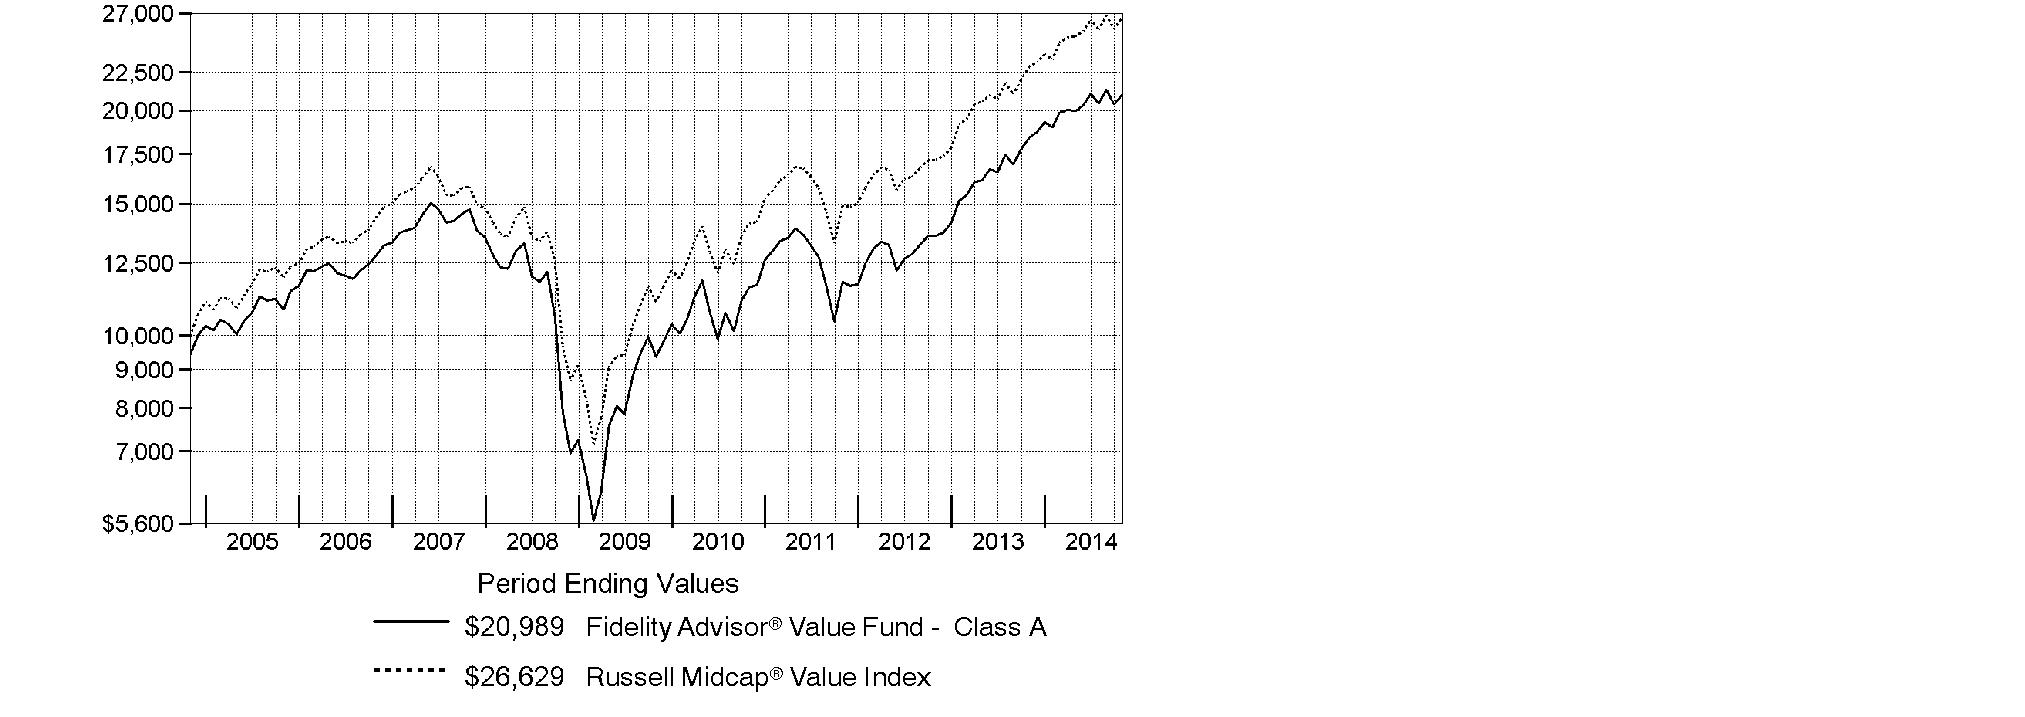
Annual Report
Management's Discussion of Fund Performance
Market Recap: The U.S. market nearly closed at an all-time high for the 12 months ending October 31, 2014, supported by low interest rates and strong corporate profits. The large-cap S&P 500® Index gained 17.27%, clawing back from an October sell-off fueled by fears of a new global economic slump. Growth stocks in the index outperformed value-oriented names. The tech-heavy Nasdaq Composite Index® advanced 19.58%, while the small-cap Russell 2000® Index returned a relatively lackluster 8.06% amid growth and valuation worries. Health care (+30%) was the top sector in the S&P 500®, spurred partly by the pharmaceuticals, biotechnology & life sciences industry. Information technology (+26%) also outperformed. Conversely, energy (+4%) lagged the index, reflecting a sharp drop in crude prices beginning in June, attributed to weaker demand and a U.S. shale-drilling supply boom. Industrials (+15%) and consumer discretionary (+9%) - sectors that tend to rise and fall with economic expectations - also trailed the broader market. Volatility was tame for much of the period but spiked to a three-year high in October amid growth concerns, Ebola fears and continued unrest in Syria, Iraq and Ukraine. Stocks finished the period strongly, however, bolstered by the relative economic strength of the U.S., which marked a six-year low in its unemployment rate.
Comments from Matthew Friedman, Co-Portfolio Manager of Fidelity Advisor® Value Fund: For the year, the fund's Class A, Class T, Class B and Class C shares advanced 14.15%, 13.88%, 13.31% and 13.29%, respectively (excluding sales charges), underperforming the 16.18% gain of the Russell Midcap® Value Index. It was a tough environment for our bottom-up strategy, and certain stock-specific choices in various sectors and industries didn't pan out this period, leading the fund to underperform. The biggest relative detractor this period was Micron Technology, a global manufacturer and marketer of semiconductor devices. We chose to avoid this big index component because we thought the improved industry structure was already reflected in the stock's valuation. Unfortunately for us, the stock rose 87% for the year. Consecutive quarters of solid sales and better-than-expected financial results appealed to investors, who were more focused on the company's profitability than its quality. Conversely, an overweighting in Broadcom, a provider of semiconductor solutions for wired and wireless communications, was the fund's biggest contributor. The stock moved sharply higher in early June after the company announced it was evaluating plans for its cellular baseband business, including a potential sale or shutdown of the division. In October, the stock benefited from the firm's announcement of better-than-expected third-quarter financial results.
The views expressed above reflect those of the portfolio manager(s) only through the end of the period as stated on the cover of this report and do not necessarily represent the views of Fidelity or any other person in the Fidelity organization. Any such views are subject to change at any time based upon market or other conditions and Fidelity disclaims any responsibility to update such views. These views may not be relied on as investment advice and, because investment decisions for a Fidelity fund are based on numerous factors, may not be relied on as an indication of trading intent on behalf of any Fidelity fund.
Annual Report
Shareholder Expense Example
As a shareholder of the Fund, you incur two types of costs: (1) transaction costs, including sales charges (loads) on purchase payments or redemption proceeds, and (2) ongoing costs, including management fees, distribution and/or service (12b-1) fees and other Fund expenses. This Example is intended to help you understand your ongoing costs (in dollars) of investing in the Fund and to compare these costs with the ongoing costs of investing in other mutual funds.
The Example is based on an investment of $1,000 invested at the beginning of the period and held for the entire period (May 1, 2014 to October 31, 2014).
Actual Expenses
The first line of the accompanying table for each class of the Fund provides information about actual account values and actual expenses. You may use the information in this line, together with the amount you invested, to estimate the expenses that you paid over the period. Simply divide your account value by $1,000.00 (for example, an $8,600 account value divided by $1,000.00 = 8.6), then multiply the result by the number in the first line for a class of the Fund under the heading entitled "Expenses Paid During Period" to estimate the expenses you paid on your account during this period. In addition, the Fund, as a shareholder in the underlying Fidelity Central Funds, will indirectly bear its pro-rata share of the fees and expenses incurred by the underlying Fidelity Central Funds. These fees and expenses are not included in the Fund's annualized expense ratio used to calculate the expense estimate in the table below.
Hypothetical Example for Comparison Purposes
The second line of the accompanying table for each class of the Fund provides information about hypothetical account values and hypothetical expenses based on a Class' actual expense ratio and an assumed rate of return of 5% per year before expenses, which is not the Class' actual return. The hypothetical account values and expenses may not be used to estimate the actual ending account balance or expenses you paid for the period. You may use this information to compare the ongoing costs of investing in the Fund and other funds. To do so, compare this 5% hypothetical example with the 5% hypothetical examples that appear in the shareholder reports of the other funds. In addition, the Fund, as a shareholder in the underlying Fidelity Central Funds, will indirectly bear its pro-rata share of the fees and expenses incurred by the underlying Fidelity Central Funds. These fees and expenses are not included in the Fund's annualized expense ratio used to calculate the expense estimate in the table below.
Please note that the expenses shown in the table are meant to highlight your ongoing costs only and do not reflect any transaction costs. Therefore, the second line of the table is useful in comparing ongoing costs only, and will not help you determine the relative total costs of owning different funds. In addition, if these transactional costs were included, your costs would have been higher.
Annual Report
| Annualized | Beginning | Ending | Expenses Paid |
Class A | 1.25% |
|
|
|
Actual |
| $ 1,000.00 | $ 1,052.40 | $ 6.47 |
HypotheticalA |
| $ 1,000.00 | $ 1,018.90 | $ 6.36 |
Class T | 1.50% |
|
|
|
Actual |
| $ 1,000.00 | $ 1,051.40 | $ 7.76 |
HypotheticalA |
| $ 1,000.00 | $ 1,017.64 | $ 7.63 |
Class B | 2.00% |
|
|
|
Actual |
| $ 1,000.00 | $ 1,048.30 | $ 10.33 |
HypotheticalA |
| $ 1,000.00 | $ 1,015.12 | $ 10.16 |
Class C | 2.00% |
|
|
|
Actual |
| $ 1,000.00 | $ 1,048.50 | $ 10.33 |
HypotheticalA |
| $ 1,000.00 | $ 1,015.12 | $ 10.16 |
Institutional Class | .96% |
|
|
|
Actual |
| $ 1,000.00 | $ 1,053.90 | $ 4.97 |
HypotheticalA |
| $ 1,000.00 | $ 1,020.37 | $ 4.89 |
A 5% return per year before expenses
B Annualized expense ratio reflects expenses net of applicable fee waivers.
* Expenses are equal to each Class' annualized expense ratio, multiplied by the average account value over the period, multiplied by 184/365 (to reflect the one-half year period).
Annual Report
Investment Changes (Unaudited)
Top Ten Stocks as of October 31, 2014 | ||
| % of fund's | % of fund's net assets |
Sempra Energy | 1.6 | 1.8 |
Edison International | 1.5 | 1.7 |
AECOM Technology Corp. | 1.4 | 0.9 |
PPL Corp. | 1.3 | 0.0 |
NiSource, Inc. | 1.3 | 1.3 |
Broadcom Corp. Class A | 1.2 | 0.9 |
Berkshire Hathaway, Inc. Class B | 1.0 | 1.1 |
Whirlpool Corp. | 1.0 | 0.0 |
Invesco Ltd. | 0.9 | 0.8 |
Jazz Pharmaceuticals PLC | 0.9 | 0.2 |
| 12.1 | |
Top Five Market Sectors as of October 31, 2014 | ||
| % of fund's | % of fund's net assets |
Financials | 28.8 | 28.2 |
Information Technology | 12.6 | 11.8 |
Consumer Discretionary | 12.0 | 11.8 |
Industrials | 10.0 | 9.5 |
Utilities | 9.8 | 10.0 |
Asset Allocation (% of fund's net assets) | |||||||
As of October 31, 2014* | As of April 30, 2014** | ||||||
 | Stocks and |
| | Stocks and |
| ||
| Other Investments 0.2% |
| | Other Investments 0.2% |
| ||
| Short-Term |
| | Short-Term |
| ||
* Foreign investments | 18.8% |
| ** Foreign investments | 17.9% |
| ||

Annual Report
Investments October 31, 2014
Showing Percentage of Net Assets
Common Stocks - 96.9% | |||
Shares | Value | ||
CONSUMER DISCRETIONARY - 12.0% | |||
Auto Components - 1.5% | |||
Delphi Automotive PLC | 4,213 | $ 290,613 | |
Tenneco, Inc. (a) | 3,100 | 162,316 | |
The Goodyear Tire & Rubber Co. | 24,061 | 582,998 | |
Visteon Corp. (a) | 3,373 | 316,725 | |
| 1,352,652 | ||
Automobiles - 0.2% | |||
Harley-Davidson, Inc. | 3,200 | 210,240 | |
Diversified Consumer Services - 1.5% | |||
H&R Block, Inc. | 7,812 | 252,406 | |
Houghton Mifflin Harcourt Co. | 35,847 | 717,298 | |
Kroton Educacional SA | 30,392 | 216,604 | |
Service Corp. International | 7,428 | 162,450 | |
| 1,348,758 | ||
Household Durables - 2.3% | |||
Helen of Troy Ltd. (a) | 3,075 | 190,189 | |
Jarden Corp. (a) | 7,829 | 509,590 | |
KB Home (e) | 36,434 | 573,471 | |
Whirlpool Corp. | 5,310 | 913,586 | |
| 2,186,836 | ||
Leisure Products - 0.2% | |||
Brunswick Corp. | 4,893 | 228,992 | |
Media - 2.7% | |||
CBS Corp. Class B | 4,046 | 219,374 | |
Lamar Advertising Co. Class A | 8,646 | 446,566 | |
Liberty Media Corp. Class C (a) | 12,056 | 577,844 | |
Live Nation Entertainment, Inc. (a) | 26,923 | 699,998 | |
Omnicom Group, Inc. | 4,300 | 308,998 | |
Sinclair Broadcast Group, Inc. Class A (e) | 7,730 | 224,557 | |
| 2,477,337 | ||
Multiline Retail - 0.7% | |||
Dillard's, Inc. Class A | 1,826 | 193,118 | |
Kohl's Corp. | 8,375 | 454,093 | |
| 647,211 | ||
Specialty Retail - 2.2% | |||
Advance Auto Parts, Inc. | 1,992 | 292,744 | |
AutoZone, Inc. (a) | 526 | 291,152 | |
Chico's FAS, Inc. | 32,323 | 487,431 | |
Office Depot, Inc. (a) | 47,838 | 249,714 | |
Rent-A-Center, Inc. | 7,730 | 239,398 | |
Common Stocks - continued | |||
Shares | Value | ||
CONSUMER DISCRETIONARY - continued | |||
Specialty Retail - continued | |||
Staples, Inc. | 14,828 | $ 188,019 | |
The Men's Wearhouse, Inc. | 5,686 | 267,413 | |
| 2,015,871 | ||
Textiles, Apparel & Luxury Goods - 0.7% | |||
Fossil Group, Inc. (a) | 2,826 | 287,291 | |
Gildan Activewear, Inc. | 3,700 | 220,414 | |
Iconix Brand Group, Inc. (a) | 4,600 | 184,046 | |
| 691,751 | ||
TOTAL CONSUMER DISCRETIONARY | 11,159,648 | ||
CONSUMER STAPLES - 3.7% | |||
Beverages - 0.6% | |||
C&C Group PLC | 30,381 | 135,308 | |
Cott Corp. | 22,646 | 137,236 | |
Molson Coors Brewing Co. Class B | 3,520 | 261,818 | |
| 534,362 | ||
Food & Staples Retailing - 0.2% | |||
Safeway, Inc. | 5,326 | 185,664 | |
Food Products - 2.2% | |||
Bunge Ltd. | 9,230 | 818,240 | |
Dean Foods Co. (e) | 31,182 | 458,687 | |
Greencore Group PLC | 40,182 | 168,668 | |
Ingredion, Inc. | 2,763 | 213,442 | |
The J.M. Smucker Co. | 3,840 | 399,360 | |
| 2,058,397 | ||
Household Products - 0.1% | |||
Svenska Cellulosa AB (SCA) (B Shares) | 6,400 | 143,096 | |
Personal Products - 0.4% | |||
Coty, Inc. Class A | 21,254 | 352,816 | |
Tobacco - 0.2% | |||
Japan Tobacco, Inc. | 4,300 | 146,712 | |
TOTAL CONSUMER STAPLES | 3,421,047 | ||
ENERGY - 5.7% | |||
Energy Equipment & Services - 1.3% | |||
BW Offshore Ltd. | 82,345 | 100,963 | |
Cameron International Corp. (a) | 3,497 | 208,246 | |
Common Stocks - continued | |||
Shares | Value | ||
ENERGY - continued | |||
Energy Equipment & Services - continued | |||
Halliburton Co. | 7,769 | $ 428,383 | |
National Oilwell Varco, Inc. | 3,271 | 237,605 | |
Odfjell Drilling A/S | 27,718 | 81,778 | |
Rowan Companies PLC | 6,313 | 153,217 | |
| 1,210,192 | ||
Oil, Gas & Consumable Fuels - 4.4% | |||
Anadarko Petroleum Corp. | 2,600 | 238,628 | |
BPZ Energy, Inc. (a) | 68,450 | 84,878 | |
Energen Corp. | 5,752 | 389,410 | |
Energy XXI (Bermuda) Ltd. | 18,400 | 141,496 | |
Imperial Oil Ltd. | 4,000 | 192,467 | |
Kinder Morgan Holding Co. LLC | 5,300 | 205,110 | |
Marathon Petroleum Corp. | 5,057 | 459,681 | |
Markwest Energy Partners LP | 2,200 | 154,110 | |
Newfield Exploration Co. (a) | 8,887 | 289,805 | |
Noble Energy, Inc. | 3,028 | 174,504 | |
Northern Oil & Gas, Inc. (a) | 12,009 | 135,702 | |
Ophir Energy PLC (a) | 32,500 | 96,338 | |
Scorpio Tankers, Inc. | 12,555 | 109,605 | |
Stone Energy Corp. (a) | 14,090 | 345,205 | |
Tesoro Corp. | 6,608 | 471,877 | |
Ultra Petroleum Corp. (a)(e) | 6,266 | 142,865 | |
Whiting Petroleum Corp. (a) | 7,548 | 462,240 | |
| 4,093,921 | ||
TOTAL ENERGY | 5,304,113 | ||
FINANCIALS - 28.5% | |||
Banks - 5.3% | |||
Bank of Ireland (a) | 212,097 | 83,857 | |
Barclays PLC sponsored ADR | 15,018 | 231,277 | |
CIT Group, Inc. | 11,744 | 574,634 | |
Citigroup, Inc. | 6,212 | 332,528 | |
EFG Eurobank Ergasias SA (a) | 290,300 | 100,770 | |
First Citizen Bancshares, Inc. | 2,737 | 687,562 | |
Investors Bancorp, Inc. | 22,300 | 239,725 | |
JPMorgan Chase & Co. | 8,969 | 542,445 | |
M&T Bank Corp. | 2,679 | 327,320 | |
PNC Financial Services Group, Inc. | 5,041 | 435,492 | |
Common Stocks - continued | |||
Shares | Value | ||
FINANCIALS - continued | |||
Banks - continued | |||
Prosperity Bancshares, Inc. | 4,100 | $ 247,599 | |
TSB Banking Group PLC | 24,500 | 105,899 | |
U.S. Bancorp | 17,519 | 746,309 | |
Wells Fargo & Co. | 5,649 | 299,905 | |
| 4,955,322 | ||
Capital Markets - 4.4% | |||
American Capital Ltd. (a) | 6,900 | 102,327 | |
Ameriprise Financial, Inc. | 3,772 | 475,913 | |
Apollo Global Management LLC Class A | 8,518 | 193,785 | |
Ares Capital Corp. | 16,957 | 271,142 | |
Artisan Partners Asset Management, Inc. | 3,000 | 145,440 | |
Carlyle Group LP | 8,860 | 245,954 | |
E*TRADE Financial Corp. (a) | 16,759 | 373,726 | |
Fortress Investment Group LLC | 29,972 | 225,389 | |
Invesco Ltd. | 21,970 | 889,126 | |
Julius Baer Group Ltd. | 2,630 | 115,024 | |
KKR & Co. LP | 16,212 | 349,531 | |
NorthStar Asset Management Group, Inc. | 10,605 | 192,163 | |
The Blackstone Group LP | 10,414 | 313,670 | |
UBS AG | 13,828 | 240,443 | |
| 4,133,633 | ||
Consumer Finance - 2.0% | |||
Capital One Financial Corp. | 8,986 | 743,771 | |
Navient Corp. | 33,807 | 668,702 | |
SLM Corp. | 9,080 | 86,714 | |
Springleaf Holdings, Inc. | 8,790 | 328,922 | |
| 1,828,109 | ||
Diversified Financial Services - 1.3% | |||
Berkshire Hathaway, Inc. Class B (a) | 6,708 | 940,193 | |
The NASDAQ OMX Group, Inc. | 5,622 | 243,208 | |
| 1,183,401 | ||
Insurance - 6.9% | |||
ACE Ltd. | 4,300 | 469,990 | |
AFLAC, Inc. | 4,768 | 284,793 | |
Allied World Assurance Co. | 7,021 | 266,798 | |
Allstate Corp. | 5,558 | 360,436 | |
AMBAC Financial Group, Inc. (a) | 20,101 | 459,911 | |
Brown & Brown, Inc. | 9,700 | 309,042 | |
Fairfax Financial Holdings Ltd. (sub. vtg.) | 1,220 | 557,397 | |
Common Stocks - continued | |||
Shares | Value | ||
FINANCIALS - continued | |||
Insurance - continued | |||
FNF Group | 15,157 | $ 452,285 | |
FNFV Group (a) | 1,399 | 18,803 | |
Genworth Financial, Inc. Class A (a) | 9,633 | 134,766 | |
Greenlight Capital Re, Ltd. (a) | 5,127 | 166,371 | |
Hilltop Holdings, Inc. (a) | 9,574 | 210,915 | |
Intact Financial Corp. | 4,134 | 277,189 | |
Old Republic International Corp. | 20,111 | 297,039 | |
ProAssurance Corp. | 4,943 | 231,234 | |
Progressive Corp. | 4,170 | 110,130 | |
Prudential PLC | 13,586 | 314,598 | |
Reinsurance Group of America, Inc. | 5,447 | 458,910 | |
StanCorp Financial Group, Inc. | 3,868 | 269,058 | |
Third Point Reinsurance Ltd. (a) | 7,708 | 117,932 | |
Torchmark Corp. | 6,998 | 370,614 | |
Validus Holdings Ltd. | 8,346 | 332,004 | |
| 6,470,215 | ||
Real Estate Investment Trusts - 6.4% | |||
Alexandria Real Estate Equities, Inc. | 4,631 | 384,373 | |
American Capital Agency Corp. | 20,736 | 471,537 | |
American Realty Capital Properties, Inc. | 2,500 | 22,175 | |
American Tower Corp. | 5,236 | 510,510 | |
Brandywine Realty Trust (SBI) | 11,300 | 174,359 | |
Digital Realty Trust, Inc. | 5,558 | 383,446 | |
Equity Lifestyle Properties, Inc. | 13,752 | 675,223 | |
Eurobank Properties Real Estate Investment Co. | 50,742 | 548,123 | |
Extra Space Storage, Inc. | 7,991 | 464,757 | |
General Growth Properties, Inc. | 4,289 | 111,128 | |
Iron Mountain, Inc. | 9,393 | 338,806 | |
iStar Financial, Inc. (a)(e) | 14,465 | 205,258 | |
MFA Financial, Inc. | 22,010 | 184,444 | |
NorthStar Realty Finance Corp. | 19,705 | 366,119 | |
Piedmont Office Realty Trust, Inc. Class A | 17,622 | 342,748 | |
Sun Communities, Inc. | 4,813 | 279,010 | |
Washington Prime Group, Inc. | 28,000 | 493,640 | |
| 5,955,656 | ||
Real Estate Management & Development - 1.7% | |||
Brookfield Asset Management, Inc. Class A | 2,500 | 122,377 | |
Forest City Enterprises, Inc. Class A (a) | 26,845 | 560,792 | |
Kennedy Wilson Europe Real Estate PLC | 12,391 | 206,148 | |
Common Stocks - continued | |||
Shares | Value | ||
FINANCIALS - continued | |||
Real Estate Management & Development - continued | |||
Kennedy-Wilson Holdings, Inc. (a) | 20,786 | $ 563,093 | |
Realogy Holdings Corp. (a) | 3,000 | 123,030 | |
| 1,575,440 | ||
Thrifts & Mortgage Finance - 0.5% | |||
Ocwen Financial Corp. (a) | 7,024 | 165,485 | |
TFS Financial Corp. | 17,100 | 255,474 | |
| 420,959 | ||
TOTAL FINANCIALS | 26,522,735 | ||
HEALTH CARE - 8.0% | |||
Biotechnology - 0.8% | |||
Aegerion Pharmaceuticals, Inc. (a)(e) | 2,272 | 45,872 | |
Amgen, Inc. | 1,287 | 208,726 | |
Cubist Pharmaceuticals, Inc. (a) | 3,289 | 237,762 | |
United Therapeutics Corp. (a) | 2,356 | 308,565 | |
| 800,925 | ||
Health Care Equipment & Supplies - 1.2% | |||
Boston Scientific Corp. (a) | 29,162 | 387,271 | |
Covidien PLC | 3,592 | 332,044 | |
DENTSPLY International, Inc. | 3,556 | 180,538 | |
The Cooper Companies, Inc. | 200 | 32,780 | |
Zimmer Holdings, Inc. | 1,800 | 200,232 | |
| 1,132,865 | ||
Health Care Providers & Services - 2.5% | |||
Accretive Health, Inc. (a) | 10,427 | 75,074 | |
Cardinal Health, Inc. | 7,888 | 619,050 | |
Catamaran Corp. (United States) (a) | 1,473 | 70,218 | |
Community Health Systems, Inc. (a) | 10,448 | 574,327 | |
HCA Holdings, Inc. (a) | 8,034 | 562,782 | |
Humana, Inc. | 2,500 | 347,125 | |
Omnicare, Inc. | 1,500 | 99,885 | |
| 2,348,461 | ||
Health Care Technology - 0.3% | |||
CompuGroup Medical AG | 11,205 | 256,960 | |
Life Sciences Tools & Services - 0.4% | |||
Agilent Technologies, Inc. | 6,845 | 378,392 | |
Pharmaceuticals - 2.8% | |||
Actavis PLC (a) | 1,476 | 358,284 | |
Common Stocks - continued | |||
Shares | Value | ||
HEALTH CARE - continued | |||
Pharmaceuticals - continued | |||
Cardiome Pharma Corp. (a) | 11,071 | $ 87,682 | |
Impax Laboratories, Inc. (a) | 8,228 | 238,365 | |
Jazz Pharmaceuticals PLC (a) | 5,033 | 849,772 | |
Perrigo Co. PLC | 1,400 | 226,030 | |
Teva Pharmaceutical Industries Ltd. sponsored ADR | 4,683 | 264,449 | |
The Medicines Company (a) | 13,276 | 336,148 | |
Theravance, Inc. | 14,170 | 227,003 | |
| 2,587,733 | ||
TOTAL HEALTH CARE | 7,505,336 | ||
INDUSTRIALS - 10.0% | |||
Aerospace & Defense - 1.9% | |||
Alliant Techsystems, Inc. | 1,600 | 187,136 | |
Curtiss-Wright Corp. | 8,875 | 614,239 | |
Finmeccanica SpA (a) | 17,632 | 158,867 | |
GenCorp, Inc. (non-vtg.) (a) | 4,300 | 72,928 | |
L-3 Communications Holdings, Inc. | 2,000 | 242,920 | |
Textron, Inc. | 8,297 | 344,574 | |
Triumph Group, Inc. | 2,683 | 186,817 | |
| 1,807,481 | ||
Air Freight & Logistics - 0.7% | |||
FedEx Corp. | 1,494 | 250,096 | |
Hub Group, Inc. Class A (a) | 6,300 | 228,627 | |
UTi Worldwide, Inc. (a) | 15,629 | 170,825 | |
| 649,548 | ||
Airlines - 0.3% | |||
JetBlue Airways Corp. (a)(e) | 23,811 | 274,779 | |
Building Products - 0.2% | |||
Allegion PLC | 4,400 | 233,596 | |
Commercial Services & Supplies - 1.2% | |||
ADT Corp. (e) | 9,749 | 349,404 | |
Progressive Waste Solution Ltd. (Canada) | 11,738 | 342,855 | |
Regus PLC | 47,400 | 149,604 | |
West Corp. | 7,558 | 241,856 | |
| 1,083,719 | ||
Common Stocks - continued | |||
Shares | Value | ||
INDUSTRIALS - continued | |||
Construction & Engineering - 1.8% | |||
AECOM Technology Corp. (a) | 39,882 | $ 1,298,149 | |
Jacobs Engineering Group, Inc. (a) | 7,200 | 341,640 | |
| 1,639,789 | ||
Electrical Equipment - 1.0% | |||
Babcock & Wilcox Co. | 7,561 | 216,245 | |
Generac Holdings, Inc. (a) | 4,300 | 194,962 | |
OSRAM Licht AG (a) | 5,651 | 198,000 | |
Regal-Beloit Corp. | 4,000 | 283,880 | |
| 893,087 | ||
Machinery - 1.1% | |||
Allison Transmission Holdings, Inc. | 5,702 | 185,201 | |
Deere & Co. | 2,544 | 217,614 | |
Manitowoc Co., Inc. | 9,513 | 198,251 | |
TriMas Corp. (a) | 5,000 | 158,300 | |
Valmet Corp. | 400 | 4,226 | |
Valmont Industries, Inc. | 1,892 | 257,634 | |
| 1,021,226 | ||
Marine - 0.1% | |||
Ultrapetrol (Bahamas) Ltd. (a) | 37,800 | 113,778 | |
Professional Services - 0.4% | |||
Dun & Bradstreet Corp. | 2,792 | 342,886 | |
Road & Rail - 0.3% | |||
CSX Corp. | 4,981 | 177,473 | |
TransForce, Inc. | 5,464 | 133,612 | |
| 311,085 | ||
Trading Companies & Distributors - 1.0% | |||
AerCap Holdings NV (a) | 12,170 | 527,448 | |
Noble Group Ltd. | 192,000 | 178,725 | |
WESCO International, Inc. (a) | 2,706 | 223,001 | |
| 929,174 | ||
TOTAL INDUSTRIALS | 9,300,148 | ||
INFORMATION TECHNOLOGY - 12.6% | |||
Communications Equipment - 1.0% | |||
Juniper Networks, Inc. | 17,856 | 376,226 | |
Plantronics, Inc. | 4,475 | 232,118 | |
QUALCOMM, Inc. | 3,805 | 298,731 | |
| 907,075 | ||
Common Stocks - continued | |||
Shares | Value | ||
INFORMATION TECHNOLOGY - continued | |||
Electronic Equipment & Components - 1.5% | |||
Ingram Micro, Inc. Class A (a) | 11,503 | $ 308,741 | |
Jabil Circuit, Inc. | 13,495 | 282,720 | |
Knowles Corp. (a) | 12,500 | 243,250 | |
TE Connectivity Ltd. | 4,765 | 291,284 | |
TTM Technologies, Inc. (a) | 33,081 | 228,590 | |
| 1,354,585 | ||
IT Services - 3.1% | |||
Amdocs Ltd. | 6,018 | 286,096 | |
CGI Group, Inc. Class A (sub. vtg.) (a) | 6,831 | 234,498 | |
Computer Sciences Corp. | 5,674 | 342,710 | |
Global Payments, Inc. | 4,041 | 325,301 | |
Leidos Holdings, Inc. | 4,400 | 160,908 | |
Quindell PLC | 30,699 | 65,806 | |
Sapient Corp. (a) | 23,600 | 408,752 | |
Total System Services, Inc. | 23,724 | 801,634 | |
Unisys Corp. (a) | 10,785 | 276,527 | |
| 2,902,232 | ||
Semiconductors & Semiconductor Equipment - 2.2% | |||
Broadcom Corp. Class A | 27,532 | 1,153,040 | |
Freescale Semiconductor, Inc. (a) | 32,773 | 651,855 | |
MagnaChip Semiconductor Corp. (a) | 8,100 | 90,153 | |
PMC-Sierra, Inc. (a) | 22,973 | 178,960 | |
| 2,074,008 | ||
Software - 3.3% | |||
Activision Blizzard, Inc. | 13,872 | 276,746 | |
Cadence Design Systems, Inc. (a) | 16,800 | 301,560 | |
Comverse, Inc. (a) | 10,763 | 234,633 | |
Constellation Software, Inc. | 809 | 227,902 | |
Interactive Intelligence Group, Inc. (a) | 4,200 | 202,692 | |
King Digital Entertainment PLC (e) | 6,600 | 75,240 | |
MicroStrategy, Inc. Class A (a) | 858 | 138,035 | |
Oracle Corp. | 16,689 | 651,705 | |
Rovi Corp. (a) | 9,200 | 192,096 | |
Symantec Corp. | 21,035 | 522,089 | |
Synopsys, Inc. (a) | 6,900 | 282,762 | |
| 3,105,460 | ||
Technology Hardware, Storage & Peripherals - 1.5% | |||
EMC Corp. | 9,166 | 263,339 | |
Common Stocks - continued | |||
Shares | Value | ||
INFORMATION TECHNOLOGY - continued | |||
Technology Hardware, Storage & Peripherals - continued | |||
NCR Corp. (a) | 20,003 | $ 553,483 | |
Samsung Electronics Co. Ltd. | 535 | 619,427 | |
| 1,436,249 | ||
TOTAL INFORMATION TECHNOLOGY | 11,779,609 | ||
MATERIALS - 6.5% | |||
Chemicals - 4.1% | |||
Agrium, Inc. | 6,062 | 593,103 | |
Airgas, Inc. | 2,043 | 227,876 | |
Ashland, Inc. | 2,586 | 279,469 | |
Axiall Corp. | 5,506 | 221,892 | |
Cabot Corp. | 4,250 | 197,328 | |
Celanese Corp. Class A | 5,736 | 336,875 | |
CF Industries Holdings, Inc. | 1,400 | 364,000 | |
Cytec Industries, Inc. | 5,796 | 270,267 | |
Eastman Chemical Co. | 3,624 | 292,747 | |
LyondellBasell Industries NV Class A | 1,920 | 175,930 | |
Methanex Corp. | 11,154 | 662,876 | |
Tronox Ltd. Class A | 7,600 | 183,768 | |
| 3,806,131 | ||
Containers & Packaging - 1.0% | |||
Rock-Tenn Co. Class A | 12,580 | 643,467 | |
Sonoco Products Co. | 6,711 | 274,279 | |
| 917,746 | ||
Metals & Mining - 1.4% | |||
Compass Minerals International, Inc. | 2,800 | 239,904 | |
Constellium NV (a) | 5,624 | 113,886 | |
Freeport-McMoRan, Inc. | 9,730 | 277,305 | |
Gem Diamonds Ltd. (a) | 11,399 | 28,310 | |
Royal Gold, Inc. | 1,595 | 91,154 | |
Steel Dynamics, Inc. | 12,900 | 296,829 | |
SunCoke Energy, Inc. | 12,176 | 291,006 | |
| 1,338,394 | ||
TOTAL MATERIALS | 6,062,271 | ||
Common Stocks - continued | |||
Shares | Value | ||
TELECOMMUNICATION SERVICES - 0.1% | |||
Diversified Telecommunication Services - 0.1% | |||
CenturyLink, Inc. | 627 | $ 26,008 | |
Frontier Communications Corp. (e) | 13,280 | 86,851 | |
| 112,859 | ||
Wireless Telecommunication Services - 0.0% | |||
T-Mobile U.S., Inc. (a) | 602 | 17,572 | |
TOTAL TELECOMMUNICATION SERVICES | 130,431 | ||
UTILITIES - 9.8% | |||
Electric Utilities - 4.8% | |||
Edison International | 22,407 | 1,402,230 | |
Exelon Corp. | 10,299 | 376,840 | |
ITC Holdings Corp. | 21,228 | 840,841 | |
NextEra Energy, Inc. | 6,586 | 660,049 | |
PPL Corp. | 35,063 | 1,226,854 | |
| 4,506,814 | ||
Gas Utilities - 1.3% | |||
Atmos Energy Corp. | 6,826 | 361,778 | |
National Fuel Gas Co. | 11,888 | 823,006 | |
| 1,184,784 | ||
Independent Power and Renewable Electricity Producers - 0.1% | |||
NextEra Energy Partners LP | 2,000 | 73,120 | |
Independent Power Producers & Energy Traders - 0.4% | |||
Dynegy, Inc. (a) | 11,115 | 339,008 | |
Multi-Utilities - 3.2% | |||
DTE Energy Co. | 3,158 | 259,461 | |
NiSource, Inc. | 28,709 | 1,207,501 | |
Sempra Energy | 13,942 | 1,533,619 | |
| 3,000,581 | ||
TOTAL UTILITIES | 9,104,307 | ||
TOTAL COMMON STOCKS (Cost $80,096,795) |
| ||
Nonconvertible Preferred Stocks - 0.1% | |||
Shares | Value | ||
FINANCIALS - 0.1% | |||
Banks - 0.1% | |||
Itau Unibanco Holding SA sponsored ADR (Cost $164,643) | 9,317 |
| $ 137,519 |
U.S. Treasury Obligations - 0.2% | ||||
| Principal Amount (d) |
| ||
U.S. Treasury Bills, yield at date of purchase 0.01% to 0.01% 11/20/14 to 1/2/15 (h) | $ 170,000 |
| ||
Preferred Securities - 0.2% | ||||
| ||||
FINANCIALS - 0.2% | ||||
Diversified Financial Services - 0.2% | ||||
Baggot Securities Ltd. 10.24% (f)(g) (Cost $153,576) | EUR | 100,000 |
| |
Money Market Funds - 4.4% | |||
Shares |
| ||
Fidelity Cash Central Fund, 0.11% (b) | 2,958,966 | 2,958,966 | |
Fidelity Securities Lending Cash Central Fund, 0.11% (b)(c) | 1,135,575 | 1,135,575 | |
TOTAL MONEY MARKET FUNDS (Cost $4,094,541) |
| ||
TOTAL INVESTMENT PORTFOLIO - 101.8% (Cost $84,679,552) | 94,833,342 | ||
NET OTHER ASSETS (LIABILITIES) - (1.8)% | (1,697,455) | ||
NET ASSETS - 100% | $ 93,135,887 | ||
Futures Contracts | |||||
Expiration Date | Underlying | Unrealized | |||
Purchased | |||||
Equity Index Contracts | |||||
2 CME E-mini S&P Midcap 400 Index Contracts (United States) | Dec. 2014 | $ 283,080 | $ (688) | ||
|
The face value of futures purchased as a percentage of net assets is 0.3% |
Currency Abbreviations | ||
EUR | - | European Monetary Unit |
Legend |
(a) Non-income producing |
(b) Affiliated fund that is generally available only to investment companies and other accounts managed by Fidelity Investments. The rate quoted is the annualized seven-day yield of the fund at period end. A complete unaudited listing of the fund's holdings as of its most recent quarter end is available upon request. In addition, each Fidelity Central Fund's financial statements, which are not covered by the Fund's Report of Independent Registered Public Accounting Firm, are available on the SEC's website or upon request. |
(c) Investment made with cash collateral received from securities on loan. |
(d) Amount is stated in United States dollars unless otherwise noted. |
(e) Security or a portion of the security is on loan at period end. |
(f) Security exempt from registration under Rule 144A of the Securities Act of 1933. These securities may be resold in transactions exempt from registration, normally to qualified institutional buyers. At the end of the period, the value of these securities amounted to $141,639 or 0.2% of net assets. |
(g) Security is perpetual in nature with no stated maturity date. |
(h) Security or a portion of the security was pledged to cover margin requirements for futures contracts. At period end, the value of securities pledged amounted to $30,000. |
Affiliated Central Funds |
Information regarding fiscal year to date income earned by the Fund from investments in Fidelity Central Funds is as follows: |
Fund | Income earned |
Fidelity Cash Central Fund | $ 3,157 |
Fidelity Securities Lending Cash Central Fund | 10,960 |
Total | $ 14,117 |
Other Information |
The following is a summary of the inputs used, as of October 31, 2014, involving the Fund's assets and liabilities carried at fair value. The inputs or methodology used for valuing securities may not be an indication of the risk associated with investing in those securities. For more information on valuation inputs, and their aggregation into the levels used in the table below, please refer to the Investment Valuation section in the accompanying Notes to Financial Statements. |
Valuation Inputs at Reporting Date: | ||||
Description | Total | Level 1 | Level 2 | Level 3 |
Investments in Securities: | ||||
Equities: | ||||
Consumer Discretionary | $ 11,159,648 | $ 11,159,648 | $ - | $ - |
Consumer Staples | 3,421,047 | 3,274,335 | 146,712 | - |
Energy | 5,304,113 | 5,304,113 | - | - |
Financials | 26,660,254 | 26,021,356 | 638,898 | - |
Health Care | 7,505,336 | 7,505,336 | - | - |
Industrials | 9,300,148 | 9,121,423 | 178,725 | - |
Information Technology | 11,779,609 | 11,779,609 | - | - |
Materials | 6,062,271 | 6,062,271 | - | - |
Telecommunication Services | 130,431 | 130,431 | - | - |
Utilities | 9,104,307 | 9,104,307 | - | - |
U.S. Government and Government Agency Obligations | 169,998 | - | 169,998 | - |
Preferred Securities | 141,639 | - | 141,639 | - |
Money Market Funds | 4,094,541 | 4,094,541 | - | - |
Total Investments in Securities: | $ 94,833,342 | $ 93,557,370 | $ 1,275,972 | $ - |
Derivative Instruments: | ||||
Liabilities | ||||
Futures Contracts | $ (688) | $ (688) | $ - | $ - |
Value of Derivative Instruments |
The following table is a summary of the Fund's value of derivative instruments by primary risk exposure as of October 31, 2014. For additional information on derivative instruments, please refer to the Derivative Instruments section in the accompanying Notes to Financial Statements. |
Primary Risk Exposure / | Value | |
| Asset | Liability |
Equity Risk | ||
Futures Contracts (a) | $ - | $ (688) |
Total Value of Derivatives | $ - | $ (688) |
(a) Reflects gross cumulative appreciation (depreciation) on futures contracts as presented in the Schedule of Investments. Only the period end receivable or payable for daily variation margin and net unrealized appreciation (depreciation) are presented in the Statement of Assets and Liabilities. |
Other Information |
Distribution of investments by country or territory of incorporation, as a percentage of total net assets, is as follows (Unaudited): |
United States of America | 81.2% |
Canada | 4.2% |
Bermuda | 3.7% |
Ireland | 2.8% |
Switzerland | 1.5% |
United Kingdom | 1.0% |
Others (Individually Less Than 1%) | 5.6% |
| 100.0% |
See accompanying notes which are an integral part of the financial statements.
Annual Report
Financial Statements
Statement of Assets and Liabilities
| October 31, 2014 | |
|
|
|
Assets | ||
Investment in securities, at value (including securities loaned of $1,117,149) - See accompanying schedule: Unaffiliated issuers (cost $80,585,011) | $ 90,738,801 |
|
Fidelity Central Funds (cost $4,094,541) | 4,094,541 |
|
Total Investments (cost $84,679,552) |
| $ 94,833,342 |
Receivable for investments sold | 633,582 | |
Receivable for fund shares sold | 58,030 | |
Dividends receivable | 81,964 | |
Distributions receivable from Fidelity Central Funds | 1,609 | |
Receivable for daily variation margin for derivative instruments | 2,518 | |
Prepaid expenses | 285 | |
Receivable from investment adviser for expense reductions | 5,575 | |
Other receivables | 1,604 | |
Total assets | 95,618,509 | |
|
|
|
Liabilities | ||
Payable to custodian bank | $ 238,660 | |
Payable for investments purchased | 823,773 | |
Payable for fund shares redeemed | 127,513 | |
Accrued management fee | 42,565 | |
Distribution and service plan fees payable | 32,076 | |
Other affiliated payables | 20,491 | |
Other payables and accrued expenses | 61,969 | |
Collateral on securities loaned, at value | 1,135,575 | |
Total liabilities | 2,482,622 | |
|
|
|
Net Assets | $ 93,135,887 | |
Net Assets consist of: |
| |
Paid in capital | $ 93,062,105 | |
Undistributed net investment income | 65,041 | |
Accumulated undistributed net realized gain (loss) on investments and foreign currency transactions | (10,143,638) | |
Net unrealized appreciation (depreciation) on investments and assets and liabilities in foreign currencies | 10,152,379 | |
Net Assets | $ 93,135,887 | |
See accompanying notes which are an integral part of the financial statements.
Annual Report
Financial Statements - continued
Statement of Assets and Liabilities - continued
| October 31, 2014 | |
|
|
|
Calculation of Maximum Offering Price Class A: | $ 21.48 | |
|
|
|
Maximum offering price per share (100/94.25 of $21.48) | $ 22.79 | |
Class T: | $ 21.27 | |
|
|
|
Maximum offering price per share (100/96.50 of $21.27) | $ 22.04 | |
Class B: | $ 20.60 | |
|
|
|
Class C: | $ 20.54 | |
|
|
|
Institutional Class: | $ 21.70 | |
A Redemption price per share is equal to net asset value less any applicable contingent deferred sales charge.
See accompanying notes which are an integral part of the financial statements.
Annual Report
Statement of Operations
| Year ended October 31, 2014 | |
|
|
|
Investment Income |
|
|
Dividends |
| $ 1,429,351 |
Interest |
| 661 |
Income from Fidelity Central Funds |
| 14,117 |
Total income |
| 1,444,129 |
|
|
|
Expenses | ||
Management fee | $ 477,097 | |
Performance adjustment | (17,834) | |
Transfer agent fees | 204,431 | |
Distribution and service plan fees | 383,942 | |
Accounting and security lending fees | 33,868 | |
Custodian fees and expenses | 77,543 | |
Independent trustees' compensation | 351 | |
Registration fees | 70,132 | |
Audit | 60,750 | |
Legal | 299 | |
Miscellaneous | 844 | |
Total expenses before reductions | 1,291,423 | |
Expense reductions | (44,209) | 1,247,214 |
Net investment income (loss) | 196,915 | |
Realized and Unrealized Gain (Loss) Net realized gain (loss) on: | ||
Investment securities: |
|
|
Unaffiliated issuers | 13,235,314 | |
Foreign currency transactions | (2,546) | |
Futures contracts | (75,121) | |
Total net realized gain (loss) |
| 13,157,647 |
Change in net unrealized appreciation (depreciation) on: Investment securities | (2,457,686) | |
Assets and liabilities in foreign currencies | (747) | |
Futures contracts | (24,736) | |
Total change in net unrealized appreciation (depreciation) |
| (2,483,169) |
Net gain (loss) | 10,674,478 | |
Net increase (decrease) in net assets resulting from operations | $ 10,871,393 | |
See accompanying notes which are an integral part of the financial statements.
Annual Report
Financial Statements - continued
Statement of Changes in Net Assets
| Year ended | Year ended |
Increase (Decrease) in Net Assets |
|
|
Operations |
|
|
Net investment income (loss) | $ 196,915 | $ 337,465 |
Net realized gain (loss) | 13,157,647 | 7,180,472 |
Change in net unrealized appreciation (depreciation) | (2,483,169) | 12,345,975 |
Net increase (decrease) in net assets resulting from operations | 10,871,393 | 19,863,912 |
Distributions to shareholders from net investment income | (112,252) | (345,665) |
Distributions to shareholders from net realized gain | (142,925) | - |
Total distributions | (255,177) | (345,665) |
Share transactions - net increase (decrease) | 3,929,186 | 2,685,061 |
Total increase (decrease) in net assets | 14,545,402 | 22,203,308 |
|
|
|
Net Assets | ||
Beginning of period | 78,590,485 | 56,387,177 |
End of period (including undistributed net investment income of $65,041 and undistributed net investment income of $61,673, respectively) | $ 93,135,887 | $ 78,590,485 |
See accompanying notes which are an integral part of the financial statements.
Annual Report
Financial Highlights - Class A
Years ended October 31, | 2014 | 2013 | 2012 | 2011 | 2010 |
Selected Per-Share Data |
|
|
|
|
|
Net asset value, beginning of period | $ 18.90 | $ 14.08 | $ 12.25 | $ 12.12 | $ 9.81 |
Income from Investment Operations |
|
|
|
|
|
Net investment income (loss) C | .09 | .11 | .07 | .03 | .06 F |
Net realized and unrealized gain (loss) | 2.58 | 4.82 | 1.79 | .17 | 2.29 |
Total from investment operations | 2.67 | 4.93 | 1.86 | .20 | 2.35 |
Distributions from net investment income | (.04) | (.11) | (.03) | (.06) | (.03) |
Distributions from net realized gain | (.04) | - | - | (.01) | (.01) |
Total distributions | (.09) H | (.11) | (.03) | (.07) | (.04) |
Net asset value, end of period | $ 21.48 | $ 18.90 | $ 14.08 | $ 12.25 | $ 12.12 |
Total Return A, B | 14.15% | 35.30% | 15.22% | 1.65% | 23.99% |
Ratios to Average Net Assets D, G |
|
|
|
|
|
Expenses before reductions | 1.29% | 1.31% | 1.35% | 1.29% | 1.33% |
Expenses net of fee waivers, if any | 1.25% | 1.25% | 1.25% | 1.25% | 1.25% |
Expenses net of all reductions | 1.25% | 1.23% | 1.25% | 1.24% | 1.24% |
Net investment income (loss) | .42% | .69% | .51% | .21% | .51% F |
Supplemental Data |
|
|
|
|
|
Net assets, end of period (000 omitted) | $ 45,759 | $ 38,397 | $ 27,817 | $ 29,635 | $ 37,972 |
Portfolio turnover rate E | 78% | 103% | 77% | 96% | 152% |
A Total returns would have been lower if certain expenses had not been reduced during the applicable periods shown.
B Total returns do not include the effect of the sales charges.
C Calculated based on average shares outstanding during the period.
D Fees and expenses of any underlying Fidelity Central Funds are not included in the Fund's expense ratio. The Fund indirectly bears its proportionate share of the expenses of any underlying Fidelity Central Funds.
E Amount does not include the portfolio activity of any underlying Fidelity Central Funds.
F Investment income per share reflects a large, non-recurring dividend which amounted to $.04 per share. Excluding this non-recurring dividend, the ratio of net investment income (loss) to average net assets would have been .13%.
G Expense ratios reflect operating expenses of the class. Expenses before reductions do not reflect amounts reimbursed by the investment adviser or reductions from brokerage service arrangements or reductions from other expense offset arrangements and do not represent the amount paid by the class during periods when reimbursements or reductions occur. Expenses net of fee waivers reflect expenses after reimbursement by the investment adviser but prior to reductions from brokerage service arrangements or other expense offset arrangements. Expenses net of all reductions represent the net expenses paid by the class.
H Total distributions of $.09 per share is comprised of distributions from net investment income of $.041 and distributions from net realized gain of $.044 per share.
See accompanying notes which are an integral part of the financial statements.
Annual Report
Financial Highlights - Class T
Years ended October 31, | 2014 | 2013 | 2012 | 2011 | 2010 |
Selected Per-Share Data |
|
|
|
|
|
Net asset value, beginning of period | $ 18.72 | $ 13.95 | $ 12.15 | $ 12.03 | $ 9.74 |
Income from Investment Operations |
|
|
|
|
|
Net investment income (loss) C | .03 | .07 | .03 | (.01) | .03 F |
Net realized and unrealized gain (loss) | 2.56 | 4.78 | 1.80 | .17 | 2.27 |
Total from investment operations | 2.59 | 4.85 | 1.83 | .16 | 2.30 |
Distributions from net investment income | - | (.08) | (.03) | (.04) | (.01) |
Distributions from net realized gain | (.04) | - | - | (.01) | (.01) |
Total distributions | (.04) | (.08) | (.03) | (.04) I | (.01) H |
Net asset value, end of period | $ 21.27 | $ 18.72 | $ 13.95 | $ 12.15 | $ 12.03 |
Total Return A, B | 13.88% | 34.94% | 15.05% | 1.35% | 23.66% |
Ratios to Average Net Assets D, G |
|
|
|
|
|
Expenses before reductions | 1.57% | 1.58% | 1.61% | 1.56% | 1.59% |
Expenses net of fee waivers, if any | 1.50% | 1.50% | 1.50% | 1.50% | 1.50% |
Expenses net of all reductions | 1.50% | 1.48% | 1.50% | 1.49% | 1.49% |
Net investment income (loss) | .17% | .44% | .26% | (.04)% | .26% F |
Supplemental Data |
|
|
|
|
|
Net assets, end of period (000 omitted) | $ 18,558 | $ 17,319 | $ 12,727 | $ 12,866 | $ 17,908 |
Portfolio turnover rate E | 78% | 103% | 77% | 96% | 152% |
A Total returns would have been lower if certain expenses had not been reduced during the applicable periods shown.
B Total returns do not include the effect of the sales charges.
C Calculated based on average shares outstanding during the period.
D Fees and expenses of any underlying Fidelity Central Funds are not included in the Fund's expense ratio. The Fund indirectly bears its proportionate share of the expenses of any underlying Fidelity Central Funds.
E Amount does not include the portfolio activity of any underlying Fidelity Central Funds.
F Investment income per share reflects a large, non-recurring dividend which amounted to $.04 per share. Excluding this non-recurring dividend, the ratio of net investment income (loss) to average net assets would have been (.12)%.
G Expense ratios reflect operating expenses of the class. Expenses before reductions do not reflect amounts reimbursed by the investment adviser or reductions from brokerage service arrangements or reductions from other expense offset arrangements and do not represent the amount paid by the class during periods when reimbursements or reductions occur. Expenses net of fee waivers reflect expenses after reimbursement by the investment adviser but prior to reductions from brokerage service arrangements or other expense offset arrangements. Expenses net of all reductions represent the net expenses paid by the class.
H Total distributions of $.01 per share is comprised of distributions from net investment income of $.008 and distributions from net realized gain of $.005 per share.
I Total distributions of $.04 per share is comprised of distributions from net investment income of $.035 and distributions from net realized gain of $.009 per share.
See accompanying notes which are an integral part of the financial statements.
Annual Report
Financial Highlights - Class B
Years ended October 31, | 2014 | 2013 | 2012 | 2011 | 2010 |
Selected Per-Share Data |
|
|
|
|
|
Net asset value, beginning of period | $ 18.18 | $ 13.54 | $ 11.85 | $ 11.75 | $ 9.54 |
Income from Investment Operations |
|
|
|
|
|
Net investment income (loss) C | (.07) | (.01) | (.03) | (.07) | (.03) F |
Net realized and unrealized gain (loss) | 2.49 | 4.65 | 1.74 | .17 | 2.24 |
Total from investment operations | 2.42 | 4.64 | 1.71 | .10 | 2.21 |
Distributions from net investment income | - | - | (.02) | - | - |
Net asset value, end of period | $ 20.60 | $ 18.18 | $ 13.54 | $ 11.85 | $ 11.75 |
Total Return A, B | 13.31% | 34.27% | 14.41% | .85% | 23.17% |
Ratios to Average Net Assets D, G |
|
|
|
|
|
Expenses before reductions | 2.13% | 2.11% | 2.13% | 2.05% | 2.08% |
Expenses net of fee waivers, if any | 2.00% | 2.00% | 2.00% | 2.00% | 2.00% |
Expenses net of all reductions | 2.00% | 1.98% | 2.00% | 1.99% | 1.99% |
Net investment income (loss) | (.33)% | (.06)% | (.24)% | (.54)% | (.24)% F |
Supplemental Data |
|
|
|
|
|
Net assets, end of period (000 omitted) | $ 1,417 | $ 2,116 | $ 2,480 | $ 3,482 | $ 4,937 |
Portfolio turnover rate E | 78% | 103% | 77% | 96% | 152% |
A Total returns would have been lower if certain expenses had not been reduced during the applicable periods shown.
B Total returns do not include the effect of the contingent deferred sales charge.
C Calculated based on average shares outstanding during the period.
D Fees and expenses of any underlying Fidelity Central Funds are not included in the Fund's expense ratio. The Fund indirectly bears its proportionate share of the expenses of any underlying Fidelity Central Funds.
E Amount does not include the portfolio activity of any underlying Fidelity Central Funds.
F Investment income per share reflects a large, non-recurring dividend which amounted to $.04 per share. Excluding this non-recurring dividend, the ratio of net investment income (loss) to average net assets would have been (.62)%.
G Expense ratios reflect operating expenses of the class. Expenses before reductions do not reflect amounts reimbursed by the investment adviser or reductions from brokerage service arrangements or reductions from other expense offset arrangements and do not represent the amount paid by the class during periods when reimbursements or reductions occur. Expenses net of fee waivers reflect expenses after reimbursement by the investment adviser but prior to reductions from brokerage service arrangements or other expense offset arrangements. Expenses net of all reductions represent the net expenses paid by the class.
See accompanying notes which are an integral part of the financial statements.
Annual Report
Financial Highlights - Class C
Years ended October 31, | 2014 | 2013 | 2012 | 2011 | 2010 |
Selected Per-Share Data |
|
|
|
|
|
Net asset value, beginning of period | $ 18.13 | $ 13.51 | $ 11.83 | $ 11.73 | $ 9.53 |
Income from Investment Operations |
|
|
|
|
|
Net investment income (loss) C | (.07) | (.01) | (.03) | (.07) | (.03) F |
Net realized and unrealized gain (loss) | 2.48 | 4.64 | 1.73 | .17 | 2.23 |
Total from investment operations | 2.41 | 4.63 | 1.70 | .10 | 2.20 |
Distributions from net investment income | - | (.01) | (.02) | - | - |
Net asset value, end of period | $ 20.54 | $ 18.13 | $ 13.51 | $ 11.83 | $ 11.73 |
Total Return A, B | 13.29% | 34.32% | 14.36% | .85% | 23.08% |
Ratios to Average Net Assets D, G |
|
|
|
|
|
Expenses before reductions | 2.06% | 2.08% | 2.10% | 2.04% | 2.08% |
Expenses net of fee waivers, if any | 2.00% | 2.00% | 2.00% | 2.00% | 2.00% |
Expenses net of all reductions | 2.00% | 1.98% | 1.99% | 1.99% | 1.99% |
Net investment income (loss) | (.33)% | (.06)% | (.24)% | (.54)% | (.24)% F |
Supplemental Data |
|
|
|
|
|
Net assets, end of period (000 omitted) | $ 17,390 | $ 14,354 | $ 9,283 | $ 8,976 | $ 9,497 |
Portfolio turnover rate E | 78% | 103% | 77% | 96% | 152% |
A Total returns would have been lower if certain expenses had not been reduced during the applicable periods shown.
B Total returns do not include the effect of the contingent deferred sales charge.
C Calculated based on average shares outstanding during the period.
D Fees and expenses of any underlying Fidelity Central Funds are not included in the Fund's expense ratio. The Fund indirectly bears its proportionate share of the expenses of any underlying Fidelity Central Funds.
E Amount does not include the portfolio activity of any underlying Fidelity Central Funds.
F Investment income per share reflects a large, non-recurring dividend which amounted to $.04 per share. Excluding this non-recurring dividend, the ratio of net investment income (loss) to average net assets would have been (.62)%.
G Expense ratios reflect operating expenses of the class. Expenses before reductions do not reflect amounts reimbursed by the investment adviser or reductions from brokerage service arrangements or reductions from other expense offset arrangements and do not represent the amount paid by the class during periods when reimbursements or reductions occur. Expenses net of fee waivers reflect expenses after reimbursement by the investment adviser but prior to reductions from brokerage service arrangements or other expense offset arrangements. Expenses net of all reductions represent the net expenses paid by the class.
See accompanying notes which are an integral part of the financial statements.
Annual Report
Financial Highlights - Institutional Class
Years ended October 31, | 2014 | 2013 | 2012 | 2011 | 2010 |
Selected Per-Share Data |
|
|
|
|
|
Net asset value, beginning of period | $ 19.09 | $ 14.22 | $ 12.34 | $ 12.21 | $ 9.88 |
Income from Investment Operations |
|
|
|
|
|
Net investment income (loss) B | .14 | .16 | .10 | .06 | .09 E |
Net realized and unrealized gain (loss) | 2.60 | 4.86 | 1.81 | .18 | 2.31 |
Total from investment operations | 2.74 | 5.02 | 1.91 | .24 | 2.40 |
Distributions from net investment income | (.09) | (.15) | (.03) | (.10) | (.06) |
Distributions from net realized gain | (.04) | - | - | (.01) | (.01) |
Total distributions | (.13) | (.15) | (.03) | (.11) | (.07) |
Net asset value, end of period | $ 21.70 | $ 19.09 | $ 14.22 | $ 12.34 | $ 12.21 |
Total Return A | 14.46% | 35.65% | 15.56% | 1.93% | 24.36% |
Ratios to Average Net Assets C, F |
|
|
|
|
|
Expenses before reductions | .97% | .96% | .99% | .97% | 1.03% |
Expenses net of fee waivers, if any | .97% | .96% | .99% | .97% | 1.00% |
Expenses net of all reductions | .97% | .94% | .99% | .96% | .99% |
Net investment income (loss) | .69% | .98% | .76% | .49% | .76% E |
Supplemental Data |
|
|
|
|
|
Net assets, end of period (000 omitted) | $ 10,011 | $ 6,405 | $ 4,080 | $ 4,869 | $ 5,894 |
Portfolio turnover rate D | 78% | 103% | 77% | 96% | 152% |
A Total returns would have been lower if certain expenses had not been reduced during the applicable periods shown.
B Calculated based on average shares outstanding during the period.
C Fees and expenses of any underlying Fidelity Central Funds are not included in the Fund's expense ratio. The Fund indirectly bears its proportionate share of the expenses of any underlying Fidelity Central Funds.
D Amount does not include the portfolio activity of any underlying Fidelity Central Funds.
E Investment income per share reflects a large, non-recurring dividend which amounted to $.04 per share. Excluding this non-recurring dividend, the ratio of net investment income (loss) to average net assets would have been .38%.
F Expense ratios reflect operating expenses of the class. Expenses before reductions do not reflect amounts reimbursed by the investment adviser or reductions from brokerage service arrangements or reductions from other expense offset arrangements and do not represent the amount paid by the class during periods when reimbursements or reductions occur. Expenses net of fee waivers reflect expenses after reimbursement by the investment adviser but prior to reductions from brokerage service arrangements or other expense offset arrangements. Expenses net of all reductions represent the net expenses paid by the class.
See accompanying notes which are an integral part of the financial statements.
Annual Report
Notes to Financial Statements
For the period ended October 31, 2014
1. Organization.
Fidelity Advisor Value Fund (the Fund) is a fund of Fidelity Advisor Series I (the Trust) and is authorized to issue an unlimited number of shares. The Trust is registered under the Investment Company Act of 1940, as amended (the 1940 Act), as an open-end management investment company organized as a Massachusetts business trust. The Fund offers Class A, Class T, Class C and Institutional Class shares, each of which, along with Class B shares, has equal rights as to assets and voting privileges. Class B shares are closed to new accounts and additional purchases, except for exchanges and reinvestments. Each class has exclusive voting rights with respect to matters that affect that class. Class B shares will automatically convert to Class A shares after a holding period of seven years from the initial date of purchase.
2. Investments in Fidelity Central Funds.
The Fund invests in Fidelity Central Funds, which are open-end investment companies generally available only to other investment companies and accounts managed by the investment adviser and its affiliates. The Fund's Schedule of Investments lists each of the Fidelity Central Funds held as of period end, if any, as an investment of the Fund, but does not include the underlying holdings of each Fidelity Central Fund. As an Investing Fund, the Fund indirectly bears its proportionate share of the expenses of the underlying Fidelity Central Funds.
The Money Market Central Funds seek preservation of capital and current income and are managed by Fidelity Investments Money Management, Inc. (FIMM), an affiliate of the investment adviser. Annualized expenses of the Money Market Central Funds as of their most recent shareholder report date are less than .01%.
A complete unaudited list of holdings for each Fidelity Central Fund is available upon request or at the Securities and Exchange Commission (the SEC) website at www.sec.gov. In addition, the financial statements of the Fidelity Central Funds, which are not covered by the Fund's Report of Independent Registered Public Accounting Firm, are available on the SEC website or upon request.
3. Significant Accounting Policies.
The financial statements have been prepared in conformity with accounting principles generally accepted in the United States of America (GAAP), which require management to make certain estimates and assumptions at the date of the financial statements. Actual results could differ from those estimates. Subsequent events, if any, through the date that the financial statements were issued have been evaluated in the preparation of
Annual Report
Notes to Financial Statements - continued
3. Significant Accounting Policies - continued
the financial statements. The following summarizes the significant accounting policies of the Fund:
Investment Valuation. Investments are valued as of 4:00 p.m. Eastern time on the last calendar day of the period. In accordance with valuation policies and procedures approved by the Board of Trustees (the Board), the Fund attempts to obtain prices from one or more third party pricing vendors or brokers to value its investments. When current market prices, quotations or currency exchange rates are not readily available or reliable, investments will be fair valued in good faith by the Fidelity Management & Research Company (FMR) Fair Value Committee (the Committee), in accordance with procedures adopted by the Board. Factors used in determining fair value vary by investment type and may include market or investment specific events, changes in interest rates and credit quality. The frequency with which these procedures are used cannot be predicted and they may be utilized to a significant extent. The Committee oversees the Fund's valuation policies and procedures and is responsible for approving and reporting to the Board all fair value determinations.
The Fund categorizes the inputs to valuation techniques used to value its investments into a disclosure hierarchy consisting of three levels as shown below:
Level 1 - quoted prices in active markets for identical investments
Level 2 - other significant observable inputs (including quoted prices for similar investments, interest rates, prepayment speeds, etc.)
Level 3 - unobservable inputs (including the Fund's own assumptions based on the best information available)
Valuation techniques used to value the Fund's investments by major category are as follows:
Equity securities, including restricted securities, for which market quotations are readily available, are valued at the last reported sale price or official closing price as reported by a third party pricing vendor on the primary market or exchange on which they are traded and are categorized as Level 1 in the hierarchy. In the event there were no sales during the day or closing prices are not available, securities are valued at the last quoted bid price or may be valued using the last available price and are generally categorized as Level 2 in the hierarchy. For foreign equity securities, when market or security specific events arise, comparisons to the valuation of American Depositary Receipts (ADRs), futures contracts, Exchange-Traded Funds (ETFs) and certain indexes as well as quoted prices for similar securities may be used and would be categorized as Level 2 in the hierarchy. Utilizing these techniques may result in transfers between Level 1 and Level 2. For equity securities, including restricted securities, where observable inputs are
Annual Report
3. Significant Accounting Policies - continued
Investment Valuation - continued
limited, assumptions about market activity and risk are used and these securities may be categorized as Level 3 in the hierarchy.
Debt securities, including restricted securities, are valued based on evaluated prices received from third party pricing vendors or from brokers who make markets in such securities. Preferred securities and U.S. government and government agency obligations are valued by pricing vendors who utilize matrix pricing which considers yield or price of bonds of comparable quality, coupon, maturity and type or by broker-supplied prices. When independent prices are unavailable or unreliable, debt securities may be valued utilizing pricing methodologies which consider similar factors that would be used by third party pricing vendors. Debt securities are generally categorized as Level 2 in the hierarchy but may be Level 3 depending on the circumstances.
Futures contracts are valued at the settlement price established each day by the board of trade or exchange on which they are traded and are categorized as Level 1 in the hierarchy. Investments in open-end mutual funds, including the Fidelity Central Funds, are valued at their closing net asset value (NAV) each business day and are categorized as Level 1 in the hierarchy.
Changes in valuation techniques may result in transfers in or out of an assigned level within the disclosure hierarchy. The aggregate value of investments by input level, as of October 31, 2014, is included at the end of the Fund's Schedule of Investments.
Foreign Currency. The Fund may use foreign currency contracts to facilitate transactions in foreign-denominated securities. Gains and losses from these transactions may arise from changes in the value of the foreign currency or if the counterparties do not perform under the contracts' terms.
Foreign-denominated assets, including investment securities, and liabilities are translated into U.S. dollars at the exchange rates at period end. Purchases and sales of investment securities, income and dividends received and expenses denominated in foreign currencies are translated into U.S. dollars at the exchange rate in effect on the transaction date.
The effects of exchange rate fluctuations on investments are included with the net realized and unrealized gain (loss) on investment securities. Other foreign currency transactions resulting in realized and unrealized gain (loss) are disclosed separately.
Investment Transactions and Income. For financial reporting purposes, the Fund's investment holdings and NAV include trades executed through the end of the last business day of the period. The NAV per share for processing shareholder transactions is calculated as of the close of business of the New York Stock Exchange (NYSE), normally
Annual Report
Notes to Financial Statements - continued
3. Significant Accounting Policies - continued
Investment Transactions and Income - continued
4:00 p.m. Eastern time and includes trades executed through the end of the prior business day. Gains and losses on securities sold are determined on the basis of identified cost and may include proceeds received from litigation. Dividend income is recorded on the ex-dividend date, except for certain dividends from foreign securities where the ex-dividend date may have passed, which are recorded as soon as the Fund is informed of the ex-dividend date. Non-cash dividends included in dividend income, if any, are recorded at the fair market value of the securities received. Income and capital gain distributions from Fidelity Central Funds, if any, are recorded on the ex-dividend date. Distributions received on securities that represent a return of capital or capital gain are recorded as a reduction of cost of investments and/or as a realized gain. Subsequent to ex-dividend date the Fund determines the components of these distributions, based upon receipt of tax filings or other correspondence relating to the underlying investment. Interest income is accrued as earned and includes coupon interest and amortization of premium and accretion of discount on debt securities as applicable. Investment income is recorded net of foreign taxes withheld where recovery of such taxes is uncertain.
Class Allocations and Expenses. Investment income, realized and unrealized capital gains and losses, common expenses of the Fund, and certain fund-level expense reductions, if any, are allocated daily on a pro-rata basis to each class based on the relative net assets of each class to the total net assets of the Fund. Each class differs with respect to transfer agent and distribution and service plan fees incurred. Certain expense reductions may also differ by class. For the reporting period, the allocated portion of income and expenses to each class as a percent of its average net assets may vary due to the timing of recording these transactions in relation to fluctuating net assets of the classes. Expenses directly attributable to a fund are charged to that fund. Expenses attributable to more than one fund are allocated among the respective funds on the basis of relative net assets or other appropriate methods. Expense estimates are accrued in the period to which they relate and adjustments are made when actual amounts are known.
Income Tax Information and Distributions to Shareholders. Each year, the Fund intends to qualify as a regulated investment company under Subchapter M of the Internal Revenue Code, including distributing substantially all of its taxable income and realized gains. As a result, no provision for U.S. Federal income taxes is required. As of October 31, 2014, the Fund did not have any unrecognized tax benefits in the financial statements; nor is the Fund aware of any tax positions for which it is reasonably possible that the total amounts of unrecognized tax benefits will significantly change in the next twelve months. The Fund files a U.S. federal tax return, in addition to state and local tax returns as required. The Fund's federal income tax returns are subject to examination by the Internal Revenue Service (IRS) for a period of three fiscal years after they are filed.
Annual Report
3. Significant Accounting Policies - continued
Income Tax Information and Distributions to Shareholders - continued
State and local tax returns may be subject to examination for an additional fiscal year depending on the jurisdiction. Foreign taxes are provided for based on the Fund's understanding of the tax rules and rates that exist in the foreign markets in which it invests.
Distributions are declared and recorded on the ex-dividend date. Income dividends and capital gain distributions are declared separately for each class. Income and capital gain distributions are determined in accordance with income tax regulations, which may differ from GAAP.
Capital accounts within the financial statements are adjusted for permanent book-tax differences. These adjustments have no impact on net assets or the results of operations. Capital accounts are not adjusted for temporary book-tax differences which will reverse in a subsequent period.
Book-tax differences are primarily due to futures contracts, foreign currency transactions, passive foreign investment companies (PFIC), partnerships, capital loss carryforwards and losses deferred due to wash sales.
The federal tax cost of investment securities and unrealized appreciation (depreciation) as of period end were as follows:
Gross unrealized appreciation | $ 13,345,781 |
Gross unrealized depreciation | (3,439,414) |
Net unrealized appreciation (depreciation) on securities | $ 9,906,367 |
|
|
Tax Cost | $ 84,926,975 |
The tax-based components of distributable earnings as of period end were as follows:
Undistributed ordinary income | $ 65,041 |
Capital loss carryforward | $ (9,896,903) |
Net unrealized appreciation (depreciation) on securities and other investments | $ 9,905,269 |
Capital loss carryforwards are only available to offset future capital gains of the Fund to the extent provided by regulations and may be limited. Under the Regulated Investment Company Modernization Act of 2010 (the Act), the Fund is permitted to carry forward capital losses incurred in taxable years beginning after December 22, 2010 for an unlimited period and such capital losses are required to be used prior to any losses that expire.
Annual Report
Notes to Financial Statements - continued
3. Significant Accounting Policies - continued
Income Tax Information and Distributions to Shareholders - continued
The capital loss carryforward information presented below, including any applicable limitation, is estimated as of fiscal period end and is subject to adjustment.
Fiscal year of expiration |
|
2017 | $ (9,896,903) |
The tax character of distributions paid was as follows:
| October 31, 2014 | October 31, 2013 |
Ordinary Income | $ 255,177 | $ 345,665 |
Restricted Securities. The Fund may invest in securities that are subject to legal or contractual restrictions on resale. These securities generally may be resold in transactions exempt from registration or to the public if the securities are registered. Disposal of these securities may involve time-consuming negotiations and expense, and prompt sale at an acceptable price may be difficult. Information regarding restricted securities is included at the end of the Fund's Schedule of Investments.
New Accounting Pronouncement. In June 2014, the Financial Accounting Standards Board issued Accounting Standard Update No. 2014-11, Repurchase-to-Maturity Transactions, Repurchase Financings, and Disclosures. The update amends the accounting for certain repurchase agreements and expands disclosure requirements for reverse repurchase agreements, securities lending and other similar transactions. The disclosure requirements are effective for annual and interim reporting periods beginning after December 15, 2014. Management is currently evaluating the impact of the Update on the Fund's financial statements and related disclosures.
4. Derivative Instruments.
Risk Exposures and the Use of Derivative Instruments. The Fund's investment objective allows the Fund to enter into various types of derivative contracts, including futures contracts. Derivatives are investments whose value is primarily derived from underlying assets, indices or reference rates and may be transacted on an exchange or over-the-counter (OTC). Derivatives may involve a future commitment to buy or sell a specified asset based on specified terms, to exchange future cash flows at periodic intervals based on a notional principal amount, or for one party to make one or more payments upon the occurrence of specified events in exchange for periodic payments from the other party.
The Fund used derivatives to increase returns and to manage exposure to certain risks as defined below. The success of any strategy involving derivatives depends on analysis of
Annual Report
4. Derivative Instruments - continued
Risk Exposures and the Use of Derivative Instruments - continued
numerous economic factors, and if the strategies for investment do not work as intended, the Fund may not achieve its objectives.
The Fund's use of derivatives increased or decreased its exposure to the following risk:
Equity Risk | Equity risk relates to the fluctuations in the value of financial instruments as a result of changes in market prices (other than those arising from interest rate risk or foreign exchange risk), whether caused by factors specific to an individual investment, its issuer, or all factors affecting all instruments traded in a market or market segment. |
The Fund is also exposed to additional risks from investing in derivatives, such as liquidity risk and counterparty credit risk. Liquidity risk is the risk that the Fund will be unable to close out the derivative in the open market in a timely manner. Counterparty credit risk is the risk that the counterparty will not be able to fulfill its obligation to the Fund. Counterparty credit risk related to exchange-traded futures contracts may be mitigated by the protection provided by the exchange on which they trade.
Investing in derivatives may involve greater risks than investing in the underlying assets directly and, to varying degrees, may involve risk of loss in excess of any initial investment and collateral received and amounts recognized in the Statement of Assets and Liabilities. In addition, there may be the risk that the change in value of the derivative contract does not correspond to the change in value of the underlying instrument.
Futures Contracts. A futures contract is an agreement between two parties to buy or sell a specified underlying instrument for a fixed price at a specified future date. The Fund used futures contracts to manage its exposure to the stock market.
Upon entering into a futures contract, a fund is required to deposit either cash or securities (initial margin) with a clearing broker in an amount equal to a certain percentage of the face value of the contract. Futures contracts are marked-to-market daily and subsequent daily payments (variation margin) are made or received by a fund depending on the daily fluctuations in the value of the futures contracts and are recorded as unrealized appreciation or (depreciation). This receivable and/or payable, if any, is included in daily variation margin for derivative instruments in the Statement of Assets and Liabilities. Realized gain or (loss) is recorded upon the expiration or closing of a futures contract.
Any open futures contracts at period end are presented in the Schedule of Investments under the caption "Futures Contracts." The underlying face amount at value reflects each contract's exposure to the underlying instrument or index at period end and is representative of volume of activity during the period. Securities deposited to meet initial margin requirements are identified in the Schedule of Investments.
Annual Report
Notes to Financial Statements - continued
4. Derivative Instruments - continued
Futures Contracts - continued
During the period the Fund recognized net realized gain (loss) of $(75,121) and a change in net unrealized appreciation (depreciation) of $(24,736) related to its investment in futures contracts. These amounts are included in the Statement of Operations.
5. Purchases and Sales of Investments.
Purchases and sales of securities, other than short-term securities, aggregated $69,973,672 and $65,695,686, respectively.
6. Fees and Other Transactions with Affiliates.
Management Fee. Fidelity Management & Research Company (the investment adviser) and its affiliates provide the Fund with investment management related services for which the Fund pays a monthly management fee. The management fee is the sum of an individual fund fee rate that is based on an annual rate of .30% of the Fund's average net assets and an annualized group fee rate that averaged .25% during the period. The group fee rate is based upon the average net assets of all the mutual funds advised by the investment adviser, including any mutual funds previously advised by the investment adviser that are currently advised by Fidelity SelectCo, LLC, an affiliate of the investment adviser. The group fee rate decreases as assets under management increase and increases as assets under management decrease. In addition, the management fee is subject to a performance adjustment (up to a maximum of ± .20% of the Fund's average net assets over a 36 month performance period). The upward or downward adjustment to the management fee is based on the relative investment performance of the Institutional Class of the Fund as compared to its benchmark index, the Russell Midcap Value Index, over the same 36 month performance period. For the reporting period, the total annual management fee rate, including the performance adjustment, was .53% of the Fund's average net assets. The performance adjustment included in the management fee rate may be higher or lower than the maximum performance adjustment rate due to the difference between the average net assets for the reporting and performance periods.
Distribution and Service Plan Fees. In accordance with Rule 12b-1 of the 1940 Act, the Fund has adopted separate Distribution and Service Plans for each class of shares. Certain classes pay Fidelity Distributors Corporation (FDC), an affiliate of the investment adviser, separate Distribution and Service Fees, each of which is based on an annual percentage of each class' average net assets. In addition, FDC may pay financial intermediaries for selling shares of the Fund and providing shareholder support services.
Annual Report
6. Fees and Other Transactions with Affiliates - continued
Distribution and Service Plan Fees - continued
For the period, the Distribution and Service Fee rates, total fees and amounts retained by FDC were as follows:
| Distribution | Service | Total Fees | Retained |
Class A | -% | .25% | $ 105,951 | $ 1,752 |
Class T | .25% | .25% | 91,376 | 247 |
Class B | .75% | .25% | 18,043 | 13,716 |
Class C | .75% | .25% | 168,572 | 29,286 |
|
|
| $ 383,942 | $ 45,001 |
Sales Load. FDC may receive a front-end sales charge of up to 5.75% for selling Class A shares and 3.50% for selling Class T shares, some of which is paid to financial intermediaries for selling shares of the Fund. Depending on the holding period, FDC may receive contingent deferred sales charges levied on Class A, Class T, Class B, and Class C redemptions. The deferred sales charges range from 5.00% to 1.00% for Class B shares, 1.00% for Class C shares, 1.00% for certain purchases of Class A shares and .25% for certain purchases of Class T shares.
For the period, sales charge amounts retained by FDC were as follows:
| Retained |
Class A | $ 14,231 |
Class T | 3,718 |
Class B* | 1,208 |
Class C* | 2,114 |
| $ 21,271 |
* When Class B and Class C shares are initially sold, FDC pays commissions from its own resources to financial intermediaries through which the sales are made.
Transfer Agent Fees. Fidelity Investments Institutional Operations Company, Inc., (FIIOC), an affiliate of the investment adviser, is the transfer, dividend disbursing and shareholder servicing agent for each class of the Fund. FIIOC receives account fees and asset-based fees that vary according to the account size and type of account of the shareholders of the respective classes of the Fund. FIIOC pays for typesetting, printing and mailing of shareholder reports, except proxy statements.
Annual Report
Notes to Financial Statements - continued
6. Fees and Other Transactions with Affiliates - continued
Transfer Agent Fees - continued
For the period, transfer agent fees for each class were as follows:
| Amount | % of |
Class A | $ 96,564 | .23 |
Class T | 46,937 | .26 |
Class B | 5,460 | .30 |
Class C | 43,003 | .25 |
Institutional Class | 12,467 | .17 |
| $ 204,431 |
|
Accounting and Security Lending Fees. Fidelity Service Company, Inc. (FSC), an affiliate of the investment adviser, maintains the Fund's accounting records. The accounting fee is based on the level of average net assets for each month. Under a separate contract, FSC administers the security lending program. The security lending fee is based on the number and duration of lending transactions.
Brokerage Commissions. The Fund placed a portion of its portfolio transactions with brokerage firms which are affiliates of the investment adviser. Brokerage commissions are included in net realized gain (loss) and change in net unrealized appreciation (depreciation) in the Statement of Operations. The commissions paid to these affiliated firms were $1,811 for the period.
Other. During the period, the investment adviser reimbursed the Fund for certain losses in the amount of $3,208.
7. Committed Line of Credit.
The Fund participates with other funds managed by the investment adviser or an affiliate in a $4.25 billion credit facility (the "line of credit") to be utilized for temporary or emergency purposes to fund shareholder redemptions or for other short-term liquidity purposes. The Fund has agreed to pay commitment fees on its pro-rata portion of the line of credit, which amounted to $137 and is reflected in Miscellaneous expenses on the Statement of Operations. During the period, the Fund did not borrow on this line of credit.
8. Security Lending.
The Fund lends portfolio securities through a lending agent from time to time in order to earn additional income. For equity securities, a lending agent is used and may loan securities to certain qualified borrowers, including Fidelity Capital Markets (FCM), a
Annual Report
8. Security Lending - continued
broker-dealer affiliated with the Fund. On the settlement date of the loan, the Fund receives collateral (in the form of U.S. Treasury obligations, letters of credit and/or cash) against the loaned securities and maintains collateral in an amount not less than 100% of the market value of the loaned securities during the period of the loan. The market value of the loaned securities is determined at the close of business of the Fund and any additional required collateral is delivered to the Fund on the next business day. If the borrower defaults on its obligation to return the securities loaned because of insolvency or other reasons, the Fund may apply collateral received from the borrower against the obligation. The Fund may experience delays and costs in recovering the securities loaned. Any cash collateral received is invested in the Fidelity Securities Lending Cash Central Fund. The value of loaned securities and cash collateral at period end are disclosed on the Fund's Statement of Assets and Liabilities. At period end, there were no security loans outstanding with FCM. Security lending income represents the income earned on investing cash collateral, less rebates paid to borrowers and any lending agent fees associated with the loan, plus any premium payments received for lending certain types of securities. Security lending income is presented in the Statement of Operations as a component of income from Fidelity Central Funds. Total security lending income during the period amounted to $10,960, including $106 from securities loaned to FCM.
9. Expense Reductions.
The investment adviser voluntarily agreed to reimburse each class to the extent annual operating expenses exceeded certain levels of average net assets as noted in the table below. Some expenses, for example interest expense, including commitment fees, are excluded from this reimbursement.
The following classes were in reimbursement during the period:
| Expense | Reimbursement |
Class A | 1.25% | $ 15,952 |
Class T | 1.50% | 12,616 |
Class B | 2.00% | 2,366 |
Class C | 2.00% | 10,070 |
|
| $ 41,004 |
Commissions paid to certain brokers with whom the investment adviser, or its affiliates, places trades on behalf of the Fund include an amount in addition to trade execution, which may be rebated back to the Fund to offset certain expenses. This amount totaled $3,180 for the period. In addition, through arrangements with the Fund's custodian, credits realized as a result of uninvested cash balances were used to reduce the Fund's expenses. During the period, these credits reduced the Fund's custody expenses by $25.
Annual Report
Notes to Financial Statements - continued
10. Distributions to Shareholders.
Distributions to shareholders of each class were as follows:
Years ended October 31, | 2014 | 2013 |
From net investment income |
|
|
Class A | $ 83,047 | $ 223,873 |
Class T | - | 71,100 |
Class C | - | 8,906 |
Institutional Class | 29,205 | 41,786 |
Total | $ 112,252 | $ 345,665 |
From net realized gain |
|
|
Class A | $ 89,124 | $ - |
Class T | 39,363 | - |
Institutional Class | 14,438 | - |
Total | $ 142,925 | $ - |
11. Share Transactions.
Share transactions for each class were as follows and may contain automatic conversions between classes or exchanges between funds:
| Shares | Dollars | ||
Years ended October 31, | 2014 | 2013 | 2014 | 2013 |
Class A |
|
|
|
|
Shares sold | 645,072 | 661,325 | $ 13,268,279 | $ 11,066,745 |
Reinvestment of distributions | 8,091 | 14,139 | 155,015 | 202,243 |
Shares redeemed | (554,574) | (619,275) | (11,319,595) | (10,353,339) |
Net increase (decrease) | 98,589 | 56,189 | $ 2,103,699 | $ 915,649 |
Class T |
|
|
|
|
Shares sold | 161,059 | 183,578 | $ 3,267,392 | $ 3,054,837 |
Reinvestment of distributions | 2,020 | 4,868 | 38,408 | 69,164 |
Shares redeemed | (215,769) | (175,709) | (4,328,239) | (2,895,363) |
Net increase (decrease) | (52,690) | 12,737 | $ (1,022,439) | $ 228,638 |
Class B |
|
|
|
|
Shares sold | 2,813 | 16,969 | $ 54,581 | $ 251,841 |
Shares redeemed | (50,387) | (83,730) | (990,350) | (1,299,094) |
Net increase (decrease) | (47,574) | (66,761) | $ (935,769) | $ (1,047,253) |
Class C |
|
|
|
|
Shares sold | 339,964 | 286,749 | $ 6,682,150 | $ 4,683,936 |
Reinvestment of distributions | - | 588 | - | 8,189 |
Shares redeemed | (285,178) | (182,473) | (5,539,053) | (2,936,174) |
Net increase (decrease) | 54,786 | 104,864 | $ 1,143,097 | $ 1,755,951 |
Annual Report
11. Share Transactions - continued
| Shares | Dollars | ||
Years ended October 31, | 2014 | 2013 | 2014 | 2013 |
Institutional Class |
|
|
|
|
Shares sold | 305,064 | 121,561 | $ 6,333,952 | $ 2,027,800 |
Reinvestment of distributions | 1,763 | 2,173 | 34,039 | 31,289 |
Shares redeemed | (181,045) | (75,216) | (3,727,393) | (1,227,013) |
Net increase (decrease) | 125,782 | 48,518 | $ 2,640,598 | $ 832,076 |
12. Other.
The Fund's organizational documents provide former and current trustees and officers with a limited indemnification against liabilities arising in connection with the performance of their duties to the Fund. In the normal course of business, the Fund may also enter into contracts that provide general indemnifications. The Fund's maximum exposure under these arrangements is unknown as this would be dependent on future claims that may be made against the Fund. The risk of material loss from such claims is considered remote.
Annual Report
Report of Independent Registered Public Accounting Firm
To the Trustees of Fidelity Advisor Series I and Shareholders of Fidelity Advisor Value Fund:
We have audited the accompanying statement of assets and liabilities of Fidelity Advisor Value Fund (the Fund), a fund of Fidelity Advisor Series I, including the schedule of investments, as of October 31, 2014, and the related statement of operations for the year then ended, the statement of changes in net assets for each of the two years in the period then ended, and the financial highlights for each of the five years in the period then ended. These financial statements and financial highlights are the responsibility of the Fund's management. Our responsibility is to express an opinion on these financial statements and financial highlights based on our audits.
We conducted our audits in accordance with the standards of the Public Company Accounting Oversight Board (United States). Those standards require that we plan and perform the audit to obtain reasonable assurance about whether the financial statements and financial highlights are free of material misstatement. The Fund is not required to have, nor were we engaged to perform, an audit of its internal control over financial reporting. Our audits included consideration of internal control over financial reporting as a basis for designing audit procedures that are appropriate in the circumstances, but not for the purpose of expressing an opinion on the effectiveness of the Fund's internal control over financial reporting. Accordingly, we express no such opinion. An audit also includes examining, on a test basis, evidence supporting the amounts and disclosures in the financial statements, assessing the accounting principles used and significant estimates made by management, as well as evaluating the overall financial statement presentation. Our procedures included confirmation of securities owned as of October 31, 2014, by correspondence with the custodians and brokers; where replies were not received from brokers, we performed other auditing procedures. We believe that our audits provide a reasonable basis for our opinion.
In our opinion, the financial statements and financial highlights referred to above present fairly, in all material respects, the financial position of Fidelity Advisor Value Fund as of October 31, 2014, the results of its operations for the year then ended, the changes in its net assets for each of the two years in the period then ended, and the financial highlights for each of the five years in the period then ended, in conformity with accounting principles generally accepted in the United States of America.
DELOITTE & TOUCHE LLP
Boston, Massachusetts
December 16, 2014
Annual Report
Trustees and Officers
The Trustees, Member of the Advisory Board, and officers of the trust and fund, as applicable, are listed below. The Board of Trustees governs the fund and is responsible for protecting the interests of shareholders. The Trustees are experienced executives who meet periodically throughout the year to oversee the fund's activities, review contractual arrangements with companies that provide services to the fund, oversee management of the risks associated with such activities and contractual arrangements, and review the fund's performance. Except for James C. Curvey, each of the Trustees oversees 174 funds. Mr. Curvey oversees 407 funds.
The Trustees hold office without limit in time except that (a) any Trustee may resign; (b) any Trustee may be removed by written instrument, signed by at least two-thirds of the number of Trustees prior to such removal; (c) any Trustee who requests to be retired or who has become incapacitated by illness or injury may be retired by written instrument signed by a majority of the other Trustees; and (d) any Trustee may be removed at any special meeting of shareholders by a two-thirds vote of the outstanding voting securities of the trust. Each Trustee who is not an interested person (as defined in the 1940 Act) of the trust and the fund (Independent Trustee), shall retire not later than the last day of the calendar year in which his or her 75th birthday occurs. The Independent Trustees may waive this mandatory retirement age policy with respect to individual Trustees. The officers and Advisory Board Member hold office without limit in time, except that any officer and Advisory Board Member may resign or may be removed by a vote of a majority of the Trustees at any regular meeting or any special meeting of the Trustees. Except as indicated, each individual has held the office shown or other offices in the same company for the past five years.
Experience, Skills, Attributes, and Qualifications of the Fund's Trustees. The Governance and Nominating Committee has adopted a statement of policy that describes the experience, qualifications, attributes, and skills that are necessary and desirable for potential Independent Trustee candidates (Statement of Policy). The Board believes that each Trustee satisfied at the time he or she was initially elected or appointed a Trustee, and continues to satisfy, the standards contemplated by the Statement of Policy. The Governance and Nominating Committee also engages professional search firms to help identify potential Independent Trustee candidates who have the experience, qualifications, attributes, and skills consistent with the Statement of Policy. From time to time, additional criteria based on the composition and skills of the current Independent Trustees, as well as experience or skills that may be appropriate in light of future changes to board composition, business conditions, and regulatory or other developments, have also been considered by the professional search firms and the Governance and Nominating Committee. In addition, the Board takes into account the Trustees' commitment and participation in Board and committee meetings, as well as their leadership of standing and ad hoc committees throughout their tenure.
In determining that a particular Trustee was and continues to be qualified to serve as a Trustee, the Board has considered a variety of criteria, none of which, in isolation, was controlling. The Board believes that, collectively, the Trustees have balanced and diverse experience, qualifications, attributes, and skills, which allow the Board to operate effectively in governing the fund and protecting the interests of shareholders. Information about the specific experience, skills, attributes, and qualifications of each Trustee, which in each case led to the Board's conclusion that the Trustee should serve (or continue to serve) as a trustee of the fund, is provided below.
Annual Report
Trustees and Officers - continued
Board Structure and Oversight Function. James C. Curvey is an interested person (as defined in the 1940 Act) and currently serves as Chairman. The Trustees have determined that an interested Chairman is appropriate and benefits shareholders because an interested Chairman has a personal and professional stake in the quality and continuity of services provided to the fund. Independent Trustees exercise their informed business judgment to appoint an individual of their choosing to serve as Chairman, regardless of whether the Trustee happens to be independent or a member of management. The Independent Trustees have determined that they can act independently and effectively without having an Independent Trustee serve as Chairman and that a key structural component for assuring that they are in a position to do so is for the Independent Trustees to constitute a substantial majority for the Board. The Independent Trustees also regularly meet in executive session. Ned C. Lautenbach serves as Chairman of the Independent Trustees and as such (i) acts as a liaison between the Independent Trustees and management with respect to matters important to the Independent Trustees and (ii) with management prepares agendas for Board meetings.
Fidelity funds are overseen by different Boards of Trustees. The fund's Board oversees Fidelity's equity and high income funds and another Board oversees Fidelity's investment-grade bond, money market, and asset allocation funds. The asset allocation funds may invest in Fidelity funds overseen by the fund's Board. The use of separate Boards, each with its own committee structure, allows the Trustees of each group of Fidelity funds to focus on the unique issues of the funds they oversee, including common research, investment, and operational issues. On occasion, the separate Boards establish joint committees to address issues of overlapping consequences for the Fidelity funds overseen by each Board.
The Trustees operate using a system of committees to facilitate the timely and efficient consideration of all matters of importance to the Trustees, the fund, and fund shareholders and to facilitate compliance with legal and regulatory requirements and oversight of the fund's activities and associated risks. The Board, acting through its committees, has charged FMR and its affiliates with (i) identifying events or circumstances the occurrence of which could have demonstrably adverse effects on the fund's business and/or reputation; (ii) implementing processes and controls to lessen the possibility that such events or circumstances occur or to mitigate the effects of such events or circumstances if they do occur; and (iii) creating and maintaining a system designed to evaluate continuously business and market conditions in order to facilitate the identification and implementation processes described in (i) and (ii) above. Because the day-to-day operations and activities of the fund are carried out by or through FMR, its affiliates and other service providers, the fund's exposure to risks is mitigated but not eliminated by the processes overseen by the Trustees. While each of the Board's committees has responsibility for overseeing different aspects of the fund's activities, oversight is exercised primarily through the Operations, Audit, and Compliance Committees. In addition, the Independent Trustees have worked with FMR to enhance the Board's oversight of investment and financial risks, legal and regulatory risks, technology risks, and operational risks, including the development of additional risk reporting to the Board. For example, a working group comprised of Independent Trustees and FMR has worked and continues to work to review the Fidelity funds' valuation-related activities, reporting and risk management. Appropriate personnel, including but not limited to the fund's Chief Compliance Officer (CCO), FMR's internal auditor, the independent accountants, the fund's Treasurer and portfolio management personnel, make periodic reports to the Board's committees, as appropriate, including an annual review of FMR's risk management program for the Fidelity funds. The responsibilities of each standing committee, including their oversight responsibilities, are described further under "Standing Committees of the Fund's Trustees."
Annual Report
The fund's Statement of Additional Information (SAI) includes more information about the Trustees. To request a free copy, call Fidelity at 1-877-208-0098.
Interested Trustees*:
Correspondence intended for each Trustee who is an interested person may be sent to Fidelity Investments, 245 Summer Street, Boston, Massachusetts 02210.
Name, Year of Birth; Principal Occupations and Other Relevant Experience+ | |
James C. Curvey (1935) | |
Year of Election or Appointment: 2007 Trustee Chairman of the Board of Trustees | |
| Mr. Curvey also serves as Trustee of other Fidelity funds. Mr. Curvey is a Director of Fidelity Research & Analysis Co. (2009-present), and Vice Chairman (2007-present) and Director of FMR LLC. In addition, Mr. Curvey serves as an Overseer for the Boston Symphony Orchestra and a member of the board of Artis-Naples, Naples, Florida, and as a Trustee for Brewster Academy, Wolfeboro, New Hampshire. Previously, Mr. Curvey served as a Director of Fidelity Investments Money Management, Inc. (2009-2014), a Director of FMR (2007-2014), and a Director of FMR Co., Inc. (2007-2014). |
Charles S. Morrison (1960) | |
Year of Election or Appointment: 2014 Trustee | |
| Mr. Morrison also serves as Trustee of other funds. He serves as a Director of Fidelity Investments Money Management, Inc. (FIMM) (2014-present), Director of Fidelity SelectCo, LLC (2014-present), President, Asset Management (2014-present), and is an employee of Fidelity Investments. Previously, Mr. Morrison served as Vice President of Fidelity's Fixed Income and Asset Allocation Funds (2012-2014), President, Fixed Income (2011-2014), Vice President of Fidelity's Money Market Funds (2005-2009), President, Money Market Group Leader of FMR (2009), and Senior Vice President, Money Market Group of FMR (2004-2009). Mr. Morrison also served as Vice President of Fidelity's Bond Funds (2002-2005), certain Balanced Funds (2002-2005), and certain Asset Allocation Funds (2002-2007), and as Senior Vice President (2002-2005) of Fidelity's Bond Division. |
* Trustees have been determined to be "Interested Trustees" by virtue of, among other things, their affiliation with the trust or various entities under common control with FMR.
+ The information above includes each Trustee's principal occupation during the last five years and other information relating to the experience, attributes, and skills relevant to each Trustee's qualifications to serve as a Trustee, which led to the conclusion that each Trustee should serve as a Trustee for the fund.
Annual Report
Independent Trustees:
Correspondence intended for each Independent Trustee (that is, the Trustees other than the Interested Trustees) may be sent to Fidelity Investments, P.O. Box 55235, Boston, Massachusetts 02205-5235.
Name, Year of Birth; Principal Occupations and Other Relevant Experience+ | |
Dennis J. Dirks (1948) | |
Year of Election or Appointment: 2005 Trustee | |
| Mr. Dirks also serves as Trustee of other Fidelity funds. Prior to his retirement in May 2003, Mr. Dirks was Chief Operating Officer and a member of the Board of The Depository Trust & Clearing Corporation (DTCC). He also served as President, Chief Operating Officer, and Board member of The Depository Trust Company (DTC) and President and Board member of the National Securities Clearing Corporation (NSCC). In addition, Mr. Dirks served as Chief Executive Officer and Board member of the Government Securities Clearing Corporation, Chief Executive Officer and Board member of the Mortgage-Backed Securities Clearing Corporation, as a Trustee and a member of the Finance Committee of Manhattan College (2005-2008), and as a Trustee and a member of the Finance Committee of AHRC of Nassau County (2006-2008). Mr. Dirks is a member of the Independent Directors Council (IDC) Governing Council (2010-present) and Board of Directors for The Brookville Center for Children's Services, Inc. (2009-present). |
Alan J. Lacy (1953) | |
Year of Election or Appointment: 2008 Trustee | |
| Mr. Lacy also serves as Trustee of other Fidelity funds. Mr. Lacy serves as Senior Adviser (2007-present) of Oak Hill Capital Partners, L.P. (private equity). Mr. Lacy also served as Chief Executive Officer (2000-2005) and Vice Chairman (2005-2006) of Sears Holdings Corporation and Sears, Roebuck and Co. (retail). In addition, Mr. Lacy serves as a member of the Board of Directors of Dave & Buster's Entertainment, Inc. (restaurant and entertainment complexes, 2010-present), Earth Fare, Inc. (retail grocery, 2012-present), The Hillman Companies, Inc. (hardware wholesalers, 2010-present), and Bristol-Myers Squibb Company (global pharmaceuticals, 2008-present). Mr. Lacy is a member of the Board of Trustees of The National Parks Conservation Association (2006-present). Previously, Mr. Lacy served as Chairman of the Board of Trustees of the National Parks Conservation Association (2008-2011) and as a member of the Board of Directors for the Western Union Company (global money transfer, 2006-2011). |
Ned C. Lautenbach (1944) | |
Year of Election or Appointment: 2000 Trustee Chairman of the Independent Trustees | |
| Mr. Lautenbach also serves as Trustee of other Fidelity funds. Mr. Lautenbach currently serves as the Lead Director of the Eaton Corporation Board of Directors (diversified industrial, 1997-present). Mr. Lautenbach is Chairman of the Board of Directors of the Philharmonic Center for the Arts in Naples, Florida (2012-present) and a member of the Council on Foreign Relations (1994-present). Previously, Mr. Lautenbach was a Partner/Advisory Partner at Clayton, Dubilier & Rice, LLC (private equity investment, 1998-2010), as well as a Director of Sony Corporation (2006-2007). |
Joseph Mauriello (1944) | |
Year of Election or Appointment: 2008 Trustee | |
| Mr. Mauriello also serves as Trustee of other Fidelity funds. Prior to his retirement in January 2006, Mr. Mauriello served in numerous senior management positions including Deputy Chairman and Chief Operating Officer (2004-2005), and Vice Chairman of Financial Services (2002-2004) of KPMG LLP US (professional services, 1965-2005). Mr. Mauriello currently serves as a member of the Board of Directors of XL Group plc. (global insurance and re-insurance, 2006-present). Previously, Mr. Mauriello served as a Director of the Hamilton Funds of the Bank of New York (2006-2007) and of Arcadia Resources Inc. (health care services and products, 2007-2012). |
Robert W. Selander (1950) | |
Year of Election or Appointment: 2011 Trustee | |
| Mr. Selander also serves as Trustee of other Fidelity funds. Previously, Mr. Selander served as a Member of the Advisory Board of other Fidelity funds (2011), and Executive Vice Chairman (2010), Chief Executive Officer (2009-2010), and President and Chief Executive Officer (1997-2009) of Mastercard, Inc. |
Cornelia M. Small (1944) | |
Year of Election or Appointment: 2005 Trustee | |
| Ms. Small also serves as Trustee of other Fidelity funds. Ms. Small is a member of the Board of Directors (2009-present) and Chair of the Investment Committee (2010-present) of the Teagle Foundation. Ms. Small also serves on the Investment Committee of the Berkshire Taconic Community Foundation (2008-present). Previously, Ms. Small served as Chairperson (2002-2008) and a member of the Investment Committee and Chairperson (2008-2012) and a member of the Board of Trustees of Smith College. In addition, Ms. Small served as Chief Investment Officer, Director of Global Equity Investments, and a member of the Board of Directors of Scudder, Stevens & Clark and Scudder Kemper Investments. |
William S. Stavropoulos (1939) | |
Year of Election or Appointment: 2002 Trustee Vice Chairman of the Independent Trustees | |
| Mr. Stavropoulos also serves as Trustee of other Fidelity funds. Mr. Stavropoulos serves as President and Founder of the Michigan Baseball Foundation, the Great Lakes Loons (2007-present). Mr. Stavropoulos is Chairman Emeritus of the Board of Directors of The Dow Chemical Company, where he previously served in numerous senior management positions, including President, CEO (1995-2000; 2002-2004), Chairman of the Executive Committee (2000-2006), and as a member of the Board of Directors (1990-2006). Currently, Mr. Stavropoulos is Chairman of the Board of Directors of Univar Inc. (global distributor of commodity and specialty chemicals), a Director of Teradata Corporation (data warehousing and technology solutions), and Maersk Inc. (industrial conglomerate), and a member of the Advisory Board for Metalmark Capital LLC (private equity investment, 2005-present). Mr. Stavropoulos is an operating advisor to Clayton, Dubilier & Rice, LLC (private equity investment). In addition, Mr. Stavropoulos is a member of the University of Notre Dame Advisory Council for the College of Science, a Trustee of the Rollin L. Gerstacker Foundation, and a Director of the Naples Philharmonic Center for the Arts. Previously, Mr. Stavropoulos served as a Director of Chemical Financial Corporation (bank holding company, 1993-2012) and Tyco International, Ltd. (multinational manufacturing and services, 2007-2012). |
David M. Thomas (1949) | |
Year of Election or Appointment: 2008 Trustee | |
| Mr. Thomas also serves as Trustee of other Fidelity funds. Mr. Thomas serves as Non-Executive Chairman of the Board of Directors of Fortune Brands Home and Security (home and security products, 2011-present), and as a member of the Board of Directors of Interpublic Group of Companies, Inc. (marketing communication, 2004-present). Previously, Mr. Thomas served as Executive Chairman (2005-2006) and Chairman and Chief Executive Officer (2000-2005) of IMS Health, Inc. (pharmaceutical and healthcare information solutions), and a Director of Fortune Brands, Inc. (consumer products, 2000-2011). |
+ The information above includes each Trustee's principal occupation during the last five years and other information relating to the experience, attributes, and skills relevant to each Trustee's qualifications to serve as a Trustee, which led to the conclusion that each Trustee should serve as a Trustee for the fund.
Advisory Board Member and Officers:
Correspondence intended for each officer and Peter S. Lynch may be sent to Fidelity Investments, 245 Summer Street, Boston, Massachusetts 02210. Officers appear below in alphabetical order.
Name, Year of Birth; Principal Occupation | |
Peter S. Lynch (1944) | |
Year of Election or Appointment: 2003 Member of the Advisory Board | |
| Mr. Lynch also serves as Member of the Advisory Board of other Fidelity funds. Mr. Lynch is Vice Chairman and a Director of FMR and FMR Co., Inc. In addition, Mr. Lynch serves as a Trustee of Boston College and as the Chairman of the Inner-City Scholarship Fund. Previously, Mr. Lynch served on the Special Olympics International Board of Directors (1997-2006). |
Elizabeth Paige Baumann (1968) | |
Year of Election or Appointment: 2012 Anti-Money Laundering (AML) Officer | |
| Ms. Baumann also serves as AML Officer of other funds. She is Chief AML Officer of FMR LLC (2012-present) and is an employee of Fidelity Investments. Previously, Ms. Baumann served as Vice President and Deputy Anti-Money Laundering Officer (2007-2012). |
William C. Coffey (1969) | |
Year of Election or Appointment: 2009 Assistant Secretary | |
| Mr. Coffey also serves as Assistant Secretary of other funds. He is Senior Vice President and Deputy General Counsel of FMR LLC (2010-present), and is an employee of Fidelity Investments. Previously, Mr. Coffey served as Vice President and Associate General Counsel of FMR LLC (2005-2009). |
Jonathan Davis (1968) | |
Year of Election or Appointment: 2010 Assistant Treasurer | |
| Mr. Davis also serves as Assistant Treasurer of other funds. Mr. Davis is an employee of Fidelity Investments. Previously, Mr. Davis served as Vice President and Associate General Counsel of FMR LLC (2003-2010). |
Adrien E. Deberghes (1967) | |
Year of Election or Appointment: 2008 Deputy Treasurer | |
| Mr. Deberghes also serves as an officer of other funds. He is an employee of Fidelity Investments (2008-present). Prior to joining Fidelity Investments, Mr. Deberghes was Senior Vice President of Mutual Fund Administration at State Street Corporation (2007-2008), Senior Director of Mutual Fund Administration at Investors Bank & Trust (2005-2007), and Director of Finance for Dunkin' Brands (2000-2005). |
Stephanie J. Dorsey (1969) | |
Year of Election or Appointment: 2010 Assistant Treasurer | |
| Ms. Dorsey also serves as an officer of other funds. She is an employee of Fidelity Investments (2008-present) and has served in other fund officer roles. Prior to joining Fidelity Investments, Ms. Dorsey served as Treasurer (2004-2008) of the JPMorgan Mutual Funds and Vice President (2004-2008) of JPMorgan Chase Bank. |
Howard J. Galligan III (1966) | |
Year of Election or Appointment: 2014 Chief Financial Officer | |
| Mr. Galligan also serves as Chief Financial Officer of other funds. Mr. Galligan serves as President of Fidelity Pricing and Cash Management Services (FPCMS) (2014-present) and as a Director of Strategic Advisers, Inc. (2008-present). Previously, Mr. Galligan served as Chief Administrative Officer of Asset Management (2011-2014) and Chief Operating Officer and Senior Vice President of Investment Support for Strategic Advisers, Inc. (2003-2011). |
Scott C. Goebel (1968) | |
Year of Election or Appointment: 2008 Secretary and Chief Legal Officer (CLO) | |
| Mr. Goebel serves as Secretary and CLO of other funds. Mr. Goebel also serves as Secretary of Fidelity SelectCo, LLC (2013-present), Fidelity Investments Money Management, Inc. (FIMM) (2010-present) and Fidelity Research and Analysis Company (FRAC) (2010-present); General Counsel, Secretary, and Senior Vice President of FMR (2008-present) and FMR Co., Inc. (2008-present); Chief Legal Officer of Fidelity Management & Research (Hong Kong) Limited (2008-present); and Assistant Secretary of Fidelity Management & Research (Japan) Limited (2008-present) and Fidelity Management & Research (U.K.) Inc. (2008-present). Previously, Mr. Goebel served as Secretary and CLO of other Fidelity funds (2008-2013), Assistant Secretary of FIMM (2008-2010), FRAC (2008-2010), and certain funds (2007-2008); and as Vice President and Secretary of Fidelity Distributors Corporation (FDC) (2005-2007). Mr. Goebel has been employed by FMR LLC or an affiliate since 2001. |
Thomas C. Hense (1964) | |
Year of Election or Appointment: 2008/2010 Vice President | |
| Mr. Hense also serves as Vice President of other funds (High Income (2008), Small Cap (2008), and Value (2010) funds). Previously, Mr. Hense served as a portfolio manager for Fidelity's Institutional Money Management Group (Pyramis) (2003-2008). |
Brian B. Hogan (1964) | |
Year of Election or Appointment: 2009 Vice President | |
| Mr. Hogan also serves as Trustee or Vice President of other funds. Mr. Hogan serves as a Director of Fidelity SelectCo, LLC (2014-present) and President of FMR's Equity Division (2009-present). Previously, Mr. Hogan served as Senior Vice President, Equity Research of FMR (2006-2009) and as a portfolio manager. |
Chris Maher (1972) | |
Year of Election or Appointment: 2013 Assistant Treasurer | |
| Mr. Maher serves as Assistant Treasurer of other funds. Mr. Maher is Vice President of Valuation Oversight and is an employee of Fidelity Investments. Previously, Mr. Maher served as Vice President of Asset Management Compliance (2013), Vice President of FMR's Program Management Group (2010-2013), and Vice President of Valuation Oversight (2008-2010). |
Kenneth B. Robins (1969) | |
Year of Election or Appointment: 2008 President and Treasurer | |
| Mr. Robins also serves as an officer of other funds. Mr. Robins serves as Executive Vice President of Fidelity Investments Money Management, Inc. (FIMM) (2013-present) and is an employee of Fidelity Investments (2004-present). Previously, Mr. Robins served in other fund officer roles. |
Stephen Sadoski (1971) | |
Year of Election or Appointment: 2012 Deputy Treasurer | |
| Mr. Sadoski also serves as Deputy Treasurer of other funds. He is an employee of Fidelity Investments (2012-present) and has served in another fund officer role. Prior to joining Fidelity Investments, Mr. Sadoski served as an assistant chief accountant in the Division of Investment Management of the Securities and Exchange Commission (SEC) (2009-2012) and as a senior manager at Deloitte & Touche LLP (1997-2009). |
Stacie M. Smith (1974) | |
Year of Election or Appointment: 2013 Deputy Treasurer | |
| Ms. Smith also serves as an officer of other funds. She is an employee of Fidelity Investments (2009-present) and has served in other fund officer roles. Prior to joining Fidelity Investments, Ms. Smith served as Senior Audit Manager of Ernst & Young LLP (1996-2009). |
Renee Stagnone (1975) | |
Year of Election or Appointment: 2013 Deputy Treasurer | |
| Ms. Stagnone also serves as Deputy Treasurer of other funds. Ms. Stagnone is an employee of Fidelity Investments. |
Linda J. Wondrack (1964) | |
Year of Election or Appointment: 2014 Chief Compliance Officer | |
| Ms. Wondrack also serves as Chief Compliance Officer of other funds. Ms. Wondrack is Executive Vice President and head of the Ethics Office and Asset Management Compliance for Fidelity Investments (2012-present). Ms. Wondrack also serves as Chief Compliance Officer of Fidelity SelectCo, LLC (2014-present); Chief Compliance Officer of Impresa Management LLC (2013-present); and Chief Compliance Officer of FMR Co., Inc., Fidelity Investments Money Management, Inc., Fidelity Management & Research (Japan) Limited, Fidelity Management & Research (U.K.) Inc., Fidelity Management & Research (Hong Kong), Fidelity Management & Research Company, Pyramis Global Advisors, LLC, and Strategic Advisers, Inc., Ballyrock Investment Advisors LLC, and Northern Neck Investors LLC (2012-present). Previously, Ms. Wondrack served as Senior Vice President and Chief Compliance Officer for Columbia Management Investment Advisers, LLC (2005-2012); Chief Compliance Officer for certain funds within the Columbia Family of Funds (2007-2012); and Senior Vice President of Compliance Risk Management at Bank of America (2005-2010). |
Joseph F. Zambello (1957) | |
Year of Election or Appointment: 2011 Deputy Treasurer | |
| Mr. Zambello also serves as Deputy Treasurer of other funds. Mr. Zambello is an employee of Fidelity Investments. Previously, Mr. Zambello served as Vice President of FMR's Program Management Group (2009-2011) and Vice President of the Transfer Agent Oversight Group (2005-2009). |
Annual Report
Distributions (Unaudited)
The Board of Trustees of Advisor Value Fund voted to pay to shareholders of record at the opening of business on record date, the following distributions per share derived from capital gains realized from sales of portfolio securities, and dividends derived from net investment income:
| Pay Date | Record Date | Dividends | Capital Gains |
Class A | 12/08/14 | 12/05/14 | $0.047 | $0.011 |
Class T | 12/08/14 | 12/05/14 | $0.000 | $0.000 |
Class B | 12/08/14 | 12/05/14 | $0.000 | $0.000 |
Class C | 12/08/14 | 12/05/14 | $0.000 | $0.000 |
Class A designates 100%, Class T designates 100%, Class B designates 100% and Class C designates 100% of the dividends distributed during the fiscal year as qualifying for the dividends-received deduction for corporate shareholders.
Class A designates 100%, Class T designates 100%, Class B designates 100% and Class C designates 100% of the dividends distributed during the fiscal year as amounts which may be taken into account as a dividend for purposes of the maximum rate under section 1(h)(11) of the Internal Revenue Code.
The fund will notify shareholders in January 2015 of amounts for use in preparing 2014 income tax returns.
Annual Report
Board Approval of Investment Advisory Contracts and Management Fees
Fidelity Advisor Value Fund
Each year, the Board of Trustees, including the Independent Trustees (together, the Board), votes on the renewal of the management contract with Fidelity Management & Research Company (FMR) and the sub-advisory agreements (together, the Advisory Contracts) for the fund. The Board, assisted by the advice of fund counsel and Independent Trustees' counsel, requests and considers a broad range of information relevant to the renewal of the Advisory Contracts throughout the year.
The Board meets regularly and, at each of its meetings, covers an extensive agenda of topics and materials and considers factors that are relevant to its annual consideration of the renewal of the fund's Advisory Contracts, including the services and support provided to the fund and its shareholders. The Board has established various standing committees (Committees), each composed of and chaired by Independent Trustees with varying backgrounds, to which the Board has assigned specific subject matter responsibilities in order to enhance effective decision-making by the Board. The Board, acting directly and through its Committees, requests and receives information concerning the annual consideration of the renewal of the fund's Advisory Contracts. The Board also meets as needed to consider matters specifically related to the Board's annual consideration of the renewal of the Advisory Contracts. Members of the Board may also meet with trustees of other Fidelity funds through ad hoc joint committees to discuss certain matters relevant to the Fidelity funds.
At its July 2014 meeting, the Board, including the Independent Trustees, unanimously determined to renew the fund's Advisory Contracts. In reaching its determination, the Board considered all factors it believed relevant, including (i) the nature, extent, and quality of the services to be provided to the fund and its shareholders (including the investment performance of the fund); (ii) the competitiveness of the fund's management fee and total expense ratio relative to peer funds; (iii) the total costs of the services to be provided by and the profits to be realized by Fidelity from its relationship with the fund; (iv) the extent to which economies of scale exist and would be realized as the fund grows; and (v) whether fee levels reflect these economies of scale, if any, for the benefit of fund shareholders. In connection with separate internal corporate reorganizations involving Fidelity Management & Research (U.K.) Inc. (FMR U.K.) and Fidelity Management & Research (Japan) Inc. (FMR Japan), the Board approved certain non-material amendments to the fund's sub-advisory agreements with FMR U.K. and FMR Japan to reflect that, after these reorganizations, FMR Investment Management (UK) Limited and Fidelity Management & Research (Japan) Limited will carry on the business of FMR U.K. and FMR Japan, respectively. The Board noted that no changes to the portfolio managers or to the foreign research or investment advisory services provided to the fund were expected in connection with either reorganization and that the same personnel and resources would continue to be available to the fund at the new entities.
Annual Report
Board Approval of Investment Advisory Contracts and
Management Fees - continued
In considering whether to renew the Advisory Contracts for the fund, the Board reached a determination, with the assistance of fund counsel and Independent Trustees' counsel and through the exercise of its business judgment, that the renewal of the Advisory Contracts was in the best interests of the fund and its shareholders and that the compensation payable under the Advisory Contracts was fair and reasonable. The Board's decision to renew the Advisory Contracts was not based on any single factor, but rather was based on a comprehensive consideration of all the information provided to the Board at its meetings throughout the year. The Board, in reaching its determination to renew the Advisory Contracts, was aware that shareholders of the fund have a broad range of investment choices available to them, including a wide choice among funds offered by Fidelity's competitors, and that the fund's shareholders, who have the opportunity to review and weigh the disclosure provided by the fund in its prospectus and other public disclosures, have chosen to invest in this fund, which is part of the Fidelity family of funds.
Nature, Extent, and Quality of Services Provided. The Board considered Fidelity's staffing as it relates to the fund, including the backgrounds of investment personnel of FMR and the sub-advisers (together, the Investment Advisers), and also considered the fund's investment objective, strategies, and related investment philosophy. The Independent Trustees also had discussions with senior management of Fidelity's investment operations and investment groups. The Board considered the structure of the portfolio manager compensation program and whether this structure provides appropriate incentives to act in the best interests of the fund. Additionally, the Board considered the portfolio managers' investments, if any, in the funds that they manage.
Resources Dedicated to Investment Management and Support Services. The Board and the Fund Oversight and Research Committees reviewed the general qualifications and capabilities of Fidelity's investment staff, including its size, education, experience, and resources, as well as Fidelity's approach to recruiting, training, managing, and compensating investment personnel. The Board noted that Fidelity has continued to increase the resources devoted to non-U.S. offices, including expansion of Fidelity's global investment organization. The Board also noted that Fidelity's analysts have extensive resources, tools and capabilities that allow them to conduct sophisticated quantitative and fundamental analysis, as well as credit analysis of issuers, counterparties and guarantors. Further, the Board believes that Fidelity's investment professionals have sufficient access to global information and data so as to provide competitive investment results over time, and that those professionals also have access to sophisticated tools that permit them to assess portfolio construction and risk and performance attribution characteristics continuously, as well as to transmit new information and research conclusions rapidly around the world. Additionally, in its deliberations, the Board considered Fidelity's trading and risk management capabilities and resources and global compliance infrastructure, which are an integral part of the investment management process.
Annual Report
Shareholder and Administrative Services. The Board considered (i) the nature, extent, quality, and cost of advisory, administrative, and shareholder services performed by the Investment Advisers and their affiliates under the Advisory Contracts and under separate agreements covering transfer agency, pricing and bookkeeping, and securities lending services for the fund; (ii) the nature and extent of the supervision of third party service providers, principally custodians and subcustodians; and (iii) the resources devoted to, and the record of compliance with, the fund's compliance policies and procedures. The Board also reviewed the allocation of fund brokerage, including allocations to brokers affiliated with the Investment Advisers, the use of brokerage commissions to pay fund expenses, and the use of "soft" commission dollars to pay for research services.
The Board noted that the growth of fund assets over time across the complex allows Fidelity to reinvest in the development of services designed to enhance the value or convenience of the Fidelity funds as investment vehicles. These services include 24-hour access to account information and market information through telephone representatives and over the Internet, investor education materials and asset allocation tools, and the expanded availability of Fidelity Investor Centers.
In 2014, the Board formed an ad hoc Committee on Transfer Agency Fees to review the variety of transfer agency fee structures throughout the industry and Fidelity's competitive positioning with respect to industry participants.
Investment in a Large Fund Family. The Board considered the benefits to shareholders of investing in a Fidelity fund, including the benefits of investing in a fund that is part of a large family of funds offering a variety of investment disciplines and providing a large variety of mutual fund investor services. The Board noted that Fidelity had taken, or had made recommendations that resulted in the Fidelity funds taking, a number of actions over the previous year that benefited particular funds, including (i) continuing to dedicate additional resources to investment research and to the support of the senior management team that oversees asset management; (ii) persisting in efforts to enhance Fidelity's global research capabilities; (iii) launching new funds and making other enhancements to meet client needs for income-oriented solutions; (iv) reducing fund expenses for certain index funds; (v) continuing to launch dedicated lower cost underlying funds to meet portfolio construction needs related to expanding underlying fund options for Fidelity funds of funds, specifically for the Freedom Fund product lines; (vi) rationalizing product lines and gaining increased efficiencies through fund mergers; (vii) launching sector-based exchange-traded funds and establishing a new Fidelity adviser to manage sector-based funds and products; (viii) continuing to develop and implement technology to improve security and increase efficiency; (ix) modifying the eligibility criteria for certain share classes to increase their marketability to a portion of the defined contribution plan market; (x) waiving redemption fees for certain qualified fund-of-fund and wrap programs and certain retirement plan transactions; and (xi) launching new Institutional Class shares of certain money market funds to attract and retain assets and to fill a gap in the money market fund lineup.
Annual Report
Board Approval of Investment Advisory Contracts and
Management Fees - continued
Investment Performance. The Board considered whether the fund has operated in accordance with its investment objective, as well as its record of compliance with its investment restrictions and its performance history. The Board noted that there was a portfolio management change for a sleeve of the fund in January 2014.
The Board took into account discussions with the Investment Advisers about fund investment performance that occur at Board meetings throughout the year. In this regard the Board noted that as part of regularly scheduled fund reviews and other reports to the Board on fund performance, the Board periodically considers annualized return information for the fund, for different time periods, measured against a securities market index ("benchmark index") and a peer group of funds with similar objectives ("peer group"). In its evaluation of fund investment performance, the Board gave particular attention to information indicating changes in performance of certain Fidelity funds for specific time periods and the Investment Advisers' explanations for any overperformance or underperformance.
In addition to reviewing absolute and relative fund performance, the Independent Trustees periodically consider the appropriateness of fund performance metrics in evaluating the results achieved. In general, the Independent Trustees believe that fund performance should be evaluated based on net performance (after fees and expenses) of both the highest performing and lowest performing classes, where applicable, compared to appropriate benchmark indices, over appropriate time periods which may include full market cycles, and compared to peer groups, as applicable, over the same periods, taking into account relevant factors including the following: general market conditions; issuer-specific information; tactical opportunities for investment; and fund cash flows and other factors.
The Independent Trustees recognize that shareholders evaluate performance on a net basis over their own holding periods, for which one-, three-, and five-year periods are often used as a proxy. For this reason, the performance information reviewed by the Board also included net cumulative calendar year total return information for the fund and an appropriate benchmark index and peer group for the most recent one-, three-, and five-year periods, as shown below. Returns are shown compared to the 25th percentile (top of box, 75% beaten) and 75th percentile (bottom of box, 25% beaten) of the peer universe.
Annual Report
Fidelity Advisor Value Fund

The Board also considered that the fund's management fee is subject to upward or downward adjustment depending upon whether, and to what extent, the fund's investment performance for the performance period exceeds, or is exceeded by, a securities index, thus leading to a performance adjustment for the same period. The Board noted that the performance adjustment provides FMR with a strong economic incentive to seek to achieve superior performance for the fund's shareholders and helps to more closely align the interests of FMR and the fund's shareholders.
Based on its review, the Board concluded that the nature, extent, and quality of services provided to the fund under the Advisory Contracts should benefit the fund's shareholders.
Competitiveness of Management Fee and Total Expense Ratio. The Board considered the fund's management fee and total expense ratio compared to "mapped groups" of competitive funds and classes. Fidelity creates "mapped groups" by combining similar Lipper investment objective categories that have comparable investment mandates. Combining Lipper investment objective categories aids the Board's management fee and total expense ratio comparisons by broadening the competitive group used for comparison and by reducing the number of universes to which various Fidelity funds are compared.
Management Fee. The Board considered two proprietary management fee comparisons for the 12-month periods shown in the chart below. The group of Lipper funds used by the Board for management fee comparisons is referred to below as the "Total Mapped Group." The Total Mapped Group comparison focuses on a fund's standing in terms of gross management fees before expense reimbursements or caps, and without giving effect to the fund's performance adjustment, relative to the total universe of funds with comparable investment mandates, regardless of whether their management fee structures also are comparable. Funds with comparable investment mandates offer exposure to similar types of securities. Funds with comparable management fee structures have similar management fee contractual arrangements (e.g., flat rate charged for advisory services, all-inclusive fee rate, etc.). "TMG %" represents the percentage of funds in the Total Mapped Group that had management fees that were lower than the fund's. For example, a hypothetical TMG % of 20% would mean that 80% of the funds in the Total Mapped Group had higher, and 20% had lower, management fees than the fund. The fund's actual TMG %s are in the chart below. The "Asset-Size Peer Group" (ASPG) comparison focuses on a fund's standing relative to a subset of non-Fidelity funds within the Total Mapped Group that are similar in size and management fee structure. For example, if a fund is in the first quartile of the ASPG, the fund's management fee ranks in the least expensive or lowest 25% of funds in the ASPG. The ASPG represents at least 15% of the funds in the Total Mapped Group with comparable asset size and management fee structures, subject to a minimum of 50 funds (or all funds in the Total Mapped Group if fewer than 50). Additional information, such as the ASPG quartile in which the fund's management fee rate ranked and the impact of the fund's performance adjustment, is also included in the chart and considered by the Board.
Annual Report
Board Approval of Investment Advisory Contracts and
Management Fees - continued
Fidelity Advisor Value Fund
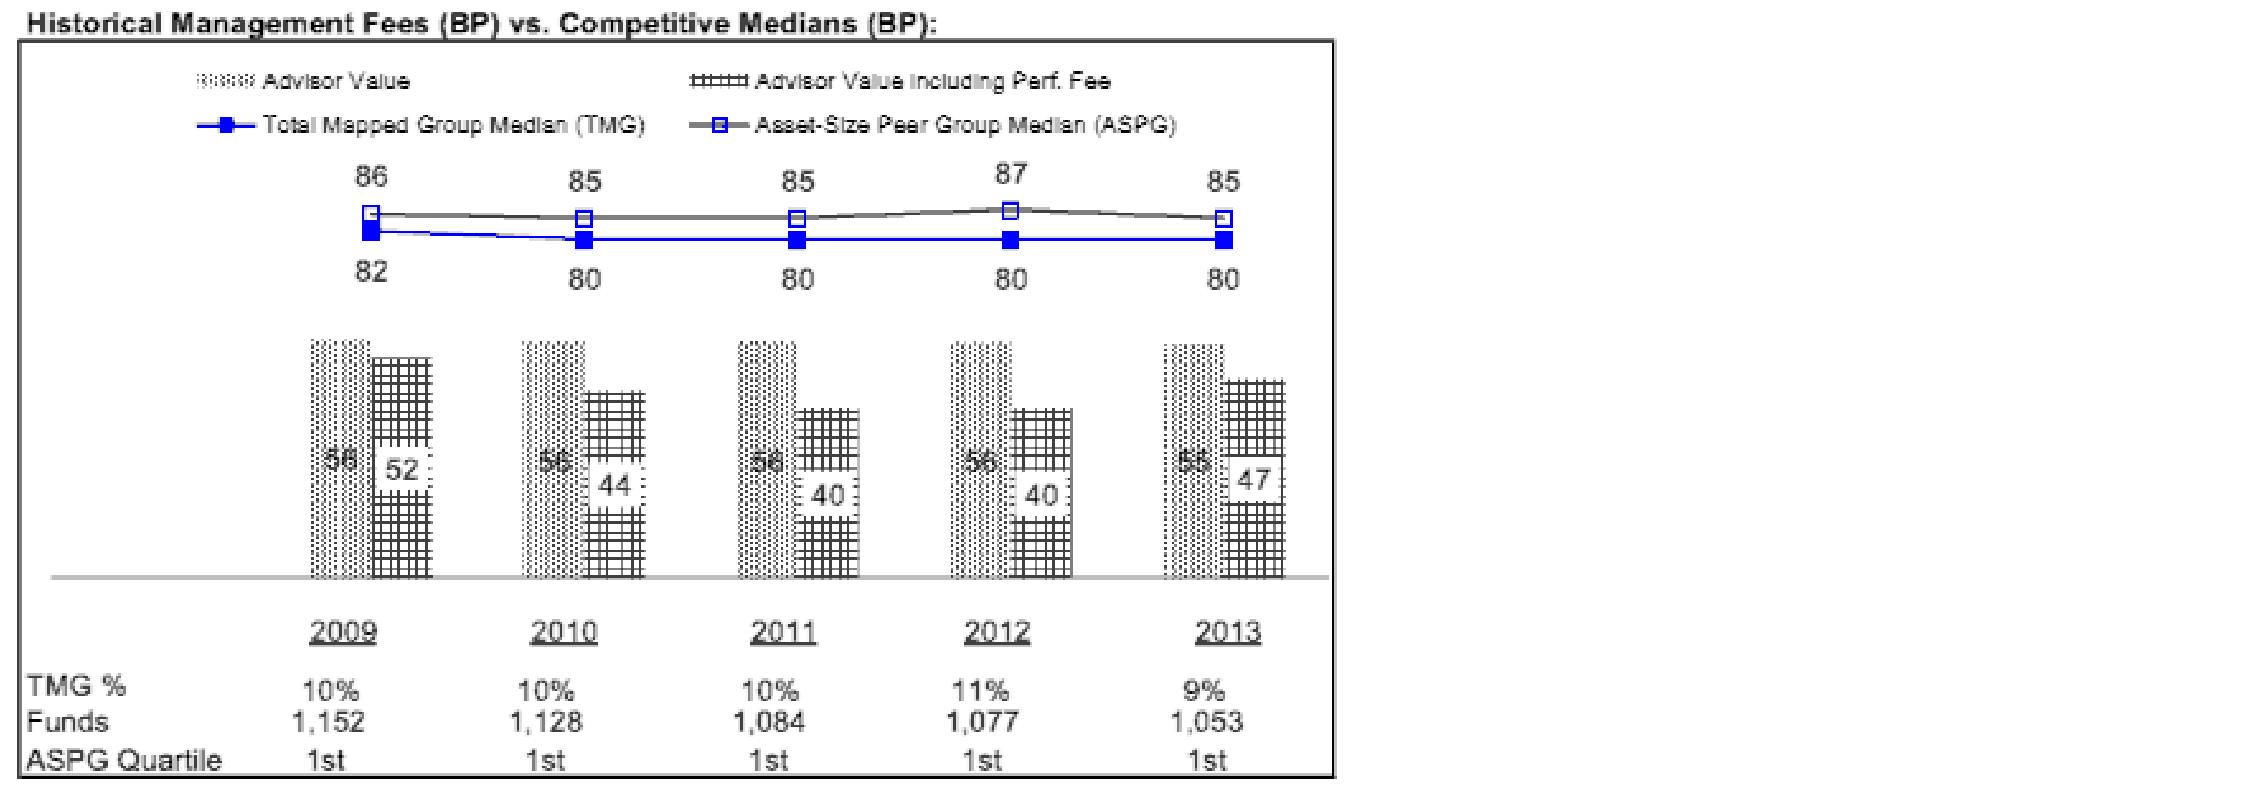
The Board noted that the fund's management fee rate ranked below the median of its Total Mapped Group and below the median of its ASPG for 2013. The Board also noted the effect of the fund's negative performance adjustment on the fund's management fee ranking.
Annual Report
The Board also noted that, in August 2013, the ad hoc Committee on Management Fees was formed to conduct an in-depth review of the management fee rates of Fidelity's active equity mutual funds. The Committee focused on the following areas: (i) standard fee structures; (ii) research consumption and trading evolution; (iii) management fee competitiveness/profitability by category; and (iv) factors that drive institutional pricing.
Based on its review, the Board concluded that the fund's management fee is fair and reasonable in light of the services that the fund receives and the other factors considered.
Total Expense Ratio. In its review of each class's total expense ratio, the Board considered the fund's management fee as well as other fund or class expenses, as applicable, such as transfer agent fees, pricing and bookkeeping fees, fund-paid 12b-1 fees, and custodial, legal, and audit fees. The Board also noted the effects of any waivers and reimbursements on fees and expenses, as well as the impact of the fund's performance adjustment. As part of its review, the Board also considered the current and historical total expense ratios of each class of the fund compared to competitive fund median expenses. Each class of the fund is compared to those funds and classes in the Total Mapped Group (used by the Board for management fee comparisons) that have a similar sales load structure.
The Board noted that the total expense ratio of Class A ranked equal to its competitive median for 2013 and the total expense ratio of each of Class T, Class B, Class C, and Institutional Class ranked above its competitive median for 2013. The Board considered that, in general, various factors can affect total expense ratios. The Board noted that the total expense ratio of Class T was above the competitive median primarily because of higher 12b-1 fees on Class T as compared to most competitor funds. Class T has a higher 12b-1 fee, but a lower front-end sales charge, than traditionally priced front-end sales charge classes. The Board considered that Class T is primarily sold load-waived in the retirement plan market where its 0.50% 12b-1 fee is comparable to competing no-load, higher 12b-1 fee classes designed specifically for retirement plans. The Board noted that the fund offers multiple classes, each of which has a different sales load and 12b-1 fee structure, and that the multiple structures are intended to offer a range of pricing options for the intermediary market. The Board also noted that the total expense ratios of the classes vary primarily by the level of their 12b-1 fees, although differences in transfer agent fees may also cause expenses to vary from class to class.
Fees Charged to Other Fidelity Clients. The Board also considered Fidelity fee structures and other information with respect to clients of Fidelity, such as other funds advised or subadvised by Fidelity, pension plan clients, and other institutional clients. The Board noted the findings of the 2013 ad hoc joint committee (created with the board of other Fidelity funds), which reviewed and compared Fidelity's institutional investment advisory business with its business of providing services to the Fidelity funds, including the differences in services provided, fees charged, and costs incurred, as well as competition in their respective marketplaces.
Annual Report
Board Approval of Investment Advisory Contracts and
Management Fees - continued
Based on its review of total expense ratios and fees charged to other Fidelity clients, the Board concluded that the total expense ratio of each class of the fund was reasonable, although in some cases above the median of the universe presented for comparison, in light of the services that the fund and its shareholders receive and the other factors considered.
Costs of the Services and Profitability. The Board considered the revenues earned and the expenses incurred by Fidelity in conducting the business of developing, marketing, distributing, managing, administering and servicing the fund and servicing the fund's shareholders. The Board also considered the level of Fidelity's profits in respect of all the Fidelity funds.
On an annual basis, Fidelity presents to the Board Fidelity's profitability for the fund. Fidelity calculates the profitability for each fund, as well as aggregate profitability for groups of Fidelity funds and all Fidelity funds, using a series of detailed revenue and cost allocation methodologies which originate with the books and records of Fidelity on which Fidelity's audited financial statements are based. The Audit Committee of the Board reviews any significant changes from the prior year's methodologies.
PricewaterhouseCoopers LLP (PwC), independent registered public accounting firm and auditor to Fidelity and certain Fidelity funds, has been engaged annually by the Board as part of the Board's assessment of Fidelity's profitability analysis. PwC's engagement includes the review and assessment of the methodologies used by Fidelity in determining the revenues and expenses attributable to Fidelity's mutual fund business, and completion of agreed-upon procedures in respect of the mathematical accuracy of fund profitability and its conformity to established allocation methodologies. After considering PwC's reports issued under the engagement and information provided by Fidelity, the Board concluded that while other allocation methods may also be reasonable, Fidelity's profitability methodologies are reasonable in all material respects.
The Board also reviewed Fidelity's non-fund businesses and fall-out benefits related to the mutual fund business as well as cases where Fidelity's affiliates may benefit from or be related to the fund's business.
The Board considered the costs of the services provided by and the profits realized by Fidelity in connection with the operation of the fund and was satisfied that the profitability was not excessive in the circumstances.
Economies of Scale. The Board considered whether there have been economies of scale in respect of the management of the Fidelity funds, whether the Fidelity funds (including the fund) have appropriately benefited from any such economies of scale, and whether there is potential for realization of any further economies of scale. The Board considered the extent to which the fund will benefit from economies of scale through increased services to the fund, through waivers or reimbursements, or through fee or expense ratio reductions. The Board also noted that in 2013, it and the boards of other Fidelity funds created an ad hoc committee (the Economies of Scale Committee) to analyze whether Fidelity attains economies of scale in respect of the management and servicing of the Fidelity funds, whether the Fidelity funds have appropriately benefited from such economies of scale, and whether there is potential for realization of any further economies of scale.
Annual Report
The Board recognized that the fund's management contract incorporates a "group fee" structure, which provides for lower group fee rates as total group assets increase, and for higher group fee rates as total group assets decrease (with "group assets" defined to include fund assets under FMR's management plus sector fund assets previously under FMR's management and currently managed by Fidelity SelectCo, LLC). FMR calculates the group fee rates based on a tiered asset "breakpoint" schedule that varies based on asset class. The Board considered that the group fee is designed to deliver the benefits of economies of scale to fund shareholders when total Fidelity fund assets increase, even if assets of any particular fund are unchanged or have declined, because some portion of Fidelity's costs are attributable to services provided to all Fidelity funds, and all funds benefit if those costs can be allocated among more assets. The Board concluded that, given the group fee structure, fund shareholders will benefit from lower management fees as group assets increase at the fund complex level, regardless of whether Fidelity achieves any such economies of scale.
The Board concluded, taking into account the analysis of the Economies of Scale Committee, that economies of scale, if any, are being appropriately shared between fund shareholders and Fidelity.
Additional Information Requested by the Board. In order to develop fully the factual basis for consideration of the Fidelity funds' Advisory Contracts, the Board requested and received additional information on certain topics, including: (i) fund performance trends and Fidelity's long-term strategies for certain funds; (ii) Fidelity's strategic marketing and product lineup goals; (iii) the methodology with respect to competitive fund data and peer group classifications; (iv) the arrangements with, and performance of, certain sub-advisers on behalf of the Fidelity funds, as well as certain proposed participating affiliate arrangements; (v) the realization of fall-out benefits in certain Fidelity business units; (vi) Fidelity's group fee structures, including the rationale for the individual fee rates of certain categories of funds and the definition of group assets; (vii) trends regarding industry use of performance fee structures and the performance adjustment methodologies applicable to the Fidelity funds; (viii) additional competitive analysis regarding the total expenses for certain classes; (ix) fund profitability methodology, including Fidelity's cost allocation methodology, and the impact of certain factors on fund profitability results; and (x) the process by which Fidelity determines sub-advisory fees for funds it advises.
Annual Report
Board Approval of Investment Advisory Contracts and
Management Fees - continued
Based on its evaluation of all of the conclusions noted above, and after considering all factors it believed relevant, the Board ultimately concluded that the advisory fee structures are fair and reasonable, and that the fund's Advisory Contracts should be renewed.
Annual Report
Investment Adviser
Fidelity Management & Research Company
Boston, MA
Investment Sub-Advisers
FMR Co., Inc.
Fidelity Management & Research
(U.K.) Inc.
Fidelity Management & Research
(Hong Kong) Limited
Fidelity Management & Research
(Japan) Limited
General Distributor
Fidelity Distributors Corporation
Smithfield, RI
Transfer and Service Agents
Fidelity Investments Institutional Operations Company, Inc.
Boston, MA
Fidelity Service Company, Inc.
Boston, MA
Custodian
The Bank of New York Mellon
New York, NY
(Fidelity Investment logo)(registered trademark)
FAV-UANN-1214
1.809012.110
(Fidelity Investment logo)(registered trademark)
Fidelity Advisor®
High Income
Fund - Class A, Class T, Class B
and Class C
Annual Report
October 31, 2014
(Fidelity Cover Art)
Contents
Performance | How the fund has done over time. | |
Management's Discussion of Fund Performance | The Portfolio Manager's review of fund performance and strategy. | |
Shareholder Expense Example | An example of shareholder expenses. | |
Investment Changes | A summary of major shifts in the fund's investments over the past six months. | |
Investments | A complete list of the fund's investments with their market values. | |
Financial Statements | Statements of assets and liabilities, operations, and changes in net assets, as well as financial highlights. | |
Notes | Notes to financial statements. | |
Report of Independent Registered Public Accounting Firm |
| |
Trustees and Officers |
| |
Distributions |
| |
Board Approval of Investment Advisory Contracts and Management Fees |
|
To view a fund's proxy voting guidelines and proxy voting record for the 12-month period ended June 30, visit http://www.fidelity.com/proxyvotingresults or visit the Securities and Exchange Commission's (SEC) web site at http://www.sec.gov. You may also call 1-877-208-0098 to request a free copy of the proxy voting guidelines.
Standard & Poor's, S&P and S&P 500 are registered service marks of The McGraw-Hill Companies, Inc. and have been licensed for use by Fidelity Distributors Corporation.
Other third-party marks appearing herein are the property of their respective owners.
All other marks appearing herein are registered or unregistered trademarks or service marks of FMR LLC or an affiliated company. © 2014 FMR LLC. All rights reserved.
Annual Report
This report and the financial statements contained herein are submitted for the general information of the shareholders of the fund. This report is not authorized for distribution to prospective investors in the fund unless preceded or accompanied by an effective prospectus.
A fund files its complete schedule of portfolio holdings with the SEC for the first and third quarters of each fiscal year on Form N-Q. Forms N-Q are available on the SEC's web site at http://www.sec.gov. A fund's Forms N-Q may be reviewed and copied at the SEC's Public Reference Room in Washington, DC. Information regarding the operation of the SEC's Public Reference Room may be obtained by calling 1-800-SEC-0330. For a complete list of a fund's portfolio holdings, view the most recent holdings listing, semiannual report, or annual report on Fidelity's web site at http://www.fidelity.com, http://www.advisor.fidelity.com, or http://www.401k.com, as applicable.
NOT FDIC INSURED • MAY LOSE VALUE • NO BANK GUARANTEE
Neither the fund nor Fidelity Distributors Corporation is a bank.
Annual Report
Performance: The Bottom Line
Average annual total return reflects the change in the value of an investment, assuming reinvestment of the class' distributions from dividend income and capital gains (the profits earned upon the sale of securities that have grown in value, if any) and assuming a constant rate of performance each year. The $10,000 table and the fund's returns do not reflect the deduction of taxes that a shareholder would pay on fund distributions or the redemption of fund shares. During periods of reimbursement by Fidelity, a fund's total return will be greater than it would be had the reimbursement not occurred. How a fund did yesterday is no guarantee of how it will do tomorrow. Returns reflect the conversion of Class B shares to Class A shares after a maximum of seven years.
Average Annual Total Returns
Periods ended October 31, 2014 | Past 1 | Past 5 | Past 10 |
Class A (incl. 4.00% sales charge) | 0.33% | 8.04% | 6.09% |
Class T (incl. 4.00% sales charge) | 0.20% | 8.00% | 6.05% |
Class B (incl. contingent deferred sales charge) A | -1.07% | 7.87% | 6.02% |
Class C (incl. contingent deferred sales charge) B | 2.66% | 8.11% | 5.71% |
A Class B shares' contingent deferred sales charges included in the past one year, past five years, and past ten years total return figures are 5%, 2%, and 0%, respectively.
B Class C shares' contingent deferred sales charges included in the past one year, past five years, and past ten years total return figures are 1%, 0%, and 0%, respectively.
Annual Report
$10,000 Over 10 Years
Let's say hypothetically that $10,000 was invested in Fidelity Advisor® High Income Fund - Class A on October 31, 2004, and the current 4.00% sales charge was paid. The chart shows how the value of your investment would have changed, and also shows how The BofA Merrill LynchSM US High Yield Constrained Index performed over the same period.
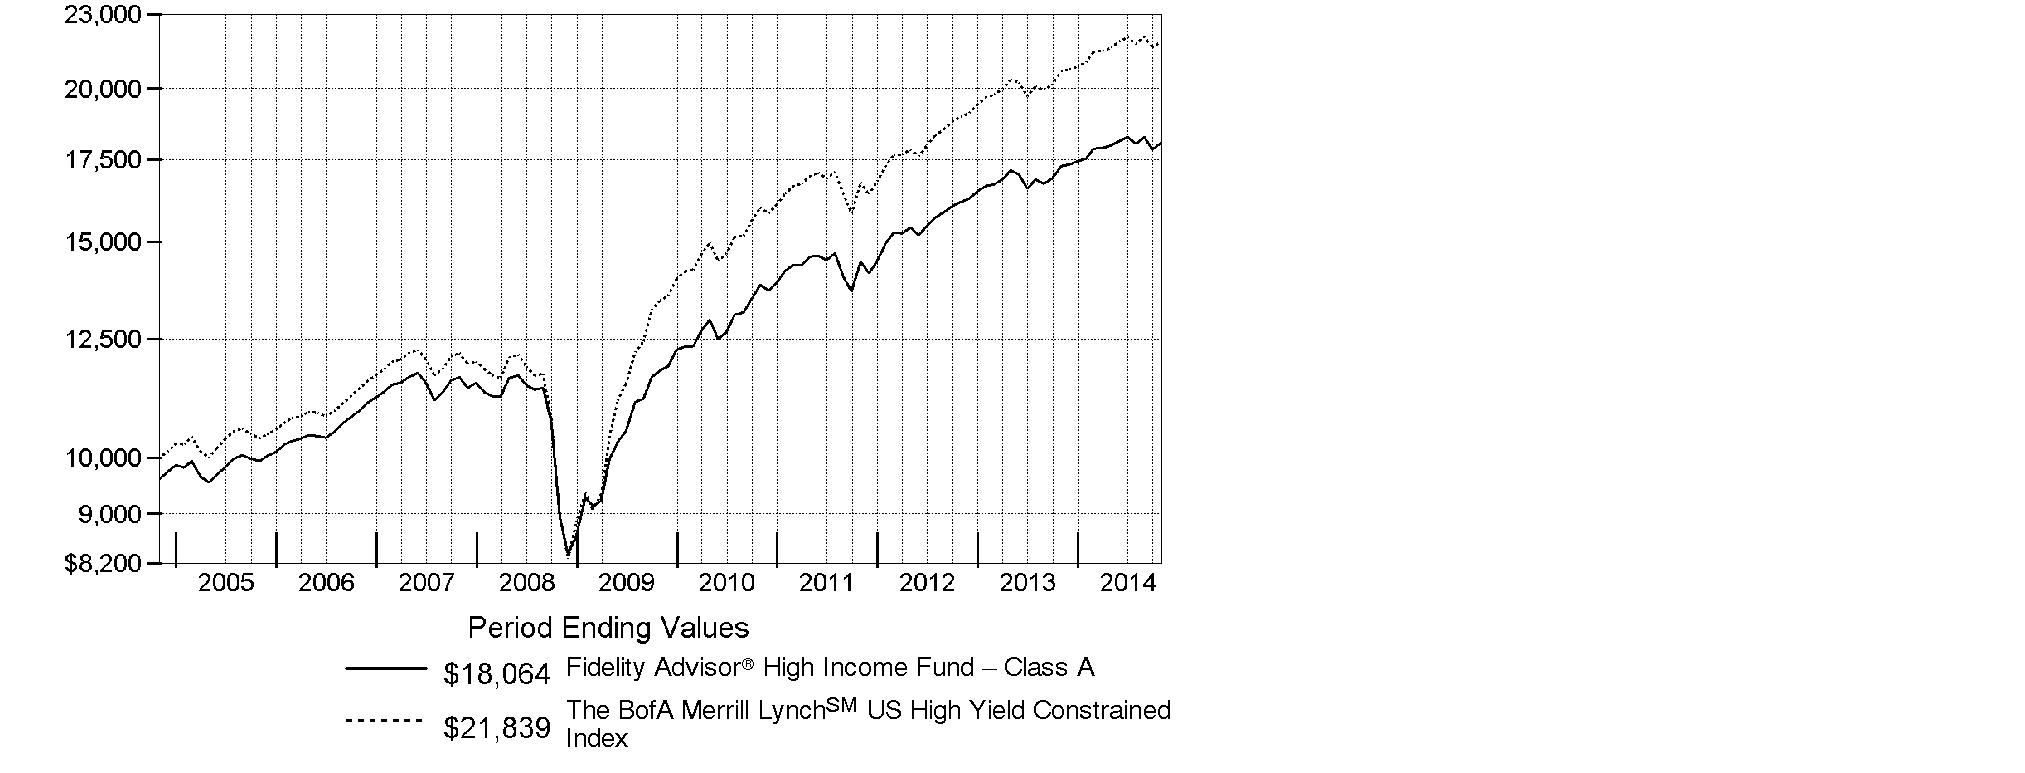
Annual Report
Management's Discussion of Fund Performance
Market Recap: High-yield bonds overcame late-period volatility to rise 5.85% for the 12 months ending October 31, 2014, as measured by The BofA Merrill LynchSM US High Yield Constrained Index, continuing a positive multiyear run. High yield benefited from a growing U.S. economy, low default rate, solid corporate fundamentals and monetary support from central banks worldwide. Early on, the index recovered from fears that the Fed might increase interest rates, in conjunction with its plan to wind down its stimulative bond-buying program. Meanwhile, weaker-than-expected economic data in the first quarter of 2014 helped to keep low policy rates in place. High yield advanced steadily until the market shifted in July, when investors exited high yield at a record pace amid unfavorable supply/demand dynamics and new concerns that the Fed could begin to tighten monetary policy. Fed Chair Janet Yellen contributed to the tumult, suggesting high-yield valuations "appear stretched." The index continued its decline in the final months of the period until it staged a slight rebound in October, as concerns about possible deflation in Europe and recession in Japan led to increased expectations for additional market intervention outside the U.S.
Comments from Matthew Conti, Portfolio Manager of Fidelity Advisor® High Income Fund: For the year, the fund's Class A, Class T, Class B and Class C shares returned 4.51%, 4.38%, 3.67% and 3.60%, respectively (excluding sales charges), underperforming the BofA Merrill Lynch index. The fund underperformed the index because it held a short duration - a measure of sensitivity to changes in interest rates - relative to the benchmark. I expected early on that interest rates would rise this period, but they fell partly due to new global growth threats. The fund also was held back by security selection in technology and utilities, and by its modest cash position, which was held for liquidity purposes. Top individual detractors included utility GenOn Energy, which I sold by period end, and energy company Vantage Drilling - listed in the fund's holdings as Offshore Group Investment. Overall, I looked to structure the fund to benefit from an improving U.S. economy, while underweighting commodity-oriented sectors. I also underweighted banks & thrifts, overweighted air transportation and liked airline leasing companies. I increased the fund's stake in telecommunications and in floating-rate bank loans, the latter of which hurt relative performance. The top relative contributor was an out-of-benchmark stake in Brazilian meat processor JBS Investments.
The views expressed above reflect those of the portfolio manager(s) only through the end of the period as stated on the cover of this report and do not necessarily represent the views of Fidelity or any other person in the Fidelity organization. Any such views are subject to change at any time based upon market or other conditions and Fidelity disclaims any responsibility to update such views. These views may not be relied on as investment advice and, because investment decisions for a Fidelity fund are based on numerous factors, may not be relied on as an indication of trading intent on behalf of any Fidelity fund.
Annual Report
Shareholder Expense Example
As a shareholder of the Fund, you incur two types of costs: (1) transaction costs, including sales charges (loads) on purchase payments or redemption proceeds, redemption fees and (2) ongoing costs, including management fees, distribution and/or service (12b-1) fees and other Fund expenses. This Example is intended to help you understand your ongoing costs (in dollars) of investing in the Fund and to compare these costs with the ongoing costs of investing in other mutual funds.
The Example is based on an investment of $1,000 invested at the beginning of the period and held for the entire period (May 1, 2014 to October 31, 2014).
Actual Expenses
The first line of the accompanying table for each class of the Fund provides information about actual account values and actual expenses. You may use the information in this line, together with the amount you invested, to estimate the expenses that you paid over the period. Simply divide your account value by $1,000.00 (for example, an $8,600 account value divided by $1,000.00 = 8.6), then multiply the result by the number in the first line for a class of the Fund under the heading entitled "Expenses Paid During Period" to estimate the expenses you paid on your account during this period. In addition, the Fund, as a shareholder in the underlying Fidelity Central Funds, will indirectly bear its pro-rata share of the fees and expenses incurred by the underlying Fidelity Central Funds. These fees and expenses are not included in the Fund's annualized expense ratio used to calculate the expense estimate in the table below.
Hypothetical Example for Comparison Purposes
The second line of the accompanying table for each class of the Fund provides information about hypothetical account values and hypothetical expenses based on a Class' actual expense ratio and an assumed rate of return of 5% per year before expenses, which is not the Class' actual return. The hypothetical account values and expenses may not be used to estimate the actual ending account balance or expenses you paid for the period. You may use this information to compare the ongoing costs of investing in the Fund and other funds. To do so, compare this 5% hypothetical example with the 5% hypothetical examples that appear in the shareholder reports of the other funds. In addition, the Fund, as a shareholder in the underlying Fidelity Central Funds, will indirectly bear its pro-rata share of the fees and expenses incurred by the underlying Fidelity Central Funds. These fees and expenses are not included in the Fund's annualized expense ratio used to calculate the expense estimate in the table below.
Please note that the expenses shown in the table are meant to highlight your ongoing costs only and do not reflect any transaction costs. Therefore, the second line of the table is useful in comparing ongoing costs only, and will not help you determine the relative total costs of owning different funds. In addition, if these transactional costs were included, your costs would have been higher.
Annual Report
| Annualized | Beginning | Ending | Expenses Paid |
Class A | 1.02% |
|
|
|
Actual |
| $ 1,000.00 | $ 1,006.00 | $ 5.16 |
HypotheticalA |
| $ 1,000.00 | $ 1,020.06 | $ 5.19 |
Class T | 1.04% |
|
|
|
Actual |
| $ 1,000.00 | $ 1,005.90 | $ 5.26 |
HypotheticalA |
| $ 1,000.00 | $ 1,019.96 | $ 5.30 |
Class B | 1.72% |
|
|
|
Actual |
| $ 1,000.00 | $ 1,002.50 | $ 8.68 |
HypotheticalA |
| $ 1,000.00 | $ 1,016.53 | $ 8.74 |
Class C | 1.79% |
|
|
|
Actual |
| $ 1,000.00 | $ 1,001.00 | $ 9.03 |
HypotheticalA |
| $ 1,000.00 | $ 1,016.18 | $ 9.10 |
Institutional Class | .85% |
|
|
|
Actual |
| $ 1,000.00 | $ 1,006.90 | $ 4.30 |
HypotheticalA |
| $ 1,000.00 | $ 1,020.92 | $ 4.33 |
A 5% return per year before expenses
B Annualized expense ratio reflects expenses net of applicable fee waivers.
* Expenses are equal to each Class' annualized expense ratio, multiplied by the average account value over the period, multiplied by 184/365 (to reflect the one-half year period).
Annual Report
Investment Changes (Unaudited)
Top Five Holdings as of October 31, 2014 | ||
(by issuer, excluding cash equivalents) | % of fund's | % of fund's net assets |
Clear Channel Communications, Inc. | 2.1 | 1.8 |
Icahn Enterprises LP/Icahn Enterprises Finance Corp. | 1.9 | 1.6 |
APX Group, Inc. | 1.6 | 1.1 |
Digicel Group Ltd. | 1.6 | 1.4 |
Tenet Healthcare Corp. | 1.6 | 1.6 |
| 8.8 | |
Top Five Market Sectors as of October 31, 2014 | ||
| % of fund's | % of fund's net assets |
Energy | 13.0 | 13.2 |
Telecommunications | 8.9 | 8.1 |
Services | 6.6 | 4.5 |
Technology | 5.5 | 7.7 |
Diversified Financial Services | 5.4 | 6.4 |
Quality Diversification (% of fund's net assets) | |||||||
As of October 31, 2014 | As of April 30, 2014 | ||||||
| BBB 0.3% |
| | BBB 1.3% |
| ||
 | BB 32.5% |
| | BB 35.1% |
| ||
 | B 46.6% |
| | B 43.2% |
| ||
| CCC,CC,C 17.7% |
| | CCC,CC,C 16.2% |
| ||
 | Not Rated 0.6% |
| | Not Rated 1.4% |
| ||
 | Equities 0.0%† |
| | Equities 0.0%† |
| ||
| Short-Term |
| | Short-Term |
| ||

We have used ratings from Moody's Investors Service, Inc. Where Moody'sTM ratings are not available, we have used S&PTM ratings. All ratings are as of the date indicated and do not reflect subsequent changes. |
Asset Allocation (% of fund's net assets) | |||||||
As of October 31, 2014* | As of April 30, 2014** | ||||||
| Nonconvertible |
| | Nonconvertible |
| ||
 | Common Stocks 0.0%† |
| | Common Stocks 0.0%† |
| ||
 | Bank Loan |
| | Bank Loan |
| ||
| Other Investments 1.3% |
| | Other Investments 0.7% |
| ||
| Short-Term |
| | Short-Term |
| ||
* Foreign investments 27.2% |
| ** Foreign investments 22.8% |
| ||||

† Amount represents less than 0.1%
Annual Report
Investments October 31, 2014
Showing Percentage of Net Assets
Nonconvertible Bonds - 85.4% | ||||
| Principal Amount | Value | ||
Aerospace - 0.9% | ||||
TransDigm, Inc.: | ||||
5.5% 10/15/20 | $ 3,965,000 | $ 3,965,000 | ||
6% 7/15/22 | 855,000 | 864,619 | ||
6.5% 7/15/24 | 840,000 | 865,200 | ||
Triumph Group, Inc.: | ||||
4.875% 4/1/21 | 1,420,000 | 1,434,200 | ||
5.25% 6/1/22 | 365,000 | 369,563 | ||
| 7,498,582 | |||
Air Transportation - 4.3% | ||||
Air Canada: | ||||
6.625% 5/15/18 (c) | 3,205,000 | 3,295,061 | ||
7.75% 4/15/21 (c) | 2,290,000 | 2,398,775 | ||
Allegiant Travel Co. 5.5% 7/15/19 | 1,070,000 | 1,094,075 | ||
American Airlines Group, Inc. 5.5% 10/1/19 (c) | 2,775,000 | 2,781,938 | ||
American Airlines, Inc. pass-thru certificates equipment trust certificate 5.625% 1/15/21 (c) | 296,810 | 303,488 | ||
Continental Airlines, Inc.: | ||||
pass-thru trust certificates 9.798% 4/1/21 | 1,075,689 | 1,202,082 | ||
6.125% 4/29/18 | 345,000 | 363,975 | ||
6.25% 10/11/21 | 1,929,134 | 2,044,882 | ||
9.25% 5/10/17 | 1,176,334 | 1,329,258 | ||
Delta Air Lines, Inc. pass-thru trust certificates: | ||||
6.375% 7/2/17 (c) | 1,375,000 | 1,433,438 | ||
6.75% 5/23/17 | 1,375,000 | 1,433,438 | ||
8.021% 8/10/22 | 1,049,008 | 1,216,849 | ||
U.S. Airways Group, Inc. 6.125% 6/1/18 | 1,950,000 | 2,013,375 | ||
U.S. Airways pass-thru certificates: | ||||
Series 2012-2C, 5.45% 6/3/18 | 2,215,000 | 2,242,688 | ||
Series 2013-1 Class B, 5.375% 5/15/23 | 450,000 | 457,875 | ||
United Air Lines, Inc. pass-thru trust certificates: | ||||
Class B, 7.336% 7/2/19 | 904,423 | 981,299 | ||
9.75% 1/15/17 | 903,885 | 1,003,313 | ||
12% 1/15/16 (c) | 172,971 | 188,971 | ||
United Continental Holdings, Inc.: | ||||
6% 12/1/20 | 2,635,000 | 2,710,756 | ||
6% 7/15/26 | 2,575,000 | 2,491,313 | ||
6% 7/15/28 | 1,705,000 | 1,624,013 | ||
6.375% 6/1/18 | 185,000 | 193,325 | ||
XPO Logistics, Inc. 7.875% 9/1/19 (c) | 1,070,000 | 1,120,825 | ||
| 33,925,012 | |||
Nonconvertible Bonds - continued | ||||
| Principal Amount | Value | ||
Automotive - 1.4% | ||||
American Axle & Manufacturing, Inc.: | ||||
5.125% 2/15/19 | $ 335,000 | $ 340,025 | ||
6.25% 3/15/21 | 2,970,000 | 3,118,500 | ||
Dana Holding Corp.: | ||||
6% 9/15/23 | 690,000 | 724,500 | ||
6.75% 2/15/21 | 1,210,000 | 1,285,625 | ||
Schaeffler Finance BV 4.75% 5/15/21 (c) | 1,460,000 | 1,456,350 | ||
Schaeffler Holding Finance BV: | ||||
6.25% 11/15/19 pay-in-kind (c)(f) | 550,000 | 569,250 | ||
6.75% 11/15/22 pay-in-kind (c)(f) | 735,000 | 777,263 | ||
6.875% 8/15/18 pay-in-kind (c)(f) | 2,965,000 | 3,105,838 | ||
| 11,377,351 | |||
Banks & Thrifts - 0.8% | ||||
Ocwen Financial Corp. 6.625% 5/15/19 (c) | 3,875,000 | 3,642,500 | ||
Royal Bank of Scotland Group PLC: | ||||
5.125% 5/28/24 | 2,140,000 | 2,167,324 | ||
6% 12/19/23 | 215,000 | 231,310 | ||
| 6,041,134 | |||
Broadcasting - 1.6% | ||||
Clear Channel Communications, Inc.: | ||||
5.5% 12/15/16 | 8,420,000 | 7,977,950 | ||
9% 12/15/19 | 1,230,000 | 1,243,069 | ||
10% 1/15/18 | 3,000,000 | 2,506,875 | ||
Gray Television, Inc. 7.5% 10/1/20 | 820,000 | 857,925 | ||
| 12,585,819 | |||
Building Materials - 2.6% | ||||
Building Materials Corp. of America: | ||||
5.375% 11/15/24 (c)(e) | 1,955,000 | 1,959,888 | ||
6.75% 5/1/21 (c) | 2,385,000 | 2,557,913 | ||
6.875% 8/15/18 (c) | 2,715,000 | 2,819,528 | ||
Building Materials Holding Corp. 9% 9/15/18 (c) | 2,790,000 | 3,006,225 | ||
CEMEX Finance LLC 6% 4/1/24 (c) | 1,190,000 | 1,213,443 | ||
CEMEX S.A.B. de CV 6.5% 12/10/19 (c) | 750,000 | 803,438 | ||
HD Supply, Inc. 7.5% 7/15/20 | 5,270,000 | 5,612,550 | ||
Headwaters, Inc.: | ||||
7.25% 1/15/19 | 520,000 | 533,000 | ||
7.625% 4/1/19 | 2,175,000 | 2,272,875 | ||
| 20,778,860 | |||
Cable TV - 2.1% | ||||
Altice SA 7.75% 5/15/22 (c) | 3,975,000 | 4,173,750 | ||
Nonconvertible Bonds - continued | ||||
| Principal Amount | Value | ||
Cable TV - continued | ||||
Cablevision Systems Corp. 7.75% 4/15/18 | $ 530,000 | $ 590,420 | ||
Cogeco Cable, Inc. 4.875% 5/1/20 (c) | 450,000 | 450,000 | ||
Numericable Group SA: | ||||
4.875% 5/15/19 (c) | 1,430,000 | 1,426,425 | ||
6% 5/15/22 (c) | 2,475,000 | 2,530,688 | ||
6.25% 5/15/24 (c) | 490,000 | 504,088 | ||
RCN Telecom Services LLC/RCN Capital Corp. 8.5% 8/15/20 (c) | 1,835,000 | 1,922,163 | ||
Virgin Media Finance PLC 6% 10/15/24 (c) | 630,000 | 655,200 | ||
Wave Holdco LLC/Wave Holdco Corp. 8.25% 7/15/19 pay-in-kind (c)(f) | 205,000 | 212,175 | ||
WaveDivision Escrow LLC/WaveDivision Escrow Corp. 8.125% 9/1/20 (c) | 3,930,000 | 4,273,875 | ||
| 16,738,784 | |||
Capital Goods - 0.5% | ||||
J.B. Poindexter & Co., Inc. 9% 4/1/22 (c) | 3,615,000 | 3,940,350 | ||
Chemicals - 2.8% | ||||
Eco Services Operations LLC/Eco Finance Corp. 8.5% 11/1/22 (c) | 1,780,000 | 1,833,400 | ||
LSB Industries, Inc. 7.75% 8/1/19 | 1,085,000 | 1,157,912 | ||
NOVA Chemicals Corp. 5% 5/1/25 (c) | 2,310,000 | 2,385,075 | ||
Nufarm Australia Ltd. 6.375% 10/15/19 (c) | 3,740,000 | 3,758,700 | ||
Trinseo Materials Operating SCA/Trinseo Materials Finance, Inc. 8.75% 2/1/19 | 8,051,000 | 8,513,933 | ||
Tronox Finance LLC 6.375% 8/15/20 | 4,605,000 | 4,731,638 | ||
| 22,380,658 | |||
Consumer Products - 0.1% | ||||
Prestige Brands, Inc. 5.375% 12/15/21 (c) | 1,125,000 | 1,088,438 | ||
Containers - 1.8% | ||||
Ardagh Finance Holdings SA 8.625% 6/15/19 pay-in-kind (c)(f) | 1,720,000 | 1,702,674 | ||
Ardagh Packaging Finance PLC/Ardagh MP Holdings U.S.A., Inc.: | ||||
3.2341% 12/15/19 (c)(f) | 2,120,000 | 2,072,300 | ||
6% 6/30/21 (c) | 1,495,000 | 1,474,444 | ||
6.25% 1/31/19 (c) | 500,000 | 503,750 | ||
6.75% 1/31/21 (c) | 580,000 | 593,050 | ||
7% 11/15/20 (c) | 105,000 | 107,100 | ||
Beverage Packaging Holdings II SA (Luxembourg) 6% 6/15/17 (c) | 1,415,000 | 1,411,463 | ||
Nonconvertible Bonds - continued | ||||
| Principal Amount | Value | ||
Containers - continued | ||||
Crown Americas LLC/Crown Americas Capital Corp. IV 4.5% 1/15/23 | $ 2,645,000 | $ 2,598,713 | ||
Reynolds Group Issuer, Inc./Reynolds Group Issuer LLC/Reynolds Group Issuer (Luxembourg) SA 5.75% 10/15/20 | 3,455,000 | 3,593,200 | ||
| 14,056,694 | |||
Diversified Financial Services - 5.1% | ||||
AerCap Ireland Capital Ltd./AerCap Global Aviation Trust: | ||||
3.75% 5/15/19 (c) | 1,790,000 | 1,776,575 | ||
4.5% 5/15/21 (c) | 1,725,000 | 1,742,250 | ||
5% 10/1/21 (c) | 2,065,000 | 2,147,600 | ||
Aircastle Ltd.: | ||||
5.125% 3/15/21 | 1,535,000 | 1,554,188 | ||
6.25% 12/1/19 | 1,175,000 | 1,251,375 | ||
FLY Leasing Ltd.: | ||||
6.375% 10/15/21 | 1,470,000 | 1,462,650 | ||
6.75% 12/15/20 | 2,710,000 | 2,791,300 | ||
Icahn Enterprises LP/Icahn Enterprises Finance Corp.: | ||||
4.875% 3/15/19 | 3,120,000 | 3,174,600 | ||
5.875% 2/1/22 | 7,155,000 | 7,351,763 | ||
6% 8/1/20 | 4,635,000 | 4,866,750 | ||
ILFC E-Capital Trust II 6.25% 12/21/65 (c)(f) | 3,100,000 | 2,999,250 | ||
International Lease Finance Corp. 5.875% 8/15/22 | 1,290,000 | 1,399,650 | ||
SLM Corp.: | ||||
4.875% 6/17/19 | 4,765,000 | 4,836,475 | ||
5.5% 1/15/19 | 2,080,000 | 2,156,960 | ||
8% 3/25/20 | 1,020,000 | 1,170,450 | ||
| 40,681,836 | |||
Diversified Media - 0.5% | ||||
MDC Partners, Inc. 6.75% 4/1/20 (c) | 1,075,000 | 1,115,313 | ||
Nielsen Finance LLC/Nielsen Finance Co. 4.5% 10/1/20 | 1,725,000 | 1,725,345 | ||
The Nielsen Co. S.a.r.l. (Luxembourg) 5.5% 10/1/21 (c) | 1,165,000 | 1,208,688 | ||
| 4,049,346 | |||
Electric Utilities - 4.1% | ||||
Atlantic Power Corp. 9% 11/15/18 | 3,340,000 | 3,356,700 | ||
Calpine Corp.: | ||||
5.375% 1/15/23 | 1,750,000 | 1,767,500 | ||
5.75% 1/15/25 | 875,000 | 885,938 | ||
Nonconvertible Bonds - continued | ||||
| Principal Amount | Value | ||
Electric Utilities - continued | ||||
NRG Energy, Inc.: | ||||
6.25% 7/15/22 | $ 2,105,000 | $ 2,199,725 | ||
6.25% 5/1/24 (c) | 2,590,000 | 2,674,175 | ||
NSG Holdings II, LLC 7.75% 12/15/25 (c) | 9,460,000 | 10,193,150 | ||
RJS Power Holdings LLC 5.125% 7/15/19 (c) | 2,280,000 | 2,268,600 | ||
The AES Corp.: | ||||
4.875% 5/15/23 | 1,120,000 | 1,117,200 | ||
7.375% 7/1/21 | 6,775,000 | 7,729,848 | ||
| 32,192,836 | |||
Energy - 11.5% | ||||
Access Midstream Partners LP/ACMP Finance Corp.: | ||||
4.875% 5/15/23 | 1,405,000 | 1,468,225 | ||
4.875% 3/15/24 | 555,000 | 579,975 | ||
American Energy-Permian Basin LLC/ AEPB Finance Corp.: | ||||
6.7413% 8/1/19 (c)(f) | 990,000 | 876,150 | ||
7.125% 11/1/20 (c) | 985,000 | 852,025 | ||
7.375% 11/1/21 (c) | 1,765,000 | 1,544,375 | ||
Antero Resources Corp. 5.125% 12/1/22 (c) | 2,240,000 | 2,240,448 | ||
Approach Resources, Inc. 7% 6/15/21 | 2,075,000 | 1,909,000 | ||
Basic Energy Services, Inc. 7.75% 2/15/19 | 350,000 | 341,250 | ||
California Resources Corp.: | ||||
5% 1/15/20 (c) | 915,000 | 928,725 | ||
5.5% 9/15/21 (c) | 1,190,000 | 1,213,800 | ||
6% 11/15/24 (c) | 795,000 | 810,900 | ||
Chesapeake Midstream Partners LP/CHKM Finance Corp.: | ||||
5.875% 4/15/21 | 1,030,000 | 1,089,225 | ||
6.125% 7/15/22 | 2,375,000 | 2,582,813 | ||
Citgo Petroleum Corp. 6.25% 8/15/22 (c) | 1,310,000 | 1,332,925 | ||
Consolidated Energy Finance SA 6.75% 10/15/19 (c) | 3,590,000 | 3,661,800 | ||
Crestwood Midstream Partners LP/Crestwood Midstream Finance Corp.: | ||||
6.125% 3/1/22 | 690,000 | 696,900 | ||
7.75% 4/1/19 | 940,000 | 988,175 | ||
Denbury Resources, Inc.: | ||||
5.5% 5/1/22 | 2,145,000 | 2,112,825 | ||
6.375% 8/15/21 | 1,555,000 | 1,624,975 | ||
Dynegy Finance I, Inc./Dynegy Finance II, Inc.: | ||||
6.75% 11/1/19 (c) | 730,000 | 755,550 | ||
7.375% 11/1/22 (c) | 725,000 | 766,688 | ||
7.625% 11/1/24 (c) | 2,890,000 | 3,063,400 | ||
Nonconvertible Bonds - continued | ||||
| Principal Amount | Value | ||
Energy - continued | ||||
Endeavor Energy Resources LP/EER Finance, Inc. 7% 8/15/21 (c) | $ 6,325,000 | $ 6,388,250 | ||
Energy Partners Ltd. 8.25% 2/15/18 | 2,645,000 | 2,565,650 | ||
Everest Acquisition LLC/Everest Acquisition Finance, Inc. 9.375% 5/1/20 | 6,175,000 | 6,746,188 | ||
Exterran Holdings, Inc. 7.25% 12/1/18 | 1,775,000 | 1,823,813 | ||
Exterran Partners LP/EXLP Finance Corp.: | ||||
6% 4/1/21 | 2,755,000 | 2,658,575 | ||
6% 10/1/22 (c) | 965,000 | 926,400 | ||
Forbes Energy Services Ltd. 9% 6/15/19 | 3,310,000 | 3,194,150 | ||
Gibson Energy, Inc. 6.75% 7/15/21 (c) | 2,425,000 | 2,576,563 | ||
Hilcorp Energy I LP/Hilcorp Finance Co. 5% 12/1/24 (c) | 925,000 | 888,000 | ||
Hornbeck Offshore Services, Inc.: | ||||
5% 3/1/21 | 1,195,000 | 1,063,550 | ||
5.875% 4/1/20 | 780,000 | 733,200 | ||
Northern Tier Energy LLC/Northern Tier Finance Corp.: | ||||
7.125% 11/15/20 | 2,695,000 | 2,829,750 | ||
7.125% 11/15/20 (c) | 1,585,000 | 1,664,250 | ||
Offshore Group Investment Ltd.: | ||||
7.125% 4/1/23 | 1,200,000 | 990,000 | ||
7.5% 11/1/19 | 5,035,000 | 4,292,338 | ||
Parsley Energy LLC/Parsley 7.5% 2/15/22 (c) | 3,895,000 | 3,817,100 | ||
Rice Energy, Inc. 6.25% 5/1/22 (c) | 5,440,000 | 5,259,800 | ||
Rosetta Resources, Inc.: | ||||
5.625% 5/1/21 | 2,060,000 | 1,998,200 | ||
5.875% 6/1/24 | 520,000 | 499,200 | ||
RSP Permian, Inc. 6.625% 10/1/22 (c) | 360,000 | 359,028 | ||
Samson Investment Co. 9.75% 2/15/20 (f) | 2,015,000 | 1,491,100 | ||
SemGroup Corp. 7.5% 6/15/21 | 2,355,000 | 2,478,638 | ||
Teine Energy Ltd. 6.875% 9/30/22 (c) | 2,745,000 | 2,600,888 | ||
Tesoro Logistics LP/Tesoro Logistics Finance Corp.: | ||||
5.5% 10/15/19 (c) | 475,000 | 488,063 | ||
6.125% 10/15/21 | 545,000 | 559,988 | ||
6.25% 10/15/22 (c) | 505,000 | 522,675 | ||
| 90,855,506 | |||
Entertainment/Film - 0.3% | ||||
CBS Outdoor Americas Capital LLC/CBS Outdoor Americas Capital Corp.: | ||||
5.25% 2/15/22 (c) | 750,000 | 774,375 | ||
5.875% 3/15/25 (c) | 1,375,000 | 1,443,750 | ||
| 2,218,125 | |||
Nonconvertible Bonds - continued | ||||
| Principal Amount | Value | ||
Environmental - 1.1% | ||||
ADS Waste Holdings, Inc. 8.25% 10/1/20 | $ 3,345,000 | $ 3,503,888 | ||
LBC Tank Terminals Holding Netherlands BV 6.875% 5/15/23 (c) | 3,403,000 | 3,624,195 | ||
Tervita Corp. 9.75% 11/1/19 (c) | 1,740,000 | 1,496,400 | ||
| 8,624,483 | |||
Food & Drug Retail - 1.4% | ||||
JBS Investments GmbH: | ||||
7.25% 4/3/24 (c) | 995,000 | 1,062,163 | ||
7.75% 10/28/20 (c) | 2,200,000 | 2,410,386 | ||
Minerva Luxmbourg SA 7.75% 1/31/23 (c) | 4,250,000 | 4,441,250 | ||
SUPERVALU, Inc. 6.75% 6/1/21 | 2,960,000 | 2,900,800 | ||
| 10,814,599 | |||
Food/Beverage/Tobacco - 3.2% | ||||
DS Waters of America, Inc. 10% 9/1/21 | 940,000 | 1,038,700 | ||
ESAL GmbH 6.25% 2/5/23 (c) | 8,940,000 | 9,118,800 | ||
FAGE Dairy Industry SA/FAGE U.S.A. Dairy Industry, Inc. 9.875% 2/1/20 (c) | 2,050,000 | 2,170,438 | ||
JBS U.S.A. LLC/JBS U.S.A. Finance, Inc.: | ||||
5.875% 7/15/24 (c) | 1,530,000 | 1,537,650 | ||
7.25% 6/1/21 (c) | 1,850,000 | 1,970,250 | ||
8.25% 2/1/20 (c) | 4,220,000 | 4,515,400 | ||
Post Holdings, Inc. 6% 12/15/22 (c) | 4,555,000 | 4,395,575 | ||
Vector Group Ltd. 7.75% 2/15/21 | 730,000 | 791,138 | ||
| 25,537,951 | |||
Gaming - 2.6% | ||||
Caesars Growth Properties Holdings LLC/Caesars Growth Properties Finance, Inc. 9.375% 5/1/22 (c) | 1,555,000 | 1,446,150 | ||
Golden Nugget Escrow, Inc. 8.5% 12/1/21 (c) | 4,475,000 | 4,452,625 | ||
MCE Finance Ltd. 5% 2/15/21 (c) | 3,535,000 | 3,481,975 | ||
Paris Las Vegas Holding LLC/Harrah's Las Vegas LLC/Flamingo Las Vegas Holdings, Inc.: | ||||
8% 10/1/20 (c) | 3,440,000 | 3,336,800 | ||
11% 10/1/21 (c) | 1,735,000 | 1,611,381 | ||
Scientific Games Corp. 6.625% 5/15/21 (c) | 5,075,000 | 4,034,625 | ||
Seminole Hard Rock Entertainment, Inc. 5.875% 5/15/21 (c) | 940,000 | 925,900 | ||
Wynn Macau Ltd. 5.25% 10/15/21 (c) | 1,080,000 | 1,080,000 | ||
| 20,369,456 | |||
Healthcare - 3.9% | ||||
AmSurg Corp. 5.625% 7/15/22 (c) | 885,000 | 916,971 | ||
Nonconvertible Bonds - continued | ||||
| Principal Amount | Value | ||
Healthcare - continued | ||||
Community Health Systems, Inc.: | ||||
5.125% 8/1/21 | $ 620,000 | $ 647,900 | ||
6.875% 2/1/22 | 2,995,000 | 3,227,113 | ||
DJO Finance LLC/DJO Finance Corp.: | ||||
7.75% 4/15/18 | 950,000 | 959,500 | ||
8.75% 3/15/18 | 110,000 | 116,050 | ||
9.875% 4/15/18 | 1,555,000 | 1,636,638 | ||
Fresenius Medical Care U.S. Finance II, Inc.: | ||||
4.125% 10/15/20 (c) | 1,900,000 | 1,905,938 | ||
4.75% 10/15/24 (c) | 1,955,000 | 1,961,109 | ||
Grifols Worldwide Operations Ltd. 5.25% 4/1/22 (c) | 720,000 | 738,000 | ||
HCA Holdings, Inc.: | ||||
5% 3/15/24 | 1,295,000 | 1,335,482 | ||
5.25% 4/15/25 | 1,395,000 | 1,445,569 | ||
Sabra Health Care LP/Sabra Capital Corp. 5.5% 2/1/21 | 3,740,000 | 3,880,250 | ||
Tenet Healthcare Corp.: | ||||
5% 3/1/19 (c) | 1,245,000 | 1,246,556 | ||
8.125% 4/1/22 | 9,670,000 | 11,084,205 | ||
| 31,101,281 | |||
Homebuilders/Real Estate - 2.1% | ||||
CBRE Group, Inc. 5% 3/15/23 | 3,000,000 | 3,060,000 | ||
D.R. Horton, Inc. 4.375% 9/15/22 | 3,175,000 | 3,135,313 | ||
Howard Hughes Corp. 6.875% 10/1/21 (c) | 1,725,000 | 1,824,188 | ||
Lennar Corp. 4.5% 6/15/19 | 1,815,000 | 1,847,906 | ||
Standard Pacific Corp. 8.375% 5/15/18 | 3,432,000 | 3,972,540 | ||
Toll Brothers Finance Corp. 4.375% 4/15/23 | 1,365,000 | 1,337,700 | ||
Weyerhaeuser Real Estate Co.: | ||||
4.375% 6/15/19 (c) | 550,000 | 547,250 | ||
5.875% 6/15/24 (c) | 400,000 | 408,000 | ||
William Lyon Homes, Inc. 5.75% 4/15/19 | 350,000 | 348,250 | ||
| 16,481,147 | |||
Hotels - 0.3% | ||||
Playa Resorts Holding BV 8% 8/15/20 (c) | 2,379,000 | 2,474,160 | ||
Leisure - 1.7% | ||||
24 Hour Holdings III LLC 8% 6/1/22 (c) | 3,435,000 | 3,246,075 | ||
NCL Corp. Ltd. 5% 2/15/18 | 3,650,000 | 3,650,000 | ||
Royal Caribbean Cruises Ltd.: | ||||
5.25% 11/15/22 | 4,025,000 | 4,206,125 | ||
7.5% 10/15/27 | 1,925,000 | 2,204,125 | ||
| 13,306,325 | |||
Nonconvertible Bonds - continued | ||||
| Principal Amount | Value | ||
Metals/Mining - 3.6% | ||||
CONSOL Energy, Inc. 5.875% 4/15/22 (c) | $ 2,850,000 | $ 2,892,750 | ||
FMG Resources (August 2006) Pty Ltd. 8.25% 11/1/19 (c) | 925,000 | 959,688 | ||
Imperial Metals Corp. 7% 3/15/19 (c) | 1,620,000 | 1,534,950 | ||
Lundin Mining Corp.: | ||||
7.5% 11/1/20 (c) | 2,045,000 | 2,131,913 | ||
7.875% 11/1/22 (c) | 2,065,000 | 2,147,600 | ||
Murray Energy Corp.: | ||||
8.625% 6/15/21 (c) | 2,275,000 | 2,348,938 | ||
9.5% 12/5/20 (c) | 4,525,000 | 4,841,750 | ||
New Gold, Inc. 6.25% 11/15/22 (c) | 3,665,000 | 3,582,538 | ||
Peabody Energy Corp.: | ||||
6.25% 11/15/21 | 2,135,000 | 2,021,578 | ||
7.875% 11/1/26 | 700,000 | 658,000 | ||
Rain CII Carbon LLC/CII Carbon Corp. 8.25% 1/15/21 (c) | 3,445,000 | 3,513,900 | ||
Signode Industrial Group Lux SA/Signode Industrial Group U.S., Inc. 6.375% 5/1/22 (c) | 1,555,000 | 1,508,350 | ||
| 28,141,955 | |||
Paper - 0.4% | ||||
Sappi Papier Holding GmbH 6.625% 4/15/21 (c) | 3,375,000 | 3,510,000 | ||
Publishing/Printing - 1.7% | ||||
Cenveo Corp. 6% 8/1/19 (c) | 3,100,000 | 2,983,750 | ||
McGraw-Hill Global Education Holdings LLC/McGraw-Hill Global Education Finance 9.75% 4/1/21 | 4,890,000 | 5,525,700 | ||
MHGE Parent LLC / MHGE Parent Finance, Inc. 8.5% 8/1/19 pay-in-kind (c)(f) | 4,120,000 | 4,068,500 | ||
R.R. Donnelley & Sons Co. 7% 2/15/22 | 700,000 | 749,000 | ||
| 13,326,950 | |||
Restaurants - 0.5% | ||||
1011778 BC ULC/New Red Finance, Inc. 6% 4/1/22 (c) | 3,290,000 | 3,335,238 | ||
NPC International, Inc./NPC Operating Co. A, Inc./NPC Operating Co. B, Inc. 10.5% 1/15/20 | 765,000 | 797,513 | ||
| 4,132,751 | |||
Services - 5.4% | ||||
Abengoa Greenfield SA 6.5% 10/1/19 (c) | 2,150,000 | 2,155,375 | ||
ADT Corp. 4.125% 4/15/19 | 2,085,000 | 2,066,756 | ||
Anna Merger Sub, Inc. 7.75% 10/1/22 (c) | 1,235,000 | 1,258,156 | ||
Nonconvertible Bonds - continued | ||||
| Principal Amount | Value | ||
Services - continued | ||||
APX Group, Inc.: | ||||
6.375% 12/1/19 | $ 6,185,000 | $ 6,076,763 | ||
8.75% 12/1/20 | 6,500,000 | 5,622,500 | ||
8.75% 12/1/20 (c) | 1,315,000 | 1,137,475 | ||
Audatex North America, Inc. 6% 6/15/21 (c) | 3,390,000 | 3,584,925 | ||
Bankrate, Inc. 6.125% 8/15/18 (c) | 1,595,000 | 1,563,100 | ||
Blueline Rent Finance Corp./Volvo 7% 2/1/19 (c) | 1,305,000 | 1,373,513 | ||
Brand Energy & Infrastructure Services, Inc. 8.5% 12/1/21 (c) | 2,650,000 | 2,640,063 | ||
CBRE Group, Inc. 5.25% 3/15/25 | 825,000 | 844,594 | ||
FTI Consulting, Inc. 6.75% 10/1/20 | 2,560,000 | 2,700,800 | ||
Garda World Security Corp.: | ||||
7.25% 11/15/21 (c) | 150,000 | 149,250 | ||
7.25% 11/15/21 (c) | 390,000 | 388,050 | ||
Hertz Corp. 6.25% 10/15/22 | 2,925,000 | 2,983,500 | ||
IHS, Inc. 5% 11/1/22 (c) | 1,830,000 | 1,857,450 | ||
The GEO Group, Inc. 5.875% 1/15/22 | 2,720,000 | 2,828,800 | ||
TransUnion Holding Co., Inc. 8.125% 6/15/18 pay-in-kind (f) | 2,975,000 | 3,094,000 | ||
| 42,325,070 | |||
Shipping - 1.6% | ||||
Aguila 3 SA 7.875% 1/31/18 (c) | 4,355,000 | 4,365,888 | ||
Navios Maritime Acquisition Corp./Navios Acquisition Finance U.S., Inc. 8.125% 11/15/21 (c) | 2,290,000 | 2,330,075 | ||
Navios Maritime Holdings, Inc.: | ||||
7.375% 1/15/22 (c) | 4,270,000 | 4,291,350 | ||
8.125% 2/15/19 | 930,000 | 899,775 | ||
Navios South American Logistics, Inc./Navios Logistics Finance U.S., Inc. 7.25% 5/1/22 (c) | 860,000 | 866,450 | ||
| 12,753,538 | |||
Steel - 1.4% | ||||
JMC Steel Group, Inc. 8.25% 3/15/18 (c) | 7,195,000 | 7,302,925 | ||
Ryerson, Inc./Joseph T Ryerson & Son, Inc.: | ||||
9% 10/15/17 | 900,000 | 947,250 | ||
11.25% 10/15/18 | 1,351,000 | 1,472,590 | ||
Steel Dynamics, Inc. 5.125% 10/1/21 (c) | 1,495,000 | 1,547,325 | ||
| 11,270,090 | |||
Super Retail - 1.0% | ||||
JC Penney Corp., Inc.: | ||||
5.65% 6/1/20 | 2,345,000 | 1,928,763 | ||
5.75% 2/15/18 | 2,690,000 | 2,515,150 | ||
Nonconvertible Bonds - continued | ||||
| Principal Amount | Value | ||
Super Retail - continued | ||||
JC Penney Corp., Inc.: - continued | ||||
7.4% 4/1/37 | $ 2,605,000 | $ 2,005,850 | ||
8.125% 10/1/19 | 1,110,000 | 1,065,600 | ||
| 7,515,363 | |||
Technology - 4.5% | ||||
ADT Corp.: | ||||
4.125% 6/15/23 | 715,000 | 657,800 | ||
6.25% 10/15/21 | 2,110,000 | 2,215,500 | ||
Advanced Micro Devices, Inc.: | ||||
6.75% 3/1/19 | 1,860,000 | 1,757,700 | ||
7% 7/1/24 | 950,000 | 833,625 | ||
BMC Software Finance, Inc. 8.125% 7/15/21 (c) | 3,760,000 | 3,600,200 | ||
Boxer Parent Co., Inc. 9% 10/15/19 pay-in-kind (c)(f) | 1,370,000 | 1,228,726 | ||
Brocade Communications Systems, Inc. 4.625% 1/15/23 | 2,210,000 | 2,154,750 | ||
Cogent Communications Finance, Inc. 5.625% 4/15/21 (c) | 625,000 | 610,938 | ||
Compiler Finance Sub, Inc. 7% 5/1/21 (c) | 675,000 | 617,625 | ||
Infor Software Parent LLC/Infor Software Parent, Inc. 7.125% 5/1/21 pay-in-kind (c)(f) | 400,000 | 405,000 | ||
Lucent Technologies, Inc.: | ||||
6.45% 3/15/29 | 5,740,000 | 5,524,750 | ||
6.5% 1/15/28 | 2,050,000 | 1,973,125 | ||
Micron Technology, Inc. 5.875% 2/15/22 (c) | 305,000 | 320,250 | ||
Nuance Communications, Inc. 5.375% 8/15/20 (c) | 5,475,000 | 5,502,375 | ||
Sungard Availability Services Capital, Inc. 8.75% 4/1/22 (c) | 2,600,000 | 1,911,000 | ||
Viasystems, Inc. 7.875% 5/1/19 (c) | 2,810,000 | 2,978,600 | ||
WideOpenWest Finance LLC/WideOpenWest Capital Corp.: | ||||
10.25% 7/15/19 | 2,170,000 | 2,381,575 | ||
13.375% 10/15/19 | 1,070,000 | 1,219,800 | ||
| 35,893,339 | |||
Telecommunications - 8.6% | ||||
Alcatel-Lucent U.S.A., Inc.: | ||||
6.75% 11/15/20 (c) | 2,115,000 | 2,178,450 | ||
8.875% 1/1/20 (c) | 2,035,000 | 2,233,413 | ||
Altice Financing SA: | ||||
6.5% 1/15/22 (c) | 390,000 | 400,725 | ||
7.875% 12/15/19 (c) | 1,650,000 | 1,759,313 | ||
Altice Finco SA 9.875% 12/15/20 (c) | 6,195,000 | 6,907,425 | ||
Nonconvertible Bonds - continued | ||||
| Principal Amount | Value | ||
Telecommunications - continued | ||||
Columbus International, Inc. 7.375% 3/30/21 (c) | $ 7,230,000 | $ 7,663,800 | ||
Digicel Group Ltd.: | ||||
6% 4/15/21 (c) | 3,365,000 | 3,398,650 | ||
7% 2/15/20 (c) | 200,000 | 207,500 | ||
7.125% 4/1/22 (c) | 1,835,000 | 1,844,175 | ||
8.25% 9/1/17 (c) | 3,535,000 | 3,618,956 | ||
8.25% 9/30/20 (c) | 3,200,000 | 3,344,000 | ||
DigitalGlobe, Inc. 5.25% 2/1/21 (c) | 5,545,000 | 5,392,513 | ||
FairPoint Communications, Inc. 8.75% 8/15/19 (c) | 2,410,000 | 2,542,550 | ||
Level 3 Escrow II, Inc. 5.375% 8/15/22 (c) | 2,635,000 | 2,681,113 | ||
MasTec, Inc. 4.875% 3/15/23 | 1,680,000 | 1,604,400 | ||
SBA Communications Corp. 4.875% 7/15/22 (c) | 1,785,000 | 1,758,002 | ||
Sprint Capital Corp.: | ||||
6.875% 11/15/28 | 3,675,000 | 3,573,938 | ||
8.75% 3/15/32 | 3,215,000 | 3,592,763 | ||
T-Mobile U.S.A., Inc.: | ||||
5.25% 9/1/18 | 1,735,000 | 1,800,063 | ||
6% 3/1/23 | 1,500,000 | 1,545,000 | ||
6.375% 3/1/25 | 2,850,000 | 2,928,375 | ||
6.464% 4/28/19 | 1,565,000 | 1,631,513 | ||
TW Telecom Holdings, Inc.: | ||||
5.375% 10/1/22 | 1,815,000 | 2,005,575 | ||
6.375% 9/1/23 | 845,000 | 963,300 | ||
Wind Acquisition Finance SA 7.375% 4/23/21 (c) | 2,230,000 | 2,179,825 | ||
| 67,755,337 | |||
TOTAL NONCONVERTIBLE BONDS (Cost $669,462,845) |
| |||
Common Stocks - 0.0% | |||
Shares |
| ||
Telecommunications - 0.0% | |||
CUI Acquisition Corp. Class E (a)(c) | 1 |
| |
Bank Loan Obligations - 11.0% | ||||
| Principal Amount |
| ||
Aerospace - 0.1% | ||||
TransDigm, Inc. Tranche D, term loan 3.75% 6/4/21 (f) | $ 977,550 | 960,443 | ||
Bank Loan Obligations - continued | ||||
| Principal Amount | Value | ||
Automotive - 0.1% | ||||
Chrysler Group LLC term loan 3.25% 12/31/18 (f) | $ 1,079,575 | $ 1,068,779 | ||
Broadcasting - 0.6% | ||||
Clear Channel Communications, Inc. Tranche D, term loan 6.904% 1/30/19 (f) | 5,025,000 | 4,742,344 | ||
Building Materials - 0.3% | ||||
GYP Holdings III Corp.: | ||||
Tranche 1LN, term loan 4.75% 4/1/21 (f) | 1,701,450 | 1,667,421 | ||
Tranche 2LN, term loan 7.75% 4/1/22 (f) | 340,000 | 339,150 | ||
| 2,006,571 | |||
Cable TV - 0.2% | ||||
Numericable LLC: | ||||
Tranche B 1LN, term loan 4.5% 5/8/20 (f) | 731,850 | 732,882 | ||
Tranche B 2LN, term loan 4.5% 5/8/20 (f) | 633,150 | 634,043 | ||
| 1,366,925 | |||
Capital Goods - 0.4% | ||||
Husky Injection Molding Systems Ltd.: | ||||
Tranche 1LN, term loan 4.25% 6/30/21 (f) | 2,271,331 | 2,240,100 | ||
Tranche 2LN, term loan 7.25% 6/30/22 (f) | 875,000 | 856,406 | ||
| 3,096,506 | |||
Containers - 0.8% | ||||
Ardagh Holdings U.S.A., Inc. Tranche B, term loan 4% 12/17/19 (f) | 1,225,000 | 1,214,281 | ||
Berlin Packaging, LLC: | ||||
Tranche 2LN, term loan 7.75% 10/1/22 (f) | 480,000 | 478,800 | ||
Tranche B 1LN, term loan 4.5% 10/1/21 (f) | 1,480,000 | 1,470,750 | ||
Signode Packaging Systems, Inc. Tranche B, term loan 4% 5/1/21 (f) | 2,994,519 | 2,934,628 | ||
| 6,098,459 | |||
Diversified Financial Services - 0.3% | ||||
Delos Finance SARL Tranche B LN, term loan 3.5% 3/6/21 (f) | 1,320,000 | 1,312,304 | ||
IBC Capital U.S. LLC: | ||||
Tranche 2LN, term loan 8% 9/9/22 (f) | 925,000 | 920,375 | ||
Tranche B 1LN, term loan 4.75% 9/11/21 (f) | 235,000 | 233,825 | ||
| 2,466,504 | |||
Electric Utilities - 0.2% | ||||
Exgen Texas Power LLC Tranche B, term loan 5.75% 9/18/21 (f) | 1,210,000 | 1,210,000 | ||
Southwire LLC, Tranche B, term loan 3.25% 2/10/21 (f) | 726,350 | 704,560 | ||
| 1,914,560 | |||
Bank Loan Obligations - continued | ||||
| Principal Amount | Value | ||
Energy - 1.5% | ||||
Chief Exploration & Development, LLC. Tranche 2LN, term loan 7.5% 5/16/21 (f) | $ 645,000 | $ 622,425 | ||
Energy Transfer Equity LP Tranche B, term loan 3.25% 12/2/19 (f) | 2,100,000 | 2,055,753 | ||
Fieldwood Energy, LLC: | ||||
Tranche 2LN, term loan 8.375% 9/30/20 (f) | 3,445,000 | 3,315,813 | ||
Tranche B 1LN, term loan 3.875% 9/30/18 (f) | 341,862 | 333,315 | ||
Moxie Patriot LLC Tranche B, term loan 6.75% 12/19/20 (f) | 3,120,000 | 3,162,900 | ||
Seadrill Operating LP Tranche B, term loan 4% 2/21/21 (f) | 2,293,235 | 2,163,919 | ||
| 11,654,125 | |||
Gaming - 0.7% | ||||
Aristocrat International (Pty) Ltd. Tranche B, term loan 4.75% 10/20/21 (f) | 2,180,000 | 2,166,375 | ||
Caesars Growth Properties Holdings, LLC Tranche 1LN, term loan 6.25% 5/8/21 (f) | 329,175 | 310,247 | ||
Las Vegas Sands LLC Tranche B, term loan 3.25% 12/19/20 (f) | 565,725 | 563,604 | ||
Scientific Games Corp. Tranch B 2LN, term loan 6% 10/21/21 (f) | 2,200,000 | 2,153,360 | ||
| 5,193,586 | |||
Healthcare - 1.2% | ||||
AmSurg Corp. Tranche B, term loan 3.75% 7/16/21 (f) | 119,700 | 119,102 | ||
Endo Luxembourg Finance I Comp Tranche B, term loan 3.25% 2/28/21 (f) | 2,099,450 | 2,071,905 | ||
Grifols, S.A. Tranche B, term loan 3.154% 2/27/21 (f) | 3,452,650 | 3,409,492 | ||
MPH Acquisition Holdings LLC Tranche B, term loan 4% 3/31/21 (f) | 1,110,909 | 1,090,080 | ||
Pharmedium Healthcare Corp.: | ||||
Tranche 2LN, term loan 7.75% 1/28/22 (f) | 1,040,000 | 1,037,400 | ||
Tranche B 1LN, term loan 4.25% 1/28/21 (f) | 1,843,000 | 1,806,140 | ||
| 9,534,119 | |||
Leisure - 0.0% | ||||
24 Hour Fitness Worldwide, Inc. Tranche B, term loan 4.75% 5/30/21 (f) | 179,550 | 179,101 | ||
Bank Loan Obligations - continued | ||||
| Principal Amount | Value | ||
Metals/Mining - 0.4% | ||||
Fortescue Metals Group Ltd. Tranche B, term loan 3.75% 6/30/19 (f) | $ 1,390,950 | $ 1,356,176 | ||
Peabody Energy Corp. Tranche B, term loan 4.25% 9/24/20 (f) | 1,821,600 | 1,753,290 | ||
| 3,109,466 | |||
Publishing/Printing - 0.5% | ||||
ARC Document Solutions, Inc. Tranche B, term loan 6.25% 12/20/18 (f) | 3,609,425 | 3,609,425 | ||
Restaurants - 0.7% | ||||
Dunkin Brands, Inc. Tranche B 4LN, term loan 3.25% 2/7/21 (f) | 5,031,689 | 4,905,896 | ||
TGI Friday's, Inc.: | ||||
Tranche B 1LN, term loan 5.25% 7/15/20 (f) | 322,267 | 321,461 | ||
Tranche B 2LN, term loan 9.25% 7/15/21 (f) | 365,000 | 359,525 | ||
| 5,586,882 | |||
Services - 1.2% | ||||
Brand Energy & Infrastructure Services, Inc. Tranche B, term loan 4.75% 11/26/20 (f) | 2,565,613 | 2,543,163 | ||
Cactus Wellhead LLC Tranche B, term loan 7% 7/31/20 (f) | 1,630,000 | 1,599,438 | ||
Garda World Security Corp.: | ||||
term loan 4% 11/8/20 (f) | 2,275,063 | 2,223,874 | ||
Tranche DD, term loan 4% 11/8/20 (f) | 581,993 | 568,898 | ||
Laureate Education, Inc. Tranche B, term loan 5% 6/16/18 (f) | 1,999,728 | 1,929,737 | ||
Lineage Logistics Holdings, LLC. Tranche B, term loan 4.5% 4/7/21 (f) | 890,525 | 871,601 | ||
| 9,736,711 | |||
Shipping - 0.1% | ||||
YRC Worldwide, Inc. Tranche B, term loan 8.25% 2/13/19 (f) | 674,900 | 661,402 | ||
Steel - 0.2% | ||||
Atkore International, Inc.: | ||||
Tranche 2LN, term loan 7.75% 10/9/21 (f) | 560,000 | 550,200 | ||
Tranche B 1LN, term loan 4.5% 4/9/21 (f) | 1,002,488 | 994,969 | ||
| 1,545,169 | |||
Bank Loan Obligations - continued | ||||
| Principal Amount | Value | ||
Super Retail - 0.2% | ||||
JC Penney Corp., Inc. Tranche B, term loan: | ||||
5% 6/20/19 (f) | $ 94,763 | $ 92,630 | ||
6% 5/22/18 (f) | 1,701,385 | 1,682,245 | ||
| 1,774,875 | |||
Technology - 1.0% | ||||
DealerTrack Holdings, Inc. Tranche B LN, term loan 3.5% 2/28/21 (f) | 1,989,135 | 1,964,271 | ||
Infor U.S., Inc. Tranche B 5LN, term loan 3.75% 6/3/20 (f) | 472,070 | 464,989 | ||
Kronos, Inc. Tranche 2LN, term loan 9.75% 4/30/20 (f) | 1,165,000 | 1,194,125 | ||
NXP BV Tranche D, term loan 3.25% 1/11/20 (f) | 2,069,100 | 2,045,823 | ||
Sungard Availability Services Capital, Inc. Tranche B, term loan 6% 3/31/19 (f) | 2,552,175 | 2,271,436 | ||
| 7,940,644 | |||
Telecommunications - 0.3% | ||||
Level 3 Financing, Inc. Tranche B 5LN, term loan 4.5% 1/31/22 (f) | 2,550,000 | 2,559,690 | ||
TOTAL BANK LOAN OBLIGATIONS (Cost $88,113,000) |
| |||
Preferred Securities - 1.3% | ||||
| ||||
Banks & Thrifts - 1.3% | ||||
Barclays Bank PLC 7.625% 11/21/22 | 4,405,000 | 4,948,383 | ||
Barclays PLC 8.25% (d)(f) | 3,590,000 | 3,744,917 | ||
Credit Agricole SA 6.625% (c)(d)(f) | 1,490,000 | 1,465,583 | ||
TOTAL PREFERRED SECURITIES (Cost $9,667,296) |
| |||
Money Market Funds - 0.5% | |||
Shares | Value | ||
Fidelity Cash Central Fund, 0.11% (b) | 4,390,954 | $ 4,390,954 | |
TOTAL INVESTMENT PORTFOLIO - 98.2% (Cost $772,498,353) | 777,191,521 | ||
NET OTHER ASSETS (LIABILITIES) - 1.8% | 14,011,579 | ||
NET ASSETS - 100% | $ 791,203,100 | ||
Legend |
(a) Non-income producing |
(b) Affiliated fund that is generally available only to investment companies and other accounts managed by Fidelity Investments. The rate quoted is the annualized seven-day yield of the fund at period end. A complete unaudited listing of the fund's holdings as of its most recent quarter end is available upon request. In addition, each Fidelity Central Fund's financial statements, which are not covered by the Fund's Report of Independent Registered Public Accounting Firm, are available on the SEC's website or upon request. |
(c) Security exempt from registration under Rule 144A of the Securities Act of 1933. These securities may be resold in transactions exempt from registration, normally to qualified institutional buyers. At the end of the period, the value of these securities amounted to $357,729,193 or 45.2% of net assets. |
(d) Security is perpetual in nature with no stated maturity date. |
(e) Security or a portion of the security purchased on a delayed delivery or when-issued basis. |
(f) Coupon rates for floating and adjustable rate securities reflect the rates in effect at period end. |
Affiliated Central Funds |
Information regarding fiscal year to date income earned by the Fund from investments in Fidelity Central Funds is as follows: |
Fund | Income earned |
Fidelity Cash Central Fund | $ 23,921 |
Other Information |
The following is a summary of the inputs used, as of October 31, 2014, involving the Fund's assets and liabilities carried at fair value. The inputs or methodology used for valuing securities may not be an indication of the risk associated with investing in those securities. For more information on valuation inputs, and their aggregation into the levels used in the table below, please refer to the Investment Valuation section in the accompanying Notes to Financial Statements. |
Valuation Inputs at Reporting Date: | ||||
Description | Total | Level 1 | Level 2 | Level 3 |
Investments in Securities: | ||||
Equities: | ||||
Telecommunication Services | $ 92,272 | $ - | $ - | $ 92,272 |
Corporate Bonds | 675,743,126 | - | 675,743,126 | - |
Bank Loan Obligations | 86,806,286 | - | 86,806,286 | - |
Preferred Securities | 10,158,883 | - | 10,158,883 | - |
Money Market Funds | 4,390,954 | 4,390,954 | - | - |
Total Investments in Securities: | $ 777,191,521 | $ 4,390,954 | $ 772,708,295 | $ 92,272 |
Distribution of investments by country or territory of incorporation, as a percentage of total net assets, is as follows (Unaudited): |
United States of America | 72.8% |
Luxembourg | 5.8% |
Canada | 4.8% |
Bermuda | 2.9% |
Austria | 1.9% |
Netherlands | 1.9% |
United Kingdom | 1.5% |
Ireland | 1.5% |
Marshall Islands | 1.3% |
Cayman Islands | 1.2% |
Australia | 1.1% |
Barbados | 1.0% |
Others (Individually Less Than 1%) | 2.3% |
| 100.0% |
See accompanying notes which are an integral part of the financial statements.
Annual Report
Financial Statements
Statement of Assets and Liabilities
| October 31, 2014 | |
|
|
|
Assets | ||
Investment in securities, at value - See accompanying schedule: Unaffiliated issuers (cost $768,107,399) | $ 772,800,567 |
|
Fidelity Central Funds (cost $4,390,954) | 4,390,954 |
|
Total Investments (cost $772,498,353) |
| $ 777,191,521 |
Cash |
| 527,901 |
Receivable for investments sold | 17,351,188 | |
Receivable for fund shares sold | 523,707 | |
Interest receivable | 12,230,084 | |
Distributions receivable from Fidelity Central Funds | 1,699 | |
Prepaid expenses | 1,840 | |
Other receivables | 5 | |
Total assets | 809,827,945 | |
|
|
|
Liabilities | ||
Payable for investments purchased | $ 8,741,112 | |
Delayed delivery | 3,260,000 | |
Payable for fund shares redeemed | 3,302,532 | |
Distributions payable | 562,965 | |
Accrued management fee | 370,486 | |
Distribution and service plan fees payable | 171,930 | |
Other affiliated payables | 159,404 | |
Other payables and accrued expenses | 56,416 | |
Total liabilities | 16,624,845 | |
|
|
|
Net Assets | $ 791,203,100 | |
Net Assets consist of: |
| |
Paid in capital | $ 766,906,160 | |
Undistributed net investment income | 3,311,724 | |
Accumulated undistributed net realized gain (loss) on investments | 16,292,048 | |
Net unrealized appreciation (depreciation) on investments | 4,693,168 | |
Net Assets | $ 791,203,100 | |
See accompanying notes which are an integral part of the financial statements.
Annual Report
Financial Statements - continued
Statement of Assets and Liabilities - continued
| October 31, 2014 | |
|
|
|
Calculation of Maximum Offering Price Class A: | $ 8.33 | |
|
|
|
Maximum offering price per share (100/96.00 of $8.33) | $ 8.68 | |
Class T: | $ 8.31 | |
|
|
|
Maximum offering price per share (100/96.00 of $8.31) | $ 8.66 | |
Class B: | $ 8.30 | |
|
|
|
Class C: | $ 8.30 | |
|
|
|
Institutional Class: | $ 8.34 | |
A Redemption price per share is equal to net asset value less any applicable contingent deferred sales charge.
See accompanying notes which are an integral part of the financial statements.
Annual Report
Statement of Operations
| Year ended October 31, 2014 | |
|
|
|
Investment Income |
|
|
Dividends |
| $ 318,332 |
Interest |
| 51,433,589 |
Income from Fidelity Central Funds |
| 23,921 |
Total income |
| 51,775,842 |
|
|
|
Expenses | ||
Management fee | $ 4,751,813 | |
Transfer agent fees | 1,720,739 | |
Distribution and service plan fees | 2,212,185 | |
Accounting fees and expenses | 311,798 | |
Custodian fees and expenses | 21,648 | |
Independent trustees' compensation | 3,503 | |
Registration fees | 92,990 | |
Audit | 67,494 | |
Legal | 5,452 | |
Miscellaneous | 7,617 | |
Total expenses before reductions | 9,195,239 | |
Expense reductions | (84,741) | 9,110,498 |
Net investment income (loss) | 42,665,344 | |
Realized and Unrealized Gain (Loss) Net realized gain (loss) on: | ||
Investment securities: |
|
|
Unaffiliated issuers |
| 19,130,548 |
Change in net unrealized appreciation (depreciation) on investment securities | (24,730,423) | |
Net gain (loss) | (5,599,875) | |
Net increase (decrease) in net assets resulting from operations | $ 37,065,469 | |
See accompanying notes which are an integral part of the financial statements.
Annual Report
Financial Statements - continued
Statement of Changes in Net Assets
| Year ended | Year ended |
Increase (Decrease) in Net Assets |
|
|
Operations |
|
|
Net investment income (loss) | $ 42,665,344 | $ 50,536,768 |
Net realized gain (loss) | 19,130,548 | 36,587,680 |
Change in net unrealized appreciation (depreciation) | (24,730,423) | (24,249,415) |
Net increase (decrease) in net assets resulting | 37,065,469 | 62,875,033 |
Distributions to shareholders from net investment income | (42,403,704) | (48,912,015) |
Distributions to shareholders from net realized gain | (37,717,635) | (10,710,125) |
Total distributions | (80,121,339) | (59,622,140) |
Share transactions - net increase (decrease) | (35,829,882) | (160,938,070) |
Redemption fees | 52,404 | 74,188 |
Total increase (decrease) in net assets | (78,833,348) | (157,610,989) |
|
|
|
Net Assets | ||
Beginning of period | 870,036,448 | 1,027,647,437 |
End of period (including undistributed net investment income of $3,311,724 and undistributed net investment income of $11,658,201, respectively) | $ 791,203,100 | $ 870,036,448 |
See accompanying notes which are an integral part of the financial statements.
Annual Report
Financial Highlights - Class A
Years ended October 31, | 2014 | 2013 | 2012 | 2011 | 2010 |
Selected Per-Share Data |
|
|
|
|
|
Net asset value, beginning of period | $ 8.77 | $ 8.73 | $ 8.38 | $ 8.59 | $ 7.87 |
Income from Investment Operations |
|
|
|
|
|
Net investment income (loss) C | .432 | .473 | .539 | .581 | .637 |
Net realized and unrealized gain (loss) | (.058) | .117 | .411 | (.204) | .673 |
Total from investment operations | .374 | .590 | .950 | .377 | 1.310 |
Distributions from net investment income | (.429) | (.457) | (.551) | (.589) | (.591) |
Distributions from net realized gain | (.386) | (.094) | (.050) | - | - |
Total distributions | (.815) | (.551) | (.601) | (.589) | (.591) |
Redemption fees added to paid in capital C | .001 | .001 | .001 | .002 | .001 |
Net asset value, end of period | $ 8.33 | $ 8.77 | $ 8.73 | $ 8.38 | $ 8.59 |
Total ReturnA, B | 4.51% | 6.99% | 11.84% | 4.53% | 17.33% |
Ratios to Average Net Assets D, F |
|
|
|
|
|
Expenses before reductions | 1.03% | 1.03% | 1.03% | 1.04% | 1.06% |
Expenses net of fee waivers, if any | 1.03% | 1.03% | 1.03% | 1.04% | 1.06% |
Expenses net of all reductions | 1.03% | 1.03% | 1.03% | 1.04% | 1.06% |
Net investment income (loss) | 5.09% | 5.40% | 6.35% | 6.82% | 7.81% |
Supplemental Data |
|
|
|
|
|
Net assets, end of period (000 omitted) | $ 243,987 | $ 280,769 | $ 331,436 | $ 264,110 | $ 278,577 |
Portfolio turnover rateE | 79% | 76% | 48% | 75% | 79% |
A Total returns would have been lower if certain expenses had not been reduced during the applicable periods shown.
B Total returns do not include the effect of the sales charges.
C Calculated based on average shares outstanding during the period.
D Fees and expenses of any underlying Fidelity Central Funds are not included in the Fund's expense ratio. The Fund indirectly bears its proportionate share of the expenses of any underlying Fidelity Central Funds.
E Amount does not include the portfolio activity of any underlying Fidelity Central Funds.
F Expense ratios reflect operating expenses of the class. Expenses before reductions do not reflect amounts reimbursed by the investment adviser or reductions from brokerage service arrangements or reductions from other expense offset arrangements and do not represent the amount paid by the class during periods when reimbursements or reductions occur. Expenses net of fee waivers reflect expenses after reimbursement by the investment adviser but prior to reductions from brokerage service arrangements or other expense offset arrangements. Expenses net of all reductions represent the net expenses paid by the class.
See accompanying notes which are an integral part of the financial statements.
Annual Report
Financial Highlights - Class T
Years ended October 31, | 2014 | 2013 | 2012 | 2011 | 2010 |
Selected Per-Share Data |
|
|
|
|
|
Net asset value, beginning of period | $ 8.76 | $ 8.72 | $ 8.37 | $ 8.57 | $ 7.86 |
Income from Investment Operations |
|
|
|
|
|
Net investment income (loss) C | .429 | .469 | .536 | .578 | .633 |
Net realized and unrealized gain (loss) | (.067) | .119 | .411 | (.193) | .665 |
Total from investment operations | .362 | .588 | .947 | .385 | 1.298 |
Distributions from net investment income | (.427) | (.455) | (.548) | (.587) | (.589) |
Distributions from net realized gain | (.386) | (.094) | (.050) | - | - |
Total distributions | (.813) | (.549) | (.598) | (.587) | (.589) |
Redemption fees added to paid in capital C | .001 | .001 | .001 | .002 | .001 |
Net asset value, end of period | $ 8.31 | $ 8.76 | $ 8.72 | $ 8.37 | $ 8.57 |
Total ReturnA, B | 4.38% | 6.97% | 11.83% | 4.63% | 17.17% |
Ratios to Average Net Assets D, F |
|
|
|
|
|
Expenses before reductions | 1.05% | 1.05% | 1.06% | 1.07% | 1.11% |
Expenses net of fee waivers, if any | 1.05% | 1.05% | 1.06% | 1.07% | 1.10% |
Expenses net of all reductions | 1.05% | 1.05% | 1.06% | 1.07% | 1.10% |
Net investment income (loss) | 5.07% | 5.38% | 6.32% | 6.79% | 7.78% |
Supplemental Data |
|
|
|
|
|
Net assets, end of period (000 omitted) | $ 86,166 | $ 90,901 | $ 105,518 | $ 92,746 | $ 119,576 |
Portfolio turnover rateE | 79% | 76% | 48% | 75% | 79% |
A Total returns would have been lower if certain expenses had not been reduced during the applicable periods shown.
B Total returns do not include the effect of the sales charges.
C Calculated based on average shares outstanding during the period.
D Fees and expenses of any underlying Fidelity Central Funds are not included in the Fund's expense ratio. The Fund indirectly bears its proportionate share of the expenses of any underlying Fidelity Central Funds.
E Amount does not include the portfolio activity of any underlying Fidelity Central Funds.
F Expense ratios reflect operating expenses of the class. Expenses before reductions do not reflect amounts reimbursed by the investment adviser or reductions from brokerage service arrangements or reductions from other expense offset arrangements and do not represent the amount paid by the class during periods when reimbursements or reductions occur. Expenses net of fee waivers reflect expenses after reimbursement by the investment adviser but prior to reductions from brokerage service arrangements or other expense offset arrangements. Expenses net of all reductions represent the net expenses paid by the class.
See accompanying notes which are an integral part of the financial statements.
Annual Report
Financial Highlights - Class B
Years ended October 31, | 2014 | 2013 | 2012 | 2011 | 2010 |
Selected Per-Share Data |
|
|
|
|
|
Net asset value, beginning of period | $ 8.75 | $ 8.71 | $ 8.36 | $ 8.57 | $ 7.85 |
Income from Investment Operations |
|
|
|
|
|
Net investment income (loss) C | .372 | .408 | .477 | .521 | .579 |
Net realized and unrealized gain (loss) | (.068) | .119 | .412 | (.204) | .676 |
Total from investment operations | .304 | .527 | .889 | .317 | 1.255 |
Distributions from net investment income | (.369) | (.394) | (.490) | (.529) | (.536) |
Distributions from net realized gain | (.386) | (.094) | (.050) | - | - |
Total distributions | (.755) | (.488) | (.540) | (.529) | (.536) |
Redemption fees added to paid in capital C | .001 | .001 | .001 | .002 | .001 |
Net asset value, end of period | $ 8.30 | $ 8.75 | $ 8.71 | $ 8.36 | $ 8.57 |
Total ReturnA, B | 3.67% | 6.24% | 11.08% | 3.81% | 16.58% |
Ratios to Average Net Assets D, F |
|
|
|
|
|
Expenses before reductions | 1.73% | 1.75% | 1.76% | 1.77% | 1.80% |
Expenses net of fee waivers, if any | 1.73% | 1.75% | 1.75% | 1.75% | 1.75% |
Expenses net of all reductions | 1.73% | 1.75% | 1.75% | 1.75% | 1.75% |
Net investment income (loss) | 4.38% | 4.68% | 5.64% | 6.11% | 7.13% |
Supplemental Data |
|
|
|
|
|
Net assets, end of period (000 omitted) | $ 9,218 | $ 13,176 | $ 17,309 | $ 19,647 | $ 29,065 |
Portfolio turnover rateE | 79% | 76% | 48% | 75% | 79% |
A Total returns would have been lower if certain expenses had not been reduced during the applicable periods shown.
B Total returns do not include the effect of the contingent deferred sales charge.
C Calculated based on average shares outstanding during the period.
D Fees and expenses of any underlying Fidelity Central Funds are not included in the Fund's expense ratio. The Fund indirectly bears its proportionate share of the expenses of any underlying Fidelity Central Funds.
E Amount does not include the portfolio activity of any underlying Fidelity Central Funds.
F Expense ratios reflect operating expenses of the class. Expenses before reductions do not reflect amounts reimbursed by the investment adviser or reductions from brokerage service arrangements or reductions from other expense offset arrangements and do not represent the amount paid by the class during periods when reimbursements or reductions occur. Expenses net of fee waivers reflect expenses after reimbursement by the investment adviser but prior to reductions from brokerage service arrangements or other expense offset arrangements. Expenses net of all reductions represent the net expenses paid by the class.
See accompanying notes which are an integral part of the financial statements.
Annual Report
Financial Highlights - Class C
Years ended October 31, | 2014 | 2013 | 2012 | 2011 | 2010 |
Selected Per-Share Data |
|
|
|
|
|
Net asset value, beginning of period | $ 8.75 | $ 8.71 | $ 8.36 | $ 8.57 | $ 7.85 |
Income from Investment Operations |
|
|
|
|
|
Net investment income (loss) C | .365 | .405 | .474 | .516 | .575 |
Net realized and unrealized gain (loss) | (.066) | .119 | .412 | (.202) | .675 |
Total from investment operations | .299 | .524 | .886 | .314 | 1.250 |
Distributions from net investment income | (.364) | (.391) | (.487) | (.526) | (.531) |
Distributions from net realized gain | (.386) | (.094) | (.050) | - | - |
Total distributions | (.750) | (.485) | (.537) | (.526) | (.531) |
Redemption fees added to paid in capital C | .001 | .001 | .001 | .002 | .001 |
Net asset value, end of period | $ 8.30 | $ 8.75 | $ 8.71 | $ 8.36 | $ 8.57 |
Total ReturnA, B | 3.60% | 6.20% | 11.03% | 3.77% | 16.51% |
Ratios to Average Net Assets D, F |
|
|
|
|
|
Expenses before reductions | 1.80% | 1.79% | 1.79% | 1.79% | 1.81% |
Expenses net of fee waivers, if any | 1.80% | 1.79% | 1.79% | 1.79% | 1.81% |
Expenses net of all reductions | 1.80% | 1.79% | 1.79% | 1.79% | 1.81% |
Net investment income (loss) | 4.32% | 4.64% | 5.60% | 6.08% | 7.07% |
Supplemental Data |
|
|
|
|
|
Net assets, end of period (000 omitted) | $ 114,455 | $ 126,952 | $ 149,591 | $ 120,710 | $ 121,796 |
Portfolio turnover rateE | 79% | 76% | 48% | 75% | 79% |
A Total returns would have been lower if certain expenses had not been reduced during the applicable periods shown.
B Total returns do not include the effect of the contingent deferred sales charge.
C Calculated based on average shares outstanding during the period.
D Fees and expenses of any underlying Fidelity Central Funds are not included in the Fund's expense ratio. The Fund indirectly bears its proportionate share of the expenses of any underlying Fidelity Central Funds.
E Amount does not include the portfolio activity of any underlying Fidelity Central Funds.
F Expense ratios reflect operating expenses of the class. Expenses before reductions do not reflect amounts reimbursed by the investment adviser or reductions from brokerage service arrangements or reductions from other expense offset arrangements and do not represent the amount paid by the class during periods when reimbursements or reductions occur. Expenses net of fee waivers reflect expenses after reimbursement by the investment adviser but prior to reductions from brokerage service arrangements or other expense offset arrangements. Expenses net of all reductions represent the net expenses paid by the class.
See accompanying notes which are an integral part of the financial statements.
Annual Report
Financial Highlights - Institutional Class
Years ended October 31, | 2014 | 2013 | 2012 | 2011 | 2010 |
Selected Per-Share Data |
|
|
|
|
|
Net asset value, beginning of period | $ 8.79 | $ 8.75 | $ 8.40 | $ 8.60 | $ 7.88 |
Income from Investment Operations |
|
|
|
|
|
Net investment income (loss) B | .447 | .489 | .556 | .598 | .655 |
Net realized and unrealized gain (loss) | (.068) | .116 | .409 | (.195) | .673 |
Total from investment operations | .379 | .605 | .965 | .403 | 1.328 |
Distributions from net investment income | (.444) | (.472) | (.566) | (.605) | (.609) |
Distributions from net realized gain | (.386) | (.094) | (.050) | - | - |
Total distributions | (.830) | (.566) | (.616) | (.605) | (.609) |
Redemption fees added to paid in capital B | .001 | .001 | .001 | .002 | .001 |
Net asset value, end of period | $ 8.34 | $ 8.79 | $ 8.75 | $ 8.40 | $ 8.60 |
Total ReturnA | 4.57% | 7.16% | 12.02% | 4.85% | 17.55% |
Ratios to Average Net Assets C, E |
|
|
|
|
|
Expenses before reductions | .87% | .87% | .88% | .88% | .89% |
Expenses net of fee waivers, if any | .85% | .85% | .85% | .85% | .85% |
Expenses net of all reductions | .85% | .85% | .85% | .85% | .85% |
Net investment income (loss) | 5.27% | 5.58% | 6.54% | 7.01% | 8.03% |
Supplemental Data |
|
|
|
|
|
Net assets, end of period (000 omitted) | $ 337,377 | $ 358,238 | $ 423,792 | $ 311,790 | $ 329,601 |
Portfolio turnover rateD | 79% | 76% | 48% | 75% | 79% |
A Total returns would have been lower if certain expenses had not been reduced during the applicable periods shown.
B Calculated based on average shares outstanding during the period.
C Fees and expenses of any underlying Fidelity Central Funds are not included in the Fund's expense ratio. The Fund indirectly bears its proportionate share of the expenses of any underlying Fidelity Central Funds.
D Amount does not include the portfolio activity of any underlying Fidelity Central Funds.
E Expense ratios reflect operating expenses of the class. Expenses before reductions do not reflect amounts reimbursed by the investment adviser or reductions from brokerage service arrangements or reductions from other expense offset arrangements and do not represent the amount paid by the class during periods when reimbursements or reductions occur. Expenses net of fee waivers reflect expenses after reimbursement by the investment adviser but prior to reductions from brokerage service arrangements or other expense offset arrangements. Expenses net of all reductions represent the net expenses paid by the class.
See accompanying notes which are an integral part of the financial statements.
Annual Report
Notes to Financial Statements
For the period ended October 31, 2014
1. Organization.
Fidelity Advisor High Income Fund (the Fund) is a fund of Fidelity Advisor Series I (the Trust) and is authorized to issue an unlimited number of shares. The Trust is registered under the Investment Company Act of 1940, as amended (the 1940 Act), as an open-end management investment company organized as a Massachusetts business trust. The Fund offers Class A, Class T, Class C and Institutional Class shares, each of which, along with Class B shares, has equal rights as to assets and voting privileges. Class B shares are closed to new accounts and additional purchases, except for exchanges and reinvestments. Each class has exclusive voting rights with respect to matters that affect that class. Class B shares will automatically convert to Class A shares after a holding period of seven years from the initial date of purchase.
2. Investments in Fidelity Central Funds.
The Fund invests in Fidelity Central Funds, which are open-end investment companies generally available only to other investment companies and accounts managed by the investment adviser and its affiliates. The Fund's Schedule of Investments lists each of the Fidelity Central Funds held as of period end, if any, as an investment of the Fund, but does not include the underlying holdings of each Fidelity Central Fund. As an Investing Fund, the Fund indirectly bears its proportionate share of the expenses of the underlying Fidelity Central Funds.
The Money Market Central Funds seek preservation of capital and current income and are managed by Fidelity Investments Money Management, Inc. (FIMM), an affiliate of the investment adviser. Annualized expenses of the Money Market Central Funds as of their most recent shareholder report date are less than .01%.
A complete unaudited list of holdings for each Fidelity Central Fund is available upon request or at the Securities and Exchange Commission (the SEC) website at www.sec.gov. In addition, the financial statements of the Fidelity Central Funds, which are not covered by the Fund's Report of Independent Registered Public Accounting Firm, are available on the SEC website or upon request.
3. Significant Accounting Policies.
The financial statements have been prepared in conformity with accounting principles generally accepted in the United States of America (GAAP), which require management to make certain estimates and assumptions at the date of the financial statements. Actual results could differ from those estimates. Subsequent events, if any, through the date that the financial statements were issued have been evaluated in the preparation of
Annual Report
Notes to Financial Statements - continued
3. Significant Accounting Policies - continued
the financial statements. The following summarizes the significant accounting policies of the Fund:
Investment Valuation. Investments are valued as of 4:00 p.m. Eastern time on the last calendar day of the period. In accordance with valuation policies and procedures approved by the Board of Trustees (the Board), the Fund attempts to obtain prices from one or more third party pricing vendors or brokers to value its investments. When current market prices, quotations or currency exchange rates are not readily available or reliable, investments will be fair valued in good faith by the Fidelity Management & Research Company (FMR) Fair Value Committee (the Committee), in accordance with procedures adopted by the Board. Factors used in determining fair value vary by investment type and may include market or investment specific events, changes in interest rates and credit quality. The frequency with which these procedures are used cannot be predicted and they may be utilized to a significant extent. The Committee oversees the Fund's valuation policies and procedures and is responsible for approving and reporting to the Board all fair value determinations.
The Fund categorizes the inputs to valuation techniques used to value its investments into a disclosure hierarchy consisting of three levels as shown below:
Level 1 - quoted prices in active markets for identical investments
Level 2 - other significant observable inputs (including quoted prices for similar investments, interest rates, prepayment speeds, etc.)
Level 3 - unobservable inputs (including the Fund's own assumptions based on the best information available)
Valuation techniques used to value the Fund's investments by major category are as follows:
Debt securities, including restricted securities, are valued based on evaluated prices received from third party pricing vendors or from brokers who make markets in such securities. Corporate bonds, bank loan obligations and preferred securities, are valued by pricing vendors who utilize matrix pricing which considers yield or price of bonds of comparable quality, coupon, maturity and type or by broker-supplied prices. When independent prices are unavailable or unreliable, debt securities may be valued utilizing pricing methodologies which consider similar factors that would be used by third party pricing vendors. Debt securities are generally categorized as Level 2 in the hierarchy but may be Level 3 depending on the circumstances. The Fund invests a significant portion of its assets in below investment grade securities. The value of these securities can be more volatile due to changes in the credit quality of the issuer and is sensitive to changes in economic, market and regulatory conditions.
Annual Report
3. Significant Accounting Policies - continued
Investment Valuation - continued
Equity securities, including restricted securities, for which market quotations are readily available, are valued at the last reported sale price or official closing price as reported by a third party pricing vendor on the primary market or exchange on which they are traded and are categorized as Level 1 in the hierarchy. In the event there were no sales during the day or closing prices are not available, securities are valued at the last quoted bid price or may be valued using the last available price and are generally categorized as Level 2 in the hierarchy. For equity securities, including restricted securities, where observable inputs are limited, assumptions about market activity and risk are used and these securities may be categorized as Level 3 in the hierarchy.
Investments in open-end mutual funds, including the Fidelity Central Funds, are valued at their closing net asset value (NAV) each business day and are categorized as Level 1 in the hierarchy.
Changes in valuation techniques may result in transfers in or out of an assigned level within the disclosure hierarchy. The aggregate value of investments by input level, as of October 31, 2014, is included at the end of the Fund's Schedule of Investments.
Investment Transactions and Income. For financial reporting purposes, the Fund's investment holdings and NAV include trades executed through the end of the last business day of the period. The NAV per share for processing shareholder transactions is calculated as of the close of business of the New York Stock Exchange (NYSE), normally 4:00 p.m. Eastern time and includes trades executed through the end of the prior business day. Gains and losses on securities sold are determined on the basis of identified cost and may include proceeds received from litigation. Dividend income is recorded on the ex-dividend date. Non-cash dividends included in dividend income, if any, are recorded at the fair market value of the securities received. Income and capital gain distributions from Fidelity Central Funds, if any, are recorded on the ex-dividend date. Interest income is accrued as earned and includes coupon interest and amortization of premium and accretion of discount on debt securities as applicable.
Class Allocations and Expenses. Investment income, realized and unrealized capital gains and losses, common expenses of the Fund, and certain fund-level expense reductions, if any, are allocated daily on a pro-rata basis to each class based on the relative net assets of each class to the total net assets of the Fund. Each class differs with respect to transfer agent and distribution and service plan fees incurred. Certain expense reductions may also differ by class. For the reporting period, the allocated portion of income and expenses to each class as a percent of its average net assets may vary due to the timing of recording these transactions in relation to fluctuating net assets of the classes. Expenses directly attributable to a fund are charged to that fund. Expenses attributable
Annual Report
Notes to Financial Statements - continued
3. Significant Accounting Policies - continued
Class Allocations and Expenses - continued
to more than one fund are allocated among the respective funds on the basis of relative net assets or other appropriate methods. Expense estimates are accrued in the period to which they relate and adjustments are made when actual amounts are known.
Income Tax Information and Distributions to Shareholders. Each year, the Fund intends to qualify as a regulated investment company under Subchapter M of the Internal Revenue Code, including distributing substantially all of its taxable income and realized gains. As a result, no provision for U.S. Federal income taxes is required. As of October 31, 2014, the Fund did not have any unrecognized tax benefits in the financial statements; nor is the Fund aware of any tax positions for which it is reasonably possible that the total amounts of unrecognized tax benefits will significantly change in the next twelve months. The Fund files a U.S. federal tax return, in addition to state and local tax returns as required. The Fund's federal income tax returns are subject to examination by the Internal Revenue Service (IRS) for a period of three fiscal years after they are filed. State and local tax returns may be subject to examination for an additional fiscal year depending on the jurisdiction.
Dividends are declared and recorded daily and paid monthly from net investment income. Distributions from realized gains, if any, are declared and recorded on the ex-dividend date. Income dividends and capital gain distributions are declared separately for each class. Income and capital gain distributions are determined in accordance with income tax regulations, which may differ from GAAP. In addition, the Fund claimed a portion of the payment made to redeeming shareholders as a distribution for income tax purposes.
Capital accounts within the financial statements are adjusted for permanent book-tax differences. These adjustments have no impact on net assets or the results of operations. Capital accounts are not adjusted for temporary book-tax differences which will reverse in a subsequent period.
Book-tax differences are primarily due to market discount and losses deferred due to wash sales.
The federal tax cost of investment securities and unrealized appreciation (depreciation) as of period end were as follows:
Gross unrealized appreciation | $ 19,254,168 |
Gross unrealized depreciation | (13,836,916) |
Net unrealized appreciation (depreciation) on securities | $ 5,417,252 |
|
|
Tax Cost | $ 771,774,269 |
Annual Report
3. Significant Accounting Policies - continued
Income Tax Information and Distributions to Shareholders - continued
The tax-based components of distributable earnings as of period end were as follows:
Undistributed ordinary income | $ 2,586,366 |
Undistributed long-term capital gain | $ 16,296,789 |
Net unrealized appreciation (depreciation) on securities and other investments | $ 5,417,252 |
The tax character of distributions paid was as follows:
| October 31, 2014 | October 31, 2013 |
Ordinary Income | $ 53,054,539 | $ 55,634,327 |
Long-term Capital Gains | 27,066,800 | 3,987,813 |
Total | $ 80,121,339 | $ 59,622,140 |
Short-Term Trading (Redemption) Fees. Shares held by investors in the Fund less than 90 days may have been subject to a redemption fee equal to 1.00% of the NAV of shares redeemed. All redemption fees, which reduce the proceeds of the shareholder redemption, are retained by the Fund and accounted for as an addition to paid in capital.
Delayed Delivery Transactions and When-Issued Securities. During the period, the Fund transacted in securities on a delayed delivery or when-issued basis. Payment and delivery may take place after the customary settlement period for that security. The price of the underlying securities and the date when the securities will be delivered and paid for are fixed at the time the transaction is negotiated. The securities purchased on a delayed delivery or when-issued basis are identified as such in the Fund's Schedule of Investments. The Fund may receive compensation for interest forgone in the purchase of a delayed delivery or when-issued security. With respect to purchase commitments, the Fund identifies securities as segregated in its records with a value at least equal to the amount of the commitment. Losses may arise due to changes in the value of the underlying securities or if the counterparty does not perform under the contract's terms, or if the issuer does not issue the securities due to political, economic, or other factors.
Restricted Securities. The Fund may invest in securities that are subject to legal or contractual restrictions on resale. These securities generally may be resold in transactions exempt from registration or to the public if the securities are registered. Disposal of these securities may involve time-consuming negotiations and expense, and prompt sale at an acceptable price may be difficult. Information regarding restricted securities is included at the end of the Fund's Schedule of Investments.
Annual Report
Notes to Financial Statements - continued
3. Significant Accounting Policies - continued
Loans and Other Direct Debt Instruments. The Fund invests in direct debt instruments which are interests in amounts owed to lenders by corporate or other borrowers. These instruments may be in the form of loans, trade claims or other receivables and may include standby financing commitments such as revolving credit facilities that obligate the Fund to supply additional cash to the borrower on demand. Loans may be acquired through assignment or participation. The Fund did not have any unfunded loan commitments, which are contractual obligations for future funding, at period end.
New Accounting Pronouncement. In June 2014, the Financial Accounting Standards Board issued Accounting Standard Update No. 2014-11, Repurchase-to-Maturity Transactions, Repurchase Financings, and Disclosures. The Update amends the accounting for certain repurchase agreements and expands disclosure requirements for reverse repurchase agreements, securities lending and other similar transactions. The disclosure requirements are effective for annual and interim reporting periods beginning after December 15, 2014. Management is currently evaluating the impact of the Update on the Fund's financial statements and related disclosures.
4. Purchases and Sales of Investments.
Purchases and sales of securities, other than short-term securities, aggregated $644,938,917 and $702,040,669, respectively.
5. Fees and Other Transactions with Affiliates.
Management Fee. Fidelity Management & Research Company (the investment adviser) and its affiliates provide the Fund with investment management related services for which the Fund pays a monthly management fee. The management fee is the sum of an individual fund fee rate that is based on an annual rate of .45% of the Fund's average net assets and an annualized group fee rate that averaged .11% during the period. The group fee rate is based upon the average net assets of all the mutual funds advised by the investment adviser, including any mutual funds previously advised by the investment adviser that are currently advised by Fidelity SelectCo, LLC, an affiliate of the investment adviser. The group fee rate decreases as assets under management increase and increases as assets under management decrease. For the reporting period, the total annual management fee rate was .56% of the Fund's average net assets.
Distribution and Service Plan Fees. In accordance with Rule 12b-1 of the 1940 Act, the Fund has adopted separate Distribution and Service Plans for each class of shares. Certain classes pay Fidelity Distributors Corporation (FDC), an affiliate of the investment adviser, separate Distribution and Service Fees, each of which is based on an
Annual Report
5. Fees and Other Transactions with Affiliates - continued
Distribution and Service Plan Fees - cotinued
annual percentage of each class' average net assets. In addition, FDC may pay financial intermediaries for selling shares of the Fund and providing shareholder support services. For the period, the Distribution and Service Fee rates, total fees and amounts retained by FDC were as follows:
| Distribution | Service | Total Fees | Retained |
Class A | -% | .25% | $ 664,142 | $ 13,341 |
Class T | -% | .25% | 224,290 | 112,672 |
Class B | .65% | .25% | 101,173 | 73,191 |
Class C | .75% | .25% | 1,222,580 | 119,939 |
|
|
| $ 2,212,185 | $ 319,143 |
Sales Load. FDC may receive a front-end sales charge of up to 4.00% for selling Class A shares and Class T shares, some of which is paid to financial intermediaries for selling shares of the Fund. Depending on the holding period, FDC may receive contingent deferred sales charges levied on Class A, Class T, Class B and Class C redemptions. The deferred sales charges range from 5.00% to 1.00% for Class B shares, 1.00% for Class C shares, 1.00% for certain purchases of Class A shares and .25% for certain purchases of Class T shares.
For the period, sales charge amounts retained by FDC were as follows:
| Retained |
Class A | $ 27,830 |
Class T | 4,337 |
Class B* | 16,274 |
Class C* | 7,528 |
| $ 55,969 |
* When Class B and Class C shares are initially sold, FDC pays commissions from its own resources to financial intermediaries through which the sales are made.
Transfer Agent Fees. Fidelity Investments Institutional Operations Company, Inc., (FIIOC), an affiliate of the investment adviser, is the transfer, dividend disbursing and shareholder servicing agent for each class of the Fund. FIIOC receives account fees and asset-based fees that vary according to the account size and type of account of the shareholders of the respective classes of the Fund. FIIOC pays for typesetting, printing and mailing of shareholder reports, except proxy statements.
Annual Report
Notes to Financial Statements - continued
5. Fees and Other Transactions with Affiliates - continued
Transfer Agent Fees - cotinued
For the period, transfer agent fees for each class were as follows:
| Amount | % of |
Class A | $ 422,299 | .16 |
Class T | 159,574 | .18 |
Class B | 23,872 | .21 |
Class C | 213,843 | .17 |
Institutional Class | 901,151 | .25 |
| $ 1,720,739 |
|
Accounting Fees. Fidelity Service Company, Inc. (FSC), an affiliate of the investment adviser, maintains the Fund's accounting records. The fee is based on the level of average net assets for each month.
6. Committed Line of Credit.
The Fund participates with other funds managed by the investment adviser or an affiliate in a $4.25 billion credit facility (the "line of credit") to be utilized for temporary or emergency purposes to fund shareholder redemptions or for other short-term liquidity purposes. The Fund has agreed to pay commitment fees on its pro-rata portion of the line of credit, which amounted to $1,380 and is reflected in Miscellaneous expenses on the Statement of Operations. During the period, the Fund did not borrow on this line of credit.
7. Expense Reductions.
The investment adviser voluntarily agreed to reimburse each class to the extent annual operating expenses exceeded certain levels of average net assets as noted in the table below. Some expenses, for example interest expense, including commitment fees, are excluded from this reimbursement.
The following classes were in reimbursement during the period:
| Expense | Reimbursement |
Institutional Class | .85% | $ 83,810 |
The investment adviser reimbursed a portion of the Fund's operating expenses during the period in the amount of $117.
Annual Report
7. Expense Reductions - continued
In addition, through arrangements with the Fund's custodian, credits realized as a result of uninvested cash balances were used to reduce the Fund's expenses. During the period, these credits reduced the Fund's custody expenses by $814.
8. Distributions to Shareholders.
Distributions to shareholders of each class were as follows:
Years ended October 31, | 2014 | 2013 |
From net investment income |
|
|
Class A | $ 13,436,571 | $ 16,314,142 |
Class T | 4,518,143 | 5,161,023 |
Class B | 492,596 | 691,999 |
Class C | 5,263,076 | 6,288,608 |
Institutional Class | 18,693,318 | 20,456,243 |
Total | $ 42,403,704 | $ 48,912,015 |
From net realized gain |
|
|
Class A | $ 11,887,120 | $ 3,483,705 |
Class T | 3,964,314 | 1,140,878 |
Class B | 562,903 | 184,860 |
Class C | 5,549,285 | 1,602,754 |
Institutional Class | 15,754,013 | 4,297,928 |
Total | $ 37,717,635 | $ 10,710,125 |
9. Share Transactions.
Share transactions for each class were as follows and may contain automatic conversions between classes or exchanges between funds:
| Shares | Shares | Dollars | Dollars |
Years ended October 31, | 2014 | 2013 | 2014 | 2013 |
Class A |
|
|
|
|
Shares sold | 6,439,376 | 7,091,246 | $ 54,608,224 | $ 62,129,968 |
Reinvestment of distributions | 2,519,401 | 1,758,588 | 21,214,725 | 15,357,657 |
Shares redeemed | (11,665,459) | (14,804,694) | (99,063,161) | (129,032,339) |
Net increase (decrease) | (2,706,682) | (5,954,860) | $ (23,240,212) | $ (51,544,714) |
Class T |
|
|
|
|
Shares sold | 1,257,168 | 1,497,548 | $ 10,623,921 | $ 13,070,279 |
Reinvestment of distributions | 870,505 | 583,493 | 7,314,998 | 5,087,202 |
Shares redeemed | (2,141,591) | (3,805,963) | (18,094,730) | (33,189,003) |
Net increase (decrease) | (13,918) | (1,724,922) | $ (155,811) | $ (15,031,522) |
Annual Report
Notes to Financial Statements - continued
9. Share Transactions - continued
| Shares | Shares | Dollars | Dollars |
Years ended October 31, | 2014 | 2013 | 2014 | 2013 |
Class B |
|
|
|
|
Shares sold | 85,249 | 88,671 | $ 721,402 | $ 772,890 |
Reinvestment of distributions | 100,036 | 75,832 | 839,626 | 660,444 |
Shares redeemed | (581,043) | (645,956) | (4,909,278) | (5,631,561) |
Net increase (decrease) | (395,758) | (481,453) | $ (3,348,250) | $ (4,198,227) |
Class C |
|
|
|
|
Shares sold | 1,902,007 | 2,788,587 | $ 16,071,421 | $ 24,348,512 |
Reinvestment of distributions | 1,062,043 | 705,870 | 8,914,818 | 6,148,005 |
Shares redeemed | (3,689,833) | (6,159,803) | (31,110,164) | (53,679,905) |
Net increase (decrease) | (725,783) | (2,665,346) | $ (6,123,925) | $ (23,183,388) |
Institutional Class |
|
|
|
|
Shares sold | 10,381,048 | 7,283,471 | $ 88,482,449 | $ 63,781,595 |
Reinvestment of distributions | 3,501,857 | 2,604,592 | 29,550,581 | 22,781,805 |
Shares redeemed | (14,208,713) | (17,581,432) | (120,994,714) | (153,543,619) |
Net increase (decrease) | (325,808) | (7,693,369) | $ (2,961,684) | $ (66,980,219) |
10. Other.
The Fund's organizational documents provide former and current trustees and officers with a limited indemnification against liabilities arising in connection with the performance of their duties to the Fund. In the normal course of business, the Fund may also enter into contracts that provide general indemnifications. The Fund's maximum exposure under these arrangements is unknown as this would be dependent on future claims that may be made against the Fund. The risk of material loss from such claims is considered remote.
Annual Report
Report of Independent Registered Public Accounting Firm
To the Trustees of Fidelity Advisor Series I and Shareholders of Fidelity Advisor High Income Fund:
We have audited the accompanying statement of assets and liabilities of Fidelity Advisor High Income Fund (the Fund), a fund of Fidelity Advisor Series I, including the schedule of investments, as of October 31, 2014, and the related statement of operations for the year then ended, the statement of changes in net assets for each of the two years in the period then ended, and the financial highlights for each of the five years in the period then ended. These financial statements and financial highlights are the responsibility of the Fund's management. Our responsibility is to express an opinion on these financial statements and financial highlights based on our audits.
We conducted our audits in accordance with the standards of the Public Company Accounting Oversight Board (United States). Those standards require that we plan and perform the audit to obtain reasonable assurance about whether the financial statements and financial highlights are free of material misstatement. The Fund is not required to have, nor were we engaged to perform, an audit of its internal control over financial reporting. Our audits included consideration of internal control over financial reporting as a basis for designing audit procedures that are appropriate in the circumstances, but not for the purpose of expressing an opinion on the effectiveness of the Fund's internal control over financial reporting. Accordingly, we express no such opinion. An audit also includes examining, on a test basis, evidence supporting the amounts and disclosures in the financial statements, assessing the accounting principles used and significant estimates made by management, as well as evaluating the overall financial statement presentation. Our procedures included confirmation of securities owned as of October 31, 2014, by correspondence with the custodians, agent banks and brokers; where replies were not received from brokers, we performed other auditing procedures. We believe that our audits provide a reasonable basis for our opinion.
In our opinion, the financial statements and financial highlights referred to above present fairly, in all material respects, the financial position of Fidelity Advisor High Income Fund as of October 31, 2014, the results of its operations for the year then ended, the changes in its net assets for each of the two years in the period then ended, and the financial highlights for each of the five years in the period then ended, in conformity with accounting principles generally accepted in the United States of America.
DELOITTE & TOUCHE LLP
Boston, Massachusetts
December 19, 2014
Annual Report
Trustees and Officers
The Trustees, Member of the Advisory Board, and officers of the trust and fund, as applicable, are listed below. The Board of Trustees governs the fund and is responsible for protecting the interests of shareholders. The Trustees are experienced executives who meet periodically throughout the year to oversee the fund's activities, review contractual arrangements with companies that provide services to the fund, oversee management of the risks associated with such activities and contractual arrangements, and review the fund's performance. Except for James C. Curvey, each of the Trustees oversees 174 funds. Mr. Curvey oversees 407 funds.
The Trustees hold office without limit in time except that (a) any Trustee may resign; (b) any Trustee may be removed by written instrument, signed by at least two-thirds of the number of Trustees prior to such removal; (c) any Trustee who requests to be retired or who has become incapacitated by illness or injury may be retired by written instrument signed by a majority of the other Trustees; and (d) any Trustee may be removed at any special meeting of shareholders by a two-thirds vote of the outstanding voting securities of the trust. Each Trustee who is not an interested person (as defined in the 1940 Act) of the trust and the fund (Independent Trustee), shall retire not later than the last day of the calendar year in which his or her 75th birthday occurs. The Independent Trustees may waive this mandatory retirement age policy with respect to individual Trustees. The officers and Advisory Board Member hold office without limit in time, except that any officer and Advisory Board Member may resign or may be removed by a vote of a majority of the Trustees at any regular meeting or any special meeting of the Trustees. Except as indicated, each individual has held the office shown or other offices in the same company for the past five years.
Experience, Skills, Attributes, and Qualifications of the Fund's Trustees. The Governance and Nominating Committee has adopted a statement of policy that describes the experience, qualifications, attributes, and skills that are necessary and desirable for potential Independent Trustee candidates (Statement of Policy). The Board believes that each Trustee satisfied at the time he or she was initially elected or appointed a Trustee, and continues to satisfy, the standards contemplated by the Statement of Policy. The Governance and Nominating Committee also engages professional search firms to help identify potential Independent Trustee candidates who have the experience, qualifications, attributes, and skills consistent with the Statement of Policy. From time to time, additional criteria based on the composition and skills of the current Independent Trustees, as well as experience or skills that may be appropriate in light of future changes to board composition, business conditions, and regulatory or other developments, have also been considered by the professional search firms and the Governance and Nominating Committee. In addition, the Board takes into account the Trustees' commitment and participation in Board and committee meetings, as well as their leadership of standing and ad hoc committees throughout their tenure.
In determining that a particular Trustee was and continues to be qualified to serve as a Trustee, the Board has considered a variety of criteria, none of which, in isolation, was controlling. The Board believes that, collectively, the Trustees have balanced and diverse experience, qualifications, attributes, and skills, which allow the Board to operate effectively in governing the fund and protecting the interests of shareholders. Information about the specific experience, skills, attributes, and qualifications of each Trustee, which in each case led to the Board's conclusion that the Trustee should serve (or continue to serve) as a trustee of the fund, is provided below.
Annual Report
Trustees and Officers - continued
Board Structure and Oversight Function. James C. Curvey is an interested person (as defined in the 1940 Act) and currently serves as Chairman. The Trustees have determined that an interested Chairman is appropriate and benefits shareholders because an interested Chairman has a personal and professional stake in the quality and continuity of services provided to the fund. Independent Trustees exercise their informed business judgment to appoint an individual of their choosing to serve as Chairman, regardless of whether the Trustee happens to be independent or a member of management. The Independent Trustees have determined that they can act independently and effectively without having an Independent Trustee serve as Chairman and that a key structural component for assuring that they are in a position to do so is for the Independent Trustees to constitute a substantial majority for the Board. The Independent Trustees also regularly meet in executive session. Ned C. Lautenbach serves as Chairman of the Independent Trustees and as such (i) acts as a liaison between the Independent Trustees and management with respect to matters important to the Independent Trustees and (ii) with management prepares agendas for Board meetings.
Fidelity funds are overseen by different Boards of Trustees. The fund's Board oversees Fidelity's equity and high income funds and another Board oversees Fidelity's investment-grade bond, money market, and asset allocation funds. The asset allocation funds may invest in Fidelity funds overseen by the fund's Board. The use of separate Boards, each with its own committee structure, allows the Trustees of each group of Fidelity funds to focus on the unique issues of the funds they oversee, including common research, investment, and operational issues. On occasion, the separate Boards establish joint committees to address issues of overlapping consequences for the Fidelity funds overseen by each Board.
The Trustees operate using a system of committees to facilitate the timely and efficient consideration of all matters of importance to the Trustees, the fund, and fund shareholders and to facilitate compliance with legal and regulatory requirements and oversight of the fund's activities and associated risks. The Board, acting through its committees, has charged FMR and its affiliates with (i) identifying events or circumstances the occurrence of which could have demonstrably adverse effects on the fund's business and/or reputation; (ii) implementing processes and controls to lessen the possibility that such events or circumstances occur or to mitigate the effects of such events or circumstances if they do occur; and (iii) creating and maintaining a system designed to evaluate continuously business and market conditions in order to facilitate the identification and implementation processes described in (i) and (ii) above. Because the day-to-day operations and activities of the fund are carried out by or through FMR, its affiliates and other service providers, the fund's exposure to risks is mitigated but not eliminated by the processes overseen by the Trustees. While each of the Board's committees has responsibility for overseeing different aspects of the fund's activities, oversight is exercised primarily through the Operations, Audit, and Compliance Committees. In addition, the Independent Trustees have worked with FMR to enhance the Board's oversight of investment and financial risks, legal and regulatory risks, technology risks, and operational risks, including the development of additional risk reporting to the Board. For example, a working group comprised of Independent Trustees and FMR has worked and continues to work to review the Fidelity funds' valuation-related activities, reporting and risk management. Appropriate personnel, including but not limited to the fund's Chief Compliance Officer (CCO), FMR's internal auditor, the independent accountants, the fund's Treasurer and portfolio management personnel, make periodic reports to the Board's committees, as appropriate, including an annual review of FMR's risk management program for the Fidelity funds. The responsibilities of each standing committee, including their oversight responsibilities, are described further under "Standing Committees of the Fund's Trustees."
Annual Report
The fund's Statement of Additional Information (SAI) includes more information about the Trustees. To request a free copy, call Fidelity at 1-877-208-0098.
Interested Trustees*:
Correspondence intended for each Trustee who is an interested person may be sent to Fidelity Investments, 245 Summer Street, Boston, Massachusetts 02210.
Name, Year of Birth; Principal Occupations and Other Relevant Experience+ | |
James C. Curvey (1935) | |
Year of Election or Appointment: 2007 Trustee Chairman of the Board of Trustees | |
| Mr. Curvey also serves as Trustee of other Fidelity funds. Mr. Curvey is a Director of Fidelity Research & Analysis Co. (2009-present), and Vice Chairman (2007-present) and Director of FMR LLC. In addition, Mr. Curvey serves as an Overseer for the Boston Symphony Orchestra and a member of the board of Artis-Naples, Naples, Florida, and as a Trustee for Brewster Academy, Wolfeboro, New Hampshire. Previously, Mr. Curvey served as a Director of Fidelity Investments Money Management, Inc. (2009-2014), a Director of FMR (2007-2014), and a Director of FMR Co., Inc. (2007-2014). |
Charles S. Morrison (1960) | |
Year of Election or Appointment: 2014 Trustee | |
| Mr. Morrison also serves as Trustee of other funds. He serves as a Director of Fidelity Investments Money Management, Inc. (FIMM) (2014-present), Director of Fidelity SelectCo, LLC (2014-present), President, Asset Management (2014-present), and is an employee of Fidelity Investments. Previously, Mr. Morrison served as Vice President of Fidelity's Fixed Income and Asset Allocation Funds (2012-2014), President, Fixed Income (2011-2014), Vice President of Fidelity's Money Market Funds (2005-2009), President, Money Market Group Leader of FMR (2009), and Senior Vice President, Money Market Group of FMR (2004-2009). Mr. Morrison also served as Vice President of Fidelity's Bond Funds (2002-2005), certain Balanced Funds (2002-2005), and certain Asset Allocation Funds (2002-2007), and as Senior Vice President (2002-2005) of Fidelity's Bond Division. |
* Trustees have been determined to be "Interested Trustees" by virtue of, among other things, their affiliation with the trust or various entities under common control with FMR.
+ The information above includes each Trustee's principal occupation during the last five years and other information relating to the experience, attributes, and skills relevant to each Trustee's qualifications to serve as a Trustee, which led to the conclusion that each Trustee should serve as a Trustee for the fund.
Annual Report
Independent Trustees:
Correspondence intended for each Independent Trustee (that is, the Trustees other than the Interested Trustees) may be sent to Fidelity Investments, P.O. Box 55235, Boston, Massachusetts 02205-5235.
Name, Year of Birth; Principal Occupations and Other Relevant Experience+ | |
Dennis J. Dirks (1948) | |
Year of Election or Appointment: 2005 Trustee | |
| Mr. Dirks also serves as Trustee of other Fidelity funds. Prior to his retirement in May 2003, Mr. Dirks was Chief Operating Officer and a member of the Board of The Depository Trust & Clearing Corporation (DTCC). He also served as President, Chief Operating Officer, and Board member of The Depository Trust Company (DTC) and President and Board member of the National Securities Clearing Corporation (NSCC). In addition, Mr. Dirks served as Chief Executive Officer and Board member of the Government Securities Clearing Corporation, Chief Executive Officer and Board member of the Mortgage-Backed Securities Clearing Corporation, as a Trustee and a member of the Finance Committee of Manhattan College (2005-2008), and as a Trustee and a member of the Finance Committee of AHRC of Nassau County (2006-2008). Mr. Dirks is a member of the Independent Directors Council (IDC) Governing Council (2010-present) and Board of Directors for The Brookville Center for Children's Services, Inc. (2009-present). |
Alan J. Lacy (1953) | |
Year of Election or Appointment: 2008 Trustee | |
| Mr. Lacy also serves as Trustee of other Fidelity funds. Mr. Lacy serves as Senior Adviser (2007-present) of Oak Hill Capital Partners, L.P. (private equity). Mr. Lacy also served as Chief Executive Officer (2000-2005) and Vice Chairman (2005-2006) of Sears Holdings Corporation and Sears, Roebuck and Co. (retail). In addition, Mr. Lacy serves as a member of the Board of Directors of Dave & Buster's Entertainment, Inc. (restaurant and entertainment complexes, 2010-present), Earth Fare, Inc. (retail grocery, 2012-present), The Hillman Companies, Inc. (hardware wholesalers, 2010-present), and Bristol-Myers Squibb Company (global pharmaceuticals, 2008-present). Mr. Lacy is a member of the Board of Trustees of The National Parks Conservation Association (2006-present). Previously, Mr. Lacy served as Chairman of the Board of Trustees of the National Parks Conservation Association (2008-2011) and as a member of the Board of Directors for the Western Union Company (global money transfer, 2006-2011). |
Ned C. Lautenbach (1944) | |
Year of Election or Appointment: 2000 Trustee Chairman of the Independent Trustees | |
| Mr. Lautenbach also serves as Trustee of other Fidelity funds. Mr. Lautenbach currently serves as the Lead Director of the Eaton Corporation Board of Directors (diversified industrial, 1997-present). Mr. Lautenbach is Chairman of the Board of Directors of the Philharmonic Center for the Arts in Naples, Florida (2012-present) and a member of the Council on Foreign Relations (1994-present). Previously, Mr. Lautenbach was a Partner/Advisory Partner at Clayton, Dubilier & Rice, LLC (private equity investment, 1998-2010), as well as a Director of Sony Corporation (2006-2007). |
Joseph Mauriello (1944) | |
Year of Election or Appointment: 2008 Trustee | |
| Mr. Mauriello also serves as Trustee of other Fidelity funds. Prior to his retirement in January 2006, Mr. Mauriello served in numerous senior management positions including Deputy Chairman and Chief Operating Officer (2004-2005), and Vice Chairman of Financial Services (2002-2004) of KPMG LLP US (professional services, 1965-2005). Mr. Mauriello currently serves as a member of the Board of Directors of XL Group plc. (global insurance and re-insurance, 2006-present). Previously, Mr. Mauriello served as a Director of the Hamilton Funds of the Bank of New York (2006-2007) and of Arcadia Resources Inc. (health care services and products, 2007-2012). |
Robert W. Selander (1950) | |
Year of Election or Appointment: 2011 Trustee | |
| Mr. Selander also serves as Trustee of other Fidelity funds. Previously, Mr. Selander served as a Member of the Advisory Board of other Fidelity funds (2011), and Executive Vice Chairman (2010), Chief Executive Officer (2009-2010), and President and Chief Executive Officer (1997-2009) of Mastercard, Inc. |
Cornelia M. Small (1944) | |
Year of Election or Appointment: 2005 Trustee | |
| Ms. Small also serves as Trustee of other Fidelity funds. Ms. Small is a member of the Board of Directors (2009-present) and Chair of the Investment Committee (2010-present) of the Teagle Foundation. Ms. Small also serves on the Investment Committee of the Berkshire Taconic Community Foundation (2008-present). Previously, Ms. Small served as Chairperson (2002-2008) and a member of the Investment Committee and Chairperson (2008-2012) and a member of the Board of Trustees of Smith College. In addition, Ms. Small served as Chief Investment Officer, Director of Global Equity Investments, and a member of the Board of Directors of Scudder, Stevens & Clark and Scudder Kemper Investments. |
William S. Stavropoulos (1939) | |
Year of Election or Appointment: 2002 Trustee Vice Chairman of the Independent Trustees | |
| Mr. Stavropoulos also serves as Trustee of other Fidelity funds. Mr. Stavropoulos serves as President and Founder of the Michigan Baseball Foundation, the Great Lakes Loons (2007-present). Mr. Stavropoulos is Chairman Emeritus of the Board of Directors of The Dow Chemical Company, where he previously served in numerous senior management positions, including President, CEO (1995-2000; 2002-2004), Chairman of the Executive Committee (2000-2006), and as a member of the Board of Directors (1990-2006). Currently, Mr. Stavropoulos is Chairman of the Board of Directors of Univar Inc. (global distributor of commodity and specialty chemicals), a Director of Teradata Corporation (data warehousing and technology solutions), and Maersk Inc. (industrial conglomerate), and a member of the Advisory Board for Metalmark Capital LLC (private equity investment, 2005-present). Mr. Stavropoulos is an operating advisor to Clayton, Dubilier & Rice, LLC (private equity investment). In addition, Mr. Stavropoulos is a member of the University of Notre Dame Advisory Council for the College of Science, a Trustee of the Rollin L. Gerstacker Foundation, and a Director of the Naples Philharmonic Center for the Arts. Previously, Mr. Stavropoulos served as a Director of Chemical Financial Corporation (bank holding company, 1993-2012) and Tyco International, Ltd. (multinational manufacturing and services, 2007-2012). |
David M. Thomas (1949) | |
Year of Election or Appointment: 2008 Trustee | |
| Mr. Thomas also serves as Trustee of other Fidelity funds. Mr. Thomas serves as Non-Executive Chairman of the Board of Directors of Fortune Brands Home and Security (home and security products, 2011-present), and as a member of the Board of Directors of Interpublic Group of Companies, Inc. (marketing communication, 2004-present). Previously, Mr. Thomas served as Executive Chairman (2005-2006) and Chairman and Chief Executive Officer (2000-2005) of IMS Health, Inc. (pharmaceutical and healthcare information solutions), and a Director of Fortune Brands, Inc. (consumer products, 2000-2011). |
+ The information above includes each Trustee's principal occupation during the last five years and other information relating to the experience, attributes, and skills relevant to each Trustee's qualifications to serve as a Trustee, which led to the conclusion that each Trustee should serve as a Trustee for the fund.
Advisory Board Member and Officers:
Correspondence intended for each officer and Peter S. Lynch may be sent to Fidelity Investments, 245 Summer Street, Boston, Massachusetts 02210. Officers appear below in alphabetical order.
Name, Year of Birth; Principal Occupation | |
Peter S. Lynch (1944) | |
Year of Election or Appointment: 2003 Member of the Advisory Board | |
| Mr. Lynch also serves as Member of the Advisory Board of other Fidelity funds. Mr. Lynch is Vice Chairman and a Director of FMR and FMR Co., Inc. In addition, Mr. Lynch serves as a Trustee of Boston College and as the Chairman of the Inner-City Scholarship Fund. Previously, Mr. Lynch served on the Special Olympics International Board of Directors (1997-2006). |
Elizabeth Paige Baumann (1968) | |
Year of Election or Appointment: 2012 Anti-Money Laundering (AML) Officer | |
| Ms. Baumann also serves as AML Officer of other funds. She is Chief AML Officer of FMR LLC (2012-present) and is an employee of Fidelity Investments. Previously, Ms. Baumann served as Vice President and Deputy Anti-Money Laundering Officer (2007-2012). |
William C. Coffey (1969) | |
Year of Election or Appointment: 2009 Assistant Secretary | |
| Mr. Coffey also serves as Assistant Secretary of other funds. He is Senior Vice President and Deputy General Counsel of FMR LLC (2010-present), and is an employee of Fidelity Investments. Previously, Mr. Coffey served as Vice President and Associate General Counsel of FMR LLC (2005-2009). |
Jonathan Davis (1968) | |
Year of Election or Appointment: 2010 Assistant Treasurer | |
| Mr. Davis also serves as Assistant Treasurer of other funds. Mr. Davis is an employee of Fidelity Investments. Previously, Mr. Davis served as Vice President and Associate General Counsel of FMR LLC (2003-2010). |
Adrien E. Deberghes (1967) | |
Year of Election or Appointment: 2008 Deputy Treasurer | |
| Mr. Deberghes also serves as an officer of other funds. He is an employee of Fidelity Investments (2008-present). Prior to joining Fidelity Investments, Mr. Deberghes was Senior Vice President of Mutual Fund Administration at State Street Corporation (2007-2008), Senior Director of Mutual Fund Administration at Investors Bank & Trust (2005-2007), and Director of Finance for Dunkin' Brands (2000-2005). |
Stephanie J. Dorsey (1969) | |
Year of Election or Appointment: 2010 Assistant Treasurer | |
| Ms. Dorsey also serves as an officer of other funds. She is an employee of Fidelity Investments (2008-present) and has served in other fund officer roles. Prior to joining Fidelity Investments, Ms. Dorsey served as Treasurer (2004-2008) of the JPMorgan Mutual Funds and Vice President (2004-2008) of JPMorgan Chase Bank. |
Howard J. Galligan III (1966) | |
Year of Election or Appointment: 2014 Chief Financial Officer | |
| Mr. Galligan also serves as Chief Financial Officer of other funds. Mr. Galligan serves as President of Fidelity Pricing and Cash Management Services (FPCMS) (2014-present) and as a Director of Strategic Advisers, Inc. (2008-present). Previously, Mr. Galligan served as Chief Administrative Officer of Asset Management (2011-2014) and Chief Operating Officer and Senior Vice President of Investment Support for Strategic Advisers, Inc. (2003-2011). |
Scott C. Goebel (1968) | |
Year of Election or Appointment: 2008 Secretary and Chief Legal Officer (CLO) | |
| Mr. Goebel serves as Secretary and CLO of other funds. Mr. Goebel also serves as Secretary of Fidelity SelectCo, LLC (2013-present), Fidelity Investments Money Management, Inc. (FIMM) (2010-present) and Fidelity Research and Analysis Company (FRAC) (2010-present); General Counsel, Secretary, and Senior Vice President of FMR (2008-present) and FMR Co., Inc. (2008-present); Chief Legal Officer of Fidelity Management & Research (Hong Kong) Limited (2008-present); and Assistant Secretary of Fidelity Management & Research (Japan) Limited (2008-present) and Fidelity Management & Research (U.K.) Inc. (2008-present). Previously, Mr. Goebel served as Secretary and CLO of other Fidelity funds (2008-2013), Assistant Secretary of FIMM (2008-2010), FRAC (2008-2010), and certain funds (2007-2008); and as Vice President and Secretary of Fidelity Distributors Corporation (FDC) (2005-2007). Mr. Goebel has been employed by FMR LLC or an affiliate since 2001. |
Thomas C. Hense (1964) | |
Year of Election or Appointment: 2008/2010 Vice President | |
| Mr. Hense also serves as Vice President of other funds (High Income (2008), Small Cap (2008), and Value (2010) funds). Previously, Mr. Hense served as a portfolio manager for Fidelity's Institutional Money Management Group (Pyramis) (2003-2008). |
Brian B. Hogan (1964) | |
Year of Election or Appointment: 2009 Vice President | |
| Mr. Hogan also serves as Trustee or Vice President of other funds. Mr. Hogan serves as a Director of Fidelity SelectCo, LLC (2014-present) and President of FMR's Equity Division (2009-present). Previously, Mr. Hogan served as Senior Vice President, Equity Research of FMR (2006-2009) and as a portfolio manager. |
Chris Maher (1972) | |
Year of Election or Appointment: 2013 Assistant Treasurer | |
| Mr. Maher serves as Assistant Treasurer of other funds. Mr. Maher is Vice President of Valuation Oversight and is an employee of Fidelity Investments. Previously, Mr. Maher served as Vice President of Asset Management Compliance (2013), Vice President of FMR's Program Management Group (2010-2013), and Vice President of Valuation Oversight (2008-2010). |
Kenneth B. Robins (1969) | |
Year of Election or Appointment: 2008 President and Treasurer | |
| Mr. Robins also serves as an officer of other funds. Mr. Robins serves as Executive Vice President of Fidelity Investments Money Management, Inc. (FIMM) (2013-present) and is an employee of Fidelity Investments (2004-present). Previously, Mr. Robins served in other fund officer roles. |
Stephen Sadoski (1971) | |
Year of Election or Appointment: 2012 Deputy Treasurer | |
| Mr. Sadoski also serves as Deputy Treasurer of other funds. He is an employee of Fidelity Investments (2012-present) and has served in another fund officer role. Prior to joining Fidelity Investments, Mr. Sadoski served as an assistant chief accountant in the Division of Investment Management of the Securities and Exchange Commission (SEC) (2009-2012) and as a senior manager at Deloitte & Touche LLP (1997-2009). |
Stacie M. Smith (1974) | |
Year of Election or Appointment: 2013 Deputy Treasurer | |
| Ms. Smith also serves as an officer of other funds. She is an employee of Fidelity Investments (2009-present) and has served in other fund officer roles. Prior to joining Fidelity Investments, Ms. Smith served as Senior Audit Manager of Ernst & Young LLP (1996-2009). |
Renee Stagnone (1975) | |
Year of Election or Appointment: 2013 Deputy Treasurer | |
| Ms. Stagnone also serves as Deputy Treasurer of other funds. Ms. Stagnone is an employee of Fidelity Investments. |
Linda J. Wondrack (1964) | |
Year of Election or Appointment: 2014 Chief Compliance Officer | |
| Ms. Wondrack also serves as Chief Compliance Officer of other funds. Ms. Wondrack is Executive Vice President and head of the Ethics Office and Asset Management Compliance for Fidelity Investments (2012-present). Ms. Wondrack also serves as Chief Compliance Officer of Fidelity SelectCo, LLC (2014-present); Chief Compliance Officer of Impresa Management LLC (2013-present); and Chief Compliance Officer of FMR Co., Inc., Fidelity Investments Money Management, Inc., Fidelity Management & Research (Japan) Limited, Fidelity Management & Research (U.K.) Inc., Fidelity Management & Research (Hong Kong), Fidelity Management & Research Company, Pyramis Global Advisors, LLC, and Strategic Advisers, Inc., Ballyrock Investment Advisors LLC, and Northern Neck Investors LLC (2012-present). Previously, Ms. Wondrack served as Senior Vice President and Chief Compliance Officer for Columbia Management Investment Advisers, LLC (2005-2012); Chief Compliance Officer for certain funds within the Columbia Family of Funds (2007-2012); and Senior Vice President of Compliance Risk Management at Bank of America (2005-2010). |
Joseph F. Zambello (1957) | |
Year of Election or Appointment: 2011 Deputy Treasurer | |
| Mr. Zambello also serves as Deputy Treasurer of other funds. Mr. Zambello is an employee of Fidelity Investments. Previously, Mr. Zambello served as Vice President of FMR's Program Management Group (2009-2011) and Vice President of the Transfer Agent Oversight Group (2005-2009). |
Annual Report
Distributions (Unaudited)
The Board of Trustees of Advisor High Income Fund voted to pay to shareholders of record at the opening of business on record date, the following distributions per share derived from capital gains realized from sales of portfolio securities:
| Pay Date | Record Date | Capital Gains |
Class A | 12/08/14 | 12/05/14 | $0.204 |
|
|
|
|
Class T | 12/08/14 | 12/05/14 | $0.204 |
|
|
|
|
Class B | 12/08/14 | 12/05/14 | $0.204 |
|
|
|
|
Class C | 12/08/14 | 12/05/14 | $0.204 |
The fund hereby designates as a capital gain dividend with respect to the taxable year ended October 31, 2014, $16,983,896, or, if subsequently determined to be different, the net capital gain of such year.
A total of .02% of the dividends distributed during the fiscal year was derived from interest on U.S. Government securities which is generally exempt from state income tax.
The fund designates $26,303,535 of distributions paid during the period January 1, 2014 to October 31, 2014, as qualifying to be taxed as interest-related dividends for nonresident alien shareholders.
The fund will notify shareholders in January 2015 of amounts for use in preparing 2014 income tax returns.
Annual Report
Board Approval of Investment Advisory Contracts and Management Fees
Fidelity Advisor High Income Fund
Each year, the Board of Trustees, including the Independent Trustees (together, the Board), votes on the renewal of the management contract with Fidelity Management & Research Company (FMR) and the sub-advisory agreements (together, the Advisory Contracts) for the fund. The Board, assisted by the advice of fund counsel and Independent Trustees' counsel, requests and considers a broad range of information relevant to the renewal of the Advisory Contracts throughout the year.
The Board meets regularly and, at each of its meetings, covers an extensive agenda of topics and materials and considers factors that are relevant to its annual consideration of the renewal of the fund's Advisory Contracts, including the services and support provided to the fund and its shareholders. The Board has established various standing committees (Committees), each composed of and chaired by Independent Trustees with varying backgrounds, to which the Board has assigned specific subject matter responsibilities in order to enhance effective decision-making by the Board. The Board, acting directly and through its Committees, requests and receives information concerning the annual consideration of the renewal of the fund's Advisory Contracts. The Board also meets as needed to consider matters specifically related to the Board's annual consideration of the renewal of the Advisory Contracts. Members of the Board may also meet with trustees of other Fidelity funds through ad hoc joint committees to discuss certain matters relevant to the Fidelity funds.
At its July 2014 meeting, the Board, including the Independent Trustees, unanimously determined to renew the fund's Advisory Contracts. In reaching its determination, the Board considered all factors it believed relevant, including (i) the nature, extent, and quality of the services to be provided to the fund and its shareholders (including the investment performance of the fund); (ii) the competitiveness of the fund's management fee and total expense ratio relative to peer funds; (iii) the total costs of the services to be provided by and the profits to be realized by Fidelity from its relationship with the fund; (iv) the extent to which economies of scale exist and would be realized as the fund grows; and (v) whether fee levels reflect these economies of scale, if any, for the benefit of fund shareholders. In connection with separate internal corporate reorganizations involving Fidelity Management & Research (U.K.) Inc. (FMR U.K.) and Fidelity Management & Research (Japan) Inc. (FMR Japan), the Board approved certain non-material amendments to the fund's sub-advisory agreements with FMR U.K. and FMR Japan to reflect that, after these reorganizations, FMR Investment Management (UK) Limited and Fidelity Management & Research (Japan) Limited will carry on the business of FMR U.K. and FMR Japan, respectively. The Board noted that no changes to the portfolio managers or to the foreign research or investment advisory services provided to the fund were expected in connection with either reorganization and that the same personnel and resources would continue to be available to the fund at the new entities.
Annual Report
Board Approval of Investment Advisory Contracts and
Management Fees - continued
In considering whether to renew the Advisory Contracts for the fund, the Board reached a determination, with the assistance of fund counsel and Independent Trustees' counsel and through the exercise of its business judgment, that the renewal of the Advisory Contracts was in the best interests of the fund and its shareholders and that the compensation payable under the Advisory Contracts was fair and reasonable. The Board's decision to renew the Advisory Contracts was not based on any single factor, but rather was based on a comprehensive consideration of all the information provided to the Board at its meetings throughout the year. The Board, in reaching its determination to renew the Advisory Contracts, was aware that shareholders of the fund have a broad range of investment choices available to them, including a wide choice among funds offered by Fidelity's competitors, and that the fund's shareholders, who have the opportunity to review and weigh the disclosure provided by the fund in its prospectus and other public disclosures, have chosen to invest in this fund, which is part of the Fidelity family of funds.
Nature, Extent, and Quality of Services Provided. The Board considered Fidelity's staffing as it relates to the fund, including the backgrounds of investment personnel of FMR and the sub-advisers (together, the Investment Advisers), and also considered the fund's investment objective, strategies, and related investment philosophy. The Independent Trustees also had discussions with senior management of Fidelity's investment operations and investment groups. The Board considered the structure of the portfolio manager compensation program and whether this structure provides appropriate incentives to act in the best interests of the fund. Additionally, the Board considered the portfolio managers' investments, if any, in the funds that they manage.
Resources Dedicated to Investment Management and Support Services. The Board and the Fund Oversight and Research Committees reviewed the general qualifications and capabilities of Fidelity's investment staff, including its size, education, experience, and resources, as well as Fidelity's approach to recruiting, training, managing, and compensating investment personnel. The Board noted that Fidelity has continued to increase the resources devoted to non-U.S. offices, including expansion of Fidelity's global investment organization. The Board also noted that Fidelity's analysts have extensive resources, tools and capabilities that allow them to conduct sophisticated quantitative and fundamental analysis, as well as credit analysis of issuers, counterparties and guarantors. Further, the Board believes that Fidelity's investment professionals have sufficient access to global information and data so as to provide competitive investment results over time, and that those professionals also have access to sophisticated tools that permit them to assess portfolio construction and risk and performance attribution characteristics continuously, as well as to transmit new information and research conclusions rapidly around the world. Additionally, in its deliberations, the Board considered Fidelity's trading and risk management capabilities and resources and global compliance infrastructure, which are an integral part of the investment management process.
Annual Report
Shareholder and Administrative Services. The Board considered (i) the nature, extent, quality, and cost of advisory, administrative, and shareholder services performed by the Investment Advisers and their affiliates under the Advisory Contracts and under separate agreements covering transfer agency, pricing and bookkeeping, and securities lending services for the fund; (ii) the nature and extent of the supervision of third party service providers, principally custodians and subcustodians; and (iii) the resources devoted to, and the record of compliance with, the fund's compliance policies and procedures. The Board also reviewed the allocation of fund brokerage, including allocations to brokers affiliated with the Investment Advisers, the use of brokerage commissions to pay fund expenses, and the use of "soft" commission dollars to pay for research services.
The Board noted that the growth of fund assets over time across the complex allows Fidelity to reinvest in the development of services designed to enhance the value or convenience of the Fidelity funds as investment vehicles. These services include 24-hour access to account information and market information through telephone representatives and over the Internet, investor education materials and asset allocation tools, and the expanded availability of Fidelity Investor Centers.
In 2014, the Board formed an ad hoc Committee on Transfer Agency Fees to review the variety of transfer agency fee structures throughout the industry and Fidelity's competitive positioning with respect to industry participants.
Investment in a Large Fund Family. The Board considered the benefits to shareholders of investing in a Fidelity fund, including the benefits of investing in a fund that is part of a large family of funds offering a variety of investment disciplines and providing a large variety of mutual fund investor services. The Board noted that Fidelity had taken, or had made recommendations that resulted in the Fidelity funds taking, a number of actions over the previous year that benefited particular funds, including (i) continuing to dedicate additional resources to investment research and to the support of the senior management team that oversees asset management; (ii) persisting in efforts to enhance Fidelity's global research capabilities; (iii) launching new funds and making other enhancements to meet client needs for income-oriented solutions; (iv) reducing fund expenses for certain index funds; (v) continuing to launch dedicated lower cost underlying funds to meet portfolio construction needs related to expanding underlying fund options for Fidelity funds of funds, specifically for the Freedom Fund product lines; (vi) rationalizing product lines and gaining increased efficiencies through fund mergers; (vii) launching sector-based exchange-traded funds and establishing a new Fidelity adviser to manage sector-based funds and products; (viii) continuing to develop and implement technology to improve security and increase efficiency; (ix) modifying the eligibility criteria for certain share classes to increase their marketability to a portion of the defined contribution plan market; (x) waiving redemption fees for certain qualified fund-of-fund and wrap programs and certain retirement plan transactions; and (xi) launching new Institutional Class shares of certain money market funds to attract and retain assets and to fill a gap in the money market fund lineup.
Annual Report
Board Approval of Investment Advisory Contracts and
Management Fees - continued
Investment Performance. The Board considered whether the fund has operated in accordance with its investment objective, as well as its record of compliance with its investment restrictions and its performance history.
The Board took into account discussions with the Investment Advisers about fund investment performance that occur at Board meetings throughout the year. In this regard the Board noted that as part of regularly scheduled fund reviews and other reports to the Board on fund performance, the Board periodically considers annualized return information for the fund, for different time periods, measured against a securities market index ("benchmark index") and a peer group of funds with similar objectives ("peer group"). In its evaluation of fund investment performance, the Board gave particular attention to information indicating changes in performance of certain Fidelity funds for specific time periods and the Investment Advisers' explanations for any overperformance or underperformance.
In addition to reviewing absolute and relative fund performance, the Independent Trustees periodically consider the appropriateness of fund performance metrics in evaluating the results achieved. In general, the Independent Trustees believe that fund performance should be evaluated based on net performance (after fees and expenses) of both the highest performing and lowest performing classes, where applicable, compared to appropriate benchmark indices, over appropriate time periods which may include full market cycles, and compared to peer groups, as applicable, over the same periods, taking into account relevant factors including the following: general market conditions; issuer-specific information; tactical opportunities for investment; and fund cash flows and other factors.
The Independent Trustees recognize that shareholders evaluate performance on a net basis over their own holding periods, for which one-, three-, and five-year periods are often used as a proxy. For this reason, the performance information reviewed by the Board also included net cumulative calendar year total return information for the fund and an appropriate benchmark index and peer group for the most recent one-, three-, and five-year periods, as shown below. Returns are shown compared to the 25th percentile (top of box, 75% beaten) and 75th percentile (bottom of box, 25% beaten) of the peer universe.
Annual Report
Fidelity Advisor High Income Fund

The Board has discussed the fund's performance with FMR, including the fund's underperformance based on more recent periods ended after 2013 (which periods are not shown in the chart above) but prior to the date of the Board's approval of the renewal of the Advisory Contracts, and has engaged with FMR to consider what steps might be taken to remediate the fund's more recent underperformance.
Based on its review, the Board concluded that the nature, extent, and quality of services provided to the fund under the Advisory Contracts should benefit the fund's shareholders.
Competitiveness of Management Fee and Total Expense Ratio. The Board considered the fund's management fee and total expense ratio compared to "mapped groups" of competitive funds and classes. Fidelity creates "mapped groups" by combining similar Lipper investment objective categories that have comparable investment mandates. Combining Lipper investment objective categories aids the Board's management fee and total expense ratio comparisons by broadening the competitive group used for comparison and by reducing the number of universes to which various Fidelity funds are compared.
Management Fee. The Board considered two proprietary management fee comparisons for the 12-month periods shown in the chart below. The group of Lipper funds used by the Board for management fee comparisons is referred to below as the "Total Mapped Group." The Total Mapped Group is broader than the Lipper peer group used by the Board for performance comparisons because the Total Mapped Group combines several Lipper investment objective categories while the Lipper peer group does not. The Total Mapped Group comparison focuses on a fund's standing in terms of gross management fees before expense reimbursements or caps relative to the total universe of funds with comparable investment mandates, regardless of whether their management fee structures also are comparable. Funds with comparable investment mandates offer exposure to similar types of securities. Funds with comparable management fee structures have similar management fee contractual arrangements (e.g., flat rate charged for advisory services, all-inclusive fee rate, etc.). "TMG %" represents the percentage of funds in the Total Mapped Group that had management fees that were lower than the fund's. For example, a hypothetical TMG % of 20% would mean that 80% of the funds in the Total Mapped Group had higher, and 20% had lower, management fees than the fund. The fund's actual TMG %s are in the chart below. The "Asset-Size Peer Group" (ASPG) comparison focuses on a fund's standing relative to a subset of non-Fidelity funds within the Total Mapped Group that are similar in size and management fee structure. For example, if a fund is in the first quartile of the ASPG, the fund's management fee ranks in the least expensive or lowest 25% of funds in the ASPG. The ASPG represents at least 15% of the funds in the Total Mapped Group with comparable asset size and management fee structures, subject to a minimum of 50 funds (or all funds in the Total Mapped Group if fewer than 50). Additional information, such as the ASPG quartile in which the fund's management fee rate ranked, is also included in the chart and considered by the Board.
Annual Report
Board Approval of Investment Advisory Contracts and
Management Fees - continued
Fidelity Advisor High Income Fund

The Board noted that the fund's management fee rate ranked below the median of its Total Mapped Group and below the median of its ASPG for 2013.
Annual Report
The Board also noted that, in August 2013, the ad hoc Committee on Management Fees was formed to conduct an in-depth review of the management fee rates of Fidelity's active equity mutual funds. The Committee focused on the following areas: (i) standard fee structures; (ii) research consumption and trading evolution; (iii) management fee competitiveness/profitability by category; and (iv) factors that drive institutional pricing.
Based on its review, the Board concluded that the fund's management fee is fair and reasonable in light of the services that the fund receives and the other factors considered.
Total Expense Ratio. In its review of each class's total expense ratio, the Board considered the fund's management fee as well as other fund or class expenses, as applicable, such as transfer agent fees, pricing and bookkeeping fees, fund-paid 12b-1 fees, and custodial, legal, and audit fees. The Board also noted the effects of any waivers and reimbursements on fees and expenses. As part of its review, the Board also considered the current and historical total expense ratios of each class of the fund compared to competitive fund median expenses. Each class of the fund is compared to those funds and classes in the Total Mapped Group (used by the Board for management fee comparisons) that have a similar sales load structure.
The Board noted that the total expense ratio of each of Class A and Class B ranked below its competitive median for 2013 and the total expense ratio of each of Class T, Class C, and Institutional Class ranked above its competitive median for 2013. The Board considered that, in general, various factors can affect total expense ratios. The Board noted that the total expense ratio of Class T was above the competitive median primarily because of higher 12b-1 fees on Class T as compared to most competitor funds. Class T has a higher 12b-1 fee, but a lower front-end sales charge, than traditionally priced front-end sales charge classes. The Board considered that Class T is primarily sold load-waived in the retirement plan market where its 0.50% 12b-1 fee is comparable to competing no-load, higher 12b-1 fee classes designed specifically for retirement plans. The Board noted that the fund offers multiple classes, each of which has a different sales load and 12b-1 fee structure, and that the multiple structures are intended to offer a range of pricing options for the intermediary market. The Board also noted that the total expense ratios of the classes vary primarily by the level of their 12b-1 fees, although differences in transfer agent fees may also cause expenses to vary from class to class.
Fees Charged to Other Fidelity Clients. The Board also considered Fidelity fee structures and other information with respect to clients of Fidelity, such as other funds advised or subadvised by Fidelity, pension plan clients, and other institutional clients. The Board noted the findings of the 2013 ad hoc joint committee (created with the board of other Fidelity funds), which reviewed and compared Fidelity's institutional investment advisory business with its business of providing services to the Fidelity funds, including the differences in services provided, fees charged, and costs incurred, as well as competition in their respective marketplaces.
Annual Report
Board Approval of Investment Advisory Contracts and
Management Fees - continued
Based on its review of total expense ratios and fees charged to other Fidelity clients, the Board concluded that the total expense ratio of each class of the fund was reasonable, although in some cases above the median of the universe presented for comparison, in light of the services that the fund and its shareholders receive and the other factors considered.
Costs of the Services and Profitability. The Board considered the revenues earned and the expenses incurred by Fidelity in conducting the business of developing, marketing, distributing, managing, administering and servicing the fund and servicing the fund's shareholders. The Board also considered the level of Fidelity's profits in respect of all the Fidelity funds.
On an annual basis, Fidelity presents to the Board Fidelity's profitability for the fund. Fidelity calculates the profitability for each fund, as well as aggregate profitability for groups of Fidelity funds and all Fidelity funds, using a series of detailed revenue and cost allocation methodologies which originate with the books and records of Fidelity on which Fidelity's audited financial statements are based. The Audit Committee of the Board reviews any significant changes from the prior year's methodologies.
PricewaterhouseCoopers LLP (PwC), independent registered public accounting firm and auditor to Fidelity and certain Fidelity funds, has been engaged annually by the Board as part of the Board's assessment of Fidelity's profitability analysis. PwC's engagement includes the review and assessment of the methodologies used by Fidelity in determining the revenues and expenses attributable to Fidelity's mutual fund business, and completion of agreed-upon procedures in respect of the mathematical accuracy of fund profitability and its conformity to established allocation methodologies. After considering PwC's reports issued under the engagement and information provided by Fidelity, the Board concluded that while other allocation methods may also be reasonable, Fidelity's profitability methodologies are reasonable in all material respects.
The Board also reviewed Fidelity's non-fund businesses and fall-out benefits related to the mutual fund business as well as cases where Fidelity's affiliates may benefit from or be related to the fund's business.
The Board considered the costs of the services provided by and the profits realized by Fidelity in connection with the operation of the fund and was satisfied that the profitability was not excessive in the circumstances.
Economies of Scale. The Board considered whether there have been economies of scale in respect of the management of the Fidelity funds, whether the Fidelity funds (including the fund) have appropriately benefited from any such economies of scale, and whether there is potential for realization of any further economies of scale. The Board considered the extent to which the fund will benefit from economies of scale through increased services to the fund, through waivers or reimbursements, or through fee or expense ratio reductions. The Board also noted that in 2013, it and the boards of other Fidelity funds created an ad hoc committee (the Economies of Scale Committee) to analyze whether Fidelity attains economies of scale in respect of the management and servicing of the Fidelity funds, whether the Fidelity funds have appropriately benefited from such economies of scale, and whether there is potential for realization of any further economies of scale.
Annual Report
The Board recognized that the fund's management contract incorporates a "group fee" structure, which provides for lower group fee rates as total group assets increase, and for higher group fee rates as total group assets decrease (with "group assets" defined to include fund assets under FMR's management plus sector fund assets previously under FMR's management and currently managed by Fidelity SelectCo, LLC). FMR calculates the group fee rates based on a tiered asset "breakpoint" schedule that varies based on asset class. The Board considered that the group fee is designed to deliver the benefits of economies of scale to fund shareholders when total Fidelity fund assets increase, even if assets of any particular fund are unchanged or have declined, because some portion of Fidelity's costs are attributable to services provided to all Fidelity funds, and all funds benefit if those costs can be allocated among more assets. The Board concluded that, given the group fee structure, fund shareholders will benefit from lower management fees as group assets increase at the fund complex level, regardless of whether Fidelity achieves any such economies of scale.
The Board concluded, taking into account the analysis of the Economies of Scale Committee, that economies of scale, if any, are being appropriately shared between fund shareholders and Fidelity.
Additional Information Requested by the Board. In order to develop fully the factual basis for consideration of the Fidelity funds' Advisory Contracts, the Board requested and received additional information on certain topics, including: (i) fund performance trends and Fidelity's long-term strategies for certain funds; (ii) Fidelity's strategic marketing and product lineup goals; (iii) the methodology with respect to competitive fund data and peer group classifications; (iv) the arrangements with, and performance of, certain sub-advisers on behalf of the Fidelity funds, as well as certain proposed participating affiliate arrangements; (v) the realization of fall-out benefits in certain Fidelity business units; (vi) Fidelity's group fee structures, including the rationale for the individual fee rates of certain categories of funds and the definition of group assets; (vii) trends regarding industry use of performance fee structures and the performance adjustment methodologies applicable to the Fidelity funds; (viii) additional competitive analysis regarding the total expenses for certain classes; (ix) fund profitability methodology, including Fidelity's cost allocation methodology, and the impact of certain factors on fund profitability results; and (x) the process by which Fidelity determines sub-advisory fees for funds it advises.
Annual Report
Board Approval of Investment Advisory Contracts and
Management Fees - continued
Based on its evaluation of all of the conclusions noted above, and after considering all factors it believed relevant, the Board ultimately concluded that the advisory fee structures are fair and reasonable, and that the fund's Advisory Contracts should be renewed.
Annual Report
Investment Adviser
Fidelity Management & Research Company
Boston, MA
Investment Sub-Advisers
FMR Co., Inc.
Fidelity Management & Research
(U.K.) Inc.
Fidelity Management & Research
(Hong Kong) Limited
Fidelity Management & Research
(Japan) Limited
General Distributor
Fidelity Distributors Corporation
Smithfield, RI
Transfer and Service Agents
Fidelity Investments Institutional Operations Company, Inc.
Boston, MA
Fidelity Service Company, Inc.
Boston, MA
Custodian
The Bank of New York Mellon
New York, NY
(Fidelity Investment logo)(registered trademark)
AHI-UANN-1214
1.784748.111
(Fidelity Investment logo)(registered trademark)
Fidelity Advisor®
High Income
Fund - Institutional Class
Annual Report
October 31, 2014
(Fidelity Cover Art)
Contents
Performance | How the fund has done over time. | |
Management's Discussion of Fund Performance | The Portfolio Manager's review of fund performance and strategy. | |
Shareholder Expense Example | An example of shareholder expenses. | |
Investment Changes | A summary of major shifts in the fund's investments over the past six months. | |
Investments | A complete list of the fund's investments with their market values. | |
Financial Statements | Statements of assets and liabilities, operations, and changes in net assets, as well as financial highlights. | |
Notes | Notes to financial statements. | |
Report of Independent Registered Public Accounting Firm |
| |
Trustees and Officers |
| |
Distributions |
| |
Board Approval of Investment Advisory Contracts and Management Fees |
|
To view a fund's proxy voting guidelines and proxy voting record for the 12-month period ended June 30, visit http://www.fidelity.com/proxyvotingresults or visit the Securities and Exchange Commission's (SEC) web site at http://www.sec.gov. You may also call 1-877-208-0098 to request a free copy of the proxy voting guidelines.
Standard & Poor's, S&P and S&P 500 are registered service marks of The McGraw-Hill Companies, Inc. and have been licensed for use by Fidelity Distributors Corporation.
Other third-party marks appearing herein are the property of their respective owners.
All other marks appearing herein are registered or unregistered trademarks or service marks of FMR LLC or an affiliated company. © 2014 FMR LLC. All rights reserved.
Annual Report
This report and the financial statements contained herein are submitted for the general information of the shareholders of the fund. This report is not authorized for distribution to prospective investors in the fund unless preceded or accompanied by an effective prospectus.
A fund files its complete schedule of portfolio holdings with the SEC for the first and third quarters of each fiscal year on Form N-Q. Forms N-Q are available on the SEC's web site at http://www.sec.gov. A fund's Forms N-Q may be reviewed and copied at the SEC's Public Reference Room in Washington, DC. Information regarding the operation of the SEC's Public Reference Room may be obtained by calling 1-800-SEC-0330. For a complete list of a fund's portfolio holdings, view the most recent holdings listing, semiannual report, or annual report on Fidelity's web site at http://www.fidelity.com, http://www.advisor.fidelity.com, or http://www.401k.com, as applicable.
NOT FDIC INSURED • MAY LOSE VALUE • NO BANK GUARANTEE
Neither the fund nor Fidelity Distributors Corporation is a bank.
Annual Report
Performance: The Bottom Line
Average annual total return reflects the change in the value of an investment, assuming reinvestment of the class' distributions from dividend income and capital gains (the profits earned upon the sale of securities that have grown in value, if any) and assuming a constant rate of performance each year. The $10,000 table and the fund's returns do not reflect the deduction of taxes that a shareholder would pay on fund distributions or the redemption of fund shares. During periods of reimbursement by Fidelity, a fund's total return will be greater than it would be had the reimbursement not occurred. How a fund did yesterday is no guarantee of how it will do tomorrow.
Average Annual Total Returns
Periods ended October 31, 2014 | Past 1 | Past 5 | Past 10 |
Institutional Class | 4.57% | 9.12% | 6.72% |
$10,000 Over 10 Years
Let's say hypothetically that $10,000 was invested in Fidelity Advisor® High Income Fund - Institutional Class on October 31, 2004. The chart shows how the value of your investment would have changed, and also shows how The BofA Merrill LynchSM US High Yield Constrained Index performed over the same period.
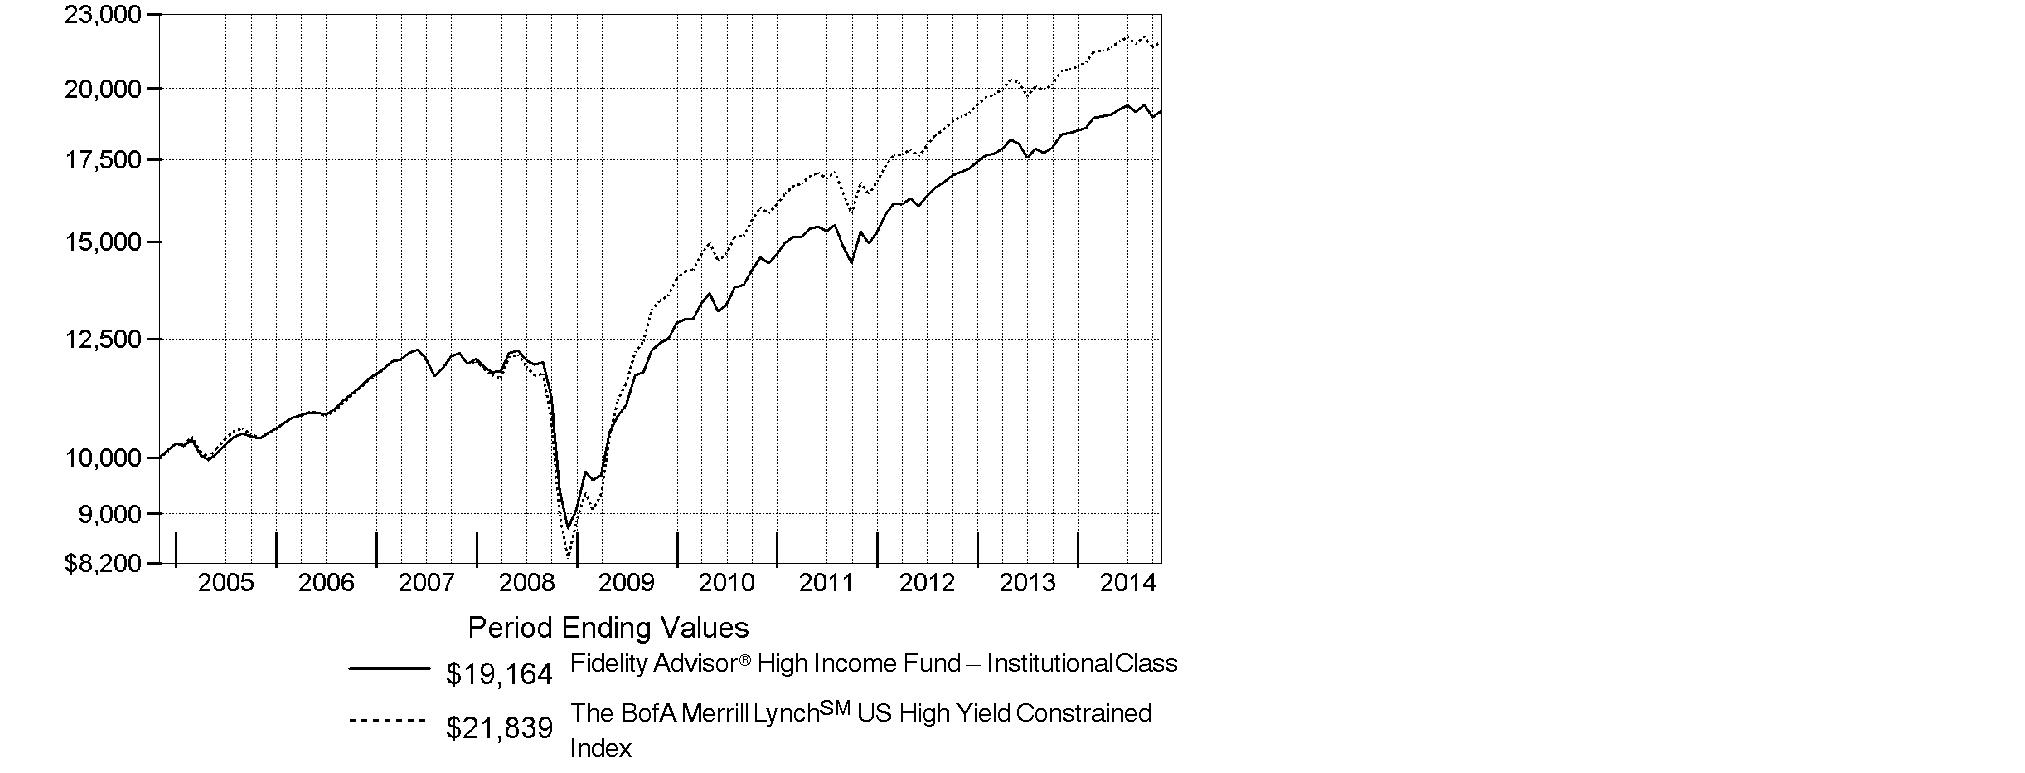
Annual Report
Management's Discussion of Fund Performance
Market Recap: High-yield bonds overcame late-period volatility to rise 5.85% for the 12 months ending October 31, 2014, as measured by The BofA Merrill LynchSM US High Yield Constrained Index, continuing a positive multiyear run. High yield benefited from a growing U.S. economy, low default rate, solid corporate fundamentals and monetary support from central banks worldwide. Early on, the index recovered from fears that the Fed might increase interest rates, in conjunction with its plan to wind down its stimulative bond-buying program. Meanwhile, weaker-than-expected economic data in the first quarter of 2014 helped to keep low policy rates in place. High yield advanced steadily until the market shifted in July, when investors exited high yield at a record pace amid unfavorable supply/demand dynamics and new concerns that the Fed could begin to tighten monetary policy. Fed Chair Janet Yellen contributed to the tumult, suggesting high-yield valuations "appear stretched." The index continued its decline in the final months of the period until it staged a slight rebound in October, as concerns about possible deflation in Europe and recession in Japan led to increased expectations for additional market intervention outside the U.S.
Comments from Matthew Conti, Portfolio Manager of Fidelity Advisor® High Income Fund: For the year, the fund's Institutional Class shares returned 4.57%, underperforming the BofA Merrill Lynch index. The fund underperformed the index because it held a short duration - a measure of sensitivity to changes in interest rates - relative to the benchmark. I expected early on that interest rates would rise this period, but they fell partly due to new global growth threats. The fund also was held back by security selection in technology and utilities, and by its modest cash position, which was held for liquidity purposes. Top individual detractors included utility GenOn Energy, which I sold by period end, and energy company Vantage Drilling - listed in the fund's holdings as Offshore Group Investment. Overall, I looked to structure the fund to benefit from an improving U.S. economy, while underweighting commodity-oriented sectors. I also underweighted banks & thrifts, overweighted air transportation and liked airline leasing companies. I increased the fund's stake in telecommunications and in floating-rate bank loans, the latter of which hurt relative performance. The top relative contributor was an out-of-benchmark stake in Brazilian meat processor JBS Investments.
The views expressed above reflect those of the portfolio manager(s) only through the end of the period as stated on the cover of this report and do not necessarily represent the views of Fidelity or any other person in the Fidelity organization. Any such views are subject to change at any time based upon market or other conditions and Fidelity disclaims any responsibility to update such views. These views may not be relied on as investment advice and, because investment decisions for a Fidelity fund are based on numerous factors, may not be relied on as an indication of trading intent on behalf of any Fidelity fund.
Annual Report
Shareholder Expense Example
As a shareholder of the Fund, you incur two types of costs: (1) transaction costs, including sales charges (loads) on purchase payments or redemption proceeds, redemption fees and (2) ongoing costs, including management fees, distribution and/or service (12b-1) fees and other Fund expenses. This Example is intended to help you understand your ongoing costs (in dollars) of investing in the Fund and to compare these costs with the ongoing costs of investing in other mutual funds.
The Example is based on an investment of $1,000 invested at the beginning of the period and held for the entire period (May 1, 2014 to October 31, 2014).
Actual Expenses
The first line of the accompanying table for each class of the Fund provides information about actual account values and actual expenses. You may use the information in this line, together with the amount you invested, to estimate the expenses that you paid over the period. Simply divide your account value by $1,000.00 (for example, an $8,600 account value divided by $1,000.00 = 8.6), then multiply the result by the number in the first line for a class of the Fund under the heading entitled "Expenses Paid During Period" to estimate the expenses you paid on your account during this period. In addition, the Fund, as a shareholder in the underlying Fidelity Central Funds, will indirectly bear its pro-rata share of the fees and expenses incurred by the underlying Fidelity Central Funds. These fees and expenses are not included in the Fund's annualized expense ratio used to calculate the expense estimate in the table below.
Hypothetical Example for Comparison Purposes
The second line of the accompanying table for each class of the Fund provides information about hypothetical account values and hypothetical expenses based on a Class' actual expense ratio and an assumed rate of return of 5% per year before expenses, which is not the Class' actual return. The hypothetical account values and expenses may not be used to estimate the actual ending account balance or expenses you paid for the period. You may use this information to compare the ongoing costs of investing in the Fund and other funds. To do so, compare this 5% hypothetical example with the 5% hypothetical examples that appear in the shareholder reports of the other funds. In addition, the Fund, as a shareholder in the underlying Fidelity Central Funds, will indirectly bear its pro-rata share of the fees and expenses incurred by the underlying Fidelity Central Funds. These fees and expenses are not included in the Fund's annualized expense ratio used to calculate the expense estimate in the table below.
Please note that the expenses shown in the table are meant to highlight your ongoing costs only and do not reflect any transaction costs. Therefore, the second line of the table is useful in comparing ongoing costs only, and will not help you determine the relative total costs of owning different funds. In addition, if these transactional costs were included, your costs would have been higher.
Annual Report
Shareholder Expense Example - continued
| Annualized | Beginning | Ending | Expenses Paid |
Class A | 1.02% |
|
|
|
Actual |
| $ 1,000.00 | $ 1,006.00 | $ 5.16 |
HypotheticalA |
| $ 1,000.00 | $ 1,020.06 | $ 5.19 |
Class T | 1.04% |
|
|
|
Actual |
| $ 1,000.00 | $ 1,005.90 | $ 5.26 |
HypotheticalA |
| $ 1,000.00 | $ 1,019.96 | $ 5.30 |
Class B | 1.72% |
|
|
|
Actual |
| $ 1,000.00 | $ 1,002.50 | $ 8.68 |
HypotheticalA |
| $ 1,000.00 | $ 1,016.53 | $ 8.74 |
Class C | 1.79% |
|
|
|
Actual |
| $ 1,000.00 | $ 1,001.00 | $ 9.03 |
HypotheticalA |
| $ 1,000.00 | $ 1,016.18 | $ 9.10 |
Institutional Class | .85% |
|
|
|
Actual |
| $ 1,000.00 | $ 1,006.90 | $ 4.30 |
HypotheticalA |
| $ 1,000.00 | $ 1,020.92 | $ 4.33 |
A 5% return per year before expenses
B Annualized expense ratio reflects expenses net of applicable fee waivers.
* Expenses are equal to each Class' annualized expense ratio, multiplied by the average account value over the period, multiplied by 184/365 (to reflect the one-half year period).
Annual Report
Investment Changes (Unaudited)
Top Five Holdings as of October 31, 2014 | ||
(by issuer, excluding cash equivalents) | % of fund's | % of fund's net assets |
Clear Channel Communications, Inc. | 2.1 | 1.8 |
Icahn Enterprises LP/Icahn Enterprises Finance Corp. | 1.9 | 1.6 |
APX Group, Inc. | 1.6 | 1.1 |
Digicel Group Ltd. | 1.6 | 1.4 |
Tenet Healthcare Corp. | 1.6 | 1.6 |
| 8.8 | |
Top Five Market Sectors as of October 31, 2014 | ||
| % of fund's | % of fund's net assets |
Energy | 13.0 | 13.2 |
Telecommunications | 8.9 | 8.1 |
Services | 6.6 | 4.5 |
Technology | 5.5 | 7.7 |
Diversified Financial Services | 5.4 | 6.4 |
Quality Diversification (% of fund's net assets) | |||||||
As of October 31, 2014 | As of April 30, 2014 | ||||||
| BBB 0.3% |
| | BBB 1.3% |
| ||
| BB 32.5% |
| | BB 35.1% |
| ||
| B 46.6% |
| | B 43.2% |
| ||
| CCC,CC,C 17.7% |
| | CCC,CC,C 16.2% |
| ||
| Not Rated 0.6% |
| | Not Rated 1.4% |
| ||
| Equities 0.0%† |
| | Equities 0.0%† |
| ||
| Short-Term |
| | Short-Term |
| ||

We have used ratings from Moody's Investors Service, Inc. Where Moody'sTM ratings are not available, we have used S&PTM ratings. All ratings are as of the date indicated and do not reflect subsequent changes. |
Asset Allocation (% of fund's net assets) | |||||||
As of October 31, 2014* | As of April 30, 2014** | ||||||
| Nonconvertible |
| | Nonconvertible |
| ||
| Common Stocks 0.0%† |
| | Common Stocks 0.0%† |
| ||
| Bank Loan |
| | Bank Loan |
| ||
| Other Investments 1.3% |
| | Other Investments 0.7% |
| ||
| Short-Term |
| | Short-Term |
| ||
* Foreign investments 27.2% |
| ** Foreign investments 22.8% |
| ||||

† Amount represents less than 0.1%
Annual Report
Investments October 31, 2014
Showing Percentage of Net Assets
Nonconvertible Bonds - 85.4% | ||||
| Principal Amount | Value | ||
Aerospace - 0.9% | ||||
TransDigm, Inc.: | ||||
5.5% 10/15/20 | $ 3,965,000 | $ 3,965,000 | ||
6% 7/15/22 | 855,000 | 864,619 | ||
6.5% 7/15/24 | 840,000 | 865,200 | ||
Triumph Group, Inc.: | ||||
4.875% 4/1/21 | 1,420,000 | 1,434,200 | ||
5.25% 6/1/22 | 365,000 | 369,563 | ||
| 7,498,582 | |||
Air Transportation - 4.3% | ||||
Air Canada: | ||||
6.625% 5/15/18 (c) | 3,205,000 | 3,295,061 | ||
7.75% 4/15/21 (c) | 2,290,000 | 2,398,775 | ||
Allegiant Travel Co. 5.5% 7/15/19 | 1,070,000 | 1,094,075 | ||
American Airlines Group, Inc. 5.5% 10/1/19 (c) | 2,775,000 | 2,781,938 | ||
American Airlines, Inc. pass-thru certificates equipment trust certificate 5.625% 1/15/21 (c) | 296,810 | 303,488 | ||
Continental Airlines, Inc.: | ||||
pass-thru trust certificates 9.798% 4/1/21 | 1,075,689 | 1,202,082 | ||
6.125% 4/29/18 | 345,000 | 363,975 | ||
6.25% 10/11/21 | 1,929,134 | 2,044,882 | ||
9.25% 5/10/17 | 1,176,334 | 1,329,258 | ||
Delta Air Lines, Inc. pass-thru trust certificates: | ||||
6.375% 7/2/17 (c) | 1,375,000 | 1,433,438 | ||
6.75% 5/23/17 | 1,375,000 | 1,433,438 | ||
8.021% 8/10/22 | 1,049,008 | 1,216,849 | ||
U.S. Airways Group, Inc. 6.125% 6/1/18 | 1,950,000 | 2,013,375 | ||
U.S. Airways pass-thru certificates: | ||||
Series 2012-2C, 5.45% 6/3/18 | 2,215,000 | 2,242,688 | ||
Series 2013-1 Class B, 5.375% 5/15/23 | 450,000 | 457,875 | ||
United Air Lines, Inc. pass-thru trust certificates: | ||||
Class B, 7.336% 7/2/19 | 904,423 | 981,299 | ||
9.75% 1/15/17 | 903,885 | 1,003,313 | ||
12% 1/15/16 (c) | 172,971 | 188,971 | ||
United Continental Holdings, Inc.: | ||||
6% 12/1/20 | 2,635,000 | 2,710,756 | ||
6% 7/15/26 | 2,575,000 | 2,491,313 | ||
6% 7/15/28 | 1,705,000 | 1,624,013 | ||
6.375% 6/1/18 | 185,000 | 193,325 | ||
XPO Logistics, Inc. 7.875% 9/1/19 (c) | 1,070,000 | 1,120,825 | ||
| 33,925,012 | |||
Nonconvertible Bonds - continued | ||||
| Principal Amount | Value | ||
Automotive - 1.4% | ||||
American Axle & Manufacturing, Inc.: | ||||
5.125% 2/15/19 | $ 335,000 | $ 340,025 | ||
6.25% 3/15/21 | 2,970,000 | 3,118,500 | ||
Dana Holding Corp.: | ||||
6% 9/15/23 | 690,000 | 724,500 | ||
6.75% 2/15/21 | 1,210,000 | 1,285,625 | ||
Schaeffler Finance BV 4.75% 5/15/21 (c) | 1,460,000 | 1,456,350 | ||
Schaeffler Holding Finance BV: | ||||
6.25% 11/15/19 pay-in-kind (c)(f) | 550,000 | 569,250 | ||
6.75% 11/15/22 pay-in-kind (c)(f) | 735,000 | 777,263 | ||
6.875% 8/15/18 pay-in-kind (c)(f) | 2,965,000 | 3,105,838 | ||
| 11,377,351 | |||
Banks & Thrifts - 0.8% | ||||
Ocwen Financial Corp. 6.625% 5/15/19 (c) | 3,875,000 | 3,642,500 | ||
Royal Bank of Scotland Group PLC: | ||||
5.125% 5/28/24 | 2,140,000 | 2,167,324 | ||
6% 12/19/23 | 215,000 | 231,310 | ||
| 6,041,134 | |||
Broadcasting - 1.6% | ||||
Clear Channel Communications, Inc.: | ||||
5.5% 12/15/16 | 8,420,000 | 7,977,950 | ||
9% 12/15/19 | 1,230,000 | 1,243,069 | ||
10% 1/15/18 | 3,000,000 | 2,506,875 | ||
Gray Television, Inc. 7.5% 10/1/20 | 820,000 | 857,925 | ||
| 12,585,819 | |||
Building Materials - 2.6% | ||||
Building Materials Corp. of America: | ||||
5.375% 11/15/24 (c)(e) | 1,955,000 | 1,959,888 | ||
6.75% 5/1/21 (c) | 2,385,000 | 2,557,913 | ||
6.875% 8/15/18 (c) | 2,715,000 | 2,819,528 | ||
Building Materials Holding Corp. 9% 9/15/18 (c) | 2,790,000 | 3,006,225 | ||
CEMEX Finance LLC 6% 4/1/24 (c) | 1,190,000 | 1,213,443 | ||
CEMEX S.A.B. de CV 6.5% 12/10/19 (c) | 750,000 | 803,438 | ||
HD Supply, Inc. 7.5% 7/15/20 | 5,270,000 | 5,612,550 | ||
Headwaters, Inc.: | ||||
7.25% 1/15/19 | 520,000 | 533,000 | ||
7.625% 4/1/19 | 2,175,000 | 2,272,875 | ||
| 20,778,860 | |||
Cable TV - 2.1% | ||||
Altice SA 7.75% 5/15/22 (c) | 3,975,000 | 4,173,750 | ||
Nonconvertible Bonds - continued | ||||
| Principal Amount | Value | ||
Cable TV - continued | ||||
Cablevision Systems Corp. 7.75% 4/15/18 | $ 530,000 | $ 590,420 | ||
Cogeco Cable, Inc. 4.875% 5/1/20 (c) | 450,000 | 450,000 | ||
Numericable Group SA: | ||||
4.875% 5/15/19 (c) | 1,430,000 | 1,426,425 | ||
6% 5/15/22 (c) | 2,475,000 | 2,530,688 | ||
6.25% 5/15/24 (c) | 490,000 | 504,088 | ||
RCN Telecom Services LLC/RCN Capital Corp. 8.5% 8/15/20 (c) | 1,835,000 | 1,922,163 | ||
Virgin Media Finance PLC 6% 10/15/24 (c) | 630,000 | 655,200 | ||
Wave Holdco LLC/Wave Holdco Corp. 8.25% 7/15/19 pay-in-kind (c)(f) | 205,000 | 212,175 | ||
WaveDivision Escrow LLC/WaveDivision Escrow Corp. 8.125% 9/1/20 (c) | 3,930,000 | 4,273,875 | ||
| 16,738,784 | |||
Capital Goods - 0.5% | ||||
J.B. Poindexter & Co., Inc. 9% 4/1/22 (c) | 3,615,000 | 3,940,350 | ||
Chemicals - 2.8% | ||||
Eco Services Operations LLC/Eco Finance Corp. 8.5% 11/1/22 (c) | 1,780,000 | 1,833,400 | ||
LSB Industries, Inc. 7.75% 8/1/19 | 1,085,000 | 1,157,912 | ||
NOVA Chemicals Corp. 5% 5/1/25 (c) | 2,310,000 | 2,385,075 | ||
Nufarm Australia Ltd. 6.375% 10/15/19 (c) | 3,740,000 | 3,758,700 | ||
Trinseo Materials Operating SCA/Trinseo Materials Finance, Inc. 8.75% 2/1/19 | 8,051,000 | 8,513,933 | ||
Tronox Finance LLC 6.375% 8/15/20 | 4,605,000 | 4,731,638 | ||
| 22,380,658 | |||
Consumer Products - 0.1% | ||||
Prestige Brands, Inc. 5.375% 12/15/21 (c) | 1,125,000 | 1,088,438 | ||
Containers - 1.8% | ||||
Ardagh Finance Holdings SA 8.625% 6/15/19 pay-in-kind (c)(f) | 1,720,000 | 1,702,674 | ||
Ardagh Packaging Finance PLC/Ardagh MP Holdings U.S.A., Inc.: | ||||
3.2341% 12/15/19 (c)(f) | 2,120,000 | 2,072,300 | ||
6% 6/30/21 (c) | 1,495,000 | 1,474,444 | ||
6.25% 1/31/19 (c) | 500,000 | 503,750 | ||
6.75% 1/31/21 (c) | 580,000 | 593,050 | ||
7% 11/15/20 (c) | 105,000 | 107,100 | ||
Beverage Packaging Holdings II SA (Luxembourg) 6% 6/15/17 (c) | 1,415,000 | 1,411,463 | ||
Nonconvertible Bonds - continued | ||||
| Principal Amount | Value | ||
Containers - continued | ||||
Crown Americas LLC/Crown Americas Capital Corp. IV 4.5% 1/15/23 | $ 2,645,000 | $ 2,598,713 | ||
Reynolds Group Issuer, Inc./Reynolds Group Issuer LLC/Reynolds Group Issuer (Luxembourg) SA 5.75% 10/15/20 | 3,455,000 | 3,593,200 | ||
| 14,056,694 | |||
Diversified Financial Services - 5.1% | ||||
AerCap Ireland Capital Ltd./AerCap Global Aviation Trust: | ||||
3.75% 5/15/19 (c) | 1,790,000 | 1,776,575 | ||
4.5% 5/15/21 (c) | 1,725,000 | 1,742,250 | ||
5% 10/1/21 (c) | 2,065,000 | 2,147,600 | ||
Aircastle Ltd.: | ||||
5.125% 3/15/21 | 1,535,000 | 1,554,188 | ||
6.25% 12/1/19 | 1,175,000 | 1,251,375 | ||
FLY Leasing Ltd.: | ||||
6.375% 10/15/21 | 1,470,000 | 1,462,650 | ||
6.75% 12/15/20 | 2,710,000 | 2,791,300 | ||
Icahn Enterprises LP/Icahn Enterprises Finance Corp.: | ||||
4.875% 3/15/19 | 3,120,000 | 3,174,600 | ||
5.875% 2/1/22 | 7,155,000 | 7,351,763 | ||
6% 8/1/20 | 4,635,000 | 4,866,750 | ||
ILFC E-Capital Trust II 6.25% 12/21/65 (c)(f) | 3,100,000 | 2,999,250 | ||
International Lease Finance Corp. 5.875% 8/15/22 | 1,290,000 | 1,399,650 | ||
SLM Corp.: | ||||
4.875% 6/17/19 | 4,765,000 | 4,836,475 | ||
5.5% 1/15/19 | 2,080,000 | 2,156,960 | ||
8% 3/25/20 | 1,020,000 | 1,170,450 | ||
| 40,681,836 | |||
Diversified Media - 0.5% | ||||
MDC Partners, Inc. 6.75% 4/1/20 (c) | 1,075,000 | 1,115,313 | ||
Nielsen Finance LLC/Nielsen Finance Co. 4.5% 10/1/20 | 1,725,000 | 1,725,345 | ||
The Nielsen Co. S.a.r.l. (Luxembourg) 5.5% 10/1/21 (c) | 1,165,000 | 1,208,688 | ||
| 4,049,346 | |||
Electric Utilities - 4.1% | ||||
Atlantic Power Corp. 9% 11/15/18 | 3,340,000 | 3,356,700 | ||
Calpine Corp.: | ||||
5.375% 1/15/23 | 1,750,000 | 1,767,500 | ||
5.75% 1/15/25 | 875,000 | 885,938 | ||
Nonconvertible Bonds - continued | ||||
| Principal Amount | Value | ||
Electric Utilities - continued | ||||
NRG Energy, Inc.: | ||||
6.25% 7/15/22 | $ 2,105,000 | $ 2,199,725 | ||
6.25% 5/1/24 (c) | 2,590,000 | 2,674,175 | ||
NSG Holdings II, LLC 7.75% 12/15/25 (c) | 9,460,000 | 10,193,150 | ||
RJS Power Holdings LLC 5.125% 7/15/19 (c) | 2,280,000 | 2,268,600 | ||
The AES Corp.: | ||||
4.875% 5/15/23 | 1,120,000 | 1,117,200 | ||
7.375% 7/1/21 | 6,775,000 | 7,729,848 | ||
| 32,192,836 | |||
Energy - 11.5% | ||||
Access Midstream Partners LP/ACMP Finance Corp.: | ||||
4.875% 5/15/23 | 1,405,000 | 1,468,225 | ||
4.875% 3/15/24 | 555,000 | 579,975 | ||
American Energy-Permian Basin LLC/ AEPB Finance Corp.: | ||||
6.7413% 8/1/19 (c)(f) | 990,000 | 876,150 | ||
7.125% 11/1/20 (c) | 985,000 | 852,025 | ||
7.375% 11/1/21 (c) | 1,765,000 | 1,544,375 | ||
Antero Resources Corp. 5.125% 12/1/22 (c) | 2,240,000 | 2,240,448 | ||
Approach Resources, Inc. 7% 6/15/21 | 2,075,000 | 1,909,000 | ||
Basic Energy Services, Inc. 7.75% 2/15/19 | 350,000 | 341,250 | ||
California Resources Corp.: | ||||
5% 1/15/20 (c) | 915,000 | 928,725 | ||
5.5% 9/15/21 (c) | 1,190,000 | 1,213,800 | ||
6% 11/15/24 (c) | 795,000 | 810,900 | ||
Chesapeake Midstream Partners LP/CHKM Finance Corp.: | ||||
5.875% 4/15/21 | 1,030,000 | 1,089,225 | ||
6.125% 7/15/22 | 2,375,000 | 2,582,813 | ||
Citgo Petroleum Corp. 6.25% 8/15/22 (c) | 1,310,000 | 1,332,925 | ||
Consolidated Energy Finance SA 6.75% 10/15/19 (c) | 3,590,000 | 3,661,800 | ||
Crestwood Midstream Partners LP/Crestwood Midstream Finance Corp.: | ||||
6.125% 3/1/22 | 690,000 | 696,900 | ||
7.75% 4/1/19 | 940,000 | 988,175 | ||
Denbury Resources, Inc.: | ||||
5.5% 5/1/22 | 2,145,000 | 2,112,825 | ||
6.375% 8/15/21 | 1,555,000 | 1,624,975 | ||
Dynegy Finance I, Inc./Dynegy Finance II, Inc.: | ||||
6.75% 11/1/19 (c) | 730,000 | 755,550 | ||
7.375% 11/1/22 (c) | 725,000 | 766,688 | ||
7.625% 11/1/24 (c) | 2,890,000 | 3,063,400 | ||
Nonconvertible Bonds - continued | ||||
| Principal Amount | Value | ||
Energy - continued | ||||
Endeavor Energy Resources LP/EER Finance, Inc. 7% 8/15/21 (c) | $ 6,325,000 | $ 6,388,250 | ||
Energy Partners Ltd. 8.25% 2/15/18 | 2,645,000 | 2,565,650 | ||
Everest Acquisition LLC/Everest Acquisition Finance, Inc. 9.375% 5/1/20 | 6,175,000 | 6,746,188 | ||
Exterran Holdings, Inc. 7.25% 12/1/18 | 1,775,000 | 1,823,813 | ||
Exterran Partners LP/EXLP Finance Corp.: | ||||
6% 4/1/21 | 2,755,000 | 2,658,575 | ||
6% 10/1/22 (c) | 965,000 | 926,400 | ||
Forbes Energy Services Ltd. 9% 6/15/19 | 3,310,000 | 3,194,150 | ||
Gibson Energy, Inc. 6.75% 7/15/21 (c) | 2,425,000 | 2,576,563 | ||
Hilcorp Energy I LP/Hilcorp Finance Co. 5% 12/1/24 (c) | 925,000 | 888,000 | ||
Hornbeck Offshore Services, Inc.: | ||||
5% 3/1/21 | 1,195,000 | 1,063,550 | ||
5.875% 4/1/20 | 780,000 | 733,200 | ||
Northern Tier Energy LLC/Northern Tier Finance Corp.: | ||||
7.125% 11/15/20 | 2,695,000 | 2,829,750 | ||
7.125% 11/15/20 (c) | 1,585,000 | 1,664,250 | ||
Offshore Group Investment Ltd.: | ||||
7.125% 4/1/23 | 1,200,000 | 990,000 | ||
7.5% 11/1/19 | 5,035,000 | 4,292,338 | ||
Parsley Energy LLC/Parsley 7.5% 2/15/22 (c) | 3,895,000 | 3,817,100 | ||
Rice Energy, Inc. 6.25% 5/1/22 (c) | 5,440,000 | 5,259,800 | ||
Rosetta Resources, Inc.: | ||||
5.625% 5/1/21 | 2,060,000 | 1,998,200 | ||
5.875% 6/1/24 | 520,000 | 499,200 | ||
RSP Permian, Inc. 6.625% 10/1/22 (c) | 360,000 | 359,028 | ||
Samson Investment Co. 9.75% 2/15/20 (f) | 2,015,000 | 1,491,100 | ||
SemGroup Corp. 7.5% 6/15/21 | 2,355,000 | 2,478,638 | ||
Teine Energy Ltd. 6.875% 9/30/22 (c) | 2,745,000 | 2,600,888 | ||
Tesoro Logistics LP/Tesoro Logistics Finance Corp.: | ||||
5.5% 10/15/19 (c) | 475,000 | 488,063 | ||
6.125% 10/15/21 | 545,000 | 559,988 | ||
6.25% 10/15/22 (c) | 505,000 | 522,675 | ||
| 90,855,506 | |||
Entertainment/Film - 0.3% | ||||
CBS Outdoor Americas Capital LLC/CBS Outdoor Americas Capital Corp.: | ||||
5.25% 2/15/22 (c) | 750,000 | 774,375 | ||
5.875% 3/15/25 (c) | 1,375,000 | 1,443,750 | ||
| 2,218,125 | |||
Nonconvertible Bonds - continued | ||||
| Principal Amount | Value | ||
Environmental - 1.1% | ||||
ADS Waste Holdings, Inc. 8.25% 10/1/20 | $ 3,345,000 | $ 3,503,888 | ||
LBC Tank Terminals Holding Netherlands BV 6.875% 5/15/23 (c) | 3,403,000 | 3,624,195 | ||
Tervita Corp. 9.75% 11/1/19 (c) | 1,740,000 | 1,496,400 | ||
| 8,624,483 | |||
Food & Drug Retail - 1.4% | ||||
JBS Investments GmbH: | ||||
7.25% 4/3/24 (c) | 995,000 | 1,062,163 | ||
7.75% 10/28/20 (c) | 2,200,000 | 2,410,386 | ||
Minerva Luxmbourg SA 7.75% 1/31/23 (c) | 4,250,000 | 4,441,250 | ||
SUPERVALU, Inc. 6.75% 6/1/21 | 2,960,000 | 2,900,800 | ||
| 10,814,599 | |||
Food/Beverage/Tobacco - 3.2% | ||||
DS Waters of America, Inc. 10% 9/1/21 | 940,000 | 1,038,700 | ||
ESAL GmbH 6.25% 2/5/23 (c) | 8,940,000 | 9,118,800 | ||
FAGE Dairy Industry SA/FAGE U.S.A. Dairy Industry, Inc. 9.875% 2/1/20 (c) | 2,050,000 | 2,170,438 | ||
JBS U.S.A. LLC/JBS U.S.A. Finance, Inc.: | ||||
5.875% 7/15/24 (c) | 1,530,000 | 1,537,650 | ||
7.25% 6/1/21 (c) | 1,850,000 | 1,970,250 | ||
8.25% 2/1/20 (c) | 4,220,000 | 4,515,400 | ||
Post Holdings, Inc. 6% 12/15/22 (c) | 4,555,000 | 4,395,575 | ||
Vector Group Ltd. 7.75% 2/15/21 | 730,000 | 791,138 | ||
| 25,537,951 | |||
Gaming - 2.6% | ||||
Caesars Growth Properties Holdings LLC/Caesars Growth Properties Finance, Inc. 9.375% 5/1/22 (c) | 1,555,000 | 1,446,150 | ||
Golden Nugget Escrow, Inc. 8.5% 12/1/21 (c) | 4,475,000 | 4,452,625 | ||
MCE Finance Ltd. 5% 2/15/21 (c) | 3,535,000 | 3,481,975 | ||
Paris Las Vegas Holding LLC/Harrah's Las Vegas LLC/Flamingo Las Vegas Holdings, Inc.: | ||||
8% 10/1/20 (c) | 3,440,000 | 3,336,800 | ||
11% 10/1/21 (c) | 1,735,000 | 1,611,381 | ||
Scientific Games Corp. 6.625% 5/15/21 (c) | 5,075,000 | 4,034,625 | ||
Seminole Hard Rock Entertainment, Inc. 5.875% 5/15/21 (c) | 940,000 | 925,900 | ||
Wynn Macau Ltd. 5.25% 10/15/21 (c) | 1,080,000 | 1,080,000 | ||
| 20,369,456 | |||
Healthcare - 3.9% | ||||
AmSurg Corp. 5.625% 7/15/22 (c) | 885,000 | 916,971 | ||
Nonconvertible Bonds - continued | ||||
| Principal Amount | Value | ||
Healthcare - continued | ||||
Community Health Systems, Inc.: | ||||
5.125% 8/1/21 | $ 620,000 | $ 647,900 | ||
6.875% 2/1/22 | 2,995,000 | 3,227,113 | ||
DJO Finance LLC/DJO Finance Corp.: | ||||
7.75% 4/15/18 | 950,000 | 959,500 | ||
8.75% 3/15/18 | 110,000 | 116,050 | ||
9.875% 4/15/18 | 1,555,000 | 1,636,638 | ||
Fresenius Medical Care U.S. Finance II, Inc.: | ||||
4.125% 10/15/20 (c) | 1,900,000 | 1,905,938 | ||
4.75% 10/15/24 (c) | 1,955,000 | 1,961,109 | ||
Grifols Worldwide Operations Ltd. 5.25% 4/1/22 (c) | 720,000 | 738,000 | ||
HCA Holdings, Inc.: | ||||
5% 3/15/24 | 1,295,000 | 1,335,482 | ||
5.25% 4/15/25 | 1,395,000 | 1,445,569 | ||
Sabra Health Care LP/Sabra Capital Corp. 5.5% 2/1/21 | 3,740,000 | 3,880,250 | ||
Tenet Healthcare Corp.: | ||||
5% 3/1/19 (c) | 1,245,000 | 1,246,556 | ||
8.125% 4/1/22 | 9,670,000 | 11,084,205 | ||
| 31,101,281 | |||
Homebuilders/Real Estate - 2.1% | ||||
CBRE Group, Inc. 5% 3/15/23 | 3,000,000 | 3,060,000 | ||
D.R. Horton, Inc. 4.375% 9/15/22 | 3,175,000 | 3,135,313 | ||
Howard Hughes Corp. 6.875% 10/1/21 (c) | 1,725,000 | 1,824,188 | ||
Lennar Corp. 4.5% 6/15/19 | 1,815,000 | 1,847,906 | ||
Standard Pacific Corp. 8.375% 5/15/18 | 3,432,000 | 3,972,540 | ||
Toll Brothers Finance Corp. 4.375% 4/15/23 | 1,365,000 | 1,337,700 | ||
Weyerhaeuser Real Estate Co.: | ||||
4.375% 6/15/19 (c) | 550,000 | 547,250 | ||
5.875% 6/15/24 (c) | 400,000 | 408,000 | ||
William Lyon Homes, Inc. 5.75% 4/15/19 | 350,000 | 348,250 | ||
| 16,481,147 | |||
Hotels - 0.3% | ||||
Playa Resorts Holding BV 8% 8/15/20 (c) | 2,379,000 | 2,474,160 | ||
Leisure - 1.7% | ||||
24 Hour Holdings III LLC 8% 6/1/22 (c) | 3,435,000 | 3,246,075 | ||
NCL Corp. Ltd. 5% 2/15/18 | 3,650,000 | 3,650,000 | ||
Royal Caribbean Cruises Ltd.: | ||||
5.25% 11/15/22 | 4,025,000 | 4,206,125 | ||
7.5% 10/15/27 | 1,925,000 | 2,204,125 | ||
| 13,306,325 | |||
Nonconvertible Bonds - continued | ||||
| Principal Amount | Value | ||
Metals/Mining - 3.6% | ||||
CONSOL Energy, Inc. 5.875% 4/15/22 (c) | $ 2,850,000 | $ 2,892,750 | ||
FMG Resources (August 2006) Pty Ltd. 8.25% 11/1/19 (c) | 925,000 | 959,688 | ||
Imperial Metals Corp. 7% 3/15/19 (c) | 1,620,000 | 1,534,950 | ||
Lundin Mining Corp.: | ||||
7.5% 11/1/20 (c) | 2,045,000 | 2,131,913 | ||
7.875% 11/1/22 (c) | 2,065,000 | 2,147,600 | ||
Murray Energy Corp.: | ||||
8.625% 6/15/21 (c) | 2,275,000 | 2,348,938 | ||
9.5% 12/5/20 (c) | 4,525,000 | 4,841,750 | ||
New Gold, Inc. 6.25% 11/15/22 (c) | 3,665,000 | 3,582,538 | ||
Peabody Energy Corp.: | ||||
6.25% 11/15/21 | 2,135,000 | 2,021,578 | ||
7.875% 11/1/26 | 700,000 | 658,000 | ||
Rain CII Carbon LLC/CII Carbon Corp. 8.25% 1/15/21 (c) | 3,445,000 | 3,513,900 | ||
Signode Industrial Group Lux SA/Signode Industrial Group U.S., Inc. 6.375% 5/1/22 (c) | 1,555,000 | 1,508,350 | ||
| 28,141,955 | |||
Paper - 0.4% | ||||
Sappi Papier Holding GmbH 6.625% 4/15/21 (c) | 3,375,000 | 3,510,000 | ||
Publishing/Printing - 1.7% | ||||
Cenveo Corp. 6% 8/1/19 (c) | 3,100,000 | 2,983,750 | ||
McGraw-Hill Global Education Holdings LLC/McGraw-Hill Global Education Finance 9.75% 4/1/21 | 4,890,000 | 5,525,700 | ||
MHGE Parent LLC / MHGE Parent Finance, Inc. 8.5% 8/1/19 pay-in-kind (c)(f) | 4,120,000 | 4,068,500 | ||
R.R. Donnelley & Sons Co. 7% 2/15/22 | 700,000 | 749,000 | ||
| 13,326,950 | |||
Restaurants - 0.5% | ||||
1011778 BC ULC/New Red Finance, Inc. 6% 4/1/22 (c) | 3,290,000 | 3,335,238 | ||
NPC International, Inc./NPC Operating Co. A, Inc./NPC Operating Co. B, Inc. 10.5% 1/15/20 | 765,000 | 797,513 | ||
| 4,132,751 | |||
Services - 5.4% | ||||
Abengoa Greenfield SA 6.5% 10/1/19 (c) | 2,150,000 | 2,155,375 | ||
ADT Corp. 4.125% 4/15/19 | 2,085,000 | 2,066,756 | ||
Anna Merger Sub, Inc. 7.75% 10/1/22 (c) | 1,235,000 | 1,258,156 | ||
Nonconvertible Bonds - continued | ||||
| Principal Amount | Value | ||
Services - continued | ||||
APX Group, Inc.: | ||||
6.375% 12/1/19 | $ 6,185,000 | $ 6,076,763 | ||
8.75% 12/1/20 | 6,500,000 | 5,622,500 | ||
8.75% 12/1/20 (c) | 1,315,000 | 1,137,475 | ||
Audatex North America, Inc. 6% 6/15/21 (c) | 3,390,000 | 3,584,925 | ||
Bankrate, Inc. 6.125% 8/15/18 (c) | 1,595,000 | 1,563,100 | ||
Blueline Rent Finance Corp./Volvo 7% 2/1/19 (c) | 1,305,000 | 1,373,513 | ||
Brand Energy & Infrastructure Services, Inc. 8.5% 12/1/21 (c) | 2,650,000 | 2,640,063 | ||
CBRE Group, Inc. 5.25% 3/15/25 | 825,000 | 844,594 | ||
FTI Consulting, Inc. 6.75% 10/1/20 | 2,560,000 | 2,700,800 | ||
Garda World Security Corp.: | ||||
7.25% 11/15/21 (c) | 150,000 | 149,250 | ||
7.25% 11/15/21 (c) | 390,000 | 388,050 | ||
Hertz Corp. 6.25% 10/15/22 | 2,925,000 | 2,983,500 | ||
IHS, Inc. 5% 11/1/22 (c) | 1,830,000 | 1,857,450 | ||
The GEO Group, Inc. 5.875% 1/15/22 | 2,720,000 | 2,828,800 | ||
TransUnion Holding Co., Inc. 8.125% 6/15/18 pay-in-kind (f) | 2,975,000 | 3,094,000 | ||
| 42,325,070 | |||
Shipping - 1.6% | ||||
Aguila 3 SA 7.875% 1/31/18 (c) | 4,355,000 | 4,365,888 | ||
Navios Maritime Acquisition Corp./Navios Acquisition Finance U.S., Inc. 8.125% 11/15/21 (c) | 2,290,000 | 2,330,075 | ||
Navios Maritime Holdings, Inc.: | ||||
7.375% 1/15/22 (c) | 4,270,000 | 4,291,350 | ||
8.125% 2/15/19 | 930,000 | 899,775 | ||
Navios South American Logistics, Inc./Navios Logistics Finance U.S., Inc. 7.25% 5/1/22 (c) | 860,000 | 866,450 | ||
| 12,753,538 | |||
Steel - 1.4% | ||||
JMC Steel Group, Inc. 8.25% 3/15/18 (c) | 7,195,000 | 7,302,925 | ||
Ryerson, Inc./Joseph T Ryerson & Son, Inc.: | ||||
9% 10/15/17 | 900,000 | 947,250 | ||
11.25% 10/15/18 | 1,351,000 | 1,472,590 | ||
Steel Dynamics, Inc. 5.125% 10/1/21 (c) | 1,495,000 | 1,547,325 | ||
| 11,270,090 | |||
Super Retail - 1.0% | ||||
JC Penney Corp., Inc.: | ||||
5.65% 6/1/20 | 2,345,000 | 1,928,763 | ||
5.75% 2/15/18 | 2,690,000 | 2,515,150 | ||
Nonconvertible Bonds - continued | ||||
| Principal Amount | Value | ||
Super Retail - continued | ||||
JC Penney Corp., Inc.: - continued | ||||
7.4% 4/1/37 | $ 2,605,000 | $ 2,005,850 | ||
8.125% 10/1/19 | 1,110,000 | 1,065,600 | ||
| 7,515,363 | |||
Technology - 4.5% | ||||
ADT Corp.: | ||||
4.125% 6/15/23 | 715,000 | 657,800 | ||
6.25% 10/15/21 | 2,110,000 | 2,215,500 | ||
Advanced Micro Devices, Inc.: | ||||
6.75% 3/1/19 | 1,860,000 | 1,757,700 | ||
7% 7/1/24 | 950,000 | 833,625 | ||
BMC Software Finance, Inc. 8.125% 7/15/21 (c) | 3,760,000 | 3,600,200 | ||
Boxer Parent Co., Inc. 9% 10/15/19 pay-in-kind (c)(f) | 1,370,000 | 1,228,726 | ||
Brocade Communications Systems, Inc. 4.625% 1/15/23 | 2,210,000 | 2,154,750 | ||
Cogent Communications Finance, Inc. 5.625% 4/15/21 (c) | 625,000 | 610,938 | ||
Compiler Finance Sub, Inc. 7% 5/1/21 (c) | 675,000 | 617,625 | ||
Infor Software Parent LLC/Infor Software Parent, Inc. 7.125% 5/1/21 pay-in-kind (c)(f) | 400,000 | 405,000 | ||
Lucent Technologies, Inc.: | ||||
6.45% 3/15/29 | 5,740,000 | 5,524,750 | ||
6.5% 1/15/28 | 2,050,000 | 1,973,125 | ||
Micron Technology, Inc. 5.875% 2/15/22 (c) | 305,000 | 320,250 | ||
Nuance Communications, Inc. 5.375% 8/15/20 (c) | 5,475,000 | 5,502,375 | ||
Sungard Availability Services Capital, Inc. 8.75% 4/1/22 (c) | 2,600,000 | 1,911,000 | ||
Viasystems, Inc. 7.875% 5/1/19 (c) | 2,810,000 | 2,978,600 | ||
WideOpenWest Finance LLC/WideOpenWest Capital Corp.: | ||||
10.25% 7/15/19 | 2,170,000 | 2,381,575 | ||
13.375% 10/15/19 | 1,070,000 | 1,219,800 | ||
| 35,893,339 | |||
Telecommunications - 8.6% | ||||
Alcatel-Lucent U.S.A., Inc.: | ||||
6.75% 11/15/20 (c) | 2,115,000 | 2,178,450 | ||
8.875% 1/1/20 (c) | 2,035,000 | 2,233,413 | ||
Altice Financing SA: | ||||
6.5% 1/15/22 (c) | 390,000 | 400,725 | ||
7.875% 12/15/19 (c) | 1,650,000 | 1,759,313 | ||
Altice Finco SA 9.875% 12/15/20 (c) | 6,195,000 | 6,907,425 | ||
Nonconvertible Bonds - continued | ||||
| Principal Amount | Value | ||
Telecommunications - continued | ||||
Columbus International, Inc. 7.375% 3/30/21 (c) | $ 7,230,000 | $ 7,663,800 | ||
Digicel Group Ltd.: | ||||
6% 4/15/21 (c) | 3,365,000 | 3,398,650 | ||
7% 2/15/20 (c) | 200,000 | 207,500 | ||
7.125% 4/1/22 (c) | 1,835,000 | 1,844,175 | ||
8.25% 9/1/17 (c) | 3,535,000 | 3,618,956 | ||
8.25% 9/30/20 (c) | 3,200,000 | 3,344,000 | ||
DigitalGlobe, Inc. 5.25% 2/1/21 (c) | 5,545,000 | 5,392,513 | ||
FairPoint Communications, Inc. 8.75% 8/15/19 (c) | 2,410,000 | 2,542,550 | ||
Level 3 Escrow II, Inc. 5.375% 8/15/22 (c) | 2,635,000 | 2,681,113 | ||
MasTec, Inc. 4.875% 3/15/23 | 1,680,000 | 1,604,400 | ||
SBA Communications Corp. 4.875% 7/15/22 (c) | 1,785,000 | 1,758,002 | ||
Sprint Capital Corp.: | ||||
6.875% 11/15/28 | 3,675,000 | 3,573,938 | ||
8.75% 3/15/32 | 3,215,000 | 3,592,763 | ||
T-Mobile U.S.A., Inc.: | ||||
5.25% 9/1/18 | 1,735,000 | 1,800,063 | ||
6% 3/1/23 | 1,500,000 | 1,545,000 | ||
6.375% 3/1/25 | 2,850,000 | 2,928,375 | ||
6.464% 4/28/19 | 1,565,000 | 1,631,513 | ||
TW Telecom Holdings, Inc.: | ||||
5.375% 10/1/22 | 1,815,000 | 2,005,575 | ||
6.375% 9/1/23 | 845,000 | 963,300 | ||
Wind Acquisition Finance SA 7.375% 4/23/21 (c) | 2,230,000 | 2,179,825 | ||
| 67,755,337 | |||
TOTAL NONCONVERTIBLE BONDS (Cost $669,462,845) |
| |||
Common Stocks - 0.0% | |||
Shares |
| ||
Telecommunications - 0.0% | |||
CUI Acquisition Corp. Class E (a)(c) | 1 |
| |
Bank Loan Obligations - 11.0% | ||||
| Principal Amount |
| ||
Aerospace - 0.1% | ||||
TransDigm, Inc. Tranche D, term loan 3.75% 6/4/21 (f) | $ 977,550 | 960,443 | ||
Bank Loan Obligations - continued | ||||
| Principal Amount | Value | ||
Automotive - 0.1% | ||||
Chrysler Group LLC term loan 3.25% 12/31/18 (f) | $ 1,079,575 | $ 1,068,779 | ||
Broadcasting - 0.6% | ||||
Clear Channel Communications, Inc. Tranche D, term loan 6.904% 1/30/19 (f) | 5,025,000 | 4,742,344 | ||
Building Materials - 0.3% | ||||
GYP Holdings III Corp.: | ||||
Tranche 1LN, term loan 4.75% 4/1/21 (f) | 1,701,450 | 1,667,421 | ||
Tranche 2LN, term loan 7.75% 4/1/22 (f) | 340,000 | 339,150 | ||
| 2,006,571 | |||
Cable TV - 0.2% | ||||
Numericable LLC: | ||||
Tranche B 1LN, term loan 4.5% 5/8/20 (f) | 731,850 | 732,882 | ||
Tranche B 2LN, term loan 4.5% 5/8/20 (f) | 633,150 | 634,043 | ||
| 1,366,925 | |||
Capital Goods - 0.4% | ||||
Husky Injection Molding Systems Ltd.: | ||||
Tranche 1LN, term loan 4.25% 6/30/21 (f) | 2,271,331 | 2,240,100 | ||
Tranche 2LN, term loan 7.25% 6/30/22 (f) | 875,000 | 856,406 | ||
| 3,096,506 | |||
Containers - 0.8% | ||||
Ardagh Holdings U.S.A., Inc. Tranche B, term loan 4% 12/17/19 (f) | 1,225,000 | 1,214,281 | ||
Berlin Packaging, LLC: | ||||
Tranche 2LN, term loan 7.75% 10/1/22 (f) | 480,000 | 478,800 | ||
Tranche B 1LN, term loan 4.5% 10/1/21 (f) | 1,480,000 | 1,470,750 | ||
Signode Packaging Systems, Inc. Tranche B, term loan 4% 5/1/21 (f) | 2,994,519 | 2,934,628 | ||
| 6,098,459 | |||
Diversified Financial Services - 0.3% | ||||
Delos Finance SARL Tranche B LN, term loan 3.5% 3/6/21 (f) | 1,320,000 | 1,312,304 | ||
IBC Capital U.S. LLC: | ||||
Tranche 2LN, term loan 8% 9/9/22 (f) | 925,000 | 920,375 | ||
Tranche B 1LN, term loan 4.75% 9/11/21 (f) | 235,000 | 233,825 | ||
| 2,466,504 | |||
Electric Utilities - 0.2% | ||||
Exgen Texas Power LLC Tranche B, term loan 5.75% 9/18/21 (f) | 1,210,000 | 1,210,000 | ||
Southwire LLC, Tranche B, term loan 3.25% 2/10/21 (f) | 726,350 | 704,560 | ||
| 1,914,560 | |||
Bank Loan Obligations - continued | ||||
| Principal Amount | Value | ||
Energy - 1.5% | ||||
Chief Exploration & Development, LLC. Tranche 2LN, term loan 7.5% 5/16/21 (f) | $ 645,000 | $ 622,425 | ||
Energy Transfer Equity LP Tranche B, term loan 3.25% 12/2/19 (f) | 2,100,000 | 2,055,753 | ||
Fieldwood Energy, LLC: | ||||
Tranche 2LN, term loan 8.375% 9/30/20 (f) | 3,445,000 | 3,315,813 | ||
Tranche B 1LN, term loan 3.875% 9/30/18 (f) | 341,862 | 333,315 | ||
Moxie Patriot LLC Tranche B, term loan 6.75% 12/19/20 (f) | 3,120,000 | 3,162,900 | ||
Seadrill Operating LP Tranche B, term loan 4% 2/21/21 (f) | 2,293,235 | 2,163,919 | ||
| 11,654,125 | |||
Gaming - 0.7% | ||||
Aristocrat International (Pty) Ltd. Tranche B, term loan 4.75% 10/20/21 (f) | 2,180,000 | 2,166,375 | ||
Caesars Growth Properties Holdings, LLC Tranche 1LN, term loan 6.25% 5/8/21 (f) | 329,175 | 310,247 | ||
Las Vegas Sands LLC Tranche B, term loan 3.25% 12/19/20 (f) | 565,725 | 563,604 | ||
Scientific Games Corp. Tranch B 2LN, term loan 6% 10/21/21 (f) | 2,200,000 | 2,153,360 | ||
| 5,193,586 | |||
Healthcare - 1.2% | ||||
AmSurg Corp. Tranche B, term loan 3.75% 7/16/21 (f) | 119,700 | 119,102 | ||
Endo Luxembourg Finance I Comp Tranche B, term loan 3.25% 2/28/21 (f) | 2,099,450 | 2,071,905 | ||
Grifols, S.A. Tranche B, term loan 3.154% 2/27/21 (f) | 3,452,650 | 3,409,492 | ||
MPH Acquisition Holdings LLC Tranche B, term loan 4% 3/31/21 (f) | 1,110,909 | 1,090,080 | ||
Pharmedium Healthcare Corp.: | ||||
Tranche 2LN, term loan 7.75% 1/28/22 (f) | 1,040,000 | 1,037,400 | ||
Tranche B 1LN, term loan 4.25% 1/28/21 (f) | 1,843,000 | 1,806,140 | ||
| 9,534,119 | |||
Leisure - 0.0% | ||||
24 Hour Fitness Worldwide, Inc. Tranche B, term loan 4.75% 5/30/21 (f) | 179,550 | 179,101 | ||
Bank Loan Obligations - continued | ||||
| Principal Amount | Value | ||
Metals/Mining - 0.4% | ||||
Fortescue Metals Group Ltd. Tranche B, term loan 3.75% 6/30/19 (f) | $ 1,390,950 | $ 1,356,176 | ||
Peabody Energy Corp. Tranche B, term loan 4.25% 9/24/20 (f) | 1,821,600 | 1,753,290 | ||
| 3,109,466 | |||
Publishing/Printing - 0.5% | ||||
ARC Document Solutions, Inc. Tranche B, term loan 6.25% 12/20/18 (f) | 3,609,425 | 3,609,425 | ||
Restaurants - 0.7% | ||||
Dunkin Brands, Inc. Tranche B 4LN, term loan 3.25% 2/7/21 (f) | 5,031,689 | 4,905,896 | ||
TGI Friday's, Inc.: | ||||
Tranche B 1LN, term loan 5.25% 7/15/20 (f) | 322,267 | 321,461 | ||
Tranche B 2LN, term loan 9.25% 7/15/21 (f) | 365,000 | 359,525 | ||
| 5,586,882 | |||
Services - 1.2% | ||||
Brand Energy & Infrastructure Services, Inc. Tranche B, term loan 4.75% 11/26/20 (f) | 2,565,613 | 2,543,163 | ||
Cactus Wellhead LLC Tranche B, term loan 7% 7/31/20 (f) | 1,630,000 | 1,599,438 | ||
Garda World Security Corp.: | ||||
term loan 4% 11/8/20 (f) | 2,275,063 | 2,223,874 | ||
Tranche DD, term loan 4% 11/8/20 (f) | 581,993 | 568,898 | ||
Laureate Education, Inc. Tranche B, term loan 5% 6/16/18 (f) | 1,999,728 | 1,929,737 | ||
Lineage Logistics Holdings, LLC. Tranche B, term loan 4.5% 4/7/21 (f) | 890,525 | 871,601 | ||
| 9,736,711 | |||
Shipping - 0.1% | ||||
YRC Worldwide, Inc. Tranche B, term loan 8.25% 2/13/19 (f) | 674,900 | 661,402 | ||
Steel - 0.2% | ||||
Atkore International, Inc.: | ||||
Tranche 2LN, term loan 7.75% 10/9/21 (f) | 560,000 | 550,200 | ||
Tranche B 1LN, term loan 4.5% 4/9/21 (f) | 1,002,488 | 994,969 | ||
| 1,545,169 | |||
Bank Loan Obligations - continued | ||||
| Principal Amount | Value | ||
Super Retail - 0.2% | ||||
JC Penney Corp., Inc. Tranche B, term loan: | ||||
5% 6/20/19 (f) | $ 94,763 | $ 92,630 | ||
6% 5/22/18 (f) | 1,701,385 | 1,682,245 | ||
| 1,774,875 | |||
Technology - 1.0% | ||||
DealerTrack Holdings, Inc. Tranche B LN, term loan 3.5% 2/28/21 (f) | 1,989,135 | 1,964,271 | ||
Infor U.S., Inc. Tranche B 5LN, term loan 3.75% 6/3/20 (f) | 472,070 | 464,989 | ||
Kronos, Inc. Tranche 2LN, term loan 9.75% 4/30/20 (f) | 1,165,000 | 1,194,125 | ||
NXP BV Tranche D, term loan 3.25% 1/11/20 (f) | 2,069,100 | 2,045,823 | ||
Sungard Availability Services Capital, Inc. Tranche B, term loan 6% 3/31/19 (f) | 2,552,175 | 2,271,436 | ||
| 7,940,644 | |||
Telecommunications - 0.3% | ||||
Level 3 Financing, Inc. Tranche B 5LN, term loan 4.5% 1/31/22 (f) | 2,550,000 | 2,559,690 | ||
TOTAL BANK LOAN OBLIGATIONS (Cost $88,113,000) |
| |||
Preferred Securities - 1.3% | ||||
| ||||
Banks & Thrifts - 1.3% | ||||
Barclays Bank PLC 7.625% 11/21/22 | 4,405,000 | 4,948,383 | ||
Barclays PLC 8.25% (d)(f) | 3,590,000 | 3,744,917 | ||
Credit Agricole SA 6.625% (c)(d)(f) | 1,490,000 | 1,465,583 | ||
TOTAL PREFERRED SECURITIES (Cost $9,667,296) |
| |||
Money Market Funds - 0.5% | |||
Shares | Value | ||
Fidelity Cash Central Fund, 0.11% (b) | 4,390,954 | $ 4,390,954 | |
TOTAL INVESTMENT PORTFOLIO - 98.2% (Cost $772,498,353) | 777,191,521 | ||
NET OTHER ASSETS (LIABILITIES) - 1.8% | 14,011,579 | ||
NET ASSETS - 100% | $ 791,203,100 | ||
Legend |
(a) Non-income producing |
(b) Affiliated fund that is generally available only to investment companies and other accounts managed by Fidelity Investments. The rate quoted is the annualized seven-day yield of the fund at period end. A complete unaudited listing of the fund's holdings as of its most recent quarter end is available upon request. In addition, each Fidelity Central Fund's financial statements, which are not covered by the Fund's Report of Independent Registered Public Accounting Firm, are available on the SEC's website or upon request. |
(c) Security exempt from registration under Rule 144A of the Securities Act of 1933. These securities may be resold in transactions exempt from registration, normally to qualified institutional buyers. At the end of the period, the value of these securities amounted to $357,729,193 or 45.2% of net assets. |
(d) Security is perpetual in nature with no stated maturity date. |
(e) Security or a portion of the security purchased on a delayed delivery or when-issued basis. |
(f) Coupon rates for floating and adjustable rate securities reflect the rates in effect at period end. |
Affiliated Central Funds |
Information regarding fiscal year to date income earned by the Fund from investments in Fidelity Central Funds is as follows: |
Fund | Income earned |
Fidelity Cash Central Fund | $ 23,921 |
Other Information |
The following is a summary of the inputs used, as of October 31, 2014, involving the Fund's assets and liabilities carried at fair value. The inputs or methodology used for valuing securities may not be an indication of the risk associated with investing in those securities. For more information on valuation inputs, and their aggregation into the levels used in the table below, please refer to the Investment Valuation section in the accompanying Notes to Financial Statements. |
Valuation Inputs at Reporting Date: | ||||
Description | Total | Level 1 | Level 2 | Level 3 |
Investments in Securities: | ||||
Equities: | ||||
Telecommunication Services | $ 92,272 | $ - | $ - | $ 92,272 |
Corporate Bonds | 675,743,126 | - | 675,743,126 | - |
Bank Loan Obligations | 86,806,286 | - | 86,806,286 | - |
Preferred Securities | 10,158,883 | - | 10,158,883 | - |
Money Market Funds | 4,390,954 | 4,390,954 | - | - |
Total Investments in Securities: | $ 777,191,521 | $ 4,390,954 | $ 772,708,295 | $ 92,272 |
Distribution of investments by country or territory of incorporation, as a percentage of total net assets, is as follows (Unaudited): |
United States of America | 72.8% |
Luxembourg | 5.8% |
Canada | 4.8% |
Bermuda | 2.9% |
Austria | 1.9% |
Netherlands | 1.9% |
United Kingdom | 1.5% |
Ireland | 1.5% |
Marshall Islands | 1.3% |
Cayman Islands | 1.2% |
Australia | 1.1% |
Barbados | 1.0% |
Others (Individually Less Than 1%) | 2.3% |
| 100.0% |
See accompanying notes which are an integral part of the financial statements.
Annual Report
Financial Statements
Statement of Assets and Liabilities
| October 31, 2014 | |
|
|
|
Assets | ||
Investment in securities, at value - See accompanying schedule: Unaffiliated issuers (cost $768,107,399) | $ 772,800,567 |
|
Fidelity Central Funds (cost $4,390,954) | 4,390,954 |
|
Total Investments (cost $772,498,353) |
| $ 777,191,521 |
Cash |
| 527,901 |
Receivable for investments sold | 17,351,188 | |
Receivable for fund shares sold | 523,707 | |
Interest receivable | 12,230,084 | |
Distributions receivable from Fidelity Central Funds | 1,699 | |
Prepaid expenses | 1,840 | |
Other receivables | 5 | |
Total assets | 809,827,945 | |
|
|
|
Liabilities | ||
Payable for investments purchased | $ 8,741,112 | |
Delayed delivery | 3,260,000 | |
Payable for fund shares redeemed | 3,302,532 | |
Distributions payable | 562,965 | |
Accrued management fee | 370,486 | |
Distribution and service plan fees payable | 171,930 | |
Other affiliated payables | 159,404 | |
Other payables and accrued expenses | 56,416 | |
Total liabilities | 16,624,845 | |
|
|
|
Net Assets | $ 791,203,100 | |
Net Assets consist of: |
| |
Paid in capital | $ 766,906,160 | |
Undistributed net investment income | 3,311,724 | |
Accumulated undistributed net realized gain (loss) on investments | 16,292,048 | |
Net unrealized appreciation (depreciation) on investments | 4,693,168 | |
Net Assets | $ 791,203,100 | |
See accompanying notes which are an integral part of the financial statements.
Annual Report
Statement of Assets and Liabilities - continued
| October 31, 2014 | |
|
|
|
Calculation of Maximum Offering Price Class A: | $ 8.33 | |
|
|
|
Maximum offering price per share (100/96.00 of $8.33) | $ 8.68 | |
Class T: | $ 8.31 | |
|
|
|
Maximum offering price per share (100/96.00 of $8.31) | $ 8.66 | |
Class B: | $ 8.30 | |
|
|
|
Class C: | $ 8.30 | |
|
|
|
Institutional Class: | $ 8.34 | |
A Redemption price per share is equal to net asset value less any applicable contingent deferred sales charge.
See accompanying notes which are an integral part of the financial statements.
Annual Report
Financial Statements - continued
Statement of Operations
| Year ended October 31, 2014 | |
|
|
|
Investment Income |
|
|
Dividends |
| $ 318,332 |
Interest |
| 51,433,589 |
Income from Fidelity Central Funds |
| 23,921 |
Total income |
| 51,775,842 |
|
|
|
Expenses | ||
Management fee | $ 4,751,813 | |
Transfer agent fees | 1,720,739 | |
Distribution and service plan fees | 2,212,185 | |
Accounting fees and expenses | 311,798 | |
Custodian fees and expenses | 21,648 | |
Independent trustees' compensation | 3,503 | |
Registration fees | 92,990 | |
Audit | 67,494 | |
Legal | 5,452 | |
Miscellaneous | 7,617 | |
Total expenses before reductions | 9,195,239 | |
Expense reductions | (84,741) | 9,110,498 |
Net investment income (loss) | 42,665,344 | |
Realized and Unrealized Gain (Loss) Net realized gain (loss) on: | ||
Investment securities: |
|
|
Unaffiliated issuers |
| 19,130,548 |
Change in net unrealized appreciation (depreciation) on investment securities | (24,730,423) | |
Net gain (loss) | (5,599,875) | |
Net increase (decrease) in net assets resulting from operations | $ 37,065,469 | |
See accompanying notes which are an integral part of the financial statements.
Annual Report
Statement of Changes in Net Assets
| Year ended | Year ended |
Increase (Decrease) in Net Assets |
|
|
Operations |
|
|
Net investment income (loss) | $ 42,665,344 | $ 50,536,768 |
Net realized gain (loss) | 19,130,548 | 36,587,680 |
Change in net unrealized appreciation (depreciation) | (24,730,423) | (24,249,415) |
Net increase (decrease) in net assets resulting | 37,065,469 | 62,875,033 |
Distributions to shareholders from net investment income | (42,403,704) | (48,912,015) |
Distributions to shareholders from net realized gain | (37,717,635) | (10,710,125) |
Total distributions | (80,121,339) | (59,622,140) |
Share transactions - net increase (decrease) | (35,829,882) | (160,938,070) |
Redemption fees | 52,404 | 74,188 |
Total increase (decrease) in net assets | (78,833,348) | (157,610,989) |
|
|
|
Net Assets | ||
Beginning of period | 870,036,448 | 1,027,647,437 |
End of period (including undistributed net investment income of $3,311,724 and undistributed net investment income of $11,658,201, respectively) | $ 791,203,100 | $ 870,036,448 |
See accompanying notes which are an integral part of the financial statements.
Annual Report
Financial Highlights - Class A
Years ended October 31, | 2014 | 2013 | 2012 | 2011 | 2010 |
Selected Per-Share Data |
|
|
|
|
|
Net asset value, beginning of period | $ 8.77 | $ 8.73 | $ 8.38 | $ 8.59 | $ 7.87 |
Income from Investment Operations |
|
|
|
|
|
Net investment income (loss) C | .432 | .473 | .539 | .581 | .637 |
Net realized and unrealized gain (loss) | (.058) | .117 | .411 | (.204) | .673 |
Total from investment operations | .374 | .590 | .950 | .377 | 1.310 |
Distributions from net investment income | (.429) | (.457) | (.551) | (.589) | (.591) |
Distributions from net realized gain | (.386) | (.094) | (.050) | - | - |
Total distributions | (.815) | (.551) | (.601) | (.589) | (.591) |
Redemption fees added to paid in capital C | .001 | .001 | .001 | .002 | .001 |
Net asset value, end of period | $ 8.33 | $ 8.77 | $ 8.73 | $ 8.38 | $ 8.59 |
Total ReturnA, B | 4.51% | 6.99% | 11.84% | 4.53% | 17.33% |
Ratios to Average Net Assets D, F |
|
|
|
|
|
Expenses before reductions | 1.03% | 1.03% | 1.03% | 1.04% | 1.06% |
Expenses net of fee waivers, if any | 1.03% | 1.03% | 1.03% | 1.04% | 1.06% |
Expenses net of all reductions | 1.03% | 1.03% | 1.03% | 1.04% | 1.06% |
Net investment income (loss) | 5.09% | 5.40% | 6.35% | 6.82% | 7.81% |
Supplemental Data |
|
|
|
|
|
Net assets, end of period (000 omitted) | $ 243,987 | $ 280,769 | $ 331,436 | $ 264,110 | $ 278,577 |
Portfolio turnover rateE | 79% | 76% | 48% | 75% | 79% |
A Total returns would have been lower if certain expenses had not been reduced during the applicable periods shown.
B Total returns do not include the effect of the sales charges.
C Calculated based on average shares outstanding during the period.
D Fees and expenses of any underlying Fidelity Central Funds are not included in the Fund's expense ratio. The Fund indirectly bears its proportionate share of the expenses of any underlying Fidelity Central Funds.
E Amount does not include the portfolio activity of any underlying Fidelity Central Funds.
F Expense ratios reflect operating expenses of the class. Expenses before reductions do not reflect amounts reimbursed by the investment adviser or reductions from brokerage service arrangements or reductions from other expense offset arrangements and do not represent the amount paid by the class during periods when reimbursements or reductions occur. Expenses net of fee waivers reflect expenses after reimbursement by the investment adviser but prior to reductions from brokerage service arrangements or other expense offset arrangements. Expenses net of all reductions represent the net expenses paid by the class.
See accompanying notes which are an integral part of the financial statements.
Annual Report
Financial Highlights - Class T
Years ended October 31, | 2014 | 2013 | 2012 | 2011 | 2010 |
Selected Per-Share Data |
|
|
|
|
|
Net asset value, beginning of period | $ 8.76 | $ 8.72 | $ 8.37 | $ 8.57 | $ 7.86 |
Income from Investment Operations |
|
|
|
|
|
Net investment income (loss) C | .429 | .469 | .536 | .578 | .633 |
Net realized and unrealized gain (loss) | (.067) | .119 | .411 | (.193) | .665 |
Total from investment operations | .362 | .588 | .947 | .385 | 1.298 |
Distributions from net investment income | (.427) | (.455) | (.548) | (.587) | (.589) |
Distributions from net realized gain | (.386) | (.094) | (.050) | - | - |
Total distributions | (.813) | (.549) | (.598) | (.587) | (.589) |
Redemption fees added to paid in capital C | .001 | .001 | .001 | .002 | .001 |
Net asset value, end of period | $ 8.31 | $ 8.76 | $ 8.72 | $ 8.37 | $ 8.57 |
Total ReturnA, B | 4.38% | 6.97% | 11.83% | 4.63% | 17.17% |
Ratios to Average Net Assets D, F |
|
|
|
|
|
Expenses before reductions | 1.05% | 1.05% | 1.06% | 1.07% | 1.11% |
Expenses net of fee waivers, if any | 1.05% | 1.05% | 1.06% | 1.07% | 1.10% |
Expenses net of all reductions | 1.05% | 1.05% | 1.06% | 1.07% | 1.10% |
Net investment income (loss) | 5.07% | 5.38% | 6.32% | 6.79% | 7.78% |
Supplemental Data |
|
|
|
|
|
Net assets, end of period (000 omitted) | $ 86,166 | $ 90,901 | $ 105,518 | $ 92,746 | $ 119,576 |
Portfolio turnover rateE | 79% | 76% | 48% | 75% | 79% |
A Total returns would have been lower if certain expenses had not been reduced during the applicable periods shown.
B Total returns do not include the effect of the sales charges.
C Calculated based on average shares outstanding during the period.
D Fees and expenses of any underlying Fidelity Central Funds are not included in the Fund's expense ratio. The Fund indirectly bears its proportionate share of the expenses of any underlying Fidelity Central Funds.
E Amount does not include the portfolio activity of any underlying Fidelity Central Funds.
F Expense ratios reflect operating expenses of the class. Expenses before reductions do not reflect amounts reimbursed by the investment adviser or reductions from brokerage service arrangements or reductions from other expense offset arrangements and do not represent the amount paid by the class during periods when reimbursements or reductions occur. Expenses net of fee waivers reflect expenses after reimbursement by the investment adviser but prior to reductions from brokerage service arrangements or other expense offset arrangements. Expenses net of all reductions represent the net expenses paid by the class.
See accompanying notes which are an integral part of the financial statements.
Annual Report
Financial Highlights - Class B
Years ended October 31, | 2014 | 2013 | 2012 | 2011 | 2010 |
Selected Per-Share Data |
|
|
|
|
|
Net asset value, beginning of period | $ 8.75 | $ 8.71 | $ 8.36 | $ 8.57 | $ 7.85 |
Income from Investment Operations |
|
|
|
|
|
Net investment income (loss) C | .372 | .408 | .477 | .521 | .579 |
Net realized and unrealized gain (loss) | (.068) | .119 | .412 | (.204) | .676 |
Total from investment operations | .304 | .527 | .889 | .317 | 1.255 |
Distributions from net investment income | (.369) | (.394) | (.490) | (.529) | (.536) |
Distributions from net realized gain | (.386) | (.094) | (.050) | - | - |
Total distributions | (.755) | (.488) | (.540) | (.529) | (.536) |
Redemption fees added to paid in capital C | .001 | .001 | .001 | .002 | .001 |
Net asset value, end of period | $ 8.30 | $ 8.75 | $ 8.71 | $ 8.36 | $ 8.57 |
Total ReturnA, B | 3.67% | 6.24% | 11.08% | 3.81% | 16.58% |
Ratios to Average Net Assets D, F |
|
|
|
|
|
Expenses before reductions | 1.73% | 1.75% | 1.76% | 1.77% | 1.80% |
Expenses net of fee waivers, if any | 1.73% | 1.75% | 1.75% | 1.75% | 1.75% |
Expenses net of all reductions | 1.73% | 1.75% | 1.75% | 1.75% | 1.75% |
Net investment income (loss) | 4.38% | 4.68% | 5.64% | 6.11% | 7.13% |
Supplemental Data |
|
|
|
|
|
Net assets, end of period (000 omitted) | $ 9,218 | $ 13,176 | $ 17,309 | $ 19,647 | $ 29,065 |
Portfolio turnover rateE | 79% | 76% | 48% | 75% | 79% |
A Total returns would have been lower if certain expenses had not been reduced during the applicable periods shown.
B Total returns do not include the effect of the contingent deferred sales charge.
C Calculated based on average shares outstanding during the period.
D Fees and expenses of any underlying Fidelity Central Funds are not included in the Fund's expense ratio. The Fund indirectly bears its proportionate share of the expenses of any underlying Fidelity Central Funds.
E Amount does not include the portfolio activity of any underlying Fidelity Central Funds.
F Expense ratios reflect operating expenses of the class. Expenses before reductions do not reflect amounts reimbursed by the investment adviser or reductions from brokerage service arrangements or reductions from other expense offset arrangements and do not represent the amount paid by the class during periods when reimbursements or reductions occur. Expenses net of fee waivers reflect expenses after reimbursement by the investment adviser but prior to reductions from brokerage service arrangements or other expense offset arrangements. Expenses net of all reductions represent the net expenses paid by the class.
See accompanying notes which are an integral part of the financial statements.
Annual Report
Financial Highlights - Class C
Years ended October 31, | 2014 | 2013 | 2012 | 2011 | 2010 |
Selected Per-Share Data |
|
|
|
|
|
Net asset value, beginning of period | $ 8.75 | $ 8.71 | $ 8.36 | $ 8.57 | $ 7.85 |
Income from Investment Operations |
|
|
|
|
|
Net investment income (loss) C | .365 | .405 | .474 | .516 | .575 |
Net realized and unrealized gain (loss) | (.066) | .119 | .412 | (.202) | .675 |
Total from investment operations | .299 | .524 | .886 | .314 | 1.250 |
Distributions from net investment income | (.364) | (.391) | (.487) | (.526) | (.531) |
Distributions from net realized gain | (.386) | (.094) | (.050) | - | - |
Total distributions | (.750) | (.485) | (.537) | (.526) | (.531) |
Redemption fees added to paid in capital C | .001 | .001 | .001 | .002 | .001 |
Net asset value, end of period | $ 8.30 | $ 8.75 | $ 8.71 | $ 8.36 | $ 8.57 |
Total ReturnA, B | 3.60% | 6.20% | 11.03% | 3.77% | 16.51% |
Ratios to Average Net Assets D, F |
|
|
|
|
|
Expenses before reductions | 1.80% | 1.79% | 1.79% | 1.79% | 1.81% |
Expenses net of fee waivers, if any | 1.80% | 1.79% | 1.79% | 1.79% | 1.81% |
Expenses net of all reductions | 1.80% | 1.79% | 1.79% | 1.79% | 1.81% |
Net investment income (loss) | 4.32% | 4.64% | 5.60% | 6.08% | 7.07% |
Supplemental Data |
|
|
|
|
|
Net assets, end of period (000 omitted) | $ 114,455 | $ 126,952 | $ 149,591 | $ 120,710 | $ 121,796 |
Portfolio turnover rateE | 79% | 76% | 48% | 75% | 79% |
A Total returns would have been lower if certain expenses had not been reduced during the applicable periods shown.
B Total returns do not include the effect of the contingent deferred sales charge.
C Calculated based on average shares outstanding during the period.
D Fees and expenses of any underlying Fidelity Central Funds are not included in the Fund's expense ratio. The Fund indirectly bears its proportionate share of the expenses of any underlying Fidelity Central Funds.
E Amount does not include the portfolio activity of any underlying Fidelity Central Funds.
F Expense ratios reflect operating expenses of the class. Expenses before reductions do not reflect amounts reimbursed by the investment adviser or reductions from brokerage service arrangements or reductions from other expense offset arrangements and do not represent the amount paid by the class during periods when reimbursements or reductions occur. Expenses net of fee waivers reflect expenses after reimbursement by the investment adviser but prior to reductions from brokerage service arrangements or other expense offset arrangements. Expenses net of all reductions represent the net expenses paid by the class.
See accompanying notes which are an integral part of the financial statements.
Annual Report
Financial Highlights - Institutional Class
Years ended October 31, | 2014 | 2013 | 2012 | 2011 | 2010 |
Selected Per-Share Data |
|
|
|
|
|
Net asset value, beginning of period | $ 8.79 | $ 8.75 | $ 8.40 | $ 8.60 | $ 7.88 |
Income from Investment Operations |
|
|
|
|
|
Net investment income (loss) B | .447 | .489 | .556 | .598 | .655 |
Net realized and unrealized gain (loss) | (.068) | .116 | .409 | (.195) | .673 |
Total from investment operations | .379 | .605 | .965 | .403 | 1.328 |
Distributions from net investment income | (.444) | (.472) | (.566) | (.605) | (.609) |
Distributions from net realized gain | (.386) | (.094) | (.050) | - | - |
Total distributions | (.830) | (.566) | (.616) | (.605) | (.609) |
Redemption fees added to paid in capital B | .001 | .001 | .001 | .002 | .001 |
Net asset value, end of period | $ 8.34 | $ 8.79 | $ 8.75 | $ 8.40 | $ 8.60 |
Total ReturnA | 4.57% | 7.16% | 12.02% | 4.85% | 17.55% |
Ratios to Average Net Assets C, E |
|
|
|
|
|
Expenses before reductions | .87% | .87% | .88% | .88% | .89% |
Expenses net of fee waivers, if any | .85% | .85% | .85% | .85% | .85% |
Expenses net of all reductions | .85% | .85% | .85% | .85% | .85% |
Net investment income (loss) | 5.27% | 5.58% | 6.54% | 7.01% | 8.03% |
Supplemental Data |
|
|
|
|
|
Net assets, end of period (000 omitted) | $ 337,377 | $ 358,238 | $ 423,792 | $ 311,790 | $ 329,601 |
Portfolio turnover rateD | 79% | 76% | 48% | 75% | 79% |
A Total returns would have been lower if certain expenses had not been reduced during the applicable periods shown.
B Calculated based on average shares outstanding during the period.
C Fees and expenses of any underlying Fidelity Central Funds are not included in the Fund's expense ratio. The Fund indirectly bears its proportionate share of the expenses of any underlying Fidelity Central Funds.
D Amount does not include the portfolio activity of any underlying Fidelity Central Funds.
E Expense ratios reflect operating expenses of the class. Expenses before reductions do not reflect amounts reimbursed by the investment adviser or reductions from brokerage service arrangements or reductions from other expense offset arrangements and do not represent the amount paid by the class during periods when reimbursements or reductions occur. Expenses net of fee waivers reflect expenses after reimbursement by the investment adviser but prior to reductions from brokerage service arrangements or other expense offset arrangements. Expenses net of all reductions represent the net expenses paid by the class.
See accompanying notes which are an integral part of the financial statements.
Annual Report
Notes to Financial Statements
For the period ended October 31, 2014
1. Organization.
Fidelity Advisor High Income Fund (the Fund) is a fund of Fidelity Advisor Series I (the Trust) and is authorized to issue an unlimited number of shares. The Trust is registered under the Investment Company Act of 1940, as amended (the 1940 Act), as an open-end management investment company organized as a Massachusetts business trust. The Fund offers Class A, Class T, Class C and Institutional Class shares, each of which, along with Class B shares, has equal rights as to assets and voting privileges. Class B shares are closed to new accounts and additional purchases, except for exchanges and reinvestments. Each class has exclusive voting rights with respect to matters that affect that class. Class B shares will automatically convert to Class A shares after a holding period of seven years from the initial date of purchase.
2. Investments in Fidelity Central Funds.
The Fund invests in Fidelity Central Funds, which are open-end investment companies generally available only to other investment companies and accounts managed by the investment adviser and its affiliates. The Fund's Schedule of Investments lists each of the Fidelity Central Funds held as of period end, if any, as an investment of the Fund, but does not include the underlying holdings of each Fidelity Central Fund. As an Investing Fund, the Fund indirectly bears its proportionate share of the expenses of the underlying Fidelity Central Funds.
The Money Market Central Funds seek preservation of capital and current income and are managed by Fidelity Investments Money Management, Inc. (FIMM), an affiliate of the investment adviser. Annualized expenses of the Money Market Central Funds as of their most recent shareholder report date are less than .01%.
A complete unaudited list of holdings for each Fidelity Central Fund is available upon request or at the Securities and Exchange Commission (the SEC) website at www.sec.gov. In addition, the financial statements of the Fidelity Central Funds, which are not covered by the Fund's Report of Independent Registered Public Accounting Firm, are available on the SEC website or upon request.
3. Significant Accounting Policies.
The financial statements have been prepared in conformity with accounting principles generally accepted in the United States of America (GAAP), which require management to make certain estimates and assumptions at the date of the financial statements. Actual results could differ from those estimates. Subsequent events, if any, through the date that the financial statements were issued have been evaluated in the preparation of
Annual Report
3. Significant Accounting Policies - continued
the financial statements. The following summarizes the significant accounting policies of the Fund:
Investment Valuation. Investments are valued as of 4:00 p.m. Eastern time on the last calendar day of the period. In accordance with valuation policies and procedures approved by the Board of Trustees (the Board), the Fund attempts to obtain prices from one or more third party pricing vendors or brokers to value its investments. When current market prices, quotations or currency exchange rates are not readily available or reliable, investments will be fair valued in good faith by the Fidelity Management & Research Company (FMR) Fair Value Committee (the Committee), in accordance with procedures adopted by the Board. Factors used in determining fair value vary by investment type and may include market or investment specific events, changes in interest rates and credit quality. The frequency with which these procedures are used cannot be predicted and they may be utilized to a significant extent. The Committee oversees the Fund's valuation policies and procedures and is responsible for approving and reporting to the Board all fair value determinations.
The Fund categorizes the inputs to valuation techniques used to value its investments into a disclosure hierarchy consisting of three levels as shown below:
Level 1 - quoted prices in active markets for identical investments
Level 2 - other significant observable inputs (including quoted prices for similar investments, interest rates, prepayment speeds, etc.)
Level 3 - unobservable inputs (including the Fund's own assumptions based on the best information available)
Valuation techniques used to value the Fund's investments by major category are as follows:
Debt securities, including restricted securities, are valued based on evaluated prices received from third party pricing vendors or from brokers who make markets in such securities. Corporate bonds, bank loan obligations and preferred securities, are valued by pricing vendors who utilize matrix pricing which considers yield or price of bonds of comparable quality, coupon, maturity and type or by broker-supplied prices. When independent prices are unavailable or unreliable, debt securities may be valued utilizing pricing methodologies which consider similar factors that would be used by third party pricing vendors. Debt securities are generally categorized as Level 2 in the hierarchy but may be Level 3 depending on the circumstances. The Fund invests a significant portion of its assets in below investment grade securities. The value of these securities can be more volatile due to changes in the credit quality of the issuer and is sensitive to changes in economic, market and regulatory conditions.
Annual Report
Notes to Financial Statements - continued
3. Significant Accounting Policies - continued
Investment Valuation - continued
Equity securities, including restricted securities, for which market quotations are readily available, are valued at the last reported sale price or official closing price as reported by a third party pricing vendor on the primary market or exchange on which they are traded and are categorized as Level 1 in the hierarchy. In the event there were no sales during the day or closing prices are not available, securities are valued at the last quoted bid price or may be valued using the last available price and are generally categorized as Level 2 in the hierarchy. For equity securities, including restricted securities, where observable inputs are limited, assumptions about market activity and risk are used and these securities may be categorized as Level 3 in the hierarchy.
Investments in open-end mutual funds, including the Fidelity Central Funds, are valued at their closing net asset value (NAV) each business day and are categorized as Level 1 in the hierarchy.
Changes in valuation techniques may result in transfers in or out of an assigned level within the disclosure hierarchy. The aggregate value of investments by input level, as of October 31, 2014, is included at the end of the Fund's Schedule of Investments.
Investment Transactions and Income. For financial reporting purposes, the Fund's investment holdings and NAV include trades executed through the end of the last business day of the period. The NAV per share for processing shareholder transactions is calculated as of the close of business of the New York Stock Exchange (NYSE), normally 4:00 p.m. Eastern time and includes trades executed through the end of the prior business day. Gains and losses on securities sold are determined on the basis of identified cost and may include proceeds received from litigation. Dividend income is recorded on the ex-dividend date. Non-cash dividends included in dividend income, if any, are recorded at the fair market value of the securities received. Income and capital gain distributions from Fidelity Central Funds, if any, are recorded on the ex-dividend date. Interest income is accrued as earned and includes coupon interest and amortization of premium and accretion of discount on debt securities as applicable.
Class Allocations and Expenses. Investment income, realized and unrealized capital gains and losses, common expenses of the Fund, and certain fund-level expense reductions, if any, are allocated daily on a pro-rata basis to each class based on the relative net assets of each class to the total net assets of the Fund. Each class differs with respect to transfer agent and distribution and service plan fees incurred. Certain expense reductions may also differ by class. For the reporting period, the allocated portion of income and expenses to each class as a percent of its average net assets may vary due to the timing of recording these transactions in relation to fluctuating net assets of the classes. Expenses directly attributable to a fund are charged to that fund. Expenses attributable
Annual Report
3. Significant Accounting Policies - continued
Class Allocations and Expenses - continued
to more than one fund are allocated among the respective funds on the basis of relative net assets or other appropriate methods. Expense estimates are accrued in the period to which they relate and adjustments are made when actual amounts are known.
Income Tax Information and Distributions to Shareholders. Each year, the Fund intends to qualify as a regulated investment company under Subchapter M of the Internal Revenue Code, including distributing substantially all of its taxable income and realized gains. As a result, no provision for U.S. Federal income taxes is required. As of October 31, 2014, the Fund did not have any unrecognized tax benefits in the financial statements; nor is the Fund aware of any tax positions for which it is reasonably possible that the total amounts of unrecognized tax benefits will significantly change in the next twelve months. The Fund files a U.S. federal tax return, in addition to state and local tax returns as required. The Fund's federal income tax returns are subject to examination by the Internal Revenue Service (IRS) for a period of three fiscal years after they are filed. State and local tax returns may be subject to examination for an additional fiscal year depending on the jurisdiction.
Dividends are declared and recorded daily and paid monthly from net investment income. Distributions from realized gains, if any, are declared and recorded on the ex-dividend date. Income dividends and capital gain distributions are declared separately for each class. Income and capital gain distributions are determined in accordance with income tax regulations, which may differ from GAAP. In addition, the Fund claimed a portion of the payment made to redeeming shareholders as a distribution for income tax purposes.
Capital accounts within the financial statements are adjusted for permanent book-tax differences. These adjustments have no impact on net assets or the results of operations. Capital accounts are not adjusted for temporary book-tax differences which will reverse in a subsequent period.
Book-tax differences are primarily due to market discount and losses deferred due to wash sales.
The federal tax cost of investment securities and unrealized appreciation (depreciation) as of period end were as follows:
Gross unrealized appreciation | $ 19,254,168 |
Gross unrealized depreciation | (13,836,916) |
Net unrealized appreciation (depreciation) on securities | $ 5,417,252 |
|
|
Tax Cost | $ 771,774,269 |
Annual Report
Notes to Financial Statements - continued
3. Significant Accounting Policies - continued
Income Tax Information and Distributions to Shareholders - continued
The tax-based components of distributable earnings as of period end were as follows:
Undistributed ordinary income | $ 2,586,366 |
Undistributed long-term capital gain | $ 16,296,789 |
Net unrealized appreciation (depreciation) on securities and other investments | $ 5,417,252 |
The tax character of distributions paid was as follows:
| October 31, 2014 | October 31, 2013 |
Ordinary Income | $ 53,054,539 | $ 55,634,327 |
Long-term Capital Gains | 27,066,800 | 3,987,813 |
Total | $ 80,121,339 | $ 59,622,140 |
Short-Term Trading (Redemption) Fees. Shares held by investors in the Fund less than 90 days may have been subject to a redemption fee equal to 1.00% of the NAV of shares redeemed. All redemption fees, which reduce the proceeds of the shareholder redemption, are retained by the Fund and accounted for as an addition to paid in capital.
Delayed Delivery Transactions and When-Issued Securities. During the period, the Fund transacted in securities on a delayed delivery or when-issued basis. Payment and delivery may take place after the customary settlement period for that security. The price of the underlying securities and the date when the securities will be delivered and paid for are fixed at the time the transaction is negotiated. The securities purchased on a delayed delivery or when-issued basis are identified as such in the Fund's Schedule of Investments. The Fund may receive compensation for interest forgone in the purchase of a delayed delivery or when-issued security. With respect to purchase commitments, the Fund identifies securities as segregated in its records with a value at least equal to the amount of the commitment. Losses may arise due to changes in the value of the underlying securities or if the counterparty does not perform under the contract's terms, or if the issuer does not issue the securities due to political, economic, or other factors.
Restricted Securities. The Fund may invest in securities that are subject to legal or contractual restrictions on resale. These securities generally may be resold in transactions exempt from registration or to the public if the securities are registered. Disposal of these securities may involve time-consuming negotiations and expense, and prompt sale at an acceptable price may be difficult. Information regarding restricted securities is included at the end of the Fund's Schedule of Investments.
Annual Report
3. Significant Accounting Policies - continued
Loans and Other Direct Debt Instruments. The Fund invests in direct debt instruments which are interests in amounts owed to lenders by corporate or other borrowers. These instruments may be in the form of loans, trade claims or other receivables and may include standby financing commitments such as revolving credit facilities that obligate the Fund to supply additional cash to the borrower on demand. Loans may be acquired through assignment or participation. The Fund did not have any unfunded loan commitments, which are contractual obligations for future funding, at period end.
New Accounting Pronouncement. In June 2014, the Financial Accounting Standards Board issued Accounting Standard Update No. 2014-11, Repurchase-to-Maturity Transactions, Repurchase Financings, and Disclosures. The Update amends the accounting for certain repurchase agreements and expands disclosure requirements for reverse repurchase agreements, securities lending and other similar transactions. The disclosure requirements are effective for annual and interim reporting periods beginning after December 15, 2014. Management is currently evaluating the impact of the Update on the Fund's financial statements and related disclosures.
4. Purchases and Sales of Investments.
Purchases and sales of securities, other than short-term securities, aggregated $644,938,917 and $702,040,669, respectively.
5. Fees and Other Transactions with Affiliates.
Management Fee. Fidelity Management & Research Company (the investment adviser) and its affiliates provide the Fund with investment management related services for which the Fund pays a monthly management fee. The management fee is the sum of an individual fund fee rate that is based on an annual rate of .45% of the Fund's average net assets and an annualized group fee rate that averaged .11% during the period. The group fee rate is based upon the average net assets of all the mutual funds advised by the investment adviser, including any mutual funds previously advised by the investment adviser that are currently advised by Fidelity SelectCo, LLC, an affiliate of the investment adviser. The group fee rate decreases as assets under management increase and increases as assets under management decrease. For the reporting period, the total annual management fee rate was .56% of the Fund's average net assets.
Distribution and Service Plan Fees. In accordance with Rule 12b-1 of the 1940 Act, the Fund has adopted separate Distribution and Service Plans for each class of shares. Certain classes pay Fidelity Distributors Corporation (FDC), an affiliate of the investment adviser, separate Distribution and Service Fees, each of which is based on an
Annual Report
Notes to Financial Statements - continued
5. Fees and Other Transactions with Affiliates - continued
Distribution and Service Plan Fees - cotinued
annual percentage of each class' average net assets. In addition, FDC may pay financial intermediaries for selling shares of the Fund and providing shareholder support services. For the period, the Distribution and Service Fee rates, total fees and amounts retained by FDC were as follows:
| Distribution | Service | Total Fees | Retained |
Class A | -% | .25% | $ 664,142 | $ 13,341 |
Class T | -% | .25% | 224,290 | 112,672 |
Class B | .65% | .25% | 101,173 | 73,191 |
Class C | .75% | .25% | 1,222,580 | 119,939 |
|
|
| $ 2,212,185 | $ 319,143 |
Sales Load. FDC may receive a front-end sales charge of up to 4.00% for selling Class A shares and Class T shares, some of which is paid to financial intermediaries for selling shares of the Fund. Depending on the holding period, FDC may receive contingent deferred sales charges levied on Class A, Class T, Class B and Class C redemptions. The deferred sales charges range from 5.00% to 1.00% for Class B shares, 1.00% for Class C shares, 1.00% for certain purchases of Class A shares and .25% for certain purchases of Class T shares.
For the period, sales charge amounts retained by FDC were as follows:
| Retained |
Class A | $ 27,830 |
Class T | 4,337 |
Class B* | 16,274 |
Class C* | 7,528 |
| $ 55,969 |
* When Class B and Class C shares are initially sold, FDC pays commissions from its own resources to financial intermediaries through which the sales are made.
Transfer Agent Fees. Fidelity Investments Institutional Operations Company, Inc., (FIIOC), an affiliate of the investment adviser, is the transfer, dividend disbursing and shareholder servicing agent for each class of the Fund. FIIOC receives account fees and asset-based fees that vary according to the account size and type of account of the shareholders of the respective classes of the Fund. FIIOC pays for typesetting, printing and mailing of shareholder reports, except proxy statements.
Annual Report
5. Fees and Other Transactions with Affiliates - continued
Transfer Agent Fees - cotinued
For the period, transfer agent fees for each class were as follows:
| Amount | % of |
Class A | $ 422,299 | .16 |
Class T | 159,574 | .18 |
Class B | 23,872 | .21 |
Class C | 213,843 | .17 |
Institutional Class | 901,151 | .25 |
| $ 1,720,739 |
|
Accounting Fees. Fidelity Service Company, Inc. (FSC), an affiliate of the investment adviser, maintains the Fund's accounting records. The fee is based on the level of average net assets for each month.
6. Committed Line of Credit.
The Fund participates with other funds managed by the investment adviser or an affiliate in a $4.25 billion credit facility (the "line of credit") to be utilized for temporary or emergency purposes to fund shareholder redemptions or for other short-term liquidity purposes. The Fund has agreed to pay commitment fees on its pro-rata portion of the line of credit, which amounted to $1,380 and is reflected in Miscellaneous expenses on the Statement of Operations. During the period, the Fund did not borrow on this line of credit.
7. Expense Reductions.
The investment adviser voluntarily agreed to reimburse each class to the extent annual operating expenses exceeded certain levels of average net assets as noted in the table below. Some expenses, for example interest expense, including commitment fees, are excluded from this reimbursement.
The following classes were in reimbursement during the period:
| Expense | Reimbursement |
Institutional Class | .85% | $ 83,810 |
The investment adviser reimbursed a portion of the Fund's operating expenses during the period in the amount of $117.
Annual Report
Notes to Financial Statements - continued
7. Expense Reductions - continued
In addition, through arrangements with the Fund's custodian, credits realized as a result of uninvested cash balances were used to reduce the Fund's expenses. During the period, these credits reduced the Fund's custody expenses by $814.
8. Distributions to Shareholders.
Distributions to shareholders of each class were as follows:
Years ended October 31, | 2014 | 2013 |
From net investment income |
|
|
Class A | $ 13,436,571 | $ 16,314,142 |
Class T | 4,518,143 | 5,161,023 |
Class B | 492,596 | 691,999 |
Class C | 5,263,076 | 6,288,608 |
Institutional Class | 18,693,318 | 20,456,243 |
Total | $ 42,403,704 | $ 48,912,015 |
From net realized gain |
|
|
Class A | $ 11,887,120 | $ 3,483,705 |
Class T | 3,964,314 | 1,140,878 |
Class B | 562,903 | 184,860 |
Class C | 5,549,285 | 1,602,754 |
Institutional Class | 15,754,013 | 4,297,928 |
Total | $ 37,717,635 | $ 10,710,125 |
9. Share Transactions.
Share transactions for each class were as follows and may contain automatic conversions between classes or exchanges between funds:
| Shares | Shares | Dollars | Dollars |
Years ended October 31, | 2014 | 2013 | 2014 | 2013 |
Class A |
|
|
|
|
Shares sold | 6,439,376 | 7,091,246 | $ 54,608,224 | $ 62,129,968 |
Reinvestment of distributions | 2,519,401 | 1,758,588 | 21,214,725 | 15,357,657 |
Shares redeemed | (11,665,459) | (14,804,694) | (99,063,161) | (129,032,339) |
Net increase (decrease) | (2,706,682) | (5,954,860) | $ (23,240,212) | $ (51,544,714) |
Class T |
|
|
|
|
Shares sold | 1,257,168 | 1,497,548 | $ 10,623,921 | $ 13,070,279 |
Reinvestment of distributions | 870,505 | 583,493 | 7,314,998 | 5,087,202 |
Shares redeemed | (2,141,591) | (3,805,963) | (18,094,730) | (33,189,003) |
Net increase (decrease) | (13,918) | (1,724,922) | $ (155,811) | $ (15,031,522) |
Annual Report
9. Share Transactions - continued
| Shares | Shares | Dollars | Dollars |
Years ended October 31, | 2014 | 2013 | 2014 | 2013 |
Class B |
|
|
|
|
Shares sold | 85,249 | 88,671 | $ 721,402 | $ 772,890 |
Reinvestment of distributions | 100,036 | 75,832 | 839,626 | 660,444 |
Shares redeemed | (581,043) | (645,956) | (4,909,278) | (5,631,561) |
Net increase (decrease) | (395,758) | (481,453) | $ (3,348,250) | $ (4,198,227) |
Class C |
|
|
|
|
Shares sold | 1,902,007 | 2,788,587 | $ 16,071,421 | $ 24,348,512 |
Reinvestment of distributions | 1,062,043 | 705,870 | 8,914,818 | 6,148,005 |
Shares redeemed | (3,689,833) | (6,159,803) | (31,110,164) | (53,679,905) |
Net increase (decrease) | (725,783) | (2,665,346) | $ (6,123,925) | $ (23,183,388) |
Institutional Class |
|
|
|
|
Shares sold | 10,381,048 | 7,283,471 | $ 88,482,449 | $ 63,781,595 |
Reinvestment of distributions | 3,501,857 | 2,604,592 | 29,550,581 | 22,781,805 |
Shares redeemed | (14,208,713) | (17,581,432) | (120,994,714) | (153,543,619) |
Net increase (decrease) | (325,808) | (7,693,369) | $ (2,961,684) | $ (66,980,219) |
10. Other.
The Fund's organizational documents provide former and current trustees and officers with a limited indemnification against liabilities arising in connection with the performance of their duties to the Fund. In the normal course of business, the Fund may also enter into contracts that provide general indemnifications. The Fund's maximum exposure under these arrangements is unknown as this would be dependent on future claims that may be made against the Fund. The risk of material loss from such claims is considered remote.
Annual Report
Report of Independent Registered Public Accounting Firm
To the Trustees of Fidelity Advisor Series I and Shareholders of Fidelity Advisor High Income Fund:
We have audited the accompanying statement of assets and liabilities of Fidelity Advisor High Income Fund (the Fund), a fund of Fidelity Advisor Series I, including the schedule of investments, as of October 31, 2014, and the related statement of operations for the year then ended, the statement of changes in net assets for each of the two years in the period then ended, and the financial highlights for each of the five years in the period then ended. These financial statements and financial highlights are the responsibility of the Fund's management. Our responsibility is to express an opinion on these financial statements and financial highlights based on our audits.
We conducted our audits in accordance with the standards of the Public Company Accounting Oversight Board (United States). Those standards require that we plan and perform the audit to obtain reasonable assurance about whether the financial statements and financial highlights are free of material misstatement. The Fund is not required to have, nor were we engaged to perform, an audit of its internal control over financial reporting. Our audits included consideration of internal control over financial reporting as a basis for designing audit procedures that are appropriate in the circumstances, but not for the purpose of expressing an opinion on the effectiveness of the Fund's internal control over financial reporting. Accordingly, we express no such opinion. An audit also includes examining, on a test basis, evidence supporting the amounts and disclosures in the financial statements, assessing the accounting principles used and significant estimates made by management, as well as evaluating the overall financial statement presentation. Our procedures included confirmation of securities owned as of October 31, 2014, by correspondence with the custodians, agent banks and brokers; where replies were not received from brokers, we performed other auditing procedures. We believe that our audits provide a reasonable basis for our opinion.
In our opinion, the financial statements and financial highlights referred to above present fairly, in all material respects, the financial position of Fidelity Advisor High Income Fund as of October 31, 2014, the results of its operations for the year then ended, the changes in its net assets for each of the two years in the period then ended, and the financial highlights for each of the five years in the period then ended, in conformity with accounting principles generally accepted in the United States of America.
DELOITTE & TOUCHE LLP
Boston, Massachusetts
December 19, 2014
Annual Report
Trustees and Officers
The Trustees, Member of the Advisory Board, and officers of the trust and fund, as applicable, are listed below. The Board of Trustees governs the fund and is responsible for protecting the interests of shareholders. The Trustees are experienced executives who meet periodically throughout the year to oversee the fund's activities, review contractual arrangements with companies that provide services to the fund, oversee management of the risks associated with such activities and contractual arrangements, and review the fund's performance. Except for James C. Curvey, each of the Trustees oversees 174 funds. Mr. Curvey oversees 407 funds.
The Trustees hold office without limit in time except that (a) any Trustee may resign; (b) any Trustee may be removed by written instrument, signed by at least two-thirds of the number of Trustees prior to such removal; (c) any Trustee who requests to be retired or who has become incapacitated by illness or injury may be retired by written instrument signed by a majority of the other Trustees; and (d) any Trustee may be removed at any special meeting of shareholders by a two-thirds vote of the outstanding voting securities of the trust. Each Trustee who is not an interested person (as defined in the 1940 Act) of the trust and the fund (Independent Trustee), shall retire not later than the last day of the calendar year in which his or her 75th birthday occurs. The Independent Trustees may waive this mandatory retirement age policy with respect to individual Trustees. The officers and Advisory Board Member hold office without limit in time, except that any officer and Advisory Board Member may resign or may be removed by a vote of a majority of the Trustees at any regular meeting or any special meeting of the Trustees. Except as indicated, each individual has held the office shown or other offices in the same company for the past five years.
Experience, Skills, Attributes, and Qualifications of the Fund's Trustees. The Governance and Nominating Committee has adopted a statement of policy that describes the experience, qualifications, attributes, and skills that are necessary and desirable for potential Independent Trustee candidates (Statement of Policy). The Board believes that each Trustee satisfied at the time he or she was initially elected or appointed a Trustee, and continues to satisfy, the standards contemplated by the Statement of Policy. The Governance and Nominating Committee also engages professional search firms to help identify potential Independent Trustee candidates who have the experience, qualifications, attributes, and skills consistent with the Statement of Policy. From time to time, additional criteria based on the composition and skills of the current Independent Trustees, as well as experience or skills that may be appropriate in light of future changes to board composition, business conditions, and regulatory or other developments, have also been considered by the professional search firms and the Governance and Nominating Committee. In addition, the Board takes into account the Trustees' commitment and participation in Board and committee meetings, as well as their leadership of standing and ad hoc committees throughout their tenure.
In determining that a particular Trustee was and continues to be qualified to serve as a Trustee, the Board has considered a variety of criteria, none of which, in isolation, was controlling. The Board believes that, collectively, the Trustees have balanced and diverse experience, qualifications, attributes, and skills, which allow the Board to operate effectively in governing the fund and protecting the interests of shareholders. Information about the specific experience, skills, attributes, and qualifications of each Trustee, which in each case led to the Board's conclusion that the Trustee should serve (or continue to serve) as a trustee of the fund, is provided below.
Annual Report
Board Structure and Oversight Function. James C. Curvey is an interested person (as defined in the 1940 Act) and currently serves as Chairman. The Trustees have determined that an interested Chairman is appropriate and benefits shareholders because an interested Chairman has a personal and professional stake in the quality and continuity of services provided to the fund. Independent Trustees exercise their informed business judgment to appoint an individual of their choosing to serve as Chairman, regardless of whether the Trustee happens to be independent or a member of management. The Independent Trustees have determined that they can act independently and effectively without having an Independent Trustee serve as Chairman and that a key structural component for assuring that they are in a position to do so is for the Independent Trustees to constitute a substantial majority for the Board. The Independent Trustees also regularly meet in executive session. Ned C. Lautenbach serves as Chairman of the Independent Trustees and as such (i) acts as a liaison between the Independent Trustees and management with respect to matters important to the Independent Trustees and (ii) with management prepares agendas for Board meetings.
Fidelity funds are overseen by different Boards of Trustees. The fund's Board oversees Fidelity's equity and high income funds and another Board oversees Fidelity's investment-grade bond, money market, and asset allocation funds. The asset allocation funds may invest in Fidelity funds overseen by the fund's Board. The use of separate Boards, each with its own committee structure, allows the Trustees of each group of Fidelity funds to focus on the unique issues of the funds they oversee, including common research, investment, and operational issues. On occasion, the separate Boards establish joint committees to address issues of overlapping consequences for the Fidelity funds overseen by each Board.
The Trustees operate using a system of committees to facilitate the timely and efficient consideration of all matters of importance to the Trustees, the fund, and fund shareholders and to facilitate compliance with legal and regulatory requirements and oversight of the fund's activities and associated risks. The Board, acting through its committees, has charged FMR and its affiliates with (i) identifying events or circumstances the occurrence of which could have demonstrably adverse effects on the fund's business and/or reputation; (ii) implementing processes and controls to lessen the possibility that such events or circumstances occur or to mitigate the effects of such events or circumstances if they do occur; and (iii) creating and maintaining a system designed to evaluate continuously business and market conditions in order to facilitate the identification and implementation processes described in (i) and (ii) above. Because the day-to-day operations and activities of the fund are carried out by or through FMR, its affiliates and other service providers, the fund's exposure to risks is mitigated but not eliminated by the processes overseen by the Trustees. While each of the Board's committees has responsibility for overseeing different aspects of the fund's activities, oversight is exercised primarily through the Operations, Audit, and Compliance Committees. In addition, the Independent Trustees have worked with FMR to enhance the Board's oversight of investment and financial risks, legal and regulatory risks, technology risks, and operational risks, including the development of additional risk reporting to the Board. For example, a working group comprised of Independent Trustees and FMR has worked and continues to work to review the Fidelity funds' valuation-related activities, reporting and risk management. Appropriate personnel, including but not limited to the fund's Chief Compliance Officer (CCO), FMR's internal auditor, the independent accountants, the fund's Treasurer and portfolio management personnel, make periodic reports to the Board's committees, as appropriate, including an annual review of FMR's risk management program for the Fidelity funds. The responsibilities of each standing committee, including their oversight responsibilities, are described further under "Standing Committees of the Fund's Trustees."
Annual Report
Trustees and Officers - continued
The fund's Statement of Additional Information (SAI) includes more information about the Trustees. To request a free copy, call Fidelity at 1-877-208-0098.
Interested Trustees*:
Correspondence intended for each Trustee who is an interested person may be sent to Fidelity Investments, 245 Summer Street, Boston, Massachusetts 02210.
Name, Year of Birth; Principal Occupations and Other Relevant Experience+ | |
James C. Curvey (1935) | |
Year of Election or Appointment: 2007 Trustee Chairman of the Board of Trustees | |
| Mr. Curvey also serves as Trustee of other Fidelity funds. Mr. Curvey is a Director of Fidelity Research & Analysis Co. (2009-present), and Vice Chairman (2007-present) and Director of FMR LLC. In addition, Mr. Curvey serves as an Overseer for the Boston Symphony Orchestra and a member of the board of Artis-Naples, Naples, Florida, and as a Trustee for Brewster Academy, Wolfeboro, New Hampshire. Previously, Mr. Curvey served as a Director of Fidelity Investments Money Management, Inc. (2009-2014), a Director of FMR (2007-2014), and a Director of FMR Co., Inc. (2007-2014). |
Charles S. Morrison (1960) | |
Year of Election or Appointment: 2014 Trustee | |
| Mr. Morrison also serves as Trustee of other funds. He serves as a Director of Fidelity Investments Money Management, Inc. (FIMM) (2014-present), Director of Fidelity SelectCo, LLC (2014-present), President, Asset Management (2014-present), and is an employee of Fidelity Investments. Previously, Mr. Morrison served as Vice President of Fidelity's Fixed Income and Asset Allocation Funds (2012-2014), President, Fixed Income (2011-2014), Vice President of Fidelity's Money Market Funds (2005-2009), President, Money Market Group Leader of FMR (2009), and Senior Vice President, Money Market Group of FMR (2004-2009). Mr. Morrison also served as Vice President of Fidelity's Bond Funds (2002-2005), certain Balanced Funds (2002-2005), and certain Asset Allocation Funds (2002-2007), and as Senior Vice President (2002-2005) of Fidelity's Bond Division. |
* Trustees have been determined to be "Interested Trustees" by virtue of, among other things, their affiliation with the trust or various entities under common control with FMR.
+ The information above includes each Trustee's principal occupation during the last five years and other information relating to the experience, attributes, and skills relevant to each Trustee's qualifications to serve as a Trustee, which led to the conclusion that each Trustee should serve as a Trustee for the fund.
Annual Report
Trustees and Officers - continued
Independent Trustees:
Correspondence intended for each Independent Trustee (that is, the Trustees other than the Interested Trustees) may be sent to Fidelity Investments, P.O. Box 55235, Boston, Massachusetts 02205-5235.
Name, Year of Birth; Principal Occupations and Other Relevant Experience+ | |
Dennis J. Dirks (1948) | |
Year of Election or Appointment: 2005 Trustee | |
| Mr. Dirks also serves as Trustee of other Fidelity funds. Prior to his retirement in May 2003, Mr. Dirks was Chief Operating Officer and a member of the Board of The Depository Trust & Clearing Corporation (DTCC). He also served as President, Chief Operating Officer, and Board member of The Depository Trust Company (DTC) and President and Board member of the National Securities Clearing Corporation (NSCC). In addition, Mr. Dirks served as Chief Executive Officer and Board member of the Government Securities Clearing Corporation, Chief Executive Officer and Board member of the Mortgage-Backed Securities Clearing Corporation, as a Trustee and a member of the Finance Committee of Manhattan College (2005-2008), and as a Trustee and a member of the Finance Committee of AHRC of Nassau County (2006-2008). Mr. Dirks is a member of the Independent Directors Council (IDC) Governing Council (2010-present) and Board of Directors for The Brookville Center for Children's Services, Inc. (2009-present). |
Alan J. Lacy (1953) | |
Year of Election or Appointment: 2008 Trustee | |
| Mr. Lacy also serves as Trustee of other Fidelity funds. Mr. Lacy serves as Senior Adviser (2007-present) of Oak Hill Capital Partners, L.P. (private equity). Mr. Lacy also served as Chief Executive Officer (2000-2005) and Vice Chairman (2005-2006) of Sears Holdings Corporation and Sears, Roebuck and Co. (retail). In addition, Mr. Lacy serves as a member of the Board of Directors of Dave & Buster's Entertainment, Inc. (restaurant and entertainment complexes, 2010-present), Earth Fare, Inc. (retail grocery, 2012-present), The Hillman Companies, Inc. (hardware wholesalers, 2010-present), and Bristol-Myers Squibb Company (global pharmaceuticals, 2008-present). Mr. Lacy is a member of the Board of Trustees of The National Parks Conservation Association (2006-present). Previously, Mr. Lacy served as Chairman of the Board of Trustees of the National Parks Conservation Association (2008-2011) and as a member of the Board of Directors for the Western Union Company (global money transfer, 2006-2011). |
Ned C. Lautenbach (1944) | |
Year of Election or Appointment: 2000 Trustee Chairman of the Independent Trustees | |
| Mr. Lautenbach also serves as Trustee of other Fidelity funds. Mr. Lautenbach currently serves as the Lead Director of the Eaton Corporation Board of Directors (diversified industrial, 1997-present). Mr. Lautenbach is Chairman of the Board of Directors of the Philharmonic Center for the Arts in Naples, Florida (2012-present) and a member of the Council on Foreign Relations (1994-present). Previously, Mr. Lautenbach was a Partner/Advisory Partner at Clayton, Dubilier & Rice, LLC (private equity investment, 1998-2010), as well as a Director of Sony Corporation (2006-2007). |
Joseph Mauriello (1944) | |
Year of Election or Appointment: 2008 Trustee | |
| Mr. Mauriello also serves as Trustee of other Fidelity funds. Prior to his retirement in January 2006, Mr. Mauriello served in numerous senior management positions including Deputy Chairman and Chief Operating Officer (2004-2005), and Vice Chairman of Financial Services (2002-2004) of KPMG LLP US (professional services, 1965-2005). Mr. Mauriello currently serves as a member of the Board of Directors of XL Group plc. (global insurance and re-insurance, 2006-present). Previously, Mr. Mauriello served as a Director of the Hamilton Funds of the Bank of New York (2006-2007) and of Arcadia Resources Inc. (health care services and products, 2007-2012). |
Robert W. Selander (1950) | |
Year of Election or Appointment: 2011 Trustee | |
| Mr. Selander also serves as Trustee of other Fidelity funds. Previously, Mr. Selander served as a Member of the Advisory Board of other Fidelity funds (2011), and Executive Vice Chairman (2010), Chief Executive Officer (2009-2010), and President and Chief Executive Officer (1997-2009) of Mastercard, Inc. |
Cornelia M. Small (1944) | |
Year of Election or Appointment: 2005 Trustee | |
| Ms. Small also serves as Trustee of other Fidelity funds. Ms. Small is a member of the Board of Directors (2009-present) and Chair of the Investment Committee (2010-present) of the Teagle Foundation. Ms. Small also serves on the Investment Committee of the Berkshire Taconic Community Foundation (2008-present). Previously, Ms. Small served as Chairperson (2002-2008) and a member of the Investment Committee and Chairperson (2008-2012) and a member of the Board of Trustees of Smith College. In addition, Ms. Small served as Chief Investment Officer, Director of Global Equity Investments, and a member of the Board of Directors of Scudder, Stevens & Clark and Scudder Kemper Investments. |
William S. Stavropoulos (1939) | |
Year of Election or Appointment: 2002 Trustee Vice Chairman of the Independent Trustees | |
| Mr. Stavropoulos also serves as Trustee of other Fidelity funds. Mr. Stavropoulos serves as President and Founder of the Michigan Baseball Foundation, the Great Lakes Loons (2007-present). Mr. Stavropoulos is Chairman Emeritus of the Board of Directors of The Dow Chemical Company, where he previously served in numerous senior management positions, including President, CEO (1995-2000; 2002-2004), Chairman of the Executive Committee (2000-2006), and as a member of the Board of Directors (1990-2006). Currently, Mr. Stavropoulos is Chairman of the Board of Directors of Univar Inc. (global distributor of commodity and specialty chemicals), a Director of Teradata Corporation (data warehousing and technology solutions), and Maersk Inc. (industrial conglomerate), and a member of the Advisory Board for Metalmark Capital LLC (private equity investment, 2005-present). Mr. Stavropoulos is an operating advisor to Clayton, Dubilier & Rice, LLC (private equity investment). In addition, Mr. Stavropoulos is a member of the University of Notre Dame Advisory Council for the College of Science, a Trustee of the Rollin L. Gerstacker Foundation, and a Director of the Naples Philharmonic Center for the Arts. Previously, Mr. Stavropoulos served as a Director of Chemical Financial Corporation (bank holding company, 1993-2012) and Tyco International, Ltd. (multinational manufacturing and services, 2007-2012). |
David M. Thomas (1949) | |
Year of Election or Appointment: 2008 Trustee | |
| Mr. Thomas also serves as Trustee of other Fidelity funds. Mr. Thomas serves as Non-Executive Chairman of the Board of Directors of Fortune Brands Home and Security (home and security products, 2011-present), and as a member of the Board of Directors of Interpublic Group of Companies, Inc. (marketing communication, 2004-present). Previously, Mr. Thomas served as Executive Chairman (2005-2006) and Chairman and Chief Executive Officer (2000-2005) of IMS Health, Inc. (pharmaceutical and healthcare information solutions), and a Director of Fortune Brands, Inc. (consumer products, 2000-2011). |
+ The information above includes each Trustee's principal occupation during the last five years and other information relating to the experience, attributes, and skills relevant to each Trustee's qualifications to serve as a Trustee, which led to the conclusion that each Trustee should serve as a Trustee for the fund.
Advisory Board Member and Officers:
Correspondence intended for each officer and Peter S. Lynch may be sent to Fidelity Investments, 245 Summer Street, Boston, Massachusetts 02210. Officers appear below in alphabetical order.
Name, Year of Birth; Principal Occupation | |
Peter S. Lynch (1944) | |
Year of Election or Appointment: 2003 Member of the Advisory Board | |
| Mr. Lynch also serves as Member of the Advisory Board of other Fidelity funds. Mr. Lynch is Vice Chairman and a Director of FMR and FMR Co., Inc. In addition, Mr. Lynch serves as a Trustee of Boston College and as the Chairman of the Inner-City Scholarship Fund. Previously, Mr. Lynch served on the Special Olympics International Board of Directors (1997-2006). |
Elizabeth Paige Baumann (1968) | |
Year of Election or Appointment: 2012 Anti-Money Laundering (AML) Officer | |
| Ms. Baumann also serves as AML Officer of other funds. She is Chief AML Officer of FMR LLC (2012-present) and is an employee of Fidelity Investments. Previously, Ms. Baumann served as Vice President and Deputy Anti-Money Laundering Officer (2007-2012). |
William C. Coffey (1969) | |
Year of Election or Appointment: 2009 Assistant Secretary | |
| Mr. Coffey also serves as Assistant Secretary of other funds. He is Senior Vice President and Deputy General Counsel of FMR LLC (2010-present), and is an employee of Fidelity Investments. Previously, Mr. Coffey served as Vice President and Associate General Counsel of FMR LLC (2005-2009). |
Jonathan Davis (1968) | |
Year of Election or Appointment: 2010 Assistant Treasurer | |
| Mr. Davis also serves as Assistant Treasurer of other funds. Mr. Davis is an employee of Fidelity Investments. Previously, Mr. Davis served as Vice President and Associate General Counsel of FMR LLC (2003-2010). |
Adrien E. Deberghes (1967) | |
Year of Election or Appointment: 2008 Deputy Treasurer | |
| Mr. Deberghes also serves as an officer of other funds. He is an employee of Fidelity Investments (2008-present). Prior to joining Fidelity Investments, Mr. Deberghes was Senior Vice President of Mutual Fund Administration at State Street Corporation (2007-2008), Senior Director of Mutual Fund Administration at Investors Bank & Trust (2005-2007), and Director of Finance for Dunkin' Brands (2000-2005). |
Stephanie J. Dorsey (1969) | |
Year of Election or Appointment: 2010 Assistant Treasurer | |
| Ms. Dorsey also serves as an officer of other funds. She is an employee of Fidelity Investments (2008-present) and has served in other fund officer roles. Prior to joining Fidelity Investments, Ms. Dorsey served as Treasurer (2004-2008) of the JPMorgan Mutual Funds and Vice President (2004-2008) of JPMorgan Chase Bank. |
Howard J. Galligan III (1966) | |
Year of Election or Appointment: 2014 Chief Financial Officer | |
| Mr. Galligan also serves as Chief Financial Officer of other funds. Mr. Galligan serves as President of Fidelity Pricing and Cash Management Services (FPCMS) (2014-present) and as a Director of Strategic Advisers, Inc. (2008-present). Previously, Mr. Galligan served as Chief Administrative Officer of Asset Management (2011-2014) and Chief Operating Officer and Senior Vice President of Investment Support for Strategic Advisers, Inc. (2003-2011). |
Scott C. Goebel (1968) | |
Year of Election or Appointment: 2008 Secretary and Chief Legal Officer (CLO) | |
| Mr. Goebel serves as Secretary and CLO of other funds. Mr. Goebel also serves as Secretary of Fidelity SelectCo, LLC (2013-present), Fidelity Investments Money Management, Inc. (FIMM) (2010-present) and Fidelity Research and Analysis Company (FRAC) (2010-present); General Counsel, Secretary, and Senior Vice President of FMR (2008-present) and FMR Co., Inc. (2008-present); Chief Legal Officer of Fidelity Management & Research (Hong Kong) Limited (2008-present); and Assistant Secretary of Fidelity Management & Research (Japan) Limited (2008-present) and Fidelity Management & Research (U.K.) Inc. (2008-present). Previously, Mr. Goebel served as Secretary and CLO of other Fidelity funds (2008-2013), Assistant Secretary of FIMM (2008-2010), FRAC (2008-2010), and certain funds (2007-2008); and as Vice President and Secretary of Fidelity Distributors Corporation (FDC) (2005-2007). Mr. Goebel has been employed by FMR LLC or an affiliate since 2001. |
Thomas C. Hense (1964) | |
Year of Election or Appointment: 2008/2010 Vice President | |
| Mr. Hense also serves as Vice President of other funds (High Income (2008), Small Cap (2008), and Value (2010) funds). Previously, Mr. Hense served as a portfolio manager for Fidelity's Institutional Money Management Group (Pyramis) (2003-2008). |
Brian B. Hogan (1964) | |
Year of Election or Appointment: 2009 Vice President | |
| Mr. Hogan also serves as Trustee or Vice President of other funds. Mr. Hogan serves as a Director of Fidelity SelectCo, LLC (2014-present) and President of FMR's Equity Division (2009-present). Previously, Mr. Hogan served as Senior Vice President, Equity Research of FMR (2006-2009) and as a portfolio manager. |
Chris Maher (1972) | |
Year of Election or Appointment: 2013 Assistant Treasurer | |
| Mr. Maher serves as Assistant Treasurer of other funds. Mr. Maher is Vice President of Valuation Oversight and is an employee of Fidelity Investments. Previously, Mr. Maher served as Vice President of Asset Management Compliance (2013), Vice President of FMR's Program Management Group (2010-2013), and Vice President of Valuation Oversight (2008-2010). |
Kenneth B. Robins (1969) | |
Year of Election or Appointment: 2008 President and Treasurer | |
| Mr. Robins also serves as an officer of other funds. Mr. Robins serves as Executive Vice President of Fidelity Investments Money Management, Inc. (FIMM) (2013-present) and is an employee of Fidelity Investments (2004-present). Previously, Mr. Robins served in other fund officer roles. |
Stephen Sadoski (1971) | |
Year of Election or Appointment: 2012 Deputy Treasurer | |
| Mr. Sadoski also serves as Deputy Treasurer of other funds. He is an employee of Fidelity Investments (2012-present) and has served in another fund officer role. Prior to joining Fidelity Investments, Mr. Sadoski served as an assistant chief accountant in the Division of Investment Management of the Securities and Exchange Commission (SEC) (2009-2012) and as a senior manager at Deloitte & Touche LLP (1997-2009). |
Stacie M. Smith (1974) | |
Year of Election or Appointment: 2013 Deputy Treasurer | |
| Ms. Smith also serves as an officer of other funds. She is an employee of Fidelity Investments (2009-present) and has served in other fund officer roles. Prior to joining Fidelity Investments, Ms. Smith served as Senior Audit Manager of Ernst & Young LLP (1996-2009). |
Renee Stagnone (1975) | |
Year of Election or Appointment: 2013 Deputy Treasurer | |
| Ms. Stagnone also serves as Deputy Treasurer of other funds. Ms. Stagnone is an employee of Fidelity Investments. |
Linda J. Wondrack (1964) | |
Year of Election or Appointment: 2014 Chief Compliance Officer | |
| Ms. Wondrack also serves as Chief Compliance Officer of other funds. Ms. Wondrack is Executive Vice President and head of the Ethics Office and Asset Management Compliance for Fidelity Investments (2012-present). Ms. Wondrack also serves as Chief Compliance Officer of Fidelity SelectCo, LLC (2014-present); Chief Compliance Officer of Impresa Management LLC (2013-present); and Chief Compliance Officer of FMR Co., Inc., Fidelity Investments Money Management, Inc., Fidelity Management & Research (Japan) Limited, Fidelity Management & Research (U.K.) Inc., Fidelity Management & Research (Hong Kong), Fidelity Management & Research Company, Pyramis Global Advisors, LLC, and Strategic Advisers, Inc., Ballyrock Investment Advisors LLC, and Northern Neck Investors LLC (2012-present). Previously, Ms. Wondrack served as Senior Vice President and Chief Compliance Officer for Columbia Management Investment Advisers, LLC (2005-2012); Chief Compliance Officer for certain funds within the Columbia Family of Funds (2007-2012); and Senior Vice President of Compliance Risk Management at Bank of America (2005-2010). |
Joseph F. Zambello (1957) | |
Year of Election or Appointment: 2011 Deputy Treasurer | |
| Mr. Zambello also serves as Deputy Treasurer of other funds. Mr. Zambello is an employee of Fidelity Investments. Previously, Mr. Zambello served as Vice President of FMR's Program Management Group (2009-2011) and Vice President of the Transfer Agent Oversight Group (2005-2009). |
Annual Report
Distributions (Unaudited)
The Board of Trustees of Advisor High Income Fund voted to pay to shareholders of record at the opening of business on record date, the following distributions per share derived from capital gains realized from sales of portfolio securities:
| Pay Date | Record Date | Capital Gains |
Institutional Class | 12/08/14 | 12/05/14 | $0.204 |
The fund hereby designates as a capital gain dividend with respect to the taxable year ended October 31, 2014, $16,983,896, or, if subsequently determined to be different, the net capital gain of such year.
A total of .02% of the dividends distributed during the fiscal year was derived from interest on U.S. Government securities which is generally exempt from state income tax.
The fund designates $26,303,535 of distributions paid during the period January 1, 2014 to October 31, 2014, as qualifying to be taxed as interest-related dividends for nonresident alien shareholders.
The fund will notify shareholders in January 2015 of amounts for use in preparing 2014 income tax returns.
Annual Report
Board Approval of Investment Advisory Contracts and Management Fees
Fidelity Advisor High Income Fund
Each year, the Board of Trustees, including the Independent Trustees (together, the Board), votes on the renewal of the management contract with Fidelity Management & Research Company (FMR) and the sub-advisory agreements (together, the Advisory Contracts) for the fund. The Board, assisted by the advice of fund counsel and Independent Trustees' counsel, requests and considers a broad range of information relevant to the renewal of the Advisory Contracts throughout the year.
The Board meets regularly and, at each of its meetings, covers an extensive agenda of topics and materials and considers factors that are relevant to its annual consideration of the renewal of the fund's Advisory Contracts, including the services and support provided to the fund and its shareholders. The Board has established various standing committees (Committees), each composed of and chaired by Independent Trustees with varying backgrounds, to which the Board has assigned specific subject matter responsibilities in order to enhance effective decision-making by the Board. The Board, acting directly and through its Committees, requests and receives information concerning the annual consideration of the renewal of the fund's Advisory Contracts. The Board also meets as needed to consider matters specifically related to the Board's annual consideration of the renewal of the Advisory Contracts. Members of the Board may also meet with trustees of other Fidelity funds through ad hoc joint committees to discuss certain matters relevant to the Fidelity funds.
At its July 2014 meeting, the Board, including the Independent Trustees, unanimously determined to renew the fund's Advisory Contracts. In reaching its determination, the Board considered all factors it believed relevant, including (i) the nature, extent, and quality of the services to be provided to the fund and its shareholders (including the investment performance of the fund); (ii) the competitiveness of the fund's management fee and total expense ratio relative to peer funds; (iii) the total costs of the services to be provided by and the profits to be realized by Fidelity from its relationship with the fund; (iv) the extent to which economies of scale exist and would be realized as the fund grows; and (v) whether fee levels reflect these economies of scale, if any, for the benefit of fund shareholders. In connection with separate internal corporate reorganizations involving Fidelity Management & Research (U.K.) Inc. (FMR U.K.) and Fidelity Management & Research (Japan) Inc. (FMR Japan), the Board approved certain non-material amendments to the fund's sub-advisory agreements with FMR U.K. and FMR Japan to reflect that, after these reorganizations, FMR Investment Management (UK) Limited and Fidelity Management & Research (Japan) Limited will carry on the business of FMR U.K. and FMR Japan, respectively. The Board noted that no changes to the portfolio managers or to the foreign research or investment advisory services provided to the fund were expected in connection with either reorganization and that the same personnel and resources would continue to be available to the fund at the new entities.
Annual Report
In considering whether to renew the Advisory Contracts for the fund, the Board reached a determination, with the assistance of fund counsel and Independent Trustees' counsel and through the exercise of its business judgment, that the renewal of the Advisory Contracts was in the best interests of the fund and its shareholders and that the compensation payable under the Advisory Contracts was fair and reasonable. The Board's decision to renew the Advisory Contracts was not based on any single factor, but rather was based on a comprehensive consideration of all the information provided to the Board at its meetings throughout the year. The Board, in reaching its determination to renew the Advisory Contracts, was aware that shareholders of the fund have a broad range of investment choices available to them, including a wide choice among funds offered by Fidelity's competitors, and that the fund's shareholders, who have the opportunity to review and weigh the disclosure provided by the fund in its prospectus and other public disclosures, have chosen to invest in this fund, which is part of the Fidelity family of funds.
Nature, Extent, and Quality of Services Provided. The Board considered Fidelity's staffing as it relates to the fund, including the backgrounds of investment personnel of FMR and the sub-advisers (together, the Investment Advisers), and also considered the fund's investment objective, strategies, and related investment philosophy. The Independent Trustees also had discussions with senior management of Fidelity's investment operations and investment groups. The Board considered the structure of the portfolio manager compensation program and whether this structure provides appropriate incentives to act in the best interests of the fund. Additionally, the Board considered the portfolio managers' investments, if any, in the funds that they manage.
Resources Dedicated to Investment Management and Support Services. The Board and the Fund Oversight and Research Committees reviewed the general qualifications and capabilities of Fidelity's investment staff, including its size, education, experience, and resources, as well as Fidelity's approach to recruiting, training, managing, and compensating investment personnel. The Board noted that Fidelity has continued to increase the resources devoted to non-U.S. offices, including expansion of Fidelity's global investment organization. The Board also noted that Fidelity's analysts have extensive resources, tools and capabilities that allow them to conduct sophisticated quantitative and fundamental analysis, as well as credit analysis of issuers, counterparties and guarantors. Further, the Board believes that Fidelity's investment professionals have sufficient access to global information and data so as to provide competitive investment results over time, and that those professionals also have access to sophisticated tools that permit them to assess portfolio construction and risk and performance attribution characteristics continuously, as well as to transmit new information and research conclusions rapidly around the world. Additionally, in its deliberations, the Board considered Fidelity's trading and risk management capabilities and resources and global compliance infrastructure, which are an integral part of the investment management process.
Annual Report
Board Approval of Investment Advisory Contracts and
Management Fees - continued
Shareholder and Administrative Services. The Board considered (i) the nature, extent, quality, and cost of advisory, administrative, and shareholder services performed by the Investment Advisers and their affiliates under the Advisory Contracts and under separate agreements covering transfer agency, pricing and bookkeeping, and securities lending services for the fund; (ii) the nature and extent of the supervision of third party service providers, principally custodians and subcustodians; and (iii) the resources devoted to, and the record of compliance with, the fund's compliance policies and procedures. The Board also reviewed the allocation of fund brokerage, including allocations to brokers affiliated with the Investment Advisers, the use of brokerage commissions to pay fund expenses, and the use of "soft" commission dollars to pay for research services.
The Board noted that the growth of fund assets over time across the complex allows Fidelity to reinvest in the development of services designed to enhance the value or convenience of the Fidelity funds as investment vehicles. These services include 24-hour access to account information and market information through telephone representatives and over the Internet, investor education materials and asset allocation tools, and the expanded availability of Fidelity Investor Centers.
In 2014, the Board formed an ad hoc Committee on Transfer Agency Fees to review the variety of transfer agency fee structures throughout the industry and Fidelity's competitive positioning with respect to industry participants.
Investment in a Large Fund Family. The Board considered the benefits to shareholders of investing in a Fidelity fund, including the benefits of investing in a fund that is part of a large family of funds offering a variety of investment disciplines and providing a large variety of mutual fund investor services. The Board noted that Fidelity had taken, or had made recommendations that resulted in the Fidelity funds taking, a number of actions over the previous year that benefited particular funds, including (i) continuing to dedicate additional resources to investment research and to the support of the senior management team that oversees asset management; (ii) persisting in efforts to enhance Fidelity's global research capabilities; (iii) launching new funds and making other enhancements to meet client needs for income-oriented solutions; (iv) reducing fund expenses for certain index funds; (v) continuing to launch dedicated lower cost underlying funds to meet portfolio construction needs related to expanding underlying fund options for Fidelity funds of funds, specifically for the Freedom Fund product lines; (vi) rationalizing product lines and gaining increased efficiencies through fund mergers; (vii) launching sector-based exchange-traded funds and establishing a new Fidelity adviser to manage sector-based funds and products; (viii) continuing to develop and implement technology to improve security and increase efficiency; (ix) modifying the eligibility criteria for certain share classes to increase their marketability to a portion of the defined contribution plan market; (x) waiving redemption fees for certain qualified fund-of-fund and wrap programs and certain retirement plan transactions; and (xi) launching new Institutional Class shares of certain money market funds to attract and retain assets and to fill a gap in the money market fund lineup.
Annual Report
Investment Performance. The Board considered whether the fund has operated in accordance with its investment objective, as well as its record of compliance with its investment restrictions and its performance history.
The Board took into account discussions with the Investment Advisers about fund investment performance that occur at Board meetings throughout the year. In this regard the Board noted that as part of regularly scheduled fund reviews and other reports to the Board on fund performance, the Board periodically considers annualized return information for the fund, for different time periods, measured against a securities market index ("benchmark index") and a peer group of funds with similar objectives ("peer group"). In its evaluation of fund investment performance, the Board gave particular attention to information indicating changes in performance of certain Fidelity funds for specific time periods and the Investment Advisers' explanations for any overperformance or underperformance.
In addition to reviewing absolute and relative fund performance, the Independent Trustees periodically consider the appropriateness of fund performance metrics in evaluating the results achieved. In general, the Independent Trustees believe that fund performance should be evaluated based on net performance (after fees and expenses) of both the highest performing and lowest performing classes, where applicable, compared to appropriate benchmark indices, over appropriate time periods which may include full market cycles, and compared to peer groups, as applicable, over the same periods, taking into account relevant factors including the following: general market conditions; issuer-specific information; tactical opportunities for investment; and fund cash flows and other factors.
The Independent Trustees recognize that shareholders evaluate performance on a net basis over their own holding periods, for which one-, three-, and five-year periods are often used as a proxy. For this reason, the performance information reviewed by the Board also included net cumulative calendar year total return information for the fund and an appropriate benchmark index and peer group for the most recent one-, three-, and five-year periods, as shown below. Returns are shown compared to the 25th percentile (top of box, 75% beaten) and 75th percentile (bottom of box, 25% beaten) of the peer universe.
Annual Report
Board Approval of Investment Advisory Contracts and
Management Fees - continued
Fidelity Advisor High Income Fund
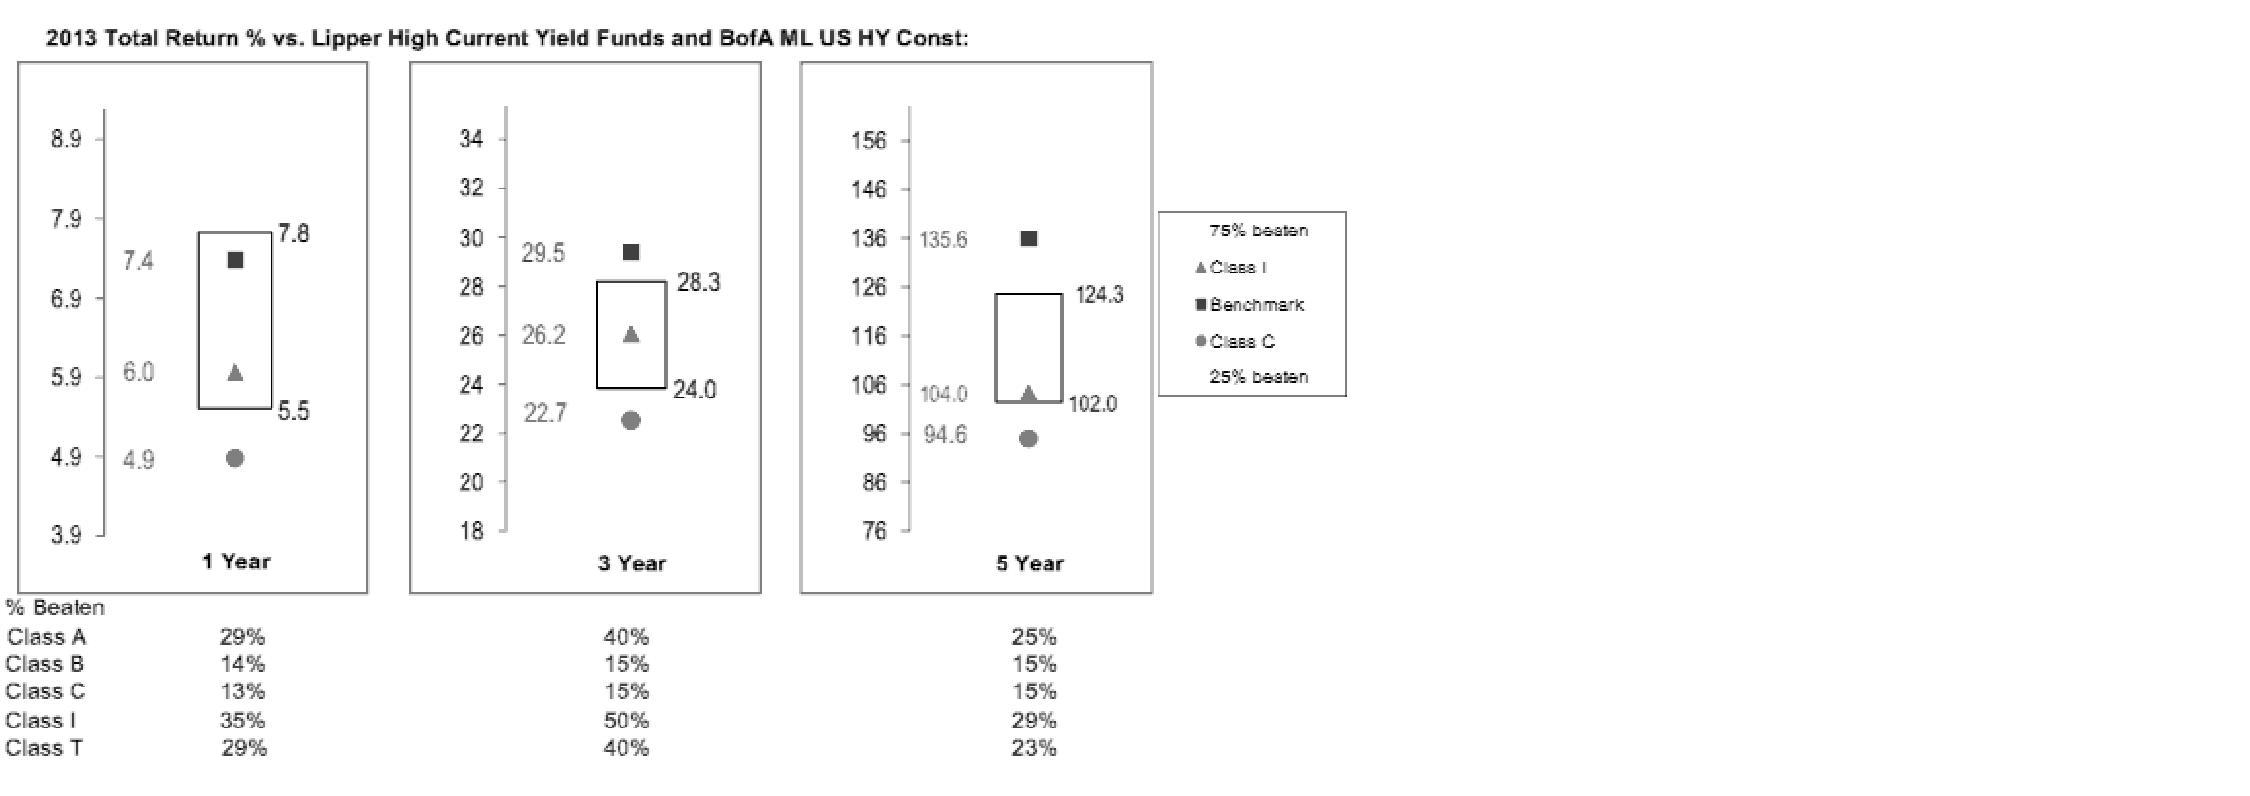
The Board has discussed the fund's performance with FMR, including the fund's underperformance based on more recent periods ended after 2013 (which periods are not shown in the chart above) but prior to the date of the Board's approval of the renewal of the Advisory Contracts, and has engaged with FMR to consider what steps might be taken to remediate the fund's more recent underperformance.
Based on its review, the Board concluded that the nature, extent, and quality of services provided to the fund under the Advisory Contracts should benefit the fund's shareholders.
Competitiveness of Management Fee and Total Expense Ratio. The Board considered the fund's management fee and total expense ratio compared to "mapped groups" of competitive funds and classes. Fidelity creates "mapped groups" by combining similar Lipper investment objective categories that have comparable investment mandates. Combining Lipper investment objective categories aids the Board's management fee and total expense ratio comparisons by broadening the competitive group used for comparison and by reducing the number of universes to which various Fidelity funds are compared.
Management Fee. The Board considered two proprietary management fee comparisons for the 12-month periods shown in the chart below. The group of Lipper funds used by the Board for management fee comparisons is referred to below as the "Total Mapped Group." The Total Mapped Group is broader than the Lipper peer group used by the Board for performance comparisons because the Total Mapped Group combines several Lipper investment objective categories while the Lipper peer group does not. The Total Mapped Group comparison focuses on a fund's standing in terms of gross management fees before expense reimbursements or caps relative to the total universe of funds with comparable investment mandates, regardless of whether their management fee structures also are comparable. Funds with comparable investment mandates offer exposure to similar types of securities. Funds with comparable management fee structures have similar management fee contractual arrangements (e.g., flat rate charged for advisory services, all-inclusive fee rate, etc.). "TMG %" represents the percentage of funds in the Total Mapped Group that had management fees that were lower than the fund's. For example, a hypothetical TMG % of 20% would mean that 80% of the funds in the Total Mapped Group had higher, and 20% had lower, management fees than the fund. The fund's actual TMG %s are in the chart below. The "Asset-Size Peer Group" (ASPG) comparison focuses on a fund's standing relative to a subset of non-Fidelity funds within the Total Mapped Group that are similar in size and management fee structure. For example, if a fund is in the first quartile of the ASPG, the fund's management fee ranks in the least expensive or lowest 25% of funds in the ASPG. The ASPG represents at least 15% of the funds in the Total Mapped Group with comparable asset size and management fee structures, subject to a minimum of 50 funds (or all funds in the Total Mapped Group if fewer than 50). Additional information, such as the ASPG quartile in which the fund's management fee rate ranked, is also included in the chart and considered by the Board.
Annual Report
Fidelity Advisor High Income Fund
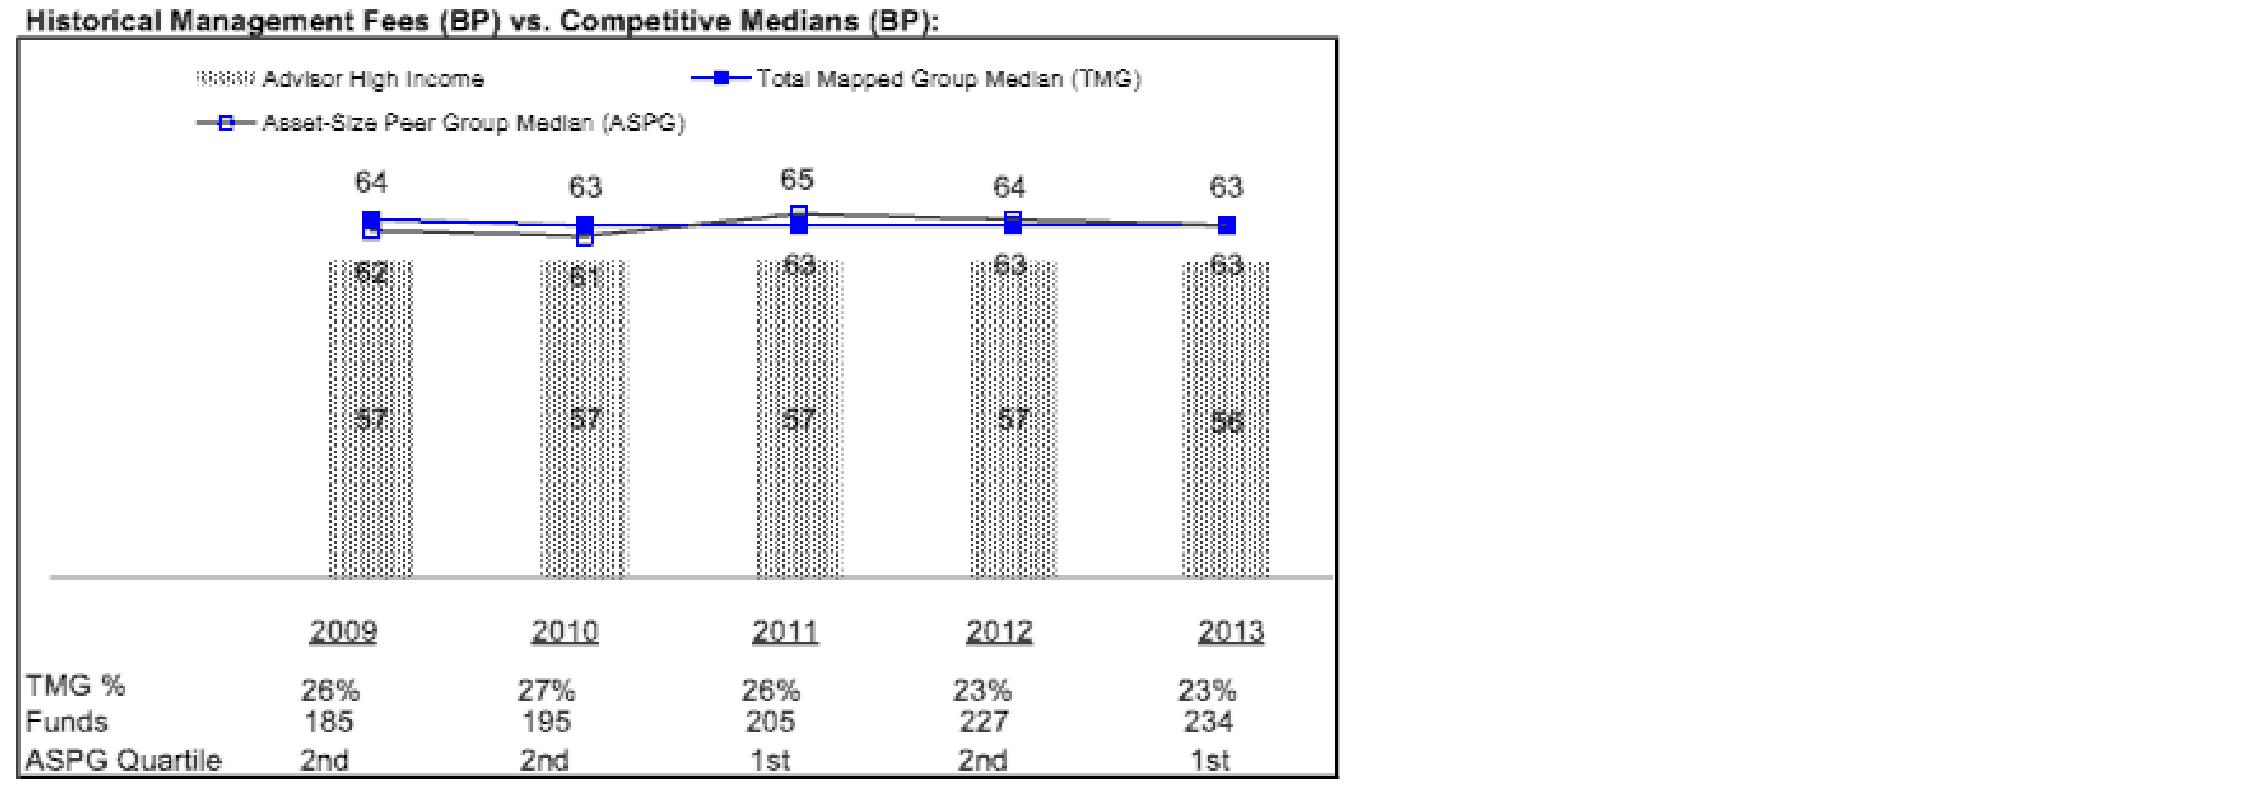
The Board noted that the fund's management fee rate ranked below the median of its Total Mapped Group and below the median of its ASPG for 2013.
Annual Report
Board Approval of Investment Advisory Contracts and
Management Fees - continued
The Board also noted that, in August 2013, the ad hoc Committee on Management Fees was formed to conduct an in-depth review of the management fee rates of Fidelity's active equity mutual funds. The Committee focused on the following areas: (i) standard fee structures; (ii) research consumption and trading evolution; (iii) management fee competitiveness/profitability by category; and (iv) factors that drive institutional pricing.
Based on its review, the Board concluded that the fund's management fee is fair and reasonable in light of the services that the fund receives and the other factors considered.
Total Expense Ratio. In its review of each class's total expense ratio, the Board considered the fund's management fee as well as other fund or class expenses, as applicable, such as transfer agent fees, pricing and bookkeeping fees, fund-paid 12b-1 fees, and custodial, legal, and audit fees. The Board also noted the effects of any waivers and reimbursements on fees and expenses. As part of its review, the Board also considered the current and historical total expense ratios of each class of the fund compared to competitive fund median expenses. Each class of the fund is compared to those funds and classes in the Total Mapped Group (used by the Board for management fee comparisons) that have a similar sales load structure.
The Board noted that the total expense ratio of each of Class A and Class B ranked below its competitive median for 2013 and the total expense ratio of each of Class T, Class C, and Institutional Class ranked above its competitive median for 2013. The Board considered that, in general, various factors can affect total expense ratios. The Board noted that the total expense ratio of Class T was above the competitive median primarily because of higher 12b-1 fees on Class T as compared to most competitor funds. Class T has a higher 12b-1 fee, but a lower front-end sales charge, than traditionally priced front-end sales charge classes. The Board considered that Class T is primarily sold load-waived in the retirement plan market where its 0.50% 12b-1 fee is comparable to competing no-load, higher 12b-1 fee classes designed specifically for retirement plans. The Board noted that the fund offers multiple classes, each of which has a different sales load and 12b-1 fee structure, and that the multiple structures are intended to offer a range of pricing options for the intermediary market. The Board also noted that the total expense ratios of the classes vary primarily by the level of their 12b-1 fees, although differences in transfer agent fees may also cause expenses to vary from class to class.
Fees Charged to Other Fidelity Clients. The Board also considered Fidelity fee structures and other information with respect to clients of Fidelity, such as other funds advised or subadvised by Fidelity, pension plan clients, and other institutional clients. The Board noted the findings of the 2013 ad hoc joint committee (created with the board of other Fidelity funds), which reviewed and compared Fidelity's institutional investment advisory business with its business of providing services to the Fidelity funds, including the differences in services provided, fees charged, and costs incurred, as well as competition in their respective marketplaces.
Annual Report
Based on its review of total expense ratios and fees charged to other Fidelity clients, the Board concluded that the total expense ratio of each class of the fund was reasonable, although in some cases above the median of the universe presented for comparison, in light of the services that the fund and its shareholders receive and the other factors considered.
Costs of the Services and Profitability. The Board considered the revenues earned and the expenses incurred by Fidelity in conducting the business of developing, marketing, distributing, managing, administering and servicing the fund and servicing the fund's shareholders. The Board also considered the level of Fidelity's profits in respect of all the Fidelity funds.
On an annual basis, Fidelity presents to the Board Fidelity's profitability for the fund. Fidelity calculates the profitability for each fund, as well as aggregate profitability for groups of Fidelity funds and all Fidelity funds, using a series of detailed revenue and cost allocation methodologies which originate with the books and records of Fidelity on which Fidelity's audited financial statements are based. The Audit Committee of the Board reviews any significant changes from the prior year's methodologies.
PricewaterhouseCoopers LLP (PwC), independent registered public accounting firm and auditor to Fidelity and certain Fidelity funds, has been engaged annually by the Board as part of the Board's assessment of Fidelity's profitability analysis. PwC's engagement includes the review and assessment of the methodologies used by Fidelity in determining the revenues and expenses attributable to Fidelity's mutual fund business, and completion of agreed-upon procedures in respect of the mathematical accuracy of fund profitability and its conformity to established allocation methodologies. After considering PwC's reports issued under the engagement and information provided by Fidelity, the Board concluded that while other allocation methods may also be reasonable, Fidelity's profitability methodologies are reasonable in all material respects.
The Board also reviewed Fidelity's non-fund businesses and fall-out benefits related to the mutual fund business as well as cases where Fidelity's affiliates may benefit from or be related to the fund's business.
The Board considered the costs of the services provided by and the profits realized by Fidelity in connection with the operation of the fund and was satisfied that the profitability was not excessive in the circumstances.
Economies of Scale. The Board considered whether there have been economies of scale in respect of the management of the Fidelity funds, whether the Fidelity funds (including the fund) have appropriately benefited from any such economies of scale, and whether there is potential for realization of any further economies of scale. The Board considered the extent to which the fund will benefit from economies of scale through increased services to the fund, through waivers or reimbursements, or through fee or expense ratio reductions. The Board also noted that in 2013, it and the boards of other Fidelity funds created an ad hoc committee (the Economies of Scale Committee) to analyze whether Fidelity attains economies of scale in respect of the management and servicing of the Fidelity funds, whether the Fidelity funds have appropriately benefited from such economies of scale, and whether there is potential for realization of any further economies of scale.
Annual Report
Board Approval of Investment Advisory Contracts and
Management Fees - continued
The Board recognized that the fund's management contract incorporates a "group fee" structure, which provides for lower group fee rates as total group assets increase, and for higher group fee rates as total group assets decrease (with "group assets" defined to include fund assets under FMR's management plus sector fund assets previously under FMR's management and currently managed by Fidelity SelectCo, LLC). FMR calculates the group fee rates based on a tiered asset "breakpoint" schedule that varies based on asset class. The Board considered that the group fee is designed to deliver the benefits of economies of scale to fund shareholders when total Fidelity fund assets increase, even if assets of any particular fund are unchanged or have declined, because some portion of Fidelity's costs are attributable to services provided to all Fidelity funds, and all funds benefit if those costs can be allocated among more assets. The Board concluded that, given the group fee structure, fund shareholders will benefit from lower management fees as group assets increase at the fund complex level, regardless of whether Fidelity achieves any such economies of scale.
The Board concluded, taking into account the analysis of the Economies of Scale Committee, that economies of scale, if any, are being appropriately shared between fund shareholders and Fidelity.
Additional Information Requested by the Board. In order to develop fully the factual basis for consideration of the Fidelity funds' Advisory Contracts, the Board requested and received additional information on certain topics, including: (i) fund performance trends and Fidelity's long-term strategies for certain funds; (ii) Fidelity's strategic marketing and product lineup goals; (iii) the methodology with respect to competitive fund data and peer group classifications; (iv) the arrangements with, and performance of, certain sub-advisers on behalf of the Fidelity funds, as well as certain proposed participating affiliate arrangements; (v) the realization of fall-out benefits in certain Fidelity business units; (vi) Fidelity's group fee structures, including the rationale for the individual fee rates of certain categories of funds and the definition of group assets; (vii) trends regarding industry use of performance fee structures and the performance adjustment methodologies applicable to the Fidelity funds; (viii) additional competitive analysis regarding the total expenses for certain classes; (ix) fund profitability methodology, including Fidelity's cost allocation methodology, and the impact of certain factors on fund profitability results; and (x) the process by which Fidelity determines sub-advisory fees for funds it advises.
Annual Report
Based on its evaluation of all of the conclusions noted above, and after considering all factors it believed relevant, the Board ultimately concluded that the advisory fee structures are fair and reasonable, and that the fund's Advisory Contracts should be renewed.
Annual Report
Investment Adviser
Fidelity Management & Research Company
Boston, MA
Investment Sub-Advisers
FMR Co., Inc.
Fidelity Management & Research
(U.K.) Inc.
Fidelity Management & Research
(Hong Kong) Limited
Fidelity Management & Research
(Japan) Limited
General Distributor
Fidelity Distributors Corporation
Smithfield, RI
Transfer and Service Agents
Fidelity Investments Institutional Operations Company, Inc.
Boston, MA
Fidelity Service Company, Inc.
Boston, MA
Custodian
The Bank of New York Mellon
New York, NY
(Fidelity Investment logo)(registered trademark)
AHII-UANN-1214
1.784749.111
(Fidelity Investment logo)(registered trademark)
Fidelity Advisor®
High Income Advantage
Fund - Class A, Class T, Class B and Class C
Annual Report
October 31, 2014
(Fidelity Cover Art)
Contents
Performance | How the fund has done over time. | |
Management's Discussion of Fund Performance | The Portfolio Manager's review of fund performance and strategy. | |
Shareholder Expense Example | An example of shareholder expenses. | |
Investment Changes | A summary of major shifts in the fund's investments over the past six months. | |
Investments | A complete list of the fund's investments with their market values. | |
Financial Statements | Statements of assets and liabilities, operations, and changes in net assets, as well as financial highlights. | |
Notes | Notes to the financial statements. | |
Report of Independent Registered Public Accounting Firm |
| |
Trustees and Officers |
| |
Distributions |
| |
Board Approval of Investment Advisory Contracts and Management Fees |
|
To view a fund's proxy voting guidelines and proxy voting record for the 12-month period ended June 30, visit http://www.fidelity.com/proxyvotingresults or visit the Securities and Exchange Commission's (SEC) web site at http://www.sec.gov. You may also call 1-877-208-0098 to request a free copy of the proxy voting guidelines.
Standard & Poor's, S&P and S&P 500 are registered service marks of The McGraw-Hill Companies, Inc. and have been licensed for use by Fidelity Distributors Corporation.
Other third-party marks appearing herein are the property of their respective owners.
All other marks appearing herein are registered or unregistered trademarks or service marks of FMR LLC or an affiliated company. © 2014 FMR LLC. All rights reserved.
Annual Report
This report and the financial statements contained herein are submitted for the general information of the shareholders of the fund. This report is not authorized for distribution to prospective investors in the fund unless preceded or accompanied by an effective prospectus.
A fund files its complete schedule of portfolio holdings with the SEC for the first and third quarters of each fiscal year on Form N-Q. Forms N-Q are available on the SEC's web site at http://www.sec.gov. A fund's Forms N-Q may be reviewed and copied at the SEC's Public Reference Room in Washington, DC. Information regarding the operation of the SEC's Public Reference Room may be obtained by calling 1-800-SEC-0330. For a complete list of a fund's portfolio holdings, view the most recent holdings listing, semiannual report, or annual report on Fidelity's web site at http://www.fidelity.com, http://www.advisor.fidelity.com, or http://www.401k.com, as applicable.
NOT FDIC INSURED • MAY LOSE VALUE • NO BANK GUARANTEE
Neither the fund nor Fidelity Distributors Corporation is a bank.
Annual Report
Performance: The Bottom Line
Average annual total return reflects the change in the value of an investment, assuming reinvestment of the class' distributions from dividend income and capital gains (the profits earned upon the sale of securities that have grown in value, if any) and assuming a constant rate of performance each year. The $10,000 table and the fund's returns do not reflect the deduction of taxes that a shareholder would pay on fund distributions or the redemption of fund shares. During periods of reimbursement by Fidelity, a fund's total return will be greater than it would be had the reimbursement not occurred. How a fund did yesterday is no guarantee of how it will do tomorrow. Returns reflect the conversion of Class B shares to Class A shares after a maximum of seven years.
Average Annual Total Returns
Periods ended October 31, 2014 | Past 1 | Past 5 | Past 10 |
Class A (incl. 4.00% sales charge) | 2.56% | 10.44% | 7.76% |
Class T (incl. 4.00% sales charge) | 2.54% | 10.42% | 7.74% |
Class B (incl. contingent deferred sales charge) A | 1.12% | 10.27% | 7.65% |
Class C (incl. contingent deferred sales charge)B | 5.05% | 10.52% | 7.38% |
A Class B shares' contingent deferred sales charges included in the past one year, past five years, and past ten years total return figures are 5%, 2%, and 0%, respectively.
B Class C shares' contingent deferred sales charges included in the past one year, past five years, and past ten years total return figures are 1%, 0%, and 0%, respectively.
Annual Report
$10,000 Over 10 Years
Let's say hypothetically that $10,000 was invested in Fidelity Advisor® High Income Advantage Fund - Class A on October 31, 2004, and the current 4.00% sales charge was paid. The chart shows how the value of your investment would have changed, and also shows how The BofA Merrill LynchSM US High Yield Constrained Index performed over the same period.
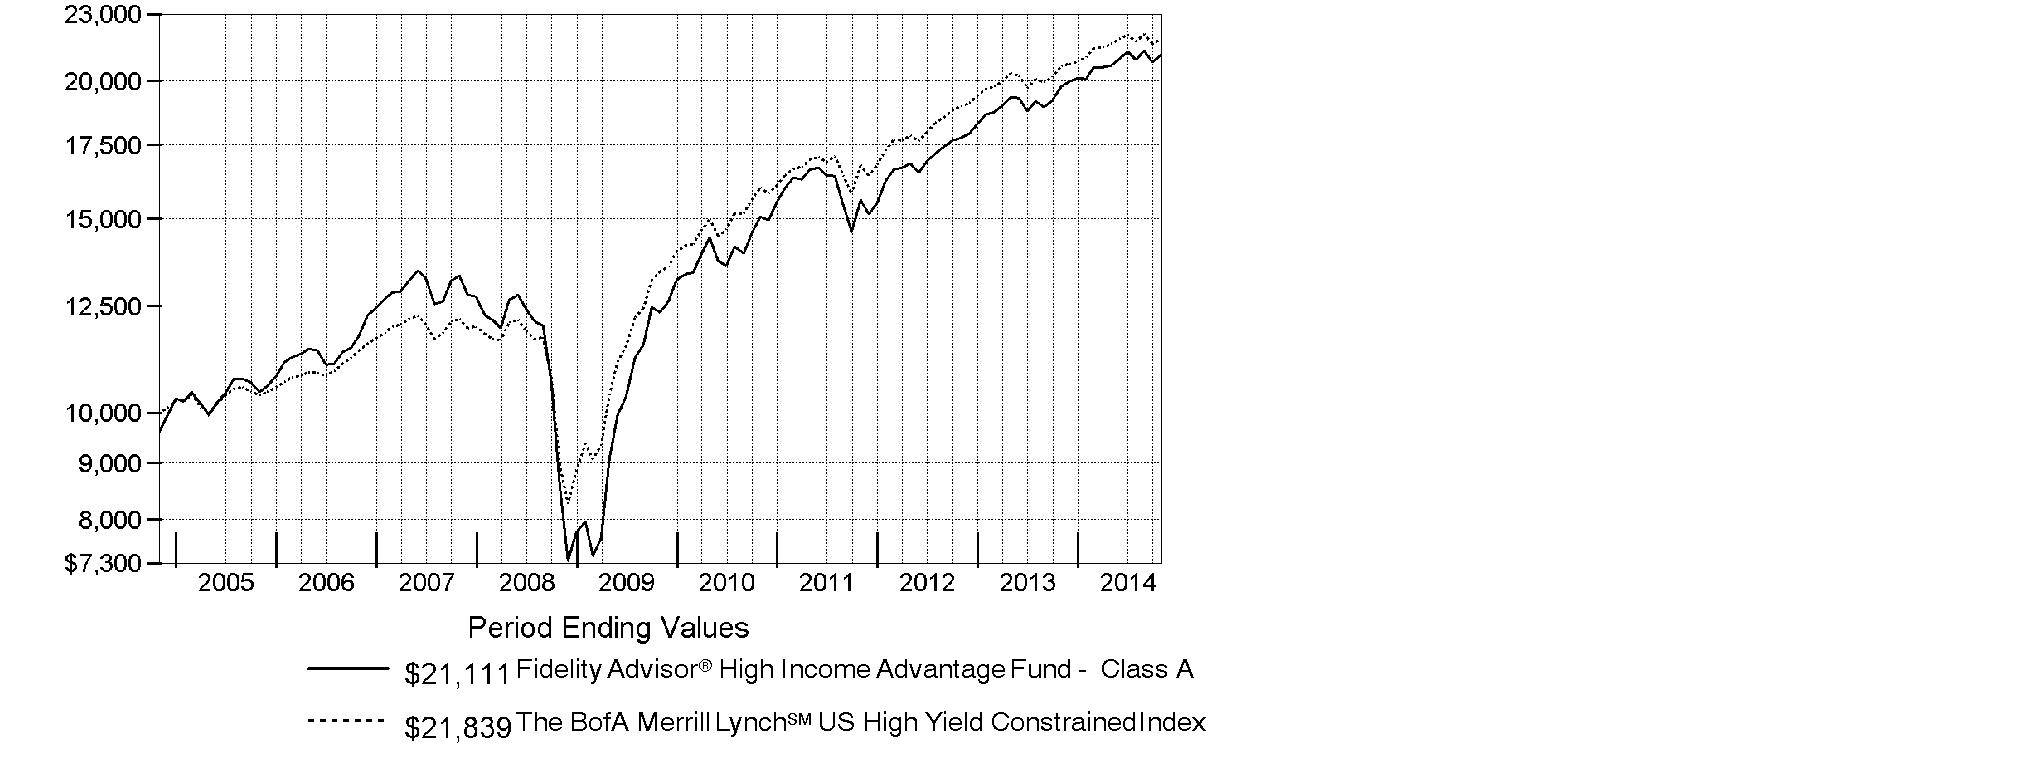
Annual Report
Management's Discussion of Fund Performance
Market Recap: High-yield bonds overcame late-period volatility to rise 5.85% for the 12 months ending October 31, 2014, as measured by The BofA Merrill LynchSM US High Yield Constrained Index, continuing a positive multiyear run. High yield benefited from a growing U.S. economy, low default rate, solid corporate fundamentals and monetary support from central banks worldwide. Early on, the index recovered from fears that the Fed might increase interest rates, in conjunction with its plan to wind down its stimulative bond-buying program. Meanwhile, weaker-than-expected economic data in the first quarter of 2014 helped to keep low policy rates in place. High yield advanced steadily until the market shifted in July, when investors exited high yield at a record pace amid unfavorable supply/demand dynamics and new concerns that the Fed could begin to tighten monetary policy. Fed Chair Janet Yellen contributed to the tumult, suggesting high-yield valuations "appear stretched." The index continued its decline in the final months of the period until it staged a slight rebound in October, as concerns about possible deflation in Europe and recession in Japan led to increased expectations for additional market intervention outside the U.S.
Comments from Harley Lank, Portfolio Manager of Fidelity Advisor® High Income Advantage Fund: For the year, the fund's Class A, Class T, Class B and Class C shares returned 6.84%, 6.81%, 6.12% and 6.05%, respectively (excluding sales charges), outperforming The BofA Merrill Lynch index. The fund performed in line with my expectations, given the market environment and how I structured the portfolio. Specifically, equities outperformed high-yield bonds, and I intentionally held about 15% of the fund's assets in common stocks. My focus on higher-quality investments in the high-yield part of the fund also buoyed relative performance, because the higher-quality bonds benefited more than lower-quality issues from declining interest rates during the period. Overall, we were helped further by favorable security selection within the high-yield bond segment of the fund. From an industry standpoint, the fund was helped most by security selection in technology, telecommunications and diversified financial services. Top contributors included Texas utility TXU - a subsidiary of Energy Future Holdings - out-of-benchmark equity holdings in semiconductor manufacturer Skyworks Solutions and bonds issued by auto financing company Ally Financial. Conversely, security selection in metals & mining hurt, including bond and common stock holdings of coal producer Alpha Natural Resources. An out-of-benchmark investment in the common stock of health-club operator Town Sports International Holdings also dampened the fund's returns.
The views expressed above reflect those of the portfolio manager(s) only through the end of the period as stated on the cover of this report and do not necessarily represent the views of Fidelity or any other person in the Fidelity organization. Any such views are subject to change at any time based upon market or other conditions and Fidelity disclaims any responsibility to update such views. These views may not be relied on as investment advice and, because investment decisions for a Fidelity fund are based on numerous factors, may not be relied on as an indication of trading intent on behalf of any Fidelity fund.
Annual Report
Shareholder Expense Example
As a shareholder of the Fund, you incur two types of costs: (1) transaction costs, including sales charges (loads) on purchase payments or redemption proceeds, redemption fees and (2) ongoing costs, including management fees, distribution and/or service (12b-1) fees and other Fund expenses. This Example is intended to help you understand your ongoing costs (in dollars) of investing in the Fund and to compare these costs with the ongoing costs of investing in other mutual funds.
The Example is based on an investment of $1,000 invested at the beginning of the period and held for the entire period (May 1, 2014 to October 31, 2014).
Actual Expenses
The first line of the accompanying table for each class of the Fund provides information about actual account values and actual expenses. You may use the information in this line, together with the amount you invested, to estimate the expenses that you paid over the period. Simply divide your account value by $1,000.00 (for example, an $8,600 account value divided by $1,000.00 = 8.6), then multiply the result by the number in the first line for a class of the Fund under the heading entitled "Expenses Paid During Period" to estimate the expenses you paid on your account during this period. In addition, the Fund, as a shareholder in the underlying Fidelity Central Funds, will indirectly bear its pro-rata share of the fees and expenses incurred by the underlying Fidelity Central Funds. These fees and expenses are not included in the Fund's annualized expense ratio used to calculate the expense estimate in the table below.
Hypothetical Example for Comparison Purposes
The second line of the accompanying table for each class of the Fund provides information about hypothetical account values and hypothetical expenses based on a Class' actual expense ratio and an assumed rate of return of 5% per year before expenses, which is not the Class' actual return. The hypothetical account values and expenses may not be used to estimate the actual ending account balance or expenses you paid for the period. You may use this information to compare the ongoing costs of investing in the Fund and other funds. To do so, compare this 5% hypothetical example with the 5% hypothetical examples that appear in the shareholder reports of the other funds. In addition, the Fund, as a shareholder in the underlying Fidelity Central Funds, will indirectly bear its pro-rata share of the fees and expenses incurred by the underlying Fidelity Central Funds. These fees and expenses are not included in the Fund's annualized expense ratio used to calculate the expense estimate in the table below.
Please note that the expenses shown in the table are meant to highlight your ongoing costs only and do not reflect any transaction costs. Therefore, the second line of the table is useful in comparing ongoing costs only, and will not help you determine the relative total costs of owning different funds. In addition, if these transactional costs were included, your costs would have been higher.
Annual Report
| Annualized | Beginning | Ending | Expenses Paid |
Class A | 1.01% |
|
|
|
Actual |
| $ 1,000.00 | $ 1,022.20 | $ 5.15 |
HypotheticalA |
| $ 1,000.00 | $ 1,020.11 | $ 5.14 |
Class T | 1.00% |
|
|
|
Actual |
| $ 1,000.00 | $ 1,022.10 | $ 5.10 |
HypotheticalA |
| $ 1,000.00 | $ 1,020.16 | $ 5.09 |
Class B | 1.72% |
|
|
|
Actual |
| $ 1,000.00 | $ 1,018.70 | $ 8.75 |
HypotheticalA |
| $ 1,000.00 | $ 1,016.53 | $ 8.74 |
Class C | 1.76% |
|
|
|
Actual |
| $ 1,000.00 | $ 1,018.40 | $ 8.95 |
HypotheticalA |
| $ 1,000.00 | $ 1,016.33 | $ 8.94 |
Institutional Class | .78% |
|
|
|
Actual |
| $ 1,000.00 | $ 1,023.70 | $ 3.98 |
HypotheticalA |
| $ 1,000.00 | $ 1,021.27 | $ 3.97 |
A 5% return per year before expenses
B Annualized expense ratio reflects expenses net of applicable fee waivers.
* Expenses are equal to each Class' annualized expense ratio, multiplied by the average account value over the period, multiplied by 184/365 (to reflect the one-half year period).
Annual Report
Investment Changes (Unaudited)
Top Five Holdings as of October 31, 2014 | ||
(by issuer, excluding cash equivalents) | % of fund's | % of fund's net assets |
International Lease Finance Corp. | 2.8 | 2.6 |
GMAC LLC | 2.7 | 2.7 |
HCA Holdings, Inc. | 2.0 | 2.3 |
SLM Corp. | 1.8 | 1.8 |
Reynolds Group Issuer, Inc./Reynolds Group Issuer LLC/Reynolds Group Issuer (Luxembourg) SA | 1.6 | 1.6 |
| 10.9 | |
Top Five Market Sectors as of October 31, 2014 | ||
| % of fund's | % of fund's net assets |
Diversified Financial Services | 9.7 | 10.0 |
Telecommunications | 9.7 | 10.0 |
Healthcare | 7.2 | 7.7 |
Energy | 7.2 | 7.5 |
Banks & Thrifts | 7.0 | 5.6 |
Quality Diversification (% of fund's net assets) | |||||||
As of October 31, 2014 | As of April 30, 2014 | ||||||
 | BBB 0.6% |
| | BBB 1.2% |
| ||
 | BB 28.4% |
| | BB 24.8% |
| ||
 | B 34.5% |
| | B 36.0% |
| ||
 | CCC,CC,C 13.5% |
| | CCC,CC,C 17.0% |
| ||
 | Not Rated 3.8% |
| | Not Rated 1.3% |
| ||
 | Equities 16.4% |
| | Equities 16.8% |
| ||
 | Short-Term |
| | Short-Term |
| ||

We have used ratings from Moody's Investors Service, Inc. Where Moody's® ratings are not available, we have used S&P® ratings. All ratings are as of the date indicated and do not reflect subsequent changes. |
Asset Allocation (% of fund's net assets) | |||||||
As of October 31, 2014* | As of April 30, 2014** | ||||||
| Nonconvertible |
| | Nonconvertible |
| ||
 | Convertible Bonds, Preferred Stocks 1.0% |
| | Convertible Bonds, Preferred Stocks 1.0% |
| ||
 | Common Stocks 15.4% |
| | Common Stocks 15.8% |
| ||
 | Bank Loan |
| | Bank Loan |
| ||
 | Other Investments 2.9% |
| | Other Investments 2.8% |
| ||
| Short-Term |
| | Short-Term |
| ||
* Foreign investments | 18.8% |
| ** Foreign investments | 18.1% |
| ||

Annual Report
Investments October 31, 2014
Showing Percentage of Net Assets
Corporate Bonds - 70.0% | ||||
| Principal | Value (000s) | ||
Convertible Bonds - 0.0% | ||||
Broadcasting - 0.0% | ||||
Mood Media Corp. 10% 10/31/15 (g) | $ 38 | $ 32 | ||
Nonconvertible Bonds - 70.0% | ||||
Aerospace - 0.2% | ||||
GenCorp, Inc. 7.125% 3/15/21 | 270 | 287 | ||
TransDigm, Inc.: | ||||
6% 7/15/22 | 2,030 | 2,053 | ||
6.5% 7/15/24 | 2,000 | 2,060 | ||
| 4,400 | |||
Air Transportation - 0.3% | ||||
Continental Airlines, Inc.: | ||||
pass-thru trust certificates 6.903% 4/19/22 | 940 | 1,001 | ||
6.125% 4/29/18 | 670 | 707 | ||
9.25% 5/10/17 | 1,071 | 1,210 | ||
United Air Lines, Inc. pass-thru trust certificates 9.75% 1/15/17 | 1,900 | 2,109 | ||
| 5,027 | |||
Automotive - 2.1% | ||||
American Axle & Manufacturing, Inc. 5.125% 2/15/19 | 750 | 761 | ||
Chassix, Inc. 9.25% 8/1/18 (g) | 765 | 742 | ||
Dana Holding Corp.: | ||||
5.375% 9/15/21 | 1,450 | 1,508 | ||
6% 9/15/23 | 1,450 | 1,523 | ||
Gates Global LLC / Gates Global Co. 6% 7/15/22 (g) | 2,235 | 2,168 | ||
General Motors Acceptance Corp. 8% 11/1/31 | 3,759 | 4,788 | ||
General Motors Financial Co., Inc.: | ||||
4.25% 5/15/23 | 1,000 | 1,030 | ||
4.75% 8/15/17 | 3,660 | 3,907 | ||
6.75% 6/1/18 | 10,220 | 11,612 | ||
LKQ Corp. 4.75% 5/15/23 | 430 | 416 | ||
Schaeffler Finance BV 4.75% 5/15/21 (g) | 5,430 | 5,416 | ||
Schaeffler Holding Finance BV: | ||||
6.25% 11/15/19 pay-in-kind (g)(i) | 2,140 | 2,215 | ||
6.75% 11/15/22 pay-in-kind (g)(i) | 1,005 | 1,063 | ||
6.875% 8/15/18 pay-in-kind (g)(i) | 2,550 | 2,671 | ||
Tenneco, Inc. 6.875% 12/15/20 | 3,362 | 3,581 | ||
| 43,401 | |||
Banks & Thrifts - 4.3% | ||||
Ally Financial, Inc.: | ||||
3.5% 1/27/19 | 3,485 | 3,494 | ||
Corporate Bonds - continued | ||||
| Principal | Value (000s) | ||
Nonconvertible Bonds - continued | ||||
Banks & Thrifts - continued | ||||
Ally Financial, Inc.: - continued | ||||
4.75% 9/10/18 | $ 3,970 | $ 4,169 | ||
8% 3/15/20 | 3,333 | 4,008 | ||
GMAC LLC: | ||||
8% 12/31/18 | 25,964 | 30,088 | ||
8% 11/1/31 | 19,887 | 25,306 | ||
Royal Bank of Scotland Group PLC: | ||||
5.125% 5/28/24 | 11,620 | 11,768 | ||
6% 12/19/23 | 8,040 | 8,650 | ||
Washington Mutual Bank 5.5% 1/15/49 (d) | 10,000 | 1 | ||
| 87,484 | |||
Broadcasting - 0.1% | ||||
AMC Networks, Inc. 7.75% 7/15/21 | 500 | 545 | ||
Clear Channel Communications, Inc. 5.5% 12/15/16 | 2,263 | 2,144 | ||
| 2,689 | |||
Building Materials - 0.7% | ||||
American Builders & Contractors Supply Co., Inc. 5.625% 4/15/21 (g) | 595 | 602 | ||
CEMEX Finance LLC 6% 4/1/24 (g) | 2,795 | 2,850 | ||
CEMEX S.A.B. de CV 5.2331% 9/30/15 (g)(i) | 4,305 | 4,387 | ||
HMAN Finance Sub Corp. 6.375% 7/15/22 (g) | 900 | 875 | ||
Nortek, Inc. 8.5% 4/15/21 | 1,520 | 1,634 | ||
USG Corp.: | ||||
5.875% 11/1/21 (g) | 430 | 444 | ||
6.3% 11/15/16 | 275 | 290 | ||
7.875% 3/30/20 (g) | 1,390 | 1,494 | ||
9.75% 1/15/18 | 1,585 | 1,827 | ||
| 14,403 | |||
Cable TV - 4.4% | ||||
Altice SA 7.75% 5/15/22 (g) | 14,575 | 15,304 | ||
CCO Holdings LLC/CCO Holdings Capital Corp.: | ||||
5.125% 2/15/23 | 2,550 | 2,544 | ||
5.25% 3/15/21 | 2,245 | 2,273 | ||
5.75% 9/1/23 | 1,545 | 1,582 | ||
5.75% 1/15/24 | 5,335 | 5,462 | ||
CCOH Safari LLC 5.5% 12/1/22 | 3,735 | 3,772 | ||
Cequel Communications Escrow I LLC/Cequel Communications Escrow Capital Corp. 6.375% 9/15/20 (g) | 535 | 558 | ||
Corporate Bonds - continued | ||||
| Principal | Value (000s) | ||
Nonconvertible Bonds - continued | ||||
Cable TV - continued | ||||
Cequel Communications Holdings I LLC/Cequel Capital Corp. 5.125% 12/15/21 (g) | $ 5,495 | $ 5,364 | ||
DISH DBS Corp.: | ||||
5% 3/15/23 | 4,695 | 4,677 | ||
5.875% 7/15/22 | 4,240 | 4,494 | ||
6.75% 6/1/21 | 5,260 | 5,839 | ||
Lynx I Corp. 5.375% 4/15/21 (g) | 1,260 | 1,307 | ||
Lynx II Corp. 6.375% 4/15/23 (g) | 710 | 751 | ||
Numericable Group SA: | ||||
4.875% 5/15/19 (g) | 7,890 | 7,870 | ||
6% 5/15/22 (g) | 15,358 | 15,704 | ||
6.25% 5/15/24 (g) | 1,150 | 1,183 | ||
RCN Telecom Services LLC/RCN Capital Corp. 8.5% 8/15/20 (g) | 3,001 | 3,144 | ||
Unitymedia Hessen GmbH & Co. KG/Unitymedia NRW GmbH: | ||||
5.5% 1/15/23 (g) | 2,145 | 2,236 | ||
7.5% 3/15/19 (g) | 705 | 742 | ||
UPCB Finance III Ltd. 6.625% 7/1/20 (g) | 1,635 | 1,721 | ||
UPCB Finance VI Ltd. 6.875% 1/15/22 (g) | 1,900 | 2,076 | ||
Virgin Media Finance PLC 6% 10/15/24 (g) | 1,620 | 1,685 | ||
| 90,288 | |||
Capital Goods - 0.2% | ||||
AECOM Technology Corp.: | ||||
5.75% 10/15/22 (g) | 1,115 | 1,174 | ||
5.875% 10/15/24 (g) | 955 | 1,010 | ||
Briggs & Stratton Corp. 6.875% 12/15/20 | 735 | 810 | ||
Shale-Inland Holdings LLC/Shale-Inland Finance Corp. 8.75% 11/15/19 (g) | 1,665 | 1,723 | ||
| 4,717 | |||
Chemicals - 1.0% | ||||
Hexion U.S. Finance Corp. 6.625% 4/15/20 | 4,605 | 4,605 | ||
LSB Industries, Inc. 7.75% 8/1/19 | 705 | 752 | ||
PolyOne Corp. 5.25% 3/15/23 | 2,215 | 2,221 | ||
Trinseo Materials Operating SCA/Trinseo Materials Finance, Inc. 8.75% 2/1/19 | 9,017 | 9,535 | ||
U.S. Coatings Acquisition, Inc./Flash Dutch 2 BV 7.375% 5/1/21 (g) | 960 | 1,039 | ||
Corporate Bonds - continued | ||||
| Principal | Value (000s) | ||
Nonconvertible Bonds - continued | ||||
Chemicals - continued | ||||
W.R. Grace & Co. - Conn: | ||||
5.125% 10/1/21 (g) | $ 1,550 | $ 1,615 | ||
5.625% 10/1/24 (g) | 620 | 653 | ||
| 20,420 | |||
Consumer Products - 0.7% | ||||
Prestige Brands, Inc.: | ||||
5.375% 12/15/21 (g) | 2,875 | 2,782 | ||
8.125% 2/1/20 | 335 | 358 | ||
Revlon Consumer Products Corp. 5.75% 2/15/21 | 10,540 | 10,540 | ||
Spectrum Brands Holdings, Inc.: | ||||
6.375% 11/15/20 | 565 | 599 | ||
6.625% 11/15/22 | 670 | 719 | ||
| 14,998 | |||
Containers - 2.5% | ||||
Ardagh Finance Holdings SA 8.625% 6/15/19 pay-in-kind (g)(i) | 1,430 | 1,416 | ||
Ardagh Packaging Finance PLC 9.125% 10/15/20 (g) | 3,369 | 3,630 | ||
Ardagh Packaging Finance PLC/Ardagh MP Holdings U.S.A., Inc.: | ||||
6% 6/30/21 (g) | 1,410 | 1,391 | ||
6.25% 1/31/19 (g) | 1,165 | 1,174 | ||
6.75% 1/31/21 (g) | 1,350 | 1,380 | ||
7% 11/15/20 (g) | 697 | 711 | ||
9.125% 10/15/20 (g) | 1,045 | 1,121 | ||
Beverage Packaging Holdings II SA (Luxembourg) 6% 6/15/17 (g) | 1,255 | 1,252 | ||
Consolidated Container Co. LLC/Consolidated Container Capital, Inc. 10.125% 7/15/20 (g) | 1,465 | 1,377 | ||
Reynolds Group Issuer, Inc./Reynolds Group Issuer LLC/Reynolds Group Issuer (Luxembourg) SA: | ||||
5.75% 10/15/20 | 10,505 | 10,925 | ||
6.875% 2/15/21 | 7,339 | 7,798 | ||
7.875% 8/15/19 | 8,387 | 8,985 | ||
8.25% 2/15/21 | 6,144 | 6,605 | ||
Sealed Air Corp. 6.5% 12/1/20 (g) | 1,730 | 1,903 | ||
Tekni-Plex, Inc. 9.75% 6/1/19 (g) | 1,114 | 1,217 | ||
| 50,885 | |||
Corporate Bonds - continued | ||||
| Principal | Value (000s) | ||
Nonconvertible Bonds - continued | ||||
Diversified Financial Services - 6.9% | ||||
AerCap Ireland Capital Ltd./AerCap Global Aviation Trust: | ||||
3.75% 5/15/19 (g) | $ 3,725 | $ 3,697 | ||
4.5% 5/15/21 (g) | 4,075 | 4,116 | ||
5% 10/1/21 (g) | 2,715 | 2,824 | ||
Aircastle Ltd. 4.625% 12/15/18 | 1,625 | 1,649 | ||
CIT Group, Inc.: | ||||
3.875% 2/19/19 | 2,570 | 2,586 | ||
5% 8/15/22 | 3,195 | 3,343 | ||
5% 8/1/23 | 4,515 | 4,713 | ||
5.375% 5/15/20 | 4,400 | 4,703 | ||
5.5% 2/15/19 (g) | 8,075 | 8,615 | ||
Icahn Enterprises LP/Icahn Enterprises Finance Corp.: | ||||
4.875% 3/15/19 | 3,930 | 3,999 | ||
5.875% 2/1/22 | 4,690 | 4,819 | ||
6% 8/1/20 | 3,840 | 4,032 | ||
International Lease Finance Corp.: | ||||
3.875% 4/15/18 | 7,210 | 7,233 | ||
5.75% 5/15/16 | 6,040 | 6,297 | ||
5.875% 8/15/22 | 10,375 | 11,257 | ||
7.125% 9/1/18 (g) | 10,309 | 11,675 | ||
8.25% 12/15/20 | 3,945 | 4,734 | ||
8.625% 1/15/22 | 11,580 | 14,359 | ||
SLM Corp.: | ||||
4.875% 6/17/19 | 9,130 | 9,267 | ||
5.5% 1/15/19 | 3,545 | 3,676 | ||
5.5% 1/25/23 | 2,245 | 2,245 | ||
6.125% 3/25/24 | 3,835 | 3,960 | ||
8% 3/25/20 | 9,700 | 11,131 | ||
8.45% 6/15/18 | 4,905 | 5,604 | ||
| 140,534 | |||
Diversified Media - 1.0% | ||||
Clear Channel Worldwide Holdings, Inc.: | ||||
Series A: | ||||
6.5% 11/15/22 | 1,225 | 1,262 | ||
7.625% 3/15/20 | 900 | 950 | ||
Series B, 6.5% 11/15/22 | 3,315 | 3,431 | ||
7.625% 3/15/20 | 4,400 | 4,681 | ||
Lamar Media Corp. 5.375% 1/15/24 | 1,080 | 1,118 | ||
Corporate Bonds - continued | ||||
| Principal | Value (000s) | ||
Nonconvertible Bonds - continued | ||||
Diversified Media - continued | ||||
Liberty Media Corp.: | ||||
8.25% 2/1/30 | $ 469 | $ 511 | ||
8.5% 7/15/29 | 529 | 586 | ||
MDC Partners, Inc. 6.75% 4/1/20 (g) | 440 | 457 | ||
National CineMedia LLC: | ||||
6% 4/15/22 | 4,035 | 4,085 | ||
7.875% 7/15/21 | 2,050 | 2,183 | ||
Nielsen Finance LLC/Nielsen Finance Co. 5% 4/15/22 (g) | 1,220 | 1,238 | ||
| 20,502 | |||
Electric Utilities - 3.8% | ||||
Calpine Corp.: | ||||
5.375% 1/15/23 | 2,615 | 2,641 | ||
5.75% 1/15/25 | 1,120 | 1,134 | ||
6% 1/15/22 (g) | 1,885 | 2,031 | ||
7.875% 1/15/23 (g) | 4,205 | 4,657 | ||
Energy Future Intermediate Holding Co. LLC/Energy Future Intermediate Holding Finance, Inc.: | ||||
11% 10/1/21 (d) | 6,237 | 7,360 | ||
12.25% 3/1/22 (d)(g) | 20,435 | 24,318 | ||
Global Partners LP/GLP Finance Corp. 6.25% 7/15/22 (g) | 535 | 530 | ||
InterGen NV 7% 6/30/23 (g) | 3,940 | 3,773 | ||
Mirant Americas Generation LLC 9.125% 5/1/31 | 690 | 645 | ||
NRG Energy, Inc. 6.625% 3/15/23 | 7,020 | 7,406 | ||
RJS Power Holdings LLC 5.125% 7/15/19 (g) | 3,830 | 3,811 | ||
The AES Corp.: | ||||
4.875% 5/15/23 | 725 | 723 | ||
5.5% 3/15/24 | 1,305 | 1,334 | ||
7.375% 7/1/21 | 2,400 | 2,738 | ||
TXU Corp.: | ||||
5.55% 11/15/14 (d)(m) | 7,757 | 6,128 | ||
6.5% 11/15/24 (d)(m) | 4,961 | 3,919 | ||
6.55% 11/15/34 (d)(m) | 4,295 | 3,393 | ||
| 76,541 | |||
Energy - 6.0% | ||||
Access Midstream Partners LP/ACMP Finance Corp.: | ||||
4.875% 5/15/23 | 2,720 | 2,842 | ||
4.875% 3/15/24 | 1,300 | 1,359 | ||
Corporate Bonds - continued | ||||
| Principal | Value (000s) | ||
Nonconvertible Bonds - continued | ||||
Energy - continued | ||||
American Energy-Permian Basin LLC/ AEPB Finance Corp.: | ||||
6.7413% 8/1/19 (g)(i) | $ 2,380 | $ 2,106 | ||
7.125% 11/1/20 (g) | 2,835 | 2,452 | ||
7.375% 11/1/21 (g) | 3,475 | 3,041 | ||
AmeriGas Finance LLC/AmeriGas Finance Corp.: | ||||
6.75% 5/20/20 | 1,260 | 1,342 | ||
7% 5/20/22 | 2,700 | 2,916 | ||
Antero Resources Corp. 5.125% 12/1/22 (g) | 3,765 | 3,766 | ||
Antero Resources Finance Corp. 5.375% 11/1/21 | 2,500 | 2,538 | ||
Atlas Pipeline Partners LP/Atlas Pipeline Finance Corp. 5.875% 8/1/23 | 1,885 | 1,956 | ||
California Resources Corp.: | ||||
5% 1/15/20 (g) | 2,340 | 2,375 | ||
5.5% 9/15/21 (g) | 3,045 | 3,106 | ||
6% 11/15/24 (g) | 2,030 | 2,071 | ||
Chesapeake Energy Corp.: | ||||
4.875% 4/15/22 | 1,890 | 1,933 | ||
5.375% 6/15/21 | 3,665 | 3,821 | ||
5.75% 3/15/23 | 2,170 | 2,376 | ||
6.125% 2/15/21 | 3,615 | 4,013 | ||
6.875% 11/15/20 | 177 | 202 | ||
Crestwood Midstream Partners LP/Crestwood Midstream Finance Corp.: | ||||
6.125% 3/1/22 | 1,520 | 1,535 | ||
7.75% 4/1/19 | 3,095 | 3,254 | ||
Denbury Resources, Inc. 4.625% 7/15/23 | 4,395 | 4,060 | ||
Diamondback Energy, Inc. 7.625% 10/1/21 | 1,545 | 1,642 | ||
Dynegy Finance I, Inc./Dynegy Finance II, Inc.: | ||||
6.75% 11/1/19 (g) | 1,855 | 1,920 | ||
7.375% 11/1/22 (g) | 3,470 | 3,670 | ||
7.625% 11/1/24 (g) | 3,465 | 3,673 | ||
Edgen Murray Corp. 8.75% 11/1/20 (g) | 1,200 | 1,320 | ||
El Paso Energy Corp. 7.75% 1/15/32 | 1,399 | 1,749 | ||
EP Energy LLC/Everest Acquisition Finance, Inc. 7.75% 9/1/22 | 1,440 | 1,519 | ||
Everest Acquisition LLC/Everest Acquisition Finance, Inc. 9.375% 5/1/20 | 3,975 | 4,343 | ||
Exterran Partners LP/EXLP Finance Corp. 6% 10/1/22 (g) | 2,280 | 2,189 | ||
Forbes Energy Services Ltd. 9% 6/15/19 | 3,470 | 3,349 | ||
Corporate Bonds - continued | ||||
| Principal | Value (000s) | ||
Nonconvertible Bonds - continued | ||||
Energy - continued | ||||
Forum Energy Technologies, Inc. 6.25% 10/1/21 | $ 1,090 | $ 1,123 | ||
Genesis Energy LP/Genesis Energy Finance Corp. 5.75% 2/15/21 | 845 | 849 | ||
Gibson Energy, Inc. 6.75% 7/15/21 (g) | 280 | 298 | ||
Gulfmark Offshore, Inc. 6.375% 3/15/22 | 560 | 510 | ||
Kinder Morgan Holding Co. LLC 5% 2/15/21 (g) | 1,695 | 1,788 | ||
Kodiak Oil & Gas Corp.: | ||||
5.5% 1/15/21 | 790 | 802 | ||
8.125% 12/1/19 | 2,010 | 2,161 | ||
Laredo Petroleum Holdings, Inc. 5.625% 1/15/22 | 2,995 | 2,950 | ||
Markwest Energy Partners LP/Markwest Energy Finance Corp. 5.5% 2/15/23 | 995 | 1,060 | ||
Offshore Group Investment Ltd.: | ||||
7.125% 4/1/23 | 2,445 | 2,017 | ||
7.5% 11/1/19 | 8,130 | 6,931 | ||
Pacific Drilling V Ltd. 7.25% 12/1/17 (g) | 1,985 | 1,968 | ||
Rose Rock Midstream LP/ Rose Rock Finance Corp. 5.625% 7/15/22 | 1,125 | 1,122 | ||
Rosetta Resources, Inc. 5.875% 6/1/24 | 1,235 | 1,186 | ||
RSP Permian, Inc. 6.625% 10/1/22 (g) | 915 | 913 | ||
Sabine Pass Liquefaction LLC: | ||||
5.625% 4/15/23 (g) | 4,530 | 4,689 | ||
5.75% 5/15/24 (g) | 3,215 | 3,324 | ||
SemGroup Corp. 7.5% 6/15/21 | 1,625 | 1,710 | ||
Star Gas Partners LP/Star Gas Finance Co. 8.875% 12/1/17 | 1,324 | 1,382 | ||
Summit Midstream Holdings LLC: | ||||
5.5% 8/15/22 | 1,520 | 1,520 | ||
7.5% 7/1/21 | 810 | 883 | ||
Targa Resources Partners LP/Targa Resources Partners Finance Corp. 6.375% 8/1/22 | 908 | 976 | ||
Teine Energy Ltd. 6.875% 9/30/22 (g) | 2,166 | 2,052 | ||
Western Refining, Inc. 6.25% 4/1/21 | 905 | 910 | ||
| 121,562 | |||
Entertainment/Film - 0.8% | ||||
CBS Outdoor Americas Capital LLC/CBS Outdoor Americas Capital Corp.: | ||||
5.25% 2/15/22 (g) | 470 | 485 | ||
5.625% 2/15/24 (g) | 510 | 532 | ||
Corporate Bonds - continued | ||||
| Principal | Value (000s) | ||
Nonconvertible Bonds - continued | ||||
Entertainment/Film - continued | ||||
Cinemark U.S.A., Inc.: | ||||
4.875% 6/1/23 | $ 2,110 | $ 2,078 | ||
5.125% 12/15/22 | 570 | 570 | ||
7.375% 6/15/21 | 1,085 | 1,164 | ||
Lions Gate Entertainment Corp. 5.25% 8/1/18 (g) | 6,095 | 6,278 | ||
Livent, Inc. yankee 9.375% 10/15/04 (d) | 11,100 | 0 | ||
NAI Entertainment Holdings LLC/NAI Entertainment Finance Corp. 5% 8/1/18 (g) | 1,425 | 1,461 | ||
Regal Entertainment Group: | ||||
5.75% 6/15/23 | 3,725 | 3,576 | ||
5.75% 2/1/25 | 555 | 524 | ||
| 16,668 | |||
Environmental - 0.4% | ||||
Clean Harbors, Inc. 5.125% 6/1/21 | 1,180 | 1,201 | ||
Covanta Holding Corp.: | ||||
5.875% 3/1/24 | 1,530 | 1,574 | ||
6.375% 10/1/22 | 1,355 | 1,443 | ||
7.25% 12/1/20 | 1,094 | 1,165 | ||
Darling International, Inc. 5.375% 1/15/22 | 1,280 | 1,283 | ||
LBC Tank Terminals Holding Netherlands BV 6.875% 5/15/23 (g) | 1,455 | 1,550 | ||
| 8,216 | |||
Food & Drug Retail - 1.9% | ||||
Albertsons Holdings LLC/Saturn Acquistion Merger Sub, Inc. 7.75% 10/15/22 (g) | 3,895 | 3,837 | ||
JBS Investments GmbH: | ||||
7.25% 4/3/24 (g) | 1,905 | 2,034 | ||
7.75% 10/28/20 (g) | 4,855 | 5,319 | ||
Minerva Luxmbourg SA 7.75% 1/31/23 (g) | 635 | 664 | ||
Pinnacle Merger Sub, Inc. 9.5% 10/1/23 (g) | 1,375 | 1,499 | ||
Rite Aid Corp.: | ||||
6.75% 6/15/21 | 11,895 | 12,698 | ||
6.875% 12/15/28 (g) | 5,785 | 6,045 | ||
7.7% 2/15/27 | 6,515 | 7,232 | ||
| 39,328 | |||
Food/Beverage/Tobacco - 1.6% | ||||
C&S Group Enterprises LLC 5.375% 7/15/22 (g) | 2,555 | 2,555 | ||
ESAL GmbH 6.25% 2/5/23 (g) | 4,565 | 4,656 | ||
Corporate Bonds - continued | ||||
| Principal | Value (000s) | ||
Nonconvertible Bonds - continued | ||||
Food/Beverage/Tobacco - continued | ||||
FAGE Dairy Industry SA/FAGE U.S.A. Dairy Industry, Inc. 9.875% 2/1/20 (g) | $ 2,275 | $ 2,409 | ||
H.J. Heinz Co. 4.25% 10/15/20 | 12,790 | 12,915 | ||
H.J. Heinz Finance Co. 7.125% 8/1/39 (g) | 300 | 332 | ||
JBS U.S.A. LLC/JBS U.S.A. Finance, Inc. 5.875% 7/15/24 (g) | 2,435 | 2,447 | ||
Post Holdings, Inc.: | ||||
6% 12/15/22 (g) | 1,195 | 1,153 | ||
6.75% 12/1/21 (g) | 5,380 | 5,373 | ||
| 31,840 | |||
Gaming - 2.4% | ||||
Caesars Growth Properties Holdings LLC/Caesars Growth Properties Finance, Inc. 9.375% 5/1/22 (g) | 7,110 | 6,612 | ||
GLP Capital LP/GLP Financing II, Inc.: | ||||
4.375% 11/1/18 | 820 | 843 | ||
4.875% 11/1/20 | 2,140 | 2,226 | ||
5.375% 11/1/23 | 1,700 | 1,789 | ||
Golden Nugget Escrow, Inc. 8.5% 12/1/21 (g) | 10,735 | 10,681 | ||
Graton Economic Development Authority 9.625% 9/1/19 (g) | 1,730 | 1,938 | ||
MCE Finance Ltd. 5% 2/15/21 (g) | 2,100 | 2,069 | ||
MGM Mirage, Inc.: | ||||
6.875% 4/1/16 | 820 | 863 | ||
8.625% 2/1/19 | 5,000 | 5,788 | ||
Paris Las Vegas Holding LLC/Harrah's Las Vegas LLC/Flamingo Las Vegas Holdings, Inc.: | ||||
8% 10/1/20 (g) | 4,505 | 4,370 | ||
11% 10/1/21 (g) | 2,725 | 2,531 | ||
Studio City Finance Ltd. 8.5% 12/1/20 (g) | 8,920 | 9,678 | ||
| 49,388 | |||
Healthcare - 5.9% | ||||
Aviv Healthcare Properties LP/Aviv Healthcare Capital Corp.: | ||||
6% 10/15/21 | 685 | 706 | ||
7.75% 2/15/19 | 4,441 | 4,663 | ||
Catamaran Corp. 4.75% 3/15/21 (Reg. S) | 1,965 | 1,950 | ||
CTR Partnership LP/CareTrust Capital Corp. 5.875% 6/1/21 | 355 | 362 | ||
DaVita HealthCare Partners, Inc.: | ||||
5.125% 7/15/24 | 4,500 | 4,590 | ||
Corporate Bonds - continued | ||||
| Principal | Value (000s) | ||
Nonconvertible Bonds - continued | ||||
Healthcare - continued | ||||
DaVita HealthCare Partners, Inc.: - continued | ||||
5.75% 8/15/22 | $ 1,970 | $ 2,088 | ||
Grifols Worldwide Operations Ltd. 5.25% 4/1/22 (g) | 2,915 | 2,988 | ||
HCA Holdings, Inc.: | ||||
4.75% 5/1/23 | 4,475 | 4,548 | ||
5% 3/15/24 | 3,060 | 3,156 | ||
5.875% 3/15/22 | 8,635 | 9,477 | ||
6.25% 2/15/21 | 2,265 | 2,438 | ||
6.5% 2/15/20 | 7,640 | 8,528 | ||
7.5% 2/15/22 | 5,095 | 5,917 | ||
7.75% 5/15/21 | 6,114 | 6,588 | ||
HealthSouth Corp. 5.75% 11/1/24 | 3,280 | 3,444 | ||
IMS Health, Inc. 6% 11/1/20 (g) | 1,175 | 1,219 | ||
Omega Healthcare Investors, Inc.: | ||||
5.875% 3/15/24 | 410 | 441 | ||
6.75% 10/15/22 | 2,631 | 2,809 | ||
Polymer Group, Inc. 6.875% 6/1/19 (g) | 890 | 879 | ||
Sabra Health Care LP/Sabra Capital Corp. 5.5% 2/1/21 | 1,080 | 1,121 | ||
Salix Pharmaceuticals Ltd. 6% 1/15/21 (g) | 620 | 671 | ||
Service Corp. International 5.375% 1/15/22 | 815 | 844 | ||
Tenet Healthcare Corp.: | ||||
4.375% 10/1/21 | 8,990 | 8,934 | ||
4.5% 4/1/21 | 1,670 | 1,674 | ||
4.75% 6/1/20 | 1,665 | 1,702 | ||
5% 3/1/19 (g) | 2,970 | 2,974 | ||
6% 10/1/20 | 1,890 | 2,032 | ||
6.75% 2/1/20 | 1,800 | 1,904 | ||
8.125% 4/1/22 | 7,570 | 8,677 | ||
Valeant Pharmaceuticals International: | ||||
5.625% 12/1/21 (g) | 1,395 | 1,385 | ||
6.75% 8/15/18 (g) | 5,800 | 6,170 | ||
7.25% 7/15/22 (g) | 315 | 332 | ||
7.5% 7/15/21 (g) | 7,250 | 7,758 | ||
VPI Escrow Corp. 6.375% 10/15/20 (g) | 2,380 | 2,442 | ||
VWR Funding, Inc. 7.25% 9/15/17 | 4,375 | 4,594 | ||
| 120,005 | |||
Homebuilders/Real Estate - 1.5% | ||||
Beazer Homes U.S.A., Inc. 7.25% 2/1/23 | 1,260 | 1,254 | ||
Corporate Bonds - continued | ||||
| Principal | Value (000s) | ||
Nonconvertible Bonds - continued | ||||
Homebuilders/Real Estate - continued | ||||
Brookfield Residential Properties, Inc./Brookfield Residential U.S. Corp. 6.125% 7/1/22 (g) | $ 1,265 | $ 1,344 | ||
Brookfield Residential Properties, Inc. 6.5% 12/15/20 (g) | 1,000 | 1,065 | ||
CBRE Group, Inc. 5% 3/15/23 | 6,805 | 6,941 | ||
D.R. Horton, Inc.: | ||||
4.75% 2/15/23 | 915 | 904 | ||
5.75% 8/15/23 | 750 | 800 | ||
Howard Hughes Corp. 6.875% 10/1/21 (g) | 3,530 | 3,733 | ||
Kennedy-Wilson, Inc. 5.875% 4/1/24 | 1,395 | 1,421 | ||
Realogy Group LLC/Realogy Co.-Issuer Corp. 4.5% 4/15/19 (g) | 3,085 | 3,093 | ||
Taylor Morrison Communities, Inc./Monarch Communities, Inc. 5.625% 3/1/24 (g) | 895 | 886 | ||
Weyerhaeuser Real Estate Co.: | ||||
4.375% 6/15/19 (g) | 1,315 | 1,308 | ||
5.875% 6/15/24 (g) | 960 | 979 | ||
William Lyon Homes, Inc. 8.5% 11/15/20 | 2,170 | 2,371 | ||
WLH PNW Finance Corp. 7% 8/15/22 (g) | 1,860 | 1,920 | ||
Woodside Homes Co. LLC/Woodside Homes Finance, Inc. 6.75% 12/15/21 (g) | 2,215 | 2,226 | ||
| 30,245 | |||
Hotels - 0.6% | ||||
Choice Hotels International, Inc. 5.75% 7/1/22 | 615 | 663 | ||
Hilton Worldwide Finance LLC/Hilton Worldwide Finance Corp. 5.625% 10/15/21 (g) | 10,040 | 10,580 | ||
| 11,243 | |||
Insurance - 0.2% | ||||
Hockey Merger Sub 2, Inc. 7.875% 10/1/21 (g) | 2,765 | 2,883 | ||
Hub Holdings LLC / Hub Holdings Finance, Inc. 8.125% 7/15/19 pay-in-kind (g)(i) | 1,220 | 1,211 | ||
| 4,094 | |||
Leisure - 0.0% | ||||
24 Hour Holdings III LLC 8% 6/1/22 (g) | 895 | 846 | ||
Metals/Mining - 1.0% | ||||
Alcoa, Inc. 5.125% 10/1/24 | 1,008 | 1,064 | ||
Alpha Natural Resources, Inc.: | ||||
6% 6/1/19 | 3,730 | 1,865 | ||
6.25% 6/1/21 | 4,245 | 2,016 | ||
9.75% 4/15/18 | 1,770 | 1,155 | ||
Corporate Bonds - continued | ||||
| Principal | Value (000s) | ||
Nonconvertible Bonds - continued | ||||
Metals/Mining - continued | ||||
Bluescope Steel Ltd./Bluescope Steel Finance 7.125% 5/1/18 (g) | $ 415 | $ 432 | ||
Calcipar SA 6.875% 5/1/18 (g) | 1,070 | 1,107 | ||
Compass Minerals International, Inc. 4.875% 7/15/24 (g) | 2,280 | 2,234 | ||
Murray Energy Corp.: | ||||
8.625% 6/15/21 (g) | 1,540 | 1,590 | ||
9.5% 12/5/20 (g) | 2,780 | 2,975 | ||
Prince Mineral Holding Corp. 12% 12/15/19 (g) | 655 | 717 | ||
Signode Industrial Group Lux SA/Signode Industrial Group U.S., Inc. 6.375% 5/1/22 (g) | 1,040 | 1,009 | ||
Walter Energy, Inc.: | ||||
9.5% 10/15/19 (g) | 3,275 | 2,841 | ||
12% 4/1/20 pay-in-kind (g)(i) | 1,545 | 680 | ||
| 19,685 | |||
Paper - 0.1% | ||||
Clearwater Paper Corp. 4.5% 2/1/23 | 2,045 | 1,994 | ||
Publishing/Printing - 1.5% | ||||
Cenveo Corp. 6% 8/1/19 (g) | 1,290 | 1,242 | ||
Griffey Intermediate, Inc./Griffey Finance Sub LLC 7% 10/15/20 (g) | 4,610 | 3,550 | ||
McGraw-Hill Global Education Holdings LLC/McGraw-Hill Global Education Finance 9.75% 4/1/21 | 14,305 | 16,165 | ||
MHGE Parent LLC / MHGE Parent Finance, Inc. 8.5% 8/1/19 pay-in-kind (g)(i) | 5,925 | 5,851 | ||
R.R. Donnelley & Sons Co.: | ||||
6% 4/1/24 | 960 | 960 | ||
6.5% 11/15/23 | 2,890 | 2,991 | ||
| 30,759 | |||
Railroad - 0.2% | ||||
Jurassic Holdings III, Inc. 6.875% 2/15/21 (Reg. S) (g) | 1,920 | 1,934 | ||
Ultrapetrol (Bahamas) Ltd. 8.875% 6/15/21 | 1,285 | 1,349 | ||
| 3,283 | |||
Restaurants - 0.5% | ||||
1011778 BC ULC/New Red Finance, Inc. 6% 4/1/22 (g) | 1,390 | 1,409 | ||
Corporate Bonds - continued | ||||
| Principal | Value (000s) | ||
Nonconvertible Bonds - continued | ||||
Restaurants - continued | ||||
Landry's Acquisition Co. 9.375% 5/1/20 (g) | $ 4,040 | $ 4,318 | ||
Landry's Holdings II, Inc. 10.25% 1/1/18 (g) | 4,205 | 4,373 | ||
| 10,100 | |||
Services - 2.8% | ||||
Ahern Rentals, Inc. 9.5% 6/15/18 (g) | 470 | 502 | ||
Anna Merger Sub, Inc. 7.75% 10/1/22 (g) | 3,165 | 3,224 | ||
APX Group, Inc.: | ||||
6.375% 12/1/19 | 8,560 | 8,410 | ||
8.75% 12/1/20 | 11,350 | 9,818 | ||
Ashtead Capital, Inc. 5.625% 10/1/24 (g) | 3,195 | 3,331 | ||
Audatex North America, Inc.: | ||||
6% 6/15/21 (g) | 8,190 | 8,661 | ||
6.125% 11/1/23 (g) | 590 | 625 | ||
Blueline Rent Finance Corp./Volvo 7% 2/1/19 (g) | 815 | 858 | ||
CBRE Group, Inc. 5.25% 3/15/25 | 2,115 | 2,165 | ||
Ceridian LLC / Comdata, Inc. 8.125% 11/15/17 (g) | 2,460 | 2,460 | ||
FTI Consulting, Inc. 6% 11/15/22 | 2,450 | 2,508 | ||
Garda World Security Corp.: | ||||
7.25% 11/15/21 (g) | 2,435 | 2,423 | ||
7.25% 11/15/21 (g) | 920 | 915 | ||
Hertz Corp.: | ||||
5.875% 10/15/20 | 990 | 997 | ||
6.25% 10/15/22 | 1,315 | 1,341 | ||
Laureate Education, Inc. 9.75% 9/1/19 (g)(i) | 6,520 | 6,716 | ||
NES Rentals Holdings, Inc. 7.875% 5/1/18 (g) | 600 | 623 | ||
TMS International Corp. 7.625% 10/15/21 (g) | 420 | 439 | ||
TransUnion Holding Co., Inc. 9.625% 6/15/18 pay-in-kind (i) | 1,255 | 1,296 | ||
| 57,312 | |||
Shipping - 1.1% | ||||
Navios Maritime Acquisition Corp./Navios Acquisition Finance U.S., Inc. 8.125% 11/15/21 (g) | 3,070 | 3,124 | ||
Navios Maritime Holdings, Inc.: | ||||
7.375% 1/15/22 (g) | 7,940 | 7,980 | ||
8.125% 2/15/19 | 2,489 | 2,408 | ||
Navios South American Logistics, Inc./Navios Logistics Finance U.S., Inc. 7.25% 5/1/22 (g) | 2,020 | 2,035 | ||
Teekay Corp. 8.5% 1/15/20 | 195 | 216 | ||
Corporate Bonds - continued | ||||
| Principal | Value (000s) | ||
Nonconvertible Bonds - continued | ||||
Shipping - continued | ||||
TRAC Intermodal LLC/TRAC Intermodal Corp. 11% 8/15/19 | $ 1,475 | $ 1,626 | ||
Western Express, Inc. 12.5% 4/15/15 (g) | 6,070 | 5,372 | ||
| 22,761 | |||
Steel - 0.9% | ||||
JMC Steel Group, Inc. 8.25% 3/15/18 (g) | 11,106 | 11,273 | ||
Ryerson, Inc./Joseph T Ryerson & Son, Inc.: | ||||
9% 10/15/17 | 5,550 | 5,841 | ||
11.25% 10/15/18 | 1,303 | 1,420 | ||
| 18,534 | |||
Super Retail - 0.5% | ||||
Asbury Automotive Group, Inc. 8.375% 11/15/20 | 788 | 851 | ||
JC Penney Corp., Inc.: | ||||
5.65% 6/1/20 | 2,375 | 1,953 | ||
5.75% 2/15/18 | 703 | 657 | ||
7.4% 4/1/37 | 775 | 597 | ||
8.125% 10/1/19 | 3,785 | 3,634 | ||
Sally Holdings LLC 5.5% 11/1/23 | 925 | 976 | ||
Sonic Automotive, Inc.: | ||||
5% 5/15/23 | 315 | 306 | ||
7% 7/15/22 | 1,390 | 1,515 | ||
| 10,489 | |||
Technology - 3.2% | ||||
Activision Blizzard, Inc. 6.125% 9/15/23 (g) | 2,075 | 2,246 | ||
ADT Corp. 6.25% 10/15/21 | 1,895 | 1,990 | ||
Avaya, Inc. 7% 4/1/19 (g) | 822 | 808 | ||
BMC Software Finance, Inc. 8.125% 7/15/21 (g) | 5,860 | 5,611 | ||
Boxer Parent Co., Inc. 9% 10/15/19 pay-in-kind (g)(i) | 3,000 | 2,691 | ||
CDW LLC/CDW Finance Corp. 6% 8/15/22 | 2,950 | 3,112 | ||
Ceridian Corp. 8.875% 7/15/19 (g) | 1,755 | 1,939 | ||
Compiler Finance Sub, Inc. 7% 5/1/21 (g) | 1,210 | 1,107 | ||
Entegris, Inc. 6% 4/1/22 (g) | 635 | 646 | ||
First Data Corp.: | ||||
6.75% 11/1/20 (g) | 3,570 | 3,820 | ||
11.25% 1/15/21 | 3,136 | 3,614 | ||
11.75% 8/15/21 | 840 | 985 | ||
Infor Software Parent LLC/Infor Software Parent, Inc. 7.125% 5/1/21 pay-in-kind (g)(i) | 950 | 962 | ||
Corporate Bonds - continued | ||||
| Principal | Value (000s) | ||
Nonconvertible Bonds - continued | ||||
Technology - continued | ||||
Lucent Technologies, Inc.: | ||||
6.45% 3/15/29 | $ 12,334 | $ 11,871 | ||
6.5% 1/15/28 | 5,415 | 5,212 | ||
Micron Technology, Inc. 5.875% 2/15/22 (g) | 1,520 | 1,596 | ||
Quad/Graphics, Inc. 7% 5/1/22 (g) | 670 | 643 | ||
SunGard Data Systems, Inc. 6.625% 11/1/19 | 3,600 | 3,726 | ||
VeriSign, Inc. 4.625% 5/1/23 | 2,525 | 2,516 | ||
WideOpenWest Finance LLC/WideOpenWest Capital Corp.: | ||||
10.25% 7/15/19 | 5,620 | 6,168 | ||
13.375% 10/15/19 | 2,840 | 3,238 | ||
| 64,501 | |||
Telecommunications - 8.7% | ||||
Alcatel-Lucent U.S.A., Inc.: | ||||
4.625% 7/1/17 (g) | 1,435 | 1,458 | ||
6.75% 11/15/20 (g) | 3,390 | 3,492 | ||
Altice Financing SA 6.5% 1/15/22 (g) | 895 | 920 | ||
Altice Finco SA: | ||||
8.125% 1/15/24 (g) | 540 | 568 | ||
9.875% 12/15/20 (g) | 945 | 1,054 | ||
Broadview Networks Holdings, Inc. 10.5% 11/15/17 | 2,915 | 2,842 | ||
Citizens Communications Co. 7.875% 1/15/27 | 4,949 | 5,147 | ||
Clearwire Communications LLC/Clearwire Finance, Inc. 14.75% 12/1/16 (g) | 5,300 | 6,546 | ||
Columbus International, Inc. 7.375% 3/30/21 (g) | 9,515 | 10,086 | ||
Digicel Group Ltd.: | ||||
6% 4/15/21 (g) | 4,580 | 4,626 | ||
7% 2/15/20 (g) | 425 | 441 | ||
7.125% 4/1/22 (g) | 3,850 | 3,869 | ||
8.25% 9/1/17 (g) | 1,025 | 1,049 | ||
8.25% 9/30/20 (g) | 10,315 | 10,779 | ||
DigitalGlobe, Inc. 5.25% 2/1/21 (g) | 695 | 676 | ||
Eileme 2 AB 11.625% 1/31/20 (g) | 2,605 | 2,983 | ||
FairPoint Communications, Inc. 8.75% 8/15/19 (g) | 2,375 | 2,506 | ||
Intelsat Jackson Holdings SA: | ||||
5.5% 8/1/23 | 5,655 | 5,669 | ||
6.625% 12/15/22 (Reg. S) | 7,870 | 8,283 | ||
7.5% 4/1/21 | 5,730 | 6,203 | ||
Intelsat Luxembourg SA: | ||||
7.75% 6/1/21 | 8,204 | 8,573 | ||
Corporate Bonds - continued | ||||
| Principal | Value (000s) | ||
Nonconvertible Bonds - continued | ||||
Telecommunications - continued | ||||
Intelsat Luxembourg SA: - continued | ||||
8.125% 6/1/23 | $ 3,585 | $ 3,809 | ||
Level 3 Communications, Inc. 8.875% 6/1/19 | 695 | 745 | ||
Level 3 Escrow II, Inc. 5.375% 8/15/22 (g) | 3,725 | 3,790 | ||
Level 3 Financing, Inc.: | ||||
6.125% 1/15/21 (g) | 2,395 | 2,512 | ||
7% 6/1/20 | 2,365 | 2,525 | ||
SBA Communications Corp. 5.625% 10/1/19 | 3,075 | 3,202 | ||
Sprint Capital Corp.: | ||||
6.875% 11/15/28 | 1,870 | 1,819 | ||
6.9% 5/1/19 | 4,761 | 5,047 | ||
8.75% 3/15/32 | 3,250 | 3,632 | ||
Sprint Communications, Inc.: | ||||
6% 12/1/16 | 6,729 | 7,124 | ||
6% 11/15/22 | 13,364 | 13,331 | ||
9% 11/15/18 (g) | 5,500 | 6,469 | ||
Sprint Corp.: | ||||
7.125% 6/15/24 (g) | 2,580 | 2,651 | ||
7.875% 9/15/23 (g) | 4,245 | 4,595 | ||
T-Mobile U.S.A., Inc.: | ||||
5.25% 9/1/18 | 1,565 | 1,624 | ||
6.25% 4/1/21 | 3,295 | 3,439 | ||
6.464% 4/28/19 | 705 | 735 | ||
6.5% 1/15/24 | 3,970 | 4,159 | ||
6.542% 4/28/20 | 2,465 | 2,601 | ||
6.625% 4/1/23 | 4,925 | 5,196 | ||
6.633% 4/28/21 | 2,225 | 2,345 | ||
6.731% 4/28/22 | 1,645 | 1,740 | ||
6.836% 4/28/23 | 480 | 508 | ||
Wind Acquisition Finance SA 4.75% 7/15/20 (g) | 5,565 | 5,440 | ||
| 176,808 | |||
TOTAL NONCONVERTIBLE BONDS | 1,425,950 | |||
TOTAL CORPORATE BONDS (Cost $1,388,827) |
| |||
Common Stocks - 15.4% | |||
Shares | Value (000s) | ||
Aerospace - 0.3% | |||
Triumph Group, Inc. | 85,000 | $ 5,919 | |
Air Transportation - 0.4% | |||
American Airlines Group, Inc. | 100,000 | 4,135 | |
Delta Air Lines, Inc. | 100,000 | 4,023 | |
| 8,158 | ||
Automotive - 0.8% | |||
Delphi Automotive PLC | 47,622 | 3,285 | |
General Motors Co. | 274,238 | 8,611 | |
General Motors Co.: | |||
warrants 7/10/16 (a) | 7,547 | 164 | |
warrants 7/10/19 (a) | 7,547 | 108 | |
Motors Liquidation Co. GUC Trust (a) | 39,254 | 907 | |
Trinseo SA | 220,098 | 3,180 | |
| 16,255 | ||
Banks & Thrifts - 0.5% | |||
Bank of America Corp. | 200,000 | 3,432 | |
JPMorgan Chase & Co. | 100,000 | 6,048 | |
Washington Mutual, Inc. (a) | 505,500 | 0 | |
WMI Holdings Corp. (a) | 17,318 | 37 | |
| 9,517 | ||
Broadcasting - 0.5% | |||
Cumulus Media, Inc. Class A (a) | 550,600 | 2,125 | |
Gray Television, Inc. (a) | 494,070 | 4,565 | |
Sinclair Broadcast Group, Inc. Class A | 100,000 | 2,905 | |
| 9,595 | ||
Building Materials - 0.1% | |||
Gibraltar Industries, Inc. (a) | 141,340 | 2,155 | |
Cable TV - 0.3% | |||
Time Warner Cable, Inc. | 41,300 | 6,080 | |
Chemicals - 0.6% | |||
Axiall Corp. | 100,000 | 4,030 | |
LyondellBasell Industries NV Class A | 84,795 | 7,770 | |
Westlake Chemical Partners LP | 3,400 | 103 | |
| 11,903 | ||
Consumer Products - 0.5% | |||
Whirlpool Corp. | 60,000 | 10,323 | |
Containers - 0.4% | |||
Graphic Packaging Holding Co. (a) | 617,874 | 7,495 | |
Common Stocks - continued | |||
Shares | Value (000s) | ||
Diversified Financial Services - 0.7% | |||
Citigroup, Inc. | 116,564 | $ 6,240 | |
The Blackstone Group LP | 300,000 | 9,036 | |
| 15,276 | ||
Energy - 0.5% | |||
EP Energy Corp. (f) | 141,500 | 2,066 | |
Ocean Rig UDW, Inc. (United States) | 235,000 | 3,231 | |
The Williams Companies, Inc. | 61,000 | 3,386 | |
Vantage Drilling Co. (a) | 2,000,000 | 1,935 | |
| 10,618 | ||
Environmental - 0.3% | |||
Darling International, Inc. (a) | 300,000 | 5,280 | |
Food/Beverage/Tobacco - 0.9% | |||
Carlyle Group LP | 72,700 | 2,018 | |
Dean Foods Co. (f) | 400,000 | 5,884 | |
Monster Beverage Corp. (a) | 100,000 | 10,088 | |
| 17,990 | ||
Gaming - 0.8% | |||
Gaming & Leisure Properties | 119,574 | 3,737 | |
Las Vegas Sands Corp. | 130,000 | 8,094 | |
Station Holdco LLC (a)(j)(l) | 1,531,479 | 4,043 | |
Station Holdco LLC (a)(j)(l) | 11,653 | 31 | |
Station Holdco LLC: | |||
unit (a)(j)(l) | 3,411 | 1 | |
warrants 6/15/18 (a)(j)(l) | 96,849 | 36 | |
| 15,942 | ||
Healthcare - 0.7% | |||
Legend Acquisition, Inc. | 18,796 | 288 | |
Legend Acquisition, Inc.: | |||
Class A warrants (a) | 28,063 | 0 | |
Class B warrants (a) | 37,006 | 0 | |
Tenet Healthcare Corp. (a) | 113,675 | 6,371 | |
Universal Health Services, Inc. Class B | 75,000 | 7,778 | |
| 14,437 | ||
Homebuilders/Real Estate - 0.5% | |||
Lennar Corp. Class A | 200,000 | 8,616 | |
Realogy Holdings Corp. (a) | 46,400 | 1,903 | |
| 10,519 | ||
Common Stocks - continued | |||
Shares | Value (000s) | ||
Hotels - 0.6% | |||
Extended Stay America, Inc. unit | 194,400 | $ 4,483 | |
Hyatt Hotels Corp. Class A (a) | 145,000 | 8,587 | |
| 13,070 | ||
Insurance - 0.3% | |||
H&R Block, Inc. | 200,000 | 6,462 | |
Leisure - 0.2% | |||
Town Sports International Holdings, Inc. | 564,202 | 3,340 | |
Metals/Mining - 0.1% | |||
Alpha Natural Resources, Inc. (a)(f) | 750,000 | 1,470 | |
AngloGold Ashanti Ltd. sponsored ADR (a) | 87,174 | 721 | |
| 2,191 | ||
Publishing/Printing - 0.0% | |||
Houghton Mifflin Harcourt Co. warrants 6/22/19 (a)(l) | 4,323 | 6 | |
Restaurants - 0.9% | |||
Bloomin' Brands, Inc. (a) | 172,900 | 3,270 | |
Dunkin' Brands Group, Inc. | 171,900 | 7,818 | |
Yum! Brands, Inc. | 100,000 | 7,183 | |
| 18,271 | ||
Services - 0.9% | |||
ARAMARK Holdings Corp. | 253,900 | 7,086 | |
KAR Auction Services, Inc. | 347,600 | 10,553 | |
WP Rocket Holdings, Inc. | 1,964,861 | 393 | |
| 18,032 | ||
Shipping - 0.3% | |||
Ship Finance International Ltd. (NY Shares) | 300,000 | 5,157 | |
Ultrapetrol (Bahamas) Ltd. (a) | 7,916 | 24 | |
| 5,181 | ||
Super Retail - 0.4% | |||
Dollar General Corp. (a) | 100,000 | 6,267 | |
Office Depot, Inc. (a) | 500,000 | 2,610 | |
| 8,877 | ||
Technology - 2.4% | |||
CDW Corp. | 300,000 | 9,252 | |
Facebook, Inc. Class A (a) | 76,094 | 5,706 | |
Freescale Semiconductor, Inc. (a) | 150,000 | 2,984 | |
Google, Inc. Class A (a) | 15,000 | 8,518 | |
NXP Semiconductors NV (a) | 125,000 | 8,583 | |
Skyworks Solutions, Inc. | 150,000 | 8,736 | |
Common Stocks - continued | |||
Shares | Value (000s) | ||
Technology - continued | |||
SoftBank Corp. ADR | 150,000 | $ 5,469 | |
Spansion, Inc. Class A (a) | 11,219 | 231 | |
| 49,479 | ||
Telecommunications - 0.5% | |||
Alibaba Group Holding Ltd. sponsored ADR | 32,200 | 3,175 | |
Broadview Networks Holdings, Inc. (a) | 189,475 | 360 | |
Pendrell Corp. (a) | 37,472 | 63 | |
T-Mobile U.S., Inc. (a) | 225,000 | 6,568 | |
| 10,166 | ||
Textiles & Apparel - 0.0% | |||
Arena Brands Holding Corp. Class B (a)(l) | 42,253 | 198 | |
TOTAL COMMON STOCKS (Cost $271,151) |
| ||
Nonconvertible Preferred Stocks - 1.0% | |||
|
|
|
|
Banks & Thrifts - 0.6% | |||
Ally Financial, Inc. 7.00% (g) | 11,491 | 11,508 | |
Diversified Financial Services - 0.4% | |||
GMAC Capital Trust I Series 2, 8.125% | 320,244 | 8,560 | |
Services - 0.0% | |||
WP Rocket Holdings, Inc. 15.00% | 1,437,822 | 1,179 | |
TOTAL NONCONVERTIBLE PREFERRED STOCKS (Cost $14,174) |
| ||
Bank Loan Obligations - 7.9% | ||||
| Principal |
| ||
Aerospace - 0.1% | ||||
TransDigm, Inc.: | ||||
Tranche C, term loan 3.75% 2/28/20 (i) | $ 864 | 849 | ||
Tranche D, term loan 3.75% 6/4/21 (i) | 2,319 | 2,279 | ||
| 3,128 | |||
Broadcasting - 0.2% | ||||
Cumulus Media Holdings, Inc. Tranch B 1LN, term loan 4.25% 12/23/20 (i) | 3,195 | 3,163 | ||
TWCC Holding Corp. Tranche 2LN, term loan 7% 6/26/20 (i) | 1,200 | 1,175 | ||
| 4,338 | |||
Bank Loan Obligations - continued | ||||
| Principal | Value (000s) | ||
Cable TV - 0.0% | ||||
Liberty Cablevision of Puerto Rico: | ||||
Tranche 1LN, term loan 4.5% 1/7/22 (i) | $ 195 | $ 194 | ||
Tranche 2LN, term loan 7.75% 7/7/23 (i) | 765 | 757 | ||
| 951 | |||
Chemicals - 0.1% | ||||
Royal Adhesives & Sealants LLC Tranche 2LN, term loan 9.75% 1/31/19 (i) | 1,960 | 1,975 | ||
Consumer Products - 0.2% | ||||
Bauer Performance Sports Ltd. Tranche B, term loan 4% 4/15/21 (i) | 1,278 | 1,267 | ||
Revlon Consumer Products Corp. term loan 4% 8/19/19 (i) | 3,206 | 3,166 | ||
Spectrum Brands Holdings, Inc. Tranche C, term loan 3.5% 9/4/19 (i) | 406 | 400 | ||
| 4,833 | |||
Containers - 0.1% | ||||
Berry Plastics Corp. Tranche E, term loan 3.75% 1/6/21 (i) | 2,015 | 1,965 | ||
Diversified Financial Services - 0.4% | ||||
AlixPartners LLP Tranche B 2LN, term loan 4% 7/10/20 (i) | 1,269 | 1,249 | ||
HarbourVest Partners LLC Tranche B, term loan 3.25% 2/4/21 (i) | 369 | 362 | ||
Ocwen Loan Servicing, LLC Tranche B, term loan 5% 2/15/18 (i) | 385 | 367 | ||
TransUnion LLC Tranche B, term loan 4% 4/9/21 (i) | 5,313 | 5,244 | ||
| 7,222 | |||
Diversified Media - 0.4% | ||||
Checkout Holding Corp. Tranche 2LN, term loan 7.75% 4/9/22 (i) | 1,080 | 1,026 | ||
McGraw-Hill School Education Tranche B, term loan 6.25% 12/18/19 (i) | 6,208 | 6,193 | ||
| 7,219 | |||
Electric Utilities - 1.5% | ||||
Calpine Construction Finance Co. LP Tranche B 2LN, term loan 3.25% 1/31/22 (i) | 5,885 | 5,716 | ||
Energy Future Holdings Corp. Tranche 1LN, term loan 4.25% 6/19/16 (i) | 23,179 | 23,121 | ||
La Frontera Generation, LLC Tranche B, term loan 4.5% 9/30/20 (i) | 1,148 | 1,140 | ||
Bank Loan Obligations - continued | ||||
| Principal | Value (000s) | ||
Electric Utilities - continued | ||||
Southcross Energy Partners LP Tranche B, term loan 5.25% 8/4/21 (i) | $ 95 | $ 94 | ||
Southcross Holdings Borrower LP Tranche B, term loan 6% 8/4/21 (i) | 175 | 172 | ||
| 30,243 | |||
Energy - 0.7% | ||||
American Energy-Marcellus LLC Tranche B 1LN, term loan 5.25% 8/4/20 (i) | 2,965 | 2,880 | ||
Atlantic Power Ltd. Partnership Tranche B LN, term loan 4.75% 2/24/21 (i) | 401 | 398 | ||
Drillships Ocean Ventures, Inc. Tranche B, term loan 5.5% 7/25/21 (i) | 743 | 712 | ||
Fieldwood Energy, LLC Tranche 2LN, term loan 8.375% 9/30/20 (i) | 7,590 | 7,305 | ||
GIM Channelview Cogeneration LLC Tranche B, term loan 4.25% 5/8/20 (i) | 194 | 194 | ||
Panda Sherman Power, LLC term loan 9% 9/14/18 (i) | 843 | 856 | ||
Panda Temple Power, LLC term loan 7.25% 4/3/19 (i) | 400 | 407 | ||
Sheridan Investment Partners I term loan 4.25% 12/16/20 (i) | 675 | 643 | ||
Sheridan Production Partners I: | ||||
Tranche A, term loan 4.25% 12/16/20 (i) | 94 | 89 | ||
Tranche M, term loan 4.25% 12/16/20 (i) | 35 | 33 | ||
| 13,517 | |||
Entertainment/Film - 0.0% | ||||
CBS Outdoor Americas Capital LLC/CBS Outdoor Americas Capital Corp. Tranche B, term loan 3% 1/31/21 (i) | 325 | 318 | ||
Livent, Inc.: | ||||
Tranche A, term loan 18% 1/15/49 pay-in-kind (a) | CAD | 289 | 256 | |
Tranche B, term loan 18% 1/15/49 pay-in-kind (a) | CAD | 176 | 156 | |
| 730 | |||
Environmental - 0.3% | ||||
The Brickman Group, Ltd. Tranche B 1LN, term loan 4% 12/18/20 (i) | 7,252 | 7,143 | ||
Food/Beverage/Tobacco - 0.1% | ||||
Arysta Lifescience SPC LLC: | ||||
Tranche B 1LN, term loan 4.5% 5/29/20 (i) | 676 | 674 | ||
Tranche B 2LN, term loan 8.25% 11/30/20 (i) | 585 | 589 | ||
| 1,263 | |||
Bank Loan Obligations - continued | ||||
| Principal | Value (000s) | ||
Gaming - 0.5% | ||||
Caesars Entertainment Resort Properties LLC Tranche B 1LN, term loan 7% 10/11/20 (i) | $ 6,074 | $ 5,786 | ||
Caesars Growth Properties Holdings, LLC Tranche 1LN, term loan 6.25% 5/8/21 (i) | 773 | 729 | ||
Graton Economic Development Authority Tranche B, term loan 9% 8/22/18 (i) | 795 | 819 | ||
Station Casinos LLC Tranche B, term loan 4.25% 3/1/20 (i) | 2,679 | 2,646 | ||
| 9,980 | |||
Healthcare - 0.6% | ||||
Dialysis Newco, Inc.: | ||||
Tranche 2LN, term loan 7.75% 10/22/21 (i) | 1,804 | 1,795 | ||
Tranche B 1LN, term loan 4.5% 4/23/21 (i) | 5,646 | 5,582 | ||
MModal IP LLC Tranche B, term loan 9% 1/31/20 (i) | 1,125 | 1,097 | ||
Patheon, Inc. Tranche B, term loan 4.2531% 3/11/21 (i) | 2,319 | 2,261 | ||
Rural/Metro Corp. Tranche B, term loan 9% 6/30/18 (i) | 461 | 430 | ||
Salix Pharmaceuticals Ltd. Tranche B, term loan 4.25% 1/2/20 (i) | 197 | 197 | ||
U.S. Renal Care, Inc.: | ||||
Tranche 2LN, term loan 8.5% 1/3/20 (i) | 120 | 120 | ||
Tranche B 2LN, term loan 4.25% 7/3/19 (i) | 193 | 192 | ||
| 11,674 | |||
Homebuilders/Real Estate - 0.2% | ||||
DTZ U.S. Borrower LLC: | ||||
Tranche 2LN, term loan 10/28/22 (k) | 905 | 907 | ||
Tranche B 1LN, term loan 10/28/21 (k) | 1,416 | 1,420 | ||
Tranche B, term loan 10/28/21 (k) | 844 | 846 | ||
Realogy Corp. Credit-Linked Deposit 4.4463% 10/10/16 (i) | 609 | 596 | ||
| 3,769 | |||
Metals/Mining - 0.0% | ||||
Ameriforge Group, Inc. Tranche B 2LN, term loan 8.75% 12/19/20 (i) | 190 | 189 | ||
Oxbow Carbon LLC Tranche B 1LN, term loan 4.25% 7/19/19 (i) | 164 | 161 | ||
| 350 | |||
Paper - 0.0% | ||||
White Birch Paper Co. Tranche 2LN, term loan 12/31/49 (d)(k) | 8,620 | 0 | ||
Bank Loan Obligations - continued | ||||
| Principal | Value (000s) | ||
Publishing/Printing - 0.0% | ||||
Houghton Mifflin Harcourt Publishing, Inc. Tranche B, term loan 4.25% 5/22/18 (i) | $ 268 | $ 267 | ||
Services - 0.7% | ||||
EFS Cogen Holdings I LLC Tranche B, term loan 3.75% 12/17/20 (i) | 224 | 221 | ||
Garda World Security Corp.: | ||||
term loan 4% 11/8/20 (i) | 642 | 628 | ||
Tranche DD, term loan 4% 11/8/20 (i) | 164 | 161 | ||
Karman Buyer Corp. Tranche 2LN, term loan 7.5% 7/25/22 (i) | 150 | 149 | ||
Laureate Education, Inc. Tranche B, term loan 5% 6/16/18 (i) | 6,305 | 6,084 | ||
The ServiceMaster Co. Tranche B, term loan 4.25% 7/1/21 (i) | 7,325 | 7,270 | ||
| 14,513 | |||
Super Retail - 0.1% | ||||
BJ's Wholesale Club, Inc. Tranche B 1LN, term loan 4.5% 9/26/19 (i) | 774 | 766 | ||
J. Crew Group, Inc. Tranche B LN, term loan 4% 3/5/21 (i) | 552 | 531 | ||
| 1,297 | |||
Technology - 1.2% | ||||
Avago Technologies, Inc. Tranche B, term loan 3.75% 5/6/21 (i) | 4,648 | 4,632 | ||
First Data Corp. Tranche B, term loan 3.653% 3/24/18 (i) | 10,435 | 10,252 | ||
Freescale Semiconductor, Inc. Tranche B 4LN, term loan 4.25% 3/1/20 (i) | 4,049 | 3,994 | ||
Infor U.S., Inc. Tranche B 5LN, term loan 3.75% 6/3/20 (i) | 1,085 | 1,069 | ||
Kronos, Inc. Tranche 2LN, term loan 9.75% 4/30/20 (i) | 3,645 | 3,736 | ||
Renaissance Learning, Inc.: | ||||
Tranche 1LN, term loan 4.5% 4/9/21 (i) | 1,020 | 1,002 | ||
Tranche 2LN, term loan 8% 4/9/22 (i) | 870 | 848 | ||
| 25,533 | |||
Telecommunications - 0.5% | ||||
Altice Financing SA Tranche B, term loan 5.5% 6/24/19 (i) | 7,946 | 7,976 | ||
Bank Loan Obligations - continued | ||||
| Principal | Value (000s) | ||
Telecommunications - continued | ||||
Intelsat Jackson Holdings SA Tranche B 2LN, term loan 3.75% 6/30/19 (i) | $ 1,635 | $ 1,621 | ||
LTS Buyer LLC Tranche 2LN, term loan 8% 4/11/21 (i) | 63 | 63 | ||
| 9,660 | |||
TOTAL BANK LOAN OBLIGATIONS (Cost $170,535) |
| |||
Preferred Securities - 2.9% | ||||
| ||||
Banks & Thrifts - 1.6% | ||||
Bank of America Corp. 5.2% (h)(i) | 2,745 | 2,606 | ||
Barclays Bank PLC 7.625% 11/21/22 | 12,695 | 14,261 | ||
Credit Agricole SA 6.625% (g)(h)(i) | 6,105 | 6,005 | ||
JPMorgan Chase & Co. 5.15% (h)(i) | 9,715 | 9,455 | ||
| 32,327 | |||
Diversified Financial Services - 1.3% | ||||
Citigroup, Inc.: | ||||
5.35% (h)(i) | 24,830 | 23,768 | ||
5.9% (h)(i) | 2,100 | 2,116 | ||
| 25,884 | |||
TOTAL PREFERRED SECURITIES (Cost $59,387) |
| |||
Money Market Funds - 2.2% | |||
Shares |
| ||
Fidelity Cash Central Fund, 0.11% (b) | 41,190,094 | 41,190 | |
Fidelity Securities Lending Cash Central Fund, 0.11% (b)(c) | 3,167,025 | 3,167 | |
TOTAL MONEY MARKET FUNDS (Cost $44,357) |
| ||
TOTAL INVESTMENT PORTFOLIO - 99.4% (Cost $1,948,431) | 2,024,102 | ||
NET OTHER ASSETS (LIABILITIES) - 0.6% | 11,999 | ||
NET ASSETS - 100% | $ 2,036,101 | ||
Currency Abbreviations | ||
CAD | - | Canadian dollar |
Legend |
(a) Non-income producing |
(b) Affiliated fund that is generally available only to investment companies and other accounts managed by Fidelity Investments. The rate quoted is the annualized seven-day yield of the fund at period end. A complete unaudited listing of the fund's holdings as of its most recent quarter end is available upon request. In addition, each Fidelity Central Fund's financial statements, which are not covered by the Fund's Report of Independent Registered Public Accounting Firm, are available on the SEC's website or upon request. |
(c) Investment made with cash collateral received from securities on loan. |
(d) Non-income producing - Security is in default. |
(e) Amount is stated in United States dollars unless otherwise noted. |
(f) Security or a portion of the security is on loan at period end. |
(g) Security exempt from registration under Rule 144A of the Securities Act of 1933. These securities may be resold in transactions exempt from registration, normally to qualified institutional buyers. At the end of the period, the value of these securities amounted to $587,950,000 or 28.9% of net assets. |
(h) Security is perpetual in nature with no stated maturity date. |
(i) Coupon rates for floating and adjustable rate securities reflect the rates in effect at period end. |
(j) Investment is owned by an entity that is treated as a corporation for U.S. tax purposes and is owned by the Fund. |
(k) The coupon rate will be determined upon settlement of the loan after period end. |
(l) Restricted securities - Investment in securities not registered under the Securities Act of 1933 (excluding 144A issues). At the end of the period, the value of restricted securities (excluding 144A issues) amounted to $4,315,000 or 0.2% of net assets. |
Additional information on each restricted holding is as follows: |
Security | Acquisition Date | Acquisition Cost (000s) |
Arena Brands Holding Corp. Class B | 6/18/97 - 7/13/98 | $ 1,538 |
Houghton Mifflin Harcourt Co. warrants 6/22/19 | 6/22/12 | $ 8 |
Station Holdco LLC | 6/17/11 - 4/1/13 | $ 1,450 |
Station Holdco LLC unit | 4/1/13 | $ 0* |
Station Holdco LLC warrants 6/15/18 | 10/28/08 - 12/1/08 | $ 3,945 |
(m) Security is subject to an agreement restricting sale entered into subsequent to period in connection with the litigation described in the Notes to Financial Statements. |
* Amount represents less than $1,000. |
Affiliated Central Funds |
Information regarding fiscal year to date income earned by the Fund from investments in Fidelity Central Funds is as follows: |
Fund | Income earned |
Fidelity Cash Central Fund | $ 76 |
Fidelity Securities Lending Cash Central Fund | 40 |
Total | $ 116 |
Other Information |
The following is a summary of the inputs used, as of October 31, 2014, involving the Fund's assets and liabilities carried at fair value. The inputs or methodology used for valuing securities may not be an indication of the risk associated with investing in those securities. For more information on valuation inputs, and their aggregation into the levels used in the table below, please refer to the Investment Valuation section in the accompanying Notes to Financial Statements. |
Valuation Inputs at Reporting Date: | ||||
Description | Total | Level 1 | Level 2 | Level 3 |
Investments in Securities: | ||||
Equities: | ||||
Consumer Discretionary | $ 117,204 | $ 112,889 | $ - | $ 4,315 |
Consumer Staples | 21,252 | 21,252 | - | - |
Energy | 17,245 | 17,245 | - | - |
Financials | 52,519 | 41,011 | 11,508 | - |
Health Care | 14,437 | 14,149 | - | 288 |
Industrials | 28,444 | 26,872 | - | 1,572 |
Information Technology | 47,185 | 47,185 | - | - |
Materials | 23,299 | 23,299 | - | - |
Telecommunication Services | 12,397 | 12,397 | - | - |
Corporate Bonds | 1,425,982 | - | 1,425,981 | 1 |
Bank Loan Obligations | 161,570 | - | 159,363 | 2,207 |
Preferred Securities | 58,211 | - | 58,211 | - |
Money Market Funds | 44,357 | 44,357 | - | - |
Total Investments in Securities: | $ 2,024,102 | $ 360,656 | $ 1,655,063 | $ 8,383 |
Distribution of investments by country or territory of incorporation, as a percentage of total net assets, is as follows (Unaudited): |
United States of America | 81.2% |
Luxembourg | 4.2% |
Canada | 2.1% |
United Kingdom | 1.8% |
Netherlands | 1.7% |
France | 1.6% |
Bermuda | 1.5% |
Ireland | 1.1% |
Cayman Islands | 1.0% |
Others (Individually Less Than 1%) | 3.8% |
| 100.0% |
See accompanying notes which are an integral part of the financial statements.
Annual Report
Financial Statements
Statement of Assets and Liabilities
Amounts in thousands (except per-share amounts) | October 31, 2014 | |
|
|
|
Assets | ||
Investment in securities, at value (including securities loaned of $3,160) - See accompanying schedule: Unaffiliated issuers (cost $1,904,074) | $ 1,979,745 |
|
Fidelity Central Funds (cost $44,357) | 44,357 |
|
Total Investments (cost $1,948,431) |
| $ 2,024,102 |
Cash |
| 416 |
Receivable for investments sold | 4,692 | |
Receivable for fund shares sold | 1,801 | |
Dividends receivable | 464 | |
Interest receivable | 24,725 | |
Distributions receivable from Fidelity Central Funds | 7 | |
Prepaid expenses | 5 | |
Other receivables | 62 | |
Total assets | 2,056,274 | |
|
|
|
Liabilities | ||
Payable for investments purchased | $ 11,165 | |
Payable for fund shares redeemed | 3,196 | |
Distributions payable | 835 | |
Accrued management fee | 943 | |
Distribution and service plan fees payable | 403 | |
Other affiliated payables | 337 | |
Other payables and accrued expenses | 127 | |
Collateral on securities loaned, at value | 3,167 | |
Total liabilities | 20,173 | |
|
|
|
Net Assets | $ 2,036,101 | |
Net Assets consist of: |
| |
Paid in capital | $ 2,429,916 | |
Undistributed net investment income | 7,002 | |
Accumulated undistributed net realized gain (loss) on investments and foreign currency transactions | (476,488) | |
Net unrealized appreciation (depreciation) on investments | 75,671 | |
Net Assets | $ 2,036,101 | |
See accompanying notes which are an integral part of the financial statements.
Annual Report
Statement of Assets and Liabilities - continued
Amounts in thousands (except per-share amounts) | October 31, 2014 | |
|
|
|
Calculation of Maximum Offering Price Class A: | $ 10.88 | |
|
|
|
Maximum offering price per share (100/96.00 of $10.88) | $ 11.33 | |
Class T: | $ 10.93 | |
|
|
|
Maximum offering price per share (100/96.00 of $10.93) | $ 11.39 | |
Class B: | $ 10.80 | |
|
|
|
Class C: | $ 10.86 | |
|
|
|
Institutional Class: | $ 10.20 | |
A Redemption price per share is equal to net asset value less any applicable contingent deferred sales charge.
See accompanying notes which are an integral part of the financial statements.
Annual Report
Financial Statements - continued
Statement of Operations
Amounts in thousands | Year ended October 31, 2014 | |
|
|
|
Investment Income |
|
|
Dividends |
| $ 9,240 |
Interest |
| 101,084 |
Income from Fidelity Central Funds |
| 116 |
Total income |
| 110,440 |
|
|
|
Expenses | ||
Management fee | $ 11,396 | |
Transfer agent fees | 3,279 | |
Distribution and service plan fees | 5,066 | |
Accounting and security lending fees | 669 | |
Custodian fees and expenses | 37 | |
Independent trustees' compensation | 9 | |
Registration fees | 116 | |
Audit | 83 | |
Legal | 37 | |
Miscellaneous | 16 | |
Total expenses before reductions | 20,708 | |
Expense reductions | (9) | 20,699 |
Net investment income (loss) | 89,741 | |
Realized and Unrealized Gain (Loss) Net realized gain (loss) on: | ||
Investment securities: |
|
|
Unaffiliated issuers | 30,797 | |
Foreign currency transactions | 4 | |
Total net realized gain (loss) |
| 30,801 |
Change in net unrealized appreciation (depreciation) on: Investment securities | 11,355 | |
Assets and liabilities in foreign currencies | (4) | |
Total change in net unrealized appreciation (depreciation) |
| 11,351 |
Net gain (loss) | 42,152 | |
Net increase (decrease) in net assets resulting from operations | $ 131,893 | |
See accompanying notes which are an integral part of the financial statements.
Annual Report
Statement of Changes in Net Assets
Amounts in thousands | Year ended | Year ended |
Increase (Decrease) in Net Assets |
|
|
Operations |
|
|
Net investment income (loss) | $ 89,741 | $ 104,188 |
Net realized gain (loss) | 30,801 | 6,723 |
Change in net unrealized appreciation (depreciation) | 11,351 | 95,481 |
Net increase (decrease) in net assets resulting from operations | 131,893 | 206,392 |
Distributions to shareholders from net investment income | (85,375) | (89,629) |
Distributions to shareholders from net realized gain | (21,730) | (24,025) |
Total distributions | (107,105) | (113,654) |
Share transactions - net increase (decrease) | 85,679 | (122,384) |
Redemption fees | 252 | 331 |
Total increase (decrease) in net assets | 110,719 | (29,315) |
|
|
|
Net Assets | ||
Beginning of period | 1,925,382 | 1,954,697 |
End of period (including undistributed net investment income of $7,002 and undistributed net investment income of $25,794, respectively) | $ 2,036,101 | $ 1,925,382 |
See accompanying notes which are an integral part of the financial statements.
Annual Report
Financial Highlights - Class A
Years ended October 31, | 2014 | 2013 | 2012 | 2011 | 2010 |
Selected Per-Share Data |
|
|
|
|
|
Net asset value, beginning of period | $ 10.73 | $ 10.21 | $ 9.59 | $ 9.87 | $ 8.60 |
Income from Investment Operations |
|
|
|
|
|
Net investment income (loss) C | .480 | .569 | .607 | .593 | .650 |
Net realized and unrealized gain (loss) | .236 | .558 | .658 | (.238) | 1.185 |
Total from investment operations | .716 | 1.127 | 1.265 | .355 | 1.835 |
Distributions from net investment income | (.449) | (.482) | (.647) | (.639) | (.550) |
Distributions from net realized gain | (.118) | (.127) | - | - | (.020) |
Total distributions | (.567) | (.609) | (.647) | (.639) | (.570) |
Redemption fees added to paid in capital C | .001 | .002 | .002 | .004 | .005 |
Net asset value, end of period | $ 10.88 | $ 10.73 | $ 10.21 | $ 9.59 | $ 9.87 |
Total ReturnA, B | 6.84% | 11.39% | 13.78% | 3.57% | 22.06% |
Ratios to Average Net Assets D, F |
|
|
|
|
|
Expenses before reductions | 1.02% | 1.02% | 1.03% | 1.03% | 1.03% |
Expenses net of fee waivers, if any | 1.02% | 1.02% | 1.03% | 1.03% | 1.03% |
Expenses net of all reductions | 1.02% | 1.02% | 1.03% | 1.03% | 1.03% |
Net investment income (loss) | 4.42% | 5.42% | 6.18% | 5.93% | 7.03% |
Supplemental Data |
|
|
|
|
|
Net assets, end of period (in millions) | $ 682 | $ 698 | $ 705 | $ 659 | $ 722 |
Portfolio turnover rateE | 41% | 66% | 66% | 68% | 53% |
A Total returns would have been lower if certain expenses had not been reduced during the applicable periods shown.
B Total returns do not include the effect of the sales charges.
C Calculated based on average shares outstanding during the period.
D Fees and expenses of any underlying Fidelity Central Funds are not included in the Fund's expense ratio. The Fund indirectly bears its proportionate share of the expenses of any underlying Fidelity Central Funds.
E Amount does not include the portfolio activity of any underlying Fidelity Central Funds.
F Expense ratios reflect operating expenses of the class. Expenses before reductions do not reflect amounts reimbursed by the investment adviser or reductions from brokerage service arrangements or reductions from other expense offset arrangements and do not represent the amount paid by the class during periods when reimbursements or reductions occur. Expenses net of fee waivers reflect expenses after reimbursement by the investment adviser but prior to reductions from brokerage service arrangements or other expense offset arrangements. Expenses net of all reductions represent the net expenses paid by the class.
See accompanying notes which are an integral part of the financial statements.
Annual Report
Financial Highlights - Class T
Years ended October 31, | 2014 | 2013 | 2012 | 2011 | 2010 |
Selected Per-Share Data |
|
|
|
|
|
Net asset value, beginning of period | $ 10.78 | $ 10.26 | $ 9.64 | $ 9.92 | $ 8.64 |
Income from Investment Operations |
|
|
|
|
|
Net investment income (loss) C | .484 | .573 | .610 | .597 | .653 |
Net realized and unrealized gain (loss) | .233 | .555 | .656 | (.241) | 1.193 |
Total from investment operations | .717 | 1.128 | 1.266 | .356 | 1.846 |
Distributions from net investment income | (.450) | (.483) | (.648) | (.640) | (.551) |
Distributions from net realized gain | (.118) | (.127) | - | - | (.020) |
Total distributions | (.568) | (.610) | (.648) | (.640) | (.571) |
Redemption fees added to paid in capital C | .001 | .002 | .002 | .004 | .005 |
Net asset value, end of period | $ 10.93 | $ 10.78 | $ 10.26 | $ 9.64 | $ 9.92 |
Total ReturnA, B | 6.81% | 11.34% | 13.72% | 3.56% | 22.09% |
Ratios to Average Net Assets D, F |
|
|
|
|
|
Expenses before reductions | 1.01% | 1.01% | 1.02% | 1.02% | 1.02% |
Expenses net of fee waivers, if any | 1.01% | 1.01% | 1.02% | 1.02% | 1.02% |
Expenses net of all reductions | 1.01% | 1.01% | 1.02% | 1.02% | 1.02% |
Net investment income (loss) | 4.43% | 5.43% | 6.19% | 5.94% | 7.04% |
Supplemental Data |
|
|
|
|
|
Net assets, end of period (in millions) | $ 504 | $ 528 | $ 547 | $ 543 | $ 645 |
Portfolio turnover rateE | 41% | 66% | 66% | 68% | 53% |
A Total returns would have been lower if certain expenses had not been reduced during the applicable periods shown.
B Total returns do not include the effect of the sales charges.
C Calculated based on average shares outstanding during the period.
D Fees and expenses of any underlying Fidelity Central Funds are not included in the Fund's expense ratio. The Fund indirectly bears its proportionate share of the expenses of any underlying Fidelity Central Funds.
E Amount does not include the portfolio activity of any underlying Fidelity Central Funds.
F Expense ratios reflect operating expenses of the class. Expenses before reductions do not reflect amounts reimbursed by the investment adviser or reductions from brokerage service arrangements or reductions from other expense offset arrangements and do not represent the amount paid by the class during periods when reimbursements or reductions occur. Expenses net of fee waivers reflect expenses after reimbursement by the investment adviser but prior to reductions from brokerage service arrangements or other expense offset arrangements. Expenses net of all reductions represent the net expenses paid by the class.
See accompanying notes which are an integral part of the financial statements.
Annual Report
Financial Highlights - Class B
Years ended October 31, | 2014 | 2013 | 2012 | 2011 | 2010 |
Selected Per-Share Data |
|
|
|
|
|
Net asset value, beginning of period | $ 10.65 | $ 10.15 | $ 9.53 | $ 9.82 | $ 8.56 |
Income from Investment Operations |
|
|
|
|
|
Net investment income (loss) C | .401 | .489 | .532 | .519 | .581 |
Net realized and unrealized gain (loss) | .237 | .542 | .663 | (.245) | 1.180 |
Total from investment operations | .638 | 1.031 | 1.195 | .274 | 1.761 |
Distributions from net investment income | (.371) | (.406) | (.577) | (.568) | (.486) |
Distributions from net realized gain | (.118) | (.127) | - | - | (.020) |
Total distributions | (.489) | (.533) | (.577) | (.568) | (.506) |
Redemption fees added to paid in capital C | .001 | .002 | .002 | .004 | .005 |
Net asset value, end of period | $ 10.80 | $ 10.65 | $ 10.15 | $ 9.53 | $ 9.82 |
Total ReturnA, B | 6.12% | 10.45% | 13.06% | 2.75% | 21.20% |
Ratios to Average Net Assets D, F |
|
|
|
|
|
Expenses before reductions | 1.74% | 1.75% | 1.75% | 1.75% | 1.74% |
Expenses net of fee waivers, if any | 1.74% | 1.75% | 1.75% | 1.75% | 1.74% |
Expenses net of all reductions | 1.74% | 1.75% | 1.75% | 1.74% | 1.74% |
Net investment income (loss) | 3.70% | 4.69% | 5.46% | 5.21% | 6.32% |
Supplemental Data |
|
|
|
|
|
Net assets, end of period (in millions) | $ 10 | $ 19 | $ 28 | $ 38 | $ 52 |
Portfolio turnover rateE | 41% | 66% | 66% | 68% | 53% |
A Total returns would have been lower if certain expenses had not been reduced during the applicable periods shown.
B Total returns do not include the effect of the contingent deferred sales charge.
C Calculated based on average shares outstanding during the period.
D Fees and expenses of any underlying Fidelity Central Funds are not included in the Fund's expense ratio. The Fund indirectly bears its proportionate share of the expenses of any underlying Fidelity Central Funds.
E Amount does not include the portfolio activity of any underlying Fidelity Central Funds.
F Expense ratios reflect operating expenses of the class. Expenses before reductions do not reflect amounts reimbursed by the investment adviser or reductions from brokerage service arrangements or reductions from other expense offset arrangements and do not represent the amount paid by the class during periods when reimbursements or reductions occur. Expenses net of fee waivers reflect expenses after reimbursement by the investment adviser but prior to reductions from brokerage service arrangements or other expense offset arrangements. Expenses net of all reductions represent the net expenses paid by the class.
See accompanying notes which are an integral part of the financial statements.
Annual Report
Financial Highlights - Class C
Years ended October 31, | 2014 | 2013 | 2012 | 2011 | 2010 |
Selected Per-Share Data |
|
|
|
|
|
Net asset value, beginning of period | $ 10.71 | $ 10.19 | $ 9.58 | $ 9.86 | $ 8.59 |
Income from Investment Operations |
|
|
|
|
|
Net investment income (loss) C | .398 | .489 | .533 | .518 | .581 |
Net realized and unrealized gain (loss) | .237 | .560 | .649 | (.237) | 1.186 |
Total from investment operations | .635 | 1.049 | 1.182 | .281 | 1.767 |
Distributions from net investment income | (.368) | (.404) | (.574) | (.565) | (.482) |
Distributions from net realized gain | (.118) | (.127) | - | - | (.020) |
Total distributions | (.486) | (.531) | (.574) | (.565) | (.502) |
Redemption fees added to paid in capital C | .001 | .002 | .002 | .004 | .005 |
Net asset value, end of period | $ 10.86 | $ 10.71 | $ 10.19 | $ 9.58 | $ 9.86 |
Total ReturnA, B | 6.05% | 10.58% | 12.85% | 2.81% | 21.20% |
Ratios to Average Net Assets D, F |
|
|
|
|
|
Expenses before reductions | 1.77% | 1.77% | 1.78% | 1.77% | 1.77% |
Expenses net of fee waivers, if any | 1.77% | 1.77% | 1.78% | 1.77% | 1.77% |
Expenses net of all reductions | 1.77% | 1.77% | 1.77% | 1.77% | 1.77% |
Net investment income (loss) | 3.67% | 4.67% | 5.44% | 5.19% | 6.29% |
Supplemental Data |
|
|
|
|
|
Net assets, end of period (in millions) | $ 182 | $ 183 | $ 180 | $ 164 | $ 186 |
Portfolio turnover rateE | 41% | 66% | 66% | 68% | 53% |
A Total returns would have been lower if certain expenses had not been reduced during the applicable periods shown.
B Total returns do not include the effect of the contingent deferred sales charge.
C Calculated based on average shares outstanding during the period.
D Fees and expenses of any underlying Fidelity Central Funds are not included in the Fund's expense ratio. The Fund indirectly bears its proportionate share of the expenses of any underlying Fidelity Central Funds.
E Amount does not include the portfolio activity of any underlying Fidelity Central Funds.
F Expense ratios reflect operating expenses of the class. Expenses before reductions do not reflect amounts reimbursed by the investment adviser or reductions from brokerage service arrangements or reductions from other expense offset arrangements and do not represent the amount paid by the class during periods when reimbursements or reductions occur. Expenses net of fee waivers reflect expenses after reimbursement by the investment adviser but prior to reductions from brokerage service arrangements or other expense offset arrangements. Expenses net of all reductions represent the net expenses paid by the class.
See accompanying notes which are an integral part of the financial statements.
Annual Report
Financial Highlights - Institutional Class
Years ended October 31, | 2014 | 2013 | 2012 | 2011 | 2010 |
Selected Per-Share Data |
|
|
|
|
|
Net asset value, beginning of period | $ 10.10 | $ 9.65 | $ 9.10 | $ 9.40 | $ 8.22 |
Income from Investment Operations |
|
|
|
|
|
Net investment income (loss) B | .474 | .561 | .598 | .595 | .642 |
Net realized and unrealized gain (loss) | .216 | .524 | .623 | (.233) | 1.128 |
Total from investment operations | .690 | 1.085 | 1.221 | .362 | 1.770 |
Distributions from net investment income | (.473) | (.510) | (.673) | (.666) | (.575) |
Distributions from net realized gain | (.118) | (.127) | - | - | (.020) |
Total distributions | (.591) | (.637) | (.673) | (.666) | (.595) |
Redemption fees added to paid in capital B | .001 | .002 | .002 | .004 | .005 |
Net asset value, end of period | $ 10.20 | $ 10.10 | $ 9.65 | $ 9.10 | $ 9.40 |
Total ReturnA | 7.02% | 11.63% | 14.07% | 3.83% | 22.33% |
Ratios to Average Net Assets C, E |
|
|
|
|
|
Expenses before reductions | .78% | .77% | .78% | .77% | .78% |
Expenses net of fee waivers, if any | .78% | .77% | .78% | .77% | .78% |
Expenses net of all reductions | .78% | .77% | .78% | .77% | .78% |
Net investment income (loss) | 4.66% | 5.68% | 6.44% | 6.19% | 7.28% |
Supplemental Data |
|
|
|
|
|
Net assets, end of period (in millions) | $ 658 | $ 497 | $ 495 | $ 498 | $ 1,336 |
Portfolio turnover rateD | 41% | 66% | 66% | 68% | 53% |
A Total returns would have been lower if certain expenses had not been reduced during the applicable periods shown.
B Calculated based on average shares outstanding during the period.
C Fees and expenses of any underlying Fidelity Central Funds are not included in the Fund's expense ratio. The Fund indirectly bears its proportionate share of the expenses of any underlying Fidelity Central Funds.
D Amount does not include the portfolio activity of any underlying Fidelity Central Funds.
E Expense ratios reflect operating expenses of the class. Expenses before reductions do not reflect amounts reimbursed by the investment adviser or reductions from brokerage service arrangements or reductions from other expense offset arrangements and do not represent the amount paid by the class during periods when reimbursements or reductions occur. Expenses net of fee waivers reflect expenses after reimbursement by the investment adviser but prior to reductions from brokerage service arrangements or other expense offset arrangements. Expenses net of all reductions represent the net expenses paid by the class.
See accompanying notes which are an integral part of the financial statements.
Annual Report
Notes to Financial Statements
For the period ended October 31, 2014
(Amounts in thousands except percentages)
1. Organization.
Fidelity Advisor High Income Advantage Fund (the Fund) is a fund of Fidelity Advisor Series I (the Trust) and is authorized to issue an unlimited number of shares. The Trust is registered under the Investment Company Act of 1940, as amended (the 1940 Act), as an open-end management investment company organized as a Massachusetts business trust. The Fund offers Class A, Class T, Class C and Institutional Class shares, each of which, along with Class B shares, has equal rights as to assets and voting privileges. Class B shares are closed to new accounts and additional purchases, except for exchanges and reinvestments. Each class has exclusive voting rights with respect to matters that affect that class. Class B shares will automatically convert to Class A shares after a holding period of seven years from the initial date of purchase.
2. Investments in Fidelity Central Funds.
The Fund invests in Fidelity Central Funds, which are open-end investment companies generally available only to other investment companies and accounts managed by the investment adviser and its affiliates. The Fund's Schedule of Investments lists each of the Fidelity Central Funds held as of period end, if any, as an investment of the Fund, but does not include the underlying holdings of each Fidelity Central Fund. As an Investing Fund, the Fund indirectly bears its proportionate share of the expenses of the underlying Fidelity Central Funds.
The Money Market Central Funds seek preservation of capital and current income and are managed by Fidelity Investments Money Management, Inc. (FIMM), an affiliate of the investment adviser. Annualized expenses of the Money Market Central Funds as of their most recent shareholder report date are less than .01%.
A complete unaudited list of holdings for each Fidelity Central Fund is available upon request or at the Securities and Exchange Commission (the SEC) website at www.sec.gov. In addition, the financial statements of the Fidelity Central Funds, which are not covered by the Fund's Report of Independent Registered Public Accounting Firm, are available on the SEC website or upon request.
3. Significant Accounting Policies.
The financial statements have been prepared in conformity with accounting principles generally accepted in the United States of America (GAAP), which require management to make certain estimates and assumptions at the date of the financial statements. Actual results could differ from those estimates. Subsequent events, if any, through the date that the financial statements were issued have been evaluated in the preparation of
Annual Report
Notes to Financial Statements - continued
(Amounts in thousands except percentages)
3. Significant Accounting Policies - continued
the financial statements. The following summarizes the significant accounting policies of the Fund:
Investment Valuation. Investments are valued as of 4:00 p.m. Eastern time on the last calendar day of the period. In accordance with valuation policies and procedures approved by the Board of Trustees (the Board), the Fund attempts to obtain prices from one or more third party pricing vendors or brokers to value its investments. When current market prices, quotations or currency exchange rates are not readily available or reliable, investments will be fair valued in good faith by the Fidelity Management & Research Company (FMR) Fair Value Committee (the Committee), in accordance with procedures adopted by the Board. Factors used in determining fair value vary by investment type and may include market or investment specific events, changes in interest rates and credit quality. The frequency with which these procedures are used cannot be predicted and they may be utilized to a significant extent. The Committee oversees the Fund's valuation policies and procedures and is responsible for approving and reporting to the Board all fair value determinations.
The Fund categorizes the inputs to valuation techniques used to value its investments into a disclosure hierarchy consisting of three levels as shown below:
Level 1 - quoted prices in active markets for identical investments
Level 2 - other significant observable inputs (including quoted prices for similar investments, interest rates, prepayment speeds, etc.)
Level 3 - unobservable inputs (including the Fund's own assumptions based on the best information available)
Valuation techniques used to value the Fund's investments by major category are as follows:
Debt securities, including restricted securities, are valued based on evaluated prices received from third party pricing vendors or from brokers who make markets in such securities. Corporate bonds, bank loan obligations and preferred securities are valued by pricing vendors who utilize matrix pricing which considers yield or price of bonds of comparable quality, coupon, maturity and type or by broker-supplied prices. When independent prices are unavailable or unreliable, debt securities may be valued utilizing pricing methodologies which consider similar factors that would be used by third party pricing vendors. Debt securities are generally categorized as Level 2 in the hierarchy but may be Level 3 depending on the circumstances. The Fund invests a significant portion of its assets in below investment grade securities. The value of these securities can be more volatile due to changes in the credit quality of the issuer and is sensitive to changes in economic, market and regulatory conditions.
Annual Report
3. Significant Accounting Policies - continued
Investment Valuation - continued
Equity securities, including restricted securities, for which market quotations are readily available, are valued at the last reported sale price or official closing price as reported by a third party pricing vendor on the primary market or exchange on which they are traded and are categorized as Level 1 in the hierarchy. In the event there were no sales during the day or closing prices are not available, securities are valued at the last quoted bid price or may be valued using the last available price and are generally categorized as Level 2 in the hierarchy. For foreign equity securities, when market or security specific events arise, comparisons to the valuation of American Depositary Receipts (ADRs), futures contracts, Exchange-Traded Funds (ETFs) and certain indexes as well as quoted prices for similar securities may be used and would be categorized as Level 2 in the hierarchy. Utilizing these techniques may result in transfers between Level 1 and Level 2. For equity securities, including restricted securities, where observable inputs are limited, assumptions about market activity and risk are used and these securities may be categorized as Level 3 in the hierarchy.
Investments in open-end mutual funds, including the Fidelity Central Funds, are valued at their closing net asset value (NAV) each business day and are categorized as Level 1 in the hierarchy.
Changes in valuation techniques may result in transfers in or out of an assigned level within the disclosure hierarchy. The aggregate value of investments by input level, as of October 31, 2014, is included at the end of the Fund's Schedule of Investments.
Foreign Currency. The Fund may use foreign currency contracts to facilitate transactions in foreign-denominated securities. Gains and losses from these transactions may arise from changes in the value of the foreign currency or if the counterparties do not perform under the contracts' terms.
Foreign-denominated assets, including investment securities, and liabilities are translated into U.S. dollars at the exchange rates at period end. Purchases and sales of investment securities, income and dividends received and expenses denominated in foreign currencies are translated into U.S. dollars at the exchange rate in effect on the transaction date.
The effects of exchange rate fluctuations on investments are included with the net realized and unrealized gain (loss) on investment securities. Other foreign currency transactions resulting in realized and unrealized gain (loss) are disclosed separately.
Investment Transactions and Income. For financial reporting purposes, the Fund's investment holdings and NAV include trades executed through the end of the last business day of the period. The NAV per share for processing shareholder transactions is
Annual Report
Notes to Financial Statements - continued
(Amounts in thousands except percentages)
3. Significant Accounting Policies - continued
Investment Transactions and Income - continued
calculated as of the close of business of the New York Stock Exchange (NYSE), normally 4:00 p.m. Eastern time and includes trades executed through the end of the prior business day. Gains and losses on securities sold are determined on the basis of identified cost and may include proceeds received from litigation. Dividend income is recorded on the ex-dividend date, except for certain dividends from foreign securities where the ex-dividend date may have passed, which are recorded as soon as the Fund is informed of the ex-dividend date. Non-cash dividends included in dividend income, if any, are recorded at the fair market value of the securities received. Income and capital gain distributions from Fidelity Central Funds, if any, are recorded on the ex-dividend date. Distributions received on securities that represent a return of capital or capital gain are recorded as a reduction of cost of investments and/or as a realized gain. Subsequent to ex-dividend date the Fund determines the components of these distributions, based upon receipt of tax filings or other correspondence relating to the underlying investment. Interest income is accrued as earned and includes coupon interest and amortization of premium and accretion of discount on debt securities as applicable. Investment income is recorded net of foreign taxes withheld where recovery of such taxes is uncertain. Debt obligations may be placed on non-accrual status and related interest income may be reduced by ceasing current accruals and writing off interest receivables when the collection of all or a portion of interest has become doubtful based on consistently applied procedures. A debt obligation is removed from non-accrual status when the issuer resumes interest payments or when collectability of interest is reasonably assured.
Class Allocations and Expenses. Investment income, realized and unrealized capital gains and losses, common expenses of the Fund, and certain fund-level expense reductions, if any, are allocated daily on a pro-rata basis to each class based on the relative net assets of each class to the total net assets of the Fund. Each class differs with respect to transfer agent and distribution and service plan fees incurred. Certain expense reductions may also differ by class. For the reporting period, the allocated portion of income and expenses to each class as a percent of its average net assets may vary due to the timing of recording these transactions in relation to fluctuating net assets of the classes. Expenses directly attributable to a fund are charged to that fund. Expenses attributable to more than one fund are allocated among the respective funds on the basis of relative net assets or other appropriate methods. Expense estimates are accrued in the period to which they relate and adjustments are made when actual amounts are known.
Deferred Trustee Compensation. Under a Deferred Compensation Plan (the Plan), independent Trustees may elect to defer receipt of a portion of their annual compensation. Deferred amounts are invested in a cross-section of Fidelity funds, are marked-to-market and remain in the Fund until distributed in accordance with the Plan. The
Annual Report
3. Significant Accounting Policies - continued
Deferred Trustee Compensation - continued
investment of deferred amounts and the offsetting payable to the Trustees are included in the accompanying Statement of Assets and Liabilities.
Income Tax Information and Distributions to Shareholders. Each year, the Fund intends to qualify as a regulated investment company under Subchapter M of the Internal Revenue Code, including distributing substantially all of its taxable income and realized gains. As a result, no provision for U.S. Federal income taxes is required. As of October 31, 2014, the Fund did not have any unrecognized tax benefits in the financial statements; nor is the Fund aware of any tax positions for which it is reasonably possible that the total amounts of unrecognized tax benefits will significantly change in the next twelve months. The Fund files a U.S. federal tax return, in addition to state and local tax returns as required. The Fund's federal income tax returns are subject to examination by the Internal Revenue Service (IRS) for a period of three fiscal years after they are filed. State and local tax returns may be subject to examination for an additional fiscal year depending on the jurisdiction. Foreign taxes are provided for based on the Fund's understanding of the tax rules and rates that exist in the foreign markets in which it invests.
Dividends are declared and recorded daily and paid monthly from net investment income. Distributions from realized gains, if any, are declared and recorded on the ex-dividend date. Income dividends and capital gain distributions are declared separately for each class. Income and capital gain distributions are determined in accordance with income tax regulations, which may differ from GAAP.
Capital accounts within the financial statements are adjusted for permanent book-tax differences. These adjustments have no impact on net assets or the results of operations. Capital accounts are not adjusted for temporary book-tax differences which will reverse in a subsequent period.
Book-tax differences are primarily due to foreign currency transactions, partnerships, defaulted bonds, market discount, equity-debt classifications, deferred trustees compensation, capital loss carryforwards and losses deferred due to wash sales.
The federal tax cost of investment securities and unrealized appreciation (depreciation) as of period end were as follows:
Gross unrealized appreciation | $ 160,266 |
Gross unrealized depreciation | (77,295) |
Net unrealized appreciation (depreciation) on securities | $ 82,971 |
|
|
Tax Cost | $ 1,941,131 |
Annual Report
Notes to Financial Statements - continued
(Amounts in thousands except percentages)
3. Significant Accounting Policies - continued
Income Tax Information and Distributions to Shareholders - continued
The tax-based components of distributable earnings as of period end were as follows:
Undistributed ordinary income | $ 392 |
Capital loss carryforward | $ (476,979) |
Net unrealized appreciation (depreciation) on securities and other investments | $ 82,971 |
Capital loss carryforwards are only available to offset future capital gains of the Fund to the extent provided by regulations and may be limited. Under the Regulated Investment Company Modernization Act of 2010 (the Act), the Fund is permitted to carry forward capital losses incurred in taxable years beginning after December 22, 2010 for an unlimited period and such capital losses are required to be used prior to any losses that expire. The capital loss carryforward information presented below, including any applicable limitation, is estimated as of fiscal period end and is subject to adjustment.
Fiscal year of expiration |
|
2017 | $ (476,979) |
The tax character of distributions paid was as follows:
| October 31, 2014 | October 31, 2013 |
Ordinary Income | $ 107,105 | $ 113,654 |
Short-Term Trading (Redemption) Fees. Shares held by investors in the Fund less than 90 days may have been subject to a redemption fee equal to 1.00% of the NAV of shares redeemed. All redemption fees, which reduce the proceeds of the shareholder redemption, are retained by the Fund and accounted for as an addition to paid in capital.
Restricted Securities. The Fund may invest in securities that are subject to legal or contractual restrictions on resale. These securities generally may be resold in transactions exempt from registration or to the public if the securities are registered. Disposal of these securities may involve time-consuming negotiations and expense, and prompt sale at an acceptable price may be difficult. Information regarding restricted securities is included at the end of the Fund's Schedule of Investments.
Loans and Other Direct Debt Instruments. The Fund invests in direct debt instruments which are interests in amounts owed to lenders by corporate or other borrowers. These instruments may be in the form of loans, trade claims or other receivables and may include standby financing commitments such as revolving credit facilities that obligate the Fund to supply additional cash to the borrower on demand. Loans may be acquired through assignment or participation, or may be made directly to a borrower. The Fund did not have any unfunded loan commitments, which are contractual obligations for future funding, at period end.
Annual Report
3. Significant Accounting Policies - continued
New Accounting Pronouncement. In June 2014, the Financial Accounting Standards Board issued Accounting Standard Update No. 2014-11, Repurchase-to-Maturity Transactions, Repurchase Financings, and Disclosures. The Update amends the accounting for certain repurchase agreements and expands disclosure requirements for reverse repurchase agreements, securities lending and other similar transactions. The disclosure requirements are effective for annual and interim reporting periods beginning after December 15, 2014. Management is currently evaluating the impact of the Update on the Fund's financial statements and related disclosures.
4. Purchases and Sales of Investments.
Purchases and sales of securities, other than short-term securities, aggregated $920,250 and $787,974, respectively.
5. Fees and Other Transactions with Affiliates.
Management Fee. Fidelity Management & Research Company (the investment adviser) and its affiliates provide the Fund with investment management related services for which the Fund pays a monthly management fee. The management fee is the sum of an individual fund fee rate that is based on an annual rate of .45% of the Fund's average net assets and an annualized group fee rate that averaged .11% during the period. The group fee rate is based upon the average net assets of all the mutual funds advised by the investment adviser, including any mutual funds previously advised by the investment adviser that are currently advised by Fidelity SelectCo, LLC, an affiliate of the investment adviser. The group fee rate decreases as assets under management increase and increases as assets under management decrease. For the reporting period, the total annual management fee rate was .56% of the Fund's average net assets.
Distribution and Service Plan Fees. In accordance with Rule 12b-1 of the 1940 Act, the Fund has adopted separate Distribution and Service Plans for each class of shares. Certain classes pay Fidelity Distributors Corporation (FDC), an affiliate of the investment adviser, separate Distribution and Service Fees, each of which is based on an annual percentage of each class' average net assets. In addition, FDC may pay financial intermediaries for selling shares of the Fund and providing shareholder support services. For the period, the Distribution and Service Fee rates, total fees and amounts retained by FDC were as follows:
| Distribution | Service | Total Fees | Retained |
Class A | -% | .25% | $ 1,767 | $ 24 |
Class T | -% | .25% | 1,311 | 8 |
Class B | .65% | .25% | 133 | 96 |
Class C | .75% | .25% | 1,855 | 144 |
|
|
| $ 5,066 | $ 272 |
Annual Report
Notes to Financial Statements - continued
(Amounts in thousands except percentages)
5. Fees and Other Transactions with Affiliates - continued
Sales Load. FDC may receive a front-end sales charge of up to 4.00% for selling Class A shares and Class T shares, some of which is paid to financial intermediaries for selling shares of the Fund. Depending on the holding period, FDC may receive contingent deferred sales charges levied on Class A, Class T, Class B, and Class C redemptions. The deferred sales charges range from 5.00% to 1.00% for Class B shares, 1.00% for Class C shares, 1.00% for certain purchases of Class A shares and .25% for certain purchases of Class T shares.
For the period, sales charge amounts retained by FDC were as follows:
| Retained |
Class A | $ 72 |
Class T | 10 |
Class B* | 8 |
Class C* | 10 |
| $ 100 |
* When Class B and Class C shares are initially sold, FDC pays commissions from its own resources to financial intermediaries through which the sales are made.
Transfer Agent Fees. Fidelity Investments Institutional Operations Company, Inc., (FIIOC), an affiliate of the investment adviser, is the transfer, dividend disbursing and shareholder servicing agent for each class of the Fund. FIIOC receives account fees and asset-based fees that vary according to the account size and type of account of the shareholders of the respective classes of the Fund. FIIOC pays for typesetting, printing and mailing of shareholder reports, except proxy statements.
For the period, transfer agent fees for each class were as follows:
| Amount | % of |
Class A | $ 1,125 | .16 |
Class T | 781 | .15 |
Class B | 34 | .23 |
Class C | 298 | .16 |
Institutional Class | 1,041 | .17 |
| $ 3,279 |
|
Accounting and Security Lending Fees. Fidelity Service Company, Inc. (FSC), an affiliate of the investment adviser, maintains the Fund's accounting records. The accounting fee is based on the level of average net assets for each month. Under a separate contract, FSC administers the security lending program. The security lending fee is based on the number and duration of lending transactions.
Annual Report
5. Fees and Other Transactions with Affiliates - continued
Brokerage Commissions. The Fund placed a portion of its portfolio transactions with brokerage firms which are affiliates of the investment adviser. Brokerage commissions are included in net realized gain (loss) and change in net unrealized appreciation (depreciation) in the Statement of Operations. The commissions paid to these affiliated firms were $6 for the period.
6. Committed Line of Credit.
The Fund participates with other funds managed by the investment adviser or an affiliate in a $4.25 billion credit facility (the "line of credit") to be utilized for temporary or emergency purposes to fund shareholder redemptions or for other short-term liquidity purposes. The Fund has agreed to pay commitment fees on its pro-rata portion of the line of credit, which amounted to $3 and is reflected in Miscellaneous expenses on the Statement of Operations. During the period, the Fund did not borrow on this line of credit.
7. Security Lending.
The Fund lends portfolio securities through a lending agent from time to time in order to earn additional income. For equity securities, a lending agent is used and may loan securities to certain qualified borrowers, including Fidelity Capital Markets (FCM), a broker-dealer affiliated with the Fund. On the settlement date of the loan, the Fund receives collateral (in the form of U.S. Treasury obligations, letters of credit and/or cash) against the loaned securities and maintains collateral in an amount not less than 100% of the market value of the loaned securities during the period of the loan. The market value of the loaned securities is determined at the close of business of the Fund and any additional required collateral is delivered to the Fund on the next business day. If the borrower defaults on its obligation to return the securities loaned because of insolvency or other reasons, the Fund may apply collateral received from the borrower against the obligation. The Fund may experience delays and costs in recovering the securities loaned. Any cash collateral received is invested in the Fidelity Securities Lending Cash Central Fund. The value of loaned securities and cash collateral at period end are disclosed on the Fund's Statement of Assets and Liabilities. Security lending income represents the income earned on investing cash collateral, less rebates paid to borrowers and any lending agent fees associated with the loan, plus any premium payments received for lending certain types of securities. Security lending income is presented in the Statement of Operations as a component of income from Fidelity Central Funds. Total security lending income during the period amounted to $40. During the period, there were no securities loaned to FCM.
Annual Report
Notes to Financial Statements - continued
(Amounts in thousands except percentages)
8. Expense Reductions.
Commissions paid to certain brokers with whom the investment adviser, or its affiliates, places trades on behalf of the Fund include an amount in addition to trade execution, which may be rebated back to the Fund to offset certain expenses. This amount totaled $7 for the period. In addition, through arrangements with the Fund's custodian, credits realized as a result of uninvested cash balances were used to reduce the Fund's expenses. During the period, these credits reduced the Fund's custody expenses by $2.
9. Distributions to Shareholders.
Distributions to shareholders of each class were as follows:
Years ended October 31, | 2014 | 2013 |
From net investment income |
|
|
Class A | $ 29,254 | $ 32,676 |
Class T | 21,657 | 24,635 |
Class B | 514 | 920 |
Class C | 6,299 | 7,083 |
Institutional Class | 27,651 | 24,315 |
Total | $ 85,375 | $ 89,629 |
From net realized gain |
|
|
Class A | $ 7,669 | $ 8,703 |
Class T | 5,773 | 6,597 |
Class B | 206 | 336 |
Class C | 2,005 | 2,235 |
Institutional Class | 6,077 | 6,154 |
Total | $ 21,730 | $ 24,025 |
10. Share Transactions.
Share transactions for each class were as follows and may contain automatic conversions between classes or exchanges between funds:
| Shares | Dollars | ||
Years ended October 31, | 2014 | 2013 | 2014 | 2013 |
Class A |
|
|
|
|
Shares sold | 12,896 | 17,380 | $ 140,028 | $ 182,432 |
Reinvestment of distributions | 2,878 | 3,187 | 31,150 | 33,277 |
Shares redeemed | (18,099) | (24,589) | (196,563) | (257,846) |
Net increase (decrease) | (2,325) | (4,022) | $ (25,385) | $ (42,137) |
Annual Report
10. Share Transactions - continued
| Shares | Dollars | ||
Years ended October 31, | 2014 | 2013 | 2014 | 2013 |
Class T |
|
|
|
|
Shares sold | 5,270 | 7,839 | $ 57,373 | $ 82,393 |
Reinvestment of distributions | 2,245 | 2,579 | 24,429 | 27,058 |
Shares redeemed | (10,414) | (14,693) | (113,473) | (154,504) |
Net increase (decrease) | (2,899) | (4,275) | $ (31,671) | $ (45,053) |
Class B |
|
|
|
|
Shares sold | 72 | 170 | $ 769 | $ 1,770 |
Reinvestment of distributions | 54 | 91 | 583 | 946 |
Shares redeemed | (981) | (1,185) | (10,557) | (12,346) |
Net increase (decrease) | (855) | (924) | $ (9,205) | $ (9,630) |
Class C |
|
|
|
|
Shares sold | 2,513 | 2,941 | $ 27,167 | $ 30,884 |
Reinvestment of distributions | 590 | 659 | 6,365 | 6,860 |
Shares redeemed | (3,396) | (4,169) | (36,746) | (43,630) |
Net increase (decrease) | (293) | (569) | $ (3,214) | $ (5,886) |
Institutional Class |
|
|
|
|
Shares sold | 24,909 | 13,983 | $ 253,746 | $ 138,423 |
Reinvestment of distributions | 2,763 | 2,463 | 28,115 | 24,250 |
Shares redeemed | (12,448) | (18,542) | (126,707) | (182,351) |
Net increase (decrease) | 15,224 | (2,096) | $ 155,154 | $ (19,678) |
11. Other.
The Fund's organizational documents provide former and current trustees and officers with a limited indemnification against liabilities arising in connection with the performance of their duties to the Fund. In the normal course of business, the Fund may also enter into contracts that provide general indemnifications. The Fund's maximum exposure under these arrangements is unknown as this would be dependent on future claims that may be made against the Fund. The risk of material loss from such claims is considered remote.
At the end of the period, Strategic Advisers Income Opportunities Fund was the owner of record of approximately 12% of the total outstanding shares of the Fund.
Annual Report
Notes to Financial Statements - continued
(Amounts in thousands except percentages)
12. Litigation.
The Fund, and other entities managed by Fidelity or its affiliates, have been named as defendants in a lawsuit brought by creditors of a subsidiary of Energy Future Holdings Corp. ("EFH"), which is currently in bankruptcy and was formerly known as TXU. The lawsuit, which is captioned as In Re: ENERGY FUTURE HOLDINGS CORP. et al. U.S. Bankruptcy Court, D. Del. Case No. 14-10979 (CSS); AVENUE CAPITAL MANAGEMENT II, LP, et al. v. FIDELITY INVESTMENTS, et al. Adversary No. 14-50797 (CSS), was filed in the United States Bankruptcy Court for the District of Delaware on October 6, 2014. The plaintiffs are seeking to enforce an alleged agreement under which the Fund and other defendants would sell certain EFH notes, as identified in the Fund's Schedule of Investments, to the plaintiffs at a specified price. Plaintiffs are seeking a declaration that an alleged right to call the securities was properly exercised and an order that the Fund and other defendants transfer the notes to the plaintiffs at the specified price. The Fund and the other defendants dispute the plaintiffs' claims and intend to defend the case vigorously. On November 19, 2014, the defendants filed a motion to dismiss contending, among other things, that the right to call the notes never came into existence and was part of a proposed settlement agreement that was never completed or approved by the bankruptcy court. The motion to dismiss has not yet been decided. If the lawsuit were to be decided in a manner adverse to the Fund, the Fund could experience a loss up to $7,119,941 as of period end. The Fund will also incur legal costs in defending the case.
Annual Report
Report of Independent Registered Public Accounting Firm
To the Trustees of Fidelity Advisor Series I and Shareholders of Fidelity Advisor High Income Advantage Fund:
We have audited the accompanying statement of assets and liabilities of Fidelity Advisor High Income Advantage Fund (the Fund), a fund of Fidelity Advisor Series I, including the schedule of investments, as of October 31, 2014, and the related statement of operations for the year then ended, the statement of changes in net assets for each of the two years in the period then ended, and the financial highlights for each of the five years in the period then ended. These financial statements and financial highlights are the responsibility of the Fund's management. Our responsibility is to express an opinion on these financial statements and financial highlights based on our audits.
We conducted our audits in accordance with the standards of the Public Company Accounting Oversight Board (United States). Those standards require that we plan and perform the audit to obtain reasonable assurance about whether the financial statements and financial highlights are free of material misstatement. The Fund is not required to have, nor were we engaged to perform, an audit of its internal control over financial reporting. Our audits included consideration of internal control over financial reporting as a basis for designing audit procedures that are appropriate in the circumstances, but not for the purpose of expressing an opinion on the effectiveness of the Fund's internal control over financial reporting. Accordingly, we express no such opinion. An audit also includes examining, on a test basis, evidence supporting the amounts and disclosures in the financial statements, assessing the accounting principles used and significant estimates made by management, as well as evaluating the overall financial statement presentation. Our procedures included confirmation of securities owned as of October 31, 2014, by correspondence with the custodians and brokers; where replies were not received from brokers, we performed other auditing procedures. We believe that our audits provide a reasonable basis for our opinion.
In our opinion, the financial statements and financial highlights referred to above present fairly, in all material respects, the financial position of Fidelity Advisor High Income Advantage Fund as of October 31, 2014, the results of its operations for the year then ended, the changes in its net assets for each of the two years in the period then ended, and the financial highlights for each of the five years in the period then ended, in conformity with accounting principles generally accepted in the United States of America.
DELOITTE & TOUCHE LLP
Boston, Massachusetts
December 22, 2014
Annual Report
Trustees and Officers
The Trustees, Member of the Advisory Board, and officers of the trust and fund, as applicable, are listed below. The Board of Trustees governs the fund and is responsible for protecting the interests of shareholders. The Trustees are experienced executives who meet periodically throughout the year to oversee the fund's activities, review contractual arrangements with companies that provide services to the fund, oversee management of the risks associated with such activities and contractual arrangements, and review the fund's performance. Except for James C. Curvey, each of the Trustees oversees 174 funds. Mr. Curvey oversees 407 funds.
The Trustees hold office without limit in time except that (a) any Trustee may resign; (b) any Trustee may be removed by written instrument, signed by at least two-thirds of the number of Trustees prior to such removal; (c) any Trustee who requests to be retired or who has become incapacitated by illness or injury may be retired by written instrument signed by a majority of the other Trustees; and (d) any Trustee may be removed at any special meeting of shareholders by a two-thirds vote of the outstanding voting securities of the trust. Each Trustee who is not an interested person (as defined in the 1940 Act) of the trust and the fund (Independent Trustee), shall retire not later than the last day of the calendar year in which his or her 75th birthday occurs. The Independent Trustees may waive this mandatory retirement age policy with respect to individual Trustees. The officers and Advisory Board Member hold office without limit in time, except that any officer and Advisory Board Member may resign or may be removed by a vote of a majority of the Trustees at any regular meeting or any special meeting of the Trustees. Except as indicated, each individual has held the office shown or other offices in the same company for the past five years.
Experience, Skills, Attributes, and Qualifications of the Fund's Trustees. The Governance and Nominating Committee has adopted a statement of policy that describes the experience, qualifications, attributes, and skills that are necessary and desirable for potential Independent Trustee candidates (Statement of Policy). The Board believes that each Trustee satisfied at the time he or she was initially elected or appointed a Trustee, and continues to satisfy, the standards contemplated by the Statement of Policy. The Governance and Nominating Committee also engages professional search firms to help identify potential Independent Trustee candidates who have the experience, qualifications, attributes, and skills consistent with the Statement of Policy. From time to time, additional criteria based on the composition and skills of the current Independent Trustees, as well as experience or skills that may be appropriate in light of future changes to board composition, business conditions, and regulatory or other developments, have also been considered by the professional search firms and the Governance and Nominating Committee. In addition, the Board takes into account the Trustees' commitment and participation in Board and committee meetings, as well as their leadership of standing and ad hoc committees throughout their tenure.
In determining that a particular Trustee was and continues to be qualified to serve as a Trustee, the Board has considered a variety of criteria, none of which, in isolation, was controlling. The Board believes that, collectively, the Trustees have balanced and diverse experience, qualifications, attributes, and skills, which allow the Board to operate effectively in governing the fund and protecting the interests of shareholders. Information about the specific experience, skills, attributes, and qualifications of each Trustee, which in each case led to the Board's conclusion that the Trustee should serve (or continue to serve) as a trustee of the fund, is provided below.
Annual Report
Board Structure and Oversight Function. James C. Curvey is an interested person (as defined in the 1940 Act) and currently serves as Chairman. The Trustees have determined that an interested Chairman is appropriate and benefits shareholders because an interested Chairman has a personal and professional stake in the quality and continuity of services provided to the fund. Independent Trustees exercise their informed business judgment to appoint an individual of their choosing to serve as Chairman, regardless of whether the Trustee happens to be independent or a member of management. The Independent Trustees have determined that they can act independently and effectively without having an Independent Trustee serve as Chairman and that a key structural component for assuring that they are in a position to do so is for the Independent Trustees to constitute a substantial majority for the Board. The Independent Trustees also regularly meet in executive session. Ned C. Lautenbach serves as Chairman of the Independent Trustees and as such (i) acts as a liaison between the Independent Trustees and management with respect to matters important to the Independent Trustees and (ii) with management prepares agendas for Board meetings.
Fidelity funds are overseen by different Boards of Trustees. The fund's Board oversees Fidelity's equity and high income funds and another Board oversees Fidelity's investment-grade bond, money market, and asset allocation funds. The asset allocation funds may invest in Fidelity funds overseen by the fund's Board. The use of separate Boards, each with its own committee structure, allows the Trustees of each group of Fidelity funds to focus on the unique issues of the funds they oversee, including common research, investment, and operational issues. On occasion, the separate Boards establish joint committees to address issues of overlapping consequences for the Fidelity funds overseen by each Board.
The Trustees operate using a system of committees to facilitate the timely and efficient consideration of all matters of importance to the Trustees, the fund, and fund shareholders and to facilitate compliance with legal and regulatory requirements and oversight of the fund's activities and associated risks. The Board, acting through its committees, has charged FMR and its affiliates with (i) identifying events or circumstances the occurrence of which could have demonstrably adverse effects on the fund's business and/or reputation; (ii) implementing processes and controls to lessen the possibility that such events or circumstances occur or to mitigate the effects of such events or circumstances if they do occur; and (iii) creating and maintaining a system designed to evaluate continuously business and market conditions in order to facilitate the identification and implementation processes described in (i) and (ii) above. Because the day-to-day operations and activities of the fund are carried out by or through FMR, its affiliates and other service providers, the fund's exposure to risks is mitigated but not eliminated by the processes overseen by the Trustees. While each of the Board's committees has responsibility for overseeing different aspects of the fund's activities, oversight is exercised primarily through the Operations, Audit, and Compliance Committees. In addition, the Independent Trustees have worked with FMR to enhance the Board's oversight of investment and financial risks, legal and regulatory risks, technology risks, and operational risks, including the development of additional risk reporting to the Board. For example, a working group comprised of Independent Trustees and FMR has worked and continues to work to review the Fidelity funds' valuation-related activities, reporting and risk management. Appropriate personnel, including but not limited to the fund's Chief Compliance Officer (CCO), FMR's internal auditor, the independent accountants, the fund's Treasurer and portfolio management personnel, make periodic reports to the Board's committees, as appropriate, including an annual review of FMR's risk management program for the Fidelity funds. The responsibilities of each standing committee, including their oversight responsibilities, are described further under "Standing Committees of the Fund's Trustees."
Annual Report
Trustees and Officers - continued
The fund's Statement of Additional Information (SAI) includes more information about the Trustees. To request a free copy, call Fidelity at 1-877-208-0098.
Interested Trustees*:
Correspondence intended for each Trustee who is an interested person may be sent to Fidelity Investments, 245 Summer Street, Boston, Massachusetts 02210.
Name, Year of Birth; Principal Occupations and Other Relevant Experience+ | |
James C. Curvey (1935) | |
Year of Election or Appointment: 2007 Trustee Chairman of the Board of Trustees | |
| Mr. Curvey also serves as Trustee of other Fidelity funds. Mr. Curvey is a Director of Fidelity Research & Analysis Co. (2009-present), and Vice Chairman (2007-present) and Director of FMR LLC. In addition, Mr. Curvey serves as an Overseer for the Boston Symphony Orchestra and a member of the board of Artis-Naples, Naples, Florida, and as a Trustee for Brewster Academy, Wolfeboro, New Hampshire. Previously, Mr. Curvey served as a Director of Fidelity Investments Money Management, Inc. (2009-2014), a Director of FMR (2007-2014), and a Director of FMR Co., Inc. (2007-2014). |
Charles S. Morrison (1960) | |
Year of Election or Appointment: 2014 Trustee | |
| Mr. Morrison also serves as Trustee of other funds. He serves as a Director of Fidelity Investments Money Management, Inc. (FIMM) (2014-present), Director of Fidelity SelectCo, LLC (2014-present), President, Asset Management (2014-present), and is an employee of Fidelity Investments. Previously, Mr. Morrison served as Vice President of Fidelity's Fixed Income and Asset Allocation Funds (2012-2014), President, Fixed Income (2011-2014), Vice President of Fidelity's Money Market Funds (2005-2009), President, Money Market Group Leader of FMR (2009), and Senior Vice President, Money Market Group of FMR (2004-2009). Mr. Morrison also served as Vice President of Fidelity's Bond Funds (2002-2005), certain Balanced Funds (2002-2005), and certain Asset Allocation Funds (2002-2007), and as Senior Vice President (2002-2005) of Fidelity's Bond Division. |
* Trustees have been determined to be "Interested Trustees" by virtue of, among other things, their affiliation with the trust or various entities under common control with FMR.
+ The information above includes each Trustee's principal occupation during the last five years and other information relating to the experience, attributes, and skills relevant to each Trustee's qualifications to serve as a Trustee, which led to the conclusion that each Trustee should serve as a Trustee for the fund.
Annual Report
Trustees and Officers - continued
Independent Trustees:
Correspondence intended for each Independent Trustee (that is, the Trustees other than the Interested Trustees) may be sent to Fidelity Investments, P.O. Box 55235, Boston, Massachusetts 02205-5235.
Name, Year of Birth; Principal Occupations and Other Relevant Experience+ | |
Dennis J. Dirks (1948) | |
Year of Election or Appointment: 2005 Trustee | |
| Mr. Dirks also serves as Trustee of other Fidelity funds. Prior to his retirement in May 2003, Mr. Dirks was Chief Operating Officer and a member of the Board of The Depository Trust & Clearing Corporation (DTCC). He also served as President, Chief Operating Officer, and Board member of The Depository Trust Company (DTC) and President and Board member of the National Securities Clearing Corporation (NSCC). In addition, Mr. Dirks served as Chief Executive Officer and Board member of the Government Securities Clearing Corporation, Chief Executive Officer and Board member of the Mortgage-Backed Securities Clearing Corporation, as a Trustee and a member of the Finance Committee of Manhattan College (2005-2008), and as a Trustee and a member of the Finance Committee of AHRC of Nassau County (2006-2008). Mr. Dirks is a member of the Independent Directors Council (IDC) Governing Council (2010-present) and Board of Directors for The Brookville Center for Children's Services, Inc. (2009-present). |
Alan J. Lacy (1953) | |
Year of Election or Appointment: 2008 Trustee | |
| Mr. Lacy also serves as Trustee of other Fidelity funds. Mr. Lacy serves as Senior Adviser (2007-present) of Oak Hill Capital Partners, L.P. (private equity). Mr. Lacy also served as Chief Executive Officer (2000-2005) and Vice Chairman (2005-2006) of Sears Holdings Corporation and Sears, Roebuck and Co. (retail). In addition, Mr. Lacy serves as a member of the Board of Directors of Dave & Buster's Entertainment, Inc. (restaurant and entertainment complexes, 2010-present), Earth Fare, Inc. (retail grocery, 2012-present), The Hillman Companies, Inc. (hardware wholesalers, 2010-present), and Bristol-Myers Squibb Company (global pharmaceuticals, 2008-present). Mr. Lacy is a member of the Board of Trustees of The National Parks Conservation Association (2006-present). Previously, Mr. Lacy served as Chairman of the Board of Trustees of the National Parks Conservation Association (2008-2011) and as a member of the Board of Directors for the Western Union Company (global money transfer, 2006-2011). |
Ned C. Lautenbach (1944) | |
Year of Election or Appointment: 2000 Trustee Chairman of the Independent Trustees | |
| Mr. Lautenbach also serves as Trustee of other Fidelity funds. Mr. Lautenbach currently serves as the Lead Director of the Eaton Corporation Board of Directors (diversified industrial, 1997-present). Mr. Lautenbach is Chairman of the Board of Directors of the Philharmonic Center for the Arts in Naples, Florida (2012-present) and a member of the Council on Foreign Relations (1994-present). Previously, Mr. Lautenbach was a Partner/Advisory Partner at Clayton, Dubilier & Rice, LLC (private equity investment, 1998-2010), as well as a Director of Sony Corporation (2006-2007). |
Joseph Mauriello (1944) | |
Year of Election or Appointment: 2008 Trustee | |
| Mr. Mauriello also serves as Trustee of other Fidelity funds. Prior to his retirement in January 2006, Mr. Mauriello served in numerous senior management positions including Deputy Chairman and Chief Operating Officer (2004-2005), and Vice Chairman of Financial Services (2002-2004) of KPMG LLP US (professional services, 1965-2005). Mr. Mauriello currently serves as a member of the Board of Directors of XL Group plc. (global insurance and re-insurance, 2006-present). Previously, Mr. Mauriello served as a Director of the Hamilton Funds of the Bank of New York (2006-2007) and of Arcadia Resources Inc. (health care services and products, 2007-2012). |
Robert W. Selander (1950) | |
Year of Election or Appointment: 2011 Trustee | |
| Mr. Selander also serves as Trustee of other Fidelity funds. Previously, Mr. Selander served as a Member of the Advisory Board of other Fidelity funds (2011), and Executive Vice Chairman (2010), Chief Executive Officer (2009-2010), and President and Chief Executive Officer (1997-2009) of Mastercard, Inc. |
Cornelia M. Small (1944) | |
Year of Election or Appointment: 2005 Trustee | |
| Ms. Small also serves as Trustee of other Fidelity funds. Ms. Small is a member of the Board of Directors (2009-present) and Chair of the Investment Committee (2010-present) of the Teagle Foundation. Ms. Small also serves on the Investment Committee of the Berkshire Taconic Community Foundation (2008-present). Previously, Ms. Small served as Chairperson (2002-2008) and a member of the Investment Committee and Chairperson (2008-2012) and a member of the Board of Trustees of Smith College. In addition, Ms. Small served as Chief Investment Officer, Director of Global Equity Investments, and a member of the Board of Directors of Scudder, Stevens & Clark and Scudder Kemper Investments. |
William S. Stavropoulos (1939) | |
Year of Election or Appointment: 2002 Trustee Vice Chairman of the Independent Trustees | |
| Mr. Stavropoulos also serves as Trustee of other Fidelity funds. Mr. Stavropoulos serves as President and Founder of the Michigan Baseball Foundation, the Great Lakes Loons (2007-present). Mr. Stavropoulos is Chairman Emeritus of the Board of Directors of The Dow Chemical Company, where he previously served in numerous senior management positions, including President, CEO (1995-2000; 2002-2004), Chairman of the Executive Committee (2000-2006), and as a member of the Board of Directors (1990-2006). Currently, Mr. Stavropoulos is Chairman of the Board of Directors of Univar Inc. (global distributor of commodity and specialty chemicals), a Director of Teradata Corporation (data warehousing and technology solutions), and Maersk Inc. (industrial conglomerate), and a member of the Advisory Board for Metalmark Capital LLC (private equity investment, 2005-present). Mr. Stavropoulos is an operating advisor to Clayton, Dubilier & Rice, LLC (private equity investment). In addition, Mr. Stavropoulos is a member of the University of Notre Dame Advisory Council for the College of Science, a Trustee of the Rollin L. Gerstacker Foundation, and a Director of the Naples Philharmonic Center for the Arts. Previously, Mr. Stavropoulos served as a Director of Chemical Financial Corporation (bank holding company, 1993-2012) and Tyco International, Ltd. (multinational manufacturing and services, 2007-2012). |
David M. Thomas (1949) | |
Year of Election or Appointment: 2008 Trustee | |
| Mr. Thomas also serves as Trustee of other Fidelity funds. Mr. Thomas serves as Non-Executive Chairman of the Board of Directors of Fortune Brands Home and Security (home and security products, 2011-present), and as a member of the Board of Directors of Interpublic Group of Companies, Inc. (marketing communication, 2004-present). Previously, Mr. Thomas served as Executive Chairman (2005-2006) and Chairman and Chief Executive Officer (2000-2005) of IMS Health, Inc. (pharmaceutical and healthcare information solutions), and a Director of Fortune Brands, Inc. (consumer products, 2000-2011). |
+ The information above includes each Trustee's principal occupation during the last five years and other information relating to the experience, attributes, and skills relevant to each Trustee's qualifications to serve as a Trustee, which led to the conclusion that each Trustee should serve as a Trustee for the fund.
Advisory Board Member and Officers:
Correspondence intended for each officer and Peter S. Lynch may be sent to Fidelity Investments, 245 Summer Street, Boston, Massachusetts 02210. Officers appear below in alphabetical order.
Name, Year of Birth; Principal Occupation | |
Peter S. Lynch (1944) | |
Year of Election or Appointment: 2003 Member of the Advisory Board | |
| Mr. Lynch also serves as Member of the Advisory Board of other Fidelity funds. Mr. Lynch is Vice Chairman and a Director of FMR and FMR Co., Inc. In addition, Mr. Lynch serves as a Trustee of Boston College and as the Chairman of the Inner-City Scholarship Fund. Previously, Mr. Lynch served on the Special Olympics International Board of Directors (1997-2006). |
Elizabeth Paige Baumann (1968) | |
Year of Election or Appointment: 2012 Anti-Money Laundering (AML) Officer | |
| Ms. Baumann also serves as AML Officer of other funds. She is Chief AML Officer of FMR LLC (2012-present) and is an employee of Fidelity Investments. Previously, Ms. Baumann served as Vice President and Deputy Anti-Money Laundering Officer (2007-2012). |
William C. Coffey (1969) | |
Year of Election or Appointment: 2009 Assistant Secretary | |
| Mr. Coffey also serves as Assistant Secretary of other funds. He is Senior Vice President and Deputy General Counsel of FMR LLC (2010-present), and is an employee of Fidelity Investments. Previously, Mr. Coffey served as Vice President and Associate General Counsel of FMR LLC (2005-2009). |
Jonathan Davis (1968) | |
Year of Election or Appointment: 2010 Assistant Treasurer | |
| Mr. Davis also serves as Assistant Treasurer of other funds. Mr. Davis is an employee of Fidelity Investments. Previously, Mr. Davis served as Vice President and Associate General Counsel of FMR LLC (2003-2010). |
Adrien E. Deberghes (1967) | |
Year of Election or Appointment: 2008 Deputy Treasurer | |
| Mr. Deberghes also serves as an officer of other funds. He is an employee of Fidelity Investments (2008-present). Prior to joining Fidelity Investments, Mr. Deberghes was Senior Vice President of Mutual Fund Administration at State Street Corporation (2007-2008), Senior Director of Mutual Fund Administration at Investors Bank & Trust (2005-2007), and Director of Finance for Dunkin' Brands (2000-2005). |
Stephanie J. Dorsey (1969) | |
Year of Election or Appointment: 2010 Assistant Treasurer | |
| Ms. Dorsey also serves as an officer of other funds. She is an employee of Fidelity Investments (2008-present) and has served in other fund officer roles. Prior to joining Fidelity Investments, Ms. Dorsey served as Treasurer (2004-2008) of the JPMorgan Mutual Funds and Vice President (2004-2008) of JPMorgan Chase Bank. |
Howard J. Galligan III (1966) | |
Year of Election or Appointment: 2014 Chief Financial Officer | |
| Mr. Galligan also serves as Chief Financial Officer of other funds. Mr. Galligan serves as President of Fidelity Pricing and Cash Management Services (FPCMS) (2014-present) and as a Director of Strategic Advisers, Inc. (2008-present). Previously, Mr. Galligan served as Chief Administrative Officer of Asset Management (2011-2014) and Chief Operating Officer and Senior Vice President of Investment Support for Strategic Advisers, Inc. (2003-2011). |
Scott C. Goebel (1968) | |
Year of Election or Appointment: 2008 Secretary and Chief Legal Officer (CLO) | |
| Mr. Goebel serves as Secretary and CLO of other funds. Mr. Goebel also serves as Secretary of Fidelity SelectCo, LLC (2013-present), Fidelity Investments Money Management, Inc. (FIMM) (2010-present) and Fidelity Research and Analysis Company (FRAC) (2010-present); General Counsel, Secretary, and Senior Vice President of FMR (2008-present) and FMR Co., Inc. (2008-present); Chief Legal Officer of Fidelity Management & Research (Hong Kong) Limited (2008-present); and Assistant Secretary of Fidelity Management & Research (Japan) Limited (2008-present) and Fidelity Management & Research (U.K.) Inc. (2008-present). Previously, Mr. Goebel served as Secretary and CLO of other Fidelity funds (2008-2013), Assistant Secretary of FIMM (2008-2010), FRAC (2008-2010), and certain funds (2007-2008); and as Vice President and Secretary of Fidelity Distributors Corporation (FDC) (2005-2007). Mr. Goebel has been employed by FMR LLC or an affiliate since 2001. |
Thomas C. Hense (1964) | |
Year of Election or Appointment: 2008/2010 Vice President | |
| Mr. Hense also serves as Vice President of other funds (High Income (2008), Small Cap (2008), and Value (2010) funds). Previously, Mr. Hense served as a portfolio manager for Fidelity's Institutional Money Management Group (Pyramis) (2003-2008). |
Brian B. Hogan (1964) | |
Year of Election or Appointment: 2009 Vice President | |
| Mr. Hogan also serves as Trustee or Vice President of other funds. Mr. Hogan serves as a Director of Fidelity SelectCo, LLC (2014-present) and President of FMR's Equity Division (2009-present). Previously, Mr. Hogan served as Senior Vice President, Equity Research of FMR (2006-2009) and as a portfolio manager. |
Chris Maher (1972) | |
Year of Election or Appointment: 2013 Assistant Treasurer | |
| Mr. Maher serves as Assistant Treasurer of other funds. Mr. Maher is Vice President of Valuation Oversight and is an employee of Fidelity Investments. Previously, Mr. Maher served as Vice President of Asset Management Compliance (2013), Vice President of FMR's Program Management Group (2010-2013), and Vice President of Valuation Oversight (2008-2010). |
Kenneth B. Robins (1969) | |
Year of Election or Appointment: 2008 President and Treasurer | |
| Mr. Robins also serves as an officer of other funds. Mr. Robins serves as Executive Vice President of Fidelity Investments Money Management, Inc. (FIMM) (2013-present) and is an employee of Fidelity Investments (2004-present). Previously, Mr. Robins served in other fund officer roles. |
Stephen Sadoski (1971) | |
Year of Election or Appointment: 2012 Deputy Treasurer | |
| Mr. Sadoski also serves as Deputy Treasurer of other funds. He is an employee of Fidelity Investments (2012-present) and has served in another fund officer role. Prior to joining Fidelity Investments, Mr. Sadoski served as an assistant chief accountant in the Division of Investment Management of the Securities and Exchange Commission (SEC) (2009-2012) and as a senior manager at Deloitte & Touche LLP (1997-2009). |
Stacie M. Smith (1974) | |
Year of Election or Appointment: 2013 Deputy Treasurer | |
| Ms. Smith also serves as an officer of other funds. She is an employee of Fidelity Investments (2009-present) and has served in other fund officer roles. Prior to joining Fidelity Investments, Ms. Smith served as Senior Audit Manager of Ernst & Young LLP (1996-2009). |
Renee Stagnone (1975) | |
Year of Election or Appointment: 2013 Deputy Treasurer | |
| Ms. Stagnone also serves as Deputy Treasurer of other funds. Ms. Stagnone is an employee of Fidelity Investments. |
Linda J. Wondrack (1964) | |
Year of Election or Appointment: 2014 Chief Compliance Officer | |
| Ms. Wondrack also serves as Chief Compliance Officer of other funds. Ms. Wondrack is Executive Vice President and head of the Ethics Office and Asset Management Compliance for Fidelity Investments (2012-present). Ms. Wondrack also serves as Chief Compliance Officer of Fidelity SelectCo, LLC (2014-present); Chief Compliance Officer of Impresa Management LLC (2013-present); and Chief Compliance Officer of FMR Co., Inc., Fidelity Investments Money Management, Inc., Fidelity Management & Research (Japan) Limited, Fidelity Management & Research (U.K.) Inc., Fidelity Management & Research (Hong Kong), Fidelity Management & Research Company, Pyramis Global Advisors, LLC, and Strategic Advisers, Inc., Ballyrock Investment Advisors LLC, and Northern Neck Investors LLC (2012-present). Previously, Ms. Wondrack served as Senior Vice President and Chief Compliance Officer for Columbia Management Investment Advisers, LLC (2005-2012); Chief Compliance Officer for certain funds within the Columbia Family of Funds (2007-2012); and Senior Vice President of Compliance Risk Management at Bank of America (2005-2010). |
Joseph F. Zambello (1957) | |
Year of Election or Appointment: 2011 Deputy Treasurer | |
| Mr. Zambello also serves as Deputy Treasurer of other funds. Mr. Zambello is an employee of Fidelity Investments. Previously, Mr. Zambello served as Vice President of FMR's Program Management Group (2009-2011) and Vice President of the Transfer Agent Oversight Group (2005-2009). |
Annual Report
Distributions (Unaudited)
The Board of Trustees of Advisor High Income Advantage Fund voted to pay to shareholders of record at the opening of business on record date, the following distributions per share derived from capital gains realized from sales of portfolio securities:
| Pay Date | Record Date | Capital Gains |
Class A | 12/08/2014 | 12/05/14 | $0.01 |
Class T | 12/08/2014 | 12/05/14 | $0.01 |
Class B | 12/08/2014 | 12/05/14 | $0.01 |
Class C | 12/08/2014 | 12/05/14 | $0.01 |
A total of 0.02% of the dividends distributed during the fiscal year was derived from interest on U.S. Government securities which is generally exempt from state income tax.
The fund designates $55,205,860.93 of distributions paid during the period January 1, 2014 to October 31, 2014 as qualifying to be taxed as interest-related dividends for nonresident alien shareholders.
Class A, Class T, Class B, and Class C designates 35% of the dividend paid 12/09/2013 as qualifying for the dividends-received deduction for corporate shareholders.
Class A, Class T, Class B, and Class C designates 39% of the dividend paid 12/09/2013 as amounts which may be taken into account as a dividend for purposes of the maximum rate under section 1(h)(11) of the Internal Revenue Code.
The fund will notify shareholders in January 2015 of amounts for use in preparing 2014 income tax returns.
Annual Report
Board Approval of Investment Advisory Contracts and Management Fees
Fidelity Advisor High Income Advantage Fund
Each year, the Board of Trustees, including the Independent Trustees (together, the Board), votes on the renewal of the management contract with Fidelity Management & Research Company (FMR) and the sub-advisory agreements (together, the Advisory Contracts) for the fund. The Board, assisted by the advice of fund counsel and Independent Trustees' counsel, requests and considers a broad range of information relevant to the renewal of the Advisory Contracts throughout the year.
The Board meets regularly and, at each of its meetings, covers an extensive agenda of topics and materials and considers factors that are relevant to its annual consideration of the renewal of the fund's Advisory Contracts, including the services and support provided to the fund and its shareholders. The Board has established various standing committees (Committees), each composed of and chaired by Independent Trustees with varying backgrounds, to which the Board has assigned specific subject matter responsibilities in order to enhance effective decision-making by the Board. The Board, acting directly and through its Committees, requests and receives information concerning the annual consideration of the renewal of the fund's Advisory Contracts. The Board also meets as needed to consider matters specifically related to the Board's annual consideration of the renewal of the Advisory Contracts. Members of the Board may also meet with trustees of other Fidelity funds through ad hoc joint committees to discuss certain matters relevant to the Fidelity funds.
At its July 2014 meeting, the Board, including the Independent Trustees, unanimously determined to renew the fund's Advisory Contracts. In reaching its determination, the Board considered all factors it believed relevant, including (i) the nature, extent, and quality of the services to be provided to the fund and its shareholders (including the investment performance of the fund); (ii) the competitiveness of the fund's management fee and total expense ratio relative to peer funds; (iii) the total costs of the services to be provided by and the profits to be realized by Fidelity from its relationship with the fund; (iv) the extent to which economies of scale exist and would be realized as the fund grows; and (v) whether fee levels reflect these economies of scale, if any, for the benefit of fund shareholders. In connection with separate internal corporate reorganizations involving Fidelity Management & Research (U.K.) Inc. (FMR U.K.) and Fidelity Management & Research (Japan) Inc. (FMR Japan), the Board approved certain non-material amendments to the fund's sub-advisory agreements with FMR U.K. and FMR Japan to reflect that, after these reorganizations, FMR Investment Management (UK) Limited and Fidelity Management & Research (Japan) Limited will carry on the business of FMR U.K. and FMR Japan, respectively. The Board noted that no changes to the portfolio managers or to the foreign research or investment advisory services provided to the fund were expected in connection with either reorganization and that the same personnel and resources would continue to be available to the fund at the new entities.
Annual Report
In considering whether to renew the Advisory Contracts for the fund, the Board reached a determination, with the assistance of fund counsel and Independent Trustees' counsel and through the exercise of its business judgment, that the renewal of the Advisory Contracts was in the best interests of the fund and its shareholders and that the compensation payable under the Advisory Contracts was fair and reasonable. The Board's decision to renew the Advisory Contracts was not based on any single factor, but rather was based on a comprehensive consideration of all the information provided to the Board at its meetings throughout the year. The Board, in reaching its determination to renew the Advisory Contracts, was aware that shareholders of the fund have a broad range of investment choices available to them, including a wide choice among funds offered by Fidelity's competitors, and that the fund's shareholders, who have the opportunity to review and weigh the disclosure provided by the fund in its prospectus and other public disclosures, have chosen to invest in this fund, which is part of the Fidelity family of funds.
Nature, Extent, and Quality of Services Provided. The Board considered Fidelity's staffing as it relates to the fund, including the backgrounds of investment personnel of FMR and the sub-advisers (together, the Investment Advisers), and also considered the fund's investment objective, strategies, and related investment philosophy. The Independent Trustees also had discussions with senior management of Fidelity's investment operations and investment groups. The Board considered the structure of the portfolio manager compensation program and whether this structure provides appropriate incentives to act in the best interests of the fund. Additionally, the Board considered the portfolio managers' investments, if any, in the funds that they manage.
Resources Dedicated to Investment Management and Support Services. The Board and the Fund Oversight and Research Committees reviewed the general qualifications and capabilities of Fidelity's investment staff, including its size, education, experience, and resources, as well as Fidelity's approach to recruiting, training, managing, and compensating investment personnel. The Board noted that Fidelity has continued to increase the resources devoted to non-U.S. offices, including expansion of Fidelity's global investment organization. The Board also noted that Fidelity's analysts have extensive resources, tools and capabilities that allow them to conduct sophisticated quantitative and fundamental analysis, as well as credit analysis of issuers, counterparties and guarantors. Further, the Board believes that Fidelity's investment professionals have sufficient access to global information and data so as to provide competitive investment results over time, and that those professionals also have access to sophisticated tools that permit them to assess portfolio construction and risk and performance attribution characteristics continuously, as well as to transmit new information and research conclusions rapidly around the world. Additionally, in its deliberations, the Board considered Fidelity's trading and risk management capabilities and resources and global compliance infrastructure, which are an integral part of the investment management process.
Annual Report
Board Approval of Investment Advisory Contracts and
Management Fees - continued
Shareholder and Administrative Services. The Board considered (i) the nature, extent, quality, and cost of advisory, administrative, and shareholder services performed by the Investment Advisers and their affiliates under the Advisory Contracts and under separate agreements covering transfer agency, pricing and bookkeeping, and securities lending services for the fund; (ii) the nature and extent of the supervision of third party service providers, principally custodians and subcustodians; and (iii) the resources devoted to, and the record of compliance with, the fund's compliance policies and procedures. The Board also reviewed the allocation of fund brokerage, including allocations to brokers affiliated with the Investment Advisers, the use of brokerage commissions to pay fund expenses, and the use of "soft" commission dollars to pay for research services.
The Board noted that the growth of fund assets over time across the complex allows Fidelity to reinvest in the development of services designed to enhance the value or convenience of the Fidelity funds as investment vehicles. These services include 24-hour access to account information and market information through telephone representatives and over the Internet, investor education materials and asset allocation tools, and the expanded availability of Fidelity Investor Centers.
In 2014, the Board formed an ad hoc Committee on Transfer Agency Fees to review the variety of transfer agency fee structures throughout the industry and Fidelity's competitive positioning with respect to industry participants.
Investment in a Large Fund Family. The Board considered the benefits to shareholders of investing in a Fidelity fund, including the benefits of investing in a fund that is part of a large family of funds offering a variety of investment disciplines and providing a large variety of mutual fund investor services. The Board noted that Fidelity had taken, or had made recommendations that resulted in the Fidelity funds taking, a number of actions over the previous year that benefited particular funds, including (i) continuing to dedicate additional resources to investment research and to the support of the senior management team that oversees asset management; (ii) persisting in efforts to enhance Fidelity's global research capabilities; (iii) launching new funds and making other enhancements to meet client needs for income-oriented solutions; (iv) reducing fund expenses for certain index funds; (v) continuing to launch dedicated lower cost underlying funds to meet portfolio construction needs related to expanding underlying fund options for Fidelity funds of funds, specifically for the Freedom Fund product lines; (vi) rationalizing product lines and gaining increased efficiencies through fund mergers; (vii) launching sector-based exchange-traded funds and establishing a new Fidelity adviser to manage sector-based funds and products; (viii) continuing to develop and implement technology to improve security and increase efficiency; (ix) modifying the eligibility criteria for certain share classes to increase their marketability to a portion of the defined contribution plan market; (x) waiving redemption fees for certain qualified fund-of-fund and wrap programs and certain retirement plan transactions; and (xi) launching new Institutional Class shares of certain money market funds to attract and retain assets and to fill a gap in the money market fund lineup.
Annual Report
Investment Performance. The Board considered whether the fund has operated in accordance with its investment objective, as well as its record of compliance with its investment restrictions and its performance history.
The Board took into account discussions with the Investment Advisers about fund investment performance that occur at Board meetings throughout the year. In this regard the Board noted that as part of regularly scheduled fund reviews and other reports to the Board on fund performance, the Board periodically considers annualized return information for the fund, for different time periods, measured against a securities market index ("benchmark index") and a peer group of funds with similar objectives ("peer group"). In its evaluation of fund investment performance, the Board gave particular attention to information indicating changes in performance of certain Fidelity funds for specific time periods and the Investment Advisers' explanations for any overperformance or underperformance.
In addition to reviewing absolute and relative fund performance, the Independent Trustees periodically consider the appropriateness of fund performance metrics in evaluating the results achieved. In general, the Independent Trustees believe that fund performance should be evaluated based on net performance (after fees and expenses) of both the highest performing and lowest performing classes, where applicable, compared to appropriate benchmark indices, over appropriate time periods which may include full market cycles, and compared to peer groups, as applicable, over the same periods, taking into account relevant factors including the following: general market conditions; issuer-specific information; tactical opportunities for investment; and fund cash flows and other factors.
The Independent Trustees recognize that shareholders evaluate performance on a net basis over their own holding periods, for which one-, three-, and five-year periods are often used as a proxy. For this reason, the performance information reviewed by the Board also included net cumulative calendar year total return information for the fund and an appropriate benchmark index and peer group for the most recent one-, three-, and five-year periods, as shown below. Returns are shown compared to the 25th percentile (top of box, 75% beaten) and 75th percentile (bottom of box, 25% beaten) of the peer universe.
Annual Report
Board Approval of Investment Advisory Contracts and
Management Fees - continued
Fidelity Advisor High Income Advantage Fund

Based on its review, the Board concluded that the nature, extent, and quality of services provided to the fund under the Advisory Contracts should benefit the fund's shareholders.
Competitiveness of Management Fee and Total Expense Ratio. The Board considered the fund's management fee and total expense ratio compared to "mapped groups" of competitive funds and classes. Fidelity creates "mapped groups" by combining similar Lipper investment objective categories that have comparable investment mandates. Combining Lipper investment objective categories aids the Board's management fee and total expense ratio comparisons by broadening the competitive group used for comparison and by reducing the number of universes to which various Fidelity funds are compared.
Management Fee. The Board considered two proprietary management fee comparisons for the 12-month periods shown in the chart below. The group of Lipper funds used by the Board for management fee comparisons is referred to below as the "Total Mapped Group." The Total Mapped Group is broader than the Lipper peer group used by the Board for performance comparisons because the Total Mapped Group combines several Lipper investment objective categories while the Lipper peer group does not. The Total Mapped Group comparison focuses on a fund's standing in terms of gross management fees before expense reimbursements or caps relative to the total universe of funds with comparable investment mandates, regardless of whether their management fee structures also are comparable. Funds with comparable investment mandates offer exposure to similar types of securities. Funds with comparable management fee structures have similar management fee contractual arrangements (e.g., flat rate charged for advisory services, all-inclusive fee rate, etc.). "TMG %" represents the percentage of funds in the Total Mapped Group that had management fees that were lower than the fund's. For example, a hypothetical TMG % of 20% would mean that 80% of the funds in the Total Mapped Group had higher, and 20% had lower, management fees than the fund. The fund's actual TMG %s are in the chart below. The "Asset-Size Peer Group" (ASPG) comparison focuses on a fund's standing relative to a subset of non-Fidelity funds within the Total Mapped Group that are similar in size and management fee structure. For example, if a fund is in the first quartile of the ASPG, the fund's management fee ranks in the least expensive or lowest 25% of funds in the ASPG. The ASPG represents at least 15% of the funds in the Total Mapped Group with comparable asset size and management fee structures, subject to a minimum of 50 funds (or all funds in the Total Mapped Group if fewer than 50). Additional information, such as the ASPG quartile in which the fund's management fee rate ranked, is also included in the chart and considered by the Board.
Annual Report
Fidelity Advisor High Income Advantage Fund
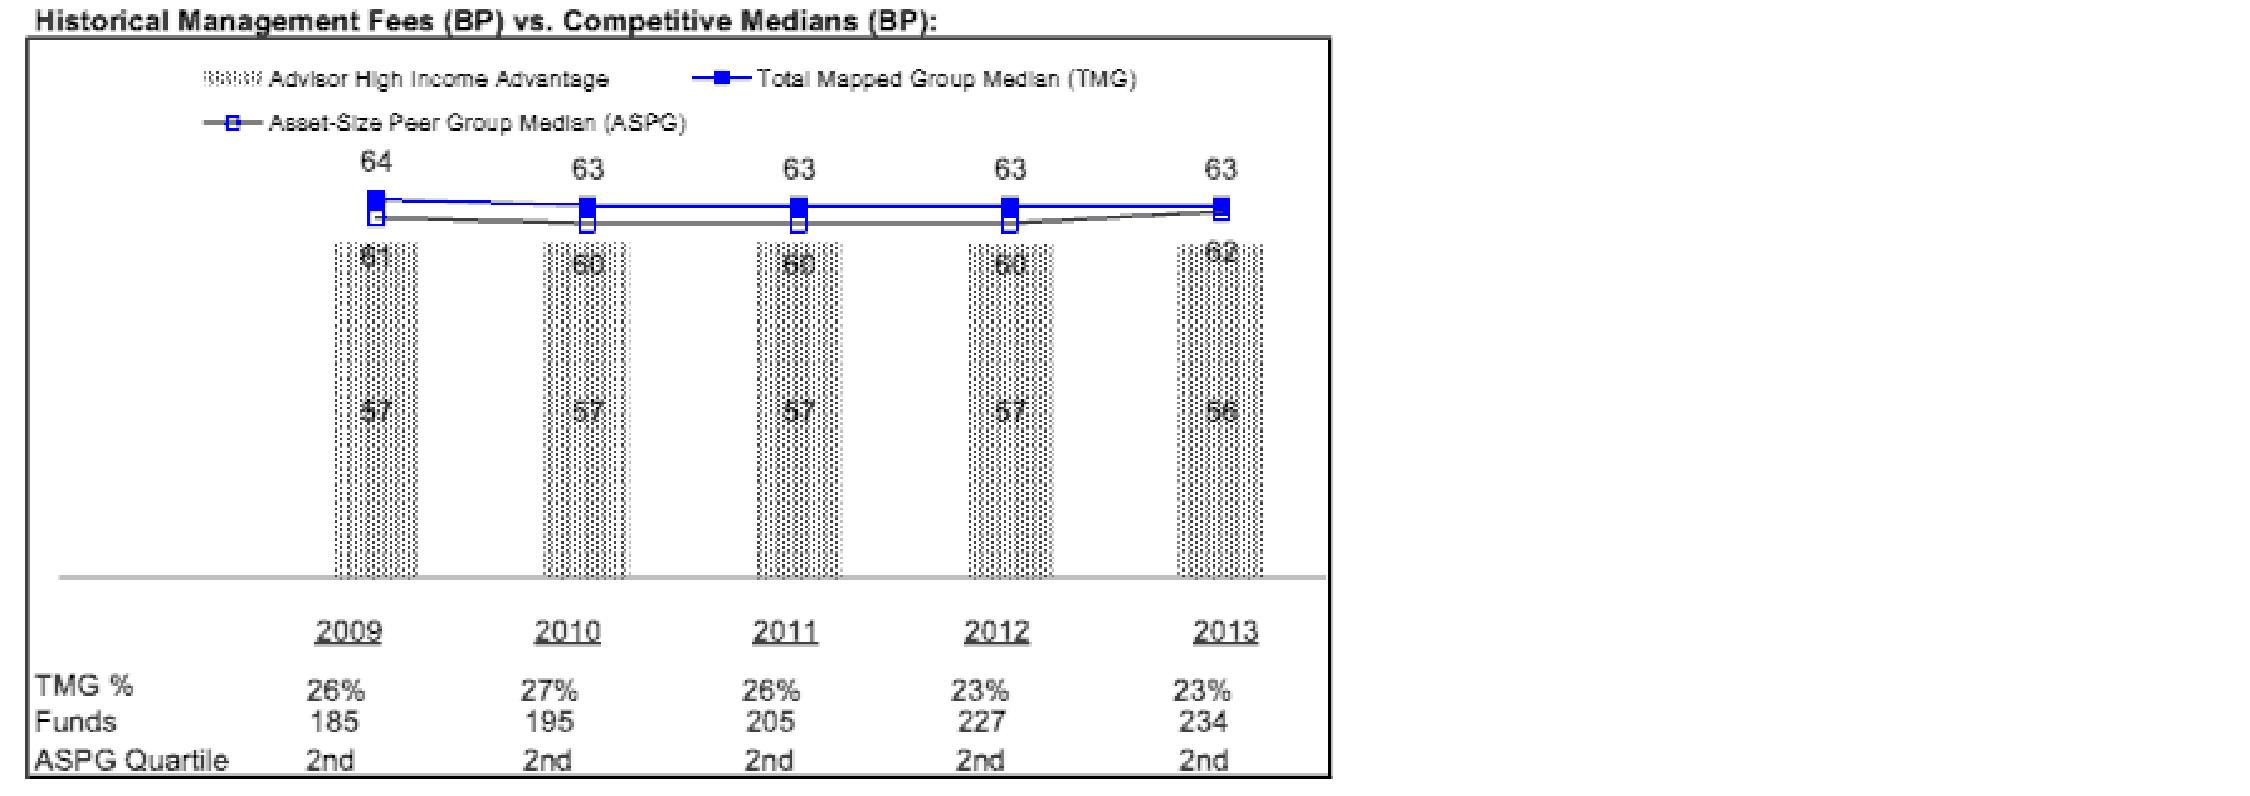
The Board noted that the fund's management fee rate ranked below the median of its Total Mapped Group and below the median of its ASPG for 2013.
The Board also noted that, in August 2013, the ad hoc Committee on Management Fees was formed to conduct an in-depth review of the management fee rates of Fidelity's active equity mutual funds. The Committee focused on the following areas: (i) standard fee structures; (ii) research consumption and trading evolution; (iii) management fee competitiveness/profitability by category; and (iv) factors that drive institutional pricing.
Annual Report
Board Approval of Investment Advisory Contracts and
Management Fees - continued
Based on its review, the Board concluded that the fund's management fee is fair and reasonable in light of the services that the fund receives and the other factors considered.
Total Expense Ratio. In its review of each class's total expense ratio, the Board considered the fund's management fee as well as other fund or class expenses, as applicable, such as transfer agent fees, pricing and bookkeeping fees, fund-paid 12b-1 fees, and custodial, legal, and audit fees. The Board also noted the effects of any waivers and reimbursements on fees and expenses. As part of its review, the Board also considered the current and historical total expense ratios of each class of the fund compared to competitive fund median expenses. Each class of the fund is compared to those funds and classes in the Total Mapped Group (used by the Board for management fee comparisons) that have a similar sales load structure.
The Board noted that the total expense ratio of each of Class A, Class T, Class B, and Institutional Class ranked below its competitive median for 2013 and the total expense ratio of Class C ranked above its competitive median for 2013. The Board considered that, in general, various factors can affect total expense ratios. The Board noted that the fund offers multiple classes, each of which has a different sales load and 12b-1 fee structure, and that the multiple structures are intended to offer a range of pricing options for the intermediary market. The Board also noted that the total expense ratios of the classes vary primarily by the level of their 12b-1 fees, although differences in transfer agent fees may also cause expenses to vary from class to class.
Fees Charged to Other Fidelity Clients. The Board also considered Fidelity fee structures and other information with respect to clients of Fidelity, such as other funds advised or subadvised by Fidelity, pension plan clients, and other institutional clients. The Board noted the findings of the 2013 ad hoc joint committee (created with the board of other Fidelity funds), which reviewed and compared Fidelity's institutional investment advisory business with its business of providing services to the Fidelity funds, including the differences in services provided, fees charged, and costs incurred, as well as competition in their respective marketplaces.
Based on its review of total expense ratios and fees charged to other Fidelity clients, the Board concluded that the total expense ratio of each class of the fund was reasonable, although Class C was above the median of the universe presented for comparison, in light of the services that the fund and its shareholders receive and the other factors considered.
Costs of the Services and Profitability. The Board considered the revenues earned and the expenses incurred by Fidelity in conducting the business of developing, marketing, distributing, managing, administering and servicing the fund and servicing the fund's shareholders. The Board also considered the level of Fidelity's profits in respect of all the Fidelity funds.
Annual Report
On an annual basis, Fidelity presents to the Board Fidelity's profitability for the fund. Fidelity calculates the profitability for each fund, as well as aggregate profitability for groups of Fidelity funds and all Fidelity funds, using a series of detailed revenue and cost allocation methodologies which originate with the books and records of Fidelity on which Fidelity's audited financial statements are based. The Audit Committee of the Board reviews any significant changes from the prior year's methodologies.
PricewaterhouseCoopers LLP (PwC), independent registered public accounting firm and auditor to Fidelity and certain Fidelity funds, has been engaged annually by the Board as part of the Board's assessment of Fidelity's profitability analysis. PwC's engagement includes the review and assessment of the methodologies used by Fidelity in determining the revenues and expenses attributable to Fidelity's mutual fund business, and completion of agreed-upon procedures in respect of the mathematical accuracy of fund profitability and its conformity to established allocation methodologies. After considering PwC's reports issued under the engagement and information provided by Fidelity, the Board concluded that while other allocation methods may also be reasonable, Fidelity's profitability methodologies are reasonable in all material respects.
The Board also reviewed Fidelity's non-fund businesses and fall-out benefits related to the mutual fund business as well as cases where Fidelity's affiliates may benefit from or be related to the fund's business.
The Board considered the costs of the services provided by and the profits realized by Fidelity in connection with the operation of the fund and was satisfied that the profitability was not excessive in the circumstances.
Economies of Scale. The Board considered whether there have been economies of scale in respect of the management of the Fidelity funds, whether the Fidelity funds (including the fund) have appropriately benefited from any such economies of scale, and whether there is potential for realization of any further economies of scale. The Board considered the extent to which the fund will benefit from economies of scale through increased services to the fund, through waivers or reimbursements, or through fee or expense ratio reductions. The Board also noted that in 2013, it and the boards of other Fidelity funds created an ad hoc committee (the Economies of Scale Committee) to analyze whether Fidelity attains economies of scale in respect of the management and servicing of the Fidelity funds, whether the Fidelity funds have appropriately benefited from such economies of scale, and whether there is potential for realization of any further economies of scale.
The Board recognized that the fund's management contract incorporates a "group fee" structure, which provides for lower group fee rates as total group assets increase, and for higher group fee rates as total group assets decrease (with "group assets" defined to include fund assets under FMR's management plus sector fund assets previously under FMR's management and currently managed by Fidelity SelectCo, LLC). FMR calculates the group fee rates based on a tiered asset "breakpoint" schedule that varies based on asset class. The Board considered that the group fee is designed to deliver the benefits of economies of scale to fund shareholders when total Fidelity fund assets increase, even if assets of any particular fund are unchanged or have declined, because some portion of Fidelity's costs are attributable to services provided to all Fidelity funds, and all funds benefit if those costs can be allocated among more assets. The Board concluded that, given the group fee structure, fund shareholders will benefit from lower management fees as group assets increase at the fund complex level, regardless of whether Fidelity achieves any such economies of scale.
Annual Report
Board Approval of Investment Advisory Contracts and
Management Fees - continued
The Board concluded, taking into account the analysis of the Economies of Scale Committee, that economies of scale, if any, are being appropriately shared between fund shareholders and Fidelity.
Additional Information Requested by the Board. In order to develop fully the factual basis for consideration of the Fidelity funds' Advisory Contracts, the Board requested and received additional information on certain topics, including: (i) fund performance trends and Fidelity's long-term strategies for certain funds; (ii) Fidelity's strategic marketing and product lineup goals; (iii) the methodology with respect to competitive fund data and peer group classifications; (iv) the arrangements with, and performance of, certain sub-advisers on behalf of the Fidelity funds, as well as certain proposed participating affiliate arrangements; (v) the realization of fall-out benefits in certain Fidelity business units; (vi) Fidelity's group fee structures, including the rationale for the individual fee rates of certain categories of funds and the definition of group assets; (vii) trends regarding industry use of performance fee structures and the performance adjustment methodologies applicable to the Fidelity funds; (viii) additional competitive analysis regarding the total expenses for certain classes; (ix) fund profitability methodology, including Fidelity's cost allocation methodology, and the impact of certain factors on fund profitability results; and (x) the process by which Fidelity determines sub-advisory fees for funds it advises.
Based on its evaluation of all of the conclusions noted above, and after considering all factors it believed relevant, the Board ultimately concluded that the advisory fee structures are fair and reasonable, and that the fund's Advisory Contracts should be renewed.
Annual Report
Investment Adviser
Fidelity Management & Research Company
Boston, MA
Investment Sub-Advisers
FMR Co., Inc.
Fidelity Management & Research
(U.K.) Inc.
Fidelity Management & Research
(Japan) Limited
Fidelity Management & Research
(Hong Kong) Limited
General Distributor
Fidelity Distributors Corporation
Smithfield, RI
Transfer and Service Agents
Fidelity Investments Institutional Operations Company, Inc.
Boston, MA
Fidelity Service Company, Inc.
Boston, MA
Custodian
The Bank of New York Mellon
New York, NY
(Fidelity Investment logo)(registered trademark)
HY-UANN-1214
1.784750.111
(Fidelity Investment logo)(registered trademark)
Fidelity Advisor®
High Income Advantage
Fund - Institutional Class
Annual Report
October 31, 2014
(Fidelity Cover Art)
Contents
Performance | How the fund has done over time. | |
Management's Discussion of Fund Performance | The Portfolio Manager's review of fund performance and strategy. | |
Shareholder Expense Example | An example of shareholder expenses. | |
Investment Changes | A summary of major shifts in the fund's investments over the past six months. | |
Investments | A complete list of the fund's investments with their market values. | |
Financial Statements | Statements of assets and liabilities, operations, and changes in net assets, as well as financial highlights. | |
Notes | Notes to the financial statements. | |
Report of Independent Registered Public Accounting Firm |
| |
Trustees and Officers |
| |
Distributions |
| |
Board Approval of Investment Advisory Contracts and Management Fees |
|
To view a fund's proxy voting guidelines and proxy voting record for the 12-month period ended June 30, visit http://www.fidelity.com/proxyvotingresults or visit the Securities and Exchange Commission's (SEC) web site at http://www.sec.gov. You may also call 1-877-208-0098 to request a free copy of the proxy voting guidelines.
Standard & Poor's, S&P and S&P 500 are registered service marks of The McGraw-Hill Companies, Inc. and have been licensed for use by Fidelity Distributors Corporation.
Other third-party marks appearing herein are the property of their respective owners.
All other marks appearing herein are registered or unregistered trademarks or service marks of FMR LLC or an affiliated company. © 2014 FMR LLC. All rights reserved.
Annual Report
This report and the financial statements contained herein are submitted for the general information of the shareholders of the fund. This report is not authorized for distribution to prospective investors in the fund unless preceded or accompanied by an effective prospectus.
A fund files its complete schedule of portfolio holdings with the SEC for the first and third quarters of each fiscal year on Form N-Q. Forms N-Q are available on the SEC's web site at http://www.sec.gov. A fund's Forms N-Q may be reviewed and copied at the SEC's Public Reference Room in Washington, DC. Information regarding the operation of the SEC's Public Reference Room may be obtained by calling 1-800-SEC-0330. For a complete list of a fund's portfolio holdings, view the most recent holdings listing, semiannual report, or annual report on Fidelity's web site at http://www.fidelity.com, http://www.advisor.fidelity.com, or http://www.401k.com, as applicable.
NOT FDIC INSURED • MAY LOSE VALUE • NO BANK GUARANTEE
Neither the fund nor Fidelity Distributors Corporation is a bank.
Annual Report
Performance: The Bottom Line
Average annual total return reflects the change in the value of an investment, assuming reinvestment of the class' distributions from dividend income and capital gains (the profits earned upon the sale of securities that have grown in value, if any) and assuming a constant rate of performance each year. The $10,000 table and the fund's returns do not reflect the deduction of taxes that a shareholder would pay on fund distributions or the redemption of fund shares. During periods of reimbursement by Fidelity, a fund's total return will be greater than it would be had the reimbursement not occurred. How a fund did yesterday is no guarantee of how it will do tomorrow.
Average Annual Total Returns
Periods ended October 31, 2014 | Past 1 | Past 5 | Past 10 |
Institutional Class | 7.02% | 11.60% | 8.44% |
$10,000 Over 10 Years
Let's say hypothetically that $10,000 was invested in Fidelity Advisor® High Income Advantage Fund - Institutional Class on October 31, 2004. The chart shows how the value of your investment would have changed, and also shows how The BofA Merrill LynchSM US High Yield Constrained Index performed over the same period.
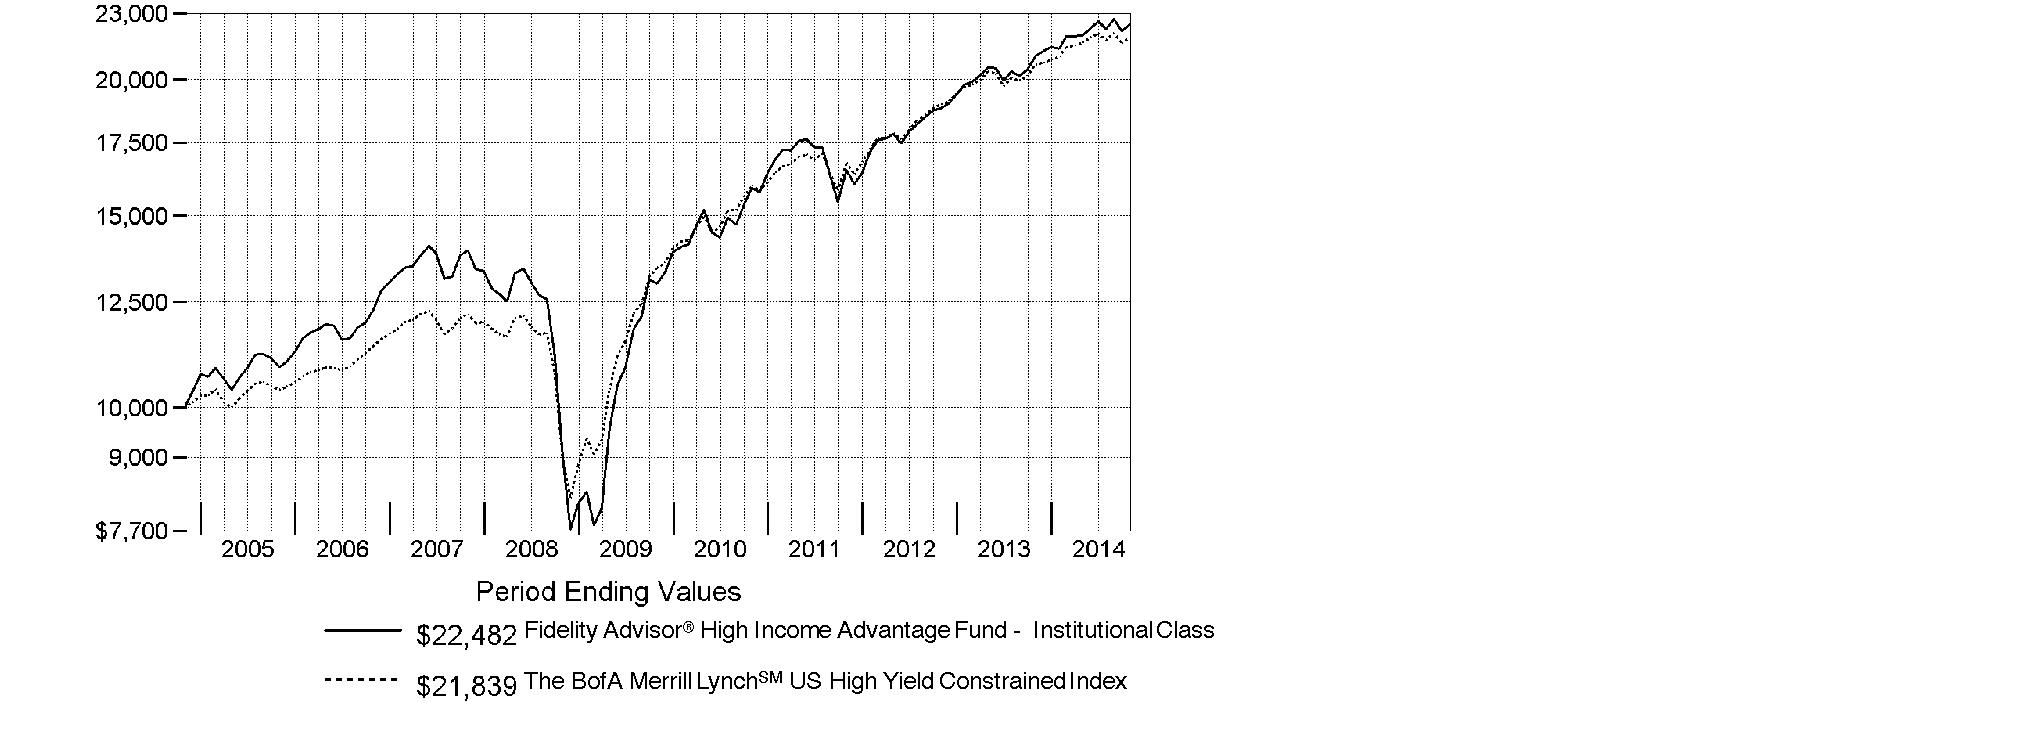
Annual Report
Management's Discussion of Fund Performance
Market Recap: High-yield bonds overcame late-period volatility to rise 5.85% for the 12 months ending October 31, 2014, as measured by The BofA Merrill LynchSM US High Yield Constrained Index, continuing a positive multiyear run. High yield benefited from a growing U.S. economy, low default rate, solid corporate fundamentals and monetary support from central banks worldwide. Early on, the index recovered from fears that the Fed might increase interest rates, in conjunction with its plan to wind down its stimulative bond-buying program. Meanwhile, weaker-than-expected economic data in the first quarter of 2014 helped to keep low policy rates in place. High yield advanced steadily until the market shifted in July, when investors exited high yield at a record pace amid unfavorable supply/demand dynamics and new concerns that the Fed could begin to tighten monetary policy. Fed Chair Janet Yellen contributed to the tumult, suggesting high-yield valuations "appear stretched." The index continued its decline in the final months of the period until it staged a slight rebound in October, as concerns about possible deflation in Europe and recession in Japan led to increased expectations for additional market intervention outside the U.S.
Comments from Harley Lank, Portfolio Manager of Fidelity Advisor® High Income Advantage Fund: For the year, the fund's Institutional Class shares returned 7.02%, outperforming The BofA Merrill Lynch index. The fund performed in line with my expectations, given the market environment and how I structured the portfolio. Specifically, equities outperformed high-yield bonds, and I intentionally held about 15% of the fund's assets in common stocks. My focus on higher-quality investments in the high-yield part of the fund also buoyed relative performance, because the higher-quality bonds benefited more than lower-quality issues from declining interest rates during the period. Overall, we were helped further by favorable security selection within the high-yield bond segment of the fund. From an industry standpoint, the fund was helped most by security selection in technology, telecommunications and diversified financial services. Top contributors included Texas utility TXU - a subsidiary of Energy Future Holdings - out-of-benchmark equity holdings in semiconductor manufacturer Skyworks Solutions and bonds issued by auto financing company Ally Financial. Conversely, security selection in metals & mining hurt, including bond and common stock holdings of coal producer Alpha Natural Resources. An out-of-benchmark investment in the common stock of health-club operator Town Sports International Holdings also dampened the fund's return.
The views expressed above reflect those of the portfolio manager(s) only through the end of the period as stated on the cover of this report and do not necessarily represent the views of Fidelity or any other person in the Fidelity organization. Any such views are subject to change at any time based upon market or other conditions and Fidelity disclaims any responsibility to update such views. These views may not be relied on as investment advice and, because investment decisions for a Fidelity fund are based on numerous factors, may not be relied on as an indication of trading intent on behalf of any Fidelity fund.
Annual Report
Shareholder Expense Example
As a shareholder of the Fund, you incur two types of costs: (1) transaction costs, including sales charges (loads) on purchase payments or redemption proceeds, redemption fees and (2) ongoing costs, including management fees, distribution and/or service (12b-1) fees and other Fund expenses. This Example is intended to help you understand your ongoing costs (in dollars) of investing in the Fund and to compare these costs with the ongoing costs of investing in other mutual funds.
The Example is based on an investment of $1,000 invested at the beginning of the period and held for the entire period (May 1, 2014 to October 31, 2014).
Actual Expenses
The first line of the accompanying table for each class of the Fund provides information about actual account values and actual expenses. You may use the information in this line, together with the amount you invested, to estimate the expenses that you paid over the period. Simply divide your account value by $1,000.00 (for example, an $8,600 account value divided by $1,000.00 = 8.6), then multiply the result by the number in the first line for a class of the Fund under the heading entitled "Expenses Paid During Period" to estimate the expenses you paid on your account during this period. In addition, the Fund, as a shareholder in the underlying Fidelity Central Funds, will indirectly bear its pro-rata share of the fees and expenses incurred by the underlying Fidelity Central Funds. These fees and expenses are not included in the Fund's annualized expense ratio used to calculate the expense estimate in the table below.
Hypothetical Example for Comparison Purposes
The second line of the accompanying table for each class of the Fund provides information about hypothetical account values and hypothetical expenses based on a Class' actual expense ratio and an assumed rate of return of 5% per year before expenses, which is not the Class' actual return. The hypothetical account values and expenses may not be used to estimate the actual ending account balance or expenses you paid for the period. You may use this information to compare the ongoing costs of investing in the Fund and other funds. To do so, compare this 5% hypothetical example with the 5% hypothetical examples that appear in the shareholder reports of the other funds. In addition, the Fund, as a shareholder in the underlying Fidelity Central Funds, will indirectly bear its pro-rata share of the fees and expenses incurred by the underlying Fidelity Central Funds. These fees and expenses are not included in the Fund's annualized expense ratio used to calculate the expense estimate in the table below.
Please note that the expenses shown in the table are meant to highlight your ongoing costs only and do not reflect any transaction costs. Therefore, the second line of the table is useful in comparing ongoing costs only, and will not help you determine the relative total costs of owning different funds. In addition, if these transactional costs were included, your costs would have been higher.
Annual Report
Shareholder Expense Example - continued
| Annualized | Beginning | Ending | Expenses Paid |
Class A | 1.01% |
|
|
|
Actual |
| $ 1,000.00 | $ 1,022.20 | $ 5.15 |
HypotheticalA |
| $ 1,000.00 | $ 1,020.11 | $ 5.14 |
Class T | 1.00% |
|
|
|
Actual |
| $ 1,000.00 | $ 1,022.10 | $ 5.10 |
HypotheticalA |
| $ 1,000.00 | $ 1,020.16 | $ 5.09 |
Class B | 1.72% |
|
|
|
Actual |
| $ 1,000.00 | $ 1,018.70 | $ 8.75 |
HypotheticalA |
| $ 1,000.00 | $ 1,016.53 | $ 8.74 |
Class C | 1.76% |
|
|
|
Actual |
| $ 1,000.00 | $ 1,018.40 | $ 8.95 |
HypotheticalA |
| $ 1,000.00 | $ 1,016.33 | $ 8.94 |
Institutional Class | .78% |
|
|
|
Actual |
| $ 1,000.00 | $ 1,023.70 | $ 3.98 |
HypotheticalA |
| $ 1,000.00 | $ 1,021.27 | $ 3.97 |
A 5% return per year before expenses
B Annualized expense ratio reflects expenses net of applicable fee waivers.
* Expenses are equal to each Class' annualized expense ratio, multiplied by the average account value over the period, multiplied by 184/365 (to reflect the one-half year period).
Annual Report
Investment Changes (Unaudited)
Top Five Holdings as of October 31, 2014 | ||
(by issuer, excluding cash equivalents) | % of fund's | % of fund's net assets |
International Lease Finance Corp. | 2.8 | 2.6 |
GMAC LLC | 2.7 | 2.7 |
HCA Holdings, Inc. | 2.0 | 2.3 |
SLM Corp. | 1.8 | 1.8 |
Reynolds Group Issuer, Inc./Reynolds Group Issuer LLC/Reynolds Group Issuer (Luxembourg) SA | 1.6 | 1.6 |
| 10.9 | |
Top Five Market Sectors as of October 31, 2014 | ||
| % of fund's | % of fund's net assets |
Diversified Financial Services | 9.7 | 10.0 |
Telecommunications | 9.7 | 10.0 |
Healthcare | 7.2 | 7.7 |
Energy | 7.2 | 7.5 |
Banks & Thrifts | 7.0 | 5.6 |
Quality Diversification (% of fund's net assets) | |||||||
As of October 31, 2014 | As of April 30, 2014 | ||||||
 | BBB 0.6% |
| | BBB 1.2% |
| ||
 | BB 28.4% |
| | BB 24.8% |
| ||
 | B 34.5% |
| | B 36.0% |
| ||
 | CCC,CC,C 13.5% |
| | CCC,CC,C 17.0% |
| ||
 | Not Rated 3.8% |
| | Not Rated 1.3% |
| ||
 | Equities 16.4% |
| | Equities 16.8% |
| ||
 | Short-Term |
| | Short-Term |
| ||

We have used ratings from Moody's Investors Service, Inc. Where Moody's® ratings are not available, we have used S&P® ratings. All ratings are as of the date indicated and do not reflect subsequent changes. |
Asset Allocation (% of fund's net assets) | |||||||
As of October 31, 2014* | As of April 30, 2014** | ||||||
| Nonconvertible |
| | Nonconvertible |
| ||
 | Convertible Bonds, Preferred Stocks 1.0% |
| | Convertible Bonds, Preferred Stocks 1.0% |
| ||
 | Common Stocks 15.4% |
| | Common Stocks 15.8% |
| ||
 | Bank Loan |
| | Bank Loan |
| ||
 | Other Investments 2.9% |
| | Other Investments 2.8% |
| ||
| Short-Term |
| | Short-Term |
| ||
* Foreign investments | 18.8% |
| ** Foreign investments | 18.1% |
| ||

Annual Report
Investments October 31, 2014
Showing Percentage of Net Assets
Corporate Bonds - 70.0% | ||||
| Principal | Value (000s) | ||
Convertible Bonds - 0.0% | ||||
Broadcasting - 0.0% | ||||
Mood Media Corp. 10% 10/31/15 (g) | $ 38 | $ 32 | ||
Nonconvertible Bonds - 70.0% | ||||
Aerospace - 0.2% | ||||
GenCorp, Inc. 7.125% 3/15/21 | 270 | 287 | ||
TransDigm, Inc.: | ||||
6% 7/15/22 | 2,030 | 2,053 | ||
6.5% 7/15/24 | 2,000 | 2,060 | ||
| 4,400 | |||
Air Transportation - 0.3% | ||||
Continental Airlines, Inc.: | ||||
pass-thru trust certificates 6.903% 4/19/22 | 940 | 1,001 | ||
6.125% 4/29/18 | 670 | 707 | ||
9.25% 5/10/17 | 1,071 | 1,210 | ||
United Air Lines, Inc. pass-thru trust certificates 9.75% 1/15/17 | 1,900 | 2,109 | ||
| 5,027 | |||
Automotive - 2.1% | ||||
American Axle & Manufacturing, Inc. 5.125% 2/15/19 | 750 | 761 | ||
Chassix, Inc. 9.25% 8/1/18 (g) | 765 | 742 | ||
Dana Holding Corp.: | ||||
5.375% 9/15/21 | 1,450 | 1,508 | ||
6% 9/15/23 | 1,450 | 1,523 | ||
Gates Global LLC / Gates Global Co. 6% 7/15/22 (g) | 2,235 | 2,168 | ||
General Motors Acceptance Corp. 8% 11/1/31 | 3,759 | 4,788 | ||
General Motors Financial Co., Inc.: | ||||
4.25% 5/15/23 | 1,000 | 1,030 | ||
4.75% 8/15/17 | 3,660 | 3,907 | ||
6.75% 6/1/18 | 10,220 | 11,612 | ||
LKQ Corp. 4.75% 5/15/23 | 430 | 416 | ||
Schaeffler Finance BV 4.75% 5/15/21 (g) | 5,430 | 5,416 | ||
Schaeffler Holding Finance BV: | ||||
6.25% 11/15/19 pay-in-kind (g)(i) | 2,140 | 2,215 | ||
6.75% 11/15/22 pay-in-kind (g)(i) | 1,005 | 1,063 | ||
6.875% 8/15/18 pay-in-kind (g)(i) | 2,550 | 2,671 | ||
Tenneco, Inc. 6.875% 12/15/20 | 3,362 | 3,581 | ||
| 43,401 | |||
Banks & Thrifts - 4.3% | ||||
Ally Financial, Inc.: | ||||
3.5% 1/27/19 | 3,485 | 3,494 | ||
Corporate Bonds - continued | ||||
| Principal | Value (000s) | ||
Nonconvertible Bonds - continued | ||||
Banks & Thrifts - continued | ||||
Ally Financial, Inc.: - continued | ||||
4.75% 9/10/18 | $ 3,970 | $ 4,169 | ||
8% 3/15/20 | 3,333 | 4,008 | ||
GMAC LLC: | ||||
8% 12/31/18 | 25,964 | 30,088 | ||
8% 11/1/31 | 19,887 | 25,306 | ||
Royal Bank of Scotland Group PLC: | ||||
5.125% 5/28/24 | 11,620 | 11,768 | ||
6% 12/19/23 | 8,040 | 8,650 | ||
Washington Mutual Bank 5.5% 1/15/49 (d) | 10,000 | 1 | ||
| 87,484 | |||
Broadcasting - 0.1% | ||||
AMC Networks, Inc. 7.75% 7/15/21 | 500 | 545 | ||
Clear Channel Communications, Inc. 5.5% 12/15/16 | 2,263 | 2,144 | ||
| 2,689 | |||
Building Materials - 0.7% | ||||
American Builders & Contractors Supply Co., Inc. 5.625% 4/15/21 (g) | 595 | 602 | ||
CEMEX Finance LLC 6% 4/1/24 (g) | 2,795 | 2,850 | ||
CEMEX S.A.B. de CV 5.2331% 9/30/15 (g)(i) | 4,305 | 4,387 | ||
HMAN Finance Sub Corp. 6.375% 7/15/22 (g) | 900 | 875 | ||
Nortek, Inc. 8.5% 4/15/21 | 1,520 | 1,634 | ||
USG Corp.: | ||||
5.875% 11/1/21 (g) | 430 | 444 | ||
6.3% 11/15/16 | 275 | 290 | ||
7.875% 3/30/20 (g) | 1,390 | 1,494 | ||
9.75% 1/15/18 | 1,585 | 1,827 | ||
| 14,403 | |||
Cable TV - 4.4% | ||||
Altice SA 7.75% 5/15/22 (g) | 14,575 | 15,304 | ||
CCO Holdings LLC/CCO Holdings Capital Corp.: | ||||
5.125% 2/15/23 | 2,550 | 2,544 | ||
5.25% 3/15/21 | 2,245 | 2,273 | ||
5.75% 9/1/23 | 1,545 | 1,582 | ||
5.75% 1/15/24 | 5,335 | 5,462 | ||
CCOH Safari LLC 5.5% 12/1/22 | 3,735 | 3,772 | ||
Cequel Communications Escrow I LLC/Cequel Communications Escrow Capital Corp. 6.375% 9/15/20 (g) | 535 | 558 | ||
Corporate Bonds - continued | ||||
| Principal | Value (000s) | ||
Nonconvertible Bonds - continued | ||||
Cable TV - continued | ||||
Cequel Communications Holdings I LLC/Cequel Capital Corp. 5.125% 12/15/21 (g) | $ 5,495 | $ 5,364 | ||
DISH DBS Corp.: | ||||
5% 3/15/23 | 4,695 | 4,677 | ||
5.875% 7/15/22 | 4,240 | 4,494 | ||
6.75% 6/1/21 | 5,260 | 5,839 | ||
Lynx I Corp. 5.375% 4/15/21 (g) | 1,260 | 1,307 | ||
Lynx II Corp. 6.375% 4/15/23 (g) | 710 | 751 | ||
Numericable Group SA: | ||||
4.875% 5/15/19 (g) | 7,890 | 7,870 | ||
6% 5/15/22 (g) | 15,358 | 15,704 | ||
6.25% 5/15/24 (g) | 1,150 | 1,183 | ||
RCN Telecom Services LLC/RCN Capital Corp. 8.5% 8/15/20 (g) | 3,001 | 3,144 | ||
Unitymedia Hessen GmbH & Co. KG/Unitymedia NRW GmbH: | ||||
5.5% 1/15/23 (g) | 2,145 | 2,236 | ||
7.5% 3/15/19 (g) | 705 | 742 | ||
UPCB Finance III Ltd. 6.625% 7/1/20 (g) | 1,635 | 1,721 | ||
UPCB Finance VI Ltd. 6.875% 1/15/22 (g) | 1,900 | 2,076 | ||
Virgin Media Finance PLC 6% 10/15/24 (g) | 1,620 | 1,685 | ||
| 90,288 | |||
Capital Goods - 0.2% | ||||
AECOM Technology Corp.: | ||||
5.75% 10/15/22 (g) | 1,115 | 1,174 | ||
5.875% 10/15/24 (g) | 955 | 1,010 | ||
Briggs & Stratton Corp. 6.875% 12/15/20 | 735 | 810 | ||
Shale-Inland Holdings LLC/Shale-Inland Finance Corp. 8.75% 11/15/19 (g) | 1,665 | 1,723 | ||
| 4,717 | |||
Chemicals - 1.0% | ||||
Hexion U.S. Finance Corp. 6.625% 4/15/20 | 4,605 | 4,605 | ||
LSB Industries, Inc. 7.75% 8/1/19 | 705 | 752 | ||
PolyOne Corp. 5.25% 3/15/23 | 2,215 | 2,221 | ||
Trinseo Materials Operating SCA/Trinseo Materials Finance, Inc. 8.75% 2/1/19 | 9,017 | 9,535 | ||
U.S. Coatings Acquisition, Inc./Flash Dutch 2 BV 7.375% 5/1/21 (g) | 960 | 1,039 | ||
Corporate Bonds - continued | ||||
| Principal | Value (000s) | ||
Nonconvertible Bonds - continued | ||||
Chemicals - continued | ||||
W.R. Grace & Co. - Conn: | ||||
5.125% 10/1/21 (g) | $ 1,550 | $ 1,615 | ||
5.625% 10/1/24 (g) | 620 | 653 | ||
| 20,420 | |||
Consumer Products - 0.7% | ||||
Prestige Brands, Inc.: | ||||
5.375% 12/15/21 (g) | 2,875 | 2,782 | ||
8.125% 2/1/20 | 335 | 358 | ||
Revlon Consumer Products Corp. 5.75% 2/15/21 | 10,540 | 10,540 | ||
Spectrum Brands Holdings, Inc.: | ||||
6.375% 11/15/20 | 565 | 599 | ||
6.625% 11/15/22 | 670 | 719 | ||
| 14,998 | |||
Containers - 2.5% | ||||
Ardagh Finance Holdings SA 8.625% 6/15/19 pay-in-kind (g)(i) | 1,430 | 1,416 | ||
Ardagh Packaging Finance PLC 9.125% 10/15/20 (g) | 3,369 | 3,630 | ||
Ardagh Packaging Finance PLC/Ardagh MP Holdings U.S.A., Inc.: | ||||
6% 6/30/21 (g) | 1,410 | 1,391 | ||
6.25% 1/31/19 (g) | 1,165 | 1,174 | ||
6.75% 1/31/21 (g) | 1,350 | 1,380 | ||
7% 11/15/20 (g) | 697 | 711 | ||
9.125% 10/15/20 (g) | 1,045 | 1,121 | ||
Beverage Packaging Holdings II SA (Luxembourg) 6% 6/15/17 (g) | 1,255 | 1,252 | ||
Consolidated Container Co. LLC/Consolidated Container Capital, Inc. 10.125% 7/15/20 (g) | 1,465 | 1,377 | ||
Reynolds Group Issuer, Inc./Reynolds Group Issuer LLC/Reynolds Group Issuer (Luxembourg) SA: | ||||
5.75% 10/15/20 | 10,505 | 10,925 | ||
6.875% 2/15/21 | 7,339 | 7,798 | ||
7.875% 8/15/19 | 8,387 | 8,985 | ||
8.25% 2/15/21 | 6,144 | 6,605 | ||
Sealed Air Corp. 6.5% 12/1/20 (g) | 1,730 | 1,903 | ||
Tekni-Plex, Inc. 9.75% 6/1/19 (g) | 1,114 | 1,217 | ||
| 50,885 | |||
Corporate Bonds - continued | ||||
| Principal | Value (000s) | ||
Nonconvertible Bonds - continued | ||||
Diversified Financial Services - 6.9% | ||||
AerCap Ireland Capital Ltd./AerCap Global Aviation Trust: | ||||
3.75% 5/15/19 (g) | $ 3,725 | $ 3,697 | ||
4.5% 5/15/21 (g) | 4,075 | 4,116 | ||
5% 10/1/21 (g) | 2,715 | 2,824 | ||
Aircastle Ltd. 4.625% 12/15/18 | 1,625 | 1,649 | ||
CIT Group, Inc.: | ||||
3.875% 2/19/19 | 2,570 | 2,586 | ||
5% 8/15/22 | 3,195 | 3,343 | ||
5% 8/1/23 | 4,515 | 4,713 | ||
5.375% 5/15/20 | 4,400 | 4,703 | ||
5.5% 2/15/19 (g) | 8,075 | 8,615 | ||
Icahn Enterprises LP/Icahn Enterprises Finance Corp.: | ||||
4.875% 3/15/19 | 3,930 | 3,999 | ||
5.875% 2/1/22 | 4,690 | 4,819 | ||
6% 8/1/20 | 3,840 | 4,032 | ||
International Lease Finance Corp.: | ||||
3.875% 4/15/18 | 7,210 | 7,233 | ||
5.75% 5/15/16 | 6,040 | 6,297 | ||
5.875% 8/15/22 | 10,375 | 11,257 | ||
7.125% 9/1/18 (g) | 10,309 | 11,675 | ||
8.25% 12/15/20 | 3,945 | 4,734 | ||
8.625% 1/15/22 | 11,580 | 14,359 | ||
SLM Corp.: | ||||
4.875% 6/17/19 | 9,130 | 9,267 | ||
5.5% 1/15/19 | 3,545 | 3,676 | ||
5.5% 1/25/23 | 2,245 | 2,245 | ||
6.125% 3/25/24 | 3,835 | 3,960 | ||
8% 3/25/20 | 9,700 | 11,131 | ||
8.45% 6/15/18 | 4,905 | 5,604 | ||
| 140,534 | |||
Diversified Media - 1.0% | ||||
Clear Channel Worldwide Holdings, Inc.: | ||||
Series A: | ||||
6.5% 11/15/22 | 1,225 | 1,262 | ||
7.625% 3/15/20 | 900 | 950 | ||
Series B, 6.5% 11/15/22 | 3,315 | 3,431 | ||
7.625% 3/15/20 | 4,400 | 4,681 | ||
Lamar Media Corp. 5.375% 1/15/24 | 1,080 | 1,118 | ||
Corporate Bonds - continued | ||||
| Principal | Value (000s) | ||
Nonconvertible Bonds - continued | ||||
Diversified Media - continued | ||||
Liberty Media Corp.: | ||||
8.25% 2/1/30 | $ 469 | $ 511 | ||
8.5% 7/15/29 | 529 | 586 | ||
MDC Partners, Inc. 6.75% 4/1/20 (g) | 440 | 457 | ||
National CineMedia LLC: | ||||
6% 4/15/22 | 4,035 | 4,085 | ||
7.875% 7/15/21 | 2,050 | 2,183 | ||
Nielsen Finance LLC/Nielsen Finance Co. 5% 4/15/22 (g) | 1,220 | 1,238 | ||
| 20,502 | |||
Electric Utilities - 3.8% | ||||
Calpine Corp.: | ||||
5.375% 1/15/23 | 2,615 | 2,641 | ||
5.75% 1/15/25 | 1,120 | 1,134 | ||
6% 1/15/22 (g) | 1,885 | 2,031 | ||
7.875% 1/15/23 (g) | 4,205 | 4,657 | ||
Energy Future Intermediate Holding Co. LLC/Energy Future Intermediate Holding Finance, Inc.: | ||||
11% 10/1/21 (d) | 6,237 | 7,360 | ||
12.25% 3/1/22 (d)(g) | 20,435 | 24,318 | ||
Global Partners LP/GLP Finance Corp. 6.25% 7/15/22 (g) | 535 | 530 | ||
InterGen NV 7% 6/30/23 (g) | 3,940 | 3,773 | ||
Mirant Americas Generation LLC 9.125% 5/1/31 | 690 | 645 | ||
NRG Energy, Inc. 6.625% 3/15/23 | 7,020 | 7,406 | ||
RJS Power Holdings LLC 5.125% 7/15/19 (g) | 3,830 | 3,811 | ||
The AES Corp.: | ||||
4.875% 5/15/23 | 725 | 723 | ||
5.5% 3/15/24 | 1,305 | 1,334 | ||
7.375% 7/1/21 | 2,400 | 2,738 | ||
TXU Corp.: | ||||
5.55% 11/15/14 (d)(m) | 7,757 | 6,128 | ||
6.5% 11/15/24 (d)(m) | 4,961 | 3,919 | ||
6.55% 11/15/34 (d)(m) | 4,295 | 3,393 | ||
| 76,541 | |||
Energy - 6.0% | ||||
Access Midstream Partners LP/ACMP Finance Corp.: | ||||
4.875% 5/15/23 | 2,720 | 2,842 | ||
4.875% 3/15/24 | 1,300 | 1,359 | ||
Corporate Bonds - continued | ||||
| Principal | Value (000s) | ||
Nonconvertible Bonds - continued | ||||
Energy - continued | ||||
American Energy-Permian Basin LLC/ AEPB Finance Corp.: | ||||
6.7413% 8/1/19 (g)(i) | $ 2,380 | $ 2,106 | ||
7.125% 11/1/20 (g) | 2,835 | 2,452 | ||
7.375% 11/1/21 (g) | 3,475 | 3,041 | ||
AmeriGas Finance LLC/AmeriGas Finance Corp.: | ||||
6.75% 5/20/20 | 1,260 | 1,342 | ||
7% 5/20/22 | 2,700 | 2,916 | ||
Antero Resources Corp. 5.125% 12/1/22 (g) | 3,765 | 3,766 | ||
Antero Resources Finance Corp. 5.375% 11/1/21 | 2,500 | 2,538 | ||
Atlas Pipeline Partners LP/Atlas Pipeline Finance Corp. 5.875% 8/1/23 | 1,885 | 1,956 | ||
California Resources Corp.: | ||||
5% 1/15/20 (g) | 2,340 | 2,375 | ||
5.5% 9/15/21 (g) | 3,045 | 3,106 | ||
6% 11/15/24 (g) | 2,030 | 2,071 | ||
Chesapeake Energy Corp.: | ||||
4.875% 4/15/22 | 1,890 | 1,933 | ||
5.375% 6/15/21 | 3,665 | 3,821 | ||
5.75% 3/15/23 | 2,170 | 2,376 | ||
6.125% 2/15/21 | 3,615 | 4,013 | ||
6.875% 11/15/20 | 177 | 202 | ||
Crestwood Midstream Partners LP/Crestwood Midstream Finance Corp.: | ||||
6.125% 3/1/22 | 1,520 | 1,535 | ||
7.75% 4/1/19 | 3,095 | 3,254 | ||
Denbury Resources, Inc. 4.625% 7/15/23 | 4,395 | 4,060 | ||
Diamondback Energy, Inc. 7.625% 10/1/21 | 1,545 | 1,642 | ||
Dynegy Finance I, Inc./Dynegy Finance II, Inc.: | ||||
6.75% 11/1/19 (g) | 1,855 | 1,920 | ||
7.375% 11/1/22 (g) | 3,470 | 3,670 | ||
7.625% 11/1/24 (g) | 3,465 | 3,673 | ||
Edgen Murray Corp. 8.75% 11/1/20 (g) | 1,200 | 1,320 | ||
El Paso Energy Corp. 7.75% 1/15/32 | 1,399 | 1,749 | ||
EP Energy LLC/Everest Acquisition Finance, Inc. 7.75% 9/1/22 | 1,440 | 1,519 | ||
Everest Acquisition LLC/Everest Acquisition Finance, Inc. 9.375% 5/1/20 | 3,975 | 4,343 | ||
Exterran Partners LP/EXLP Finance Corp. 6% 10/1/22 (g) | 2,280 | 2,189 | ||
Forbes Energy Services Ltd. 9% 6/15/19 | 3,470 | 3,349 | ||
Corporate Bonds - continued | ||||
| Principal | Value (000s) | ||
Nonconvertible Bonds - continued | ||||
Energy - continued | ||||
Forum Energy Technologies, Inc. 6.25% 10/1/21 | $ 1,090 | $ 1,123 | ||
Genesis Energy LP/Genesis Energy Finance Corp. 5.75% 2/15/21 | 845 | 849 | ||
Gibson Energy, Inc. 6.75% 7/15/21 (g) | 280 | 298 | ||
Gulfmark Offshore, Inc. 6.375% 3/15/22 | 560 | 510 | ||
Kinder Morgan Holding Co. LLC 5% 2/15/21 (g) | 1,695 | 1,788 | ||
Kodiak Oil & Gas Corp.: | ||||
5.5% 1/15/21 | 790 | 802 | ||
8.125% 12/1/19 | 2,010 | 2,161 | ||
Laredo Petroleum Holdings, Inc. 5.625% 1/15/22 | 2,995 | 2,950 | ||
Markwest Energy Partners LP/Markwest Energy Finance Corp. 5.5% 2/15/23 | 995 | 1,060 | ||
Offshore Group Investment Ltd.: | ||||
7.125% 4/1/23 | 2,445 | 2,017 | ||
7.5% 11/1/19 | 8,130 | 6,931 | ||
Pacific Drilling V Ltd. 7.25% 12/1/17 (g) | 1,985 | 1,968 | ||
Rose Rock Midstream LP/ Rose Rock Finance Corp. 5.625% 7/15/22 | 1,125 | 1,122 | ||
Rosetta Resources, Inc. 5.875% 6/1/24 | 1,235 | 1,186 | ||
RSP Permian, Inc. 6.625% 10/1/22 (g) | 915 | 913 | ||
Sabine Pass Liquefaction LLC: | ||||
5.625% 4/15/23 (g) | 4,530 | 4,689 | ||
5.75% 5/15/24 (g) | 3,215 | 3,324 | ||
SemGroup Corp. 7.5% 6/15/21 | 1,625 | 1,710 | ||
Star Gas Partners LP/Star Gas Finance Co. 8.875% 12/1/17 | 1,324 | 1,382 | ||
Summit Midstream Holdings LLC: | ||||
5.5% 8/15/22 | 1,520 | 1,520 | ||
7.5% 7/1/21 | 810 | 883 | ||
Targa Resources Partners LP/Targa Resources Partners Finance Corp. 6.375% 8/1/22 | 908 | 976 | ||
Teine Energy Ltd. 6.875% 9/30/22 (g) | 2,166 | 2,052 | ||
Western Refining, Inc. 6.25% 4/1/21 | 905 | 910 | ||
| 121,562 | |||
Entertainment/Film - 0.8% | ||||
CBS Outdoor Americas Capital LLC/CBS Outdoor Americas Capital Corp.: | ||||
5.25% 2/15/22 (g) | 470 | 485 | ||
5.625% 2/15/24 (g) | 510 | 532 | ||
Corporate Bonds - continued | ||||
| Principal | Value (000s) | ||
Nonconvertible Bonds - continued | ||||
Entertainment/Film - continued | ||||
Cinemark U.S.A., Inc.: | ||||
4.875% 6/1/23 | $ 2,110 | $ 2,078 | ||
5.125% 12/15/22 | 570 | 570 | ||
7.375% 6/15/21 | 1,085 | 1,164 | ||
Lions Gate Entertainment Corp. 5.25% 8/1/18 (g) | 6,095 | 6,278 | ||
Livent, Inc. yankee 9.375% 10/15/04 (d) | 11,100 | 0 | ||
NAI Entertainment Holdings LLC/NAI Entertainment Finance Corp. 5% 8/1/18 (g) | 1,425 | 1,461 | ||
Regal Entertainment Group: | ||||
5.75% 6/15/23 | 3,725 | 3,576 | ||
5.75% 2/1/25 | 555 | 524 | ||
| 16,668 | |||
Environmental - 0.4% | ||||
Clean Harbors, Inc. 5.125% 6/1/21 | 1,180 | 1,201 | ||
Covanta Holding Corp.: | ||||
5.875% 3/1/24 | 1,530 | 1,574 | ||
6.375% 10/1/22 | 1,355 | 1,443 | ||
7.25% 12/1/20 | 1,094 | 1,165 | ||
Darling International, Inc. 5.375% 1/15/22 | 1,280 | 1,283 | ||
LBC Tank Terminals Holding Netherlands BV 6.875% 5/15/23 (g) | 1,455 | 1,550 | ||
| 8,216 | |||
Food & Drug Retail - 1.9% | ||||
Albertsons Holdings LLC/Saturn Acquistion Merger Sub, Inc. 7.75% 10/15/22 (g) | 3,895 | 3,837 | ||
JBS Investments GmbH: | ||||
7.25% 4/3/24 (g) | 1,905 | 2,034 | ||
7.75% 10/28/20 (g) | 4,855 | 5,319 | ||
Minerva Luxmbourg SA 7.75% 1/31/23 (g) | 635 | 664 | ||
Pinnacle Merger Sub, Inc. 9.5% 10/1/23 (g) | 1,375 | 1,499 | ||
Rite Aid Corp.: | ||||
6.75% 6/15/21 | 11,895 | 12,698 | ||
6.875% 12/15/28 (g) | 5,785 | 6,045 | ||
7.7% 2/15/27 | 6,515 | 7,232 | ||
| 39,328 | |||
Food/Beverage/Tobacco - 1.6% | ||||
C&S Group Enterprises LLC 5.375% 7/15/22 (g) | 2,555 | 2,555 | ||
ESAL GmbH 6.25% 2/5/23 (g) | 4,565 | 4,656 | ||
Corporate Bonds - continued | ||||
| Principal | Value (000s) | ||
Nonconvertible Bonds - continued | ||||
Food/Beverage/Tobacco - continued | ||||
FAGE Dairy Industry SA/FAGE U.S.A. Dairy Industry, Inc. 9.875% 2/1/20 (g) | $ 2,275 | $ 2,409 | ||
H.J. Heinz Co. 4.25% 10/15/20 | 12,790 | 12,915 | ||
H.J. Heinz Finance Co. 7.125% 8/1/39 (g) | 300 | 332 | ||
JBS U.S.A. LLC/JBS U.S.A. Finance, Inc. 5.875% 7/15/24 (g) | 2,435 | 2,447 | ||
Post Holdings, Inc.: | ||||
6% 12/15/22 (g) | 1,195 | 1,153 | ||
6.75% 12/1/21 (g) | 5,380 | 5,373 | ||
| 31,840 | |||
Gaming - 2.4% | ||||
Caesars Growth Properties Holdings LLC/Caesars Growth Properties Finance, Inc. 9.375% 5/1/22 (g) | 7,110 | 6,612 | ||
GLP Capital LP/GLP Financing II, Inc.: | ||||
4.375% 11/1/18 | 820 | 843 | ||
4.875% 11/1/20 | 2,140 | 2,226 | ||
5.375% 11/1/23 | 1,700 | 1,789 | ||
Golden Nugget Escrow, Inc. 8.5% 12/1/21 (g) | 10,735 | 10,681 | ||
Graton Economic Development Authority 9.625% 9/1/19 (g) | 1,730 | 1,938 | ||
MCE Finance Ltd. 5% 2/15/21 (g) | 2,100 | 2,069 | ||
MGM Mirage, Inc.: | ||||
6.875% 4/1/16 | 820 | 863 | ||
8.625% 2/1/19 | 5,000 | 5,788 | ||
Paris Las Vegas Holding LLC/Harrah's Las Vegas LLC/Flamingo Las Vegas Holdings, Inc.: | ||||
8% 10/1/20 (g) | 4,505 | 4,370 | ||
11% 10/1/21 (g) | 2,725 | 2,531 | ||
Studio City Finance Ltd. 8.5% 12/1/20 (g) | 8,920 | 9,678 | ||
| 49,388 | |||
Healthcare - 5.9% | ||||
Aviv Healthcare Properties LP/Aviv Healthcare Capital Corp.: | ||||
6% 10/15/21 | 685 | 706 | ||
7.75% 2/15/19 | 4,441 | 4,663 | ||
Catamaran Corp. 4.75% 3/15/21 (Reg. S) | 1,965 | 1,950 | ||
CTR Partnership LP/CareTrust Capital Corp. 5.875% 6/1/21 | 355 | 362 | ||
DaVita HealthCare Partners, Inc.: | ||||
5.125% 7/15/24 | 4,500 | 4,590 | ||
Corporate Bonds - continued | ||||
| Principal | Value (000s) | ||
Nonconvertible Bonds - continued | ||||
Healthcare - continued | ||||
DaVita HealthCare Partners, Inc.: - continued | ||||
5.75% 8/15/22 | $ 1,970 | $ 2,088 | ||
Grifols Worldwide Operations Ltd. 5.25% 4/1/22 (g) | 2,915 | 2,988 | ||
HCA Holdings, Inc.: | ||||
4.75% 5/1/23 | 4,475 | 4,548 | ||
5% 3/15/24 | 3,060 | 3,156 | ||
5.875% 3/15/22 | 8,635 | 9,477 | ||
6.25% 2/15/21 | 2,265 | 2,438 | ||
6.5% 2/15/20 | 7,640 | 8,528 | ||
7.5% 2/15/22 | 5,095 | 5,917 | ||
7.75% 5/15/21 | 6,114 | 6,588 | ||
HealthSouth Corp. 5.75% 11/1/24 | 3,280 | 3,444 | ||
IMS Health, Inc. 6% 11/1/20 (g) | 1,175 | 1,219 | ||
Omega Healthcare Investors, Inc.: | ||||
5.875% 3/15/24 | 410 | 441 | ||
6.75% 10/15/22 | 2,631 | 2,809 | ||
Polymer Group, Inc. 6.875% 6/1/19 (g) | 890 | 879 | ||
Sabra Health Care LP/Sabra Capital Corp. 5.5% 2/1/21 | 1,080 | 1,121 | ||
Salix Pharmaceuticals Ltd. 6% 1/15/21 (g) | 620 | 671 | ||
Service Corp. International 5.375% 1/15/22 | 815 | 844 | ||
Tenet Healthcare Corp.: | ||||
4.375% 10/1/21 | 8,990 | 8,934 | ||
4.5% 4/1/21 | 1,670 | 1,674 | ||
4.75% 6/1/20 | 1,665 | 1,702 | ||
5% 3/1/19 (g) | 2,970 | 2,974 | ||
6% 10/1/20 | 1,890 | 2,032 | ||
6.75% 2/1/20 | 1,800 | 1,904 | ||
8.125% 4/1/22 | 7,570 | 8,677 | ||
Valeant Pharmaceuticals International: | ||||
5.625% 12/1/21 (g) | 1,395 | 1,385 | ||
6.75% 8/15/18 (g) | 5,800 | 6,170 | ||
7.25% 7/15/22 (g) | 315 | 332 | ||
7.5% 7/15/21 (g) | 7,250 | 7,758 | ||
VPI Escrow Corp. 6.375% 10/15/20 (g) | 2,380 | 2,442 | ||
VWR Funding, Inc. 7.25% 9/15/17 | 4,375 | 4,594 | ||
| 120,005 | |||
Homebuilders/Real Estate - 1.5% | ||||
Beazer Homes U.S.A., Inc. 7.25% 2/1/23 | 1,260 | 1,254 | ||
Corporate Bonds - continued | ||||
| Principal | Value (000s) | ||
Nonconvertible Bonds - continued | ||||
Homebuilders/Real Estate - continued | ||||
Brookfield Residential Properties, Inc./Brookfield Residential U.S. Corp. 6.125% 7/1/22 (g) | $ 1,265 | $ 1,344 | ||
Brookfield Residential Properties, Inc. 6.5% 12/15/20 (g) | 1,000 | 1,065 | ||
CBRE Group, Inc. 5% 3/15/23 | 6,805 | 6,941 | ||
D.R. Horton, Inc.: | ||||
4.75% 2/15/23 | 915 | 904 | ||
5.75% 8/15/23 | 750 | 800 | ||
Howard Hughes Corp. 6.875% 10/1/21 (g) | 3,530 | 3,733 | ||
Kennedy-Wilson, Inc. 5.875% 4/1/24 | 1,395 | 1,421 | ||
Realogy Group LLC/Realogy Co.-Issuer Corp. 4.5% 4/15/19 (g) | 3,085 | 3,093 | ||
Taylor Morrison Communities, Inc./Monarch Communities, Inc. 5.625% 3/1/24 (g) | 895 | 886 | ||
Weyerhaeuser Real Estate Co.: | ||||
4.375% 6/15/19 (g) | 1,315 | 1,308 | ||
5.875% 6/15/24 (g) | 960 | 979 | ||
William Lyon Homes, Inc. 8.5% 11/15/20 | 2,170 | 2,371 | ||
WLH PNW Finance Corp. 7% 8/15/22 (g) | 1,860 | 1,920 | ||
Woodside Homes Co. LLC/Woodside Homes Finance, Inc. 6.75% 12/15/21 (g) | 2,215 | 2,226 | ||
| 30,245 | |||
Hotels - 0.6% | ||||
Choice Hotels International, Inc. 5.75% 7/1/22 | 615 | 663 | ||
Hilton Worldwide Finance LLC/Hilton Worldwide Finance Corp. 5.625% 10/15/21 (g) | 10,040 | 10,580 | ||
| 11,243 | |||
Insurance - 0.2% | ||||
Hockey Merger Sub 2, Inc. 7.875% 10/1/21 (g) | 2,765 | 2,883 | ||
Hub Holdings LLC / Hub Holdings Finance, Inc. 8.125% 7/15/19 pay-in-kind (g)(i) | 1,220 | 1,211 | ||
| 4,094 | |||
Leisure - 0.0% | ||||
24 Hour Holdings III LLC 8% 6/1/22 (g) | 895 | 846 | ||
Metals/Mining - 1.0% | ||||
Alcoa, Inc. 5.125% 10/1/24 | 1,008 | 1,064 | ||
Alpha Natural Resources, Inc.: | ||||
6% 6/1/19 | 3,730 | 1,865 | ||
6.25% 6/1/21 | 4,245 | 2,016 | ||
9.75% 4/15/18 | 1,770 | 1,155 | ||
Corporate Bonds - continued | ||||
| Principal | Value (000s) | ||
Nonconvertible Bonds - continued | ||||
Metals/Mining - continued | ||||
Bluescope Steel Ltd./Bluescope Steel Finance 7.125% 5/1/18 (g) | $ 415 | $ 432 | ||
Calcipar SA 6.875% 5/1/18 (g) | 1,070 | 1,107 | ||
Compass Minerals International, Inc. 4.875% 7/15/24 (g) | 2,280 | 2,234 | ||
Murray Energy Corp.: | ||||
8.625% 6/15/21 (g) | 1,540 | 1,590 | ||
9.5% 12/5/20 (g) | 2,780 | 2,975 | ||
Prince Mineral Holding Corp. 12% 12/15/19 (g) | 655 | 717 | ||
Signode Industrial Group Lux SA/Signode Industrial Group U.S., Inc. 6.375% 5/1/22 (g) | 1,040 | 1,009 | ||
Walter Energy, Inc.: | ||||
9.5% 10/15/19 (g) | 3,275 | 2,841 | ||
12% 4/1/20 pay-in-kind (g)(i) | 1,545 | 680 | ||
| 19,685 | |||
Paper - 0.1% | ||||
Clearwater Paper Corp. 4.5% 2/1/23 | 2,045 | 1,994 | ||
Publishing/Printing - 1.5% | ||||
Cenveo Corp. 6% 8/1/19 (g) | 1,290 | 1,242 | ||
Griffey Intermediate, Inc./Griffey Finance Sub LLC 7% 10/15/20 (g) | 4,610 | 3,550 | ||
McGraw-Hill Global Education Holdings LLC/McGraw-Hill Global Education Finance 9.75% 4/1/21 | 14,305 | 16,165 | ||
MHGE Parent LLC / MHGE Parent Finance, Inc. 8.5% 8/1/19 pay-in-kind (g)(i) | 5,925 | 5,851 | ||
R.R. Donnelley & Sons Co.: | ||||
6% 4/1/24 | 960 | 960 | ||
6.5% 11/15/23 | 2,890 | 2,991 | ||
| 30,759 | |||
Railroad - 0.2% | ||||
Jurassic Holdings III, Inc. 6.875% 2/15/21 (Reg. S) (g) | 1,920 | 1,934 | ||
Ultrapetrol (Bahamas) Ltd. 8.875% 6/15/21 | 1,285 | 1,349 | ||
| 3,283 | |||
Restaurants - 0.5% | ||||
1011778 BC ULC/New Red Finance, Inc. 6% 4/1/22 (g) | 1,390 | 1,409 | ||
Corporate Bonds - continued | ||||
| Principal | Value (000s) | ||
Nonconvertible Bonds - continued | ||||
Restaurants - continued | ||||
Landry's Acquisition Co. 9.375% 5/1/20 (g) | $ 4,040 | $ 4,318 | ||
Landry's Holdings II, Inc. 10.25% 1/1/18 (g) | 4,205 | 4,373 | ||
| 10,100 | |||
Services - 2.8% | ||||
Ahern Rentals, Inc. 9.5% 6/15/18 (g) | 470 | 502 | ||
Anna Merger Sub, Inc. 7.75% 10/1/22 (g) | 3,165 | 3,224 | ||
APX Group, Inc.: | ||||
6.375% 12/1/19 | 8,560 | 8,410 | ||
8.75% 12/1/20 | 11,350 | 9,818 | ||
Ashtead Capital, Inc. 5.625% 10/1/24 (g) | 3,195 | 3,331 | ||
Audatex North America, Inc.: | ||||
6% 6/15/21 (g) | 8,190 | 8,661 | ||
6.125% 11/1/23 (g) | 590 | 625 | ||
Blueline Rent Finance Corp./Volvo 7% 2/1/19 (g) | 815 | 858 | ||
CBRE Group, Inc. 5.25% 3/15/25 | 2,115 | 2,165 | ||
Ceridian LLC / Comdata, Inc. 8.125% 11/15/17 (g) | 2,460 | 2,460 | ||
FTI Consulting, Inc. 6% 11/15/22 | 2,450 | 2,508 | ||
Garda World Security Corp.: | ||||
7.25% 11/15/21 (g) | 2,435 | 2,423 | ||
7.25% 11/15/21 (g) | 920 | 915 | ||
Hertz Corp.: | ||||
5.875% 10/15/20 | 990 | 997 | ||
6.25% 10/15/22 | 1,315 | 1,341 | ||
Laureate Education, Inc. 9.75% 9/1/19 (g)(i) | 6,520 | 6,716 | ||
NES Rentals Holdings, Inc. 7.875% 5/1/18 (g) | 600 | 623 | ||
TMS International Corp. 7.625% 10/15/21 (g) | 420 | 439 | ||
TransUnion Holding Co., Inc. 9.625% 6/15/18 pay-in-kind (i) | 1,255 | 1,296 | ||
| 57,312 | |||
Shipping - 1.1% | ||||
Navios Maritime Acquisition Corp./Navios Acquisition Finance U.S., Inc. 8.125% 11/15/21 (g) | 3,070 | 3,124 | ||
Navios Maritime Holdings, Inc.: | ||||
7.375% 1/15/22 (g) | 7,940 | 7,980 | ||
8.125% 2/15/19 | 2,489 | 2,408 | ||
Navios South American Logistics, Inc./Navios Logistics Finance U.S., Inc. 7.25% 5/1/22 (g) | 2,020 | 2,035 | ||
Teekay Corp. 8.5% 1/15/20 | 195 | 216 | ||
Corporate Bonds - continued | ||||
| Principal | Value (000s) | ||
Nonconvertible Bonds - continued | ||||
Shipping - continued | ||||
TRAC Intermodal LLC/TRAC Intermodal Corp. 11% 8/15/19 | $ 1,475 | $ 1,626 | ||
Western Express, Inc. 12.5% 4/15/15 (g) | 6,070 | 5,372 | ||
| 22,761 | |||
Steel - 0.9% | ||||
JMC Steel Group, Inc. 8.25% 3/15/18 (g) | 11,106 | 11,273 | ||
Ryerson, Inc./Joseph T Ryerson & Son, Inc.: | ||||
9% 10/15/17 | 5,550 | 5,841 | ||
11.25% 10/15/18 | 1,303 | 1,420 | ||
| 18,534 | |||
Super Retail - 0.5% | ||||
Asbury Automotive Group, Inc. 8.375% 11/15/20 | 788 | 851 | ||
JC Penney Corp., Inc.: | ||||
5.65% 6/1/20 | 2,375 | 1,953 | ||
5.75% 2/15/18 | 703 | 657 | ||
7.4% 4/1/37 | 775 | 597 | ||
8.125% 10/1/19 | 3,785 | 3,634 | ||
Sally Holdings LLC 5.5% 11/1/23 | 925 | 976 | ||
Sonic Automotive, Inc.: | ||||
5% 5/15/23 | 315 | 306 | ||
7% 7/15/22 | 1,390 | 1,515 | ||
| 10,489 | |||
Technology - 3.2% | ||||
Activision Blizzard, Inc. 6.125% 9/15/23 (g) | 2,075 | 2,246 | ||
ADT Corp. 6.25% 10/15/21 | 1,895 | 1,990 | ||
Avaya, Inc. 7% 4/1/19 (g) | 822 | 808 | ||
BMC Software Finance, Inc. 8.125% 7/15/21 (g) | 5,860 | 5,611 | ||
Boxer Parent Co., Inc. 9% 10/15/19 pay-in-kind (g)(i) | 3,000 | 2,691 | ||
CDW LLC/CDW Finance Corp. 6% 8/15/22 | 2,950 | 3,112 | ||
Ceridian Corp. 8.875% 7/15/19 (g) | 1,755 | 1,939 | ||
Compiler Finance Sub, Inc. 7% 5/1/21 (g) | 1,210 | 1,107 | ||
Entegris, Inc. 6% 4/1/22 (g) | 635 | 646 | ||
First Data Corp.: | ||||
6.75% 11/1/20 (g) | 3,570 | 3,820 | ||
11.25% 1/15/21 | 3,136 | 3,614 | ||
11.75% 8/15/21 | 840 | 985 | ||
Infor Software Parent LLC/Infor Software Parent, Inc. 7.125% 5/1/21 pay-in-kind (g)(i) | 950 | 962 | ||
Corporate Bonds - continued | ||||
| Principal | Value (000s) | ||
Nonconvertible Bonds - continued | ||||
Technology - continued | ||||
Lucent Technologies, Inc.: | ||||
6.45% 3/15/29 | $ 12,334 | $ 11,871 | ||
6.5% 1/15/28 | 5,415 | 5,212 | ||
Micron Technology, Inc. 5.875% 2/15/22 (g) | 1,520 | 1,596 | ||
Quad/Graphics, Inc. 7% 5/1/22 (g) | 670 | 643 | ||
SunGard Data Systems, Inc. 6.625% 11/1/19 | 3,600 | 3,726 | ||
VeriSign, Inc. 4.625% 5/1/23 | 2,525 | 2,516 | ||
WideOpenWest Finance LLC/WideOpenWest Capital Corp.: | ||||
10.25% 7/15/19 | 5,620 | 6,168 | ||
13.375% 10/15/19 | 2,840 | 3,238 | ||
| 64,501 | |||
Telecommunications - 8.7% | ||||
Alcatel-Lucent U.S.A., Inc.: | ||||
4.625% 7/1/17 (g) | 1,435 | 1,458 | ||
6.75% 11/15/20 (g) | 3,390 | 3,492 | ||
Altice Financing SA 6.5% 1/15/22 (g) | 895 | 920 | ||
Altice Finco SA: | ||||
8.125% 1/15/24 (g) | 540 | 568 | ||
9.875% 12/15/20 (g) | 945 | 1,054 | ||
Broadview Networks Holdings, Inc. 10.5% 11/15/17 | 2,915 | 2,842 | ||
Citizens Communications Co. 7.875% 1/15/27 | 4,949 | 5,147 | ||
Clearwire Communications LLC/Clearwire Finance, Inc. 14.75% 12/1/16 (g) | 5,300 | 6,546 | ||
Columbus International, Inc. 7.375% 3/30/21 (g) | 9,515 | 10,086 | ||
Digicel Group Ltd.: | ||||
6% 4/15/21 (g) | 4,580 | 4,626 | ||
7% 2/15/20 (g) | 425 | 441 | ||
7.125% 4/1/22 (g) | 3,850 | 3,869 | ||
8.25% 9/1/17 (g) | 1,025 | 1,049 | ||
8.25% 9/30/20 (g) | 10,315 | 10,779 | ||
DigitalGlobe, Inc. 5.25% 2/1/21 (g) | 695 | 676 | ||
Eileme 2 AB 11.625% 1/31/20 (g) | 2,605 | 2,983 | ||
FairPoint Communications, Inc. 8.75% 8/15/19 (g) | 2,375 | 2,506 | ||
Intelsat Jackson Holdings SA: | ||||
5.5% 8/1/23 | 5,655 | 5,669 | ||
6.625% 12/15/22 (Reg. S) | 7,870 | 8,283 | ||
7.5% 4/1/21 | 5,730 | 6,203 | ||
Intelsat Luxembourg SA: | ||||
7.75% 6/1/21 | 8,204 | 8,573 | ||
Corporate Bonds - continued | ||||
| Principal | Value (000s) | ||
Nonconvertible Bonds - continued | ||||
Telecommunications - continued | ||||
Intelsat Luxembourg SA: - continued | ||||
8.125% 6/1/23 | $ 3,585 | $ 3,809 | ||
Level 3 Communications, Inc. 8.875% 6/1/19 | 695 | 745 | ||
Level 3 Escrow II, Inc. 5.375% 8/15/22 (g) | 3,725 | 3,790 | ||
Level 3 Financing, Inc.: | ||||
6.125% 1/15/21 (g) | 2,395 | 2,512 | ||
7% 6/1/20 | 2,365 | 2,525 | ||
SBA Communications Corp. 5.625% 10/1/19 | 3,075 | 3,202 | ||
Sprint Capital Corp.: | ||||
6.875% 11/15/28 | 1,870 | 1,819 | ||
6.9% 5/1/19 | 4,761 | 5,047 | ||
8.75% 3/15/32 | 3,250 | 3,632 | ||
Sprint Communications, Inc.: | ||||
6% 12/1/16 | 6,729 | 7,124 | ||
6% 11/15/22 | 13,364 | 13,331 | ||
9% 11/15/18 (g) | 5,500 | 6,469 | ||
Sprint Corp.: | ||||
7.125% 6/15/24 (g) | 2,580 | 2,651 | ||
7.875% 9/15/23 (g) | 4,245 | 4,595 | ||
T-Mobile U.S.A., Inc.: | ||||
5.25% 9/1/18 | 1,565 | 1,624 | ||
6.25% 4/1/21 | 3,295 | 3,439 | ||
6.464% 4/28/19 | 705 | 735 | ||
6.5% 1/15/24 | 3,970 | 4,159 | ||
6.542% 4/28/20 | 2,465 | 2,601 | ||
6.625% 4/1/23 | 4,925 | 5,196 | ||
6.633% 4/28/21 | 2,225 | 2,345 | ||
6.731% 4/28/22 | 1,645 | 1,740 | ||
6.836% 4/28/23 | 480 | 508 | ||
Wind Acquisition Finance SA 4.75% 7/15/20 (g) | 5,565 | 5,440 | ||
| 176,808 | |||
TOTAL NONCONVERTIBLE BONDS | 1,425,950 | |||
TOTAL CORPORATE BONDS (Cost $1,388,827) |
| |||
Common Stocks - 15.4% | |||
Shares | Value (000s) | ||
Aerospace - 0.3% | |||
Triumph Group, Inc. | 85,000 | $ 5,919 | |
Air Transportation - 0.4% | |||
American Airlines Group, Inc. | 100,000 | 4,135 | |
Delta Air Lines, Inc. | 100,000 | 4,023 | |
| 8,158 | ||
Automotive - 0.8% | |||
Delphi Automotive PLC | 47,622 | 3,285 | |
General Motors Co. | 274,238 | 8,611 | |
General Motors Co.: | |||
warrants 7/10/16 (a) | 7,547 | 164 | |
warrants 7/10/19 (a) | 7,547 | 108 | |
Motors Liquidation Co. GUC Trust (a) | 39,254 | 907 | |
Trinseo SA | 220,098 | 3,180 | |
| 16,255 | ||
Banks & Thrifts - 0.5% | |||
Bank of America Corp. | 200,000 | 3,432 | |
JPMorgan Chase & Co. | 100,000 | 6,048 | |
Washington Mutual, Inc. (a) | 505,500 | 0 | |
WMI Holdings Corp. (a) | 17,318 | 37 | |
| 9,517 | ||
Broadcasting - 0.5% | |||
Cumulus Media, Inc. Class A (a) | 550,600 | 2,125 | |
Gray Television, Inc. (a) | 494,070 | 4,565 | |
Sinclair Broadcast Group, Inc. Class A | 100,000 | 2,905 | |
| 9,595 | ||
Building Materials - 0.1% | |||
Gibraltar Industries, Inc. (a) | 141,340 | 2,155 | |
Cable TV - 0.3% | |||
Time Warner Cable, Inc. | 41,300 | 6,080 | |
Chemicals - 0.6% | |||
Axiall Corp. | 100,000 | 4,030 | |
LyondellBasell Industries NV Class A | 84,795 | 7,770 | |
Westlake Chemical Partners LP | 3,400 | 103 | |
| 11,903 | ||
Consumer Products - 0.5% | |||
Whirlpool Corp. | 60,000 | 10,323 | |
Containers - 0.4% | |||
Graphic Packaging Holding Co. (a) | 617,874 | 7,495 | |
Common Stocks - continued | |||
Shares | Value (000s) | ||
Diversified Financial Services - 0.7% | |||
Citigroup, Inc. | 116,564 | $ 6,240 | |
The Blackstone Group LP | 300,000 | 9,036 | |
| 15,276 | ||
Energy - 0.5% | |||
EP Energy Corp. (f) | 141,500 | 2,066 | |
Ocean Rig UDW, Inc. (United States) | 235,000 | 3,231 | |
The Williams Companies, Inc. | 61,000 | 3,386 | |
Vantage Drilling Co. (a) | 2,000,000 | 1,935 | |
| 10,618 | ||
Environmental - 0.3% | |||
Darling International, Inc. (a) | 300,000 | 5,280 | |
Food/Beverage/Tobacco - 0.9% | |||
Carlyle Group LP | 72,700 | 2,018 | |
Dean Foods Co. (f) | 400,000 | 5,884 | |
Monster Beverage Corp. (a) | 100,000 | 10,088 | |
| 17,990 | ||
Gaming - 0.8% | |||
Gaming & Leisure Properties | 119,574 | 3,737 | |
Las Vegas Sands Corp. | 130,000 | 8,094 | |
Station Holdco LLC (a)(j)(l) | 1,531,479 | 4,043 | |
Station Holdco LLC (a)(j)(l) | 11,653 | 31 | |
Station Holdco LLC: | |||
unit (a)(j)(l) | 3,411 | 1 | |
warrants 6/15/18 (a)(j)(l) | 96,849 | 36 | |
| 15,942 | ||
Healthcare - 0.7% | |||
Legend Acquisition, Inc. | 18,796 | 288 | |
Legend Acquisition, Inc.: | |||
Class A warrants (a) | 28,063 | 0 | |
Class B warrants (a) | 37,006 | 0 | |
Tenet Healthcare Corp. (a) | 113,675 | 6,371 | |
Universal Health Services, Inc. Class B | 75,000 | 7,778 | |
| 14,437 | ||
Homebuilders/Real Estate - 0.5% | |||
Lennar Corp. Class A | 200,000 | 8,616 | |
Realogy Holdings Corp. (a) | 46,400 | 1,903 | |
| 10,519 | ||
Common Stocks - continued | |||
Shares | Value (000s) | ||
Hotels - 0.6% | |||
Extended Stay America, Inc. unit | 194,400 | $ 4,483 | |
Hyatt Hotels Corp. Class A (a) | 145,000 | 8,587 | |
| 13,070 | ||
Insurance - 0.3% | |||
H&R Block, Inc. | 200,000 | 6,462 | |
Leisure - 0.2% | |||
Town Sports International Holdings, Inc. | 564,202 | 3,340 | |
Metals/Mining - 0.1% | |||
Alpha Natural Resources, Inc. (a)(f) | 750,000 | 1,470 | |
AngloGold Ashanti Ltd. sponsored ADR (a) | 87,174 | 721 | |
| 2,191 | ||
Publishing/Printing - 0.0% | |||
Houghton Mifflin Harcourt Co. warrants 6/22/19 (a)(l) | 4,323 | 6 | |
Restaurants - 0.9% | |||
Bloomin' Brands, Inc. (a) | 172,900 | 3,270 | |
Dunkin' Brands Group, Inc. | 171,900 | 7,818 | |
Yum! Brands, Inc. | 100,000 | 7,183 | |
| 18,271 | ||
Services - 0.9% | |||
ARAMARK Holdings Corp. | 253,900 | 7,086 | |
KAR Auction Services, Inc. | 347,600 | 10,553 | |
WP Rocket Holdings, Inc. | 1,964,861 | 393 | |
| 18,032 | ||
Shipping - 0.3% | |||
Ship Finance International Ltd. (NY Shares) | 300,000 | 5,157 | |
Ultrapetrol (Bahamas) Ltd. (a) | 7,916 | 24 | |
| 5,181 | ||
Super Retail - 0.4% | |||
Dollar General Corp. (a) | 100,000 | 6,267 | |
Office Depot, Inc. (a) | 500,000 | 2,610 | |
| 8,877 | ||
Technology - 2.4% | |||
CDW Corp. | 300,000 | 9,252 | |
Facebook, Inc. Class A (a) | 76,094 | 5,706 | |
Freescale Semiconductor, Inc. (a) | 150,000 | 2,984 | |
Google, Inc. Class A (a) | 15,000 | 8,518 | |
NXP Semiconductors NV (a) | 125,000 | 8,583 | |
Skyworks Solutions, Inc. | 150,000 | 8,736 | |
Common Stocks - continued | |||
Shares | Value (000s) | ||
Technology - continued | |||
SoftBank Corp. ADR | 150,000 | $ 5,469 | |
Spansion, Inc. Class A (a) | 11,219 | 231 | |
| 49,479 | ||
Telecommunications - 0.5% | |||
Alibaba Group Holding Ltd. sponsored ADR | 32,200 | 3,175 | |
Broadview Networks Holdings, Inc. (a) | 189,475 | 360 | |
Pendrell Corp. (a) | 37,472 | 63 | |
T-Mobile U.S., Inc. (a) | 225,000 | 6,568 | |
| 10,166 | ||
Textiles & Apparel - 0.0% | |||
Arena Brands Holding Corp. Class B (a)(l) | 42,253 | 198 | |
TOTAL COMMON STOCKS (Cost $271,151) |
| ||
Nonconvertible Preferred Stocks - 1.0% | |||
|
|
|
|
Banks & Thrifts - 0.6% | |||
Ally Financial, Inc. 7.00% (g) | 11,491 | 11,508 | |
Diversified Financial Services - 0.4% | |||
GMAC Capital Trust I Series 2, 8.125% | 320,244 | 8,560 | |
Services - 0.0% | |||
WP Rocket Holdings, Inc. 15.00% | 1,437,822 | 1,179 | |
TOTAL NONCONVERTIBLE PREFERRED STOCKS (Cost $14,174) |
| ||
Bank Loan Obligations - 7.9% | ||||
| Principal |
| ||
Aerospace - 0.1% | ||||
TransDigm, Inc.: | ||||
Tranche C, term loan 3.75% 2/28/20 (i) | $ 864 | 849 | ||
Tranche D, term loan 3.75% 6/4/21 (i) | 2,319 | 2,279 | ||
| 3,128 | |||
Broadcasting - 0.2% | ||||
Cumulus Media Holdings, Inc. Tranch B 1LN, term loan 4.25% 12/23/20 (i) | 3,195 | 3,163 | ||
TWCC Holding Corp. Tranche 2LN, term loan 7% 6/26/20 (i) | 1,200 | 1,175 | ||
| 4,338 | |||
Bank Loan Obligations - continued | ||||
| Principal | Value (000s) | ||
Cable TV - 0.0% | ||||
Liberty Cablevision of Puerto Rico: | ||||
Tranche 1LN, term loan 4.5% 1/7/22 (i) | $ 195 | $ 194 | ||
Tranche 2LN, term loan 7.75% 7/7/23 (i) | 765 | 757 | ||
| 951 | |||
Chemicals - 0.1% | ||||
Royal Adhesives & Sealants LLC Tranche 2LN, term loan 9.75% 1/31/19 (i) | 1,960 | 1,975 | ||
Consumer Products - 0.2% | ||||
Bauer Performance Sports Ltd. Tranche B, term loan 4% 4/15/21 (i) | 1,278 | 1,267 | ||
Revlon Consumer Products Corp. term loan 4% 8/19/19 (i) | 3,206 | 3,166 | ||
Spectrum Brands Holdings, Inc. Tranche C, term loan 3.5% 9/4/19 (i) | 406 | 400 | ||
| 4,833 | |||
Containers - 0.1% | ||||
Berry Plastics Corp. Tranche E, term loan 3.75% 1/6/21 (i) | 2,015 | 1,965 | ||
Diversified Financial Services - 0.4% | ||||
AlixPartners LLP Tranche B 2LN, term loan 4% 7/10/20 (i) | 1,269 | 1,249 | ||
HarbourVest Partners LLC Tranche B, term loan 3.25% 2/4/21 (i) | 369 | 362 | ||
Ocwen Loan Servicing, LLC Tranche B, term loan 5% 2/15/18 (i) | 385 | 367 | ||
TransUnion LLC Tranche B, term loan 4% 4/9/21 (i) | 5,313 | 5,244 | ||
| 7,222 | |||
Diversified Media - 0.4% | ||||
Checkout Holding Corp. Tranche 2LN, term loan 7.75% 4/9/22 (i) | 1,080 | 1,026 | ||
McGraw-Hill School Education Tranche B, term loan 6.25% 12/18/19 (i) | 6,208 | 6,193 | ||
| 7,219 | |||
Electric Utilities - 1.5% | ||||
Calpine Construction Finance Co. LP Tranche B 2LN, term loan 3.25% 1/31/22 (i) | 5,885 | 5,716 | ||
Energy Future Holdings Corp. Tranche 1LN, term loan 4.25% 6/19/16 (i) | 23,179 | 23,121 | ||
La Frontera Generation, LLC Tranche B, term loan 4.5% 9/30/20 (i) | 1,148 | 1,140 | ||
Bank Loan Obligations - continued | ||||
| Principal | Value (000s) | ||
Electric Utilities - continued | ||||
Southcross Energy Partners LP Tranche B, term loan 5.25% 8/4/21 (i) | $ 95 | $ 94 | ||
Southcross Holdings Borrower LP Tranche B, term loan 6% 8/4/21 (i) | 175 | 172 | ||
| 30,243 | |||
Energy - 0.7% | ||||
American Energy-Marcellus LLC Tranche B 1LN, term loan 5.25% 8/4/20 (i) | 2,965 | 2,880 | ||
Atlantic Power Ltd. Partnership Tranche B LN, term loan 4.75% 2/24/21 (i) | 401 | 398 | ||
Drillships Ocean Ventures, Inc. Tranche B, term loan 5.5% 7/25/21 (i) | 743 | 712 | ||
Fieldwood Energy, LLC Tranche 2LN, term loan 8.375% 9/30/20 (i) | 7,590 | 7,305 | ||
GIM Channelview Cogeneration LLC Tranche B, term loan 4.25% 5/8/20 (i) | 194 | 194 | ||
Panda Sherman Power, LLC term loan 9% 9/14/18 (i) | 843 | 856 | ||
Panda Temple Power, LLC term loan 7.25% 4/3/19 (i) | 400 | 407 | ||
Sheridan Investment Partners I term loan 4.25% 12/16/20 (i) | 675 | 643 | ||
Sheridan Production Partners I: | ||||
Tranche A, term loan 4.25% 12/16/20 (i) | 94 | 89 | ||
Tranche M, term loan 4.25% 12/16/20 (i) | 35 | 33 | ||
| 13,517 | |||
Entertainment/Film - 0.0% | ||||
CBS Outdoor Americas Capital LLC/CBS Outdoor Americas Capital Corp. Tranche B, term loan 3% 1/31/21 (i) | 325 | 318 | ||
Livent, Inc.: | ||||
Tranche A, term loan 18% 1/15/49 pay-in-kind (a) | CAD | 289 | 256 | |
Tranche B, term loan 18% 1/15/49 pay-in-kind (a) | CAD | 176 | 156 | |
| 730 | |||
Environmental - 0.3% | ||||
The Brickman Group, Ltd. Tranche B 1LN, term loan 4% 12/18/20 (i) | 7,252 | 7,143 | ||
Food/Beverage/Tobacco - 0.1% | ||||
Arysta Lifescience SPC LLC: | ||||
Tranche B 1LN, term loan 4.5% 5/29/20 (i) | 676 | 674 | ||
Tranche B 2LN, term loan 8.25% 11/30/20 (i) | 585 | 589 | ||
| 1,263 | |||
Bank Loan Obligations - continued | ||||
| Principal | Value (000s) | ||
Gaming - 0.5% | ||||
Caesars Entertainment Resort Properties LLC Tranche B 1LN, term loan 7% 10/11/20 (i) | $ 6,074 | $ 5,786 | ||
Caesars Growth Properties Holdings, LLC Tranche 1LN, term loan 6.25% 5/8/21 (i) | 773 | 729 | ||
Graton Economic Development Authority Tranche B, term loan 9% 8/22/18 (i) | 795 | 819 | ||
Station Casinos LLC Tranche B, term loan 4.25% 3/1/20 (i) | 2,679 | 2,646 | ||
| 9,980 | |||
Healthcare - 0.6% | ||||
Dialysis Newco, Inc.: | ||||
Tranche 2LN, term loan 7.75% 10/22/21 (i) | 1,804 | 1,795 | ||
Tranche B 1LN, term loan 4.5% 4/23/21 (i) | 5,646 | 5,582 | ||
MModal IP LLC Tranche B, term loan 9% 1/31/20 (i) | 1,125 | 1,097 | ||
Patheon, Inc. Tranche B, term loan 4.2531% 3/11/21 (i) | 2,319 | 2,261 | ||
Rural/Metro Corp. Tranche B, term loan 9% 6/30/18 (i) | 461 | 430 | ||
Salix Pharmaceuticals Ltd. Tranche B, term loan 4.25% 1/2/20 (i) | 197 | 197 | ||
U.S. Renal Care, Inc.: | ||||
Tranche 2LN, term loan 8.5% 1/3/20 (i) | 120 | 120 | ||
Tranche B 2LN, term loan 4.25% 7/3/19 (i) | 193 | 192 | ||
| 11,674 | |||
Homebuilders/Real Estate - 0.2% | ||||
DTZ U.S. Borrower LLC: | ||||
Tranche 2LN, term loan 10/28/22 (k) | 905 | 907 | ||
Tranche B 1LN, term loan 10/28/21 (k) | 1,416 | 1,420 | ||
Tranche B, term loan 10/28/21 (k) | 844 | 846 | ||
Realogy Corp. Credit-Linked Deposit 4.4463% 10/10/16 (i) | 609 | 596 | ||
| 3,769 | |||
Metals/Mining - 0.0% | ||||
Ameriforge Group, Inc. Tranche B 2LN, term loan 8.75% 12/19/20 (i) | 190 | 189 | ||
Oxbow Carbon LLC Tranche B 1LN, term loan 4.25% 7/19/19 (i) | 164 | 161 | ||
| 350 | |||
Paper - 0.0% | ||||
White Birch Paper Co. Tranche 2LN, term loan 12/31/49 (d)(k) | 8,620 | 0 | ||
Bank Loan Obligations - continued | ||||
| Principal | Value (000s) | ||
Publishing/Printing - 0.0% | ||||
Houghton Mifflin Harcourt Publishing, Inc. Tranche B, term loan 4.25% 5/22/18 (i) | $ 268 | $ 267 | ||
Services - 0.7% | ||||
EFS Cogen Holdings I LLC Tranche B, term loan 3.75% 12/17/20 (i) | 224 | 221 | ||
Garda World Security Corp.: | ||||
term loan 4% 11/8/20 (i) | 642 | 628 | ||
Tranche DD, term loan 4% 11/8/20 (i) | 164 | 161 | ||
Karman Buyer Corp. Tranche 2LN, term loan 7.5% 7/25/22 (i) | 150 | 149 | ||
Laureate Education, Inc. Tranche B, term loan 5% 6/16/18 (i) | 6,305 | 6,084 | ||
The ServiceMaster Co. Tranche B, term loan 4.25% 7/1/21 (i) | 7,325 | 7,270 | ||
| 14,513 | |||
Super Retail - 0.1% | ||||
BJ's Wholesale Club, Inc. Tranche B 1LN, term loan 4.5% 9/26/19 (i) | 774 | 766 | ||
J. Crew Group, Inc. Tranche B LN, term loan 4% 3/5/21 (i) | 552 | 531 | ||
| 1,297 | |||
Technology - 1.2% | ||||
Avago Technologies, Inc. Tranche B, term loan 3.75% 5/6/21 (i) | 4,648 | 4,632 | ||
First Data Corp. Tranche B, term loan 3.653% 3/24/18 (i) | 10,435 | 10,252 | ||
Freescale Semiconductor, Inc. Tranche B 4LN, term loan 4.25% 3/1/20 (i) | 4,049 | 3,994 | ||
Infor U.S., Inc. Tranche B 5LN, term loan 3.75% 6/3/20 (i) | 1,085 | 1,069 | ||
Kronos, Inc. Tranche 2LN, term loan 9.75% 4/30/20 (i) | 3,645 | 3,736 | ||
Renaissance Learning, Inc.: | ||||
Tranche 1LN, term loan 4.5% 4/9/21 (i) | 1,020 | 1,002 | ||
Tranche 2LN, term loan 8% 4/9/22 (i) | 870 | 848 | ||
| 25,533 | |||
Telecommunications - 0.5% | ||||
Altice Financing SA Tranche B, term loan 5.5% 6/24/19 (i) | 7,946 | 7,976 | ||
Bank Loan Obligations - continued | ||||
| Principal | Value (000s) | ||
Telecommunications - continued | ||||
Intelsat Jackson Holdings SA Tranche B 2LN, term loan 3.75% 6/30/19 (i) | $ 1,635 | $ 1,621 | ||
LTS Buyer LLC Tranche 2LN, term loan 8% 4/11/21 (i) | 63 | 63 | ||
| 9,660 | |||
TOTAL BANK LOAN OBLIGATIONS (Cost $170,535) |
| |||
Preferred Securities - 2.9% | ||||
| ||||
Banks & Thrifts - 1.6% | ||||
Bank of America Corp. 5.2% (h)(i) | 2,745 | 2,606 | ||
Barclays Bank PLC 7.625% 11/21/22 | 12,695 | 14,261 | ||
Credit Agricole SA 6.625% (g)(h)(i) | 6,105 | 6,005 | ||
JPMorgan Chase & Co. 5.15% (h)(i) | 9,715 | 9,455 | ||
| 32,327 | |||
Diversified Financial Services - 1.3% | ||||
Citigroup, Inc.: | ||||
5.35% (h)(i) | 24,830 | 23,768 | ||
5.9% (h)(i) | 2,100 | 2,116 | ||
| 25,884 | |||
TOTAL PREFERRED SECURITIES (Cost $59,387) |
| |||
Money Market Funds - 2.2% | |||
Shares |
| ||
Fidelity Cash Central Fund, 0.11% (b) | 41,190,094 | 41,190 | |
Fidelity Securities Lending Cash Central Fund, 0.11% (b)(c) | 3,167,025 | 3,167 | |
TOTAL MONEY MARKET FUNDS (Cost $44,357) |
| ||
TOTAL INVESTMENT PORTFOLIO - 99.4% (Cost $1,948,431) | 2,024,102 | ||
NET OTHER ASSETS (LIABILITIES) - 0.6% | 11,999 | ||
NET ASSETS - 100% | $ 2,036,101 | ||
Currency Abbreviations | ||
CAD | - | Canadian dollar |
Legend |
(a) Non-income producing |
(b) Affiliated fund that is generally available only to investment companies and other accounts managed by Fidelity Investments. The rate quoted is the annualized seven-day yield of the fund at period end. A complete unaudited listing of the fund's holdings as of its most recent quarter end is available upon request. In addition, each Fidelity Central Fund's financial statements, which are not covered by the Fund's Report of Independent Registered Public Accounting Firm, are available on the SEC's website or upon request. |
(c) Investment made with cash collateral received from securities on loan. |
(d) Non-income producing - Security is in default. |
(e) Amount is stated in United States dollars unless otherwise noted. |
(f) Security or a portion of the security is on loan at period end. |
(g) Security exempt from registration under Rule 144A of the Securities Act of 1933. These securities may be resold in transactions exempt from registration, normally to qualified institutional buyers. At the end of the period, the value of these securities amounted to $587,950,000 or 28.9% of net assets. |
(h) Security is perpetual in nature with no stated maturity date. |
(i) Coupon rates for floating and adjustable rate securities reflect the rates in effect at period end. |
(j) Investment is owned by an entity that is treated as a corporation for U.S. tax purposes and is owned by the Fund. |
(k) The coupon rate will be determined upon settlement of the loan after period end. |
(l) Restricted securities - Investment in securities not registered under the Securities Act of 1933 (excluding 144A issues). At the end of the period, the value of restricted securities (excluding 144A issues) amounted to $4,315,000 or 0.2% of net assets. |
Additional information on each restricted holding is as follows: |
Security | Acquisition Date | Acquisition Cost (000s) |
Arena Brands Holding Corp. Class B | 6/18/97 - 7/13/98 | $ 1,538 |
Houghton Mifflin Harcourt Co. warrants 6/22/19 | 6/22/12 | $ 8 |
Station Holdco LLC | 6/17/11 - 4/1/13 | $ 1,450 |
Station Holdco LLC unit | 4/1/13 | $ 0* |
Station Holdco LLC warrants 6/15/18 | 10/28/08 - 12/1/08 | $ 3,945 |
(m) Security is subject to an agreement restricting sale entered into subsequent to period in connection with the litigation described in the Notes to Financial Statements. |
* Amount represents less than $1,000. |
Affiliated Central Funds |
Information regarding fiscal year to date income earned by the Fund from investments in Fidelity Central Funds is as follows: |
Fund | Income earned |
Fidelity Cash Central Fund | $ 76 |
Fidelity Securities Lending Cash Central Fund | 40 |
Total | $ 116 |
Other Information |
The following is a summary of the inputs used, as of October 31, 2014, involving the Fund's assets and liabilities carried at fair value. The inputs or methodology used for valuing securities may not be an indication of the risk associated with investing in those securities. For more information on valuation inputs, and their aggregation into the levels used in the table below, please refer to the Investment Valuation section in the accompanying Notes to Financial Statements. |
Valuation Inputs at Reporting Date: | ||||
Description | Total | Level 1 | Level 2 | Level 3 |
Investments in Securities: | ||||
Equities: | ||||
Consumer Discretionary | $ 117,204 | $ 112,889 | $ - | $ 4,315 |
Consumer Staples | 21,252 | 21,252 | - | - |
Energy | 17,245 | 17,245 | - | - |
Financials | 52,519 | 41,011 | 11,508 | - |
Health Care | 14,437 | 14,149 | - | 288 |
Industrials | 28,444 | 26,872 | - | 1,572 |
Information Technology | 47,185 | 47,185 | - | - |
Materials | 23,299 | 23,299 | - | - |
Telecommunication Services | 12,397 | 12,397 | - | - |
Corporate Bonds | 1,425,982 | - | 1,425,981 | 1 |
Bank Loan Obligations | 161,570 | - | 159,363 | 2,207 |
Preferred Securities | 58,211 | - | 58,211 | - |
Money Market Funds | 44,357 | 44,357 | - | - |
Total Investments in Securities: | $ 2,024,102 | $ 360,656 | $ 1,655,063 | $ 8,383 |
Distribution of investments by country or territory of incorporation, as a percentage of total net assets, is as follows (Unaudited): |
United States of America | 81.2% |
Luxembourg | 4.2% |
Canada | 2.1% |
United Kingdom | 1.8% |
Netherlands | 1.7% |
France | 1.6% |
Bermuda | 1.5% |
Ireland | 1.1% |
Cayman Islands | 1.0% |
Others (Individually Less Than 1%) | 3.8% |
| 100.0% |
See accompanying notes which are an integral part of the financial statements.
Annual Report
Financial Statements
Statement of Assets and Liabilities
Amounts in thousands (except per-share amounts) | October 31, 2014 | |
|
|
|
Assets | ||
Investment in securities, at value (including securities loaned of $3,160) - See accompanying schedule: Unaffiliated issuers (cost $1,904,074) | $ 1,979,745 |
|
Fidelity Central Funds (cost $44,357) | 44,357 |
|
Total Investments (cost $1,948,431) |
| $ 2,024,102 |
Cash |
| 416 |
Receivable for investments sold | 4,692 | |
Receivable for fund shares sold | 1,801 | |
Dividends receivable | 464 | |
Interest receivable | 24,725 | |
Distributions receivable from Fidelity Central Funds | 7 | |
Prepaid expenses | 5 | |
Other receivables | 62 | |
Total assets | 2,056,274 | |
|
|
|
Liabilities | ||
Payable for investments purchased | $ 11,165 | |
Payable for fund shares redeemed | 3,196 | |
Distributions payable | 835 | |
Accrued management fee | 943 | |
Distribution and service plan fees payable | 403 | |
Other affiliated payables | 337 | |
Other payables and accrued expenses | 127 | |
Collateral on securities loaned, at value | 3,167 | |
Total liabilities | 20,173 | |
|
|
|
Net Assets | $ 2,036,101 | |
Net Assets consist of: |
| |
Paid in capital | $ 2,429,916 | |
Undistributed net investment income | 7,002 | |
Accumulated undistributed net realized gain (loss) on investments and foreign currency transactions | (476,488) | |
Net unrealized appreciation (depreciation) on investments | 75,671 | |
Net Assets | $ 2,036,101 | |
See accompanying notes which are an integral part of the financial statements.
Annual Report
Statement of Assets and Liabilities - continued
Amounts in thousands (except per-share amounts) | October 31, 2014 | |
|
|
|
Calculation of Maximum Offering Price Class A: | $ 10.88 | |
|
|
|
Maximum offering price per share (100/96.00 of $10.88) | $ 11.33 | |
Class T: | $ 10.93 | |
|
|
|
Maximum offering price per share (100/96.00 of $10.93) | $ 11.39 | |
Class B: | $ 10.80 | |
|
|
|
Class C: | $ 10.86 | |
|
|
|
Institutional Class: | $ 10.20 | |
A Redemption price per share is equal to net asset value less any applicable contingent deferred sales charge.
See accompanying notes which are an integral part of the financial statements.
Annual Report
Financial Statements - continued
Statement of Operations
Amounts in thousands | Year ended October 31, 2014 | |
|
|
|
Investment Income |
|
|
Dividends |
| $ 9,240 |
Interest |
| 101,084 |
Income from Fidelity Central Funds |
| 116 |
Total income |
| 110,440 |
|
|
|
Expenses | ||
Management fee | $ 11,396 | |
Transfer agent fees | 3,279 | |
Distribution and service plan fees | 5,066 | |
Accounting and security lending fees | 669 | |
Custodian fees and expenses | 37 | |
Independent trustees' compensation | 9 | |
Registration fees | 116 | |
Audit | 83 | |
Legal | 37 | |
Miscellaneous | 16 | |
Total expenses before reductions | 20,708 | |
Expense reductions | (9) | 20,699 |
Net investment income (loss) | 89,741 | |
Realized and Unrealized Gain (Loss) Net realized gain (loss) on: | ||
Investment securities: |
|
|
Unaffiliated issuers | 30,797 | |
Foreign currency transactions | 4 | |
Total net realized gain (loss) |
| 30,801 |
Change in net unrealized appreciation (depreciation) on: Investment securities | 11,355 | |
Assets and liabilities in foreign currencies | (4) | |
Total change in net unrealized appreciation (depreciation) |
| 11,351 |
Net gain (loss) | 42,152 | |
Net increase (decrease) in net assets resulting from operations | $ 131,893 | |
See accompanying notes which are an integral part of the financial statements.
Annual Report
Statement of Changes in Net Assets
Amounts in thousands | Year ended | Year ended |
Increase (Decrease) in Net Assets |
|
|
Operations |
|
|
Net investment income (loss) | $ 89,741 | $ 104,188 |
Net realized gain (loss) | 30,801 | 6,723 |
Change in net unrealized appreciation (depreciation) | 11,351 | 95,481 |
Net increase (decrease) in net assets resulting from operations | 131,893 | 206,392 |
Distributions to shareholders from net investment income | (85,375) | (89,629) |
Distributions to shareholders from net realized gain | (21,730) | (24,025) |
Total distributions | (107,105) | (113,654) |
Share transactions - net increase (decrease) | 85,679 | (122,384) |
Redemption fees | 252 | 331 |
Total increase (decrease) in net assets | 110,719 | (29,315) |
|
|
|
Net Assets | ||
Beginning of period | 1,925,382 | 1,954,697 |
End of period (including undistributed net investment income of $7,002 and undistributed net investment income of $25,794, respectively) | $ 2,036,101 | $ 1,925,382 |
See accompanying notes which are an integral part of the financial statements.
Annual Report
Financial Highlights - Class A
Years ended October 31, | 2014 | 2013 | 2012 | 2011 | 2010 |
Selected Per-Share Data |
|
|
|
|
|
Net asset value, beginning of period | $ 10.73 | $ 10.21 | $ 9.59 | $ 9.87 | $ 8.60 |
Income from Investment Operations |
|
|
|
|
|
Net investment income (loss) C | .480 | .569 | .607 | .593 | .650 |
Net realized and unrealized gain (loss) | .236 | .558 | .658 | (.238) | 1.185 |
Total from investment operations | .716 | 1.127 | 1.265 | .355 | 1.835 |
Distributions from net investment income | (.449) | (.482) | (.647) | (.639) | (.550) |
Distributions from net realized gain | (.118) | (.127) | - | - | (.020) |
Total distributions | (.567) | (.609) | (.647) | (.639) | (.570) |
Redemption fees added to paid in capital C | .001 | .002 | .002 | .004 | .005 |
Net asset value, end of period | $ 10.88 | $ 10.73 | $ 10.21 | $ 9.59 | $ 9.87 |
Total ReturnA, B | 6.84% | 11.39% | 13.78% | 3.57% | 22.06% |
Ratios to Average Net Assets D, F |
|
|
|
|
|
Expenses before reductions | 1.02% | 1.02% | 1.03% | 1.03% | 1.03% |
Expenses net of fee waivers, if any | 1.02% | 1.02% | 1.03% | 1.03% | 1.03% |
Expenses net of all reductions | 1.02% | 1.02% | 1.03% | 1.03% | 1.03% |
Net investment income (loss) | 4.42% | 5.42% | 6.18% | 5.93% | 7.03% |
Supplemental Data |
|
|
|
|
|
Net assets, end of period (in millions) | $ 682 | $ 698 | $ 705 | $ 659 | $ 722 |
Portfolio turnover rateE | 41% | 66% | 66% | 68% | 53% |
A Total returns would have been lower if certain expenses had not been reduced during the applicable periods shown.
B Total returns do not include the effect of the sales charges.
C Calculated based on average shares outstanding during the period.
D Fees and expenses of any underlying Fidelity Central Funds are not included in the Fund's expense ratio. The Fund indirectly bears its proportionate share of the expenses of any underlying Fidelity Central Funds.
E Amount does not include the portfolio activity of any underlying Fidelity Central Funds.
F Expense ratios reflect operating expenses of the class. Expenses before reductions do not reflect amounts reimbursed by the investment adviser or reductions from brokerage service arrangements or reductions from other expense offset arrangements and do not represent the amount paid by the class during periods when reimbursements or reductions occur. Expenses net of fee waivers reflect expenses after reimbursement by the investment adviser but prior to reductions from brokerage service arrangements or other expense offset arrangements. Expenses net of all reductions represent the net expenses paid by the class.
See accompanying notes which are an integral part of the financial statements.
Annual Report
Financial Highlights - Class T
Years ended October 31, | 2014 | 2013 | 2012 | 2011 | 2010 |
Selected Per-Share Data |
|
|
|
|
|
Net asset value, beginning of period | $ 10.78 | $ 10.26 | $ 9.64 | $ 9.92 | $ 8.64 |
Income from Investment Operations |
|
|
|
|
|
Net investment income (loss) C | .484 | .573 | .610 | .597 | .653 |
Net realized and unrealized gain (loss) | .233 | .555 | .656 | (.241) | 1.193 |
Total from investment operations | .717 | 1.128 | 1.266 | .356 | 1.846 |
Distributions from net investment income | (.450) | (.483) | (.648) | (.640) | (.551) |
Distributions from net realized gain | (.118) | (.127) | - | - | (.020) |
Total distributions | (.568) | (.610) | (.648) | (.640) | (.571) |
Redemption fees added to paid in capital C | .001 | .002 | .002 | .004 | .005 |
Net asset value, end of period | $ 10.93 | $ 10.78 | $ 10.26 | $ 9.64 | $ 9.92 |
Total ReturnA, B | 6.81% | 11.34% | 13.72% | 3.56% | 22.09% |
Ratios to Average Net Assets D, F |
|
|
|
|
|
Expenses before reductions | 1.01% | 1.01% | 1.02% | 1.02% | 1.02% |
Expenses net of fee waivers, if any | 1.01% | 1.01% | 1.02% | 1.02% | 1.02% |
Expenses net of all reductions | 1.01% | 1.01% | 1.02% | 1.02% | 1.02% |
Net investment income (loss) | 4.43% | 5.43% | 6.19% | 5.94% | 7.04% |
Supplemental Data |
|
|
|
|
|
Net assets, end of period (in millions) | $ 504 | $ 528 | $ 547 | $ 543 | $ 645 |
Portfolio turnover rateE | 41% | 66% | 66% | 68% | 53% |
A Total returns would have been lower if certain expenses had not been reduced during the applicable periods shown.
B Total returns do not include the effect of the sales charges.
C Calculated based on average shares outstanding during the period.
D Fees and expenses of any underlying Fidelity Central Funds are not included in the Fund's expense ratio. The Fund indirectly bears its proportionate share of the expenses of any underlying Fidelity Central Funds.
E Amount does not include the portfolio activity of any underlying Fidelity Central Funds.
F Expense ratios reflect operating expenses of the class. Expenses before reductions do not reflect amounts reimbursed by the investment adviser or reductions from brokerage service arrangements or reductions from other expense offset arrangements and do not represent the amount paid by the class during periods when reimbursements or reductions occur. Expenses net of fee waivers reflect expenses after reimbursement by the investment adviser but prior to reductions from brokerage service arrangements or other expense offset arrangements. Expenses net of all reductions represent the net expenses paid by the class.
See accompanying notes which are an integral part of the financial statements.
Annual Report
Financial Highlights - Class B
Years ended October 31, | 2014 | 2013 | 2012 | 2011 | 2010 |
Selected Per-Share Data |
|
|
|
|
|
Net asset value, beginning of period | $ 10.65 | $ 10.15 | $ 9.53 | $ 9.82 | $ 8.56 |
Income from Investment Operations |
|
|
|
|
|
Net investment income (loss) C | .401 | .489 | .532 | .519 | .581 |
Net realized and unrealized gain (loss) | .237 | .542 | .663 | (.245) | 1.180 |
Total from investment operations | .638 | 1.031 | 1.195 | .274 | 1.761 |
Distributions from net investment income | (.371) | (.406) | (.577) | (.568) | (.486) |
Distributions from net realized gain | (.118) | (.127) | - | - | (.020) |
Total distributions | (.489) | (.533) | (.577) | (.568) | (.506) |
Redemption fees added to paid in capital C | .001 | .002 | .002 | .004 | .005 |
Net asset value, end of period | $ 10.80 | $ 10.65 | $ 10.15 | $ 9.53 | $ 9.82 |
Total ReturnA, B | 6.12% | 10.45% | 13.06% | 2.75% | 21.20% |
Ratios to Average Net Assets D, F |
|
|
|
|
|
Expenses before reductions | 1.74% | 1.75% | 1.75% | 1.75% | 1.74% |
Expenses net of fee waivers, if any | 1.74% | 1.75% | 1.75% | 1.75% | 1.74% |
Expenses net of all reductions | 1.74% | 1.75% | 1.75% | 1.74% | 1.74% |
Net investment income (loss) | 3.70% | 4.69% | 5.46% | 5.21% | 6.32% |
Supplemental Data |
|
|
|
|
|
Net assets, end of period (in millions) | $ 10 | $ 19 | $ 28 | $ 38 | $ 52 |
Portfolio turnover rateE | 41% | 66% | 66% | 68% | 53% |
A Total returns would have been lower if certain expenses had not been reduced during the applicable periods shown.
B Total returns do not include the effect of the contingent deferred sales charge.
C Calculated based on average shares outstanding during the period.
D Fees and expenses of any underlying Fidelity Central Funds are not included in the Fund's expense ratio. The Fund indirectly bears its proportionate share of the expenses of any underlying Fidelity Central Funds.
E Amount does not include the portfolio activity of any underlying Fidelity Central Funds.
F Expense ratios reflect operating expenses of the class. Expenses before reductions do not reflect amounts reimbursed by the investment adviser or reductions from brokerage service arrangements or reductions from other expense offset arrangements and do not represent the amount paid by the class during periods when reimbursements or reductions occur. Expenses net of fee waivers reflect expenses after reimbursement by the investment adviser but prior to reductions from brokerage service arrangements or other expense offset arrangements. Expenses net of all reductions represent the net expenses paid by the class.
See accompanying notes which are an integral part of the financial statements.
Annual Report
Financial Highlights - Class C
Years ended October 31, | 2014 | 2013 | 2012 | 2011 | 2010 |
Selected Per-Share Data |
|
|
|
|
|
Net asset value, beginning of period | $ 10.71 | $ 10.19 | $ 9.58 | $ 9.86 | $ 8.59 |
Income from Investment Operations |
|
|
|
|
|
Net investment income (loss) C | .398 | .489 | .533 | .518 | .581 |
Net realized and unrealized gain (loss) | .237 | .560 | .649 | (.237) | 1.186 |
Total from investment operations | .635 | 1.049 | 1.182 | .281 | 1.767 |
Distributions from net investment income | (.368) | (.404) | (.574) | (.565) | (.482) |
Distributions from net realized gain | (.118) | (.127) | - | - | (.020) |
Total distributions | (.486) | (.531) | (.574) | (.565) | (.502) |
Redemption fees added to paid in capital C | .001 | .002 | .002 | .004 | .005 |
Net asset value, end of period | $ 10.86 | $ 10.71 | $ 10.19 | $ 9.58 | $ 9.86 |
Total ReturnA, B | 6.05% | 10.58% | 12.85% | 2.81% | 21.20% |
Ratios to Average Net Assets D, F |
|
|
|
|
|
Expenses before reductions | 1.77% | 1.77% | 1.78% | 1.77% | 1.77% |
Expenses net of fee waivers, if any | 1.77% | 1.77% | 1.78% | 1.77% | 1.77% |
Expenses net of all reductions | 1.77% | 1.77% | 1.77% | 1.77% | 1.77% |
Net investment income (loss) | 3.67% | 4.67% | 5.44% | 5.19% | 6.29% |
Supplemental Data |
|
|
|
|
|
Net assets, end of period (in millions) | $ 182 | $ 183 | $ 180 | $ 164 | $ 186 |
Portfolio turnover rateE | 41% | 66% | 66% | 68% | 53% |
A Total returns would have been lower if certain expenses had not been reduced during the applicable periods shown.
B Total returns do not include the effect of the contingent deferred sales charge.
C Calculated based on average shares outstanding during the period.
D Fees and expenses of any underlying Fidelity Central Funds are not included in the Fund's expense ratio. The Fund indirectly bears its proportionate share of the expenses of any underlying Fidelity Central Funds.
E Amount does not include the portfolio activity of any underlying Fidelity Central Funds.
F Expense ratios reflect operating expenses of the class. Expenses before reductions do not reflect amounts reimbursed by the investment adviser or reductions from brokerage service arrangements or reductions from other expense offset arrangements and do not represent the amount paid by the class during periods when reimbursements or reductions occur. Expenses net of fee waivers reflect expenses after reimbursement by the investment adviser but prior to reductions from brokerage service arrangements or other expense offset arrangements. Expenses net of all reductions represent the net expenses paid by the class.
See accompanying notes which are an integral part of the financial statements.
Annual Report
Financial Highlights - Institutional Class
Years ended October 31, | 2014 | 2013 | 2012 | 2011 | 2010 |
Selected Per-Share Data |
|
|
|
|
|
Net asset value, beginning of period | $ 10.10 | $ 9.65 | $ 9.10 | $ 9.40 | $ 8.22 |
Income from Investment Operations |
|
|
|
|
|
Net investment income (loss) B | .474 | .561 | .598 | .595 | .642 |
Net realized and unrealized gain (loss) | .216 | .524 | .623 | (.233) | 1.128 |
Total from investment operations | .690 | 1.085 | 1.221 | .362 | 1.770 |
Distributions from net investment income | (.473) | (.510) | (.673) | (.666) | (.575) |
Distributions from net realized gain | (.118) | (.127) | - | - | (.020) |
Total distributions | (.591) | (.637) | (.673) | (.666) | (.595) |
Redemption fees added to paid in capital B | .001 | .002 | .002 | .004 | .005 |
Net asset value, end of period | $ 10.20 | $ 10.10 | $ 9.65 | $ 9.10 | $ 9.40 |
Total ReturnA | 7.02% | 11.63% | 14.07% | 3.83% | 22.33% |
Ratios to Average Net Assets C, E |
|
|
|
|
|
Expenses before reductions | .78% | .77% | .78% | .77% | .78% |
Expenses net of fee waivers, if any | .78% | .77% | .78% | .77% | .78% |
Expenses net of all reductions | .78% | .77% | .78% | .77% | .78% |
Net investment income (loss) | 4.66% | 5.68% | 6.44% | 6.19% | 7.28% |
Supplemental Data |
|
|
|
|
|
Net assets, end of period (in millions) | $ 658 | $ 497 | $ 495 | $ 498 | $ 1,336 |
Portfolio turnover rateD | 41% | 66% | 66% | 68% | 53% |
A Total returns would have been lower if certain expenses had not been reduced during the applicable periods shown.
B Calculated based on average shares outstanding during the period.
C Fees and expenses of any underlying Fidelity Central Funds are not included in the Fund's expense ratio. The Fund indirectly bears its proportionate share of the expenses of any underlying Fidelity Central Funds.
D Amount does not include the portfolio activity of any underlying Fidelity Central Funds.
E Expense ratios reflect operating expenses of the class. Expenses before reductions do not reflect amounts reimbursed by the investment adviser or reductions from brokerage service arrangements or reductions from other expense offset arrangements and do not represent the amount paid by the class during periods when reimbursements or reductions occur. Expenses net of fee waivers reflect expenses after reimbursement by the investment adviser but prior to reductions from brokerage service arrangements or other expense offset arrangements. Expenses net of all reductions represent the net expenses paid by the class.
See accompanying notes which are an integral part of the financial statements.
Annual Report
Notes to Financial Statements
For the period ended October 31, 2014
(Amounts in thousands except percentages)
1. Organization.
Fidelity Advisor High Income Advantage Fund (the Fund) is a fund of Fidelity Advisor Series I (the Trust) and is authorized to issue an unlimited number of shares. The Trust is registered under the Investment Company Act of 1940, as amended (the 1940 Act), as an open-end management investment company organized as a Massachusetts business trust. The Fund offers Class A, Class T, Class C and Institutional Class shares, each of which, along with Class B shares, has equal rights as to assets and voting privileges. Class B shares are closed to new accounts and additional purchases, except for exchanges and reinvestments. Each class has exclusive voting rights with respect to matters that affect that class. Class B shares will automatically convert to Class A shares after a holding period of seven years from the initial date of purchase.
2. Investments in Fidelity Central Funds.
The Fund invests in Fidelity Central Funds, which are open-end investment companies generally available only to other investment companies and accounts managed by the investment adviser and its affiliates. The Fund's Schedule of Investments lists each of the Fidelity Central Funds held as of period end, if any, as an investment of the Fund, but does not include the underlying holdings of each Fidelity Central Fund. As an Investing Fund, the Fund indirectly bears its proportionate share of the expenses of the underlying Fidelity Central Funds.
The Money Market Central Funds seek preservation of capital and current income and are managed by Fidelity Investments Money Management, Inc. (FIMM), an affiliate of the investment adviser. Annualized expenses of the Money Market Central Funds as of their most recent shareholder report date are less than .01%.
A complete unaudited list of holdings for each Fidelity Central Fund is available upon request or at the Securities and Exchange Commission (the SEC) website at www.sec.gov. In addition, the financial statements of the Fidelity Central Funds, which are not covered by the Fund's Report of Independent Registered Public Accounting Firm, are available on the SEC website or upon request.
3. Significant Accounting Policies.
The financial statements have been prepared in conformity with accounting principles generally accepted in the United States of America (GAAP), which require management to make certain estimates and assumptions at the date of the financial statements. Actual results could differ from those estimates. Subsequent events, if any, through the date that the financial statements were issued have been evaluated in the preparation of
Annual Report
Notes to Financial Statements - continued
(Amounts in thousands except percentages)
3. Significant Accounting Policies - continued
the financial statements. The following summarizes the significant accounting policies of the Fund:
Investment Valuation. Investments are valued as of 4:00 p.m. Eastern time on the last calendar day of the period. In accordance with valuation policies and procedures approved by the Board of Trustees (the Board), the Fund attempts to obtain prices from one or more third party pricing vendors or brokers to value its investments. When current market prices, quotations or currency exchange rates are not readily available or reliable, investments will be fair valued in good faith by the Fidelity Management & Research Company (FMR) Fair Value Committee (the Committee), in accordance with procedures adopted by the Board. Factors used in determining fair value vary by investment type and may include market or investment specific events, changes in interest rates and credit quality. The frequency with which these procedures are used cannot be predicted and they may be utilized to a significant extent. The Committee oversees the Fund's valuation policies and procedures and is responsible for approving and reporting to the Board all fair value determinations.
The Fund categorizes the inputs to valuation techniques used to value its investments into a disclosure hierarchy consisting of three levels as shown below:
Level 1 - quoted prices in active markets for identical investments
Level 2 - other significant observable inputs (including quoted prices for similar investments, interest rates, prepayment speeds, etc.)
Level 3 - unobservable inputs (including the Fund's own assumptions based on the best information available)
Valuation techniques used to value the Fund's investments by major category are as follows:
Debt securities, including restricted securities, are valued based on evaluated prices received from third party pricing vendors or from brokers who make markets in such securities. Corporate bonds, bank loan obligations and preferred securities are valued by pricing vendors who utilize matrix pricing which considers yield or price of bonds of comparable quality, coupon, maturity and type or by broker-supplied prices. When independent prices are unavailable or unreliable, debt securities may be valued utilizing pricing methodologies which consider similar factors that would be used by third party pricing vendors. Debt securities are generally categorized as Level 2 in the hierarchy but may be Level 3 depending on the circumstances. The Fund invests a significant portion of its assets in below investment grade securities. The value of these securities can be more volatile due to changes in the credit quality of the issuer and is sensitive to changes in economic, market and regulatory conditions.
Annual Report
3. Significant Accounting Policies - continued
Investment Valuation - continued
Equity securities, including restricted securities, for which market quotations are readily available, are valued at the last reported sale price or official closing price as reported by a third party pricing vendor on the primary market or exchange on which they are traded and are categorized as Level 1 in the hierarchy. In the event there were no sales during the day or closing prices are not available, securities are valued at the last quoted bid price or may be valued using the last available price and are generally categorized as Level 2 in the hierarchy. For foreign equity securities, when market or security specific events arise, comparisons to the valuation of American Depositary Receipts (ADRs), futures contracts, Exchange-Traded Funds (ETFs) and certain indexes as well as quoted prices for similar securities may be used and would be categorized as Level 2 in the hierarchy. Utilizing these techniques may result in transfers between Level 1 and Level 2. For equity securities, including restricted securities, where observable inputs are limited, assumptions about market activity and risk are used and these securities may be categorized as Level 3 in the hierarchy.
Investments in open-end mutual funds, including the Fidelity Central Funds, are valued at their closing net asset value (NAV) each business day and are categorized as Level 1 in the hierarchy.
Changes in valuation techniques may result in transfers in or out of an assigned level within the disclosure hierarchy. The aggregate value of investments by input level, as of October 31, 2014, is included at the end of the Fund's Schedule of Investments.
Foreign Currency. The Fund may use foreign currency contracts to facilitate transactions in foreign-denominated securities. Gains and losses from these transactions may arise from changes in the value of the foreign currency or if the counterparties do not perform under the contracts' terms.
Foreign-denominated assets, including investment securities, and liabilities are translated into U.S. dollars at the exchange rates at period end. Purchases and sales of investment securities, income and dividends received and expenses denominated in foreign currencies are translated into U.S. dollars at the exchange rate in effect on the transaction date.
The effects of exchange rate fluctuations on investments are included with the net realized and unrealized gain (loss) on investment securities. Other foreign currency transactions resulting in realized and unrealized gain (loss) are disclosed separately.
Investment Transactions and Income. For financial reporting purposes, the Fund's investment holdings and NAV include trades executed through the end of the last business day of the period. The NAV per share for processing shareholder transactions is
Annual Report
Notes to Financial Statements - continued
(Amounts in thousands except percentages)
3. Significant Accounting Policies - continued
Investment Transactions and Income - continued
calculated as of the close of business of the New York Stock Exchange (NYSE), normally 4:00 p.m. Eastern time and includes trades executed through the end of the prior business day. Gains and losses on securities sold are determined on the basis of identified cost and may include proceeds received from litigation. Dividend income is recorded on the ex-dividend date, except for certain dividends from foreign securities where the ex-dividend date may have passed, which are recorded as soon as the Fund is informed of the ex-dividend date. Non-cash dividends included in dividend income, if any, are recorded at the fair market value of the securities received. Income and capital gain distributions from Fidelity Central Funds, if any, are recorded on the ex-dividend date. Distributions received on securities that represent a return of capital or capital gain are recorded as a reduction of cost of investments and/or as a realized gain. Subsequent to ex-dividend date the Fund determines the components of these distributions, based upon receipt of tax filings or other correspondence relating to the underlying investment. Interest income is accrued as earned and includes coupon interest and amortization of premium and accretion of discount on debt securities as applicable. Investment income is recorded net of foreign taxes withheld where recovery of such taxes is uncertain. Debt obligations may be placed on non-accrual status and related interest income may be reduced by ceasing current accruals and writing off interest receivables when the collection of all or a portion of interest has become doubtful based on consistently applied procedures. A debt obligation is removed from non-accrual status when the issuer resumes interest payments or when collectability of interest is reasonably assured.
Class Allocations and Expenses. Investment income, realized and unrealized capital gains and losses, common expenses of the Fund, and certain fund-level expense reductions, if any, are allocated daily on a pro-rata basis to each class based on the relative net assets of each class to the total net assets of the Fund. Each class differs with respect to transfer agent and distribution and service plan fees incurred. Certain expense reductions may also differ by class. For the reporting period, the allocated portion of income and expenses to each class as a percent of its average net assets may vary due to the timing of recording these transactions in relation to fluctuating net assets of the classes. Expenses directly attributable to a fund are charged to that fund. Expenses attributable to more than one fund are allocated among the respective funds on the basis of relative net assets or other appropriate methods. Expense estimates are accrued in the period to which they relate and adjustments are made when actual amounts are known.
Deferred Trustee Compensation. Under a Deferred Compensation Plan (the Plan), independent Trustees may elect to defer receipt of a portion of their annual compensation. Deferred amounts are invested in a cross-section of Fidelity funds, are marked-to-market and remain in the Fund until distributed in accordance with the Plan. The
Annual Report
3. Significant Accounting Policies - continued
Deferred Trustee Compensation - continued
investment of deferred amounts and the offsetting payable to the Trustees are included in the accompanying Statement of Assets and Liabilities.
Income Tax Information and Distributions to Shareholders. Each year, the Fund intends to qualify as a regulated investment company under Subchapter M of the Internal Revenue Code, including distributing substantially all of its taxable income and realized gains. As a result, no provision for U.S. Federal income taxes is required. As of October 31, 2014, the Fund did not have any unrecognized tax benefits in the financial statements; nor is the Fund aware of any tax positions for which it is reasonably possible that the total amounts of unrecognized tax benefits will significantly change in the next twelve months. The Fund files a U.S. federal tax return, in addition to state and local tax returns as required. The Fund's federal income tax returns are subject to examination by the Internal Revenue Service (IRS) for a period of three fiscal years after they are filed. State and local tax returns may be subject to examination for an additional fiscal year depending on the jurisdiction. Foreign taxes are provided for based on the Fund's understanding of the tax rules and rates that exist in the foreign markets in which it invests.
Dividends are declared and recorded daily and paid monthly from net investment income. Distributions from realized gains, if any, are declared and recorded on the ex-dividend date. Income dividends and capital gain distributions are declared separately for each class. Income and capital gain distributions are determined in accordance with income tax regulations, which may differ from GAAP.
Capital accounts within the financial statements are adjusted for permanent book-tax differences. These adjustments have no impact on net assets or the results of operations. Capital accounts are not adjusted for temporary book-tax differences which will reverse in a subsequent period.
Book-tax differences are primarily due to foreign currency transactions, partnerships, defaulted bonds, market discount, equity-debt classifications, deferred trustees compensation, capital loss carryforwards and losses deferred due to wash sales.
The federal tax cost of investment securities and unrealized appreciation (depreciation) as of period end were as follows:
Gross unrealized appreciation | $ 160,266 |
Gross unrealized depreciation | (77,295) |
Net unrealized appreciation (depreciation) on securities | $ 82,971 |
|
|
Tax Cost | $ 1,941,131 |
Annual Report
Notes to Financial Statements - continued
(Amounts in thousands except percentages)
3. Significant Accounting Policies - continued
Income Tax Information and Distributions to Shareholders - continued
The tax-based components of distributable earnings as of period end were as follows:
Undistributed ordinary income | $ 392 |
Capital loss carryforward | $ (476,979) |
Net unrealized appreciation (depreciation) on securities and other investments | $ 82,971 |
Capital loss carryforwards are only available to offset future capital gains of the Fund to the extent provided by regulations and may be limited. Under the Regulated Investment Company Modernization Act of 2010 (the Act), the Fund is permitted to carry forward capital losses incurred in taxable years beginning after December 22, 2010 for an unlimited period and such capital losses are required to be used prior to any losses that expire. The capital loss carryforward information presented below, including any applicable limitation, is estimated as of fiscal period end and is subject to adjustment.
Fiscal year of expiration |
|
2017 | $ (476,979) |
The tax character of distributions paid was as follows:
| October 31, 2014 | October 31, 2013 |
Ordinary Income | $ 107,105 | $ 113,654 |
Short-Term Trading (Redemption) Fees. Shares held by investors in the Fund less than 90 days may have been subject to a redemption fee equal to 1.00% of the NAV of shares redeemed. All redemption fees, which reduce the proceeds of the shareholder redemption, are retained by the Fund and accounted for as an addition to paid in capital.
Restricted Securities. The Fund may invest in securities that are subject to legal or contractual restrictions on resale. These securities generally may be resold in transactions exempt from registration or to the public if the securities are registered. Disposal of these securities may involve time-consuming negotiations and expense, and prompt sale at an acceptable price may be difficult. Information regarding restricted securities is included at the end of the Fund's Schedule of Investments.
Loans and Other Direct Debt Instruments. The Fund invests in direct debt instruments which are interests in amounts owed to lenders by corporate or other borrowers. These instruments may be in the form of loans, trade claims or other receivables and may include standby financing commitments such as revolving credit facilities that obligate the Fund to supply additional cash to the borrower on demand. Loans may be acquired through assignment or participation, or may be made directly to a borrower. The Fund did not have any unfunded loan commitments, which are contractual obligations for future funding, at period end.
Annual Report
3. Significant Accounting Policies - continued
New Accounting Pronouncement. In June 2014, the Financial Accounting Standards Board issued Accounting Standard Update No. 2014-11, Repurchase-to-Maturity Transactions, Repurchase Financings, and Disclosures. The Update amends the accounting for certain repurchase agreements and expands disclosure requirements for reverse repurchase agreements, securities lending and other similar transactions. The disclosure requirements are effective for annual and interim reporting periods beginning after December 15, 2014. Management is currently evaluating the impact of the Update on the Fund's financial statements and related disclosures.
4. Purchases and Sales of Investments.
Purchases and sales of securities, other than short-term securities, aggregated $920,250 and $787,974, respectively.
5. Fees and Other Transactions with Affiliates.
Management Fee. Fidelity Management & Research Company (the investment adviser) and its affiliates provide the Fund with investment management related services for which the Fund pays a monthly management fee. The management fee is the sum of an individual fund fee rate that is based on an annual rate of .45% of the Fund's average net assets and an annualized group fee rate that averaged .11% during the period. The group fee rate is based upon the average net assets of all the mutual funds advised by the investment adviser, including any mutual funds previously advised by the investment adviser that are currently advised by Fidelity SelectCo, LLC, an affiliate of the investment adviser. The group fee rate decreases as assets under management increase and increases as assets under management decrease. For the reporting period, the total annual management fee rate was .56% of the Fund's average net assets.
Distribution and Service Plan Fees. In accordance with Rule 12b-1 of the 1940 Act, the Fund has adopted separate Distribution and Service Plans for each class of shares. Certain classes pay Fidelity Distributors Corporation (FDC), an affiliate of the investment adviser, separate Distribution and Service Fees, each of which is based on an annual percentage of each class' average net assets. In addition, FDC may pay financial intermediaries for selling shares of the Fund and providing shareholder support services. For the period, the Distribution and Service Fee rates, total fees and amounts retained by FDC were as follows:
| Distribution | Service | Total Fees | Retained |
Class A | -% | .25% | $ 1,767 | $ 24 |
Class T | -% | .25% | 1,311 | 8 |
Class B | .65% | .25% | 133 | 96 |
Class C | .75% | .25% | 1,855 | 144 |
|
|
| $ 5,066 | $ 272 |
Annual Report
Notes to Financial Statements - continued
(Amounts in thousands except percentages)
5. Fees and Other Transactions with Affiliates - continued
Sales Load. FDC may receive a front-end sales charge of up to 4.00% for selling Class A shares and Class T shares, some of which is paid to financial intermediaries for selling shares of the Fund. Depending on the holding period, FDC may receive contingent deferred sales charges levied on Class A, Class T, Class B, and Class C redemptions. The deferred sales charges range from 5.00% to 1.00% for Class B shares, 1.00% for Class C shares, 1.00% for certain purchases of Class A shares and .25% for certain purchases of Class T shares.
For the period, sales charge amounts retained by FDC were as follows:
| Retained |
Class A | $ 72 |
Class T | 10 |
Class B* | 8 |
Class C* | 10 |
| $ 100 |
* When Class B and Class C shares are initially sold, FDC pays commissions from its own resources to financial intermediaries through which the sales are made.
Transfer Agent Fees. Fidelity Investments Institutional Operations Company, Inc., (FIIOC), an affiliate of the investment adviser, is the transfer, dividend disbursing and shareholder servicing agent for each class of the Fund. FIIOC receives account fees and asset-based fees that vary according to the account size and type of account of the shareholders of the respective classes of the Fund. FIIOC pays for typesetting, printing and mailing of shareholder reports, except proxy statements.
For the period, transfer agent fees for each class were as follows:
| Amount | % of |
Class A | $ 1,125 | .16 |
Class T | 781 | .15 |
Class B | 34 | .23 |
Class C | 298 | .16 |
Institutional Class | 1,041 | .17 |
| $ 3,279 |
|
Accounting and Security Lending Fees. Fidelity Service Company, Inc. (FSC), an affiliate of the investment adviser, maintains the Fund's accounting records. The accounting fee is based on the level of average net assets for each month. Under a separate contract, FSC administers the security lending program. The security lending fee is based on the number and duration of lending transactions.
Annual Report
5. Fees and Other Transactions with Affiliates - continued
Brokerage Commissions. The Fund placed a portion of its portfolio transactions with brokerage firms which are affiliates of the investment adviser. Brokerage commissions are included in net realized gain (loss) and change in net unrealized appreciation (depreciation) in the Statement of Operations. The commissions paid to these affiliated firms were $6 for the period.
6. Committed Line of Credit.
The Fund participates with other funds managed by the investment adviser or an affiliate in a $4.25 billion credit facility (the "line of credit") to be utilized for temporary or emergency purposes to fund shareholder redemptions or for other short-term liquidity purposes. The Fund has agreed to pay commitment fees on its pro-rata portion of the line of credit, which amounted to $3 and is reflected in Miscellaneous expenses on the Statement of Operations. During the period, the Fund did not borrow on this line of credit.
7. Security Lending.
The Fund lends portfolio securities through a lending agent from time to time in order to earn additional income. For equity securities, a lending agent is used and may loan securities to certain qualified borrowers, including Fidelity Capital Markets (FCM), a broker-dealer affiliated with the Fund. On the settlement date of the loan, the Fund receives collateral (in the form of U.S. Treasury obligations, letters of credit and/or cash) against the loaned securities and maintains collateral in an amount not less than 100% of the market value of the loaned securities during the period of the loan. The market value of the loaned securities is determined at the close of business of the Fund and any additional required collateral is delivered to the Fund on the next business day. If the borrower defaults on its obligation to return the securities loaned because of insolvency or other reasons, the Fund may apply collateral received from the borrower against the obligation. The Fund may experience delays and costs in recovering the securities loaned. Any cash collateral received is invested in the Fidelity Securities Lending Cash Central Fund. The value of loaned securities and cash collateral at period end are disclosed on the Fund's Statement of Assets and Liabilities. Security lending income represents the income earned on investing cash collateral, less rebates paid to borrowers and any lending agent fees associated with the loan, plus any premium payments received for lending certain types of securities. Security lending income is presented in the Statement of Operations as a component of income from Fidelity Central Funds. Total security lending income during the period amounted to $40. During the period, there were no securities loaned to FCM.
Annual Report
Notes to Financial Statements - continued
(Amounts in thousands except percentages)
8. Expense Reductions.
Commissions paid to certain brokers with whom the investment adviser, or its affiliates, places trades on behalf of the Fund include an amount in addition to trade execution, which may be rebated back to the Fund to offset certain expenses. This amount totaled $7 for the period. In addition, through arrangements with the Fund's custodian, credits realized as a result of uninvested cash balances were used to reduce the Fund's expenses. During the period, these credits reduced the Fund's custody expenses by $2.
9. Distributions to Shareholders.
Distributions to shareholders of each class were as follows:
Years ended October 31, | 2014 | 2013 |
From net investment income |
|
|
Class A | $ 29,254 | $ 32,676 |
Class T | 21,657 | 24,635 |
Class B | 514 | 920 |
Class C | 6,299 | 7,083 |
Institutional Class | 27,651 | 24,315 |
Total | $ 85,375 | $ 89,629 |
From net realized gain |
|
|
Class A | $ 7,669 | $ 8,703 |
Class T | 5,773 | 6,597 |
Class B | 206 | 336 |
Class C | 2,005 | 2,235 |
Institutional Class | 6,077 | 6,154 |
Total | $ 21,730 | $ 24,025 |
10. Share Transactions.
Share transactions for each class were as follows and may contain automatic conversions between classes or exchanges between funds:
| Shares | Dollars | ||
Years ended October 31, | 2014 | 2013 | 2014 | 2013 |
Class A |
|
|
|
|
Shares sold | 12,896 | 17,380 | $ 140,028 | $ 182,432 |
Reinvestment of distributions | 2,878 | 3,187 | 31,150 | 33,277 |
Shares redeemed | (18,099) | (24,589) | (196,563) | (257,846) |
Net increase (decrease) | (2,325) | (4,022) | $ (25,385) | $ (42,137) |
Annual Report
10. Share Transactions - continued
| Shares | Dollars | ||
Years ended October 31, | 2014 | 2013 | 2014 | 2013 |
Class T |
|
|
|
|
Shares sold | 5,270 | 7,839 | $ 57,373 | $ 82,393 |
Reinvestment of distributions | 2,245 | 2,579 | 24,429 | 27,058 |
Shares redeemed | (10,414) | (14,693) | (113,473) | (154,504) |
Net increase (decrease) | (2,899) | (4,275) | $ (31,671) | $ (45,053) |
Class B |
|
|
|
|
Shares sold | 72 | 170 | $ 769 | $ 1,770 |
Reinvestment of distributions | 54 | 91 | 583 | 946 |
Shares redeemed | (981) | (1,185) | (10,557) | (12,346) |
Net increase (decrease) | (855) | (924) | $ (9,205) | $ (9,630) |
Class C |
|
|
|
|
Shares sold | 2,513 | 2,941 | $ 27,167 | $ 30,884 |
Reinvestment of distributions | 590 | 659 | 6,365 | 6,860 |
Shares redeemed | (3,396) | (4,169) | (36,746) | (43,630) |
Net increase (decrease) | (293) | (569) | $ (3,214) | $ (5,886) |
Institutional Class |
|
|
|
|
Shares sold | 24,909 | 13,983 | $ 253,746 | $ 138,423 |
Reinvestment of distributions | 2,763 | 2,463 | 28,115 | 24,250 |
Shares redeemed | (12,448) | (18,542) | (126,707) | (182,351) |
Net increase (decrease) | 15,224 | (2,096) | $ 155,154 | $ (19,678) |
11. Other.
The Fund's organizational documents provide former and current trustees and officers with a limited indemnification against liabilities arising in connection with the performance of their duties to the Fund. In the normal course of business, the Fund may also enter into contracts that provide general indemnifications. The Fund's maximum exposure under these arrangements is unknown as this would be dependent on future claims that may be made against the Fund. The risk of material loss from such claims is considered remote.
At the end of the period, Strategic Advisers Income Opportunities Fund was the owner of record of approximately 12% of the total outstanding shares of the Fund.
Annual Report
Notes to Financial Statements - continued
(Amounts in thousands except percentages)
12. Litigation.
The Fund, and other entities managed by Fidelity or its affiliates, have been named as defendants in a lawsuit brought by creditors of a subsidiary of Energy Future Holdings Corp. ("EFH"), which is currently in bankruptcy and was formerly known as TXU. The lawsuit, which is captioned as In Re: ENERGY FUTURE HOLDINGS CORP. et al. U.S. Bankruptcy Court, D. Del. Case No. 14-10979 (CSS); AVENUE CAPITAL MANAGEMENT II, LP, et al. v. FIDELITY INVESTMENTS, et al. Adversary No. 14-50797 (CSS), was filed in the United States Bankruptcy Court for the District of Delaware on October 6, 2014. The plaintiffs are seeking to enforce an alleged agreement under which the Fund and other defendants would sell certain EFH notes, as identified in the Fund's Schedule of Investments, to the plaintiffs at a specified price. Plaintiffs are seeking a declaration that an alleged right to call the securities was properly exercised and an order that the Fund and other defendants transfer the notes to the plaintiffs at the specified price. The Fund and the other defendants dispute the plaintiffs' claims and intend to defend the case vigorously. On November 19, 2014, the defendants filed a motion to dismiss contending, among other things, that the right to call the notes never came into existence and was part of a proposed settlement agreement that was never completed or approved by the bankruptcy court. The motion to dismiss has not yet been decided. If the lawsuit were to be decided in a manner adverse to the Fund, the Fund could experience a loss up to $7,119,941 as of period end. The Fund will also incur legal costs in defending the case.
Annual Report
Report of Independent Registered Public Accounting Firm
To the Trustees of Fidelity Advisor Series I and Shareholders of Fidelity Advisor High Income Advantage Fund:
We have audited the accompanying statement of assets and liabilities of Fidelity Advisor High Income Advantage Fund (the Fund), a fund of Fidelity Advisor Series I, including the schedule of investments, as of October 31, 2014, and the related statement of operations for the year then ended, the statement of changes in net assets for each of the two years in the period then ended, and the financial highlights for each of the five years in the period then ended. These financial statements and financial highlights are the responsibility of the Fund's management. Our responsibility is to express an opinion on these financial statements and financial highlights based on our audits.
We conducted our audits in accordance with the standards of the Public Company Accounting Oversight Board (United States). Those standards require that we plan and perform the audit to obtain reasonable assurance about whether the financial statements and financial highlights are free of material misstatement. The Fund is not required to have, nor were we engaged to perform, an audit of its internal control over financial reporting. Our audits included consideration of internal control over financial reporting as a basis for designing audit procedures that are appropriate in the circumstances, but not for the purpose of expressing an opinion on the effectiveness of the Fund's internal control over financial reporting. Accordingly, we express no such opinion. An audit also includes examining, on a test basis, evidence supporting the amounts and disclosures in the financial statements, assessing the accounting principles used and significant estimates made by management, as well as evaluating the overall financial statement presentation. Our procedures included confirmation of securities owned as of October 31, 2014, by correspondence with the custodians and brokers; where replies were not received from brokers, we performed other auditing procedures. We believe that our audits provide a reasonable basis for our opinion.
In our opinion, the financial statements and financial highlights referred to above present fairly, in all material respects, the financial position of Fidelity Advisor High Income Advantage Fund as of October 31, 2014, the results of its operations for the year then ended, the changes in its net assets for each of the two years in the period then ended, and the financial highlights for each of the five years in the period then ended, in conformity with accounting principles generally accepted in the United States of America.
DELOITTE & TOUCHE LLP
Boston, Massachusetts
December 22, 2014
Annual Report
Trustees and Officers
The Trustees, Member of the Advisory Board, and officers of the trust and fund, as applicable, are listed below. The Board of Trustees governs the fund and is responsible for protecting the interests of shareholders. The Trustees are experienced executives who meet periodically throughout the year to oversee the fund's activities, review contractual arrangements with companies that provide services to the fund, oversee management of the risks associated with such activities and contractual arrangements, and review the fund's performance. Except for James C. Curvey, each of the Trustees oversees 174 funds. Mr. Curvey oversees 407 funds.
The Trustees hold office without limit in time except that (a) any Trustee may resign; (b) any Trustee may be removed by written instrument, signed by at least two-thirds of the number of Trustees prior to such removal; (c) any Trustee who requests to be retired or who has become incapacitated by illness or injury may be retired by written instrument signed by a majority of the other Trustees; and (d) any Trustee may be removed at any special meeting of shareholders by a two-thirds vote of the outstanding voting securities of the trust. Each Trustee who is not an interested person (as defined in the 1940 Act) of the trust and the fund (Independent Trustee), shall retire not later than the last day of the calendar year in which his or her 75th birthday occurs. The Independent Trustees may waive this mandatory retirement age policy with respect to individual Trustees. The officers and Advisory Board Member hold office without limit in time, except that any officer and Advisory Board Member may resign or may be removed by a vote of a majority of the Trustees at any regular meeting or any special meeting of the Trustees. Except as indicated, each individual has held the office shown or other offices in the same company for the past five years.
Experience, Skills, Attributes, and Qualifications of the Fund's Trustees. The Governance and Nominating Committee has adopted a statement of policy that describes the experience, qualifications, attributes, and skills that are necessary and desirable for potential Independent Trustee candidates (Statement of Policy). The Board believes that each Trustee satisfied at the time he or she was initially elected or appointed a Trustee, and continues to satisfy, the standards contemplated by the Statement of Policy. The Governance and Nominating Committee also engages professional search firms to help identify potential Independent Trustee candidates who have the experience, qualifications, attributes, and skills consistent with the Statement of Policy. From time to time, additional criteria based on the composition and skills of the current Independent Trustees, as well as experience or skills that may be appropriate in light of future changes to board composition, business conditions, and regulatory or other developments, have also been considered by the professional search firms and the Governance and Nominating Committee. In addition, the Board takes into account the Trustees' commitment and participation in Board and committee meetings, as well as their leadership of standing and ad hoc committees throughout their tenure.
In determining that a particular Trustee was and continues to be qualified to serve as a Trustee, the Board has considered a variety of criteria, none of which, in isolation, was controlling. The Board believes that, collectively, the Trustees have balanced and diverse experience, qualifications, attributes, and skills, which allow the Board to operate effectively in governing the fund and protecting the interests of shareholders. Information about the specific experience, skills, attributes, and qualifications of each Trustee, which in each case led to the Board's conclusion that the Trustee should serve (or continue to serve) as a trustee of the fund, is provided below.
Annual Report
Board Structure and Oversight Function. James C. Curvey is an interested person (as defined in the 1940 Act) and currently serves as Chairman. The Trustees have determined that an interested Chairman is appropriate and benefits shareholders because an interested Chairman has a personal and professional stake in the quality and continuity of services provided to the fund. Independent Trustees exercise their informed business judgment to appoint an individual of their choosing to serve as Chairman, regardless of whether the Trustee happens to be independent or a member of management. The Independent Trustees have determined that they can act independently and effectively without having an Independent Trustee serve as Chairman and that a key structural component for assuring that they are in a position to do so is for the Independent Trustees to constitute a substantial majority for the Board. The Independent Trustees also regularly meet in executive session. Ned C. Lautenbach serves as Chairman of the Independent Trustees and as such (i) acts as a liaison between the Independent Trustees and management with respect to matters important to the Independent Trustees and (ii) with management prepares agendas for Board meetings.
Fidelity funds are overseen by different Boards of Trustees. The fund's Board oversees Fidelity's equity and high income funds and another Board oversees Fidelity's investment-grade bond, money market, and asset allocation funds. The asset allocation funds may invest in Fidelity funds overseen by the fund's Board. The use of separate Boards, each with its own committee structure, allows the Trustees of each group of Fidelity funds to focus on the unique issues of the funds they oversee, including common research, investment, and operational issues. On occasion, the separate Boards establish joint committees to address issues of overlapping consequences for the Fidelity funds overseen by each Board.
The Trustees operate using a system of committees to facilitate the timely and efficient consideration of all matters of importance to the Trustees, the fund, and fund shareholders and to facilitate compliance with legal and regulatory requirements and oversight of the fund's activities and associated risks. The Board, acting through its committees, has charged FMR and its affiliates with (i) identifying events or circumstances the occurrence of which could have demonstrably adverse effects on the fund's business and/or reputation; (ii) implementing processes and controls to lessen the possibility that such events or circumstances occur or to mitigate the effects of such events or circumstances if they do occur; and (iii) creating and maintaining a system designed to evaluate continuously business and market conditions in order to facilitate the identification and implementation processes described in (i) and (ii) above. Because the day-to-day operations and activities of the fund are carried out by or through FMR, its affiliates and other service providers, the fund's exposure to risks is mitigated but not eliminated by the processes overseen by the Trustees. While each of the Board's committees has responsibility for overseeing different aspects of the fund's activities, oversight is exercised primarily through the Operations, Audit, and Compliance Committees. In addition, the Independent Trustees have worked with FMR to enhance the Board's oversight of investment and financial risks, legal and regulatory risks, technology risks, and operational risks, including the development of additional risk reporting to the Board. For example, a working group comprised of Independent Trustees and FMR has worked and continues to work to review the Fidelity funds' valuation-related activities, reporting and risk management. Appropriate personnel, including but not limited to the fund's Chief Compliance Officer (CCO), FMR's internal auditor, the independent accountants, the fund's Treasurer and portfolio management personnel, make periodic reports to the Board's committees, as appropriate, including an annual review of FMR's risk management program for the Fidelity funds. The responsibilities of each standing committee, including their oversight responsibilities, are described further under "Standing Committees of the Fund's Trustees."
Annual Report
Trustees and Officers - continued
The fund's Statement of Additional Information (SAI) includes more information about the Trustees. To request a free copy, call Fidelity at 1-877-208-0098.
Interested Trustees*:
Correspondence intended for each Trustee who is an interested person may be sent to Fidelity Investments, 245 Summer Street, Boston, Massachusetts 02210.
Name, Year of Birth; Principal Occupations and Other Relevant Experience+ | |
James C. Curvey (1935) | |
Year of Election or Appointment: 2007 Trustee Chairman of the Board of Trustees | |
| Mr. Curvey also serves as Trustee of other Fidelity funds. Mr. Curvey is a Director of Fidelity Research & Analysis Co. (2009-present), and Vice Chairman (2007-present) and Director of FMR LLC. In addition, Mr. Curvey serves as an Overseer for the Boston Symphony Orchestra and a member of the board of Artis-Naples, Naples, Florida, and as a Trustee for Brewster Academy, Wolfeboro, New Hampshire. Previously, Mr. Curvey served as a Director of Fidelity Investments Money Management, Inc. (2009-2014), a Director of FMR (2007-2014), and a Director of FMR Co., Inc. (2007-2014). |
Charles S. Morrison (1960) | |
Year of Election or Appointment: 2014 Trustee | |
| Mr. Morrison also serves as Trustee of other funds. He serves as a Director of Fidelity Investments Money Management, Inc. (FIMM) (2014-present), Director of Fidelity SelectCo, LLC (2014-present), President, Asset Management (2014-present), and is an employee of Fidelity Investments. Previously, Mr. Morrison served as Vice President of Fidelity's Fixed Income and Asset Allocation Funds (2012-2014), President, Fixed Income (2011-2014), Vice President of Fidelity's Money Market Funds (2005-2009), President, Money Market Group Leader of FMR (2009), and Senior Vice President, Money Market Group of FMR (2004-2009). Mr. Morrison also served as Vice President of Fidelity's Bond Funds (2002-2005), certain Balanced Funds (2002-2005), and certain Asset Allocation Funds (2002-2007), and as Senior Vice President (2002-2005) of Fidelity's Bond Division. |
* Trustees have been determined to be "Interested Trustees" by virtue of, among other things, their affiliation with the trust or various entities under common control with FMR.
+ The information above includes each Trustee's principal occupation during the last five years and other information relating to the experience, attributes, and skills relevant to each Trustee's qualifications to serve as a Trustee, which led to the conclusion that each Trustee should serve as a Trustee for the fund.
Annual Report
Trustees and Officers - continued
Independent Trustees:
Correspondence intended for each Independent Trustee (that is, the Trustees other than the Interested Trustees) may be sent to Fidelity Investments, P.O. Box 55235, Boston, Massachusetts 02205-5235.
Name, Year of Birth; Principal Occupations and Other Relevant Experience+ | |
Dennis J. Dirks (1948) | |
Year of Election or Appointment: 2005 Trustee | |
| Mr. Dirks also serves as Trustee of other Fidelity funds. Prior to his retirement in May 2003, Mr. Dirks was Chief Operating Officer and a member of the Board of The Depository Trust & Clearing Corporation (DTCC). He also served as President, Chief Operating Officer, and Board member of The Depository Trust Company (DTC) and President and Board member of the National Securities Clearing Corporation (NSCC). In addition, Mr. Dirks served as Chief Executive Officer and Board member of the Government Securities Clearing Corporation, Chief Executive Officer and Board member of the Mortgage-Backed Securities Clearing Corporation, as a Trustee and a member of the Finance Committee of Manhattan College (2005-2008), and as a Trustee and a member of the Finance Committee of AHRC of Nassau County (2006-2008). Mr. Dirks is a member of the Independent Directors Council (IDC) Governing Council (2010-present) and Board of Directors for The Brookville Center for Children's Services, Inc. (2009-present). |
Alan J. Lacy (1953) | |
Year of Election or Appointment: 2008 Trustee | |
| Mr. Lacy also serves as Trustee of other Fidelity funds. Mr. Lacy serves as Senior Adviser (2007-present) of Oak Hill Capital Partners, L.P. (private equity). Mr. Lacy also served as Chief Executive Officer (2000-2005) and Vice Chairman (2005-2006) of Sears Holdings Corporation and Sears, Roebuck and Co. (retail). In addition, Mr. Lacy serves as a member of the Board of Directors of Dave & Buster's Entertainment, Inc. (restaurant and entertainment complexes, 2010-present), Earth Fare, Inc. (retail grocery, 2012-present), The Hillman Companies, Inc. (hardware wholesalers, 2010-present), and Bristol-Myers Squibb Company (global pharmaceuticals, 2008-present). Mr. Lacy is a member of the Board of Trustees of The National Parks Conservation Association (2006-present). Previously, Mr. Lacy served as Chairman of the Board of Trustees of the National Parks Conservation Association (2008-2011) and as a member of the Board of Directors for the Western Union Company (global money transfer, 2006-2011). |
Ned C. Lautenbach (1944) | |
Year of Election or Appointment: 2000 Trustee Chairman of the Independent Trustees | |
| Mr. Lautenbach also serves as Trustee of other Fidelity funds. Mr. Lautenbach currently serves as the Lead Director of the Eaton Corporation Board of Directors (diversified industrial, 1997-present). Mr. Lautenbach is Chairman of the Board of Directors of the Philharmonic Center for the Arts in Naples, Florida (2012-present) and a member of the Council on Foreign Relations (1994-present). Previously, Mr. Lautenbach was a Partner/Advisory Partner at Clayton, Dubilier & Rice, LLC (private equity investment, 1998-2010), as well as a Director of Sony Corporation (2006-2007). |
Joseph Mauriello (1944) | |
Year of Election or Appointment: 2008 Trustee | |
| Mr. Mauriello also serves as Trustee of other Fidelity funds. Prior to his retirement in January 2006, Mr. Mauriello served in numerous senior management positions including Deputy Chairman and Chief Operating Officer (2004-2005), and Vice Chairman of Financial Services (2002-2004) of KPMG LLP US (professional services, 1965-2005). Mr. Mauriello currently serves as a member of the Board of Directors of XL Group plc. (global insurance and re-insurance, 2006-present). Previously, Mr. Mauriello served as a Director of the Hamilton Funds of the Bank of New York (2006-2007) and of Arcadia Resources Inc. (health care services and products, 2007-2012). |
Robert W. Selander (1950) | |
Year of Election or Appointment: 2011 Trustee | |
| Mr. Selander also serves as Trustee of other Fidelity funds. Previously, Mr. Selander served as a Member of the Advisory Board of other Fidelity funds (2011), and Executive Vice Chairman (2010), Chief Executive Officer (2009-2010), and President and Chief Executive Officer (1997-2009) of Mastercard, Inc. |
Cornelia M. Small (1944) | |
Year of Election or Appointment: 2005 Trustee | |
| Ms. Small also serves as Trustee of other Fidelity funds. Ms. Small is a member of the Board of Directors (2009-present) and Chair of the Investment Committee (2010-present) of the Teagle Foundation. Ms. Small also serves on the Investment Committee of the Berkshire Taconic Community Foundation (2008-present). Previously, Ms. Small served as Chairperson (2002-2008) and a member of the Investment Committee and Chairperson (2008-2012) and a member of the Board of Trustees of Smith College. In addition, Ms. Small served as Chief Investment Officer, Director of Global Equity Investments, and a member of the Board of Directors of Scudder, Stevens & Clark and Scudder Kemper Investments. |
William S. Stavropoulos (1939) | |
Year of Election or Appointment: 2002 Trustee Vice Chairman of the Independent Trustees | |
| Mr. Stavropoulos also serves as Trustee of other Fidelity funds. Mr. Stavropoulos serves as President and Founder of the Michigan Baseball Foundation, the Great Lakes Loons (2007-present). Mr. Stavropoulos is Chairman Emeritus of the Board of Directors of The Dow Chemical Company, where he previously served in numerous senior management positions, including President, CEO (1995-2000; 2002-2004), Chairman of the Executive Committee (2000-2006), and as a member of the Board of Directors (1990-2006). Currently, Mr. Stavropoulos is Chairman of the Board of Directors of Univar Inc. (global distributor of commodity and specialty chemicals), a Director of Teradata Corporation (data warehousing and technology solutions), and Maersk Inc. (industrial conglomerate), and a member of the Advisory Board for Metalmark Capital LLC (private equity investment, 2005-present). Mr. Stavropoulos is an operating advisor to Clayton, Dubilier & Rice, LLC (private equity investment). In addition, Mr. Stavropoulos is a member of the University of Notre Dame Advisory Council for the College of Science, a Trustee of the Rollin L. Gerstacker Foundation, and a Director of the Naples Philharmonic Center for the Arts. Previously, Mr. Stavropoulos served as a Director of Chemical Financial Corporation (bank holding company, 1993-2012) and Tyco International, Ltd. (multinational manufacturing and services, 2007-2012). |
David M. Thomas (1949) | |
Year of Election or Appointment: 2008 Trustee | |
| Mr. Thomas also serves as Trustee of other Fidelity funds. Mr. Thomas serves as Non-Executive Chairman of the Board of Directors of Fortune Brands Home and Security (home and security products, 2011-present), and as a member of the Board of Directors of Interpublic Group of Companies, Inc. (marketing communication, 2004-present). Previously, Mr. Thomas served as Executive Chairman (2005-2006) and Chairman and Chief Executive Officer (2000-2005) of IMS Health, Inc. (pharmaceutical and healthcare information solutions), and a Director of Fortune Brands, Inc. (consumer products, 2000-2011). |
+ The information above includes each Trustee's principal occupation during the last five years and other information relating to the experience, attributes, and skills relevant to each Trustee's qualifications to serve as a Trustee, which led to the conclusion that each Trustee should serve as a Trustee for the fund.
Advisory Board Member and Officers:
Correspondence intended for each officer and Peter S. Lynch may be sent to Fidelity Investments, 245 Summer Street, Boston, Massachusetts 02210. Officers appear below in alphabetical order.
Name, Year of Birth; Principal Occupation | |
Peter S. Lynch (1944) | |
Year of Election or Appointment: 2003 Member of the Advisory Board | |
| Mr. Lynch also serves as Member of the Advisory Board of other Fidelity funds. Mr. Lynch is Vice Chairman and a Director of FMR and FMR Co., Inc. In addition, Mr. Lynch serves as a Trustee of Boston College and as the Chairman of the Inner-City Scholarship Fund. Previously, Mr. Lynch served on the Special Olympics International Board of Directors (1997-2006). |
Elizabeth Paige Baumann (1968) | |
Year of Election or Appointment: 2012 Anti-Money Laundering (AML) Officer | |
| Ms. Baumann also serves as AML Officer of other funds. She is Chief AML Officer of FMR LLC (2012-present) and is an employee of Fidelity Investments. Previously, Ms. Baumann served as Vice President and Deputy Anti-Money Laundering Officer (2007-2012). |
William C. Coffey (1969) | |
Year of Election or Appointment: 2009 Assistant Secretary | |
| Mr. Coffey also serves as Assistant Secretary of other funds. He is Senior Vice President and Deputy General Counsel of FMR LLC (2010-present), and is an employee of Fidelity Investments. Previously, Mr. Coffey served as Vice President and Associate General Counsel of FMR LLC (2005-2009). |
Jonathan Davis (1968) | |
Year of Election or Appointment: 2010 Assistant Treasurer | |
| Mr. Davis also serves as Assistant Treasurer of other funds. Mr. Davis is an employee of Fidelity Investments. Previously, Mr. Davis served as Vice President and Associate General Counsel of FMR LLC (2003-2010). |
Adrien E. Deberghes (1967) | |
Year of Election or Appointment: 2008 Deputy Treasurer | |
| Mr. Deberghes also serves as an officer of other funds. He is an employee of Fidelity Investments (2008-present). Prior to joining Fidelity Investments, Mr. Deberghes was Senior Vice President of Mutual Fund Administration at State Street Corporation (2007-2008), Senior Director of Mutual Fund Administration at Investors Bank & Trust (2005-2007), and Director of Finance for Dunkin' Brands (2000-2005). |
Stephanie J. Dorsey (1969) | |
Year of Election or Appointment: 2010 Assistant Treasurer | |
| Ms. Dorsey also serves as an officer of other funds. She is an employee of Fidelity Investments (2008-present) and has served in other fund officer roles. Prior to joining Fidelity Investments, Ms. Dorsey served as Treasurer (2004-2008) of the JPMorgan Mutual Funds and Vice President (2004-2008) of JPMorgan Chase Bank. |
Howard J. Galligan III (1966) | |
Year of Election or Appointment: 2014 Chief Financial Officer | |
| Mr. Galligan also serves as Chief Financial Officer of other funds. Mr. Galligan serves as President of Fidelity Pricing and Cash Management Services (FPCMS) (2014-present) and as a Director of Strategic Advisers, Inc. (2008-present). Previously, Mr. Galligan served as Chief Administrative Officer of Asset Management (2011-2014) and Chief Operating Officer and Senior Vice President of Investment Support for Strategic Advisers, Inc. (2003-2011). |
Scott C. Goebel (1968) | |
Year of Election or Appointment: 2008 Secretary and Chief Legal Officer (CLO) | |
| Mr. Goebel serves as Secretary and CLO of other funds. Mr. Goebel also serves as Secretary of Fidelity SelectCo, LLC (2013-present), Fidelity Investments Money Management, Inc. (FIMM) (2010-present) and Fidelity Research and Analysis Company (FRAC) (2010-present); General Counsel, Secretary, and Senior Vice President of FMR (2008-present) and FMR Co., Inc. (2008-present); Chief Legal Officer of Fidelity Management & Research (Hong Kong) Limited (2008-present); and Assistant Secretary of Fidelity Management & Research (Japan) Limited (2008-present) and Fidelity Management & Research (U.K.) Inc. (2008-present). Previously, Mr. Goebel served as Secretary and CLO of other Fidelity funds (2008-2013), Assistant Secretary of FIMM (2008-2010), FRAC (2008-2010), and certain funds (2007-2008); and as Vice President and Secretary of Fidelity Distributors Corporation (FDC) (2005-2007). Mr. Goebel has been employed by FMR LLC or an affiliate since 2001. |
Thomas C. Hense (1964) | |
Year of Election or Appointment: 2008/2010 Vice President | |
| Mr. Hense also serves as Vice President of other funds (High Income (2008), Small Cap (2008), and Value (2010) funds). Previously, Mr. Hense served as a portfolio manager for Fidelity's Institutional Money Management Group (Pyramis) (2003-2008). |
Brian B. Hogan (1964) | |
Year of Election or Appointment: 2009 Vice President | |
| Mr. Hogan also serves as Trustee or Vice President of other funds. Mr. Hogan serves as a Director of Fidelity SelectCo, LLC (2014-present) and President of FMR's Equity Division (2009-present). Previously, Mr. Hogan served as Senior Vice President, Equity Research of FMR (2006-2009) and as a portfolio manager. |
Chris Maher (1972) | |
Year of Election or Appointment: 2013 Assistant Treasurer | |
| Mr. Maher serves as Assistant Treasurer of other funds. Mr. Maher is Vice President of Valuation Oversight and is an employee of Fidelity Investments. Previously, Mr. Maher served as Vice President of Asset Management Compliance (2013), Vice President of FMR's Program Management Group (2010-2013), and Vice President of Valuation Oversight (2008-2010). |
Kenneth B. Robins (1969) | |
Year of Election or Appointment: 2008 President and Treasurer | |
| Mr. Robins also serves as an officer of other funds. Mr. Robins serves as Executive Vice President of Fidelity Investments Money Management, Inc. (FIMM) (2013-present) and is an employee of Fidelity Investments (2004-present). Previously, Mr. Robins served in other fund officer roles. |
Stephen Sadoski (1971) | |
Year of Election or Appointment: 2012 Deputy Treasurer | |
| Mr. Sadoski also serves as Deputy Treasurer of other funds. He is an employee of Fidelity Investments (2012-present) and has served in another fund officer role. Prior to joining Fidelity Investments, Mr. Sadoski served as an assistant chief accountant in the Division of Investment Management of the Securities and Exchange Commission (SEC) (2009-2012) and as a senior manager at Deloitte & Touche LLP (1997-2009). |
Stacie M. Smith (1974) | |
Year of Election or Appointment: 2013 Deputy Treasurer | |
| Ms. Smith also serves as an officer of other funds. She is an employee of Fidelity Investments (2009-present) and has served in other fund officer roles. Prior to joining Fidelity Investments, Ms. Smith served as Senior Audit Manager of Ernst & Young LLP (1996-2009). |
Renee Stagnone (1975) | |
Year of Election or Appointment: 2013 Deputy Treasurer | |
| Ms. Stagnone also serves as Deputy Treasurer of other funds. Ms. Stagnone is an employee of Fidelity Investments. |
Linda J. Wondrack (1964) | |
Year of Election or Appointment: 2014 Chief Compliance Officer | |
| Ms. Wondrack also serves as Chief Compliance Officer of other funds. Ms. Wondrack is Executive Vice President and head of the Ethics Office and Asset Management Compliance for Fidelity Investments (2012-present). Ms. Wondrack also serves as Chief Compliance Officer of Fidelity SelectCo, LLC (2014-present); Chief Compliance Officer of Impresa Management LLC (2013-present); and Chief Compliance Officer of FMR Co., Inc., Fidelity Investments Money Management, Inc., Fidelity Management & Research (Japan) Limited, Fidelity Management & Research (U.K.) Inc., Fidelity Management & Research (Hong Kong), Fidelity Management & Research Company, Pyramis Global Advisors, LLC, and Strategic Advisers, Inc., Ballyrock Investment Advisors LLC, and Northern Neck Investors LLC (2012-present). Previously, Ms. Wondrack served as Senior Vice President and Chief Compliance Officer for Columbia Management Investment Advisers, LLC (2005-2012); Chief Compliance Officer for certain funds within the Columbia Family of Funds (2007-2012); and Senior Vice President of Compliance Risk Management at Bank of America (2005-2010). |
Joseph F. Zambello (1957) | |
Year of Election or Appointment: 2011 Deputy Treasurer | |
| Mr. Zambello also serves as Deputy Treasurer of other funds. Mr. Zambello is an employee of Fidelity Investments. Previously, Mr. Zambello served as Vice President of FMR's Program Management Group (2009-2011) and Vice President of the Transfer Agent Oversight Group (2005-2009). |
Annual Report
Distributions (Unaudited)
The Board of Trustees of Advisor High Income Advantage Fund voted to pay to shareholders of record at the opening of business on record date, the following distributions per share derived from capital gains realized from sales of portfolio securities:
| Pay Date | Record Date | Capital Gains |
Institutional Class | 12/08/14 | 12/05/14 | $0.01 |
A total of 0.02% of the dividends distributed during the fiscal year was derived from interest on U.S. Government securities which is generally exempt from state income tax.
The fund designates $55,205,860.93 of distributions paid during the period January 1, 2014 to October 31, 2014 as qualifying to be taxed as interest-related dividends for nonresident alien shareholders.
Institutional Class designates 35% of the dividend paid 12/09/2013 as qualifying for the dividends-received deduction for corporate shareholders.
Institutional Class designates 39% of the dividend paid 12/09/2013 as amounts which may be taken into account as a dividend for purposes of the maximum rate under section 1(h)(11) of the Internal Revenue Code.
The fund will notify shareholders in January 2015 of amounts for use in preparing 2014 income tax returns.
Annual Report
Board Approval of Investment Advisory Contracts and Management Fees
Fidelity Advisor High Income Advantage Fund
Each year, the Board of Trustees, including the Independent Trustees (together, the Board), votes on the renewal of the management contract with Fidelity Management & Research Company (FMR) and the sub-advisory agreements (together, the Advisory Contracts) for the fund. The Board, assisted by the advice of fund counsel and Independent Trustees' counsel, requests and considers a broad range of information relevant to the renewal of the Advisory Contracts throughout the year.
The Board meets regularly and, at each of its meetings, covers an extensive agenda of topics and materials and considers factors that are relevant to its annual consideration of the renewal of the fund's Advisory Contracts, including the services and support provided to the fund and its shareholders. The Board has established various standing committees (Committees), each composed of and chaired by Independent Trustees with varying backgrounds, to which the Board has assigned specific subject matter responsibilities in order to enhance effective decision-making by the Board. The Board, acting directly and through its Committees, requests and receives information concerning the annual consideration of the renewal of the fund's Advisory Contracts. The Board also meets as needed to consider matters specifically related to the Board's annual consideration of the renewal of the Advisory Contracts. Members of the Board may also meet with trustees of other Fidelity funds through ad hoc joint committees to discuss certain matters relevant to the Fidelity funds.
At its July 2014 meeting, the Board, including the Independent Trustees, unanimously determined to renew the fund's Advisory Contracts. In reaching its determination, the Board considered all factors it believed relevant, including (i) the nature, extent, and quality of the services to be provided to the fund and its shareholders (including the investment performance of the fund); (ii) the competitiveness of the fund's management fee and total expense ratio relative to peer funds; (iii) the total costs of the services to be provided by and the profits to be realized by Fidelity from its relationship with the fund; (iv) the extent to which economies of scale exist and would be realized as the fund grows; and (v) whether fee levels reflect these economies of scale, if any, for the benefit of fund shareholders. In connection with separate internal corporate reorganizations involving Fidelity Management & Research (U.K.) Inc. (FMR U.K.) and Fidelity Management & Research (Japan) Inc. (FMR Japan), the Board approved certain non-material amendments to the fund's sub-advisory agreements with FMR U.K. and FMR Japan to reflect that, after these reorganizations, FMR Investment Management (UK) Limited and Fidelity Management & Research (Japan) Limited will carry on the business of FMR U.K. and FMR Japan, respectively. The Board noted that no changes to the portfolio managers or to the foreign research or investment advisory services provided to the fund were expected in connection with either reorganization and that the same personnel and resources would continue to be available to the fund at the new entities.
Annual Report
In considering whether to renew the Advisory Contracts for the fund, the Board reached a determination, with the assistance of fund counsel and Independent Trustees' counsel and through the exercise of its business judgment, that the renewal of the Advisory Contracts was in the best interests of the fund and its shareholders and that the compensation payable under the Advisory Contracts was fair and reasonable. The Board's decision to renew the Advisory Contracts was not based on any single factor, but rather was based on a comprehensive consideration of all the information provided to the Board at its meetings throughout the year. The Board, in reaching its determination to renew the Advisory Contracts, was aware that shareholders of the fund have a broad range of investment choices available to them, including a wide choice among funds offered by Fidelity's competitors, and that the fund's shareholders, who have the opportunity to review and weigh the disclosure provided by the fund in its prospectus and other public disclosures, have chosen to invest in this fund, which is part of the Fidelity family of funds.
Nature, Extent, and Quality of Services Provided. The Board considered Fidelity's staffing as it relates to the fund, including the backgrounds of investment personnel of FMR and the sub-advisers (together, the Investment Advisers), and also considered the fund's investment objective, strategies, and related investment philosophy. The Independent Trustees also had discussions with senior management of Fidelity's investment operations and investment groups. The Board considered the structure of the portfolio manager compensation program and whether this structure provides appropriate incentives to act in the best interests of the fund. Additionally, the Board considered the portfolio managers' investments, if any, in the funds that they manage.
Resources Dedicated to Investment Management and Support Services. The Board and the Fund Oversight and Research Committees reviewed the general qualifications and capabilities of Fidelity's investment staff, including its size, education, experience, and resources, as well as Fidelity's approach to recruiting, training, managing, and compensating investment personnel. The Board noted that Fidelity has continued to increase the resources devoted to non-U.S. offices, including expansion of Fidelity's global investment organization. The Board also noted that Fidelity's analysts have extensive resources, tools and capabilities that allow them to conduct sophisticated quantitative and fundamental analysis, as well as credit analysis of issuers, counterparties and guarantors. Further, the Board believes that Fidelity's investment professionals have sufficient access to global information and data so as to provide competitive investment results over time, and that those professionals also have access to sophisticated tools that permit them to assess portfolio construction and risk and performance attribution characteristics continuously, as well as to transmit new information and research conclusions rapidly around the world. Additionally, in its deliberations, the Board considered Fidelity's trading and risk management capabilities and resources and global compliance infrastructure, which are an integral part of the investment management process.
Annual Report
Board Approval of Investment Advisory Contracts and
Management Fees - continued
Shareholder and Administrative Services. The Board considered (i) the nature, extent, quality, and cost of advisory, administrative, and shareholder services performed by the Investment Advisers and their affiliates under the Advisory Contracts and under separate agreements covering transfer agency, pricing and bookkeeping, and securities lending services for the fund; (ii) the nature and extent of the supervision of third party service providers, principally custodians and subcustodians; and (iii) the resources devoted to, and the record of compliance with, the fund's compliance policies and procedures. The Board also reviewed the allocation of fund brokerage, including allocations to brokers affiliated with the Investment Advisers, the use of brokerage commissions to pay fund expenses, and the use of "soft" commission dollars to pay for research services.
The Board noted that the growth of fund assets over time across the complex allows Fidelity to reinvest in the development of services designed to enhance the value or convenience of the Fidelity funds as investment vehicles. These services include 24-hour access to account information and market information through telephone representatives and over the Internet, investor education materials and asset allocation tools, and the expanded availability of Fidelity Investor Centers.
In 2014, the Board formed an ad hoc Committee on Transfer Agency Fees to review the variety of transfer agency fee structures throughout the industry and Fidelity's competitive positioning with respect to industry participants.
Investment in a Large Fund Family. The Board considered the benefits to shareholders of investing in a Fidelity fund, including the benefits of investing in a fund that is part of a large family of funds offering a variety of investment disciplines and providing a large variety of mutual fund investor services. The Board noted that Fidelity had taken, or had made recommendations that resulted in the Fidelity funds taking, a number of actions over the previous year that benefited particular funds, including (i) continuing to dedicate additional resources to investment research and to the support of the senior management team that oversees asset management; (ii) persisting in efforts to enhance Fidelity's global research capabilities; (iii) launching new funds and making other enhancements to meet client needs for income-oriented solutions; (iv) reducing fund expenses for certain index funds; (v) continuing to launch dedicated lower cost underlying funds to meet portfolio construction needs related to expanding underlying fund options for Fidelity funds of funds, specifically for the Freedom Fund product lines; (vi) rationalizing product lines and gaining increased efficiencies through fund mergers; (vii) launching sector-based exchange-traded funds and establishing a new Fidelity adviser to manage sector-based funds and products; (viii) continuing to develop and implement technology to improve security and increase efficiency; (ix) modifying the eligibility criteria for certain share classes to increase their marketability to a portion of the defined contribution plan market; (x) waiving redemption fees for certain qualified fund-of-fund and wrap programs and certain retirement plan transactions; and (xi) launching new Institutional Class shares of certain money market funds to attract and retain assets and to fill a gap in the money market fund lineup.
Annual Report
Investment Performance. The Board considered whether the fund has operated in accordance with its investment objective, as well as its record of compliance with its investment restrictions and its performance history.
The Board took into account discussions with the Investment Advisers about fund investment performance that occur at Board meetings throughout the year. In this regard the Board noted that as part of regularly scheduled fund reviews and other reports to the Board on fund performance, the Board periodically considers annualized return information for the fund, for different time periods, measured against a securities market index ("benchmark index") and a peer group of funds with similar objectives ("peer group"). In its evaluation of fund investment performance, the Board gave particular attention to information indicating changes in performance of certain Fidelity funds for specific time periods and the Investment Advisers' explanations for any overperformance or underperformance.
In addition to reviewing absolute and relative fund performance, the Independent Trustees periodically consider the appropriateness of fund performance metrics in evaluating the results achieved. In general, the Independent Trustees believe that fund performance should be evaluated based on net performance (after fees and expenses) of both the highest performing and lowest performing classes, where applicable, compared to appropriate benchmark indices, over appropriate time periods which may include full market cycles, and compared to peer groups, as applicable, over the same periods, taking into account relevant factors including the following: general market conditions; issuer-specific information; tactical opportunities for investment; and fund cash flows and other factors.
The Independent Trustees recognize that shareholders evaluate performance on a net basis over their own holding periods, for which one-, three-, and five-year periods are often used as a proxy. For this reason, the performance information reviewed by the Board also included net cumulative calendar year total return information for the fund and an appropriate benchmark index and peer group for the most recent one-, three-, and five-year periods, as shown below. Returns are shown compared to the 25th percentile (top of box, 75% beaten) and 75th percentile (bottom of box, 25% beaten) of the peer universe.
Annual Report
Board Approval of Investment Advisory Contracts and
Management Fees - continued
Fidelity Advisor High Income Advantage Fund
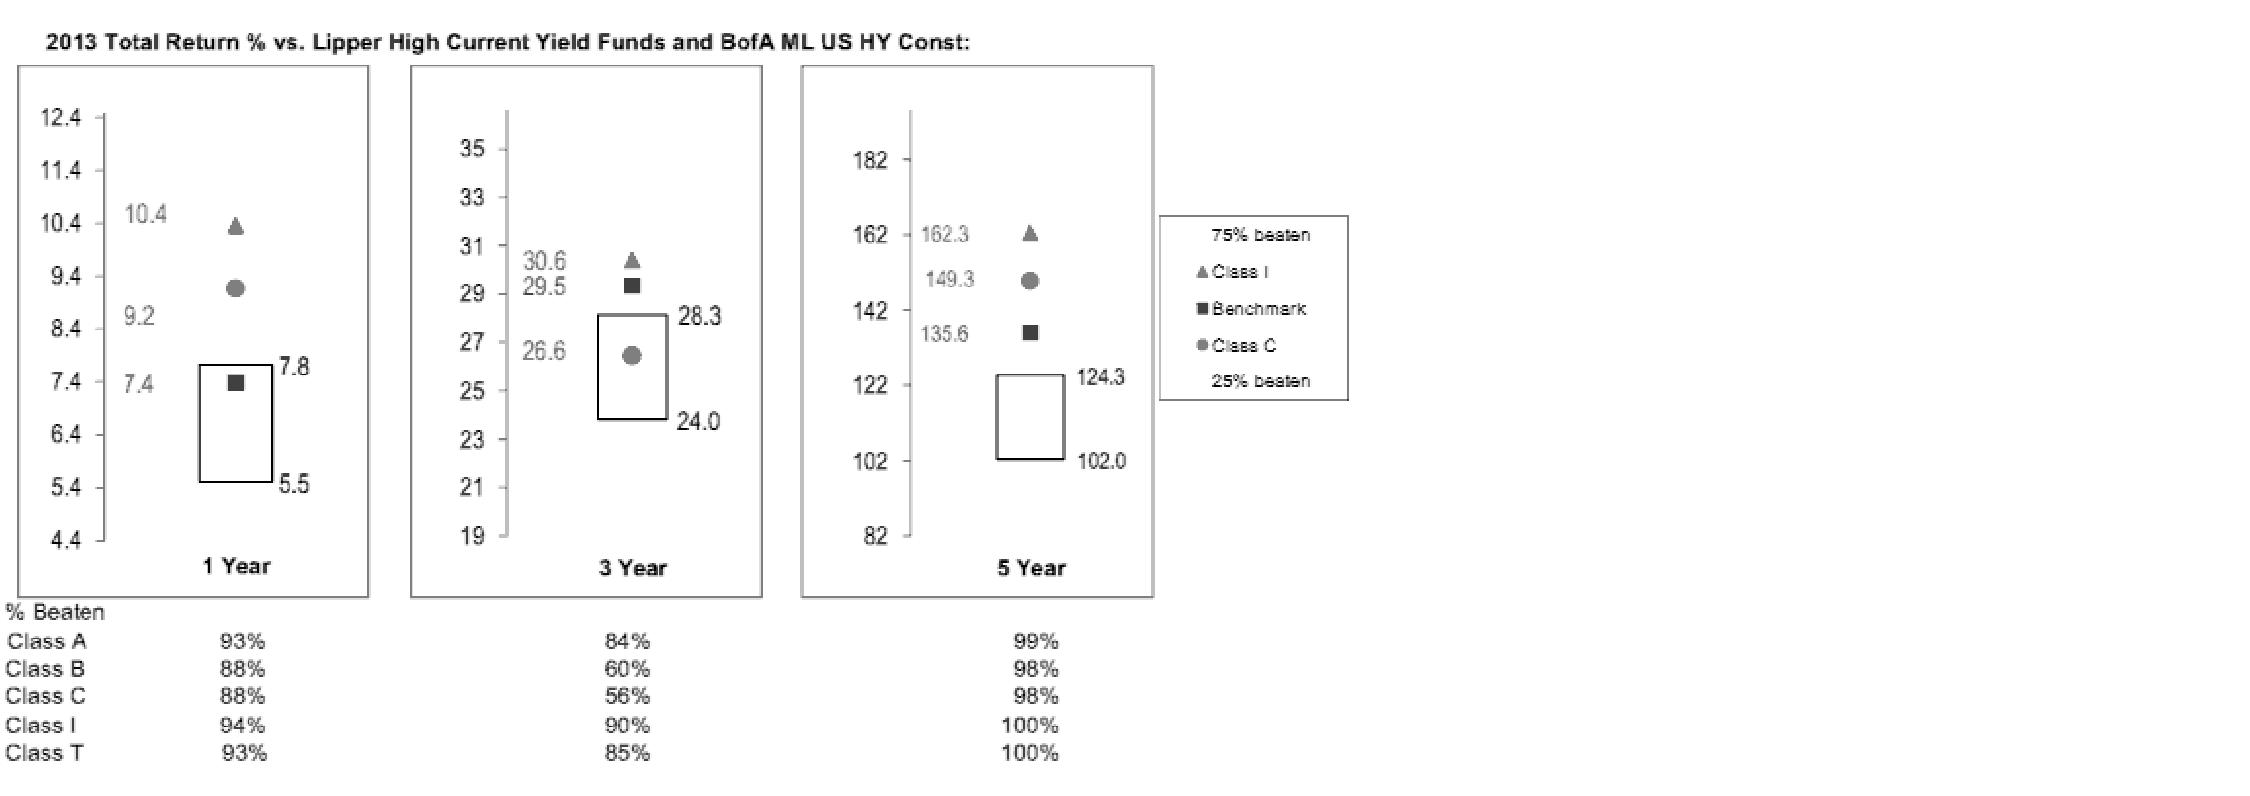
Based on its review, the Board concluded that the nature, extent, and quality of services provided to the fund under the Advisory Contracts should benefit the fund's shareholders.
Competitiveness of Management Fee and Total Expense Ratio. The Board considered the fund's management fee and total expense ratio compared to "mapped groups" of competitive funds and classes. Fidelity creates "mapped groups" by combining similar Lipper investment objective categories that have comparable investment mandates. Combining Lipper investment objective categories aids the Board's management fee and total expense ratio comparisons by broadening the competitive group used for comparison and by reducing the number of universes to which various Fidelity funds are compared.
Management Fee. The Board considered two proprietary management fee comparisons for the 12-month periods shown in the chart below. The group of Lipper funds used by the Board for management fee comparisons is referred to below as the "Total Mapped Group." The Total Mapped Group is broader than the Lipper peer group used by the Board for performance comparisons because the Total Mapped Group combines several Lipper investment objective categories while the Lipper peer group does not. The Total Mapped Group comparison focuses on a fund's standing in terms of gross management fees before expense reimbursements or caps relative to the total universe of funds with comparable investment mandates, regardless of whether their management fee structures also are comparable. Funds with comparable investment mandates offer exposure to similar types of securities. Funds with comparable management fee structures have similar management fee contractual arrangements (e.g., flat rate charged for advisory services, all-inclusive fee rate, etc.). "TMG %" represents the percentage of funds in the Total Mapped Group that had management fees that were lower than the fund's. For example, a hypothetical TMG % of 20% would mean that 80% of the funds in the Total Mapped Group had higher, and 20% had lower, management fees than the fund. The fund's actual TMG %s are in the chart below. The "Asset-Size Peer Group" (ASPG) comparison focuses on a fund's standing relative to a subset of non-Fidelity funds within the Total Mapped Group that are similar in size and management fee structure. For example, if a fund is in the first quartile of the ASPG, the fund's management fee ranks in the least expensive or lowest 25% of funds in the ASPG. The ASPG represents at least 15% of the funds in the Total Mapped Group with comparable asset size and management fee structures, subject to a minimum of 50 funds (or all funds in the Total Mapped Group if fewer than 50). Additional information, such as the ASPG quartile in which the fund's management fee rate ranked, is also included in the chart and considered by the Board.
Annual Report
Fidelity Advisor High Income Advantage Fund

The Board noted that the fund's management fee rate ranked below the median of its Total Mapped Group and below the median of its ASPG for 2013.
The Board also noted that, in August 2013, the ad hoc Committee on Management Fees was formed to conduct an in-depth review of the management fee rates of Fidelity's active equity mutual funds. The Committee focused on the following areas: (i) standard fee structures; (ii) research consumption and trading evolution; (iii) management fee competitiveness/profitability by category; and (iv) factors that drive institutional pricing.
Annual Report
Board Approval of Investment Advisory Contracts and
Management Fees - continued
Based on its review, the Board concluded that the fund's management fee is fair and reasonable in light of the services that the fund receives and the other factors considered.
Total Expense Ratio. In its review of each class's total expense ratio, the Board considered the fund's management fee as well as other fund or class expenses, as applicable, such as transfer agent fees, pricing and bookkeeping fees, fund-paid 12b-1 fees, and custodial, legal, and audit fees. The Board also noted the effects of any waivers and reimbursements on fees and expenses. As part of its review, the Board also considered the current and historical total expense ratios of each class of the fund compared to competitive fund median expenses. Each class of the fund is compared to those funds and classes in the Total Mapped Group (used by the Board for management fee comparisons) that have a similar sales load structure.
The Board noted that the total expense ratio of each of Class A, Class T, Class B, and Institutional Class ranked below its competitive median for 2013 and the total expense ratio of Class C ranked above its competitive median for 2013. The Board considered that, in general, various factors can affect total expense ratios. The Board noted that the fund offers multiple classes, each of which has a different sales load and 12b-1 fee structure, and that the multiple structures are intended to offer a range of pricing options for the intermediary market. The Board also noted that the total expense ratios of the classes vary primarily by the level of their 12b-1 fees, although differences in transfer agent fees may also cause expenses to vary from class to class.
Fees Charged to Other Fidelity Clients. The Board also considered Fidelity fee structures and other information with respect to clients of Fidelity, such as other funds advised or subadvised by Fidelity, pension plan clients, and other institutional clients. The Board noted the findings of the 2013 ad hoc joint committee (created with the board of other Fidelity funds), which reviewed and compared Fidelity's institutional investment advisory business with its business of providing services to the Fidelity funds, including the differences in services provided, fees charged, and costs incurred, as well as competition in their respective marketplaces.
Based on its review of total expense ratios and fees charged to other Fidelity clients, the Board concluded that the total expense ratio of each class of the fund was reasonable, although Class C was above the median of the universe presented for comparison, in light of the services that the fund and its shareholders receive and the other factors considered.
Costs of the Services and Profitability. The Board considered the revenues earned and the expenses incurred by Fidelity in conducting the business of developing, marketing, distributing, managing, administering and servicing the fund and servicing the fund's shareholders. The Board also considered the level of Fidelity's profits in respect of all the Fidelity funds.
Annual Report
On an annual basis, Fidelity presents to the Board Fidelity's profitability for the fund. Fidelity calculates the profitability for each fund, as well as aggregate profitability for groups of Fidelity funds and all Fidelity funds, using a series of detailed revenue and cost allocation methodologies which originate with the books and records of Fidelity on which Fidelity's audited financial statements are based. The Audit Committee of the Board reviews any significant changes from the prior year's methodologies.
PricewaterhouseCoopers LLP (PwC), independent registered public accounting firm and auditor to Fidelity and certain Fidelity funds, has been engaged annually by the Board as part of the Board's assessment of Fidelity's profitability analysis. PwC's engagement includes the review and assessment of the methodologies used by Fidelity in determining the revenues and expenses attributable to Fidelity's mutual fund business, and completion of agreed-upon procedures in respect of the mathematical accuracy of fund profitability and its conformity to established allocation methodologies. After considering PwC's reports issued under the engagement and information provided by Fidelity, the Board concluded that while other allocation methods may also be reasonable, Fidelity's profitability methodologies are reasonable in all material respects.
The Board also reviewed Fidelity's non-fund businesses and fall-out benefits related to the mutual fund business as well as cases where Fidelity's affiliates may benefit from or be related to the fund's business.
The Board considered the costs of the services provided by and the profits realized by Fidelity in connection with the operation of the fund and was satisfied that the profitability was not excessive in the circumstances.
Economies of Scale. The Board considered whether there have been economies of scale in respect of the management of the Fidelity funds, whether the Fidelity funds (including the fund) have appropriately benefited from any such economies of scale, and whether there is potential for realization of any further economies of scale. The Board considered the extent to which the fund will benefit from economies of scale through increased services to the fund, through waivers or reimbursements, or through fee or expense ratio reductions. The Board also noted that in 2013, it and the boards of other Fidelity funds created an ad hoc committee (the Economies of Scale Committee) to analyze whether Fidelity attains economies of scale in respect of the management and servicing of the Fidelity funds, whether the Fidelity funds have appropriately benefited from such economies of scale, and whether there is potential for realization of any further economies of scale.
The Board recognized that the fund's management contract incorporates a "group fee" structure, which provides for lower group fee rates as total group assets increase, and for higher group fee rates as total group assets decrease (with "group assets" defined to include fund assets under FMR's management plus sector fund assets previously under FMR's management and currently managed by Fidelity SelectCo, LLC). FMR calculates the group fee rates based on a tiered asset "breakpoint" schedule that varies based on asset class. The Board considered that the group fee is designed to deliver the benefits of economies of scale to fund shareholders when total Fidelity fund assets increase, even if assets of any particular fund are unchanged or have declined, because some portion of Fidelity's costs are attributable to services provided to all Fidelity funds, and all funds benefit if those costs can be allocated among more assets. The Board concluded that, given the group fee structure, fund shareholders will benefit from lower management fees as group assets increase at the fund complex level, regardless of whether Fidelity achieves any such economies of scale.
Annual Report
Board Approval of Investment Advisory Contracts and
Management Fees - continued
The Board concluded, taking into account the analysis of the Economies of Scale Committee, that economies of scale, if any, are being appropriately shared between fund shareholders and Fidelity.
Additional Information Requested by the Board. In order to develop fully the factual basis for consideration of the Fidelity funds' Advisory Contracts, the Board requested and received additional information on certain topics, including: (i) fund performance trends and Fidelity's long-term strategies for certain funds; (ii) Fidelity's strategic marketing and product lineup goals; (iii) the methodology with respect to competitive fund data and peer group classifications; (iv) the arrangements with, and performance of, certain sub-advisers on behalf of the Fidelity funds, as well as certain proposed participating affiliate arrangements; (v) the realization of fall-out benefits in certain Fidelity business units; (vi) Fidelity's group fee structures, including the rationale for the individual fee rates of certain categories of funds and the definition of group assets; (vii) trends regarding industry use of performance fee structures and the performance adjustment methodologies applicable to the Fidelity funds; (viii) additional competitive analysis regarding the total expenses for certain classes; (ix) fund profitability methodology, including Fidelity's cost allocation methodology, and the impact of certain factors on fund profitability results; and (x) the process by which Fidelity determines sub-advisory fees for funds it advises.
Based on its evaluation of all of the conclusions noted above, and after considering all factors it believed relevant, the Board ultimately concluded that the advisory fee structures are fair and reasonable, and that the fund's Advisory Contracts should be renewed.
Annual Report
Investment Adviser
Fidelity Management & Research Company Boston, MA
Investment Sub-Advisers
FMR Co., Inc.
Fidelity Management & Research
(U.K.) Inc.
Fidelity Management & Research
(Japan) Limited
Fidelity Management & Research
(Hong Kong) Limited
General Distributor
Fidelity Distributors Corporation
Smithfield, RI
Transfer and Service Agents
Fidelity Investments Institutional Operations Company, Inc.
Boston, MA
Fidelity Service Company, Inc.
Boston, MA
Custodian
The Bank of New York Mellon
New York, NY
(Fidelity Investment logo)(registered trademark)
HYI-UANN-1214
1.784751.111
(Fidelity Investment logo)(registered trademark)
Fidelity Advisor®
Floating Rate High Income
Fund - Class A, Class T, Class B
and Class C
Annual Report
October 31, 2014
(Fidelity Cover Art)
Contents
Performance | How the fund has done over time. | |
Management's Discussion of Fund Performance | The Portfolio Manager's review of fund performance and strategy. | |
Shareholder Expense Example | An example of shareholder expenses. | |
Investment Changes | A summary of major shifts in the fund's investments over the past six months. | |
Investments | A complete list of the fund's investments with their market values. | |
Financial Statements | Statements of assets and liabilities, operations, and changes in net assets, as well as financial highlights. | |
Notes | Notes to financial statements. | |
Report of Independent Registered Public Accounting Firm |
| |
Trustees and Officers |
| |
Distributions |
| |
Board Approval of Investment Advisory Contracts and Management Fees |
|
To view a fund's proxy voting guidelines and proxy voting record for the 12-month period ended June 30, visit http://www.fidelity.com/proxyvotingresults or visit the Securities and Exchange Commission's (SEC) web site at http://www.sec.gov. You may also call 1-877-208-0098 to request a free copy of the proxy voting guidelines.
Standard & Poor's, S&P and S&P 500 are registered service marks of The McGraw-Hill Companies, Inc. and have been licensed for use by Fidelity Distributors Corporation.
Other third-party marks appearing herein are the property of their respective owners.
All other marks appearing herein are registered or unregistered trademarks or service marks of FMR LLC or an affiliated company. © 2014 FMR LLC. All rights reserved.
Annual Report
This report and the financial statements contained herein are submitted for the general information of the shareholders of the fund. This report is not authorized for distribution to prospective investors in the fund unless preceded or accompanied by an effective prospectus.
A fund files its complete schedule of portfolio holdings with the SEC for the first and third quarters of each fiscal year on Form N-Q. Forms N-Q are available on the SEC's web site at http://www.sec.gov. A fund's Forms N-Q may be reviewed and copied at the SEC's Public Reference Room in Washington, DC. Information regarding the operation of the SEC's Public Reference Room may be obtained by calling 1-800-SEC-0330. For a complete list of a fund's portfolio holdings, view the most recent holdings listing, semiannual report, or annual report on Fidelity's web site at http://www.fidelity.com, http://www.advisor.fidelity.com, or http://www.401k.com, as applicable.
NOT FDIC INSURED • MAY LOSE VALUE • NO BANK GUARANTEE
Neither the fund nor Fidelity Distributors Corporation is a bank.
Annual Report
Performance: The Bottom Line
Average annual total return reflects the change in the value of an investment, assuming reinvestment of the class' distributions from dividend income and capital gains (the profits earned upon the sale of securities that have grown in value, if any) and assuming a constant rate of performance each year. The $10,000 table and the fund's returns do not reflect the deduction of taxes that a shareholder would pay on fund distributions or the redemption of fund shares. During periods of reimbursement by Fidelity, a fund's total return will be greater than it would be had the reimbursement not occurred. How a fund did yesterday is no guarantee of how it will do tomorrow. Returns reflect the conversion of Class B shares to Class A shares after a maximum of seven years.
Average Annual Total Returns
Periods ended October 31, 2014 | Past 1 | Past 5 | Past 10 |
Class A (incl. 2.75% sales charge) | -0.76% | 3.98% | 3.76% |
Class T (incl. 2.75% sales charge) | -0.84% | 3.92% | 3.72% |
Class B (incl. contingent deferred sales charge) A | -2.03% | 3.74% | 3.66% |
Class C (incl. contingent deferred sales charge) B | 0.30% | 3.79% | 3.30% |
A Class B shares' contingent deferred sales charges included in the past one year, past five years, and past ten years total return figures are 3.5%, 1.5%, and 0%, respectively.
B Class C shares' contingent deferred sales charges included in the past one year, past five years, and past ten years total return figures are 1%, 0%, and 0%, respectively.
Annual Report
$10,000 Over 10 Years
Let's say hypothetically that $10,000 was invested in Fidelity Advisor® Floating Rate High Income Fund - Class A on October 31, 2004, and the current 2.75% sales charge was paid. The chart shows how the value of your investment would have changed, and also shows how the S&P®/LSTA Leveraged Performing Loan Index performed over the same period.
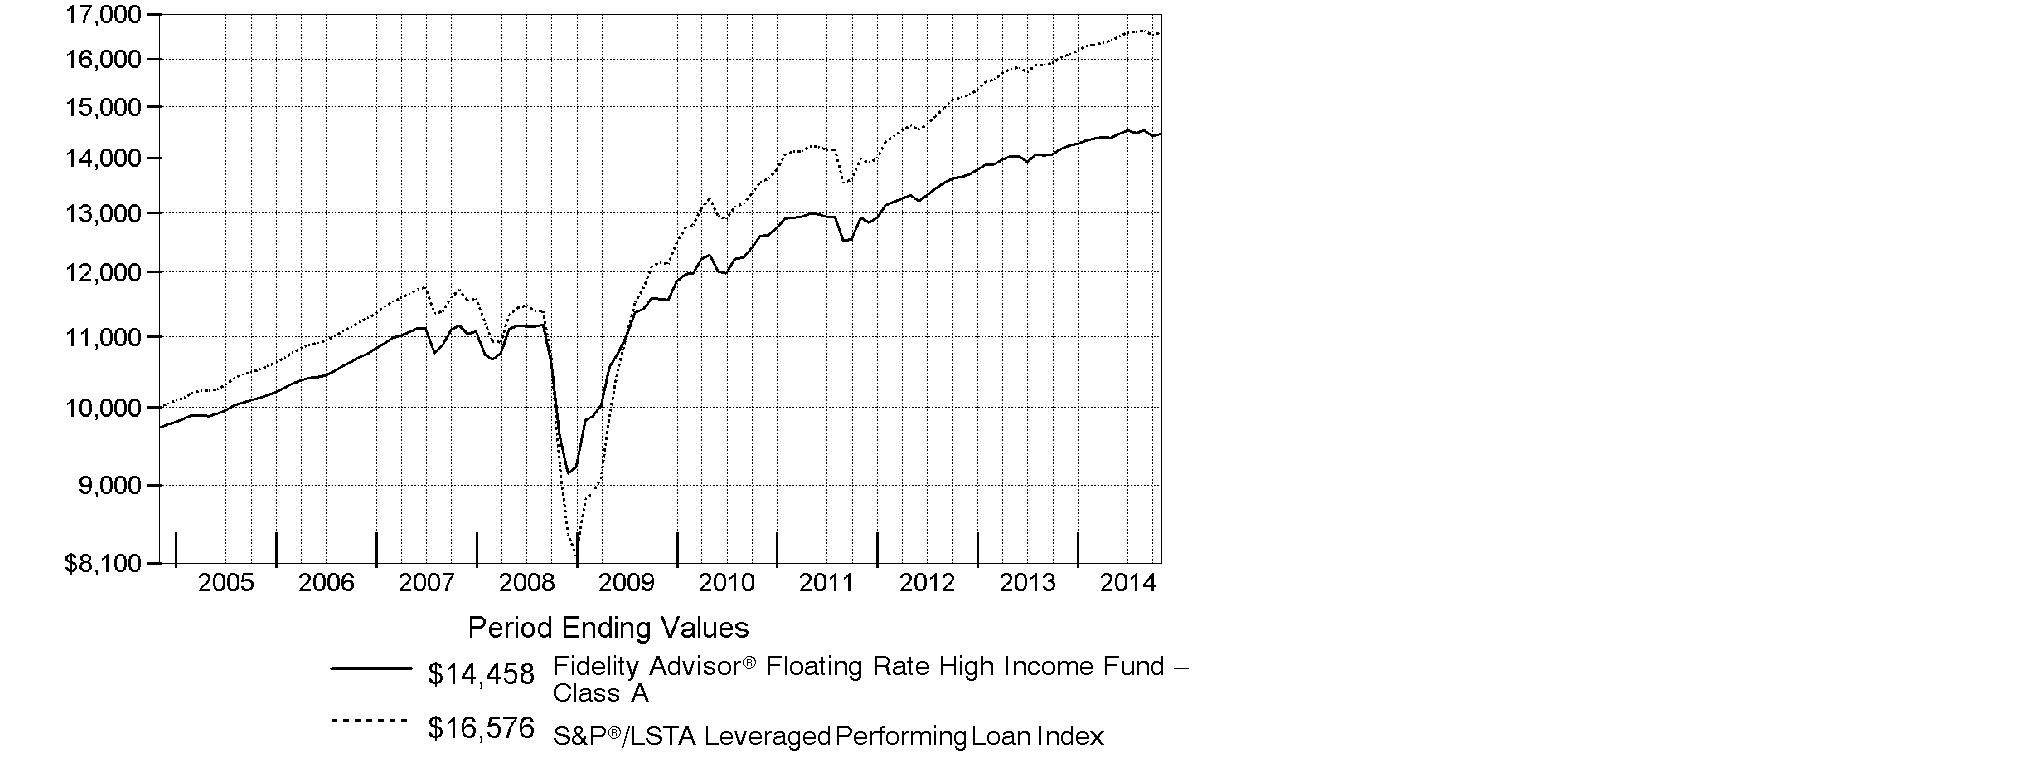
Annual Report
Management's Discussion of Fund Performance
Market Recap: Floating-rate bank loans generated a positive return for the 12 months ending October 31, 2014, but performance weakened in the period's latter months amid outflows from retail mutual funds. For the year, the S&P®/LSTA Leveraged Performing Loan Index rose 3.43%, modestly underperforming the broad investment-grade fixed-income market, as measured by the 4.14% return of the Barclays® U.S. Aggregate Bond Index, but trailing the 5.85% gain of The BofA Merrill LynchSM US High Yield Constrained Index by a greater margin. Within the S&P/LSTA index, B-rated and CCC-rated loans were the best performers, partly fueled by demand from collateralized loan obligations (CLOs) - structured investment vehicles in which business loans are pooled to create a diversified income stream. CLOs prefer to buy B-rated loans because their higher yields enable CLOs to more easily meet their funding costs and overall return objectives. CCC-rated loans benefited from increased investor demand for second-lien loans, which offer higher yields than first-lien loans, given their subordinated position. Meanwhile, loans issued by the largest issuers within the index, many of which are rated BB, tended to underperform due to their comparatively lower yields. From an industry perspective, the best-performing groups were utilities and publishing, whereas food service, nonferrous metals/mining and air transport were among the weakest performers.
Comments from Eric Mollenhauer, Portfolio Manager of Fidelity Advisor® Floating Rate High Income Fund: For the year, the fund's Class A, Class T, Class B and Class C shares rose 2.05%, 1.96%, 1.42% and 1.29%, respectively, (excluding sales charges), trailing the S&P®/LSTA Leveraged Performing Loan Index. Relative to the index, our more-conservative positioning kept the fund underweighted in the better-performing B-rated and CCC-rated areas of the market. Additionally, our positions in loans from some of the largest issuers - which we tend to hold given the fund's large asset base - hampered performance versus the benchmark, as did our 5% average cash stake. In terms of individual holdings, an underweighting in distressed Texas electric utility TXU Energy - the retail subsidiary of Energy Future Holdings - was the biggest relative detractor. Walter Energy, which produces and exports coal used in steel production, slightly detracted. On the plus side, steering clear of index components Education Management Group, a provider of higher-education programs for working adults, and Weight Watchers International, which offers weight-loss services, proved advantageous. Not holding children's clothing retailer and index member Gymboree also was slightly additive to performance.
The views expressed above reflect those of the portfolio manager(s) only through the end of the period as stated on the cover of this report and do not necessarily represent the views of Fidelity or any other person in the Fidelity organization. Any such views are subject to change at any time based upon market or other conditions and Fidelity disclaims any responsibility to update such views. These views may not be relied on as investment advice and, because investment decisions for a Fidelity fund are based on numerous factors, may not be relied on as an indication of trading intent on behalf of any Fidelity fund.
Annual Report
Shareholder Expense Example
As a shareholder of the Fund, you incur two types of costs: (1) transaction costs, including sales charges (loads) on purchase payments or redemption proceeds, redemption fees and (2) ongoing costs, including management fees, distribution and/or service (12b-1) fees and other Fund expenses. This Example is intended to help you understand your ongoing costs (in dollars) of investing in the Fund and to compare these costs with the ongoing costs of investing in other mutual funds.
The Example is based on an investment of $1,000 invested at the beginning of the period and held for the entire period (May 1, 2014 to October 31, 2014).
Actual Expenses
The first line of the accompanying table for each class of the Fund provides information about actual account values and actual expenses. You may use the information in this line, together with the amount you invested, to estimate the expenses that you paid over the period. Simply divide your account value by $1,000.00 (for example, an $8,600 account value divided by $1,000.00 = 8.6), then multiply the result by the number in the first line for a class of the Fund under the heading entitled "Expenses Paid During Period" to estimate the expenses you paid on your account during this period. A small balance maintenance fee of $12.00 that is charged once a year may apply for certain accounts with a value of less than $2,000. This fee is not included in the table below. If it was, the estimate of expenses you paid during the period would be higher, and your ending account value lower, by this amount. In addition, the Fund, as a shareholder in the underlying Fidelity Central Funds, will indirectly bear its pro-rata share of the fees and expenses incurred by the underlying Fidelity Central Funds. These fees and expenses are not included in the Fund's annualized expense ratio used to calculate the expense estimate in the table below.
Hypothetical Example for Comparison Purposes
The second line of the accompanying table for each class of the Fund provides information about hypothetical account values and hypothetical expenses based on a Class' actual expense ratio and an assumed rate of return of 5% per year before expenses, which is not the Class' actual return. The hypothetical account values and expenses may not be used to estimate the actual ending account balance or expenses you paid for the period. You may use this information to compare the ongoing costs of investing in the Fund and other funds. To do so, compare this 5% hypothetical example with the 5% hypothetical examples that appear in the shareholder reports of the other funds. A small balance maintenance fee of $12.00 that is charged once a year may apply for certain accounts with a value of less than $2,000. This fee is not included in the table below. If it was, the estimate of expenses you paid during the period would be higher, and your ending account value lower, by this amount. In addition, the Fund, as a shareholder in the underlying Fidelity Central Funds, will indirectly bear its pro-rata share of the fees and expenses incurred by the underlying Fidelity Central Funds. These fees and expenses are not included in the Fund's annualized expense ratio used to calculate the expense estimate in the table below.
Please note that the expenses shown in the table are meant to highlight your ongoing costs only and do not reflect any transaction costs. Therefore, the second line of the table is useful in comparing ongoing costs only, and will not help you determine the relative total costs of owning different funds. In addition, if these transactional costs were included, your costs would have been higher.
Annual Report
| Annualized | Beginning | Ending | Expenses Paid |
Class A | .96% |
|
|
|
Actual |
| $ 1,000.00 | $ 1,005.00 | $ 4.85 |
HypotheticalA |
| $ 1,000.00 | $ 1,020.37 | $ 4.89 |
Class T | 1.06% |
|
|
|
Actual |
| $ 1,000.00 | $ 1,004.60 | $ 5.36 |
HypotheticalA |
| $ 1,000.00 | $ 1,019.86 | $ 5.40 |
Class B | 1.48% |
|
|
|
Actual |
| $ 1,000.00 | $ 1,001.40 | $ 7.47 |
HypotheticalA |
| $ 1,000.00 | $ 1,017.74 | $ 7.53 |
Class C | 1.71% |
|
|
|
Actual |
| $ 1,000.00 | $ 1,001.30 | $ 8.63 |
HypotheticalA |
| $ 1,000.00 | $ 1,016.59 | $ 8.69 |
Fidelity Floating Rate High Income Fund | .68% |
|
|
|
Actual |
| $ 1,000.00 | $ 1,006.50 | $ 3.44 |
HypotheticalA |
| $ 1,000.00 | $ 1,021.78 | $ 3.47 |
Institutional Class | .73% |
|
|
|
Actual |
| $ 1,000.00 | $ 1,006.20 | $ 3.69 |
HypotheticalA |
| $ 1,000.00 | $ 1,021.53 | $ 3.72 |
A 5% return per year before expenses
B Annualized expense ratio reflects expenses net of applicable fee waivers.
* Expenses are equal to each Class' annualized expense ratio, multiplied by the average account value over the period, multiplied by 184/365 (to reflect the one-half year period).
Annual Report
Investment Changes (Unaudited)
Top Five Holdings as of October 31, 2014 | ||
(by issuer, excluding cash equivalents) | % of fund's | % of fund's net assets |
HCA Holdings, Inc. | 3.0 | 3.2 |
H.J. Heinz Co. | 2.6 | 2.6 |
Community Health Systems, Inc. | 2.6 | 2.7 |
Albertson's LLC | 1.9 | 0.2 |
Fortescue Metals Group Ltd. | 1.9 | 1.7 |
| 12.0 | |
Top Five Market Sectors as of October 31, 2014 | ||
| % of fund's | % of fund's net assets |
Technology | 10.1 | 10.9 |
Healthcare | 9.8 | 11.9 |
Energy | 6.7 | 4.6 |
Gaming | 6.5 | 5.8 |
Telecommunications | 6.4 | 6.5 |
Quality Diversification (% of fund's net assets) | |||||||
As of October 31, 2014 | As of April 30, 2014 | ||||||
 | BBB 5.1% |
| | BBB 5.9% |
| ||
 | BB 43.0% |
| | BB 38.8% |
| ||
 | B 40.7% |
| | B 42.5% |
| ||
 | CCC,CC,C 2.5% |
| | CCC,CC,C 2.8% |
| ||
 | D 0.0% |
|  | D 0.0%† |
| ||
 | Not Rated 3.7% |
| | Not Rated 4.7% |
| ||
 | Equities 0.2% |
| | Equities 0.2% |
| ||
 | Short-Term |
| | Short-Term |
| ||

We have used ratings from Moody's Investors Service, Inc. Where Moody's® ratings are not available, we have used S&P® ratings. All ratings are as of the date indicated and do not reflect subsequent changes. |
† Amount represents less than 0.1% | |||||||
Asset Allocation (% of fund's net assets) | |||||||
As of October 31, 2014* | As of April 30, 2014** | ||||||
| Bank Loan |
| | Bank Loan |
| ||
 | Nonconvertible |
| | Nonconvertible |
| ||
| Common Stocks 0.2% |
| | Common Stocks 0.2% |
| ||
| Short-Term |
| | Short-Term |
| ||
* Foreign investments | 11.7% |
| ** Foreign investments | 10.5% |
| ||

Annual Report
Investments October 31, 2014
Showing Percentage of Net Assets
Bank Loan Obligations (f) - 88.3% | ||||
| Principal Amount (000s) | Value (000s) | ||
Aerospace - 1.1% | ||||
Gemini HDPE LLC Tranche B, term loan 4.75% 8/7/21 (e) | $ 17,631 | $ 17,499 | ||
TransDigm, Inc. Tranche C, term loan 3.75% 2/28/20 (e) | 144,149 | 141,627 | ||
| 159,126 | |||
Air Transportation - 0.1% | ||||
U.S. Airways, Inc. Tranche B 2LN, term loan 3% 11/23/16 (e) | 14,750 | 14,529 | ||
Automotive - 1.6% | ||||
Chrysler Group LLC: | ||||
term loan 3.25% 12/31/18 (e) | 53,730 | 53,193 | ||
Tranche B, term loan 3.5% 5/24/17 (e) | 81,245 | 80,737 | ||
Federal-Mogul Corp. Tranche C, term loan 4.75% 4/15/21 (e) | 9,975 | 9,913 | ||
North American Lifting Holdings, Inc.: | ||||
Tranche 1LN, term loan 5.5% 11/27/20 (e) | 16,879 | 16,689 | ||
Tranche 2LN, term loan 10% 11/27/21 (e) | 24,370 | 24,096 | ||
The Gates Corp. Tranche B 1LN, term loan 4.25% 7/3/21 (e) | 20,000 | 19,800 | ||
Tower Automotive Holdings U.S.A. LLC term loan 4% 4/23/20 (e) | 26,612 | 26,312 | ||
| 230,740 | |||
Broadcasting - 2.3% | ||||
Clear Channel Capital I LLC Tranche B, term loan 3.804% 1/29/16 (e) | 38,701 | 38,459 | ||
Clear Channel Communications, Inc. Tranche D, term loan 6.904% 1/30/19 (e) | 68,720 | 64,855 | ||
ION Media Networks, Inc. Tranche B, term loan 5% 12/18/20 (e) | 28,783 | 28,783 | ||
Nielsen Finance LLC Tranche B 2LN, term loan 3.1525% 4/15/21 (e) | 69,625 | 69,538 | ||
TWCC Holding Corp. term loan 3.5% 2/11/17 (e) | 56,020 | 55,152 | ||
Univision Communications, Inc. Tranche C 4LN, term loan 4% 3/1/20 (e) | 81,602 | 80,718 | ||
| 337,505 | |||
Building Materials - 0.4% | ||||
American Builders & Contractors Supply Co., Inc. Tranche B, term loan 3.5% 4/16/20 (e) | 34,733 | 33,923 | ||
Bank Loan Obligations (f) - continued | ||||
| Principal Amount (000s) | Value (000s) | ||
Building Materials - continued | ||||
Armstrong World Industries, Inc. Tranche B, term loan 3.5% 3/15/20 (e) | $ 23,590 | $ 23,295 | ||
Ply Gem Industries, Inc. Tranche B, term loan 4% 2/1/21 (e) | 7,060 | 6,918 | ||
| 64,136 | |||
Cable TV - 4.4% | ||||
Atlantic Broad Tranche B, term loan 3.25% 11/30/19 (e) | 19,952 | 19,729 | ||
Cequel Communications LLC Tranche B, term loan 3.5% 2/14/19 (e) | 106,928 | 105,324 | ||
Charter Communications Operating LLC: | ||||
Tranche E, term loan 3% 7/1/20 (e) | 48,716 | 47,985 | ||
Tranche F, term loan 3% 1/3/21 (e) | 94,232 | 91,523 | ||
CSC Holdings LLC Tranche B, term loan 2.654% 4/17/20 (e) | 68,595 | 67,140 | ||
Liberty Cablevision of Puerto Rico Tranche 1LN, term loan 4.5% 1/7/22 (e) | 14,000 | 13,895 | ||
Numericable LLC: | ||||
Tranche B 1LN, term loan 4.5% 5/8/20 (e) | 47,013 | 47,079 | ||
Tranche B 2LN, term loan 4.5% 5/8/20 (e) | 40,672 | 40,730 | ||
UPC Broadband Holding BV Tranche AH, term loan 3.25% 6/30/21 (e) | 34,000 | 33,193 | ||
Virgin Media Finance PLC Tranche B, term loan 3.5% 6/7/20 (e) | 55,000 | 53,969 | ||
WideOpenWest Finance LLC Tranche B, term loan 4.75% 4/1/19 (e) | 29,513 | 29,439 | ||
Ziggo B.V.: | ||||
Tranche B 1LN, term loan: | ||||
3.25% 1/15/22 (e) | 35,286 | 34,403 | ||
3.25% 1/15/22 (e) | 2,063 | 2,011 | ||
Tranche B 2LN, term loan: | ||||
1/15/22 (g)(h) | 1,934 | 1,886 | ||
3.25% 1/15/22 (e) | 22,134 | 21,581 | ||
Tranche B 3LN, term loan 1/15/22 (g)(h) | 39,583 | 38,594 | ||
| 648,481 | |||
Capital Goods - 0.7% | ||||
Doncasters PLC Tranche B 2LN, term loan 9.5% 10/9/20 (e) | 7,374 | 7,355 | ||
Doosan Infracore, Inc. Tranche B, term loan 4.5% 5/28/21 (e) | 38,723 | 38,723 | ||
Bank Loan Obligations (f) - continued | ||||
| Principal Amount (000s) | Value (000s) | ||
Capital Goods - continued | ||||
SRAM LLC. Tranche B, term loan 4.0182% 4/10/20 (e) | $ 37,335 | $ 36,588 | ||
Utex Industries, Inc. Tranche B 1LN, term loan 5% 5/22/21 (e) | 14,828 | 14,680 | ||
| 97,346 | |||
Chemicals - 0.9% | ||||
Arizona Chem U.S., Inc.: | ||||
Tranche 2LN, term loan 7.5% 6/12/22 (e) | 6,605 | 6,597 | ||
Tranche B 1LN, term loan 4.5% 6/12/21 (e) | 20,214 | 20,138 | ||
MacDermid, Inc. Tranche B 1LN, term loan 4% 6/7/20 (e) | 34,356 | 33,583 | ||
Styrolution U.S. Holding LLC Tranche B 1LN, term loan 10/31/19 (g) | 20,000 | 19,792 | ||
Tata Chemicals North America, Inc. Tranche B, term loan 3.75% 8/9/20 (e) | 12,838 | 12,613 | ||
U.S. Coatings Acquisition, Inc. Tranche B, term loan 3.75% 2/1/20 (e) | 41,200 | 40,376 | ||
| 133,099 | |||
Consumer Products - 0.8% | ||||
Kate Spade & Co. Tranche B, term loan 4% 4/10/21 (e) | 17,920 | 17,427 | ||
Revlon Consumer Products Corp.: | ||||
term loan 4% 8/19/19 (e) | 30,768 | 30,383 | ||
Tranche B, term loan 3.25% 11/19/17 (e) | 13,500 | 13,314 | ||
Sun Products Corp. Tranche B, term loan 5.5% 3/23/20 (e) | 15,021 | 13,444 | ||
Tempur Sealy International, Inc. Tranche B, term loan 3.5% 3/18/20 (e) | 15,555 | 15,361 | ||
Wilsonart LLC Tranche B, term loan 4% 10/31/19 (e) | 32,657 | 32,113 | ||
| 122,042 | |||
Containers - 2.0% | ||||
Ardagh Holdings U.S.A., Inc. Tranche B, term loan 4% 12/17/19 (e) | 55,352 | 54,868 | ||
Berry Plastics Corp. Tranche E, term loan 3.75% 1/6/21 (e) | 14,925 | 14,552 | ||
Berry Plastics Group, Inc. term loan 3.5% 2/8/20 (e) | 99,575 | 96,588 | ||
BWAY Holding Co. Tranche B, term loan 5.5% 8/14/20 (e) | 19,950 | 20,050 | ||
Consolidated Container Co. Tranche B, term loan 5% 7/3/19 (e) | 8,800 | 8,690 | ||
Multi Packaging Solutions, Inc. term loan 4.25% 9/30/20 (e) | 4,347 | 4,281 | ||
Bank Loan Obligations (f) - continued | ||||
| Principal Amount (000s) | Value (000s) | ||
Containers - continued | ||||
Reynolds Consumer Products Holdings, Inc. Tranche B, term loan 4% 12/1/18 (e) | $ 87,652 | $ 86,338 | ||
Tricorbraun, Inc. Tranche B, term loan 4% 5/3/18 (e) | 3,804 | 3,745 | ||
| 289,112 | |||
Diversified Financial Services - 2.4% | ||||
AlixPartners LLP Tranche B 2LN, term loan 4% 7/10/20 (e) | 19,750 | 19,437 | ||
Delos Finance SARL Tranche B LN, term loan 3.5% 3/6/21 (e) | 51,095 | 50,797 | ||
Energy & Minerals Group Tranche B, term loan 4.75% 3/27/20 (e) | 14,920 | 14,845 | ||
Fly Funding II Sarl Tranche B, term loan 4.5% 8/9/19 (e) | 14,529 | 14,529 | ||
Flying Fortress, Inc. term loan 3.5% 6/30/17 (e) | 97,833 | 97,471 | ||
HarbourVest Partners LLC Tranche B, term loan 3.25% 2/4/21 (e) | 13,737 | 13,479 | ||
Home Loan Servicing Solutions Ltd. Tranche B, term loan 4.5% 6/27/20 (e) | 14,566 | 13,692 | ||
IBC Capital U.S. LLC Tranche B 1LN, term loan 4.75% 9/11/21 (e) | 25,000 | 24,875 | ||
LPL Holdings, Inc. Tranche B, term loan 3.25% 3/29/19 (e) | 32,680 | 32,233 | ||
TransUnion LLC Tranche B, term loan 4% 4/9/21 (e) | 72,113 | 71,166 | ||
| 352,524 | |||
Diversified Media - 0.5% | ||||
Advanstar Communications, Inc. Tranche B 1LN, term loan 5.5% 4/29/19 (e) | 8,373 | 8,362 | ||
McGraw-Hill School Education Tranche B, term loan 6.25% 12/18/19 (e) | 18,361 | 18,315 | ||
WMG Acquisition Corp. term loan 3.75% 7/1/20 (e) | 50,440 | 48,422 | ||
| 75,099 | |||
Electric Utilities - 5.6% | ||||
Alinta Energy Finance Pty. Ltd. Tranche B, term loan: | ||||
2.3821% 8/13/18 (e)(h) | 3,030 | 3,045 | ||
6.375% 8/13/19 (e) | 45,849 | 46,078 | ||
Calpine Construction Finance Co. LP: | ||||
Tranche B 1LN, term loan 3% 5/3/20 (e) | 84,698 | 82,051 | ||
Tranche B 2LN, term loan 3.25% 1/31/22 (e) | 54,052 | 52,498 | ||
Calpine Corp.: | ||||
Tranche B 2LN, term loan 4% 4/1/18 (e) | 11,654 | 11,596 | ||
Tranche B 3LN, term loan 4% 10/9/19 (e) | 29,412 | 29,118 | ||
Tranche B, term loan 4% 4/1/18 (e) | 107,816 | 107,277 | ||
Bank Loan Obligations (f) - continued | ||||
| Principal Amount (000s) | Value (000s) | ||
Electric Utilities - continued | ||||
Dynegy, Inc. Tranche B 2LN, term loan 4% 4/23/20 (e) | $ 25,636 | $ 25,475 | ||
Energy Future Holdings Corp. Tranche 1LN, term loan 4.25% 6/19/16 (e) | 79,884 | 79,684 | ||
EquiPower Resources Holdings LLC: | ||||
Tranche B 1LN, term loan 4.25% 12/21/18 (e) | 13,687 | 13,602 | ||
Tranche C, term loan 4.25% 12/31/19 (e) | 32,048 | 31,848 | ||
Essential Power LLC Tranche B, term loan 4.75% 8/8/19 (e) | 15,949 | 15,949 | ||
Exgen Texas Power LLC Tranche B, term loan 5.75% 9/18/21 (e) | 45,000 | 45,000 | ||
Houston Fuel Oil Terminal Co. Tranche B, term loan 4.25% 8/19/21 (e) | 10,500 | 10,290 | ||
InterGen NV Tranche B, term loan 5.5% 6/13/20 (e) | 33,493 | 33,409 | ||
La Frontera Generation, LLC Tranche B, term loan 4.5% 9/30/20 (e) | 63,751 | 63,273 | ||
NRG Energy, Inc. Tranche B, term loan 2.75% 7/1/18 (e) | 41,672 | 40,994 | ||
Southcross Energy Partners LP Tranche B, term loan 5.25% 8/4/21 (e) | 7,357 | 7,320 | ||
Southcross Holdings Borrower LP Tranche B, term loan 6% 8/4/21 (e) | 13,381 | 13,181 | ||
Star West Generation LLC Tranche B, term loan 4.25% 3/13/20 (e) | 22,176 | 21,954 | ||
Tempus Public Foundation Generation Holdings LLC Tranche B, term loan 4.75% 12/31/17 (e) | 13,378 | 12,743 | ||
TXU Energy LLC Tranche B, term loan: | ||||
4.6469% 10/10/17 (c)(e) | 66,622 | 48,384 | ||
4.6469% 10/10/14 (c)(e) | 10,052 | 7,300 | ||
USIC Holdings, Inc. Tranche B, term loan 4% 7/10/20 (e) | 16,294 | 16,029 | ||
| 818,098 | |||
Energy - 6.0% | ||||
Alon U.S.A. Partners LP term loan 9.25% 11/26/18 (e) | 8,733 | 8,821 | ||
Atlantic Power Ltd. Partnership Tranche B LN, term loan 4.75% 2/24/21 (e) | 24,065 | 23,915 | ||
Drillships Ocean Ventures, Inc. Tranche B, term loan 5.5% 7/25/21 (e) | 30,923 | 29,624 | ||
Empire Generating Co. LLC: | ||||
Tranche B, term loan 5.25% 3/14/21 (e) | 29,526 | 29,416 | ||
Tranche C, term loan 5.25% 3/14/21 (e) | 2,070 | 2,063 | ||
EP Energy LLC term loan 4.5% 4/30/19 (e) | 1,500 | 1,478 | ||
Everest Acquisition LLC Tranche B 3LN, term loan 3.5% 5/24/18 (e) | 42,333 | 41,593 | ||
Bank Loan Obligations (f) - continued | ||||
| Principal Amount (000s) | Value (000s) | ||
Energy - continued | ||||
ExGen Renewables I, LLC Tranche B term loan 5.25% 2/6/21 (e) | $ 15,289 | $ 15,442 | ||
Expro Finservices S.a.r.l. Tranche B, term loan 5.75% 9/2/21 (e) | 52,000 | 50,895 | ||
Fieldwood Energy, LLC: | ||||
Tranche 2LN, term loan 8.375% 9/30/20 (e) | 140,755 | 135,477 | ||
Tranche B 1LN, term loan 3.875% 9/30/18 (e) | 39,625 | 38,634 | ||
Floatel International Ltd. Tranche B, term loan 6% 6/27/20 (e) | 37,198 | 35,989 | ||
GIM Channelview Cogeneration LLC Tranche B, term loan 4.25% 5/8/20 (e) | 11,845 | 11,831 | ||
Moxie Patriot LLC Tranche B, term loan 6.75% 12/19/20 (e) | 13,000 | 13,179 | ||
MRC Global, Inc. Tranche B, term loan 5% 11/9/19 (e) | 44,525 | 44,583 | ||
Northeast Wind Capital II, LLC Tranche B, term loan 5% 11/14/20 (e) | 14,051 | 14,051 | ||
Offshore Group Investment Ltd. Tranche B, term loan 5% 10/25/17 (e) | 15,785 | 14,522 | ||
Overseas Shipholding Group, Inc. Tranche B, term loan: | ||||
5.25% 8/5/19 (e) | 15,845 | 15,746 | ||
5.75% 8/5/19 (e) | 11,641 | 11,554 | ||
Pacific Drilling SA Tranche B, term loan 4.5% 6/3/18 (e) | 24,347 | 23,251 | ||
Panda Sherman Power, LLC term loan 9% 9/14/18 (e) | 19,956 | 20,256 | ||
Panda Temple Power, LLC term loan 7.25% 4/3/19 (e) | 11,000 | 11,179 | ||
Ruby Western Pipeline Holdings LLC Tranche B, term loan 3.5% 3/27/20 (e) | 28,599 | 28,456 | ||
Samson Investment Co. Tranche B 2LN, term loan 5% 9/25/18 (e) | 20,800 | 19,136 | ||
Seadrill Operating LP Tranche B, term loan 4% 2/21/21 (e) | 60,873 | 57,441 | ||
Sheridan Investment Partners I term loan 4.25% 12/16/20 (e) | 44,963 | 42,827 | ||
Sheridan Investment Partners I, LLC Tranche B 2LN, term loan 4.25% 10/1/19 (e) | 20,181 | 19,374 | ||
Sheridan Production Partners I: | ||||
Tranche A, term loan 4.25% 12/16/20 (e) | 6,255 | 5,958 | ||
Tranche M, term loan 4.25% 12/16/20 (e) | 2,333 | 2,222 | ||
TPF II Power, LLC Tranche B, term loan 5.5% 10/2/21 (e) | 67,020 | 67,355 | ||
Vantage Drilling Co. Tranche B, term loan 5.75% 3/28/19 (e) | 14,775 | 13,076 | ||
Western Refining, Inc. Tranche B, term loan 4.25% 11/12/20 (e) | 26,157 | 25,896 | ||
| 875,240 | |||
Bank Loan Obligations (f) - continued | ||||
| Principal Amount (000s) | Value (000s) | ||
Entertainment/Film - 0.9% | ||||
AMC Entertainment, Inc. Tranche B, term loan 3.5% 4/30/20 (e) | $ 24,637 | $ 24,268 | ||
CBS Outdoor Americas Capital LLC/CBS Outdoor Americas Capital Corp. Tranche B, term loan 3% 1/31/21 (e) | 26,660 | 26,093 | ||
Digital Cinema Implementation Partners, LLC Tranche B, term loan 3.25% 5/17/21 (e) | 40,965 | 40,248 | ||
Live Nation Entertainment, Inc. Tranche B, term loan 3.5% 8/16/20 (e) | 14,273 | 14,202 | ||
William Morris Endeavor Entertainment, LLC. Tranche B 1LN, term loan 5.25% 5/6/21 (e) | 29,913 | 29,464 | ||
| 134,275 | |||
Environmental - 0.8% | ||||
ADS Waste Holdings, Inc. Tranche B 2LN, term loan 3.75% 10/9/19 (e) | 25,370 | 24,806 | ||
Tervita Corp. Tranche B 1LN, term loan 6.25% 5/15/18 (e) | 24,642 | 23,841 | ||
The Brickman Group, Ltd.: | ||||
Tranche 2LN, term loan 7.5% 12/18/21 (e) | 5,690 | 5,548 | ||
Tranche B 1LN, term loan 4% 12/18/20 (e) | 51,492 | 50,720 | ||
WTG Holdings III Corp. Tranche B 1LN, term loan 4.75% 1/15/21 (e) | 10,918 | 10,822 | ||
| 115,737 | |||
Food & Drug Retail - 3.2% | ||||
Albertson's LLC: | ||||
Tranche B 3LN, term loan 4% 8/25/19 (e) | 63,000 | 62,685 | ||
Tranche B 4LN, term loan: | ||||
4.5% 8/25/21 (e) | 200,000 | 200,000 | ||
4.5% 8/25/21 (e) | 19,920 | 19,920 | ||
Ferrara Candy Co., Inc. Tranche B, term loan 7.5% 6/18/18 (e) | 23,462 | 22,406 | ||
Mallinckrodt International Finance S.A. Tranche B 1LN, term loan 3.5% 3/19/21 (e) | 30,945 | 30,636 | ||
Performance Food Group, Inc. Tranche 2LN, term loan 6.25% 11/14/19 (e) | 7,306 | 7,269 | ||
PRA Holdings, Inc. Tranche B, term loan 4.5% 9/23/20 (e) | 17,780 | 17,536 | ||
Rite Aid Corp.: | ||||
Tranche 2 LN2, term loan 4.875% 6/21/21 (e) | 25,210 | 25,178 | ||
Tranche 2LN, term loan 5.75% 8/21/20 (e) | 9,080 | 9,137 | ||
Tranche B 7LN, term loan 3.5% 2/21/20 (e) | 37,896 | 37,422 | ||
Bank Loan Obligations (f) - continued | ||||
| Principal Amount (000s) | Value (000s) | ||
Food & Drug Retail - continued | ||||
Sprouts Farmers Market LLC Tranche B, term loan 4% 4/23/20 (e) | $ 19,193 | $ 19,049 | ||
SUPERVALU, Inc. Tranche B, term loan 4.5% 3/21/19 (e) | 14,710 | 14,434 | ||
| 465,672 | |||
Food/Beverage/Tobacco - 3.8% | ||||
AdvancePierre Foods, Inc. Tranche 2LN, term loan 9.5% 10/10/17 (e) | 3,000 | 2,966 | ||
Arysta Lifescience SPC LLC: | ||||
Tranche B 1LN, term loan 4.5% 5/29/20 (e) | 36,470 | 36,333 | ||
Tranche B 2LN, term loan 8.25% 11/30/20 (e) | 25,000 | 25,188 | ||
Big Heart Pet Brands Tranche B LN, term loan 3.5% 3/8/20 (e) | 49,750 | 48,009 | ||
Flavors Holdings, Inc. Tranche B 1LN, term loan 6.75% 4/3/20 (e) | 6,000 | 5,775 | ||
H.J. Heinz Co.: | ||||
Tranche B 1LN, term loan 3.25% 6/7/19 (e) | 19,700 | 19,503 | ||
Tranche B 2LN, term loan 3.5% 6/7/20 (e) | 367,041 | 363,354 | ||
JBS U.S.A. LLC Tranche B, term loan 3.75% 5/25/18 (e) | 19,242 | 19,049 | ||
OSI Restaurant Partners LLC Tranche B, term loan 3.5% 10/26/19 (e) | 9,154 | 9,039 | ||
Post Holdings, Inc. Tranche B, term loan 3.75% 6/2/21 (e) | 18,150 | 18,081 | ||
| 547,297 | |||
Gaming - 6.4% | ||||
Aristocrat International (Pty) Ltd. Tranche B, term loan 4.75% 10/20/21 (e) | 40,000 | 39,750 | ||
Bally Technologies, Inc. Tranche B, term loan 4.25% 11/25/20 (e) | 22,172 | 22,033 | ||
Boyd Gaming Corp. Tranche B, term loan 4% 8/14/20 (e) | 25,433 | 25,051 | ||
Caesars Entertainment Resort Properties LLC Tranche B 1LN, term loan 7% 10/11/20 (e) | 211,686 | 201,631 | ||
Caesars Growth Properties Holdings, LLC Tranche 1LN, term loan 6.25% 5/8/21 (e) | 146,238 | 137,830 | ||
CityCenter Holdings LLC Tranche B, term loan 4.25% 10/16/20 (e) | 50,332 | 49,955 | ||
Golden Nugget, Inc. Tranche B, term loan: | ||||
5.5% 11/21/19 (e) | 46,006 | 46,236 | ||
5.5% 11/21/19 (e) | 19,717 | 19,816 | ||
Graton Economic Development Authority Tranche B, term loan 9% 8/22/18 (e) | 7,301 | 7,520 | ||
Bank Loan Obligations (f) - continued | ||||
| Principal Amount (000s) | Value (000s) | ||
Gaming - continued | ||||
Las Vegas Sands LLC Tranche B, term loan 3.25% 12/19/20 (e) | $ 49,575 | $ 49,389 | ||
MGM Mirage, Inc. Tranche B, term loan 3.5% 12/20/19 (e) | 98,936 | 97,828 | ||
Mohegan Tribal Gaming Authority Tranche B, term loan 5.5% 11/19/19 (e) | 29,621 | 28,733 | ||
Pinnacle Entertainment, Inc. Tranche B 2LN, term loan 3.75% 8/13/20 (e) | 20,586 | 20,175 | ||
Scientific Games Corp.: | ||||
Tranch B 2LN, term loan 6% 10/21/21 (e) | 68,000 | 66,558 | ||
Tranche B, term loan 4.25% 10/18/20 (e) | 95,435 | 93,288 | ||
Station Casinos LLC Tranche B, term loan 4.25% 3/1/20 (e) | 16,215 | 16,012 | ||
Yonkers Racing Corp. Tranche B 1LN, term loan 4.25% 8/20/19 (e) | 13,951 | 12,137 | ||
| 933,942 | |||
Healthcare - 9.4% | ||||
Alkermes, Inc. term loan 3.5% 9/25/19 (e) | 13,505 | 13,302 | ||
AmSurg Corp. Tranche B, term loan 3.75% 7/16/21 (e) | 22,294 | 22,183 | ||
Community Health Systems, Inc.: | ||||
Tranche D, term loan 4.25% 1/27/21 (e) | 323,223 | 323,223 | ||
Tranche E, term loan 3.4846% 1/25/17 (e) | 47,336 | 46,981 | ||
DaVita HealthCare Partners, Inc. Tranche B, term loan 3.5% 6/24/21 (e) | 70,324 | 69,621 | ||
Drumm Investors LLC Tranche B, term loan 6.75% 5/4/18 (e) | 73,014 | 73,562 | ||
Emergency Medical Services Corp. Tranche B, term loan 4% 5/25/18 (e) | 28,494 | 28,273 | ||
Grifols, S.A. Tranche B, term loan 3.154% 2/27/21 (e) | 44,755 | 44,196 | ||
HCA Holdings, Inc.: | ||||
Tranche A 4LN, term loan 2.654% 2/2/16 (e) | 271,316 | 270,312 | ||
Tranche B 4LN, term loan 2.9831% 5/1/18 (e) | 35,690 | 35,557 | ||
Tranche B 5LN, term loan 2.904% 3/31/17 (e) | 116,356 | 115,925 | ||
HCR Healthcare LLC Tranche B, term loan 5% 4/6/18 (e) | 35,959 | 34,700 | ||
IASIS Healthcare LLC Tranche B 2LN, term loan 4.5% 5/3/18 (e) | 34,388 | 34,346 | ||
Millennium Labs, LLC Tranche B, term loan 5.25% 4/16/21 (e) | 23,242 | 23,242 | ||
MPH Acquisition Holdings LLC Tranche B, term loan 4% 3/31/21 (e) | 52,368 | 51,386 | ||
National Mentor Holdings, Inc. Tranche B, term loan 4.75% 1/31/21 (e) | 12,848 | 12,735 | ||
Bank Loan Obligations (f) - continued | ||||
| Principal Amount (000s) | Value (000s) | ||
Healthcare - continued | ||||
Polymer Group, Inc. Tranche B, term loan 5.25% 12/19/19 (e) | $ 19,858 | $ 19,758 | ||
Quintiles Transnational Corp. Tranche B 3LN, term loan 3.75% 6/8/18 (e) | 24,938 | 24,813 | ||
Skilled Healthcare Group, Inc. term loan 7% 4/9/16 (e) | 16,317 | 16,276 | ||
Surgery Center Holdings, Inc. Tranche B 1LN, term loan 5.25% 7/24/20 (e) | 7,685 | 7,666 | ||
U.S. Renal Care, Inc.: | ||||
Tranche 2LN, term loan 8.5% 1/3/20 (e) | 5,545 | 5,559 | ||
Tranche B 2LN, term loan 4.25% 7/3/19 (e) | 29,913 | 29,651 | ||
Valeant Pharmaceuticals International: | ||||
Tranche BC 2LN, term loan 3.5% 12/11/19 (e) | 26,437 | 26,238 | ||
Tranche BD 2LN, term loan 3.5% 2/13/19 (e) | 44,598 | 44,319 | ||
| 1,373,824 | |||
Homebuilders/Real Estate - 0.7% | ||||
CBRE Group, Inc. Tranche B, term loan 2.9025% 3/28/21 (e) | 14,917 | 14,805 | ||
Realogy Corp. Credit-Linked Deposit 4.4463% 10/10/16 (e) | 1,551 | 1,519 | ||
Realogy Group LLC Tranche B, term loan 3.75% 3/5/20 (e) | 89,232 | 88,786 | ||
| 105,110 | |||
Hotels - 3.5% | ||||
Four Seasons Holdings, Inc.: | ||||
Tranche 2LN, term loan 6.25% 12/27/20 (e) | 15,420 | 15,459 | ||
Tranche B 1LN, term loan 3.5% 6/27/20 (e) | 50,883 | 50,437 | ||
Hilton Worldwide Finance, LLC Tranche B, term loan 3.5% 10/25/20 (e) | 266,974 | 264,171 | ||
La Quinta Intermediate Holdings LLC Tranche B LN, Tranche B, term loan 4% 4/14/21 (e) | 124,714 | 123,779 | ||
Playa Resorts Holding BV Tranche B, term loan 4% 8/9/19 (e) | 40,106 | 39,505 | ||
Ryman Hospitality Properties, Inc. Tranche B, term loan 3.75% 1/15/21 (e) | 11,357 | 11,257 | ||
| 504,608 | |||
Insurance - 0.2% | ||||
CNO Financial Group, Inc. Tranche B 2LN, term loan 3.75% 9/28/18 (e) | 11,784 | 11,828 | ||
HUB International Ltd. Tranche B 1LN, term loan 4.25% 10/2/20 (e) | 17,413 | 17,195 | ||
| 29,023 | |||
Bank Loan Obligations (f) - continued | ||||
| Principal Amount (000s) | Value (000s) | ||
Leisure - 0.8% | ||||
24 Hour Fitness Worldwide, Inc. Tranche B, term loan 4.75% 5/30/21 (e) | $ 33,651 | $ 33,567 | ||
ClubCorp Club Operations, Inc. Tranche B, term loan 4.5% 7/24/20 (e) | 23,912 | 23,702 | ||
Planet Fitness Holdings, LLC. Tranche B, term loan 4.75% 3/31/21 (e) | 19,651 | 19,651 | ||
SeaWorld Parks & Entertainment, Inc. Tranche B 2LN, term loan 3% 5/14/20 (e) | 40,417 | 38,801 | ||
Seminole Hard Rock Entertainment, Inc. Tranche B, term loan 3.5% 5/14/20 (e) | 5,409 | 5,301 | ||
| 121,022 | |||
Metals/Mining - 4.4% | ||||
Alpha Natural Resources, Inc. Tranche B, term loan 3.5% 5/22/20 (e) | 4,373 | 3,717 | ||
American Rock Salt Co. LLC: | ||||
Tranche 2LN, term loan 8% 5/20/22 (e) | 3,000 | 3,008 | ||
Tranche B 1LN, term loan 4.75% 5/20/21 (e) | 16,958 | 16,788 | ||
Ameriforge Group, Inc.: | ||||
Tranche B 1LN, term loan 5% 12/19/19 (e) | 7,519 | 7,456 | ||
Tranche B 2LN, term loan 8.75% 12/19/20 (e) | 3,000 | 2,985 | ||
Doncasters Group, LLC Tranche B 1LN, term loan 4.5% 4/9/20 (e) | 28,356 | 27,647 | ||
Fairmount Minerals Ltd. Tranche B 2LN, term loan 4.5% 9/5/19 (e) | 21,495 | 21,388 | ||
Fortescue Metals Group Ltd. Tranche B, term loan 3.75% 6/30/19 (e) | 278,078 | 271,126 | ||
Murray Energy Corp. Tranche B 1LN, term loan 5.25% 12/5/19 (e) | 45,551 | 45,323 | ||
Novelis, Inc. Tranche B, term loan 3.75% 3/10/17 (e) | 34,878 | 34,574 | ||
Oxbow Carbon LLC: | ||||
Tranche 2LN, term loan 8% 1/19/20 (e) | 20,000 | 19,500 | ||
Tranche B 1LN, term loan 4.25% 7/19/19 (e) | 12,038 | 11,827 | ||
Peabody Energy Corp. Tranche B, term loan 4.25% 9/24/20 (e) | 60,831 | 58,550 | ||
U.S. Silica Co. Tranche B, term loan 4% 7/23/20 (e) | 24,154 | 23,792 | ||
Walter Energy, Inc. Tranche B, term loan 7.25% 4/1/18 (e) | 109,526 | 94,466 | ||
| 642,147 | |||
Paper - 0.0% | ||||
Bear Island Paper Co. LLC Tranche B 2LN, term loan 14% 9/13/17 (e) | 234 | 234 | ||
Bank Loan Obligations (f) - continued | ||||
| Principal Amount (000s) | Value (000s) | ||
Publishing/Printing - 1.3% | ||||
Cengage Learning Acquisitions, Inc. Tranche 1LN, term loan 7% 3/31/20 (e) | $ 50,158 | $ 50,283 | ||
Dex Media East LLC term loan 6% 12/31/16 (e) | 5,326 | 4,314 | ||
Dex Media West LLC/Dex Media West Finance Co. term loan 8% 12/31/16 (e) | 1,239 | 1,128 | ||
Getty Images, Inc. Tranche B, term loan 4.75% 10/18/19 (e) | 97,460 | 90,760 | ||
Houghton Mifflin Harcourt Publishing, Inc. Tranche B, term loan 4.25% 5/22/18 (e) | 19,759 | 19,660 | ||
McGraw-Hill Global Education Holdings, LLC Tranche B, term loan 5.75% 3/22/19 (e) | 16,015 | 16,056 | ||
Newsday LLC Tranche A, term loan 3.654% 10/12/16 (e) | 9,815 | 9,742 | ||
| 191,943 | |||
Restaurants - 0.9% | ||||
Burger King Worldwide, Inc. Tranche B, term loan 4.5% 10/27/21 (e) | 35,000 | 34,869 | ||
Dunkin Brands, Inc. Tranche B 4LN, term loan 3.25% 2/7/21 (e) | 54,801 | 53,431 | ||
Focus Brands, Inc. Trancher B 1LN, term loan 4.25% 2/21/18 (e) | 4,556 | 4,499 | ||
Landry's Restaurants, Inc. Tranche B, term loan 4% 4/24/18 (e) | 8,989 | 8,958 | ||
Red Lobster Hospitality LLC Tranche B, term loan 6.25% 7/28/21 (e) | 28,815 | 28,743 | ||
| 130,500 | |||
Services - 4.0% | ||||
ARAMARK Corp.: | ||||
Credit-Linked Deposit 3.6525% 7/26/16 (e) | 3,579 | 3,538 | ||
Tranche F, term loan 3.25% 2/24/21 (e) | 74,625 | 73,879 | ||
3.6525% 7/26/16 (e) | 4,666 | 4,631 | ||
Avis Budget Group, Inc. Tranche B, term loan 3% 3/15/19 (e) | 9,775 | 9,653 | ||
Bright Horizons Family Solutions, Inc. Tranche B, term loan 3.7501% 1/30/20 (e) | 23,207 | 22,772 | ||
Cactus Wellhead LLC Tranche B, term loan 7% 7/31/20 (e) | 23,500 | 23,059 | ||
Coinmach Service Corp. Tranche B, term loan 4.25% 11/14/19 (e) | 50,746 | 50,188 | ||
EFS Cogen Holdings I LLC Tranche B, term loan 3.75% 12/17/20 (e) | 18,015 | 17,790 | ||
Bank Loan Obligations (f) - continued | ||||
| Principal Amount (000s) | Value (000s) | ||
Services - continued | ||||
Filtration Group Corp. Tranche 2LN, term loan 8.25% 11/21/21 (e) | $ 3,860 | $ 3,826 | ||
Hertz Corp.: | ||||
Tranche B 2LN, term loan 3% 3/11/18 (e) | 62,354 | 60,757 | ||
Tranche B, term loan 3.75% 3/11/18 (e) | 22,517 | 22,235 | ||
Karman Buyer Corp.: | ||||
term loan 3.75% 7/25/21 (e)(h) | 769 | 761 | ||
Tranche 1LN, term loan 4.25% 7/25/21 (e) | 23,076 | 22,817 | ||
Tranche 2LN, term loan 7.5% 7/25/22 (e) | 11,490 | 11,433 | ||
Laureate Education, Inc. Tranche B, term loan 5% 6/16/18 (e) | 159,610 | 154,024 | ||
Lineage Logistics Holdings, LLC. Tranche B, term loan 4.5% 4/7/21 (e) | 47,743 | 46,728 | ||
Nord Anglia Education Tranche B, term loan 4.5% 3/31/21 (e) | 14,439 | 14,367 | ||
Redtop Acquisitions Ltd.: | ||||
Tranche 2LN, term loan 8.25% 6/3/21 (e) | 4,963 | 4,987 | ||
Tranche B 1LN, term loan 4.5% 12/3/20 (e) | 5,962 | 5,962 | ||
The ServiceMaster Co. Tranche B, term loan 4.25% 7/1/21 (e) | 35,000 | 34,738 | ||
| 588,145 | |||
Shipping - 0.3% | ||||
Harvey Gulf International Tranche B, term loan 5.5% 6/18/20 (e) | 22,101 | 20,885 | ||
YRC Worldwide, Inc. Tranche B, term loan 8.25% 2/13/19 (e) | 27,294 | 26,748 | ||
| 47,633 | |||
Super Retail - 3.3% | ||||
Academy Ltd. Tranche B, term loan 4.5% 8/3/18 (e) | 21,979 | 21,897 | ||
Bass Pro Group LLC Tranche B, term loan 3.75% 11/20/19 (e) | 24,161 | 23,919 | ||
BJ's Wholesale Club, Inc.: | ||||
Tranche 2LN, term loan 8.5% 3/31/20 (e) | 20,110 | 20,089 | ||
Tranche B 1LN, term loan 4.5% 9/26/19 (e) | 62,493 | 61,812 | ||
Burlington Coat Factory Warehouse Corp. Tranche B, term loan 4.25% 8/13/21 (e) | 24,938 | 24,782 | ||
General Nutrition Centers, Inc. Tranche B, term loan 3.25% 3/4/19 (e) | 52,858 | 51,536 | ||
J. Crew Group, Inc. Tranche B LN, term loan 4% 3/5/21 (e) | 59,859 | 57,543 | ||
JC Penney Corp., Inc. Tranche B, term loan: | ||||
5% 6/20/19 (e) | 17,666 | 17,268 | ||
Bank Loan Obligations (f) - continued | ||||
| Principal Amount (000s) | Value (000s) | ||
Super Retail - continued | ||||
JC Penney Corp., Inc. Tranche B, term loan: - continued | ||||
6% 5/22/18 (e) | $ 82,629 | $ 81,699 | ||
PETCO Animal Supplies, Inc. term loan 4% 11/24/17 (e) | 35,156 | 34,804 | ||
Sears Holdings Corp. Tranche ABL, term loan 5.5% 6/30/18 (e) | 72,000 | 69,840 | ||
Sports Authority, Inc. Tranche B, term loan 7.5% 11/16/17 (e) | 7,416 | 6,971 | ||
The Hillman Group, Inc. Tranche B, term loan 4.5% 6/30/21 (e) | 13,127 | 13,029 | ||
| 485,189 | |||
Technology - 9.7% | ||||
Activision Blizzard, Inc. Tranche B, term loan 3.25% 10/11/20 (e) | 112,210 | 112,210 | ||
Applied Systems, Inc.: | ||||
Tranche B 1LN, term loan 4.25% 1/23/21 (e) | 14,183 | 13,935 | ||
Tranche B 2LN, term loan 7.5% 1/23/22 (e) | 3,630 | 3,621 | ||
Avago Technologies, Inc. Tranche B, term loan 3.75% 5/6/21 (e) | 54,626 | 54,428 | ||
BMC Software Finance, Inc. Tranche B, term loan: | ||||
5% 9/10/20 (e) | 19,356 | 18,896 | ||
5% 9/10/20 (e) | 150,648 | 148,012 | ||
Carros U.S., LLC Tranche B, term loan 4.5% 9/30/21 (e) | 15,585 | 15,566 | ||
CompuCom Systems, Inc. Tranche B, term loan 4.25% 5/9/20 (e) | 27,689 | 26,166 | ||
Computer Discount Warehouse (CDW) LLC, Tranche B, term loan 3.25% 4/29/20 (e) | 56,918 | 55,495 | ||
Dell International LLC Tranche B, term loan 4.5% 4/29/20 (e) | 214,945 | 215,224 | ||
Fibertech Networks, LLC Tranche B 1LN, term loan 4% 12/18/19 (e) | 17,919 | 17,627 | ||
First Data Corp.: | ||||
term loan 3.653% 3/24/17 (e) | 83,529 | 82,068 | ||
Tranche B, term loan: | ||||
3.653% 3/24/18 (e) | 80,000 | 78,600 | ||
3.653% 9/24/18 (e) | 40,000 | 39,300 | ||
Freescale Semiconductor, Inc. Tranche B 4LN, term loan 4.25% 3/1/20 (e) | 52,974 | 52,245 | ||
Generac Power Systems, Inc. Tranche B, term loan 3.25% 5/31/20 (e) | 64,994 | 63,531 | ||
Genesys Telecommunications Laboratories, Inc. Tranche B, term loan 4.5% 11/13/20 (e) | 5,032 | 5,007 | ||
Bank Loan Obligations (f) - continued | ||||
| Principal Amount (000s) | Value (000s) | ||
Technology - continued | ||||
GXS Group, Inc. Tranche B, term loan 3.25% 1/16/21 (e) | $ 16,873 | $ 16,619 | ||
Infor U.S., Inc.: | ||||
Tranche B 3LN, term loan 3.75% 6/3/20 (e) | 24,201 | 23,838 | ||
Tranche B 5LN, term loan 3.75% 6/3/20 (e) | 57,427 | 56,566 | ||
Information Resources, Inc. Tranche B, term loan 4.75% 9/30/20 (e) | 16,139 | 16,139 | ||
Kronos, Inc.: | ||||
Tranche 2LN, term loan 9.75% 4/30/20 (e) | 29,845 | 30,591 | ||
Tranche B 1LN, term loan 4.5% 10/30/19 (e) | 41,606 | 41,450 | ||
Nuance Communications, Inc. Tranche C, term loan 2.91% 8/7/19 (e) | 28,460 | 27,748 | ||
Renaissance Learning, Inc.: | ||||
Tranche 1LN, term loan 4.5% 4/9/21 (e) | 24,378 | 23,951 | ||
Tranche 2LN, term loan 8% 4/9/22 (e) | 11,500 | 11,213 | ||
Sophia L.P. Tranche B 1LN, term loan 4% 7/19/18 (e) | 7,176 | 7,104 | ||
SunGard Data Systems, Inc.: | ||||
Tranche C, term loan 3.9061% 2/28/17 (e) | 32,706 | 32,542 | ||
Tranche E, term loan 4% 3/8/20 (e) | 44,917 | 44,748 | ||
Syniverse Holdings, Inc. Tranche B, term loan: | ||||
4% 4/23/19 (e) | 19,390 | 19,027 | ||
4% 4/23/19 (e) | 9,598 | 9,418 | ||
Vantiv LLC Tranche B, term loan 3.75% 6/13/21 (e) | 31,416 | 31,259 | ||
WP Mustang Holdings, LLC. Tranche B 1LN, term loan 5.5% 5/29/21 (e) | 22,309 | 22,337 | ||
| 1,416,481 | |||
Telecommunications - 5.6% | ||||
Altice Financing SA Tranche B, term loan 5.5% 6/24/19 (e) | 159,858 | 160,458 | ||
Crown Castle Operating Co. Tranche B 2LN, term loan 3% 1/31/21 (e) | 89,773 | 88,987 | ||
Digicel International Finance Ltd.: | ||||
Tranche D 1LN, term loan 3.75% 3/31/17 (e) | 9,000 | 8,955 | ||
Tranche D-2, term loan 3.75% 3/31/19 (e) | 23,560 | 23,148 | ||
DigitalGlobe, Inc. Tranche B, term loan 3.75% 1/31/20 (e) | 14,391 | 14,283 | ||
FairPoint Communications, Inc. Tranche B, term loan 7.5% 2/14/19 (e) | 18,230 | 18,321 | ||
FPL FiberNet, LLC. Tranche A, term loan 3.4841% 7/22/19 (e) | 20,000 | 20,000 | ||
Genesys Telecom Holdings U.S., Inc. Tranche B, term loan 4.5% 2/8/20 (e) | 24,687 | 23,915 | ||
Bank Loan Obligations (f) - continued | ||||
| Principal Amount (000s) | Value (000s) | ||
Telecommunications - continued | ||||
Integra Telecom Holdings, Inc. Tranche B, term loan 5.25% 2/22/19 (e) | $ 12,805 | $ 12,758 | ||
Intelsat Jackson Holdings SA Tranche B 2LN, term loan 3.75% 6/30/19 (e) | 132,070 | 130,921 | ||
Level 3 Financing, Inc.: | ||||
Tranche B 3LN, term loan 4% 8/1/19 (e) | 13,330 | 13,263 | ||
Tranche B 4LN, term loan 4% 1/15/20 (e) | 73,000 | 72,635 | ||
Tranche B 5LN, term loan 4.5% 1/31/22 (e) | 24,000 | 24,091 | ||
LTS Buyer LLC: | ||||
Tranche 2LN, term loan 8% 4/11/21 (e) | 3,868 | 3,839 | ||
Tranche B 1LN, term loan 4% 4/11/20 (e) | 33,247 | 32,749 | ||
SBA Senior Finance II, LLC term loan 3.25% 3/24/21 (e) | 34,913 | 34,302 | ||
Securus Technologies Holdings, Inc.: | ||||
Tranche 2LN, term loan 9% 4/30/21 (e) | 4,635 | 4,572 | ||
Tranche B 1LN, term loan 4.75% 4/30/20 (e) | 39,962 | 39,463 | ||
TCH-2 Holdings, LLC. Tranche B 1LN, term loan 5.5% 5/12/21 (e) | 14,963 | 14,814 | ||
Telesat Holding, Inc. Tranche B, term loan 3.5% 3/28/19 (e) | 63,963 | 63,483 | ||
Windstream Corp. Tranche B 4LN, term loan 3.5% 1/23/20 (e) | 19,463 | 19,293 | ||
| 824,250 | |||
Textiles & Apparel - 0.3% | ||||
Party City Holdings, Inc. Tranche B LN, term loan 4% 7/27/19 (e) | 44,965 | 44,002 | ||
TOTAL BANK LOAN OBLIGATIONS (Cost $13,050,387) |
| |||
Nonconvertible Bonds - 6.7% | ||||
| ||||
Automotive - 0.3% | ||||
General Motors Acceptance Corp. 2.4336% 12/1/14 (e) | 40,000 | 39,880 | ||
Banks & Thrifts - 1.1% | ||||
Ally Financial, Inc.: | ||||
2.9108% 7/18/16 (e) | 75,000 | 75,915 | ||
3.125% 1/15/16 | 4,000 | 4,050 | ||
4.625% 6/26/15 | 4,000 | 4,082 | ||
GMAC LLC 2.4336% 12/1/14 (e) | 70,187 | 70,228 | ||
| 154,275 | |||
Nonconvertible Bonds - continued | ||||
| Principal Amount (000s) | Value (000s) | ||
Broadcasting - 0.2% | ||||
AMC Networks, Inc. 4.75% 12/15/22 | $ 6,600 | $ 6,551 | ||
Clear Channel Communications, Inc. 9% 12/15/19 | 8,677 | 8,769 | ||
Starz LLC/Starz Finance Corp. 5% 9/15/19 | 9,000 | 9,270 | ||
Univision Communications, Inc. 6.75% 9/15/22 (d) | 5,368 | 5,958 | ||
| 30,548 | |||
Building Materials - 0.1% | ||||
CEMEX S.A.B. de CV 4.9806% 10/15/18 (d)(e) | 10,000 | 10,345 | ||
Cable TV - 0.5% | ||||
CCO Holdings LLC/CCO Holdings Capital Corp.: | ||||
5.125% 2/15/23 | 17,065 | 17,022 | ||
5.25% 3/15/21 | 13,070 | 13,233 | ||
Cequel Communications Escrow I LLC/Cequel Communications Escrow Capital Corp. 6.375% 9/15/20 (d) | 10,815 | 11,275 | ||
Lynx I Corp. 5.375% 4/15/21 (d) | 5,000 | 5,188 | ||
Numericable Group SA 4.875% 5/15/19 (d) | 27,120 | 27,052 | ||
Virgin Media Finance PLC 4.875% 2/15/22 | 2,000 | 1,880 | ||
| 75,650 | |||
Capital Goods - 0.0% | ||||
Shale-Inland Holdings LLC/Shale-Inland Finance Corp. 8.75% 11/15/19 (d) | 3,000 | 3,105 | ||
Chemicals - 0.0% | ||||
Nufarm Australia Ltd. 6.375% 10/15/19 (d) | 5,000 | 5,025 | ||
Containers - 0.7% | ||||
Ardagh Packaging Finance PLC/Ardagh MP Holdings U.S.A., Inc. 3.2341% 12/15/19 (d)(e) | 42,330 | 41,378 | ||
Reynolds Group Issuer, Inc./Reynolds Group Issuer LLC/Reynolds Group Issuer (Luxembourg) SA: | ||||
5.75% 10/15/20 | 58,325 | 60,658 | ||
7.125% 4/15/19 | 5,000 | 5,194 | ||
| 107,230 | |||
Diversified Financial Services - 0.7% | ||||
CIT Group, Inc.: | ||||
4.75% 2/15/15 (d) | 14,000 | 14,105 | ||
5% 5/15/17 | 7,000 | 7,333 | ||
Icahn Enterprises LP/Icahn Enterprises Finance Corp.: | ||||
3.5% 3/15/17 | 18,720 | 18,626 | ||
4.875% 3/15/19 | 15,000 | 15,263 | ||
International Lease Finance Corp.: | ||||
2.1841% 6/15/16 (e) | 29,485 | 29,374 | ||
3.875% 4/15/18 | 7,000 | 7,022 | ||
Nonconvertible Bonds - continued | ||||
| Principal Amount (000s) | Value (000s) | ||
Diversified Financial Services - continued | ||||
International Lease Finance Corp.: - continued | ||||
4.875% 4/1/15 | $ 4,000 | $ 4,047 | ||
6.25% 5/15/19 | 10,000 | 10,938 | ||
| 106,708 | |||
Diversified Media - 0.1% | ||||
Clear Channel Worldwide Holdings, Inc.: | ||||
Series A, 6.5% 11/15/22 | 5,130 | 5,284 | ||
Series B, 6.5% 11/15/22 | 13,870 | 14,355 | ||
| 19,639 | |||
Electric Utilities - 0.3% | ||||
Energy Future Intermediate Holding Co. LLC/Energy Future Intermediate Holding Finance, Inc. 12.25% 3/1/22 (c)(d) | 11,000 | 13,090 | ||
NRG Energy, Inc. 6.625% 3/15/23 | 4,000 | 4,220 | ||
The AES Corp. 3.2336% 6/1/19 (e) | 21,435 | 21,321 | ||
| 38,631 | |||
Energy - 0.7% | ||||
Access Midstream Partners LP/ACMP Finance Corp. 4.875% 5/15/23 | 7,000 | 7,315 | ||
American Energy-Permian Basin LLC/ AEPB Finance Corp. 6.7413% 8/1/19 (d)(e) | 35,000 | 30,975 | ||
Atlas Pipeline Partners LP/Atlas Pipeline Finance Corp.: | ||||
5.875% 8/1/23 | 3,000 | 3,113 | ||
6.625% 10/1/20 | 5,645 | 5,984 | ||
Chesapeake Energy Corp. 3.4806% 4/15/19 (e) | 29,720 | 29,741 | ||
Citgo Petroleum Corp. 6.25% 8/15/22 (d) | 10,000 | 10,175 | ||
Northern Tier Energy LLC/Northern Tier Finance Corp. 7.125% 11/15/20 | 4,000 | 4,200 | ||
Targa Resources Partners LP/Targa Resources Partners Finance Corp. 6.375% 8/1/22 | 4,492 | 4,829 | ||
Western Refining, Inc. 6.25% 4/1/21 | 5,305 | 5,332 | ||
| 101,664 | |||
Entertainment/Film - 0.0% | ||||
Cinemark U.S.A., Inc. 5.125% 12/15/22 | 3,185 | 3,185 | ||
Food/Beverage/Tobacco - 0.0% | ||||
ESAL GmbH 6.25% 2/5/23 (d) | 4,000 | 4,080 | ||
Gaming - 0.1% | ||||
MCE Finance Ltd. 5% 2/15/21 (d) | 10,000 | 9,850 | ||
Healthcare - 0.4% | ||||
Community Health Systems, Inc. 5.125% 8/15/18 | 10,755 | 11,185 | ||
Nonconvertible Bonds - continued | ||||
| Principal Amount (000s) | Value (000s) | ||
Healthcare - continued | ||||
DaVita HealthCare Partners, Inc. 5.75% 8/15/22 | $ 8,235 | $ 8,729 | ||
HCA Holdings, Inc. 3.75% 3/15/19 | 25,000 | 25,063 | ||
Tenet Healthcare Corp. 4.75% 6/1/20 | 8,680 | 8,875 | ||
| 53,852 | |||
Homebuilders/Real Estate - 0.1% | ||||
CBRE Group, Inc. 5% 3/15/23 | 17,990 | 18,350 | ||
Leisure - 0.0% | ||||
Six Flags Entertainment Corp. 5.25% 1/15/21 (d) | 4,000 | 4,020 | ||
Metals/Mining - 0.0% | ||||
Peabody Energy Corp. 6% 11/15/18 | 5,000 | 4,838 | ||
Publishing/Printing - 0.1% | ||||
Cenveo Corp. 6% 8/1/19 (d) | 9,850 | 9,481 | ||
Services - 0.1% | ||||
Avis Budget Car Rental LLC/Avis Budget Finance, Inc. 2.9836% 12/1/17 (e) | 14,410 | 14,429 | ||
TransUnion Holding Co., Inc. 9.625% 6/15/18 pay-in-kind (e) | 3,000 | 3,098 | ||
| 17,527 | |||
Technology - 0.4% | ||||
Brocade Communications Systems, Inc. 4.625% 1/15/23 | 7,235 | 7,054 | ||
First Data Corp. 6.75% 11/1/20 (d) | 25,460 | 27,242 | ||
NXP BV/NXP Funding LLC: | ||||
5.75% 2/15/21 (d) | 14,760 | 15,572 | ||
5.75% 3/15/23 (d) | 5,000 | 5,288 | ||
| 55,156 | |||
Telecommunications - 0.8% | ||||
Altice Financing SA: | ||||
6.5% 1/15/22 (d) | 7,240 | 7,439 | ||
7.875% 12/15/19 (d) | 4,000 | 4,265 | ||
Columbus International, Inc. 7.375% 3/30/21 (d) | 14,535 | 15,407 | ||
DigitalGlobe, Inc. 5.25% 2/1/21 (d) | 3,905 | 3,798 | ||
Intelsat Jackson Holdings SA 6.625% 12/15/22 (Reg. S) | 20,000 | 21,050 | ||
Level 3 Financing, Inc. 3.8229% 1/15/18 (d)(e) | 15,000 | 15,038 | ||
Sprint Capital Corp.: | ||||
6.875% 11/15/28 | 4,000 | 3,890 | ||
6.9% 5/1/19 | 5,000 | 5,300 | ||
Sprint Communications, Inc.: | ||||
6% 11/15/22 | 30,000 | 29,925 | ||
Nonconvertible Bonds - continued | ||||
| Principal Amount (000s) | Value (000s) | ||
Telecommunications - continued | ||||
Sprint Communications, Inc.: - continued | ||||
9% 11/15/18 (d) | $ 3,000 | $ 3,529 | ||
Telesat Canada/Telesat LLC 6% 5/15/17 (d) | 3,000 | 3,092 | ||
| 112,733 | |||
TOTAL NONCONVERTIBLE BONDS (Cost $970,187) |
| |||
Common Stocks - 0.2% | |||
Shares |
| ||
Broadcasting - 0.0% | |||
Cumulus Media, Inc. Class A (a) | 229,315 | 885 | |
ION Media Networks, Inc. (a) | 2,842 | 2,014 | |
| 2,899 | ||
Chemicals - 0.2% | |||
LyondellBasell Industries NV Class A | 245,943 | 22,536 | |
Electric Utilities - 0.0% | |||
Calpine Corp. (a) | 20,715 | 473 | |
Homebuilders/Real Estate - 0.0% | |||
Newhall Holding Co. LLC Class A (a) | 289,870 | 617 | |
Hotels - 0.0% | |||
Tropicana Las Vegas Hotel & Casino, Inc. Class A (a) | 48,650 | 1,678 | |
Paper - 0.0% | |||
White Birch Cayman Holdings Ltd. (a) | 12,570 | 0 | |
Publishing/Printing - 0.0% | |||
Houghton Mifflin Harcourt Co. warrants 6/22/19 (a)(i) | 13,699 | 21 | |
Telecommunications - 0.0% | |||
FairPoint Communications, Inc. (a) | 34,287 | 569 | |
TOTAL COMMON STOCKS (Cost $16,121) |
| ||
Other - 0.0% | |||
|
|
|
|
Other - 0.0% | |||
Idearc, Inc. Claim (a) | 1,888,944 |
| |
Money Market Funds - 4.0% | |||
Shares | Value (000s) | ||
Fidelity Cash Central Fund, 0.11% (b) | 581,718,991 | $ 581,719 | |
TOTAL INVESTMENT PORTFOLIO - 99.2% (Cost $14,618,414) | 14,514,395 | ||
NET OTHER ASSETS (LIABILITIES) - 0.8% | 110,911 | ||
NET ASSETS - 100% | $ 14,625,306 | ||
Legend |
(a) Non-income producing |
(b) Affiliated fund that is generally available only to investment companies and other accounts managed by Fidelity Investments. The rate quoted is the annualized seven-day yield of the fund at period end. A complete unaudited listing of the fund's holdings as of its most recent quarter end is available upon request. In addition, each Fidelity Central Fund's financial statements, which are not covered by the Fund's Report of Independent Registered Public Accounting Firm, are available on the SEC's website or upon request. |
(c) Non-income producing - Security is in default. |
(d) Security exempt from registration under Rule 144A of the Securities Act of 1933. These securities may be resold in transactions exempt from registration, normally to qualified institutional buyers. At the end of the period, the value of these securities amounted to $305,772,000 or 2.1% of net assets. |
(e) Coupon rates for floating and adjustable rate securities reflect the rates in effect at period end. |
(f) Remaining maturities of bank loan obligations may be less than the stated maturities shown as a result of contractual or optional prepayments by the borrower. Such prepayments cannot be predicted with certainty. |
(g) The coupon rate will be determined upon settlement of the loan after period end. |
(h) Position or a portion of the position represents an unfunded loan commitment. At period end, the total principal amount and market value of unfunded commitments totaled $44,153,000 and $43,122,000, respectively. |
(i) Restricted securities - Investment in securities not registered under the Securities Act of 1933 (excluding 144A issues). At the end of the period, the value of restricted securities (excluding 144A issues) amounted to $21,000 or 0.0% of net assets. |
Additional information on each restricted holding is as follows: |
Security | Acquisition Date | Acquisition Cost (000s) |
Houghton Mifflin Harcourt Co. warrants 6/22/19 | 6/22/12 | $ 26 |
Affiliated Central Funds |
Information regarding fiscal year to date income earned by the Fund from investments in Fidelity Central Funds is as follows: |
Fund | Income earned |
Fidelity Cash Central Fund | $ 1,200 |
Other Information |
The following is a summary of the inputs used, as of October 31, 2014, involving the Fund's assets and liabilities carried at fair value. The inputs or methodology used for valuing securities may not be an indication of the risk associated with investing in those securities. For more information on valuation inputs, and their aggregation into the levels used in the table below, please refer to the Investment Valuation section in the accompanying Notes to Financial Statements. |
Valuation Inputs at Reporting Date: | ||||
Description | Total | Level 1 | Level 2 | Level 3 |
Investments in Securities: | ||||
Equities: | ||||
Consumer Discretionary | $ 4,598 | $ 885 | $ - | $ 3,713 |
Financials | 617 | - | - | 617 |
Materials | 22,536 | 22,536 | - | - |
Telecommunication Services | 569 | 569 | - | - |
Utilities | 473 | 473 | - | - |
Bank Loan Obligations | 12,918,111 | - | 12,850,315 | 67,796 |
Corporate Bonds | 985,772 | - | 985,772 | - |
Other | - | - | - | - |
Money Market Funds | 581,719 | 581,719 | - | - |
Total Investments in Securities: | $ 14,514,395 | $ 606,182 | $ 13,836,087 | $ 72,126 |
Distribution of investments by country or territory of incorporation, as a percentage of total net assets, is as follows (Unaudited): |
United States of America | 88.3% |
Luxembourg | 3.1% |
Australia | 2.5% |
Netherlands | 2.0% |
United Kingdom | 1.1% |
Others (Individually Less Than 1%) | 3.0% |
| 100.0% |
See accompanying notes which are an integral part of the financial statements.
Annual Report
Financial Statements
Statement of Assets and Liabilities
Amounts in thousands (except per-share amounts) | October 31, 2014 | |
|
|
|
Assets | ||
Investment in securities, at value - See accompanying schedule: Unaffiliated issuers (cost $14,036,695) | $ 13,932,676 |
|
Fidelity Central Funds (cost $581,719) | 581,719 |
|
Total Investments (cost $14,618,414) |
| $ 14,514,395 |
Cash |
| 62,292 |
Receivable for investments sold | 137,394 | |
Receivable for fund shares sold | 9,748 | |
Interest receivable | 58,716 | |
Distributions receivable from Fidelity Central Funds | 56 | |
Prepaid expenses | 49 | |
Other receivables | 1 | |
Total assets | 14,782,651 | |
|
|
|
Liabilities | ||
Payable for investments purchased | $ 109,248 | |
Payable for fund shares redeemed | 28,093 | |
Distributions payable | 10,158 | |
Accrued management fee | 6,908 | |
Distribution and service plan fees payable | 1,014 | |
Other affiliated payables | 1,795 | |
Other payables and accrued expenses | 129 | |
Total liabilities | 157,345 | |
|
|
|
Net Assets | $ 14,625,306 | |
Net Assets consist of: |
| |
Paid in capital | $ 14,631,284 | |
Undistributed net investment income | 67,963 | |
Accumulated undistributed net realized gain (loss) on investments | 30,078 | |
Net unrealized appreciation (depreciation) on investments | (104,019) | |
Net Assets | $ 14,625,306 | |
See accompanying notes which are an integral part of the financial statements.
Annual Report
Statement of Assets and Liabilities - continued
Amounts in thousands (except per-share amounts) | October 31, 2014 | |
|
|
|
Calculation of Maximum Offering Price Class A: | $ 9.85 | |
|
|
|
Maximum offering price per share (100/97.25 of $9.85) | $ 10.13 | |
Class T: | $ 9.84 | |
|
|
|
Maximum offering price per share (100/97.25 of $9.84) | $ 10.12 | |
Class B: | $ 9.83 | |
|
|
|
Class C: | $ 9.85 | |
|
|
|
Fidelity Floating Rate High Income Fund: | $ 9.84 | |
|
|
|
Institutional Class: | $ 9.83 | |
A Redemption price per share is equal to net asset value less any applicable contingent deferred sales charge.
See accompanying notes which are an integral part of the financial statements.
Annual Report
Financial Statements - continued
Statement of Operations
Amounts in thousands | Year ended October 31, 2014 | |
|
|
|
Investment Income |
|
|
Dividends |
| $ 1,907 |
Interest |
| 656,802 |
Income from Fidelity Central Funds |
| 1,200 |
Total income |
| 659,909 |
|
|
|
Expenses | ||
Management fee | $ 89,463 | |
Transfer agent fees | 20,662 | |
Distribution and service plan fees | 13,935 | |
Accounting fees and expenses | 1,815 | |
Custodian fees and expenses | 194 | |
Independent trustees' compensation | 66 | |
Registration fees | 448 | |
Audit | 173 | |
Legal | 53 | |
Miscellaneous | 115 | |
Total expenses before reductions | 126,924 | |
Expense reductions | (59) | 126,865 |
Net investment income (loss) | 533,044 | |
Realized and Unrealized Gain (Loss) Net realized gain (loss) on: | ||
Investment securities: |
|
|
Unaffiliated issuers |
| 33,692 |
Change in net unrealized appreciation (depreciation) on investment securities | (219,514) | |
Net gain (loss) | (185,822) | |
Net increase (decrease) in net assets resulting from operations | $ 347,222 | |
See accompanying notes which are an integral part of the financial statements.
Annual Report
Statement of Changes in Net Assets
Amounts in thousands | Year ended | Year ended |
Increase (Decrease) in Net Assets |
|
|
Operations |
|
|
Net investment income (loss) | $ 533,044 | $ 410,895 |
Net realized gain (loss) | 33,692 | 72,218 |
Change in net unrealized appreciation (depreciation) | (219,514) | 9,078 |
Net increase (decrease) in net assets resulting | 347,222 | 492,191 |
Distributions to shareholders from net investment income | (519,702) | (375,589) |
Distributions to shareholders from net realized gain | (57,139) | (52,959) |
Total distributions | (576,841) | (428,548) |
Share transactions - net increase (decrease) | (610,631) | 4,793,436 |
Redemption fees | 671 | 916 |
Total increase (decrease) in net assets | (839,579) | 4,857,995 |
|
|
|
Net Assets | ||
Beginning of period | 15,464,885 | 10,606,890 |
End of period (including undistributed net investment income of $67,963 and undistributed net investment income of $122,241, respectively) | $ 14,625,306 | $ 15,464,885 |
See accompanying notes which are an integral part of the financial statements.
Annual Report
Financial Highlights - Class A
Years ended October 31, | 2014 | 2013 | 2012 | 2011 | 2010 |
Selected Per-Share Data |
|
|
|
|
|
Net asset value, beginning of period | $ 9.99 | $ 9.94 | $ 9.73 | $ 9.79 | $ 9.31 |
Income from Investment Operations |
|
|
|
|
|
Net investment income (loss) C | .317 | .310 | .340 | .317 | .391 |
Net realized and unrealized gain (loss) | (.114) | .070 | .195 | (.080) | .425 |
Total from investment operations | .203 | .380 | .535 | .237 | .816 |
Distributions from net investment income | (.307) | (.282) | (.325) | (.298) | (.287) |
Distributions from net realized gain | (.036) | (.049) | - | - | (.050) |
Total distributions | (.343) | (.331) | (.325) | (.298) | (.337) |
Redemption fees added to paid in capital C | - G | .001 | - G | .001 | .001 |
Net asset value, end of period | $ 9.85 | $ 9.99 | $ 9.94 | $ 9.73 | $ 9.79 |
Total ReturnA, B | 2.05% | 3.89% | 5.60% | 2.46% | 8.96% |
Ratios to Average Net Assets D, F |
|
|
|
|
|
Expenses before reductions | .98% | .99% | .99% | 1.00% | 1.03% |
Expenses net of fee waivers, if any | .98% | .99% | .99% | 1.00% | 1.03% |
Expenses net of all reductions | .98% | .99% | .99% | 1.00% | 1.03% |
Net investment income (loss) | 3.17% | 3.11% | 3.47% | 3.25% | 4.11% |
Supplemental Data |
|
|
|
|
|
Net assets, end of period (in millions) | $ 1,185 | $ 1,681 | $ 1,305 | $ 1,587 | $ 1,064 |
Portfolio turnover rateE | 54% | 62% | 49% | 54% | 43% |
A Total returns would have been lower if certain expenses had not been reduced during the applicable periods shown.
B Total returns do not include the effect of the sales charges.
C Calculated based on average shares outstanding during the period.
D Fees and expenses of any underlying Fidelity Central Funds are not included in the Fund's expense ratio. The Fund indirectly bears its proportionate share of the expenses of any underlying Fidelity Central Funds.
E Amount does not include the portfolio activity of any underlying Fidelity Central Funds.
F Expense ratios reflect operating expenses of the class. Expenses before reductions do not reflect amounts reimbursed by the investment adviser or reductions from brokerage service arrangements or reductions from other expense offset arrangements and do not represent the amount paid by the class during periods when reimbursements or reductions occur. Expenses net of fee waivers reflect expenses after reimbursement by the investment adviser but prior to reductions from brokerage service arrangements or other expense offset arrangements. Expenses net of all reductions represent the net expenses paid by the class.
G Amount represents less than $.001 per share.
See accompanying notes which are an integral part of the financial statements.
Annual Report
Financial Highlights - Class T
Years ended October 31, | 2014 | 2013 | 2012 | 2011 | 2010 |
Selected Per-Share Data |
|
|
|
|
|
Net asset value, beginning of period | $ 9.98 | $ 9.93 | $ 9.72 | $ 9.77 | $ 9.30 |
Income from Investment Operations |
|
|
|
|
|
Net investment income (loss) C | .306 | .299 | .330 | .312 | .391 |
Net realized and unrealized gain (loss) | (.112) | .071 | .195 | (.070) | .416 |
Total from investment operations | .194 | .370 | .525 | .242 | .807 |
Distributions from net investment income | (.298) | (.272) | (.315) | (.293) | (.288) |
Distributions from net realized gain | (.036) | (.049) | - | - | (.050) |
Total distributions | (.334) | (.321) | (.315) | (.293) | (.338) |
Redemption fees added to paid in capital C | - G | .001 | - G | .001 | .001 |
Net asset value, end of period | $ 9.84 | $ 9.98 | $ 9.93 | $ 9.72 | $ 9.77 |
Total ReturnA, B | 1.96% | 3.79% | 5.50% | 2.51% | 8.87% |
Ratios to Average Net Assets D, F |
|
|
|
|
|
Expenses before reductions | 1.07% | 1.09% | 1.09% | 1.05% | 1.02% |
Expenses net of fee waivers, if any | 1.07% | 1.09% | 1.09% | 1.05% | 1.02% |
Expenses net of all reductions | 1.07% | 1.09% | 1.09% | 1.05% | 1.02% |
Net investment income (loss) | 3.08% | 3.01% | 3.37% | 3.19% | 4.12% |
Supplemental Data |
|
|
|
|
|
Net assets, end of period (in millions) | $ 240 | $ 272 | $ 241 | $ 271 | $ 242 |
Portfolio turnover rateE | 54% | 62% | 49% | 54% | 43% |
A Total returns would have been lower if certain expenses had not been reduced during the applicable periods shown.
B Total returns do not include the effect of the sales charges.
C Calculated based on average shares outstanding during the period.
D Fees and expenses of any underlying Fidelity Central Funds are not included in the Fund's expense ratio. The Fund indirectly bears its proportionate share of the expenses of any underlying Fidelity Central Funds.
E Amount does not include the portfolio activity of any underlying Fidelity Central Funds.
F Expense ratios reflect operating expenses of the class. Expenses before reductions do not reflect amounts reimbursed by the investment adviser or reductions from brokerage service arrangements or reductions from other expense offset arrangements and do not represent the amount paid by the class during periods when reimbursements or reductions occur. Expenses net of fee waivers reflect expenses after reimbursement by the investment adviser but prior to reductions from brokerage service arrangements or other expense offset arrangements. Expenses net of all reductions represent the net expenses paid by the class.
G Amount represents less than $.001 per share.
See accompanying notes which are an integral part of the financial statements.
Annual Report
Financial Highlights - Class B
Years ended October 31, | 2014 | 2013 | 2012 | 2011 | 2010 |
Selected Per-Share Data |
|
|
|
|
|
Net asset value, beginning of period | $ 9.98 | $ 9.93 | $ 9.72 | $ 9.77 | $ 9.30 |
Income from Investment Operations |
|
|
|
|
|
Net investment income (loss) C | .264 | .256 | .288 | .266 | .341 |
Net realized and unrealized gain (loss) | (.123) | .071 | .195 | (.070) | .416 |
Total from investment operations | .141 | .327 | .483 | .196 | .757 |
Distributions from net investment income | (.255) | (.229) | (.273) | (.247) | (.238) |
Distributions from net realized gain | (.036) | (.049) | - | - | (.050) |
Total distributions | (.291) | (.278) | (.273) | (.247) | (.288) |
Redemption fees added to paid in capital C | - G | .001 | - G | .001 | .001 |
Net asset value, end of period | $ 9.83 | $ 9.98 | $ 9.93 | $ 9.72 | $ 9.77 |
Total ReturnA, B | 1.42% | 3.35% | 5.05% | 2.03% | 8.30% |
Ratios to Average Net Assets D, F |
|
|
|
|
|
Expenses before reductions | 1.50% | 1.52% | 1.52% | 1.52% | 1.55% |
Expenses net of fee waivers, if any | 1.50% | 1.52% | 1.52% | 1.52% | 1.55% |
Expenses net of all reductions | 1.50% | 1.52% | 1.52% | 1.52% | 1.55% |
Net investment income (loss) | 2.64% | 2.58% | 2.94% | 2.72% | 3.59% |
Supplemental Data |
|
|
|
|
|
Net assets, end of period (in millions) | $ 17 | $ 23 | $ 24 | $ 32 | $ 43 |
Portfolio turnover rateE | 54% | 62% | 49% | 54% | 43% |
A Total returns would have been lower if certain expenses had not been reduced during the applicable periods shown.
B Total returns do not include the effect of the contingent deferred sales charge.
C Calculated based on average shares outstanding during the period.
D Fees and expenses of any underlying Fidelity Central Funds are not included in the Fund's expense ratio. The Fund indirectly bears its proportionate share of the expenses of any underlying Fidelity Central Funds.
E Amount does not include the portfolio activity of any underlying Fidelity Central Funds.
F Expense ratios reflect operating expenses of the class. Expenses before reductions do not reflect amounts reimbursed by the investment adviser or reductions from brokerage service arrangements or reductions from other expense offset arrangements and do not represent the amount paid by the class during periods when reimbursements or reductions occur. Expenses net of fee waivers reflect expenses after reimbursement by the investment adviser but prior to reductions from brokerage service arrangements or other expense offset arrangements. Expenses net of all reductions represent the net expenses paid by the class.
G Amount represents less than $.001 per share.
See accompanying notes which are an integral part of the financial statements.
Annual Report
Financial Highlights - Class C
Years ended October 31, | 2014 | 2013 | 2012 | 2011 | 2010 |
Selected Per-Share Data |
|
|
|
|
|
Net asset value, beginning of period | $ 9.99 | $ 9.94 | $ 9.73 | $ 9.78 | $ 9.31 |
Income from Investment Operations |
|
|
|
|
|
Net investment income (loss) C | .241 | .235 | .267 | .244 | .321 |
Net realized and unrealized gain (loss) | (.113) | .070 | .195 | (.070) | .415 |
Total from investment operations | .128 | .305 | .462 | .174 | .736 |
Distributions from net investment income | (.232) | (.207) | (.252) | (.225) | (.217) |
Distributions from net realized gain | (.036) | (.049) | - | - | (.050) |
Total distributions | (.268) | (.256) | (.252) | (.225) | (.267) |
Redemption fees added to paid in capital C | - G | .001 | - G | .001 | .001 |
Net asset value, end of period | $ 9.85 | $ 9.99 | $ 9.94 | $ 9.73 | $ 9.78 |
Total ReturnA, B | 1.29% | 3.11% | 4.81% | 1.80% | 8.05% |
Ratios to Average Net Assets D, F |
|
|
|
|
|
Expenses before reductions | 1.73% | 1.74% | 1.74% | 1.74% | 1.76% |
Expenses net of fee waivers, if any | 1.73% | 1.74% | 1.74% | 1.74% | 1.76% |
Expenses net of all reductions | 1.73% | 1.74% | 1.74% | 1.74% | 1.76% |
Net investment income (loss) | 2.41% | 2.35% | 2.72% | 2.50% | 3.38% |
Supplemental Data |
|
|
|
|
|
Net assets, end of period (in millions) | $ 835 | $ 960 | $ 806 | $ 852 | $ 622 |
Portfolio turnover rateE | 54% | 62% | 49% | 54% | 43% |
A Total returns would have been lower if certain expenses had not been reduced during the applicable periods shown.
B Total returns do not include the effect of the contingent deferred sales charge.
C Calculated based on average shares outstanding during the period.
D Fees and expenses of any underlying Fidelity Central Funds are not included in the Fund's expense ratio. The Fund indirectly bears its proportionate share of the expenses of any underlying Fidelity Central Funds.
E Amount does not include the portfolio activity of any underlying Fidelity Central Funds.
F Expense ratios reflect operating expenses of the class. Expenses before reductions do not reflect amounts reimbursed by the investment adviser or reductions from brokerage service arrangements or reductions from other expense offset arrangements and do not represent the amount paid by the class during periods when reimbursements or reductions occur. Expenses net of fee waivers reflect expenses after reimbursement by the investment adviser but prior to reductions from brokerage service arrangements or other expense offset arrangements. Expenses net of all reductions represent the net expenses paid by the class.
G Amount represents less than $.001 per share.
See accompanying notes which are an integral part of the financial statements.
Annual Report
Financial Highlights - Fidelity Floating Rate High Income Fund
Years ended October 31, | 2014 | 2013 | 2012 | 2011 | 2010 |
Selected Per-Share Data |
|
|
|
|
|
Net asset value, beginning of period | $ 9.98 | $ 9.93 | $ 9.72 | $ 9.77 | $ 9.30 |
Income from Investment Operations |
|
|
|
|
|
Net investment income (loss) B | .344 | .337 | .368 | .345 | .418 |
Net realized and unrealized gain (loss) | (.113) | .071 | .195 | (.070) | .417 |
Total from investment operations | .231 | .408 | .563 | .275 | .835 |
Distributions from net investment income | (.335) | (.310) | (.353) | (.326) | (.316) |
Distributions from net realized gain | (.036) | (.049) | - | - | (.050) |
Total distributions | (.371) | (.359) | (.353) | (.326) | (.366) |
Redemption fees added to paid in capital B | - F | .001 | - F | .001 | .001 |
Net asset value, end of period | $ 9.84 | $ 9.98 | $ 9.93 | $ 9.72 | $ 9.77 |
Total ReturnA | 2.34% | 4.19% | 5.91% | 2.86% | 9.18% |
Ratios to Average Net Assets C, E |
|
|
|
|
|
Expenses before reductions | .69% | .70% | .71% | .71% | .73% |
Expenses net of fee waivers, if any | .69% | .70% | .71% | .71% | .73% |
Expenses net of all reductions | .69% | .70% | .71% | .71% | .73% |
Net investment income (loss) | 3.45% | 3.39% | 3.75% | 3.53% | 4.41% |
Supplemental Data |
|
|
|
|
|
Net assets, end of period (in millions) | $ 9,032 | $ 8,882 | $ 5,720 | $ 5,399 | $ 3,566 |
Portfolio turnover rateD | 54% | 62% | 49% | 54% | 43% |
A Total returns would have been lower if certain expenses had not been reduced during the applicable periods shown.
B Calculated based on average shares outstanding during the period.
C Fees and expenses of any underlying Fidelity Central Funds are not included in the Fund's expense ratio. The Fund indirectly bears its proportionate share of the expenses of any underlying Fidelity Central Funds.
D Amount does not include the portfolio activity of any underlying Fidelity Central Funds.
E Expense ratios reflect operating expenses of the class. Expenses before reductions do not reflect amounts reimbursed by the investment adviser or reductions from brokerage service arrangements or reductions from other expense offset arrangements and do not represent the amount paid by the class during periods when reimbursements or reductions occur. Expenses net of fee waivers reflect expenses after reimbursement by the investment adviser but prior to reductions from brokerage service arrangements or other expense offset arrangements. Expenses net of all reductions represent the net expenses paid by the class.
F Amount represents less than $.001 per share.
See accompanying notes which are an integral part of the financial statements.
Annual Report
Financial Highlights - Institutional Class
Years ended October 31, | 2014 | 2013 | 2012 | 2011 | 2010 |
Selected Per-Share Data |
|
|
|
|
|
Net asset value, beginning of period | $ 9.97 | $ 9.92 | $ 9.71 | $ 9.77 | $ 9.29 |
Income from Investment Operations |
|
|
|
|
|
Net investment income (loss) B | .339 | .332 | .363 | .341 | .415 |
Net realized and unrealized gain (loss) | (.113) | .071 | .196 | (.079) | .427 |
Total from investment operations | .226 | .403 | .559 | .262 | .842 |
Distributions from net investment income | (.330) | (.305) | (.349) | (.323) | (.313) |
Distributions from net realized gain | (.036) | (.049) | - | - | (.050) |
Total distributions | (.366) | (.354) | (.349) | (.323) | (.363) |
Redemption fees added to paid in capital B | - F | .001 | - F | .001 | .001 |
Net asset value, end of period | $ 9.83 | $ 9.97 | $ 9.92 | $ 9.71 | $ 9.77 |
Total ReturnA | 2.29% | 4.15% | 5.87% | 2.72% | 9.27% |
Ratios to Average Net Assets C, E |
|
|
|
|
|
Expenses before reductions | .74% | .75% | .75% | .75% | .76% |
Expenses net of fee waivers, if any | .74% | .75% | .75% | .75% | .76% |
Expenses net of all reductions | .74% | .75% | .75% | .75% | .76% |
Net investment income (loss) | 3.40% | 3.34% | 3.71% | 3.50% | 4.38% |
Supplemental Data |
|
|
|
|
|
Net assets, end of period (in millions) | $ 3,317 | $ 3,646 | $ 2,510 | $ 1,992 | $ 1,138 |
Portfolio turnover rateD | 54% | 62% | 49% | 54% | 43% |
A Total returns would have been lower if certain expenses had not been reduced during the applicable periods shown.
B Calculated based on average shares outstanding during the period.
C Fees and expenses of any underlying Fidelity Central Funds are not included in the Fund's expense ratio. The Fund indirectly bears its proportionate share of the expenses of any underlying Fidelity Central Funds.
D Amount does not include the portfolio activity of any underlying Fidelity Central Funds.
E Expense ratios reflect operating expenses of the class. Expenses before reductions do not reflect amounts reimbursed by the investment adviser or reductions from brokerage service arrangements or reductions from other expense offset arrangements and do not represent the amount paid by the class during periods when reimbursements or reductions occur. Expenses net of fee waivers reflect expenses after reimbursement by the investment adviser but prior to reductions from brokerage service arrangements or other expense offset arrangements. Expenses net of all reductions represent the net expenses paid by the class.
F Amount represents less than $.001 per share.
See accompanying notes which are an integral part of the financial statements.
Annual Report
Notes to Financial Statements
For the period ended October 31, 2014
(Amounts in thousands except percentages)
1. Organization.
Fidelity Advisor Floating Rate High Income Fund (the Fund) is a fund of Fidelity Advisor Series I (the Trust) and is authorized to issue an unlimited number of shares. The Trust is registered under the Investment Company Act of 1940, as amended (the 1940 Act), as an open-end management investment company organized as a Massachusetts business trust. The Fund offers Class A, Class T, Class C, Fidelity Floating Rate High Income Fund and Institutional Class shares, each of which, along with Class B shares, has equal rights as to assets and voting privileges. Class B shares are closed to new accounts and additional purchases, except for exchanges and reinvestments. Each class has exclusive voting rights with respect to matters that affect that class. Class B shares will automatically convert to Class A shares after a holding period of seven years from the initial date of purchase.
2. Investments in Fidelity Central Funds.
The Fund invests in Fidelity Central Funds, which are open-end investment companies generally available only to other investment companies and accounts managed by the investment adviser and its affiliates. The Fund's Schedule of Investments lists each of the Fidelity Central Funds held as of period end, if any, as an investment of the Fund, but does not include the underlying holdings of each Fidelity Central Fund. As an Investing Fund, the Fund indirectly bears its proportionate share of the expenses of the underlying Fidelity Central Funds.
The Money Market Central Funds seek preservation of capital and current income and are managed by Fidelity Investments Money Management, Inc. (FIMM), an affiliate of the investment adviser. Annualized expenses of the Money Market Central Funds as of their most recent shareholder report date are less than .01%.
A complete unaudited list of holdings for each Fidelity Central Fund is available upon request or at the Securities and Exchange Commission (the SEC) website at www.sec.gov. In addition, the financial statements of the Fidelity Central Funds, which are not covered by the Fund's Report of Independent Registered Public Accounting Firm, are available on the SEC website or upon request.
3. Significant Accounting Policies.
The financial statements have been prepared in conformity with accounting principles generally accepted in the United States of America (GAAP), which require management to make certain estimates and assumptions at the date of the financial statements. Actual results could differ from those estimates. Subsequent events, if any, through the date that the financial statements were issued have been evaluated in the preparation of
Annual Report
Notes to Financial Statements - continued
(Amounts in thousands except percentages)
3. Significant Accounting Policies - continued
the financial statements. The following summarizes the significant accounting policies of the Fund:
Investment Valuation. Investments are valued as of 4:00 p.m. Eastern time on the last calendar day of the period. In accordance with valuation policies and procedures approved by the Board of Trustees (the Board), the Fund attempts to obtain prices from one or more third party pricing vendors or brokers to value its investments. When current market prices, quotations or currency exchange rates are not readily available or reliable, investments will be fair valued in good faith by the Fidelity Management & Research Company (FMR) Fair Value Committee (the Committee), in accordance with procedures adopted by the Board. Factors used in determining fair value vary by investment type and may include market or investment specific events, changes in interest rates and credit quality. The frequency with which these procedures are used cannot be predicted and they may be utilized to a significant extent. The Committee oversees the Fund's valuation policies and procedures and is responsible for approving and reporting to the Board all fair value determinations.
The Fund categorizes the inputs to valuation techniques used to value its investments into a disclosure hierarchy consisting of three levels as shown below:
Level 1 - quoted prices in active markets for identical investments
Level 2 - other significant observable inputs (including quoted prices for similar investments, interest rates, prepayment speeds, etc.)
Level 3 - unobservable inputs (including the Fund's own assumptions based on the best information available)
Valuation techniques used to value the Fund's investments by major category are as follows:
Debt securities, including restricted securities, are valued based on evaluated prices received from third party pricing vendors or from brokers who make markets in such securities. Corporate bonds and bank loan obligations are valued by pricing vendors who utilize matrix pricing which considers yield or price of bonds of comparable quality, coupon, maturity and type or by broker-supplied prices. When independent prices are unavailable or unreliable, debt securities may be valued utilizing pricing methodologies which consider similar factors that would be used by third party pricing vendors. Debt securities are generally categorized as Level 2 in the hierarchy but may be Level 3 depending on the circumstances. The Fund invests a significant portion of its assets in below investment grade securities. The value of these securities can be more volatile due to changes in the credit quality of the issuer and is sensitive to changes in economic, market and regulatory conditions.
Annual Report
3. Significant Accounting Policies - continued
Investment Valuation - continued
Equity securities, including restricted securities, for which market quotations are readily available, are valued at the last reported sale price or official closing price as reported by a third party pricing vendor on the primary market or exchange on which they are traded and are categorized as Level 1 in the hierarchy. In the event there were no sales during the day or closing prices are not available, securities are valued at the last quoted bid price or may be valued using the last available price and are generally categorized as Level 2 in the hierarchy. For foreign equity securities, when market or security specific events arise, comparisons to the valuation of American Depositary Receipts (ADRs), futures contracts, Exchange-Traded Funds (ETFs) and certain indexes as well as quoted prices for similar securities may be used and would be categorized as Level 2 in the hierarchy. Utilizing these techniques may result in transfers between Level 1 and Level 2. For equity securities, including restricted securities, where observable inputs are limited, assumptions about market activity and risk are used and these securities may be categorized as Level 3 in the hierarchy.
Investments in open-end mutual funds, including the Fidelity Central Funds, are valued at their closing net asset value (NAV) each business day and are categorized as Level 1 in the hierarchy.
Changes in valuation techniques may result in transfers in or out of an assigned level within the disclosure hierarchy. The aggregate value of investments by input level, as of October 31, 2014 is included at the end of the Fund's Schedule of Investments.
Investment Transactions and Income. For financial reporting purposes, the Fund's investment holdings and NAV include trades executed through the end of the last business day of the period. The NAV per share for processing shareholder transactions is calculated as of the close of business of the New York Stock Exchange (NYSE), normally 4:00 p.m. Eastern time and includes trades executed through the end of the prior business day. Gains and losses on securities sold are determined on the basis of identified cost and may include proceeds received from litigation. Dividend income is recorded on the ex-dividend date, except for certain dividends from foreign securities where the ex-dividend date may have passed, which are recorded as soon as the Fund is informed of the ex-dividend date. Non-cash dividends included in dividend income, if any, are recorded at the fair market value of the securities received. Income and capital gain distributions from Fidelity Central Funds, if any, are recorded on the ex-dividend date. Distributions received on securities that represent a return of capital or capital gain are recorded as a reduction of cost of investments and/or as a realized gain. Subsequent to ex-dividend date the Fund determines the components of these distributions, based upon receipt of tax filings or other correspondence relating to the underlying investment. Interest income is accrued as earned and includes coupon interest and amortization of
Annual Report
Notes to Financial Statements - continued
(Amounts in thousands except percentages)
3. Significant Accounting Policies - continued
Investment Transactions and Income - continued
premium and accretion of discount on debt securities as applicable. Debt obligations may be placed on non-accrual status and related interest income may be reduced by ceasing current accruals and writing off interest receivables when the collection of all or a portion of interest has become doubtful based on consistently applied procedures. A debt obligation is removed from non-accrual status when the issuer resumes interest payments or when collectability of interest is reasonably assured. The Fund earns certain fees in connection with its floating rate loan purchasing activities. These fees are in addition to interest payments earned and may include amendment fees, consent fees and prepayment fees. These fees are recorded as Interest in the accompanying financial statements.
Class Allocations and Expenses. Investment income, realized and unrealized capital gains and losses, common expenses of the Fund, and certain fund-level expense reductions, if any, are allocated daily on a pro-rata basis to each class based on the relative net assets of each class to the total net assets of the Fund. Each class differs with respect to transfer agent and distribution and service plan fees incurred. Certain expense reductions may also differ by class. For the reporting period, the allocated portion of income and expenses to each class as a percent of its average net assets may vary due to the timing of recording these transactions in relation to fluctuating net assets of the classes. Expenses directly attributable to a fund are charged to that fund. Expenses attributable to more than one fund are allocated among the respective funds on the basis of relative net assets or other appropriate methods. Expense estimates are accrued in the period to which they relate and adjustments are made when actual amounts are known.
Income Tax Information and Distributions to Shareholders. Each year, the Fund intends to qualify as a regulated investment company under Subchapter M of the Internal Revenue Code, including distributing substantially all of its taxable income and realized gains. As a result, no provision for U.S. Federal income taxes is required. As of October 31, 2014, the Fund did not have any unrecognized tax benefits in the financial statements; nor is the Fund aware of any tax positions for which it is reasonably possible that the total amounts of unrecognized tax benefits will significantly change in the next twelve months. The Fund files a U.S. federal tax return, in addition to state and local tax returns as required. The Fund's federal income tax returns are subject to examination by the Internal Revenue Service (IRS) for a period of three fiscal years after they are filed. State and local tax returns may be subject to examination for an additional fiscal year depending on the jurisdiction.
Annual Report
3. Significant Accounting Policies - continued
Income Tax Information and Distributions to Shareholders - continued
Dividends are declared and recorded daily and paid monthly from net investment income. Distributions from realized gains, if any, are declared and recorded on the ex-dividend date. Income dividends and capital gain distributions are declared separately for each class. Income and capital gain distributions are determined in accordance with income tax regulations, which may differ from GAAP.
Capital accounts within the financial statements are adjusted for permanent book-tax differences. These adjustments have no impact on net assets or the results of operations. Capital accounts are not adjusted for temporary book-tax differences which will reverse in a subsequent period.
Book-tax differences are primarily due to market discount, capital loss carryforwards and losses deferred due to wash sales.
The federal tax cost of investment securities and unrealized appreciation (depreciation) as of period end were as follows:
Gross unrealized appreciation | $ 113,253 |
Gross unrealized depreciation | (175,816) |
Net unrealized appreciation (depreciation) on securities | $ (62,563) |
|
|
Tax Cost | $ 14,576,958 |
The tax-based components of distributable earnings as of period end were as follows:
Undistributed ordinary income | $ 26,256 |
Undistributed long-term capital gain | $ 30,329 |
Net unrealized appreciation (depreciation) on securities and other investments | $ (62,562) |
The tax character of distributions paid was as follows:
| October 31, 2014 | October 31, 2013 |
Ordinary Income | $ 576,841 | $ 428,548 |
Short-Term Trading (Redemption) Fees. Shares held by investors in the Fund less than 60 days may have been subject to a redemption fee equal to 1.00% of the NAV of shares redeemed. All redemption fees, which reduce the proceeds of the shareholder redemption, are retained by the Fund and accounted for as an addition to paid in capital.
Annual Report
Notes to Financial Statements - continued
(Amounts in thousands except percentages)
3. Significant Accounting Policies - continued
Restricted Securities. The Fund may invest in securities that are subject to legal or contractual restrictions on resale. These securities generally may be resold in transactions exempt from registration or to the public if the securities are registered. Disposal of these securities may involve time-consuming negotiations and expense, and prompt sale at an acceptable price may be difficult. Information regarding restricted securities is included at the end of the Fund's Schedule of Investments.
Loans and Other Direct Debt Instruments. The Fund invests in direct debt instruments which are interests in amounts owed to lenders by corporate or other borrowers. These instruments may be in the form of loans, trade claims or other receivables and may include standby financing commitments such as revolving credit facilities that obligate the Fund to supply additional cash to the borrower on demand. Loans may be acquired through assignment or participation, or may be made directly to a borrower. The Fund also invests in unfunded loan commitments, which are contractual obligations for future funding. Information regarding unfunded commitments is included at the end of the Fund's Schedule of Investments.
Purchases and Sales of Investments. Purchases and sales of securities (including principal repayments of bank loan obligations), other than short-term securities, aggregated $8,114,227 and $8,057,054, respectively.
New Accounting Pronouncement. In June 2014, the Financial Accounting Standards Board issued Accounting Standard Update No. 2014-11, Repurchase-to-Maturity Transactions, Repurchase Financings, and Disclosures. The Update amends the accounting for certain repurchase agreements and expands disclosure requirements for reverse repurchase agreements, securities lending and other similar transactions. The disclosure requirements are effective for annual and interim reporting periods beginning after December 15, 2014. Management is currently evaluating the impact of the Update on the Fund's financial statements and related disclosures.
4. Fees and Other Transactions with Affiliates.
Management Fee. Fidelity Management & Research Company (the investment adviser) and its affiliates provide the Fund with investment management related services for which the Fund pays a monthly management fee. The management fee is the sum of an individual fund fee rate that is based on an annual rate of .45% of the Fund's average net assets and an annualized group fee rate that averaged .11% during the period. The group fee rate is based upon the average net assets of all the mutual funds advised by the investment adviser, including any mutual funds previously advised by the investment adviser that are currently advised by Fidelity SelectCo, LLC, an affiliate of the investment adviser. The group fee rate decreases as assets under management increase and increases as assets under management decrease. For the reporting period, the total annual management fee rate was .56% of the Fund's average net assets.
Annual Report
4. Fees and Other Transactions with Affiliates - continued
Distribution and Service Plan Fees. In accordance with Rule 12b-1 of the 1940 Act, the Fund has adopted separate Distribution and Service Plans for each class of shares. Certain classes pay Fidelity Distributors Corporation (FDC), an affiliate of the investment adviser, separate Distribution and Service Fees, each of which is based on an annual percentage of each class' average net assets. In addition, FDC may pay financial intermediaries for selling shares of the Fund and providing shareholder support services. For the period, the Distribution and Service Fee rates, total fees and amounts retained by FDC were as follows:
| Distribution | Service | Total Fees | Retained |
Class A | -% | .25% | $ 3,857 | $ 158 |
Class T | -% | .25% | 659 | 2 |
Class B | .55% | .15% | 142 | 112 |
Class C | .75% | .25% | 9,277 | 1,498 |
|
|
| $ 13,935 | $ 1,770 |
Sales Load. FDC may receive a front-end sales charge of up to 2.75% for selling Class A shares and Class T shares, some of which is paid to financial intermediaries for selling shares of the Fund. Depending on the holding period, FDC may receive contingent deferred sales charges levied on Class A, Class T, Class B and Class C redemptions. The deferred sales charges range from 3.50% to 1.00% for Class B shares, 1.00% for Class C shares, 1.00% or .50% for certain purchases of Class A shares and .25% for certain purchases of Class T shares.
For the period, sales charge amounts retained by FDC were as follows:
| Retained |
Class A | $ 79 |
Class T | 12 |
Class B* | 22 |
Class C* | 104 |
| $ 217 |
* When Class B and Class C shares are initially sold, FDC pays commissions from its own resources to financial intermediaries through which the sales are made.
Transfer Agent Fees. Fidelity Investments Institutional Operations Company, Inc., (FIIOC), an affiliate of the investment adviser, is the transfer, dividend disbursing and shareholder servicing agent for each class of the Fund. FIIOC receives account fees and asset-based fees that vary according to the account size and type of account of the shareholders of the respective classes of the Fund. FIIOC pays for typesetting, printing and mailing of shareholder reports, except proxy statements.
Annual Report
Notes to Financial Statements - continued
(Amounts in thousands except percentages)
4. Fees and Other Transactions with Affiliates - continued
Transfer Agent Fees - continued
For the period, transfer agent fees for each class were as follows:
| Amount | % of |
Class A | $ 2,252 | .15 |
Class T | 626 | .24 |
Class B | 45 | .22 |
Class C | 1,372 | .15 |
Fidelity Floating Rate High Income Fund | 10,472 | .11 |
Institutional Class | 5,895 | .16 |
| $ 20,662 |
|
Accounting Fees. Fidelity Service Company, Inc. (FSC), an affiliate of the investment adviser, maintains the Fund's accounting records. The fee is based on the level of average net assets for each month.
5. Committed Line of Credit.
The Fund participates with other funds managed by the investment adviser or an affiliate in a $4.25 billion credit facility (the "line of credit") to be utilized for temporary or emergency purposes to fund shareholder redemptions or for other short-term liquidity purposes. The Fund has agreed to pay commitment fees on its pro-rata portion of the line of credit, which amounted to $26 and is reflected in Miscellaneous expenses on the Statement of Operations. During the period, the Fund did not borrow on this line of credit.
6. Expense Reductions.
Through arrangements with the Fund's custodian, credits realized as a result of uninvested cash balances were used to reduce the Fund's expenses. During the period, these credits reduced the Fund's custody expenses by $53.
In addition, the investment adviser reimbursed a portion of the Fund's operating expenses during the period in the amount of $6.
Annual Report
7. Distributions to Shareholders.
Distributions to shareholders of each class were as follows:
Years ended October 31, | 2014 | 2013 |
From net investment income |
|
|
Class A | $ 47,339 | $ 41,401 |
Class T | 7,875 | 7,141 |
Class B | 519 | 529 |
Class C | 21,575 | 18,030 |
Fidelity Floating Rate High Income Fund | 321,211 | 214,851 |
Institutional Class | 121,183 | 93,637 |
Total | $ 519,702 | $ 375,589 |
From net realized gain |
|
|
Class A | $ 6,085 | $ 6,467 |
Class T | 983 | 1,176 |
Class B | 81 | 117 |
Class C | 3,472 | 3,997 |
Fidelity Floating Rate High Income Fund | 33,019 | 28,516 |
Institutional Class | 13,499 | 12,686 |
Total | $ 57,139 | $ 52,959 |
8. Share Transactions.
Share transactions for each class were as follows and may contain automatic conversions between classes or exchanges between funds:
| Shares | Dollars | ||
Years ended October 31, | 2014 | 2013 | 2014 | 2013 |
Class A |
|
|
|
|
Shares sold | 32,788 | 75,563 | $ 327,152 | $ 753,535 |
Reinvestment of distributions | 4,526 | 3,658 | 45,087 | 36,455 |
Shares redeemed | (85,268) | (42,208) | (849,518) | (421,018) |
Net increase (decrease) | (47,954) | 37,013 | $ (477,279) | $ 368,972 |
Class T |
|
|
|
|
Shares sold | 3,546 | 10,009 | $ 35,348 | $ 99,597 |
Reinvestment of distributions | 806 | 727 | 8,018 | 7,232 |
Shares redeemed | (7,285) | (7,688) | (72,473) | (76,547) |
Net increase (decrease) | (2,933) | 3,048 | $ (29,107) | $ 30,282 |
Class B |
|
|
|
|
Shares sold | 199 | 663 | $ 1,993 | $ 6,596 |
Reinvestment of distributions | 50 | 50 | 494 | 495 |
Shares redeemed | (838) | (851) | (8,343) | (8,474) |
Net increase (decrease) | (589) | (138) | $ (5,856) | $ (1,383) |
Annual Report
Notes to Financial Statements - continued
(Amounts in thousands except percentages)
8. Share Transactions - continued
| Shares | Dollars | ||
Years ended October 31, | 2014 | 2013 | 2014 | 2013 |
Class C |
|
|
|
|
Shares sold | 12,315 | 30,392 | $ 122,843 | $ 303,076 |
Reinvestment of distributions | 1,906 | 1,609 | 18,981 | 16,022 |
Shares redeemed | (25,513) | (17,011) | (254,028) | (169,644) |
Net increase (decrease) | (11,292) | 14,990 | $ (112,204) | $ 149,454 |
Fidelity Floating Rate High Income Fund |
|
|
|
|
Shares sold | 320,632 | 483,346 | $ 3,194,510 | $ 4,812,772 |
Reinvestment of distributions | 29,181 | 20,114 | 290,182 | 200,158 |
Shares redeemed | (321,413) | (189,555) | (3,193,979) | (1,887,500) |
Net increase (decrease) | 28,400 | 313,905 | $ 290,713 | $ 3,125,430 |
Institutional Class |
|
|
|
|
Shares sold | 123,632 | 203,411 | $ 1,230,573 | $ 2,024,367 |
Reinvestment of distributions | 7,408 | 5,909 | 73,620 | 58,759 |
Shares redeemed | (159,132) | (96,688) | (1,581,091) | (962,445) |
Net increase (decrease) | (28,092) | 112,632 | $ (276,898) | $ 1,120,681 |
9. Other.
The Fund's organizational documents provide former and current trustees and officers with a limited indemnification against liabilities arising in connection with the performance of their duties to the Fund. In the normal course of business, the Fund may also enter into contracts that provide general indemnifications. The Fund's maximum exposure under these arrangements is unknown as this would be dependent on future claims that may be made against the Fund. The risk of material loss from such claims is considered remote.
Annual Report
Report of Independent Registered Public Accounting Firm
To the Trustees of Fidelity Advisor Series I and Shareholders of Fidelity Advisor Floating Rate High Income Fund:
We have audited the accompanying statement of assets and liabilities of Fidelity Advisor Floating Rate High Income Fund (the Fund), a fund of Fidelity Advisor Series I, including the schedule of investments, as of October 31, 2014, and the related statement of operations for the year then ended, the statement of changes in net assets for each of the two years in the period then ended, and the financial highlights for each of the five years in the period then ended. These financial statements and financial highlights are the responsibility of the Fund's management. Our responsibility is to express an opinion on these financial statements and financial highlights based on our audits.
We conducted our audits in accordance with the standards of the Public Company Accounting Oversight Board (United States). Those standards require that we plan and perform the audit to obtain reasonable assurance about whether the financial statements and financial highlights are free of material misstatement. The Fund is not required to have, nor were we engaged to perform, an audit of its internal control over financial reporting. Our audits included consideration of internal control over financial reporting as a basis for designing audit procedures that are appropriate in the circumstances, but not for the purpose of expressing an opinion on the effectiveness of the Fund's internal control over financial reporting. Accordingly, we express no such opinion. An audit also includes examining, on a test basis, evidence supporting the amounts and disclosures in the financial statements, assessing the accounting principles used and significant estimates made by management, as well as evaluating the overall financial statement presentation. Our procedures included confirmation of securities owned as of October 31, 2014, by correspondence with the custodians, agent banks and brokers; where replies were not received from brokers, we performed other auditing procedures. We believe that our audits provide a reasonable basis for our opinion.
In our opinion, the financial statements and financial highlights referred to above present fairly, in all material respects, the financial position of Fidelity Advisor Floating Rate High Income Fund as of October 31, 2014, the results of its operations for the year then ended, the changes in its net assets for each of the two years in the period then ended, and the financial highlights for each of the five years in the period then ended, in conformity with accounting principles generally accepted in the United States of America.
DELOITTE & TOUCHE LLP
Boston, Massachusetts
December 22, 2014
Annual Report
Trustees and Officers
The Trustees, Member of the Advisory Board, and officers of the trust and fund, as applicable, are listed below. The Board of Trustees governs the fund and is responsible for protecting the interests of shareholders. The Trustees are experienced executives who meet periodically throughout the year to oversee the fund's activities, review contractual arrangements with companies that provide services to the fund, oversee management of the risks associated with such activities and contractual arrangements, and review the fund's performance. Except for James C. Curvey, each of the Trustees oversees 174 funds. Mr. Curvey oversees 407 funds.
The Trustees hold office without limit in time except that (a) any Trustee may resign; (b) any Trustee may be removed by written instrument, signed by at least two-thirds of the number of Trustees prior to such removal; (c) any Trustee who requests to be retired or who has become incapacitated by illness or injury may be retired by written instrument signed by a majority of the other Trustees; and (d) any Trustee may be removed at any special meeting of shareholders by a two-thirds vote of the outstanding voting securities of the trust. Each Trustee who is not an interested person (as defined in the 1940 Act) of the trust and the fund (Independent Trustee), shall retire not later than the last day of the calendar year in which his or her 75th birthday occurs. The Independent Trustees may waive this mandatory retirement age policy with respect to individual Trustees. The officers and Advisory Board Member hold office without limit in time, except that any officer and Advisory Board Member may resign or may be removed by a vote of a majority of the Trustees at any regular meeting or any special meeting of the Trustees. Except as indicated, each individual has held the office shown or other offices in the same company for the past five years.
Experience, Skills, Attributes, and Qualifications of the Fund's Trustees. The Governance and Nominating Committee has adopted a statement of policy that describes the experience, qualifications, attributes, and skills that are necessary and desirable for potential Independent Trustee candidates (Statement of Policy). The Board believes that each Trustee satisfied at the time he or she was initially elected or appointed a Trustee, and continues to satisfy, the standards contemplated by the Statement of Policy. The Governance and Nominating Committee also engages professional search firms to help identify potential Independent Trustee candidates who have the experience, qualifications, attributes, and skills consistent with the Statement of Policy. From time to time, additional criteria based on the composition and skills of the current Independent Trustees, as well as experience or skills that may be appropriate in light of future changes to board composition, business conditions, and regulatory or other developments, have also been considered by the professional search firms and the Governance and Nominating Committee. In addition, the Board takes into account the Trustees' commitment and participation in Board and committee meetings, as well as their leadership of standing and ad hoc committees throughout their tenure.
In determining that a particular Trustee was and continues to be qualified to serve as a Trustee, the Board has considered a variety of criteria, none of which, in isolation, was controlling. The Board believes that, collectively, the Trustees have balanced and diverse experience, qualifications, attributes, and skills, which allow the Board to operate effectively in governing the fund and protecting the interests of shareholders. Information about the specific experience, skills, attributes, and qualifications of each Trustee, which in each case led to the Board's conclusion that the Trustee should serve (or continue to serve) as a trustee of the fund, is provided below.
Annual Report
Trustees and Officers - continued
Board Structure and Oversight Function. James C. Curvey is an interested person (as defined in the 1940 Act) and currently serves as Chairman. The Trustees have determined that an interested Chairman is appropriate and benefits shareholders because an interested Chairman has a personal and professional stake in the quality and continuity of services provided to the fund. Independent Trustees exercise their informed business judgment to appoint an individual of their choosing to serve as Chairman, regardless of whether the Trustee happens to be independent or a member of management. The Independent Trustees have determined that they can act independently and effectively without having an Independent Trustee serve as Chairman and that a key structural component for assuring that they are in a position to do so is for the Independent Trustees to constitute a substantial majority for the Board. The Independent Trustees also regularly meet in executive session. Ned C. Lautenbach serves as Chairman of the Independent Trustees and as such (i) acts as a liaison between the Independent Trustees and management with respect to matters important to the Independent Trustees and (ii) with management prepares agendas for Board meetings.
Fidelity funds are overseen by different Boards of Trustees. The fund's Board oversees Fidelity's equity and high income funds and another Board oversees Fidelity's investment-grade bond, money market, and asset allocation funds. The asset allocation funds may invest in Fidelity funds overseen by the fund's Board. The use of separate Boards, each with its own committee structure, allows the Trustees of each group of Fidelity funds to focus on the unique issues of the funds they oversee, including common research, investment, and operational issues. On occasion, the separate Boards establish joint committees to address issues of overlapping consequences for the Fidelity funds overseen by each Board.
The Trustees operate using a system of committees to facilitate the timely and efficient consideration of all matters of importance to the Trustees, the fund, and fund shareholders and to facilitate compliance with legal and regulatory requirements and oversight of the fund's activities and associated risks. The Board, acting through its committees, has charged FMR and its affiliates with (i) identifying events or circumstances the occurrence of which could have demonstrably adverse effects on the fund's business and/or reputation; (ii) implementing processes and controls to lessen the possibility that such events or circumstances occur or to mitigate the effects of such events or circumstances if they do occur; and (iii) creating and maintaining a system designed to evaluate continuously business and market conditions in order to facilitate the identification and implementation processes described in (i) and (ii) above. Because the day-to-day operations and activities of the fund are carried out by or through FMR, its affiliates and other service providers, the fund's exposure to risks is mitigated but not eliminated by the processes overseen by the Trustees. While each of the Board's committees has responsibility for overseeing different aspects of the fund's activities, oversight is exercised primarily through the Operations, Audit, and Compliance Committees. In addition, the Independent Trustees have worked with FMR to enhance the Board's oversight of investment and financial risks, legal and regulatory risks, technology risks, and operational risks, including the development of additional risk reporting to the Board. For example, a working group comprised of Independent Trustees and FMR has worked and continues to work to review the Fidelity funds' valuation-related activities, reporting and risk management. Appropriate personnel, including but not limited to the fund's Chief Compliance Officer (CCO), FMR's internal auditor, the independent accountants, the fund's Treasurer and portfolio management personnel, make periodic reports to the Board's committees, as appropriate, including an annual review of FMR's risk management program for the Fidelity funds. The responsibilities of each standing committee, including their oversight responsibilities, are described further under "Standing Committees of the Fund's Trustees."
Annual Report
The fund's Statement of Additional Information (SAI) includes more information about the Trustees. To request a free copy, call Fidelity at 1-877-208-0098.
Interested Trustees*:
Correspondence intended for each Trustee who is an interested person may be sent to Fidelity Investments, 245 Summer Street, Boston, Massachusetts 02210.
Name, Year of Birth; Principal Occupations and Other Relevant Experience+ | |
James C. Curvey (1935) | |
Year of Election or Appointment: 2007 Trustee Chairman of the Board of Trustees | |
| Mr. Curvey also serves as Trustee of other Fidelity funds. Mr. Curvey is a Director of Fidelity Research & Analysis Co. (2009-present), and Vice Chairman (2007-present) and Director of FMR LLC. In addition, Mr. Curvey serves as an Overseer for the Boston Symphony Orchestra and a member of the board of Artis-Naples, Naples, Florida, and as a Trustee for Brewster Academy, Wolfeboro, New Hampshire. Previously, Mr. Curvey served as a Director of Fidelity Investments Money Management, Inc. (2009-2014), a Director of FMR (2007-2014), and a Director of FMR Co., Inc. (2007-2014). |
Charles S. Morrison (1960) | |
Year of Election or Appointment: 2014 Trustee | |
| Mr. Morrison also serves as Trustee of other funds. He serves as a Director of Fidelity Investments Money Management, Inc. (FIMM) (2014-present), Director of Fidelity SelectCo, LLC (2014-present), President, Asset Management (2014-present) and is an employee of Fidelity Investments. Previously, Mr. Morrison served as Vice President of Fidelity's Fixed Income and Asset Allocation Funds (2012-2014), President, Fixed Income (2011-2014), Vice President of Fidelity's Money Market Funds (2005-2009), President, Money Market Group Leader of FMR (2009), and Senior Vice President, Money Market Group of FMR (2004-2009). Mr. Morrison also served as Vice President of Fidelity's Bond Funds (2002-2005), certain Balanced Funds (2002-2005), and certain Asset Allocation Funds (2002-2007), and as Senior Vice President (2002-2005) of Fidelity's Bond Division. |
* Trustees have been determined to be "Interested Trustees" by virtue of, among other things, their affiliation with the trust or various entities under common control with FMR.
+ The information above includes each Trustee's principal occupation during the last five years and other information relating to the experience, attributes, and skills relevant to each Trustee's qualifications to serve as a Trustee, which led to the conclusion that each Trustee should serve as a Trustee for the fund.
Annual Report
Independent Trustees:
Correspondence intended for each Independent Trustee (that is, the Trustees other than the Interested Trustees) may be sent to Fidelity Investments, P.O. Box 55235, Boston, Massachusetts 02205-5235.
Name, Year of Birth; Principal Occupations and Other Relevant Experience+ | |
Dennis J. Dirks (1948) | |
Year of Election or Appointment: 2005 Trustee | |
| Mr. Dirks also serves as Trustee of other Fidelity funds. Prior to his retirement in May 2003, Mr. Dirks was Chief Operating Officer and a member of the Board of The Depository Trust & Clearing Corporation (DTCC). He also served as President, Chief Operating Officer, and Board member of The Depository Trust Company (DTC) and President and Board member of the National Securities Clearing Corporation (NSCC). In addition, Mr. Dirks served as Chief Executive Officer and Board member of the Government Securities Clearing Corporation, Chief Executive Officer and Board member of the Mortgage-Backed Securities Clearing Corporation, as a Trustee and a member of the Finance Committee of Manhattan College (2005-2008), and as a Trustee and a member of the Finance Committee of AHRC of Nassau County (2006-2008). Mr. Dirks is a member of the Independent Directors Council (IDC) Governing Council (2010-present) and Board of Directors for The Brookville Center for Children's Services, Inc. (2009-present). |
Alan J. Lacy (1953) | |
Year of Election or Appointment: 2008 Trustee | |
| Mr. Lacy also serves as Trustee of other Fidelity funds. Mr. Lacy serves as Senior Adviser (2007-present) of Oak Hill Capital Partners, L.P. (private equity). Mr. Lacy also served as Chief Executive Officer (2000-2005) and Vice Chairman (2005-2006) of Sears Holdings Corporation and Sears, Roebuck and Co. (retail). In addition, Mr. Lacy serves as a member of the Board of Directors of Dave & Buster's Entertainment, Inc. (restaurant and entertainment complexes, 2010-present), Earth Fare, Inc. (retail grocery, 2012-present), The Hillman Companies, Inc. (hardware wholesalers, 2010-present), and Bristol-Myers Squibb Company (global pharmaceuticals, 2008-present). Mr. Lacy is a member of the Board of Trustees of The National Parks Conservation Association (2006-present). Previously, Mr. Lacy served as Chairman of the Board of Trustees of the National Parks Conservation Association (2008-2011) and as a member of the Board of Directors for the Western Union Company (global money transfer, 2006-2011). |
Ned C. Lautenbach (1944) | |
Year of Election or Appointment: 2000 Trustee Chairman of the Independent Trustees | |
| Mr. Lautenbach also serves as Trustee of other Fidelity funds. Mr. Lautenbach currently serves as the Lead Director of the Eaton Corporation Board of Directors (diversified industrial, 1997-present). Mr. Lautenbach is Chairman of the Board of Directors of the Philharmonic Center for the Arts in Naples, Florida (2012-present) and a member of the Council on Foreign Relations (1994-present). Previously, Mr. Lautenbach was a Partner/Advisory Partner at Clayton, Dubilier & Rice, LLC (private equity investment, 1998-2010), as well as a Director of Sony Corporation (2006-2007). |
Joseph Mauriello (1944) | |
Year of Election or Appointment: 2008 Trustee | |
| Mr. Mauriello also serves as Trustee of other Fidelity funds. Prior to his retirement in January 2006, Mr. Mauriello served in numerous senior management positions including Deputy Chairman and Chief Operating Officer (2004-2005), and Vice Chairman of Financial Services (2002-2004) of KPMG LLP US (professional services, 1965-2005). Mr. Mauriello currently serves as a member of the Board of Directors of XL Group plc. (global insurance and re-insurance, 2006-present). Previously, Mr. Mauriello served as a Director of the Hamilton Funds of the Bank of New York (2006-2007) and of Arcadia Resources Inc. (health care services and products, 2007-2012). |
Robert W. Selander (1950) | |
Year of Election or Appointment: 2011 Trustee | |
| Mr. Selander also serves as Trustee of other Fidelity funds. Previously, Mr. Selander served as a Member of the Advisory Board of other Fidelity funds (2011), and Executive Vice Chairman (2010), Chief Executive Officer (2009-2010), and President and Chief Executive Officer (1997-2009) of Mastercard, Inc. |
Cornelia M. Small (1944) | |
Year of Election or Appointment: 2005 Trustee | |
| Ms. Small also serves as Trustee of other Fidelity funds. Ms. Small is a member of the Board of Directors (2009-present) and Chair of the Investment Committee (2010-present) of the Teagle Foundation. Ms. Small also serves on the Investment Committee of the Berkshire Taconic Community Foundation (2008-present). Previously, Ms. Small served as Chairperson (2002-2008) and a member of the Investment Committee and Chairperson (2008-2012) and a member of the Board of Trustees of Smith College. In addition, Ms. Small served as Chief Investment Officer, Director of Global Equity Investments, and a member of the Board of Directors of Scudder, Stevens & Clark and Scudder Kemper Investments. |
William S. Stavropoulos (1939) | |
Year of Election or Appointment: 2002 Trustee Vice Chairman of the Independent Trustees | |
| Mr. Stavropoulos also serves as Trustee of other Fidelity funds. Mr. Stavropoulos serves as President and Founder of the Michigan Baseball Foundation, the Great Lakes Loons (2007-present). Mr. Stavropoulos is Chairman Emeritus of the Board of Directors of The Dow Chemical Company, where he previously served in numerous senior management positions, including President, CEO (1995-2000; 2002-2004), Chairman of the Executive Committee (2000-2006), and as a member of the Board of Directors (1990-2006). Currently, Mr. Stavropoulos is Chairman of the Board of Directors of Univar Inc. (global distributor of commodity and specialty chemicals), a Director of Teradata Corporation (data warehousing and technology solutions), and Maersk Inc. (industrial conglomerate), and a member of the Advisory Board for Metalmark Capital LLC (private equity investment, 2005-present). Mr. Stavropoulos is an operating advisor to Clayton, Dubilier & Rice, LLC (private equity investment). In addition, Mr. Stavropoulos is a member of the University of Notre Dame Advisory Council for the College of Science, a Trustee of the Rollin L. Gerstacker Foundation, and a Director of the Naples Philharmonic Center for the Arts. Previously, Mr. Stavropoulos served as a Director of Chemical Financial Corporation (bank holding company, 1993-2012) and Tyco International, Ltd. (multinational manufacturing and services, 2007-2012). |
David M. Thomas (1949) | |
Year of Election or Appointment: 2008 Trustee | |
| Mr. Thomas also serves as Trustee of other Fidelity funds. Mr. Thomas serves as Non-Executive Chairman of the Board of Directors of Fortune Brands Home and Security (home and security products, 2011-present), and as a member of the Board of Directors of Interpublic Group of Companies, Inc. (marketing communication, 2004-present). Previously, Mr. Thomas served as Executive Chairman (2005-2006) and Chairman and Chief Executive Officer (2000-2005) of IMS Health, Inc. (pharmaceutical and healthcare information solutions), and a Director of Fortune Brands, Inc. (consumer products, 2000-2011). |
+ The information above includes each Trustee's principal occupation during the last five years and other information relating to the experience, attributes, and skills relevant to each Trustee's qualifications to serve as a Trustee, which led to the conclusion that each Trustee should serve as a Trustee for the fund.
Advisory Board Member and Officers:
Correspondence intended for each officer and Peter S. Lynch may be sent to Fidelity Investments, 245 Summer Street, Boston, Massachusetts 02210. Officers appear below in alphabetical order.
Name, Year of Birth; Principal Occupation | |
Peter S. Lynch (1944) | |
Year of Election or Appointment: 2003 Member of the Advisory Board | |
| Mr. Lynch also serves as Member of the Advisory Board of other Fidelity funds. Mr. Lynch is Vice Chairman and a Director of FMR and FMR Co., Inc. In addition, Mr. Lynch serves as a Trustee of Boston College and as the Chairman of the Inner-City Scholarship Fund. Previously, Mr. Lynch served on the Special Olympics International Board of Directors (1997-2006). |
Elizabeth Paige Baumann (1968) | |
Year of Election or Appointment: 2012 Anti-Money Laundering (AML) Officer | |
| Ms. Baumann also serves as AML Officer of other funds. She is Chief AML Officer of FMR LLC (2012-present) and is an employee of Fidelity Investments. Previously, Ms. Baumann served as Vice President and Deputy Anti-Money Laundering Officer (2007-2012). |
William C. Coffey (1969) | |
Year of Election or Appointment: 2009 Assistant Secretary | |
| Mr. Coffey also serves as Assistant Secretary of other funds. He is Senior Vice President and Deputy General Counsel of FMR LLC (2010-present), and is an employee of Fidelity Investments. Previously, Mr. Coffey served as Vice President and Associate General Counsel of FMR LLC (2005-2009). |
Jonathan Davis (1968) | |
Year of Election or Appointment: 2010 Assistant Treasurer | |
| Mr. Davis also serves as Assistant Treasurer of other funds. Mr. Davis is an employee of Fidelity Investments. Previously, Mr. Davis served as Vice President and Associate General Counsel of FMR LLC (2003-2010). |
Adrien E. Deberghes (1967) | |
Year of Election or Appointment: 2008 Deputy Treasurer | |
| Mr. Deberghes also serves as an officer of other funds. He is an employee of Fidelity Investments (2008-present). Prior to joining Fidelity Investments, Mr. Deberghes was Senior Vice President of Mutual Fund Administration at State Street Corporation (2007-2008), Senior Director of Mutual Fund Administration at Investors Bank & Trust (2005-2007), and Director of Finance for Dunkin' Brands (2000-2005). |
Stephanie J. Dorsey (1969) | |
Year of Election or Appointment: 2010 Assistant Treasurer | |
| Ms. Dorsey also serves as an officer of other funds. She is an employee of Fidelity Investments (2008-present) and has served in other fund officer roles. Prior to joining Fidelity Investments, Ms. Dorsey served as Treasurer (2004-2008) of the JPMorgan Mutual Funds and Vice President (2004-2008) of JPMorgan Chase Bank. |
Howard J. Galligan III (1966) | |
Year of Election or Appointment: 2014 Chief Financial Officer | |
| Mr. Galligan also serves as Chief Financial Officer of other funds. Mr. Galligan serves as President of Fidelity Pricing and Cash Management Services (FPCMS) (2014-present) and as a Director of Strategic Advisers, Inc. (2008-present). Previously, Mr. Galligan served as Chief Administrative Officer of Asset Management (2011-2014) and Chief Operating Officer and Senior Vice President of Investment Support for Strategic Advisers, Inc. (2003-2011). |
Scott C. Goebel (1968) | |
Year of Election or Appointment: 2008 Secretary and Chief Legal Officer (CLO) | |
| Mr. Goebel serves as Secretary and CLO of other funds. Mr. Goebel also serves as Secretary of Fidelity SelectCo, LLC (2013-present), Fidelity Investments Money Management, Inc. (FIMM) (2010-present) and Fidelity Research and Analysis Company (FRAC) (2010-present); General Counsel, Secretary, and Senior Vice President of FMR (2008-present) and FMR Co., Inc. (2008-present); Chief Legal Officer of Fidelity Management & Research (Hong Kong) Limited (2008-present); and Assistant Secretary of Fidelity Management & Research (Japan) Limited (2008-present) and Fidelity Management & Research (U.K.) Inc. (2008-present). Previously, Mr. Goebel served as Secretary and CLO of other Fidelity funds (2008-2013), Assistant Secretary of FIMM (2008-2010), FRAC (2008-2010), and certain funds (2007-2008); and as Vice President and Secretary of Fidelity Distributors Corporation (FDC) (2005-2007). Mr. Goebel has been employed by FMR LLC or an affiliate since 2001. |
Thomas C. Hense (1964) | |
Year of Election or Appointment: 2008/2010 Vice President | |
| Mr. Hense also serves as Vice President of other funds (High Income (2008), Small Cap (2008), and Value (2010) funds). Previously, Mr. Hense served as a portfolio manager for Fidelity's Institutional Money Management Group (Pyramis) (2003-2008). |
Brian B. Hogan (1964) | |
Year of Election or Appointment: 2009 Vice President | |
| Mr. Hogan also serves as Trustee or Vice President of other funds. Mr. Hogan serves as a Director of Fidelity SelectCo, LLC (2014-present) and President of FMR's Equity Division (2009-present). Previously, Mr. Hogan served as Senior Vice President, Equity Research of FMR (2006-2009) and as a portfolio manager. |
Chris Maher (1972) | |
Year of Election or Appointment: 2013 Assistant Treasurer | |
| Mr. Maher serves as Assistant Treasurer of other funds. Mr. Maher is Vice President of Valuation Oversight and is an employee of Fidelity Investments. Previously, Mr. Maher served as Vice President of Asset Management Compliance (2013), Vice President of FMR's Program Management Group (2010-2013), and Vice President of Valuation Oversight (2008-2010). |
Kenneth B. Robins (1969) | |
Year of Election or Appointment: 2008 President and Treasurer | |
| Mr. Robins also serves as an officer of other funds. Mr. Robins serves as Executive Vice President of Fidelity Investments Money Management, Inc. (FIMM) (2013-present) and is an employee of Fidelity Investments (2004-present). Previously, Mr. Robins served in other fund officer roles. |
Stephen Sadoski (1971) | |
Year of Election or Appointment: 2012 Deputy Treasurer | |
| Mr. Sadoski also serves as Deputy Treasurer of other funds. He is an employee of Fidelity Investments (2012-present) and has served in another fund officer role. Prior to joining Fidelity Investments, Mr. Sadoski served as an assistant chief accountant in the Division of Investment Management of the Securities and Exchange Commission (SEC) (2009-2012) and as a senior manager at Deloitte & Touche LLP (1997-2009). |
Stacie M. Smith (1974) | |
Year of Election or Appointment: 2013 Deputy Treasurer | |
| Ms. Smith also serves as an officer of other funds. She is an employee of Fidelity Investments (2009-present) and has served in other fund officer roles. Prior to joining Fidelity Investments, Ms. Smith served as Senior Audit Manager of Ernst & Young LLP (1996-2009). |
Renee Stagnone (1975) | |
Year of Election or Appointment: 2013 Deputy Treasurer | |
| Ms. Stagnone also serves as Deputy Treasurer of other funds. Ms. Stagnone is an employee of Fidelity Investments. |
Linda J. Wondrack (1964) | |
Year of Election or Appointment: 2014 Chief Compliance Officer | |
| Ms. Wondrack also serves as Chief Compliance Officer of other funds. Ms. Wondrack is Executive Vice President and head of the Ethics Office and Asset Management Compliance for Fidelity Investments (2012-present). Ms. Wondrack also serves as Chief Compliance Officer of Fidelity SelectCo, LLC (2014-present); Chief Compliance Officer of Impresa Management LLC (2013-present); and Chief Compliance Officer of FMR Co., Inc., Fidelity Investments Money Management, Inc., Fidelity Management & Research (Japan) Limited, Fidelity Management & Research (U.K.) Inc., Fidelity Management & Research (Hong Kong), Fidelity Management & Research Company, Pyramis Global Advisors, LLC, and Strategic Advisers, Inc., Ballyrock Investment Advisors LLC, and Northern Neck Investors LLC (2012-present). Previously, Ms. Wondrack served as Senior Vice President and Chief Compliance Officer for Columbia Management Investment Advisers, LLC (2005-2012); Chief Compliance Officer for certain funds within the Columbia Family of Funds (2007-2012); and Senior Vice President of Compliance Risk Management at Bank of America (2005-2010). |
Joseph F. Zambello (1957) | |
Year of Election or Appointment: 2011 Deputy Treasurer | |
| Mr. Zambello also serves as Deputy Treasurer of other funds. Mr. Zambello is an employee of Fidelity Investments. Previously, Mr. Zambello served as Vice President of FMR's Program Management Group (2009-2011) and Vice President of the Transfer Agent Oversight Group (2005-2009). |
Annual Report
Distributions (Unaudited)
The Board of Trustees of Fidelity Advisor Floating Rate High Income Fund voted to pay to shareholders of record at the opening of business on record date, the following distributions per share derived from capital gains realized from sales of portfolio securities, and dividends derived from net investment income:
| Pay Date | Record Date | Capital Gains |
Class A | 12/08/14 | 12/05/14 | $0.04 |
Class T | 12/08/14 | 12/05/14 | $0.04 |
Class B | 12/08/14 | 12/05/14 | $0.04 |
Class C | 12/08/14 | 12/05/14 | $0.04 |
The fund hereby designates as a capital gain dividend with respect to the taxable year ended October 31, 2014, $30,329,073, or, if subsequently determined to be different, the net capital gain of such year.
A total of 0.06% of the dividends distributed during the fiscal year was derived from interest on U.S. Government securities which is generally exempt from state income tax.
The fund designates $349,385,772 of distributions paid during the period January 1, 2014 to October 31, 2014 as qualifying to be taxed as interest-related dividends for nonresident alien shareholders.
The fund will notify shareholders in January 2015 of amounts for use in preparing 2014 income tax returns.
Annual Report
Board Approval of Investment Advisory Contracts and Management Fees
Fidelity Advisor Floating Rate High Income Fund
Each year, the Board of Trustees, including the Independent Trustees (together, the Board), votes on the renewal of the management contract with Fidelity Management & Research Company (FMR) and the sub-advisory agreements (together, the Advisory Contracts) for the fund. The Board, assisted by the advice of fund counsel and Independent Trustees' counsel, requests and considers a broad range of information relevant to the renewal of the Advisory Contracts throughout the year.
The Board meets regularly and, at each of its meetings, covers an extensive agenda of topics and materials and considers factors that are relevant to its annual consideration of the renewal of the fund's Advisory Contracts, including the services and support provided to the fund and its shareholders. The Board has established various standing committees (Committees), each composed of and chaired by Independent Trustees with varying backgrounds, to which the Board has assigned specific subject matter responsibilities in order to enhance effective decision-making by the Board. The Board, acting directly and through its Committees, requests and receives information concerning the annual consideration of the renewal of the fund's Advisory Contracts. The Board also meets as needed to consider matters specifically related to the Board's annual consideration of the renewal of the Advisory Contracts. Members of the Board may also meet with trustees of other Fidelity funds through ad hoc joint committees to discuss certain matters relevant to the Fidelity funds.
At its July 2014 meeting, the Board, including the Independent Trustees, unanimously determined to renew the fund's Advisory Contracts. In reaching its determination, the Board considered all factors it believed relevant, including (i) the nature, extent, and quality of the services to be provided to the fund and its shareholders (including the investment performance of the fund); (ii) the competitiveness of the fund's management fee and total expense ratio relative to peer funds; (iii) the total costs of the services to be provided by and the profits to be realized by Fidelity from its relationship with the fund; (iv) the extent to which economies of scale exist and would be realized as the fund grows; and (v) whether fee levels reflect these economies of scale, if any, for the benefit of fund shareholders. In connection with separate internal corporate reorganizations involving Fidelity Management & Research (U.K.) Inc. (FMR U.K.) and Fidelity Management & Research (Japan) Inc. (FMR Japan), the Board approved certain non-material amendments to the fund's sub-advisory agreements with FMR U.K. and FMR Japan to reflect that, after these reorganizations, FMR Investment Management (UK) Limited and Fidelity Management & Research (Japan) Limited will carry on the business of FMR U.K. and FMR Japan, respectively. The Board noted that no changes to the portfolio managers or to the foreign research or investment advisory services provided to the fund were expected in connection with either reorganization and that the same personnel and resources would continue to be available to the fund at the new entities.
Annual Report
Board Approval of Investment Advisory Contracts and
Management Fees - continued
In considering whether to renew the Advisory Contracts for the fund, the Board reached a determination, with the assistance of fund counsel and Independent Trustees' counsel and through the exercise of its business judgment, that the renewal of the Advisory Contracts was in the best interests of the fund and its shareholders and that the compensation payable under the Advisory Contracts was fair and reasonable. The Board's decision to renew the Advisory Contracts was not based on any single factor, but rather was based on a comprehensive consideration of all the information provided to the Board at its meetings throughout the year. The Board, in reaching its determination to renew the Advisory Contracts, was aware that shareholders of the fund have a broad range of investment choices available to them, including a wide choice among funds offered by Fidelity's competitors, and that the fund's shareholders, who have the opportunity to review and weigh the disclosure provided by the fund in its prospectus and other public disclosures, have chosen to invest in this fund, which is part of the Fidelity family of funds.
Nature, Extent, and Quality of Services Provided. The Board considered Fidelity's staffing as it relates to the fund, including the backgrounds of investment personnel of FMR and the sub-advisers (together, the Investment Advisers), and also considered the fund's investment objective, strategies, and related investment philosophy. The Independent Trustees also had discussions with senior management of Fidelity's investment operations and investment groups. The Board considered the structure of the portfolio manager compensation program and whether this structure provides appropriate incentives to act in the best interests of the fund. Additionally, the Board considered the portfolio managers' investments, if any, in the funds that they manage.
Resources Dedicated to Investment Management and Support Services. The Board and the Fund Oversight and Research Committees reviewed the general qualifications and capabilities of Fidelity's investment staff, including its size, education, experience, and resources, as well as Fidelity's approach to recruiting, training, managing, and compensating investment personnel. The Board noted that Fidelity has continued to increase the resources devoted to non-U.S. offices, including expansion of Fidelity's global investment organization. The Board also noted that Fidelity's analysts have extensive resources, tools and capabilities that allow them to conduct sophisticated quantitative and fundamental analysis, as well as credit analysis of issuers, counterparties and guarantors. Further, the Board believes that Fidelity's investment professionals have sufficient access to global information and data so as to provide competitive investment results over time, and that those professionals also have access to sophisticated tools that permit them to assess portfolio construction and risk and performance attribution characteristics continuously, as well as to transmit new information and research conclusions rapidly around the world. Additionally, in its deliberations, the Board considered Fidelity's trading and risk management capabilities and resources and global compliance infrastructure, which are an integral part of the investment management process.
Annual Report
Shareholder and Administrative Services. The Board considered (i) the nature, extent, quality, and cost of advisory, administrative, and shareholder services performed by the Investment Advisers and their affiliates under the Advisory Contracts and under separate agreements covering transfer agency, pricing and bookkeeping, and securities lending services for the fund; (ii) the nature and extent of the supervision of third party service providers, principally custodians and subcustodians; and (iii) the resources devoted to, and the record of compliance with, the fund's compliance policies and procedures. The Board also reviewed the allocation of fund brokerage, including allocations to brokers affiliated with the Investment Advisers, the use of brokerage commissions to pay fund expenses, and the use of "soft" commission dollars to pay for research services.
The Board noted that the growth of fund assets over time across the complex allows Fidelity to reinvest in the development of services designed to enhance the value or convenience of the Fidelity funds as investment vehicles. These services include 24-hour access to account information and market information through telephone representatives and over the Internet, investor education materials and asset allocation tools, and the expanded availability of Fidelity Investor Centers.
In 2014, the Board formed an ad hoc Committee on Transfer Agency Fees to review the variety of transfer agency fee structures throughout the industry and Fidelity's competitive positioning with respect to industry participants.
Investment in a Large Fund Family. The Board considered the benefits to shareholders of investing in a Fidelity fund, including the benefits of investing in a fund that is part of a large family of funds offering a variety of investment disciplines and providing a large variety of mutual fund investor services. The Board noted that Fidelity had taken, or had made recommendations that resulted in the Fidelity funds taking, a number of actions over the previous year that benefited particular funds, including (i) continuing to dedicate additional resources to investment research and to the support of the senior management team that oversees asset management; (ii) persisting in efforts to enhance Fidelity's global research capabilities; (iii) launching new funds and making other enhancements to meet client needs for income-oriented solutions; (iv) reducing fund expenses for certain index funds; (v) continuing to launch dedicated lower cost underlying funds to meet portfolio construction needs related to expanding underlying fund options for Fidelity funds of funds, specifically for the Freedom Fund product lines; (vi) rationalizing product lines and gaining increased efficiencies through fund mergers; (vii) launching sector-based exchange-traded funds and establishing a new Fidelity adviser to manage sector-based funds and products; (viii) continuing to develop and implement technology to improve security and increase efficiency; (ix) modifying the eligibility criteria for certain share classes to increase their marketability to a portion of the defined contribution plan market; (x) waiving redemption fees for certain qualified fund-of-fund and wrap programs and certain retirement plan transactions; and (xi) launching new Institutional Class shares of certain money market funds to attract and retain assets and to fill a gap in the money market fund lineup.
Annual Report
Board Approval of Investment Advisory Contracts and
Management Fees - continued
Investment Performance. The Board considered whether the fund has operated in accordance with its investment objective, as well as its record of compliance with its investment restrictions and its performance history. The Board noted that there was a portfolio management change for the fund in April 2013.
The Board took into account discussions with the Investment Advisers about fund investment performance that occur at Board meetings throughout the year. In this regard the Board noted that as part of regularly scheduled fund reviews and other reports to the Board on fund performance, the Board periodically considers annualized return information for the fund, for different time periods, measured against a securities market index ("benchmark index") and a peer group of funds with similar objectives ("peer group"). In its evaluation of fund investment performance, the Board gave particular attention to information indicating changes in performance of certain Fidelity funds for specific time periods and the Investment Advisers' explanations for any overperformance or underperformance.
In addition to reviewing absolute and relative fund performance, the Independent Trustees periodically consider the appropriateness of fund performance metrics in evaluating the results achieved. In general, the Independent Trustees believe that fund performance should be evaluated based on net performance (after fees and expenses) of both the highest performing and lowest performing classes, where applicable, compared to appropriate benchmark indices, over appropriate time periods which may include full market cycles, and compared to peer groups, as applicable, over the same periods, taking into account relevant factors including the following: general market conditions; issuer-specific information; tactical opportunities for investment; and fund cash flows and other factors.
The Independent Trustees recognize that shareholders evaluate performance on a net basis over their own holding periods, for which one-, three-, and five-year periods are often used as a proxy. For this reason, the performance information reviewed by the Board also included net cumulative calendar year total return information for the fund and an appropriate benchmark index and peer group for the most recent one-, three-, and five-year periods, as shown below. Returns are shown compared to the 25th percentile (top of box, 75% beaten) and 75th percentile (bottom of box, 25% beaten) of the peer universe.
Annual Report
Fidelity Advisor Floating Rate High Income Fund

The Board has discussed the fund's underperformance with FMR and has engaged with FMR to consider what steps might be taken to remediate the fund's underperformance.
Based on its review, the Board concluded that the nature, extent, and quality of services provided to the fund under the Advisory Contracts should benefit the fund's shareholders.
Competitiveness of Management Fee and Total Expense Ratio. The Board considered the fund's management fee and total expense ratio compared to "mapped groups" of competitive funds and classes. Fidelity creates "mapped groups" by combining similar Lipper investment objective categories that have comparable investment mandates. Combining Lipper investment objective categories aids the Board's management fee and total expense ratio comparisons by broadening the competitive group used for comparison and by reducing the number of universes to which various Fidelity funds are compared.
Management Fee. The Board considered two proprietary management fee comparisons for the 12-month periods shown in the chart below. The group of Lipper funds used by the Board for management fee comparisons is referred to below as the "Total Mapped Group." The Total Mapped Group is broader than the Lipper peer group used by the Board for performance comparisons because the Total Mapped Group combines several Lipper investment objective categories while the Lipper peer group does not. The Total Mapped Group comparison focuses on a fund's standing in terms of gross management fees before expense reimbursements or caps relative to the total universe of funds with comparable investment mandates, regardless of whether their management fee structures also are comparable. Funds with comparable investment mandates offer exposure to similar types of securities. Funds with comparable management fee structures have similar management fee contractual arrangements (e.g., flat rate charged for advisory services, all-inclusive fee rate, etc.). "TMG %" represents the percentage of funds in the Total Mapped Group that had management fees that were lower than the fund's. For example, a hypothetical TMG % of 20% would mean that 80% of the funds in the Total Mapped Group had higher, and 20% had lower, management fees than the fund. The fund's actual TMG %s are in the chart below. The "Asset-Size Peer Group" (ASPG) comparison focuses on a fund's standing relative to a subset of non-Fidelity funds within the Total Mapped Group that are similar in size and management fee structure. For example, if a fund is in the first quartile of the ASPG, the fund's management fee ranks in the least expensive or lowest 25% of funds in the ASPG. The ASPG represents at least 15% of the funds in the Total Mapped Group with comparable asset size and management fee structures, subject to a minimum of 50 funds (or all funds in the Total Mapped Group if fewer than 50). Additional information, such as the ASPG quartile in which the fund's management fee rate ranked, is also included in the chart and considered by the Board.
Annual Report
Board Approval of Investment Advisory Contracts and
Management Fees - continued
Fidelity Advisor Floating Rate High Income Fund
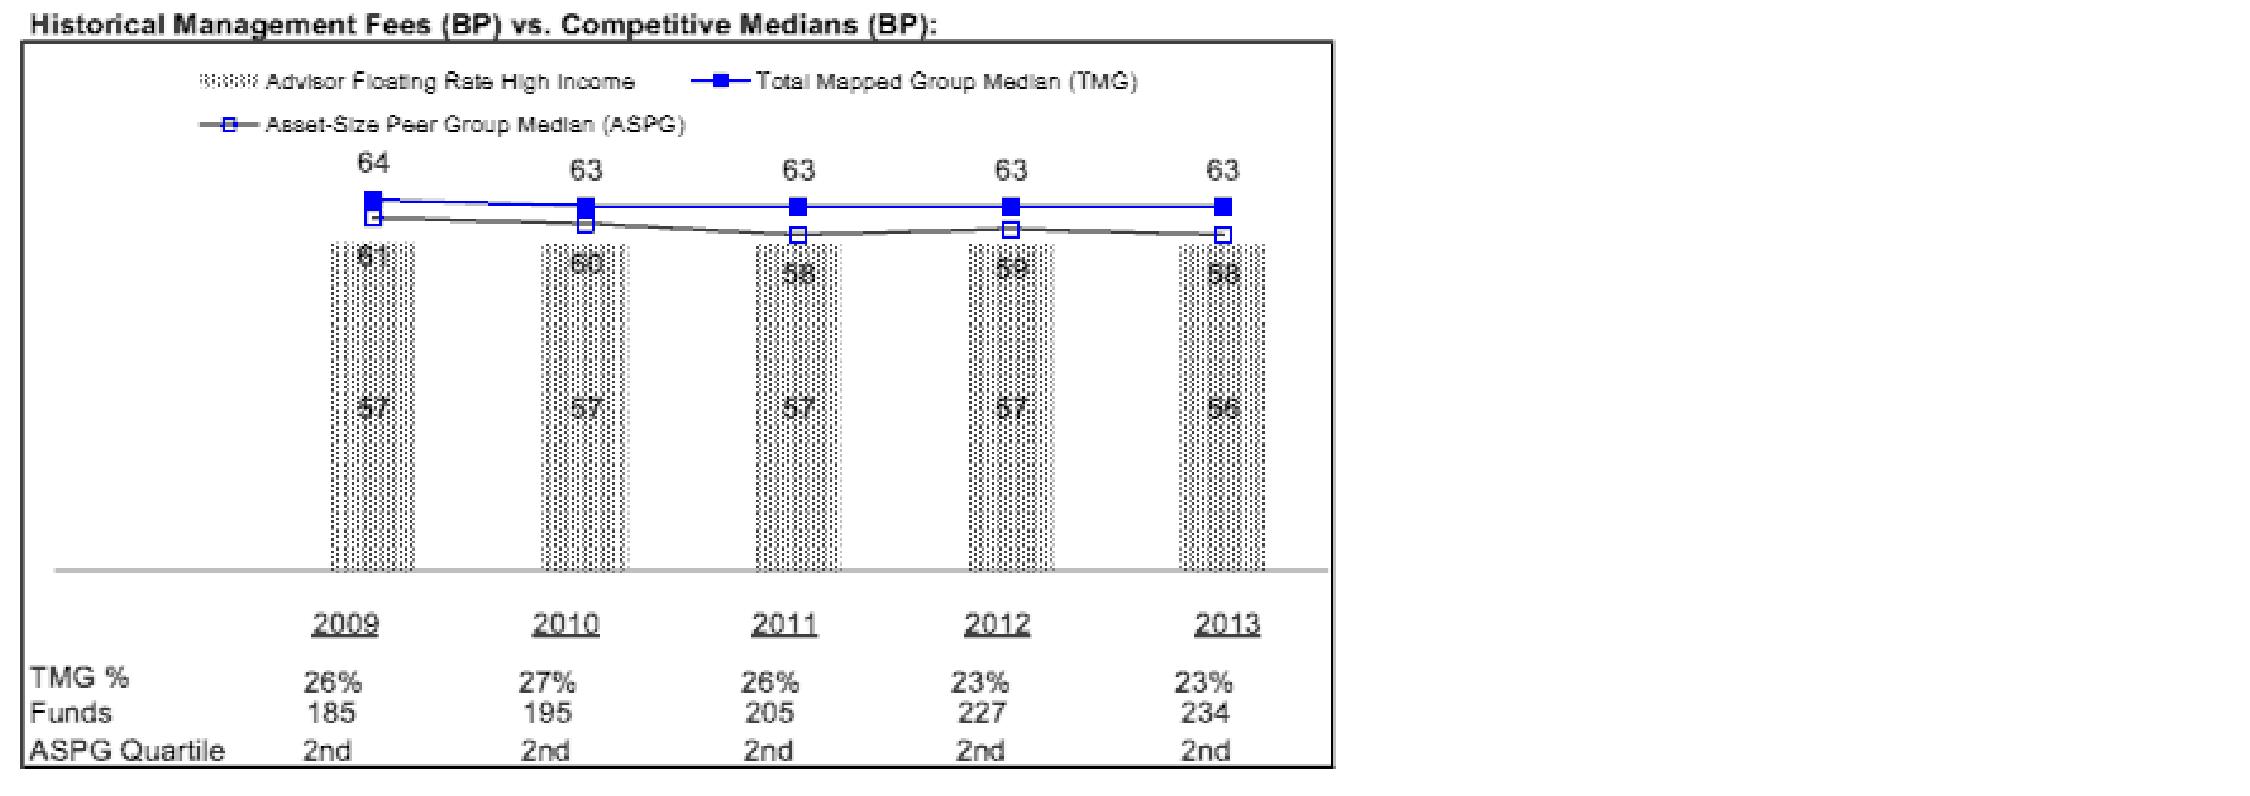
The Board noted that the fund's management fee rate ranked below the median of its Total Mapped Group and below the median of its ASPG for 2013.
The Board also noted that, in August 2013, the ad hoc Committee on Management Fees was formed to conduct an in-depth review of the management fee rates of Fidelity's active equity mutual funds. The Committee focused on the following areas: (i) standard fee structures; (ii) research consumption and trading evolution; (iii) management fee competitiveness/profitability by category; and (iv) factors that drive institutional pricing.
Annual Report
Based on its review, the Board concluded that the fund's management fee is fair and reasonable in light of the services that the fund receives and the other factors considered.
Total Expense Ratio. In its review of each class's total expense ratio, the Board considered the fund's management fee as well as other fund or class expenses, as applicable, such as transfer agent fees, pricing and bookkeeping fees, fund-paid 12b-1 fees, and custodial, legal, and audit fees. The Board also noted the effects of any waivers and reimbursements on fees and expenses. As part of its review, the Board also considered the current and historical total expense ratios of each class of the fund compared to competitive fund median expenses. Each class of the fund is compared to those funds and classes in the Total Mapped Group (used by the Board for management fee comparisons) that have a similar sales load structure.
The Board noted that the total expense ratio of each of Class A, Class B, Institutional Class, and the retail class ranked below its competitive median for 2013, the total expense ratio of Class C ranked equal to its competitive median for 2013, and the total expense ratio of Class T ranked above its competitive median for 2013. The Board considered that, in general, various factors can affect total expense ratios. The Board noted that the total expense ratio of Class T was above the competitive median primarily because of higher 12b-1 fees on Class T as compared to most competitor funds. Class T has a higher 12b-1 fee, but a lower front-end sales charge, than traditionally priced front-end sales charge classes. The Board considered that Class T is primarily sold load-waived in the retirement plan market where its 0.50% 12b-1 fee is comparable to competing no-load, higher 12b-1 fee classes designed specifically for retirement plans. The Board noted that the fund offers multiple classes, each of which has a different sales load and 12b-1 fee structure, and that the multiple structures are intended to offer a range of pricing options for the intermediary market. The Board also noted that the total expense ratios of the classes vary primarily by the level of their 12b-1 fees, although differences in transfer agent fees may also cause expenses to vary from class to class.
Fees Charged to Other Fidelity Clients. The Board also considered Fidelity fee structures and other information with respect to clients of Fidelity, such as other funds advised or subadvised by Fidelity, pension plan clients, and other institutional clients. The Board noted the findings of the 2013 ad hoc joint committee (created with the board of other Fidelity funds), which reviewed and compared Fidelity's institutional investment advisory business with its business of providing services to the Fidelity funds, including the differences in services provided, fees charged, and costs incurred, as well as competition in their respective marketplaces.
Annual Report
Board Approval of Investment Advisory Contracts and
Management Fees - continued
Based on its review of total expense ratios and fees charged to other Fidelity clients, the Board concluded that the total expense ratio of each class of the fund was reasonable, although Class T was above the median of the universe presented for comparison, in light of the services that the fund and its shareholders receive and the other factors considered.
Costs of the Services and Profitability. The Board considered the revenues earned and the expenses incurred by Fidelity in conducting the business of developing, marketing, distributing, managing, administering and servicing the fund and servicing the fund's shareholders. The Board also considered the level of Fidelity's profits in respect of all the Fidelity funds.
On an annual basis, Fidelity presents to the Board Fidelity's profitability for the fund. Fidelity calculates the profitability for each fund, as well as aggregate profitability for groups of Fidelity funds and all Fidelity funds, using a series of detailed revenue and cost allocation methodologies which originate with the books and records of Fidelity on which Fidelity's audited financial statements are based. The Audit Committee of the Board reviews any significant changes from the prior year's methodologies.
PricewaterhouseCoopers LLP (PwC), independent registered public accounting firm and auditor to Fidelity and certain Fidelity funds, has been engaged annually by the Board as part of the Board's assessment of Fidelity's profitability analysis. PwC's engagement includes the review and assessment of the methodologies used by Fidelity in determining the revenues and expenses attributable to Fidelity's mutual fund business, and completion of agreed-upon procedures in respect of the mathematical accuracy of fund profitability and its conformity to established allocation methodologies. After considering PwC's reports issued under the engagement and information provided by Fidelity, the Board concluded that while other allocation methods may also be reasonable, Fidelity's profitability methodologies are reasonable in all material respects.
The Board also reviewed Fidelity's non-fund businesses and fall-out benefits related to the mutual fund business as well as cases where Fidelity's affiliates may benefit from or be related to the fund's business.
The Board considered the costs of the services provided by and the profits realized by Fidelity in connection with the operation of the fund and was satisfied that the profitability was not excessive in the circumstances.
Economies of Scale. The Board considered whether there have been economies of scale in respect of the management of the Fidelity funds, whether the Fidelity funds (including the fund) have appropriately benefited from any such economies of scale, and whether there is potential for realization of any further economies of scale. The Board considered the extent to which the fund will benefit from economies of scale through increased services to the fund, through waivers or reimbursements, or through fee or expense ratio reductions. The Board also noted that in 2013, it and the boards of other Fidelity funds created an ad hoc committee (the Economies of Scale Committee) to analyze whether Fidelity attains economies of scale in respect of the management and servicing of the Fidelity funds, whether the Fidelity funds have appropriately benefited from such economies of scale, and whether there is potential for realization of any further economies of scale.
Annual Report
The Board recognized that the fund's management contract incorporates a "group fee" structure, which provides for lower group fee rates as total group assets increase, and for higher group fee rates as total group assets decrease (with "group assets" defined to include fund assets under FMR's management plus sector fund assets previously under FMR's management and currently managed by Fidelity SelectCo, LLC). FMR calculates the group fee rates based on a tiered asset "breakpoint" schedule that varies based on asset class. The Board considered that the group fee is designed to deliver the benefits of economies of scale to fund shareholders when total Fidelity fund assets increase, even if assets of any particular fund are unchanged or have declined, because some portion of Fidelity's costs are attributable to services provided to all Fidelity funds, and all funds benefit if those costs can be allocated among more assets. The Board concluded that, given the group fee structure, fund shareholders will benefit from lower management fees as group assets increase at the fund complex level, regardless of whether Fidelity achieves any such economies of scale.
The Board concluded, taking into account the analysis of the Economies of Scale Committee, that economies of scale, if any, are being appropriately shared between fund shareholders and Fidelity.
Additional Information Requested by the Board. In order to develop fully the factual basis for consideration of the Fidelity funds' Advisory Contracts, the Board requested and received additional information on certain topics, including: (i) fund performance trends and Fidelity's long-term strategies for certain funds; (ii) Fidelity's strategic marketing and product lineup goals; (iii) the methodology with respect to competitive fund data and peer group classifications; (iv) the arrangements with, and performance of, certain sub-advisers on behalf of the Fidelity funds, as well as certain proposed participating affiliate arrangements; (v) the realization of fall-out benefits in certain Fidelity business units; (vi) Fidelity's group fee structures, including the rationale for the individual fee rates of certain categories of funds and the definition of group assets; (vii) trends regarding industry use of performance fee structures and the performance adjustment methodologies applicable to the Fidelity funds; (viii) additional competitive analysis regarding the total expenses for certain classes; (ix) fund profitability methodology, including Fidelity's cost allocation methodology, and the impact of certain factors on fund profitability results; and (x) the process by which Fidelity determines sub-advisory fees for funds it advises.
Annual Report
Board Approval of Investment Advisory Contracts and
Management Fees - continued
Based on its evaluation of all of the conclusions noted above, and after considering all factors it believed relevant, the Board ultimately concluded that the advisory fee structures are fair and reasonable, and that the fund's Advisory Contracts should be renewed.
Annual Report
Investment Adviser
Fidelity Management & Research Company
Boston, MA
Investment Sub-Advisers
FMR Co., Inc.
Fidelity Management & Research
(Japan) Limited
Fidelity Management & Research
(Hong Kong) Limited
Fidelity Management & Research
(U.K.) Inc.
General Distributor
Fidelity Distributors Corporation
Smithfield, RI
Transfer and Service Agents
Fidelity Investments Institutional Operations Company, Inc.
Boston, MA
Fidelity Service Company, Inc.
Boston, MA
Custodian
The Bank of New York Mellon
New York, NY
(Fidelity Investment logo)(registered trademark)
AFR-UANN-1214
1.784741.111
Fidelity®
Floating Rate High Income
Fund
(A Class of Fidelity Advisor®
Floating Rate High Income Fund)
Annual Report
October 31, 2014
Contents
Performance | How the fund has done over time. | |
Management's Discussion of Fund Performance | The Portfolio Manager's review of fund performance and strategy. | |
Shareholder Expense Example | An example of shareholder expenses. | |
Investment Changes | A summary of major shifts in the fund's investments over the past six months. | |
Investments | A complete list of the fund's investments with their market values. | |
Financial Statements | Statements of assets and liabilities, operations, and changes in net assets, as well as financial highlights. | |
Notes | Notes to financial statements. | |
Report of Independent Registered Public Accounting Firm |
| |
Trustees and Officers |
| |
Distributions |
| |
Board Approval of Investment Advisory Contracts and Management Fees |
|
To view a fund's proxy voting guidelines and proxy voting record for the 12-month period ended June 30, visit http://www.fidelity.com/proxyvotingresults or visit the Securities and Exchange Commission's (SEC) web site at http://www.sec.gov. You may also call 1-800-544-8544 to request a free copy of the proxy voting guidelines.
Standard & Poor's, S&P and S&P 500 are registered service marks of The McGraw-Hill Companies, Inc. and have been licensed for use by Fidelity Distributors Corporation.
Other third-party marks appearing herein are the property of their respective owners.
All other marks appearing herein are registered or unregistered trademarks or service marks of FMR LLC or an affiliated company. © 2014 FMR LLC. All rights reserved.
Annual Report
This report and the financial statements contained herein are submitted for the general information of the shareholders of the fund. This report is not authorized for distribution to prospective investors in the fund unless preceded or accompanied by an effective prospectus.
A fund files its complete schedule of portfolio holdings with the SEC for the first and third quarters of each fiscal year on Form N-Q. Forms N-Q are available on the SEC's web site at http://www.sec.gov. A fund's Forms N-Q may be reviewed and copied at the SEC's Public Reference Room in Washington, DC. Information regarding the operation of the SEC's Public Reference Room may be obtained by calling 1-800-SEC-0330. For a complete list of a fund's portfolio holdings, view the most recent holdings listing, semiannual report, or annual report on Fidelity's web site at http://www.fidelity.com, http://www.advisor.fidelity.com, or http://www.401k.com, as applicable.
NOT FDIC INSURED • MAY LOSE VALUE • NO BANK GUARANTEE
Neither the fund nor Fidelity Distributors Corporation is a bank.
Annual Report
Performance: The Bottom Line
Average annual total return reflects the change in the value of an investment, assuming reinvestment of the class' distributions from dividend income and capital gains (the profits earned upon the sale of securities that have grown in value, if any) and assuming a constant rate of performance each year. The $10,000 table and the fund's returns do not reflect the deduction of taxes that a shareholder would pay on fund distributions or the redemption of fund shares. During periods of reimbursement by Fidelity, a fund's total return will be greater than it would be had the reimbursement not occurred. How a fund did yesterday is no guarantee of how it will do tomorrow.
Average Annual Total Returns
Periods ended October 31, 2014 | Past 1 | Past 5 | Past 10 years |
Fidelity® Floating Rate High Income Fund | 2.34% | 4.87% | 4.34% |
$10,000 Over 10 Years
Let's say hypothetically that $10,000 was invested in Fidelity ® Floating Rate High Income Fund, a class of the fund, on October 31, 2004. The chart shows how the value of your investment would have changed, and also shows how the S&P®/LSTA Leveraged Performing Loan Index performed over the same period.
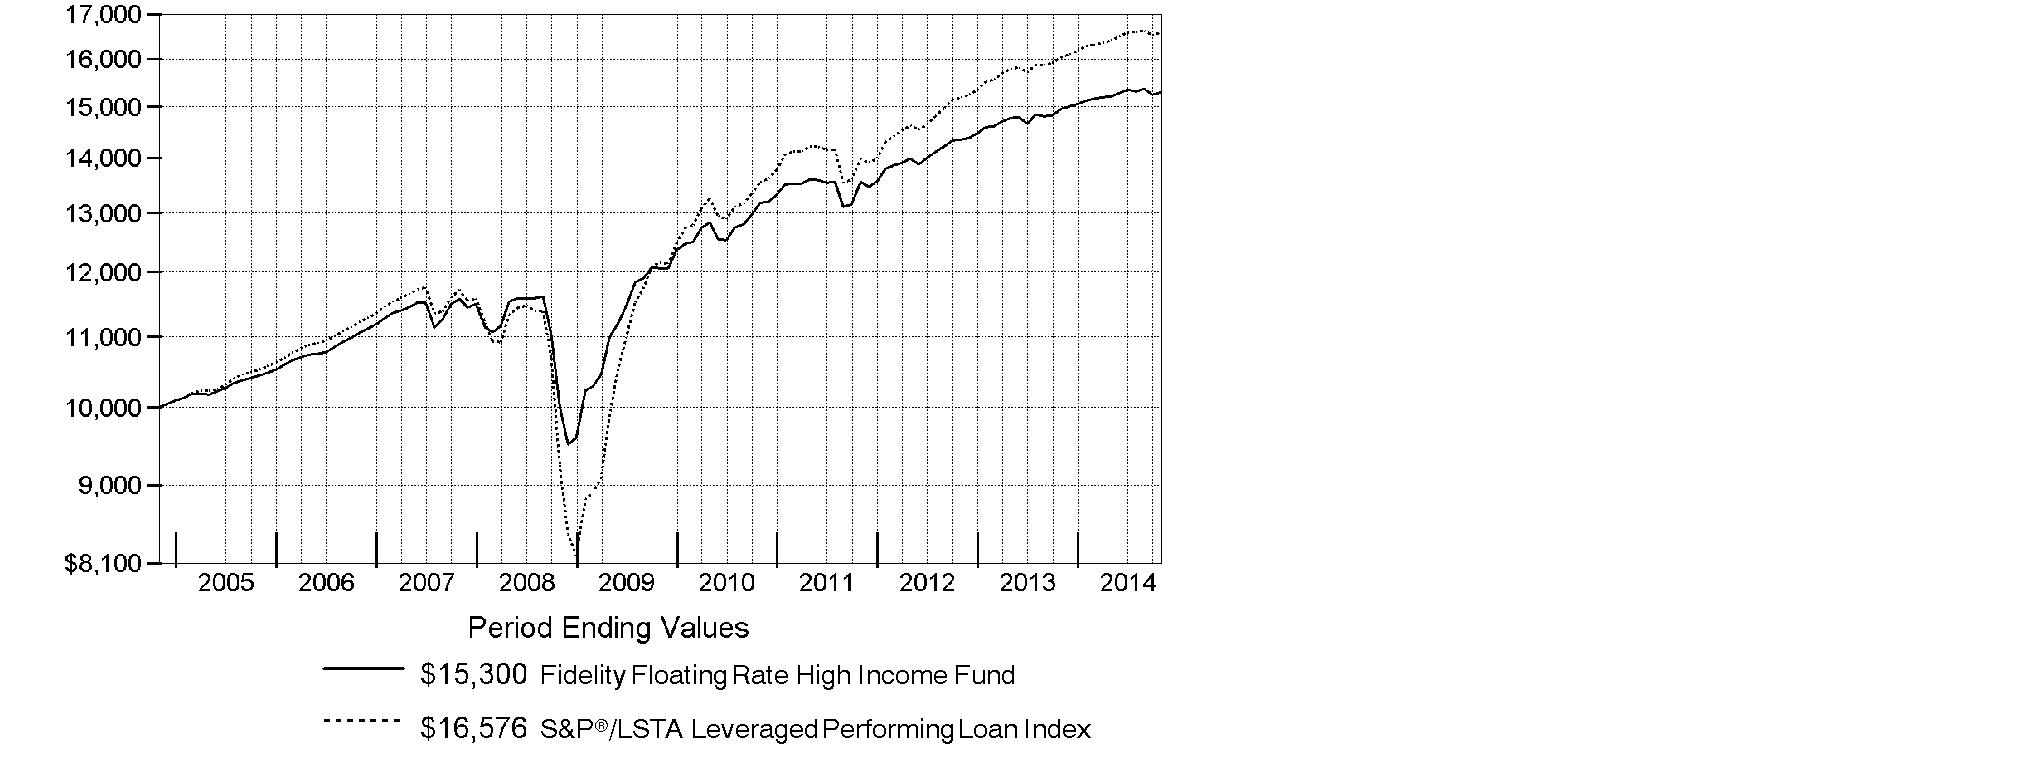
Annual Report
Management's Discussion of Fund Performance
Market Recap: Floating-rate bank loans generated a positive return for the 12 months ending October 31, 2014, but performance weakened in the period's latter months amid strong outflows from retail mutual funds. For the year, the S&P®/LSTA Leveraged Performing Loan Index rose 3.43%, modestly underperforming the broad investment-grade fixed-income market, as measured by the 4.14% return of the Barclays® U.S. Aggregate Bond Index, but trailing the 5.85% gain of The BofA Merrill LynchSM US High Yield Constrained Index by a greater margin. Within the S&P®/LSTA index, B-rated and CCC-rated loans were the best performers, partly fueled by demand from collateralized loan obligations (CLOs) - structured investment vehicles in which business loans are pooled to create a diversified income stream. CLOs prefer to buy B-rated loans because their higher yields enable CLOs to more easily meet their funding costs and overall return objectives. CCC-rated loans benefited from increased investor demand for second-lien loans, which offer higher yields than first-lien loans, given their subordinated position. Meanwhile, loans issued by the largest issuers within the index, many of which are rated BB, tended to underperform due to their comparatively lower yields. From an industry perspective, the best-performing groups were utilities and publishing, whereas food service, nonferrous metals/mining and air transport were among the weakest performers.
Comments from Eric Mollenhauer, Portfolio Manager of Fidelity® Floating Rate High Income Fund: For the year, the fund's Retail Class shares rose 2.34%, trailing the S&P®/LSTA Leveraged Performing Loan Index. Relative to the index, our more-conservative positioning kept the fund underweighted in the better-performing B-rated and CCC-rated areas of the market. Additionally, our positions in loans from some of the largest issuers - which we tend to hold given the fund's large asset base - hampered performance versus the benchmark, as did our 5% average cash stake. In terms of individual holdings, an underweighting in distressed Texas electric utility TXU Energy - the retail subsidiary of Energy Future Holdings - was the biggest relative detractor. Walter Energy, which produces and exports coal used in steel production, slightly detracted. On the plus side, steering clear of index components Education Management Group, a provider of higher-education programs for working adults, and Weight Watchers International, which offers weight-loss services, proved advantageous. Not holding children's clothing retailer and index member Gymboree also was slightly additive to performance.
The views expressed above reflect those of the portfolio manager(s) only through the end of the period as stated on the cover of this report and do not necessarily represent the views of Fidelity or any other person in the Fidelity organization. Any such views are subject to change at any time based upon market or other conditions and Fidelity disclaims any responsibility to update such views. These views may not be relied on as investment advice and, because investment decisions for a Fidelity fund are based on numerous factors, may not be relied on as an indication of trading intent on behalf of any Fidelity fund.
Annual Report
Shareholder Expense Example
As a shareholder of the Fund, you incur two types of costs: (1) transaction costs, including sales charges (loads) on purchase payments or redemption proceeds, redemption fees and (2) ongoing costs, including management fees, distribution and/or service (12b-1) fees and other Fund expenses. This Example is intended to help you understand your ongoing costs (in dollars) of investing in the Fund and to compare these costs with the ongoing costs of investing in other mutual funds.
The Example is based on an investment of $1,000 invested at the beginning of the period and held for the entire period (May 1, 2014 to October 31, 2014).
Actual Expenses
The first line of the accompanying table for each class of the Fund provides information about actual account values and actual expenses. You may use the information in this line, together with the amount you invested, to estimate the expenses that you paid over the period. Simply divide your account value by $1,000.00 (for example, an $8,600 account value divided by $1,000.00 = 8.6), then multiply the result by the number in the first line for a class of the Fund under the heading entitled "Expenses Paid During Period" to estimate the expenses you paid on your account during this period. A small balance maintenance fee of $12.00 that is charged once a year may apply for certain accounts with a value of less than $2,000. This fee is not included in the table below. If it was, the estimate of expenses you paid during the period would be higher, and your ending account value lower, by this amount. In addition, the Fund, as a shareholder in the underlying Fidelity Central Funds, will indirectly bear its pro-rata share of the fees and expenses incurred by the underlying Fidelity Central Funds. These fees and expenses are not included in the Fund's annualized expense ratio used to calculate the expense estimate in the table below.
Hypothetical Example for Comparison Purposes
The second line of the accompanying table for each class of the Fund provides information about hypothetical account values and hypothetical expenses based on a Class' actual expense ratio and an assumed rate of return of 5% per year before expenses, which is not the Class' actual return. The hypothetical account values and expenses may not be used to estimate the actual ending account balance or expenses you paid for the period. You may use this information to compare the ongoing costs of investing in the Fund and other funds. To do so, compare this 5% hypothetical example with the 5% hypothetical examples that appear in the shareholder reports of the other funds. A small balance maintenance fee of $12.00 that is charged once a year may apply for certain accounts with a value of less than $2,000. This fee is not included in the table below. If it was, the estimate of expenses you paid during the period would be higher, and your ending account value lower, by this amount. In addition, the Fund, as a shareholder in the underlying Fidelity Central Funds, will indirectly bear its pro-rata share of the fees and expenses incurred by the underlying Fidelity Central Funds. These fees and expenses are not included in the Fund's annualized expense ratio used to calculate the expense estimate in the table below.
Please note that the expenses shown in the table are meant to highlight your ongoing costs only and do not reflect any transaction costs. Therefore, the second line of the table is useful in comparing ongoing costs only, and will not help you determine the relative total costs of owning different funds. In addition, if these transactional costs were included, your costs would have been higher.
Annual Report
Shareholder Expense Example - continued
| Annualized | Beginning | Ending | Expenses Paid |
Class A | .96% |
|
|
|
Actual |
| $ 1,000.00 | $ 1,005.00 | $ 4.85 |
HypotheticalA |
| $ 1,000.00 | $ 1,020.37 | $ 4.89 |
Class T | 1.06% |
|
|
|
Actual |
| $ 1,000.00 | $ 1,004.60 | $ 5.36 |
HypotheticalA |
| $ 1,000.00 | $ 1,019.86 | $ 5.40 |
Class B | 1.48% |
|
|
|
Actual |
| $ 1,000.00 | $ 1,001.40 | $ 7.47 |
HypotheticalA |
| $ 1,000.00 | $ 1,017.74 | $ 7.53 |
Class C | 1.71% |
|
|
|
Actual |
| $ 1,000.00 | $ 1,001.30 | $ 8.63 |
HypotheticalA |
| $ 1,000.00 | $ 1,016.59 | $ 8.69 |
Fidelity Floating Rate High Income Fund | .68% |
|
|
|
Actual |
| $ 1,000.00 | $ 1,006.50 | $ 3.44 |
HypotheticalA |
| $ 1,000.00 | $ 1,021.78 | $ 3.47 |
Institutional Class | .73% |
|
|
|
Actual |
| $ 1,000.00 | $ 1,006.20 | $ 3.69 |
HypotheticalA |
| $ 1,000.00 | $ 1,021.53 | $ 3.72 |
A 5% return per year before expenses
B Annualized expense ratio reflects expenses net of applicable fee waivers.
* Expenses are equal to each Class' annualized expense ratio, multiplied by the average account value over the period, multiplied by 184/365 (to reflect the one-half year period).
Annual Report
Investment Changes (Unaudited)
Top Five Holdings as of October 31, 2014 | ||
(by issuer, excluding cash equivalents) | % of fund's | % of fund's net assets |
HCA Holdings, Inc. | 3.0 | 3.2 |
H.J. Heinz Co. | 2.6 | 2.6 |
Community Health Systems, Inc. | 2.6 | 2.7 |
Albertson's LLC | 1.9 | 0.2 |
Fortescue Metals Group Ltd. | 1.9 | 1.7 |
| 12.0 | |
Top Five Market Sectors as of October 31, 2014 | ||
| % of fund's | % of fund's net assets |
Technology | 10.1 | 10.9 |
Healthcare | 9.8 | 11.9 |
Energy | 6.7 | 4.6 |
Gaming | 6.5 | 5.8 |
Telecommunications | 6.4 | 6.5 |
Quality Diversification (% of fund's net assets) | |||||||
As of October 31, 2014 | As of April 30, 2014 | ||||||
 | BBB 5.1% |
| | BBB 5.9% |
| ||
 | BB 43.0% |
| | BB 38.8% |
| ||
 | B 40.7% |
| | B 42.5% |
| ||
 | CCC,CC,C 2.5% |
| | CCC,CC,C 2.8% |
| ||
 | D 0.0% |
|  | D 0.0%† |
| ||
 | Not Rated 3.7% |
| | Not Rated 4.7% |
| ||
 | Equities 0.2% |
| | Equities 0.2% |
| ||
 | Short-Term |
| | Short-Term |
| ||

We have used ratings from Moody's Investors Service, Inc. Where Moody's® ratings are not available, we have used S&P® ratings. All ratings are as of the date indicated and do not reflect subsequent changes. |
† Amount represents less than 0.1% | |||||||
Asset Allocation (% of fund's net assets) | |||||||
As of October 31, 2014* | As of April 30, 2014** | ||||||
| Bank Loan |
| | Bank Loan |
| ||
| Nonconvertible |
| | Nonconvertible |
| ||
| Common Stocks 0.2% |
| | Common Stocks 0.2% |
| ||
| Short-Term |
| | Short-Term |
| ||
* Foreign investments | 11.7% |
| ** Foreign investments | 10.5% |
| ||

Annual Report
Investments October 31, 2014
Showing Percentage of Net Assets
Bank Loan Obligations (f) - 88.3% | ||||
| Principal Amount (000s) | Value (000s) | ||
Aerospace - 1.1% | ||||
Gemini HDPE LLC Tranche B, term loan 4.75% 8/7/21 (e) | $ 17,631 | $ 17,499 | ||
TransDigm, Inc. Tranche C, term loan 3.75% 2/28/20 (e) | 144,149 | 141,627 | ||
| 159,126 | |||
Air Transportation - 0.1% | ||||
U.S. Airways, Inc. Tranche B 2LN, term loan 3% 11/23/16 (e) | 14,750 | 14,529 | ||
Automotive - 1.6% | ||||
Chrysler Group LLC: | ||||
term loan 3.25% 12/31/18 (e) | 53,730 | 53,193 | ||
Tranche B, term loan 3.5% 5/24/17 (e) | 81,245 | 80,737 | ||
Federal-Mogul Corp. Tranche C, term loan 4.75% 4/15/21 (e) | 9,975 | 9,913 | ||
North American Lifting Holdings, Inc.: | ||||
Tranche 1LN, term loan 5.5% 11/27/20 (e) | 16,879 | 16,689 | ||
Tranche 2LN, term loan 10% 11/27/21 (e) | 24,370 | 24,096 | ||
The Gates Corp. Tranche B 1LN, term loan 4.25% 7/3/21 (e) | 20,000 | 19,800 | ||
Tower Automotive Holdings U.S.A. LLC term loan 4% 4/23/20 (e) | 26,612 | 26,312 | ||
| 230,740 | |||
Broadcasting - 2.3% | ||||
Clear Channel Capital I LLC Tranche B, term loan 3.804% 1/29/16 (e) | 38,701 | 38,459 | ||
Clear Channel Communications, Inc. Tranche D, term loan 6.904% 1/30/19 (e) | 68,720 | 64,855 | ||
ION Media Networks, Inc. Tranche B, term loan 5% 12/18/20 (e) | 28,783 | 28,783 | ||
Nielsen Finance LLC Tranche B 2LN, term loan 3.1525% 4/15/21 (e) | 69,625 | 69,538 | ||
TWCC Holding Corp. term loan 3.5% 2/11/17 (e) | 56,020 | 55,152 | ||
Univision Communications, Inc. Tranche C 4LN, term loan 4% 3/1/20 (e) | 81,602 | 80,718 | ||
| 337,505 | |||
Building Materials - 0.4% | ||||
American Builders & Contractors Supply Co., Inc. Tranche B, term loan 3.5% 4/16/20 (e) | 34,733 | 33,923 | ||
Bank Loan Obligations (f) - continued | ||||
| Principal Amount (000s) | Value (000s) | ||
Building Materials - continued | ||||
Armstrong World Industries, Inc. Tranche B, term loan 3.5% 3/15/20 (e) | $ 23,590 | $ 23,295 | ||
Ply Gem Industries, Inc. Tranche B, term loan 4% 2/1/21 (e) | 7,060 | 6,918 | ||
| 64,136 | |||
Cable TV - 4.4% | ||||
Atlantic Broad Tranche B, term loan 3.25% 11/30/19 (e) | 19,952 | 19,729 | ||
Cequel Communications LLC Tranche B, term loan 3.5% 2/14/19 (e) | 106,928 | 105,324 | ||
Charter Communications Operating LLC: | ||||
Tranche E, term loan 3% 7/1/20 (e) | 48,716 | 47,985 | ||
Tranche F, term loan 3% 1/3/21 (e) | 94,232 | 91,523 | ||
CSC Holdings LLC Tranche B, term loan 2.654% 4/17/20 (e) | 68,595 | 67,140 | ||
Liberty Cablevision of Puerto Rico Tranche 1LN, term loan 4.5% 1/7/22 (e) | 14,000 | 13,895 | ||
Numericable LLC: | ||||
Tranche B 1LN, term loan 4.5% 5/8/20 (e) | 47,013 | 47,079 | ||
Tranche B 2LN, term loan 4.5% 5/8/20 (e) | 40,672 | 40,730 | ||
UPC Broadband Holding BV Tranche AH, term loan 3.25% 6/30/21 (e) | 34,000 | 33,193 | ||
Virgin Media Finance PLC Tranche B, term loan 3.5% 6/7/20 (e) | 55,000 | 53,969 | ||
WideOpenWest Finance LLC Tranche B, term loan 4.75% 4/1/19 (e) | 29,513 | 29,439 | ||
Ziggo B.V.: | ||||
Tranche B 1LN, term loan: | ||||
3.25% 1/15/22 (e) | 35,286 | 34,403 | ||
3.25% 1/15/22 (e) | 2,063 | 2,011 | ||
Tranche B 2LN, term loan: | ||||
1/15/22 (g)(h) | 1,934 | 1,886 | ||
3.25% 1/15/22 (e) | 22,134 | 21,581 | ||
Tranche B 3LN, term loan 1/15/22 (g)(h) | 39,583 | 38,594 | ||
| 648,481 | |||
Capital Goods - 0.7% | ||||
Doncasters PLC Tranche B 2LN, term loan 9.5% 10/9/20 (e) | 7,374 | 7,355 | ||
Doosan Infracore, Inc. Tranche B, term loan 4.5% 5/28/21 (e) | 38,723 | 38,723 | ||
Bank Loan Obligations (f) - continued | ||||
| Principal Amount (000s) | Value (000s) | ||
Capital Goods - continued | ||||
SRAM LLC. Tranche B, term loan 4.0182% 4/10/20 (e) | $ 37,335 | $ 36,588 | ||
Utex Industries, Inc. Tranche B 1LN, term loan 5% 5/22/21 (e) | 14,828 | 14,680 | ||
| 97,346 | |||
Chemicals - 0.9% | ||||
Arizona Chem U.S., Inc.: | ||||
Tranche 2LN, term loan 7.5% 6/12/22 (e) | 6,605 | 6,597 | ||
Tranche B 1LN, term loan 4.5% 6/12/21 (e) | 20,214 | 20,138 | ||
MacDermid, Inc. Tranche B 1LN, term loan 4% 6/7/20 (e) | 34,356 | 33,583 | ||
Styrolution U.S. Holding LLC Tranche B 1LN, term loan 10/31/19 (g) | 20,000 | 19,792 | ||
Tata Chemicals North America, Inc. Tranche B, term loan 3.75% 8/9/20 (e) | 12,838 | 12,613 | ||
U.S. Coatings Acquisition, Inc. Tranche B, term loan 3.75% 2/1/20 (e) | 41,200 | 40,376 | ||
| 133,099 | |||
Consumer Products - 0.8% | ||||
Kate Spade & Co. Tranche B, term loan 4% 4/10/21 (e) | 17,920 | 17,427 | ||
Revlon Consumer Products Corp.: | ||||
term loan 4% 8/19/19 (e) | 30,768 | 30,383 | ||
Tranche B, term loan 3.25% 11/19/17 (e) | 13,500 | 13,314 | ||
Sun Products Corp. Tranche B, term loan 5.5% 3/23/20 (e) | 15,021 | 13,444 | ||
Tempur Sealy International, Inc. Tranche B, term loan 3.5% 3/18/20 (e) | 15,555 | 15,361 | ||
Wilsonart LLC Tranche B, term loan 4% 10/31/19 (e) | 32,657 | 32,113 | ||
| 122,042 | |||
Containers - 2.0% | ||||
Ardagh Holdings U.S.A., Inc. Tranche B, term loan 4% 12/17/19 (e) | 55,352 | 54,868 | ||
Berry Plastics Corp. Tranche E, term loan 3.75% 1/6/21 (e) | 14,925 | 14,552 | ||
Berry Plastics Group, Inc. term loan 3.5% 2/8/20 (e) | 99,575 | 96,588 | ||
BWAY Holding Co. Tranche B, term loan 5.5% 8/14/20 (e) | 19,950 | 20,050 | ||
Consolidated Container Co. Tranche B, term loan 5% 7/3/19 (e) | 8,800 | 8,690 | ||
Multi Packaging Solutions, Inc. term loan 4.25% 9/30/20 (e) | 4,347 | 4,281 | ||
Bank Loan Obligations (f) - continued | ||||
| Principal Amount (000s) | Value (000s) | ||
Containers - continued | ||||
Reynolds Consumer Products Holdings, Inc. Tranche B, term loan 4% 12/1/18 (e) | $ 87,652 | $ 86,338 | ||
Tricorbraun, Inc. Tranche B, term loan 4% 5/3/18 (e) | 3,804 | 3,745 | ||
| 289,112 | |||
Diversified Financial Services - 2.4% | ||||
AlixPartners LLP Tranche B 2LN, term loan 4% 7/10/20 (e) | 19,750 | 19,437 | ||
Delos Finance SARL Tranche B LN, term loan 3.5% 3/6/21 (e) | 51,095 | 50,797 | ||
Energy & Minerals Group Tranche B, term loan 4.75% 3/27/20 (e) | 14,920 | 14,845 | ||
Fly Funding II Sarl Tranche B, term loan 4.5% 8/9/19 (e) | 14,529 | 14,529 | ||
Flying Fortress, Inc. term loan 3.5% 6/30/17 (e) | 97,833 | 97,471 | ||
HarbourVest Partners LLC Tranche B, term loan 3.25% 2/4/21 (e) | 13,737 | 13,479 | ||
Home Loan Servicing Solutions Ltd. Tranche B, term loan 4.5% 6/27/20 (e) | 14,566 | 13,692 | ||
IBC Capital U.S. LLC Tranche B 1LN, term loan 4.75% 9/11/21 (e) | 25,000 | 24,875 | ||
LPL Holdings, Inc. Tranche B, term loan 3.25% 3/29/19 (e) | 32,680 | 32,233 | ||
TransUnion LLC Tranche B, term loan 4% 4/9/21 (e) | 72,113 | 71,166 | ||
| 352,524 | |||
Diversified Media - 0.5% | ||||
Advanstar Communications, Inc. Tranche B 1LN, term loan 5.5% 4/29/19 (e) | 8,373 | 8,362 | ||
McGraw-Hill School Education Tranche B, term loan 6.25% 12/18/19 (e) | 18,361 | 18,315 | ||
WMG Acquisition Corp. term loan 3.75% 7/1/20 (e) | 50,440 | 48,422 | ||
| 75,099 | |||
Electric Utilities - 5.6% | ||||
Alinta Energy Finance Pty. Ltd. Tranche B, term loan: | ||||
2.3821% 8/13/18 (e)(h) | 3,030 | 3,045 | ||
6.375% 8/13/19 (e) | 45,849 | 46,078 | ||
Calpine Construction Finance Co. LP: | ||||
Tranche B 1LN, term loan 3% 5/3/20 (e) | 84,698 | 82,051 | ||
Tranche B 2LN, term loan 3.25% 1/31/22 (e) | 54,052 | 52,498 | ||
Calpine Corp.: | ||||
Tranche B 2LN, term loan 4% 4/1/18 (e) | 11,654 | 11,596 | ||
Tranche B 3LN, term loan 4% 10/9/19 (e) | 29,412 | 29,118 | ||
Tranche B, term loan 4% 4/1/18 (e) | 107,816 | 107,277 | ||
Bank Loan Obligations (f) - continued | ||||
| Principal Amount (000s) | Value (000s) | ||
Electric Utilities - continued | ||||
Dynegy, Inc. Tranche B 2LN, term loan 4% 4/23/20 (e) | $ 25,636 | $ 25,475 | ||
Energy Future Holdings Corp. Tranche 1LN, term loan 4.25% 6/19/16 (e) | 79,884 | 79,684 | ||
EquiPower Resources Holdings LLC: | ||||
Tranche B 1LN, term loan 4.25% 12/21/18 (e) | 13,687 | 13,602 | ||
Tranche C, term loan 4.25% 12/31/19 (e) | 32,048 | 31,848 | ||
Essential Power LLC Tranche B, term loan 4.75% 8/8/19 (e) | 15,949 | 15,949 | ||
Exgen Texas Power LLC Tranche B, term loan 5.75% 9/18/21 (e) | 45,000 | 45,000 | ||
Houston Fuel Oil Terminal Co. Tranche B, term loan 4.25% 8/19/21 (e) | 10,500 | 10,290 | ||
InterGen NV Tranche B, term loan 5.5% 6/13/20 (e) | 33,493 | 33,409 | ||
La Frontera Generation, LLC Tranche B, term loan 4.5% 9/30/20 (e) | 63,751 | 63,273 | ||
NRG Energy, Inc. Tranche B, term loan 2.75% 7/1/18 (e) | 41,672 | 40,994 | ||
Southcross Energy Partners LP Tranche B, term loan 5.25% 8/4/21 (e) | 7,357 | 7,320 | ||
Southcross Holdings Borrower LP Tranche B, term loan 6% 8/4/21 (e) | 13,381 | 13,181 | ||
Star West Generation LLC Tranche B, term loan 4.25% 3/13/20 (e) | 22,176 | 21,954 | ||
Tempus Public Foundation Generation Holdings LLC Tranche B, term loan 4.75% 12/31/17 (e) | 13,378 | 12,743 | ||
TXU Energy LLC Tranche B, term loan: | ||||
4.6469% 10/10/17 (c)(e) | 66,622 | 48,384 | ||
4.6469% 10/10/14 (c)(e) | 10,052 | 7,300 | ||
USIC Holdings, Inc. Tranche B, term loan 4% 7/10/20 (e) | 16,294 | 16,029 | ||
| 818,098 | |||
Energy - 6.0% | ||||
Alon U.S.A. Partners LP term loan 9.25% 11/26/18 (e) | 8,733 | 8,821 | ||
Atlantic Power Ltd. Partnership Tranche B LN, term loan 4.75% 2/24/21 (e) | 24,065 | 23,915 | ||
Drillships Ocean Ventures, Inc. Tranche B, term loan 5.5% 7/25/21 (e) | 30,923 | 29,624 | ||
Empire Generating Co. LLC: | ||||
Tranche B, term loan 5.25% 3/14/21 (e) | 29,526 | 29,416 | ||
Tranche C, term loan 5.25% 3/14/21 (e) | 2,070 | 2,063 | ||
EP Energy LLC term loan 4.5% 4/30/19 (e) | 1,500 | 1,478 | ||
Everest Acquisition LLC Tranche B 3LN, term loan 3.5% 5/24/18 (e) | 42,333 | 41,593 | ||
Bank Loan Obligations (f) - continued | ||||
| Principal Amount (000s) | Value (000s) | ||
Energy - continued | ||||
ExGen Renewables I, LLC Tranche B term loan 5.25% 2/6/21 (e) | $ 15,289 | $ 15,442 | ||
Expro Finservices S.a.r.l. Tranche B, term loan 5.75% 9/2/21 (e) | 52,000 | 50,895 | ||
Fieldwood Energy, LLC: | ||||
Tranche 2LN, term loan 8.375% 9/30/20 (e) | 140,755 | 135,477 | ||
Tranche B 1LN, term loan 3.875% 9/30/18 (e) | 39,625 | 38,634 | ||
Floatel International Ltd. Tranche B, term loan 6% 6/27/20 (e) | 37,198 | 35,989 | ||
GIM Channelview Cogeneration LLC Tranche B, term loan 4.25% 5/8/20 (e) | 11,845 | 11,831 | ||
Moxie Patriot LLC Tranche B, term loan 6.75% 12/19/20 (e) | 13,000 | 13,179 | ||
MRC Global, Inc. Tranche B, term loan 5% 11/9/19 (e) | 44,525 | 44,583 | ||
Northeast Wind Capital II, LLC Tranche B, term loan 5% 11/14/20 (e) | 14,051 | 14,051 | ||
Offshore Group Investment Ltd. Tranche B, term loan 5% 10/25/17 (e) | 15,785 | 14,522 | ||
Overseas Shipholding Group, Inc. Tranche B, term loan: | ||||
5.25% 8/5/19 (e) | 15,845 | 15,746 | ||
5.75% 8/5/19 (e) | 11,641 | 11,554 | ||
Pacific Drilling SA Tranche B, term loan 4.5% 6/3/18 (e) | 24,347 | 23,251 | ||
Panda Sherman Power, LLC term loan 9% 9/14/18 (e) | 19,956 | 20,256 | ||
Panda Temple Power, LLC term loan 7.25% 4/3/19 (e) | 11,000 | 11,179 | ||
Ruby Western Pipeline Holdings LLC Tranche B, term loan 3.5% 3/27/20 (e) | 28,599 | 28,456 | ||
Samson Investment Co. Tranche B 2LN, term loan 5% 9/25/18 (e) | 20,800 | 19,136 | ||
Seadrill Operating LP Tranche B, term loan 4% 2/21/21 (e) | 60,873 | 57,441 | ||
Sheridan Investment Partners I term loan 4.25% 12/16/20 (e) | 44,963 | 42,827 | ||
Sheridan Investment Partners I, LLC Tranche B 2LN, term loan 4.25% 10/1/19 (e) | 20,181 | 19,374 | ||
Sheridan Production Partners I: | ||||
Tranche A, term loan 4.25% 12/16/20 (e) | 6,255 | 5,958 | ||
Tranche M, term loan 4.25% 12/16/20 (e) | 2,333 | 2,222 | ||
TPF II Power, LLC Tranche B, term loan 5.5% 10/2/21 (e) | 67,020 | 67,355 | ||
Vantage Drilling Co. Tranche B, term loan 5.75% 3/28/19 (e) | 14,775 | 13,076 | ||
Western Refining, Inc. Tranche B, term loan 4.25% 11/12/20 (e) | 26,157 | 25,896 | ||
| 875,240 | |||
Bank Loan Obligations (f) - continued | ||||
| Principal Amount (000s) | Value (000s) | ||
Entertainment/Film - 0.9% | ||||
AMC Entertainment, Inc. Tranche B, term loan 3.5% 4/30/20 (e) | $ 24,637 | $ 24,268 | ||
CBS Outdoor Americas Capital LLC/CBS Outdoor Americas Capital Corp. Tranche B, term loan 3% 1/31/21 (e) | 26,660 | 26,093 | ||
Digital Cinema Implementation Partners, LLC Tranche B, term loan 3.25% 5/17/21 (e) | 40,965 | 40,248 | ||
Live Nation Entertainment, Inc. Tranche B, term loan 3.5% 8/16/20 (e) | 14,273 | 14,202 | ||
William Morris Endeavor Entertainment, LLC. Tranche B 1LN, term loan 5.25% 5/6/21 (e) | 29,913 | 29,464 | ||
| 134,275 | |||
Environmental - 0.8% | ||||
ADS Waste Holdings, Inc. Tranche B 2LN, term loan 3.75% 10/9/19 (e) | 25,370 | 24,806 | ||
Tervita Corp. Tranche B 1LN, term loan 6.25% 5/15/18 (e) | 24,642 | 23,841 | ||
The Brickman Group, Ltd.: | ||||
Tranche 2LN, term loan 7.5% 12/18/21 (e) | 5,690 | 5,548 | ||
Tranche B 1LN, term loan 4% 12/18/20 (e) | 51,492 | 50,720 | ||
WTG Holdings III Corp. Tranche B 1LN, term loan 4.75% 1/15/21 (e) | 10,918 | 10,822 | ||
| 115,737 | |||
Food & Drug Retail - 3.2% | ||||
Albertson's LLC: | ||||
Tranche B 3LN, term loan 4% 8/25/19 (e) | 63,000 | 62,685 | ||
Tranche B 4LN, term loan: | ||||
4.5% 8/25/21 (e) | 200,000 | 200,000 | ||
4.5% 8/25/21 (e) | 19,920 | 19,920 | ||
Ferrara Candy Co., Inc. Tranche B, term loan 7.5% 6/18/18 (e) | 23,462 | 22,406 | ||
Mallinckrodt International Finance S.A. Tranche B 1LN, term loan 3.5% 3/19/21 (e) | 30,945 | 30,636 | ||
Performance Food Group, Inc. Tranche 2LN, term loan 6.25% 11/14/19 (e) | 7,306 | 7,269 | ||
PRA Holdings, Inc. Tranche B, term loan 4.5% 9/23/20 (e) | 17,780 | 17,536 | ||
Rite Aid Corp.: | ||||
Tranche 2 LN2, term loan 4.875% 6/21/21 (e) | 25,210 | 25,178 | ||
Tranche 2LN, term loan 5.75% 8/21/20 (e) | 9,080 | 9,137 | ||
Tranche B 7LN, term loan 3.5% 2/21/20 (e) | 37,896 | 37,422 | ||
Bank Loan Obligations (f) - continued | ||||
| Principal Amount (000s) | Value (000s) | ||
Food & Drug Retail - continued | ||||
Sprouts Farmers Market LLC Tranche B, term loan 4% 4/23/20 (e) | $ 19,193 | $ 19,049 | ||
SUPERVALU, Inc. Tranche B, term loan 4.5% 3/21/19 (e) | 14,710 | 14,434 | ||
| 465,672 | |||
Food/Beverage/Tobacco - 3.8% | ||||
AdvancePierre Foods, Inc. Tranche 2LN, term loan 9.5% 10/10/17 (e) | 3,000 | 2,966 | ||
Arysta Lifescience SPC LLC: | ||||
Tranche B 1LN, term loan 4.5% 5/29/20 (e) | 36,470 | 36,333 | ||
Tranche B 2LN, term loan 8.25% 11/30/20 (e) | 25,000 | 25,188 | ||
Big Heart Pet Brands Tranche B LN, term loan 3.5% 3/8/20 (e) | 49,750 | 48,009 | ||
Flavors Holdings, Inc. Tranche B 1LN, term loan 6.75% 4/3/20 (e) | 6,000 | 5,775 | ||
H.J. Heinz Co.: | ||||
Tranche B 1LN, term loan 3.25% 6/7/19 (e) | 19,700 | 19,503 | ||
Tranche B 2LN, term loan 3.5% 6/7/20 (e) | 367,041 | 363,354 | ||
JBS U.S.A. LLC Tranche B, term loan 3.75% 5/25/18 (e) | 19,242 | 19,049 | ||
OSI Restaurant Partners LLC Tranche B, term loan 3.5% 10/26/19 (e) | 9,154 | 9,039 | ||
Post Holdings, Inc. Tranche B, term loan 3.75% 6/2/21 (e) | 18,150 | 18,081 | ||
| 547,297 | |||
Gaming - 6.4% | ||||
Aristocrat International (Pty) Ltd. Tranche B, term loan 4.75% 10/20/21 (e) | 40,000 | 39,750 | ||
Bally Technologies, Inc. Tranche B, term loan 4.25% 11/25/20 (e) | 22,172 | 22,033 | ||
Boyd Gaming Corp. Tranche B, term loan 4% 8/14/20 (e) | 25,433 | 25,051 | ||
Caesars Entertainment Resort Properties LLC Tranche B 1LN, term loan 7% 10/11/20 (e) | 211,686 | 201,631 | ||
Caesars Growth Properties Holdings, LLC Tranche 1LN, term loan 6.25% 5/8/21 (e) | 146,238 | 137,830 | ||
CityCenter Holdings LLC Tranche B, term loan 4.25% 10/16/20 (e) | 50,332 | 49,955 | ||
Golden Nugget, Inc. Tranche B, term loan: | ||||
5.5% 11/21/19 (e) | 46,006 | 46,236 | ||
5.5% 11/21/19 (e) | 19,717 | 19,816 | ||
Graton Economic Development Authority Tranche B, term loan 9% 8/22/18 (e) | 7,301 | 7,520 | ||
Bank Loan Obligations (f) - continued | ||||
| Principal Amount (000s) | Value (000s) | ||
Gaming - continued | ||||
Las Vegas Sands LLC Tranche B, term loan 3.25% 12/19/20 (e) | $ 49,575 | $ 49,389 | ||
MGM Mirage, Inc. Tranche B, term loan 3.5% 12/20/19 (e) | 98,936 | 97,828 | ||
Mohegan Tribal Gaming Authority Tranche B, term loan 5.5% 11/19/19 (e) | 29,621 | 28,733 | ||
Pinnacle Entertainment, Inc. Tranche B 2LN, term loan 3.75% 8/13/20 (e) | 20,586 | 20,175 | ||
Scientific Games Corp.: | ||||
Tranch B 2LN, term loan 6% 10/21/21 (e) | 68,000 | 66,558 | ||
Tranche B, term loan 4.25% 10/18/20 (e) | 95,435 | 93,288 | ||
Station Casinos LLC Tranche B, term loan 4.25% 3/1/20 (e) | 16,215 | 16,012 | ||
Yonkers Racing Corp. Tranche B 1LN, term loan 4.25% 8/20/19 (e) | 13,951 | 12,137 | ||
| 933,942 | |||
Healthcare - 9.4% | ||||
Alkermes, Inc. term loan 3.5% 9/25/19 (e) | 13,505 | 13,302 | ||
AmSurg Corp. Tranche B, term loan 3.75% 7/16/21 (e) | 22,294 | 22,183 | ||
Community Health Systems, Inc.: | ||||
Tranche D, term loan 4.25% 1/27/21 (e) | 323,223 | 323,223 | ||
Tranche E, term loan 3.4846% 1/25/17 (e) | 47,336 | 46,981 | ||
DaVita HealthCare Partners, Inc. Tranche B, term loan 3.5% 6/24/21 (e) | 70,324 | 69,621 | ||
Drumm Investors LLC Tranche B, term loan 6.75% 5/4/18 (e) | 73,014 | 73,562 | ||
Emergency Medical Services Corp. Tranche B, term loan 4% 5/25/18 (e) | 28,494 | 28,273 | ||
Grifols, S.A. Tranche B, term loan 3.154% 2/27/21 (e) | 44,755 | 44,196 | ||
HCA Holdings, Inc.: | ||||
Tranche A 4LN, term loan 2.654% 2/2/16 (e) | 271,316 | 270,312 | ||
Tranche B 4LN, term loan 2.9831% 5/1/18 (e) | 35,690 | 35,557 | ||
Tranche B 5LN, term loan 2.904% 3/31/17 (e) | 116,356 | 115,925 | ||
HCR Healthcare LLC Tranche B, term loan 5% 4/6/18 (e) | 35,959 | 34,700 | ||
IASIS Healthcare LLC Tranche B 2LN, term loan 4.5% 5/3/18 (e) | 34,388 | 34,346 | ||
Millennium Labs, LLC Tranche B, term loan 5.25% 4/16/21 (e) | 23,242 | 23,242 | ||
MPH Acquisition Holdings LLC Tranche B, term loan 4% 3/31/21 (e) | 52,368 | 51,386 | ||
National Mentor Holdings, Inc. Tranche B, term loan 4.75% 1/31/21 (e) | 12,848 | 12,735 | ||
Bank Loan Obligations (f) - continued | ||||
| Principal Amount (000s) | Value (000s) | ||
Healthcare - continued | ||||
Polymer Group, Inc. Tranche B, term loan 5.25% 12/19/19 (e) | $ 19,858 | $ 19,758 | ||
Quintiles Transnational Corp. Tranche B 3LN, term loan 3.75% 6/8/18 (e) | 24,938 | 24,813 | ||
Skilled Healthcare Group, Inc. term loan 7% 4/9/16 (e) | 16,317 | 16,276 | ||
Surgery Center Holdings, Inc. Tranche B 1LN, term loan 5.25% 7/24/20 (e) | 7,685 | 7,666 | ||
U.S. Renal Care, Inc.: | ||||
Tranche 2LN, term loan 8.5% 1/3/20 (e) | 5,545 | 5,559 | ||
Tranche B 2LN, term loan 4.25% 7/3/19 (e) | 29,913 | 29,651 | ||
Valeant Pharmaceuticals International: | ||||
Tranche BC 2LN, term loan 3.5% 12/11/19 (e) | 26,437 | 26,238 | ||
Tranche BD 2LN, term loan 3.5% 2/13/19 (e) | 44,598 | 44,319 | ||
| 1,373,824 | |||
Homebuilders/Real Estate - 0.7% | ||||
CBRE Group, Inc. Tranche B, term loan 2.9025% 3/28/21 (e) | 14,917 | 14,805 | ||
Realogy Corp. Credit-Linked Deposit 4.4463% 10/10/16 (e) | 1,551 | 1,519 | ||
Realogy Group LLC Tranche B, term loan 3.75% 3/5/20 (e) | 89,232 | 88,786 | ||
| 105,110 | |||
Hotels - 3.5% | ||||
Four Seasons Holdings, Inc.: | ||||
Tranche 2LN, term loan 6.25% 12/27/20 (e) | 15,420 | 15,459 | ||
Tranche B 1LN, term loan 3.5% 6/27/20 (e) | 50,883 | 50,437 | ||
Hilton Worldwide Finance, LLC Tranche B, term loan 3.5% 10/25/20 (e) | 266,974 | 264,171 | ||
La Quinta Intermediate Holdings LLC Tranche B LN, Tranche B, term loan 4% 4/14/21 (e) | 124,714 | 123,779 | ||
Playa Resorts Holding BV Tranche B, term loan 4% 8/9/19 (e) | 40,106 | 39,505 | ||
Ryman Hospitality Properties, Inc. Tranche B, term loan 3.75% 1/15/21 (e) | 11,357 | 11,257 | ||
| 504,608 | |||
Insurance - 0.2% | ||||
CNO Financial Group, Inc. Tranche B 2LN, term loan 3.75% 9/28/18 (e) | 11,784 | 11,828 | ||
HUB International Ltd. Tranche B 1LN, term loan 4.25% 10/2/20 (e) | 17,413 | 17,195 | ||
| 29,023 | |||
Bank Loan Obligations (f) - continued | ||||
| Principal Amount (000s) | Value (000s) | ||
Leisure - 0.8% | ||||
24 Hour Fitness Worldwide, Inc. Tranche B, term loan 4.75% 5/30/21 (e) | $ 33,651 | $ 33,567 | ||
ClubCorp Club Operations, Inc. Tranche B, term loan 4.5% 7/24/20 (e) | 23,912 | 23,702 | ||
Planet Fitness Holdings, LLC. Tranche B, term loan 4.75% 3/31/21 (e) | 19,651 | 19,651 | ||
SeaWorld Parks & Entertainment, Inc. Tranche B 2LN, term loan 3% 5/14/20 (e) | 40,417 | 38,801 | ||
Seminole Hard Rock Entertainment, Inc. Tranche B, term loan 3.5% 5/14/20 (e) | 5,409 | 5,301 | ||
| 121,022 | |||
Metals/Mining - 4.4% | ||||
Alpha Natural Resources, Inc. Tranche B, term loan 3.5% 5/22/20 (e) | 4,373 | 3,717 | ||
American Rock Salt Co. LLC: | ||||
Tranche 2LN, term loan 8% 5/20/22 (e) | 3,000 | 3,008 | ||
Tranche B 1LN, term loan 4.75% 5/20/21 (e) | 16,958 | 16,788 | ||
Ameriforge Group, Inc.: | ||||
Tranche B 1LN, term loan 5% 12/19/19 (e) | 7,519 | 7,456 | ||
Tranche B 2LN, term loan 8.75% 12/19/20 (e) | 3,000 | 2,985 | ||
Doncasters Group, LLC Tranche B 1LN, term loan 4.5% 4/9/20 (e) | 28,356 | 27,647 | ||
Fairmount Minerals Ltd. Tranche B 2LN, term loan 4.5% 9/5/19 (e) | 21,495 | 21,388 | ||
Fortescue Metals Group Ltd. Tranche B, term loan 3.75% 6/30/19 (e) | 278,078 | 271,126 | ||
Murray Energy Corp. Tranche B 1LN, term loan 5.25% 12/5/19 (e) | 45,551 | 45,323 | ||
Novelis, Inc. Tranche B, term loan 3.75% 3/10/17 (e) | 34,878 | 34,574 | ||
Oxbow Carbon LLC: | ||||
Tranche 2LN, term loan 8% 1/19/20 (e) | 20,000 | 19,500 | ||
Tranche B 1LN, term loan 4.25% 7/19/19 (e) | 12,038 | 11,827 | ||
Peabody Energy Corp. Tranche B, term loan 4.25% 9/24/20 (e) | 60,831 | 58,550 | ||
U.S. Silica Co. Tranche B, term loan 4% 7/23/20 (e) | 24,154 | 23,792 | ||
Walter Energy, Inc. Tranche B, term loan 7.25% 4/1/18 (e) | 109,526 | 94,466 | ||
| 642,147 | |||
Paper - 0.0% | ||||
Bear Island Paper Co. LLC Tranche B 2LN, term loan 14% 9/13/17 (e) | 234 | 234 | ||
Bank Loan Obligations (f) - continued | ||||
| Principal Amount (000s) | Value (000s) | ||
Publishing/Printing - 1.3% | ||||
Cengage Learning Acquisitions, Inc. Tranche 1LN, term loan 7% 3/31/20 (e) | $ 50,158 | $ 50,283 | ||
Dex Media East LLC term loan 6% 12/31/16 (e) | 5,326 | 4,314 | ||
Dex Media West LLC/Dex Media West Finance Co. term loan 8% 12/31/16 (e) | 1,239 | 1,128 | ||
Getty Images, Inc. Tranche B, term loan 4.75% 10/18/19 (e) | 97,460 | 90,760 | ||
Houghton Mifflin Harcourt Publishing, Inc. Tranche B, term loan 4.25% 5/22/18 (e) | 19,759 | 19,660 | ||
McGraw-Hill Global Education Holdings, LLC Tranche B, term loan 5.75% 3/22/19 (e) | 16,015 | 16,056 | ||
Newsday LLC Tranche A, term loan 3.654% 10/12/16 (e) | 9,815 | 9,742 | ||
| 191,943 | |||
Restaurants - 0.9% | ||||
Burger King Worldwide, Inc. Tranche B, term loan 4.5% 10/27/21 (e) | 35,000 | 34,869 | ||
Dunkin Brands, Inc. Tranche B 4LN, term loan 3.25% 2/7/21 (e) | 54,801 | 53,431 | ||
Focus Brands, Inc. Trancher B 1LN, term loan 4.25% 2/21/18 (e) | 4,556 | 4,499 | ||
Landry's Restaurants, Inc. Tranche B, term loan 4% 4/24/18 (e) | 8,989 | 8,958 | ||
Red Lobster Hospitality LLC Tranche B, term loan 6.25% 7/28/21 (e) | 28,815 | 28,743 | ||
| 130,500 | |||
Services - 4.0% | ||||
ARAMARK Corp.: | ||||
Credit-Linked Deposit 3.6525% 7/26/16 (e) | 3,579 | 3,538 | ||
Tranche F, term loan 3.25% 2/24/21 (e) | 74,625 | 73,879 | ||
3.6525% 7/26/16 (e) | 4,666 | 4,631 | ||
Avis Budget Group, Inc. Tranche B, term loan 3% 3/15/19 (e) | 9,775 | 9,653 | ||
Bright Horizons Family Solutions, Inc. Tranche B, term loan 3.7501% 1/30/20 (e) | 23,207 | 22,772 | ||
Cactus Wellhead LLC Tranche B, term loan 7% 7/31/20 (e) | 23,500 | 23,059 | ||
Coinmach Service Corp. Tranche B, term loan 4.25% 11/14/19 (e) | 50,746 | 50,188 | ||
EFS Cogen Holdings I LLC Tranche B, term loan 3.75% 12/17/20 (e) | 18,015 | 17,790 | ||
Bank Loan Obligations (f) - continued | ||||
| Principal Amount (000s) | Value (000s) | ||
Services - continued | ||||
Filtration Group Corp. Tranche 2LN, term loan 8.25% 11/21/21 (e) | $ 3,860 | $ 3,826 | ||
Hertz Corp.: | ||||
Tranche B 2LN, term loan 3% 3/11/18 (e) | 62,354 | 60,757 | ||
Tranche B, term loan 3.75% 3/11/18 (e) | 22,517 | 22,235 | ||
Karman Buyer Corp.: | ||||
term loan 3.75% 7/25/21 (e)(h) | 769 | 761 | ||
Tranche 1LN, term loan 4.25% 7/25/21 (e) | 23,076 | 22,817 | ||
Tranche 2LN, term loan 7.5% 7/25/22 (e) | 11,490 | 11,433 | ||
Laureate Education, Inc. Tranche B, term loan 5% 6/16/18 (e) | 159,610 | 154,024 | ||
Lineage Logistics Holdings, LLC. Tranche B, term loan 4.5% 4/7/21 (e) | 47,743 | 46,728 | ||
Nord Anglia Education Tranche B, term loan 4.5% 3/31/21 (e) | 14,439 | 14,367 | ||
Redtop Acquisitions Ltd.: | ||||
Tranche 2LN, term loan 8.25% 6/3/21 (e) | 4,963 | 4,987 | ||
Tranche B 1LN, term loan 4.5% 12/3/20 (e) | 5,962 | 5,962 | ||
The ServiceMaster Co. Tranche B, term loan 4.25% 7/1/21 (e) | 35,000 | 34,738 | ||
| 588,145 | |||
Shipping - 0.3% | ||||
Harvey Gulf International Tranche B, term loan 5.5% 6/18/20 (e) | 22,101 | 20,885 | ||
YRC Worldwide, Inc. Tranche B, term loan 8.25% 2/13/19 (e) | 27,294 | 26,748 | ||
| 47,633 | |||
Super Retail - 3.3% | ||||
Academy Ltd. Tranche B, term loan 4.5% 8/3/18 (e) | 21,979 | 21,897 | ||
Bass Pro Group LLC Tranche B, term loan 3.75% 11/20/19 (e) | 24,161 | 23,919 | ||
BJ's Wholesale Club, Inc.: | ||||
Tranche 2LN, term loan 8.5% 3/31/20 (e) | 20,110 | 20,089 | ||
Tranche B 1LN, term loan 4.5% 9/26/19 (e) | 62,493 | 61,812 | ||
Burlington Coat Factory Warehouse Corp. Tranche B, term loan 4.25% 8/13/21 (e) | 24,938 | 24,782 | ||
General Nutrition Centers, Inc. Tranche B, term loan 3.25% 3/4/19 (e) | 52,858 | 51,536 | ||
J. Crew Group, Inc. Tranche B LN, term loan 4% 3/5/21 (e) | 59,859 | 57,543 | ||
JC Penney Corp., Inc. Tranche B, term loan: | ||||
5% 6/20/19 (e) | 17,666 | 17,268 | ||
Bank Loan Obligations (f) - continued | ||||
| Principal Amount (000s) | Value (000s) | ||
Super Retail - continued | ||||
JC Penney Corp., Inc. Tranche B, term loan: - continued | ||||
6% 5/22/18 (e) | $ 82,629 | $ 81,699 | ||
PETCO Animal Supplies, Inc. term loan 4% 11/24/17 (e) | 35,156 | 34,804 | ||
Sears Holdings Corp. Tranche ABL, term loan 5.5% 6/30/18 (e) | 72,000 | 69,840 | ||
Sports Authority, Inc. Tranche B, term loan 7.5% 11/16/17 (e) | 7,416 | 6,971 | ||
The Hillman Group, Inc. Tranche B, term loan 4.5% 6/30/21 (e) | 13,127 | 13,029 | ||
| 485,189 | |||
Technology - 9.7% | ||||
Activision Blizzard, Inc. Tranche B, term loan 3.25% 10/11/20 (e) | 112,210 | 112,210 | ||
Applied Systems, Inc.: | ||||
Tranche B 1LN, term loan 4.25% 1/23/21 (e) | 14,183 | 13,935 | ||
Tranche B 2LN, term loan 7.5% 1/23/22 (e) | 3,630 | 3,621 | ||
Avago Technologies, Inc. Tranche B, term loan 3.75% 5/6/21 (e) | 54,626 | 54,428 | ||
BMC Software Finance, Inc. Tranche B, term loan: | ||||
5% 9/10/20 (e) | 19,356 | 18,896 | ||
5% 9/10/20 (e) | 150,648 | 148,012 | ||
Carros U.S., LLC Tranche B, term loan 4.5% 9/30/21 (e) | 15,585 | 15,566 | ||
CompuCom Systems, Inc. Tranche B, term loan 4.25% 5/9/20 (e) | 27,689 | 26,166 | ||
Computer Discount Warehouse (CDW) LLC, Tranche B, term loan 3.25% 4/29/20 (e) | 56,918 | 55,495 | ||
Dell International LLC Tranche B, term loan 4.5% 4/29/20 (e) | 214,945 | 215,224 | ||
Fibertech Networks, LLC Tranche B 1LN, term loan 4% 12/18/19 (e) | 17,919 | 17,627 | ||
First Data Corp.: | ||||
term loan 3.653% 3/24/17 (e) | 83,529 | 82,068 | ||
Tranche B, term loan: | ||||
3.653% 3/24/18 (e) | 80,000 | 78,600 | ||
3.653% 9/24/18 (e) | 40,000 | 39,300 | ||
Freescale Semiconductor, Inc. Tranche B 4LN, term loan 4.25% 3/1/20 (e) | 52,974 | 52,245 | ||
Generac Power Systems, Inc. Tranche B, term loan 3.25% 5/31/20 (e) | 64,994 | 63,531 | ||
Genesys Telecommunications Laboratories, Inc. Tranche B, term loan 4.5% 11/13/20 (e) | 5,032 | 5,007 | ||
Bank Loan Obligations (f) - continued | ||||
| Principal Amount (000s) | Value (000s) | ||
Technology - continued | ||||
GXS Group, Inc. Tranche B, term loan 3.25% 1/16/21 (e) | $ 16,873 | $ 16,619 | ||
Infor U.S., Inc.: | ||||
Tranche B 3LN, term loan 3.75% 6/3/20 (e) | 24,201 | 23,838 | ||
Tranche B 5LN, term loan 3.75% 6/3/20 (e) | 57,427 | 56,566 | ||
Information Resources, Inc. Tranche B, term loan 4.75% 9/30/20 (e) | 16,139 | 16,139 | ||
Kronos, Inc.: | ||||
Tranche 2LN, term loan 9.75% 4/30/20 (e) | 29,845 | 30,591 | ||
Tranche B 1LN, term loan 4.5% 10/30/19 (e) | 41,606 | 41,450 | ||
Nuance Communications, Inc. Tranche C, term loan 2.91% 8/7/19 (e) | 28,460 | 27,748 | ||
Renaissance Learning, Inc.: | ||||
Tranche 1LN, term loan 4.5% 4/9/21 (e) | 24,378 | 23,951 | ||
Tranche 2LN, term loan 8% 4/9/22 (e) | 11,500 | 11,213 | ||
Sophia L.P. Tranche B 1LN, term loan 4% 7/19/18 (e) | 7,176 | 7,104 | ||
SunGard Data Systems, Inc.: | ||||
Tranche C, term loan 3.9061% 2/28/17 (e) | 32,706 | 32,542 | ||
Tranche E, term loan 4% 3/8/20 (e) | 44,917 | 44,748 | ||
Syniverse Holdings, Inc. Tranche B, term loan: | ||||
4% 4/23/19 (e) | 19,390 | 19,027 | ||
4% 4/23/19 (e) | 9,598 | 9,418 | ||
Vantiv LLC Tranche B, term loan 3.75% 6/13/21 (e) | 31,416 | 31,259 | ||
WP Mustang Holdings, LLC. Tranche B 1LN, term loan 5.5% 5/29/21 (e) | 22,309 | 22,337 | ||
| 1,416,481 | |||
Telecommunications - 5.6% | ||||
Altice Financing SA Tranche B, term loan 5.5% 6/24/19 (e) | 159,858 | 160,458 | ||
Crown Castle Operating Co. Tranche B 2LN, term loan 3% 1/31/21 (e) | 89,773 | 88,987 | ||
Digicel International Finance Ltd.: | ||||
Tranche D 1LN, term loan 3.75% 3/31/17 (e) | 9,000 | 8,955 | ||
Tranche D-2, term loan 3.75% 3/31/19 (e) | 23,560 | 23,148 | ||
DigitalGlobe, Inc. Tranche B, term loan 3.75% 1/31/20 (e) | 14,391 | 14,283 | ||
FairPoint Communications, Inc. Tranche B, term loan 7.5% 2/14/19 (e) | 18,230 | 18,321 | ||
FPL FiberNet, LLC. Tranche A, term loan 3.4841% 7/22/19 (e) | 20,000 | 20,000 | ||
Genesys Telecom Holdings U.S., Inc. Tranche B, term loan 4.5% 2/8/20 (e) | 24,687 | 23,915 | ||
Bank Loan Obligations (f) - continued | ||||
| Principal Amount (000s) | Value (000s) | ||
Telecommunications - continued | ||||
Integra Telecom Holdings, Inc. Tranche B, term loan 5.25% 2/22/19 (e) | $ 12,805 | $ 12,758 | ||
Intelsat Jackson Holdings SA Tranche B 2LN, term loan 3.75% 6/30/19 (e) | 132,070 | 130,921 | ||
Level 3 Financing, Inc.: | ||||
Tranche B 3LN, term loan 4% 8/1/19 (e) | 13,330 | 13,263 | ||
Tranche B 4LN, term loan 4% 1/15/20 (e) | 73,000 | 72,635 | ||
Tranche B 5LN, term loan 4.5% 1/31/22 (e) | 24,000 | 24,091 | ||
LTS Buyer LLC: | ||||
Tranche 2LN, term loan 8% 4/11/21 (e) | 3,868 | 3,839 | ||
Tranche B 1LN, term loan 4% 4/11/20 (e) | 33,247 | 32,749 | ||
SBA Senior Finance II, LLC term loan 3.25% 3/24/21 (e) | 34,913 | 34,302 | ||
Securus Technologies Holdings, Inc.: | ||||
Tranche 2LN, term loan 9% 4/30/21 (e) | 4,635 | 4,572 | ||
Tranche B 1LN, term loan 4.75% 4/30/20 (e) | 39,962 | 39,463 | ||
TCH-2 Holdings, LLC. Tranche B 1LN, term loan 5.5% 5/12/21 (e) | 14,963 | 14,814 | ||
Telesat Holding, Inc. Tranche B, term loan 3.5% 3/28/19 (e) | 63,963 | 63,483 | ||
Windstream Corp. Tranche B 4LN, term loan 3.5% 1/23/20 (e) | 19,463 | 19,293 | ||
| 824,250 | |||
Textiles & Apparel - 0.3% | ||||
Party City Holdings, Inc. Tranche B LN, term loan 4% 7/27/19 (e) | 44,965 | 44,002 | ||
TOTAL BANK LOAN OBLIGATIONS (Cost $13,050,387) |
| |||
Nonconvertible Bonds - 6.7% | ||||
| ||||
Automotive - 0.3% | ||||
General Motors Acceptance Corp. 2.4336% 12/1/14 (e) | 40,000 | 39,880 | ||
Banks & Thrifts - 1.1% | ||||
Ally Financial, Inc.: | ||||
2.9108% 7/18/16 (e) | 75,000 | 75,915 | ||
3.125% 1/15/16 | 4,000 | 4,050 | ||
4.625% 6/26/15 | 4,000 | 4,082 | ||
GMAC LLC 2.4336% 12/1/14 (e) | 70,187 | 70,228 | ||
| 154,275 | |||
Nonconvertible Bonds - continued | ||||
| Principal Amount (000s) | Value (000s) | ||
Broadcasting - 0.2% | ||||
AMC Networks, Inc. 4.75% 12/15/22 | $ 6,600 | $ 6,551 | ||
Clear Channel Communications, Inc. 9% 12/15/19 | 8,677 | 8,769 | ||
Starz LLC/Starz Finance Corp. 5% 9/15/19 | 9,000 | 9,270 | ||
Univision Communications, Inc. 6.75% 9/15/22 (d) | 5,368 | 5,958 | ||
| 30,548 | |||
Building Materials - 0.1% | ||||
CEMEX S.A.B. de CV 4.9806% 10/15/18 (d)(e) | 10,000 | 10,345 | ||
Cable TV - 0.5% | ||||
CCO Holdings LLC/CCO Holdings Capital Corp.: | ||||
5.125% 2/15/23 | 17,065 | 17,022 | ||
5.25% 3/15/21 | 13,070 | 13,233 | ||
Cequel Communications Escrow I LLC/Cequel Communications Escrow Capital Corp. 6.375% 9/15/20 (d) | 10,815 | 11,275 | ||
Lynx I Corp. 5.375% 4/15/21 (d) | 5,000 | 5,188 | ||
Numericable Group SA 4.875% 5/15/19 (d) | 27,120 | 27,052 | ||
Virgin Media Finance PLC 4.875% 2/15/22 | 2,000 | 1,880 | ||
| 75,650 | |||
Capital Goods - 0.0% | ||||
Shale-Inland Holdings LLC/Shale-Inland Finance Corp. 8.75% 11/15/19 (d) | 3,000 | 3,105 | ||
Chemicals - 0.0% | ||||
Nufarm Australia Ltd. 6.375% 10/15/19 (d) | 5,000 | 5,025 | ||
Containers - 0.7% | ||||
Ardagh Packaging Finance PLC/Ardagh MP Holdings U.S.A., Inc. 3.2341% 12/15/19 (d)(e) | 42,330 | 41,378 | ||
Reynolds Group Issuer, Inc./Reynolds Group Issuer LLC/Reynolds Group Issuer (Luxembourg) SA: | ||||
5.75% 10/15/20 | 58,325 | 60,658 | ||
7.125% 4/15/19 | 5,000 | 5,194 | ||
| 107,230 | |||
Diversified Financial Services - 0.7% | ||||
CIT Group, Inc.: | ||||
4.75% 2/15/15 (d) | 14,000 | 14,105 | ||
5% 5/15/17 | 7,000 | 7,333 | ||
Icahn Enterprises LP/Icahn Enterprises Finance Corp.: | ||||
3.5% 3/15/17 | 18,720 | 18,626 | ||
4.875% 3/15/19 | 15,000 | 15,263 | ||
International Lease Finance Corp.: | ||||
2.1841% 6/15/16 (e) | 29,485 | 29,374 | ||
3.875% 4/15/18 | 7,000 | 7,022 | ||
Nonconvertible Bonds - continued | ||||
| Principal Amount (000s) | Value (000s) | ||
Diversified Financial Services - continued | ||||
International Lease Finance Corp.: - continued | ||||
4.875% 4/1/15 | $ 4,000 | $ 4,047 | ||
6.25% 5/15/19 | 10,000 | 10,938 | ||
| 106,708 | |||
Diversified Media - 0.1% | ||||
Clear Channel Worldwide Holdings, Inc.: | ||||
Series A, 6.5% 11/15/22 | 5,130 | 5,284 | ||
Series B, 6.5% 11/15/22 | 13,870 | 14,355 | ||
| 19,639 | |||
Electric Utilities - 0.3% | ||||
Energy Future Intermediate Holding Co. LLC/Energy Future Intermediate Holding Finance, Inc. 12.25% 3/1/22 (c)(d) | 11,000 | 13,090 | ||
NRG Energy, Inc. 6.625% 3/15/23 | 4,000 | 4,220 | ||
The AES Corp. 3.2336% 6/1/19 (e) | 21,435 | 21,321 | ||
| 38,631 | |||
Energy - 0.7% | ||||
Access Midstream Partners LP/ACMP Finance Corp. 4.875% 5/15/23 | 7,000 | 7,315 | ||
American Energy-Permian Basin LLC/ AEPB Finance Corp. 6.7413% 8/1/19 (d)(e) | 35,000 | 30,975 | ||
Atlas Pipeline Partners LP/Atlas Pipeline Finance Corp.: | ||||
5.875% 8/1/23 | 3,000 | 3,113 | ||
6.625% 10/1/20 | 5,645 | 5,984 | ||
Chesapeake Energy Corp. 3.4806% 4/15/19 (e) | 29,720 | 29,741 | ||
Citgo Petroleum Corp. 6.25% 8/15/22 (d) | 10,000 | 10,175 | ||
Northern Tier Energy LLC/Northern Tier Finance Corp. 7.125% 11/15/20 | 4,000 | 4,200 | ||
Targa Resources Partners LP/Targa Resources Partners Finance Corp. 6.375% 8/1/22 | 4,492 | 4,829 | ||
Western Refining, Inc. 6.25% 4/1/21 | 5,305 | 5,332 | ||
| 101,664 | |||
Entertainment/Film - 0.0% | ||||
Cinemark U.S.A., Inc. 5.125% 12/15/22 | 3,185 | 3,185 | ||
Food/Beverage/Tobacco - 0.0% | ||||
ESAL GmbH 6.25% 2/5/23 (d) | 4,000 | 4,080 | ||
Gaming - 0.1% | ||||
MCE Finance Ltd. 5% 2/15/21 (d) | 10,000 | 9,850 | ||
Healthcare - 0.4% | ||||
Community Health Systems, Inc. 5.125% 8/15/18 | 10,755 | 11,185 | ||
Nonconvertible Bonds - continued | ||||
| Principal Amount (000s) | Value (000s) | ||
Healthcare - continued | ||||
DaVita HealthCare Partners, Inc. 5.75% 8/15/22 | $ 8,235 | $ 8,729 | ||
HCA Holdings, Inc. 3.75% 3/15/19 | 25,000 | 25,063 | ||
Tenet Healthcare Corp. 4.75% 6/1/20 | 8,680 | 8,875 | ||
| 53,852 | |||
Homebuilders/Real Estate - 0.1% | ||||
CBRE Group, Inc. 5% 3/15/23 | 17,990 | 18,350 | ||
Leisure - 0.0% | ||||
Six Flags Entertainment Corp. 5.25% 1/15/21 (d) | 4,000 | 4,020 | ||
Metals/Mining - 0.0% | ||||
Peabody Energy Corp. 6% 11/15/18 | 5,000 | 4,838 | ||
Publishing/Printing - 0.1% | ||||
Cenveo Corp. 6% 8/1/19 (d) | 9,850 | 9,481 | ||
Services - 0.1% | ||||
Avis Budget Car Rental LLC/Avis Budget Finance, Inc. 2.9836% 12/1/17 (e) | 14,410 | 14,429 | ||
TransUnion Holding Co., Inc. 9.625% 6/15/18 pay-in-kind (e) | 3,000 | 3,098 | ||
| 17,527 | |||
Technology - 0.4% | ||||
Brocade Communications Systems, Inc. 4.625% 1/15/23 | 7,235 | 7,054 | ||
First Data Corp. 6.75% 11/1/20 (d) | 25,460 | 27,242 | ||
NXP BV/NXP Funding LLC: | ||||
5.75% 2/15/21 (d) | 14,760 | 15,572 | ||
5.75% 3/15/23 (d) | 5,000 | 5,288 | ||
| 55,156 | |||
Telecommunications - 0.8% | ||||
Altice Financing SA: | ||||
6.5% 1/15/22 (d) | 7,240 | 7,439 | ||
7.875% 12/15/19 (d) | 4,000 | 4,265 | ||
Columbus International, Inc. 7.375% 3/30/21 (d) | 14,535 | 15,407 | ||
DigitalGlobe, Inc. 5.25% 2/1/21 (d) | 3,905 | 3,798 | ||
Intelsat Jackson Holdings SA 6.625% 12/15/22 (Reg. S) | 20,000 | 21,050 | ||
Level 3 Financing, Inc. 3.8229% 1/15/18 (d)(e) | 15,000 | 15,038 | ||
Sprint Capital Corp.: | ||||
6.875% 11/15/28 | 4,000 | 3,890 | ||
6.9% 5/1/19 | 5,000 | 5,300 | ||
Sprint Communications, Inc.: | ||||
6% 11/15/22 | 30,000 | 29,925 | ||
Nonconvertible Bonds - continued | ||||
| Principal Amount (000s) | Value (000s) | ||
Telecommunications - continued | ||||
Sprint Communications, Inc.: - continued | ||||
9% 11/15/18 (d) | $ 3,000 | $ 3,529 | ||
Telesat Canada/Telesat LLC 6% 5/15/17 (d) | 3,000 | 3,092 | ||
| 112,733 | |||
TOTAL NONCONVERTIBLE BONDS (Cost $970,187) |
| |||
Common Stocks - 0.2% | |||
Shares |
| ||
Broadcasting - 0.0% | |||
Cumulus Media, Inc. Class A (a) | 229,315 | 885 | |
ION Media Networks, Inc. (a) | 2,842 | 2,014 | |
| 2,899 | ||
Chemicals - 0.2% | |||
LyondellBasell Industries NV Class A | 245,943 | 22,536 | |
Electric Utilities - 0.0% | |||
Calpine Corp. (a) | 20,715 | 473 | |
Homebuilders/Real Estate - 0.0% | |||
Newhall Holding Co. LLC Class A (a) | 289,870 | 617 | |
Hotels - 0.0% | |||
Tropicana Las Vegas Hotel & Casino, Inc. Class A (a) | 48,650 | 1,678 | |
Paper - 0.0% | |||
White Birch Cayman Holdings Ltd. (a) | 12,570 | 0 | |
Publishing/Printing - 0.0% | |||
Houghton Mifflin Harcourt Co. warrants 6/22/19 (a)(i) | 13,699 | 21 | |
Telecommunications - 0.0% | |||
FairPoint Communications, Inc. (a) | 34,287 | 569 | |
TOTAL COMMON STOCKS (Cost $16,121) |
| ||
Other - 0.0% | |||
|
|
|
|
Other - 0.0% | |||
Idearc, Inc. Claim (a) | 1,888,944 |
| |
Money Market Funds - 4.0% | |||
Shares | Value (000s) | ||
Fidelity Cash Central Fund, 0.11% (b) | 581,718,991 | $ 581,719 | |
TOTAL INVESTMENT PORTFOLIO - 99.2% (Cost $14,618,414) | 14,514,395 | ||
NET OTHER ASSETS (LIABILITIES) - 0.8% | 110,911 | ||
NET ASSETS - 100% | $ 14,625,306 | ||
Legend |
(a) Non-income producing |
(b) Affiliated fund that is generally available only to investment companies and other accounts managed by Fidelity Investments. The rate quoted is the annualized seven-day yield of the fund at period end. A complete unaudited listing of the fund's holdings as of its most recent quarter end is available upon request. In addition, each Fidelity Central Fund's financial statements, which are not covered by the Fund's Report of Independent Registered Public Accounting Firm, are available on the SEC's website or upon request. |
(c) Non-income producing - Security is in default. |
(d) Security exempt from registration under Rule 144A of the Securities Act of 1933. These securities may be resold in transactions exempt from registration, normally to qualified institutional buyers. At the end of the period, the value of these securities amounted to $305,772,000 or 2.1% of net assets. |
(e) Coupon rates for floating and adjustable rate securities reflect the rates in effect at period end. |
(f) Remaining maturities of bank loan obligations may be less than the stated maturities shown as a result of contractual or optional prepayments by the borrower. Such prepayments cannot be predicted with certainty. |
(g) The coupon rate will be determined upon settlement of the loan after period end. |
(h) Position or a portion of the position represents an unfunded loan commitment. At period end, the total principal amount and market value of unfunded commitments totaled $44,153,000 and $43,122,000, respectively. |
(i) Restricted securities - Investment in securities not registered under the Securities Act of 1933 (excluding 144A issues). At the end of the period, the value of restricted securities (excluding 144A issues) amounted to $21,000 or 0.0% of net assets. |
Additional information on each restricted holding is as follows: |
Security | Acquisition Date | Acquisition Cost (000s) |
Houghton Mifflin Harcourt Co. warrants 6/22/19 | 6/22/12 | $ 26 |
Affiliated Central Funds |
Information regarding fiscal year to date income earned by the Fund from investments in Fidelity Central Funds is as follows: |
Fund | Income earned |
Fidelity Cash Central Fund | $ 1,200 |
Other Information |
The following is a summary of the inputs used, as of October 31, 2014, involving the Fund's assets and liabilities carried at fair value. The inputs or methodology used for valuing securities may not be an indication of the risk associated with investing in those securities. For more information on valuation inputs, and their aggregation into the levels used in the table below, please refer to the Investment Valuation section in the accompanying Notes to Financial Statements. |
Valuation Inputs at Reporting Date: | ||||
Description | Total | Level 1 | Level 2 | Level 3 |
Investments in Securities: | ||||
Equities: | ||||
Consumer Discretionary | $ 4,598 | $ 885 | $ - | $ 3,713 |
Financials | 617 | - | - | 617 |
Materials | 22,536 | 22,536 | - | - |
Telecommunication Services | 569 | 569 | - | - |
Utilities | 473 | 473 | - | - |
Bank Loan Obligations | 12,918,111 | - | 12,850,315 | 67,796 |
Corporate Bonds | 985,772 | - | 985,772 | - |
Other | - | - | - | - |
Money Market Funds | 581,719 | 581,719 | - | - |
Total Investments in Securities: | $ 14,514,395 | $ 606,182 | $ 13,836,087 | $ 72,126 |
Distribution of investments by country or territory of incorporation, as a percentage of total net assets, is as follows (Unaudited): |
United States of America | 88.3% |
Luxembourg | 3.1% |
Australia | 2.5% |
Netherlands | 2.0% |
United Kingdom | 1.1% |
Others (Individually Less Than 1%) | 3.0% |
| 100.0% |
See accompanying notes which are an integral part of the financial statements.
Annual Report
Financial Statements
Statement of Assets and Liabilities
Amounts in thousands (except per-share amounts) | October 31, 2014 | |
|
|
|
Assets | ||
Investment in securities, at value - See accompanying schedule: Unaffiliated issuers (cost $14,036,695) | $ 13,932,676 |
|
Fidelity Central Funds (cost $581,719) | 581,719 |
|
Total Investments (cost $14,618,414) |
| $ 14,514,395 |
Cash |
| 62,292 |
Receivable for investments sold | 137,394 | |
Receivable for fund shares sold | 9,748 | |
Interest receivable | 58,716 | |
Distributions receivable from Fidelity Central Funds | 56 | |
Prepaid expenses | 49 | |
Other receivables | 1 | |
Total assets | 14,782,651 | |
|
|
|
Liabilities | ||
Payable for investments purchased | $ 109,248 | |
Payable for fund shares redeemed | 28,093 | |
Distributions payable | 10,158 | |
Accrued management fee | 6,908 | |
Distribution and service plan fees payable | 1,014 | |
Other affiliated payables | 1,795 | |
Other payables and accrued expenses | 129 | |
Total liabilities | 157,345 | |
|
|
|
Net Assets | $ 14,625,306 | |
Net Assets consist of: |
| |
Paid in capital | $ 14,631,284 | |
Undistributed net investment income | 67,963 | |
Accumulated undistributed net realized gain (loss) on investments | 30,078 | |
Net unrealized appreciation (depreciation) on investments | (104,019) | |
Net Assets | $ 14,625,306 | |
See accompanying notes which are an integral part of the financial statements.
Annual Report
Financial Statements - continued
Statement of Assets and Liabilities - continued
Amounts in thousands (except per-share amounts) | October 31, 2014 | |
|
|
|
Calculation of Maximum Offering Price Class A: | $ 9.85 | |
|
|
|
Maximum offering price per share (100/97.25 of $9.85) | $ 10.13 | |
Class T: | $ 9.84 | |
|
|
|
Maximum offering price per share (100/97.25 of $9.84) | $ 10.12 | |
Class B: | $ 9.83 | |
|
|
|
Class C: | $ 9.85 | |
|
|
|
Fidelity Floating Rate High Income Fund: | $ 9.84 | |
|
|
|
Institutional Class: | $ 9.83 | |
A Redemption price per share is equal to net asset value less any applicable contingent deferred sales charge.
See accompanying notes which are an integral part of the financial statements.
Annual Report
Statement of Operations
Amounts in thousands | Year ended October 31, 2014 | |
|
|
|
Investment Income |
|
|
Dividends |
| $ 1,907 |
Interest |
| 656,802 |
Income from Fidelity Central Funds |
| 1,200 |
Total income |
| 659,909 |
|
|
|
Expenses | ||
Management fee | $ 89,463 | |
Transfer agent fees | 20,662 | |
Distribution and service plan fees | 13,935 | |
Accounting fees and expenses | 1,815 | |
Custodian fees and expenses | 194 | |
Independent trustees' compensation | 66 | |
Registration fees | 448 | |
Audit | 173 | |
Legal | 53 | |
Miscellaneous | 115 | |
Total expenses before reductions | 126,924 | |
Expense reductions | (59) | 126,865 |
Net investment income (loss) | 533,044 | |
Realized and Unrealized Gain (Loss) Net realized gain (loss) on: | ||
Investment securities: |
|
|
Unaffiliated issuers |
| 33,692 |
Change in net unrealized appreciation (depreciation) on investment securities | (219,514) | |
Net gain (loss) | (185,822) | |
Net increase (decrease) in net assets resulting from operations | $ 347,222 | |
See accompanying notes which are an integral part of the financial statements.
Annual Report
Financial Statements - continued
Statement of Changes in Net Assets
Amounts in thousands | Year ended | Year ended |
Increase (Decrease) in Net Assets |
|
|
Operations |
|
|
Net investment income (loss) | $ 533,044 | $ 410,895 |
Net realized gain (loss) | 33,692 | 72,218 |
Change in net unrealized appreciation (depreciation) | (219,514) | 9,078 |
Net increase (decrease) in net assets resulting | 347,222 | 492,191 |
Distributions to shareholders from net investment income | (519,702) | (375,589) |
Distributions to shareholders from net realized gain | (57,139) | (52,959) |
Total distributions | (576,841) | (428,548) |
Share transactions - net increase (decrease) | (610,631) | 4,793,436 |
Redemption fees | 671 | 916 |
Total increase (decrease) in net assets | (839,579) | 4,857,995 |
|
|
|
Net Assets | ||
Beginning of period | 15,464,885 | 10,606,890 |
End of period (including undistributed net investment income of $67,963 and undistributed net investment income of $122,241, respectively) | $ 14,625,306 | $ 15,464,885 |
See accompanying notes which are an integral part of the financial statements.
Annual Report
Financial Highlights - Class A
Years ended October 31, | 2014 | 2013 | 2012 | 2011 | 2010 |
Selected Per-Share Data |
|
|
|
|
|
Net asset value, beginning of period | $ 9.99 | $ 9.94 | $ 9.73 | $ 9.79 | $ 9.31 |
Income from Investment Operations |
|
|
|
|
|
Net investment income (loss) C | .317 | .310 | .340 | .317 | .391 |
Net realized and unrealized gain (loss) | (.114) | .070 | .195 | (.080) | .425 |
Total from investment operations | .203 | .380 | .535 | .237 | .816 |
Distributions from net investment income | (.307) | (.282) | (.325) | (.298) | (.287) |
Distributions from net realized gain | (.036) | (.049) | - | - | (.050) |
Total distributions | (.343) | (.331) | (.325) | (.298) | (.337) |
Redemption fees added to paid in capital C | - G | .001 | - G | .001 | .001 |
Net asset value, end of period | $ 9.85 | $ 9.99 | $ 9.94 | $ 9.73 | $ 9.79 |
Total ReturnA, B | 2.05% | 3.89% | 5.60% | 2.46% | 8.96% |
Ratios to Average Net Assets D, F |
|
|
|
|
|
Expenses before reductions | .98% | .99% | .99% | 1.00% | 1.03% |
Expenses net of fee waivers, if any | .98% | .99% | .99% | 1.00% | 1.03% |
Expenses net of all reductions | .98% | .99% | .99% | 1.00% | 1.03% |
Net investment income (loss) | 3.17% | 3.11% | 3.47% | 3.25% | 4.11% |
Supplemental Data |
|
|
|
|
|
Net assets, end of period (in millions) | $ 1,185 | $ 1,681 | $ 1,305 | $ 1,587 | $ 1,064 |
Portfolio turnover rateE | 54% | 62% | 49% | 54% | 43% |
A Total returns would have been lower if certain expenses had not been reduced during the applicable periods shown.
B Total returns do not include the effect of the sales charges.
C Calculated based on average shares outstanding during the period.
D Fees and expenses of any underlying Fidelity Central Funds are not included in the Fund's expense ratio. The Fund indirectly bears its proportionate share of the expenses of any underlying Fidelity Central Funds.
E Amount does not include the portfolio activity of any underlying Fidelity Central Funds.
F Expense ratios reflect operating expenses of the class. Expenses before reductions do not reflect amounts reimbursed by the investment adviser or reductions from brokerage service arrangements or reductions from other expense offset arrangements and do not represent the amount paid by the class during periods when reimbursements or reductions occur. Expenses net of fee waivers reflect expenses after reimbursement by the investment adviser but prior to reductions from brokerage service arrangements or other expense offset arrangements. Expenses net of all reductions represent the net expenses paid by the class.
G Amount represents less than $.001 per share.
See accompanying notes which are an integral part of the financial statements.
Annual Report
Financial Highlights - Class T
Years ended October 31, | 2014 | 2013 | 2012 | 2011 | 2010 |
Selected Per-Share Data |
|
|
|
|
|
Net asset value, beginning of period | $ 9.98 | $ 9.93 | $ 9.72 | $ 9.77 | $ 9.30 |
Income from Investment Operations |
|
|
|
|
|
Net investment income (loss) C | .306 | .299 | .330 | .312 | .391 |
Net realized and unrealized gain (loss) | (.112) | .071 | .195 | (.070) | .416 |
Total from investment operations | .194 | .370 | .525 | .242 | .807 |
Distributions from net investment income | (.298) | (.272) | (.315) | (.293) | (.288) |
Distributions from net realized gain | (.036) | (.049) | - | - | (.050) |
Total distributions | (.334) | (.321) | (.315) | (.293) | (.338) |
Redemption fees added to paid in capital C | - G | .001 | - G | .001 | .001 |
Net asset value, end of period | $ 9.84 | $ 9.98 | $ 9.93 | $ 9.72 | $ 9.77 |
Total ReturnA, B | 1.96% | 3.79% | 5.50% | 2.51% | 8.87% |
Ratios to Average Net Assets D, F |
|
|
|
|
|
Expenses before reductions | 1.07% | 1.09% | 1.09% | 1.05% | 1.02% |
Expenses net of fee waivers, if any | 1.07% | 1.09% | 1.09% | 1.05% | 1.02% |
Expenses net of all reductions | 1.07% | 1.09% | 1.09% | 1.05% | 1.02% |
Net investment income (loss) | 3.08% | 3.01% | 3.37% | 3.19% | 4.12% |
Supplemental Data |
|
|
|
|
|
Net assets, end of period (in millions) | $ 240 | $ 272 | $ 241 | $ 271 | $ 242 |
Portfolio turnover rateE | 54% | 62% | 49% | 54% | 43% |
A Total returns would have been lower if certain expenses had not been reduced during the applicable periods shown.
B Total returns do not include the effect of the sales charges.
C Calculated based on average shares outstanding during the period.
D Fees and expenses of any underlying Fidelity Central Funds are not included in the Fund's expense ratio. The Fund indirectly bears its proportionate share of the expenses of any underlying Fidelity Central Funds.
E Amount does not include the portfolio activity of any underlying Fidelity Central Funds.
F Expense ratios reflect operating expenses of the class. Expenses before reductions do not reflect amounts reimbursed by the investment adviser or reductions from brokerage service arrangements or reductions from other expense offset arrangements and do not represent the amount paid by the class during periods when reimbursements or reductions occur. Expenses net of fee waivers reflect expenses after reimbursement by the investment adviser but prior to reductions from brokerage service arrangements or other expense offset arrangements. Expenses net of all reductions represent the net expenses paid by the class.
G Amount represents less than $.001 per share.
See accompanying notes which are an integral part of the financial statements.
Annual Report
Financial Highlights - Class B
Years ended October 31, | 2014 | 2013 | 2012 | 2011 | 2010 |
Selected Per-Share Data |
|
|
|
|
|
Net asset value, beginning of period | $ 9.98 | $ 9.93 | $ 9.72 | $ 9.77 | $ 9.30 |
Income from Investment Operations |
|
|
|
|
|
Net investment income (loss) C | .264 | .256 | .288 | .266 | .341 |
Net realized and unrealized gain (loss) | (.123) | .071 | .195 | (.070) | .416 |
Total from investment operations | .141 | .327 | .483 | .196 | .757 |
Distributions from net investment income | (.255) | (.229) | (.273) | (.247) | (.238) |
Distributions from net realized gain | (.036) | (.049) | - | - | (.050) |
Total distributions | (.291) | (.278) | (.273) | (.247) | (.288) |
Redemption fees added to paid in capital C | - G | .001 | - G | .001 | .001 |
Net asset value, end of period | $ 9.83 | $ 9.98 | $ 9.93 | $ 9.72 | $ 9.77 |
Total ReturnA, B | 1.42% | 3.35% | 5.05% | 2.03% | 8.30% |
Ratios to Average Net Assets D, F |
|
|
|
|
|
Expenses before reductions | 1.50% | 1.52% | 1.52% | 1.52% | 1.55% |
Expenses net of fee waivers, if any | 1.50% | 1.52% | 1.52% | 1.52% | 1.55% |
Expenses net of all reductions | 1.50% | 1.52% | 1.52% | 1.52% | 1.55% |
Net investment income (loss) | 2.64% | 2.58% | 2.94% | 2.72% | 3.59% |
Supplemental Data |
|
|
|
|
|
Net assets, end of period (in millions) | $ 17 | $ 23 | $ 24 | $ 32 | $ 43 |
Portfolio turnover rateE | 54% | 62% | 49% | 54% | 43% |
A Total returns would have been lower if certain expenses had not been reduced during the applicable periods shown.
B Total returns do not include the effect of the contingent deferred sales charge.
C Calculated based on average shares outstanding during the period.
D Fees and expenses of any underlying Fidelity Central Funds are not included in the Fund's expense ratio. The Fund indirectly bears its proportionate share of the expenses of any underlying Fidelity Central Funds.
E Amount does not include the portfolio activity of any underlying Fidelity Central Funds.
F Expense ratios reflect operating expenses of the class. Expenses before reductions do not reflect amounts reimbursed by the investment adviser or reductions from brokerage service arrangements or reductions from other expense offset arrangements and do not represent the amount paid by the class during periods when reimbursements or reductions occur. Expenses net of fee waivers reflect expenses after reimbursement by the investment adviser but prior to reductions from brokerage service arrangements or other expense offset arrangements. Expenses net of all reductions represent the net expenses paid by the class.
G Amount represents less than $.001 per share.
See accompanying notes which are an integral part of the financial statements.
Annual Report
Financial Highlights - Class C
Years ended October 31, | 2014 | 2013 | 2012 | 2011 | 2010 |
Selected Per-Share Data |
|
|
|
|
|
Net asset value, beginning of period | $ 9.99 | $ 9.94 | $ 9.73 | $ 9.78 | $ 9.31 |
Income from Investment Operations |
|
|
|
|
|
Net investment income (loss) C | .241 | .235 | .267 | .244 | .321 |
Net realized and unrealized gain (loss) | (.113) | .070 | .195 | (.070) | .415 |
Total from investment operations | .128 | .305 | .462 | .174 | .736 |
Distributions from net investment income | (.232) | (.207) | (.252) | (.225) | (.217) |
Distributions from net realized gain | (.036) | (.049) | - | - | (.050) |
Total distributions | (.268) | (.256) | (.252) | (.225) | (.267) |
Redemption fees added to paid in capital C | - G | .001 | - G | .001 | .001 |
Net asset value, end of period | $ 9.85 | $ 9.99 | $ 9.94 | $ 9.73 | $ 9.78 |
Total ReturnA, B | 1.29% | 3.11% | 4.81% | 1.80% | 8.05% |
Ratios to Average Net Assets D, F |
|
|
|
|
|
Expenses before reductions | 1.73% | 1.74% | 1.74% | 1.74% | 1.76% |
Expenses net of fee waivers, if any | 1.73% | 1.74% | 1.74% | 1.74% | 1.76% |
Expenses net of all reductions | 1.73% | 1.74% | 1.74% | 1.74% | 1.76% |
Net investment income (loss) | 2.41% | 2.35% | 2.72% | 2.50% | 3.38% |
Supplemental Data |
|
|
|
|
|
Net assets, end of period (in millions) | $ 835 | $ 960 | $ 806 | $ 852 | $ 622 |
Portfolio turnover rateE | 54% | 62% | 49% | 54% | 43% |
A Total returns would have been lower if certain expenses had not been reduced during the applicable periods shown.
B Total returns do not include the effect of the contingent deferred sales charge.
C Calculated based on average shares outstanding during the period.
D Fees and expenses of any underlying Fidelity Central Funds are not included in the Fund's expense ratio. The Fund indirectly bears its proportionate share of the expenses of any underlying Fidelity Central Funds.
E Amount does not include the portfolio activity of any underlying Fidelity Central Funds.
F Expense ratios reflect operating expenses of the class. Expenses before reductions do not reflect amounts reimbursed by the investment adviser or reductions from brokerage service arrangements or reductions from other expense offset arrangements and do not represent the amount paid by the class during periods when reimbursements or reductions occur. Expenses net of fee waivers reflect expenses after reimbursement by the investment adviser but prior to reductions from brokerage service arrangements or other expense offset arrangements. Expenses net of all reductions represent the net expenses paid by the class.
G Amount represents less than $.001 per share.
See accompanying notes which are an integral part of the financial statements.
Annual Report
Financial Highlights - Fidelity Floating Rate High Income Fund
Years ended October 31, | 2014 | 2013 | 2012 | 2011 | 2010 |
Selected Per-Share Data |
|
|
|
|
|
Net asset value, beginning of period | $ 9.98 | $ 9.93 | $ 9.72 | $ 9.77 | $ 9.30 |
Income from Investment Operations |
|
|
|
|
|
Net investment income (loss) B | .344 | .337 | .368 | .345 | .418 |
Net realized and unrealized gain (loss) | (.113) | .071 | .195 | (.070) | .417 |
Total from investment operations | .231 | .408 | .563 | .275 | .835 |
Distributions from net investment income | (.335) | (.310) | (.353) | (.326) | (.316) |
Distributions from net realized gain | (.036) | (.049) | - | - | (.050) |
Total distributions | (.371) | (.359) | (.353) | (.326) | (.366) |
Redemption fees added to paid in capital B | - F | .001 | - F | .001 | .001 |
Net asset value, end of period | $ 9.84 | $ 9.98 | $ 9.93 | $ 9.72 | $ 9.77 |
Total ReturnA | 2.34% | 4.19% | 5.91% | 2.86% | 9.18% |
Ratios to Average Net Assets C, E |
|
|
|
|
|
Expenses before reductions | .69% | .70% | .71% | .71% | .73% |
Expenses net of fee waivers, if any | .69% | .70% | .71% | .71% | .73% |
Expenses net of all reductions | .69% | .70% | .71% | .71% | .73% |
Net investment income (loss) | 3.45% | 3.39% | 3.75% | 3.53% | 4.41% |
Supplemental Data |
|
|
|
|
|
Net assets, end of period (in millions) | $ 9,032 | $ 8,882 | $ 5,720 | $ 5,399 | $ 3,566 |
Portfolio turnover rateD | 54% | 62% | 49% | 54% | 43% |
A Total returns would have been lower if certain expenses had not been reduced during the applicable periods shown.
B Calculated based on average shares outstanding during the period.
C Fees and expenses of any underlying Fidelity Central Funds are not included in the Fund's expense ratio. The Fund indirectly bears its proportionate share of the expenses of any underlying Fidelity Central Funds.
D Amount does not include the portfolio activity of any underlying Fidelity Central Funds.
E Expense ratios reflect operating expenses of the class. Expenses before reductions do not reflect amounts reimbursed by the investment adviser or reductions from brokerage service arrangements or reductions from other expense offset arrangements and do not represent the amount paid by the class during periods when reimbursements or reductions occur. Expenses net of fee waivers reflect expenses after reimbursement by the investment adviser but prior to reductions from brokerage service arrangements or other expense offset arrangements. Expenses net of all reductions represent the net expenses paid by the class.
F Amount represents less than $.001 per share.
See accompanying notes which are an integral part of the financial statements.
Annual Report
Financial Highlights - Institutional Class
Years ended October 31, | 2014 | 2013 | 2012 | 2011 | 2010 |
Selected Per-Share Data |
|
|
|
|
|
Net asset value, beginning of period | $ 9.97 | $ 9.92 | $ 9.71 | $ 9.77 | $ 9.29 |
Income from Investment Operations |
|
|
|
|
|
Net investment income (loss) B | .339 | .332 | .363 | .341 | .415 |
Net realized and unrealized gain (loss) | (.113) | .071 | .196 | (.079) | .427 |
Total from investment operations | .226 | .403 | .559 | .262 | .842 |
Distributions from net investment income | (.330) | (.305) | (.349) | (.323) | (.313) |
Distributions from net realized gain | (.036) | (.049) | - | - | (.050) |
Total distributions | (.366) | (.354) | (.349) | (.323) | (.363) |
Redemption fees added to paid in capital B | - F | .001 | - F | .001 | .001 |
Net asset value, end of period | $ 9.83 | $ 9.97 | $ 9.92 | $ 9.71 | $ 9.77 |
Total ReturnA | 2.29% | 4.15% | 5.87% | 2.72% | 9.27% |
Ratios to Average Net Assets C, E |
|
|
|
|
|
Expenses before reductions | .74% | .75% | .75% | .75% | .76% |
Expenses net of fee waivers, if any | .74% | .75% | .75% | .75% | .76% |
Expenses net of all reductions | .74% | .75% | .75% | .75% | .76% |
Net investment income (loss) | 3.40% | 3.34% | 3.71% | 3.50% | 4.38% |
Supplemental Data |
|
|
|
|
|
Net assets, end of period (in millions) | $ 3,317 | $ 3,646 | $ 2,510 | $ 1,992 | $ 1,138 |
Portfolio turnover rateD | 54% | 62% | 49% | 54% | 43% |
A Total returns would have been lower if certain expenses had not been reduced during the applicable periods shown.
B Calculated based on average shares outstanding during the period.
C Fees and expenses of any underlying Fidelity Central Funds are not included in the Fund's expense ratio. The Fund indirectly bears its proportionate share of the expenses of any underlying Fidelity Central Funds.
D Amount does not include the portfolio activity of any underlying Fidelity Central Funds.
E Expense ratios reflect operating expenses of the class. Expenses before reductions do not reflect amounts reimbursed by the investment adviser or reductions from brokerage service arrangements or reductions from other expense offset arrangements and do not represent the amount paid by the class during periods when reimbursements or reductions occur. Expenses net of fee waivers reflect expenses after reimbursement by the investment adviser but prior to reductions from brokerage service arrangements or other expense offset arrangements. Expenses net of all reductions represent the net expenses paid by the class.
F Amount represents less than $.001 per share.
See accompanying notes which are an integral part of the financial statements.
Annual Report
Notes to Financial Statements
For the period ended October 31, 2014
(Amounts in thousands except percentages)
1. Organization.
Fidelity Advisor Floating Rate High Income Fund (the Fund) is a fund of Fidelity Advisor Series I (the Trust) and is authorized to issue an unlimited number of shares. The Trust is registered under the Investment Company Act of 1940, as amended (the 1940 Act), as an open-end management investment company organized as a Massachusetts business trust. The Fund offers Class A, Class T, Class C, Fidelity Floating Rate High Income Fund and Institutional Class shares, each of which, along with Class B shares, has equal rights as to assets and voting privileges. Class B shares are closed to new accounts and additional purchases, except for exchanges and reinvestments. Each class has exclusive voting rights with respect to matters that affect that class. Class B shares will automatically convert to Class A shares after a holding period of seven years from the initial date of purchase.
2. Investments in Fidelity Central Funds.
The Fund invests in Fidelity Central Funds, which are open-end investment companies generally available only to other investment companies and accounts managed by the investment adviser and its affiliates. The Fund's Schedule of Investments lists each of the Fidelity Central Funds held as of period end, if any, as an investment of the Fund, but does not include the underlying holdings of each Fidelity Central Fund. As an Investing Fund, the Fund indirectly bears its proportionate share of the expenses of the underlying Fidelity Central Funds.
The Money Market Central Funds seek preservation of capital and current income and are managed by Fidelity Investments Money Management, Inc. (FIMM), an affiliate of the investment adviser. Annualized expenses of the Money Market Central Funds as of their most recent shareholder report date are less than .01%.
A complete unaudited list of holdings for each Fidelity Central Fund is available upon request or at the Securities and Exchange Commission (the SEC) website at www.sec.gov. In addition, the financial statements of the Fidelity Central Funds, which are not covered by the Fund's Report of Independent Registered Public Accounting Firm, are available on the SEC website or upon request.
3. Significant Accounting Policies.
The financial statements have been prepared in conformity with accounting principles generally accepted in the United States of America (GAAP), which require management to make certain estimates and assumptions at the date of the financial statements. Actual results could differ from those estimates. Subsequent events, if any, through the date that the financial statements were issued have been evaluated in the preparation of
Annual Report
3. Significant Accounting Policies - continued
the financial statements. The following summarizes the significant accounting policies of the Fund:
Investment Valuation. Investments are valued as of 4:00 p.m. Eastern time on the last calendar day of the period. In accordance with valuation policies and procedures approved by the Board of Trustees (the Board), the Fund attempts to obtain prices from one or more third party pricing vendors or brokers to value its investments. When current market prices, quotations or currency exchange rates are not readily available or reliable, investments will be fair valued in good faith by the Fidelity Management & Research Company (FMR) Fair Value Committee (the Committee), in accordance with procedures adopted by the Board. Factors used in determining fair value vary by investment type and may include market or investment specific events, changes in interest rates and credit quality. The frequency with which these procedures are used cannot be predicted and they may be utilized to a significant extent. The Committee oversees the Fund's valuation policies and procedures and is responsible for approving and reporting to the Board all fair value determinations.
The Fund categorizes the inputs to valuation techniques used to value its investments into a disclosure hierarchy consisting of three levels as shown below:
Level 1 - quoted prices in active markets for identical investments
Level 2 - other significant observable inputs (including quoted prices for similar investments, interest rates, prepayment speeds, etc.)
Level 3 - unobservable inputs (including the Fund's own assumptions based on the best information available)
Valuation techniques used to value the Fund's investments by major category are as follows:
Debt securities, including restricted securities, are valued based on evaluated prices received from third party pricing vendors or from brokers who make markets in such securities. Corporate bonds and bank loan obligations are valued by pricing vendors who utilize matrix pricing which considers yield or price of bonds of comparable quality, coupon, maturity and type or by broker-supplied prices. When independent prices are unavailable or unreliable, debt securities may be valued utilizing pricing methodologies which consider similar factors that would be used by third party pricing vendors. Debt securities are generally categorized as Level 2 in the hierarchy but may be Level 3 depending on the circumstances. The Fund invests a significant portion of its assets in below investment grade securities. The value of these securities can be more volatile due to changes in the credit quality of the issuer and is sensitive to changes in economic, market and regulatory conditions.
Annual Report
Notes to Financial Statements - continued
(Amounts in thousands except percentages)
3. Significant Accounting Policies - continued
Investment Valuation - continued
Equity securities, including restricted securities, for which market quotations are readily available, are valued at the last reported sale price or official closing price as reported by a third party pricing vendor on the primary market or exchange on which they are traded and are categorized as Level 1 in the hierarchy. In the event there were no sales during the day or closing prices are not available, securities are valued at the last quoted bid price or may be valued using the last available price and are generally categorized as Level 2 in the hierarchy. For foreign equity securities, when market or security specific events arise, comparisons to the valuation of American Depositary Receipts (ADRs), futures contracts, Exchange-Traded Funds (ETFs) and certain indexes as well as quoted prices for similar securities may be used and would be categorized as Level 2 in the hierarchy. Utilizing these techniques may result in transfers between Level 1 and Level 2. For equity securities, including restricted securities, where observable inputs are limited, assumptions about market activity and risk are used and these securities may be categorized as Level 3 in the hierarchy.
Investments in open-end mutual funds, including the Fidelity Central Funds, are valued at their closing net asset value (NAV) each business day and are categorized as Level 1 in the hierarchy.
Changes in valuation techniques may result in transfers in or out of an assigned level within the disclosure hierarchy. The aggregate value of investments by input level, as of October 31, 2014 is included at the end of the Fund's Schedule of Investments.
Investment Transactions and Income. For financial reporting purposes, the Fund's investment holdings and NAV include trades executed through the end of the last business day of the period. The NAV per share for processing shareholder transactions is calculated as of the close of business of the New York Stock Exchange (NYSE), normally 4:00 p.m. Eastern time and includes trades executed through the end of the prior business day. Gains and losses on securities sold are determined on the basis of identified cost and may include proceeds received from litigation. Dividend income is recorded on the ex-dividend date, except for certain dividends from foreign securities where the ex-dividend date may have passed, which are recorded as soon as the Fund is informed of the ex-dividend date. Non-cash dividends included in dividend income, if any, are recorded at the fair market value of the securities received. Income and capital gain distributions from Fidelity Central Funds, if any, are recorded on the ex-dividend date. Distributions received on securities that represent a return of capital or capital gain are recorded as a reduction of cost of investments and/or as a realized gain. Subsequent to ex-dividend date the Fund determines the components of these distributions, based upon receipt of tax filings or other correspondence relating to the underlying investment. Interest income is accrued as earned and includes coupon interest and amortization of
Annual Report
3. Significant Accounting Policies - continued
Investment Transactions and Income - continued
premium and accretion of discount on debt securities as applicable. Debt obligations may be placed on non-accrual status and related interest income may be reduced by ceasing current accruals and writing off interest receivables when the collection of all or a portion of interest has become doubtful based on consistently applied procedures. A debt obligation is removed from non-accrual status when the issuer resumes interest payments or when collectability of interest is reasonably assured. The Fund earns certain fees in connection with its floating rate loan purchasing activities. These fees are in addition to interest payments earned and may include amendment fees, consent fees and prepayment fees. These fees are recorded as Interest in the accompanying financial statements.
Class Allocations and Expenses. Investment income, realized and unrealized capital gains and losses, common expenses of the Fund, and certain fund-level expense reductions, if any, are allocated daily on a pro-rata basis to each class based on the relative net assets of each class to the total net assets of the Fund. Each class differs with respect to transfer agent and distribution and service plan fees incurred. Certain expense reductions may also differ by class. For the reporting period, the allocated portion of income and expenses to each class as a percent of its average net assets may vary due to the timing of recording these transactions in relation to fluctuating net assets of the classes. Expenses directly attributable to a fund are charged to that fund. Expenses attributable to more than one fund are allocated among the respective funds on the basis of relative net assets or other appropriate methods. Expense estimates are accrued in the period to which they relate and adjustments are made when actual amounts are known.
Income Tax Information and Distributions to Shareholders. Each year, the Fund intends to qualify as a regulated investment company under Subchapter M of the Internal Revenue Code, including distributing substantially all of its taxable income and realized gains. As a result, no provision for U.S. Federal income taxes is required. As of October 31, 2014, the Fund did not have any unrecognized tax benefits in the financial statements; nor is the Fund aware of any tax positions for which it is reasonably possible that the total amounts of unrecognized tax benefits will significantly change in the next twelve months. The Fund files a U.S. federal tax return, in addition to state and local tax returns as required. The Fund's federal income tax returns are subject to examination by the Internal Revenue Service (IRS) for a period of three fiscal years after they are filed. State and local tax returns may be subject to examination for an additional fiscal year depending on the jurisdiction.
Annual Report
Notes to Financial Statements - continued
(Amounts in thousands except percentages)
3. Significant Accounting Policies - continued
Income Tax Information and Distributions to Shareholders - continued
Dividends are declared and recorded daily and paid monthly from net investment income. Distributions from realized gains, if any, are declared and recorded on the ex-dividend date. Income dividends and capital gain distributions are declared separately for each class. Income and capital gain distributions are determined in accordance with income tax regulations, which may differ from GAAP.
Capital accounts within the financial statements are adjusted for permanent book-tax differences. These adjustments have no impact on net assets or the results of operations. Capital accounts are not adjusted for temporary book-tax differences which will reverse in a subsequent period.
Book-tax differences are primarily due to market discount, capital loss carryforwards and losses deferred due to wash sales.
The federal tax cost of investment securities and unrealized appreciation (depreciation) as of period end were as follows:
Gross unrealized appreciation | $ 113,253 |
Gross unrealized depreciation | (175,816) |
Net unrealized appreciation (depreciation) on securities | $ (62,563) |
|
|
Tax Cost | $ 14,576,958 |
The tax-based components of distributable earnings as of period end were as follows:
Undistributed ordinary income | $ 26,256 |
Undistributed long-term capital gain | $ 30,329 |
Net unrealized appreciation (depreciation) on securities and other investments | $ (62,562) |
The tax character of distributions paid was as follows:
| October 31, 2014 | October 31, 2013 |
Ordinary Income | $ 576,841 | $ 428,548 |
Short-Term Trading (Redemption) Fees. Shares held by investors in the Fund less than 60 days may have been subject to a redemption fee equal to 1.00% of the NAV of shares redeemed. All redemption fees, which reduce the proceeds of the shareholder redemption, are retained by the Fund and accounted for as an addition to paid in capital.
Annual Report
3. Significant Accounting Policies - continued
Restricted Securities. The Fund may invest in securities that are subject to legal or contractual restrictions on resale. These securities generally may be resold in transactions exempt from registration or to the public if the securities are registered. Disposal of these securities may involve time-consuming negotiations and expense, and prompt sale at an acceptable price may be difficult. Information regarding restricted securities is included at the end of the Fund's Schedule of Investments.
Loans and Other Direct Debt Instruments. The Fund invests in direct debt instruments which are interests in amounts owed to lenders by corporate or other borrowers. These instruments may be in the form of loans, trade claims or other receivables and may include standby financing commitments such as revolving credit facilities that obligate the Fund to supply additional cash to the borrower on demand. Loans may be acquired through assignment or participation, or may be made directly to a borrower. The Fund also invests in unfunded loan commitments, which are contractual obligations for future funding. Information regarding unfunded commitments is included at the end of the Fund's Schedule of Investments.
Purchases and Sales of Investments. Purchases and sales of securities (including principal repayments of bank loan obligations), other than short-term securities, aggregated $8,114,227 and $8,057,054, respectively.
New Accounting Pronouncement. In June 2014, the Financial Accounting Standards Board issued Accounting Standard Update No. 2014-11, Repurchase-to-Maturity Transactions, Repurchase Financings, and Disclosures. The Update amends the accounting for certain repurchase agreements and expands disclosure requirements for reverse repurchase agreements, securities lending and other similar transactions. The disclosure requirements are effective for annual and interim reporting periods beginning after December 15, 2014. Management is currently evaluating the impact of the Update on the Fund's financial statements and related disclosures.
4. Fees and Other Transactions with Affiliates.
Management Fee. Fidelity Management & Research Company (the investment adviser) and its affiliates provide the Fund with investment management related services for which the Fund pays a monthly management fee. The management fee is the sum of an individual fund fee rate that is based on an annual rate of .45% of the Fund's average net assets and an annualized group fee rate that averaged .11% during the period. The group fee rate is based upon the average net assets of all the mutual funds advised by the investment adviser, including any mutual funds previously advised by the investment adviser that are currently advised by Fidelity SelectCo, LLC, an affiliate of the investment adviser. The group fee rate decreases as assets under management increase and increases as assets under management decrease. For the reporting period, the total annual management fee rate was .56% of the Fund's average net assets.
Annual Report
Notes to Financial Statements - continued
(Amounts in thousands except percentages)
4. Fees and Other Transactions with Affiliates - continued
Distribution and Service Plan Fees. In accordance with Rule 12b-1 of the 1940 Act, the Fund has adopted separate Distribution and Service Plans for each class of shares. Certain classes pay Fidelity Distributors Corporation (FDC), an affiliate of the investment adviser, separate Distribution and Service Fees, each of which is based on an annual percentage of each class' average net assets. In addition, FDC may pay financial intermediaries for selling shares of the Fund and providing shareholder support services. For the period, the Distribution and Service Fee rates, total fees and amounts retained by FDC were as follows:
| Distribution | Service | Total Fees | Retained |
Class A | -% | .25% | $ 3,857 | $ 158 |
Class T | -% | .25% | 659 | 2 |
Class B | .55% | .15% | 142 | 112 |
Class C | .75% | .25% | 9,277 | 1,498 |
|
|
| $ 13,935 | $ 1,770 |
Sales Load. FDC may receive a front-end sales charge of up to 2.75% for selling Class A shares and Class T shares, some of which is paid to financial intermediaries for selling shares of the Fund. Depending on the holding period, FDC may receive contingent deferred sales charges levied on Class A, Class T, Class B and Class C redemptions. The deferred sales charges range from 3.50% to 1.00% for Class B shares, 1.00% for Class C shares, 1.00% or .50% for certain purchases of Class A shares and .25% for certain purchases of Class T shares.
For the period, sales charge amounts retained by FDC were as follows:
| Retained |
Class A | $ 79 |
Class T | 12 |
Class B* | 22 |
Class C* | 104 |
| $ 217 |
* When Class B and Class C shares are initially sold, FDC pays commissions from its own resources to financial intermediaries through which the sales are made.
Transfer Agent Fees. Fidelity Investments Institutional Operations Company, Inc., (FIIOC), an affiliate of the investment adviser, is the transfer, dividend disbursing and shareholder servicing agent for each class of the Fund. FIIOC receives account fees and asset-based fees that vary according to the account size and type of account of the shareholders of the respective classes of the Fund. FIIOC pays for typesetting, printing and mailing of shareholder reports, except proxy statements.
Annual Report
4. Fees and Other Transactions with Affiliates - continued
Transfer Agent Fees - continued
For the period, transfer agent fees for each class were as follows:
| Amount | % of |
Class A | $ 2,252 | .15 |
Class T | 626 | .24 |
Class B | 45 | .22 |
Class C | 1,372 | .15 |
Fidelity Floating Rate High Income Fund | 10,472 | .11 |
Institutional Class | 5,895 | .16 |
| $ 20,662 |
|
Accounting Fees. Fidelity Service Company, Inc. (FSC), an affiliate of the investment adviser, maintains the Fund's accounting records. The fee is based on the level of average net assets for each month.
5. Committed Line of Credit.
The Fund participates with other funds managed by the investment adviser or an affiliate in a $4.25 billion credit facility (the "line of credit") to be utilized for temporary or emergency purposes to fund shareholder redemptions or for other short-term liquidity purposes. The Fund has agreed to pay commitment fees on its pro-rata portion of the line of credit, which amounted to $26 and is reflected in Miscellaneous expenses on the Statement of Operations. During the period, the Fund did not borrow on this line of credit.
6. Expense Reductions.
Through arrangements with the Fund's custodian, credits realized as a result of uninvested cash balances were used to reduce the Fund's expenses. During the period, these credits reduced the Fund's custody expenses by $53.
In addition, the investment adviser reimbursed a portion of the Fund's operating expenses during the period in the amount of $6.
Annual Report
Notes to Financial Statements - continued
(Amounts in thousands except percentages)
7. Distributions to Shareholders.
Distributions to shareholders of each class were as follows:
Years ended October 31, | 2014 | 2013 |
From net investment income |
|
|
Class A | $ 47,339 | $ 41,401 |
Class T | 7,875 | 7,141 |
Class B | 519 | 529 |
Class C | 21,575 | 18,030 |
Fidelity Floating Rate High Income Fund | 321,211 | 214,851 |
Institutional Class | 121,183 | 93,637 |
Total | $ 519,702 | $ 375,589 |
From net realized gain |
|
|
Class A | $ 6,085 | $ 6,467 |
Class T | 983 | 1,176 |
Class B | 81 | 117 |
Class C | 3,472 | 3,997 |
Fidelity Floating Rate High Income Fund | 33,019 | 28,516 |
Institutional Class | 13,499 | 12,686 |
Total | $ 57,139 | $ 52,959 |
8. Share Transactions.
Share transactions for each class were as follows and may contain automatic conversions between classes or exchanges between funds:
| Shares | Dollars | ||
Years ended October 31, | 2014 | 2013 | 2014 | 2013 |
Class A |
|
|
|
|
Shares sold | 32,788 | 75,563 | $ 327,152 | $ 753,535 |
Reinvestment of distributions | 4,526 | 3,658 | 45,087 | 36,455 |
Shares redeemed | (85,268) | (42,208) | (849,518) | (421,018) |
Net increase (decrease) | (47,954) | 37,013 | $ (477,279) | $ 368,972 |
Class T |
|
|
|
|
Shares sold | 3,546 | 10,009 | $ 35,348 | $ 99,597 |
Reinvestment of distributions | 806 | 727 | 8,018 | 7,232 |
Shares redeemed | (7,285) | (7,688) | (72,473) | (76,547) |
Net increase (decrease) | (2,933) | 3,048 | $ (29,107) | $ 30,282 |
Class B |
|
|
|
|
Shares sold | 199 | 663 | $ 1,993 | $ 6,596 |
Reinvestment of distributions | 50 | 50 | 494 | 495 |
Shares redeemed | (838) | (851) | (8,343) | (8,474) |
Net increase (decrease) | (589) | (138) | $ (5,856) | $ (1,383) |
Annual Report
8. Share Transactions - continued
| Shares | Dollars | ||
Years ended October 31, | 2014 | 2013 | 2014 | 2013 |
Class C |
|
|
|
|
Shares sold | 12,315 | 30,392 | $ 122,843 | $ 303,076 |
Reinvestment of distributions | 1,906 | 1,609 | 18,981 | 16,022 |
Shares redeemed | (25,513) | (17,011) | (254,028) | (169,644) |
Net increase (decrease) | (11,292) | 14,990 | $ (112,204) | $ 149,454 |
Fidelity Floating Rate High Income Fund |
|
|
|
|
Shares sold | 320,632 | 483,346 | $ 3,194,510 | $ 4,812,772 |
Reinvestment of distributions | 29,181 | 20,114 | 290,182 | 200,158 |
Shares redeemed | (321,413) | (189,555) | (3,193,979) | (1,887,500) |
Net increase (decrease) | 28,400 | 313,905 | $ 290,713 | $ 3,125,430 |
Institutional Class |
|
|
|
|
Shares sold | 123,632 | 203,411 | $ 1,230,573 | $ 2,024,367 |
Reinvestment of distributions | 7,408 | 5,909 | 73,620 | 58,759 |
Shares redeemed | (159,132) | (96,688) | (1,581,091) | (962,445) |
Net increase (decrease) | (28,092) | 112,632 | $ (276,898) | $ 1,120,681 |
9. Other.
The Fund's organizational documents provide former and current trustees and officers with a limited indemnification against liabilities arising in connection with the performance of their duties to the Fund. In the normal course of business, the Fund may also enter into contracts that provide general indemnifications. The Fund's maximum exposure under these arrangements is unknown as this would be dependent on future claims that may be made against the Fund. The risk of material loss from such claims is considered remote.
Annual Report
Report of Independent Registered Public Accounting Firm
To the Trustees of Fidelity Advisor Series I and Shareholders of Fidelity Advisor Floating Rate High Income Fund:
We have audited the accompanying statement of assets and liabilities of Fidelity Advisor Floating Rate High Income Fund (the Fund), a fund of Fidelity Advisor Series I, including the schedule of investments, as of October 31, 2014, and the related statement of operations for the year then ended, the statement of changes in net assets for each of the two years in the period then ended, and the financial highlights for each of the five years in the period then ended. These financial statements and financial highlights are the responsibility of the Fund's management. Our responsibility is to express an opinion on these financial statements and financial highlights based on our audits.
We conducted our audits in accordance with the standards of the Public Company Accounting Oversight Board (United States). Those standards require that we plan and perform the audit to obtain reasonable assurance about whether the financial statements and financial highlights are free of material misstatement. The Fund is not required to have, nor were we engaged to perform, an audit of its internal control over financial reporting. Our audits included consideration of internal control over financial reporting as a basis for designing audit procedures that are appropriate in the circumstances, but not for the purpose of expressing an opinion on the effectiveness of the Fund's internal control over financial reporting. Accordingly, we express no such opinion. An audit also includes examining, on a test basis, evidence supporting the amounts and disclosures in the financial statements, assessing the accounting principles used and significant estimates made by management, as well as evaluating the overall financial statement presentation. Our procedures included confirmation of securities owned as of October 31, 2014, by correspondence with the custodians, agent banks and brokers; where replies were not received from brokers, we performed other auditing procedures. We believe that our audits provide a reasonable basis for our opinion.
In our opinion, the financial statements and financial highlights referred to above present fairly, in all material respects, the financial position of Fidelity Advisor Floating Rate High Income Fund as of October 31, 2014, the results of its operations for the year then ended, the changes in its net assets for each of the two years in the period then ended, and the financial highlights for each of the five years in the period then ended, in conformity with accounting principles generally accepted in the United States of America.
DELOITTE & TOUCHE LLP
Boston, Massachusetts
December 22, 2014
Annual Report
Trustees and Officers
The Trustees, Member of the Advisory Board, and officers of the trust and fund, as applicable, are listed below. The Board of Trustees governs the fund and is responsible for protecting the interests of shareholders. The Trustees are experienced executives who meet periodically throughout the year to oversee the fund's activities, review contractual arrangements with companies that provide services to the fund, oversee management of the risks associated with such activities and contractual arrangements, and review the fund's performance. Except for James C. Curvey, each of the Trustees oversees 174 funds. Mr. Curvey oversees 407 funds.
The Trustees hold office without limit in time except that (a) any Trustee may resign; (b) any Trustee may be removed by written instrument, signed by at least two-thirds of the number of Trustees prior to such removal; (c) any Trustee who requests to be retired or who has become incapacitated by illness or injury may be retired by written instrument signed by a majority of the other Trustees; and (d) any Trustee may be removed at any special meeting of shareholders by a two-thirds vote of the outstanding voting securities of the trust. Each Trustee who is not an interested person (as defined in the 1940 Act) of the trust and the fund (Independent Trustee), shall retire not later than the last day of the calendar year in which his or her 75th birthday occurs. The Independent Trustees may waive this mandatory retirement age policy with respect to individual Trustees. The officers and Advisory Board Member hold office without limit in time, except that any officer and Advisory Board Member may resign or may be removed by a vote of a majority of the Trustees at any regular meeting or any special meeting of the Trustees. Except as indicated, each individual has held the office shown or other offices in the same company for the past five years.
Experience, Skills, Attributes, and Qualifications of the Fund's Trustees. The Governance and Nominating Committee has adopted a statement of policy that describes the experience, qualifications, attributes, and skills that are necessary and desirable for potential Independent Trustee candidates (Statement of Policy). The Board believes that each Trustee satisfied at the time he or she was initially elected or appointed a Trustee, and continues to satisfy, the standards contemplated by the Statement of Policy. The Governance and Nominating Committee also engages professional search firms to help identify potential Independent Trustee candidates who have the experience, qualifications, attributes, and skills consistent with the Statement of Policy. From time to time, additional criteria based on the composition and skills of the current Independent Trustees, as well as experience or skills that may be appropriate in light of future changes to board composition, business conditions, and regulatory or other developments, have also been considered by the professional search firms and the Governance and Nominating Committee. In addition, the Board takes into account the Trustees' commitment and participation in Board and committee meetings, as well as their leadership of standing and ad hoc committees throughout their tenure.
In determining that a particular Trustee was and continues to be qualified to serve as a Trustee, the Board has considered a variety of criteria, none of which, in isolation, was controlling. The Board believes that, collectively, the Trustees have balanced and diverse experience, qualifications, attributes, and skills, which allow the Board to operate effectively in governing the fund and protecting the interests of shareholders. Information about the specific experience, skills, attributes, and qualifications of each Trustee, which in each case led to the Board's conclusion that the Trustee should serve (or continue to serve) as a trustee of the fund, is provided below.
Annual Report
Trustees and Officers - continued
Board Structure and Oversight Function. James C. Curvey is an interested person (as defined in the 1940 Act) and currently serves as Chairman. The Trustees have determined that an interested Chairman is appropriate and benefits shareholders because an interested Chairman has a personal and professional stake in the quality and continuity of services provided to the fund. Independent Trustees exercise their informed business judgment to appoint an individual of their choosing to serve as Chairman, regardless of whether the Trustee happens to be independent or a member of management. The Independent Trustees have determined that they can act independently and effectively without having an Independent Trustee serve as Chairman and that a key structural component for assuring that they are in a position to do so is for the Independent Trustees to constitute a substantial majority for the Board. The Independent Trustees also regularly meet in executive session. Ned C. Lautenbach serves as Chairman of the Independent Trustees and as such (i) acts as a liaison between the Independent Trustees and management with respect to matters important to the Independent Trustees and (ii) with management prepares agendas for Board meetings.
Fidelity funds are overseen by different Boards of Trustees. The fund's Board oversees Fidelity's equity and high income funds and another Board oversees Fidelity's investment-grade bond, money market, and asset allocation funds. The asset allocation funds may invest in Fidelity funds overseen by the fund's Board. The use of separate Boards, each with its own committee structure, allows the Trustees of each group of Fidelity funds to focus on the unique issues of the funds they oversee, including common research, investment, and operational issues. On occasion, the separate Boards establish joint committees to address issues of overlapping consequences for the Fidelity funds overseen by each Board.
The Trustees operate using a system of committees to facilitate the timely and efficient consideration of all matters of importance to the Trustees, the fund, and fund shareholders and to facilitate compliance with legal and regulatory requirements and oversight of the fund's activities and associated risks. The Board, acting through its committees, has charged FMR and its affiliates with (i) identifying events or circumstances the occurrence of which could have demonstrably adverse effects on the fund's business and/or reputation; (ii) implementing processes and controls to lessen the possibility that such events or circumstances occur or to mitigate the effects of such events or circumstances if they do occur; and (iii) creating and maintaining a system designed to evaluate continuously business and market conditions in order to facilitate the identification and implementation processes described in (i) and (ii) above. Because the day-to-day operations and activities of the fund are carried out by or through FMR, its affiliates and other service providers, the fund's exposure to risks is mitigated but not eliminated by the processes overseen by the Trustees. While each of the Board's committees has responsibility for overseeing different aspects of the fund's activities, oversight is exercised primarily through the Operations, Audit, and Compliance Committees. In addition, the Independent Trustees have worked with FMR to enhance the Board's oversight of investment and financial risks, legal and regulatory risks, technology risks, and operational risks, including the development of additional risk reporting to the Board. For example, a working group comprised of Independent Trustees and FMR has worked and continues to work to review the Fidelity funds' valuation-related activities, reporting and risk management. Appropriate personnel, including but not limited to the fund's Chief Compliance Officer (CCO), FMR's internal auditor, the independent accountants, the fund's Treasurer and portfolio management personnel, make periodic reports to the Board's committees, as appropriate, including an annual review of FMR's risk management program for the Fidelity funds. The responsibilities of each standing committee, including their oversight responsibilities, are described further under "Standing Committees of the Fund's Trustees."
Annual Report
The fund's Statement of Additional Information (SAI) includes more information about the Trustees. To request a free copy, call Fidelity at 1-800-544-8544.
Interested Trustees*:
Correspondence intended for each Trustee who is an interested person may be sent to Fidelity Investments, 245 Summer Street, Boston, Massachusetts 02210.
Name, Year of Birth; Principal Occupations and Other Relevant Experience+ | |
James C. Curvey (1935) | |
Year of Election or Appointment: 2007 Trustee Chairman of the Board of Trustees | |
| Mr. Curvey also serves as Trustee of other Fidelity funds. Mr. Curvey is a Director of Fidelity Research & Analysis Co. (2009-present), and Vice Chairman (2007-present) and Director of FMR LLC. In addition, Mr. Curvey serves as an Overseer for the Boston Symphony Orchestra and a member of the board of Artis-Naples, Naples, Florida, and as a Trustee for Brewster Academy, Wolfeboro, New Hampshire. Previously, Mr. Curvey served as a Director of Fidelity Investments Money Management, Inc. (2009-2014), a Director of FMR (2007-2014), and a Director of FMR Co., Inc. (2007-2014). |
Charles S. Morrison (1960) | |
Year of Election or Appointment: 2014 Trustee | |
| Mr. Morrison also serves as Trustee of other funds. He serves as a Director of Fidelity Investments Money Management, Inc. (FIMM) (2014-present), Director of Fidelity SelectCo, LLC (2014-present), President, Asset Management (2014-present) and is an employee of Fidelity Investments. Previously, Mr. Morrison served as Vice President of Fidelity's Fixed Income and Asset Allocation Funds (2012-2014), President, Fixed Income (2011-2014), Vice President of Fidelity's Money Market Funds (2005-2009), President, Money Market Group Leader of FMR (2009), and Senior Vice President, Money Market Group of FMR (2004-2009). Mr. Morrison also served as Vice President of Fidelity's Bond Funds (2002-2005), certain Balanced Funds (2002-2005), and certain Asset Allocation Funds (2002-2007), and as Senior Vice President (2002-2005) of Fidelity's Bond Division. |
* Trustees have been determined to be "Interested Trustees" by virtue of, among other things, their affiliation with the trust or various entities under common control with FMR.
+ The information above includes each Trustee's principal occupation during the last five years and other information relating to the experience, attributes, and skills relevant to each Trustee's qualifications to serve as a Trustee, which led to the conclusion that each Trustee should serve as a Trustee for the fund.
Annual Report
Independent Trustees:
Correspondence intended for each Independent Trustee (that is, the Trustees other than the Interested Trustees) may be sent to Fidelity Investments, P.O. Box 55235, Boston, Massachusetts 02205-5235.
Name, Year of Birth; Principal Occupations and Other Relevant Experience+ | |
Dennis J. Dirks (1948) | |
Year of Election or Appointment: 2005 Trustee | |
| Mr. Dirks also serves as Trustee of other Fidelity funds. Prior to his retirement in May 2003, Mr. Dirks was Chief Operating Officer and a member of the Board of The Depository Trust & Clearing Corporation (DTCC). He also served as President, Chief Operating Officer, and Board member of The Depository Trust Company (DTC) and President and Board member of the National Securities Clearing Corporation (NSCC). In addition, Mr. Dirks served as Chief Executive Officer and Board member of the Government Securities Clearing Corporation, Chief Executive Officer and Board member of the Mortgage-Backed Securities Clearing Corporation, as a Trustee and a member of the Finance Committee of Manhattan College (2005-2008), and as a Trustee and a member of the Finance Committee of AHRC of Nassau County (2006-2008). Mr. Dirks is a member of the Independent Directors Council (IDC) Governing Council (2010-present) and Board of Directors for The Brookville Center for Children's Services, Inc. (2009-present). |
Alan J. Lacy (1953) | |
Year of Election or Appointment: 2008 Trustee | |
| Mr. Lacy also serves as Trustee of other Fidelity funds. Mr. Lacy serves as Senior Adviser (2007-present) of Oak Hill Capital Partners, L.P. (private equity). Mr. Lacy also served as Chief Executive Officer (2000-2005) and Vice Chairman (2005-2006) of Sears Holdings Corporation and Sears, Roebuck and Co. (retail). In addition, Mr. Lacy serves as a member of the Board of Directors of Dave & Buster's Entertainment, Inc. (restaurant and entertainment complexes, 2010-present), Earth Fare, Inc. (retail grocery, 2012-present), The Hillman Companies, Inc. (hardware wholesalers, 2010-present), and Bristol-Myers Squibb Company (global pharmaceuticals, 2008-present). Mr. Lacy is a member of the Board of Trustees of The National Parks Conservation Association (2006-present). Previously, Mr. Lacy served as Chairman of the Board of Trustees of the National Parks Conservation Association (2008-2011) and as a member of the Board of Directors for the Western Union Company (global money transfer, 2006-2011). |
Ned C. Lautenbach (1944) | |
Year of Election or Appointment: 2000 Trustee Chairman of the Independent Trustees | |
| Mr. Lautenbach also serves as Trustee of other Fidelity funds. Mr. Lautenbach currently serves as the Lead Director of the Eaton Corporation Board of Directors (diversified industrial, 1997-present). Mr. Lautenbach is Chairman of the Board of Directors of the Philharmonic Center for the Arts in Naples, Florida (2012-present) and a member of the Council on Foreign Relations (1994-present). Previously, Mr. Lautenbach was a Partner/Advisory Partner at Clayton, Dubilier & Rice, LLC (private equity investment, 1998-2010), as well as a Director of Sony Corporation (2006-2007). |
Joseph Mauriello (1944) | |
Year of Election or Appointment: 2008 Trustee | |
| Mr. Mauriello also serves as Trustee of other Fidelity funds. Prior to his retirement in January 2006, Mr. Mauriello served in numerous senior management positions including Deputy Chairman and Chief Operating Officer (2004-2005), and Vice Chairman of Financial Services (2002-2004) of KPMG LLP US (professional services, 1965-2005). Mr. Mauriello currently serves as a member of the Board of Directors of XL Group plc. (global insurance and re-insurance, 2006-present). Previously, Mr. Mauriello served as a Director of the Hamilton Funds of the Bank of New York (2006-2007) and of Arcadia Resources Inc. (health care services and products, 2007-2012). |
Robert W. Selander (1950) | |
Year of Election or Appointment: 2011 Trustee | |
| Mr. Selander also serves as Trustee of other Fidelity funds. Previously, Mr. Selander served as a Member of the Advisory Board of other Fidelity funds (2011), and Executive Vice Chairman (2010), Chief Executive Officer (2009-2010), and President and Chief Executive Officer (1997-2009) of Mastercard, Inc. |
Cornelia M. Small (1944) | |
Year of Election or Appointment: 2005 Trustee | |
| Ms. Small also serves as Trustee of other Fidelity funds. Ms. Small is a member of the Board of Directors (2009-present) and Chair of the Investment Committee (2010-present) of the Teagle Foundation. Ms. Small also serves on the Investment Committee of the Berkshire Taconic Community Foundation (2008-present). Previously, Ms. Small served as Chairperson (2002-2008) and a member of the Investment Committee and Chairperson (2008-2012) and a member of the Board of Trustees of Smith College. In addition, Ms. Small served as Chief Investment Officer, Director of Global Equity Investments, and a member of the Board of Directors of Scudder, Stevens & Clark and Scudder Kemper Investments. |
William S. Stavropoulos (1939) | |
Year of Election or Appointment: 2002 Trustee Vice Chairman of the Independent Trustees | |
| Mr. Stavropoulos also serves as Trustee of other Fidelity funds. Mr. Stavropoulos serves as President and Founder of the Michigan Baseball Foundation, the Great Lakes Loons (2007-present). Mr. Stavropoulos is Chairman Emeritus of the Board of Directors of The Dow Chemical Company, where he previously served in numerous senior management positions, including President, CEO (1995-2000; 2002-2004), Chairman of the Executive Committee (2000-2006), and as a member of the Board of Directors (1990-2006). Currently, Mr. Stavropoulos is Chairman of the Board of Directors of Univar Inc. (global distributor of commodity and specialty chemicals), a Director of Teradata Corporation (data warehousing and technology solutions), and Maersk Inc. (industrial conglomerate), and a member of the Advisory Board for Metalmark Capital LLC (private equity investment, 2005-present). Mr. Stavropoulos is an operating advisor to Clayton, Dubilier & Rice, LLC (private equity investment). In addition, Mr. Stavropoulos is a member of the University of Notre Dame Advisory Council for the College of Science, a Trustee of the Rollin L. Gerstacker Foundation, and a Director of the Naples Philharmonic Center for the Arts. Previously, Mr. Stavropoulos served as a Director of Chemical Financial Corporation (bank holding company, 1993-2012) and Tyco International, Ltd. (multinational manufacturing and services, 2007-2012). |
David M. Thomas (1949) | |
Year of Election or Appointment: 2008 Trustee | |
| Mr. Thomas also serves as Trustee of other Fidelity funds. Mr. Thomas serves as Non-Executive Chairman of the Board of Directors of Fortune Brands Home and Security (home and security products, 2011-present), and as a member of the Board of Directors of Interpublic Group of Companies, Inc. (marketing communication, 2004-present). Previously, Mr. Thomas served as Executive Chairman (2005-2006) and Chairman and Chief Executive Officer (2000-2005) of IMS Health, Inc. (pharmaceutical and healthcare information solutions), and a Director of Fortune Brands, Inc. (consumer products, 2000-2011). |
+ The information above includes each Trustee's principal occupation during the last five years and other information relating to the experience, attributes, and skills relevant to each Trustee's qualifications to serve as a Trustee, which led to the conclusion that each Trustee should serve as a Trustee for the fund.
Advisory Board Member and Officers:
Correspondence intended for each officer and Peter S. Lynch may be sent to Fidelity Investments, 245 Summer Street, Boston, Massachusetts 02210. Officers appear below in alphabetical order.
Name, Year of Birth; Principal Occupation | |
Peter S. Lynch (1944) | |
Year of Election or Appointment: 2003 Member of the Advisory Board | |
| Mr. Lynch also serves as Member of the Advisory Board of other Fidelity funds. Mr. Lynch is Vice Chairman and a Director of FMR and FMR Co., Inc. In addition, Mr. Lynch serves as a Trustee of Boston College and as the Chairman of the Inner-City Scholarship Fund. Previously, Mr. Lynch served on the Special Olympics International Board of Directors (1997-2006). |
Elizabeth Paige Baumann (1968) | |
Year of Election or Appointment: 2012 Anti-Money Laundering (AML) Officer | |
| Ms. Baumann also serves as AML Officer of other funds. She is Chief AML Officer of FMR LLC (2012-present) and is an employee of Fidelity Investments. Previously, Ms. Baumann served as Vice President and Deputy Anti-Money Laundering Officer (2007-2012). |
William C. Coffey (1969) | |
Year of Election or Appointment: 2009 Assistant Secretary | |
| Mr. Coffey also serves as Assistant Secretary of other funds. He is Senior Vice President and Deputy General Counsel of FMR LLC (2010-present), and is an employee of Fidelity Investments. Previously, Mr. Coffey served as Vice President and Associate General Counsel of FMR LLC (2005-2009). |
Jonathan Davis (1968) | |
Year of Election or Appointment: 2010 Assistant Treasurer | |
| Mr. Davis also serves as Assistant Treasurer of other funds. Mr. Davis is an employee of Fidelity Investments. Previously, Mr. Davis served as Vice President and Associate General Counsel of FMR LLC (2003-2010). |
Adrien E. Deberghes (1967) | |
Year of Election or Appointment: 2008 Deputy Treasurer | |
| Mr. Deberghes also serves as an officer of other funds. He is an employee of Fidelity Investments (2008-present). Prior to joining Fidelity Investments, Mr. Deberghes was Senior Vice President of Mutual Fund Administration at State Street Corporation (2007-2008), Senior Director of Mutual Fund Administration at Investors Bank & Trust (2005-2007), and Director of Finance for Dunkin' Brands (2000-2005). |
Stephanie J. Dorsey (1969) | |
Year of Election or Appointment: 2010 Assistant Treasurer | |
| Ms. Dorsey also serves as an officer of other funds. She is an employee of Fidelity Investments (2008-present) and has served in other fund officer roles. Prior to joining Fidelity Investments, Ms. Dorsey served as Treasurer (2004-2008) of the JPMorgan Mutual Funds and Vice President (2004-2008) of JPMorgan Chase Bank. |
Howard J. Galligan III (1966) | |
Year of Election or Appointment: 2014 Chief Financial Officer | |
| Mr. Galligan also serves as Chief Financial Officer of other funds. Mr. Galligan serves as President of Fidelity Pricing and Cash Management Services (FPCMS) (2014-present) and as a Director of Strategic Advisers, Inc. (2008-present). Previously, Mr. Galligan served as Chief Administrative Officer of Asset Management (2011-2014) and Chief Operating Officer and Senior Vice President of Investment Support for Strategic Advisers, Inc. (2003-2011). |
Scott C. Goebel (1968) | |
Year of Election or Appointment: 2008 Secretary and Chief Legal Officer (CLO) | |
| Mr. Goebel serves as Secretary and CLO of other funds. Mr. Goebel also serves as Secretary of Fidelity SelectCo, LLC (2013-present), Fidelity Investments Money Management, Inc. (FIMM) (2010-present) and Fidelity Research and Analysis Company (FRAC) (2010-present); General Counsel, Secretary, and Senior Vice President of FMR (2008-present) and FMR Co., Inc. (2008-present); Chief Legal Officer of Fidelity Management & Research (Hong Kong) Limited (2008-present); and Assistant Secretary of Fidelity Management & Research (Japan) Limited (2008-present) and Fidelity Management & Research (U.K.) Inc. (2008-present). Previously, Mr. Goebel served as Secretary and CLO of other Fidelity funds (2008-2013), Assistant Secretary of FIMM (2008-2010), FRAC (2008-2010), and certain funds (2007-2008); and as Vice President and Secretary of Fidelity Distributors Corporation (FDC) (2005-2007). Mr. Goebel has been employed by FMR LLC or an affiliate since 2001. |
Thomas C. Hense (1964) | |
Year of Election or Appointment: 2008/2010 Vice President | |
| Mr. Hense also serves as Vice President of other funds (High Income (2008), Small Cap (2008), and Value (2010) funds). Previously, Mr. Hense served as a portfolio manager for Fidelity's Institutional Money Management Group (Pyramis) (2003-2008). |
Brian B. Hogan (1964) | |
Year of Election or Appointment: 2009 Vice President | |
| Mr. Hogan also serves as Trustee or Vice President of other funds. Mr. Hogan serves as a Director of Fidelity SelectCo, LLC (2014-present) and President of FMR's Equity Division (2009-present). Previously, Mr. Hogan served as Senior Vice President, Equity Research of FMR (2006-2009) and as a portfolio manager. |
Chris Maher (1972) | |
Year of Election or Appointment: 2013 Assistant Treasurer | |
| Mr. Maher serves as Assistant Treasurer of other funds. Mr. Maher is Vice President of Valuation Oversight and is an employee of Fidelity Investments. Previously, Mr. Maher served as Vice President of Asset Management Compliance (2013), Vice President of FMR's Program Management Group (2010-2013), and Vice President of Valuation Oversight (2008-2010). |
Kenneth B. Robins (1969) | |
Year of Election or Appointment: 2008 President and Treasurer | |
| Mr. Robins also serves as an officer of other funds. Mr. Robins serves as Executive Vice President of Fidelity Investments Money Management, Inc. (FIMM) (2013-present) and is an employee of Fidelity Investments (2004-present). Previously, Mr. Robins served in other fund officer roles. |
Stephen Sadoski (1971) | |
Year of Election or Appointment: 2012 Deputy Treasurer | |
| Mr. Sadoski also serves as Deputy Treasurer of other funds. He is an employee of Fidelity Investments (2012-present) and has served in another fund officer role. Prior to joining Fidelity Investments, Mr. Sadoski served as an assistant chief accountant in the Division of Investment Management of the Securities and Exchange Commission (SEC) (2009-2012) and as a senior manager at Deloitte & Touche LLP (1997-2009). |
Stacie M. Smith (1974) | |
Year of Election or Appointment: 2013 Deputy Treasurer | |
| Ms. Smith also serves as an officer of other funds. She is an employee of Fidelity Investments (2009-present) and has served in other fund officer roles. Prior to joining Fidelity Investments, Ms. Smith served as Senior Audit Manager of Ernst & Young LLP (1996-2009). |
Renee Stagnone (1975) | |
Year of Election or Appointment: 2013 Deputy Treasurer | |
| Ms. Stagnone also serves as Deputy Treasurer of other funds. Ms. Stagnone is an employee of Fidelity Investments. |
Linda J. Wondrack (1964) | |
Year of Election or Appointment: 2014 Chief Compliance Officer | |
| Ms. Wondrack also serves as Chief Compliance Officer of other funds. Ms. Wondrack is Executive Vice President and head of the Ethics Office and Asset Management Compliance for Fidelity Investments (2012-present). Ms. Wondrack also serves as Chief Compliance Officer of Fidelity SelectCo, LLC (2014-present); Chief Compliance Officer of Impresa Management LLC (2013-present); and Chief Compliance Officer of FMR Co., Inc., Fidelity Investments Money Management, Inc., Fidelity Management & Research (Japan) Limited, Fidelity Management & Research (U.K.) Inc., Fidelity Management & Research (Hong Kong), Fidelity Management & Research Company, Pyramis Global Advisors, LLC, and Strategic Advisers, Inc., Ballyrock Investment Advisors LLC, and Northern Neck Investors LLC (2012-present). Previously, Ms. Wondrack served as Senior Vice President and Chief Compliance Officer for Columbia Management Investment Advisers, LLC (2005-2012); Chief Compliance Officer for certain funds within the Columbia Family of Funds (2007-2012); and Senior Vice President of Compliance Risk Management at Bank of America (2005-2010). |
Joseph F. Zambello (1957) | |
Year of Election or Appointment: 2011 Deputy Treasurer | |
| Mr. Zambello also serves as Deputy Treasurer of other funds. Mr. Zambello is an employee of Fidelity Investments. Previously, Mr. Zambello served as Vice President of FMR's Program Management Group (2009-2011) and Vice President of the Transfer Agent Oversight Group (2005-2009). |
Annual Report
Distributions (Unaudited)
The Board of Trustees of Fidelity Floating Rate High Income Fund voted to pay to shareholders of record at the opening of business on record date, the following distributions per share derived from capital gains realized from sales of portfolio securities, and dividends derived from net investment income:
| Pay Date | Record Date | Capital Gains |
Fidelity Floating Rate High Income Fund | 12/08/14 | 12/05/14 | $0.04 |
The fund hereby designates as a capital gain dividend with respect to the taxable year ended October 31, 2014, $30,329,073, or, if subsequently determined to be different, the net capital gain of such year.
A total of 0.06% of the dividends distributed during the fiscal year was derived from interest on U.S. Government securities which is generally exempt from state income tax.
The fund designates $349,385,772 of distributions paid during the period January 1, 2014 to October 31, 2014 as qualifying to be taxed as interest-related dividends for nonresident alien shareholders.
The fund will notify shareholders in January 2015 of amounts for use in preparing 2014 income tax returns.
Annual Report
Board Approval of Investment Advisory Contracts and Management Fees
Fidelity Advisor Floating Rate High Income Fund
Each year, the Board of Trustees, including the Independent Trustees (together, the Board), votes on the renewal of the management contract with Fidelity Management & Research Company (FMR) and the sub-advisory agreements (together, the Advisory Contracts) for the fund. The Board, assisted by the advice of fund counsel and Independent Trustees' counsel, requests and considers a broad range of information relevant to the renewal of the Advisory Contracts throughout the year.
The Board meets regularly and, at each of its meetings, covers an extensive agenda of topics and materials and considers factors that are relevant to its annual consideration of the renewal of the fund's Advisory Contracts, including the services and support provided to the fund and its shareholders. The Board has established various standing committees (Committees), each composed of and chaired by Independent Trustees with varying backgrounds, to which the Board has assigned specific subject matter responsibilities in order to enhance effective decision-making by the Board. The Board, acting directly and through its Committees, requests and receives information concerning the annual consideration of the renewal of the fund's Advisory Contracts. The Board also meets as needed to consider matters specifically related to the Board's annual consideration of the renewal of the Advisory Contracts. Members of the Board may also meet with trustees of other Fidelity funds through ad hoc joint committees to discuss certain matters relevant to the Fidelity funds.
At its July 2014 meeting, the Board, including the Independent Trustees, unanimously determined to renew the fund's Advisory Contracts. In reaching its determination, the Board considered all factors it believed relevant, including (i) the nature, extent, and quality of the services to be provided to the fund and its shareholders (including the investment performance of the fund); (ii) the competitiveness of the fund's management fee and total expense ratio relative to peer funds; (iii) the total costs of the services to be provided by and the profits to be realized by Fidelity from its relationship with the fund; (iv) the extent to which economies of scale exist and would be realized as the fund grows; and (v) whether fee levels reflect these economies of scale, if any, for the benefit of fund shareholders. In connection with separate internal corporate reorganizations involving Fidelity Management & Research (U.K.) Inc. (FMR U.K.) and Fidelity Management & Research (Japan) Inc. (FMR Japan), the Board approved certain non-material amendments to the fund's sub-advisory agreements with FMR U.K. and FMR Japan to reflect that, after these reorganizations, FMR Investment Management (UK) Limited and Fidelity Management & Research (Japan) Limited will carry on the business of FMR U.K. and FMR Japan, respectively. The Board noted that no changes to the portfolio managers or to the foreign research or investment advisory services provided to the fund were expected in connection with either reorganization and that the same personnel and resources would continue to be available to the fund at the new entities.
Annual Report
Board Approval of Investment Advisory Contracts and
Management Fees - continued
In considering whether to renew the Advisory Contracts for the fund, the Board reached a determination, with the assistance of fund counsel and Independent Trustees' counsel and through the exercise of its business judgment, that the renewal of the Advisory Contracts was in the best interests of the fund and its shareholders and that the compensation payable under the Advisory Contracts was fair and reasonable. The Board's decision to renew the Advisory Contracts was not based on any single factor, but rather was based on a comprehensive consideration of all the information provided to the Board at its meetings throughout the year. The Board, in reaching its determination to renew the Advisory Contracts, was aware that shareholders of the fund have a broad range of investment choices available to them, including a wide choice among funds offered by Fidelity's competitors, and that the fund's shareholders, who have the opportunity to review and weigh the disclosure provided by the fund in its prospectus and other public disclosures, have chosen to invest in this fund, which is part of the Fidelity family of funds.
Nature, Extent, and Quality of Services Provided. The Board considered Fidelity's staffing as it relates to the fund, including the backgrounds of investment personnel of FMR and the sub-advisers (together, the Investment Advisers), and also considered the fund's investment objective, strategies, and related investment philosophy. The Independent Trustees also had discussions with senior management of Fidelity's investment operations and investment groups. The Board considered the structure of the portfolio manager compensation program and whether this structure provides appropriate incentives to act in the best interests of the fund. Additionally, the Board considered the portfolio managers' investments, if any, in the funds that they manage.
Resources Dedicated to Investment Management and Support Services. The Board and the Fund Oversight and Research Committees reviewed the general qualifications and capabilities of Fidelity's investment staff, including its size, education, experience, and resources, as well as Fidelity's approach to recruiting, training, managing, and compensating investment personnel. The Board noted that Fidelity has continued to increase the resources devoted to non-U.S. offices, including expansion of Fidelity's global investment organization. The Board also noted that Fidelity's analysts have extensive resources, tools and capabilities that allow them to conduct sophisticated quantitative and fundamental analysis, as well as credit analysis of issuers, counterparties and guarantors. Further, the Board believes that Fidelity's investment professionals have sufficient access to global information and data so as to provide competitive investment results over time, and that those professionals also have access to sophisticated tools that permit them to assess portfolio construction and risk and performance attribution characteristics continuously, as well as to transmit new information and research conclusions rapidly around the world. Additionally, in its deliberations, the Board considered Fidelity's trading and risk management capabilities and resources and global compliance infrastructure, which are an integral part of the investment management process.
Annual Report
Shareholder and Administrative Services. The Board considered (i) the nature, extent, quality, and cost of advisory, administrative, and shareholder services performed by the Investment Advisers and their affiliates under the Advisory Contracts and under separate agreements covering transfer agency, pricing and bookkeeping, and securities lending services for the fund; (ii) the nature and extent of the supervision of third party service providers, principally custodians and subcustodians; and (iii) the resources devoted to, and the record of compliance with, the fund's compliance policies and procedures. The Board also reviewed the allocation of fund brokerage, including allocations to brokers affiliated with the Investment Advisers, the use of brokerage commissions to pay fund expenses, and the use of "soft" commission dollars to pay for research services.
The Board noted that the growth of fund assets over time across the complex allows Fidelity to reinvest in the development of services designed to enhance the value or convenience of the Fidelity funds as investment vehicles. These services include 24-hour access to account information and market information through telephone representatives and over the Internet, investor education materials and asset allocation tools, and the expanded availability of Fidelity Investor Centers.
In 2014, the Board formed an ad hoc Committee on Transfer Agency Fees to review the variety of transfer agency fee structures throughout the industry and Fidelity's competitive positioning with respect to industry participants.
Investment in a Large Fund Family. The Board considered the benefits to shareholders of investing in a Fidelity fund, including the benefits of investing in a fund that is part of a large family of funds offering a variety of investment disciplines and providing a large variety of mutual fund investor services. The Board noted that Fidelity had taken, or had made recommendations that resulted in the Fidelity funds taking, a number of actions over the previous year that benefited particular funds, including (i) continuing to dedicate additional resources to investment research and to the support of the senior management team that oversees asset management; (ii) persisting in efforts to enhance Fidelity's global research capabilities; (iii) launching new funds and making other enhancements to meet client needs for income-oriented solutions; (iv) reducing fund expenses for certain index funds; (v) continuing to launch dedicated lower cost underlying funds to meet portfolio construction needs related to expanding underlying fund options for Fidelity funds of funds, specifically for the Freedom Fund product lines; (vi) rationalizing product lines and gaining increased efficiencies through fund mergers; (vii) launching sector-based exchange-traded funds and establishing a new Fidelity adviser to manage sector-based funds and products; (viii) continuing to develop and implement technology to improve security and increase efficiency; (ix) modifying the eligibility criteria for certain share classes to increase their marketability to a portion of the defined contribution plan market; (x) waiving redemption fees for certain qualified fund-of-fund and wrap programs and certain retirement plan transactions; and (xi) launching new Institutional Class shares of certain money market funds to attract and retain assets and to fill a gap in the money market fund lineup.
Annual Report
Board Approval of Investment Advisory Contracts and
Management Fees - continued
Investment Performance. The Board considered whether the fund has operated in accordance with its investment objective, as well as its record of compliance with its investment restrictions and its performance history. The Board noted that there was a portfolio management change for the fund in April 2013.
The Board took into account discussions with the Investment Advisers about fund investment performance that occur at Board meetings throughout the year. In this regard the Board noted that as part of regularly scheduled fund reviews and other reports to the Board on fund performance, the Board periodically considers annualized return information for the fund, for different time periods, measured against a securities market index ("benchmark index") and a peer group of funds with similar objectives ("peer group"). In its evaluation of fund investment performance, the Board gave particular attention to information indicating changes in performance of certain Fidelity funds for specific time periods and the Investment Advisers' explanations for any overperformance or underperformance.
In addition to reviewing absolute and relative fund performance, the Independent Trustees periodically consider the appropriateness of fund performance metrics in evaluating the results achieved. In general, the Independent Trustees believe that fund performance should be evaluated based on net performance (after fees and expenses) of both the highest performing and lowest performing classes, where applicable, compared to appropriate benchmark indices, over appropriate time periods which may include full market cycles, and compared to peer groups, as applicable, over the same periods, taking into account relevant factors including the following: general market conditions; issuer-specific information; tactical opportunities for investment; and fund cash flows and other factors.
The Independent Trustees recognize that shareholders evaluate performance on a net basis over their own holding periods, for which one-, three-, and five-year periods are often used as a proxy. For this reason, the performance information reviewed by the Board also included net cumulative calendar year total return information for the fund and an appropriate benchmark index and peer group for the most recent one-, three-, and five-year periods, as shown below. Returns are shown compared to the 25th percentile (top of box, 75% beaten) and 75th percentile (bottom of box, 25% beaten) of the peer universe.
Annual Report
Fidelity Advisor Floating Rate High Income Fund

The Board has discussed the fund's underperformance with FMR and has engaged with FMR to consider what steps might be taken to remediate the fund's underperformance.
Based on its review, the Board concluded that the nature, extent, and quality of services provided to the fund under the Advisory Contracts should benefit the fund's shareholders.
Competitiveness of Management Fee and Total Expense Ratio. The Board considered the fund's management fee and total expense ratio compared to "mapped groups" of competitive funds and classes. Fidelity creates "mapped groups" by combining similar Lipper investment objective categories that have comparable investment mandates. Combining Lipper investment objective categories aids the Board's management fee and total expense ratio comparisons by broadening the competitive group used for comparison and by reducing the number of universes to which various Fidelity funds are compared.
Management Fee. The Board considered two proprietary management fee comparisons for the 12-month periods shown in the chart below. The group of Lipper funds used by the Board for management fee comparisons is referred to below as the "Total Mapped Group." The Total Mapped Group is broader than the Lipper peer group used by the Board for performance comparisons because the Total Mapped Group combines several Lipper investment objective categories while the Lipper peer group does not. The Total Mapped Group comparison focuses on a fund's standing in terms of gross management fees before expense reimbursements or caps relative to the total universe of funds with comparable investment mandates, regardless of whether their management fee structures also are comparable. Funds with comparable investment mandates offer exposure to similar types of securities. Funds with comparable management fee structures have similar management fee contractual arrangements (e.g., flat rate charged for advisory services, all-inclusive fee rate, etc.). "TMG %" represents the percentage of funds in the Total Mapped Group that had management fees that were lower than the fund's. For example, a hypothetical TMG % of 20% would mean that 80% of the funds in the Total Mapped Group had higher, and 20% had lower, management fees than the fund. The fund's actual TMG %s are in the chart below. The "Asset-Size Peer Group" (ASPG) comparison focuses on a fund's standing relative to a subset of non-Fidelity funds within the Total Mapped Group that are similar in size and management fee structure. For example, if a fund is in the first quartile of the ASPG, the fund's management fee ranks in the least expensive or lowest 25% of funds in the ASPG. The ASPG represents at least 15% of the funds in the Total Mapped Group with comparable asset size and management fee structures, subject to a minimum of 50 funds (or all funds in the Total Mapped Group if fewer than 50). Additional information, such as the ASPG quartile in which the fund's management fee rate ranked, is also included in the chart and considered by the Board.
Annual Report
Board Approval of Investment Advisory Contracts and
Management Fees - continued
Fidelity Advisor Floating Rate High Income Fund

The Board noted that the fund's management fee rate ranked below the median of its Total Mapped Group and below the median of its ASPG for 2013.
The Board also noted that, in August 2013, the ad hoc Committee on Management Fees was formed to conduct an in-depth review of the management fee rates of Fidelity's active equity mutual funds. The Committee focused on the following areas: (i) standard fee structures; (ii) research consumption and trading evolution; (iii) management fee competitiveness/profitability by category; and (iv) factors that drive institutional pricing.
Annual Report
Based on its review, the Board concluded that the fund's management fee is fair and reasonable in light of the services that the fund receives and the other factors considered.
Total Expense Ratio. In its review of each class's total expense ratio, the Board considered the fund's management fee as well as other fund or class expenses, as applicable, such as transfer agent fees, pricing and bookkeeping fees, fund-paid 12b-1 fees, and custodial, legal, and audit fees. The Board also noted the effects of any waivers and reimbursements on fees and expenses. As part of its review, the Board also considered the current and historical total expense ratios of each class of the fund compared to competitive fund median expenses. Each class of the fund is compared to those funds and classes in the Total Mapped Group (used by the Board for management fee comparisons) that have a similar sales load structure.
The Board noted that the total expense ratio of each of Class A, Class B, Institutional Class, and the retail class ranked below its competitive median for 2013, the total expense ratio of Class C ranked equal to its competitive median for 2013, and the total expense ratio of Class T ranked above its competitive median for 2013. The Board considered that, in general, various factors can affect total expense ratios. The Board noted that the total expense ratio of Class T was above the competitive median primarily because of higher 12b-1 fees on Class T as compared to most competitor funds. Class T has a higher 12b-1 fee, but a lower front-end sales charge, than traditionally priced front-end sales charge classes. The Board considered that Class T is primarily sold load-waived in the retirement plan market where its 0.50% 12b-1 fee is comparable to competing no-load, higher 12b-1 fee classes designed specifically for retirement plans. The Board noted that the fund offers multiple classes, each of which has a different sales load and 12b-1 fee structure, and that the multiple structures are intended to offer a range of pricing options for the intermediary market. The Board also noted that the total expense ratios of the classes vary primarily by the level of their 12b-1 fees, although differences in transfer agent fees may also cause expenses to vary from class to class.
Fees Charged to Other Fidelity Clients. The Board also considered Fidelity fee structures and other information with respect to clients of Fidelity, such as other funds advised or subadvised by Fidelity, pension plan clients, and other institutional clients. The Board noted the findings of the 2013 ad hoc joint committee (created with the board of other Fidelity funds), which reviewed and compared Fidelity's institutional investment advisory business with its business of providing services to the Fidelity funds, including the differences in services provided, fees charged, and costs incurred, as well as competition in their respective marketplaces.
Annual Report
Board Approval of Investment Advisory Contracts and
Management Fees - continued
Based on its review of total expense ratios and fees charged to other Fidelity clients, the Board concluded that the total expense ratio of each class of the fund was reasonable, although Class T was above the median of the universe presented for comparison, in light of the services that the fund and its shareholders receive and the other factors considered.
Costs of the Services and Profitability. The Board considered the revenues earned and the expenses incurred by Fidelity in conducting the business of developing, marketing, distributing, managing, administering and servicing the fund and servicing the fund's shareholders. The Board also considered the level of Fidelity's profits in respect of all the Fidelity funds.
On an annual basis, Fidelity presents to the Board Fidelity's profitability for the fund. Fidelity calculates the profitability for each fund, as well as aggregate profitability for groups of Fidelity funds and all Fidelity funds, using a series of detailed revenue and cost allocation methodologies which originate with the books and records of Fidelity on which Fidelity's audited financial statements are based. The Audit Committee of the Board reviews any significant changes from the prior year's methodologies.
PricewaterhouseCoopers LLP (PwC), independent registered public accounting firm and auditor to Fidelity and certain Fidelity funds, has been engaged annually by the Board as part of the Board's assessment of Fidelity's profitability analysis. PwC's engagement includes the review and assessment of the methodologies used by Fidelity in determining the revenues and expenses attributable to Fidelity's mutual fund business, and completion of agreed-upon procedures in respect of the mathematical accuracy of fund profitability and its conformity to established allocation methodologies. After considering PwC's reports issued under the engagement and information provided by Fidelity, the Board concluded that while other allocation methods may also be reasonable, Fidelity's profitability methodologies are reasonable in all material respects.
The Board also reviewed Fidelity's non-fund businesses and fall-out benefits related to the mutual fund business as well as cases where Fidelity's affiliates may benefit from or be related to the fund's business.
The Board considered the costs of the services provided by and the profits realized by Fidelity in connection with the operation of the fund and was satisfied that the profitability was not excessive in the circumstances.
Economies of Scale. The Board considered whether there have been economies of scale in respect of the management of the Fidelity funds, whether the Fidelity funds (including the fund) have appropriately benefited from any such economies of scale, and whether there is potential for realization of any further economies of scale. The Board considered the extent to which the fund will benefit from economies of scale through increased services to the fund, through waivers or reimbursements, or through fee or expense ratio reductions. The Board also noted that in 2013, it and the boards of other Fidelity funds created an ad hoc committee (the Economies of Scale Committee) to analyze whether Fidelity attains economies of scale in respect of the management and servicing of the Fidelity funds, whether the Fidelity funds have appropriately benefited from such economies of scale, and whether there is potential for realization of any further economies of scale.
Annual Report
The Board recognized that the fund's management contract incorporates a "group fee" structure, which provides for lower group fee rates as total group assets increase, and for higher group fee rates as total group assets decrease (with "group assets" defined to include fund assets under FMR's management plus sector fund assets previously under FMR's management and currently managed by Fidelity SelectCo, LLC). FMR calculates the group fee rates based on a tiered asset "breakpoint" schedule that varies based on asset class. The Board considered that the group fee is designed to deliver the benefits of economies of scale to fund shareholders when total Fidelity fund assets increase, even if assets of any particular fund are unchanged or have declined, because some portion of Fidelity's costs are attributable to services provided to all Fidelity funds, and all funds benefit if those costs can be allocated among more assets. The Board concluded that, given the group fee structure, fund shareholders will benefit from lower management fees as group assets increase at the fund complex level, regardless of whether Fidelity achieves any such economies of scale.
The Board concluded, taking into account the analysis of the Economies of Scale Committee, that economies of scale, if any, are being appropriately shared between fund shareholders and Fidelity.
Additional Information Requested by the Board. In order to develop fully the factual basis for consideration of the Fidelity funds' Advisory Contracts, the Board requested and received additional information on certain topics, including: (i) fund performance trends and Fidelity's long-term strategies for certain funds; (ii) Fidelity's strategic marketing and product lineup goals; (iii) the methodology with respect to competitive fund data and peer group classifications; (iv) the arrangements with, and performance of, certain sub-advisers on behalf of the Fidelity funds, as well as certain proposed participating affiliate arrangements; (v) the realization of fall-out benefits in certain Fidelity business units; (vi) Fidelity's group fee structures, including the rationale for the individual fee rates of certain categories of funds and the definition of group assets; (vii) trends regarding industry use of performance fee structures and the performance adjustment methodologies applicable to the Fidelity funds; (viii) additional competitive analysis regarding the total expenses for certain classes; (ix) fund profitability methodology, including Fidelity's cost allocation methodology, and the impact of certain factors on fund profitability results; and (x) the process by which Fidelity determines sub-advisory fees for funds it advises.
Annual Report
Board Approval of Investment Advisory Contracts and
Management Fees - continued
Based on its evaluation of all of the conclusions noted above, and after considering all factors it believed relevant, the Board ultimately concluded that the advisory fee structures are fair and reasonable, and that the fund's Advisory Contracts should be renewed.
Annual Report
Investment Adviser
Fidelity Management & Research Company
Boston, MA
Investment Sub-Advisers
FMR Co., Inc.
Fidelity Management & Research
(Japan) Limited
Fidelity Management & Research
(Hong Kong) Limited
Fidelity Management & Research
(U.K.) Inc.
General Distributor
Fidelity Distributors Corporation
Smithfield, RI
Transfer and Service Agents
Fidelity Investments Institutional
Operations Company, Inc.
Boston, MA
Fidelity Service Company, Inc.
Boston, MA
Custodian
The Bank of New York Mellon
New York, NY
The Fidelity Telephone Connection
Mutual Fund 24-Hour Service
Exchanges/Redemptions
and Account Assistance 1-800-544-6666
Product Information 1-800-544-6666
Retirement Accounts 1-800-544-4774
(8 a.m. - 9 p.m.)
TDD Service 1-800-544-0118
for the deaf and hearing impaired
(9 a.m. - 9 p.m. Eastern time)
Fidelity Automated Service
Telephone (FAST®)
1-800-544-5555
Automated line for quickest service
(Fidelity Investment logo)(registered trademark)
Corporate Headquarters
245 Summer St., Boston, MA 02210
www.fidelity.com
FHI-UANN-1214
1.784743.111
(Fidelity Investment logo)(registered trademark)
Fidelity Advisor®
Floating Rate High Income
Fund - Institutional Class
Annual Report
October 31, 2014
(Fidelity Cover Art)
Contents
Performance | How the fund has done over time. | |
Management's Discussion of Fund Performance | The Portfolio Manager's review of fund performance and strategy. | |
Shareholder Expense Example | An example of shareholder expenses. | |
Investment Changes | A summary of major shifts in the fund's investments over the past six months. | |
Investments | A complete list of the fund's investments with their market values. | |
Financial Statements | Statements of assets and liabilities, operations, and changes in net assets, as well as financial highlights. | |
Notes | Notes to financial statements. | |
Report of Independent Registered Public Accounting Firm |
| |
Trustees and Officers |
| |
Distributions |
| |
Board Approval of Investment Advisory Contracts and Management Fees |
|
To view a fund's proxy voting guidelines and proxy voting record for the 12-month period ended June 30, visit http://www.fidelity.com/proxyvotingresults or visit the Securities and Exchange Commission's (SEC) web site at http://www.sec.gov. You may also call 1-877-208-0098 to request a free copy of the proxy voting guidelines.
Standard & Poor's, S&P and S&P 500 are registered service marks of The McGraw-Hill Companies, Inc. and have been licensed for use by Fidelity Distributors Corporation.
Other third-party marks appearing herein are the property of their respective owners.
All other marks appearing herein are registered or unregistered trademarks or service marks of FMR LLC or an affiliated company. © 2014 FMR LLC. All rights reserved.
Annual Report
This report and the financial statements contained herein are submitted for the general information of the shareholders of the fund. This report is not authorized for distribution to prospective investors in the fund unless preceded or accompanied by an effective prospectus.
A fund files its complete schedule of portfolio holdings with the SEC for the first and third quarters of each fiscal year on Form N-Q. Forms N-Q are available on the SEC's web site at http://www.sec.gov. A fund's Forms N-Q may be reviewed and copied at the SEC's Public Reference Room in Washington, DC. Information regarding the operation of the SEC's Public Reference Room may be obtained by calling 1-800-SEC-0330. For a complete list of a fund's portfolio holdings, view the most recent holdings listing, semiannual report, or annual report on Fidelity's web site at http://www.fidelity.com, http://www.advisor.fidelity.com, or http://www.401k.com, as applicable.
NOT FDIC INSURED • MAY LOSE VALUE • NO BANK GUARANTEE
Neither the fund nor Fidelity Distributors Corporation is a bank.
Annual Report
Performance: The Bottom Line
Average annual total return reflects the change in the value of an investment, assuming reinvestment of the class' distributions from dividend income and capital gains (the profits earned upon the sale of securities that have grown in value, if any) and assuming a constant rate of performance each year. The $10,000 table and the fund's returns do not reflect the deduction of taxes that a shareholder would pay on fund distributions or the redemption of fund shares. During periods of reimbursement by Fidelity, a fund's total return will be greater than it would be had the reimbursement not occurred. How a fund did yesterday is no guarantee of how it will do tomorrow.
Average Annual Total Returns
Periods ended October 31, 2014 | Past 1 | Past 5 | Past 10 |
Institutional Class | 2.29% | 4.83% | 4.30% |
$10,000 Over 10 Years
Let's say hypothetically that $10,000 was invested in Fidelity Advisor® Floating Rate High Income Fund - Institutional Class on October 31, 2004. The chart shows how the value of your investment would have changed, and also shows how the S&P®/LSTA Leveraged Performing Loan Index performed over the same period.
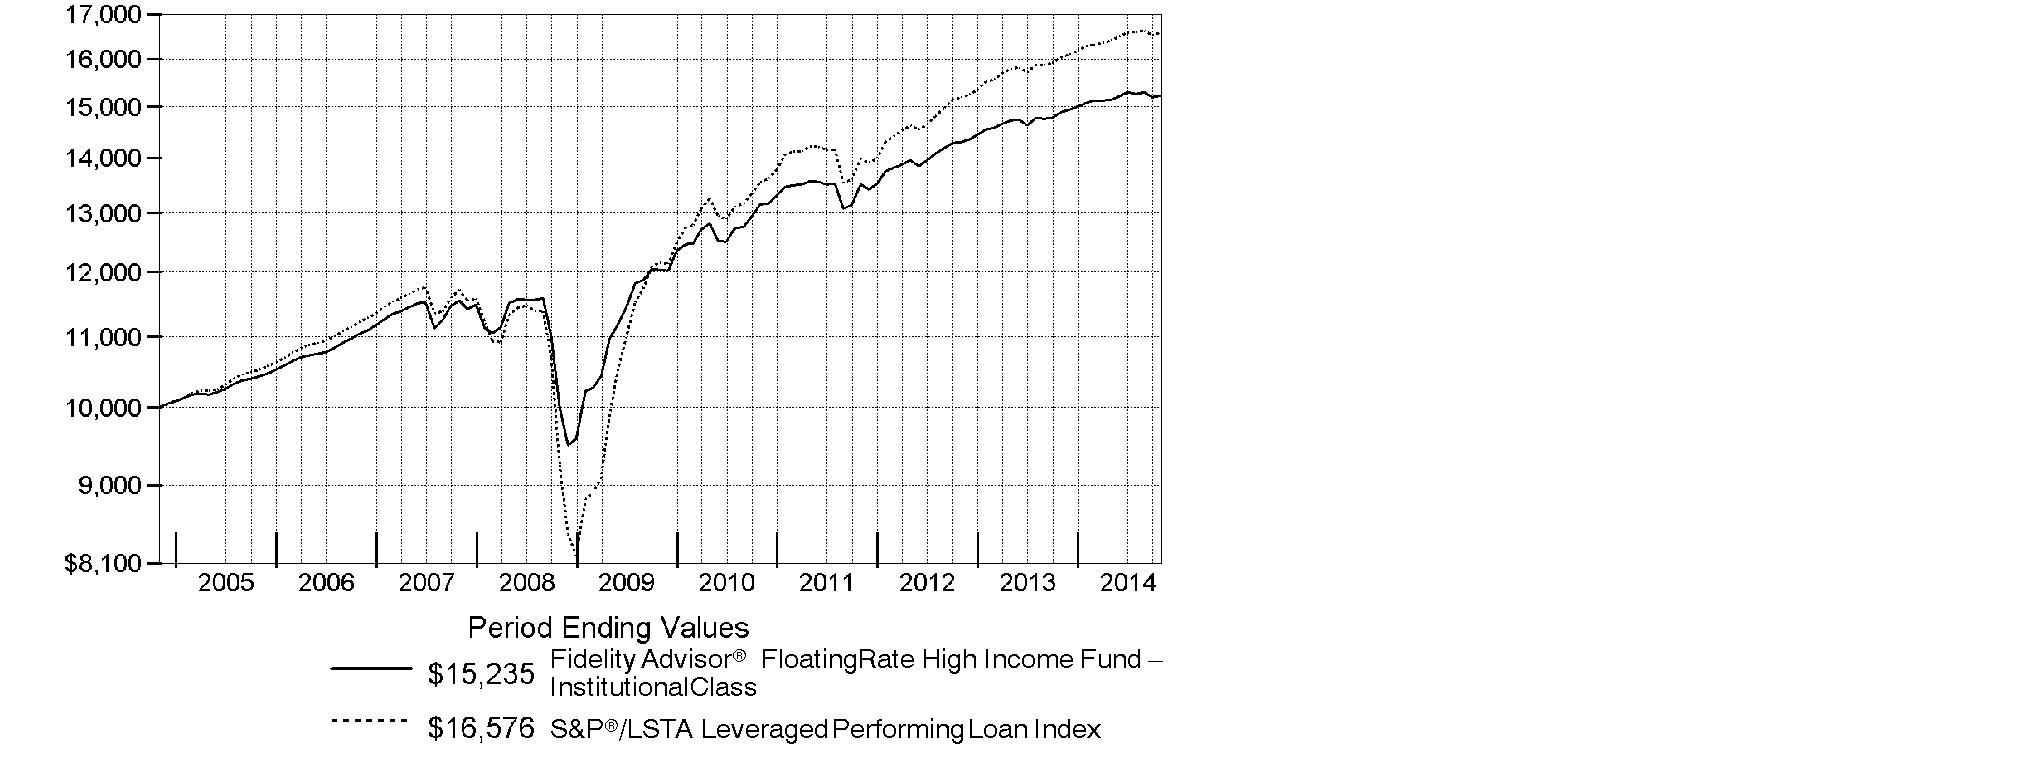
Annual Report
Management's Discussion of Fund Performance
Market Recap: Floating-rate bank loans generated a positive return for the 12 months ending October 31, 2014, but performance weakened in the period's latter months amid outflows from retail mutual funds. For the year, the S&P®/LSTA Leveraged Performing Loan Index rose 3.43%, modestly underperforming the broad investment-grade fixed-income market, as measured by the 4.14% return of the Barclays® U.S. Aggregate Bond Index, but trailing the 5.85% gain of The BofA Merrill LynchSM US High Yield Constrained Index by a greater margin. Within the S&P/LSTA index, B-rated and CCC-rated loans were the best performers, partly fueled by demand from collateralized loan obligations (CLOs) - structured investment vehicles in which business loans are pooled to create a diversified income stream. CLOs prefer to buy B-rated loans because their higher yields enable CLOs to more easily meet their funding costs and overall return objectives. CCC-rated loans benefited from increased investor demand for second-lien loans, which offer higher yields than first-lien loans, given their subordinated position. Meanwhile, loans issued by the largest issuers within the index, many of which are rated BB, tended to underperform due to their comparatively lower yields. From an industry perspective, the best-performing groups were utilities and publishing, whereas food service, nonferrous metals/mining and air transport were among the weakest performers.
Comments from Eric Mollenhauer, Portfolio Manager of Fidelity Advisor® Floating Rate High Income Fund: For the year, the fund's Institutional Class shares rose 2.29%, trailing the S&P®/LSTA Leveraged Performing Loan Index. Relative to the index, our more-conservative positioning kept the fund underweighted in the better-performing B-rated and CCC-rated areas of the market. Additionally, our positions in loans from some of the largest issuers - which we tend to hold given the fund's large asset base - hampered performance versus the benchmark, as did our 5% average cash stake. In terms of individual holdings, an underweighting in distressed Texas electric utility TXU Energy - the retail subsidiary of Energy Future Holdings - was the biggest relative detractor. Walter Energy, which produces and exports coal used in steel production, slightly detracted. On the plus side, steering clear of index components Education Management Group, a provider of higher-education programs for working adults, and Weight Watchers International, which offers weight-loss services, proved advantageous. Not holding children's clothing retailer and index member Gymboree also was slightly additive to performance.
The views expressed above reflect those of the portfolio manager(s) only through the end of the period as stated on the cover of this report and do not necessarily represent the views of Fidelity or any other person in the Fidelity organization. Any such views are subject to change at any time based upon market or other conditions and Fidelity disclaims any responsibility to update such views. These views may not be relied on as investment advice and, because investment decisions for a Fidelity fund are based on numerous factors, may not be relied on as an indication of trading intent on behalf of any Fidelity fund.
Annual Report
Shareholder Expense Example
As a shareholder of the Fund, you incur two types of costs: (1) transaction costs, including sales charges (loads) on purchase payments or redemption proceeds, redemption fees and (2) ongoing costs, including management fees, distribution and/or service (12b-1) fees and other Fund expenses. This Example is intended to help you understand your ongoing costs (in dollars) of investing in the Fund and to compare these costs with the ongoing costs of investing in other mutual funds.
The Example is based on an investment of $1,000 invested at the beginning of the period and held for the entire period (May 1, 2014 to October 31, 2014).
Actual Expenses
The first line of the accompanying table for each class of the Fund provides information about actual account values and actual expenses. You may use the information in this line, together with the amount you invested, to estimate the expenses that you paid over the period. Simply divide your account value by $1,000.00 (for example, an $8,600 account value divided by $1,000.00 = 8.6), then multiply the result by the number in the first line for a class of the Fund under the heading entitled "Expenses Paid During Period" to estimate the expenses you paid on your account during this period. A small balance maintenance fee of $12.00 that is charged once a year may apply for certain accounts with a value of less than $2,000. This fee is not included in the table below. If it was, the estimate of expenses you paid during the period would be higher, and your ending account value lower, by this amount. In addition, the Fund, as a shareholder in the underlying Fidelity Central Funds, will indirectly bear its pro-rata share of the fees and expenses incurred by the underlying Fidelity Central Funds. These fees and expenses are not included in the Fund's annualized expense ratio used to calculate the expense estimate in the table below.
Hypothetical Example for Comparison Purposes
The second line of the accompanying table for each class of the Fund provides information about hypothetical account values and hypothetical expenses based on a Class' actual expense ratio and an assumed rate of return of 5% per year before expenses, which is not the Class' actual return. The hypothetical account values and expenses may not be used to estimate the actual ending account balance or expenses you paid for the period. You may use this information to compare the ongoing costs of investing in the Fund and other funds. To do so, compare this 5% hypothetical example with the 5% hypothetical examples that appear in the shareholder reports of the other funds. A small balance maintenance fee of $12.00 that is charged once a year may apply for certain accounts with a value of less than $2,000. This fee is not included in the table below. If it was, the estimate of expenses you paid during the period would be higher, and your ending account value lower, by this amount. In addition, the Fund, as a shareholder in the underlying Fidelity Central Funds, will indirectly bear its pro-rata share of the fees and expenses incurred by the underlying Fidelity Central Funds. These fees and expenses are not included in the Fund's annualized expense ratio used to calculate the expense estimate in the table below.
Please note that the expenses shown in the table are meant to highlight your ongoing costs only and do not reflect any transaction costs. Therefore, the second line of the table is useful in comparing ongoing costs only, and will not help you determine the relative total costs of owning different funds. In addition, if these transactional costs were included, your costs would have been higher.
Annual Report
Shareholder Expense Example - continued
| Annualized | Beginning | Ending | Expenses Paid |
Class A | .96% |
|
|
|
Actual |
| $ 1,000.00 | $ 1,005.00 | $ 4.85 |
HypotheticalA |
| $ 1,000.00 | $ 1,020.37 | $ 4.89 |
Class T | 1.06% |
|
|
|
Actual |
| $ 1,000.00 | $ 1,004.60 | $ 5.36 |
HypotheticalA |
| $ 1,000.00 | $ 1,019.86 | $ 5.40 |
Class B | 1.48% |
|
|
|
Actual |
| $ 1,000.00 | $ 1,001.40 | $ 7.47 |
HypotheticalA |
| $ 1,000.00 | $ 1,017.74 | $ 7.53 |
Class C | 1.71% |
|
|
|
Actual |
| $ 1,000.00 | $ 1,001.30 | $ 8.63 |
HypotheticalA |
| $ 1,000.00 | $ 1,016.59 | $ 8.69 |
Fidelity Floating Rate High Income Fund | .68% |
|
|
|
Actual |
| $ 1,000.00 | $ 1,006.50 | $ 3.44 |
HypotheticalA |
| $ 1,000.00 | $ 1,021.78 | $ 3.47 |
Institutional Class | .73% |
|
|
|
Actual |
| $ 1,000.00 | $ 1,006.20 | $ 3.69 |
HypotheticalA |
| $ 1,000.00 | $ 1,021.53 | $ 3.72 |
A 5% return per year before expenses
B Annualized expense ratio reflects expenses net of applicable fee waivers.
* Expenses are equal to each Class' annualized expense ratio, multiplied by the average account value over the period, multiplied by 184/365 (to reflect the one-half year period).
Annual Report
Investment Changes (Unaudited)
Top Five Holdings as of October 31, 2014 | ||
(by issuer, excluding cash equivalents) | % of fund's | % of fund's net assets |
HCA Holdings, Inc. | 3.0 | 3.2 |
H.J. Heinz Co. | 2.6 | 2.6 |
Community Health Systems, Inc. | 2.6 | 2.7 |
Albertson's LLC | 1.9 | 0.2 |
Fortescue Metals Group Ltd. | 1.9 | 1.7 |
| 12.0 | |
Top Five Market Sectors as of October 31, 2014 | ||
| % of fund's | % of fund's net assets |
Technology | 10.1 | 10.9 |
Healthcare | 9.8 | 11.9 |
Energy | 6.7 | 4.6 |
Gaming | 6.5 | 5.8 |
Telecommunications | 6.4 | 6.5 |
Quality Diversification (% of fund's net assets) | |||||||
As of October 31, 2014 | As of April 30, 2014 | ||||||
 | BBB 5.1% |
| | BBB 5.9% |
| ||
 | BB 43.0% |
| | BB 38.8% |
| ||
 | B 40.7% |
| | B 42.5% |
| ||
 | CCC,CC,C 2.5% |
| | CCC,CC,C 2.8% |
| ||
 | D 0.0% |
|  | D 0.0%† |
| ||
 | Not Rated 3.7% |
| | Not Rated 4.7% |
| ||
 | Equities 0.2% |
| | Equities 0.2% |
| ||
 | Short-Term |
| | Short-Term |
| ||

We have used ratings from Moody's Investors Service, Inc. Where Moody's® ratings are not available, we have used S&P® ratings. All ratings are as of the date indicated and do not reflect subsequent changes. |
† Amount represents less than 0.1% | |||||||
Asset Allocation (% of fund's net assets) | |||||||
As of October 31, 2014* | As of April 30, 2014** | ||||||
| Bank Loan |
| | Bank Loan |
| ||
| Nonconvertible |
| | Nonconvertible |
| ||
| Common Stocks 0.2% |
| | Common Stocks 0.2% |
| ||
| Short-Term |
| | Short-Term |
| ||
* Foreign investments | 11.7% |
| ** Foreign investments | 10.5% |
| ||

Annual Report
Investments October 31, 2014
Showing Percentage of Net Assets
Bank Loan Obligations (f) - 88.3% | ||||
| Principal Amount (000s) | Value (000s) | ||
Aerospace - 1.1% | ||||
Gemini HDPE LLC Tranche B, term loan 4.75% 8/7/21 (e) | $ 17,631 | $ 17,499 | ||
TransDigm, Inc. Tranche C, term loan 3.75% 2/28/20 (e) | 144,149 | 141,627 | ||
| 159,126 | |||
Air Transportation - 0.1% | ||||
U.S. Airways, Inc. Tranche B 2LN, term loan 3% 11/23/16 (e) | 14,750 | 14,529 | ||
Automotive - 1.6% | ||||
Chrysler Group LLC: | ||||
term loan 3.25% 12/31/18 (e) | 53,730 | 53,193 | ||
Tranche B, term loan 3.5% 5/24/17 (e) | 81,245 | 80,737 | ||
Federal-Mogul Corp. Tranche C, term loan 4.75% 4/15/21 (e) | 9,975 | 9,913 | ||
North American Lifting Holdings, Inc.: | ||||
Tranche 1LN, term loan 5.5% 11/27/20 (e) | 16,879 | 16,689 | ||
Tranche 2LN, term loan 10% 11/27/21 (e) | 24,370 | 24,096 | ||
The Gates Corp. Tranche B 1LN, term loan 4.25% 7/3/21 (e) | 20,000 | 19,800 | ||
Tower Automotive Holdings U.S.A. LLC term loan 4% 4/23/20 (e) | 26,612 | 26,312 | ||
| 230,740 | |||
Broadcasting - 2.3% | ||||
Clear Channel Capital I LLC Tranche B, term loan 3.804% 1/29/16 (e) | 38,701 | 38,459 | ||
Clear Channel Communications, Inc. Tranche D, term loan 6.904% 1/30/19 (e) | 68,720 | 64,855 | ||
ION Media Networks, Inc. Tranche B, term loan 5% 12/18/20 (e) | 28,783 | 28,783 | ||
Nielsen Finance LLC Tranche B 2LN, term loan 3.1525% 4/15/21 (e) | 69,625 | 69,538 | ||
TWCC Holding Corp. term loan 3.5% 2/11/17 (e) | 56,020 | 55,152 | ||
Univision Communications, Inc. Tranche C 4LN, term loan 4% 3/1/20 (e) | 81,602 | 80,718 | ||
| 337,505 | |||
Building Materials - 0.4% | ||||
American Builders & Contractors Supply Co., Inc. Tranche B, term loan 3.5% 4/16/20 (e) | 34,733 | 33,923 | ||
Bank Loan Obligations (f) - continued | ||||
| Principal Amount (000s) | Value (000s) | ||
Building Materials - continued | ||||
Armstrong World Industries, Inc. Tranche B, term loan 3.5% 3/15/20 (e) | $ 23,590 | $ 23,295 | ||
Ply Gem Industries, Inc. Tranche B, term loan 4% 2/1/21 (e) | 7,060 | 6,918 | ||
| 64,136 | |||
Cable TV - 4.4% | ||||
Atlantic Broad Tranche B, term loan 3.25% 11/30/19 (e) | 19,952 | 19,729 | ||
Cequel Communications LLC Tranche B, term loan 3.5% 2/14/19 (e) | 106,928 | 105,324 | ||
Charter Communications Operating LLC: | ||||
Tranche E, term loan 3% 7/1/20 (e) | 48,716 | 47,985 | ||
Tranche F, term loan 3% 1/3/21 (e) | 94,232 | 91,523 | ||
CSC Holdings LLC Tranche B, term loan 2.654% 4/17/20 (e) | 68,595 | 67,140 | ||
Liberty Cablevision of Puerto Rico Tranche 1LN, term loan 4.5% 1/7/22 (e) | 14,000 | 13,895 | ||
Numericable LLC: | ||||
Tranche B 1LN, term loan 4.5% 5/8/20 (e) | 47,013 | 47,079 | ||
Tranche B 2LN, term loan 4.5% 5/8/20 (e) | 40,672 | 40,730 | ||
UPC Broadband Holding BV Tranche AH, term loan 3.25% 6/30/21 (e) | 34,000 | 33,193 | ||
Virgin Media Finance PLC Tranche B, term loan 3.5% 6/7/20 (e) | 55,000 | 53,969 | ||
WideOpenWest Finance LLC Tranche B, term loan 4.75% 4/1/19 (e) | 29,513 | 29,439 | ||
Ziggo B.V.: | ||||
Tranche B 1LN, term loan: | ||||
3.25% 1/15/22 (e) | 35,286 | 34,403 | ||
3.25% 1/15/22 (e) | 2,063 | 2,011 | ||
Tranche B 2LN, term loan: | ||||
1/15/22 (g)(h) | 1,934 | 1,886 | ||
3.25% 1/15/22 (e) | 22,134 | 21,581 | ||
Tranche B 3LN, term loan 1/15/22 (g)(h) | 39,583 | 38,594 | ||
| 648,481 | |||
Capital Goods - 0.7% | ||||
Doncasters PLC Tranche B 2LN, term loan 9.5% 10/9/20 (e) | 7,374 | 7,355 | ||
Doosan Infracore, Inc. Tranche B, term loan 4.5% 5/28/21 (e) | 38,723 | 38,723 | ||
Bank Loan Obligations (f) - continued | ||||
| Principal Amount (000s) | Value (000s) | ||
Capital Goods - continued | ||||
SRAM LLC. Tranche B, term loan 4.0182% 4/10/20 (e) | $ 37,335 | $ 36,588 | ||
Utex Industries, Inc. Tranche B 1LN, term loan 5% 5/22/21 (e) | 14,828 | 14,680 | ||
| 97,346 | |||
Chemicals - 0.9% | ||||
Arizona Chem U.S., Inc.: | ||||
Tranche 2LN, term loan 7.5% 6/12/22 (e) | 6,605 | 6,597 | ||
Tranche B 1LN, term loan 4.5% 6/12/21 (e) | 20,214 | 20,138 | ||
MacDermid, Inc. Tranche B 1LN, term loan 4% 6/7/20 (e) | 34,356 | 33,583 | ||
Styrolution U.S. Holding LLC Tranche B 1LN, term loan 10/31/19 (g) | 20,000 | 19,792 | ||
Tata Chemicals North America, Inc. Tranche B, term loan 3.75% 8/9/20 (e) | 12,838 | 12,613 | ||
U.S. Coatings Acquisition, Inc. Tranche B, term loan 3.75% 2/1/20 (e) | 41,200 | 40,376 | ||
| 133,099 | |||
Consumer Products - 0.8% | ||||
Kate Spade & Co. Tranche B, term loan 4% 4/10/21 (e) | 17,920 | 17,427 | ||
Revlon Consumer Products Corp.: | ||||
term loan 4% 8/19/19 (e) | 30,768 | 30,383 | ||
Tranche B, term loan 3.25% 11/19/17 (e) | 13,500 | 13,314 | ||
Sun Products Corp. Tranche B, term loan 5.5% 3/23/20 (e) | 15,021 | 13,444 | ||
Tempur Sealy International, Inc. Tranche B, term loan 3.5% 3/18/20 (e) | 15,555 | 15,361 | ||
Wilsonart LLC Tranche B, term loan 4% 10/31/19 (e) | 32,657 | 32,113 | ||
| 122,042 | |||
Containers - 2.0% | ||||
Ardagh Holdings U.S.A., Inc. Tranche B, term loan 4% 12/17/19 (e) | 55,352 | 54,868 | ||
Berry Plastics Corp. Tranche E, term loan 3.75% 1/6/21 (e) | 14,925 | 14,552 | ||
Berry Plastics Group, Inc. term loan 3.5% 2/8/20 (e) | 99,575 | 96,588 | ||
BWAY Holding Co. Tranche B, term loan 5.5% 8/14/20 (e) | 19,950 | 20,050 | ||
Consolidated Container Co. Tranche B, term loan 5% 7/3/19 (e) | 8,800 | 8,690 | ||
Multi Packaging Solutions, Inc. term loan 4.25% 9/30/20 (e) | 4,347 | 4,281 | ||
Bank Loan Obligations (f) - continued | ||||
| Principal Amount (000s) | Value (000s) | ||
Containers - continued | ||||
Reynolds Consumer Products Holdings, Inc. Tranche B, term loan 4% 12/1/18 (e) | $ 87,652 | $ 86,338 | ||
Tricorbraun, Inc. Tranche B, term loan 4% 5/3/18 (e) | 3,804 | 3,745 | ||
| 289,112 | |||
Diversified Financial Services - 2.4% | ||||
AlixPartners LLP Tranche B 2LN, term loan 4% 7/10/20 (e) | 19,750 | 19,437 | ||
Delos Finance SARL Tranche B LN, term loan 3.5% 3/6/21 (e) | 51,095 | 50,797 | ||
Energy & Minerals Group Tranche B, term loan 4.75% 3/27/20 (e) | 14,920 | 14,845 | ||
Fly Funding II Sarl Tranche B, term loan 4.5% 8/9/19 (e) | 14,529 | 14,529 | ||
Flying Fortress, Inc. term loan 3.5% 6/30/17 (e) | 97,833 | 97,471 | ||
HarbourVest Partners LLC Tranche B, term loan 3.25% 2/4/21 (e) | 13,737 | 13,479 | ||
Home Loan Servicing Solutions Ltd. Tranche B, term loan 4.5% 6/27/20 (e) | 14,566 | 13,692 | ||
IBC Capital U.S. LLC Tranche B 1LN, term loan 4.75% 9/11/21 (e) | 25,000 | 24,875 | ||
LPL Holdings, Inc. Tranche B, term loan 3.25% 3/29/19 (e) | 32,680 | 32,233 | ||
TransUnion LLC Tranche B, term loan 4% 4/9/21 (e) | 72,113 | 71,166 | ||
| 352,524 | |||
Diversified Media - 0.5% | ||||
Advanstar Communications, Inc. Tranche B 1LN, term loan 5.5% 4/29/19 (e) | 8,373 | 8,362 | ||
McGraw-Hill School Education Tranche B, term loan 6.25% 12/18/19 (e) | 18,361 | 18,315 | ||
WMG Acquisition Corp. term loan 3.75% 7/1/20 (e) | 50,440 | 48,422 | ||
| 75,099 | |||
Electric Utilities - 5.6% | ||||
Alinta Energy Finance Pty. Ltd. Tranche B, term loan: | ||||
2.3821% 8/13/18 (e)(h) | 3,030 | 3,045 | ||
6.375% 8/13/19 (e) | 45,849 | 46,078 | ||
Calpine Construction Finance Co. LP: | ||||
Tranche B 1LN, term loan 3% 5/3/20 (e) | 84,698 | 82,051 | ||
Tranche B 2LN, term loan 3.25% 1/31/22 (e) | 54,052 | 52,498 | ||
Calpine Corp.: | ||||
Tranche B 2LN, term loan 4% 4/1/18 (e) | 11,654 | 11,596 | ||
Tranche B 3LN, term loan 4% 10/9/19 (e) | 29,412 | 29,118 | ||
Tranche B, term loan 4% 4/1/18 (e) | 107,816 | 107,277 | ||
Bank Loan Obligations (f) - continued | ||||
| Principal Amount (000s) | Value (000s) | ||
Electric Utilities - continued | ||||
Dynegy, Inc. Tranche B 2LN, term loan 4% 4/23/20 (e) | $ 25,636 | $ 25,475 | ||
Energy Future Holdings Corp. Tranche 1LN, term loan 4.25% 6/19/16 (e) | 79,884 | 79,684 | ||
EquiPower Resources Holdings LLC: | ||||
Tranche B 1LN, term loan 4.25% 12/21/18 (e) | 13,687 | 13,602 | ||
Tranche C, term loan 4.25% 12/31/19 (e) | 32,048 | 31,848 | ||
Essential Power LLC Tranche B, term loan 4.75% 8/8/19 (e) | 15,949 | 15,949 | ||
Exgen Texas Power LLC Tranche B, term loan 5.75% 9/18/21 (e) | 45,000 | 45,000 | ||
Houston Fuel Oil Terminal Co. Tranche B, term loan 4.25% 8/19/21 (e) | 10,500 | 10,290 | ||
InterGen NV Tranche B, term loan 5.5% 6/13/20 (e) | 33,493 | 33,409 | ||
La Frontera Generation, LLC Tranche B, term loan 4.5% 9/30/20 (e) | 63,751 | 63,273 | ||
NRG Energy, Inc. Tranche B, term loan 2.75% 7/1/18 (e) | 41,672 | 40,994 | ||
Southcross Energy Partners LP Tranche B, term loan 5.25% 8/4/21 (e) | 7,357 | 7,320 | ||
Southcross Holdings Borrower LP Tranche B, term loan 6% 8/4/21 (e) | 13,381 | 13,181 | ||
Star West Generation LLC Tranche B, term loan 4.25% 3/13/20 (e) | 22,176 | 21,954 | ||
Tempus Public Foundation Generation Holdings LLC Tranche B, term loan 4.75% 12/31/17 (e) | 13,378 | 12,743 | ||
TXU Energy LLC Tranche B, term loan: | ||||
4.6469% 10/10/17 (c)(e) | 66,622 | 48,384 | ||
4.6469% 10/10/14 (c)(e) | 10,052 | 7,300 | ||
USIC Holdings, Inc. Tranche B, term loan 4% 7/10/20 (e) | 16,294 | 16,029 | ||
| 818,098 | |||
Energy - 6.0% | ||||
Alon U.S.A. Partners LP term loan 9.25% 11/26/18 (e) | 8,733 | 8,821 | ||
Atlantic Power Ltd. Partnership Tranche B LN, term loan 4.75% 2/24/21 (e) | 24,065 | 23,915 | ||
Drillships Ocean Ventures, Inc. Tranche B, term loan 5.5% 7/25/21 (e) | 30,923 | 29,624 | ||
Empire Generating Co. LLC: | ||||
Tranche B, term loan 5.25% 3/14/21 (e) | 29,526 | 29,416 | ||
Tranche C, term loan 5.25% 3/14/21 (e) | 2,070 | 2,063 | ||
EP Energy LLC term loan 4.5% 4/30/19 (e) | 1,500 | 1,478 | ||
Everest Acquisition LLC Tranche B 3LN, term loan 3.5% 5/24/18 (e) | 42,333 | 41,593 | ||
Bank Loan Obligations (f) - continued | ||||
| Principal Amount (000s) | Value (000s) | ||
Energy - continued | ||||
ExGen Renewables I, LLC Tranche B term loan 5.25% 2/6/21 (e) | $ 15,289 | $ 15,442 | ||
Expro Finservices S.a.r.l. Tranche B, term loan 5.75% 9/2/21 (e) | 52,000 | 50,895 | ||
Fieldwood Energy, LLC: | ||||
Tranche 2LN, term loan 8.375% 9/30/20 (e) | 140,755 | 135,477 | ||
Tranche B 1LN, term loan 3.875% 9/30/18 (e) | 39,625 | 38,634 | ||
Floatel International Ltd. Tranche B, term loan 6% 6/27/20 (e) | 37,198 | 35,989 | ||
GIM Channelview Cogeneration LLC Tranche B, term loan 4.25% 5/8/20 (e) | 11,845 | 11,831 | ||
Moxie Patriot LLC Tranche B, term loan 6.75% 12/19/20 (e) | 13,000 | 13,179 | ||
MRC Global, Inc. Tranche B, term loan 5% 11/9/19 (e) | 44,525 | 44,583 | ||
Northeast Wind Capital II, LLC Tranche B, term loan 5% 11/14/20 (e) | 14,051 | 14,051 | ||
Offshore Group Investment Ltd. Tranche B, term loan 5% 10/25/17 (e) | 15,785 | 14,522 | ||
Overseas Shipholding Group, Inc. Tranche B, term loan: | ||||
5.25% 8/5/19 (e) | 15,845 | 15,746 | ||
5.75% 8/5/19 (e) | 11,641 | 11,554 | ||
Pacific Drilling SA Tranche B, term loan 4.5% 6/3/18 (e) | 24,347 | 23,251 | ||
Panda Sherman Power, LLC term loan 9% 9/14/18 (e) | 19,956 | 20,256 | ||
Panda Temple Power, LLC term loan 7.25% 4/3/19 (e) | 11,000 | 11,179 | ||
Ruby Western Pipeline Holdings LLC Tranche B, term loan 3.5% 3/27/20 (e) | 28,599 | 28,456 | ||
Samson Investment Co. Tranche B 2LN, term loan 5% 9/25/18 (e) | 20,800 | 19,136 | ||
Seadrill Operating LP Tranche B, term loan 4% 2/21/21 (e) | 60,873 | 57,441 | ||
Sheridan Investment Partners I term loan 4.25% 12/16/20 (e) | 44,963 | 42,827 | ||
Sheridan Investment Partners I, LLC Tranche B 2LN, term loan 4.25% 10/1/19 (e) | 20,181 | 19,374 | ||
Sheridan Production Partners I: | ||||
Tranche A, term loan 4.25% 12/16/20 (e) | 6,255 | 5,958 | ||
Tranche M, term loan 4.25% 12/16/20 (e) | 2,333 | 2,222 | ||
TPF II Power, LLC Tranche B, term loan 5.5% 10/2/21 (e) | 67,020 | 67,355 | ||
Vantage Drilling Co. Tranche B, term loan 5.75% 3/28/19 (e) | 14,775 | 13,076 | ||
Western Refining, Inc. Tranche B, term loan 4.25% 11/12/20 (e) | 26,157 | 25,896 | ||
| 875,240 | |||
Bank Loan Obligations (f) - continued | ||||
| Principal Amount (000s) | Value (000s) | ||
Entertainment/Film - 0.9% | ||||
AMC Entertainment, Inc. Tranche B, term loan 3.5% 4/30/20 (e) | $ 24,637 | $ 24,268 | ||
CBS Outdoor Americas Capital LLC/CBS Outdoor Americas Capital Corp. Tranche B, term loan 3% 1/31/21 (e) | 26,660 | 26,093 | ||
Digital Cinema Implementation Partners, LLC Tranche B, term loan 3.25% 5/17/21 (e) | 40,965 | 40,248 | ||
Live Nation Entertainment, Inc. Tranche B, term loan 3.5% 8/16/20 (e) | 14,273 | 14,202 | ||
William Morris Endeavor Entertainment, LLC. Tranche B 1LN, term loan 5.25% 5/6/21 (e) | 29,913 | 29,464 | ||
| 134,275 | |||
Environmental - 0.8% | ||||
ADS Waste Holdings, Inc. Tranche B 2LN, term loan 3.75% 10/9/19 (e) | 25,370 | 24,806 | ||
Tervita Corp. Tranche B 1LN, term loan 6.25% 5/15/18 (e) | 24,642 | 23,841 | ||
The Brickman Group, Ltd.: | ||||
Tranche 2LN, term loan 7.5% 12/18/21 (e) | 5,690 | 5,548 | ||
Tranche B 1LN, term loan 4% 12/18/20 (e) | 51,492 | 50,720 | ||
WTG Holdings III Corp. Tranche B 1LN, term loan 4.75% 1/15/21 (e) | 10,918 | 10,822 | ||
| 115,737 | |||
Food & Drug Retail - 3.2% | ||||
Albertson's LLC: | ||||
Tranche B 3LN, term loan 4% 8/25/19 (e) | 63,000 | 62,685 | ||
Tranche B 4LN, term loan: | ||||
4.5% 8/25/21 (e) | 200,000 | 200,000 | ||
4.5% 8/25/21 (e) | 19,920 | 19,920 | ||
Ferrara Candy Co., Inc. Tranche B, term loan 7.5% 6/18/18 (e) | 23,462 | 22,406 | ||
Mallinckrodt International Finance S.A. Tranche B 1LN, term loan 3.5% 3/19/21 (e) | 30,945 | 30,636 | ||
Performance Food Group, Inc. Tranche 2LN, term loan 6.25% 11/14/19 (e) | 7,306 | 7,269 | ||
PRA Holdings, Inc. Tranche B, term loan 4.5% 9/23/20 (e) | 17,780 | 17,536 | ||
Rite Aid Corp.: | ||||
Tranche 2 LN2, term loan 4.875% 6/21/21 (e) | 25,210 | 25,178 | ||
Tranche 2LN, term loan 5.75% 8/21/20 (e) | 9,080 | 9,137 | ||
Tranche B 7LN, term loan 3.5% 2/21/20 (e) | 37,896 | 37,422 | ||
Bank Loan Obligations (f) - continued | ||||
| Principal Amount (000s) | Value (000s) | ||
Food & Drug Retail - continued | ||||
Sprouts Farmers Market LLC Tranche B, term loan 4% 4/23/20 (e) | $ 19,193 | $ 19,049 | ||
SUPERVALU, Inc. Tranche B, term loan 4.5% 3/21/19 (e) | 14,710 | 14,434 | ||
| 465,672 | |||
Food/Beverage/Tobacco - 3.8% | ||||
AdvancePierre Foods, Inc. Tranche 2LN, term loan 9.5% 10/10/17 (e) | 3,000 | 2,966 | ||
Arysta Lifescience SPC LLC: | ||||
Tranche B 1LN, term loan 4.5% 5/29/20 (e) | 36,470 | 36,333 | ||
Tranche B 2LN, term loan 8.25% 11/30/20 (e) | 25,000 | 25,188 | ||
Big Heart Pet Brands Tranche B LN, term loan 3.5% 3/8/20 (e) | 49,750 | 48,009 | ||
Flavors Holdings, Inc. Tranche B 1LN, term loan 6.75% 4/3/20 (e) | 6,000 | 5,775 | ||
H.J. Heinz Co.: | ||||
Tranche B 1LN, term loan 3.25% 6/7/19 (e) | 19,700 | 19,503 | ||
Tranche B 2LN, term loan 3.5% 6/7/20 (e) | 367,041 | 363,354 | ||
JBS U.S.A. LLC Tranche B, term loan 3.75% 5/25/18 (e) | 19,242 | 19,049 | ||
OSI Restaurant Partners LLC Tranche B, term loan 3.5% 10/26/19 (e) | 9,154 | 9,039 | ||
Post Holdings, Inc. Tranche B, term loan 3.75% 6/2/21 (e) | 18,150 | 18,081 | ||
| 547,297 | |||
Gaming - 6.4% | ||||
Aristocrat International (Pty) Ltd. Tranche B, term loan 4.75% 10/20/21 (e) | 40,000 | 39,750 | ||
Bally Technologies, Inc. Tranche B, term loan 4.25% 11/25/20 (e) | 22,172 | 22,033 | ||
Boyd Gaming Corp. Tranche B, term loan 4% 8/14/20 (e) | 25,433 | 25,051 | ||
Caesars Entertainment Resort Properties LLC Tranche B 1LN, term loan 7% 10/11/20 (e) | 211,686 | 201,631 | ||
Caesars Growth Properties Holdings, LLC Tranche 1LN, term loan 6.25% 5/8/21 (e) | 146,238 | 137,830 | ||
CityCenter Holdings LLC Tranche B, term loan 4.25% 10/16/20 (e) | 50,332 | 49,955 | ||
Golden Nugget, Inc. Tranche B, term loan: | ||||
5.5% 11/21/19 (e) | 46,006 | 46,236 | ||
5.5% 11/21/19 (e) | 19,717 | 19,816 | ||
Graton Economic Development Authority Tranche B, term loan 9% 8/22/18 (e) | 7,301 | 7,520 | ||
Bank Loan Obligations (f) - continued | ||||
| Principal Amount (000s) | Value (000s) | ||
Gaming - continued | ||||
Las Vegas Sands LLC Tranche B, term loan 3.25% 12/19/20 (e) | $ 49,575 | $ 49,389 | ||
MGM Mirage, Inc. Tranche B, term loan 3.5% 12/20/19 (e) | 98,936 | 97,828 | ||
Mohegan Tribal Gaming Authority Tranche B, term loan 5.5% 11/19/19 (e) | 29,621 | 28,733 | ||
Pinnacle Entertainment, Inc. Tranche B 2LN, term loan 3.75% 8/13/20 (e) | 20,586 | 20,175 | ||
Scientific Games Corp.: | ||||
Tranch B 2LN, term loan 6% 10/21/21 (e) | 68,000 | 66,558 | ||
Tranche B, term loan 4.25% 10/18/20 (e) | 95,435 | 93,288 | ||
Station Casinos LLC Tranche B, term loan 4.25% 3/1/20 (e) | 16,215 | 16,012 | ||
Yonkers Racing Corp. Tranche B 1LN, term loan 4.25% 8/20/19 (e) | 13,951 | 12,137 | ||
| 933,942 | |||
Healthcare - 9.4% | ||||
Alkermes, Inc. term loan 3.5% 9/25/19 (e) | 13,505 | 13,302 | ||
AmSurg Corp. Tranche B, term loan 3.75% 7/16/21 (e) | 22,294 | 22,183 | ||
Community Health Systems, Inc.: | ||||
Tranche D, term loan 4.25% 1/27/21 (e) | 323,223 | 323,223 | ||
Tranche E, term loan 3.4846% 1/25/17 (e) | 47,336 | 46,981 | ||
DaVita HealthCare Partners, Inc. Tranche B, term loan 3.5% 6/24/21 (e) | 70,324 | 69,621 | ||
Drumm Investors LLC Tranche B, term loan 6.75% 5/4/18 (e) | 73,014 | 73,562 | ||
Emergency Medical Services Corp. Tranche B, term loan 4% 5/25/18 (e) | 28,494 | 28,273 | ||
Grifols, S.A. Tranche B, term loan 3.154% 2/27/21 (e) | 44,755 | 44,196 | ||
HCA Holdings, Inc.: | ||||
Tranche A 4LN, term loan 2.654% 2/2/16 (e) | 271,316 | 270,312 | ||
Tranche B 4LN, term loan 2.9831% 5/1/18 (e) | 35,690 | 35,557 | ||
Tranche B 5LN, term loan 2.904% 3/31/17 (e) | 116,356 | 115,925 | ||
HCR Healthcare LLC Tranche B, term loan 5% 4/6/18 (e) | 35,959 | 34,700 | ||
IASIS Healthcare LLC Tranche B 2LN, term loan 4.5% 5/3/18 (e) | 34,388 | 34,346 | ||
Millennium Labs, LLC Tranche B, term loan 5.25% 4/16/21 (e) | 23,242 | 23,242 | ||
MPH Acquisition Holdings LLC Tranche B, term loan 4% 3/31/21 (e) | 52,368 | 51,386 | ||
National Mentor Holdings, Inc. Tranche B, term loan 4.75% 1/31/21 (e) | 12,848 | 12,735 | ||
Bank Loan Obligations (f) - continued | ||||
| Principal Amount (000s) | Value (000s) | ||
Healthcare - continued | ||||
Polymer Group, Inc. Tranche B, term loan 5.25% 12/19/19 (e) | $ 19,858 | $ 19,758 | ||
Quintiles Transnational Corp. Tranche B 3LN, term loan 3.75% 6/8/18 (e) | 24,938 | 24,813 | ||
Skilled Healthcare Group, Inc. term loan 7% 4/9/16 (e) | 16,317 | 16,276 | ||
Surgery Center Holdings, Inc. Tranche B 1LN, term loan 5.25% 7/24/20 (e) | 7,685 | 7,666 | ||
U.S. Renal Care, Inc.: | ||||
Tranche 2LN, term loan 8.5% 1/3/20 (e) | 5,545 | 5,559 | ||
Tranche B 2LN, term loan 4.25% 7/3/19 (e) | 29,913 | 29,651 | ||
Valeant Pharmaceuticals International: | ||||
Tranche BC 2LN, term loan 3.5% 12/11/19 (e) | 26,437 | 26,238 | ||
Tranche BD 2LN, term loan 3.5% 2/13/19 (e) | 44,598 | 44,319 | ||
| 1,373,824 | |||
Homebuilders/Real Estate - 0.7% | ||||
CBRE Group, Inc. Tranche B, term loan 2.9025% 3/28/21 (e) | 14,917 | 14,805 | ||
Realogy Corp. Credit-Linked Deposit 4.4463% 10/10/16 (e) | 1,551 | 1,519 | ||
Realogy Group LLC Tranche B, term loan 3.75% 3/5/20 (e) | 89,232 | 88,786 | ||
| 105,110 | |||
Hotels - 3.5% | ||||
Four Seasons Holdings, Inc.: | ||||
Tranche 2LN, term loan 6.25% 12/27/20 (e) | 15,420 | 15,459 | ||
Tranche B 1LN, term loan 3.5% 6/27/20 (e) | 50,883 | 50,437 | ||
Hilton Worldwide Finance, LLC Tranche B, term loan 3.5% 10/25/20 (e) | 266,974 | 264,171 | ||
La Quinta Intermediate Holdings LLC Tranche B LN, Tranche B, term loan 4% 4/14/21 (e) | 124,714 | 123,779 | ||
Playa Resorts Holding BV Tranche B, term loan 4% 8/9/19 (e) | 40,106 | 39,505 | ||
Ryman Hospitality Properties, Inc. Tranche B, term loan 3.75% 1/15/21 (e) | 11,357 | 11,257 | ||
| 504,608 | |||
Insurance - 0.2% | ||||
CNO Financial Group, Inc. Tranche B 2LN, term loan 3.75% 9/28/18 (e) | 11,784 | 11,828 | ||
HUB International Ltd. Tranche B 1LN, term loan 4.25% 10/2/20 (e) | 17,413 | 17,195 | ||
| 29,023 | |||
Bank Loan Obligations (f) - continued | ||||
| Principal Amount (000s) | Value (000s) | ||
Leisure - 0.8% | ||||
24 Hour Fitness Worldwide, Inc. Tranche B, term loan 4.75% 5/30/21 (e) | $ 33,651 | $ 33,567 | ||
ClubCorp Club Operations, Inc. Tranche B, term loan 4.5% 7/24/20 (e) | 23,912 | 23,702 | ||
Planet Fitness Holdings, LLC. Tranche B, term loan 4.75% 3/31/21 (e) | 19,651 | 19,651 | ||
SeaWorld Parks & Entertainment, Inc. Tranche B 2LN, term loan 3% 5/14/20 (e) | 40,417 | 38,801 | ||
Seminole Hard Rock Entertainment, Inc. Tranche B, term loan 3.5% 5/14/20 (e) | 5,409 | 5,301 | ||
| 121,022 | |||
Metals/Mining - 4.4% | ||||
Alpha Natural Resources, Inc. Tranche B, term loan 3.5% 5/22/20 (e) | 4,373 | 3,717 | ||
American Rock Salt Co. LLC: | ||||
Tranche 2LN, term loan 8% 5/20/22 (e) | 3,000 | 3,008 | ||
Tranche B 1LN, term loan 4.75% 5/20/21 (e) | 16,958 | 16,788 | ||
Ameriforge Group, Inc.: | ||||
Tranche B 1LN, term loan 5% 12/19/19 (e) | 7,519 | 7,456 | ||
Tranche B 2LN, term loan 8.75% 12/19/20 (e) | 3,000 | 2,985 | ||
Doncasters Group, LLC Tranche B 1LN, term loan 4.5% 4/9/20 (e) | 28,356 | 27,647 | ||
Fairmount Minerals Ltd. Tranche B 2LN, term loan 4.5% 9/5/19 (e) | 21,495 | 21,388 | ||
Fortescue Metals Group Ltd. Tranche B, term loan 3.75% 6/30/19 (e) | 278,078 | 271,126 | ||
Murray Energy Corp. Tranche B 1LN, term loan 5.25% 12/5/19 (e) | 45,551 | 45,323 | ||
Novelis, Inc. Tranche B, term loan 3.75% 3/10/17 (e) | 34,878 | 34,574 | ||
Oxbow Carbon LLC: | ||||
Tranche 2LN, term loan 8% 1/19/20 (e) | 20,000 | 19,500 | ||
Tranche B 1LN, term loan 4.25% 7/19/19 (e) | 12,038 | 11,827 | ||
Peabody Energy Corp. Tranche B, term loan 4.25% 9/24/20 (e) | 60,831 | 58,550 | ||
U.S. Silica Co. Tranche B, term loan 4% 7/23/20 (e) | 24,154 | 23,792 | ||
Walter Energy, Inc. Tranche B, term loan 7.25% 4/1/18 (e) | 109,526 | 94,466 | ||
| 642,147 | |||
Paper - 0.0% | ||||
Bear Island Paper Co. LLC Tranche B 2LN, term loan 14% 9/13/17 (e) | 234 | 234 | ||
Bank Loan Obligations (f) - continued | ||||
| Principal Amount (000s) | Value (000s) | ||
Publishing/Printing - 1.3% | ||||
Cengage Learning Acquisitions, Inc. Tranche 1LN, term loan 7% 3/31/20 (e) | $ 50,158 | $ 50,283 | ||
Dex Media East LLC term loan 6% 12/31/16 (e) | 5,326 | 4,314 | ||
Dex Media West LLC/Dex Media West Finance Co. term loan 8% 12/31/16 (e) | 1,239 | 1,128 | ||
Getty Images, Inc. Tranche B, term loan 4.75% 10/18/19 (e) | 97,460 | 90,760 | ||
Houghton Mifflin Harcourt Publishing, Inc. Tranche B, term loan 4.25% 5/22/18 (e) | 19,759 | 19,660 | ||
McGraw-Hill Global Education Holdings, LLC Tranche B, term loan 5.75% 3/22/19 (e) | 16,015 | 16,056 | ||
Newsday LLC Tranche A, term loan 3.654% 10/12/16 (e) | 9,815 | 9,742 | ||
| 191,943 | |||
Restaurants - 0.9% | ||||
Burger King Worldwide, Inc. Tranche B, term loan 4.5% 10/27/21 (e) | 35,000 | 34,869 | ||
Dunkin Brands, Inc. Tranche B 4LN, term loan 3.25% 2/7/21 (e) | 54,801 | 53,431 | ||
Focus Brands, Inc. Trancher B 1LN, term loan 4.25% 2/21/18 (e) | 4,556 | 4,499 | ||
Landry's Restaurants, Inc. Tranche B, term loan 4% 4/24/18 (e) | 8,989 | 8,958 | ||
Red Lobster Hospitality LLC Tranche B, term loan 6.25% 7/28/21 (e) | 28,815 | 28,743 | ||
| 130,500 | |||
Services - 4.0% | ||||
ARAMARK Corp.: | ||||
Credit-Linked Deposit 3.6525% 7/26/16 (e) | 3,579 | 3,538 | ||
Tranche F, term loan 3.25% 2/24/21 (e) | 74,625 | 73,879 | ||
3.6525% 7/26/16 (e) | 4,666 | 4,631 | ||
Avis Budget Group, Inc. Tranche B, term loan 3% 3/15/19 (e) | 9,775 | 9,653 | ||
Bright Horizons Family Solutions, Inc. Tranche B, term loan 3.7501% 1/30/20 (e) | 23,207 | 22,772 | ||
Cactus Wellhead LLC Tranche B, term loan 7% 7/31/20 (e) | 23,500 | 23,059 | ||
Coinmach Service Corp. Tranche B, term loan 4.25% 11/14/19 (e) | 50,746 | 50,188 | ||
EFS Cogen Holdings I LLC Tranche B, term loan 3.75% 12/17/20 (e) | 18,015 | 17,790 | ||
Bank Loan Obligations (f) - continued | ||||
| Principal Amount (000s) | Value (000s) | ||
Services - continued | ||||
Filtration Group Corp. Tranche 2LN, term loan 8.25% 11/21/21 (e) | $ 3,860 | $ 3,826 | ||
Hertz Corp.: | ||||
Tranche B 2LN, term loan 3% 3/11/18 (e) | 62,354 | 60,757 | ||
Tranche B, term loan 3.75% 3/11/18 (e) | 22,517 | 22,235 | ||
Karman Buyer Corp.: | ||||
term loan 3.75% 7/25/21 (e)(h) | 769 | 761 | ||
Tranche 1LN, term loan 4.25% 7/25/21 (e) | 23,076 | 22,817 | ||
Tranche 2LN, term loan 7.5% 7/25/22 (e) | 11,490 | 11,433 | ||
Laureate Education, Inc. Tranche B, term loan 5% 6/16/18 (e) | 159,610 | 154,024 | ||
Lineage Logistics Holdings, LLC. Tranche B, term loan 4.5% 4/7/21 (e) | 47,743 | 46,728 | ||
Nord Anglia Education Tranche B, term loan 4.5% 3/31/21 (e) | 14,439 | 14,367 | ||
Redtop Acquisitions Ltd.: | ||||
Tranche 2LN, term loan 8.25% 6/3/21 (e) | 4,963 | 4,987 | ||
Tranche B 1LN, term loan 4.5% 12/3/20 (e) | 5,962 | 5,962 | ||
The ServiceMaster Co. Tranche B, term loan 4.25% 7/1/21 (e) | 35,000 | 34,738 | ||
| 588,145 | |||
Shipping - 0.3% | ||||
Harvey Gulf International Tranche B, term loan 5.5% 6/18/20 (e) | 22,101 | 20,885 | ||
YRC Worldwide, Inc. Tranche B, term loan 8.25% 2/13/19 (e) | 27,294 | 26,748 | ||
| 47,633 | |||
Super Retail - 3.3% | ||||
Academy Ltd. Tranche B, term loan 4.5% 8/3/18 (e) | 21,979 | 21,897 | ||
Bass Pro Group LLC Tranche B, term loan 3.75% 11/20/19 (e) | 24,161 | 23,919 | ||
BJ's Wholesale Club, Inc.: | ||||
Tranche 2LN, term loan 8.5% 3/31/20 (e) | 20,110 | 20,089 | ||
Tranche B 1LN, term loan 4.5% 9/26/19 (e) | 62,493 | 61,812 | ||
Burlington Coat Factory Warehouse Corp. Tranche B, term loan 4.25% 8/13/21 (e) | 24,938 | 24,782 | ||
General Nutrition Centers, Inc. Tranche B, term loan 3.25% 3/4/19 (e) | 52,858 | 51,536 | ||
J. Crew Group, Inc. Tranche B LN, term loan 4% 3/5/21 (e) | 59,859 | 57,543 | ||
JC Penney Corp., Inc. Tranche B, term loan: | ||||
5% 6/20/19 (e) | 17,666 | 17,268 | ||
Bank Loan Obligations (f) - continued | ||||
| Principal Amount (000s) | Value (000s) | ||
Super Retail - continued | ||||
JC Penney Corp., Inc. Tranche B, term loan: - continued | ||||
6% 5/22/18 (e) | $ 82,629 | $ 81,699 | ||
PETCO Animal Supplies, Inc. term loan 4% 11/24/17 (e) | 35,156 | 34,804 | ||
Sears Holdings Corp. Tranche ABL, term loan 5.5% 6/30/18 (e) | 72,000 | 69,840 | ||
Sports Authority, Inc. Tranche B, term loan 7.5% 11/16/17 (e) | 7,416 | 6,971 | ||
The Hillman Group, Inc. Tranche B, term loan 4.5% 6/30/21 (e) | 13,127 | 13,029 | ||
| 485,189 | |||
Technology - 9.7% | ||||
Activision Blizzard, Inc. Tranche B, term loan 3.25% 10/11/20 (e) | 112,210 | 112,210 | ||
Applied Systems, Inc.: | ||||
Tranche B 1LN, term loan 4.25% 1/23/21 (e) | 14,183 | 13,935 | ||
Tranche B 2LN, term loan 7.5% 1/23/22 (e) | 3,630 | 3,621 | ||
Avago Technologies, Inc. Tranche B, term loan 3.75% 5/6/21 (e) | 54,626 | 54,428 | ||
BMC Software Finance, Inc. Tranche B, term loan: | ||||
5% 9/10/20 (e) | 19,356 | 18,896 | ||
5% 9/10/20 (e) | 150,648 | 148,012 | ||
Carros U.S., LLC Tranche B, term loan 4.5% 9/30/21 (e) | 15,585 | 15,566 | ||
CompuCom Systems, Inc. Tranche B, term loan 4.25% 5/9/20 (e) | 27,689 | 26,166 | ||
Computer Discount Warehouse (CDW) LLC, Tranche B, term loan 3.25% 4/29/20 (e) | 56,918 | 55,495 | ||
Dell International LLC Tranche B, term loan 4.5% 4/29/20 (e) | 214,945 | 215,224 | ||
Fibertech Networks, LLC Tranche B 1LN, term loan 4% 12/18/19 (e) | 17,919 | 17,627 | ||
First Data Corp.: | ||||
term loan 3.653% 3/24/17 (e) | 83,529 | 82,068 | ||
Tranche B, term loan: | ||||
3.653% 3/24/18 (e) | 80,000 | 78,600 | ||
3.653% 9/24/18 (e) | 40,000 | 39,300 | ||
Freescale Semiconductor, Inc. Tranche B 4LN, term loan 4.25% 3/1/20 (e) | 52,974 | 52,245 | ||
Generac Power Systems, Inc. Tranche B, term loan 3.25% 5/31/20 (e) | 64,994 | 63,531 | ||
Genesys Telecommunications Laboratories, Inc. Tranche B, term loan 4.5% 11/13/20 (e) | 5,032 | 5,007 | ||
Bank Loan Obligations (f) - continued | ||||
| Principal Amount (000s) | Value (000s) | ||
Technology - continued | ||||
GXS Group, Inc. Tranche B, term loan 3.25% 1/16/21 (e) | $ 16,873 | $ 16,619 | ||
Infor U.S., Inc.: | ||||
Tranche B 3LN, term loan 3.75% 6/3/20 (e) | 24,201 | 23,838 | ||
Tranche B 5LN, term loan 3.75% 6/3/20 (e) | 57,427 | 56,566 | ||
Information Resources, Inc. Tranche B, term loan 4.75% 9/30/20 (e) | 16,139 | 16,139 | ||
Kronos, Inc.: | ||||
Tranche 2LN, term loan 9.75% 4/30/20 (e) | 29,845 | 30,591 | ||
Tranche B 1LN, term loan 4.5% 10/30/19 (e) | 41,606 | 41,450 | ||
Nuance Communications, Inc. Tranche C, term loan 2.91% 8/7/19 (e) | 28,460 | 27,748 | ||
Renaissance Learning, Inc.: | ||||
Tranche 1LN, term loan 4.5% 4/9/21 (e) | 24,378 | 23,951 | ||
Tranche 2LN, term loan 8% 4/9/22 (e) | 11,500 | 11,213 | ||
Sophia L.P. Tranche B 1LN, term loan 4% 7/19/18 (e) | 7,176 | 7,104 | ||
SunGard Data Systems, Inc.: | ||||
Tranche C, term loan 3.9061% 2/28/17 (e) | 32,706 | 32,542 | ||
Tranche E, term loan 4% 3/8/20 (e) | 44,917 | 44,748 | ||
Syniverse Holdings, Inc. Tranche B, term loan: | ||||
4% 4/23/19 (e) | 19,390 | 19,027 | ||
4% 4/23/19 (e) | 9,598 | 9,418 | ||
Vantiv LLC Tranche B, term loan 3.75% 6/13/21 (e) | 31,416 | 31,259 | ||
WP Mustang Holdings, LLC. Tranche B 1LN, term loan 5.5% 5/29/21 (e) | 22,309 | 22,337 | ||
| 1,416,481 | |||
Telecommunications - 5.6% | ||||
Altice Financing SA Tranche B, term loan 5.5% 6/24/19 (e) | 159,858 | 160,458 | ||
Crown Castle Operating Co. Tranche B 2LN, term loan 3% 1/31/21 (e) | 89,773 | 88,987 | ||
Digicel International Finance Ltd.: | ||||
Tranche D 1LN, term loan 3.75% 3/31/17 (e) | 9,000 | 8,955 | ||
Tranche D-2, term loan 3.75% 3/31/19 (e) | 23,560 | 23,148 | ||
DigitalGlobe, Inc. Tranche B, term loan 3.75% 1/31/20 (e) | 14,391 | 14,283 | ||
FairPoint Communications, Inc. Tranche B, term loan 7.5% 2/14/19 (e) | 18,230 | 18,321 | ||
FPL FiberNet, LLC. Tranche A, term loan 3.4841% 7/22/19 (e) | 20,000 | 20,000 | ||
Genesys Telecom Holdings U.S., Inc. Tranche B, term loan 4.5% 2/8/20 (e) | 24,687 | 23,915 | ||
Bank Loan Obligations (f) - continued | ||||
| Principal Amount (000s) | Value (000s) | ||
Telecommunications - continued | ||||
Integra Telecom Holdings, Inc. Tranche B, term loan 5.25% 2/22/19 (e) | $ 12,805 | $ 12,758 | ||
Intelsat Jackson Holdings SA Tranche B 2LN, term loan 3.75% 6/30/19 (e) | 132,070 | 130,921 | ||
Level 3 Financing, Inc.: | ||||
Tranche B 3LN, term loan 4% 8/1/19 (e) | 13,330 | 13,263 | ||
Tranche B 4LN, term loan 4% 1/15/20 (e) | 73,000 | 72,635 | ||
Tranche B 5LN, term loan 4.5% 1/31/22 (e) | 24,000 | 24,091 | ||
LTS Buyer LLC: | ||||
Tranche 2LN, term loan 8% 4/11/21 (e) | 3,868 | 3,839 | ||
Tranche B 1LN, term loan 4% 4/11/20 (e) | 33,247 | 32,749 | ||
SBA Senior Finance II, LLC term loan 3.25% 3/24/21 (e) | 34,913 | 34,302 | ||
Securus Technologies Holdings, Inc.: | ||||
Tranche 2LN, term loan 9% 4/30/21 (e) | 4,635 | 4,572 | ||
Tranche B 1LN, term loan 4.75% 4/30/20 (e) | 39,962 | 39,463 | ||
TCH-2 Holdings, LLC. Tranche B 1LN, term loan 5.5% 5/12/21 (e) | 14,963 | 14,814 | ||
Telesat Holding, Inc. Tranche B, term loan 3.5% 3/28/19 (e) | 63,963 | 63,483 | ||
Windstream Corp. Tranche B 4LN, term loan 3.5% 1/23/20 (e) | 19,463 | 19,293 | ||
| 824,250 | |||
Textiles & Apparel - 0.3% | ||||
Party City Holdings, Inc. Tranche B LN, term loan 4% 7/27/19 (e) | 44,965 | 44,002 | ||
TOTAL BANK LOAN OBLIGATIONS (Cost $13,050,387) |
| |||
Nonconvertible Bonds - 6.7% | ||||
| ||||
Automotive - 0.3% | ||||
General Motors Acceptance Corp. 2.4336% 12/1/14 (e) | 40,000 | 39,880 | ||
Banks & Thrifts - 1.1% | ||||
Ally Financial, Inc.: | ||||
2.9108% 7/18/16 (e) | 75,000 | 75,915 | ||
3.125% 1/15/16 | 4,000 | 4,050 | ||
4.625% 6/26/15 | 4,000 | 4,082 | ||
GMAC LLC 2.4336% 12/1/14 (e) | 70,187 | 70,228 | ||
| 154,275 | |||
Nonconvertible Bonds - continued | ||||
| Principal Amount (000s) | Value (000s) | ||
Broadcasting - 0.2% | ||||
AMC Networks, Inc. 4.75% 12/15/22 | $ 6,600 | $ 6,551 | ||
Clear Channel Communications, Inc. 9% 12/15/19 | 8,677 | 8,769 | ||
Starz LLC/Starz Finance Corp. 5% 9/15/19 | 9,000 | 9,270 | ||
Univision Communications, Inc. 6.75% 9/15/22 (d) | 5,368 | 5,958 | ||
| 30,548 | |||
Building Materials - 0.1% | ||||
CEMEX S.A.B. de CV 4.9806% 10/15/18 (d)(e) | 10,000 | 10,345 | ||
Cable TV - 0.5% | ||||
CCO Holdings LLC/CCO Holdings Capital Corp.: | ||||
5.125% 2/15/23 | 17,065 | 17,022 | ||
5.25% 3/15/21 | 13,070 | 13,233 | ||
Cequel Communications Escrow I LLC/Cequel Communications Escrow Capital Corp. 6.375% 9/15/20 (d) | 10,815 | 11,275 | ||
Lynx I Corp. 5.375% 4/15/21 (d) | 5,000 | 5,188 | ||
Numericable Group SA 4.875% 5/15/19 (d) | 27,120 | 27,052 | ||
Virgin Media Finance PLC 4.875% 2/15/22 | 2,000 | 1,880 | ||
| 75,650 | |||
Capital Goods - 0.0% | ||||
Shale-Inland Holdings LLC/Shale-Inland Finance Corp. 8.75% 11/15/19 (d) | 3,000 | 3,105 | ||
Chemicals - 0.0% | ||||
Nufarm Australia Ltd. 6.375% 10/15/19 (d) | 5,000 | 5,025 | ||
Containers - 0.7% | ||||
Ardagh Packaging Finance PLC/Ardagh MP Holdings U.S.A., Inc. 3.2341% 12/15/19 (d)(e) | 42,330 | 41,378 | ||
Reynolds Group Issuer, Inc./Reynolds Group Issuer LLC/Reynolds Group Issuer (Luxembourg) SA: | ||||
5.75% 10/15/20 | 58,325 | 60,658 | ||
7.125% 4/15/19 | 5,000 | 5,194 | ||
| 107,230 | |||
Diversified Financial Services - 0.7% | ||||
CIT Group, Inc.: | ||||
4.75% 2/15/15 (d) | 14,000 | 14,105 | ||
5% 5/15/17 | 7,000 | 7,333 | ||
Icahn Enterprises LP/Icahn Enterprises Finance Corp.: | ||||
3.5% 3/15/17 | 18,720 | 18,626 | ||
4.875% 3/15/19 | 15,000 | 15,263 | ||
International Lease Finance Corp.: | ||||
2.1841% 6/15/16 (e) | 29,485 | 29,374 | ||
3.875% 4/15/18 | 7,000 | 7,022 | ||
Nonconvertible Bonds - continued | ||||
| Principal Amount (000s) | Value (000s) | ||
Diversified Financial Services - continued | ||||
International Lease Finance Corp.: - continued | ||||
4.875% 4/1/15 | $ 4,000 | $ 4,047 | ||
6.25% 5/15/19 | 10,000 | 10,938 | ||
| 106,708 | |||
Diversified Media - 0.1% | ||||
Clear Channel Worldwide Holdings, Inc.: | ||||
Series A, 6.5% 11/15/22 | 5,130 | 5,284 | ||
Series B, 6.5% 11/15/22 | 13,870 | 14,355 | ||
| 19,639 | |||
Electric Utilities - 0.3% | ||||
Energy Future Intermediate Holding Co. LLC/Energy Future Intermediate Holding Finance, Inc. 12.25% 3/1/22 (c)(d) | 11,000 | 13,090 | ||
NRG Energy, Inc. 6.625% 3/15/23 | 4,000 | 4,220 | ||
The AES Corp. 3.2336% 6/1/19 (e) | 21,435 | 21,321 | ||
| 38,631 | |||
Energy - 0.7% | ||||
Access Midstream Partners LP/ACMP Finance Corp. 4.875% 5/15/23 | 7,000 | 7,315 | ||
American Energy-Permian Basin LLC/ AEPB Finance Corp. 6.7413% 8/1/19 (d)(e) | 35,000 | 30,975 | ||
Atlas Pipeline Partners LP/Atlas Pipeline Finance Corp.: | ||||
5.875% 8/1/23 | 3,000 | 3,113 | ||
6.625% 10/1/20 | 5,645 | 5,984 | ||
Chesapeake Energy Corp. 3.4806% 4/15/19 (e) | 29,720 | 29,741 | ||
Citgo Petroleum Corp. 6.25% 8/15/22 (d) | 10,000 | 10,175 | ||
Northern Tier Energy LLC/Northern Tier Finance Corp. 7.125% 11/15/20 | 4,000 | 4,200 | ||
Targa Resources Partners LP/Targa Resources Partners Finance Corp. 6.375% 8/1/22 | 4,492 | 4,829 | ||
Western Refining, Inc. 6.25% 4/1/21 | 5,305 | 5,332 | ||
| 101,664 | |||
Entertainment/Film - 0.0% | ||||
Cinemark U.S.A., Inc. 5.125% 12/15/22 | 3,185 | 3,185 | ||
Food/Beverage/Tobacco - 0.0% | ||||
ESAL GmbH 6.25% 2/5/23 (d) | 4,000 | 4,080 | ||
Gaming - 0.1% | ||||
MCE Finance Ltd. 5% 2/15/21 (d) | 10,000 | 9,850 | ||
Healthcare - 0.4% | ||||
Community Health Systems, Inc. 5.125% 8/15/18 | 10,755 | 11,185 | ||
Nonconvertible Bonds - continued | ||||
| Principal Amount (000s) | Value (000s) | ||
Healthcare - continued | ||||
DaVita HealthCare Partners, Inc. 5.75% 8/15/22 | $ 8,235 | $ 8,729 | ||
HCA Holdings, Inc. 3.75% 3/15/19 | 25,000 | 25,063 | ||
Tenet Healthcare Corp. 4.75% 6/1/20 | 8,680 | 8,875 | ||
| 53,852 | |||
Homebuilders/Real Estate - 0.1% | ||||
CBRE Group, Inc. 5% 3/15/23 | 17,990 | 18,350 | ||
Leisure - 0.0% | ||||
Six Flags Entertainment Corp. 5.25% 1/15/21 (d) | 4,000 | 4,020 | ||
Metals/Mining - 0.0% | ||||
Peabody Energy Corp. 6% 11/15/18 | 5,000 | 4,838 | ||
Publishing/Printing - 0.1% | ||||
Cenveo Corp. 6% 8/1/19 (d) | 9,850 | 9,481 | ||
Services - 0.1% | ||||
Avis Budget Car Rental LLC/Avis Budget Finance, Inc. 2.9836% 12/1/17 (e) | 14,410 | 14,429 | ||
TransUnion Holding Co., Inc. 9.625% 6/15/18 pay-in-kind (e) | 3,000 | 3,098 | ||
| 17,527 | |||
Technology - 0.4% | ||||
Brocade Communications Systems, Inc. 4.625% 1/15/23 | 7,235 | 7,054 | ||
First Data Corp. 6.75% 11/1/20 (d) | 25,460 | 27,242 | ||
NXP BV/NXP Funding LLC: | ||||
5.75% 2/15/21 (d) | 14,760 | 15,572 | ||
5.75% 3/15/23 (d) | 5,000 | 5,288 | ||
| 55,156 | |||
Telecommunications - 0.8% | ||||
Altice Financing SA: | ||||
6.5% 1/15/22 (d) | 7,240 | 7,439 | ||
7.875% 12/15/19 (d) | 4,000 | 4,265 | ||
Columbus International, Inc. 7.375% 3/30/21 (d) | 14,535 | 15,407 | ||
DigitalGlobe, Inc. 5.25% 2/1/21 (d) | 3,905 | 3,798 | ||
Intelsat Jackson Holdings SA 6.625% 12/15/22 (Reg. S) | 20,000 | 21,050 | ||
Level 3 Financing, Inc. 3.8229% 1/15/18 (d)(e) | 15,000 | 15,038 | ||
Sprint Capital Corp.: | ||||
6.875% 11/15/28 | 4,000 | 3,890 | ||
6.9% 5/1/19 | 5,000 | 5,300 | ||
Sprint Communications, Inc.: | ||||
6% 11/15/22 | 30,000 | 29,925 | ||
Nonconvertible Bonds - continued | ||||
| Principal Amount (000s) | Value (000s) | ||
Telecommunications - continued | ||||
Sprint Communications, Inc.: - continued | ||||
9% 11/15/18 (d) | $ 3,000 | $ 3,529 | ||
Telesat Canada/Telesat LLC 6% 5/15/17 (d) | 3,000 | 3,092 | ||
| 112,733 | |||
TOTAL NONCONVERTIBLE BONDS (Cost $970,187) |
| |||
Common Stocks - 0.2% | |||
Shares |
| ||
Broadcasting - 0.0% | |||
Cumulus Media, Inc. Class A (a) | 229,315 | 885 | |
ION Media Networks, Inc. (a) | 2,842 | 2,014 | |
| 2,899 | ||
Chemicals - 0.2% | |||
LyondellBasell Industries NV Class A | 245,943 | 22,536 | |
Electric Utilities - 0.0% | |||
Calpine Corp. (a) | 20,715 | 473 | |
Homebuilders/Real Estate - 0.0% | |||
Newhall Holding Co. LLC Class A (a) | 289,870 | 617 | |
Hotels - 0.0% | |||
Tropicana Las Vegas Hotel & Casino, Inc. Class A (a) | 48,650 | 1,678 | |
Paper - 0.0% | |||
White Birch Cayman Holdings Ltd. (a) | 12,570 | 0 | |
Publishing/Printing - 0.0% | |||
Houghton Mifflin Harcourt Co. warrants 6/22/19 (a)(i) | 13,699 | 21 | |
Telecommunications - 0.0% | |||
FairPoint Communications, Inc. (a) | 34,287 | 569 | |
TOTAL COMMON STOCKS (Cost $16,121) |
| ||
Other - 0.0% | |||
|
|
|
|
Other - 0.0% | |||
Idearc, Inc. Claim (a) | 1,888,944 |
| |
Money Market Funds - 4.0% | |||
Shares | Value (000s) | ||
Fidelity Cash Central Fund, 0.11% (b) | 581,718,991 | $ 581,719 | |
TOTAL INVESTMENT PORTFOLIO - 99.2% (Cost $14,618,414) | 14,514,395 | ||
NET OTHER ASSETS (LIABILITIES) - 0.8% | 110,911 | ||
NET ASSETS - 100% | $ 14,625,306 | ||
Legend |
(a) Non-income producing |
(b) Affiliated fund that is generally available only to investment companies and other accounts managed by Fidelity Investments. The rate quoted is the annualized seven-day yield of the fund at period end. A complete unaudited listing of the fund's holdings as of its most recent quarter end is available upon request. In addition, each Fidelity Central Fund's financial statements, which are not covered by the Fund's Report of Independent Registered Public Accounting Firm, are available on the SEC's website or upon request. |
(c) Non-income producing - Security is in default. |
(d) Security exempt from registration under Rule 144A of the Securities Act of 1933. These securities may be resold in transactions exempt from registration, normally to qualified institutional buyers. At the end of the period, the value of these securities amounted to $305,772,000 or 2.1% of net assets. |
(e) Coupon rates for floating and adjustable rate securities reflect the rates in effect at period end. |
(f) Remaining maturities of bank loan obligations may be less than the stated maturities shown as a result of contractual or optional prepayments by the borrower. Such prepayments cannot be predicted with certainty. |
(g) The coupon rate will be determined upon settlement of the loan after period end. |
(h) Position or a portion of the position represents an unfunded loan commitment. At period end, the total principal amount and market value of unfunded commitments totaled $44,153,000 and $43,122,000, respectively. |
(i) Restricted securities - Investment in securities not registered under the Securities Act of 1933 (excluding 144A issues). At the end of the period, the value of restricted securities (excluding 144A issues) amounted to $21,000 or 0.0% of net assets. |
Additional information on each restricted holding is as follows: |
Security | Acquisition Date | Acquisition Cost (000s) |
Houghton Mifflin Harcourt Co. warrants 6/22/19 | 6/22/12 | $ 26 |
Affiliated Central Funds |
Information regarding fiscal year to date income earned by the Fund from investments in Fidelity Central Funds is as follows: |
Fund | Income earned |
Fidelity Cash Central Fund | $ 1,200 |
Other Information |
The following is a summary of the inputs used, as of October 31, 2014, involving the Fund's assets and liabilities carried at fair value. The inputs or methodology used for valuing securities may not be an indication of the risk associated with investing in those securities. For more information on valuation inputs, and their aggregation into the levels used in the table below, please refer to the Investment Valuation section in the accompanying Notes to Financial Statements. |
Valuation Inputs at Reporting Date: | ||||
Description | Total | Level 1 | Level 2 | Level 3 |
Investments in Securities: | ||||
Equities: | ||||
Consumer Discretionary | $ 4,598 | $ 885 | $ - | $ 3,713 |
Financials | 617 | - | - | 617 |
Materials | 22,536 | 22,536 | - | - |
Telecommunication Services | 569 | 569 | - | - |
Utilities | 473 | 473 | - | - |
Bank Loan Obligations | 12,918,111 | - | 12,850,315 | 67,796 |
Corporate Bonds | 985,772 | - | 985,772 | - |
Other | - | - | - | - |
Money Market Funds | 581,719 | 581,719 | - | - |
Total Investments in Securities: | $ 14,514,395 | $ 606,182 | $ 13,836,087 | $ 72,126 |
Distribution of investments by country or territory of incorporation, as a percentage of total net assets, is as follows (Unaudited): |
United States of America | 88.3% |
Luxembourg | 3.1% |
Australia | 2.5% |
Netherlands | 2.0% |
United Kingdom | 1.1% |
Others (Individually Less Than 1%) | 3.0% |
| 100.0% |
See accompanying notes which are an integral part of the financial statements.
Annual Report
Financial Statements
Statement of Assets and Liabilities
Amounts in thousands (except per-share amounts) | October 31, 2014 | |
|
|
|
Assets | ||
Investment in securities, at value - See accompanying schedule: Unaffiliated issuers (cost $14,036,695) | $ 13,932,676 |
|
Fidelity Central Funds (cost $581,719) | 581,719 |
|
Total Investments (cost $14,618,414) |
| $ 14,514,395 |
Cash |
| 62,292 |
Receivable for investments sold | 137,394 | |
Receivable for fund shares sold | 9,748 | |
Interest receivable | 58,716 | |
Distributions receivable from Fidelity Central Funds | 56 | |
Prepaid expenses | 49 | |
Other receivables | 1 | |
Total assets | 14,782,651 | |
|
|
|
Liabilities | ||
Payable for investments purchased | $ 109,248 | |
Payable for fund shares redeemed | 28,093 | |
Distributions payable | 10,158 | |
Accrued management fee | 6,908 | |
Distribution and service plan fees payable | 1,014 | |
Other affiliated payables | 1,795 | |
Other payables and accrued expenses | 129 | |
Total liabilities | 157,345 | |
|
|
|
Net Assets | $ 14,625,306 | |
Net Assets consist of: |
| |
Paid in capital | $ 14,631,284 | |
Undistributed net investment income | 67,963 | |
Accumulated undistributed net realized gain (loss) on investments | 30,078 | |
Net unrealized appreciation (depreciation) on investments | (104,019) | |
Net Assets | $ 14,625,306 | |
See accompanying notes which are an integral part of the financial statements.
Annual Report
Financial Statements - continued
Statement of Assets and Liabilities - continued
Amounts in thousands (except per-share amounts) | October 31, 2014 | |
|
|
|
Calculation of Maximum Offering Price Class A: | $ 9.85 | |
|
|
|
Maximum offering price per share (100/97.25 of $9.85) | $ 10.13 | |
Class T: | $ 9.84 | |
|
|
|
Maximum offering price per share (100/97.25 of $9.84) | $ 10.12 | |
Class B: | $ 9.83 | |
|
|
|
Class C: | $ 9.85 | |
|
|
|
Fidelity Floating Rate High Income Fund: | $ 9.84 | |
|
|
|
Institutional Class: | $ 9.83 | |
A Redemption price per share is equal to net asset value less any applicable contingent deferred sales charge.
See accompanying notes which are an integral part of the financial statements.
Annual Report
Statement of Operations
Amounts in thousands | Year ended October 31, 2014 | |
|
|
|
Investment Income |
|
|
Dividends |
| $ 1,907 |
Interest |
| 656,802 |
Income from Fidelity Central Funds |
| 1,200 |
Total income |
| 659,909 |
|
|
|
Expenses | ||
Management fee | $ 89,463 | |
Transfer agent fees | 20,662 | |
Distribution and service plan fees | 13,935 | |
Accounting fees and expenses | 1,815 | |
Custodian fees and expenses | 194 | |
Independent trustees' compensation | 66 | |
Registration fees | 448 | |
Audit | 173 | |
Legal | 53 | |
Miscellaneous | 115 | |
Total expenses before reductions | 126,924 | |
Expense reductions | (59) | 126,865 |
Net investment income (loss) | 533,044 | |
Realized and Unrealized Gain (Loss) Net realized gain (loss) on: | ||
Investment securities: |
|
|
Unaffiliated issuers |
| 33,692 |
Change in net unrealized appreciation (depreciation) on investment securities | (219,514) | |
Net gain (loss) | (185,822) | |
Net increase (decrease) in net assets resulting from operations | $ 347,222 | |
See accompanying notes which are an integral part of the financial statements.
Annual Report
Financial Statements - continued
Statement of Changes in Net Assets
Amounts in thousands | Year ended | Year ended |
Increase (Decrease) in Net Assets |
|
|
Operations |
|
|
Net investment income (loss) | $ 533,044 | $ 410,895 |
Net realized gain (loss) | 33,692 | 72,218 |
Change in net unrealized appreciation (depreciation) | (219,514) | 9,078 |
Net increase (decrease) in net assets resulting | 347,222 | 492,191 |
Distributions to shareholders from net investment income | (519,702) | (375,589) |
Distributions to shareholders from net realized gain | (57,139) | (52,959) |
Total distributions | (576,841) | (428,548) |
Share transactions - net increase (decrease) | (610,631) | 4,793,436 |
Redemption fees | 671 | 916 |
Total increase (decrease) in net assets | (839,579) | 4,857,995 |
|
|
|
Net Assets | ||
Beginning of period | 15,464,885 | 10,606,890 |
End of period (including undistributed net investment income of $67,963 and undistributed net investment income of $122,241, respectively) | $ 14,625,306 | $ 15,464,885 |
See accompanying notes which are an integral part of the financial statements.
Annual Report
Financial Highlights - Class A
Years ended October 31, | 2014 | 2013 | 2012 | 2011 | 2010 |
Selected Per-Share Data |
|
|
|
|
|
Net asset value, beginning of period | $ 9.99 | $ 9.94 | $ 9.73 | $ 9.79 | $ 9.31 |
Income from Investment Operations |
|
|
|
|
|
Net investment income (loss) C | .317 | .310 | .340 | .317 | .391 |
Net realized and unrealized gain (loss) | (.114) | .070 | .195 | (.080) | .425 |
Total from investment operations | .203 | .380 | .535 | .237 | .816 |
Distributions from net investment income | (.307) | (.282) | (.325) | (.298) | (.287) |
Distributions from net realized gain | (.036) | (.049) | - | - | (.050) |
Total distributions | (.343) | (.331) | (.325) | (.298) | (.337) |
Redemption fees added to paid in capital C | - G | .001 | - G | .001 | .001 |
Net asset value, end of period | $ 9.85 | $ 9.99 | $ 9.94 | $ 9.73 | $ 9.79 |
Total ReturnA, B | 2.05% | 3.89% | 5.60% | 2.46% | 8.96% |
Ratios to Average Net Assets D, F |
|
|
|
|
|
Expenses before reductions | .98% | .99% | .99% | 1.00% | 1.03% |
Expenses net of fee waivers, if any | .98% | .99% | .99% | 1.00% | 1.03% |
Expenses net of all reductions | .98% | .99% | .99% | 1.00% | 1.03% |
Net investment income (loss) | 3.17% | 3.11% | 3.47% | 3.25% | 4.11% |
Supplemental Data |
|
|
|
|
|
Net assets, end of period (in millions) | $ 1,185 | $ 1,681 | $ 1,305 | $ 1,587 | $ 1,064 |
Portfolio turnover rateE | 54% | 62% | 49% | 54% | 43% |
A Total returns would have been lower if certain expenses had not been reduced during the applicable periods shown.
B Total returns do not include the effect of the sales charges.
C Calculated based on average shares outstanding during the period.
D Fees and expenses of any underlying Fidelity Central Funds are not included in the Fund's expense ratio. The Fund indirectly bears its proportionate share of the expenses of any underlying Fidelity Central Funds.
E Amount does not include the portfolio activity of any underlying Fidelity Central Funds.
F Expense ratios reflect operating expenses of the class. Expenses before reductions do not reflect amounts reimbursed by the investment adviser or reductions from brokerage service arrangements or reductions from other expense offset arrangements and do not represent the amount paid by the class during periods when reimbursements or reductions occur. Expenses net of fee waivers reflect expenses after reimbursement by the investment adviser but prior to reductions from brokerage service arrangements or other expense offset arrangements. Expenses net of all reductions represent the net expenses paid by the class.
G Amount represents less than $.001 per share.
See accompanying notes which are an integral part of the financial statements.
Annual Report
Financial Highlights - Class T
Years ended October 31, | 2014 | 2013 | 2012 | 2011 | 2010 |
Selected Per-Share Data |
|
|
|
|
|
Net asset value, beginning of period | $ 9.98 | $ 9.93 | $ 9.72 | $ 9.77 | $ 9.30 |
Income from Investment Operations |
|
|
|
|
|
Net investment income (loss) C | .306 | .299 | .330 | .312 | .391 |
Net realized and unrealized gain (loss) | (.112) | .071 | .195 | (.070) | .416 |
Total from investment operations | .194 | .370 | .525 | .242 | .807 |
Distributions from net investment income | (.298) | (.272) | (.315) | (.293) | (.288) |
Distributions from net realized gain | (.036) | (.049) | - | - | (.050) |
Total distributions | (.334) | (.321) | (.315) | (.293) | (.338) |
Redemption fees added to paid in capital C | - G | .001 | - G | .001 | .001 |
Net asset value, end of period | $ 9.84 | $ 9.98 | $ 9.93 | $ 9.72 | $ 9.77 |
Total ReturnA, B | 1.96% | 3.79% | 5.50% | 2.51% | 8.87% |
Ratios to Average Net Assets D, F |
|
|
|
|
|
Expenses before reductions | 1.07% | 1.09% | 1.09% | 1.05% | 1.02% |
Expenses net of fee waivers, if any | 1.07% | 1.09% | 1.09% | 1.05% | 1.02% |
Expenses net of all reductions | 1.07% | 1.09% | 1.09% | 1.05% | 1.02% |
Net investment income (loss) | 3.08% | 3.01% | 3.37% | 3.19% | 4.12% |
Supplemental Data |
|
|
|
|
|
Net assets, end of period (in millions) | $ 240 | $ 272 | $ 241 | $ 271 | $ 242 |
Portfolio turnover rateE | 54% | 62% | 49% | 54% | 43% |
A Total returns would have been lower if certain expenses had not been reduced during the applicable periods shown.
B Total returns do not include the effect of the sales charges.
C Calculated based on average shares outstanding during the period.
D Fees and expenses of any underlying Fidelity Central Funds are not included in the Fund's expense ratio. The Fund indirectly bears its proportionate share of the expenses of any underlying Fidelity Central Funds.
E Amount does not include the portfolio activity of any underlying Fidelity Central Funds.
F Expense ratios reflect operating expenses of the class. Expenses before reductions do not reflect amounts reimbursed by the investment adviser or reductions from brokerage service arrangements or reductions from other expense offset arrangements and do not represent the amount paid by the class during periods when reimbursements or reductions occur. Expenses net of fee waivers reflect expenses after reimbursement by the investment adviser but prior to reductions from brokerage service arrangements or other expense offset arrangements. Expenses net of all reductions represent the net expenses paid by the class.
G Amount represents less than $.001 per share.
See accompanying notes which are an integral part of the financial statements.
Annual Report
Financial Highlights - Class B
Years ended October 31, | 2014 | 2013 | 2012 | 2011 | 2010 |
Selected Per-Share Data |
|
|
|
|
|
Net asset value, beginning of period | $ 9.98 | $ 9.93 | $ 9.72 | $ 9.77 | $ 9.30 |
Income from Investment Operations |
|
|
|
|
|
Net investment income (loss) C | .264 | .256 | .288 | .266 | .341 |
Net realized and unrealized gain (loss) | (.123) | .071 | .195 | (.070) | .416 |
Total from investment operations | .141 | .327 | .483 | .196 | .757 |
Distributions from net investment income | (.255) | (.229) | (.273) | (.247) | (.238) |
Distributions from net realized gain | (.036) | (.049) | - | - | (.050) |
Total distributions | (.291) | (.278) | (.273) | (.247) | (.288) |
Redemption fees added to paid in capital C | - G | .001 | - G | .001 | .001 |
Net asset value, end of period | $ 9.83 | $ 9.98 | $ 9.93 | $ 9.72 | $ 9.77 |
Total ReturnA, B | 1.42% | 3.35% | 5.05% | 2.03% | 8.30% |
Ratios to Average Net Assets D, F |
|
|
|
|
|
Expenses before reductions | 1.50% | 1.52% | 1.52% | 1.52% | 1.55% |
Expenses net of fee waivers, if any | 1.50% | 1.52% | 1.52% | 1.52% | 1.55% |
Expenses net of all reductions | 1.50% | 1.52% | 1.52% | 1.52% | 1.55% |
Net investment income (loss) | 2.64% | 2.58% | 2.94% | 2.72% | 3.59% |
Supplemental Data |
|
|
|
|
|
Net assets, end of period (in millions) | $ 17 | $ 23 | $ 24 | $ 32 | $ 43 |
Portfolio turnover rateE | 54% | 62% | 49% | 54% | 43% |
A Total returns would have been lower if certain expenses had not been reduced during the applicable periods shown.
B Total returns do not include the effect of the contingent deferred sales charge.
C Calculated based on average shares outstanding during the period.
D Fees and expenses of any underlying Fidelity Central Funds are not included in the Fund's expense ratio. The Fund indirectly bears its proportionate share of the expenses of any underlying Fidelity Central Funds.
E Amount does not include the portfolio activity of any underlying Fidelity Central Funds.
F Expense ratios reflect operating expenses of the class. Expenses before reductions do not reflect amounts reimbursed by the investment adviser or reductions from brokerage service arrangements or reductions from other expense offset arrangements and do not represent the amount paid by the class during periods when reimbursements or reductions occur. Expenses net of fee waivers reflect expenses after reimbursement by the investment adviser but prior to reductions from brokerage service arrangements or other expense offset arrangements. Expenses net of all reductions represent the net expenses paid by the class.
G Amount represents less than $.001 per share.
See accompanying notes which are an integral part of the financial statements.
Annual Report
Financial Highlights - Class C
Years ended October 31, | 2014 | 2013 | 2012 | 2011 | 2010 |
Selected Per-Share Data |
|
|
|
|
|
Net asset value, beginning of period | $ 9.99 | $ 9.94 | $ 9.73 | $ 9.78 | $ 9.31 |
Income from Investment Operations |
|
|
|
|
|
Net investment income (loss) C | .241 | .235 | .267 | .244 | .321 |
Net realized and unrealized gain (loss) | (.113) | .070 | .195 | (.070) | .415 |
Total from investment operations | .128 | .305 | .462 | .174 | .736 |
Distributions from net investment income | (.232) | (.207) | (.252) | (.225) | (.217) |
Distributions from net realized gain | (.036) | (.049) | - | - | (.050) |
Total distributions | (.268) | (.256) | (.252) | (.225) | (.267) |
Redemption fees added to paid in capital C | - G | .001 | - G | .001 | .001 |
Net asset value, end of period | $ 9.85 | $ 9.99 | $ 9.94 | $ 9.73 | $ 9.78 |
Total ReturnA, B | 1.29% | 3.11% | 4.81% | 1.80% | 8.05% |
Ratios to Average Net Assets D, F |
|
|
|
|
|
Expenses before reductions | 1.73% | 1.74% | 1.74% | 1.74% | 1.76% |
Expenses net of fee waivers, if any | 1.73% | 1.74% | 1.74% | 1.74% | 1.76% |
Expenses net of all reductions | 1.73% | 1.74% | 1.74% | 1.74% | 1.76% |
Net investment income (loss) | 2.41% | 2.35% | 2.72% | 2.50% | 3.38% |
Supplemental Data |
|
|
|
|
|
Net assets, end of period (in millions) | $ 835 | $ 960 | $ 806 | $ 852 | $ 622 |
Portfolio turnover rateE | 54% | 62% | 49% | 54% | 43% |
A Total returns would have been lower if certain expenses had not been reduced during the applicable periods shown.
B Total returns do not include the effect of the contingent deferred sales charge.
C Calculated based on average shares outstanding during the period.
D Fees and expenses of any underlying Fidelity Central Funds are not included in the Fund's expense ratio. The Fund indirectly bears its proportionate share of the expenses of any underlying Fidelity Central Funds.
E Amount does not include the portfolio activity of any underlying Fidelity Central Funds.
F Expense ratios reflect operating expenses of the class. Expenses before reductions do not reflect amounts reimbursed by the investment adviser or reductions from brokerage service arrangements or reductions from other expense offset arrangements and do not represent the amount paid by the class during periods when reimbursements or reductions occur. Expenses net of fee waivers reflect expenses after reimbursement by the investment adviser but prior to reductions from brokerage service arrangements or other expense offset arrangements. Expenses net of all reductions represent the net expenses paid by the class.
G Amount represents less than $.001 per share.
See accompanying notes which are an integral part of the financial statements.
Annual Report
Financial Highlights - Fidelity Floating Rate High Income Fund
Years ended October 31, | 2014 | 2013 | 2012 | 2011 | 2010 |
Selected Per-Share Data |
|
|
|
|
|
Net asset value, beginning of period | $ 9.98 | $ 9.93 | $ 9.72 | $ 9.77 | $ 9.30 |
Income from Investment Operations |
|
|
|
|
|
Net investment income (loss) B | .344 | .337 | .368 | .345 | .418 |
Net realized and unrealized gain (loss) | (.113) | .071 | .195 | (.070) | .417 |
Total from investment operations | .231 | .408 | .563 | .275 | .835 |
Distributions from net investment income | (.335) | (.310) | (.353) | (.326) | (.316) |
Distributions from net realized gain | (.036) | (.049) | - | - | (.050) |
Total distributions | (.371) | (.359) | (.353) | (.326) | (.366) |
Redemption fees added to paid in capital B | - F | .001 | - F | .001 | .001 |
Net asset value, end of period | $ 9.84 | $ 9.98 | $ 9.93 | $ 9.72 | $ 9.77 |
Total ReturnA | 2.34% | 4.19% | 5.91% | 2.86% | 9.18% |
Ratios to Average Net Assets C, E |
|
|
|
|
|
Expenses before reductions | .69% | .70% | .71% | .71% | .73% |
Expenses net of fee waivers, if any | .69% | .70% | .71% | .71% | .73% |
Expenses net of all reductions | .69% | .70% | .71% | .71% | .73% |
Net investment income (loss) | 3.45% | 3.39% | 3.75% | 3.53% | 4.41% |
Supplemental Data |
|
|
|
|
|
Net assets, end of period (in millions) | $ 9,032 | $ 8,882 | $ 5,720 | $ 5,399 | $ 3,566 |
Portfolio turnover rateD | 54% | 62% | 49% | 54% | 43% |
A Total returns would have been lower if certain expenses had not been reduced during the applicable periods shown.
B Calculated based on average shares outstanding during the period.
C Fees and expenses of any underlying Fidelity Central Funds are not included in the Fund's expense ratio. The Fund indirectly bears its proportionate share of the expenses of any underlying Fidelity Central Funds.
D Amount does not include the portfolio activity of any underlying Fidelity Central Funds.
E Expense ratios reflect operating expenses of the class. Expenses before reductions do not reflect amounts reimbursed by the investment adviser or reductions from brokerage service arrangements or reductions from other expense offset arrangements and do not represent the amount paid by the class during periods when reimbursements or reductions occur. Expenses net of fee waivers reflect expenses after reimbursement by the investment adviser but prior to reductions from brokerage service arrangements or other expense offset arrangements. Expenses net of all reductions represent the net expenses paid by the class.
F Amount represents less than $.001 per share.
See accompanying notes which are an integral part of the financial statements.
Annual Report
Financial Highlights - Institutional Class
Years ended October 31, | 2014 | 2013 | 2012 | 2011 | 2010 |
Selected Per-Share Data |
|
|
|
|
|
Net asset value, beginning of period | $ 9.97 | $ 9.92 | $ 9.71 | $ 9.77 | $ 9.29 |
Income from Investment Operations |
|
|
|
|
|
Net investment income (loss) B | .339 | .332 | .363 | .341 | .415 |
Net realized and unrealized gain (loss) | (.113) | .071 | .196 | (.079) | .427 |
Total from investment operations | .226 | .403 | .559 | .262 | .842 |
Distributions from net investment income | (.330) | (.305) | (.349) | (.323) | (.313) |
Distributions from net realized gain | (.036) | (.049) | - | - | (.050) |
Total distributions | (.366) | (.354) | (.349) | (.323) | (.363) |
Redemption fees added to paid in capital B | - F | .001 | - F | .001 | .001 |
Net asset value, end of period | $ 9.83 | $ 9.97 | $ 9.92 | $ 9.71 | $ 9.77 |
Total ReturnA | 2.29% | 4.15% | 5.87% | 2.72% | 9.27% |
Ratios to Average Net Assets C, E |
|
|
|
|
|
Expenses before reductions | .74% | .75% | .75% | .75% | .76% |
Expenses net of fee waivers, if any | .74% | .75% | .75% | .75% | .76% |
Expenses net of all reductions | .74% | .75% | .75% | .75% | .76% |
Net investment income (loss) | 3.40% | 3.34% | 3.71% | 3.50% | 4.38% |
Supplemental Data |
|
|
|
|
|
Net assets, end of period (in millions) | $ 3,317 | $ 3,646 | $ 2,510 | $ 1,992 | $ 1,138 |
Portfolio turnover rateD | 54% | 62% | 49% | 54% | 43% |
A Total returns would have been lower if certain expenses had not been reduced during the applicable periods shown.
B Calculated based on average shares outstanding during the period.
C Fees and expenses of any underlying Fidelity Central Funds are not included in the Fund's expense ratio. The Fund indirectly bears its proportionate share of the expenses of any underlying Fidelity Central Funds.
D Amount does not include the portfolio activity of any underlying Fidelity Central Funds.
E Expense ratios reflect operating expenses of the class. Expenses before reductions do not reflect amounts reimbursed by the investment adviser or reductions from brokerage service arrangements or reductions from other expense offset arrangements and do not represent the amount paid by the class during periods when reimbursements or reductions occur. Expenses net of fee waivers reflect expenses after reimbursement by the investment adviser but prior to reductions from brokerage service arrangements or other expense offset arrangements. Expenses net of all reductions represent the net expenses paid by the class.
F Amount represents less than $.001 per share.
See accompanying notes which are an integral part of the financial statements.
Annual Report
Notes to Financial Statements
For the period ended October 31, 2014
(Amounts in thousands except percentages)
1. Organization.
Fidelity Advisor Floating Rate High Income Fund (the Fund) is a fund of Fidelity Advisor Series I (the Trust) and is authorized to issue an unlimited number of shares. The Trust is registered under the Investment Company Act of 1940, as amended (the 1940 Act), as an open-end management investment company organized as a Massachusetts business trust. The Fund offers Class A, Class T, Class C, Fidelity Floating Rate High Income Fund and Institutional Class shares, each of which, along with Class B shares, has equal rights as to assets and voting privileges. Class B shares are closed to new accounts and additional purchases, except for exchanges and reinvestments. Each class has exclusive voting rights with respect to matters that affect that class. Class B shares will automatically convert to Class A shares after a holding period of seven years from the initial date of purchase.
2. Investments in Fidelity Central Funds.
The Fund invests in Fidelity Central Funds, which are open-end investment companies generally available only to other investment companies and accounts managed by the investment adviser and its affiliates. The Fund's Schedule of Investments lists each of the Fidelity Central Funds held as of period end, if any, as an investment of the Fund, but does not include the underlying holdings of each Fidelity Central Fund. As an Investing Fund, the Fund indirectly bears its proportionate share of the expenses of the underlying Fidelity Central Funds.
The Money Market Central Funds seek preservation of capital and current income and are managed by Fidelity Investments Money Management, Inc. (FIMM), an affiliate of the investment adviser. Annualized expenses of the Money Market Central Funds as of their most recent shareholder report date are less than .01%.
A complete unaudited list of holdings for each Fidelity Central Fund is available upon request or at the Securities and Exchange Commission (the SEC) website at www.sec.gov. In addition, the financial statements of the Fidelity Central Funds, which are not covered by the Fund's Report of Independent Registered Public Accounting Firm, are available on the SEC website or upon request.
3. Significant Accounting Policies.
The financial statements have been prepared in conformity with accounting principles generally accepted in the United States of America (GAAP), which require management to make certain estimates and assumptions at the date of the financial statements. Actual results could differ from those estimates. Subsequent events, if any, through the date that the financial statements were issued have been evaluated in the preparation of
Annual Report
3. Significant Accounting Policies - continued
the financial statements. The following summarizes the significant accounting policies of the Fund:
Investment Valuation. Investments are valued as of 4:00 p.m. Eastern time on the last calendar day of the period. In accordance with valuation policies and procedures approved by the Board of Trustees (the Board), the Fund attempts to obtain prices from one or more third party pricing vendors or brokers to value its investments. When current market prices, quotations or currency exchange rates are not readily available or reliable, investments will be fair valued in good faith by the Fidelity Management & Research Company (FMR) Fair Value Committee (the Committee), in accordance with procedures adopted by the Board. Factors used in determining fair value vary by investment type and may include market or investment specific events, changes in interest rates and credit quality. The frequency with which these procedures are used cannot be predicted and they may be utilized to a significant extent. The Committee oversees the Fund's valuation policies and procedures and is responsible for approving and reporting to the Board all fair value determinations.
The Fund categorizes the inputs to valuation techniques used to value its investments into a disclosure hierarchy consisting of three levels as shown below:
Level 1 - quoted prices in active markets for identical investments
Level 2 - other significant observable inputs (including quoted prices for similar investments, interest rates, prepayment speeds, etc.)
Level 3 - unobservable inputs (including the Fund's own assumptions based on the best information available)
Valuation techniques used to value the Fund's investments by major category are as follows:
Debt securities, including restricted securities, are valued based on evaluated prices received from third party pricing vendors or from brokers who make markets in such securities. Corporate bonds and bank loan obligations are valued by pricing vendors who utilize matrix pricing which considers yield or price of bonds of comparable quality, coupon, maturity and type or by broker-supplied prices. When independent prices are unavailable or unreliable, debt securities may be valued utilizing pricing methodologies which consider similar factors that would be used by third party pricing vendors. Debt securities are generally categorized as Level 2 in the hierarchy but may be Level 3 depending on the circumstances. The Fund invests a significant portion of its assets in below investment grade securities. The value of these securities can be more volatile due to changes in the credit quality of the issuer and is sensitive to changes in economic, market and regulatory conditions.
Annual Report
Notes to Financial Statements - continued
(Amounts in thousands except percentages)
3. Significant Accounting Policies - continued
Investment Valuation - continued
Equity securities, including restricted securities, for which market quotations are readily available, are valued at the last reported sale price or official closing price as reported by a third party pricing vendor on the primary market or exchange on which they are traded and are categorized as Level 1 in the hierarchy. In the event there were no sales during the day or closing prices are not available, securities are valued at the last quoted bid price or may be valued using the last available price and are generally categorized as Level 2 in the hierarchy. For foreign equity securities, when market or security specific events arise, comparisons to the valuation of American Depositary Receipts (ADRs), futures contracts, Exchange-Traded Funds (ETFs) and certain indexes as well as quoted prices for similar securities may be used and would be categorized as Level 2 in the hierarchy. Utilizing these techniques may result in transfers between Level 1 and Level 2. For equity securities, including restricted securities, where observable inputs are limited, assumptions about market activity and risk are used and these securities may be categorized as Level 3 in the hierarchy.
Investments in open-end mutual funds, including the Fidelity Central Funds, are valued at their closing net asset value (NAV) each business day and are categorized as Level 1 in the hierarchy.
Changes in valuation techniques may result in transfers in or out of an assigned level within the disclosure hierarchy. The aggregate value of investments by input level, as of October 31, 2014 is included at the end of the Fund's Schedule of Investments.
Investment Transactions and Income. For financial reporting purposes, the Fund's investment holdings and NAV include trades executed through the end of the last business day of the period. The NAV per share for processing shareholder transactions is calculated as of the close of business of the New York Stock Exchange (NYSE), normally 4:00 p.m. Eastern time and includes trades executed through the end of the prior business day. Gains and losses on securities sold are determined on the basis of identified cost and may include proceeds received from litigation. Dividend income is recorded on the ex-dividend date, except for certain dividends from foreign securities where the ex-dividend date may have passed, which are recorded as soon as the Fund is informed of the ex-dividend date. Non-cash dividends included in dividend income, if any, are recorded at the fair market value of the securities received. Income and capital gain distributions from Fidelity Central Funds, if any, are recorded on the ex-dividend date. Distributions received on securities that represent a return of capital or capital gain are recorded as a reduction of cost of investments and/or as a realized gain. Subsequent to ex-dividend date the Fund determines the components of these distributions, based upon receipt of tax filings or other correspondence relating to the underlying investment. Interest income is accrued as earned and includes coupon interest and amortization of
Annual Report
3. Significant Accounting Policies - continued
Investment Transactions and Income - continued
premium and accretion of discount on debt securities as applicable. Debt obligations may be placed on non-accrual status and related interest income may be reduced by ceasing current accruals and writing off interest receivables when the collection of all or a portion of interest has become doubtful based on consistently applied procedures. A debt obligation is removed from non-accrual status when the issuer resumes interest payments or when collectability of interest is reasonably assured. The Fund earns certain fees in connection with its floating rate loan purchasing activities. These fees are in addition to interest payments earned and may include amendment fees, consent fees and prepayment fees. These fees are recorded as Interest in the accompanying financial statements.
Class Allocations and Expenses. Investment income, realized and unrealized capital gains and losses, common expenses of the Fund, and certain fund-level expense reductions, if any, are allocated daily on a pro-rata basis to each class based on the relative net assets of each class to the total net assets of the Fund. Each class differs with respect to transfer agent and distribution and service plan fees incurred. Certain expense reductions may also differ by class. For the reporting period, the allocated portion of income and expenses to each class as a percent of its average net assets may vary due to the timing of recording these transactions in relation to fluctuating net assets of the classes. Expenses directly attributable to a fund are charged to that fund. Expenses attributable to more than one fund are allocated among the respective funds on the basis of relative net assets or other appropriate methods. Expense estimates are accrued in the period to which they relate and adjustments are made when actual amounts are known.
Income Tax Information and Distributions to Shareholders. Each year, the Fund intends to qualify as a regulated investment company under Subchapter M of the Internal Revenue Code, including distributing substantially all of its taxable income and realized gains. As a result, no provision for U.S. Federal income taxes is required. As of October 31, 2014, the Fund did not have any unrecognized tax benefits in the financial statements; nor is the Fund aware of any tax positions for which it is reasonably possible that the total amounts of unrecognized tax benefits will significantly change in the next twelve months. The Fund files a U.S. federal tax return, in addition to state and local tax returns as required. The Fund's federal income tax returns are subject to examination by the Internal Revenue Service (IRS) for a period of three fiscal years after they are filed. State and local tax returns may be subject to examination for an additional fiscal year depending on the jurisdiction.
Annual Report
Notes to Financial Statements - continued
(Amounts in thousands except percentages)
3. Significant Accounting Policies - continued
Income Tax Information and Distributions to Shareholders - continued
Dividends are declared and recorded daily and paid monthly from net investment income. Distributions from realized gains, if any, are declared and recorded on the ex-dividend date. Income dividends and capital gain distributions are declared separately for each class. Income and capital gain distributions are determined in accordance with income tax regulations, which may differ from GAAP.
Capital accounts within the financial statements are adjusted for permanent book-tax differences. These adjustments have no impact on net assets or the results of operations. Capital accounts are not adjusted for temporary book-tax differences which will reverse in a subsequent period.
Book-tax differences are primarily due to market discount, capital loss carryforwards and losses deferred due to wash sales.
The federal tax cost of investment securities and unrealized appreciation (depreciation) as of period end were as follows:
Gross unrealized appreciation | $ 113,253 |
Gross unrealized depreciation | (175,816) |
Net unrealized appreciation (depreciation) on securities | $ (62,563) |
|
|
Tax Cost | $ 14,576,958 |
The tax-based components of distributable earnings as of period end were as follows:
Undistributed ordinary income | $ 26,256 |
Undistributed long-term capital gain | $ 30,329 |
Net unrealized appreciation (depreciation) on securities and other investments | $ (62,562) |
The tax character of distributions paid was as follows:
| October 31, 2014 | October 31, 2013 |
Ordinary Income | $ 576,841 | $ 428,548 |
Short-Term Trading (Redemption) Fees. Shares held by investors in the Fund less than 60 days may have been subject to a redemption fee equal to 1.00% of the NAV of shares redeemed. All redemption fees, which reduce the proceeds of the shareholder redemption, are retained by the Fund and accounted for as an addition to paid in capital.
Annual Report
3. Significant Accounting Policies - continued
Restricted Securities. The Fund may invest in securities that are subject to legal or contractual restrictions on resale. These securities generally may be resold in transactions exempt from registration or to the public if the securities are registered. Disposal of these securities may involve time-consuming negotiations and expense, and prompt sale at an acceptable price may be difficult. Information regarding restricted securities is included at the end of the Fund's Schedule of Investments.
Loans and Other Direct Debt Instruments. The Fund invests in direct debt instruments which are interests in amounts owed to lenders by corporate or other borrowers. These instruments may be in the form of loans, trade claims or other receivables and may include standby financing commitments such as revolving credit facilities that obligate the Fund to supply additional cash to the borrower on demand. Loans may be acquired through assignment or participation, or may be made directly to a borrower. The Fund also invests in unfunded loan commitments, which are contractual obligations for future funding. Information regarding unfunded commitments is included at the end of the Fund's Schedule of Investments.
Purchases and Sales of Investments. Purchases and sales of securities (including principal repayments of bank loan obligations), other than short-term securities, aggregated $8,114,227 and $8,057,054, respectively.
New Accounting Pronouncement. In June 2014, the Financial Accounting Standards Board issued Accounting Standard Update No. 2014-11, Repurchase-to-Maturity Transactions, Repurchase Financings, and Disclosures. The Update amends the accounting for certain repurchase agreements and expands disclosure requirements for reverse repurchase agreements, securities lending and other similar transactions. The disclosure requirements are effective for annual and interim reporting periods beginning after December 15, 2014. Management is currently evaluating the impact of the Update on the Fund's financial statements and related disclosures.
4. Fees and Other Transactions with Affiliates.
Management Fee. Fidelity Management & Research Company (the investment adviser) and its affiliates provide the Fund with investment management related services for which the Fund pays a monthly management fee. The management fee is the sum of an individual fund fee rate that is based on an annual rate of .45% of the Fund's average net assets and an annualized group fee rate that averaged .11% during the period. The group fee rate is based upon the average net assets of all the mutual funds advised by the investment adviser, including any mutual funds previously advised by the investment adviser that are currently advised by Fidelity SelectCo, LLC, an affiliate of the investment adviser. The group fee rate decreases as assets under management increase and increases as assets under management decrease. For the reporting period, the total annual management fee rate was .56% of the Fund's average net assets.
Annual Report
Notes to Financial Statements - continued
(Amounts in thousands except percentages)
4. Fees and Other Transactions with Affiliates - continued
Distribution and Service Plan Fees. In accordance with Rule 12b-1 of the 1940 Act, the Fund has adopted separate Distribution and Service Plans for each class of shares. Certain classes pay Fidelity Distributors Corporation (FDC), an affiliate of the investment adviser, separate Distribution and Service Fees, each of which is based on an annual percentage of each class' average net assets. In addition, FDC may pay financial intermediaries for selling shares of the Fund and providing shareholder support services. For the period, the Distribution and Service Fee rates, total fees and amounts retained by FDC were as follows:
| Distribution | Service | Total Fees | Retained |
Class A | -% | .25% | $ 3,857 | $ 158 |
Class T | -% | .25% | 659 | 2 |
Class B | .55% | .15% | 142 | 112 |
Class C | .75% | .25% | 9,277 | 1,498 |
|
|
| $ 13,935 | $ 1,770 |
Sales Load. FDC may receive a front-end sales charge of up to 2.75% for selling Class A shares and Class T shares, some of which is paid to financial intermediaries for selling shares of the Fund. Depending on the holding period, FDC may receive contingent deferred sales charges levied on Class A, Class T, Class B and Class C redemptions. The deferred sales charges range from 3.50% to 1.00% for Class B shares, 1.00% for Class C shares, 1.00% or .50% for certain purchases of Class A shares and .25% for certain purchases of Class T shares.
For the period, sales charge amounts retained by FDC were as follows:
| Retained |
Class A | $ 79 |
Class T | 12 |
Class B* | 22 |
Class C* | 104 |
| $ 217 |
* When Class B and Class C shares are initially sold, FDC pays commissions from its own resources to financial intermediaries through which the sales are made.
Transfer Agent Fees. Fidelity Investments Institutional Operations Company, Inc., (FIIOC), an affiliate of the investment adviser, is the transfer, dividend disbursing and shareholder servicing agent for each class of the Fund. FIIOC receives account fees and asset-based fees that vary according to the account size and type of account of the shareholders of the respective classes of the Fund. FIIOC pays for typesetting, printing and mailing of shareholder reports, except proxy statements.
Annual Report
4. Fees and Other Transactions with Affiliates - continued
Transfer Agent Fees - continued
For the period, transfer agent fees for each class were as follows:
| Amount | % of |
Class A | $ 2,252 | .15 |
Class T | 626 | .24 |
Class B | 45 | .22 |
Class C | 1,372 | .15 |
Fidelity Floating Rate High Income Fund | 10,472 | .11 |
Institutional Class | 5,895 | .16 |
| $ 20,662 |
|
Accounting Fees. Fidelity Service Company, Inc. (FSC), an affiliate of the investment adviser, maintains the Fund's accounting records. The fee is based on the level of average net assets for each month.
5. Committed Line of Credit.
The Fund participates with other funds managed by the investment adviser or an affiliate in a $4.25 billion credit facility (the "line of credit") to be utilized for temporary or emergency purposes to fund shareholder redemptions or for other short-term liquidity purposes. The Fund has agreed to pay commitment fees on its pro-rata portion of the line of credit, which amounted to $26 and is reflected in Miscellaneous expenses on the Statement of Operations. During the period, the Fund did not borrow on this line of credit.
6. Expense Reductions.
Through arrangements with the Fund's custodian, credits realized as a result of uninvested cash balances were used to reduce the Fund's expenses. During the period, these credits reduced the Fund's custody expenses by $53.
In addition, the investment adviser reimbursed a portion of the Fund's operating expenses during the period in the amount of $6.
Annual Report
Notes to Financial Statements - continued
(Amounts in thousands except percentages)
7. Distributions to Shareholders.
Distributions to shareholders of each class were as follows:
Years ended October 31, | 2014 | 2013 |
From net investment income |
|
|
Class A | $ 47,339 | $ 41,401 |
Class T | 7,875 | 7,141 |
Class B | 519 | 529 |
Class C | 21,575 | 18,030 |
Fidelity Floating Rate High Income Fund | 321,211 | 214,851 |
Institutional Class | 121,183 | 93,637 |
Total | $ 519,702 | $ 375,589 |
From net realized gain |
|
|
Class A | $ 6,085 | $ 6,467 |
Class T | 983 | 1,176 |
Class B | 81 | 117 |
Class C | 3,472 | 3,997 |
Fidelity Floating Rate High Income Fund | 33,019 | 28,516 |
Institutional Class | 13,499 | 12,686 |
Total | $ 57,139 | $ 52,959 |
8. Share Transactions.
Share transactions for each class were as follows and may contain automatic conversions between classes or exchanges between funds:
| Shares | Dollars | ||
Years ended October 31, | 2014 | 2013 | 2014 | 2013 |
Class A |
|
|
|
|
Shares sold | 32,788 | 75,563 | $ 327,152 | $ 753,535 |
Reinvestment of distributions | 4,526 | 3,658 | 45,087 | 36,455 |
Shares redeemed | (85,268) | (42,208) | (849,518) | (421,018) |
Net increase (decrease) | (47,954) | 37,013 | $ (477,279) | $ 368,972 |
Class T |
|
|
|
|
Shares sold | 3,546 | 10,009 | $ 35,348 | $ 99,597 |
Reinvestment of distributions | 806 | 727 | 8,018 | 7,232 |
Shares redeemed | (7,285) | (7,688) | (72,473) | (76,547) |
Net increase (decrease) | (2,933) | 3,048 | $ (29,107) | $ 30,282 |
Class B |
|
|
|
|
Shares sold | 199 | 663 | $ 1,993 | $ 6,596 |
Reinvestment of distributions | 50 | 50 | 494 | 495 |
Shares redeemed | (838) | (851) | (8,343) | (8,474) |
Net increase (decrease) | (589) | (138) | $ (5,856) | $ (1,383) |
Annual Report
8. Share Transactions - continued
| Shares | Dollars | ||
Years ended October 31, | 2014 | 2013 | 2014 | 2013 |
Class C |
|
|
|
|
Shares sold | 12,315 | 30,392 | $ 122,843 | $ 303,076 |
Reinvestment of distributions | 1,906 | 1,609 | 18,981 | 16,022 |
Shares redeemed | (25,513) | (17,011) | (254,028) | (169,644) |
Net increase (decrease) | (11,292) | 14,990 | $ (112,204) | $ 149,454 |
Fidelity Floating Rate High Income Fund |
|
|
|
|
Shares sold | 320,632 | 483,346 | $ 3,194,510 | $ 4,812,772 |
Reinvestment of distributions | 29,181 | 20,114 | 290,182 | 200,158 |
Shares redeemed | (321,413) | (189,555) | (3,193,979) | (1,887,500) |
Net increase (decrease) | 28,400 | 313,905 | $ 290,713 | $ 3,125,430 |
Institutional Class |
|
|
|
|
Shares sold | 123,632 | 203,411 | $ 1,230,573 | $ 2,024,367 |
Reinvestment of distributions | 7,408 | 5,909 | 73,620 | 58,759 |
Shares redeemed | (159,132) | (96,688) | (1,581,091) | (962,445) |
Net increase (decrease) | (28,092) | 112,632 | $ (276,898) | $ 1,120,681 |
9. Other.
The Fund's organizational documents provide former and current trustees and officers with a limited indemnification against liabilities arising in connection with the performance of their duties to the Fund. In the normal course of business, the Fund may also enter into contracts that provide general indemnifications. The Fund's maximum exposure under these arrangements is unknown as this would be dependent on future claims that may be made against the Fund. The risk of material loss from such claims is considered remote.
Annual Report
Report of Independent Registered Public Accounting Firm
To the Trustees of Fidelity Advisor Series I and Shareholders of Fidelity Advisor Floating Rate High Income Fund:
We have audited the accompanying statement of assets and liabilities of Fidelity Advisor Floating Rate High Income Fund (the Fund), a fund of Fidelity Advisor Series I, including the schedule of investments, as of October 31, 2014, and the related statement of operations for the year then ended, the statement of changes in net assets for each of the two years in the period then ended, and the financial highlights for each of the five years in the period then ended. These financial statements and financial highlights are the responsibility of the Fund's management. Our responsibility is to express an opinion on these financial statements and financial highlights based on our audits.
We conducted our audits in accordance with the standards of the Public Company Accounting Oversight Board (United States). Those standards require that we plan and perform the audit to obtain reasonable assurance about whether the financial statements and financial highlights are free of material misstatement. The Fund is not required to have, nor were we engaged to perform, an audit of its internal control over financial reporting. Our audits included consideration of internal control over financial reporting as a basis for designing audit procedures that are appropriate in the circumstances, but not for the purpose of expressing an opinion on the effectiveness of the Fund's internal control over financial reporting. Accordingly, we express no such opinion. An audit also includes examining, on a test basis, evidence supporting the amounts and disclosures in the financial statements, assessing the accounting principles used and significant estimates made by management, as well as evaluating the overall financial statement presentation. Our procedures included confirmation of securities owned as of October 31, 2014, by correspondence with the custodians, agent banks and brokers; where replies were not received from brokers, we performed other auditing procedures. We believe that our audits provide a reasonable basis for our opinion.
In our opinion, the financial statements and financial highlights referred to above present fairly, in all material respects, the financial position of Fidelity Advisor Floating Rate High Income Fund as of October 31, 2014, the results of its operations for the year then ended, the changes in its net assets for each of the two years in the period then ended, and the financial highlights for each of the five years in the period then ended, in conformity with accounting principles generally accepted in the United States of America.
DELOITTE & TOUCHE LLP
Boston, Massachusetts
December 22, 2014
Annual Report
Trustees and Officers
The Trustees, Member of the Advisory Board, and officers of the trust and fund, as applicable, are listed below. The Board of Trustees governs the fund and is responsible for protecting the interests of shareholders. The Trustees are experienced executives who meet periodically throughout the year to oversee the fund's activities, review contractual arrangements with companies that provide services to the fund, oversee management of the risks associated with such activities and contractual arrangements, and review the fund's performance. Except for James C. Curvey, each of the Trustees oversees 174 funds. Mr. Curvey oversees 407 funds.
The Trustees hold office without limit in time except that (a) any Trustee may resign; (b) any Trustee may be removed by written instrument, signed by at least two-thirds of the number of Trustees prior to such removal; (c) any Trustee who requests to be retired or who has become incapacitated by illness or injury may be retired by written instrument signed by a majority of the other Trustees; and (d) any Trustee may be removed at any special meeting of shareholders by a two-thirds vote of the outstanding voting securities of the trust. Each Trustee who is not an interested person (as defined in the 1940 Act) of the trust and the fund (Independent Trustee), shall retire not later than the last day of the calendar year in which his or her 75th birthday occurs. The Independent Trustees may waive this mandatory retirement age policy with respect to individual Trustees. The officers and Advisory Board Member hold office without limit in time, except that any officer and Advisory Board Member may resign or may be removed by a vote of a majority of the Trustees at any regular meeting or any special meeting of the Trustees. Except as indicated, each individual has held the office shown or other offices in the same company for the past five years.
Experience, Skills, Attributes, and Qualifications of the Fund's Trustees. The Governance and Nominating Committee has adopted a statement of policy that describes the experience, qualifications, attributes, and skills that are necessary and desirable for potential Independent Trustee candidates (Statement of Policy). The Board believes that each Trustee satisfied at the time he or she was initially elected or appointed a Trustee, and continues to satisfy, the standards contemplated by the Statement of Policy. The Governance and Nominating Committee also engages professional search firms to help identify potential Independent Trustee candidates who have the experience, qualifications, attributes, and skills consistent with the Statement of Policy. From time to time, additional criteria based on the composition and skills of the current Independent Trustees, as well as experience or skills that may be appropriate in light of future changes to board composition, business conditions, and regulatory or other developments, have also been considered by the professional search firms and the Governance and Nominating Committee. In addition, the Board takes into account the Trustees' commitment and participation in Board and committee meetings, as well as their leadership of standing and ad hoc committees throughout their tenure.
In determining that a particular Trustee was and continues to be qualified to serve as a Trustee, the Board has considered a variety of criteria, none of which, in isolation, was controlling. The Board believes that, collectively, the Trustees have balanced and diverse experience, qualifications, attributes, and skills, which allow the Board to operate effectively in governing the fund and protecting the interests of shareholders. Information about the specific experience, skills, attributes, and qualifications of each Trustee, which in each case led to the Board's conclusion that the Trustee should serve (or continue to serve) as a trustee of the fund, is provided below.
Annual Report
Trustees and Officers - continued
Board Structure and Oversight Function. James C. Curvey is an interested person (as defined in the 1940 Act) and currently serves as Chairman. The Trustees have determined that an interested Chairman is appropriate and benefits shareholders because an interested Chairman has a personal and professional stake in the quality and continuity of services provided to the fund. Independent Trustees exercise their informed business judgment to appoint an individual of their choosing to serve as Chairman, regardless of whether the Trustee happens to be independent or a member of management. The Independent Trustees have determined that they can act independently and effectively without having an Independent Trustee serve as Chairman and that a key structural component for assuring that they are in a position to do so is for the Independent Trustees to constitute a substantial majority for the Board. The Independent Trustees also regularly meet in executive session. Ned C. Lautenbach serves as Chairman of the Independent Trustees and as such (i) acts as a liaison between the Independent Trustees and management with respect to matters important to the Independent Trustees and (ii) with management prepares agendas for Board meetings.
Fidelity funds are overseen by different Boards of Trustees. The fund's Board oversees Fidelity's equity and high income funds and another Board oversees Fidelity's investment-grade bond, money market, and asset allocation funds. The asset allocation funds may invest in Fidelity funds overseen by the fund's Board. The use of separate Boards, each with its own committee structure, allows the Trustees of each group of Fidelity funds to focus on the unique issues of the funds they oversee, including common research, investment, and operational issues. On occasion, the separate Boards establish joint committees to address issues of overlapping consequences for the Fidelity funds overseen by each Board.
The Trustees operate using a system of committees to facilitate the timely and efficient consideration of all matters of importance to the Trustees, the fund, and fund shareholders and to facilitate compliance with legal and regulatory requirements and oversight of the fund's activities and associated risks. The Board, acting through its committees, has charged FMR and its affiliates with (i) identifying events or circumstances the occurrence of which could have demonstrably adverse effects on the fund's business and/or reputation; (ii) implementing processes and controls to lessen the possibility that such events or circumstances occur or to mitigate the effects of such events or circumstances if they do occur; and (iii) creating and maintaining a system designed to evaluate continuously business and market conditions in order to facilitate the identification and implementation processes described in (i) and (ii) above. Because the day-to-day operations and activities of the fund are carried out by or through FMR, its affiliates and other service providers, the fund's exposure to risks is mitigated but not eliminated by the processes overseen by the Trustees. While each of the Board's committees has responsibility for overseeing different aspects of the fund's activities, oversight is exercised primarily through the Operations, Audit, and Compliance Committees. In addition, the Independent Trustees have worked with FMR to enhance the Board's oversight of investment and financial risks, legal and regulatory risks, technology risks, and operational risks, including the development of additional risk reporting to the Board. For example, a working group comprised of Independent Trustees and FMR has worked and continues to work to review the Fidelity funds' valuation-related activities, reporting and risk management. Appropriate personnel, including but not limited to the fund's Chief Compliance Officer (CCO), FMR's internal auditor, the independent accountants, the fund's Treasurer and portfolio management personnel, make periodic reports to the Board's committees, as appropriate, including an annual review of FMR's risk management program for the Fidelity funds. The responsibilities of each standing committee, including their oversight responsibilities, are described further under "Standing Committees of the Fund's Trustees."
Annual Report
The fund's Statement of Additional Information (SAI) includes more information about the Trustees. To request a free copy, call Fidelity at 1-877-208-0098.
Interested Trustees*:
Correspondence intended for each Trustee who is an interested person may be sent to Fidelity Investments, 245 Summer Street, Boston, Massachusetts 02210.
Name, Year of Birth; Principal Occupations and Other Relevant Experience+ | |
James C. Curvey (1935) | |
Year of Election or Appointment: 2007 Trustee Chairman of the Board of Trustees | |
| Mr. Curvey also serves as Trustee of other Fidelity funds. Mr. Curvey is a Director of Fidelity Research & Analysis Co. (2009-present), and Vice Chairman (2007-present) and Director of FMR LLC. In addition, Mr. Curvey serves as an Overseer for the Boston Symphony Orchestra and a member of the board of Artis-Naples, Naples, Florida, and as a Trustee for Brewster Academy, Wolfeboro, New Hampshire. Previously, Mr. Curvey served as a Director of Fidelity Investments Money Management, Inc. (2009-2014), a Director of FMR (2007-2014), and a Director of FMR Co., Inc. (2007-2014). |
Charles S. Morrison (1960) | |
Year of Election or Appointment: 2014 Trustee | |
| Mr. Morrison also serves as Trustee of other funds. He serves as a Director of Fidelity Investments Money Management, Inc. (FIMM) (2014-present), Director of Fidelity SelectCo, LLC (2014-present), President, Asset Management (2014-present) and is an employee of Fidelity Investments. Previously, Mr. Morrison served as Vice President of Fidelity's Fixed Income and Asset Allocation Funds (2012-2014), President, Fixed Income (2011-2014), Vice President of Fidelity's Money Market Funds (2005-2009), President, Money Market Group Leader of FMR (2009), and Senior Vice President, Money Market Group of FMR (2004-2009). Mr. Morrison also served as Vice President of Fidelity's Bond Funds (2002-2005), certain Balanced Funds (2002-2005), and certain Asset Allocation Funds (2002-2007), and as Senior Vice President (2002-2005) of Fidelity's Bond Division. |
* Trustees have been determined to be "Interested Trustees" by virtue of, among other things, their affiliation with the trust or various entities under common control with FMR.
+ The information above includes each Trustee's principal occupation during the last five years and other information relating to the experience, attributes, and skills relevant to each Trustee's qualifications to serve as a Trustee, which led to the conclusion that each Trustee should serve as a Trustee for the fund.
Annual Report
Independent Trustees:
Correspondence intended for each Independent Trustee (that is, the Trustees other than the Interested Trustees) may be sent to Fidelity Investments, P.O. Box 55235, Boston, Massachusetts 02205-5235.
Name, Year of Birth; Principal Occupations and Other Relevant Experience+ | |
Dennis J. Dirks (1948) | |
Year of Election or Appointment: 2005 Trustee | |
| Mr. Dirks also serves as Trustee of other Fidelity funds. Prior to his retirement in May 2003, Mr. Dirks was Chief Operating Officer and a member of the Board of The Depository Trust & Clearing Corporation (DTCC). He also served as President, Chief Operating Officer, and Board member of The Depository Trust Company (DTC) and President and Board member of the National Securities Clearing Corporation (NSCC). In addition, Mr. Dirks served as Chief Executive Officer and Board member of the Government Securities Clearing Corporation, Chief Executive Officer and Board member of the Mortgage-Backed Securities Clearing Corporation, as a Trustee and a member of the Finance Committee of Manhattan College (2005-2008), and as a Trustee and a member of the Finance Committee of AHRC of Nassau County (2006-2008). Mr. Dirks is a member of the Independent Directors Council (IDC) Governing Council (2010-present) and Board of Directors for The Brookville Center for Children's Services, Inc. (2009-present). |
Alan J. Lacy (1953) | |
Year of Election or Appointment: 2008 Trustee | |
| Mr. Lacy also serves as Trustee of other Fidelity funds. Mr. Lacy serves as Senior Adviser (2007-present) of Oak Hill Capital Partners, L.P. (private equity). Mr. Lacy also served as Chief Executive Officer (2000-2005) and Vice Chairman (2005-2006) of Sears Holdings Corporation and Sears, Roebuck and Co. (retail). In addition, Mr. Lacy serves as a member of the Board of Directors of Dave & Buster's Entertainment, Inc. (restaurant and entertainment complexes, 2010-present), Earth Fare, Inc. (retail grocery, 2012-present), The Hillman Companies, Inc. (hardware wholesalers, 2010-present), and Bristol-Myers Squibb Company (global pharmaceuticals, 2008-present). Mr. Lacy is a member of the Board of Trustees of The National Parks Conservation Association (2006-present). Previously, Mr. Lacy served as Chairman of the Board of Trustees of the National Parks Conservation Association (2008-2011) and as a member of the Board of Directors for the Western Union Company (global money transfer, 2006-2011). |
Ned C. Lautenbach (1944) | |
Year of Election or Appointment: 2000 Trustee Chairman of the Independent Trustees | |
| Mr. Lautenbach also serves as Trustee of other Fidelity funds. Mr. Lautenbach currently serves as the Lead Director of the Eaton Corporation Board of Directors (diversified industrial, 1997-present). Mr. Lautenbach is Chairman of the Board of Directors of the Philharmonic Center for the Arts in Naples, Florida (2012-present) and a member of the Council on Foreign Relations (1994-present). Previously, Mr. Lautenbach was a Partner/Advisory Partner at Clayton, Dubilier & Rice, LLC (private equity investment, 1998-2010), as well as a Director of Sony Corporation (2006-2007). |
Joseph Mauriello (1944) | |
Year of Election or Appointment: 2008 Trustee | |
| Mr. Mauriello also serves as Trustee of other Fidelity funds. Prior to his retirement in January 2006, Mr. Mauriello served in numerous senior management positions including Deputy Chairman and Chief Operating Officer (2004-2005), and Vice Chairman of Financial Services (2002-2004) of KPMG LLP US (professional services, 1965-2005). Mr. Mauriello currently serves as a member of the Board of Directors of XL Group plc. (global insurance and re-insurance, 2006-present). Previously, Mr. Mauriello served as a Director of the Hamilton Funds of the Bank of New York (2006-2007) and of Arcadia Resources Inc. (health care services and products, 2007-2012). |
Robert W. Selander (1950) | |
Year of Election or Appointment: 2011 Trustee | |
| Mr. Selander also serves as Trustee of other Fidelity funds. Previously, Mr. Selander served as a Member of the Advisory Board of other Fidelity funds (2011), and Executive Vice Chairman (2010), Chief Executive Officer (2009-2010), and President and Chief Executive Officer (1997-2009) of Mastercard, Inc. |
Cornelia M. Small (1944) | |
Year of Election or Appointment: 2005 Trustee | |
| Ms. Small also serves as Trustee of other Fidelity funds. Ms. Small is a member of the Board of Directors (2009-present) and Chair of the Investment Committee (2010-present) of the Teagle Foundation. Ms. Small also serves on the Investment Committee of the Berkshire Taconic Community Foundation (2008-present). Previously, Ms. Small served as Chairperson (2002-2008) and a member of the Investment Committee and Chairperson (2008-2012) and a member of the Board of Trustees of Smith College. In addition, Ms. Small served as Chief Investment Officer, Director of Global Equity Investments, and a member of the Board of Directors of Scudder, Stevens & Clark and Scudder Kemper Investments. |
William S. Stavropoulos (1939) | |
Year of Election or Appointment: 2002 Trustee Vice Chairman of the Independent Trustees | |
| Mr. Stavropoulos also serves as Trustee of other Fidelity funds. Mr. Stavropoulos serves as President and Founder of the Michigan Baseball Foundation, the Great Lakes Loons (2007-present). Mr. Stavropoulos is Chairman Emeritus of the Board of Directors of The Dow Chemical Company, where he previously served in numerous senior management positions, including President, CEO (1995-2000; 2002-2004), Chairman of the Executive Committee (2000-2006), and as a member of the Board of Directors (1990-2006). Currently, Mr. Stavropoulos is Chairman of the Board of Directors of Univar Inc. (global distributor of commodity and specialty chemicals), a Director of Teradata Corporation (data warehousing and technology solutions), and Maersk Inc. (industrial conglomerate), and a member of the Advisory Board for Metalmark Capital LLC (private equity investment, 2005-present). Mr. Stavropoulos is an operating advisor to Clayton, Dubilier & Rice, LLC (private equity investment). In addition, Mr. Stavropoulos is a member of the University of Notre Dame Advisory Council for the College of Science, a Trustee of the Rollin L. Gerstacker Foundation, and a Director of the Naples Philharmonic Center for the Arts. Previously, Mr. Stavropoulos served as a Director of Chemical Financial Corporation (bank holding company, 1993-2012) and Tyco International, Ltd. (multinational manufacturing and services, 2007-2012). |
David M. Thomas (1949) | |
Year of Election or Appointment: 2008 Trustee | |
| Mr. Thomas also serves as Trustee of other Fidelity funds. Mr. Thomas serves as Non-Executive Chairman of the Board of Directors of Fortune Brands Home and Security (home and security products, 2011-present), and as a member of the Board of Directors of Interpublic Group of Companies, Inc. (marketing communication, 2004-present). Previously, Mr. Thomas served as Executive Chairman (2005-2006) and Chairman and Chief Executive Officer (2000-2005) of IMS Health, Inc. (pharmaceutical and healthcare information solutions), and a Director of Fortune Brands, Inc. (consumer products, 2000-2011). |
+ The information above includes each Trustee's principal occupation during the last five years and other information relating to the experience, attributes, and skills relevant to each Trustee's qualifications to serve as a Trustee, which led to the conclusion that each Trustee should serve as a Trustee for the fund.
Advisory Board Member and Officers:
Correspondence intended for each officer and Peter S. Lynch may be sent to Fidelity Investments, 245 Summer Street, Boston, Massachusetts 02210. Officers appear below in alphabetical order.
Name, Year of Birth; Principal Occupation | |
Peter S. Lynch (1944) | |
Year of Election or Appointment: 2003 Member of the Advisory Board | |
| Mr. Lynch also serves as Member of the Advisory Board of other Fidelity funds. Mr. Lynch is Vice Chairman and a Director of FMR and FMR Co., Inc. In addition, Mr. Lynch serves as a Trustee of Boston College and as the Chairman of the Inner-City Scholarship Fund. Previously, Mr. Lynch served on the Special Olympics International Board of Directors (1997-2006). |
Elizabeth Paige Baumann (1968) | |
Year of Election or Appointment: 2012 Anti-Money Laundering (AML) Officer | |
| Ms. Baumann also serves as AML Officer of other funds. She is Chief AML Officer of FMR LLC (2012-present) and is an employee of Fidelity Investments. Previously, Ms. Baumann served as Vice President and Deputy Anti-Money Laundering Officer (2007-2012). |
William C. Coffey (1969) | |
Year of Election or Appointment: 2009 Assistant Secretary | |
| Mr. Coffey also serves as Assistant Secretary of other funds. He is Senior Vice President and Deputy General Counsel of FMR LLC (2010-present), and is an employee of Fidelity Investments. Previously, Mr. Coffey served as Vice President and Associate General Counsel of FMR LLC (2005-2009). |
Jonathan Davis (1968) | |
Year of Election or Appointment: 2010 Assistant Treasurer | |
| Mr. Davis also serves as Assistant Treasurer of other funds. Mr. Davis is an employee of Fidelity Investments. Previously, Mr. Davis served as Vice President and Associate General Counsel of FMR LLC (2003-2010). |
Adrien E. Deberghes (1967) | |
Year of Election or Appointment: 2008 Deputy Treasurer | |
| Mr. Deberghes also serves as an officer of other funds. He is an employee of Fidelity Investments (2008-present). Prior to joining Fidelity Investments, Mr. Deberghes was Senior Vice President of Mutual Fund Administration at State Street Corporation (2007-2008), Senior Director of Mutual Fund Administration at Investors Bank & Trust (2005-2007), and Director of Finance for Dunkin' Brands (2000-2005). |
Stephanie J. Dorsey (1969) | |
Year of Election or Appointment: 2010 Assistant Treasurer | |
| Ms. Dorsey also serves as an officer of other funds. She is an employee of Fidelity Investments (2008-present) and has served in other fund officer roles. Prior to joining Fidelity Investments, Ms. Dorsey served as Treasurer (2004-2008) of the JPMorgan Mutual Funds and Vice President (2004-2008) of JPMorgan Chase Bank. |
Howard J. Galligan III (1966) | |
Year of Election or Appointment: 2014 Chief Financial Officer | |
| Mr. Galligan also serves as Chief Financial Officer of other funds. Mr. Galligan serves as President of Fidelity Pricing and Cash Management Services (FPCMS) (2014-present) and as a Director of Strategic Advisers, Inc. (2008-present). Previously, Mr. Galligan served as Chief Administrative Officer of Asset Management (2011-2014) and Chief Operating Officer and Senior Vice President of Investment Support for Strategic Advisers, Inc. (2003-2011). |
Scott C. Goebel (1968) | |
Year of Election or Appointment: 2008 Secretary and Chief Legal Officer (CLO) | |
| Mr. Goebel serves as Secretary and CLO of other funds. Mr. Goebel also serves as Secretary of Fidelity SelectCo, LLC (2013-present), Fidelity Investments Money Management, Inc. (FIMM) (2010-present) and Fidelity Research and Analysis Company (FRAC) (2010-present); General Counsel, Secretary, and Senior Vice President of FMR (2008-present) and FMR Co., Inc. (2008-present); Chief Legal Officer of Fidelity Management & Research (Hong Kong) Limited (2008-present); and Assistant Secretary of Fidelity Management & Research (Japan) Limited (2008-present) and Fidelity Management & Research (U.K.) Inc. (2008-present). Previously, Mr. Goebel served as Secretary and CLO of other Fidelity funds (2008-2013), Assistant Secretary of FIMM (2008-2010), FRAC (2008-2010), and certain funds (2007-2008); and as Vice President and Secretary of Fidelity Distributors Corporation (FDC) (2005-2007). Mr. Goebel has been employed by FMR LLC or an affiliate since 2001. |
Thomas C. Hense (1964) | |
Year of Election or Appointment: 2008/2010 Vice President | |
| Mr. Hense also serves as Vice President of other funds (High Income (2008), Small Cap (2008), and Value (2010) funds). Previously, Mr. Hense served as a portfolio manager for Fidelity's Institutional Money Management Group (Pyramis) (2003-2008). |
Brian B. Hogan (1964) | |
Year of Election or Appointment: 2009 Vice President | |
| Mr. Hogan also serves as Trustee or Vice President of other funds. Mr. Hogan serves as a Director of Fidelity SelectCo, LLC (2014-present) and President of FMR's Equity Division (2009-present). Previously, Mr. Hogan served as Senior Vice President, Equity Research of FMR (2006-2009) and as a portfolio manager. |
Chris Maher (1972) | |
Year of Election or Appointment: 2013 Assistant Treasurer | |
| Mr. Maher serves as Assistant Treasurer of other funds. Mr. Maher is Vice President of Valuation Oversight and is an employee of Fidelity Investments. Previously, Mr. Maher served as Vice President of Asset Management Compliance (2013), Vice President of FMR's Program Management Group (2010-2013), and Vice President of Valuation Oversight (2008-2010). |
Kenneth B. Robins (1969) | |
Year of Election or Appointment: 2008 President and Treasurer | |
| Mr. Robins also serves as an officer of other funds. Mr. Robins serves as Executive Vice President of Fidelity Investments Money Management, Inc. (FIMM) (2013-present) and is an employee of Fidelity Investments (2004-present). Previously, Mr. Robins served in other fund officer roles. |
Stephen Sadoski (1971) | |
Year of Election or Appointment: 2012 Deputy Treasurer | |
| Mr. Sadoski also serves as Deputy Treasurer of other funds. He is an employee of Fidelity Investments (2012-present) and has served in another fund officer role. Prior to joining Fidelity Investments, Mr. Sadoski served as an assistant chief accountant in the Division of Investment Management of the Securities and Exchange Commission (SEC) (2009-2012) and as a senior manager at Deloitte & Touche LLP (1997-2009). |
Stacie M. Smith (1974) | |
Year of Election or Appointment: 2013 Deputy Treasurer | |
| Ms. Smith also serves as an officer of other funds. She is an employee of Fidelity Investments (2009-present) and has served in other fund officer roles. Prior to joining Fidelity Investments, Ms. Smith served as Senior Audit Manager of Ernst & Young LLP (1996-2009). |
Renee Stagnone (1975) | |
Year of Election or Appointment: 2013 Deputy Treasurer | |
| Ms. Stagnone also serves as Deputy Treasurer of other funds. Ms. Stagnone is an employee of Fidelity Investments. |
Linda J. Wondrack (1964) | |
Year of Election or Appointment: 2014 Chief Compliance Officer | |
| Ms. Wondrack also serves as Chief Compliance Officer of other funds. Ms. Wondrack is Executive Vice President and head of the Ethics Office and Asset Management Compliance for Fidelity Investments (2012-present). Ms. Wondrack also serves as Chief Compliance Officer of Fidelity SelectCo, LLC (2014-present); Chief Compliance Officer of Impresa Management LLC (2013-present); and Chief Compliance Officer of FMR Co., Inc., Fidelity Investments Money Management, Inc., Fidelity Management & Research (Japan) Limited, Fidelity Management & Research (U.K.) Inc., Fidelity Management & Research (Hong Kong), Fidelity Management & Research Company, Pyramis Global Advisors, LLC, and Strategic Advisers, Inc., Ballyrock Investment Advisors LLC, and Northern Neck Investors LLC (2012-present). Previously, Ms. Wondrack served as Senior Vice President and Chief Compliance Officer for Columbia Management Investment Advisers, LLC (2005-2012); Chief Compliance Officer for certain funds within the Columbia Family of Funds (2007-2012); and Senior Vice President of Compliance Risk Management at Bank of America (2005-2010). |
Joseph F. Zambello (1957) | |
Year of Election or Appointment: 2011 Deputy Treasurer | |
| Mr. Zambello also serves as Deputy Treasurer of other funds. Mr. Zambello is an employee of Fidelity Investments. Previously, Mr. Zambello served as Vice President of FMR's Program Management Group (2009-2011) and Vice President of the Transfer Agent Oversight Group (2005-2009). |
Annual Report
Distributions (Unaudited)
The Board of Trustees of Advisor Floating Rate High Income Fund voted to pay to shareholders of record at the opening of business on record date, the following distributions per share derived from capital gains realized from sales of portfolio securities, and dividends derived from net investment income:
| Pay Date | Record Date | Capital Gains |
Institutional Class | 12/08/14 | 12/08/14 | $0.04 |
The fund hereby designates as a capital gain dividend with respect to the taxable year ended October 31, 2014, $30,329,073, or, if subsequently determined to be different, the net capital gain of such year.
A total of 0.06% of the dividends distributed during the fiscal year was derived from interest on U.S. Government securities which is generally exempt from state income tax.
The fund designates $349,385,772 of distributions paid during the period January 1, 2014 to October 1, 2014 as qualifying to be taxed as interest-related dividends for nonresident alien shareholders.
The fund will notify shareholders in January 2015 of amounts for use in preparing 2014 income tax returns.
Annual Report
Board Approval of Investment Advisory Contracts and Management Fees
Fidelity Advisor Floating Rate High Income Fund
Each year, the Board of Trustees, including the Independent Trustees (together, the Board), votes on the renewal of the management contract with Fidelity Management & Research Company (FMR) and the sub-advisory agreements (together, the Advisory Contracts) for the fund. The Board, assisted by the advice of fund counsel and Independent Trustees' counsel, requests and considers a broad range of information relevant to the renewal of the Advisory Contracts throughout the year.
The Board meets regularly and, at each of its meetings, covers an extensive agenda of topics and materials and considers factors that are relevant to its annual consideration of the renewal of the fund's Advisory Contracts, including the services and support provided to the fund and its shareholders. The Board has established various standing committees (Committees), each composed of and chaired by Independent Trustees with varying backgrounds, to which the Board has assigned specific subject matter responsibilities in order to enhance effective decision-making by the Board. The Board, acting directly and through its Committees, requests and receives information concerning the annual consideration of the renewal of the fund's Advisory Contracts. The Board also meets as needed to consider matters specifically related to the Board's annual consideration of the renewal of the Advisory Contracts. Members of the Board may also meet with trustees of other Fidelity funds through ad hoc joint committees to discuss certain matters relevant to the Fidelity funds.
At its July 2014 meeting, the Board, including the Independent Trustees, unanimously determined to renew the fund's Advisory Contracts. In reaching its determination, the Board considered all factors it believed relevant, including (i) the nature, extent, and quality of the services to be provided to the fund and its shareholders (including the investment performance of the fund); (ii) the competitiveness of the fund's management fee and total expense ratio relative to peer funds; (iii) the total costs of the services to be provided by and the profits to be realized by Fidelity from its relationship with the fund; (iv) the extent to which economies of scale exist and would be realized as the fund grows; and (v) whether fee levels reflect these economies of scale, if any, for the benefit of fund shareholders. In connection with separate internal corporate reorganizations involving Fidelity Management & Research (U.K.) Inc. (FMR U.K.) and Fidelity Management & Research (Japan) Inc. (FMR Japan), the Board approved certain non-material amendments to the fund's sub-advisory agreements with FMR U.K. and FMR Japan to reflect that, after these reorganizations, FMR Investment Management (UK) Limited and Fidelity Management & Research (Japan) Limited will carry on the business of FMR U.K. and FMR Japan, respectively. The Board noted that no changes to the portfolio managers or to the foreign research or investment advisory services provided to the fund were expected in connection with either reorganization and that the same personnel and resources would continue to be available to the fund at the new entities.
Annual Report
Board Approval of Investment Advisory Contracts and
Management Fees - continued
In considering whether to renew the Advisory Contracts for the fund, the Board reached a determination, with the assistance of fund counsel and Independent Trustees' counsel and through the exercise of its business judgment, that the renewal of the Advisory Contracts was in the best interests of the fund and its shareholders and that the compensation payable under the Advisory Contracts was fair and reasonable. The Board's decision to renew the Advisory Contracts was not based on any single factor, but rather was based on a comprehensive consideration of all the information provided to the Board at its meetings throughout the year. The Board, in reaching its determination to renew the Advisory Contracts, was aware that shareholders of the fund have a broad range of investment choices available to them, including a wide choice among funds offered by Fidelity's competitors, and that the fund's shareholders, who have the opportunity to review and weigh the disclosure provided by the fund in its prospectus and other public disclosures, have chosen to invest in this fund, which is part of the Fidelity family of funds.
Nature, Extent, and Quality of Services Provided. The Board considered Fidelity's staffing as it relates to the fund, including the backgrounds of investment personnel of FMR and the sub-advisers (together, the Investment Advisers), and also considered the fund's investment objective, strategies, and related investment philosophy. The Independent Trustees also had discussions with senior management of Fidelity's investment operations and investment groups. The Board considered the structure of the portfolio manager compensation program and whether this structure provides appropriate incentives to act in the best interests of the fund. Additionally, the Board considered the portfolio managers' investments, if any, in the funds that they manage.
Resources Dedicated to Investment Management and Support Services. The Board and the Fund Oversight and Research Committees reviewed the general qualifications and capabilities of Fidelity's investment staff, including its size, education, experience, and resources, as well as Fidelity's approach to recruiting, training, managing, and compensating investment personnel. The Board noted that Fidelity has continued to increase the resources devoted to non-U.S. offices, including expansion of Fidelity's global investment organization. The Board also noted that Fidelity's analysts have extensive resources, tools and capabilities that allow them to conduct sophisticated quantitative and fundamental analysis, as well as credit analysis of issuers, counterparties and guarantors. Further, the Board believes that Fidelity's investment professionals have sufficient access to global information and data so as to provide competitive investment results over time, and that those professionals also have access to sophisticated tools that permit them to assess portfolio construction and risk and performance attribution characteristics continuously, as well as to transmit new information and research conclusions rapidly around the world. Additionally, in its deliberations, the Board considered Fidelity's trading and risk management capabilities and resources and global compliance infrastructure, which are an integral part of the investment management process.
Annual Report
Shareholder and Administrative Services. The Board considered (i) the nature, extent, quality, and cost of advisory, administrative, and shareholder services performed by the Investment Advisers and their affiliates under the Advisory Contracts and under separate agreements covering transfer agency, pricing and bookkeeping, and securities lending services for the fund; (ii) the nature and extent of the supervision of third party service providers, principally custodians and subcustodians; and (iii) the resources devoted to, and the record of compliance with, the fund's compliance policies and procedures. The Board also reviewed the allocation of fund brokerage, including allocations to brokers affiliated with the Investment Advisers, the use of brokerage commissions to pay fund expenses, and the use of "soft" commission dollars to pay for research services.
The Board noted that the growth of fund assets over time across the complex allows Fidelity to reinvest in the development of services designed to enhance the value or convenience of the Fidelity funds as investment vehicles. These services include 24-hour access to account information and market information through telephone representatives and over the Internet, investor education materials and asset allocation tools, and the expanded availability of Fidelity Investor Centers.
In 2014, the Board formed an ad hoc Committee on Transfer Agency Fees to review the variety of transfer agency fee structures throughout the industry and Fidelity's competitive positioning with respect to industry participants.
Investment in a Large Fund Family. The Board considered the benefits to shareholders of investing in a Fidelity fund, including the benefits of investing in a fund that is part of a large family of funds offering a variety of investment disciplines and providing a large variety of mutual fund investor services. The Board noted that Fidelity had taken, or had made recommendations that resulted in the Fidelity funds taking, a number of actions over the previous year that benefited particular funds, including (i) continuing to dedicate additional resources to investment research and to the support of the senior management team that oversees asset management; (ii) persisting in efforts to enhance Fidelity's global research capabilities; (iii) launching new funds and making other enhancements to meet client needs for income-oriented solutions; (iv) reducing fund expenses for certain index funds; (v) continuing to launch dedicated lower cost underlying funds to meet portfolio construction needs related to expanding underlying fund options for Fidelity funds of funds, specifically for the Freedom Fund product lines; (vi) rationalizing product lines and gaining increased efficiencies through fund mergers; (vii) launching sector-based exchange-traded funds and establishing a new Fidelity adviser to manage sector-based funds and products; (viii) continuing to develop and implement technology to improve security and increase efficiency; (ix) modifying the eligibility criteria for certain share classes to increase their marketability to a portion of the defined contribution plan market; (x) waiving redemption fees for certain qualified fund-of-fund and wrap programs and certain retirement plan transactions; and (xi) launching new Institutional Class shares of certain money market funds to attract and retain assets and to fill a gap in the money market fund lineup.
Annual Report
Board Approval of Investment Advisory Contracts and
Management Fees - continued
Investment Performance. The Board considered whether the fund has operated in accordance with its investment objective, as well as its record of compliance with its investment restrictions and its performance history. The Board noted that there was a portfolio management change for the fund in April 2013.
The Board took into account discussions with the Investment Advisers about fund investment performance that occur at Board meetings throughout the year. In this regard the Board noted that as part of regularly scheduled fund reviews and other reports to the Board on fund performance, the Board periodically considers annualized return information for the fund, for different time periods, measured against a securities market index ("benchmark index") and a peer group of funds with similar objectives ("peer group"). In its evaluation of fund investment performance, the Board gave particular attention to information indicating changes in performance of certain Fidelity funds for specific time periods and the Investment Advisers' explanations for any overperformance or underperformance.
In addition to reviewing absolute and relative fund performance, the Independent Trustees periodically consider the appropriateness of fund performance metrics in evaluating the results achieved. In general, the Independent Trustees believe that fund performance should be evaluated based on net performance (after fees and expenses) of both the highest performing and lowest performing classes, where applicable, compared to appropriate benchmark indices, over appropriate time periods which may include full market cycles, and compared to peer groups, as applicable, over the same periods, taking into account relevant factors including the following: general market conditions; issuer-specific information; tactical opportunities for investment; and fund cash flows and other factors.
The Independent Trustees recognize that shareholders evaluate performance on a net basis over their own holding periods, for which one-, three-, and five-year periods are often used as a proxy. For this reason, the performance information reviewed by the Board also included net cumulative calendar year total return information for the fund and an appropriate benchmark index and peer group for the most recent one-, three-, and five-year periods, as shown below. Returns are shown compared to the 25th percentile (top of box, 75% beaten) and 75th percentile (bottom of box, 25% beaten) of the peer universe.
Annual Report
Fidelity Advisor Floating Rate High Income Fund
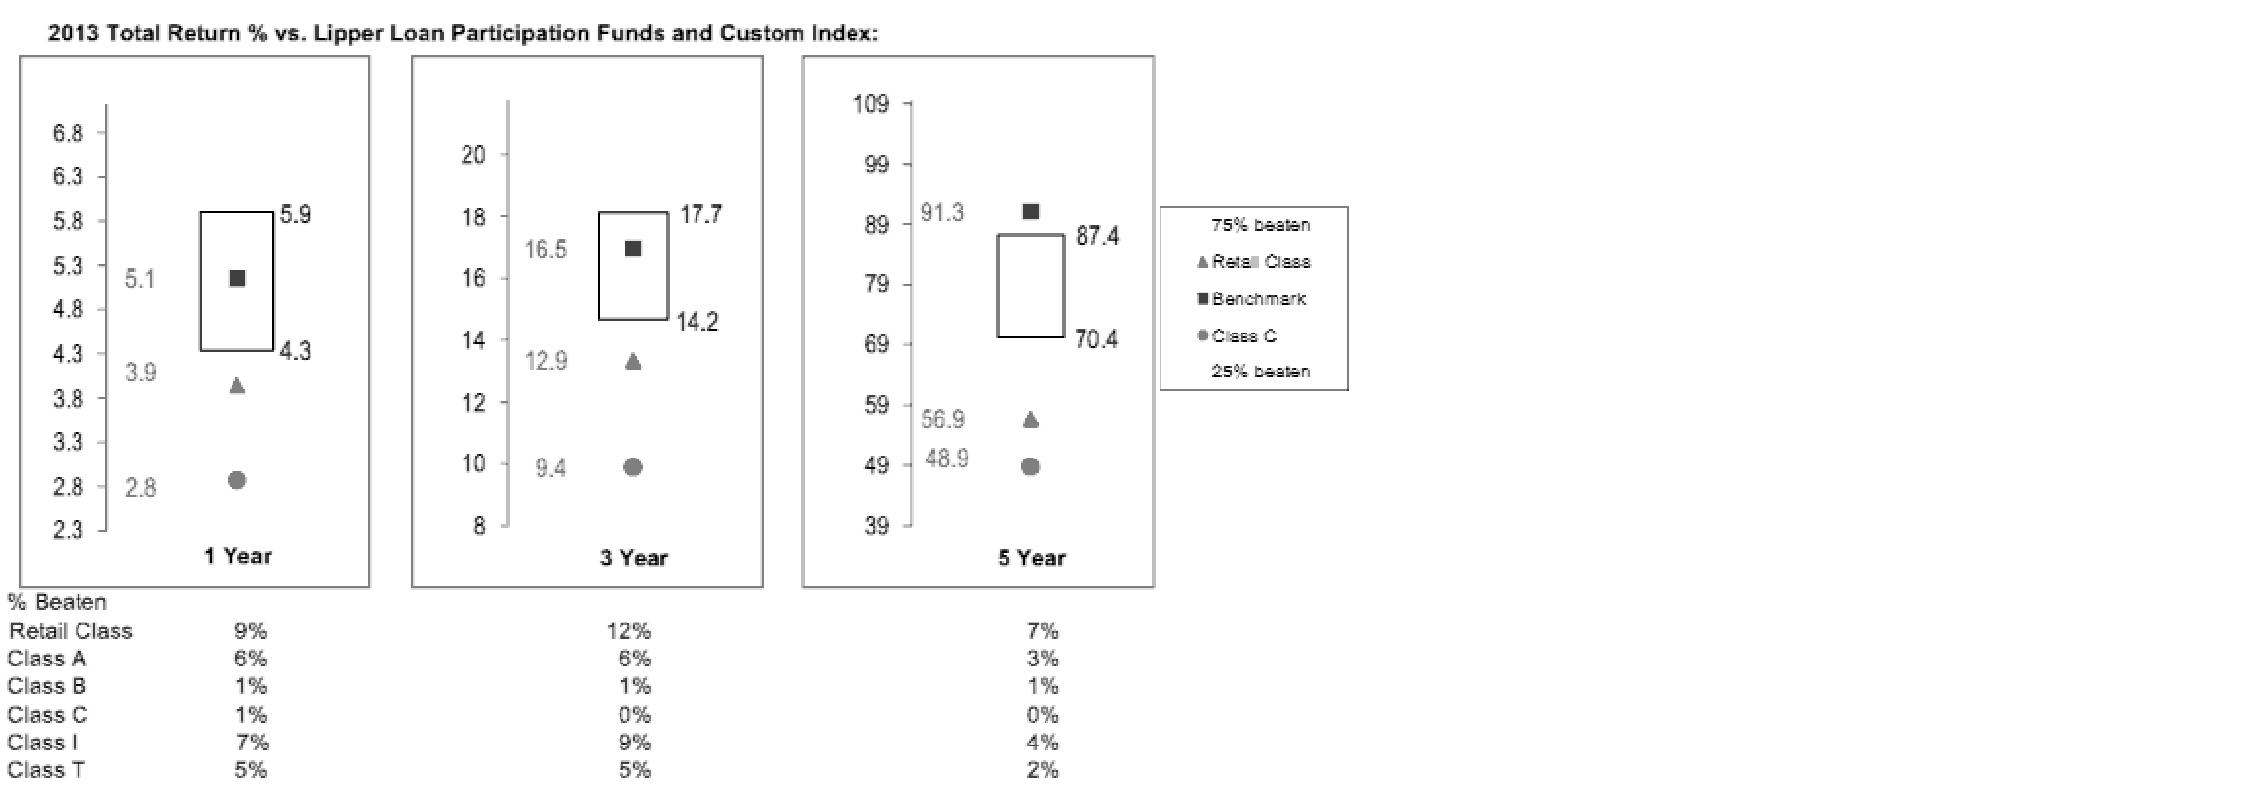
The Board has discussed the fund's underperformance with FMR and has engaged with FMR to consider what steps might be taken to remediate the fund's underperformance.
Based on its review, the Board concluded that the nature, extent, and quality of services provided to the fund under the Advisory Contracts should benefit the fund's shareholders.
Competitiveness of Management Fee and Total Expense Ratio. The Board considered the fund's management fee and total expense ratio compared to "mapped groups" of competitive funds and classes. Fidelity creates "mapped groups" by combining similar Lipper investment objective categories that have comparable investment mandates. Combining Lipper investment objective categories aids the Board's management fee and total expense ratio comparisons by broadening the competitive group used for comparison and by reducing the number of universes to which various Fidelity funds are compared.
Management Fee. The Board considered two proprietary management fee comparisons for the 12-month periods shown in the chart below. The group of Lipper funds used by the Board for management fee comparisons is referred to below as the "Total Mapped Group." The Total Mapped Group is broader than the Lipper peer group used by the Board for performance comparisons because the Total Mapped Group combines several Lipper investment objective categories while the Lipper peer group does not. The Total Mapped Group comparison focuses on a fund's standing in terms of gross management fees before expense reimbursements or caps relative to the total universe of funds with comparable investment mandates, regardless of whether their management fee structures also are comparable. Funds with comparable investment mandates offer exposure to similar types of securities. Funds with comparable management fee structures have similar management fee contractual arrangements (e.g., flat rate charged for advisory services, all-inclusive fee rate, etc.). "TMG %" represents the percentage of funds in the Total Mapped Group that had management fees that were lower than the fund's. For example, a hypothetical TMG % of 20% would mean that 80% of the funds in the Total Mapped Group had higher, and 20% had lower, management fees than the fund. The fund's actual TMG %s are in the chart below. The "Asset-Size Peer Group" (ASPG) comparison focuses on a fund's standing relative to a subset of non-Fidelity funds within the Total Mapped Group that are similar in size and management fee structure. For example, if a fund is in the first quartile of the ASPG, the fund's management fee ranks in the least expensive or lowest 25% of funds in the ASPG. The ASPG represents at least 15% of the funds in the Total Mapped Group with comparable asset size and management fee structures, subject to a minimum of 50 funds (or all funds in the Total Mapped Group if fewer than 50). Additional information, such as the ASPG quartile in which the fund's management fee rate ranked, is also included in the chart and considered by the Board.
Annual Report
Board Approval of Investment Advisory Contracts and
Management Fees - continued
Fidelity Advisor Floating Rate High Income Fund

The Board noted that the fund's management fee rate ranked below the median of its Total Mapped Group and below the median of its ASPG for 2013.
The Board also noted that, in August 2013, the ad hoc Committee on Management Fees was formed to conduct an in-depth review of the management fee rates of Fidelity's active equity mutual funds. The Committee focused on the following areas: (i) standard fee structures; (ii) research consumption and trading evolution; (iii) management fee competitiveness/profitability by category; and (iv) factors that drive institutional pricing.
Annual Report
Based on its review, the Board concluded that the fund's management fee is fair and reasonable in light of the services that the fund receives and the other factors considered.
Total Expense Ratio. In its review of each class's total expense ratio, the Board considered the fund's management fee as well as other fund or class expenses, as applicable, such as transfer agent fees, pricing and bookkeeping fees, fund-paid 12b-1 fees, and custodial, legal, and audit fees. The Board also noted the effects of any waivers and reimbursements on fees and expenses. As part of its review, the Board also considered the current and historical total expense ratios of each class of the fund compared to competitive fund median expenses. Each class of the fund is compared to those funds and classes in the Total Mapped Group (used by the Board for management fee comparisons) that have a similar sales load structure.
The Board noted that the total expense ratio of each of Class A, Class B, Institutional Class, and the retail class ranked below its competitive median for 2013, the total expense ratio of Class C ranked equal to its competitive median for 2013, and the total expense ratio of Class T ranked above its competitive median for 2013. The Board considered that, in general, various factors can affect total expense ratios. The Board noted that the total expense ratio of Class T was above the competitive median primarily because of higher 12b-1 fees on Class T as compared to most competitor funds. Class T has a higher 12b-1 fee, but a lower front-end sales charge, than traditionally priced front-end sales charge classes. The Board considered that Class T is primarily sold load-waived in the retirement plan market where its 0.50% 12b-1 fee is comparable to competing no-load, higher 12b-1 fee classes designed specifically for retirement plans. The Board noted that the fund offers multiple classes, each of which has a different sales load and 12b-1 fee structure, and that the multiple structures are intended to offer a range of pricing options for the intermediary market. The Board also noted that the total expense ratios of the classes vary primarily by the level of their 12b-1 fees, although differences in transfer agent fees may also cause expenses to vary from class to class.
Fees Charged to Other Fidelity Clients. The Board also considered Fidelity fee structures and other information with respect to clients of Fidelity, such as other funds advised or subadvised by Fidelity, pension plan clients, and other institutional clients. The Board noted the findings of the 2013 ad hoc joint committee (created with the board of other Fidelity funds), which reviewed and compared Fidelity's institutional investment advisory business with its business of providing services to the Fidelity funds, including the differences in services provided, fees charged, and costs incurred, as well as competition in their respective marketplaces.
Annual Report
Board Approval of Investment Advisory Contracts and
Management Fees - continued
Based on its review of total expense ratios and fees charged to other Fidelity clients, the Board concluded that the total expense ratio of each class of the fund was reasonable, although Class T was above the median of the universe presented for comparison, in light of the services that the fund and its shareholders receive and the other factors considered.
Costs of the Services and Profitability. The Board considered the revenues earned and the expenses incurred by Fidelity in conducting the business of developing, marketing, distributing, managing, administering and servicing the fund and servicing the fund's shareholders. The Board also considered the level of Fidelity's profits in respect of all the Fidelity funds.
On an annual basis, Fidelity presents to the Board Fidelity's profitability for the fund. Fidelity calculates the profitability for each fund, as well as aggregate profitability for groups of Fidelity funds and all Fidelity funds, using a series of detailed revenue and cost allocation methodologies which originate with the books and records of Fidelity on which Fidelity's audited financial statements are based. The Audit Committee of the Board reviews any significant changes from the prior year's methodologies.
PricewaterhouseCoopers LLP (PwC), independent registered public accounting firm and auditor to Fidelity and certain Fidelity funds, has been engaged annually by the Board as part of the Board's assessment of Fidelity's profitability analysis. PwC's engagement includes the review and assessment of the methodologies used by Fidelity in determining the revenues and expenses attributable to Fidelity's mutual fund business, and completion of agreed-upon procedures in respect of the mathematical accuracy of fund profitability and its conformity to established allocation methodologies. After considering PwC's reports issued under the engagement and information provided by Fidelity, the Board concluded that while other allocation methods may also be reasonable, Fidelity's profitability methodologies are reasonable in all material respects.
The Board also reviewed Fidelity's non-fund businesses and fall-out benefits related to the mutual fund business as well as cases where Fidelity's affiliates may benefit from or be related to the fund's business.
The Board considered the costs of the services provided by and the profits realized by Fidelity in connection with the operation of the fund and was satisfied that the profitability was not excessive in the circumstances.
Economies of Scale. The Board considered whether there have been economies of scale in respect of the management of the Fidelity funds, whether the Fidelity funds (including the fund) have appropriately benefited from any such economies of scale, and whether there is potential for realization of any further economies of scale. The Board considered the extent to which the fund will benefit from economies of scale through increased services to the fund, through waivers or reimbursements, or through fee or expense ratio reductions. The Board also noted that in 2013, it and the boards of other Fidelity funds created an ad hoc committee (the Economies of Scale Committee) to analyze whether Fidelity attains economies of scale in respect of the management and servicing of the Fidelity funds, whether the Fidelity funds have appropriately benefited from such economies of scale, and whether there is potential for realization of any further economies of scale.
Annual Report
The Board recognized that the fund's management contract incorporates a "group fee" structure, which provides for lower group fee rates as total group assets increase, and for higher group fee rates as total group assets decrease (with "group assets" defined to include fund assets under FMR's management plus sector fund assets previously under FMR's management and currently managed by Fidelity SelectCo, LLC). FMR calculates the group fee rates based on a tiered asset "breakpoint" schedule that varies based on asset class. The Board considered that the group fee is designed to deliver the benefits of economies of scale to fund shareholders when total Fidelity fund assets increase, even if assets of any particular fund are unchanged or have declined, because some portion of Fidelity's costs are attributable to services provided to all Fidelity funds, and all funds benefit if those costs can be allocated among more assets. The Board concluded that, given the group fee structure, fund shareholders will benefit from lower management fees as group assets increase at the fund complex level, regardless of whether Fidelity achieves any such economies of scale.
The Board concluded, taking into account the analysis of the Economies of Scale Committee, that economies of scale, if any, are being appropriately shared between fund shareholders and Fidelity.
Additional Information Requested by the Board. In order to develop fully the factual basis for consideration of the Fidelity funds' Advisory Contracts, the Board requested and received additional information on certain topics, including: (i) fund performance trends and Fidelity's long-term strategies for certain funds; (ii) Fidelity's strategic marketing and product lineup goals; (iii) the methodology with respect to competitive fund data and peer group classifications; (iv) the arrangements with, and performance of, certain sub-advisers on behalf of the Fidelity funds, as well as certain proposed participating affiliate arrangements; (v) the realization of fall-out benefits in certain Fidelity business units; (vi) Fidelity's group fee structures, including the rationale for the individual fee rates of certain categories of funds and the definition of group assets; (vii) trends regarding industry use of performance fee structures and the performance adjustment methodologies applicable to the Fidelity funds; (viii) additional competitive analysis regarding the total expenses for certain classes; (ix) fund profitability methodology, including Fidelity's cost allocation methodology, and the impact of certain factors on fund profitability results; and (x) the process by which Fidelity determines sub-advisory fees for funds it advises.
Annual Report
Board Approval of Investment Advisory Contracts and
Management Fees - continued
Based on its evaluation of all of the conclusions noted above, and after considering all factors it believed relevant, the Board ultimately concluded that the advisory fee structures are fair and reasonable, and that the fund's Advisory Contracts should be renewed.
Annual Report
Investment Adviser
Fidelity Management & Research Company
Boston, MA
Investment Sub-Advisers
FMR Co., Inc.
Fidelity Management & Research
(Japan) Limited
Fidelity Management & Research
(Hong Kong) Limited
Fidelity Management & Research
(U.K.) Inc.
General Distributor
Fidelity Distributors Corporation
Smithfield, RI
Transfer and Service Agents
Fidelity Investments Institutional Operations Company, Inc.
Boston, MA
Fidelity Service Company, Inc.
Boston, MA
Custodian
The Bank of New York Mellon
New York, NY
(Fidelity Investment logo)(registered trademark)
AFRI-UANN-1214
1.784742.111
Item 2. Code of Ethics
As of the end of the period, October 31, 2014, Fidelity Advisor Series I (the trust) has adopted a code of ethics, as defined in Item 2 of Form N-CSR, that applies to its President and Treasurer and its Chief Financial Officer. A copy of the code of ethics is filed as an exhibit to this Form N-CSR.
Item 3. Audit Committee Financial Expert
The Board of Trustees of the trust has determined that Joseph Mauriello is an audit committee financial expert, as defined in Item 3 of Form N-CSR. Mr. Mauriello is independent for purposes of Item 3 of Form N-CSR.
Item 4. Principal Accountant Fees and Services
Fees and Services
The following table presents fees billed by Deloitte & Touche LLP, the member firms of Deloitte Touche Tohmatsu, and their respective affiliates (collectively, "Deloitte Entities") in each of the last two fiscal years for services rendered to Fidelity Advisor Floating Rate High Income Fund, Fidelity Advisor High Income Advantage Fund, Fidelity Advisor High Income Fund, and Fidelity Advisor Value Fund (the "Funds"):
Services Billed by Deloitte Entities
October 31, 2014 FeesA
| Audit Fees | Audit-Related Fees | Tax Fees | All Other Fees |
Fidelity Advisor Floating Rate High Income Fund | $140,000 | $- | $5,800 | $3,900 |
Fidelity Advisor High Income Advantage Fund | $65,000 | $- | $6,100 | $1,000 |
Fidelity Advisor High Income Fund | $55,000 | $- | $5,800 | $800 |
Fidelity Advisor Value Fund | $42,000 | $- | $6,100 | $600 |
October 31, 2013 FeesA
| Audit Fees | Audit-Related Fees | Tax Fees | All Other Fees |
Fidelity Advisor Floating Rate High Income Fund | $141,000 | $- | $5,800 | $2,700 |
Fidelity Advisor High Income Advantage Fund | $65,000 | $- | $5,900 | $800 |
Fidelity Advisor High Income Fund | $56,000 | $- | $5,800 | $700 |
Fidelity Advisor Value Fund | $43,000 | $- | $5,900 | $500 |
A Amounts may reflect rounding.
The following table presents fees billed by Deloitte Entities that were required to be approved by the Audit Committee for services that relate directly to the operations and financial reporting of the Funds and that are rendered on behalf of Fidelity Management & Research Company ("FMR") and entities controlling, controlled by, or under common control with FMR (not including any sub-adviser whose role is primarily portfolio management and is subcontracted with or overseen by another investment adviser) that provide ongoing services to the Funds ("Fund Service Providers"):
Services Billed by Deloitte Entities
| October 31, 2014A | October 31, 2013A |
Audit-Related Fees | $150,000 | $1,010,000 |
Tax Fees | $- | $- |
All Other Fees | $590,000 | $800,000 |
A Amounts may reflect rounding.
"Audit-Related Fees" represent fees billed for assurance and related services that are reasonably related to the performance of the fund audit or the review of the fund's financial statements and that are not reported under Audit Fees.
"Tax Fees" represent fees billed for tax compliance, tax advice or tax planning that relate directly to the operations and financial reporting of the fund.
"All Other Fees" represent fees billed for services provided to the fund or Fund Service Provider, a significant portion of which are assurance related, that relate directly to the operations and financial reporting of the fund, excluding those services that are reported under Audit Fees, Audit-Related Fees or Tax Fees.
Assurance services must be performed by an independent public accountant.
* * *
The aggregate non-audit fees billed by Deloitte Entities for services rendered to the Funds, FMR (not including any sub-adviser whose role is primarily portfolio management and is subcontracted with or overseen by another investment adviser), and any Fund Service Provider for each of the last two fiscal years of the Funds are as follows:
Billed By | October 31, 2014 A | October 31, 2013 A |
Deloitte Entities | $1,855,000 | $1,950,000 |
A Amounts may reflect rounding.
The trust's Audit Committee has considered non-audit services that were not pre-approved that were provided by Deloitte Entities to Fund Service Providers to be compatible with maintaining the independence of Deloitte Entities in its audit of the Funds, taking into account representations from Deloitte Entities, in accordance with Public Company Accounting Oversight Board rules, regarding its independence from the Funds and their related entities and FMR's review of the appropriateness and permissibility under applicable law of such non-audit services prior to their provision to the Fund Service Providers.
Audit Committee Pre-Approval Policies and Procedures
The trust's Audit Committee must pre-approve all audit and non-audit services provided by a fund's independent registered public accounting firm relating to the operations or financial reporting of the fund. Prior to the commencement of any audit or non-audit services to a fund, the Audit Committee reviews the services to determine whether they are appropriate and permissible under applicable law.
The Audit Committee has adopted policies and procedures to, among other purposes, provide a framework for the Committee's consideration of non-audit services by the audit firms that audit the Fidelity funds. The policies and procedures require that any non-audit service provided by a fund audit firm to a Fidelity fund and any non-audit service provided by a fund auditor to a Fund Service Provider that relates directly to the operations and financial reporting of a Fidelity fund ("Covered Service") are subject to approval by the Audit Committee before such service is provided.
All Covered Services must be approved in advance of provision of the service either: (i) by formal resolution of the Audit Committee, or (ii) by oral or written approval of the service by the Chair of the Audit Committee (or if the Chair is unavailable, such other member of the Audit Committee as may be designated by the Chair to act in the Chair's absence). The approval contemplated by (ii) above is permitted where the Treasurer determines that action on such an engagement is necessary before the next meeting of the Audit Committee.
Non-audit services provided by a fund audit firm to a Fund Service Provider that do not relate directly to the operations and financial reporting of a Fidelity fund are reported to the Audit Committee on a periodic basis.
Non-Audit Services Approved Pursuant to Rule 2-01(c)(7)(i)(C) and (ii) of Regulation S-X ("De Minimis Exception")
There were no non-audit services approved or required to be approved by the Audit Committee pursuant to the De Minimis Exception during the Funds' last two fiscal years relating to services provided to (i) the Funds or (ii) any Fund Service Provider that relate directly to the operations and financial reporting of the Funds.
Item 5. Audit Committee of Listed Registrants
Not applicable.
Item 6. Investments
(a) Not applicable.
(b) Not applicable
Item 7. Disclosure of Proxy Voting Policies and Procedures for Closed-End Management Investment Companies
Not applicable.
Item 8. Portfolio Managers of Closed-End Management Investment Companies
Not applicable.
Item 9. Purchase of Equity Securities by Closed-End Management Investment Company and Affiliated Purchasers
Not applicable.
Item 10. Submission of Matters to a Vote of Security Holders
There were no material changes to the procedures by which shareholders may recommend nominees to the trust's Board of Trustees.
Item 11. Controls and Procedures
(a)(i) The President and Treasurer and the Chief Financial Officer have concluded that the trust's disclosure controls and procedures (as defined in Rule 30a-3(c) under the Investment Company Act) provide reasonable assurances that material information relating to the trust is made known to them by the appropriate persons, based on their evaluation of these controls and procedures as of a date within 90 days of the filing date of this report.
(a)(ii) There was no change in the trust's internal control over financial reporting (as defined in Rule 30a-3(d) under the Investment Company Act) that occurred during the second fiscal quarter of the period covered by this report that has materially affected, or is reasonably likely to materially affect, the trust's internal control over financial reporting.
Item 12. Exhibits
(a) | (1) | Code of Ethics pursuant to Item 2 of Form N-CSR is filed and attached hereto as EX-99.CODE ETH. |
(a) | (2) | Certification pursuant to Rule 30a-2(a) under the Investment Company Act of 1940 (17 CFR 270.30a-2(a)) is filed and attached hereto as Exhibit 99.CERT. |
(a) | (3) | Not applicable. |
(b) |
| Certification pursuant to Rule 30a-2(b) under the Investment Company Act of 1940 (17 CFR 270.30a-2(b)) is furnished and attached hereto as Exhibit 99.906CERT. |
SIGNATURES
Pursuant to the requirements of the Securities Exchange Act of 1934 and the Investment Company Act of 1940, the registrant has duly caused this report to be signed on its behalf by the undersigned, thereunto duly authorized.
Fidelity Advisor Series I
By: | /s/Kenneth B. Robins |
| Kenneth B. Robins |
| President and Treasurer |
|
|
Date: | December 26, 2014 |
Pursuant to the requirements of the Securities Exchange Act of 1934 and the Investment Company Act of 1940, this report has been signed below by the following persons on behalf of the registrant and in the capacities and on the dates indicated.
By: | /s/Kenneth B. Robins |
| Kenneth B. Robins |
| President and Treasurer |
|
|
Date: | December 26, 2014 |
By: | /s/Howard J. Galligan III |
| Howard J. Galligan III |
| Chief Financial Officer |
|
|
Date: | December 26, 2014 |