UNITED STATES
SECURITIES AND EXCHANGE COMMISSION
Washington, D.C. 20549
FORM N-CSR
CERTIFIED SHAREHOLDER REPORT OF REGISTERED
MANAGEMENT INVESTMENT COMPANIES
Investment Company Act file number 811-03785
Fidelity Advisor Series I
(Exact name of registrant as specified in charter)
245 Summer St., Boston, Massachusetts 02210
(Address of principal executive offices) (Zip code)
Nicole Macarchuk, Secretary
245 Summer St.
Boston, Massachusetts 02210
(Name and address of agent for service)
Registrant's telephone number, including area code:
617-563-7000
| |
Date of fiscal year end: | December 31 |
|
|
Date of reporting period: | December 31, 2024 |
Item 1.
Reports to Stockholders
| |
| | ANNUAL SHAREHOLDER REPORT | AS OF DECEMBER 31, 2024 | This report describes changes to the Fund that occurred during the reporting period. |
| | Fidelity Advisor® Mid Cap II Fund Fidelity Advisor® Mid Cap II Fund Class Z : FZAMX |
| | | |
This annual shareholder report contains information about Fidelity Advisor® Mid Cap II Fund for the period January 1, 2024 to December 31, 2024. You can find additional information about the Fund at fundresearch.fidelity.com/prospectus/sec. You can also request this information by contacting us at 1-877-208-0098 or by sending an e-mail to fidfunddocuments@fidelity.com.
What were your Fund costs for the last year?(based on hypothetical $10,000 investment)
FUND COST (PREVIOUS YEAR)
| | Costs of a $10,000 investment | Costs paid as a percentage of a $10,000 investment | |
| Class Z | $ 63 | 0.58% | |
What affected the Fund's performance this period?
•U.S. equities gained in 2024, driven by a sturdy economy, the Federal Reserve's long-anticipated pivot to cutting interest rates and the potential for artificial intelligence to drive transformative change.
•Against this backdrop, security selection was the primary contributor to the fund's performance versus the S&P MidCap 400 Index for the year, led by the consumer discretionary sector. Stock picks in consumer staples and financials also boosted the fund's relative performance.
•The top individual relative contributor was our non-benchmark stake in Vertiv Holdings (+142%). This period we decreased our stake in the stock. An overweight in Deckers Outdoor (+81%) helped as well. We decreased our position in 2024. A non-benchmark holding in Howmet Aerospace gained 112% and further bolstered the fund's result. The stock was not held at period end.
•In contrast, the biggest detractor from performance versus the benchmark was stock picking in information technology. Also hurting our result was security selection in energy and utilities. Lastly, the fund's position in cash also detracted.
•Not owning Texas Pacific Land, a benchmark component that gained 117%, was the largest individual relative detractor. A stake in Super Micro Computer (+276%) also hurt. The stock was not held at period end. Another notable relative detractor was our position in Emcor (+111%), an investment we established this period.
•Notable changes in positioning include higher allocations to the health care and financials sectors.
How did the Fund perform over the past 10 years?
CUMULATIVE PERFORMANCE
December 31, 2014 through December 31, 2024.
Initial investment of $10,000.
Class Z | $10,000 | $9,862 | $11,052 | $13,341 | $11,375 | $14,086 | $16,741 | $20,989 | $17,909 | $20,627 | $24,206 |
S&P MidCap 400® Index | $10,000 | $9,782 | $11,811 | $13,730 | $12,208 | $15,407 | $17,511 | $21,847 | $18,993 | $22,115 | $25,196 |
Russell 3000® Index | $10,000 | $10,048 | $11,327 | $13,721 | $13,002 | $17,035 | $20,593 | $25,877 | $20,907 | $26,334 | $32,604 |
| | 2014 | 2015 | 2016 | 2017 | 2018 | 2019 | 2020 | 2021 | 2022 | 2023 | 2024 |
AVERAGE ANNUAL TOTAL RETURNS:| | 1 Year | 5 Year | 10 Year |
| Class Z | 17.35% | 11.44% | 9.24% |
| S&P MidCap 400® Index | 13.93% | 10.34% | 9.68% |
| Russell 3000® Index | 23.81% | 13.86% | 12.55% |
Visit institutional.fidelity.com for more recent performance information. |
The Fund's past performance is not a good predictor of the Fund's future performance. The graph and table do not reflect the deduction of taxes that a shareholder would pay on fund distributions or redemption of fund shares. |
Key Fund Statistics(as of December 31, 2024)
KEY FACTS | | |
| Fund Size | $1,551,980,039 | |
| Number of Holdings | 180 | |
| Total Advisory Fee | $9,939,485 | |
| Portfolio Turnover | 52% | |
What did the Fund invest in?
(as of December 31, 2024)
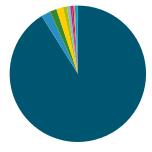
MARKET SECTORS (% of Fund's net assets) | | |
| Financials | 20.1 | |
| Industrials | 18.0 | |
| Consumer Discretionary | 12.3 | |
| Health Care | 11.7 | |
| Information Technology | 9.8 | |
| Real Estate | 6.5 | |
| Energy | 6.0 | |
| Materials | 5.2 | |
| Consumer Staples | 4.9 | |
| Utilities | 3.4 | |
| Communication Services | 1.8 | |
| |
| Common Stocks | 99.7 |
| Short-Term Investments and Net Other Assets (Liabilities) | 0.3 |
ASSET ALLOCATION (% of Fund's net assets) |
|
| | Common Stocks - 99.7 |
| | Short-Term Investments and Net Other Assets (Liabilities) - 0.3 |
| |
| United States | 91.1 |
| Canada | 2.2 |
| Israel | 1.6 |
| United Kingdom | 1.6 |
| Belgium | 0.9 |
| Puerto Rico | 0.8 |
| Brazil | 0.4 |
| Italy | 0.4 |
| France | 0.3 |
| Others | 0.7 |
GEOGRAPHIC DIVERSIFICATION (% of Fund's net assets) |
|
| | United States - 91.1 |
| | Canada - 2.2 |
| | Israel - 1.6 |
| | United Kingdom - 1.6 |
| | Belgium - 0.9 |
| | Puerto Rico - 0.8 |
| | Brazil - 0.4 |
| | Italy - 0.4 |
| | France - 0.3 |
| | Others - 0.7 |
| |
TOP HOLDINGS(% of Fund's net assets) | | |
| US Foods Holding Corp | 1.5 | |
| Reinsurance Group of America Inc | 1.4 | |
| East West Bancorp Inc | 1.4 | |
| ITT Inc | 1.3 | |
| Williams-Sonoma Inc | 1.3 | |
| Wintrust Financial Corp | 1.3 | |
| Performance Food Group Co | 1.2 | |
| Primerica Inc | 1.2 | |
| AptarGroup Inc | 1.2 | |
| Wix.com Ltd | 1.2 | |
| | 13.0 | |
How has the Fund changed?
This is a summary of certain changes to the Fund since January 1, 2024. For more complete information, you may review the Fund's next prospectus, which we expect to be available by March 1, 2025 at fundresearch.fidelity.com/prospectus/sec or upon request at 1-877-208-0098 or by sending an e-mail to fidfunddocuments@fidelity.com.
The fund's transfer agent and pricing & bookkeeping fees were changed to a fixed rate effective December 1, 2023. Effective March 1, 2024, the fund's management contract was amended to incorporate administrative services previously covered under separate services agreements (transfer agent and pricing & bookkeeping). The amended contract incorporates a management fee rate that may vary by class. The Adviser or an affiliate pays certain expenses of managing and operating the fund out of each class's management fee. | |
| Fidelity, the Fidelity Investments Logo and all other Fidelity trademarks or service marks used herein are trademarks or service marks of FMR LLC. Any third-party marks that are used herein are trademarks or service marks of their respective owners. © 2025 FMR LLC. All rights reserved. |
| | For additional information about the Fund; including its prospectus, financial information, holdings and proxy information, scan the QR code or visit fundresearch.fidelity.com/prospectus/sec 1.9914263.100 2538-TSRA-0325 |
| |
| | ANNUAL SHAREHOLDER REPORT | AS OF DECEMBER 31, 2024 | This report describes changes to the Fund that occurred during the reporting period. |
| | Fidelity Advisor® Mid Cap II Fund Fidelity Advisor® Mid Cap II Fund Class C : FIICX |
| | | |
This annual shareholder report contains information about Fidelity Advisor® Mid Cap II Fund for the period January 1, 2024 to December 31, 2024. You can find additional information about the Fund at fundresearch.fidelity.com/prospectus/sec. You can also request this information by contacting us at 1-877-208-0098 or by sending an e-mail to fidfunddocuments@fidelity.com.
What were your Fund costs for the last year?(based on hypothetical $10,000 investment)
FUND COST (PREVIOUS YEAR)
| | Costs of a $10,000 investment | Costs paid as a percentage of a $10,000 investment | |
| Class C | $ 185 | 1.71% | |
What affected the Fund's performance this period?
•U.S. equities gained in 2024, driven by a sturdy economy, the Federal Reserve's long-anticipated pivot to cutting interest rates and the potential for artificial intelligence to drive transformative change.
•Against this backdrop, security selection was the primary contributor to the fund's performance versus the S&P MidCap 400 Index for the year, led by the consumer discretionary sector. Stock picks in consumer staples and financials also boosted the fund's relative performance.
•The top individual relative contributor was our non-benchmark stake in Vertiv Holdings (+142%). This period we decreased our stake in the stock. An overweight in Deckers Outdoor (+81%) helped as well. We decreased our position in 2024. A non-benchmark holding in Howmet Aerospace gained 112% and further bolstered the fund's result. The stock was not held at period end.
•In contrast, the biggest detractor from performance versus the benchmark was stock picking in information technology. Also hurting our result was security selection in energy and utilities. Lastly, the fund's position in cash also detracted.
•Not owning Texas Pacific Land, a benchmark component that gained 117%, was the largest individual relative detractor. A stake in Super Micro Computer (+276%) also hurt. The stock was not held at period end. Another notable relative detractor was our position in Emcor (+111%), an investment we established this period.
•Notable changes in positioning include higher allocations to the health care and financials sectors.
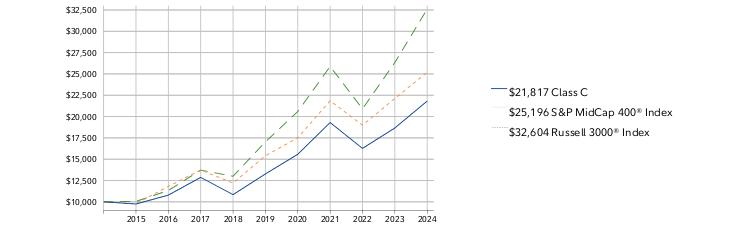
How did the Fund perform over the past 10 years?
CUMULATIVE PERFORMANCE
December 31, 2014 through December 31, 2024.
Initial investment of $10,000.
Class C | $10,000 | $9,743 | $10,789 | $12,867 | $10,844 | $13,272 | $15,576 | $19,300 | $16,268 | $18,660 | $21,817 |
S&P MidCap 400® Index | $10,000 | $9,782 | $11,811 | $13,730 | $12,208 | $15,407 | $17,511 | $21,847 | $18,993 | $22,115 | $25,196 |
Russell 3000® Index | $10,000 | $10,048 | $11,327 | $13,721 | $13,002 | $17,035 | $20,593 | $25,877 | $20,907 | $26,334 | $32,604 |
| | 2014 | 2015 | 2016 | 2017 | 2018 | 2019 | 2020 | 2021 | 2022 | 2023 | 2024 |
AVERAGE ANNUAL TOTAL RETURNS:| | 1 Year | 5 Year | 10 Year |
| Class C (incl. contingent deferred sales charge) | 15.08% | 10.11% | 8.11% |
| Class C | 16.08% | 10.11% | 8.11% |
| S&P MidCap 400® Index | 13.93% | 10.34% | 9.68% |
| Russell 3000® Index | 23.81% | 13.86% | 12.55% |
Visit institutional.fidelity.com for more recent performance information. |
The Fund's past performance is not a good predictor of the Fund's future performance. The graph and table do not reflect the deduction of taxes that a shareholder would pay on fund distributions or redemption of fund shares. |
Key Fund Statistics(as of December 31, 2024)
KEY FACTS | | |
| Fund Size | $1,551,980,039 | |
| Number of Holdings | 180 | |
| Total Advisory Fee | $9,939,485 | |
| Portfolio Turnover | 52% | |
What did the Fund invest in?
(as of December 31, 2024)
MARKET SECTORS (% of Fund's net assets) | | |
| Financials | 20.1 | |
| Industrials | 18.0 | |
| Consumer Discretionary | 12.3 | |
| Health Care | 11.7 | |
| Information Technology | 9.8 | |
| Real Estate | 6.5 | |
| Energy | 6.0 | |
| Materials | 5.2 | |
| Consumer Staples | 4.9 | |
| Utilities | 3.4 | |
| Communication Services | 1.8 | |
| |
| Common Stocks | 99.7 |
| Short-Term Investments and Net Other Assets (Liabilities) | 0.3 |
ASSET ALLOCATION (% of Fund's net assets) |
|
| | Common Stocks - 99.7 |
| | Short-Term Investments and Net Other Assets (Liabilities) - 0.3 |
| |
| United States | 91.1 |
| Canada | 2.2 |
| Israel | 1.6 |
| United Kingdom | 1.6 |
| Belgium | 0.9 |
| Puerto Rico | 0.8 |
| Brazil | 0.4 |
| Italy | 0.4 |
| France | 0.3 |
| Others | 0.7 |
GEOGRAPHIC DIVERSIFICATION (% of Fund's net assets) |
|
| | United States - 91.1 |
| | Canada - 2.2 |
| | Israel - 1.6 |
| | United Kingdom - 1.6 |
| | Belgium - 0.9 |
| | Puerto Rico - 0.8 |
| | Brazil - 0.4 |
| | Italy - 0.4 |
| | France - 0.3 |
| | Others - 0.7 |
| |
TOP HOLDINGS(% of Fund's net assets) | | |
| US Foods Holding Corp | 1.5 | |
| Reinsurance Group of America Inc | 1.4 | |
| East West Bancorp Inc | 1.4 | |
| ITT Inc | 1.3 | |
| Williams-Sonoma Inc | 1.3 | |
| Wintrust Financial Corp | 1.3 | |
| Performance Food Group Co | 1.2 | |
| Primerica Inc | 1.2 | |
| AptarGroup Inc | 1.2 | |
| Wix.com Ltd | 1.2 | |
| | 13.0 | |
How has the Fund changed?
This is a summary of certain changes to the Fund since January 1, 2024. For more complete information, you may review the Fund's next prospectus, which we expect to be available by March 1, 2025 at fundresearch.fidelity.com/prospectus/sec or upon request at 1-877-208-0098 or by sending an e-mail to fidfunddocuments@fidelity.com.
The fees associated with this class changed during the reporting year. The variations in class fees are primarily the result of the following changes:- Management fee
- Operating expenses
The fund's transfer agent and pricing & bookkeeping fees were changed to a fixed rate effective December 1, 2023. Effective March 1, 2024, the fund's management contract was amended to incorporate administrative services previously covered under separate services agreements (transfer agent and pricing & bookkeeping). The amended contract incorporates a management fee rate that may vary by class. The Adviser or an affiliate pays certain expenses of managing and operating the fund out of each class's management fee. | |
| Fidelity, the Fidelity Investments Logo and all other Fidelity trademarks or service marks used herein are trademarks or service marks of FMR LLC. Any third-party marks that are used herein are trademarks or service marks of their respective owners. © 2025 FMR LLC. All rights reserved. |
| | For additional information about the Fund; including its prospectus, financial information, holdings and proxy information, scan the QR code or visit fundresearch.fidelity.com/prospectus/sec 1.9914260.100 1361-TSRA-0325 |
| |
| | ANNUAL SHAREHOLDER REPORT | AS OF DECEMBER 31, 2024 | This report describes changes to the Fund that occurred during the reporting period. |
| | Fidelity Advisor® Mid Cap II Fund Fidelity Advisor® Mid Cap II Fund Class A : FIIAX |
| | | |
This annual shareholder report contains information about Fidelity Advisor® Mid Cap II Fund for the period January 1, 2024 to December 31, 2024. You can find additional information about the Fund at fundresearch.fidelity.com/prospectus/sec. You can also request this information by contacting us at 1-877-208-0098 or by sending an e-mail to fidfunddocuments@fidelity.com.
What were your Fund costs for the last year?(based on hypothetical $10,000 investment)
FUND COST (PREVIOUS YEAR)
| | Costs of a $10,000 investment | Costs paid as a percentage of a $10,000 investment | |
| Class A | $ 105 | 0.96% | |
What affected the Fund's performance this period?
•U.S. equities gained in 2024, driven by a sturdy economy, the Federal Reserve's long-anticipated pivot to cutting interest rates and the potential for artificial intelligence to drive transformative change.
•Against this backdrop, security selection was the primary contributor to the fund's performance versus the S&P MidCap 400 Index for the year, led by the consumer discretionary sector. Stock picks in consumer staples and financials also boosted the fund's relative performance.
•The top individual relative contributor was our non-benchmark stake in Vertiv Holdings (+142%). This period we decreased our stake in the stock. An overweight in Deckers Outdoor (+81%) helped as well. We decreased our position in 2024. A non-benchmark holding in Howmet Aerospace gained 112% and further bolstered the fund's result. The stock was not held at period end.
•In contrast, the biggest detractor from performance versus the benchmark was stock picking in information technology. Also hurting our result was security selection in energy and utilities. Lastly, the fund's position in cash also detracted.
•Not owning Texas Pacific Land, a benchmark component that gained 117%, was the largest individual relative detractor. A stake in Super Micro Computer (+276%) also hurt. The stock was not held at period end. Another notable relative detractor was our position in Emcor (+111%), an investment we established this period.
•Notable changes in positioning include higher allocations to the health care and financials sectors.
How did the Fund perform over the past 10 years?
CUMULATIVE PERFORMANCE
December 31, 2014 through December 31, 2024.
Initial investment of $10,000 and the current sales charge was paid.
Class A | $9,425 | $9,251 | $10,324 | $12,414 | $10,540 | $12,997 | $15,381 | $19,214 | $16,328 | $18,729 | $21,898 |
S&P MidCap 400® Index | $10,000 | $9,782 | $11,811 | $13,730 | $12,208 | $15,407 | $17,511 | $21,847 | $18,993 | $22,115 | $25,196 |
Russell 3000® Index | $10,000 | $10,048 | $11,327 | $13,721 | $13,002 | $17,035 | $20,593 | $25,877 | $20,907 | $26,334 | $32,604 |
| | 2014 | 2015 | 2016 | 2017 | 2018 | 2019 | 2020 | 2021 | 2022 | 2023 | 2024 |
AVERAGE ANNUAL TOTAL RETURNS:| | 1 Year | 5 Year | 10 Year |
| Class A (incl. 5.75% sales charge) | 10.20% | 9.69% | 8.15% |
| Class A (without 5.75% sales charge) | 16.92% | 11.00% | 8.80% |
| S&P MidCap 400® Index | 13.93% | 10.34% | 9.68% |
| Russell 3000® Index | 23.81% | 13.86% | 12.55% |
Visit institutional.fidelity.com for more recent performance information. |
The Fund's past performance is not a good predictor of the Fund's future performance. The graph and table do not reflect the deduction of taxes that a shareholder would pay on fund distributions or redemption of fund shares. |
Key Fund Statistics(as of December 31, 2024)
KEY FACTS | | |
| Fund Size | $1,551,980,039 | |
| Number of Holdings | 180 | |
| Total Advisory Fee | $9,939,485 | |
| Portfolio Turnover | 52% | |
What did the Fund invest in?
(as of December 31, 2024)
MARKET SECTORS (% of Fund's net assets) | | |
| Financials | 20.1 | |
| Industrials | 18.0 | |
| Consumer Discretionary | 12.3 | |
| Health Care | 11.7 | |
| Information Technology | 9.8 | |
| Real Estate | 6.5 | |
| Energy | 6.0 | |
| Materials | 5.2 | |
| Consumer Staples | 4.9 | |
| Utilities | 3.4 | |
| Communication Services | 1.8 | |
| |
| Common Stocks | 99.7 |
| Short-Term Investments and Net Other Assets (Liabilities) | 0.3 |
ASSET ALLOCATION (% of Fund's net assets) |
|
| | Common Stocks - 99.7 |
| | Short-Term Investments and Net Other Assets (Liabilities) - 0.3 |
| |
| United States | 91.1 |
| Canada | 2.2 |
| Israel | 1.6 |
| United Kingdom | 1.6 |
| Belgium | 0.9 |
| Puerto Rico | 0.8 |
| Brazil | 0.4 |
| Italy | 0.4 |
| France | 0.3 |
| Others | 0.7 |
GEOGRAPHIC DIVERSIFICATION (% of Fund's net assets) |
|
| | United States - 91.1 |
| | Canada - 2.2 |
| | Israel - 1.6 |
| | United Kingdom - 1.6 |
| | Belgium - 0.9 |
| | Puerto Rico - 0.8 |
| | Brazil - 0.4 |
| | Italy - 0.4 |
| | France - 0.3 |
| | Others - 0.7 |
| |
TOP HOLDINGS(% of Fund's net assets) | | |
| US Foods Holding Corp | 1.5 | |
| Reinsurance Group of America Inc | 1.4 | |
| East West Bancorp Inc | 1.4 | |
| ITT Inc | 1.3 | |
| Williams-Sonoma Inc | 1.3 | |
| Wintrust Financial Corp | 1.3 | |
| Performance Food Group Co | 1.2 | |
| Primerica Inc | 1.2 | |
| AptarGroup Inc | 1.2 | |
| Wix.com Ltd | 1.2 | |
| | 13.0 | |
How has the Fund changed?
This is a summary of certain changes to the Fund since January 1, 2024. For more complete information, you may review the Fund's next prospectus, which we expect to be available by March 1, 2025 at fundresearch.fidelity.com/prospectus/sec or upon request at 1-877-208-0098 or by sending an e-mail to fidfunddocuments@fidelity.com.
The fund's transfer agent and pricing & bookkeeping fees were changed to a fixed rate effective December 1, 2023. Effective March 1, 2024, the fund's management contract was amended to incorporate administrative services previously covered under separate services agreements (transfer agent and pricing & bookkeeping). The amended contract incorporates a management fee rate that may vary by class. The Adviser or an affiliate pays certain expenses of managing and operating the fund out of each class's management fee. | |
| Fidelity, the Fidelity Investments Logo and all other Fidelity trademarks or service marks used herein are trademarks or service marks of FMR LLC. Any third-party marks that are used herein are trademarks or service marks of their respective owners. © 2025 FMR LLC. All rights reserved. |
| | For additional information about the Fund; including its prospectus, financial information, holdings and proxy information, scan the QR code or visit fundresearch.fidelity.com/prospectus/sec 1.9914259.100 1359-TSRA-0325 |
| |
| | ANNUAL SHAREHOLDER REPORT | AS OF DECEMBER 31, 2024 | This report describes changes to the Fund that occurred during the reporting period. |
| | Fidelity Advisor® Mid Cap II Fund Fidelity Advisor® Mid Cap II Fund Class M : FITIX |
| | | |
This annual shareholder report contains information about Fidelity Advisor® Mid Cap II Fund for the period January 1, 2024 to December 31, 2024. You can find additional information about the Fund at fundresearch.fidelity.com/prospectus/sec. You can also request this information by contacting us at 1-877-208-0098 or by sending an e-mail to fidfunddocuments@fidelity.com.
What were your Fund costs for the last year?(based on hypothetical $10,000 investment)
FUND COST (PREVIOUS YEAR)
| | Costs of a $10,000 investment | Costs paid as a percentage of a $10,000 investment | |
| Class M | $ 131 | 1.21% | |
What affected the Fund's performance this period?
•U.S. equities gained in 2024, driven by a sturdy economy, the Federal Reserve's long-anticipated pivot to cutting interest rates and the potential for artificial intelligence to drive transformative change.
•Against this backdrop, security selection was the primary contributor to the fund's performance versus the S&P MidCap 400 Index for the year, led by the consumer discretionary sector. Stock picks in consumer staples and financials also boosted the fund's relative performance.
•The top individual relative contributor was our non-benchmark stake in Vertiv Holdings (+142%). This period we decreased our stake in the stock. An overweight in Deckers Outdoor (+81%) helped as well. We decreased our position in 2024. A non-benchmark holding in Howmet Aerospace gained 112% and further bolstered the fund's result. The stock was not held at period end.
•In contrast, the biggest detractor from performance versus the benchmark was stock picking in information technology. Also hurting our result was security selection in energy and utilities. Lastly, the fund's position in cash also detracted.
•Not owning Texas Pacific Land, a benchmark component that gained 117%, was the largest individual relative detractor. A stake in Super Micro Computer (+276%) also hurt. The stock was not held at period end. Another notable relative detractor was our position in Emcor (+111%), an investment we established this period.
•Notable changes in positioning include higher allocations to the health care and financials sectors.
How did the Fund perform over the past 10 years?
CUMULATIVE PERFORMANCE
December 31, 2014 through December 31, 2024.
Initial investment of $10,000 and the current sales charge was paid.
Class M | $9,650 | $9,453 | $10,523 | $12,618 | $10,693 | $13,155 | $15,530 | $19,347 | $16,408 | $18,773 | $21,888 |
S&P MidCap 400® Index | $10,000 | $9,782 | $11,811 | $13,730 | $12,208 | $15,407 | $17,511 | $21,847 | $18,993 | $22,115 | $25,196 |
Russell 3000® Index | $10,000 | $10,048 | $11,327 | $13,721 | $13,002 | $17,035 | $20,593 | $25,877 | $20,907 | $26,334 | $32,604 |
| | 2014 | 2015 | 2016 | 2017 | 2018 | 2019 | 2020 | 2021 | 2022 | 2023 | 2024 |
AVERAGE ANNUAL TOTAL RETURNS:| | 1 Year | 5 Year | 10 Year |
| Class M (incl. 3.50% sales charge) | 12.51% | 9.93% | 8.15% |
| Class M (without 3.50% sales charge) | 16.59% | 10.72% | 8.53% |
| S&P MidCap 400® Index | 13.93% | 10.34% | 9.68% |
| Russell 3000® Index | 23.81% | 13.86% | 12.55% |
Visit institutional.fidelity.com for more recent performance information. |
The Fund's past performance is not a good predictor of the Fund's future performance. The graph and table do not reflect the deduction of taxes that a shareholder would pay on fund distributions or redemption of fund shares. |
Key Fund Statistics(as of December 31, 2024)
KEY FACTS | | |
| Fund Size | $1,551,980,039 | |
| Number of Holdings | 180 | |
| Total Advisory Fee | $9,939,485 | |
| Portfolio Turnover | 52% | |
What did the Fund invest in?
(as of December 31, 2024)
MARKET SECTORS (% of Fund's net assets) | | |
| Financials | 20.1 | |
| Industrials | 18.0 | |
| Consumer Discretionary | 12.3 | |
| Health Care | 11.7 | |
| Information Technology | 9.8 | |
| Real Estate | 6.5 | |
| Energy | 6.0 | |
| Materials | 5.2 | |
| Consumer Staples | 4.9 | |
| Utilities | 3.4 | |
| Communication Services | 1.8 | |
| |
| Common Stocks | 99.7 |
| Short-Term Investments and Net Other Assets (Liabilities) | 0.3 |
ASSET ALLOCATION (% of Fund's net assets) |
|
| | Common Stocks - 99.7 |
| | Short-Term Investments and Net Other Assets (Liabilities) - 0.3 |
| |
| United States | 91.1 |
| Canada | 2.2 |
| Israel | 1.6 |
| United Kingdom | 1.6 |
| Belgium | 0.9 |
| Puerto Rico | 0.8 |
| Brazil | 0.4 |
| Italy | 0.4 |
| France | 0.3 |
| Others | 0.7 |
GEOGRAPHIC DIVERSIFICATION (% of Fund's net assets) |
|
| | United States - 91.1 |
| | Canada - 2.2 |
| | Israel - 1.6 |
| | United Kingdom - 1.6 |
| | Belgium - 0.9 |
| | Puerto Rico - 0.8 |
| | Brazil - 0.4 |
| | Italy - 0.4 |
| | France - 0.3 |
| | Others - 0.7 |
| |
TOP HOLDINGS(% of Fund's net assets) | | |
| US Foods Holding Corp | 1.5 | |
| Reinsurance Group of America Inc | 1.4 | |
| East West Bancorp Inc | 1.4 | |
| ITT Inc | 1.3 | |
| Williams-Sonoma Inc | 1.3 | |
| Wintrust Financial Corp | 1.3 | |
| Performance Food Group Co | 1.2 | |
| Primerica Inc | 1.2 | |
| AptarGroup Inc | 1.2 | |
| Wix.com Ltd | 1.2 | |
| | 13.0 | |
How has the Fund changed?
This is a summary of certain changes to the Fund since January 1, 2024. For more complete information, you may review the Fund's next prospectus, which we expect to be available by March 1, 2025 at fundresearch.fidelity.com/prospectus/sec or upon request at 1-877-208-0098 or by sending an e-mail to fidfunddocuments@fidelity.com.
The fund's transfer agent and pricing & bookkeeping fees were changed to a fixed rate effective December 1, 2023. Effective March 1, 2024, the fund's management contract was amended to incorporate administrative services previously covered under separate services agreements (transfer agent and pricing & bookkeeping). The amended contract incorporates a management fee rate that may vary by class. The Adviser or an affiliate pays certain expenses of managing and operating the fund out of each class's management fee. | |
| Fidelity, the Fidelity Investments Logo and all other Fidelity trademarks or service marks used herein are trademarks or service marks of FMR LLC. Any third-party marks that are used herein are trademarks or service marks of their respective owners. © 2025 FMR LLC. All rights reserved. |
| | For additional information about the Fund; including its prospectus, financial information, holdings and proxy information, scan the QR code or visit fundresearch.fidelity.com/prospectus/sec 1.9914261.100 1362-TSRA-0325 |
| |
| | ANNUAL SHAREHOLDER REPORT | AS OF DECEMBER 31, 2024 | This report describes changes to the Fund that occurred during the reporting period. |
| | Fidelity Advisor® Mid Cap II Fund Fidelity Advisor® Mid Cap II Fund Class I : FIIMX |
| | | |
This annual shareholder report contains information about Fidelity Advisor® Mid Cap II Fund for the period January 1, 2024 to December 31, 2024. You can find additional information about the Fund at fundresearch.fidelity.com/prospectus/sec. You can also request this information by contacting us at 1-877-208-0098 or by sending an e-mail to fidfunddocuments@fidelity.com.
What were your Fund costs for the last year?(based on hypothetical $10,000 investment)
FUND COST (PREVIOUS YEAR)
| | Costs of a $10,000 investment | Costs paid as a percentage of a $10,000 investment | |
| Class I | $ 77 | 0.71% | |
What affected the Fund's performance this period?
•U.S. equities gained in 2024, driven by a sturdy economy, the Federal Reserve's long-anticipated pivot to cutting interest rates and the potential for artificial intelligence to drive transformative change.
•Against this backdrop, security selection was the primary contributor to the fund's performance versus the S&P MidCap 400 Index for the year, led by the consumer discretionary sector. Stock picks in consumer staples and financials also boosted the fund's relative performance.
•The top individual relative contributor was our non-benchmark stake in Vertiv Holdings (+142%). This period we decreased our stake in the stock. An overweight in Deckers Outdoor (+81%) helped as well. We decreased our position in 2024. A non-benchmark holding in Howmet Aerospace gained 112% and further bolstered the fund's result. The stock was not held at period end.
•In contrast, the biggest detractor from performance versus the benchmark was stock picking in information technology. Also hurting our result was security selection in energy and utilities. Lastly, the fund's position in cash also detracted.
•Not owning Texas Pacific Land, a benchmark component that gained 117%, was the largest individual relative detractor. A stake in Super Micro Computer (+276%) also hurt. The stock was not held at period end. Another notable relative detractor was our position in Emcor (+111%), an investment we established this period.
•Notable changes in positioning include higher allocations to the health care and financials sectors.
How did the Fund perform over the past 10 years?
CUMULATIVE PERFORMANCE
December 31, 2014 through December 31, 2024.
Initial investment of $10,000.
Class I | $10,000 | $9,848 | $11,020 | $13,285 | $11,319 | $13,995 | $16,609 | $20,801 | $17,728 | $20,392 | $23,894 |
S&P MidCap 400® Index | $10,000 | $9,782 | $11,811 | $13,730 | $12,208 | $15,407 | $17,511 | $21,847 | $18,993 | $22,115 | $25,196 |
Russell 3000® Index | $10,000 | $10,048 | $11,327 | $13,721 | $13,002 | $17,035 | $20,593 | $25,877 | $20,907 | $26,334 | $32,604 |
| | 2014 | 2015 | 2016 | 2017 | 2018 | 2019 | 2020 | 2021 | 2022 | 2023 | 2024 |
AVERAGE ANNUAL TOTAL RETURNS:| | 1 Year | 5 Year | 10 Year |
| Class I | 17.17% | 11.29% | 9.10% |
| S&P MidCap 400® Index | 13.93% | 10.34% | 9.68% |
| Russell 3000® Index | 23.81% | 13.86% | 12.55% |
Visit institutional.fidelity.com for more recent performance information. |
The Fund's past performance is not a good predictor of the Fund's future performance. The graph and table do not reflect the deduction of taxes that a shareholder would pay on fund distributions or redemption of fund shares. |
Key Fund Statistics(as of December 31, 2024)
KEY FACTS | | |
| Fund Size | $1,551,980,039 | |
| Number of Holdings | 180 | |
| Total Advisory Fee | $9,939,485 | |
| Portfolio Turnover | 52% | |
What did the Fund invest in?
(as of December 31, 2024)
MARKET SECTORS (% of Fund's net assets) | | |
| Financials | 20.1 | |
| Industrials | 18.0 | |
| Consumer Discretionary | 12.3 | |
| Health Care | 11.7 | |
| Information Technology | 9.8 | |
| Real Estate | 6.5 | |
| Energy | 6.0 | |
| Materials | 5.2 | |
| Consumer Staples | 4.9 | |
| Utilities | 3.4 | |
| Communication Services | 1.8 | |
| |
| Common Stocks | 99.7 |
| Short-Term Investments and Net Other Assets (Liabilities) | 0.3 |
ASSET ALLOCATION (% of Fund's net assets) |
|
| | Common Stocks - 99.7 |
| | Short-Term Investments and Net Other Assets (Liabilities) - 0.3 |
| |
| United States | 91.1 |
| Canada | 2.2 |
| Israel | 1.6 |
| United Kingdom | 1.6 |
| Belgium | 0.9 |
| Puerto Rico | 0.8 |
| Brazil | 0.4 |
| Italy | 0.4 |
| France | 0.3 |
| Others | 0.7 |
GEOGRAPHIC DIVERSIFICATION (% of Fund's net assets) |
|
| | United States - 91.1 |
| | Canada - 2.2 |
| | Israel - 1.6 |
| | United Kingdom - 1.6 |
| | Belgium - 0.9 |
| | Puerto Rico - 0.8 |
| | Brazil - 0.4 |
| | Italy - 0.4 |
| | France - 0.3 |
| | Others - 0.7 |
| |
TOP HOLDINGS(% of Fund's net assets) | | |
| US Foods Holding Corp | 1.5 | |
| Reinsurance Group of America Inc | 1.4 | |
| East West Bancorp Inc | 1.4 | |
| ITT Inc | 1.3 | |
| Williams-Sonoma Inc | 1.3 | |
| Wintrust Financial Corp | 1.3 | |
| Performance Food Group Co | 1.2 | |
| Primerica Inc | 1.2 | |
| AptarGroup Inc | 1.2 | |
| Wix.com Ltd | 1.2 | |
| | 13.0 | |
How has the Fund changed?
This is a summary of certain changes to the Fund since January 1, 2024. For more complete information, you may review the Fund's next prospectus, which we expect to be available by March 1, 2025 at fundresearch.fidelity.com/prospectus/sec or upon request at 1-877-208-0098 or by sending an e-mail to fidfunddocuments@fidelity.com.
The fund's transfer agent and pricing & bookkeeping fees were changed to a fixed rate effective December 1, 2023. Effective March 1, 2024, the fund's management contract was amended to incorporate administrative services previously covered under separate services agreements (transfer agent and pricing & bookkeeping). The amended contract incorporates a management fee rate that may vary by class. The Adviser or an affiliate pays certain expenses of managing and operating the fund out of each class's management fee. | |
| Fidelity, the Fidelity Investments Logo and all other Fidelity trademarks or service marks used herein are trademarks or service marks of FMR LLC. Any third-party marks that are used herein are trademarks or service marks of their respective owners. © 2025 FMR LLC. All rights reserved. |
| | For additional information about the Fund; including its prospectus, financial information, holdings and proxy information, scan the QR code or visit fundresearch.fidelity.com/prospectus/sec 1.9914262.100 1363-TSRA-0325 |
Item 2.
Code of Ethics
As of the end of the period, December 31, 2024, Fidelity Advisor Series I (the trust) has adopted a code of ethics, as defined in Item 2 of Form N-CSR, that applies to its President and Treasurer and its Chief Financial Officer. A copy of the code of ethics is filed as an exhibit to this Form N-CSR.
Item 3.
Audit Committee Financial Expert
The Board of Trustees of the trust has determined that Donald F. Donahue is an audit committee financial expert, as defined in Item 3 of Form N-CSR. Mr. Donahue is independent for purposes of Item 3 of Form N-CSR.
Item 4.
Principal Accountant Fees and Services
Fees and Services
The following table presents fees billed by Deloitte & Touche LLP, the member firms of Deloitte Touche Tohmatsu, and their respective affiliates (collectively, “Deloitte Entities”) in each of the last two fiscal years for services rendered to Fidelity Advisor Mid Cap II Fund (the “Fund”):
Services Billed by Deloitte Entities
December 31, 2024 FeesA
| | | | |
| Audit Fees | Audit-Related Fees | Tax Fees | All Other Fees |
Fidelity Advisor Mid Cap II Fund | $39,200 | $- | $7,800 | $900 |
| | | | |
| Audit Fees | Audit-Related Fees | Tax Fees | All Other Fees |
Fidelity Advisor Mid Cap II Fund | $39,300 | $- | $8,200 | $1,000 |
A Amounts may reflect rounding.
The following table(s) present(s) fees billed by Deloitte Entities that were required to be approved by the Audit Committee for services that relate directly to the operations and financial reporting of the Fund(s) and that are rendered on behalf of Fidelity Management & Research Company LLC ("FMR") and entities controlling, controlled by, or under common control with FMR (not including any sub-adviser whose role is primarily portfolio management and is subcontracted with or overseen by another investment adviser) that provide ongoing services to the Fund(s) (“Fund Service Providers”):
Services Billed by Deloitte Entities
| | |
| December 31, 2024A | December 31, 2023A |
Audit-Related Fees | $125,000 | $75,000 |
Tax Fees | $- | $- |
All Other Fees | $2,929,500 | $- |
A Amounts may reflect rounding.
“Audit-Related Fees” represent fees billed for assurance and related services that are reasonably related to the performance of the fund audit or the review of the fund's financial statements and that are not reported under Audit Fees.
“Tax Fees” represent fees billed for tax compliance, tax advice or tax planning that relate directly to the operations and financial reporting of the fund.
“All Other Fees” represent fees billed for services provided to the fund or Fund Service Provider, a significant portion of which are assurance related, that relate directly to the operations and financial reporting of the fund, excluding those services that are reported under Audit Fees, Audit-Related Fees or Tax Fees.
Assurance services must be performed by an independent public accountant.
* * *
The aggregate non-audit fees billed by Deloitte Entities for services rendered to the Fund(s), FMR (not including any sub-adviser whose role is primarily portfolio management and is subcontracted with or overseen by another investment adviser), and any Fund Service Provider for each of the last two fiscal years of the Fund(s) are as follows:
| | |
Billed By | December 31, 2024A | December 31, 2023A |
Deloitte Entities | $3,357,700 | $5,366,300 |
A Amounts may reflect rounding.
The trust's Audit Committee has considered non-audit services that were not pre-approved that were provided by Deloitte Entities to Fund Service Providers to be compatible with maintaining the independence of Deloitte Entities in its(their) audit of the Fund(s), taking into account representations from Deloitte Entities, in accordance with Public Company Accounting Oversight Board rules, regarding its independence from the Fund(s) and its(their) related entities and FMR’s review of the appropriateness and permissibility under applicable law of such non-audit services prior to their provision to the Fund(s) Service Providers.
Audit Committee Pre-Approval Policies and Procedures
The trust’s Audit Committee must pre-approve all audit and non-audit services provided by a fund’s independent registered public accounting firm relating to the operations or financial reporting of the fund. Prior to the commencement of any audit or non-audit services to a fund, the Audit Committee reviews the services to determine whether they are appropriate and permissible under applicable law.
The Audit Committee has adopted policies and procedures to, among other purposes, provide a framework for the Committee’s consideration of non-audit services by the audit firms that audit the Fidelity funds. The policies and procedures require that any non-audit service provided by a fund audit firm to a Fidelity fund and any non-audit service provided by a fund auditor to a Fund Service Provider that relates directly to the operations and financial reporting of a Fidelity fund (“Covered Service”) are subject to approval by the Audit Committee before such service is provided.
All Covered Services must be approved in advance of provision of the service either: (i) by formal resolution of the Audit Committee, or (ii) by oral or written approval of the service by the Chair of the Audit Committee (or if the Chair is unavailable, such other member of the Audit Committee as may be designated by the Chair to act in the Chair’s absence). The approval contemplated by (ii) above is permitted where the Treasurer determines that action on such an engagement is necessary before the next meeting of the Audit Committee.
Non-audit services provided by a fund audit firm to a Fund Service Provider that do not relate directly to the operations and financial reporting of a Fidelity fund are reported to the Audit Committee periodically.
Non-Audit Services Approved Pursuant to Rule 2-01(c)(7)(i)(C) and (ii) of Regulation S-X (“De Minimis Exception”)
There were no non-audit services approved or required to be approved by the Audit Committee pursuant to the De Minimis Exception during the Fund’s(s’) last two fiscal years relating to services provided to (i) the Fund(s) or (ii) any Fund Service Provider that relate directly to the operations and financial reporting of the Fund(s).
The Registrant has not retained, for the preparation of the audit report on the financial statements included in the Form N-CSR, a registered public accounting firm that has a branch or office that is located in a foreign jurisdiction and that the Public Company Accounting Oversight Board (the “PCAOB”) has determined that the PCAOB is unable to inspect or investigate completely because of a position taken by an authority in the foreign jurisdiction.
The Registrant is not a “foreign issuer,” as defined in 17 CFR 240.3b-4.
Item 5.
Audit Committee of Listed Registrants
Not applicable.
Item 6.
Investments
(a)
Not applicable.
(b)
Not applicable.
Item 7.
Financial Statements and Financial Highlights for Open-End Management Investment Companies
Fidelity Advisor® Mid Cap II Fund
Annual Report
December 31, 2024
Contents
To view a fund's proxy voting guidelines and proxy voting record for the 12-month period ended June 30, visit http://www.fidelity.com/proxyvotingresults or visit the Securities and Exchange Commission's (SEC) web site at http://www.sec.gov.
You may also call 1-877-208-0098 to request a free copy of the proxy voting guidelines.
Standard & Poor's, S&P and S&P 500 are registered service marks of The McGraw-Hill Companies, Inc. and have been licensed for use by Fidelity Distributors Corporation.
Other third-party marks appearing herein are the property of their respective owners.
All other marks appearing herein are registered or unregistered trademarks or service marks of FMR LLC or an affiliated company. © 2025 FMR LLC. All rights reserved.
This report and the financial statements contained herein are submitted for the general information of the shareholders of the Fund. This report is not authorized for distribution to prospective investors in the Fund unless preceded or accompanied by an effective prospectus.
A fund files its complete schedule of portfolio holdings with the SEC for the first and third quarters of each fiscal year on Form N-PORT. Forms N-PORT are available on the SEC's web site at http://www.sec.gov. A fund's Forms N-PORT may be reviewed and copied at the SEC's Public Reference Room in Washington, DC. Information regarding the operation of the SEC's Public Reference Room may be obtained by calling 1-800-SEC-0330.
For a complete list of a fund's portfolio holdings, view the most recent holdings listing, semiannual report, or annual report on Fidelity's web site at http://www.fidelity.com, http://www.institutional.fidelity.com, or http://www.401k.com, as applicable.
NOT FDIC INSURED •MAY LOSE VALUE •NO BANK GUARANTEE
Neither the Fund nor Fidelity Distributors Corporation is a bank.
Item 7: Financial Statements and Financial Highlights for Open-End Management Investment Companies (Annual Report)
Fidelity Advisor® Mid Cap II Fund
Schedule of Investments December 31, 2024
Showing Percentage of Net Assets
| Common Stocks - 99.7% |
| | | Shares | Value ($) |
| BELGIUM - 0.9% | | | |
| Health Care - 0.9% | | | |
| Pharmaceuticals - 0.9% | | | |
| UCB SA | | 69,100 | 13,757,145 |
| BRAZIL - 0.4% | | | |
| Materials - 0.4% | | | |
| Metals & Mining - 0.4% | | | |
| Wheaton Precious Metals Corp | | 116,600 | 6,563,085 |
| CANADA - 2.2% | | | |
| Consumer Discretionary - 0.4% | | | |
| Specialty Retail - 0.4% | | | |
| Aritzia Inc Subordinate Voting Shares (a) | | 167,300 | 6,219,703 |
| Energy - 0.2% | | | |
| Oil, Gas & Consumable Fuels - 0.2% | | | |
| MEG Energy Corp | | 205,800 | 3,378,817 |
| Financials - 0.5% | | | |
| Capital Markets - 0.5% | | | |
| TMX Group Ltd | | 237,500 | 7,316,081 |
| Industrials - 0.9% | | | |
| Commercial Services & Supplies - 0.9% | | | |
| RB Global Inc (United States) | | 150,700 | 13,594,647 |
| Materials - 0.2% | | | |
| Metals & Mining - 0.2% | | | |
| Teck Resources Ltd Class B (United States) | | 79,100 | 3,205,922 |
| TOTAL CANADA | | | 33,715,170 |
| FRANCE - 0.3% | | | |
| Health Care - 0.3% | | | |
| Life Sciences Tools & Services - 0.3% | | | |
| Sartorius Stedim Biotech | | 25,100 | 4,906,169 |
| GERMANY - 0.2% | | | |
| Health Care - 0.2% | | | |
| Biotechnology - 0.2% | | | |
| BioNTech SE ADR (a) | | 27,300 | 3,110,835 |
| ISRAEL - 1.6% | | | |
| Information Technology - 1.6% | | | |
| IT Services - 1.2% | | | |
| Wix.com Ltd (a) | | 85,100 | 18,258,205 |
| Semiconductors & Semiconductor Equipment - 0.4% | | | |
| Nova Ltd (a) | | 33,800 | 6,656,910 |
| TOTAL ISRAEL | | | 24,915,115 |
| ITALY - 0.4% | | | |
| Industrials - 0.4% | | | |
| Electrical Equipment - 0.4% | | | |
| Prysmian SpA | | 95,900 | 6,125,182 |
| JAPAN - 0.3% | | | |
| Information Technology - 0.3% | | | |
| Semiconductors & Semiconductor Equipment - 0.3% | | | |
| Allegro MicroSystems Inc (a) | | 211,907 | 4,632,287 |
| NETHERLANDS - 0.2% | | | |
| Health Care - 0.2% | | | |
| Biotechnology - 0.2% | | | |
| Argenx SE ADR (a) | | 4,500 | 2,767,499 |
| PUERTO RICO - 0.8% | | | |
| Financials - 0.8% | | | |
| Banks - 0.8% | | | |
| Popular Inc | | 136,300 | 12,820,378 |
| UNITED KINGDOM - 1.6% | | | |
| Energy - 1.0% | | | |
| Energy Equipment & Services - 1.0% | | | |
| TechnipFMC PLC | | 513,000 | 14,846,220 |
| Financials - 0.2% | | | |
| Insurance - 0.2% | | | |
| Fidelis Insurance Holdings Ltd | | 227,600 | 4,126,388 |
| Information Technology - 0.4% | | | |
| Software - 0.4% | | | |
| Sage Group PLC/The | | 359,000 | 5,721,271 |
| TOTAL UNITED KINGDOM | | | 24,693,879 |
| UNITED STATES - 90.8% | | | |
| Communication Services - 1.8% | | | |
| Entertainment - 1.6% | | | |
| Liberty Media Corp-Liberty Formula One Class C (a) | | 83,400 | 7,727,844 |
| Live Nation Entertainment Inc (a) | | 97,200 | 12,587,400 |
| TKO Group Holdings Inc Class A (a) | | 33,400 | 4,746,474 |
| | | | 25,061,718 |
| Interactive Media & Services - 0.2% | | | |
| Pinterest Inc Class A (a) | | 122,500 | 3,552,500 |
TOTAL COMMUNICATION SERVICES | | | 28,614,218 |
| | | | |
| Consumer Discretionary - 11.9% | | | |
| Diversified Consumer Services - 3.1% | | | |
| Duolingo Inc Class A (a) | | 45,900 | 14,882,157 |
| Grand Canyon Education Inc (a) | | 95,700 | 15,675,660 |
| Service Corp International/US | | 218,800 | 17,464,616 |
| | | | 48,022,433 |
| Hotels, Restaurants & Leisure - 3.6% | | | |
| Aramark | | 349,700 | 13,047,307 |
| Churchill Downs Inc | | 89,316 | 11,927,259 |
| Dutch Bros Inc Class A (a) | | 137,800 | 7,217,964 |
| Light & Wonder Inc Class A (a) | | 128,200 | 11,073,916 |
| Red Rock Resorts Inc Class A | | 77,900 | 3,602,096 |
| Texas Roadhouse Inc | | 48,100 | 8,678,683 |
| | | | 55,547,225 |
| Household Durables - 1.5% | | | |
| Cavco Industries Inc (a) | | 12,600 | 5,622,498 |
| NVR Inc (a) | | 815 | 6,665,804 |
| Taylor Morrison Home Corp (a) | | 114,200 | 6,990,182 |
| Toll Brothers Inc | | 35,500 | 4,471,225 |
| | | | 23,749,709 |
| Specialty Retail - 2.5% | | | |
| Dick's Sporting Goods Inc | | 78,600 | 17,986,824 |
| Williams-Sonoma Inc | | 111,000 | 20,554,980 |
| | | | 38,541,804 |
| Textiles, Apparel & Luxury Goods - 1.2% | | | |
| Deckers Outdoor Corp (a) | | 62,750 | 12,743,898 |
| PVH Corp | | 61,600 | 6,514,199 |
| | | | 19,258,097 |
TOTAL CONSUMER DISCRETIONARY | | | 185,119,268 |
| | | | |
| Consumer Staples - 4.9% | | | |
| Consumer Staples Distribution & Retail - 4.5% | | | |
| Albertsons Cos Inc | | 226,700 | 4,452,388 |
| BJ's Wholesale Club Holdings Inc (a) | | 190,100 | 16,985,435 |
| Performance Food Group Co (a) | | 226,800 | 19,175,940 |
| Sprouts Farmers Market Inc (a) | | 54,900 | 6,976,143 |
| US Foods Holding Corp (a) | | 329,100 | 22,201,086 |
| | | | 69,790,992 |
| Food Products - 0.4% | | | |
| Simply Good Foods Co/The (a) | | 109,800 | 4,280,004 |
| Westrock Coffee Co (a)(b) | | 422,034 | 2,709,458 |
| | | | 6,989,462 |
TOTAL CONSUMER STAPLES | | | 76,780,454 |
| | | | |
| Energy - 4.8% | | | |
| Energy Equipment & Services - 1.9% | | | |
| Baker Hughes Co Class A | | 207,300 | 8,503,446 |
| Kodiak Gas Services Inc | | 139,500 | 5,695,785 |
| Valaris Ltd (a) | | 127,707 | 5,649,758 |
| Weatherford International PLC | | 128,200 | 9,182,966 |
| | | | 29,031,955 |
| Oil, Gas & Consumable Fuels - 2.9% | | | |
| Antero Resources Corp (a) | | 442,100 | 15,495,605 |
| Ovintiv Inc | | 223,500 | 9,051,750 |
| Permian Resources Corp Class A | | 906,800 | 13,039,784 |
| Range Resources Corp | | 208,297 | 7,494,526 |
| | | | 45,081,665 |
TOTAL ENERGY | | | 74,113,620 |
| | | | |
| Financials - 18.6% | | | |
| Banks - 7.3% | | | |
| Bancorp Inc/The (a) | | 230,200 | 12,115,426 |
| BOK Financial Corp | | 71,200 | 7,579,240 |
| Cadence Bank | | 231,400 | 7,971,730 |
| East West Bancorp Inc | | 214,188 | 20,510,643 |
| First Citizens BancShares Inc/NC Class A | | 6,000 | 12,678,120 |
| First Interstate BancSystem Inc Class A | | 119,500 | 3,880,165 |
| Huntington Bancshares Inc/OH | | 226,600 | 3,686,782 |
| KeyCorp | | 865,400 | 14,832,956 |
| Pinnacle Financial Partners Inc | | 73,800 | 8,441,982 |
| Wintrust Financial Corp | | 158,400 | 19,754,064 |
| | | | 111,451,108 |
| Capital Markets - 3.8% | | | |
| Blue Owl Capital Inc Class A | | 577,300 | 13,427,998 |
| Houlihan Lokey Inc Class A | | 61,700 | 10,714,822 |
| Northern Trust Corp | | 87,200 | 8,938,000 |
| Raymond James Financial Inc | | 88,286 | 13,713,464 |
| Stifel Financial Corp | | 120,600 | 12,793,248 |
| | | | 59,587,532 |
| Financial Services - 2.0% | | | |
| Essent Group Ltd | | 219,929 | 11,972,935 |
| PennyMac Financial Services Inc | | 62,600 | 6,393,964 |
| Toast Inc Class A (a) | | 339,900 | 12,389,355 |
| | | | 30,756,254 |
| Insurance - 5.5% | | | |
| American Financial Group Inc/OH | | 87,200 | 11,940,296 |
| Arch Capital Group Ltd | | 77,100 | 7,120,185 |
| First American Financial Corp | | 158,300 | 9,884,252 |
| Hartford Financial Services Group Inc/The | | 58,000 | 6,345,200 |
| Old Republic International Corp | | 177,100 | 6,409,249 |
| Primerica Inc | | 70,058 | 19,015,142 |
| Reinsurance Group of America Inc | | 101,591 | 21,702,886 |
| Selective Insurance Group Inc | | 34,600 | 3,235,792 |
| | | | 85,653,002 |
TOTAL FINANCIALS | | | 287,447,896 |
| | | | |
| Health Care - 10.1% | | | |
| Biotechnology - 2.1% | | | |
| Arcellx Inc (a) | | 38,500 | 2,952,565 |
| Arrowhead Pharmaceuticals Inc (a) | | 133,715 | 2,513,842 |
| Avidity Biosciences Inc (a) | | 67,800 | 1,971,624 |
| Blueprint Medicines Corp (a) | | 37,800 | 3,296,916 |
| Centessa Pharmaceuticals PLC ADR (a) | | 117,400 | 1,966,450 |
| Crinetics Pharmaceuticals Inc (a) | | 41,300 | 2,111,669 |
| Exact Sciences Corp (a) | | 110,000 | 6,180,900 |
| Krystal Biotech Inc (a) | | 10,453 | 1,637,567 |
| SpringWorks Therapeutics Inc (a) | | 23,000 | 830,990 |
| United Therapeutics Corp (a) | | 24,600 | 8,679,864 |
| | | | 32,142,387 |
| Health Care Equipment & Supplies - 2.8% | | | |
| Cooper Cos Inc/The (a) | | 62,756 | 5,769,159 |
| Glaukos Corp (a) | | 27,500 | 4,123,350 |
| Insulet Corp (a) | | 19,700 | 5,143,079 |
| Integer Holdings Corp (a)(b) | | 50,400 | 6,679,008 |
| Lantheus Holdings Inc (a) | | 19,800 | 1,771,308 |
| Masimo Corp (a) | | 81,635 | 13,494,266 |
| TransMedics Group Inc (a)(b) | | 96,700 | 6,029,245 |
| | | | 43,009,415 |
| Health Care Providers & Services - 3.2% | | | |
| Astrana Health Inc (a) | | 67,041 | 2,113,802 |
| BrightSpring Health Services Inc (a) | | 363,900 | 6,197,217 |
| Encompass Health Corp | | 171,000 | 15,791,850 |
| Molina Healthcare Inc (a) | | 26,700 | 7,771,035 |
| Tenet Healthcare Corp (a) | | 97,425 | 12,297,958 |
| Universal Health Services Inc Class B | | 30,400 | 5,454,368 |
| | | | 49,626,230 |
| Life Sciences Tools & Services - 1.5% | | | |
| 10X Genomics Inc Class A (a) | | 37,600 | 539,936 |
| Avantor Inc (a) | | 542,500 | 11,430,475 |
| Bruker Corp | | 120,900 | 7,087,158 |
| Repligen Corp (a) | | 26,900 | 3,871,986 |
| | | | 22,929,555 |
| Pharmaceuticals - 0.5% | | | |
| Elanco Animal Health Inc (a) | | 745,400 | 9,026,794 |
TOTAL HEALTH CARE | | | 156,734,381 |
| | | | |
| Industrials - 16.7% | | | |
| Aerospace & Defense - 0.5% | | | |
| Axon Enterprise Inc (a) | | 13,500 | 8,023,320 |
| Air Freight & Logistics - 0.3% | | | |
| GXO Logistics Inc (a) | | 102,466 | 4,457,271 |
| Building Products - 1.1% | | | |
| AZEK Co Inc/The Class A (a) | | 282,900 | 13,429,263 |
| Simpson Manufacturing Co Inc | | 25,200 | 4,178,916 |
| | | | 17,608,179 |
| Commercial Services & Supplies - 1.3% | | | |
| ACV Auctions Inc Class A (a) | | 453,900 | 9,804,240 |
| CECO Environmental Corp (a)(b) | | 164,100 | 4,960,743 |
| Clean Harbors Inc (a) | | 26,000 | 5,983,640 |
| | | | 20,748,623 |
| Construction & Engineering - 2.0% | | | |
| Comfort Systems USA Inc | | 29,900 | 12,679,394 |
| EMCOR Group Inc | | 27,800 | 12,618,420 |
| Quanta Services Inc | | 17,600 | 5,562,480 |
| | | | 30,860,294 |
| Electrical Equipment - 2.0% | | | |
| Acuity Brands Inc | | 28,600 | 8,354,918 |
| AMETEK Inc | | 57,600 | 10,382,976 |
| nVent Electric PLC | | 92,000 | 6,270,720 |
| Vertiv Holdings Co Class A | | 50,900 | 5,782,749 |
| | | | 30,791,363 |
| Ground Transportation - 1.8% | | | |
| JB Hunt Transport Services Inc | | 34,649 | 5,913,198 |
| Saia Inc (a) | | 25,900 | 11,803,407 |
| XPO Inc (a) | | 74,000 | 9,705,100 |
| | | | 27,421,705 |
| Machinery - 5.1% | | | |
| Allison Transmission Holdings Inc | | 42,500 | 4,592,550 |
| Chart Industries Inc (a) | | 77,400 | 14,771,016 |
| Crane Co | | 108,900 | 16,525,575 |
| Ingersoll Rand Inc | | 111,000 | 10,041,060 |
| ITT Inc | | 144,259 | 20,611,726 |
| Westinghouse Air Brake Technologies Corp | | 62,100 | 11,773,539 |
| | | | 78,315,466 |
| Passenger Airlines - 0.3% | | | |
| Alaska Air Group Inc (a)(b) | | 64,800 | 4,195,800 |
| Professional Services - 1.3% | | | |
| Dayforce Inc (a)(b) | | 123,900 | 9,000,096 |
| Maximus Inc | | 28,800 | 2,149,920 |
| TransUnion | | 93,600 | 8,677,656 |
| | | | 19,827,672 |
| Trading Companies & Distributors - 1.0% | | | |
| DNOW Inc (a) | | 301,674 | 3,924,779 |
| Watsco Inc | | 26,000 | 12,321,140 |
| | | | 16,245,919 |
TOTAL INDUSTRIALS | | | 258,495,612 |
| | | | |
| Information Technology - 7.5% | | | |
| Communications Equipment - 0.7% | | | |
| Digi International Inc (a) | | 338,400 | 10,229,832 |
| Electronic Equipment, Instruments & Components - 3.1% | | | |
| Belden Inc | | 91,500 | 10,303,815 |
| Coherent Corp (a) | | 162,200 | 15,365,206 |
| Flex Ltd (a) | | 313,100 | 12,019,909 |
| Jabil Inc | | 40,474 | 5,824,209 |
| OSI Systems Inc (a) | | 31,316 | 5,243,237 |
| | | | 48,756,376 |
| Semiconductors & Semiconductor Equipment - 2.5% | | | |
| First Solar Inc (a) | | 32,900 | 5,798,296 |
| MKS Instruments Inc | | 137,200 | 14,322,308 |
| Semtech Corp (a) | | 79,800 | 4,935,630 |
| Teradyne Inc | | 82,000 | 10,325,440 |
| Universal Display Corp | | 21,700 | 3,172,540 |
| | | | 38,554,214 |
| Software - 1.0% | | | |
| Appfolio Inc Class A (a) | | 5,100 | 1,258,272 |
| Informatica Inc Class A (a) | | 154,200 | 3,998,406 |
| Manhattan Associates Inc (a) | | 18,200 | 4,918,368 |
| Monday.com Ltd (a) | | 20,500 | 4,826,520 |
| | | | 15,001,566 |
| Technology Hardware, Storage & Peripherals - 0.2% | | | |
| Western Digital Corp (a) | | 72,400 | 4,317,212 |
TOTAL INFORMATION TECHNOLOGY | | | 116,859,200 |
| | | | |
| Materials - 4.6% | | | |
| Chemicals - 1.8% | | | |
| Axalta Coating Systems Ltd (a) | | 410,800 | 14,057,576 |
| Element Solutions Inc | | 565,500 | 14,380,665 |
| | | | 28,438,241 |
| Construction Materials - 0.5% | | | |
| Martin Marietta Materials Inc | | 14,600 | 7,540,900 |
| Containers & Packaging - 2.3% | | | |
| AptarGroup Inc | | 119,600 | 18,789,160 |
| Avery Dennison Corp | | 44,000 | 8,233,720 |
| International Paper Co | | 163,700 | 8,810,334 |
| | | | 35,833,214 |
TOTAL MATERIALS | | | 71,812,355 |
| | | | |
| Real Estate - 6.5% | | | |
| Health Care REITs - 1.2% | | | |
| Omega Healthcare Investors Inc | | 161,100 | 6,097,635 |
| Ventas Inc | | 222,200 | 13,085,358 |
| | | | 19,182,993 |
| Industrial REITs - 1.3% | | | |
| EastGroup Properties Inc | | 75,800 | 12,165,142 |
| Terreno Realty Corp | | 138,000 | 8,161,320 |
| | | | 20,326,462 |
| Real Estate Management & Development - 0.4% | | | |
| Jones Lang LaSalle Inc (a) | | 25,800 | 6,531,012 |
| Residential REITs - 0.7% | | | |
| Invitation Homes Inc | | 208,700 | 6,672,139 |
| Sun Communities Inc | | 32,000 | 3,935,040 |
| | | | 10,607,179 |
| Retail REITs - 1.5% | | | |
| Acadia Realty Trust | | 454,700 | 10,985,552 |
| Agree Realty Corp | | 108,600 | 7,650,870 |
| Macerich Co/The | | 223,500 | 4,452,120 |
| | | | 23,088,542 |
| Specialized REITs - 1.4% | | | |
| Four Corners Property Trust Inc | | 312,500 | 8,481,250 |
| Lamar Advertising Co Class A | | 105,600 | 12,855,744 |
| | | | 21,336,994 |
TOTAL REAL ESTATE | | | 101,073,182 |
| | | | |
| Utilities - 3.4% | | | |
| Electric Utilities - 0.7% | | | |
| PG&E Corp | | 525,000 | 10,594,500 |
| Gas Utilities - 0.2% | | | |
| Southwest Gas Holdings Inc | | 54,400 | 3,846,624 |
| Independent Power and Renewable Electricity Producers - 1.3% | | | |
| AES Corp/The | | 541,900 | 6,974,253 |
| Vistra Corp | | 90,000 | 12,408,300 |
| | | | 19,382,553 |
| Multi-Utilities - 0.6% | | | |
| CenterPoint Energy Inc | | 141,500 | 4,489,795 |
| NorthWestern Corp | | 102,400 | 5,474,304 |
| | | | 9,964,099 |
| Water Utilities - 0.6% | | | |
| Essential Utilities Inc | | 237,900 | 8,640,528 |
TOTAL UTILITIES | | | 52,428,304 |
| | | | |
| TOTAL UNITED STATES | | | 1,409,478,490 |
| TOTAL COMMON STOCKS (Cost $1,161,903,053) | | | 1,547,485,234 |
| | | | |
| Money Market Funds - 1.7% |
| | | Yield (%) | Shares | Value ($) |
| Fidelity Cash Central Fund (c) | | 4.36 | 5,336,351 | 5,337,418 |
| Fidelity Securities Lending Cash Central Fund (c)(d) | | 4.35 | 21,100,290 | 21,102,400 |
| TOTAL MONEY MARKET FUNDS (Cost $26,439,818) | | | | 26,439,818 |
| | | | | |
| TOTAL INVESTMENT IN SECURITIES - 101.4% (Cost $1,188,342,871) | 1,573,925,052 |
NET OTHER ASSETS (LIABILITIES) - (1.4)% | (21,945,013) |
| NET ASSETS - 100.0% | 1,551,980,039 |
| | |
Legend
| (b) | Security or a portion of the security is on loan at period end. |
| (c) | Affiliated fund that is generally available only to investment companies and other accounts managed by Fidelity Investments. The rate quoted is the annualized seven-day yield of the fund at period end. A complete unaudited listing of the fund's holdings as of its most recent quarter end is available upon request. In addition, each Fidelity Central Fund's financial statements, which are not covered by the Fund's Report of Independent Registered Public Accounting Firm, are available on the SEC's website or upon request. |
| (d) | Investment made with cash collateral received from securities on loan. |
Affiliated Central Funds
Fiscal year to date information regarding the Fund's investments in Fidelity Central Funds, including the ownership percentage, is presented below.
| Affiliate | Value, beginning of period ($) | Purchases ($) | Sales Proceeds ($) | Dividend Income ($) | Realized Gain (loss) ($) | Change in Unrealized appreciation (depreciation) ($) | Value, end of period ($) | Shares, end of period | % ownership, end of period |
| Fidelity Cash Central Fund | 10,232,493 | 365,701,320 | 370,596,039 | 1,078,359 | (355) | (1) | 5,337,418 | 5,336,351 | 0.0% |
| Fidelity Securities Lending Cash Central Fund | 42,433,562 | 277,233,862 | 298,565,024 | 343,965 | - | - | 21,102,400 | 21,100,290 | 0.1% |
| Total | 52,666,055 | 642,935,182 | 669,161,063 | 1,422,324 | (355) | (1) | 26,439,818 | 26,436,641 | |
| | | | | | | | | | |
Amounts in the dividend income column in the above table include any capital gain distributions from underlying funds, which are presented in the corresponding line item in the Statement of Operations, if applicable.
Amounts in the dividend income column for Fidelity Securities Lending Cash Central Fund represents the income earned on investing cash collateral, less rebates paid to borrowers and any lending agent fees associated with the loan, plus any premium payments received for lending certain types of securities.
Amounts included in the purchases and sales proceeds columns may include in-kind transactions, if applicable.
Investment Valuation
The following is a summary of the inputs used, as of December 31, 2024, involving the Fund's assets and liabilities carried at fair value. The inputs or methodology used for valuing securities may not be an indication of the risk associated with investing in those securities. For more information on valuation inputs, and their aggregation into the levels used below, please refer to the Investment Valuation section in the accompanying Notes to Financial Statements.
| Valuation Inputs at Reporting Date: |
| Description | Total ($) | Level 1 ($) | Level 2 ($) | Level 3 ($) |
Investments in Securities: | | | | |
|
| Common Stocks | | | | |
Communication Services | 28,614,218 | 28,614,218 | - | - |
Consumer Discretionary | 191,338,971 | 191,338,971 | - | - |
Consumer Staples | 76,780,454 | 76,780,454 | - | - |
Energy | 92,338,657 | 92,338,657 | - | - |
Financials | 311,710,743 | 311,710,743 | - | - |
Health Care | 181,276,029 | 181,276,029 | - | - |
Industrials | 278,215,441 | 278,215,441 | - | - |
Information Technology | 152,127,873 | 152,127,873 | - | - |
Materials | 81,581,362 | 81,581,362 | - | - |
Real Estate | 101,073,182 | 101,073,182 | - | - |
Utilities | 52,428,304 | 52,428,304 | - | - |
|
| Money Market Funds | 26,439,818 | 26,439,818 | - | - |
| Total Investments in Securities: | 1,573,925,052 | 1,573,925,052 | - | - |
Financial Statements
| Statement of Assets and Liabilities |
As of December 31, 2024 |
| Assets | | | | |
| Investment in securities, at value (including securities loaned of $20,991,838) - See accompanying schedule: | | | | |
Unaffiliated issuers (cost $1,161,903,053) | $ | 1,547,485,234 | | |
Fidelity Central Funds (cost $26,439,818) | | 26,439,818 | | |
| | | | | |
| | | | | |
| Total Investment in Securities (cost $1,188,342,871) | | | $ | 1,573,925,052 |
| Foreign currency held at value (cost $26,837) | | | | 26,305 |
| Receivable for investments sold | | | | 45,761 |
| Receivable for fund shares sold | | | | 531,381 |
| Dividends receivable | | | | 1,023,518 |
| Distributions receivable from Fidelity Central Funds | | | | 48,927 |
| Prepaid expenses | | | | 1,336 |
| Other receivables | | | | 26,579 |
Total assets | | | | 1,575,628,859 |
| Liabilities | | | | |
| Payable to custodian bank | $ | 87 | | |
| Payable for investments purchased | | 149,224 | | |
| Payable for fund shares redeemed | | 1,103,413 | | |
| Accrued management fee | | 916,584 | | |
| Distribution and service plan fees payable | | 326,931 | | |
| Other payables and accrued expenses | | 50,181 | | |
| Collateral on securities loaned | | 21,102,400 | | |
| Total liabilities | | | | 23,648,820 |
| Net Assets | | | $ | 1,551,980,039 |
| Net Assets consist of: | | | | |
| Paid in capital | | | $ | 1,104,067,311 |
| Total accumulated earnings (loss) | | | | 447,912,728 |
| Net Assets | | | $ | 1,551,980,039 |
| | | | | |
| Net Asset Value and Maximum Offering Price | | | | |
| Class A : | | | | |
Net Asset Value and redemption price per share ($764,953,253 ÷ 33,045,168 shares)(a) | | | $ | 23.15 |
| Maximum offering price per share (100/94.25 of $23.15) | | | $ | 24.56 |
| Class M : | | | | |
Net Asset Value and redemption price per share ($297,934,182 ÷ 13,450,022 shares)(a) | | | $ | 22.15 |
| Maximum offering price per share (100/96.50 of $22.15) | | | $ | 22.95 |
| Class C : | | | | |
Net Asset Value and offering price per share ($37,225,338 ÷ 2,025,554 shares)(a) | | | $ | 18.38 |
| Class I : | | | | |
Net Asset Value, offering price and redemption price per share ($360,932,816 ÷ 14,826,853 shares) | | | $ | 24.34 |
| Class Z : | | | | |
Net Asset Value, offering price and redemption price per share ($90,934,450 ÷ 3,740,841 shares) | | | $ | 24.31 |
(a)Redemption price per share is equal to net asset value less any applicable contingent deferred sales charge. |
| Statement of Operations |
| Year ended December 31, 2024 |
| Investment Income | | | | |
| Dividends | | | $ | 16,071,649 |
| Income from Fidelity Central Funds (including $343,965 from security lending) | | | | 1,422,324 |
| Total income | | | | 17,493,973 |
| Expenses | | | | |
| Management fee | $ | 10,002,231 | | |
| Transfer agent fees | | 412,402 | | |
| Distribution and service plan fees | | 3,739,963 | | |
| Accounting fees | | 65,359 | | |
| Custodian fees and expenses | | 25,021 | | |
| Independent trustees' fees and expenses | | 6,470 | | |
| Registration fees | | 98,243 | | |
| Audit fees | | 71,656 | | |
| Legal | | 11,267 | | |
| Miscellaneous | | 38,530 | | |
| Total expenses before reductions | | 14,471,142 | | |
| Expense reductions | | (64,924) | | |
| Total expenses after reductions | | | | 14,406,218 |
| Net Investment income (loss) | | | | 3,087,755 |
| Realized and Unrealized Gain (Loss) | | | | |
| Net realized gain (loss) on: | | | | |
| Investment Securities: | | | | |
| Unaffiliated issuers | | 157,531,142 | | |
| Redemptions in-kind | | 89,755,821 | | |
| Fidelity Central Funds | | (355) | | |
| Foreign currency transactions | | (37,420) | | |
| Total net realized gain (loss) | | | | 247,249,188 |
| Change in net unrealized appreciation (depreciation) on: | | | | |
| Investment Securities: | | | | |
| Unaffiliated issuers | | (19,203,845) | | |
| Fidelity Central Funds | | (1) | | |
| Assets and liabilities in foreign currencies | | (6,660) | | |
| Total change in net unrealized appreciation (depreciation) | | | | (19,210,506) |
| Net gain (loss) | | | | 228,038,682 |
| Net increase (decrease) in net assets resulting from operations | | | $ | 231,126,437 |
| Statement of Changes in Net Assets |
| |
| | Year ended December 31, 2024 | | Year ended December 31, 2023 |
| Increase (Decrease) in Net Assets | | | | |
| Operations | | | | |
| Net investment income (loss) | $ | 3,087,755 | $ | 2,839,155 |
| Net realized gain (loss) | | 247,249,188 | | 65,642,240 |
| Change in net unrealized appreciation (depreciation) | | (19,210,506) | | 117,750,989 |
| Net increase (decrease) in net assets resulting from operations | | 231,126,437 | | 186,232,384 |
| Distributions to shareholders | | (103,421,668) | | (36,429,267) |
| | | | | |
| Share transactions - net increase (decrease) | | 19,479,270 | | (75,406,965) |
| Total increase (decrease) in net assets | | 147,184,039 | | 74,396,152 |
| | | | | |
| Net Assets | | | | |
| Beginning of period | | 1,404,796,000 | | 1,330,399,848 |
| End of period | $ | 1,551,980,039 | $ | 1,404,796,000 |
| | | | | |
| | | | | |
Financial Highlights
Fidelity Advisor® Mid Cap II Fund Class A |
| |
| Years ended December 31, | | 2024 | | 2023 | | 2022 | | 2021 | | 2020 |
Selected Per-Share Data | | | | | | | | | | |
| Net asset value, beginning of period | $ | 21.21 | $ | 18.98 | $ | 23.56 | $ | 22.59 | $ | 19.31 |
| Income from Investment Operations | | | | | | | | | | |
Net investment income (loss) A,B | | .04 | | .04 | | .04 | | .03 | | .01 |
| Net realized and unrealized gain (loss) | | 3.49 | | 2.74 | | (3.54) | | 5.40 | | 3.52 |
| Total from investment operations | | 3.53 | | 2.78 | | (3.50) | | 5.43 | | 3.53 |
| Distributions from net investment income | | (.05) | | (.04) | | (.02) | | (.01) | | (.03) |
| Distributions from net realized gain | | (1.55) | | (.51) | | (1.06) | | (4.46) | | (.22) |
| Total distributions | | (1.59) C | | (.55) | | (1.08) | | (4.46) C | | (.25) |
| Net asset value, end of period | $ | 23.15 | $ | 21.21 | $ | 18.98 | $ | 23.56 | $ | 22.59 |
Total Return D,E | | | | 14.70% | | (15.02)% | | 24.92% | | 18.34% |
Ratios to Average Net Assets B,F,G | | | | | | | | | | |
| Expenses before reductions | | .97% | | 1.01% | | 1.01% | | 1.00% | | 1.05% |
| Expenses net of fee waivers, if any | | | | 1.00% | | 1.01% | | 1.00% | | 1.05% |
| Expenses net of all reductions | | .96% | | 1.00% | | 1.01% | | 1.00% | | 1.04% |
| Net investment income (loss) | | .19% | | .19% | | .17% | | .11% | | .06% |
| Supplemental Data | | | | | | | | | | |
| Net assets, end of period (000 omitted) | $ | 764,953 | $ | 698,537 | $ | 651,156 | $ | 828,601 | $ | 674,103 |
Portfolio turnover rate H | | | | 47% | | 34% | | 42% | | 43% |
ACalculated based on average shares outstanding during the period.
BNet investment income (loss) is affected by the timing of the declaration of dividends by any underlying mutual funds or exchange-traded funds (ETFs). Net investment income (loss) of any mutual funds or ETFs is not included in the Fund's net investment income (loss) ratio.
CTotal distributions per share do not sum due to rounding.
DTotal returns would have been lower if certain expenses had not been reduced during the applicable periods shown.
ETotal returns do not include the effect of the sales charges.
FFees and expenses of any underlying mutual funds or exchange-traded funds (ETFs) are not included in the Fund's expense ratio. The Fund indirectly bears its proportionate share of these expenses. For additional expense information related to investments in Fidelity Central Funds, please refer to the "Investments in Fidelity Central Funds" note found in the Notes to Financial Statements section of the most recent Annual or Semi-Annual report.
GExpense ratios reflect operating expenses of the class. Expenses before reductions do not reflect amounts reimbursed, waived, or reduced through arrangements with the investment adviser, brokerage services, or other offset arrangements, if applicable, and do not represent the amount paid by the class during periods when reimbursements, waivers or reductions occur.
HAmount does not include the portfolio activity of any underlying mutual funds or exchange-traded funds (ETFs), derivatives or securities that mature within one year from acquisition.
IPortfolio turnover rate excludes securities received or delivered in-kind.
Fidelity Advisor® Mid Cap II Fund Class M |
| |
| Years ended December 31, | | 2024 | | 2023 | | 2022 | | 2021 | | 2020 |
Selected Per-Share Data | | | | | | | | | | |
| Net asset value, beginning of period | $ | 20.37 | $ | 18.26 | $ | 22.74 | $ | 21.94 | $ | 18.78 |
| Income from Investment Operations | | | | | | | | | | |
Net investment income (loss) A,B | | (.01) | | (.01) | | (.01) | | (.03) | | (.03) |
| Net realized and unrealized gain (loss) | | 3.34 | | 2.63 | | (3.41) | | 5.23 | | 3.41 |
| Total from investment operations | | 3.33 | | 2.62 | | (3.42) | | 5.20 | | 3.38 |
| Distributions from net realized gain | | (1.55) | | (.51) | | (1.06) | | (4.40) | | (.22) |
| Total distributions | | (1.55) | | (.51) | | (1.06) | | (4.40) | | (.22) |
| Net asset value, end of period | $ | 22.15 | $ | 20.37 | $ | 18.26 | $ | 22.74 | $ | 21.94 |
Total Return C,D | | | | 14.42% | | (15.19)% | | 24.58% | | 18.05% |
Ratios to Average Net Assets B,E,F | | | | | | | | | | |
| Expenses before reductions | | 1.22% | | 1.25% | | 1.25% | | 1.25% | | 1.28% |
| Expenses net of fee waivers, if any | | | | 1.25% | | 1.25% | | 1.25% | | 1.28% |
| Expenses net of all reductions | | 1.21% | | 1.25% | | 1.25% | | 1.25% | | 1.28% |
| Net investment income (loss) | | (.06)% | | (.06)% | | (.07)% | | (.13)% | | (.17)% |
| Supplemental Data | | | | | | | | | | |
| Net assets, end of period (000 omitted) | $ | 297,934 | $ | 276,480 | $ | 268,867 | $ | 347,492 | $ | 308,136 |
Portfolio turnover rate G | | | | 47% | | 34% | | 42% | | 43% |
ACalculated based on average shares outstanding during the period.
BNet investment income (loss) is affected by the timing of the declaration of dividends by any underlying mutual funds or exchange-traded funds (ETFs). Net investment income (loss) of any mutual funds or ETFs is not included in the Fund's net investment income (loss) ratio.
CTotal returns would have been lower if certain expenses had not been reduced during the applicable periods shown.
DTotal returns do not include the effect of the sales charges.
EFees and expenses of any underlying mutual funds or exchange-traded funds (ETFs) are not included in the Fund's expense ratio. The Fund indirectly bears its proportionate share of these expenses. For additional expense information related to investments in Fidelity Central Funds, please refer to the "Investments in Fidelity Central Funds" note found in the Notes to Financial Statements section of the most recent Annual or Semi-Annual report.
FExpense ratios reflect operating expenses of the class. Expenses before reductions do not reflect amounts reimbursed, waived, or reduced through arrangements with the investment adviser, brokerage services, or other offset arrangements, if applicable, and do not represent the amount paid by the class during periods when reimbursements, waivers or reductions occur.
GAmount does not include the portfolio activity of any underlying mutual funds or exchange-traded funds (ETFs), derivatives or securities that mature within one year from acquisition.
HPortfolio turnover rate excludes securities received or delivered in-kind.
Fidelity Advisor® Mid Cap II Fund Class C |
| |
| Years ended December 31, | | 2024 | | 2023 | | 2022 | | 2021 | | 2020 |
Selected Per-Share Data | | | | | | | | | | |
| Net asset value, beginning of period | $ | 17.21 | $ | 15.59 | $ | 19.71 | $ | 19.51 | $ | 16.82 |
| Income from Investment Operations | | | | | | | | | | |
Net investment income (loss) A,B | | (.10) | | (.10) | | (.11) | | (.15) | | (.12) |
| Net realized and unrealized gain (loss) | | 2.82 | | 2.23 | | (2.95) | | 4.63 | | 3.03 |
| Total from investment operations | | 2.72 | | 2.13 | | (3.06) | | 4.48 | | 2.91 |
| Distributions from net realized gain | | (1.55) | | (.51) | | (1.06) | | (4.28) | | (.22) |
| Total distributions | | (1.55) | | (.51) | | (1.06) | | (4.28) | | (.22) |
| Net asset value, end of period | $ | 18.38 | $ | 17.21 | $ | 15.59 | $ | 19.71 | $ | 19.51 |
Total Return C,D | | | | 13.74% | | (15.71)% | | 23.91% | | 17.36% |
Ratios to Average Net Assets B,E,F | | | | | | | | | | |
| Expenses before reductions | | 1.72% | | 1.82% | | 1.83% | | 1.83% | | 1.86% |
| Expenses net of fee waivers, if any | | | | 1.82% | | 1.83% | | 1.82% | | 1.86% |
| Expenses net of all reductions | | 1.71% | | 1.82% | | 1.83% | | 1.82% | | 1.85% |
| Net investment income (loss) | | (.56)% | | (.63)% | | (.65)% | | (.71)% | | (.75)% |
| Supplemental Data | | | | | | | | | | |
| Net assets, end of period (000 omitted) | $ | 37,225 | $ | 38,594 | $ | 43,947 | $ | 67,519 | $ | 93,765 |
Portfolio turnover rate G | | | | 47% | | 34% | | 42% | | 43% |
ACalculated based on average shares outstanding during the period.
BNet investment income (loss) is affected by the timing of the declaration of dividends by any underlying mutual funds or exchange-traded funds (ETFs). Net investment income (loss) of any mutual funds or ETFs is not included in the Fund's net investment income (loss) ratio.
CTotal returns would have been lower if certain expenses had not been reduced during the applicable periods shown.
DTotal returns do not include the effect of the contingent deferred sales charge.
EFees and expenses of any underlying mutual funds or exchange-traded funds (ETFs) are not included in the Fund's expense ratio. The Fund indirectly bears its proportionate share of these expenses. For additional expense information related to investments in Fidelity Central Funds, please refer to the "Investments in Fidelity Central Funds" note found in the Notes to Financial Statements section of the most recent Annual or Semi-Annual report.
FExpense ratios reflect operating expenses of the class. Expenses before reductions do not reflect amounts reimbursed, waived, or reduced through arrangements with the investment adviser, brokerage services, or other offset arrangements, if applicable, and do not represent the amount paid by the class during periods when reimbursements, waivers or reductions occur.
GAmount does not include the portfolio activity of any underlying mutual funds or exchange-traded funds (ETFs), derivatives or securities that mature within one year from acquisition.
HPortfolio turnover rate excludes securities received or delivered in-kind.
Fidelity Advisor® Mid Cap II Fund Class I |
| |
| Years ended December 31, | | 2024 | | 2023 | | 2022 | | 2021 | | 2020 |
Selected Per-Share Data | | | | | | | | | | |
| Net asset value, beginning of period | $ | 22.23 | $ | 19.86 | $ | 24.59 | $ | 23.41 | $ | 19.99 |
| Income from Investment Operations | | | | | | | | | | |
Net investment income (loss) A,B | | .11 | | .10 | | .09 | | .10 | | .07 |
| Net realized and unrealized gain (loss) | | 3.65 | | 2.87 | | (3.69) | | 5.61 | | 3.65 |
| Total from investment operations | | 3.76 | | 2.97 | | (3.60) | | 5.71 | | 3.72 |
| Distributions from net investment income | | (.11) | | (.09) | | (.07) | | (.07) | | (.08) |
| Distributions from net realized gain | | (1.55) | | (.51) | | (1.06) | | (4.46) | | (.22) |
| Total distributions | | (1.65) C | | (.60) | | (1.13) | | (4.53) | | (.30) |
| Net asset value, end of period | $ | 24.34 | $ | 22.23 | $ | 19.86 | $ | 24.59 | $ | 23.41 |
Total Return D | | | | 15.03% | | (14.77)% | | 25.24% | | 18.68% |
Ratios to Average Net Assets B,E,F | | | | | | | | | | |
| Expenses before reductions | | .71% | | .74% | | .74% | | .73% | | .76% |
| Expenses net of fee waivers, if any | | | | .73% | | .73% | | .73% | | .76% |
| Expenses net of all reductions | | .71% | | .73% | | .73% | | .73% | | .75% |
| Net investment income (loss) | | .45% | | .46% | | .45% | | .39% | | .35% |
| Supplemental Data | | | | | | | | | | |
| Net assets, end of period (000 omitted) | $ | 360,933 | $ | 318,290 | $ | 308,672 | $ | 419,860 | $ | 378,711 |
Portfolio turnover rate G | | | | 47% | | 34% | | 42% | | 43% |
ACalculated based on average shares outstanding during the period.
BNet investment income (loss) is affected by the timing of the declaration of dividends by any underlying mutual funds or exchange-traded funds (ETFs). Net investment income (loss) of any mutual funds or ETFs is not included in the Fund's net investment income (loss) ratio.
CTotal distributions per share do not sum due to rounding.
DTotal returns would have been lower if certain expenses had not been reduced during the applicable periods shown.
EFees and expenses of any underlying mutual funds or exchange-traded funds (ETFs) are not included in the Fund's expense ratio. The Fund indirectly bears its proportionate share of these expenses. For additional expense information related to investments in Fidelity Central Funds, please refer to the "Investments in Fidelity Central Funds" note found in the Notes to Financial Statements section of the most recent Annual or Semi-Annual report.
FExpense ratios reflect operating expenses of the class. Expenses before reductions do not reflect amounts reimbursed, waived, or reduced through arrangements with the investment adviser, brokerage services, or other offset arrangements, if applicable, and do not represent the amount paid by the class during periods when reimbursements, waivers or reductions occur.
GAmount does not include the portfolio activity of any underlying mutual funds or exchange-traded funds (ETFs), derivatives or securities that mature within one year from acquisition.
HPortfolio turnover rate excludes securities received or delivered in-kind.
Fidelity Advisor® Mid Cap II Fund Class Z |
| |
| Years ended December 31, | | 2024 | | 2023 | | 2022 | | 2021 | | 2020 |
Selected Per-Share Data | | | | | | | | | | |
| Net asset value, beginning of period | $ | 22.20 | $ | 19.83 | $ | 24.56 | $ | 23.39 | $ | 19.97 |
| Income from Investment Operations | | | | | | | | | | |
Net investment income (loss) A,B | | .14 | | .12 | | .12 | | .13 | | .09 |
| Net realized and unrealized gain (loss) | | 3.66 | | 2.88 | | (3.69) | | 5.60 | | 3.66 |
| Total from investment operations | | 3.80 | | 3.00 | | (3.57) | | 5.73 | | 3.75 |
| Distributions from net investment income | | (.14) | | (.12) | | (.10) | | (.11) | | (.11) |
| Distributions from net realized gain | | (1.55) | | (.51) | | (1.06) | | (4.46) | | (.22) |
| Total distributions | | (1.69) | | (.63) | | (1.16) | | (4.56) C | | (.33) |
| Net asset value, end of period | $ | 24.31 | $ | 22.20 | $ | 19.83 | $ | 24.56 | $ | 23.39 |
Total Return D | | | | 15.18% | | (14.67)% | | 25.38% | | 18.84% |
Ratios to Average Net Assets B,E,F | | | | | | | | | | |
| Expenses before reductions | | .59% | | .61% | | .61% | | .61% | | .63% |
| Expenses net of fee waivers, if any | | | | .60% | | .61% | | .61% | | .63% |
| Expenses net of all reductions | | .58% | | .60% | | .61% | | .61% | | .62% |
| Net investment income (loss) | | .57% | | .59% | | .57% | | .51% | | .48% |
| Supplemental Data | | | | | | | | | | |
| Net assets, end of period (000 omitted) | $ | 90,934 | $ | 72,894 | $ | 57,758 | $ | 49,283 | $ | 31,800 |
Portfolio turnover rate G | | | | 47% | | 34% | | 42% | | 43% |
ACalculated based on average shares outstanding during the period.
BNet investment income (loss) is affected by the timing of the declaration of dividends by any underlying mutual funds or exchange-traded funds (ETFs). Net investment income (loss) of any mutual funds or ETFs is not included in the Fund's net investment income (loss) ratio.
CTotal distributions per share do not sum due to rounding.
DTotal returns would have been lower if certain expenses had not been reduced during the applicable periods shown.
EFees and expenses of any underlying mutual funds or exchange-traded funds (ETFs) are not included in the Fund's expense ratio. The Fund indirectly bears its proportionate share of these expenses. For additional expense information related to investments in Fidelity Central Funds, please refer to the "Investments in Fidelity Central Funds" note found in the Notes to Financial Statements section of the most recent Annual or Semi-Annual report.
FExpense ratios reflect operating expenses of the class. Expenses before reductions do not reflect amounts reimbursed, waived, or reduced through arrangements with the investment adviser, brokerage services, or other offset arrangements, if applicable, and do not represent the amount paid by the class during periods when reimbursements, waivers or reductions occur.
GAmount does not include the portfolio activity of any underlying mutual funds or exchange-traded funds (ETFs), derivatives or securities that mature within one year from acquisition.
HPortfolio turnover rate excludes securities received or delivered in-kind.
Notes to Financial Statements
For the period ended December 31, 2024
1. Organization.
Fidelity Advisor Mid Cap II Fund (the Fund) is a fund of Fidelity Advisor Series I (the Trust) and is authorized to issue an unlimited number of shares. The Trust is registered under the Investment Company Act of 1940, as amended (the 1940 Act), as an open-end management investment company organized as a Massachusetts business trust. The Fund offers Class A, Class M, Class C, Class I and Class Z shares, each of which has equal rights as to assets and voting privileges. Class A, Class M, Class C, Class I and Class Z are Fidelity Advisor classes. Each class has exclusive voting rights with respect to matters that affect that class. Class C shares will automatically convert to Class A shares after a holding period of eight years from the initial date of purchase, with certain exceptions.
2. Investments in Fidelity Central Funds.
Funds may invest in Fidelity Central Funds, which are open-end investment companies generally available only to other investment companies and accounts managed by the investment adviser and its affiliates. The Schedule of Investments lists any Fidelity Central Funds held as an investment as of period end, but does not include the underlying holdings of each Fidelity Central Fund. An investing fund indirectly bears its proportionate share of the expenses of the underlying Fidelity Central Funds.
Based on its investment objective, each Fidelity Central Fund may invest or participate in various investment vehicles or strategies that are similar to those of the investing fund. These strategies are consistent with the investment objectives of the investing fund and may involve certain economic risks which may cause a decline in value of each of the Fidelity Central Funds and thus a decline in the value of the investing fund.
| Fidelity Central Fund | Investment Manager | Investment Objective | Investment Practices | Expense RatioA |
| Fidelity Money Market Central Funds | Fidelity Management & Research Company LLC (FMR) | Each fund seeks to obtain a high level of current income consistent with the preservation of capital and liquidity. | Short-term Investments | Less than .005% |
A Expenses expressed as a percentage of average net assets and are as of each underlying Central Fund's most recent annual or semi-annual shareholder report.
A complete unaudited list of holdings for each Fidelity Central Fund is available upon request or at the Securities and Exchange Commission website at www.sec.gov. In addition, the financial statements of the Fidelity Central Funds which contain the significant accounting policies (including investment valuation policies) of those funds, and are not covered by the Report of Independent Registered Public Accounting Firm, are available on the Securities and Exchange Commission website or upon request.
3. Significant Accounting Policies.
The Fund is an investment company and applies the accounting and reporting guidance of the Financial Accounting Standards Board (FASB) Accounting Standards Codification Topic 946 Financial Services - Investment Companies. The financial statements have been prepared in conformity with accounting principles generally accepted in the United States of America (GAAP), which require management to make certain estimates and assumptions at the date of the financial statements. Actual results could differ from those estimates. The Fund operates as a single operating segment. The Fund's income, expenses, assets, and performance are regularly monitored and assessed as a whole by the investment adviser and other individuals responsible for oversight functions of the Trust, using the information presented in the financial statements and financial highlights. Subsequent events, if any, through the date that the financial statements were issued have been evaluated in the preparation of the financial statements. The Fund's Schedule of Investments lists any underlying mutual funds or exchange-traded funds (ETFs) but does not include the underlying holdings of these funds. The following summarizes the significant accounting policies of the Fund:
Investment Valuation. Investments are valued as of 4:00 p.m. Eastern time on the last calendar day of the period. The Board of Trustees (the Board) has designated the Fund's investment adviser as the valuation designee responsible for the fair valuation function and performing fair value determinations as needed. The investment adviser has established a Fair Value Committee (the Committee) to carry out the day-to-day fair valuation responsibilities and has adopted policies and procedures to govern the fair valuation process and the activities of the Committee. In accordance with these fair valuation policies and procedures, which have been approved by the Board, the Fund attempts to obtain prices from one or more third party pricing services or brokers to value its investments. When current market prices, quotations or currency exchange rates are not readily available or reliable, investments will be fair valued in good faith by the Committee, in accordance with the policies and procedures. Factors used in determining fair value vary by investment type and may include market or investment specific events, transaction data, estimated cash flows, and market observations of comparable investments. The frequency that the fair valuation procedures are used cannot be predicted and they may be utilized to a significant extent. The Committee manages the Fund's fair valuation practices and maintains the fair valuation policies and procedures. The Fund's investment adviser reports to the Board information regarding the fair valuation process and related material matters.
The Fund categorizes the inputs to valuation techniques used to value its investments into a disclosure hierarchy consisting of three levels as shown below:
Level 1 - unadjusted quoted prices in active markets for identical investments
Level 2 - other significant observable inputs (including quoted prices for similar investments, interest rates, prepayment speeds, etc.)
Level 3 - unobservable inputs (including the Fund's own assumptions based on the best information available)
Valuation techniques used to value the Fund's investments by major category are as follows:
Equity securities, including restricted securities, for which market quotations are readily available, are valued at the last reported sale price or official closing price as reported by a third party pricing service on the primary market or exchange on which they are traded and are categorized as Level 1 in the hierarchy. In the event there were no sales during the day or closing prices are not available, securities are valued at the last quoted bid price or may be valued using the last available price and are generally categorized as Level 2 in the hierarchy. For foreign equity securities, when market or security specific events arise, comparisons to the valuation of American Depositary Receipts (ADRs), futures contracts, Exchange-Traded Funds (ETFs) and certain indexes as well as quoted prices for similar securities may be used and would be categorized as Level 2 in the hierarchy. For equity securities, including restricted securities, where observable inputs are limited, assumptions about market activity and risk are used and these securities may be categorized as Level 3 in the hierarchy.
Investments in open-end mutual funds, including the Fidelity Central Funds, are valued at their closing net asset value (NAV) each business day and are categorized as Level 1 in the hierarchy.
Changes in valuation techniques may result in transfers in or out of an assigned level within the disclosure hierarchy. The aggregate value of investments by input level as of December 31, 2024 is included at the end of the Fund's Schedule of Investments.
Foreign Currency. Certain Funds may use foreign currency contracts to facilitate transactions in foreign-denominated securities. Gains and losses from these transactions may arise from changes in the value of the foreign currency or if the counterparties do not perform under the contracts' terms.
Foreign-denominated assets, including investment securities, and liabilities are translated into U.S. dollars at the exchange rates at period end. Purchases and sales of investment securities, income and dividends received, and expenses denominated in foreign currencies are translated into U.S. dollars at the exchange rate in effect on the transaction date.
The effects of exchange rate fluctuations on investments are included with the net realized and unrealized gain (loss) on investment securities. Other foreign currency transactions resulting in realized and unrealized gain (loss) are disclosed separately.
Investment Transactions and Income. For financial reporting purposes, the Fund's investment holdings and NAV include trades executed through the end of the last business day of the period. The NAV per share for processing shareholder transactions is calculated as of the close of business of the New York Stock Exchange (NYSE), normally 4:00 p.m. Eastern time and includes trades executed through the end of the prior business day. Gains and losses on securities sold are determined on the basis of identified cost and include proceeds received from litigation. Commissions paid to certain brokers with whom the investment adviser, or its affiliates, places trades on behalf of a fund include an amount in addition to trade execution, which may be rebated back to a fund. Any such rebates are included in net realized gain (loss) on investments in the Statement of Operations. Dividend income is recorded on the ex-dividend date, except for certain dividends from foreign securities where the ex-dividend date may have passed, which are recorded as soon as the Fund is informed of the ex-dividend date. Non-cash dividends included in dividend income, if any, are recorded at the fair market value of the securities received. Income and capital gain distributions from Fidelity Central Funds, if any, are recorded on the ex-dividend date. Certain distributions received by the Fund represent a return of capital or capital gain. The Fund determines the components of these distributions subsequent to the ex-dividend date, based upon receipt of tax filings or other correspondence relating to the underlying investment. These distributions are recorded as a reduction of cost of investments and/or as a realized gain. Investment income is recorded net of foreign taxes withheld where recovery of such taxes is uncertain. Funds may file withholding tax reclaims in certain jurisdictions to recover a portion of amounts previously withheld. Any withholding tax reclaims income is included in the Statement of Operations in dividends. Any receivables for withholding tax reclaims are included in the Statement of Assets and Liabilities in dividends receivable.
Class Allocations and Expenses. Investment income, realized and unrealized capital gains and losses, common expenses of a fund, and certain fund-level expense reductions, if any, are allocated daily on a pro-rata basis to each class based on the relative net assets of each class to the total net assets of a fund. Each class differs with respect to transfer agent and distribution and service plan fees incurred, as applicable. Certain expense reductions may also differ by class, if applicable. For the reporting period, the allocated portion of income and expenses to each class as a percent of its average net assets may vary due to the timing of recording these transactions in relation to fluctuating net assets of the classes. Expenses directly attributable to a fund are charged to that fund. Expenses attributable to more than one fund are allocated among the respective funds on the basis of relative net assets or other appropriate methods. Expenses included in the accompanying financial statements reflect the expenses of that fund and do not include any expenses associated with any underlying mutual funds or exchange-traded funds (ETFs). Although not included in a fund's expenses, a fund indirectly bears its proportionate share of these expenses through the net asset value of each underlying mutual fund or exchange-traded fund (ETF). Expense estimates are accrued in the period to which they relate and adjustments are made when actual amounts are known.
Income Tax Information and Distributions to Shareholders. Each year, the Fund intends to qualify as a regulated investment company under Subchapter M of the Internal Revenue Code, including distributing substantially all of its taxable income and realized gains. As a result, no provision for U.S. Federal income taxes is required. As of December 31, 2024, the Fund did not have any unrecognized tax benefits in the financial statements; nor is the Fund aware of any tax positions for which it is reasonably possible that the total amounts of unrecognized tax benefits will significantly change in the next twelve months. The Fund files a U.S. federal tax return, in addition to state and local tax returns as required. The Fund's federal income tax returns are subject to examination by the Internal Revenue Service (IRS) for a period of three fiscal years after they are filed. State and local tax returns may be subject to examination for an additional fiscal year depending on the jurisdiction. Foreign taxes are provided for based on the Fund's understanding of the tax rules and rates that exist in the foreign markets in which it invests.
Distributions are declared and recorded on the ex-dividend date. Income and capital gain distributions are declared separately for each class. Income and capital gain distributions are determined in accordance with income tax regulations, which may differ from GAAP. In addition, the Fund claimed a portion of the payment made to redeeming shareholders as a distribution for income tax purposes.
Capital accounts within the financial statements are adjusted for permanent book-tax differences. These adjustments have no impact on net assets or the results of operations. Capital accounts are not adjusted for temporary book-tax differences which will reverse in a subsequent period.
Book-tax differences are primarily due to foreign currency transactions, redemptions in-kind and losses deferred due to wash sales and excise tax regulations.
As of period end, the cost and unrealized appreciation (depreciation) in securities, and derivatives if applicable, for federal income tax purposes were as follows:
| Gross unrealized appreciation | $438,651,745 |
| Gross unrealized depreciation | (53,846,773) |
| Net unrealized appreciation (depreciation) | $384,804,972 |
| Tax Cost | $1,189,120,080 |
The tax-based components of distributable earnings as of period end were as follows:
| Undistributed long-term capital gain | $63,731,725 |
| Net unrealized appreciation (depreciation) on securities and other investments | $384,798,036 |
The Fund intends to elect to defer to its next fiscal year $9,595 of ordinary losses recognized during the period January 1, 2024 to December 31, 2024.
The tax character of distributions paid was as follows:
| | December 31, 2024 | December 31, 2023 |
| Ordinary Income | $3,520,357 | $ 2,837,201 |
| Long-term Capital Gains | 99,901,311 | 33,592,066 |
| Total | $103,421,668 | $ 36,429,267 |
New Accounting Pronouncement. FASB Accounting Standards Update (ASU) 2023-07 Segment Reporting (Topic 280): Improvements to Reportable Segment Disclosures became effective in this reporting period. ASU 2023-07 enhances segment information disclosure in the notes to financial statements.
4. Purchases and Sales of Investments.
Purchases and sales of securities, other than short-term securities and in-kind transactions, as applicable, are noted in the table below.
| | Purchases ($) | Sales ($) |
| Fidelity Advisor Mid Cap II Fund | 823,824,038 | 776,562,589 |
Unaffiliated Redemptions In-Kind. Shares that were redeemed in-kind for investments, including accrued interest and cash, if any, are shown in the table below. The net realized gain or loss on investments delivered through in-kind redemptions is included in the "Net realized gain (loss) on: Redemptions in-kind" line in the accompanying Statement of Operations. The amount of the in-kind redemptions is included in share transactions in the accompanying Statement of Changes in Net Assets. There was no gain or loss for federal income tax purposes.
| | Shares | Total net realized gain or loss ($) | Total Proceeds ($) |
| Fidelity Advisor Mid Cap II Fund | 5,401,525 | 89,755,821 | 130,652,677 |
5. Fees and Other Transactions with Affiliates.
Management Fee. Fidelity Management & Research Company LLC (the investment adviser) and its affiliates provide the Fund with investment management related services for which the Fund pays a monthly management fee.
Effective March 1, 2024, the Fund's management contract was amended to incorporate administrative services previously covered under separate services agreements (Transfer Agent and Accounting agreements). The amended contract incorporates a management fee rate that may vary by class. The investment adviser or an affiliate pays certain expenses of managing and operating the Fund out of each class's management fee. Each class of the Fund pays a management fee to the investment adviser. The management fee is calculated and paid to the investment adviser every month. When determining a class's management fee, a mandate rate is calculated based on the monthly average net assets of a group of funds advised by FMR within a designated asset class. A discount rate is subtracted from the mandate rate once the Fund's monthly average net assets reach a certain level. The mandate rate and discount rate may vary by class. The annual management fee rate for a class of shares of the Fund is the lesser of (1) the class's mandate rate reduced by the class's discount rate (if applicable) or (2) the amount set forth in the following table.
| | Maximum Management Fee Rate % |
| Class A | .71 |
| Class M | .70 |
| Class C | .72 |
| Class I | .69 |
| Class Z | .56 |
One-twelfth of the management fee rate for a class is applied to the average net assets of the class for the month, giving a dollar amount which is the management fee for the class for that month. A different management fee rate may be applicable to each class of the Fund. The difference between classes is the result of separate arrangements for class-level services and/or waivers of certain expenses. It is not the result of any difference in advisory or custodial fees or other expenses related to the management of the Fund's assets, which do not vary by class. For the portion of the reporting period on or after March 1, 2024, the total annualized management fee rates were as follows:
| | Total Management Fee Rate % |
| Class A | .70 |
| Class M | .70 |
| Class C | .70 |
| Class I | .69 |
| Class Z | .56 |
Prior to March 1, 2024, the management fee was the sum of an individual fund fee rate that was based on an annual rate of .30% of the Fund's average net assets and an annualized group fee rate that averaged .22% during the period. The group fee rate was based upon the monthly average net assets of a group of registered investment companies with which the investment adviser has management contracts. The group fee rate decreased as assets under management increased and increased as assets under management decreased. For the portion of the reporting period prior to March 1, 2024, the total annualized management fee rate was .52%.
Effective March 1, 2024, the Fund's sub-advisory agreements with FMR Investment Management (UK) Limited, Fidelity Management & Research (Hong Kong) Limited, and Fidelity Management & Research (Japan) Limited were amended to provide that the investment adviser pays each sub-adviser monthly fees equal to 110% of the sub-adviser's costs for providing sub-advisory services.
Distribution and Service Plan Fees. In accordance with Rule 12b-1 of the 1940 Act, the Fund has adopted separate Distribution and Service Plans for each class of shares. Certain classes pay Fidelity Distributors Company LLC (FDC), an affiliate of the investment adviser, separate Distribution and Service Fees, each of which is based on an annual percentage of each class' average net assets. In addition, FDC may pay financial intermediaries for selling shares of the Fund and providing shareholder support services. For the period, the Distribution and Service Fee rates, total fees and amounts retained by FDC were as follows:
| | Distribution Fee | Service Fee | Total Fees ($) | Retained by FDC ($) |
| Class A | - % | .25% | 1,883,586 | 21,957 |
| Class M | .25% | .25% | 1,469,676 | 1,736 |
| Class C | .75% | .25% | 386,701 | 39,061 |
| | | | 3,739,963 | 62,754 |
Sales Load. FDC may receive a front-end sales charge of up to 5.75% for selling Class A shares and 3.50% for selling Class M shares, some of which is paid to financial intermediaries for selling shares of the Fund. Depending on the holding period, FDC may receive contingent deferred sales charges levied on Class A, Class M and Class C redemptions. The deferred sales charges are 1.00% for Class C shares, 1.00% for certain purchases of Class A shares and .25% for certain purchases of Class M shares.
For the period, sales charge amounts retained by FDC were as follows:
| | Retained by FDC ($) |
| Class A | 97,809 |
| Class M | 8,397 |
Class CA | 1,105 |
| | 107,311 |
A When Class C shares are initially sold, FDC pays commissions from its own resources to financial intermediaries through which the sales are made.
Transfer Agent Fees. Fidelity Investments Institutional Operations Company LLC (FIIOC), an affiliate of the investment adviser, is the transfer, dividend disbursing and shareholder servicing agent for each class of the Fund. Effective March 1, 2024, the Fund's management contract was amended to incorporate transfer agent services and associated fees previously covered under a separate services agreement. FIIOC pays for typesetting, printing and mailing of shareholder reports, except proxy statements.
During the period January 1, 2024 through February 29, 2024, the transfer agent fees for each class were a fixed annual rate of class-level average net assets as follows:
| | Amount ($) | % of Class-Level Average Net Assets | |
| Class A | 219,379 | .1873 | |
| Class M | 84,006 | .1816 | |
| Class C | 12,780 | .2000 | |
| Class I | 91,117 | .1710 | |
| Class Z | 5,120 | .0420 | |
| | 412,402 | |
| | | | |
Accounting Fees. Fidelity Service Company, Inc. (FSC), an affiliate of the investment adviser, maintains the Fund's accounting records. Effective March 1, 2024, the Fund's management contract was amended to incorporate accounting services and associated fees previously covered under a separate services agreement.
During the period January 1, 2024 through February 29, 2024, the accounting fees were a fixed annual rate of average net assets as follows:
| | % of Average Net Assets |
| Fidelity Advisor Mid Cap II Fund | .0278 |
Brokerage Commissions. A portion of portfolio transactions were placed with brokerage firms which are affiliates of the investment adviser. Brokerage commissions are included in net realized gain (loss) and change in net unrealized appreciation (depreciation) in the Statement of Operations. The commissions paid to these affiliated firms were as follows:
| | Amount ($) |
| Fidelity Advisor Mid Cap II Fund | 16,791 |
Interfund Trades. Funds may purchase from or sell securities to other Fidelity Funds under procedures adopted by the Board. The procedures have been designed to ensure these interfund trades are executed in accordance with Rule 17a-7 of the 1940 Act. Any interfund trades are included within the respective purchases and sales amounts shown in the Purchases and Sales of Investments note. Interfund trades during the period are noted in the table below.
| | Purchases ($) | Sales ($) | Realized Gain (Loss) ($) |
| Fidelity Advisor Mid Cap II Fund | 34,577,499 | 66,152,713 | 13,285,353 |
6. Committed Line of Credit.
Certain Funds participate with other funds managed by the investment adviser or an affiliate in a $4.25 billion credit facility (the "line of credit") to be utilized for temporary or emergency purposes to fund shareholder redemptions or for other short-term liquidity purposes.
Commitment fees are charged based on the unused amount of the line of credit at an annual rate of .10%, and then allocated to each participating fund based on its pro-rata portion of the line of credit. The commitment fees are reflected in Miscellaneous expenses on the Statement of Operations, and are listed below.
Interest is charged to a participating fund based on its borrowings at an annual rate of .75% plus the highest of (i) daily SOFR plus a .10% spread adjustment, (ii) Federal Funds Effective Rate, or (iii) Overnight Bank Funding Rate. During the period, there were no borrowings on this line of credit.
The line of credit agreement will expire in March 2025 unless extended or renewed.
| | Amount ($) |
| Fidelity Advisor Mid Cap II Fund | 2,316 |
7. Security Lending.
Funds lend portfolio securities from time to time in order to earn additional income. Lending agents are used, including National Financial Services (NFS), an affiliate of the investment adviser. Pursuant to a securities lending agreement, NFS will receive a fee, which is capped at 9.9% of a fund's daily lending revenue, for its services as lending agent. A fund may lend securities to certain qualified borrowers, including NFS. On the settlement date of the loan, a fund receives collateral (in the form of U.S. Treasury obligations, letters of credit and/or cash) against the loaned securities and maintains collateral in an amount not less than 100% of the market value of the loaned securities during the period of the loan. The market value of the loaned securities is determined at the close of business of a fund and any additional required collateral is delivered to a fund on the next business day. A fund or borrower may terminate the loan at any time, and if the borrower defaults on its obligation to return the securities loaned because of insolvency or other reasons, a fund may apply collateral received from the borrower against the obligation. A fund may experience delays and costs in recovering the securities loaned. Any cash collateral received is invested in the Fidelity Securities Lending Cash Central Fund. Any loaned securities are identified as such in the Schedule of Investments, and the value of loaned securities and cash collateral at period end, as applicable, are presented in the Statement of Assets and Liabilities. Security lending income represents the income earned on investing cash collateral, less rebates paid to borrowers and any lending agent fees associated with the loan, plus any premium payments received for lending certain types of securities. Security lending income is presented in the Statement of Operations as a component of income from Fidelity Central Funds. Affiliated security lending activity, if any, was as follows:
| | Total Security Lending Fees Paid to NFS ($) | Security Lending Income From Securities Loaned to NFS ($) | Value of Securities Loaned to NFS at Period End ($) |
| Fidelity Advisor Mid Cap II Fund | 35,973 | 1 | 9,069 |
8. Expense Reductions.
Through arrangements with the Fund's custodian, credits realized as a result of certain uninvested cash balances were used to reduce the Fund's expenses. During the period, custodian credits reduced the Fund's expenses by $2,178.
In addition, during the period the investment adviser or an affiliate reimbursed and/or waived a portion of fund-level operating expenses in the amount of $62,746.
9. Distributions to Shareholders.
Distributions to shareholders of each class were as follows:
| | Year ended December 31, 2024 | Year ended December 31, 2023 |
| Fidelity Advisor Mid Cap II Fund | | |
| Distributions to shareholders | | |
| Class A | $50,908,220 | $17,817,596 |
| Class M | 20,111,922 | 6,875,696 |
| Class C | 3,111,777 | 1,149,830 |
| Class I | 23,439,417 | 8,531,302 |
| Class Z | 5,850,332 | 2,054,843 |
Total | $103,421,668 | $36,429,267 |
10. Share Transactions.
Share transactions for each class were as follows and may contain in-kind transactions, automatic conversions between classes or exchanges between affiliated funds:
| | Shares | Shares | Dollars | Dollars |
| | Year ended December 31, 2024 | Year ended December 31, 2023 | Year ended December 31, 2024 | Year ended December 31, 2023 |
| Fidelity Advisor Mid Cap II Fund | | | | |
| Class A | | | | |
| Shares sold | 2,445,315 | 2,185,721 | $56,614,706 | $43,554,512 |
| Reinvestment of distributions | 2,198,808 | 839,770 | 49,948,242 | 17,508,191 |
| Shares redeemed | (4,531,117) | (4,393,704) | (104,621,718) | (87,258,816) |
| Net increase (decrease) | 113,006 | (1,368,213) | $1,941,230 | $(26,196,113) |
| Class M | | | | |
| Shares sold | 1,225,254 | 1,195,294 | $27,223,505 | $22,862,679 |
| Reinvestment of distributions | 915,844 | 339,748 | 19,906,054 | 6,801,096 |
| Shares redeemed | (2,266,132) | (2,685,219) | (50,033,931) | (51,432,309) |
| Net increase (decrease) | (125,034) | (1,150,177) | $(2,904,372) | $(21,768,534) |
| Class C | | | | |
| Shares sold | 271,979 | 257,566 | $5,058,379 | $4,189,883 |
| Reinvestment of distributions | 171,398 | 67,629 | 3,103,397 | 1,145,412 |
| Shares redeemed | (659,851) | (901,908) | (12,176,340) | (14,639,971) |
| Net increase (decrease) | (216,474) | (576,713) | $(4,014,564) | $(9,304,676) |
| Class I | | | | |
| Shares sold | 8,342,425 | 2,520,823 | $203,462,057 | $52,033,530 |
| Reinvestment of distributions | 952,903 | 380,315 | 22,774,581 | 8,308,885 |
| Shares redeemed | (8,789,361) | (4,121,434) | (212,765,325) | (86,018,710) |
| Net increase (decrease) | 505,967 | (1,220,296) | $13,471,313 | $(25,676,295) |
| Class Z | | | | |
| Shares sold | 990,003 | 4,402,323 | $24,104,444 | $90,252,580 |
| Reinvestment of distributions | 220,731 | 85,738 | 5,275,954 | 1,871,329 |
| Shares redeemed | (753,914) | (4,116,180) | (18,394,735) | (84,585,256) |
| Net increase (decrease) | 456,820 | 371,881 | $10,985,663 | $7,538,653 |
11. Other.
A fund's organizational documents provide former and current trustees and officers with a limited indemnification against liabilities arising in connection with the performance of their duties to the fund. In the normal course of business, a fund may also enter into contracts that provide general indemnifications. A fund's maximum exposure under these arrangements is unknown as this would be dependent on future claims that may be made against a fund. The risk of material loss from such claims is considered remote.
12. Risk and Uncertainties.
Many factors affect a fund's performance. Developments that disrupt global economies and financial markets, such as pandemics, epidemics, outbreaks of infectious diseases, war, terrorism, and environmental disasters, may significantly affect a fund's investment performance. The effects of these developments to a fund will be impacted by the types of securities in which a fund invests, the financial condition, industry, economic sector, and geographic location of an issuer, and a fund's level of investment in the securities of that issuer. Significant concentrations in security types, issuers, industries, sectors, and geographic locations may magnify the factors that affect a fund's performance.
Report of Independent Registered Public Accounting Firm
To the Board of Trustees of Fidelity Advisor Series I and the Shareholders of Fidelity Advisor Mid Cap II Fund:
Opinion on the Financial Statements and Financial Highlights
We have audited the accompanying statement of assets and liabilities of Fidelity Advisor Mid Cap II Fund (the "Fund"), a fund of Fidelity Advisor Series I, including the schedule of investments, as of December 31, 2024, the related statement of operations for the year then ended, the statement of changes in net assets for each of the two years in the period then ended, the financial highlights for each of the five years in the period then ended, and the related notes. In our opinion, the financial statements and financial highlights present fairly, in all material respects, the financial position of the Fund as of December 31, 2024, and the results of its operations for the year then ended, the changes in its net assets for each of the two years in the period then ended, and the financial highlights for each of the five years in the period then ended in conformity with accounting principles generally accepted in the United States of America.
Basis for Opinion
These financial statements and financial highlights are the responsibility of the Fund's management. Our responsibility is to express an opinion on the Fund's financial statements and financial highlights based on our audits. We are a public accounting firm registered with the Public Company Accounting Oversight Board (United States) (PCAOB) and are required to be independent with respect to the Fund in accordance with the U.S. federal securities laws and the applicable rules and regulations of the Securities and Exchange Commission and the PCAOB.
We conducted our audits in accordance with the standards of the PCAOB. Those standards require that we plan and perform the audit to obtain reasonable assurance about whether the financial statements and financial highlights are free of material misstatement, whether due to error or fraud. The Fund is not required to have, nor were we engaged to perform, an audit of its internal control over financial reporting. As part of our audits, we are required to obtain an understanding of internal control over financial reporting but not for the purpose of expressing an opinion on the effectiveness of the Fund's internal control over financial reporting. Accordingly, we express no such opinion.
Our audits included performing procedures to assess the risks of material misstatement of the financial statements and financial highlights, whether due to error or fraud, and performing procedures that respond to those risks. Such procedures included examining, on a test basis, evidence regarding the amounts and disclosures in the financial statements and financial highlights. Our audits also included evaluating the accounting principles used and significant estimates made by management, as well as evaluating the overall presentation of the financial statements and financial highlights. Our procedures included confirmation of securities owned as of December 31, 2024, by correspondence with the custodian and brokers; when replies were not received from brokers, we performed other auditing procedures. We believe that our audits provide a reasonable basis for our opinion.
/s/ Deloitte & Touche LLP
Boston, Massachusetts
February 11, 2025
We have served as the auditor of one or more of the Fidelity investment companies since 1999.
Distributions
(Unaudited)The dividend and capital gains distributions for the fund(s) are available on Fidelity.com or Institutional.Fidelity.com.
The fund hereby designates as a capital gain dividend with respect to the taxable year ended December 31, 2024, $146,697,002, or, if subsequently determined to be different, the net capital gain of such year.
Class A, Class I, and Class Z designate 100% of the dividends distributed during the fiscal year as qualifying for the dividends-received deduction for corporate shareholders.
Class A, Class I, and Class Z designate 100% of the dividends distributed during the fiscal year as amounts which may be taken into account as a dividend for purposes of the maximum rate under section 1(h)(11) of the Internal Revenue Code.
The fund will notify shareholders in January 2025 of amounts for use in preparing 2024 income tax returns.
Item 8: Changes in and Disagreements with Accountants for Open-End Management Investment Companies
(Unaudited)
Note: This is not applicable for any fund included in this document.
Item 9: Proxy Disclosures for Open-End Management Investment Companies
(Unaudited)
| A special meeting of shareholders was held on July 16, 2024. The results of votes taken among shareholders on the proposal before them are reported below. Each vote reported represents one dollar of net asset value held on the record date for the meeting. |
| Proposal 1 |
| To elect a Board of Trustees. |
| | # of Votes | % of Votes |
| Bettina Doulton |
| Affirmative | 47,400,603,662.68 | 97.08 |
| Withheld | 1,424,803,996.20 | 2.92 |
| TOTAL | 48,825,407,658.88 | 100.00 |
| Robert A. Lawrence |
| Affirmative | 47,280,328,204.40 | 96.84 |
| Withheld | 1,545,079,454.48 | 3.16 |
| TOTAL | 48,825,407,658.88 | 100.00 |
| Vijay C. Advani |
| Affirmative | 47,288,044,991.48 | 96.85 |
| Withheld | 1,537,362,667.40 | 3.15 |
| TOTAL | 48,825,407,658.88 | 100.00 |
| Thomas P. Bostick |
| Affirmative | 47,248,851,088.69 | 96.77 |
| Withheld | 1,576,556,570.19 | 3.23 |
| TOTAL | 48,825,407,658.88 | 100.00 |
| Donald F. Donahue |
| Affirmative | 47,287,004,182.74 | 96.85 |
| Withheld | 1,538,403,476.14 | 3.15 |
| TOTAL | 48,825,407,658.88 | 100.00 |
| Vicki L. Fuller |
| Affirmative | 47,375,183,539.48 | 97.03 |
| Withheld | 1,450,224,119.40 | 2.97 |
| TOTAL | 48,825,407,658.88 | 100.00 |
| Patricia L. Kampling |
| Affirmative | 47,389,656,970.86 | 97.06 |
| Withheld | 1,435,750,688.02 | 2.94 |
| TOTAL | 48,825,407,658.88 | 100.00 |
| Thomas A. Kennedy |
| Affirmative | 47,281,489,897.71 | 96.84 |
| Withheld | 1,543,917,761.17 | 3.16 |
| TOTAL | 48,825,407,658.88 | 100.00 |
| Oscar Munoz |
| Affirmative | 47,282,750,545.47 | 96.84 |
| Withheld | 1,542,657,113.41 | 3.16 |
| TOTAL | 48,825,407,658.88 | 100.00 |
| Karen B. Peetz |
| Affirmative | 47,356,505,980.29 | 96.99 |
| Withheld | 1,468,901,678.59 | 3.01 |
| TOTAL | 48,825,407,658.88 | 100.00 |
| David M. Thomas |
| Affirmative | 47,225,423,215.83 | 96.72 |
| Withheld | 1,599,984,443.05 | 3.28 |
| TOTAL | 48,825,407,658.88 | 100.00 |
| Susan Tomasky |
| Affirmative | 47,353,387,805.21 | 96.99 |
| Withheld | 1,472,019,853.67 | 3.01 |
| TOTAL | 48,825,407,658.88 | 100.00 |
| Michael E. Wiley |
| Affirmative | 47,278,279,663.75 | 96.83 |
| Withheld | 1,547,127,995.13 | 3.17 |
| TOTAL | 48,825,407,658.88 | 100.00 |
| | | |
| Proposal 1 reflects trust-wide proposal and voting results. |
Item 10: Remuneration Paid to Directors, Officers, and others of Open-End Management Investment Companies
(Unaudited)
Note: This information is disclosed as part of the financial statements for each Fund as part of Item 7: Financial Statements and Financial Highlights for Open-End Management Investment companies.
Item 11: Statement Regarding Basis for Approval of Investment Advisory Contract
(Unaudited)
Note: This is not applicable for any fund included in this document.
1.801442.120
AMP-ANN-0325
Item 8.
Changes in and Disagreements with Accountants for Open-End Management Investment Companies
See Item 7.
Item 9.
Proxy Disclosures for Open-End Management Investment Companies
See Item 7.
Item 10.
Remuneration Paid to Directors, Officers, and Others of Open-End Management Investment Companies
See Item 7.
Item 11.
Statement Regarding Basis for Approval of Investment Advisory Contract
See Item 7.
Item 12.
Disclosure of Proxy Voting Policies and Procedures for Closed-End Management Investment Companies
Not applicable.
Item 13.
Portfolio Managers of Closed-End Management Investment Companies
Not applicable.
Item 14.
Purchase of Equity Securities by Closed-End Management Investment Company and Affiliated Purchasers
Not applicable.
Item 15.
Submission of Matters to a Vote of Security Holders
There were no material changes to the procedures by which shareholders may recommend nominees to the trust’s Board of Trustees.
Item 16.
Controls and Procedures
(a)(i) The President and Treasurer and the Chief Financial Officer have concluded that the trust’s disclosure controls and procedures (as defined in Rule 30a-3(c) under the Investment Company Act) provide reasonable assurances that material information relating to the trust is made known to them by the appropriate persons, based on their evaluation of these controls and procedures as of a date within 90 days of the filing date of this report.
(a)(ii) There was no change in the trust’s internal control over financial reporting (as defined in Rule 30a-3(d) under the Investment Company Act) that occurred during the period covered by this report that has materially affected, or is reasonably likely to materially affect, the trust’s internal control over financial reporting.
Item 17.
Disclosure of Securities Lending Activities for Closed-End Management Investment Companies
Not applicable.
Item 18.
Recovery of Erroneously Awarded Compensation
(a)
Not applicable.
(b)
Not applicable.
Item 19.
Exhibits
SIGNATURES
Pursuant to the requirements of the Securities Exchange Act of 1934 and the Investment Company Act of 1940, the registrant has duly caused this report to be signed on its behalf by the undersigned, thereunto duly authorized.
Fidelity Advisor Series I
|
By: | /s/Stacie M. Smith |
| Stacie M. Smith |
| President and Treasurer (Principal Executive Officer) |
|
|
Date: | February 21, 2025 |
Pursuant to the requirements of the Securities Exchange Act of 1934 and the Investment Company Act of 1940, this report has been signed below by the following persons on behalf of the registrant and in the capacities and on the dates indicated.
|
By: | /s/Stacie M. Smith |
| Stacie M. Smith |
| President and Treasurer (Principal Executive Officer) |
|
|
Date: | February 21, 2025 |
|
By: | /s/Stephanie Caron |
| Stephanie Caron |
| Chief Financial Officer (Principal Financial Officer) |
|
|
Date: | February 21, 2025 |