Exhibit 99.18
Section F
DETAILED FINANCIAL FRAMEWORK
F.1

INTRODUCTION
This section of the Québec Economic Plan presents the government’s detailed financial framework for 2017-2018 to 2019-2020.1
The information provided concerns:
| — | the detailed change in consolidated revenue and expenditure, as well as adjustments made since the March 2017 Québec Economic Plan; |
| | |
| — | the forecast for revenue and expenditure by departmental portfolio; |
| | |
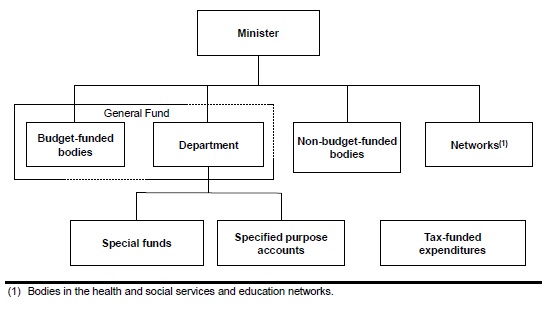
| — | the change in the financial framework for each of the reporting entity’s sectoral components, particularly the General Fund, special funds, specified purpose accounts, non-budget-funded bodies and bodies in the health and social services and education networks; |
| | |
| — | the government’s non-budgetary transactions and net financial surpluses or requirements. |
The five-year financial framework, that is, the government’s financial forecasts up to 2022-2023, is presented in Section A of this document.
In addition, a sensitivity analysis of economic and fiscal variables is presented in Section G of Additional Information 2018-2019.
____________________________________
| 1 | The budgetary data presented throughout this section for 2017-2018 and subsequent years are forecasts. |
| | | |
| | Detailed Financial Framework | F.3 |
| 1. | CHANGE IN CONSOLIDATED REVENUE AND EXPENDITURE |
1.1 Change in the budgetary balance
The Québec Economic Plan presents a financial framework that achieves a balanced budget with an anticipated surplus of $850 million for 2017-2018 and continued fiscal balance thereafter. On the whole, growth of spending is being kept at a pace compatible with that of revenue.
| — | In 2017-2018, due to the reduction of the tax burden, consolidated revenue grew by 4.2%. Consolidated expenditure, for its part, grew by 5.6%. |
| | |
| — | In 2018-2019, consolidated revenue is expected to grow by 2.2% and consolidated expenditure by 4.5%. |
The government will continue to make deposits of dedicated revenues in the Generations Fund. Deposits total $2.3 billion in 2017-2018 and will amount to $2.5 billion in 2018-2019.
TABLE F.1
| Change in the summary financial framework |
| (millions of dollars) |
| | | March 2017 | | | | | | March 2018 | |
| | | 2017-2018 | | | Adjustments | | | 2017-2018 | | | 2018-2019 | | | 2019-2020 | |
| Own-source revenue | | 84 279 | | | 248 | | | 84 527 | | | 85 923 | | | 88 595 | |
| % change | | 2.8 | | | | | | 2.2 | | | 1.7 | | | 3.1 | |
| Federal transfers | | 22 029 | | | 640 | | | 22 669 | | | 23 674 | | | 24 764 | |
| % change | | 7.5 | | | | | | 12.3 | | | 4.4 | | | 4.6 | |
| Consolidated revenue | | 106 308 | | | 888 | | | 107 196 | | | 109 597 | | | 113 359 | |
| % change | | 3.7 | | | | | | 4.2 | | | 2.2 | | | 3.4 | |
| Mission expenditures | | –93 852 | | | –965 | | | –94 817 | | | –99 313 | | | –102 066 | |
| % change | | 3.8 | | | | | | 6.5 | | | 4.7 | | | 2.8 | |
| Debt service | | –9 868 | | | 631 | | | –9 237 | | | –9 380 | | | –9 422 | |
| % change | | 1.9 | | | | | | –3.0 | | | 1.5 | | | 0.4 | |
| Consolidated expenditure | | –103 720 | | | –334 | | | –104 054 | | | –108 693 | | | –111 488 | |
| % change | | 3.6 | | | | | | 5.6 | | | 4.5 | | | 2.6 | |
| Contingency reserve | | –100 | | | 100 | | | — | | | — | | | –100 | |
| SURPLUS | | 2 488 | | | 654 | | | 3 142 | | | 904 | | | 1 771 | |
| BALANCED BUDGET ACT(1) | | | | | | | | | | | | | | | |
| Deposits of dedicated revenues | | | | | | | | | | | | | | | |
| in the Generations Fund | | –2 488 | | | 196 | | | –2 292 | | | –2 491 | | | –2 707 | |
| Use of the stabilization reserve | | — | | | — | | | — | | | 1 587 | | | 936 | |
| BUDGETARY BALANCE(2) | | — | | | 850 | | | 850 | | | — | | | — | |
| (1) | Information on the Balanced Budget Act, including the operation of the stabilization reserve, is provided in Section D of Additional Information 2018-2019. |
| (2) | Budgetary balance within the meaning of the Balanced Budget Act after use of the stabilization reserve. |
| | | |
| | Detailed Financial Framework | F.5 |
| [ ] | Detailed adjustments made in 2017-2018 since the March 2017 Québec Economic Plan |
The adjustments made to the financial framework since the March 2017 Québec Economic Plan enable a surplus of $850 million to be achieved.
The economic and budgetary situation leads to a positive adjustment of $3.0 billion in the financial framework. This improvement has made it possible to cover the cost of the measures in the Québec Economic Plan since March 2017, totalling $2.2 billion.
TABLE F.2
| Adjustments made to the financial framework in 2017-2018 since March 2017 |
| (millions of dollars) |
| | | | | | Adjustments for 2017-2018 | | | | |
| | | | | | Economic | | | | | | | | | | |
| | | | | | and | | | Québec | | | | | | | |
| | | | | | budgetary | | | Economic | | | Total | | | | |
| | | March 2017 | | | situation | | | Plan | | | adjustments | | | March 2018 | |
| Own-source revenue excluding revenue from government enterprises | | | | | | | | | | | | | | | |
| – Tax revenue | | 65 770 | | | 806 | | | –971 | | | –165 | | | 65 605 | |
| – Other revenue | | 14 029 | | | 158 | | | — | | | 158 | | | 14 187 | |
| – Subtotal | | 79 799 | | | 964 | | | –971 | | | –7 | | | 79 792 | |
| Revenue from government enterprises | | 4 480 | | | 255 | | | — | | | 255 | | | 4 735 | |
| Federal transfers | | 22 029 | | | 640 | | | — | | | 640 | | | 22 669 | |
| Consolidated revenue | | 106 308 | | | 1 859 | | | –971 | | | 888 | | | 107 196 | |
| Mission expenditures | | | | | | | | | | | | | | | |
| – Program spending | | –72 591 | | | 1 110 | | | –1 110 | | | — | | | –72 591 | |
| – Other expenditure | | –21 261 | | | –859 | | | –106 | | | –965 | | | –22 226 | |
| – Subtotal | | –93 852 | | | 251 | | | –1 216 | | | –965 | | | –94 817 | |
| Debt service | | –9 868 | | | 631 | | | — | | | 631 | | | –9 237 | |
| Consolidated expenditure | | –103 720 | | | 882 | | | –1 216 | | | –334 | | | –104 054 | |
| Contingency reserve | | –100 | | | 100 | | | — | | | 100 | | | — | |
| SURPLUS (DEFICIT) | | 2 488 | | | 2 841 | | | –2 187 | | | 654 | | | 3 142 | |
| BALANCED BUDGET ACT | | | | | | | | | | | | | | | |
| Deposits of dedicated revenues in the Generations Fund | | –2 488 | | | 196 | | | — | | | 196 | | | –2 292 | |
| Use of the stabilization reserve | | — | | | — | | | — | | | — | | | — | |
| BUDGETARY BALANCE(1) | | — | | | 3 037 | | | –2 187 | | | 850 | | | 850 | |
| (1) | Budgetary balance within the meaning of the Balanced Budget Act after use of the stabilization reserve. |
| | Budget 2018-2019 | |
| F.6 | Economic Plan | |
1.2 Change in consolidated revenue
This section presents the government’s updated consolidated revenue and the change in this revenue for 2017-2018 to 2019-2020.
Consolidated revenue totals $107.2 billion in 2017-2018, that is, $84.5 billion in own-source revenue and $22.7 billion in revenue from federal transfers.
— | Consolidated revenue is adjusted upward by $888 million compared with the forecast in the March 2017 Québec Economic Plan. |
Revenue is expected to grow by 4.2% in 2017-2018, 2.2% in 2018-2019 and 3.4% in 2019-2020.
TABLE F.3
| Change in consolidated revenue |
| (millions of dollars) |
| | | March 2017 | | | | | | | | | March 2018 | | | | |
| | | 2017-2018 | | | Adjustments | | | 2017-2018 | | | 2018-2019 | | | 2019-2020 | |
| Own-source revenue excluding revenue from government enterprises | | 79 799 | | | –7 | | | 79 792 | | | 81 591 | | | 84 125 | |
| % change | | 3.3 | | | | | | 2.5 | | | 2.3 | | | 3.1 | |
| Revenue from government enterprises | | 4 480 | | | 255 | | | 4 735 | | | 4 332 | | | 4 470 | |
| % change | | –5.7 | | | | | | –3.3 | | | –8.5 | | | 3.2 | |
| Own-source revenue | | 84 279 | | | 248 | | | 84 527 | | | 85 923 | | | 88 595 | |
| % change | | 2.8 | | | | | | 2.2 | | | 1.7 | | | 3.1 | |
| Federal transfers | | 22 029 | | | 640 | | | 22 669 | | | 23 674 | | | 24 764 | |
| % change | | 7.5 | | | | | | 12.3 | | | 4.4 | | | 4.6 | |
| TOTAL | | 106 308 | | | 888 | | | 107 196 | | | 109 597 | | | 113 359 | |
| % change | | 3.7 | | | | | | 4.2 | | | 2.2 | | | 3.4 | |
| | | |
| | Detailed Financial Framework | F.7 |
| 1.2.1 | Own-source revenue excluding revenue from government enterprises |
Own-source revenue excluding revenue from government enterprises consists chiefly of tax revenue, which is made up of personal income tax, contributions for health services, corporate taxes, school property tax and consumption taxes. How it changes is closely tied to economic activity in Québec and to changes in the tax systems.
Own-source revenue excluding revenue from government enterprises also includes revenue from other sources, that is, duties and permits and miscellaneous revenue, such as interest, the sale of goods and services, as well as fines, forfeitures and recoveries.
Most own-source revenue excluding revenue from government enterprises is deposited in the General Fund to finance the government’s missions. The remainder of this revenue is paid, in particular, into special funds (for funding specific programs) and the Generations Fund (for reducing the debt), as well as to non-budget-funded bodies and bodies in the health and social services and education networks (for funding their activities).
[ ] Adjustments for 2017-2018
For fiscal 2017-2018, own-source revenue excluding revenue from government enterprises totals $79.8 billion, which represents an increase of 2.5% relative to the revenue observed for fiscal 2016-2017.
Compared with the forecast in the Québec Economic Plan of March 2017, own-source revenue excluding revenue from government enterprises is adjusted downward by $7 million.
• Tax revenue
Revenue from personal income tax is adjusted downward by $1.5 billion for fiscal 2017-2018 relative to the forecast in the March 2017 Québec Economic Plan.
| — | This adjustment is explained mainly by the additional reduction in the tax burden of nearly $1.0 billion per year as of 2017-2018 resulting from the decrease in the bottom tax bracket from 16% to 15%. |
| | |
| — | It also reflects the recurrence of the lower level of tax payable for 2016. |
| | |
| — | However, this adjustment is partly offset by higher-than-expected withholdings at source since the beginning of the fiscal year due to the higher-than-anticipated level of wages and salaries observed in 2017. |
| | Budget 2018-2019 | |
| F- 8 | Economic Plan | |
TABLE F.4
| Change in own-source revenue excluding revenue from government enterprises |
| (millions of dollars) |
| | | March 2017 | | | | | | March 2018 | |
| | | 2017-2018 | | | Adjustments | | | 2017-2018 | | | 2018-2019 | | | 2019-2020 | |
| Tax revenue | | | | | | | | | | | | | | | |
| Personal income tax | | 30 569 | | | –1 454 | | | 29 115 | | | 30 549 | | | 31 974 | |
| % change | | 3.0 | | | | | | –0.4 | | | 4.9 | | | 4.7 | |
| Contributions for health | | | | | | | | | | | | | | | |
| services | | 6 036 | | | 13 | | | 6 049 | | | 6 028 | | | 6 168 | |
| % change | | 0.2 | | | | | | 1.3 | | | –0.3 | | | 2.3 | |
| Corporate taxes | | 7 227 | | | 673 | | | 7 900 | | | 8 028 | | | 8 060 | |
| % change | | 4.9 | | | | | | 5.6 | | | 1.6 | | | 0.4 | |
| School property tax | | 2 257 | | | –15 | | | 2 242 | | | 1 817 | | | 1 706 | |
| % change | | 4.3 | | | | | | 3.4 | | | –19.0 | | | –6.1 | |
| Consumption taxes | | 19 681 | | | 618 | | | 20 299 | | | 20 921 | | | 21 418 | |
| % change | | 2.6 | | | | | | 5.2 | | | 3.1 | | | 2.4 | |
| Other revenue | | | | | | | | | | | | | | | |
| Duties and permits | | 3 710 | | | 237 | | | 3 947 | | | 3 797 | | | 3 979 | |
| % change | | 11.5 | | | | | | 19.7 | | | –3.8 | | | 4.8 | |
| Miscellaneous revenue | | 10 319 | | | –79 | | | 10 240 | | | 10 451 | | | 10 820 | |
| % change | | 3.8 | | | | | | –1.5 | | | 2.1 | | | 3.5 | |
| TOTAL | | 79 799 | | | –7 | | | 79 792 | | | 81 591 | | | 84 125 | |
| % change | | 3.3 | | | | | | 2.5 | | | 2.3 | | | 3.1 | |
Contributions for health services are adjusted upward by $13 million for 2017-2018. This adjustment reflects the higher-than-anticipated level of wages and salaries in 2017.
Revenue from corporate taxes is adjusted upward by $673 million for fiscal 2017-2018. This adjustment reflects an increase in tax revenues that is in keeping with the favourable results observed in late 2016-2017 and the growth of the net operating surplus of corporations in 2017 which was stronger than forecast in the March 2017 Québec Economic Plan.
The school property tax is adjusted downward by $15 million in 2017-2018. The revenue from this tax is consistent with that forecast in the Québec Economic Plan of March 2017.
Revenue from consumption taxes is adjusted upward by $618 million in 2017-2018. This adjustment arises mainly from the Québec sales tax owing to growth in household consumption (excluding food products and housing), which is higher than forecast in the March 2017 Québec Economic Plan.
| | | |
| | Detailed Financial Framework | F.9 |
• Other revenue
Revenue from duties and permits is adjusted upward by $237 million in 2017-2018, reflecting essentially the higher-than-expected revenue collected under Québec’s cap-and-trade system for greenhouse gas emission allowances.
In addition, miscellaneous revenue is adjusted downward by $79 million due, in particular, to the lower-than-forecast investment income of the Generations Fund.
[ ] Outlook for 2018-2019 and 2019-2020
Own-source revenue excluding revenue from government enterprises will grow by 2.3% in 2018-2019 and 3.1% in 2019-2020. This growth reflects essentially the economic activity forecast for those years.
• Tax revenue
Personal income tax, the government’s largest revenue source, will increase by 4.9% in 2018-2019 and 4.7% in 2019-2020, settling at $30.5 billion and $32.0 billion, respectively.
| — | This change reflects, in particular, the growth of household income, indexation of the personal income tax system and the progressive nature of the tax system. |
| | |
| — | It also reflects the contribution of pension income to the growth of income subject to tax, particularly income from private pension plans. |
| | |
| — | It also takes into account the impact of various tax measures announced in this economic plan, including the enhancement of the tax credit for experienced workers. |
Contributions for health services will decrease by 0.3% in 2018-2019 and increase by 2.3% in 2019-2020, settling at $6.0 billion and $6.2 billion, respectively. This change reflects the fact that wages and salaries are expected to grow by 4.1% in 2018 and 3.2% in 2019. It also takes into account the impact of the gradual reduction of the Health Services Fund (HSF) contribution rate as of the day following the budget speech, for all Québec SMBs.
Revenue from corporate taxes will grow by 1.6% in 2018-2019 and 0.4% in 2019-2020, to $8.0 billion and $8.1 billion, respectively.
| — | This change reflects essentially the projected growth of the net operating surplus of corporations, established at 4.9% in 2018 and 4.8% in 2019. |
| | |
| — | It also takes into account the measures implemented to ease the tax burden, including the gradual reduction of the general corporate income tax rate announced in the March 2015 Québec Economic Plan and the gradual reduction of the tax rate to 4% for all SMBs announced in this economic plan. |
| | Budget 2018-2019 | |
| F- 10 | Economic Plan | |
Revenue from the school property tax will decline by 19.0% in 2018-2019 and 6.1% in 2019-2020, reflecting the impact of the proposed reform of the school tax system.2
Revenue from consumption taxes will grow by 3.1% in 2018-2019 and 2.4% in 2019-2020, reaching $20.9 billion and $21.4 billion, respectively.
| — | This growth mainly reflects robust household consumption (excluding food products and housing) of 4.5% in 2018 and 3.3% in 2019. |
| | |
| — | In addition, the gradual elimination of restrictions on input tax refunds for large businesses, as of January 1, 2018, is having a downward effect on the growth of consumption tax revenue. |
• Other revenue
Revenue from duties and permits will decrease by 3.8% in 2018-2019 and grow by 4.8% in 2019-2020. This change is explained primarily by the change in anticipated revenue under Québec’s cap-and-trade system for greenhouse gas emission allowances.
Miscellaneous revenue will climb by 2.1% in 2018-2019 and 3.5% in 2019-2020. This growth stems mainly from the investment income of the Generations Fund and the anticipated revenue of special funds, non-budget-funded bodies and bodies in the health and social services and education networks.
________________________________________
2 Subject to the passage of Bill 166,An Act to reform the school tax system.
| | | |
| | Detailed Financial Framework | F.11 |
1.2.2 Revenue from government enterprises
[ ] Adjustments for 2017-2018
For 2017-2018, revenue from government enterprises is adjusted upward by $255 million, to $4.7 billion. This adjustment can be attributed to an increase in the results of Hydro-Québec due to the cold weather in recent months, and to an increase in the results of Loto-Québec in all of its activity sectors owing, in particular, to an increase in traffic and a renewal of the gaming offer.
[ ] Outlook for 2018-2019 and 2019-2020
Revenue from government enterprises will stand at $4.3 billion in 2018-2019 and $4.5 billion in 2019-2020.
| — | The change in 2018-2019 mainly reflects the decline in the anticipated results of Hydro-Québec resulting from a forecast based on normal temperatures. |
| | |
| — | The change in 2019-2020 mainly reflects an increase in the anticipated results of Hydro-Québec due to the fact that demand in Québec is expected to grow. |
TABLE F.5
| Change in revenue from government enterprises |
| (millions of dollars) |
| | | March 2017 | | | | | | March 2018 | |
| | | 2017-2018 | | | Adjustments | | | 2017-2018 | | | 2018-2019 | | | 2019-2020 | |
| Hydro-Québec | | 2 150 | | | 125 | | | 2 275 | | | 2 075 | | | 2 275 | |
| Loto-Québec | | 1 142 | | | 132 | | | 1 274 | | | 1 236 | | | 1 231 | |
| Société des alcools du Québec | | 1 089 | | | 10 | | | 1 099 | | | 1 112 | | | 1 146 | |
| Other(1) | | 99 | | | –12 | | | 87 | | | –91 | | | –182 | |
| TOTAL | | 4 480 | | | 255 | | | 4 735 | | | 4 332 | | | 4 470 | |
| % change | | –5.7 | | | | | | –3.3 | | | –8.5 | | | 3.2 | |
| (1) | Includes the forecast for other government enterprises, in particular Investissement Québec, and the impact of the Electricity Discount Program for Consumers Billed at Rate L. |
| | Budget 2018-2019 | |
| F- 12 | Economic Plan | |
| Accounting standards applicable to Hydro-Québec |
| |
Since January 1, 2015, Hydro-Québec has determined its financial results using United States generally accepted accounting principles (U.S. GAAP). Since the publication of Public Accounts 2014-2015, Hydro-Québec’s results have undergone an accounting adjustment in order to consolidate them with those of the government using International Financial Reporting Standards (IFRS). |
|
For 2017-2018, revenue from Hydro-Québec is forecast at $2 750 million before taking into account the $475-million accounting impact related to the application of IFRS standards. |
|
For 2018-2019 and 2019-2020, the accounting impact is estimated at $475 million. |
|
Change in revenue from Hydro-Québec |
(millions of dollars) |
| | | March 2017 | | | | | | March 2018 | |
| | | 2017-2018 | | | Adjustments | | | 2017-2018 | | | 2018-2019 | | | 2019-2020 | |
| Net results (U.S. GAAP)(1) | | 2 575 | | | 175 | | | 2 750 | | | 2 550 | | | 2 750 | |
| Accounting adjustment to | | | | | | | | | | | | | | | |
| IFRS standards | | –425 | | | –50 | | | –475 | | | –475 | | | –475 | |
| NET RESULTS IN THE GOVERNMENT’S FINANCIAL FRAMEWORK | | 2 150 | | | 125 | | | 2 275 | | | 2 075 | | | 2 275 | |
| (1) | Other energy businesses in Canada use U.S. GAAP to determine their financial results. |
| | |
| | | |
| | Detailed Financial Framework | F.13 |
1.2.3 Revenues from federal transfers
[ ] Adjustments for 2017-2018
In 2017-2018, revenues from federal transfers show a 12.3% increase to a total of $22.7 billion, that is, $640 million more than forecast in the March 2017 Québec Economic Plan.
These adjustments are explained essentially by increases of:
| — | $478 million in other programs due, in particular, to: |
| | — | a higher-than-anticipated degree of completion of municipal projects funded by the Société de financement des infrastructures locales du Québec; |
| | | |
| | — | an increase in revenue from the federal Disaster Financial Assistance Arrangements program in connection with the spring flooding in Québec in 2017; |
| | | |
| | — | $101 million in health transfers attributed primarily to a downward adjustment of the value of the special Québec abatement, which is subtracted from these transfers. |
TABLE F.6
| Change in federal transfer revenues |
| (millions of dollars) |
| | | March 2017 | | | | | | March 2018 | |
| | | 2017-2018 | | | Adjustments | | | 2017-2018 | | | 2018-2019 | | | 2019-2020 | |
| Equalization | | 11 081 | | | — | | | 11 081 | | | 11 732 | | | 13 150 | |
| % change | | 10.5 | | | | | | 10.5 | | | 5.9 | | | 12.1 | |
| Health transfers | | 6 110 | | | 101 | | | 6 211 | | | 6 431 | | | 6 757 | |
| % change | | 2.8 | | | | | | 4.5 | | | 3.5 | | | 5.1 | |
| Transfers for post-secondary education and other social programs | | 1 640 | | | 61 | | | 1 701 | | | 1 659 | | | 1 690 | |
| % change | | 0.3 | | | | | | 4.0 | | | –2.5 | | | 1.9 | |
| Other programs | | 3 198 | | | 478 | | | 3 676 | | | 3 852 | | | 3 167 | |
| % change | | 10.8 | | | | | | 43.1 | | | 4.8 | | | –17.8 | |
| TOTAL | | 22 029 | | | 640 | | | 22 669 | | | 23 674 | | | 24 764 | |
| % change | | 7.5 | | | | | | 12.3 | | | 4.4 | | | 4.6 | |
| | Budget 2018-2019 | |
| F- 14 | Economic Plan | |
[ ] Outlook for 2018-2019 and 2019-2020
In 2018-2019, federal transfers will reach $23.7 billion, which represents an increase of 4.4% . This growth results primarily from a 5.9% rise in equalization revenue stemming, in particular, from an adjustment payment of $576 million to Québec.
In 2019-2020, federal transfers will total $24.8 billion, which represents an increase of 4.6% . This change results, in particular, from:
| — | an anticipated increase of 12.1% in equalization revenue due, among other things, to an increase in the equalization envelope, based on Canada's nominal GDP, which includes the impact of the adjustment payment for 2018-2019 and as well as the growth in disparities in fiscal capacity compared to 2018-2019; |
| | |
| — | a 17.8% decline in revenue from other programs, which can be explained, in particular, by the end of infrastructure programs under Phase 1 of the federal infrastructure plan. |
| | | |
| | Detailed Financial Framework | F.15 |
| Adjustment payment in 2018-2019 |
| |
Equalization payments are calculated on the basis of a province’s fiscal capacity, which is defined as the revenue it would obtain if it applied the average tax rates in effect in the ten provinces to its own tax bases, namely, personal income tax, corporate income tax, consumption taxes, natural resources and property taxes. In other words, a province’s fiscal capacity is its capacity to collect revenue. |
| |
The objective of the equalization program is to offset disparities in the fiscal capacity of the provinces compared to the average of the ten provinces and enable provinces that receive equalization to provide reasonably comparable levels of public services with a tax effort corresponding to the average of the ten provinces. |
| |
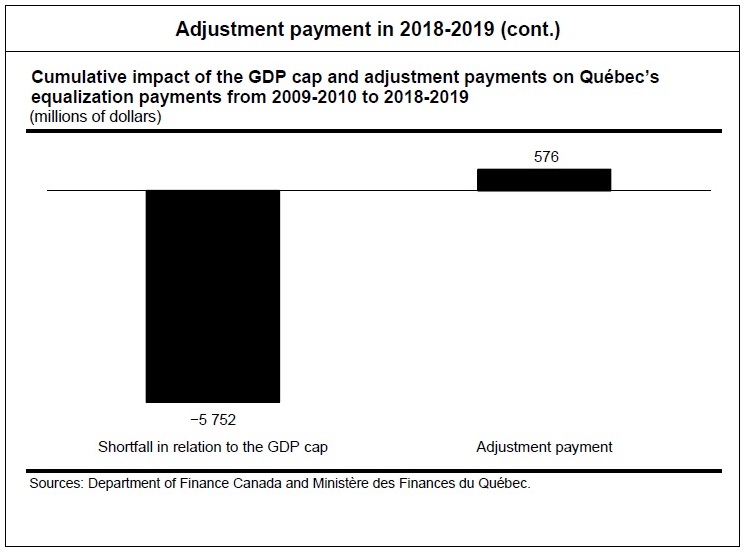
| – | Note that this objective has not been achieved since the application of the GDP cap by the federal government in 2009-2010, because the disparities in fiscal capacity as compared to the average of the ten provinces have been higher than the equalization envelope, which has been limited to Canada’s nominal GDP growth. Therefore, the disparities in fiscal capacity compared to the average of the ten provinces have not been fully offset. |
| | |
| – | Over the past nine years, Québec has had a significant shortfall of $5.8 billion because of this GDP cap, and this has required a greater tax effort to provide reasonably comparable levels of public services. |
| |
Since 2014, the decline in revenue stemming from the drop in oil prices has had a downward effect on the fiscal capacity of oil-producing provinces (Newfoundland and Labrador, Saskatchewan and Alberta) and on the average fiscal capacity of the ten provinces, thereby reducing disparities in fiscal capacity compared to the average of the ten provinces. |
| |
In 2018-2019, for the first time since 2009-2010, the sum of equalization payments to the recipient provinces, which are calculated on the basis of disparities in fiscal capacity as compared to the average of the ten provinces, are insufficient for the size of the equalization envelope determined by the growth in Canada’s nominal GDP.1 |
| |
| – | Under the Federal–Provincial Fiscal Arrangements Act, the federal government decided to make adjustment payments of $1.8-billion to fill this gap, including $576 million to Québec. |
| | |
| – | Note that the adjustment payment of $576 million to Québec in 2018-2019 will offset only a fraction—10%—of the losses incurred since the imposition of the GDP cap ($5.8 billion). |
| | |
| 1 | The equalization envelope for 2018-2019 ($19.0 billion) was determined using the average annual growth rate of Canada’s nominal GDP for 2016, 2017 and 2018, which is up 3.9% compared to that for 2017-2018 ($18.3 billion). |
| | Budget 2018-2019 | |
| F- 16 | Economic Plan | |
| | | |
| | Detailed Financial Framework | F.17 |
1.3 Change in consolidated expenditure
Consolidated expenditure consists primarily of program spending by government departments, spending by special funds, non-budget-funded bodies and bodies in the health and social services and education networks, and debt service.
Consolidated expenditure stands at $104.1 billion in 2017-2018. This represents an upward adjustment of $334 million relative to the Québec Economic Plan of March 2017.
— | Program spending remains unchanged compared with the Québec Economic Plan of March 2017, and other consolidated expenditure will increase by $965 million. |
| | |
| — | In addition, spending on debt service is $631 million lower. |
Consolidated expenditure will stand at $108.7 billion in 2018-2019 and $111.5 billion in 2019-2020, representing growth of 4.5% and 2.6%, respectively.
TABLE F.7
| Change in consolidated expenditure |
| (millions of dollars) |
| | | March 2017 | | | | | | March 2018 | |
| | | 2017-2018 | | | Adjustments | | | 2017-2018 | | | 2018-2019 | | | 2019-2020 | |
| Program spending(1) | | 72 591 | | | — | | | 72 591 | | | 76 869 | | | 79 682 | |
| % change | | 4.1 | | | | | | 4.6 | | | 5.9 | | | 3.7 | |
| Other consolidated | | | | | | | | | | | | | | | |
| expenditure(2) | | 21 261 | | | 965 | | | 22 226 | | | 22 444 | | | 22 384 | |
| % change | | 3.0 | | | | | | 13.2 | | | 1.0 | | | –0.3 | |
| Mission expenditures | | 93 852 | | | 965 | | | 94 817 | | | 99 313 | | | 102 066 | |
| % change | | 3.8 | | | | | | 6.5 | | | 4.7 | | | 2.8 | |
| Debt service | | 9 868 | | | –631 | | | 9 237 | | | 9 380 | | | 9 422 | |
| % change | | 1.9 | | | | | | –3.0 | | | 1.5 | | | 0.4 | |
| TOTAL | | 103 720 | | | 334 | | | 104 054 | | | 108 693 | | | 111 488 | |
| % change | | 3.6 | | | | | | 5.6 | | | 4.5 | | | 2.6 | |
| (1) | Includes transfers intended for consolidated entities. |
| (2) | Includes consolidation adjustments. |
| | Budget 2018-2019 | |
| F- 18 | Economic Plan | |
1.3.1 Mission expenditures
[ ] Adjustments for 2017-2018
In 2017-2018, mission expenditures will stand at $94.8 billion, which corresponds to an upward adjustment of $965 million compared with the forecast in the March 2017 Québec Economic Plan.
TABLE F.8
| Change in mission expenditures |
| (millions of dollars) |
| | | March 2017 | | | | | | March 2018 | |
| | | 2017-2018 | | | Adjustments | | | 2017-2018 | | | 2018-2019 | | | 2019-2020 | |
| Health and Social Services | | 40 223 | | | 17 | | | 40 240 | | | 42 062 | | | 43 768 | |
| % change | | 4.3 | | | | | | 3.9 | | | 4.6 | (1) | | 4.1 | |
| Education and Culture | | 22 662 | | | –90 | | | 22 572 | | | 23 781 | | | 24 645 | |
| % change | | 4.0 | | | | | | 4.3 | | | 5.0 | (1) | | 3.6 | |
| Economy and Environment | | 12 965 | | | 868 | | | 13 833 | | | 14 374 | | | 14 338 | |
| % change | | 2.1 | | | | | | 12.1 | | | 3.9 | | | –0.3 | |
| Support for Individuals and | | | | | | | | | | | | | | | |
| Families | | 9 935 | | | 178 | | | 10 113 | | | 10 372 | | | 10 489 | |
| % change | | 1.0 | | | | | | 5.5 | | | 3.3 | (1) | | 1.1 | |
| Administration and Justice | | 8 067 | | | –8 | | | 8 059 | | | 8 724 | | | 8 826 | |
| % change | | 7.4 | | | | | | 20.1 | | | 8.3 | | | 1.2 | |
| TOTAL | | 93 852 | | | 965 | | | 94 817 | | | 99 313 | | | 102 066 | |
| Variation en % | | 3.8 | | | | | | 6.5 | | | 4.7 | | | 2.8 | |
| (1) | To assess growth in 2018-2019 based on comparable spending levels, the percent changes for that year were calculated by excluding, from 2017-2018 expenditures, transfers from the provision for francization attributed to the Health and Social Services mission ($12 million) and the Support for Individuals and Families mission ($75 million) and including them in the 2016-2017 expenditures of the Education and Culture mission. |
| | | |
| | Detailed Financial Framework | F.19 |
This adjustment is explained by:
| — | a $17-million increase in the expenditures of the Health and Social Services mission, owing, in particular, to the additional funding for the health and social services network announced in the November 2017 update of the Québec Economic Plan; |
| | |
| — | a $90-million decrease in the expenditures of the Education and Culture mission, due to lower depreciation expenses in the education networks; |
| | |
| — | an $868-million increase in the expenditures of the Economy and Environment mission, resulting, in particular, from the initiatives announced since the March 2017 Québec Economic Plan; |
| | |
| — | a $178-million increase in the expenditures of the Support for Individuals and Families mission, due, in particular, to the measures announced in the November 2017 update of the Québec Economic Plan, including the supplement for the purchase of school supplies under child assistance; Outlook for 2018-2019 and 2019-2020. |
[ ] Outlook for 2018-2019 and 2019-2020
In 2018-2019 and 2019-2020, mission expenditures will amount to $99.3 billion and $102.1 billion, respectively.
| | Budget 2018-2019 | |
| F- 20 | Economic Plan | |
| Program spending |
| |
| Adjustments for 2017-2018 |
| |
In 2017-2018, program spending amounts to $72.6 billion, which represents an increase of 4.6% and is unchanged compared with the forecast in the March 2017 Québec Economic Plan. |
|
In addition, adjustments of $266 million have been observed in the various portfolios and they stem from additional investments in public services, in particular: |
| |
| – | $105 million in the Santé et Services sociaux portfolio; |
| | |
| – | $187 million in the Éducation et Enseignement supérieur portfolio. |
| |
| These additional investments are being funded essentially by the Contingency Fund. |
| |
| Outlook for 2018-2019 and 2019-2020 |
| |
In 2018-2019, program spending will total $76.4 billion, with growth of 5.2% before the impact of the school tax system reform. |
| |
| – | Spending on the Santé et Services sociaux portfolio will amount to $38.5 billion, with growth of 4.6%. As for spending on the Éducation et Enseignement supérieur portfolio, it will stand at $18.9 billion, which amounts to growth of 5.0%. |
| |
| In 2019-2020, program spending will total $79.0 billion, with growth of 3.4% before the impact of the school tax system reform. |
| |
| Change in program spending | | | | | | | | | | | | | | | |
| (millions of dollars) | | | | | | | | | | | | | | | |
| | | March 2017 | | | | | | March 2018 | |
| | | | | | | | | 2017- | | | 2018- | | | 2019- | |
| | | 2017-2018 | | | Adjustments | | | 2018- | | | 2019- | | | 2020- | |
| Santé et Services sociaux | | 36 764 | | | 105 | | | 36 869 | | | 38 541 | | | 40 076 | |
| % change | | 4.2 | | | | | | 4.2 | | | 4.6 | (1) | | 4.0 | |
| Éducation et Enseignement | | | | | | | | | | | | | | | |
| supérieur | | 17 882 | | | 187 | | | 18 069 | | | 18 881 | | | 19 595 | |
| % change | | 4.2 | | | | | | 5.4 | | | 5.0 | (1) | | 3.8 | |
| Other portfolios | | 17 067 | | | –27 | | | 17 040 | | | 17 870 | | | 18 764 | |
| % change | | 1.8 | | | | | | 1.1 | | | 4.3 | (1) | | 5.0 | |
| Contingency Fund | | 879 | | | –266 | | | 613 | | | 1 078 | | | 568 | |
| Subtotal(2) | | 72 591 | | | — | | | 72 591 | | | 76 371 | | | 79 003 | |
| % change | | 4.1 | | | | | | 4.6 | | | 5.2 | | | 3.4 | |
| Reform of the school tax | | | | | | | | | | | | | | | |
| system | | — | | | — | | | — | | | 499 | | | 679 | |
| TOTAL | | 72 591 | | | — | | | 72 591 | | | 76 869 | | | 79 682 | |
| % change | | 4.1 | | | | | | 4.6 | | | 5.9 | | | 3.7 | |
| Note: Totals may not add due to rounding. |
| (1) | To assess growth in 2018-2019 based on comparable spending levels, the percent changes for that year were calculated by excluding, from 2017-2018 expenditures, transfers from the provision for francization attributed to the Santé et Services sociaux ($12 million) and the Éducation et Enseignement supérieur ($79 million) portfolios and including them in the 2017-2018 expenditures of the other portfolios. |
| (2) | Program spending before taking into account the impact of the reform of the school tax system. |
| | |
| | | |
| | Detailed Financial Framework | F.21 |
1.3.2 Debt service
[ ] Adjustments for 2017-2018
In 2017-2018, debt service amounts to $9.2 billion, that is, $7.4 billion for direct debt service and $1.8 billion in interest on the liability for the retirement plans and other future benefits of public and parapublic sector employees.
Compared with the March 2017 Québec Economic Plan, debt service is adjusted downward by $631 million in 2017-2018, mainly because of lower-than-expected long-term interest rates and the higher-than-anticipated return on the Retirement Plans Sinking Fund (RPSF) in 2016-2017, which has a downward effect on debt service as of 2017-2018. The income of the RPSF is applied against debt service.
[ ] Outlook for 2018-2019 and 2019-2020
Debt service will grow by 1.5% in 2018-2019 and 0.4% in 2019-2020 mainly because of the anticipated increase in interest rates and capital investments.
TABLE F.9
| Change in debt service |
| (millions of dollars) |
| | | March 2017 | | | | | | March 2018 | |
| | | 2017-2018 | | | Adjustments | | | 2017-2018 | | | 2018-2019 | | | 2019-2020 | |
| Direct debt service | | 7 865 | | | –441 | | | 7 424 | | | 7 991 | | | 8 381 | |
| % change | | 7.4 | | | | | | 2.9 | | | 7.6 | | | 4.9 | |
| Interest on the liability for the retirement plans and other employee future benefits(1) | | 2 003 | | | –190 | | | 1 813 | | | 1 389 | | | 1 041 | |
| % change | | –15.2 | | | | | | –21.5 | | | –23.4 | | | –25.1 | |
| TOTAL | | 9 868 | | | –631 | | | 9 237 | | | 9 380 | | | 9 422 | |
| % change | | 1.9 | | | | | | –3.0 | | | 1.5 | | | 0.4 | |
| (1) | This corresponds to the interest on obligations relating to the retirement plans and other employee future benefits of public and parapublic sector employees, minus the investment income of the Retirement Plans Sinking Fund, individual funds and funds for other employee future benefit programs. |
| | Budget 2018-2019 | |
| F- 22 | Economic Plan | |
The rapid reduction in interest on the liability for the retirement plans and other employee future benefits can be explained by the investment income of the RPSF, which increases every year. The RPSF shows continued growth driven by returns and the absence of withdrawals.
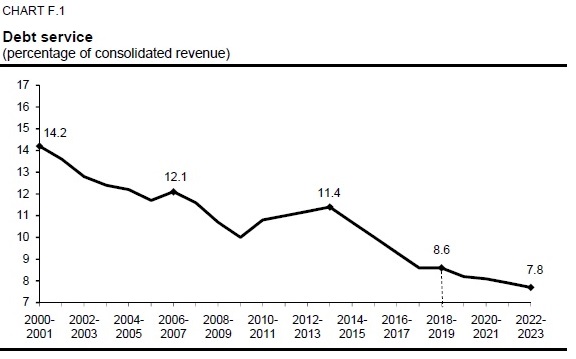
• A sharp decline in the proportion of revenue devoted to debt service
A large proportion of the government’s revenue is devoted to paying interest on the debt. However, this proportion is declining.
In 2018-2019, the proportion of revenue devoted to debt service will stand at 8.6%, down sharply from the early 2000s. It will decrease in the coming years owing, in particular, to the use of the Generations Fund to repay the debt.
| | | |
| | Detailed Financial Framework | F.-23 |
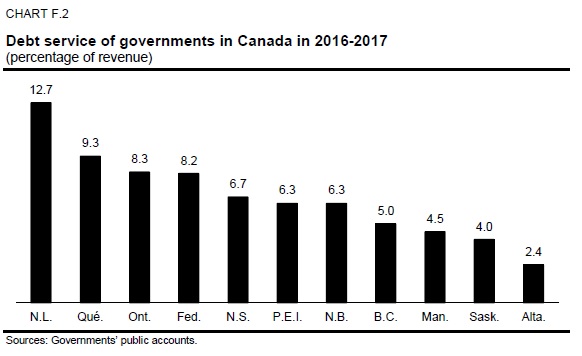
• Comparison of the debt service of governments in Canada
In 2016-2017, Québec was the government that devoted the largest proportion of its revenue to debt service, after Newfoundland and Labrador. This results from the fact that Québec is the second most heavily indebted province after Newfoundland and Labrador.
| | Budget 2018-2019 | |
| F- 24 | Economic Plan | |
| 2. | CONSOLIDATED REVENUE AND EXPENDITURE BY DEPARTMENTAL PORTFOLIO |
To fulfil its missions, the government sets up programs that are directly administered by government departments and bodies.
A departmental portfolio groups all of the entities under the responsibility of a minister, including the department and bodies.
Tables F.10 and F.11 present the revenue and expenditure forecasts for 2018-2019 by portfolio and sector.
Appendix 3 lists the entities making up each portfolio.
2.1 Consolidated revenue
The own-source revenue of entities, as well as revenue allocated to them by law, is credited to the portfolio of the minister responsible for those entities.
With total revenue of $94.2 billion in 2018-2019, the Finances portfolio is the one with the highest revenue. The revenue of this portfolio is very high compared to that of the other portfolios because it includes, among other things, the net results of government enterprises, as well as sums collected in order to fund public services of the State that are not allocated to another entity by law, such as:
| — | income and property taxes collected by Revenu Québec; |
| | |
| — | the Québec sales tax; |
| | |
| — | the main federal transfers. |
The other portfolios with the highest revenue in 2018-2019 are:
| — | Transports, Mobilité durable et Électrification des transports, whose revenue of $4.7 billion is derived in particular from the specific tax on fuel and fees for motor vehicles; |
| | |
| — | Éducation et Enseignement supérieur, whose revenue of $4.3 billion is derived in particular from the school property tax and tuition fees; |
| | |
| — | Santé et Services sociaux, whose revenue of $4.3 billion is drawn mainly from the sale of goods and services of the health and social services network and contributions to the Québec prescription drug insurance plan. |
| | | |
| | Detailed Financial Framework | F-25 |
TABLE F.10
| Consolidated revenue by portfolio and sector – 2018-2019 |
| (millions of dollars) |
| | | Consolidated Revenue Fund | |
| | | | | | | | | | | | |
| | | | | | | | | | | Specified | |
| | General | | | Special | | | Generations | | | purpose | |
| | Fund | | | funds | | | Fund | | | accounts | |
| Affaires municipales et Occupation du territoire | | 10 | | | 107 | | | — | | | 393 | |
| Agriculture, Pêcheries et Alimentation | | 22 | | | — | | | — | | | 92 | |
| Assemblée nationale(2) | | 1 | | | — | | | — | | | — | |
| Conseil du trésor et Administration gouvernementale | | 1 | | | — | | | — | | | — | |
| Conseil exécutif | | — | | | — | | | — | | | — | |
| Culture et Communications | | 5 | | | 25 | | | — | | | 3 | |
| Développement durable, Environnement et Lutte contre les changements climatiques | | — | | | 768 | | | — | | | 3 | |
| Économie, Science et Innovation | | 3 | | | 449 | | | — | | | 49 | |
| Éducation et Enseignement supérieur | | 183 | | | 114 | | | — | | | 132 | |
| Énergie et Ressources naturelles | | 29 | | | 212 | | | — | | | — | |
| Famille | | 19 | | | 2 454 | | | — | | | — | |
| Finances | | 80 621 | | | 2 777 | | | 2 491 | | | 504 | |
| Forêts, Faune et Parcs | | 42 | | | 487 | | | — | | | 8 | |
| Immigration, Diversité et Inclusion | | 616 | | | — | | | — | | | 6 | |
| Justice | | 236 | | | 121 | | | — | | | 1 | |
| Relations internationales et Francophonie | | — | | | — | | | — | | | — | |
| Santé et Services sociaux | | 38 | | | 211 | | | — | | | 164 | |
| Sécurité publique | | 44 | | | 650 | | | — | | | 193 | |
| Tourisme | | — | | | 228 | | | — | | | — | |
| Transports, Mobilité durable et Électrification des transports | | 51 | | | 4 415 | | | — | | | — | |
| Travail, Emploi et Solidarité sociale | | 886 | | | 1 407 | | | — | | | — | |
| Subtotal | | 82 807 | | | 14 426 | | | 2 491 | | | 1 548 | |
| Inter-portfolio eliminations(1) | | — | | | — | | | — | | | — | |
| TOTAL | | 82 807 | | | 14 426 | | | 2 491 | | | 1 548 | |
Note: Totals may not add due to rounding.
| (1) | Consolidation adjustments resulting mainly from the elimination of reciprocal transactions between entities in the same portfolio (intra-portfolio eliminations) or different portfolios (inter-portfolio eliminations). |
| (2) | Includes the “Persons Appointed by the National Assembly” portfolio. |
| | Budget 2018-2019 | |
| F- 26 | Economic Plan | |
| | | | | | | | | Bodies in the | | | | | | | |
| | | | | | | | | health and social | | | | | | | |
| | | Tax-funded | | | Non-budget- | | | services and | | | Intra-portfolio | | | Consolidated | |
| | | transfers | | | funded bodies | | | education networks | | | eliminations(1 | ) | | revenue | |
| | | | | | | | | | | | | | | |
| | — | | | 1 270 | | | — | | | –536 | | | 1 244 | |
| | | — | | | 531 | | | — | | | –520 | | | 125 | |
| | | — | | | — | | | — | | | — | | | 1 | |
| | | | | | | | | | | | | | | |
| | — | | | 1 591 | | | — | | | –436 | | | 1 156 | |
| | | — | | | 3 | | | — | | | –2 | | | — | |
| | | — | | | 520 | | | — | | | –425 | | | 128 | |
| | | | | | | | | | | | | | | |
| | | | | | | | | | | | | | | |
| | | — | | | 42 | | | — | | | –4 | | | 809 | |
| | | — | | | 294 | | | — | | | –488 | | | 307 | |
| | | — | | | 64 | | | 17 662 | | | –13 822 | | | 4 332 | |
| | | — | | | 235 | | | — | | | –86 | | | 391 | |
| | | — | | | — | | | — | | | –2 423 | | | 50 | |
| | | 6 970 | | | 2 369 | | | — | | | –1 510 | | | 94 221 | |
| | | — | | | 158 | | | — | | | –241 | | | 454 | |
| | | — | | | — | | | — | | | — | | | 622 | |
| | | — | | | 215 | | | — | | | –199 | | | 373 | |
| | | | | | | | | | | | | | | | |
| | — | | | 9 | | | — | | | –3 | | | 6 | |
| | | — | | | 17 223 | | | 27 043 | | | –40 395 | | | 4 285 | |
| | | — | | | 41 | | | — | | | –331 | | | 597 | |
| | | — | | | 151 | | | — | | | –210 | | | 169 | |
| | | | | | | | | | | | | | | |
| | — | | | 443 | | | — | | | –237 | | | 4 672 | |
| | | — | | | 29 | | | — | | | –1 198 | | | 1 124 | |
| | | 6 970 | | | 25 188 | | | 44 705 | | | –63 068 | | | 115 067 | |
| | | — | | | — | | | — | | | — | | | –5 470 | |
| | | 6 970 | | | 25 188 | | | 44 705 | | | –63 068 | | | 109 597 | |
| | | |
| | Detailed Financial Framework | F-27 |
| Departmental portfolios |
| |
To fulfil its missions, the government sets up programs that government entities, including departments or bodies, directly administer. The array of entities for which a minister is responsible constitutes a portfolio. |
| |
The publication of revenue and expenditure by departmental portfolio better informs public decision-makers about the financial resources available to them for all of the entities for which they are responsible. |
| |
| – | The presentation of information in this manner is an additional budget management tool that helps to make public decision-makers more accountable with respect to their entire departmental portfolio. |
| | |
| – | Furthermore, it enables public decision-makers to obtain a comprehensive view of the breakdown of their resources in each sectoral component of the government’s financial organization. |
| | |
The composition of and level of revenue and expenditure in each portfolio varies depending on the nature of the mission and the programs for which the minister in question is responsible. Accordingly, the expenditures of certain portfolios will exceed their revenues, while the revenues of other portfolios will exceed their expenditures. |
| |
| Departmental portfolio |
 |
| | Budget 2018-2019 | |
| F- 28 | Economic Plan | |
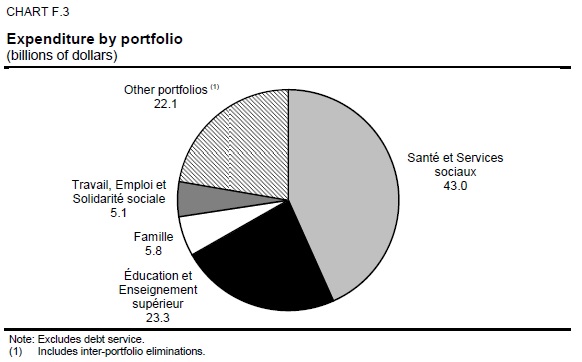
2.2 Consolidated expenditure
The expenditures of a departmental portfolio include the expenditures of entities under the responsibility of a minister, as well as tax-funded expenditures, the nature of which corresponds to the area covered by the portfolio.
The portfolios that will have the highest level of spending in 2018-2019 are:
| — | Santé et Services sociaux, whose expenditures of $43.0 billion include, in particular, the activities of the health and social services network and the programs administered by the Régie de l’assurance maladie du Québec; |
| | |
| — | Éducation et Enseignement supérieur, whose expenditures of $23.3 billion, are allocated primarily to the activities of the education networks and to student financial assistance; |
| | |
| — | Famille, whose expenditures of $5.8 billion include transfers for subsidized educational childcare services and the refundable tax credit for child assistance; |
| | |
| — | Travail, Emploi et Solidarité sociale, whose expenditures of $5.1 billion include, in particular, last-resort financial assistance programs and employment assistance measures. |
| | | |
| | Detailed Financial Framework | F.29 |
TABLE F.11
| Consolidated expenditure by portfolio and sector – 2018-2019 |
| (millions of dollars) |
| | | Consolidated Revenue fund | |
| | | | | | | | | | | | | |
| | | | | | | | Specified | | | | |
| | General | | | Special | | | purpose | | | Tax-funded | |
| | Fund | | | funds | | | accounts | | | expenditures | |
| Affaires municipales et Occupation du territoire | | 1 889 | | | 121 | | | 393 | | | 1 | |
| Agriculture, Pêcheries et Alimentation | | 899 | | | — | | | 92 | | | — | |
| Assemblée nationale(2) | | 328 | | | — | | | — | | | — | |
| Conseil du trésor et Administration gouvernementale | | 1 722 | | | — | | | — | | | — | |
| Conseil exécutif | | 463 | | | — | | | — | | | — | |
| Culture et Communications | | 726 | | | 33 | | | 3 | | | 337 | |
| Développement durable, Environnement et Lutte contre les changements climatiques | | 176 | | | 880 | | | 3 | | | 12 | |
| Économie, Science et Innovation | | 1 017 | | | 365 | | | 49 | | | 1 083 | |
| Éducation et Enseignement supérieur | | 19 380 | | | 139 | | | 132 | | | 136 | |
| Énergie et Ressources naturelles | | 84 | | | 190 | | | — | | | 183 | |
| Famille | | 2 657 | | | 2 459 | | | — | | | 3 111 | |
| Finances | | 201 | | | 1 065 | | | 504 | | | 848 | |
| Forêts, Faune et Parcs | | 489 | | | 538 | | | 8 | | | 14 | |
| Immigration, Diversité et Inclusion | | 339 | | | — | | | 6 | | | — | |
| Justice | | 1 017 | | | 141 | | | 1 | | | — | |
| Relations internationales et Francophonie | | 112 | | | — | | | — | | | — | |
| Santé et Services sociaux | | 38 541 | | | 210 | | | 164 | | | 735 | |
| Sécurité publique | | 1 588 | | | 650 | | | 193 | | | 6 | |
| Tourisme | | 185 | | | 229 | | | — | | | — | |
| Transports, Mobilité durable et Électrification des transports | | 698 | | | 3 883 | | | — | | | 27 | |
| Travail, Emploi et Solidarité sociale | | 4 360 | | | 1 414 | | | — | | | 477 | |
| Inter-portfolio eliminations(1) | | — | | | — | | | — | | | — | |
| Subtotal | | 76 869 | | | 12 317 | | | 1 548 | | | 6 970 | |
| Debt service | | 7 160 | | | 2 449 | | | — | | | — | |
| TOTAL | | 84 030 | | | 14 766 | | | 1 548 | | | 6 970 | |
Note: Totals may not add due to rounding.
| (1) | Consolidation adjustments resulting mainly from the elimination of reciprocal transactions between entities in the same portfolio (intra-portfolio eliminations) or different portfolios (inter-portfolio eliminations). |
| (2) | Includes the “Persons Appointed by the National Assembly” portfolio. |
| | Budget 2018-2019 | |
| F- 30 | Economic Plan | |
| | | | | Bodies in the | | | | | | | | | | |
| | | | | health and social | | | | | | | | | | |
| | Non-budget- | | | services and | | | Intra-portfolio | | | Inter-portfolio | | | Consolidated | |
| | funded bodies | | | education networks | | | eliminations(1 | ) | | eliminations(1 | ) | | expenditure | |
| | | | | | | | | | | | | | | |
| | 1 235 | | | — | | | –536 | | | — | | | 3 103 | |
| | 403 | | | — | | | –520 | | | — | | | 875 | |
| | — | | | — | | | — | | | — | | | 328 | |
| | | | | | | | | | | | | | | |
| | 1 426 | | | — | | | –436 | | | — | | | 2 711 | |
| | 3 | | | — | | | –2 | | | — | | | 464 | |
| | 514 | | | — | | | –425 | | | — | | | 1 188 | |
| | | | | | | | | | | | | | | |
| | | | | | | | | | | | | | | |
| | 41 | | | — | | | –4 | | | — | | | 1 107 | |
| | 293 | | | — | | | –488 | | | — | | | 2 319 | |
| | 61 | | | 17 248 | | | –13 822 | | | — | | | 23 273 | |
| | 232 | | | — | | | –86 | | | — | | | 603 | |
| | — | | | — | | | –2 423 | | | — | | | 5 804 | |
| | 2 049 | | | — | | | –1 501 | | | — | | | 3 166 | |
| | 153 | | | — | | | –241 | | | — | | | 960 | |
| | — | | | — | | | — | | | — | | | 345 | |
| | 225 | | | — | | | –199 | | | — | | | 1 184 | |
| | | | | | | | | | | | | | | |
| | 9 | | | — | | | –3 | | | — | | | 118 | |
| | 17 213 | | | 26 545 | | | –40 395 | | | — | | | 43 013 | |
| | 41 | | | — | | | –331 | | | — | | | 2 146 | |
| | 140 | | | — | | | –210 | | | — | | | 344 | |
| | | | | | | | | | | | | | | |
| | 435 | | | — | | | –237 | | | — | | | 4 806 | |
| | 29 | | | — | | | –1 198 | | | — | | | 5 082 | |
| | — | | | — | | | — | | | –3 626 | | | –3 626 | |
| | 24 501 | | | 43 793 | | | –63 059 | | | –3 626 | | | 99 313 | |
| | 579 | | | 938 | | | –9 | | | –1 737 | | | 9 380 | |
| | 25 080 | | | 44 731 | | | –63 068 | | | –5 363 | | | 108 693 | |
| | | |
| | Detailed Financial Framework | F.31 |
3. FINANCIAL FRAMEWORK BY SECTOR
The consolidated financial framework presents the sectoral components included in the government reporting entity that reflect the financial organization of public and parapublic sector activities. Table F.12 presents the forecast revenue and expenditure of these different components for fiscal 2017-2018 to 2019-2020.
Tables F.13 to F.22 present, for 2017-2018 to 2019-2020, transactions carried out by the General Fund, special funds, specified purpose accounts, non-budget-funded bodies and bodies in the health and social services and education networks, as well as tax-funded expenditures.
| | | |
| | Detailed Financial Framework | F.33 |
TABLE F.12
| Financial framework for consolidated revenue and expenditure by sector | | | | | | | | | |
| (millions of dollars) | | | | | | | | | |
| | | 2017-2018 | | | 2018-2019 | | | 2019-2020 | |
| Revenue | | | | | | | | | |
| General Fund | | 80 605 | | | 82 807 | | | 86 694 | |
| Special funds | | 12 780 | | | 13 440 | | | 13 945 | |
| Generations Fund | | 2 292 | | | 2 491 | | | 2 707 | |
| Specified purpose accounts | | 1 569 | | | 1 548 | | | 939 | |
| Non-budget-funded bodies | | 21 268 | | | 21 180 | | | 21 850 | |
| Bodies in the health and social services | | | | | | | | | |
| network | | 25 654 | | | 27 043 | | | 28 086 | |
| Bodies in the education networks | | 16 909 | | | 17 662 | | | 18 542 | |
| Tax-funded transfers(1) | | 6 711 | | | 6 970 | | | 7 081 | |
| Consolidation adjustments(2) | | –60 592 | | | –63 544 | | | –66 485 | |
| Total consolidated revenue | | 107 196 | | | 109 597 | | | 113 359 | |
| Expenditure | | | | | | | | | |
| Mission expenditures | | | | | | | | | |
| General Fund (program spending) | | –72 591 | | | –76 869 | | | –79 682 | |
| Special funds | | –11 580 | | | –12 066 | | | –12 487 | |
| Specified purpose accounts | | –1 569 | | | –1 548 | | | –939 | |
| Non-budget funded bodies | | –20 210 | | | –20 494 | | | –21 164 | |
| Bodies in the health and social services | | | | | | | | | |
| network | | –25 209 | | | –26 545 | | | –27 499 | |
| Bodies in the education networks | | –16 432 | | | –17 248 | | | –18 057 | |
| Tax-funded expenditures(1) | | –6 711 | | | –6 970 | | | –7 081 | |
| Consolidation adjustments(2) | | 59 485 | | | 62 427 | | | 64 843 | |
| Total mission expenditures | | –94 817 | | | –99 313 | | | –102 066 | |
| Debt service | | | | | | | | | |
| General Fund | | –7 220 | | | –7 160 | | | –7 023 | |
| Consolidated entities(3) | | –2 017 | | | –2 220 | | | –2 399 | |
| Total debt service | | –9 237 | | | –9 380 | | | –9 422 | |
| Total consolidated expenditure | | –104 054 | | | –108 693 | | | –111 488 | |
| Contingency reserve | | — | | | — | | | –100 | |
| SURPLUS | | 3 142 | | | 904 | | | 1 771 | |
| BALANCED BUDGET ACT | | | | | | | | | |
| Deposits of dedicated revenues in the | | | | | | | | | |
| Generations Fund | | –2 292 | | | –2 491 | | | –2 707 | |
| Use of the stabilization reserve | | — | | | 1 587 | | | 936 | |
| BUDGETARY BALANCE(4) | | 850 | | | — | | | — | |
| (1) | Includes doubtful tax accounts. |
| (2) | These adjustments result mainly from the elimination of reciprocal transactions between entities in different sectors. |
| (3) | Includes consolidation adjustments. |
| (4) | Budgetary balance within the meaning of the Balanced Budget Act, after use of the stabilization reserve. |
| | Budget 2018-2019 | |
| F- 34 | Economic Plan | |
| Change in consolidated revenue and expenditure by sector |
| |
| The following table shows the change in consolidated revenue and expenditure by sector from 2017-2018 to 2019-2020. |
| |
| Change in consolidated revenue and expenditure by sector | | | | | | | | | |
| (per cent) | | | | | | | | | |
| | | 2017-2018 | | | 2018-2019 | | | 2019-2020 | |
| Revenue | | | | | | | | | |
| General Fund | | 3.1 | | | 2.7 | | | 4.7 | |
| Special funds | | 9.7 | | | 5.2 | | | 3.8 | |
| Generations Fund | | 14.5 | | | 8.7 | | | 8.7 | |
| Specified purpose accounts | | 59.1 | | | –1.3 | | | –39.3 | |
| Non-budget-funded bodies | | 0.7 | | | –0.4 | | | 3.2 | |
| Bodies in the health and social services | | | | | | | | | |
| network | | 3.1 | | | 5.4 | | | 3.9 | |
| Bodies in the education networks | | 4.3 | | | 4.5 | | | 5.0 | |
| Tax-funded transfers(1) | | 2.9 | | | 3.9 | | | 1.6 | |
| TOTAL CONSOLIDATED REVENUE | | 4.2 | | | 2.2 | | | 3.4 | |
| Expenditure | | | | | | | | | |
| Mission expenditures | | | | | | | | | |
| General Fund (program spending) | | 4.6 | | | 5.9 | | | 3.7 | |
| Special funds | | 14.7 | | | 4.2 | | | 3.5 | |
| Specified purpose accounts | | 59.1 | | | –1.3 | | | –39.3 | |
| Non-budget-funded bodies | | 1.4 | | | 1.4 | | | 3.3 | |
| Bodies in the health and social services | | | | | | | | | |
| network | | 3.1 | | | 5.3 | | | 3.6 | |
| Bodies in the education networks | | 5.3 | | | 5.0 | | | 4.7 | |
| Tax-funded expenditures(1) | | 2.9 | | | 3.9 | | | 1.6 | |
| Total mission expenditures | | 6.5 | | | 4.7 | | | 2.8 | |
| Debt service | | | | | | | | | |
| General Fund | | –4.3 | | | –0.8 | | | –1.9 | |
| Consolidated entities(2) | | 1.7 | | | 10.1 | | | 8.1 | |
| Total debt service | | –3.0 | | | 1.5 | | | 0.4 | |
| TOTAL CONSOLIDATED EXPENDITURE | | 5.6 | | | 4.5 | | | 2.6 | |
| (1) | Includes doubtful tax accounts. |
| (2) | Includes consolidation adjustments. |
| | |
| | | |
| | Detailed Financial Framework | F.35 |
3.1 General Fund
The General Fund finances nearly three quarters of the government’s consolidated expenditure.
The revenue of the General Fund, which consists of own-source revenue and federal transfers, totals $80.6 billion in 2017-2018 and will increase by 2.7% in 2018-2019 and 4.7% in 2019-2020, to $82.8 billion and $86.7 billion, respectively.
The expenditures of the General Fund, which include, in particular, program spending, stand at $79.8 billion in 2017-2018 and will grow by 5.3% in 2018-2019 and 3.2% in 2019-2020, to $84.0 billion and $86.7 billion, respectively.
TABLE F.13
| Summary of the budgetary transactions of the General Fund | | | | | | | | | |
| (millions of dollars) | | | | | | | | | |
| | | 2017-2018 | | | 2018-2019 | | | 2019-2020 | |
| Revenue | | | | | | | | | |
| Income and property taxes | | 35 469 | | | 36 658 | | | 38 121 | |
| Consumption taxes | | 18 945 | | | 19 578 | | | 20 132 | |
| Duties and permits | | 296 | | | 303 | | | 318 | |
| Miscellaneous revenue | | 1 344 | | | 1 352 | | | 1 352 | |
| Revenue from government enterprises | | 4 302 | | | 3 872 | | | 3 955 | |
| Own-source revenue | | 60 356 | | | 61 763 | | | 63 878 | |
| % change | | 1.3 | | | 2.3 | | | 3.4 | |
| Federal transfers | | 20 249 | | | 21 044 | | | 22 816 | |
| Total revenue | | 80 605 | | | 82 807 | | | 86 694 | |
| % change | | 3.1 | | | 2.7 | | | 4.7 | |
| Expenditure | | | | | | | | | |
| Program spending | | –72 591 | | | –76 869 | | | –79 682 | |
| % change | | 4.6 | | | 5.9 | | | 3.7 | |
| Debt service | | –7 220 | | | –7 160 | | | –7 023 | |
| Total expenditure | | –79 811 | | | –84 029 | | | –86 705 | |
| % change | | 3.8 | | | 5.3 | | | 3.2 | |
| Contingency reserve | | — | | | — | | | –100 | |
| SURPLUS (DEFICIT) | | 794 | | | –1 222 | | | –111 | |
| | Budget 2018-2019 | |
| F- 36 | Economic Plan | |
3.2 Special funds
Special funds are entities set up by law to finance certain activities within government departments and bodies.
The activities of special funds may be funded, in particular, through tax revenues, fees or transfers from program spending.
The following table shows the forecasts pertaining to special funds for 2017-2018 to 2019-2020.
TABLE F.14
| Summary of the budgetary transactions of special funds(1) | | | | | | | | | |
| (millions of dollars) | | | | | | | | | |
| | | 2017-2018 | | | 2018-2019 | | | 2019-2020 | |
| Revenue | | | | | | | | | |
| Income and property taxes | | 974 | | | 1 045 | | | 1 079 | |
| Consumption taxes | | 2 462 | | | 2 534 | | | 2 540 | |
| Duties and permits | | 2 305 | | | 2 038 | | | 2 133 | |
| Miscellaneous revenue | | 2 125 | | | 2 354 | | | 2 573 | |
| Own-source revenue | | 7 866 | | | 7 971 | | | 8 325 | |
| % change | | 12.1 | | | 1.3 | | | 4.4 | |
| Québec government transfers | | 4 682 | | | 4 901 | | | 5 064 | |
| % change | | 3.6 | | | 4.7 | | | 3.3 | |
| Federal transfers | | 232 | | | 568 | | | 556 | |
| Total revenue | | 12 780 | | | 13 440 | | | 13 945 | |
| % change | | 9.7 | | | 5.2 | | | 3.8 | |
| Expenditure | | | | | | | | | |
| Mission expenditures | | –11 580 | | | –12 066 | | | –12 487 | |
| % change | | 14.7 | | | 4.2 | | | 3.5 | |
| Debt service | | –1 522 | | | –1 714 | | | –1 857 | |
| Total expenditure | | –13 102 | | | –13 780 | | | –14 344 | |
| % change | | 12.7 | | | 5.2 | | | 4.1 | |
| SURPLUS (DEFICIT) | | –322 | | | –340 | | | –399 | |
| (1) | Excludes the Generations Fund. |
The revenue of the special funds amounts to $12.8 billion in 2017-2018, which represents a change of 9.7% . This revenue will total $13.4 billion in 2018-2019 and $13.9 billion in 2019-2020, representing a change of 5.2% and 3.8%, respectively.
| | | |
| | Detailed Financial Framework | F.37 |
In 2017-2018, the mission expenditures of special funds stand at $11.6 billion, which represents a change of 14.7% . They will total $12.1 billion in 2018-2019 and $12.5 billion in 2019-2020, representing a change of 4.2% and 3.5%, respectively.
The growth in spending by special funds stems mainly from:
| — | the Land Transportation Network Fund (LTNF), for financing road network and public transit infrastructure; |
| | |
| — | the Green Fund, given the implementation of the 2013-2020 Climate Change Action Plan (2013-2020 CCAP); |
| | |
| — | the Economic Development Fund, which reflects the change in payments of financial assistance to businesses. |
TABLE F.15
| Mission expenditures of special funds |
| (millions of dollars) |
| | | 2017-2018 | | | 2018-2019 | | | 2019-2020 | |
| Land Transportation Network Fund (LTNF) | | 3 804 | (1) | | 3 587 | | | 3 788 | |
| Green Fund | | 709 | | | 792 | | | 789 | |
| Economic Development Fund | | 219 | | | 352 | | | 290 | |
| Elimination of reciprocal transactions between the | | | | | | | | | |
| LTNF and the Green Fund | | –254 | | | –238 | | | –231 | |
| Subtotal | | 4 478 | | | 4 493 | | | 4 636 | |
| % change | | 33.3 | | | 0.3 | | | 3.2 | |
| Other special funds(2) | | 7 102 | | | 7 573 | | | 7 851 | |
| % change | | 5.5 | | | 6.6 | | | 3.7 | |
| TOTAL | | 11 580 | | | 12 066 | | | 12 487 | |
| % change | | 14.7 | | | 4.2 | | | 3.5 | |
| (1) | This amount includes the government’s contribution of $733 million to the Autorité régionale de transport métropolitain for the operation of the Réseau express métropolitain (REM). The breakdown of the contribution is presented in the budget paper Electric Mobility: Sustainable Development of all Transportation Modes. |
| (2) | These amounts include other eliminations of reciprocal transactions between special funds. |
| | Budget 2018-2019 | |
| F- 38 | Economic Plan | |
| Reconciliation of the special funds’ expenditure budget with the |
| government’s consolidated financial framework |
| |
The Secrétariat du Conseil du trésor tables the budget of the special funds in the National Assembly in order for the expenditure and investment forecasts of these entities to be approved. |
| |
The following table illustrates the reconciliation of the expenditures presented in the special funds’ budget with those presented in the Québec Economic Plan. |
| |
Expenditures to service the debt of the Financing Fund are not subject to authorization by the National Assembly since the advances received by the Financing Fund are derived from loans made by the government. Expenditures to service the debt of these borrowings are already covered by the General Fund and are repaid by the clientele of the Financing Fund. |
| |
The Act respecting the Ministère des Finances (CQLR, chapter M-24.01) provides for special treatment of the Financing Fund because of its role as financial intermediary between the General Fund and its clientele, which consists of public bodies and special funds. |
| |
In addition, the Québec Economic Plan presents the consolidated financial framework of the Québec government, including the reporting entity’s various sectoral components. The spending forecasts for special funds included in the consolidated financial framework incorporate the elimination of reciprocal transactions between entities in the same sector (i.e. between special funds). |
| |
| Reconciliation of the special funds’ expenditure budget with the government’s consolidated financial framework |
| (millions of dollars) |
| | | 2018-2019 | |
| Expenditure budget of special funds to be approved by the National Assembly | | 12 964 | |
| Expenditures already approved by the National Assembly | | 89 | |
| Debt service of the Financing Fund | | 1 511 | |
| Subtotal | | 14 564 | |
| Elimination of reciprocal transactions between special funds | | –784 | (1) |
| Expenditure of special funds presented in the Québec Economic Plan | | 13 780 | |
| (1) | Including $735 million attributable to reciprocal transactions of the Financing Fund with the other special funds. |
| | |
| | | |
| | Detailed Financial Framework | F.39 |
[ ] Generations Fund
Revenues dedicated to the Generations Fund amount to $2.3 billion in 2017-2018 and will reach $2.5 billion in 2018-2019 and $2.7 billion in 2019-2020.
As at March 31, 2020, the book value of the Generations Fund will be $14.0 billion. The results of and change in the Generations Fund are presented in greater detail in Section D of Additional Information 2018-2019.
TABLE F.16
| Summary of the budgetary transactions of the Generations Fund |
| (millions of dollars) |
| | | 2017-2018 | | | 2018-2019 | | | 2019-2020 | |
| Revenue | | | | | | | | | |
| Consumption taxes | | | | | | | | | |
| Specific tax on alcoholic beverages | | 500 | | | 500 | | | 500 | |
| Subtotal | | 500 | | | 500 | | | 500 | |
| Duties and permits | | | | | | | | | |
| Water-power royalties | | 802 | | | 787 | | | 805 | |
| Mining revenues | | 133 | | | 230 | | | 272 | |
| Subtotal | | 935 | | | 1 017 | | | 1 077 | |
| Miscellaneous revenue | | | | | | | | | |
| Unclaimed property | | 6 | | | 15 | | | 15 | |
| Investment income | | 418 | | | 499 | | | 600 | |
| Subtotal | | 424 | | | 514 | | | 615 | |
| Government enterprises | | | | | | | | | |
| Indexation of the price of heritage electricity | | 218 | | | 245 | | | 300 | |
| Additional contribution from Hydro-Québec | | 215 | | | 215 | | | 215 | |
| Subtotal | | 433 | | | 460 | | | 515 | |
| TOTAL REVENUE | | 2 292 | | | 2 491 | | | 2 707 | |
| | Budget 2018-2019 | |
| F- 40 | Economic Plan | |
3.3 Specified purpose accounts
A specified purpose account is a financial management mechanism that enables a government department to record separately sums paid into the Consolidated Revenue Fund by a third party under a contract or an agreement that provides for the sums to be allocated to a specific purpose.
The following table shows the forecasts pertaining to specified purpose accounts for 2017-2018 to 2019-2020.
TABLE F.17
| Summary of the budgetary transactions of specified purpose accounts |
| (millions of dollars) |
| | | 2017-2018 | | | 2018-2019 | | | 2019-2020 | |
| Revenue | | | | | | | | | |
| Miscellaneous revenue | | 166 | | | 188 | | | 171 | |
| Own-source revenue | | 166 | | | 188 | | | 171 | |
| % change | | –21.7 | | | 13.3 | | | –9.0 | |
| Federal transfers | | 1 403 | | | 1 360 | | | 768 | |
| Total revenue | | 1 569 | | | 1 548 | | | 939 | |
| % change | | 59.1 | | | –1.3 | | | –39.3 | |
| Expenditure | | | | | | | | | |
| Mission expenditures | | –1 569 | | | –1 548 | | | –939 | |
| Total expenditure | | –1 569 | | | –1 548 | | | –939 | |
| % change | | 59.1 | | | –1.3 | | | –39.3 | |
| SURPLUS | | — | | | — | | | — | |
The revenue and expenditure of specified purpose accounts total $1.6 billion for 2017-2018. This revenue and expenditure will stand at $1.5 billion in 2018-2019 and $0.9 billion in 2019-2020.
The change in the revenue and expenditure of specified purpose accounts is explained chiefly by:
| — | agreements under Phase 1 of the federal infrastructure plan: |
| | — | the Post-Secondary Institutions Strategic Investment Fund, |
| | | |
| | — | the Clean Water and Wastewater Fund; |
| — | the federal Disaster Financial Assistance Arrangements program in connection with the spring flooding in Québec in 2017; |
| | |
| — | the expiry of certain federal infrastructure project agreements. |
| | | |
| | Detailed Financial Framework | F-41 |
3.4 Non-budget-funded bodies
Non-budget-funded bodies were created to provide specific public services.
The following table shows the forecasts pertaining to non-budget-funded bodies for 2017-2018 to 2019-2020.
TABLE F.18
| Summary of the budgetary transactions of non-budget-funded bodies |
| (millions of dollars) |
| | | 2017-2018 | | | 2018-2019 | | | 2019-2020 | |
| Revenue | | | | | | | | | |
| Consumption taxes | | 40 | | | 28 | | | 28 | |
| Duties and permits | | 411 | | | 439 | | | 451 | |
| Miscellaneous revenue | | 6 013 | | | 5 866 | | | 5 962 | |
| Own-source revenue | | 6 464 | | | 6 333 | | | 6 441 | |
| % change | | 0.5 | | | –2.0 | | | 1.7 | |
| Québec government transfers | | 13 521 | | | 13 729 | | | 14 466 | |
| % change | | −1.6 | | | 1.5 | | | 5.4 | |
| Federal transfers | | 1 283 | | | 1 118 | | | 943 | |
| Total revenue | | 21 268 | | | 21 180 | | | 21 850 | |
| % change | | 0.7 | | | –0.4 | | | 3.2 | |
| Expenditure | | | | | | | | | |
| Mission expenditures | | –20 210 | | | –20 494 | | | –21 164 | |
| % change | | 1.4 | | | 1.4 | | | 3.3 | |
| Debt service | | –595 | | | –579 | | | –609 | |
| Total expenditure | | –20 805 | | | –21 073 | | | –21 773 | |
| % change | | 0.9 | | | 1.3 | | | 3.3 | |
| SURPLUS | | 463 | | | 107 | | | 77 | |
The revenue of non-budget-funded bodies amounts to $21.3 billion in 2017-2018, which represents a change of 0.7% . This revenue will stand at $21.2 billion in 2018-2019 and $21.9 billion in 2019-2020, representing a change of –0.4% and 3.2%, respectively.
The mission expenditures of non-budget-funded bodies stand at $20.2 billion in 2017-2018, which represents growth of 1.4% . This spending will total $20.5 billion in 2018-2019 and $21.2 billion in 2019-2020, representing growth of 1.4% and 3.3%, respectively.
| | Budget 2018-2019 | |
| F- 42 | Economic Plan | |
The growth in spending by non-budget-funded bodies stems mainly from the Régie de l’assurance maladie du Québec and the Fonds de l’assurance médicaments.
TABLE F.19
| Mission expenditures of non-budget-funded bodies |
| (millions of dollars) |
| | | 2017-2018 | | | 2018-2019 | | | 2019-2020 | |
| Régie de l'assurance maladie du Québec (RAMQ) | | 12 678 | | | 12 869 | | | 13 382 | |
| Fonds de l'assurance médicaments (FAM) | | 3 596 | | | 3 675 | | | 3 821 | |
| Elimination of reciprocal transactions between RAMQ and the PDIF | | –3 587 | | | –3 666 | | | –3 812 | |
| Subtotal | | 12 687 | | | 12 878 | | | 13 391 | |
| % change | | 2.3 | | | 1.5 | | | 4.0 | |
| Other non-budget-funded bodies(1) | | 7 523 | | | 7 616 | | | 7 773 | |
| % change | | 0.0 | | | 1.2 | | | 2.1 | |
| TOTAL | | 20 210 | | | 20 494 | | | 21 164 | |
| % change | | 1.4 | | | 1.4 | | | 3.3 | |
| (1) | Includes other eliminations of reciprocal transactions between non-budget-funded bodies. |
| | | |
| | Detailed Financial Framework | F.43 |
| Reconciliation of the expenditure budget of non-budget-funded bodies |
| with the government’s consolidated financial framework |
| |
| The Secrétariat du Conseil du trésor tables the revenue and expenditure forecasts for non-budget-funded bodies in the National Assembly. |
| |
| The following table illustrates the reconciliation of the expenditures presented in the budget of non-budget-funded bodies with those presented in the Québec Economic Plan. |
| |
| The Québec Economic Plan presents the consolidated financial framework of the Québec government, including the reporting entity’s various sectoral components. The forecasts for non-budget-funded bodies included in the consolidated financial framework incorporate: |
| |
| – | the elimination of reciprocal transactions between entities in the same sector; |
| | |
| – | harmonization entries intended to harmonize the entities’ forecasts with the government’s accounting policies. |
| | |
| Reconciliation of the expenditure budget of non-budget-funded bodies with the government’s consolidated financial framework | |
| (millions of dollars) | |
| | |
| | 2018-2019 |
| | |
| Expenditure budget of non-budget-funded bodies to be tabled in the National Assembly | 24 996 |
| Elimination of reciprocal transactions between non-budget-funded bodies and harmonizations | –3 923(1) |
| | |
| Expenditure of non-budget-funded bodies presented in the Québec Economic Plan | 21 073 |
| (1) | Including $3.7 billion attributable to reciprocal transactions of the Régie de l’assurance maladie du Québec with the Fonds de l’assurance médicaments. |
| | |
| | Budget 2018-2019 | |
| F- 44 | Economic Plan | |
3.5 Bodies in the health and social services and education networks
[ ] Bodies in the health and social services network
Bodies in the health and social services network include integrated health and social services centres as well as other public institutions and regional authorities.
The following table shows the forecasts pertaining to bodies in the health and social services network for 2017-2018 to 2019-2020.
TABLE F.20
| Summary of the budgetary transactions of bodies in the health and social services network |
| (millions of dollars) |
| | | 2017-2018 | | | 2018-2019 | | | 2019-2020 | |
| Revenue | | | | | | | | | |
| Miscellaneous revenue | | 2 442 | | | 2 511 | | | 2 582 | |
| Own-source revenue | | 2 442 | | | 2 511 | | | 2 582 | |
| % change | | –0.9 | | | 2.8 | | | 2.8 | |
| Québec government transfers | | 23 061 | | | 24 381 | | | 25 353 | |
| % change | | 3.6 | | | 5.7 | | | 4.0 | |
| Federal transfers | | 151 | | | 151 | | | 151 | |
| Total revenue | | 25 654 | | | 27 043 | | | 28 086 | |
| % change | | 3.1 | | | 5.4 | | | 3.9 | |
| Expenditure | | | | | | | | | |
| Mission expenditures | | –25 209 | | | –26 545 | | | –27 499 | |
| % change | | 3.1 | | | 5.3 | | | 3.6 | |
| Debt service | | –445 | | | –498 | | | –587 | |
| Total expenditure | | –25 654 | | | –27 043 | | | –28 086 | |
| % change | | 3.1 | | | 5.4 | | | 3.9 | |
| SURPLUS | | — | | | — | | | — | |
The revenue of bodies in the health and social services network amounts to $25.7 billion for 2017-2018, which represents a change of 3.1% . This revenue will stand at $27.0 billion in 2018-2019 and $28.1 billion in 2019-2020, representing a change of 5.4% and 3.9%, respectively.
The mission expenditures of bodies in the health and social services network stand at $25.2 billion in 2017-2018, which represents a change of 3.1% . This spending will total $26.5 billion in 2018-2019 and $27.5 billion in 2019-2020, representing a change of 5.3% and 3.6%, respectively.
| | | |
| | Detailed Financial Framework | F.45 |
[ ] Bodies in the Education networks
Bodies in the education networks consist of school boards, the Comité de gestion de la taxe scolaire de l’île de Montréal, CEGEPs and the Université du Québec and its constituents.
The following table shows the forecasts pertaining to bodies in the education networks for 2017-2018 to 2019-2020.
TABLE F.21
| Summary of the budgetary transactions of bodies in the education networks |
| (millions of dollars) |
| | | 2017-2018 | | | 2018-2019 | | | 2019-2020 | |
| Revenue | | | | | | | | | |
| Income and property taxes | | 2 242 | | | 1 817 | | | 1 706 | |
| Miscellaneous revenue | | 1 775 | | | 1 808 | | | 1 861 | |
| Own-source revenue | | 4 017 | | | 3 625 | | | 3 567 | |
| % change | | 2.0 | | | –9.8 | | | –1.6 | |
| Québec government transfers | | 12 737 | | | 13 882 | | | 14 820 | |
| % change | | 5.3 | | | 9.0 | | | 6.8 | |
| Federal transfers | | 155 | | | 155 | | | 155 | |
| Total revenue | | 16 909 | | | 17 662 | | | 18 542 | |
| % change | | 4.3 | | | 4.5 | | | 5.0 | |
| Expenditure | | | | | | | | | |
| Mission expenditures | | –16 432 | | | –17 248 | | | –18 057 | |
| % change | | 5.3 | | | 5.0 | | | 4.7 | |
| Debt service | | –377 | | | –440 | | | –493 | |
| Total expenditure | | –16 809 | | | –17 688 | | | –18 550 | |
| % change | | 5.4 | | | 5.2 | | | 4.9 | |
| SURPLUS (DEFICIT) | | 100 | | | –26 | | | –8 | |
The revenue of bodies in the education networks totals $16.9 billion in 2017-2018, which represents a change of 4.3% . This revenue will amount to $17.7 billion in 2018-2019 and $18.5 billion in 2019-2020, representing a change of 4.5% and 5.0%, respectively.
The mission expenditures of bodies in the education networks stand at $16.4 billion in 2017-2018, which represents a change of 5.3% . This spending will total $17.2 billion in 2018-2019 and $18.1 billion in 2019-2020, representing a change of 5.0% and 4.7%, respectively.
| | Budget 2018-2019 | |
| F- 46 | Economic Plan | |
3.6 Tax-funded expenditures
Refundable tax credits for individuals and corporations, which are similar to taxation-related transfer expenditures, are recorded in spending rather than as reductions in revenue. Expenditures related to doubtful tax accounts are added to these refundable tax credits.
Tax-funded expenditures show an increase of 2.9% in 2017-2018 in relation to the previous year and will grow by 3.9% in 2018-2019 and 1.6% in 2019-2020. This change is explained in particular by certain measures announced in:
| — | the March 2016 Québec Economic Plan, including the enhancements to work premiums for households without children and to the tax shield; |
| | |
| — | the March 2017 Québec Economic Plan, including the refundable tax credit for the upgrading of residential waste water treatment systems; |
| | |
| — | the November 2017 update of the Québec Economic Plan, including the supplement of $100 per child for the purchase of school supplies; |
| | |
| — | the March 2018 Québec Economic Plan, including the one-year extension of the RénoVert tax credit. |
TABLE F.22
| Summary of budgetary transactions relating to tax-funded expenditures |
| (millions of dollars) |
| | | 2017-2018 | | | 2018-2019 | | | 2019-2020 | |
| Revenue | | | | | | | | | |
| Personal income tax | | 4 669 | | | 4 938 | | | 4 973 | |
| Corporate taxes | | 1 783 | | | 1 778 | | | 1 846 | |
| Consumption taxes | | 259 | | | 254 | | | 262 | |
| Total revenue | | 6 711 | | | 6 970 | | | 7 081 | |
| % change | | 2.9 | | | 3.9 | | | 1.6 | |
| Expenditure | | –6 711 | | | –6 970 | | | –7 081 | |
| % change | | 2.9 | | | 3.9 | | | 1.6 | |
| SURPLUS | | — | | | — | | | — | |
| | | |
| | Detailed Financial Framework | F.47 |
4. NET FINANCIAL SURPLUSES OR REQUIREMENTS
Net financial surpluses or requirements represent the difference between the government's cash inflow and disbursements. These net financial surpluses or requirements take into account changes in the budgetary balance on an accrual basis, resources or requirements arising from the acquisition or disposal of capital assets, investments, loans and advances and from other activities such as paying accounts payable and collecting accounts receivable.
The government will post a financial surplus of $2.3 billion for 2017-2018, a financial requirement of 2.1 billion for fiscal 2018-2019 and a financial surplus of $1.2 billion for 2019-2020.
TABLE F.23
| Net financial surpluses or requirements(1) |
| (millions of dollars) |
| | | 2017-2018 | | | 2018-2019 | | | 2019-2020 | |
| SURPLUS (DEFICIT) | | 3 142 | | | 904 | | | 1 771 | |
| Non-budgetary transactions | | | | | | | | | |
| Investments, loans and advances | | –2 036 | | | –2 294 | | | –2 099 | |
| Capital investments | | –2 388 | | | –3 093 | | | –2 877 | |
| Retirement plans and other employee future benefits | | 3 010 | | | 2 879 | | | 2 991 | |
| Other accounts | | 537 | | | –480 | | | 1 387 | |
| Total non-budgetary transactions | | –877 | | | –2 988 | | | –598 | |
| NET FINANCIAL SURPLUS (REQUIREMENTS) | | 2 265 | | | –2 084 | | | 1 173 | |
| (1) | A negative entry indicates a financial requirement and a positive entry, a source of financing. |
[ ] Investments, loans and advances
Investments, loans and advances include mainly investments made by the government in its enterprises and loans and advances granted to entities not included in the government reporting entity.
Net financial requirements for investments, loans and advances are estimated at $2.0 billion for 2017-2018, $2.3 billion for 2018-2019 and $2.1 billion for 2019-2020. Investments, loans and advances include the government’s investments in the Réseau express métropolitain (REM) de Montréal in 2017-2018, 2018-2019 and 2019-2020.
| | | |
| | Detailed Financial Framework | F.49 |
[ ] Capital expenditures
In 2017-2018, forecast net financial requirements associated with net capital investments amount to $2.4 billion.
Net financial requirements attributable to net investments for fiscal 2018-2019 and 2019-2020 will stand at $3.1 billion and $2.9 million, respectively.
TABLE F.24
| Net capital investments(1) |
| (millions of dollars) |
| | | 2017-2018 | | | 2018-2019 | | | 2019-2020 | |
| Investments | | –6 721 | | | –7 505 | | | –7 429 | |
| Depreciation | | 4 193 | | | 4 309 | | | 4 449 | |
| Net investments | | –2 528 | | | –3 196 | | | –2 980 | |
| Less: PPP investments(2) | | 140 | | | 103 | | | 103 | |
| NET CAPITAL INVESTMENTS | | –2 388 | | | –3 093 | | | –2 877 | |
| (1) | A negative entry indicates a financial requirement and a positive entry, a source of financing. |
| (2) | Investments made under public-private partnership (PPP) agreements correspond to new commitments that are taken into account in the government’s gross debt. In accordance with the government’s accounting policies, PPP investments are recognized in the government’s assets as well as in its debt. |
[ ] Retirement plans and other employee future benefits
The non-budgetary balance of the retirement plans and other employee future benefits is expected to increase by $3.0 billion for fiscal 2017-2018, $2.9 billion for 2018-2019 and $3.0 billion for 2019-2020.
[ ] Other accounts
Net financial surpluses or requirements for other accounts consist of a series of changes in assets and liabilities such as accounts receivable and accounts payable.
The change in the government’s other accounts reduces net financial requirements by $537 million for 2017-2018 and will raise net financial requirements by $480 million for 2018-2019. In 2019-2020, other accounts will generate a financial surplus of $1.4 billion.
| | Budget 2018-2019 | |
| F- 50 | Economic Plan | |
[ ] Net financial surpluses or requirements by sector
The following table shows net financial surpluses or requirements by sector, namely, the General Fund, consolidated entities and the Generations Fund.
TABLE F.25
| Net financial surpluses or requirements by sector(1) |
| (millions of dollars) |
| | | 2017-2018 | | | 2018-2019 | | | 2019-2020 | |
| General Fund | | 4 340 | | | –11 | | | 2 935 | |
| Consolidated entities(2) | | –4 367 | | | –4 564 | | | –4 469 | |
| Generations Fund | | 2 292 | | | 2 491 | | | 2 707 | |
| NET FINANCIAL SURPLUSES (REQUIREMENTS) | | 2 265 | | | –2 084 | | | 1 173 | |
| (1) | A negative entry indicates a financial requirement and a positive entry, a source of financing. |
| (2) | Excludes the Generations Fund. |
| | | |
| | Detailed Financial Framework | F.51 |
| APPENDIX 1: | ALLOCATION OF REVENUE FROM |
| | CONSUMPTION TAXES |
[ ] Consumption taxes
Consumption taxes include sales taxes and specific taxes. Sales taxes include, in particular, the Québec sales tax (QST) and the tax on insurance premiums, while specific taxes are applied to fuel, tobacco products and alcoholic beverages.
For 2017-2018, revenue from consumption taxes amounts to $20.3 billion, that is, $16.4 billion from sales taxes and $3.9 billion from specific taxes.
TABLE F.26
| Revenue from consumption taxes |
| (millions of dollars) |
| | | 2017-2018 | | | 2018-2019 | | | 2019-2020 | |
| Sale tax(1) | | 16 367 | | | 16 967 | | | 17 459 | |
| Specific taxes | | | | | | | | | |
| Fuel | | 2 276 | | | 2 321 | | | 2 353 | |
| Tobacco products | | 1 023 | | | 993 | | | 961 | |
| Alcoholic beverages(2) | | 633 | | | 640 | | | 645 | |
| Subtotal | | 3 932 | | �� | 3 954 | | | 3 959 | |
| TOTAL | | 20 299 | | | 20 921 | | | 21 418 | |
| (1) | Includes revenue from pari mutuel. |
| (2) | Includes an annual amount of $500 million dedicated to the Generations Fund. |
| | | |
| | Detailed Financial Framework | F.53 |
• Sales tax
Within the meaning of the Act respecting the Québec sales tax,3 sales taxes include the QST as well as the tax on insurance premiums, the tax on lodging and the specific duty on new tires. For 2017-2018, sales tax revenue stands at $16.4 billion. More specifically:
| — | the revenue of the General Fund derived from the QST and the tax on insurance premiums amounts to $17.9 billion; |
| | |
| — | revenue of $109 million derived mainly from the tax on lodging, is allocated to the Tourism Partnership Fund to promote and develop tourism; |
| | |
| — | revenue of $31 million derived in particular from the specific duty on new tires ($3 per tire), is earmarked for the Société québécoise de récupération et de recyclage (RECYC-QUÉBEC) to finance the recycling of used tires. |
Sales taxes also take into account the cost of the solidarity tax credit and consolidation adjustments, such as the elimination of reciprocal transactions between entities in different sectors.
TABLE F.27
| Allocation of sales tax revenue |
| (millions of dollars) |
| | | 2017-2018 | | | 2018-2019 | | | 2019-2020 | |
| General Fund(1) | | 17 891 | | | 18 552 | | | 19 103 | |
| Tourism Partnership Fund | | 109 | | | 112 | | | 117 | |
| RECYC-QUÉBEC | | 31 | | | 28 | | | 28 | |
| Solidarity tax credit and other(2) | | –1 664 | | | –1 725 | | | –1 789 | |
| TOTAL | | 16 367 | | | 16 967 | | | 17 459 | |
| (1) | Includes revenue from pari mutuel. |
| (2) | Includes, in particular, the solidarity tax credit and the partial rebate of the QST paid on property and services acquired by bodies in the health and social services and education networks. |
________________________________________
3 CQLR, chapter T-0.1.
| | Budget 2018-2019 | |
| F- 54 | Economic Plan | |
• Specific taxes
• Specific tax on fuel
For 2017-2018, the government’s own-source revenue from the specific tax on fuel totals $2.3 billion. This amount includes:
— | revenue from the specific tax of 19.2 cents per litre of gasoline and 20.2 cents per litre of diesel fuel paid into the Land Transportation Network Fund (LTNF) to finance the road network and public transit infrastructure ($2.2 billion): |
| | — | Revenue from the LTNF also includes revenue from the specific tax of 1 cent per litre of gasoline sold within the territory of the Gaspésie–Îles-de- la-Madeleine administrative region to improve public transportation services in this region ($1.5 million); |
— | revenue from the specific tax of 3 cents per litre on kerosene fuel (domestic), aviation fuel and fuel oil for locomotives, paid into the General Fund ($17 million); |
The activities of the Agence métropolitaine de transport (AMT) were transferred on June 1, 2017 to the Autorité régionale de transport métropolitain and the Réseau de transport métropolitain, bodies that are not included in the government reporting entity.
— | Revenue from the specific tax of 3 cents per litre of gasoline sold within the territory of the AMT before June 1, 2017 ($18 million), was paid to the AMT, for public transportation services in Greater Montréal. |
TABLE F.28
| Allocation of revenue from the specific taxes on fuel |
| (millions of dollars) |
| | | 2017-2018 | | | 2018-2019 | | | 2019-2020 | |
| LTNF | | 2 241 | | | 2 303 | | | 2 335 | |
| General Fund | | 17 | | | 18 | | | 18 | |
| AMT | | 18 | (1) | | — | | | — | |
| TOTAL | | 2 276 | | | 2 321 | | | 2 353 | |
| (1) | Includes a consolidation adjustment of $9 million. |
| | | |
| | Detailed Financial Framework | F.55 |
• Specific tax on tobacco products
For 2017-2018, tax revenue from the sale of tobacco products amounts to $1 023 million, including $904 million paid into the General Fund and $119 million allocated to various special funds.
TABLE F.29
| Allocation of revenue from the specific tax on tobacco products |
| (millions of dollars) |
| | | 2017-2018 | | | 2018-2019 | | | 2019-2020 | |
| General Fund | | 904 | | | 868 | | | 866 | |
| Special funds | | | | | | | | | |
| Sports and Physical Activity Development Fund(1) | | 68 | | | 70 | | | 70 | |
| Québec Cultural Heritage Fund | | 16 | | | 20 | | | 20 | |
| Fund for the Promotion of a Healthy Lifestyle(2) | | — | | | — | | | — | |
| Early Childhood Development Fund | | 15 | | | 15 | | | — | |
| Caregiver Support Fund | | 15 | | | 15 | | | — | |
| Avenir Mécénat Culture Fund | | 5 | | | 5 | | | 5 | |
| Subtotal | | 119 | | | 125 | | | 95 | |
| TOTAL | | 1 023 | | | 993 | | | 961 | |
| (1) | This fund includes an allocation of $8 million in 2017-2018 subject to the passage, by March 31, 2018 at the latest, of the Act respecting mainly the implementation of certain provisions of the Budget Speeches of 17 March 2016 and 28 March 2017. |
| (2) | This fund is being eliminated as of 2017-2018, following the passage, by March 31, 2018 at the latest, of the Act respecting mainly the implementation of certain provisions of the Budget Speeches of 17 March 2016 and 28 March 2017. The revenues will be allocated to the General Fund and the expenditures will be covered by the Ministère de la Santé et des Services sociaux. |
| | Budget 2018-2019 | |
| F- 56 | Economic Plan | |
• Specific tax on alcoholic beverages
Tax revenue from the sale of alcoholic beverages totals $633 million in 2017-2018. This revenue will reach $645 million in 2019-2020.
— | Since 2016-2017, an annual amount of $500 million drawn from the specific tax on alcoholic beverages has been allocated to the Generations Fund. |
TABLE F.30
| Allocation of revenue from the specific tax on alcoholic beverages |
| (millions of dollars) |
| | | 2017-2018 | | | 2018-2019 | | | 2019-2020 | |
| General Fund | | 133 | | | 140 | | | 145 | |
| Generations Fund | | 500 | | | 500 | | | 500 | |
| TOTAL | | 633 | | | 640 | | | 645 | |
| | | |
| | Detailed Financial Framework | F-57 |
| APPENDIX 2: | DETAILED FINANCIAL FRAMEWORK |
| | BY SECTOR |
| | | |
| | Detailed Financial Framework | F.59 |
TABLE F.31
| Detailed financial framework by sector |
| (millions of dollars) |
| | | 2017-2018 | |
| | | Fonds consolidé du revenu | |
| | | | | | | | | | | | |
| | | | | | | | | | | | |
| | | | | | | | | | | Specified | |
| | | | | | | | Generations | | | purpose | |
| | General Fund | | | Special funds | | | Fund | | | accounts | |
| Revenue | | | | | | | | | | | | |
| Personal income tax | | 22 193 | | | 771 | | | — | | | — | |
| Contributions for health services | | 7 362 | | | — | | | — | | | — | |
| Corporate taxes | | 5 914 | | | 203 | | | — | | | — | |
| School property tax | | — | | | — | | | — | | | — | |
| Consumption taxes | | 18 945 | | | 2 462 | | | 500 | | | — | |
| Duties and permits | | 296 | | | 2 305 | | | 935 | | | — | |
| Miscellaneous revenue | | 1 344 | | | 2 125 | | | 424 | | | 166 | |
| Revenue from government | | | | | | | | | | | | |
| enterprises | | 4 302 | | | — | | | 433 | | | — | |
| Own-source revenue | | 60 356 | | | 7 866 | | | 2 292 | | | 166 | |
| Québec government transfers | | — | | | 4 682 | | | — | | | — | |
| Federal transfers | | 20 249 | | | 232 | | | — | | | 1 403 | |
| Total revenue | | 80 605 | | | 12 780 | | | 2 292 | | | 1 569 | |
| Expenditure | | | | | | | | | | | | |
| Mission expenditures | | –72 591 | | | –11 580 | | | — | | | –1 569 | |
| Debt service | | –7 220 | | | –1 522 | | | — | | | — | |
| Total expenditure | | –79 811 | | | –13 102 | | | — | | | –1 569 | |
| Contingency reserve | | — | | | | | | | | | | |
| SURPLUS (DEFICIT) | | 794 | | | –322 | | | 2 292 | | | — | |
| BALANCED BUDGET ACT | | | | | | | | | | | | |
| Deposits of dedicated revenues in the Generations Fund | | | | | | | | –2 292 | | | | |
| Use of the stabilization reserve | | | | | | | | | | | | |
| BUDGETARY BALANCE(3) | | | | | | | | | | | | |
| (1) | Includes doubtful tax accounts. |
| (2) | Reclassification of abatements and consolidation adjustments resulting mainly from the elimination of reciprocal transactions between entities in different sectors. |
| (3) | Budgetary balance within the meaning of the Balanced Budget Act, after use of the stabilization reserve. |
| | Budget 2018-2019 | |
| F- 60 | Economic Plan | |
| 2017-2018 | |
| | | | | | | | | | | | | | | | | | | |
| | | | | | | | | Bodies in | | | | | | | | | | |
| | | | | | | | | the health | | | | | | | | | | |
| | | | | | Non-budget- | | | and social | | | Bodies in the | | | | | | | |
| | | Tax-funded | | | funded | | | services | | | education | | | Consolidation | | | Consolidated | |
| | | expenditures(1 | ) | | bodies | | | network | | | networks | | | adjustments(2 | ) | | results | |
| | | | | | | | | | | | | | | | | | |
| | | 4 669 | | | — | | | — | | | — | | | 1 482 | | | 29 115 | |
| | | — | | | — | | | — | | | — | | | –1 313 | | | 6 049 | |
| | | 1 783 | | | — | | | — | | | — | | | — | | | 7 900 | |
| | | — | | | — | | | — | | | 2 242 | | | — | | | 2 242 | |
| | | 259 | | | 40 | | | — | | | — | | | –1 907 | | | 20 299 | |
| | | — | | | 411 | | | — | | | — | | | — | | | 3 947 | |
| | — | | | 6 013 | | | 2 442 | | | 1 775 | | | –4 049 | | | 10 240 | |
| | | | | | | | | | | | | | | | | | |
| | — | | | — | | | — | | | — | | | — | | | 4 735 | |
| | | 6 711 | | | 6 464 | | | 2 442 | | | 4 017 | | | –5 787 | | | 84 527 | |
| | — | | | 13 521 | | | 23 061 | | | 12 737 | | | –54 001 | | | — | |
| | | — | | | 1 283 | | | 151 | | | 155 | | | –804 | | | 22 669 | |
| | | 6 711 | | | 21 268 | | | 25 654 | | | 16 909 | | | –60 592 | | | 107 196 | |
| | | | | | | | | | | | | | | | | | |
| | | –6 711 | | | –20 210 | | | –25 209 | | | –16 432 | | | 59 485 | | | –94 817 | |
| | | — | | | –595 | | | –445 | | | –377 | | | 922 | | | –9 237 | |
| | | –6 711 | | | –20 805 | | | –25 654 | | | –16 809 | | | 60 407 | | | –104 054 | |
| | | | | | | | | | | | | | | | | | — | |
| | | — | | | 463 | | | — | | | 100 | | | –185 | | | 3 142 | |
| | | | | | | | | | | | | | | | | | |
| | | | | | | | | | | | | | | | | | |
| | | | | | | | | | | | | | | | | –2 292 | |
| | | | | | | | | | | | | | | | | | — | |
| | | | | | | | | | | | | | | | | | 850 | |
| | | |
| | Detailed Financial Framework | F.61 |
TABLE F.32
| Detailed financial framework by sector |
| (millions of dollars) |
| | | 2018-2019 | |
| | | Consolidated Revenue Fund | |
| | | | | | | | | | | | | |
| | | | | | | | | | | | | |
| | | | | | | | | | | | Specified | |
| | | | | | | | | Generations | | | purpose | |
| | | General Fund | | | Special funds | | | Fund | | | accounts | |
| Revenue | | | | | | | | | | | | |
| Personal income tax | | 23 238 | | | 833 | | | — | | | — | |
| Contributions for health services | | 7 382 | | | — | | | — | | | — | |
| Corporate taxes | | 6 038 | | | 212 | | | — | | | — | |
| School property tax | | — | | | — | | | — | | | — | |
| Consumption taxes | | 19 578 | | | 2 534 | | | 500 | | | — | |
| Duties and permits | | 303 | | | 2 038 | | | 1 017 | | | — | |
| Miscellaneous revenue | | 1 352 | | | 2 354 | | | 514 | | | 188 | |
| Revenue from government enterprises | | 3 872 | | | — | | | 460 | | | — | |
| Own-source revenue | | 61 763 | | | 7 971 | | | 2 491 | | | 188 | |
| Québec government transfers | | — | | | 4 901 | | | — | | | — | |
| Federal transfers | | 21 044 | | | 568 | | | — | | | 1 360 | |
| Total revenue | | 82 807 | | | 13 440 | | | 2 491 | | | 1 548 | |
| Expenditure | | | | | | | | | | | | |
| Mission expenditures | | –76 869 | | | –12 066 | | | — | | | –1 548 | |
| Debt service | | –7 160 | | | –1 714 | | | — | | | — | |
| Total expenditure | | –84 029 | | | –13 780 | | | — | | | –1 548 | |
| Contingency reserve | | — | | | | | | | | | | |
| SURPLUS (DEFICIT) | | –1 222 | | | –340 | | | 2 491 | | | — | |
| BALANCED BUDGET ACT | | | | | | | | | | | | |
| Deposits of dedicated revenues in the Generations Fund | | | | | | | | –2 491 | | | | |
| Use of the stabilization reserve | | | | | | | | | | | | |
| BUDGETARY BALANCE(3) | | | | | | | | | | | | |
| (1) | Includes doubtful tax accounts. |
| (2) | Reclassification of abatements and consolidation adjustments resulting mainly from the elimination of reciprocal transactions between entities in different sectors. |
| (3) | Budgetary balance within the meaning of the Balanced Budget Act, after use of the stabilization reserve. |
| | Budget 2018-2019 | |
| F- 62 | Economic Plan | |
| 2018-2019 | |
| | | | | | | | | | | | | | | | | | | |
| | | | | | | | | Bodies in | | | | | | | | | | |
| | | | | | | | | the health | | | | | | | | | | |
| | | | | | Non-budget- | | | and social | | | Bodies in the | | | | | | | |
| | | Tax-funded | | | funded | | | services | | | education | | | Consolidation | | | Consolidated | |
| | | expenditures(1) | | | bodies | | | network | | | networks | | | adjustments(2 | ) | | results | |
| | | | | | | | | | | | | | | | | | |
| | | 4 938 | | | — | | | — | | | — | | | 1 540 | | | 30 549 | |
| | | — | | | — | | | — | | | — | | | –1 354 | | | 6 028 | |
| | | 1 778 | | | — | | | — | | | — | | | — | | | 8 028 | |
| | | — | | | — | | | — | | | 1 817 | | | — | | | 1 817 | |
| | | 254 | | | 28 | | | — | | | — | | | –1 973 | | | 20 921 | |
| | | — | | | 439 | | | — | | | — | | | — | | | 3 797 | |
| | | — | | | 5 866 | | | 2 511 | | | 1 808 | | | –4 142 | | | 10 451 | |
| | | | | | | | | | | | | | | | | | |
| | — | | | — | | | — | | | — | | | — | | | 4 332 | |
| | | 6 970 | | | 6 333 | | | 2 511 | | | 3 625 | | | –5 929 | | | 85 923 | |
| | — | | | 13 729 | | | 24 381 | | | 13 882 | | | –56 893 | | | — | |
| | | — | | | 1 118 | | | 151 | | | 155 | | | –722 | | | 23 674 | |
| | | 6 970 | | | 21 180 | | | 27 043 | | | 17 662 | | | –63 544 | | | 109 597 | |
| | | | | | | | | | | | | | | | | | |
| | | –6 970 | | | –20 494 | | | –26 545 | | | –17 248 | | | 62 427 | | | –99 313 | |
| | | — | | | –579 | | | –498 | | | –440 | | | 1 011 | | | –9 380 | |
| | | –6 970 | | | –21 073 | | | –27 043 | | | –17 688 | | | 63 438 | | | –108 693 | |
| | | | | | | | | | | | | | | | | | — | |
| | | — | | | 107 | | | — | | | –26 | | | –106 | | | 904 | |
| | | | | | | | | | | | | | | | | | |
| | | | | | | | | | | | | | | | | | |
| | | | | | | | | | | | | | | | | –2 491 | |
| | | | | | | | | | | | | | | | | | 1 587 | |
| | | | | | | | | | | | | | | | | | — | |
| | | |
| | Detailed Financial Framework | F.63 |
TABLE F.33
| Detailed financial framework by sector |
| (millions of dollars) |
| | | 2019-2020 | |
| | | Consolidated Revenue Fund | |
| | | | | | | | | | | | | |
| | | | | | | | | | | | | |
| | | | | | | | | | | | Specified | |
| | | | | | Special | | | Generations | | | purpose | |
| | | General Fund | | | Funds | | | Fund | | | accounts | |
| Revenue | | | | | | | | | | | | |
| Personal income tax | | 24 569 | | | 860 | | | — | | | — | |
| Contributions for health services | | 7 557 | | | — | | | — | | | — | |
| Corporate taxes | | 5 995 | | | 219 | | | — | | | — | |
| School property tax | | — | | | — | | | — | | | — | |
| Consumption taxes | | 20 132 | | | 2 540 | | | 500 | | | — | |
| Duties and permits | | 318 | | | 2 133 | | | 1 077 | | | — | |
| Miscellaneous revenue | | 1 352 | | | 2 573 | | | 615 | | | 171 | |
| Revenue from government | | | | | | | | | | | | |
| enterprises | | 3 955 | | | — | | | 515 | | | — | |
| Own-source revenue | | 63 878 | | | 8 325 | | | 2 707 | | | 171 | |
| Québec government transfers | | — | | | 5 064 | | | — | | | — | |
| Federal transfers | | 22 816 | | | 556 | | | — | | | 768 | |
| Total revenue | | 86 694 | | | 13 945 | | | 2 707 | | | 939 | |
| Expenditure | | | | | | | | | | | | |
| Mission expenditures | | –79 682 | | | –12 487 | | | — | | | –939 | |
| Debt service | | –7 023 | | | –1 857 | | | — | | | — | |
| Total expenditure | | –86 705 | | | –14 344 | | | — | | | –939 | |
| Contingency reserve | | –100 | | | | | | | | | | |
| SURPLUS (DEFICIT) | | –111 | | | –399 | | | 2 707 | | | — | |
| BALANCED BUDGET ACT | | | | | | | | | | | | |
| Deposits of dedicated revenues in | | | | | | | | | | | | |
| the Generations Fund | | | | | | | | –2 707 | | | | |
| Use of the stabilization reserve | | | | | | | | | | | | |
| BUDGETARY BALANCE(3) | | | | | | | | | | | | |
| (1) | Includes doubtful tax accounts. |
| (2) | Reclassification of abatements and consolidation adjustments resulting mainly from the elimination of reciprocal transactions between entities in different sectors. |
| (3) | Budgetary balance within the meaning of the Balanced Budget Act, after use of the stabilization reserve. |
| | Budget 2018-2019 | |
| F- 64 | Economic Plan | |
| 2019-2020 | |
| | | | | | | | | | | | | | | | | | | |
| | | | | | | | | Bodies in | | | | | | | | | | |
| | | | | | | | | the health | | | | | | | | | | |
| | | | | | Non-budget- | | | and social | | | Bodies in the | | | | | | | |
| | | Tax-funded | | | funded | | | services | | | education | | | Consolidation | | | Consolidated | |
| | | expenditures(1) | | | bodies | | | network | | | networks | | | adjustments(2) | | | results | |
| | | | | | | | | | | | | | | | | | |
| | | 4 973 | | | — | | | — | | | — | | | 1 572 | | | 31 974 | |
| | | — | | | — | | | — | | | — | | | –1 389 | | | 6 168 | |
| | | 1 846 | | | — | | | — | | | — | | | — | | | 8 060 | |
| | | — | | | — | | | — | | | 1 706 | | | — | | | 1 706 | |
| | | 262 | | | 28 | | | — | | | — | | | –2 044 | | | 21 418 | |
| | | — | | | 451 | | | — | | | — | | | — | | | 3 979 | |
| | | — | | | 5 962 | | | 2 582 | | | 1 861 | | | –4 296 | | | 10 820 | |
| | | | | | | | | | | | | | | | | | |
| | — | | | — | | | — | | | — | | | — | | | 4 470 | |
| | | 7 081 | | | 6 441 | | | 2 582 | | | 3 567 | | | –6 157 | | | 88 595 | |
| | — | | | 14 466 | | | 25 353 | | | 14 820 | | | –59 703 | | | — | |
| | | — | | | 943 | | | 151 | | | 155 | | | –625 | | | 24 764 | |
| | | 7 081 | | | 21 850 | | | 28 086 | | | 18 542 | | | –66 485 | | | 113 359 | |
| | | | | | | | | | | | | | | | | | |
| | | –7 081 | | | –21 164 | | | –27 499 | | | –18 057 | | | 64 843 | | | –102 066 | |
| | | — | | | –609 | | | –587 | | | –493 | | | 1 147 | | | –9 422 | |
| | | –7 081 | | | –21 773 | | | –28 086 | | | –18 550 | | | 65 990 | | | –111 488 | |
| | | | | | | | | | | | | | | | | | –100 | |
| | | — | | | 77 | | | — | | | –8 | | | –495 | | | 1 771 | |
| | | | | | | | | | | | | | | | | | |
| | | | | | | | | | | | | | | | | | |
| | | | | | | | | | | | | | | | | –2 707 | |
| | | | | | | | | | | | | | | | | | 936 | |
| | | | | | | | | | | | | | | | | | — | |
| | | |
| | Detailed Financial Framework | F.65 |
| APPENDIX 3: | LIST OF ENTITIES INCLUDED IN THE |
| | FINANCIAL FRAMEWORK |
| | | |
| | Detailed Financial Framework | F.67 |
TABLE F.34
| List of entities included in the financial framework |
| Affaires municipales et Occupation du | | | Culture et Communications | |
| territoire | | | Ministère de la Culture et | |
| Ministère des Affaires municipales et de | | | des Communications | Dept |
| l’Occupation du territoire | Dept | | Commission de toponymie | BFB |
| Commission municipale du Québec | BFB | | Conseil du patrimoine culturel du Québec | BFB |
| Office de la protection du consommateur | BFB | | Conseil supérieur de la langue française | BFB |
| Régie du logement | BFB | | Office québécois de la langue française | BFB |
| Territories Development fund | SF | | Avenir Mécénat Culture Fund | SF |
| Régie du bâtiment du Québec | NBFB | | Québec Cultural Heritage Fund | SF |
| Société d’habitation du Québec | NBFB | | Bibliothèque et Archives nationales | |
| | | | du Québec | NBFB |
| Agriculture, Pêcheries et Alimentation | | | Conseil des arts et des lettres du Québec | NBFB |
| Ministère de l’Agriculture, des Pêcheries et | | | Conservatoire de musique et d’art | |
| de l’Alimentation | Dept | | dramatique du Québec | NBFB |
| Commission de protection du territoire | | | Musée d’Art contemporain de Montréal | NBFB |
| agricole du Québec | BFB | | Musée de la Civilisation | NBFB |
| Régie des marchés agricoles et | | | Musée national des beaux-arts du Québec | NBFB |
| alimentaires du Québec | BFB | | | |
| | | | Société de développement des entreprises | |
| La Financière agricole du Québec | NBFB | | culturelles | NBFB |
| | | | Société de la Place des Arts de Montréal | NBFB |
| National Assembly | | | Société de télédiffusion du Québec | NBFB |
| National Assembly | Other | | Société du Grand Théâtre de Québec | NBFB |
| | | | | |
| Conseil du trésor et Administration | | | Développement durable, Environnement | |
| gouvernementale | | | et Lutte contre les changements | |
| Secrétariat du Conseil du trésor | Dept | | climatiques | |
| Commission de la fonction publique | BFB | | Ministère du Développement durable, de | |
| Autorité des marchés publics | NBFB | | l’Environnement et de la Lutte contre | |
| | | | les changements climatiques | Dept |
| Centre de services partagés du Québec | NBFB | | Bureau d’audiences publiques sur | |
| Société québécoise des infrastructures | NBFB | | l’environnement | BFB |
| | | | Green Fund | SF |
| Conseil exécutif | | | Fund for the Protection of the Environment | |
| Ministère du Conseil exécutif | Dept | | and the Waters in the Domain of the State | SF |
| Commission d’accès à l’information | BFB | | Conseil de gestion du Fonds vert | NBFB |
| Centre de la francophonie des Amériques | NBFB | | Société québécoise de récupération et | |
| | | | de recyclage | NBFB |
Legend: | Dept: department; BFB: budget-funded body; SF: special fund; NBFB: non-budget-funded body; HSSE: bodies in the health and social services and education networks. |
| | Budget 2018-2019 | |
| F- 68 | Economic Plan | |
TABLE F.34 (cont.)
| List of entities included in the financial framework (cont.) |
| Économie, Science et Innovation | | | Énergie et Ressources naturelles | |
| Ministère de l’Économie, de la Science et | | | Ministère de l’Énergie et des Ressources | |
| de l’Innovation | Dept | | naturelles | Dept |
| Commission de l’éthique en science et | | | Territorial Information Fund | SF |
| en technologie | BFB | | Energy Transition Fund | SF |
| Mining and Hydrocarbon Capital Fund | SF | | Natural Resources Fund | SF |
| Economic Development Fund | SF | | Régie de l’énergie | NBFB |
| Fonds de recherche du Québec – Nature | | | Société de développement de la | |
| et technologies | NBFB | | Baie-James | NBFB |
| Fonds de recherche du Québec – Santé | NBFB | | Société du Plan Nord | NBFB |
| Fonds de recherche du Québec – Société | | | Transition énergétique Québec | NBFB |
| et culture | NBFB | | | |
| Centre de recherche industrielle du Québec | NBFB | | | |
| Société du parc industriel et portuaire de | | | Famille | |
| Bécancour | NBFB | | Ministère de la Famille | Dept |
| | | | Curateur public | BFB |
| Éducation et Enseignement supérieur | | | Caregiver Support Fund | SF |
| Ministère de l’Éducation et de | | | Educational Childcare Services Fund | SF |
| l’Enseignement supérieur | Dept | | Early Childhood Development Fund | SF |
| Comité consultatif sur l’accessibilité | | | | |
| financière aux études | BFB | | | |
| | | | Finances | |
| Commission consultative de l’enseignement | | | | |
| privé | BFB | | Ministère des Finances | Dept |
| Commission d’évaluation de l’enseignement | | | Financing Fund | SF |
| collégial | BFB | | Generations Fund | SF |
| Conseil du statut de la femme | BFB | | IFC Montréal Fund | SF |
| Conseil supérieur de l’éducation | BFB | | Fonds du Plan Nord | SF |
| Capitale-Nationale Region Fund | SF | | Fund of the Financial Markets | |
| University Excellence and Performance | | | Administrative Tribunal | SF |
| Fund | SF | | Tax Administration Fund | SF |
| Sports and Physical Activity Development | | | Agence du revenu du Québec | NBFB |
| Fund | SF | | Autorité des marchés financiers | NBFB |
| Commission de la capitale nationale | | | | |
| du Québec | NBFB | | Financement-Québec | NBFB |
| Institut de tourisme et d’hôtellerie du | | | Institut de la statistique du Québec | NBFB |
| Québec | NBFB | | Société de financement des infrastructures | |
| Institut national des mines | NBFB | | locales du Québec | NBFB |
| | | | Government enterprises(1) | Other |
| Collèges d’enseignement général et | | | | |
| professionnel | HSSE | | | |
| Commissions scolaires | HSSE | | | |
| Université du Québec et ses constituantes | HSSE | | | |
| (1) | At the financial level, the net results of government enterprises are credited to the Finances portfolio. However, the administration of a government enterprise may come under another portfolio. |
| | | |
| | Detailed Financial Framework | F.69 |
TABLE F.34 (cont.)
| List of entities included in the financial framework (cont.) |
| Forêts, Faune et Parcs | | | Persons appointed by the National | |
| Ministère des Forêts, de la Faune et | | | Assembly | |
| des Parcs | Dept | | Ethics Commissioner | BFB |
| Natural Resources Fund — Sustainable | | | Lobbyists Commissioner | BFB |
| Forest Development Component | SF | | Chief Electoral Officer | BFB |
| Fondation de la faune du Québec | NBFB | | Québec Ombudsman | BFB |
| Société des établissements de plein air | | | Auditor General | BFB |
| du Québec | NBFB | | | |
| | | | | |
| | | | Relations internationales et | |
| Immigration, Diversité et Inclusion | | | Francophonie | |
| Ministère de l’Immigration, de la Diversité et | | | Ministère des Relations internationales et | |
| de l’Inclusion | Dept | | de la Francophonie | Dept |
| | | | Office Québec-Monde pour la jeunesse | NBFB |
| Justice | | | | |
| Ministère de la Justice | Dept | | Santé et Services sociaux | |
| Committee on the Remuneration of Judges | BFB | | Ministère de la Santé et des Services | |
| Committee on the Remuneration of | | | sociaux | Dept |
| Criminal and Penal Prosecuting Attorneys | BFB | | Commissaire à la santé et au bien-être | BFB |
| Commission des droits de la personne et | | | Office des personnes handicapées du | |
| des droits de la jeunesse | BFB | | Québec | BFB |
| Conseil de la justice administrative | BFB | | Health and Social Services Information | |
| Conseil de la magistrature | BFB | | Resources Fund | SF |
| Directeur des poursuites criminelles et | | | Corporation d’urgences-santé | NBFB |
| pénales | BFB | | Fonds de l’assurance médicaments | NBFB |
| Human Rights Tribunal | BFB | | Héma-Québec | NBFB |
| Access to Justice Fund | SF | | Institut national d’excellence en santé et | |
| Crime Victims Assistance Fund | SF | | en services sociaux | NBFB |
| Register Fund of the Ministère de la Justice | SF | | Institut national de santé publique du | |
| Fund of the Administrative Tribunal of | | | Québec | NBFB |
| Québec | SF | | Régie de l’assurance maladie du Québec | NBFB |
| Public Contracts Fund | SF | | Integrated health and social services | |
| Commission des services juridiques | NBFB | | centres, other public institutions and | |
| | | | regional authorities | HSSE |
| Fonds d’aide aux actions collectives | NBFB | | | |
| Office des professions du Québec | NBFB | | | |
| Société québécoise d’information juridique | NBFB | | | |
| | Budget 2018-2019 | |
| F- 70 | Economic Plan | |
TABLE F.34 (cont.)
| List of entities included in the financial framework (cont.) |
| Sécurité publique | | | Travail, Emploi et Solidarité sociale | |
| Ministère de la Sécurité publique | Dept | | Ministère du Travail, de l’Emploi et | |
| Bureau des enquêtes indépendantes | BFB | | de la Solidarité sociale | Dept |
| Bureau du coroner | BFB | | Commission des partenaires du marché | |
| | | | du travail | BFB |
| Comité de déontologie policière | BFB | | Assistance Fund for Independent | |
| Commissaire à la déontologie policière | BFB | | Community Action | SF |
| Commissaire à la lutte contre la corruption | BFB | | Labour Market Development Fund | SF |
| Commission québécoise des libérations | | | Goods and Services Fund | SF |
| conditionnelles | BFB | | Information Technology Fund of the | |
| Régie des alcools, des courses et des jeux | BFB | | Ministère de l’Emploi et de la Solidarité | |
| Police Services Fund | SF | | sociale | SF |
| École nationale de police du Québec | NBFB | | Administrative Labour Tribunal Fund | SF |
| École nationale des pompiers du Québec | NBFB | | Québec Social Initiatives Fund | SF |
| | | | Office de la sécurité du revenu | |
| | | | des chasseurs et piégeurs cris | NBFB |
| Tourisme | | | | |
| Ministère du Tourisme | Dept | | | |
| Tourism Partnership Fund | SF | | | |
| Régie des installations olympiques | NBFB | | | |
| Société du Centre des congrès de Québec | NBFB | | | |
| Société du Palais des congrès de Montréal | NBFB | | | |
| | | | | |
| Transports, Mobilité durable et | | | | |
| Électrification des transports | | | | |
| Ministère des Transports, de la Mobilité | | | | |
| durable et de l’Électrification des transports | Dept | | | |
| Commission des transports du Québec | BFB | | | |
| Government Air Services Fund | SF | | | |
| Rolling Stock Management Fund | SF | | | |
| Highway Safety Fund | SF | | | |
| Land Transportation Network Fund | SF | | | |
| Société de l’assurance automobile | | | | |
| du Québec | NBFB | | | |
| Société des Traversiers du Québec | NBFB | | | |
| | | |
| | Detailed Financial Framework | F.71 |