Exhibit 99.19
Section G
THE QUÉBEC GOVERNMENT’S DEBT
G.1
G.2

| 1. | REDUCTION OF THE DEBT |
| | |
| 1.1 | Québec is on track to achieve its debt reduction objectives |
The government has set debt reduction objectives that have been included in the
Act to reduce the debt and establish the Generations Fund.
— | For fiscal 2025-2026, the gross debt must not exceed 45% of GDP, while the debt representing accumulated deficits must not exceed 17% of GDP. |
Note that there was a very broad consensus around the adoption of this Act in 2006.
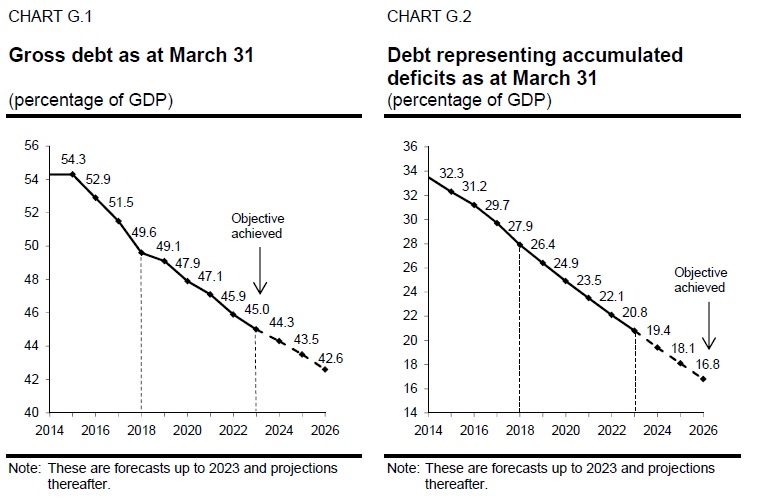
The gross debt burden has decreased for the third year in a row. As at March 31, 2018, the gross debt will stand at $204.5 billion. As a proportion of the economy, this is equivalent to 49.6% of GDP.
The ratio will stand at 45.0% as at March 31, 2023; the gross debt reduction objective stipulated in the Act will thus have been achieved.
As at March 31, 2018, the debt representing accumulated deficits will amount to $115.1 billion, or 27.9% of GDP. The objective of reducing the debt representing accumulated deficits will be achieved in 2025-2026, as stipulated in the Act.
| | The Québec | |
| | Government’s Debt | G.3 |
Québec is on track to achieve its debt reduction objectives thanks to:
— | the return to a balanced budget in 2015-2016 and continued fiscal balance thereafter; |
| | |
| — | economic growth, which is helping to ease the debt burden; |
| | |
| — | deposits to the Generations Fund since 2006-2007. |
| | Budget 2018-2019 | |
| G.4 | Economic Plan | |
1.2 A strategy with good results
The debt reduction strategy pursued by the government since 2006 is getting good results.
| — | In 2006, only a few months after the announcement of the creation of the Generations Fund, two credit rating agencies, Moody’s and DBRS, upgraded Québec’s credit rating, specifically mentioning the government’s commitment to reduce its debt. |
| | |
| — | In 2015-2016, thanks to the return to budget balance, the gross-debt-to-GDP ratio fell for the first time since 2008-2009. For that fiscal year, the gross debt even declined in absolute terms, a first since the late 1950s. |
| | |
| — | Québec is no longer the most indebted province in Canada. |
| | |
| — | In 2017, Standard & Poor’s improved Québec’s credit rating owing, in particular, to the government’s debt control. |
| | |
| — | The objective of reducing the gross debt to 45% of GDP will be achieved in 2022-2023. |
| | |
| — | The objective of reducing the debt representing accumulated deficits to 17% of GDP will be achieved in 2025-2026, as stipulated in the Act. |
[ ] Continued control of the debt
Once the debt reduction objectives have been achieved, the government intends to take steps to ensure that the gross debt burden remains below 45% of GDP and the debt representing accumulated deficits below 17% of GDP.
To that end, the government will continue managing public finances in a responsible manner by continuing to deposit the projected amounts in the Generations Fund.
Gradual reduction of the gross debt burden beyond 2025-2026 will enable Québec to address:
| — | the demographic change, which is slowing growth of the labour pool; |
| | |
| — | the need to maintain a high level of investment spending on infrastructure; |
| | |
| — | a possible economic slowdown resulting from the global economic situation. |
Moreover, reducing the debt burden will continue to contribute to economic growth by creating a climate of confidence that is conducive to investment and growth in productivity.
| | The Québec | |
| | Government’s Debt | G-5 |
| Reduction of the debt: a strategy recognized by credit rating agencies |
| |
The fact that the government is continuing to implement its debt reduction strategy is important to credit rating agencies. |
|
For example, in June 2017, Fitch credit rating agency noted that the stable outlook assigned to Québec’s credit rating was based on the assumption that the debt burden would be reduced in the coming years: |
|
The Stable Outlook at the current rating level assumes the Province retains its focus on lowering the burden of debt. The resumption of
significant borrowing to support operating deficits would result in a downgrade.1 |
|
Moody’s credit rating agency, for its part, noted that the stable outlook assigned to Québec’s credit rating was based on the assumption that Québec would maintain a balanced budget over the medium term, making it possible to gradually reduce the debt burden: |
|
The rating outlook is stable reflecting the assumption that the province will succeed in recording balanced budgets across the medium term,
allowing for a gradual decrease in the debt burden.2 |
|
The Generations Fund: a key component of the strategy |
|
Credit rating agencies and investors welcome the Generations Fund, which represents a concrete commitment on the part of the government to reduce the debt. |
|
When the Generations Fund was created in 2006, DBRS noted that this initiative demonstrated the province’s determination to contain the growth of the debt. |
|
Standard & Poor’s, for its part, noted that Québec’s credit rating was supported, in particular, by the province’s intention to reduce its debt burden through deposits to the Generations Fund. |
|
By making a positive contribution to Québec’s credit quality, the Generations Fund ensures that Québec maintains access to a large pool of investors on financial markets in Canada and abroad. |
|
Note that Québec’s debt on financial markets will stand at $195.6 billion as at March 31, 2018. |
|
| 1 | Fitch, press release, June 13, 2017. |
| 2 | Moody’s, Credit Opinion, June 21, 2017. |
| | Budget 2018-2019 | |
| G.6 | Economic Plan | |
1.3 $10-billion repayment of the debt over the next five years
The Generations Fund will stand at $12.8 billion as at March 31, 2018. In accordance with the Act, the sums accumulated in the fund may be used solely to repay the debt.
The March 2018 Québec Economic Plan is providing for the use of a sum of $10 billion from the Generations Fund, at the rate of $2 billion a year from 2018-2019 to 2022-2023, to repay maturing borrowings on financial markets.
The Generations Fund will continue to receive revenues dedicated to debt reduction every year, but a portion of this asset will be used to repay maturing borrowings, as provided for in the Act.
Indeed, the Act to reduce the debt and establish the Generations Fund already stipulates that the Minister of Finance may take any sum from the Generations Fund to repay the debt. Therefore, such action by the government does not require a legislative amendment. What is new is that a schedule has been established for using the Generations Fund.
This $10-billion repayment of the debt over the next five years will reduce interest charges on the debt. Starting in 2018-2019, all Quebecers will thus be able to reap the benefits of these debt reduction efforts.
TABLE G.1
| Use of the Generations Fund to repay the debt |
| (millions of dollars) |
| | | 2017- | | | 2018- | | | 2019- | | | 2020- | | | 2021- | | | 2022- | | | | |
| | | 2018- | | | 2019- | | | 2020- | | | 2021- | | | 2022- | | | 2023- | | | Total | |
| | | | | | | | | | | | | | | | | | | | | | |
| Book value, beginning of year | | 10 523 | | | 12 815 | | | 13 306 | | | 14 013 | | | 15 004 | | | 16 269 | | | | |
| | | | | | | | | | | | | | | | | | | | | | |
| Revenues dedicated to the Generations Fund | | 2 292 | | | 2 491 | | | 2 707 | | | 2 991 | | | 3 265 | | | 3 502 | | | | |
| | | | | | | | | | | | | | | | | | | | | | |
| Use of the Generations Fund to repay maturing borrowings | | — | | | −2 000 | | | −2 000 | | | −2 000 | | | −2 000 | | | −2 000 | | | −10 000 | |
| | | | | | | | | | | | | | | | | | | | | | |
| BOOK VALUE, END OF YEAR | | 12 815 | | | 13 306 | | | 14 013 | | | 15 004 | | | 16 269 | | | 17 771 | | | | |
Since its creation in 2006, the sums deposited to the Generations Fund have been managed by the Caisse de dépôt et placement du Québec. Using the Generations Fund to repay the debt will also make it possible to realize part of the investment income and thereby profit from the good returns recorded in recent years.
| | The Québec | |
| | Government’s Debt | G.7 |
The Generations Fund will continue to grow gradually over the coming years, even after the allocation of a portion of it to debt repayment.
| — | As at March 31, 2023, the Generations Fund will amount to $17.8 billion. |
[ ] A balanced approach
The government’s approach is balanced. Sums earmarked for the Generations Fund will continue to be deposited in it and a portion of this asset, that is, $2 billion a year as of 2018-2019, will be used to pay the debt and thus free up interest savings that will serve to fund public services.
Using a larger portion of the Generations Fund to pay the debt could jeopardize the achievement of the debt reduction objectives. This is because the Generations Fund generates investment income that accelerates debt reduction. Using a larger portion of the Generations Fund would have a downward effect on that income and would thus slow reduction of the debt burden.
Using $2 billion a year from the Generations Fund to pay the debt will both ensure that the debt reduction objectives are achieved by 2025-2026 and reduce government spending on interest on the debt for the benefit of Quebecers as a whole.
| | Budget 2018-2019 | |
| G.8 | Economic Plan | |
| Reduction of the debt on financial markets |
| |
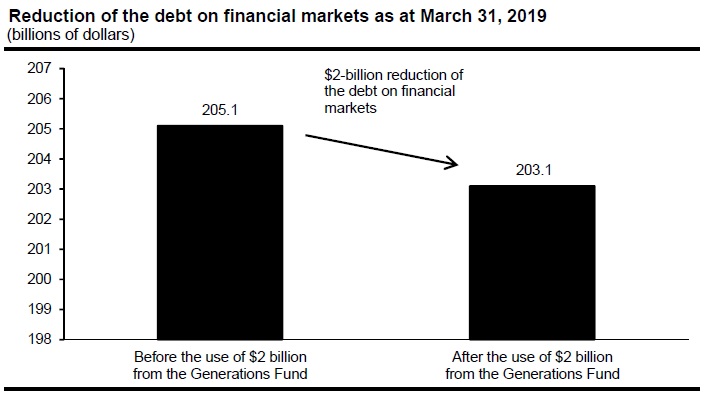
| Using the Generations Fund to pay the debt will reduce by an equivalent amount the consolidated direct debt, that is, the debt issued on financial markets. |
| |
| For example, as at March 31, 2019, the government’s debt on financial markets will decrease from $205.1 billion to $203.1 billion after the repayment of $2 billion from the Generations Fund. |
| |
 |
| |
However, this will have no impact on the gross debt, since the Generations Fund is subtracted from that debt. |
| |
| Gross debt as at March 31, 2019 |
| (millions of dollars) |
| | | Before the use of | | | | | | After the use of | |
| | | $2 billion from the | | | | | | $2 billion from the | |
| | | Generations Fund to | | | | | | Generations Fund | |
| | | repay the debt | | | Debt repayment | | | to repay the debt | |
| | | | | | | | | | |
| Consolidated direct debt | | 205 058 | | | −2 000 | | | 203 058 | |
| | | | | | | | | | |
| Plus: Retirement plans and other employee future benefits | | 19 666 | | | — | | | 19 666 | |
| | | | | | | | | | |
| Less: Generations Fund | | −15 306 | | | 2 000 | | | −13 306 | |
| | | | | | | | | | |
| GROSS DEBT | | 209 418 | | | — | | | 209 418 | |
| | | | | | | | | | |
| % of GDP | | 49.1 | | | — | | | 49.1 | |
| | | | | | | | | | |
| | The Québec | |
| | Government’s Debt | G.9 |
| Reduction of the debt on financial markets (cont.) |
| |
A $2-billion reduction in borrowings to be refinanced in 2018-2019 |
|
The government refinances maturing borrowings every year. In concrete terms, using the Generations Fund to pay the debt will reduce such refinancing. |
|
For example, in 2018-2019, repayments of government borrowings will total $16.6 billion. The use of a sum of $2 billion from the Generations Fund will reduce the refinancing of maturing borrowings from $16.6 billion to $14.6 billion and, at the same time, reduce the government’s debt on financial markets. |
| | Budget 2018-2019 | |
| G.10 | Economic Plan | |
1.3.1 Savings of $1.1 billion in interest on the debt over five years
Using the Generations Fund to pay the debt will lead to savings of nearly $1.1 billion in debt service over five years.
Government expenditure consists of mission expenditures and debt service. For the same level of spending, a reduction in debt service means an increase in the sums that can be allocated to the government’s missions, such as Health and Social Services or Education and Culture.
Quebecers will thus reap the benefits of the debt reduction efforts starting in 2018-2019.
In 2022-2023, nearly $400 million more per year will be allocated to the funding of public services.
TABLE G.2
| Interest savings on the debt resulting from repayment of the debt |
| (millions of dollars) |
| | | 2018- | | | 2019- | | | 2020- | | | 2021- | | | 2022- | | | | |
| | | 2019 | | | 2020 | | | 2021 | | | 2022 | | | 2023 | | | Total | |
| | | | | | | | | | | | | | | | | | | |
| Interest savings on the debt | | 61 | | | 130 | | | 209 | | | 295 | | | 383 | | | 1 078 | |
| | The Québec | |
| | Government’s Debt | G.11 |
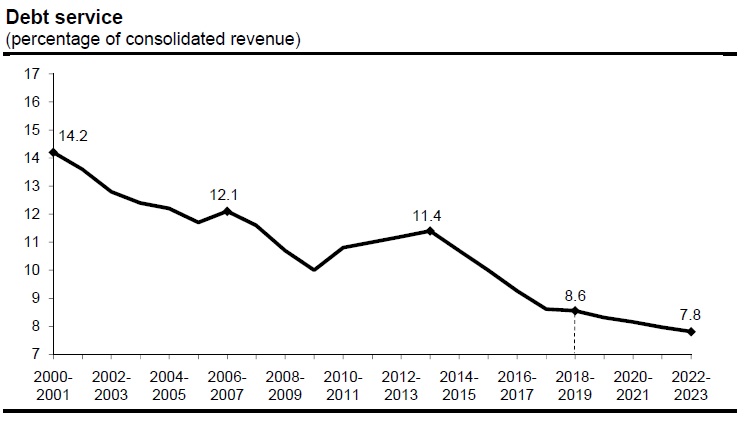
1.3.2 A sharp decline in the proportion of revenue devoted to debt service
A large proportion of the government’s revenue is devoted to paying interest on the debt. However, this proportion is declining.
In 2018-2019, the proportion of revenue devoted to debt service will stand at 8.6%, down sharply from the early 2000s. It will decrease in the coming years owing, in particular, to the use of the Generations Fund to pay the debt.
In addition, sound management of public finances led to an improvement in Québec’s credit rating in June 2017, enabling the government to continue benefiting from advantageous borrowing costs on financial markets.
CHART G.3
| | Budget 2018-2019 | |
| G.12 | Economic Plan | |
1.4 Generations Fund
Deposits to the Generations Fund will amount to $2.5 billion in 2018-2019.
The balance of the Generations Fund will remain high over the next five years, from 2018-2019 to 2022-2023, even after the use of $2 billion a year to repay maturing borrowings.
The sums accumulated in the Generations Fund will reach $17.8 billion as at March 31, 2023.
These sums will come primarily from:
| — | water-power royalties paid by Hydro-Québec and private producers of hydro-electricity; |
| | |
| — | revenue generated by the indexation of the price of heritage electricity; |
| | |
| — | mining revenues; |
| | |
| — | an amount derived from the specific tax on alcoholic beverages; |
| | — | In 2013, the government chose to offset the impact on the debt of the additional deficits caused by the decision to postpone for two years the return to a balanced budget, which was forecast for 2013-2014, by increasing deposits to the Generations Fund drawn from the specific tax on alcoholic beverages as of 2016-2017. |
— | investment income that accumulates in the Generations Fund and thus accelerates debt reduction. |
| | The Québec | |
| | Government’s Debt | G.13 |
TABLE G.3
| Generations Fund |
| (millions of dollars) |
| | | 2017- | | | 2018- | | | 2019- | | | 2020- | | | 2021- | | | 2022- | |
| | | 2018 | | | 2019 | | | 2020 | | | 2021 | | | 2022 | | | 2023 | |
| Book value, beginning of year | | 10 523 | | | 12 815 | | | 13 306 | | | 14 013 | | | 15 004 | | | 16 269 | |
| Dedicated revenues | | | | | | | | | | | | | | | | | | |
| Water-power royalties | | | | | | | | | | | | | | | | | | |
| Hydro-Québec | | 700 | | | 687 | | | 703 | | | 727 | | | 734 | | | 761 | |
| Private producers | | 102 | | | 100 | | | 102 | | | 104 | | | 106 | | | 108 | |
| Subtotal | | 802 | | | 787 | | | 805 | | | 831 | | | 840 | | | 869 | |
| Indexation of the price of heritage electricity | | 218 | | | 245 | | | 300 | | | 385 | | | 470 | | | 565 | |
| Additional contribution from Hydro-Québec | | 215 | | | 215 | | | 215 | | | 215 | | | 215 | | | 215 | |
| Mining revenues | | 133 | | | 230 | | | 272 | | | 324 | | | 356 | | | 388 | |
| Specific tax on alcoholic beverages | | 500 | | | 500 | | | 500 | | | 500 | | | 500 | | | 500 | |
| Unclaimed property | | 6 | | | 15 | | | 15 | | | 15 | | | 15 | | | 15 | |
| Investment income(1) | | 418 | | | 499 | | | 600 | | | 721 | | | 869 | | | 950 | |
| Total dedicated revenues | | 2 292 | | | 2 491 | | | 2 707 | | | 2 991 | | | 3 265 | | | 3 502 | |
| Use of the Generations Fund to repay | | | | | | | | | | | | | | | | | | |
| maturing borrowings | | — | | | −2 000 | | | −2 000 | | | −2 000 | | | −2 000 | | | −2 000 | |
| BOOK VALUE, END OF YEAR | | 12 815 | | | 13 306 | | | 14 013 | | | 15 004 | | | 16 269 | | | 17 771 | |
| (1) | The investment income of the Generations Fund corresponds to realized investment income (interest income, dividends, gains on the disposal of assets, etc.). Therefore, the forecast may be adjusted upward or downward according to the timing of realized gains or losses. |
| | Budget 2018-2019 | |
| G.14 | Economic Plan | |
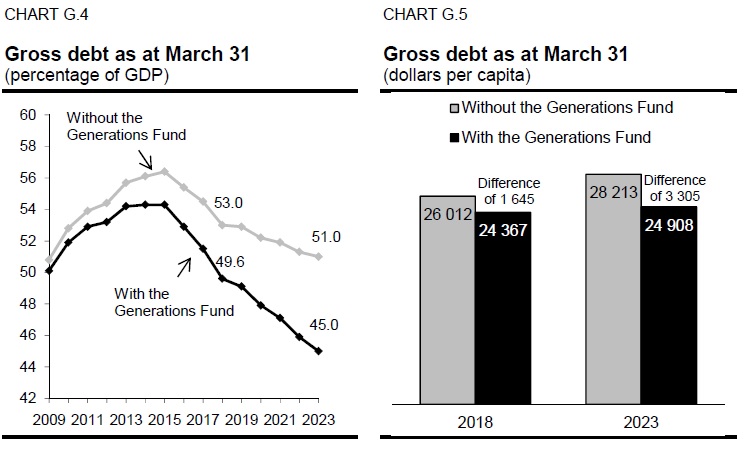
[ ] The importance of the Generations Fund
The Generations Fund is the most powerful instrument of intergenerational equity ever adopted by a Québec government.
Without the deposits made in the Generations Fund, the ratio of gross debt to GDP would be much higher. As at March 31, 2023, the gross debt burden will stand at 45.0% of GDP. Without the Generations Fund, the forecast would be 51.0% of GDP, or 6.0 percentage points higher.
This difference means that if the government had not created the Generations Fund in 2006, the gross debt forecast as at March 31, 2023 would be $28.8 billion higher.1
This represents $3 305 on a per capita basis. As at March 31, 2023, the gross debt per capita will stand at $24 908. Without the Generations Fund, it would be $28 213 per capita.
______________________________________
| 1 | The $28.8 billion-difference is $11 billion higher than the balance of the Generations Fund as at March 31, 2023 ($17.8 billion) owing to the use of $11 billion from the Generations Fund to repay maturing borrowings ($1 billion in 2013-2014 and $10 billion from 2018-2019 to 2022-2023). |
| | | |
| | The Québec | |
| | Government’s Debt | G.15 |
[ ] Investment income of the Generations Fund
The government’s debt reduction strategy, which has been pursued since 2006, is to dedicate revenues to the Generations Fund every year and to entrust the management of these sums to the Caisse de dépôt et placement du Québec in order to obtain returns exceeding the government’s borrowing costs.
Since the first deposit was made to the Generations Fund in January 2007, the return has been higher than the cost of new borrowings by the government 10 years out of 11.
| — | From 2007 to 2017, the average return was 5.6%, while the average cost of new borrowings was 3.5%, which represents a difference of 2.1 percentage points. |
| | |
| — | Over the past nine years, from 2009 to 2017, so as to exclude the global financial crisis of 2008, the average return was 9.3%, while the average cost of new borrowings was 3.2% for this period, which represents a difference of 6.1 percentage points. |
| TABLE G.4 |
| |
| Comparison of the Generations Fund’s annual return and the Québec government’s borrowing costs |
| (per cent, on a calendar year basis) |
| | | Return of the | | | Cost of new | | | Difference | |
| | | Generations Fund | | | borrowings(1 | ) | | (percentage points) | |
| 2007 | | 5.6 | | | 4.7 | | | 0.9 | |
| 2008 | | −22.4 | | | 4.5 | | | −26.9 | |
| 2009 | | 11.3 | | | 4.4 | | | 6.9 | |
| 2010 | | 12.3 | | | 4.1 | | | 8.2 | |
| 2011 | | 4.0 | | | 3.7 | | | 0.3 | |
| 2012 | | 8.4 | | | 3.0 | | | 5.4 | |
| 2013 | | 12.0 | | | 3.3 | | | 8.7 | |
| 2014 | | 11.7 | | | 3.2 | | | 8.5 | |
| 2015 | | 8.1 | | | 2.4 | | | 5.7 | |
| 2016 | | 7.3 | | | 2.2 | | | 5.1 | |
| 2017 | | 8.5 | | | 2.5 | | | 6.0 | |
(1) The government’s borrowing costs correspond to the yield on 10-year maturity Québec bonds. Source: PC-Bond for the yield on 10-year maturity Québec bonds.
| | Budget 2018-2019 | |
| G.16 | Economic Plan | |
In the coming years, the Generations Fund will continue to generate investment income, creating leverage for repayment of the debt.
— | In 2021-2022, investment income will amount to $869 million, or 26.6% of the revenues dedicated to the Generations Fund. It will then be the main source of revenues dedicated to the Generations Fund. |
CHART G.6
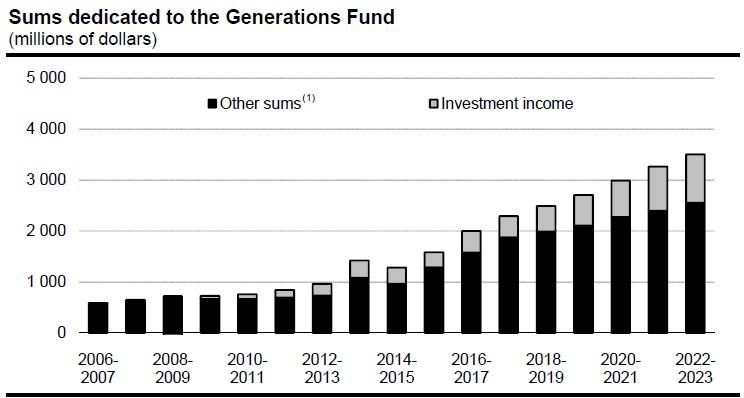
| (1) | These sums include revenues dedicated to the Generations Fund (excluding investment income) and certain one-time deposits, such as the $131-million deposit made in 2015-2016 from the accumulated surplus of the Commission des normes du travail. |
| | The Québec | |
| | Government’s Debt | G.17 |
| Book value and market value of the Generations Fund |
| |
The following table shows the book and market values of the Generations Fund since its creation. The book value is used to calculate the gross debt. |
| |
As at March 31, 2017, the market value of the Generations Fund was $1.7 billion higher than its book value. |
| |
| Book value and market value of the Generations Fund as at March 31 | | | | | | | | | |
| (millions of dollars) | | | | | | | | | |
| | | Book value | | | Market value | | | Difference | |
| 2007 | | 584 | | | 576 | | | 8 | |
| 2008 | | 1 233 | | | 1 147 | | | 86 | |
| 2009 | | 1 952 | | | 1 598 | | | 354 | |
| 2010 | | 2 677 | | | 2 556 | | | 121 | |
| 2011 | | 3 437 | | | 3 524 | | | −87 | |
| 2012 | | 4 277 | | | 4 375 | | | −98 | |
| 2013 | | 5 238 | | | 5 550 | | | −312 | |
| 2014 | | 5 659 | | | 6 299 | | | −640 | |
| 2015 | | 6 938 | | | 8 182 | | | −1 244 | |
| 2016 | | 8 522 | | | 9 562 | | | −1 040 | |
| 2017 | | 10 523 | | | 12 243 | | | −1 720 | |
| | | | | | | | | | |
| | Budget 2018-2019 | |
| G.18 | Economic Plan | |
1.5 Gross debt
The gross debt represents the amount of debt issued on financial markets plus the net liability for the retirement plans and other future benefits of public and parapublic sector employees, minus the balance of the Generations Fund.
As at March 31, 2018, the gross debt will stand at $204.5 billion. As a proportion of the economy, this is equivalent to 49.6% of GDP. The debt burden is expected to show a gradual and steady decline over the five-year forecast period. The ratio of gross debt to GDP will be 45.0% as at March 31, 2023.
TABLE G.5
| Gross debt as at March 31 |
| (millions of dollars) |
| | | 2017 | | | 2018 | | | 2019 | | | 2020 | | | 2021 | | | 2022 | | | 2023 | |
| Consolidated direct debt | | 189 366 | | | 195 550 | | | 203 058 | | | 207 978 | | | 214 813 | | | 220 282 | | | 227 102 | |
Plus: Retirement plans and
other employee future
benefits(1) | | 24 647 | | | 21 798 | | | 19 666 | | | 17 155 | | | 14 342 | | | 11 063 | | | 7 545 | |
| Less: Generations Fund | | −10 523 | | | −12 815 | | | −13 306 | | | −14 013 | | | −15 004 | | | −16 269 | | | −17 771 | |
| GROSS DEBT | | 203 490 | | | 204 533 | | | 209 418 | | | 211 120 | | | 214 151 | | | 215 076 | | | 216 876 | |
| % of GDP | | 51.5 | | | 49.6 | | | 49.1 | | | 47.9 | | | 47.1 | | | 45.9 | | | 45.0 | |
| (1) | The net liability for the retirement plans and other employee future benefits is expected to decline mainly because of the Retirement Plans Sinking Fund (RPSF), which is an asset that grows at a faster pace than the corresponding liability. For further details on the retirement plans and other employee future benefits, see section 3. |
| | The Québec | |
| | Government’s Debt | G.19 |
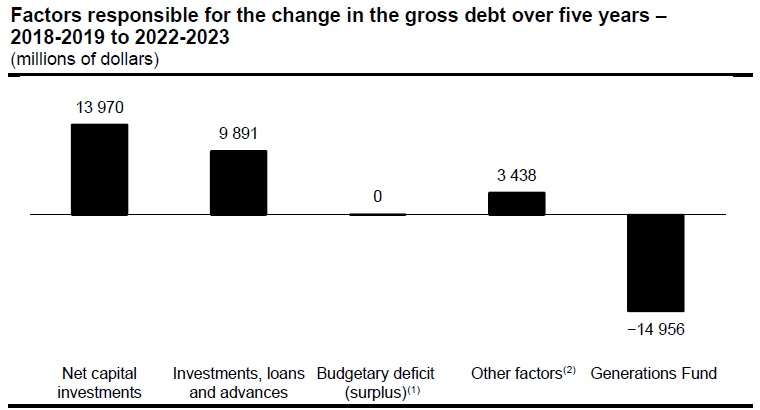
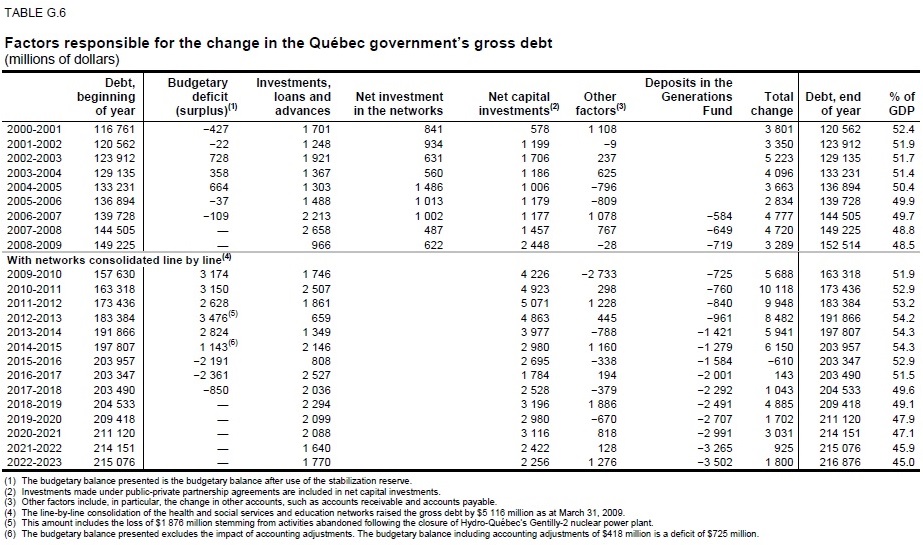
| 1.5.1 | Capital investments: the main factor responsible for the change in the gross debt |
The gross debt will rise in absolute terms over the coming years, mainly because of capital investments, but its weight in the economy will continue to decline.
Over the next five years, from 2018-2019 to 2022-2023, the gross debt will rise overall by $12.3 billion, primarily because of capital investments.2 This factor will increase the gross debt by $14.0 billion.
Investments, loans and advances3 will increase the gross debt by $9.9 billion over five years.
Deposits in the Generations Fund will lead to a $15.0 -billion reduction in the gross debt over five years.
CHART G.7
| | |
| (1) | The budgetary balance presented is the budgetary balance after use of the stabilization reserve. |
| (2) | Other factors include, in particular, the change in other accounts, such as accounts receivable and accounts payable. |
____________________________________
| 2 | These are net capital investments, which consist of gross investments minus depreciation expenses. Even though gross investments have an impact on the gross debt, net capital investments are presented in the factors responsible for the change in the gross debt due to the fact that depreciation expenses are presented in the budgetary balance. |
| 3 | For example, Hydro-Québec pays the government every year a dividend corresponding to 75% of its net earnings. Hydro-Québec uses the portion of net earnings (25%) not paid to the government to fund its own investments, particularly hydroelectric dams. For the government, this constitutes an investment in Hydro-Québec that creates a financial requirement and thus leads to an increase in the gross debt. |
| | Budget 2018-2019 | |
| G.20 | Economic Plan | |
| | The Québec | |
| | Government’s Debt | G.21 |
1.6 Debt representing accumulated deficits
The debt representing accumulated deficits corresponds to the difference between the Québec government’s liabilities and its financial and non-financial assets as a whole. According to the Act to reduce the debt and establish the Generations Fund, this debt is the accumulated deficits figuring in the government’s financial statements plus the balance of the stabilization reserve.
As at March 31, 2018, the debt representing accumulated deficits will stand at $115.1 billion, or 27.9% of GDP. As a proportion of GDP, the debt representing accumulated deficits began to decrease in 2013-2014 and will continue to fall over the coming years, reaching 20.8% as at March 31, 2023.
TABLE G.7
| Factors responsible for the change in the debt representing accumulated deficits |
| (millions of dollars) |
| | | | | | | | | Allocation | | | | | | Revenues | | | | | | | | | | |
| | | Debt, | | | Budgetary | | | to the | | | | | | dedicated to | | | | | | | | | | |
| | | beginning | | | deficit | | | stabilization | | | Accounting | | | Generations | | | Total | | | Debt, end | | | % of | |
| | | of year | | | (surplus)(1) | | | reserve | | | adjustments | | | the Fund | | | change | | | of year | | | GDP | |
| 2012-2013 | | 115 220 | | | 3 476 | (2) | | — | | | 4 880 | | | −961 | | | 7 395 | | | 122 615 | | | 34.6 | |
| 2013-2014 | | 122 615 | | | 2 824 | | | — | | | −2 308 | | | −1 121 | | | −605 | | | 122 010 | | | 33.5 | |
| 2014-2015 | | 122 010 | | | 1 143 | (3) | | — | | | −606 | | | −1 279 | | | −742 | | | 121 268 | | | 32.3 | |
| 2015-2016 | | 121 268 | | | −2 191 | | | 2 191 | | | 306 | | | −1 453 | | | −1 147 | | | 120 121 | | | 31.2 | |
| 2016-2017 | | 120 121 | | | −2 361 | | | 2 361 | | | −719 | | | −2 001 | | | −2 720 | | | 117 401 | | | 29.7 | |
| 2017-2018 | | 117 401 | | | −850 | | | 850 | | | — | | | −2 292 | | | −2 292 | | | 115 109 | | | 27.9 | |
| 2018-2019 | | 115 109 | | | — | | | — | | | — | | | −2 491 | | | −2 491 | | | 112 618 | | | 26.4 | |
| 2019-2020 | | 112 618 | | | — | | | — | | | — | | | −2 707 | | | −2 707 | | | 109 911 | | | 24.9 | |
| 2020-2021 | | 109 911 | | | — | | | — | | | — | | | −2 991 | | | −2 991 | | | 106 920 | | | 23.5 | |
| 2021-2022 | | 106 920 | | | — | | | — | | | — | | | −3 265 | | | −3 265 | | | 103 655 | | | 22.1 | |
| 2022-2023 | | 103 655 | | | — | | | — | | | — | | | −3 502 | | | −3 502 | | | 100 153 | | | 20.8 | |
| (1) | The budgetary balance presented is the budgetary balance after use of the stabilization reserve. |
| (2) | This amount includes the loss of $1 876 million stemming from activities abandoned following the closure of Hydro-Québec’s Gentilly-2 nuclear power plant. |
| (3) | The budgetary balance presented excludes the impact of accounting adjustments. The budgetary balance including accounting adjustments of $418 million is a deficit of $725 million. |
| | Budget 2018-2019 | |
| G.22 | Economic Plan | |
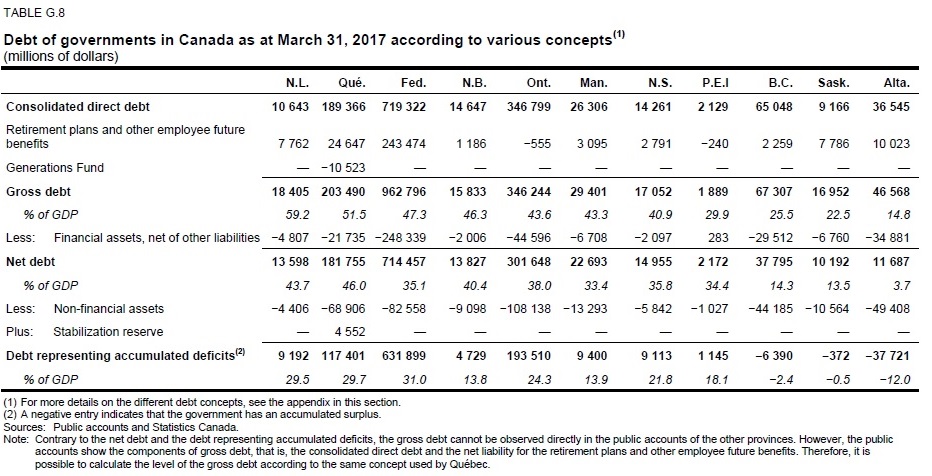
1.7 Comparison of the debt of governments in Canada
On the basis of gross debt and percentage of GDP, Québec is the second most indebted province after Newfoundland and Labrador.
As at March 31, 2017, the federal government’s ratio of debt representing accumulated deficits to GDP was higher than that of each of the provinces.
CHART G.8
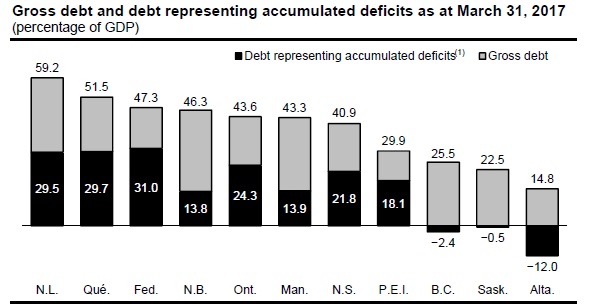
(1) A negative entry indicates that the government has an accumulated surplus. Sources: Public accounts and Statistics Canada.
| | The Québec | |
| | Government’s Debt | G.23 |
| Québec is gradually approaching the |
| the average of the Canadian provinces |
| |
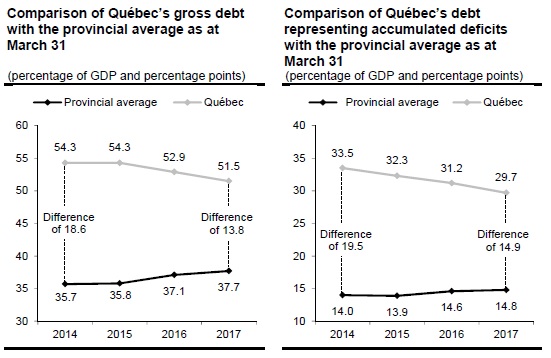
Québec’s debt load is higher than the Canadian provincial average, but the gap is gradually getting narrower. |
|
From March 31, 2014 to March 31, 2017, the gross-debt-to-GDP ratio fell from 54.3% to 51.5% in Québec, while it rose from 35.7% to 37.7% on average in the Canadian provinces.1 The gap with the average of the ten provinces has thus decreased from 18.6 to 13.8 percentage points in three years. |
|
This is also the case of the debt representing accumulated deficits. The gap decreased from 19.5 to 14.9 percentage points between 2014 and 2017. |
| |
 |
| 1 | Weighted averages have been used. |
| | Budget 2018-2019 | |
| G.24 | Economic Plan | |
| | The Québec | |
| | Government’s Debt | G.25 |
1.8 Debt projection up to 2035
Once the debt reduction objectives have been achieved, the debt burden should continue to decrease, thanks to continued fiscal balance and deposits in the Generations Fund.
| — | The debt burden projection up to 2035 includes, as in the case of the projection up to 2023, the use of a sum of $2 billion per year from the Generations Fund to repay maturing borrowings. |
As at March 31, 2035, the gross debt burden should reach 34.6% of GDP, a level lower than the current average of the Canadian provinces (37.7% of GDP as at March 31, 2017).4
| — | Gradual reduction of the debt burden through deposits in the Generations Fund will help to maintain a high level of public infrastructure investment without exerting additional pressure on the level of the debt. |
The debt representing accumulated deficits should reach 5.1% of GDP as at March 31, 2035.
| — | Over that period, Québec could get closer to eliminating the debt representing accumulated deficits, that is, the debt that does not correspond to any assets, commonly called the “grocery debt”. |
| | |
| — | Three Canadian provinces are already in this situation: British Columbia, Alberta and Saskatchewan. |
Gradual elimination of the debt representing accumulated deficits is precisely part of a broader search for greater intergenerational equity. Once this objective has been achieved, the gross debt will correspond solely to assets, in particular investments in public infrastructure, that benefit the taxpayers who shoulder this debt.
The Generations Fund will continue to grow over the years. It should amount to $59.7 billion as at March 31, 2035.
_______________________________________
| 4 | For more information on the projections up to 2034-2035, see the budget paper Generations Fund: Québec is Shedding Its Debt. |
| | Budget 2018-2019 | |
| G.26 | Economic Plan | |
| TABLE G.9 |
| |
| Projections of the debt burden and the balance of the Generations Fund as at March 31 |
| (millions of dollars and percentage of GDP) |
| | | Ratio of gross | | | Ratio of debt representing | | | Balance of the | |
| | | debt to GDP | | | accumulated deficits to GDP | | | Generations Fund | |
| 2019 | | 49.1% | | | 26.4% | | | 13 306 | |
| 2020 | | 47.9% | | | 24.9% | | | 14 013 | |
| 2021 | | 47.1% | | | 23.5% | | | 15 004 | |
| 2022 | | 45.9% | | | 22.1% | | | 16 269 | |
| 2023 | | 45.0% | | | 20.8% | | | 17 771 | |
| 2024 | | 44.3% | | | 19.4% | | | 19 525 | |
| 2025 | | 43.5% | | | 18.1% | | | 21 549 | |
| 2026 | | 42.6% | | | 16.8% | | | 23 855 | |
| 2027 | | 41.7% | | | 15.4% | | | 26 433 | |
| 2028 | | 40.7% | | | 14.1% | | | 29 308 | |
| 2029 | | 39.8% | | | 12.8% | | | 32 498 | |
| 2030 | | 39.0% | | | 11.5% | | | 36 030 | |
| 2031 | | 38.2% | | | 10.2% | | | 39 926 | |
| 2032 | | 37.3% | | | 8.9% | | | 44 214 | |
| 2033 | | 36.4% | | | 7.6% | | | 48 912 | |
| 2034 | | 35.5% | | | 6.4% | | | 54 059 | |
| 2035 | | 34.6% | | | 5.1% | | | 59 678 | |
Note: These are forecasts up to 2023 and projections thereafter.
| | The Québec | |
| | Government’s Debt | G.27 |
2. FINANCING STRATEGY AND DEBT MANAGEMENT
2.1 Financing program
The government’s financing program for 2017-2018 amounts to $17.9 billion, which is $6.6 billion more than forecast in the March 2017 budget.
This upward revision can be attributed mainly to pre-financing for the following year.
TABLE G.10
| The government’s financing program in 2017-2018 |
| (millions of dollars) |
| | | March 2017 | | | Revisions | | | March 2018 | |
| GENERAL FUND | | | | | | | | | |
| Net financial requirements(1) | | 3 013 | | | −3 002 | | | 11 | |
| Repayments of borrowings | | 5 484 | | | 298 | | | 5 782 | |
| Change in cash position(2) | | −5 433 | | | −2 499 | | | −7 932 | |
| Deposits in the Retirement Plans Sinking Fund (RPSF)(3) | | — | | | 1 500 | | | 1 500 | |
| Transactions under the credit policy(4) | | — | | | −577 | | | −577 | |
| Contributions to the Sinking Fund for borrowings | | — | | | 1 684 | | | 1 684 | |
| Pre-financing | | — | | | 9 342 | | | 9 342 | |
| GENERAL FUND | | 3 064 | | | 6 746 | | | 9 810 | |
| FINANCING FUND | | 7 000 | | | 200 | | | 7 200 | |
| FINANCEMENT-QUÉBEC | | 1 200 | | | −300 | | | 900 | |
| TOTAL | | 11 264 | | | 6 646 | | | 17 910 | (5) |
| Including: repayments of borrowings | | 10 992 | | | 308 | | | 11 300 | |
| Note: | A negative entry indicates a source of financing and a positive entry, a financial requirement. |
| (1) | These amounts exclude the net financial requirements of consolidated entities funded through the |
| Financing Fund. They are adjusted to take into account, in particular, the non-receipt of revenues of the RPSF and of funds dedicated to other employee future benefits. |
| (2) | The change in cash position corresponds to pre-financing carried out the previous year. |
| (3) | Deposits in the RPSF are optional. They are recorded in the financing program only once they are made. |
| (4) | Under the credit policy, which is designed to limit financial risk with respect to counterparties, the government disburses or receives amounts following, in particular, movements in exchange rates. These amounts have no effect on the debt. |
| (5) | This data is based on borrowings contracted as at March 14, 2018. |
| | The Québec | |
| | Government’s Debt | G.29 |
The financing program will amount to $13.4 billion in 2018-2019.
For the following four years, from 2019-2020 to 2022-2023, it will average $18.7 billion a year.
Using the Generations Fund to repay maturing borrowings ($2 billion a year as of 2018-2019) will help to reduce the government’s borrowing requirements.
| TABLE G.11 |
| |
| The government’s financing program, 2018-2019 to 2022-2023 |
| (millions of dollars) |
| | | 2018-2019 | | | 2019-2020 | | | 2020-2021 | | | 2021-2022 | | | 2022-2023 | |
| GENERAL FUND | | | | | | | | | | | | | | | |
| Net financial requirements(1) | | 5 012 | | | 2 556 | | | 3 628 | | | 2 764 | | | 4 953 | |
| Repayments of borrowings | | 8 252 | | | 8 215 | | | 7 674 | | | 11 969 | | | 9 467 | |
| Use of the Generations Fund to | | | | | | | | | | | | | | | |
| repay maturing borrowings | | −2 000 | | | −2 000 | | | −2 000 | | | −2 000 | | | −2 000 | |
| Change in cash position(2) | | −9 342 | | | — | | | — | | | — | | | — | |
| GENERAL FUND | | 1 922 | | | 8 771 | | | 9 302 | | | 12 733 | | | 12 420 | |
| FINANCING FUND | | 10 100 | | | 7 500 | | | 7 400 | | | 6 300 | | | 5 700 | |
| FINANCEMENT-QUÉBEC | | 1 400 | | | 2 300 | | | 1 400 | | | 700 | | | 300 | |
| TOTAL | | 13 422 | | | 18 571 | | | 18 102 | | | 19 733 | | | 18 420 | |
| Including: repayments of borrowings | | 16 559 | | | 14 079 | | | 11 580 | | | 15 335 | | | 12 628 | |
Note: A negative entry indicates a source of financing and a positive entry, a financial requirement.
| (1) | These amounts exclude the net financial requirements of consolidated entities funded through the Financing Fund. They are adjusted to take into account, in particular, the non-receipt of revenues of the RPSF and of funds dedicated to other employee future benefits. |
| (2) | The change in cash position corresponds to pre-financing carried out the previous year. |
| | Budget 2018-2019 | |
| G.30 | Economic Plan | |
2.2 Financing strategy
The government aims to borrow at the lowest possible cost. To that end, it applies a strategy for diversifying sources of funding by market, financial instrument and maturity.
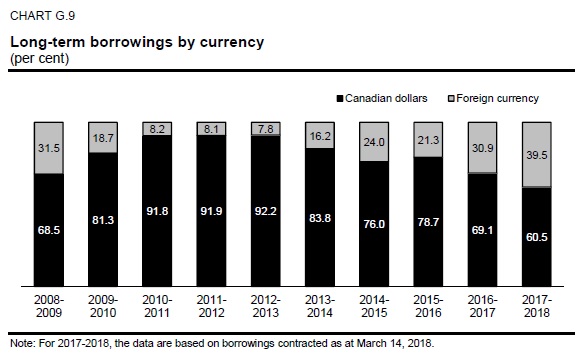
2.2.1 Diversification by market
Financing transactions are carried out regularly on most markets, namely, in Canada, the United States, Europe, Australia and Asia.
From 2008-2009 to 2017-2018, an average of 20% of borrowings were contracted in foreign currency. Nonetheless, the government keeps no exposure of its debt to those currencies (see section 2.5) .
In 2017-2018, the government has carried out 39.5% of its borrowings on foreign markets:
| — | 2.25 billion euros (CAN$3.4 billion); |
| | |
| — | US$2.5 billion (CAN$3.2 billion); |
| | |
| — | 300 million pounds sterling (CAN$521 million). |
| | The Québec | |
| | Government’s Debt | G.31 |
After 2016-2017, this was another exceptional year with regard to financing on foreign markets. Excellent opportunities arose, particularly on the European market, where Québec completed the largest euro issue in its history (2.25 billion euros). The equivalent of this borrowing in Canadian dollars makes it the largest in Québec’s history. Québec also contracted its first borrowing in pounds sterling since 1996.
The government continues to market its bonds by meeting with current and potential buyers on a regular basis. This year, in addition to his annual visit to New York and Europe, the Minister of Finance added a visit to Asia. Asian investors purchase Québec bonds denominated in various currencies, including the Canadian dollar, the U.S. dollar, the Australian dollar, the yen and the euro.
In addition, given that the Chinese capital market is growing significantly and has a promising future, the government is exploring the possibility of issuing bonds in renminbis at some point.
However, it is important to mention that Canada is still the main market on which Québec contracts borrowings. In fact, the proportion of Québec’s gross debt in Canadian dollars is expected to be 81.5% 5 as at March 31, 2018.
____________________________
| 5 | This is the proportion before taking into account interest rate and currency swap agreements. The proportion of Québec’s gross debt in Canadian dollars will be 100% after taking these agreements into account. |
| | Budget 2018-2019 | |
| G.32 | Economic Plan | |
2.2.2 Diversification by instrument
To satisfy investors’ needs, an extensive array of financial products is used in the course of financing transactions.
Long-term instruments consist primarily of bonds (conventional and green) and floating interest rate notes.
CHART G.10

Note: The data are based on borrowings contracted as at March 14, 2018.
| (1) | Savings products issued by Épargne Placements Québec. |
| (2) | The government uses interest rate and currency swap agreements to neutralize interest rate risk. After these agreements are taken into account, the proportion of the gross debt at floating interest rates is expected to stand at 5.0% as at March 31, 2018. |
| (3) | These borrowings are from immigrant investors. The sums advanced by immigrant investors are lent to the government through Investissement Québec. With the income generated by the investments, Investissement Québec funds two assistance programs for Québec businesses: the Business Assistance – Immigrant Investor Program and the Employment Integration Program for Immigrants and Visible Minorities. |
| | The Québec | |
| | Government’s Debt | G.33 |
| Green Bond program |
| |
In 2017, the government engaged in green finance with the launching of a Green Bond program that funds projects providing tangible benefits with regard to protecting the environment, reducing greenhouse gas (GHG) emissions or adapting to climate change. |
| |
In this way, the government is contributing to the development of a socially responsible investment market and facilitating the shift to a low-carbon intensity economy. |
| |
The inaugural $500-million issue of green bonds on February 24, 2017 was a huge success on financial markets. Building on this success, the Québec government launched a second issue of green bonds, also for $500 million, on February 22, 2018. |
| |
Given the demand for Québec’s green bonds and the government’s commitment to the environment, Québec will be a regular issuer of green bonds. Through these two issues, the government is funding public transit projects such as the replacement of Société de transport de Montréal métro cars (with AZUR trains). |
| |
Besides seeking to diversify its sources of funding, the Ministère des Finances du Québec is aligning itself with new infrastructure financing trends. By putting this program in place, Québec is demonstrating not only its commitment to developing the green bond market, but also its commitment to protecting the environment. |
| |
| Highlights |
| |
| – | Québec’s green bonds, which are part of the government’s annual borrowing program, have the same characteristics as conventional bonds as far as price, yield, maturity and credit ratings are concerned. |
| | |
| – | The Green Bond program draws on the Green Bond Principles, a set of core guidelines introduced in 2014 by a group of financial institutions seeking to improve transparency in this rapidly growing market. |
| | |
| – | The framework of Québec’s Green Bond program has received the highest rating possible from CICERO (Center for International Climate Research). |
| | |
| – | Québec and Ontario are the only two provinces that issue green bonds on the Canadian market. |
| | |
| | For further details, please visit:
www.finances.gouv.qc.ca/en/RI_GB_Green_Bonds.asp. |
| | |
| | Budget 2018-2019 | |
| G.34 | Economic Plan | |
2.2.3 Diversification by maturity
Maturities of new borrowings are distributed over time to obtain a stable refinancing profile and ensure the government’s regular presence on capital markets.
In 2017-2018, 30.8% of the borrowings contracted had a maturity of less than 10 years, 53.4% had a maturity of 10 years and 15.8% had a maturity of 30 years or more.
TABLE G.12
| Long-term borrowings(1) contracted in 2017-2018 by maturity |
| (per cent) |
| Maturity | | % | |
| Less than 10 years | | 30.8 | |
| 10 years | | 53.4 | |
| 30 years or more | | 15.8 | |
| TOTAL | | 100.0 | |
Note: The data are based on borrowings contracted as at March 14, 2018. | | | |
| (1) | Long-term borrowings correspond to borrowings with a maturity of more than one year. |
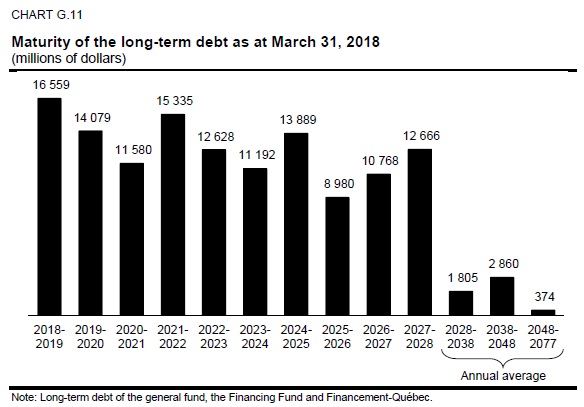
This diversification by maturity is reflected on the maturity of the debt. As at March 31, 2018, the average maturity of the debt, that is, of all borrowings contracted, is expected to be 11 years.
| | The Québec | |
| | Government’s Debt | G.35 |
The following chart shows, for each year, the maturity of the long-term debt as at March 31, 2018. For example, repayments of borrowings will amount to $16 559 million in 2018-2019 and $14 079 million in 2019-2020. The maturity of the debt extends to 2076-2077, with one borrowing maturing on December 1, 2076.
| | Budget 2018-2019 | |
| G.36 | Economic Plan | |
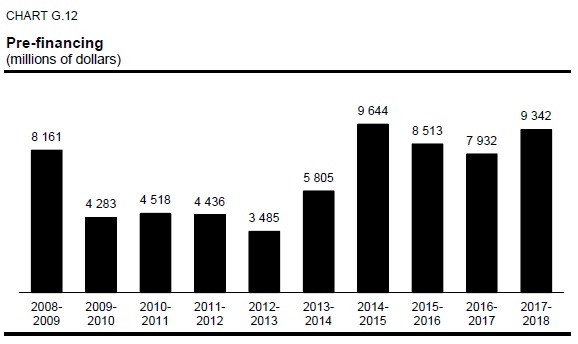
2.3 Pre-financing
The government carries out pre-financing to take advantage of favourable market conditions. These are borrowings that would normally be contracted during the following fiscal year.
In 2017-2018, the government carried out pre-financing totalling $9.3 billion. The average for the past ten years is $6.6 billion per year.
| | The Québec | |
| | Government’s Debt | G.37 |
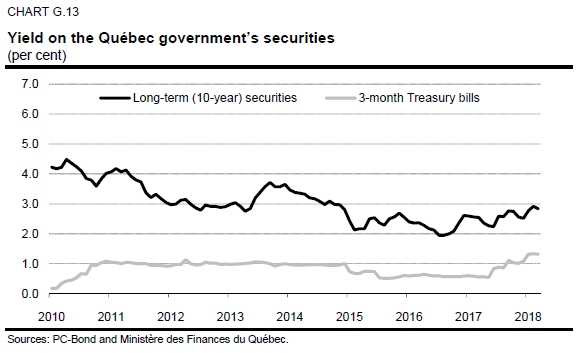
2.4 Yield on Québec’s debt securities
The yield on the Québec government’s 10-year securities is currently about 2.8%, while that on short-term securities is roughly 1.3% . Since the beginning of year 2010, the yield has averaged 3.0% for long-term securities and 0.8% for short-term securities.
The increase in yield observed since early summer 2017 reflects, among other things, the decision by the Bank of Canada to raise its key interest rate.
| | Budget 2018-2019 | |
| G.38 | Economic Plan | |
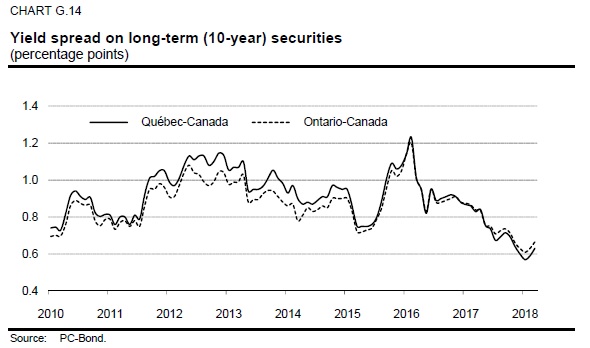
Since January 1, 2010, the spread between the yield on 10-year securities of the Québec government and those of the federal government has varied between 0.6 and 1.2 percentage points. The spread is currently about 0.6 percentage point. The same trend has been observed with regard to the spread between the yield on the long-term securities of Ontario and the federal government.
In June 2017, Standard & Poor’s raised Québec’s credit rating.
Since that announcement, a spread in favour of Québec has been observed between the yield on 10-year securities of Québec and those of Ontario.
| | The Québec | |
| | Government’s Debt | G.39 |
2.5 Debt management strategy
The government’s debt management strategy aims to minimize the cost of debt while limiting the risks related to fluctuations in foreign exchange and interest rates.
The government uses a range of financial instruments, particularly interest rate and currency swap agreements (swaps), to achieve desired debt proportions by currency and interest rate.
[ ] Structure of the gross debt by currency
As at March 31, 2018, before taking swaps into account, 81.5% of the gross debt is expected to be in Canadian dollars, 9.8% in U.S. dollars, 6.7% in euros, 0.8% in Australian dollars, 0.8% in Swiss francs and 0.4% in other foreign currencies (in yens, in Hong Kong dollars and in pounds sterling).
However, after taking swaps into account, the gross debt in its entirety will be denominated in Canadian dollars.
Since 2012-2013, the government has maintained no exposure of its debt to foreign currencies.
Swaps help to neutralize the variations of foreign exchange rates on debt service.
TABLE G.13
| Structure of the gross debt by currency |
| (per cent) |
| | | Before swaps | | | After swaps | |
| Canadian dollar | | 81.5 | | | 100.0 | |
| U.S. dollar | | 9.8 | | | 0.0 | |
| Euro | | 6.7 | | | 0.0 | |
| Australian dollar | | 0.8 | | | 0.0 | |
| Swiss franc | | 0.8 | | | 0.0 | |
| Other (yen, Hong Kong dollar, pound sterling) | | 0.4 | | | 0.0 | |
| TOTAL | | 100.0 | | | 100.0 | |
Note: Gross debt including pre-financing.
| | Budget 2018-2019 | |
| G.40 | Economic Plan | |
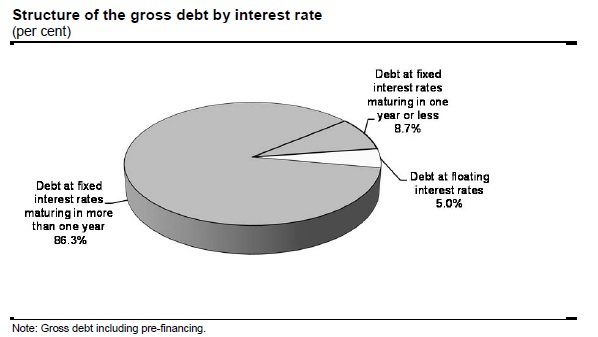
[ ] Structure of the gross debt by interest rate
The government keeps part of its debt at fixed interest rates and part at floating interest rates.
As at March 31, 2018, after taking swaps into account, the proportion of the gross debt at fixed interest rates is expected to be 95.0%, while the proportion at floating interest rates is expected to be of 5.0% .
In addition, as at March 31, 2018, the proportion of the gross debt repayable or subject to an interest rate change in 2018-2019 is expected to be 13.7% . This proportion includes the debt at floating interest rates (5.0%) as well as the debt at fixed rates, which will have to be repaid6 or refinanced in 2018-2019 (8.7%) .
CHART G.15
____________________________
| 6 | Includes, in particular, long-term borrowings that will be repaid from the $2 billion taken from the Generations Fund in 2018-2019. |
| | The Québec | |
| | Government’s Debt | G.41 |
| Summary of long-term borrowings in 2017-2018 | | | | | | |
| Currency | | $ million | | | % | |
| CANADIAN DOLLAR | | | | | | |
| Conventional bonds | | 7 385 | | | 41.2 | |
| Floating interest rate notes | | 1 501 | | | 8.4 | |
| Immigrant investors | | 1 080 | | | 6.0 | |
| Green bonds | | 499 | | | 2.8 | |
| Savings products issued by Épargne Placements Québec | | 376 | | | 2.1 | |
| Subtotal | | 10 841 | | | 60.5 | |
| OTHER CURRENCIES | | | | | | |
| Euro | | 3 360 | | | 18.8 | |
| U.S. dollar | | 3 188 | | | 17.8 | |
| Pound sterling | | 521 | | | 2.9 | |
| Subtotal | | 7 069 | | | 39.5 | |
| TOTAL | | 17 910 | | | 100.0 | |
| Note: | The data are based on borrowings contracted as at March 14, 2018. |
| | |
| | Budget 2018-2019 | |
| G.42 | Economic Plan | |
| 3. | INFORMATION ON THE RETIREMENT PLANS AND ON FUNDS DEPOSITED WITH THE CAISSE DE DÉPÔT ET PLACEMENT DU QUÉBEC |
3.1 Retirement plans liability
The Québec government covers its share of the funding of its employees’ retirement plans, which are defined-benefit plans. In its financial statements, the government discloses the present value of the retirement benefits that it will pay to its employees, taking into account the conditions governing their plan as well as their years of service. This value is called the retirement plans liability. It does not take into account the sums accumulated to pay retirement benefits, particularly the Retirement Plans Sinking Fund (RPSF).
The net liability for the retirement plans and other employee future benefits, which is included in the gross debt, is calculated by subtracting from the liability the balance of the sums accumulated to pay for these benefits. The balances concerned are those of the RPSF, the Accumulated Sick Leave Fund and the Survivor’s Pension Plan Fund.
As at March 31, 2017, the net liability for the retirement plans and other employee future benefits stood at $24.6 billion.
TABLE G.14
| Net liability for the retirement plans and other employee future benefits as at March 31, 2017 |
| (millions of dollars) |
| Retirement plans | | | |
| Liability for the Government and Public Employees Retirement Plan (RREGOP) | | 57 634 | |
| Liability for the Pension Plan of Management Personnel (PPMP) and the | | | |
| Retirement Plan for Senior Officials (RPSO) | | 13 613 | |
| Liability for the other plans(1) | | 18 028 | |
| Retirement plans liability | | 89 275 | |
| Less: Retirement Plans Sinking Fund (RPSF) | | −64 598 | |
| Net retirement plans liability | | 24 677 | |
| Other employee future benefits | | | |
| Other employee future benefits liability | | 1 479 | |
| Less: Funds dedicated to other employee future benefits | | −1 509 | |
| Net other employee future benefits liability | | −30 | |
| NET LIABILITY FOR THE RETIREMENT PLANS AND OTHER EMPLOYEE FUTURE BENEFITS | | 24 647 | |
| (1) | The liability for the other plans takes into account the assets of the other plans, including those of the Pension Plan of the Université du Québec. |
| | The Québec | |
| | Government’s Debt | G.43 |
| The actuarial obligation in regard to certain retirees under the Pension Plan |
| of Management Personnel is assumed by the government |
| |
In December 2016, an agreement was reached between the government and its management personnel on the working conditions of those staff members. Under the Act to foster the financial health and sustainability of the Pension Plan of Management Personnel and to amend various legislative provisions (S.Q. 2017, chapter 7), the government is assuming responsibility for paying the pensions of retirees under the Pension Plan for Management Personnel (PPMP) as at December 31, 2014 and of their surviving spouses. In exchange, the portion of the PPMP participants’ fund attributable to those benefits was transferred to the Retirement Plans Sinking Fund (RPSF) on June 1, 2017. At that date, the amount of the obligations and of the transferred funds both totalled $5 billion. |
| |
Since the amount of the additional obligations being charged to the government was equivalent to the amount of the assets received by the RPSF, no material impact on the net retirement plans liability was recognized at the time of this transfer. |
| |
| | Budget 2018-2019 | |
| G.44 | Economic Plan | |
[ ] Annual retirement plans expenditure
Every year, the government records its expenditure as an employer with regard to the retirement plans. This expenditure comprises:
| — | the net cost of vested benefits, namely, the present value of retirement benefits that employees have accumulated for work performed during the year, net of contributions paid, that is, $2 293 million in 2016-2017; |
| | |
| — | the amortization of revisions to the government’s actuarial obligations arising from previous updates of actuarial valuations, for a cost of $633 million in 2016-2017. |
In 2016-2017, government spending in respect of the retirement plans thus stood at $2 926 million.
TABLE G.15
| Spending in respect of the retirement plans |
| (millions of dollars) |
| | | 2016-2017 | |
| Net cost of vested benefits | | 2 293 | |
| Amortization of revisions stemming from actuarial valuations | | 633 | (1) |
| SPENDING IN RESPECT OF THE RETIREMENT PLANS | | 2 926 | |
| (1) | This amount includes the impact of the changes made to certain plans, mainly RREGOP (decrease of $672 million). |
| | The Québec | |
| | Government’s Debt | G.45 |
[ ] Interest on the retirement plans liability
The government records an interest charge on the retirement plans liability. This stems from the fact that, historically, it decided to manage its contributions to the retirement plans of its employees internally rather than have an external fund manage them.
This reduced borrowings on financial markets and growth in the direct debt. On the other hand, the commitments in respect of the retirement plans of government employees are shown as a liability and the government must record an interest charge calculated on the value of the actuarial obligations in respect of these plans.
However, the investment income of the RPSF must be subtracted from this amount. The interest charge on the retirement plans liability is included in the government’s debt service.
TABLE G.16
| Interest on the retirement plans liability |
| (millions of dollars) |
| | | 2016-2017 | |
| Interest on the actuarial obligations relating to the retirement plans(1) | | 5 683 | |
| Less: Investment income of the RPSF | | −3 360 | |
| INTEREST ON THE RETIREMENT PLANS LIABILITY | | 2 323 | |
| (1) | This interest is net of the income of specific funds of the plans. |
| | Budget 2018-2019 | |
| G.46 | Economic Plan | |
[ ] Retirement Plans Sinking Fund
The Retirement Plans Sinking Fund (RPSF) is an asset that was created in 1993 for the purpose of paying the retirement benefits of public and parapublic sector employees. As at March 31, 2018, the RPSF’s book value will be $75 416 million.
TABLE G.17
| Change in the RPSF |
| (millions of dollars) |
| | | Book value, | | | | | | Imputed | | | Book value, | |
| | | beginning of year | | | Deposits | | | investment income | | | end of year | |
| 1993-1994 | | — | | | 850 | | | 4 | | | 854 | |
| 1994-1995 | | 854 | | | — | | | −5 | | | 849 | |
| 1995-1996 | | 849 | | | — | | | 74 | | | 923 | |
| 1996-1997 | | 923 | | | — | | | 91 | | | 1 014 | |
| 1997-1998 | | 1 095 | (1) | | — | | | 84 | | | 1 179 | |
| 1998-1999 | | 1 179 | | | 944 | | | 86 | | | 2 209 | |
| 1999-2000 | | 2 209 | | | 2 612 | | | 219 | | | 5 040 | |
| 2000-2001 | | 5 040 | | | 1 607 | | | 412 | | | 7 059 | |
| 2001-2002 | | 7 059 | | | 2 535 | | | 605 | | | 10 199 | |
| 2002-2003 | | 10 199 | | | 900 | | | 741 | | | 11 840 | |
| 2003-2004 | | 11 840 | | | 1 502 | | | 862 | | | 14 204 | |
| 2004-2005 | | 14 204 | | | 3 202 | | | 927 | | | 18 333 | |
| 2005-2006 | | 18 333 | | | 3 000 | | | 1 230 | | | 22 563 | |
| 2006-2007 | | 22 437 | (1) | | 3 000 | | | 1 440 | | | 26 877 | |
| 2007-2008 | | 26 877 | | | 3 000 | | | 1 887 | | | 31 764 | |
| 2008-2009 | | 31 749 | (2) | | 2 100 | | | 2 176 | | | 36 025 | |
| 2009-2010 | | 36 025 | | | — | | | 2 175 | | | 38 200 | |
| 2010-2011 | | 38 200 | | | 2 000 | | | 2 065 | | | 42 265 | |
| 2011-2012 | | 42 265 | | | 1 000 | | | 2 087 | | | 45 352 | |
| 2012-2013 | | 45 352 | | | 1 000 | | | 1 992 | | | 48 344 | |
| 2013-2014 | | 48 344 | | | 1 000 | | | 1 989 | | | 51 333 | |
| 2014-2015 | | 51 333 | | | 1 500 | | | 2 430 | | | 55 263 | |
| 2015-2016 | | 55 263 | | | 1 500 | | | 2 975 | | | 59 738 | |
| 2016-2017 | | 59 738 | | | 1 500 | | | 3 360 | | | 64 598 | |
| 2017-2018 | | 64 598 | | | 6 571 | (3) | | 4 247 | | | 75 416 | |
| (1) | These amounts take into account restatements arising from the government accounting reforms of 1997-1998 and 2006-2007. |
| (2) | This amount takes into account an adjustment arising from consideration of the expected average remaining service life (EARSL) of participants in the PPMP. |
| (3) | This amount includes deposits totalling $1.5 billion and the transfer of approximately $5 billion from the participants’ fund of the PPMP under the Act to foster the financial health and sustainability of the Pension Plan of Management Personnel and to amend various legislative provisions (S.Q. 2017, chapter 7). |
| | The Québec | |
| | Government’s Debt | G.47 |
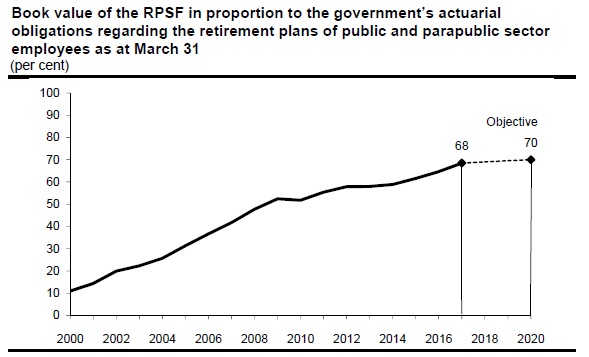
[ ] A flexible deposit policy
In December 1999, as part of the agreement concluded for the renewal of its employees’ collective agreements, the government set the objective that the book value of the sums accumulated in the RPSF would be equal, in 2020, to 70% of its actuarial obligations in regard to the retirement plans of public and parapublic sector employees.
However, the government has all the necessary flexibility in applying this policy. Deposits in the RPSF are made only when market conditions are favourable, particularly with respect to interest rates and market receptiveness to bond issues.
As at March 31, 2017, the RPSF’s book value represented 68% of the government’s actuarial obligations in regard to the retirement plans of public and parapublic sector employees.
CHART G.16
| | Budget 2018-2019 | |
| G.48 | Economic Plan | |
[ ] A decline in debt service
Deposits in the RPSF entail a reduction in the government’s debt service. Indeed, the rates of return on funds managed by the Caisse de dépôt et placement du Québec are generally higher than interest rates on Québec government bonds issued to finance deposits in the RPSF.
Therefore, the income of the RPSF, which is applied against the government’s debt service, is usually higher than the additional interest charge that arises from new borrowings. This leads to a net decrease in the government’s debt service.
Since the RPSF was created, the return obtained by the Caisse has been higher than the cost of new borrowings by the government 19 years out of 24.
| — | From 1994 to 2017, the average return was 7.2%, while the average cost of new borrowings was 5.0%, which represents a difference of 2.2 percentage points. |
| | |
| — | Over the past nine years, from 2009 to 2017, so as to exclude the global financial crisis of 2008, the average return was 9.6%, while the average cost of new borrowings was 3.2% for this period, which represents a difference of 6.4 percentage points. |
| | The Québec | |
| | Government’s Debt | G.49 |
TABLE G.18
| Comparison of the RPSF’s annual return and the Québec government’s borrowing costs |
| (per cent, on a calendar year basis) |
| | Return of the RPSF | Cost of new borrowings(1) | Difference (percentage points) |
| 1994 | −3.3 | 9.2 | −12.5 |
| 1995 | 17.0 | 8.9 | 8.1 |
| 1996 | 16.1 | 7.7 | 8.4 |
| 1997 | 13.4 | 6.5 | 6.9 |
| 1998 | 10.4 | 5.8 | 4.6 |
| 1999 | 15.3 | 6.0 | 9.3 |
| 2000 | 7.2 | 6.5 | 0.7 |
| 2001 | −4.7 | 6.1 | −10.8 |
| 2002 | −8.5 | 5.8 | −14.3 |
| 2003 | 14.9 | 5.2 | 9.7 |
| 2004 | 11.4 | 5.0 | 6.4 |
| 2005 | 13.5 | 4.5 | 9.0 |
| 2006 | 13.5 | 4.6 | 8.9 |
| 2007 | 5.2 | 4.7 | 0.5 |
| 2008 | −25.6 | 4.5 | −30.1 |
| 2009 | 10.7 | 4.4 | 6.3 |
| 2010 | 13.4 | 4.1 | 9.3 |
| 2011 | 3.5 | 3.7 | −0.2 |
| 2012 | 9.4 | 3.0 | 6.4 |
| 2013 | 12.6 | 3.3 | 9.3 |
| 2014 | 11.9 | 3.2 | 8.7 |
| 2015 | 8.3 | 2.4 | 5.9 |
| 2016 | 7.8 | 2.2 | 5.6 |
| 2017 | 9.0 | 2.5 | 6.5 |
(1) The government’s borrowing costs correspond to the yield on 10-year maturity Québec bonds.
Source: PC-Bond for the yield on 10-year maturity Québec bonds.
| | Budget 2018-2019 | |
| G.50 | Economic Plan | |
[ ] Anticipated decrease in the net retirement plans liability
The net liability for the retirement plans and other employee future benefits will decrease rapidly in the coming years, reaching $7.5 billion as at March 31, 2023. The pace of the decrease is such that the net liability for the retirement plans and other employee future benefits could be eliminated in the medium term.
The net liability for the retirement plans and other employee future benefits is calculated by subtracting, in particular, the value of the RPSF from the liability. Since the RPSF’s value is expected to grow more quickly than the liability, the net liability is expected to decline. Indeed, the accumulation phase of the RPSF is ongoing. This fund shows continued growth driven by returns and by the absence of withdrawals. The corresponding liability is growing less rapidly because it takes benefit payments into account.
CHART G.17
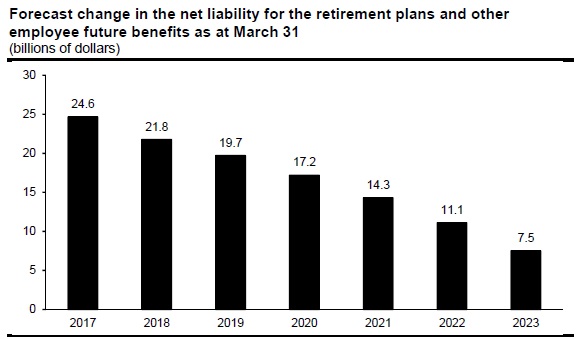
Note: | The decrease observed as at March 31, 2018 in the net liability for the retirement plans and other employee future benefits can be explained, in particular, by deposits totalling $1.5 billion in the RPSF in 2017-2018. |
| | The Québec | |
| | Government’s Debt | G.51 |
| 3.2 | Returns on the main funds deposited by the Ministère des Finances with the Caisse de dépôt et placement du Québec |
Funds deposited by the Ministère des Finances with the Caisse de dépôt et placement du Québec (the RPSF, the Generations Fund and the Accumulated Sick Leave Fund) are managed in accordance with an investment policy established by the Ministère des Finances in cooperation with the Caisse.
This investment policy is established taking several factors into account, including 10-year return, standard deviation and correlation forecasts for various categories of assets, opportunities for investing in these assets and recommendations of the Caisse.
In 2017, the return on funds deposited by the Ministère des Finances with the Caisse de dépôt et placement du Québec was 8.97% for the RPSF, 8.52% for the Generations Fund and 8.97% for the Accumulated Sick Leave Fund. The investment policy of these funds is presented in the box on page G.55.
TABLE G.19
| Market value and return in 2017 of the main funds deposited by the Ministère des Finances with the Caisse de dépôt et placement du Québec |
| | | Market value as at |
| | Return | December 31, 2017 |
| | (%) | ($ million) |
| Retirement Plans Sinking Fund (RPSF) | 8.97 | 78 468 |
| Generations Fund | 8.52 | 13 780 |
| Accumulated Sick Leave Fund (ASLF) | 8.97 | 1 191 |
| | Budget 2018-2019 | |
| G.52 | Economic Plan | |
3.2.1 Retirement Plans Sinking Fund
The RPSF posted a return of 8.97% in 2017. Its market value was $78 468 million as at December 31, 2017.
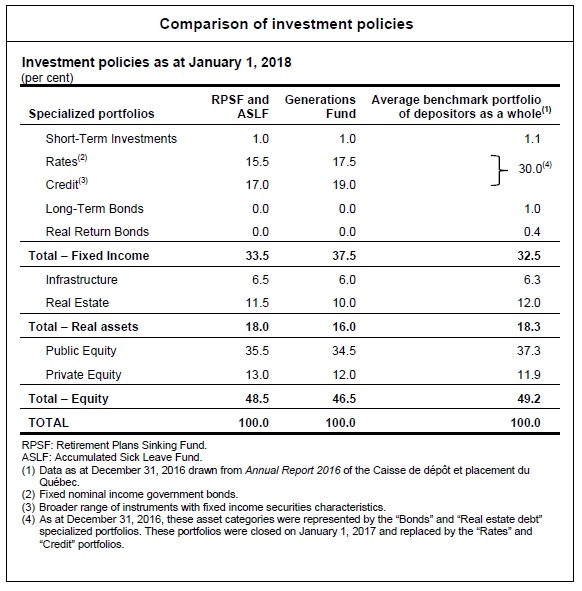
The investment policy of the RPSF consists of 33.5% fixed-income securities (e.g. bonds), 18.0% real assets (real estate and infrastructure) and 48.5% equities.
TABLE G.20
| Investment policy of the RPSF as at January 1, 2018 |
| (per cent) |
| | Benchmark portfolio of the | Average benchmark portfolio |
| | RPSF | of depositors as a whole(1) |
| Fixed-income securities | 33.5 | 32.5 |
| Real assets | 18.0 | 18.3 |
| Equities | 48.5 | 49.2 |
| TOTAL | 100.0 | 100.0 |
(1) Data as at December 31, 2016 drawn from Annual Report 2016 of the Caisse de dépôt et placement du Québec.
With its investment policy, the RPSF should generate an annual return of 6.35% . It is important to note that the RPSF’s investment policy is based on a long-term horizon and constitutes the benchmark portfolio for the Caisse. However, through active management, the Caisse adjusts the allocation of the RPSF’s assets, particularly to take fluctuations in the economic and financial situation into account.
| | The Québec | |
| | Government’s Debt | G.53 |
3.2.2 Generations Fund
The Generations Fund posted a return of 8.52% in 2017. Its market value was $13 780 million as at December 31, 2017.
The investment policy of the Generations Fund consists of 37.5% fixed-income securities (e.g. bonds), 16.0% real assets (real estate and infrastructure) and 46.5% equities.
TABLE G.21
| Investment policy of the Generations Fund as at January 1, 2018 |
| (per cent) |
| | Benchmark portfolio of the | Average benchmark portfolio |
| | Generations Fund | of depositors as a whole(1) |
| Fixed-income securities | 37.5 | 32.5 |
| Real assets | 16.0 | 18.3 |
| Equities | 46.5 | 49.2 |
| TOTAL | 100.0 | 100.0 |
(1) Data as at December 31, 2016 drawn from Annual Report 2016 of the Caisse de dépôt et placement du Québec.
3.2.3 Accumulated Sick Leave Fund
The Accumulated Sick Leave Fund (ASLF) posted a return of 8.97% in 2017. Its market value was $1 191 million as at December 31, 2017.
The assets of the ASLF are managed by the Caisse in accordance with an investment policy established by the Ministère des Finances in cooperation with the Caisse. The ASLF’s investment policy is identical to that of the RPSF.
| | Budget 2018-2019 | |
| G.54 | Economic Plan | |
| | The Québec | |
| | Government’s Debt | G.55 |
4. CREDIT RATINGS
4.1 The Québec government’s credit ratings
A borrower’s credit rating measures its capacity to pay the interest on its debt and repay the principal at maturity. To establish the credit rating of a borrower like the Québec government, credit rating agencies analyze a series of factors. Among the main factors are the size, structure and vitality of the economy, the situation on the labour market, fiscal competitiveness and the budgetary situation, as well as debt and liquidity levels.
To express the quality of a borrower’s credit, credit rating agencies use rating scales, namely, a scale for long-term debt and a scale for short-term debt.
| | The Québec | |
| | Government’s Debt | G.57 |
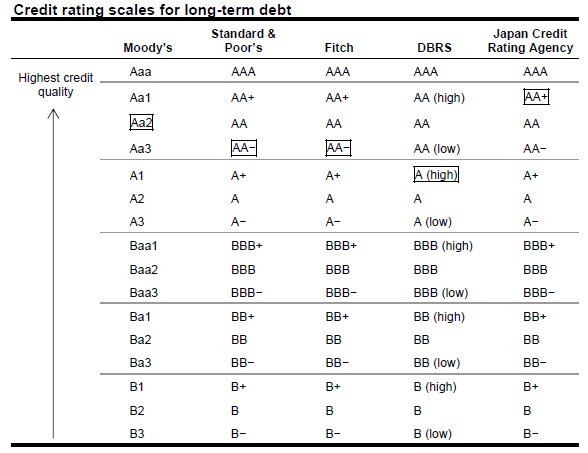
[ ] Credit ratings for long-term debt
The following table shows the rating scales used by rating agencies for long-term debt. The higher the credit quality, the higher will be the rating on the scale. This means, for example, that a borrower rated “AA” presents a lower credit risk than a borrower rated “A”.
The Québec government’s current credit ratings are shown in the boxes. They differ from one credit rating agency to another because of the methodology used by each agency to determine credit risk.
TABLE G.22
| | Budget 2018-2019 | |
| G.58 | Economic Plan | |
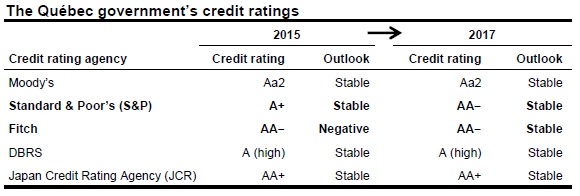
[ ] Increase in Québec’s credit rating
In June 2017, rating agency Standard & Poor’s (S&P) upgraded Québec’s credit rating from “A+” to “AA−”, a first since 1993. In fact, Québec recovered the credit rating it had with S&P from 1982 to 1993.
This improvement in Québec’s credit rating can be attributed to the government’s responsible management of public finances. The gross debt burden has been declining since 2015-2016. Budgetary surpluses were posted in 2015-2016 and 2016-2017. A budgetary surplus is forecast in 2017-2018 and the budget is expected to remain balanced in subsequent years.
S&P also explained that its decision was based on the fact that Quebec’s economy is very strong and diversified. It includes major sectors such as aerospace, transportation, telecommunications and aluminium production.
In 2017, the other credit rating agencies (Moody’s, Fitch, DBRS and Japan Credit Rating Agency) affirmed Québec’s credit rating with a stable outlook.
It should be recalled that in June 2016, Fitch had upgraded the outlook related to Québec’s credit rating by raising it from “negative” to “stable”, due to the return to a balanced budget. Fitch had previously downgraded this outlook in December 2013, following the postponement of a balanced budget to 2015-2016, announced in November 2013.
TABLE G.23
| | The Québec | |
| | Government’s Debt | G.59 |
[ ] Change in Québec’s credit ratings
The following chart shows the change in Québec’s credit ratings since 2002. In June 2017, S&P raised Québec’s credit rating by one notch, from “A+” to “AA−”.
The three main international credit rating agencies (Moody's, S&P and Fitch) now assign Québec a credit rating in the “double A” category.
CHART G.18

| | Budget 2018-2019 | |
| G.60 | Economic Plan | |
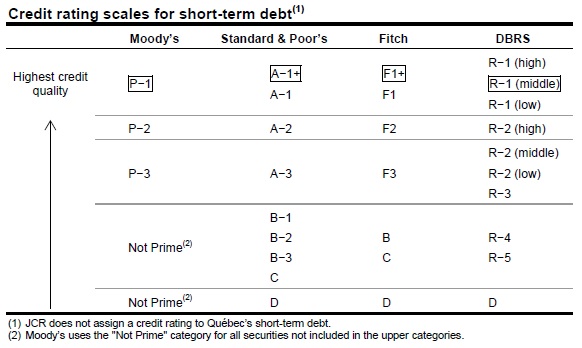
[ ] Credit ratings for short-term debt
The following table shows the rating scales used by rating agencies for short-term debt. The higher the credit quality, the higher will be the rating on the scale. The Québec government’s current credit ratings are shown in the boxes.
TABLE G.24
| | The Québec | |
| | Government’s Debt | G.61 |
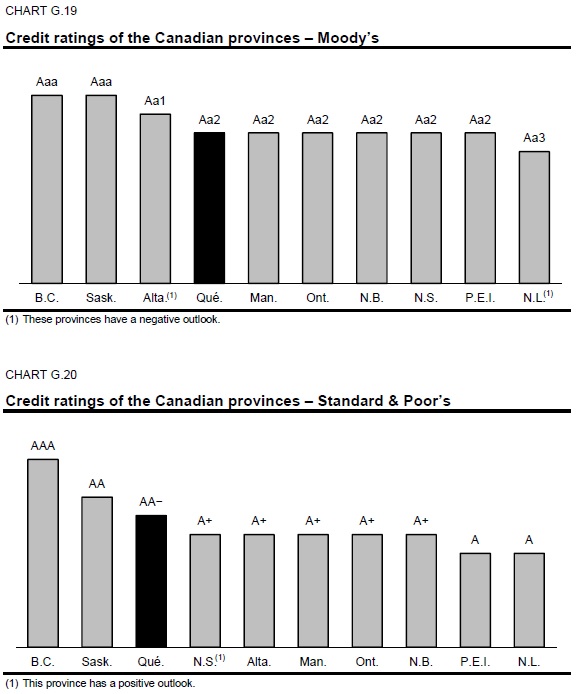
| 4.2 | Comparison of the credit ratings of the Canadian provinces |
The following charts show the credit ratings of the Canadian provinces as at March 14, 2018. No chart is given for JCR since Québec is the only province that receives a credit rating from that agency.
| | Budget 2018-2019 | |
| G.62 | Economic Plan | |

| | The Québec | |
| | Government’s Debt | G.63 |
APPENDIX: DIFFERENT CONCEPTS OF DEBT
Several concepts of debt are used to measure a government’s indebtedness. The following table presents data on Québec’s debt according to three concepts, namely, gross debt, net debt and debt representing accumulated deficits.
TABLE G.25
| Debt of the Québec government as at March 31 |
| (millions of dollars) |
| | | 2017 | | | 2018 | | | 2019 | | | 2020 | | | 2021 | | | 2022 | | | 2023 | |
GROSS DEBT(1) | | 203 490 | | | 204 533 | | | 209 418 | | | 211 120 | | | 214 151 | | | 215 076 | | | 216 876 | |
% of GDP | | 51.5 | | | 49.6 | | | 49.1 | | | 47.9 | | | 47.1 | | | 45.9 | | | 45.0 | |
Less: Financial assets, net of other liabilities | | −21 735 | | | −23 392 | | | −25 985 | | | −26 478 | | | −28 905 | | | −30 673 | | | −33 719 | |
NET DEBT | | 181 755 | | | 181 141 | | | 183 433 | | | 184 642 | | | 185 246 | | | 184 403 | | | 183 157 | |
% of GDP | | 46.0 | | | 43.9 | | | 43.0 | | | 41.9 | | | 40.7 | | | 39.4 | | | 38.0 | |
Less: Non-financial assets | | −68 906 | | | −71 434 | | | −74 630 | | | −77 610 | | | −80 726 | | | −83 148 | | | −85 404 | |
Plus: Stabilization reserve | | 4 552 | | | 5 402 | | | 3 815 | | | 2 879 | | | 2 400 | | | 2 400 | | | 2 400 | |
DEBT REPRESENTING ACCUMULATED DEFICITS(2) | | 117 401 | | | 115 109 | | | 112 618 | | | 109 911 | | | 106 920 | | | 103 655 | | | 100 153 | |
% of GDP | | 29.7 | | | 27.9 | | | 26.4 | | | 24.9 | | | 23.5 | | | 22.1 | | | 20.8 | |
| (1) | The gross debt excludes pre-financing and takes into account the sums accumulated in the Generations Fund. |
| (2) | According to the Act to reduce the debt and establish the Generations Fund, the debt representing accumulated deficits consists of the accumulated deficits figuring in the government’s financial statements plus the balance of the stabilization reserve. |
| | The Québec | |
| | Government’s Debt | G.65 |
[ ] Net debt
The net debt is equal to the Québec government’s liabilities less its financial assets. It represents the debt that has funded capital investments and current expenditures.
As at March 31, 2018, the net debt will stand at $181.1 billion, or 43.9% of GDP. As a proportion of GDP, the net debt began to decrease in 2013-2014 and will continue to fall over the coming years, reaching 38.0% of GDP as at March 31, 2023.
TABLE G.26
| Factors responsible for the change in the net debt |
| (millions of dollars) |
| | | | | | Revenues | | | |
| | Net debt, | Budgetary | | | dedicated to the | | Net debt, | |
| | beginning | deficit | Net capital | | Generations | Total | end of | % of |
| | of year | (surplus)(1) | investments | Other | Fund | change | year | GDP |
| 2012-2013 | 167 700 | 3 476(2) | 4 863 | 4 959 | −961 | 12 337 | 180 037 | 50.9 |
| 2013-2014 | 180 037 | 2 824 | 3 977 | −2 302 | −1 121 | 3 378 | 183 415 | 50.3 |
| 2014-2015 | 183 415 | 1 143(3) | 2 980 | −572 | −1 279 | 2 272 | 185 687 | 49.4 |
| 2015-2016 | 185 687 | −2 191 | 2 695 | 287 | −1 453 | −662 | 185 025 | 48.1 |
| 2016-2017 | 185 025 | −2 361 | 1 784 | −692 | −2 001 | −3 270 | 181 755 | 46.0 |
| 2017-2018 | 181 755 | −850 | 2 528 | — | −2 292 | −614 | 181 141 | 43.9 |
| 2018-2019 | 181 141 | — | 3 196 | 1 587 | −2 491 | 2 292 | 183 433 | 43.0 |
| 2019-2020 | 183 433 | — | 2 980 | 936 | −2 707 | 1 209 | 184 642 | 41.9 |
| 2020-2021 | 184 642 | — | 3 116 | 479 | −2 991 | 604 | 185 246 | 40.7 |
| 2021-2022 | 185 246 | — | 2 422 | — | −3 265 | −843 | 184 403 | 39.4 |
| 2022-2023 | 184 403 | — | 2 256 | — | −3 502 | −1 246 | 183 157 | 38.0 |
| (1) | The budgetary balance presented is the budgetary balance after use of the stabilization reserve. |
| (2) | This amount includes the loss of $1 876 million stemming from activities abandoned following the closure of Hydro-Québec’s Gentilly-2 nuclear power plant. |
| (3) | The budgetary balance presented excludes the impact of accounting adjustments. The budgetary balance including accounting adjustments of $418 million is a deficit of $725 million. |
| | Budget 2018-2019 | |
| G.66 | Economic Plan | |
[ ] Public sector debt
The public sector debt includes the government’s gross debt as well as the debt of Hydro-Québec, the municipalities, universities other than the Université du Québec and its constituents, and other government enterprises. This debt has served, in particular, to fund public infrastructure, such as roads, schools, hospitals, hydroelectric dams and water treatment plants.
As at March 31, 2018, Québec’s public sector debt will stand at $273.3 billion, or 66.3% of GDP. These figures must be put into perspective for they do not take into account the economic value of certain assets held by the government, such as Hydro-Québec, the Société des alcools du Québec and Loto-Québec.
The ratio of public sector debt has been falling since 2015-2016.
TABLE G.27
| Public sector debt as at March 31 |
| (millions of dollars) |
| | | 2014 | | | 2015 | | | 2016 | | | 2017 | | | 2018 | |
| Government’s gross debt | | 197 807 | | | 203 957 | | | 203 347 | | | 203 490 | | | 204 533 | |
| Hydro-Québec | | 40 361 | | | 41 662 | | | 43 843 | | | 42 882 | | | 43 078 | |
| Municipalities(1) | | 22 622 | | | 23 305 | | | 23 846 | | | 24 058 | | | 24 008 | |
| Universities other than the Université du | | | | | | | | | | | | | | | |
| Québec and its constituents(2) | | 1 610 | | | 1 624 | | | 1 608 | | | 1 656 | | | 1 656 | |
| Other government enterprises(3) | | 433 | | | 383 | | | 308 | | | 258 | | | — | |
| PUBLIC SECTOR DEBT | | 262 833 | | | 270 931 | | | 272 952 | | | 272 344 | | | 273 275 | |
| % of GDP | | 72.1 | | | 72.1 | | | 71.0 | | | 69.0 | | | 66.3 | |
| (1) | These amounts correspond to the long-term debt contracted by municipalities in their own name. Part of this debt is subsidized by the government ($3 451 million as at March 31, 2018). |
| (2) | These amounts correspond to the debt contracted by universities other than the Université du Québec and its constituents in their own name. Part of this debt is subsidized by the government ($1 012 million as at March 31, 2018). |
| (3) | These amounts correspond to the debt of the Financing Fund used to finance government enterprises and entities not included in the reporting entity. As of 2018, this debt is included in the gross debt ($218 million as at March 31, 2018). |
| | The Québec | |
| | Government’s Debt | G.67 |